Embed Size (px)
Citation preview
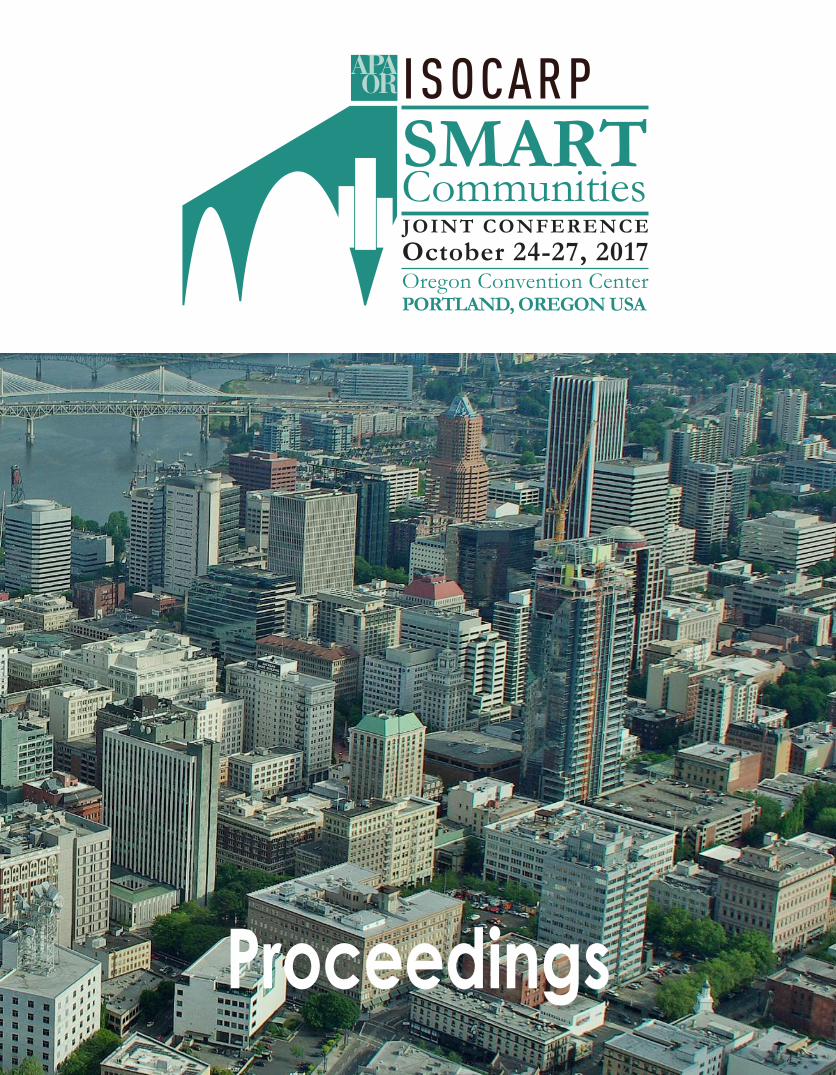
October 24-27, 2017Oregon Convention CenterPORTLAND, OREGON USA
JOINT CONFERENCE
Conference Brochure
Team Members & IntroductionProgramme & SchedulesWorkshops, Events & TracksKeynotesPoster Presentations ISOCARP & OAPA Programmes ISOCARP & OAPA Awards List of Participants General Information
Proceedings
Proceedings of Joint Conference ISOCARP-OAPA - 53rd ISOCARP CongressPortland, Oregon, USA, October 24-27, 2017Smart CommunitiesEditors: Hongyang Wang & Slawomir Ledwon©ISOCARP 2017Produced and published by ISOCARP ISBN: 978-94-90354-51-0
International Society of City and Regional Planners
https://isocarp.org/
OAPA The Oregon Chapter of the American Planning Association
http://www.oregonapa.org/
October 24-27, 2017Oregon Convention CenterPORTLAND, OREGON USA
JOINT CONFERENCE
Conference Brochure
Team Members & IntroductionProgramme & SchedulesWorkshops, Events & TracksKeynotesPoster Presentations ISOCARP & OAPA Programmes ISOCARP & OAPA Awards List of Participants General Information
The Joint Conference of ISOCARP and the Oregon Chapter of the American Planning Association (OAPA) – 53rd ISOCARP Congress – will be the world planning congress immediately following HABITAT III, the vicennial global summit for urbanization and planning. This means, from a classical planning perspective which would put 20 years as the long term for strategic visioning, our congress will be the first action congress to implement the New Urban Agenda and the International Guidelines on Urban and Territorial Planning. For both of the core documents of Habitat III, ISOCARP played a key role as the most representative community of global planners.
The Congress deliberately selected “Smart Communities” as the central theme, converging the two movements that have fundamentally transformed and will continue dominating the urbanization and planning sphere, the global habitat movement (since Habitat I) and the development of information and communication technologies (ICTs). It is the ICT sector that delivered the smart city initiative. But the global habitat movement is essentially tackling smart urbanization and planning issues from a typical planning way. However, none of the divergent journeys has led to satisfactory solutions for smart sustainable planning and urbanization. The ICT tide has been bringing up new infrastructures,
new products and economies, new ways of organization, new spaces, new life styles, new ways of knowledge production and new individuals, new powers, new politics and new societies. Some may consider these as “smart”. But many have realized that all of these can be important supports for but none is automatically “smart”. For more people, “smart” vaguely refers to some kinds of “logic” of the world such as connected, networked and systematical. But for most, after all, it is the value meanings of “smart” that hide deep in their mind, e.g. clever and proper. In this sense, the habitat movement would have even more relevance to smart city and planning. Such understanding of “smart” certainly has fundamental legitimacy. But it also opens the door to all apparently desirable values and tools, such as green, equal, inclusive, justice, healthy, efficient, forward-looking, comprehensive, and planning, design, policy, governance, finance, democracy, etc. Eventually, “smart something” is becoming the newest universal language and substantially empty concept in planning: it means everything and hence nothing. Is such a dilemma also applicable to planning in general?
Striving to be a congress of implementation following Habitat III after 40 years of global habitat movement, working in partnership with the Oregon Chapter of the American
Planning Association (OAPA), the 53rd ISOCARP Congress aims to confront the critical challenges or even crises for planning today. The Congress Team enthusiastically invite global planners and trans-disciplinary colleagues to contribute criticisms, debates and out-of-box constructive solutions for the urgent smart planning and smart urbanism agenda. We realize the diversified meaning and aspects of “smart”, from the smart technology, smart infrastructure and smart space, to the smart economy, smart society and above all, smart people. But above all kinds of “smart”, our Congress, the annual party of global planners, seeks to reaffirm the “smart” identity and scope of planning as the art to create synergetic spatial solutions according to a specific context. That is, beautiful spatial synergy is the core planning sense of “smart” which will articulate, support and create other kinds of “smart”. Therefore, it is true that planning may have to take into account essentially everything. But planners’ major expertise is our comprehensive synergetic capability of understanding planning contexts, creating planning schemes and managing planning implementations. The planning scheme is to design spaces with the best possible social, economic and environmental effects. And today, all of these have to be synergized with the elements of ICTs:
by Hongyang Wang, General Rapporteur
Introduction
1
Smart understanding of our planning context: We are in what kind of new planning context, socially, economically, environmentally and spatially because of the influences of new factors such as (not exclusively) ICTs? How are the factors like internet, big-data, AI and e-government etc reshaping our society and economy?
Smart planning methods: How to improve our planning methods with the new possibilities of technologies and tools including ICTs, to conduct more scientific and human-oriented data-collection, analysis, scheme creation and verification, and public participation? Is the big-data as powerful as assumed by some?
Smart planning schemes and smart urban future: In an era with ICTs and other new developments, what are the innovative synergetic spatial schemes which can help make buildings, infrastructures, spaces, economies, societies, people and nature smarter? How to create harmonious synergies between/among the big and small, historical, modern and postmodern, development, culture and nature, work, life and health, technology and human, people of different ages, genders, abilities and beliefs, and region, city, towns and villages? With ICTs, what
kind of new spaces are our cities, regions and communities evolving towards, and what new utopias can we imagine? And certainly, with the support of ICTs and modern transportations, scale has been condensed and so should be the distance among people. These help make our new urban world a world of Smart Communities.
Smart planning implementations: In today’s society, market and governance system which has been greatly changed due to many reasons including internet, what are the new ways for plan-promotion and implementation?
It is in an ICT era to reaffirm the duty and technologies of planning as the trans- disciplinary, sector and people coordinative spatial solution creator. The congress will explore the above questions from six “horizontal” sectoral tracks:
1. Technology, infrastructure and buildings
2. Governance and inclusive communities
3. Culture, community experience and the sharing economy
4. Resilience, adaptation and disaster mitigation
5. Technology and small communities6. Post-smart communities and the new frontiers
The congress program will include plenary sessions, concurrent sessions of papers, inclusive debates, seminar on cases or projects, workshops, and social and cultural events which will ensure a series of unforgettable experiences for all participants. It is worth mentioning that we will organize the congress jointly with local planning profession association, OAPA, which will present us with all kinds of ideas and the smart city of Portland. Apart from the regular papers, case studies, projects, practical experiences, and researches relevant to the theme and topics are all welcome.
We look forward to your contribution to make a smart congress!
2
Short OutlinesPapers
Track 1: Technology, infrastructure and buildings
Track 2: Governance and inclusive communities
Track 3: Smart culture, urban experience and shared economy
Track 4: Resilience, adaptation and disaster mitigation
Track 5: Technology and small communities
Track 6: Post-smart communities and the new frontiers
Authors are responsible for the content of the short outlines and the full papers
which are listed in the order of their presentations in each track.
3
Overview of technology, infrastructure and buildingsTowns, cities or metropolitan regions are a concentration of millions of people, many mixed human activities, buildings, infrastructure and technology that form a complex and dynamic system. People, their activities, buildings, infrastructure and technology directly relate and form a complex city community. In the light of the world sustainable development goals and the congress theme on smart communities, it means that human activities, buildings, infrastructure and technology must be planned and developed in an integrated way so as to serve all people and interests in the city and the region. “Smart communities” also means planning and developing socio-economic activities, buildings, infrastructure and technologies that are accessible, affordable, energy efficient, green and environmentally friendly and sourced locally. As complex entities, cities must have appropriate information and communication technology (ICT) system to effectively manage them.
Track 1 is focused on three sectors that reflect experience from both developing and developed world cities and regions. The three sectors are – information and communication technology, buildings, and infrastructure.
1. Information and communication technology (ICT)The term “smart” development of communities is closely related to the use of ICT in the planning, development and management of cities. It is well known that information is power. In order to effectively plan and manage the complex cities, adequate information must be collected, analyzed and processed to inform decision making. This sector will be looking at various ICT options as it relates to urban planning and management, buildings, and infrastructure works. How effective and smart are these ICT options in different world cities and sectors?
-How can ICT support city planning, development and management?
-What is the data requirement for an integrated urban ICT system?
A number of ICT tools, case studies and projects are presented and illustrate the application in city planning and management.
2. BuildingsCities are a concentration of and a mixed complex system of buildings. Building structures vary from simple residential units to huge, tall and complex blocks that include shopping malls, offices, hotels, and industrial parks. Building design, construction and operation technology in cities is changing fast and becoming complex. Buildings must now be “green and smart” – energy efficient, environmentally friendly and use local materials.
The sector will present actual projects, highlighting the various stages in planning, design, construction and operation of the building works. The presentation will also be aimed at rating the building works as being smart and green. The use of World Green Building Council standards or other national rating standards will be encouraged.
-How do we make urban spaces and buildings more green and livable?
-Various options explored include – new technology options in movement and interaction, street design, and green buildings.
3. InfrastructureThe Infrastructure and utilities system has been described as the life blood system of a city. World urban population is growing fast and the increasing demand is putting a lot of strain on the supply and maintenance of infrastructure services. The sector will address various sub-sectors, including water supply, sanitation, drainage, energy, communication and transport.
Cities are major consumers of water. Many cities are faced with acute water shortage as the supply is not able to meet the demand. Water sources are getting depleted and many are getting polluted. What are the exact water challenges facing world cities and what
efforts have been put in place to tackle these challenges? What smart technology options are available to sort out the water challenges in our cities?
Inadequate poor waste water and solid waste disposal systems and floods are challenges facing many towns and cities globally. What smart and green technology options are available to tackle these problems? The potential for waste water recycling and ban on use of plastics will be areas of interest in the congress.
In any country, cities are the major consumers of electrical energy and fossil fuel. Production of electricity from nuclear fuel, coal and oil is no longer considered sustainable and poses serious risks to the environment and human health. The use of smarter and greener energy sources like solar and wind is receiving encouraging support globally. What green energy potential exists in different countries and cities and what is the level of utilization? How has technology improved the supply and use of green energy supply?
The Congress will also be addressing the transport challenge in our cities. Cities are faced with heavy traffic jams, long commuter distances, heavy usage of the private car, poor public transport services, high transport costs, high accident risks, and air pollution. There is poor provision for walking and cycling infrastructure. What safer, smarter and greener transport technology options are available in out towns?
We invite you to discuss smart technology, buildings and infrastructure.
-What new energy and transport technology options are available to promote sustainable urban development?
Some of the potential solutions available include solar products and expanding the pedestrian infrastructure in our cities.
Track 1: Technology, infrastructure and buildings
by Mairura Omwenga
Co-moderator for Sessions 3 & 6:Kirsten Tilleman
Co-moderator for Session 8 Aaron Ray
4
Session 1: Information & communication technology & data systems25 October (Wednesday) 11:00-12:30
Guy VLOEBERGH, OMGEVING cvba/University of Antwerp; Bjorn BRACKE, Pieter VAN DEN BROECK, Antwerp, Belgium
ECODISTR-ICT, Integrated decision support tool for retrofit and renewal towards sustainable districtsThe ECODISTR-ICT project was a four-year research project in which an integrated decision support system (IDSS) for sustainable retrofitting projects on district level was developed and tested in different case studies. The IDDS helps to align all stakeholders and decisionmakers to reach a mutually supported vision, based on comprehensible data.
Yi LIU, Shanshan ZHANG, Tian WANG, Harbin Institute of Technology, Harbin, China
Study on the rationality of resource allocation in rural medical space based on spatial data analysisThis paper constructs the theoretical model on the rationality of resource allocation in rural medical space on the basis of spatial data analysis method, which brings new regulation and guidance on resources allocation in medical space.
Piotr Marek SMOLNICKI, Gdansk University of Technology, Gdansk, Poland Connected & automated urban mobility, zombie cars and kitchen knives: will autonomous automobiles, self-driving car-sharing and ride-hailing, and driverless shuttles harm cities?The author presents assumptions how three different emerging automated mobility technical-organisational solutions: autonomous automobiles, self-driving cars and driverless shuttles could impact metropolitan structures of both cities and suburban areas.
Aida DOBRUNA, Sadije KELMENDI, Artnet HASKUKA, Lumnije GASHI-SHABANI, Rudina QERIMI, Shkelqim DACI, Drita NUSHI, Kosovo Center for Urban Research PRO-Planning, Pristina, Kosovo
Cut costs not commodities; co-generation for future generationsAn introduction to Pristina’s latest undertakings with respect to becoming a smart city. First efforts include district heating, its efficiency and cost-effectiveness towards a more budget friendly heating alternative.
Raina SINGH, The Energy and Resources Institute, New Delhi, IndiaIndia’s Smart Cities paving the way for sustainable and resilient urban growth: case study –DharamshalaCase study of Dharamshala, one of the cities under India’s Smart Cities Mission, and its endeavours towards smart, resilient, and sustainable growth. The paper will discuss ‘smart solutions’ being adopted by the city and highlight its efforts to align with SDG 11, the New Urban Agenda and Paris Climate Agreement.
Session 2: Beyond the black box: communicating data and evidence to the public25 October (Wednesday) 14:00-15:30
Moderator: Katie MANGLE, Alta Planning + DesignPortland, USA Speakers: Kelly RODGERS, Streetsmart, Portland, Mike SELLINGER, Alta Planning + Design, Portland, Oregon, USA
How can planners better integrate data and evidence in transportation planning? Explore three approaches to presenting data and research to help communities make more informed decisions. Discussion will explore the role of data, the tension between generalized research and local contexts, and transparency in decision-making.
Session 3: Sustainable buildings and urban space25 October (Wednesday) 16:00-17:30
Joanna PRIGARA, Aalborg University, Aalborg, Denmark The re-defined city spaceContemporary cities, influenced by technology and mobility needs of their users, face the challenge of re-adaptation. The future of streets as known is questioned and a solution promoting a different movement pattern between buildings is proposed. The re-defined city space academic project design provides insight in the advantage of a programmable city.
Kefa OMOTI MOSE, Parliament of Kenya, Nairobi, Kenya A study of the effects of planning and accessibility challenges on parliamentary functions in KenyaLegislators play an important role in the entrenchment of planning practice and influence national planning policy decisions. However, planning and public places design systems in Kenya and other developing countries have failed to ensure the inclusion of legislators with disabilities. This paper examines the effects of inaccessibility.
Peter Njeru NJUE, University of Nairobi, Nairobi, Kenya; Marylyn Mumbua MUSYIMI, Architectural Association of Kenya, Nairobi, Kenya
Building information modelling in urbanising KenyaThis paper explores best practice in BIM use around the world as a catalyst for harnessing technology to address the challenge of rapid urbanization change. In advocating for BIM institutionalisation and integration with existing e-permitting systems in Kenya, this paper will suggest ways these best practices can appropriately applied.
Lui LI, Timothy HEATH, the University of Nottingham, Nottingham, UK Vertical farms: the innovative trinity of plant factory technology, smart green infrastructure and high rise buildingsBased on potential tremendous advantages of vertical farm, the paper will articulate how the concept can become reality through holistic design solutions involve integrating plant factory technology, smart green infrastructure and high-rise building into an efficient modern controlled ‘living installation’ that demonstrate roles in more sustainable and better urban environments.
Yi FENG, Nanjing, China Effects of street built environment on street vitality, an empirical study in Nanjing, ChinaAn empirical study with a statistical approach is conducted to find out the critical factors in the built environment that lead to street vitality.
Daniele VETTORATO, Urban and Regional Energy Systems – European Academy (EURAC), Bolzano, Italy
Smart city planning: from theory to application. The case study of Bolzano, a smart European cityThe paper discusses how to move from the theoretical concept of smart urban planning to real application in cities. An innovative urban planning framework is provided and applied to Bolzano, a lighthouse smart city involved in a European project. The discussion focuses on the replicability of this innovative planning experience.
Session 4: The unpaved road to housing affordability: what role does technology play?26 October (Thursday) 11:00-12:30
Moderator: Robert PARKER, Community Service Center, EUGENE, USASpeakers: Nicholas MELTZER, Community Service Center, University of Oregon; Eugene, Rebecca LEWIS, University of Oregon, Eugene; Emily BROWN, USDA Rural Development North Dakota; Sadie DINATALE, CASA of Oregon,Sherwood,; Andrew MARTIN, Lane Transit District, Eugene; Ethan STUCKMAYER, Mackenzie, Portland, USA
This session will present a holistic picture of the causes and potential solutions to housing affordability, and illustrate how a more informed conversation can tell whether technology is helpful or hurtful to enhancing livability.
Session 5: Autonomous vehicles: what the revolution means for you26 October (Thursday) 14:00-15:30
Moderator: Ben WEBER, SERA Architects, Portland, USASpeakers: Heidi GUENIN, Gridworks, Portland, USA; Peter HURLEY, Portland Bureau of Transportation, USA; Jeff HOSEA, SERA Architects, Portland, USA
The implications of autonomous vehicles for cities, places, and people are immense. Planners, designers, policy-makers, and transportation operators face many unknowns preparing for the changing mobility landscape it will bring. We will explore some of the biggest questions facing our profession as we seek to responsibly accommodate an autonomous future.
The content of the short outlines is the responsibility of authors.
5
18
Session 7: Washington County transportation futures study27 October (Friday) 11:00-12:30
Moderator: Chris DEFFEBACH, Washington County, Hillsboro, USA Speakers: Terry MOORE, ECONorthwest, PORTLAND, USA; Erin WARDELL, Washington County, Hillsboro, USA; Dyami VALENTINE, Washington County, Hillsboro, USA; Jeanne LAWSON, JLA, USA
The Washington County Transportation Futures Study evaluated long-term transportation strategies and investments needed to sustain the County’s economic health and quality of life for decades to come. The Study looked 50 years in the future, focusing on longer-term land use and transportation challenges and opportunities.
Session 8: Green smart buildings and development27 October (Friday) 14:00-15:30
Hong LENG, Yutong XIAO, Harbin Institute of Technology, Harbin, China Associations between public space preference and residents’ personal characteristics in Northeast small towns of ChinaIn this paper, by using mathematical methods, we focus on the correlation research of public space preference and residents’ personal characteristics on the scale of northeast small towns in China.
Ahmad SOHAIL, Mercator Research Institute on Global Commons and Climate Change (MCC), Berlin, Technische Universität Berlin, Germany, LabSet, Delhi, India; Felix CREUTZIG, Mercator Research Institute on Global Commons and Climate Change (MCC), Berlin, Technische Universität Berlin, Germany; Shonali PACHAURI, International Institute for Applied Systems Analysis, Berlin, Germany
Urban planning strategies for improving public health and reducing emissions: a co-benefits approachThis study shows that electricity-related issues like kitchen/stove/piped-water are crucial to reduce short term morbidity but also increase emissions. Synergies can if at all be reaped by a non-motorized transport/cycling strategy.
Roshmi SEN, Subrata CHATTOPADHYAY, IIT Kharagpur, Kharagpur, India; Forrest MEGGERS, Princeton University, Princeton, USA
Planning for centralized cooling systems in high density mass housing in tropics– towards smart energy policy in residential communitiesThe given study outlines the various available alternative centralized cooling technologies applicable to mass housing complexes. The study theninvestigates upon the institutional mechanisms, cost sharing strategies and ownership models towards implementing such centralized cooling systems in high density housing stock for developing nations.
Keith DAVIS, Philadelphia, USA Advancing equitable community development goals with ‘Do It Yourself’ technologyPhiladelphia is realizing significant growth; but, leveraging development interest to shape a healthier built environment remains a challenge. In my presentation, I will introduce a tool that harnesses the power of open data to cast light on neighborhood health disparities and potentially impactful projects… All on your smart phone.
Session 6: Smart infrastructure and transport26 October (Thursday) 16:00-17:30
Dong ZHENG, Shanghai Tongji Urban Planning & Design Institute, Shanghai, China
New energy and technology promote the ecological sustainable development and improve the living conditions of historic towns south of Yangtze RiverStrategies and methods to apply new energy and technology to promote ecological sustainable development and improve the living conditions of historic towns South of Yangtze River without destroying the landscape characteristics of the historic towns.
Julia UBEDA BRIONES, Amsterdam, Netherlands Walkability in Amsterdam: from scientific research to pedestrian policy makingThis study case is a successful example of applied research in the city of Amsterdam. It highlights the transition from walkability scientific research studies, combined with current pedestrian policies, to applicable knowledge to the city itself; a valid methodology is set up to analyse the walkability in the study area.
Benjamin SCHEERBARTH, Eckwerk Entwicklungs GmbH, Berlin, Germany Scrutinizing greenness and smartness in new construction: toward an economical, context-conscious, and circular approach. The case of Das Eckwerk, BerlinDrawing on practical experience from the planning of “Das Eckwerk”, an innovation hub with student living, the author suggests that the bottleneck to building smart is not the availability of smart and eco-innovative technologies but rather the linearity of value chains in urban development, which disincentives their deployment.
Ian CARLTON, Emily PICHA, ECONorthwest + MapCraft.io, Portland, USA Betting on transit and TOD in Las VegasTaking a play out of the Portland transit planning playbook, Las Vegas is placing a bet that coordinated transportation and land use planning will galvanize support for regional transit investments. This presentation will highlight an innovative process that allowed the Regional Transportation Commission to better understand their TOD opportunities.
Bowen CHEN, Tongji University, Shanghai, China Dynamic evolution of community population spatial distribution in Guangzhou under the impact of urban rail transitBased on the fifth and the sixth census data materials of Guangzhou, the paper uses the methods of GIS spatial analysis and mathematical modeling to analyze the spatial characteristics and evolution trend of community population distribution under the influence of large-scale and high-speed urban rail transit construction from 2000.
Le ZHU, Nanjing University, Nanjing, China Bus nirvana: The experience and revelation of Nanjing develop Transit MetropolisThe study is based on a thorough interpretation of public transport supply and demand. It gives an analysis on what is the basic power for the development of a transit metropolis.
6
Inclusiveness means not leaving anyone on the roadside. And this, in all the dimensions of the ordinary, personal and community life of everyone (E. Mounier). The world has never been so rich. At the same time, it has never been so unequal and destructive of societies, environment, biodiversity and millennial institutions. The world is now limited in resources. So, to face with resource constraints, cross-cutting approach is necessary. Faced with riches, an inclusive world is possible! It is possible to change look, mentality, individual and collective posture … and transform the world towards inclusiveness!
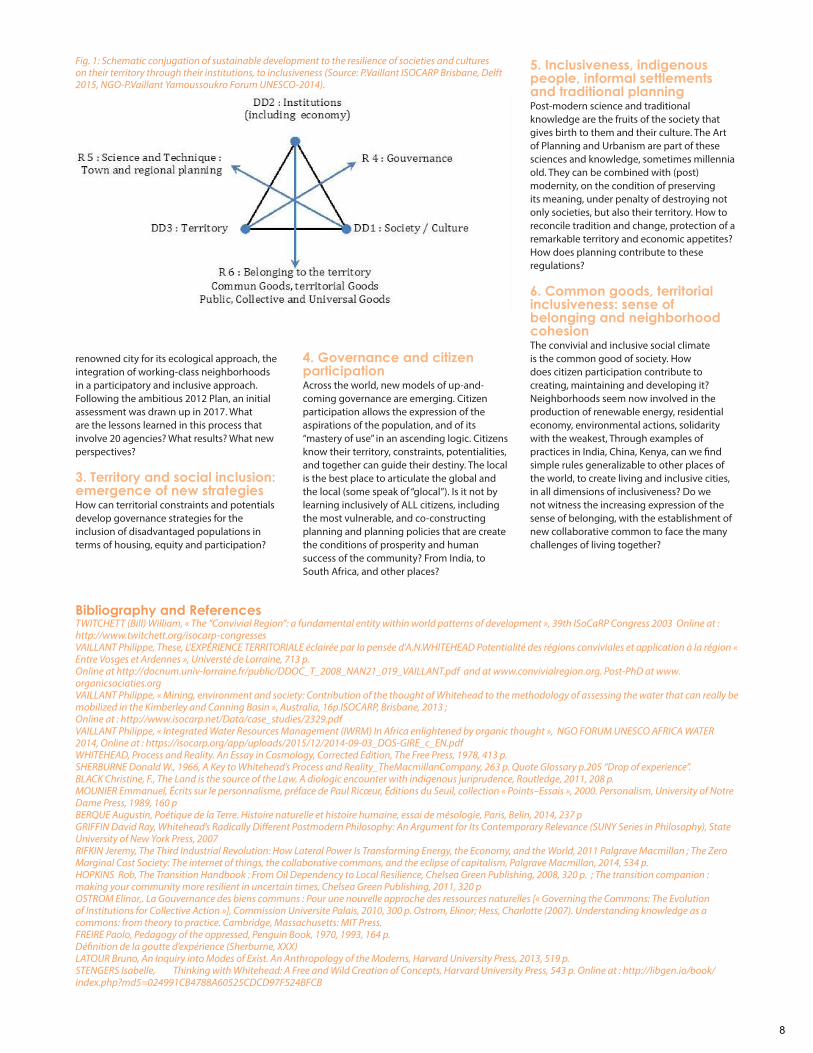
It takes few words to say this essential, but it takes all the words to make it real, and put into play, putting into motion all the dimensions at the same time. The urban planner has a privileged contribution to give to the world. To achieve inclusiveness, today, we must combine sustainable development with a view to the resilience of societies and cultures on their territory, through their institutions. It is proposed to observe inclusivity in the following interactions:
This scheme applies to the different territorial scales, including cities (about 100 km2, radius of 6 km), agglomerations (2000 km2, radius of 25 km) and regions (about 32 000 km2, 100 km radius) create convivial and inclusive regions (W. (B.) Twitchett, thesis 1995 and ISOCARP, 2003. See also ISOCARP 2004, 2005, 2008, http://www.twitchett.org/isocarp-congresses). Is not now the regional level that articulates urban, rural and natural planning, from the potential, but mostly territorial limits (UN-PPPV-49 & 136). Show the three axes, or vectors, from the sustainable development:
Governance, based on territory, is specific to each society and its institutions. The territory is the basic brick of governance. (P.Calame 1997, 2013, Foundation for Human Progress -FPH-) In the old wisdom of indigenous peoples, “The Land is the source of the Law“ (CF
Black, 2011). Is this not the meaning, for example, new approaches like economy relocalization, the increasing importance of the Social Solidarity Economy, residential economy, the functional economy, short circuits, producer-to-consumer schemes, local currencies and local citizen participation?
Science and technology, including planning, are society-based, are carried by institutions on a territory. Society and its culture are the source of science and technology. (B.Latour, 2013, I.Stengers, 2010);
Common, territorial, public, collective or universal Goods, well maintained, fertilize the territory and the society. Water, sustainable development, climate … Public and private institutions (whose economy is only one dimension) are – or should be – the place of community expression of Common Goods. (E.Osborn, 2010, J.Rifkin, 2011, 2014). The social climate is also part of the common good, as well as connection to the territory, sense of belonging.
This transversal way of seeing, thinking, acting is organic, processual, transcultural (AN Whitehead, PR-1978, A. Berque, 2013, DR Griffin, 2007, J. Grange, 1997 & 1999, P .Vaillant, 2008). It is friendly and fraternal by combining unity and diversity. These inclusive processes allow for “co-growth of things together”, “con-crescence”. Each concrescence shape the experience of everyday drops (Whitehead 1978-PR 334-328) path to inclusiveness.
All drops of experience from around the world come together in this intelligent way (Smart Way Toward inclusiveness) to become transformation vectors of our societies towards inclusiveness. The declination of the scheme on the theme of inclusiveness, crossed with the proposed contributions, leads to the following themes
Definition of inclusive intelligent communities
Institutions and inclusivity
Territory and social inclusion: emergence of new strategies
Governance and citizen participationPlanning and inclusiveness: indigenous peoples, informal settlements and traditional planning.
An organic methodological method will be proposed for setting link presented drops of experiences, encourage comparisons, and feed the dialogue and exchange of experience, in a dialogical relationship (P. Freire, 1993 J. Marin, Unesco 2014) : Learn from the Other, different, and enrich ourselves with our differences. On the other hand, the exchanges on the selected cases, and the debates will be fed by the link with the exhibitors, the posters, and the numerous papers proposed for publication at the congress
1. Definition of inclusive intelligent communitiesA definition of the inclusiveness and the modes of governance that favors it is necessary in the first place. This is the occasion in a first session to discuss the new proposals of Habitat III, in its many occurrences on inclusiveness, and how to promote it on the territories.
A second session specifies this new way of seeing and undertaking through major initiatives, at the planning scales of the region, cities, towns and neighborhoods, agglomeration, region, state, continent and planet. China wonders how to combine historic and (post) modernity, India undertakes the implementation of 100 Smart Cities, Lagos city 12 million people asks the crucial questions, Kenya declines an approach to planning democratic. Other insights will enrich the definition of inclusiveness.
2. Institutions and inclusivenessPortland is the case of an institution to face the challenges of inclusion of populations. Coming to Portland is an opportunity to see, live the initiatives of an internationally
Track 2: Governance and inclusive communities
Co-moderator for Sessions 2 & 4: Grace Stainbeck
Co-moderator for Session 5:Kaitlin Berger
Moderator for Track 2 cont.:Damian Syrnyk (27 Oct 11:00)
by Philippe Vaillant, France
7
renowned city for its ecological approach, the integration of working-class neighborhoods in a participatory and inclusive approach. Following the ambitious 2012 Plan, an initial assessment was drawn up in 2017. What are the lessons learned in this process that involve 20 agencies? What results? What new perspectives?
3. Territory and social inclusion: emergence of new strategiesHow can territorial constraints and potentials develop governance strategies for the inclusion of disadvantaged populations in terms of housing, equity and participation?
4. Governance and citizen participationAcross the world, new models of up-and-coming governance are emerging. Citizen participation allows the expression of the aspirations of the population, and of its “mastery of use” in an ascending logic. Citizens know their territory, constraints, potentialities, and together can guide their destiny. The local is the best place to articulate the global and the local (some speak of “glocal”). Is it not by learning inclusively of ALL citizens, including the most vulnerable, and co-constructing planning and planning policies that are create the conditions of prosperity and human success of the community? From India, to South Africa, and other places?
5. Inclusiveness, indigenous people, informal settlements and traditional planningPost-modern science and traditional knowledge are the fruits of the society that gives birth to them and their culture. The Art of Planning and Urbanism are part of these sciences and knowledge, sometimes millennia old. They can be combined with (post) modernity, on the condition of preserving its meaning, under penalty of destroying not only societies, but also their territory. How to reconcile tradition and change, protection of a remarkable territory and economic appetites? How does planning contribute to these regulations?
6. Common goods, territorial inclusiveness: sense of belonging and neighborhood cohesionThe convivial and inclusive social climate is the common good of society. How does citizen participation contribute to creating, maintaining and developing it? Neighborhoods seem now involved in the production of renewable energy, residential economy, environmental actions, solidarity with the weakest, Through examples of practices in India, China, Kenya, can we find simple rules generalizable to other places of the world, to create living and inclusive cities, in all dimensions of inclusiveness? Do we not witness the increasing expression of the sense of belonging, with the establishment of new collaborative common to face the many challenges of living together?
Bibliography and ReferencesTWITCHETT (Bill) William, « The “Convivial Region”: a fundamental entity within world patterns of development », 39th ISoCaRP Congress 2003 Online at : http://www.twitchett.org/isocarp-congressesVAILLANT Philippe, These, L’EXPÉRIENCE TERRITORIALE éclairée par la pensée d’A.N.WHITEHEAD Potentialité des régions conviviales et application à la région « Entre Vosges et Ardennes », Universté de Lorraine, 713 p. Online at http://docnum.univ-lorraine.fr/public/DDOC_T_2008_NAN21_019_VAILLANT.pdf and at www.convivialregion.org. Post-PhD at www.organicsociaties.orgVAILLANT Philippe, « Mining, environment and society: Contribution of the thought of Whitehead to the methodology of assessing the water that can really be mobilized in the Kimberley and Canning Basin », Australia, 16p.ISOCARP, Brisbane, 2013 ;Online at : http://www.isocarp.net/Data/case_studies/2329.pdfVAILLANT Philippe, « Integrated Water Resources Management (IWRM) In Africa enlightened by organic thought », NGO FORUM UNESCO AFRICA WATER 2014, Online at : https://isocarp.org/app/uploads/2015/12/2014-09-03_DOS-GIRE_c_EN.pdfWHITEHEAD, Process and Reality. An Essay in Cosmology, Corrected Edition, The Free Press, 1978, 413 p.SHERBURNE Donald W., 1966, A Key to Whitehead’s Process and Reality_TheMacmillanCompany, 263 p. Quote Glossary p.205 “Drop of experience”.BLACK Christine, F., The Land is the source of the Law. A diologic encounter with indigenous juriprudence, Routledge, 2011, 208 p.MOUNIER Emmanuel, Écrits sur le personnalisme, préface de Paul Ricœur, Éditions du Seuil, collection « Points–Essais », 2000. Personalism, University of Notre Dame Press, 1989, 160 pBERQUE Augustin, Poétique de la Terre. Histoire naturelle et histoire humaine, essai de mésologie, Paris, Belin, 2014, 237 pGRIFFIN David Ray, Whitehead’s Radically Different Postmodern Philosophy: An Argument for Its Contemporary Relevance (SUNY Series in Philosophy), State University of New York Press, 2007RIFKIN Jeremy, The Third Industrial Revolution: How Lateral Power Is Transforming Energy, the Economy, and the World, 2011 Palgrave Macmillan ; The Zero Marginal Cost Society: The internet of things, the collaborative commons, and the eclipse of capitalism, Palgrave Macmillan, 2014, 534 p.HOPKINS Rob, The Transition Handbook : From Oil Dependency to Local Resilience, Chelsea Green Publishing, 2008, 320 p. ; The transition companion : making your community more resilient in uncertain times, Chelsea Green Publishing, 2011, 320 pOSTROM Elinor,. La Gouvernance des biens communs : Pour une nouvelle approche des ressources naturelles [« Governing the Commons: The Evolution of Institutions for Collective Action »], Commission Universite Palais, 2010, 300 p. Ostrom, Elinor; Hess, Charlotte (2007). Understanding knowledge as a commons: from theory to practice. Cambridge, Massachusetts: MIT Press.FREIRE Paolo, Pedagogy of the oppressed, Penguin Book, 1970, 1993, 164 p.Définition de la goutte d’expérience (Sherburne, XXX)LATOUR Bruno, An Inquiry into Modes of Exist. An Anthropology of the Moderns, Harvard University Press, 2013, 519 p.STENGERS Isabelle, Thinking with Whitehead: A Free and Wild Creation of Concepts, Harvard University Press, 543 p. Online at : http://libgen.io/book/index.php?md5=024991CB4788A60525CDCD97F524BFCB
Fig. 1: Schematic conjugation of sustainable development to the resilience of societies and cultures on their territory through their institutions, to inclusiveness (Source: P.Vaillant ISOCARP Brisbane, Delft 2015, NGO-P.Vaillant Yamoussoukro Forum UNESCO-2014).
8
Session 1: The Portland Plan: measuring progress towards equity25 October (Wednesday) 11:00-12:30
Moderator: Eric ENGSTROM, City of Portland, Portland, USA Speakers: Andre BAUGH, Group AGB, USA; Kimberly BRANAM, Prosper Portland, Portland; Andrea VALDERRAMA, City of Portland, Portland, USA
Portland is often cited as a planning success, but it is challenged by persistent racial disparities. In 2008 the City joined with 20 other agencies to create a common strategy to advance equity - the Portland Plan. This session will discuss the plan, review progress, and explore lessons learned.
Session 2: Defining inclusive smart communities25 October (Wednesday) 14:00-15:30
Awais PIRACHA, Karthik KUMAR, Western Sydney University, Minchinbury, Australia
‘Smart’ governance in the 100 Smart City Mission of IndiaThis research is an attempt to discover what importance has been given to the governance and participatory planning by the 100 Smart City Mission? It examines the aims and strategies and assesses participatory planning and smart governance initiatives in the selected Smart Cities.
Arpan PAUL, Ankhi BANERJEE, Joy SEN, Indian Institute of Technology Kharagpur, Kharagpur, India
A policy development framework for inclusive communities to achieve desired livabilityEver increasing population pressure within cities has created a concern for their future regarding from social well-being perspectives. At this setting, the importance of inclusive communities has re-emerged in urban planning domain. This paper attempts to evaluate livability through parameters representing the major components of an inclusive community.
Mengyue LI; Peng ZENG; Zhong YU, Tianjin, China Deliberative planning and its implementation path in historic districts renewal: a comparative study on Chifeng Road in Tianjin and Enning Road in GuangzhouBased on interviews and materials collected from media, this paper took the Enning Road renovation project in Guangzhou as an example, and illustrated the deliberative planning and its implementation path in historic districts renewal.
Ryan KRUEGER, City of Troutdale, Troutdale, USA Regional coordination and workforce housing: a review of western U.S. tourism-base resort economiesThe provision of affordable housing, particularly in high amenity economies, has increasingly becoming the single-most important policy consideration facing local decision makers in Western resort communities. This case-study research seek to understand whether the creation of regional decision making platforms could lead to increased availability of cost-effective housing solutions.
Haydee Jacklyn QUINTANA MALUBAY, University of the Philippines, Taguig, Philippines
Smart world:reengineering the planning process through a global planning codeFrom a big picture vantage point, reengineering the planning process through a global planning code is a smart initiative that will revolutionize planning practice for the whole world. Extraction of the vital elements for such a Code from the UN Habitat Conference inputs is the first step.
Session 3: The International Guidelines on Urban and Territorial Planning: bridge for planning & innovation25 October (Wednesday) 16:00-17:30
Moderator: Andrea OYUELA, United Nations Human Settlements Programme (UN-Habitat), Nairobi, Kenya
UN-Habitat’s International Guidelines on Urban and Territorial Planning are a universal reference framework that can bring planning and innovation together through their territorial approach to planning and by enabling institutional integration within planning systems, in order to achieve more compact, inclusive, better integrated, connected and climate resilient cities and territories.
Session 4: Inclusiveness, indigenous people, informal settlement and traditional planning26 October (Thursday) 11:00-12:30
Maitreyi YELLAPRAGADA, Milieu5 Design Studio, Bellevue, USA; Shubhi SONAL, REVA Institute of Technology and Management, Bangalore, India
Data-driven approach towards Inclusive Urban Transportation: A case of HyderabadThe planning and design of transport systems are not often inclusive of its users. This paper aims to assess transportation systems for inclusivity by analyzing datasets of users on parameters pertaining to safety, infrastructure etc for urban local bodies to make conclusive decisions in improving the existing transport amenities.
Jing QIAO; Hong GENG, HuaZhong University of Science and Technology, Wuhan, China
Research on the development path of inclusive rural communities in the context of pseudo counter-urbanization taking Wuhan in China as an exampleBy taking Wuhan City as an example and exploring from the perspective of pseudo-counter-urbanization, this paper is designed to analyze the current dilemma in front of rural community development and propose the principle of building inclusive smart contraction-oriented rural communities based on Wuhan’s urbanization characteristics.
Siyabonga NJEKE, KZN Department of Co-operative Governance and Traditional Affairs, Durban, South Africa
The development of traditional settlement master plans: A response to undocumented indigenous planning practices in rural kwaZulu-NatalDiscussing the disjuncture’s of the past that are still influential in planning legislation in the present South African planning context. Through reflecting on the impact this had on the governance and planning in rural communities to further explore the challenges posed on service delivery within the 5 identified traditional/rural communities.
Tamra MABBOTT; Ed SULLIVAN, Umatilla County, Pendleton, USA Renewable energy project siting - an evaluation of Oregon and California processesRenewable Portfolio Standards will instigate a large number of new energy generation and transmission projects with potential impacts on landscape, habitat, farm land and people. The proposed panel will evaluate the land use planning and permitting approaches in the States of Oregon and California.
Session 5: Governance and citizen participation26 October (Thursday) 14:00-15:30
Mischka JACOBUS; Stuart Paul DENOON-STEVENS; Verna NEL, University of Free State, Bloemfontein, South Africa
Encouraging inclusive communities through zoning reformOppressive zoning practices as a form of development control in South Africa has been criticised. This ‘oppression’ is evidently depicted in the Town Planning Schemes. This paper indicates how land use regulations have affected the livelihoods of the urban poor and indicates the impact of governance in inclusive community building.
Rose MUSYOKA; Herbert MUSOGA, National Land Commission, Nairobi, Kenya; KAKUCHA MBWAGWA, Center for Urban and Regional Planning, Nairobi, Kenya
Is devolution a panacea for making planning more democratic? The Kenyan experienceUsing the plan preparation process of the Lamu County Spatial Plan as a case study, we investigate the role that devolution has played in making planning more democratic. We also inquire into the level to which public participation has been broadened and deepened to realize inclusivity and good governance.
Dirk ENGELKE, HSR Hochschule für Technik Rapperswil, Rapperswil, Switzerland; KIWITT, Verband Region Stuttgart, Stuttgart, Germany
Does technology or the people rule smart communities? – governance and participation in the age of digitizationDesigning a governance strategy to balance smart technologies with their algorithm based decision logic and democratic planning procedures is key for city regions to become a smart community. By
The content of the short outlines is the responsibility of authors.
9

the help of different case studies the authors point out basic factors for such governance strategy.
Mthobisi MASINGA, KENA Consult (Pty) Ltd. , Pretoria, South AfricaRural land use management & regulatory guidelines The Guidelines are a strategic instrument to help in the achievement of various policy objectives nationally. They will provide the necessary guidance in the defining of rural areas, framing of desired rural spatial planning outcomes and facilitate interaction between the various spheres of government towards achieving such desired outcomes.
Session 6: Smart City governance co-creating inclusive places26 October (Thursday) 16:00-17:30
Moderator: David LUDLOW, UWE, Bristol, UKSpeakers: Ahn JUNGJOON, Seoul Metropolitan Government, South Korea; Kevin MARTIN, City of Portland, USA; Jonas BYLUND, JPI Urban Europe; Peter ULRICH, ICLEI European Secretariat
Smart city governance innovations are redefining opportunities for city planning globally. Societal and technological innovation provides a dynamic that is driving the generation of new models of integrated and participatory land use planning. The key session question is how can urban planning effectively engage to promote open co-created urban governance?
Session 7: Neigbourhood cohesion27 October (Friday) 11:00-12:30
Abdulrazak MOHAMED, School of Planning and Architecture, Vijayawada, India
Building of “new neighbourhood climate” of sustainable use of water and energy resources for making smart communities and smart neighbourhoods in cities in IndiaBuilding a new “Neighbourhood Climate” where the households and communities take up useful actions which are environment sensitive and sustainable. The creation of a “Neighhourhood Behavior” and a “New Household Culture” by doing individually and collectively towards environmental friendly and socially relevant actions.
Shraddha BAHIRAT; Sanghamitra BASU, IIT Khragapur, Kharagpur, India Understanding gated communities of India and their impact on the neighbourhood cohesion with special focus on digital technology as a means of communication and governanceWhile understanding ‘Gated Communities’ as a new form of urban residential development in India, this paper examines the impact of such developments and digital technology on the neighbourhood cohesion. The study is based on a questionnaire based pilot survey conducted in six gated communities and their surrounding neighbourhoods in Bangalore.
Haining CHEN; Jianguo WANG, Southeast University, Nanjing, China Coping with ‘online urbanization’: envision the Big Data industry’s effects on urban patternsThe paper mainly elaborates the research on big data industry’s effects to foresee how this emerging field will affect the urban patterns in the new era which we can identify as the era of online urbanization. Big data industry development in Nanjing, China will be explicated as the research case.
David CAPELLI; TECH Miami Inc., Miami; Carla MAYS, MAYS CIVIC INNOVATION; Michael CABALEERO; Libby BARNES, USA
Placekeeping: Building the economy for smart & sustainable neighborhood developmentThere is an urgent need to increase more inclusive sustainability and equity-based development in Priority Development Areas (PDAs) by increasing the number of diverse professionals with market-validated training. We are launching an educational series to teach professionals a participatory/community based design process for accreditation in sustainable community & economic development.
Session 8: Equitable growth policies and community partnerships drive a city’s housing strategy along a major transit corridor27 October (Friday) 14:00-15:30
Moderator: Ryan CURREN, City of Portland, Portland, USASpeakers: Matthew TSCHABOLD, Portland Housing Bureau, USA; Rachael DUKE, Community Partners for Affordable Housing, USA
A panel discussion on one equitable TOD planning effort with the city planning and policy staff and the community-based organizations participating in the process. Learn how shared equity goals, clear and complimentary roles, and inclusive community engagement operationalizes equitable growth policies for new light rail investments.
Track 2 continued: Governance and Inclusive Communities27 October (Friday) 11:00-12:30 (Track 6 / Session 7)
Ghada MOURAD: Heba KHALIL; Mohamed ZAYED, Faculty of Engineering, Cairo University, Cairo, Egypt
Evaluation of the situation in Greater Cairo with regards to citizen participation in urban governance through the emerging information and communication technologiesThe paper evaluates citizen participation in urban governance through the emerging information and communication technologies in Greater Cairo. It explores one of the local cases that took advantage of the emerging technologies for participation, and measures readiness of Greater Cairo inhabitants to participate through these technologies using a questionnaire survey.
Ying ZHANG, Shanghai, China Early childhood community facilities in China--gap and prospectThe paper aims to present the significance and insufficiency of the early childhood community facilities in China, and to find the directions of the development in the future.
Herbert MUSOGA; Rose KITUR; Tom CHAVANGI, National Land Commission, Nairobi, Kenya;
Exploring polycentric potential for planning for vibrant secondary towns: A planning scenario case study of Mumias Town, Western KenyaThrough a case study of planning of Mumias Town in Western Kenya we share the experiences of applying the polycentricity concept to a developing country setting. We explore the opportunities presented by the apparent morphology juxtaposed upon the administrative structure to realize devolution aspirations.
Xiaobo LU; Junyan YANG, Southeast University, Nanjing, China Inclusive urban design based on the shared waterfront:a project of Nantong Nine-RiversIn order to build a waterfront open space suitable for walking with high accessibility, beautiful environment and diversified activities, the Nantong Nine-rivers Urban Design project proposes an inclusive urban design approach through space accessibility design, mixing functions, ecological restoration and organizing various activities.
Valliappan ALAGAPPAN, Vijayawada School of Planning and Architecture, Vijayawada, India
Is Accessibility Indices, a smart decision support system (DSS) tool for measuring access of mobility impaired in public spaces? A comprehensive review of literature.Accessibility for mobility impaired in built environment leads to efficient utilization, revisit of places and reduces disparity. The accessibility indices developed at various contexts, does not address the relative, absolute access, intensity and categories of disability, gender and age groups. The tool developed will act as smart decision support system.
10
Track 2 continued: Governance and inclusive communities27 October (Friday) 14:00-15:30 (Track 5 / Session 8)
Amit KAUR; Sumana GUPTA, Indian Institute of Technology (IIT) Kharagpur, Kharagpur, India
A Comparative study of satisfaction level for middle-income group residents’ of government housings and public private partnership housingsPublic Private Partnership model and group housings provided by government agencies of West Bengal, India highlight the role of governance in making the Middle Income Group more inclusive. However, the PPP model is more successful, evident from higher stated residents’ satisfaction level with the costs incurred and value of savings.
Xiao CHEN, WANG, Nanjing, China An inclusive study on the renewal of urban fringe area - a case study of the four villages in Hangzhou Shiqiao sub-districtUrban fringe area has certain complexity in the aspects of society and comes across a series of “inclusive” social contradiction. The research summarizes the existing problems and methods for urban fringe area renewal and takes four villages of Shiqiao sub-district in Hangzhou as an example for renewal.
Mukoya Kent ALWAKA, Nairobi Water and Sewerage Company, Nairobi, Kenya
An integrated assessment of the effectiveness of multiple level water governance structure: case study of Kenya water sectorEffective management and access to water resources is vital to sustainable development and good governance.
Philippe VAILLANT, University of Lorraine, Charleville-Mezieres, France
‘City policy’ in the 7 underprivileged districts of Ardenne Métropole: comparison of solutions with other districts in Europe and in the worldIn view of urban riots in France since 1983, we can say that the policy of the City” is considered as a failure. The case study presented here deals with the new French solutions bases in 7 districts of the Ardennes Métropole, compared to Europe and in the World.”
11
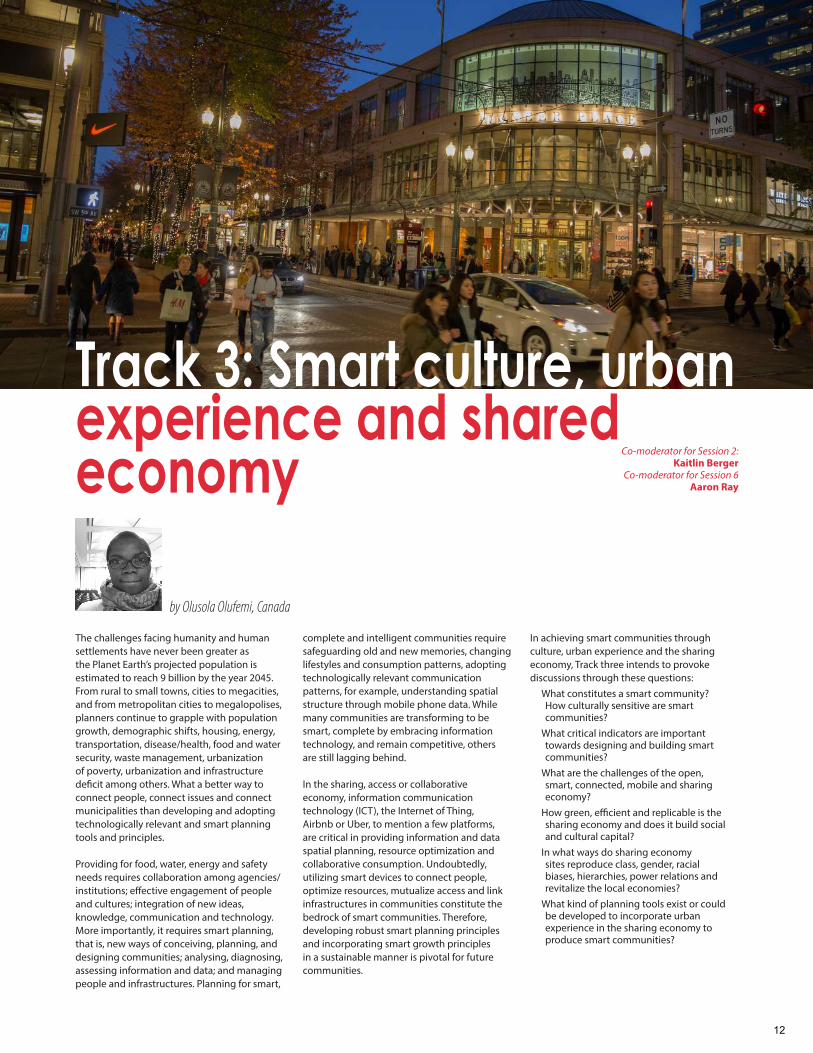
Track 3: Smart culture, urban experience and shared economy
by Olusola Olufemi, Canada
The challenges facing humanity and human settlements have never been greater as the Planet Earth’s projected population is estimated to reach 9 billion by the year 2045. From rural to small towns, cities to megacities, and from metropolitan cities to megalopolises, planners continue to grapple with population growth, demographic shifts, housing, energy, transportation, disease/health, food and water security, waste management, urbanization of poverty, urbanization and infrastructure deficit among others. What a better way to connect people, connect issues and connect municipalities than developing and adopting technologically relevant and smart planning tools and principles.
Providing for food, water, energy and safety needs requires collaboration among agencies/institutions; effective engagement of people and cultures; integration of new ideas, knowledge, communication and technology. More importantly, it requires smart planning, that is, new ways of conceiving, planning, and designing communities; analysing, diagnosing, assessing information and data; and managing people and infrastructures. Planning for smart,
complete and intelligent communities require safeguarding old and new memories, changing lifestyles and consumption patterns, adopting technologically relevant communication patterns, for example, understanding spatial structure through mobile phone data. While many communities are transforming to be smart, complete by embracing information technology, and remain competitive, others are still lagging behind.
In the sharing, access or collaborative economy, information communication technology (ICT), the Internet of Thing, Airbnb or Uber, to mention a few platforms, are critical in providing information and data spatial planning, resource optimization and collaborative consumption. Undoubtedly, utilizing smart devices to connect people, optimize resources, mutualize access and link infrastructures in communities constitute the bedrock of smart communities. Therefore, developing robust smart planning principles and incorporating smart growth principles in a sustainable manner is pivotal for future communities.
In achieving smart communities through culture, urban experience and the sharing economy, Track three intends to provoke discussions through these questions:
What constitutes a smart community? How culturally sensitive are smart communities?
What critical indicators are important towards designing and building smart communities?
What are the challenges of the open, smart, connected, mobile and sharing economy?
How green, efficient and replicable is the sharing economy and does it build social and cultural capital?
In what ways do sharing economy sites reproduce class, gender, racial biases, hierarchies, power relations and revitalize the local economies?
What kind of planning tools exist or could be developed to incorporate urban experience in the sharing economy to produce smart communities?
Co-moderator for Session 2:Kaitlin Berger
Co-moderator for Session 6 Aaron Ray
12
Session 1: Making good great: transforming 20th century industrial district into a next generation employment center25 October (Wednesday) 11:00-12:30
Moderator: Amy KOSKI, City of Milwaukie, USASpeakers: Alex DUPEY, MIG Inc. Portland, USA; Matthew CRAIGIE, ECONorthwest, USA
The North Milwaukie Industrial Area Plan seeks to reintroduce the environment to this traditional warehouse/distribution industrial hub through rebranding as an ecodistrict and leveraging of existing business’ innovation. Creative land use strategies will help integrate increased employment density and connectivity rooted in the principals of preserving precious industrial land.
Session 2: Smart mobility, digital transformation and energy efficiency25 October (Wednesday) 14:00-15:30
Rumeysa CEYLAN, Aysegül OZBAKIR, Zeynep MEREY ENLIL, Yildiz Technical University, Istanbul, Turkey
Let’s Be Smart and Reduce Our Energy Use! This paper focuses on how individuals learn to reduce their energy consumption towards an energy efficient lifestyle in three domains: dwelling, mobility and food.The research is an attempt to propose an individual learning feedback mechanism to reduce energy use through a web based platform which is compatible with smart phones.
Stephan REISS-SCHMIDT, City of Munich, Munich, Germany Digital transformation: cities between reaction and integrated strategies - case study Munich, GermanyDigital transformation is not a mere technical question, but an important action field for integrated urban strategies. The example of the EU-funded project Smarter Together in Munich shows the relevance of urban laboratories and co-creation for cutural an social innovation processes.
Xiaomin ZHU, Shanghai, China Smart communities: the coexisting of the high tech future and the intimate neighborhood pastSmart communities bring not only more convenient life to people but also create a belonging and identity to them.
Smart culture, regenerative planning and sustainable economy
Zhao NING, Guangzhou, China; Jianjun WANG JIANJUN, Yongsheng SUN, Zhenhua ZHANG, Yao HU, China
Reconsideration of conservation and regeneration of a suburban historic village: case study of Banghu Xu in Guangzhou, ChinaThis paper, focusing on the development requirements of both historic villages and the city, rethinks the planning measures on conservation and regeneration in the pilot village of BanghuXu, China. In this study a plan, which includes a bottom-line protection mechanism and an operation mechanism, was made to activate this area.
Kasumi SUSAKI, Ryukoku University, Kyoto, Japan Evaluation of Japanese residential area from a view point of living with companion animals - a case study in Japan’s Hanshin-areaThis paper presents issues of Japanese urban residential areas. The area is examined from the viewpoint of living with companion animals. The reason to take this viewpoint is that there is a connection with welfare issues and quality of life which are supported by planning.
Session 3: Smart City placemaking in Kashiwa-no-ha, Japan25 October (Wednesday) 16:00-17:30
Moderator: Charles KELLEY, ZGF Architects LLP, Portland, USASpeakers: Amy JARVIS, ZGF Architects LLP, Portland, USA; Mitsu YAMAZAKI, Ziba Design
Kashiwa-no-ha Smart City, once a transit-oriented development, pioneers a new urban planning approach to create a resilient neighborhood. The master plan focuses on smart city placemaking and community stakeholder engagement for a collective vision. Kashiwa-
no-ha recently became the largest LEED Neighborhood Development Plan Platinum-certified smart city in the world.
Session 4: Smart communities, smart technology and new planning tools 26 October (Thursday) 11:00-12:30
Zeynep GUNAY, Ervin SEZGIN, Eda BEYAZIT, Gorsev ARGIN, Istanbul Technical University, Istanbul, Turkey
How smart is my planning education? Experiential reflections from Istanbul Technical University in building the smart communityBased on the experiential Planning Studio of the ITU, the paper introduces a smart platform to rethink planning education as a cornerstone of responsive, participatory and inclusive urban settlements: How smart is our planning education? What are pedagogical tools and methodologies for going smart? How does it affect transformative change?
Mani DHINGRA, Subrata CHATTOPADHYAY, Indian Institute of Technology, Kharagpur, Kharagpur, India
Exploring the real smartness in an urban context through a deductive meta-synthesis approachA deductive meta-synthesis approach on the concept of urban smartness. The main issue with conflating and the self-congratulatory Smart City are its market-led urban agenda without keeping in mind the needs of its local community. A new context-free and community oriented definition of Smart City is proposed.
Malgorzata HANZL, Lodz University of Technology, Lodz, Poland Analyses of human behaviour in public spacesThe studies of human behaviour are emerging rapidly. However intensive, the research remains disperse. The studies conducted in urban design, pedestrian mobility and small group behaviour and video analyses overlap. The paper aims at an overview of available methods, looking for their further application in the field of urban design.
Adriano BISELLO, Eurac research, Padua, Italy; Giuliano MARELLA, University of Padua, Padua, Italy; Daniele VETTORATO, Eurac research, Padova, Italy
Residential property price barometers: a reliable tool for smart citizens? First evidences from ItalyDeciding to buy an apartment is always a crucial moment. Some web services offer a rough estimation of a likely value on the market. Unfortunately, they often lack a robust appraisal method. This research investigates the already available tools and suggests improvements to more reliable services for smart citizens.
Gonca AKGUL, Aysegül OZBAKIR, Zeynep MEREY ENLIL, Yildiz Technical University, Istanbul, Turkey
A spark of change: awareness on energy consumption through the mobility choicesWhen the energy use rates are examined, it is observed that transportation is one of the significant sectors that accounts for roughly 27% of total world energy consumption. This paper focuses on individual’s choices on urban mobility, and aims to understand how learning platforms affect behavior on mobility towards sustainability.
Session 5: Story of Place: A framework for regenerative planning26 October (Thursday) 14:00-15:30
Moderator: Timothy MURPHY, Regenesis Group, Santa Fe, USASpeakers: Timothy MURPHY , Ray LUCCHESI, Regenesis Group, Santa Fe, USA
A dialogue-based session on Story of Place®, a methodology for engaging community stakeholders in an inquiry into the unique potential of their place. Story of Place speaks to both how a place works and what it strives to contribute to the world, providing a powerful basis for planning work.
The content of the short outlines is the responsibility of authors.
13
Session 6: Shared economies, social integration and engagement26 October (Thursday) 16:00-17:30
Deddy KURNIAWAN HALIM, Jimbaran Hijau, Matana Univ, Jimbaran, Indonesia; Putu Agung PRIANTA, Jimbaran Hijau group, Bali, Indonesia
Jimbaran Hijau: in search of sustainable inclusive development for smart communitiesJimbaran Hijau is set to become the island’s premier place that takes integrated development aiming to serve growing Bali as live, work and play destination which strive to make a new mark on inclusive, creative, smart and vibrant community village with green and healthy lifestyle.
Hong GENG, Erpeng SHI, Huazhong University of Science and Technology, Wuhan, China
The influence of shared bicycle on the Chinese university community and the guidance of planning - a case study of Huazhong University of Science and TechnologyWe will analyse the impact of shared bicycles on the campus community and and give solutions from the planning perspective for optimization.
Jiabin WEI, Xiang LI, Siyuan TANG, Tongji University, Shanghai, China Practice and analysis of sharing sports facilities in China - A comparative study of government-led and internet-led sharing modesAccording to the sharing cases of sports facilities in Chinese cities, this paper defines two kinds of sharing mode: government-led and Internet-led. This paper made a comparative study of the two sharing modes from many aspects and put forward a new model framework.
Martin TZOU, EDF; Shu DU, China Center for Urban Development, Beijing, China
Cultural obstacles of sharing economy experiences in China and impacts on Chinese citiesThe recent massive success of the “sharing economy” model in the field of urban mobility in Chinese cities is highly controversial on its impact on the urban space, hiding at the same time the emergence of a truly community based sharing model in China.
Chengcheng LIU, Tianjin Urban Planning & Design Institute, Tianjin, China The construction of Chinese smart communities:“last mile ”of serving the public lifeIn order to meet the needs of public life within the “last mile”, in planning and construction of the China smart community, the Internet +” concept is used. It is intended to enhance the hommization of community planning, to meet the needs of the public, promote public service and convenience services.”
Kumar RAJENDRA, Ansal University, Gurgaon, India Urban village vs. slum: boon for Indian city developmentIn today’s world major cities are becoming hubs for migrations from smaller cities and towns. Our existing cities’ limits of infrastructures are in danger because of the exponential population increase. Slums are becoming a part of a metropolis. Hence there is a need of integration of slum as urban elements.
Session 7: Urban Planning Advisory Teams: Practices from Wuhan and Bodø27 October (Friday) 11:00-12:30
Moderators: Martin Dubbeling and Milena Ivkovic, ISOCARP Vice-PresidentsIn 2017, ISOCARP organised two Urban Planning Advisory Team (UPAT) workshops, one in Wuhan (China) and the second in Bodø (Norway). ISOCARP has selected two teams of seven experts to travel to Wuhan and Bodø to stay and work for a week. In Wuhan the UPAT team assessed the recent redevelopments in the Zhongshan Avenue Districts, a large historical district in the Hankou area of Wuhan. For the City of Bodø the UPAT team offered their expertise in the development of the new airport and how this development can contribute to become a leading and smart city. The UPAT Seminar will take 90 minutes, starting of with an introduction of +10 years of UPAT workshops and continues with the results of the two 2017 UPAT workshops. The two UPAT teams present and share the outcomes of the 25th UPAT workshop in Wuhan, China, and the 26th UPAT workshop in Bodø, Norway. A discussion and the introductions of the 2018 UPAT workshops that ISOCARP has in preparation will conclude the UPAT Seminar. The outgoing and incoming ISOCARP Vice Presidents UPATs (Martin Dubbeling 2011-2017 and Milena Ivkovic 2017-2020) will host and moderate the UPAT Seminar.
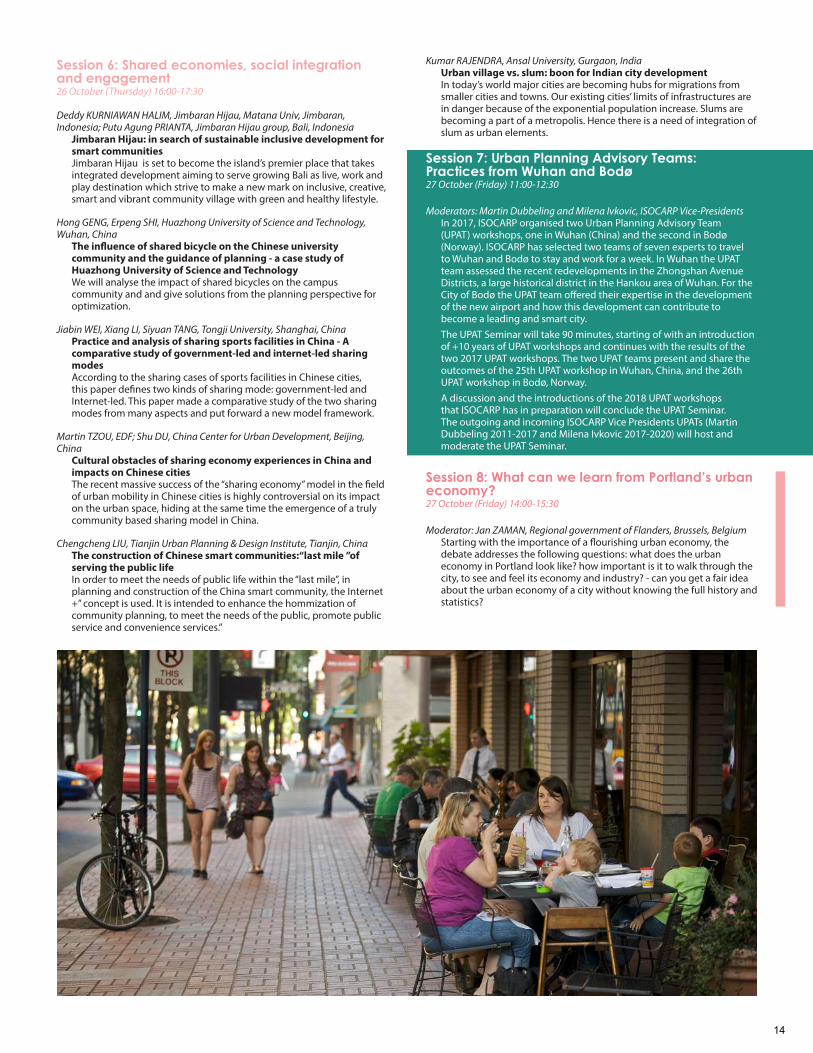
Session 8: What can we learn from Portland’s urban economy?27 October (Friday) 14:00-15:30
Moderator: Jan ZAMAN, Regional government of Flanders, Brussels, Belgium Starting with the importance of a flourishing urban economy, the debate addresses the following questions: what does the urban economy in Portland look like? how important is it to walk through the city, to see and feel its economy and industry? - can you get a fair idea about the urban economy of a city without knowing the full history and statistics?
14
Co-moderator for Sessions 1 & 6:Drew DeVitis
Co-moderator for Sessions 2 & 4:Amanda Ferguson
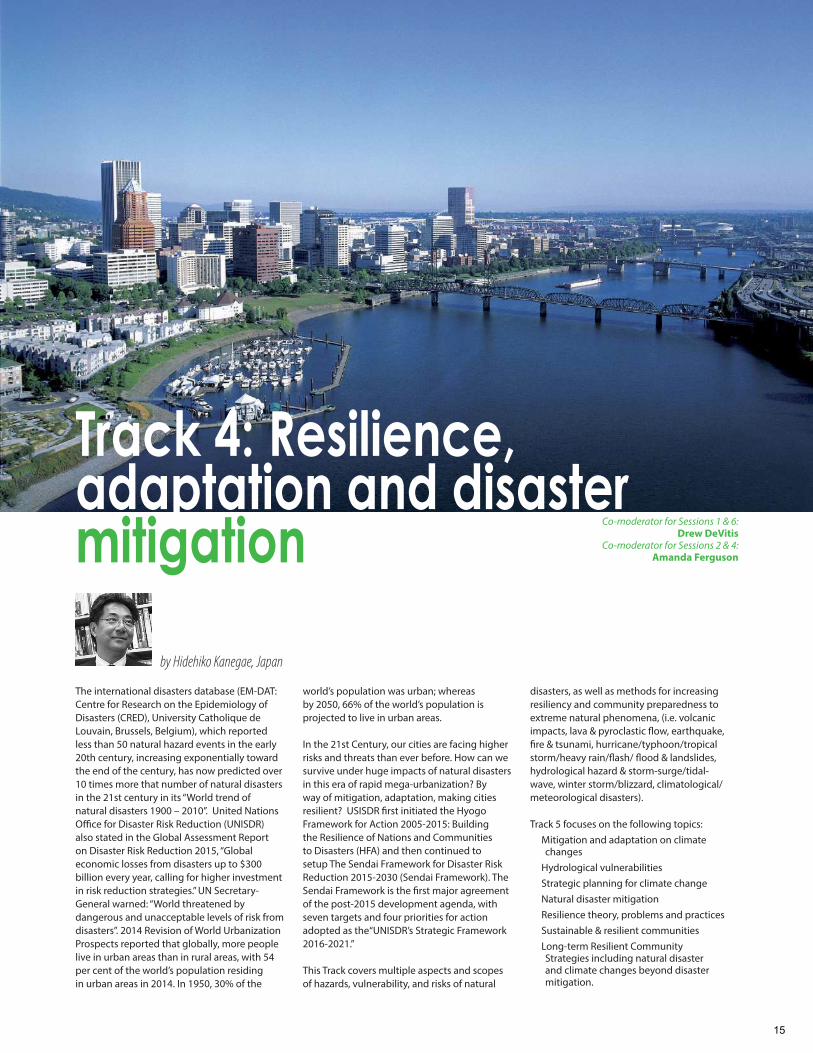
Track 4: Resilience, adaptation and disaster mitigation
by Hidehiko Kanegae, Japan
The international disasters database (EM-DAT: Centre for Research on the Epidemiology of Disasters (CRED), University Catholique de Louvain, Brussels, Belgium), which reported less than 50 natural hazard events in the early 20th century, increasing exponentially toward the end of the century, has now predicted over 10 times more that number of natural disasters in the 21st century in its “World trend of natural disasters 1900 – 2010”. United Nations Office for Disaster Risk Reduction (UNISDR) also stated in the Global Assessment Report on Disaster Risk Reduction 2015, “Global economic losses from disasters up to $300 billion every year, calling for higher investment in risk reduction strategies.” UN Secretary-General warned: “World threatened by dangerous and unacceptable levels of risk from disasters”. 2014 Revision of World Urbanization Prospects reported that globally, more people live in urban areas than in rural areas, with 54 per cent of the world’s population residing in urban areas in 2014. In 1950, 30% of the
world’s population was urban; whereas by 2050, 66% of the world’s population is projected to live in urban areas.
In the 21st Century, our cities are facing higher risks and threats than ever before. How can we survive under huge impacts of natural disasters in this era of rapid mega-urbanization? By way of mitigation, adaptation, making cities resilient? USISDR first initiated the Hyogo Framework for Action 2005-2015: Building the Resilience of Nations and Communities to Disasters (HFA) and then continued to setup The Sendai Framework for Disaster Risk Reduction 2015-2030 (Sendai Framework). The Sendai Framework is the first major agreement of the post-2015 development agenda, with seven targets and four priorities for action adopted as the“UNISDR’s Strategic Framework 2016-2021.”
This Track covers multiple aspects and scopes of hazards, vulnerability, and risks of natural
disasters, as well as methods for increasing resiliency and community preparedness to extreme natural phenomena, (i.e. volcanic impacts, lava & pyroclastic flow, earthquake, fire & tsunami, hurricane/typhoon/tropical storm/heavy rain/flash/ flood & landslides, hydrological hazard & storm-surge/tidal-wave, winter storm/blizzard, climatological/meteorological disasters).
Track 5 focuses on the following topics:Mitigation and adaptation on climate changes
Hydrological vulnerabilitiesStrategic planning for climate changeNatural disaster mitigationResilience theory, problems and practicesSustainable & resilient communitiesLong-term Resilient Community Strategies including natural disaster and climate changes beyond disaster mitigation.
15
Session 1: Mitigation and adaptation on climate changes - Strategic planning for climate change
25 October (Wednesday) 11:00-12:30
Qing YUAN, Tingting YU, China, Harbin Institute of Technology, Harbin, China; Kevin WALSH, Craig NITSCHKE, The University of Melbourne, Australia
Spatial modeling for landscape vulnerability assessment with climate change through TACA and GIS in Heilongjiang, ChinaIn this paper, by using mathematical methods we focus on the correlation research of public space preference and residents’ personal characteristics on the scale of northeast small towns in China.
Aliu OGUNFOWORA, Masterplan Consult Ltd, Lagos, Nigeria Effects of climate change on Lagos coastal communitiesClimate change has been an issue that has drawn back the growth and development of communities in Lagos and Nigeria at large. If communities must be smart, therefore a mitigation process must be in place to enhance growth and development.
Lena NIEL, OTTER, Deltares, Utrecht, Netherlands Adaptation support tool for implementing the New Urban Agenda in citiesThis paper introduces an ecosystem based approach using the Adaptation Support Tool to help implement the New Urban Agenda on a local level. It demonstrates the effectiveness of nature-based solutions for increasing urban resilience, by showing where and how these solutions can be integrated in urban plans.
Mahak AGRAWAL, SPA Delhi, Delhi, India Climate resilient urban development strategies for a Mega city: A case of NCT of DelhiClimate change is an acid bath. Recently, onus of discourse has shifted from global to urban level for two reasons. First, they account for over 70% of global greenhouse gas emissions. Second, they house over 50% the global population. Hence, cities are both victims and prime reason for climate change.
Session 2: Hydrological vulnerabilities25 October (Wednesday) 14:00-15:30
Michael DOYLE, Swiss Federal Institute of Technology, Lausanne, Switzerland Urban underground potential in Dakar, Senegal: reversing the paradigm of ‘needs to resources’In response to urban planning’s tendency to consider underground resource potential in a sectorial and needs-based manner, this paper presents a mapping method for evaluating multi-use urban underground potential and examines the underground potential of Dakar, Senegal, a city with a complicated relationship to its underground.
Mao FENG, Wanmin ZHAO, Chongqing University, Chongqing, China; Tao ZHANG, Tongji University, Shanghai, China
Research on green infrastructure construction in mountainous watershed citiesThis paper based on full consideration landscape features in mountainous watershed cities, using landscape ecology theory,through the method of hydrology and minimum cumulative resistance analysis,taking Guangyuan city of Sichuan province in China as an example,put forward the planning path and framework of green infrastructure construction in mountainous watershed cities.
Tao ZHANG, Tongji University, Shanghai , China; Mao FENG, Chongqing University, Chongqing, China
The research on multi-scale urban flood control and storm drainage based on economical security of river basinThis paper presents a “basin-city-field” multi-scale flood control and drainage planning and management mode based on ecological security. Besides, overall and small watershed system and the changing process thereof are regarded as the basic research unit in this paper, which breaks the traditional way of dividing research units.
Pedro GARCIA, LEAU - CICANT, Lisbon, PortugalUrban waterfront in symbiosis with natureThe research focus on urban waterfronts solutions that implement soft ways of dealing with territories challenged by climate change; retaining functions or transforming infrastructures. The selected case
studies contribute for a stronger improved city that reaches long term strategies in symbiosis with nature.
Session 4: Natural disaster mitigation26 October (Thursday) 11:00-12:30
Paola RIZZI, Luana DI LUDOVICO, Federico D’ASCANIO, University of L’Aquila, L’Aquila, Italy
From fragile to resilient territories. The reconstruction after earthquake in central ItalyTo decrease vulnerability and to increase resilience is a shared worldwide issue, but there are some features and peculiarities of Italy (namely the average of historical heritages and landscapes) that are going to effect the efficiency of actions and strategies that require a shared Strategic Agenda among the public and private domains.
Connie OZAWA, Portland State University, Portland, USA; Sanda KAUFMAN, Cleveland State University, Cleveland, USA; Deborah SHMUELI, University of Haifa, Haifa, Israel
Mining collaborative planning for disaster preparedness and responseNatural and technological hazards have consequences of a scale and severity far exceeding most human experience. The literature stresses the importance of community involvement before, during and after disaster. This paper brings collaborative planning principles to disaster management to build community resilience in the face of uncertain, future calamitous events.
Colin ROWAN, Levee Ready Columbia, Portland, USASpecial purpose district woes, state land use goals, and land behind levees in OregonThis presentation explores development in leveed areas from the perspective of land use planning and statutory authority in Oregon. The presenter will explore issues faced by special districts, the interplay between various agencies in comprehensive planning, and the limitations of statutory and regulatory authority confronted by levee operators.
Resilience theory, problems and practices
Chao MA, Shanchao WANG, Lijian REN, Yingxia YUN, Tianjin University, Tianjin, China
Strategy research of improving city resilience in urban comprehensive disaster prevention and reductionWe summarized the promoting of community resilience in disaster prevention and reduction planning, and improvements for executing such plans by enhancing community resilience. We propose enhancing post-disaster community resilience in several ways.
Session 5: Central city scenic resources protection plan26 October (Thursday) 14:00-15:30
Moderator: Mindy BROOKS, City of Portland, Portland, USA Speaker: Neil LOEHLEIN, City of Portland, Portland, USA
As part of the Central City 2035 Plan, scenic resources, such as views of Mt Hood, are proposed for protection. These protections are necessary to maintain the icon views and scenic quality of Portland.
Session 6: Sustainable and resilient communities26 October (Thursday) 16:00-17:30
Jacob KALMAKOFF, UN-Habitat, Nairobi, Kenya Mis-Romanticism of intermediary cities and participation? The case of MoroniParticipatory planning, community engagement and public consultations are mandatory parts of many planning processes. Both vulnerable to the effects of climate change while relatively self-sustaining, smaller communities may hold the key for better resilience strategies. Can effective participation in resilience planning be a solution for areas of low capacity?
The content of the short outlines is the responsibility of authors.
16
29
Tzu-Ling CHEN, Hsueh-Sheng CHANG, NCKU, Tainan City, Taiwan Increase resilience in right community under potential earthquake riskThe study provides a new perspective on disaster mitigation management by considering earthquake disaster probability, governmental preparedness and earthquake risk perceptions to increase resilience in right community under potential earthquake risk.
Yang DENG, Beijing Forestry University, Beijing, China The exploration on the ecological ways of traditional Chinese settlement constructionThe characteristics of water resources in different regions of China vary considerably. Water resource is an important factor influencing the settlement pattern. From the perspective of ecology, harmonious coexistence of water environment and settlement is the basis of sustainable development. The traditional settlement can be described as genuine “wisdom community”.
Raina SINGH, The Energy and Resources Institute, New Delhi, India Role of ICT based tools for building climate resilient infrastructure services - Panaji and Visakhapatnam, IndiaThis paper looks at climate resilience planning efforts in two Indian coastal cities-Panaji and Visakhapatnam. The paper discusses the role of an ICT based approach for building climate resilient infrastructure services in these cities and explores its potential as a planning and decision making tool for achieving SDG 11.
Session 7: Strengthening the disaster resilience of academic research communities27 October (Friday) 11:00-12:30
Moderator: Kirk PAWLOWSKI, ESD 112’s Construction Services Group (CSG), Vancouver, Washington, USASpeakers: Lisa BROWN, National Academy of Science, Engineering and Medicine, Washington DC; Andre LEDUC, University of Oregon, USA
Members of the US National Academies of Sciences, Engineering, and Medicine Committee on “Strengthening the Disaster Resilience of Academic Research Communities,” will share the Committee’s recommendations to support disaster response and recovery planning, the development of a more resilient built environment, and the capital financial considerations in funding resilient communities.
Session 8: Digital innovations in urban planning and design from a global perspective 27 October (Friday) 14:00-15:30
UN Habitat, Ericsson Research, Johannesburg Development Agency, ArcadisSpeakers: Pontus WESTERBERG, UN-Habitat, Kenya; Bert SMOLDERS, Arcadis, Netherlands; Joakim FORMO, Ericsson Strategic Design, Norway; Xolisile SITHOLE, Johannesburg Development Agency, South Africa
Digital technologies are becoming increasingly important in urban development and management. Ubiquitous sensor networks, digital data and urban dashboards, as well as data accessibility, privacy and accountability are becoming common concepts as part of urban development worldwide. Smart technology is resulting in radical transformation of cities in many areas, including in the field of city and regional planning. In this session, UN-Habitat, Ericsson Strategic Design, Arcadis and the Johannesburg Development Agency will present recent explorations into the use of ‘mixed reality’ – a mix of virtual and augmented reality – for visualisation and community participation processes in urban planning and design. Building on UN-Habitat, Mojang and Microsoft’s innovative Block by Block programme, which uses Minecraft as a community participation tool in urban design, the project partners were able to successfully use a mixed reality platform to visualise co-created 3D designs of a public space in Johannesburg, South Africa.
17
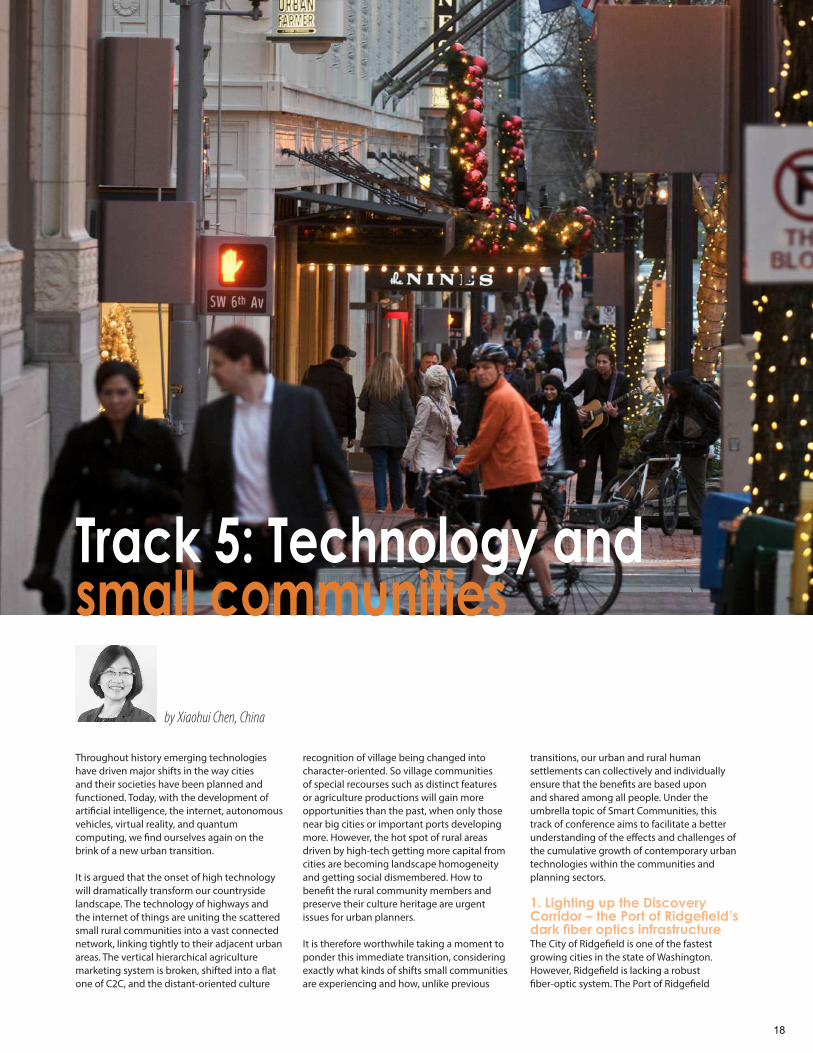
Track 5: Technology and small communities
by Xiaohui Chen, China
Throughout history emerging technologies have driven major shifts in the way cities and their societies have been planned and functioned. Today, with the development of artificial intelligence, the internet, autonomous vehicles, virtual reality, and quantum computing, we find ourselves again on the brink of a new urban transition.
It is argued that the onset of high technology will dramatically transform our countryside landscape. The technology of highways and the internet of things are uniting the scattered small rural communities into a vast connected network, linking tightly to their adjacent urban areas. The vertical hierarchical agriculture marketing system is broken, shifted into a flat one of C2C, and the distant-oriented culture
recognition of village being changed into character-oriented. So village communities of special recourses such as distinct features or agriculture productions will gain more opportunities than the past, when only those near big cities or important ports developing more. However, the hot spot of rural areas driven by high-tech getting more capital from cities are becoming landscape homogeneity and getting social dismembered. How to benefit the rural community members and preserve their culture heritage are urgent issues for urban planners.
It is therefore worthwhile taking a moment to ponder this immediate transition, considering exactly what kinds of shifts small communities are experiencing and how, unlike previous
transitions, our urban and rural human settlements can collectively and individually ensure that the benefits are based upon and shared among all people. Under the umbrella topic of Smart Communities, this track of conference aims to facilitate a better understanding of the effects and challenges of the cumulative growth of contemporary urban technologies within the communities and planning sectors.
1. Lighting up the Discovery Corridor – the Port of Ridgefield’s dark fiber optics infrastructureThe City of Ridgefield is one of the fastest growing cities in the state of Washington. However, Ridgefield is lacking a robust fiber-optic system. The Port of Ridgefield
18
is proposing to invest in dark fiber-optic infrastructure to promote world-class, high performance economic development in southwest Washington’s Discovery Corridor.
2. Smart CommunitiesWith the help of science and technology, smart communities can not only improve the quality of our lives, but also bring new opportunities for the development of cities and rural areas as well. In this context, how to planning a more eco and liveable village in the traditional agriculture area? How to achieve smart placemaking by using innovative approach? How can we better use the applications and tools to plan smarter local communities? How to resolve rural-urban crisis by adopting the appropriate technology? What are the practical way do smart community benefit residents? To answer these questions, we need to look world widely, where the smart communities are bringing great opportunities to these places, so as to seek for some inspirations.
3. Technology and societyNew information and communication technologies are increasingly present in the functioning and management of cities. As a result, access to information and technology is becoming increasingly important for the communities. For rural area and poor communities, the lack of access to information and technology will be a huge disadvantage. Meanwhile, in urban areas, the establishment of spatial technological infrastructure is also crucial for urban planning. Furthermore, with the support of data analysis, quality of residential public space for social behaviour is providing an effective decision reference for
increasing social interaction and community bonding.
4. Online interactive mapping: Tips and tools for small communitiesMany planners in the Portland region are aware of the City of Portland’s “map app”, an online interactive map developed as part of outreach for the City’s update to the Comprehensive Plan. But what options are available to a smaller jurisdiction without experienced programmers and advanced software licenses? And, beyond developing an online tool, what are the best ways to successfully integrate web-based maps and spatial information into a broader outreach program? This panel session will feature speakers from the City of Portland as well as smaller jurisdictions who have experience building and using online interactive maps to present and obtain information as part of a public outreach strategy.
5. Technology and small communitiesTechnology has boosted the emergence of new economy. We witnessed technology brings new opportunities for the development of small scale industries which effectively promoting the poverty reduction. We also witnessed the new entrepreneurial model is constantly derived at the community level. Technology reinforces the interactions among small communities, thereby exacerbating the interflow of information between urban and rural areas. Furthermore, technology has also effectively promoted the smart transformation of traditional housing and helped to achieve
social integration in historical cities, which brought more possibilities to forming a modern neighbourhood.
6. Technology and big dataData is expanding our horizon. The advancement of technology and rising ration of big data usage is changing the data acquisition and analysis tools in urban planning, not only increasing the possibility of citizen engagement in decision making processes, but also offering the universal tools to plan for urban planning. With new information at the disposal of planners, how to make technology and big data become effective planning and analysis tools? How to use new technology approaches to obtain user friendly data in smart community and transportation planning? Furthermore, how does technology help in participatory planning, community engagement and public consultations?
7. Improving multi-agency program transparency and accountability via a scalable, performance measure tracking web platformThe Lake Tahoe Environment Improvement Program (EIP) is a partnership of over 50 different federal, state and local agencies, private interests, and the Washoe Tribe. The Tahoe Regional Planning Agency worked with Sitka Technology Group to build an online platform to coordinate data collection, increase transparency, and showcase progress success.
Session 1: Improving multi-agency program transparency and accountability via a scalable web platform for performance measure tracking25 October (Wednesday) 11:00-12:30
Moderator: Matt DENISTON, Sitka Technology Group, Portland, USASpeakers: John BURNS, Sitka Technology Group, Portland, USA; Jeanne MCNAMARA, Tahoe Regional Planning Agency, Stateline, USA; Brittany JENSEN, Gold Ridge Resource Conservation District, USA
The Lake Tahoe Environmental Improvement Program Project Tracker website has been instrumental in improving data coordination, increasing transparency, and showcasing progress as it tracks $2 billion in funding and more than 700 cross-agency projects. Learn more about this industry-leading, open-source platform and how other organizations are leveraging it.
Session 2: Smart communities25 October (Wednesday) 14:00-15:30
Xiong GUOPING, Southeast University, Nanjing, China Study on the eco-village planning in Yangtze River DeltaThe presentation is about technology and small communities.
Sadije KELMENDI, Lumnije GASHI-SHABANI, Artnet HASKUKA, Drita NUSHI, Aida DOBRUNA, Rudina QERIMI, Shkelqim DACI, Kosovo Center for Urban Research PRO-Planning, Pristina, Kosovo
Smart placemaking in the newest country of EuropeA paper that presents the outcomes of an innovative approach for placemaking in Kosovo, a country with the youngest population in Europe, developed with high school and university students of the capital city of Prishtina and rural Gracanica, through emotional mapping with geoblog mobile app and website.
Slawomir LEDWON, Ministry of Municipality and Environment, Doha, Qatar Smart(er) local communitiesThis paper is a critical assessment of how modern tools influence the way local communities are organised and interact. Although in the shown examples most of interactions are virtual, the leading common aspect is locality. Nowadays it is crucial to understand how these can help to build stronger local communities.
Yizhou ZHAO, Lian LU, Dikang DU,Tsinghua University, Beijing, China A data guide smart-transformation of traditional housing in urban context. The case study of Sandaoguai traditional community in ChinaThis paper proposes a valuable direction of smart communities: a data guide smart-transformation traditional housing in urban context, based on the case study of Sandaoguai traditional community in China.
The content of the short outlines is the responsibility of authors.
19
Taru JAIN; Rose GEOFFREY;, Marilyn JOHNSON, Monash University , MALVERN EAST, Australia
Local Government Policy in Response to Car sharing Innovation- Case of Melbourne ‘the most liveable city’The study aims to understand local policy response to an increasing demand for shared cars in Melbourne. An online survey will be used to explore key challenges faced by the councils in adopting car sharing in their local government area.
Session 3: Technology and society25 October (Wednesday) 16:00-17:30
Umar JIMOH, Ayodeji OBAYOMI, University of Ibadan, Ibadan, Nigeria Challenges of integrating rural community into teletopia world: the case of Gbedun and Alabidun Village of Ona-Ara LGA, NigeriaUrban infrastructural building has remained the planning focus with a share neglect of the rural area despite the symbiotic relationship that exists among them particularly in Nigeria. Adoption of ‘teletopia’ in planning helps in integrating the two sectors which will enhance the quality performance and interactivity of urban service delivery.
Maryam HUSSAIN, Yasser HAMAM, Qatar National Master Plan, Doha, Qatar The role of spatial technology in shaping Qatar’s urban futureThe paper illustrates the main features of the spatial technological approach with advanced spatial analytical techniques used in Qatar and how it is assisting the generation of Qatar National Master Plan (QNMP).
Technology and big data
Michele MELCHIORRI, Urban Habitat Lab, Domodossola, Italy Analyzing urban and rural settlements with remote sensing: comparing national trends of rural growth with the global human settlement layerGeospatial data have become a resource for territorial analysis and a need for policymaking. This study relies on the Global Human Settlements Layer (produced at the European Commission Joint Research Centre) baseline data to analyze at national level the growth of rural settlements in terms of population and built-up areas.
Xin TONG; Yaowu WANG; Qingfeng ZHOU, Shenzhen Graduate School, Shenzhen, China
Relationship of transit-oriented development communities factors based on point of interest and metro ridership data – a case study of ShenzhenBy using POI data from GaoDe map and smart IC card records from metro stations, this paper analyzes the density, diversity and transit ridership ratio around 118 TOD stations in Shen Zhen, China. It discusses the relationships among those factors and finds the most influential factor that affects ridership.
Ellen CURRIER, Lane Council of Governments, Eugene, USA Creating user friendly transportation dataTransportation data can be inaccessible and difficult to access even for planning staff. To address this issue, Central Lane Metropolitan Planning Organization created an user friendly data portal using the Tableau software package that allows for simple sharing of data and workbook visualization schemes with citizens and partner agencies.
Session 4: Sustainable Development Goals26 October (Thursday) 11:00-12:30
Moderator: Tim VAN EPP, AICP, Chair of the APA International DivisionSpeakers: Tim VAN EPP, AICP, Chair of the APA International Division, USA; Shipra NARANG SURI, ISOCARP’s Vice-President, Technical Assistance/ projects, and Coordinator, Urban Planning and Design Branch, UN-Habitat, Kenya/India; Greg SCRUGGS, AICP, Senior Correspondent for CitiScope, USA; Andrew POTTS, Nixon Peabody LP, USA
The APA International Division is sponsoring this session exploring implementation of the UN’s Sustainable Development Goals (SDGs) and New Urban Agenda (NUA), including the roles and approaches of the UN, APA, ISOCARP, ICOMOS and, in particular, US cities. Tim Van Epp, AICP, Chair of the APA International Division, will moderate and provide a general overview of the SDGs and NUA as well as APA’s roles and activities in facilitating their implementation. Shipra Narang Suri, ISOCARP’s Vice-President, Technical Assistance/ projects, and Coordinator, Urban Planning and Design Branch, UN-Habitat, will provide an updated overview of the UN’s implementation of the SDGs and NUA, as well as UN initiatives to mainstream and consolidate its urban functions and implications for SDGs and NUA. Greg Scruggs, AICP, Senior Correspondent for CitiScope, will talk about SDGs implementation by US cities, including a project to pilot them in Baltimore, Maryland, New York City and San Jose, California. Andrew Potts, Partner, Nixon Peabody LLP, will talk for ICOMOS about global efforts to leverage cultural heritage for resilience, and to localize and measure SDG Goal 11 and the 6 heritage-related NUA provisions.
Session 5: Online interactive mapping: Tips & tools for small communities26 October (Thursday) 14:00-15:30
Moderator: Rebecca HEWITT, Angelo Planning Group, Portland, USASpeakers: Marty STOCKTON, City of Portland, USA; Kalin SCHMOLDT; JLA Public Involvement; Matt HUGHART, Kittelson Associates; Kyra SCHNEIDER, Angelo Planning Group, USA
Learn from the experience of planners who have who have experience building and using online interactive maps to present and obtain information as part of public outreach for planning projects. Come be inspired and learn best practices for how to use these tools in your own community.
Session 6: Neighborhoods, parks, and food access-Creative approaches to community outreach in Salem, OR26 October (Thursday) 16:00-17:30
Moderator: Lisa ANDERSON-OGILVIE, Deputy Community Development, City of Salem, USASpeakers: Eunice KIM, NESCA; Annie GORSKI; Toni WHITLER, City of Salem, USA
Plans and public outreach guide our work in Salem. Hear three case studies that highlight creative approaches to community outreach. We will discuss outreach that went beyond traditional methods to help shape planning for three projects: a parks master plan, urban renewal strategic plan and food study, and neighborhood plan.
Session 7: Lighting up the discovery corridor – the port of Ridgefield’s dark fiber optics infrastructure27 October (Friday) 11:00-12:30
Moderator: Scott KEILLOR, BergerABAM, Vancouver, Washington, USASpeakers: Nelson HOLMBERG, Port of Ridgefield, Ridgefield, USA; Mike BOMAR, Columbia River Economic Development Council, USA; Jeff NITEN, City of Ridgefield, USA; Melissa ULAND, BergerABAM, Vancouver, USA
The Port of Ridgefield is proposing to invest in dark fiber-optic infrastructure to promote world-class, high performance economic development in Southwest Washington’s Discovery Corridor.
Session 8: Track 2 continued...
20
Track 6: Post-smart communities and the new frontiers
by Zaheer Allam, Mauritius
Cities are witnessing an increasing rate of densification and expansion, coupled with a flow of transient movement. Indeed, globalisation has brought an increasing dependency on transportation, whether through cars, buses, light rail, or aeroplanes, rendering our cities as a platform for hosting business, commerce, and other activities. Such a busy environment brought its fair share of challenges in regards to traffic, energy, water, waste, and the other components that contribute to the functioning of the city.
With the advent of internet connectivity and with the increasing knowledge of the causes of climate change, various communities adopted various ‘smart’ and innovative solutions to tackle such issues to better achieve a sustainable and resilient urban fabric.
However, with the increasing technological progress, and the effect of Moore’s law on pricing, new models are emerging to better tackle finance, governance, movement flows, business, commerce and others. The city witnesses a change in policies as it re-invents the way it functions. Various components, invisible decades ago, come into play in the form of big data, new technologies and techniques and cross-disciplinary measures through science and urban planning.
This emerging novel way, and cross disciplinary approach, to view cities gives rise to new ways to view;
Technology and big dataPlanning and governancePeople and societyFuture urban economicsCities of the future.
This track dwells into the transition of cities in adopting new techniques for management, design and planning, and showcases emerging trends and share findings to better channel resources to address contextual challenges.
1. Technology and big dataAs we enter a connected world; we embrace big data. Through those connections, we find at our disposal extremely large data sets that may reveal patterns and trends. With new information at the disposal of planners, how can those be used to better plan for the community? Furthermore, as we are witnessing the global adoption of mobile phones, data from mobile phones can depict an accurate understanding of transient flows and crowd representation. We also witness the inclusion of smart energy mapping tools and its influence on design and planning. We further understand the relationship between mobile devices, planning, utilities, urban space and local democracy.
2. Planning and governanceWe witnessed an increasing flow of migratory flux to cities over the past decades, stressing on existing resources, wealth and jobs distribution and influencing its societal, environmental, economic and political fabric. Against this backdrop, how can we turn challenged neighbourhoods into smart neighbourhoods? How is urbanisation affecting rural areas? What are the regulations to take into account while planning eco-cities? Dwelling further, design decisions and implementation phases can be challenging from a professional, societal, and legal standpoint. What kind of planning tools are at our disposal and what kind of platform could be proposed to address those challenges for planning professionals? How can data influence design planning and urban space management?
3. People and societyAs various cities around the world brand themselves as ‘Smart’ by adopting easy and ‘plug and play’ scenarios, the question arises; what is really a smart city, and what conceptual promises do they hold in regards to contemporary cities? Engaging with new technologies and easy data manipulation and the holistic planning perspectives can help researchers, planners and other professionals
view the city in an entirely new way. New tools, forums, and platforms emerges that can better showcase planning from a multidisciplinary perspective. Emerging concepts, frameworks, policies and planning ideas include green and cultural elements in masterplanning. The case of the Green loop in Portland ponders on the subject matter. Moreover, new technologies also highlights the need for constant learning and adaptation, as resistance to change in a fast paced world can often lead to a heavy societal cost. In this regards, as we rush towards adopting new technologies and automation, are we running towards unemployment?
4. Future urban economicsSince the advent of ‘Au Bon Marche’, the first shopping centre in France, efforts in design has shown exponential growth to influencing design decisions for the shopfront, façade, interiors and even more. We also acknowledge the increasing use of vehicular transportation and its impact on both economy and environment. An increasing trend of automated vehicles is seen on the rise and questions are raised about its negative impacts. As we further this discussion and dwell into the new technologies that are at our disposal and those that are yet to come, we asks ourselves; How will the future of retail expand to affect our urban morphology, and how can we mitigate the negative impacts of automated vehicles?
5. Cities of the futureThe sharing economy, e-commerce and autonomous vehicles are influencing urban planning decisions, and movement flows within the urban fabric. As new technologies influence the way we move in and across cities, they ultimately reflect on the external picture of city management, revenue and politics. What are the existing frameworks that may respond to those emerging technologies while catering to the societal needs for liveable cities? Moreover, with the advent of urbanisation and its stress on the urban fringe, how do we preserve the rural identity?
21
Session 1: Made in China25 October (Wednesday) 11:00-12:30
Moderator: Martin DUBBELING and Milena Ivkovic, ISOCARP Vice-PresidentsChina is planning to build 285 eco cities across the country in order to become the world’s leading power in sustainability, urban water management, and green energy. This policy marks China’s new approach to transform China’s cities in green and sustainable urban areas. The “Made in China” session explores the State of the Art in China’s rapid urban development.
Session 2: Cities leading through energy analysis & planning25 October (Wednesday) 14:00-15:30
Moderator: Kale ROBERTS, ICLEI-Local Governments for Sustainability, USASpeakers: Kale ROBERTS & Andrea MARTIN, Cascadia Consulting Group Seattle, USA
The U.S. Department of Energy Cities Leading through Energy Analysis and Planning (C-LEAP) project enhances municipal GHG inventory practice by creating methods and tools to attribute changes between inventories to the impacts of policies and programs along with other external drivers, such as economic activity and weather.
Session 3: 10 Years of ISOCARP Awards25 October (Wednesday) 16:00-17:30
Moderator: Martin DUBBELING, ISOCARP Vice PresidentIn 2017 ISOCARP celebrates 10 successful editions of the ISOCARP Awards for Excellence. The ISOCARP Awards for Excellence are conferred in recognition of exceptionally innovative urban and regional initiatives. These Awards were created in 2005 as the highest honour that the International Society of City and Regional Planners can award to a city, region or an institution. Until 2017 ISOCARP has acknowledged 43 cities, regions of institutions with the ISOCARP Awards for Excellence in 10 editions between 2005 and 2016. Amongst the laureates are the cities of Nanjing, Durban, Wuhan, Amsterdam, Bilbao, Singapore, Antwerp, Abu Dhabi, Brussels and Ottawa. ISOCARP has invited 10 laureates of the past editions Awards for Excellence to present their award winning cities and projects. The ISOCARP Awards Seminar will take 90 minutes, starting off with an introduction and overview of the 10 past editions of the ISOCARP Awards of Excellence and continues with 10 pitches of projects and cities from 5 regions (North America, Europe, Middle East, Africa and Asia) that won the ISOCARP Awards for Excellence between 2005 and 2017. ISOCARP past president Alfonso Vegara (2003-2006), the initiator of the Awards for Excellence, and ISOCARP president-elect Martin Dubbeling (2017-2018) - representing Ana Peric, Vice President Awards and Communication - will host and moderate the Awards Seminar.1. Cato Manor Redevelopment, Durban (2005)2. Spatial Structure Plan, Antwerp (2008), Park Spoor Noord, Antwerp (2015)3. Strategic Planning Guangzhou City (2010)4. Rahat Bedouin City, Israel (2011)5. Strategic Development Plan, Shantou (2012)6. Xiangshan Harbor, Ningbo (2014)7. Canal Zone Project, Ghent (2015) 8. Luhe City Center, Nanjing (2015)9. ZIBI Redevelopment, Ottowa (2016)10. Canal Zone Project, Brussels (2016)
Session 4: Planning and governance26 October (Thursday) 11:00-12:30
SKL International, Sweden - Paul DIXELIUS, Development Director at SKL International; Helena OHLSSON, Urban Specialist at the SymbioCity Secretariat
The SymbioCity Approach The SymbioCity Approach is used as a practical instrument to implement the New Urban Agenda in developing countries. This process for multidisciplinary, holistic and integrated sustainable development consist of various tools for e.g. analyses, evaluation, public participation and gender-sensitive planning to enable improved quality of life for all citizens. This process guides local governments to bridge the gap between sectors and stakeholders and turning challenges into opportunities.
Technology & big data
Dorota KAMROWSKA-ZALUSKA; Hanna OBRACHT-PRONDZYNSKA, Gdansk University of Technology, Gdansk, Poland; Emanuele NABONI, The Royal Danish Academy of Fine Arts Schools of Architecture, Design and Conservation, Denmark
Big Data as opportunity to enhance design sustainabilityThe aim of this presentation is to show the possibility of using Big Data based instruments to support restorative design. The proposed research is conducted in the framework of COST Action RESTORE Rethinking sustainability toward a regenerative economy aiming to advocate, mentor and influence restorative built environment.
Session 5: People and society26 October (Thursday) 14:00-15:30
Ali ALRAOUF, Abdulla AL-KARRANI, Urban Planning Section, Doha, Qatar Smart, resilient or just communities: interrogating the urbanity of contemporary Qatari and Gulf CitiesThe paper aims to revise the authenticity of smart cities conceptual premises and the future of contemporary cities. The paper conducts a number of comparative analyses and provides cases from the regional and international context to argue for a more holistic understanding of the swiftly emerging concept “Smart City”.
Stephen GOLDIE, Abu Dhabi Department of Planning & Municipalities, Abu Dhabi, UAE
The jobless city - revolution or paradise?The 4th Industrial Revolution is changing the nature of work. Around 80% of existing jobs will be automated. If these are not replaced by new, as yet unthought-of of work, then there are only two possible futures: revolution or paradise. How will we plan and build the jobless city?
Future urban economics
Slawomir LEDWON, Ministry of Municipality and Environment, Doha, Qatar Future smart retail: urban, virtual or both?The paper presents various aspects of technologies used in retailing and how they impact the way customers shop nowadays, and will probably do in the future. It discusses the possible future scenarios of changing the built form of cities to incorporate these changes.
Alexis BIDDLE, DKS Associates, Portland, USA Avoiding the nightmare: how a dynamic VMT tax for automated vehicles can achieve public policy goalsThis paper explores the possibility of implementing a dynamic Vehicle Miles Traveled Tax to mitigate negative impacts of automated vehicles.
The content of the short outlines is the responsibility of authors.
22
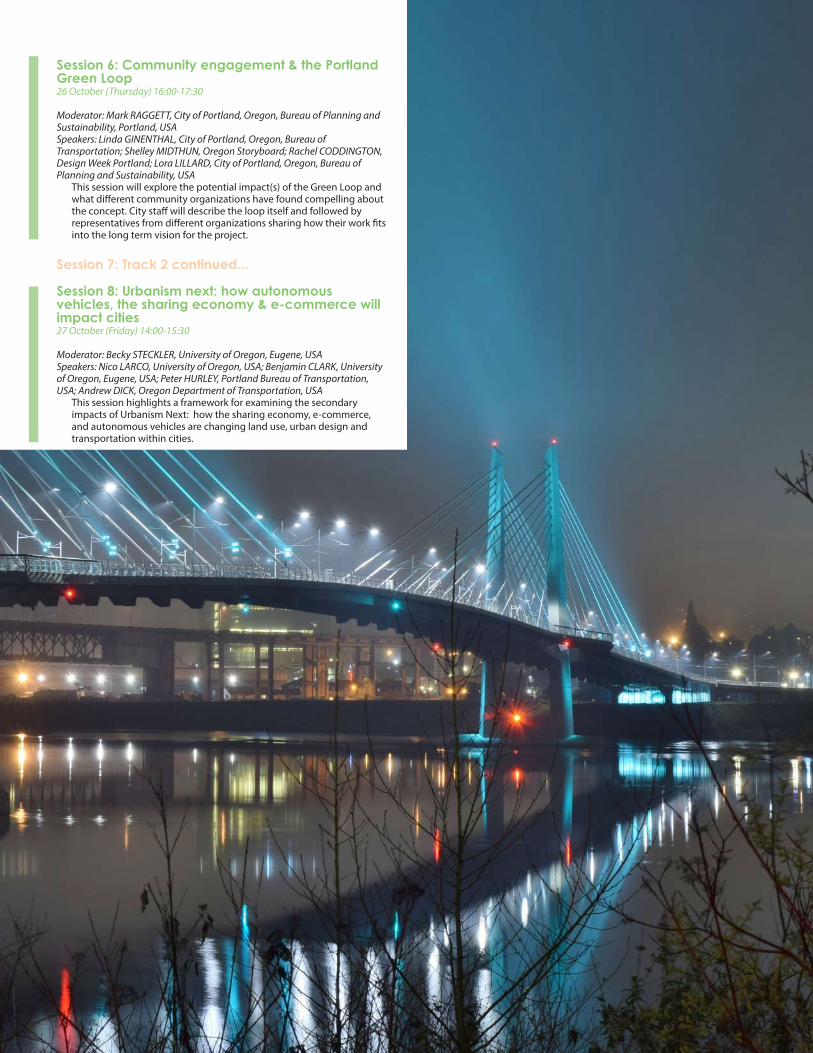
35
Session 6: Community engagement & the Portland Green Loop26 October (Thursday) 16:00-17:30
Moderator: Mark RAGGETT, City of Portland, Oregon, Bureau of Planning and Sustainability, Portland, USA Speakers: Linda GINENTHAL, City of Portland, Oregon, Bureau of Transportation; Shelley MIDTHUN, Oregon Storyboard; Rachel CODDINGTON, Design Week Portland; Lora LILLARD, City of Portland, Oregon, Bureau of Planning and Sustainability, USA
This session will explore the potential impact(s) of the Green Loop and what different community organizations have found compelling about the concept. City staff will describe the loop itself and followed by representatives from different organizations sharing how their work fits into the long term vision for the project.
Session 7: Track 2 continued...
Session 8: Urbanism next: how autonomous vehicles, the sharing economy & e-commerce will impact cities27 October (Friday) 14:00-15:30
Moderator: Becky STECKLER, University of Oregon, Eugene, USASpeakers: Nico LARCO, University of Oregon, USA; Benjamin CLARK, University of Oregon, Eugene, USA; Peter HURLEY, Portland Bureau of Transportation, USA; Andrew DICK, Oregon Department of Transportation, USA
This session highlights a framework for examining the secondary impacts of Urbanism Next: how the sharing economy, e-commerce, and autonomous vehicles are changing land use, urban design and transportation within cities.
23

Track 1: Technology, infrastructure and buildings
24
Ecodistr-ICT research project.
An integrated decision support tool for retrofit and renewal towards
sustainable districts
Björn BRACKE (OMGEVING), Pieter VAN DEN BROECK (KU Leuven), Guy VLOEBERGH (OMGEVING, University of Antwerp), Belgium
Abstract
The ECODISTR‐ICT project, was a three-year research project (2013-2016) funded by the 7th
Framework Programme of the European Union, in which an integrated decision support
system (IDSS) for sustainable retrofitting of projects on district level was developed and tested.
The IDDS helps to align all stakeholders and decision-makers to reach a mutually supported
vision, based on comprehensive data. The project included research institutes, software
developers and practitioners in the fields of urban planning, architecture and engineering, and
was coordinated by the Flemish research institute VITO. The software was designed according
to an agile transdisciplinary development method that delivered incremental updates that were
directly tested in the case studies, which provided in return valuable input for the further
development. As leader of the work package 5, the case study testing, OMGEVING reflects in
this paper on the research project and the case study Kiel in Antwerp.
1. Introduction
Energy consumption of buildings, taking into account the whole life cycle, is responsible for 40% of total EU energy consumption and for 36% of the EU’s total CO2 emissions (European Commission, n.d.). New buildings only account for 1% to 1.5% of the overall building stock. Therefore the regeneration of the other 99% of the often outdated building stock poses a major challenge in order to meet the EU climate and energy targets. The nature and the size of this challenge requires a strategy that transcends the renovation of singular buildings and a focus on urbanized areas with high concentrations of (old) buildings. Accelerating the current dynamics of building renovation is however a very complex challenge. An enormous diversity of stakeholders are involved in the built environment. The inhabitants, local policy makers, housing associations, developers, suppliers of components or subsystems, contractors/builders, service providers, and many others play a role in taking decisions about the design, the construction, occupation, retrofitting or renewal of buildings and districts. Currently, many of these stakeholders have their own decision-making processes that are not or only partially integrated.
The ECODISTR‐ICT project (https://ecodistr-ict.eu/) developed an integrated decision support system (IDSS) for sustainable retrofitting projects on district level, which can help to align all stakeholders and decisionmakers to reach a mutually supported vision, based on comprehensive data. This includes two important functionalities. The first is to show all the different needs of stakeholders in a single, integrated software environment, as the ambition
25
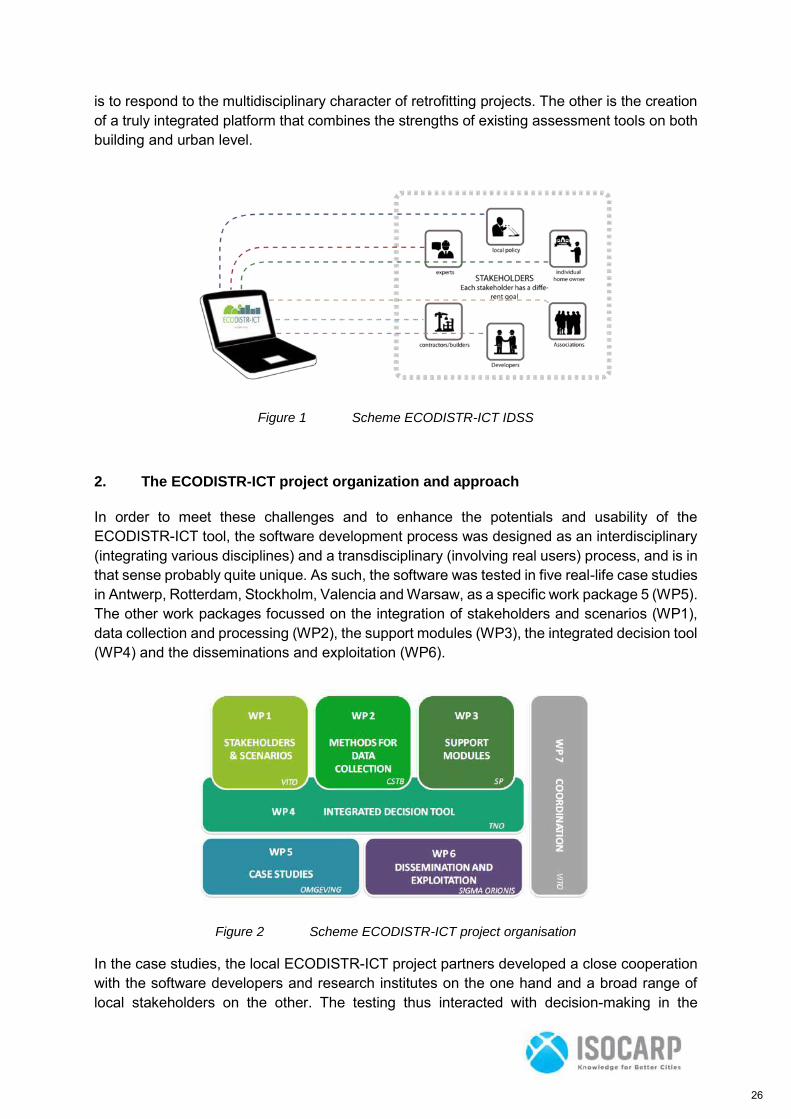
is to respond to the multidisciplinary character of retrofitting projects. The other is the creation of a truly integrated platform that combines the strengths of existing assessment tools on both building and urban level.
Figure 1 Scheme ECODISTR-ICT IDSS
2. The ECODISTR-ICT project organization and approach
In order to meet these challenges and to enhance the potentials and usability of the ECODISTR-ICT tool, the software development process was designed as an interdisciplinary (integrating various disciplines) and a transdisciplinary (involving real users) process, and is in that sense probably quite unique. As such, the software was tested in five real-life case studies in Antwerp, Rotterdam, Stockholm, Valencia and Warsaw, as a specific work package 5 (WP5). The other work packages focussed on the integration of stakeholders and scenarios (WP1), data collection and processing (WP2), the support modules (WP3), the integrated decision tool (WP4) and the disseminations and exploitation (WP6).
Figure 2 Scheme ECODISTR-ICT project organisation
In the case studies, the local ECODISTR-ICT project partners developed a close cooperation with the software developers and research institutes on the one hand and a broad range of local stakeholders on the other. The testing thus interacted with decision-making in the
26
ECODISTR-ICT consortium on the focus, target groups, business model, support modules and structure of the software, but - to a certain extent - also with decision-making in the case study areas themselves. As such, the role of the case studies was to take part in three parallel interactive processes:
1. creating the IDSS, using a scrum-like development process (as often used in the ICT domain);
2. developing a multi-stakeholder interaction process for retrofitting districts, based on using the new IDSS, in the domain of the (urban retrofitting) process facilitation domain;
3. developing alternatives for a new retrofitted district, using an interactive process and the new IDSS, in the district retrofitting domain.
All of these processes can be seen as constituted by stages and/or tracks of specification, design, implementation and evaluation, as well as complex interactions and iterative feedback loops. Furthermore, they had different participants, lead partners, goals and speeds. On top of that, the people involved in these three processes had backgrounds in different domains, were framed by different trainings and theories, had different methodologies and approaches, and operated with different stakes in the development and implementation of the software. Choosing for an interactive approach in the ECODISTR-ICT development process, thus entailed organizing the alignment and the interaction between the people, methodologies and theoretical backgrounds of the three domains (ICT, process facilitation, district retrofitting).
3. The design of the IDSS
In order to make the IDSS useful in an environment of ‘urban governance’, the first step was to understand how decision-making processes take place in general and therefore also in an urban multiple stakeholder context. Initially, the theoretical background on decision-making processes mobilised in ECODISTR-ICT, was based on models of Carpenter et al. and Steinitz (Luiten et al., 2014). The software-supported steps distinguish two stages in the decision-making process: define ambition and decide. Each of these stages have in-between steps and there are also iterations among the different steps. Figure 3 explains the different in-between steps and the interaction with the IDSS. These steps are explained in detail in the next chapter for the case study Kiel in Antwerp.
Figure 3 Basic decision-making process steps, second level: stage A – define ambition
27
Figure 4 Basic decision-making process steps: stage B - decide
The basic decision-making process involves many other decisions in itself (selecting Key Performance Indicators or KPIs, weighting, re-prioritizing, dealing with the new decisions emerging with the alternatives, etc.). Thus, even the basic decision-making process is not easy without a support of tools, particularly if there is no integration among them.
4. The case study Kiel in Antwerp
In the ECODISTR-ICT project, OMGEVING was responsible to introduce practical experience into the process of software development, and set up a real life case study in the Kiel neighbourhood (Kiel-west) in Antwerp, Belgium. The neighbourhood Kiel-west (approximately 34 ha) is part of a bigger district ‘Het Kiel’ in the south of Antwerp and is characterized by its multicultural and low-income character. The district contains a diverse housing stock, ranging from modernist high-rise social housing blocks to privately owned small scale housing. The interim findings and products from ECODISTR-ICT were confronted with a real life context in different stages and different forms during the project. In this chapter we explain the process and the involvement of local stakeholders, and the interactions with the IDSS in the case study. Therefore we use the different steps of the decision making process that are part of the IDSS.
28
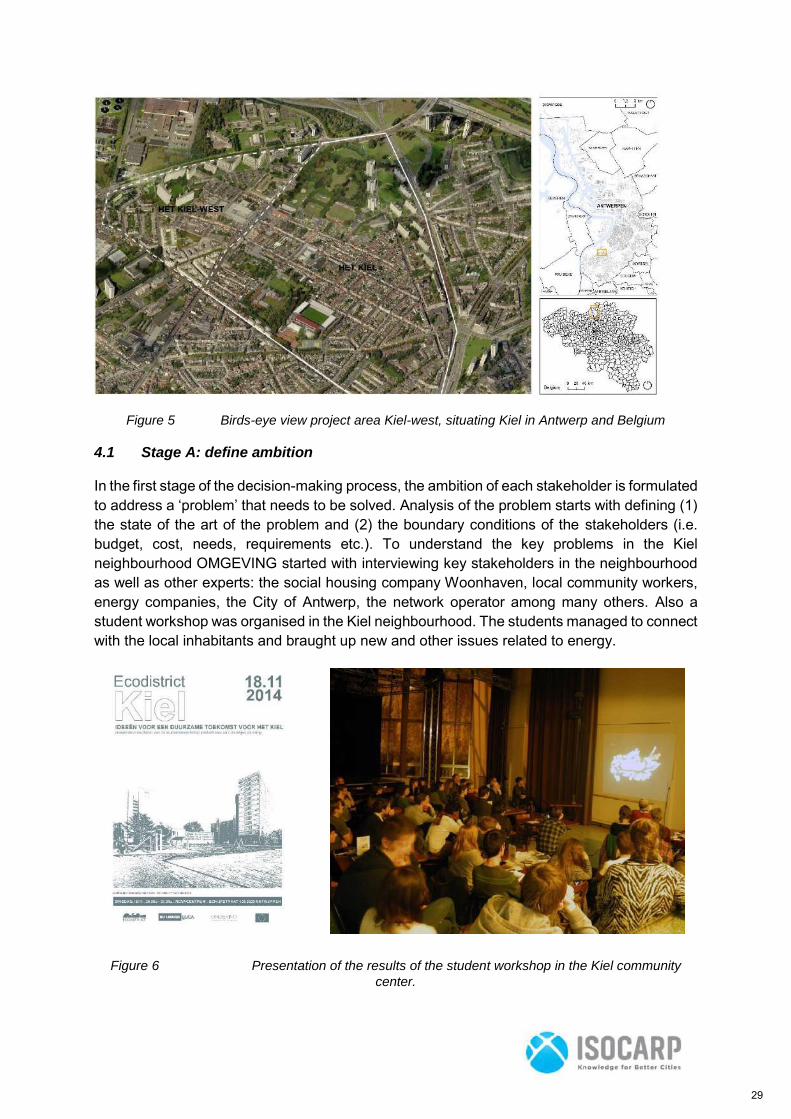
Figure 5 Birds-eye view project area Kiel-west, situating Kiel in Antwerp and Belgium
4.1 Stage A: define ambition In the first stage of the decision-making process, the ambition of each stakeholder is formulated to address a ‘problem’ that needs to be solved. Analysis of the problem starts with defining (1) the state of the art of the problem and (2) the boundary conditions of the stakeholders (i.e. budget, cost, needs, requirements etc.). To understand the key problems in the Kiel neighbourhood OMGEVING started with interviewing key stakeholders in the neighbourhood as well as other experts: the social housing company Woonhaven, local community workers, energy companies, the City of Antwerp, the network operator among many others. Also a student workshop was organised in the Kiel neighbourhood. The students managed to connect with the local inhabitants and braught up new and other issues related to energy.
Figure 6 Presentation of the results of the student workshop in the Kiel community
center.
29
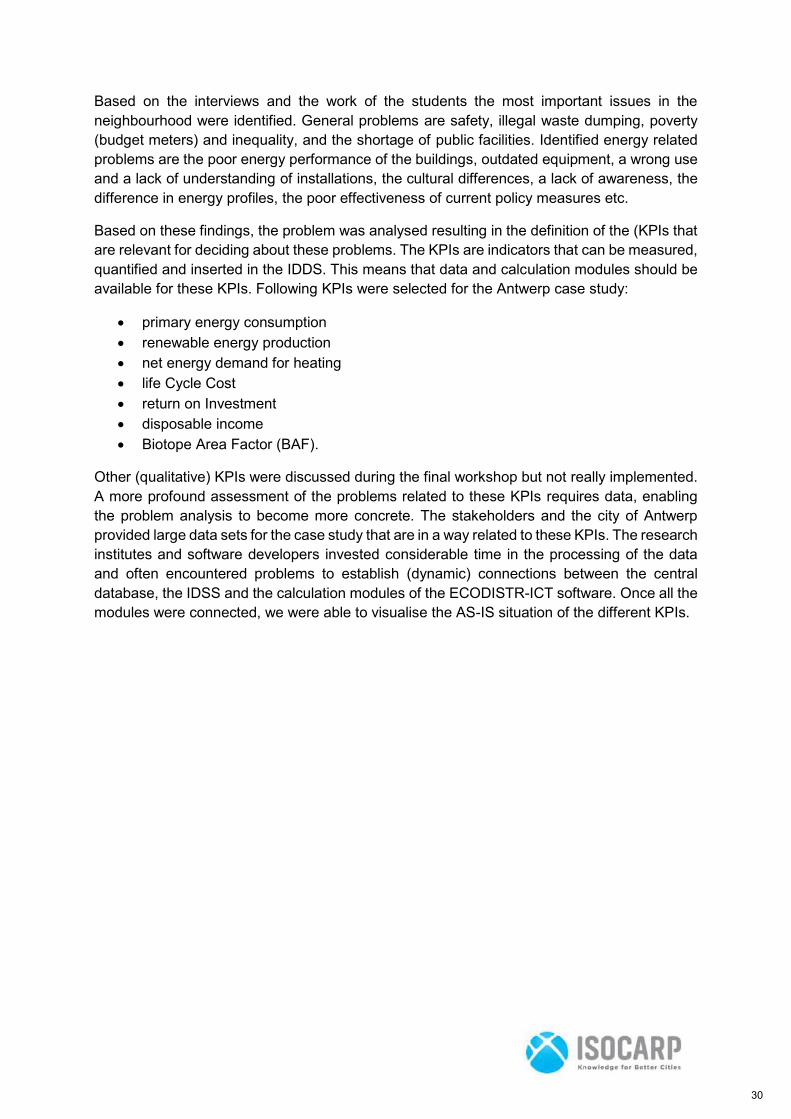
Based on the interviews and the work of the students the most important issues in the neighbourhood were identified. General problems are safety, illegal waste dumping, poverty (budget meters) and inequality, and the shortage of public facilities. Identified energy related problems are the poor energy performance of the buildings, outdated equipment, a wrong use and a lack of understanding of installations, the cultural differences, a lack of awareness, the difference in energy profiles, the poor effectiveness of current policy measures etc.
Based on these findings, the problem was analysed resulting in the definition of the (KPIs that are relevant for deciding about these problems. The KPIs are indicators that can be measured, quantified and inserted in the IDDS. This means that data and calculation modules should be available for these KPIs. Following KPIs were selected for the Antwerp case study:
primary energy consumption renewable energy production net energy demand for heating life Cycle Cost return on Investment disposable income Biotope Area Factor (BAF).
Other (qualitative) KPIs were discussed during the final workshop but not really implemented. A more profound assessment of the problems related to these KPIs requires data, enabling the problem analysis to become more concrete. The stakeholders and the city of Antwerp provided large data sets for the case study that are in a way related to these KPIs. The research institutes and software developers invested considerable time in the processing of the data and often encountered problems to establish (dynamic) connections between the central database, the IDSS and the calculation modules of the ECODISTR-ICT software. Once all the modules were connected, we were able to visualise the AS-IS situation of the different KPIs.
30
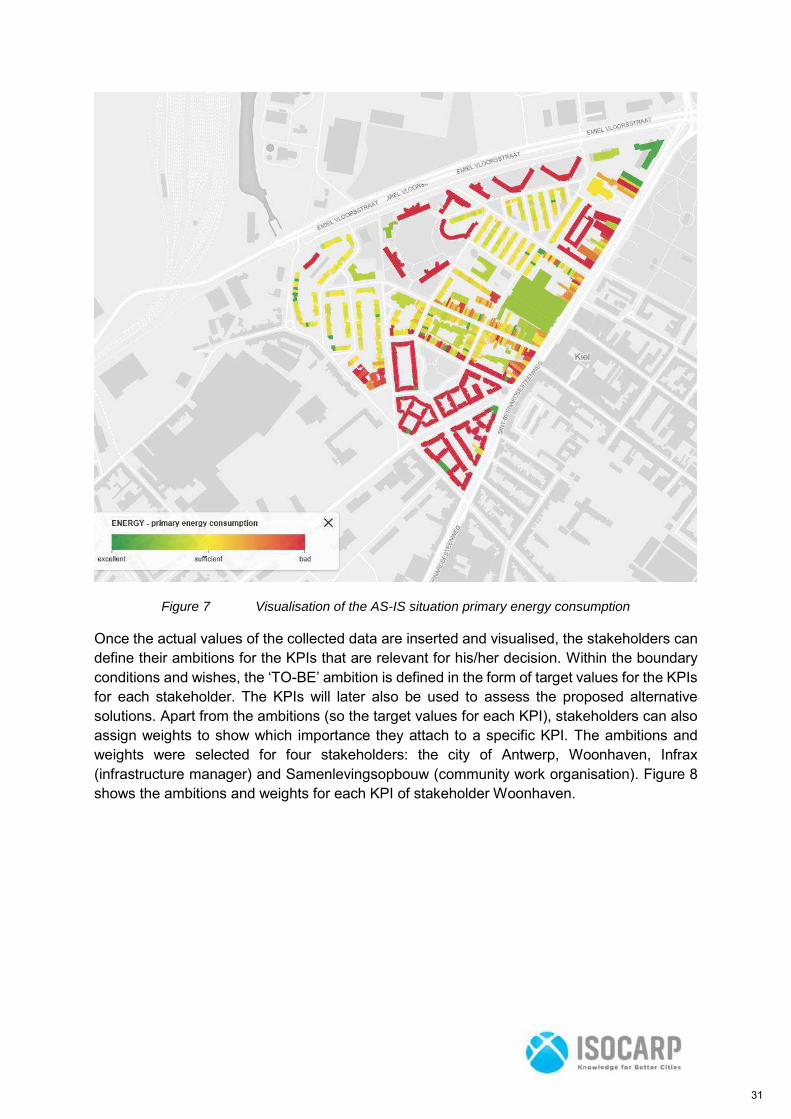
Figure 7 Visualisation of the AS-IS situation primary energy consumption
Once the actual values of the collected data are inserted and visualised, the stakeholders can define their ambitions for the KPIs that are relevant for his/her decision. Within the boundary conditions and wishes, the ‘TO-BE’ ambition is defined in the form of target values for the KPIs for each stakeholder. The KPIs will later also be used to assess the proposed alternative solutions. Apart from the ambitions (so the target values for each KPI), stakeholders can also assign weights to show which importance they attach to a specific KPI. The ambitions and weights were selected for four stakeholders: the city of Antwerp, Woonhaven, Infrax (infrastructure manager) and Samenlevingsopbouw (community work organisation). Figure 8 shows the ambitions and weights for each KPI of stakeholder Woonhaven.
31
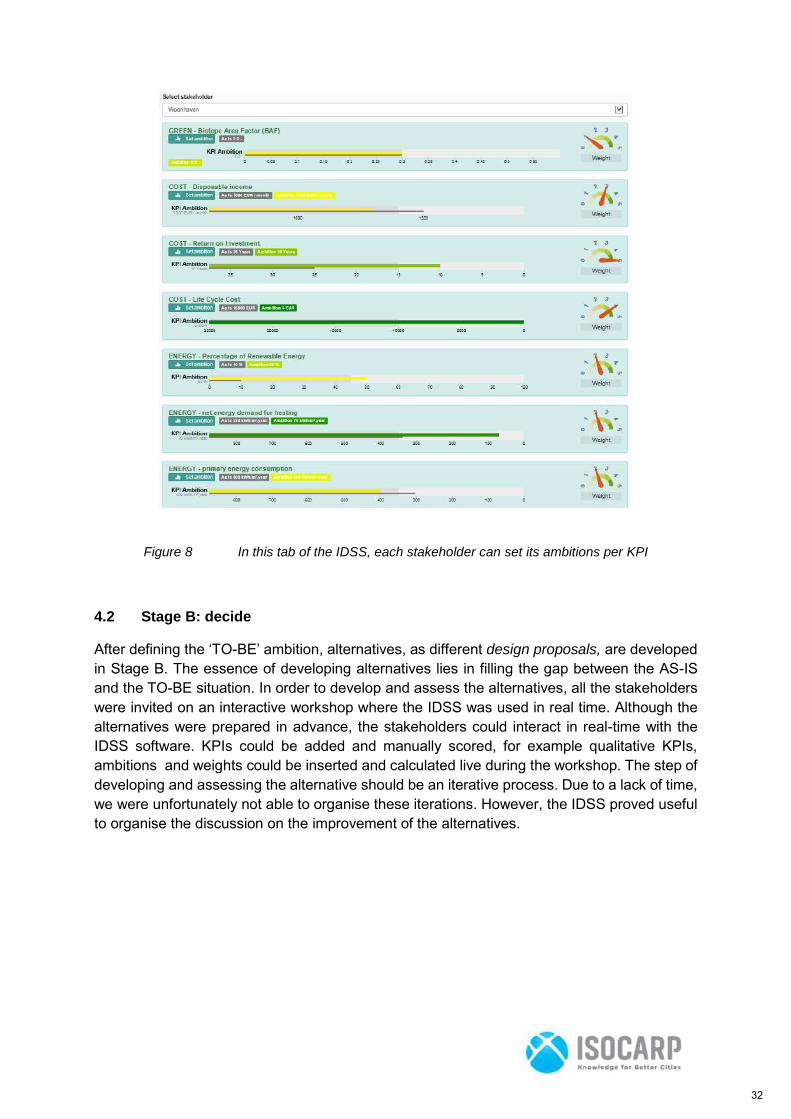
Figure 8 In this tab of the IDSS, each stakeholder can set its ambitions per KPI
4.2 Stage B: decide
After defining the ‘TO-BE’ ambition, alternatives, as different design proposals, are developed in Stage B. The essence of developing alternatives lies in filling the gap between the AS-IS and the TO-BE situation. In order to develop and assess the alternatives, all the stakeholders were invited on an interactive workshop where the IDSS was used in real time. Although the alternatives were prepared in advance, the stakeholders could interact in real-time with the IDSS software. KPIs could be added and manually scored, for example qualitative KPIs, ambitions and weights could be inserted and calculated live during the workshop. The step of developing and assessing the alternative should be an iterative process. Due to a lack of time, we were unfortunately not able to organise these iterations. However, the IDSS proved useful to organise the discussion on the improvement of the alternatives.
32
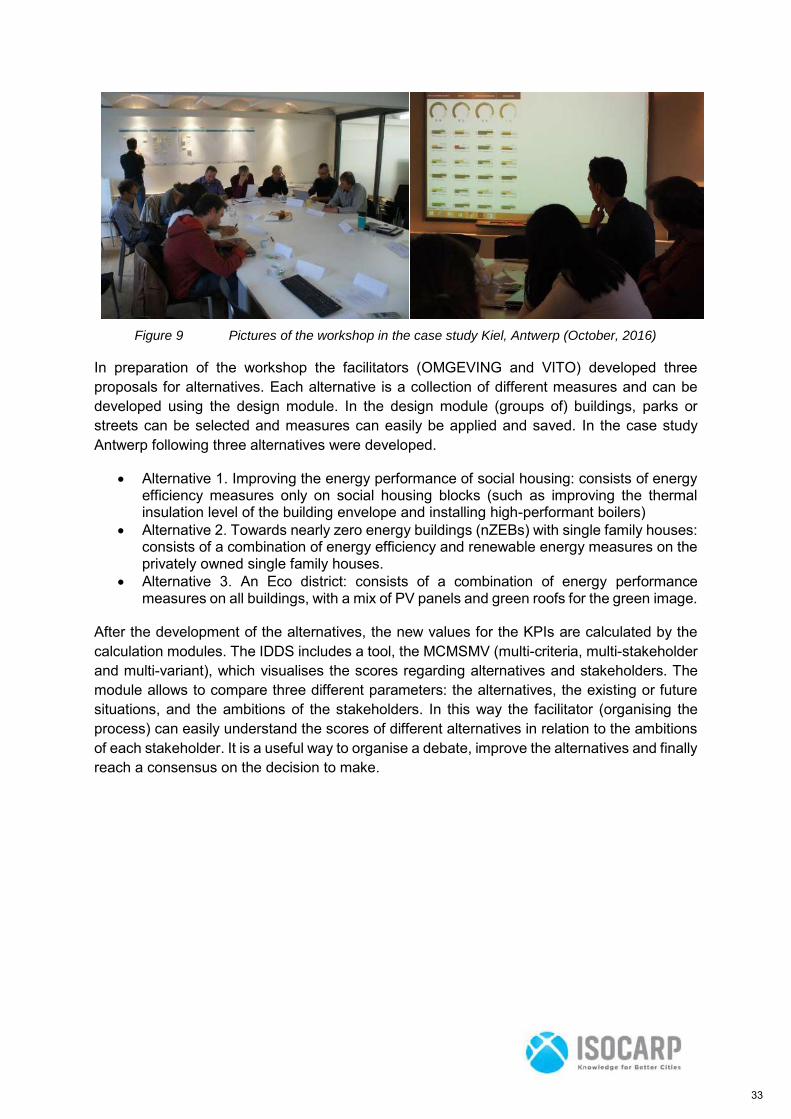
Figure 9 Pictures of the workshop in the case study Kiel, Antwerp (October, 2016)
In preparation of the workshop the facilitators (OMGEVING and VITO) developed three proposals for alternatives. Each alternative is a collection of different measures and can be developed using the design module. In the design module (groups of) buildings, parks or streets can be selected and measures can easily be applied and saved. In the case study Antwerp following three alternatives were developed.
Alternative 1. Improving the energy performance of social housing: consists of energy efficiency measures only on social housing blocks (such as improving the thermal insulation level of the building envelope and installing high-performant boilers)
Alternative 2. Towards nearly zero energy buildings (nZEBs) with single family houses: consists of a combination of energy efficiency and renewable energy measures on the privately owned single family houses.
Alternative 3. An Eco district: consists of a combination of energy performance measures on all buildings, with a mix of PV panels and green roofs for the green image.
After the development of the alternatives, the new values for the KPIs are calculated by the calculation modules. The IDDS includes a tool, the MCMSMV (multi-criteria, multi-stakeholder and multi-variant), which visualises the scores regarding alternatives and stakeholders. The module allows to compare three different parameters: the alternatives, the existing or future situations, and the ambitions of the stakeholders. In this way the facilitator (organising the process) can easily understand the scores of different alternatives in relation to the ambitions of each stakeholder. It is a useful way to organise a debate, improve the alternatives and finally reach a consensus on the decision to make.
33
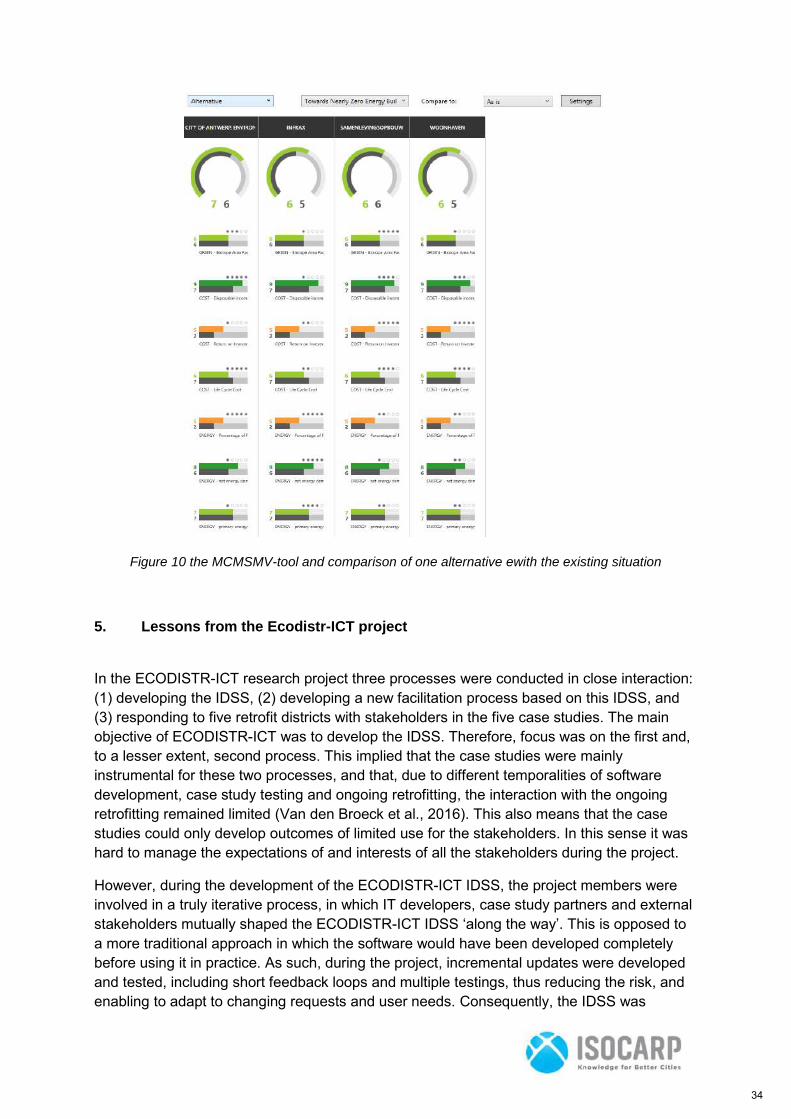
Figure 10 the MCMSMV-tool and comparison of one alternative ewith the existing situation
5. Lessons from the Ecodistr-ICT project
In the ECODISTR-ICT research project three processes were conducted in close interaction: (1) developing the IDSS, (2) developing a new facilitation process based on this IDSS, and (3) responding to five retrofit districts with stakeholders in the five case studies. The main objective of ECODISTR-ICT was to develop the IDSS. Therefore, focus was on the first and, to a lesser extent, second process. This implied that the case studies were mainly instrumental for these two processes, and that, due to different temporalities of software development, case study testing and ongoing retrofitting, the interaction with the ongoing retrofitting remained limited (Van den Broeck et al., 2016). This also means that the case studies could only develop outcomes of limited use for the stakeholders. In this sense it was hard to manage the expectations of and interests of all the stakeholders during the project.
However, during the development of the ECODISTR-ICT IDSS, the project members were involved in a truly iterative process, in which IT developers, case study partners and external stakeholders mutually shaped the ECODISTR-ICT IDSS ‘along the way’. This is opposed to a more traditional approach in which the software would have been developed completely before using it in practice. As such, during the project, incremental updates were developed and tested, including short feedback loops and multiple testings, thus reducing the risk, and enabling to adapt to changing requests and user needs. Consequently, the IDSS was
34
developed as a flexible and modular structure, allowing users to repeat the basic steps as often and in whatever sequence as deemed necessary, to work on different levels, to address a wide range of case-specific quantitative as well as qualitative KPIs, to change priorities as to which calculation modules are mobilised, etc.
Interactions with stakeholders learn that there is indeed a need for tools to support urban retrofit projects and to gain knowledge based on the growing availability of data. Thanks to the agile transdisciplinary development method, the ECODISTR-ICT IDDS is largely adapted to cope with these challenges. The experiences of the case studies prove that the IDSS can indeed help to inform decisions based on a stakeholder and process oriented approach. Further lessons will be learned by applying the IDSS in practice. The partners in ECODISTR-ICT encourage future users to share their real-life experiences, and contribute to the further development of this open source system.
The IDSS tool was developed with very high ambitions regarding its flexibility and functionalities. This means it has the potential to be used by many different stakeholders in various projects or contexts. It can be used as a tool for analysis, data collection, design, stakeholder management, participation and communication or assessment and evaluation. The tool can deal with this wide range of functionalities, but at the same time it is not 100% suited yet for one specific use. Many of the Antwerp stakeholders were most enthusiastic about the participation and communication potential of the IDSS. Working on the specialisation of the tool in real life case studies is probably one of the biggest challenges for the coming years.
Many stakeholders are more and more willing to provide large sets of data on urban conditions. However, using and connecting this data is a very complex and time consuming operation. Many stakeholders use their own data formats, systems and templates. In the ECODISTR-ICT project this was one of the main hurdles that often caused delays. Furthermore data must be screened on reliability. Reliable, accurate and updated data is the basis for good results and full support for decision-making.
Finally, the question remains whether the theoretical stage model as explained in section 3 as well as the ECODISTR-ICT software, sufficiently fit reality. Decision-making processes are more complex than the stage model shows, as they take place at different levels, involve multiple stakeholders, face different and even conflicting ambitions, and have to handle different performance expectations. This complexity was expressed in the three interacting processes during the making of the ECODISTR-ICT software. The making of the software included continuous communication and discussion amongst a large set of partners with different backgrounds and stakes. Software engineers, city-planners, sociologists,… needed to find a common language to express expectations, technical bottlenecks, deal with changing scopes, etc. Significant efforts were dedicated to enable this conversation on a regular basis, and to reach common understanding on the goals of the next design sprint. Also, the approach catered for constantly changing scopes and priorities. Partner organizations and even individuals took the responsibility of going beyond the boundaries between tasks and work packages, requiring commitment and trust from all partners beyond the ‘legal agreements’ made in the description of work and consortium agreement. Dealing with frustration from using intermediate versions of the software required keeping the attention and focus of the stakeholders and trying to organize a discussion on the content, as well as providing valuable feedback to the software developers. Ways had to be found to
35
align the timing imposed by the case studies with the pace of development in the distinct work packages, data, calculation modules, dashboard etc., to maintain trust and cooperation between the different participants of the development process. And especially, the pathways of the software development were mixed with activities taking place ‘in real life’ in the case study locations. It proved hard to attune the testing phase with existing processes of renewal in the neighbourhood. As such, many challenges regarding the application of an IDSS in a real-life process still need to be addressed, including the timing of usage and the connection to the ‘momentum’ in ongoing processes and the agendas of their stakeholders, the difficulty to preserve qualitative KPIs, the danger of reducing the necessary iteration to single uses, the abstraction of power relations and power structures, the loss of pursued transparency, and the reduction of a broad range of district ‘qualities’ to a limited set of KPIs.
References
EUROPEAN COMMISSION (n.d.): Energy-efficient Buildings: Challenges ahead. [Online] European Commission. Available from: http://ec.europa.eu/research/industrial_technologies/eeb-challenges-ahead_en.html [Accessed 17/02/2016].
Luiten, B., Willems, E., van der Helm, P., Bektas, E., Schaminee, S., Jongeneel, S., Verbeke, S., van de Vyver, I., Kronvall, J., Rudena A., Capener, C., Van den Broeck, P. (2014), Functional design of the Integrated Decision Support System, Deliverable 4.1, Ecodistr-ICT research project, European Commission
Van den Broeck, P., Bracke, B., Roels, D., Van de Vyver, I., Verbeke, S., Luiten, B. (2016a), Conclusion report on the governance of retrofitting and the use of the Ecodistr-ICT tool, deliverable 5.4, ECODISTR-ICT research project, European Commission
Van den Broeck, P., Bracke, B., Roels, D., Van de Vyver, I. (2016b), Final report of the different case studies, a strategy for sustainable renewal of the district, deliverable 5.3, ECODISTR-ICT research project, European Commission
36
Liu/Zhang/Wang resource allocation in rural medical space ISOCARP-OAPA Conference 2017
1
Study on the Rationality of Resource Allocation in Rural MedicalSpace Based on Spatial Data Analysis
1. Yi Liu, Harbin Institute of Technology, China.2. Shanshan Zhang, Harbin Institute of Technology, China.
3. Tian Wang, Harbin Institute of Technology, China.
AbstractWith the transformation and rapid development of scaled process in rural areas, ruralpopulation composition and resource ratio is constantly changing, but the insufficient medicalservice, a shortage of medical resources, lag behind medical development, the imbalancedevelopment of regions still exists for a long time. Therefore, we should not only researchrural Medical Building and renovation, but also research rural medical space resourceallocation when we work on resource allocation in rural medical space.On the basis ofspatial data analysis, this paper selects and extracts impact factors of rural medical spaceresource allocation from the spatial structure, spatial autocorrelation and network analysis. Itfocuses on space distribution and spatial accessibility of medical resources to establish theinfluencing factors of resources allocation in rural medical space, construct a theoreticalrationality study model on rural resource allocation in medical space to get a new cognition,interpretation, prediction and control on it. At the same time, the latest researchachievements in related fields such as clinical medicine, sociology and management arebrought into the research on architecture. It enhances rural medical space resourceallocation to theoretical height through cross disciplines.It needs to explain that the modelcan be used in different regions to plan and guide for medical resource allocation incorresponding space, but it also needs to change with regional special status, policy, climate,cultural environment and other factors.
keywordResource Allocation; Rural Medical Space; Spatial Data Analysis; GIS.
1. IntroductionThe era of data has made us quickly obtain a large number of natural, ecological,environmental and socio-economic data information, increased more possibilities to theresource allocation research, and even greatly promoted the new medical service systemand medical resource allocation model;in addition, the research on space environment datarepresented by GIS technology has been widely applied in the field of public health andrepresented a good development trend.The accelerating process of urbanization hasconstantly changed the rural population composition and resource ratio, but the long-termlack of medical services, a serious shortage of medical resources,the backward developmentof medical and health services and regional imbalances are very common.In China, the ruralpopulation accounts for 71% of the total, but the rural areas only have 20% of healthresources and seriously lack health professional and technical personnel; what’s more, theincreasingly aging rural population composition has made many farmers believe that healthcare is more urgent to be solved than pension.The survey shows that 17% of farmers neverworry about their pension and 23% of farmers rarely worry, but 70% worry very much.Theresearch on resource allocation in rural medical space is not just the transformation of ruralhospitals, but the summary of the whole rural medical system,and aims to improve thequantification of relevant indicators, construct an integrated medical and health servicesystem with the complete system, complementary functions and efficient operation under thebackground of big data, and further make everyone enjoy equal medical and health services.
37

Liu/Zhang/Wang resource allocation in rural medical space ISOCARP-OAPA Conference 2017
2
2. Influencing Factors of Resource Allocation in Medical Space2.1 Definition of "resource allocation in medical space"Medical resource allocation has two meanings: the first is the allocation of medical resources,known as initial allocation,and characterized by incremental allocation; the second is theflowing of medical resources, known as re-allocation, and characterized by stockadjustment.The medical resource allocation should follow three basic principles of need,fairness and benefit, and transformed into bearing ability, fairness and inclination in the studyof resource allocation in medical space. It is essential to focus on regional tendencies causedby regional climate and environmental differences, common and frequent disease differencesunder the premise of bearing ability and fairness; the effective utilization of limited medicalresources based on medical service supply and demand balance can achieve the largestmedical service benefits.
Resource allocation in medical space is to explore the optimal allocation from the perspectiveof urban planning and according to the understanding of spatial domain, the demand andfunction, the environment suitability and the acceptance degree of people, and its researchaims to directly connect resource allocation with population environment, propose the layoutprogram to realize the optimal fairness and spatial accessibility for distribution of regionalmedical resources through the comprehensive analysis of resource distribution and utilizationin regional medical institutions. Only when all medical resources can meet the balance ofsupply and demand, the allocation can obtain the greatest social and economic benefits andcan be called the reasonable or optimal.2.2 Evaluation of resource allocation in medical spaceThe object in the evaluation of resource allocation in medical space refers to human,financial, and material resources invested in the medical and health services by the society,including medical equipment and facilities, hospital bed resources, health funding funded bythe government or medical institutions and human resources represented by healthtechnology; Therefore, it is necessary to focus on rational resource spatial allocation andcoordinated resource function in the deployment of medical resources, including theincreased production factors (human, bed and equipment), rational distribution and evenimprovement of medical resources utilization efficiency based on existing resourcesaccording to the actual requirements of residents.The purpose of evaluating resourceallocation in rural medical space is to understand its present situation, find medically under-served area, analyze the rationality of resource allocation and further put forward feasiblemeasures to enhance the evaluation and early warning.2.3 Expansion of influencing factorsThe influencing factors of traditional resource allocation in medical space mainly includeiatrogenic, medical technology, drug-induced, hospital environment, equipment andorganizational management.However, the spatial structure and auto-correlation analysishave allowed us to quantify the spatial accessibility and its impact on medical resources, andconduct more accurate evaluation by combining network spatial data analysis along with thegradual improvement of spatial data analysis and its wide application in medicalfield.Therefore, based on traditional influencing factors of resource allocation in medicalspace, we should further consider geo-spatial characteristics of medical resources,especially the spatial and temporal distribution and spatial accessibility to make more perfectindex system.
3. Application of Spatial Data Analysis3.1 Property of spatial data analysisThe theory of spatial analysis,originated from quantitative revolution in geography in 1960s,isa structure model to analyze point, line and plane on the map or two-or three-dimensionalspaces defined by geographical coordinates with quantitative (mainly statistical) process andtechnique, and later spatial analysis focuses on inherent characteristics, spatial selection
38

Liu/Zhang/Wang resource allocation in rural medical space ISOCARP-OAPA Conference 2017
3
process of geographic space and its influence on spatial and temporal evolution of complexspatial systems, and spatial data analysis has been beyond the scope of traditional statisticsafter 30 years of development.It should be pointed out that it includes mathematical thinkingof spatial structure analysis, spatial auto-correlation analysis, spatial interpolation technologyand various spatial simulation models based on graphics operations (such as overlayanalysis, buffer analysis and network analysis), which is significantly different with the spatialgeometric analysis provided by GIS.
Spatial data analysis focuses on the relationship between things with spatial properties, thecognition, interpretation, prediction and regulation of spatial information, and the resultsdepend on the distribution of events and provide for the public and private users.Its mainpurpose is: ① spatial information cognition,meaning to efficiently obtain and scientificallydescribe spatial data; ② spatial information interpretation, meaning the understanding andreasonable explanation of the space process;③ spatial information prediction;④ scientificregulation of spatial events.3.2 Characteristic of spatial data analysisDifferent from CAD and map making system, one of its main characteristics is the ability toprocess spatial data, and generally, spatial data provides two types of information:① thespatial position data of description objects (their topological relations), which is positionaldata and topological data;②non-spatial properties of description object include property dataor thematic data,and spatial data analysis often involves the error of spatial data, dataintegration, the detailed degree of data and appropriate spatial analysis method.The dataerror can be generated in the measurement of positional and property data and furtherpassed in various operations and analyzes,which can also produce some errors.
Different types of data in the integration process may be incompatible, which is also one ofthe characteristics of spatial data. This kind of incompatibility may be caused by differentspatial reference systems, data layers at different times, comprehensive degree andpositional errors of different data, which has received more and more attention.
Finally, as sample independence in routine statistical analysis is one of the most basicassumptions, spatial data is not suitable for routine statistical analysis due to the non-independence of objects and events in spatial distribution. Essentially, it is determined by thespatial dependence and spatial heterogeneity of geographical phenomena.3.3 Exploratory spatial data analysis(ESDA)More and more generated spatial data has led to "rich data, but weak theory" in the field ofGIS, so the analytical technology that"let the data speak for themselves",which is ExploratorySpatial Data Analysis (ESDA) is very necessary.ESDA refers to the structure and solution toanalyze and identify the nature of spatial information,and further guide the deterministicmodel with statistical principles and graphics,which is actually a "data-driven" analysismethod.ESDA focuses on spatial dependence and heterogeneity, describing spatialdistribution, revealing the structure of spatial relations, giving different forms of spatialheterogeneity and finding singular observation,and without many prior knowledge, theory andassumptions.
①Application in spatial and temporal distribution. In the case of spatial data analysis used inthe spatial and temporal distribution of health resources, Christina Frank et al. conducted aspatial analysis of Lyme disease and obtained the temporal and spatial distribution trend ofthe disease in Maryland from 1993 to 1998 based on postal code.F. Cipriani et al. conducteda comparative analysis of drink-related deaths in Italy from 1980 to 1990 and the resultsshowed that there was a significant difference in drink-related death rates of various regions,and further proved differences in immunization among populations.B. Solca et al. analyzedthe differences in iodine uptake in different regions,urban and rural areas, identified the riskpopulation for the lack of iodine, and found small difference between rural and urban areas,but large difference between regions and further determined the risk area lacking iodine. Wu
39
Liu/Zhang/Wang resource allocation in rural medical space ISOCARP-OAPA Conference 2017
4
Kegong also made an analysis and comparison of distribution differences of patients witharsenic poisoning in Inner Mongolia, and reached the range of risk population.Geoffrey T.F etal. analyzed the temporal and spatial clustering distribution of populosis in California,andspatial analysis on data from 1973 to 1992 has determined spatial distribution of disease andobtained the association between disease and population, meaning milk-consumption livinghabit of descendants in Span is closely related to the disease.
② Application in spatial accessibility.Spatial accessibility refers to the convenience ofreaching a target area from the given area and widely used in urban planning, transportation,geography, which has spatial characteristics, temporal significance and can fully reflecteconomic and social values. Its influencing factors include spatial distribution of medicalinstitutions, traffic needs, traffic supply and travel time.The accessibility of geometric networkbased on spatial data analysis can be measured by spatial distance (distance cost), timedistance (time cost), economic distance (economic cost) and other basic factors,and itsmeasurement method mainly includes distance method, contour method, cumulativeopportunity method, gravity model method, space-time method, balance coefficient methodand utility method.
In the accessibility case research of spatial data analysis applied to health resources, Loveand Lindquist adopted GIS and its related tools to calculate and represent the spatialaccessibility of older population in Illinois relative to medical facilities, and concluded mostelders are closer to the medical service network, 80% have a a hospital to choose within 4.8miles, and two hospitals within 11.6 miles.Accurate medical spatial accessibility indicator canbe measured by GIS to clearly describe the competition between the varioushospitals.Anderson first proposed the accessibility model relative to multidimensionalvariables of medical facilities in 1968, which plays an important role in utilizing medicalservices.Wolinsky(1990)provided the detailed dynamic development framework on utilizationof medical services and the application of earlier specialist outpatient services.Gesler andMeade(1988)reviewed the inherent attributes of relevant positional services, such asdistance, population characteristic, and daily activity space relative to medical routineresources.Gartell et al.(1998) studied the breast cancer with spatial data processing bydividing patients into different groups based on zip code, their social class andsocioeconomic data of the relevant census and distance from the surgeon's home, andfurther concluded that its incidence is closely related to the number of medical examinationsand female doctors.Kwan(2003) recorded daily specific activities and time of the researchobjects with her colleagues and made a three-dimensional model, in which time is the thirddimension.
In short, the spatial data analysis has been widely applied in the spatial and temporaldistribution of health resources, but the quantitative description of its distribution law shouldhave the further research and application.In this aspect, the methods on spatial and temporaldistribution in spatial data analysis, such as Moran I statistics and G * statistics, can wellcharacterize the spatial aggregation and correlation degree of research objects .
4. Building a Theoretical Model of Resource Allocation in Medical Space4.1Setting a goalFirstly, we can determine the required basic factors of resource allocation in medical spaceand put forward the relevant allocation elements through combining the common medicalproblems and present situation in the target area and theoretical data, in order to providetheoretical basis and data support for the follow-up research.Secondly, we should clear thelevel relationship and weight between the factors by establishing resource allocationevaluation system in medical space. Thirdly, we construct the resource allocation model inrural medical space and select the typical region for interpolation verification to optimize thecalculation accuracy of the model. Finally, we put forward resource allocation strategy in ruralmedical space to provide technical support for urban design.
40
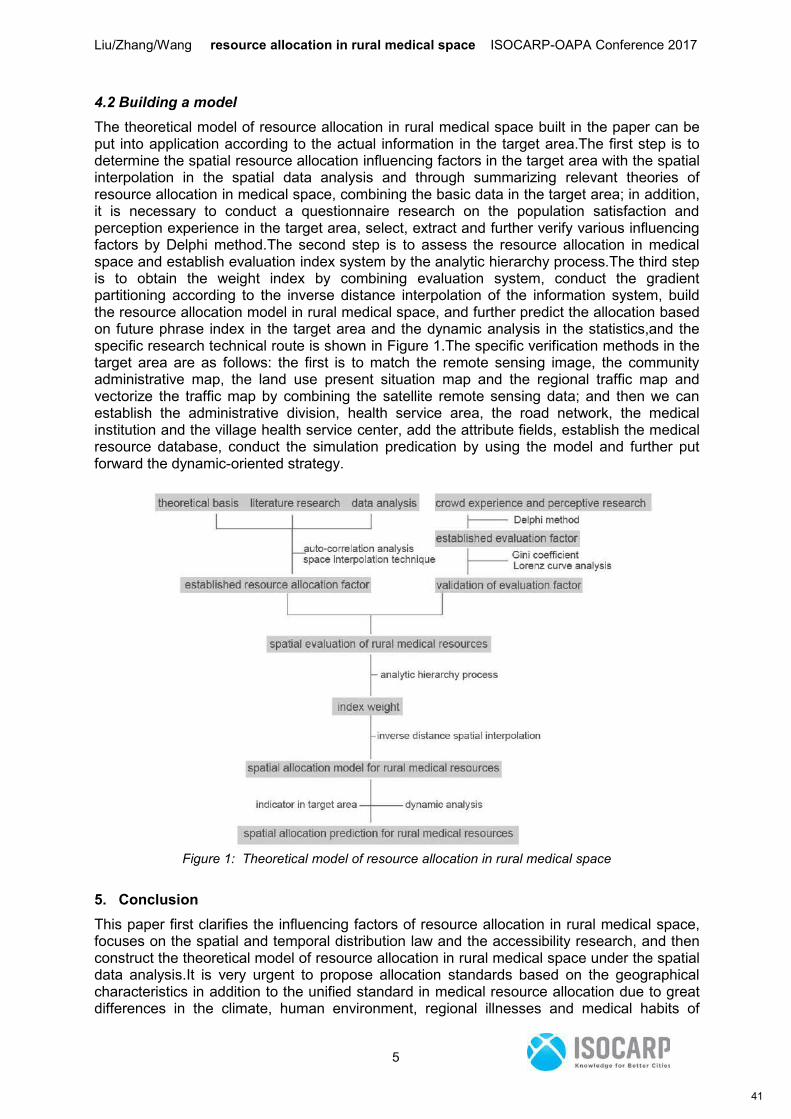
Liu/Zhang/Wang resource allocation in rural medical space ISOCARP-OAPA Conference 2017
5
4.2 Building a modelThe theoretical model of resource allocation in rural medical space built in the paper can beput into application according to the actual information in the target area.The first step is todetermine the spatial resource allocation influencing factors in the target area with the spatialinterpolation in the spatial data analysis and through summarizing relevant theories ofresource allocation in medical space, combining the basic data in the target area; in addition,it is necessary to conduct a questionnaire research on the population satisfaction andperception experience in the target area, select, extract and further verify various influencingfactors by Delphi method.The second step is to assess the resource allocation in medicalspace and establish evaluation index system by the analytic hierarchy process.The third stepis to obtain the weight index by combining evaluation system, conduct the gradientpartitioning according to the inverse distance interpolation of the information system, buildthe resource allocation model in rural medical space, and further predict the allocation basedon future phrase index in the target area and the dynamic analysis in the statistics,and thespecific research technical route is shown in Figure 1.The specific verification methods in thetarget area are as follows: the first is to match the remote sensing image, the communityadministrative map, the land use present situation map and the regional traffic map andvectorize the traffic map by combining the satellite remote sensing data; and then we canestablish the administrative division, health service area, the road network, the medicalinstitution and the village health service center, add the attribute fields, establish the medicalresource database, conduct the simulation predication by using the model and further putforward the dynamic-oriented strategy.
Figure 1: Theoretical model of resource allocation in rural medical space
5. ConclusionThis paper first clarifies the influencing factors of resource allocation in rural medical space,focuses on the spatial and temporal distribution law and the accessibility research, and thenconstruct the theoretical model of resource allocation in rural medical space under the spatialdata analysis.It is very urgent to propose allocation standards based on the geographicalcharacteristics in addition to the unified standard in medical resource allocation due to greatdifferences in the climate, human environment, regional illnesses and medical habits of
41
Liu/Zhang/Wang resource allocation in rural medical space ISOCARP-OAPA Conference 2017
6
residents.And generally, the safety and efficiency are two important factors to enhancemedical standards,but for the rural health care, the relatively small service population andhigh efficiency of medical treatment have made that most cured diseases focus on healthprotection, and the safety is relatively high. Therefore, we must start from the fundamentalmedical resources allocation to improve the rural medical standard and the matching degreebetween medical resource and patients, and further realize the rational allocation based onenvironmental conditions.
References:1. Shanshan Zhang, Nan Liu(2014). The Evolutions of Medical Building Network Structure forEmerging Infectious Disease Protection and Control. Cell Biochemistry and Biophysics,Vol.70.No(3).
2. Hongzhe Zhang, Shanshan Zhang , Nan Liu(2015).
Model Computing System for Emergent Infectious Disease Prevention and Control AbilityEvaluation of Medical Building Network . Journal of Digital InformationManagement, Vol.13.No(5).
3. Phillip Longman(2012).Best Care Anywhere,Berrett-koehler Publishers,Inc.
42
Connected & Automated Urban Mobility, Zombie Cars and Kitchen Knives
Will Autonomous Automobiles, Self-Driving Car-Sharing and Ride-Hailing, and Driverless Shuttles harm Cities?
Piotr Marek SMOLNICKI, Gdańsk University of Technology, Poland Contact email address: [email protected]
Topic: Technology, infrastructure and buildings
Synopsis: The paper presents a survey of surveyed experts’ assumptions of how three different emerging automated mobility technical-organizational solutions: Autonomous Automobiles, Self-Driving Car-Sharing and Ride-Hailing, and Driverless Shuttles relate to the metropolitan structures of both cities and suburban areas.
Keywords: Automated Mobility, Autonomous Vehicles, Driverless Vehicles, Self-Driving Cars, Connected and Automated Driving.
1 Introduction
The paper focuses on the particular relation between mobility automation and spatial structures. It is based on the notion that municipalities will ignore absorption strategies, therefore will not be well prepared for the revolutionary technological diffusion of fully-automated vehicles. This notion is based on historical evidence of personal mobility and current research related to each of the solutions in the metropolitan area, which are briefly reviewed below. Due to the current emergence of mobility automation, there is a deficiency of supportive evidence to verify the thesis that cities are prepared for mobility revolution which already began and will advance exponentially. Furthermore, present analyses mostly emphasize how emerging mobility solutions will alter transport efficiency or affect mass transit usage, rather than their impact on urban morphology, metropolitan society, or local communities. The mobility automation will have different results depending on the morphology of metropolises, their urban core, suburban sprawl or functional hinterland. Therefore, the author surveyed globally 36 highly skilled experts, conducting two-round Delphi studies based on scenarios from his previous research. The survey consisted of 35 research questions (statements/theses) which all but one concerned a probability of the medium-term 5-15-year future regarding mobility automation. The result presents the experts’ assumptions how three diverse emerging automated mobility technical-organizational solutions relate to the metropolitan structures (economic, physical, social), including both cities and suburban areas. These solutions, based on the author’s previous research are: the Autonomous Automobiles, the Self-Driving Car-Sharing and Ride-Hailing, and the Driverless Shuttles. The assumptions of benefits and disadvantages emerging from each spatial-technical relationship - the usability and ability to harm cities caused by ubiquitous automated mobility – are compared to the ubiquitous kitchen knives.i The study results should be used to create or modify legislation and municipal policy to avoid future side effects and to endorse the optimal effects from implementing these new transportation technologies.
2 Literature Review
In general, the following study deals with the complex problem of technological diffusion. Technologies are being implemented to solve particular problems, although they are followed by unforeseen or ignored side effects which emerge throughout technological adoption
43
(Smolnicki, 2015). This research focuses on detection of possible negative consequences in regard to urban spatial structures and assumed scenarios. The technology itself cannot be discussed without understanding the context of inter alia social (Castells, 2012: 228) and economical (e.g.: Maas et al., 2009: 116) structures. Since time immemorial urban social-economical-spatial structures were under significant impact of technological development, while determining diffusion of technologies (Mumford, 1961; Benevolo, 1995; Mumford, 2010). In this regard, two major opposite theories exist: technological determinism and social construction of technology.
The presented research concerns relations between mobility automation and metropolitan spatial structures recently carried out by numerous researchers and writers in various contexts (Sullivan, 2015: 201; O'Toole, 2016; Wayner, 2015: 564; Bridges, 2015: 3155; Wadud, 2016: 2; Heinrichs and Cyganski, 2015; Klein, 2014; Morris, 2015; Harris, 2016; Mui and Carroll, 2013: 323; Greenblatt and Shaheen, 2015; Brunner, 2015). Connected and Automated Driving (CAD) is widely considered a revolutionary and disruptive change in mobility, as well as in human life and spatial development. The author previously diagramed fully automated mobility against the background of existing urban modes of transport and derived a typology of four distinctive modes of fully automated travel (Smolnicki and Sołtys, 2016b: 2186) which follows the use of three vehicle types: (1) Autonomous Automobiles, (2) Self-driving Shared (Car-sharing) and Hailed (Ride-hailing) Cars, and (3) Driverless Shuttles. The author also assumed various scenarios of the impact of each fully-automated mode of transport on metropolitan (urban and suburban) spatial structures (Smolnicki and Sołtys, 2016b: 2188). Distinction between regular vehicles from “pod” like vehicles and between evolutionary and revolutionary approaches to vehicle automation were simultaneously proposed by Nordhoff, van Arem and Happee (2016: 64). Although, it is not possible to predict the exact future of new solutions universal laws can be still applied and extrapolated from historical trends or estimated using analogies to credible historical and contemporary examples. There is not enough space to explain all of them but this section of the paper presents a brief scrutiny of the knowledge on which the research part is based.
Yacov Zahavi formulated a model which described that “travelers attempt to maximize their utility of spatial and economic opportunities, represented by the total daily travel distance, subject to constraints of time and money budgets” (1979). He assumed that a household “must choose a certain combination of modes to maximize its total spatial and economic opportunities, as represented by the total travel distance” (Zahavi, 1979: ii–iii). A conclusion of this theory is that the faster people travel does not mean they save more time, but rather consume more space. Basing on Zahavi’s assumption that average everyday travel takes one hour, Cesare Marchetti conducted research on the historical evidence on a time span ranging through ages until automotive revolution. The results show that city scope depends on the mode of transport, including walking (1994: 77). Therefore, various consequences may occur according to this theory which could be applied to emerging mobility solutions. For example, fully-automated vehicles are not engaging riders, therefore people who prefer working or relaxing, instead of “wasting” time driving, can switch to autonomous automobiles (Wadud, 2016: 2; Wayner, 2015: 1095; Sullivan, 2015: 201). There are numerous examples of significant impacts which the conventional automobile had on spatial structures (Lefebvre, 2009: 237; Mumford, 1961: 430, 461, 503-510, 549-550; Wallis, 1987; Kunstler, 2013; Montgomery, 2013; Speck, 2013; Marohn Jr., 2014; Wolfe, 2013). A typical household can spend 11-15% of its money budget on travel (after Ausubel et al., 1998: 141). The question is how to anticipate the consequences when fully-automated self-driving “taxis” (ride-hailing), shared cars, and driverless public transit emerge. Perhaps longer distances traveled will result, rather than the household gathering savings, and only the time-budget will stay constant. Already, car-sharing fleets have expanded to suburban areas (Shaheen and Cohen, 2013: 6). In order to prevent negative consequences, the author proposed adaptive road pricing and gamification dependent on direction traveled (Smolnicki, 2017: 214–215).
44
Urban policy and especially spatial planning determine the implementation of a specific type of automobile as much as an automobile impacts the physical development. For example, flat owners who do not own a car pay construction costs of garage parking of their neighbors (Shoup, 2011a: 562), therefore they may be incentivized to buy a car in in order to be treated equally to the motorized neighbors. The solution might be a new paradigm of Mobility Oriented Development which shifts investors from being only building companies (real estate developers) to being also mobility service companies (or MODs), thereby providing minimum parking required for a shared mobility service (Smolnicki, 2017: 215–217). This solution could work, for example for both Self-driving Car-sharing and Driverless Shuttles dropping people to the nearest transit network. Although vehicle full-automation combined with ride-hailing and car sharing could significantly reduce the need of parking (Fagnant and Kockelman, 2015: 174) the need of parking policy changes by municipalities would become even more urgent.
The transportation infrastructure generates high costs of construction and maintenance as well as indirect costs, such as diabetics, obesity, asthma, car-related injuries (Speck, 2013: 531), mobility costs, insurance (Schwartz, 2015: 1747) food and goods transport and storage (Frey and Yaneske, 2007: 86–87) and parking (Shoup, 2011b: 615). Moreover, the infrastructure is not used efficiently because capacity is designed for peak hours, and the same is true for roads and parking. The more infrastructure is built, the more it is used, therefore congestion reappears, especially on minor previously quiet roads. It reflects the theory of induced demand or Jevons’ paradox of efficiency (Jevons, 1866: 124–125), also known as rebound effect - in transportation related theories were, e.g. Downs-Thomson paradox (after: Zhang et al., 2016: 104–105) and Lewis-Mogridge law (Polimeni et al., 2008: 86-91, 145, 176-177 apply; Mogridge, 1990). Mobility automation enables more efficient use of infrastructure, which may result in both positive and negative results though, from reduction of necessary infrastructure to filling up the infrastructure with traffic and therefore provoking to build more.
Future personal and group mobility will be more shared reflecting the 'Mobility as a Service' (MaaS) paradigm (Smolnicki, 2017) whose name is credited to the Finnish engineer Sampo Hietanen (2014). Determined by various local conditions, it is estimated that one shared car can replace between four to as much us twenty-three cars (Badger, 2013: 184; Shaheen and Cohen, 2013: 9; Neckermann, 2015: 1640; Ceille, 2015: 5). However, in the medium term future car sharing will not replace privately owned cars but complement them (Bundesverband CarSharing e. V., 2015). Car sharing has also potential to reduce vehicle kilometers travelled (Shaheen and Cohen, 2013: 9). Various impacts may occur due to implementing fully-automated car-sharing depending on private-public participation (Smolnicki and Sołtys, 2016a: 817). It is worth to mentioning that public transit can be endangered due to self-driving car-sharing (O'Toole, 2016). And the last but not least, fully automated mobility is considered as much safer and smarter than human driving, besides bringing other meaningful benefits (Fagnant and Kockelman, 2015: 174) like increased mobility of youths, elders and disabled. It may also impact the streetscape, e.g. narrowing road lanes and widening sidewalks (Glotz-Richter, 2017). The purpose of the research is to find correlation between experts’ assumptions on what is presented above and other plausible examples.
3 Methodology
The objective of the study was to forecast the most probable future of mobility automation in the urban context. For this purpose the Delphi methodii was chosen which is similar to experts’ panels techniques but anonymized (experts do not know each other's answers) and to in-depth interviews with a quantitative approach whereby experts' opinions can be quantified and used in multiple rounds. “Delphi uses a panel of experts and […] seeks to arrive at a consensus on complex problems” (Davidson, 2013: 54). The Delphi technique
45
was used for production automation already in1960’s (as mentioned in: Helmer-Hirschberg, 1967).
The study is based on a modified e-Delphi method/techniqueiii using an online survey. At present, the Delphi technique is widely used for various purposes,iv especially where there is incomplete knowledge about a problem or phenomenon, therefore it may be used to develop forecasts (after: Skulmoski et al., 2007), “predicting the occurrence of future events” (Hsu and Sandford, 2007). Other methods are also used for forecasting: Visioning is dedicated to community oriented planning to develop a strategy to reach a final vision; Modelling estimates the future based on historical trends (Lemp et al., 2008); or Prediction Markets based on market price preferences (Green et al., 2007). The Delphi technique is intended to experiment with models rather than in reality, therefore it can be called a “pseudo experiment” (Helmer-Hirschberg, 1967: 6). The model results depend on the output interpretation of individual experts (Helmer-Hirschberg, 1967).v
The experts for the research were chosen from the author’s professional network due to their expertise. For the purpose of a higher rate of responses, experts were informed that the survey would be anonymized.vi A “self-evaluation” process was conducted, due to the specific condition of the Delphi research: the need of higher expertise rather number of experts. More than 100 experts were contacted with 36 responding.
During the study some disadvantages emerged. A double negation confused experts and one of the research questions was modified during round two. Another disadvantage of the method is that the second round of questions could be understood as both the probability of the event happening in the future which was intended, or the probability that the responses of round one were right if misinterpreted, therefore producing disturbing results. Since the number of experts is less important than the quality of their expertise there is no need of surveying many, and it did not matter that only half of the experts took part in the second round due to lack of time and impatience of the experts. Responses in a probability scope of 40%-60% were not taking into consideration in the final results as some experts marked middle probability commenting they had chosen neutral responses and asked not to be considered. Last but not least, the understanding of language was a problem as the author’s professional expressions were interpreted differently by other professions. For example, the word “transit” used in the meaning of mass (public) transport, could be understood as inter-local or inter-regional traffic.
4 Research
The survey was conducted in two rounds taken August 8th-14th and 20th-26th 2017. The first section of the first round survey form was a covering letter and the experts’ self-evaluation of expertise. Only questions in this part were obligatory to answer, including email addresses and experts’ names. Invited Respondents self-evaluated their expertise in four categories: (1) Urban planning; (2) Transportation planning; (3) Connected and Automated Vehicles; and (4) Digital Services & Mobility as a Service (MaaS). It was facultative to provide a self-evaluation of additional expertise in an open-ended field. The self-evaluation was divided into five options: (1) Not applicable; (2) I am interested in this topic; (3) I am somehow connected with this topic; (4) I focus on this topic; (5) I am a well-known expert on this topic. For experts whose main expertise was not mentioned an open-ended field was provided.
The research part of the first round survey form was divided into four sections: (1) General theses; (2) Automated or autonomous automobiles; (3) Self-driving car-sharing and ride-hailing; (4) Driverless shuttles. The first round survey form included an open-ended field for Additional comments. The research part of the form contained 35 questions with the possibility to respond quantitatively (one research question was based on Likert’s scale of agreement and the rest on a probability scale) and qualitatively (the “Commentary” open-ended fields). The first research question stated a general thesis and responses could be provided on the agreement Likert’s scale (1-5) with the possibility of additional Commentary.
46
The rest of the subsequent theses/statements were about the future in 5-15 years, with explanatory clarifications. The experts were responding on a probability scale ranging from 1 to 10, where a “1” meant “Not probable (0-10%)” and a “10” meant “Very probable (90-100%)”.
Due to more or less diversified responses, a verification of experts’ previous responses was conducted to reach consensus. Each statement in the second round was modified by adding the probability assumed by a majority of experts during the first round. The second round statements were also modified according to suggestions in the previous round comments. During round two the experts verified their responses in regard to the majority of the experts' responses from round one. If the expert did not agree with the majority of the experts' responses, he was asked to justify his or her response in an open-ended field. Experts were also asked to skip any answers they were unsure of. Before responding to the research questions the experts were provided with important information about the survey, i.a.:
The "Majority" is defined as between 51%-66% of the experts; the "Vast Majority" is defined as more than 66% of the experts.
All statements concern the range of 5-15 years in the future.
Statements are modified (with major modifications in brackets "[...]") for clarification purposes due to suggestions in first round Comments.
In the 1-5 Agreement Scale: (1) means "I strongly disagree", (2) means "I disagree", (3) means "I neither agree or disagree", (4) means "I agree", and (5) means "I strongly agree".
In the 1-10 Probability Scale: (1) means a 0-10% probability, (2) means a 10-20% probability, ..., (10) means a 90-100% probability.
In the final results a Majority and a Vast majority were defined more restrictively, accordingly 50-75% and 75-100%.
The following sections were presented:
General Theses. The topics of this section were mobility in general, connected and automated driving (CAD), Mobility as a Service (MaaS), Urban Planning and Transportation Planning.
Automated or autonomous automobiles. The topic of this section was described as follows: Automated or autonomous automobiles are conventional cars with systems of high-level automation. These vehicles are an evolutionary version of conventional cars. Already all significant automakers produce cars with some kind of automation, i.a. with advanced driving assistance systems (ADAS). The new released Tesla model 3 is already equipped with a computer which is allowed to carry out all driving control if the system is wirelessly updated, when legislation allows autonomous driving of the automobiles.
Self-driving car-sharing and ride-hailing. The topic of this section was described as follows: Self-driving car-sharing is when you can individually pick up a car from the street without driving it yourself. Self-driving ride-hailing is when a person orders a car such as a taxi which has no need of taxi-driver, and they don't drive the car themselves.
Driverless shuttles. The topic of this section was described as follows: A driverless shuttle is a fully automated group transit vehicle with a capacity of around 10 passengers. It may ride on a fixed route or on flexible on-demand routes. It may be operated similarly to an elevator or via e-hailing communication device application.
47
5 Results
Expertise. During both rounds 33 and 17 experts with various expertise responded in the survey describing their backgrounds. Experts are anonymized, therefore for the purpose of this paper the following summary of their expertise is presented:
Academia professionals: assistant professors, adjunct professors, PhDs, center director, head of the mobility department,
Business professionals: founder, CEO, business owner, entrepreneur, vehicle mobility entrepreneur,
Transportation professionals: transportation engineers and planners, mobility planning consultants, smart mobility solutions and products integrated with urban policies and street design measures, sustainable mobility, urban transport expert, Public transport consultant, connected and automated vehicles, transportation industries,
Urban and regional professionals: urban designer, urban and regional planners, urban and regional strategy and consultants, urban researcher, urban underground infrastructure, urban systems, also urban planner in transport industry, smart cities,
Digital mobility services and CAD’s: new mobility services, mobility service program manager, system engineer, theoretical and practical aspects of Mobility as a Service (MaaS), chief digital officer, autonomous driving, IoT,
Policy: municipal and national government leads, legislation, regulation and policy researchers, policy officer, reviewer of EU projects on autonomous transport,
Management: MBA, management consultants, strategic advisor, managing relationship with automated vehicles manufacturers, project manager, senior project manager, director,
Emerging technologies: electric mobility journalist, futurist, trend-watcher, keynote speaker,
The experts live and work on all continents.
Table 1 presents the number of experts with different levels of familiarity in each topic of expertise. The purpose was to justify the experts' invitation by the author, as well as to compare experts’ responses with different backgrounds. Comparison does not form part of the paper and further research is needed.
Expertise or High Expertise in the topic is considered when the respondent stated: I focus on this topic or I am a well-known expert in this topic (bolded in Table 1). According to the responses delivered 14 respondents (out of 33) have expertise or high expertise in Urban Planning (UP), 18 in Transportation Planning (TP), 19 in Connected and Automated Vehicles (CAVs), and 21 in Digital Services & Mobility as a Service (MaaS). As some considered themselves also as Somehow connected to topics, the following number of respondents are connected to each topic: 27 – UP, 28 – TP, 28 – CAVs, and 29 – MaaS. That means the vast majority of respondents consider themselves as being concerned with all topics. The self-evaluation was not repeated in round two due to limited experts’ time, although some experts exchanged in round two.
48
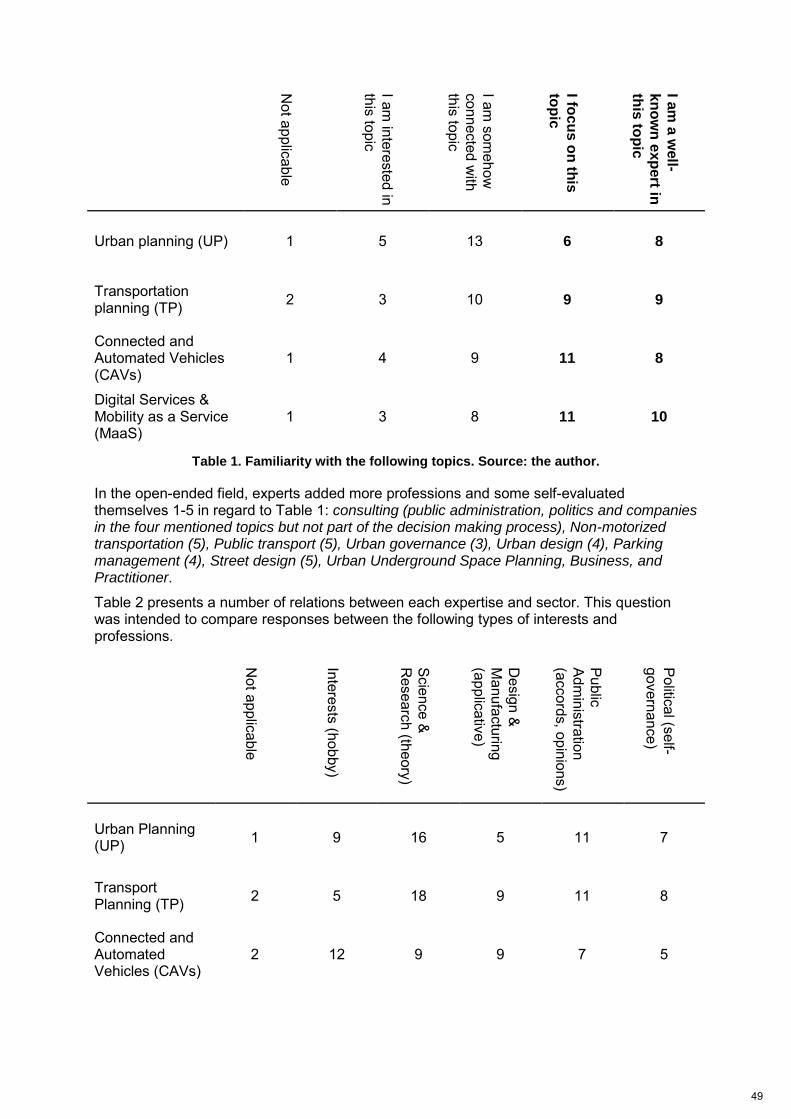
Not applicable
I am interested in
this topic
I am som
ehow
connected with
this topic
I focu
s o
n th
is
top
ic
I am
a w
ell-
kn
ow
n e
xp
ert in
this
top
ic
Urban planning (UP) 1 5 13 6 8
Transportation planning (TP) 2 3 10 9 9
Connected and Automated Vehicles (CAVs)
1 4 9 11 8
Digital Services & Mobility as a Service (MaaS)
1 3 8 11 10
Table 1. Familiarity with the following topics. Source: the author.
In the open-ended field, experts added more professions and some self-evaluated themselves 1-5 in regard to Table 1: consulting (public administration, politics and companies in the four mentioned topics but not part of the decision making process), Non-motorized transportation (5), Public transport (5), Urban governance (3), Urban design (4), Parking management (4), Street design (5), Urban Underground Space Planning, Business, and Practitioner.
Table 2 presents a number of relations between each expertise and sector. This question was intended to compare responses between the following types of interests and professions.
Not applicable
Interests (hobby)
Science &
Research (theory)
Design &
Manufacturing
(applicative)
Public Adm
inistration (accords, opinions)
Political (self-governance)
Urban Planning (UP) 1 9 16 5 11 7
Transport Planning (TP) 2 5 18 9 11 8
Connected and Automated Vehicles (CAVs)
2 12 9 9 7 5
49
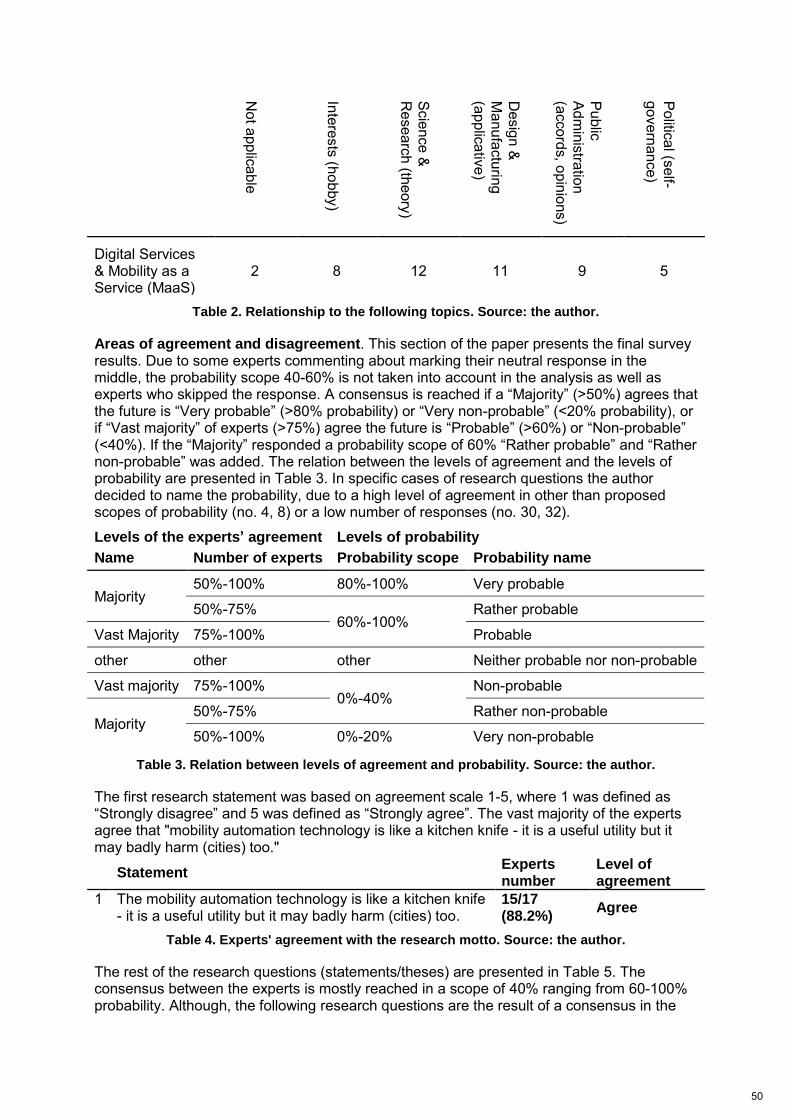
Not applicable
Interests (hobby)
Science &
Research (theory)
Design &
Manufacturing
(applicative)
Public Adm
inistration (accords, opinions)
Political (self-governance)
Digital Services & Mobility as a Service (MaaS)
2 8 12 11 9 5
Table 2. Relationship to the following topics. Source: the author.
Areas of agreement and disagreement. This section of the paper presents the final survey results. Due to some experts commenting about marking their neutral response in the middle, the probability scope 40-60% is not taken into account in the analysis as well as experts who skipped the response. A consensus is reached if a “Majority” (>50%) agrees that the future is “Very probable” (>80% probability) or “Very non-probable” (<20% probability), or if “Vast majority” of experts (>75%) agree the future is “Probable” (>60%) or “Non-probable” (<40%). If the “Majority” responded a probability scope of 60% “Rather probable” and “Rather non-probable” was added. The relation between the levels of agreement and the levels of probability are presented in Table 3. In specific cases of research questions the author decided to name the probability, due to a high level of agreement in other than proposed scopes of probability (no. 4, 8) or a low number of responses (no. 30, 32).
Levels of the experts’ agreement Levels of probability
Name Number of experts Probability scope Probability name
Majority 50%-100% 80%-100% Very probable
50%-75% 60%-100%
Rather probable
Vast Majority 75%-100% Probable
other other other Neither probable nor non-probable
Vast majority 75%-100% 0%-40%
Non-probable
Majority 50%-75% Rather non-probable
50%-100% 0%-20% Very non-probable
Table 3. Relation between levels of agreement and probability. Source: the author.
The first research statement was based on agreement scale 1-5, where 1 was defined as “Strongly disagree” and 5 was defined as “Strongly agree”. The vast majority of the experts agree that "mobility automation technology is like a kitchen knife - it is a useful utility but it may badly harm (cities) too."
Statement Experts number
Level of agreement
1 The mobility automation technology is like a kitchen knife - it is a useful utility but it may badly harm (cities) too.
15/17 (88.2%) Agree
Table 4. Experts' agreement with the research motto. Source: the author.
The rest of the research questions (statements/theses) are presented in Table 5. The consensus between the experts is mostly reached in a scope of 40% ranging from 60-100% probability. Although, the following research questions are the result of a consensus in the
50
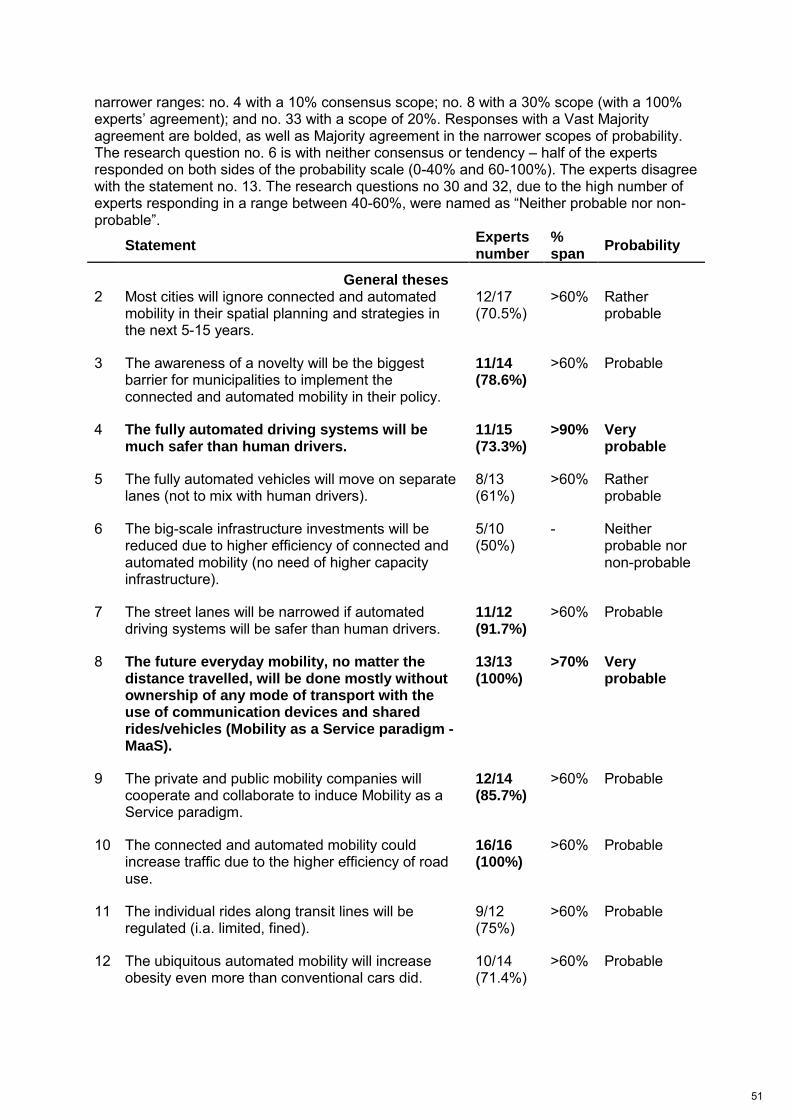
narrower ranges: no. 4 with a 10% consensus scope; no. 8 with a 30% scope (with a 100% experts’ agreement); and no. 33 with a scope of 20%. Responses with a Vast Majority agreement are bolded, as well as Majority agreement in the narrower scopes of probability. The research question no. 6 is with neither consensus or tendency – half of the experts responded on both sides of the probability scale (0-40% and 60-100%). The experts disagree with the statement no. 13. The research questions no 30 and 32, due to the high number of experts responding in a range between 40-60%, were named as “Neither probable nor non-probable”.
Statement Experts number
% span
Probability
General theses 2 Most cities will ignore connected and automated
mobility in their spatial planning and strategies in the next 5-15 years.
12/17 (70.5%)
>60% Rather probable
3 The awareness of a novelty will be the biggest barrier for municipalities to implement the connected and automated mobility in their policy.
11/14 (78.6%)
>60% Probable
4 The fully automated driving systems will be much safer than human drivers.
11/15 (73.3%)
>90% Very probable
5 The fully automated vehicles will move on separate lanes (not to mix with human drivers).
8/13 (61%)
>60% Rather probable
6 The big-scale infrastructure investments will be reduced due to higher efficiency of connected and automated mobility (no need of higher capacity infrastructure).
5/10 (50%)
- Neither probable nor non-probable
7 The street lanes will be narrowed if automated driving systems will be safer than human drivers.
11/12 (91.7%)
>60% Probable
8 The future everyday mobility, no matter the distance travelled, will be done mostly without ownership of any mode of transport with the use of communication devices and shared rides/vehicles (Mobility as a Service paradigm - MaaS).
13/13 (100%)
>70% Very probable
9 The private and public mobility companies will cooperate and collaborate to induce Mobility as a Service paradigm.
12/14 (85.7%)
>60% Probable
10 The connected and automated mobility could increase traffic due to the higher efficiency of road use.
16/16 (100%)
>60% Probable
11 The individual rides along transit lines will be regulated (i.a. limited, fined).
9/12 (75%)
>60% Probable
12 The ubiquitous automated mobility will increase obesity even more than conventional cars did.
10/14 (71.4%)
>60% Probable
51
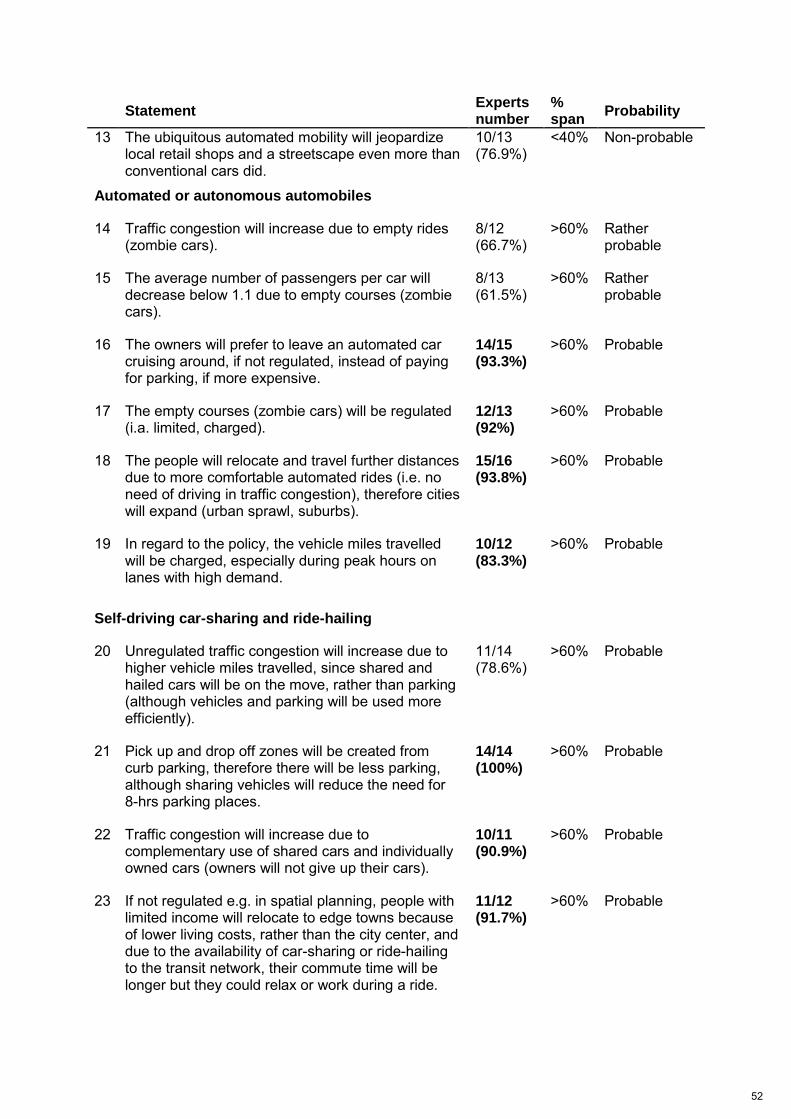
Statement Experts number
% span
Probability
13 The ubiquitous automated mobility will jeopardize local retail shops and a streetscape even more than conventional cars did.
10/13 (76.9%)
<40% Non-probable
Automated or autonomous automobiles
14 Traffic congestion will increase due to empty rides (zombie cars).
8/12 (66.7%)
>60% Rather probable
15 The average number of passengers per car will decrease below 1.1 due to empty courses (zombie cars).
8/13 (61.5%)
>60% Rather probable
16 The owners will prefer to leave an automated car cruising around, if not regulated, instead of paying for parking, if more expensive.
14/15 (93.3%)
>60% Probable
17 The empty courses (zombie cars) will be regulated (i.a. limited, charged).
12/13 (92%)
>60% Probable
18 The people will relocate and travel further distances due to more comfortable automated rides (i.e. no need of driving in traffic congestion), therefore cities will expand (urban sprawl, suburbs).
15/16 (93.8%)
>60% Probable
19 In regard to the policy, the vehicle miles travelled will be charged, especially during peak hours on lanes with high demand.
10/12 (83.3%)
>60% Probable
Self-driving car-sharing and ride-hailing
20 Unregulated traffic congestion will increase due to higher vehicle miles travelled, since shared and hailed cars will be on the move, rather than parking (although vehicles and parking will be used more efficiently).
11/14 (78.6%)
>60% Probable
21 Pick up and drop off zones will be created from curb parking, therefore there will be less parking, although sharing vehicles will reduce the need for 8-hrs parking places.
14/14 (100%)
>60% Probable
22 Traffic congestion will increase due to complementary use of shared cars and individually owned cars (owners will not give up their cars).
10/11 (90.9%)
>60% Probable
23 If not regulated e.g. in spatial planning, people with limited income will relocate to edge towns because of lower living costs, rather than the city center, and due to the availability of car-sharing or ride-hailing to the transit network, their commute time will be longer but they could relax or work during a ride.
11/12 (91.7%)
>60% Probable
52
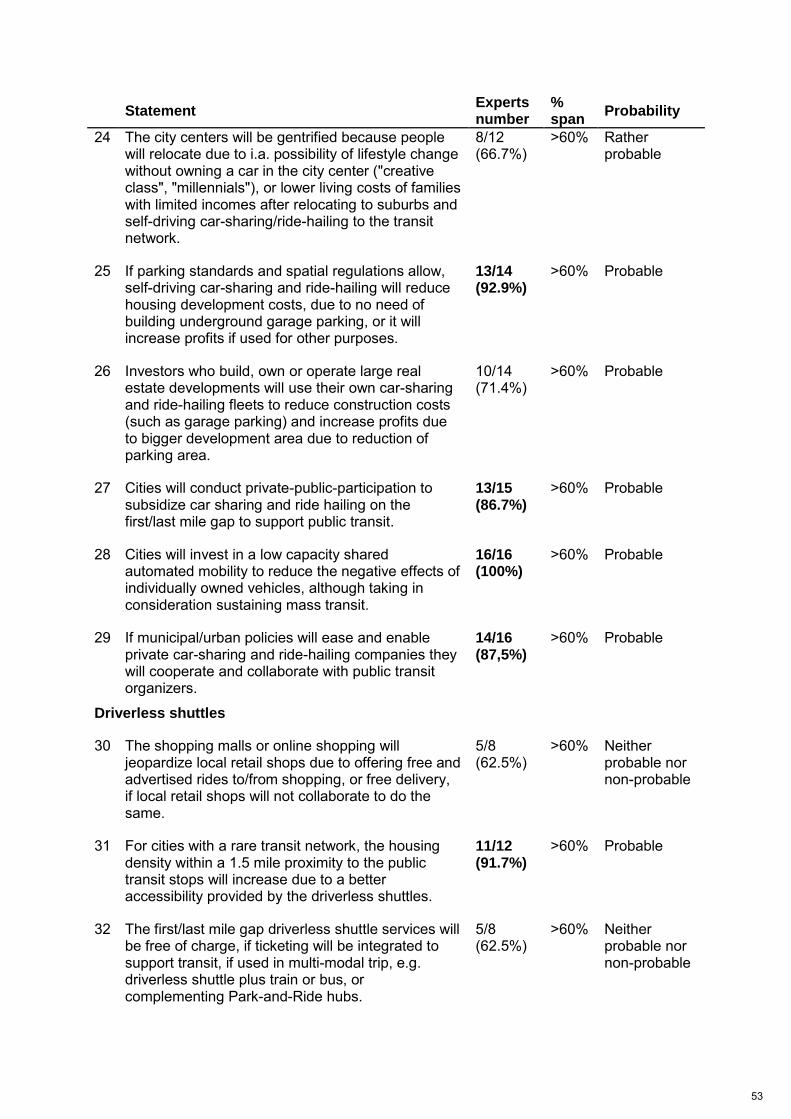
Statement Experts number
% span
Probability
24 The city centers will be gentrified because people will relocate due to i.a. possibility of lifestyle change without owning a car in the city center ("creative class", "millennials"), or lower living costs of families with limited incomes after relocating to suburbs and self-driving car-sharing/ride-hailing to the transit network.
8/12 (66.7%)
>60% Rather probable
25 If parking standards and spatial regulations allow, self-driving car-sharing and ride-hailing will reduce housing development costs, due to no need of building underground garage parking, or it will increase profits if used for other purposes.
13/14 (92.9%)
>60% Probable
26 Investors who build, own or operate large real estate developments will use their own car-sharing and ride-hailing fleets to reduce construction costs (such as garage parking) and increase profits due to bigger development area due to reduction of parking area.
10/14 (71.4%)
>60% Probable
27 Cities will conduct private-public-participation to subsidize car sharing and ride hailing on the first/last mile gap to support public transit.
13/15 (86.7%)
>60% Probable
28 Cities will invest in a low capacity shared automated mobility to reduce the negative effects of individually owned vehicles, although taking in consideration sustaining mass transit.
16/16 (100%)
>60% Probable
29 If municipal/urban policies will ease and enable private car-sharing and ride-hailing companies they will cooperate and collaborate with public transit organizers.
14/16 (87,5%)
>60% Probable
Driverless shuttles
30 The shopping malls or online shopping will jeopardize local retail shops due to offering free and advertised rides to/from shopping, or free delivery, if local retail shops will not collaborate to do the same.
5/8 (62.5%)
>60% Neither probable nor non-probable
31 For cities with a rare transit network, the housing density within a 1.5 mile proximity to the public transit stops will increase due to a better accessibility provided by the driverless shuttles.
11/12 (91.7%)
>60% Probable
32 The first/last mile gap driverless shuttle services will be free of charge, if ticketing will be integrated to support transit, if used in multi-modal trip, e.g. driverless shuttle plus train or bus, or complementing Park-and-Ride hubs.
5/8 (62.5%)
>60% Neither probable nor non-probable
53
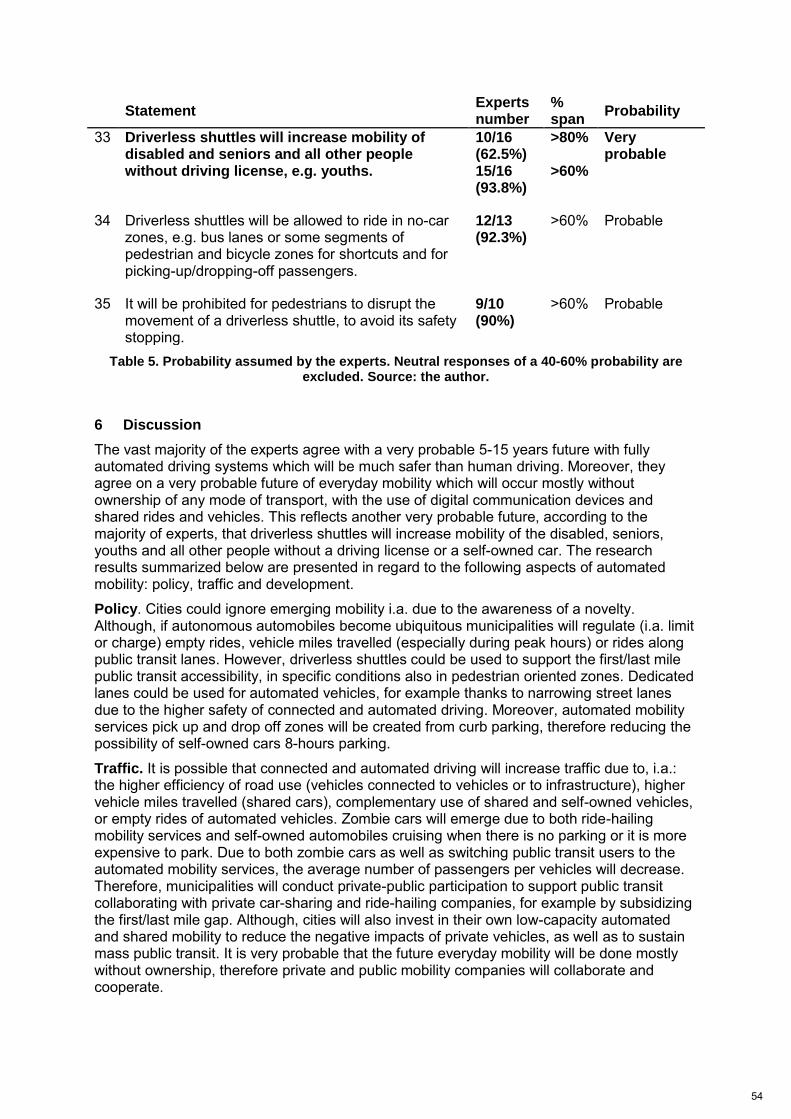
Statement Experts number
% span
Probability
33 Driverless shuttles will increase mobility of disabled and seniors and all other people without driving license, e.g. youths.
10/16 (62.5%) 15/16 (93.8%)
>80% >60%
Very probable
34 Driverless shuttles will be allowed to ride in no-car zones, e.g. bus lanes or some segments of pedestrian and bicycle zones for shortcuts and for picking-up/dropping-off passengers.
12/13 (92.3%)
>60% Probable
35 It will be prohibited for pedestrians to disrupt the movement of a driverless shuttle, to avoid its safety stopping.
9/10 (90%)
>60% Probable
Table 5. Probability assumed by the experts. Neutral responses of a 40-60% probability are excluded. Source: the author.
6 Discussion
The vast majority of the experts agree with a very probable 5-15 years future with fully automated driving systems which will be much safer than human driving. Moreover, they agree on a very probable future of everyday mobility which will occur mostly without ownership of any mode of transport, with the use of digital communication devices and shared rides and vehicles. This reflects another very probable future, according to the majority of experts, that driverless shuttles will increase mobility of the disabled, seniors, youths and all other people without a driving license or a self-owned car. The research results summarized below are presented in regard to the following aspects of automated mobility: policy, traffic and development.
Policy. Cities could ignore emerging mobility i.a. due to the awareness of a novelty. Although, if autonomous automobiles become ubiquitous municipalities will regulate (i.a. limit or charge) empty rides, vehicle miles travelled (especially during peak hours) or rides along public transit lanes. However, driverless shuttles could be used to support the first/last mile public transit accessibility, in specific conditions also in pedestrian oriented zones. Dedicated lanes could be used for automated vehicles, for example thanks to narrowing street lanes due to the higher safety of connected and automated driving. Moreover, automated mobility services pick up and drop off zones will be created from curb parking, therefore reducing the possibility of self-owned cars 8-hours parking.
Traffic. It is possible that connected and automated driving will increase traffic due to, i.a.: the higher efficiency of road use (vehicles connected to vehicles or to infrastructure), higher vehicle miles travelled (shared cars), complementary use of shared and self-owned vehicles, or empty rides of automated vehicles. Zombie cars will emerge due to both ride-hailing mobility services and self-owned automobiles cruising when there is no parking or it is more expensive to park. Due to both zombie cars as well as switching public transit users to the automated mobility services, the average number of passengers per vehicles will decrease. Therefore, municipalities will conduct private-public participation to support public transit collaborating with private car-sharing and ride-hailing companies, for example by subsidizing the first/last mile gap. Although, cities will also invest in their own low-capacity automated and shared mobility to reduce the negative impacts of private vehicles, as well as to sustain mass public transit. It is very probable that the future everyday mobility will be done mostly without ownership, therefore private and public mobility companies will collaborate and cooperate.
54
Development. Cities will expand due to citizens’ relocation when connected and automated driving increases everyday travel, therefore gentrification could emerge in city centers. It is due to lower income citizens relocating to cheaper suburban areas and (in general well educated) “creative class” and “millennials” relocating to city centers i.a. due to ubiquitous easy access without car ownership (self-driving car-sharing and ride-hailing). Therefore, higher housing intensity could emerge in the 1.5 mile proximity to the public transit network when self-driving car and driverless shuttle “first/last mile” services are provided. Moreover, if parking standards and regulations allow, development costs will be reduced due to less need of surface, garage and underground parking construction. It will also free new development areas. These possibilities will depend on spatial regulations as well as the districts' accessibility to the automated mobility services, for example offering the firs/last mile access to a public transit network.
Unknown. According to the experts' opinions, it is unknown if big-scale infrastructure investments will be reduced due to higher efficiency of connected and automated mobility. Perhaps, a rebound effect of induced demand will emerge, although it is dependent on smart policy, including governmental subsidiaries, which determine investments even if they are not necessary. It is also unknown if free and advertised private vehicles used for shopping malls or internet shopping will jeopardize local retail shops. Some experts commented that although shopping malls are already “dead” local retail shops can do the same, as they are attractive to other kinds of clients than on-line shoppers.
7 Conclusions
A vast majority of the survey results confirms assumptions presented as the research questions (theses/statements). Assumed impacts on metropolitan spatial structures could be both positive and negative, depending on legal aspects and municipal policy environment. In general, mobility automation is an important tool, although it may be used tragically the way it is reflected in the study motto: “The mobility automation technology is like a kitchen knife - it is a useful utility but it may badly harm (cities) too”. The future mobility in 5-15 years will be much safer and more accessible for the people who cannot drive themselves or do not own a car, following the Mobility as a Service (MaaS) paradigm (no need of vehicle ownership). Under an upright policy the development costs will be reduced, mass public transit will be supported, therefore affordable urban housing will grow. However, if regulations will be depraved, the ubiquitous automated mobility will lead to numerous side effects, i.a. growth of traffic congestion, obesity, urban sprawl, or reduced mass public transit use. Good or bad impacts depends not on personal choices but on smart regulations and education. Responsibility should be taken by both the municipalities and the national and regional states.
Research usability. The study results should be used to create new or, to modify existing legislation and municipal policy to avoid future adverse side effects and to approach the optimal effects from implementing these new transportation technologies. In particular, the results should be used by municipalities (town and transportation planners) for better diffusion of automated mobility preparation through information technology.
Further research. Further research is needed. Comparison of responses between groups of experts with different backgrounds will show potential future misunderstandings which could determine possibilities. The second research proposal is to conduct an open survey to check general opinion and compare it with experts’ responses. Moreover, the ideas provided in the open-ended fields could be used to extend the scope of research questions. Furthermore, future case studies will be necessary to validate each of the assumed relations.
Acknowledgements. This study would not be the same without the help of few associates and colleagues. Professor Elżbieta Wojnicka-Sycz, an expert in foresight research technically supervised the survey. Matthew Henderson provided proofreading of the form and Mrs. Judith Ryser of subediting the paper. Krzysztof Stachura, Michał Jaśkiewicz and Łukasz
55
Bugalski were sharing their thoughts and helpful comments. Although these colleagues and peers helped to refine my argument, the ideas herein along with their deficiencies are my responsibility. Last but not least, I thank all experts for their precious time. Their input was a valuable addition to this study and to the general research.
About the general research. This study results from the author’s four-year research at the Gdansk University of Technology, the topic of which emerged as a result of the author’s early essay (2014) written for the PhD course subject of Professor Małgorzata Dymnicka. After that the essay was turned into a scholar paper “The influence of modern technologies on spatial structures” (Smolnicki, 2015). As a result, the author focused on the gap between transportation and urban planning and devised a PhD Course about the “Relations Between Emerging Mobility Solutions and Metropolitan Spatial Structures”.
8 References
Publications
Ausubel JH, Marchetti C and Meyer PS (1998) Toward green mobility: The evolution of transport. European Review 6(02): 137–156.
Badger E (2013) Share everything: Collaborative consumption arises from urbanization, and it’s here to stay. In: Mathis S and Cary J (eds) City 2.0: The Habitat of the Future and How to Get There: Ted Conferences.
Benevolo L (1995) Miasto w dziejach Europy. Warszawa: Krąg; Volumen.
Bridges R (2015) Driverless Car Revolution: Buy Mobility, Not Metal.
Brunner U (2015) Urban Planning for the Driverless Car: Impact of Driverless Cars on the Built Environment and Transportation Infrastructure. IABSE Symposium Report 105(6): 1–2 (accessed 8 April 2016).
Castells M (2012) Networks of Outrage and Hope: Social Movements in the Internet Age. Malden, MA, USA: Polity Press.
Dalkey NC and Helmer-Hirschberg O (1962) An Experimental Application of the Delphi Method to the Use of Experts. Memorandum.
Davidson PL (2013) The Delphi technique in doctoral research: Considerations and rationale. Review of Higher Education and Self-learning 6(22): 53–65.
Fagnant DJ and Kockelman K (2015) Preparing a nation for autonomous vehicles: Opportunities, barriers and policy recommendations. Transportation Research Part A: Policy and Practice 77: 167–181 (accessed 14 March 2016).
Frey H and Yaneske P (2007) Visions of sustainability: Cities and regions. London, New York: Taylor & Francis.
Glotz-Richter M (2017) Wenn Autos autonom werden: Automatisiertes Fahren in der Stadt- und Verkehrsentwicklungsplanung.
Green KC, Armstrong JS and Graefe A (2007) Methods to Elicit Forecasts from Groups: Delphi and Prediction Markets Compared. Foresight: The International Journal of Applied Forecasting(4663).
Greenblatt JB and Shaheen SA (2015) Automated Vehicles, On-Demand Mobility, and Environmental Impacts. Current Sustainable/Renewable Energy Reports 2(3): 74–81 (accessed 14 March 2016).
Heinrichs D and Cyganski R (2015) Automated Driving: How It Could Enter Our Cities and How This Might Affect Our Mobility Decisions. disP - The Planning Review 51(2): 74–79 (accessed 4 April 2016).
56
Helmer-Hirschberg O (1967) Analysis of the Future: The Delphi Method.
Hsu C-C and Sandford BA (2007) The Delphi Technique: Making Sense Of Consensus. Practical Assessment, Research & Evaluation 12(10).
Jevons WS (1866) The Coal Question: An Inquiry Concerning the Progress of the Nation, and the Probable Exhaustion of Our Coal-Mines. London: Macmillan and Co.
Kunstler JH (2013) The Geography of Nowhere: The Rise and Decline of America’s Man-made Landscape: Kunstler.com.
Lefebvre H (2009) Space and the State. In: Brenner N, Elden S and Moore G (eds) State, space, world: Selected essays. Minneapolis, London: University of Minnesota Press.
Lemp JD, Zhou B(B), Kockelman K and Parmenter BM (2008) Visioning Vs. Modeling: Analyzing the Land Use-Transportation Futures of Urban Regions. pre-print. Journal of Urban Planning and Development 134(3): 97–109.
Maas W, Sverdlov A and Waugh E (2009) Visionary cities. Rotterdam, New York: NAi Publishers; [Distributed by] D.A.P./Distributed Art Publishers.
Marchetti C (1994) Anthropological invariants in travel behavior. Technological Forecasting and Social Change 47(1): 75–88 (accessed 23 April 2016).
Marohn CL Jr. (2014) A World Class Transportation System: Transportation Finance for a New Economy.
Mogridge MJH (1990) Travel in Towns: Jam yesterday, jam today and jam tomorrow? London: Palgrave Macmillan UK.
Montgomery C (2013) Happy city: Transforming our lives through urban design. New York: Farrar, Straus and Giroux.
Mui C and Carroll PB (2013) Driverless Cars: Trillions Are Up For Grabs.
Mumford L (1961) The city in history: Its origins, its transformations, and its prospects. New York: Harcourt Brace Jovanovich.
Mumford L (2010) Technics and civilization. Chicago: University of Chicago Press.
Neckermann L (2015) The Mobility Revolution: Zero Emissions, Zero Accidents, Zero Ownership: Matador.
Nordhoff S, van Arem B and Happee R (2016) Conceptual Model to Explain, Predict, and Improve User Acceptance of Driverless Podlike Vehicles. In: Compendium of Papers, pp. 60–67.
Polimeni JM, Mayumi K, Giampietro M and Alcott B (2008) The Jevons Paradox and the Myth of Resource Efficiency Improvements: Earthscan.
Schwartz SI (2015) Street smart: The rise of cities and the fall of cars. New York: Public Affairs.
Shaheen SA and Cohen AP (2013) Carsharing and Personal Vehicle Services: Worldwide Market Developments and Emerging Trends. International Journal of Sustainable Transportation 7(1): 5–34 (accessed 14 March 2016).
Shoup DC (2011a) The High Cost of Free Parking. Chicago, Washington: American Planning Association.
Shoup DC (2011b) Who Should Pay for Parking? The Conversation. In: Kuznicki J (ed.) There Ain’t No Such Thing as Free Parking (Cato Unbound Book 42011): Cato Institute, 556–779.
Skulmoski GJ, Hartman FT and Krahn J (2007) The Delphi Method for Graduate Research. Journal of Information Technology Education 6.
57
Smolnicki PM (2015) The influence of modern technologies on spatial structures. In: Czubenko M and Tatara M (eds) PhD Interdisciplinary Journal: Special Issue. BIOTech Conference 2014. Gdańsk: Gdansk University of Technology Press, pp. 67–75.
Smolnicki PM (2017) Mobility Oriented Development (MOD): Public-Private Partnership in Urban Parking & Traffic Management with the Use of Autonomous Automobiles, Car-sharing, Ridesharing Modes of Transport & Mobility as a Service (MaaS). In: Brdulak A and Brdulak H (eds) Happy City: How to plan and create the best livable area for the people: Springer International Publishing, pp. 207–220.
Smolnicki PM and Sołtys J (2016a) Car-sharing: The Impact on Metropolitan Spatial Structures. CBU International Conference Proceedings 4: 814–819.
Smolnicki PM and Sołtys J (2016b) Driverless Mobility: The Impact on Metropolitan Spatial Structures. Procedia Engineering 161: 2184–2190.
Speck J (2013) Walkable cities: Why redesigning our communities around walking is the best medicine. In: Mathis S and Cary J (eds) City 2.0: The Habitat of the Future and How to Get There: Ted Conferences, 521–636.
Sullivan P (2015) Getting Ready for Driverless Cars: Everything you need to know to invest now in the companies developing the technology that will revolutionize the way we commute.
Wadud Z (2016) Self-Driving Cars: Will they reduce energy use?
Wallis A (1987) Ameryka - miasto. Warszawa: Krajowa Agencja Wydawnicza.
Wayner PC (2015) Future Ride v2: 99 Ways the Self-Driving, Autonomous Car Will Change Everything from Buying Groceries to Teen Romance to Surviving a Hurricane to … Home to Simply Getting From Here to There: Create Space Independent Publishing Platform.
Wolfe CR (2013) Urbanism Without Effort: Reconnecting with First Principles of the City. Washington, DC, Covelo, London: Island Press.
Zahavi Y (1979) The ‘UMOT’ Project. Final Report. Bethesda, Maryland.
Zhang F, Lindsey R and Yang H (2016) The Downs–Thomson paradox with imperfect mode substitutes and alternative transit administration regimes. Transportation Research Part B: Methodological 86: 104–127 (accessed 1 May 2016).
Web pages
Bundesverband CarSharing e. V. (2015) ‘Carsharing expands rapidly into new towns and communities’. Available at: http://www.carsharing.de/presse/pressemitteilungen/carsharing-expands-rapidly-into-new-towns-and-communities-more-than-25.
Harris M (2016) Optimus Ride Wants Autonomous Ride-Sharing Without Human Drivers in the Way. Available at: http://spectrum.ieee.org/cars-that-think/transportation/self-driving/optimus-ride-wants-autonomous-ridesharing-without-human-drivers-in-the-way/?utm_source=carsthatthink&utm_medium=email&utm_campaign= (accessed 17 March 2016).
Klein G (2014) We Need to Think Bigger About Transit-Oriented Development. Available at: http://www.citylab.com/commute/2014/07/we-need-to-think-bigger-about-transit-oriented-development/373838/ (accessed 26 March 2016).
Morris DZ (2015) Only 6% of Cities are Preparing for Driverless Cars. Available at: http://fortune.com/2015/12/02/somerville-driverless-car/.
58
O’Toole R (2016) Transit is dead. Let’s prepare for the next mobility revolution. Available at: https://www.washingtonpost.com/news/in-theory/wp/2016/03/01/transit-is-dead-lets-prepare-for-the-next-mobility-revolution/ (accessed 12 March 2016).
Presentations
Hietanen S and Sahala S (2014) Mobility as a Service: Can it be even better than owning a car? Presentation. Helsinki.
Smolnicki PM (2016) Autonomous/Automated Automobiles vs. Self-driving Cars/Vehicles vs. Driverless Shuttles/Pods/Podcars: Understanding different impacts of each automated mobility solution on metropolitan (urban and suburban) spatial structures. CIVITAS conference presentation. Gdynia.
Ceille K (2015) Moving Beyond Disruption. Media Lab Building, Cambridge, MA.
i “Kitchen knives” comparison was proposed by the author during the Civitas conference session after his presentation (Smolnicki, 2016). ii Delphi method was developed in 1950’s at the RAND Corporation (Dalkey and Helmer-Hirschberg, 1962: 11). iii Various labels appear in literature, such as method or technique as well as other modifications (after: Davidson, 2013: 54). iv The Delphi method is used in the author’s PhD dissertation – as it was done by many others before that (after: Skulmoski et al., 2007). v “The Delphi method is an iterative process to collect and distil the anonymous judgements of experts using a series of data collection and analysis techniques interspersed with feedback” (Skulmoski et al., 2007). The goal in the Delphi method is to reach a consensus among experts, which needs subsequent rounds of surveying (Hsu and Sandford, 2007) until achieving 70-80% rate of consensus (Hsu and Sandford, 2007). If there are diverse opinions a single combined position should be derived (Helmer-Hirschberg, 1967: 4–5). There are various numbers of experts proposed in literature but the majority of the studies have between 15 and 20 experts (Hsu and Sandford, 2007) but critical component of the research is the selection of the experts with knowledge and experience corresponding to the research topic, as well as their willingness and sufficient time to participate and, of course, communication skills (Skulmoski et al., 2007). vi The anonymity of experts helps to avoid issues of modifying or changing opinions due to relating to other experts (Davidson, 2013: 55).
59
��������� ������ ��������������������������������������������������� �������� !""#��$���%��&� �!�!�$���� �����
������ ��������������������������������������������������� �������� !""#��$���%��&� �!�!�$���� ����� ���'())*+,+-.
**/0��123456.,76*8,6,3456.,76*696)- :��*:��*;��*:���������<*���%���������*���*������*%���������3(6=>. ?���&�%*?������*@�?*:��������A*����A*B����*:�����*���*C����D������*@DE�@������%A*@D&FGH&;IA*B����*JC;K&BL*J@�������%������LM>N,(6=>.O5P K�F��*B�������A*F���Q�*K�F��*R����F������A*S����Q�*?���&�%*G�1�1�A*������*?���&�%*T�����A*D�����*K�F��*?���A*F�1��U��*?���&�%*;���A*?����*V>+97 ��*H�������%WA*�������������*���*�������%X-YZ>.853456.,76*6-[6@�������A*���*������*���*���%��*���WA*�*�������*��*���*�����������*���*��*���*D������*��*B�����*&�*���*����!1��* ���*���\�*�������*�����������*&�*�������*��������*��*����*��*���*������ �*��*��Q��*����������A�������������*���*��������*����������*���*���*����������*��������*]���*�����*��*����������A*��*��*������*��*�!�"�"1��*��*�����*����A*��* ����*#�̂ *J��A��"1��L*�*�������*��*����������*�����*]�����*��������������*����A*���*����������*� �����%*��������* ���*�#1��*J#_��̂ *��*���*�����*�����L*�������*��*���*����������*���* ���*�����*����"1��*J����̂ *��*���*�����*�����L�@�������*�*���������*��*���*�������*������%*W���A*����%��*�W*�*�����*�����W*�����*H����1�A����������*�����%*���*�_���*&�*����*����*��*�����*��A���*�������*J��A���*��������*���*�A��������������*����������L�*&�*�����A*���*������%*����*�����*�����*�A���A�������̀*���*����*�����������������*����������*������*��"K]��*H��*�����W*������*��� ��1*��*��1�*���*!����!*��* ����*������W ���*���W*��������*��*���*������a��*���*��*���*���WA*���*� �*����W*����*���*������*�����*���*������%�;���������A*���*�����*������%*�����*�����������*���*��%��W*�������%�*?��*��*����*�����������*�����������W* �*������*��*�����*��*����������W*���*����������*������%<*�������%*��*�\���*����%W*���������A��������*���*����������*�����%*��*�����W*���%���]���*���*��*��*�� *��������%��A*���*���*����*����*�����*�����%�*���%���������*����*���*H@@*B����*0*����*�*��*��������W*���*�*����*��������*����*��W*%����*����*��b*�������*���W*����1�*� �W*����*���*����������*����*��*@��������*H��*��*����*�*���%�������%*��������������*��*���*��������W*���*�\���* �� ���*���������* ���*���*��������*������%*�����%������0W*�������%*����a��* ���*�*����*U����������*������%*�����A*���*������%*�����W*��*����%��*��*�����������������*�W*��"̂ *���*�� ��*��*����������*�\��������*�W*����*����*��*�������*c�*H���*����������*�������*�*������*�����*��*���* ������*��*���*����a���*0W*�������*�������%*��������*������%* ���*���%���������A*���*���W ����*��*����*��*���*��*���\�����*��*���*�������*c*��*W����*H�1��%*����*�������*���*���������*������*��*���������*��Q���A* ����*���*���\������W*!�*�������*cA*��*�*���*��*�W*����*��*���W*����*W���*��*��A*���*��Q��� ����*�����*����1����*�*���*����%*����*�������*������%* ����*�U���*���*���������A*�����������W*������%�*����*U����������*���*���������*������%*W����;��������A*���*�������%�*��*���%���������*���*���*���W*�������*��*������%�*&�*���*��Q����W*��I���������%�����*��������A*�������*������%*�������*��W*���*����������*�����*���* ���*���* ����*��� ����%*���*���*�����������%*��*���*������*������* ����*������*������*U��������*��*����������W�*H������%*����*���*��*��*���*�����*���*���* �W*���*����*����*�������W*����%*���*�*������*����*�������������W*%����������?������*������%*��*@�������*���*���W*�����*�*�������������*�����������*��*��������*������%A*���*��*����������* �����*�����*����������*��*���*D������*��*B����*G�����%*F�����%W*b���b�#A*����*���������W*�������������*��*������W*��*������%*��WA*����������*��*��������*��*��*����%WA*��������������*��*����%W�������*�����a��*���*���������W*������������*��*�� *��������%��*����*��*���*����*����������*�����������������%�A* ����*�������%*���*���������*��*�������������*��������/�2F���*�*��Q���*����������*���*���W*�� ���*���������*����������*�W*���������%*��������A*�����*����������������*�������*���*���*��������WA*���*���*����*��*����* ���*���*���������*IC*%���*��*������%*��������*�W����W*����*���*���������*���*!d̂ *����%W*����%/�2*��������* ���*���*��������*��������1�/�2*K�����W*��*I�������*?���������A*efghijkl*mn*ompmqm*rfstkuv*wtxstfvy*J����z���#LA*�����/�2*R�@*&�������A*H��*C�*��*I���������W*���*G�����%A*{|f*}~gslt*mn*�mvfufxstkmu*mu*�ufxvy*�muph~gtkmuA*�����**/0��12 60
Beyondtheblackbox:communicatingdataandevidencetothepublic
Moderator: Katie MANGLE, Alta Planning + DesignPortland, USA Speakers: Kelly RODGERS, Streetsmart, Portland, Mike SELLINGER, Alta Planning + Design, Portland, Oregon, USA
The relationship between certain transportation strategies, such as complete streets, and the goals
we have for our communities, such as improved safety and health, have been described and
documented in the research literature. However, this information isn’t readily accessible to those
who need it: planners, elected officials, and the communities they serve. In a growing performance‐
based transportation planning context, having the evidence at hand to educate community
members and decision‐makers about the effectiveness of different strategies is critical.
Streetsmart, an online tool created by a non‐profit organization, is a research synthesis, resource
clearinghouse, and communication platform for transportation planning. Its vision is to change the
conversation about transportation—to broaden it beyond the idea of mobility and into the notion of
access; to help people understand the consequences of their investments on community goals; and
to offer greater transparency and accountability in the transportation decision‐making process. It
anticipates a performance‐based planning environment, and as such, organizes information around
the performance of transportation strategies.
In this highly interactive session, we will walk through a prototype of Streetsmart, an online platform
that translates inaccessible empirical evidence into something actionable for practitioners. Through
a series of questions to the audience, we will discuss the following:
1) How to use evidence in decision‐making and when it the process it is useful
2) How to communicate complex interactions between transportation investments and community
goals—translating research into a format actionable by practitioners
3) The role of the analyst vs. the advocate and what information they need for their job
4) How to bridge disciplinary silos through the creation of a common language and technology
platform.
61
Prigara, Joanna Re-defined city space ISOCARP-OAPA Conference 2017
1
The re-defined city space
Joanna Marta PRIGARA, Aalborg University, Denmark
Contemporary cities, influenced by technology and mobility needs of their users, begin to face the challenge of re-adaptation. The future of streets as known shall be questioned and explored to find a different design defining the space between buildings. The proceeding technological advance demands a response in city planning. Hence the question of how to shape the future city space, with respect to changes in mobility trends. The concept for the re-defined city space is presented in the academic project “The Road Not Taken”. It provides an insight for why shall planning look into the future, while applying the technological change in mobilities together with the advantages of a programmable city. The paper describes new forms of mobility and their possible impact on the street spaces. Further, it proposes a shift of the current urban paradigm to a new set of planning concepts supported with utopian thinking. Finally, the project focuses on reinvention of the space to become more livable and ecological with the advance in the car industry.
Introduction
The contemporary city is driven by growing advances of technology. In this context, it is important to explore the possibilities of new development and planning trends. To know the future means to better understand the present. Everyday life is an important topic of investigation (Mayer, 2010). Constant flow of information, widely accepted invasion of media in everyday life together with data collection and storage reveals the need to reconsider planning policies for the contemporary cities. The everyday routine is a stage for social interactions that defines and gives a structure to what people do (Giddens, 2004). By understanding which trends and technologies drive city inhabitants in everyday life, the city can better address them and respond to the new emerging technological patterns. Planning shall respond to these small scale inputs as well as the big technology changes that might revolutionize mobility on an individual and shared basis. Hence the importance of creating future scenarios as well as criticizing and redeveloping elements of the city that have remained unchanged and have a potential to serve in a different way.
Technology advance
The will to connect is clearly visible in the contemporary society, where technology shapes its foreground and background attention. Technology gave a convenient tool for constructing identity and creating new forms of social interaction (Jensen, 2008). Society has changed, individuals willingly share and expose personal data. Constant exchange of information, which is collected and stored, opens several possibilities to study the city space, especially in terms of mobility patterns.
Technology changes altering future planning become visible in the individual transportation. Google has started experimenting with self-driving cars already in 2009. These units are under testing. Highly equipped in sensors and software, they are supposed to detect other users on the road and respond to their movement accordingly. Designed to increase safety on the roads, such future cars might also have an implication on the city space. If the surroundings are detected with sensors, potentially, the street as known might no longer have the shape as commonly known. In case of public transport, first self-driving busses have shown up in Europe in the second half of 2016. The small units tested, carried up to 12
62
Prigara, Joanna Re-defined city space ISOCARP-OAPA Conference 2017
2
people and travel at a low speed of 10 or 20 km/h. In Switzerland, this futuristic bus drove around the old town where normal bus access has not been possible. In addition, such units might be an answer to decreasing car usage in big city centers or in the places with a limited access for traditional buses.
Technology driven societies and changes in transportation themes shall be reflected in the way cities are planned. Constant exchange of information enriches the cyber network that can be used in the city analysis phase. Collecting data about everyday life patterns of mobile people: the routs they take, places they stop individually, places they gather in a group, places they visit; gaining an image of such mobility patterns gives a knowledge of how the space between the building volumes is used. Harvesting these data enables a better understanding of where the critical points of contact emerge and shall be taken care of. Critical points of contact are the sites of difference, where the mobile systems change or where the flow and its quality is changed (Jensen, Morelli, 2011). Adding the layer of transportation units evolution increases the potential of re-defining the streets as known. The movement and its safety become a branch of the invisible, programmable layer. Detection systems become a guarantor of safety and potentially a linear street is no longer needed. If the self-driving cars are flexible to react to other users of space, their presence might not require a spatial separation. This can be a breakthrough, especially in city centers, where the street space and the surface parking space could be redefined in favor for pedestrians.
The need to look forward
Utopian thinking can be perceived as a stimuli for change (Pinder, 2005). Contemporary cities face different challenges seeking a planning and designing response. Hence, in order to extend what is possible, it is important to desire the impossible. Strategies and actions shall consider making probable what is impossible today (Lefevbre, 1973/76). This utopian view can justify why a change in thinking about the present city space shall take place now. This includes an idea for a car-free future city or a new way of city space development. Even though contemporary theorists argue, that utopian visions are only hopes with nearly no chance of being realized, without them, there would be no ideas for the future planning or designing direction (Harvey, 2000). A utopian vision should be critical as it questions and challenges the present establishment, yet shall be explored to create a fruitful potential and a constructive vision (Friedman, 2002). The future of mobility has been questioned since the second half of the twentieth century and different ideas have been proposed. Visions by modernists have been dominated with the role of the car as a uniform part of the city that increases the connection between the functionally divided parts and highlights the beauty of speed in life (Jensen and Freudendal-Pedersen, 2012). An opposing view was provided by the Situationist movement which did not support the car dominating vision. It proposed to think of an alternative mobility system altogether. Situationists argued, that car driven lifestyle erodes the everyday life. Inspiration from this group can be seen in forming actions such as “Critical Mass” when cyclists take over the main city streets (Jensen and Freudendal-Pedersen, 2012). Separation of the living place and working place results in everyday mobility dictating a lifestyle with reduced leisure time. Adding the climatic changes caused by CO2 emission brings the need for creating a response to a post-car future (Dennis and Urry, 2009). Making utopias allows to challenge the taken-for-granted aspects of city life and challenge what is possible and impossible. It allows to be opened for possibilities (Pinder, 2005). Concluding, utopias allow to search for alternatives which are valuable to contemporary cities, especially in the situation of the coming technological changes.
63
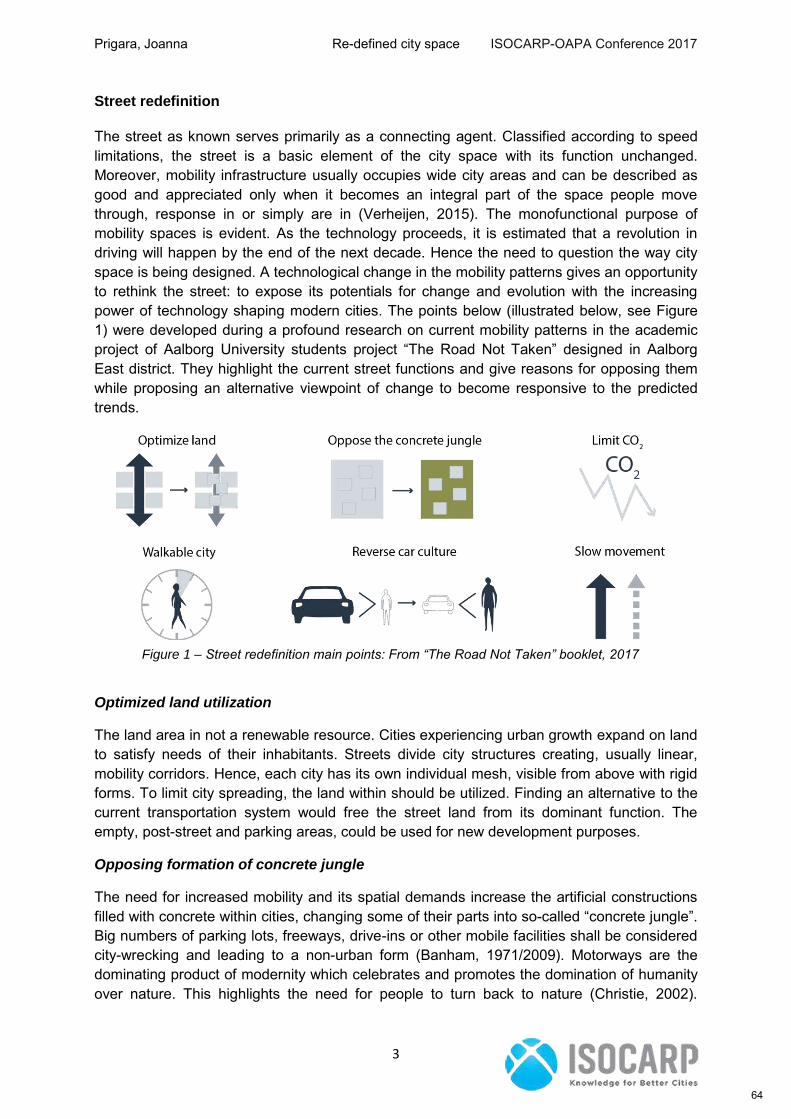
Prigara, Joanna Re-defined city space ISOCARP-OAPA Conference 2017
3
Street redefinition
The street as known serves primarily as a connecting agent. Classified according to speed limitations, the street is a basic element of the city space with its function unchanged. Moreover, mobility infrastructure usually occupies wide city areas and can be described as good and appreciated only when it becomes an integral part of the space people move through, response in or simply are in (Verheijen, 2015). The monofunctional purpose of mobility spaces is evident. As the technology proceeds, it is estimated that a revolution in driving will happen by the end of the next decade. Hence the need to question the way city space is being designed. A technological change in the mobility patterns gives an opportunity to rethink the street: to expose its potentials for change and evolution with the increasing power of technology shaping modern cities. The points below (illustrated below, see Figure 1) were developed during a profound research on current mobility patterns in the academic project of Aalborg University students project “The Road Not Taken” designed in Aalborg East district. They highlight the current street functions and give reasons for opposing them while proposing an alternative viewpoint of change to become responsive to the predicted trends.
Optimized land utilization
The land area in not a renewable resource. Cities experiencing urban growth expand on land to satisfy needs of their inhabitants. Streets divide city structures creating, usually linear, mobility corridors. Hence, each city has its own individual mesh, visible from above with rigid forms. To limit city spreading, the land within should be utilized. Finding an alternative to the current transportation system would free the street land from its dominant function. The empty, post-street and parking areas, could be used for new development purposes.
Opposing formation of concrete jungle
The need for increased mobility and its spatial demands increase the artificial constructions filled with concrete within cities, changing some of their parts into so-called “concrete jungle”. Big numbers of parking lots, freeways, drive-ins or other mobile facilities shall be considered city-wrecking and leading to a non-urban form (Banham, 1971/2009). Motorways are the dominating product of modernity which celebrates and promotes the domination of humanity over nature. This highlights the need for people to turn back to nature (Christie, 2002).
Figure 1 – Street redefinition main points: From “The Road Not Taken” booklet, 2017
64
Prigara, Joanna Re-defined city space ISOCARP-OAPA Conference 2017
4
Redefining the city space could make a way for introducing more green and biologically active areas, as a connection with them causes a feeling of satisfaction (Lynch, 1981).
Limiting CO2 emission
Separation of the living and working places results in a necessary, everyday mobility. CO2 emissions cause climatic changes which require a response in planning. Passenger cars themselves are responsible for 12% of CO2 emitted in Europe (Climate Action, 2017). An average EU citizen produces 9.1t of CO2 annually. Aalborg East – City Centre daily commuter releases 4 grams CO2. If the district is to be developed it brings around 2.2t of CO2 daily, while EU tries to bring the values down.
Reducing the need for far-reaching car movement
Promotion of a pedestrian friendly neighborhood joined with the idea of 5-min city, where all necessary services are within a walkable reach, reduces the need for a car. By providing a high quality and vibrant mixture of uses and job opportunities in the place you live, not only the time consumed on traffic is gone, but also the streets are freed. Such movement requires rethinking of the contemporary city model and introducing a different, favorable solution which contains a mixture of traffic free areas and zones resembling the mobility areas as known operating the inter-local movement. Thus, far-reaching movement would be covered by a smart system of public transit hubs, connecting neighborhoods on a local scale and a regional scale.
Reversing the car culture religion
Functional separation of the 70’s developments has degraded pedestrians and highlighted the cars. Car culture is expressed through the monumental infrastructure and in the city composition: when the streets form main axes of composition. Transformed streets could be the trigger to become a symbolic and functional backbone of a renewed urban core. Yet, it is important to remember about turning the space into a human friendly scale design. The altered city areas could structure urban flows and in a larger extent lead the future development (Haspeslagh, 2015).
Promotion of the slow movement
Contemporary city is built for cars – the speed agent. It is a promotion of the beauty of speed. The car does not leave enough space for nature, it highlights the fuss and clatter around each individual (Honore, 2015). Hence raised a culture opposing the view that faster life means a better life. Slow movement highlights quality over quantity. Slow urbanism concentrates on decreasing the speed of life by not designing for cars. Building mixed-use areas, living in a greater density, involving nature in the design and living close to the working place are the core principles of the slow urbanism (Honore, 2015). Concentration on human scale, promotion of walking and cycling culture together with a healthy balance between work and leisure are images of a Slow city that are possible happen in 50 years (Honore, 2015)
The Road Not Taken project
“The Road Not Taken” is a project developed by students of Aalborg University who created a proposal of redesigning the space between buildings. The title suggests a strong
65
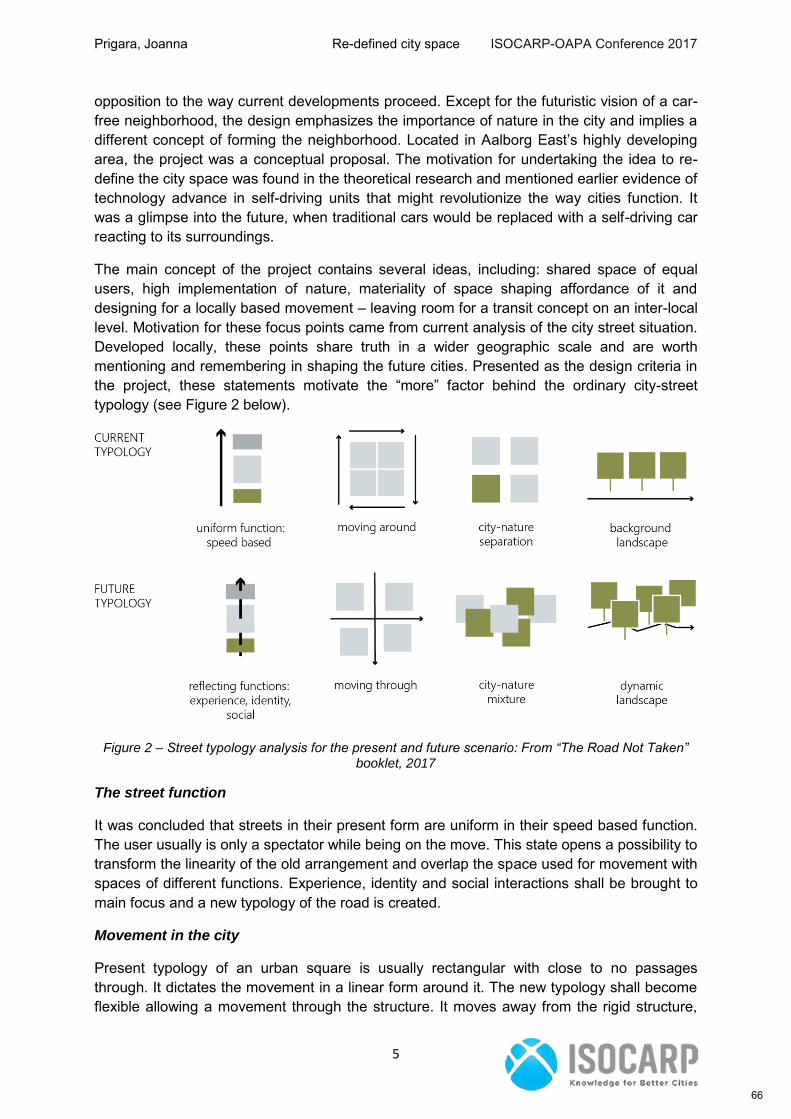
Prigara, Joanna Re-defined city space ISOCARP-OAPA Conference 2017
5
opposition to the way current developments proceed. Except for the futuristic vision of a car-free neighborhood, the design emphasizes the importance of nature in the city and implies a different concept of forming the neighborhood. Located in Aalborg East’s highly developing area, the project was a conceptual proposal. The motivation for undertaking the idea to re-define the city space was found in the theoretical research and mentioned earlier evidence of technology advance in self-driving units that might revolutionize the way cities function. It was a glimpse into the future, when traditional cars would be replaced with a self-driving car reacting to its surroundings.
The main concept of the project contains several ideas, including: shared space of equal users, high implementation of nature, materiality of space shaping affordance of it and designing for a locally based movement – leaving room for a transit concept on an inter-local level. Motivation for these focus points came from current analysis of the city street situation. Developed locally, these points share truth in a wider geographic scale and are worth mentioning and remembering in shaping the future cities. Presented as the design criteria in the project, these statements motivate the “more” factor behind the ordinary city-street typology (see Figure 2 below).
Figure 2 – Street typology analysis for the present and future scenario: From “The Road Not Taken” booklet, 2017
The street function
It was concluded that streets in their present form are uniform in their speed based function. The user usually is only a spectator while being on the move. This state opens a possibility to transform the linearity of the old arrangement and overlap the space used for movement with spaces of different functions. Experience, identity and social interactions shall be brought to main focus and a new typology of the road is created.
Movement in the city
Present typology of an urban square is usually rectangular with close to no passages through. It dictates the movement in a linear form around it. The new typology shall become flexible allowing a movement through the structure. It moves away from the rigid structure,
66
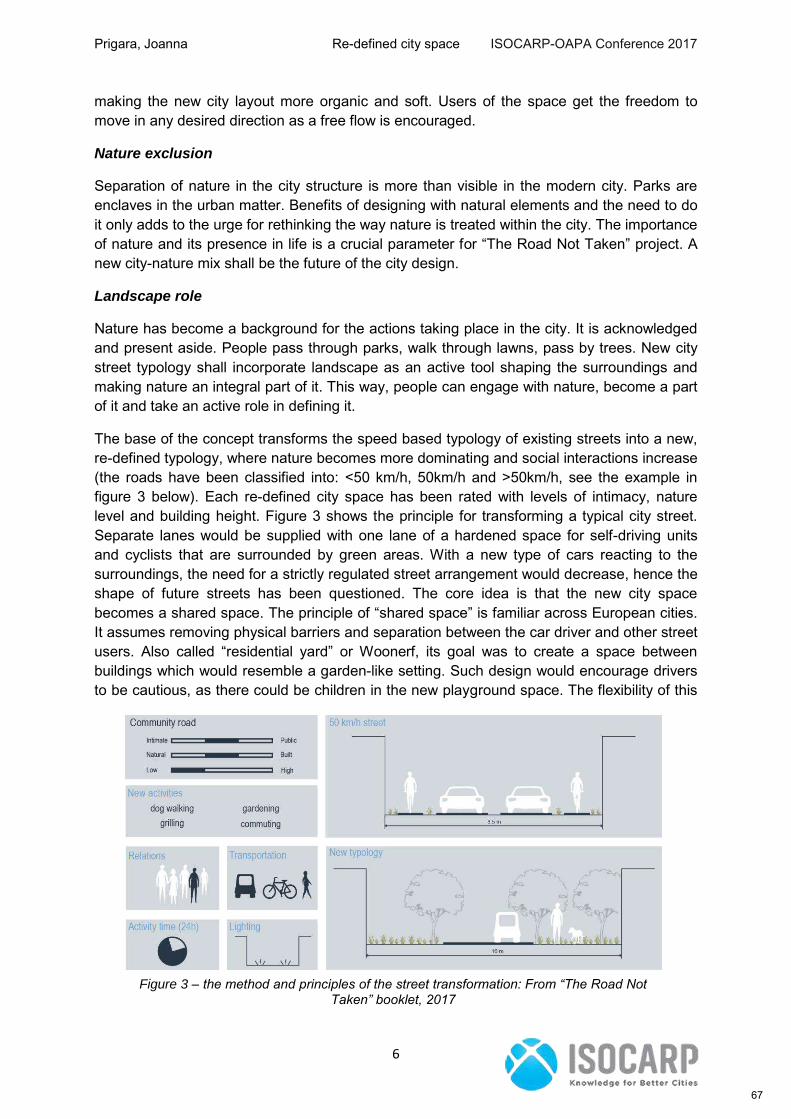
Prigara, Joanna Re-defined city space ISOCARP-OAPA Conference 2017
6
making the new city layout more organic and soft. Users of the space get the freedom to move in any desired direction as a free flow is encouraged.
Nature exclusion
Separation of nature in the city structure is more than visible in the modern city. Parks are enclaves in the urban matter. Benefits of designing with natural elements and the need to do it only adds to the urge for rethinking the way nature is treated within the city. The importance of nature and its presence in life is a crucial parameter for “The Road Not Taken” project. A new city-nature mix shall be the future of the city design.
Landscape role
Nature has become a background for the actions taking place in the city. It is acknowledged and present aside. People pass through parks, walk through lawns, pass by trees. New city street typology shall incorporate landscape as an active tool shaping the surroundings and making nature an integral part of it. This way, people can engage with nature, become a part of it and take an active role in defining it.
The base of the concept transforms the speed based typology of existing streets into a new, re-defined typology, where nature becomes more dominating and social interactions increase (the roads have been classified into: <50 km/h, 50km/h and >50km/h, see the example in figure 3 below). Each re-defined city space has been rated with levels of intimacy, nature level and building height. Figure 3 shows the principle for transforming a typical city street. Separate lanes would be supplied with one lane of a hardened space for self-driving units and cyclists that are surrounded by green areas. With a new type of cars reacting to the surroundings, the need for a strictly regulated street arrangement would decrease, hence the shape of future streets has been questioned. The core idea is that the new city space becomes a shared space. The principle of “shared space” is familiar across European cities. It assumes removing physical barriers and separation between the car driver and other street users. Also called “residential yard” or Woonerf, its goal was to create a space between buildings which would resemble a garden-like setting. Such design would encourage drivers to be cautious, as there could be children in the new playground space. The flexibility of this
Figure 3 – the method and principles of the street transformation: From “The Road Not Taken” booklet, 2017
67
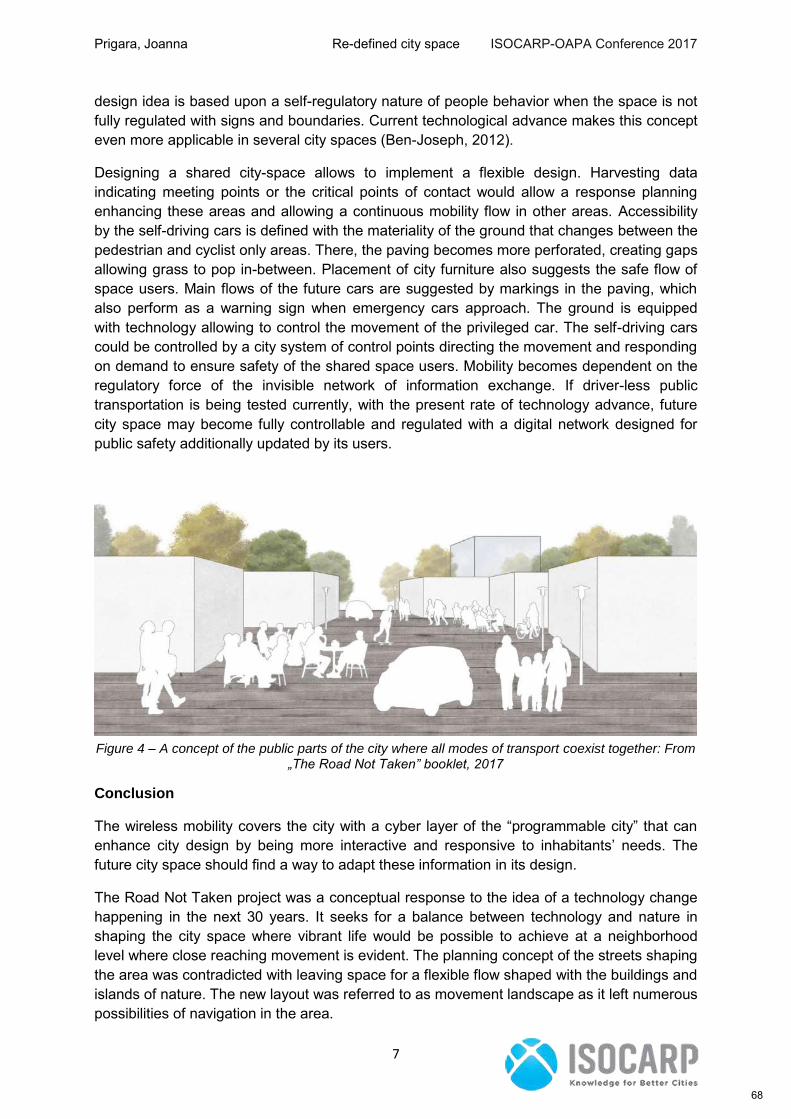
Prigara, Joanna Re-defined city space ISOCARP-OAPA Conference 2017
7
design idea is based upon a self-regulatory nature of people behavior when the space is not fully regulated with signs and boundaries. Current technological advance makes this concept even more applicable in several city spaces (Ben-Joseph, 2012).
Designing a shared city-space allows to implement a flexible design. Harvesting data indicating meeting points or the critical points of contact would allow a response planning enhancing these areas and allowing a continuous mobility flow in other areas. Accessibility by the self-driving cars is defined with the materiality of the ground that changes between the pedestrian and cyclist only areas. There, the paving becomes more perforated, creating gaps allowing grass to pop in-between. Placement of city furniture also suggests the safe flow of space users. Main flows of the future cars are suggested by markings in the paving, which also perform as a warning sign when emergency cars approach. The ground is equipped with technology allowing to control the movement of the privileged car. The self-driving cars could be controlled by a city system of control points directing the movement and responding on demand to ensure safety of the shared space users. Mobility becomes dependent on the regulatory force of the invisible network of information exchange. If driver-less public transportation is being tested currently, with the present rate of technology advance, future city space may become fully controllable and regulated with a digital network designed for public safety additionally updated by its users.
Conclusion
The wireless mobility covers the city with a cyber layer of the “programmable city” that can enhance city design by being more interactive and responsive to inhabitants’ needs. The future city space should find a way to adapt these information in its design.
The Road Not Taken project was a conceptual response to the idea of a technology change happening in the next 30 years. It seeks for a balance between technology and nature in shaping the city space where vibrant life would be possible to achieve at a neighborhood level where close reaching movement is evident. The planning concept of the streets shaping the area was contradicted with leaving space for a flexible flow shaped with the buildings and islands of nature. The new layout was referred to as movement landscape as it left numerous possibilities of navigation in the area.
Figure 4 – A concept of the public parts of the city where all modes of transport coexist together: From „The Road Not Taken” booklet, 2017
68

Prigara, Joanna Re-defined city space ISOCARP-OAPA Conference 2017
8
The main criticism of the concept questions the efficiency of movement in the designed shared space. Flexible movement allowing all users to move unpredictably would imply a slow car movement with constant attention of all space users or a limited amount of space users. The concept would not fit city centers which are vibrant and overcrowded. These tend to become car-free zones in major European cities. However, the project could have a potential in creating buffer zones in areas that are aimed to be pedestrianized yet need a support of individual transportation on an inter-local level.
As technology becomes more dominant in a wider range of everyday life aspects, planning cities shall seek for a response looking forward. The rhythm, dreams, hopes and expectations of everyday life give mobilities a deeper meaning, serving a certain, individual purpose (Freudendal, Pedersen 2009). The technological changes shall accompany the evolution of the city space in terms of changing mobility patterns. Re-adapting the street areas as shared spaces will be a long process and different in case of each city.
References
Banham, 1971/2009. in Designing Mobilities, Ole. B. Jensen, Aalborg University Press, 2014
Ben-Joseph, E. 2012. Rethinking a lot, the design and culture of parking, The MIT Press Cambridge, Massachusets, London, England
Dennis K. and Urry J., 2009. After the Car, Cambridge: Polity
Friedman J., 2002. The Prospect of Cities, Minneapolis: University of Minnesota Press
Giddens 2004. Socjologia, Warszawa: PWN
Harvey D., 2000. Spaces of Hope, Edinburgh, Edinburgh University Press
Jensen O. B. 2008, Networked mobilities and new sites of mediated interaction, Paper for the Critical Digital ‘What Matters(?)’ Conference Harvard Graduate School of Design
Jensen O. B. and Freudal-Pedersen M., 2012. Utopias of Mobilities in Utopia: Social Theory and the
Future, Routledge
Jensen O. B. and Morelli N., 2011. Critical Points of Contact – Exploring networked relations in urban
mobility and service design
Lefebvre H., 1973/1976. The survival of Capitalism, New York: St. Martin’s Press
Lynch K., 1981. Good City Form, Massachusets Institute of Technology, first edition.
Majer A., 2010. Socjologia i przestrzeń miejska, Warszawa: PWN
Pinder D., 2005. Visions of the city: Utopianism, Power and Politics in Twentieth Century Urbanism, Edinburgh University Press.
Online sources
Climate action, 2017 [online article]. Reducing Co2 emissions from passenger cars, European Commission <https://ec.europa.eu/clima/policies/transport/vehicles/cars_en#tab-0-3> [Accessed: 24.05.2017]
Eldredge B., 2016.[online article] Self-driving bus buses are now on the road in Helsinki, Curbed. <https://www.curbed.com/2016/8/31/12691516/self-driving-bus-vehicles-finland-helsinki-transportation> [Accessed 20.07.17]
Haspeslagh W., 2015. [online article] Urban cells, MMKM <http://www.mmkm.it/blog/2015/12/5/urban-cells> [Accessed: 10.05.2017]
69

Prigara, Joanna Re-defined city space ISOCARP-OAPA Conference 2017
9
Honore C, 2015. [online interview article] In An Advocate of Slow, interview by Jurkina M., Future Urbanism <http://futureurbanism.com/interview/an-advocate-of-slow/> [Accessed 10.05.2017]
MyClimate, 2017 [online calculating engine] <https://co2.myclimate.org/en/car_calculators/new> [Accessed: 24.05.2017]
The local, 2016. [online article] Self-driving shuttles premiere in Sion, The Local Switzerland <https://www.thelocal.ch/20160623/self-driving-shuttles-premiere-in-sion> [Accessed 20.07.17]
70
A study of Accessibility Challenges for Persons with Disabilities and
the Effect on Parliamentary Functions in Kenya
Kefa Misuko OMOTI (PhD), Parliament of the Republic of Kenya,
E-mail [email protected]. Tel. +254718003514
ABSTRACT
Following the adoption of the Convention for the Rights of People with Disability by the International community and subsequent domestication of its protocol in the year 2008, Kenya, among many other developing countries anchored the Convention on the Rights of Persons with Disabilities (CRPWD), in her Constitution and enacted the enabling legislation in 2012. The Constitution entrenched inclusivity by providing for representation of Persons with Disabilities (PWDs) in Parliament and County Assemblies. The PWDs Legislators are entrusted with the important role of the entrenching the PWD agenda in national development. It is however, not clear if the CRPWD initiatives are facilitative of the PWDs agenda or merely cosmetic since effects of accessibility on Parliamentary functions have been scarcely discussed in literature. This paper therefore, traces the upshot of accessibility on legislation, representation, budget making and oversight in the Kenya. It focuses on the steady rise in numbers of PWD legislators in National and County assemblies and their involvement in plenary and committee engagements with specific emphasis on the accessibility of the premises and facilities they use. The study adopted the descriptive/diagnostic design. Interview schedules were used to collect data from respondents selected through theoretical Purposive Sampling. Data was analyzed using the grounded theory approach and summarized in descriptive statistics. It was established that PWDs suffered more from attitudinal barriers as compared to physical and communicative barriers. The study recommends sensitization of non-disabled members of Parliament and an amendment of the Kenyan PWD Act.
Key Words: Legislation, Disability, Accessibility, Mobility
Introduction
In the year 2010, Kenya experienced a rebirth of the Kenyan nation through the promulgation of a new and more progressive Constitution. A notable inclusion in the Constitution was a comprehensive bill of rights which contains PWDs empowerment provisions as envisaged under the CRPWD, including equality and freedom from discrimination, human dignity, and access to information for all citizens. To boost equal opportunity, the Constitution on affirmative basis provides for representation of marginalised groups such as women, youth and Persons with Disabilities (PWD) at the Kenyan Parliament and the 47 County Assemblies.
Article 54 of the Constitution of Kenya (2010), requires the state to ensure a progressive implementation of the principle that at least 5% of all elective and appointative bodies are persons with disabilities, while Articles 97, 98 and 177 provide for the representation of PWDs at the National Assembly, Senate and County Assemblies respectively, through nomination by
71
political parties on the basis of seats garnered during a national election (RoK, 2010). In the year 2013 therefore, PWDs including the sightless, partially sighted, the physically challenged and the deaf were for the first time in the history of Kenya represented in Parliament and the newly created County Assemblies in fulfillment of the constitutional requirements. To enhance their participation in the Kenyan political landscape and ultimately influence the efficiency and effectiveness of policy decisions, there was urgent need to mainstream the implementation of the CRPWD provisions on accessibility, especially the Universal design (UD) concept (Mattila and Papageorgou, 2016).
Disability in the Context of Accessibility
The Oxford advanced learners dictionary equates access to a ‘way of entering or reaching a place’. This echoes the definition by Levinison and Krizek (2005) which also defines accessibility as the capacity to get what one needs including the possibility of getting to the places where those needs can be met. The definition implies considerations of cost and time of reaching a destination including the suitability and attractiveness of the activity one intends to be involved in. Viewed under the lenses of parliamentary functions, accessibility refers to the level of attractiveness in terms of convenience, comfort, economy and variety of opportunities available for PWD legislators at various locations which motivate their involvement in the parliamentary activities or sets of activities.
Disability on the other hand has been defined as the disadvantage of restriction of activity caused by contemporary social organization that takes little account of people who have impairments and therefore, excludes them from involvement in regular societal activities (Reeve, 2006). Other researchers (Mitra, 2006; Barnes, 2006; Barnes, 2011) explain disability as a versatile concept capable of being described from a medical point of view, social scope or human rights perceptions. It is therefore a multifaceted concept that may adopt different definitions for different circumstances, be they medical, administrative or policy needs. This understanding seems to have guided the draughters of the Kenya Persons with Disabilities Act (2003, revised 2012) (RoK, 2012) which defines disability as:
‘a physical, sensory, mental or other impairment including visual, hearing, learning,
physical incapability which impacts adversely on social, economic or environmental
participation’
The medical view point is based on the World Health Organization (WHO) initiative attempt to provide a universally accepted definition of disability as outlined in a 1980 publication entitled “the International Classification of Impairments, Disability and Handicap (ICIDH)”. The publication classifies the three categories as follows:
i) Impairment- refers to any loss or abnormality of psychological, physiological or anatomical structure or function
ii) Disability- points to any restriction or lack of ability to perform an activity in the range of a
72
normal human being
iii) Handicap- a disadvantage owing to impairment that limits or prevents the fulfillment of normal roles, including social economic disadvantages
The medical model therefore viewed disability as an individual problem caused by various reasons such as disease, injury or some other health conditions that necessitate medical attention. The medical aspects in question were categorized either as those that would never improve or those that would get better with appropriate medical care and rehabilitation. This theory was profoundly criticized, particularly in relation to the alleged conceptualizing of disability from a narrow interpretation of normality (Mitra, 2006).
The social theory approach as championed by a British organization called the Union of the Physically Impaired against Segregation (UPIAS), rejected disability on medical grounds and placed the disability problem on society. It denied the existence of any express causal relationship between impairment and disability and redefined disability to include social oppression comparable to levels of injustice and intolerance meted out to marginalised groups such as women, lesbians and gay men. This allowed disability to be seen as something imposed on top of impairment, leading to uncalled for segregation and barring of the affected members of society from full participation. UPIAS therefore, viewed the disabled as oppressed public and considered disability as a form of serious disadvantage or restriction of participation, caused by present-day social organization. Social theorists assumed society took little account of people with physical impairment and effectively excluded them from social activities (Barnes, 2011).
According to the social model, disability is not attributable to the individual but to societal conditions. It attempted to shift attention from the individual operational limitations to challenges posed by the restraining environmental barriers and disabling tendencies of the wider society by focusing on what it was that denied PWD their human rights, and identified the actions that needed to be taken to separate the disabling environment from the impairments(Shakespeare and Watson, 2002). One way of achieving this was by stretching the characterization to take account of all impairments such as sensory and cognitive, physical and economic factors such as poverty and inadequate access to public places which subjected PWD to dehumanizing experiences. This approach effectively opened doors for a wide range of interventions including legislative and design measures. It has been hailed as a tool with which to provide insights into the disabling tendencies of society in order to generate policy and practices for the elimination of discrimination (Emilian and Stephanidis, 2005)
Finally, the human rights approach to disability came on board when the international community adopted the stance that subjugation and omission of persons with disabilities needed to be viewed from the human rights perspective, since PWD had inherent self worthy as human beings who should therefore, be treated with dignity. Because of this approach, the United Nations General Assembly adopted the Convention of Rights of Persons with Disabilities (CRPD) in the year 2006. This gave way to the recognition of PWDs as subjects of rights and appreciation of disability as a form of diversity, effectively flagging the notion of distinguishing
73
PWDs on account of characteristics and eliminating barriers to full participation of PWDs of certain characteristics (Levinison and Krizek, 2005).
The development of theory from the medical model, the social model that came into effect in 2008 and currently the Human rights model has had far reaching effects. Significantly, this opened the non-discrimination gates wider, with the appreciation of PWDs as people with rights to live and enjoy meaningful interaction and participation in community activities. The world has since witnessed the development of legislation at various levels including local, national and international that provide for the inclusion of the principles of Universal design (UD) into the production of physical environments. The UD initiative and legislation efforts are briefly discussed below.
The Universal Design Concept
Coined in 1998 by Ronal Mace, UD refers to a deliberate design of products and environments in ways that render them usable by all people to the greatest extent possible, without the need of adaptation or specialized design (Bernes, 2011). This was fronted by a group of architects, environmental designers and researchers who came up with 7 UD principles for use in examining existing designs, guiding new designs and educating the public about PWD sensitive products and environments. The principles ranged from equitable use, flexibility, simplicity and low physical effort, tolerance of error and size of approach spaces (Rimmer, 2005).
Besides aesthetics, the principles and guidelines focused on minimization of segregation and stigmatization of users while at the same time ensuring privacy, variety, simplicity of use and safety for individual users. Emphasis was laid on provision of legible information on all sensory modalities, in platforms that were compatible with most of the devices that people with sensory limitations use, especially where such information would help minimize or eliminate hazards and errors. UD was envisaged to reduce on efforts by PWDs in accessing places through minimized repetitive actions and sustained physical effort. Finally, UD aimed to facilitate a clear line of sight to important elements for any seated or standing user and provide adequate space for use of assistive devices or personal assistance (Rimmer and Rowland, 2008).
The UD idea led to the discourses on social inclusion and human diversity with the aspiration of improving environments to the point that the use of assistive technologies would not be necessary. It has been hailed as a prudent idea which, if well implemented would enable everyone to carry out their daily activities in comfort and safety without undue impediment and difficulty. The UD concept consequently witnessed positive developments including construction of building with ramps in addition to stairs, lifts and automatic doors accessible by wheel chair (Mitra, 2006).UD has however, been criticized on account of its inapplicability in mainstream disability concerns. Research has proved that is not possible to have a universal design that accommodates every PWD because everyone experiences their impairment differently, and a slight improvement for one set of PWDs might trigger discomfort for another.
Legislative Instruments
At the international level, the fight against discrimination on account of disability dates back to
74
the 60s and early 70s when wealthy countries such as the United States (US) and Britain enacted legislations to outlaw discrimination and guide the rehabilitation of the affected nationals. By 1973, the US congress had enacted the rehabilitation Act that expressly prohibited discrimination in any federally funded government programme. This gave momentum to efforts by the United Nations (UN) to provide a commonly applicable guideline, which was eventually realized by the espousal of the declaration of the rights of the mentally restarted persons and the rights of the disabled in 1973. In later years, the UN, following persistent lobbying by pressure groups adopted a series of initiatives to mainstream the concerns of PWDs (Hinto, 2003; Kakoloo, 2005; Hammel, et al 2015).
The Convention on Rights for Persons with Disabilities (CRPWD)
In December, 2006, the UN adopted the CRPWD and its optional protocol. This was the first comprehensive human rights document by the UN targeting PWDs to be adopted and domesticated by various countries. Article 29 of the Convention disallowed the perception of PWDs as objects charity and medical handling that required care, and instead, affirmed the view of PWDs as subjects with constitutional rights and capabilities of claiming the same and making decisions for their lives based on their free, educated consent and connection to communities. The Article roots for the rights of PWDs to influence conditions of their individual and associational lives and further influence government through regulatory institutions.
The CRPWD is a celebrated human rights instrument with a clear social development dimension that reaffirms the enjoyment of all human rights and basic freedoms by PWDs. It clarifies how all the rights apply to PWDS and identifies areas that require adaptations for essential exercise of the rights, and where the rights have been violated, the CRPWD makes provisions for enforcement. Its implementation has however, failed to provide the expected results because sadly, in every region, PWDs often live on the margins of society, deprived of some of the most precious experiences, such as lack of access to amusement and public spaces. The Convention called for urgent adoption of legislative measures to ensure PWDs could exercise their rights to political participation on equal measure as their non disabled counterparts.
National Legislation
It is a requirement of international law and practice that worldwide treaties and protocols be domesticated and implemented by state parties. State parties are required further to ensure the relevant domestic law and practices are consistent with the provisions of the treaties, especially sections that deal with constitutional guarantees on equality and protection by the law. In Kenya, this requirement was actualized under Article 27 of the Constitution of Kenya (2010) (RoK, 2010) which asserts that every person is equal before the law and has the right of equal protection and equal benefit. The Constitution further empowers the state to make legislative measures including affirmative action programmes and policies to redress any disadvantage suffered by any group of individuals.
75
To give effect to Article 27, the Kenyan Government initiated the enactment of the Persons with Disabilities Act (RoK, 2012) (CAP 113 of the laws of Kenya) which furthermore established an independent commission, named the National Council for People with Disabilities, for protecting the rights of PWDS. The PWD Act provides for issuance of enforcement mechanisms in cases of rights violation and encourages secure rehabilitation of PWDs among other measures. Section 21 of the PWD Act entitles PWDS to a barrier free and disability friendly environment to enable them to have access to buildings, social amenities and assistive devices and other equipment to promote mobility.
The Act envisages a situation where public buildings are adapted to suit the needs of PWDS and therefore empowers the council to issue enforcement notices where buildings are inaccessible to PWDS on account of structural, physical or organizational impediments. The Act however, disallows issuance of adjustment orders to government owned buildings without the express approval of the minister for health.
While the Implementation of legislations and adoption of UD initiatives between the year 2012 and present increased pressure for removal of barriers and enhancement of access for leisure time and amusement activities and general involvement in community activities, the impact of such measures is not clear in literature. Save for scanty discussions on the participation of PWDs (Vilchinisky and Findler, 2004) in political processes such as voting, contacting politicians and engaging in demonstrations, the ease or otherwise of their access to functional areas and its potential impact on overall performance has not been adequately documented. A richer understanding of the relationship between accessibility barriers and parliamentary functions would facilitate the development of opportunities for improvement and the development of systems, policies and standards that promote full participation of PWDs in parliamentary discourses.
Scholars are in agreement that accessibility environments might have improved in wealth countries since 2008, but remain dire in developing countries (Kadir, et al 2012). Hammel et al (2015) argue that there is a complex interaction between the person, their environment and levels of participation in community behavior, with the environment playing either a facilitative or restrictive role. This assessment may contribute to available knowledge on extent of involvement of PWDs in parliamentary roles and inform policy reviews to enhance participation. The aim of this paper therefore, was to investigate the character of accessibility challenges for PWDs and its impacts on Parliamentary functions in Kenya.
Methods
The study was carried out through observation and telephone interviews targeting members of the Kenyan Parliament and County Assemblies living with disabilities (PWDs). Telephone interviews were adopted because they permitted contact with respondents from all parts of the Country within the time allowed for the research while the observation technique was considered suitable because the investigator works in a parliamentary setting with regular interactions with county assemblies. The respondents were selected using purposive theoretical sampling, resulting in a diverse combined sample in terms of age, sex and nature of disability.
76
The PWDs were requested to summarize their experiences regarding architectural and environmental features of Parliamentary premises. The interview transcripts and recorded observations were coded and ranked in broad themes using the constant comparison analysis strategy. The data was also summarized in descriptive statistics.
Results
The investigation interviewed 25 PWDs comprising of 14 women and 11 men. 88% of the respondents had mobility challenges, 8% had low vision while 4% had hearing impairments. Analysis of the interview themes revealed insightful impacts of various accessibility conditions on perceived effectiveness of PWDs legislators in their core mandate. The respondents narrated how different accessibility conditions influenced their participation in the core parliamentary functions of oversight, budget making, legislation and representation. The accessibility conditions mentioned included attitudinal, physical and communication access barriers as discussed below.
Attitudinal Access Barriers
A number of respondents (60%) reported having encountered attitudinal barriers in the course of their parliamentary functions. These manifested in refusal of nomination and involvement of the PWDs as representatives of marginalized groups by non-disabled members and non involvement of PWDs in key assembly committees. Respondents felt alienated by exclusion from key assembly committees such as the budget and appropriation, Finance and Implementation committees. In return, the exclusion from the committees denies PWDs opportunities to participate in decision making and implementation processes for fast tracking the realization of the PWD agenda and follow up on executive undertakings. These cumulatively undermined the legislative and representation functions of the assemblies.
Despite the popular adage “nothing for us without us”, PWDs were hardly consulted during the implementation of measures meant to improve accessibility. Examples were given where planners, architects and engineers working for county assemblies embarked on construction of ramps and hand rails without the input of PWDS. Respondents claimed the improvement projects in Siaya, Kisumu, Kilifi and National assembly resulted in the development of ramps that were both too short and steep or too rough for the comfort of manual wheel chair users. Access to public galleries at the county of Busia was compromised because the hand rails were installed up to half way the flight while the debate chamber floor at the national assembly was too spongy and steep for crutch users because PWDs were not consulted during its design and construction stage. Respondents alleged that while some of the implementation flaws were attributed to low technical capacities at the county level, much of it was attributable to disregard and prejudice by non-disabled members of the assemblies.
Respondents also indicated verbal discriminative behavior by non-disabled members including being referred to as beggars and unnecessary baggage. A respondent from the County assembly of Machakos indicated that it was not unusual to hear depressing comments such as:
77
‘You are so used to begging that you always want more’
It was indicated that the perception of PWDs as beggars often led to slow implementation of the PWD agenda in the assemblies. The study learnt that while some county governments failed to budget for the mainstreaming of the PWD agenda, others deliberately refused to spend money voted for the provision of assistive facilities and services that would improve physical accessibility. For instance, in Kisumu, Siaya, Nairobi, Vihiga and Makueni Counties, the executive declined to budget for the implementation of the PWD Bills while in Kajiado, in the financial year 2016/2017, funds set a site for purchase of assistive services remained unspent and returned to the County treasury by the end of the financial year.
Physical Access Barriers
Majority of the respondents (88%) had mobility disablement and therefore relied on wheelchairs or crutches. The study revealed that save for the national assembly and the county assembly of Tana River, accessibility to committee rooms, documentation centres, leadership offices including the Clerk and Speaker’s offices was compromised. A respondent regretted having in the past visited the National assembly where for him to access the speaker’s gallery, he had to endure the humiliation of being carried on a security officer’s back like a child because no ramp was provided in addition to the stairs. At the county assembly of Nairobi for example, critical administrative offices such as licensing, accounts and procurement were located on the upper floors of the 14 storey City Hall Annex complex, accessible only by stairs and lifts. Respondents lamented that the lifts being old, broke down frequently, and since no ramp was provided, it was not possible for wheelchair users to access important officials and services located on the upper floors.
Unavailability or unsuitability of ramps coupled with narrow walkways was reported by 96% of the respondents. At the National Assembly, it was noted that no ramp was provided at the main entrance to Parliament buildings, the health club, the speaker’s gallery and the public gallery. At the county assembly of Siaya, the ramp installed during adjustment of an existing assembly hall was too short and steep for wheel chair users while at Nyandarua, Kilifi, Kericho, Busia, Kajiado and Bungoma, the provision of ramps to upper floors and galleries was nonexistent. One respondent indicated that:
“The ramps installed in older buildings of the assembly are either too short, steep, have no hand rails or just too rough…It is better to struggle up the stairs than on the steep ramp. The walkways and doors are also too narrow for wheel chair users”
The effect of ramps on accessibility was confounded by a general lack of assistive devices and services at the county assemblies. It was only at the National Assembly and the County Assembly of Bomet where assistive staff and wheel chairs were provided for PWDs, especially during the rainy season when the floor was too slippery for crutch users. Respondents felt the lack of suitably constructed ramps denied them opportunity to effectively participate in oversight activities that were normally operationalized at the committee rooms.
Oversight visits to project areas were also affected whenever PWDs needed to travel outside
78
Nairobi where in most cases assistive services and staff were not provided for. One respondent regretted that he always had to be left behind in the car while his non-disabled colleagues toured oversight projects areas and occasionally had to be substituted by a non-disabled Member of Parliament. He pointed out a scenario where he was unable to join his nondisabled colleagues during project familiarization tour and spent 3 days in his hotel room in Kisumu City. The respondents believed inaccessibility to functional areas led to weak oversight and legislation because they did not originate nor benefit from the PWDs perspectives. By denying disabled members of the public access to galleries and committee rooms during oversight hearing and bill processing sessions denied disabled members of the opportunity to contribute to law making by way of petitions and presentations.
The investigation revealed a general lack of convenience facilities such as toilets and waiting rooms. It was indicated that the toilet facilities specifically designed for use by PWDs were few and far apart. In the National assembly for instance, the toilets were only provided at the Continental building. There was no suitable toilet located near the debating chamber and the main restaurant. PWDs had to cross a busy road to Continental house to access restrooms and this affected their participation in functional areas. At the counties, respondents complained of toilets facilities with doors that could not close properly and lack of supporting rails for crutch users.
The design and location of functional areas such as plenary hall, parking lot and administrative offices influenced accessibility and therefore, impacted on parliamentary functions. Respondents claimed that at Nyandarua, the parking lot was located 500M away from the assembly while the walk way between the assembly premises and the parking areas was not covered, making it difficult PWDs on crutches or wheel chair to navigate during rainy seasons. This meant non attendance of assembly responsibilities during the rainy season for PWDs. At the County of Wajir, the Governor’s office was said to be located 3KM away from the County Assembly Premises, making it inaccessible for PWDs.
The same situation prevails in Vihiga, where the county assembly is located about 2 KM away from the executive office of the Governor. Because of the distance, PWDs with mobility challenges fail to follow up on government undertakings on behalf of their constituents. A respondent from Wajir County complained that she had to be hospitalized every time she trekked to the Governor’s office on crutches, effectively denying the opportunity to follow up implementation of legislation and policies with the county executive.
Of significant importance was the seating arrangement in the plenary halls. 23 respondents (92%) indicated that the seats reserved for PWDs were too few and located at the rear where it was not possible to follow proceedings especially for low-vision PWDs. At the National Assembly, respondents asserted it was not possible to catch the speaker’s eye during plenary because the seats reserved for PWDs were located too far at the back. A respondent at the National assembly lamented:
“Whenever I want to make contribution, I have to request the sergeant at Arms to alert the speaker since it is not possible to stand up and compete for his attention with the
79
non-disabled members. I have no access to his office because it is located too far from the lifts, so I cannot consult him in advance either.”
In some county assemblies’ halls, the seats suitable for PWDs were sandwiched between seats meant for use by non-disabled, which meant that whenever the PWDs needed to exit the hall, immediate neighbours had to rise and give way. This was considered disruptive and negatively affected participation in legislation. In others assemblies, the seats set aside were too few compared to number of PWDS. In Nyandarua County Assembly for instance, one seat was designated to be shared among the 4 PWDs. This demotivated PWDs and reduced their presence and contribution in the plenary hall to the bare minimum at any given time.
The involvement of PWDs in legislation was equally affected by the quality of the floor surface and lighting. At the Kenya National Assembly, it was alleged that the plenary floor steeped towards the speaker’s seat and was covered with thick, squishy carpet that restricted the movement of PWDs on crutches. In other assemblies such as Bomet and Meru, the plenary floor and reception areas were reported to be too slippery because of the quality of tiles used for construction while the chamber floor was too spongy because of the quality of carpet used. The floor surface quality negatively impacted on PWDs on crutches since they were unable to approach the speaker for consultation and therefore, could not successfully participate in the legislation and representation functions.
The representation function was further negatively affected by lack of suitable office space for PWDs. 18 (72%) respondents complained of lack of space at the assemblies which made it difficult for PWDs to hold consultative meetings between PWDs and members of their constituencies and lobby groups. It was revealed that even those at the national parliament who were allocated offices, the spaces were too narrow to accommodate two visitors on wheel chair at the same time. PWDs therefore, preferred to hold consultative meetings at the road side, the parking lot, at home and for those that could afford, at hotels. This state of affairs was more complicated in counties such as Siaya where there were no waiting rooms for visitors and PWDs clients had to wait under trees. All Interviewees felt this hampered their representation role.
Communicative Access Barriers
The study revealed that 7 (28%) of the respondents encountered low communication accessibility. It was indicated that PWDs, above all those with poor sight experienced challenges in retrieval of important documents such as the order paper, statutory reports prepared by the Auditor General and Controller of Budget, since these were not available on Braille. It was claimed that the visually impaired also experienced challenges accessing lift at the National Parliament since there was no brail signage.
The signage challenge was also reported for people with hearing and mobility challenges. While PWDs with mobility lamented of poor signage with respect to condition of floor surfaces, those with hearing difficulties expressed dissatisfaction with level of sign language translation at the
80
County assemblies. Communication shortcomings lowered the extent of participation in the critical parliamentary functions. While the lack of sign language interpreters lowered the level of participation of PWDs with poor hearing, the lack of brail and related signage lowered the level of contribution of the visually impaired to the legislative and oversight functions because they were not able to peruse documents and prepare for oversight visits in advance.
Discussion
The study purposed to investigate the character of accessibility challenges facing PWDs legislators and the effects on Parliamentary functions. Data was collected using telephone interviews and observations. Results indicate presence of attitudinal, communicative and physical barriers that cumulatively weaken the participation of PWDs in parliamentary functions. Attitudinal barriers were identified as the most restrictive impediment that often led to non involvement of PWDs in key Parliamentary committees and accessibility adjustment programmes. This supports the assertion by Vilchinisky and Findler (2004) that attitudes could either greatly facilitate or interfere with the process of PWDs participation in political activities. It is also consistent with the findings by Barnes (2011), who in a study of the importance of universal design, came to the conclusion that social barriers inhibited the participation of PWDs in society activities. Despite the clarion call of nothing for us without us, PWDs are rarely consulted during design and implementation of adjustment measures, leading to unsuitable interventions that seem to solve accessibility problems for one form of disability by creating challenges for another. For instance, improving mobility on the plenary halls by installing tiles makes the floor too slippery for crutch users. The research reckons, it is neither possible to involve everyone in design nor provide solutions suitable for all forms of disability, because, as argued by Shakespeare (2006), every PWD experience their disability differently. However, provision of assistive devices including wheel chairs and personal assistants could make significant improvements. Measures should then be taken to ensure PWDs have appropriately suitable levels of accessibility to debating chambers, through proper rearrangement of the seating order, to minimize disruptions during debate. The current arrangement where the reserved seats are located at the back or sandwiched between nondisabled member seats denies low vision PWDs opportunity to fully participate in legislation activities. The distribution of facilities such as office space, waiting rooms, toilet facilities, assistive devices and assistants seemed to favour non-disabled members, more so at the County Assemblies. The resultant feelings of frustration, alienation and discrimination led to dissatisfaction and withdrawal from key functions such as sponsoring bills, which effectively slowed down the legislative agenda. This supports the impression by Rimmer and Rowland (2008), who argued that failure to attend to the attitudinal and infrastructural barriers, would make it difficult for PWDs to engage in public activities. Communicative barriers identified by the investigation ranging from poor or lack of signage on lifts, floors and walkways to absence of sign language interpreters and Braille facilities have potential to lower member participation in functions such as legislation because of inability to scrutinize documents and prepare for debate.
The study highlights critical areas of accessibility that influence the involvement of PWDs in parliamentary discourse. It identifies opportunities for the development of policy, technological
81
and administrative measures to encourage the participation of PWDs parliamentary roles.
Study Limitations
The study experienced various limitations that could affect accuracy and transferability of the findings. The study was carried out during an electioneering period in Kenya which affected the availability of the target PWDs for detailed interviews. The investigation did not also adequately take into account the concerns of respondents with hearing disabilities, as some were not able to participate in the telephone interviews.
References
Barnes, C. (2006). Independent futures. Policies, practices and the illusion of inclusion Barnes, C. (2011). Disability and the importance design for all. Journal of accessibility and
universal design for all, Vol. 1 (1) 54- 79 Emiliani, P. and Stephanidis, C. (2005). Universal access to ambient intelligence environments:
opportunities and challenges for people with disabilities. IBM systems journal Vol. 4 (2005) 605- 670
Hammel, J.; Magasi, S. Heinman ,A. (2015). Journal of archives of physical medicine
rehabilitation, Vol. 96 (205) 578- 588 Hinto, C. A. (2003). The perceptions of people with disabilities as to the effectiveness of the
American with disability Act. Journal of disabilities studies, Vol. 13 (4) 211- 222 Kadir, S. A.; Jamaludin, M and Rahim, A. A. (2012). Building managers perception in regards to
accessibility and universal design implementation in public buildings. Journal of social and behavioral sciences, Vol. 35 (2012) 129- 136
Kakoloo, M. O. (2005). Kenya: minorities, indigenous peoples and ethnic diversity Minority rights group
Levinson, D. and Krizek, K (2005). Planning for accessibility in theory and in practice. Susan Handy, California
Mattila, M. and Papageorgio, A. (2016). Disability, perceived discrimination and political participation. Journal of political science review ….
Mitra, S. (2006). The capability approach and disability. Journal of disability policy studies, Vol. 16 (4) 236- 247
Republic of Kenya (RoK)(2010). The Constitution of Kenya. Government Printer, Nairobi Republic of Kenya (RoK)(2003). The Persons with Disabilities Act. Government Printer, Nairobi Rimmer, J. (2005). The conspicuous absence of people with disabilities in fitness and recreation
facilities: lack of interest or lack of access? The science of health promotion journal, Vol. 19 (5) 327- 329
Rimmer, J.H and Rowland, J. (2008). Health promotion for people with disabilities: implications for empowering the person and promoting disability friendly environments. American
journal of lifestyle medicine, Vol. 2(5) 409- 421 Shakespeare, T. W. (2006). Disability rights and wrongs. London: Routledge Shakespeare, T. W and Watson N. (2002). The social model of disability: an outdated ideology.
Research in social science and disability, Vol. 2 (2002) 9 - 28
82
Njue,P & Musyimi, M: Building Information Modelling in Urbanizing Kenya: Joint OAPA-ISOCARP Conference/ 53rd ISOCARP Congress 2017
1
Building Information Modelling In Urbanising Kenya
Peter NJUE, University of Nairobi, KENYA
Marylyn MUSYIMI, Architectural Association of Kenya, KENYA
Introduction
With the largest economy is East and Central Africa, Kenya serves as a regional centre for
banking, technology and infrastructure. In the last ten years Kenya has experienced strong
growth and development, largely anchored in the Country’s Vision 2030. Vision 2030 is a
long term view of Kenya’s development intended to transform Kenya into a middle income
country with a high quality of life by 2030. The vision is anchored on 3 pillars; economic,
social and political. For ease of implementation, the vision is entrenched in the 2010
constitution and has been divided into 5-year mid-term plans (MTP’s) coinciding with the
electoral calendar. The current MTP was adopted in 2013 and includes a strong focus on
digital transformation. This is so because, technology is increasingly playing a valuable role
in communities, but also a highly disruptive role.
Infrastructure development has been identified as one of the pillars for Kenya’s vision 2030
development blueprint, GoK (2007). Infrastructure development and an active construction
industry are indicators of a thriving economy. These two activities also promote the
development of other industries within the economy through backward linkages. Park (1989),
has confirmed that the construction industry generates one of the highest multiplier effects
through its extensive backward and forward linkages with other sectors of the economy.
Infrastructure development, and indeed the attainment of Kenya’s vision 2030, shall be
hinged on how technology shall be leveraged towards these goals. From technology
perspective, a building information model is a project simulation consisting of the 3D models
of the project components with links to all the required information connected with the project
planning, design, construction or operation. (Kymmell,2008)
Over the years, a strong case has been made for the adoption of BIM in the construction
industry and especially in Europe, North America and Australia. According to the National
BIM Survey 2014, carried out in the UK, ‘awareness of BIM is now almost universal at 95%
and adoption rates are accelerating with more than half of respondents (54%), now using it
in 2015 up 15% from 2014, and 93% predicting adoption by 2016’. (McGraw Hill
Construction, 2014). Musyimi (2016) discusses BIM adoption in the Kenyan context, the
challenges faced and how adoption can be encouraged and finally concludes that BIM can
provide an effective support for design and construction, as well as an effective collaboration
and communication platform that can be used as a management tool within the construction
industry. Of note is that the study found out that, there are no known Kenyan BIM standards
83

Njue,P & Musyimi, M: Building Information Modelling in Urbanizing Kenya: Joint OAPA-ISOCARP Conference/ 53rd ISOCARP Congress 2017
2
or implementation guidelines, institutions in Nairobi County requiring BIM adoption on their
projects or bodies driving BIM adoption in Nairobi County. This is despite the study reporting
improved productivity, better project quality and performance, faster project delivery and
reduced wastage after the adoption of BIM.
How Technology Is Changing Our Communities
Our communities are changing as a result of technology. Increased technological
possibilities are resulting in faster and cheaper production of goods and services; the advent
of technology has seen a shift in the needs of our communities, from requiring basic
provision of infrastructure to need for more advanced technology appropriate infrastructure;
technology has changed how information is communicated and received in our communities,
and finally technology and its rapid speed of change has meant that we now question the
viability of our existing buildings and infrastructure, and a step further, the viability even of
the plans we have for future development. It is possible through specific and deliberate
strategies to harness the benefits of technology. To do this, communities and built industry
professionals need to have a clear strategy that identifies where the biggest difference can
be made with technology, and then align infrastructure and building provision goals and
technology requirements with choices that are guided by a community-centred approach. To
think, how will implementing this technology affect the community in which it is
implemented? In Kenya, as elsewhere in the developing world, rapid urbanisation processes
and the unregulated physical growth of towns have emerged as major development planning
issues. Controlling development effectively requires a range of measures. The Solution is to
harness technology to steer urbanisation.
This paper delves into two main aspects of technology in Kenya, and how these can be
harnessed to produce the best possible synergy to propel the country towards its vision
2030. The paper explores best practice in BIM use worldwide, informing technology use in
addressing challenging rapidly urbanising communities. In advocating for BIM
institutionalisation and integration with e-permitting systems in Kenya, this paper suggests
ways these best practices can be applied to Kenya.
In the city of Nairobi, it is believed that 80% of the buildings are constructed without
approval, despite the existence of many planning and development instruments, and their
institutions (Daily Nation, 2009). Most growth in rapidly urbanising developing world cities,
such as Nairobi, takes place on the urban edge; often existing settlements link to form
extended urban corridors. Such growth presents a host of planning issues and challenges:
settlements tend to be informal, unserviced and fragmented, with a mix of tenure systems
and, in many cases, beyond the boundaries of single municipal governments. The challenge
84
Njue,P & Musyimi, M: Building Information Modelling in Urbanizing Kenya: Joint OAPA-ISOCARP Conference/ 53rd ISOCARP Congress 2017
3
of development control in Kenya is highlighted in numerous incidences of building collapse
and fire tragedies, AAK (2011), Daily Nation (2012a), Daily Nation (2012b), Daily Nation
(2013), with the most recent collapse being in June of 2017, where a seven storey
residential building collapsed in the residential area of Kware, Nairobi. The Architectural
Association of Kenya, AAK in the run up to the 2017 General Elections carried a sustained
social media campaign titled ‘The Kenya We Want’ in which the Association highlighted
among other issues the need for effective development control as a way to make Kenyan
cities and human settlements inclusive, safe, resilient and sustainable. According to the
AAK, the city of Nairobi has only 15 enforcement officers who are expected to supervise
6000 live building sites in the county, a recipe for disaster. AAK (2017).
Agyeman, S. et al (2016) postulates that the challenges in acquisition of building permits
contributes significantly to mushrooming of illegal structures and proposes an integrated
permit system as a solution to this. A similar solution is proposed by Ng’etich, J.K et al
(2014). According to Agyeman et al, the intrinsic challenges identified in building permit
acquisition systems include: lack of integrated central database management system for
permit agencies and analogous institutions involved in the permit processing system, too
many processing steps, increased cost of construction and loss of value due to bureaucratic
delays, lack of coordination between the land agencies and the local authorities, differing
land ownership practices, inappropriate feedback systems and inadequate number of staff
for the field inspection and monitoring. These challenges are cross-cutting across Kenya,
and indeed many developing countries.
Ng’etich, J.K et al (2014), discusses the challenges faced in implementing development
control in one Kenyan town jurisdiction, Eldoret. These include: high cost of design,
processing and approval, inordinate delays, bureaucratic ambience or paper chasing, too
many actors and instruments, conflicting institutions and duplication of efforts, discretionary
decision making, lack of premises for development control decisions, political interference
and vested interests, increased planning disputes; paucity of data on plot ownership, limited
resources and personnel for development control. Ng’etich proposes an urban development
control Agency should be created with the sole purpose of coordinating and harmonizing all
urban development control activities and initiatives. This again points to the implementation
of an integrated permit system. For such a system to operate effectively; there will be need
to harmonize all instruments and standards of development control present in Kenya,
including; Kenya Civil Aviation regulations, Public Health, Physical planning Act, Cap 286,
KURA regulations, Urban Areas and Cities Act 2011 and EMC By- Laws 2008. The model
which is replicable elsewhere brings on board, EMC /or the Municipal Board, Public Health,
Physical Planning, National Land Commission(NLC),County Government, County Land
Boards, Kenya Urban Roads Authority (KURA),Kenya Civil Aviation Authority, National
85

Njue,P & Musyimi, M: Building Information Modelling in Urbanizing Kenya: Joint OAPA-ISOCARP Conference/ 53rd ISOCARP Congress 2017
4
Environmental Management Authority (NEMA) ,the Neighbourhood Associations/ or Area
Development committees, and the National Building Authority. Numerous forms and
schedules for applications and approval processes and for fees charged should be
harmonized.
Some progress has been made toward the stemming of ad hoc development in Kenya,
evidenced by the launch of the first ever National Spatial Plan on 1st March 2017. The
National Building Inspectorate, whose mandate is the audit of buildings for conformity with
land registration, planning zoning, building standards and structural soundness, has also
been able to carry out an audit of 5000 buildings countrywide, with 640 being found to be
structurally unsound. AAK (2017). The relatively young National Construction Authority,
enacted by the National Construction Authority Act in 2011, has also been able to stem
rogue contractors and reduce malpractice by registering about 25000 contractors within the
Kenyan building industry. All indications are that the stage is being set in Kenya for more
effective and efficient development control.
E-Permitting
According to the Study on Development control framework in Kenya (2011), 70 per cent (or
more) of construction in all local authorities are carried out without permission especially in
low income neighbourhoods. The rate is lower (40-50%) in higher income neighbourhoods.
To reduce the number of illegal constructions, Nairobi City has been trying since 2006 to
improve the permit system including change in evaluation process by establishing Technical
Committees and re-organizing the office for efficient process. The Technical Committee,
composed of departments in Nairobi City and professionals (Architectural Association of
Kenya, Kenya Institute of Planners, Nairobi Water Supply Company, etc), meets every two
weeks to discuss and approve applications. These efforts have shortened the process to
less than 30 days. In addition to these efforts, in 2011, Kenya benefitted from the first sub-
Sahara’s automated construction permit management system outside of South Africa, in an
attempt that cut down costs and time both for applicants and for the regulator. Popularly
known as the E-Permit system.
Electronic permitting (E-Permitting) is a set of computer-based tools and services that
automate and streamline the building permit process. IFC and the World Bank supported
Kenya’s efforts to establish the new system by advising on its design and installation,
training city council staff on its use, and raising awareness of the system among relevant
stakeholders. Kenya’s E-permit system has so far been launched in four counties, that is,
Nairobi, Kiambu, Mombasa and Kisumu, with plans underway for launch in three more
counties. This electronic approval system has significantly improved operations resulting in:
improved communication between relevant departments thereby reducing approval delays;
improved transparency through the electronic submission and processing of all documents;
86

Njue,P & Musyimi, M: Building Information Modelling in Urbanizing Kenya: Joint OAPA-ISOCARP Conference/ 53rd ISOCARP Congress 2017
5
and it has enabled these counties to keep accurate information on the investments in real
estate (commercial and residential) in their counties.
Kenya’s e-permit system has been deemed so successful, Rwanda, Iraq and Afghanistan
are using it to benchmark their own processes. With support from the World Bank Group,
both Kenya and Rwanda have instituted ICT reforms related to e-construction permitting.
These reforms have demonstrated that low- and middle-income economies can introduce
successful ICT platforms with a relatively wide range of solutions from the start. The new
automated system launched in September 2011 by the City Council of Nairobi (CCN) was
developed in less than two years and included training of the CCN staff and building code
officials. The training reduced time of approval by 80 percent and transaction costs for the
private sector by 60 percent. The City Council surpassed its revenue targets after it
registered a 300 percent increase in permit applications. International Finance Corporation,
(2015).
Despite challenges in the prevalent ICT and legal infrastructure in Kenya, the web-based
software application introduced by the City Council of Nairobi (CCN) enabled eight major
functions that radically transformed the management of construction permitting and
inspections in Nairobi after 2011. These key functions included: Online registration of
building professionals and property developers; Online submission of building plans;
Workflow management, specifically concurrent review and evaluation; Online issuance of
permit upon approval; Document management and archiving; Support for field inspections
using mobile devices; Client interactions through SMS/email notifications and online tracking
and Management reporting and oversight. IFC (2015).
In Rwanda, the plan is to scale up the system to serve all District One Stop Centres. Already
successful in Kigali, further system deployment will start with the Secondary Cities (Rubavu,
Musanze, Muhanga, Rusizi, Huye and Nyagatare) and later on move to the remaining
Districts until the whole country gets covered. The Rwandan E-permitting system has gone a
step further to include:
Profiling of ongoing constructions for inspection process: The system allows building
inspectors to review ongoing constructions and decide those which make the most
monitoring sense to inspect.
Capturing of inspection data using smart phones: The system allows building inspectors to
go to site and capture inspection data via mobile devices. Photos of key aspects of the
construction can also be uploaded during such inspections.
Intelligent Reporting: The system assists super-users to generate reports on different
subjects depending on their wishes. It can automatically generate reports on urbanization
growth rate of a given District basing on figures of permits issued over a given period of time.
87
Njue,P & Musyimi, M: Building Information Modelling in Urbanizing Kenya: Joint OAPA-ISOCARP Conference/ 53rd ISOCARP Congress 2017
6
Inspection feature: The system assists inspectors to access all documents related to a given
site or plot inspected by use of QR Code scanning which directs straight to the concerned
file in the system. Forged documents or permits can also be detected using QR Codes
scanning.
E-permitting has been able to reduce to a large extent the endemic problem of corruption.
According to Stewart (2016), about $1.26 Trillion is lost to corruption annually in developing
countries. Whereas the cost of redressing Africa’s entire infrastructure deficit is estimated at
a fraction of that, $75 Billion per year. Kenya bleeds $6 Billion to corruption annually,
Reuters (2016). The best way to close the world’s and Kenya’s infrastructure gap is to stop
corruption. E-permitting presents one way to do this. Corruption leads not only to economic
losses but to loss of lives from dangerous and unsafe infrastructure as highlighted previously
by the collapsed buildings and fire incidences. According to Transparency International, the
current levels of corruption mean that any country with a development vision for 2030 will
have to wait until 2035 to achieve their goals. Governments should therefore be re-doubling
their efforts to remove any opportunity for corruption in the infrastructure sector across the
project life-cycle, from procurement and financing through to operations and management.
In their Policy position paper of 2015 titled, ’Managing Building Development’, the
Architectural Association of Kenya recommended that Counties in Kenya need to adopt
development control processes that are fast to discourage non-compliance which is abetted
by the slow process. Development control should be made accessible to all citizens
regardless of social class to enable all sections of the Kenyan societies to enjoy the benefits
of effective development control regimes which lead to more liveable, sustainable and
inclusive neighbourhoods. BIM offers the opportunity to do so. With BIM it is possible to
integrate various aspects of development control and infrastructure and building provision,
from site surveys, through to communication of feedback by client communities on one
platform. Real time data of geospatial and engineering aspects can be analysed against the
relevant codes and at the same time communicating feedback both to the developers and
their consultants. Being able to make good decisions based on accurate data is critical to
managing development control efficiently and effectively. And being able to harness the right
data at the right time to answer the right questions is key in driving value. BIM allows real
time mining of data on buildings and their associated planning contexts for effective
management of the development control process.
In establishing the adoption of BIM use in Kenya, Musyimi (2016) employed a research
design method on BIM and world best practice that was both exploratory and descriptive.
Exploratory where insights into the study were obtained though the review of literature and
88
Njue,P & Musyimi, M: Building Information Modelling in Urbanizing Kenya: Joint OAPA-ISOCARP Conference/ 53rd ISOCARP Congress 2017
7
these insights then used as a guide for the descriptive study where individual respondents
were asked about their perceptions and personal experiences as pertains BIM adoption. The
main data collection tool was a semi-structured survey questionnaire that resulted in both
quantitative and qualitative data. The study population was the 55 registered members of the
construction management professional body with a response rate of 36.4%. The research
found that 25% of those interviewed were using BIM. Of the 75% that were not using BIM,
80% were planning to adopt it within the next 5 years. This shows that there is interest in
BIM and many firms are gearing up to adopt. This is therefore the right time for the
institutionalisation of BIM by linking it to E-permitting in Kenya.
The AAK in their study on ‘Managing Development Control’ (2015) surveyed some 17 local
authorities spread across 14 counties and four development control agencies were surveyed
for the Study on Development Control Frameworks in Kenya. These included Nairobi,
Kiambu, Nyeri, Machakos, Moyale, Garissa, Marsabit, Kajiado, Kericho, Kisumu and
Kakamega counties. Primary data was collected through questionnaires, interviews and
observation. A sample of 143 members from the public, 51 practitioners from the built
environment, 412 developers, 17 District Physical Planners, 34 officers from four public
institutions, 12 Neighbourhood Associations, and the Director of Physical Planning were
surveyed by questionnaire. The response rate was 62 per cent. A stakeholders’ workshop
was held to validate the preliminary findings of the study and seek feedback. The institutional
framework for development control is reviewed and mapped against international best
practices from Botswana, Switzerland and Singapore. Observed data was captured through
photography. Physical development plans of the 17 Local Authorities were obtained from the
Municipalities or the Ministry of Lands, and sample photographs of development projects
mapped on to the development plans. Data collected was presented and analysed using the
Statistical Package for Social Scientists (SPSS) and presented using descriptive statistics,
tables and figures.
Musyimi (2016) found that information on construction projects comes in a multiplicity of
formats and from multiple sources. The more this information can be communicated from a
single source, the better. BIM allows precisely this. By enabling central information
management, BIM makes the project management process more efficient, therefore adding
even more value to the delivery of construction projects. From the study, it was found that
improved productivity, better project quality and performance, faster project delivery and
reduced wastage were the greatest advantages reported after the adoption of BIM. In
conclusion the study recommended that Construction industry regulators in Kenya should
actively take up the mantle on BIM implementation and provide support to construction
89
Njue,P & Musyimi, M: Building Information Modelling in Urbanizing Kenya: Joint OAPA-ISOCARP Conference/ 53rd ISOCARP Congress 2017
8
practitioners by way of institutionalizing BIM implementation procedures and timelines for the
country.
AAK (2015) on its part recommends measures at different levels where action is expected to
spark efficient development control practices. These are policy, legal framework, governance
and institutional framework, the process of development control and capacity development.
In particular, and on the process of development control, the recommendation is that
Counties need to adopt development control processes that are fast to discourage non-
compliance which is abetted by the slow process. Development control should be made
accessible to all citizens regardless of social class to enable all sections of the Kenyan
societies to enjoy the benefits of effective development control regimes which lead to more
liveable, sustainable and inclusive neighbourhoods.
BIM And E-Permitting: The Development Control Solution To Rapid Urbanisation
According to the World Bank (2015), the potential offered by ICT solutions has been only
marginally tapped in the area of building code administration systems, specifically in
permitting and inspection procedures. The slow adaptation of ICT solutions for building code
administration perpetuates inefficient practices and postpones such advances as easily
accessible archives; coordinated inspections; integration of land titling, cadastral, land use,
and building information; improved documentation; and effective mechanisms to relay
inspection results back to builders and owners. Although many of these deficiencies can be
addressed through legal, regulatory, and process reforms, information technology has a key
role in improving efficiency, transparency, and accountability in building code administration.
enya’s information and communication technology (ICT) sector contributed about 12% to
GDP in 2015, showing a steady growth from 2006 when it made up 9% of the economy.
KoTDA says that by 2020, ICT will create 100,000 jobs and bring in Kshs 1Billion annualy.
Kenya has 32.3 Million mobile subscribers with 79.2% mobile penetration rate, according to
KCA. Many of the country’s projects focus on developing products that reach Kenya’s
poorest through SMS services available on basic mobile phones. These same platforms can
be harnessed to help the urban poor especially report on buildings that contravene building
regulations and standards by the development of a product linked to the County E-permit
systems. This will help institutions such as NBI that have limited capacity to go out in the
field and identify these buildings to build their data base. This can later be used to determine
improvements or demolitions as may be deemed necessary. The challenge of rapid
urbanisation is also that it requires planners, developers, owners and governments to think
holistically about the needs of a community. This necessitates a direct connection with the
communities in question. Mobile phones present a good solution to this.
90

Njue,P & Musyimi, M: Building Information Modelling in Urbanizing Kenya: Joint OAPA-ISOCARP Conference/ 53rd ISOCARP Congress 2017
9
By linking BIM with E-Permitting and hinging largely on the mobile phone platform, Kenya
can pioneer in a development control system that is not only one-stop, but one that connects
directly to the communities in question with real time feedback via mobile phone networks.
The following section describes how.
Proposal For Implementation Of BIM For E-Permitting In Kenya
It is proposed that BIM can be integrated to E-permitting in the outlined steps as follows:
I. Integration of development control into a one stop function: this will allow both the
authorities offering the service and the citizenry to have access to al relevant information
without physically moving from one office to another. A One-stop shop is a data storage
bank/unit with various linkages which can be accessed by land agencies and other
stakeholders Forkuo E. K., & Asiedu S. B. (2009)
II. Coordination of approving agencies: Harmonize and coordinate institutions and related
agencies that deal with development control process and management. This will help in
reducing political interference and lengthy circulation processes which make the process
tedious and expensive. AAK (2015).
III. Capacity building: this will be a concerted effort of approving authorities, technical
institutions and professional associations to ensure capacity right from the approving
staff to the private technical professionals making development submissions for
approval.
IV. Digitization of records: this will involve making all documents relating to land use and
land tenure available online for ease of access and reference. From national spatial
plans to survey plans and details of ownership and use of individual parcels of land.
V. Integration of design code and building code checks into BIM software rendering it
capable of evaluating approval submissions for permitting.
There are basically 5 stages through which compliance of a new construction with building
standards can be assured. The section below suggests ways in which BIM can be integrated
to each of these steps as an aid to E-permitting.
1. Submission of building application to the local authority: BIM can be employed as the
platform for submission, which means that submissions will no longer be of 2-
dimensional information but rather of 3 dimensional models that carry with them various
metadata on the proposed developments such as environmental performance and other
analysis.
2. Review process by local authority: By the integration of design code and building codes
into BIM software, development application review can be digitised through the simplified
programming that introduces customised algorithms and design checks to enable the
91
Njue,P & Musyimi, M: Building Information Modelling in Urbanizing Kenya: Joint OAPA-ISOCARP Conference/ 53rd ISOCARP Congress 2017
10
software carry out prerequisite checks on the submitted 3- dimensional proposals and
their associated Meta data.
3. Issuance of building permit: this shall be recommended based on an evaluation report
generated after all desired checks have been made on the submitted development
proposal by the software.
4. Inspection of construction: By linking submission information available to the authorities
with information on location, linked to existing mapping systems, it will be easy to locate
live sites remotely and to allocate inspection and enforcement staff appropriately.
Construction progress can then be recorded on digital devices such as tablets and
uploaded onto the one-stop system for record and reference.
5. Issuance of occupancy permit: based on the recorded information on progressive
inspection and progress of construction, the system will be able to generate a report
upon which occupancy permit may be granted. This can be relayed electronically to the
developer, eliminating the need for physical trips to the authority and reducing paper
based transactions.
Beyond integration of BIM and E-Permitting the following measures are recommended to
support the integration and enhancement of development control.
1. Use of the private sector in compliance checks in order to build capacity: private
professionals across the divide from planners to Architects should be certified by the
regulatory Authorities to provide 3rd party review services as a good number of them are
now conversant with BIM. This can be done in liaison with professional Associations
such as the AAK.
2. Continued strengthening of the legal and administrative capacity of regulators in the
development control sphere: has highlighted in earlier sections, Kenya has and
continues to set the stage for more efficient and effective system of development control.
This should also be supported by building the capacity of civil staff before they are
exposed to the demands of the new systems.
3. Offer compliance support: Rather than just enforce, building regulators should take it to
the next level and reach out to stakeholders to offer advice and guidance, which is touted
as a sure way to improve compliance. World Bank (2015).
4. Increase transparency in building code administration: by use of online and mobile
phone platforms to make available, land use plans, guidelines for the permitting process
and requirements for permit applications. This will increase access to regulatory
information by the stakeholders, which is associated to greater trust in regulatory quality
according to the World Bank.
5. A coming together of larger regulatory context institutions to support the integration in
each of their spheres. These are: education and training institutions, accreditation
92

Njue,P & Musyimi, M: Building Information Modelling in Urbanizing Kenya: Joint OAPA-ISOCARP Conference/ 53rd ISOCARP Congress 2017
11
bodies, professional associations, the financial sector, the political regime, and industry
practitioners both in the public and the private sector.
6. Establishment of a legal basis for online transactions and digital signatures, as this will
be the basis of the integrated online system.
7. Adopt the integrated system incrementally, to allow for adjustment to changing context
and to take care of arising issues. The use of open-source technologies with no licensing
cost will also reduce the associated capital investment.
8. Make use of public building programs as entry points for the integrated BIM E-permit
system such as proposed public housing projects: This will ensure that the system is
allowed to take advantage of the technical capacity and budgetary allocation already
available to such projects. This will also provide a platform to demonstrate successful
implementation and use of the system.
9. Sensitize and educate the public on the need for development control compliance: this
will create demand for compliance among the populace, who in turn can pressure
professionals and developers to comply.
This paper has proposed the integration of BIM and the E-Permitting process in Kenya. It
advocates for BIM institutionalisation and goes further to suggest ways in which the
integration can be done. The challenges prevalent in development control in Kenya have
been discussed and possible ways of alleviating them highlighted, among them the current
E-Permitting system. Still some challenges persist such as the need for a speedier approval
process. The integration is posited to cure these. Below is outlined a proposal for the
implementation of this integration as a demonstration of the practicability and applicability of
this work in the Kenyan context.
BODY ACTION ACTIVITIES
Level 1:National Level Adoption National Level legislation and institutions
The development of national BIM standards and legal framework for use of online transactions on development control. In partnership with previous partners such as IFC and World Bank.
• Define national priorities and develop a national implementation plan
• Establish legislation on online transactions and BIM standards
• Review existing legislation in relation to BIM in E-Permitting
• Budgetary allocation Level 2: National Level to County Level Scaling County Level legislation and institutions
The scaling of national BIM Standards and legal framework for online development control to county level. Customisation to particular county codes and policies.
• Scale national implementation plans to counties
• Establish institutional capacity at county level
• Engage county stakeholders for buy-in
93
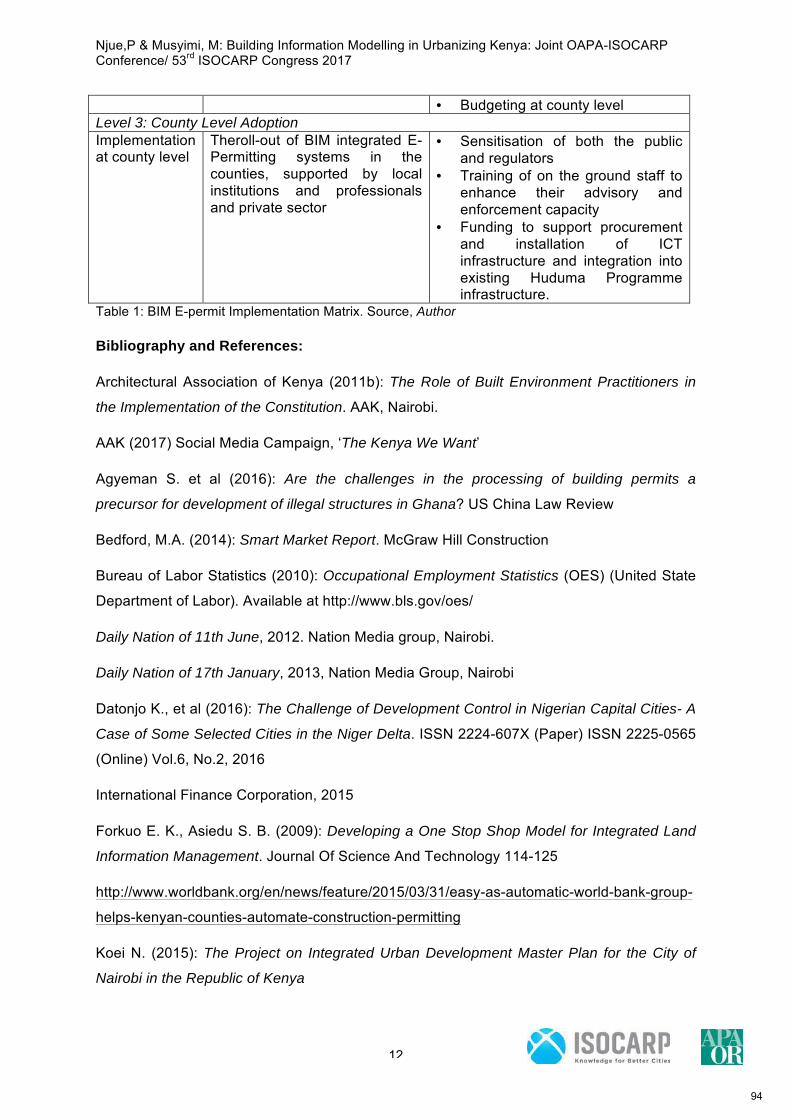
Njue,P & Musyimi, M: Building Information Modelling in Urbanizing Kenya: Joint OAPA-ISOCARP Conference/ 53rd ISOCARP Congress 2017
12
• Budgeting at county level Level 3: County Level Adoption Implementation at county level
Theroll-out of BIM integrated E-Permitting systems in the counties, supported by local institutions and professionals and private sector
• Sensitisation of both the public and regulators
• Training of on the ground staff to enhance their advisory and enforcement capacity
• Funding to support procurement and installation of ICT infrastructure and integration into existing Huduma Programme infrastructure.
Table 1: BIM E-permit Implementation Matrix. Source, Author
Bibliography and References:
Architectural Association of Kenya (2011b): The Role of Built Environment Practitioners in
the Implementation of the Constitution. AAK, Nairobi.
AAK (2017) Social Media Campaign, ‘The Kenya We Want’
Agyeman S. et al (2016): Are the challenges in the processing of building permits a
precursor for development of illegal structures in Ghana? US China Law Review
Bedford, M.A. (2014): Smart Market Report. McGraw Hill Construction
Bureau of Labor Statistics (2010): Occupational Employment Statistics (OES) (United State
Department of Labor). Available at http://www.bls.gov/oes/
Daily Nation of 11th June, 2012. Nation Media group, Nairobi.
Daily Nation of 17th January, 2013, Nation Media Group, Nairobi
Datonjo K., et al (2016): The Challenge of Development Control in Nigerian Capital Cities- A
Case of Some Selected Cities in the Niger Delta. ISSN 2224-607X (Paper) ISSN 2225-0565
(Online) Vol.6, No.2, 2016
International Finance Corporation, 2015
Forkuo E. K., Asiedu S. B. (2009): Developing a One Stop Shop Model for Integrated Land
Information Management. Journal Of Science And Technology 114-125
http://www.worldbank.org/en/news/feature/2015/03/31/easy-as-automatic-world-bank-group-
helps-kenyan-counties-automate-construction-permitting
Koei N. (2015): The Project on Integrated Urban Development Master Plan for the City of
Nairobi in the Republic of Kenya
94
Njue,P & Musyimi, M: Building Information Modelling in Urbanizing Kenya: Joint OAPA-ISOCARP Conference/ 53rd ISOCARP Congress 2017
13
Kymmell, W. (2008) Building Information Modeling: Planning and Managing Projects with 4D
CAD and Simulations, USA:McGraw Hill Construction
Ministry of Works, Manama, Kingdom of Bahrain (2015): Municipalities Affairs and Urban,
Building Permit. Available at http://www.municipality.gov.bh/
Miriri, D. (2016): Third of Kenyan budget lost to corruption: anti-graft chief, Thu Mar 10 2016,
available at https://www.google.com/amp/mobile.reuters.com/article/amp/idUSKCN0WC1H8,
Reuters 2016 accessed 11th Aug 2017.
Musyimi, M.M (2016): Building Information Modelling Adoption in Construction Project
Management in Kenya: A case study of Nairobi County. MA Thesis, University of Nairobi.
Ngetich K., et al (2014): A Study on the Effectiveness of Urban Development Control
Instruments and Practices in Eldoret Municipality, Kenya Journal of Emerging Trends in
Engineering and Applied Sciences (JETEAS) 5(2): 83-91 © Scholarlink Research Institute
Journals, 2014 (ISSN: 2141-7016)
Park, S.H. (1989): Linkages between industry and services and their implications for urban
employment generation in developing countries. Journal of Development Economics, 30(2),
359-79.
World Bank and IFC (2013): Dealing With Construction Permits. Washington, D.C., USA:
World Bank Group and International Finance Corporation 2013. Available at
http://www.doingbusiness.org/data/exploretopics/starting-a-business
World Bank, Automating Kenya’s Permits System under the Theme: Information and
Communication Technology. Kenya Investment Climate Program with Support from World
Bank Group in Partnership with the European Union, the Netherlands, and the United
Kingdom, (Nairobi, Kenya 2011a). Available at http://www.wbginvestmentclimate.org
World Bank (2015): Building regulation for resilience Managing Risks for Safer Cities
Z. Hekrdlová, et al (2014): Software Platform for the Integration of Design Code Checks into
Building Information Modelling
95
Abstract title Vertical Farms: the Innovative Trinity of Plant Factory Technology, Smart Green
Infrastructure and High Rise Buildings
Author Arch. Urb. LI Lecturer, the University of Nottingham, Nottingham Visiting Scholar Now,
United Kingdom (Presenting author)
Co-author(s) Prof Dr Timothy
Abstract
Contemporary achievements in science and technology have created the opportunity to turn past
dreams into reality. At a time when society is increasingly concerned about the destruction of natural
resources and ecologies together with climate change, food security, etc. we have the potential to
plan and design a more sustainable future. Whilst urban agriculture, in various typologies, has found
increasing popularity in recent years, the vertical farm concept has yet to advance beyond the
drawing board. Nevertheless, as a potential new building and agricultural typology it offers
tremendous scope to secure safe food production, reduce deforestation, save water, increase
productivity, etc. within a modern controlled environment. To do so, will involve integrating modern
agricultural technology, green infrastructure and high-rise building into an efficient ‘machine’ for
food production. Many architects and researchers have, for the past decade or so, speculated on
such a creative approach, however, we are still awaiting the construction of a true vertical farm
despite the existence of the required technologies. At a time when realization of the concept is surely
nearing reality and public acceptance and cost reductions are becoming feasible, this paper will
examine the potential for vertical farms to become integrated into new urban mixed-use
developments. As such, they can play not only a central role in smart green infrastructure but also
reduce the footprint of fresh food, leave more land for gardens and recreational space. Significantly,
the potential of such building typologies as education vehicles should also be encouraged leading to
healthier lifestyle and improving social and economic harmony. Based on these advantages, the
paper will also articulate how the concept can become reality through holistic design solutions that
demonstrate their role in more sustainable urban environments, innovative characteristic and
commonsense design suitable for diversely district and people, will lead us to better life in the future.
96
FENG, Yi Effects of Built Environment on Street Vitality ISOCARP-OAPA Conference 2017
1
Effects of Street Built Environment on Street Vitality, an
Empirical Study in Nanjing, China (Effects of Street Built Environment on Street Vitality, an Empirical Study in Nanjing, China)
Yi FENG, Nanjing University, China
Abstract:
Daily activities, like walking, shopping, eating and contacting happen on streets everyday. Street vitality, which derives from Jacobs’ theory (Jacobs, 1961), is one of the ultimate goals of planners and architects. Many scholars paid attention to relationship between built environment and activities as well as design principles to raise vitality. However, relevant empirical study on a street scale with statistical analysis is not common.
In this paper, an empirical study is conducted to find out critical factors in built environment that lead to street vitality based on a lively lane in Nanjing, China. Some overwhelming principles are examined, as well as other typical features in the observed street to find out the decisive factors to street vitality, both in meso and micro scale. Accordingly, related suggestions on streets to improve vitality are made in the end.
1. Introduction
Streets, especially minor streets and sidewalks, are crowded with daily activities, like walking, shopping, eating and interacting. Street vitality, which derives from Jacobs’ theory (Jacobs, 1961), is one of the ultimate goals of planners and architects to achieve. Many scholars paid attention to relationship between built environment and activities (Brown etc., 2009; Brownson etc., 2009) as well as design principles to raise vitality (Alan etc., 2012). Lively street is always believed to have connections with good built environment (Jacobs, 1961; Sung etc., 2013; Sarkar, 2015). Urban planners and architects have been making efforts to make such built environment for decades, by approaches including planting more trees and keeping boutique artificial facilities. Many believe that good landscape facilities can improve outdoor activities. However, to what extend do such improvement come into effect is not well explored. Some also argue that not all factors of the so-called good built environment contribute to the vitality of street equally, and the more decisive ones should be found (Brownson etc., 2009). In general, mechanisms by which built environment may contribute to the vitality of street is less explored. Also, studies on more detailed, context-depended effects in developing countries are also few. Moreover, scale matters, as empirical study on a street scale, instead of the commonly used macros scale, are not found in the main body of existing literature. The main research question thus of this paper is: This study tries to close these gaps by conducting a case study at street level, including both micro and meso levels, in a city undergoing tremendous urbanization process in China. Quantitative methods are mainly used to get empirical results with a creative “make a video” way to collect data. Qualitative methods are also used as supplement. Comparison at meso scale, including comparison of factors in both built environment and human activities are made according to data. Panel regression at micro scale is also made. This paper is structured as follows. This section introduces the main study question of this paper and the gap to close. The second section makes an overview of literature on street vitality and the way built environment influence such vitality. The third section is the methodology part, including the research area, approaches at meso and micro levels and
97
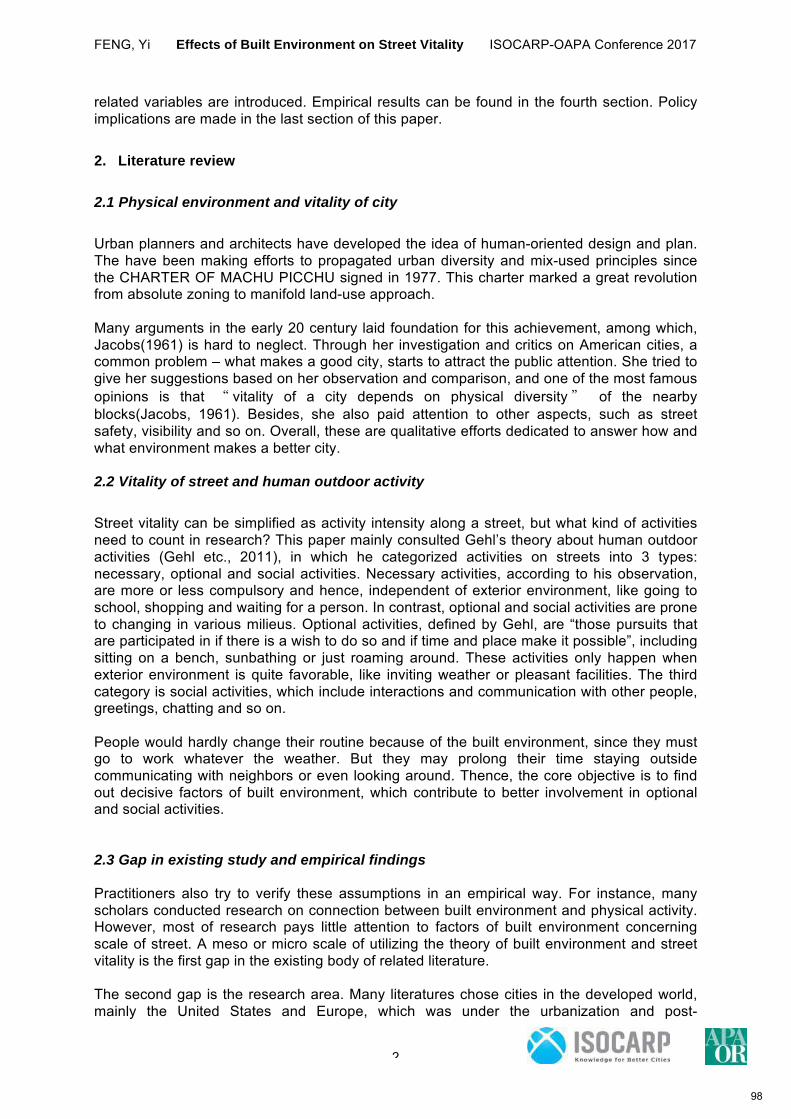
FENG, Yi Effects of Built Environment on Street Vitality ISOCARP-OAPA Conference 2017
2
related variables are introduced. Empirical results can be found in the fourth section. Policy implications are made in the last section of this paper.
2. Literature review
2.1 Physical environment and vitality of city
Urban planners and architects have developed the idea of human-oriented design and plan. The have been making efforts to propagated urban diversity and mix-used principles since the CHARTER OF MACHU PICCHU signed in 1977. This charter marked a great revolution from absolute zoning to manifold land-use approach. Many arguments in the early 20 century laid foundation for this achievement, among which, Jacobs(1961) is hard to neglect. Through her investigation and critics on American cities, a common problem – what makes a good city, starts to attract the public attention. She tried to give her suggestions based on her observation and comparison, and one of the most famous opinions is that � vitality of a city depends on physical diversity � of the nearby blocks(Jacobs, 1961). Besides, she also paid attention to other aspects, such as street safety, visibility and so on. Overall, these are qualitative efforts dedicated to answer how and what environment makes a better city. 2.2 Vitality of street and human outdoor activity
Street vitality can be simplified as activity intensity along a street, but what kind of activities need to count in research? This paper mainly consulted Gehl’s theory about human outdoor activities (Gehl etc., 2011), in which he categorized activities on streets into 3 types: necessary, optional and social activities. Necessary activities, according to his observation, are more or less compulsory and hence, independent of exterior environment, like going to school, shopping and waiting for a person. In contrast, optional and social activities are prone to changing in various milieus. Optional activities, defined by Gehl, are “those pursuits that are participated in if there is a wish to do so and if time and place make it possible”, including sitting on a bench, sunbathing or just roaming around. These activities only happen when exterior environment is quite favorable, like inviting weather or pleasant facilities. The third category is social activities, which include interactions and communication with other people, greetings, chatting and so on. People would hardly change their routine because of the built environment, since they must go to work whatever the weather. But they may prolong their time staying outside communicating with neighbors or even looking around. Thence, the core objective is to find out decisive factors of built environment, which contribute to better involvement in optional and social activities. 2.3 Gap in existing study and empirical findings Practitioners also try to verify these assumptions in an empirical way. For instance, many scholars conducted research on connection between built environment and physical activity. However, most of research pays little attention to factors of built environment concerning scale of street. A meso or micro scale of utilizing the theory of built environment and street vitality is the first gap in the existing body of related literature. The second gap is the research area. Many literatures chose cities in the developed world, mainly the United States and Europe, which was under the urbanization and post-
98
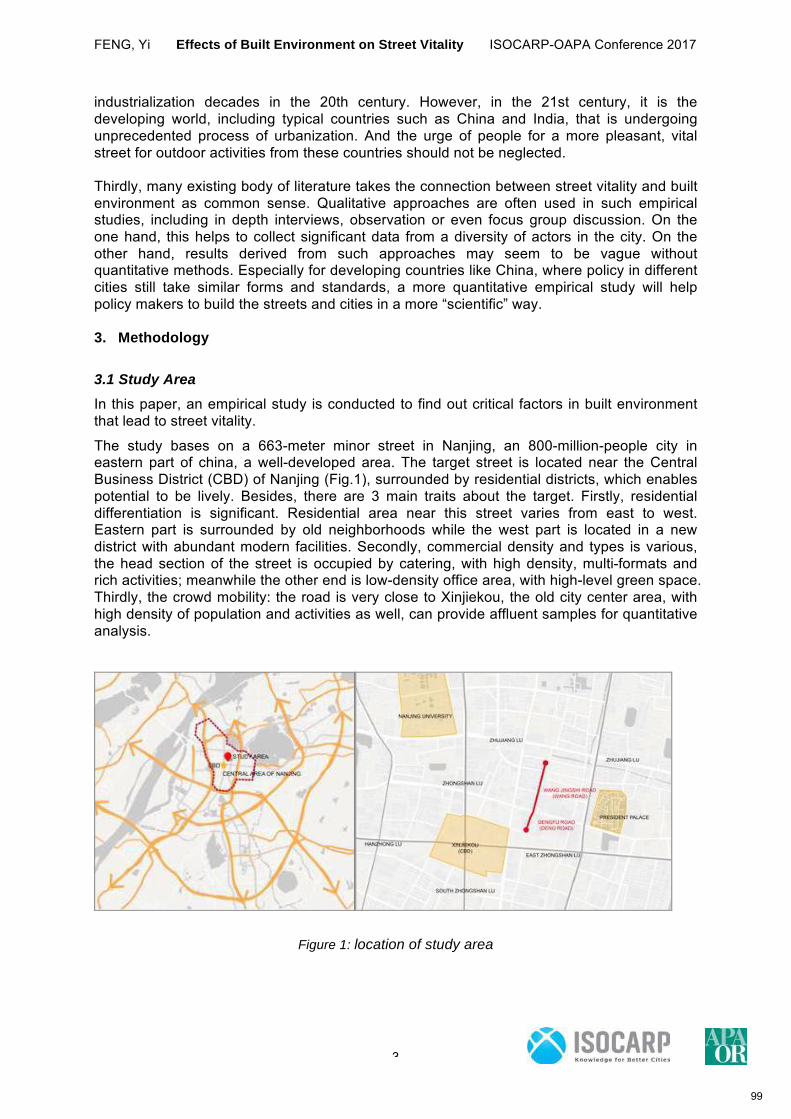
FENG, Yi Effects of Built Environment on Street Vitality ISOCARP-OAPA Conference 2017
3
industrialization decades in the 20th century. However, in the 21st century, it is the developing world, including typical countries such as China and India, that is undergoing unprecedented process of urbanization. And the urge of people for a more pleasant, vital street for outdoor activities from these countries should not be neglected. Thirdly, many existing body of literature takes the connection between street vitality and built environment as common sense. Qualitative approaches are often used in such empirical studies, including in depth interviews, observation or even focus group discussion. On the one hand, this helps to collect significant data from a diversity of actors in the city. On the other hand, results derived from such approaches may seem to be vague without quantitative methods. Especially for developing countries like China, where policy in different cities still take similar forms and standards, a more quantitative empirical study will help policy makers to build the streets and cities in a more “scientific” way. 3. Methodology
3.1 Study Area
In this paper, an empirical study is conducted to find out critical factors in built environment that lead to street vitality.
The study bases on a 663-meter minor street in Nanjing, an 800-million-people city in eastern part of china, a well-developed area. The target street is located near the Central Business District (CBD) of Nanjing (Fig.1), surrounded by residential districts, which enables potential to be lively. Besides, there are 3 main traits about the target. Firstly, residential differentiation is significant. Residential area near this street varies from east to west. Eastern part is surrounded by old neighborhoods while the west part is located in a new district with abundant modern facilities. Secondly, commercial density and types is various, the head section of the street is occupied by catering, with high density, multi-formats and rich activities; meanwhile the other end is low-density office area, with high-level green space. Thirdly, the crowd mobility: the road is very close to Xinjiekou, the old city center area, with high density of population and activities as well, can provide affluent samples for quantitative analysis.
Figure 1: location of study area
99
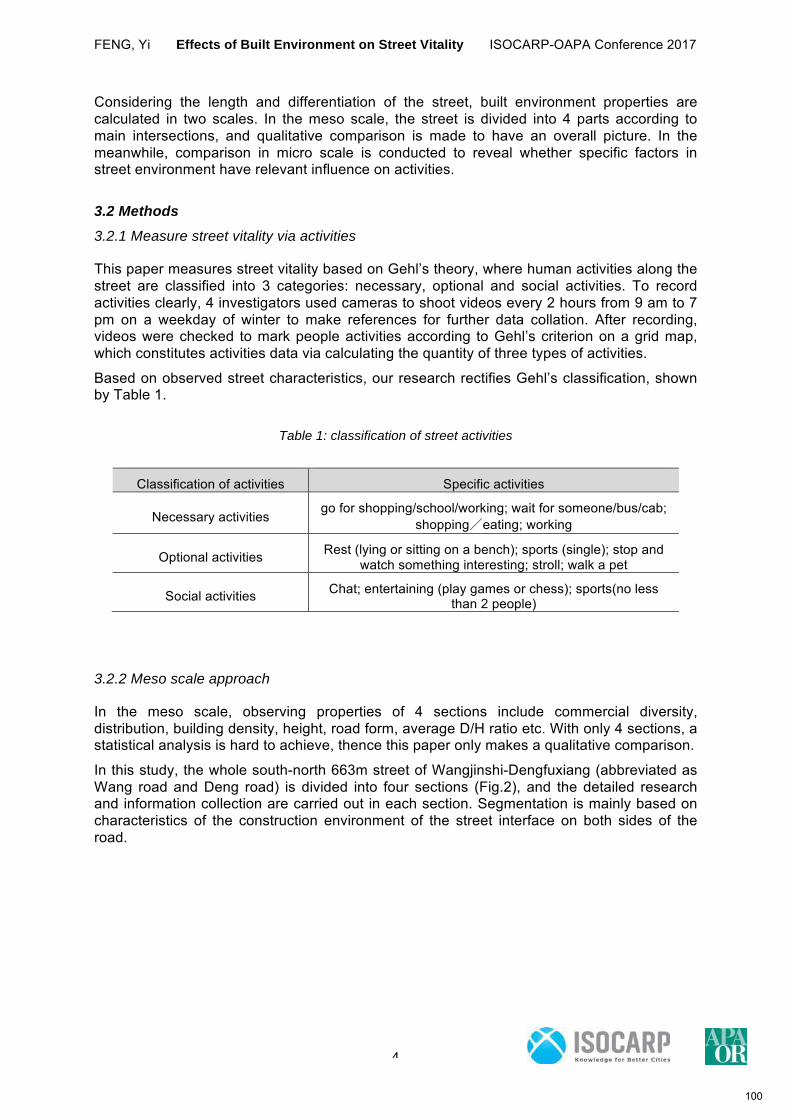
FENG, Yi Effects of Built Environment on Street Vitality ISOCARP-OAPA Conference 2017
4
Considering the length and differentiation of the street, built environment properties are calculated in two scales. In the meso scale, the street is divided into 4 parts according to main intersections, and qualitative comparison is made to have an overall picture. In the meanwhile, comparison in micro scale is conducted to reveal whether specific factors in street environment have relevant influence on activities.
3.2 Methods
3.2.1 Measure street vitality via activities
This paper measures street vitality based on Gehl’s theory, where human activities along the street are classified into 3 categories: necessary, optional and social activities. To record activities clearly, 4 investigators used cameras to shoot videos every 2 hours from 9 am to 7 pm on a weekday of winter to make references for further data collation. After recording, videos were checked to mark people activities according to Gehl’s criterion on a grid map, which constitutes activities data via calculating the quantity of three types of activities.
Based on observed street characteristics, our research rectifies Gehl’s classification, shown by Table 1.
Table 1: classification of street activities
Classification of activities Specific activities
Necessary activities go for shopping/school/working; wait for someone/bus/cab;
shopping�eating; working
Optional activities Rest (lying or sitting on a bench); sports (single); stop and watch something interesting; stroll; walk a pet
Social activities Chat; entertaining (play games or chess); sports(no less than 2 people)
3.2.2 Meso scale approach
In the meso scale, observing properties of 4 sections include commercial diversity, distribution, building density, height, road form, average D/H ratio etc. With only 4 sections, a statistical analysis is hard to achieve, thence this paper only makes a qualitative comparison.
In this study, the whole south-north 663m street of Wangjinshi-Dengfuxiang (abbreviated as Wang road and Deng road) is divided into four sections (Fig.2), and the detailed research and information collection are carried out in each section. Segmentation is mainly based on characteristics of the construction environment of the street interface on both sides of the road.
100
FENG, Yi Effects of Built Environment on Street Vitality ISOCARP-OAPA Conference 2017
5
Figure 2: 4 sections of study area
Section one: north part of Wang road, starting with the Ji’e lane, ending with Yang lane, passing through Hong Miao District and the ninth middle school of Nanjing city, with a length of 153 meters, and a high rate of near-line rate. The average D/H value is about 0.74.
Section two: middle part of Wang road, starting with Yang Xiang, ending with Shi lane, passing through Hong Miao District and Xiang district, with a total length of about 129m. The shop density of section two is also very high, as well as the types and quantity of commercial activities, but there is a big difference between the east side and the west side of the interface. The D/H value is about 0.47.
Section three: south part of Wang road, from Shi lane, ending at Yangtze Road, with a length of 165m. Different from previous two sections filled with small catering, section three is occupied by a big retail department store, and three large shopping malls. From the third section, buildings become wider and the height began to increase. The average D/H value of the section is 0.69.
Section four: Deng road section, from Yangtze Road, ending at Qingshi street, with a length of 206m. It passes through upscale apartments in downtown Nanjing, and Garden Plazas on both sides of the street are provided with fancy facilities with less commercial activities. The average D/H value of the section is 0.24.
Qualitative comparison of 4 sections on built environment and activities will be given in the results of this paper.
3.2.3 Micro scale approach
The purpose of this study in micro scale is to discuss the relationship between built environmental elements and street vitality, whose indicator is human activities. Thence, the dependent variable is human activity, and the independent variable is the environmental factors.
This paper uses grid-marking method, video recording to collect data, with a total of 6 time periods and 154 grids (the whole street is divided into 154 8-meter grids along the street centerline (Fig.3)), thus 154 * 6 = 924 data were obtained.
Specifically, according to three categories of activities, necessary ones that have little connection with built environment, are not the focus of this study (but also can be obtained,
101
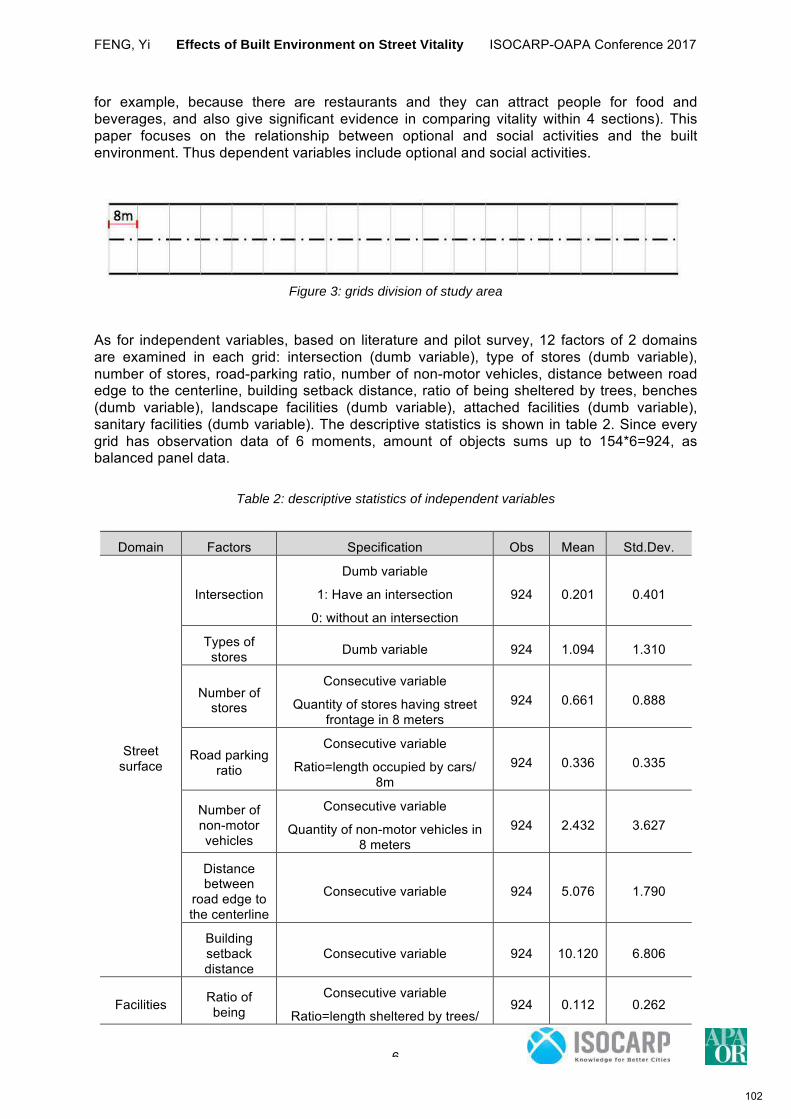
FENG, Yi Effects of Built Environment on Street Vitality ISOCARP-OAPA Conference 2017
6
for example, because there are restaurants and they can attract people for food and beverages, and also give significant evidence in comparing vitality within 4 sections). This paper focuses on the relationship between optional and social activities and the built environment. Thus dependent variables include optional and social activities.
Figure 3: grids division of study area
As for independent variables, based on literature and pilot survey, 12 factors of 2 domains are examined in each grid: intersection (dumb variable), type of stores (dumb variable), number of stores, road-parking ratio, number of non-motor vehicles, distance between road edge to the centerline, building setback distance, ratio of being sheltered by trees, benches (dumb variable), landscape facilities (dumb variable), attached facilities (dumb variable), sanitary facilities (dumb variable). The descriptive statistics is shown in table 2. Since every grid has observation data of 6 moments, amount of objects sums up to 154*6=924, as balanced panel data.
Table 2: descriptive statistics of independent variables
Domain Factors Specification Obs Mean Std.Dev.
Street surface
Intersection
Dumb variable
1: Have an intersection
0: without an intersection
924 0.201 0.401
Types of stores Dumb variable 924 1.094 1.310
Number of stores
Consecutive variable
Quantity of stores having street frontage in 8 meters
924 0.661 0.888
Road parking ratio
Consecutive variable
Ratio=length occupied by cars/ 8m
924 0.336 0.335
Number of non-motor vehicles
Consecutive variable
Quantity of non-motor vehicles in 8 meters
924 2.432 3.627
Distance between
road edge to the centerline
Consecutive variable 924 5.076 1.790
Building setback distance
Consecutive variable 924 10.120 6.806
Facilities Ratio of being
Consecutive variable
Ratio=length sheltered by trees/ 924 0.112 0.262
102
FENG, Yi Effects of Built Environment on Street Vitality ISOCARP-OAPA Conference 2017
7
sheltered by trees
8m
Benches
Dumb variable
1: Have benches
0: without any bench
924 0.222 0.416
Landscape facilities
Dumb variable
1: Have landscape facilities
0: without any landscape facilities
924 0.318 0.466
Attached facilities
Dumb variable
1: Have attached facilities
0: without any attached facilities
924 0.078 0.291
Sanitation facilities
Dumb variable
1: Have sanitary facilities
0: without sanitary facilities
924 0.117 0.321
4. Results
4.1 Comparison in meso scale
4.1.1 Comparison in built environment
In general, built environment of the study area varies. Though the object street is short in length, it represents three typical types of residential roads.
First type is the northern part of Wang road, which is a representative of Nanjing traditional snack street, with intensive stores and restaurants, coexistence of human and motorized vehicles, and non-motor vehicle parking anywhere. This section is lively and filled with marketplace, but lacks of green and open space, rest facilities or other facilities. Another type is the south part of Wang Road, representing lively streets in rather newly residential districts, with various kinds of shopping mall, a larger scale than the first type, and parking of motorized vehicles as well as non-motor vehicles is significant. Deng section shows an inner street within a high-level residential area, with abundant facilities and ecofriendly landscape, especially high quality rest facilities, landscape sketches and equipped with well-designed and efficient management and maintenance as well.
4.1.2 Comparison in human activities
Accordingly, human activities also vary significantly in 4 sections.
As for intensity, density and frequency of activities, three sections in Wang road are relatively high, remaining lively state all the daytime, while Deng section is relatively low, keeping relatively quiet during observation time.
In terms of the types of activities, activities happened in the four sections are mainly necessary activities, but there are also differences. Necessary activities of the north and middle section of the Wang road are mainly catering and working, while activities in Deng section is only comprised of going outside and walking.
As for optional activities and social activities, the key indicator of street vitality, 3 sections in Wang road still shows a great vitality, including the elderly exercising, family walking, workers rest, pedestrians stopping and observation, neighborhood communication, young people walking the dog, children playing And other types of activities. Deng section, even though less lively in these activities in intensity, provides rich types of activities, like keeping fit, sports with facilities and square dancing, that highly rely on space and facilities.
103
FENG, Yi Effects of Built Environment on Street Vitality ISOCARP-OAPA Conference 2017
8
Table 3: comparison in built environment and human activities in 4 sections
Section North Wang road
Middle Wang road
South Wang road Deng road
Built environme
nt
Mixed land use 4 5 4 1
Main commercial type Catering Catering Retail Null
Average D/H 0.74 0.47 0.69 0.24
Road section Pedestrian-vehicles mixed
Pedestrian-vehicles mixed
Pedestrian-vehicles mixed
Pedestrian-vehicles
separation
Motorized vehicles parking 2 2 2 3
Non-motorized vehicles parking 5 3 2 1
Green space 1 1 1 4
Rest facilities 0 1 0 4
Landscape facilities 0 0 0 5
Facilities management 1 1 2 5
Human street
activities
Activities intensity 4 4 4 2
Activities density 4 4 4 1
Peak time of activities
Morning rush for working
Afternoon rush for going home
Morning rush for working
3pm for picking up children
Necessary activities 4 5 4 3
Optional activities 2 2 1 1
Social activities 2 2 1 1
• Notes: some factors are shown in five point rating grades based on comparison with other sections, from 1 to 5
4.2 Panel regression in micro scale
Using panel data with 924 objects, 2 dependent variables and 12 independent variables, this paper conducts a panel regression model to identify the most decisive factors.
4.2.1 Redefine variables
Firstly, use factor analysis to sort out independent factors. After factor analysis, 12 independent variables can accumulatively explain 54.81% of the given field. To optimize the rate, this study deletes several variables according to results of autocorrelation. As the correlation results, intersection has significant correlation with the number of stores and road-parking ratio. Distance between road edge to the centerline, and the building setback distance both have significant correlation with the number of stores, benches and landscape facilities. Ratio of being sheltered by trees has significant correlation with the number of non-
104
FENG, Yi Effects of Built Environment on Street Vitality ISOCARP-OAPA Conference 2017
9
motorized vehicles and landscape facilities. Attached facilities have significant correlation with the number of non-motorized vehicles and sanitary facilities.
In further calculation, this study drops these 5 factors while keep 7 main factors, raising the accumulative rate to 65.23%. Kept factors are: type of stores (dumb variable), number of stores, road-parking ratio, number of non-motor vehicles, benches (dumb variable), landscape facilities (dumb variable), and sanitary facilities (dumb variable).
Based on 7 factors, we use factor analysis to reclassify factors, which is shown in table 3. According to respective weight in 3 generated factors, factor1 is mainly comprised of benches and landscape facilities, and attributes of stores and road-parking (negative) ratio constitutes factor2, while sanitary facilities and non-motor vehicles constitutes factor3. Thence, 3 factors used in next regression are recreational facilities, density and diversity of stores and road-parking, and attached facilities.
Table 3: rotated component matrix
Rotated component matrix
Factors Component
1 2 3
Number of stores -0.393 0.664 0.180
Type of stores -0.549 0.325 0.461
Road-parking ratio -0.151 -0.765 0.103
Number of non-motor vehicles -0.280 0.185 0.651
Benches 0.818 0.283 0.068
Landscape facilities 0.797 -0.227 -0.082
Sanitary facilities 0.203 -0.220 0.792
As for dependent variables, considering data quality, we process data to change all values>=1 to 1, to represent occurrence of optional or social activities. Therefore, values of 2 dependent variables become 0 or 1 to prepare for panel logistic regression model. Accordingly, 3 independent factors generated by factor analysis needs to be normalized.
4.2.2 Panel regression results
This study uses panel logistic regression model with random effects in Stata to propose the logistic function. Regression results for optional activities and social activities are shown in table 4 and table 5 respectively.
Table 4: optional activities panel logistic regression result
Optional activities Coefficient Standard error P value
Recreational facilities -1.681 0.602 0.005
Density and diversity of stores and road- 4.047 0.713 0.000
105
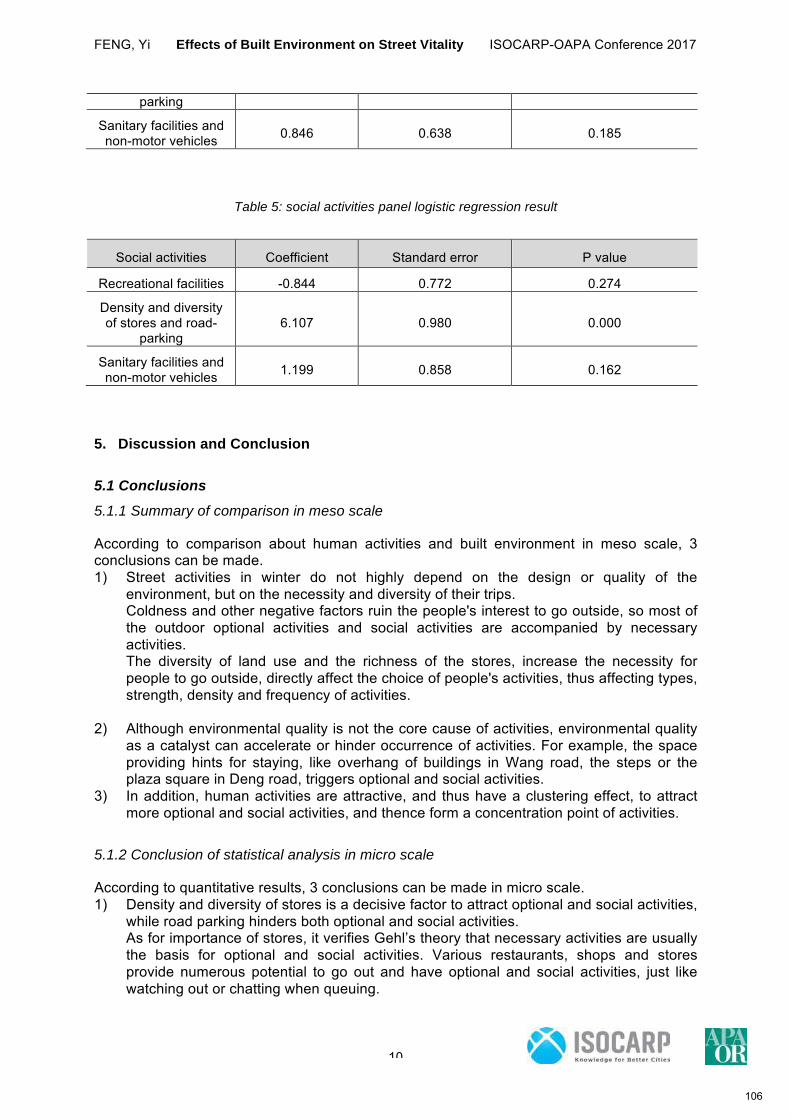
FENG, Yi Effects of Built Environment on Street Vitality ISOCARP-OAPA Conference 2017
10
parking
Sanitary facilities and non-motor vehicles 0.846 0.638 0.185
Table 5: social activities panel logistic regression result
Social activities Coefficient Standard error P value
Recreational facilities -0.844 0.772 0.274
Density and diversity of stores and road-
parking 6.107 0.980 0.000
Sanitary facilities and non-motor vehicles 1.199 0.858 0.162
5. Discussion and Conclusion
5.1 Conclusions
5.1.1 Summary of comparison in meso scale
According to comparison about human activities and built environment in meso scale, 3 conclusions can be made. 1) Street activities in winter do not highly depend on the design or quality of the
environment, but on the necessity and diversity of their trips. Coldness and other negative factors ruin the people's interest to go outside, so most of the outdoor optional activities and social activities are accompanied by necessary activities. The diversity of land use and the richness of the stores, increase the necessity for people to go outside, directly affect the choice of people's activities, thus affecting types, strength, density and frequency of activities.
2) Although environmental quality is not the core cause of activities, environmental quality as a catalyst can accelerate or hinder occurrence of activities. For example, the space providing hints for staying, like overhang of buildings in Wang road, the steps or the plaza square in Deng road, triggers optional and social activities.
3) In addition, human activities are attractive, and thus have a clustering effect, to attract more optional and social activities, and thence form a concentration point of activities.
5.1.2 Conclusion of statistical analysis in micro scale
According to quantitative results, 3 conclusions can be made in micro scale. 1) Density and diversity of stores is a decisive factor to attract optional and social activities,
while road parking hinders both optional and social activities. As for importance of stores, it verifies Gehl’s theory that necessary activities are usually the basis for optional and social activities. Various restaurants, shops and stores provide numerous potential to go out and have optional and social activities, just like watching out or chatting when queuing.
106
FENG, Yi Effects of Built Environment on Street Vitality ISOCARP-OAPA Conference 2017
11
Road parking, a negative component of factor 1, shows a significantly negative correlation with street vitality, since cars occupy pedestrians’ space and impact people’s sight towards stores facing the street.
1) Recreational facilities do not have significant connection with street vitality. We can
even find a rather significantly negative correlation with optional activities, since in our study area, northern sections have fewer facilities and lack of design but has a lively atmosphere of activities.
2) Sanitary facilities do not have significantly negative correlation with street vitality.
We do not find any significant evidence to prove these attached facilities impede street vitality.
5.2 Reflection
This paper uses qualitative and quantitative approach to find out decisive factors of built environment to street vitality. Statistical method especially panel logistic regression model is creatively used in micro scale to make the empirical process more scientifically.
However, there are two problems in this approach. One is the process of grid division, we also need to reconsider whether the grid width impacts the final results. The other problem is the data source, which is typical but not big enough, and the object road is only six hundred meters, may not be able to effectively reflect the research question. Therefore, the conclusions of this study need to be further explored.
5.3 Policy implications
Based on the observation and analysis of this study, the following suggestions for improvement are made on the Wang-Deng road:
Wang road needs to solve the parking problem. It is maybe possible to use three-dimensional or underground parking in the vicinity of this area to reduce parking along the way. For non-motor vehicles, perhaps non-motor vehicle parking and "low wall" concept can be combined to solve the parking problem at the same time, to create some semi-private space public activities.
At the same time, the road attachments and infrastructure need to be sorted out, for instance, clearing wires and air conditioning machines on the street, to reduce the impacts on pedestrians. In addition, this road can also increase trees and other green facilities, to make the street a more pleasant place and more conducive to the occurrence of optional and social activities.
Deng section needs to re-design. It may be appropriate to increase commercial activities, like changing the original green space-based open space into green and commercial combination, to attract crowds by creating hot spots.
107
FENG, Yi Effects of Built Environment on Street Vitality ISOCARP-OAPA Conference 2017
12
References: Jacobs, J. (1961) The death and life of great American cities, New York: Vintage Books.
Brown, B. B., Yamada, I., Smith, K. R., Zick, C. D., Kowaleskijones, L., & Fan, J. X. (2009). “Mixed land use and walkability: variations in land use measures and relationships with bmi, overweight, and obesity”. Health & Place, Vol.15, No.4, pp.1130-1141.
Brownson, R. C., Hoehner, C. M., Day, K., Forsyth, A., & Sallis, J. F. (2009). “Measuring the built environment for physical activity: state of the science”. American Journal of Preventive Medicine, Vol.36, No.4.
Alan March, Yogita Rijal, Sara Wilkinson, & Ebru Firidin Özgür. (2012). “Measuring building adaptability and street vitality”. Planning Practice & Research, Vol. 27, No.5, pp.531-552.
Sung, H. G., Go, D. H., & Chang, G. C. (2013). “Evidence of jacobs’s street life in the great seoul city: identifying the association of physical environment with walking activity on streets”. Cities, Vol.35, No.S1, pp.164-173.
Sarkar, C., Webster, C., Pryor, M., Tang, D., Melbourne, S., & Zhang, X., et al. (2015). “Exploring associations between urban green, street design and walking: results from the greater london boroughs”. Landscape & Urban Planning, Vol.143, pp.112-125.
Gehl, J., & Koch, J. (2011). Life Between Buildings: Using Public Space. Van Nostrand Reinhold.
108
Abstract title Smart City planning: from theory to application. The case study of Bolzano, a Smart
European city
Author Dr Vettorato, Daniele, Urban and Regional Energy Systems – European Academy (EURAC),
BOLZANO, Italy (Presenting author)
Abstract
The theoretical concept of Smartness applied to urban planning has now been under discussion for
some years. In fact, however, just a few applications on real urban dynamics have been developed.
Lighthouse projects are still needed to provide examples, guidelines and frameworks to support
urban planners and decision makers in the transition from traditional planning approaches to the
new “smart” paradigm. The discussion is even more interesting when it comes to finding interactions
between smart planning and sustainable planning for cities, particularly in the application of the
smart concept to the integration of specific urban domains (i.e. energy, mobility and ICT).
In this paper, an innovative urban planning framework for the “sustainable and smart transition” of
urban systems is proposed. Sustainable and Smart transition is considered as a driver to change
urban planning practices and targets through the integration of energy, mobility and ICT. Hard
domains of innovation (buildings and districts, mobility infrastructure, energy and ICT) and soft
domains of innovation (collaborative planning, consumer behaviors management and data
management) are crossed with a cost-benefit evaluation of possible solutions. The framework is
discussed and applied to Bolzano, a lighthouse city involved in the European project SINFONIA. The
replicability of this innovative urban planning experience is commented.
109
Theunpavedroadtohousingaffordability:whatroledoestechnologyplay?
Moderator: Robert PARKER, Community Service Center, EUGENE, USA
Speakers: Nicholas MELTZER, Community Service Center, University of Oregon; Eugene, Rebecca LEWIS, University of Oregon, Eugene; Emily BROWN, USDA Rural Development North Dakota; Sadie DiNatale, CASA of Oregon,Sherwood,; Andrew Martin, Lane Transit District, Eugene; Ethan Stuckmayer, Mackenzie, Portland, USA
This panel session is two-fold. First, it summarizes an in-depth study of Oregon’s land use program and issues of housing affordability using quantitative and qualitative data. The research relies on data analysis (U.S. Census and Property Assessor’s), interviews, surveys, and a literature review. The results summarize not only changes in population and density over time, but the issues faced by cities in increasing housing affordability at a very local level.
Second, it presents the results of three related research projects that examined separate and related issues of affordability: the regulatory barriers surrounding alternative housing choices including tiny homes, obstacles in the zoning code and public perception of increasing density via the “missing middle,” and the impacts of short term rentals (i.e. AirBnB) on housing affordability in Oregon and what, if anything, cities are doing to address it.
110
Autonomousvehicles:whattherevolutionmeansforyou
Moderator: Ben WEBER, SERA Architects, Portland, USA
Speakers: Heidi GUENIN, Gridworks, Portland, USA; Peter HURLEY, Portland Bureau of Transportation, USA; Jeff HOSEA, SERA Architects, Portland, USA
“Game‐changing”, “disruptive”, “paradigm‐shifting”. All superlatives assigned liberally to the
prospect of autonomous vehicles (known commonly as “driverless cars”) changing the way we move
around the shape of places we go. The technology is variously promised as five or fifty years away
from adoption; we don’t know if people will own more cars, or buy in to a much smaller fleet of
shared vehicles; what will it mean for safety, for parking, for where we live, for productivity, for the
environment? It’s potentially one of the hottest topics of the last few years across several fields,
from car manufacturers, to software developments, to city planners. AVs won’t be ignored.
We aren’t technologists or traffic engineers. We are urbanists and humanists most concerned with
how people actually engage with their environments and the tools that economic and technological
success had afforded us. In this session we will discuss the impacts that may come from AVs to your
grandmothers, or your 12 year old child, using language that your grandmother or 12 year old child
can understand. In our audience we may very well have attendees from China’s booming
megalopolises, and we certainly do from Oregon’s small towns. AVs will play very different roles
across the range of urban and rural places spread across our planet.
As practitioners, we use tools such as land use maps, development pro formas, and parking codes to
shape urban environments. Before we can even get to those in the coming decades we need to
explore some of the simplest and most vexing questions facing human‐kind as autonomous vehicles
could completely upend over a century of common thinking about planning. How will AVs impact
land uses, private vehicle ownership, environmental protections, and, most importantly, the day‐to‐
day lives of people in cities and rural places.
What is we can cut parking needs by 80%? What if a two‐hour commute in a AV is no longer a
burden? What if the wealthy can pay for premium AV service, leaving the poor with inferior service?
What happens to transit as we know it? We’ll have an expert panel to explore some of these
questions, but we also want the session to focus on audience participation and an exchange
between the scores or hundreds of informed and curious voices in attendance.
Attendees won’t leave with all the answers, but we’ll aspire to leave them better informed to ask the
necessary questions in their profession to figure out how autonomous vehicles fit in to their
communities.
111
DONG Zheng New energy and Technology in historic towns ISOCARP-OAPA Conference 2017
1
New Energy and Technology Promote the Ecological Sustainable
Development and Improve the Living Conditions of Historic Towns in South of Yangtze River
(The Application of New energy and Technology in the Historic Towns in South of Yangtze River — Promote the Ecological Sustainable Development and Improve the Living
Conditions )
DONG Zheng; Shanghai Tongji Urban Planning and Design Institute; China FAN Yanqun; Shanghai Tongji Urban Planning and Design Institute; China
1. Introduction Historic water towns in south of Yangtze River were mostly constructed in the Ming & Qing Dynasty, which are the traditional ha bitat formed spontaneously without overall planning. In the construction of the traditional habitat, consciously making use of the local natural conditions, the habitants adopted the appropriate town planning, con struction techniques and building materials to construct the comparatively comfortable living environment which are characterized by “Simple and unsophist icated natural landscape of small bridges, running water, and household” and in harmony with the natural environment. However, with the arrival of the indu strial era, the extensive application of traditional fossil energy, the construction of modern buildings su ch as f actories and multi-storey residential buildings, the increase of population density and other changes in the historic towns have broke the harmony between the historic to wns and the na tural environment, which cause d adverse effects on the natural ecological en vironment and the living condition s of the residents. In addition, the highly dense texture of the historic towns also bring challe nges to the construction of modern infrastructure. Nowadays, the development, supply and applic ation of clean reproducible ener gy are popularized gradually and the technologies of green building have been quite mat ure. The fast-developing new energy and technology can not only so lve the problems caused by the consumption of traditio nal fossil energy and t he construction of the modern buildings, but also bring about a more positive impact on the ecologica l sustainable development and the living conditions of the historic to wns in the future with the contin uous development of technology. Therefore, now it is essential to focus on the research of h ow to actively apply the new energy and te chnology to promote the ecological sustainable development and improve the living cond itions of historic to wns without causing damage to historic towns’ historical and cultural values.
2. Natural Environment Characteristics of the Historic Towns In natural and human geography, the region, where the h istoric towns in south of Yangtze River are located, refers in particular to the reg ion in south of the middle and lower Yangtze River. There are few mountains, plenty of rivers and lakes in the ar ea and the terrain is comparatively gentle. The region belongs to the subtropical zon es with a typica l monsoon climate (Duan et al., 2002). There are adeq uate light and abundant rain in the region. The four seasons of the region are distinct with the cold and rainless winter and t he hot, rain y and high humidity
112
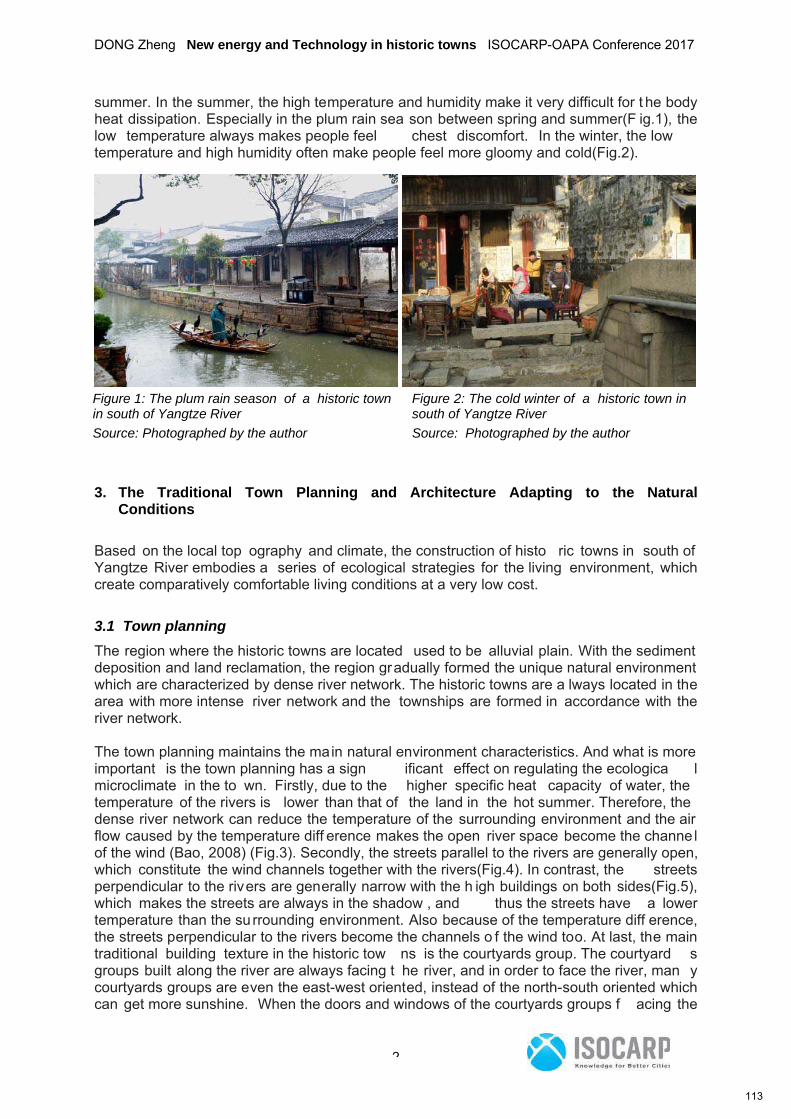
DONG Zheng New energy and Technology in historic towns ISOCARP-OAPA Conference 2017
2
summer. In the summer, the high temperature and humidity make it very difficult for t he body heat dissipation. Especially in the plum rain sea son between spring and summer(F ig.1), the low temperature always makes people feel chest discomfort. In the winter, the low temperature and high humidity often make people feel more gloomy and cold(Fig.2).
3. The Traditional Town Planning and Architecture Adapting to the Natural
Conditions
Based on the local top ography and climate, the construction of histo ric towns in south of Yangtze River embodies a series of ecological strategies for the living environment, which create comparatively comfortable living conditions at a very low cost.
3.1 Town planning
The region where the historic towns are located used to be alluvial plain. With the sediment deposition and land reclamation, the region gradually formed the unique natural environment which are characterized by dense river network. The historic towns are a lways located in the area with more intense river network and the townships are formed in accordance with the river network. The town planning maintains the main natural environment characteristics. And what is more important is the town planning has a sign ificant effect on regulating the ecologica l microclimate in the to wn. Firstly, due to the higher specific heat capacity of water, the temperature of the rivers is lower than that of the land in the hot summer. Therefore, the dense river network can reduce the temperature of the surrounding environment and the air flow caused by the temperature diff erence makes the open river space become the channel of the wind (Bao, 2008) (Fig.3). Secondly, the streets parallel to the rivers are generally open, which constitute the wind channels together with the rivers(Fig.4). In contrast, the streets perpendicular to the rivers are generally narrow with the h igh buildings on both sides(Fig.5), which makes the streets are always in the shadow , and thus the streets have a lower temperature than the su rrounding environment. Also because of the temperature diff erence, the streets perpendicular to the rivers become the channels o f the wind too. At last, the main traditional building texture in the historic tow ns is the courtyards group. The courtyard s groups built along the river are always facing t he river, and in order to face the river, man y courtyards groups are even the east-west oriented, instead of the north-south oriented which can get more sunshine. When the doors and windows of the courtyards groups f acing the
Figure 1: The plum rain season of a historic town in south of Yangtze River
Source: Photographed by the author
Figure 2: The cold winter of a historic town in south of Yangtze River
Source: Photographed by the author
113
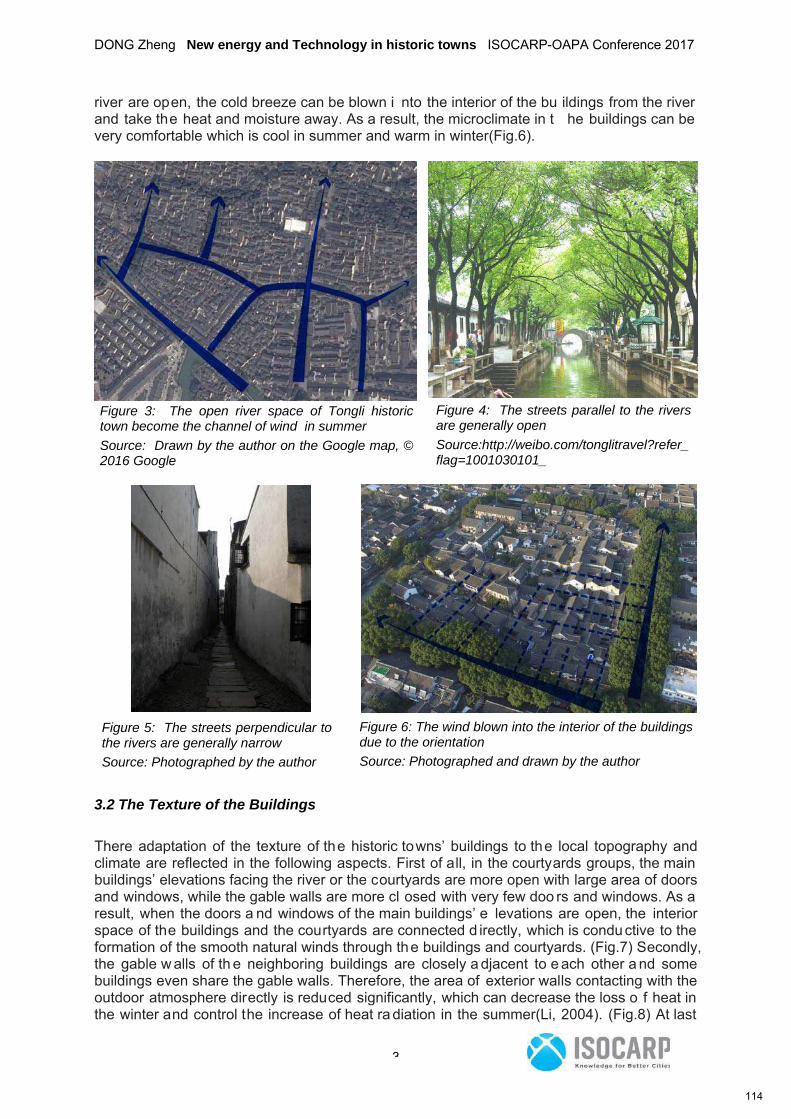
DONG Zheng New energy and Technology in historic towns ISOCARP-OAPA Conference 2017
3
river are open, the cold breeze can be blown i nto the interior of the bu ildings from the river and take the heat and moisture away. As a result, the microclimate in t he buildings can be very comfortable which is cool in summer and warm in winter(Fig.6).
3.2 The Texture of the Buildings
There adaptation of the texture of the historic towns’ buildings to the local topography and climate are reflected in the following aspects. First of all, in the courtyards groups, the main buildings’ elevations facing the river or the courtyards are more open with large area of doors and windows, while the gable walls are more cl osed with very few doo rs and windows. As a result, when the doors a nd windows of the main buildings’ e levations are open, the interior space of the buildings and the courtyards are connected d irectly, which is conductive to the formation of the smooth natural winds through the buildings and courtyards. (Fig.7) Secondly, the gable w alls of th e neighboring buildings are closely a djacent to e ach other a nd some buildings even share the gable walls. Therefore, the area of exterior walls contacting with the outdoor atmosphere directly is reduced significantly, which can decrease the loss o f heat in the winter and control the increase of heat ra diation in the summer(Li, 2004). (Fig.8) At last
Figure 3: The open river space of Tongli historic town become the channel of wind in summer
Source: Drawn by the author on the Google map, © 2016 Google
Figure 4: The streets parallel to the rivers are generally open
Source:http://weibo.com/tonglitravel?refer_flag=1001030101_
Figure 5: The streets perpendicular to the rivers are generally narrow
Source: Photographed by the author
Figure 6: The wind blown into the interior of the buildings due to the orientation
Source: Photographed and drawn by the author
114
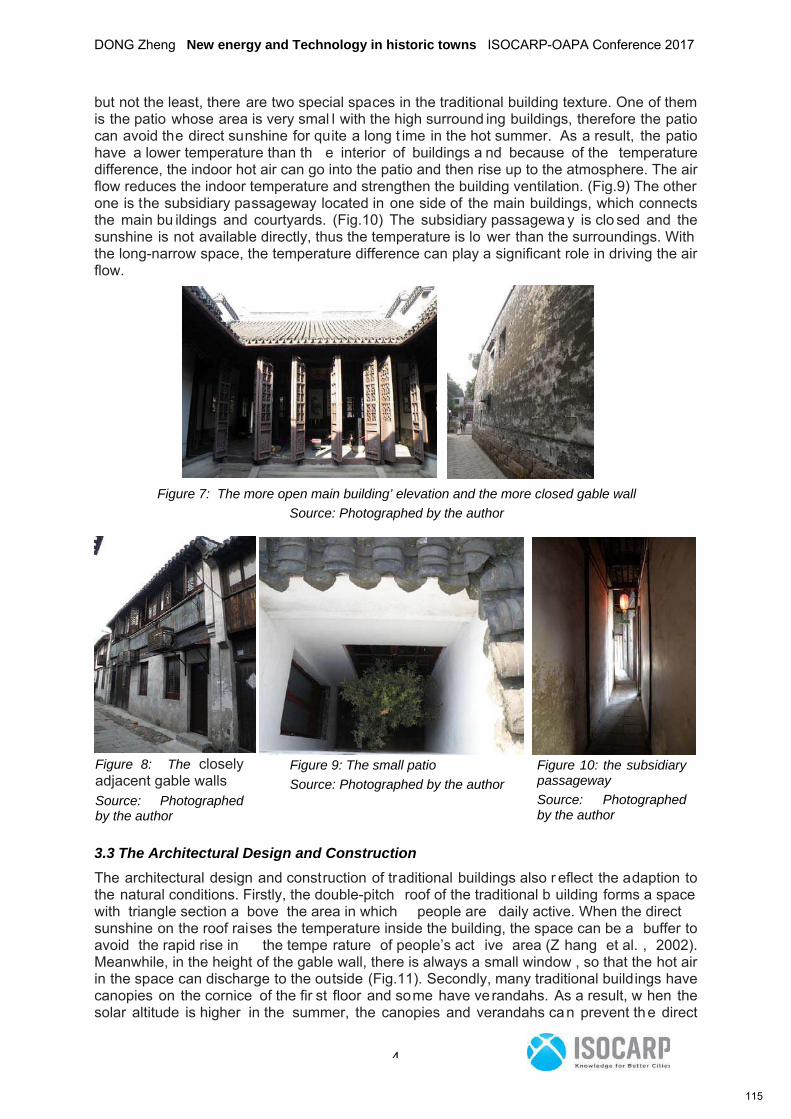
DONG Zheng New energy and Technology in historic towns ISOCARP-OAPA Conference 2017
4
but not the least, there are two special spaces in the traditional building texture. One of them is the patio whose area is very smal l with the high surround ing buildings, therefore the patio can avoid the direct sunshine for quite a long t ime in the hot summer. As a result, the patio have a lower temperature than th e interior of buildings a nd because of the temperature difference, the indoor hot air can go into the patio and then rise up to the atmosphere. The air flow reduces the indoor temperature and strengthen the building ventilation. (Fig.9) The other one is the subsidiary passageway located in one side of the main buildings, which connects the main bu ildings and courtyards. (Fig.10) The subsidiary passagewa y is clo sed and the sunshine is not available directly, thus the temperature is lo wer than the surroundings. With the long-narrow space, the temperature difference can play a significant role in driving the air flow.
3.3 The Architectural Design and Construction
The architectural design and construction of traditional buildings also r eflect the adaption to the natural conditions. Firstly, the double-pitch roof of the traditional b uilding forms a space with triangle section a bove the area in which people are daily active. When the direct sunshine on the roof raises the temperature inside the building, the space can be a buffer to avoid the rapid rise in the tempe rature of people’s act ive area (Z hang et al. , 2002). Meanwhile, in the height of the gable wall, there is always a small window , so that the hot air in the space can discharge to the outside (Fig.11). Secondly, many traditional buildings have canopies on the cornice of the fir st floor and some have verandahs. As a result, w hen the solar altitude is higher in the summer, the canopies and verandahs can prevent the direct
Figure 7: The more open main building’ elevation and the more closed gable wall
Source: Photographed by the author
Figure 8: The closely adjacent gable walls
Source: Photographed by the author
Figure 9: The small patio
Source: Photographed by the author
Figure 10: the subsidiary passageway
Source: Photographed by the author
115

DONG Zheng New energy and Technology in historic towns ISOCARP-OAPA Conference 2017
5
radiation of sunshine into the interio r of the bu ildings. However, when the solar a ltitude is lower in the winter, the sunshine can radiate into the buildings deeply (Fig.12). Thirdly, the color of traditional building’s whitewashed wall is light and the surface is smooth, which ca n reduce the heat absorption of the wall. At last, as there is plenty of rain in the region, in order to prevent the erosion of the wall by the rain and erosion of the indoor ground by the humidity, on the one hand, the traditional building raise s the building foundation by stone, so that th e indoor ground is higher than the street or the courtyard, and on the other hand, the plinth of the exterior wall made by stone o r plaster can avoid the rain splashing on th e wall after dripping to the floor and block the ground moisture from penetrating into the wall.
4. The Problems and Challenges Along with the Social, Economy and Culture
Transitions in the Industrial Era The traditional construction of the historic to wns has attached grea t importance to the adaptation to the natural condition s. However, with the arrival of the industrial er a and the social, economy and culture transitions, the construction during this period pa ys more attention to the economy, which has had some adverse effects on the historic towns’ natural ecological environment and the living conditions of the residents. 4.1 Wastewater and Waste Gas Generated from the Traditional Fossil Energy Have Had
an Adverse Effect on the Natural Environment
In the early days of the establishme nt of The People's Republic of China (1949), the people was living in great po verty. In order to develop the e conomy, the historic to wns have experienced some indu strial development processes , su ch as t he “Great Steelmaking”
Figure 11: The space with triangle section formed by the double-pitch roof
Source: Photographed and drawn by the author
Figure 12: Different direct radiation of sunshine into the buildings in different season with the canopies and verandahs
Source: Bao (2008), “A Preliminary Study of the Traditional Architecture and Construction Strategies in Southeast China which Adapt to the Climate”
116
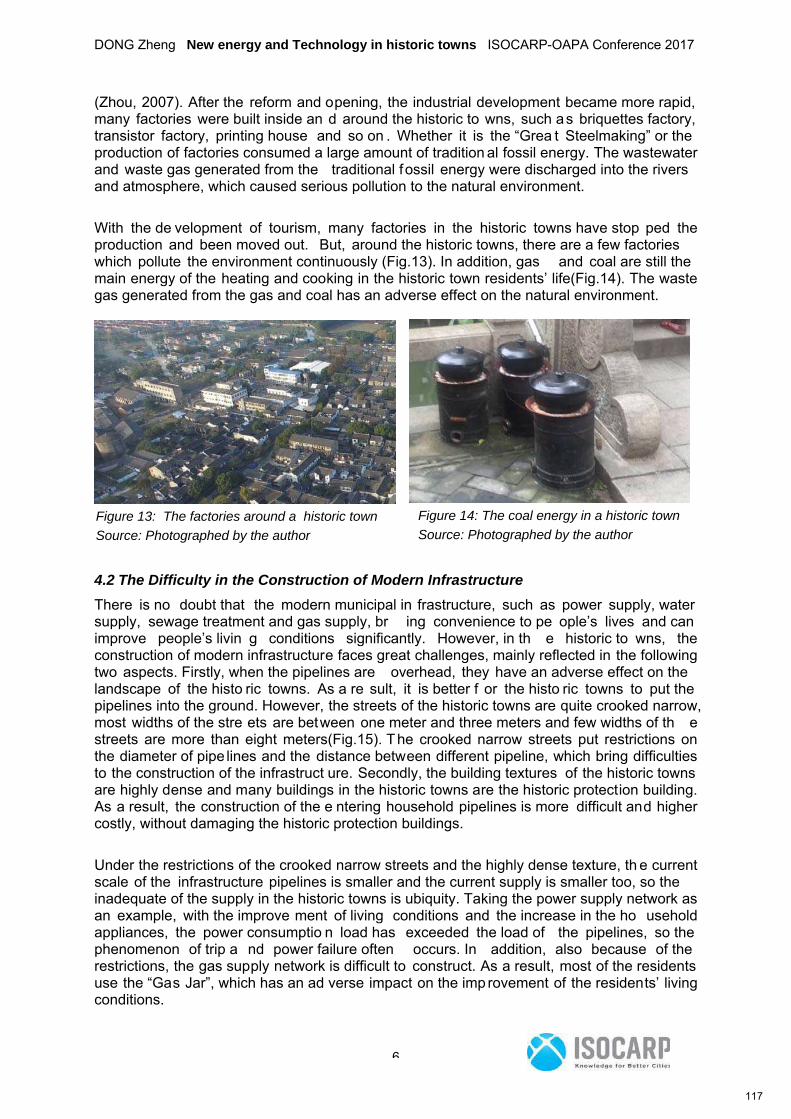
DONG Zheng New energy and Technology in historic towns ISOCARP-OAPA Conference 2017
6
(Zhou, 2007). After the reform and opening, the industrial development became more rapid, many factories were built inside an d around the historic to wns, such as briquettes factory, transistor factory, printing house and so on . Whether it is the “Grea t Steelmaking” or the production of factories consumed a large amount of tradition al fossil energy. The wastewater and waste gas generated from the traditional fossil energy were discharged into the rivers and atmosphere, which caused serious pollution to the natural environment.
With the de velopment of tourism, many factories in the historic towns have stop ped the production and been moved out. But, around the historic towns, there are a few factories which pollute the environment continuously (Fig.13). In addition, gas and coal are still the main energy of the heating and cooking in the historic town residents’ life(Fig.14). The waste gas generated from the gas and coal has an adverse effect on the natural environment.
4.2 The Difficulty in the Construction of Modern Infrastructure
There is no doubt that the modern municipal in frastructure, such as power supply, water supply, sewage treatment and gas supply, br ing convenience to pe ople’s lives and can improve people’s livin g conditions significantly. However, in th e historic to wns, the construction of modern infrastructure faces great challenges, mainly reflected in the following two aspects. Firstly, when the pipelines are overhead, they have an adverse effect on the landscape of the histo ric towns. As a re sult, it is better f or the histo ric towns to put the pipelines into the ground. However, the streets of the historic towns are quite crooked narrow, most widths of the stre ets are between one meter and three meters and few widths of th e streets are more than eight meters(Fig.15). The crooked narrow streets put restrictions on the diameter of pipe lines and the distance between different pipeline, which bring difficulties to the construction of the infrastruct ure. Secondly, the building textures of the historic towns are highly dense and many buildings in the historic towns are the historic protection building. As a result, the construction of the e ntering household pipelines is more difficult and higher costly, without damaging the historic protection buildings.
Under the restrictions of the crooked narrow streets and the highly dense texture, th e current scale of the infrastructure pipelines is smaller and the current supply is smaller too, so the inadequate of the supply in the historic towns is ubiquity. Taking the power supply network as an example, with the improve ment of living conditions and the increase in the ho usehold appliances, the power consumptio n load has exceeded the load of the pipelines, so the phenomenon of trip a nd power failure often occurs. In addition, also because of the restrictions, the gas supply network is difficult to construct. As a result, most of the residents use the “Gas Jar”, which has an ad verse impact on the imp rovement of the residents’ living conditions.
Figure 13: The factories around a historic town
Source: Photographed by the author
Figure 14: The coal energy in a historic town
Source: Photographed by the author
117
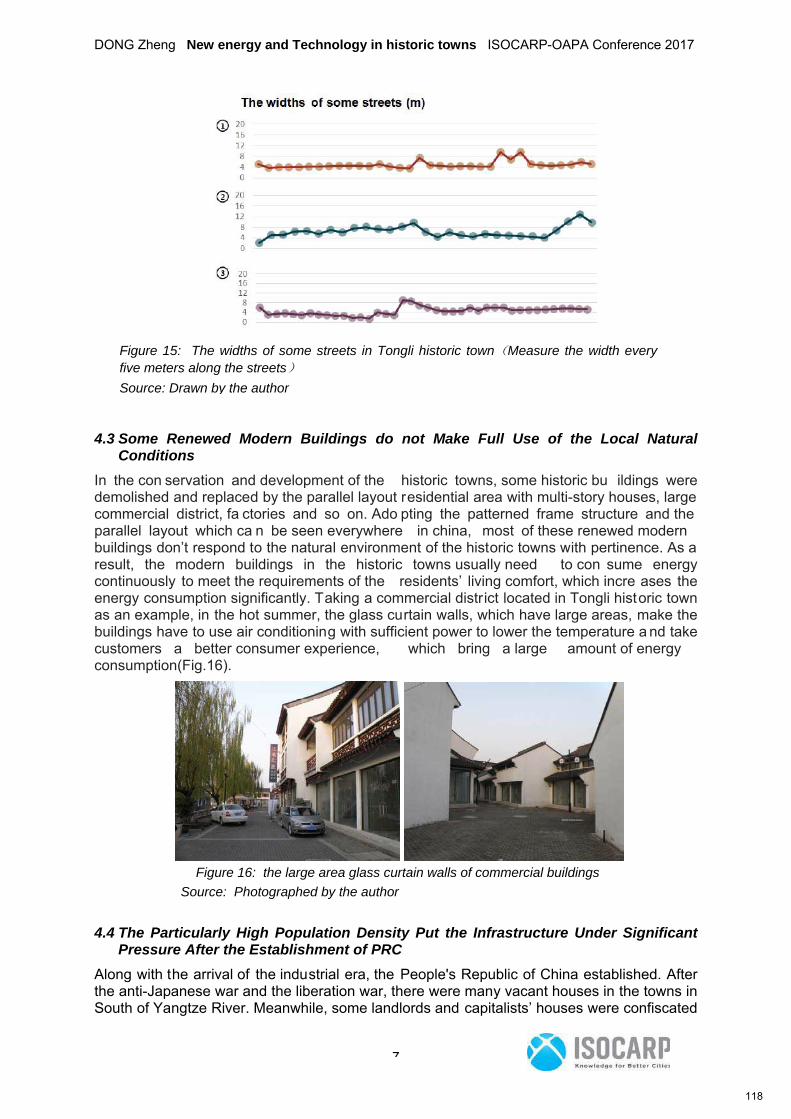
DONG Zheng New energy and Technology in historic towns ISOCARP-OAPA Conference 2017
7
4.3 Some Renewed Modern Buildings do not Make Full Use of the Local Natural
Conditions
In the con servation and development of the historic towns, some historic bu ildings were demolished and replaced by the parallel layout residential area with multi-story houses, large commercial district, fa ctories and so on. Ado pting the patterned frame structure and the parallel layout which ca n be seen everywhere in china, most of these renewed modern buildings don’t respond to the natural environment of the historic towns with pertinence. As a result, the modern buildings in the historic towns usually need to con sume energy continuously to meet the requirements of the residents’ living comfort, which incre ases the energy consumption significantly. Taking a commercial district located in Tongli historic town as an example, in the hot summer, the glass curtain walls, which have large areas, make the buildings have to use air conditioning with sufficient power to lower the temperature a nd take customers a better consumer experience, which bring a large amount of energy consumption(Fig.16).
Figure 16: the large area glass curtain walls of commercial buildings
Source: Photographed by the author
4.4 The Particularly High Population Density Put the Infrastructure Under Significant
Pressure After the Establishment of PRC
Along with the arrival of the industrial era, the People's Republic of China established. After the anti-Japanese war and the liberation war, there were many vacant houses in the towns in South of Yangtze River. Meanwhile, some landlords and capitalists’ houses were confiscated
Figure 15: The widths of some streets in Tongli historic town(Measure the width every five meters along the streets)
Source: Drawn by the author
118
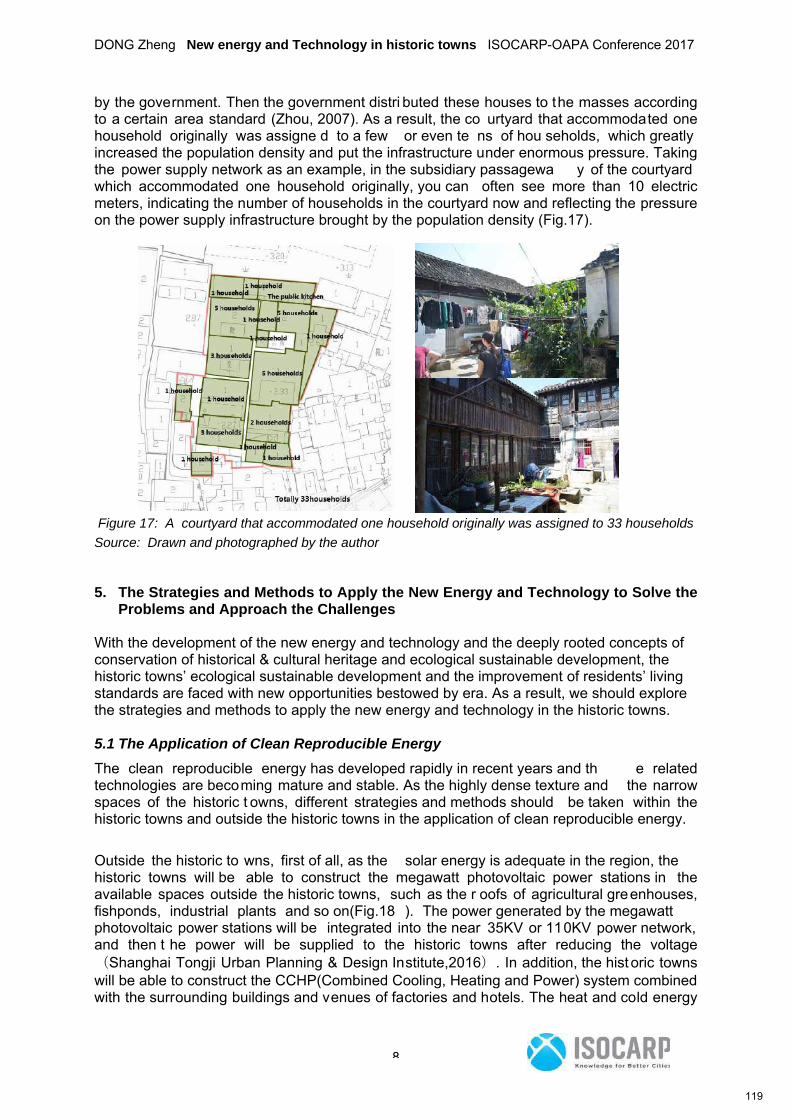
DONG Zheng New energy and Technology in historic towns ISOCARP-OAPA Conference 2017
8
by the government. Then the government distri buted these houses to the masses according to a certain area standard (Zhou, 2007). As a result, the co urtyard that accommodated one household originally was assigne d to a few or even te ns of hou seholds, which greatly increased the population density and put the infrastructure under enormous pressure. Taking the power supply network as an example, in the subsidiary passagewa y of the courtyard which accommodated one household originally, you can often see more than 10 electric meters, indicating the number of households in the courtyard now and reflecting the pressure on the power supply infrastructure brought by the population density (Fig.17).
Figure 17: A courtyard that accommodated one household originally was assigned to 33 households
Source: Drawn and photographed by the author 5. The Strategies and Methods to Apply the New Energy and Technology to Solve the
Problems and Approach the Challenges With the development of the new energy and technology and the deeply rooted concepts of conservation of historical & cultural heritage and ecological sustainable development, the historic towns’ ecological sustainable development and the improvement of residents’ living standards are faced with new opportunities bestowed by era. As a result, we should explore the strategies and methods to apply the new energy and technology in the historic towns. 5.1 The Application of Clean Reproducible Energy
The clean reproducible energy has developed rapidly in recent years and th e related technologies are becoming mature and stable. As the highly dense texture and the narrow spaces of the historic t owns, different strategies and methods should be taken within the historic towns and outside the historic towns in the application of clean reproducible energy.
Outside the historic to wns, first of all, as the solar energy is adequate in the region, the historic towns will be able to construct the megawatt photovoltaic power stations in the available spaces outside the historic towns, such as the r oofs of agricultural greenhouses, fishponds, industrial plants and so on(Fig.18 ). The power generated by the megawatt photovoltaic power stations will be integrated into the near 35KV or 110KV power network, and then t he power will be supplied to the historic towns after reducing the voltage(Shanghai Tongji Urban Planning & Design Institute,2016). In addition, the hist oric towns will be able to construct the CCHP(Combined Cooling, Heating and Power) system combined with the surrounding buildings and venues of factories and hotels. The heat and cold energy
119

DONG Zheng New energy and Technology in historic towns ISOCARP-OAPA Conference 2017
9
will mainly be supplied to the public buildings, such as hotels and commercial buildings, and the power will be integrated into the near power network.
Within the historic towns, first ly, it will be abl e to constr uct miniature photovoltaic power projects, making use of every available spaces, buildings and facilities such as parking lots, building roofs, street lights and so on(Fig.19). The power generate d by the miniature photovoltaic power projects will be integrated into low voltage power network an d will be principally used locally. Secondly, the abundant groundwater resources are available reproducible energy under better development conditions. Making use of the wells which can often be seen in every historic town in sou th of Yangtze River(Fig.20), the historic t owns will be able to construct the water source heat pump system to supply heat and cold energy to the near households, which will be able to endow the ancient wells wit h new function at the same time. At last, making use of the monsoon climate, the historic t owns will be able to construct the wind power generatio n system combined with the miniature facilit ies such as street lights and so on. What’s more, corresponding to the national policy, the historic tow ns will be able to popularize the new energy vehicle both within and outside the historic towns. The methods include the use of electric vehicles, the installat ion of charg ing piles, the reduction of high-pollution vehicles and so on.
5.2 The upgrade of infrastructure
With the development of technology, the cap acity and stability of infrastructure and the integrated technology of different pipelines have been improved a nd developed, which provides p owerful solutions to the challenges posed by the high ly dense textures, the crooked narrow streets and high population density of the h istoric towns. Taking the Tongli historic town as an example, the original specifications of th e cable in the historic to wns are six and ten square millimeters. With the development of tourism and the improvement of the residents’ living conditions, the sp ecifications have been unable to b urden the fast-growing electricity load (Huang, 2016). As a result, the T ongli historic town carried out the renovation and upgrading projects of infrastructure in 2016. The specification of the cable was upgraded to sixteen square millimeters (Fig.2 1) and the electrica l wires in the al leys were o rganized and lumped together, which met the demand for electricity of the residents and tourists. Then, taking the Wuzhen historic town as an example of the assemblage of pipelines, through the pavement of special m aterials in t he ground, the impact between different pipelines are reduced and the safe distance of different pipelines are shortened. As a result, the different pipelines, such as rain water pipe, sewage pi pe, cable, telecommunication pipeline, gas
Figure 18: The megawatt photovoltaic power station on the roof of greenhouse
Source: The Construction and Development Planning of Tongli New Energy Town
Figure 19: A miniature photovoltaic power project
Source: http://www.shushi100.com/albums/g-3105/
Figure 20: The wells in Zhenze Historic town
Source: Photographed by the author
120
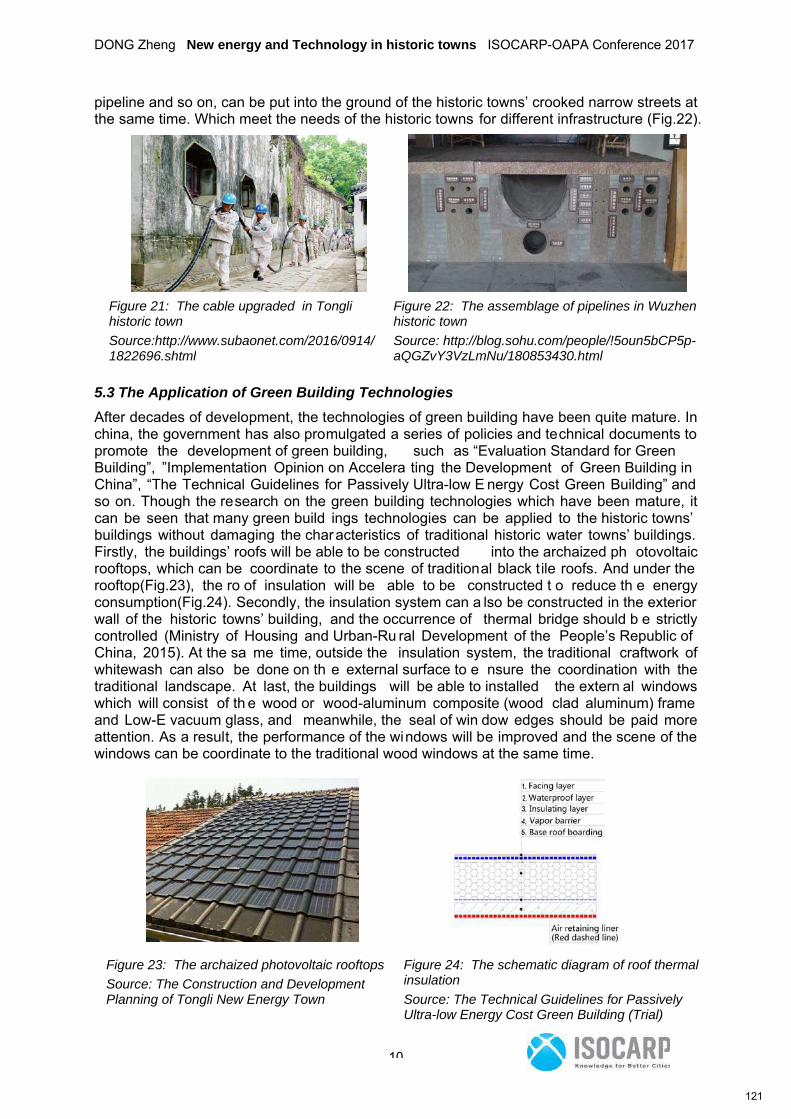
DONG Zheng New energy and Technology in historic towns ISOCARP-OAPA Conference 2017
10
pipeline and so on, can be put into the ground of the historic towns’ crooked narrow streets at the same time. Which meet the needs of the historic towns for different infrastructure (Fig.22).
5.3 The Application of Green Building Technologies
After decades of development, the technologies of green building have been quite mature. In china, the government has also promulgated a series of policies and technical documents to promote the development of green building, such as “Evaluation Standard for Green Building”, ”Implementation Opinion on Accelera ting the Development of Green Building in China”, “The Technical Guidelines for Passively Ultra-low E nergy Cost Green Building” and so on. Though the research on the green building technologies which have been mature, it can be seen that many green build ings technologies can be applied to the historic towns’ buildings without damaging the characteristics of traditional historic water towns’ buildings. Firstly, the buildings’ roofs will be able to be constructed into the archaized ph otovoltaic rooftops, which can be coordinate to the scene of traditional black tile roofs. And under the rooftop(Fig.23), the ro of insulation will be able to be constructed t o reduce th e energy consumption(Fig.24). Secondly, the insulation system can a lso be constructed in the exterior wall of the historic towns’ building, and the occurrence of thermal bridge should b e strictly controlled (Ministry of Housing and Urban-Ru ral Development of the People’s Republic of China, 2015). At the sa me time, outside the insulation system, the traditional craftwork of whitewash can also be done on th e external surface to e nsure the coordination with the traditional landscape. At last, the buildings will be able to installed the extern al windows which will consist of th e wood or wood-aluminum composite (wood clad aluminum) frame and Low-E vacuum glass, and meanwhile, the seal of win dow edges should be paid more attention. As a result, the performance of the windows will be improved and the scene of the windows can be coordinate to the traditional wood windows at the same time.
Figure 21: The cable upgraded in Tongli historic town
Source:http://www.subaonet.com/2016/0914/1822696.shtml
Figure 22: The assemblage of pipelines in Wuzhen historic town
Source: http://blog.sohu.com/people/!5oun5bCP5p-aQGZvY3VzLmNu/180853430.html
Figure 23: The archaized photovoltaic rooftops
Source: The Construction and Development Planning of Tongli New Energy Town
Figure 24: The schematic diagram of roof thermal insulation
Source: The Technical Guidelines for Passively Ultra-low Energy Cost Green Building (Trial)
121
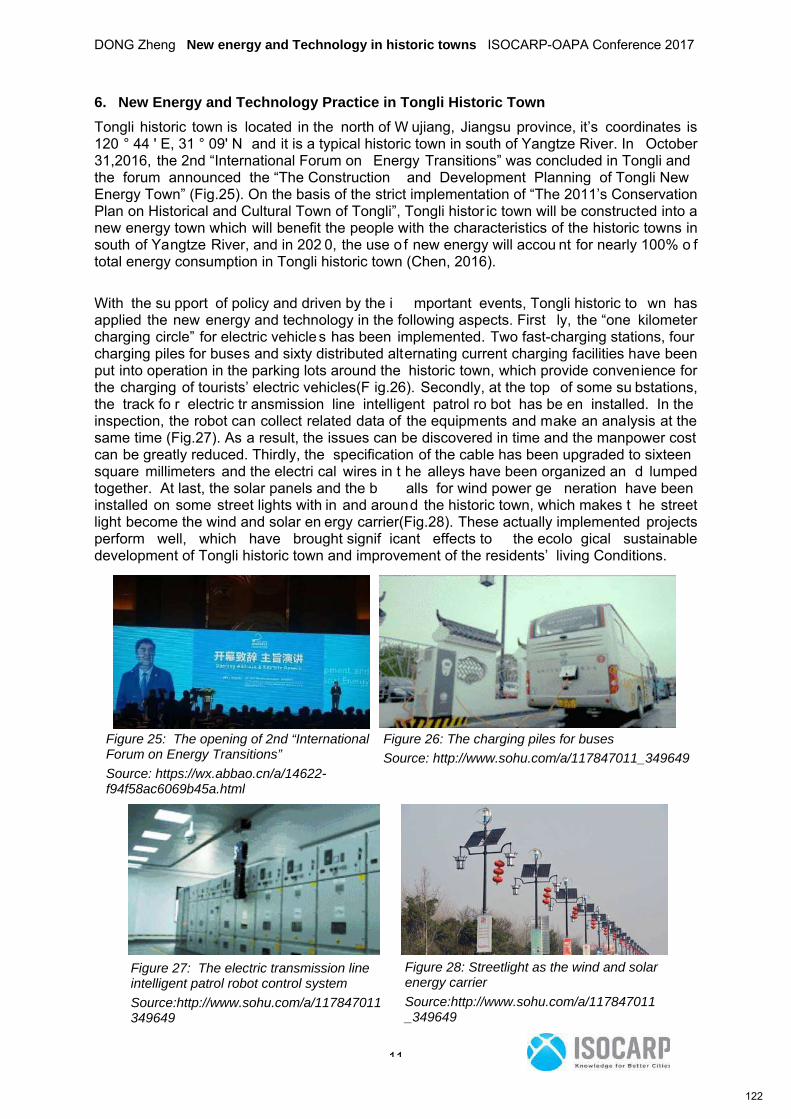
DONG Zheng New energy and Technology in historic towns ISOCARP-OAPA Conference 2017
11
6. New Energy and Technology Practice in Tongli Historic Town
Tongli historic town is located in the north of W ujiang, Jiangsu province, it’s coordinates is 120 ° 44 ' E, 31 ° 09' N and it is a typical historic town in south of Yangtze River. In October 31,2016, the 2nd “International Forum on Energy Transitions” was concluded in Tongli and the forum announced the “The Construction and Development Planning of Tongli New Energy Town” (Fig.25). On the basis of the strict implementation of “The 2011’s Conservation Plan on Historical and Cultural Town of Tongli”, Tongli histor ic town will be constructed into a new energy town which will benefit the people with the characteristics of the historic towns in south of Yangtze River, and in 202 0, the use o f new energy will accou nt for nearly 100% o f total energy consumption in Tongli historic town (Chen, 2016).
With the su pport of policy and driven by the i mportant events, Tongli historic to wn has applied the new energy and technology in the following aspects. First ly, the “one kilometer charging circle” for electric vehicles has been implemented. Two fast-charging stations, four charging piles for buses and sixty distributed alternating current charging facilities have been put into operation in the parking lots around the historic town, which provide convenience for the charging of tourists’ electric vehicles(F ig.26). Secondly, at the top of some su bstations, the track fo r electric tr ansmission line intelligent patrol ro bot has be en installed. In the inspection, the robot can collect related data of the equipments and make an analysis at the same time (Fig.27). As a result, the issues can be discovered in time and the manpower cost can be greatly reduced. Thirdly, the specification of the cable has been upgraded to sixteen square millimeters and the electri cal wires in t he alleys have been organized an d lumped together. At last, the solar panels and the b alls for wind power ge neration have been installed on some street lights with in and around the historic town, which makes t he street light become the wind and solar en ergy carrier(Fig.28). These actually implemented projects perform well, which have brought signif icant effects to the ecolo gical sustainable development of Tongli historic town and improvement of the residents’ living Conditions.
Figure 25: The opening of 2nd “International Forum on Energy Transitions”
Source: https://wx.abbao.cn/a/14622-f94f58ac6069b45a.html
Figure 26: The charging piles for buses
Source: http://www.sohu.com/a/117847011_349649
Figure 27: The electric transmission line intelligent patrol robot control system
Source:http://www.sohu.com/a/117847011349649
Figure 28: Streetlight as the wind and solar energy carrier
Source:http://www.sohu.com/a/117847011_349649
122
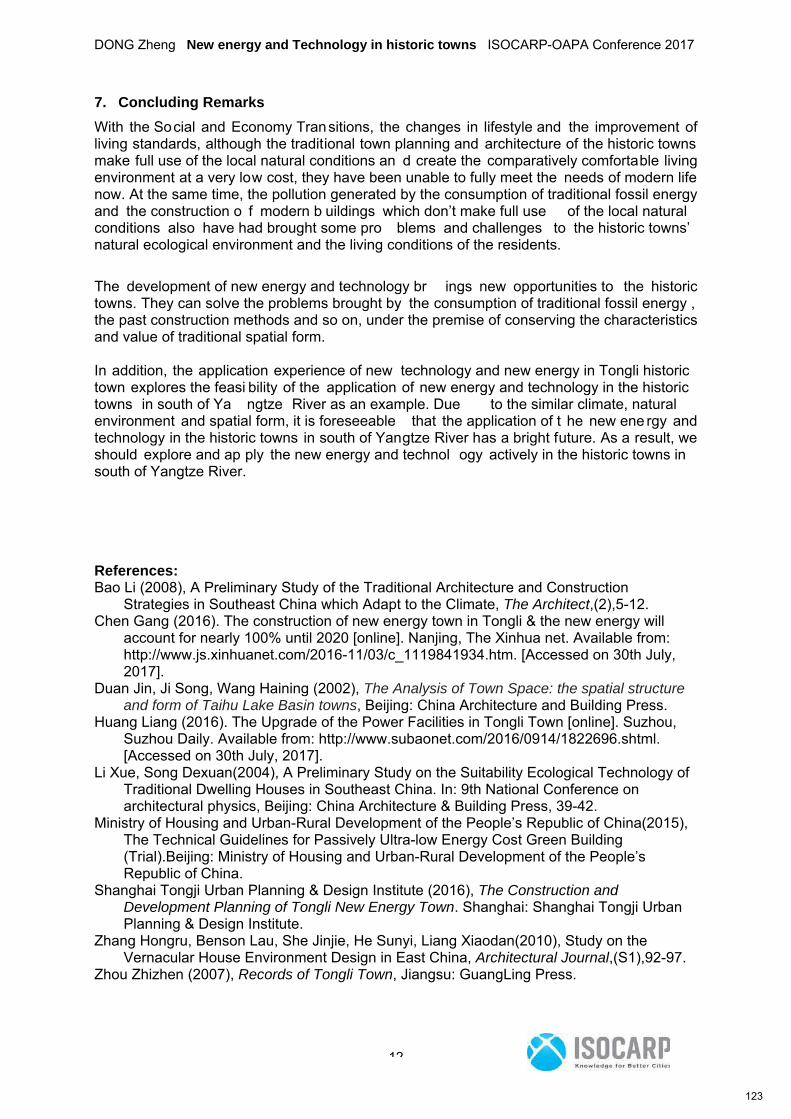
DONG Zheng New energy and Technology in historic towns ISOCARP-OAPA Conference 2017
12
7. Concluding Remarks
With the Social and Economy Transitions, the changes in lifestyle and the improvement of living standards, although the traditional town planning and architecture of the historic towns make full use of the local natural conditions an d create the comparatively comfortable living environment at a very low cost, they have been unable to fully meet the needs of modern life now. At the same time, the pollution generated by the consumption of traditional fossil energy and the construction o f modern b uildings which don’t make full use of the local natural conditions also have had brought some pro blems and challenges to the historic towns’ natural ecological environment and the living conditions of the residents.
The development of new energy and technology br ings new opportunities to the historic towns. They can solve the problems brought by the consumption of traditional fossil energy , the past construction methods and so on, under the premise of conserving the characteristics and value of traditional spatial form. In addition, the application experience of new technology and new energy in Tongli historic town explores the feasi bility of the application of new energy and technology in the historic towns in south of Ya ngtze River as an example. Due to the similar climate, natural environment and spatial form, it is foreseeable that the application of t he new ene rgy and technology in the historic towns in south of Yangtze River has a bright future. As a result, we should explore and ap ply the new energy and technol ogy actively in the historic towns in south of Yangtze River.
References: Bao Li (2008), A Preliminary Study of the Traditional Architecture and Construction
Strategies in Southeast China which Adapt to the Climate, The Architect,(2),5-12. Chen Gang (2016). The construction of new energy town in Tongli & the new energy will
account for nearly 100% until 2020 [online]. Nanjing, The Xinhua net. Available from: http://www.js.xinhuanet.com/2016-11/03/c_1119841934.htm. [Accessed on 30th July, 2017].
Duan Jin, Ji Song, Wang Haining (2002), The Analysis of Town Space: the spatial structure and form of Taihu Lake Basin towns, Beijing: China Architecture and Building Press.
Huang Liang (2016). The Upgrade of the Power Facilities in Tongli Town [online]. Suzhou, Suzhou Daily. Available from: http://www.subaonet.com/2016/0914/1822696.shtml. [Accessed on 30th July, 2017].
Li Xue, Song Dexuan(2004), A Preliminary Study on the Suitability Ecological Technology of Traditional Dwelling Houses in Southeast China. In: 9th National Conference on architectural physics, Beijing: China Architecture & Building Press, 39-42.
Ministry of Housing and Urban-Rural Development of the People’s Republic of China(2015), The Technical Guidelines for Passively Ultra-low Energy Cost Green Building (Trial).Beijing: Ministry of Housing and Urban-Rural Development of the People’s Republic of China.
Shanghai Tongji Urban Planning & Design Institute (2016), The Construction and Development Planning of Tongli New Energy Town. Shanghai: Shanghai Tongji Urban Planning & Design Institute.
Zhang Hongru, Benson Lau, She Jinjie, He Sunyi, Liang Xiaodan(2010), Study on the Vernacular House Environment Design in East China, Architectural Journal,(S1),92-97.
Zhou Zhizhen (2007), Records of Tongli Town, Jiangsu: GuangLing Press.
123
Ubeda, Julia Walkability: from research to policy making ISOCARP-OAPA Conference2017
1
Walkability in Amsterdam: from scientific research to effective pedestrian policy making
Julia UBEDA BRIONES, Amsterdam Municipality – Verkeer en Openbare Ruimte – Kennis en Kaders (Team onderzoek en kennis), The Netherlands
Synopsis
This study case is a successful example of applied scientific research related to the walkability concept and the pedestrian infrastructure, developed within Amsterdam Municipality (Gemeente Amsterdam). This paper highlights the transition from walkability scientific research studies to tangible and spatial knowledge about the pedestrian physical infrastructure, specifically, sidewalks in a pilot area of the city. Geographical Information Systems (GIS) tools have supported the development of this study. The aim and objectives of the current pedestrian policy have been considered and implemented along the research design. The result is the setting of a valid methodology to visualize, analyze and evaluate the walkability current state in the study area that serves as a basis for effective decision-making and policy-making further development. 1. Introduction
Amsterdam Municipality (Gemeente Amsterdam) works towards the development of a pedestrian agenda and it aims to invest consistently in order to improve the pedestrian mobility and the pedestrian physical infrastructure (MobiliteitsAanpak 2030, Gemeente Amsterdam, 2013). Furthermore, pedestrian mobility has been recently considered as a traffic mode that needs to be tracked and modeled (Kader Voetganger, Gemeente Amsterdam, 2016). The main pedestrian policy – Kader Voetganger (Kader Voetganger Gemeente Amsterdam, 2016) – sets certain motives and goals to be achieved regarding pedestrian mobility, however, it is still very ambiguous. In addition to Kader Voetganger, there are as well many policy products and studies concerning pedestrians within the Gemeente Amsterdam although this knowledge is spread amongst different departments. Moreover, there is no direct connection between the walking mobility with the design requirements of the pedestrian infrastructure; there are no specific guidelines to design such infrastructure in terms of space requirements, since there is a lack of knowledge regarding how much space is actually required to walk comfortably. Additionally, there is a lack of data and real pedestrian numbers; therefore, most of the pedestrian-related studies are based on assumptions and estimations. Gemeente Amsterdam has recently updated the pedestrian network in the city - Plusnetten and Hoofdnetten (Beleidskader Verkeersnetten, Gemeente Amsterdam, 2016). The goal of establishing these networks is to determine in which streets pedestrians should have priority and to provide enough and good quality pedestrian space in those. Subsequently, it is required to address the state of the Amsterdam walkable space prior to develop further any policy or to take any action. Twenty three percent of the trips within the city are made on foot as the first mean of transport, moreover, around the 80% of the tourists move on foot when visiting the city (Thermometer van de Bereikbaarheid, Gemeente Amsterdam, 2016). Due to these reasons, the claim over the (pedestrian) public infrastructure is under an increasing pressure,
124

Ubeda, Julia Walkability: from research to policy making ISOCARP-OAPA Conference2017
2
especially in the city center. Amsterdam is a perfect example of compact city, for this reason, there is no need of promoting walkability as it occurs in other cities worldwide, in Amsterdam, the focus should be on improving that walkability. It is essential for the city to develop specific pedestrian policies, phase that obviously requires previous and in-depth research on the topic. Since walkability is a spatial concept; the use of GIS tools is a good manner of visualizing and analyzing walkability information (Holloenstein and Bleisch, 2016). Additionally, Verkeer en Openbare Ruimte (V&OR) department (Traffic and Public Space department) considers that GIS tools and techniques should be further explored within the team in order to improve the quality of the analysis and to enhance the GIS potential of creating new information.
The objective of this research is to develop a valid methodology to visualize, analyze and evaluate the walkability current state in the city of Amsterdam (pilot area). The process is supported by the use of spatial datasets and GIS tools and it is focused on the main pedestrian infrastructure element: sidewalks. The derived goal of this study is to raise awareness, especially amongst the members of the Traffic and Public Space department, about the analysis potential of GIS tools and about how these tools could support and complement the policies development process.
In section 1. has been described the research context, the research relevance and main objective of this study. Section 2. - Theoretical framework – comprises the main findings from the literature and bibliographical review and it outlines the main conclusions from them. Based on these conclusions, the methodological framework, foundation of the research, is developed; it is described in section 3 - Methodology. The main results and maps of the study are presented in section 4. - Results. Lastly, section 5. gathers the main conclusions; opportunities and limitations are further discussed too.
2. Theoretical Framework
This research requires a very strong exploratory phase in order to build the theoretical framework and the subsequent methodology: it is essential to define the already comprehensive walkability concept and to adapt it to the Amsterdam case. The theoretical framework first incises in understanding what is meant when discussing the walkability conception, that is why this section comprises an inventory about walkability studies from other cities around the globe, GIS-based walkability studies are reviewed as well. Likewise, this section includes an inventory of current policies, frameworks and guidelines related to pedestrians within Gemeente Amsterdam. Lastly, ice-breaking interviews were needed to properly approach the topic although the conclusions from the interviews are not included in this paper. Here, only the main conclusions of walkability studies and studies within the Gemeente are presented. The methodology is finally set up upon completion of this comprehensive exploratory phase.
2.1. Policies and pedestrian related studies within Gemeente Amsterdam
This sub-section includes the policies and studies within the Gemeente that have been used to frame the research and that have been implemented somehow in the research design process.
125
Ubeda, Julia Walkability: from research to policy making ISOCARP-OAPA Conference2017
3
Kader van Voetganger (the main pedestrian policy to date, launched on May, 2016) has placed the first effort in bringing the pedestrian knowledge together and making pedestrians a priority. Ruimtevraag van de voetganger (Ruimtevraag van de voetganger, Gemeente Amsterdam, 2016) is a pedestrian study carried out by the Gemeente that clearly states the importance of having enough pedestrian space, fact that mainly relays on sidewalks free of obstacles (effective width). The pedestrian Plusnet network, already presented in section 1, is the most tangible product for pedestrians; however, the visualization still lays on the car network. Stadstraten or City Streets are streets that host a high number of activities and host different transport modes. There is a need to understand those shared-streets and how to prioritize one transport mode over another. The Verblijversdichtheidsindex (VDI) or Sojourners Density Index shows the daily average leisurers (year 2014) making use of the public space, this index displays the differences at a neighborhood level. This index has served as an inspiration to estimate how many people are using the public space, however, it needs further development to be applied to this research. The purpose of the Telplan2018 is to obtain a reliable dataset with pedestrian traffic intensities based on real counts at specified locations in Amsterdam. Pedestrian traffic peaks are different by the type of location; therefore, it is important to select different street types. They are classified according to the next groups: Stadstraat (many activities and transport modes), touristic street, residential street, work or laboural street and recreational street. This concept about different street types will be also implemented in the current research. Determining the trip purpose is important because different street types attract different audiences and, consequently, they will have different peak times of use.
2.2. Walkability literature review
The main conclusion from the walkability literature review is that the walkability concept is broad and complex, it is challenging to quantify it and it is mainly a combination of several criteria, including objective and subjective factors. It is important to differentiate mobility types or walking purposes (recreational vs. goal oriented) as Choi (2013) or Gehl (2010) stated. Human behavior and surrounding environment have both an impact in determining walking (Sallis et al., 2008). Mixed-land use (Brown et al., 2009; van Dyck et al., 2010; Yamada et al., 2012) house and jobs density, diversity (Cervero and Kockelman, 1997) also play a main role promoting the walkability of a neighbourhood. Hillier and Lida, (2005), Gauvin et al. (2005), Gebel et al. (2007). Borst et al. (2008) state that walkability is an index of the quality of the neighbourhood. Urban network configuration and street connectivity determine the walkability degree too (Hillier and Hanson, 1984). Subjective factors and aesthetic features determine the route choice, especially in recreational trips, however, they are difficult to quantify through the use of GIS tools Gauvin et al. (2005); Giles-Corti et al. (2005); Troped et al. (2010), Koohsari et al. (2015) investigate the influence that specific street features have on people preferences for route choices – especially in recreational routes- some of these are: presence of shadow, absence of windiness and other microclimatic characteristics, low traffic and air pollution, presence of resting places (benches, potable water fountains, etc.), non-concrete surface cover,
126
Ubeda, Julia Walkability: from research to policy making ISOCARP-OAPA Conference2017
4
accessibility from many streets or public spaces, sufficient width of a sidewalk, safety (considering crime and traffic accidents). This list gives a good overview about the countless parameters that influence people's choice of transportation and their subjectivity.
According to Gehl (2010), one of the most important prerequisites that make a city walkable and guarantee a comfortable walk is as simple as enough room to walk relatively free (Gehl Architects, 2004). ”Crowded sidewalks are unacceptable and a problem worldwide”. Pedestrians also encounter other obstacles placed there by design: street furniture, parked cars or partially parked on the sidewalk. Undisciplined and unregulated parked bikes on the sidewalks complete the scene that pedestrians have to face in urban environments (Gehl, 2010). Nevertheless, this does not mean that width sidewalks should be designed everywhere, citing Valero Sosa (2014): “Sometimes it is a quantity problem; you might design enormous sidewalks and nobody walking there” - therefore it is necessary to estimate the demand that exist or will exist on those sidewalks. 2.3. GIS-based walkability studies Walkability is a spatial concept therefore using GIS tools seems the perfect approach to analyze this concept (Hollenstein and Bleisch, 2016). In general, indices are the way to proceed in purely GIS-based approaches to study walkability, making use of existing and easily accessible data (Hollenstein and Bleish, 2016). These data might include street network design, population density, land use mix and access to destinations. ESRI defines walkability as a measure of the community effectiveness in promoting walking and biking as alternatives to drive cars to reach shops, schools and other common destinations. There are multiple showcases that use ESRI software to analyze walkability; Rattan et al. (2012) quantified walkability in Ontario, Canada combining 3 concepts: Density, Diversity and Design. Holbrow (2010) built a walkability raster surface of Washington, USA. The methodology was based on calculating walking distances from specific locations: grocery stores, parks, and metro stations. The last example included in this section is the Jeff Speck walkability analysis in downtown Albuquerque, New Mexico, USA (Speck, J. 2014). It has been included because is one of the fewest walkability studies that has been performed as a preliminary study for city policy making. Jeff Speck study made use of GIS tools as well: however, he only opts for including the frontages that are expected to attract pedestrians. The methodology followed by most of the walkability studies that use GIS tools can be mainly grouped in two categories; 1. Studies using raster calculations: these studies are mainly based on a criteria selection, raster analysis and their subsequent overlay. These tools show the potential and possibilities of using GIS, however, the results might be vague and imprecise to be used by Gemeente Amsterdam 2. Studies based on counting the number of specific amenities or main destinations (shops, groceries, transport hubs or schools) in a selected walking distance on a network (normally from 400 m to 800 m). The assumption is: the higher the number of activities or attractions, the most likely the environment will support walking. The drawback of these methodologies is that the physical infrastructure quality is not included anyhow. Consequently, a new approach should be developed to properly tackle this study. What is clear is that the designed methodology will strongly depend on the selected scale; the lower the scale the greater the details. For instance, raster analysis is more appropriate
127
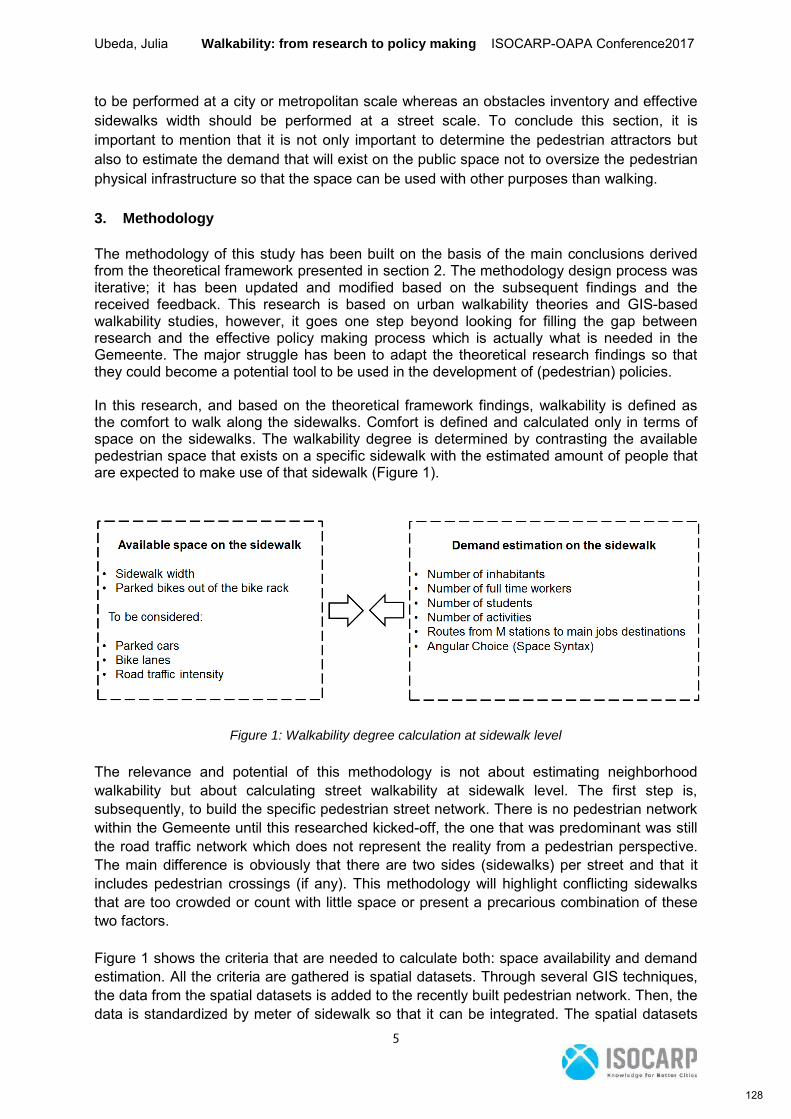
Ubeda, Julia Walkability: from research to policy making ISOCARP-OAPA Conference2017
5
to be performed at a city or metropolitan scale whereas an obstacles inventory and effective sidewalks width should be performed at a street scale. To conclude this section, it is important to mention that it is not only important to determine the pedestrian attractors but also to estimate the demand that will exist on the public space not to oversize the pedestrian physical infrastructure so that the space can be used with other purposes than walking.
3. Methodology
The methodology of this study has been built on the basis of the main conclusions derived from the theoretical framework presented in section 2. The methodology design process was iterative; it has been updated and modified based on the subsequent findings and the received feedback. This research is based on urban walkability theories and GIS-based walkability studies, however, it goes one step beyond looking for filling the gap between research and the effective policy making process which is actually what is needed in the Gemeente. The major struggle has been to adapt the theoretical research findings so that they could become a potential tool to be used in the development of (pedestrian) policies. In this research, and based on the theoretical framework findings, walkability is defined as the comfort to walk along the sidewalks. Comfort is defined and calculated only in terms of space on the sidewalks. The walkability degree is determined by contrasting the available pedestrian space that exists on a specific sidewalk with the estimated amount of people that are expected to make use of that sidewalk (Figure 1).
Figure 1: Walkability degree calculation at sidewalk level
The relevance and potential of this methodology is not about estimating neighborhood walkability but about calculating street walkability at sidewalk level. The first step is, subsequently, to build the specific pedestrian street network. There is no pedestrian network within the Gemeente until this researched kicked-off, the one that was predominant was still the road traffic network which does not represent the reality from a pedestrian perspective. The main difference is obviously that there are two sides (sidewalks) per street and that it includes pedestrian crossings (if any). This methodology will highlight conflicting sidewalks that are too crowded or count with little space or present a precarious combination of these two factors. Figure 1 shows the criteria that are needed to calculate both: space availability and demand estimation. All the criteria are gathered is spatial datasets. Through several GIS techniques, the data from the spatial datasets is added to the recently built pedestrian network. Then, the data is standardized by meter of sidewalk so that it can be integrated. The spatial datasets
128
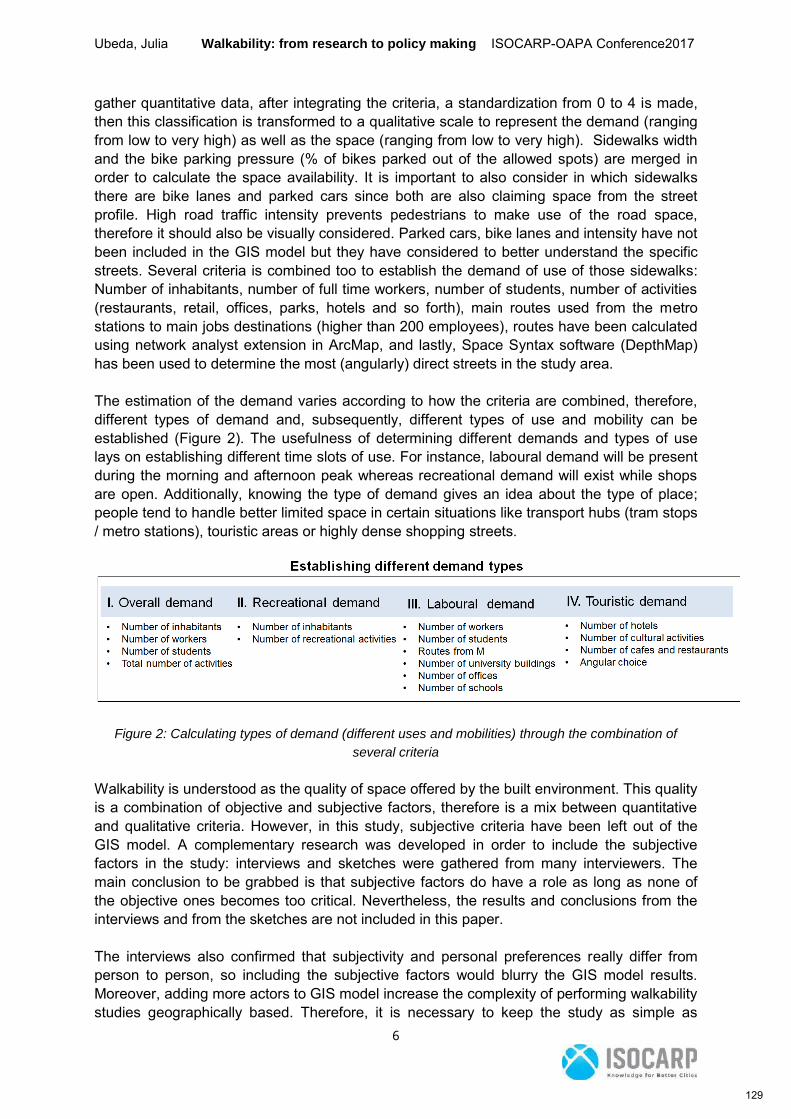
Ubeda, Julia Walkability: from research to policy making ISOCARP-OAPA Conference2017
6
gather quantitative data, after integrating the criteria, a standardization from 0 to 4 is made, then this classification is transformed to a qualitative scale to represent the demand (ranging from low to very high) as well as the space (ranging from low to very high). Sidewalks width and the bike parking pressure (% of bikes parked out of the allowed spots) are merged in order to calculate the space availability. It is important to also consider in which sidewalks there are bike lanes and parked cars since both are also claiming space from the street profile. High road traffic intensity prevents pedestrians to make use of the road space, therefore it should also be visually considered. Parked cars, bike lanes and intensity have not been included in the GIS model but they have considered to better understand the specific streets. Several criteria is combined too to establish the demand of use of those sidewalks: Number of inhabitants, number of full time workers, number of students, number of activities (restaurants, retail, offices, parks, hotels and so forth), main routes used from the metro stations to main jobs destinations (higher than 200 employees), routes have been calculated using network analyst extension in ArcMap, and lastly, Space Syntax software (DepthMap) has been used to determine the most (angularly) direct streets in the study area. The estimation of the demand varies according to how the criteria are combined, therefore, different types of demand and, subsequently, different types of use and mobility can be established (Figure 2). The usefulness of determining different demands and types of use lays on establishing different time slots of use. For instance, laboural demand will be present during the morning and afternoon peak whereas recreational demand will exist while shops are open. Additionally, knowing the type of demand gives an idea about the type of place; people tend to handle better limited space in certain situations like transport hubs (tram stops / metro stations), touristic areas or highly dense shopping streets.
Figure 2: Calculating types of demand (different uses and mobilities) through the combination of
several criteria
Walkability is understood as the quality of space offered by the built environment. This quality is a combination of objective and subjective factors, therefore is a mix between quantitative and qualitative criteria. However, in this study, subjective criteria have been left out of the GIS model. A complementary research was developed in order to include the subjective factors in the study: interviews and sketches were gathered from many interviewers. The main conclusion to be grabbed is that subjective factors do have a role as long as none of the objective ones becomes too critical. Nevertheless, the results and conclusions from the interviews and from the sketches are not included in this paper. The interviews also confirmed that subjectivity and personal preferences really differ from person to person, so including the subjective factors would blurry the GIS model results. Moreover, adding more actors to GIS model increase the complexity of performing walkability studies geographically based. Therefore, it is necessary to keep the study as simple as
129
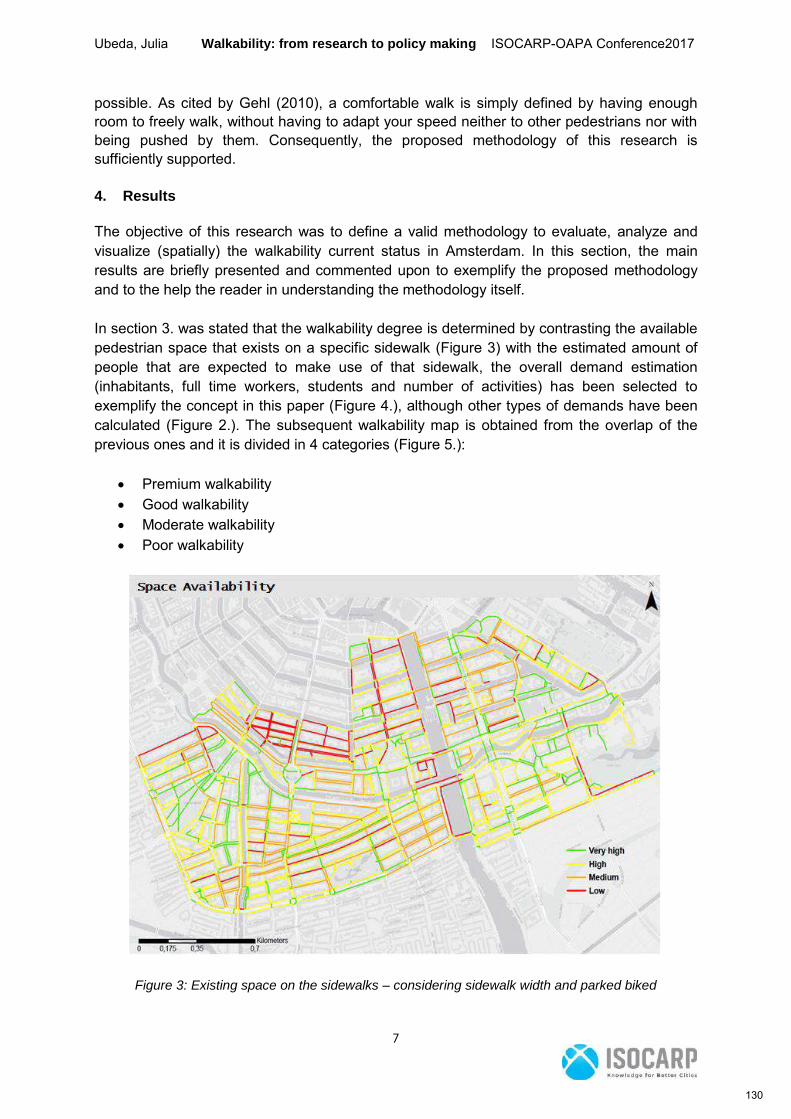
Ubeda, Julia Walkability: from research to policy making ISOCARP-OAPA Conference2017
7
possible. As cited by Gehl (2010), a comfortable walk is simply defined by having enough room to freely walk, without having to adapt your speed neither to other pedestrians nor with being pushed by them. Consequently, the proposed methodology of this research is sufficiently supported.
4. Results
The objective of this research was to define a valid methodology to evaluate, analyze and visualize (spatially) the walkability current status in Amsterdam. In this section, the main results are briefly presented and commented upon to exemplify the proposed methodology and to the help the reader in understanding the methodology itself. In section 3. was stated that the walkability degree is determined by contrasting the available pedestrian space that exists on a specific sidewalk (Figure 3) with the estimated amount of people that are expected to make use of that sidewalk, the overall demand estimation (inhabitants, full time workers, students and number of activities) has been selected to exemplify the concept in this paper (Figure 4.), although other types of demands have been calculated (Figure 2.). The subsequent walkability map is obtained from the overlap of the previous ones and it is divided in 4 categories (Figure 5.):
Premium walkability Good walkability Moderate walkability Poor walkability
Figure 3: Existing space on the sidewalks – considering sidewalk width and parked biked
130
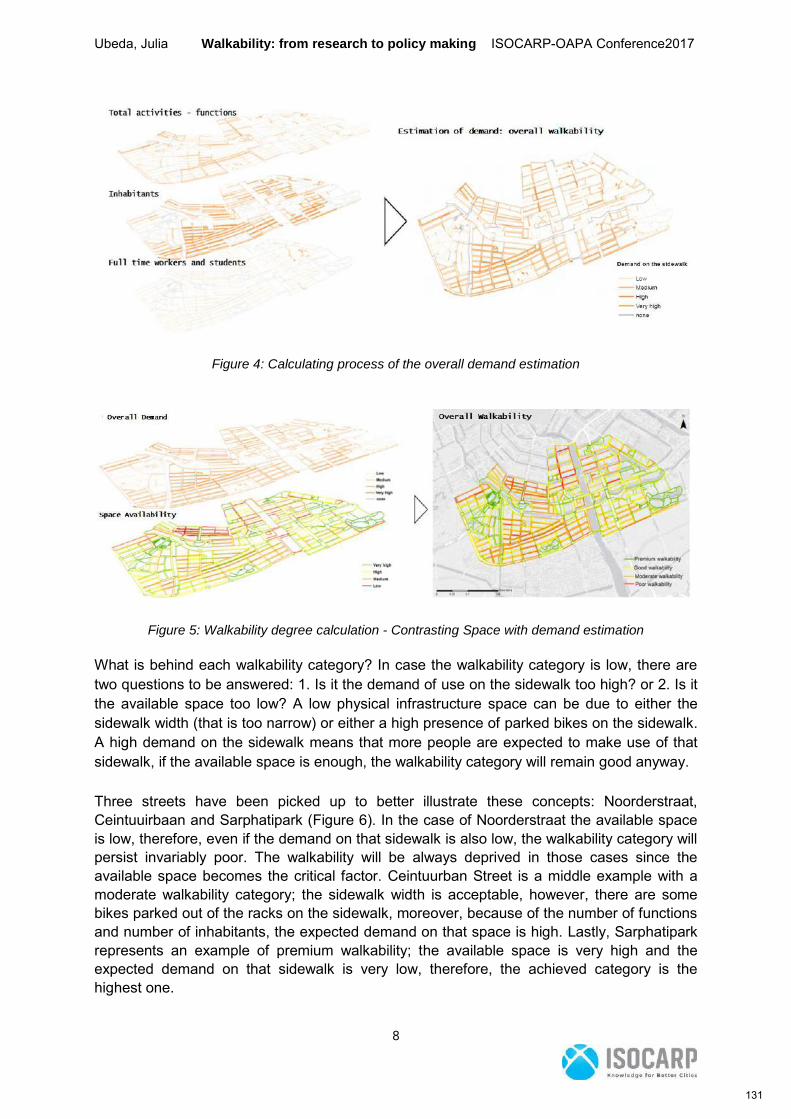
Ubeda, Julia Walkability: from research to policy making ISOCARP-OAPA Conference2017
8
Figure 4: Calculating process of the overall demand estimation
Figure 5: Walkability degree calculation - Contrasting Space with demand estimation
What is behind each walkability category? In case the walkability category is low, there are two questions to be answered: 1. Is it the demand of use on the sidewalk too high? or 2. Is it the available space too low? A low physical infrastructure space can be due to either the sidewalk width (that is too narrow) or either a high presence of parked bikes on the sidewalk. A high demand on the sidewalk means that more people are expected to make use of that sidewalk, if the available space is enough, the walkability category will remain good anyway. Three streets have been picked up to better illustrate these concepts: Noorderstraat, Ceintuuirbaan and Sarphatipark (Figure 6). In the case of Noorderstraat the available space is low, therefore, even if the demand on that sidewalk is also low, the walkability category will persist invariably poor. The walkability will be always deprived in those cases since the available space becomes the critical factor. Ceintuurban Street is a middle example with a moderate walkability category; the sidewalk width is acceptable, however, there are some bikes parked out of the racks on the sidewalk, moreover, because of the number of functions and number of inhabitants, the expected demand on that space is high. Lastly, Sarphatipark represents an example of premium walkability; the available space is very high and the expected demand on that sidewalk is very low, therefore, the achieved category is the highest one.
131
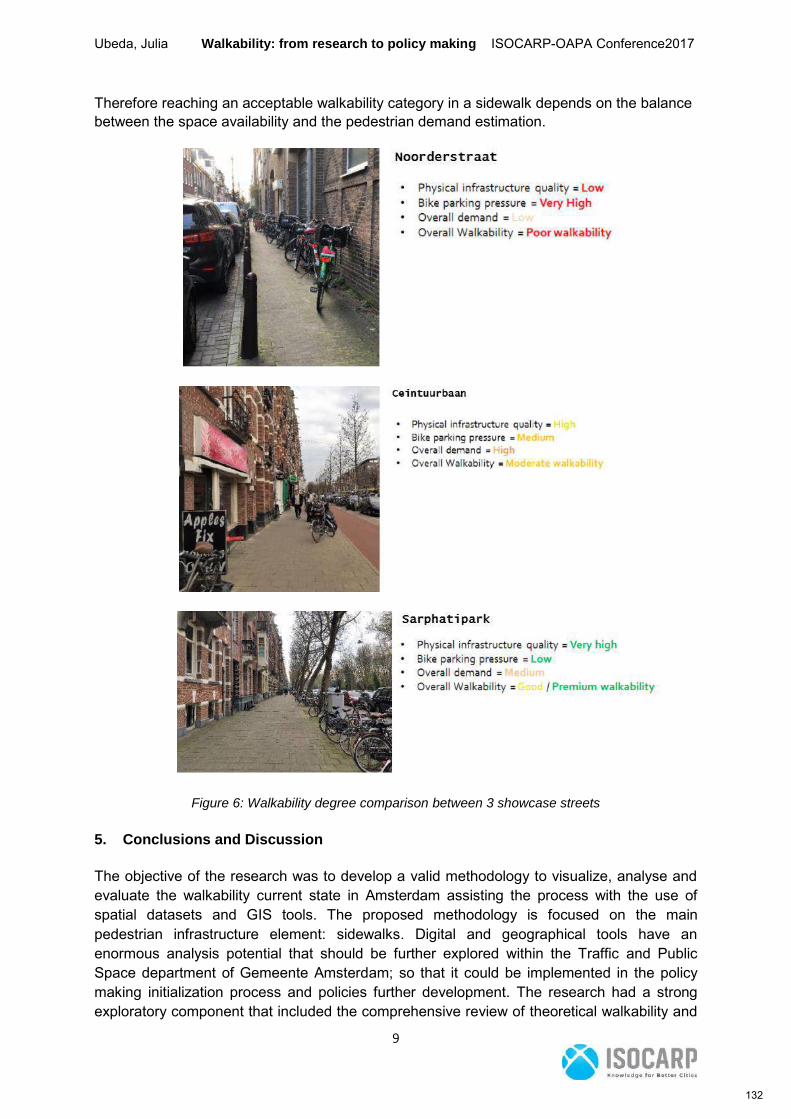
Ubeda, Julia Walkability: from research to policy making ISOCARP-OAPA Conference2017
9
Therefore reaching an acceptable walkability category in a sidewalk depends on the balance between the space availability and the pedestrian demand estimation.
Figure 6: Walkability degree comparison between 3 showcase streets
5. Conclusions and Discussion
The objective of the research was to develop a valid methodology to visualize, analyse and evaluate the walkability current state in Amsterdam assisting the process with the use of spatial datasets and GIS tools. The proposed methodology is focused on the main pedestrian infrastructure element: sidewalks. Digital and geographical tools have an enormous analysis potential that should be further explored within the Traffic and Public Space department of Gemeente Amsterdam; so that it could be implemented in the policy making initialization process and policies further development. The research had a strong exploratory component that included the comprehensive review of theoretical walkability and
132
Ubeda, Julia Walkability: from research to policy making ISOCARP-OAPA Conference2017
10
GIS-based walkability scientific studies. Besides, pedestrian policies and guidelines within Gemeente Amsterdam were also reviewed in order to determine the goals to be achieved. The major struggle was to adapt the theoretical research findings so that they become a potential tool to be used in the pedestrian policies development. The walkability degree is calculated contrasting the available space with the expected demand of use on that sidewalk. The proposed methodology is a successful product that allows the (spatial) visualization, analysis and evaluation of the walkability state that will be scaled-up for the whole city. The main observation is that reaching the premium walkability degree (the highest one) is very difficult when this methodology is applied; even if the sidewalks are wide enough, as soon as the demand is ranging from medium to very high, the walkability category decreases. Moreover, having a premium walkability does not necessarily mean that the walkability is perfect; it depicts that the demand is too low in relation with the amount of the space, so the sidewalk might be oversized and that space could be exploited for other use. On the other hand, streets with a good walkability degree represent the perfect balance between space and demand, and therefore, they should be considered as the reference streets. Moderate walkability should be deeper analysed: maybe the demand is only extremely high at specific times so pedestrians can handle it or maybe it is very low that is does not require special action by now. Finally, attention should be always given at streets with poor walkability. Even if the demand is very low in those streets (as it occurs in Noordestraat), a poor walkability degree always depicts extremely low available space to walk. A high number of sidewalks are quite narrow and the minimum size of 1.80 is not reached there. Too narrow streets (below 2 m) are perceived as not comfortable therefore, some action should be considered in those.
5.1. Opportunities and limitations One of the main contributions of this research, aside of achieving the main objective, is the construction of a specific pedestrian network for the city that could be further used to calculate accessibility and pedestrian travelling times. Real numbers about pedestrian counts can be added to the network so that it can be included in the traffic model. It also provides an overview on how sidewalks are used in Amsterdam thanks to the demand estimation of use; different target groups and different time slots of use can be estimated. Decisions and pedestrian policies development can be taken over based on the further analysis of the results. This method allows speeding up the process since many procedures are automated. Finally, another remark is the importance of geographically locate the bottlenecks in the specific area or in the city. Patterns or repetitive scenarios of conflict are easily depicted and revealed. The process has been automated as much as possible, however, not all the used tools gave the results that represent 100% the reality since it is still a model: a lot of visual checking, and manual editing is required in order to build up the provided maps. The number of activities does not mean number of people as it occurs with inhabitants, workers or students, therefore, the model is based on assumptions to calculate the demand. An important observation is that this research is only considering the available space and the demand that
133
Ubeda, Julia Walkability: from research to policy making ISOCARP-OAPA Conference2017
11
exist on pedestrian sidewalks, footways and park paths, have not been considered. Results therefore, do not represent the walkability on those spaces. Finally, and to conclude the limitations of this research, it should be mentioned that the model is terribly sensitive to how the pedestrian network has been generated, especially in the space syntax results.
6. References
Borst, H., Miedema, H., Vries, S., Graham, J. and J Dongen, J van. (2008) “Relationships between street characteristics and perceived attractiveness for walking reported by elderly people”. Journal of Environmental Psychology 28(4), 353-361. Brown, B. B., Yamada, I., Smith, K. R., Zick, C. D., Kowaleski-Jones, L., and Fan, J. X. (2009). ”Mixed land use and walkability: Variations in land use measures and relationships with BMI, overweight, and obesity”. Health and Place 15(4), 1130-1141. Cervero R. and Kockelman K. (1997). ”Travel demand and the 3ds: density, diversity, and design”. Transportation Research Part D 2(3), 199–219. Choi, E. (2013). ”Understanding Walkability: Dealing with the complexity behind pedestrian behaviour”. Proceedings of 9th International Space Syntax Symposium, Sejong University, Seoul. 14 pp. Dyck, D. van, Cerin, E., Cardon, G., Deforche, B., Sallis, J. F., Owen, N., and De Bourdeaudhuij, I. (2010). ”Physical activity as a mediator of the associations between neighborhood walkability and adiposity in Belgian adults”. Health and Place, 16(5), 952-960. Gauvin, L., Richard, L., Craig, C. L., Spivock, M., Riva, M., Forster, M.and Potvin, L. (2005). ”From walkability to active living potential: an “ecometric” validation study”. American Journal of Preventive Medicine 28(2), 126-133. Gebel K, Bauman A.E. and Petticrew M. (2007). ”The physical environment and physical activity: a critical appraisal of review articles”. American Journal of Preventive Medicine 32, 361–369. Gemeente Amsterdam. (2013). Amsterdam Aantrekkelijk en Bereikbaar, MobiliteitsAanpak 2030. 80 pp. Gemeente Amsterdam (2016). Concept Kader Voetganger. (not published). Gemeente Amsterdam (2016) Thermometer van de Bereikbaarheid 2016. Gemeente Amsterdam (2016). Ruimtevraag van de voetganger (Ruben de Bruijne). Gehl, J. (2010). Cities for People, Washington: Island Press. 288pp. Gehl Architects, (2004). Towards a Fine City for People: Public Spaces and Public Life, London: Gehl Architects, Central London Partnership and Transport for London. Giles-Corti, B., Broomhall, M. H., Knuiman, M., Collins, C., Douglas, K., Ng, K. and Donovan, R. J. (2005). ”Increasing walking: how important is distance to, attractiveness, and size of public open space? ”. American Journal of Preventive Medicine, 28(2), 169-176. Hillier, B. and Hanson, J. (1984). The Social Logic of Space, Cambridge: Cambridge University Press.103pp.
134
Ubeda, Julia Walkability: from research to policy making ISOCARP-OAPA Conference2017
12
Hillier, B. and Lida, S. (2005). ”Network and Psychological effects in urban movement”. In Cohn and Mark (Eds), Proceedings of Spatial Information Theory: International Conference, COSIT 2005, LNCS 3693, pp. 475-490, Springer-Verlag, Berlin. Holbrow, G. (2010). ”Walking the Network. A novel methodology for measuring walkability using distance to destinations along a network”. Case study location: Washington, D.C. Hollenstein, D. and Bleisch, S. (2016). ”Walkability for different urban granularities”. The International Archives of the Photogrammetry, Remote Sensing and Spatial Information Sciences, Volume XLI-B2, XXIII ISPRS Congress, July 2016, Prague. Doi:10.5194/isprsarchives-XLI-B2-703-2016. Koohsari, M. J., Mavoa, S., Villianueva, K., Sugiyama, T., Badland, H., Kaczynski, A. T. and Giles-Corti, B. (2015). ”Public open space, physical activity, urban design and public health: Concepts, methods and research agenda”. Health and Place 33, 75-82. Rattan, A., Campese, A. and Eden, Ch. (2012). ”Modeling walkability. Automating analysis so it is easily repeated”. Winter, Esri.com. Sallis, J. F., Owen, N., and Fisher, E. B. (2008). ”Ecological models of health behaviour”. In K. Glanz, B. Rimer & K. Viswanath (Eds.), Health behaviour and health education: Theory, research, and practice (Vol. 4, pp. 465-486.). San Francisco: Jossey-Bass Speck, J. (2014). ”Alburquerque, New Mexico: Downtown walkability analysis”. AICP, CNU-A, Leed-AP, asla, Speck and Asssociates LLC. 100pp. Troped, P. J., Wilson, J. S., Matthews, C. E., Cromley, E. K., and Melly, S. J. (2010). ”The built environment and location-based physical activity”. American Journal of Preventive Medicine 38(4), 429-438. Valera- Sosa, A. (2014). Walkability for Health. Center for Health Design. 52pp Yamada, I. , Brown, B. , Smith, K. , Zick, C. , Lori Kowaleski-Jones, L. and Fan, J. (2012). ”Mixed land use and obesity: an empirical comparison of alternative land use measures and geographic scales”. The Professional Geographer 64 (2), 157-177
135
Abstract title Scrutinizing Greenness and Smartness in New Construction: Toward an Economical,
Context-Conscious, and Circular Approach. The Case of Das Eckwerk, Berlin
Author M.Sc. Scheerbarth, Benjamin, Eckwerk Entwicklungs GmbH, BERLIN, Germany (Presenting
author)
Abstract
Whether or not the buzz is justified, the technophiliac concept of the smart city and its promise of
unprecedented (resource) efficiency became the central paradigm of present day urban
development politics. However, with a few notable exceptions the day-to-day praxis of local urban
development carries forward its struggle to negotiate the expectations of the triple bottom line.
While the advancement of eco-innovative technologies (BIM, IoT, LED, PV, etc.) outpaces itself, the
way buildings are planned (market-led), built (with largely non-regenerative materials), used
(inflexibly) and demolished (instead of recycled) has not changed significantly in recent history.
Drawing on practical experiences from the planning of Das Eckwerk, a major bottom-up urban
development initiative in Berlin, we find that the bottleneck to building smarter is the linearity of
value chains in urban development, real estate and architecture, which often hinder sustainable
technologies to play (and pay) out.
These practical lessons reflect and exemplify the concerns and ambitions of what Stahel has long
coined the functional economy (1986) or, later, the performance economy (2006, 2010) and what
Hawker, Lovins and Lovins referred to as an economy of service and flow (1999), i.e. the strategy of
selling and procuring performance instead of goods to incentivize and reward resource productivity.
While the first applications of closed-loop or circular logics to industrial processes date back to the
1970s (e.g. Boulding, 1966; Stahel & Reday, 1976), their widespread political recognition and
prioritization is relatively young (see e.g. McKinsey report series for the Ellen MacArthur Foundation,
2013; European Commission Action Plan for the Circular Economy, 2015)
In our quest to identify and negotiate relevant business models, we elaborate on what we suggest to
be a precondition for them to take hold: a systemic divorce of certain elements of technical
equipment from the building envelope. This separation has at least four dimensions: material
(exposing technology inside buildings), spatial (extending technology beyond buildings), temporal
(exploiting different lifecycles of technology and buildings), and financial (partitioning investment
volumes).
We close by highlighting some of the challenges and implications this act of technology ‘outsourcing’
might entail: a general shift from ownership towards service provision, a corresponding shift in
professional roles from producers to service providers and, lastly, redefined frameworks of self-
expression. Despite a certain site and context specificity, the questions, lessons and partly
precedential solutions being developed at Das Eckwerk are expected to be of great relevance to
urban development projects grappling with questions of profitability, sustainability, and affordability.
136
Abstract title Betting on Transit and TOD in Las Vegas
Author Dr Carlton, Ian, ECONorthwest + MapCraft.io, PORTLAND, United States of America
(Presenting author)
Abstract
Taking a play out of the Portland transit planning playbook, Las Vegas is placing a bet that
coordinated transit and land use planning will galvanize support for fixed-guideway transit
investments in a region that previously rejected transit system investments on three occasions. This
presentation will highlight technological innovations in GIS analysis that are allowing the Regional
Transportation Commission (RTC) of Southern Nevada to better understand the feasibility of real
estate investments around potential transit alignments. ECONorthwest created a custom web tool to
assess TOD feasibility across the Las Vegas region, which helped foster deep discussions about the
future of the area. In the web-based GIS interface, users performed on-the-fly sensitivity analyses of
policy and market changes along proposed transit corridors to see immediate results in intuitive
color-coded maps. Whether it was testing different transit modes, alternative route alignments, or
different local land use policies, the team was able to update millions of real estate pro formas in
seconds to demonstrate transit's potential impact on land development, a feedback loop that would
typically require weeks of recalibration and might be avoided to prevent delays in the transit
planning process. The team was able to explore and compare saved land use scenarios online and
export results in tabular and shape-file formats for use in the region's transportation modeling. The
GIS tool allowed for a richer decision-making process and, hopefully, a more thoughtful and widely
supported transit system plan in the Las Vegas valley.
137
Dynamic Evolution of Community Population Spatial Distribution
in Guangzhou Under the Impact of Urban Rail Transit
CHEN Bowen, Tongji University, Shanghai, China
Synopsis: The construction of urban rail transit is an important technical factor affecting the flow of community population and the reconstruction of urban space. The development and utilization of rail transit in big cities in developing countries will lead to rapid changes in urban space in a few years, with rapid construction and high level of technology. This study selected third China Guangzhou city as a typical case, the population spatial distribution is a critical factor in the city space structure, the static characteristics and dynamic evolution often become an important indicator to measure the city spatial structure. Based on the fifth and sixth census data of Guangzhou City, this paper analyzes the characteristics and evolution of the spatial distribution of urban population in Guangzhou from 2000 to 2010.The results show that the urban space in Guangzhou is still a typical single center structure, while the process of suburbanization is constantly strengthening, and the spatial distribution of the population is moving towards equilibrium and decentralization step by step. On this basis, the evolution of the spatial distribution of Guangzhou's population is further explained from the perspective of urban economics.Finally, the development of Guangzhou's urban structure is considered and looked forward to.
1. Introduction Guangzhou is the third largest city in China, the State Council's three major comprehensive gateway cities and international metropolises, and the political, economic and cultural center of the Southern China region[1]. Since the reform and opening to the outside world, with the rapid urbanization and rapid economic development, Guangzhou has also faced a series of challenges, such as the continuous growth of urban population and the reconstruction of the population space[2]. Population problem has increasingly become the focus of urban development in Guangzhou. This paper uses the fifth and 2010 and sixth census data in 2000 to do static analysis and dynamic comparison. From 2000 to 2010 in Guangzhou city administrative division adjustment, administrative divisions in 2000 when the general standard, then the 10 district consists of Dongshan, Yuexiu, Tianhe, Fangcun, Liwan, Whampoa, Panyu and Huadu, Baiyun, Zengcheng and Conghua city by 2, a total of 155 street and town (hereinafter referred to as the for the street). The 2010 sixth census Street area and population corresponding to the administrative division of the fifth census on the merger. Using the geographic information software ArcGIS 10, the population and spatial data of each street in Guangzhou city were extracted, and the population density map was drawn. The population density model regression analysis fitted distribution model of population density in space in 2000 and Guangzhou in 2010, and further from the evolution of the population of Guangzhou city spatial distribution from the perspective of economics explanation. Finally, the development of urban structure in Guangzhou is considered and looked forward to. 2. Characteristics and Evolution of Community Population Spatial Distribution
2.1 Spatial distribution of population density
138
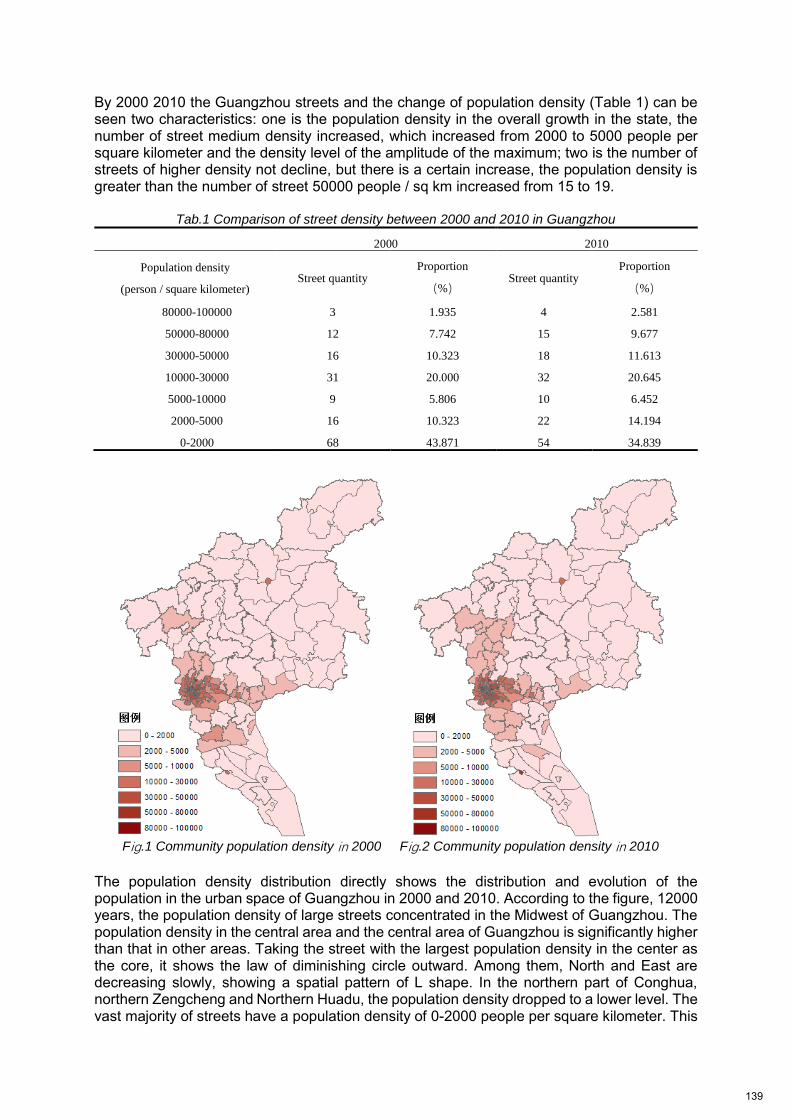
By 2000 2010 the Guangzhou streets and the change of population density (Table 1) can be seen two characteristics: one is the population density in the overall growth in the state, the number of street medium density increased, which increased from 2000 to 5000 people per square kilometer and the density level of the amplitude of the maximum; two is the number of streets of higher density not decline, but there is a certain increase, the population density is greater than the number of street 50000 people / sq km increased from 15 to 19.
Tab.1 Comparison of street density between 2000 and 2010 in Guangzhou
2000 2010
Population density
(person / square kilometer) Street quantity
Proportion
(%) Street quantity
Proportion
(%)
80000-100000 3 1.935 4 2.581
50000-80000 12 7.742 15 9.677
30000-50000 16 10.323 18 11.613
10000-30000 31 20.000 32 20.645
5000-10000 9 5.806 10 6.452
2000-5000 16 10.323 22 14.194
0-2000 68 43.871 54 34.839
Fig.1 Community population density in 2000 Fig.2 Community population density in 2010
The population density distribution directly shows the distribution and evolution of the population in the urban space of Guangzhou in 2000 and 2010. According to the figure, 12000 years, the population density of large streets concentrated in the Midwest of Guangzhou. The population density in the central area and the central area of Guangzhou is significantly higher than that in other areas. Taking the street with the largest population density in the center as the core, it shows the law of diminishing circle outward. Among them, North and East are decreasing slowly, showing a spatial pattern of L shape. In the northern part of Conghua, northern Zengcheng and Northern Huadu, the population density dropped to a lower level. The vast majority of streets have a population density of 0-2000 people per square kilometer. This
139
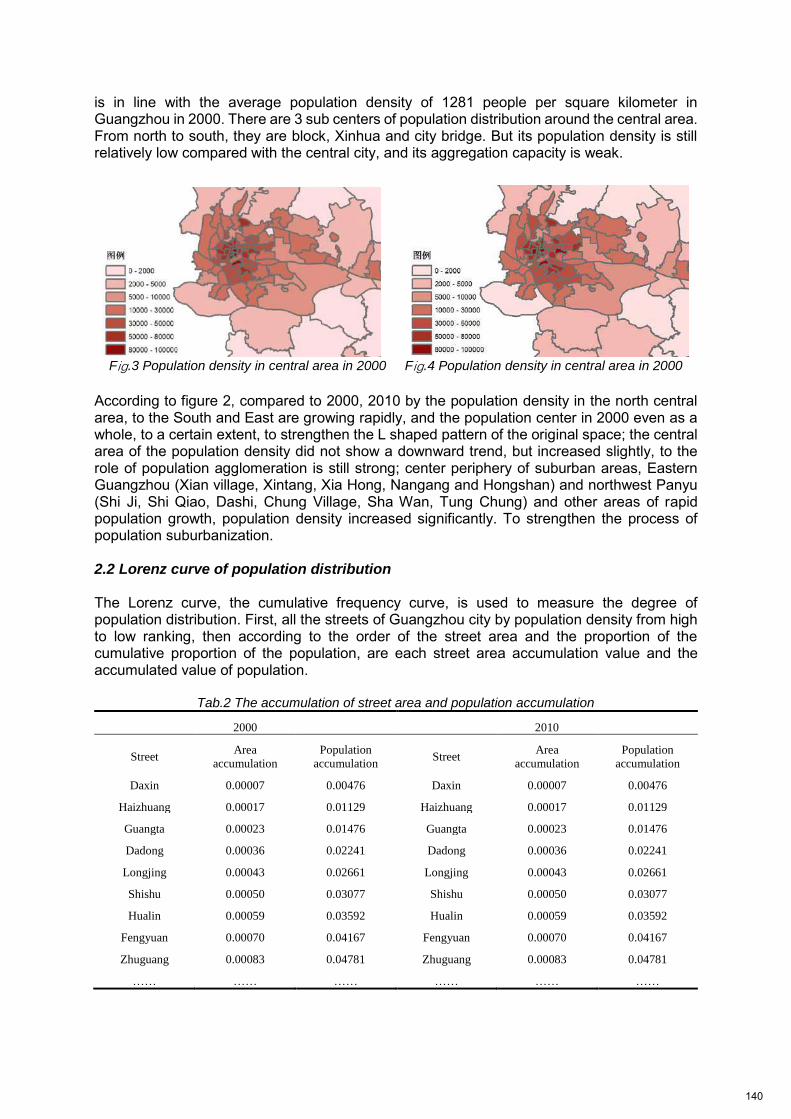
is in line with the average population density of 1281 people per square kilometer in Guangzhou in 2000. There are 3 sub centers of population distribution around the central area. From north to south, they are block, Xinhua and city bridge. But its population density is still relatively low compared with the central city, and its aggregation capacity is weak.
Fig.3 Population density in central area in 2000 Fig.4 Population density in central area in 2000
According to figure 2, compared to 2000, 2010 by the population density in the north central area, to the South and East are growing rapidly, and the population center in 2000 even as a whole, to a certain extent, to strengthen the L shaped pattern of the original space; the central area of the population density did not show a downward trend, but increased slightly, to the role of population agglomeration is still strong; center periphery of suburban areas, Eastern Guangzhou (Xian village, Xintang, Xia Hong, Nangang and Hongshan) and northwest Panyu (Shi Ji, Shi Qiao, Dashi, Chung Village, Sha Wan, Tung Chung) and other areas of rapid population growth, population density increased significantly. To strengthen the process of population suburbanization. 2.2 Lorenz curve of population distribution The Lorenz curve, the cumulative frequency curve, is used to measure the degree of population distribution. First, all the streets of Guangzhou city by population density from high to low ranking, then according to the order of the street area and the proportion of the cumulative proportion of the population, are each street area accumulation value and the accumulated value of population.
Tab.2 The accumulation of street area and population accumulation
2000 2010
Street Area
accumulation
Population
accumulation Street
Area
accumulation
Population
accumulation
Daxin 0.00007 0.00476 Daxin 0.00007 0.00476
Haizhuang 0.00017 0.01129 Haizhuang 0.00017 0.01129
Guangta 0.00023 0.01476 Guangta 0.00023 0.01476
Dadong 0.00036 0.02241 Dadong 0.00036 0.02241
Longjing 0.00043 0.02661 Longjing 0.00043 0.02661
Shishu 0.00050 0.03077 Shishu 0.00050 0.03077
Hualin 0.00059 0.03592 Hualin 0.00059 0.03592
Fengyuan 0.00070 0.04167 Fengyuan 0.00070 0.04167
Zhuguang 0.00083 0.04781 Zhuguang 0.00083 0.04781
…… …… …… …… …… ……
140
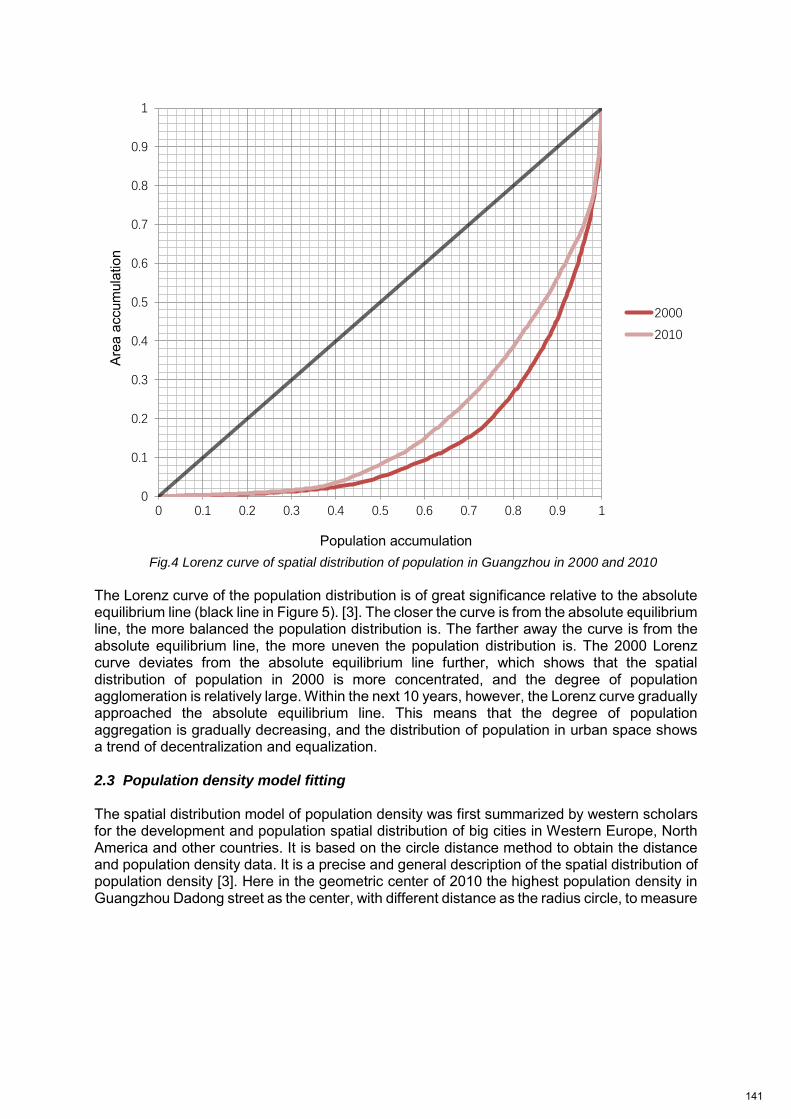
Fig.4 Lorenz curve of spatial distribution of population in Guangzhou in 2000 and 2010
The Lorenz curve of the population distribution is of great significance relative to the absolute equilibrium line (black line in Figure 5). [3]. The closer the curve is from the absolute equilibrium line, the more balanced the population distribution is. The farther away the curve is from the absolute equilibrium line, the more uneven the population distribution is. The 2000 Lorenz curve deviates from the absolute equilibrium line further, which shows that the spatial distribution of population in 2000 is more concentrated, and the degree of population agglomeration is relatively large. Within the next 10 years, however, the Lorenz curve gradually approached the absolute equilibrium line. This means that the degree of population aggregation is gradually decreasing, and the distribution of population in urban space shows a trend of decentralization and equalization. 2.3 Population density model fitting The spatial distribution model of population density was first summarized by western scholars for the development and population spatial distribution of big cities in Western Europe, North America and other countries. It is based on the circle distance method to obtain the distance and population density data. It is a precise and general description of the spatial distribution of population density [3]. Here in the geometric center of 2010 the highest population density in Guangzhou Dadong street as the center, with different distance as the radius circle, to measure
0
0.1
0.2
0.3
0.4
0.5
0.6
0.7
0.8
0.9
1
0 0.1 0.2 0.3 0.4 0.5 0.6 0.7 0.8 0.9 1
面积累加值
人口累加值
2000
2010
Population accumulation
Are
a ac
cum
ulat
ion
141
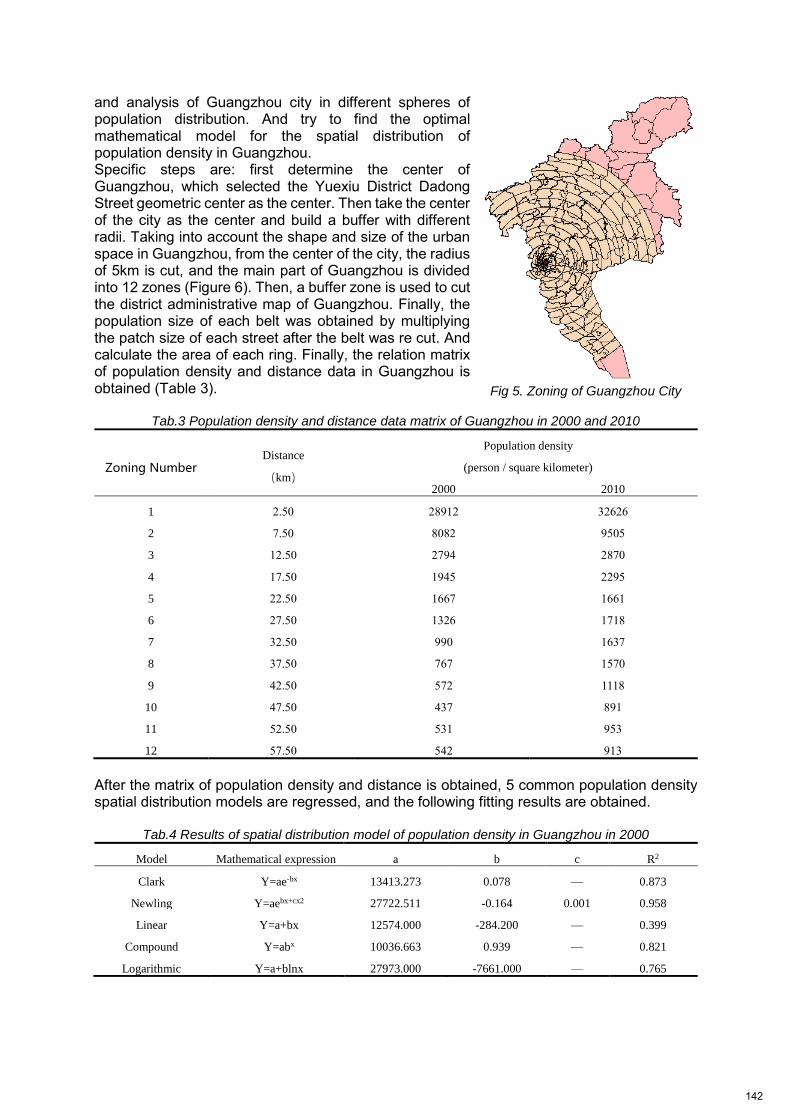
and analysis of Guangzhou city in different spheres of population distribution. And try to find the optimal mathematical model for the spatial distribution of population density in Guangzhou. Specific steps are: first determine the center of Guangzhou, which selected the Yuexiu District Dadong Street geometric center as the center. Then take the center of the city as the center and build a buffer with different radii. Taking into account the shape and size of the urban space in Guangzhou, from the center of the city, the radius of 5km is cut, and the main part of Guangzhou is divided into 12 zones (Figure 6). Then, a buffer zone is used to cut the district administrative map of Guangzhou. Finally, the population size of each belt was obtained by multiplying the patch size of each street after the belt was re cut. And calculate the area of each ring. Finally, the relation matrix of population density and distance data in Guangzhou is obtained (Table 3).
Tab.3 Population density and distance data matrix of Guangzhou in 2000 and 2010
Zoning Number Distance
(km)
Population density
(person / square kilometer)
2000 2010
1 2.50 28912 32626
2 7.50 8082 9505
3 12.50 2794 2870
4 17.50 1945 2295
5 22.50 1667 1661
6 27.50 1326 1718
7 32.50 990 1637
8 37.50 767 1570
9 42.50 572 1118
10 47.50 437 891
11 52.50 531 953
12 57.50 542 913
After the matrix of population density and distance is obtained, 5 common population density spatial distribution models are regressed, and the following fitting results are obtained.
Tab.4 Results of spatial distribution model of population density in Guangzhou in 2000
Model Mathematical expression a b c R2
Clark Y=ae-bx 13413.273 0.078 — 0.873
Newling Y=aebx+cx2 27722.511 -0.164 0.001 0.958
Linear Y=a+bx 12574.000 -284.200 — 0.399
Compound Y=abx 10036.663 0.939 — 0.821
Logarithmic Y=a+blnx 27973.000 -7661.000 — 0.765
Fig 5. Zoning of Guangzhou City
142
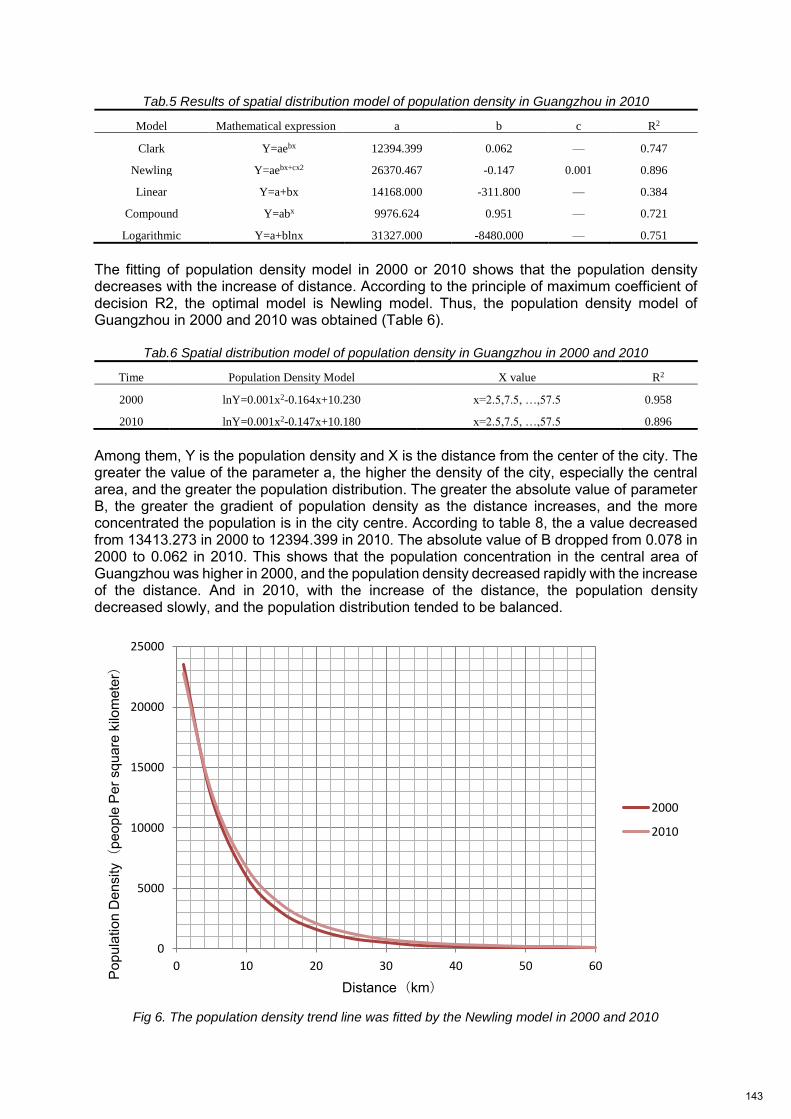
Tab.5 Results of spatial distribution model of population density in Guangzhou in 2010
Model Mathematical expression a b c R2
Clark Y=aebx 12394.399 0.062 — 0.747
Newling Y=aebx+cx2 26370.467 -0.147 0.001 0.896
Linear Y=a+bx 14168.000 -311.800 — 0.384
Compound Y=abx 9976.624 0.951 — 0.721
Logarithmic Y=a+blnx 31327.000 -8480.000 — 0.751
The fitting of population density model in 2000 or 2010 shows that the population density decreases with the increase of distance. According to the principle of maximum coefficient of decision R2, the optimal model is Newling model. Thus, the population density model of Guangzhou in 2000 and 2010 was obtained (Table 6).
Tab.6 Spatial distribution model of population density in Guangzhou in 2000 and 2010
Time Population Density Model X value R2
2000 lnY=0.001x2-0.164x+10.230 x=2.5,7.5, …,57.5 0.958
2010 lnY=0.001x2-0.147x+10.180 x=2.5,7.5, …,57.5 0.896
Among them, Y is the population density and X is the distance from the center of the city. The greater the value of the parameter a, the higher the density of the city, especially the central area, and the greater the population distribution. The greater the absolute value of parameter B, the greater the gradient of population density as the distance increases, and the more concentrated the population is in the city centre. According to table 8, the a value decreased from 13413.273 in 2000 to 12394.399 in 2010. The absolute value of B dropped from 0.078 in 2000 to 0.062 in 2010. This shows that the population concentration in the central area of Guangzhou was higher in 2000, and the population density decreased rapidly with the increase of the distance. And in 2010, with the increase of the distance, the population density decreased slowly, and the population distribution tended to be balanced.
Fig 6. The population density trend line was fitted by the Newling model in 2000 and 2010
0
5000
10000
15000
20000
25000
0 10 20 30 40 50 60
人口
密度
(人
/平方
公里)
距离(千米)
2000
2010
Distance(km)
Pop
ulat
ion
Den
sity(
peop
le P
er s
quar
e ki
lom
eter)
143
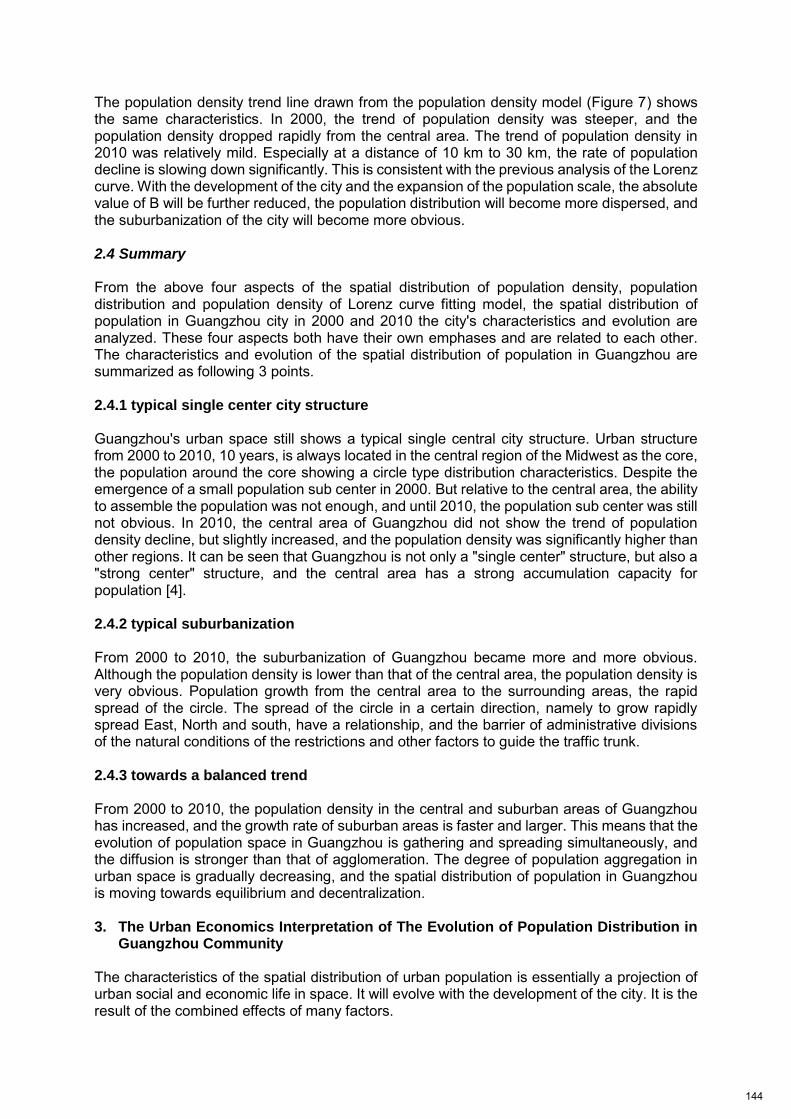
The population density trend line drawn from the population density model (Figure 7) shows the same characteristics. In 2000, the trend of population density was steeper, and the population density dropped rapidly from the central area. The trend of population density in 2010 was relatively mild. Especially at a distance of 10 km to 30 km, the rate of population decline is slowing down significantly. This is consistent with the previous analysis of the Lorenz curve. With the development of the city and the expansion of the population scale, the absolute value of B will be further reduced, the population distribution will become more dispersed, and the suburbanization of the city will become more obvious. 2.4 Summary From the above four aspects of the spatial distribution of population density, population distribution and population density of Lorenz curve fitting model, the spatial distribution of population in Guangzhou city in 2000 and 2010 the city's characteristics and evolution are analyzed. These four aspects both have their own emphases and are related to each other. The characteristics and evolution of the spatial distribution of population in Guangzhou are summarized as following 3 points. 2.4.1 typical single center city structure Guangzhou's urban space still shows a typical single central city structure. Urban structure from 2000 to 2010, 10 years, is always located in the central region of the Midwest as the core, the population around the core showing a circle type distribution characteristics. Despite the emergence of a small population sub center in 2000. But relative to the central area, the ability to assemble the population was not enough, and until 2010, the population sub center was still not obvious. In 2010, the central area of Guangzhou did not show the trend of population density decline, but slightly increased, and the population density was significantly higher than other regions. It can be seen that Guangzhou is not only a "single center" structure, but also a "strong center" structure, and the central area has a strong accumulation capacity for population [4]. 2.4.2 typical suburbanization From 2000 to 2010, the suburbanization of Guangzhou became more and more obvious. Although the population density is lower than that of the central area, the population density is very obvious. Population growth from the central area to the surrounding areas, the rapid spread of the circle. The spread of the circle in a certain direction, namely to grow rapidly spread East, North and south, have a relationship, and the barrier of administrative divisions of the natural conditions of the restrictions and other factors to guide the traffic trunk. 2.4.3 towards a balanced trend From 2000 to 2010, the population density in the central and suburban areas of Guangzhou has increased, and the growth rate of suburban areas is faster and larger. This means that the evolution of population space in Guangzhou is gathering and spreading simultaneously, and the diffusion is stronger than that of agglomeration. The degree of population aggregation in urban space is gradually decreasing, and the spatial distribution of population in Guangzhou is moving towards equilibrium and decentralization. 3. The Urban Economics Interpretation of The Evolution of Population Distribution in
Guangzhou Community The characteristics of the spatial distribution of urban population is essentially a projection of urban social and economic life in space. It will evolve with the development of the city. It is the result of the combined effects of many factors.
144

3.1 Urban economic development and residents' income increase From 2000 to 2010, the per capita GDP of Guangzhou rose from 25626 yuan to 87458 yuan, with an average annual growth of 6183 yuan. The development of urban economy and the formation of agglomeration economic benefits form benign interaction. On the one hand, more enterprises and people gathered in Guangzhou, which brought about the demand for land. And the central area is too tense to bear the new population (Figure 8), and the development from the central area to the outside is an inevitable trend and demand. On the other hand, the improvement of the economic level has increased the income of residents to some extent, the purchasing power of residents has increased, and the demand for housing has risen. Suburban houses have attracted great attention to urban residents because of their lower price and beautiful environment. It can be seen that the development of urban economy leads to the increase of residents' income, and the increase of income stimulates the demand for housing and promotes the suburbanization of population.
Fig 7. Land use efficiency of Guangzhou Municipality in 2010
3.2 Housing choice under the principle of cost minimization The significant growth of the population in the suburbs of Guangzhou means that more and more urban residents tend to locate their residences on the outskirts of the central area instead of the outer suburbs. According to the residential location model, residential choice can be abstracted to weigh the cost of housing and commuting cost, housing costs include rent or house prices, including commuting or commuting costs on school transportation cost and time cost. As the distance from the central district increases, housing costs are falling and commuting costs are rising, and residents will rationally choose their own homes at the minimum of the sum of the two (Figure 9).
Fig. 8 Cost of residential location
0.00%
20.00%
40.00%
60.00%
80.00%
100.00%
120.00%
越秀 海珠 天河 黄埔 荔湾 白云 番禺 花都 南沙 萝岗Yuexiu Haizhu Tianhe Huangpu Liwan Baiyun Panyu Huadu Nansha Luogang
Total Cost
Commuting Cost 1
Commuting Cost 2
Housing Cost
Distance from central city
Cos
t
145
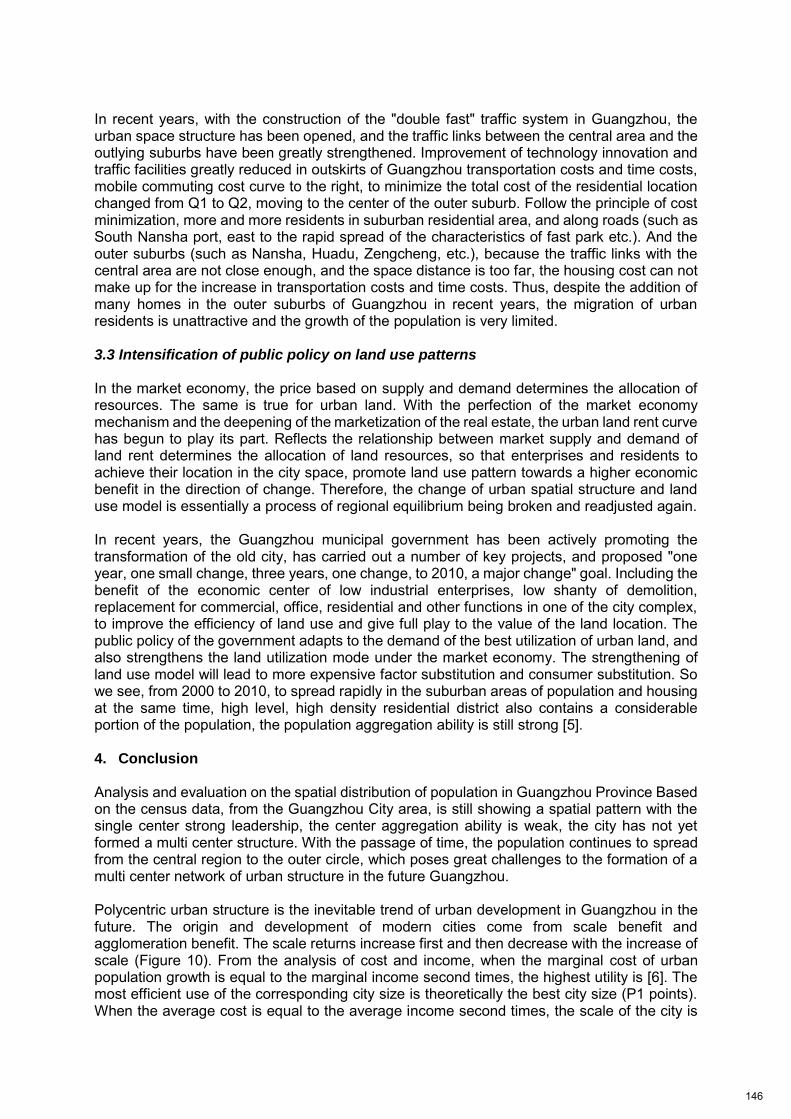
In recent years, with the construction of the "double fast" traffic system in Guangzhou, the urban space structure has been opened, and the traffic links between the central area and the outlying suburbs have been greatly strengthened. Improvement of technology innovation and traffic facilities greatly reduced in outskirts of Guangzhou transportation costs and time costs, mobile commuting cost curve to the right, to minimize the total cost of the residential location changed from Q1 to Q2, moving to the center of the outer suburb. Follow the principle of cost minimization, more and more residents in suburban residential area, and along roads (such as South Nansha port, east to the rapid spread of the characteristics of fast park etc.). And the outer suburbs (such as Nansha, Huadu, Zengcheng, etc.), because the traffic links with the central area are not close enough, and the space distance is too far, the housing cost can not make up for the increase in transportation costs and time costs. Thus, despite the addition of many homes in the outer suburbs of Guangzhou in recent years, the migration of urban residents is unattractive and the growth of the population is very limited. 3.3 Intensification of public policy on land use patterns In the market economy, the price based on supply and demand determines the allocation of resources. The same is true for urban land. With the perfection of the market economy mechanism and the deepening of the marketization of the real estate, the urban land rent curve has begun to play its part. Reflects the relationship between market supply and demand of land rent determines the allocation of land resources, so that enterprises and residents to achieve their location in the city space, promote land use pattern towards a higher economic benefit in the direction of change. Therefore, the change of urban spatial structure and land use model is essentially a process of regional equilibrium being broken and readjusted again. In recent years, the Guangzhou municipal government has been actively promoting the transformation of the old city, has carried out a number of key projects, and proposed "one year, one small change, three years, one change, to 2010, a major change" goal. Including the benefit of the economic center of low industrial enterprises, low shanty of demolition, replacement for commercial, office, residential and other functions in one of the city complex, to improve the efficiency of land use and give full play to the value of the land location. The public policy of the government adapts to the demand of the best utilization of urban land, and also strengthens the land utilization mode under the market economy. The strengthening of land use model will lead to more expensive factor substitution and consumer substitution. So we see, from 2000 to 2010, to spread rapidly in the suburban areas of population and housing at the same time, high level, high density residential district also contains a considerable portion of the population, the population aggregation ability is still strong [5]. 4. Conclusion Analysis and evaluation on the spatial distribution of population in Guangzhou Province Based on the census data, from the Guangzhou City area, is still showing a spatial pattern with the single center strong leadership, the center aggregation ability is weak, the city has not yet formed a multi center structure. With the passage of time, the population continues to spread from the central region to the outer circle, which poses great challenges to the formation of a multi center network of urban structure in the future Guangzhou. Polycentric urban structure is the inevitable trend of urban development in Guangzhou in the future. The origin and development of modern cities come from scale benefit and agglomeration benefit. The scale returns increase first and then decrease with the increase of scale (Figure 10). From the analysis of cost and income, when the marginal cost of urban population growth is equal to the marginal income second times, the highest utility is [6]. The most efficient use of the corresponding city size is theoretically the best city size (P1 points). When the average cost is equal to the average income second times, the scale of the city is
146
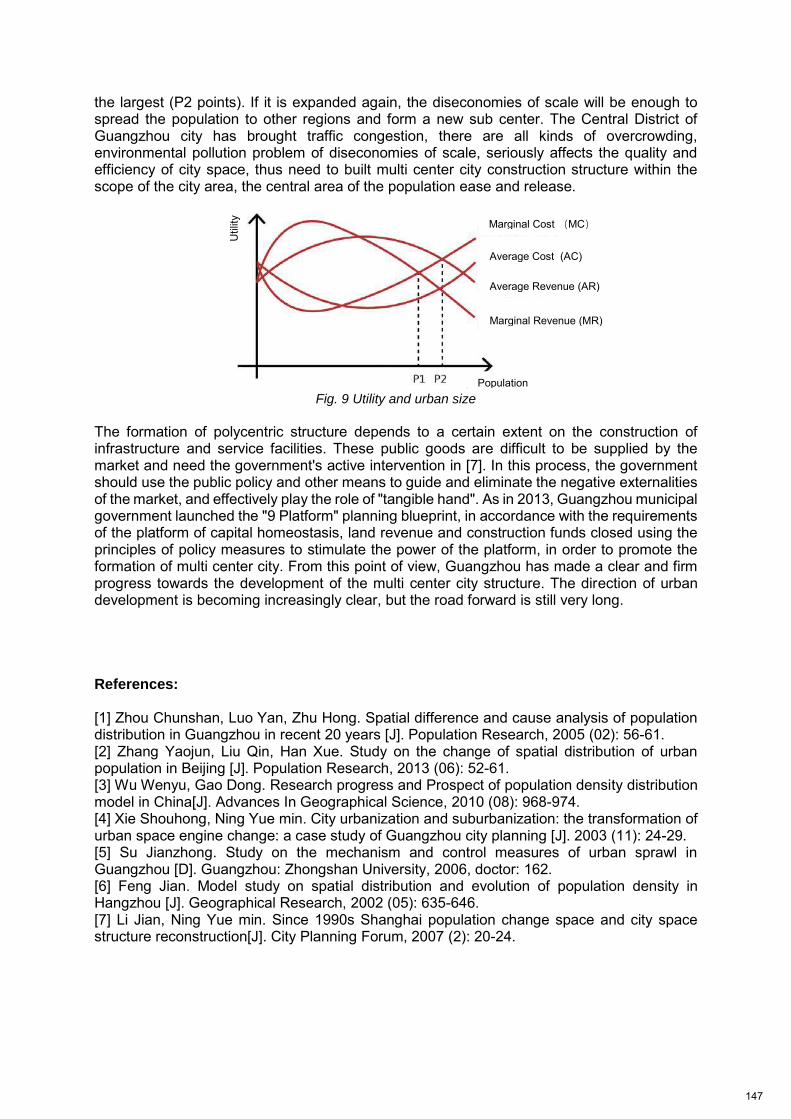
the largest (P2 points). If it is expanded again, the diseconomies of scale will be enough to spread the population to other regions and form a new sub center. The Central District of Guangzhou city has brought traffic congestion, there are all kinds of overcrowding, environmental pollution problem of diseconomies of scale, seriously affects the quality and efficiency of city space, thus need to built multi center city construction structure within the scope of the city area, the central area of the population ease and release.
Fig. 9 Utility and urban size
The formation of polycentric structure depends to a certain extent on the construction of infrastructure and service facilities. These public goods are difficult to be supplied by the market and need the government's active intervention in [7]. In this process, the government should use the public policy and other means to guide and eliminate the negative externalities of the market, and effectively play the role of "tangible hand". As in 2013, Guangzhou municipal government launched the "9 Platform" planning blueprint, in accordance with the requirements of the platform of capital homeostasis, land revenue and construction funds closed using the principles of policy measures to stimulate the power of the platform, in order to promote the formation of multi center city. From this point of view, Guangzhou has made a clear and firm progress towards the development of the multi center city structure. The direction of urban development is becoming increasingly clear, but the road forward is still very long. References: [1] Zhou Chunshan, Luo Yan, Zhu Hong. Spatial difference and cause analysis of population distribution in Guangzhou in recent 20 years [J]. Population Research, 2005 (02): 56-61. [2] Zhang Yaojun, Liu Qin, Han Xue. Study on the change of spatial distribution of urban population in Beijing [J]. Population Research, 2013 (06): 52-61. [3] Wu Wenyu, Gao Dong. Research progress and Prospect of population density distribution model in China[J]. Advances In Geographical Science, 2010 (08): 968-974. [4] Xie Shouhong, Ning Yue min. City urbanization and suburbanization: the transformation of urban space engine change: a case study of Guangzhou city planning [J]. 2003 (11): 24-29. [5] Su Jianzhong. Study on the mechanism and control measures of urban sprawl in Guangzhou [D]. Guangzhou: Zhongshan University, 2006, doctor: 162. [6] Feng Jian. Model study on spatial distribution and evolution of population density in Hangzhou [J]. Geographical Research, 2002 (05): 635-646. [7] Li Jian, Ning Yue min. Since 1990s Shanghai population change space and city space structure reconstruction[J]. City Planning Forum, 2007 (2): 20-24.
Marginal Cost (MC)
Average Cost (AC)
Average Revenue (AR)
Marginal Revenue (MR)
Population
Util
ity
147
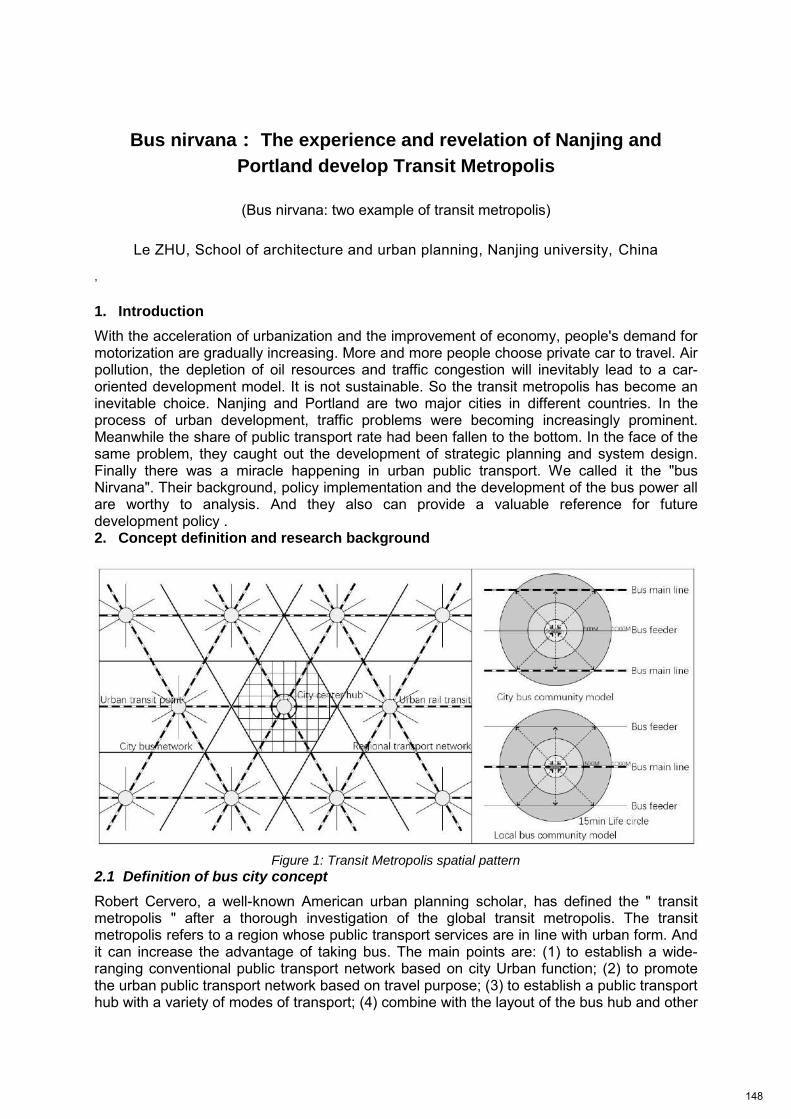
Bus nirvana: The experience and revelation of Nanjing and
Portland develop Transit Metropolis
(Bus nirvana: two example of transit metropolis)
Le ZHU, School of architecture and urban planning, Nanjing university, China
, 1. Introduction
With the acceleration of urbanization and the improvement of economy, people's demand for motorization are gradually increasing. More and more people choose private car to travel. Air pollution, the depletion of oil resources and traffic congestion will inevitably lead to a car-oriented development model. It is not sustainable. So the transit metropolis has become an inevitable choice. Nanjing and Portland are two major cities in different countries. In the process of urban development, traffic problems were becoming increasingly prominent. Meanwhile the share of public transport rate had been fallen to the bottom. In the face of the same problem, they caught out the development of strategic planning and system design. Finally there was a miracle happening in urban public transport. We called it the "bus Nirvana". Their background, policy implementation and the development of the bus power all are worthy to analysis. And they also can provide a valuable reference for future development policy . 2. Concept definition and research background
Figure 1: Transit Metropolis spatial pattern
2.1 Definition of bus city concept
Robert Cervero, a well-known American urban planning scholar, has defined the " transit metropolis " after a thorough investigation of the global transit metropolis. The transit metropolis refers to a region whose public transport services are in line with urban form. And it can increase the advantage of taking bus. The main points are: (1) to establish a wide-ranging conventional public transport network based on city Urban function; (2) to promote the urban public transport network based on travel purpose; (3) to establish a public transport hub with a variety of modes of transport; (4) combine with the layout of the bus hub and other
148
supporting services to improve the construction of facilities; (5) to implement the bus regional franchise. The spatial characteristics of transit metropolis is that the city form and public transport network highly fit (Figure 1).
2.2 Research object selection
Although Nanjing and Portland are in the different countries, they all known for the development of public transport. Nanjing is the capital city of Jiangsu province, located in the eastern part of China, the middle of the Yangtze River. There are 11 districts, with a total area of 6597 square kilometers. The built area in 2013 are 752.83 square kilometers, and the resident population is 818.78 million. Portland is a city located in the United States Oregon, near the Willamette River into the mouth of the Columbia River, belonging to the western United States. Portland is the most populous city in Oregon. According to the 2013 population data, the urban population of Portland is more than 59 million people. While the Portland-based Portland metropolitan area is home to 2.41 million people, the 19th largest US urban area (Table 1).
Tab.1 The overview of Nanjing and Portland
2.3 ted research progress and research ideas
Domestic and foreign scholars have a lot of research on the construction of public transport in Nanjing and Portland. Mainly related to the construction of the relevant planning system, the improvement of traffic index system, the development model, multi-level public transport system to build and so on. Some people consider about the construction of the Portland multi-way public transport system(Jianhong, YE & Xiaohong, CHEN & Hua, ZHANG 2013); Based on the study of the urban spatial characteristics of Portland, it puts forward the development model of public transport oriented(Fengming, SU 2015). There are also some people through the analysis of urban traffic problems in Nanjing and finding that we can improve the city spatial to support the green transport built (Xianteng, LIU & Qing, SHEN & Li, ZHU 2009); Some scholars analyze the specific factors that affect the sharing rate of bus trips (Fei, SHI & Yang, JU 2015). And there are also some people focus on the bus community. They pointed out that the development of TOD model is a good way to solve the problem of urban transport (Yanping, CHEN 2000).
In this paper, through the parallel comparison of Nanjing and Portland try to analyze the development course, the opportunities and challenges of the city. So as to dig out the city's public transport intrinsic motivation. Based on the development of bus supply and demand, we try to discuss the relationship between the development of public transport and land efficient development model. Finally put forward feasible suggestions for the construction of
149

sustainable urban public transport with the multi-subject participation and multi-form development perspective. 3. Development process
3.1 Nanjing public transport development process
Fig.2 Nanjing bus transit total share rate and public transportation share rate figure
The construction of transit metropolis is not smooth sailing. According to the change characteristics of Nanjing bus transit total share rate and public transportation share rate, divide the development progress into three stages: (1)the bus travel decline stage; (2)the rapid growth stage; (3)the steady development stage. (Figure 2)
3.1.1 Phase 1: The decline period of bus travel (1986-1997)
With China opening the door to the world, people's income steadily increased. The number of non-motorized private transport was rapid growth, such as bikes, motorcycles and so on (Figure 3). In that stage, the rate of people using public transport fell to the bottom. By 1997, the number of bus trips was 319,000, and the share rate of public transport was reduced to 8.19%. The public transport development was difficult.
Fig.3 Nanjing residents travel traffic structure
First from the perspective of residents to analyze their reluctance to choose the public transport for daily travels. Through the analysis of the questionnaire about people’s willingness at daily travel in 1997. It can be seen that residents had dissatisfaction with bus travel in three main sections. It was too crowded (29.7%), not on time (19.4%) and waiting for too long (18.2%). All of these indicated that the level of public transport services were far from the residents expectation, and the quality of public transport services should be improved. At the same time about 9.3% of the residents chose bus travel were
150
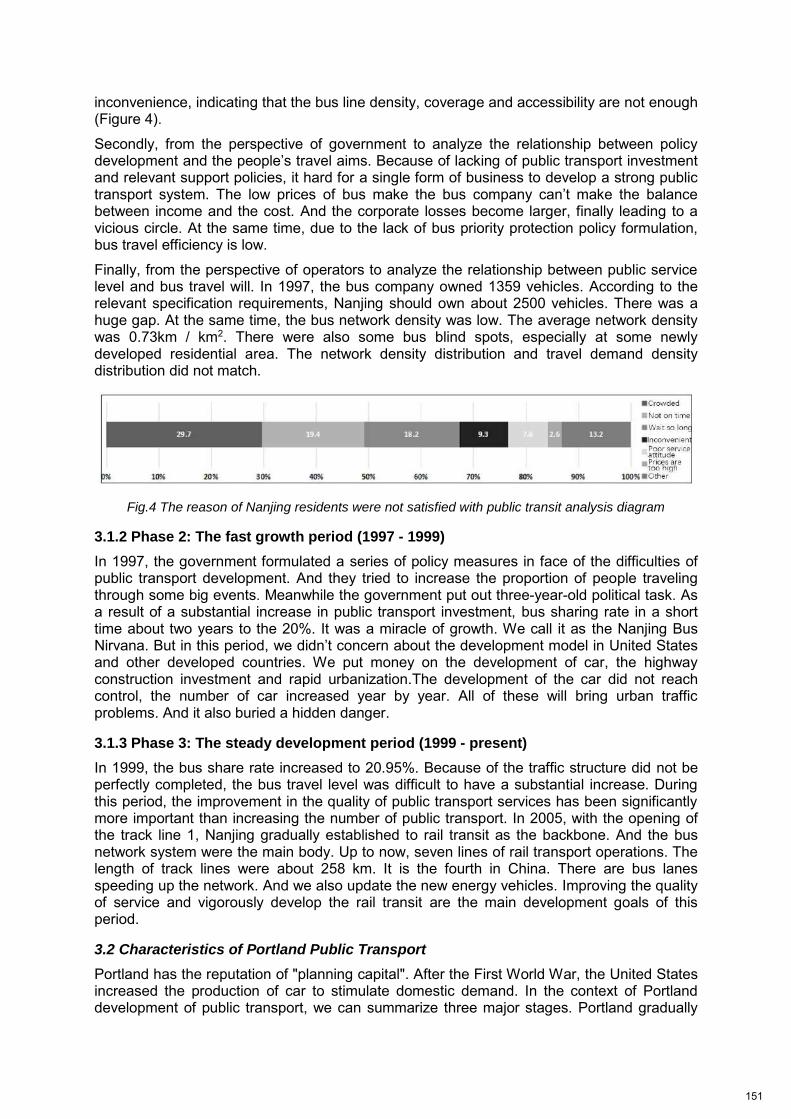
inconvenience, indicating that the bus line density, coverage and accessibility are not enough (Figure 4).
Secondly, from the perspective of government to analyze the relationship between policy development and the people’s travel aims. Because of lacking of public transport investment and relevant support policies, it hard for a single form of business to develop a strong public transport system. The low prices of bus make the bus company can’t make the balance between income and the cost. And the corporate losses become larger, finally leading to a vicious circle. At the same time, due to the lack of bus priority protection policy formulation, bus travel efficiency is low.
Finally, from the perspective of operators to analyze the relationship between public service level and bus travel will. In 1997, the bus company owned 1359 vehicles. According to the relevant specification requirements, Nanjing should own about 2500 vehicles. There was a huge gap. At the same time, the bus network density was low. The average network density was 0.73km / km2. There were also some bus blind spots, especially at some newly developed residential area. The network density distribution and travel demand density distribution did not match.
Fig.4 The reason of Nanjing residents were not satisfied with public transit analysis diagram
3.1.2 Phase 2: The fast growth period (1997 - 1999)
In 1997, the government formulated a series of policy measures in face of the difficulties of public transport development. And they tried to increase the proportion of people traveling through some big events. Meanwhile the government put out three-year-old political task. As a result of a substantial increase in public transport investment, bus sharing rate in a short time about two years to the 20%. It was a miracle of growth. We call it as the Nanjing Bus Nirvana. But in this period, we didn’t concern about the development model in United States and other developed countries. We put money on the development of car, the highway construction investment and rapid urbanization.The development of the car did not reach control, the number of car increased year by year. All of these will bring urban traffic problems. And it also buried a hidden danger.
3.1.3 Phase 3: The steady development period (1999 - present)
In 1999, the bus share rate increased to 20.95%. Because of the traffic structure did not be perfectly completed, the bus travel level was difficult to have a substantial increase. During this period, the improvement in the quality of public transport services has been significantly more important than increasing the number of public transport. In 2005, with the opening of the track line 1, Nanjing gradually established to rail transit as the backbone. And the bus network system were the main body. Up to now, seven lines of rail transport operations. The length of track lines were about 258 km. It is the fourth in China. There are bus lanes speeding up the network. And we also update the new energy vehicles. Improving the quality of service and vigorously develop the rail transit are the main development goals of this period.
3.2 Characteristics of Portland Public Transport
Portland has the reputation of "planning capital". After the First World War, the United States increased the production of car to stimulate domestic demand. In the context of Portland development of public transport, we can summarize three major stages. Portland gradually
151
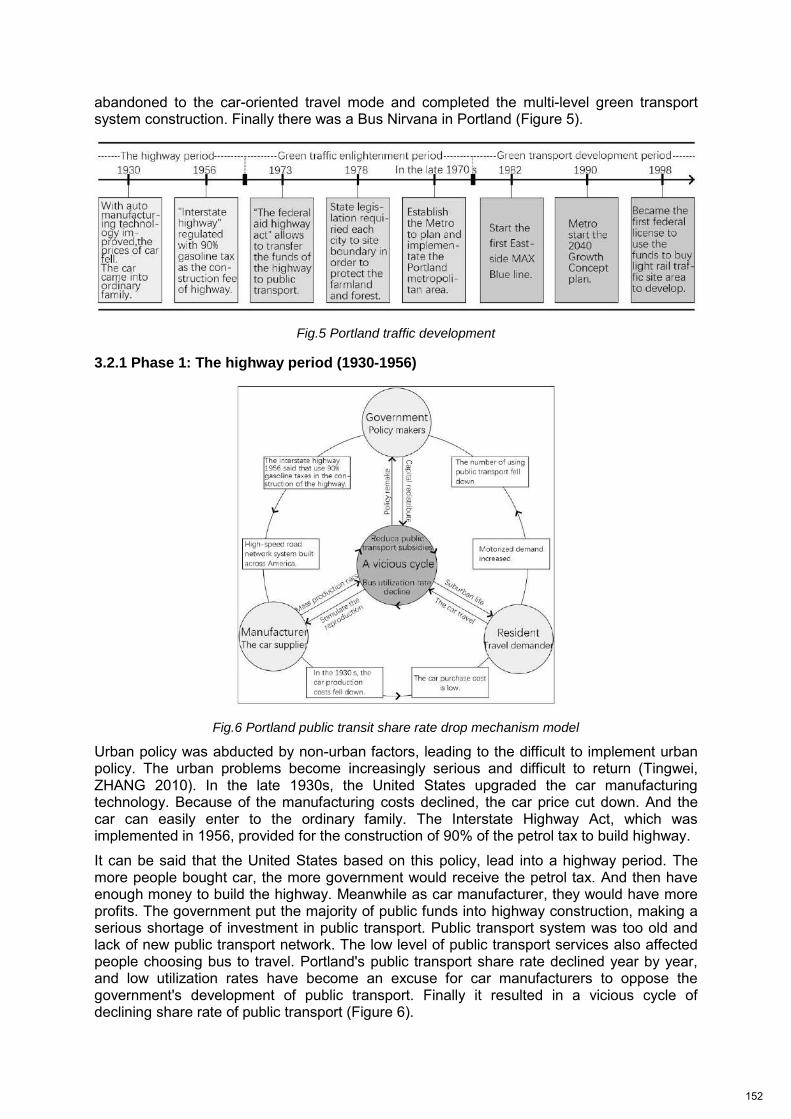
abandoned to the car-oriented travel mode and completed the multi-level green transport system construction. Finally there was a Bus Nirvana in Portland (Figure 5).
Fig.5 Portland traffic development
3.2.1 Phase 1: The highway period (1930-1956)
Fig.6 Portland public transit share rate drop mechanism model
Urban policy was abducted by non-urban factors, leading to the difficult to implement urban policy. The urban problems become increasingly serious and difficult to return (Tingwei, ZHANG 2010). In the late 1930s, the United States upgraded the car manufacturing technology. Because of the manufacturing costs declined, the car price cut down. And the car can easily enter to the ordinary family. The Interstate Highway Act, which was implemented in 1956, provided for the construction of 90% of the petrol tax to build highway.
It can be said that the United States based on this policy, lead into a highway period. The more people bought car, the more government would receive the petrol tax. And then have enough money to build the highway. Meanwhile as car manufacturer, they would have more profits. The government put the majority of public funds into highway construction, making a serious shortage of investment in public transport. Public transport system was too old and lack of new public transport network. The low level of public transport services also affected people choosing bus to travel. Portland's public transport share rate declined year by year, and low utilization rates have become an excuse for car manufacturers to oppose the government's development of public transport. Finally it resulted in a vicious cycle of declining share rate of public transport (Figure 6).
152
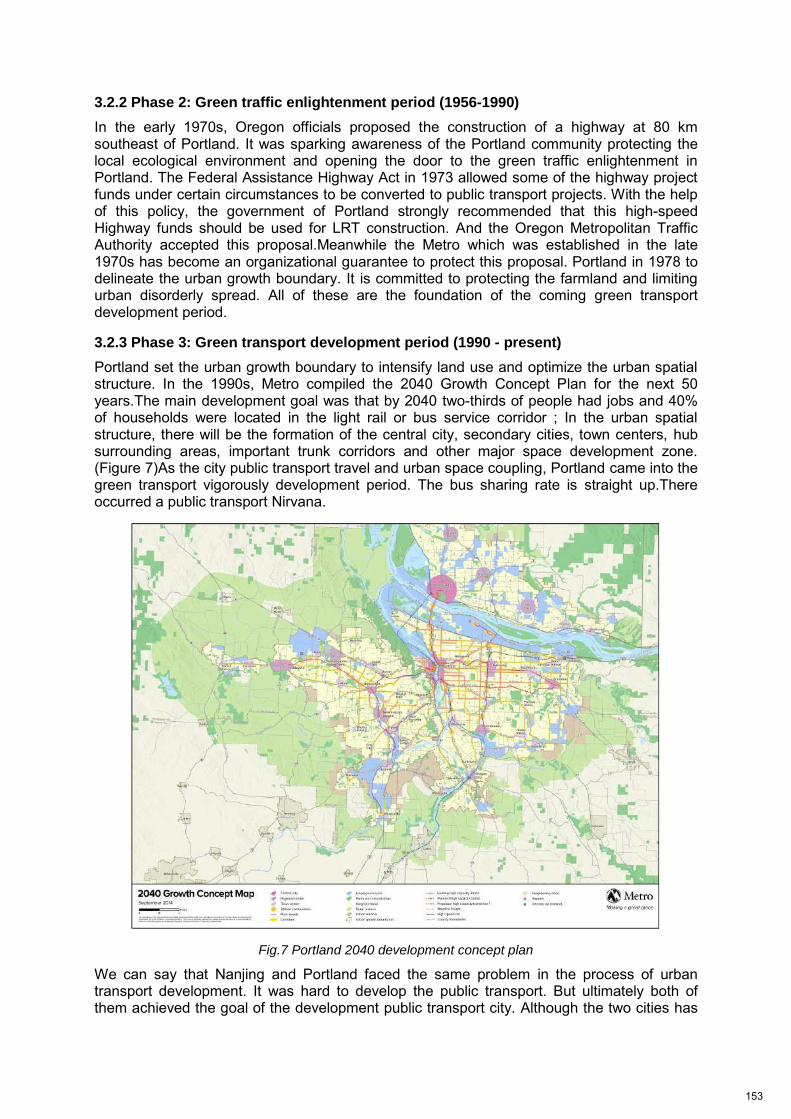
3.2.2 Phase 2: Green traffic enlightenment period (1956-1990)
In the early 1970s, Oregon officials proposed the construction of a highway at 80 km southeast of Portland. It was sparking awareness of the Portland community protecting the local ecological environment and opening the door to the green traffic enlightenment in Portland. The Federal Assistance Highway Act in 1973 allowed some of the highway project funds under certain circumstances to be converted to public transport projects. With the help of this policy, the government of Portland strongly recommended that this high-speed Highway funds should be used for LRT construction. And the Oregon Metropolitan Traffic Authority accepted this proposal.Meanwhile the Metro which was established in the late 1970s has become an organizational guarantee to protect this proposal. Portland in 1978 to delineate the urban growth boundary. It is committed to protecting the farmland and limiting urban disorderly spread. All of these are the foundation of the coming green transport development period.
3.2.3 Phase 3: Green transport development period (1990 - present)
Portland set the urban growth boundary to intensify land use and optimize the urban spatial structure. In the 1990s, Metro compiled the 2040 Growth Concept Plan for the next 50 years.The main development goal was that by 2040 two-thirds of people had jobs and 40% of households were located in the light rail or bus service corridor ; In the urban spatial structure, there will be the formation of the central city, secondary cities, town centers, hub surrounding areas, important trunk corridors and other major space development zone. (Figure 7)As the city public transport travel and urban space coupling, Portland came into the green transport vigorously development period. The bus sharing rate is straight up.There occurred a public transport Nirvana.
Fig.7 Portland 2040 development concept plan
We can say that Nanjing and Portland faced the same problem in the process of urban transport development. It was hard to develop the public transport. But ultimately both of them achieved the goal of the development public transport city. Although the two cities has
153
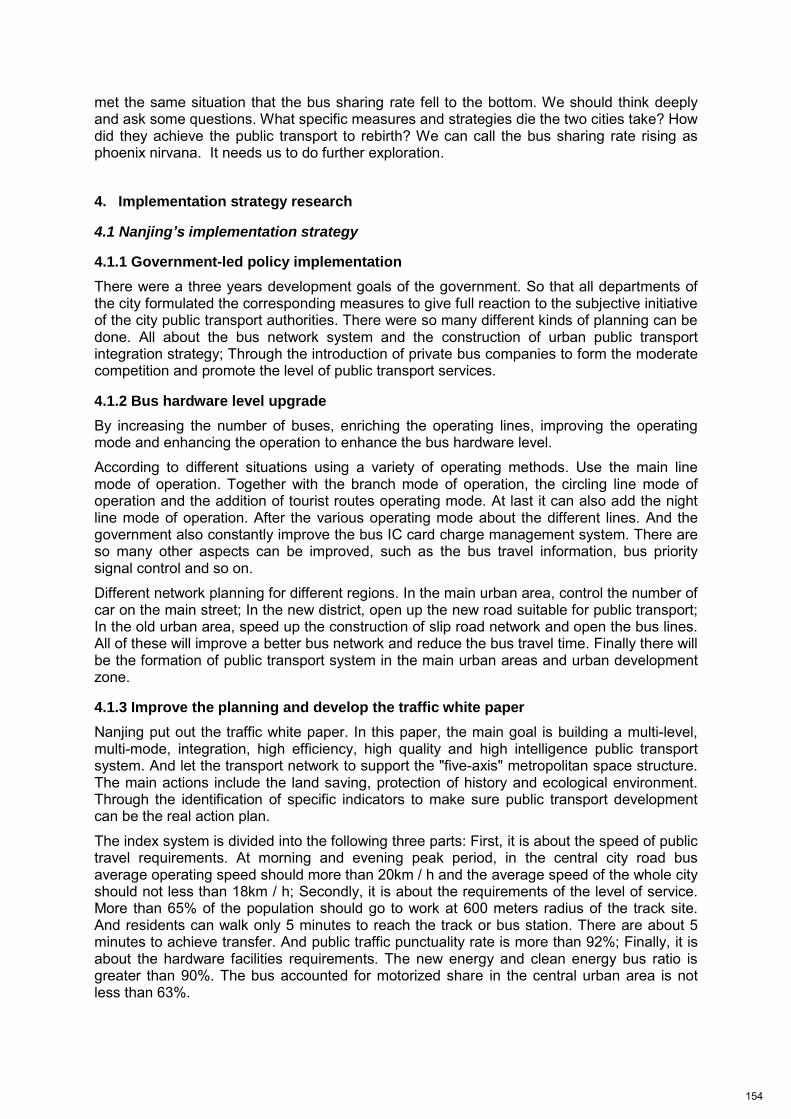
met the same situation that the bus sharing rate fell to the bottom. We should think deeply and ask some questions. What specific measures and strategies die the two cities take? How did they achieve the public transport to rebirth? We can call the bus sharing rate rising as phoenix nirvana. It needs us to do further exploration.
4. Implementation strategy research
4.1 Nanjing’s implementation strategy
4.1.1 Government-led policy implementation
There were a three years development goals of the government. So that all departments of the city formulated the corresponding measures to give full reaction to the subjective initiative of the city public transport authorities. There were so many different kinds of planning can be done. All about the bus network system and the construction of urban public transport integration strategy; Through the introduction of private bus companies to form the moderate competition and promote the level of public transport services.
4.1.2 Bus hardware level upgrade
By increasing the number of buses, enriching the operating lines, improving the operating mode and enhancing the operation to enhance the bus hardware level.
According to different situations using a variety of operating methods. Use the main line mode of operation. Together with the branch mode of operation, the circling line mode of operation and the addition of tourist routes operating mode. At last it can also add the night line mode of operation. After the various operating mode about the different lines. And the government also constantly improve the bus IC card charge management system. There are so many other aspects can be improved, such as the bus travel information, bus priority signal control and so on.
Different network planning for different regions. In the main urban area, control the number of car on the main street; In the new district, open up the new road suitable for public transport; In the old urban area, speed up the construction of slip road network and open the bus lines. All of these will improve a better bus network and reduce the bus travel time. Finally there will be the formation of public transport system in the main urban areas and urban development zone.
4.1.3 Improve the planning and develop the traffic white paper
Nanjing put out the traffic white paper. In this paper, the main goal is building a multi-level, multi-mode, integration, high efficiency, high quality and high intelligence public transport system. And let the transport network to support the "five-axis" metropolitan space structure. The main actions include the land saving, protection of history and ecological environment. Through the identification of specific indicators to make sure public transport development can be the real action plan.
The index system is divided into the following three parts: First, it is about the speed of public travel requirements. At morning and evening peak period, in the central city road bus average operating speed should more than 20km / h and the average speed of the whole city should not less than 18km / h; Secondly, it is about the requirements of the level of service. More than 65% of the population should go to work at 600 meters radius of the track site. And residents can walk only 5 minutes to reach the track or bus station. There are about 5 minutes to achieve transfer. And public traffic punctuality rate is more than 92%; Finally, it is about the hardware facilities requirements. The new energy and clean energy bus ratio is greater than 90%. The bus accounted for motorized share in the central urban area is not less than 63%.
154
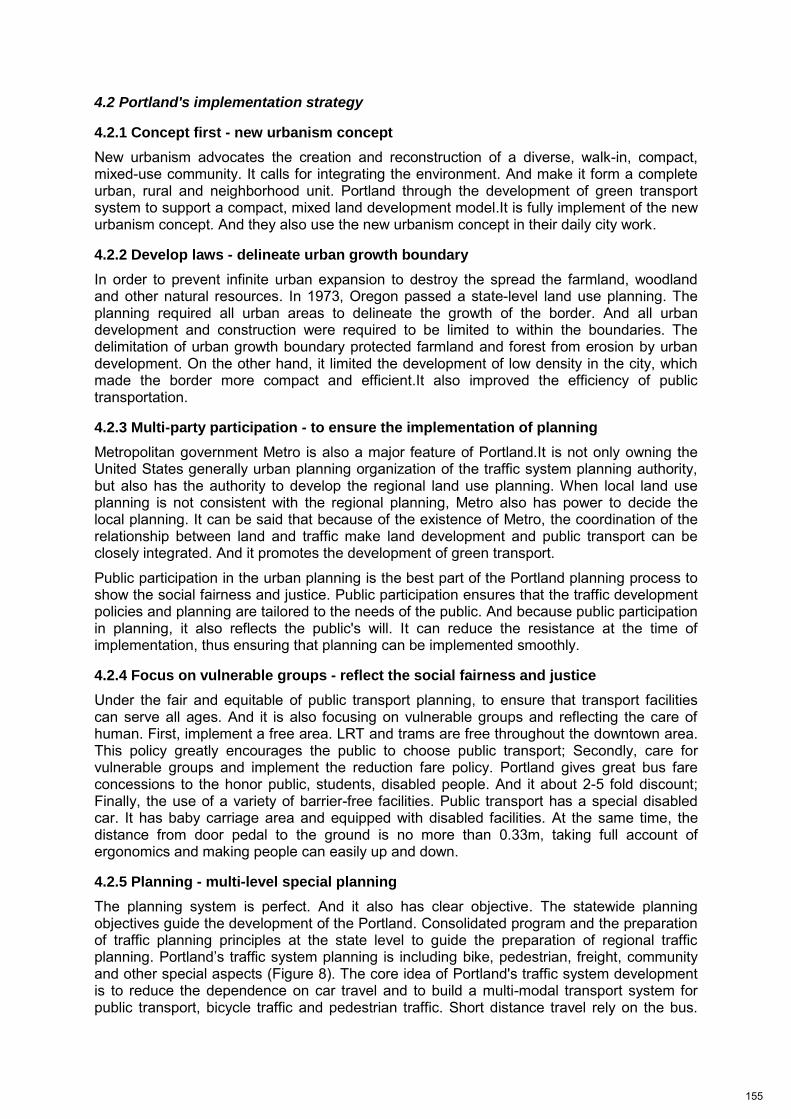
4.2 Portland's implementation strategy
4.2.1 Concept first - new urbanism concept
New urbanism advocates the creation and reconstruction of a diverse, walk-in, compact, mixed-use community. It calls for integrating the environment. And make it form a complete urban, rural and neighborhood unit. Portland through the development of green transport system to support a compact, mixed land development model.It is fully implement of the new urbanism concept. And they also use the new urbanism concept in their daily city work.
4.2.2 Develop laws - delineate urban growth boundary
In order to prevent infinite urban expansion to destroy the spread the farmland, woodland and other natural resources. In 1973, Oregon passed a state-level land use planning. The planning required all urban areas to delineate the growth of the border. And all urban development and construction were required to be limited to within the boundaries. The delimitation of urban growth boundary protected farmland and forest from erosion by urban development. On the other hand, it limited the development of low density in the city, which made the border more compact and efficient.It also improved the efficiency of public transportation.
4.2.3 Multi-party participation - to ensure the implementation of planning
Metropolitan government Metro is also a major feature of Portland.It is not only owning the United States generally urban planning organization of the traffic system planning authority, but also has the authority to develop the regional land use planning. When local land use planning is not consistent with the regional planning, Metro also has power to decide the local planning. It can be said that because of the existence of Metro, the coordination of the relationship between land and traffic make land development and public transport can be closely integrated. And it promotes the development of green transport.
Public participation in the urban planning is the best part of the Portland planning process to show the social fairness and justice. Public participation ensures that the traffic development policies and planning are tailored to the needs of the public. And because public participation in planning, it also reflects the public's will. It can reduce the resistance at the time of implementation, thus ensuring that planning can be implemented smoothly.
4.2.4 Focus on vulnerable groups - reflect the social fairness and justice
Under the fair and equitable of public transport planning, to ensure that transport facilities can serve all ages. And it is also focusing on vulnerable groups and reflecting the care of human. First, implement a free area. LRT and trams are free throughout the downtown area. This policy greatly encourages the public to choose public transport; Secondly, care for vulnerable groups and implement the reduction fare policy. Portland gives great bus fare concessions to the honor public, students, disabled people. And it about 2-5 fold discount; Finally, the use of a variety of barrier-free facilities. Public transport has a special disabled car. It has baby carriage area and equipped with disabled facilities. At the same time, the distance from door pedal to the ground is no more than 0.33m, taking full account of ergonomics and making people can easily up and down.
4.2.5 Planning - multi-level special planning
The planning system is perfect. And it also has clear objective. The statewide planning objectives guide the development of the Portland. Consolidated program and the preparation of traffic planning principles at the state level to guide the preparation of regional traffic planning. Portland’s traffic system planning is including bike, pedestrian, freight, community and other special aspects (Figure 8). The core idea of Portland's traffic system development is to reduce the dependence on car travel and to build a multi-modal transport system for public transport, bicycle traffic and pedestrian traffic. Short distance travel rely on the bus.
155
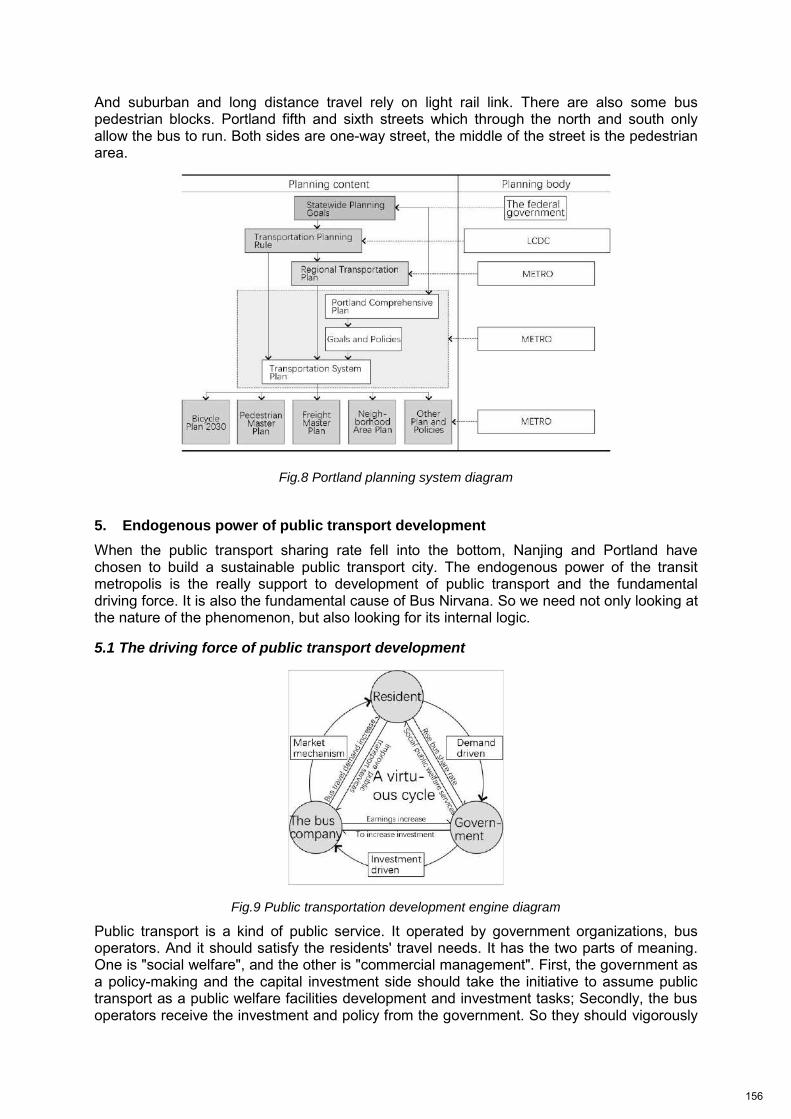
And suburban and long distance travel rely on light rail link. There are also some bus pedestrian blocks. Portland fifth and sixth streets which through the north and south only allow the bus to run. Both sides are one-way street, the middle of the street is the pedestrian area.
Fig.8 Portland planning system diagram
5. Endogenous power of public transport development
When the public transport sharing rate fell into the bottom, Nanjing and Portland have chosen to build a sustainable public transport city. The endogenous power of the transit metropolis is the really support to development of public transport and the fundamental driving force. It is also the fundamental cause of Bus Nirvana. So we need not only looking at the nature of the phenomenon, but also looking for its internal logic.
5.1 The driving force of public transport development
Fig.9 Public transportation development engine diagram
Public transport is a kind of public service. It operated by government organizations, bus operators. And it should satisfy the residents' travel needs. It has the two parts of meaning. One is "social welfare", and the other is "commercial management". First, the government as a policy-making and the capital investment side should take the initiative to assume public transport as a public welfare facilities development and investment tasks; Secondly, the bus operators receive the investment and policy from the government. So they should vigorously
156
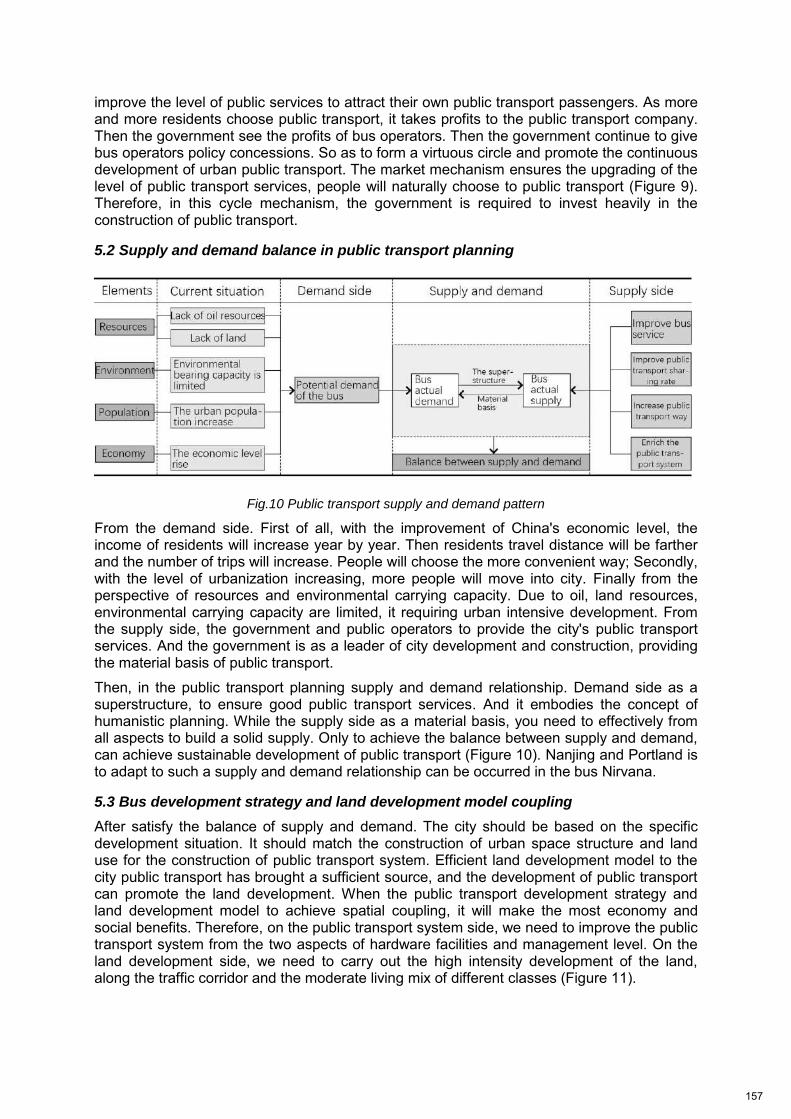
improve the level of public services to attract their own public transport passengers. As more and more residents choose public transport, it takes profits to the public transport company. Then the government see the profits of bus operators. Then the government continue to give bus operators policy concessions. So as to form a virtuous circle and promote the continuous development of urban public transport. The market mechanism ensures the upgrading of the level of public transport services, people will naturally choose to public transport (Figure 9). Therefore, in this cycle mechanism, the government is required to invest heavily in the construction of public transport.
5.2 Supply and demand balance in public transport planning
Fig.10 Public transport supply and demand pattern
From the demand side. First of all, with the improvement of China's economic level, the income of residents will increase year by year. Then residents travel distance will be farther and the number of trips will increase. People will choose the more convenient way; Secondly, with the level of urbanization increasing, more people will move into city. Finally from the perspective of resources and environmental carrying capacity. Due to oil, land resources, environmental carrying capacity are limited, it requiring urban intensive development. From the supply side, the government and public operators to provide the city's public transport services. And the government is as a leader of city development and construction, providing the material basis of public transport.
Then, in the public transport planning supply and demand relationship. Demand side as a superstructure, to ensure good public transport services. And it embodies the concept of humanistic planning. While the supply side as a material basis, you need to effectively from all aspects to build a solid supply. Only to achieve the balance between supply and demand, can achieve sustainable development of public transport (Figure 10). Nanjing and Portland is to adapt to such a supply and demand relationship can be occurred in the bus Nirvana.
5.3 Bus development strategy and land development model coupling
After satisfy the balance of supply and demand. The city should be based on the specific development situation. It should match the construction of urban space structure and land use for the construction of public transport system. Efficient land development model to the city public transport has brought a sufficient source, and the development of public transport can promote the land development. When the public transport development strategy and land development model to achieve spatial coupling, it will make the most economy and social benefits. Therefore, on the public transport system side, we need to improve the public transport system from the two aspects of hardware facilities and management level. On the land development side, we need to carry out the high intensity development of the land, along the traffic corridor and the moderate living mix of different classes (Figure 11).
157
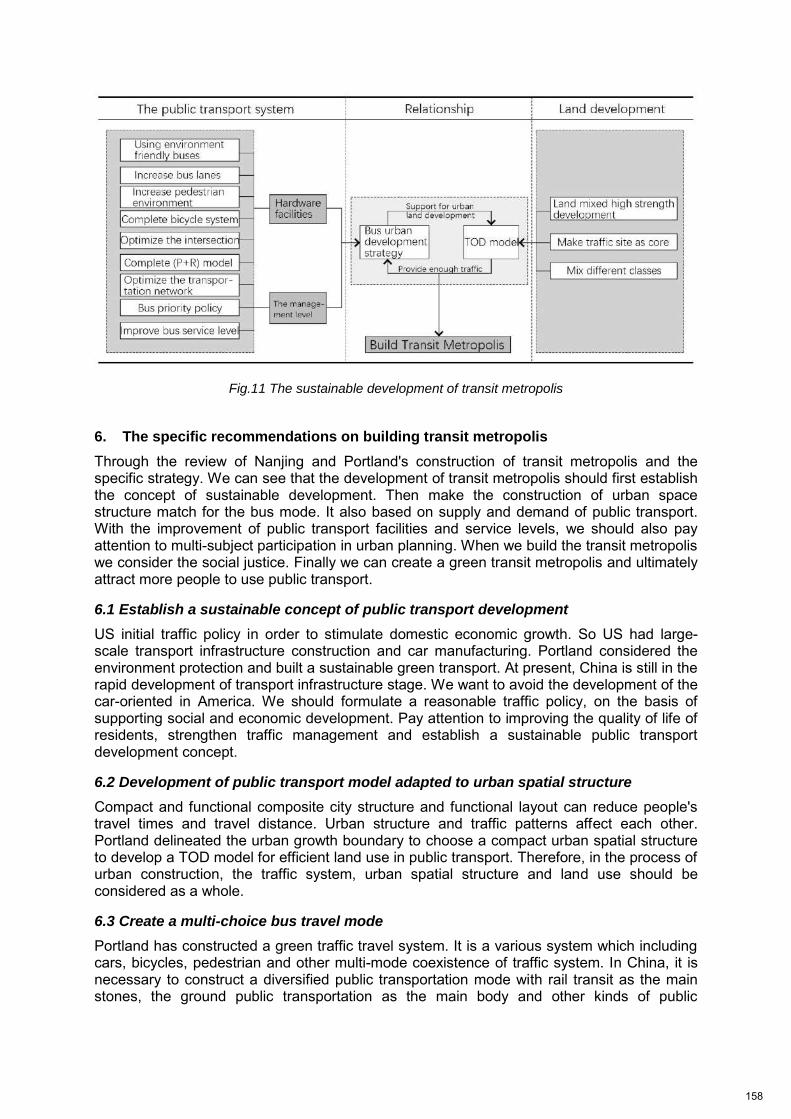
Fig.11 The sustainable development of transit metropolis
6. The specific recommendations on building transit metropolis
Through the review of Nanjing and Portland's construction of transit metropolis and the specific strategy. We can see that the development of transit metropolis should first establish the concept of sustainable development. Then make the construction of urban space structure match for the bus mode. It also based on supply and demand of public transport. With the improvement of public transport facilities and service levels, we should also pay attention to multi-subject participation in urban planning. When we build the transit metropolis we consider the social justice. Finally we can create a green transit metropolis and ultimately attract more people to use public transport.
6.1 Establish a sustainable concept of public transport development
US initial traffic policy in order to stimulate domestic economic growth. So US had large-scale transport infrastructure construction and car manufacturing. Portland considered the environment protection and built a sustainable green transport. At present, China is still in the rapid development of transport infrastructure stage. We want to avoid the development of the car-oriented in America. We should formulate a reasonable traffic policy, on the basis of supporting social and economic development. Pay attention to improving the quality of life of residents, strengthen traffic management and establish a sustainable public transport development concept.
6.2 Development of public transport model adapted to urban spatial structure
Compact and functional composite city structure and functional layout can reduce people's travel times and travel distance. Urban structure and traffic patterns affect each other. Portland delineated the urban growth boundary to choose a compact urban spatial structure to develop a TOD model for efficient land use in public transport. Therefore, in the process of urban construction, the traffic system, urban spatial structure and land use should be considered as a whole.
6.3 Create a multi-choice bus travel mode
Portland has constructed a green traffic travel system. It is a various system which including cars, bicycles, pedestrian and other multi-mode coexistence of traffic system. In China, it is necessary to construct a diversified public transportation mode with rail transit as the main stones, the ground public transportation as the main body and other kinds of public
158
transportation as foundation. Make it become an important material basis for attracting more people to choose public transport.
6.4 Ensuring integrated planning
From Portland's planning system, we can see that it from the state to the city have various layers of special planning. And ultimately put the planning concept to the implementation of space. Therefore, we should take into account the urban spatial form, land use status. Make the public transport as the guide, to guide the urban planning and urban design. We also should give priority to the protection of public transport corridors, lines and station. Finally form a complete public transport planning system.
6.5 Focus on public participation
Based on the relationship between supply and demand of public transport, the government has played a leading role in the society. Only after the government strong investment, made the bus company's service level increase significantly. It can also attract more people to use public transport. So it provides adequate passenger flow to ensure the bus company's profit. It will be a virtuous circle; Secondly, we should pay attention to the interests of the residents demands. At Portland in the preparation of the planning of residents to actively participate in the planning of the preparation is completed, making the planning content to be implemented very well, as residents should take the initiative to participate Planning, the full response to their own interests. In this regard, the Chinese citizens don’t have enough sense of participation. And of course, the government should first build a public participation platform; Finally, in the specific planning, we should take full account of vulnerable groups of public transport travel demands. Not only improve the travel facilities, but also give them preferential policies on travel. It reflects the fair in using public transport. References:
Jianhong, YE & Xiaohong, CHEN & Hua, ZHANG (2013) “Reducing the reliance on automobiles: Portland multi-modal transportation system development”, Urban transport of China, Vol.11 No.1 (Janurary)
Fengming, SU (2015) “Benign interaction between urban growth and transport development—Portland city ”, China transportation review , Vol. 37 No.6 (June)
Xianteng, LIU (2011) “Competitiveness in travel modes: an analysis on the development of urban transit in Chinese major cities—The case of Nanjing”, Urban planning forum , Vol. 196 No.4 (August)
Xianteng, LIU (2009) “An analysis on measures to enhance the competitiveness of public transport”, Urban planning forum , Vol. 180 No.2 (April)
Xianteng, LIU & Qing, SHEN & Li, ZHU (2009) “Imbalance transport demand-supply and measures in metropolitan areas of China: a case study of Nanjing”, Planners, Vol.33 No.1 (January)
Fei, SHI & Yang, JU (2015) “Analysis on influence factors of public transportation share: an empirical study of central Nanjing ”, City planning review, Vol.39 No.2 (February)
Yanping, CHEN (2000) “The public transport community and the urban land use form guided by the public transport”, City planning review, Vol. 24 No.3 (March)
Tingwei, ZHANG (2010) “Factor analysis on America urban transformation in 1950-2050 and lessons to Chinese cities(I)”, City planning review, Vol34. No.8 (August)
United States Department of Transportation, Federal Highway Administration[R]. Summary of Travel Trends: 1995 Nation-wide Personal Transport Survey, Draft, 1999.
159
Federal Highway Administration. Highway Statistics Series[R]. Washington DC: US Department of Transportation, 1990–2009.
Metro Regional Government. Timeline and History[EB/OL]. http://www.oregonmetro. gov/index.cfm/go/by.web/ id=2935.
Qiaoling, LUO & Martineau, DAVID (2010) “The urban transportation policies green transition and practice in the U.S.”, Planners, Vol. 26 No.9 (September)
Jangxing, MAO & Xiaopei, YAN (2004) “An international study on the mutual relationship between urban transport system land use”, Urban planning review, Vol. 28 No.7 (July)
Ozawa C. (2004)The Portland Edge: Challenges and Successes in Growing Communities, Washington DC: Island Press
United States Department of Transportation. Bureau of Transportation Statistics[R]. American Travel Survey data, 1997.
Cevero,R & Murphy,S & Ferrell,C. (2004)Transit-oriented Development in the United States:Experiences,Challenges,and Prospects[R].Washington,DC:Transit Cooperative Research Program. 2004.
Ping, JIANG (2006) “The U.S. transportation legislation and up-to-date transportation authorization act”, Urban transport of China, Vol. 14 No.1 (January)
Dehui, WEI & Li, CHEN & Yizhao, YANG (2016) “Experience and implications of livable city construction practice in Portland, Oregon, the USA”, Urban planning oversea, Vol. 31 No.5 (May)
Hua, Li & Hongjun, ZHANG (2005) “Brief analysis of U.S. Transport Development Policies”, Urban planning oversea, Vol. 20 No.3 (March)
Hui, CAO (2014) “Thoughts on improving the city public transport share rate”, Traffic & Transportation, Vol. 19 No.1 (June)
Chiming, GUAN & Gonghao, CUI (2003) “A probe into transit-oriented spatial structure patern of metropolis in China ”, City planning review, Vol. 27 No.10 (October)
Shijun, WANG(2011) “Urban Mobility and Social Exclusion in China”, Urban planning forum, Vol. 196 No.4 (August)
160
WashingtonCountytransportationfuturesstudy
Moderator: Chris DEFFEBACH, Washington County, Hillsboro, USA
Speakers: Terry MOORE, ECONorthwest, PORTLAND, USA; Erin WARDELL, Washington County, Hillsboro, USA; Dyami VALENTINE, Washington County, Hillsboro, USA; Jeanne LAWSON, JLA, USA
The Washington County Transportation Futures Study evaluated long‐term transportation strategies
and investments needed to sustain the County’s economic health and quality of life for decades to
come. The Study looked about 50 years in the future, focusing on longer‐term land use and
transportation challenges and opportunities. Funded by the Oregon Legislature in 2013, the Study
lasted for 2 years and focused on longer‐term land use and transportation challenges and
opportunities. The Study offers insight into transportation needs and comparisons between policy
choices on how to meet future travel needs.
This Study was a unique opportunity to examine the implications of different policy choices for
transportation investments that will best serve the cumulative growth in population and
employment in the region. Given the time horizon of this work, much farther out than the typical 20
year planning horizon, the Study involved a significant amount of research into drivers of future
behavior which may change land use and transportation. The 50‐year look at the future presented
challenges for the modeling tools and other data analysis techniques traditionally used for
transportation planning. Involving the public and making a policy framework for the study were also
challenging given both the 50‐year time horizon and the complexity of the technical information
generated. This session will focus on how the project team handled these unique challenges and
opportunities at each phase of the project. Session attendees will leave with an understanding of our
process and will be able to apply lessons learned to their own long range transportation and land use
projects.
161
Associations between Public Space Preference and Residents’
Personal Characteristics in Northeast Small Towns of China
Hong Leng Hei Longjiang Cold Region Urban-Rural Human Settlements Science Key Laboratory
Room 111, Harbin Institute of Technology, School of Architecture , No.66, Xidazhi Street, Nangang District, Harbin City, Heilongjiang Province, 150006, China
[email protected] Yutong Xiao
Affiliation, Harbin Institute of Technology, School of Architecture
No.66, Xidazhi Street, Nangang District, Harbin City, Heilongjiang Province, 150006, China [email protected]
Abstract
Using data from a survey of residents in small towns of China conducted by the Ministry of Housing and Urban-Rural Development of the People’s Republic of China (MOHURD), this study aims to investigate whether there are relationships between public space preference and personal characteristics of residents in northeast small towns of China with the goal of proposing suggestions for further public space construction of small towns. By using chi-square test, associations between residents’ four personal characteristics and public space preference were assessed respectively. The results revealed that there was a strong correlation between the income characteristic of residents and public place preference. However, the other three characteristics of residents correlated strongly with some of the public space preference, whereas associated weakly with the rest. Based on the outcome of the research, suggestions of public space construction were proposed.
Keywords: Public space preference, Residents’ personal characteristics, Northeast small towns of China, Planning strategy
1.Background
In recent years, as the great progressing of China's new rural construction, under the support of governments, construction situation of rural areas tends to improve gradually, but still at different levels (Leng Hong and Li Tong, 2016). For the purpose of understanding the current living circumstance of residents in small towns and promoting the construction of small towns in China, the Ministry of Housing and Urban-Rural Development of the People’s Republic of China launched an intimate survey program of small towns nationwide
162
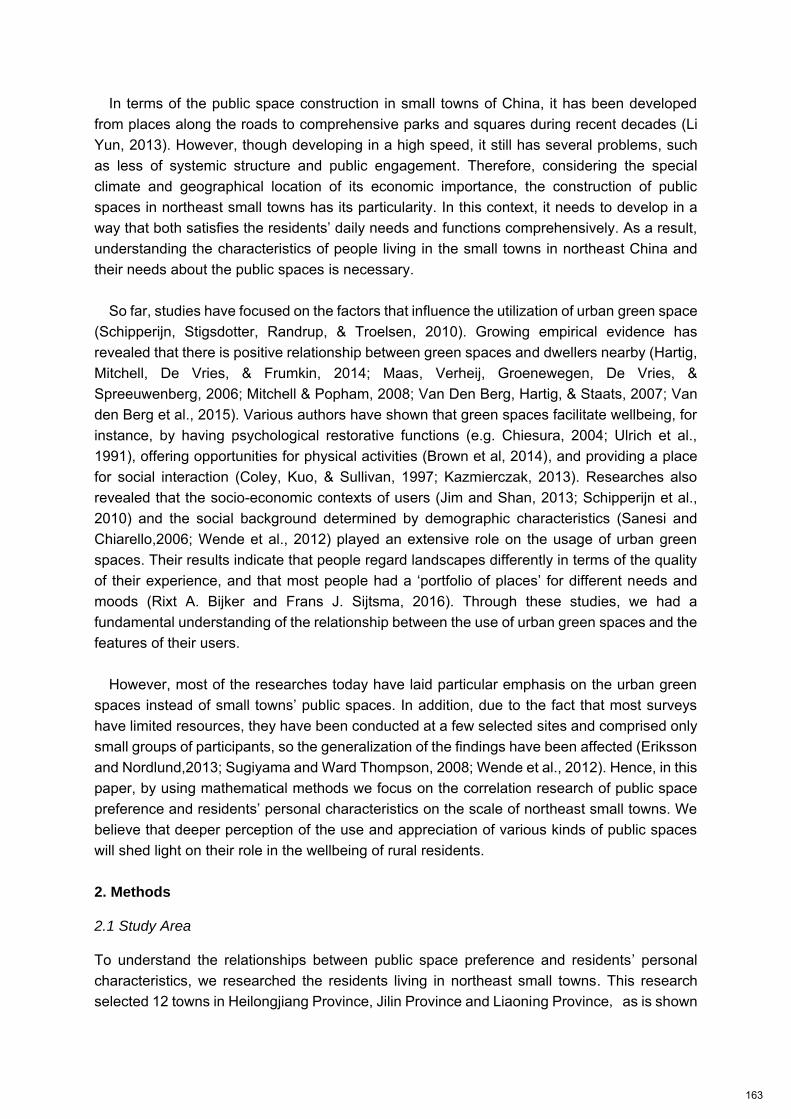
In terms of the public space construction in small towns of China, it has been developed from places along the roads to comprehensive parks and squares during recent decades (Li Yun, 2013). However, though developing in a high speed, it still has several problems, such as less of systemic structure and public engagement. Therefore, considering the special climate and geographical location of its economic importance, the construction of public spaces in northeast small towns has its particularity. In this context, it needs to develop in a way that both satisfies the residents’ daily needs and functions comprehensively. As a result, understanding the characteristics of people living in the small towns in northeast China and their needs about the public spaces is necessary.
So far, studies have focused on the factors that influence the utilization of urban green space
(Schipperijn, Stigsdotter, Randrup, & Troelsen, 2010). Growing empirical evidence has revealed that there is positive relationship between green spaces and dwellers nearby (Hartig, Mitchell, De Vries, & Frumkin, 2014; Maas, Verheij, Groenewegen, De Vries, & Spreeuwenberg, 2006; Mitchell & Popham, 2008; Van Den Berg, Hartig, & Staats, 2007; Van den Berg et al., 2015). Various authors have shown that green spaces facilitate wellbeing, for instance, by having psychological restorative functions (e.g. Chiesura, 2004; Ulrich et al., 1991), offering opportunities for physical activities (Brown et al, 2014), and providing a place for social interaction (Coley, Kuo, & Sullivan, 1997; Kazmierczak, 2013). Researches also revealed that the socio-economic contexts of users (Jim and Shan, 2013; Schipperijn et al., 2010) and the social background determined by demographic characteristics (Sanesi and Chiarello,2006; Wende et al., 2012) played an extensive role on the usage of urban green spaces. Their results indicate that people regard landscapes differently in terms of the quality of their experience, and that most people had a ‘portfolio of places’ for different needs and moods (Rixt A. Bijker and Frans J. Sijtsma, 2016). Through these studies, we had a fundamental understanding of the relationship between the use of urban green spaces and the features of their users.
However, most of the researches today have laid particular emphasis on the urban green
spaces instead of small towns’ public spaces. In addition, due to the fact that most surveys have limited resources, they have been conducted at a few selected sites and comprised only small groups of participants, so the generalization of the findings have been affected (Eriksson and Nordlund,2013; Sugiyama and Ward Thompson, 2008; Wende et al., 2012). Hence, in this paper, by using mathematical methods we focus on the correlation research of public space preference and residents’ personal characteristics on the scale of northeast small towns. We believe that deeper perception of the use and appreciation of various kinds of public spaces will shed light on their role in the wellbeing of rural residents. 2. Methods
2.1 Study Area
To understand the relationships between public space preference and residents’ personal characteristics, we researched the residents living in northeast small towns. This research selected 12 towns in Heilongjiang Province, Jilin Province and Liaoning Province, as is shown
163

in Fig.1.In terms of geographical scope, it included all three provinces in Northeast of China (Liu, 2013). Three towns each with typical feature located in different provinces provided a detailed research material so that the findings would come with more general significance.
Fig.1. The location of 12 small towns
Source: graphing by author
2.2 Public space
As the definition of public space in this paper, it is divided into four main categories: places around the house, park/square, fitness spot and gymnasium.
Places around the house is a unique kind of public space of small towns in China. During the site survey, we found that residents usually had enough space for various activities around the house, such as planting ahead the house, as is shown in Fig.2. What’s more, streets in small towns as well as places behind the house offer space for residents to chat with each other or wandering along the streets.
Park/square is the most common public space which could be found in each of northeast small towns. For example, in Fuzhoucheng town, there is a square located in the center of the town where people could gather here (Fig.4). In addition, as the most popular activities among elder dwellers, square dance plays an important role in residents’ lives, as is shown in Fig.5.
Fitness spot and gymnasium are places for residents to exercise in northeast small towns. Though having similar functions, these two kinds of public space are different in size and locations. Fitness spot is an open space which provide fundamental facilities for exercise around the neighbourhood, whereas gymnasium is an enclosed space. However, with much higher cost, gymnasium could be found in some of the northeast small towns while others couldn’t during our site survey.
164
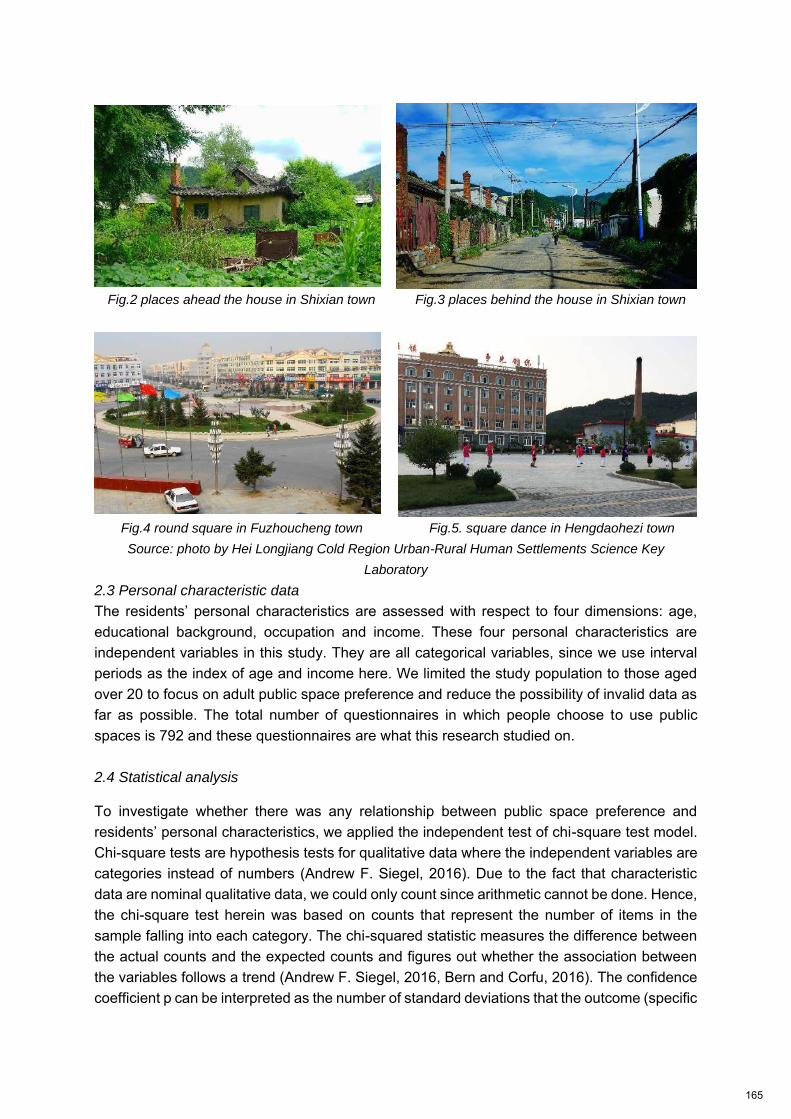
Fig.2 places ahead the house in Shixian town Fig.3 places behind the house in Shixian town
Fig.4 round square in Fuzhoucheng town Fig.5. square dance in Hengdaohezi town
Source: photo by Hei Longjiang Cold Region Urban-Rural Human Settlements Science Key
Laboratory
2.3 Personal characteristic data
The residents’ personal characteristics are assessed with respect to four dimensions: age, educational background, occupation and income. These four personal characteristics are independent variables in this study. They are all categorical variables, since we use interval periods as the index of age and income here. We limited the study population to those aged over 20 to focus on adult public space preference and reduce the possibility of invalid data as far as possible. The total number of questionnaires in which people choose to use public spaces is 792 and these questionnaires are what this research studied on. 2.4 Statistical analysis
To investigate whether there was any relationship between public space preference and residents’ personal characteristics, we applied the independent test of chi-square test model. Chi-square tests are hypothesis tests for qualitative data where the independent variables are categories instead of numbers (Andrew F. Siegel, 2016). Due to the fact that characteristic data are nominal qualitative data, we could only count since arithmetic cannot be done. Hence, the chi-square test herein was based on counts that represent the number of items in the sample falling into each category. The chi-squared statistic measures the difference between the actual counts and the expected counts and figures out whether the association between the variables follows a trend (Andrew F. Siegel, 2016, Bern and Corfu, 2016). The confidence coefficient p can be interpreted as the number of standard deviations that the outcome (specific
165
categorical characteristic of residents) changes for a standard deviation of the predictor (number of residents choosing the specific public places).
The dependent variable was the number of residents choosing one of the four kinds of public places. The chi-square test was calculated by created a cross tabulation first, and then:
𝑥2 = 𝑛 (∑𝐴2
𝑛𝑅𝑛𝐶− 1)
df = (𝑅 − 1)(𝐶 − 1) , where x2 is the chi-square value of the two variables n is the total number of columns nR is the sum number of the row nC is the sum number of the column A is the actual frequency of the characteristic-specific resident number R represents the number of columns C represents the number of rows If there are over 20% cells have expected count less than 5, then we use Fisher’s Exact Test to research the correlation. We calculated age-, income-, educational background- and occupation-specific number of residents for each town and numbers for each category of public space. If the result reveals that x2<0.05, then there exists a strong correlation between the two variables; if x2>0.05, then the two variables are weakly correlated. What’s more, the association follows the trend of the data when there is a strong correlation. Models were run using SPSS 23.0. 3.Results
3.1 Residents’ Personal Characteristics in Northeast small towns of China
The result reveals that aging of the population is a serious challenge faced by the small towns residents. 24 percent of residents are over 60 years old(Fig.6), which is far more than the standard percentage (10%). In terms of the income level of small town residents, nearly half of the residents earn less than 1000 yuan per month (Fig.7).
Fig.6. Residents age proportion Fig.7. Residents income proportion
Source: graphing by author Source: graphing by author
6%
15%
27%
52%
20-30 30-40 40-50 over 50
26%
33%12%
13%
6%4%
0-1000 1000-2000 2000-3000
3000-4000 4000-5000 over 5000
166
Fig.8. Residents educational background proportion
Source: graphing by author
The educational background of residents in northeast small towns concentrates on junior school and high school (technical and vocational school included) degree (Fig.8). Lacking high educated talents continues to be a severe problem in small towns since the percentage of residents with degrees above bachelor is no more than 10%. Due to the fact that a large proportion of residents are farmers (Fig.9), the construction level of small towns still need to be improved.
Fig.9. Residents occupation proportion
Source: graphing by author
3.2 Correlations of Public Space Preference and Residents’ Personal Characteristics Age
and Public Space Preference
Places around the
house
Park/Square Fitness spot Gymnasium
Age 20-30 21 35 2 3
30-40 50 77 3 1
40-50 121 119 15 0
0ver 50 195 196 26 9
Income 0-1000 154 170 20 7
1000-2000 127 112 12 1
2000-3000 60 66 2 0
3000-4000 25 47 5 3
4000-5000 13 24 4 0
11.36%
45.96%
22%
13.01%
5.30%
0.51%0.00%
50.00%
below primaryschool
junior school high school(technical and
vocationalschool
included)
junior college bachelor abovepostgraduate
below primary school
junior school
high school( technical and vocationalschool included)junior college
bachelor
above postgraduate
159
45 6488
250
11
7292
20
0
50
100
150
200
250
300
state organ enterpriseworker
merhcant labor farmer student unemployed retired others
state organ enterprise worker merhcant labor farmer student unemployed retired others
167
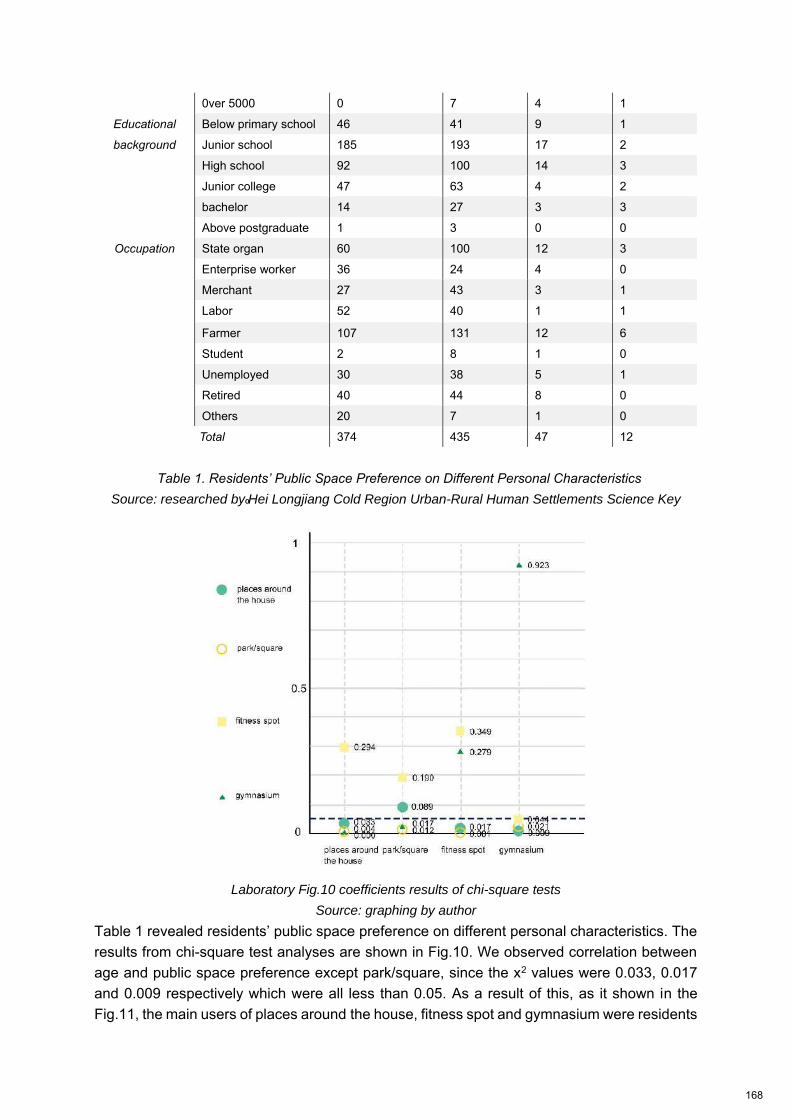
0ver 5000 0 7 4 1
Educational
background
Below primary school 46 41 9 1
Junior school 185 193 17 2
High school 92 100 14 3
Junior college 47 63 4 2
bachelor 14 27 3 3
Above postgraduate 1 3 0 0
Occupation State organ 60 100 12 3
Enterprise worker 36 24 4 0
Merchant 27 43 3 1
Labor 52 40 1 1
Farmer 107 131 12 6
Student 2 8 1 0
Unemployed 30 38 5 1
Retired 40 44 8 0
Others 20 7 1 0
Total 374 435 47 12
Table 1. Residents’ Public Space Preference on Different Personal Characteristics
Source: researched by Hei Longjiang Cold Region Urban-Rural Human Settlements Science Key
Laboratory Fig.10 coefficients results of chi-square tests
Source: graphing by author
Table 1 revealed residents’ public space preference on different personal characteristics. The results from chi-square test analyses are shown in Fig.10. We observed correlation between age and public space preference except park/square, since the x2 values were 0.033, 0.017 and 0.009 respectively which were all less than 0.05. As a result of this, as it shown in the Fig.11, the main users of places around the house, fitness spot and gymnasium were residents
168
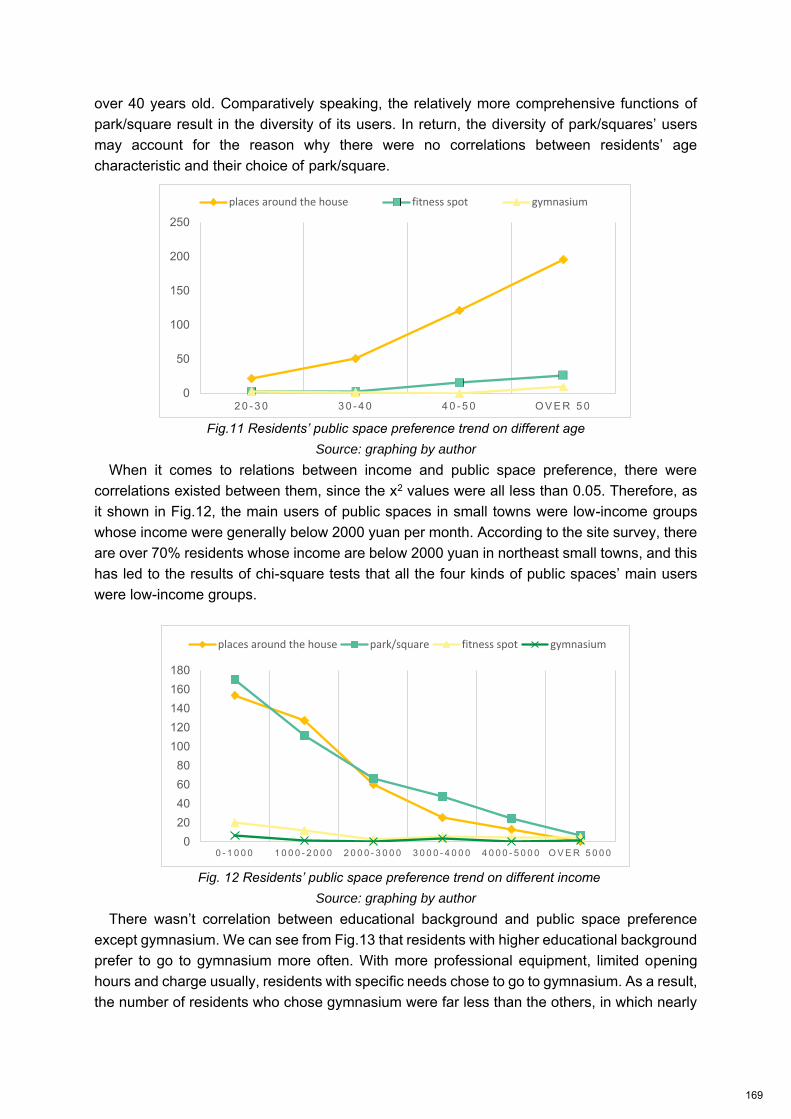
over 40 years old. Comparatively speaking, the relatively more comprehensive functions of park/square result in the diversity of its users. In return, the diversity of park/squares’ users may account for the reason why there were no correlations between residents’ age characteristic and their choice of park/square.
Fig.11 Residents’ public space preference trend on different age
Source: graphing by author
When it comes to relations between income and public space preference, there were correlations existed between them, since the x2 values were all less than 0.05. Therefore, as it shown in Fig.12, the main users of public spaces in small towns were low-income groups whose income were generally below 2000 yuan per month. According to the site survey, there are over 70% residents whose income are below 2000 yuan in northeast small towns, and this has led to the results of chi-square tests that all the four kinds of public spaces’ main users were low-income groups.
Fig. 12 Residents’ public space preference trend on different income
Source: graphing by author
There wasn’t correlation between educational background and public space preference except gymnasium. We can see from Fig.13 that residents with higher educational background prefer to go to gymnasium more often. With more professional equipment, limited opening hours and charge usually, residents with specific needs chose to go to gymnasium. As a result, the number of residents who chose gymnasium were far less than the others, in which nearly
0
50
100
150
200
250
2 0 - 3 0 3 0 - 4 0 4 0 - 5 0 O V E R 5 0
places around the house fitness spot gymnasium
020406080
100120140160180
0 - 1 0 0 0 1 0 0 0 - 2 0 0 0 2 0 0 0 - 3 0 0 0 3 0 0 0 - 4 0 0 0 4 0 0 0 - 5 0 0 0 O V E R 5 0 0 0
places around the house park/square fitness spot gymnasium
169
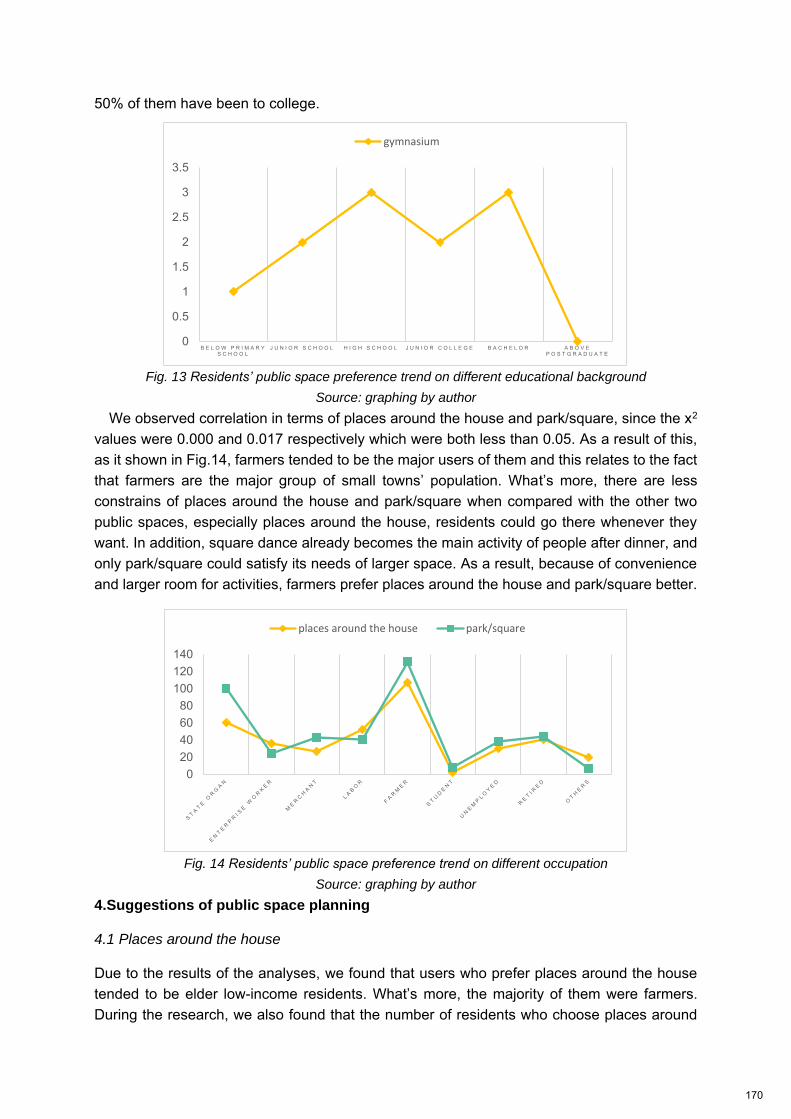
50% of them have been to college.
Fig. 13 Residents’ public space preference trend on different educational background
Source: graphing by author
We observed correlation in terms of places around the house and park/square, since the x2 values were 0.000 and 0.017 respectively which were both less than 0.05. As a result of this, as it shown in Fig.14, farmers tended to be the major users of them and this relates to the fact that farmers are the major group of small towns’ population. What’s more, there are less constrains of places around the house and park/square when compared with the other two public spaces, especially places around the house, residents could go there whenever they want. In addition, square dance already becomes the main activity of people after dinner, and only park/square could satisfy its needs of larger space. As a result, because of convenience and larger room for activities, farmers prefer places around the house and park/square better.
Fig. 14 Residents’ public space preference trend on different occupation
Source: graphing by author
4.Suggestions of public space planning
4.1 Places around the house
Due to the results of the analyses, we found that users who prefer places around the house tended to be elder low-income residents. What’s more, the majority of them were farmers. During the research, we also found that the number of residents who choose places around
020406080
100120140
places around the house park/square
0
0.5
1
1.5
2
2.5
3
3.5
B E L O W P R I M A R Y S C H O O L
J U N I O R S C H O O L H I G H S C H O O L J U N I O R C O L L E G E B A C H E L O R A B O V E P O S T G R A D U A T E
gymnasium
170
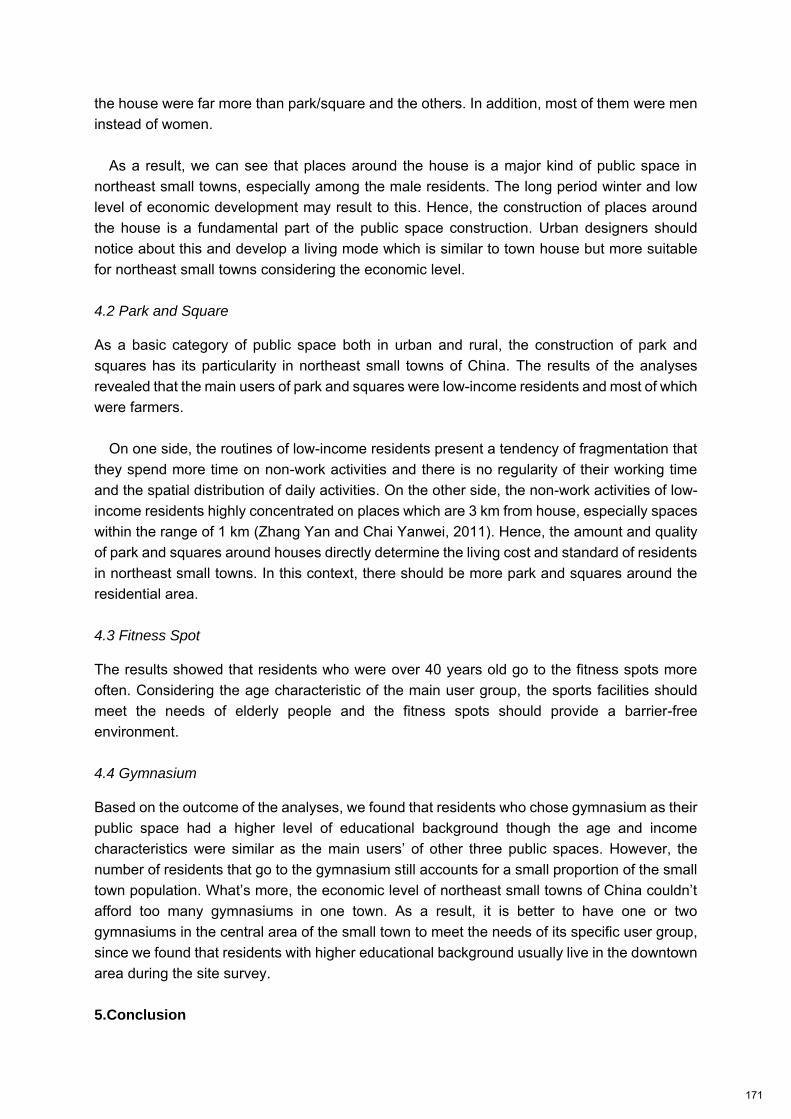
the house were far more than park/square and the others. In addition, most of them were men instead of women.
As a result, we can see that places around the house is a major kind of public space in
northeast small towns, especially among the male residents. The long period winter and low level of economic development may result to this. Hence, the construction of places around the house is a fundamental part of the public space construction. Urban designers should notice about this and develop a living mode which is similar to town house but more suitable for northeast small towns considering the economic level.
4.2 Park and Square
As a basic category of public space both in urban and rural, the construction of park and squares has its particularity in northeast small towns of China. The results of the analyses revealed that the main users of park and squares were low-income residents and most of which were farmers.
On one side, the routines of low-income residents present a tendency of fragmentation that
they spend more time on non-work activities and there is no regularity of their working time and the spatial distribution of daily activities. On the other side, the non-work activities of low-income residents highly concentrated on places which are 3 km from house, especially spaces within the range of 1 km (Zhang Yan and Chai Yanwei, 2011). Hence, the amount and quality of park and squares around houses directly determine the living cost and standard of residents in northeast small towns. In this context, there should be more park and squares around the residential area.
4.3 Fitness Spot
The results showed that residents who were over 40 years old go to the fitness spots more often. Considering the age characteristic of the main user group, the sports facilities should meet the needs of elderly people and the fitness spots should provide a barrier-free environment.
4.4 Gymnasium
Based on the outcome of the analyses, we found that residents who chose gymnasium as their public space had a higher level of educational background though the age and income characteristics were similar as the main users’ of other three public spaces. However, the number of residents that go to the gymnasium still accounts for a small proportion of the small town population. What’s more, the economic level of northeast small towns of China couldn’t afford too many gymnasiums in one town. As a result, it is better to have one or two gymnasiums in the central area of the small town to meet the needs of its specific user group, since we found that residents with higher educational background usually live in the downtown area during the site survey.
5.Conclusion
171
The result revealed that there was a strong correlation between the income characteristic of residents and public place preference. However, the other three characteristics of residents correlated strongly with some of the public space preference, whereas associated weakly with the rest. Since a large proportion of the public spaces’ main user group were elderly, public spaces in northeast small towns should functions comprehensively and meet the needs of elderly simultaneously. Considering the generation replacement of the small town population, the available period of the findings is suggested as 10 years. As for small towns in Northeast of China, the generalization of the findings is available. Associations between residents’ characteristics and public space preference in other regions of China could be studied by this method. Acknowledgements
This study was financially supported by the National Natural Science Foundation of China (No. 51578176) and Heilongjiang Arts and Science Planned Program (2014B025). References
Bern, Corfu, 2016. The chi-square test. American Journal of Orthodontics and Dentofacial Orthopedics. 150, 898–899
Brown, G., Schebella, M. F., & Weber, D. (2014). Using participatory GIS to measure physical activity and urban park benefits. Landscape and Urban Planning, 121, 34–44.
Chiesura, A. (2004). The role of urban parks for the sustainable city. Landscape and Urban Planning, 68, 129–138.
Coley, R. L., Kuo, F. E., & Sullivan, W. C. (1997). Where does community grow? The social context created by nature. Urban Public Housing. Environment and Behaviour, 29(4), 468–494.
Eriksson, L., Nordlund, A., 2013. How is setting preference related to intention to engage in forest recreation activities? Urban For. Urban Green. 12, 481–489.
Greece, Bern, Corfu, 2016. The chi-square test for trend. American Journal of Orthodontics and
Dentofacial Orthopedics Hartig, T., Mitchell, R., De Vries, S., & Frumkin, H. (2014). Nature and health. Annual Review of Public
Health, 35, 207–228. Jim, C.Y., Shan, X., 2013. Socioeconomic effect on perception of urban green spaces in Guangzhou,
China. Cities 31, 123–131. Kazmierczak, A. (2013). The contribution of local parks to neighbourhood social ties. Landscape and
Urban Planning, 109(1), 31–44. Leng Hong, Li Tong , 2016. Research on Public Open Space of Rural Areas in Severe Cold Regions
based on Survey of Residents on the Behavioral Activity. Procedia Engineering, 146, 327–334 Li Yun, 2013. Research on construction of public place of small towns. Liu Chengjun, 2013. The small towns development countermeasure research of northeast China Maas, J., Verheij, R. A., Groenewegen, P. P., De Vries, S., & Spreeuwenberg, P. (2006). Green space,
urbanity, and health: How strong is the relation? Journal of Epidemiology and Community Health, 60(7), 587–592.
172
Mitchell, R., & Popham, F. (2008). Effect of exposure to natural environment on health inequalities: an observational population study. Lancet, 372, 1655–1660.
Rixt A. Bijker, Frans J. Sijtsma, 2016. A portfolio of natural places: Using a participatory GIS tool to compare the appreciation and use of green spaces inside and outside urban areas by urban residents. Landscape and Urban Planning 158, 155–165
Schipperijn, J., Stigsdotter, U. K., Randrup, TB, Troelsen, & J. (2010). Influences on the use of urban green space—A case study in Odense, Denmark. Urban Forestry &. Urban Greening, 9(1), 25–32.
Sanesi, G., Chiarello, F., 2006. Residents and urban green spaces: the case of Bari. Urban For. Urban
Green. 4, 125–134. Sugiyama, T., Ward Thompson, C., 2008. Associations between characteristics of neighbourhood open
space and older people’s walking. Urban For. Urban Green. 7, 41–51. Ulrich, R. S., Simons, R. F., Losito, B. D., Fiorito, E., Miles, M. A., & Zelson, M. (1991). Stress recovery
during exposure to natural and urban environments. Journal of Environmental Psychology, 11, 201–230.
Van Den Berg, A. E., Hartig, T., & Staats, H. (2007). Preference for nature in urbanized societies: Stress, restoration, and the pursuit of sustainability. Journal of Social Issues, 63(1), 79–96.
Van den Berg, M., Wendel-Vos, W., Van Poppel, M., Kemper, H., Van Mechelen, W., & Maas, J. (2015). Health benefits of green spaces in the living environment: A systematic review of epidemiological studies. Urban Forestry & Urban Greening, 14, 806–816.
Wende, H.E.W., Zarger, R.K., Mihelcic, J.R., 2012. Accessibility and usability: green space preferences, perceptions, and barriers in a rapidly urbanizing city in Latin America. Landscape Urban Planning. 107, 272–282.
Zhang Yan,Chai Yan-Wei, 2011. The Spatio-temporal Activity Pattern of the Middle and the Low-income Residents in Beijing,China. Scientia Geographica Sinica, 9, 1056–1064.
173
Ahmad et al. A co-benefits approach for urban planning ISOCARP-OAPA Conference 2017
1
Urban Planning Strategies for Improving Public Health and Reducing Emissions: A
Co-benefits Approach
Sohail AHMAD1, 2, 3, Shonali PACHAURI4, Felix CREUTZIG1, 2
1Mercator Research Institute on Global Commons and Climate Change (MCC) Torgauer Straße 12-15 10829 Berlin Germany
2Sustainability Economics of Human Settlements,Technische Universität Berlin, 10623 Berlin, Germany
3LabSet, Delhi, India 4International Institute for Applied Systems Analysis (IIASA) - Schlossplatz 1 - A-2361
Laxenburg, Austria
Abstract. Energy-efficient urbanization and public health pose major development challenges for India. Both issues are intensively studied. But their interaction is not well understood. Here we assess how specific urban development measures affect public health and household-related emissions, identifying synergies and trade-offs by analyzing nationally representative household surveys from 2005 and 2012. Our analysis confirms previous characterizations of the environmental-health transition, but also points to an important role of energy use and urbanization as modifiers of this transition. We find that non-motorized transport is a sweet spot for development, contributing both to reducing emissions and improving public health in cities. Urbanization and improved access to basic services reduce short-term morbidity. However, improvements in socio-economic and other built environment variables have a limited influence in stemming the significant growth in major morbidity in Indian cities. Our analysis suggests that a 10% increase in urbanization and concurrent improvement in access to modern cooking and water infrastructures could reduce traditional disease prevalence in 2.4 million people. This would result in a modest increase in electricity related emissions of 84 ktCO2e annually. Promoting energy-efficient mobility systems, for instance by a 10% increase in cycling, can however, reduce modern disease prevalence in 0.3 million people while also abating GHG emissions. These findings provide empirical evidence to validate that energy-efficient and sustainable urbanization can address both public health and climate change challenges simultaneously.
Keywords: sustainable development; morbidity; environmental health transition; India; energy-efficient urbanization
174
Ahmad et al. A co-benefits approach for urban planning ISOCARP-OAPA Conference 2017
2
1. Introduction
India is projected to add 400 million new urbanites to its existing 410 million by 2050 (UN-DESA, 2014). In other words, India’s urban population will double in one generation. Urbanization offers the chance of a better life for many, including potentially improved access to infrastructure and living conditions (UN Habitat, 2009). Yet, when public policy lags behind urbanization, as is currently the case in India and other emerging nations, it results in a new set of challenges. Where urban growth proceeds unplanned, dismal living conditions and inadequate infrastructure lead to growing inequities and an urbanization of poverty (Ravallion et al., 2007, McGranahan and Satterthwaite, 2014). In 2011, an estimated 17.2 percent of urban Indians were living in slums under detrimental public health conditions (Census of India, 2011). Improving health and wellbeing of these populations requires rapid infrastructure development and extending modern services and amenities to all. However, rapid expansion of infrastructure in cities and rising personal incomes can, in turn, result in growing environmental footprints and associated health impacts. On average, household greenhouse gas and pollutant emissions from urban areas already exceed those from rural areas (Krey et al., 2012, Donglan et al., 2010, O'Neill et al., 2012). However, urban infrastructures are also at the center of demand-side action for climate change mitigation (Creutzig et al., 2016a, Creutzig et al., 2016b) and provide opportunities for improving social stability and economic well-being (Bongardt et al., 2010). Of total household emissions in urban India, three-fourth are from electricity and private transport energy use (Ahmad et al., 2015). A significant fraction of urban populations in developing countries today thus face multiple overlapping environmental health risks and opportunities concurrently (Marcotullio and Lee, 2003, Kjellstrom et al., 2007).
Energy, transport, climate, and building policies all offer significant potential to improve the sustainability of cities. But understanding of the potential health co-benefits and risks of these policies remains limited, especially at the level of individuals and households. Evidence on potential synergies and tradeoffs among Sustainable Development Goals (SDGs) related to health and wellbeing (SDG 3), clean water and sanitation (SDG 6), affordable and clean energy (SDG 7), sustainable cities and communities (SDG 11) and climate action (SDG 13) is lacking (United Nations, 2015). The few studies that assess the health burdens of specific transport and energy policies do so at an aggregate level (Woodcock et al., 2009, Wilkinson et al., 2009). Yet understanding of the differential health outcomes and vulnerabilities of urban populations in developing countries and the multiple energy, transport and infrastructural correlates and confounders of these has not received adequate attention. Here we contribute to improving this understanding empirically using microdata from two rounds of the most recently available nationally representative longitudinal surveys from India (Desai et al., 2010, Desai et al., 2015). We assess if there is a sweet spot in urban development by analyzing the effects of specific measures that can lower environmental pollution and result in better public health for all. We focus on understanding differences in traditional disease, i.e. short term morbidity, and modern disease prevalence, i.e. major morbidity among Indians, as well as their residential and transport energy spending that correlate with emissions. We find significant differences in energy and transport spending and morbidity patterns among rural and urban households, about half of which can be attributed to differences in socioeconomic conditions and endowments. Our analyses suggest that prioritizing clean cooking, water, and improved sanitation access can effectively reduce short term morbidity. Furthermore, providing for active (non-motorized) and public transit mobility options can reduce major morbidity, while simultaneously also contributing to energy-efficient and low-carbon urbanization. Thus sustainable infrastructure development in cities can achieve public health as well as local and global environmental objectives and goals. This requires multi-sector integrated
175
Ahmad et al. A co-benefits approach for urban planning ISOCARP-OAPA Conference 2017
3
approaches to urban policies and planning to realize the greatest gains to human and environmental health and to improve livability in cities.
In the following, we first describe our data sources and methods. We next present results of our empirical analysis. Finally, we discuss key implications of our results.
2. Methods
This section presents the data employed and describes the health measures, energy and transport spending based emissions measures, and other explanatory variables used in this study. We also present the statistical methods and tests for model validation applied in our analysis.
2.1 Data Sources
This paper uses the Indian Human Development Surveys (IHDS) I (2004-05) and II (2011-12), which are nationally representative and multi-topic surveys (Desai et al., 2015, Desai et al., 2010). While IHDS I surveyed 41,554 households (215,754 individuals), IHDS II re-interviewed 83% of the original households surveyed in IHDS I, as well as additional samples, so that a total of 42,152 households (204,568 individuals) were surveyed in this round. The samples are nationally representative, spread across 33 (now 34) states and union territories over rural and urban areas, covering questions on health, education, employment, expenditures, economic status, marriage, fertility, gender relations, and social capital.
2.2 Health Measures
The health measures are based on information collected at the individual level, where individuals are classified as either having short term morbidity (STM), or major morbidity (MM), or neither. An individual is assumed to have STM if she/he had fever, cough, or diarrhea in the last 30 days. An individual is assumed to have MM if she/he has been diagnosed with high blood pressure, heart disease, diabetes, or asthma ever. About 10% of the population that have both STM and MM are excluded from the statistical regression analysis conducted in this study (see Fig s1 for the distribution of population by morbidity status in 2012).
2.3 Energy and Transport Spending based Emissions Measures
The dataset includes detailed household consumption expenditures over the past 30 days, including data on electricity spending, and private transport spending (expenditures on diesel, petrol, CNG, and maintenance of owned vehicle). These spendings are a proxy for household energy use. These spendings may vary slightly spatially and in scale of consumption (for electricity), given differences in prices. The mean spending on electricity and private transport in 2012 are 58 ₹/capita and 76 ₹/capita respectively. Employing the data on household consumption expenditure on electricity and private transport, we estimate emissions from electricity and private transport using the methodology described in Box S1. The annual per capita emissions from electricity and private transport are estimated to be 0.282 tCO2e and 0.052 tCO2e respectively in 2012, corresponding to 21% of economy-wide per capita emissions (including the burning of fossil fuels and the manufacture of cement) (World Bank, 2012).
2.4 Explanatory Variables
We group these variables into four categories – built environment, basic services, energy and transport, and other control variables that consist of socioeconomic and demographics characteristics of the households. The built environment consists of location of settlements (urban and rural), basic services include modern stove, piped water, flush toilet, separate kitchen, and overcrowding (i.e. three or more persons living in a room). The variables related
176
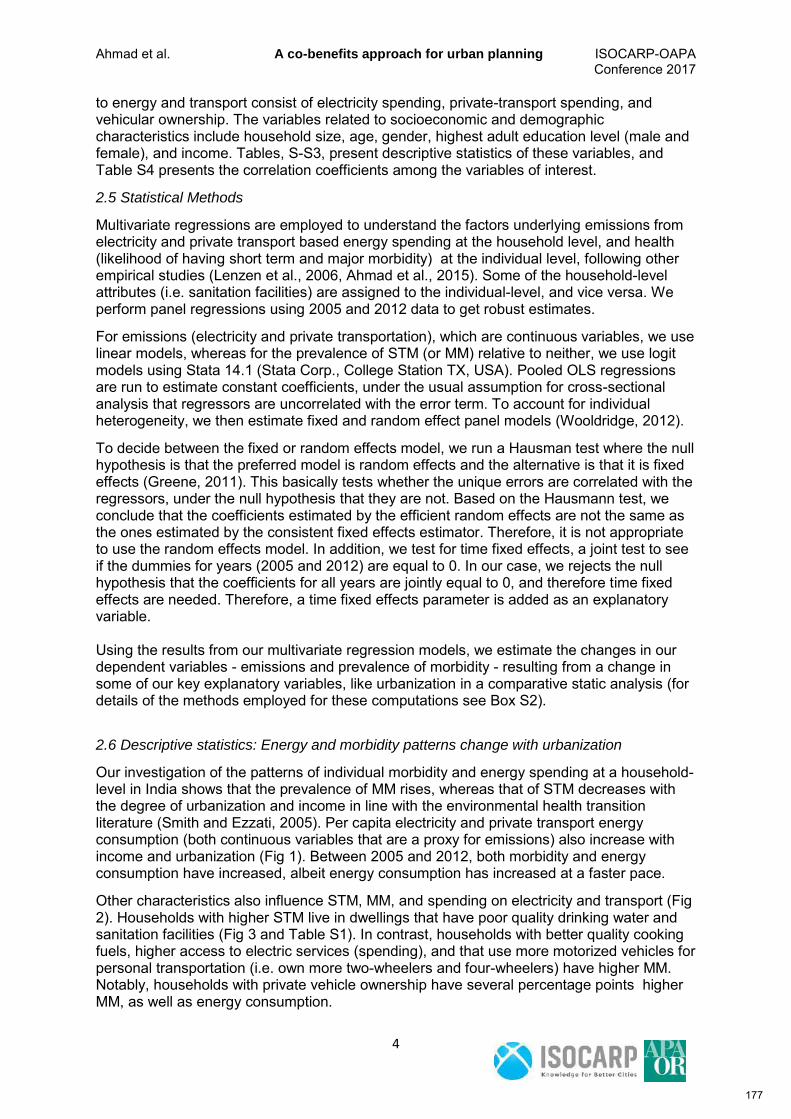
Ahmad et al. A co-benefits approach for urban planning ISOCARP-OAPA Conference 2017
4
to energy and transport consist of electricity spending, private-transport spending, and vehicular ownership. The variables related to socioeconomic and demographic characteristics include household size, age, gender, highest adult education level (male and female), and income. Tables, S-S3, present descriptive statistics of these variables, and Table S4 presents the correlation coefficients among the variables of interest.
2.5 Statistical Methods
Multivariate regressions are employed to understand the factors underlying emissions from electricity and private transport based energy spending at the household level, and health (likelihood of having short term and major morbidity) at the individual level, following other empirical studies (Lenzen et al., 2006, Ahmad et al., 2015). Some of the household-level attributes (i.e. sanitation facilities) are assigned to the individual-level, and vice versa. We perform panel regressions using 2005 and 2012 data to get robust estimates.
For emissions (electricity and private transportation), which are continuous variables, we use linear models, whereas for the prevalence of STM (or MM) relative to neither, we use logit models using Stata 14.1 (Stata Corp., College Station TX, USA). Pooled OLS regressions are run to estimate constant coefficients, under the usual assumption for cross-sectional analysis that regressors are uncorrelated with the error term. To account for individual heterogeneity, we then estimate fixed and random effect panel models (Wooldridge, 2012).
To decide between the fixed or random effects model, we run a Hausman test where the null hypothesis is that the preferred model is random effects and the alternative is that it is fixed effects (Greene, 2011). This basically tests whether the unique errors are correlated with the regressors, under the null hypothesis that they are not. Based on the Hausmann test, we conclude that the coefficients estimated by the efficient random effects are not the same as the ones estimated by the consistent fixed effects estimator. Therefore, it is not appropriate to use the random effects model. In addition, we test for time fixed effects, a joint test to see if the dummies for years (2005 and 2012) are equal to 0. In our case, we rejects the null hypothesis that the coefficients for all years are jointly equal to 0, and therefore time fixed effects are needed. Therefore, a time fixed effects parameter is added as an explanatory variable. Using the results from our multivariate regression models, we estimate the changes in our dependent variables - emissions and prevalence of morbidity - resulting from a change in some of our key explanatory variables, like urbanization in a comparative static analysis (for details of the methods employed for these computations see Box S2).
2.6 Descriptive statistics: Energy and morbidity patterns change with urbanization
Our investigation of the patterns of individual morbidity and energy spending at a household-level in India shows that the prevalence of MM rises, whereas that of STM decreases with the degree of urbanization and income in line with the environmental health transition literature (Smith and Ezzati, 2005). Per capita electricity and private transport energy consumption (both continuous variables that are a proxy for emissions) also increase with income and urbanization (Fig 1). Between 2005 and 2012, both morbidity and energy consumption have increased, albeit energy consumption has increased at a faster pace.
Other characteristics also influence STM, MM, and spending on electricity and transport (Fig 2). Households with higher STM live in dwellings that have poor quality drinking water and sanitation facilities (Fig 3 and Table S1). In contrast, households with better quality cooking fuels, higher access to electric services (spending), and that use more motorized vehicles for personal transportation (i.e. own more two-wheelers and four-wheelers) have higher MM. Notably, households with private vehicle ownership have several percentage points higher MM, as well as energy consumption.
177
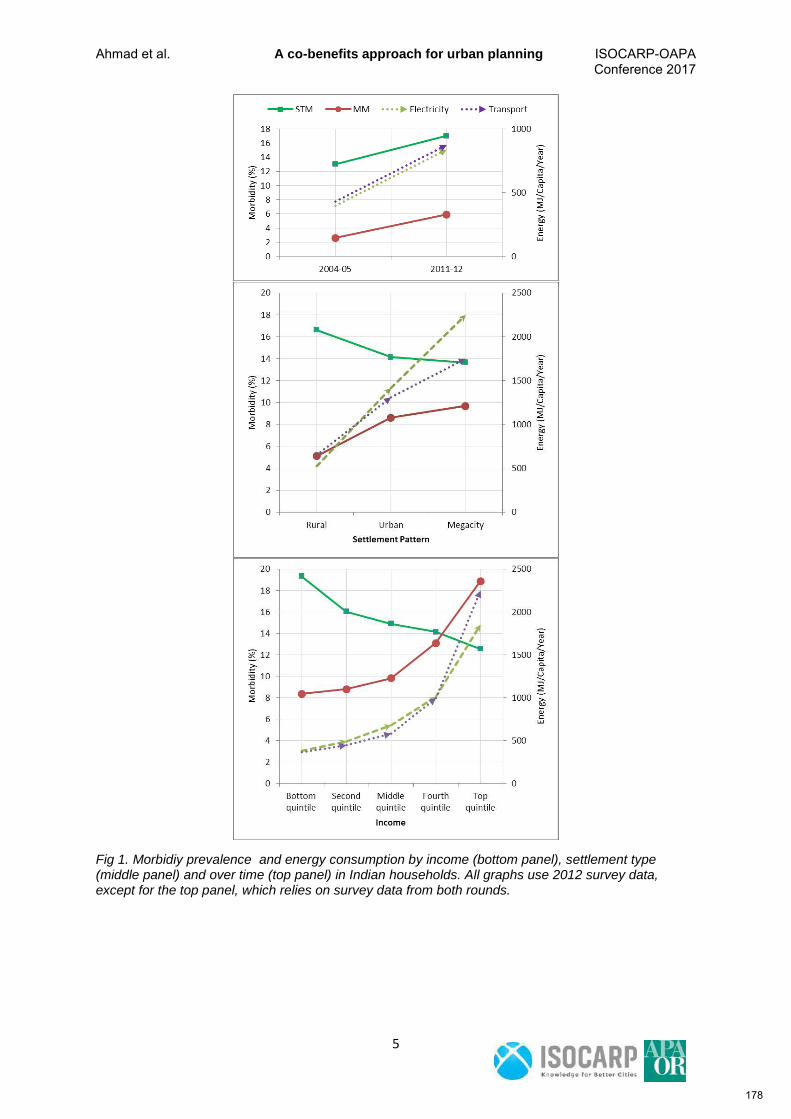
Ahmad et al. A co-benefits approach for urban planning ISOCARP-OAPA Conference 2017
5
Fig 1. Morbidiy prevalence and energy consumption by income (bottom panel), settlement type (middle panel) and over time (top panel) in Indian households. All graphs use 2012 survey data, except for the top panel, which relies on survey data from both rounds.
178
Ahmad et al. A co-benefits approach for urban planning ISOCARP-OAPA Conference 2017
6
Fig 2. Comparing prevalence of morbidity and energy consumption to the national average, by basic services, vehicle ownership and living space in India for 2005 and 2012. The national averages: STM (15%), MM (5%), electricity spending 524₹/capita/year, and transport spending 880₹/capita/year (spending in 2005 ₹).
3. Multivariate regression results: Access to electricity reduces traditional diseases, access to cycling modern diseases
To analyze these differences further and test the statistical significance of various household characteristics in explaining traditional disease (STM) and modern disease (MM) prevalence, as well as electricity and transport energy spending, we present here the fixed effect model results organized by the following categories of explanatory variables: built environment, basic services , energy and transport, and socio-economic and demographic characteristics of the households (Table 1 & 2). 3.1 Built Environment
Inhabitants of megacities have lower odds (0.68 times) of STM than rural inhabitants. But unlike other findings from low-income countries (van der Sande et al., 2000) we do not observe statistically significant higher MM, after controlling for other variables like income. Moreover, we do not find statistically significant differences in STM and MM between smaller cities (urban category) and rural inhabitants, contrary to the hypothesis that urban inhabitants have lower incidence of STM and higher incidence of MM (Gupta et al., 2009, Agarwal, 2011). Households in smaller cities spend more on transport and electricity than rural households. After controlling for other variables, including income, we find electricity spending in megacities is lower than in other areas, suggesting possible efficiencies of scale (Bettencourt et al., 2007). The lower electricity spending among megacity inhabitants could also be explained by other household characteristics e.g., family work pattern and density of human settlement (Makido et al., 2012), which are not controlled for here. Megacities have lower traditional disease prevalence and household electricity spending (use), but higher utilization of private transport, and consequently higher emissions of air pollutants and greenhouse gases than other urban areas, when controlling for all other variables.
179

Ahmad et al. A co-benefits approach for urban planning ISOCARP-OAPA Conference 2017
7
3.2 Basic Services
Access to basic services, specifically to modern stoves, piped water, and flush toilet, lowers the odds of STM, but has no significant effect on the odds of MM. Our results echo previous findings that show that switching from traditional to modern non-solid cooking fuels brings about large reductions in household smoke, therefore improving health (Wilkinson et al., 2009). Households with access to these basic services are also likely to spend more on energy. However, households with access to piped water spend 4.2% less on electricity, ceteris paribus. Housing space provides the immediate environment where individuals spend two-thirds of their time (Brasche and Bischof, 2005). It also provides an environment for the household economy. Therefore, it is likely to play an important role in overall morbidity outcomes (Shaw, 2004, Krieger and Higgins, 2002) as well as energy spending, required for lighting and space conditioning. We assess the influence of dwelling space, using two proxy variables – separate kitchen and room per capita – on morbidity and energy spending. Dwelling units with a separate kitchen are less exposed to smoke, resulting in reduced disease prevalence. Previous studies have shown that lower room per capita, resulting in inadequate space or overcrowding, is associated with a lack of privacy and stress, which contribute to both physical and mental illness, transmission of tuberculosis and respiratory infections (Krieger and Higgins, 2002), and increased incidents of accidents. Our results reveal that inhabitants living in dwelling units with a separate kitchen have lower STM (p<0.01) and MM (p<0.1) compared to those without a separate kitchen. In contrast, STM and MM are positively associated with room per capita suggesting that for a unit increase in room per capita the odds of STM increases by 16% and the odds of MM increases by 18%, holding other variables constant. These findings are against intuition, as more space ought to reduce STM. The average room per capita in urban smaller city households (0.59) is higher than in megacities (0.53) and rural (0.52) households. It is likely that households with higher room per capita are located in peripheral urban areas, which could have poorer access to certain municipal services, which are not controlled for here, e.g., solid waste management, that could trigger higher STM. Moreover living in peripheral urban areas might be associated with longer commute times (more exposure to air pollution) and more sedentary livestyles that could trigger to higher prevalence of MM. We also find that spending on electricity and transport increases with separate kitchen and more room per capita. 3.3 Electricity and Transport
Increased electricity spending is correlated with decreasing STM, whereas private-transport spending is positively correlated with increasing MM. Interestingly, we do not find a statistically significant influence of electricity spending on MM and transport spending on STM, ceteris paribus. These findings suggest that adequate access to electricity can reduce the incidence of STM, and enhanced non-motorized personal transport can lower the incidence of MM. Owning a bicycle is associated with lower STM as well as MM (p<0.1), everything else held constant. This findings complement our earlier one that indicates a correlation between transport spending and MM. Ownership of vehicles also explains variations in electricity and transport spending. We find that households with a motorcycle, compared to those without one, spend 11% and 102% more on electricity and transport, respectively, ceteris paribus. Similarly, households with a car, compared to those without one, spend 7% and 63% more on electricity and transport, respectively.
180
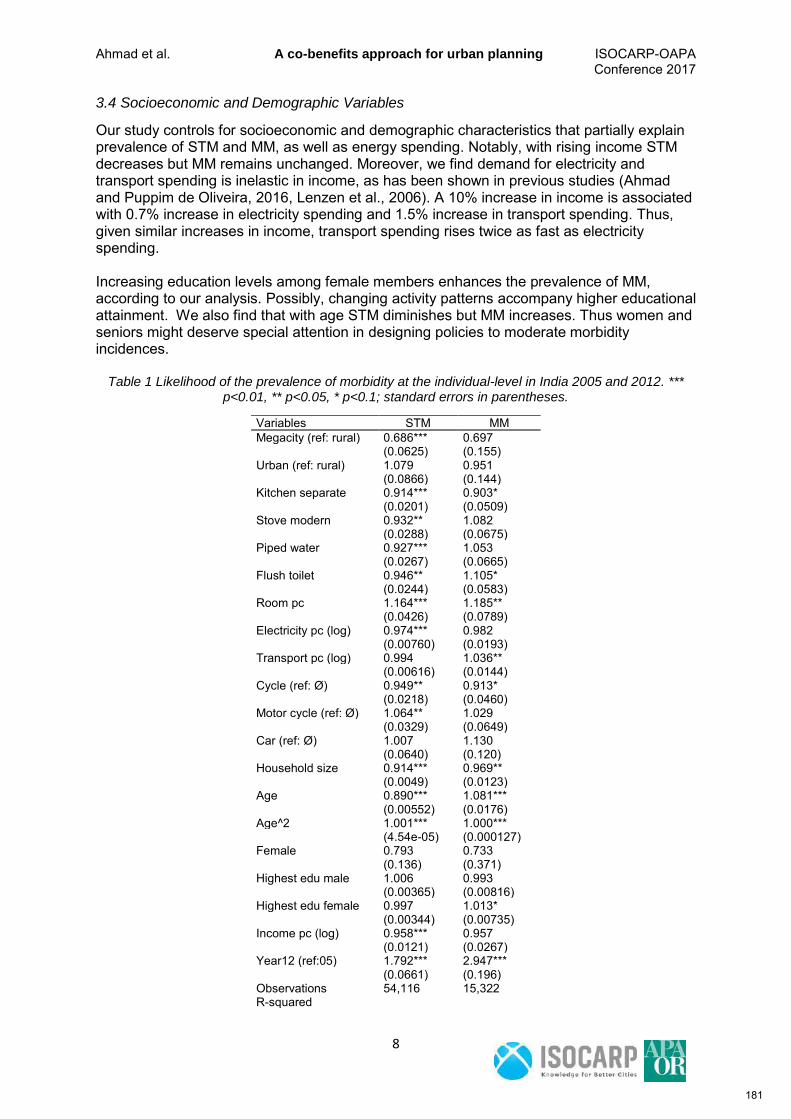
Ahmad et al. A co-benefits approach for urban planning ISOCARP-OAPA Conference 2017
8
3.4 Socioeconomic and Demographic Variables
Our study controls for socioeconomic and demographic characteristics that partially explain prevalence of STM and MM, as well as energy spending. Notably, with rising income STM decreases but MM remains unchanged. Moreover, we find demand for electricity and transport spending is inelastic in income, as has been shown in previous studies (Ahmad and Puppim de Oliveira, 2016, Lenzen et al., 2006). A 10% increase in income is associated with 0.7% increase in electricity spending and 1.5% increase in transport spending. Thus, given similar increases in income, transport spending rises twice as fast as electricity spending. Increasing education levels among female members enhances the prevalence of MM, according to our analysis. Possibly, changing activity patterns accompany higher educational attainment. We also find that with age STM diminishes but MM increases. Thus women and seniors might deserve special attention in designing policies to moderate morbidity incidences.
Table 1 Likelihood of the prevalence of morbidity at the individual-level in India 2005 and 2012. *** p<0.01, ** p<0.05, * p<0.1; standard errors in parentheses.
Variables STM MM Megacity (ref: rural) 0.686*** 0.697 (0.0625) (0.155) Urban (ref: rural) 1.079 0.951 (0.0866) (0.144) Kitchen separate 0.914*** 0.903* (0.0201) (0.0509) Stove modern 0.932** 1.082 (0.0288) (0.0675) Piped water 0.927*** 1.053 (0.0267) (0.0665) Flush toilet 0.946** 1.105* (0.0244) (0.0583) Room pc 1.164*** 1.185** (0.0426) (0.0789) Electricity pc (log) 0.974*** 0.982 (0.00760) (0.0193) Transport pc (log) 0.994 1.036** (0.00616) (0.0144) Cycle (ref: Ø) 0.949** 0.913* (0.0218) (0.0460) Motor cycle (ref: Ø) 1.064** 1.029 (0.0329) (0.0649) Car (ref: Ø) 1.007 1.130 (0.0640) (0.120) Household size 0.914*** 0.969** (0.0049) (0.0123) Age 0.890*** 1.081*** (0.00552) (0.0176) Age^2 1.001*** 1.000*** (4.54e-05) (0.000127) Female 0.793 0.733 (0.136) (0.371) Highest edu male 1.006 0.993 (0.00365) (0.00816) Highest edu female 0.997 1.013* (0.00344) (0.00735) Income pc (log) 0.958*** 0.957 (0.0121) (0.0267) Year12 (ref:05) 1.792*** 2.947*** (0.0661) (0.196) Observations 54,116 15,322 R-squared
181
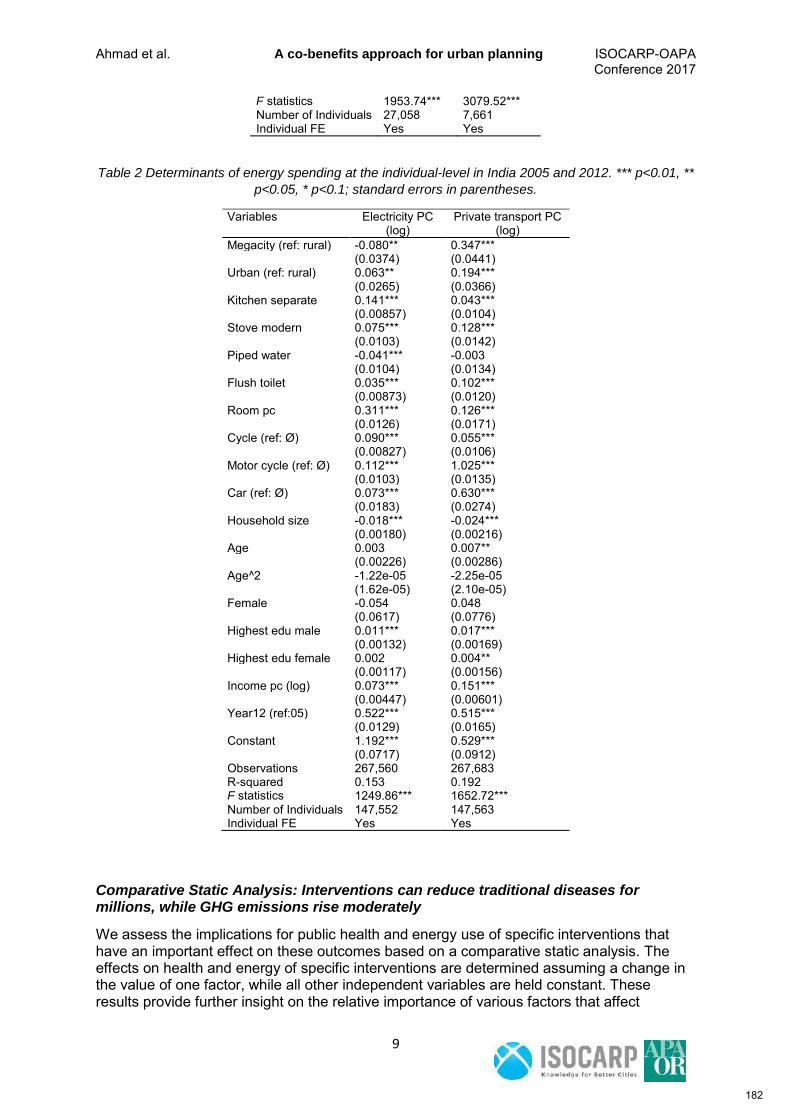
Ahmad et al. A co-benefits approach for urban planning ISOCARP-OAPA Conference 2017
9
F statistics 1953.74*** 3079.52*** Number of Individuals 27,058 7,661 Individual FE Yes Yes
Table 2 Determinants of energy spending at the individual-level in India 2005 and 2012. *** p<0.01, **
p<0.05, * p<0.1; standard errors in parentheses.
Variables Electricity PC (log)
Private transport PC (log)
Megacity (ref: rural) -0.080** 0.347*** (0.0374) (0.0441) Urban (ref: rural) 0.063** 0.194*** (0.0265) (0.0366) Kitchen separate 0.141*** 0.043*** (0.00857) (0.0104) Stove modern 0.075*** 0.128*** (0.0103) (0.0142) Piped water -0.041*** -0.003 (0.0104) (0.0134) Flush toilet 0.035*** 0.102*** (0.00873) (0.0120) Room pc 0.311*** 0.126*** (0.0126) (0.0171) Cycle (ref: Ø) 0.090*** 0.055*** (0.00827) (0.0106) Motor cycle (ref: Ø) 0.112*** 1.025*** (0.0103) (0.0135) Car (ref: Ø) 0.073*** 0.630*** (0.0183) (0.0274) Household size -0.018*** -0.024*** (0.00180) (0.00216) Age 0.003 0.007** (0.00226) (0.00286) Age^2 -1.22e-05 -2.25e-05 (1.62e-05) (2.10e-05) Female -0.054 0.048 (0.0617) (0.0776) Highest edu male 0.011*** 0.017*** (0.00132) (0.00169) Highest edu female 0.002 0.004** (0.00117) (0.00156) Income pc (log) 0.073*** 0.151*** (0.00447) (0.00601) Year12 (ref:05) 0.522*** 0.515*** (0.0129) (0.0165) Constant 1.192*** 0.529*** (0.0717) (0.0912) Observations 267,560 267,683 R-squared 0.153 0.192 F statistics 1249.86*** 1652.72*** Number of Individuals 147,552 147,563 Individual FE Yes Yes
Comparative Static Analysis: Interventions can reduce traditional diseases for millions, while GHG emissions rise moderately
We assess the implications for public health and energy use of specific interventions that have an important effect on these outcomes based on a comparative static analysis. The effects on health and energy of specific interventions are determined assuming a change in the value of one factor, while all other independent variables are held constant. These results provide further insight on the relative importance of various factors that affect
182
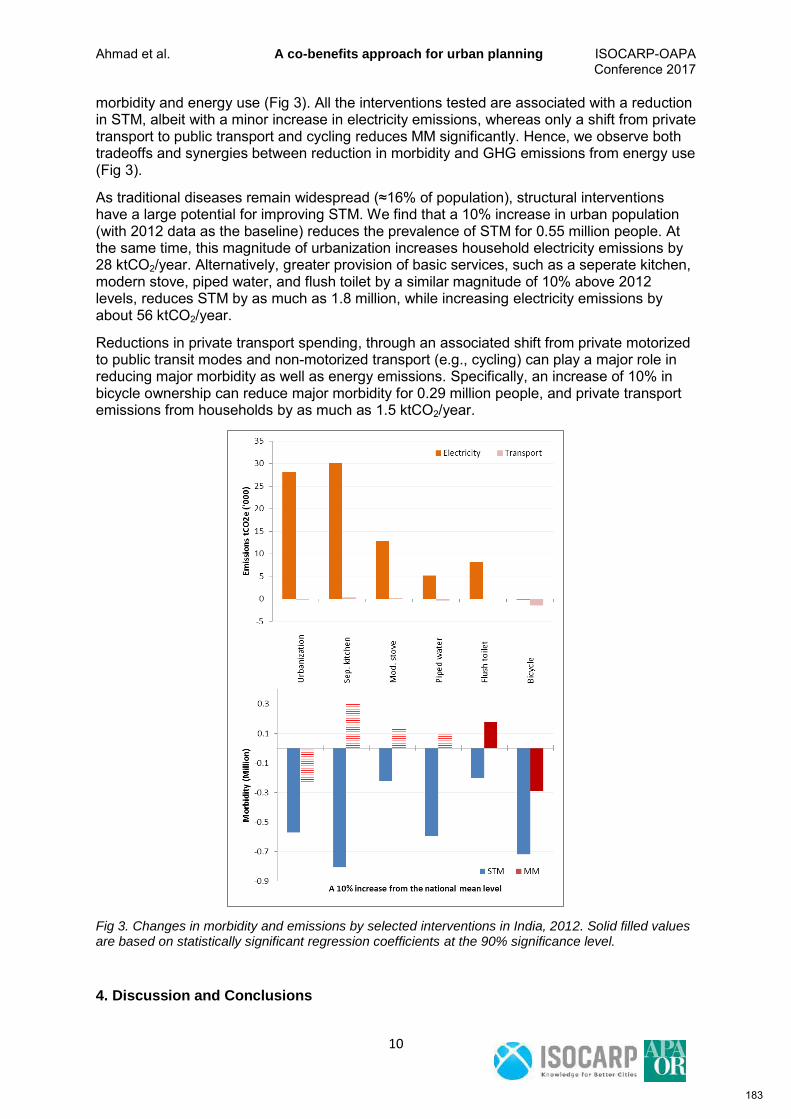
Ahmad et al. A co-benefits approach for urban planning ISOCARP-OAPA Conference 2017
10
morbidity and energy use (Fig 3). All the interventions tested are associated with a reduction in STM, albeit with a minor increase in electricity emissions, whereas only a shift from private transport to public transport and cycling reduces MM significantly. Hence, we observe both tradeoffs and synergies between reduction in morbidity and GHG emissions from energy use (Fig 3).
As traditional diseases remain widespread (≈16% of population), structural interventions have a large potential for improving STM. We find that a 10% increase in urban population (with 2012 data as the baseline) reduces the prevalence of STM for 0.55 million people. At the same time, this magnitude of urbanization increases household electricity emissions by 28 ktCO2/year. Alternatively, greater provision of basic services, such as a seperate kitchen, modern stove, piped water, and flush toilet by a similar magnitude of 10% above 2012 levels, reduces STM by as much as 1.8 million, while increasing electricity emissions by about 56 ktCO2/year.
Reductions in private transport spending, through an associated shift from private motorized to public transit modes and non-motorized transport (e.g., cycling) can play a major role in reducing major morbidity as well as energy emissions. Specifically, an increase of 10% in bicycle ownership can reduce major morbidity for 0.29 million people, and private transport emissions from households by as much as 1.5 ktCO2/year.
Fig 3. Changes in morbidity and emissions by selected interventions in India, 2012. Solid filled values are based on statistically significant regression coefficients at the 90% significance level.
4. Discussion and Conclusions
183
Ahmad et al. A co-benefits approach for urban planning ISOCARP-OAPA Conference 2017
11
Better public health and energy-efficient urbanization are primary challenges for low-carbon and inclusive development in India. Three key findings emerge from our study that inform how we can address both these challenges: the provision of non-motorized transport (NMT) as a sweet spot for sustainable development, improving publich health while reducing greenhouse gas emissions; the role of urbanization and access to household infrastructure in reducing short-term morbidity; limited evidence of the impact of socio-economic and built environment interventions, except in the case of the transport sector, in reducing major morbidity.
The promotion of non-motorized and public transit, through its affect on private transport spending and bicycle use, is associated with lower major morbidity as well as transport related emissions. However, trends in India and other developing economies indicate that the share of bicycles is declining and private motorized vehicle ownership is rising with economic development ((Pucher et al., 2005), and also see table S5). Beyond greater modern disease prevalence, private motorized transport also augments the risk of road traffic injuries, air and noise pollution, which pose a major global public health challenge (Garg and Hyder, 2006, Sharma, 2008). Hence, the provision of efficient and clean transport systems – through a combination of high-quality mass transit and safe bicycle infrastructures (Bongardt et al., 2013) – could be highly beneficial for both public health and climate change mitigation.
Other than these transport related interventions, our study did not find any evidence of other socio-economic or built environment related factors in mitigating major morbidity, which has increased significantly between 2005 and 2012. This also suggests that solutions might lie in measures beyond those studied here, such as better diets and physical activity.
Our study also provides empirical evidence of the role of urbanization and access to basic amenities in mitigating short term morbidity. Interestingly, we find that direct interventions to improve access to clean water and sanitation systems are much more effective in reducing the prevalence of STM than urbanization alone (Fig 3).
In contrast to other studies, we rely on microdata from nationally representative household surveys to analyze the prevalence of morbidity at an individual level, and transport and energy related emissions at a househehold level, while controlling for socio-economic and built environment related variables. Methodologically, we use cross-sectional and panel regressions to identify a sweet spot for sustainable development, and provide evidence of interventions that can improve quality of life in cities. Some caveats of our analysis are the relatively short time span of seven years (2005 and 2012) between the two surveys employed, and the use of subjective measurements of morbidity as captured in the surveys. Future work can build on this analysis by taking a wider systems perspective and uncovering the underlying causal mechanisms behind rising morbidity and emissions in cities. The availability of longer panel series and better data could also inform more spatially differentiated analysis, and allow for other important health and emissions drivers such as nutrition (food demand) and physical activity patterns to be incorporated.
Our results have important implications for policy, particularly for the nexus between energy-efficient urbanization, climate change mitigation, and sustainable development. With urbanization, directed energy use from cities is expected to more than triple between 2005 and 2050 globally. However, smart urbanization strategies, such as those that rely on higher transport fuel prices, could reduce energy demand by 25% (Creutzig et al., 2015). For no world region is this result more relevant than for India that is expecting the highest absolute urbanization among all countries. Our analysis of households in India shows that a shift in transport spending from private motorized means to clean mass transit and more bicycles could also benefit public health by reducing the prevalence of modern diseases like diabetes. Thus, higher taxes on gasoline and diesel to finance clean mass transit, such as BRT systems, could benefit public health and the climate. The opposite is likely to be true for electricity, however. We find that an increase in electricity consumption is associated with
184

Ahmad et al. A co-benefits approach for urban planning ISOCARP-OAPA Conference 2017
12
greater utilization of clean cooking and water infrastructures, and a significant decrease in traditional diseases. Hence, a blunt tax increase on electricity for climate change mitigation might hinder the achievement of other sustainable development goals, and in particular, improved public health. In fact, climate mitgiation policies in South Asia that lead to higher fossil fuel costs are likely to slow down clean cooking fuel uptake if not compensated for by other social protection measures (Cameron et al., 2016). Significantly, previous research suggests that expanding electricity access to households has a relatively marginal contribution to national greenhouse gas emissions increases (Pachauri, 2014). Climate policies hence need to be cognizant of the potential public health benefits of higher energy and electricity use, especially when starting from very low levels. Our analysis of these nexus issues provides empirical evidence to validate that energy-efficient and sustainable urbanization can address both public health and climate change challenges simultaneously.
185
Ahmad et al. A co-benefits approach for urban planning ISOCARP-OAPA Conference 2017
13
References
Agarwal, S. 2011. The state of urban health in India; comparing the poorest quartile to the rest of the urban population in selected states and cities. Environment and Urbanization, 23, 13-28.
Ahmad, S., Baiocchi, G. & Creutzig, F. 2015. CO2 Emissions from Direct Energy Use of Urban Households in India. Environmental Science & Technology, 49, 11312-11320.
Ahmad, S. & Puppim de Oliveira, J. A. 2016. Determinants of urban mobility in India: Lessons for promoting sustainable and inclusive urban transportation in developing countries. Transport Policy, 50, 106-114.
Bettencourt, L. M., Lobo, J., Helbing, D., Kühnert, C. & West, G. B. 2007. Growth, innovation, scaling, and the pace of life in cities. Proceedings of the national academy of sciences, 104, 7301-7306.
Bongardt, D., Breithaupt, M. & Creutzig, F. Beyond the fossil city: Towards low carbon transport and green growth. Fifth Regional EST Forum, 2010.
Bongardt, D., Creutzig, F., Hüging, H., Sakamoto, K., Bakker, S., Gota, S. & Böhler-Baedeker, S. 2013. Low-carbon land transport: policy handbook, Routledge.
Brasche, S. & Bischof, W. 2005. Daily time spent indoors in German homes – Baseline data for the assessment of indoor exposure of German occupants. International Journal of Hygiene and Environmental Health, 208, 247-253.
Cameron, C., Pachauri, S., Rao, N. D., McCollum, D., Rogelj, J. & Riahi, K. 2016. Policy trade-offs between climate mitigation and clean cook-stove access in South Asia. Nature Energy, 1, 15010.
Census of India 2011. Primary Census Abstract for Slum. In: OFFICE OF THE REGISTRAR GENERAL & CENSUS COMMISSIONER, I. (ed.). Delhi.
Creutzig, F., Agoston, P., Minx, J. C., Canadell, J. G., Andrew, R. M., Le Quéré, C., Peters, G. P., Sharifi, A., Yamagata, Y. & Dhakal, S. 2016a. Urban infrastructure choices structure climate solutions. Nature Climate Change, 6, 1054-1056.
Creutzig, F., Baiocchi, G., Bierkandt, R., Pichler, P.-P. & Seto, K. C. 2015. Global typology of urban energy use and potentials for an urbanization mitigation wedge. Proceedings of the National Academy of Sciences, 112, 6283-6288.
Creutzig, F., Fernandez, B., Haberl, H., Khosla, R., Mulugetta, Y. & Seto, K. C. 2016b. Beyond Technology: Demand-Side Solutions to Climate Change Mitigation. Annual Review of Environment and Resources, 41.
Desai, S., Vanneman, R. & National Council of Applied Economic Research 2010. India Human Development Survey (IHDS), 2005. New Delhi: Inter-university Consortium for Political and Social Research (ICPSR) [distributor].
Desai, S., Vanneman, R. & National Council of Applied Economic Research 2015. India Human Development Survey-II (IHDS-II), 2011-12. New Delhi: Inter-university Consortium for Political and Social Research (ICPSR) [distributor].
Donglan, Z., Dequn, Z. & Peng, Z. 2010. Driving forces of residential CO2 emissions in urban and rural China: An index decomposition analysis. Energy Policy, 38, 3377-3383.
Garg, N. & Hyder, A. A. 2006. Exploring the relationship between development and road traffic injuries: a case study from India. The European Journal of Public Health, 16, 487-491.
Greene, W. 2011. Econometric Analysis, NJ, Prentice Hall, Upper Saddle River. Gupta, K., Arnold, F. & Lhungdim, H. 2009. Health and living conditions in eight Indian cities.
National Family Health Survey (NFHS-3) India 2005-06. Kjellstrom, T., Friel, S., Dixon, J., Corvalan, C., Rehfuess, E., Campbell-Lendrum, D., Gore,
F. & Bartram, J. 2007. Urban environmental health hazards and health equity. Journal of urban health, 84, 86-97.
Krey, V., O'Neill, B. C., van Ruijven, B., Chaturvedi, V., Daioglou, V., Eom, J., Jiang, L., Nagai, Y., Pachauri, S. & Ren, X. 2012. Urban and rural energy use and carbon dioxide emissions in Asia. Energy Economics, 34, S272-S283.
186
Ahmad et al. A co-benefits approach for urban planning ISOCARP-OAPA Conference 2017
14
Krieger, J. & Higgins, D. L. 2002. Housing and Health: Time Again for Public Health Action. American Journal of Public Health, 92, 758-768.
Lenzen, M., Wier, M., Cohen, C., Hayami, H., Pachauri, S. & Schaeffer, R. 2006. A comparative multivariate analysis of household energy requirements in Australia, Brazil, Denmark, India and Japan. Energy, 31, 181-207.
Makido, Y., Dhakal, S. & Yamagata, Y. 2012. Relationship between urban form and CO2 emissions: Evidence from fifty Japanese cities. Urban Climate, 2, 55-67.
Marcotullio, P. & Lee, Y.-s. 2003. Urban environmental transitions and urban transportation systems: A comparison of the North American and Asian experiences. International Development Planning Review, 25, 325-354.
McGranahan, G. & Satterthwaite, D. 2014. Urbanisation: Concepts and Trends, IIED. Metz, B., Solomon, S., Kuijpers, L., Andersen, S. O., Davidson, O., Pons, J., de Jager, D.,
Kestin, T., Manning, M. & Meyer, L. 2005. Safeguarding the Ozone Layer and the Global Climate System: Issues related to hydrofluorocarbons and perfluorocarbons, New York, Cambridge University Press.
NSSO 2012. Consumer Expenditure -Type 1. In: MINISTRY OF STATISTICS AND PROGRAMME IMPLEMENTATION, G. O. I. (ed.). Delhi: Ministry of Statistics and Programme Implementation, Government of Inida.
O'Neill, B. C., Ren, X., Jiang, L. & Dalton, M. 2012. The effect of urbanization on energy use in India and China in the iPETS model. Energy Economics, 34, S339-S345.
Pachauri, S. 2014. Household electricity access a trivial contributor to CO2 emissions growth in India. Nature Clim. Change, 4, 1073-1076.
Pucher, J., Korattyswaropam, N., Mittal, N. & Ittyerah, N. 2005. Urban transport crisis in India. Transport Policy, 12, 185-198.
Ravallion, M., Chen, S. & Sangraula, P. 2007. New evidence on the urbanization of global poverty. Population and Development Review, 33, 667-701.
Sharma, B. 2008. Road traffic injuries: a major global public health crisis. Public health, 122, 1399-1406.
Shaw, M. 2004. Housing and public health. Annu. Rev. Public Health, 25, 397-418. Smith, K. R. & Ezzati, M. 2005. How environmental health risks change with development:
the epidemiologic and environmental risk transitions revisited. Annu. Rev. Environ. Resour., 30, 291-333.
UN-DESA 2014. World Urbanization Prospects: The 2014 Revision, , CD-ROM Edition. UN Habitat 2009. Planning Sustainable Cities: Global Report on Human Settlements 2009,
London, Earthscan. United Nations. 2015. Sustainable Development Goals: 17 Goals to Transform Our World
[Online]. Available: http://www.un.org/sustainabledevelopment/ [Accessed 7 March 2016].
van der Sande, M. A., Milligan, P. J., Nyan, O. A., Rowley, J. T., Banya, W. A., Ceesay, S. M., Dolmans, W. M., Thien, T., McAdam, K. P. & Walraven, G. E. 2000. Blood pressure patterns and cardiovascular risk factors in rural and urban gambian communities. Journal of human hypertension, 14, 489-496.
Wilkinson, P., Smith, K. R., Davies, M., Adair, H., Armstrong, B. G., Barrett, M., Bruce, N., Haines, A., Hamilton, I. & Oreszczyn, T. 2009. Public health benefits of strategies to reduce greenhouse-gas emissions: household energy. The Lancet, 374, 1917-1929.
Woodcock, J., Edwards, P., Tonne, C., Armstrong, B. G., Ashiru, O., Banister, D., Beevers, S., Chalabi, Z., Chowdhury, Z. & Cohen, A. 2009. Public health benefits of strategies to reduce greenhouse-gas emissions: urban land transport. The Lancet, 374, 1930-1943.
Wooldridge, J. 2012. Introductory econometrics: A modern approach, Cengage Learning. World Bank 2012. CO2 emissions (metric tons per capita). In: CARBON DIOXIDE
INFORMATION ANALYSIS CENTER, E. S. D., OAK RIDGE NATIONAL LABORATORY, TENNESSEE, UNITED STATES. (ed.). Washington, DC.
187
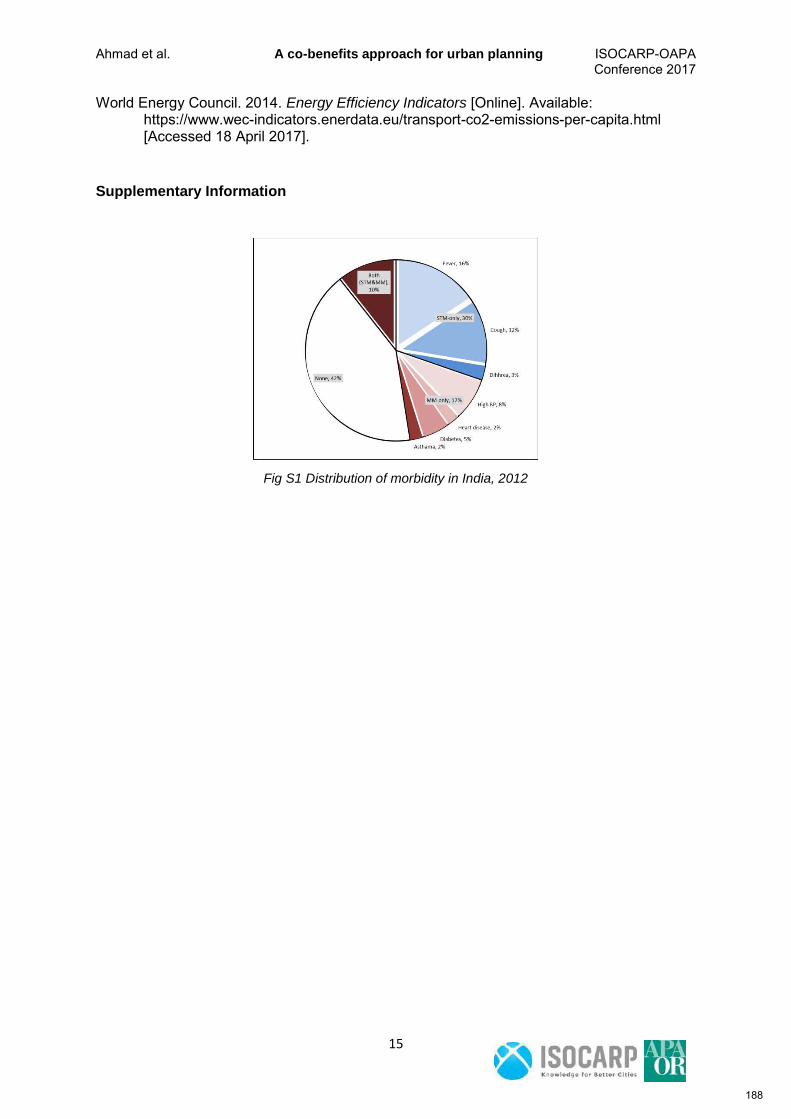
Ahmad et al. A co-benefits approach for urban planning ISOCARP-OAPA Conference 2017
15
World Energy Council. 2014. Energy Efficiency Indicators [Online]. Available: https://www.wec-indicators.enerdata.eu/transport-co2-emissions-per-capita.html [Accessed 18 April 2017].
Supplementary Information
Fig S1 Distribution of morbidity in India, 2012
188
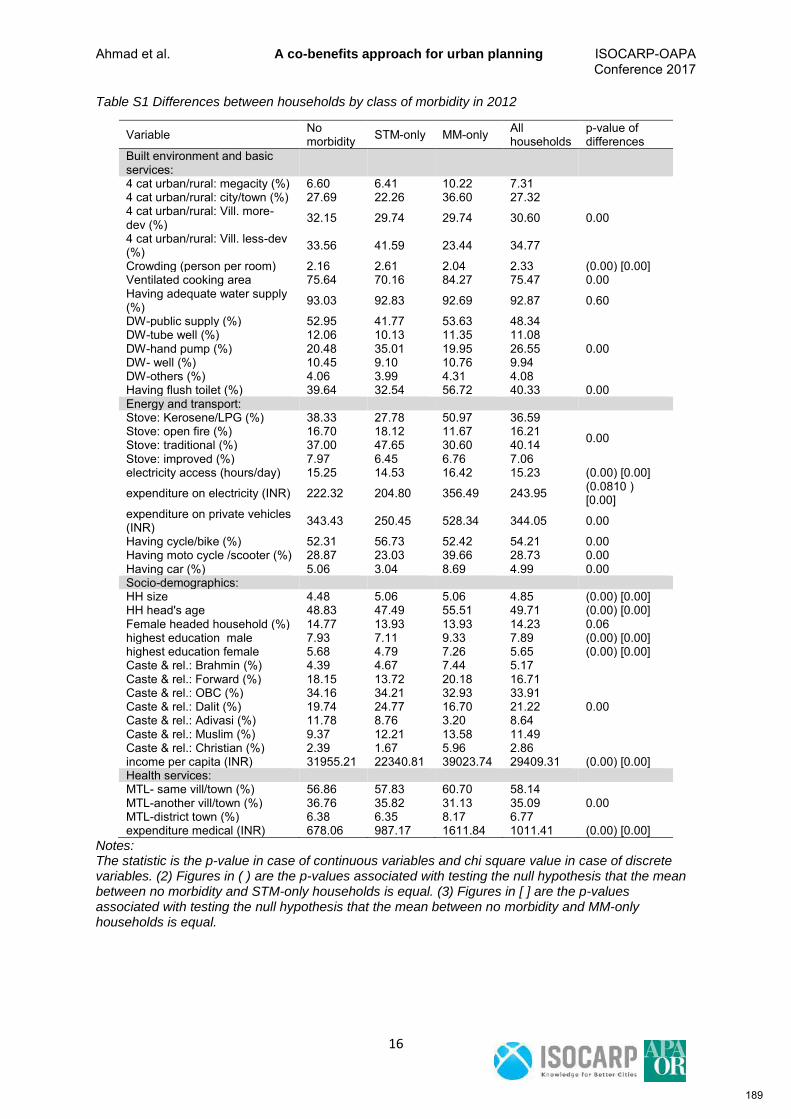
Ahmad et al. A co-benefits approach for urban planning ISOCARP-OAPA Conference 2017
16
Table S1 Differences between households by class of morbidity in 2012
Variable No morbidity STM-only MM-only All
households p-value of differences
Built environment and basic services:
4 cat urban/rural: megacity (%) 6.60 6.41 10.22 7.31
0.00
4 cat urban/rural: city/town (%) 27.69 22.26 36.60 27.32 4 cat urban/rural: Vill. more-dev (%) 32.15 29.74 29.74 30.60
4 cat urban/rural: Vill. less-dev (%) 33.56 41.59 23.44 34.77
Crowding (person per room) 2.16 2.61 2.04 2.33 (0.00) [0.00] Ventilated cooking area 75.64 70.16 84.27 75.47 0.00 Having adequate water supply (%) 93.03 92.83 92.69 92.87 0.60
DW-public supply (%) 52.95 41.77 53.63 48.34
0.00 DW-tube well (%) 12.06 10.13 11.35 11.08 DW-hand pump (%) 20.48 35.01 19.95 26.55 DW- well (%) 10.45 9.10 10.76 9.94 DW-others (%) 4.06 3.99 4.31 4.08 Having flush toilet (%) 39.64 32.54 56.72 40.33 0.00 Energy and transport: Stove: Kerosene/LPG (%) 38.33 27.78 50.97 36.59
0.00 Stove: open fire (%) 16.70 18.12 11.67 16.21 Stove: traditional (%) 37.00 47.65 30.60 40.14 Stove: improved (%) 7.97 6.45 6.76 7.06 electricity access (hours/day) 15.25 14.53 16.42 15.23 (0.00) [0.00]
expenditure on electricity (INR) 222.32 204.80 356.49 243.95 (0.0810 ) [0.00]
expenditure on private vehicles (INR) 343.43 250.45 528.34 344.05 0.00
Having cycle/bike (%) 52.31 56.73 52.42 54.21 0.00 Having moto cycle /scooter (%) 28.87 23.03 39.66 28.73 0.00 Having car (%) 5.06 3.04 8.69 4.99 0.00 Socio-demographics: HH size 4.48 5.06 5.06 4.85 (0.00) [0.00] HH head's age 48.83 47.49 55.51 49.71 (0.00) [0.00] Female headed household (%) 14.77 13.93 13.93 14.23 0.06 highest education male 7.93 7.11 9.33 7.89 (0.00) [0.00] highest education female 5.68 4.79 7.26 5.65 (0.00) [0.00] Caste & rel.: Brahmin (%) 4.39 4.67 7.44 5.17
0.00
Caste & rel.: Forward (%) 18.15 13.72 20.18 16.71 Caste & rel.: OBC (%) 34.16 34.21 32.93 33.91 Caste & rel.: Dalit (%) 19.74 24.77 16.70 21.22 Caste & rel.: Adivasi (%) 11.78 8.76 3.20 8.64 Caste & rel.: Muslim (%) 9.37 12.21 13.58 11.49 Caste & rel.: Christian (%) 2.39 1.67 5.96 2.86 income per capita (INR) 31955.21 22340.81 39023.74 29409.31 (0.00) [0.00] Health services: MTL- same vill/town (%) 56.86 57.83 60.70 58.14
0.00 MTL-another vill/town (%) 36.76 35.82 31.13 35.09 MTL-district town (%) 6.38 6.35 8.17 6.77 expenditure medical (INR) 678.06 987.17 1611.84 1011.41 (0.00) [0.00]
Notes: The statistic is the p-value in case of continuous variables and chi square value in case of discrete variables. (2) Figures in ( ) are the p-values associated with testing the null hypothesis that the mean between no morbidity and STM-only households is equal. (3) Figures in [ ] are the p-values associated with testing the null hypothesis that the mean between no morbidity and MM-only households is equal.
189
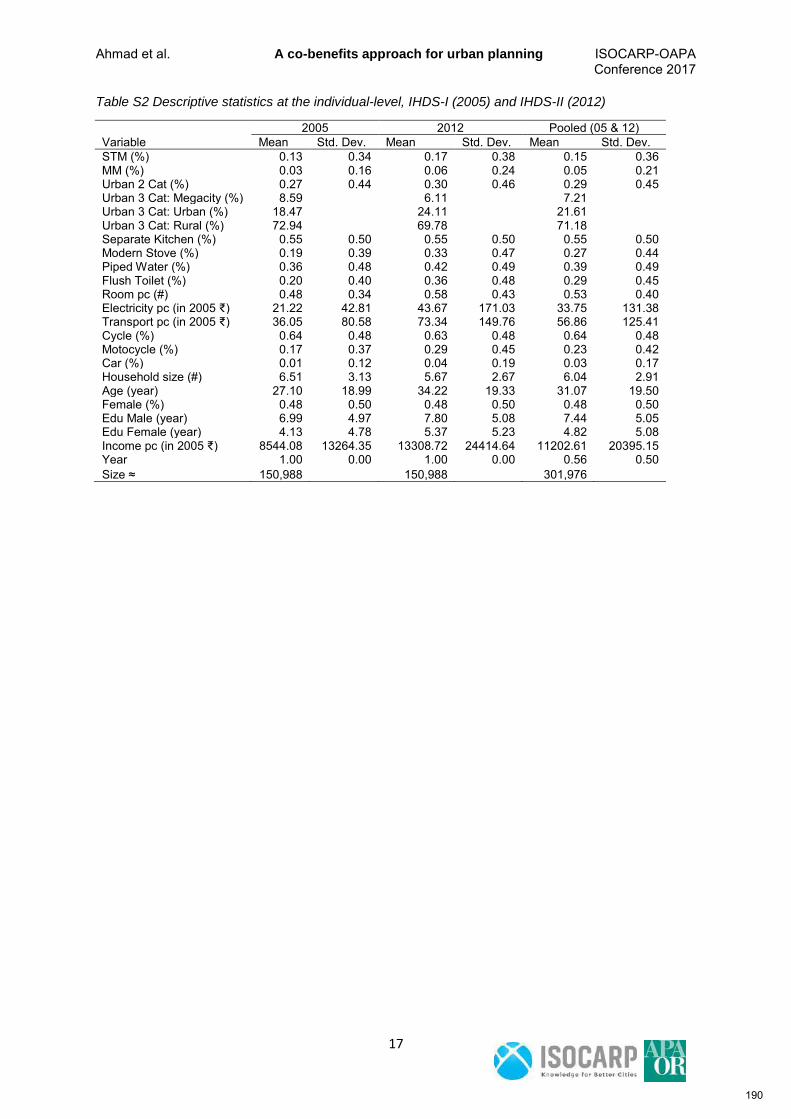
Ahmad et al. A co-benefits approach for urban planning ISOCARP-OAPA Conference 2017
17
Table S2 Descriptive statistics at the individual-level, IHDS-I (2005) and IHDS-II (2012)
2005 2012 Pooled (05 & 12)
Variable Mean Std. Dev. Mean Std. Dev. Mean Std. Dev. STM (%) 0.13 0.34 0.17 0.38 0.15 0.36 MM (%) 0.03 0.16 0.06 0.24 0.05 0.21 Urban 2 Cat (%) 0.27 0.44 0.30 0.46 0.29 0.45 Urban 3 Cat: Megacity (%) 8.59 6.11 7.21 Urban 3 Cat: Urban (%) 18.47 24.11 21.61 Urban 3 Cat: Rural (%) 72.94 69.78 71.18 Separate Kitchen (%) 0.55 0.50 0.55 0.50 0.55 0.50 Modern Stove (%) 0.19 0.39 0.33 0.47 0.27 0.44 Piped Water (%) 0.36 0.48 0.42 0.49 0.39 0.49 Flush Toilet (%) 0.20 0.40 0.36 0.48 0.29 0.45 Room pc (#) 0.48 0.34 0.58 0.43 0.53 0.40 Electricity pc (in 2005 ₹) 21.22 42.81 43.67 171.03 33.75 131.38 Transport pc (in 2005 ₹) 36.05 80.58 73.34 149.76 56.86 125.41 Cycle (%) 0.64 0.48 0.63 0.48 0.64 0.48 Motocycle (%) 0.17 0.37 0.29 0.45 0.23 0.42 Car (%) 0.01 0.12 0.04 0.19 0.03 0.17 Household size (#) 6.51 3.13 5.67 2.67 6.04 2.91 Age (year) 27.10 18.99 34.22 19.33 31.07 19.50 Female (%) 0.48 0.50 0.48 0.50 0.48 0.50 Edu Male (year) 6.99 4.97 7.80 5.08 7.44 5.05 Edu Female (year) 4.13 4.78 5.37 5.23 4.82 5.08 Income pc (in 2005 ₹) 8544.08 13264.35 13308.72 24414.64 11202.61 20395.15 Year 1.00 0.00 1.00 0.00 0.56 0.50 Size ≈ 150,988
150,988
301,976
190
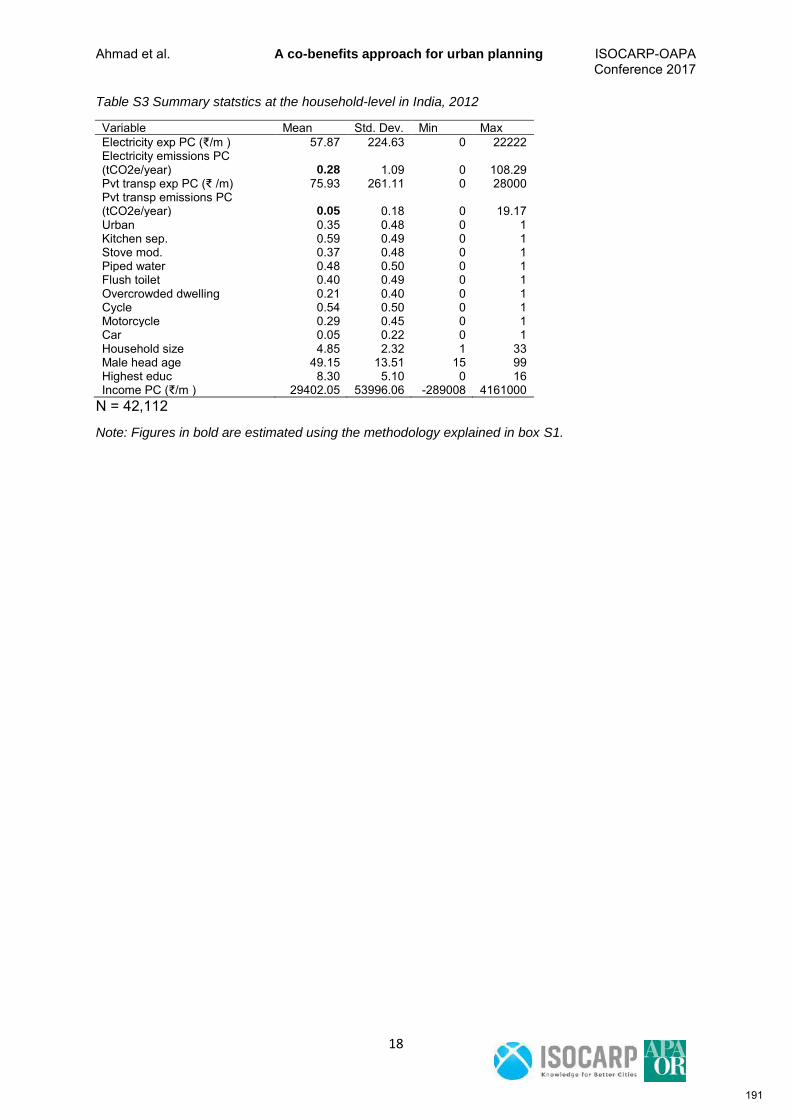
Ahmad et al. A co-benefits approach for urban planning ISOCARP-OAPA Conference 2017
18
Table S3 Summary statstics at the household-level in India, 2012
Variable Mean Std. Dev. Min Max Electricity exp PC (₹/m ) 57.87 224.63 0 22222 Electricity emissions PC (tCO2e/year) 0.28 1.09 0 108.29 Pvt transp exp PC (₹ /m) 75.93 261.11 0 28000 Pvt transp emissions PC (tCO2e/year) 0.05 0.18 0 19.17 Urban 0.35 0.48 0 1 Kitchen sep. 0.59 0.49 0 1 Stove mod. 0.37 0.48 0 1 Piped water 0.48 0.50 0 1 Flush toilet 0.40 0.49 0 1 Overcrowded dwelling 0.21 0.40 0 1 Cycle 0.54 0.50 0 1 Motorcycle 0.29 0.45 0 1 Car 0.05 0.22 0 1 Household size 4.85 2.32 1 33 Male head age 49.15 13.51 15 99 Highest educ 8.30 5.10 0 16 Income PC (₹/m ) 29402.05 53996.06 -289008 4161000
N = 42,112
Note: Figures in bold are estimated using the methodology explained in box S1.
191
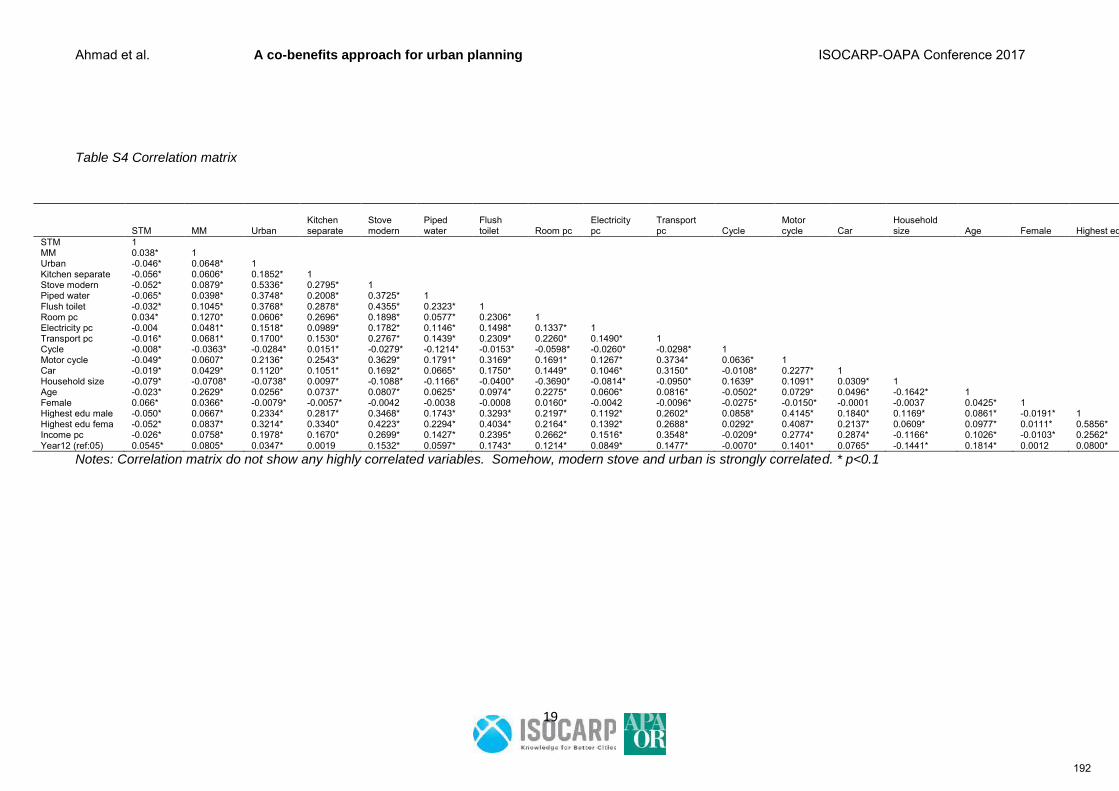
Ahmad et al. A co-benefits approach for urban planning ISOCARP-OAPA Conference 2017
19
Table S4 Correlation matrix
STM MM Urban Kitchen separate
Stove modern
Piped water
Flush toilet Room pc
Electricity pc
Transport pc Cycle
Motor cycle Car
Household size Age Female Highest edu male
Highest edu female Income pc
STM 1 MM 0.038* 1
Urban -0.046* 0.0648* 1 Kitchen separate -0.056* 0.0606* 0.1852* 1
Stove modern -0.052* 0.0879* 0.5336* 0.2795* 1 Piped water -0.065* 0.0398* 0.3748* 0.2008* 0.3725* 1
Flush toilet -0.032* 0.1045* 0.3768* 0.2878* 0.4355* 0.2323* 1 Room pc 0.034* 0.1270* 0.0606* 0.2696* 0.1898* 0.0577* 0.2306* 1
Electricity pc -0.004 0.0481* 0.1518* 0.0989* 0.1782* 0.1146* 0.1498* 0.1337* 1 Transport pc -0.016* 0.0681* 0.1700* 0.1530* 0.2767* 0.1439* 0.2309* 0.2260* 0.1490* 1
Cycle -0.008* -0.0363* -0.0284* 0.0151* -0.0279* -0.1214* -0.0153* -0.0598* -0.0260* -0.0298* 1 Motor cycle -0.049* 0.0607* 0.2136* 0.2543* 0.3629* 0.1791* 0.3169* 0.1691* 0.1267* 0.3734* 0.0636* 1
Car -0.019* 0.0429* 0.1120* 0.1051* 0.1692* 0.0665* 0.1750* 0.1449* 0.1046* 0.3150* -0.0108* 0.2277* 1 Household size -0.079* -0.0708* -0.0738* 0.0097* -0.1088* -0.1166* -0.0400* -0.3690* -0.0814* -0.0950* 0.1639* 0.1091* 0.0309* 1
Age -0.023* 0.2629* 0.0256* 0.0737* 0.0807* 0.0625* 0.0974* 0.2275* 0.0606* 0.0816* -0.0502* 0.0729* 0.0496* -0.1642* 1 Female 0.066* 0.0366* -0.0079* -0.0057* -0.0042 -0.0038 -0.0008 0.0160* -0.0042 -0.0096* -0.0275* -0.0150* -0.0001 -0.0037 0.0425* 1
Highest edu male -0.050* 0.0667* 0.2334* 0.2817* 0.3468* 0.1743* 0.3293* 0.2197* 0.1192* 0.2602* 0.0858* 0.4145* 0.1840* 0.1169* 0.0861* -0.0191* 1 Highest edu fema -0.052* 0.0837* 0.3214* 0.3340* 0.4223* 0.2294* 0.4034* 0.2164* 0.1392* 0.2688* 0.0292* 0.4087* 0.2137* 0.0609* 0.0977* 0.0111* 0.5856* 1
Income pc -0.026* 0.0758* 0.1978* 0.1670* 0.2699* 0.1427* 0.2395* 0.2662* 0.1516* 0.3548* -0.0209* 0.2774* 0.2874* -0.1166* 0.1026* -0.0103* 0.2562* 0.2773* 1 Year12 (ref:05) 0.0545* 0.0805* 0.0347* 0.0019 0.1532* 0.0597* 0.1743* 0.1214* 0.0849* 0.1477* -0.0070* 0.1401* 0.0765* -0.1441* 0.1814* 0.0012 0.0800* 0.1212* 0.1160*
Notes: Correlation matrix do not show any highly correlated variables. Somehow, modern stove and urban is strongly correlated. * p<0.1
192
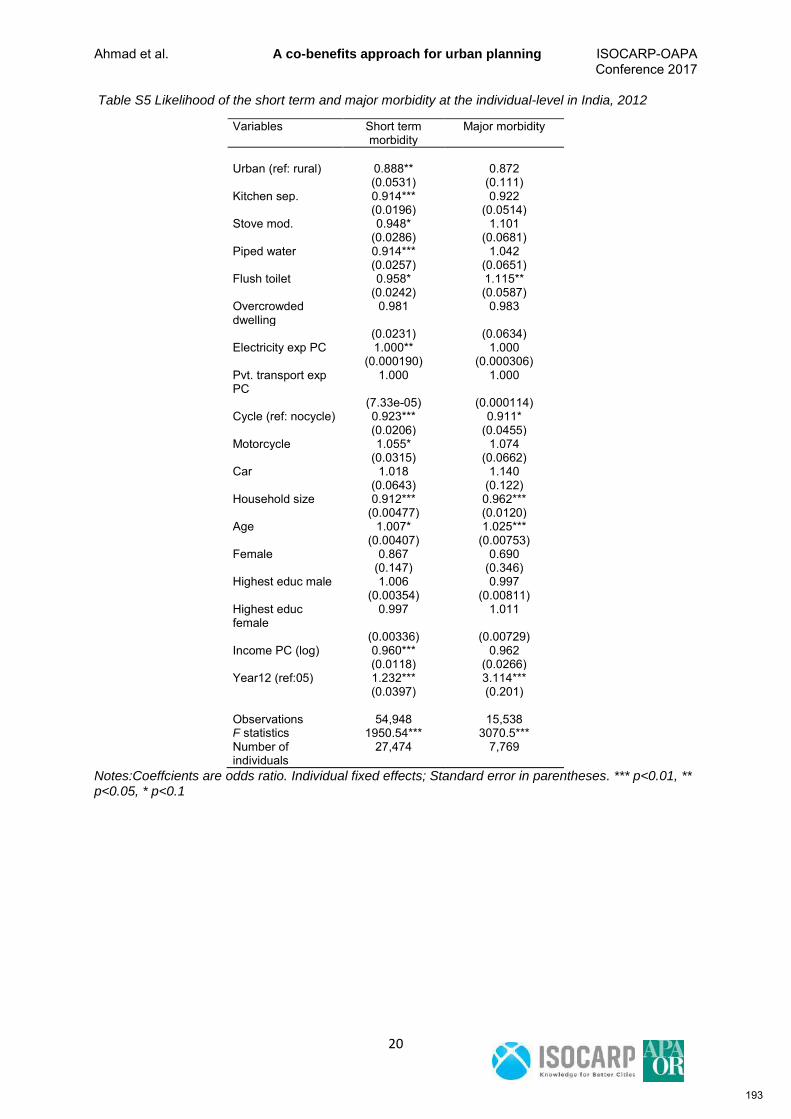
Ahmad et al. A co-benefits approach for urban planning ISOCARP-OAPA Conference 2017
20
Table S5 Likelihood of the short term and major morbidity at the individual-level in India, 2012
Variables Short term morbidity
Major morbidity
Urban (ref: rural) 0.888** 0.872 (0.0531) (0.111) Kitchen sep. 0.914*** 0.922 (0.0196) (0.0514) Stove mod. 0.948* 1.101 (0.0286) (0.0681) Piped water 0.914*** 1.042 (0.0257) (0.0651) Flush toilet 0.958* 1.115** (0.0242) (0.0587) Overcrowded dwelling
0.981 0.983
(0.0231) (0.0634) Electricity exp PC 1.000** 1.000 (0.000190) (0.000306) Pvt. transport exp PC
1.000 1.000
(7.33e-05) (0.000114) Cycle (ref: nocycle) 0.923*** 0.911* (0.0206) (0.0455) Motorcycle 1.055* 1.074 (0.0315) (0.0662) Car 1.018 1.140 (0.0643) (0.122) Household size 0.912*** 0.962*** (0.00477) (0.0120) Age 1.007* 1.025*** (0.00407) (0.00753) Female 0.867 0.690 (0.147) (0.346) Highest educ male 1.006 0.997 (0.00354) (0.00811) Highest educ female
0.997 1.011
(0.00336) (0.00729) Income PC (log) 0.960*** 0.962 (0.0118) (0.0266) Year12 (ref:05) 1.232*** 3.114*** (0.0397) (0.201) Observations 54,948 15,538 F statistics 1950.54*** 3070.5*** Number of individuals
27,474 7,769
Notes:Coeffcients are odds ratio. Individual fixed effects; Standard error in parentheses. *** p<0.01, ** p<0.05, * p<0.1
193
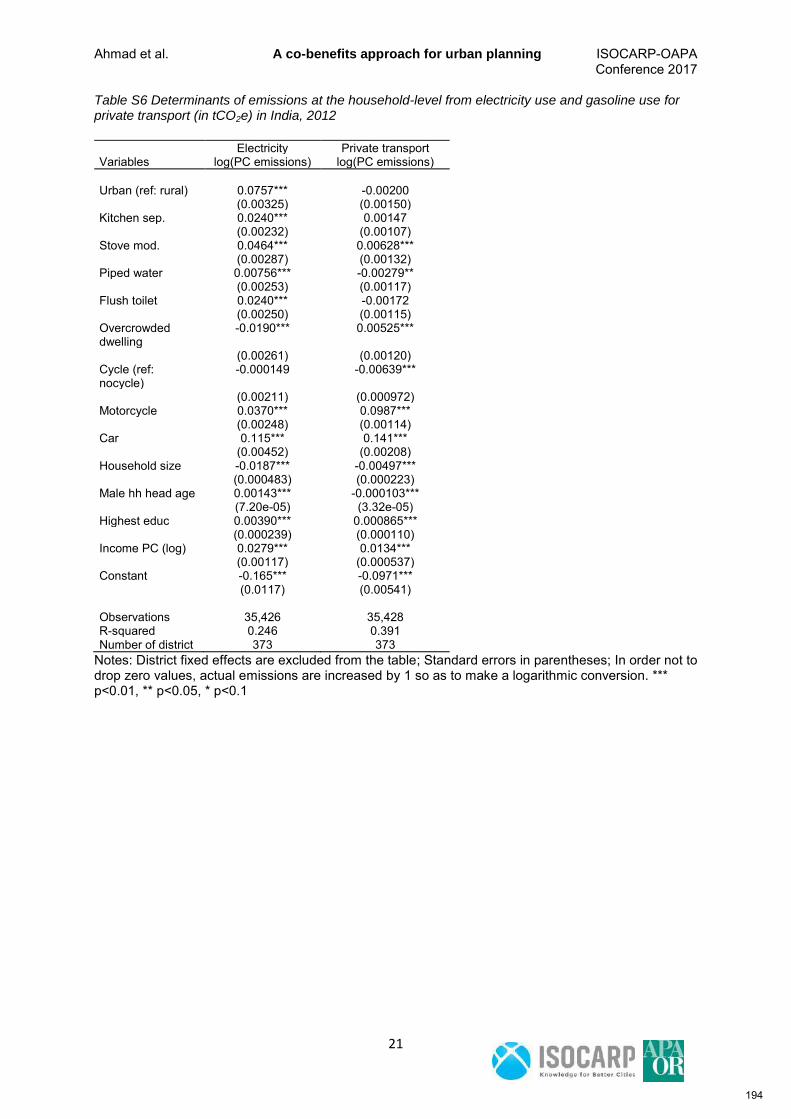
Ahmad et al. A co-benefits approach for urban planning ISOCARP-OAPA Conference 2017
21
Table S6 Determinants of emissions at the household-level from electricity use and gasoline use for private transport (in tCO2e) in India, 2012
Electricity Private transport Variables log(PC emissions) log(PC emissions) Urban (ref: rural) 0.0757*** -0.00200 (0.00325) (0.00150) Kitchen sep. 0.0240*** 0.00147 (0.00232) (0.00107) Stove mod. 0.0464*** 0.00628*** (0.00287) (0.00132) Piped water 0.00756*** -0.00279** (0.00253) (0.00117) Flush toilet 0.0240*** -0.00172 (0.00250) (0.00115) Overcrowded dwelling
-0.0190*** 0.00525***
(0.00261) (0.00120) Cycle (ref: nocycle)
-0.000149 -0.00639***
(0.00211) (0.000972) Motorcycle 0.0370*** 0.0987*** (0.00248) (0.00114) Car 0.115*** 0.141*** (0.00452) (0.00208) Household size -0.0187*** -0.00497*** (0.000483) (0.000223) Male hh head age 0.00143*** -0.000103*** (7.20e-05) (3.32e-05) Highest educ 0.00390*** 0.000865*** (0.000239) (0.000110) Income PC (log) 0.0279*** 0.0134*** (0.00117) (0.000537) Constant -0.165*** -0.0971*** (0.0117) (0.00541) Observations 35,426 35,428 R-squared 0.246 0.391 Number of district 373 373
Notes: District fixed effects are excluded from the table; Standard errors in parentheses; In order not to drop zero values, actual emissions are increased by 1 so as to make a logarithmic conversion. *** p<0.01, ** p<0.05, * p<0.1
194
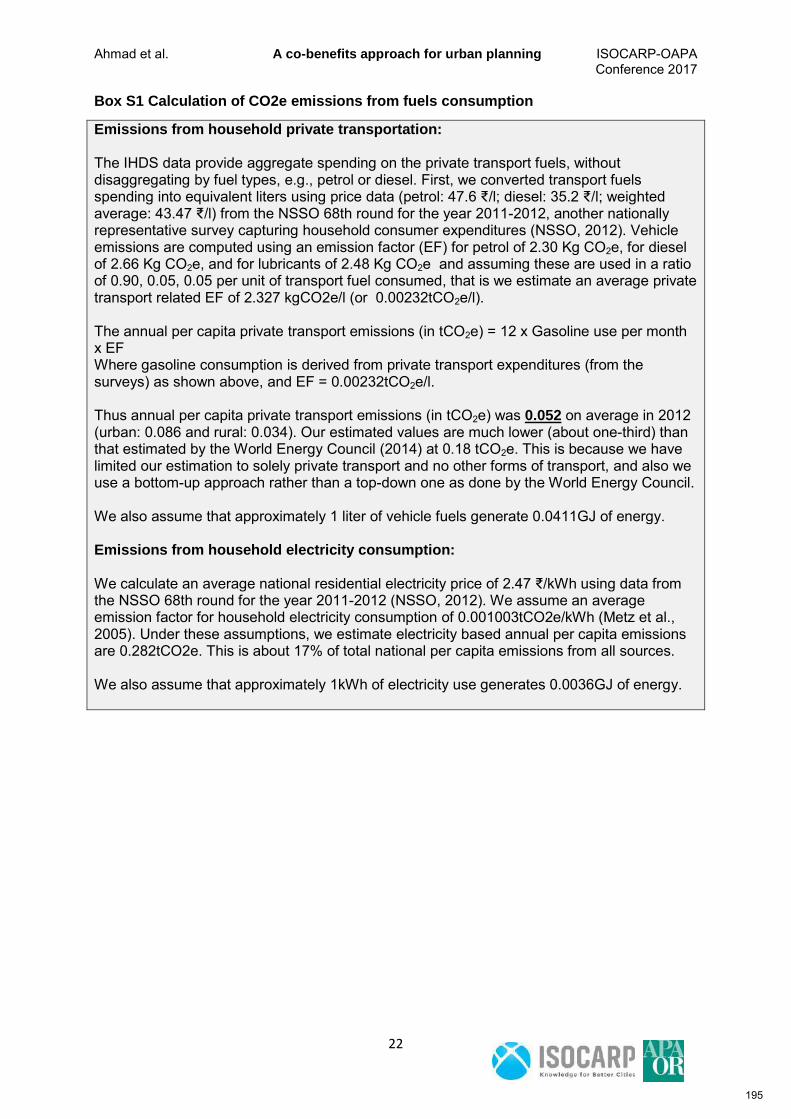
Ahmad et al. A co-benefits approach for urban planning ISOCARP-OAPA Conference 2017
22
Box S1 Calculation of CO2e emissions from fuels consumption
Emissions from household private transportation: The IHDS data provide aggregate spending on the private transport fuels, without disaggregating by fuel types, e.g., petrol or diesel. First, we converted transport fuels spending into equivalent liters using price data (petrol: 47.6 ₹/l; diesel: 35.2 ₹/l; weighted average: 43.47 ₹/l) from the NSSO 68th round for the year 2011-2012, another nationally representative survey capturing household consumer expenditures (NSSO, 2012). Vehicle emissions are computed using an emission factor (EF) for petrol of 2.30 Kg CO2e, for diesel of 2.66 Kg CO2e, and for lubricants of 2.48 Kg CO2e and assuming these are used in a ratio of 0.90, 0.05, 0.05 per unit of transport fuel consumed, that is we estimate an average private transport related EF of 2.327 kgCO2e/l (or 0.00232tCO2e/l). The annual per capita private transport emissions (in tCO2e) = 12 x Gasoline use per month x EF Where gasoline consumption is derived from private transport expenditures (from the surveys) as shown above, and EF = 0.00232tCO2e/l. Thus annual per capita private transport emissions (in tCO2e) was 0.052 on average in 2012 (urban: 0.086 and rural: 0.034). Our estimated values are much lower (about one-third) than that estimated by the World Energy Council (2014) at 0.18 tCO2e. This is because we have limited our estimation to solely private transport and no other forms of transport, and also we use a bottom-up approach rather than a top-down one as done by the World Energy Council. We also assume that approximately 1 liter of vehicle fuels generate 0.0411GJ of energy. Emissions from household electricity consumption: We calculate an average national residential electricity price of 2.47 ₹/kWh using data from the NSSO 68th round for the year 2011-2012 (NSSO, 2012). We assume an average emission factor for household electricity consumption of 0.001003tCO2e/kWh (Metz et al., 2005). Under these assumptions, we estimate electricity based annual per capita emissions are 0.282tCO2e. This is about 17% of total national per capita emissions from all sources. We also assume that approximately 1kWh of electricity use generates 0.0036GJ of energy.
195
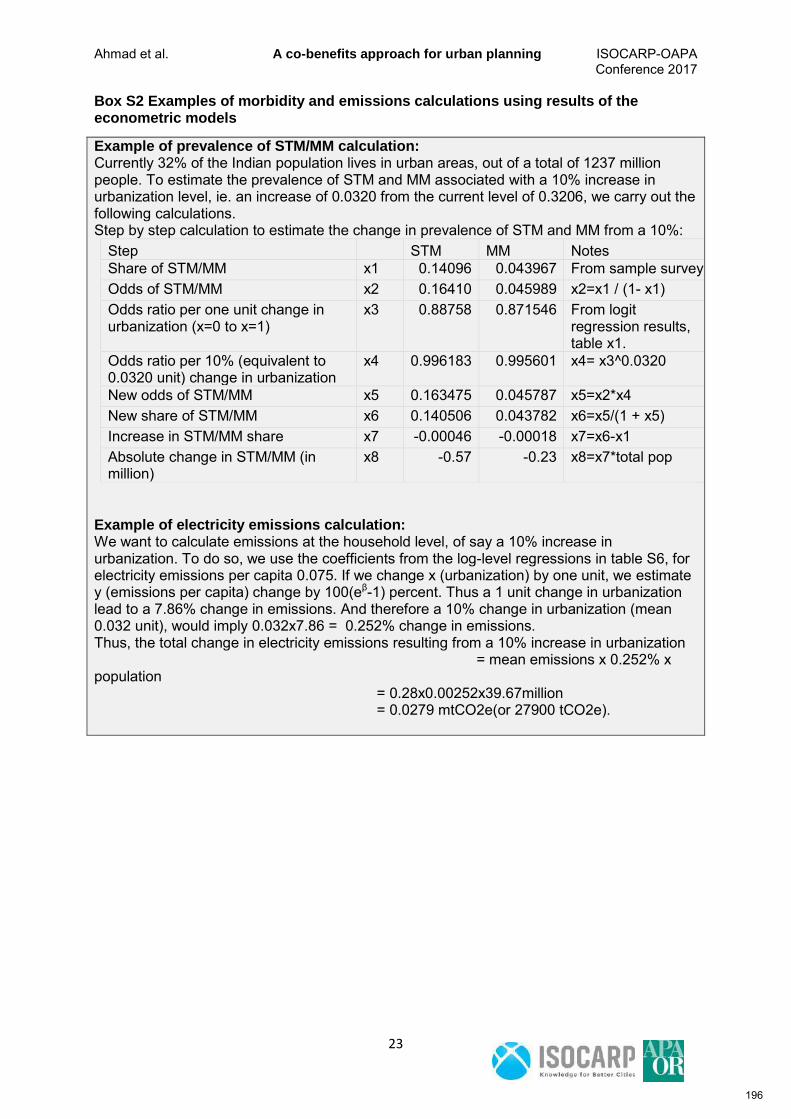
Ahmad et al. A co-benefits approach for urban planning ISOCARP-OAPA Conference 2017
23
Box S2 Examples of morbidity and emissions calculations using results of the econometric models
Example of prevalence of STM/MM calculation: Currently 32% of the Indian population lives in urban areas, out of a total of 1237 million people. To estimate the prevalence of STM and MM associated with a 10% increase in urbanization level, ie. an increase of 0.0320 from the current level of 0.3206, we carry out the following calculations. Step by step calculation to estimate the change in prevalence of STM and MM from a 10%:
Step STM MM Notes Share of STM/MM x1 0.14096 0.043967 From sample survey Odds of STM/MM x2 0.16410 0.045989 x2=x1 / (1- x1) Odds ratio per one unit change in urbanization (x=0 to x=1)
x3 0.88758 0.871546 From logit regression results, table x1.
Odds ratio per 10% (equivalent to 0.0320 unit) change in urbanization
x4 0.996183 0.995601 x4= x3^0.0320
New odds of STM/MM x5 0.163475 0.045787 x5=x2*x4 New share of STM/MM x6 0.140506 0.043782 x6=x5/(1 + x5) Increase in STM/MM share x7 -0.00046 -0.00018 x7=x6-x1 Absolute change in STM/MM (in million)
x8 -0.57 -0.23 x8=x7*total pop
Example of electricity emissions calculation: We want to calculate emissions at the household level, of say a 10% increase in urbanization. To do so, we use the coefficients from the log-level regressions in table S6, for electricity emissions per capita 0.075. If we change x (urbanization) by one unit, we estimate y (emissions per capita) change by 100(eβ-1) percent. Thus a 1 unit change in urbanization lead to a 7.86% change in emissions. And therefore a 10% change in urbanization (mean 0.032 unit), would imply 0.032x7.86 = 0.252% change in emissions. Thus, the total change in electricity emissions resulting from a 10% increase in urbanization = mean emissions x 0.252% x population
= 0.28x0.00252x39.67million = 0.0279 mtCO2e(or 27900 tCO2e).
196
Sen, Roshmi Centralized cooling systems ISOCARP-OAPA Conference 2017 Meggers, Forrest in housing communities Chattopadhyay, Subrata
1
Planning for centralized cooling systems in high density mass housing in tropics– towards smart energy policy in residential
communities
Roshmi SEN, Indian Institute of Technology Kharagpur, India
Forrest MEGGERS, Princeton University, USA Subrata CHATTOPADHYAY, Indian Institute of Technology Kharagpur, India
Synopsis
The given study explores the potential of centralized cooling systems applicable to mass housing complexes in community as compared to the pre-existing split air conditioning systems. The study then investigates institutional mechanisms towards implementing such centralized cooling systems in high density mass housing stock for developing nations.
1. Introduction
1.1 Cooling need in the developing world
Developing nations are home to the fastest growing cities. The majority of such cities belong to hot climates. Henceforth the need for cooling in the residential urban areas is expected to rise rapidly in the coming decades. A study (Sivak, 2009) highlighted that 38 out of 50 largest metropolitan cities are in developing countries. While analyzing local cooling and heating degree days data, the study found that 24 out of 38 of such mega-cities were having cooling demand that significantly exceeded the heating demand. Indian megacities Madras, Ahmedabad, Mumbai, Kolkata, Delhi and Bangalore accounted for among the cities with highest cooling degree days. The study anticipated a rise in the global cooling energy demand due to rise of individual income in developing countries. The study (Isaac and van Vuuren, 2009), popularized by the Economist magazine and widely cited worldwide analyzed the heating and air conditioning energy demand for global residential sector in the 21st century and inferred that the global heating demand to be decreased by 34% under the influence of climate change by 2100, while the global air conditioning demand is expected to be increased exponentially by 72% by 2100 mostly driven by income growth, in a regional scale a considerable impact is expected to be seen in South Asia. Even though this study overestimated the cooling demand by assuming cooling temperature setpoint at 18°C for calculating cooling degree days in terms of mean outdoor temperature, the trend for increasing global cooling demand is evident from various other sources also. The study (Mendelsohn et al., 2000) which analyzed the country specific market impacts of global warming in three climate change scenarios, found that the damages from the increased energy costs due to cooling would be intense in the tropics where most of the world’s projected population would live and where cooling would be expensive. A study by Lawrence Berkeley National Laboratory (Nihar Shah et al., 2015) projected the global air conditioning stock to increase by 70 percent from 2015 to 2030. Cooling is therefore one of the areas of the largest anticipated growth of energy demand, and any improvements to the efficiency of cooling systems can have significant impact on future energy scenarios.
1.2 The case of urban India
India is one of the fastest developing economies in the world with a rising level of income. An additional 497 million people are expected to live in Indian megacities by 2050 (World Urbanization Prospects, the 2011 Revision, 2012). This will increase the challenges of
197
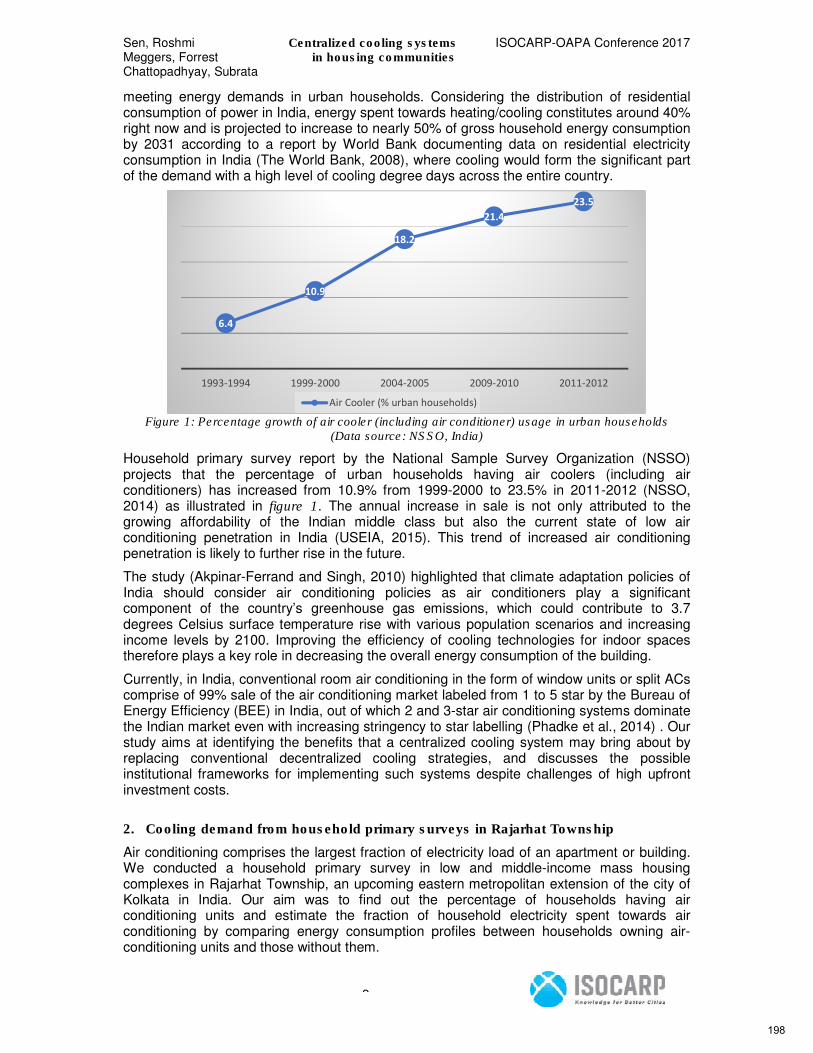
Sen, Roshmi Centralized cooling systems ISOCARP-OAPA Conference 2017 Meggers, Forrest in housing communities Chattopadhyay, Subrata
2
meeting energy demands in urban households. Considering the distribution of residential consumption of power in India, energy spent towards heating/cooling constitutes around 40% right now and is projected to increase to nearly 50% of gross household energy consumption by 2031 according to a report by World Bank documenting data on residential electricity consumption in India (The World Bank, 2008), where cooling would form the significant part of the demand with a high level of cooling degree days across the entire country.
Figure 1: Percentage growth of air cooler (including air conditioner) usage in urban households
(Data source: NSSO, India)
Household primary survey report by the National Sample Survey Organization (NSSO) projects that the percentage of urban households having air coolers (including air conditioners) has increased from 10.9% from 1999-2000 to 23.5% in 2011-2012 (NSSO, 2014) as illustrated in figure 1. The annual increase in sale is not only attributed to the growing affordability of the Indian middle class but also the current state of low air conditioning penetration in India (USEIA, 2015). This trend of increased air conditioning penetration is likely to further rise in the future.
The study (Akpinar-Ferrand and Singh, 2010) highlighted that climate adaptation policies of India should consider air conditioning policies as air conditioners play a significant component of the country’s greenhouse gas emissions, which could contribute to 3.7 degrees Celsius surface temperature rise with various population scenarios and increasing income levels by 2100. Improving the efficiency of cooling technologies for indoor spaces therefore plays a key role in decreasing the overall energy consumption of the building.
Currently, in India, conventional room air conditioning in the form of window units or split ACs comprise of 99% sale of the air conditioning market labeled from 1 to 5 star by the Bureau of Energy Efficiency (BEE) in India, out of which 2 and 3-star air conditioning systems dominate the Indian market even with increasing stringency to star labelling (Phadke et al., 2014) . Our study aims at identifying the benefits that a centralized cooling system may bring about by replacing conventional decentralized cooling strategies, and discusses the possible institutional frameworks for implementing such systems despite challenges of high upfront investment costs.
2. Cooling demand from household primary surveys in Rajarhat Township
Air conditioning comprises the largest fraction of electricity load of an apartment or building. We conducted a household primary survey in low and middle-income mass housing complexes in Rajarhat Township, an upcoming eastern metropolitan extension of the city of Kolkata in India. Our aim was to find out the percentage of households having air conditioning units and estimate the fraction of household electricity spent towards air conditioning by comparing energy consumption profiles between households owning air-conditioning units and those without them.
6.4
10.9
18.2
21.4
23.5
1993-1994 1999-2000 2004-2005 2009-2010 2011-2012
Air Cooler (% urban households)
198
Sen, Roshmi Centralized cooling systems ISOCARP-OAPA Conference 2017 Meggers, Forrest in housing communities Chattopadhyay, Subrata
3
Our dataset comprised of six housing complexes with housing units belonging to middle-income (MIG) and low-income (LIG) groups. Three of the housing complexes had both LIG and MIG income groups while among the rest, one was MIG and two were LIG housing complexes. Electricity billing data was collected for around the year. The electricity meters were either prepaid or post-paid for three monthly installments. Three types of trends of utility billing data was found from the year-round household energy consumption surveys whose trend could be grossly classified and clustered into data for six months of summer (March-August), three months of autumn (September-November) and three months of winter (December-February). Air conditioning operated predominantly in the six months of summer and occasionally in the autumn seasons, as were reported from the surveys and were also found from the utility bills.
Table 1 – Dataset for AC electricity consumption in LIG and MIG households
Name of the housing complex in Rajarhat Township
Total no. of households
No. of households surveyed
% households with AC
Mean monthly energy consumption units (kWh) during peak summer in households with AC units
Mean monthly energy consumption units (kWh) during peak summer in households without AC units
Mean % increase in monthly energy consumption in household with AC units
MIG
Sukhabrishti 3287 170 35.88 227.58 131.59 72.94
Moonbeam 560 128 53.91 230.26 170.49 35.06
East Enclave
96 59 50.85 295.89 146.57 101.87
Uttara 184 48 77.08 350.21 158.69 120.69
LIG
Sukhabrishti 2118 161 12.42 159.30 87.877 81.27
Starlit 608 62 4.84 182.21 96.843 88.15
Balaka 928 128 2.34 172.34 129.47 33.11
East Enclave
80 20 30.00 197.09 100.92 95.28
Uttara 48 24 37.50 204.32 125.75 62.47
The table 1 provides information for AC energy consumption for each housing complex relating to the data collected. The datasets are described in detail below:
LIG housing
LIG housing units are usually four storied walk-up apartments. Total number of housing units surveyed in this category was 395 out of which some incomplete or inaccurate surveys were rejected. The final number of samples analysed was 393 (a sample size>384 for infinite population represents it with 95% confidence interval or p<0.05 (Cochran, William G, 1977)) to arrive at a trend for LIG households in Rajarhat Township. Out of the total number of housing units surveyed, a total of 10.4% of the housing units were reported to be having one air conditioning unit installed in the bedroom spaces. For those housing units installed with AC units, the annual average energy consumption was found to be 1772 kWh and for households without AC units the value was about 1097 kWh. As for individual housing complexes surveyed in this income group, the increase in electricity unit consumption in air-conditioned households ranged between 63% and 95% on average among the housing clusters during peak summer seasons (see table 1).
MIG housing
MIG houses are commonly five or more storied apartments in a mass housing complex. Out of the total number of sample housing units 405 (>384 for infinite sample size and p<0.05)
199
Sen, Roshmi Centralized cooling systems ISOCARP-OAPA Conference 2017 Meggers, Forrest in housing communities Chattopadhyay, Subrata
4
analysed in this category, it was found that 70% of the households were air conditioned out of which 14% of the entire sample had more than one air conditioning units. The average annual energy consumption per household reported was 3169 kWh for households with AC units and 1474 kWh for households without ACs. For individual households surveyed in this income group, the increase in electricity unit consumption ranged between 35% and 120% for AC households on average among the housing clusters during peak summer months (see table 1).
The given housing stock analysis helped to assess the energy demands related to air conditioning usage in apartments belonging to the affordable housing sector and hence the cooling demand. As expected, the MIG units used the air conditioning systems more extensively as compared to the LIG units. However, the current rate of low AC penetration in LIG households is indicative of the rising AC usage with rising income levels and the expanding middle class in India in future.
3. Low exergy cooling systems for buildings
Exergy denotes the energy quality of a system. It is a concept derived from the laws of thermodynamics and indicates the useful work a system can produce while interacting with its surroundings as it moves towards a state of equilibrium acting as a heat engine. The total energy of the system can then be broken down into exergy and anergy. While exergy is the work extracted from a thermodynamic cycle, anergy is the fraction of energy that gets dispersed or destroyed in the process while the system approaches equilibrium.
The concept of exergy can be extended to building design. The heat pump which is a heat engine operating in reverse, represents the principal component of exergy analysis in buildings (Meggers et al., 2012). When set up for cooling or air conditioning, the heat pump removes heat from the building into its surroundings.
The coefficient of performance (COP) measures the cooling efficiency of an air conditioning system. It defines how much heat can be removed from the building per unit input of work. It is given by the following expression– COP = g*Tc/(Th-Tc)
where Tc is the temperature of the cold reservoir, Th is the temperature of the hot reservoir, g is the exergetic efficiency of a cooling system. A low exergy building system accomplishes the goal of removing of heat from the building by minimum amount of exergy input, which can be achieved by maximizing the COP of the heat pump, that is by minimizing the temperature difference between Th and Tc in the above expression. In case of low-exergy cooling systems, this is achieved by a ‘high temperature cooling’ or increasing the supply temperature of the cooling source.
The ‘Energy in Building and Communities’ program by the International Energy Agency has outlined various projects for implementing low exergy community systems. The currently ongoing IEA Annex 64 project aims at achieving optimized performance of community energy supply systems with exergy principle where ‘high-temperature cooling’ is most effective. Keeping this in context, the replacement of the individual room air conditioning units with centralized cooling systems in high density housing communities is likely to improve energy performance, emissions and eradicate the detrimental effects of individual units on urban microclimate with centralized heat rejection.
3.1 Centralized vs decentralized cooling systems in terms of low exergy cooling
Current context – individual room air conditioners
In India, most of the conventional room AC units are installed after the construction and are must be purchased by the occupants or users. They are not efficient and come with high operating costs, placing both the burden of capital cost and high energy costs on the individual households. These packaged air conditioning units are also easily retrofitted, but often proper professional installation of split units or improper self-installation of window-units
200
Sen, Roshmi Centralized cooling systems ISOCARP-OAPA Conference 2017 Meggers, Forrest in housing communities Chattopadhyay, Subrata
5
results in further inefficiencies. Independent of these direct inefficiencies, the buildings are often setup with condenser unit locations stacked with one above the other in multi storied apartments. This leads to what is known as the ‘stack effect’ where rejected heat from the air conditioning units creates hot air rising up and subsequently reduce AC unit efficiency in upper floors which are subject to higher on-coil temperatures (Bruelisauer et al., 2014). The room ACs not only create this stack effect, but also reduce the aesthetic appearance of the facades of the apartment buildings, but attempts to hide the aesthetics of the split units only results in further trapping of hot air and has been shown to double electricity demand in some cases (Bruelisauer et al., 2014). Unitized window air conditioners and split unit systems with independent condensers present a challenge as they are readily available and easy to retrofit. They have become the default mode of cooling adoption. Although this allows a more natural technology uptake, it makes access to cooling strongly limited by financial means. Although not able to match the market accessibility of individual households, centralized system present major opportunities to drastically increase efficiency while also shifting costs away from consumers and towards effective financial incentives for developers, consultants and operators.
Centralized cooling system in housing complexes – district cooling
District cooling technology refers to a centralized cooling and heat rejection system where chilled water is distributed from a centralized chiller plant to the housing complexes. Based upon the cooling demand, the chilled water supply system would be provided to the individual households, as a part of capital expenditure while installing a district cooling infrastructure, and would be connected an indoor heat exchanger for each household to utilize the chilled water connection for cooling. The billing for the cooling infrastructure is done based upon the actual usage of the chilled water in the households, which can be managed by a central operator where the increase in efficiency of the overall system has the potential to enable profit still to be maintained by the system manager while the users still pay less than they would for electricity to run an independent unitized AC system.
Figure 2 – Schematic view of a district cooling network
Comparison of cooling efficiency of individual room air conditioners with district cooling
Centralized cooling plants offer much higher cooling efficiency in high load density areas measured in terms of COP. We did a baseline cooling efficiency calculation comparing the COPs in the two scenarios- district cooling vs individual room air conditioners, taking the case of MIG households from our surveys discussed in section 2. In India, the COP standards of individual room air conditions that dominate the market are set by the Bureau of Energy Efficiency (BEE). The table 2 highlights the COP for cooling also denoted as EER (Energy efficiency ratio) as benchmarked by BEE in its standard (3A) for the current situation in India. Presently, 2 and 3-star air conditioning units generally dominate the
201
Sen, Roshmi Centralized cooling systems ISOCARP-OAPA Conference 2017 Meggers, Forrest in housing communities Chattopadhyay, Subrata
6
air conditioning market. Considering this, for split and window air conditioners, we assumed a bracket of COP scenarios between 2.7 and 2.9. Average summer AC electricity for MIG households is estimated by the difference in mean energy consumption between households with and without AC units. This is multiplied by the COP to obtain an estimate of the cooling demand or the heat removed from the building. The estimated cooling demand is taken as a basis of calculation of the AC electricity for district cooling. A district cooling has a higher exergetic efficiency and so we assume a g-value of 0.6 against 0.5 for individual room air conditioners. We assumed the heat rejection temperature in evaporative cooling tower of a district cooling unit as 30°C and the supply temperature of chilled water as 8°C. For individual split units, the evaporator temperature is assumed to be 8°C and the condenser temperature between 55-60°C to obtain a COP range of 2.7 to 2.9. The calculated summer monthly AC consumption for district cooling was found to be ranging between 35 and 40% of the consumption by room air conditioning, based upon the COPs assumed for these split units. The table 3 gives a comparison of the summer monthly AC electricity gains of a district cooling system over a split air conditioning unit based upon the COPs of the system. So, it could be inferred from this baseline calculation that centralized cooling can bring about 60-65% reduction of AC electricity consumption in the households.
Table 2: Star rating band by BEE to be valid in India between January 2014 to December 2017
Star Rating
SPLIT ACs WINDOW ACs
Minimum EER
Maximum EER
Minimum EER
Maximum EER
1 star 2.7 2.89 2.5 2.69
2 star 2.9 3.09 2.7 2.89
3 star 3.1 3.29 2.9 3.09
4 star 3.3 3.49 3.1 3.29
5 star 3.5 3.3
Table 3: Comparison in the reduction in AC electricity due to District cooling
Cooling system
Condenser
Temperature (Th)
Evaporator Temperature
(Tc)
Exergetic
efficiency (g)
COP Summer monthly
AC electricity
(kWh)
Cooling demand (kWh)
% reduction in summer
monthly AC
electricity
Individual units
55-60 8 0.5 2.7-2.9
115.8 312.9-346.3
District cooling
30 8 0.6 7.66 40.83-45.17
312.9-346.3
65-60
4. Key benefits of centralized cooling systems
District cooling infrastructure comes with obvious challenges of high upfront capital investment costs. However, when deployed in dense neighbourhoods, such centralized cooling systems can offer several benefits in terms of emission reduction, costs, operational efficiency and clean energy production.
Energy benefits
In the above section, we discussed the efficiency that can be achieved by installing low exergy centralized cooling systems in terms of COP. The reduction in consumption of AC electricity not only leads to considerable energy savings, but also emission reductions by cutting down upon a major fraction of the household electricity demand.
Clean energy and emission reduction benefits
District cooling comes with easy integrability with renewable energy sources which helps in cutting down upon greenhouse gas emissions of a community. District cooling coupled with
202
Sen, Roshmi Centralized cooling systems ISOCARP-OAPA Conference 2017 Meggers, Forrest in housing communities Chattopadhyay, Subrata
7
renewable energy interventions have been successfully and commonly deployed in many university campus communities. Renewable energy systems when integrated with district cooling, can integrate high amount of clean energy in residential energy consumption sector. When there is no individual AC units involved in the households the building electricity, the electrical demand comes down in the building scale, making rooftop PV installations, for example, able to cover a majority of demand. At the same time, the cooling electricity demand is removed from individual buildings to the central plant making it easier to generate from renewable energy, which can be integrated with the cooling facility. As for individual households, it is difficult to mobilize such renewable technology interventions as the households would be reluctant to pay towards the upfront capital investment costs of energy technologies. Various kinds of renewable technologies can be integrated with a district cooling plant which include geothermal, solar, biomass and waste cold energy (Gang et al., 2016). Thinking at the community level therefore enables policy mechanisms to support implementation of completely renewable and GHG free energy technologies.
Financial benefits – low operating costs District cooling comes with the financial benefits of much lower operating costs in the long run. There is a shift of cost of buying split units from individual residents to housing community level capital investment towards a district cooling system such that the household owners pay only for the chilled water supply based upon the cooling demand.
Qualitative benefits - operational efficiency and urban aesthetics
District cooling integrates the cooling infrastructure to the community comfort and convenience for the customers. From qualitative perspectives, the system is quiet contrasting conventional cooling systems. Centralized operation and maintenance makes it a more reliable service. District cooling offers improved urban aesthetics by replacing the individual room ACs disrupting the view of the building façade.
5. Institutional mechanisms for implementing centralized cooling
To understand the planning, implementation and delivery of a district cooling system, it is important to note the role of various institutions that can be brought together to implement such community scale infrastructures. In this section, we attempt to discuss such institutional mechanisms, the challenges being faced and the possible ways to mobilize them.
5.1 Role of private developer – financing the capital costs
In India, most housing communities are built by private real estate developers. Social housing models have PPP arrangements where the private developer finances the project and partners with the municipal government which acts as a facilitator of land and other resources. In this way, the private sector with its capital investments becomes the housing provider and the government plays the role of the enabler in social housing projects. As the capital investor, the involvement of the private sector is therefore important in capturing cost effective energy efficient solutions in housing communities. In India, currently, the installation costs for district cooling systems can be upto two times more than the initial investment costs for split air conditioning systems. A market survey revealed the initial investment cost of district cooling system equivalent to 1-ton air conditioning would cost 60000-70000 INR without thermal storage and about 100000 INR with thermal storage against 50000 INR for 5-star and 30000 for 2-star 1.5-ton AC split units. This would entail an increase of 40-70% of the upfront capital cost investment for a district cooling plant catering to a housing community. The private developer can play a key role in promoting such cooling infrastructures while operating in a business model. The capital costs of a community scale cooling infrastructure would constitute only 2-4% cost of construction of the entire apartment complex, and it is subsequently a source of revenue generation during the operating phase. An ESCO may play the role here in helping the private developer in identifying the savings from their investments in such cooling infrastructure. We propose a build-own-operate (BOO) model where the private developer would receive a concession
203
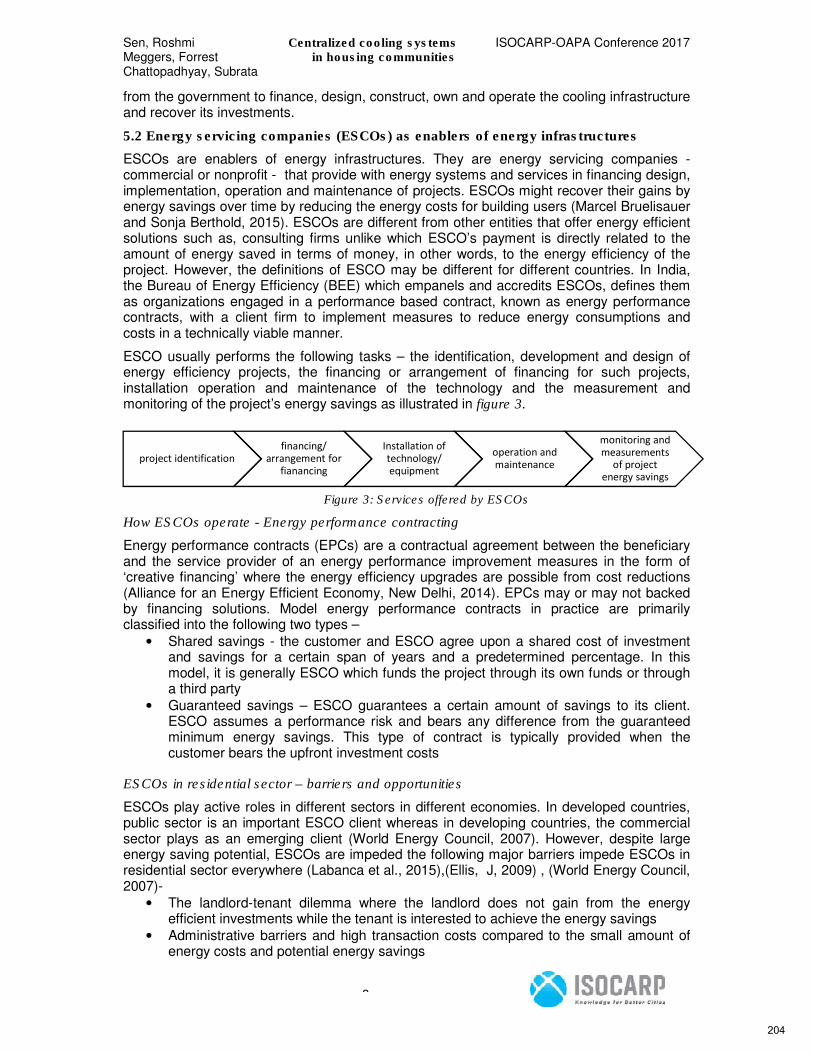
Sen, Roshmi Centralized cooling systems ISOCARP-OAPA Conference 2017 Meggers, Forrest in housing communities Chattopadhyay, Subrata
8
from the government to finance, design, construct, own and operate the cooling infrastructure and recover its investments.
5.2 Energy servicing companies (ESCOs) as enablers of energy infrastructures
ESCOs are enablers of energy infrastructures. They are energy servicing companies - commercial or nonprofit - that provide with energy systems and services in financing design, implementation, operation and maintenance of projects. ESCOs might recover their gains by energy savings over time by reducing the energy costs for building users (Marcel Bruelisauer and Sonja Berthold, 2015). ESCOs are different from other entities that offer energy efficient solutions such as, consulting firms unlike which ESCO’s payment is directly related to the amount of energy saved in terms of money, in other words, to the energy efficiency of the project. However, the definitions of ESCO may be different for different countries. In India, the Bureau of Energy Efficiency (BEE) which empanels and accredits ESCOs, defines them as organizations engaged in a performance based contract, known as energy performance contracts, with a client firm to implement measures to reduce energy consumptions and costs in a technically viable manner.
ESCO usually performs the following tasks – the identification, development and design of energy efficiency projects, the financing or arrangement of financing for such projects, installation operation and maintenance of the technology and the measurement and monitoring of the project’s energy savings as illustrated in figure 3.
Figure 3: Services offered by ESCOs
How ESCOs operate - Energy performance contracting
Energy performance contracts (EPCs) are a contractual agreement between the beneficiary and the service provider of an energy performance improvement measures in the form of ‘creative financing’ where the energy efficiency upgrades are possible from cost reductions (Alliance for an Energy Efficient Economy, New Delhi, 2014). EPCs may or may not backed by financing solutions. Model energy performance contracts in practice are primarily classified into the following two types –
• Shared savings - the customer and ESCO agree upon a shared cost of investment and savings for a certain span of years and a predetermined percentage. In this model, it is generally ESCO which funds the project through its own funds or through a third party
• Guaranteed savings – ESCO guarantees a certain amount of savings to its client. ESCO assumes a performance risk and bears any difference from the guaranteed minimum energy savings. This type of contract is typically provided when the customer bears the upfront investment costs
ESCOs in residential sector – barriers and opportunities
ESCOs play active roles in different sectors in different economies. In developed countries, public sector is an important ESCO client whereas in developing countries, the commercial sector plays as an emerging client (World Energy Council, 2007). However, despite large energy saving potential, ESCOs are impeded the following major barriers impede ESCOs in residential sector everywhere (Labanca et al., 2015),(Ellis, J, 2009) , (World Energy Council, 2007)-
• The landlord-tenant dilemma where the landlord does not gain from the energy efficient investments while the tenant is interested to achieve the energy savings
• Administrative barriers and high transaction costs compared to the small amount of energy costs and potential energy savings
project identificationfinancing/
arrangement for fianancing
Installation of technology/ equipment
operation and maintenance
monitoring and measurements
of project energy savings
204
Sen, Roshmi Centralized cooling systems ISOCARP-OAPA Conference 2017 Meggers, Forrest in housing communities Chattopadhyay, Subrata
9
• Many stakeholders involved making decision making difficult
• Energy savings in the residential sector being much more correlated to individual needs than in other sectors making it difficult to track the exact consumption baseline, inducing elevated risk to the energy saving contracting
Nevertheless, it is not impossible to overcome these potential barriers, as discussed below (Labanca et al., 2015), (World Energy Council, 2007) -
• A ‘community model’ by (Paolo Bertoldi et al., 2006) which proposes the creation of community networks where decisions are to be taken on behalf of or by a group of community members or end-users in the same location. This kind of model is aptly applicable for district cooling programs meant for housing complexes delivered by a private developer solely or in partnership with the government usually in case of social housing. It helps to realize the economies of scale by installing energy efficiency solutions to several dwelling units belonging to the community all in one go where the ESCO can play the role of a facilitator for designing, implementation, operation and maintenance and energy billing of the entire district cooling system. The local government here can play a key role in diffusion of the model in community scale so that the entire community level district cooling infrastructure can be contracted out to an ESCO. The community model of pooling buildings together can also bring down the high transaction costs related to the fragmentation of the mass market
• By improving the quality and quantity of information on energy consumption in buildings by introducing smart metering and billing systems, thus strengthening the monitoring procedure for individual household energy consumption
In the United States social housing has acted as a profitable sub market for ESCOs where the scale is large and there is a need to cut operating costs for housings stocks according to study conducted by Canada Mortgage and Housing Corporation that investigated upon the market of EPCs in Canadian housing sector (Khaund, 2013).
ESCOs in developing countries
In developing countries, ESCO is still a new concept, the greatest challenges faced by ESCOs being in the financing sector. Banks are conservative to ESCO projects since they cannot judge the creditworthiness of such new entities or their clients. Also, EPC contracts compete with the energy subsidies in developing countries created to protect the interest of the poor. However, there are several enabling factors for ESCOs to work in developing countries which include rising GDPs and economies of scale that can be achieved by addressing a large population mass. India has high potentials for energy savings. However, the absence of policy support, weak financing and legal frameworks and lack of expertise in energy performance contracting have been barriers to the development of ESCOs. As cooling infrastructure forms a significant portion of energy consumption in housing, ESCOs can play a key role in enabling them in housing communities and due to an increasing demand of electricity and a significant demand supply gap, there is a vast opportunity for ESCOs to grow and play significant roles in India in demand side energy management by providing energy efficient infrastructure solutions. High fragmentation of the mass market is one of the major barriers impeding the growth of ESCOs (Labanca et al., 2015). However, thinking of energy performance contracting in community scale is likely to work in their favour due to the economies of scale achieved in such an infrastructure delivery models. Our data in section 2 indicates a significant increase in electricity consumption due to AC unit installation in households belonging to MIG and LIGs, which are also likely to face a high AC penetration in future. Nevertheless, the current cooling demand is much higher in housing communities belonging to the HIGs (high income groups) and India has high energy costs in upcoming large scale real estate models where ESCOs can play a strong role in promoting community scale cooling systems.
205
Sen, Roshmi Centralized cooling systems ISOCARP-OAPA Conference 2017 Meggers, Forrest in housing communities Chattopadhyay, Subrata
10
5.3 Role of governmental support
A strong governmental support in the form of incentives, subsidies and tax exemptions are necessary for the survival of energy enabling infrastructures. In developing countries, the governmental support has been a key player for the success of ESCOs by removal of barriers hindering them in the initial stages. Case studies from China and North America have shown success in governmental support in terms of strategic supports for the ESCO to operate or assistance through market creations.
5.3 Role of international actors
International actors can play as significant motivators towards enabling energy efficient infrastructures, the most challenging part being promoting the financing of such infrastructures. Past case studies have shown how international development agencies and financial actors such as the World Bank, US Agency for International Development (USAID), European Bank for Reconstruction and Development have played significant roles towards raising capital funds and fostering the promotion of energy enablers such as ESCOs in various developing countries where ESCO startups are complex and unknown entities (Ellis, J, 2009).
International infrastructure providing companies selling energy technologies can play a vital role in increasing awareness on the benefits of installing them. The Indian subsidiary of the Denmark based company Danfoss Group for example has been trying to create awareness among stakeholders on energy saving technologies in gated communities as a part of the district energy in cities initiative set up by the United Nations Environment Program (UNEP, 2016).
Conclusions
India is heavily dependent upon energy imports. For densely crowded metropolitan cities in developing nations like India the potential gains achieved from district cooling can be very high due to its scale. Improving the efficiency of cooling systems could consequently act as a major intervention towards reaching CO2 emission targets and checking global warming potential in urban areas. In addition, current air conditioning units are a significant contributor to the anthropogenic urban heat island, which simultaneously causes additional heat stress and decreases the efficiency of cooling systems. Addressing cooling demand in a holistic urban analysis considering district systems provides opportunities to evaluate and mitigate many of these negative effects simultaneously, but requires a meaningful change to the policy, economics, and technology of traditional air conditioning.
Individual room ACs consume nearly twice AC electricity in Indian households, even though they comprise 99% of the air conditioning market. The given study is a part of an ongoing research which considers the various alternative low exergy cooling scenarios that might replace the current individual room air conditioners operating with high running costs of energy and electricity in housing complexes in Indian context. Community scale cooling systems is still new to the context of developing nations. While such systems come with the benefits of cleaner energy technologies, lower energy and emission costs during the operating life cycle, their deployments are likely to face a massive challenge of upfront capital investment costs. Finally, the paradigm shift of cooling infrastructure from individual to the community scale is likely to mitigate negative impacts of large indirect costs - improving comfort, productivity, human health and the overall quality of life in the community level.
Acknowledgements
The authors would like to acknowledge Fulbright-Nehru Doctoral Research Fellowship grant for carrying out this ongoing collaborative research work in CHAOS lab at Princeton
206
Sen, Roshmi Centralized cooling systems ISOCARP-OAPA Conference 2017 Meggers, Forrest in housing communities Chattopadhyay, Subrata
11
University and the Housing and Urban Development Corporation of India (HUDCO) towards funding support for the household primary surveys.
References
Akpinar-Ferrand, E., Singh, A., 2010. Modeling increased demand of energy for air conditioners and consequent CO2 emissions to minimize health risks due to climate change in India. Environ. Sci. Policy 13, 702–712. doi:10.1016/j.envsci.2010.09.009
Alliance for an Energy Efficient Economy, New Delhi, 2014. Developing Model ESCO Performance Contracts (EPCs) for Industrial Projects: Guide to performance contracting in India.
Bertoldi, Paolo, Rezessy, Silvia, Hinnels, Mark, 2006. Liberating the Power of Energy Services and ESCOs in a Liberalised Energy Market - EU Science Hub - European Commission, in: EU Science Hub. Presented at the Proceedings of the 4th International Conference on Energy Efficiency in Domestic Appliances and Lighting, European Commission DG JRC, pp. 21–32.
Bruelisauer, M, Berthold, S, 2015. Reclaiming Backlanes.
Bruelisauer, M., Meggers, F., Saber, E., Li, C., Leibundgut, H., 2014. Stuck in a stack—Temperature measurements of the microclimate around split type condensing units in a high rise building in Singapore. Energy Build. 71, 28–37. doi:10.1016/j.enbuild.2013.11.056
Cochran, William G, 1977. Sampling Techniques. John WIley and Sons.
Ellis, J, 2009. Energy service companies in developing countries: Potential and Practice. Internatioal Institute for Sustainable Development.
Gang, W., Wang, S., Xiao, F., Gao, D., 2016. District cooling systems: Technology integration, system optimization, challenges and opportunities for applications. Renew. Sustain. Energy Rev. 53, 253–264. doi:10.1016/j.rser.2015.08.051
Isaac, M., van Vuuren, D.P., 2009. Modeling global residential sector energy demand for heating and air conditioning in the context of climate change. Energy Policy 37, 507–521. doi:10.1016/j.enpol.2008.09.051
Khaund, K, 2013. Energy Performance Contracting and the Residential Sector. Can. Mortg. Hous. Corp.
Labanca, N., Suerkemper, F., Bertoldi, P., Irrek, W., Duplessis, B., 2015. Energy efficiency services for residential buildings: market situation and existing potentials in the European Union. J. Clean. Prod., Special Issue: Toward a Regenerative Sustainability Paradigm for the Built Environment: from vision to reality 109, 284–295. doi:10.1016/j.jclepro.2015.02.077
Meggers, F., Ritter, V., Goffin, P., Baetschmann, M., Leibundgut, H., 2012. Low exergy building systems implementation. Energy 41, 48–55. doi:10.1016/j.energy.2011.07.031
Mendelsohn, R., Morrison, W., Schlesinger, M.E., Andronova, N.G., 2000. Country-Specific Market Impacts of Climate Change. Clim. Change 45, 553–569. doi:10.1023/A:1005598717174
NSSO, 2014. Household consumption of various goods and services in India 2011-2012 - NSS 68th round. Ministry of Statistics and Program Implementation, Government of India.
Phadke, A., Abhyankar, N., Shah, N., 2014. Avoiding 100 New Power Plants by Increasing Efficiency of Room Air Conditioners in India: Opportunities and Challenges [WWW Document].
207
Sen, Roshmi Centralized cooling systems ISOCARP-OAPA Conference 2017 Meggers, Forrest in housing communities Chattopadhyay, Subrata
12
Shah, N, Wei, M, Letschert, V, Phadke, A, 2015. Benefits of Leapfrogging to Superefficiency and Low Global Warming Potential Refrigerants in Room Air Conditioning.
Sivak, M., 2009. Potential energy demand for cooling in the 50 largest metropolitan areas of the world: Implications for developing countries. Energy Policy 37, 1382–1384. doi:10.1016/j.enpol.2008.11.031
The World Bank, 2008. Residential consumption of electricity in India- documentation of data and methodology.
UNEP, 2016. District cooling costs less than personal ACs | DISTRICT ENERGY INITIATIVE [WWW Document]. URL http://www.districtenergyinitiative.org/district-cooling-costs-less-personal-acs (accessed 8.16.17).
USEIA, 2015. India likely to experience continued growth in electricity use for air conditioning - Today in Energy - U.S. Energy Information Administration (EIA) [WWW Document]. URL https://www.eia.gov/todayinenergy/detail.php?id=23512 (accessed 7.28.17).
World Energy Council, 2007. An Assessment of Energy Service Companies (ESCOs) Worldwide.
World Urbanization Prospects, the 2011 Revision (Report), 2012.
208
Abstract title Advancing Equitable Community Development Goals with "Do It Yourself"
Technology
Author Davis, Keith, PHILADELPHIA, United States of America (Presenting author)
Abstract
The rate of globablization and urbanization today is cause for increased mindfulness of the impacts
of the built environment on public health. This re-awakening is captured by the American Planning
Association’s “Planning and Community Health Center”, in their 2014 “Healthy Plan Making” report.
The report examines case studies of seven new, health-promoting, local government plans; and
extracts best practices for incorporating health goals into long-range planning. But as today’s
generation of comprehensive plans mature, implementation remains elusive. Economic and
environmental goals continue to overshadow health and equity outcomes. Needed is an instrument
that illuminates the relationship between public health and individual development projects,
providing solid ground for decision makers to advance healthy, equitable, sustainable benefits from
planning goal creation through to individual project implementation.
Philadelphia recognizes the potential for development and infrastructure improvements to impact
health outcomes. The City Planning Department has identified spatially-defined health disparities,
created partners in health, and incorporated health objectives into their recent APA-award winning
Philadelphia2035 comprehensive plan update. To create, improve, and expand health-supportive
land use and infrastructure, Philadelphia2035 establishes policies to cluster neighborhood centers,
promote active transportation, and increase access to both open space and healthy foods. By
promoting health determinants, these strategies help prioritize resources at the nexus of public
health and city planning. But those neighborhoods especially saddled with poor health outcomes are
particularly resistant to broad-based policies with casual enforcement or non-specific language, thus
perpetuating the continuation of health disparities across the city.
In this project presentation, I will begin by demonstrating how health disparities are perpetuated
locally, and discuss ways to ensure policies aimed at reducing said health disparities are hitting their
marks. Next, I will demonstrate a new and highly adaptable application that uses popular technology
to harness the power of open spatial data, casting light on neighborhood health disparities and
potentially impactful projects. We will explore how this interactive tool can help community groups
recognize and discuss potential health impacts when meeting with developers for the first time;
inform zoning boards weighing the merits of a project’s hardship; support policy makers seeking
supportive and quantifiable metrics; or aide city planners aiming to shore-up sustainable
development objectives. The gross result is an increased ability to address health disparities on a
case-by-case basis. Finally, participants will see how this tool, designed to support transparent
government in Philadelphia, is made available for use by anyone with a smart phone and a passing
interest.
209
INFRINGEMENT ON PLANNING STANDARDS BY PETROL FILLING
STATTIONS OWNERS IN AKURE, NIGERIA
BY:
OLUFAYO, O, OMOLE, F.K and KOLAWOLE, A.J
Department of Urban and Regional Planning
Federal University of Technology, Akure, Nigeria.
Correspondent Author: [email protected]
Abstract
Nigerian cities and towns are getting congested with every nook and cranny filled with
petrol filling stations (PFSs). PFSs are built on little available spaces, in-between residential
buildings, raising real fears of environmental hazards. This research aimed at scrutinizing the
infringement of petrol filling stations owners on planning standards. 415 of the total buildings
within 150 metres radius to PFSs were randomly selected for field survey (on-site
measurement). A total survey was carried-out on the 87 functional PFSs, while oral interview
was conducted on the Directors of physical planning at the Ondo State Development and
Property Corporation and Ondo State Ministry of Housing and Urban Development. All data
collected were analyzed using univariate analysis. The study revealed that about 85% of the
PFSs in Akure were not in compliance with the planning standard of 1800m2 recommended land
area for the siting of PFSs, 64.3% of the total buildings fall less than 100 metres to the PFSs,
the recommended distance between PFSs were no strongly adhere to, weak enforcement of
planning standards due to government/political interference and lack of modern planning
equipment’s also contributed to the infringement of planning standards in Akure. It is suggested
that there should be a synergy between the approving bodies for effective enforcement of
planning standards, also government should assist in procuring modern planning equipment’s
for effective development control activities, Policy framework that gives the professionals in the
ministry, local and state governments the capacity to fulfill their constitutional obligation is
required in order to ameliorate political interference.
Keywords: Infringement, Location Pattern, Petrol Filling Station, Planning Standard,
Sustainable Development.
210
1.0 Introduction
The technological initiative of man towards the development of automobile and the
discovery of petroleum triggered the building of petrol filling stations (PFSs) at strategic
locations to meet the demand of vehicle owners (Abdul, Suriatini and Remy, 2009, as cited in
Blamah, Vivan, Tagwi and Ezemokwe, 2012). Omole (2001) posits that a petrol filling station by
definition is a commercial facility where fuel and lubricants for automobiles among other goods
are sold. Fuels sold at petrol filling stations include Petrol (Premium Motor Spirit [PMS],
Liquefied Natural Gas [LNG], diesel (Automated Gas Oil [AGO]) and Kerosene (Dual Purpose
Kerosene [DPK]). In recent times, there has been a sustained increase in the number of PFSs
established in different part of the country. The reasons for such unprecedented increase are
the rapid growth in urbanization which has produced greater demand of vehicles, resulting in
more fuel consumption and the attractive price of petrol both at control price and black market
prices which made more people to go into the petrol retailing business (Smart, 2002).
In view of this development, many oil marketers take advantage of this need and build
PFSs haphazardly without giving consideration to the possible effects of its locations. It has now
generally been recognized that economic development can be a major contributing factor to
growing environmental problems particularly when such development is not sustainable. Keeble
(1968) opines that PFSs should be located not only where they can be easily accessible but
where the dangers that are attached to it can be minimized. Nigerian cities and towns are
getting congested with every nook and cranny filled with PFSs. Even in residential areas, PFSs
are built on little available spaces, in-between residential buildings, raising real fears of
environmental hazards and fire outbreaks. Consequently, some insidious effects of the
indiscriminate location of PFSs at certain points in some cities including Akure have been over-
looked. Therefore, the defiance of standards in the location and distribution of PFSs has been
the order of the day (Omole, 2001; Alabi, 2004). On papers, DPR has stringent guidelines for
building of PFSs, paying very serious attention to safety and environment, but in reality and by
the way PFSs are located in street corners, near residential houses, the guidelines are
observed more in breach.
The proliferation of PFSs in Akure is quite disturbing. Observation shows that numerous
PFSs are developed along major/access roads which are narrow to accommodate such
services. With the nature of the haphazard and unprecedented developments of PFSs, one
wonders if the developers of the PFSs have really satisfied the requirements and have
undergone the processes for approval and development in the study area. Many PFSs were
noticed to be too close to each other having a distance of less than 1km on the same lane and
211
less than 500m on adjourning lane also most of the pumps were located less than 100 metres to
residential and public buildings as against the planning standard of its locations. Some even
were developed side by side wherefore having a higher tendency of enormous and wider effects
on the immediate environment.
Hence, the research tends to extricate the infringement of PFSs to planning standards
by PFSs owners in Akure, Nigeria.
2.0 Literature Review and Conceptual Framework
Human being is not only dependent on the physical environment for livelihood, but also
in a number of ways they are capable of controlling and influencing the physical environment.
However, in the quest to improve their standard of living and to fulfill their ever-increasing
diversified and sophisticated needs, human use of the physical environment is often excessive
and uncontrolled. As such, in the process of economic and infrastructural development,
environment has not been given its due respect and has often been sidelined which leads to
further degradation of the environment (Jamaluddin, Kadaruddin, Kadir and Azahan, 2009).
Omole (1994) opines that systematic linkages among activities on land are to ensure
sustainability. The linkages are such that a wrongful placement could mar the physical setting
and siting of these facilities and services. Furthermore, Ayeni, (1991) and Omole, (2001)
stressed that the issue of standard is another major thing in the location of PFSs. Neufert (1980)
further amplifies this in architect data in which the following are identified and considered
necessary in the location and construction of PFSs in a city. These are: site size, set-back and
road pattern, vehicle road speed, air and water supply, number of pumps, canopy, drainage,
petrol store, safety devices, lighting etc.
2.1 Planning Criteria for Location of PFSs
DPR (2010) stated that PFSs should be located within a growth centre or an urban area
except in circumstances where it can be shown through appropriate studies that the need exists
or otherwise.
The criteria for the locations of PFSs by DPR among others include;
a. Stations should be located at a minimum of 100 m from any public institution such as
schools, churches, public libraries, auditoriums, hospitals, public playgrounds, etc.
b. Distance between one petrol station and another should not be less than 1000m
c. Filling Stations will not be allowed in any area where the traffic situation is such that it
will cause obstructions in entering or leaving a station or on tight curves where visibility
is not adequate.
d. Buildings are to be located a minimum of 12m from road property boundaries to provide
212

adequate area for maneuvering of vehicles in the service area.
e. Petrol pumps shall be located a minimum 100m from any residential building.
f. Where the site adjoins the side or rear boundary of a residential lot, a solid wall 3 m in
height should be constructed and maintained along that lot boundary.
g. Signs should be in accordance with the Advertisement Regulations and should be
located so as not to reflect the sun into the face of motorists and should be large enough
so that they can be seen from a reasonable distance at a reasonable speed.
h. The Investor should approach the Infrastructure Advertisement Department for both the
regulations and approval of the location of the signage.
i. Stations are to be equipped with fire-fighting and fire protection equipment installed in
accordance with the National Police (NP), Federal Environmental Protection Agency and
the Ministry in charge of disaster management.
j. All volatile flammable liquid storage tanks shall be installed below ground in compliance
with the requirements of the Ministry of Trade and Industry.
k. Proper facilities for storage and disposal of used and waste oil and gas must be
provided.
l. Waste water from the washing of motor vehicles and sewage disposal should be to the
satisfaction of the FEPA.
m. Notice of intent to construct and operate a Petrol Filling Station should be posted on the
site to enable adjacent owners within a specified radius to object if they so desire.
n. Fuel should be stored in double-walled containers/tanks to minimize leakage and
prevent
contamination of ground water.
o. A minimum distance of 10 m should be maintained between UST and dispensing
pumps.
p. UST should be installed at a minimum distance of 10 m from front plot boundaries.
q. Normally no access to or from a filling station shall be closer than 45m to any road
intersection or 75 m from the intersection of two main roads.
r. A minimum distance of 30 m should be maintained between UST and water source.
2.2 Concept of Physical Planning
The concept of planning can be traced down to creation as some reaffirmed that God
Himself was the first planner and the progenitor of zoning concept (Ajibola, et al 2011 as cited in
Eke, 2014). Keeble (1969) defines physical planning as the art and science of ordering the use
of land and the character and sitting of buildings and communication routes so as to secure
213
maximum practicable degree of economy, convenience and beauty. Similarly, Olujimi (2009)
sees Land use planning as the spatial reflection of human activity on land; and whose efficient
arrangement and harmonious coordination are basic to physical planning. While the Nigeria
Institute of Town Planners conceives physical or land use planning as requiring ‘participatory
and integrated processes of allocating land for promoting sustainable development’ (Falade,
2012). From the above definitions, Physical Planning is a conscious but comprehensive
approach to orderly and healthy use and management of the natural environment of human
settlements (Bakare, 2012). Location pattern of PFSs in the study area may be difficult to attain
without the role of physical planning and how its understanding could facilitate a balanced and
sustainable national development (NPC, 2009). As noticed in the study area that many of the
PFSs were located within residential areas and also too close to residential buildings as against
physical planning specification. It is obvious that regulating and controlling the establishment
and location pattern of PFSs part of the activities of physical planning.
2.3 Concept of Sustainable Development
Sustainable development can be defined as development that caters for the needs of
people without compromising the needs for the future generations (Barrow, 2006).
To achieve sustainable development a set of ‘tools’, of which EIA is one, are needed. EIA
needs to include the social participatory and economic issues alongside the environmental
issues. If these elements are included, the key links between EIA and sustainable
development would be addressed.
Economic
Sustainability
Social Environment
214

Figure 1: Sustainable Development System Source: Govender, 2009
The need for the development of filling stations must always be balanced with the need to
protect the environment. As with other infrastructure developments, the development of filling
stations forms part of a growing economy. An increase in development also results in an
increase in employment opportunities, which results in a greater proportion of the
population owning cars and utilising public transportation systems. The three basic
components above namely economic, social and the environment need to work together for
the concept of sustainable development to function. If the economic aspect is not there to
support the environment, there will be a malfunctioning, so also, if the social framework is
lacking there will be a great abnormality. In turn, filling stations need to be developed to cater
for the needs of the larger amount of cars on the road networks and not to the detriment of
the environment (Govender, 2009).
3.0 The Study Area and Research Methodology
3.1 The Study Area
Akure South LGA is located in Ondo State in the South-Western geopolitical zone of
Nigeria. It occupies a land area of 37,134 hectares (35 Sq.km). It lies between latitude 60 95’ and
70 15’ North on the Equator and longitude 50 15’and 50 40’ East of the Greenwich Meridian
(Macmillan, 2006). The study area is bounded by Owo Local Government Area in the East,
Akure North and Ifedore Local Government Areas to the North, Ile-Oluji/Okeigbo Local
Government Area in the West and Idanre Local Government in the South. Also the study area
has some notable roads, which include; Akure/Owo express way, Ilesa road, Oyemekun road,
Oja-Oba road, Arakale road, Ondo road, Alagbaka road and Ijoka road among others (figures. 2
and 3). The population growth in Akure agrees with the increase in vehicular ownership which
gives rise to the number of PFSs in Akure. However, this increase of PFSs and their location
pattern is of great concern to urban planners.
215
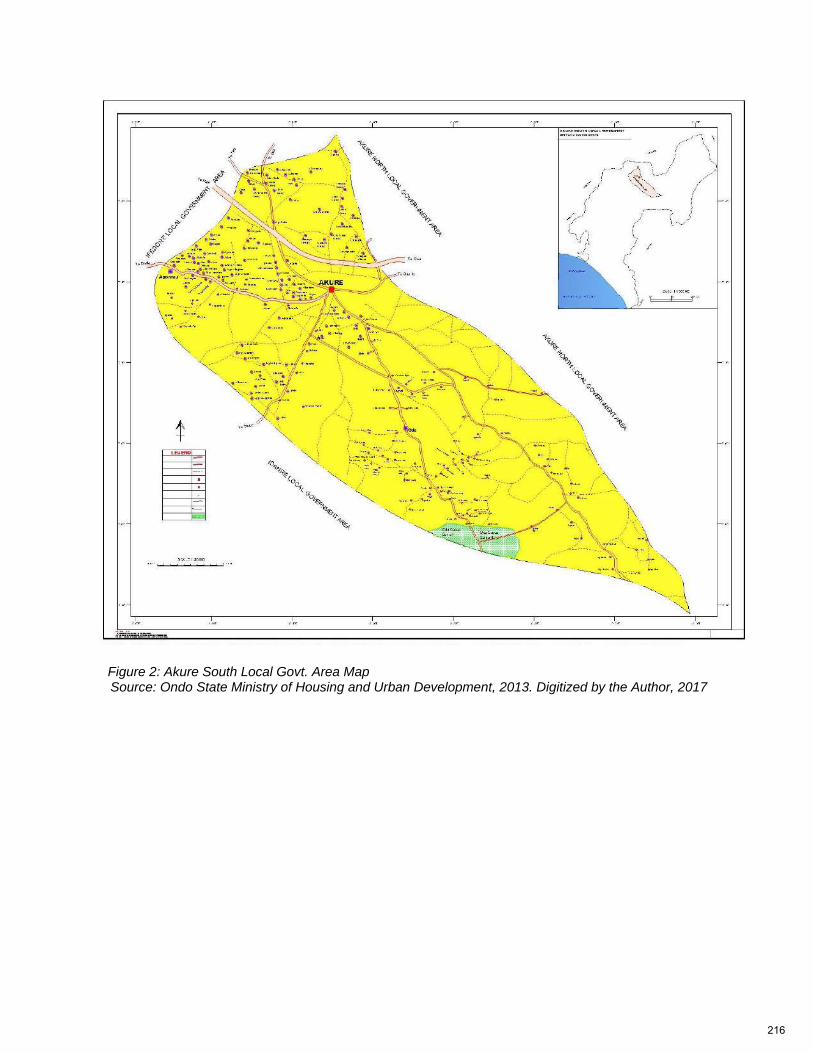
Figure 2: Akure South Local Govt. Area Map Source: Ondo State Ministry of Housing and Urban Development, 2013. Digitized by the Author, 2017
216
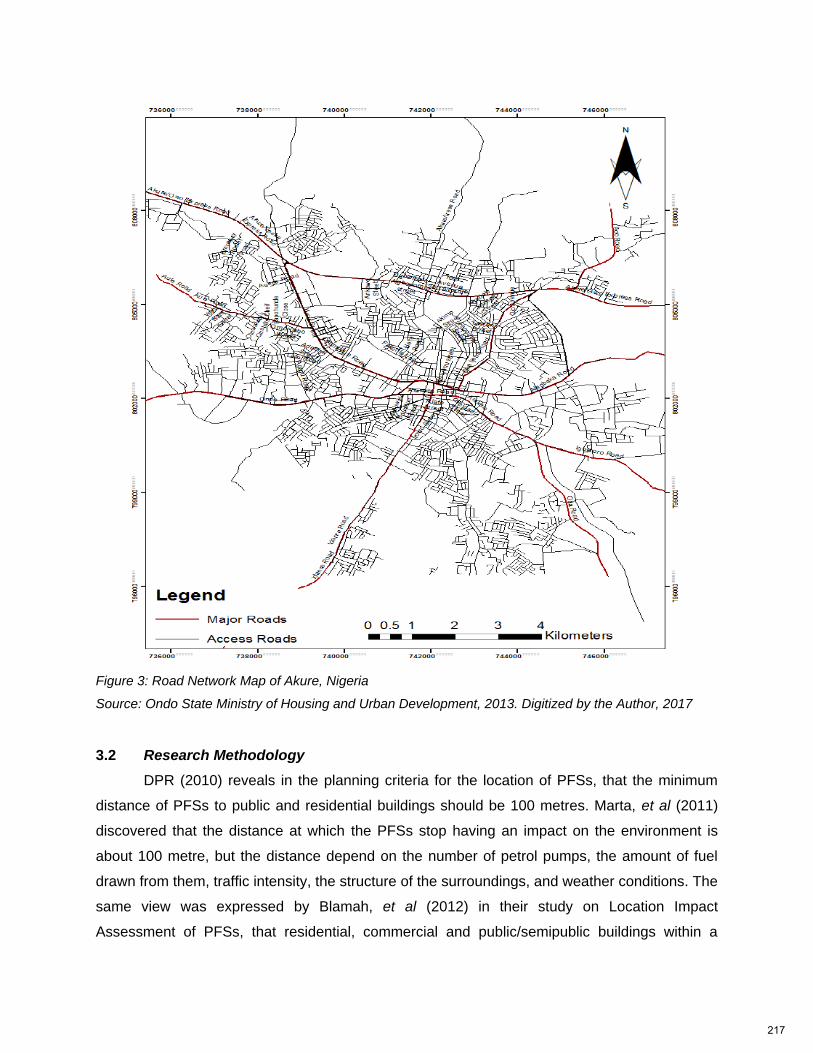
Figure 3: Road Network Map of Akure, Nigeria
Source: Ondo State Ministry of Housing and Urban Development, 2013. Digitized by the Author, 2017
3.2 Research Methodology
DPR (2010) reveals in the planning criteria for the location of PFSs, that the minimum
distance of PFSs to public and residential buildings should be 100 metres. Marta, et al (2011)
discovered that the distance at which the PFSs stop having an impact on the environment is
about 100 metre, but the distance depend on the number of petrol pumps, the amount of fuel
drawn from them, traffic intensity, the structure of the surroundings, and weather conditions. The
same view was expressed by Blamah, et al (2012) in their study on Location Impact
Assessment of PFSs, that residential, commercial and public/semipublic buildings within a
217
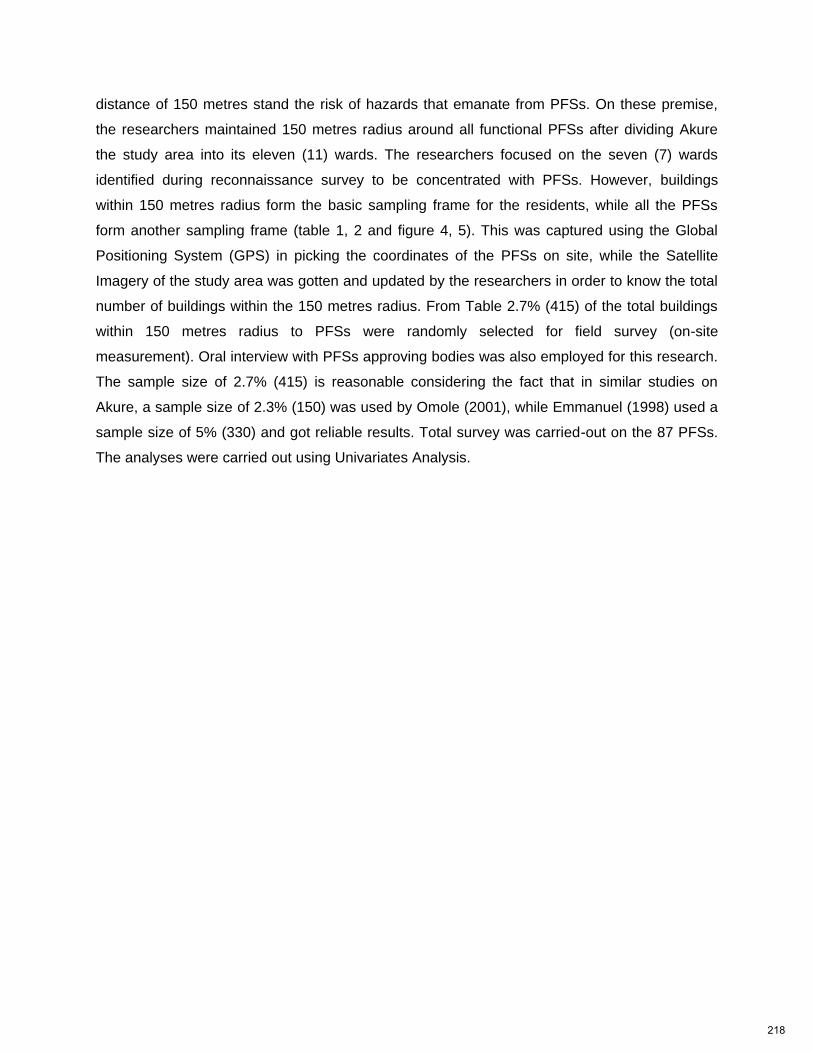
distance of 150 metres stand the risk of hazards that emanate from PFSs. On these premise,
the researchers maintained 150 metres radius around all functional PFSs after dividing Akure
the study area into its eleven (11) wards. The researchers focused on the seven (7) wards
identified during reconnaissance survey to be concentrated with PFSs. However, buildings
within 150 metres radius form the basic sampling frame for the residents, while all the PFSs
form another sampling frame (table 1, 2 and figure 4, 5). This was captured using the Global
Positioning System (GPS) in picking the coordinates of the PFSs on site, while the Satellite
Imagery of the study area was gotten and updated by the researchers in order to know the total
number of buildings within the 150 metres radius. From Table 2.7% (415) of the total buildings
within 150 metres radius to PFSs were randomly selected for field survey (on-site
measurement). Oral interview with PFSs approving bodies was also employed for this research.
The sample size of 2.7% (415) is reasonable considering the fact that in similar studies on
Akure, a sample size of 2.3% (150) was used by Omole (2001), while Emmanuel (1998) used a
sample size of 5% (330) and got reliable results. Total survey was carried-out on the 87 PFSs.
The analyses were carried out using Univariates Analysis.
218
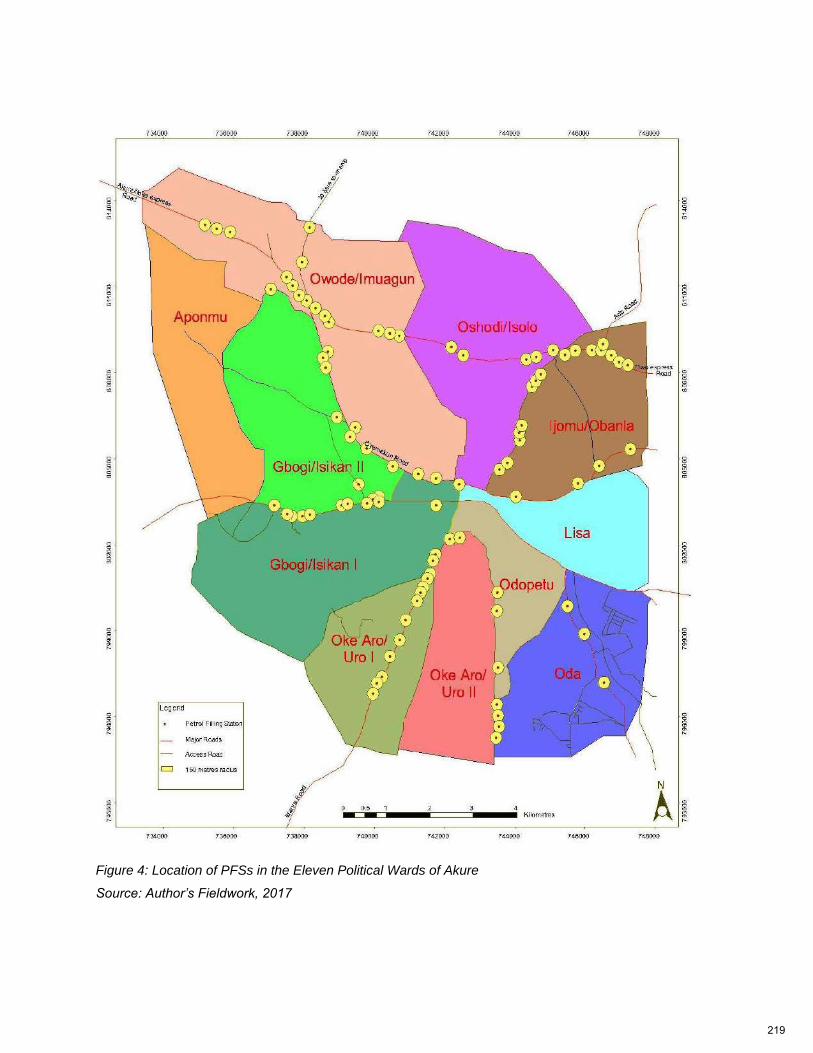
Figure 4: Location of PFSs in the Eleven Political Wards of Akure
Source: Author’s Fieldwork, 2017
219
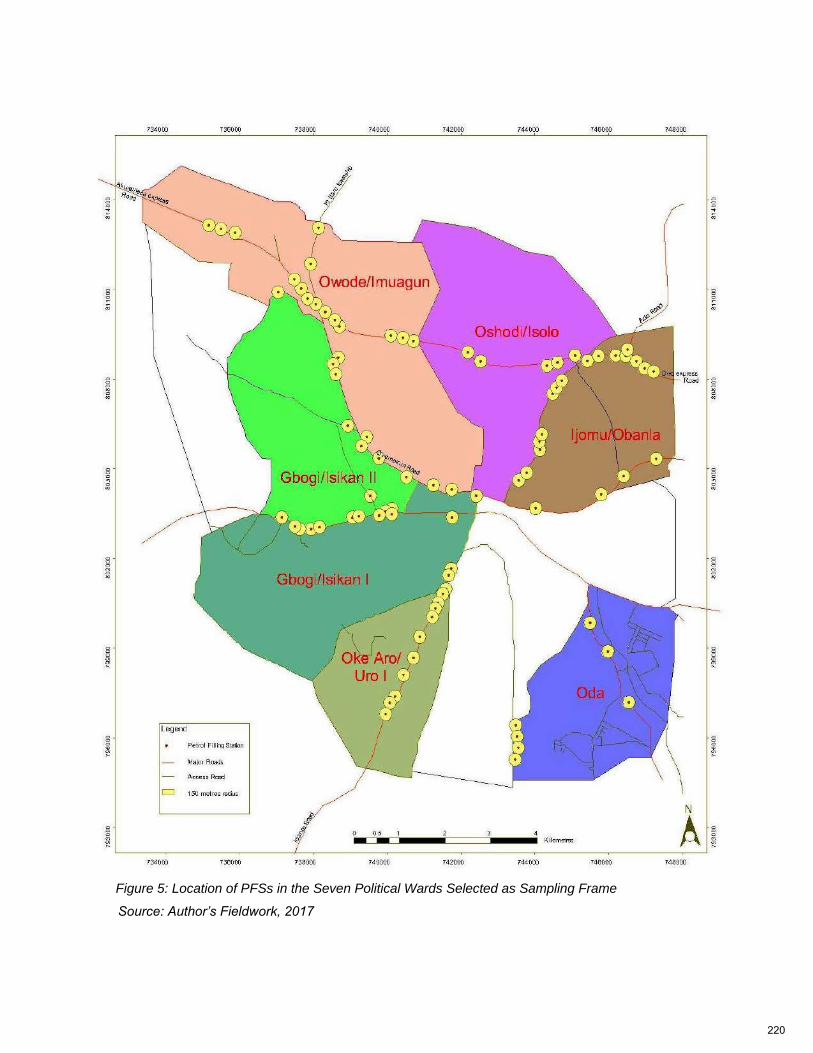
Figure 5: Location of PFSs in the Seven Political Wards Selected as Sampling Frame
Source: Author’s Fieldwork, 2017
220
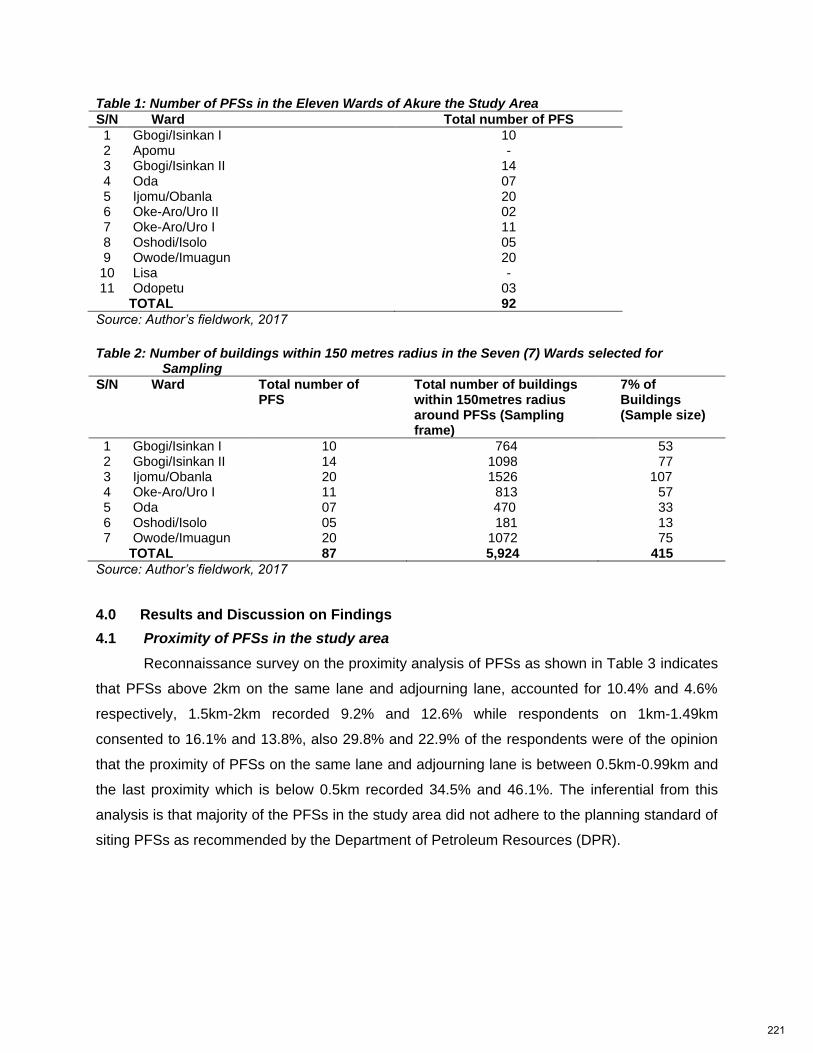
Table 1: Number of PFSs in the Eleven Wards of Akure the Study Area
S/N Ward Total number of PFS
1 Gbogi/Isinkan I 10 2 Apomu - 3 Gbogi/Isinkan II 14 4 Oda 07 5 Ijomu/Obanla 20 6 Oke-Aro/Uro II 02 7 Oke-Aro/Uro I 11 8 Oshodi/Isolo 05 9 Owode/Imuagun 20 10 Lisa - 11 Odopetu 03
TOTAL 92
Source: Author’s fieldwork, 2017
Table 2: Number of buildings within 150 metres radius in the Seven (7) Wards selected for Sampling
S/N Ward Total number of PFS
Total number of buildings within 150metres radius around PFSs (Sampling frame)
7% of Buildings (Sample size)
1 Gbogi/Isinkan I 10 764 53 2 Gbogi/Isinkan II 14 1098 77 3 Ijomu/Obanla 20 1526 107 4 Oke-Aro/Uro I 11 813 57 5 Oda 07 470 33 6 Oshodi/Isolo 05 181 13 7 Owode/Imuagun 20 1072 75
TOTAL 87 5,924 415
Source: Author’s fieldwork, 2017
4.0 Results and Discussion on Findings
4.1 Proximity of PFSs in the study area
Reconnaissance survey on the proximity analysis of PFSs as shown in Table 3 indicates
that PFSs above 2km on the same lane and adjourning lane, accounted for 10.4% and 4.6%
respectively, 1.5km-2km recorded 9.2% and 12.6% while respondents on 1km-1.49km
consented to 16.1% and 13.8%, also 29.8% and 22.9% of the respondents were of the opinion
that the proximity of PFSs on the same lane and adjourning lane is between 0.5km-0.99km and
the last proximity which is below 0.5km recorded 34.5% and 46.1%. The inferential from this
analysis is that majority of the PFSs in the study area did not adhere to the planning standard of
siting PFSs as recommended by the Department of Petroleum Resources (DPR).
221
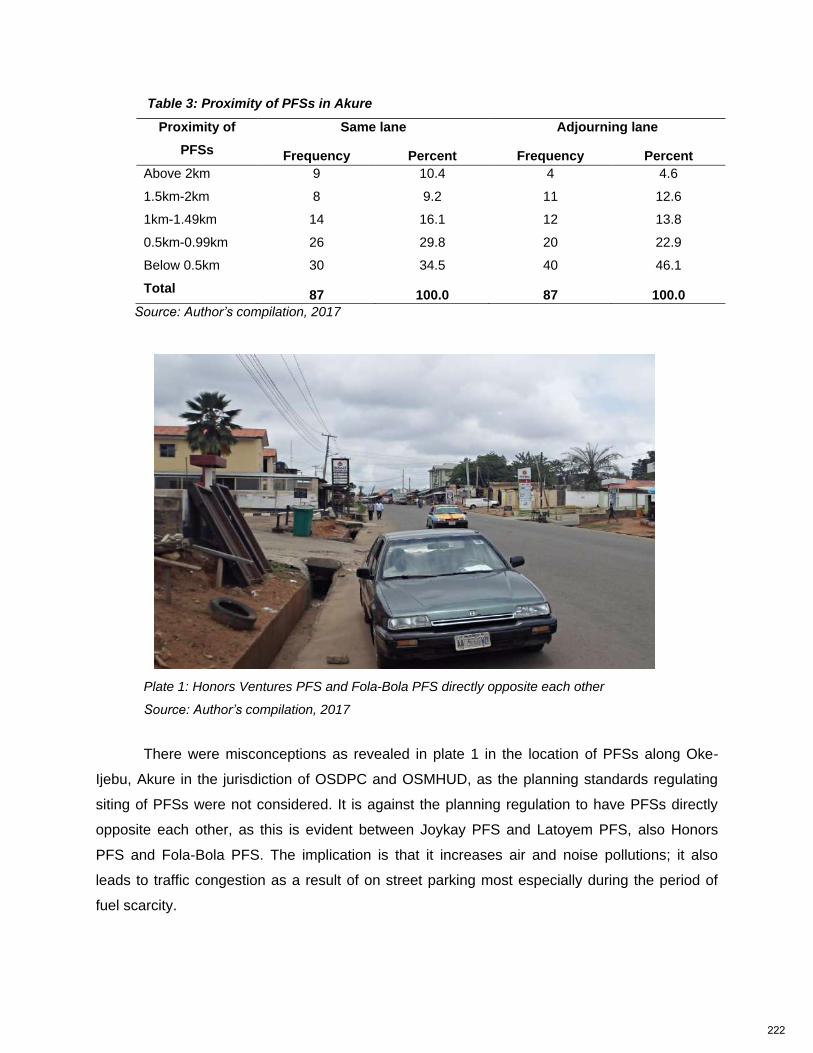
Table 3: Proximity of PFSs in Akure
Proximity of
PFSs
Same lane Adjourning lane
Frequency Percent Frequency Percent
Above 2km 9 10.4 4 4.6
1.5km-2km 8 9.2 11 12.6
1km-1.49km 14 16.1 12 13.8
0.5km-0.99km 26 29.8 20 22.9
Below 0.5km 30 34.5 40 46.1
Total 87 100.0 87 100.0
Source: Author’s compilation, 2017
Plate 1: Honors Ventures PFS and Fola-Bola PFS directly opposite each other
Source: Author’s compilation, 2017
There were misconceptions as revealed in plate 1 in the location of PFSs along Oke-
Ijebu, Akure in the jurisdiction of OSDPC and OSMHUD, as the planning standards regulating
siting of PFSs were not considered. It is against the planning regulation to have PFSs directly
opposite each other, as this is evident between Joykay PFS and Latoyem PFS, also Honors
PFS and Fola-Bola PFS. The implication is that it increases air and noise pollutions; it also
leads to traffic congestion as a result of on street parking most especially during the period of
fuel scarcity.
222
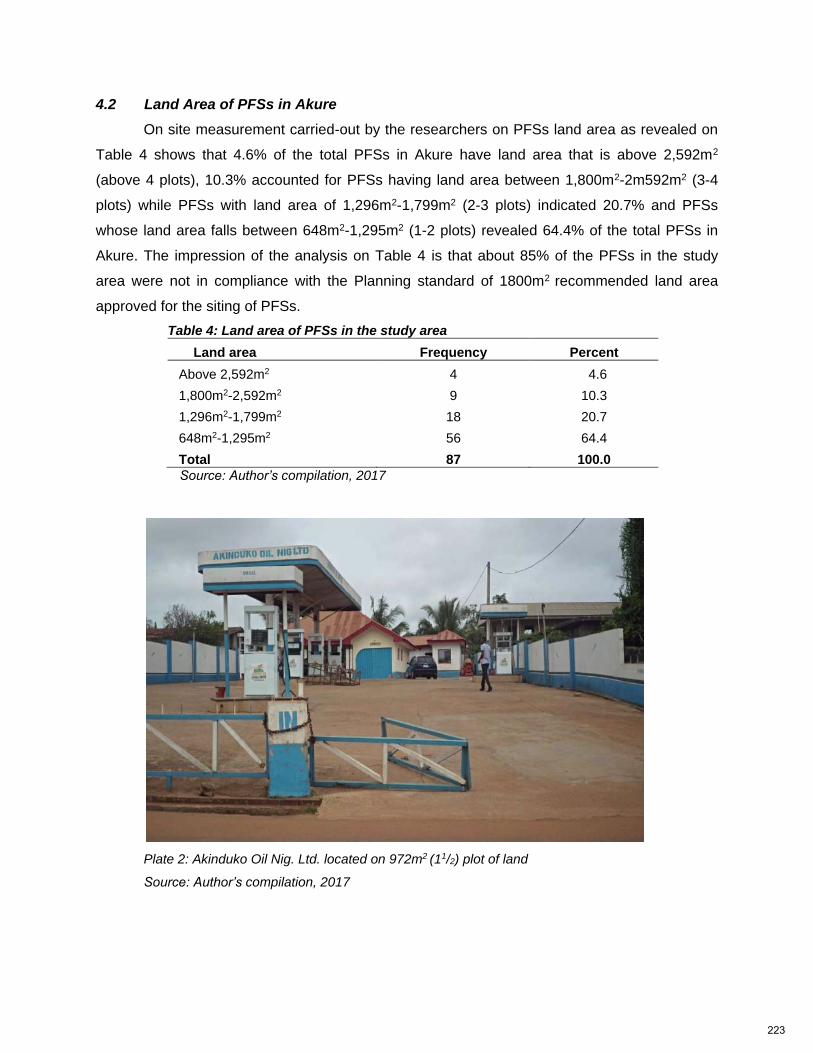
4.2 Land Area of PFSs in Akure
On site measurement carried-out by the researchers on PFSs land area as revealed on
Table 4 shows that 4.6% of the total PFSs in Akure have land area that is above 2,592m2
(above 4 plots), 10.3% accounted for PFSs having land area between 1,800m2-2m592m2 (3-4
plots) while PFSs with land area of 1,296m2-1,799m2 (2-3 plots) indicated 20.7% and PFSs
whose land area falls between 648m2-1,295m2 (1-2 plots) revealed 64.4% of the total PFSs in
Akure. The impression of the analysis on Table 4 is that about 85% of the PFSs in the study
area were not in compliance with the Planning standard of 1800m2 recommended land area
approved for the siting of PFSs.
Table 4: Land area of PFSs in the study area
Land area Frequency Percent
Above 2,592m2 4 4.6
1,800m2-2,592m2 9 10.3
1,296m2-1,799m2 18 20.7
648m2-1,295m2 56 64.4
Total 87 100.0
Source: Author’s compilation, 2017
Plate 2: Akinduko Oil Nig. Ltd. located on 972m2 (11/2) plot of land
Source: Author’s compilation, 2017
223
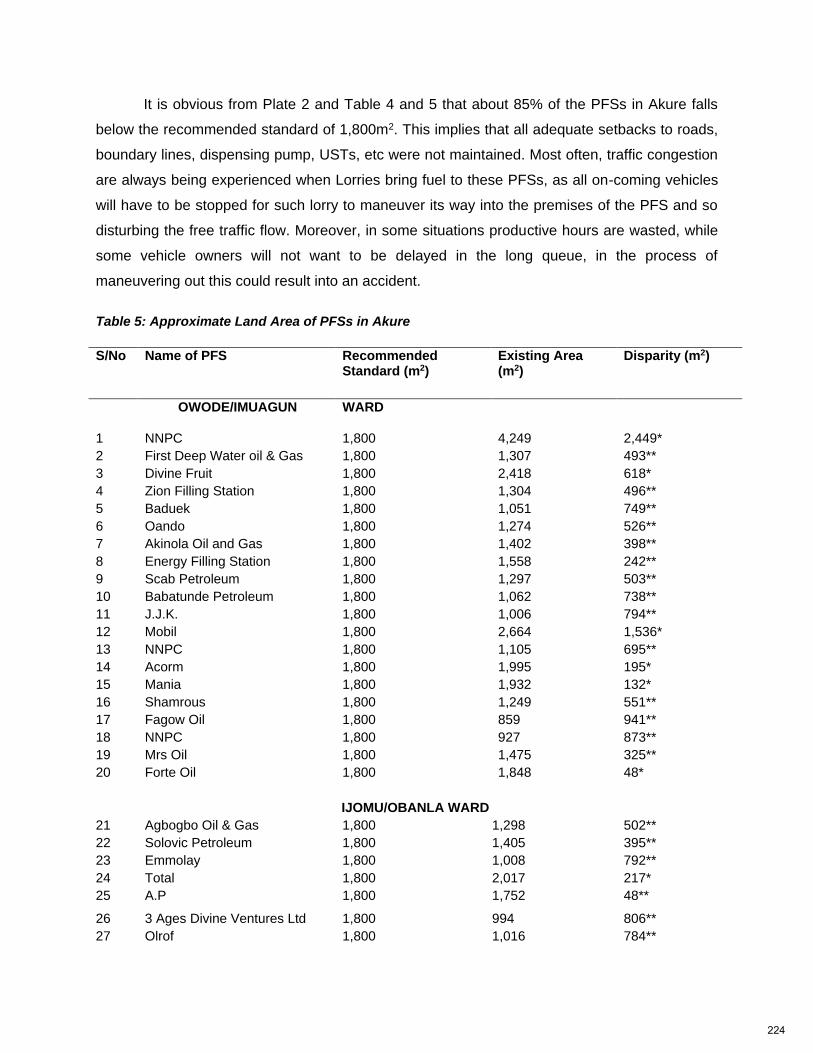
It is obvious from Plate 2 and Table 4 and 5 that about 85% of the PFSs in Akure falls
below the recommended standard of 1,800m2. This implies that all adequate setbacks to roads,
boundary lines, dispensing pump, USTs, etc were not maintained. Most often, traffic congestion
are always being experienced when Lorries bring fuel to these PFSs, as all on-coming vehicles
will have to be stopped for such lorry to maneuver its way into the premises of the PFS and so
disturbing the free traffic flow. Moreover, in some situations productive hours are wasted, while
some vehicle owners will not want to be delayed in the long queue, in the process of
maneuvering out this could result into an accident.
Table 5: Approximate Land Area of PFSs in Akure
S/No Name of PFS
Recommended Standard (m2)
Existing Area (m2)
Disparity (m2)
OWODE/IMUAGUN WARD
1 NNPC 1,800 4,249 2,449*
2 First Deep Water oil & Gas 1,800 1,307 493**
3 Divine Fruit 1,800 2,418 618*
4 Zion Filling Station 1,800 1,304 496**
5 Baduek 1,800 1,051 749**
6 Oando 1,800 1,274 526**
7 Akinola Oil and Gas 1,800 1,402 398**
8 Energy Filling Station 1,800 1,558 242**
9 Scab Petroleum 1,800 1,297 503**
10 Babatunde Petroleum 1,800 1,062 738**
11 J.J.K. 1,800 1,006 794**
12 Mobil 1,800 2,664 1,536*
13 NNPC 1,800 1,105 695**
14 Acorm 1,800 1,995 195*
15 Mania 1,800 1,932 132*
16 Shamrous 1,800 1,249 551**
17 Fagow Oil 1,800 859 941**
18 NNPC 1,800 927 873**
19 Mrs Oil 1,800 1,475 325**
20 Forte Oil 1,800 1,848 48*
IJOMU/OBANLA WARD
21 Agbogbo Oil & Gas 1,800 1,298 502**
22 Solovic Petroleum 1,800 1,405 395**
23 Emmolay 1,800 1,008 792**
24 Total 1,800 2,017 217*
25 A.P 1,800 1,752 48**
26 3 Ages Divine Ventures Ltd 1,800 994 806**
27 Olrof 1,800 1,016 784**
224
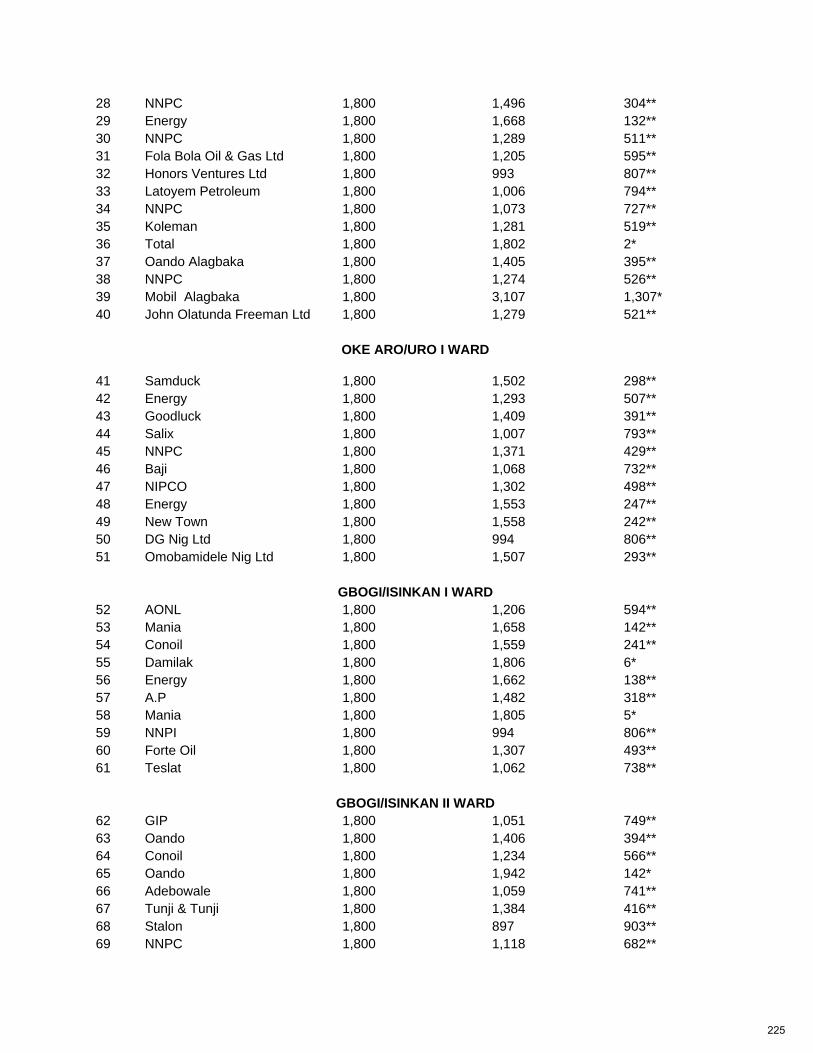
28 NNPC 1,800 1,496 304**
29 Energy 1,800 1,668 132**
30 NNPC 1,800 1,289 511**
31 Fola Bola Oil & Gas Ltd 1,800 1,205 595**
32 Honors Ventures Ltd 1,800 993 807**
33 Latoyem Petroleum 1,800 1,006 794**
34 NNPC 1,800 1,073 727**
35 Koleman 1,800 1,281 519**
36 Total 1,800 1,802 2*
37 Oando Alagbaka 1,800 1,405 395**
38 NNPC 1,800 1,274 526**
39 Mobil Alagbaka 1,800 3,107 1,307*
40 John Olatunda Freeman Ltd 1,800 1,279 521**
OKE ARO/URO I WARD
41 Samduck 1,800 1,502 298**
42 Energy 1,800 1,293 507**
43 Goodluck 1,800 1,409 391**
44 Salix 1,800 1,007 793**
45 NNPC 1,800 1,371 429**
46 Baji 1,800 1,068 732**
47 NIPCO 1,800 1,302 498**
48 Energy 1,800 1,553 247**
49 New Town 1,800 1,558 242**
50 DG Nig Ltd 1,800 994 806**
51 Omobamidele Nig Ltd 1,800 1,507 293**
GBOGI/ISINKAN I WARD
52 AONL 1,800 1,206 594**
53 Mania 1,800 1,658 142**
54 Conoil 1,800 1,559 241**
55 Damilak 1,800 1,806 6*
56 Energy 1,800 1,662 138**
57 A.P 1,800 1,482 318**
58 Mania 1,800 1,805 5*
59 NNPI 1,800 994 806**
60 Forte Oil 1,800 1,307 493**
61 Teslat 1,800 1,062 738**
GBOGI/ISINKAN II WARD
62 GIP 1,800 1,051 749**
63 Oando 1,800 1,406 394**
64 Conoil 1,800 1,234 566**
65 Oando 1,800 1,942 142*
66 Adebowale 1,800 1,059 741**
67 Tunji & Tunji 1,800 1,384 416**
68 Stalon 1,800 897 903**
69 NNPC 1,800 1,118 682**
225
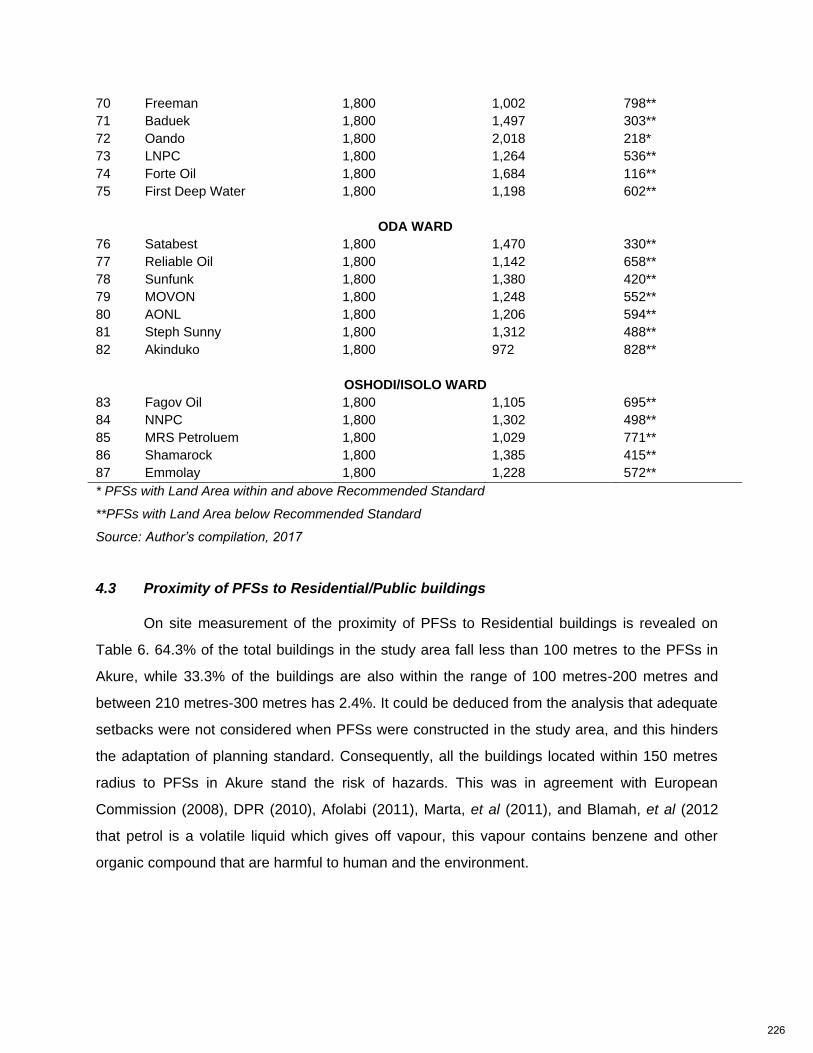
70 Freeman 1,800 1,002 798**
71 Baduek 1,800 1,497 303**
72 Oando 1,800 2,018 218*
73 LNPC 1,800 1,264 536**
74 Forte Oil 1,800 1,684 116**
75 First Deep Water 1,800 1,198 602**
ODA WARD
76 Satabest 1,800 1,470 330**
77 Reliable Oil 1,800 1,142 658**
78 Sunfunk 1,800 1,380 420**
79 MOVON 1,800 1,248 552**
80 AONL 1,800 1,206 594**
81 Steph Sunny 1,800 1,312 488**
82 Akinduko 1,800 972 828**
OSHODI/ISOLO WARD
83 Fagov Oil 1,800 1,105 695**
84 NNPC 1,800 1,302 498**
85 MRS Petroluem 1,800 1,029 771**
86 Shamarock 1,800 1,385 415**
87 Emmolay 1,800 1,228 572**
* PFSs with Land Area within and above Recommended Standard
**PFSs with Land Area below Recommended Standard
Source: Author’s compilation, 2017
4.3 Proximity of PFSs to Residential/Public buildings
On site measurement of the proximity of PFSs to Residential buildings is revealed on
Table 6. 64.3% of the total buildings in the study area fall less than 100 metres to the PFSs in
Akure, while 33.3% of the buildings are also within the range of 100 metres-200 metres and
between 210 metres-300 metres has 2.4%. It could be deduced from the analysis that adequate
setbacks were not considered when PFSs were constructed in the study area, and this hinders
the adaptation of planning standard. Consequently, all the buildings located within 150 metres
radius to PFSs in Akure stand the risk of hazards. This was in agreement with European
Commission (2008), DPR (2010), Afolabi (2011), Marta, et al (2011), and Blamah, et al (2012
that petrol is a volatile liquid which gives off vapour, this vapour contains benzene and other
organic compound that are harmful to human and the environment.
226
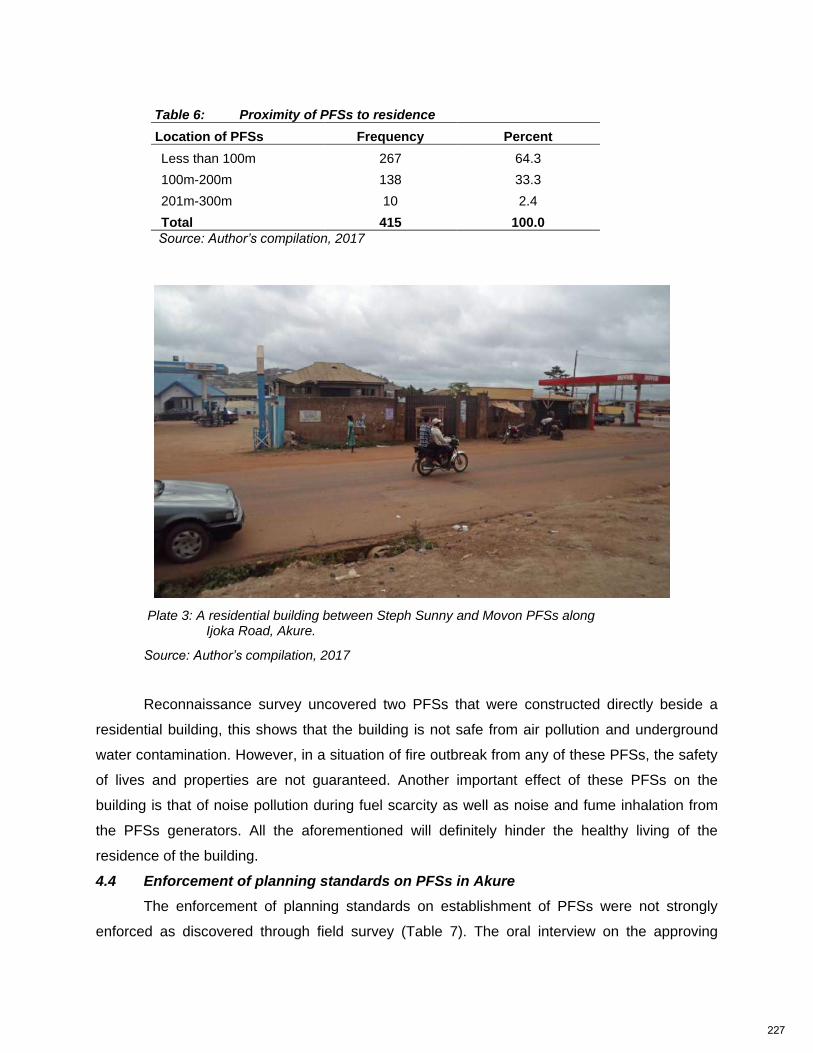
Table 6: Proximity of PFSs to residence
Location of PFSs Frequency Percent
Less than 100m 267 64.3
100m-200m 138 33.3
201m-300m 10 2.4
Total 415 100.0
Source: Author’s compilation, 2017
Plate 3: A residential building between Steph Sunny and Movon PFSs along Ijoka Road, Akure.
Source: Author’s compilation, 2017
Reconnaissance survey uncovered two PFSs that were constructed directly beside a
residential building, this shows that the building is not safe from air pollution and underground
water contamination. However, in a situation of fire outbreak from any of these PFSs, the safety
of lives and properties are not guaranteed. Another important effect of these PFSs on the
building is that of noise pollution during fuel scarcity as well as noise and fume inhalation from
the PFSs generators. All the aforementioned will definitely hinder the healthy living of the
residence of the building.
4.4 Enforcement of planning standards on PFSs in Akure
The enforcement of planning standards on establishment of PFSs were not strongly
enforced as discovered through field survey (Table 7). The oral interview on the approving
227
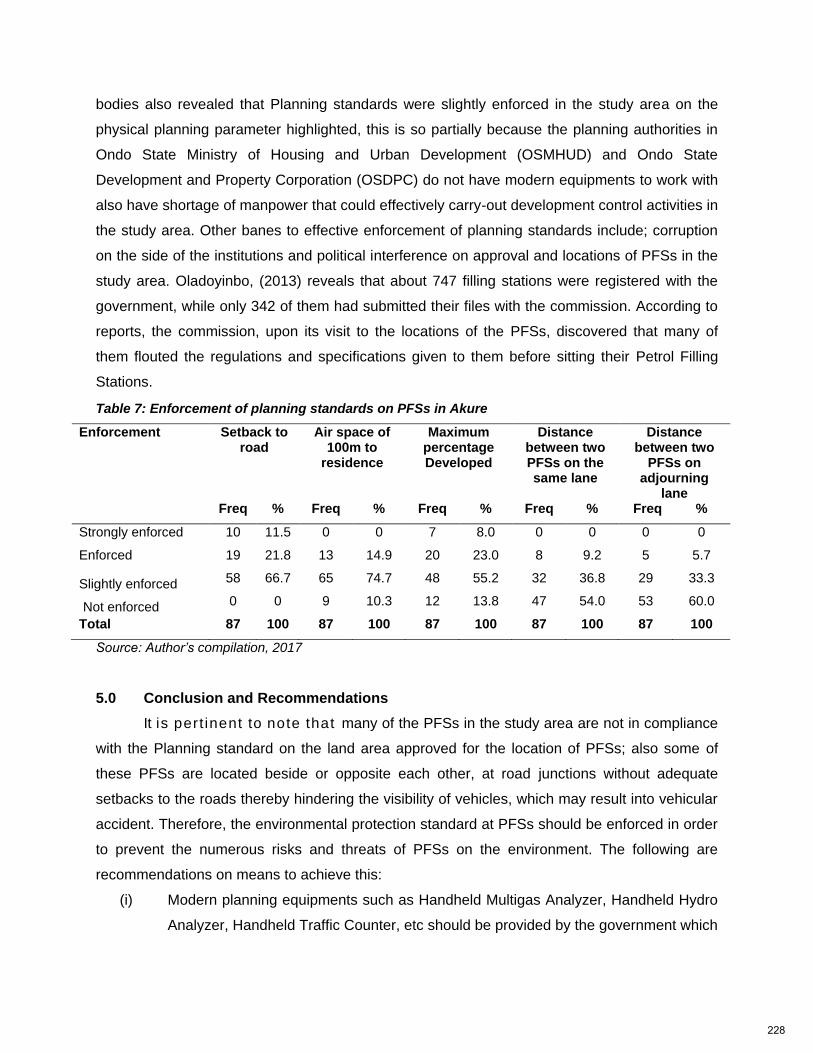
bodies also revealed that Planning standards were slightly enforced in the study area on the
physical planning parameter highlighted, this is so partially because the planning authorities in
Ondo State Ministry of Housing and Urban Development (OSMHUD) and Ondo State
Development and Property Corporation (OSDPC) do not have modern equipments to work with
also have shortage of manpower that could effectively carry-out development control activities in
the study area. Other banes to effective enforcement of planning standards include; corruption
on the side of the institutions and political interference on approval and locations of PFSs in the
study area. Oladoyinbo, (2013) reveals that about 747 filling stations were registered with the
government, while only 342 of them had submitted their files with the commission. According to
reports, the commission, upon its visit to the locations of the PFSs, discovered that many of
them flouted the regulations and specifications given to them before sitting their Petrol Filling
Stations.
Table 7: Enforcement of planning standards on PFSs in Akure
Enforcement Setback to road
Air space of 100m to
residence
Maximum percentage Developed
Distance between two PFSs on the same lane
Distance between two
PFSs on adjourning
lane Freq % Freq % Freq % Freq % Freq %
Strongly enforced 10 11.5 0 0 7 8.0 0 0 0 0
Enforced 19 21.8 13 14.9 20 23.0 8 9.2 5 5.7
Slightly enforced 58 66.7 65 74.7 48 55.2 32 36.8 29 33.3
Not enforced 0 0 9 10.3 12 13.8 47 54.0 53 60.0
Total 87 100 87 100 87 100 87 100 87 100
Source: Author’s compilation, 2017
5.0 Conclusion and Recommendations
It is pert inent to note that many of the PFSs in the study area are not in compliance
with the Planning standard on the land area approved for the location of PFSs; also some of
these PFSs are located beside or opposite each other, at road junctions without adequate
setbacks to the roads thereby hindering the visibility of vehicles, which may result into vehicular
accident. Therefore, the environmental protection standard at PFSs should be enforced in order
to prevent the numerous risks and threats of PFSs on the environment. The following are
recommendations on means to achieve this:
(i) Modern planning equipments such as Handheld Multigas Analyzer, Handheld Hydro
Analyzer, Handheld Traffic Counter, etc should be provided by the government which
228
could be used to create an enabling environment for living. Also qualified personnel
should be recruited for the development control activities.
(ii) Any officer caught in the act of compromising planning standards should be made to
face the wrought of the law and completely dismissal also enforcement of workable
planning standards policy should be implemented on the proximity of PFSs to
residential/public buildings.
(iii) Policy framework that gives the professionals in the Ministry, local and state
governments the capacity to fulfill their constitutional obligation is required in order to
ameliorate political interference.
(iv) Synergy between OSMHUD and OSDPC on how to effectively implement the
planning standards putting into cognizance distance between PFSs.
(v) It is proposed that the plot size of a PFS should be such that will accommodate all
component of a PFS, as well as without causing any hindrances to the movement of
vehicles of expected dimensions within a PFS and this should be strictly enforced.
References
Abdul, H., Suriatini I. and Remy M. 2009. Site potent ia l i ty of pe t ro l stations based on traffic counts. Centre for Real Estate Studies Universiti Teknologi Malaysia. Paper presented at the European Real Estate Society’s Conference, Stockholm, Sweden. Available at http://www.eres2009.com/papers/6J Traffic%20counts%20of%20petrol%20station-1.pdf). Retrieved on July11, 2016
Afolabi, O.T, Olajide, F.O and Omotayo, S.K. 2011. Assessment of safety practices in filling
stations in Ile-Ife, South Western Nigeria. Journal of Community Medicine and Primary Health Care. 23 (1 & 2): 9-15
Ajibola, M. O., Olaniyan A. and Simon, R. F.201. Assessing the effects of urban planning
on residential property values In Agege, Lagos. European Scientific Journal. 8(11) Alabi F.M 2004. Assessing the location of petrol filling stations in Saki, Nigeria. The
Environscope a Multidisciplinary Journal. 1(1) 44-49 Ayeni, B. 1991. Public facilities locations using maximal service distance. An example of
Research for Development. NISER, Ibadan. 17, (5): 18-36
Bakare, G. O. 2012. Rule of law, physical planning and urban governance in Nigeria: A Panacea to Sustainable Urban Development. Ontario International Development Agency ISSN: 1923-6654 (print) ISSN 1923-6662 (online). Available at http://www.ssrn.com/link/OIDA-Intl-Journal-Sustainable-Dev.html
Barrow, C.J. 2006. Environmental management for sustainable development. 2nd
Edition. London.
229
Blamah, N.V, Vivan, E.L, Tagwi M.V and Ezemokwe I.U 2012. Locational impact assessment ofg Service stations along Abuja-Keffi Road and Environs in Karu, Abuja, Nigeria. Journal of Environmental Management and Safety. 3, (5) 106 -126 Available at http:// www.cepajournal.com. Retrieved May 10, 2017.
Department of Petroleum Resources 2010. Guidelines for liquefied petroleum gas: The
Procedures and Conditions to be fulfilled before the grant of Approval and License for the Construction, Modification, and Relocation of LPG filling stations. Available at http://www.nigerianoil-gas.com. Retrieved May 27, 2016
Eke, E.E. 2014. The conditions of public conveniences in Agege Local Government Area,
Lagos. An unpublished M.Tech Thesis. Federal University of Technology, Akure, Nigeria.
Emmanuel, A.A. 1998. Locations of petrol filling stations and their implications in Akure,
Nigeria. An unpublished B.Tech. Thesis. Federal University of Technology, Akure, Nigeria.
Falade, J.B. 2012. Contributions of land use planning to national development, Paper
Presented at 5th Annual Lecture at School of Environmental Technology, Federal University of Technology, Akure
Govender, V. 2009. Filling station and associated contamination: Remediation and
Proposed Mitigation Measures. Unpublished Master’s Thesis University of Witwatersrand, South Africa. pp. 126
Jamaluddin, M.J, Kadaruddin, A, Kadir, A, and Azahan, A 2009. Development, environmental
degradation and environmental management in Malaysia. European Journal of Social Sciences, 9(2).
Keebles, L. 1969. Principles and practice of town and country planning, Estate Gazette, London. Macmillan Nigeria 2006. Secondary atlas. Lagos: Macmillan, Nigeria Marta, D.M, Isabel, M, Morales, T, Enrique, G, Ferradas, A.B.C, Jonathan, B.R 2011.
Assessing the impact of petrol stations on their Immediate Surroundings. Journal of Environmental Management. 91(12): 2754 DOI. Available at http://www.sciencedaily.com. Retrieved April 11, 2017
Neufert, E, 1980. Architect Data London BSB. Professional Books.
Available at http://www.e-bookspdf.org/download/architecture-data-by-neufert.html Retrieved May 21, 2016
National Planning Commission 2009. Nigeria Vision 20:2020. Report of the vision 2020 National Technical Working Group on Employment, Abuja. Federal Government of Nigeria
Oladoyinbo, Y. 2013. Ondo state government set to demolish illegal filling stations. The
Nigeria Tribune, 12 June, p.11. Available at http://myondostate.com/w3/ondo-state-mimiko-govt-to-demolish-petrolstations/#responds). Retrieved June 30, 2016
230

Olujimi, J.A.B. 2009. Evolving a planning strategy for managing urban sprawl in Nigeria.
Human Ecology, 25(3), 201-208. Available at http://www.krepublishers.com. Retrieved June 19, 2016
Omole, F.K. 1994 Towards an effective administration of development control in Ilesa,
Osun State, Nigeria. Unpublished M.Sc Thesis. University of Benin, Nigeria. Omole, F.K. 2001. Location analysis of petroleum filling stations in Akure-Nigeria.
International Journal on Transport Studies. 1 (1): 16-31 Smart, N.U. 2002. Environmental Management and Protection, Spotlite Publishers, 113-114.
231
Sen, Roshmi Centralized cooling systems ISOCARP-OAPA Conference 2017 Meggers, Forrest in housing communities Chattopadhyay, Subrata
1
Planning for centralized cooling systems in high density mass housing in tropics– towards smart energy policy in residential
communities
Roshmi SEN, Indian Institute of Technology Kharagpur, India
Forrest MEGGERS, Princeton University, USA Subrata CHATTOPADHYAY, Indian Institute of Technology Kharagpur, India
Synopsis
The given study explores the potential of centralized cooling systems applicable to mass housing complexes in community as compared to the pre-existing split air conditioning systems. The study then investigates institutional mechanisms towards implementing such centralized cooling systems in high density mass housing stock for developing nations.
1. Introduction
1.1 Cooling need in the developing world
Developing nations are home to the fastest growing cities. The majority of such cities belong to hot climates. Henceforth the need for cooling in the residential urban areas is expected to rise rapidly in the coming decades. A study (Sivak, 2009) highlighted that 38 out of 50 largest metropolitan cities are in developing countries. While analyzing local cooling and heating degree days data, the study found that 24 out of 38 of such mega-cities were having cooling demand that significantly exceeded the heating demand. Indian megacities Madras, Ahmedabad, Mumbai, Kolkata, Delhi and Bangalore accounted for among the cities with highest cooling degree days. The study anticipated a rise in the global cooling energy demand due to rise of individual income in developing countries. The study (Isaac and van Vuuren, 2009), popularized by the Economist magazine and widely cited worldwide analyzed the heating and air conditioning energy demand for global residential sector in the 21st century and inferred that the global heating demand to be decreased by 34% under the influence of climate change by 2100, while the global air conditioning demand is expected to be increased exponentially by 72% by 2100 mostly driven by income growth, in a regional scale a considerable impact is expected to be seen in South Asia. Even though this study overestimated the cooling demand by assuming cooling temperature setpoint at 18°C for calculating cooling degree days in terms of mean outdoor temperature, the trend for increasing global cooling demand is evident from various other sources also. The study (Mendelsohn et al., 2000) which analyzed the country specific market impacts of global warming in three climate change scenarios, found that the damages from the increased energy costs due to cooling would be intense in the tropics where most of the world’s projected population would live and where cooling would be expensive. A study by Lawrence Berkeley National Laboratory (Nihar Shah et al., 2015) projected the global air conditioning stock to increase by 70 percent from 2015 to 2030. Cooling is therefore one of the areas of the largest anticipated growth of energy demand, and any improvements to the efficiency of cooling systems can have significant impact on future energy scenarios.
1.2 The case of urban India
India is one of the fastest developing economies in the world with a rising level of income. An additional 497 million people are expected to live in Indian megacities by 2050 (World Urbanization Prospects, the 2011 Revision, 2012). This will increase the challenges of meeting
232
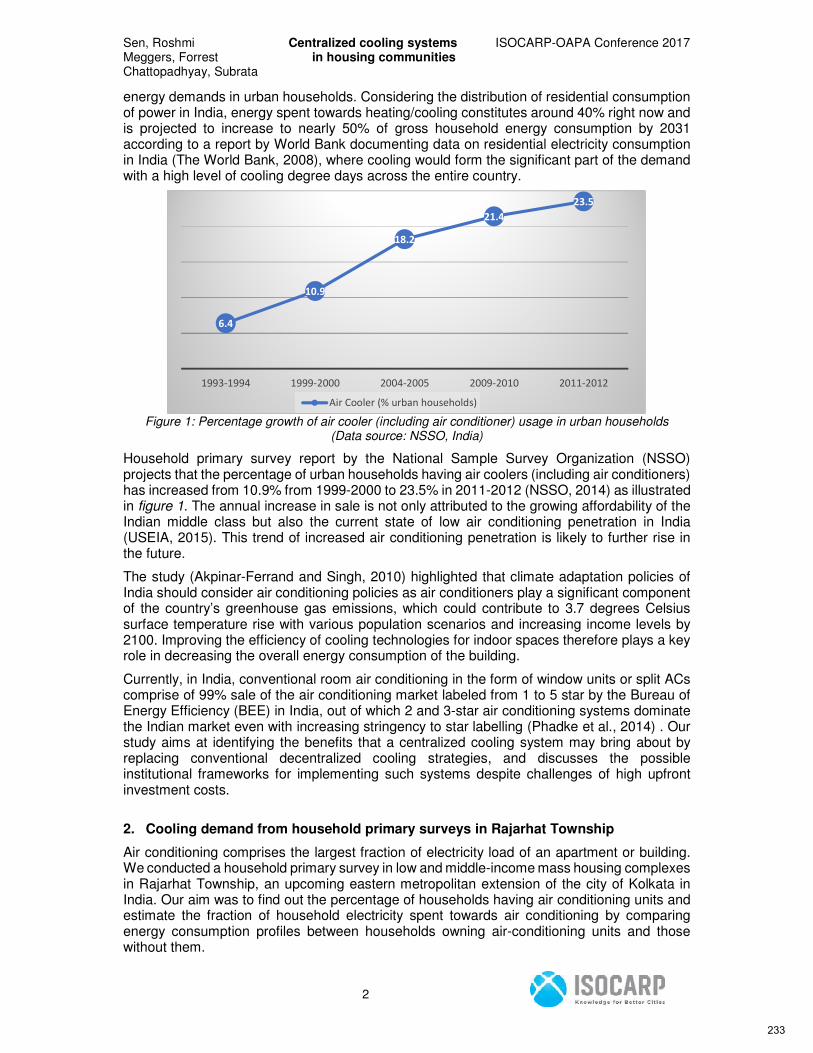
Sen, Roshmi Centralized cooling systems ISOCARP-OAPA Conference 2017 Meggers, Forrest in housing communities Chattopadhyay, Subrata
2
energy demands in urban households. Considering the distribution of residential consumption of power in India, energy spent towards heating/cooling constitutes around 40% right now and is projected to increase to nearly 50% of gross household energy consumption by 2031 according to a report by World Bank documenting data on residential electricity consumption in India (The World Bank, 2008), where cooling would form the significant part of the demand with a high level of cooling degree days across the entire country.
Figure 1: Percentage growth of air cooler (including air conditioner) usage in urban households
(Data source: NSSO, India)
Household primary survey report by the National Sample Survey Organization (NSSO) projects that the percentage of urban households having air coolers (including air conditioners) has increased from 10.9% from 1999-2000 to 23.5% in 2011-2012 (NSSO, 2014) as illustrated in figure 1. The annual increase in sale is not only attributed to the growing affordability of the Indian middle class but also the current state of low air conditioning penetration in India (USEIA, 2015). This trend of increased air conditioning penetration is likely to further rise in the future.
The study (Akpinar-Ferrand and Singh, 2010) highlighted that climate adaptation policies of India should consider air conditioning policies as air conditioners play a significant component of the country’s greenhouse gas emissions, which could contribute to 3.7 degrees Celsius surface temperature rise with various population scenarios and increasing income levels by 2100. Improving the efficiency of cooling technologies for indoor spaces therefore plays a key role in decreasing the overall energy consumption of the building.
Currently, in India, conventional room air conditioning in the form of window units or split ACs comprise of 99% sale of the air conditioning market labeled from 1 to 5 star by the Bureau of Energy Efficiency (BEE) in India, out of which 2 and 3-star air conditioning systems dominate the Indian market even with increasing stringency to star labelling (Phadke et al., 2014) . Our study aims at identifying the benefits that a centralized cooling system may bring about by replacing conventional decentralized cooling strategies, and discusses the possible institutional frameworks for implementing such systems despite challenges of high upfront investment costs.
2. Cooling demand from household primary surveys in Rajarhat Township
Air conditioning comprises the largest fraction of electricity load of an apartment or building. We conducted a household primary survey in low and middle-income mass housing complexes in Rajarhat Township, an upcoming eastern metropolitan extension of the city of Kolkata in India. Our aim was to find out the percentage of households having air conditioning units and estimate the fraction of household electricity spent towards air conditioning by comparing energy consumption profiles between households owning air-conditioning units and those without them.
6.4
10.9
18.2
21.4
23.5
1993-1994 1999-2000 2004-2005 2009-2010 2011-2012
Air Cooler (% urban households)
233
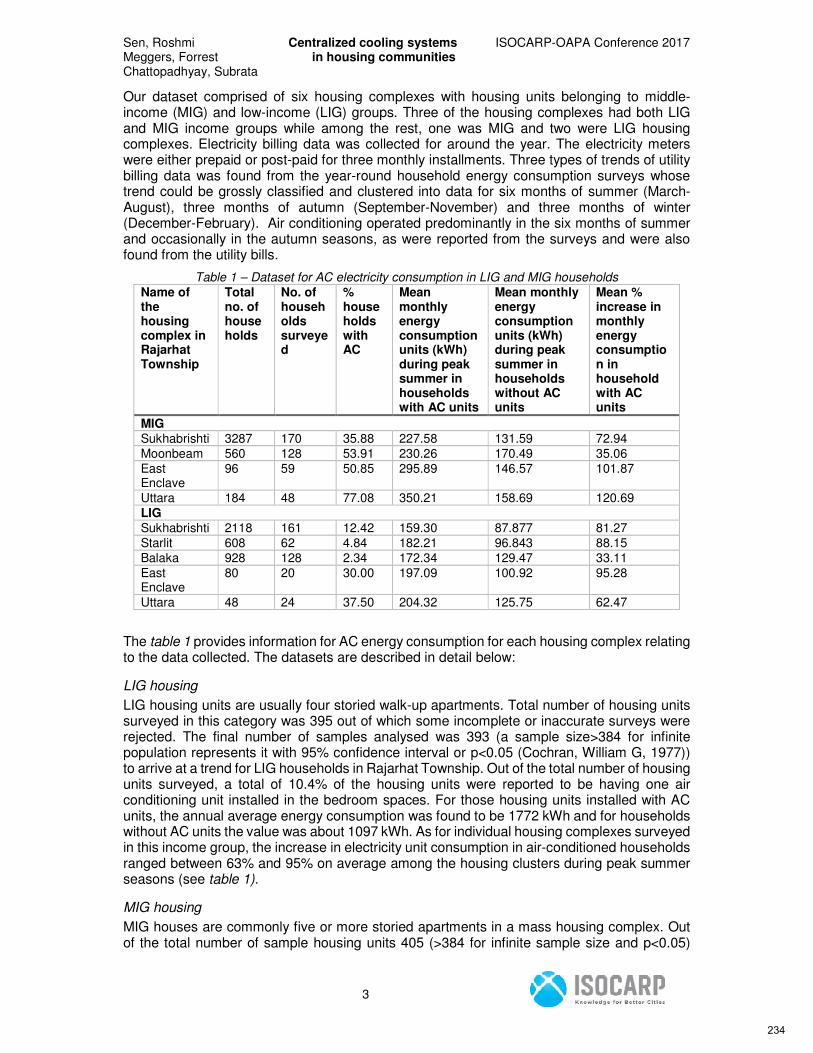
Sen, Roshmi Centralized cooling systems ISOCARP-OAPA Conference 2017 Meggers, Forrest in housing communities Chattopadhyay, Subrata
3
Our dataset comprised of six housing complexes with housing units belonging to middle-income (MIG) and low-income (LIG) groups. Three of the housing complexes had both LIG and MIG income groups while among the rest, one was MIG and two were LIG housing complexes. Electricity billing data was collected for around the year. The electricity meters were either prepaid or post-paid for three monthly installments. Three types of trends of utility billing data was found from the year-round household energy consumption surveys whose trend could be grossly classified and clustered into data for six months of summer (March-August), three months of autumn (September-November) and three months of winter (December-February). Air conditioning operated predominantly in the six months of summer and occasionally in the autumn seasons, as were reported from the surveys and were also found from the utility bills.
Table 1 – Dataset for AC electricity consumption in LIG and MIG households
Name of the housing complex in Rajarhat Township
Total no. of households
No. of households surveyed
% households with AC
Mean monthly energy consumption units (kWh) during peak summer in households with AC units
Mean monthly energy consumption units (kWh) during peak summer in households without AC units
Mean % increase in monthly energy consumption in household with AC units
MIG
Sukhabrishti 3287 170 35.88 227.58 131.59 72.94
Moonbeam 560 128 53.91 230.26 170.49 35.06
East Enclave
96 59 50.85 295.89 146.57 101.87
Uttara 184 48 77.08 350.21 158.69 120.69
LIG
Sukhabrishti 2118 161 12.42 159.30 87.877 81.27
Starlit 608 62 4.84 182.21 96.843 88.15
Balaka 928 128 2.34 172.34 129.47 33.11
East Enclave
80 20 30.00 197.09 100.92 95.28
Uttara 48 24 37.50 204.32 125.75 62.47
The table 1 provides information for AC energy consumption for each housing complex relating to the data collected. The datasets are described in detail below:
LIG housing
LIG housing units are usually four storied walk-up apartments. Total number of housing units surveyed in this category was 395 out of which some incomplete or inaccurate surveys were rejected. The final number of samples analysed was 393 (a sample size>384 for infinite population represents it with 95% confidence interval or p<0.05 (Cochran, William G, 1977)) to arrive at a trend for LIG households in Rajarhat Township. Out of the total number of housing units surveyed, a total of 10.4% of the housing units were reported to be having one air conditioning unit installed in the bedroom spaces. For those housing units installed with AC units, the annual average energy consumption was found to be 1772 kWh and for households without AC units the value was about 1097 kWh. As for individual housing complexes surveyed in this income group, the increase in electricity unit consumption in air-conditioned households ranged between 63% and 95% on average among the housing clusters during peak summer seasons (see table 1).
MIG housing
MIG houses are commonly five or more storied apartments in a mass housing complex. Out of the total number of sample housing units 405 (>384 for infinite sample size and p<0.05)
234
Sen, Roshmi Centralized cooling systems ISOCARP-OAPA Conference 2017 Meggers, Forrest in housing communities Chattopadhyay, Subrata
4
analysed in this category, it was found that 50% of the households were air conditioned out of which 14% of the entire sample had more than one air conditioning units. The average annual energy consumption per household reported was 3169 kWh for households with AC units and 1474 kWh for households without ACs. For individual households surveyed in this income group, the increase in electricity unit consumption ranged between 35% and 120% for AC households on average among the housing clusters during peak summer months (see table 1).
The given housing stock analysis helped to assess the energy demands related to air conditioning usage in apartments belonging to the affordable housing sector and hence the cooling demand. As expected, the MIG units used the air conditioning systems more extensively as compared to the LIG units. However, the current rate of low AC penetration in LIG households is indicative of the rising AC usage with rising income levels and the expanding middle class in India in future.
3. Low exergy cooling systems for buildings
Exergy denotes the energy quality of a system. It is a concept derived from the laws of thermodynamics and indicates the useful work a system can produce while interacting with its surroundings as it moves towards a state of equilibrium acting as a heat engine. The total energy of the system can then be broken down into exergy and anergy. While exergy is the work extracted from a thermodynamic cycle, anergy is the fraction of energy that gets dispersed or destroyed in the process while the system approaches equilibrium.
The concept of exergy can be extended to building design. The heat pump which is a heat engine operating in reverse, represents the principal component of exergy analysis in buildings (Meggers et al., 2012). When set up for cooling or air conditioning, the heat pump removes heat from the building into its surroundings.
The coefficient of performance (COP) measures the cooling efficiency of an air conditioning system. It defines how much heat can be removed from the building per unit input of work. It is given by the following expression– COP = g*Tc/(Th-Tc)
where Tc is the temperature of the cold reservoir, Th is the temperature of the hot reservoir, g is the exergetic efficiency of a cooling system. A low exergy building system accomplishes the goal of removing of heat from the building by minimum amount of exergy input, which can be achieved by maximizing the COP of the heat pump, that is by minimizing the temperature difference between Th and Tc in the above expression. In case of low-exergy cooling systems, this is achieved by a ‘high temperature cooling’ or increasing the supply temperature of the cooling source.
The ‘Energy in Building and Communities’ program by the International Energy Agency has outlined various projects for implementing low exergy community systems. The currently ongoing IEA Annex 64 project aims at achieving optimized performance of community energy supply systems with exergy principle where ‘high-temperature cooling’ is most effective. Keeping this in context, the replacement of the individual room air conditioning units with centralized cooling systems in high density housing communities is likely to improve energy performance, emissions and eradicate the detrimental effects of individual units on urban microclimate with centralized heat rejection.
3.1 Centralized vs decentralized cooling systems in terms of low exergy cooling
Current context – individual room air conditioners
In India, most of the conventional room AC units are installed after the construction and are must be purchased by the occupants or users. They are not efficient and come with high operating costs, placing both the burden of capital cost and high energy costs on the individual households. These packaged air conditioning units are also easily retrofitted, but often proper professional installation of split units or improper self-installation of window-units results in
235
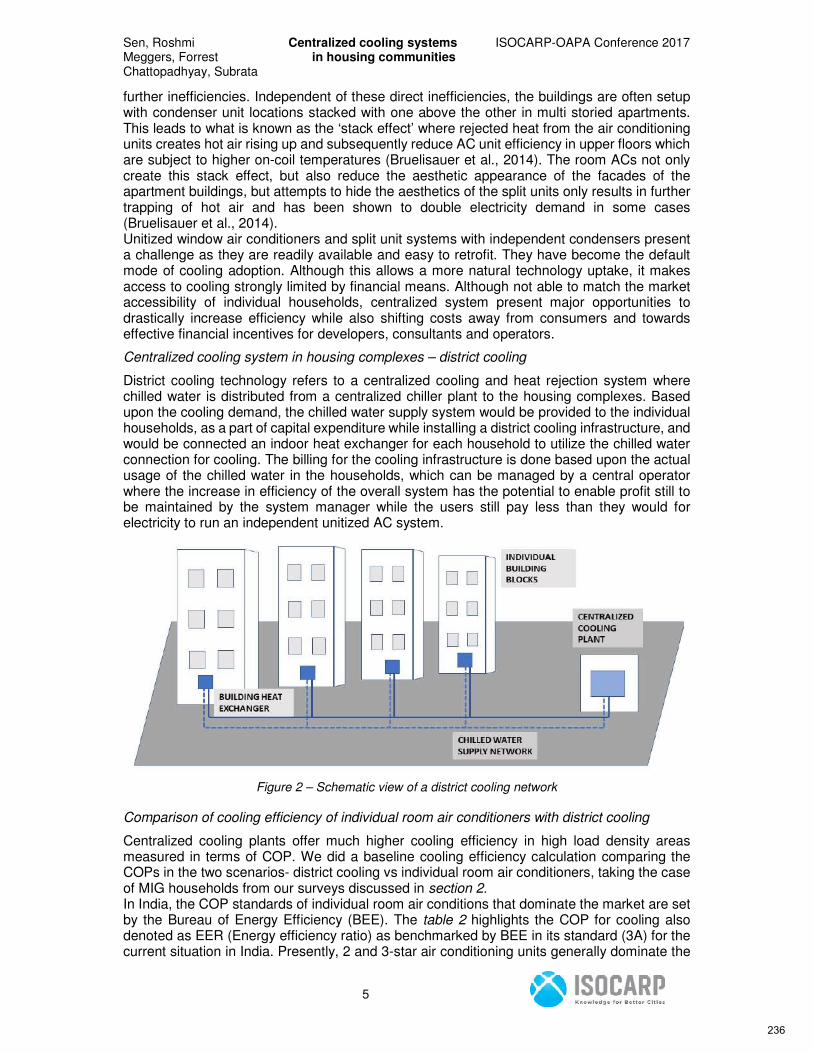
Sen, Roshmi Centralized cooling systems ISOCARP-OAPA Conference 2017 Meggers, Forrest in housing communities Chattopadhyay, Subrata
5
further inefficiencies. Independent of these direct inefficiencies, the buildings are often setup with condenser unit locations stacked with one above the other in multi storied apartments. This leads to what is known as the ‘stack effect’ where rejected heat from the air conditioning units creates hot air rising up and subsequently reduce AC unit efficiency in upper floors which are subject to higher on-coil temperatures (Bruelisauer et al., 2014). The room ACs not only create this stack effect, but also reduce the aesthetic appearance of the facades of the apartment buildings, but attempts to hide the aesthetics of the split units only results in further trapping of hot air and has been shown to double electricity demand in some cases (Bruelisauer et al., 2014). Unitized window air conditioners and split unit systems with independent condensers present a challenge as they are readily available and easy to retrofit. They have become the default mode of cooling adoption. Although this allows a more natural technology uptake, it makes access to cooling strongly limited by financial means. Although not able to match the market accessibility of individual households, centralized system present major opportunities to drastically increase efficiency while also shifting costs away from consumers and towards effective financial incentives for developers, consultants and operators.
Centralized cooling system in housing complexes – district cooling
District cooling technology refers to a centralized cooling and heat rejection system where chilled water is distributed from a centralized chiller plant to the housing complexes. Based upon the cooling demand, the chilled water supply system would be provided to the individual households, as a part of capital expenditure while installing a district cooling infrastructure, and would be connected an indoor heat exchanger for each household to utilize the chilled water connection for cooling. The billing for the cooling infrastructure is done based upon the actual usage of the chilled water in the households, which can be managed by a central operator where the increase in efficiency of the overall system has the potential to enable profit still to be maintained by the system manager while the users still pay less than they would for electricity to run an independent unitized AC system.
Figure 2 – Schematic view of a district cooling network
Comparison of cooling efficiency of individual room air conditioners with district cooling
Centralized cooling plants offer much higher cooling efficiency in high load density areas measured in terms of COP. We did a baseline cooling efficiency calculation comparing the COPs in the two scenarios- district cooling vs individual room air conditioners, taking the case of MIG households from our surveys discussed in section 2. In India, the COP standards of individual room air conditions that dominate the market are set by the Bureau of Energy Efficiency (BEE). The table 2 highlights the COP for cooling also denoted as EER (Energy efficiency ratio) as benchmarked by BEE in its standard (3A) for the current situation in India. Presently, 2 and 3-star air conditioning units generally dominate the
236
Sen, Roshmi Centralized cooling systems ISOCARP-OAPA Conference 2017 Meggers, Forrest in housing communities Chattopadhyay, Subrata
6
air conditioning market. Considering this, for split and window air conditioners, we assumed a bracket of COP scenarios between 2.7 and 2.9. Average summer AC electricity for MIG households is estimated by the difference in mean energy consumption between households with and without AC units. This is multiplied by the COP to obtain an estimate of the cooling demand or the heat removed from the building. The estimated cooling demand is taken as a basis of calculation of the AC electricity for district cooling. A district cooling has a higher exergetic efficiency and so we assume a g-value of 0.6 against 0.5 for individual room air conditioners. We assumed the heat rejection temperature in evaporative cooling tower of a district cooling unit as 30°C and the supply temperature of chilled water as 8°C. For individual split units, the evaporator temperature is assumed to be 8°C and the condenser temperature between 55-60°C to obtain a COP range of 2.7 to 2.9. The calculated summer monthly AC consumption for district cooling was found to be ranging between 35 and 40% of the consumption by room air conditioning, based upon the COPs assumed for these split units. The table 3 gives a comparison of the summer monthly AC electricity gains of a district cooling system over a split air conditioning unit based upon the COPs of the system. So, it could be inferred from this baseline calculation that centralized cooling can bring about 50-65% reduction of AC electricity consumption in the households.
Table 2: Star rating band by BEE to be valid in India between January 2014 to December 2017
Star Rating
SPLIT ACs WINDOW ACs
Minimum EER
Maximum EER
Minimum EER
Maximum EER
1 star 2.7 2.89 2.5 2.69
2 star 2.9 3.09 2.7 2.89
3 star 3.1 3.29 2.9 3.09
4 star 3.3 3.49 3.1 3.29
5 star 3.5 3.3
Table 3: Comparison in the reduction in AC electricity due to District cooling Cooling system
Condenser
Temperature (Th) degC
Evaporator Temperature
(Tc) degC
Exergetic efficiency
(g)
COP Summer monthly
AC electricity
(kWh)
Cooling demand (kWh)
% reduction in summer monthly AC electricity
Individual units
55-60 8 0.5 2.7-2.9
115.8 312.9-346.3
District cooling
30-35 (wet bulb
temperature)
8 0.6 6.24-7.66
40.83-55.44
312.9-346.3
50-65
4. Key benefits of centralized cooling systems
District cooling infrastructure comes with obvious challenges of high upfront capital investment costs. However, when deployed in dense neighbourhoods, such centralized cooling systems can offer several benefits in terms of emission reduction, costs, operational efficiency and clean energy production.
Energy benefits
In the above section, we discussed the efficiency that can be achieved by installing low exergy centralized cooling systems in terms of COP. The reduction in consumption of AC electricity not only leads to considerable energy savings, but also emission reductions by cutting down upon a major fraction of the household electricity demand.
Clean energy and emission reduction benefits
District cooling comes with easy integrability with renewable energy sources which helps in cutting down upon greenhouse gas emissions of a community. District cooling coupled with renewable energy interventions have been successfully and commonly deployed in many
237
Sen, Roshmi Centralized cooling systems ISOCARP-OAPA Conference 2017 Meggers, Forrest in housing communities Chattopadhyay, Subrata
7
university campus communities. Renewable energy systems when integrated with district cooling, can integrate high amount of clean energy in residential energy consumption sector. When there is no individual AC units involved in the households the building electricity, the electrical demand comes down in the building scale, making rooftop PV installations, for example, able to cover a majority of demand. At the same time, the cooling electricity demand is removed from individual buildings to the central plant making it easier to generate from renewable energy, which can be integrated with the cooling facility. As for individual households, it is difficult to mobilize such renewable technology interventions as the households would be reluctant to pay towards the upfront capital investment costs of energy technologies. Various kinds of renewable technologies can be integrated with a district cooling plant which include geothermal, solar, biomass and waste cold energy (Gang et al., 2016). Thinking at the community level therefore enables policy mechanisms to support implementation of completely renewable and GHG free energy technologies.
Financial benefits – low operating costs
District cooling comes with the financial benefits of much lower operating costs in the long run. There is a shift of cost of buying split units from individual residents to housing community level capital investment towards a district cooling system such that the household owners pay only for the chilled water supply based upon the cooling demand.
Qualitative benefits - operational efficiency and urban aesthetics
District cooling integrates the cooling infrastructure to the community comfort and convenience for the customers. From qualitative perspectives, the system is quiet contrasting conventional cooling systems. Centralized operation and maintenance makes it a more reliable service. District cooling offers improved urban aesthetics by replacing the individual room ACs disrupting the view of the building façade.
5. Institutional mechanisms for implementing centralized cooling
To understand the planning, implementation and delivery of a district cooling system, it is important to note the role of various institutions that can be brought together to implement such community scale infrastructures. In this section, we attempt to discuss such institutional mechanisms, the challenges being faced and the possible ways to mobilize them.
5.1 Role of private developer – financing the capital costs
In India, most housing communities are built by private real estate developers. Social housing models have PPP arrangements where the private developer finances the project and partners with the municipal government which acts as a facilitator of land and other resources. In this way, the private sector with its capital investments becomes the housing provider and the government plays the role of the enabler in social housing projects. As the capital investor, the involvement of the private sector is therefore important in capturing cost effective energy efficient solutions in housing communities. In India, currently, the installation costs for district cooling systems can be upto two times more than the initial investment costs for split air conditioning systems. A market survey revealed the initial investment cost of district cooling system equivalent to 1-ton air conditioning would cost 60000-70000 INR without thermal storage and about 100000 INR with thermal storage against 50000 INR for 5-star and 30000 for 2-star 1.5-ton AC split units. This would entail an increase of 40-70% of the upfront capital cost investment for a district cooling plant catering to a housing community. The private developer can play a key role in promoting such cooling infrastructures while operating in a business model. The capital costs of a community scale cooling infrastructure would constitute only 4-8% cost of construction of the entire apartment complex, and it is subsequently a source of revenue generation during the operating phase. An ESCO may play the role here in helping the private developer in identifying the savings from their investments in such cooling infrastructure. We propose a build-own-operate (BOO) model where the private developer would receive a concession from the government to
238

Sen, Roshmi Centralized cooling systems ISOCARP-OAPA Conference 2017 Meggers, Forrest in housing communities Chattopadhyay, Subrata
8
finance, design, construct, own and operate the cooling infrastructure and recover its investments.
5.2 Energy servicing companies (ESCOs) as enablers of energy infrastructures
ESCOs are enablers of energy infrastructures. They are energy servicing companies - commercial or nonprofit - that provide with energy systems and services in financing design, implementation, operation and maintenance of projects. ESCOs might recover their gains by energy savings over time by reducing the energy costs for building users (Marcel Bruelisauer and Sonja Berthold, 2015). ESCOs are different from other entities that offer energy efficient solutions such as, consulting firms unlike which ESCO’s payment is directly related to the amount of energy saved in terms of money, in other words, to the energy efficiency of the project. However, the definitions of ESCO may be different for different countries. In India, the Bureau of Energy Efficiency (BEE) which empanels and accredits ESCOs, defines them as organizations engaged in a performance based contract, known as energy performance contracts, with a client firm to implement measures to reduce energy consumptions and costs in a technically viable manner.
ESCO usually performs the following tasks – the identification, development and design of energy efficiency projects, the financing or arrangement of financing for such projects, installation operation and maintenance of the technology and the measurement and monitoring of the project’s energy savings as illustrated in figure 3.
Figure 3: Services offered by ESCOs
How ESCOs operate - Energy performance contracting
Energy performance contracts (EPCs) are a contractual agreement between the beneficiary and the service provider of an energy performance improvement measures in the form of ‘creative financing’ where the energy efficiency upgrades are possible from cost reductions (Alliance for an Energy Efficient Economy, New Delhi, 2014). EPCs may or may not backed by financing solutions. Model energy performance contracts in practice are primarily classified into the following two types –
• Shared savings - the customer and ESCO agree upon a shared cost of investment and savings for a certain span of years and a predetermined percentage. In this model, it is generally ESCO which funds the project through its own funds or through a third party
• Guaranteed savings – ESCO guarantees a certain amount of savings to its client. ESCO assumes a performance risk and bears any difference from the guaranteed minimum energy savings. This type of contract is typically provided when the customer bears the upfront investment costs
ESCOs in residential sector – barriers and opportunities
ESCOs play active roles in different sectors in different economies. In developed countries, public sector is an important ESCO client whereas in developing countries, the commercial sector plays as an emerging client (World Energy Council, 2007). However, despite large energy saving potential, ESCOs are impeded the following major barriers impede ESCOs in residential sector everywhere (Labanca et al., 2015),(Ellis, J, 2009) , (World Energy Council, 2007)-
• The landlord-tenant dilemma where the landlord does not gain from the energy efficient investments while the tenant is interested to achieve the energy savings
• Administrative barriers and high transaction costs compared to the small amount of energy costs and potential energy savings
• Many stakeholders involved making decision making difficult
project identificationfinancing/
arrangement for fianancing
Installation of technology/ equipment
operation and maintenance
monitoring and measurements
of project energy savings
239
Sen, Roshmi Centralized cooling systems ISOCARP-OAPA Conference 2017 Meggers, Forrest in housing communities Chattopadhyay, Subrata
9
• Energy savings in the residential sector being much more correlated to individual needs than in other sectors making it difficult to track the exact consumption baseline, inducing elevated risk to the energy saving contracting
Nevertheless, it is not impossible to overcome these potential barriers, as discussed below (Labanca et al., 2015), (World Energy Council, 2007) -
• A ‘community model’ by (Paolo Bertoldi et al., 2006) which proposes the creation of community networks where decisions are to be taken on behalf of or by a group of community members or end-users in the same location. This kind of model is aptly applicable for district cooling programs meant for housing complexes delivered by a private developer solely or in partnership with the government usually in case of social housing. It helps to realize the economies of scale by installing energy efficiency solutions to several dwelling units belonging to the community all in one go where the ESCO can play the role of a facilitator for designing, implementation, operation and maintenance and energy billing of the entire district cooling system. The local government here can play a key role in diffusion of the model in community scale so that the entire community level district cooling infrastructure can be contracted out to an ESCO. The community model of pooling buildings together can also bring down the high transaction costs related to the fragmentation of the mass market
• By improving the quality and quantity of information on energy consumption in buildings by introducing smart metering and billing systems, thus strengthening the monitoring procedure for individual household energy consumption
In the United States social housing has acted as a profitable sub market for ESCOs where the scale is large and there is a need to cut operating costs for housings stocks according to study conducted by Canada Mortgage and Housing Corporation that investigated upon the market of EPCs in Canadian housing sector (Khaund, 2013).
ESCOs in developing countries
In developing countries, ESCO is still a new concept, the greatest challenges faced by ESCOs being in the financing sector. Banks are conservative to ESCO projects since they cannot judge the creditworthiness of such new entities or their clients. Also, EPC contracts compete with the energy subsidies in developing countries created to protect the interest of the poor. However, there are several enabling factors for ESCOs to work in developing countries which include rising GDPs and economies of scale that can be achieved by addressing a large population mass. India has high potentials for energy savings. However, the absence of policy support, weak financing and legal frameworks and lack of expertise in energy performance contracting have been barriers to the development of ESCOs. As cooling infrastructure forms a significant portion of energy consumption in housing, ESCOs can play a key role in enabling them in housing communities and due to an increasing demand of electricity and a significant demand supply gap, there is a vast opportunity for ESCOs to grow and play significant roles in India in demand side energy management by providing energy efficient infrastructure solutions. High fragmentation of the mass market is one of the major barriers impeding the growth of ESCOs (Labanca et al., 2015). However, thinking of energy performance contracting in community scale is likely to work in their favour due to the economies of scale achieved in such an infrastructure delivery models. Our data in section 2 indicates a significant increase in electricity consumption due to AC unit installation in households belonging to MIG and LIGs, which are also likely to face a high AC penetration in future. Nevertheless, the current cooling demand is much higher in housing communities belonging to the HIGs (high income groups) and India has high energy costs in upcoming large scale real estate models where ESCOs can play a strong role in promoting community scale cooling systems.
5.3 Role of governmental support
240
Sen, Roshmi Centralized cooling systems ISOCARP-OAPA Conference 2017 Meggers, Forrest in housing communities Chattopadhyay, Subrata
10
A strong governmental support in the form of incentives, subsidies and tax exemptions are necessary for the survival of energy enabling infrastructures. In developing countries, the governmental support has been a key player for the success of ESCOs by removal of barriers hindering them in the initial stages. Case studies from China and North America have shown success in governmental support in terms of strategic supports for the ESCO to operate or assistance through market creations.
5.3 Role of international actors
International actors can play as significant motivators towards enabling energy efficient infrastructures, the most challenging part being promoting the financing of such infrastructures. Past case studies have shown how international development agencies and financial actors such as the World Bank, US Agency for International Development (USAID), European Bank for Reconstruction and Development have played significant roles towards raising capital funds and fostering the promotion of energy enablers such as ESCOs in various developing countries where ESCO startups are complex and unknown entities (Ellis, J, 2009).
International infrastructure providing companies selling energy technologies can play a vital role in increasing awareness on the benefits of installing them. The Indian subsidiary of the Denmark based company Danfoss Group for example has been trying to create awareness among stakeholders on energy saving technologies in gated communities as a part of the district energy in cities initiative set up by the United Nations Environment Program (UNEP, 2016).
Conclusions
India is heavily dependent upon energy imports. For densely crowded metropolitan cities in developing nations like India the potential gains achieved from district cooling can be very high due to its scale. Improving the efficiency of cooling systems could consequently act as a major intervention towards reaching CO2 emission targets and checking global warming potential in urban areas. In addition, current air conditioning units are a significant contributor to the anthropogenic urban heat island, which simultaneously causes additional heat stress and decreases the efficiency of cooling systems. Addressing cooling demand in a holistic urban analysis considering district systems provides opportunities to evaluate and mitigate many of these negative effects simultaneously, but requires a meaningful change to the policy, economics, and technology of traditional air conditioning.
Individual room ACs consume nearly twice AC electricity in Indian households, even though they comprise 99% of the air conditioning market. The given study is a part of an ongoing research which considers the various alternative low exergy cooling scenarios that might replace the current individual room air conditioners operating with high running costs of energy and electricity in housing complexes in Indian context. Community scale cooling systems is still new to the context of developing nations. While such systems come with the benefits of cleaner energy technologies, lower energy and emission costs during the operating life cycle, their deployments are likely to face a massive challenge of upfront capital investment costs. Finally, the paradigm shift of cooling infrastructure from individual to the community scale is likely to mitigate negative impacts of large indirect costs - improving comfort, productivity, human health and the overall quality of life in the community level.
Acknowledgements
The authors would like to acknowledge Fulbright-Nehru Doctoral Research Fellowship grant for carrying out this ongoing collaborative research work in CHAOS lab at Princeton University and the Housing and Urban Development Corporation of India (HUDCO) towards funding support for the household primary surveys.
References
241
Sen, Roshmi Centralized cooling systems ISOCARP-OAPA Conference 2017 Meggers, Forrest in housing communities Chattopadhyay, Subrata
11
Akpinar-Ferrand, E., Singh, A., 2010. Modeling increased demand of energy for air conditioners and consequent CO2 emissions to minimize health risks due to climate change in India. Environ. Sci. Policy 13, 702–712. doi:10.1016/j.envsci.2010.09.009
Alliance for an Energy Efficient Economy, New Delhi, 2014. Developing Model ESCO Performance Contracts (EPCs) for Industrial Projects: Guide to performance contracting in India.
Bertoldi, Paolo, Rezessy, Silvia, Hinnels, Mark, 2006. Liberating the Power of Energy Services and ESCOs in a Liberalised Energy Market - EU Science Hub - European Commission, in: EU Science Hub. Presented at the Proceedings of the 4th International Conference on Energy Efficiency in Domestic Appliances and Lighting, European Commission DG JRC, pp. 21–32.
Bruelisauer, M, Berthold, S, 2015. Reclaiming Backlanes.
Bruelisauer, M., Meggers, F., Saber, E., Li, C., Leibundgut, H., 2014. Stuck in a stack—Temperature measurements of the microclimate around split type condensing units in a high rise building in Singapore. Energy Build. 71, 28–37. doi:10.1016/j.enbuild.2013.11.056
Cochran, William G, 1977. Sampling Techniques. John WIley and Sons.
Ellis, J, 2009. Energy service companies in developing countries: Potential and Practice. Internatioal Institute for Sustainable Development.
Gang, W., Wang, S., Xiao, F., Gao, D., 2016. District cooling systems: Technology integration, system optimization, challenges and opportunities for applications. Renew. Sustain. Energy Rev. 53, 253–264. doi:10.1016/j.rser.2015.08.051
Isaac, M., van Vuuren, D.P., 2009. Modeling global residential sector energy demand for heating and air conditioning in the context of climate change. Energy Policy 37, 507–521. doi:10.1016/j.enpol.2008.09.051
Khaund, K, 2013. Energy Performance Contracting and the Residential Sector. Can. Mortg. Hous. Corp.
Labanca, N., Suerkemper, F., Bertoldi, P., Irrek, W., Duplessis, B., 2015. Energy efficiency services for residential buildings: market situation and existing potentials in the European Union. J. Clean. Prod., Special Issue: Toward a Regenerative Sustainability Paradigm for the Built Environment: from vision to reality 109, 284–295. doi:10.1016/j.jclepro.2015.02.077
Meggers, F., Ritter, V., Goffin, P., Baetschmann, M., Leibundgut, H., 2012. Low exergy building systems implementation. Energy 41, 48–55. doi:10.1016/j.energy.2011.07.031
Mendelsohn, R., Morrison, W., Schlesinger, M.E., Andronova, N.G., 2000. Country-Specific Market Impacts of Climate Change. Clim. Change 45, 553–569. doi:10.1023/A:1005598717174
NSSO, 2014. Household consumption of various goods and services in India 2011-2012 - NSS 68th round. Ministry of Statistics and Program Implementation, Government of India.
Phadke, A., Abhyankar, N., Shah, N., 2014. Avoiding 100 New Power Plants by Increasing Efficiency of Room Air Conditioners in India: Opportunities and Challenges [WWW Document].
Shah, N, Wei, M, Letschert, V, Phadke, A, 2015. Benefits of Leapfrogging to Superefficiency and Low Global Warming Potential Refrigerants in Room Air Conditioning.
242

Sen, Roshmi Centralized cooling systems ISOCARP-OAPA Conference 2017 Meggers, Forrest in housing communities Chattopadhyay, Subrata
12
Sivak, M., 2009. Potential energy demand for cooling in the 50 largest metropolitan areas of the world: Implications for developing countries. Energy Policy 37, 1382–1384. doi:10.1016/j.enpol.2008.11.031
The World Bank, 2008. Residential consumption of electricity in India- documentation of data and methodology.
UNEP, 2016. District cooling costs less than personal ACs | DISTRICT ENERGY INITIATIVE [WWW Document]. URL http://www.districtenergyinitiative.org/district-cooling-costs-less-personal-acs (accessed 8.16.17).
USEIA, 2015. India likely to experience continued growth in electricity use for air conditioning - Today in Energy - U.S. Energy Information Administration (EIA) [WWW Document]. URL https://www.eia.gov/todayinenergy/detail.php?id=23512 (accessed 7.28.17).
World Energy Council, 2007. An Assessment of Energy Service Companies (ESCOs) Worldwide.
World Urbanization Prospects, the 2011 Revision (Report), 2012.
243
Track 2: Governance and inclusive communities
244

ThePortlandPlan:Measuringprogresstowardsequity
Moderator: Eric ENGSTROM, City of Portland, Portland, USA Speakers: Andre BAUGH, Group AGB, USA; Kimberly BRANAM, Prosper Portland, Portland; Andrea
VALDERRAMA, City of Portland, Portland, USA
For generations, Portlanders have strived to create a great city. Instead of creating sprawl, Portland
linked land use and transportation, and poured resources into building strong neighborhoods.
Portland is known for recapturing its waterfront, re‐introducing streetcar, and adopting the first
local plan to lower carbon emissions. Despite this, there are major challenges on the horizon. Not all
Portlanders have equitable access to opportunities.
In 2008 the City joined with 20 other agencies to create a common strategy, with shared measures
of success. The resulting Portland Plan was adopted in 2012. The plan has three integrated
strategies: Thriving Educated Youth; Economic Prosperity and Affordability; and Healthy Connected
City. These three strategies are held together by a commitment to advancing equity.
The process and reach of the Portland Plan challenged and expanded the scope of planning practice
in Portland, talking it beyond an emphasis on land use, transportation and urban design. AICP
members will learn about some of the ideas and practices that inspired the plan.
Publichealth‐citiesdesignsothehealthychoiceistheeasychoice(inspiredbyRobertOgilvie,ChangeLabSolutions)
Urban/regionaleconomicdevelopment(inspiredbyRobertWeissbourd,BrookingInstitute)
Educationandyouthsuccess(inspiredbythePromiseNeighborhoodsprogram,andJudithBellofPolicyLink)
Greeninfrastructure(inspiredbyCynthiaGirlingandRonKellett,UBC Equityasacentralplanningprinciple(inspiredbyJulianAgyeman,Tufts)
A 2017 Portland Plan progress report showed positive progress on 7 of the 12 measures of success.
But several metrics are going in the wrong direction.
The challenges explored in the Portland Plan are faced by many other cities. The process exposed
the challenges of coordinating a strategic vision across multiple agencies, but it set the stage for a
new phase of planning practice in Portland.
AICP members will learn how a land use agency adapted its physical planning and urban design
approach to consider social equity principles. This session will discuss the plan, review progress, and
explore lessons learned. With the Portland Plan, a group of agencies established a framework for
interdisciplinary collaboration, which may serve as a case study for practicing planners trying to
break through agency silos. Session speakers will reflect on the utility of setting numerical goals, and
will discuss current strategies to address shortcomings. Speakers will add their own expertise in
economic development, community development, and community involvement. AICP members will
hear how Portland is approaching national issues like growing economic inequality and racial justice.
245
Community Participation and ICT-driven Governance in Smart
Cities Mission of India
Awais PIRACHA, Karthik KUMAR, Western Sydney University, Australia
Short Abstract
This research evaluates the community participation initiatives and the ICT incorporated e-Governance mechanisms undertaken by three Indian cities within Smart Cities Mission of the Indian Government. Secondary data was analyzed using the theoretical frameworks of community participation and Arnstein’s ladder of citizen participation. The study found that the cities have organized well-planned community consultation drives, to understand the needs and opinions of the community prior to the preparation of the Smart City Proposals.
1. Introduction
Cities and urban regions play a crucial role in social and economic development of a country. Stokes (2015) argues that the large and dense cities of the current century can be highly productive and made more sustainable for a viable future. He further contends that, with the increased levels of globalization, world has become more connected than ever before in terms of capital and resources. However, the massive rural-urban migration of citizens presents challenges to the governments. Along with the positives that come with densely populated cities in terms of human capital and increased productivity, there also arises the need to tackle increasing challenges in traffic management, access to public resources, crimes and the waste management. These challenges have led the urban planning professionals to search for different approaches in urban design, planning, finance, management of infrastructure, governance and provision of services. Adapting to the current age of extensive technological advancements, these approaches have been linked with the incorporated use of modern Information and Communications Technology (ICT) systems. The focus of this research is to examine the attributes of community participation and governance that incorporates the technological advancements in ICTs, in the Smart Cities Mission of the Indian Government.
India’s economy is growing very fast. India is also experiencing rapid urbanization and the associated issues of pollution, traffic congestion, unemployment, and loss of agricultural land to urban development. In order to overcome these urban issues and to join the established global leaders in ‘smart cities’, the Government of India announced the Smart City Mission, with the aim of achieving 100 smart cities by 2022. As described in the mission guidelines, the participating cities are approved based on their submissions to the Ministry of Urban Development, Government of India. The cities can transform into smart cities by either: Retrofitting (introducing planning strategies, to the existing built-up areas along with other policies, which help in achieving the smart city objectives and making the area more efficient and livable); Redevelopment (replacing the existing built-up environment with new planned layouts and smart initiatives); Greenfield development (introducing smart solutions to vacant lands, usually more than 250 ac res, utilizing innovative planning, financing, and implementation tools such as land-pooling and land-reconstitution for the provision of affordable housing and other infrastructure and economy developments); and Pan-city Initiatives (application of smart city solutions into the existing city-wide infrastructure by the utilization of ICTs). The proposals can either be an individual application of these methods or a mix of the above-mentioned methods (Ministry of Urban Development, 2016). This research is an attempt to answer the following questions:
246
• How significant is citizen participation in devising the urban planning initiatives related to Smart Cities Mission?
• How does the Smart Cities Mission facilitate/promote participatory planning? • How can the incorporated ICT promote participatory planning and governance?
2. The Smart Cities Movement
From the early 1990s the cities which aligned their developments with the technological advancements, proclaimed themselves as smart cities or with the prefix of ‘smart’ synonyms such as ‘digital city’, ‘intelligent city’, and s o on. The major cities which did so included Bangalore, San Diego, Amsterdam (Papa et al. 2013). The cities had proclaimed themselves smart owing to the economic growth they experienced due to the establishment of the technological industries within their limits. The main intention of these movements were to increase the user base of the information technology.
Due to the non-availability of universal definition for smart cities, the world initially witnessed the trend of cities proclaiming themselves as smart cities purely based on their technological advancements rather than ‘smart’ urban management practices. Hollands (2008), critiques this self-declaratory nature of the smart cities, and argues that the cities without empirical evidence tend to proclaim themselves as smart due to the lack of proper defining elements. He asks the ‘smart’ cities to validate their claims beyond the boundaries of advancements in ICTs. Hollands (2008) can be considered as the turning point that inspired the social scientists and the cities to consider the quality of life and livability standards when contesting Smart City proclamations.
In the recent years, the concept of smart cities has gained global attention and has stimulated incorporating of the ICTs use in the urban planning, management and governance. The need to develop smart cities all over the world has led to the formation of professional communities who work collaboratively to understand and learn architecture, engineering, utilities, planning, environmental sciences, communication, information technology and the public policies and finances (Zbornik, 2015).
Various definitions have been suggested in the growing literature on smart cities published in the past few years (Deakin, 2014; Meijer and Rodriguez, B, 2013; Nam and Pardo, 2011; Sinkiene, Grumadaite and Liugailaite-Radzvuckiebe, 2014). These authors, while support the concept of smart city, also agree that its definition is still unclear. Deakin (2014) characterizes the smart city as the utilization of the ICTs to meet the citizen’s demand and argues that citizen-centric processes are essential for the working of the smart city. Caragliu and Nijkamp (2009) refer smart cities as cities that achieve the sustainable development which incorporate the social capital, traditional and m odern ICT infrastructure, by effective management of the natural resources and participatory planning. Frost and Sullivan (2014) argue that smart governance, smart mobility, smart living, smart building, smart environment, smart healthcare, and smart energy are characterizing factors of ‘smart cities’. Although the city is viewed as a complex system of interlinked mechanisms, many researchers such as, Albino, et al., (2015); Dirks, Keeling, and Dencik (2009) break down the concept of smart city into numerous individual aspects, features and dimensions.
Even though there isn’t a universal definition of ‘smart city’, the government/governing bodies define smart city according to their vision of that urban region. Depending on how the concept is visualized the definition differs in accordance to the level of the regions development, citizens’ willingness to embrace the new smart cities and how they plan to live there (Zbornik, 2015). Celino and Kotoulas (2013) believe that, the benefits of using ICTs in the urban governance are often overshadowed by the economics of the related projects by the governments.
The phrase smart city has been adopted by several leading technological companies such as Cisco, IBM and S iemens which have developed an interest in the application of the ICT systems in the cities’ infrastructure, buildings designs and the public safety (Portland, 2011).
247
3. Citizen and Smart Cities
The main aspect of smart cities is providing quality life to the residents and have clean and sustainable environments using smart solutions. The city should be able to provide basic amenities such as water, electricity, infrastructure resources and equipped with mobility and public transport. The city should also incorporate a sophisticated Information and Communications Technology infrastructure that will cater for the high tech needs of the city and ensure digital security to all citizens. The planning system should adapt to the e-governance using smart solutions to simplify and r ationalize the development processes streamlining the development application assessments and other governance matters.
Smart city concept can be understood in three frameworks, namely: Technology framework - the concepts of cities developed based on t heir heavy reliance of technology (Digital City, Intelligent City, Virtual City); Human framework - the developments of the city crafted by the human infrastructure (Creative City, Learning City, Humane City, Knowledge City); and Institutional framework - the movements which are enforced by the institutions and political systems.
Musa (2016) explains in his ‘Roadmap to developing Smart Cities’, the step-by-step procedures for identifying and de fining what the community is about; understanding the community and its needs; developing policies which drive the smart city mission goals; and involving and engaging the community in the decision making process.
With smart cities, there is the reduced resource consumption such as energy and water which in turn reduces carbon emissions (New York City 2007). The system utilizes the existing infrastructures and makes improvements to provide quality life for the citizens (Stockholm 2006). The system will avail new services that have not existed before. The commercial enterprises will be improved through real time transmission of data on the cities services (Singapore 2011). The city can have real time data of the demand for services in the city and thus can manage the available resources. Using smart mechanisms, a city can be able to manage disasters in a more prepared way.
The smart cities can have negatives. Researchers using social theory, point out the intelligence collection in the smart cities is a c ritical area which needs to be addressed. In surveillance camera footage it is very easy to recognize facial features and smartphones can be traced using GPS (Zipf, 2009). The smart cities are likely to change the social norms and behaviors of the citizens (Khatoun and Zeadally, 2016). The technology can allow the city to exercise control in the society (Cleantechblog and Ling, 2013). The information that flows through the network needs to be handled and addressed in a smart way to ensure that it is more benefit to the city citizens (Caragliu, and Nijkamp, 2009). The macro and micro levels in the cities need to be addressed first before decisions are made on adopting the smart cities theory.
The Intelligent Communities of the Year list 1999-2010, identified the significant strategies and the spatial intelligence feats achieved by the cities of Suwon (South Korea), Stockholm (Sweden), Gangnam District of Seoul (South Korea), Waterloo, Ontario (Canada), Taipei (Taiwan), Mitaka (Japan), Glasgow (Scotland, UK), Calgary (Alberta, Canada), Seoul (South Korea), New York City (USA), LaGrange, Georgia (USA), and Singapore. These cities were recognized for their efforts in developing broadband networks and e -services sustaining innovation ecosystems, growth, and inclusion.
There are numerous other cities which with their innovations and initiatives are in pursuit to join the Smart Cities list. Amsterdam (2009) through a combination of more than 170+ projects developed through collaborative efforts of its citizens, government and businesses is highly active in this area. Barcelona through its CityOS strategy is utilizing the sensors for real time management of data analysis in controlling the irrigation systems, traffic response management, and an innovative all green route for emergency vehicles. Smart Dublin; Santa Cruz, Laguna Croata; Madrid; Manchester (2015); Milton Keynes; Stockholm; Smart nation Singapore; Smart Cities Mission of India (2014) are other examples.
248
4. Smartness in Governance
UNDP (1997) characterizes good governance with eight aspects: Participation: the residents are provided with and equal opportunity to express their voices irrespective of any barriers like caste or gender holding them back; Rule of Law: the legal frameworks have to be impartially implemented; Transparency: the information, processes and the institutions have to be di rectly accessible and a free flow of information is present; Responsiveness: all the relevant stakeholders have to be addressed by the institutions; Consensus Orientation; Equity: equal opportunities being provided for all; Effectiveness and Efficiency: making the best use of available resources and producing results that meet the needs; Accountability: the decision makers, who include the government, private sector and the organizations accept and be responsible for their actions to the public and concerned stakeholders; Strategic Vision: leaders demonstrate strong and long-term strategies based on the deeper understanding of the historic, cultural and social complications present in the region.
Digitalization of the records was introduced in the government offices even before the establishment of internet (Deakin and Alwinkle, 2007). The use of systems in the offices has progressed along with the advancements in the ICTs. The current expansion of the ICTs has incorporated the technological convergence, mobile pervasiveness and the internet of things, which is complimented by approaches towards cloud and ubiquitous computing, open and big data etc. However, there is a lack clear matric in defining the effect of societal take-up of digital means which can actually improve the living standards in the global cities. In the pre-text of smart cities being ICT driven, there has been a common neglect in considering the ICT-enabled governance aspect of the city in the rush to digitalize everything. Smart governance can be utilization of ICTs to simplify and improve the internal operations of the government; facilitating the public service interactions between the governments, citizens and other stakeholders; promoting participatory planning; ensuring social inclusiveness and providing equal opportunity (Misuraca, 2010).
Jacquire (2008) points to the tensions between the varied levels of administration in a system of multiple interactions and conflicting views on sustainable development. The trends in ICT enabled networks and solutions in governance should be complimented by the traditional objective of urban planning and public policies. Misuraca, Ferro and Carelo (2010) argue that the implementation of ICTs in smart governance should optimize the transparency in urban services and improve the quality of life of the citizens.
A number of authors have discussed the importance of participatory planning and citizen involvement as the key concepts for the frameworks in smart governance (Albino, et al., 2015; Caragliu, Del Bo and Nijkamp 2009; Chourabi et al., 2012; Giffinger et al., 2007; Misuraca, Reid and Deakin 2011; Nam and Pardo 2011). Albino et al., suggest that governance is central to implementing citizen-friendly smart city initiatives, as it makes the decision-making process transparent; and i t also promotes community participation for the implementation, monitoring, and evaluation of these initiatives (Misuraca, et al., 2011). It is also found that the lack of collaboration between the stakeholders in governance causes many hardships in delivering the smart city mission not at just the design and implementation but also at later stages.
5. Citizens’ Participation in Planning and Governance
The notion of participation gained importance in the mid-1970s. By the 1990s the practice of participation had become popular, since it was viewed as the response to the limitations to the top-down approach that was widely practiced in the development processes. As described by Cohen and Uphoff (1980), participation refers to the assembly of a large number of people who are involved in certain situations and actions that improves their well-being.
Arnstein (1969) proposed the ladder of Citizen Participation that differentiates the levels of community involvement into eight rungs, under the groups of Non-participation, Tokenism,
249
and Citizen Power. The Therapy and Manipulation, under the Non-Participation is the state where the citizens are not given the chance to participate, but are left to the power holders to educate, and are usually left forced down with the planning decisions. The second category of the ladder, as Arnstein describes, is just a form of participation practice that pacifies the voices urging for citizen involvement in the decision making process, by keeping them informed; collecting the citizens’ responses to just understand their needs; or having the citizen just for the sake of placating. These do demonstrate some level of Citizen participation, but is ineffective as Participatory Planning which places a significant portion of the decision making power with the citizen bodies. The highest forms of citizen participation are the Partnership, Delegated Power, and Citizen Control, under the Citizen Power, which actually does value the inputs of the community and where citizen can actually involve in the decision making.
The whole purpose of the urban planning is creating and making the places attractive and livable. The urban theorists such as Jacobs (1961) and Whyte (1980), have stressed the importance of designing the urban places as spaces for social interaction, with the vision of attracting people and providing the sense of place to the residents where they can live with social security and promote social activities.
Place-making is the practice of distinguishing private, public and m ixed-use spaces in a society and clearly defining the role of those places in the society. While, private places are considered individual properties and l ess productive spaces, the public and t he mixed-use spaces are the nodes for social interaction and their development should to be emphasized. A vibrant place is characterized by: uses and activities, comfort and i mage, access and linkage, and sociability (Kjartansdóttir, 2014). A place shall not necessarily be bound t o a house or building and slum clearance program is not all about moving them to better localities but providing with facilities and a menities to improve the social connections and promote their well-being.
In India, the notion of citizen participation is limited to the monthly meetings held in the villages to discuss the problems of the village and o ccasionally the independent village panchayats (judicial and representative meetings) where the residents gather at a designated place. The urban population of India take to the social media to drive campaigns and post their views on any discussions being made. While this notion can neither be deemed successful nor unsuccessful, there is a need for an ac tive platform to encourage citizen participation in the planning system. The Arnstein’s ladder of Citizen Participation is used in this research to evaluate the level of participation implemented by the community consultation drives organized under the Smart Cities Mission of India.
In the following three sections the smart city proposals for Varanasi, Shivamogga and Vadodara are described. For each city a br ief overview of its profile, discussion on community consultation initiatives conducted as a part of devising the smart city strategy and existing and proposed governance mechanisms in the city incorporated with ICT are described. The city profile is explained using the information from the corresponding Smart City Proposals and Tourism and Civic Management websites. The Citizen consultation and the e-Governance sections have been des cribed using the Smart City Proposals of the respective cities as the reference.
6. Varanasi: #SmartKashi- Smart City Proposal
“To rejuvenate the oldest Indian living city of Varanasi as a great place to live and visit by conserving and showcasing its enriched heritage, culture, spirituality and traditions through innovative social and financial inclusion solutions.”
The historic city of Varanasi, also known as Benares or Kashi, is located along the banks of Ganges (commonly known as river Ganga), in the state of Uttar Pradesh, in North India (Mohanty, 1993). Varanasi derives its name from the two tributaries of Ganges i.e. Varuna and Assi. It is a major religious hub, associated with several dynasties which ruled India and
250
the art and c ultural legacy left behind through the ages. According to the archaeological evidences found in the historic sites, the earliest urban settlements in Varanasi is believed to be date back to 2000BCE, which puts the city among the ‘World’s oldest continuously inhabited cities’ as described by Fletcher (2010).
Varanasi city is the headquarters of Varanasi district. The Varanasi is an ur ban agglomeration of seven urban sub-units spaning an area of 112.26 sq.km. Being in the Indo-Gangetic Plains of North India, the land is very fertile, due to the replenishing the soil by periodic flooding in the Ganges. According to provisional data from the Census of India (2011), the Varanasi urban agglomeration houses a population of 1,435,113, with 761,060 men and 674,053 women with a sex ratio of 887 females every 1,000 males. However, the area under Varanasi Nagar Nigam has a population of 1,100,748 with a ratio of 883 females for every 1,000 males. The literacy rate in the urban agglomeration is 79.28% while that in the municipal corporation area is 78%. Approximately 138,000 people in the municipal area live in slums.
Economy of Varanasi is powered by the textile manufacturing industry, trade and commerce, and tourism. Varanasi's manufacturing industry is not well developed and is dominated by small-scale industries and household production. Varanasi is well-connected by air, rail and road to all parts of the country. Within the city mobility is provided by taxis, rickshaws, and cycle rickshaws.
The Citizen consultation of Varanasi SCP: Varanasi’s proposal for Phase 2 of the Smart Cities Challenge was drafted by putting the citizens’ right in the center of all discussions. Varanasi Municipal Corporation’s (VMC) outreach to the residents involved a m assive awareness and di scussion campaign which leveraged: Print-media (60 articles), Radio (coverage across 3 c hannels), Advertising (165 hoardings), Tableau vehicles (6,000 km coverage distance) and Social Media (reaching 200,000 citizen). Citizen connect was a multi-pronged approach that was adopted across 175 workshops, which incorporated the involvement of diverse group representation of key demographics including: renowned personalities from Arts and Culture, established academia, NGOs, tourism industry, the business community, and economically weaker sections. The vision statement of #SmartKashi was derived by the active involvement and the input of the citizen who raising a wide range of issues. The citizen responses were captured in the form of more than 440,000 survey and questionnaire forms, which were collected through strategically located booths at prominent locations and municipality offices. Social media played an i mportant role in connecting more than 210,000 individuals. Online posts educating people to participate in the decision-making process reached more than 1.6 million people.
Citizens of Varanasi were engaged in a participatory decision making process throughout the life cycle through multiple mediums. The Nagar Nigam hosted more than 175 focus group discussions, wherein representatives of various community and business groups were invited to conduct SWOT analysis, construct vision and det ermine goals for the city in correspondence with the government authorities. Schools and colleges organized essay and art competitions to engage the students and youth. Workshops with prominent citizens from the fields of arts, literature, sports also included several Padma awardees such as Padma Vibhushan Thumri singer Girija Devi. Vernacular dailies were also roped in to organize workshops with diverse citizen groups.
e-Governance in Varanasi: The existing online governance structure in Varanasi has already seen the implementation of several techniques which utilize the ICTs, in connecting to the citizen and providing an ease of operation to avail the government services. A few initiatives which have been i mplemented by the Varanasi Municipal Corporation are: Improved communication between VMC and c itizens using telephone, mobile and online grievance redress system; IGRS system enables efficient and qualitative redress of grievances in addition to communication; Varanasi 311, a hotline number launched for complaint
251
registration and follow-up on the action taken report; Social media: FB/Twitter/WhatsApp and Website provide effective communication e-Newsletter published monthly on VMC website.
In addition to this, the VMC website also has incorporated dashboards hosting important communications, notifications, citizen-forms and other statutory documents such as: Government Orders; public-notices; Development Plans; Annual budgets and Balance Sheets, Monthly progress reports, and hos ts of dedicated dashboards for the citizens to complete the online transactions related to tax payment, bill payment, and the submission of tenders for government contracts.
7. Shivamogga: Shivamogga Smart City Proposal
Shivamogga: “Gateway to Malnad” Transforms into a leading “Eco-Tourism Destination” through Green Urbanism.
The city of Shivamogga (officially renamed in 2014 from Shimoga), is an ecological paradise situated in the Western Ghats region in the state of Karnataka. Being situated as the gateway for the Western Ghats, the city is also known as the ‘Gateway of Malnad’. Almost the entire region of the Shivamogga is surrounded by lush greenery and abundant rainfall, and was declared as the World Heritage Site in 2012. According to the statistics by the Shivamogga City Municipal Corporation, the entire city spans over 50 km2, located in tropical wet and dry climate. The winter and the early parts of the summer are typically dry, with the average summer temperatures reaching a high of 35°C. The abundant rainfall occurs between the months of June and October, with about 1000mm rainfall during the month of July.
According to the Census of India (2011), Shivamogga city has a population of 322,428, of which 161,978 (51%) are male and 160,450 (49%) are female. It has been recognized as an educational hub which houses a 150-year old functioning school, the literacy rate of Shivamogga is quite high at 88.02% against the National average of 59.5%; of which the male literacy is 91.32% and the female literacy 84.7%.
The main source of income for the city is the manufacturing and the export industries. The city especially promotes the export of the local produce of areca nut, which is grown in and the surrounding districts. The city also benefits from the tourist activities associated with the lush, wild adventurous hotspots in the Western Ghats.
The City is connected to the state capital Bangalore and other major cities of Karnataka such as, Mysore and M angalore by an ex cellent 4 l ane highways. The National highway 206 connects the city with Bangalore, which is accessible by comfortable bus services provided by the state-run Transportation Service (KSRTC). While the rail network doesn’t connect Shivamogga directly with the other parts of the country directly, the nearest junction of Birur is just 51kms away which has a direct connectivity to Mumbai. The Shivamogga Airport is under-construction which is proposed to connect to Bangalore and Mangalore both of which have International.
The Citizen consultation of Shivamogga SCP: The Smart City Proposal of Shimoga is unanimously opted for Retrofitting and Redevelopment of approximately 6km2 region, in two distinct divisions of the city which also includes the scarcely developed stretch of River Tunga. The Smart City proposal was prepared by deriving the vision of the citizens for the city. Through a combination of various techniques to reach out to the citizens such as use of women empowerment organizations (Stree Shakti Sangha) for women participation; Open discussion forums to involve the youth; Political meetings to convey the political interests in the smart city program implementation; Ward level consultation to identify the problems and the intent of the citizens in a more localized level; and the Extensive use of smart media like dedicated Facebook page, government dashboard, for consulting, informing and deciding the vision of the smart city proposal.
252
With the intent of reaching out to maximum number of citizens in the short span of 100 days, the Shivamogga City Municipal Corporation achieved a connectivity and response of 40% of its citizens. The group of the citizens consulted included the administrative staff and the political stakeholders (250+), professionals and media personnel (3000+), students (7000+ from more than 25 colleges and the two universities), citizens including slum-dwellers (80,000+), representatives of the Women empowerment groups (3,000+), and 26 industrial associations, and o ther associations such as hawker’s association, builders’ association, religious groups, Indian Medical Association, etc. It is also interesting to note that ‘street plays’, which is associated with arts and culture of the Karnataka State, was extensively used to spread the message and capture the involvement of the citizens.
e-Governance in Shivamogga: The Shivamogga City Municipal Corporation (SCMC), is already equipped with an i nteractive online governance platform, which includes Sakala (2011) - the website designed for provision of services to the citizens through online platforms within stipulated timeframes and Bhoomi (2006) - a platform for paperless transactions of land registrations and property documents management. The website of the SCMC has a das hboard which guides the users through the simplified procedures of completing the registration transactions and, also many payments of fees and taxes, which before used to be a hassle consuming almost an entire day of the citizens. A few dashboards which are currently functional are: Janhita- dashboard for public complaints/ online grievance redressal system; Jalanidhi - Water and Sewerage database; Vyapar - Trade license database; Nirmaan - Building approval database. The website has been updated with the smart city proposal theme, requesting the citizens to input their visions for the smart city of Shivamogga. But sadly, the officials have failed to constantly update the website in keeping with the progress of the smart city implementation plans.
8. Vadodara: Vadodara Smart City Proposal
“Conserve and Enhance Vadodara’s rich Culture and Heritage through its sensitive transformation into a Vibrant City that fosters equitable and sustainable development and offers world-class quality of life to all its citizens”
Spanning an ar ea of 225km2 the cultural capital of Gujarat, Vadodara (formerly known as Baroda) is the third largest city in the West Indian state after Ahmedabad and S urat. Historically associated with the Maratha Royal Family of Gaekwads, it houses iconic palaces and structures of heritage value dating at least three centuries old. The city is renowned for being the industrial, cultural and educational hub of western India. It houses esteemed institutes and industries which are of national and regional significance. The Indian Census (2011) reports the population of Vadodara to be 1,666,703, consisting a gender distribution of 869,467 males and 801,159 females. The literacy rate of the city is at an astonishing 94.5%, owing to the educational institutes of national stature.
The city is well connected by air, road and the rail network, to the major cities and metropolis of the country such as Delhi, Mumbai, Ahmedabad, Bangalore. The National highway, which passes through the city, connects the cities of Mumbai, Delhi and Ahmedabad, due to which the city is known as Gateway to the Golden Quadrilateral. The Vadodara Airport is well connected with the frequent domestic flights to all the major airports of the country. In October 2016, Prime Minister Narendra Modi inaugurated the new international terminal, which is the second Green Airport after Kochi. The Vadodara junction is the major hub for the Western Railway network, and houses the largest electric locomotive shed in the country. The city also boasts an efficient public transportation system incorporated by the buses (owned and oper ated by Vadodara Mahanagar Seva Sadan), auto rickshaws, and taxis, which ply on the well maintained internal road network of the city.
Vadodara is the industrial hub of the state with manufacturing and processing industries of petrochemicals, engineering, chemicals, plastics, with the IT and foreign exchange services
253
joining in recently. L&T have established their Knowledge City, and MasterCard has built the TechHub in the city.
The Citizen consultation in preparing the proposal: Citizen consultation process covered 48% of the city population. To get citizen opinion and involvement, various events, activities, education, spread of information through announcements about the Smart City Challenge and the purpose pertaining to this were widely broadcast through all channels, both online (MyGov, VMC Website) as well as offline print media, social media (Whatsapp etc), ward meetings etc. were conducted periodically. Survey forms were also distributed to citizens and their inputs were valued as the base for articulation of the vision and goals. Analysis of the data from over 864,832 returned forms, online entries, call center updates was compiled to categorize the most critical areas that needs to be addressed. To get public suggestions on the specific topics through comments events like the Happy Street and National Book Fair, were organized. Each stage of consultation was considered as an opp ortunity to identify keywords and priority areas for shaping the city vision statement. The k eywords, that emerged from the citizens’ consultative process, like SUSTAINABLE, HERITAGE, SENSITIVE TRANSFORMATION, VIBRANT, EQUITABLE etc. were used for finalization of vision statement. Inputs and opinions received through various on-line and off-line media were sorted in accordance with the essential smart city features and incorporated while preparing the vision. Suitable means of citizen engagement for every section of the society were adopted.
e-Governance in Vadodara:All statutory documents relating to VMC like GPMC Act, GDCR Rules, Citizens' Charter and pro-active disclosures by all departments under Right to Information Act are uploaded on the VMC website. Detailed information regarding procedures for obtaining various permissions and licenses, as well as availing various services are uploaded on the website of VMC and 'Smart City Vadodara' mobile application.
VMC is bridging the gap between citizens and administration through both pro-active and responsive IT-enabled initiatives. All developmental works are planned through a consultative process involving citizens and pe ople's representatives. ICT platforms like 'SWAGAT', 'LOK DARBAR', 'JAN-SEVA KENDRAS' etc. have made the administration more accountable and c itizens-friendly. Exhaustive use of IT and particularly the social media through ‘Smart City Vadodara’ mobile application, real-time on-line systems for feedback and grievance redress etc. have enabled effective two-way communication with the citizens.
VMC website houses all information relevant and useful to the citizens including monthly e-bulletins to appraise citizens regarding various programs taken up by VMC, also the portal has the following dash-boards for data analysis and p roject management: Dashboard for Financial Analysis of various tax receipts and receivables; Dashboard for effective grievance redress system; and Dashboard for real time monitoring and review of various on-going projects. Various stake-holder departments within the Vadodara Municipal Corporation area have also adopted IT dash-boards for effective management of their day-to-day work.
9. Discussion
The Smart City Proposal submissions of the three cities have been successfully completed to satisfy the objectives and the guidelines prescribed by the Ministry of Urban Development, and according to the Smart Cities Mission template. Since this research is only focused on the community participation and the incorporation of ICTs in governance, the data available in the proposals is analyzed only for these traits eliminating the other detailed descriptions of the development strategies and the infrastructure initiatives. All the three cities, which were selected by their respective states had an established involvement of ICTs in their governance, as a result of the policies adopted by their state governments.
254
Varanasi, which is the historic and globally-recognized city, has been a bit slow in adapting to the technological innovations in the past owing to the priorities in preserving the heritage value of the city, but has been m aking good use of the technological assistance being provided. The Shivamogga city which is considered as a political hometown for many noted politicians of the state and nation was quick to respond and adapt to the changes. The presence of an excellent educational base enabled the city to harness the youth and student potential in devising the necessary frameworks and technological innovations. The City of Vadodara, which is located in the Prime Minister home-state of Gujrat, has successfully adapted to the privileges being granted to the state and has proven as an exemplar for the other cities. The innovative use of developing the smartphone application for promoting the city’s inclination towards the Smart Cities Mission demonstrates existence of an innovative pool within the administration and the city’s determination to achieve the smart city goals.
All the proposals have made good use of the current technologies, such as installing sensors and CCTV cameras for surveillance and traffic management; upgrading the infrastructure services to clean, underground-ducted network of electricity, water and sewage; GIS mapping for property management; and much more. While all the proposals do provide the overview of the citizen consultation processes, Shivamogga stands out for providing the actual statistics associated with the process. Shivamogga has consulted with 40% of its populace, while Varanasi has involved 30%. Vadodara leads the two other cities by registering 48% coverage of its citizens. All the three have employed unique mechanisms and discussion forums for attracting the involvement of their citizens.
Upon observing the strategies of Smart City Mission of India, there is a sense of importance given to the citizen participation, since the citizens should feel the belonging to the place, socially included and s ecure, and that the smart city solutions promote their well-being. However, the amount of importance given to it is not sufficient (between 1-5% of the proposal assessment criteria prescribed by the Ministry). There is also limited information provided as to how the citizens ought to be involved during the preparation of the Smart City Proposal and during the implementation of these solutions.
The consultation process adopted in these three proposals can be referred to the Informative and Consultation rungs of Arnstein’s Ladder of Community Participation (1969). The consultation and the citizen involvement was carried out to understand the needs of the citizens, but there is less substantial evidence to claim the community participation in the actual decision making process. There is also no evidence, depicting the community review of the draft proposal prior to submission.
The community consultation process employed by the cities under the Smart Cities Mission is quite similar to the community consultation processes being practiced all over the world. The new Mayor’s Office of Urban Mechatronics of Boston City (2016) invited the citizen suggestions for its development as Smart City by the use of a dedi cated hotline, social events, smartphone application etc. The Greater Sydney Commission (2015) has employed similar community consultation drive to involve the citizens in drafting the District Plans, which included open community events, talk buses (which were deployed to schools and distinctive social places in the region to engage the citizens), Sydney Picture competitions and feedback from the Facebook community.
The current technological age of smartphone usage has supported the online participation of the community which can be obs erved through the online contests, reviews, posts on dedicated pages in social media platforms such as Facebook and Twitter. The Smart Cities Mission intended to involve the community in the decision making process, but, since the Mission is still in its initial state, it is interesting to find out how the citizens are actually involved when implementing the approved strategies.
255
10. Conclusions
In the current globalized age which is burdened with the issues associated with Urbanization, the movement of developing or adapting the cities to be Smart Cities, seems to be the right direction, as it enhances the quality of life for the residents through reliable, faster and easy to use ICT platforms. The world has already witnessed numerous strategies employed by various cities to incorporate the ICTs in their daily functioning and governance. It can be predicted that there will be many other cities joining the movement.
The Indian Government has started the Smart Cities Mission with the vison of transforming the nation with 100 c onnected and replicable smart cities by 2022. The Ministry of Urban Development is responsible to devise the guidelines, select the cities, and monitor the implementation of these Smart City Strategies. The Smart Cities Mission aims to achieve the quality of life for the citizens by the advancements in Infrastructure, Mobility, Healthcare, Education, and Social Services by employing ICTs.
India is known for the technological pool of academia, professionals and institutions which have been recognized globally. Through the contributions of these institutions and personnel significant technologies have been i mplemented by the city and r egional governments to incorporate the ICTs in the governance mechanism.
Three city proposals were appraised for the extent of community consultation in developing the smart city vision and proposals and current use of ICTs in the governance present in the cities. All three cities intending to transform into Smart City have conducted and extensive community consultation and citizen involvement campaigns. The consultation covered large numbers of citizen from various backgrounds through innovative approaches such as utilizing the smart media, organizing the events to attract the citizens, involving the youth and students in understanding the vision for the future. References: Albino, V, Berardi, U, Dangelico, RM 2015, ‘Smart cities: definitions, dimensions, performance and initiatives’, Journal of urban technology, Vol 22, pp 3-221. Arnstein, SR 1969, ‘A ladder of citizen participation’, Journal of the American Institute of Planners, Vol 35, No. 4, pp. 216-224. Caragliu, A, Del Bo, C, Nijkamp, P, 2009, Smart Cities in Europe, paper presented at 3rd European Conference in Regional science-CERS 2009, Kosice, Slovak Republic. Cleantechblog, and Ling, F 2013, Smart Cities, Cleantech Blog, 2013-11. Celino, I, Kotoulas, S 2013, ‘Smart cities’, IEEE Internet Computing, Vol 17, pp 8-11. Chourabi, H, Nam, T, Walker, S, Gil-Garcia, JR, Mellouli, S, Nahon, K & Scholl, JR 2012, ‘Understanding smart cities: An integrative framework’, Paper presented at the 45th Hawaii International Conference on System Sciences, Maui, HI, pp. 2289–2297. Cocchia A 2014, ‘Smart and Digital City: A Systematic Literature Review’, Springer International Publishing, Switzerland, pp 13-43, DOI: 10.1007/978-3-319-06160-3_2. Deakin, M, Al Waer, H 2011, From intelligent to smart cities, Intelligent Buildings International, 3:3, 140-152, DOI: 10.1080/17508975.2011.586671 Deakin, M 2014, Smart cities: The state-of-the-art and governance challenge, Triple Helix, Vol 1, pp 1–16. Dirks, S, Keeling, M, Dencik, J 2009, How smart is your city? Helping cities measure progress, Somers, NY: IBM Institute for Business Value. Giffinger, R, Fertner, C, Kramar, H, Kalasek, R, Pichler-Milanovic ́, N, & Meijers, E 2007, ‘Smart cities: Ranking of European medium-sized cities’, Centre of Regional Science (SRF), Vienna University of Technology, Vienna, Austria, DOI: 10.1093/cjres/rsu013. Hollands, R 2008, ‘Will the real smart cities stand up? Creative, progressive, or just entrepreneurial’, City, Vol 12(3), pp 302-320. Jacquier, C, 2008, Urban governance: Forging a path between complications and complexity, Paper presented at the symposium ‘‘Towards New Territorial Governance’’, Reims, France.
256

Kapoor, R 2015, ‘Here’s what Indian startups need to thrive’, The Economic Times. Khatoun, R, & Zeadally, S, 2016, ‘Smart cities’, Communications of the ACM, Vol 59, pp 46-57. Meijer, A, Rodrıguez Bolıvar, M P 2013, Governing the smart city: Scaling-up the search for socio-techno synergy, Edinburgh, Scotland: EGPA. Ministry of Urban Development, Government of India, accessed online www.moud.gov.in. Misuraca, G 2010, ‘Theoretical framework and k ey principles towards the development of a pol icy assessment framework for ICT-enabled governance at city level’, Concept paper, European Commission JRC-IPTS, Seville. Misuraca, G, Reid, A, Deakin, M 2 011, ‘Exploring emerging ICT-enabled governance models in European cities: Analysis of the mapping survey to identify key city governance policy areas most impacted by ICTs’, European Commission, JRC Technical Notes, Seville. Mohanty, B. ed., 1993. Urbanisation in Developing Countries: Basic Services and Community Participation (No. 1). Concept Publishing Company. Musa, S 2016, ‘Smart Cities: A Roadmap for Development’ retrieved online from http://www.academia.edu/21181336/Smart_City_Roadmap. Nam, T, Pardo, TA 2011, ‘Smart city as urban innovation: Focusing on management, policy, and context’, Proceedings of the 5th International Conference on Theory and Practice of Electronic Governance—ICEGOV2011, Tallinn, Estonia, pp. 185–194. New York, USA: ACM Press. Nam, T, Pardo, T A 2011, Conceptualizing smart city with dimensions of technology, people, and institutions, In Proceedings of the 12th Annual International Conference on Digital Government Research, College Park, MD, pp. 282–291, New York, USA: ACM Press. New York City 2007, NYC rolling out new technology projects, http://www.crainsnewyork.com/article/20091001/FREE/910019988[22 Oct 2016] Papa R, Garguilo C and Galderisi A 2013, ‘Towards an urban planners’ perspective on smart cities’, TeMA Journal of Land Use, Mobility and Environment, Vol 6, No 1, pp 5-17. Portland 2011, Electric vehicle infrastructure drives Portland's economy and e nvironment, http://www.oregonlive.com/opinion/index.ssf/2011/05/electric_vehicle_infrastruct ur.html[22 Oct 2016] Shivamogga 2015, Smart City Proposal, submission made to the Ministry of Urban Development, in response to the Smart City Mission- India, retrieved from, http://smartcities.gov.in/upload/uploadfiles/files/SmartCityProposal_KA-03-SMG.pdf. Singapore 2010, Singapore Government Info-communications Development Authority, http://www.ida.gov.sg/home/index.aspx Sinkiene, J, Grumadaite, K, Liugailaite-Radzvickiene, L 2014, Diversity of theoretical approaches to the concept of smart city, Paper presented at 8th International Scientific Conference “Business and management 2014”, Vilnius, Lithuania, pp. 933–940. Singapore 2011, Singapore LiveTraffic, http://www.livetraffic.sg/mobileapp[22 Oct 2016] Smart Cities Mission, 2014, Government of India, accessed online http://smartcities.gov.in/content/. Stokes, P 2015, "Smart cities" - dynamic sustainability issues and challenges for "old world" economies: a case from the United Kingdom. Dynamic Relationships Management Journal. 4, pp. 3-22. Vadodara 2016, Smart City Proposal, submission made to the Ministry of Urban Development, in response to the Smart City Mission- India, retrieved from, http://smartcities.gov.in/upload/uploadfiles/files/Vadodara_SCP.pdf. Varanasi 2015, Smart City Proposal, submission made to the Ministry of Urban Development, in response to the Smart City Mission- India, retrieved from, http://smartcities.gov.in/upload/uploadfiles/files/Varanasi_SCP.pdf. Zipf, GK 2009, Human Behavior and the Principle of Least Effort, Addison-Wesley, Cambridge, MA Zbornik 2015 Smart City conferences- IS 2012, 8-12, October 2012, Ljubljana, Slovenia.
257
A policy development framework for inclusive communities to
achieve desired livability
Arpan PAUL, Indian Institute of Technology Kharagpur, India Ankhi BANERJEE, Indian Institute of Technology Kharagpur, India
Joy SEN, Indian Institute of Technology Kharagpur, India
Abstract:
The increasing trend of urbanization and its impact on urban environment are a major concern for Indian cities. To ensure and pursue good livability within Indian cities, the significance of inclusive community approach has re-surfaced. The aim of the present paper is to identify the major components of an inclusive community in the developing context of India. As a case study, Kolkata Metropolitan Area (KMA), the largest multicultural Indian urban agglomeration has been selected. The paper has developed a policy framework through linking various sub regional governances based on the case study of KMA. The purpose of the framework is to understand the major parameters of inclusive community participation and the ways to achieve the desired levels of livability at the overall metropolitan decision making. To arrive at the framework, first an index of inclusiveness has been initiated through Factor Analysis (FA). The index then identifies and interprets the degree of livability across the metropolis based on a mosaic of various sub regional governances. In the final segment, the paper has forwarded the interpretation through a validation obtained from a spot opinion survey of residents within KMA. The framework offers a good platform for city and regional planners to best understand the degree of conformity between the observed and desired community preferences on aggregate inclusive prosperity and participatory policies expressed by the residents. Based on the observed variations and the extent of conformity, the paper concludes with an understanding of the dynamics of inclusive community participation within a metropolis to best achieve the desired levels of livability. Keywords: Livability, Community Participation, Inclusive Communities, Inclusive Prosperity, Factor Analysis
1 Introduction
Livability is a holistic paradigm (Jomehpour, 2015) of human development (Wyatt, 2009) and community well-being (Tilaki et al., 2014) based on augmentation of the twin physical-environmental (Kaal, 2011) and the cultural dimensions of an urban and regional space (Ruth and Franklin, 2014). The ability to dwell in a certain physical space with appropriate preparedness in the cultural and environmental dimensions (Balsas, 2004) is a prerequisite for livability. Today livability is a basic yardstick (Kunstler, Philibert-Petit and Steil, 2016) to measure the quality of life of inclusive communities (Rusk, 2010) within any major city or systems of cities (Phillis, Kouikoglou and Verdugo, 2017).
At present, 54% of the world’s population are inhabited in the urban areas (World Urbanization Prospects, 2014) and in India, urbanization is expected to rise 60% by 2050. The impact of the rising population pressure on the urban environment (Pacione, 2003) is a major concern for all policy makers and researchers (Paul and Sen, 2017). From this perspective, inclusive community approach has re-emerged in city and regional planning domain (Kabir, 2006) to assess a deep and inclusive relationship between citizens and their surroundings.
“Inclusive community” is an extensive term with no defined or universally agreed definitions (Community and Quality of Life: Data Needs for Informed Decision Making, 2002). In most of the cases, the researchers and policy makers have established the dimensions and aspects of inclusive community based on their own views and research outcomes. On one hand, American Association of Retired Persons (AARP) has defined an inclusive community as one
258

that is safe and secure, has affordable and appropriate housing and transportation options, and offers supportive community services (Lehning and Harmon, 2013). On the other hand, Brian Scott illustrated that, “an inclusive community has involved individuals and businesses in decision making processes into community-reinforcing and wellbeing activities (Wheeler, 2001). Of the two, the present paper has consolidated that, an inclusive community is a well facilitated and accessible community (Rusk, 2010) with equitable provision and delivery of urban services and strong governance.
In developing nations, due to presence of multicultural milieu, the urban governances on the regional scales are needed to encourage inclusive community approach with a strong involvement of community participations in the decision making processes. The community participation can sustain inclusive prosperity in economic development, health and security, growth and skills, and can make a tangible, long-term difference in levels and distribution of community’s livability (Inclusive Communities: A guide for Local Authorities, 2014). However, inclusive communities are also important to sub-regional governance in terms of delivering services, supporting economic growth and making decisions at the face of good or bad economic and political circumstances (Inclusive Communities: A guide for Local Authorities, 2014). So, sub-regional governance and inclusive communities are maintaining a harmonious relationship to conserve and improve the overall livability.
The present paper is trying to develop a policy framework for identifying the major components of inclusive communities to achieve desired livability. Based on an increasing significance of livability in the intertwined milieu of inclusive communities, sub-regional governance and urban development, the study embarks upon two key research questions:
Firstly, which are the major components of an inclusive community from developing perspectives?
Secondly, what is the dynamics of an inclusive community to achieve good and equitable distribution of levels of desired livability across the city and its region?
In order to address these questions, a methodological approach has been suggested. (Figure 1) Furthermore, a spot opinion survey has been conducted to validate the theoretical proposition.
2 Methods
The paper has been divided into three segments. At first, the variables defining community inclusiveness have been identified from literature studies. Then, an inclusiveness index has been formulated based on Factor Analysis (FA). Finally, a spot opinion survey has been done to understand the observed and desired livability mosaic within the study area. A detailed methodological framework is given below:
259
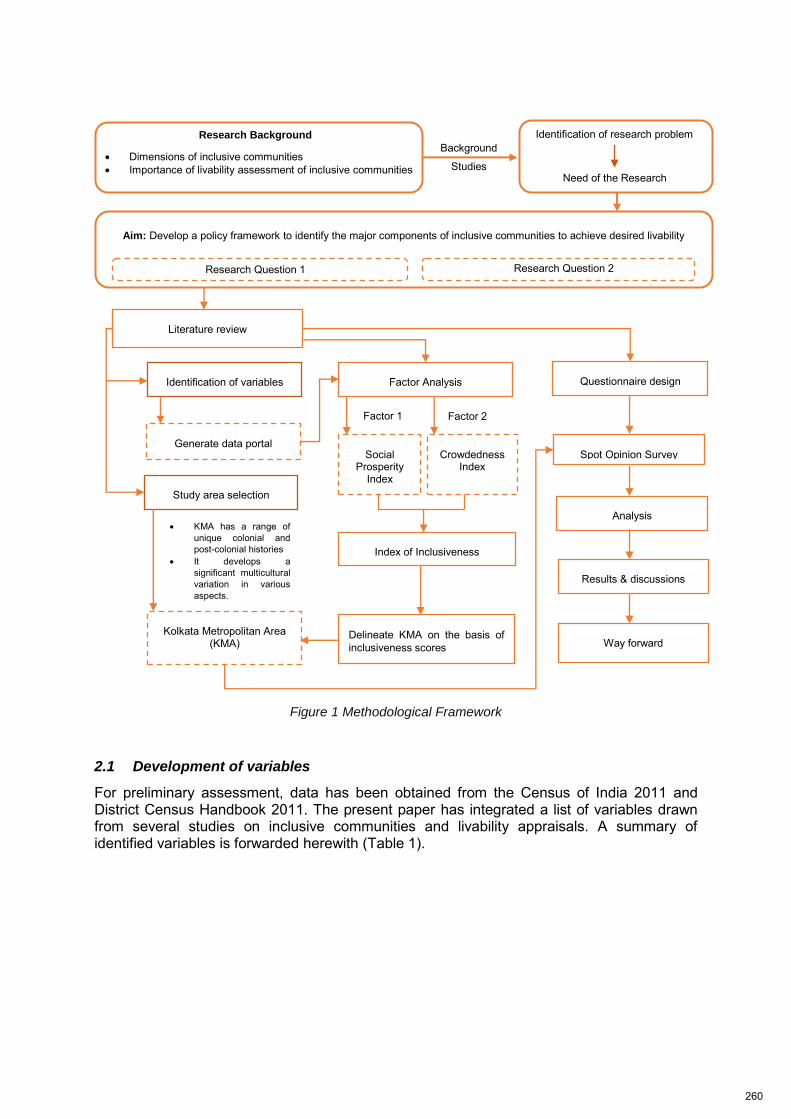
Figure 1 Methodological Framework
2.1 Development of variables
For preliminary assessment, data has been obtained from the Census of India 2011 and District Census Handbook 2011. The present paper has integrated a list of variables drawn from several studies on inclusive communities and livability appraisals. A summary of identified variables is forwarded herewith (Table 1).
Questionnaire design
Need of the Research
Research Background
Research Question 1
Literature review
Study area selection
Generate data portal
Identification of variables Factor Analysis
Spot Opinion Survey
Analysis
Results & discussions
Research Question 2
Index of Inclusiveness
Delineate KMA on the basis of inclusiveness scores
Kolkata Metropolitan Area (KMA)
Dimensions of inclusive communities Importance of livability assessment of inclusive communities
Identification of research problem
Aim: Develop a policy framework to identify the major components of inclusive communities to achieve desired livability
Way forward
Social Prosperity
Index
Crowdedness Index
Factor 1 Factor 2
KMA has a range of unique colonial and post-colonial histories
It develops a significant multicultural variation in various aspects.
Background
Studies
260
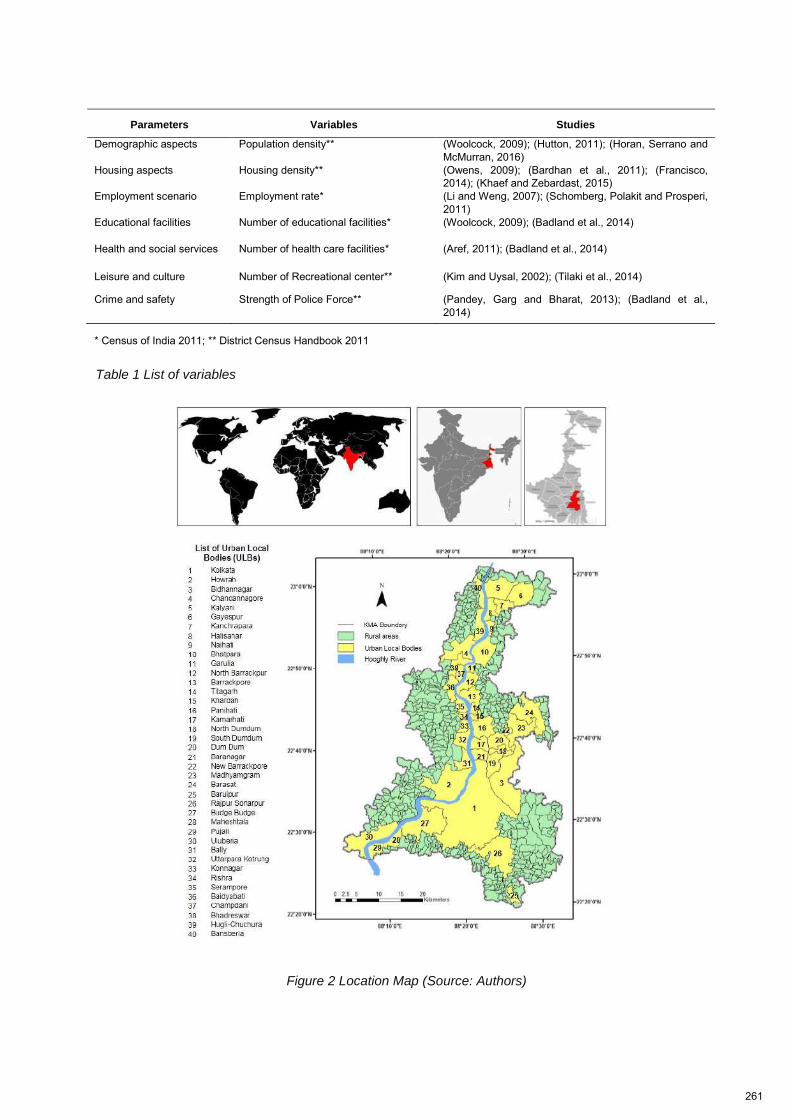
* Census of India 2011; ** District Census Handbook 2011
Parameters Variables Studies
Demographic aspects Population density** (Woolcock, 2009); (Hutton, 2011); (Horan, Serrano and McMurran, 2016)
Housing aspects Housing density** (Owens, 2009); (Bardhan et al., 2011); (Francisco, 2014); (Khaef and Zebardast, 2015)
Employment scenario Employment rate* (Li and Weng, 2007); (Schomberg, Polakit and Prosperi, 2011)
Educational facilities Number of educational facilities* (Woolcock, 2009); (Badland et al., 2014)
Health and social services Number of health care facilities* (Aref, 2011); (Badland et al., 2014)
Leisure and culture Number of Recreational center** (Kim and Uysal, 2002); (Tilaki et al., 2014)
Crime and safety Strength of Police Force** (Pandey, Garg and Bharat, 2013); (Badland et al., 2014)
Table 1 List of variables
Figure 2 Location Map (Source: Authors)
261
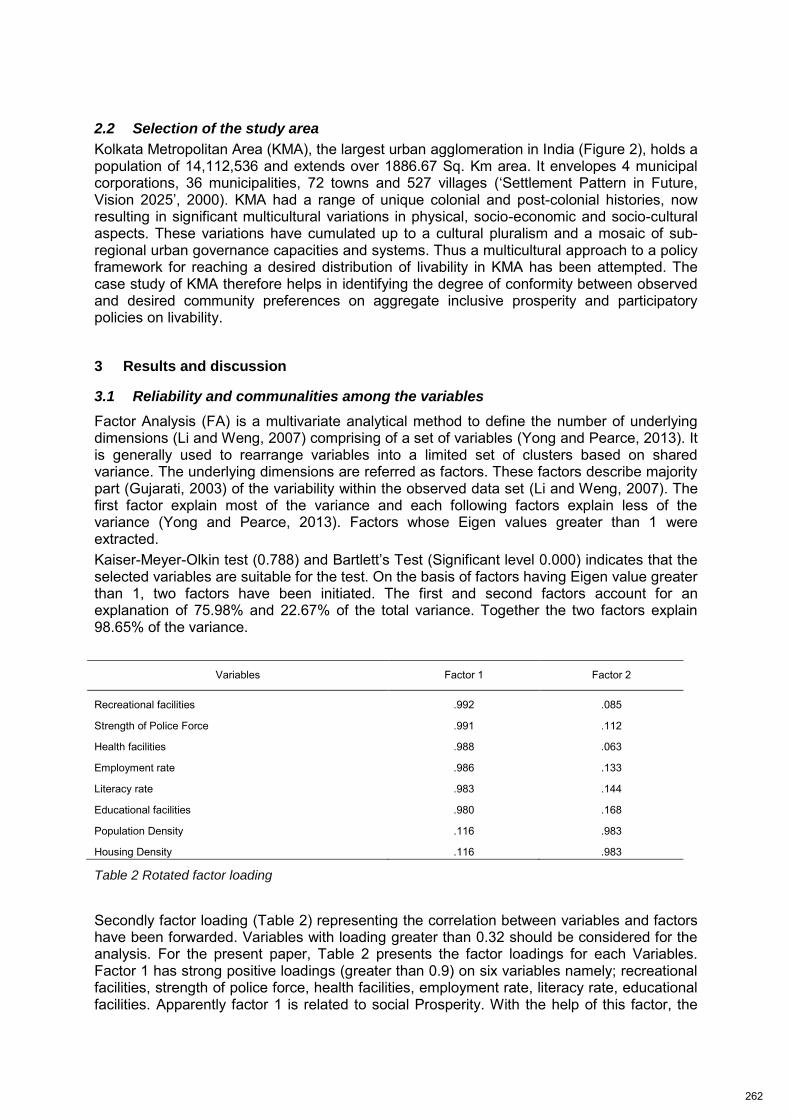
2.2 Selection of the study area
Kolkata Metropolitan Area (KMA), the largest urban agglomeration in India (Figure 2), holds a population of 14,112,536 and extends over 1886.67 Sq. Km area. It envelopes 4 municipal corporations, 36 municipalities, 72 towns and 527 villages (‘Settlement Pattern in Future, Vision 2025’, 2000). KMA had a range of unique colonial and post-colonial histories, now resulting in significant multicultural variations in physical, socio-economic and socio-cultural aspects. These variations have cumulated up to a cultural pluralism and a mosaic of sub-regional urban governance capacities and systems. Thus a multicultural approach to a policy framework for reaching a desired distribution of livability in KMA has been attempted. The case study of KMA therefore helps in identifying the degree of conformity between observed and desired community preferences on aggregate inclusive prosperity and participatory policies on livability.
3 Results and discussion
3.1 Reliability and communalities among the variables
Factor Analysis (FA) is a multivariate analytical method to define the number of underlying dimensions (Li and Weng, 2007) comprising of a set of variables (Yong and Pearce, 2013). It is generally used to rearrange variables into a limited set of clusters based on shared variance. The underlying dimensions are referred as factors. These factors describe majority part (Gujarati, 2003) of the variability within the observed data set (Li and Weng, 2007). The first factor explain most of the variance and each following factors explain less of the variance (Yong and Pearce, 2013). Factors whose Eigen values greater than 1 were extracted. Kaiser-Meyer-Olkin test (0.788) and Bartlett’s Test (Significant level 0.000) indicates that the selected variables are suitable for the test. On the basis of factors having Eigen value greater than 1, two factors have been initiated. The first and second factors account for an explanation of 75.98% and 22.67% of the total variance. Together the two factors explain 98.65% of the variance.
Variables Factor 1 Factor 2
Recreational facilities .992 .085
Strength of Police Force .991 .112
Health facilities .988 .063
Employment rate .986 .133
Literacy rate .983 .144
Educational facilities .980 .168
Population Density .116 .983
Housing Density .116 .983
Table 2 Rotated factor loading
Secondly factor loading (Table 2) representing the correlation between variables and factors have been forwarded. Variables with loading greater than 0.32 should be considered for the analysis. For the present paper, Table 2 presents the factor loadings for each Variables. Factor 1 has strong positive loadings (greater than 0.9) on six variables namely; recreational facilities, strength of police force, health facilities, employment rate, literacy rate, educational facilities. Apparently factor 1 is related to social Prosperity. With the help of this factor, the
262
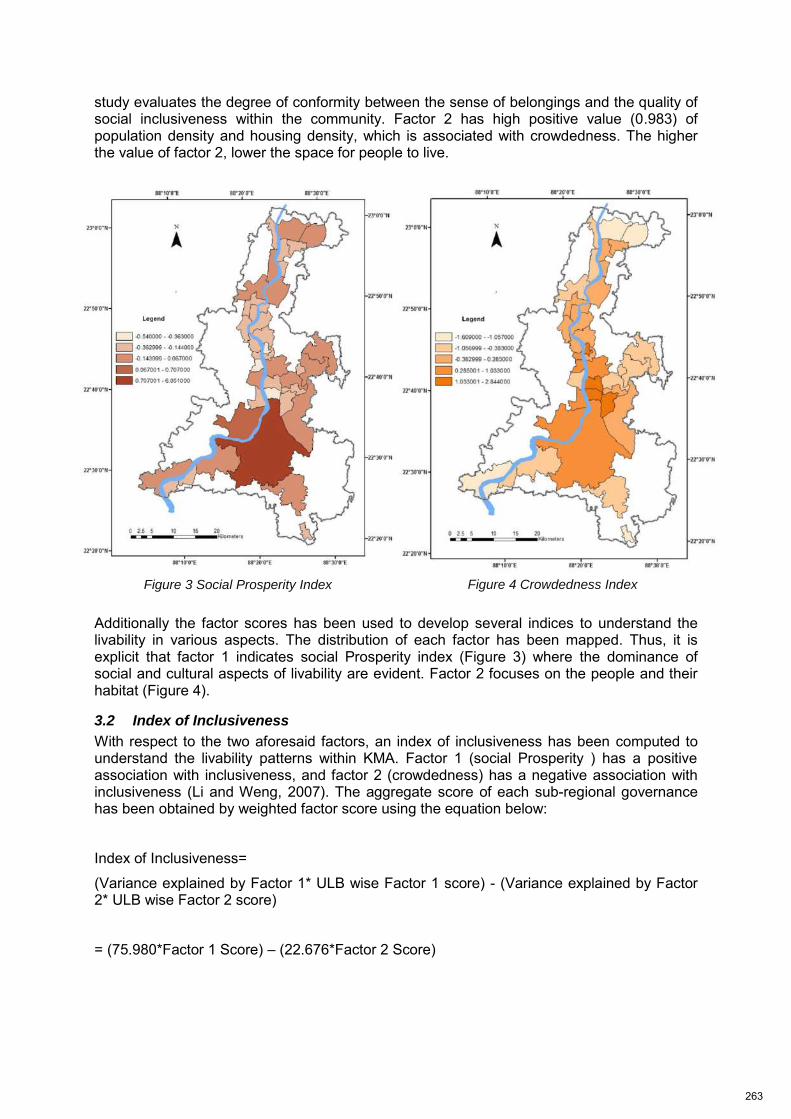
Figure 4 Crowdedness Index Figure 3 Social Prosperity Index
study evaluates the degree of conformity between the sense of belongings and the quality of social inclusiveness within the community. Factor 2 has high positive value (0.983) of population density and housing density, which is associated with crowdedness. The higher the value of factor 2, lower the space for people to live.
Additionally the factor scores has been used to develop several indices to understand the livability in various aspects. The distribution of each factor has been mapped. Thus, it is explicit that factor 1 indicates social Prosperity index (Figure 3) where the dominance of social and cultural aspects of livability are evident. Factor 2 focuses on the people and their habitat (Figure 4).
3.2 Index of Inclusiveness
With respect to the two aforesaid factors, an index of inclusiveness has been computed to understand the livability patterns within KMA. Factor 1 (social Prosperity ) has a positive association with inclusiveness, and factor 2 (crowdedness) has a negative association with inclusiveness (Li and Weng, 2007). The aggregate score of each sub-regional governance has been obtained by weighted factor score using the equation below:
Index of Inclusiveness=
(Variance explained by Factor 1* ULB wise Factor 1 score) - (Variance explained by Factor 2* ULB wise Factor 2 score)
= (75.980*Factor 1 Score) – (22.676*Factor 2 Score)
263
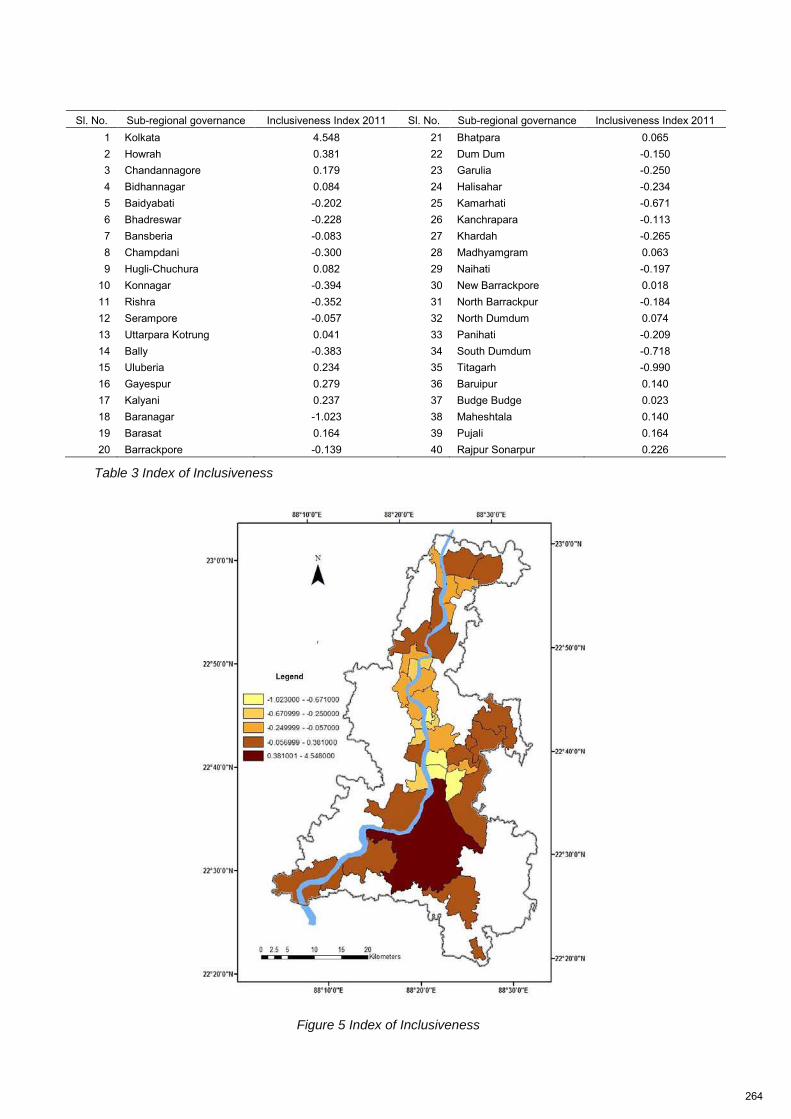
Sl. No. Sub-regional governance Inclusiveness Index 2011 Sl. No. Sub-regional governance Inclusiveness Index 2011
1 Kolkata 4.548 21 Bhatpara 0.065 2 Howrah 0.381 22 Dum Dum -0.150 3 Chandannagore 0.179 23 Garulia -0.250 4 Bidhannagar 0.084 24 Halisahar -0.234 5 Baidyabati -0.202 25 Kamarhati -0.671 6 Bhadreswar -0.228 26 Kanchrapara -0.113 7 Bansberia -0.083 27 Khardah -0.265 8 Champdani -0.300 28 Madhyamgram 0.063 9 Hugli-Chuchura 0.082 29 Naihati -0.197
10 Konnagar -0.394 30 New Barrackpore 0.018 11 Rishra -0.352 31 North Barrackpur -0.184 12 Serampore -0.057 32 North Dumdum 0.074 13 Uttarpara Kotrung 0.041 33 Panihati -0.209 14 Bally -0.383 34 South Dumdum -0.718 15 Uluberia 0.234 35 Titagarh -0.990 16 Gayespur 0.279 36 Baruipur 0.140 17 Kalyani 0.237 37 Budge Budge 0.023 18 Baranagar -1.023 38 Maheshtala 0.140 19 Barasat 0.164 39 Pujali 0.164 20 Barrackpore -0.139 40 Rajpur Sonarpur 0.226
Table 3 Index of Inclusiveness
Figure 5 Index of Inclusiveness
264
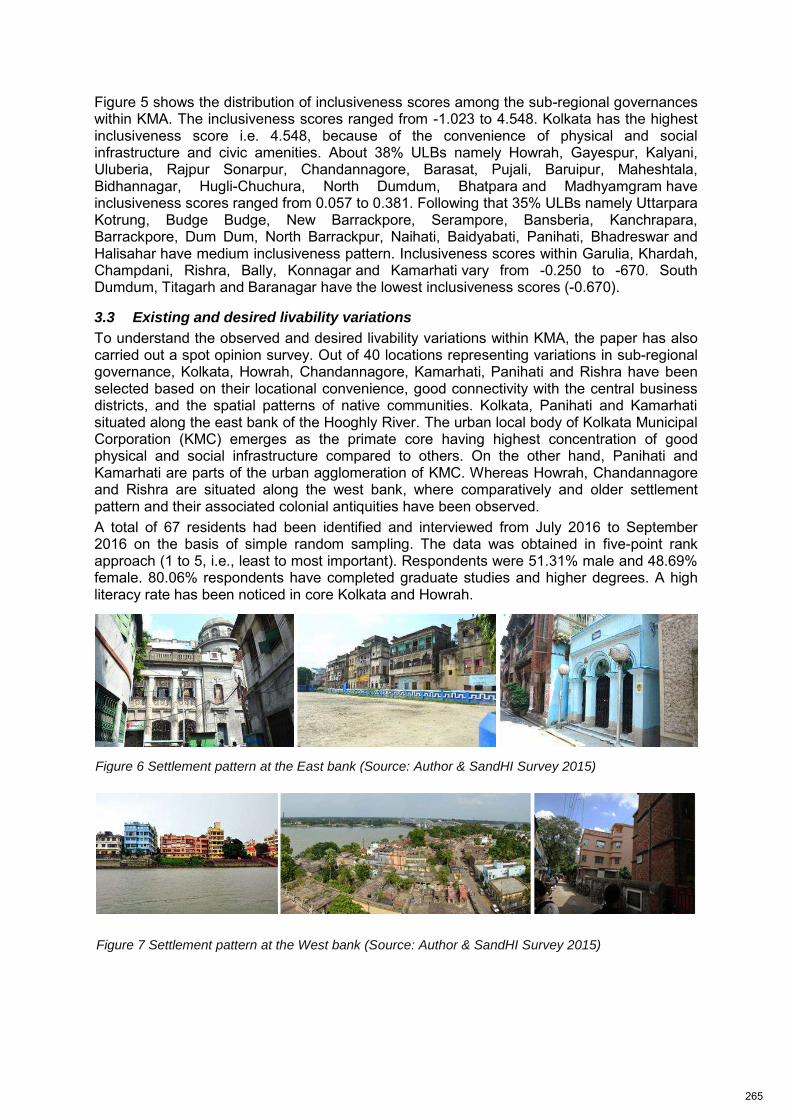
Figure 5 shows the distribution of inclusiveness scores among the sub-regional governances within KMA. The inclusiveness scores ranged from -1.023 to 4.548. Kolkata has the highest inclusiveness score i.e. 4.548, because of the convenience of physical and social infrastructure and civic amenities. About 38% ULBs namely Howrah, Gayespur, Kalyani, Uluberia, Rajpur Sonarpur, Chandannagore, Barasat, Pujali, Baruipur, Maheshtala, Bidhannagar, Hugli-Chuchura, North Dumdum, Bhatpara and Madhyamgram have inclusiveness scores ranged from 0.057 to 0.381. Following that 35% ULBs namely Uttarpara Kotrung, Budge Budge, New Barrackpore, Serampore, Bansberia, Kanchrapara, Barrackpore, Dum Dum, North Barrackpur, Naihati, Baidyabati, Panihati, Bhadreswar and Halisahar have medium inclusiveness pattern. Inclusiveness scores within Garulia, Khardah, Champdani, Rishra, Bally, Konnagar and Kamarhati vary from -0.250 to -670. South Dumdum, Titagarh and Baranagar have the lowest inclusiveness scores (-0.670).
3.3 Existing and desired livability variations
To understand the observed and desired livability variations within KMA, the paper has also carried out a spot opinion survey. Out of 40 locations representing variations in sub-regional governance, Kolkata, Howrah, Chandannagore, Kamarhati, Panihati and Rishra have been selected based on their locational convenience, good connectivity with the central business districts, and the spatial patterns of native communities. Kolkata, Panihati and Kamarhati situated along the east bank of the Hooghly River. The urban local body of Kolkata Municipal Corporation (KMC) emerges as the primate core having highest concentration of good physical and social infrastructure compared to others. On the other hand, Panihati and Kamarhati are parts of the urban agglomeration of KMC. Whereas Howrah, Chandannagore and Rishra are situated along the west bank, where comparatively and older settlement pattern and their associated colonial antiquities have been observed. A total of 67 residents had been identified and interviewed from July 2016 to September 2016 on the basis of simple random sampling. The data was obtained in five-point rank approach (1 to 5, i.e., least to most important). Respondents were 51.31% male and 48.69% female. 80.06% respondents have completed graduate studies and higher degrees. A high literacy rate has been noticed in core Kolkata and Howrah.
Figure 6 Settlement pattern at the East bank (Source: Author & SandHI Survey 2015)
Figure 7 Settlement pattern at the West bank (Source: Author & SandHI Survey 2015)
265
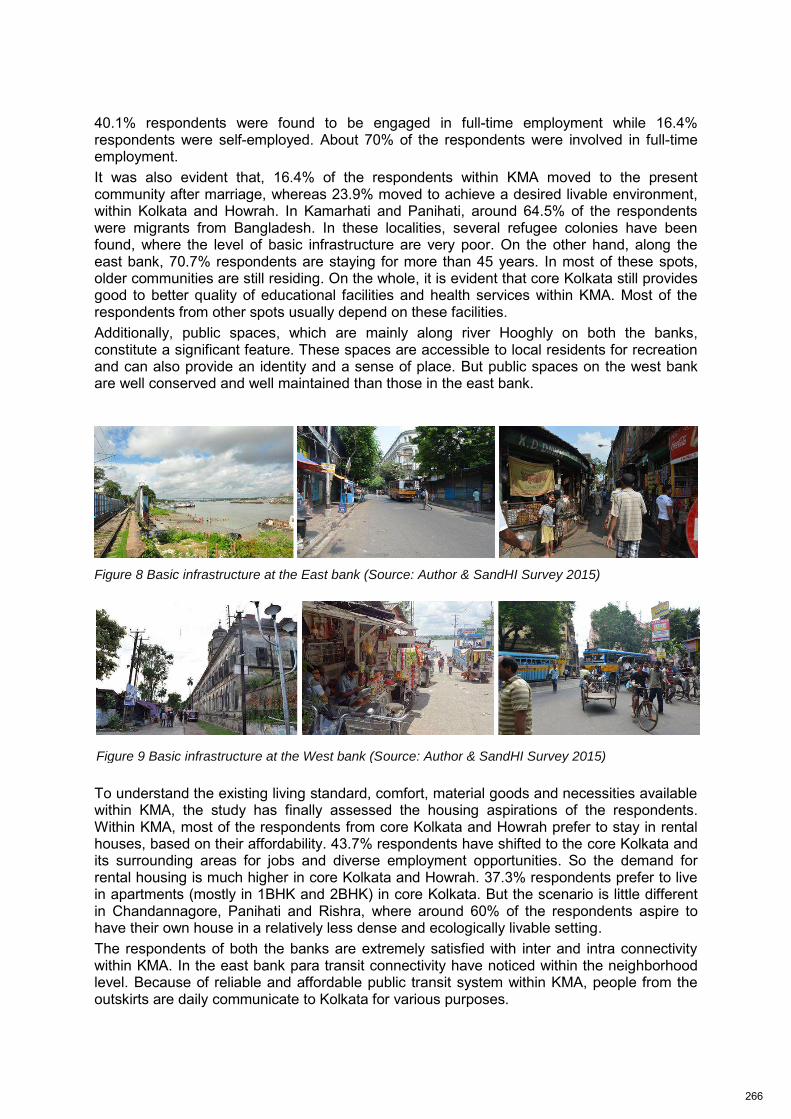
40.1% respondents were found to be engaged in full-time employment while 16.4% respondents were self-employed. About 70% of the respondents were involved in full-time employment. It was also evident that, 16.4% of the respondents within KMA moved to the present community after marriage, whereas 23.9% moved to achieve a desired livable environment, within Kolkata and Howrah. In Kamarhati and Panihati, around 64.5% of the respondents were migrants from Bangladesh. In these localities, several refugee colonies have been found, where the level of basic infrastructure are very poor. On the other hand, along the east bank, 70.7% respondents are staying for more than 45 years. In most of these spots, older communities are still residing. On the whole, it is evident that core Kolkata still provides good to better quality of educational facilities and health services within KMA. Most of the respondents from other spots usually depend on these facilities. Additionally, public spaces, which are mainly along river Hooghly on both the banks, constitute a significant feature. These spaces are accessible to local residents for recreation and can also provide an identity and a sense of place. But public spaces on the west bank are well conserved and well maintained than those in the east bank.
To understand the existing living standard, comfort, material goods and necessities available within KMA, the study has finally assessed the housing aspirations of the respondents. Within KMA, most of the respondents from core Kolkata and Howrah prefer to stay in rental houses, based on their affordability. 43.7% respondents have shifted to the core Kolkata and its surrounding areas for jobs and diverse employment opportunities. So the demand for rental housing is much higher in core Kolkata and Howrah. 37.3% respondents prefer to live in apartments (mostly in 1BHK and 2BHK) in core Kolkata. But the scenario is little different in Chandannagore, Panihati and Rishra, where around 60% of the respondents aspire to have their own house in a relatively less dense and ecologically livable setting. The respondents of both the banks are extremely satisfied with inter and intra connectivity within KMA. In the east bank para transit connectivity have noticed within the neighborhood level. Because of reliable and affordable public transit system within KMA, people from the outskirts are daily communicate to Kolkata for various purposes.
Figure 9 Basic infrastructure at the West bank (Source: Author & SandHI Survey 2015)
Figure 8 Basic infrastructure at the East bank (Source: Author & SandHI Survey 2015)
266
4 Conclusion
The present study has responded to the two research questions to best perceive an effective way to assess livability for inclusive communities within a metropolis. The findings are:
i. With regard to the first research question, the present paper has identified the significant dimensions of sub-regional governances and allied aspects of inclusive communities drawn from literature reviews. To understand the desired array of livability and its distribution, an index of inclusiveness has been formulated based on FA. From this index it is evident that core Kolkata has the highest inclusiveness score (4.548); because of the presence of efficient physical and social infrastructure and delivery of adequate public services. However, the rest of the sub-regional governances, across the remaining metropolis have inclusiveness scores ranging from -1.023 to 0.381. It signifies that within KMA, an inequity has been observed.
ii. The second research issue was to utilize the findings of inequity for an additional understanding of the dynamics of inclusive community within KMA. The objective here is to achieve the desired levels of livability over time. In this segment, a spot opinion survey was therefore conducted to perceive a ground-level exploration of the existing and future preferences of metropolitan livability variations. From the result, it is further evident that the livability variations of Kolkata and Howrah are much better than the other groupings of sub-regional governances.
The paper has focused on identifying the variables of inclusive communities within a city and its regional space. The findings drawn from the largest multicultural Indian urban agglomeration have provided an imperative direction for future research on assessment of livability potential using the significance of inclusive communities. The findings also assist policy makers, who are interested to assimilate the inclusive communities and urban governance system to operationalize a working framework. It has become obvious that a dynamics of inclusive community participation can be governed to arrive at a desired future of metropolitan development. The paper has likely initiated the same by assessing the dynamics of inclusive communities to achieve the desired levels of livability. The paper additionally recommends future research possibilities to examine the potent role of inclusive communities and its integration with systems of governance to best augment livable spaces within the regional settings of a metropolis.
Acknowledgement
The authors acknowledge Department of Architecture and Regional Planning, Indian Institute of Technology Kharagpur India in the initial process performed for the development of the concept. Special acknowledgements goes to Science-Heritage' initiative (SandHI), Indian Institute of Technology Kharagpur India for their enormous support and encouragement.
References
Aref, F. (2011) ‘The effects of tourism on quality of life: A case study of Shiraz, Iran’, Life Science Journal, 8(2), pp. 26–30.
Badland, H., Whitzman, C., Lowe, M., Davern, M., Aye, L., Butterworth, I., Hes, D. and Giles-Corti, B. (2014) ‘Urban liveability: Emerging lessons from Australia for exploring the potential for indicators to measure the social determinants of health’, Social Science and Medicine. Elsevier Ltd, 111, pp. 64–73. doi: 10.1016/j.socscimed.2014.04.003.
Balsas, C. J. L. (2004) ‘Measuring the livability of an urban centre: an exploratory study of key performance indicators’, Planning Practice and Research, 19(1), pp. 101–110. doi: 10.1080/0269745042000246603.
Bardhan, R., Kurisu, H., Kiyo and Hanaki, K. (2011) ‘Linking Urban Form & Quality of Life in Kolkata , India’, ISOCARP Congress, 47(section 2), pp. 1–12. Available at: http://www.isocarp.net/data/case_studies/1923.pdf.
267

Community and Quality of Life: Data Needs for Informed Decision Making (2002) National Academy Press. Washington, D.C. Available at: https://www.nap.edu/download/10262.
Francisco, S. (2014) ‘A comparative study of the morphological characteristics of residential areas in San Francisco’, ITU A|Z, 11(2), pp. 173–189.
Gujarati, D. N. (2003) Basic Econometrics. Edited by L. Sutton. McGraw-Hill Higher Education. Available at: http://himayatullah.weebly.com/uploads/5/3/4/0/53400977/gujarati_book.pdf.
Horan, T. A., Serrano, K. J. and McMurran, G. (2016) GIS for Livable Communities : Examination of Community Perceptions of Assets , Liabilities and Transportation Improvements. Available at: http://transweb.sjsu.edu/MTIportal/research/publications/documents/GIS.htm.
Hutton, T. A. (2011) ‘Thinking Metropolis: From the “Livable Region” to the “Sustainable Metropolis” in Vancouver’, International Planning Studies, 16(3), pp. 237–255. doi: 10.1080/13563475.2011.591144.
Inclusive Communities: A guide for Local Authorities (2014). United Kingdom. Available at: https://www.disabilityrightsuk.org/sites/default/files/pdf/1 InclusivecommunitiesLAguidance.pdf.
Jenks, M., Jones, C., Irvine, K. N., Fuller, R. A., Devine-Wright, P., Tratalos, J., Payne, S. R., Warren, P. H., Lomas, K. J. and Gaston, K. J. (2008) ‘Sustainable City Form’, Springer, 2, pp. 215-237–237. doi: 10.1007/978-1-4020-8647-2.
Jomehpour, M. (2015) ‘Assessing the Livability of the New and Old Parts of Tehran, Municipality Districts 22 and 10 of Tehran’, OIDA International Journal of Sustainable Development, 8(9), pp. 87–96. Available at: https://papers.ssrn.com/sol3/papers.cfm?abstract_id=2695580.
Kaal, H. (2011) ‘A conceptual history of livability: Dutch scientists, politicians, policy makers & citizens and the quest for a livable city’, City, 15(November), pp. 532–547. Available at: http://www.tandfonline.com/doi/pdf/10.1080/13604813.2011.595094?needAccess=true.
Kabir, K. (2006) ‘Planning Sustainable and Livable Cities in Nigeria’, Research Journal of Social Sciences, 1(1), pp. 40–50.
Khaef, S. and Zebardast, E. (2015) ‘Assessing Quality of Life Dimensions in Deteriorated Inner Areas : A case from Javadieh Neighborhood in Tehran Metropolis’, Social Indicators Research. Springer Netherlands, (13). doi: 10.1007/s11205-015-0986-6.
Kim, K. and Uysal, M. (2002) ‘The effects of tourism impacts upon quality of life of residents in the community’, 3144378, p. 289-289 . Available at: http://search.proquest.com/docview/305522151?accountid=13042%5Cnhttp://oxfordsfx.hosted.exlibrisgroup.com/oxford?url_ver=Z39.88-2004&rft_val_fmt=info:ofi/fmt:kev:mtx:dissertation&genre=dissertations+&+theses&sid=ProQ:ProQuest+Dissertations+&+Theses+Global&a.
Kunstler, M., Philibert-Petit, E. and Steil, L. (2016) ‘the Future of Cities Measuring Sustainability’, p. 32. Available at: http://zakuski.utsa.edu/~salingar/TFOC.pdf.
Land and water Resources Council (2002) Indicators of livable communities, Maine Development Foundation. Maine. Available at: https://www1.maine.gov/dacf/municipalplanning/docs/indlivcomm.pdf.
Lehning, A. and Harmon, A. (2013) Livable Community Indicators for Sustainable Aging in Place Livable Community Indicators for Sustainable Aging in Place.
Li, G. and Weng, Q. (2007) ‘Measuring the quality of life in city of Indianapolis by integration of remote sensing and census data’, International Journal of Remote Sensing, 28(2), pp. 249–267. doi: 10.1080/01431160600735624.
Owens, C. (2009) Challenges in Evaluating Livability in Vancouver, Canada. Pacione, M. (2003) ‘Quality-Of-Life Research in Urban Geography’, Urban Geography, 24(4), pp.
314–339. doi: 10.2747/0272-3638.24.4.314. Pandey, R. U., Garg, Y. K. and Bharat, A. (2013) ‘Understanding qualitative conceptions of
livability : an indian perspective’, International Journal of Research in Engineering and Technology, pp. 374–380.
Paul, A. and Sen, J. (2017) ‘Identifying Factors for Evaluating Livability Potential within a Metropolis: A Case of Kolkata’, International Journal of Civil, Environmental, Structural, Construction and Architectural Engineering, 11(1), pp. 50–55. Available at: http://waset.org/publications/10007409/identifying-factors-for-evaluating-livability-potential-within-a-metropolis-a-case-of-kolkata-.
Phillis, Y. A., Kouikoglou, V. S. and Verdugo, C. (2017) ‘Urban sustainability assessment and
268
ranking of cities’, Computers, Environment and Urban Systems, 64, pp. 254–265. doi: 10.1016/j.compenvurbsys.2017.03.002.
Rusk, D. (2010) Building Sustainable, Inclusive Communities: How America can pursue smart growth and reunite our metropolitan communities. Available at: http://www.prrac.org/pdf/SustainableInclusiveCommunities.pdf.
Ruth, M. and Franklin, R. S. (2014) ‘Livability for all? Conceptual limits and practical implications’, Applied Geography. Elsevier Ltd, 49, pp. 18–23. doi: 10.1016/j.apgeog.2013.09.018.
Schomberg, Y., Polakit, K. and Prosperi, D. (2011) ‘Spatial Partitioning of Livability Indices: South Florida Case Study’, Real Corp 2011: Change for stability: Lifecycles of Cities and Regions, 6(May), pp. 895–904.
‘Settlement Pattern in Future, Vision 2025’ (2000). Kolkata: KMDA. Tilaki, M. J. M., Abdullah, A., Bahauddin, A. and Marzbali, M. H. (2014) ‘The Necessity of Increasing
Livability for George Town World Heritage Site : An Analytical Review’, Modern Applied Science, 8(1), pp. 123–133. doi: 10.5539/mas.v8n1p123.
Wheeler, S. (2001) Livable Communities: Creating Safe and Livable Neighborhoods, Towns, and Regions in California, Institute of Urban and Regional Development UC Berkeley. Available at: http://escholarship.org/uc/item/8xf2d6jg.pdf.
Woolcock, G. (2009) ‘Measuring Up?: Assessing the Liveability of Australian Cities’, State of Australian Cities: National Conference. Available at: http://soac.fbe.unsw.edu.au/2009/PDF/Woolcock Geoffrey.pdf.
World Urbanization Prospects (2014) United Nations. New York: United Nations. doi: 10.4054/DemRes.2005.12.9.
Wyatt, R. (2009) ‘Heuristic Approaches to Urban Livability’, Malaysian Journal of Environmental Management, 10(1), pp. 43–66.
Yong, A. G. and Pearce, S. (2013) ‘A Beginner ’ s Guide to Factor Analysis : Focusing on Exploratory Factor Analysis’, Tutorials in Quantitative Methods for Psychology, 9(2), pp. 79–94. Available at: http://www.tqmp.org/RegularArticles/vol09-2/p079/p079.pdf.
269
Deliberative Planning and Its Implementation Path in Historic
Districts Renewal: A Comparative Study on Chifeng Road in
Tianjin and Enning Road in Guangzhou
Mengyue Li, Architecture School of Tianjin University, China
Peng Zeng, Architecture School of Tianjin University, China
Zhong Yu, Urban and Rural Planning and Design Institute of Henan Province,China
1 Introduction
China's socio-economic background is quietly different from the West. In historic districts renewal, the unilateral decision-making of the government is widely used. This planning mode meet the efficiency goal of urban construction and improve the living environment of the residents. At the same time, it has made great economic contribution to the urban estate economy. However, the system of urban renewal is deeply affected by the original "all-powerful government”, public participation usually exists in name only. It is apparently not suited to the new social situation with the soundness of the legal system and the improvement of public awareness of rights. With the deepening of China's economic system reform, Urban planning will gradually from the traditional "top-down" and emphasizing the government-led to the deliberative planning system which based on "consultation and compromise" and pay attention to the balance of interests. How to make deliberative planning effective become a issue of concern. The Chifeng Road regeneration in Tianjin and the Enning Road regeneration in Guangzhou are presentative cases of historic districts renewal. Faced with common problems, different participants have brought different ways of dealing, so that the validity of the consultations in the two cases is quite different. Through the comparison of the two cases, this paper elaborates deliberative planning and its effective implementation Path. So as to provide reference for other historic districts renewal practice.
2 The Connotation of Deliberative Planning and Its Predicament in China
2.1 The Connotation of Deliberative Planning
John Forester proposed the deliberative planning in 1999. He elaborated on the theory and practice of deliberative planning in the book " The Deliberative Practitioner: Encouraging Participatory Planning Processes”. The concept of" Deliberative Planning " is similar to the " Communicative Plan” and "Collaborative Planning”. Although these theories differ in form and
formulation, their core content is to view planning as a process of building consensus and promoting social collaboration. Deliberative planning more emphasis on fully reflect the interests demands of multiple participants, through a comprehensible, true, right and sincere
270
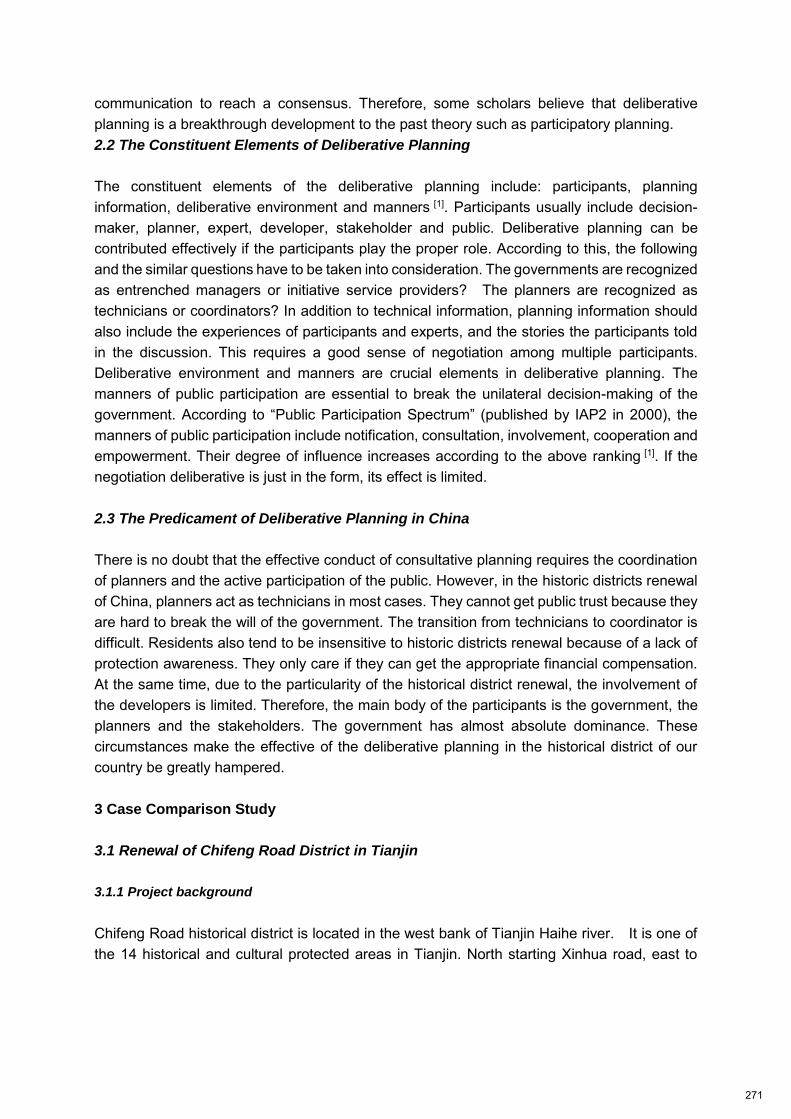
communication to reach a consensus. Therefore, some scholars believe that deliberative planning is a breakthrough development to the past theory such as participatory planning. 2.2 The Constituent Elements of Deliberative Planning
The constituent elements of the deliberative planning include: participants, planning information, deliberative environment and manners [1]. Participants usually include decision-maker, planner, expert, developer, stakeholder and public. Deliberative planning can be contributed effectively if the participants play the proper role. According to this, the following and the similar questions have to be taken into consideration. The governments are recognized as entrenched managers or initiative service providers? The planners are recognized as technicians or coordinators? In addition to technical information, planning information should also include the experiences of participants and experts, and the stories the participants told in the discussion. This requires a good sense of negotiation among multiple participants. Deliberative environment and manners are crucial elements in deliberative planning. The manners of public participation are essential to break the unilateral decision-making of the government. According to “Public Participation Spectrum” (published by IAP2 in 2000), the
manners of public participation include notification, consultation, involvement, cooperation and empowerment. Their degree of influence increases according to the above ranking [1]. If the negotiation deliberative is just in the form, its effect is limited. 2.3 The Predicament of Deliberative Planning in China
There is no doubt that the effective conduct of consultative planning requires the coordination of planners and the active participation of the public. However, in the historic districts renewal of China, planners act as technicians in most cases. They cannot get public trust because they are hard to break the will of the government. The transition from technicians to coordinator is difficult. Residents also tend to be insensitive to historic districts renewal because of a lack of protection awareness. They only care if they can get the appropriate financial compensation. At the same time, due to the particularity of the historical district renewal, the involvement of the developers is limited. Therefore, the main body of the participants is the government, the planners and the stakeholders. The government has almost absolute dominance. These circumstances make the effective of the deliberative planning in the historical district of our country be greatly hampered.
3 Case Comparison Study
3.1 Renewal of Chifeng Road District in Tianjin
3.1.1 Project background
Chifeng Road historical district is located in the west bank of Tianjin Haihe river. It is one of the 14 historical and cultural protected areas in Tianjin. North starting Xinhua road, east to
271
Yingkou road, south to Nanjing road and west to Harbin road. The total area is 17.47 hectares. As the representative of residential history district, the characteristics of the garden house and the lane building in Chifeng Road are obvious, bearing the typical historical information of Tianjin modern concession. As time goes on, the Chifeng Road disteict has experienced problems of interior damage and backwardness of municipal infrastructure. In 2005, the Chifeng Road district was designated as historical and cultural preservation area. Since then, Chifeng Road district has experienced several repairs and remediation. It mainly focuses on street environment, infrastructure and building repair [2]. 3.1.2 Renewal process review
In 2005, “The Historical and Cultural City Protection Plan of Tianjin (2005-2020)” has designated 9 historical and cultural protected areas like Chifeng Road. In 2008, “The Protection
Ordinance of the Famous Historical and Cultural City” was promulgated. In order to strengthen
and clarify the protection of historical and cultural districts, in 2009, organizations carried out the adjustment and refinement of the historical and cultural districts of the central city, as well as the adjustment and purification of the purple line. And finally it identified 14 major historical and cultural protected areas such as Chifeng Road, and put forward the content of protection and requirements of control. In 2012, the municipal government of Tianjin approved “The
Protection Planning for The Five Old Streets of Downtown Tianjin”. Then, Chifeng Road historical and cultural district has been designated as a multi-functional integrated district with French style residences and a large number of historic residential buildings. All kinds of planning study for Chifeng Road renewal provides a technical support, however, from the planning and implementation effect, it did not achieve “living protection”. In the past renovation of Chifeng Road, residents were informed and participated in it by the public survey and circulars which are just perfunctorily. The results are in two negative outcomes. On the one hand, in order to meet the needs of development, this project required the removal of illegal buildings and the transformation of shop facade in the streets. Relocating original residents and introducing other businesses have caused a lot of discontent. The original residents were unable to work as usual, and the cultural district's cultural atmosphere and vitality declined. On the other hand, residents don't care about the protection and renewal of the district. They only hope that the government gives residents proper financial compensation. In recent years, a group of people who have paid attention to the history and culture of Tianjin formed a volunteer team to protect the city's history. A communication site called Tianjin Memory has been established by them. However, expert groups and non-governmental organizations have not become effective complementary forces in the renewal of Chifeng Road
Fig.1 Location of Chifeng Road
Source: Author self-painted
Block
272
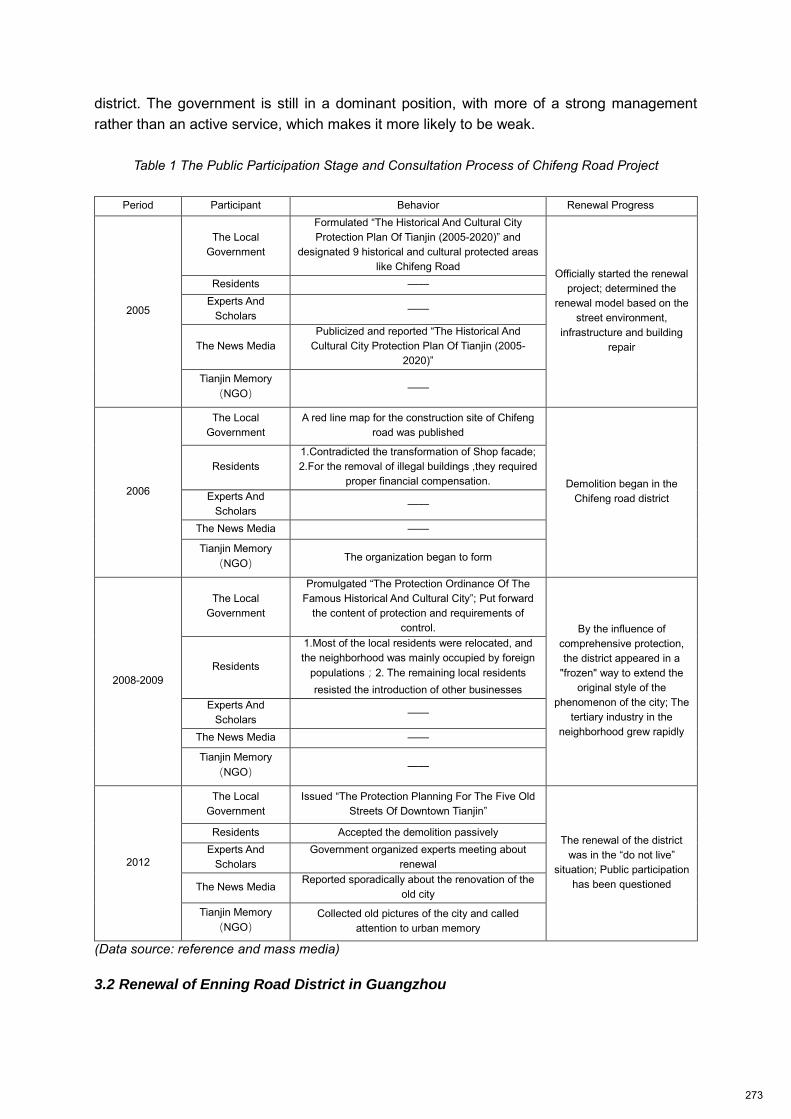
district. The government is still in a dominant position, with more of a strong management rather than an active service, which makes it more likely to be weak.
Table 1 The Public Participation Stage and Consultation Process of Chifeng Road Project
Period Participant Behavior Renewal Progress
2005
The Local
Government
Formulated “The Historical And Cultural City
Protection Plan Of Tianjin (2005-2020)” and
designated 9 historical and cultural protected areas
like Chifeng Road Officially started the renewal
project; determined the
renewal model based on the
street environment,
infrastructure and building
repair
Residents —— Experts And
Scholars ——
The News Media Publicized and reported “The Historical And
Cultural City Protection Plan Of Tianjin (2005-
2020)”
Tianjin Memory
(NGO) ——
2006
The Local
Government A red line map for the construction site of Chifeng
road was published
Demolition began in the
Chifeng road district
Residents 1.Contradicted the transformation of Shop facade;
2.For the removal of illegal buildings ,they required
proper financial compensation. Experts And
Scholars ——
The News Media ——
Tianjin Memory
(NGO) The organization began to form
2008-2009
The Local
Government
Promulgated “The Protection Ordinance Of The
Famous Historical And Cultural City”; Put forward
the content of protection and requirements of
control. By the influence of
comprehensive protection,
the district appeared in a
"frozen" way to extend the
original style of the
phenomenon of the city; The
tertiary industry in the
neighborhood grew rapidly
Residents
1.Most of the local residents were relocated, and
the neighborhood was mainly occupied by foreign
populations;2. The remaining local residents
resisted the introduction of other businesses Experts And
Scholars ——
The News Media ——
Tianjin Memory
(NGO) ——
2012
The Local
Government Issued “The Protection Planning For The Five Old
Streets Of Downtown Tianjin”
The renewal of the district
was in the “do not live”
situation; Public participation
has been questioned
Residents Accepted the demolition passively Experts And
Scholars Government organized experts meeting about
renewal
The News Media Reported sporadically about the renovation of the
old city
Tianjin Memory
(NGO) Collected old pictures of the city and called
attention to urban memory
(Data source: reference and mass media)
3.2 Renewal of Enning Road District in Guangzhou
273
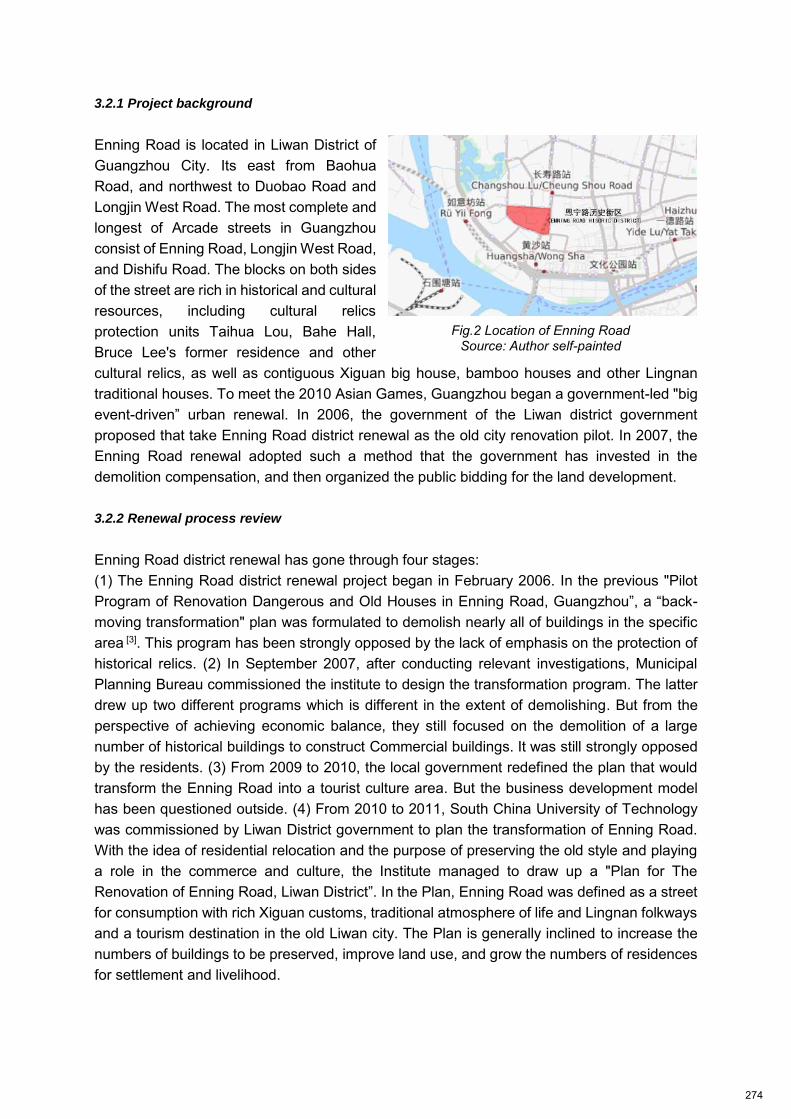
3.2.1 Project background
Enning Road is located in Liwan District of Guangzhou City. Its east from Baohua Road, and northwest to Duobao Road and Longjin West Road. The most complete and longest of Arcade streets in Guangzhou consist of Enning Road, Longjin West Road, and Dishifu Road. The blocks on both sides of the street are rich in historical and cultural resources, including cultural relics protection units Taihua Lou, Bahe Hall, Bruce Lee's former residence and other cultural relics, as well as contiguous Xiguan big house, bamboo houses and other Lingnan traditional houses. To meet the 2010 Asian Games, Guangzhou began a government-led "big event-driven” urban renewal. In 2006, the government of the Liwan district government proposed that take Enning Road district renewal as the old city renovation pilot. In 2007, the Enning Road renewal adopted such a method that the government has invested in the demolition compensation, and then organized the public bidding for the land development. 3.2.2 Renewal process review
Enning Road district renewal has gone through four stages: (1) The Enning Road district renewal project began in February 2006. In the previous "Pilot Program of Renovation Dangerous and Old Houses in Enning Road, Guangzhou”, a “back-moving transformation" plan was formulated to demolish nearly all of buildings in the specific area [3]. This program has been strongly opposed by the lack of emphasis on the protection of historical relics. (2) In September 2007, after conducting relevant investigations, Municipal Planning Bureau commissioned the institute to design the transformation program. The latter drew up two different programs which is different in the extent of demolishing. But from the perspective of achieving economic balance, they still focused on the demolition of a large number of historical buildings to construct Commercial buildings. It was still strongly opposed by the residents. (3) From 2009 to 2010, the local government redefined the plan that would transform the Enning Road into a tourist culture area. But the business development model has been questioned outside. (4) From 2010 to 2011, South China University of Technology was commissioned by Liwan District government to plan the transformation of Enning Road. With the idea of residential relocation and the purpose of preserving the old style and playing a role in the commerce and culture, the Institute managed to draw up a "Plan for The Renovation of Enning Road, Liwan District”. In the Plan, Enning Road was defined as a street
for consumption with rich Xiguan customs, traditional atmosphere of life and Lingnan folkways and a tourism destination in the old Liwan city. The Plan is generally inclined to increase the numbers of buildings to be preserved, improve land use, and grow the numbers of residences for settlement and livelihood.
Fig.2 Location of Enning Road Source: Author self-painted
274
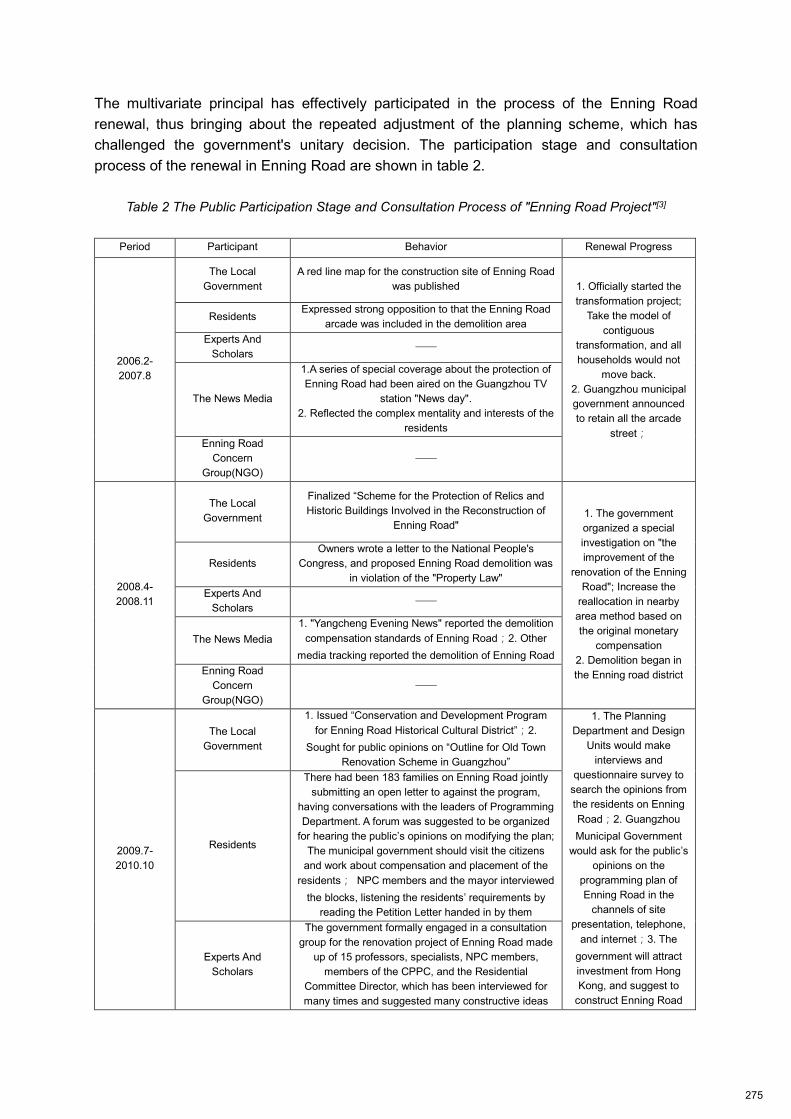
The multivariate principal has effectively participated in the process of the Enning Road renewal, thus bringing about the repeated adjustment of the planning scheme, which has challenged the government's unitary decision. The participation stage and consultation process of the renewal in Enning Road are shown in table 2.
Table 2 The Public Participation Stage and Consultation Process of "Enning Road Project"[3]
Period Participant Behavior Renewal Progress
2006.2-
2007.8
The Local
Government A red line map for the construction site of Enning Road
was published 1. Officially started the
transformation project;
Take the model of
contiguous
transformation, and all
households would not
move back. 2. Guangzhou municipal
government announced
to retain all the arcade
street;
Residents Expressed strong opposition to that the Enning Road
arcade was included in the demolition area Experts And
Scholars ——
The News Media
1.A series of special coverage about the protection of
Enning Road had been aired on the Guangzhou TV
station "News day". 2. Reflected the complex mentality and interests of the
residents Enning Road
Concern
Group(NGO) ——
2008.4-
2008.11
The Local
Government
Finalized “Scheme for the Protection of Relics and
Historic Buildings Involved in the Reconstruction of
Enning Road" 1. The government
organized a special
investigation on "the
improvement of the
renovation of the Enning
Road"; Increase the
reallocation in nearby
area method based on
the original monetary
compensation 2. Demolition began in
the Enning road district
Residents Owners wrote a letter to the National People's
Congress, and proposed Enning Road demolition was
in violation of the "Property Law" Experts And
Scholars ——
The News Media 1. "Yangcheng Evening News" reported the demolition
compensation standards of Enning Road;2. Other
media tracking reported the demolition of Enning Road Enning Road
Concern
Group(NGO) ——
2009.7-
2010.10
The Local
Government
1. Issued “Conservation and Development Program
for Enning Road Historical Cultural District”;2.
Sought for public opinions on “Outline for Old Town
Renovation Scheme in Guangzhou”
1. The Planning
Department and Design
Units would make
interviews and
questionnaire survey to
search the opinions from
the residents on Enning
Road;2. Guangzhou
Municipal Government
would ask for the public’s
opinions on the
programming plan of
Enning Road in the
channels of site
presentation, telephone,
and internet;3. The
government will attract
investment from Hong
Kong, and suggest to
construct Enning Road
Residents
There had been 183 families on Enning Road jointly
submitting an open letter to against the program,
having conversations with the leaders of Programming
Department. A forum was suggested to be organized
for hearing the public’s opinions on modifying the plan;
The municipal government should visit the citizens
and work about compensation and placement of the
residents; NPC members and the mayor interviewed
the blocks, listening the residents’ requirements by
reading the Petition Letter handed in by them
Experts And
Scholars
The government formally engaged in a consultation
group for the renovation project of Enning Road made
up of 15 professors, specialists, NPC members,
members of the CPPC, and the Residential
Committee Director, which has been interviewed for
many times and suggested many constructive ideas
275
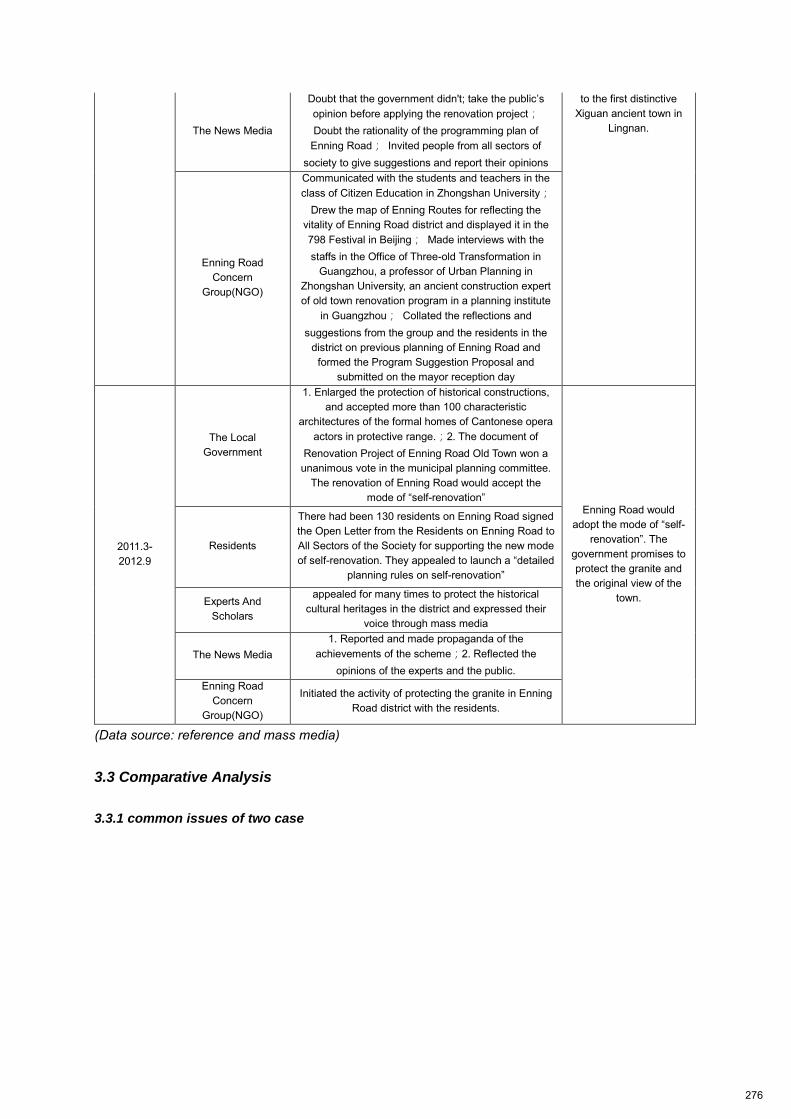
The News Media
Doubt that the government didn't; take the public’s
opinion before applying the renovation project;
Doubt the rationality of the programming plan of
Enning Road; Invited people from all sectors of
society to give suggestions and report their opinions
to the first distinctive
Xiguan ancient town in
Lingnan.
Enning Road
Concern
Group(NGO)
Communicated with the students and teachers in the
class of Citizen Education in Zhongshan University;
Drew the map of Enning Routes for reflecting the
vitality of Enning Road district and displayed it in the
798 Festival in Beijing; Made interviews with the
staffs in the Office of Three-old Transformation in
Guangzhou, a professor of Urban Planning in
Zhongshan University, an ancient construction expert
of old town renovation program in a planning institute
in Guangzhou; Collated the reflections and
suggestions from the group and the residents in the
district on previous planning of Enning Road and
formed the Program Suggestion Proposal and
submitted on the mayor reception day
2011.3-
2012.9
The Local
Government
1. Enlarged the protection of historical constructions,
and accepted more than 100 characteristic
architectures of the formal homes of Cantonese opera
actors in protective range.;2. The document of
Renovation Project of Enning Road Old Town won a
unanimous vote in the municipal planning committee.
The renovation of Enning Road would accept the
mode of “self-renovation” Enning Road would
adopt the mode of “self-
renovation”. The
government promises to
protect the granite and
the original view of the
town.
Residents
There had been 130 residents on Enning Road signed
the Open Letter from the Residents on Enning Road to
All Sectors of the Society for supporting the new mode
of self-renovation. They appealed to launch a “detailed
planning rules on self-renovation”
Experts And
Scholars
appealed for many times to protect the historical
cultural heritages in the district and expressed their
voice through mass media
The News Media 1. Reported and made propaganda of the
achievements of the scheme;2. Reflected the
opinions of the experts and the public. Enning Road
Concern
Group(NGO)
Initiated the activity of protecting the granite in Enning
Road district with the residents.
(Data source: reference and mass media)
3.3 Comparative Analysis
3.3.1 common issues of two case
276
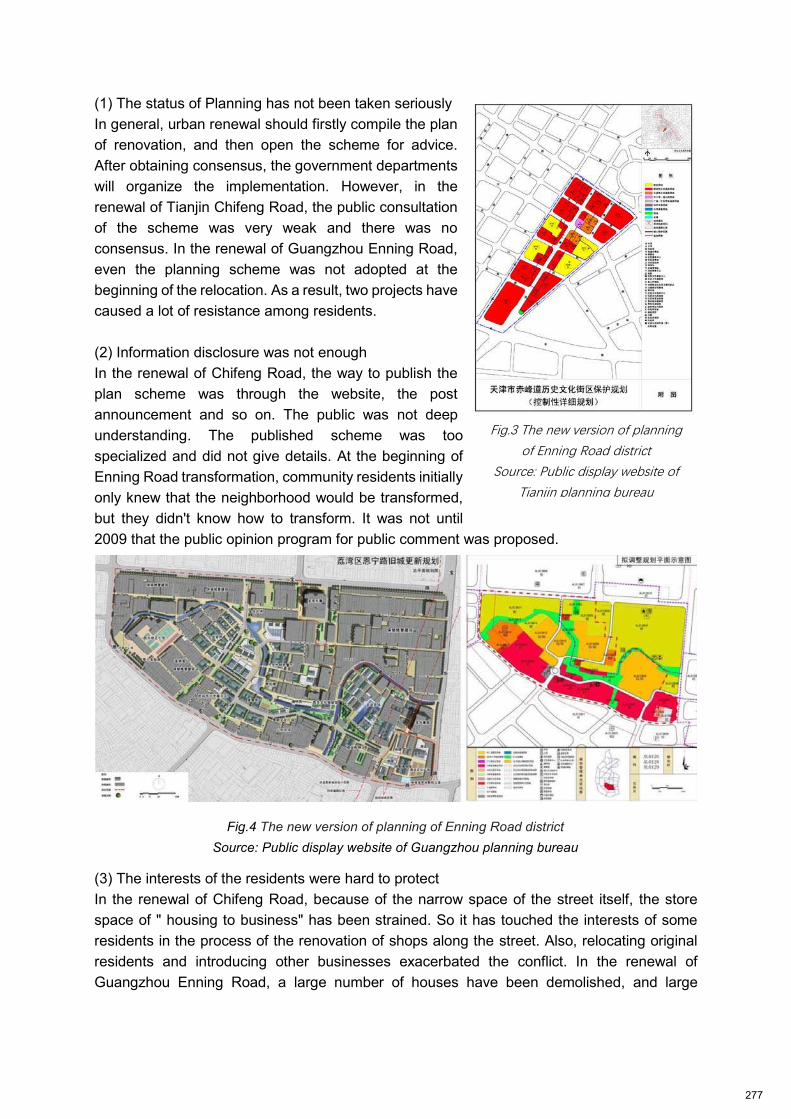
(1) The status of Planning has not been taken seriously In general, urban renewal should firstly compile the plan of renovation, and then open the scheme for advice. After obtaining consensus, the government departments will organize the implementation. However, in the renewal of Tianjin Chifeng Road, the public consultation of the scheme was very weak and there was no consensus. In the renewal of Guangzhou Enning Road, even the planning scheme was not adopted at the beginning of the relocation. As a result, two projects have caused a lot of resistance among residents. (2) Information disclosure was not enough In the renewal of Chifeng Road, the way to publish the plan scheme was through the website, the post announcement and so on. The public was not deep understanding. The published scheme was too specialized and did not give details. At the beginning of Enning Road transformation, community residents initially only knew that the neighborhood would be transformed, but they didn't know how to transform. It was not until 2009 that the public opinion program for public comment was proposed.
(3) The interests of the residents were hard to protect In the renewal of Chifeng Road, because of the narrow space of the street itself, the store space of " housing to business" has been strained. So it has touched the interests of some residents in the process of the renovation of shops along the street. Also, relocating original residents and introducing other businesses exacerbated the conflict. In the renewal of Guangzhou Enning Road, a large number of houses have been demolished, and large
Fig.3 The new version of planning
of Enning Road district
Source: Public display website of
Tianjin planning bureau
Fig.4 The new version of planning of Enning Road district
Source: Public display website of Guangzhou planning bureau
277
numbers of original residents have been forced to move away. There is not a small number of people who are unable to relocate because of problems with housing rights. 3.3.2 The negotiated planning of validity difference and analysis of its causes
The Renovation of Enning Road is undoubtedly the more effective one in the two cases, which is the typical case that the unilateral decision-making of the government met up with challenges. The continuous negotiations and compromise between government and the public make unitary decision-making transfer to diversified participation, and finally the power of the public influences the government's decision-making, which is relatively rare in our country. After analysis, it results from that the participants have played different roles. (1) Local government In the renovation of Tianjin Chifeng Road, the government played a strong role in the management, emphasizing the authority of planning. In the renovation of Enning Road, the local government was the leader, however unlike the absolute authority of the traditional government, the local government was also obviously affected by public opinions, and its power receives checked and balanced to certain degree. As citizens and experts and scholars, media and other social actors made strong opposition and criticized, local government had to conduct self-review, and modified the planning program [5]. (2) Risidents In the renovation of Tianjin Chifeng Road, the mentality that residents showed more was to ask for reasonable economic compensation, but not cared about the changes of living environment, only part of the residents make negative oppositions to the demolition because the compensation did not meet their psychological expectations, therefore the power did not get full play; in the renovation of Enning Road, citizens from Enning Road district actively raised their demands through various channels, such as informing the situation to the upper related departments, giving away the news to media, accepting media interviews, joint neighbour protests (pulling banners, sticking the slogan, etc.) so as to "resist" the government unilateral "hegemony", which showed a certain resistance power. (3) Experts and scholars During the transformation of Enning Road, experts and scholars in related fields such as urban planning, architecture, culture have been interviewed many times and participated in the expert group organized by government, and they put forth constructive comments mainly on the protection of historical buildings, spatial pattern, and commercial development degree. Experts and scholars’ discourse had a certain authority and persuasion, and it was also easy to be expressed through a variety of media spread, which played vital roles in the promotion of renovation of Enning Road. In the transformation of Chifeng Road, expert reviews are only brought into the program review link, therefore it did not form an effective supplement. (4) Non-Governmental Organizations
278
A group of citizens who pay attention to the history and culture of Tianjin, the protection and development, spontaneously formed a private protection volunteer team, established a communication site called Tianjin memory, which became a communication platform of historical information. Related Guangzhou college students organized the "Enning Road Concern Group", which put forth planning and modification suggestions of the Enning Road’s
historical and cultural heritage resources, the investigation of the residents there. However, in the two cases, the participation degree of the two organizations was different, and there was a clear absence of the participation of civil organizations in Chifeng Road renovation. While in Enning Road renovation, "Enning Road Concern Group" not only served as a bridge among resident, government, and experts, but also made residents better understand their own neighborhoods and improve the public awareness of residents through interviews and searching historical information, in such way to make residents interest demands be not only about the demolition compensation, but also recognized the importance of protecting their own homes. (5) News media Guangzhou has the most developed and open news media in China. The news media (including online media) had continuous, spicy, intensive attentions on Enning Road renovation, which played crucial role in the direction of renovation and planning of Enning Road. The relevant news reports of Tianjin Chifeng Road renovation were less. Until today, searching "Enning Road renovation" on Baidu websites, the related reports are about 1160; and related reports of "Chifeng Road renovation" is almost no.
4.Strategies of Ensuring the Effective Implementation of Deliberative Planning in
Historic District
From the two cases above, we can see that NGO and the news media played a crucial role in the negotiation of renovation of historic district. After further analysis, the role of NGO is to seriously survey and reflect the views of residents, protect the public interest and enhance public awareness; and the role of news media is to put pressure on the government to balance government power, and promote the negotiation among government and residents, experts,NGO. This phenomenon reflects the public’s demands on non-government organizations which represent the public interest and a communication platform and the multi-party participation system. In the moment, the forms of China's planning negotiation are planning agency hearing, planning forum, community planner system, civic forum, democratic earnest talk, etc., however the effect of negotiated planning is not ideal. Therefore, in order to ensure the smooth implementation of negotiated planning, we should focus on: (1) Determination of statutory planning is based on core controlling elements Deliberative Planning also focuses on the authority of planning. In the early stages, it is necessary to determine the rigid indicators (determined, not negotiable) and flexible (negotiable) indicators; and it needs to convert the results of the negotiation into the common principles by means of the statutory plan to ensure the effective implementation of the plan.
279
(2) Establishing a government-leading multi-participatory mechanism From the experience of western developed countries, the realization of multiple participation of the decision-making of old city renovation needs to be carried out under the premise of system setting (such as public participation system and community participation system), and it ought to be through the participation of the third party organization (nonprofit organization, civil society organization, non-government organization). Therefore, in the renovation of old city, the government should pay attention to how to establish a multiple participatory mechanism under the guidance of the government. And government should accept and effectively organize various social forces to promote the reconstruction of the old city, and attach great importance to the construction of the negotiated platform between the various government departments. In the meantime, it is needed to establish a formal public participation process, pinpoint various plans’ public participation system in each link such as
before the planning and after the completion of the initial results, the public making a major objection, before the final results being released, after the final results, etc . (3) Promoting the planning which takes the public will as orientation, and planning technology as aid In the deliberative planning, the public opinion is the main force deciding the planning, and the planning technology is in a secondary position. In the early stages of planning, we should take public opinions as lead and greatly absorb public opinions; in the middle stage of the planning, the technical department formed many comparative schemes according to the public opinions. At the end of the planning period, the technical department refined the plan and the public decided the plan. Amid the progress of the society, urban planning continuously develops. And the deliberative planning will also play more and more important role in coordinating the future of multiple social interests’ demands, safeguarding the balance of multiple interests, and promoting the public
interest to be maximized. In "Enning Road Project", the public have broken passive identity in the past, and they have safeguarded the public interests and have made substantive influences on planning decisions. This effect is far-reaching for providing reference for our country’s deliberative planning.
Acknowledgements
This study was financially supported by National Natural Science Foundation of China (Grant
NO:51678393 ) and Humanities and Social Sciences Foundation of Ministry of Education of
China (NO:14YJCZH195).
References:
[1] Xu Mingming (2017) “A Review of Studies on Communicative Planning and a Reflection on
Its Application in China “, Urban Planning International, Vol. 32, No.3.
280
[2]Lu Bin, Chen Yu, Li Xin (2014) “From The Perspective of Public Participation in the Current
Residential Historic District Transformation Dilemma: Taking Chifeng as an Example”. Urban
Development Studies, Vol. 21, Add.2. [3] Lin Dongyang, Zhou Kebin, Wang Shifu(2012)”Urban Regeneration and Public Participation
in Guangzhou: Discussion from ’Enning Street Event’//Urban Planning Society of China.
Diversity and Inclusion: Proceedings of Annual Urban Planning Conference 2012. [4] Yang Honglie (2012) “Yang Honglie. Rescue and Protection Planning for Historic Arcade
Street of Enning Road in Guangzhou”, China Ancient City, Vol. 8, No.6. [5] XIE Dixiang, ZHU Xuemei(2014)” Social Conflict, Interest Game and Historic Districts
Regeneration: A Case Study of Enning Street in Guangzhou”, Urban Development Studies,
Vol. 21, No.3. [6] Lu Yuan (2005)” Protection of the Interests of Disadvantaged Groups in the Plan-Making
Process of City Renewal”, Modern Urban Research, Vol. 12, No.11.
281
Regional Coordination and Workforce Housing: A Review of Western
U.S. Tourism-base Resort Economies
Ryan KRUEGER; Clemson University; United States of America
Synopsis: Regionalism has been a popular solution proposed to address housing affordability. While it has been well-cited as a possible solution, in practice regional coordination requires
efficient municipal relationships and operational capacity that may be beyond the capabilities of many rural communities. In order to determine the likelihood that regional coordination can be used to address growing housing affordability concerns in Western high-amenity and resort
areas, this research presents findings from two case study locations: Flathead County, Montana and Gallatin County, Montana. Relying on in-person interviews across a range of actor classes
as well as targeted community focus groups, this research details the current ability to coordinate regionally in these two resort areas. Analysis of the survey outcomes show that while there are reasons to be optimistic that regional coordination in these locations on other issues will eventually lead to a regional focus on housing, at this time present resistance to thinking
beyond city boundaries by local officials is likely to remain an impediment to implanting a regional solutions focused on community housing needs.
282

DEDICATION To my family and mentors for their endless support, enduring patience, love, and motivation. And to the friends that have been lost in the last year, ski and jam in peace.
283
Table of Contents
TABLE OF CONTENTS…………………………………………………………………………….3 - 4 CHAPTER ONE:
1.1 REGIONALISM AND HOUSING IN THE NEW WEST………………………………5 - 6 1.2 OBJECTIVES OF STUDY……………………………………………………………..……6
1.3 SCOPE OF RESEARCH……………………………………………………………..……..6 1.4 OUTLINE OF STUDY...……………………………………….…………………….......6 - 7 CHAPTER TWO:
2.1 WORKFORCE HOUSING………………………………………………………………..…8 2.2 DEFINING WORKFORCE POPULATIONS…………………………………………..8 - 9 2.3 RETROSPECTIVE OF AFFORDABLE HOUSING POLICIES IN THE U.S. ….…9 - 11 2.4 ADDITIONAL FACTORS IMPACTING WORKFORCE HOUSING.......…………11 - 12
2.5 WORKFORCE HOUSING LOCATIONAL FACTORS………………………….....13 - 14 CHAPTER 3:
3.1 RESORT AREAS, TOURISM ECONOMIES, AND SEASONALITY…...…..……15 - 16 3.2 MENITY MIGRANTS VS WORKFORCE POPULATIONS…………………….…16 - 17 CHAPTER 4:
4.1 REGIONALISM, THE SOLUTION? …………………………………………………18 - 19 4.2 LIMITS TO REGIONALISM………………………………..…….……………..……19 - 20 CHAPTER 5:
5.1 METHODOLOGY………………………………………………………………...…………21 5.2 FILLING IN THE GAPS…………………………………..…………………….................21
5.3 SELECTING MSAs BY DEFINING TOURISM ECONOMIES…………...….……22 - 25 5.4 PRECISION IN THE METHODS OF STUDY..………………………………….…25 - 27 5.5 AUTHENTICITY IN CONDUCTIVE QUALITATIVE RESEARCH……………………..27 5.6 COLLECTION METHODS……………………………………………………………27 - 28
5.7 TRANSCRIPTION, CODING, AND CLASSIFICATION OF DATA………………29 - 30 CHAPTER 6:
6.1 FINDINGS…………………………………………………………………………………..31 6.2 CASE 1: FLATHEAD COUNTY, MONTANA……………..………..………………32 - 39 6.3 CASE 2: GALLATIN COUNTY, MONTANA……………….……………….………40 - 47 6.4 ADDITIONAL FINDINGS OF NOTE…………………………...……………………47 - 50 CHAPTER 7:
7.1 DISCUSSION OF FINDINGS…………………………………………………...…...51 - 53 7.2 LIMITATIONS…………………………………………………………………….………....53
7.3 IMPLICATIONS AND POLICY SUGGESTIONS…………………………………..53 - 55 7.4 CLOSING………………………………………..…………………………………………..55 APPENDICES APPENDIX 1: INTERVIEW PROTOCOL INITIAL TEMPLATE……………………….56 - 57 APPEDIX 2: INTERVIEW PROTOCOL ECONOMIC DEVELOPMENT…….…….…58 - 59 APPENDIX 3: INTERVIEW PROTOCOL EMPLOYER…………………..……………60 - 61 APPENDIX 4: INTERVIEW PROTOCOL HOUSING POLICY………..………………62 - 63
284

APPENDIX 5: INTERVIEW PROTOCOL PLANNING...….……………………………64 - 65 APPENDIX 6: INTERVIEW PROTOCOL DEVELOPMENT COMMUNITY…..…………..66 APPENDIX 7: FOCUS GROUP PROTOCOL………………………….………………….…67 APPENDIX 8: FOCUS GROUP SURVEY……………………………………….…...…68 - 69 APPENDIX 9: TOOLS AND TECHNIQUES………………………………………….…70 - 75 REFERENCES…………………………………………………………………………...…………76 - 83
285
1.1 CHAPTER ONE - REGIONALISM AND HOUSING IN THE NEW WEST “A region, someone has wryly observed, is an area safely larger than the last to whose problem we found no solution.” – Jane Jacobs, The Death and Life of Great American Cities While pressures on workforce populations may have once appeared as an anomaly resigned to tourist or high amenity areas, it has been laid bare as an issue faced by global communities and metropolitan areas alike (Clark et al, 2006). Local and state efforts to discuss workforce housing began on a micro scale in places like Aspen and Telluride in the 1970s. Conferences were held to address this important topic by the Aspen Institute (Moy et al, 2000). Lack of affordable housing options in high amenity areas in the 1970s was then viewed as an isolated issue. It has now come to be more completely understood as the canary in the coal mine for housing affordability for settings across the globe. It was only in the 1990s that recognition for the need for a distinct focus on workforce housing came to the forefront of conversations on affordable housing. In a growing number of communities across the U.S., a clamor arose for the separation of workforce housing from other types of affordable housing initiatives and new strategies that can be used to effectively address deficiencies in workforce housing (Sullivan, 2004). Regionalism is possibly one concept that can be better employed to facilitate the creation of workforce housing options in these high amenity areas. Housing is vital to human survival. In the Western United States, it could be argued that a number of other wicked problems might require mitigation efforts that should supersede those in affordable housing. Long-term access to clean abundant water and sustained economic improvements are likely some of the first that come to mind. However, on those subjects you will find much agreement in a call to action across the Rocky Mountain States. In the matter of best practices for addressing deficiencies in workforce housing stocks in the Rockies, much like many other high amenity areas, such consensus is not currently available. Review of newspapers in these mountain towns illustrates the nature of the current housing ‘crises’ facing the West (Dickie 2015; Vincent, 2015a; Tornow, 2016). In mid-November, 2015 the Bozeman, Montana-based Bozeman Daily Chronicle published an article that identified workforce housing as the “single most fraught issue facing Bozeman” (Dietrich, 2015). In Jackson, WY recent town council meetings have been highly contentious and specific outcomes hard to quantify as they relate to future implementation of workforce housing projects (Vincent, 2015a). With such uncertainty on the methods needed to address housing affordability in these resort locations, further study of coordination between stakeholders involved in this complex issue seems crucial. Western resort housing affordability problems are complex and cover large land areas, thus it appears likely that regional coordination could be an important factor to consider in a study of workforce housing in these locations. Western Rocky Mountain communities present unique characteristics that indicate regional coordination is likely required in planning and economic development efforts. Sprawling robust commuter-sheds are possibly inevitable due to limits of developable land. Meteorological conditions present in these regions create unique travel patterns and may limit public transit options, further complicating efforts in housing. Future engineering projects, some proposed almost solely to address commuter populations, will also require multiagency coordination. For example, in Jackson, WY a long proposed tunnel under the current path over Teton Pass that empties into Teton County, ID has recently been revived as a potential, though unlikely, solution for commuters living Idaho and commuting into the resort town of Jackson (Henderson, 2015). Such is the nature of current efforts to provide additional workforce housing in high amenity Western resort areas. And it implies that affordable housing is a complex issue that is almost assuredly going to require ‘regional’ solutions.
286
Many, if not most, of the federal housing policies of that last century have focused on low-income populations, but increasing pressure on available stocks of affordable housing across all income ranges are likely to change this trend. Moreover, policies available to regional actors that can be used to improve workforce-housing offerings have been slower to develop (Parlow, 2015). An understanding of what makes these policies most effective is evolving alongside their implementation. For Western resort areas, often characterized by high amenities and low-wage job opportunities, the need for affordable workforce housing is not a new topic of conversation. What has changed more recently is the increase in second homeowners and amenity migrants that have driven up rents and decreased available local housing stocks. As Western resort areas and their associated commuter sheds often include large land areas, workforce housing is now firmly a regional issue in need of collaborative solutions. This research will explore the history of workforce housing in the U.S., the growth of Western resort areas and their community culture, and relationships between officials who are tasked with finding housing solutions for their communities. The goal of this research is to fill gaps discovered in a review of relevant literature. Since Rocky Mountain resort areas are unique and specialized economies, the central research question to be examined is to what extent current regional policy coordination exists regarding the current and future development of affordable workforce housing solutions? 1.2 Objectives of Study The objective of this study is to determine the level of regional coordination in general and as it is applied to workforce housing. The primary goals of this research is threefold: 1) determine the capacity to coordinate regionally; 2) examine the current levels of coordination in regards to workforce housing availability; and 3) to provide recommendations on future actions possible for application to regional housing workforce housing affordability campaigns. “Successful” regional housing coordination is influenced by an understanding of housing as a regional issue, a mandate for participation in regional efforts, the presence of regional housing organizations, the character of other local organizations, local government relationships, and a history of regional coordination. 1.3 Scope of Research
This research will focus on two rural resort areas in Montana: Flathead County and Gallatin County. These locations were isolated based on their similarities in geography, levels of service sector employment, and location in the same state in order facilitate a robust comparison of case study findings. In each area housing affordability has been identified as a priority concern and the levels of regional coordination on these efforts have yet to be explored. 1.4 Outline of Study To facilitate this research, literature on workforce housing, resort areas and tourism, and regionalism were synthesized. Discussion of materials relevant to this research are included to frame this study. Descriptions of case study selection methods, as well as the creation of the conceptual structure necessary to determine the nature of regional housing coordination, is provided. Findings detail this relationship and also indicate likelihood that future efforts to coordinate regionally will occur, both in relationship to housing affordability and more broadly, round out this study. Ultimately, the central research question to be asked is: what is the nature of regional coordination on workforce housing policy in Western U.S. resort regions?
287

To attain this goal, the chapters of this report are organized as follows: Chapter One is the introduction; Chapter Two provides background on the concept workforce housing as well as relevant associated policies; Chapter Three covers resort areas, tourism economies, and seasonality; Chapter Four examines regionalism; Chapter Five covers the methods of study; Chapter Six details the findings; and, finally, Chapter Seven provides discussion of these findings.
288
2.1 CHAPTER TWO - WORKFORCE HOUSING Housing affordability is a topic that received much attention in relevant literature (Hoover and Vernon, 1962; Burnham, 1998; Belden and Wiener, 1999; Burt et al, 2001). The Smart Growth Manual highlights the importance of providing a variety of housing options, stating “a metropolitan area cannot function effectively unless every municipality provides its fair share of affordable housing” (Duany and Speck, 2010, pp. 1.7). Green Leigh and Blakely make this point as well and highlight additional possible negative externalities associate with a dearth of affordable housing:
“…police officers and nurses have been unable to live within their employing communities, which would allow them to respond most rapidly to emergencies; local schools have trouble staffing and maintaining adequate student-teacher ratios, and the level of service in the retail businesses is compromised” (2013, pp. 146).
This is exactly what is happening in a growing number of urban and rural areas. In Jackson, WY, soon only one out of sixteen (16) uniformed patrol officers will reside in Teton County (Vincent, 2015b). Essential employees are being forced to edges of these central tourist areas, eventually being pushed out all-together to search for new opportunities. The argument for housing affordability is not just a moral one but also reveals an extraordinary threat to local economic functioning and vitality. If employees are not encouraged to plant roots in a community due to the unaffordability of housing, high workforce turnover is possible. As one Senior Vice President for Tyson Foods noted in a 2005 report on workforce housing options, even a small percentage in employment turnover can have millions of dollars of retraining costs associated with such events (Smith et al., 2006). Worker attraction and ultimately retention are as important as initial business attraction efforts (Parlow, 2015). The alternative to not being able to house workforce populations is comparably lower skilled workers over time, a possible brain drain of qualified individuals to lower cost markets, and, ultimately, a lower competitive advantage for remaining industry due to limits on future business expansion. Furthermore, the populations that make these vibrant communities thrive is in danger of being replaced by populations that are less integrated and involved in the preservation of the natural and cultural amenities in the unique amenity-rich areas. 2.2 Defining “Workforce” Populations The Urban Land Institute (ULI) has defined these middle income workers as those with family area median income (AMI) of 60-120% for any of geographic areas established by U.S. Department of Housing and Urban Development (HUD) (Terwilliger Center for Housing, 2015). HUD uses both area median income and median family income (MFI) when administering various affordable housing programs, but it does not have an established income threshold to describe workforce populations. HUD does caution that households should spend no more than 30% of total household income on rent or mortgage payments lest they be overburdened (Schwartz and Wilson, 2007). While these are useful measures, they exclude expenses associated with housing choice such as transportation costs (Urban Land Institute, 2009). Whatever criteria are specified, it is important to understand that thresholds for housing affordability may require some adjustment to be implemented in a specific region (Schwartz, 2015). As a result, housing policies implemented would benefit from follow-up study to ensure they were performing as expected. Popular colloquial definitions of low-income populations are
289
likely not able to capture the nuances of workforce populations (Blair, 1991). Measures of employment that only consider year-round, full-time employment with an income above the poverty line may likewise be insufficient for economic development planning (Green Leigh and Blakely, 2013; “Poverty”, 2015). It is important to reiterate that few agency definitions that describe income and earnings include environmental or commuting costs in their income level calculations. As local officials are adopting affordable housing policies it should be clear what metrics are to be used and the possible limits associated with those measures. By differentiating workforce populations from other populations seeking affordable housing, additional policy prescriptions are likely possible. ULI definitions for income will suffice for this study of workforce populations, however it is also important to describe what types of occupations are included under the umbrella of ‘workforce employees’. All essential employees necessary for community functionality define one category of workforce employees. Examples of these types of workers include emergency services personal, teachers, and city administrators (Clark, 2006; Green Leigh and Blakely, 2013). Building on this definition it seems beneficial to add additional low-middle income service workers, university or healthcare employees, manufacturing workers, and non-profit staff members to this synthesized description of workforce employment types (Parlow, 2015). Workforce populations are thus moderate wage workers employed in many recognized professions. A review of affordable housing policy in the U.S. over the last eighty years shows that housing for these critical workers has been neglected as a subject of study over much of that time period. What is less clear from review of the federal policies is how future housing efforts will support workforce populations, but state and local efforts may be tipping the scales toward more national level intervention. 2.3 Retrospective of Affordable Housing Policies in the U.S. Workforce housing policy was not disentangled from affordable housing policy in the U.S. in early legislation. The distinction is a modern one, likely linked to contemporary expansions in societal understandings of social equity and economic development. While examples of early workforce housing initiatives are easily discovered, such as U.S. towns built and operated by mining companies in the 1800s, these types of housing projects bear little resemblance to their present-day counterparts. The promulgation of modern affordable housing programs began in earnest in the 1930s during the early years of the New Deal (Parlow, 2015). The federal government served as the primary growth agent driving development of affordable housing, and public housing authorities began to dominate the expansion of low-income housing offerings (Schwartz, 2015). The National Housing Act of 1934 created the Federal Housing Administration (FHA) to develop construction standards and to back private bank loans made by private lenders for new home construction for low-income populations (Schwartz, 2015). Early FHA loans were primarily used to assist exclusively low-income residents (U.S. Department of Housing and Urban Development, 2015c). As this housing program coincided with the Great Depression, there was not a much distinction made between low-income and workforce populations since workers of all socioeconomic levels were desperate for jobs. FHA loans were slow to be offered to middle income populations, however in recent years FHA loans have been made more readily available to provide for middle income housing rental subsidy options (Schwartz, 2015). As the nation began its rise out of the Great Depression, legislation aimed at providing access to low-income housing continued to shape federal policy (U.S. Department of Housing and Urban Development, 2015a). The 1930s saw numerous federal affordable housing programs enacted including the National Housing Act, Federal Home Loan Bank Act, Homeowners’ Loan Act,
290
National Industrial Recovery Act, and U.S. Housing Act. Each further complimented early federal efforts targeting low-income housing, however none of these were likely as influential on current policy as the Federal Housing Administration (FHA) and its FHA loan program (Schwartz, 2015). This new legislation provided a number of new tools to advance the collective mission of providing affordable housing to wider swaths of low-income U.S. population. These included mortgage insurance, vouchers, block grants, and tax incentives (“U.S. Public Law 73-479", 1934; Orlebeke, 2000). Some of these tools would decades later be retrofitted to provide financial assistance on a limited basis to workforce housing populations, but for the most part the policy outcomes of the 1930s were directed at low-income groups (Orlebeke, 2000). U.S. workforce housing policy saw little additional progress in the 1940s and 50s. The decline in urban population centers prompted an ever-increasing focus on low-income, urban housing policies (“U.S. Department of Housing and Urban Development - 1930-2010”, 2015). The Public Housing Act of 1949 was a primary driver of efforts used in an attempt to reduce the residential flight from urban areas. Much like policies implemented during the Depression, it did little to differentiate between low-income and middle-income workers (Schwartz, 2015). Beginning under the leadership of President John F. Kennedy, the Section 221(d)(3) Below Market Interest Rate program became one of the first legislative actions to specifically focus on supporting moderate-income families’ home buying efforts (Schwartz, 2015). This program was unpopular and short-lived, replaced seven years later by President Lyndon Johnson with Program Section 236 that returned the focus of affordable housing to low-income populations (“Project-based Section 8 and Section 236/RAP”; Schwartz, 2015). The 1960s also brought the creation of the Department of Housing and Urban Development (HUD) in 1965 and the HUD Act of 1968, which produced a powerful new agency focused on housing policy (“U.S. Department of Housing and Urban Development”, 2015a). HUD was established as a cabinet level agency with a mandate to assist low-income families in leasing efforts of privately owned housing (“U.S. Department of Housing and Urban Development”, 2015a). HUD, then as now, serves as the interpreter for AMI requirements necessary to qualify for federal housing subsidies. President Richard Nixon followed Johnson in 1969 and the new administration altered the course of national affordable housing policy considerably. Nixon’s administration initiated a moratorium on new subsidy commitments for federal low-income housing projects (Orlebeke, 2000). An outgrowth of the President’s Third Annual Report on National Housing Goals, Nixon placed severe limits on HUD programs in 1973 (Orlebeke, 2000). Nixon believed that with the middle class exodus from the urban centers to the suburbs large sections of good housing stocks were now available to meet the needs of low-income populations. The Nixon administration thus questioned additional construction of new housing for low-income residents (Orlebeke, 2000). Nixon was also important in the enactment of the Housing and Community Development Act of 1974 (HCDA) (Schwartz, 2015). Broadening the scope of Section 8 housing vouchers as well as creating the Community Development Block Grant (CDBG) program, Nixon and the HCDA assisted in creating affordable housing that attempted to scale down the direct construction role of the federal government (Schwartz, 2015). After decades of federal implementation of housing policies, the CDBG program placed the oversight of low-income housing construction with local governments (Smith et al, 2006). While the Section 8 voucher program was scaled back in 1985, the CDBG program continues to remain a force for community development of affordable housing projects primarily assisting low-income populations. In recent years CDBG funds have also been used to assist middle-income residents in a growing number of situations (Schwartz, 2015).
291
Beginning in the early 1980s, HUD was asked to prepare for Congress reports on housing needs for very low-income renters (Schwartz, 2015). Following this study, several additional federal level programs were created to find solutions to the housing needs of low-income populations (Parlow, 2015; Moy et al, 2000). The federal policies of the 1980s were almost exclusively directed at low-income populations with two notable exceptions. First, the Financial Institutions, Reform, Recovery, and Enforcement Act of 1989 (FIRREA) addressed the secondary mortgage market (Schwartz, 2015). FIRREA contributed to workforce housing indirectly through the creation of new loan capital financing options, providing new opportunities for credit to first time homebuyers. The second program tangentially impactful on workforce housing during this decade was the Low Income Housing Tax Credit (LIHTC). Created by the Tax Reform Act of 1986, the LIHTC provided individuals and companies present equity for eligible costs to incentivize investment in low-income housing (Orlebeke, 2000). The LIHTC program, found in Section 42 of the IRS Code, is administered jointly by the IRS and state and local officials. It currently provides nearly $8 billion in annual budget authority to issue tax credits for the acquisition, rehabilitation, or new construction of rental housing for low-income populations. (U.S. Department of Housing and Urban Development, 2015b; FHA Mortgage Center, 2015). LIHTCs have almost exclusively been focused on populations making no more than 60% AMI. (FHA Mortgage Center, 2015). LIHTCs provide the opportunity for public private partnerships in which state and local governments can adapt the LIHTC program to meet their housing needs under broad federal guidelines (U.S. Department of Housing and Urban Development, 2015b). During the presidency of Ronald Regan, deep federal budget cuts, more than 85%, were enacted to limit federal housing assistance funds (Gilderbloom and Appelbaum, 1988). In the late 1980s the dominance of single-family home construction became a significant contributor to the lack of available additional housing types (Schwartz, 2015). As buildup to the looming financial crisis, fluctuations in mortgage interest rates impaired mortgage financing further impacted the stocks of available housing in a large number of domestic settings (Schwartz, 2015). Just prior to the 2007 recession, the plight of a variety of workforce populations was putting pressure on officials to more earnestly address housing affordability (Gardner, 2009). This pressure abated following the housing market crash in the late 2000s, however the market has now rebounded and housing affordability remains a critical issue for the future. One final program that is important to review here is the HOME Investment Partnerships Program created by the Cranston-Gonzalez National Affordable Housing Act of 1990 (Jones, 2014). This federal block grant program offers assistance to states and localities to be allocated for affordable housing for low-income households (Jones, 2014). HUD distributes this funding according to a specific formula, with 40% going to states and the balance being allocated to localities (Jones, 2014). These “participating jurisdictions” must commit to contribute permanent matching funds of 25% to receive HOME funds (Jones, 2014). Administration of funds can be handled by these participating jurisdictions or by a designated agency (Jones, 2014). Funding for the HOME program fell between $1.5 and $2 billion annually until the end of FY2014, when funding levels fell to approximately $1 billion annually (Jones, 2014). The HOME program is a significant funding mechanism utilized to facilitate the creation of affordable housing solutions. 2.4 Additional Factors Impacting Workforce Housing After being largely ignored from the 1930s through the early 2000s, workforce housing is now gaining new attention. Workforce housing is being actively addressed through a number of high profile test cases across the U.S. In New York City ordinances are in place to ensure the construction of workforce housing or fees in lieu are received as new real estate development continues (N.Y. GMU Law, Article 16a, § 699-b, 2015). The proliferation of rental boards that
292
oversee rental rates is another policy outgrowth of the search for more affordable rental options (Vincent, 2015c). Rental policies and boards have a long history of use in urban areas but are less popular in rural areas. The implementation of such policies has delivered mixed results but presents another tool policy tool available to land planners when looking to create housing affordability solutions. Another northeastern state, New Jersey, is partnering to build a teachers’ village to provide an affordable housing mixed development primarily marketed to teachers (Isaacson, 2013). Boston, Massachusetts has decided to build dorms to house students and to lower stresses on other workforces housing stocks (Logan, 2015). In Florida, State Officials see threats to workforce populations, such as high housing costs, as impediments to long-term business recruitment. As a result, Florida has begun to use its economic development authority to develop more affordable housing options. Market-based solutions have been another popular modern method suggested to mitigate threats to housing affordability. Following the recession in 2007 housing markets have now mostly rebounded in many places, and housing affordability may be reaching similar critical levels seen prior to the market decline. As more employees find jobs in service-based industries, many are seeing their wages stagnate and their real income decline in the face of rising housing costs. With less personal income is available for housing, both environmental and economic impacts are also continuing to be compounded (Viveiros et al, 2015). Real wages have stagnated and housing construction is also being curtailed further limiting the supply of affordable housing (Parlow, 2015). It will likely be a number of years before effectiveness of these new programs can be accurately determined. One growing influence on the supply of housing, including workforce housing, is the expansion of short-term rental services. Rental by owner services such as Airbnb, HomeAway, and VRBO have seen a significant rise in popularity and are growing in use much like other aspects of the “sharing” economy. The impact these services have had on the on housing availability has been an evolving topic of discussion. Somewhat predictably, executives at Airbnb recently discounted the impact that short-term rentals have on the housing market and do not see the necessity of policies to regulate the practice (Garnick, 2015). City officials too have been slow to impose restrictions in some places. Seattle officials have declined to regulate short-term rentals since they do not see these types of services impacting the availability of rental housing (Garnick, 2015). In other markets, such as New York City and New Orleans, where housing affordability has remained an important topic of discussion, the effect of short-term rentals on rental prices has been more heavily cited as major influencer on rental pricing and availability (Muniz, 2016; Walker, 2016). Short-term rental services are not new, but their popularity has seen rapid growth with the development of online markets, and policy makers have largely been slow to respond. New regulations of these types of services have slowly been put into place, but there are ongoing discussions about whether they constitute a taking (Jefferson-Jones, 2014). Where codes have been put into place, either prior to or in response to the growing use of short-term rentals, a further troublesome component of these ordinances has been enforcement. Reliance on neighbors policing neighbors has largely been ineffective and enforcement by local officials has also been deficient (Walker, 2016). Research is mounting to support claims that short-term rentals are drastically impacting housing markets worldwide, and the regulatory responses to this are likely to play an important role in housing availability in the coming years (Walker, 2016; Lee, 2016).
293
2.5 Workforce Housing Locational Factors Broadly, as housing costs in U.S. central cities began to rise in the late 1990 and then again following the recession in 2007, middle-income workers have found themselves forced to relocate to fringe areas (McIlwain, 2001; Parlow, 2015). Essential workers once living in the central cities now found themselves commuting further distances each day. The implications of this new normal raises important questions about land use planning and economic development (Green Leigh and Blakely, 2013). Housing costs in the neighboring hinterlands were substantially lower, presenting an obvious location for growth for commuter communities and the growth of edge cities without the need for policy interventions. In regard to high amenity areas, this possible location for future housing development at the edge of current development is threated by a lack of available developable land and rising costs in outlying areas. While sprawl may have once been an acceptable option to provide more housing options, the realities on the ground in high-amenity areas limit the application of these types of policies (McIlwain, 2001; Parlow, 2015 These growing commuter populations have to travel longer distances and contributes to the externalities associated with urban sprawl (Haughey, 2002). Long commutes, heavy traffic, and less open space are just a few of the negative effects of relegating workforce housing away from central employment areas (Carter, 2010). These “hidden” costs are hard to effectively measure and complicate efforts that land use policies have had in addressing deficiencies in workforce housing. These costs also are not generally included in the measures that many communities have adopted to guide them, and the costs included in determination of housing cost burdens, such as AMI, have not evolved address this deficiency. The plight of these middle-income workers, specifically in the Western U.S., has gained some notoriety but the research on this subject is still fledgling (Clark et al, 2006; Moss, 2006; Parlow, 2015). Commuter communities can be thought of as bedroom communities, as their primary purpose is to supply housing for those working in central cities (Calthorpe, 1993; Clark et al, 2006). Population growth, and the new commercial and residential development it entails, is assured for much of the U.S. This provides a rational nexus for planners to consider workforce populations regionally in their decision making process (American Planning Association, 1998). Though most in-migrant homeowners assume that they will save money when they buy a lower cost house on the edge of the central city, one study found that they overestimate the savings, because they pay approximately $.75 to commute for each $1 saved on housing (Dymi, 2006). Economic equity concerns in communities are also taking on an increased priority amongst area economic development officials (Parlow, 2015). While many communities had adopted some measures to address this housing affordability prior to the recession, after the housing market crash many of these same communities repealed these policies (Parlow, 2015). Local officials no longer saw the need for these policies in the face of declining housing markets. Market conditions had leveled the playing field for a time and real estate development practitioners saw this as chance to encourage repeal of these restrictive land use guidelines. This shortsighted policy shift came under fire as real estate prices rebounded in the years after the recession and affordable housing options diminished as a result of new economic growth. It is important to briefly explore the moral arguments for thinking about housing for the future, not just making attempts to address current conditions. Hoover and Vernon noted in their seminal work that the location of jobs and residents “are related, of course, one throwing light on the other” (Hoover and Vernon, 1959, pp. 121). Many noted moralists suggest that the current cost of doing business is equally as important as the social equity concerns for the future (Thoreau,
294

1962; Leopold, 1968; Turner, 1991; McKibben, 2010; Schumacher, 2010). Quality of life impacts should be equally considered with the same intensity as potential economic development opportunities. With workforce housing now dissected and detailed, it is now possible to move on to a review of resort and tourism economies that will aid in defining possible study area locations for workforce housing in these unique markets.
295
3.1 CHAPTER THREE - RESORT AREAS, TOURISM ECONOMIES, AND SEASONALITY The roots of skiing lie in overland travel derived from ancient subsistence cultures. Today’s popular American ski mountain often bear little resemblance to the rudimentary way of life. Ski resort areas in the U.S. were essentially always conceived as a means to generate tourism spending. After the sport spread from the Midwest to California via mining camps, skiing saw great surge in popularity nationwide following the 1932 Winter Olympics in Lake Placed (Clifford, 2003). Recognizing this opportunity, executives at the Union Pacific railroad founded Sun Valley Idaho in 1935 as a means to sell train tickets and real estate opportunities (Clifford, 2003). With the potential identified for future development and economic growth in these areas it was only a matter of time until others too seized on this possibility. By 1939, skiing had by some estimates become a $20-million-dollar industry (Clifford, 2003). World War II brought this momentum to a halt but the ski pioneers that would come out of the war would soon create the modern ski industry. The much hailed Tenth Mountain Division, which trained near what would later become Vail, were key in the Italian high-alpine campaign at the end of the war (Clifford, 2003). Around ten thousand Americans were skiers prior to the war, however about two hundred thousand had tried it as a section of military training by 1945 (Clifford, 2003). The veterans that had served in the Tenth would directly contribute in propelling the ski industry in the U.S. in its next formative steps (Shelton, 2008). After the initial development of the ski towns following World War II, the restrictions on future development became clear almost immediately. In Western U.S. resort communities, limited available land and the attractiveness of area amenities placed a unique amount of pressure on housing for the local workforce populations. Middle-income workers were increasingly being forced to the margins of the central resort areas by outside flows of capital investment in real estate in these resort communities (Clark et al, 2006; Parlow, 2015). Resorts communities offer a further limit to sprawl absorbing commuter populations, as many of these Western resort communities are abutted by large tracts of public lands limiting growth. With these limits in the availability of developable land, enhancements to workforce housing in central cities was and remains limited. In central resort areas this fact, in partnership with this influx of residents primarily deriving income from outside the region, is fueling conflicts related to the provision of affordable housing. The question of housing in resort areas is a “special manifestation” of a housing problem that is present in many other locations across the U.S. (Clark, 2006, pp. 151). Resort areas are composed of communities that are in proximity to amenity based attractions, such as ski resorts. These regions may include both incorporated and unincorporated areas, but it is likely that the regional boundary is “more or less conterminous with the regional housing market” (Clark et al, 2006, pp. 152). Making up this resort region are commuter communities that lie in the commuter shed of a central city which often, but not exclusively, is the city nearest the resort area. Regions may encompass a single county or multiple counties, and this is largely dependent on geographic limitations. For example, Jackson, WY is located on one side of a massive overland mountain pass while its primary commuter populations reside across this divide in Idaho. Geographic barriers can thus present policy and administrative complications that further challenge remedies to housing commuter populations. In mountain resort areas the important amenities were originally outside of the central city, making simpler economic models of urban spatial form like those of Alonso difficult to apply (1964). Theoretical models of housing location suggest that the high level of amenities located outside the city center observed in Western resort areas would imply higher income populations would reside outside of the central city, as is sometimes seen (Brueckner et al, 1999). However,
296
the presence of entertainment and cultural amenities in central cities in some western resort regions, combined with the positive feedback created when high income individuals consume them, could make such cities almost as attractive to wealthy residents (Brueckner et al. 1999). The town of Jackson Hole, WY, is an example of this effect. In rural areas, the limited cultural amenities might make those that exist even more valuable to those with higher incomes, increasing housing costs in cities even further. For increasing sections of the Western resort region population rents are rising exponentially faster than real wages. These communities that make up the region are having difficulty responding quickly to these changing conditions. As is often the case in tourist economies, there exists a spatial mismatch of jobs and housing. The lack of workforce housing options can serve as a limiting factor in consumer and business service attraction (Turok, 2010). Moreover, outside capital flows from second homeowners presents a limit on the real estate market that may negatively impact employee and business attraction in these resort communities (Hall and Muller, 2004; McIntyre et al, 2006). External capital investment in these resort areas has dwarfed internal capital investment and further exacerbated affordable housing concerns (Clark et al, 2006). Renewed growth in the rental housing market has further contributed to the lack of a variety of housing options. Employers are aware of the desire of employees to live in high amenity tourist areas and often lower wages in these smaller markets reflect this knowledge. Employers often justify the lower wages by arguing that the cost of living is lower in “rural” areas, but this argument breaks down in resort areas where housing prices are more comparable to those in larger metro markets (Barber, 2015). Lower wages compound the problem of affordable housing options in these tourism economies. There are also ecological concerns with locating on the edges that include loss of open space that accompanies real estate development, impacts on animal migration patterns, and increases in pollution levels. Discussions of seasonal employment in Western resort areas is an added impediment for affordable housing programs. Seasonal employees often require housing year round when unemployed for a significant portion of the year. This sub-population also acts as an impactful force on the workforce housing market in these regions. Furthermore, the line between seasonal resort employee and full-time resident worker is blurry, at best. In order to include resort employees in the definition of workforce housing a nuanced definition is beneficial. Seasonal employees include anyone contracted by a commercial resort enterprise (Clark et al, 2006). Any of the ancillary industries that rely on the resort and reside onsite, such as rental shops or guide shops, can also be categorized as resort employment, as these services depend on the resort for the bulk of their business. Resort employees may retain employment at the resort area year round, however many rotate between jobs at the resorts and other positions, such as trail crew members or wildland firefighters in the summer season. Specific mention of these sub-populations then serves to highlight yet another reason the study of workforce housing in resort areas has been a complicated endeavor. 3.2 Amenity Migrants vs. Workforce Populations An auxiliary topic of discussion necessary for review of workforce housing in the Western U.S. resort areas is that of amenity migrants and second homeowners. Amenity migrants journey to ecologically and culturally rich areas in search of Earth’s remaining irreplaceable places or for a sense of spirituality (Moss, 2006; Glorioso and Moss, 2007; McIntyre, 2009). Amenity migrations have also been referred to as the expansion of post-materialism/post-productivism (Abramson and Inglehart, 1995; Wiltsie and Wyckoff, 2003), lifestyle migration (Hoey, 2005), voluntary simplicity (Pierce, 2000), the experience economy (Pine and Gilmore, 1999), or journeys toward
297
a ‘sustainable future’ (Jacob, 1997). Previous research has spoken to the uniqueness of the natural topography and ethos of Western mountain communities as further reasons why amenity migrants seek out these areas (Clark, 1999; Moss, 2006; Clark et al, 2006; Glorioso and Moss, 2007). Ecological and social amenities have been shown to be statistically significant drivers the growth in population in the rural West (Rasker and Hansen, 2000). Amenity migrants are often second-home owners with a desire to maintain viewscapes and isolation (Moss, 2006). This puts pressure on city officials to encourage low-density development options to preserve this portion of the tax base. On the other side of the spectrum are seasonal workers who may remain in a resort region for only a few months or perhaps several years depending upon available employment options (Clark et al, 2006). The factors that draw amenity migrants and workforce populations are synonymous, and it can be difficult to plan for the two group concurrently. Different perspectives and priorities can hinder planning and collaboration for these user groups. As a result of this disparity there are further ecological and sociological changes that are being seen in the “New West” (Hansen et al, 2002). Workforce populations are likely more permanent in their housing and employment situations than amenity migrants. There does, however, exist fluidity in the classification of an individual into either category. Amenity migrants may become part of the workforce or they may quickly move to another place that appears equally rich in amenities. Moreover, amenity migrants may possess exceptional personal wealth that does not require participation in a local labor force. Many of these individuals will, however, find employment and this can be for any number of possible reasons. Research has noted that the sense of community possessed by amenity migrants is frequently less than that of workforce populations (Moss, 2006). The presences of these migrants and this lack of community participation can represent a threat to the development of local, long-term housing strategies. Complete differentiation of workforce populations and amenity migrants is difficult, perhaps impossible, and complicates efforts across all types of policy initiatives. Patterns of amenity migration have been studied in a number of domestic and international settings (Moss, 2006; Glorioso & Moss, 2007; Golding, 2014). It is important to understand that these migrants can be from any socioeconomic background, however, it is likely the affluent newcomers have the most debilitating effect on workforce housing (Golding, 2014). Second homeowners are spending only a few weeks or months in these places each year, possibly owning ideal real estate that could be utilized to support community housing needs broadly (McIntyre et al, 2006). The effects of such practices in the face of a limited developable land base has been studied in some depth recently, and ethnographic studies are also beginning to fill in gaps on this subject (Clark, 1999; Clifford, 2002; Clark et al, 2006; Moss, 2006; Glorioso and Moss, 2007; Hines, 2011). The majority of these studies have focused on the central city or outlying areas, and none have effectively examined the interplay of the relationships between these two spatial locations. Furthermore, much of this research geographically bounded to the central city. Both of these considerations impacted the selected methods planned for this research proposal.
298
4.1 CHAPTER FOUR - REGIONALISM, THE SOLUTION? Regional coordination has been touted as the answer to numerous difficult problems in the past with mixed results in application. Regional planning is not new; although advocates of ‘new’ regionalism try to make the case that it is inherently different from early theoretical constructs (Wheeler, 2002). Regionalism can be traced back to the early 20th century, and such thinkers as Patrick Geddes and Lewis Mumford. Geddes, Mumford and other early proponents saw regionalism as a method to apply holistic, normative approaches to the problems encountered in 19th century industrial cities. This body of theory has evolved since the 1920s, transforming from ecological regionalism to the concept of ‘new’ regionalism (Wheeler, 2002). Regional planning has been applied to address numerous economic, environmental, and social conflicts since its inception. New perspectives of regionalism have developed and review of these ideas provides a path to study regionalism and housing in Western resort areas. Regionalism has been shown to assist in articulating housing concerns broadly. Whether as a vessel for the promotion of civil rights or in the expansion of equity, viewing housing broadly and regionally has been shown to yield productive outcomes (Swanstrom, 2006; Cresswell et al, 2003). In Western States, where county land areas are typically expansive, a regional understanding may be required to address housing concerns. Regionalism might thus be necessary but legal mandates may not exist to require the adoption and implementation of such concepts with regards to housing (Turok, 2009; Swanstrom, 2006). Normative arguments for the implementation of regional regimes that focus on housing has not been enough to facilitate the spread of associated legal regimes (Calthorpe, 1993; Rusk, 1993; Wheeler, 2007). But regional legal frameworks applied to water policy or hazard mitigation also developed from early normative arguments, so it is highly probably that housing could also fit this mold (Moss, 2006; Gill and Clark, 2006). When studying regionalism, an examination of the local history of collaboration can help illuminate the nature of the application of the concept in practice. In locations such as international borders or where land uses cross municipal boundaries, regionalism appears to be more frequently applied (Gloriso and Moss, 2007). There has also been a recognition by scholars that regional participation may also be a means to reinvigorate traditional campaigns. For example, research has shown that regional equity efforts are more effective if tied to environmental issues, especially amongst low- and middle-income populations (Rast, 2006). Furthermore, a history of regional collaboration is also an indicator of future collaboration, begetting more regional and public participation that perpetuate regional relationships (Savitch and Vogel, 2000; Olberding, 2002). This same research also shows that there are positive feedback effects from regional collaboration, and places that have used it before are more likely to do so in the future (Savitch and Vogel, 2000; Olberding, 2002). A history of collaboration is one thing but the nature of the relationships between actors in existing or proposed regional efforts is a further important topic to be considered. While boundaries may be fluid in regards to economic or environmental concerns, these same limits present real challenges to regional cooperation (Lagendijk and Cornford, 2000). Much has been made that economic and administrative conditions in central cities and their associated suburban areas are significantly correlated, however this does not mean that local planning or economic development administrators are clamoring for regional coordination (Savitch et al 1979, 1987; Ledebur and Barnes, 1993; Voith, 1992). Instead, the nature of past relationships is likely to impose a great deal of force on the development and use of regionalism for decisions that are not required under a legal mandate (e.g. intergovernmental agreement, memorandum of understanding, etc.).
299
The character of local organizations has also been portrayed as an important function and an influencer on regional participation (Gargan, 1981). Furthermore, a study of character also helps to illuminate the scope practice adopted in regards to administration of required tasks. There exists a popular mindset in policy and planning that if certain issues fall outside the city or growth management boundaries they are thus not the responsibility of any one municipality (Hall, 2008; Foster, 2011). The presence of this “not my job” mentality can create severe problems if issues are judged in such a rigid format and may indicate that regional coordination is less likely (Hall, 2008). On the other hand, if officials are able to plan beyond their borders this outcome presents real opportunities for more impactful policies and the probability that enhanced regional relationships can flourish (Foster, 2001). Regional groups have been shown to be an effective means to address specific issues and may also be more apt at procurement of funds to address these issues (Hall, 2008). Community and economic development efforts often operate in this manner (Swanstrom, 2006). Much of the literature suggests that regional groups with a honed mission and operational staff are likely to be effective in regionally coordinated efforts (Hall, 2008; Swanstrom, 2006). It has also been shown that regional groups staffed by volunteers may lack the organizational or financial capital to be effective (Norris, 2001). This suggests that the nature as well as the presence of regional actors is also important to consider when studying regionalism. Moreover, the type of power structure adopted and whether local authority has been ceded in any capacity to a regional group further illuminates the nature of the regional relationships (Norris, 2001). The presence of coercive elements necessary to encourage participation by local and regional groups in regional action provides a likely indicator that regionalism is viewed as holistically important (Norris, 2001). The argument for applying a regional perspective to a study of housing has been directly studied by Norman Krumholz in the 1970s. His research found regionalism vital in order to address deficiencies in affordable housing in Cleveland (Krumholz, 2011). Productive partnerships between the central city, the county, and other local organizations were portrayed as required in order to effectively mitigate threats to housing affordability (Krumholz, 2011). In these successful planning efforts applied to the whole “real city” as John Rusk termed it, the linkages discussed above are highlighted (Rusk, 1993; Krumholz, 2011). This then frames the study of workforce housing in resort areas and provides a grounding to develop a unique methodology that can facilitate this research. 4.2 Limits to Regionalism The previous discussion highlights likely characteristics or linkages that can be used to study regionalism. Before continuing to this methodology, a brief discussion of the limits to regionalism is important. The argument for regionalism is compelling, however in practice there are still shortfalls witnessed in pure regionalism. Regionalism has been shown to buttress local weaknesses in the economy and community (Turok, 2009). Regionalism can also lead to the expansive growth of undifferentiated hinterlands (Turok, 2009). With higher levels of coordination, it seems possible to perpetuate spatial inequalities and unsustainable development processes (Jonas and Ward, 2007; Neuman and Hull, 2009). Regionalism may also require consolidation of power in ways that undermine components of our democratic system. Advocating that most decisions be made at the subsidiarity level is one method meant to ameliorate this concern however it may not be enough (Swanstrom, 2006).
300

Regional coalitions may be too politically impotent to be utilized consistently to address regional issues (Norris, 2001). Where expressions of frustration at regional actions is more likely to be encountered is in elections at the local level. It has been shown that local officials are more likely to be held accountable by their local electorate for outcomes at the regional level (Gerber and Gibson, 2009). The cost of regional participation is another concern, as the capital required to maintain this level of coordination must come from somewhere. Rural or poor areas are more likely to struggle to acquire funds or staff necessary for participation. Finally, conflict resolution mechanisms between regional and local actors are troublesome to enforce and may be all-together ineffective (Gerber and Gibson, 2009). Without an effective method of conflict resolution between local and regional actors it seems cooperation and support from the community will remain in jeopardy. How these limits to regionalism will impact this study of workforce housing is unknown at this time, but proceeding with caution under the auspices of regional coordination offering a mechanism to study workforce housing appears founded.
301
5.1 CHAPTER FIVE - METHODOLOGY In order to examine regional efforts directed at workforce housing in Western resort areas, a multiple case study design was employed. Two case study locations were selected and compared for commonalities in regional coordination. Data reviewed for this research includes archival research, interviews, and focus groups. The precise nature of this selection process is laid out in a step-by-step process below. 5.2 Filling in the Gaps This study proposes a method of study to partly remedy deficiencies discovered in this research process by exploring regional interaction specifically in regards to workforce housing. The limits to current understanding of regional coordination in Western tourism economies in high amenity areas have been highlighted above. Regional coordination has seen a growth in popularity for a number of types of uses, including coordination on environmental, economic, and infrastructure projects. Another reason that regional coordination has seen its popularity increase is due to changing commuter patterns, as housing costs have continued to push residents further afield from central employment centers into growing bedroom communities. When taken together, all of these factors contribute to the development of a research plan that examines the character of workforce housing in Western resort areas The choice of selection criteria for case study locations was heavily influenced by previous research on Western resort economies, such as that of Tom Clark. Clark and others have highlighted that economic and social connections are important to consider when examining possible case study sites (Clark, 1999; Clark et al, 2006). One way to capture both is through an examination of commuter patterns through the review of Micropolitan Statistical Areas. The U.S. Office of Management and Budget defined micropolitan areas in 2010 as follows:
• A Core Based Statistical Area associated with at least one urban cluster that has a population of at least 10,000, but less than 50,000. The Micropolitan Statistical Area comprises the central county or counties containing the core, plus adjacent outlying counties having a high degree of social and economic integration with the central county or counties as measured through commuting (U.S. Office of Management and Budget, 2010).
This definition highlights strong social and economic cohesion, thus making it effective to determine a geographic scope of study. The use of micropolitan areas is also closely synonymous with county level measures of employment and commuter patterns in these locations. Moreover, micropolitan areas also appear in line with the terminus of the regional housing market (Clark et al, 2006). An area of study must orbit some specified location that can be studied through the use of robust data. This study has attempted to show the difficulty of endeavors to select the most suitable land area for analysis of regional relationships. Regional literature suggests as much, as does research on Western U.S. resort areas. Furthermore, personal experience has shown that counties in Western states are likely the limit of regional coordination on most subjects due to the large land areas included in these counties, however it is likely that regional coordination is not bounded by these defined municipal borders. County-level measures, for counties that include Micropolitan Statistical Areas, will be used here and, while the limits in using this method have been discussed, these selection criteria for case study locations and interview candidates is the most appropriate for the needs of this qualitative research.
302
5.3 Selecting MSAs by Defining Tourism Economies Building on the premise that the nature of micropolitan areas inherently implies increased intra-regional flows, possible case study locations were further narrowed by two additional factors: location in one of seven Rocky Mountain States and proximity to a ski resort area. The Rocky Mountain States included in this research are Arizona, Colorado, Idaho, Montana, New Mexico, Utah, and Wyoming (Nevada is sometimes included in classifications of the Rocky Mountain West however Nevada was excluded for this study). Ski resorts present a unique identifying characteristic and will likely signal a robust expression of the location being identified as a tourist economy. As a result, these areas will likely see larger negative impacts on workforce housing availability due to the limits of developable land, high real estate costs, and scale of the possible commuter sheds necessary for affordable housing alternatives. Casting a wide net to examine resort communities in the Rocky Mountain region yields hundreds of possible locations from which to select locations for study. To narrow this list, the Snowsports Industries of America members resort locator website was consulted to determine resort location and proximate distance from the nearest linked central city area ("Resort and Retail Locator - Snowlink", 2015). Overlaying Census designated Micropolitan Statistical Areas with central cities that lie in proximity to these ski resort locations, a list of possible case study areas was narrowed to 20 entries (Table 1) ("Resort and Retail Locator - Snowlink", 2015). In order to capture the most precise view of employment patterns from available public data, Table 1 includes counties that encapsulate the micropolitan areas. As discussed above, for this research it is most appropriate to define the county and micropolitan area as roughly synonymous to one another. Micropolitan level data available from the U.S. Census’ American Fact is not precise and presents limits for review of tourism economies in these resort locations. Many, if not most, of the commuter shed boundaries and relevant economic criteria necessary for the designation of micropolitan areas extend to the county level in these Western states. It is then possible to use the more precise county-level measures of employment available from the U.S. Census Bureau of Labor Services (BLS) to determine the size of the tourist sector in these possible case study locations.
303
Table 1: Counties and Resorts Included in Selected Micropolitan Statistical Areas For this research a resort region can be classified as such through an examination of the total share of the employment directly related to tourism. Tom Clark used industry or NAICS codes 71 and 72, which represented arts, entertainment, recreation, accommodation and food services, in order to determine the share of the tourist economy in his case study locations. The BLS aggregates NAICS codes 71 and 72 in a supersector titled ‘Leisure and Hospitality’ (BLS, 2015). This supersector of service providing industries will be used to calculate percent of total tourism economies for proposed study locations identified above. Table 2 displays county level BLS data for total employed workers, resident workers in the Leisure and Hospitality supersector, and the percentage of these workers of total employment. The mean percentage of resident workers in Leisure and Hospitality for these selected micropolitan areas is 18.1%, while the national mean across all jurisdictions is 10.6%. The percent of total workforce in leisure and hospitality range from 3.4% (Los Alamos, NM) to 36.8% (Edwards, CO). The top counties in terms of percent of total workforce in leisure and hospitality also coincide with several of the most renowned U.S. ski resorts (See Table 1). A few notes on this data are necessary. Total private employment has been cited in this research for calculating the percentage of leisure and hospitality workers. Moreover, totals for national and county level employment included non-farm data. Figure 1 displays the distribution of these figures for these twenty MSA areas. The histogram shows the data is skewed to the right, which mean it is likely that several larger values are skewing the mean toward these higher values. Reviewing the median employment in Leisure and Hospitality sectors (15%) for the 20 possible study areas supports this finding.
Micropolitian Statistical Areas (MSA) Counties that Comprise MSA Resort(s)
Edwards, CO EagleBeaver Creek Resort; Vail Ski Resort
Durango, CO La PlataDurango Mountain Resort; Hesperus Ski Area
Steamboat Springs, CO RouttHowelsen Ski Area; Steamboat Ski Resort
Edwards-Glenwood Springs, CO CBSA Eagle; Garfield Sunlight Mountain Resort
Hailey, ID Blaine; CamasBald Mountain; Rotarun; Soldier Mountain; Sun Valley
Rexburg, ID Jefferson; Madison Kelly CanyonSandpoint, ID Bonner Schweitzer MountainTwin Falls, ID Twin Falls Magic MountainBurley, ID Cassia PomerelleMountain Home, ID Elmore Maverick MountainBozeman, MT Gallatin Big Sky; Bridger BowlHelena, MT Lewis and Clark Great Divide
Kalispell, MT Flathead Big Mountain; Blacktail MountainLos Alamos, NM Los Alamos Pajarit Mountain
Taos, NM TaosRed River Ski Area; Sipapu; Taos Ski Valley
Alamogordo, NM Otero Ski CloudcroftCedar City, UT Iron Brian Head
Summit Park, UT SummitDeer Valley; Park City Mountain Resort
Jackson, WY-ID Teton, ID; Teton, WYGrand Targhee; Jackson Hole Mountain Resort; Snow King
Laramie, WY Albany Snowy Range
304
Table 2: Tourism Workforce by Selected Counties and Associated County
Figure 1: Percentage of Total Workers in Tourism Services (BLS 2014) To review, available case study locations had thus been narrowed according to the following criteria:
1. A list of ski resorts was compiled and cross referenced with counties that also included a Micropolitan Statistical Area in the Rocky Mountain Region;
2. For these locations, the percentage of the tourism economy employment was computed to allow for comparison;
3. This resulted in 20 possible case study locations. (Table 3) Examining all of these locations is beyond the scope of this study but several can be excluded in order to narrow the focus of this research once more. Summit Park County, UT can be excluded due to its proximity to Salt Lake City, a major urban area. Like Summit Park County, Edwards and Glenwood Springs Counties comprise a combined statistical area. This factor was considered when examining possible study area locations and ultimately was a contributing factor in the decision to exclude these areas from this research. The locations below the national mean and area median percentages for Leisure and Hospitality workers were also not to be considered. Teton County, Idaho and Wyoming were eliminated due the complex nature of the two state relationship of this micropolitan area. Table 4 details the reason specific locations were excluded from this study. After excluding 14 locations, six possible options remain scattered across five states (Table 5).
305
Table 4. Possible Study Area Locations and Reasons for Exclusion
Table 5: Possible Case Study Selection Locations On some level all selection criteria are subjective, however by following this aforementioned process it is now possible to propose which locations will allow for the use of a replicative case study design. Due to exclusions already discussed and complicating factors present in several of these remaining possible study area locations, this list can be further trimmed. Taos County was excluded from this research as a result of the unique geographic landscape surrounding the resort area that may disparately impact efforts in affordable housing. Finally, if literal replication is to occur, only three possible Counties remain clear options to pursue as case study locations: La Plata County, CO; Flathead County, MT and Gallatin County, MT. These locations are similar enough to each other in percentage of tourism employment and their rural nature to make them appropriate to conduct an analysis of regional coordination. Due to a desire to mediate as many differences in overarching policies that govern housing, the fact that two possible options are in the same state presents an attractive path forward. As a result, the case study locations selected were Gallatin County, MT and Flathead County, MT. 5.4 Precision in the Methods of Study In order to examine the “plausible relationships” regarding regionalism and housing, a comparative case study review was selected (Babbie, 2007; Yin, 2009). As has been articulated throughout this report, this research is meant to look at the nexus of workforce housing and
Micropolitian Statistical Area (County or Counties that Comprise MSA)
Percent of Total Workforce in Leisure and Hospitality (BLS 2014) Reason excluded
1. Edwards, CO (Eagle County) 36.8% CSA component2. Summit Park, UT (Summit County) 36.5% CSA component3. Jackson, WY-ID (Teton County, WY and Teton County, ID) 36.1% MSA lies in two states4. Taos, NM (Taos County) 26.6%5. Edwards-Glenwood Springs CSA, CO (Eagle and Garfield Counties) 25.9% CSA component6. Steamboat Springs, CO (Routt County) 25.7%7. Hailey, ID (Blaine and Camas Counties) 24.8%8. Kalispell, MT (Flathead County) 17.0%9. Bozeman, MT (Gallatin County) 16.3%10. Durango, CO (La Plata County) 16.2%11. Laramie, WY (Albany County) 13.8% Below median value12. Cedar City, UT (Iron County) 13.6% Below median value13. Sandpoint, ID (Bonner County) 13.4% Below median value14. Mountain Home, ID (Elmore County) 10.7% At or below national mean value15. Helena, MT (Lewis and Clark County) 10.5% At or below national mean value16. Alamogordo, NM (Otero County) 9.9% At or below national mean value17. Twin Falls, ID (Twin Falls County) 9.6% At or below national mean value18. Rexburg, ID (Jefferson and Madison Counties) 8.3% At or below national mean value19. Burley, ID (Cassia County) 6.3% At or below national mean value20. Los Alamos, NM (Los Alamos County) 3.4% At or below national mean value
Micropolitian Statistical Area (County or Counties that Comprise MSA)
Percent of Total Workforce in Leisure and Hospitality (BLS 2014)
Taos County, NM 26.6%Routt County, CO 25.7%Blaine and Camas Counties, ID 24.8%Flathead County, MT 17.0%Gallatin County, MT 16.3%La Plata County, CO 16.2%
306
regional actions (Chart 1). In order to study the nature of this relationship, the collection of qualitative data was required in order to allow for discussion and comparison. Robert Yin’s data collection concepts guided the data gathering process for this research (2009), with in-person and limited phone interviews serving as the primary data collection method. Focus groups of significant housing consumer classes were also held to increase the quality of the findings. Once these interviews were completed and transcribed, the process by which this occurred is detailed below, it was possible to assign responses into a case study database that make it possible to analyze and compare data. Candidates for interviews were derived from the aforementioned detailed study of research and personal experience in these areas. These candidates came from specific classes that were developed in consultation of relevant literature as well as feedback made with contacts in these locations. This latter step allowed for snowball sampling, and increased the representation of actors in case study locations. The classes of actors interviewed included actors that were designated as follows:
• Housing Policy; • Planning; • Employers (Service Sector, Public Sector, and Other Large Area Employers); • Development/Construction/Architecture or Engineering firms; • Economic Development; • And Focus Groups of housing consumers.
Each of these classes of primary actors is to be represented by at least one participant from the case study counties. Interviews with secondary actors, such as with non-tourism sector employers with large employee bases or focus groups of area employees, was also included when possible. Definitions of each of these actor classes also helps to clarify why each was consulted. Housing policy officials are those whose primary role is related to housing in the case study areas or at the State level. These are primarily non-profit, public, or private entities that are engaging in construction of housing options or are sanctioned as an official actor on housing policy. In the popular lexicon of housing policy, housing authorities or Habitat for Humanity could be considered ubiquitous entities in most communities, however these examples should not be considered exhaustive representation of the group nor should it be assumed that each is represented in each case study area (e.g. housing authorities are not present in every area covered by the selected case study counties). Planning actors are those that are primarily employed in established public land use planning agencies or private consulting firms. Employers is a broad category of candidates that can be further distilled down to their representative industries. For this study employers were selected to represent the Leisure and Hospitality sector for the resorts and service employers, essential employers such as the hospitals and schools, and additional large area employers as timing allowed. The Development community was represented in these interviews with area advocates for the builders, as well as architects and housing construction entities that were building affordable housing in the case study locations. Economic Development officials consulted included public and private agencies whose primary focus is in business development and who represented local business interests. Chambers of Commerce, for example, were classified under this heading as well.
307
Finally, focus groups were convened using snowball sampling for service sector employees and essential employees for each of the case study areas. These focus groups were used to compliment expected outcomes from discussions with primary actors in order to provide more context to ongoing housing actions in these case study locations. 5.5 Authenticity in Conducting Qualitative Research Before moving on to proposed research methods it is important to briefly highlight the need for authenticity when conducting interviews in qualitative research. This inherent requirement is related to the researchers’ ability to engage the relevant stakeholders and provide assurances that the responses gathered have validity as well as confidentiality. J. Dwight Hines points out, like other researchers before him, that it is not possible to simply show up in rural resort communities in the West and expect residents to be inviting or eager to participate in research (2010; Yodanis, 2006). In order to mitigate this limit on qualitative analysis personal connections are key (Hines, 2010). This research relied heavily on previously established connections made from time living in Western resort areas. Moreover, these initial contacts contributed toward a snowball sampling method that secured additional participation in interviews and focus groups. 5.6 Collection Methods Interviews were held in-person in Montana for the vast majority of these exchanges. In a situation where an in-person interview was not possible, phone interviews were conducted as an alternative. Interviews were recorded for reference and response coding. A list of the initial research interview frame is detailed in Appendix 1, while specific interview frames for each actor class are covered in Appendix 2 – 6. The focus group questions as well as the focus group survey are included in Appendix 7 – 8. The outcomes of the focus group surveys are also included in the Appendix and were meant as further frames to this study. These outcomes will not be discussed in the findings section of this research. The findings of these interviews were assigned to a case study database and assignment to this case study database is discussed below. In order to protect anonymity which ensured higher levels of participation in the research, quotes have not been attributed to individuals in the findings. Data will also be aggregated and suppressed as needed in order to ensure personal protection. The interview protocols were submitted and approved according the prescribe Institutional Review Board (IRB) procedures for Clemson University. Interviews were held in Gallatin County and Flathead County over the course of 10 days in late February and early March, 2016. Interviews were conducted primarily during normal expected business operating hours, with focus groups held after hours to ensure robust participation. Each interview lasted approximately an hour and focus groups were slightly longer at about an hour-and-a-half each. The types of questions selected for these interviews were a combination of open- and closed-ended questions (Bernard and Ryan, 2009). Interview candidates from each of the designated actor classes was assured before conducting the field research of their anonymity. Interview were intended to be recorded using a voice recorder specifically designated for this purpose, however technical issues necessitated that an Apply iPhone using the Voice Memo application be substituted instead. One interview was lost due to a technical error. Table 6 details the contributors to this study in more detail. At least one representative from each actor class was secured, thus offering more assurances in the documented outcomes. Probing for responses primarily involved the use of the “uh-huh” and the “tell-me-more” methods discussed by Bernard and Ryan (2009).
308
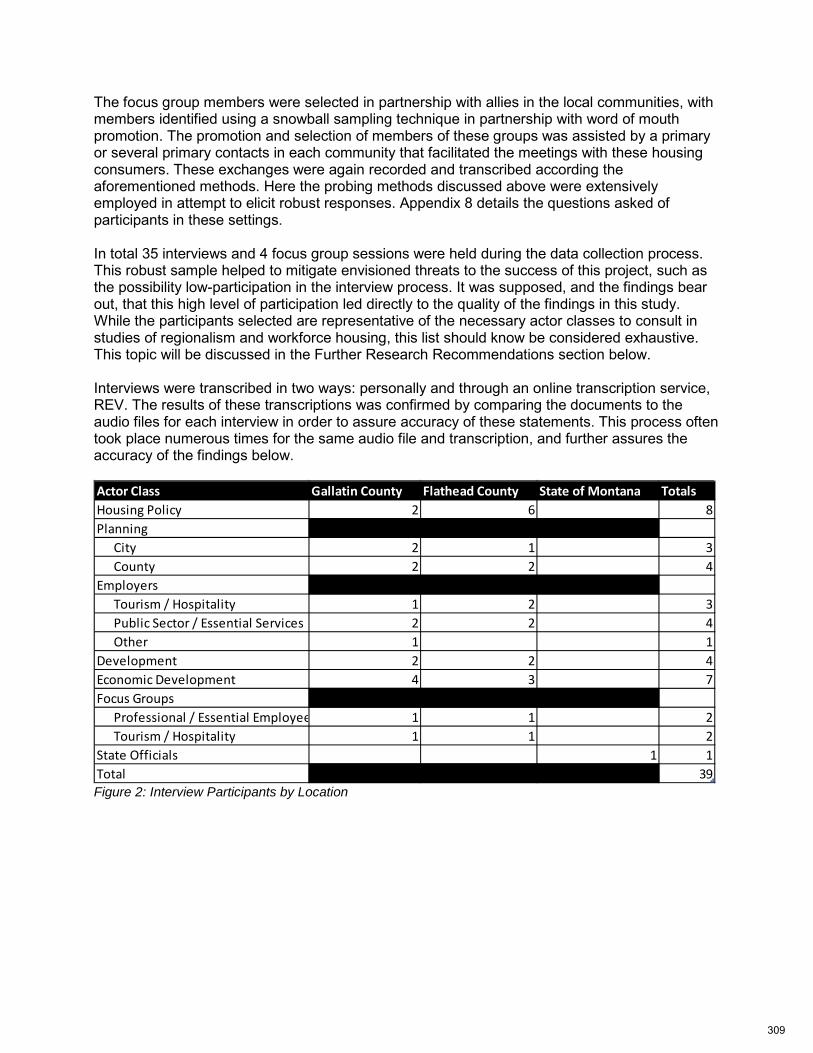
The focus group members were selected in partnership with allies in the local communities, with members identified using a snowball sampling technique in partnership with word of mouth promotion. The promotion and selection of members of these groups was assisted by a primary or several primary contacts in each community that facilitated the meetings with these housing consumers. These exchanges were again recorded and transcribed according the aforementioned methods. Here the probing methods discussed above were extensively employed in attempt to elicit robust responses. Appendix 8 details the questions asked of participants in these settings. In total 35 interviews and 4 focus group sessions were held during the data collection process. This robust sample helped to mitigate envisioned threats to the success of this project, such as the possibility low-participation in the interview process. It was supposed, and the findings bear out, that this high level of participation led directly to the quality of the findings in this study. While the participants selected are representative of the necessary actor classes to consult in studies of regionalism and workforce housing, this list should know be considered exhaustive. This topic will be discussed in the Further Research Recommendations section below. Interviews were transcribed in two ways: personally and through an online transcription service, REV. The results of these transcriptions was confirmed by comparing the documents to the audio files for each interview in order to assure accuracy of these statements. This process often took place numerous times for the same audio file and transcription, and further assures the accuracy of the findings below.
Figure 2: Interview Participants by Location
Actor Class Gallatin County Flathead County State of Montana TotalsHousing Policy 2 6 8Planning
City 2 1 3County 2 2 4
EmployersTourism / Hospitality 1 2 3Public Sector / Essential Services 2 2 4Other 1 1
Development 2 2 4Economic Development 4 3 7Focus Groups
Professional / Essential Employee 1 1 2Tourism / Hospitality 1 1 2
State Officials 1 1Total 39
309
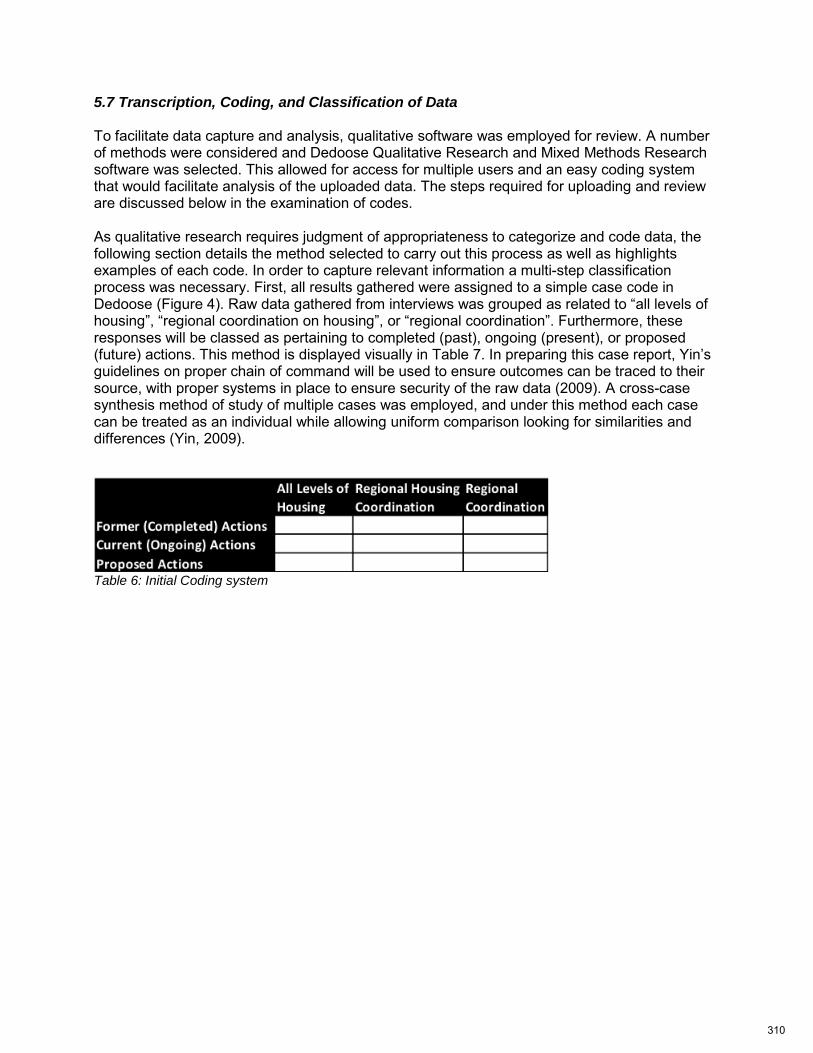
5.7 Transcription, Coding, and Classification of Data To facilitate data capture and analysis, qualitative software was employed for review. A number of methods were considered and Dedoose Qualitative Research and Mixed Methods Research software was selected. This allowed for access for multiple users and an easy coding system that would facilitate analysis of the uploaded data. The steps required for uploading and review are discussed below in the examination of codes. As qualitative research requires judgment of appropriateness to categorize and code data, the following section details the method selected to carry out this process as well as highlights examples of each code. In order to capture relevant information a multi-step classification process was necessary. First, all results gathered were assigned to a simple case code in Dedoose (Figure 4). Raw data gathered from interviews was grouped as related to “all levels of housing”, “regional coordination on housing”, or “regional coordination”. Furthermore, these responses will be classed as pertaining to completed (past), ongoing (present), or proposed (future) actions. This method is displayed visually in Table 7. In preparing this case report, Yin’s guidelines on proper chain of command will be used to ensure outcomes can be traced to their source, with proper systems in place to ensure security of the raw data (2009). A cross-case synthesis method of study of multiple cases was employed, and under this method each case can be treated as an individual while allowing uniform comparison looking for similarities and differences (Yin, 2009).
Table 6: Initial Coding system
310
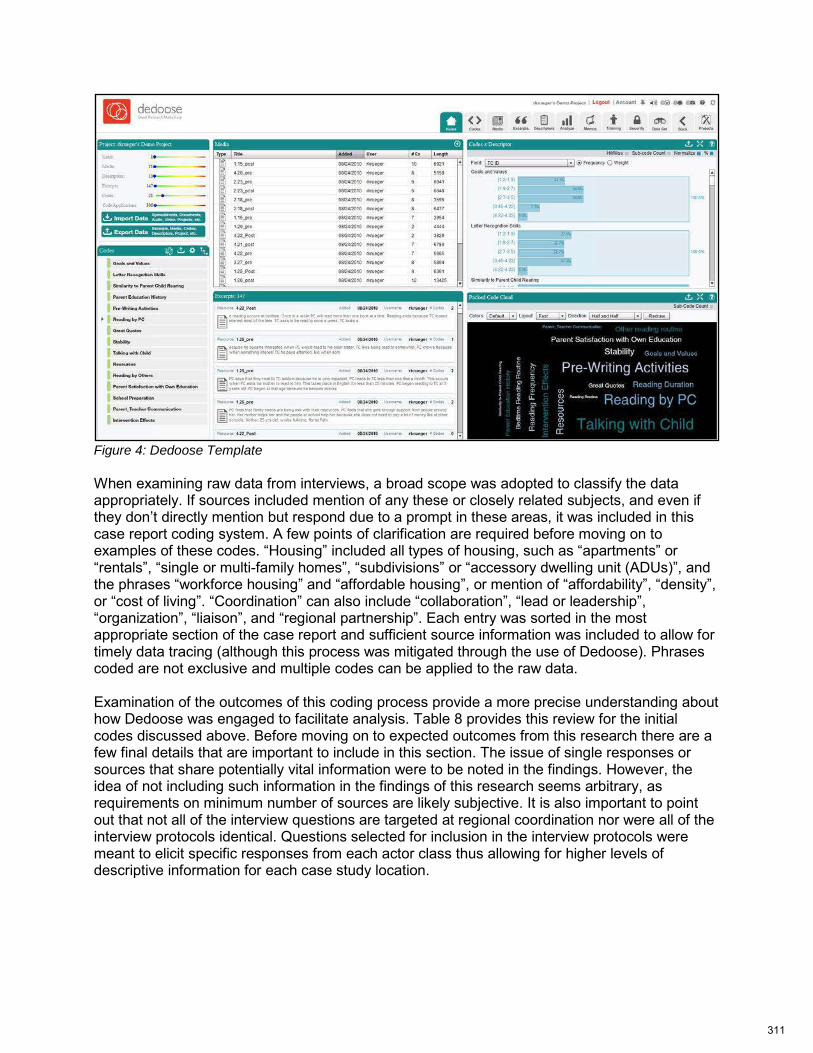
Figure 4: Dedoose Template When examining raw data from interviews, a broad scope was adopted to classify the data appropriately. If sources included mention of any these or closely related subjects, and even if they don’t directly mention but respond due to a prompt in these areas, it was included in this case report coding system. A few points of clarification are required before moving on to examples of these codes. “Housing” included all types of housing, such as “apartments” or “rentals”, “single or multi-family homes”, “subdivisions” or “accessory dwelling unit (ADUs)”, and the phrases “workforce housing” and “affordable housing”, or mention of “affordability”, “density”, or “cost of living”. “Coordination” can also include “collaboration”, “lead or leadership”, “organization”, “liaison”, and “regional partnership”. Each entry was sorted in the most appropriate section of the case report and sufficient source information was included to allow for timely data tracing (although this process was mitigated through the use of Dedoose). Phrases coded are not exclusive and multiple codes can be applied to the raw data. Examination of the outcomes of this coding process provide a more precise understanding about how Dedoose was engaged to facilitate analysis. Table 8 provides this review for the initial codes discussed above. Before moving on to expected outcomes from this research there are a few final details that are important to include in this section. The issue of single responses or sources that share potentially vital information were to be noted in the findings. However, the idea of not including such information in the findings of this research seems arbitrary, as requirements on minimum number of sources are likely subjective. It is also important to point out that not all of the interview questions are targeted at regional coordination nor were all of the interview protocols identical. Questions selected for inclusion in the interview protocols were meant to elicit specific responses from each actor class thus allowing for higher levels of descriptive information for each case study location.
311
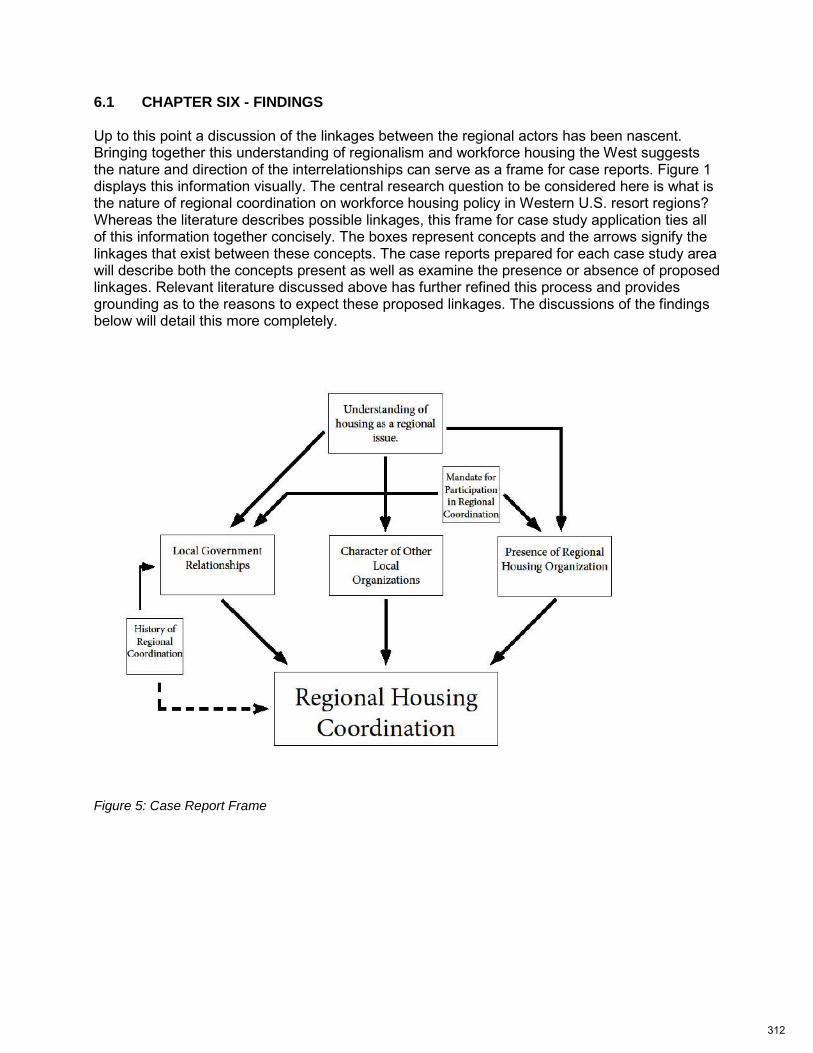
6.1 CHAPTER SIX - FINDINGS Up to this point a discussion of the linkages between the regional actors has been nascent. Bringing together this understanding of regionalism and workforce housing the West suggests the nature and direction of the interrelationships can serve as a frame for case reports. Figure 1 displays this information visually. The central research question to be considered here is what is the nature of regional coordination on workforce housing policy in Western U.S. resort regions? Whereas the literature describes possible linkages, this frame for case study application ties all of this information together concisely. The boxes represent concepts and the arrows signify the linkages that exist between these concepts. The case reports prepared for each case study area will describe both the concepts present as well as examine the presence or absence of proposed linkages. Relevant literature discussed above has further refined this process and provides grounding as to the reasons to expect these proposed linkages. The discussions of the findings below will detail this more completely.
Figure 5: Case Report Frame
312
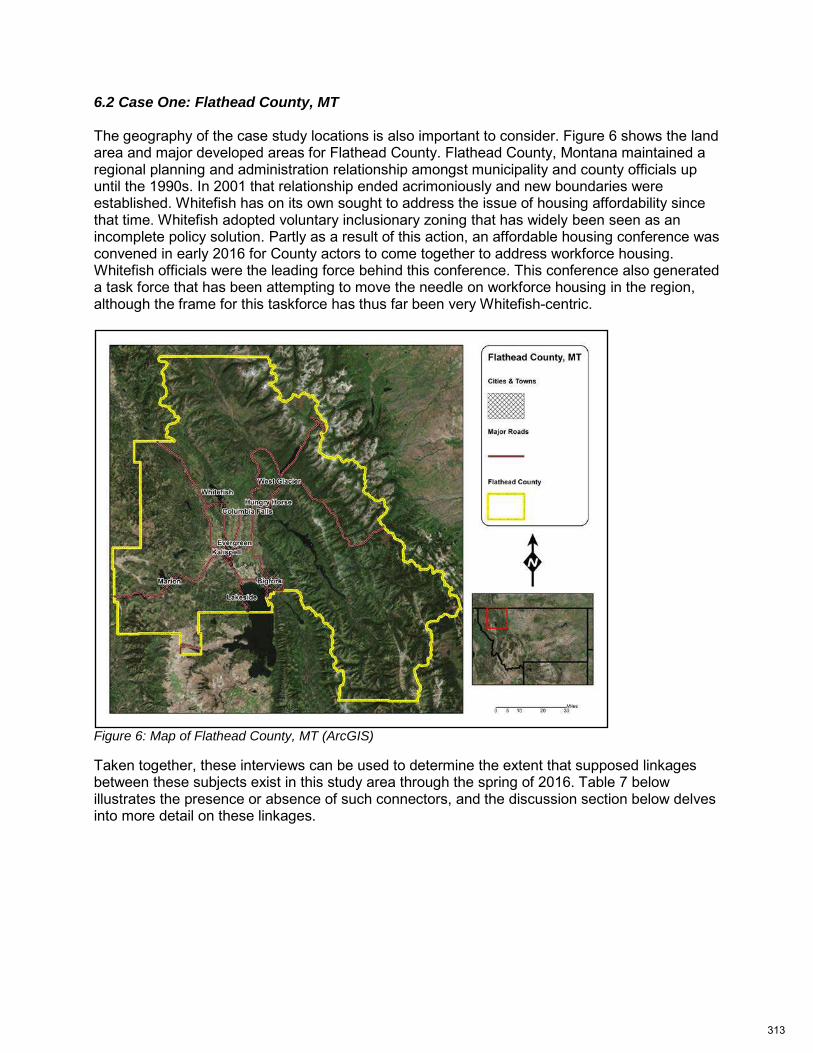
6.2 Case One: Flathead County, MT The geography of the case study locations is also important to consider. Figure 6 shows the land area and major developed areas for Flathead County. Flathead County, Montana maintained a regional planning and administration relationship amongst municipality and county officials up until the 1990s. In 2001 that relationship ended acrimoniously and new boundaries were established. Whitefish has on its own sought to address the issue of housing affordability since that time. Whitefish adopted voluntary inclusionary zoning that has widely been seen as an incomplete policy solution. Partly as a result of this action, an affordable housing conference was convened in early 2016 for County actors to come together to address workforce housing. Whitefish officials were the leading force behind this conference. This conference also generated a task force that has been attempting to move the needle on workforce housing in the region, although the frame for this taskforce has thus far been very Whitefish-centric.
Figure 6: Map of Flathead County, MT (ArcGIS)
Taken together, these interviews can be used to determine the extent that supposed linkages between these subjects exist in this study area through the spring of 2016. Table 7 below illustrates the presence or absence of such connectors, and the discussion section below delves into more detail on these linkages.
313
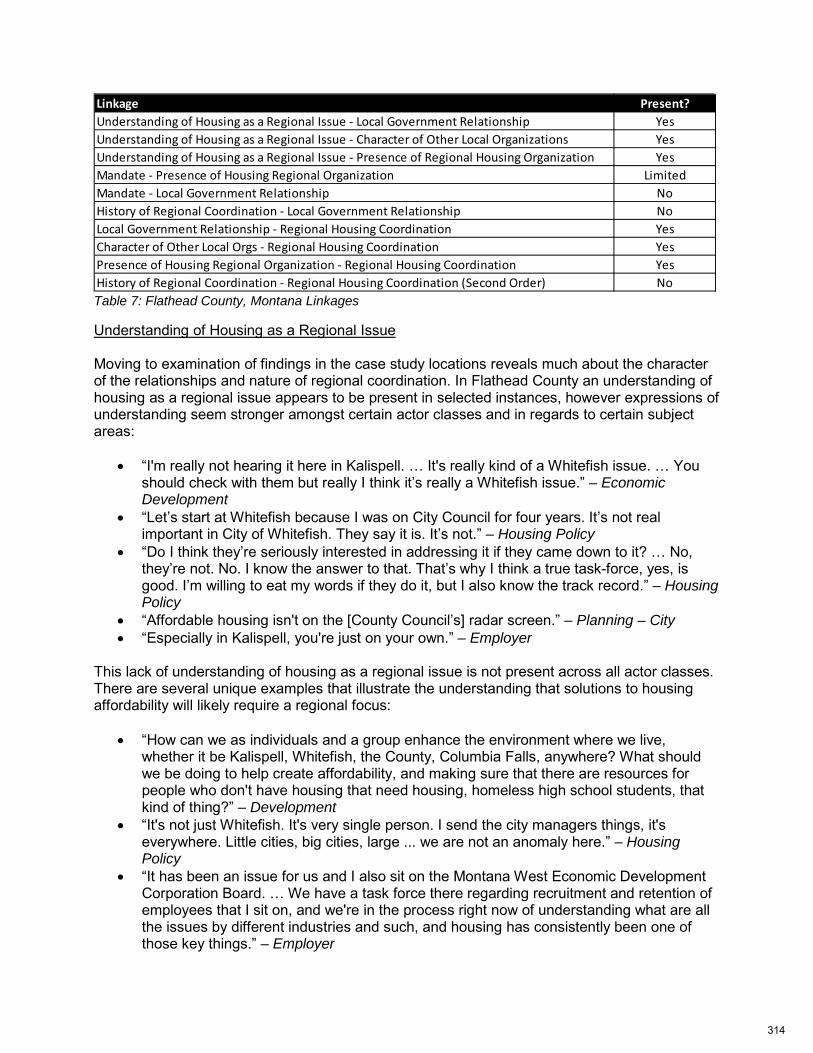
Table 7: Flathead County, Montana Linkages
Understanding of Housing as a Regional Issue Moving to examination of findings in the case study locations reveals much about the character of the relationships and nature of regional coordination. In Flathead County an understanding of housing as a regional issue appears to be present in selected instances, however expressions of understanding seem stronger amongst certain actor classes and in regards to certain subject areas:
• “I'm really not hearing it here in Kalispell. … It's really kind of a Whitefish issue. … You should check with them but really I think it’s really a Whitefish issue.” – Economic Development
• “Let’s start at Whitefish because I was on City Council for four years. It’s not real important in City of Whitefish. They say it is. It’s not.” – Housing Policy
• “Do I think they’re seriously interested in addressing it if they came down to it? … No, they’re not. No. I know the answer to that. That’s why I think a true task-force, yes, is good. I’m willing to eat my words if they do it, but I also know the track record.” – Housing Policy
• “Affordable housing isn't on the [County Council’s] radar screen.” – Planning – City • “Especially in Kalispell, you're just on your own.” – Employer
This lack of understanding of housing as a regional issue is not present across all actor classes. There are several unique examples that illustrate the understanding that solutions to housing affordability will likely require a regional focus:
• “How can we as individuals and a group enhance the environment where we live, whether it be Kalispell, Whitefish, the County, Columbia Falls, anywhere? What should we be doing to help create affordability, and making sure that there are resources for people who don't have housing that need housing, homeless high school students, that kind of thing?” – Development
• “It's not just Whitefish. It's very single person. I send the city managers things, it's everywhere. Little cities, big cities, large ... we are not an anomaly here.” – Housing Policy
• “It has been an issue for us and I also sit on the Montana West Economic Development Corporation Board. … We have a task force there regarding recruitment and retention of employees that I sit on, and we're in the process right now of understanding what are all the issues by different industries and such, and housing has consistently been one of those key things.” – Employer
Linkage Present?Understanding of Housing as a Regional Issue - Local Government Relationship YesUnderstanding of Housing as a Regional Issue - Character of Other Local Organizations YesUnderstanding of Housing as a Regional Issue - Presence of Regional Housing Organization YesMandate - Presence of Housing Regional Organization LimitedMandate - Local Government Relationship NoHistory of Regional Coordination - Local Government Relationship NoLocal Government Relationship - Regional Housing Coordination YesCharacter of Other Local Orgs - Regional Housing Coordination YesPresence of Housing Regional Organization - Regional Housing Coordination YesHistory of Regional Coordination - Regional Housing Coordination (Second Order) No
314

• “I’m happy with the way council has reacted to this and with the involvement that they’ve had personally on the process. The Mayor and three Councilors participated one-way shape or form on the taskforce or one of its committees. They’re all actively participating. I’m convinced of their true concern about the issue. I’m convinced of their true concern for the welfare of Whitefish as a community. That’s very encouraging.” – Economic Development
There also appear a number of reasons that this understanding has evolved:
• “At this point in time in Whitefish, again, the people who are concerned about it are the business people, the people who understand where the community is going in terms of how we're kind of shutting out diversity. If we don't do something about the housing situation, the difficulty in hiring people, and the premium wages that have to be paid ... Even at that, like we discussed earlier in this conversation, the market may not be serving that niche, even with a higher salary.” – Development
• “Columbia Falls is our bedroom community for Whitefish for sure, but also including Happy Valley and parts of Kalispell.” – Focus Group
• “I witnessed a pretty bad car accident and 911 was called immediately and it was at least almost 30 minutes before anybody could get there because they didn't live close to where the ambulances were and the other thing was ... the fire station could only afford to keep 3 [emergency personnel] on. They needed 2 ambulances and we asked this one woman who came and she said I'm in EMT but I'm off duty but I'm here, I'll do whatever I can do. We asked her what was the deal and she said that's the deal. Number one, no one has anywhere to live.” – Housing Policy
This understanding that housing solutions require regional participation is seemingly growing amongst many of the agencies operating in the County, however the public may not share this consideration:
• “People have the ability to build affordable housing in Whitefish and they're not taking advantage of it, or it's just too much of a process to fight if it's not worth it for them because you're dealing with neighborhood backlash too.” – Housing Policy
• “Some of the people that are the biggest complainers, that are the biggest people who are concerned about this, are people who have moved here recently. I get frustrated with that concern, because it's like, you moved here because you understood that this is a cool community filled with golf courses and fishing guides and rafting and skiing, the parks, and all the things that are here, but those things can only exist in a way that you want to want to participate in them if there are good employees working there.” – Employer
• “Another issue is that nobody wants ... Well, nobody wants affordable housing in their backyard.” – Housing Policy
• “A lot of the challenges I think generally … is the private property rights attitude. … ‘Don't tell me what I can do on my property, but by the way, my neighbor is pissing me off’.” – Planning – City
Mandate for Participation in Regional Coordination
Administrative or legal mandates are also important to consider when examining the operational nature of regional coordination. In Flathead County outcomes from previous policy actions related to housing affordability have been questioned:
315
• “How the city is helping us and how the community is helping us and has tried to in the past is through our original voluntary inclusionary zoning. If you understand the definition of that we've received very little from that. It doesn't work.” – Housing Policy
• Speaker 1: “[Policies in place that are helping address workforce housing?] A big fat zero.” Speaker 2: “There's none.” – Housing Policy
The lack of coercive elements or penalties for non-compliance (e.g. conditioning permit approval on specific affordable housing dedications) appear to be a limiting factor in the effectiveness of mandates specifically related to housing affordability:
• “Because it is voluntary, they say ‘yes’ to get things approved, and then it always changes. If it was mandatory instead of voluntary…or even if they're not going to go ahead, and they're not going to be doing the affordable housing, at least if there's a larger penalty for not doing it.” – Housing Policy
• “There was an opportunity where he was going to be building a new development, and it was a suggestion of the city, ‘Can you set aside some for affordable housing?’ And they come to the City Council meeting, and they say that they're going to do that, and the project gets approved, but there's no penalty, or there's nothing to stick to them, to say you have to do this. They say that they're going to have affordable housing in the project, and then it gets approved, and then once the project is going they say, ‘It's actually not going to be profitable for us to do this, it's going to be more complicated’. They go ahead and they don't do it at all. That's what seems to happen to us, as we see opportunities where we go, ‘Oh my gosh, this will be great. There's going to be a developer coming in who promises there's going to be affordable housing’, so we can get excited, and our board members can go, ‘I know him, I can give him a call,’ and then it never works out.” – Housing Policy
Enforcement is cited as a factor in the development of affordable housing options:
• “Oh, enforcement is a huge lack. You can see houses where the roofs have fallen in in neighborhoods. The City of Kalispell won't enforce it unless somebody complains.” – Economic Development
It is unclear if a policy mandate or increased enforcement would effectively mitigate some of the challenges witnessed in building more affordable housing options, however it seems the free market may not be an adequate driver on its own:
• “The issue is, in my mind, it's simply the size of the houses that we're building. It's really that simple. We're not focused on building smaller houses. We're not building 1,000 square foot houses. We're not.” – Housing Policy
Local Government Relationships
The nature of local governmental relationships in Flathead County appears to be fragmented. Interviews also revealed a history of negativity:
• “Now Whitefish is just at the city limits. They have no relationship outside the city limits and they have a foul relationship with the County Commissioners because of that. Whitefish has always been aggressive. We're going to chart our own course. They got slapped.” – Planning – City
316

• “Columbia Falls is suing because they're taking … Whitefish's workers, workforce, because they can't afford to live in Whitefish.” – Housing Policy
Government relationships may also be outright inefficient:
• “No I was really glad that the chair of the County Commissioners came to an open house … a few weeks ago because we are trying to get them to write a letter of support for our tax credit application ... [someone] at the County had to go through [someone] else. [One] wrote the letter and [the other] massaged the letter and then took it to County Commissioners because [they] knew [that] Commissioner wouldn't sign the type of letter we originally wanted [them] to sign.” – Housing Policy
In a somewhat expected outcome, it seems that the relationships are fluid and can be altered by new administrations or officials:
• “Our last mayor had no faith in the Land Trust so [they] would always give push-back. The mayor before that…was really into it, was really into any types of housing and [they have] even been the one who's done the big push for putting housing in over a lot of the commercial spaces here in downtown.” – Housing Policy
It does seem, however, that new actions, such as the ongoing Workforce Housing Task Force, are seeking to remedy past schisms in agency relationships:
• “Honestly, the City of Whitefish doesn't really agree on much, and this has actually brought together businesses that I wouldn't necessarily think would sit together in a room.” – Employer
• “I think what they're doing is great, I think all of the different parts, having the city manager there, having Council people there, and the Chamber's involvement. You have everybody in both Kalispell and Whitefish housing authorities, so it's finally putting everybody in one room and saying, ‘Yes, we all deal with this,’ and we've all been going on and saying we have this problem, but now it's actually doing something about it. I think it will be productive.” – Housing Policy
Such actions, while encouraging on their face, may not be as inclusive as need be for a long-term regional outcome from this task force:
• “[How involved are we with the Housing Task Force?] Not at all.” – Planning – County And they may ignore the political realities on the ground:
• “The focus of our entire Council is not there. Politically I don't see it happening here.” – Planning – County
Character of Other Local Organizations The character of local organizations in addition to regional housing groups illustrates the limits of current capacity to take on new challenges, such as leadership for a regional coordinating agency:
317
• “I don't think a Chamber could provide a regional leadership role because we have six Chambers of Commerce, so I think that makes a statement in itself.” – Economic Development
• “The county level is very conservative. If you talk to them, if you go before the County Commissioners and then you go before City Council here, you get a whole different read from City Council here than you do [the County].” – Housing Policy
• “I guess the only thing I would add is if that regional organization that we talked about at the outset, that does not exist, if that did exist, if we had some umbrella organization, even if it were only a communication platform, for people to talk to each other, I think our job would be easier, but we don't and it is what it is.” – Planning – City
Leadership for such regionally coordinated efforts has thus far come as an ad-hoc development:
• “The Whitefish Chamber of Commerce raised their hand and they said, ‘We will take the leadership role as long as all the rest of you, the business community, Montana West, the City, will sit at the table with us and collaborate and give support. Somebody needs to take the leadership role and lead this effort.’ They raised their hand, and so because they raised their hand, we're supporting it.” – Economic Development
The application of regionalism, especially in regards to planning and housing policy, is not assured and recent developments seem to be the most robust action on these fronts in many years:
• “The community and the region is involved. Everybody's talking about it. They're not just talking. They created something. They got this task force together, invited the correct people, are working towards, ... especially with the PR people ... working towards getting the world out there. Getting the community to understand what the definition of affordable housing is. What we're trying to create.” – Housing Policy
Presence of Regional Housing Organization There are regional housing organizations and associated programs that seem to be effective currently at addressing housing affordability in the region:
• “What we now have is we started our land trust. We are not a typical land trust program, as we were developing our documents. The lending institutions found it difficult. It was just difficult to separate land from home. This is Montana. …We decided at the time to stay with a deed-restricted program.” – Housing Policy
• “Community Action Partnership (CAP) is the one, and that's who we utilize. We send our families to their programs to learn about housing, but that's the only ones that I know of.” – Housing Policy
• “[An organization that is really effective working on that regional level?] Undoubtedly, it [is] CAP.” – Housing Policy
And the use of these organizations as facilitators or coordinators is supported by some outside these groups, although the extent that these groups have the capabilities to take on an expanded role is uncertain:
• “For me, it would make sense to be able to put some pressure on an organization that has paid people.” – Development
318
History of Regional Coordination Regional coordination in Flathead County is not unheard of, although its primary use seems to be in relation to economic development:
• “With a county to the south of us, Lake County, we participated in funding the fiber [optic] in Lake County going through Flathead County and up into Lincoln County from an internet service provider that's headquartered in Lake County.” – Employer
• “We launched an effort, three or four years ago to put together a community organization to promote additional air service to the valley, and again, in a regional approach. It certainly benefits Whitefish directly, because we were finding ourselves in a position where we have lots of large ski groups who would like to come up here in the winter time, … the ski season is our second most important fast of the tourism economy here. One that we have a lot of room for growth. Ski groups from across the country, they have a difficult time getting here, because of the limited air capacity we have coming in and it’s fairly expensive. … We launched an effort to try and to diversify that a little bit, to trend in the industry. … We’ve put together, our organization team with, I think, there’s 19 other folks on the board of directors of another [group] … called “Glacier Aerial”. It’s basically a regional group of Chamber folks but business people as well.” – Economic Development
• “Montana West Economic Development is a regional organization that has most of the major employers who are members and sit on the board. There's a board and an executive board. [They] have determined affordable housing is not something that [they] are going to take the lead on, but we're going to monitor it as part of this task force.” – Employer
Regional Housing Coordination Regional efforts to address housing has not seen the same level of use as it has for economic or community development, with recent actions dominating the bulk its application:
• “Like I said, if you had come last year at this time, nothing was happening. Everybody knew there was an issue, but absolutely no meetings. Last summer, when we had that housing summit, it was the first time that I had met most of the different groups. … I know some people are a little bit more familiar, but it's one of those things where it takes one person to say, "We need to have a meeting about this," and bring people together.” – Housing Policy
Regionally coordinated efforts addressing workforce housing are developing but it seems there still may be territorial disputes, confusion as to the extent of the region to be included in studies and policy applications, and misunderstandings on what constitutes success:
• “Oh, and the other issue that we had that there was territorial boundaries in a sense. …I'm not going to go into a community where I'm not welcomed. If they don't want me there, I'm not going to go there.” – Housing Policy
• “My hope was that it would be regional, but Whitefish is really the only community that is putting a priority on this. The other communities, Kalispell and Columbia Falls, this has not, this is not a priority, or if it is, we haven't heard that it is.” – Economic Development
• “All they do is talk about it. Seriously, every year you probably see it covered. Every two years, all they do is talk about it, but there's nothing ever done about it.” – Development
319

It seems certain that confidence in the capabilities of local efforts has influenced decisions on future efforts:
• “One of the keys is because it affects the central workers and the employers, the city Chamber of Commerce, economic development organization, and business have come together to collaborate to create what they call a “Workforce Housing Task Force”. And the Housing Authority as well is included. They would like to have a strategic plan. They do understand, the city understands that their voluntary zoning requirements are not working. They are reaching out to hire a professional to give them guidance and options of what they can adopt and enforce to secure affordable housing.” – Economic Development
320
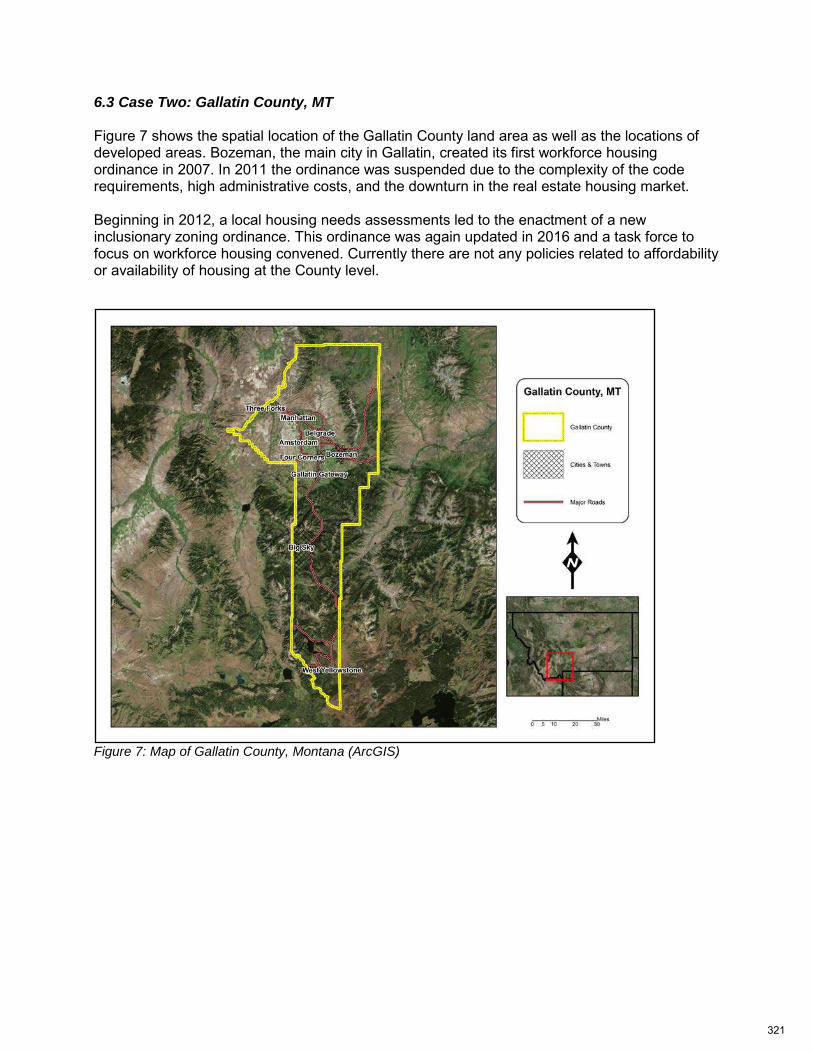
6.3 Case Two: Gallatin County, MT Figure 7 shows the spatial location of the Gallatin County land area as well as the locations of developed areas. Bozeman, the main city in Gallatin, created its first workforce housing ordinance in 2007. In 2011 the ordinance was suspended due to the complexity of the code requirements, high administrative costs, and the downturn in the real estate housing market. Beginning in 2012, a local housing needs assessments led to the enactment of a new inclusionary zoning ordinance. This ordinance was again updated in 2016 and a task force to focus on workforce housing convened. Currently there are not any policies related to affordability or availability of housing at the County level.
Figure 7: Map of Gallatin County, Montana (ArcGIS)
321
The linkages discovered in Gallatin County are highlighted in Table 8.
Table 8: Gallatin County, Montana Linkages
Understanding of Housing as a Regional Issue The understanding of housing as a regional issue in Gallatin County may be more ubiquitous than in Flathead. It was far less common to hear respondents here describe housing as confined to a specific geographic location. Only one response generated such comprehension:
• “Bozeman … they got a real problem over there.” – Planning – City In visualizing a continuum of affordable housing policy actions, Gallatin County would be on the other end of the spectrum from Flathead County. Gallatin County has already gone through its housing needs assessment and ordinance processes, while Flathead has just waded into those actions. Perhaps this has led policy makers to assume that the housing needs of the region have been addressed effectively by enactment of this new Bozeman-centric policy:
• Speaker 1: “We were really careful to caution the city about that because there was maybe some widespread idea that once you have housing ordinance you'll fix everything…” Speaker 2: “The Mayor actually said that we were going to take affordable housing off the agenda for next year.” Speaker 1: “[We hope he was kidding].” – Housing Policy
It also appears that certain sections of the community are not directly involved in the conversations regarding regional understanding of housing, and this could indicate that a holistic regional understanding of housing does not exist:
• “We did not have many developers who engaged in the process at all.” – Planning • “Also, in the affordable housing piece because that, that is, I think it's a squeamish area
for people in the business world. They acknowledge it. They know it's there, no one wants to talk that much about it.” – Housing Policy
However, with the ongoing conversations in Gallatin County, it is feasible that knowledge of housing as a regional influencer has begun to mature:
• “I think the community is pretty saturated with the affordable housing conversation.” – Housing Policy
Linkage Present?Understanding of Housing as a Regional Issue - Local Government Relationship YesUnderstanding of Housing as a Regional Issue - Character of Other Local Organizations NoUnderstanding of Housing as a Regional Issue - Presence of Regional Housing Organization YesMandate - Presence of Regional Housing Organization NoMandate - Local Government Relationship NoHistory of Regional Coordination - Local Government Relationship LimitedLocal Government Relationship - Regional Housing Coordination NoCharacter of Other Local Orgs - Regional Housing Coordination NoPresence of Regional Housing Organization - Regional Housing Coordination LimitedHistory of Regional Coordination - Regional Housing Coordination (Second Order) No
322
• “I think from our having this conversation at the City Commission at the local level, we're hearing from the hospital, we're hearing from the university, we're hearing from our larger employers that they struggle to bring in the employees that they want as a result of housing challenge.” – Housing Policy
Much like Flathead County, the citizenry appears to be the most vocal proponents to the creation of affordable housing and thus may not have bought into the idea of the need to address housing regionally. Blind NIMBYism may not be at work but some derivative of this way of thinking is possibly influencing action on housing affordability:
• “Even more so neighbors that don't want density. They are protecting their private property rights. They're worried about bad renters. That is the biggest thing we deal with. If someone comes in with a great idea and a bag of money, there's very few places to implement it.” – Development
• “The attitude of town is [it’s] not ... government's role is not to get involved in housing.” – Housing Policy
Mandate for Participation in Regional Coordination Administrative or legal mandates here are impactful on the operational nature of regional coordination and nature of relationships related to this factor. Affordable housing is a popular topic to include in guiding documents, such as comprehensive or growth management plans, but these documents may be doing little guiding in practice:
• "I mean [housing affordability] is something that is talked about in those [guiding] documents, [but] it has not significantly guided, no.” – Planning – County
Moreover, there exists little in the way of direct policy actions aimed at housing affordability outside Bozeman:
• “In our conversation both at the County level, Gallatin County level and at the City of Belgrade level, their housing policy, and in West Yellowstone, is really ineffective. It's basically not there. It's not a priority for the County to do anything on housing. City of Belgrade says, ‘Yeah, we need housing,’ but their growth policy doesn't specifically have any kind of policies that allow for any systemic growth or development of, quote, unquote, “workforce housing”. Town of West Yellowstone, their housing plan also says, ‘Yeah, housing is critical issue.’ It comes and goes but there's no comprehensive policy that the town is implementing that says, ‘A blighted cabin that's uninhabitable, we're just going to continue to let the owners sell it for a half a million dollars and we're not going to do anything about it.’ There aren't any specific policies in the communities that we're working with right now other than Bozeman.” – Housing Policy
A further limiting factor for regional coordination on housing is the differences in codes and their enforcement across municipal boundaries:
• “[We] would love to see some projects that are geared toward workforce housing in the County but we don't have regulations to mandate it.” – Planning – County
Current policy prescriptions appear confined to the central city of Bozeman:
323
• “You get a subsidy for impact fees, potential down payment assistance from the City, down payment assistance for your home.” – Planning – City
• “One of Bozeman's first attempts at creating more affordable housing was a restricted lot, restricted size unit ordinance.” – Housing Policy
At the same time these same policies may be further exacerbating the deficiencies in housing stocks:
• “I think there's the attempt to avoid inclusionary zoning, allowing contractors to pay their way out of having to build affordable housing, allows the city to get money but not the land. It's not the money that the city needs for housing. It's the land that the city needs for housing. If they pay $35,000 to the city, if they build 10 houses, it's easy for a contractor to put $3,500 worth of extra cost in any of those houses to recoup the $35,000. The way it's set up with them being able to buy their way out, there's really no incentive for that contractor to provide the land. … But if the city is really serious about workforce housing, I think they need to not provide an easy out. To me a $35,000 payment to address workforce housing is an easy out.” – Housing Policy
However, interest currently exists in creating additional market driven housing options that can be facilitated by changing policies or administrative framework:
• “Supposedly they're supposed to be the opportunity under this new policy or practice where you could have smaller lots to be able to put houses on. There's a big push [by the public] for small homes, 700 square feet, 600 and 800 square feet” – Housing Policy
Unlike nearby resort areas that have adopted linkage fees, Bozeman and Gallatin County have yet to consider this approach seriously:
• “Not particularly because there aren't really any requirements at this point so this isn't like Jackson Hole where if you want to open a business you've got to house your employees.” – Housing Policy
Furthermore, there is also fear by housing consumers that attempts to rectify deficient living conditions will be met with retribution by the property owners or landlords. This is another area in which current policy outcomes do not offer a satisfactory resolution mechanism:
• “Lack of resources by the town to enforce code. Lack of people turning in bad units for fear of losing the unit they do have. If they say, ‘Hey, I've got this big problem.’ They're like, ‘Okay, we'll fix it, but you're out,’ and then they lose that one spot they had, so that's kind of the broad housing topic with a lot to cover underneath.” – Housing Policy
Local Government Relationships The relationship between local government officials appears strained or non-existent:
• “Yeah and [the] City and the County don't work together. … The City [does] what they are going to do.” – Housing Policy
• “There hasn't been a lot of coordination or collaboration on land use issues between these entities historically." – Planning – County
324
• “On the County side, to get out of the City there is very little to no conversation at all what should happen on the County and the smaller communities, they generally don't have the resources to think this way. Bozeman is fortunate because it's a prosperous city, they have capacity, they have staff. They can sort of do this kind of stuff. Lot of smaller outlying areas have very little.” – Economic Development
While the nature of local government relationships is not overtly positive in Gallatin County, these same officials appear able to maintain civility when engaging across other actor classes:
• “The relationship hadn't always been really positive. I don't know some of the builders who could tell you now it's not altogether that positive but I would have to say that they are beyond civil.” – Planning – City
However, this civility does not mean that frustrations regarding affordable housing policy outcomes do not exist:
• “I’m pretty irritated with the city with how they handled it. The biggest part of it is I felt like [the] builders were really treated as the enemy on this, that it was their fault that housing was so expensive. … I think it made both groups really confrontational with the other and as a result nobody wanted to work with the other one because we were all mad at each other.” – Development
A further indicator that the lines of communication are ineffective is illustrated by actors from different classes simultaneously talking past each other when coordinating:
• “For two years before we were talking about an affordable housing program, we were building a relationship. In my mind, that made all the difference in the world because although they're not happy with the program, they're not happy with the potential mandatory requirement of the program, they understand that I understand their business and that a lot of the actually incentives. We ask them what incentives would you like in the program, they told me and myself and the consultant we used to create the program.” – Planning – City
• “Part of my biggest issues with it was it was a foregone conclusion. The answer was going to be inclusionary zoning no matter what [was found in the housing report].” – Development
Character of Other Local Organizations The character of local organizations other than those facilitating housing suggests that perhaps the scale at which regional action is currently occurring is not appropriate for application to address housing affordability. Current actions appear to be taking place at the super-regional level more so than the regional level:
• “What is it in square miles of the area that [Human Resources Development Council] covers doing five counties? It's crazy. They're doing everything, right? They do Head Start and Streamline and down payment assistance and Road to Home program. They must have absolutely amazing people working over there.” – Planning – City
325
Presence of Regional Housing Coordination There are several regional housing organizations but their presence is more likely tied to disbursement of federal housing dollars than by a mandate locally to address workforce housing. One organization in particular, the Human Resources Development Council (HRDC), was highlighted as primary actor working to address workforce and low-income housing:
• "In my time here that role has been primarily played by HRDC. … [They are doing] more than anyone else." – Planning – County
• “I think HRDC has been taking the lead in workforce housing issues. They are the ones that are really out front. The County's done some work with that too helping with grants.” – Housing Policy
However, HRDC’s mission is not one of regional coordination:
• “HRDC does an incredible effective job at trying to fulfill their different mission-driven work in a regional area but from my understanding of what they do, their focus has never been on ensuring coordination but between local governments or regions where they work.” – Planning – City
They are seen, however, as being the most likely actor in this region that could fill this void in regional coordination on housing:
• “Yeah, I think HRDC, I think there is probably ... I would think there is room on the team for help. … I think they've got a head start but I think they ... If they were able to be funded and therefore increase their capacity for housing, they have a lot of respect locally, so they might be able to accomplish more than just a new organization coming into town.” – Economic Development
• “Well, I think one of the prime role players in Bozeman has been the HRDC, because that's an entity that's already involved, and has the framework to continue in a role of being the resource for people, whether they're already within the community, or coming into the community. I think that they have the infrastructure to be the information resource for affordable housing here. …I don't know if it's a role that they're interested in. I think that they're primarily poised as an information source when it comes to management of that. I don't know. It may exist, but I'm not familiar with anything other than, again, property management companies who may specialize in certain types of property management, and some of those are involved in some of the properties that are managed particularly for affordable housing.” – Employer
HRDC appears to be already engaging in this role of coordinator, even if not mandated to do so:
• “HRDC contacted [the local architecture firms]. Here's the deal. We want to have some of the competition. We want to gather you guys together. You guys to come with ... We want to come up with an affordable home, a model. There's no payment in it.” – Development
History of Regional Coordination Regional coordination, however, has proven effective in regards to economic development efforts in certain situations:
326
• “The example project that I have is the fiber-optic board. … There's general consensus,
I'm sure the service providers would disagree, but there's general consensus that Bozeman suffers from not having access to high speed redundant affordable fiber, and I would argue that that is the 21st century infrastructure. ...If we're not getting it together, we're going to be behind the curve and we, already, sort of are.” – Economic Development
• “My example is in the photonic sector. We created, with the assistance of the business community, the photonics companies, the Montana Photonics Industry Alliance, a sector group, and [an] industry group. … There were 30 plus companies that were out in Bozeman, spread all over the place, all doing something in photonics, but they were never talking to each other, they didn't know each other. It was a very disparate group of companies. Through this organization, we were able to pull them together, and finally have a forum where they could talk about what their needs are, and what their concerns are, and why it had value to come together.” – Economic Development
Strictly operational regional entities or agencies coordinating consistently at that level may be limited to hazard mitigation, however:
• “No none. Not in terms of land use planning. [The] disaster and emergency services coordinator might have for example have other planning activities that he is doing [at the regional level].” – Planning – County
While limited evidence of regional coordination exists there are signs that conversations are developing, if slowly:
• “The City Commissioners are meeting quarterly with the County Commissioners to just try to build good working relationships and more and common understanding with each other.” – Planning – City
• “We are working to create what's called the Planning Coordination Committee right now jointly with the City of Bozeman, Gallatin County, and City of Belgrade. [It will] function as a forum for the County and two municipal entities to talk about land use planning issues in the triangle area of Bozeman, Belgrade, and Four Corners.” – Planning – County
Here too limits regarding the current ability to engage and speed at which coordination occurs are evident:
• “We're working on the [Planning Coordination Committee]. [Others are] moving full steam ahead. Is has not gone to [through all the appropriate channels]. … The absolute role and the outcomes and the benchmarks for accomplishing something have not been established for this group. As with most things in local government, the devil is in the details. Everybody can get around and sit around the table and talk but what is accomplishing something and what is success has not been outlined.” – Planning – City
Perhaps this is due to a history of responding to crisis rather than of a desire to get out ahead of the issues:
• “Montana is learning the hard way in some respects that some of the bigger issues we face are regional nature and yet we have no mechanism, no political mechanism or no agency, no structure of any kind really to deal with it. Other than when I say ad-hoc when
327
it comes up, it kind of just looms up and then all of a sudden there is a sort of a, uh, we got to do something. – Economic Development
It is also possible that this finding is an ingrained cultural differences that exist in the West that inherently influence the effectiveness of such proposals:
• "Differences with communities in the region and because of our rugged individualism that Montanans embrace kind of feel like we are in this on our own and there is not a lot of good opportunities to collaborate." – Planning – County
Regional Housing Coordination Regional housing coordination then appears to still be searching for its identity. The current Workforce Housing Task Force covers Bozeman alone and efforts beyond the central city have been nibbling at the edges of the County:
• “[They have] really been pushing for this housing plan to go forward. … We are expected to go in front of the community on April 5th or in front of the Council for the purpose of, ‘Council, will you adapt this plan [for West Yellowstone]?’” – Housing Policy
• “We work with HRDC [in Big Sky]. We're working with folks that are associated with [a private club] right now where they're trying to create affordable housing.” – Development
6.4 Additional Findings of Note The definition of the terminus of the region as described by Clark was central in bounding the case study locations, and there were many examples that supported his claim. Flathead County specifically provided extensive backing across numerous actor classes to backup Flathead County as the best description of the region:
• "I would consider it to be Flathead County." – Focus Group • "Probably a region for this area would generally, in terms of us affecting areas, would
probably be from Flathead County would be a good … once you get outside of that Flathead County you really get into different areas that we don’t ever deal with. I don’t like to say it because [who I work for]. It’s just Flathead. That would be a region that our tourists come to that they stay within this area. We’re in an envelope of mountains on both sides so I would call this a region down at the bottom of Flathead Lake which is a little bit of Lake County, too." – Housing Policy
• “I think it could be [Flathead County]. Just thinking about the geography, and the central places in Flathead County versus, say a county this size back east, where we've got the county of course, Kalispell, Whitefish and Columbia Falls, that's all we have incorporated. County this size back east, you may have a county and you may have six or seven or eight communities. Right there you got a good one county coop.” – Planning – County
• “We've tested for how people kind of define this area and the phrase that works best for our audience is Flathead Valley.” – Economic Development
Flathead County may in fact be too small to effectively capture the extent of the region in other actors’ minds:
• “Well, I might go beyond the Valley, but I see it as Flathead Country, Lake County, and Lincoln County. I know that other see us, including Sanders ... I'm thinking there's one
328
other one, but I can't think of what it is, but those are the ones that I identify." – Housing Policy
• “When I take of region right now I'm looking at a retail service area or our trade area. That's the area that we impact. We impact about 150,000 people. Kalispell is a secondary trade center. We're a medical community center. People coming into our community from that area. Our area, when I talk about regionalism from that standpoint, it's an economic definition, is Polson to the south 50 miles. It's the Idaho border to the west. It is Browning to the east on the other side of the mountains. Browning actually comes, the medical community comes here. It is somewhere early up into Canada. That's our market area. The Canadians come down. 2 years ago was probably the last time, 3 years ago was the last time we had a commission on it. 10% of all our land sales [were] Canadian." – Planning – City
• “I consider the Valley all the way to the Park, to the border, both all the way to Eureka, to Canada, and then sort of as far south as Polson.” – Employer
Concepts of the reach of the region in Gallatin County were more variable. There was support for Gallatin County as the edge of the region:
• “Yeah, so we would consider that Gallatin County." – Planning – City But perhaps the increased level of commuting patterns and relationship with neighboring Livingston to the west of Gallatin County is having a strong pull on the orbit of the region:
• “Our official region is Park County and Gallatin County.” – Economic Development • “I would probably include Park and Gallatin counties in that. Because we really don't go
much outside of that. We have employees that live as far as up out of Three Forks in the hills and all the way to Livingston, but really no further than that, that anybody is commuting.” – Employer
• “From our perspective, yeah, our region is Park and Gallatin Counties.” – Housing Policy And there are places within Gallatin County that may be too spatially isolated to be effectively thought of as regionally relevant:
• “West Yellowstone? No way. That's way too far. Twisty roads, no way.” – Development • “The easiest way that I define the regional market is being Gallatin County for the most
part really focused more on the valley, Big Sky and West Yellowstone really do their own things, and then reaching over into Livingston, [they are in the region].” – Development
The rise of home rental services that provide an alternative to hotel rentals, groups such as Airbnb or VRBO, have been highlighted as likely impacting housing availability in numerous areas. In Flathead and Gallatin Counties the growth in the use of secondary home rentals appears to be having an effect but its extent is hard to effectively measure. This from Flathead County:
• “What it sounds like just from this general back and forth now that the VRBO/Airbnb may not be as large an influence here as it is in some other places.” – Planning – City
• “It's a big deal not because I'm against people making income. It has taken neighborhoods and it has changed them, the character of the neighborhood. Where is your loyalty? Where do your freedoms stretch? It's a pretty wrapped up issue.” – Planning – City
329
• “It wouldn't probably be such an issue if there was more housing, or if there were more hotels. Now that's kind of what they're saying too, is they have that new hotel, there's two new hotels going in in Whitefish. So they're saying, there's actually going to be beds this year. It's always been there, they're selling out every year and that kind of thing, so it's worth it for people to say, "I'm going to make some extra money on my place because nothing is available, and I can charge really expensive rates, because there's nothing [available]”.” – Housing Policy
Others in Flathead see the use of these services as actually expanding the rental availability opportunities:
• “A lot of our winter employees with stay in Airbnb and VRBOs. Rent it for the winter. Then those turn into summer, nightly rentals, and a lot of them are in zoning areas that do not allow that. It really limits the housing, especially in the summer.” – Employer
The more interesting finding uncovered by a discussion on Airbnb and VRBO was the ubiquitous practice of non-enforcement, for policies in regard to this practice and in general. In Flathead County regarding secondary home rental policies:
• "Which right now, I think a lot of it's just nobody wants to report it, but to the extent that you reported it ... Yeah, the city just doesn't do nothing." – Housing Policy
• “We will probably throw our hands up at the end of the Planning Board work session and say, ‘What are we going to do?’ We get a complaint every year, complaint every 6 months, they're not legal. I doubt that we'll do anything.” – Planning – City
As previously stated, this feeling that there is a lack of enforcement extends beyond the use of home rental services:
• “Oh, yeah, absolutely. We get calls all the time of, well, yeah, maybe all the time. Not an infrequent basis about a couple things, but the one I can think of not too long ago, up in the big mountain area, in one of those detached townhouse, whatever you want to call them, someplace up there, I can't remember exactly where, but an owner called and said, ‘Hey, right next door in the unit next door to me, there's like 15 people living in there.’ It was like, it's a 3 bedroom. They're ski bums. They're working Big Mountain. They're lifties. I felt for her because I had some kids that went to Mammoth and were ski bums and they had some friends that basically took over, it's a mess. It's really ... It's like, yeah, what do you do? I said, ‘Hey, why don't you contact the fire department. We don't have a building department, so don't know exactly ... We have no building or fire codes to regulate, essentially.’ It could be the fact that there could be some fire code violations.” – Planning – County
• “I've never seen anything enforced … enforcement is a huge lack. You can see houses where the roofs have fallen in in neighborhoods. The City of Kalispell won't enforce it unless somebody complains.” – Economic Development
The trends for enforcement of policies may be similar in Gallatin County in regards to secondary home rentals, however the understanding of enforcement as insufficient was not as widespread as in Flathead:
• “Well, the thing is with something like that, a city’s code enforcement especially in a time like now when the code enforcement needs to be out inspecting all sorts of buildings that
330

you don’t want to strain your resources going after the Airbnb’s, that stuff just becomes complaint-based. They’re not going to bother with it unless somebody calls the police about it and nobody calls the police about it because it’s really usually not that big of a deal unless somebody has a huge Airbnb’s next door, when it’s the 12-bedroom house that’s getting an entire college hockey team.” – Development
A final interesting outcomes of the interview process that is pertinent to share here before discussing the implications of the findings follows. In regards to being a “local” in these mountain town, often a highly contentious issue, it appears there is consensus amongst housing consumers to this definition. It is not owning a home, spending locally, or voting or community participation. It seems to be most related to state of birth. The discussion of being local is interesting as it gets to the heart of community self-description and, possibly, the application of policy to encourage preservation of the local characteristics:
• “It’s someone who grew up here.” – Focus Group – Flathead County • “Born and raised here is a local in my view. I just don't feel like a local.” – Focus Group –
Gallatin County
331
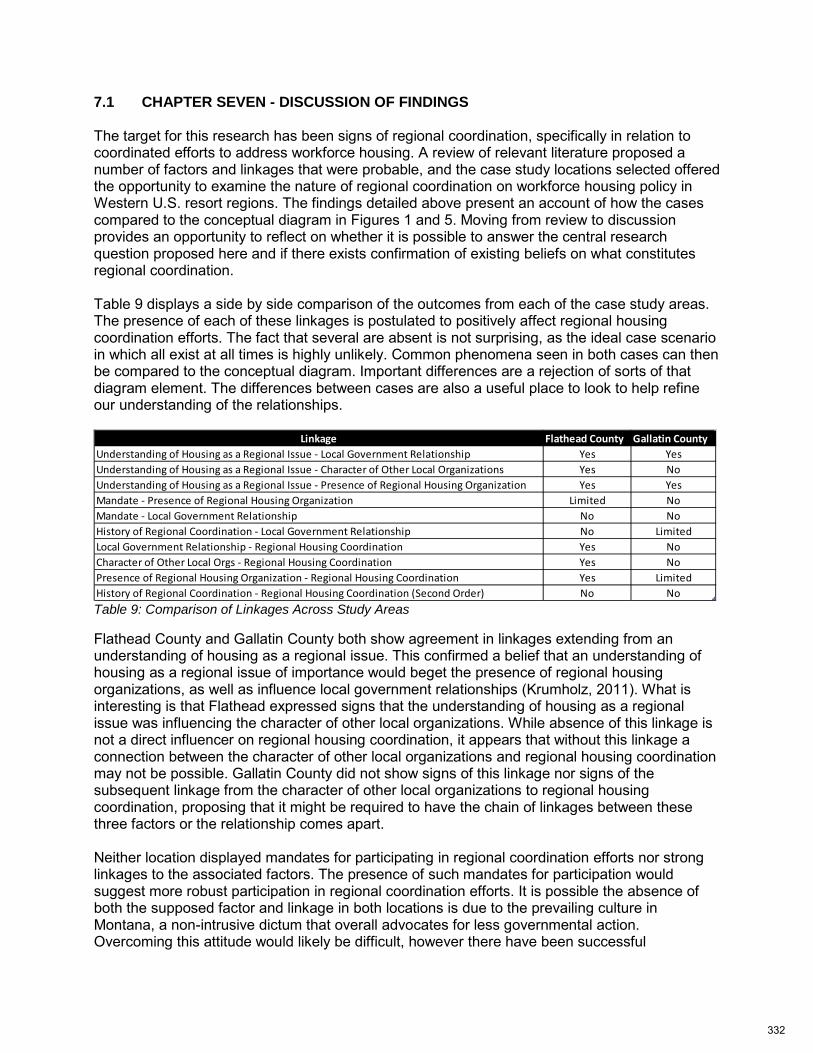
7.1 CHAPTER SEVEN - DISCUSSION OF FINDINGS The target for this research has been signs of regional coordination, specifically in relation to coordinated efforts to address workforce housing. A review of relevant literature proposed a number of factors and linkages that were probable, and the case study locations selected offered the opportunity to examine the nature of regional coordination on workforce housing policy in Western U.S. resort regions. The findings detailed above present an account of how the cases compared to the conceptual diagram in Figures 1 and 5. Moving from review to discussion provides an opportunity to reflect on whether it is possible to answer the central research question proposed here and if there exists confirmation of existing beliefs on what constitutes regional coordination. Table 9 displays a side by side comparison of the outcomes from each of the case study areas. The presence of each of these linkages is postulated to positively affect regional housing coordination efforts. The fact that several are absent is not surprising, as the ideal case scenario in which all exist at all times is highly unlikely. Common phenomena seen in both cases can then be compared to the conceptual diagram. Important differences are a rejection of sorts of that diagram element. The differences between cases are also a useful place to look to help refine our understanding of the relationships.
Table 9: Comparison of Linkages Across Study Areas
Flathead County and Gallatin County both show agreement in linkages extending from an understanding of housing as a regional issue. This confirmed a belief that an understanding of housing as a regional issue of importance would beget the presence of regional housing organizations, as well as influence local government relationships (Krumholz, 2011). What is interesting is that Flathead expressed signs that the understanding of housing as a regional issue was influencing the character of other local organizations. While absence of this linkage is not a direct influencer on regional housing coordination, it appears that without this linkage a connection between the character of other local organizations and regional housing coordination may not be possible. Gallatin County did not show signs of this linkage nor signs of the subsequent linkage from the character of other local organizations to regional housing coordination, proposing that it might be required to have the chain of linkages between these three factors or the relationship comes apart. Neither location displayed mandates for participating in regional coordination efforts nor strong linkages to the associated factors. The presence of such mandates for participation would suggest more robust participation in regional coordination efforts. It is possible the absence of both the supposed factor and linkage in both locations is due to the prevailing culture in Montana, a non-intrusive dictum that overall advocates for less governmental action. Overcoming this attitude would likely be difficult, however there have been successful
Linkage Flathead County Gallatin CountyUnderstanding of Housing as a Regional Issue - Local Government Relationship Yes YesUnderstanding of Housing as a Regional Issue - Character of Other Local Organizations Yes NoUnderstanding of Housing as a Regional Issue - Presence of Regional Housing Organization Yes YesMandate - Presence of Regional Housing Organization Limited NoMandate - Local Government Relationship No NoHistory of Regional Coordination - Local Government Relationship No LimitedLocal Government Relationship - Regional Housing Coordination Yes NoCharacter of Other Local Orgs - Regional Housing Coordination Yes NoPresence of Regional Housing Organization - Regional Housing Coordination Yes LimitedHistory of Regional Coordination - Regional Housing Coordination (Second Order) No No
332
campaigns that have been able to do so. Campaigns targeting such issues as public lands protections and public access to these protected lands are just a few examples. Moss, and Gill and Clark also offer instances of water policy and hazard mitigation planning as possible examples to examine in Western areas looking to develop more efficient regional efforts (Moss, 2006; Gill and Clark, 2006). Turning to these examples may provide a method to introduce a mandate for participation in regional efforts to address housing affordability. Initial conversations and experiences that spawned this research suggested that regional coordination was limited but the results of this study confirm lower than expected levels. Montana seems dependent on crisis preceding action, and this research further confirmed this prospect. Regional coordination is thus limited in both locations, the economic development examples not-with-standing. What it seems is more likely occurring is coordination at the sub- and super-regional levels. For example, in Gallatin County, HRDC is operating at the super-regional level, providing services and planning for a five county area. Among planning actors however, conversations are occurring at the sub-regional level. This does not mean all sub-regional actors are being included in this dialogical exchange. In Gallatin County, representatives from out-of-county towns such as Livingston and Gardiner are often included in regional conversations. Officials from West Yellowstone, located within Gallatin County, however, may be excluded. The limits of the region as the county boundary seemed to some extent align with those proposed by Clark and others, however these boundaries in practice do not seem equally equipped to adapt to changes in regional characteristics (e.g. the emergence or decline of an employment center) (Clark et al., 2006). Furthermore, the relationship of Gallatin County to its neighbors is spatially different than that of Flathead County to its neighbors. Flathead County contains a massive lake that separates large portions of the inhabited land area in Flathead County from its neighbors to the south. Moreover, significant mountain ranges that do not have year round passes provide natural barriers to the east and west of Flathead County. To the north lies the Canadian border and a limited number of large urban areas that offer commuter sheds. In Gallatin County there is a significant commuter population to the east in Livingston, and Bozeman lies directly on the Interstate 90 corridor. The factors present in each location likely are influential in how officials view their respective regions, however it is theoretically more likely that Gallatin County should show more signs of regional coordination due the nature of its relationships to its neighbors and the existence of the Interstate. It is somewhat surprising that in fact Flathead County displayed more robust indicators of ongoing regional coordination. According to researchers this will likely lead to productive housing outcomes in the long-term (Swanstrom, 2006; Cresswell et al., 2003). Further monitoring of these ongoing efforts in the Flathead can confirm or disprove this assumption. Initially it was supposed that there might be something unique about housing that makes it more unlikely to see regional coordination revolving around the topic. It is instead more plausible that there is something unique about Montana that makes efforts at regional coordination more challenging in general. Overcoming this incumbent factor to create meaningful regionally coordinated outcomes and, possibly, regional agencies is not covered in this research but provides a logical next step in the development of studies on the subject of regional coordination in Western communities. This research confirmed many of the long-held beliefs regarding regionalism. Likewise, it revealed that in at least one of the study locations (Flathead) current efforts at regional housing coordination matched expected relationships established from review of the associated literature.
333
The additional findings of note displayed that the conceptualization for regional review being conducted at the County level was moderately appropriate in both locations. Flathead County appears more suitable for the use of this boundary while Gallatin County and neighboring Park County may be more appropriate to consider as the region. Moreover, the extent of Gallatin County to be included in discussions of the region is an interesting outcome of this section and this finding is likely pertinent to local policy and organizational decisions. Quotes on the impact of secondary home rental services are also of interest, however it is the feeling that enforcement improvements are necessary in both locations to ensure availability of housing stocks. This is unquestionably true Flathead County, but perhaps in both locations to some extent, and decisions regarding future policy selections would be wise to take this factor into account. 7.2 Limitations Before moving to policy suggestions implied by these outcomes it is important to discuss a few limitations encountered in this research, as well as how future studies could be improve this line of reasoning. Examining the participants for each location reveals that some actor classes have likely been oversampled. A further limiting factor is in relation to the aggregation of data. While this practice is vital to protect anonymity, it may limit the application of these findings and associated discussions. This research model was not able to interview every actor or class of actors, so it is possible that additional signs of regionalism or regional housing coordination could be uncovered with more exhaustive interviews. Moreover, this research attempted to capture examples of past and future regional coordination, but predominately excelled at discussing current relationships. Finally, if future studies on this subject are conducted additional resources should be used to verify findings discovered through the interview process. For example, City or County Council minutes present another source that could be examined to corroborate statements given in the interviews. 7.3 Implications & Policy Suggestions
There are several general policy implications, including many that have been widely applied in communities across the U.S., that arise from this study. Much like many of the other wicked problems in the world, there are no silver bullets. Current methods and ways of thinking regarding policies for mitigating workforce housing threats should be considered holistically, as many of the proposed policy solutions, such as inclusionary zoning, require strong and ongoing support from the market to maintain this policy in practice. If another housing crisis were to materialize, much like the real estate downturn in 2007-2008, the effect on housing affordability campaigns would be stymied. It is significantly likely, however, that conversations regarding housing affordability will come up again at some future date after such a downturn ends and housing markets rebound. Diversifying the policy options available will provide more long-term solutions, especially in the face of evolving real estate markets. Staying with inclusionary zoning, the most currently popular and infamous of the affordable housing tools, the monetary requirements in lieu of dedicating affordable housing in future developments need to be set at high enough levels to ensure participation or adequate funding for meaningful housing solutions. With real estate prices seeing record marks annually, it is becoming easier for developers to pass along any fee charged in lieu of providing affordable housing to their consumers. The cost of land is also rising and the options for the future are dwindling due to the presence of public lands and undevelopable areas. This means that fees collected from an inclusionary program in lieu of dedication do not suffice to secure additional housing for low-income or workforce populations. The retention of newly created affordable or workforce housing stocks must also be assured. New developments must guarantee that
334
housing will remain in the pool of affordables for the long-term (e.g. 50 years or more), as well as ensure these housing stocks will see routine maintenance necessary for their longevity. The literature on regionalism suggests that a rich social network is necessary when attempting to increase coordination levels. While there is evidence that social structures are somewhat robust in these areas, the pushback from second-homeowners and the NIMBYism attitude presents a future threat to this social cohesion. It has been shown that increases in tourists, retirees, and second home ownership impacts the participation and character of amenity areas substantially (Moss, 2006). Whereas there will almost assuredly never be policies put into place that push back against the migration of those types of amenity seekers, building an understanding among existing residents on the threats of inaction regarding housing affordability may be a means to mitigate these threats. Remaining on the topic of NIMBYism, the threat posed by this attitude cannot be overstated. A policy guideline developed in Colorado that may be used to develop policy prescriptions elsewhere shows that this attitude can undermine or eliminate policies in the tool kit necessary to create affordable housing options (Appendix 9). Campaigns to address the prevalence of this attitude will require sensitivity to the self-reliant mindset and desire to see limited government action taken into account. Ultimately the exact nature of how to develop those campaigns is beyond the scope of this study, however this finding highlights the work to be done in these regions if housing affordability is to be addressed substantially. The lack of enforcement, for both secondary housing rentals and in general, also presents a real threat to long-term workforce housing solutions. At some point housing affordability policies are likely to require meaningfully enforcement of secondary home rental policies through such services as Airbnb and others. Whereas the most immediate response from planners will be that there is not the staff availability nor desire to be an enforcer, these limitations have to be addressed and worked around. Failure to do so blunts many outcomes from planning for housing affordability and shows that those charged with implementing future housing affordability efforts may be ineffective in this charge. Furthermore, policies that require self-policing are likely not to be effective, as the ‘Montana Way’ plausibly precludes neighbors from turning in other neighbors. This could be due to loyalty or due to an understanding of the impotence of enforcement, but whatever the reasoning it is important to consider this requirement when drafting future policy actions. If housing policies are going to be influential throughout the region, agencies and land use authorities would likely need to consider enactment of uniform policies across municipal boundaries. If policy coordination is not possible, perhaps coordination in regards to other types of service improvements that can decentralize or disperse housing pressure might be worthy of review. For example, it might be possible to find ways to increase uniformity for school program and level of service offerings. Providing more competitive school systems across a wider geographic area seems to be a sound strategy to avoid pockets of over- and underdeveloped educational service areas, and thus increase the attractiveness of new homebuyers of broader income levels across a wider commuter-shed area (Peters, 2016). Conversations regarding regional coordination on policies or school improvements appear more readily possible in Flathead County than in Gallatin County, however this current finding of coordination potential does not specify that coordination capacity in either location cannot wax or wane in the future. Finally, while urban sprawl has often been decried as a negative externality of community development, there is proof in practice that sprawl can aid in some ways at reducing rental and homeownership costs. It would be cautioned that sprawl, much like other affordable housing mechanisms, cannot be employed alone. The importance of a planning effort that included a
335
wide coalition of community stakeholders cannot be overstated. While costly and time consuming, outcomes seem to be more effective when following such a planning action. 7.4 Closing This study of regionalism was spawned by a desire to examine the nature of attitudes regarding housing affordability in resort areas. Regionalism can be a useful tool to develop interagency relationships as well as bolster the outcomes expected from campaigns in housing, expanding the focus area to craft more widespread solutions. The danger in utilizing regionalism is that there may not be the capacity to support this type of bureaucracy, either in terms of financial support or personal support. It may also support existing attitudes that hinder the application of efforts widely and beyond municipal boundaries. The results of this research confirmed several of these expectations. This study sought to examine relationships amongst pertinent actors in Western resort communities, zeroing in on the Montana resort areas of Flathead County and Gallatin County. Through interviews and focus groups, the nature of these present relationships was uncovered and the propensity for future regional action explored. Relevant actors yielded productive information that can possibly be applied to future regional actions and, optimistically, will yield more productive actions in these locations. Moreover, by collecting a description of the current capacity for regionalism, comparisons to future attitudes toward on this topic are possible. Regional actions are somewhat as expected in these locations and may not provide a robust launch pad for future housing affordability campaigns. In Flathead County it appears that relevant actors are poised to collaborate on regional activities, and this may possible due to the nature of the previous operational framework in place for City and County actors. Gallatin County has never had such a structure and likely suffers as a result. Regional coordination efforts targeting housing affordability in Gallatin are more likely to require highly developed protocols in place as well as extensive support in order to be effective. As a whole though, both locations are still developing their methods to address housing affordability and future studies may find the presence of increased linkages. In closing, regional coordination requires both an effective means to convey regional outcomes as well as a self-aware understanding these types of policy actions will be more productive than the alternative. The linkages between regional housing coordination and other influences provides a path to discover the nature of regional relationships and can be used to direct policy applications. Perhaps this finding alone will produce more vigorous outcomes as a result of this research.
336

Appendix 1: Interview Protocol Initial Template:
Section 1: Role and Regional Relationships
1. How would you define your role (Director/Executive Director/CEO…etc.) and affiliation (employee or employer)?
a. Policymaker (Planning, Economic development, Chamber of Commerce) b. Non-profit (HRDC, Habitat, Housing Authority) c. State/Federal Agency d. Real Estate Development/Construction/Architecture or Engineering firm e. Tourism/Resort f. Other (Identify sector)
2. List the 3 highest priority topics that you collaborate about on a County or Regional level. (Discussion of broad issues, such as protecting the environment, should be complimented with examples of efforts in action as well as how the issues relates with current critical happenings.)
a. Describe a successful project that has been addressed in regionally coordinated manner?
b. Partners involved in each of these examples? c. How often do you meet about those topics?
i. What is the organizational structure and authority? 3. Are there any proposed/future projects that you are aware of that will likely require
regional coordination? a. What topics are the focus of these efforts?
4. Is there recognized regional authority, such as a Council of Government or Chamber of Commerce, that coordinates similar types of projects or are projects assigned to a variety of agencies depending on circumstances?
a. What is their jurisdiction/range of focus? 5. What is the boundary of the smallest land area that you would define as a region?
a. What are some of the challenges you see collaborating at this level? Section 2: Workforce Housing
6. Do you own or rent your current residence? a. What is your monthly rent or mortgage payment? (Offer range of options)
7. Estimate the area median income for your region. a. Are transportation costs included in federal methods for determining area median
income? (Yes/No) 8. How would you define populations that would be the focus of workforce housing
initiatives? a. Area median income is an often-used classification system necessary for the
mandatory implementation of affordable or workforce housing policies and ordinances, inclusionary zoning for example. What area median income do you feel should be considered when developing these types of policies? (Offer range of options)
9. How important is the consideration of workforce or affordable housing in your long-term personal and professional decision making when considering long-term residency in your current location? It is the most important issue I face / Important but not critical / Of little importance/ Not important
10. Rate your satisfaction with current efforts to craft long-term solutions to provide additional workforce and low-income affordable housing options in your community? Very Satisfied / Satisfied / Not Satisfied / Unknown
337

11. What types of strategies have been proposed in your community to address workforce housing? (Offer options)
Section 3: Community Perspective
12. What types of public transportation options are available in our community? 13. Are you aware of the use of an outside consultant(s) to prepare housing reports,
comprehensive plan elements, or zoning ordinances for adoption by the city council? a. Have any of these consultants hosted community charrettes and did you attend in
either a professional or citizen oriented role? 14. Any additional comments you would like to include about coordination in this region?
338
Appendix 2: Interview Protocol Economic Development: Dr. Timothy Green Ryan Krueger Regional Coordination Patterns for Workforce Housing in Mountain West Tourism Economies THINK ABOUT COST OF LIVING INSTEAD OF HOUSING AFFORDABILITY
1. How would you define your role (Director/Executive Director/CEO…etc.) and professional affiliation (employee or employer)? What other roles like this have you held (prior relevant work experience)?
a. Policymaker (Planning, Economic development, Chamber of Commerce) b. Non-profit (HRDC, Habitat, Housing Authority) c. State/Federal Agency d. Real Estate Development/Construction/Architecture or Engineering firm e. Tourism/Resort f. Other (Identify sector)
2. What are the topics, limit 5 or so, that currently dominate your time in your professional role?
3. Who are some of the partners involved with you in each of these examples? a. If responses include partners beyond the local/county scale THAN ask:
i. I noticed that you mentioned partners that operate beyond the local scale. Would you classify these projects as regional in scope?
b. If not, THAN ask: i. What types of projects might require you to seek additional partners at a
higher operational level? 4. What makes up your local region?
a. What are some of the challenges you see collaborating at this level? 5. Are there specific projects that you have collaborated on at that scale? (Discussion of
broad issues, such as protecting the environment, should be complimented with examples of efforts in action as well as how the issues relates with current critical happenings.)
a. Who else is involved in each of these examples? b. What was your organizations involvement? c. What is the current status? Ongoing? d. Did you consider these projects successful?
6. Are there any other problems or issues that you are aware of that will likely require coordination at a similar level in the near future?
7. CUE: You mentioned/did not mention housing policy or affordability in our previous discussion. How important is this issue for future economic development for your region? Put another way, has the issue of housing affordability impacted you and your organization’s mission? (IF YES) - (IF NO - What are the most important issues for the future of (PLACE)? Is there any concern with those issues regarding cost of living or housing affordability?)Are you seeing an impact on new business recruitment?
a. What about business retention? b. Are employers voicing concerns to you about employee recruitment/retention as a
result of a lack of affordable housing? c. What percentage (estimate) of potential employers cite housing affordability as a
concern in conversations about relocation?
339

d. If there has been a substantial impact on either business recruitment or employee recruitment and retention, what types of strategies are you using or hope to use to mitigate this concern?
8. (IF YES) How would you define the people or professions that would be most in need of housing options in the future?
9. (IF YES) Rate your satisfaction with current efforts to craft long-term solutions to provide additional workforce and low-income affordable housing options in your community?
10. (IF YES) What types of strategies would you like to see proposed in your community to address workforce housing? (Prompt - Transit)
a. Who do you think is most well-positioned to develop and implement these types of strategies?
11. (IF YES) Are you aware of any employers currently contributing to affordable housing stocks for their workers?
12. (IF YES) Or advocating for additional housing stocks, either voluntarily or policy? 13. Is there recognized organization that is a clear position to lead with reference to Question
4 that coordinates similar types of projects or are project assignment responsibilities shared amongst a variety of agencies depending on circumstances?
a. Are they well positioned to do this? Why or why not? 14. Any additional comments you would like to include?
340

Appendix 3: Interview Protocol Employer: Dr. Timothy Green Ryan Krueger Regional Coordination Patterns for Workforce Housing in Mountain West Tourism Economies Section 1: Role and Regional Relationships
1. How would you define your role (Director/Executive Director/CEO…etc.) and professional affiliation (employee or employer)? What other roles like this have you held (prior relevant work experience)?
a. Policymaker (Planning, Economic development, Chamber of Commerce) b. Non-profit (HRDC, Habitat, Housing Authority) c. State/Federal Agency d. Real Estate Development/Construction/Architecture or Engineering firm e. Tourism/Resort f. Other (Identify sector)
2. What is your biggest challenge in recruitment? 3. Why do you think that is? 4. What type of recruitment tools are you using?
a. How far afield are finding you have to go to recruit quality employees? b. What percentage of your workforce is recruited locally? c. Are locally recruited employees likely to fill moderately skilled positions or high
skilled positions? 5. Do you provide housing assistance services for new or current employees?
a. If yes, describe these services. b. Does this depend on role they are being recruited for?
6. Has the issue of housing affordability and costs of living impacted you in your role? a. Is this issue impacting employee recruitment? b. What about employee retention? c. What percentage (estimate) of your potential employees cite housing affordability
as a concern when interviewing for open positions or considering long-term area employment with [EMPLOYER]?
7. How would you define the people or professions that would be the focus of local workforce housing initiatives? (CLARIFY WORKFORCE VS AFFORDABLE HOUSING HERE IF NECESSARY)
8. Rate your satisfaction with current efforts to craft long-term solutions to provide additional workforce and low-income affordable housing options in your community?
9. What types of strategies would you like to see proposed in your community to address workforce housing? (Offer options or open-ended?)
10. Are you [EMPLOYER] currently contributing to affordable housing stocks in this region, either voluntarily or by requirement?
11. Have you been consulted about current or future campaigns to address rising costs of living in your local region?
a. Who else was/is involved in those conversations? 12. What makes up your local region?
a. What are some of the challenges you see collaborating at this level? b. Describe a successful project that you have participated in at thie level. c. How often were you or your group/organization consulted for these projects? d. Who were the partners involved in each of these examples? e. Are these initiatives ongoing?
341

13. Are there any proposed/future projects that you are aware of that will likely require regional coordination?
a. What topics are the focus of these efforts? 14. Is there recognized regional authority, such as a Council of Government or Chamber of
Commerce, that coordinates similar types of projects or are project assignment responsibilities shared amongst a variety of agencies depending on circumstances?
a. What is their jurisdiction/range of focus? 15. Any additional comments you would like to include about coordination on affordable
housing in this region?
342
Appendix 4: Interview Protocol Housing Policy: Dr. Timothy Green Ryan Krueger Regional Coordination Patterns for Workforce Housing in Mountain West Tourism Economies
1. How would you define your role (Director/Executive Director/CEO…etc.) and professional affiliation (employee or employer)? What other roles like this have you held (prior relevant work experience)?
a. Policymaker (Planning, Economic development, Chamber of Commerce) b. Non-profit (HRDC, Habitat, Housing Authority) c. State/Federal Agency d. Real Estate Development/Construction/Architecture or Engineering firm e. Tourism/Resort f. Other (Identify sector)
2. What is the mission of your organization? a. How would you define the difference in people and professions classified as in
need of affordable housing versus workforce housing? (THIS RESEARCH WILL FOCUS ON WORKFORCE HOUSING UNLESS OTHERWISE NOTED)
b. Does your organization look at housing affordability for both types of populations? i. If yes, percent of each.
c. Do you have staff dedicated to providing assistance to workforce populations? d. What types of specific tools or resources, top 3-5, do you use to address
workforce housing deficiencies? These can be policies used at the local level but those will be discussed below in more detail.
i. How effective has each been? ii. Where did you turn to learn more about these tools or strategies - (internal
vs external resources)? b. What local policies are in place to address workforce housing?
i. Rate your satisfaction with these? ii. What could be improved? iii. Have you been involved in crafting these policies? iv. What types of policies have been the most well-received by the public? v. What types of policies have been most contentious?
c. Do you have an individual on staff currently assigned to focus exclusively on workforce housing affordability?
i. What is their background/experience? d. Are you aware of a local regional task force or other collection of individuals
focused on workforce housing? i. Are you involved? How? (Resources, technical advising, etc.) ii. In a leadership role?
3. How would you define your local region? a. What are some of the challenges you see collaborating at this level? b. Is there a recognized regional authority, such as a Council of Government or
Chamber of Commerce, that coordinates workforce housing efforts at this level? 4. Is your organization actively contributing funds, expertise, or other direct methods to
enhancing available workforce housing stocks in the local region? a. Do you build at or below market rate homes? b. What are some of the funding tools you use to support such efforts? c. Who have you partnered with on such projects?
343

d. Have they contributed funding? e. Do you own or manage workforce rental housing options? f. Are there limits to the rental term for these units?
5. What types of strategies would you like to see proposed in your community to address workforce housing? (Prompt - Transit)
a. Who do you think is most well-positioned to implement such ideas? 6. How important is the issue of workforce housing for future planning decisions of your
region? a. Has cost of living been a priority in preparing guiding documents, such as updates
to Growth Management/Comp. Plans or Master Plans? 7. Are you aware of employers currently contributing to affordable housing stocks in this
region, either voluntarily or by requirement? a. What about providing consultation on future housing decisions for employees?
8. Are there any policies in place to limit homeowners in using services like VRBO, AirBNB, or other similar services in order to maintain availability of rental housing stocks for regional residents and employees?
a. How widespread do you think this practice is in this region? 9. Any additional comments you would like to include?
344

Appendix 5: Interview Protocol Planning: Dr. Timothy Green Ryan Krueger Regional Coordination Patterns for Workforce Housing in Mountain West Tourism Economies
1. How would you define your role (Director/Executive Director/CEO…etc.) and professional affiliation (employee or employer)? What other roles like this have you held (prior relevant work experience)?
a. Policymaker (Planning, Economic development, Chamber of Commerce) b. Non-profit (HRDC, Habitat, Housing Authority) c. State/Federal Agency d. Real Estate Development/Construction/Architecture or Engineering firm e. Tourism/Resort f. Other (Identify sector)
2. How would you define your local region? a. What are some of the challenges you see collaborating at this level? b. Are there specific projects that you have collaborated on at that scale?
(Discussion of broad issues, such as protecting the environment, should be complimented with examples of efforts in action as well as how the issues relates with current critical happenings.)
c. Who else is involved in each of these examples? d. What was your organizations involvement? e. What is the current status? Ongoing? f. Did you consider these projects successful? g. How would rank each of these in terms of priority for your professional success?
3. Are there any other problems or issues that you are aware of that will likely require coordination at a similar level in the near future?
4. Is there recognized regional authority, such as a Council of Government or Chamber of Commerce, that coordinates similar types of projects or are project assignment responsibilities shared amongst a variety of agencies depending on circumstances?
a. What is their jurisdiction/range of focus? 5. CUE: You mentioned/did not mention housing policy or pricing in our previous
discussion. How important is this issue for future planning decisions for your region? (IF YES) - (IF NO - What are the most important issues for the future of (PLACE)? Is there any concern with those issues regarding cost of living or housing affordability?)
a. Has cost of living been a priority in preparing guiding documents, such as updates to Growth Management/Comp. Plans or Master Plans?
6. (IF YES) How would you define the people or professions that would be the focus of local workforce housing initiatives? (CLARIFY WORKFORCE VS AFFORDABLE HOUSING HERE IF NECESSARY)
a. Are these people or professions the primary focus of current local initiatives of housing affordability campaigns?
7. (IF YES) What types of strategies or tools have been used in your community to address workforce housing?
e. Where did you turn to learn more about these tools or strategies - (internal vs external resources)?
f. What types of strategies have been best received? g. What types of policies have been most contentious?
345

h. Do you have an individual on staff currently assigned to focus on housing affordability?
i. What is there background/experience? i. (IF NO TO 7d) - What about a task force or other collection of individuals focused
on this issue? i. Are you involved? How? (Resources, technical advising, etc.) ii. In a leadership role?
8. What types of policies might you like to see proposed or considered in your community in future workforce housing initiatives?
9. Are you aware of employers currently contributing to affordable housing stocks in this region, either voluntarily or by requirement?
a. What about providing consultation on future housing decisions for employees? 10. Rate your satisfaction with current efforts to craft long-term solutions to provide additional
workforce and low-income affordable housing options in your community? 11. Are there any policies in place to limit homeowners in using services like VRBO, AirBNB,
or other similar services in order to maintain availability of rental housing stocks for regional residents and employees?
a. How widespread do you think this practice is in this region? 12. Any additional comments you would like to include?
346

Appendix 6: Interview Protocol Development Community: Dr. Timothy Green Ryan Krueger Regional Coordination Patterns for Workforce Housing in Mountain West Tourism Economies
1. How would you define your role and professional affiliation? a. How long have you operated in this area?
2. Describe your role in the local real estate market, including things like total annual sales or average number of homes completed/sold?
3. Describe what makes up the local regional housing market. a. Are there developers operating exclusively at (or below) this level? b. Is it currently dominated by custom homebuilders or national firms? c. What is the current health of the real estate market?
4. What are the top 3 or so issues that you are aware of that will likely impact the long-term health of the local region’s real estate market?
5. CUE: You mentioned/did not mention housing affordability previously. How important is this issue for future development of your region?
a. How have policies regarding housing affordability impacted you and your work? b. What policies do you feel are effective? c. Ineffective? d. Have you been involved in crafting these policies?
6. Turning now to populations impacted by high costs of living, how would you define the people or professions that would be the focus of local workforce housing affordability initiatives? (CLARIFY WORKFORCE VS AFFORDABLE HOUSING HERE IF NECESSARY)
7. As an employer who employs individuals that likely can be classified as members of the workforce population, have regional housing policies impacted your ability to hire and retain quality employees?
a. Do you provide any housing or subsidies for housing for your employees? 8. Is your organization actively contributing funds, expertise, or other direct methods to
enhancing available workforce housing stocks in the local region? a. Do you build at or below market rate homes? b. Is this by mandate of policy? c. What percent of the homes that you build annually would be classified as at or
below market rate? d. What are some of the tools you have been able to use to see a reasonable return
on this investment of time and resources? e. Have you partnered with anyone in the local region to build such homes? f. Have they contributed funding to support such projects? g. What percent of construction costs (estimate) would on average be covered by
such funding mechanisms? 9. Rate your satisfaction with current efforts to craft long-term solutions to provide
additional workforce and low-income affordable housing options in your community? a. What could be improved?
10. What types of strategies would you like to see proposed in your community to address workforce housing? (Prompt - Transit)
a. Who do you think is most well-positioned to develop and implement these types of strategies?
11. Any additional comments you would like to include?
347

Appendix 7: Focus Group Protocol:
Dr. Timothy Green Ryan Krueger Regional Coordination Patterns for Workforce Housing in Mountain West Tourism Economies (Try to speak one at a time.)
1. How would each of you define your local region? 2. How would you define a local?
a. Is it home ownership? b. Is it a period of time? c. Is it paying property taxes? d. How many have a Montana Driver’s License? Do you consider that a sufficient
indicator of localism? e. Voting or community participation?
3. How has housing affordability impacted you or people you know? a. Will it factor into your long-term decision to stay here? b. Did you receive any employer support in your initial housing search? If so, what
kind? c. Would you have wanted such support? d. Commuter time. e. Inability to buy.
4. What types of strategies or tools are you aware of in your community to address workforce housing, including task forces or community engagement methods?
a. What else might be done? 5. Ask follow-up questions as necessary.
348

Appendix 8: Focus Group Survey: Dr. Timothy Green Ryan Krueger Regional Coordination Patterns for Workforce Housing in Mountain West Tourism Economies
(Circle a response in the parenthesis)
1. What is current primary place of employment and job title?
a. Is this the same job that you held when you first moved here?
b. Do you normally work one job or multiple jobs a year?
c. Do you have more than one job currently?
d. How do you get back and forth to work?
e. Regardless of number of jobs, what is your average daily roundtrip commute for all employment? (Total minutes)
f. Are you a seasonal employee? (Yes / No)
g. If you answered yes to the question above please answer the following questions:
i. Is your primary job seasonal work?
ii. What seasons are you employed?
iii. Are those jobs in this local region?
h. How long have you lived in this area? (years and months)
i. Under what pretenses did you move here? (Employment - Seasonal or FT, family, etc.)
i. Were you recruited?
j. Did housing affordability factor into your initial decision to move here?
k. Will it factor into your long-term decision to stay here?
2. Do you currently own or rent?
a. What percent of your pay goes to rent or mortgage? (estimate)
349

i. Have you been forced to move from a home in this region due to increasing rents or the home being sold while you were renting? (Yes / No)
3. Briefly describe your family and relationship status.
a. Are you aware of campaigns in your community to address workforce housing? (Yes / No)
i. What tools have been suggested, if known? b. Do you attend city or county council meetings regularly (as a citizen)?
(Yes / No)
c. Rate your satisfaction with current efforts to craft long-term solutions to provide additional workforce and low-income affordable housing options in your community?
(Very satisfactory / Somewhat satisfactory / Neutral / Somewhat unsatisfactory / Very unsatisfactory / No opinion)
350
Appendix 9: Tools and Techniques
Affordable Housing Tools and Techniques (Colorado circa 2005) Program Program
Description Public
Administrative Responsibilitie
s
Types of Units
Produced
Primary Group Served
Political or Legal Issues
Considerations & Unintended
Consequences
Incen
tives
Density Bonus
Provisions allowing an increase in
density if all or part of the
increased density is made
affordable to a defined
household/income group
Administration of zoning and deed
restrictions
Single-family or
multi-family / MF more likely
if price controls
are required
Wide range of needs
may be met
Nexus not required/ conflict w/open space
goals, growth rate concerns,/
N.I.M.B.Y./(Stipulating maximum bonus might help mitigate
political issues)
Must have low ceilings on
allowed density to motivate
developers to pursue
incentives. Price controls are perceived as
disincentive by the private
sector. Without price controls low income, seasonal
and entry level housing needs
are unlikely to be met
351
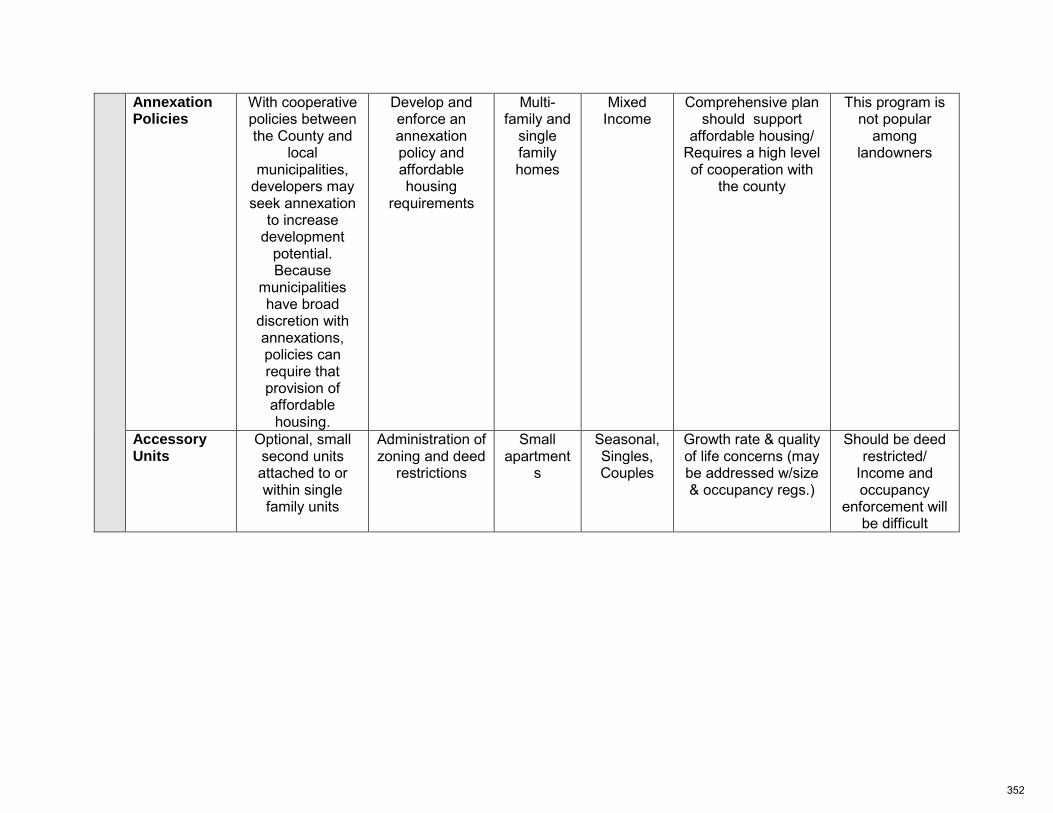
Annexation Policies
With cooperative policies between the County and
local municipalities,
developers may seek annexation
to increase development
potential. Because
municipalities have broad
discretion with annexations, policies can require that provision of affordable housing.
Develop and enforce an annexation policy and affordable housing
requirements
Multi-family and
single family homes
Mixed Income
Comprehensive plan should support
affordable housing/ Requires a high level of cooperation with
the county
This program is not popular
among landowners
Accessory Units
Optional, small second units attached to or within single family units
Administration of zoning and deed
restrictions
Small apartment
s
Seasonal, Singles, Couples
Growth rate & quality of life concerns (may be addressed w/size & occupancy regs.)
Should be deed restricted/
Income and occupancy
enforcement will be difficult
352
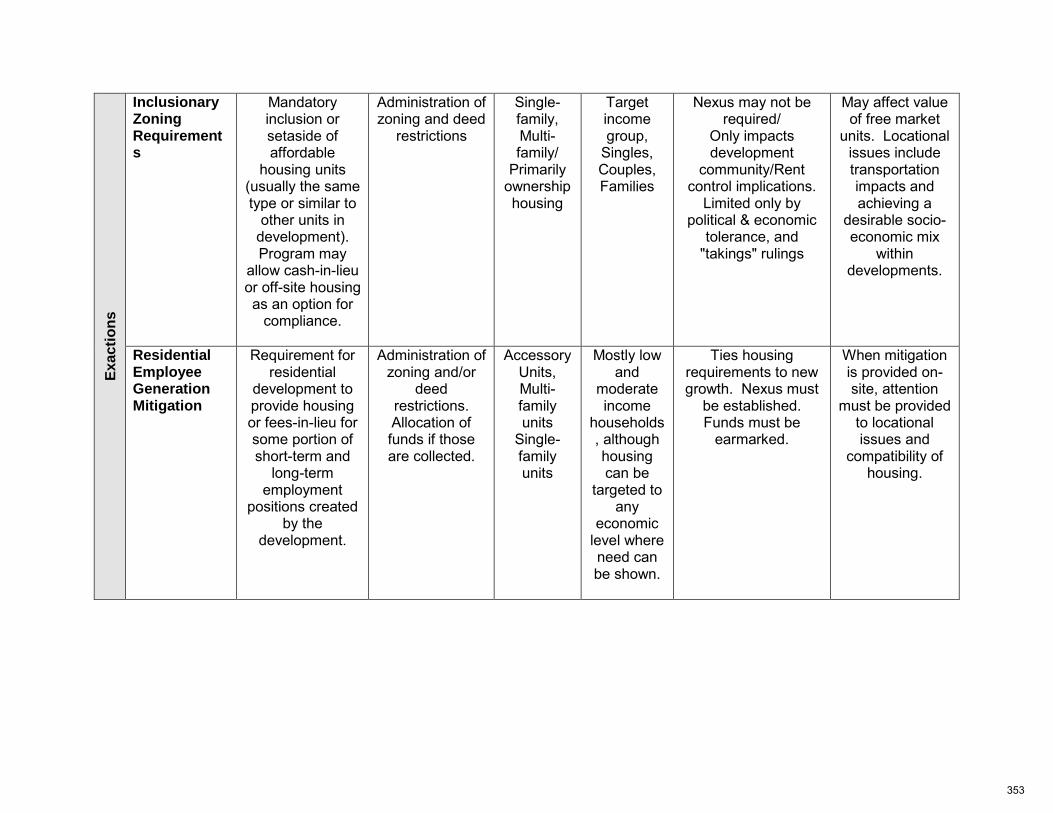
Exacti
on
s
Inclusionary Zoning Requirements
Mandatory inclusion or setaside of affordable
housing units (usually the same type or similar to
other units in development). Program may
allow cash-in-lieu or off-site housing as an option for
compliance.
Administration of zoning and deed
restrictions
Single-family, Multi-family/
Primarily ownership housing
Target income group,
Singles, Couples, Families
Nexus may not be required/
Only impacts development
community/Rent control implications.
Limited only by political & economic
tolerance, and "takings" rulings
May affect value of free market
units. Locational issues include transportation impacts and achieving a
desirable socio-economic mix
within developments.
Residential Employee Generation Mitigation
Requirement for residential
development to provide housing or fees-in-lieu for some portion of short-term and
long-term employment
positions created by the
development.
Administration of zoning and/or
deed restrictions. Allocation of funds if those are collected.
Accessory Units, Multi-family units
Single-family units
Mostly low and
moderate income
households, although housing can be
targeted to any
economic level where need can be shown.
Ties housing requirements to new growth. Nexus must
be established. Funds must be
earmarked.
When mitigation is provided on-site, attention
must be provided to locational issues and
compatibility of housing.
353
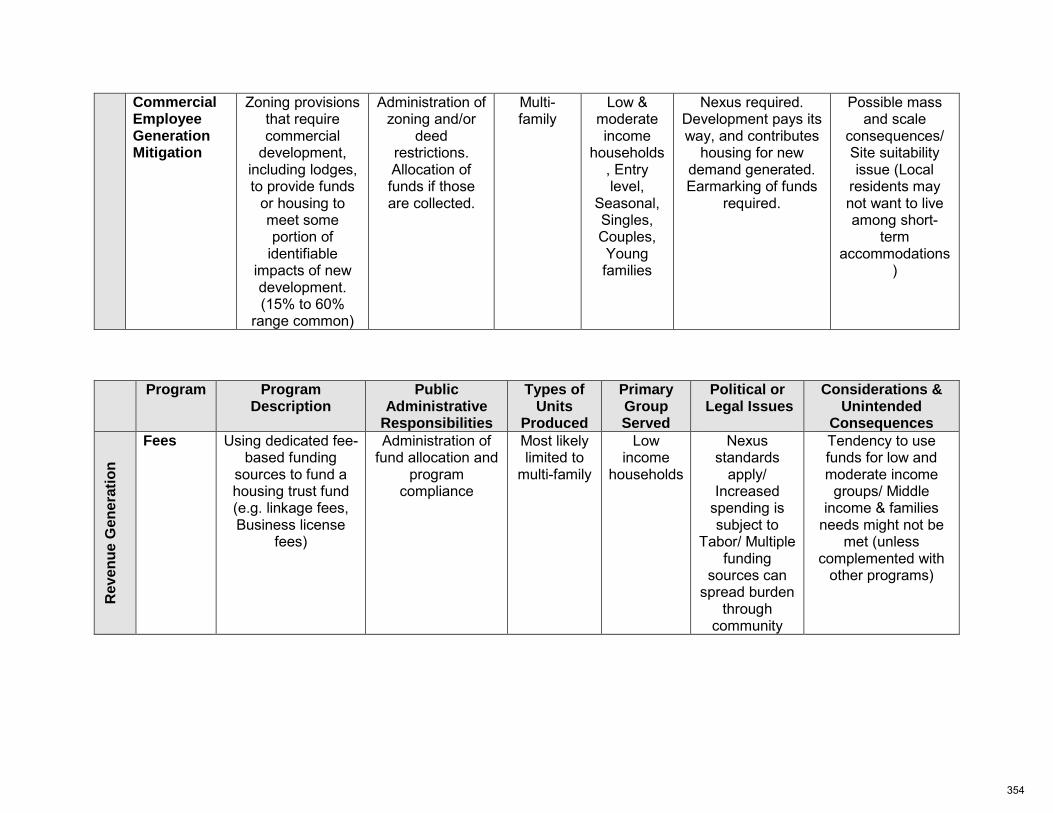
Commercial Employee Generation Mitigation
Zoning provisions that require commercial
development, including lodges, to provide funds
or housing to meet some portion of
identifiable impacts of new development. (15% to 60%
range common)
Administration of zoning and/or
deed restrictions. Allocation of funds if those are collected.
Multi-family
Low & moderate income
households, Entry level,
Seasonal, Singles, Couples, Young families
Nexus required. Development pays its way, and contributes
housing for new demand generated. Earmarking of funds
required.
Possible mass and scale
consequences/ Site suitability issue (Local
residents may not want to live among short-
term accommodations
)
Program Program
Description Public
Administrative Responsibilities
Types of Units
Produced
Primary Group Served
Political or Legal Issues
Considerations & Unintended
Consequences
Reven
ue G
en
era
tio
n
Fees Using dedicated fee-based funding
sources to fund a housing trust fund (e.g. linkage fees, Business license
fees)
Administration of fund allocation and
program compliance
Most likely limited to
multi-family
Low income
households
Nexus standards
apply/ Increased
spending is subject to
Tabor/ Multiple funding
sources can spread burden
through community
Tendency to use funds for low and moderate income
groups/ Middle income & families
needs might not be met (unless
complemented with other programs)
354
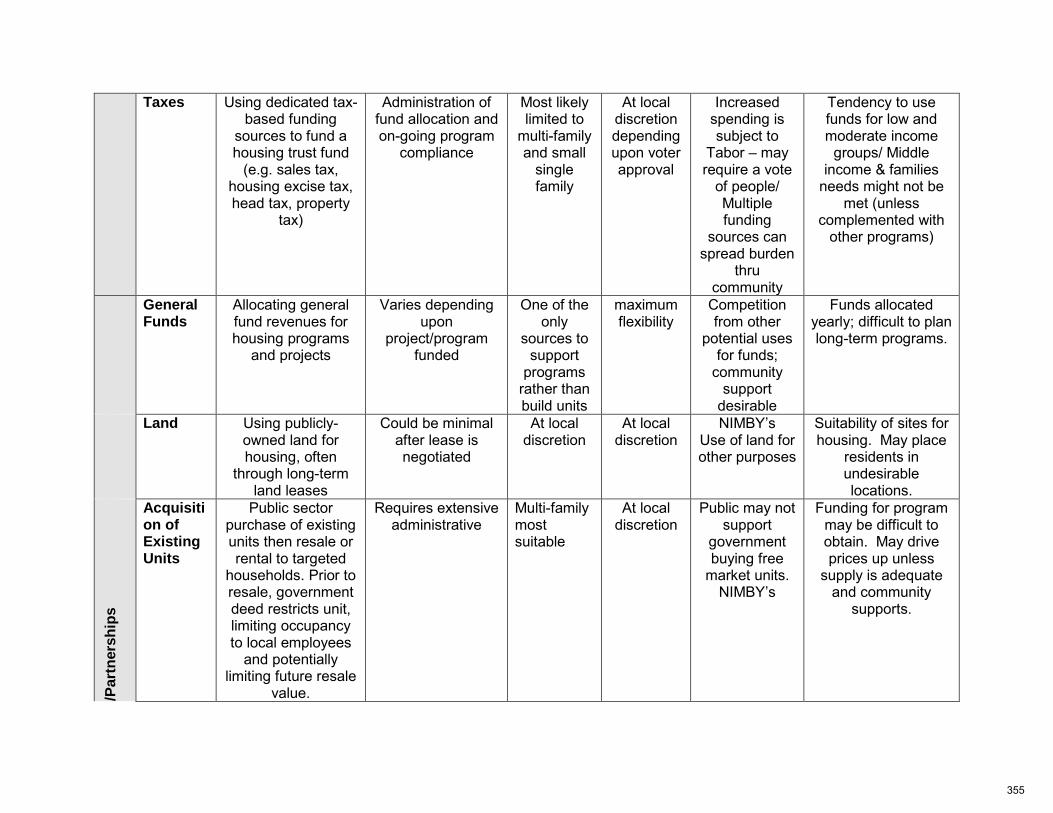
Taxes Using dedicated tax-based funding
sources to fund a housing trust fund
(e.g. sales tax, housing excise tax, head tax, property
tax)
Administration of fund allocation and on-going program
compliance
Most likely limited to
multi-family and small
single family
At local discretion depending upon voter approval
Increased spending is subject to
Tabor – may require a vote
of people/ Multiple funding
sources can spread burden
thru community
Tendency to use funds for low and moderate income
groups/ Middle income & families
needs might not be met (unless
complemented with other programs)
General Funds
Allocating general fund revenues for housing programs
and projects
Varies depending upon
project/program funded
One of the only
sources to support
programs rather than build units
maximum flexibility
Competition from other
potential uses for funds;
community support
desirable
Funds allocated yearly; difficult to plan long-term programs.
Land Using publicly-owned land for housing, often
through long-term land leases
Could be minimal after lease is negotiated
At local discretion
At local discretion
NIMBY’s Use of land for other purposes
Suitability of sites for housing. May place
residents in undesirable locations.
/Part
ners
hip
s
Acquisition of Existing Units
Public sector purchase of existing units then resale or rental to targeted
households. Prior to resale, government deed restricts unit, limiting occupancy to local employees
and potentially limiting future resale
value.
Requires extensive administrative
Multi-family most suitable
At local discretion
Public may not support
government buying free
market units. NIMBY’s
Funding for program may be difficult to obtain. May drive prices up unless
supply is adequate and community
supports.
355
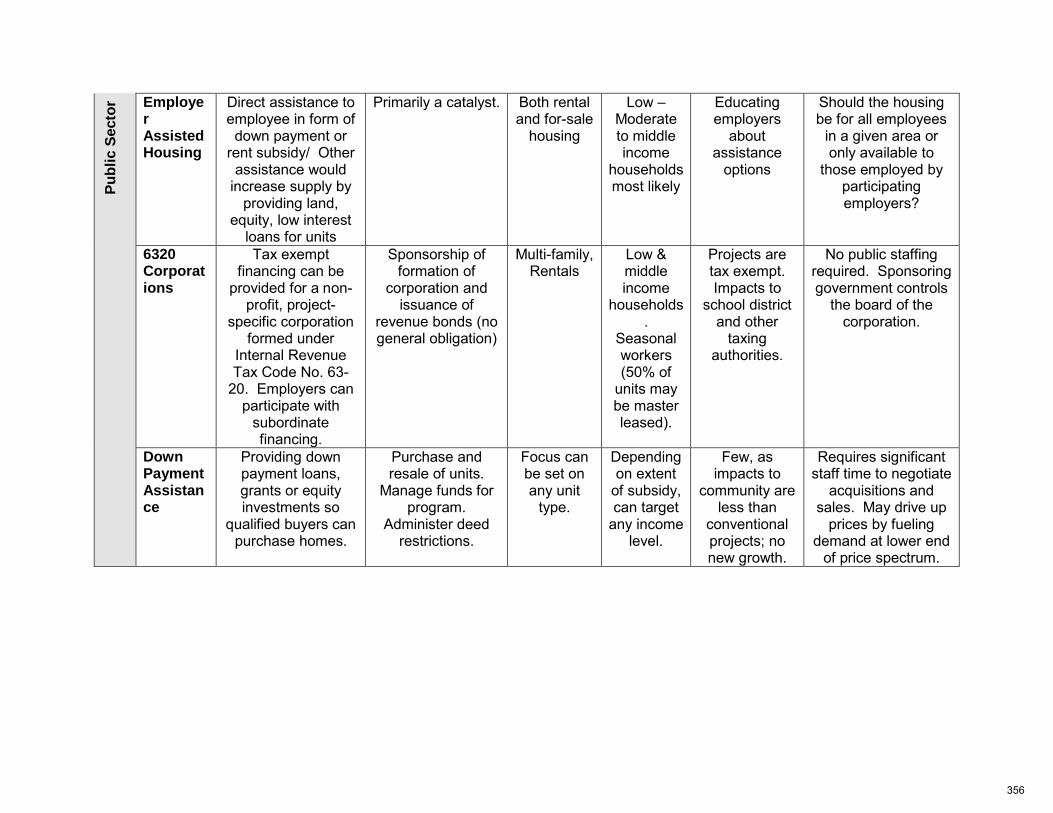
Pu
bli
c S
ecto
r Employer Assisted Housing
Direct assistance to employee in form of down payment or
rent subsidy/ Other assistance would
increase supply by providing land,
equity, low interest loans for units
Primarily a catalyst. Both rental and for-sale
housing
Low –Moderate to middle income
households most likely
Educating employers
about assistance
options
Should the housing be for all employees
in a given area or only available to
those employed by participating employers?
6320 Corporations
Tax exempt financing can be
provided for a non-profit, project-
specific corporation formed under
Internal Revenue Tax Code No. 63-
20. Employers can participate with
subordinate financing.
Sponsorship of formation of
corporation and issuance of
revenue bonds (no general obligation)
Multi-family, Rentals
Low & middle income
households.
Seasonal workers (50% of
units may be master leased).
Projects are tax exempt. Impacts to
school district and other
taxing authorities.
No public staffing required. Sponsoring government controls
the board of the corporation.
Down Payment Assistance
Providing down payment loans, grants or equity investments so
qualified buyers can purchase homes.
Purchase and resale of units.
Manage funds for program.
Administer deed restrictions.
Focus can be set on any unit
type.
Depending on extent
of subsidy, can target
any income level.
Few, as impacts to
community are less than
conventional projects; no new growth.
Requires significant staff time to negotiate
acquisitions and sales. May drive up
prices by fueling demand at lower end
of price spectrum.
356
References Abramson, P. and Inglehart, R. F. (2009). Value change in global perspective. University of Michigan Press. Alonso, W. (1964). The historic and the structural theories of urban form: Their implications for urban renewal. Land Economics, 227-231. Babbie, E. (2007). The practice of social research. California: Thomson Wadsworth. Barber, M. (2015). From $800 to $2000, these are the median rents of ski country's most popular towns. [online] Skicurbed.com. Available at: http://ski.curbed.com/archives/2015/06/from-800-to-2000-these-are-the-median-rents-of-the-high-countrys-most-popular-ski-towns.php [Accessed 8 Oct. 2015]. Belden, J. and Wiener, R. (1999). Housing in rural america: Building affordable and inclusive communities. Thousand Oaks: Sage Publications. Bernard, H. R. and Ryan, G. W. (2009). Analyzing qualitative data: Systematic approaches. SAGE publications. Blair, J.P. (1991). Urban and regional economics. Richard D Irwin. Bls.gov, (2015). About the leisure and hospitality supersector. [online] Available at: http://www.bls.gov/iag/tgs/iag70.htm [Accessed 24 Nov. 2015]. Brueckner, J. K. Thisse, J. F. and Zenou, Y. (1999). Why is central Paris rich and downtown Detroit poor?: An amenity-based theory. European Economic Review, 43(1), pp. 91-107. Burnham, R. (1998). Housing ourselves: Creating affordable sustainable shelter. New York: McGraw Hill. Calthorpe, P. (1993). The next American metropolis: Ecology, community, and the American dream. Princeton Architectural Press. Carter, M. P. (2010). How evictions from subsidized housing routinely violate the rights of persons with mental illness. Northwest Journal & Social Policy, 5 (1), pp. 118. Clark, T. (1999). Migration to exurban areas in the rocky mountain west: Dimensions and land use implications. In: Annual Meeting. Chicago, Illinois: Association of Collegiate Schools of Planning. Clark, T. Gill, A. and Hartmann, R. (2006). Mountain resort planning and development in an era of globalization. New York: Cognizant Communication. Clifford, H. (2003). Downhill slide. San Francisco: Sierra Club Books Cresswell, S. Wishy, J. and Maxwell, T. (2003). Fostering social equity and economic opportunity through citizen participation: An innovative approach to municipal service delivery.
357
Dickie, G. (2015). In Colorado, a 'rental crisis' forces workers into the woods. High Country News, [online]. Available at: http://www.hcn.org/articles/rental-crunch-in-mountain-towns-forces-workers-into-woods [Accessed 24 Nov. 2015]. Dietrich, E. (2015). Housing affordability plan back on Bozeman commission agenda. Bozeman Daily Chronicle, [online]. Available http://www.bozemandailychronicle.com/news/city/housing-affordability-plan-back-on-bozeman-commission-agenda/article_0839ea2e-b2a3-5387-bfdd-35e5c13691fd.html [Accessed 24 Nov. 2015]. Duany, A. and Speck, J. (2010). The smart growth manual. New York: McGraw-Hill. Dymi, A. (2006). Commuting adds to housing cost. National Mortgage News, [online] 30(5), pp. 56-56. Available at: http://connection.ebscohost.com/c/articles/22875083/commuting-adds-housing-cost [Accessed 2 Oct. 2015]. Enterprisecommunity.com, (2015). About LIHTC. [online] Available at: http://www.enterprisecommunity.com/financing-and-development/low-income-housing-tax-credits/about-lihtc [Accessed 24 Nov. 2015]. FHAMortgageCenter.com. (2015). History of FHA Loans. [online] Available at: http://www.fhamortgagecenter.com/fha_lending_guide/fha_loan_history.html [Accessed 24 Nov. 2015]. Findlaw.com. (2015). N.Y. GMU. LAW § 699-b: NY Code - Section 699-B: Long Island workforce housing program. [online] Available at: http://codes.lp.findlaw.com/nycode/GMU/16-A/699-b [Accessed 24 Nov. 2015]. Foster, K.A. (2001). Regionalism on purpose. Cambridge, MA: Lincoln Institute of Land Policy. Gallup.com. (2015). Gallup analytics. [online] Available at: https://analytics.gallup.com/Profiles/ [Accessed 24 Nov. 2015]. Gargan, J. J. (1981). Consideration of local government capacity. Public Administration Review, 41(6), pp. 649-658. Garnick, C. (2015). Airbnb says its rentals aren't affecting local housing affordability. Seattle Times, [online]. Available at: http://www.seattletimes.com/business/airbnb-says-its-rentals-arent-affecting-housing-affordability/ [Accessed 19 Apr. 2016]. Gerber, E. and Gibson, C. (2009). Balancing regionalism and localism: How institutions and incentives shape American transportation policy. American Journal of Political Science, 53(3), pp. 633-648. Gilderbloom, J.I. and Appelbaum, R.P. (1988). Rethinking rental housing. Pennsylvania: Temple University Press. Glorioso, R. S. and Moss, L. A. (2007). Amenity migration to mountain regions: Current knowledge and a strategic construct for sustainable management. Social Change, 37(1), pp. 137-161.
358
Golding, S. A. (2014). Migration and inequality in the rural United States: Connecting urban to rural and local to global. Sociology Compass, 8(3), pp. 324-335. Green Leigh, N. and Blakely, E.J. (2013). Planning local economic development: Theory and practice. Sage. Hall, J. (2008). The forgotten regional organizations: Creating capacity for economic development. Public Administration Review, 68(1), pp. 110-125. Hansen, A.J. Rasker, R. Maxwell, B. Rotella, J.J. Johnson, J.D. Wright Parmenter, A. Langner, U. Cohen, W.B Lawrence, R.L. and Kraska, M.P.V. (2002). Ecological causes and consequences of demographic change in the new west. Bioscience, 52(2), pp. 151-162. Haughey, R. M. (2003). Workforce housing: barriers, solutions, and model programs. Washington DC: Urban land Institute. Henderson, S. (2015). Teton Pass tunnel idea resurfaces. Teton Valley News, [online]. Available at: http://www.tetonvalleynews.net/news/teton-pass-tunnel-idea-resurfaces/article_058aabae-15e2-11e5-908f-678b2f58665a.html [Accessed 18 Apr. 2016]. Hines, J. D. (2010). In pursuit of experience: The postindustrial gentrification of the rural American West. Ethnography, 11(2), pp. 285-308. Hines, J. D. (2012). The post‐industrial regime of production/consumption and the rural gentrification of the new west archipelago. Antipode, 44(1), pp. 74-97. Hoey, B. A. (2005). From pi to pie moral narratives of noneconomic migration and starting over in the postindustrial Midwest. Journal of Contemporary Ethnography, 34(5), pp. 586-624. Hoover, E. M. and Vernon, R. (1959). Anatomy of a metropolis: The changing distribution of people and jobs within the New York Metropolitan Region. Cambridge: Harvard University Press. Housingmatter.org (2015). Finding a housing solution for Palm Beach county: How housing matters. [online] Available at: http://howhousingmatters.org/articles/finding-a-housing-solution-for-palm-beach-county/ [Accessed 24 Nov. 2015]. Isaacson, B. (2013). 'Teachers village' developers have big dreams for downtown Newark. Huffington Post, [online]. Available at: http://www.huffingtonpost.com/2013/09/25/teachers-village-newark_n_3991678.html [Accessed 24 Nov. 2015]. Jacob, J. (2006). New pioneers: The back-to-the-land movement and the search for a sustainable future. University Park, PA: Penn State Press. Jefferson-Jones, J. (2014). Airbnb and the housing segment of the modern sharing economy: are short-term rental restrictions an unconstitutional taking. Hastings Const. LQ, 42, pp. 557. Joint Center for Housing Studies, (2005). Strengthening our workforce and our communities through housing solutions. [online] Available at: http://www.jchs.harvard.edu/research/publications/strengthening-our-workforce-and-our-communities-through-housing-solutions [Accessed 7 Oct. 2015].
359
Jonas, A. E. and Ward, K. (2007). There's more than one way to be ‘serious’ about city‐regions. International Journal of Urban and Regional Research, 31(3), pp. 647-656. Jones, K. (2014). An overview of the HOME investment partnerships program: R40118. [online] Federation of American Scientists. Available at: https://www.fas.org/sgp/crs/misc/R40118.pdf [Accessed 20 Apr. 2016]. Lagendijk, A. and Cornford, J. (2000). Regional institutions and knowledge - Tracking new forms of regional development policy. Geoforum, 31, pp. 209-218. Ledebur, L.C. and Barnes, W.R. (1993). All in it together. Washington, DC: National League of Cities. Lee, D. (2016). How Airbnb short-term rentals exacerbate Los Angeles's affordable housing crisis: Analysis and policy recommendations. Harvard Law & Policy Review, 10, pp. 229-255. Leopold, A. (1968). A sand county almanac and the sketches here and there. New York: Oxford University Press. Logan, T. (2015). Surge in dorm building drives Boston housing construction to a 15-year high - The Boston Globe, [online]. Available at: https://www.bostonglobe.com/business/2015/10/29/surge-dorm-building-drives-boston-housing-construction-year-high/EhFHWRFRxsfIMikBGaoXmJ/story.html [Accessed 24 Nov. 2015]. Krumholz, N. (2011). Making equity planning work: Leadership in the public sector. Philadelphia, PA: Temple University Press. Malizia, E. E. and Feser, E. J. (1999). Understanding local economic development. New Brunswick, N.J: Center for Urban Policy Research. McIlwain, J. K. (2001). Show me the money: A proposed federal response to urban sprawl. Journal of Affordable Housing & Community Development Law, 11(1), pp. 26-37. McIntyre, N. (2009). Rethinking amenity migration: integrating mobility, lifestyle and social-ecological systems. Die Erde, 140(3), pp. 229. McIntyre, N. Williams, D. and McHugh, K. (2006). Multiple dwelling and tourism: Negotiating place, home and identity. Cambridge, MA: Cabi Publishing. McKibben, B. (2010). Eearth: Making life on a tough new planet. New York: St. Martin’s Griffin. Miller, S. (2012). Legal neighborhoods. Harvard Environmental Law Review, 105(37). Moss, L. A. (2006). The amenity migrants: Seeking and sustaining mountains and their cultures. Cambridge, MA: Cabi Publishing. Moy, K. Okagaki, A. and Leibsohn, D. (2000). Affordable housing: Systems for production, finance and community development.
360
Muniz, M. (2016). The impacts of short-term rentals on housing affordability. [online] Global Real Estate Experts. Available at: http://www.globalrealestateexperts.com/2016/02/the-impacts-of-short-term-rentals-on-housing-affordability/ [Retrieved 20 Apr. 2016]. Neuman, M. and Hull, A. (2009). The futures of the city region. Regional Studies, 43(6), pp. 777-787. Norris, D. (2001). Prospects for regional governance under the new regionalism: Economic imperatives versus political impediments. Journal of Urban Affairs, 23(5), pp. 557-571. OCC.gov. (2015). Low-income housing tax credits: Affordable housing investment opportunities for banks. [online] U.S. Office of the Comptroller of Currency Available at: http://www.occ.gov/topics/community-affairs/publications/insights/insights-low-income-housing-tax-credits.pdf [Accessed 24 Nov. 2015]. Olberding, J. C. (2002). Does regionalism beget regionalism? The relationship between norms and regional partnerships for economic development. Public Administration Review, 62(4), pp. 480-491. Ooi, N. Laing, J. and Mair, J. (2015). Social capital as a heuristic device to explore sociocultural sustainability: A case study of mountain resort tourism in the community of steamboat springs, Colorado, USA. Journal of Sustainable Tourism, 23(3), pp. 417-436. Orlebeke, Charles J. (2000). The evolution of low-income housing policy, 1949-1999. Housing Policy Debate, 11(2), pp. 480-520. Parlow, M. J. (2015). Whither workforce housing? Journal of Affordable Housing & Community Development Law, 23(3), pp. 373-391. Parr, J. (1999). Growth-pole strategies in regional economic planning: A retrospective view, part one origins and advocacy. Urban Studies, 36(7), pp. 1195-1215. Peters, M. (2016). How to make city housing more affordable. Wall Street Journal, [online]. Available at: http://www.wsj.com/articles/how-to-make-city-housing-more-affordable-1461550190 [Accessed 27 Apr. 2016]. Pierce, L. B. (2000). Choosing simplicity: Real people finding peace and fulfillment in a complex world. Gallagher Press. Pine, B. J. and Gilmore, J. H. (1999). The experience economy: Work is theatre & every business a stage. Harvard Business Press. Planning.org, (1998). Policy Guide on Impact Fees. [online] Available at: https://www.planning.org/policy/guides/adopted/impactfees.htm [Accessed 8 Oct. 2015]. Rasker, R. and Hansen, A. (2000). Natural amenities and population growth in the Greater Yellowstone Region. Human Ecology Review, 7(2), pp. 30-40. Rast, J. (2006). Environmental justice and the new regionalism. Journal of Planning Education and Research, 25(3), pp. 249-263.
361
Rusk, D. (2003). Cities without suburbs. Washington, DC: Woodrow Wilson Center Press. Savitch, H. Collins D. Sanders, D. and Markham, J. (1993). Ties that bind: central cities, suburbs, and the new metropolitan region. Economic Development Quarterly, 7(4), pp. 341-357. Savitch, H. and Vogel, R. (2000). Introduction: Paths to new regionalism. State and Local Government Review, 32(3), pp. 158-168. Schumacher, E.F. (2010). Small is beautiful: Economics as if people mattered. New York: Harper Perennial. Schwartz, A. F. (2015). Housing policy in the United States. New York: Routledge. Schwartz, M. and Wilson, E. (2007). Who can afford to live in a home? A look at data from the 2006 American Community Survey. [online] U.S. Census Bureau. Available at: http://www.census.gov/housing/census/publications/who-can-afford.pdf [Accessed 24 Nov. 2015]. Shelton, P. (2008). The legacy of the 10th Mountain men. High Country News, [online]. Available at: https://www.hcn.org/issues/367/17617 [Accessed 18 Mar. 2016]. Smith, J. L. Bennett, L. Smith, J. and Wright, P. (2006). Public housing transformation: Evolving national policy. Armonk, NY: M.E. Sharpe. SnowSports Industries America, (2015). Resort and Retail Locator – Snowlink. [online] Available at: http://www.snowlink.com/travel/resort-locator/ [Accessed 8 Nov. 2015]. Sullivan, T. (2004). Putting the force in workforce housing. Planning, 70, pp. 26-31. Swanstrom, T. (2001). What we argue about when we argue about regionalism. Journal of Urban Affairs J Urban Affairs, 23(5), pp. 479-496. Swanstrom, T. (2006). Regionalism, equality and democracy. Urban Affairs Review, 42(2), pp. 249-257. Terwilliger Center for Housing - Urban Land Institute, (2015). The state of the nation's housing. [online] Available at: http://uli.org/research/centers-initiatives/terwilliger-center-for-housing/ [Accessed 24 Nov. 2015]. Thoreau, H.D. (1962). Walden and other writings. New York, NY: Bantam Books. Turok, I. (2009). Limits to the mega-city region: Conflicting local and regional needs. Regional Studies, 43(6), pp. 845-862. Turok, I. (2010). Public universities and regional development. Urban Studies, pp. 3165-3167. Turner, J. (2010). Travels in the greater Yellowstone. New York: Thomas Dunne Books & St. Martin’s Griffin.
362
ULI.org. (2009). Bay area burden. [online] Urban Land Institute. Available at: http://uli.org/wp-content/uploads/2012/06/Bay-Area-Burden-1026-LowRes2.pdf [Accessed 24 Nov. 2015]. Urban Land Institute. (2009). Priced out: Persistence of the workforce housing gap in the Washington, D.C., Metro Area. Washington DC: Urban Land Institute. U.S. Census Bureau, (2015). Poverty. U.S. Department of Housing and Urban Development - 1930-2010. (2015a). U.S. Department of Housing and Urban Development - 1930-2010. [online] Available at: https://www.huduser.gov/hud_timeline/ [Accessed 2 May 2016]. U.S. Department of Housing and Urban Development. (2015b). LIHTCs. [online] Available at: http://www.huduser.gov/portal/datasets/lihtc.html [Accessed 24 Nov. 2015]. U.S. Department of Housing and Urban Development. (2015c). Federal Housing Administration/U.S. Department of Housing and Urban Development (HUD). [online] Available at: https://portal.hud.gov/hudportal/HUD?src=/federal_housing_administration [Accessed 21 Oct. 2015]. U.S. Office of Management and Budget. (2010). Part IV 2010 standards for delineating Metropolitan and Micropolitan Statistical Areas. [online] Available at: https://www.whitehouse.gov/sites/default/files/omb/assets/fedreg_2010/06282010_metro_standards-Complete.pdf [Accessed 4 Nov. 2015]. U.S. Public Law 73-479, 73d Congress, H.R. 9620, Box 54, Folder 1. [1934] (U.S. House of Representatives). Vincent, R. (2015a). The buzz: Silently opposed. Planet JH, [online]. Available at: http://planetjh.com/2015/07/07/the-buzz-silently-opposed/ [Accessed 24 Nov. 2015]. Vincent, R. (2015b). The buzz: : The faces of blair 3. Planet JH, [online]. Available at: http://planetjh.com/2015/07/07/the-buzz-the-faces-of-blair-3/ [Accessed 24 Nov. 2015]. Vincent, R. (2015c). Editor’s note: Lessons from blair. Planet JH, [online]. Available at: http://planetjh.com/2015/08/11/editors-note-lessons-from-blair/http://planetjh.com/2015/08/11/editors-note-lessons-from-blair/ [Accessed 24 Nov. 2015]. Virginia Housing Development Authority, (2013). Project-based Section 8 and Section 236/RAP. Viveiros, J. Ault, M. and Sturtevant, L. (2015). Paycheck to paycheck. [online] Available at: http://media.wix.com/ugd/19cfbe_e17dd74fd626472d8b2febba4caec37b.pdf [Accessed 24 Nov. 2015]. Voith, R. (1992). City and suburban growth: Substitutes or complements? Business Review, 31, pp. 23-33. Walker, R. (2016). Airbnb pits neighbor against neighbor in tourist-friendly New Orleans. NY Times, [online] Available at: http://www.nytimes.com/2016/03/06/business/airbnb-pits-neighbor-against-neighbor-in-tourist-friendly-new-orleans.html?mwrsm=Email [Accessed 19 Apr. 2016].
363
Wheeler, S. M. (2002). The new regionalism: key characteristics of an emerging movement. Journal of the American Planning Association, 68(3), pp. 267-278. Wiltsie, M. and Wyckoff, W. (2003). Reinventing Red Lodge: The making of a new western landscape, 1884–2000. Imagining the Big Open: Nature, identity, and play in the New West, pp.125-151. Yin, R. K. (2009). Case study research design and methods fourth edition. Thousand Oaks, CA: Applied Social Research Methods Series. Yodanis, C. (2006). A place in town doing class in a coffee shop. Journal of Contemporary Ethnography, 35(3), pp. 341-366.
364
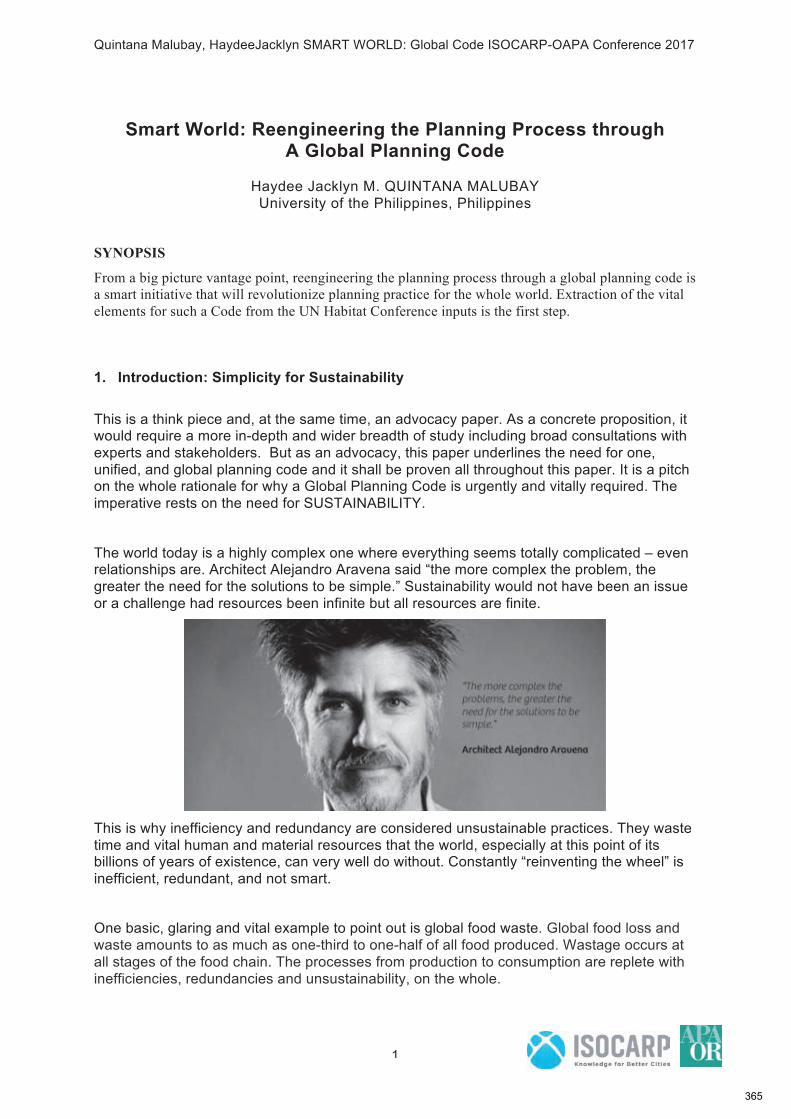
Quintana Malubay, HaydeeJacklyn SMART WORLD: Global Code ISOCARP-OAPA Conference 2017
1
Smart World: Reengineering the Planning Process through
A Global Planning Code
Haydee Jacklyn M. QUINTANA MALUBAY
University of the Philippines, Philippines
SYNOPSIS
From a big picture vantage point, reengineering the planning process through a global planning code is
a smart initiative that will revolutionize planning practice for the whole world. Extraction of the vital
elements for such a Code from the UN Habitat Conference inputs is the first step.
1. Introduction: Simplicity for Sustainability
This is a think piece and, at the same time, an advocacy paper. As a concrete proposition, it would require a more in-depth and wider breadth of study including broad consultations with
experts and stakeholders. But as an advocacy, this paper underlines the need for one,
unified, and global planning code and it shall be proven all throughout this paper. It is a pitch on the whole rationale for why a Global Planning Code is urgently and vitally required. The
imperative rests on the need for SUSTAINABILITY.
The world today is a highly complex one where everything seems totally complicated – even relationships are. Architect Alejandro Aravena said “the more complex the problem, the
greater the need for the solutions to be simple.” Sustainability would not have been an issue
or a challenge had resources been infinite but all resources are finite.
This is why inefficiency and redundancy are considered unsustainable practices. They waste
time and vital human and material resources that the world, especially at this point of its billions of years of existence, can very well do without. Constantly “reinventing the wheel” is
inefficient, redundant, and not smart.
One basic, glaring and vital example to point out is global food waste. Global food loss and
waste amounts to as much as one-third to one-half of all food produced. Wastage occurs at
all stages of the food chain. The processes from production to consumption are replete with
inefficiencies, redundancies and unsustainability, on the whole.
365
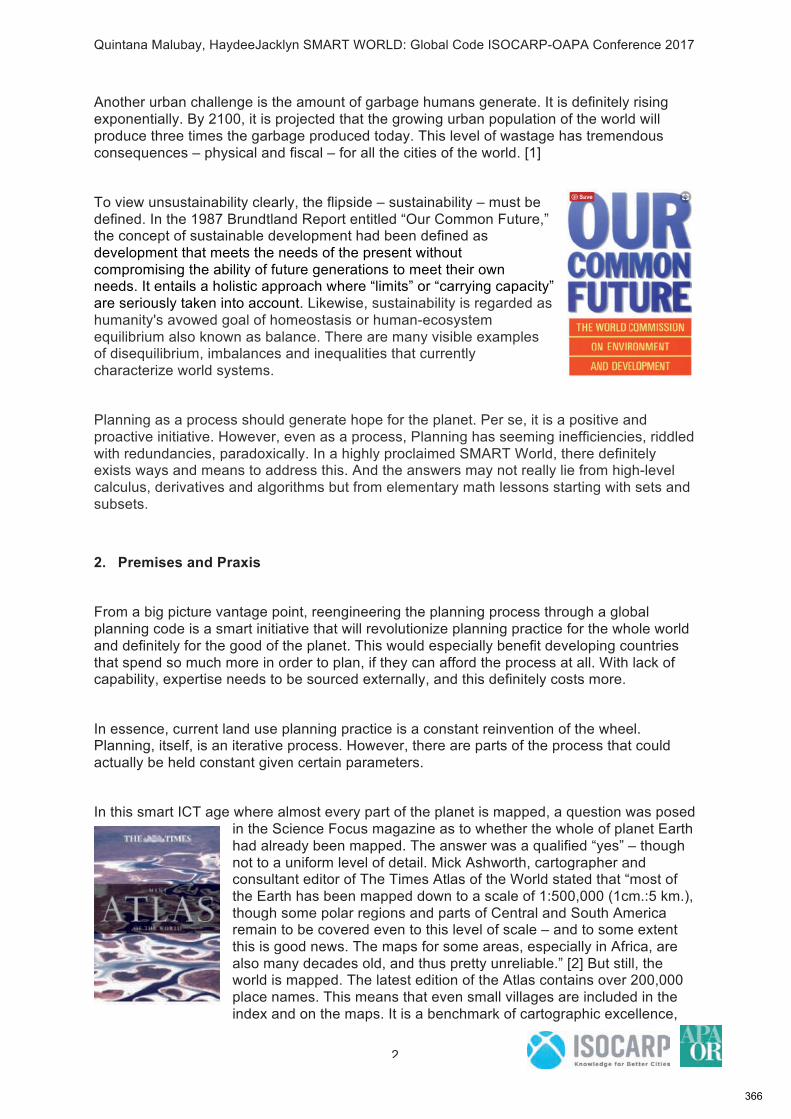
Quintana Malubay, HaydeeJacklyn SMART WORLD: Global Code ISOCARP-OAPA Conference 2017
2
Another urban challenge is the amount of garbage humans generate. It is definitely rising
exponentially. By 2100, it is projected that the growing urban population of the world will
produce three times the garbage produced today. This level of wastage has tremendous
consequences – physical and fiscal – for all the cities of the world. [1]
To view unsustainability clearly, the flipside – sustainability – must be
defined. In the 1987 Brundtland Report entitled “Our Common Future,” the concept of sustainable development had been defined as
development that meets the needs of the present without
compromising the ability of future generations to meet their own needs. It entails a holistic approach where “limits” or “carrying capacity”
are seriously taken into account. Likewise, sustainability is regarded as
humanity's avowed goal of homeostasis or human-ecosystem
equilibrium also known as balance. There are many visible examples of disequilibrium, imbalances and inequalities that currently
characterize world systems.
Planning as a process should generate hope for the planet. Per se, it is a positive and
proactive initiative. However, even as a process, Planning has seeming inefficiencies, riddled
with redundancies, paradoxically. In a highly proclaimed SMART World, there definitely exists ways and means to address this. And the answers may not really lie from high-level
calculus, derivatives and algorithms but from elementary math lessons starting with sets and
subsets.
2. Premises and Praxis
From a big picture vantage point, reengineering the planning process through a global
planning code is a smart initiative that will revolutionize planning practice for the whole world
and definitely for the good of the planet. This would especially benefit developing countries
that spend so much more in order to plan, if they can afford the process at all. With lack of capability, expertise needs to be sourced externally, and this definitely costs more.
In essence, current land use planning practice is a constant reinvention of the wheel. Planning, itself, is an iterative process. However, there are parts of the process that could
actually be held constant given certain parameters.
In this smart ICT age where almost every part of the planet is mapped, a question was posed
in the Science Focus magazine as to whether the whole of planet Earth
had already been mapped. The answer was a qualified “yes” – though
not to a uniform level of detail. Mick Ashworth, cartographer and consultant editor of The Times Atlas of the World stated that “most of
the Earth has been mapped down to a scale of 1:500,000 (1cm.:5 km.),
though some polar regions and parts of Central and South America remain to be covered even to this level of scale – and to some extent
this is good news. The maps for some areas, especially in Africa, are
also many decades old, and thus pretty unreliable.” [2] But still, the world is mapped. The latest edition of the Atlas contains over 200,000
place names. This means that even small villages are included in the
index and on the maps. It is a benchmark of cartographic excellence,
366
Quintana Malubay, HaydeeJacklyn SMART WORLD: Global Code ISOCARP-OAPA Conference 2017
3
trusted by governments, media and international organizations as reference source.
Given this, a global planning code can look at the totality of the Earth where planners can
classify the whole world into ridge-to-reef typologies. Through the process of deduction or deductive reasoning – a basic form of valid reasoning that begins with a general statement,
or hypothesis, and examines the possibilities to reach a specific, logical conclusion –
planners can then match the appropriate spatial strategies for the biggest region or the smallest community. Deduction follows the scientific method to test hypotheses and theories.
[3]
Typologies constitute roughly half of the process. They can be a powerful tool in a qualitative
study and can be most useful when systematically applied as shared techniques. This giga
or terra or perhaps even a more mammoth (term)-scale planning process will definitely entail
discounting political/country boundaries, as an exercise. The output will be ridge-to-reef typologies.
The International Union for the Conservation of Nature (IUCN), whose vision is “a just world that values and conserves nature,” is impelled
by its mission to “influence, encourage and assist societies throughout
the world to conserve the integrity and diversity of nature and to ensure that any use of natural resources is equitable and ecologically
sustainable.” Known as the “voice of nature” in the world stage and
established in 1948, IUCN consists of both government and civil
society organizations and provides public, private and non-governmental organizations with the knowledge and tools that enable human progress,
economic development and nature conservation to take place together. [4] IUCN adopts the
ridge-to-reef (R2R) planning process – tracing water resources from the watersheds to the world’s oceans.
After having classified land from the summit to the seas, codes can then be formulated. The
whole world is a SET. The land classifications are the SUBSETS. For each subset, codes can be formulated; thresholds can be comprehensively established.
An IF-THEN process for every typology can be prepared with corresponding implementing regulations drawn from the framework. For instance, “IF ridge, THEN the following
considerations and restrictions;” “IF rivers, THEN these regulations;” “IF coast, THEN the
following DOs and DON’Ts.” This constitutes half of the total process. Broad strokes, at the onset, could be considered a huge help already in streamlining the process. Through the
maturation of this very process, more details can be articulated. Dialogue can ensue thereby
giving more clarity and fairness to the resultant code.
Planning for the remaining unique features of an area constitutes the other half; roughly half;
probably more, probably less, depending on the area. But in the end, this had shortened the
process to a proportion that is smart, more efficient, less redundant. By doing deductive reasoning, planning can save “half” of the total effort. This constitutes REENGINEERING by
streamlining the process. This would then revolutionize planning practice. Focus can then be
directed towards implementation, the twin and waterloo of Planning. Mother Earth will be all the better for it.
367
Quintana Malubay, HaydeeJacklyn SMART WORLD: Global Code ISOCARP-OAPA Conference 2017
4
Sidebar: The Imperatives
In a dynamically evolving, changing world, there are certain imperatives that cannot be
overemphasized. These include:
(1) avoiding wastes and inefficiencies; this applies to governance, policy formulation and implementation, also personal practices);
(2) speed in delivery (there is really no more time to spare);
(3) intentionality and focus; (4) balance in the face of tremendous inequality; there is no balance when the world’s
equilibrium tilts towards a one out of seven billion world population living in informal
settlements – wallowing in abject poverty; living in spaces unfit for human habitation; (5) legitimacy (formalism in the face of high informality – Kibera, Kenya – informal
settlements are not even in the map and therefore are not legitimate and virtually non-
existent, even when they are “in-your-face;” and
(6) the imperative of making honest judgment calls and taking full responsibility towards survival and self-preservation.
3. Current Planning Process
Inefficiency and Redundancy
In doing Planning in the Philippines, I am a witness to the inefficiency all Planners face. Each
local government unit is mandated by law to undertake a land use planning process from the
first one when the law was initially passed in the 90s, and then every three years succeeding it. Fulfilling the intent and the letter of the law is very low. It is also rendered meaningless as
it is merely sheer compliance.
The country is yet to enact a National Land Use Law after several attempts of the Philippine
legislature to pass one – clearly irreconcilable given the conflicting vested interests of its
members. Having done Planning at myriad levels including level of the city or the local
government unit, it is evident that with a larger platform – such as the Provincial Development and Physical Framework Plan, several local units would definitely benefit from
not having to reproduce background and baseline information that could be projected from
the bigger and higher vantage point of the larger scale planning area – the province.
Most provinces have an average of thirty (30) to forty (40) municipalities, cities or local
government units within its territorial and administrative jurisdiction. Magnifying this into the national level where there are more than one thousand four hundred (1,400+) local
government units for the thirty million (30,000,000) hectares of the country, this would
translate into efficiency for the process, avoid superfluity and focusing efforts only onto the
truly essential aspects to be planned.
Indeed, with half the effort emanating from an already typified baseline referenced from the
typology, a standard LOOK for all places in the world would arise. It is not very ideal to look like every other place. The other half of the effort, the UNIQUE portion, would receive greater
attention, even at the level of the details. This consists of the more important and valued
parts. This is the core of the being of a place. This spells one’s IDENTITY.
368

Quintana Malubay, HaydeeJacklyn SMART WORLD: Global Code ISOCARP-OAPA Conference 2017
5
As a member of the American Planning Association for about a decade now and reading
about the Planning practices in different countries, and in addition, exposure to various
planning narratives from international conferences attended, I have observed that the same
Philippine planning experience holds true for most other developing countries, as well. In contrast, developed countries have simplified their planning processes and thereby ensured
that it gets done. With most other developing countries, there is lack of technical and
planning capability. There is that need for constant capability-building programs in order to formulate a Plan. Upon quick online survey, data on the extent of countries of the world that
are unable to do proper Planning, is not available. [This is one study possibly for ISOCARP
to undertake to give value to city and regional planning the world over.]
This reality has become apparent through the
whole process of formulating the New Urban
Agenda post UN Habitat III. Local government units in developing nations
continue to experience knowledge gaps in
dealing with spatial dynamics and urban development. To be specific, this ineptitude is manifest in addressing the urban challenge of
informal-settlement upgrading and likewise around geospatial analysis infrastructure.
Coupled with outdated planning education and instruments, these local government units in developing countries simply are unable to address the challenges confronting them. [5]
Rethinking and retooling are requisites for urban planners of the future. They must act
creatively — and differently – change not only in skills, attitudes and also in mindsets. This is the most critical aspect of urban transformation. Planners will need to acknowledge and
engage with the realities of cities of the developing world, the Global South. Issues of urban
informality, outdated legal frameworks, the negative effects of climate change and increasing land-based urban conflicts — planners will need to address all of these urban dynamics. Yet
in many cities today, planners tend to wish away the existence of urban informality, poverty
and political systems that give no room for professional practice. [6]
With such a tall order, a new way of delivering the Planning service needs to be introduced
and widely adopted. This new way of Planning and a Global Planning Code is the needed
power to energize the process.
4. A Vision for a Reengineered Planning Process through a Global Planning Code
For this think piece cum advocacy paper, it is necessary to establish and define what a code is. A CODE, from the purview of this paper is a set of conventions governing a particular
sphere; it is also a set of rules and standards adhered to by a society/economy/polity.
With ICT providing platforms for smart actions, the question can a global code with more
teeth be enacted, begs to be asked. I have often wondered about the magnitude and scale of
the planning inefficiency including implementation failures magnified globally. In reverse, with a Global Planning Code, how much inefficiency can be averted with the benefits accruing to
Mother Earth?
There are simple examples on how this can be done. Models include the Ten Commandments where serious Christians shake in fear to violate. The Code of Hammurabi,
369
Quintana Malubay, HaydeeJacklyn SMART WORLD: Global Code ISOCARP-OAPA Conference 2017
6
where until now, the applicability of the underlying principles has not changed – an eye for an
eye, a tooth for a tooth. There are building codes adopted by most countries; some need
updating though. In the Code of Hammurabi, buildings and parapets are included in the
program.
However, the call for a simple code that could really apply to all planned urbanization
processes the world over is hereby issued and advocated. For, not to do so is a total disservice to the population and intelligence or “smartness” of this world.
There are ostensible formulas and standards that can be extended to build this Global Planning Code. One such principle is the Pareto Rule where the 80% of the commonalities
outlined above is characterized under the various typologies and where 20% encompasses
the uniqueness of an area.
This means that rather than reinventing the wheel each time the planning process is
undertaken, efforts are minimized and are only targeted towards the 20% of the uniqueness
or differences of an area or locality – the ridge, the river, or the reef, and so on.
The 20% spells the identity for a Planning area. In the deliberation processes, comparisons
and contrasts are resorted to as part of the deduction procedure, to be specific, in Focus Group Discussions (FGDs), or in charrettes. There are, of course, exceptions to the rule. And
this is where the caveat essentially lies.
5. The Proposed Code Virtually Applied on UN Habitat III goal
To reiterate and to reemphasize the point, with ICT providing platforms for smart actions, the question can a global code with more teeth be
enacted, begs to be asked. And indeed, for this effort projected onto the
world stage, only global institutions can provide some teeth. The United
Nations, specifically the UN Habitat, can work on this code, a possible offshoot of the New Urban Agenda. These types of institutions are
already in place. Though power over countries and organizations is not
really a UN edge, it does command moral suasion.
As a planning policy area, SETTLEMENTS are a huge, global, urban challenge, most
specifically informal settlements. Focusing on SETTLEMENTS is a case in point here, the core mission of UN Habitat conferences, to positively respond to the glaring and manifest
data that one-seventh of the world population visibly lives in slums unfit for human habitation,
wallowing in abject poverty and blight.
370
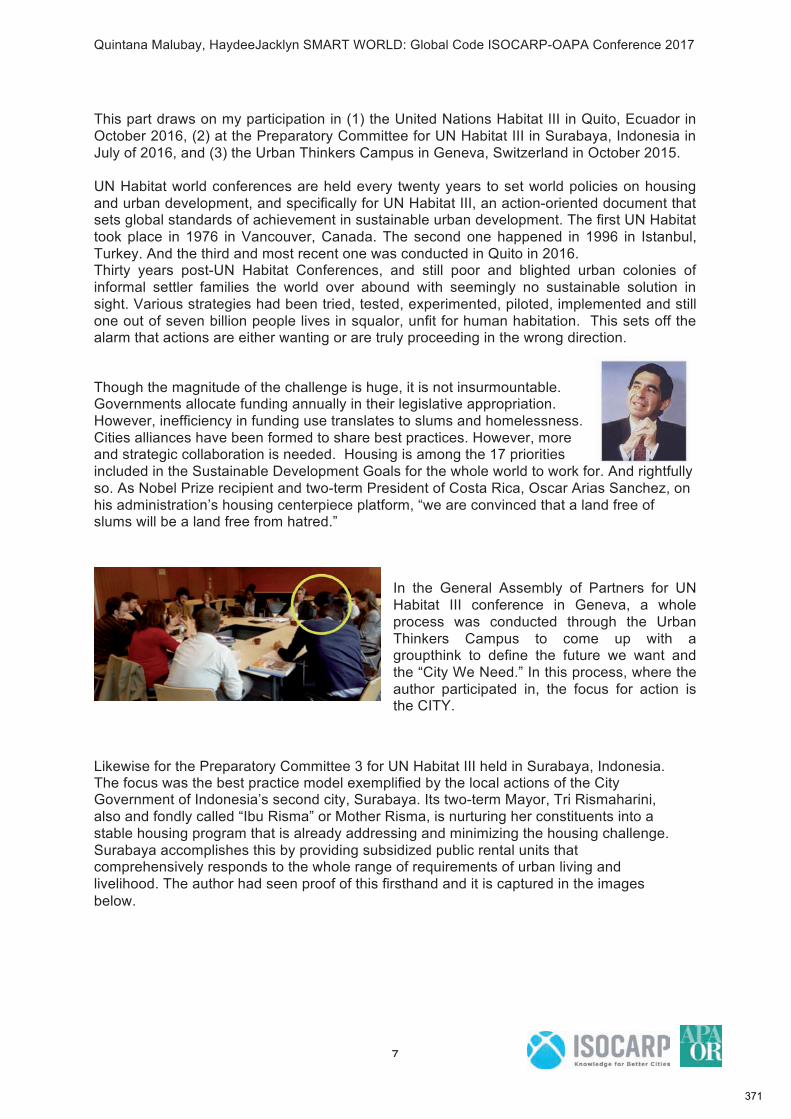
Quintana Malubay, HaydeeJacklyn SMART WORLD: Global Code ISOCARP-OAPA Conference 2017
7
This part draws on my participation in (1) the United Nations Habitat III in Quito, Ecuador in
October 2016, (2) at the Preparatory Committee for UN Habitat III in Surabaya, Indonesia in
July of 2016, and (3) the Urban Thinkers Campus in Geneva, Switzerland in October 2015.
UN Habitat world conferences are held every twenty years to set world policies on housing
and urban development, and specifically for UN Habitat III, an action-oriented document that sets global standards of achievement in sustainable urban development. The first UN Habitat
took place in 1976 in Vancouver, Canada. The second one happened in 1996 in Istanbul,
Turkey. And the third and most recent one was conducted in Quito in 2016. Thirty years post-UN Habitat Conferences, and still poor and blighted urban colonies of
informal settler families the world over abound with seemingly no sustainable solution in
sight. Various strategies had been tried, tested, experimented, piloted, implemented and still
one out of seven billion people lives in squalor, unfit for human habitation. This sets off the alarm that actions are either wanting or are truly proceeding in the wrong direction.
Though the magnitude of the challenge is huge, it is not insurmountable. Governments allocate funding annually in their legislative appropriation.
However, inefficiency in funding use translates to slums and homelessness.
Cities alliances have been formed to share best practices. However, more and strategic collaboration is needed. Housing is among the 17 priorities
included in the Sustainable Development Goals for the whole world to work for. And rightfully
so. As Nobel Prize recipient and two-term President of Costa Rica, Oscar Arias Sanchez, on
his administration’s housing centerpiece platform, “we are convinced that a land free of slums will be a land free from hatred.”
In the General Assembly of Partners for UN
Habitat III conference in Geneva, a whole
process was conducted through the Urban
Thinkers Campus to come up with a groupthink to define the future we want and
the “City We Need.” In this process, where the
author participated in, the focus for action is the CITY.
Likewise for the Preparatory Committee 3 for UN Habitat III held in Surabaya, Indonesia. The focus was the best practice model exemplified by the local actions of the City Government of Indonesia’s second city, Surabaya. Its two-term Mayor, Tri Rismaharini,
also and fondly called “Ibu Risma” or Mother Risma, is nurturing her constituents into a
stable housing program that is already addressing and minimizing the housing challenge.
Surabaya accomplishes this by providing subsidized public rental units that comprehensively responds to the whole range of requirements of urban living and
livelihood. The author had seen proof of this firsthand and it is captured in the images
below.
371
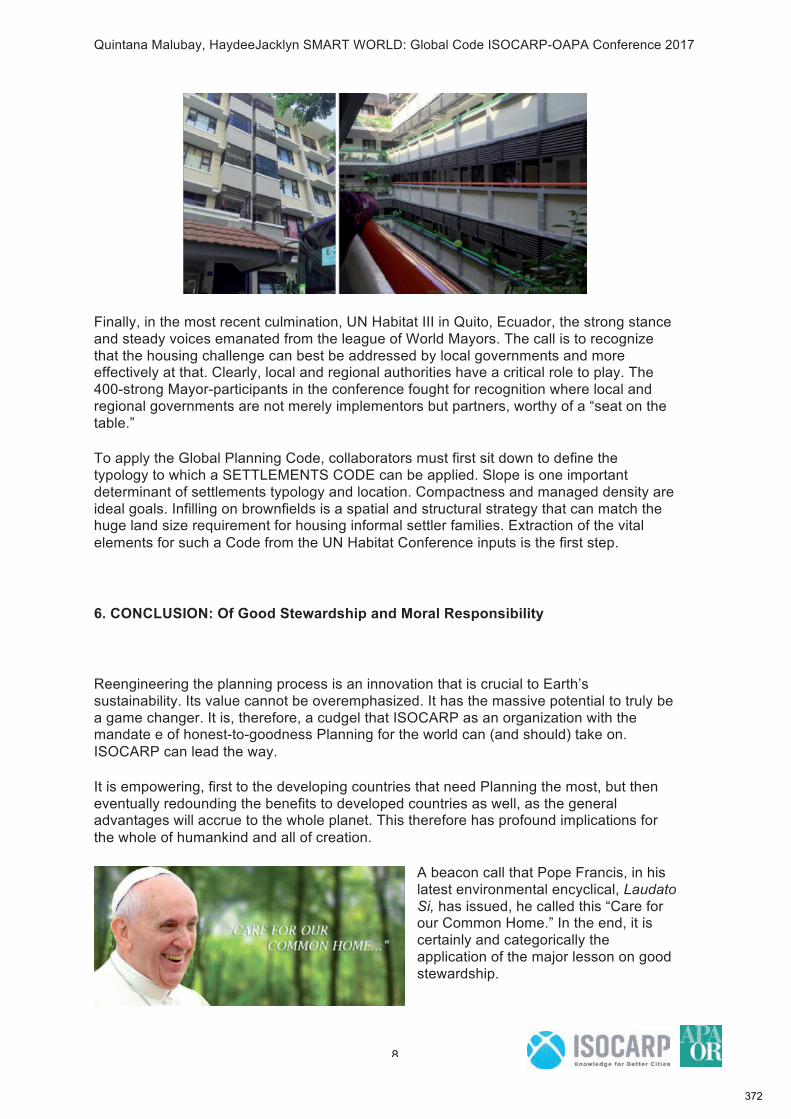
Quintana Malubay, HaydeeJacklyn SMART WORLD: Global Code ISOCARP-OAPA Conference 2017
8
Finally, in the most recent culmination, UN Habitat III in Quito, Ecuador, the strong stance
and steady voices emanated from the league of World Mayors. The call is to recognize
that the housing challenge can best be addressed by local governments and more effectively at that. Clearly, local and regional authorities have a critical role to play. The
400-strong Mayor-participants in the conference fought for recognition where local and
regional governments are not merely implementors but partners, worthy of a “seat on the
table.”
To apply the Global Planning Code, collaborators must first sit down to define the
typology to which a SETTLEMENTS CODE can be applied. Slope is one important
determinant of settlements typology and location. Compactness and managed density are
ideal goals. Infilling on brownfields is a spatial and structural strategy that can match the huge land size requirement for housing informal settler families. Extraction of the vital
elements for such a Code from the UN Habitat Conference inputs is the first step.
6. CONCLUSION: Of Good Stewardship and Moral Responsibility
Reengineering the planning process is an innovation that is crucial to Earth’s
sustainability. Its value cannot be overemphasized. It has the massive potential to truly be
a game changer. It is, therefore, a cudgel that ISOCARP as an organization with the mandate e of honest-to-goodness Planning for the world can (and should) take on.
ISOCARP can lead the way.
It is empowering, first to the developing countries that need Planning the most, but then
eventually redounding the benefits to developed countries as well, as the general advantages will accrue to the whole planet. This therefore has profound implications for
the whole of humankind and all of creation.
A beacon call that Pope Francis, in his
latest environmental encyclical, Laudato
Si, has issued, he called this “Care for our Common Home.” In the end, it is
certainly and categorically the
application of the major lesson on good
stewardship.
372
Quintana Malubay, HaydeeJacklyn SMART WORLD: Global Code ISOCARP-OAPA Conference 2017
9
For the Settlements policy area, a simplified but unified global code will definitely make
real the vision to start making a dent into debilitating and ever-growing challenges in this
dynamically-urbanizing world now more than half of humankind call home, and one-
seventh sadly call homelessness.
Transforming how Planning is done will bring back real HOPE to our increasingly hapless
world. It is every Planner’s responsibility.
Endnotes
[1] http://www.worldbank.org/en/news/feature/2013/10/30/global-waste-on-pace-to-triple
[2] http://www.sciencefocus.com/qa/has-all-earth-been-mapped.
[3] https://www.livescience.com/21569-deduction-vs-induction.html
[4] https://www.iucn.org/about
[5] http://citiscope.org/habitatIII/commentary/2016/08/developing-countries-face-catastrophic-
lack-urban-planning-capacity
[6] http://citiscope.org/habitatIII/commentary/2016/08/developing-countries-face-catastrophic-lack-urban-planning-capacity
References:
Brundtland, Gro Harlem, 1987, Our Common Future, Oxford University Press.
Kaye, Debra, with Karen Kelly, 2013, Red Thread Thinking: Weaving Together Connections for Brilliant Ideas and Profitable Innovation, McGraw Hill.
Online references: Wikipedia, Google
Paulus, Trina, 1972, Hope for the Flowers, Paulist Press.
Pope Francis, Laudato Si. Papal Encyclical on the Environment.
Schumacher, Ernst Friedrich, 1973, Small is Beautiful: A Study of Economics as if People
Mattered, Blond & Briggs.
373
TheInternationalGuidelinesonUrbanandTerritorialPlanning:bridgeforplanning&innovation
Moderator: Andrea OYUELA, United Nations Human Settlements Programme (UN‐Habitat), Nairobi, Kenya
Urban planning is back in fashion. As the world’s urban population continues to increase, it is
expected that it will rise to 60% by the year 2030, making it clear now that the future is urban. While
cities have brought forth challenges for their residents and the natural environment, they have also
become places for opportunities as well as playgrounds for innovation. The past years have
showcased how we have harnessed the power of technology to improve decision‐making and the
development of physical urban interventions, guiding cities towards a smarter growth. Likewise, the
world has witnessed a paradigm shift in planning as it becomes more people‐centered, a trend that
peaked with the New Urban Agenda (NUA) declaration at the Habitat III conference in 2016, a
document that set the path for governments and citizens to target sustainable urban development
over the next 20 years.
UN‐Habitat’s International Guidelines on Urban and Territorial Planning (IG‐UTP or Guidelines) have
a leading role in this movement. Approved by UN‐Habitat’s Governing Council in 2015, they are the
first universal framework for planning targeted at the improvement policies, plans, designs and
implementation processes that will lead to more compact, socially inclusive, better integrated and
connected cities and territories that foster sustainable urban development and are resilient to
climate change. The Guidelines have brought forth two key concepts to the table, an ‘integrated’
and ‘territorial’ approach to planning that enables the integration of levels (vertical) and sectors
(horizontal), working across the spatial planning continuum, all the way from urban to rural.
Moreover, the Guidelines have explicitly been referred to in the NUA as a key means for its
implementation (paragraph 93), consequently becoming instrumental to the attainment of other
global targets such as the Sustainable Development Goals, particularly Goal 11 on cities. The 53rd
ISOCARP Congress is timely then, as it is the first planning platform to take place after the Habitat III
summit to advance the implementation of the actions and recommendations contained in the IG‐
UTP and the New Urban Agenda.
Under the context set by the congress, the Guidelines are a ‘smart’ framework for today’s planning
community. On the one hand, their comprehensive approach enables fostering synergies among
planning constituents through their localization within a specific context; generally, a challenge not
confronted before due to the absence of universal guidance. On the other hand, they advocate for
smart planning in the sense that they strive to achieve ‘intelligent’ decision‐making and formulation
of policies and strategies that take into account the value of principles for sustainable urban
development, such as connectivity and compactness to foster urban competiveness. This is to be
done through a consideration of information and communication technologies (ICTs) that inform and
assist the effectiveness of urban and territorial planning processes as suggested in the following
examples:
“National governments should establish and maintain information databases, registers and mapping
systems on population land, environmental resources, infrastructure, services and related needs, as
a basis for the preparation and revision of spatial plans and regulations. Those systems should
374
combine the use of local knowledge and modern information and communication technologies and
allow for regional and city‐specific disaggregation.”
Recommendation C16(c)
“National governments should promote environmentally sound technologies, geospatial
technologies for data collection, information and communication technologies, street addressing,
land registration and property recording systems, as well as networking and knowledge sharing to
support technically and socially the implementation of urban and territorial plans.”
Recommendation D21(i)
At a time of such rapid social and technological changes, planning efforts must keep pace with these
transformations while also being a well‐informed process that ensures a sustainable development of
cities and their surrounding territories. The New Urban Agenda advocates for this re‐invention of
planning, e.g. paragraph 66 of the declaration, empowering planning constituents to innovate and
make use of the available resources and solutions in an ‘intelligent’ manner to achieve its goal of
inclusive and healthy cities for all. Considering the contribution of the IG‐UTP to the implementation
of the NUA, focus must be placed on both processes (implementation) and outputs (policies, plans,
designs) as targeted by the Guidelines, taking advantage of today’s world being more connected
now than ever, meaning, making use of the constantly occurring sharing of information, new
theories, concepts, and technological solutions at the global level. Thus, the Guidelines can act as a
catalyst for bridging planning and innovation together, and thus make of use smart‐planned
urbanization as a transformative force to ensure a sustainable future and the well‐being of its
citizens.
How are the IG‐UTP moving towards ‘smart’ planning and solutions?
More concretely, several areas of work within UN‐Habitat’s implementation program for the IG‐UTP
are taking advantage of today’s technological innovations for improving planning processes around
the world. Firstly, as part of their Handbook and toolkit for localization, a series of mobile Apps are
being developed to assist the stakeholder groups in carrying out the review and subsequent reform
of their local planning system. The overall objective of these tools is to encourage the well‐informed
improvement of local planning policies, strategies and processes in an integrated manner. In
addition, not only will these tools assist the stakeholders, however, as they will also enable UN‐
Habitat to collect information from these contexts remotely.
Secondly, in line with their goal of enhancing knowledge for improved urban and territorial planning,
the IG‐UTP Compendium of Inspiring Practices and other resources are being developed into an
online crowd‐sourced platform that will enable sharing best practices, tools, and concepts in order
to raise awareness and inspire planning stakeholders to take action within their specific context.
Through dissemination of examples and knowledge, well‐informed and integrated decision‐making
can be done by planning constituencies, consequently leading to more sustainable urban
development.
Third, and in the area of application, UN‐Habitat is formulating a number of pilot projects for
implementing the IG‐UTP through the ‘lens’ of health in collaboration with the Government of
Norway and the World Health Organization. One of the projects will look into spatial mapping and
data collection tools that build the knowledge base, carry out analysis and generate scenarios, and
375
inform processes that lead to healthy urban and territorial planning and the well‐being of citizens
and the environment. Among the tools being formulated is an application for the mapping
component of the pilot project, which will be later linked to the platform for knowledge
management and sharing under development.
Lastly, and at the broader level, several initiatives within UN‐Habitat are linking to the work and
targets of the Guidelines as well. The Global Public Space Programme launched in 2011, for example,
provides support to cities (mainly located in the majority world) for designing and building quality
public spaces in partnership with local governments. One of the programme’s main components is
pioneering the improvement of public spaces by using the popular video game Minecraft as a tool to
engage communities in the design process of a public space. Externally, projects and initiatives such
as the SymbioCity Approach , are showcasing the potential and outcomes of ‘smarter’ urban
development by unlocking synergies within components of urban systems, in a similar line to the
integrative and systemic approach advocated by the IG‐UTP. It is through a collective effort that the
targets of the IG‐UTP and universal agendas can be met, using them as an umbrella framework to
enable bringing planning and innovation together for the improvement of planning systems for more
sustainable cities and territories.
OBJECTIVES OF THE SESSION
Ultimately, the session at the 53rd ISOCARP Congress aims at raising awareness and knowledge of
the audience in regards to the IG‐UTP, their potential for contributing to the New Urban Agenda,
and their ability as an enabling framework for considering smart growth and technological solutions
to guide sustainable urbanization, in line with the theme of the congress. In addition, the session
intends to serve as platform for bringing different representatives of the planning community
together to illustrate, based on their experiences, the potential of the IG‐UTP as an enabling
framework for well‐informed, comprehensive decision‐making and planning practices. A number of
recommendations in the IG‐UTP encourage its four stakeholder groups to take action in this respect
(e.g. B2‐10(e), C16(c), 20(b), D21(i)), and therefore, serve as a reference for ‘intelligent’ planning as
they advocate for planning that is integrated, inclusive, healthy, connected, and systemic, to name a
few characteristics.
Therefore, the IG‐UTP session has the following specific objectives:
1. To illustrate the potential of the Guidelines for the achievement of global targets, including
the New Urban Agenda and SDG 11.
2. To illustrate how the Guidelines can serve as a reference framework that encourages the
consideration and use of ‘smart’ planning and technological innovation to guide sustainable
urbanization.
3. To showcase experiences of well‐informed, ‘smart’ planning processes and projects, linking
their foundational concepts and outcomes to the work of the IG‐UTP and other targets of
sustainable urbanization.
4. To serve as a platform for bringing members of the planning community together to
advocate for and reflect on the way forward towards using the Guidelines as a medium for ‘smart’
development, in line with the multi‐stakeholder spirit of the IG‐UTP.
376
Data-driven approach towards Inclusive Urban Transportation: A case of Hyderabad, India
Maitreyi YELLAPRAGADA, Independent Architecture and Planning Professional, INDIA
Shubhi SONAL, Associate Professor, REVA Institute of Technology and Management, INDIA
Conference Track: Governance and Inclusive Communities
Short Abstract:
Transportation systems, the backbone of the cities in India, are not often inclusive of its users during planning and design. This paper aims to assess transportation systems for inclusivity by analyzing datasets of users on specific, pre-determined parameters for urban local bodies to make conclusive decisions in improving the existing transport amenities in terms of its ability to serve all.
1. Introduction
1.1 Inclusive Approach to Planning
The of concept of inclusive planning first originated in the form of inclusionary zoning meant to encourage production of affordable housing. The average sale prices for single family homes between 1973 and 1980 in Los Angeles rose by 183% rendering housing unaffordable to common man. A set of controls and incentives were formulated with an aim to regulate escalating sale prices of homes by making housing affordable and with an intention to create income-integrated communities. (R.Ellickson, 1981). "An inclusive city is one that values all people and their needs equally. It is one in which all residents—including the most marginalized of poor workers—have a representative voice in governance, planning, and budgeting processes, and have access to sustainable livelihoods, legal housing and affordable basic services such as water/sanitation and an electricity supply.” (R.Douglas)
The above perspectives on inclusion in the context of Urban Planning, help in deriving a simple and lucid definition which states Inclusive Planning to constitute inclusion of all stakeholders in the process of planning, management and development, moving towards a common goal.
In brief, Inclusive Planning process aims at
• Connecting and integrating all sections of the society • Striving for equal opportunities for all
1.2 Importance of inclusive planning in transportation
Inclusive planning approach finds substantial significance in the transportation sector. Transportation is considered the lifeline of a nation. (A. Kant, 2016). The purpose of transport systems is to connect people to each other and to opportunities for business, work and leisure. Public transportation systems are essential to the functioning of large cities. (International Transport Forum, 2014). Transportation is vital for independent living: finding a job, shopping, enjoying life with family and friends, and going out to the movies or restaurants. And from the World Bank perspective, it is a crucial element for staying out of poverty (J.Babinard, 2010)
377
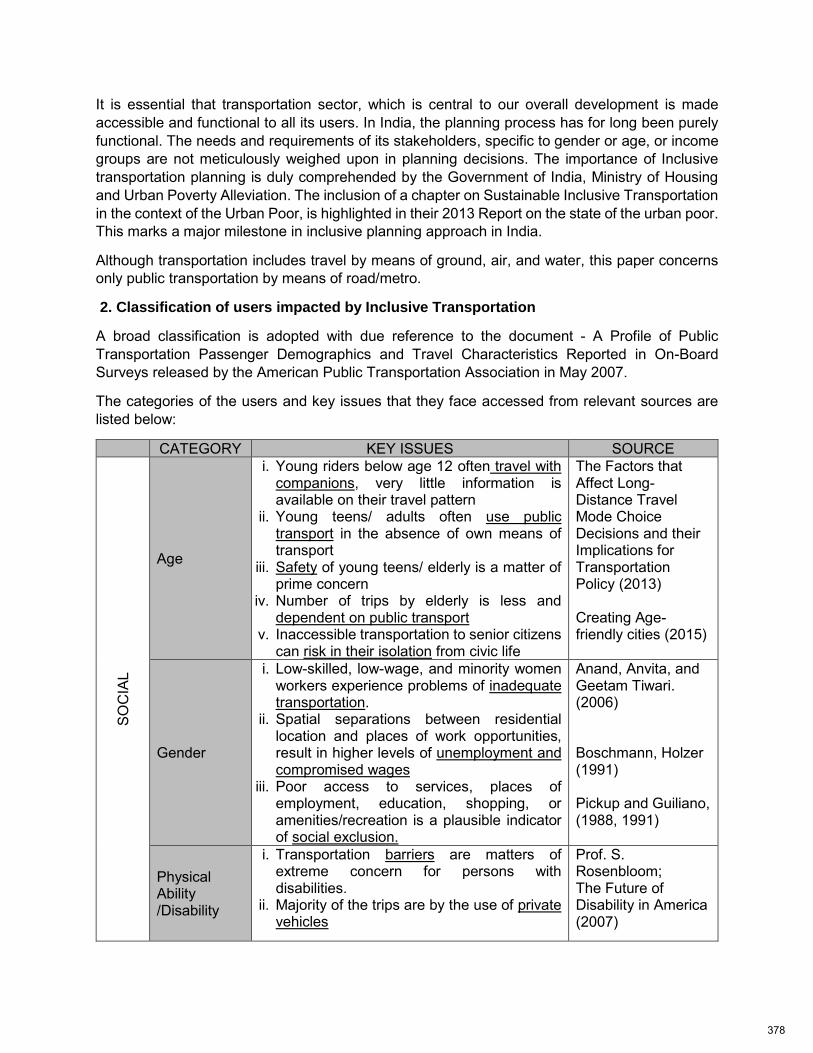
It is essential that transportation sector, which is central to our overall development is made accessible and functional to all its users. In India, the planning process has for long been purely functional. The needs and requirements of its stakeholders, specific to gender or age, or income groups are not meticulously weighed upon in planning decisions. The importance of Inclusive transportation planning is duly comprehended by the Government of India, Ministry of Housing and Urban Poverty Alleviation. The inclusion of a chapter on Sustainable Inclusive Transportation in the context of the Urban Poor, is highlighted in their 2013 Report on the state of the urban poor. This marks a major milestone in inclusive planning approach in India.
Although transportation includes travel by means of ground, air, and water, this paper concerns only public transportation by means of road/metro.
2. Classification of users impacted by Inclusive Transportation
A broad classification is adopted with due reference to the document - A Profile of Public Transportation Passenger Demographics and Travel Characteristics Reported in On-Board Surveys released by the American Public Transportation Association in May 2007.
The categories of the users and key issues that they face accessed from relevant sources are listed below:
CATEGORY KEY ISSUES SOURCE
SOC
IAL
Age
i. Young riders below age 12 often travel with companions, very little information is available on their travel pattern
ii. Young teens/ adults often use public transport in the absence of own means of transport
iii. Safety of young teens/ elderly is a matter of prime concern
iv. Number of trips by elderly is less and dependent on public transport
v. Inaccessible transportation to senior citizens can risk in their isolation from civic life
The Factors that Affect Long-Distance Travel Mode Choice Decisions and their Implications for Transportation Policy (2013) Creating Age-friendly cities (2015)
Gender
i. Low-skilled, low-wage, and minority women workers experience problems of inadequate transportation.
ii. Spatial separations between residential location and places of work opportunities, result in higher levels of unemployment and compromised wages
iii. Poor access to services, places of employment, education, shopping, or amenities/recreation is a plausible indicator of social exclusion.
Anand, Anvita, and Geetam Tiwari. (2006) Boschmann, Holzer (1991) Pickup and Guiliano, (1988, 1991)
Physical Ability /Disability
i. Transportation barriers are matters of extreme concern for persons with disabilities.
ii. Majority of the trips are by the use of private vehicles
Prof. S. Rosenbloom; The Future of Disability in America (2007)
378
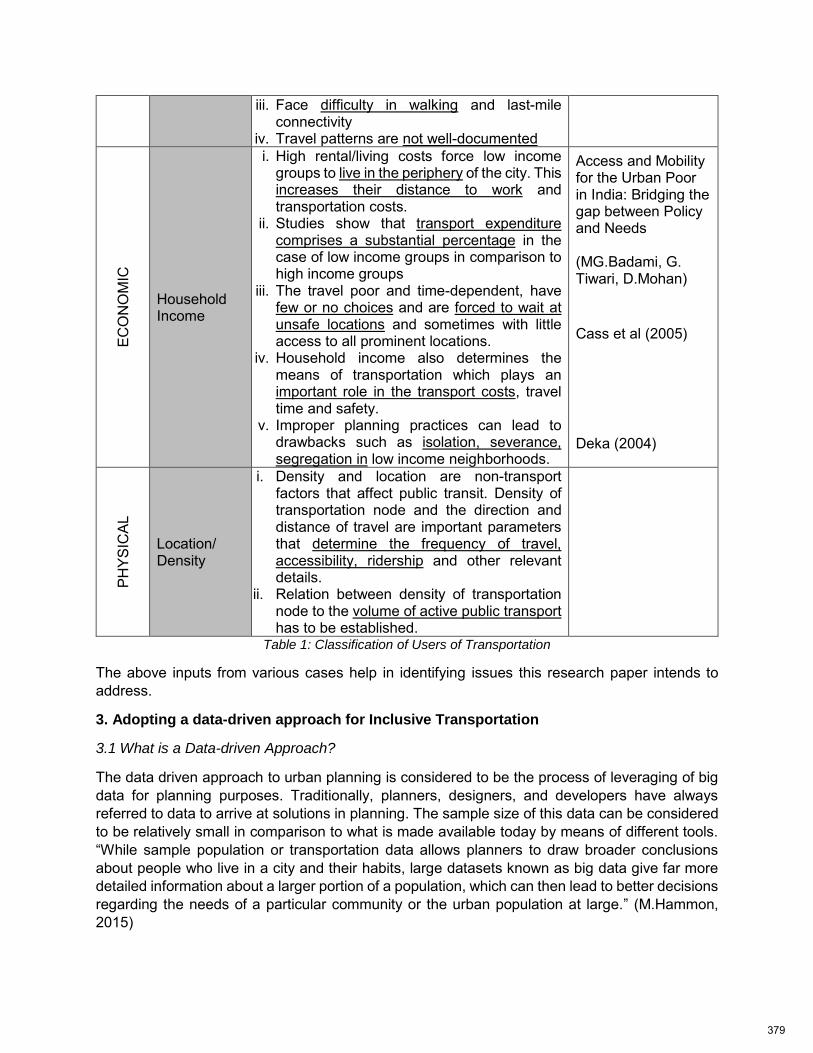
iii. Face difficulty in walking and last-mile connectivity
iv. Travel patterns are not well-documented EC
ON
OM
IC
Household Income
i. High rental/living costs force low income groups to live in the periphery of the city. This increases their distance to work and transportation costs.
ii. Studies show that transport expenditure comprises a substantial percentage in the case of low income groups in comparison to high income groups
iii. The travel poor and time-dependent, have few or no choices and are forced to wait at unsafe locations and sometimes with little access to all prominent locations.
iv. Household income also determines the means of transportation which plays an important role in the transport costs, travel time and safety.
v. Improper planning practices can lead to drawbacks such as isolation, severance, segregation in low income neighborhoods.
Access and Mobility for the Urban Poor in India: Bridging the gap between Policy and Needs (MG.Badami, G. Tiwari, D.Mohan)
Cass et al (2005)
Deka (2004)
PHYS
ICAL
Location/ Density
i. Density and location are non-transport factors that affect public transit. Density of transportation node and the direction and distance of travel are important parameters that determine the frequency of travel, accessibility, ridership and other relevant details.
ii. Relation between density of transportation node to the volume of active public transport has to be established.
Table 1: Classification of Users of Transportation
The above inputs from various cases help in identifying issues this research paper intends to address.
3. Adopting a data-driven approach for Inclusive Transportation
3.1 What is a Data-driven Approach?
The data driven approach to urban planning is considered to be the process of leveraging of big data for planning purposes. Traditionally, planners, designers, and developers have always referred to data to arrive at solutions in planning. The sample size of this data can be considered to be relatively small in comparison to what is made available today by means of different tools. “While sample population or transportation data allows planners to draw broader conclusions about people who live in a city and their habits, large datasets known as big data give far more detailed information about a larger portion of a population, which can then lead to better decisions regarding the needs of a particular community or the urban population at large.” (M.Hammon, 2015)
379
3.2 Benefits of adopting a data-driven approach
The process of planning has been evolving continuously. The fast-changing dynamics of our cities also need continuous verification and reform especially in the transportation sector. In this scenario, the need of the hour is strategic planning that takes into purview the fast-paced city dynamics and responds accordingly rather than a one-time action plan.
The dictionary defines big data as extremely large data sets that may be analyzed computationally to reveal patterns, trends, and associations, especially relating to human behavior and interactions. A few benefits of using big data as a tool for planning, managing and improving cities as suggested by M.Hammon are listed below:
i. Larger datasets are made available for making data-driven decisions that are practical and holistic.
ii. Resources can be allocated and utilized in an optimum and efficient way.
iii. Continuous evaluation of existing programs and policies aids in assessment of decisions’ effectiveness.
iv. Near or Real-time analysis can be adopted to analyze continuous changes in parameters under study. This helps in making the planning process more dynamic.
v. The quantitative data in the form of statistics, models, maps, and simulations can be used by planners to demonstrate the process of decision-making.
vi. The study of patterns and structures within datasets help to gain new insights while analyzing relationships between them.
vii. Public-private partnerships can be employed to obtain, aggregate, analyze, and apply data to cities in ways that benefit all parties involved and ultimately improve the quality of urban life.
These benefits collectively address the need for adopting a data-driven strategy to inclusive planning. A previous study conducted by the authors aimed at Measuring Gender Inclusiveness highlighted few discrepancies due to small data samples. Additionally, the perception based surveys were in some cases invalid as it was not obtained from the targeted users. This was presented at the International Conference on Urban Planning, Governance and Design for Reducing Urban Conflicts and Violence.
4. Objectives and Limitations
The main emphasis of this paper is towards making transportation systems inclusive for the society as a whole in the context of an urban center located in a developing country like India. In this study, we shall consider the case of the city of Hyderabad and focus our studies around the upcoming Metro Rail intended to connect the city along 3 lines/ routes.
i. Data on transportation is not well-organized and incomplete for planners and decision-makers to make conclusive inferences. Although information on passenger count, travel patterns and traffic patterns can be obtained from relevant surveys, it is observed that definitive information on passenger demographics, user type, perception of transportation, needs and sense of safety are absent. Procuring this missing link can help in establishing a constructive framework for making the transportation systems inclusive for all.
380
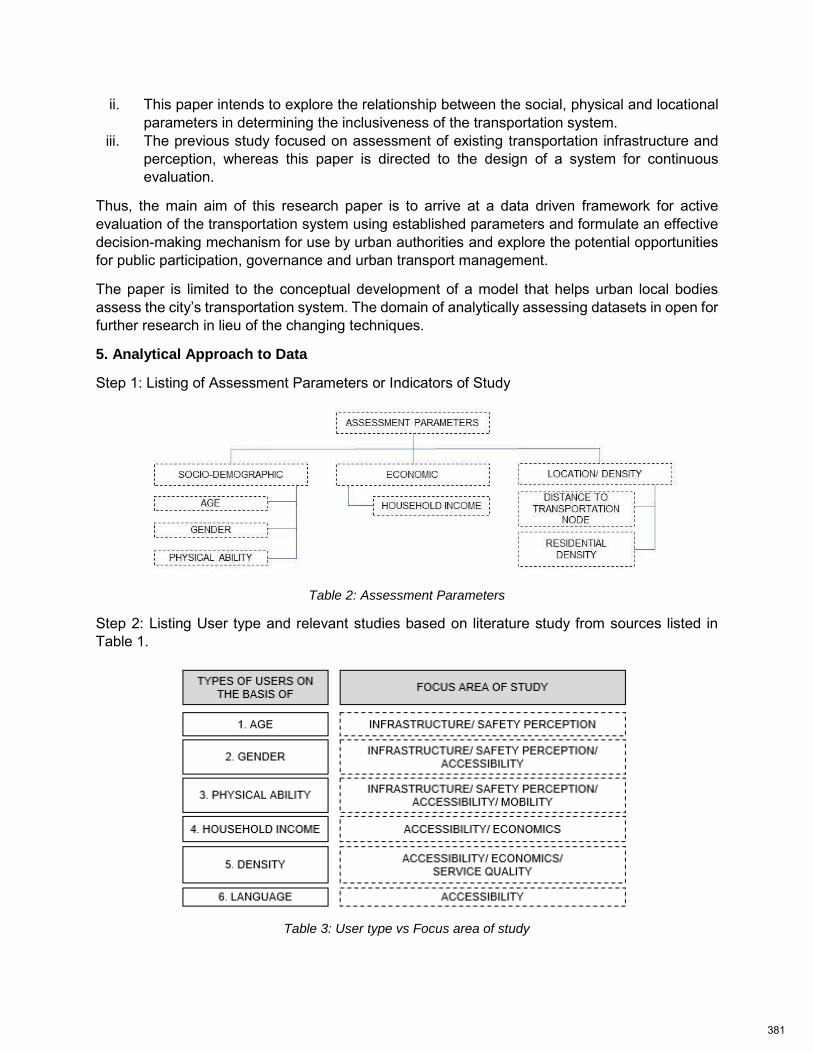
ii. This paper intends to explore the relationship between the social, physical and locational parameters in determining the inclusiveness of the transportation system.
iii. The previous study focused on assessment of existing transportation infrastructure and perception, whereas this paper is directed to the design of a system for continuous evaluation.
Thus, the main aim of this research paper is to arrive at a data driven framework for active evaluation of the transportation system using established parameters and formulate an effective decision-making mechanism for use by urban authorities and explore the potential opportunities for public participation, governance and urban transport management.
The paper is limited to the conceptual development of a model that helps urban local bodies assess the city’s transportation system. The domain of analytically assessing datasets in open for further research in lieu of the changing techniques.
5. Analytical Approach to Data
Step 1: Listing of Assessment Parameters or Indicators of Study
Table 2: Assessment Parameters
Step 2: Listing User type and relevant studies based on literature study from sources listed in Table 1.
Table 3: User type vs Focus area of study
381
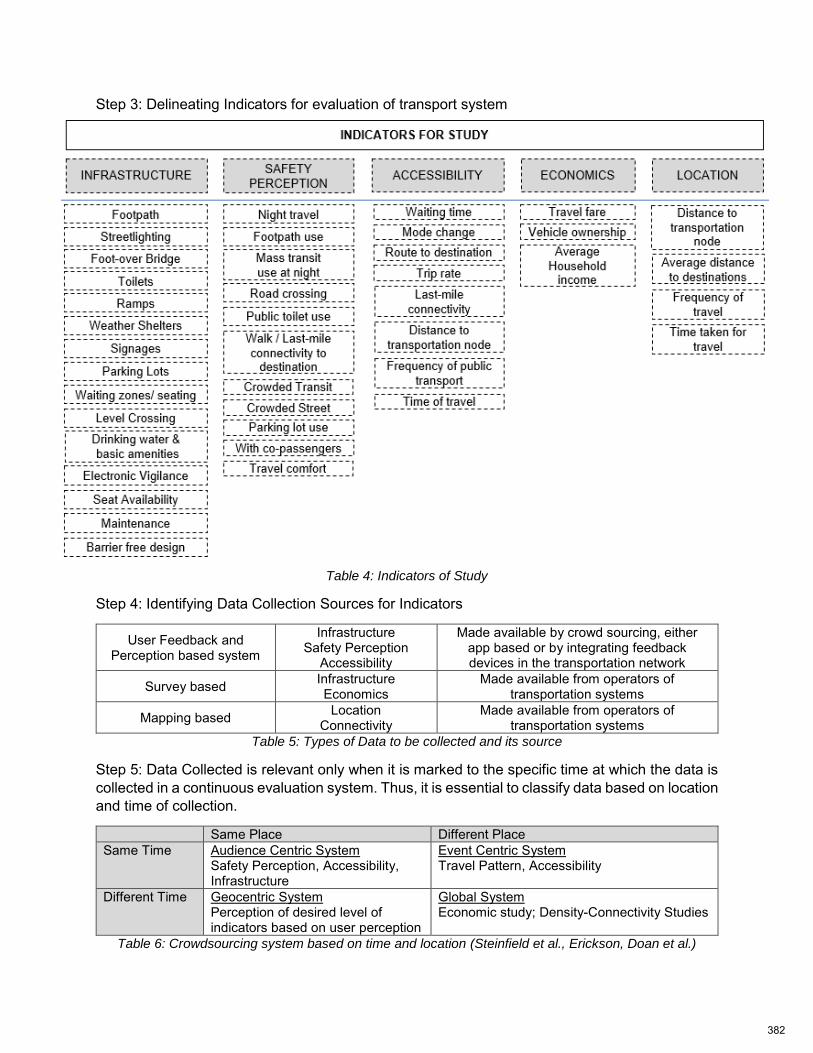
Step 3: Delineating Indicators for evaluation of transport system
Table 4: Indicators of Study
Step 4: Identifying Data Collection Sources for Indicators
User Feedback and Perception based system
Infrastructure Safety Perception
Accessibility
Made available by crowd sourcing, either app based or by integrating feedback devices in the transportation network
Survey based Infrastructure Economics
Made available from operators of transportation systems
Mapping based Location Connectivity
Made available from operators of transportation systems
Table 5: Types of Data to be collected and its source
Step 5: Data Collected is relevant only when it is marked to the specific time at which the data is collected in a continuous evaluation system. Thus, it is essential to classify data based on location and time of collection.
Same Place Different Place Same Time Audience Centric System
Safety Perception, Accessibility, Infrastructure
Event Centric System Travel Pattern, Accessibility
Different Time Geocentric System Perception of desired level of indicators based on user perception
Global System Economic study; Density-Connectivity Studies
Table 6: Crowdsourcing system based on time and location (Steinfield et al., Erickson, Doan et al.)
382
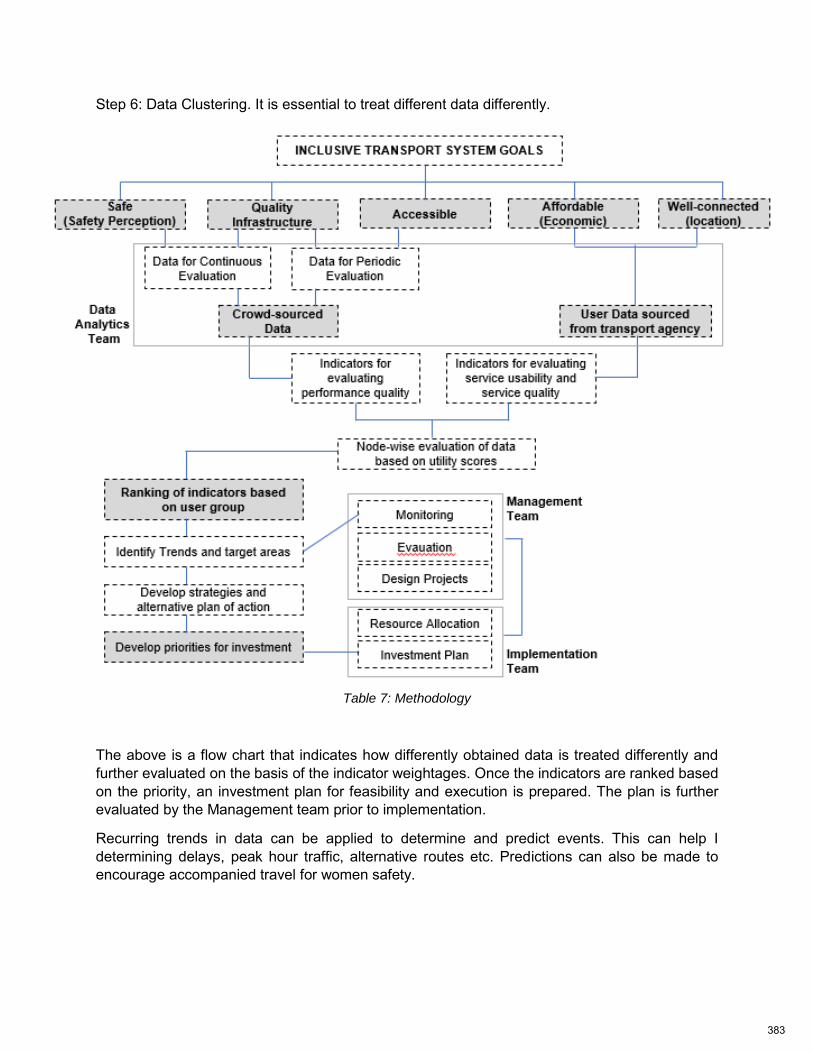
Step 6: Data Clustering. It is essential to treat different data differently.
Table 7: Methodology
The above is a flow chart that indicates how differently obtained data is treated differently and further evaluated on the basis of the indicator weightages. Once the indicators are ranked based on the priority, an investment plan for feasibility and execution is prepared. The plan is further evaluated by the Management team prior to implementation.
Recurring trends in data can be applied to determine and predict events. This can help I determining delays, peak hour traffic, alternative routes etc. Predictions can also be made to encourage accompanied travel for women safety.
383
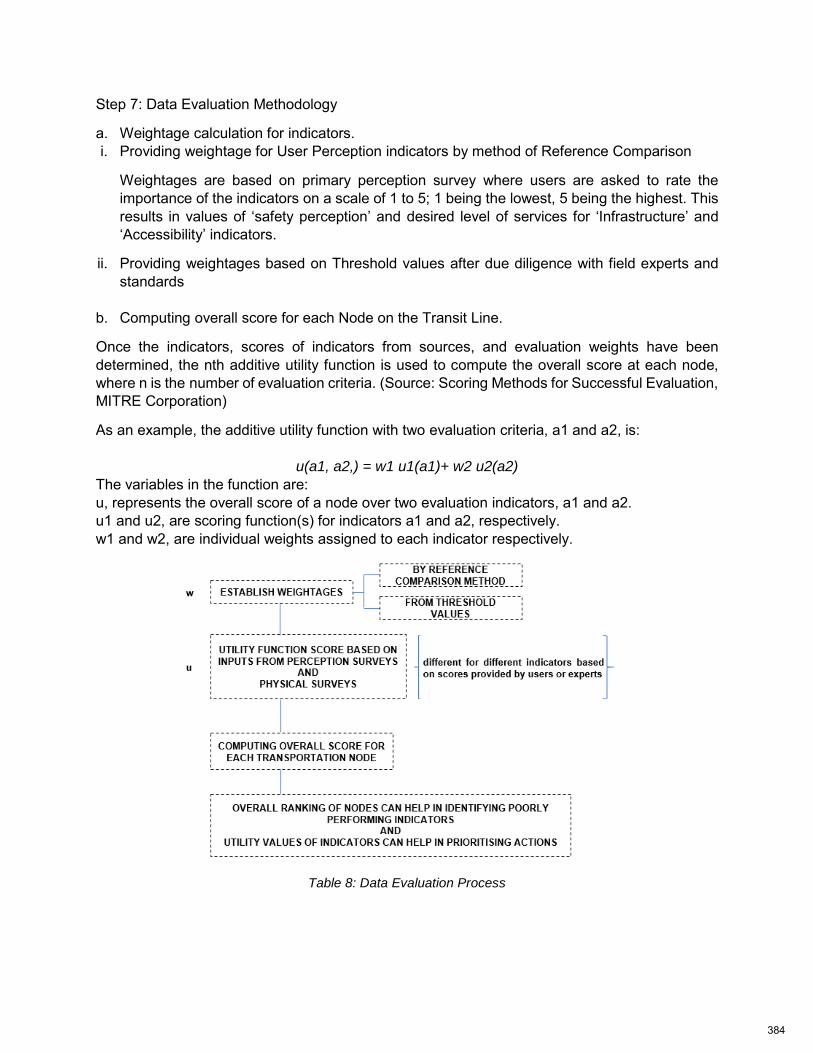
Step 7: Data Evaluation Methodology
a. Weightage calculation for indicators. i. Providing weightage for User Perception indicators by method of Reference Comparison
Weightages are based on primary perception survey where users are asked to rate the importance of the indicators on a scale of 1 to 5; 1 being the lowest, 5 being the highest. This results in values of ‘safety perception’ and desired level of services for ‘Infrastructure’ and ‘Accessibility’ indicators.
ii. Providing weightages based on Threshold values after due diligence with field experts and standards
b. Computing overall score for each Node on the Transit Line.
Once the indicators, scores of indicators from sources, and evaluation weights have been determined, the nth additive utility function is used to compute the overall score at each node, where n is the number of evaluation criteria. (Source: Scoring Methods for Successful Evaluation, MITRE Corporation)
As an example, the additive utility function with two evaluation criteria, a1 and a2, is:
u(a1, a2,) = w1 u1(a1)+ w2 u2(a2)
The variables in the function are: u, represents the overall score of a node over two evaluation indicators, a1 and a2. u1 and u2, are scoring function(s) for indicators a1 and a2, respectively. w1 and w2, are individual weights assigned to each indicator respectively.
Table 8: Data Evaluation Process
384
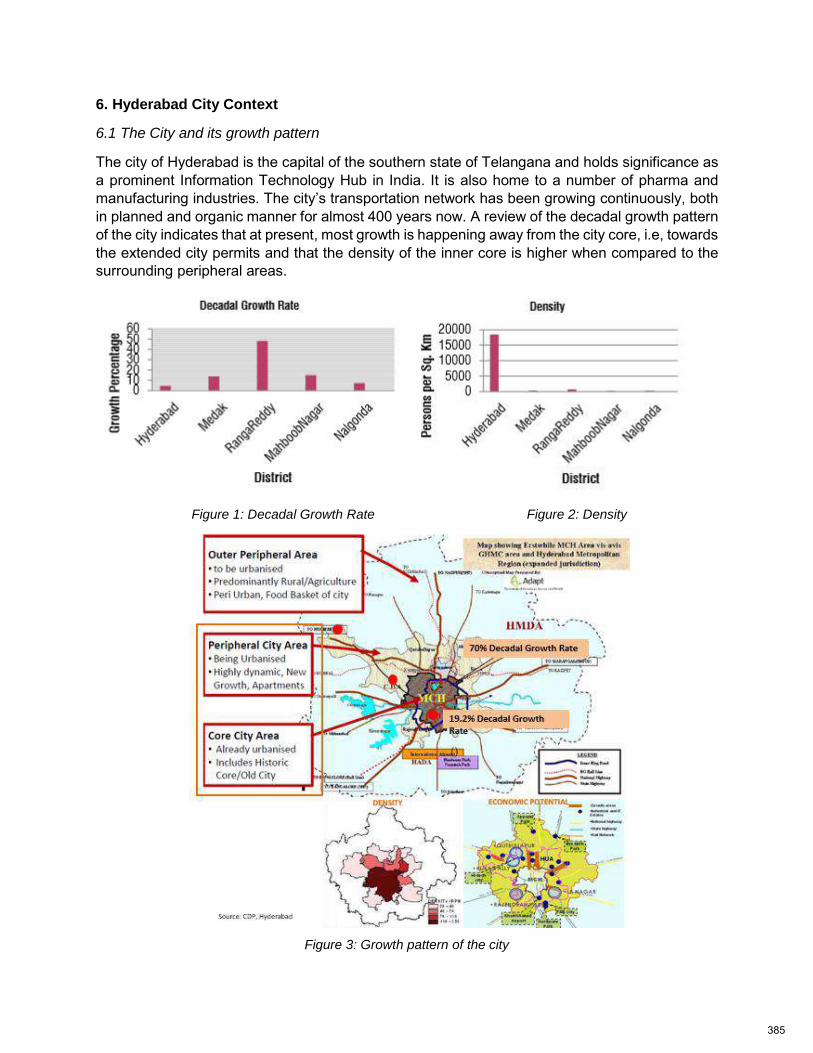
6. Hyderabad City Context
6.1 The City and its growth pattern
The city of Hyderabad is the capital of the southern state of Telangana and holds significance as a prominent Information Technology Hub in India. It is also home to a number of pharma and manufacturing industries. The city’s transportation network has been growing continuously, both in planned and organic manner for almost 400 years now. A review of the decadal growth pattern of the city indicates that at present, most growth is happening away from the city core, i.e, towards the extended city permits and that the density of the inner core is higher when compared to the surrounding peripheral areas.
Figure 1: Decadal Growth Rate Figure 2: Density
Figure 3: Growth pattern of the city
385
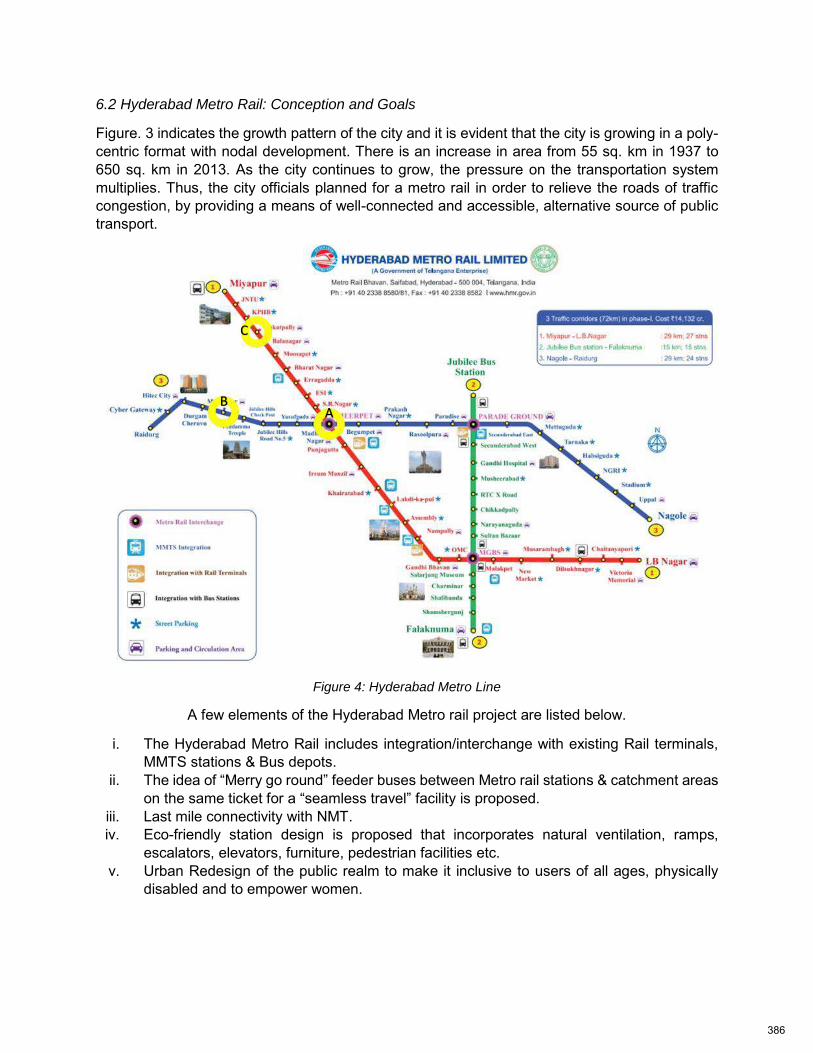
6.2 Hyderabad Metro Rail: Conception and Goals
Figure. 3 indicates the growth pattern of the city and it is evident that the city is growing in a poly-centric format with nodal development. There is an increase in area from 55 sq. km in 1937 to 650 sq. km in 2013. As the city continues to grow, the pressure on the transportation system multiplies. Thus, the city officials planned for a metro rail in order to relieve the roads of traffic congestion, by providing a means of well-connected and accessible, alternative source of public transport.
Figure 4: Hyderabad Metro Line
A few elements of the Hyderabad Metro rail project are listed below.
i. The Hyderabad Metro Rail includes integration/interchange with existing Rail terminals, MMTS stations & Bus depots.
ii. The idea of “Merry go round” feeder buses between Metro rail stations & catchment areas on the same ticket for a “seamless travel” facility is proposed.
iii. Last mile connectivity with NMT. iv. Eco-friendly station design is proposed that incorporates natural ventilation, ramps,
escalators, elevators, furniture, pedestrian facilities etc. v. Urban Redesign of the public realm to make it inclusive to users of all ages, physically
disabled and to empower women.
A B
C
386
7. Integrating the Evaluation Model to the Hyderabad Metro Rail system.
The Hyderabad metro rail system was proposed to curb the increasing personal vehicles (addition at the rate of 0.3 million per annum) in the absence of an efficient and reliable public transport system in the city. Hyderabad is a hub of pharma, research institutes and IT/ITES Service sector. The present circumstances indicate a positive growth rate in terms of both, population and area. This can further degrade the already declining condition of traffic management caused due heavy traffic congestion and increase the pollution levels of the city. In order for the metro rail to be successful in tackling these concerns, it is essential, that the metro rail system extend itself as a reliable, well-connected and comfortable means of travel for all. The inclusiveness of the metro rail system can result in increased use of public transport, thereby reducing congestion and providing faster means of travel.
Thus, it is relevant to propose a model for evaluation of the metro-rail system which helps to
• propagate public interest in public transport and participation • make the decision-making process easier and transparent • address present loopholes in providing an inclusive transport system.
A pilot study (using traditional survey technique) was conducted at three locations (listed in figure. 4) based on the density of the transportation node. The above three locations were evaluated for the indicators listed earlier. Overall cumulative scores are indicated below.
EVALUATION CRITERIA WEIGHTAGE/1 NODE A NODE B NODE C AVG.
INFRASTRUCTURE 0.75 4 2.3 2.5 2.93 SAFETY 1 2.34 1.76 2.4 2.16 ACCESSIBILITY 0.5 4 3.6 4.1 3.9 AFFORDABILITY 0.75 3.64 3.23 3.76 3.54 MOBILITY 0.75 2.81 2.93 2.84 2.86 OVERALL 2.58 1.98 2.25
Table 9: Overall scores of Study Parameters
The above table highlights the importance attributed to each parameter by the users and preliminary survey outputs in the form of weightages. These weightages help in arriving at a weighted average based on the importance of a parameter with respect to other parameters, thus, establishes a priority ranking in evaluation.
Overall, at the city level, it is observed that perception of safety is least of all parameters calling for immediate action to enhance the feeling of safety and security among users. Accessibility to the transportation network is rated highest. It can be noticed from weighted averages, that Node B is least inclusive in comparison to Node A and Node C.
387
8. Conclusions
The Indian government, today, has set its focus around the concept of development of smart cities. Smart cities primarily, in part, are centric to a vision that integrates information and communication technology (ICT) and Internet of Things (IOT) to manage and develop the city’s assets. A smart city promotes use of urban informatics and technology to improve the efficiency of services, allows city officials to interact directly with the community, monitor the city infrastructure and thus enable a better quality of life. The information and knowledge gathered are keys to tackling inefficiency. (Caragliu and Nijkamp 2009).
This initiative taken up by the government of India, forms the crux of this research proposal. It brings forth the need of data collection and analysis to take into purview the difficulties of the citizens and offer appropriate solutions. In scenarios where quantitative data is limited or incomplete, decision-making is equivocal. Similarly, it is also essential to establish the relevance of data collected to the problem at hand in these times of excess data.
Crowdsourced transport apps are picking up in the private sector, whereas a scaled-up application of the same has not been initiated by local governments in India. The integration of this framework into a travel application for the Hyderabad Metro Rail can help in obtaining crowdsourced data from smart phone users. In a developing country like India, not all citizens are in possession of a smart phone. In order to advocate for equal opportunities for all, special devices can be places in the passenger cars of the metro rail for feedback from all sections of the society.
This research paper is limited to the conceptual development of a framework for data driven approach to inclusive transportation systems. The analytical modeling of data and making predictions through analytics are open to further research.
9. Challenges in adopting a Data Driven Approach
i. Technological
The biggest challenge is to adopt to a technology based and driven mechanism that shall be responsible for decision-making. It would require additional support to the government and transport agency in terms of software development and maintenance.
ii. Financial
Although crowdsourcing platforms can be beneficial economically, as data is sourced directly and the need for physical survey is eliminated to a large extent, the investment costs for developing the software and its maintenance are critical to planning for such a system.
388
10. References
Boschmann, E. Eric, and Mei-Po Kwan, (2008), "Toward socially sustainable urban transportation: Progress and potentials." International Journal of Sustainable Transportation, Vol. 2.No.3, pp. 138-157. Holzer HJ. (1991), "The spatial mismatch hypothesis: What has the evidence shown?" Urban Studies, Vol.28, No. 1, pp. - 105–122 Giuliano G., Pickup L, (2005), "Transport and social exclusion in Europe and the USA" . Donaghy K , Poppelreuter S , Rudinger G (eds.), Social Dimensions of Sustainable Transport: Transatlantic Perspectives . Ashgate , Aldershot, Hants, England; Burlington , VT . Kwan M-P. (1999). "Gender and individual access to urban opportunities: A study using space-Time measures". The Professional Geographer, Vol.51, No.2, pp-210 – 227. Anand, Anvita, and Geetam Tiwari. (2006) "A gendered perspective of the Shelter–Transport–Livelihood Link: the case of poor women in Delhi." Transport Reviews Vol.26, No.1, pp- 63-80 D. Molvig (2015), “Creating Age-Friendly cities”; Accessed on: 8-13-2017 Singh Sanjay, Studies in Business and Economics no.11(3)/2016 “Assessment of Passenger Satisfaction with Public Bus Transport Services: A Case Study of Lucknow City (India) Mary Hammon (2015), “Data Driven – Leveraging the potential of big data for planning.” American Planning Association, Planning Magazine, Accessed on: 8-13-2017 www2.mitre.org/work/sepo/toolkits/STEP/files/ScoringMethodsContent.pdf, Accessed on: 8-13-2017
389
Research On the Development Path of Inclusive Rural
Communities in the Context of Pseudo Counter-urbanization
——Taking Wuhan in China as an example
Jing Qiao* and Hong Geng* Hua Zhong University of Science and Technology,Architecture and Urban Planning School,China. [email protected] Hua Zhong University of Science and Technology, Architecture and Urban Planning School,China. [email protected]
Abstract: "Counter-urbanization" refers to the voluntary flow of population in Western
developed countries, which emerges at the stage of considerable urbanization and upon high
urban-rural integration. Its driving force is that urban residents pursue a low-cost and high-
quality life, or that enterprise migrates from the city to the countryside in order to maximize
their profits. Therefore, the demographic structure and development vitality of rural
communities should be stable and sustainable in the process of counter-urbanization. However,
in the undergoing "counter-urbanization" occurring in some Chinese cities, the rural
communities are beleaguered by population aging, social hollowing, unstable social structure,
unpowered economic core, reduced public service efficiency and other problems. Surveys
have found that such "counter-urbanization" is actually a result of Chinese special urban-rural
administrative division system and the current urban development level. The deficiencies in
existing household registration system and land system as well as the development reality of
great urban-rural gap in public service level indicate that such phenomenon is pseudo-counter-
urbanization. In Wuhan, for example, the increase in the agricultural population is actually only
in the dimension of household registration management, whereas those rural residents, in fact,
flow into the city for working every year rather than are really permanent. This group of rural
population generally belongs to the lower-middle class in the society, which is attracted by
economic factors and forced to flow between the city and the countryside rather than voluntarily
migrate as the case of wealthy class in Western countries. Secondly, Wuhan has not yet
developed to the stage of counter-urbanization in terms of space, economy, public services,
etc. On the one hand, its main urban areas expect larger development space that reveals its
sustainable population aggregation capacity. On the other hand, the unban-rural integration in
public service is far from sufficient conditions and resources to allow the countryside to attract
population return. In consequence, in the context of such "pseudo-counter-urbanization", the
concurrent business behavior of rural population, who live in the countryside but work in the
city will continue for a long period, accompanied by the contradiction between reduction in
actual rural communities and increase in population in household registration. Therefore, it is
an important issue faced by rural communities to realize the inclusive development of "smart
contraction" through dealing with such periodical labor outflow and incomplete dependence on
rural communities. By taking Wuhan City as an example and exploring from the perspective of
390
"pseudo-counter-urbanization", this paper is designed to analyze the current dilemma in front
of rural community development and propose the principle of building inclusive smart
contraction-oriented rural communities based on Wuhan's urbanization characteristics. First of
all, the diversified integration of industries with the countryside should be promoted to include
the concurrent business behavior of flowing rural residents through the community construction
model of "basic production unit village", which can fundamentally activate the vitality of
sustainable development of rural communities and gradually realize the local urbanization of
rural population. Secondly, subject to the trend of urban and rural public service network
development, a network rural community system, which is based on "living circles" and
connected via public service sharing, should be established to improve the allocation and use
efficiency of public service facilities in rural communities. Finally, with a rural community as a
basic unit, a community construction ideas emphasizing both "bottom line retaining" and
"optimized upgrading" is proposed, thereby contributing to stabilizing China's rural society and
giving full play to its role as "reservoir" and "stabilizer" in the urbanization process.
1. The pattern of manifestation and formation mechanism of “Pseudo Counter-
urbanization”
"Counter urbanization" refers to the process that a large number of urban population and resources flow to rural areas and small towns when western countries’ development of urbanization comes to a certain stage and the development of big cites begins to slow down [1]. According to the curve of urbanization and the experience of developed countries, "counter urbanization" generally appears in the stable development stage of the urbanization rate, and is an inevitable stage in urbanization. With great development of China’s urbanization, the "non-agricultural to agricultural transfer" in household registration has quietly appeared in some places. Contrary to the usual "agricultural to non-agricultural transfer" trend in urbanization, some people hope that their urban household registration could be transferred into rural household registration. For example, in Hangzhou City and Tongxiang City of Zhejiang Province there have been collective requirements of college students for inter-provincial "agricultural to non-agricultural transfer". And a national survey also shows that more than 75% of migrant farmers are not willing to give up their agricultural household registrations. This situation appears to belong to "counter urbanization", but its logic and connotation are some different from the "counter urbanization" experienced by developed countries. Meanwhile, under this influence of this special phenomenon, the rural Communities, especially in the metropolitan area, have changed in many ways.
1.1 The connoction and features of "counter-urbanization"
1.1.1 Internal driving force and external conditions of "counter-urbanization"
Residents’ pursuit of low-cost, high-quality life and enterprises’ goal of prioritizing profits are the internal driving force of "counter-urbanization" [2]. In the 1970s, developed countries accumulated the results of rapid development of urbanization, while their traffic congestion, environmental pollution and other "urban diseases" became increasingly serious. Urban space was unable to meet the residents’ high quality needs for production, living, recreation and transportation and other basic functions. Enterprises would increasingly tend to use small towns or rural areas with lower element cost. Therefore, when a city develops to a certain scale, residents and businesses begin to relocate, to seek lower living
391
costs and better living environment. On the other hand, with the continuous improvement of information technology and transportation network, the space and time distance between urban and rural areas was shortening, providing necessary technical conditions for "counter urbanization". At the same time, to deal with "urban diseases" and the dual urban-rural economic contradiction, the western governments generally implemented the rural-urban relations policy of supporting agriculture in return and rural areas, strengthening rural infrastructure construction, improving the rural public service level, and narrowing the urban-rural gap [2], providing policy guarantee for attracting elements like population and capital and to transfer from large cities to small towns and rural areas.
1.1.2 Charcteristics of the urban and rural development under the “Pseudo
Counter-urbanization”
In the "counter urbanization" of Western developed countries, their urban-rural relations also showed certain characteristics, specifically in population flow, spatial change and public services:
(1) The class of population flow was the rich class, and it was the free flow between urban
and rural areas.
Western developed countries have experienced four stages: urbanization, suburban urbanization, counter urbanization, and re-urbanization. From the suburban urbanization, the outward flow of population began to emerge, first appearing in the rich, and later extending to the middle class. Its initial power, as mentioned above, was the city residents beginning to pursuing a better living environment. Therefore, the essence of its population flow is "free flow" of pursuing higher life quality, and only the social class above the middle class has the capital for "free flow".
(2) The space of central cities space got nearly saturated, with high level of urbanization,
their functions spilling over.
The urban population of London in the UK decreased by 100,000 from 1950 to 1970, and after 1970, the speed and scale of "counter urbanization" accelerated. In the 1950s, the British urban population decreased by 20,000 per year, in the 1960s 40,000, and in the 1970s 90,000. In France, Germany, the United States, Japan, and other countries, the urban population also decreased at different degrees each year [3]. From Figure 1, it can be found that the backgrounds of the urbanizations in developed countries were all stages with high-level urbanization. The city scale had been over a long-term accumulation of elements, and its space development was in a saturated state. These were the significant spatial features of counter urbanization.
392
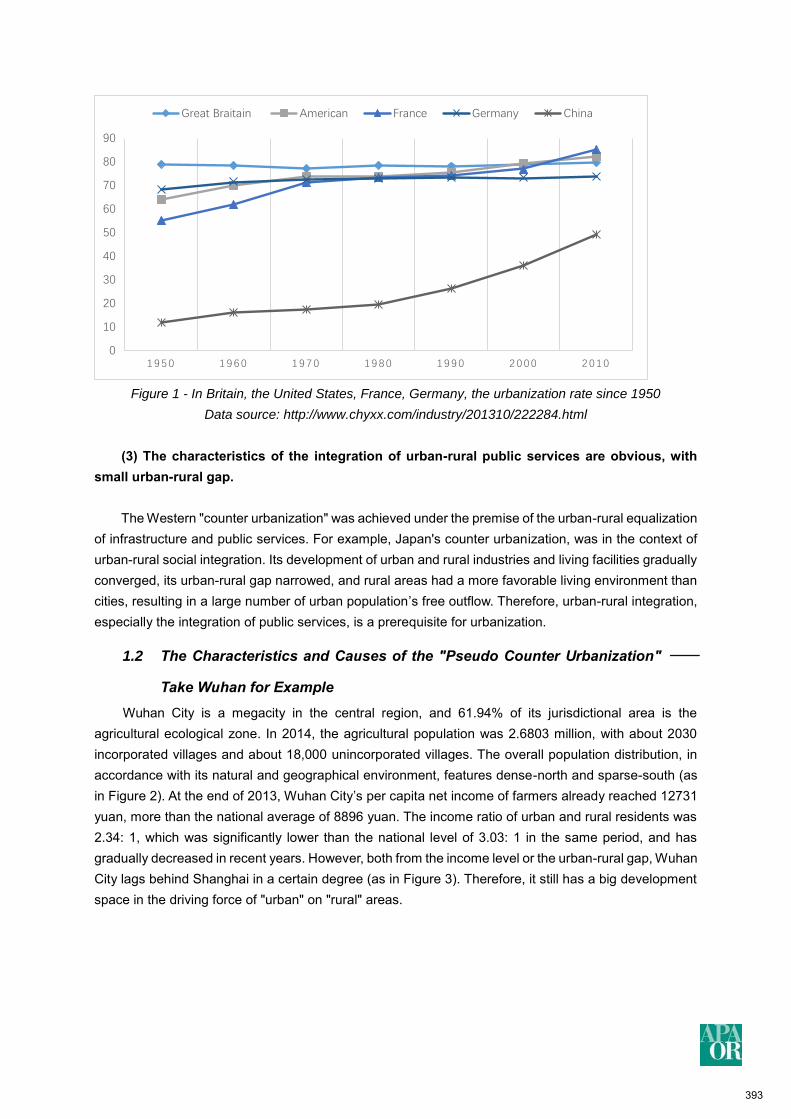
Figure 1 - In Britain, the United States, France, Germany, the urbanization rate since 1950
Data source: http://www.chyxx.com/industry/201310/222284.html
(3) The characteristics of the integration of urban-rural public services are obvious, with
small urban-rural gap.
The Western "counter urbanization" was achieved under the premise of the urban-rural equalization of infrastructure and public services. For example, Japan's counter urbanization, was in the context of urban-rural social integration. Its development of urban and rural industries and living facilities gradually converged, its urban-rural gap narrowed, and rural areas had a more favorable living environment than cities, resulting in a large number of urban population’s free outflow. Therefore, urban-rural integration, especially the integration of public services, is a prerequisite for urbanization.
1.2 The Characteristics and Causes of the "Pseudo Counter Urbanization" ——
Take Wuhan for Example
Wuhan City is a megacity in the central region, and 61.94% of its jurisdictional area is the agricultural ecological zone. In 2014, the agricultural population was 2.6803 million, with about 2030 incorporated villages and about 18,000 unincorporated villages. The overall population distribution, in accordance with its natural and geographical environment, features dense-north and sparse-south (as in Figure 2). At the end of 2013, Wuhan City’s per capita net income of farmers already reached 12731 yuan, more than the national average of 8896 yuan. The income ratio of urban and rural residents was 2.34: 1, which was significantly lower than the national level of 3.03: 1 in the same period, and has gradually decreased in recent years. However, both from the income level or the urban-rural gap, Wuhan City lags behind Shanghai in a certain degree (as in Figure 3). Therefore, it still has a big development space in the driving force of "urban" on "rural" areas.
0
10
20
30
40
50
60
70
80
90
1 9 5 0 1 9 6 0 1 9 7 0 1 9 8 0 1 9 9 0 2 0 0 0 2 0 1 0
Great Braitain American France Germany China
393
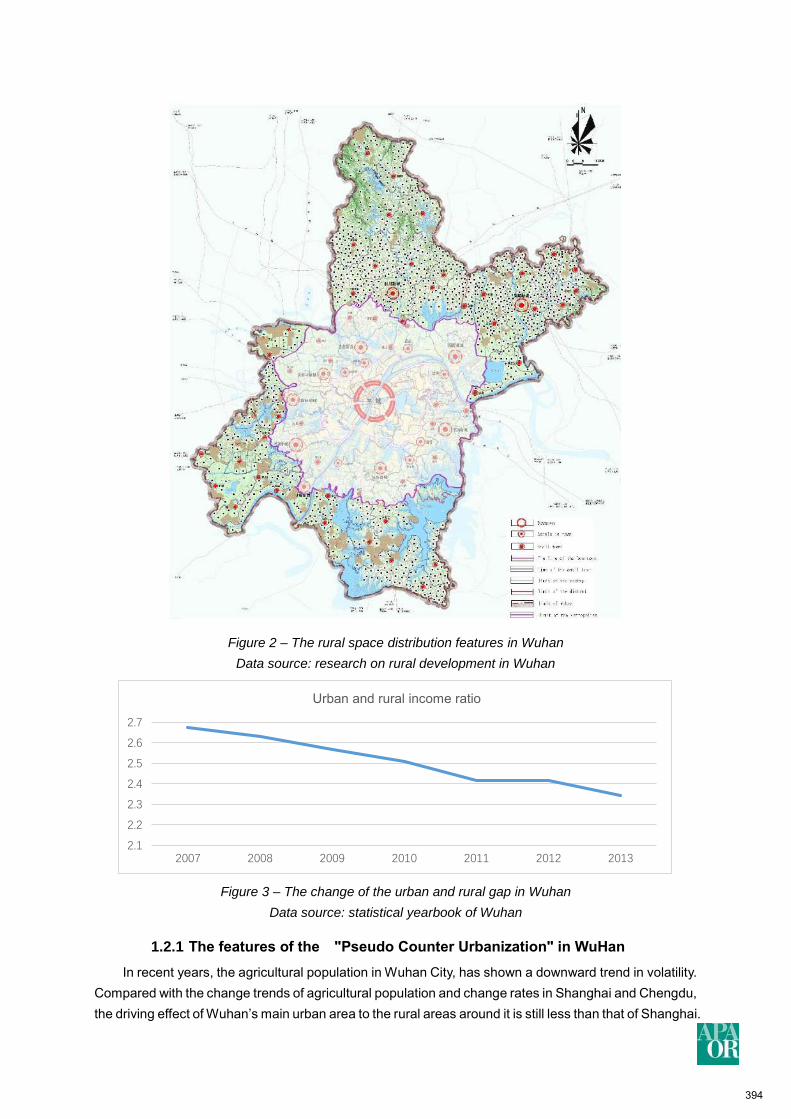
Figure 2 – The rural space distribution features in Wuhan
Data source: research on rural development in Wuhan
Figure 3 – The change of the urban and rural gap in Wuhan
Data source: statistical yearbook of Wuhan
1.2.1 The features of the "Pseudo Counter Urbanization" in WuHan
In recent years, the agricultural population in Wuhan City, has shown a downward trend in volatility. Compared with the change trends of agricultural population and change rates in Shanghai and Chengdu, the driving effect of Wuhan’s main urban area to the rural areas around it is still less than that of Shanghai.
2.1
2.2
2.3
2.4
2.5
2.6
2.7
2007 2008 2009 2010 2011 2012 2013
Urban and rural income ratio
394
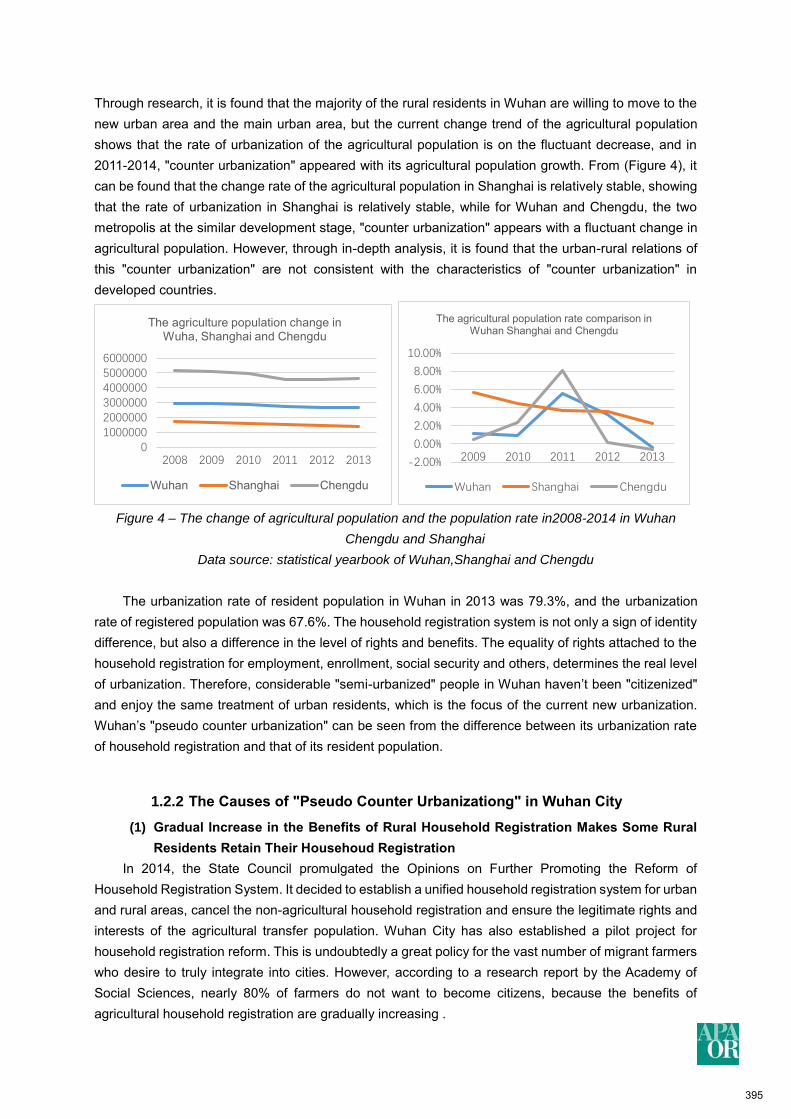
Through research, it is found that the majority of the rural residents in Wuhan are willing to move to the new urban area and the main urban area, but the current change trend of the agricultural population shows that the rate of urbanization of the agricultural population is on the fluctuant decrease, and in 2011-2014, "counter urbanization" appeared with its agricultural population growth. From (Figure 4), it can be found that the change rate of the agricultural population in Shanghai is relatively stable, showing that the rate of urbanization in Shanghai is relatively stable, while for Wuhan and Chengdu, the two metropolis at the similar development stage, "counter urbanization" appears with a fluctuant change in agricultural population. However, through in-depth analysis, it is found that the urban-rural relations of this "counter urbanization" are not consistent with the characteristics of "counter urbanization" in developed countries.
Figure 4 – The change of agricultural population and the population rate in2008-2014 in Wuhan
Chengdu and Shanghai
Data source: statistical yearbook of Wuhan,Shanghai and Chengdu
The urbanization rate of resident population in Wuhan in 2013 was 79.3%, and the urbanization
rate of registered population was 67.6%. The household registration system is not only a sign of identity difference, but also a difference in the level of rights and benefits. The equality of rights attached to the household registration for employment, enrollment, social security and others, determines the real level of urbanization. Therefore, considerable "semi-urbanized" people in Wuhan haven’t been "citizenized" and enjoy the same treatment of urban residents, which is the focus of the current new urbanization. Wuhan’s "pseudo counter urbanization" can be seen from the difference between its urbanization rate of household registration and that of its resident population.
1.2.2 The Causes of "Pseudo Counter Urbanizationg" in Wuhan City
(1) Gradual Increase in the Benefits of Rural Household Registration Makes Some Rural
Residents Retain Their Househoud Registration
In 2014, the State Council promulgated the Opinions on Further Promoting the Reform of Household Registration System. It decided to establish a unified household registration system for urban and rural areas, cancel the non-agricultural household registration and ensure the legitimate rights and interests of the agricultural transfer population. Wuhan City has also established a pilot project for household registration reform. This is undoubtedly a great policy for the vast number of migrant farmers who desire to truly integrate into cities. However, according to a research report by the Academy of Social Sciences, nearly 80% of farmers do not want to become citizens, because the benefits of agricultural household registration are gradually increasing .
0100000020000003000000400000050000006000000
2008 2009 2010 2011 2012 2013
The agriculture population change in Wuha, Shanghai and Chengdu
Wuhan Shanghai Chengdu
-2.00%
0.00%
2.00%
4.00%
6.00%
8.00%
10.00%
2009 2010 2011 2012 2013
The agricultural population rate comparison in Wuhan Shanghai and Chengdu
Wuhan Shanghai Chengdu
395
(2) Economy Essentially Determines the Direction and Duration of the Rura Population’s
Flow
Through the survey of some rural villages in Jiangxia District and Xinzhou District of Wuhan City, it was found that farmers' income in agriculture is far less than that as migrant workers. Therefore, the young and middle-aged labor in rural areas chooses to work as migrant workers in cities to earn the annual income of 50-100 thousand yuan. The survey also found that agricultural income accounted for about 20% - 45% of the total income of farmers, and only a few agricultural villages could reach 60%.
The economy determines the outflow of the rural population in nature, but the instability of being a
migrant worker in cities and the gap between migrant workers and urban workers in social security have led to the fact that the duration of migrant workers' work in cities is uncertain, and the high cost of urban life makes farmers not afford to completely settle in cities. Therefore, the outflow of rural labor is cyclical and repetitive. In Professor He Xuefeng’s view, farmers’ migrating into cities itself is a repeated, long-term process, and cannot be achieved overnight. British urbanization, from the clustering, suburbanization, counter urbanization, to urban-rural integration, took 250 years, France 120 years, and the United States, Canada, and Japan about 100 years [4]. In rough calculation, according to the annual income of 12731 yuan of farmers, and the main city’s housing price of 8,000 yuan/㎡ and the new city area of 3,000 yuan/㎡, if a farmer would purchase an apartment of 70 ㎡, he would spend, respectively, 43 years and 16 years (not taking into account price increases and living expenses). In other words, it still needs to take Wuhan farmers at least 20 years to completely migrate into the city, and the citizenization of migrant workers is still a long process.
(3) The Contradiction of the Uniqueness and Binding of Land Lead to the Instability of
Farmers’ Flow
Under the current land system and collective construction land system, land is still the only means of production for farmers. Therefore, it is difficult for farmers to give up their only living guarantee and enter the city to engage in an unstable, not decent job. During the process of land transfer, farmers and village collectives don’t participating the sharing of the value-added benefits for the non-agricultural use of agricultural land. On the other hand, for migrant farmers, the land without high output efficiency becomes encumbrance and binding. This contradiction caused by the uniqueness and binding makes the land use ineffective, and also leads to different willingness of land transfer for farmers with different land amounts, resulting in the instability of the rural-to-urban flow.
Therefore, in summary, the current "counter urbanization" in Wuhan City is actually a "pseudo
counter urbanization". It is not the same process as the developed countries "counter urbanization", but a special phenomenon formed in the urbanization under China’s special dual urban-rural system. In this special urbanization phenomenon, the urban-rural relations are still in a relatively fragmented and antagonistic state. However, with the macro regulation in policy and the economic development, Wuhan’s urban-rural relations will face a new development trend in population, space, public services, and other aspects in the new round of urbanization development.
396
2. Characteristics and Problems of Rural Community Development under the Context
of “Pseudo Counter-urbanization”
2.1 Increasingly Diluted Rural Community Spaces as a Result of the Contradiction
between the Increase of Household Registration Population and the Decrease
of Permanent Residential Population
A notable characteristic in “pseudo counter-urbanization” is the contradiction between the increase of household registration population and the decrease of permanent residential population. Differing from counter-urbanization, the migratory population involved in the process of “pseudo counter-urbanization” is not dominated by suburbanized middle class, but is mainly comprised of migrant rural workers. Given the excessively high costs for settling in cities and peasants’ inability to get themselves registered as urban residents, most peasants still retain their rural resident status and farming lands, as a way to increase income and the bottom line in case they decided to return and stay home. Therefore, the migratory population is characterized by its volatility, as well as the phenomenon of “forced migration” attributed to low incomes. Estimated against the natural population growth rate of Wuhan – 7.5‰, the rural population increased between 2013 and 2014 has been basically consistent with the number of the natural growth. Hence, it can be concluded that there has been little mechanical change in rural population over recent years, and the rural population increase has been mainly driven by natural growth. As the intrinsic value of rural household register, especially in terms of the ownership of contracted land and homestand, is increasingly higher, most rural residents still occupy appreciable sizes of rural community spaces in the process of their out-migration. Therefore, rural communities have exhibited problems like continuingly diluted spaces and extensive use of them. According to relevant statistical data of Wuhan City, the area of construction land per capita for rural residents in 2015 was 166 ㎡, even higher than the per-capital upper limit set by the state – 150 ㎡. Whereas, actual surveys have found that the “hollowing out” phenomenon in rural communities is ubiquitous, and some villages even suffer from a hollowing rate as high as 90%.
2.2 Most Communities in Lack of the Vitality for Sustainable Development owing
to the Ubiquity of Migratory Pluriactivity among Rural Population
The direct consequences of the hollowed-out rural communities are, firstly, diluted utilization of space functions, and secondly, reduced sustainability for the vitality of community development. The vitality of rural communities stems from two aspects: economic development and social culture. From the perspective of economic development, on the one hand, the modernized and large-scale agricultural production has liberated a growing number of rural laborers out of farming; on the other hand, along with the increasingly heightened urban-rural divide, the income gap between agricultural production and working in cities has also been continuingly widened, and the phenomenon of pluriactivity among migratory population increasingly prevalent. In the peripheral areas of Wuhan City, there is a phenomenon of rural population outflows which have a cycle of one week, one month, or even one year. Therefore, abandoned agricultural land is commonly seen in some parts of rural areas, especially land in hilly regions on which large-scale operations can hardly be carried out. The depression suffered by rural industries has intensified the motivation for rural population outflows, plunging the hollowing-out development of rural communities into an accumulative cycle of casual effect. Over time, rural
397
communities will completely collapse in a foreseeable future. From the perspective of social culture, a community is a cohesive unit that encompasses same spiritual perceptions towards common culture and customs, etc., where people are basic carriers. Whereas, along with the uncertainty and continuing population outflows, communities have seen their cultural carriers dissociated and their social structures loosened. The development of rural communities and the vitality of their existence are essentially unsustainable.
2.3 Efficiency of Public Service Facilities in Communities Undermined by the
Factually Instable Continuing Outflow of Rural Residents
As equalization of public services is still in its mid-stage across the central area of China, public service facilities are allocated primarily based on a top-down hierarchical method in rural communities. In particular, thanks to multiple rounds of preferential policies, the standardization of public service facility allocation in rural communities, in terms of their type, grade and scale, has been basically popularized across the peripheral villages of Wuhan City. However, a sampling survey carried out in Yanghu Village and Yingxiong Village of Jiangxia District has found that except for meeting their basic public service needs, rural residents mainly use public service facilities in urban districts, and basic public services rendered in villages, despite their availability, suffer from low rate of utilization given the extremely low standards for facility allocation. In real life, the unstable continuing outflow of rural residents has resulted in a significant drop in the efficiency of community public service facilities; in the meantime, the salience of the aging population in rural communities, as well as the lack of elderly support and wellbeing facilities, has also led to a low community life quality.
3. The Trend of an Inclusion-oriented Rural Community Development in Wuhan Under
the Context of “Pseudo Counter-urbanization”
3.1 Inclusion of Community Spaces: Providing Backstop for Migratory Rural
Population Taking on Pluriactivity
Rural communities constitute the carrier to sustain rural life and social stability. Rural areas warrant peasants’ economic interests, and secondly, are the ultimate destination where migrant workers return, making them the reservoir and stabilizer for the modernization and urbanization in China. Should economic turmoil break out across the state, migrant workers still could return to rural communities, which function as a buffer zone for modernization. The phenomenon of “pseudo counter-urbanization” may persist given that migratory pluriactivity among rural population will undergo a long, iterative process. Rural communities in Wuhan will still assume the crucial function of social security for some time to come, in addition to other functions like agricultural production, ecological conservation and transmission of rural cultures. Therefore, one the one hand, the function of rural communities as a buffer space between urban and rural areas repeatedly reciprocated by migratory pluriactivity rural population should be retained, but without being excessive or in undisciplined growth; on the other hand, rural communities should explore the fundamental support that drives its sustainability – the industry development, especially by extending the development connotation for agriculture-based industries, in order to provide a decent life for residents that will ultimately stay in rural communities.
398
3.2 Inclusion of Community Development: Get Prepared to Accept the Urban
Population Inflow Driven by Counter-urbanization
With the development of urbanization,the reduction of rural population is inevitable trend. In accordance with the relevant theory and international experience, when the urbanization rate is greater than 60% and agricultural workers accounted for less than 20% of the proportion of all employees, the dual urban-rural economic development stage, in the labor transfer level, has ended the dual structure, which means that the stock surplus labor has been finished being transferred [5]. In 2013, the proportion of the first industry practitioners in Wuhan was 9.7%, in theory, having crossed the "second Lewis turning point", but the future transfer of rural surplus labor will continue to exist. Because the rural areas of Wuhan are mainly concentrated in six new urban areas, the urbanization rate of the six new urban areas in 2014 was only 51.36%, which is lower than the national average of 54.77%. In the same period, the proportion of non-agricultural labor force in the new urban area was 64.8 %. In accordance with the 13th "Five-Year Plan" of Wuhan City, during this period there are still 50,000 of rural surplus labor needing to be transferred. However, because the population has been over the demographic dividend range, the rate of population transfer will slow down in some sense. Although it is the phenomenon of “pseudo counter-urbanization” that is currently present in Wuhan City, the diversified development agricultural industries across rural areas on the outskirts of the city has resulted in a “5+2” life pattern among a part of urban population who choose to spend their weekends in rural communities. Therefore, communities in suburban areas of metropolises should adopt a more inclusive vision for their development, and well-conditioned rural communities should get prepared to accept the urban population inflow driven by real counter-urbanization.
3.3 Inclusion of Community Services: Integrated into a Networked Urban-rural
Public Service Sharing System
As mentioned earlier, rural community residents are still heavily reliant on basic community public service facilities to meet their needs, and their use of the public service facilities to meet upgraded needs is more dependent on the level and quality of services that these facilities can provide than distance. The reason behind this is that given the rapid urbanization today, spatiotemporal distance no longer constitutes a barrier for rural residents to use facilities. Therefore, the public service function of communities should become more inclusive by shifting from the hierarchical and passive allocation approach into the active integration into a networked urban-rural sharing system, improving the utilization efficiency of community public service facilities and tallying with the trend of a networked relationship between cities and towns. In the meantime, attentions should also be paid to the service utilization characteristics of the left-behind elderly and children in order to endow the quality of community services with greater humanistic concerns.
4. Exploration of the Development Route for Inclusive Rural Communities
4.1 Promote the Integrative Development between Industries and Rural Areas to
Stimulate Vitality for the Sustainable Development of Communities
Presently, under the influence of the mode of the “semi-working and semi-farming based on based on intergenerational division of labor”, a typical semi-separated rural production model between industries and villages has been exhibited in rural areas of Wuhan City. Nonetheless, as the fundamental
399
driving force for the development of rural areas, industries have been suffering from the outflow of factors; if this trend cannot be relieved, the decline and shrinkage of rural areas will create huge burdens for the urbanization progress. Although urbanization is a process of de-agriculturalization of agricultural factors, the quality of urbanization should be reflected not just in the process and outcome of de-agriculturalization, but also in the efficient agglomeration and orderly release of agricultural factors. Hence, a “industry-village” integrative rural production model should be taken as the stabilizer and reservoir for future urbanization of Wuhan. The development of industries should be integrated with that of rural communities, and guidance should be provided throughout different stages. In the preliminary stage, while steadily promoting the transfer of rural population to cities, agricultural scalization, featurization and informatization should be promoted, and the scale effect of urban and suburban agriculture be expanded to fulfill modernized agricultural development in surrounding areas of metropolises, and to scientifically release rural laborers through the progress of agricultural modernization and scalization. In the middle stage, operative development and construction in rural areas should be protected and expanded to expand the connotation of rural industries; when agricultural modernization has reached a certain extent, the development of the tertiary industries dominated by recreational agriculture and rural tourism should be expanded; the industrial chain of agriculture should be prolonged to make rural tourism a major approach to increase peasants’ incomes, and consumer industries, as represented by agricultural tourism and holiday recreation open to metropolitans, should be developed into the leading industries in rural areas. In the later stage, along with the advancement of urban-rural factor exchange system reform, the force of market control should be adopted in the development of rural industries, and diversified developers should be introduced to encourage the development of new industries like ecotourism, creational tourism, nursing home and healthcare, innovative design, e-commerce, etc. Special attentions should be given to the development modes of rural industries, as well as to the protection of peasants’ interest when they conduct market behaviors in a market environment. Peasants should be facilitated to increase their resistance and resilience to market risks, transmit the traditional and cultural legacy of rural communities, and to stimulate the vitality for sustainable development.
4.2 Promote Public Service Efficiency in Rural Communities based on a Living
Circle-based Sharing Relationship
The emergence of new industries and technological revolution has brought about profound changes in residents’ way of life or production, and the network systems such as rail transit have become more and more mature. The traditional hierarchical relationship between urban and rural systems limited by administrative divisions has been broken in some fields of functional relationships. The network characteristics of factor flow and energy transfer are more obvious. The urban-rural relations show an obvious network trend. The living circle of the most important public facilities in the rural areas has undergone a change without the limitation of the stratification of the administrative division. But the architecture of the rural area is still necessary to exist, and its significance lies in improving the efficiency of the facilities. Therefore, the future urban-rural public service sharing relationship should take the residents' facility use as the basis of the construction of the rural space system and "living circle" should be taken as a link between urban and rural areas, to form a network time-space relationship and society sharing relationship. Utilization efficiency of supporting services in rural communities should be improved through a division of different tiers of living cycles. In the meantime, in-depth studies of well-being and educational facilities should be carried out to address particular social problems, such as
400
population aging and left-behind children, so that countermeasures and construction standards can be proposed to facilitate community services to reach an optimal level in terms of inclusion, efficiency and humanistic concern.
4.3 Steer Spaces into a Smart Decline, Grasp the Coordination between Minimum
Guarantee and Optimization of Rural Community Development
Urbanization is a process in which resource elements continuously converge from rural areas into cities. Therefore, decline in the number of villages and shrinkage of human settlement environment will be an inevitable trend and phenomenon during the process of urbanization. Rural areas nonetheless will still serve important functions in terms of the production, life, industry and ecology in the future, therefore, a “smart decline” strategy integrating “minimum guarantee” and “optimization” should be adopted as the development strategy of rural spaces, especially to those rural communities that suffer from apparent space dilution. In terms of the general goal, proposing a smart decline strategy for the development of human settlement spaces in rural areas has been based on the overall trend of rural development throughout the country; in particular, rural areas on the outskirts of metropolises, as the ones that suffer from high population outflows, are in the face of an awkward situation in which they have become a “grey space” in the urban-rural development. Not only need they face the competition and pressure of high costs as a result of the population migration from main urban areas, they are also subject to the impetus from themselves to pursue a higher level of life. Therefore, the situation of rural population outflow is more complicated. In the meantime, as the main urban areas face a demand for a continuous outward expansion, a collision between such a demand and the population outflow of peripheral rural areas has taken place, making the transformation and optimization of rural community spaces in the periphery of Wuhan City a pressing and urgent task. On the one hand, the function of rural communities to serve production and life should be replenished, perfected and improved. On the other hand, with the elevation of urbanization levels, the overall scale of rural community spaces will shrink, bringing new changes to the distribution of residential areas; thus, both the needs of current-stage development and the influences of scale decline in the future should be considered when planning out the function allocation and social distribution; further, owing to the uncertainty of population migration as a result of the incomplete urbanization, the idea of “minimum guarantee” should be incorporated into the development strategy of rural community spaces to ensure their basic functions during the process of urbanization of rural areas.
5. Conclusion
Rural communities are the most fundamental units to sustain the production and life of rural residents. In the tide of urbanization across China, the complexity and uncertainty of population migration has spawned a special phenomenon of “pseudo counter-urbanization” in peripheral rural communities of metropolises, and has also profoundly affected the development of all aspects of rural communities, including space, industry and public service. Although many problems are inevitable during the progress of urbanization and social development, such as hollowing-out and population aging, etc., inevitability does not necessarily justify their unreasonableness. We need to construct more inclusive and flexible rural communities to adapt to the development regularities in urbanization. Inclusion should not be restricted only to the aspect of physical spaces. Rather, inclusion should cover the population of different classes, occupations, and ages, particularly, cover a variety of social problems
401
emerging from the steady urbanization of rural areas. It should be an inclusion that reconciles the continuance of rural cultures and modern civilizations, and the present and future of rural areas.
Refrence
[1] ZHANG Jing, LI Chenggu(2012) Evolution of Urban-Rural Relationship in Central Cities of China during Transformation Period[J]. ACTA GEOGRAPHICA SINICA,08:1021-1030.
[2] ZHENG Guo, YE Yu-min. The Stage of Chinese Urban-Rural Relation and its Development Model(J). OURNAL OF RENMIN UNIVERSITY OF CHINA,2009, (06):87-92
[3] Fan Lingyun. Evolution and Reflection on Rural Planning of City-cluster Areas from the Perspective of Urban-rural Relationship: A Case Study of Suzhou[J]. Urban Planning Forum,2015, (06):106-113 DANG Xinxiang , HANG Dinging. Self-organization in the Development of Urban-rural relations and its Significance in the Rural Planning of our Country[J]. Urban Development Studies, 2014,(03):119-124.
[4] FENG Benwei , ANG Jingjun , ANG Yong. Development Transformation and Planning Strategies of the Rural Space in Southern Jiangsu on the View of New Urban-Rural Relationship[J]. Urban Development Studies,2015,(10):14-21
[5] DING Shouyi. Rural Cultural Renaissance and Urban-rural Relations Reconstruction: Study of He gezhuang Village Mode[J]. Urban Development Studies, 2013, (10):5-9
402
Abstract title The development of traditional settlement master plans: A response to
undocumented indigenous planning practices in rural kwaZulu-Natal.
Author Njeke Mr , Siyabonga, KZN Department of Co-operative Governance and Traditional Affairs ,
DURBAN , South Africa (Presenting author)
Keywords
Abstract
Communication is a fundamental instrument in the processes of planning as it plays a significant role
in ensuring that the beneficiaries contribute to the practical delivery of the intervention. This is
achieved through engaging all relevant stakeholders through workshops, providing information for
understanding and engagement through various forms of discourse. The challenges facing the South
African rural communities appear to be similar in some instances and unique in others. To effectively
solve these challenges requires diverse viewpoints but most importantly numerous levels of action
that extend beyond the scope of contemporary planning. This has been one of the multiple lessons
from my numerous engagements in co-ordinating and facilitating workshops with traditional leaders
of tribes (Amakhosi ezizwe), more recently during the preparation of the five (5) provincial traditional
settlement master plans (TSMP). The traditional master plans are not an express statutory
requirement within the kwaZulu-Natal province. They originate from the observation that there has
been minimal focus on physical planning in traditional/rural community areas despite the presence
of contemporary planning legislation. Through engagements with traditional councils it was found
that there are challenges regarding the process in which land allocation is conducted as this varies
from one traditional council to the other. These challenges could be attributed to the lack of access
to information on technical systems, principles and factors that should be considered when allocating
land, particularly for residential purposes. This is further exacerbated by the non-existence of
guidelines that are influenced by indigenous knowledge of land allocation fused with technical
planning systems. Traditional communities rely on their respective traditional councils in charge of
the land allocation process to duly allocate land. In certain instances, this has led to the overlapping
of land rights and the allocation of uses on land that is not suitable for development, endangering
the lives of the occupiers i.e. allocation along on flood lines, this was averted through information
sharing and the use of GIS and GPS technology. The development of the traditional settlement
master plans was developed through considerable engagements with the affected communities and
informed by extensive site visits to determine and define the role of the study area within the greater
municipal area. Useful planning approaches can be drawn from planning theory as it places great
accent on public participation in order to understand and meet public demands. Therefore; the
distribution of goods and services to communities should be based on everyone benefiting equitably.
There is a growing need to guide settlement planning in traditional areas in particular. The new
transformative approach to development calls for a schematised approach to guide development in
order to cater for the competing development pressures, growing rural communities and the need to
preserve cultural practices and the natural resources. The aim of the study was to therefore
determine the indigenous land allocation systems, tools and institutional arrangements in respect of
land allocation; whilst at the same time determining a practical interface between the land allocation
and the land use management system of the municipality. Thus the study advocates for collaborative
planning between the municipality and the Traditional Council through inclusive governance. It is
403

vital for the two systems of governance at local level to find common ground and collaborate in
decisions of land use and development management. The paper aims to contribute towards
collaborative planning practice by reflecting on the work conducted in KwaZulu-Natal.
404

Abstract title Renewable Energy Project Siting - An Evaluation of Oregon and California Processes
Author Mabbott, Tamra, Umatilla County, PENDLETON, United States of America (Presenting author)
Abstract
Renewable Energy Project Siting – An Evaluation of Oregon and California Processes
MODERATOR: Tamra Mabbott, Planning Director, Umatilla County and OAPA Vice-President. Ms.
Mabbott has years of experience permitting natural gas, wind, solar and transmission projects. She
served on the Governor’s Energy Advisory Task Force in 1997 and the Oregon Energy Plan Update
Subgroup on permitting in 2012.
PANELISTS:
Ed Sullivan, Oregon Land Use Attorney and Planner recently retired from practicing law but remains
engaged in land use planning in Oregon, especially to advocate for affordable housing advocate as
well as to promote Oregon’s statewide planning program. Mr. Sullivan recently published “The Slow
Evolution of Energy Planning – One’ State’s Experience,” March 2017 Volume 40, Issue 3, Zoning and
Planning Law Report.
Ruchi Sadhir, Energy Advisor to Oregon Governor Kate Brown, is an electrical engineer and attorney
who advises on technical and policy matters. Most recently Ms. Sadhir facilitated the Governor’s
Advisory Committee on Energy and Agriculture in the Umatilla Basin. That committee was focused on
resolving conflicts between transmission and agriculture. Ms. Sadhir authored the committee report
“Governor’s Advisory Committee on Agriculture in the Umatilla Basin,” February 24, 2017.
Kate Kelly, is a land use planner in California and has devoted most of her career to natural resource
and energy projects. In 2012 Ms. Kelly authored “Smart from the Start: Responsible Renewable
Energy Development in the Southern San Joaquin Valley, CA.”
Karen Douglas, (invited) is a lead attorney for the California Public Utility Commission where she
works on planning and other energy development projects. Ms. Douglas can speak about the legal
and process requirements for permitting in California.
SESSION DESCRIPTION:
Oregon’s regulatory approach to permitting energy generation projects has mixed outcomes. The
Oregon Energy Facility Siting Council was established in the 1970’s to super site large-scale power
generation plants, beginning with the Trojan Nuclear Power Plant. Since that time, the type and scale
of energy generation has changed, especially with the onslaught of wind and solar projects. The EFSC
super-siting role is a marked departure from land use permitting under Oregon’s celebrated
Statewide Land Use Planning Program.
The panelists from Oregon will provide an overview of the Oregon regulatory process, including the
legal, planning and stakeholder (political) issues from a local and state perspective. Both Oregon
panelists will share their insight into opportunities for changes to the permitting process and
standards in Oregon.
405

California energy facility permitting transpires at the local level where there is a wide variety of
regulatory approaches and outcomes. Beginning in 2010, several counties partnered with a variety of
conservation, farming and environmental groups to develop long range plans for renewable energy
development. This landscape level approach is new and measurement of the outcome is just
beginning.
The panelists from California will also provide an overview of California’s regulatory process,
including the legal, planning and stakeholder issues from a local and state perspective. Both
California panelists will share their observations about the new landscape level planning, and, their
insight into opportunities for changes to the permitting process and standards in California.
The moderator will facilitate a question and answer session among the panelists and the audience.
The audience can expect a robust conversation with the targeted goal of developing a list of
concepts/best practices to implement.
Contact:
Tamra Mabbott, Planning Director
216 Se Fourth Street
Pendleton, OR 97801
(541) 278-6246
406
Encouraging Inclusive Communities Through Zoning Reform:
The case of Upper Ashbury, Bloemfontein.
Mischka JACOBUS, University of Free State, South Africa
Stuart Paul DENOON-STEVENS (co-author), University of Free State, South Africa
Professor Verna NEL (co-author), University of Free State, South Africa
Synopsis: The use of Euclidean Zoning practices as a form of development control in South Africa has been criticised for being oppressive. This exclusion is evidently depicted in the town planning schemes. This paper indicates how land use regulations have affected the livelihoods of the urban poor and indicates the impact of governance in inclusive community building.
1. Introduction
Conventional Euclidean Zoning approaches in South Africa have failed to address the needs of the urban poor. Thus, more appropriate and inclusive zoning regulations and Land Use Management Systems have captured the interests of various academics. In particular, Berrisford (2011: 210) characterises the planning law in South Africa, as ‘an oppressive force for the poor’. This form of oppression brings about no significant form of societal benefits for the poor (Rubin, 2008) & (Berrisford, 2011). Although formal land use controls are under statutory compliance, there is an evident disconnect with the needs of the poor which is recognised. Various authors indicate that conventional zoning is oppressive, rigid and that the zoning system in South Africa is simply not effective. Conventional Euclidean zoning fails to consider the needs of the urban poor and is criticized for separating people and land uses. (See in this regard; Berrisford (2011), Brown (2001), Denoon- Stevens (2016), Nel (2016), Ovens, Kitchen, Parnell and Williams (2007), Rubin (2008), Talen (2012), UN-Habitat (2009) and Watson (2009)) Furthermore, Brown (2001) asserts that municipal regulations impede the genuine attempts of the urban poor to support and sustain themselves. Rubin (2008) argues that people living in lower income areas purposefully ignore the land use regulations because they do not support or encourage activities that will support their livelihoods. Hence, this supports the contention that regulations which are inappropriate result in informal economic activity. For this reason, this research study ultimately aims to provide an appropriate set of zoning regulations that deal with these inadequacies.
In order to effectively address inapt land use regulations for low income areas, this paper will develop a series of regulation that allows for the majority of activities in the proposed residential area which will prevent land uses which are truly undesirable. More appropriate planning for the urban poor is an evident concern (See in this regard: Berrisford, 2011; Charlton, 2008; Roy, 2005; Watson, 1993; Ovens, Kitchen, Parnell and Williams; 2007) therefore this paper will adopt the concept by Glasser. Glasser (2013) states that any planning law which requires 80% of the people to change the way that they are living, is unlikely to succeed, but with a planning law that regularizes the way that 80% of the people are living, there is a greater chance of successful implementation. Although deeming something ‘appropriate’ can be a difficult task, Glasser’s concept (2013) regarding planning law is particularly critical in determining an appropriate set of land use regulations for the proposed residential area. Given the aforementioned notion of Glasser (2013), the main goal of this research is, through land use regulation, to permit land uses and a building form which support the livelihoods of the urban poor. Secondly, to re-evaluate stringent land uses which no longer reflect the current (2017) reality of Upper Ashbury. This will in turn provide sufficient control over permitted land uses and create opportunities which support and enable the urban poor. Given the above, the sequence of the paper will be as follows: first, a brief
407
historical outline of Land Use Management in South Africa, its associated problems and possible solutions, followed by a historical account of the study area, Upper Ashbury in Heidedal, Bloemfontein. This will be followed by a summary of the research methods and then the results of the study which encompasses sections on the demographic and household analysis of the study area. Penultimate, a section on zoning reform for SMART communities and finally, a conclusion and recommendations is provided.
2. Land Use Management in South Africa
Land Use Management is a system comprised of various activities which ultimately result in the most effective means to allocate and utilise land and urban space (Fekade, 2000). Van Wyk (2012) further defines the concept as a tool which is used to alter the land and urban space, be it in the form of development applications such as rezoning, removal or restrictive conditions, etc. Land Use Management is a broad realm or system which intends to guide and control the growth of cities (Fekade, 2000) through a set of processes which include the acquisition and trading of land, the rights and regulations pertaining to that land, and its further development (Planact, 2007). Land Use Management in South Africa is rooted in modernist thinking and underlain by Apartheid planning techniques which advocated separating and controlling people and land. This form of separation created a spatial form which included that of several injustices such as restricting Non-White South Africans from opportunities and reserving social and economic opportunities and rights for the minority (Rubin, 2008). South Africa’s planning system adopted a dual system of control, that of land use and spatial access by different racial groups (Charlton, 2008). Hendler (2015) indicates that segregated living spaces were governed by three categories. Firstly; town locations, which indicated which racial group may live where. Then, employer accommodation referred to the government permitting domestic servants to live on their employer’s property for cheap labour. Thirdly, the government controlled the movement of people through “pass” laws to prevent squatting in the city.
Since South Africa’s democratic dispensation (as of 1994), policy makers have advocated a complete reform of previous policies and legislation which hindered social and economic opportunities for Non-White South Africans. However, Rubin (2008) and Parnell & Pieterse (2010) indicates that since the inception of post-apartheid policies and legislation at national and local level, there has been very little progression and improvement in the thinking and practices of land use management in South African cities. This is evident in the continued use and management of land which fails to encompass the objectives of democracy, spatial efficiency and sustainability. Hendler (2015) agrees by indicating that by simply abolishing land use regulations does not result in integrated and sustainable living spaces. Parnell (2007) further critiques that although cities in the South has called for a ‘developmental state agenda’, in reality poor cities are still faced with overpowering poverty and mismanagement in providing the poor with a better quality of life. Nel (2016) and Rubin (2008) furthermore note that the Land Management System in South Africa suffers from two challenges to cope with alternative and more innovative land management systems. The first is municipal capacity (Satterthwaite, 2011), meaning there is a huge shortage of people who have the actual qualifications or skills to implement or manage the demands of post-apartheid policies. Secondly, Rubin (2008) alludes to the notion that there is an inability of planning departments to access newer legislation or simply no time to train people in the application and implementation thereof, especially smaller municipalities in South Africa. Given the exploration of Land Use Management in South Africa, the following includes a section on the disjuncture between Land Use Management and the Spatial Planning and Land Use Management Act, 2013 (No 16 of 2013).
408
2.1. Land Use Management and The Spatial Planning and Land Use Management Act, 2013 (No 16 of 2013)
The Spatial Planning and Land Use Management Act 16 of 2013, otherwise known as SPLUMA, was promulgated and now acts as the sole piece of national legislation for spatial policy and land use management in South Africa (Nel, 2016). SPLUMA mandates five developmental principles and objectives namely; spatial justice, spatial sustainability, efficiency, spatial resilience and the principle of good administration (South Africa. Spatial Planning and Land Use Management Act, 2013). This section focuses on the main disconnect between the conventional Euclidean Zoning system and the newly enacted national legislation, SPLUMA.
Given the opening assertion, Nel (2016) specifically critiques that the current conventional zoning in South Africa is not in line with the objectives set in SPLUMA. Firstly, the principle of spatial justice; the spatial injustices have emerged from the legacy of apartheid and is evident in law enforcement as well, where in predominantly ‘White’ or high income areas, land use regulations are strictly enforced, whereas in ‘Black’ or low income areas, there is very little to no law enforcement or land management, thus neglecting to secure the health and land regulations (Nel, 2016). Berrisford (2011) adds to the debate by noting that there is an obvious disjuncture of land use regulations and law enforcement in Black and White areas which is a characteristic that vouches that zoning is an exclusive and exclusionary form of land management and control. Charman, Peterson & Piper (2013) critiques that liquor outlets, in particular, are heavily regulated in township areas, and the basis for this is in part due to a lack of zoning rights which leads to some provinces being unable to obtain liquor licenses. The issue seems more to be that LUMS enforcement in low-income areas is inappropriate given the nature and needs of these areas. Furthermore, Ben-Joseph (2004) asserts that zoning is often exclusionary given the time taken to approve development applications and conditions set, which in turn lead to higher property prices. Similarly, Schilderman & Lowe (2002) indicate that housing options for the urban poor are led by an intricate set of regulations which establishes the quality of the housing as well as the cost. Hence, the need for the urban poor to look for alternative housing solutions due to the fact that access to housing is directly linked to the standards and regulations in use, which is difficult for the urban poor to meet. Not only is access to housing difficult but equally so is the means to generate an income therein (Schilderman & Lowe 2002).
Nel (2016) states that zoning establishes who may or may not live in an area and is exclusive to certain income groups, which is naturally in conflict with the principle of spatial justice. Berrisford (2011) agrees, stating that planning law has unashamedly been used to affirm ‘the interests of a small minority against the interests of the majority’. The Spatial Planning and Land Use Management Act 16 of 2013 (South Africa. SPLUMA, 2013: 18) advocates redress in section 7(a) (iii), stating that “Spatial planning mechanisms, including land use schemes, must incorporate provisions that enable redress in access to land by disadvantaged communities and persons.” However, the assertions by Nel (2016) and Berrisford (2011) above regarding the current zoning scheme, say otherwise. The above quote from SPLUMA indicates redress in access to land by the urban poor. The poor, however, are denied access to land specifically for business purposes due to costly and complex land use applications. Van Wyk & Oranje (2014) concur with Nel (2016), stating that whether the newly national legislation SPLUMA is to be a success remains to be seen. Euclidean zoning, as currently practised in South Africa, is also in conflict with the principle of spatial sustainability as Talen (2012) and Nel (2016) note that zoning is used for specific uses rather than the interaction between them, thus neglecting aesthetics and design of an urban area.
The mono-functional uses which forms zoning leads to various problems such as work spaces being relatively far from residential places, which often leads to the urban poor commuting long distances to non-residential spaces, and this also places immense pressure on infrastructural capacity and costs (Nel, 2016). Yigitcanlar, Kamruzzaman and Teriman
409
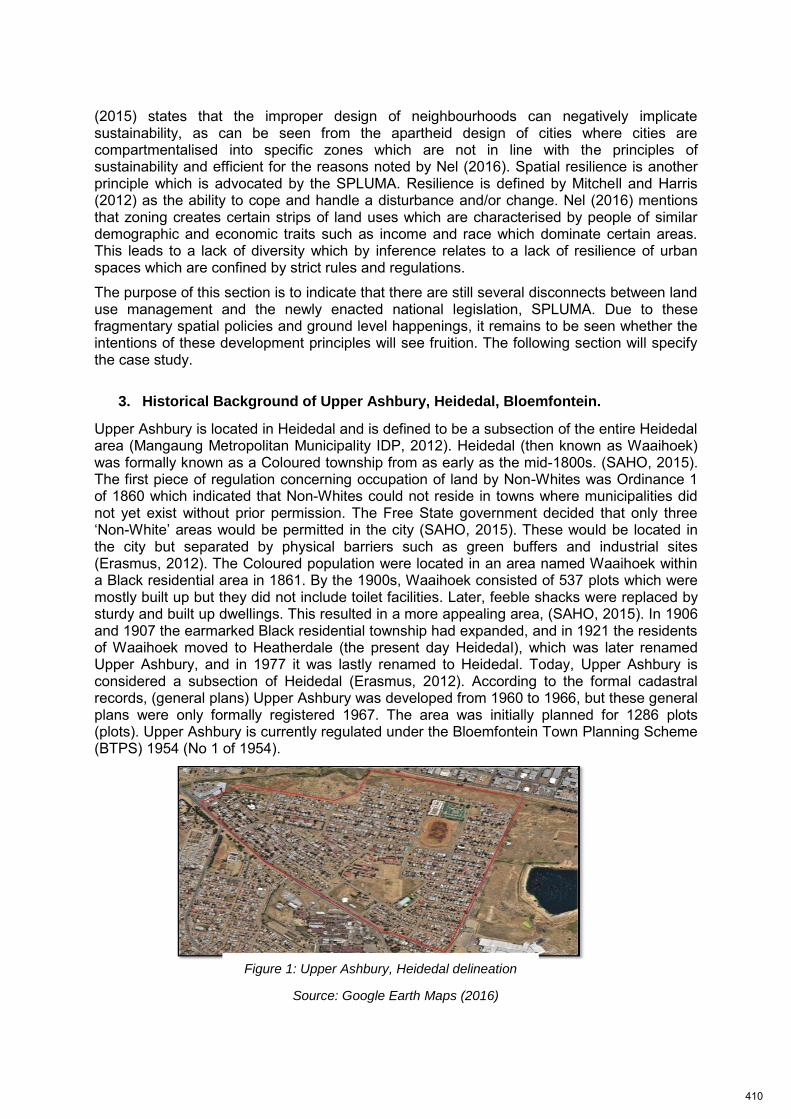
(2015) states that the improper design of neighbourhoods can negatively implicate sustainability, as can be seen from the apartheid design of cities where cities are compartmentalised into specific zones which are not in line with the principles of sustainability and efficient for the reasons noted by Nel (2016). Spatial resilience is another principle which is advocated by the SPLUMA. Resilience is defined by Mitchell and Harris (2012) as the ability to cope and handle a disturbance and/or change. Nel (2016) mentions that zoning creates certain strips of land uses which are characterised by people of similar demographic and economic traits such as income and race which dominate certain areas. This leads to a lack of diversity which by inference relates to a lack of resilience of urban spaces which are confined by strict rules and regulations.
The purpose of this section is to indicate that there are still several disconnects between land use management and the newly enacted national legislation, SPLUMA. Due to these fragmentary spatial policies and ground level happenings, it remains to be seen whether the intentions of these development principles will see fruition. The following section will specify the case study.
3. Historical Background of Upper Ashbury, Heidedal, Bloemfontein.
Upper Ashbury is located in Heidedal and is defined to be a subsection of the entire Heidedal area (Mangaung Metropolitan Municipality IDP, 2012). Heidedal (then known as Waaihoek) was formally known as a Coloured township from as early as the mid-1800s. (SAHO, 2015). The first piece of regulation concerning occupation of land by Non-Whites was Ordinance 1 of 1860 which indicated that Non-Whites could not reside in towns where municipalities did not yet exist without prior permission. The Free State government decided that only three ‘Non-White’ areas would be permitted in the city (SAHO, 2015). These would be located in the city but separated by physical barriers such as green buffers and industrial sites (Erasmus, 2012). The Coloured population were located in an area named Waaihoek within a Black residential area in 1861. By the 1900s, Waaihoek consisted of 537 plots which were mostly built up but they did not include toilet facilities. Later, feeble shacks were replaced by sturdy and built up dwellings. This resulted in a more appealing area, (SAHO, 2015). In 1906 and 1907 the earmarked Black residential township had expanded, and in 1921 the residents of Waaihoek moved to Heatherdale (the present day Heidedal), which was later renamed Upper Ashbury, and in 1977 it was lastly renamed to Heidedal. Today, Upper Ashbury is considered a subsection of Heidedal (Erasmus, 2012). According to the formal cadastral records, (general plans) Upper Ashbury was developed from 1960 to 1966, but these general plans were only formally registered 1967. The area was initially planned for 1286 plots (plots). Upper Ashbury is currently regulated under the Bloemfontein Town Planning Scheme (BTPS) 1954 (No 1 of 1954).
Source: Google Earth Maps (2016)
Figure 1: Upper Ashbury, Heidedal delineation
410
4. Method
The overall research paradigm stems from a pragmatic viewpoint. Hence, the author made use of ‘intervention research’ which is best described by Rothman and Thomas (1994) as a design method which is utilised to essentially provide possible pragmatic solutions to research issues. This research is based on two sources of data. Firstly, a survey was undertaken of the built form of Upper Ashbury. This was the primary source of data for this study. Noting that the plots amounted to 1212 units in the study area, a sample of 221 plots was used, which resulted in a confidence level of 95% and just under a 6% margin of error. In order to allow for a spatially representative spread of the area of Upper Ashbury, a systematic sampling technique (Kothari, 2004) was utilised to determine that every 5th household is to be surveyed. Due to a lack of available data of this nature, the most appropriate data collection method included using the area tool on Google Earth Pro to determine the calculations necessary for the coverage and street-and-side setbacks. This was then verified and supplemented with on-site photography, observation and a land use survey. The second source of data included the qualitative component which comprised of semi-structured interviews in July 2016 with four participants. The questions were open-ended thus they were analysed and themes were extracted to determine similar land use issues or solutions coming through. These interviews were a supplementary source of data.
5. Results
The purpose of this section is twofold. Firstly, to provide a demographic and infrastructure overview of Upper Ashbury. Secondly, to provide a household overview of the area in order to effectively present the land use contraventions and the implications thereof.
5.1. Demographic and Infrastructure overview
The total population amounts to 8943 people, with a relatively even gender distribution of 4553 (51%) females and 4391 (49%) males. The Coloured population group amounts to 7636 people, thus making up 85% of the population (Statistics South Africa, 2011). The annual household income profile of Upper Ashbury is relatively mixed, with a large portion, roughly 30.89% of the households earning from no income to R19600 (approximately USD$1471) per annum. The annual income ranges from R19601-R307600 (USD$1471- $23095) amounts to 65.26% and the income range from ‘R307 601–more’ amounts to a small percentage of 3.85% (Statistics South Africa, 2011). The income distribution of the area indicates that most of the households reflect a low-middle income class area. In terms of employment, there are 2652 people (45. 01%) formally employed, but equally so, there are numerous people who are not economically active (2059 people, 35. 95%) and a small portion of the people are discouraged work seekers or unemployed, 5.38% and 14.66% respectively (Statistics South Africa, 2011).
It is critically important to note that more than half of the people in Upper Ashbury are not formally employed which subsequently indicates the importance of the informal sector and the survivalist activities occurring in the area. Statistics South Africa (2011) indicates that 7446 people have a grade 12 qualification or less. This amounts to 95.24% of the population of Upper Ashbury however only 112 people have gone onto pursue higher degrees or diplomas. Another alarming statistic is the number of people who have no schooling, this amount to 260 people. It is not a substantial number, but it is worth noting as it is the second largest education level category. Upper Ashbury is a serviced site with built-in water and sewage infrastructure. It is one of the first Coloured townships to be built after the enactment of Group Areas Act (SAHO, 2015) and the mid-block lavatory very much represented the planning of the time for Non-Whites – discriminatory and degrading. The author found 60 mid-block lavatories out of the 221 households surveyed.
411
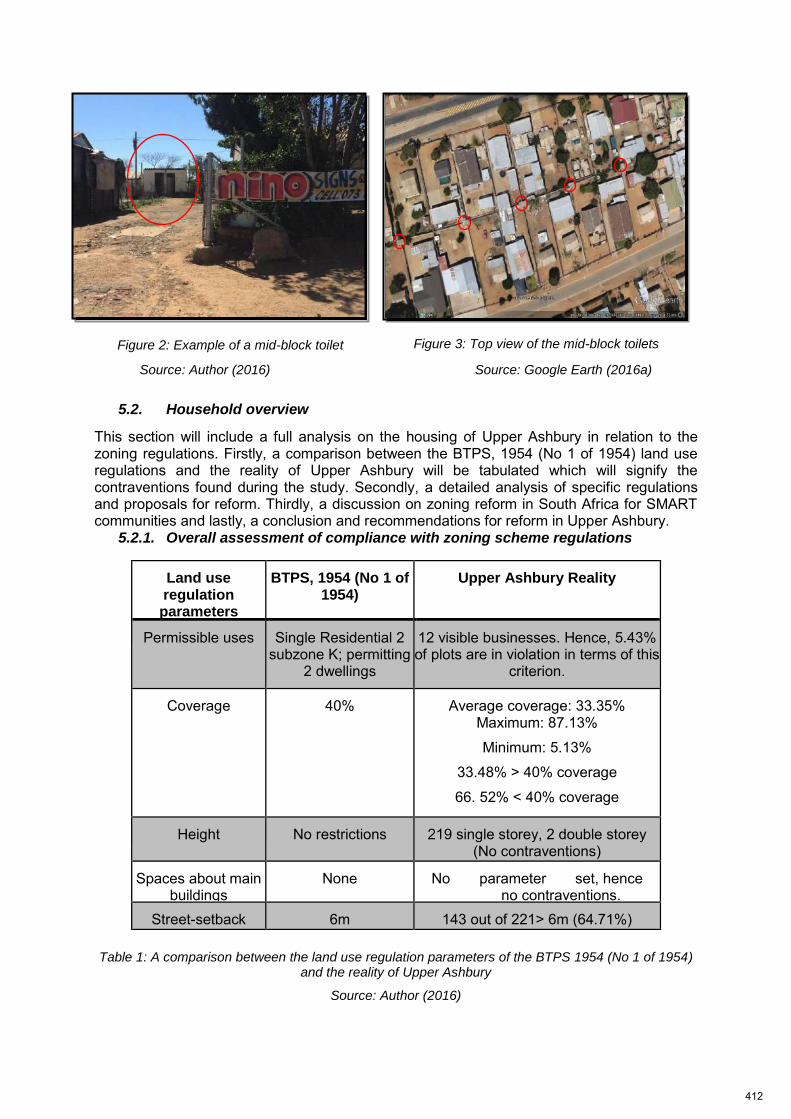
Source: Author (2016) Source: Google Earth (2016a)
5.2. Household overview
This section will include a full analysis on the housing of Upper Ashbury in relation to the zoning regulations. Firstly, a comparison between the BTPS, 1954 (No 1 of 1954) land use regulations and the reality of Upper Ashbury will be tabulated which will signify the contraventions found during the study. Secondly, a detailed analysis of specific regulations and proposals for reform. Thirdly, a discussion on zoning reform in South Africa for SMART communities and lastly, a conclusion and recommendations for reform in Upper Ashbury.
5.2.1. Overall assessment of compliance with zoning scheme regulations
Table 1: A comparison between the land use regulation parameters of the BTPS 1954 (No 1 of 1954) and the reality of Upper Ashbury
Source: Author (2016)
Land use regulation parameters
BTPS, 1954 (No 1 of 1954)
Upper Ashbury Reality
Permissible uses Single Residential 2 subzone K; permitting
2 dwellings
12 visible businesses. Hence, 5.43% of plots are in violation in terms of this
criterion.
Coverage 40% Average coverage: 33.35% Maximum: 87.13%
Minimum: 5.13%
33.48% > 40% coverage
66. 52% < 40% coverage
Height No restrictions 219 single storey, 2 double storey (No contraventions)
Spaces about main buildings
None No parameter set, hence no contraventions.
Street-setback 6m 143 out of 221> 6m (64.71%)
Figure 3: Top view of the mid-block toilets
Figure 2: Example of a mid-block toilet
412
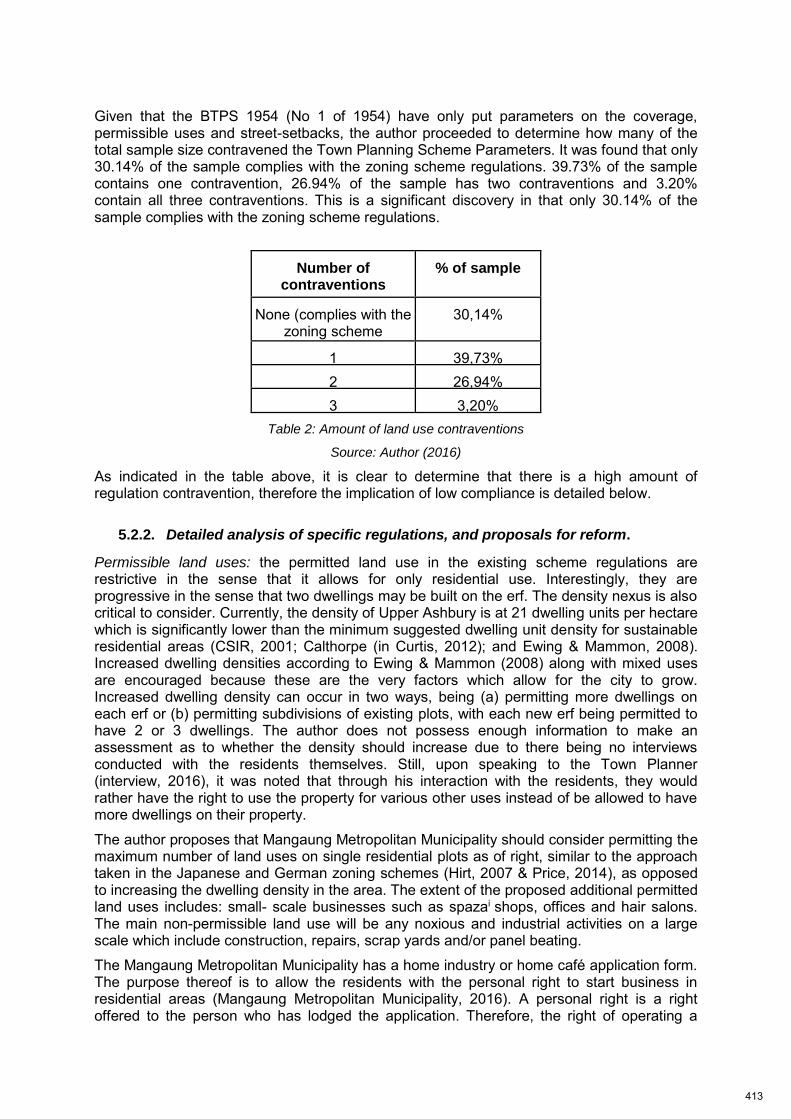
Given that the BTPS 1954 (No 1 of 1954) have only put parameters on the coverage, permissible uses and street-setbacks, the author proceeded to determine how many of the total sample size contravened the Town Planning Scheme Parameters. It was found that only 30.14% of the sample complies with the zoning scheme regulations. 39.73% of the sample contains one contravention, 26.94% of the sample has two contraventions and 3.20% contain all three contraventions. This is a significant discovery in that only 30.14% of the sample complies with the zoning scheme regulations.
Number of contraventions
% of sample
None (complies with the zoning scheme
regulations)
30,14%
1 39,73% 2 26,94% 3 3,20%
Table 2: Amount of land use contraventions
Source: Author (2016)
As indicated in the table above, it is clear to determine that there is a high amount of regulation contravention, therefore the implication of low compliance is detailed below.
5.2.2. Detailed analysis of specific regulations, and proposals for reform.
Permissible land uses: the permitted land use in the existing scheme regulations are restrictive in the sense that it allows for only residential use. Interestingly, they are progressive in the sense that two dwellings may be built on the erf. The density nexus is also critical to consider. Currently, the density of Upper Ashbury is at 21 dwelling units per hectare which is significantly lower than the minimum suggested dwelling unit density for sustainable residential areas (CSIR, 2001; Calthorpe (in Curtis, 2012); and Ewing & Mammon, 2008). Increased dwelling densities according to Ewing & Mammon (2008) along with mixed uses are encouraged because these are the very factors which allow for the city to grow. Increased dwelling density can occur in two ways, being (a) permitting more dwellings on each erf or (b) permitting subdivisions of existing plots, with each new erf being permitted to have 2 or 3 dwellings. The author does not possess enough information to make an assessment as to whether the density should increase due to there being no interviews conducted with the residents themselves. Still, upon speaking to the Town Planner (interview, 2016), it was noted that through his interaction with the residents, they would rather have the right to use the property for various other uses instead of be allowed to have more dwellings on their property.
The author proposes that Mangaung Metropolitan Municipality should consider permitting the maximum number of land uses on single residential plots as of right, similar to the approach taken in the Japanese and German zoning schemes (Hirt, 2007 & Price, 2014), as opposed to increasing the dwelling density in the area. The extent of the proposed additional permitted land uses includes: small- scale businesses such as spazai shops, offices and hair salons. The main non-permissible land use will be any noxious and industrial activities on a large scale which include construction, repairs, scrap yards and/or panel beating.
The Mangaung Metropolitan Municipality has a home industry or home café application form. The purpose thereof is to allow the residents with the personal right to start business in residential areas (Mangaung Metropolitan Municipality, 2016). A personal right is a right offered to the person who has lodged the application. Therefore, the right of operating a
413
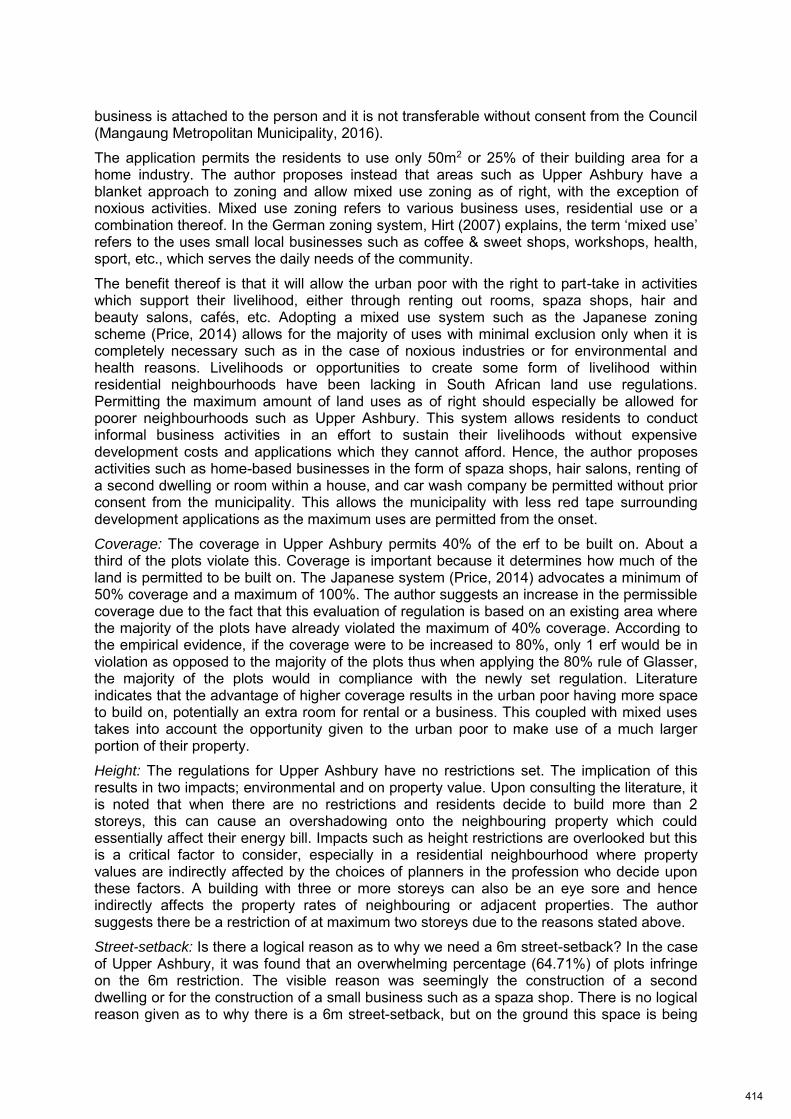
business is attached to the person and it is not transferable without consent from the Council (Mangaung Metropolitan Municipality, 2016).
The application permits the residents to use only 50m2 or 25% of their building area for a home industry. The author proposes instead that areas such as Upper Ashbury have a blanket approach to zoning and allow mixed use zoning as of right, with the exception of noxious activities. Mixed use zoning refers to various business uses, residential use or a combination thereof. In the German zoning system, Hirt (2007) explains, the term ‘mixed use’ refers to the uses small local businesses such as coffee & sweet shops, workshops, health, sport, etc., which serves the daily needs of the community.
The benefit thereof is that it will allow the urban poor with the right to part-take in activities which support their livelihood, either through renting out rooms, spaza shops, hair and beauty salons, cafés, etc. Adopting a mixed use system such as the Japanese zoning scheme (Price, 2014) allows for the majority of uses with minimal exclusion only when it is completely necessary such as in the case of noxious industries or for environmental and health reasons. Livelihoods or opportunities to create some form of livelihood within residential neighbourhoods have been lacking in South African land use regulations. Permitting the maximum amount of land uses as of right should especially be allowed for poorer neighbourhoods such as Upper Ashbury. This system allows residents to conduct informal business activities in an effort to sustain their livelihoods without expensive development costs and applications which they cannot afford. Hence, the author proposes activities such as home-based businesses in the form of spaza shops, hair salons, renting of a second dwelling or room within a house, and car wash company be permitted without prior consent from the municipality. This allows the municipality with less red tape surrounding development applications as the maximum uses are permitted from the onset.
Coverage: The coverage in Upper Ashbury permits 40% of the erf to be built on. About a third of the plots violate this. Coverage is important because it determines how much of the land is permitted to be built on. The Japanese system (Price, 2014) advocates a minimum of 50% coverage and a maximum of 100%. The author suggests an increase in the permissible coverage due to the fact that this evaluation of regulation is based on an existing area where the majority of the plots have already violated the maximum of 40% coverage. According to the empirical evidence, if the coverage were to be increased to 80%, only 1 erf would be in violation as opposed to the majority of the plots thus when applying the 80% rule of Glasser, the majority of the plots would in compliance with the newly set regulation. Literature indicates that the advantage of higher coverage results in the urban poor having more space to build on, potentially an extra room for rental or a business. This coupled with mixed uses takes into account the opportunity given to the urban poor to make use of a much larger portion of their property.
Height: The regulations for Upper Ashbury have no restrictions set. The implication of this results in two impacts; environmental and on property value. Upon consulting the literature, it is noted that when there are no restrictions and residents decide to build more than 2 storeys, this can cause an overshadowing onto the neighbouring property which could essentially affect their energy bill. Impacts such as height restrictions are overlooked but this is a critical factor to consider, especially in a residential neighbourhood where property values are indirectly affected by the choices of planners in the profession who decide upon these factors. A building with three or more storeys can also be an eye sore and hence indirectly affects the property rates of neighbouring or adjacent properties. The author suggests there be a restriction of at maximum two storeys due to the reasons stated above.
Street-setback: Is there a logical reason as to why we need a 6m street-setback? In the case of Upper Ashbury, it was found that an overwhelming percentage (64.71%) of plots infringe on the 6m restriction. The visible reason was seemingly the construction of a second dwelling or for the construction of a small business such as a spaza shop. There is no logical reason given as to why there is a 6m street-setback, but on the ground this space is being
414
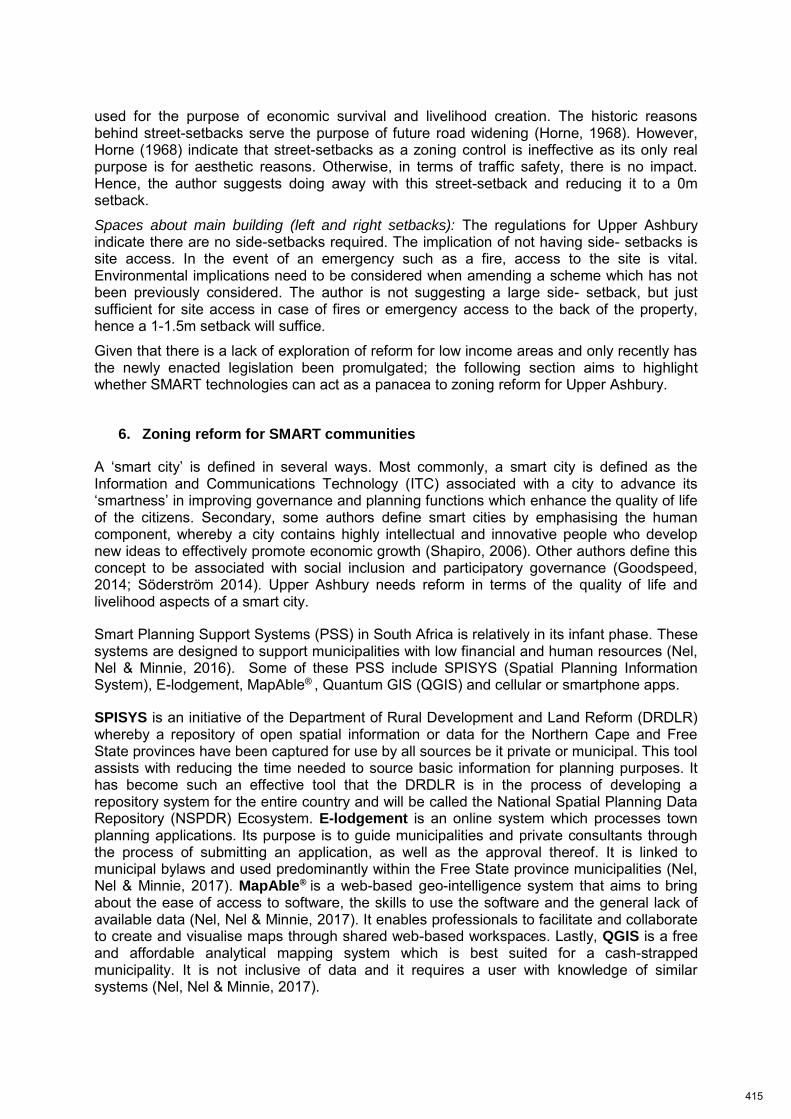
used for the purpose of economic survival and livelihood creation. The historic reasons behind street-setbacks serve the purpose of future road widening (Horne, 1968). However, Horne (1968) indicate that street-setbacks as a zoning control is ineffective as its only real purpose is for aesthetic reasons. Otherwise, in terms of traffic safety, there is no impact. Hence, the author suggests doing away with this street-setback and reducing it to a 0m setback.
Spaces about main building (left and right setbacks): The regulations for Upper Ashbury indicate there are no side-setbacks required. The implication of not having side- setbacks is site access. In the event of an emergency such as a fire, access to the site is vital. Environmental implications need to be considered when amending a scheme which has not been previously considered. The author is not suggesting a large side- setback, but just sufficient for site access in case of fires or emergency access to the back of the property, hence a 1-1.5m setback will suffice.
Given that there is a lack of exploration of reform for low income areas and only recently has the newly enacted legislation been promulgated; the following section aims to highlight whether SMART technologies can act as a panacea to zoning reform for Upper Ashbury.
6. Zoning reform for SMART communities
A ‘smart city’ is defined in several ways. Most commonly, a smart city is defined as the Information and Communications Technology (ITC) associated with a city to advance its ‘smartness’ in improving governance and planning functions which enhance the quality of life of the citizens. Secondary, some authors define smart cities by emphasising the human component, whereby a city contains highly intellectual and innovative people who develop new ideas to effectively promote economic growth (Shapiro, 2006). Other authors define this concept to be associated with social inclusion and participatory governance (Goodspeed, 2014; Söderström 2014). Upper Ashbury needs reform in terms of the quality of life and livelihood aspects of a smart city.
Smart Planning Support Systems (PSS) in South Africa is relatively in its infant phase. These systems are designed to support municipalities with low financial and human resources (Nel, Nel & Minnie, 2016). Some of these PSS include SPISYS (Spatial Planning Information System), E-lodgement, MapAble® , Quantum GIS (QGIS) and cellular or smartphone apps.
SPISYS is an initiative of the Department of Rural Development and Land Reform (DRDLR) whereby a repository of open spatial information or data for the Northern Cape and Free State provinces have been captured for use by all sources be it private or municipal. This tool assists with reducing the time needed to source basic information for planning purposes. It has become such an effective tool that the DRDLR is in the process of developing a repository system for the entire country and will be called the National Spatial Planning Data Repository (NSPDR) Ecosystem. E-lodgement is an online system which processes town planning applications. Its purpose is to guide municipalities and private consultants through the process of submitting an application, as well as the approval thereof. It is linked to municipal bylaws and used predominantly within the Free State province municipalities (Nel, Nel & Minnie, 2017). MapAble® is a web-based geo-intelligence system that aims to bring about the ease of access to software, the skills to use the software and the general lack of available data (Nel, Nel & Minnie, 2017). It enables professionals to facilitate and collaborate to create and visualise maps through shared web-based workspaces. Lastly, QGIS is a free and affordable analytical mapping system which is best suited for a cash-strapped municipality. It is not inclusive of data and it requires a user with knowledge of similar systems (Nel, Nel & Minnie, 2017).
415
Given the nature of the area of Upper Ashbury and the level of expertise required, perhaps within the context of Upper Ashbury, it would be best to take a step back. In order for a city to become ‘smart,’ it is a critical precondition that the regulations in place are in line with the realities of citizens, otherwise we might just have high-technological governance that still does not align with the lived reality of citizens. This study subsequently provides a methodology that municipalities can use to test the alignment between regulation and lived realities. Perhaps this then is the ‘true’ definition of a smart city in a developing country – not necessarily one which is technology driven, but rather a city that is aware of citizens lived realities, and which regulate in such a way to accommodate these practises.
7. Recommendations and Conclusion
This research study has effectively indicated how and why re-evaluating land use regulations for Upper Ashbury, Bloemfontein is critically important, not only for the study area in question but for similar places as well. The use of modernist and oppressive zoning techniques has been to the detriment of the urban poor. The data collected has proven that the regulations set for the study area does not take cognisance of the priorities of the urban poor. It was argued in theory that it is vital that good urban planning laws reflect the values of an area and this is precisely why re-evaluating the regulations for Upper Ashbury is essential. Alternative zoning schemes such as form-based codes and performance-based zoning have also proven to be out of the financial and skills capacity of the local government in South Africa. Hence, the author has taken a pragmatic approach to proposing new land use regulations which are better suited for the area.
The three major land use contraventions found were from the street-setbacks, coverage, and land uses. These contraventions made it clear that only 30.14% of the sample of Upper Ashbury is in compliance with the Bloemfontein Town Planning Scheme. An alarming 68.86% of the sample contain at least one to three contraventions in terms of street-setbacks, coverage or land use. Glasser’s (2013) 80% rule is critically important in this regard in which it highlights that re-evaluation of the BTPS regulations for Upper Ashbury is absolutely necessary. Given that the scheme does not reflect the reality on the ground, Massey’s (2014) argument of counter-conduct activities is also proving to come out strongly in this study when looking at the vast amount of contraventions. It is clear that resistance to set regulations through counter-conduct activities in Upper Ashbury is taking place. This is a clear indication that space in Upper Ashbury is important to the people as the majority of the sample made more use of the street-setback space and the coverage. Noting that some form of land use regulation is always required for the health and safety of the residents as well as environmental protection, land use regulations also need to take cognisance of the social and economic impact on people’s lives. It is therefore fundamental that the livelihood priorities of people living in Upper Ashbury are taken into account.
The implication of this research on the planning profession is that Town Planners need to be aware of making decisions that will affect the livelihood and well-being of people. It is critically important to create land use regulations which are better aligned with the realities on the ground as opposed to adhering to needless land use regulations. Planners need to create spaces and cities in which all people have the opportunity to empower themselves and their lives. Hence, social and economic implications need to be considered alongside planning regulations, not only for the wealthy but for the poor as well.
416
References:
Ben-Joseph, E (2004) “Future of standards and rules in shaping place: Beyond the urban genetic code”. Journal of urban planning and development, Vol. 130, No. 2, (May).
Berrisford, S (2011) “Why it is difficult to change urban planning laws in African countries.” Urban Forum, Vol, 22 No. 3, (September).
Brown, A (2001) “Cities for the urban poor in Zimbabwe: urban space as a resource for sustainable development”. Development in Practice, Vol. 11, No. 2- 3, (July).
Charman, A.J., Petersen, L.M. and Piper, L (2013) “Enforced informalisation: The case of liquor retailers in South Africa.” Development Southern Africa, Vol. 30, No. 4-5, (August).
Charlton, S (2008) Second Economy Strategy: Addressing inequalities and economic marginalisation. The state of land use management in South Africa. TIPS: Urban LandMark.
CSIR. 2001. Guidelines for Human Settlement Planning and Design.
Curtis, C (2012) Delivering the 'D' in transit-oriented development: Examining the town planning challenge. Journal of Transport and Land Use, Vol. 5, No. 3, (January).
De Soto, H (1990) The other path: The invisible revolution in the third world. New York: Routledge.
Denoon-Stevens, S.P (2016) “Developing an appropriate land use methodology to promote spatially just, formal retail areas in developing countries: The case of the City of Cape Town, South Africa”, Land Use Policy, Vol. 54, No. 1, (July)
Denoon-Stevens, S.P. 2016a. Tabled summary of SPLUMA development principles and its relevance to microenterprises in low income areas. [Unpublished]. October, 2016.
Erasmus, P.A (2012) “Old perceptions and new identities in Heidedal ‘I am the names you call me and the names that are no longer known’”, African Identities, Vol. 10, No. 4, (April).
Erasmus, P (2013) “Assessment of an Indigenous Learning Project: The Khoekhoe and San Early Learning Centre in Heidedal”, J SocSci, Vol. 34, No. 3, (January).
Ewing, K. & Mammon, N (2008) Cape Town Den[City]: Towards Sustainable Urban Form. Sustainable Resources Use Paper: Theme- Urban Form Prepared for the Sustainability Institute. Cape Town.
Fekade, W (2000) “Deficits of formal urban land management and informal responses under rapid urban growth, an international perspective”, Habitat International, Vol. 24, No. 2, (June).
Glasser, M (2013) Land Use Law and the City: Towards Inclusive Planning. In: Wouters, J., Ninio, A. and Doherty, T. [eds.], 2015. The World Bank Legal Review Volume 6 Improving Delivery in Development: The Role of Voice, Social Contract, and Accountability. World Bank Publications.
Goodspeed, R (2014) “Smart cities: moving beyond urban cybernetics to tackle wicked problems”. Cambridge Journal of Regions, Economy and Society Vol. 8, No. 1, (March)
Google Earth Maps.2016a. Example of a mid-block toilet in Ashbury[Online]. Available from:https://www.google.co.za/maps/place/Ashbury,+Bloemfontein,+9323/@ 29.1334585,26.2456477,140m/data=!3m1!1e3!4m5!3m4!1s0x1e8fcf6cf3ea4d19:0x73824c29a5860461!8m2!3d-29.1485493!4d26.2570385?hl=en [Accessed June 2016].
Hendler, P (2015) The History of Spatial Planning and Land Use in South Africa. In: Joseph, S. Magni, P. & Maree, G. The Urban Land Paper Series Vol 1: South African Cities Network. New York: Archipelago Books.
417
Hirt, S. (2007) “The devil is in the definitions: Contrasting American and German approaches to zoning”. Journal of the American Planning Association, Vol. 73, No. 4, (December)
Kothari, C.R (2004) Research methodology: Methods and techniques. New Age International.
Mangaung Local Municipality. Department of Urban Planning and Housing, 2011.Bloemfontein Town Planning Scheme no 1 of 54.
Mangaung Metropolitan Municipality. 2016. Application for a home industry or house café.
Mangaung Metropolitan Municipality. 2012. Integrated Development Plan (2012-2016). Bloemfontein. Mangaung Metropolitan Municipality.
Massey, R.T (2014) “Exploring counter-conduct in upgraded informal settlements: The case of women residents in Makhaza and New Rest (Cape Town), South Africa”. Habitat International, Vol. 44, No. 1, (October).
Mitchell, T. and Harris, K. 2012. Resilience: A risk management approach. ODI Background Note. Overseas Development Institute: London.
Nel, V (2016) “A better zoning system for South Africa?” Land Use Policy, Vol. 55, No. 1, (September).
Nel, V., Nel, D., & Minnie, S. 2017. Making small cities smart in South Africa. [Unpublished].
Ovens, W., Kitchen, F., Parnell, S. and Williams, A. 2007. Land management and democratic governance in five South African metropolitan areas: Overview report. Unpublished report produced for CUBES, Planact, and Urban LandMark.
Parnell, S (2007) Urban governance in the South: the politics of rights and development. A handbook of political geography. Sage: London.
Parnell, S. and Pieterse, E (2010) “The ‘right to the city’: institutional imperatives of a developmental state”. International journal of urban and regional research, Vol. 34 No. 1, (February).
Payne, G.K. and Majale, M (2004) The urban housing manual: Making regulatory frameworks work for the poor. Earthscan
Planact. 2007. Urban land: space for the poor in the City of Johannesburg? Summary of findings of a 2007 joint Planact/ CUBES study on Land Management and Democratic Governance in the City of Johannesburg.
Price, A. 2014. Japanese zoning. [Online]. Available from: http://urbankchoze.blogspot.co.za/2014/04/japanese-zoning.html [Accessed August 2016]
Rothman, J. and Thomas, E.J (1994). Intervention research: design and development for the human service. Psychology Press.
Roy, A (2005) “Urban informality: toward an epistemology of planning”. Journal of the American Planning Association, Vol. 71, No. 2, (November).
Rubin, M. 2008. Land management and democratic governance in Johannesburg: Synthesis report. Commissioned by Urban LandMark, Planact and CUBES, with Ford Foundation funding.
SAHO. 2015. South African History Online: towards a people’s history: Bloemfontein the Segregated city. [Online]. Available from: http://www.sahistory.org.za/article/bloemfontein-segregated-city. [Accessed on 31 October 2016].
Satterthwaite, D (2011) “How urban societies can adapt to resource shortage and climate change”. Philosophical Transactions of the Royal Society of London A: Mathematical, Physical and Engineering Sciences, Vol. 369 No. 1942, (April).
418
Schilderman, T. and Lowe, L. 2002.The impact of regulations on urban development and the livelihoods of the urban poor. ITDG February.
Silber, G., Selebalo, L., &Mtshiyo, H. 2016. Why urban policy alone won’t solve South Africa’s inequality problem. Ford Foundation. [Online]. Available from: http://www.fordfoundation.org/ideas/equals-change-blog/posts/why-urban-policy- alone-won-t-solve-south-africa-s-inequality-problem/ [Accessed 25 October 2016].
Shapiro, J. M (2006) “Smart cities: quality of life, productivity, and the growth effects of human capital”. The review of economics and statistics, Vol. 88 No. 2, (September)
Söderström, O., Paasche, T., and Klauser, F (2014) Smart cities as corporate storytelling. City, Vol. 18 No. 3, (June)
South Africa. 2013. Spatial Planning and Land Use Management Act. (Proclamation No. 559). Government Gazette, 36730(578), August 5. (Regulation gazette No. 36730). Cape Town: Government Printer.
Statistics South Africa. 2011. Small Area Layer Data.
Survey Monkey. 1999. Sample Size Calculator. [Online]. Available from: https://www.surveymonkey.com/mp/sample-size-calculator/ [Accessed March 2016].
Talen, E (2012) City rules: How regulations affect urban form. Island Press.
UN-Habitat (2009) Planning sustainable cities: global report on human settlements. Nairobi: UN-Habitat
Von Broembsen, M. 2008. Spaza owners seek business status. [Online]. Available from: http://www.mba.co.za/article!rootid=62subdirectoryid=850. Accessed August 2017.
Van Wyk, J (2012) Planning law. Juta and Company Ltd.
Van Wyk, J. and Oranje, M (2014) “The post-1994 South African spatial planning system and Bill of Rights: A meaningful and mutually beneficial fit?” Planning Theory, Vol. 13 No. 4, (December)
Watson, V (1993) “The need for more appropriate forms of urban management: the case of land use controls and home businesses”. Development Southern Africa, Vol 10 No 2, (February).
Watson, V (2009) “The planned city sweeps the poor away…’: Urban planning and 21st century urbanization”, Progress in planning, Vol. 72 No. 3, (October).
Yigitcanlar, T., Kamruzzaman, M. and Teriman, S (2015) “Neighborhood sustainability assessment: Evaluating residential development sustainability in a developing country context”, Sustainability, Vol. 7 No. 3, (March)
iA spaza shop is an informal business run from either a room in a house or a shack and is operated from a small house where customers purchase grocery items from outside the house or shack; it is also commonly known as a much less sophisticated grocery shop (Von Broembsen, 2008:1).
419
Is Devolution a Panacea for making Planning more Democratic? The Kenyan Experience
Rose MUSYOKA, MKIP, MAAK (TP), Renson MBWAGWA, MKIP, MAAK (TP), and Herbert MUSOGA, MKIP, MAAK (TP), National Land Commission, Kenya
Abstract
Public participation is one of the fundamental national values and principles of governance stipulated in
Article 10 of the Kenya Constitution 2010. Article 174 © provides that one of the objects of devolution is to
“to give power of self-governance to the people and enhance their participation in the exercise
of the power of the state and in making decisions affecting them”. The Constitution further
devolves planning to the County Governments with the mandate to prepare, approve, implement and review
plans and county level public policies. The County Governments Act 2012 additionally obligates County
Governments to plan as a basis for application of public funds.
Using the plan preparation process of the Lamu County Spatial Plan as a case study, we investigate the role
that devolution has played in making planning more democratic. The overarching argument of this paper is
that planning is an essential public service and forum for articulation of common interests that are crucial
to good governance and realization of inclusive communities. Therefore, structured, broadened and
deepened public participation embedded in policy and legislation as well as giving due expression and
application in planning processes is an indispensable bed-rock. We consider that sharing of best practices in
this area will add to the knowledge in achieving planning that substantially and positively impacts on society
and specifically on vulnerable groups.
1.0 Introduction
As a departure from the centralized system of governance, the Kenyan people formulated and embraced the Kenya Constitution 2010 which puts the people at the center of state affairs and devolves governance to the counties, stating that “all sovereign power belongs to the people of
Kenya --- the people may exercise their sovereign power either directly or through their
democratically elected representatives” (article 1(1-2) Kenya Republic 2010; pp19). This opening statement sets the direction of and cadence for conducting public undertakings and provides the reference point for public participation in land use planning in Kenya.
This paper is an appraisal of how public participation has leveraged the latitude presented by the devolved governance structures in preparing a spatial plan in one of the units of devolution, Lamu County in Kenya. This is upon the premises that land use planning as a local action provides a foremost opportunity for the citizens to exercise their power to participate and influence public affairs. This is done in the context of national policy and legislative context. Land use planning is critical in enabling the assertion of rights and citizen values and presents an opportunity to allow for engagement of communities to determine the future use of local natural resources (Leung, 2004). We further consider land use planning as “the scientific, aesthetic, and orderly disposition of land, resources, facilities and services with a view to securing the physical, economic and social efficiency, health and well-being of urban and rural communities” (Canadian Institute of Planners, 2005). Thus the manner in which public participation is conducted in the planning process is fundamental to establishing a foundation upon which subsequent citizen rights will be realized.
420
2.0 Theoretical Reference
The study makes reference to previous works which recognize that:
“Participation must be collaborative and it should incorporate not only citizens, but also organized
interests, profit-making and non-profit organizations, planners and public administrators in a common
framework where all are interacting and influencing one another and all are acting independently in
the world as well. This is not one-way communication from citizens to government or government to
citizens. It is a multi-dimensional model where communication, learning and action are joined
together and where the polity, interests and citizenry co-evolve. --- participatory methods involve
collaboration, dialogue and interaction. They are inclusive. They are not reactive, but focused on
anticipating and defining future actions (Innes an Booher, 2004, pp 422-423).
It is also recognized that participation is of mutual benefit: by involving individuals more directly in decisions that affect their lives, participation is seen as a way of strengthening the legitimacy and accountability of democratic institutions (Creasy, 2007; Cornwall, 2008; Beetham et al., 2008); Secondly, involving people in local decision-making processes and bringing them together around a common cause or interest can empower communities and help build social cohesion (CLG, 2006a; Home Office, 2004b; Blake et al., 2008; Foot, 2009). Thirdly, participation is considered a tool for reforming public services and for providing services that are better suited to people’s needs and that are more efficient (Lead beater, 2004; Parker, 2007; Duffy, 2007). Finally, participation may lead to increased political efficacy and satisfaction gained from influencing change to personal development and growth in self-esteem from learning new skills such as public speaking (CLG, 2008b; Barnes and Shardlow, 1997; Popay et al., 2007). Participation is thus associated with ‘greater social justice, more effective public services and a society of self-confident citizens’ (Beetham et al., 2008: 11) as well as being an expression of active citizenship (Brannan et al., 2006).
The study took cognizance of Arnstein’s foundational theory of citizen participation acknowledging the three main stages of nonparticipation, tokenism and citizen power (Arnstein, 1969). The appraisal is focused on the stage of citizen empowerment as the relevant context. 3.0 Methodology
The research sample was constrained by the fact that out of the 47 counties (devolved governance units) in the country only Lamu had managed to walk the whole process of preparing a County Spatial Plan within the current land use planning framework. The stages of the planning process presented points of enquiry as to the breadth and depth of public participation. Criteria for evaluation were derived from the constitutional and legislative expectations and aspirations. As well literature review provided additional benchmarks that informed the appraisal. These included: criteria for stakeholders selection; timely access to information, data, documents, and other information relevant or related to plan formulation; protection and promotion of the interest and rights of minorities, marginalized groups and communities and their access to relevant information; reasonable balance in the roles and obligations of county government and non-state actors in decision-making processes to promote shared responsibility and partnership, and to provide complementary authority and oversight.
421
4.0 Constitutional and Legal Context for Devolution and Public Participation 4.1 Constitution of Kenya 2010
(i) Objects and Principles of Devolution
Some of the prime objects and principles of devolution that have a direct implication on land use planning in Kenya include: Objects of devolution
(a) To promote democratic and accountable exercise of power; to give powers of self-governance to the people and enhance the participation of the people in the exercise of the powers of the State and in making decisions affecting them;
(b) To recognize the right of communities to manage their own affairs and to further their development;
(c) To protect and promote the interests and rights of minorities and marginalized communities; (d) To promote social and economic development and the provision of proximate, easily
accessible services throughout Kenya.
Principles of Devolution
(a) County Governments shall be based on democratic principles and the separation of powers; (b) County Governments shall have reliable sources of revenue to enable them to govern and
deliver services effectively; and (c) No more than two-thirds of the members of representative bodies in each county government
shall be of the same gender.
(ii) Public Participation
Article 201(a) of the Constitution elaborates that public participation will be key, guiding all aspects of public finance. The Constitution further states, in Article 197, that at the level of every County assembly, counties shall also “facilitate public participation and involvement in the legislative and other business of the assembly and its public participation and county assembly powers and privileges.” The state is also required under article 69 to encourage public participation in the management, protection and conservation of the environment. (iii) Access to Information
Article 35 provides citizens the right to information held by the State and obligates the State to publish and publicize any important information affecting the nation. (iv) Role of Citizens
Citizens are obliged to cooperate with State organs and other persons to protect and conserve the environment and ensure ecologically sustainable development and use of natural resources (article 69(3). 4.2 County Governments Act 2012
The County Government Act, 2012 provides that ‘citizen participation’ in county governments shall be based upon the following principles: timely access to information, data, documents, and other information relevant or related to policy formulation and implementation. Reasonable access to the
422
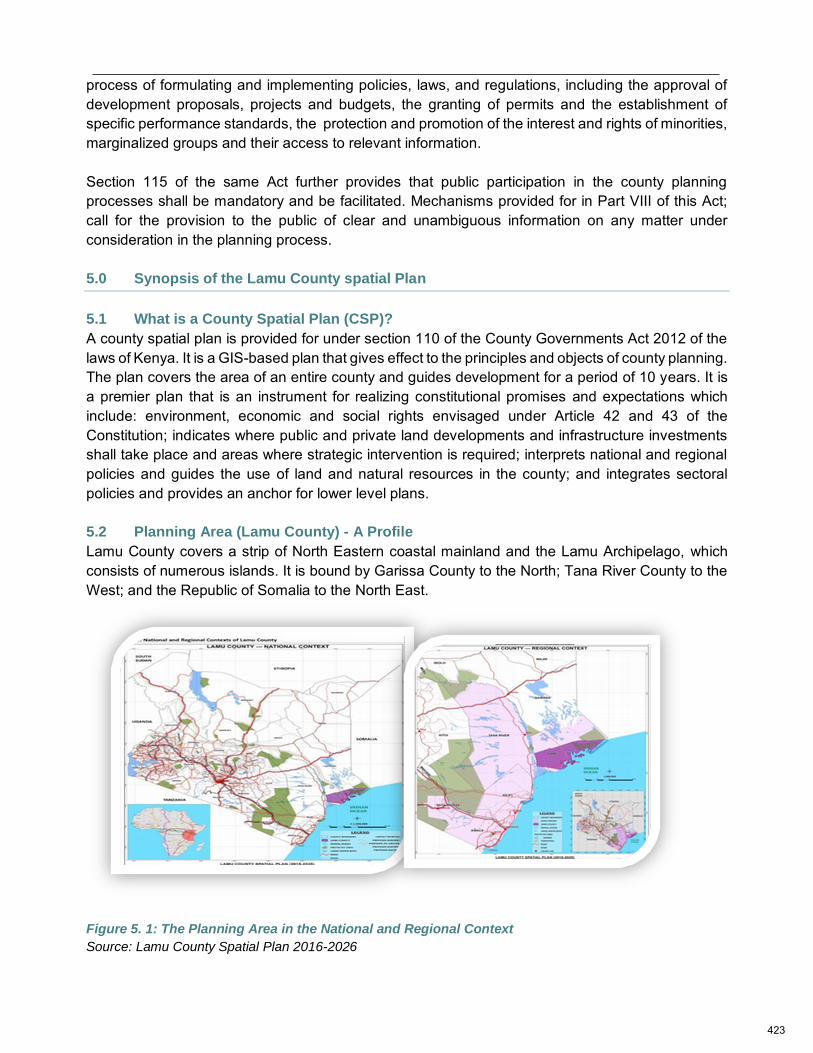
process of formulating and implementing policies, laws, and regulations, including the approval of development proposals, projects and budgets, the granting of permits and the establishment of specific performance standards, the protection and promotion of the interest and rights of minorities, marginalized groups and their access to relevant information. Section 115 of the same Act further provides that public participation in the county planning processes shall be mandatory and be facilitated. Mechanisms provided for in Part VIII of this Act; call for the provision to the public of clear and unambiguous information on any matter under consideration in the planning process. 5.0 Synopsis of the Lamu County spatial Plan
5.1 What is a County Spatial Plan (CSP)?
A county spatial plan is provided for under section 110 of the County Governments Act 2012 of the laws of Kenya. It is a GIS-based plan that gives effect to the principles and objects of county planning. The plan covers the area of an entire county and guides development for a period of 10 years. It is a premier plan that is an instrument for realizing constitutional promises and expectations which include: environment, economic and social rights envisaged under Article 42 and 43 of the Constitution; indicates where public and private land developments and infrastructure investments shall take place and areas where strategic intervention is required; interprets national and regional policies and guides the use of land and natural resources in the county; and integrates sectoral policies and provides an anchor for lower level plans. 5.2 Planning Area (Lamu County) - A Profile
Lamu County covers a strip of North Eastern coastal mainland and the Lamu Archipelago, which consists of numerous islands. It is bound by Garissa County to the North; Tana River County to the West; and the Republic of Somalia to the North East.
Figure 5. 1: The Planning Area in the National and Regional Context
Source: Lamu County Spatial Plan 2016-2026
423
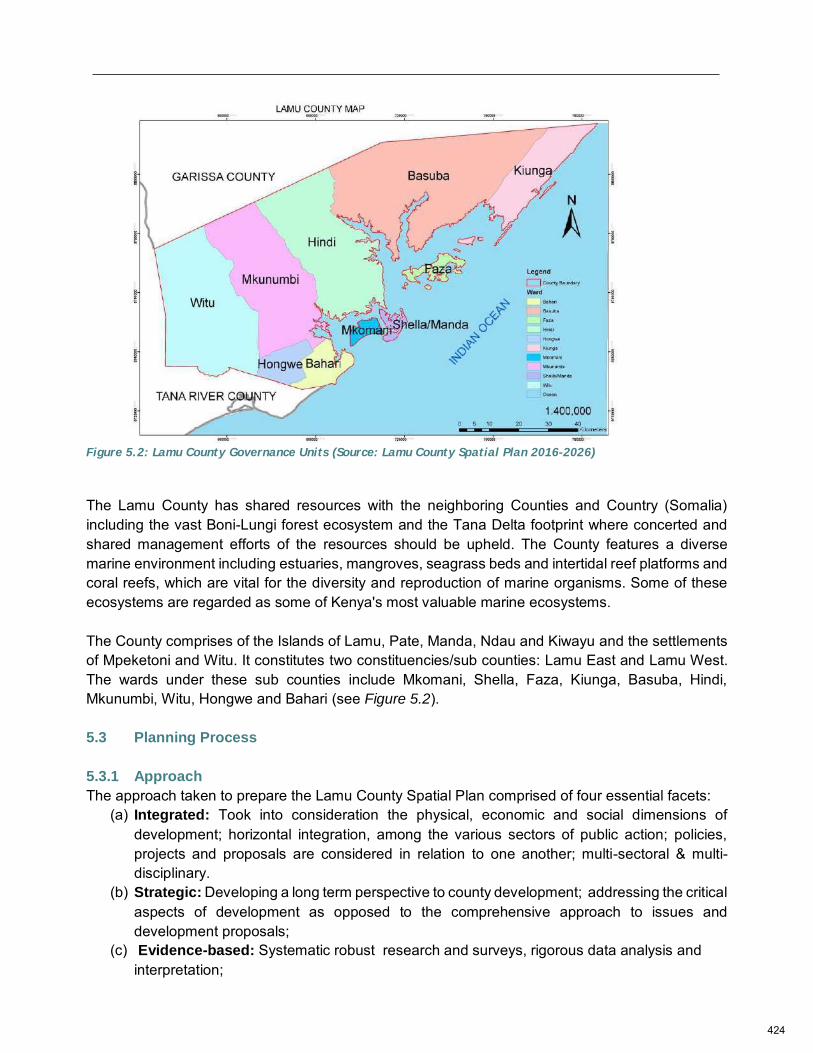
Figure 5.2: Lamu County Governance Units (Source: Lamu County Spatial Plan 2016-2026)
The Lamu County has shared resources with the neighboring Counties and Country (Somalia) including the vast Boni-Lungi forest ecosystem and the Tana Delta footprint where concerted and shared management efforts of the resources should be upheld. The County features a diverse marine environment including estuaries, mangroves, seagrass beds and intertidal reef platforms and coral reefs, which are vital for the diversity and reproduction of marine organisms. Some of these ecosystems are regarded as some of Kenya's most valuable marine ecosystems. The County comprises of the Islands of Lamu, Pate, Manda, Ndau and Kiwayu and the settlements of Mpeketoni and Witu. It constitutes two constituencies/sub counties: Lamu East and Lamu West. The wards under these sub counties include Mkomani, Shella, Faza, Kiunga, Basuba, Hindi, Mkunumbi, Witu, Hongwe and Bahari (see Figure 5.2). 5.3 Planning Process
5.3.1 Approach
The approach taken to prepare the Lamu County Spatial Plan comprised of four essential facets: (a) Integrated: Took into consideration the physical, economic and social dimensions of
development; horizontal integration, among the various sectors of public action; policies, projects and proposals are considered in relation to one another; multi-sectoral & multi-disciplinary.
(b) Strategic: Developing a long term perspective to county development; addressing the critical aspects of development as opposed to the comprehensive approach to issues and development proposals;
(c) Evidence-based: Systematic robust research and surveys, rigorous data analysis and interpretation;
424

(d) Result- orientation –aimed at achieve specific objectives, resolving issues and harnessing emerging potential/opportunities;
(e) Participatory – structured, broadened and deepened citizen engagement
5.3.2 Summary of Steps in the Process of Preparing the Lamu County Spatial Plan
Preparation of the county Spatial Plan entailed several steps that are sequential but over-lapped at some stages. The steps are summarized in figure 5.3, below:
Figure 5.3: Summary of steps in Preparing the Lamu County Spatial Plan (source: Authors’ Construct)
Public participation was embedded in the entire planning process but more elaborately at the second, fourth, sixth and ninth stages. 6.0 Appraisal of Public Participation in the Process of Preparing the Lamu County Spatial
Plan
6.1 Stakeholder Analysis criteria
Several criteria informed the selection and engagement of stakeholders. These included: territorial representation; special interest groups; marginalized communities; client and legislative mandate; specialized expertise groups.
(i) Territorial Representation
Stakeholder engagement was based on the lowest unit of devolution and governance i.e. ward level (see Figure 5.2). All the ten wards were covered, namely Basuba, Kiunga, Faza (Lamu East Constituency); Mkunumbi, Hindi, Witu, Mkomani, Hongwe, Bahari and Shella (Lamu East Constituency) to:
allow the planning team to provide a chance for the citizens to present their development concerns;
1.
Pre-Planning
2.
Stakeholder Engagement
3.
Situation Analysis
4.
Stakeholder Engagement
5.
Plan Proposal Formulation
6.Stakeholder engagement
7.Final Plan
8.Approval
9.Launching and Dissemination
10.Implementation
425
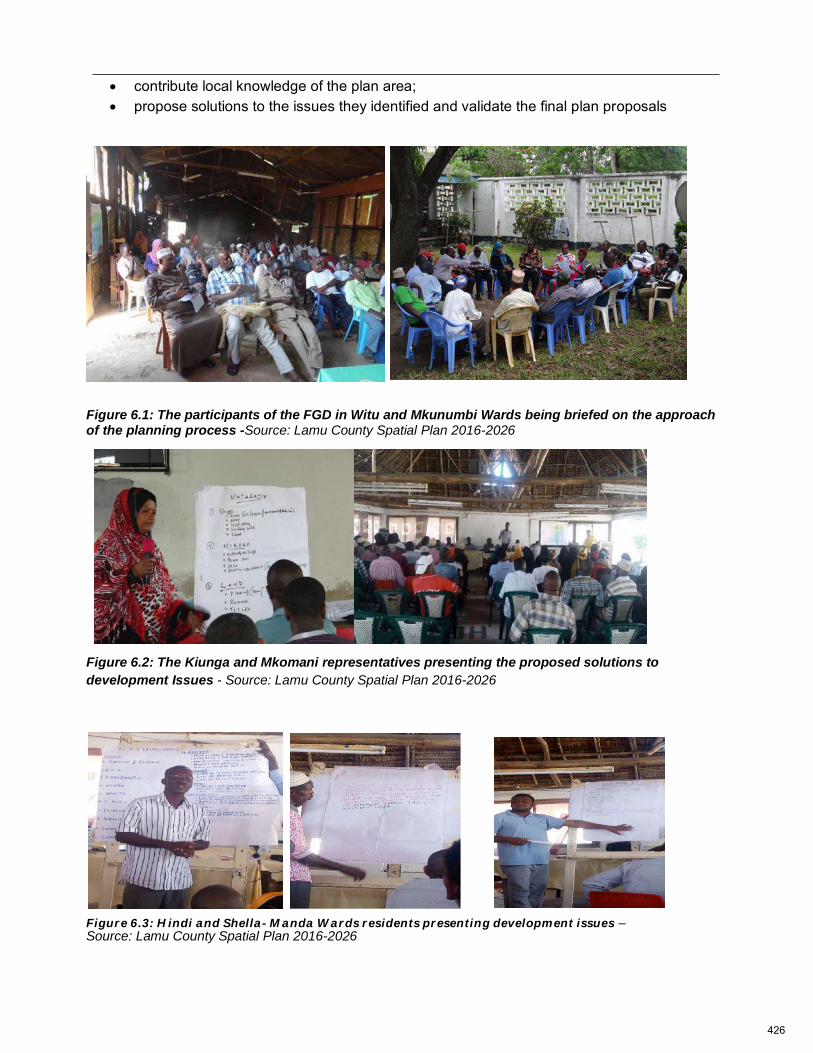
contribute local knowledge of the plan area; propose solutions to the issues they identified and validate the final plan proposals
Figure 6.1: The participants of the FGD in Witu and Mkunumbi Wards being briefed on the approach of the planning process -Source: Lamu County Spatial Plan 2016-2026
Figure 6.2: The Kiunga and Mkomani representatives presenting the proposed solutions to
development Issues - Source: Lamu County Spatial Plan 2016-2026
Figure 6.3: Hindi and Shella- Manda Wards residents presenting development issues – Source: Lamu County Spatial Plan 2016-2026
426
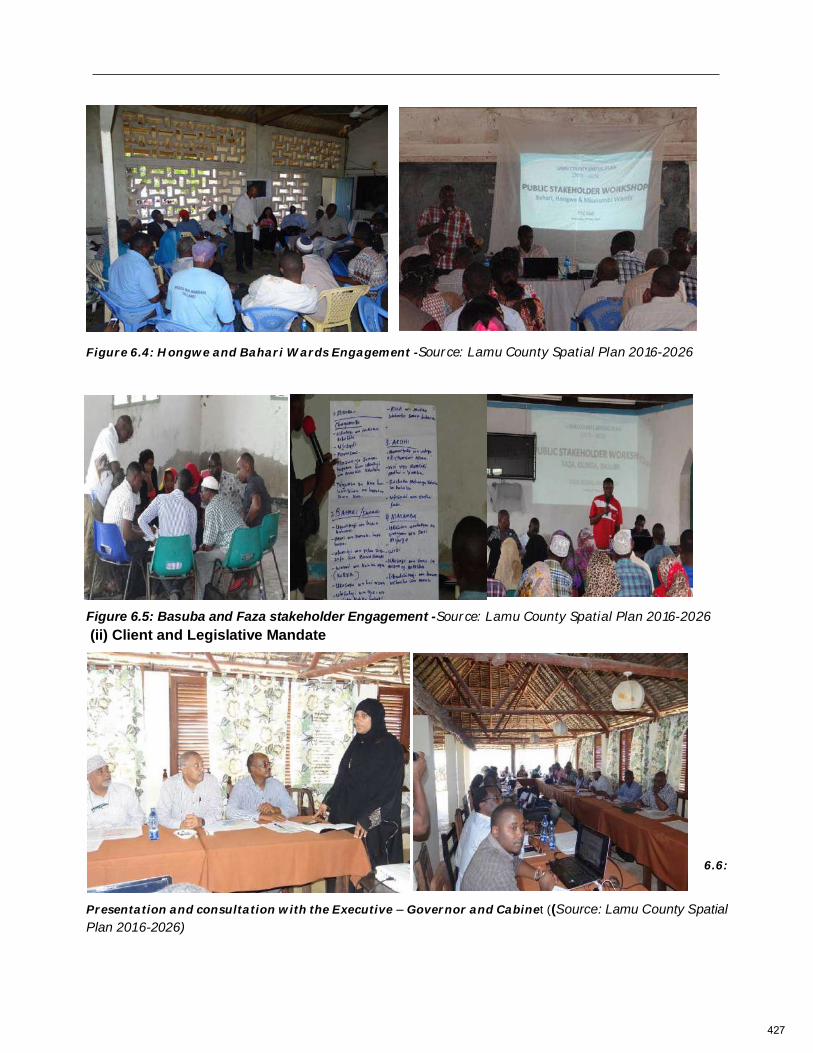
Figure 6.4: Hongwe and Bahari Wards Engagement -Source: Lamu County Spatial Plan 2016-2026
Figure 6.5: Basuba and Faza stakeholder Engagement -Source: Lamu County Spatial Plan 2016-2026
(ii) Client and Legislative Mandate
6.6:
Presentation and consultation with the Executive – Governor and Cabinet ((Source: Lamu County Spatial
Plan 2016-2026)
427
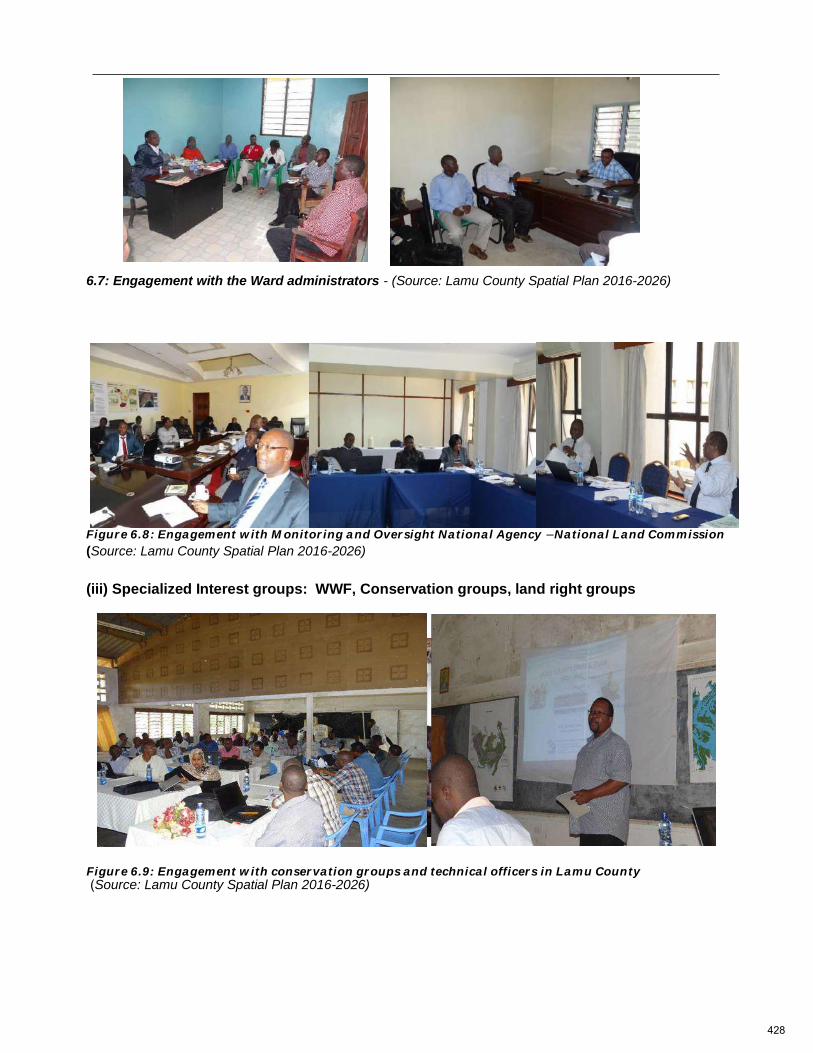
6.7: Engagement with the Ward administrators - (Source: Lamu County Spatial Plan 2016-2026)
Figure 6.8: Engagement with Monitoring and Oversight National Agency –National Land Commission (Source: Lamu County Spatial Plan 2016-2026)
(iii) Specialized Interest groups: WWF, Conservation groups, land right groups
Figure 6.9: Engagement with conservation groups and technical officers in Lamu County (Source: Lamu County Spatial Plan 2016-2026)
428
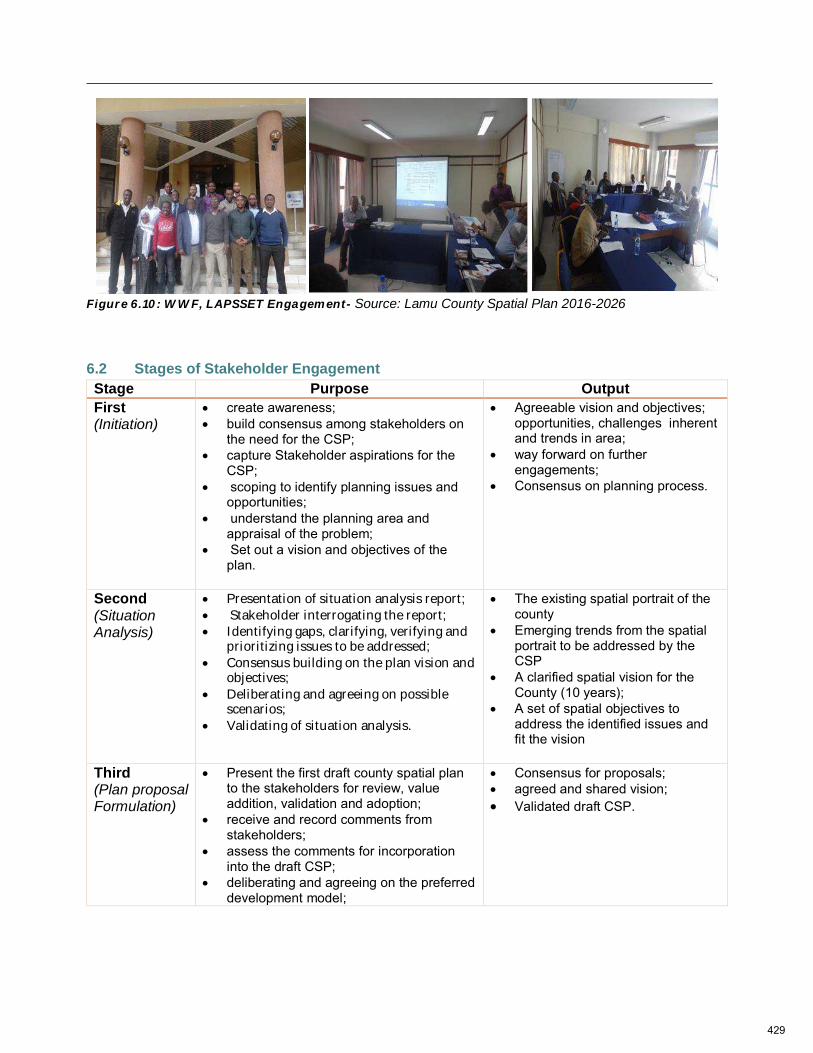
Figure 6.10: WWF, LAPSSET Engagement- Source: Lamu County Spatial Plan 2016-2026
6.2 Stages of Stakeholder Engagement
Stage Purpose Output
First (Initiation)
create awareness; build consensus among stakeholders on
the need for the CSP; capture Stakeholder aspirations for the
CSP; scoping to identify planning issues and
opportunities; understand the planning area and
appraisal of the problem; Set out a vision and objectives of the
plan.
Agreeable vision and objectives; opportunities, challenges inherent and trends in area;
way forward on further engagements;
Consensus on planning process.
Second (Situation Analysis)
Presentation of situation analysis report;
Stakeholder interrogating the report;
Identifying gaps, clarifying, verifying and prioritizing issues to be addressed;
Consensus building on the plan vision and objectives;
Deliberating and agreeing on possible scenarios;
Validating of situation analysis.
The existing spatial portrait of the county
Emerging trends from the spatial portrait to be addressed by the CSP
A clarified spatial vision for the County (10 years);
A set of spatial objectives to address the identified issues and fit the vision
Third (Plan proposal Formulation)
Present the first draft county spatial plan to the stakeholders for review, value addition, validation and adoption;
receive and record comments from stakeholders;
assess the comments for incorporation into the draft CSP;
deliberating and agreeing on the preferred development model;
Consensus for proposals; agreed and shared vision; Validated draft CSP.
429
Stage Purpose Output
Fourth (Launch)
the climax offering an opportunity for the County Government to adopt the plan as government manifesto; and
rally the citizens to ownership and implementation of the plan;
Availing of the plan on the county website and translation into Kiswahili for wider readership.
Ownership of the plan by citizens as shared and agreed framework for county development
Source: Lamu County Spatial Plan 2016-2026
6.3 Information Flow, Language of Communication and ICT and GIS Application Application of ICT and GIS technology resulted in a number of benefits including: improved mapping – better access to maps, improved map currency, more effective thematic mapping, and reduced storage cost; greater efficiency in retrieval of information; faster and more extensive access to the types of geographical information important to planning and the ability to explore a wider range of formulating development options; improved analysis; better communication to the public and planning team; improved quality of services, for example speedier access to information for planning application processing. ICT was extensively applied in mobilization of the stakeholders and sharing of information. The language of communication was mostly Kiswahili which is the native language and also national, widely used and understood by the residents of Lamu County. This ensured that all communities were able to participate effectively in the planning process.
6.4 Availability of Resources to Facilitate Public Participation
Resources to facilitate public participation were supplemented through collaboration and support from World Wide Fund (WWF). This is an active non - State agency that is involved in conservation activities within the county. The County Government as the client played a major role in providing additional support in mobilizing and engaging the stakeholders at each stage in the planning process. This ensured a steady and reliable flow of resources to the consultancy and resulted in sustained engagement and development of trust with the public.
7.0 Conclusion and Lessons Learnt
7.1Opportunities offered by devolution for more democratized land use planning
Devolution offers a compelling platform for creating the requisite environment for facilitating democratization of land use planning in a number of ways, including:
430
Empowerment of the sub-national governance units to deliver on land use planning
as an essential public service.
In the Kenyan case the Constitution requires that devolution of functions and responsibilities is accompanied by adequate resources to enable realization of the functions. The ward level which was the unit of stakeholder engagement during planning coincides with the unit of budget disbursement of development funding at the county level. Therefore, the subsequent projects and programmes for each ward will be drawn from the County Spatial Plan.
Definition, assignment and clarification of the roles, responsibilities and powers of
the various actors in land use planning
The institutional framework for devolution provided for by the constitution and subsequent policy and legislation is facilitative of public participation in land use planning by defining the roles of the various actors and agencies. This enabled more effective stakeholder identification and engagement.
Establishment of appropriate constraints and limits of what can be done, by whom
and when at the sub-national units
This enables the protection and promotion of the interest and rights of minorities, marginalized groups and communities and their access to relevant information. It also creates certainty in the delivery of the land use planning service at the local level.
Defines and delimits the sub-national units in geographical terms
This facilitates identification and engagement of stakeholders within convenient venues and provides effective and meaningful participation.
Defines and establishes the vertical relationships with the national governance units
and the horizontal relations between the sub-national units
This expedites support and policy guidance in monitoring and oversight of land use planning processes. It also necessitates reasonable balance in the roles and obligations of county government and non-state actors in decision-making processes to promote shared responsibility and partnership, and to provide complementary authority and oversight.
Provides latitude for broadened and deepened citizen participation in land use
planning
By localizing the planning function to the counties (sub-national governance units) and providing resources to enable public participation at the lowest unit of governance, devolution permits involvement of more citizens at the local level and grants adequate time for engagement.
7.2 Challenges to Harnessing the Latitude offered by Devolution for more Participatory
Land Use Planning
Some of the apparent challenges in realizing the benefits offered by devolution for broadening and deepening of public participation include: resource constraints, low level of civic education;
431
inadequate human resource capacity at the sub-national level to supervise and provide support to planning consultancies;
balancing short-term political interests and strategic long-term planning perspective; timing of planning processes against the socio-cultural schedules; Consultancy time limits against the demands for extended and repeated public participation
engagements. References
1. Leung, Hok-Lin. Land Use Planning Made Plain, Second Edition: University of Toronto
Press,2004
2. http://www/bisomessdictionary.com/definition/land-useplanning.html
3. Judith E. Innes and David E. Booher. Reframing public Participation: Strategies for the
21st Century; Planning Theory and Practice, Vol. 5, No. 4, 419-436, December 2004
4. Kenya, Republic, (2010), Constitution of Kenya 2010. Nairobi: Government Printers.
5. Kenya, Republic, (2011), Urban Areas and Cities Act 2011. Nairobi: Government Printers.
6. Kenya, Republic, (2012), County Governments Act 2012. Nairobi: Government Printers.
7. Kenya, Republic, (2010), 2009 Kenya Population and Housing Census. Nairobi: Government
Printers.
8. Kenya, Republic of (2008), Kenya vision 2030. Nairobi: Government Printers.
9. Arnstein, S. (1969). A ladder of citizen participation. Journal of the American Institute of Planners,
35, 216-214.
10. Klosterman, Richard E. 1985. Arguments for and against planning. Town Planning Review,
56(1), pp. 5-20
11. Legates, Richard and Stout, Frederic (eds.) (2011), The City Reader (Fifth Edition), London and
New York: Routledge Taylor and Francis Group
12. Stoker, G. and Young, S. (1993) Cities in the 1990s. London: Longman.
13. Stoker, G. and Mossberger, K. (1994) Urban regime theory in comparative perspective.
14. Environment and Planning C. Government and Policy, 12(2): 195–212.
UN-HABITAT (2011) Economic Role of Cities, Nairobi: United Nations Human Settlement
Programme
15. Vigar, G. Healey, P. Hull, A. and Davoudi, S. (2000), Planning, Governance and Spatial
16. Strategy in Britain: An Institutional Analysis. New York: St. MARYINS PRESS, INC 175 Fifth
Avenue.
17. Wassner, Robert (200) Readings in Public Economics, Issues and Public Policy, 350 Main
18. Street, MA 02148-5020, USA, 9600 Garsington Road, Oxford ox42DQ, UK: Blackwell
Publishing
19. Creasy, S. (2007) ‘Introduction: Participation at the Core’ in S.Creasy (Ed) Participation Nation:
connecting citizens to the public realm, Involve: London.
20. Cornwall, A. (2008) ‘Unpacking ‘Participation’: models, meanings and practices’, Community
Development Journal, 43(3): 269-283.
21. Beetham, D., Blick, A., Margetts, H. and Weir, S. (2008) Power and Participation in Modern
Britain: a literature review for Democratic Audit,Wembley: Creative Print Group
22. Blake, G., Diamond, J., Foot, J., Gidley, B., Mayo, M., Shukra, K. and Yarnit, M.(2008)
Community Engagement and Community Cohesion, York: Joseph Rowntree Foundation.
432

23. Duffy, S. (2007) ‘Participative public services’ in Parker, S. and Parker, S. (Eds) Unlocking
Innovation: Why citizens hold the key to public service reform, London: Demos.
24. Foot, J. (2009) Citizen Involvement in Local Governance, York: Joseph Rowntree Foundation
25. Leadbeater, C. (2004) Personalisation through participation: a new script for public services,
London: Demos
Parker, S. (2007) ‘Participation: A new operating system for public services?’ in S. Creasy (Ed)
Participation Nation: Reconnecting Citizens to the Public Realm, London: Involve.
433
Does technology or the people rule smart communities?
Governance and participation in the age of digitalization
Dirk ENGELKE, Professor for Spatial Development, University for Applied Science Rapperswil, Switzerland
Thomas KIWITT, Managing Director, Verband Region Stuttgart, Germany
Development and prosperity of cities and in particular of European cities are determined by several key factors like economic situation, demography and social participation, infrastructure and adoption to physical conditions like topography and climate. In particular European cities are also the result of an extensive public decision-making process and majority decisions in local assemblies according to administrative action. Digitalization and smart city concepts are addressing the named key factors by e.g. opening new economic opportunities, changing demography and social participation, optimizing the use of infrastructure or a more dynamic adoption to physical conditions. Doing so digitalization and smart city concepts have also a significant impact on the public discussion and the decision-making process itself (DIN 2017). Urban activists (Alsever 2015, De Castro 2015) as well as city government bodies like the Association of German Cities emphasis the importance that smart city concepts have to be designed to support the successful model of local self-governance and a development that is finally controlled by the respective citizenship. The smart city concept and the new opportunities coming up by digitalization are not end of itself. Finally they help to achieve the sustainable development goals (as set by the UN) faster and more efficient. By addressing these development goals the scope of smart city has to be widened up to the regional perimeter to generate a sustainable development.
This paper raises the question, if technology or the people rule smart communities. It discusses governance and participation in the age of digitalization on the city and the regional level as well. It concentrates on the perspective of spatial planning and focusing in particular to the cities and regions of Stuttgart, Germany and Zurich, Switzerland where the authors practice and research on the change processes caused by digitalization. Both are “reflective practitioners” in the sense of Donald Schön and in this respect the paper is a “reflection-in-action" (Schön 1987) and less a purely scientific paper. 1. Governance and change processes in the European City
Talking about digitalization and the change process it causes one has to take the decision-making process and the capacity for change process of European cities in mind. The history of European cities but also smaller independent towns in countries like Germany and Switzerland follows a long-standing traditional approach of local self-government: within a defined framework of legal and technical standards. The definition of strategic development goals, commitments on land-use or the extension and operation of local infrastructure are subject to municipalities home rule. It is best made visible by the three elements of sustainable development (social, economic and ecologic aspects) that decision-making in the field of local development is most often based on consideration: Aiming at the composition of different – sometimes even opposing – positions within a complex political procedure.
434
Especially in planning procedures (e.g. the update of local land-use plans where most of the key factors are addressed) the public is given the opportunity to participate directly. Everybody is invited not just to elect the decision-makers (as part of representative democracy) but also to give his opinion to the concrete circumstances e.g. the plan’s content and in the case of Switzerland to vote on the results directly. The methodology and procedures has been developed further during the last years – in particular with the intention to get more people involved in public participation processes. However, the basic principle that final decision-making is made by the people or elected officials has never been questioned. In doing so, the important long-term, interdisciplinary perspective – that can also be subject to different political values – is safeguarded. The process of decision-making itself can be legally controlled for flaws in the course of consideration. Unlike the funding of absolutistic cities or New Towns set up by more contemporary developers the aforementioned approach assures a broad inclusion of the citizenship – which has become a kind of trademark for urban development in European Cities. Considering that approx. half of the European population live in small and medium sized communities (ESPON 2013) this trademark leads to a strong local identity – in particular in the case study regions in Germany and Switzerland. This kind of identity and decision-making influences the change process caused by digitalization a lot. Implementations of Smart city concepts like in Masdar City or Singapore are hard to imagine in the decision-making culture of European Cites. The following chapter will focus on subjects and governance issues of the smart city under the described circumstances. 2. Smart technology: Subjects and governance issues of the smart city
Smart technologies are an opportunity to improve the efficiency of infrastructure, raise the quality of live and to achieve the sustainability goals set by UN and national strategies. In that respect they affect numerous aspects of urban subjects like mobility or energy as well as public health, eGovernment, security, logistics or buildings. The technically most advanced – and therefore most visible – subject of digitalization in urban technologies are mobility and energy (Engelke 2017). Topics like “autonomous driving” or “smart grids” are well discussed in media in many cities.
Under the focus of governance and participation in the age of digitalization three main topics appear to be the curtail: data self-determination, participation and inclusion as well as public welfare orientation.
435
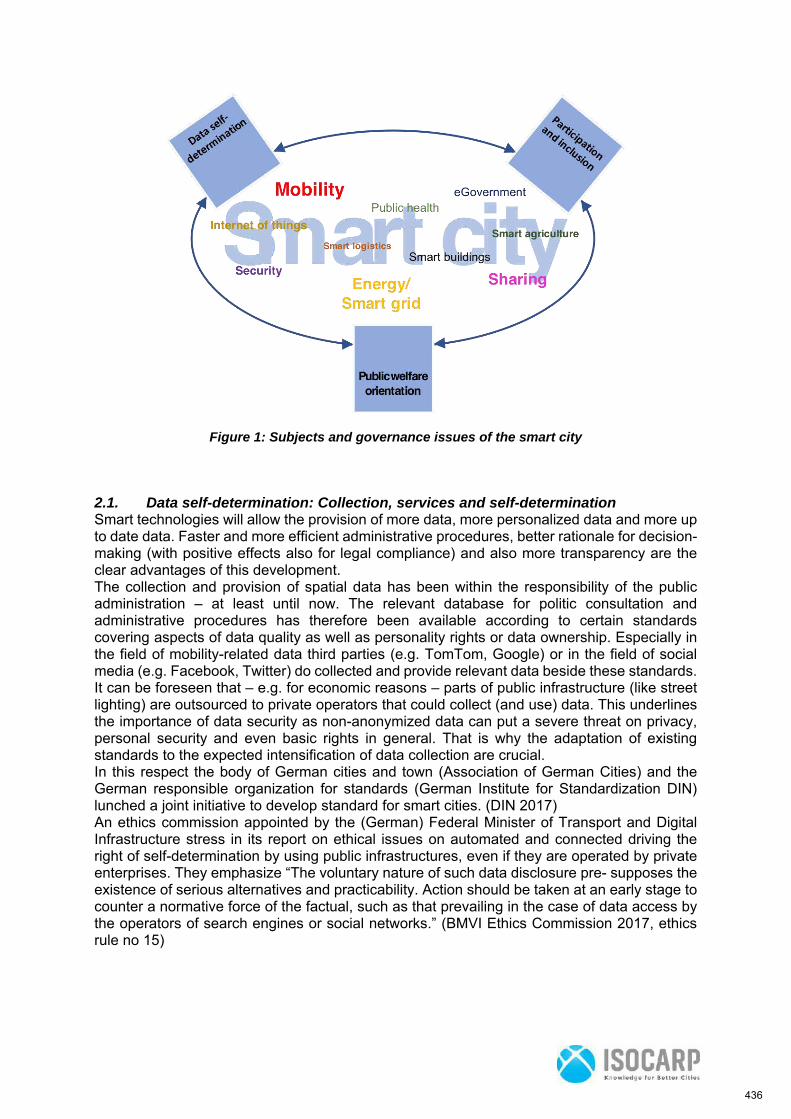
Figure 1: Subjects and governance issues of the smart city
2.1. Data self-determination: Collection, services and self-determination Smart technologies will allow the provision of more data, more personalized data and more up to date data. Faster and more efficient administrative procedures, better rationale for decision-making (with positive effects also for legal compliance) and also more transparency are the clear advantages of this development. The collection and provision of spatial data has been within the responsibility of the public administration – at least until now. The relevant database for politic consultation and administrative procedures has therefore been available according to certain standards covering aspects of data quality as well as personality rights or data ownership. Especially in the field of mobility-related data third parties (e.g. TomTom, Google) or in the field of social media (e.g. Facebook, Twitter) do collected and provide relevant data beside these standards. It can be foreseen that – e.g. for economic reasons – parts of public infrastructure (like street lighting) are outsourced to private operators that could collect (and use) data. This underlines the importance of data security as non-anonymized data can put a severe threat on privacy, personal security and even basic rights in general. That is why the adaptation of existing standards to the expected intensification of data collection are crucial. In this respect the body of German cities and town (Association of German Cities) and the German responsible organization for standards (German Institute for Standardization DIN) lunched a joint initiative to develop standard for smart cities. (DIN 2017) An ethics commission appointed by the (German) Federal Minister of Transport and Digital Infrastructure stress in its report on ethical issues on automated and connected driving the right of self-determination by using public infrastructures, even if they are operated by private enterprises. They emphasize “The voluntary nature of such data disclosure pre- supposes the existence of serious alternatives and practicability. Action should be taken at an early stage to counter a normative force of the factual, such as that prevailing in the case of data access by the operators of search engines or social networks.” (BMVI Ethics Commission 2017, ethics rule no 15)
436
2.2. Participation and inclusion: Getting more people digital – and involved Digitalization could bring several advantages regarding the outreach and participation in planning and other procedures to support decision-making: An improved comprehensibility, more transparency, better visualization and a better, more up to date data in general. But also new services and distribution channels are expected, that could improve access and support outreach to groups less attracted by classical media. Moreover, new formats of participation (e.g. crowdfunded urban project or „Hackathlons“) can lead to results that go beyond known standards – both in terms of quality and quantity. (see also Assenmacher 2017) However, it is important to bear in mind, that not all people in smart cities are included in these activities. For example do more than 10% of the population in Germany and Switzerland do not have access to internet – and can therefore hardly be addressed by this new formats (Germany: 11%, Switzerland 12% by Hootsuite 2017). Even if also the classic formats like “public announcements” might never had reached all parts of the population an appropriate mixture of on- and offline outreach activities is important (at least for a transition period) to achieve an inclusive system with sufficient coverage. 2.3. Public welfare orientation: Interdisciplinary, long-term oriented and targeting
common goods Germany’s „Smart City Charta“ (BBSR 2017) calls for an interdisciplinary, cross-section use of new technologies. This will allow an overall perspective beyond the silos of different resorts and responsibilities. Such a holistic approach is characteristic for strategical decision-making – with an extensive consideration of aspects from different perspectives to target common goods in smart cities. In planning terms, this completeness is subject to legal relevance – and crucial for the lawfulness of any decision. With the massive widening of data available from more heterogeneous sources and conclusions generated from these data base the challenges for lawful decision-making will grow. Moreover, the complexity of consultancy documents provided for elected local officials has already reached the limits of reasonableness (at least in cases with high public awareness e.g. new roads, wind turbines). However, an allegedly easy way out by finding decisions automatically based on certain algorithms is not an option: The German „Smart City Charta“ states clearly that elected officials/ counselors could never be substituted by such procedures. Talking about strategic decisions the aspect of time is an important one in this context – twofold: First, the political procedures need time for debate, negotiation and majority-building. Furthermore, decision-making in spatial and city planning is coined by a far above average perspective: The usual time horizon of 10 to 15 years is used only in few other fields of politics. Contrary to that, actuality it is a typical feature of smart cities – which is supposed to allow a short-term fine tuning. More extreme positions already tend to see the possibility of a “post voting society”, where actual surveys can render democracy (as a mid-term feedback system) unnecessary. (Mokka 2017) Despite this, the availability of up to date data could be an important issue to support decision-making – if it can be related to long term perspective and strategic guidelines.
The named three topics data self-determination, participation and inclusion as well as public welfare orientation are not only topics of the smart city itself. Their impact on the urban fabric is wider than the administrative boundaries of a city. Therefore the following chapter will focus on the scaling-up to a wider spatial level.
437
3. Catchment area of a smart cities: Scaling-up from city to city-region
The debate on smart cities is lead by local administrative units and the respective umbrella organizations. This focuses on citizens as an important target group for further action. However, this limitation is less appropriate: Even the antique Greek polis has been defined by the entirety of the population – within the city plus the hinterland. And still the European city is defined by a “surplus meaning”: City is, where most important facilities (for culture, shopping, education, medical support etc.) are. Alone because of the important amount of coverage that comes from the customers / users in the hinterland, it is most necessary to focus on a perimeter beyond city-limits. Especially for the small and medium sized local united in Germany and Switzerland the economic feasibility of many of the aforementioned installations is not possible without a (much) wider catchment area. As smart solutions do most often aim at improved mobility and accessibility it is most important, not to focus only on the residents of a city but the totality of potential users / customers. Having the case study of Stuttgart Region, Germany in mind 75% of all employees do not work in their town of residence but commute to other jurisdictions. Nevertheless, they expect – of course – that their commute works reliable, comfortable and sustainable – even beyond administrative borders. Besides travelling to work, many other functional relationships are established independently from jurisdictions, e.g. economic supply chains, flood protection, open spaces. Despite all these interdependencies, the areas described is coined by small-scale administrative structures. Within Stuttgart Region alone, a population of 2.7 Mio. Is distributed over 179 independent (and self-confident) local jurisdictions. These local units are coordinated by legal and procedural standards, but especially in prospering and fast growing urban areas some deficits become obvious: The provision of affordable housing, adaptation of important infrastructure and development of open spaces do not follow the growing demand. Excisting instruments for cost-benefits compensation do not meet the requirements of this complex situation. That is where smart city approaches have to start to support inter-/supra-municipal cooperation. But current research does not address the question how smart city approaches affect the existing catchment areas and the accordingly hinterland-connectivity. The authors raise the concern that introducing new, uncoordinated technical features might increase the already existing difficulties of cooperation within the city and its catchment area. This danger can be described by the example of traffic management: Stuttgart City discussed the closing of several roads to meet the EU-standards for air quality. Neighboring cities – that would of course have been affected – have never been integrated in decision-making. More examples can be found in other aspects of traffic management (e.g. gate-keeper traffic lights, that restrict traffic flow into a city – but causing congestions in neighboring towns). This – already very complex – situation faces additional tightening by the activities of private stakeholders. Their data has a significant influence on routing of commuters and travelers – by now most often without any sufficient consultation of local traffic management. Also the opportunities for an improved participation can contribute to the sustainable development goals only if supra-municipal coordination is assured. The description of the decision-making culture in the German case study shows that the spatial divergence of work and residence is significant for the citizen’s position: All democratic right to participation are limited to the town of residence. The general intention – to have all aspects of a city accordingly represented – is in many cases overruled by the particular interests e.g. having a quiet residential neighborhood. The provision of (necessary) additional residential or commercial areas has since than became a real challenge for several communities.
438
Both examples make clear how crucial a supra-municipal cooperation and an integration democratic decision-making procedures is for a successful implantation of smart city element in spatial and city development strategies. Especially for the small and medium sized cities in urban agglomerations this is most challenging, as they have to keep up with often more capable administrations in larger (core-)cities. However, the standard solutions of large system providers might not be the one-fits-all solution and less suitable to meet the broad variety of local demand. That is why the German “Smart City Charta” calls for regional alliances to find adequate solutions. In this perspective cooperation on regional scale can be most efficient:
1. In Germany and Switzerland regions are mainly defined monocentric as the catchment areas of a primary center i.e. the biggest/ or most important city of the area. In most case the perimeter of these regions cover most activities of the population.
2. This regions feature structures that can support decision-making and administrative measures on supra-municipal level.
It is this regional, supra-municipal level where „Smart City“ – or to be more precise „Smart Region“ approaches can most efficiently support sustainable development. 4. Make new ideas come true: Providing testbeds for Smart Regions
Digitalization, “a fusion of new technologies, blurring the lines between the physical, digital, and biological worlds” like Klaus Schwab, Founder and Executive Chairman of the World Economic Forum describes it, will change cities and regions (Schwab 2016). Doing so smart technology can significantly improve the options of sustainable spatial planning on regional and city level. Especially the:
- collection and provision of data; - organization of outreach and participation; - partial interests and public welfare; - as well as political communication and management measures;
will experience massive changes with the introduction of new technologies. However, many open questions remain – most important concerning the concordance with decision-making procedures and (mandatory and binding) planning documents. Some of the core issues might not be solved by theoretical debate but call for a practical testbed: “Freezones” that allow the observation of impact in a controlled field trial. In Germany – and recently also in Austria and the Netherlands – the concept of an Internationale Bauausstellung (IBA) (lit. International building exhibition) is an established platform for such trials. The aforementioned aspects could therefore be also an important field for the recently started „Internationale Bauausstellung StadtRegion Stuttgart 2027“ that is planned to run until 2027 an present built-up solutions as well as innovative approaches in participation and decision-making. The preconditions for making smart solutions a basic topic of this IBA seem to be positive: The federal state of Baden-Württemberg has actively contributed to the German “Smart City Charta”; Stuttgart Region with its directly elected regional assembly provides a role model for governance on regional level; the municipalities can provide capable administrations; the Universities and companies can provide a huge amount of innovative capacity and excellence. In addition to that, all levels are well integrated networks on national and international level. Demand – and also the awareness – for smart solutions on regional level is obviously.
439
5. Considerations for governance and participation in the age of digitalization Summing up the discussion on governance and participation in the age of digitalization six considerations should be mentioned. The considerations, worked out by a “reflection-in-action", do not only emphasis the need to act they are also emphasis the gaps in research on smart regions. Considerations for governance and participation in the age of digitalization:
1. Quality and reliability of data is crucial for profound and lawful decision-making – no matter where data comes from. Standards and transparency are important.
2. Public outreach and participation can be more efficient with smart technology. But access for all – inclusion – has to be guaranteed.
3. Long-term oriented and common goods targeting political decision-making is the core business of elected officials or the people. It cannot been given to algorithm – even in smart jurisdictions.
4. The smart city has to be designed for the users – not just the residents. Therefore smart cities need to cooperate as smart region. Especially small and medium sized cities have to be integrated in that larger context.
5. The change process towards a smart city needs local identity, independency and furthermore additional resources – and should not be substituted by standard solutions.
6. Smart solutions have to come true – testbeds are crucial.
References: Alsever, Jennifer (2015): 4 Smart Cities That Put People First. WIRED,
www.wired.com/brandlab/2015/10/4-smart-cities-that-put-people-first, read: 11.08.2017 Assenmacher, Kai (2017) Crowdfunding als kommunale Finanzierungsalternative.
Heidelberg: Springer-Gabler De Castro, Renato (2015): What is the role of citizens in smart cities? Quora,
www.quora.com/What-is-the-role-of-citizens-in-smart-cities, read: 11.08.2017 DIN Deutsches Institut für Normung (2017): Technologie und Mensch in der Kommune von
morgen - Impulspapier zu Normen und Standards Smart City. Berlin: DIN Engelke, Dirk (2017) Die Digitalisierung definiert den Raum neu. forum raumentwicklung,
2/2017, Bern: ARE ESPON (2013) Hidden potential of Small and Medium Sized Towns. Brussels: ESPON BMVI Ethics Commission appointed by the (German) Federal Minister of Transport and
Digital Infrastructure (2017) Report Automated and Connected Driving. Berlin: BMVI Federal Institute for Research on Building, Urban Affairs and Spatial Development (BBSR)
under the portfolio of the German Federal Ministry for the Environment, Nature Conservation, Building and Nuclear Safety (BMUB) (2017): Smart City Charter (Germany) – Making digital transformation at the local level sustainable. Bonn: BBSR
Hootsuite (2017): Digital in Western Europe 2017. www.slideshare.net/wearesocialsg/digital-in-2017-western-europe, read: 11.08.2017
Mokka, Roope (2017): Digitale Transformation in den Kommunen nachhaltig gestalten. In: Ergebnisprotokoll der konstituierenden Sitzung Dialogprozess Smart Cities im Kontext der integrierten nachhaltigen Stadtentwicklung. Bonn: BBSR
Schön, Donald A. (1987) Educating the reflective practitioner. San Francisco: Jossey-Bass Publishers
Schwab, Klaus (2016) The Fourth Industrial Revolution. Davos: WEF
440
Rural Land Use Management & Regulatory Guidelines for South
Africa
Mthobisi MASINGA, Peter NJENGA, Mac Mashiri, Maartin FRIEDRICH, James
CHAKWIZIRA, Petrus STEYN, Thamsanxa MSITHINI. KENA Consult (Pty) Ltd, South Africa.
1. Introduction to the Guidelines Rural Land Use Management & Regulatory Guidelines for rural areas, in part, refers to a process of developing a framework that seeks to integrate land uses in rural areas to formal municipal planning processes. In addition, the linkages between the guidelines and mainstream local level planning tools and instruments such as integrated development plans (IDPs), land use schemes (LUSs) and spatial development frameworks (SDFs) are articulated.
1.1 Synopsis of Contemporary Rural Land Use and Management Issues in South Africa
Municipal Planning and specifically Spatial Planning and Land Use Management (SPLUM) in rural areas has largely been ineffective. Development of rural areas has been impeded by inadequate technical and governance capabilities of municipalities in dealing with the physical complexities and multiple administrative systems inherited from the past. The failure to include rural areas into formal municipal planning processes has created gaps which manifest themselves in poor infrastructure provision, slow land reform, declining agricultural production and uncomplimentary land uses. Overall, municipalities in South Africa face multiple and complex challenges that relate to:
Inadequate rural land use management policies, plans and interventions Fragmented and extended rural municipal geographies that present service and
coverage delivery difficulties, and Inadequate financial resources and budgeting to enable coverage of rural areas.
It is against this backdrop that incentivising rural development is a prime objective of South Africa’s development policies. It is recognised that the social and economic transformation of South Africa would be incomplete without the implementation of fundamental interventions to address the challenges faced daily by the majority of people in rural areas. A key development priority for South Africa is therefore the promotion of social and economic rights to enhance social inclusion, reduce poverty and ensure the protection of the environment. A pivotal development endeavour of the country is to bring rural areas into the development mainstream by focusing on innovations in respect of land regulation, land tenure systems, land reforms and land governance systems as key resources in rural areas and markets. The Spatial Planning and Land Use Management Act 16 of 2013 (SPLUMA) requires the adoption of a single and inclusive Land Use Scheme (LUS) that will operate in a municipal administration area. The land use schemes, spatial policies and frameworks must cover both urban and rural areas, taking into specific account the historical, capacity and governance challenges that have constrained integration of rural areas into formal planning processes. The need for a guideline document relating to rural land use and management as one practical intervention to assist with the promotion of inclusive, sustainable and integrated rural-urban development landscapes in South Africa cannot be over-emphasised. Challenges created through various historical processes are recognised as part of the underlying structural problems to be addressed through the implementation of these Guidelines.
441
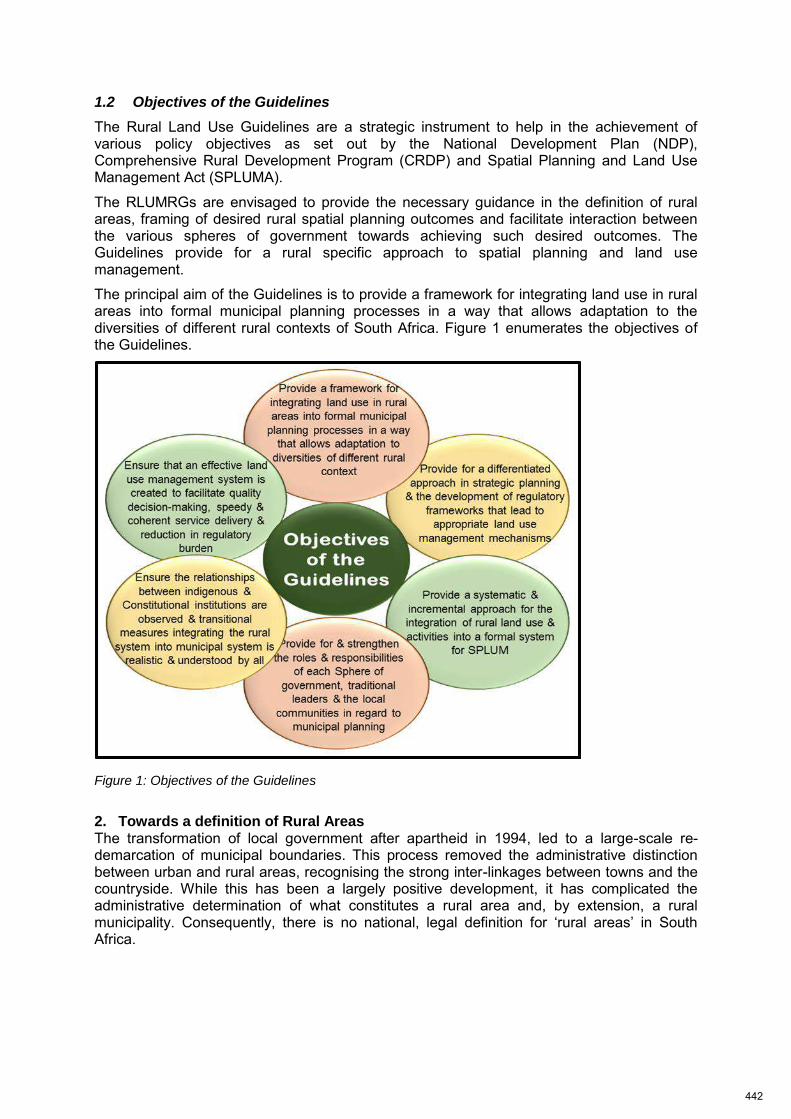
1.2 Objectives of the Guidelines
The Rural Land Use Guidelines are a strategic instrument to help in the achievement of various policy objectives as set out by the National Development Plan (NDP), Comprehensive Rural Development Program (CRDP) and Spatial Planning and Land Use Management Act (SPLUMA).
The RLUMRGs are envisaged to provide the necessary guidance in the definition of rural areas, framing of desired rural spatial planning outcomes and facilitate interaction between the various spheres of government towards achieving such desired outcomes. The Guidelines provide for a rural specific approach to spatial planning and land use management.
The principal aim of the Guidelines is to provide a framework for integrating land use in rural areas into formal municipal planning processes in a way that allows adaptation to the diversities of different rural contexts of South Africa. Figure 1 enumerates the objectives of the Guidelines.
Figure 1: Objectives of the Guidelines
2. Towards a definition of Rural Areas The transformation of local government after apartheid in 1994, led to a large-scale re-demarcation of municipal boundaries. This process removed the administrative distinction between urban and rural areas, recognising the strong inter-linkages between towns and the countryside. While this has been a largely positive development, it has complicated the administrative determination of what constitutes a rural area and, by extension, a rural municipality. Consequently, there is no national, legal definition for ‘rural areas’ in South Africa.
442
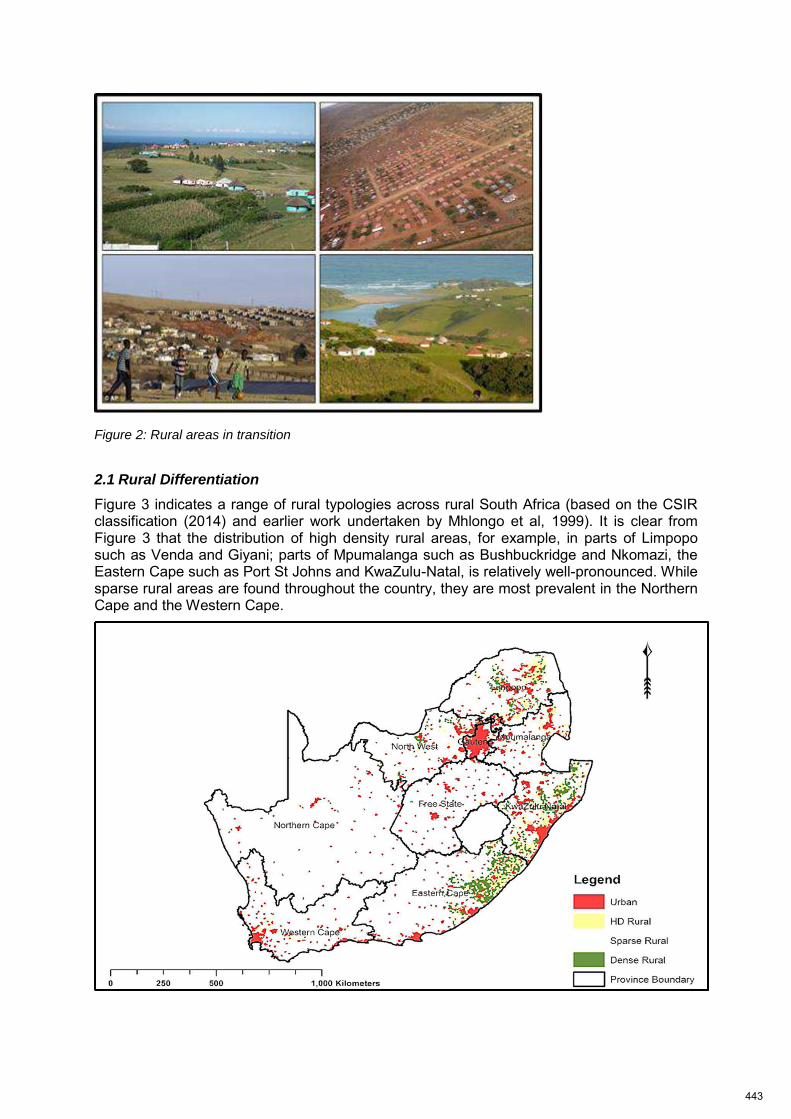
Figure 2: Rural areas in transition
2.1 Rural Differentiation
Figure 3 indicates a range of rural typologies across rural South Africa (based on the CSIR classification (2014) and earlier work undertaken by Mhlongo et al, 1999). It is clear from Figure 3 that the distribution of high density rural areas, for example, in parts of Limpopo such as Venda and Giyani; parts of Mpumalanga such as Bushbuckridge and Nkomazi, the Eastern Cape such as Port St Johns and KwaZulu-Natal, is relatively well-pronounced. While sparse rural areas are found throughout the country, they are most prevalent in the Northern Cape and the Western Cape.
443
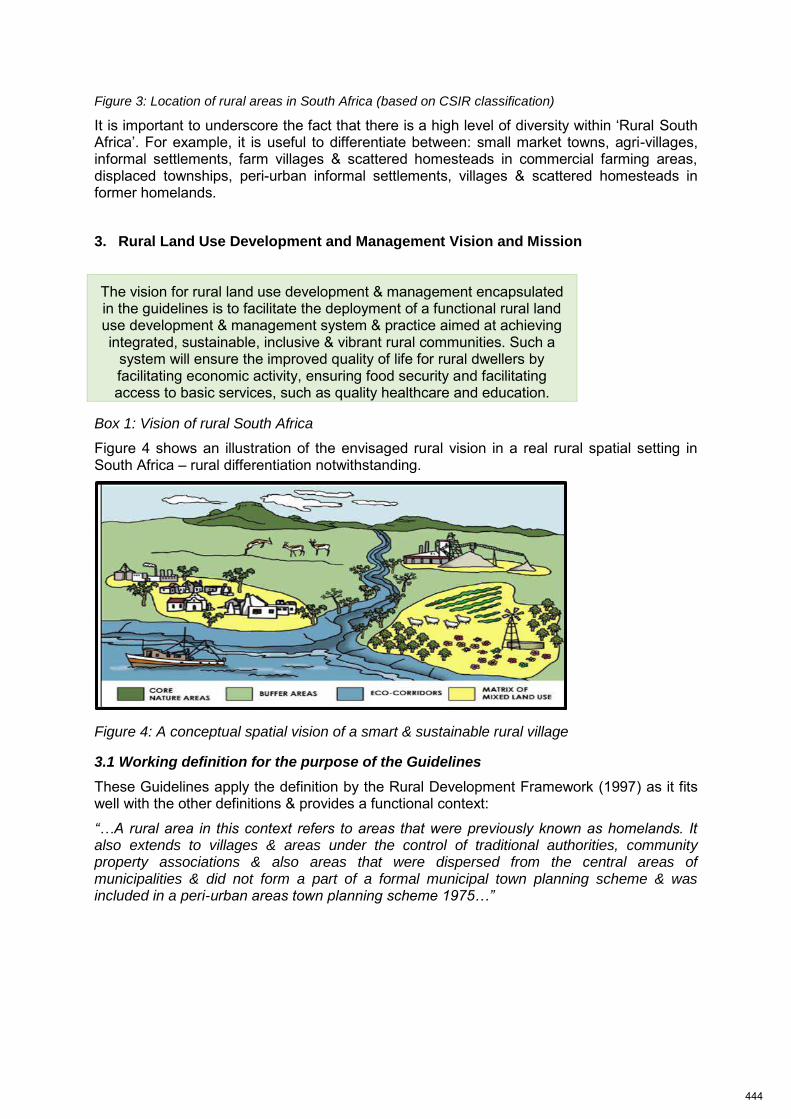
Figure 3: Location of rural areas in South Africa (based on CSIR classification)
It is important to underscore the fact that there is a high level of diversity within ‘Rural South Africa’. For example, it is useful to differentiate between: small market towns, agri-villages, informal settlements, farm villages & scattered homesteads in commercial farming areas, displaced townships, peri-urban informal settlements, villages & scattered homesteads in former homelands.
3. Rural Land Use Development and Management Vision and Mission
The vision for rural land use development & management encapsulated in the guidelines is to facilitate the deployment of a functional rural land use development & management system & practice aimed at achieving integrated, sustainable, inclusive & vibrant rural communities. Such a
system will ensure the improved quality of life for rural dwellers by facilitating economic activity, ensuring food security and facilitating access to basic services, such as quality healthcare and education.
Box 1: Vision of rural South Africa
Figure 4 shows an illustration of the envisaged rural vision in a real rural spatial setting in South Africa – rural differentiation notwithstanding.
Figure 4: A conceptual spatial vision of a smart & sustainable rural village
3.1 Working definition for the purpose of the Guidelines
These Guidelines apply the definition by the Rural Development Framework (1997) as it fits well with the other definitions & provides a functional context:
“…A rural area in this context refers to areas that were previously known as homelands. It also extends to villages & areas under the control of traditional authorities, community property associations & also areas that were dispersed from the central areas of municipalities & did not form a part of a formal municipal town planning scheme & was included in a peri-urban areas town planning scheme 1975…”
444
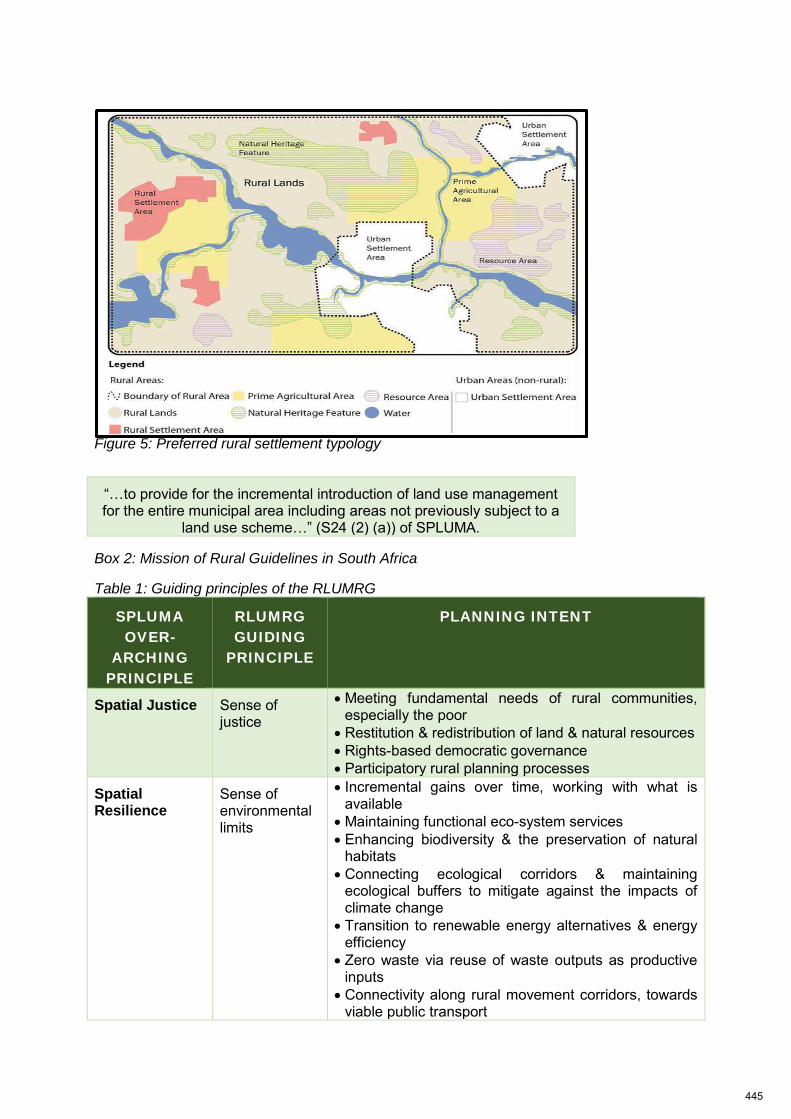
Figure 5: Preferred rural settlement typology
“…to provide for the incremental introduction of land use management for the entire municipal area including areas not previously subject to a
land use scheme…” (S24 (2) (a)) of SPLUMA.
Box 2: Mission of Rural Guidelines in South Africa
Table 1: Guiding principles of the RLUMRG
SPLUMA
OVER-
ARCHING
PRINCIPLE
RLUMRG
GUIDING
PRINCIPLE
PLANNING INTENT
Spatial Justice Sense of justice
Meeting fundamental needs of rural communities, especially the poor
Restitution & redistribution of land & natural resources Rights-based democratic governance Participatory rural planning processes
Spatial Resilience
Sense of environmental limits
Incremental gains over time, working with what is available
Maintaining functional eco-system services Enhancing biodiversity & the preservation of natural
habitats Connecting ecological corridors & maintaining
ecological buffers to mitigate against the impacts of climate change
Transition to renewable energy alternatives & energy efficiency
Zero waste via reuse of waste outputs as productive inputs
Connectivity along rural movement corridors, towards viable public transport
445
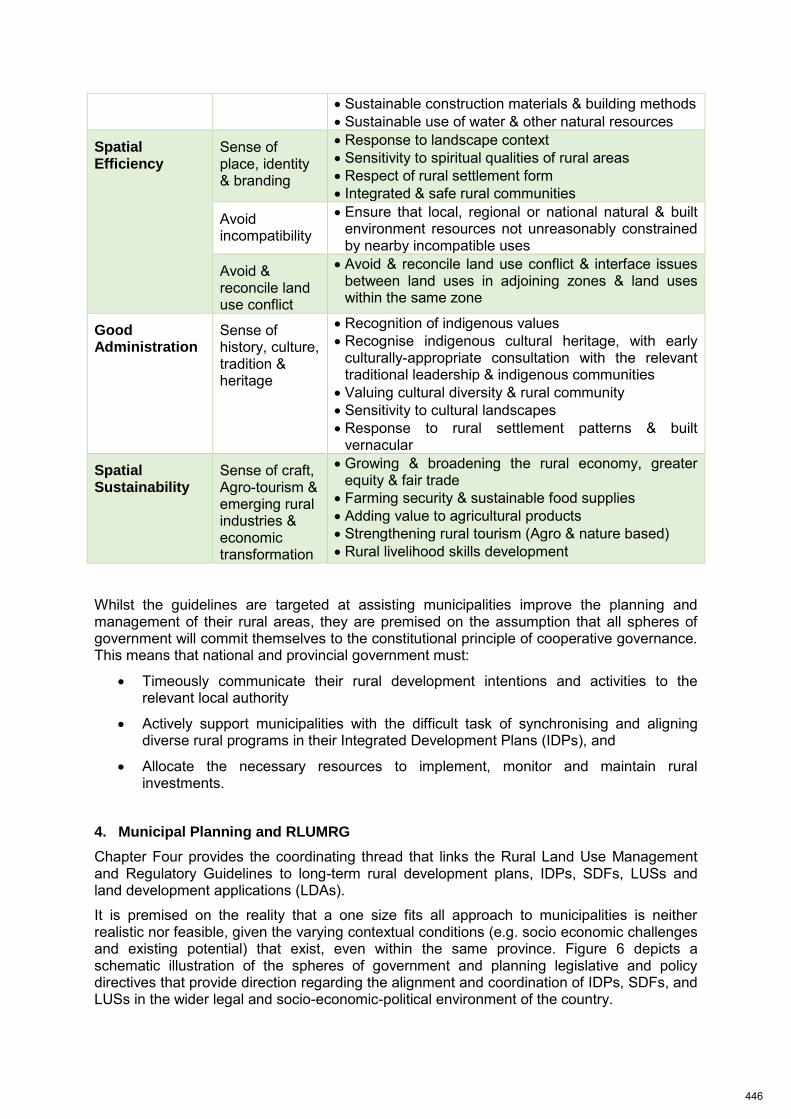
Sustainable construction materials & building methods Sustainable use of water & other natural resources
Spatial Efficiency
Sense of place, identity & branding
Response to landscape context Sensitivity to spiritual qualities of rural areas Respect of rural settlement form Integrated & safe rural communities
Avoid incompatibility
Ensure that local, regional or national natural & built environment resources not unreasonably constrained by nearby incompatible uses
Avoid & reconcile land use conflict
Avoid & reconcile land use conflict & interface issues between land uses in adjoining zones & land uses within the same zone
Good Administration
Sense of history, culture, tradition & heritage
Recognition of indigenous values Recognise indigenous cultural heritage, with early
culturally-appropriate consultation with the relevant traditional leadership & indigenous communities
Valuing cultural diversity & rural community Sensitivity to cultural landscapes Response to rural settlement patterns & built
vernacular
Spatial Sustainability
Sense of craft, Agro-tourism & emerging rural industries & economic transformation
Growing & broadening the rural economy, greater equity & fair trade
Farming security & sustainable food supplies Adding value to agricultural products Strengthening rural tourism (Agro & nature based) Rural livelihood skills development
Whilst the guidelines are targeted at assisting municipalities improve the planning and management of their rural areas, they are premised on the assumption that all spheres of government will commit themselves to the constitutional principle of cooperative governance. This means that national and provincial government must:
Timeously communicate their rural development intentions and activities to the relevant local authority
Actively support municipalities with the difficult task of synchronising and aligning diverse rural programs in their Integrated Development Plans (IDPs), and
Allocate the necessary resources to implement, monitor and maintain rural investments.
4. Municipal Planning and RLUMRG
Chapter Four provides the coordinating thread that links the Rural Land Use Management and Regulatory Guidelines to long-term rural development plans, IDPs, SDFs, LUSs and land development applications (LDAs).
It is premised on the reality that a one size fits all approach to municipalities is neither realistic nor feasible, given the varying contextual conditions (e.g. socio economic challenges and existing potential) that exist, even within the same province. Figure 6 depicts a schematic illustration of the spheres of government and planning legislative and policy directives that provide direction regarding the alignment and coordination of IDPs, SDFs, and LUSs in the wider legal and socio-economic-political environment of the country.
446
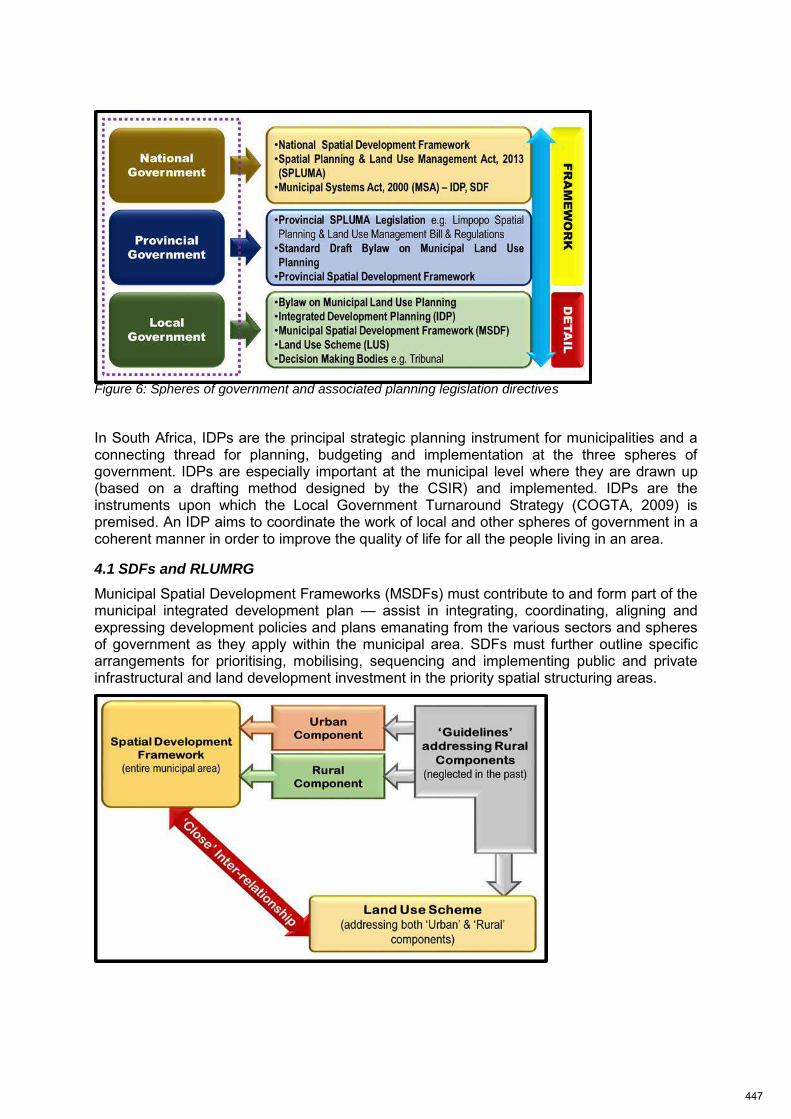
Figure 6: Spheres of government and associated planning legislation directives
In South Africa, IDPs are the principal strategic planning instrument for municipalities and a connecting thread for planning, budgeting and implementation at the three spheres of government. IDPs are especially important at the municipal level where they are drawn up (based on a drafting method designed by the CSIR) and implemented. IDPs are the instruments upon which the Local Government Turnaround Strategy (COGTA, 2009) is premised. An IDP aims to coordinate the work of local and other spheres of government in a coherent manner in order to improve the quality of life for all the people living in an area.
4.1 SDFs and RLUMRG
Municipal Spatial Development Frameworks (MSDFs) must contribute to and form part of the municipal integrated development plan — assist in integrating, coordinating, aligning and expressing development policies and plans emanating from the various sectors and spheres of government as they apply within the municipal area. SDFs must further outline specific arrangements for prioritising, mobilising, sequencing and implementing public and private infrastructural and land development investment in the priority spatial structuring areas.
447
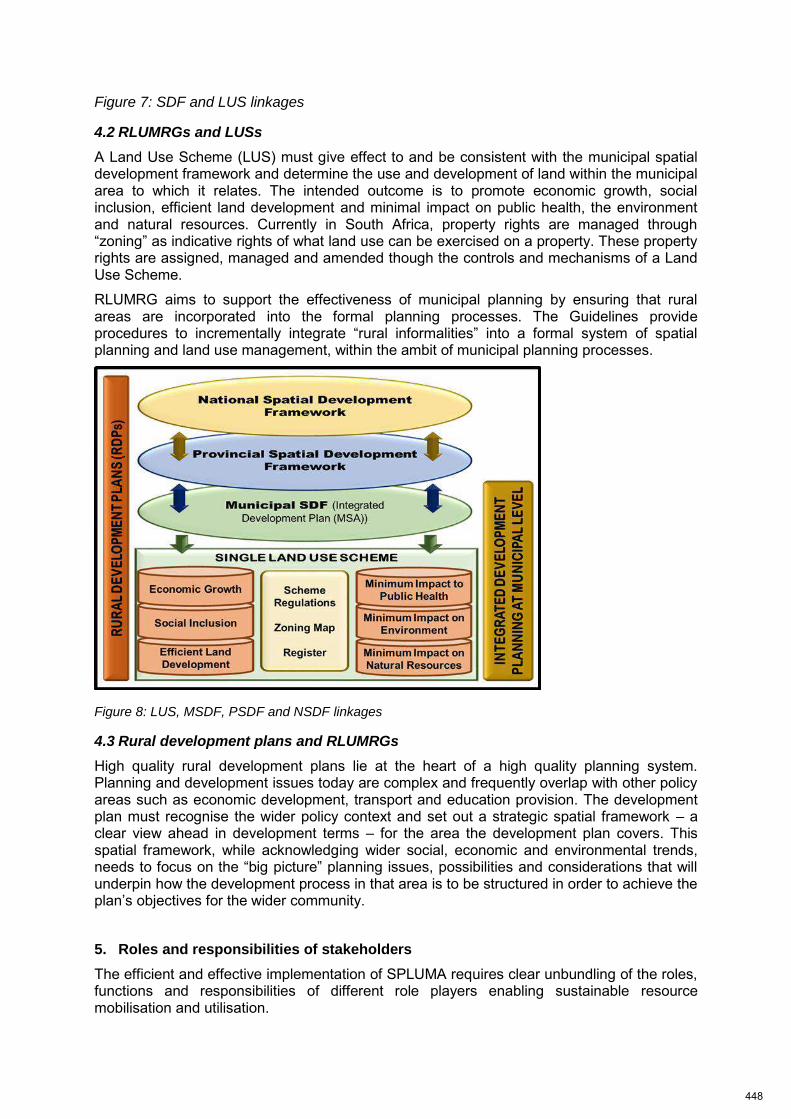
Figure 7: SDF and LUS linkages
4.2 RLUMRGs and LUSs
A Land Use Scheme (LUS) must give effect to and be consistent with the municipal spatial development framework and determine the use and development of land within the municipal area to which it relates. The intended outcome is to promote economic growth, social inclusion, efficient land development and minimal impact on public health, the environment and natural resources. Currently in South Africa, property rights are managed through “zoning” as indicative rights of what land use can be exercised on a property. These property rights are assigned, managed and amended though the controls and mechanisms of a Land Use Scheme.
RLUMRG aims to support the effectiveness of municipal planning by ensuring that rural areas are incorporated into the formal planning processes. The Guidelines provide procedures to incrementally integrate “rural informalities” into a formal system of spatial planning and land use management, within the ambit of municipal planning processes.
Figure 8: LUS, MSDF, PSDF and NSDF linkages
4.3 Rural development plans and RLUMRGs
High quality rural development plans lie at the heart of a high quality planning system. Planning and development issues today are complex and frequently overlap with other policy areas such as economic development, transport and education provision. The development plan must recognise the wider policy context and set out a strategic spatial framework – a clear view ahead in development terms – for the area the development plan covers. This spatial framework, while acknowledging wider social, economic and environmental trends, needs to focus on the “big picture” planning issues, possibilities and considerations that will underpin how the development process in that area is to be structured in order to achieve the plan’s objectives for the wider community.
5. Roles and responsibilities of stakeholders
The efficient and effective implementation of SPLUMA requires clear unbundling of the roles, functions and responsibilities of different role players enabling sustainable resource mobilisation and utilisation.
448
5.1 Role and function of municipalities
The roles and functions of local government are specifically addressed in Chapter 7 of the Constitution of the Republic of South Africa (1996). Matters of importance for development and planning in municipalities are found in Sections 152 and 153 of this Constitution. Section 152 states that the objects of local government are to:
Provide democratic and accountable government for local communities
Ensure the provision of services to communities in a sustainable manner
Promote social and economic development
Promote a safe and healthy environment, and
Encourage the involvement of communities and community organisations in the matters of local government.
5.2 Role and Function of Traditional Councils
5.2.1 Rationale for Engaging Traditional Council in Municipal Development Matters
Significant parts of these Guidelines will be implemented in former homelands and other areas under Traditional Councils and Community Property Associations. Furthermore, since the advent of wall-to-wall municipalities in the year 2000, the institution of Traditional Leadership cannot and should not be overlooked because many municipal policies touch on land management issues that are within the jurisdiction of Traditional Councils. Administering of land matters in the case of Traditional Councils includes demarcation and allocation of land for various land uses, primarily for residential, businesses, as well as for subsistence farming in a communal manner (Brynard and Musitha, 2011:114; Bikam and Chakwizira, 2014:145).
However, the current responsibility of administering land in a formal planning system is assigned to municipalities through SPLUMA and its land use management systems, such as the Spatial Development Framework (SDF) and wall-to-wall Land Use Schemes. It is important to note though that SPLUMA does provide for roles and responsibilities with particular reference to the roles of traditional councils, for example:
S20(2) – MSDF must be prepared in accordance with the provisions of the MSA S23(2)
Subject to MSA and Traditional Leadership and Governance Framework Act, a municipality, in performance of its duties must allow for the participation of traditional councils
S24(2)(c) – Incremental introduction of LUS in areas under traditional leadership.
In addition, S29(1)(b)(iii)) of the MSA provides for traditional authorities to be identified and consulted in drafting of an IDP and SDF. Added to this provision, and as enumerated in Box 3, S4 of the Traditional Leadership and Governance Framework Act (41 of 2003) outlines the roles and functions of traditional leaders in terms of, inter alia:
Supporting municipalities in the identification of community needs Facilitating the involvement of the traditional community in the development or
amendment of the integrated development plan of a municipality in whose area that community resides
Participating in the development of policy and legislation at local level Participating in development programs of municipalities and of the provincial and
national spheres of government
449
Promoting the ideals of cooperative governance, integrated development planning, sustainable development and service delivery.
Box 3: Functions of Traditional Councils
Section 4(1) of the Traditional Leadership and Governance Framework Act, 41 of 2003 states that Traditional Councils have the following functions:
Administering the affairs of the traditional community in accordance with customs and tradition
Assisting, supporting and guiding traditional leaders in the performance of their functions
Supporting municipalities in the identification of community needs
Facilitating the involvement of the traditional community in the development or amendment of the integrated development plan of a municipality in whose area that community resides
Recommending, after consultation with the relevant local and provincial houses of traditional leaders, appropriate interventions to government that will contribute to development and service delivery within the area of jurisdiction of the traditional council
Participating in the development of policy and legislation at local level
Participating in development programmes of municipalities and of the provincial and national spheres of government
Promoting the ideals of cooperative governance, integrated development planning, sustainable development and service delivery
Promoting indigenous knowledge systems for sustainable development and disaster management
Alerting any relevant municipality to any hazard or calamity that threatens the area of jurisdiction of the traditional council in question, or the well-being of people living in such area of jurisdiction, and contributing to disaster management in general;
Sharing information and cooperating with other traditional councils; and
Performing the functions conferred by customary law, customs and statutory law consistent with the Constitution.
Based on the foregoing, it is clear that Traditional Leaders through their Traditional Councils have a definite role and function in spatial planning, land use development and management. Thus the need for municipalities and other stakeholders such as developers to engage and involve traditional councils in rural land use development and management processes cannot be over-emphasised.
5.2.2 Modalities for involving and engaging Traditional Leaders
The institution, status and role of traditional leadership and traditional councils, according to Customary Law, are recognized, subject to the relevant Constitutional provisions. SPLUMA provides that subject to Section 81 of the Municipal Structures Act, 1998 and the Traditional Leadership and Governance Framework Act, 2003 (TLGFA, 2003), a municipality, in the performance of its duties including land use planning, development and management must allow the participation of traditional councils. It is thus important to ensure that traditional councils play a formal, visible and pivotal role in land development matters in rural areas under their jurisdiction. In this regard, Traditional Councils should (Mashiri et al, 2017):
Actively participate in development committees as well as provide inputs in the development of legislation, policies and plans including Bylaws, SDFs and LUSs
Proactively galvanise communities within their areas of jurisdiction to actively participate in spatial planning and land use management processes
Facilitate land development applications in rural areas under their jurisdiction, including providing official letters of recommendation in support or otherwise of such land development applications, and
450

Proactively lead an iterative, inclusive and consultative process to broaden land use classes by soliciting for and compiling a list of land uses that are largely peculiar to communal areas to be included in the development of wall-to-wall land use schemes. Such a process of expanding the land use and spatial planning meta-language together with actual land uses is intended to reflect and entrench rural areas’ cultural diversity and requirements.
Given their resources and the socio-political and developmental capital that could accrue to the municipal jurisdiction as a result of harmonious and cooperative governance, municipalities are encouraged to proactively facilitate some of these activities.
6. The Guidelines
This chapter presents the Rural Land Use and Regulatory Management Guidelines. Covering typical rural land use typologies, the chapter advances the need for municipalities, in consultation with traditional councils and other stakeholders, to set thresholds or standards with a view to assisting in guiding, directing and managing current and future development in rural areas. The guidelines also recognise that the mix of land uses in rural residential areas is integral to the local subsistence economy and should thus be promoted while also making provision for local economic enterprise development that requires larger spaces than that provided in traditional rural settlement areas.
The following land uses may be considered for rural areas:
Conservation and agriculture related uses
Rural industry linked to the imminent potential and accessibility of the raw materials
Accommodation establishments
Smallholder agriculture
Rural housing – based on the local typologies
Infrastructure installations – engineering infrastructure and ICT infrastructure for institutional uses such as schools, clinics and government departments
Tourism and recreational facilities – at various scales linked to unique and pristine environmental feature
Climate and flood risk management – which incorporate the approach to progressively introduce land us management in certain areas where natural growth was mismanaged and there is a conflict with resources i.e. floodplains, erosion and sensitive areas
Rural business – acknowledgement of the economic structure and dynamics of the settlement typology and scale, and
New settlements – assisting and guiding the development of new settlements on the ‘Key Principles’ outlined previously
6.1 Planning for Communal lands
Communal areas consist of various land use typologies including, amongst others, settlements, agriculture, communal grazing and communal conservation areas that require protection in terms of bio-diversity.
The main objectives for managing Communal Lands are as follows for e.g:
451
Protect and conserve vegetation, water, fish and wildlife resources, productive soil resources for agriculture and forestry, and other resources vital to the sustenance of the local economy
Carefully manage and enhance the use, production, conservation or extraction of soils, timber, minerals and other natural resources
6.1.1 Regulation for Rural Residential Settlements
The designation and development of existing/new Rural Residential area should be undertaken where the following minimum conditions are met for e.g:
Land use compatibility and resource protection should be achieved by the design of the new development
Environmental impacts and hazard risks should be adequately mitigated
Compliance with national, provincial and local land use regulations, as they exist or as they are amended, to provide for establishment of new rural residential (and related uses) should be observed
Plan for rural residential (and related uses), taking cognisance of the organic growth of households and families in the area of jurisdiction should be developed;
6.1.2 Development standards for Rural residential
In evaluating proposals for development within rural residential and related uses, the following aspects should be considered for e.g:
The potential impacts of such development on the visual, timber, agricultural and other resources contained in the rural lands immediately surrounding the rural residential subdivision
7. Way Forward
7.1 Desired Outcomes & Implementation Mechanisms
The ultimate desired outcomes of the Rural Land Use Guidelines are:
Coherence in how South African municipalities undertake rural land use planning & clarity regarding the contents of these plans
Alignment of municipal rural land use planning with the rural spatial plans prepared by other institutions
Clarity to the Government’s social partners on the location, nature & form of development that could be accommodated beyond the “urban edge”
Uniformity in how municipalities manage the pressures for rural land use change & management; and
Cooperation, alignment & integration between the spheres of government
7.2 Desired Outcomes & Implementation Mechanisms
The initiative should be broadly underpinned by a strategy that covers:
Legal & institutional framework development: refinement of land policy, the development of secondary legislation & developing land management organizations at central & district levels
452
Development of a national system & program for land tenure regularisation: systematically bring land to first registration & to allow all citizens equal access to the new systems
Development of low cost, effective & simplified land administration system at national & decentralised levels & operational guidelines: to secure land rights & promote investment through regulated land transactions, &
Development of a national land use master plan for land planning & development control to ensure rational use of land & effective development as well as environment protection
7.3 Review of the Guidelines
The guidelines are based on current rural LUM information, knowledge & practice for South Africa
Further investigation, research & innovation in rural LUM & practice may in future establish new practices & redefine best practice for rural LUM in South Africa.
The guidelines will therefore be revised as new information relating to the design, operation & management of rural land uses becomes available
Major reviews are envisaged once every five years if necessary
Between reviews, technical notes will be used to disseminate information on developments in practice
The eventual alignment of the guidelines will be synchronised with the first SPLUMA compliant SDFs & LUSs approval in municipalities throughout SA
References:
1. ANDREW, M. & Fox, R.C. (2004) “Under-cultivation” and Intensification in the Transkei: A Case Study of Historical Changes in the Use of Arable Land in Nompa, Shixini. Development Southern Africa, 21 (4): 687–706.
2. BIKAM, P. & Chakwizira, J. (2014) Involvement of traditional leadership in land use planning & development projects in South Africa: Lessons for local government planners. International Journal of Humanities and Social Science, Vol. 4, No. 13; November 2014.
3. BRYNARD, P. & Musitha, M. (2011) Role of traditional authorities in the implementation of integrated development planning policy (IDP) in Vhembe District, Limpopo Province. December 2011, Polokwane.
4. COUNCIL FOR SCIENTIFIC & INDUSTRIAL RESEARCH (2014) A Critical Valuation of the Operational Application of Various Settlement Typologies in South Africa. August 6, 2014. Pretoria, South Africa.
5. DEPARTMENT OF COOPERATIVE GOVERNANCE AND TRADITIONAL AFFAIRS (2009) Local Government Turnaround Strategy (LGTAS). December 2, 2009. Pretoria, South Africa.
6. DEPARTMENT OF RURAL DEVELOPMENT & LAND REFORM (2009) Comprehensive Rural Development Programme (CRDP). Pretoria.
453
7. DEPARTMENT OF RURAL DEVELOPMENT & LAND REFORM (2013). Spatial Planning & Land Use Management Act, 2013, Act 16 of 2013. Pretoria.
8. HEALEY, P. (2006) Relational Complexity and the Imaginative Power of Strategic Spatial Planning. European Planning Studies, 14(4): 525–546.
9. KWAZULU-NATAL DEVELOPMENT PLANNING & DEVELOPMENT COMMISSION (2010) Land Use Management Systems in Rural Areas, KwaZulu-Natal Planning & Development Commission, PR323/2010 ISBN: 978-0-621-39766-6. Pietermaritzburg.
10. MASHIRI, M. Chakwizira, J. Njenga, P. Steyn, P. Masinga, M. & Msithini, T. (2017) Spatial Planning & Land Use Management Policy for Limpopo, Office of the Premier, Polokwane.
11. MHLONGO, M. Green, C. Naude, A. & Mashiri, M. (1999) Development of a typology for rural areas in South Africa. Department of Transport, Pretoria.
12. NATIONAL ASSEMBLY (1996) Chapter 12, Section 211-212, The South African Constitution. Cape Town, South Africa.
13. NATIONAL ASSEMBLY (1996) Constitution of the Republic of South Africa. Cape Town, South Africa.
14. NATIONAL PLANNING COMMISSION (2011). National Development Plan – Vision 2030. August 2011, Pretoria, South Africa.
15. REID D. G. (Eds.) (1999) Ecotourism development in eastern & southern Africa, Weaver Press, Harare, Zimbabwe
16. SOUTH AFRICAN GOVERNMENT (1995) Development Facilitation Act, Act 67 of 1997. Pretoria, South Africa.
17. SOUTH AFRICAN GOVERNMENT (2000) Municipal Systems Act, Act 32 of 2000. Pretoria, South Africa.
18. SOUTH AFRICAN GOVERNMENT (2003) Traditional Leadership and Governance Framework Act (TLGFA). December 19 Pretoria, South Africa.
19. STATISTICS CANADA (2002) Rural and Small Town Canada Analysis Bulletin. Catalogue NO. 21-006-XIE Vol3, No. 6, March 2002.Toronto, Canada
20. STATISTICS SOUTH AFRICA (2001), Census 2001 Results, Pretoria, South Africa.
21. THE SCOTTISH GVERNMENT (2010) The Macaulay Land Capability for Agriculture (LCA) Classification. Macaulay Land Use Research Institute, Scotland, UK.
22. UNITED NATIONS (1992) UN Convention on Biological Diversity. June 1992: Rio de Janeiro, Brazil.
454

SmartCitygovernanceco‐creatinginclusiveplaces
Moderator: David LUDLOW, UWE, Bristol, UK
Speakers: Ahn JUNGJOON, Seoul Metropolitan Government, South Korea; Kevin MARTIN, City of Portland, USA; Jonas BYLUND, JPI Urban Europe; Peter ULRICH, ICLEI European Secretariat
Smart city governance innovations are redefining the options and opportunities for city planning
globally. The interplay of societal and technological innovation provides a universal dynamic that is
driving the generation of new models of integrated and participatory, inclusive and open
governance, and land use planning. This dynamic is however impacting and disrupting the existing
orthodoxies of governance, and raising numerous questions for urban planning. How can urban
planning effectively engage and lead, as necessary, in urban innovation systems to promote a new
open co‐defined, co‐created and inclusive urban governance? What are the most effective transition
pathways to this new urban governance? To what extent can common solutions and models of
urban governance be applied universally and effective globally, as proposed? The session Smart City
Governance Co‐creating Inclusive Communities will address these issues and more, supported by an
expert panel representing all facets of the innovation ecosystem, drawing on European, US and
global experience. The focus of the session will be active dialogue with all delegates guided by a
series of speed presentations, including interview and question engagements.
455
Understanding gated communities of India and their impact on the
neighbourhood cohesion with special focus on digital technology
as a means of communication and governance
Shraddha BAHIRAT, Indian Institute of Technology Kharagpur, India
Sanghamitra BASU, Indian Institute of Technology Kharagpur, India
Abstract
Many of India's metropolitan cities are experiencing a rapid urban transformation in the form of the gated enclave housing, which has proliferated the city’s urban fabric, adding a new element to the existing cityscapes. The paper tries to understand this new form of urban residential development in India through an extensive literature study.
Through a questionnaire based pilot survey, conducted within six gated communities of Bangalore, this paper aims to understand the impact of a gated community on the neighbourhood cohesion of the wider neighbourhood. Through group discussions and semi-structured interviews conducted with the residents of the Gated Communities in Bangalore, the paper endeavours to understand the role of new technology and social networking and their implications on community cohesion and governance within the Gated Communities. The outcome of this study shall provide a deeper insight on the social consequences of the Gated Communities on their surrounding neighbourhood and city at large and it is expected to throw a light on how technology, internet, social networking apps, and online markets are bringing about a change in the concept of community and neighbourhoods.
Keywords: Gated Communities, Neighbourhood Cohesion, Digital Technology
1. Introduction
Review of recent urban policies show a shift in basic approach; focus is now given more and more towards the type of planned development that would not only promote sustainability through mixed uses and revitalised public spaces but would also encourage social contact, tolerance and political engagement. However, contrary to this focus, this is also the time when Gated Communities, a concept based on exclusivity and protected secured environment, as the name suggests, are showing a significant growth in their demand and increasing popularity as one of the most preferred housing options in urban areas. Gating contravenes the planning principles of openness, access, diversity and equity by creating exclusive, reactionary and socially isolating places (Grant & Mittelsteadt, 2004; Grant, 2005). A sense of social exclusiveness and spatial demarcation are quite obvious in the fortress-like forms (in most cases) of gated communities. However, In the light of growing neo-liberalism and political, socio-economic impetus, behind an increasing sense of fear (Xu, 2009), it is evident that the market demand for Gated Communities (GCs henceforth) is likely to continue to grow and become stronger.
A sizable academic planning literature deals with gating in a negative context and the socio-spatial aftermath of gated community development has been a major focus of multidisciplinary researches and debates (Xu, 2009) in this area. Based on available information from literature study (of the researches carried out globally), it has been observed that, in the field of GC, research from urban design perspectives relating physical design and social segregation, or even from the realm of environmental design, is quite
456
limited, if not rare. However in this context, Talen (1999) states that, the translation between environment and behaviour may not be direct, though design may nevertheless have a catalytic effect. She argues that physical environments having an effect on human behaviour is not in dispute. What remains questionable is the degree to which this effect comes close to any particular dimension of community bonding. Thus to measure or understand the impact of physical design of GCs in a wider neighbourhood context, it is necessary to take into account not just physical but also non-physical influences. With this basic understanding and question, this study, which is a part of an ongoing doctoral research, tries to investigate the role of design parameters of Gated Communities and their impact on the cohesion of the neighbourhood as a whole. A pilot survey was conducted in six GCs of Bangalore which is India’s premier information technology (IT) hub, a magnet for multinational corporations and high-skill personnel. However, the pilot survey, interestingly, has brought into picture, the role technology plays, as a non-physical influence, in changing the patterns of interaction amongst people today. The findings of this pilot survey suggest that in the area of social contacts and communication, we also need to factor in opportunities brought in by digital technology as means for communication and facilitating group formation that often transcends physical proximity and barrier. This paper therefore tries to examine, whether the high end technology, which is increasingly becoming a part of everyday life, has obliterated the need of physical proximity, day to day facial contact , and whether the technological improvement been able to ensure a real sense of security and safety in these GCs. But before that, we need to understand the role and evolution of GCs in context of India and also understand the impact of IT on social interaction in such areas/ communities.
2. Understanding Gated Communities of India
In India, traditional GCs may have been shaped for various reasons: of which memberships in caste, region or religion were probably the most prominent of all (Brosius, 2012). In the context of colonial town planning too, Indian cities have gone through spatial segregation, where ‘white town’ and ‘black town’ were signifiers of colonial power politics based on the concept of race as cited by Brosius (2012). Similarly, housing colonies built immediately after the independence, were based on the employment position of the state administrators within governmental sectors, creating a social segregation amongst employees of various cadres.
However, the contemporary form of GCs, have emerged mainly with economic liberalisation since the turn of the last millennium. Based, on the literature review the major factors responsible for the growth and expansion of these new developments can be summarised as:
1. Implementation of the policy of promoting SEZ’s attracting foreign direct investment (FDI) in the manufacturing sector through special tax incentives. With the state government playing the role of land assembler. (Mahadevia, 2013)
2. Implementation of new township policies in different states of India, along with the FDI policy for township at national government level, to facilitate real estate development. (Mahadevia, 2013)
3. The repealing of the Urban Land Ceiling and Regulation Act (ULCRA) of 1976. (Mahadevia, 2013)
4. Rapid expansion of the new urban middle classes and diaspora of the NRI culture, due to the enhanced integration of India in the world economy. (Wissink, 2013; King, 1998; Brosius, 2012; Srivastava, 2015)
457
Thus facilitated by public policies, many cities in India, are now experiencing a rapid urban transformation and segmentation of spaces (Mahadevia, 2013; Brosius, 2012; Wissink, 2013). Chacko & Varghese (2009) make similar observations on the growth of the gated enclave housing, which have burgeoned on the peripheries of many of India's metropolitan cities such as Delhi, Mumbai, Bangalore (Bengaluru), Chennai, Kolkata and Hyderabad since the late 1990s, adding a new element to existing cityscapes. However, the emergence of the contemporary form of GCs in India is not just the reflection of the changing national and state level policies but also combination of the desires of a growing new urban middle class and the diaspora of the NRI culture in India creating the need for new type of residential and leisure spaces. (Wissink, 2013; King, 1998; Brosius, 2012; Srivastava, 2015). Thus emergence of these contemporary GC has been predominantly been all about class and money which mattered first and foremost (Brosius, 2012).
Mitra and others (2013) observe that post liberalization, the private sector has played as one of the leading actor in the urban development process. As these developments work on a maximum profit basis, they are generally situated in places of lowest land cost having basic trunk infrastructure and subsequently creating islands of gated communities predominantly for the middle and upper segments of the population. Based on the observations made by Mitra and others (2013), it may be noted that these developments tend to disrupt the socio-economic profile of the surroundings. The residents of such development usually have their own means of transport, and since all the amenities are provided within the GC itself, they may not feel any need to interact with the immediate outside community at all. And the GC then becomes an isolated island of paradise which not only creates social divides but increases the land values in the surroundings, without giving any overall benefits to the existing communities.
Brosius (2012) argues on similar lines by quoting Michael Sorkin that these enclave within the Indian city do not seem to take any notice of their environment and it appears that the space in between, the connections which make sense of form is entirely missing; and the enclaves act in a way as if the space between them (enclaves and integrated township) is just a means of transport from A to B. Due to this spatial hierarchisation, the space surrounding these enclaves becomes an allegorical no-go-zone. This has led to a rising concern over the growing GC in many cities in India, and this is quite similar to the issues about GCs at a global scale. Mitra and others (2013) quote Amitabh Kundu who states that the switch-over from planning to free market, has not given any particular impetus to urban growth; on the other hand, it has only helped to institutionalize disparity and strengthened the process of segmentation of the cities into rich and poor colonies. Hence, there is a need to have a deeper contextual understanding of these form of developments in India and examine their impact on the Indian cities.
3. Information and communication technology (ICT) and neighbourhood cohesion
within Gated Communities.
The everyday life of individuals is increasingly relevant of ICT and have had a drastic impact on the way individuals communicate. (Musyoka, et al., 2017; Crang, et al., 2007; Drago, 2015). The impact of ICT on social interaction is still being understood by various researchers as Przybylski & Weinstein (2012) (as cited by Drago, 2015) suggest that very little is known about how the frequent presence of these devices in social settings influences face-to-face interactions. Some literature suggests that technology has a negative effect on both the quality and quantity of face-to-face communication (Drago, 2015); yet Baym as cited by Adler (2013) emphasis that researches are indicating that digital communications enhance relationships and that the more you communicate with people using devices and technology, the more likely you are to communicate with those people face to face. Literature suggest that cohousing communities like GCs designed according to social contact design principles to have an optimal environment for social interactions; and that physical
458
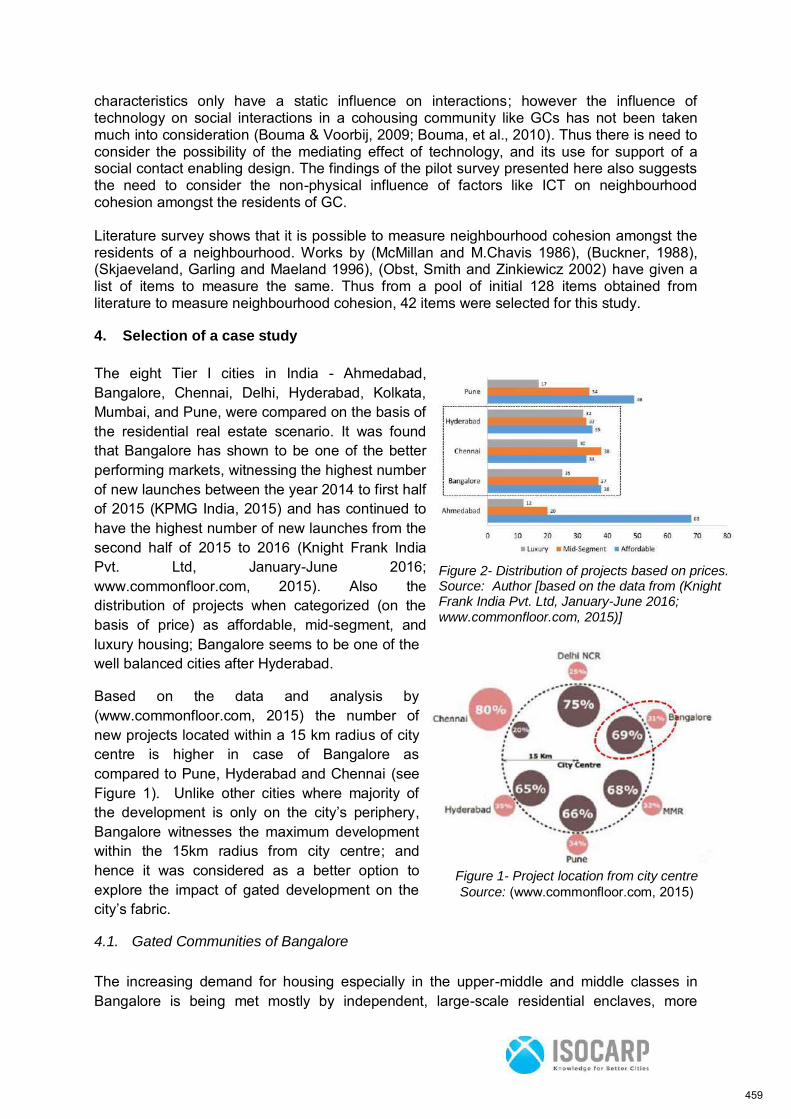
characteristics only have a static influence on interactions; however the influence of technology on social interactions in a cohousing community like GCs has not been taken much into consideration (Bouma & Voorbij, 2009; Bouma, et al., 2010). Thus there is need to consider the possibility of the mediating effect of technology, and its use for support of a social contact enabling design. The findings of the pilot survey presented here also suggests the need to consider the non-physical influence of factors like ICT on neighbourhood cohesion amongst the residents of GC. Literature survey shows that it is possible to measure neighbourhood cohesion amongst the residents of a neighbourhood. Works by (McMillan and M.Chavis 1986), (Buckner, 1988), (Skjaeveland, Garling and Maeland 1996), (Obst, Smith and Zinkiewicz 2002) have given a list of items to measure the same. Thus from a pool of initial 128 items obtained from literature to measure neighbourhood cohesion, 42 items were selected for this study.
4. Selection of a case study
The eight Tier I cities in India - Ahmedabad, Bangalore, Chennai, Delhi, Hyderabad, Kolkata, Mumbai, and Pune, were compared on the basis of the residential real estate scenario. It was found that Bangalore has shown to be one of the better performing markets, witnessing the highest number of new launches between the year 2014 to first half of 2015 (KPMG India, 2015) and has continued to have the highest number of new launches from the second half of 2015 to 2016 (Knight Frank India Pvt. Ltd, January-June 2016; www.commonfloor.com, 2015). Also the distribution of projects when categorized (on the basis of price) as affordable, mid-segment, and luxury housing; Bangalore seems to be one of the well balanced cities after Hyderabad.
Based on the data and analysis by (www.commonfloor.com, 2015) the number of new projects located within a 15 km radius of city centre is higher in case of Bangalore as compared to Pune, Hyderabad and Chennai (see Figure 1). Unlike other cities where majority of the development is only on the city’s periphery, Bangalore witnesses the maximum development within the 15km radius from city centre; and hence it was considered as a better option to explore the impact of gated development on the city’s fabric.
4.1. Gated Communities of Bangalore
The increasing demand for housing especially in the upper-middle and middle classes in Bangalore is being met mostly by independent, large-scale residential enclaves, more
Figure 1- Project location from city centre
Source: (www.commonfloor.com, 2015)
Figure 2- Distribution of projects based on prices. Source: Author [based on the data from (Knight Frank India Pvt. Ltd, January-June 2016; www.commonfloor.com, 2015)]
459
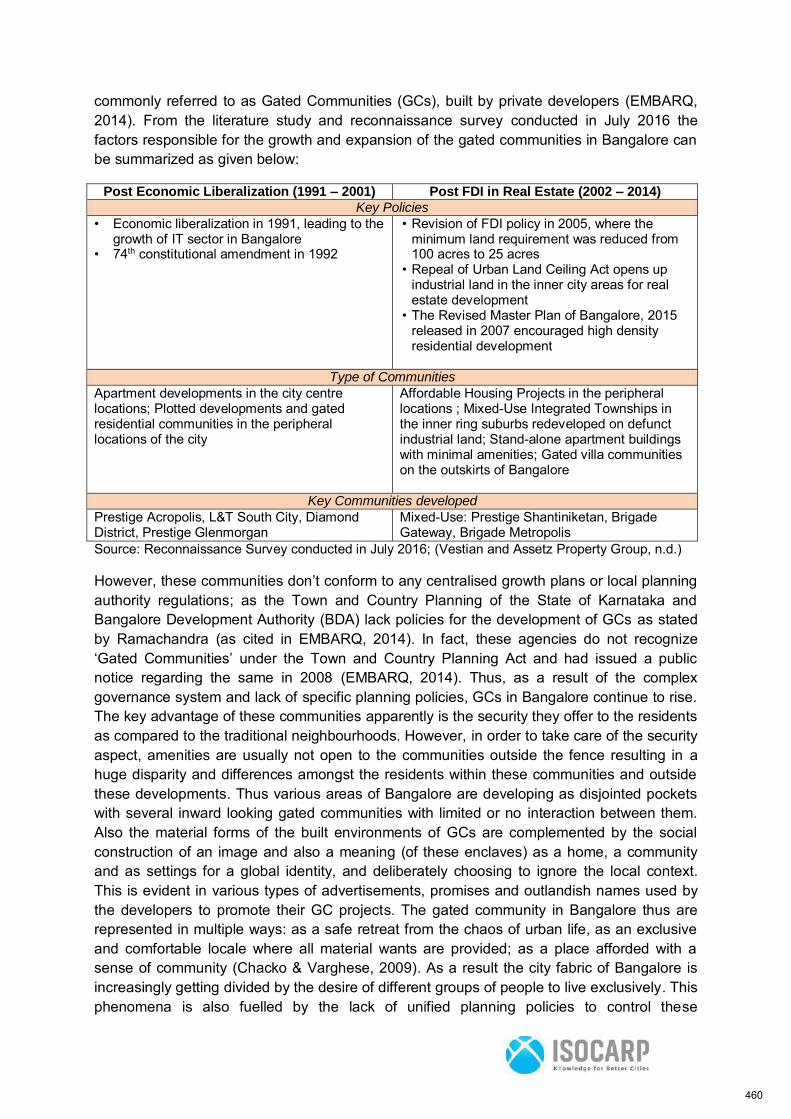
commonly referred to as Gated Communities (GCs), built by private developers (EMBARQ, 2014). From the literature study and reconnaissance survey conducted in July 2016 the factors responsible for the growth and expansion of the gated communities in Bangalore can be summarized as given below:
Post Economic Liberalization (1991 – 2001) Post FDI in Real Estate (2002 – 2014)
Key Policies
• Economic liberalization in 1991, leading to the growth of IT sector in Bangalore
• 74th constitutional amendment in 1992
• Revision of FDI policy in 2005, where the minimum land requirement was reduced from 100 acres to 25 acres
• Repeal of Urban Land Ceiling Act opens up industrial land in the inner city areas for real estate development
• The Revised Master Plan of Bangalore, 2015 released in 2007 encouraged high density residential development
Type of Communities
Apartment developments in the city centre locations; Plotted developments and gated residential communities in the peripheral locations of the city
Affordable Housing Projects in the peripheral locations ; Mixed-Use Integrated Townships in the inner ring suburbs redeveloped on defunct industrial land; Stand-alone apartment buildings with minimal amenities; Gated villa communities on the outskirts of Bangalore
Key Communities developed
Prestige Acropolis, L&T South City, Diamond District, Prestige Glenmorgan
Mixed-Use: Prestige Shantiniketan, Brigade Gateway, Brigade Metropolis
Source: Reconnaissance Survey conducted in July 2016; (Vestian and Assetz Property Group, n.d.)
However, these communities don’t conform to any centralised growth plans or local planning authority regulations; as the Town and Country Planning of the State of Karnataka and Bangalore Development Authority (BDA) lack policies for the development of GCs as stated by Ramachandra (as cited in EMBARQ, 2014). In fact, these agencies do not recognize ‘Gated Communities’ under the Town and Country Planning Act and had issued a public notice regarding the same in 2008 (EMBARQ, 2014). Thus, as a result of the complex governance system and lack of specific planning policies, GCs in Bangalore continue to rise. The key advantage of these communities apparently is the security they offer to the residents as compared to the traditional neighbourhoods. However, in order to take care of the security aspect, amenities are usually not open to the communities outside the fence resulting in a huge disparity and differences amongst the residents within these communities and outside these developments. Thus various areas of Bangalore are developing as disjointed pockets with several inward looking gated communities with limited or no interaction between them. Also the material forms of the built environments of GCs are complemented by the social construction of an image and also a meaning (of these enclaves) as a home, a community and as settings for a global identity, and deliberately choosing to ignore the local context. This is evident in various types of advertisements, promises and outlandish names used by the developers to promote their GC projects. The gated community in Bangalore thus are represented in multiple ways: as a safe retreat from the chaos of urban life, as an exclusive and comfortable locale where all material wants are provided; as a place afforded with a sense of community (Chacko & Varghese, 2009). As a result the city fabric of Bangalore is increasingly getting divided by the desire of different groups of people to live exclusively. This phenomena is also fuelled by the lack of unified planning policies to control these
460
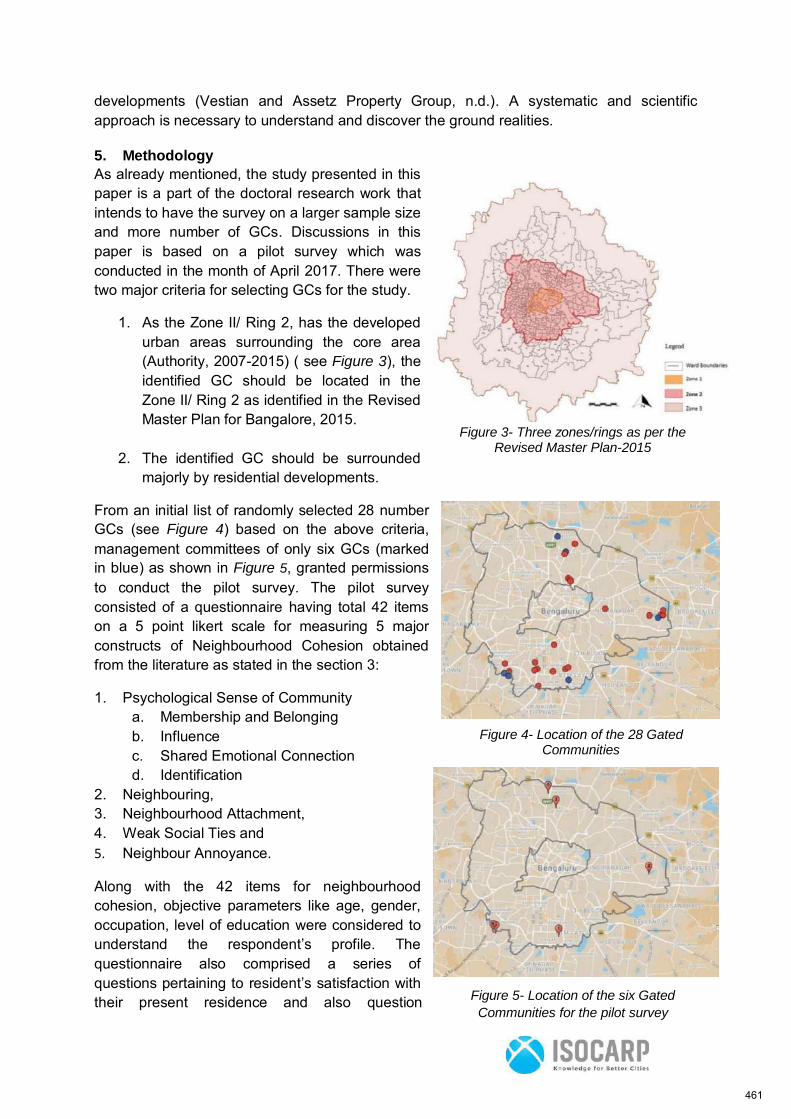
developments (Vestian and Assetz Property Group, n.d.). A systematic and scientific approach is necessary to understand and discover the ground realities.
5. Methodology
As already mentioned, the study presented in this paper is a part of the doctoral research work that intends to have the survey on a larger sample size and more number of GCs. Discussions in this paper is based on a pilot survey which was conducted in the month of April 2017. There were two major criteria for selecting GCs for the study.
1. As the Zone II/ Ring 2, has the developed urban areas surrounding the core area (Authority, 2007-2015) ( see Figure 3), the identified GC should be located in the Zone II/ Ring 2 as identified in the Revised Master Plan for Bangalore, 2015.
2. The identified GC should be surrounded majorly by residential developments.
From an initial list of randomly selected 28 number GCs (see Figure 4) based on the above criteria, management committees of only six GCs (marked in blue) as shown in Figure 5, granted permissions to conduct the pilot survey. The pilot survey consisted of a questionnaire having total 42 items on a 5 point likert scale for measuring 5 major constructs of Neighbourhood Cohesion obtained from the literature as stated in the section 3:
1. Psychological Sense of Community a. Membership and Belonging b. Influence c. Shared Emotional Connection d. Identification
2. Neighbouring, 3. Neighbourhood Attachment, 4. Weak Social Ties and 5. Neighbour Annoyance.
Along with the 42 items for neighbourhood cohesion, objective parameters like age, gender, occupation, level of education were considered to understand the respondent’s profile. The questionnaire also comprised a series of questions pertaining to resident’s satisfaction with their present residence and also question
Figure 3- Three zones/rings as per the Revised Master Plan-2015
Figure 4- Location of the 28 Gated Communities
Figure 5- Location of the six Gated
Communities for the pilot survey
461
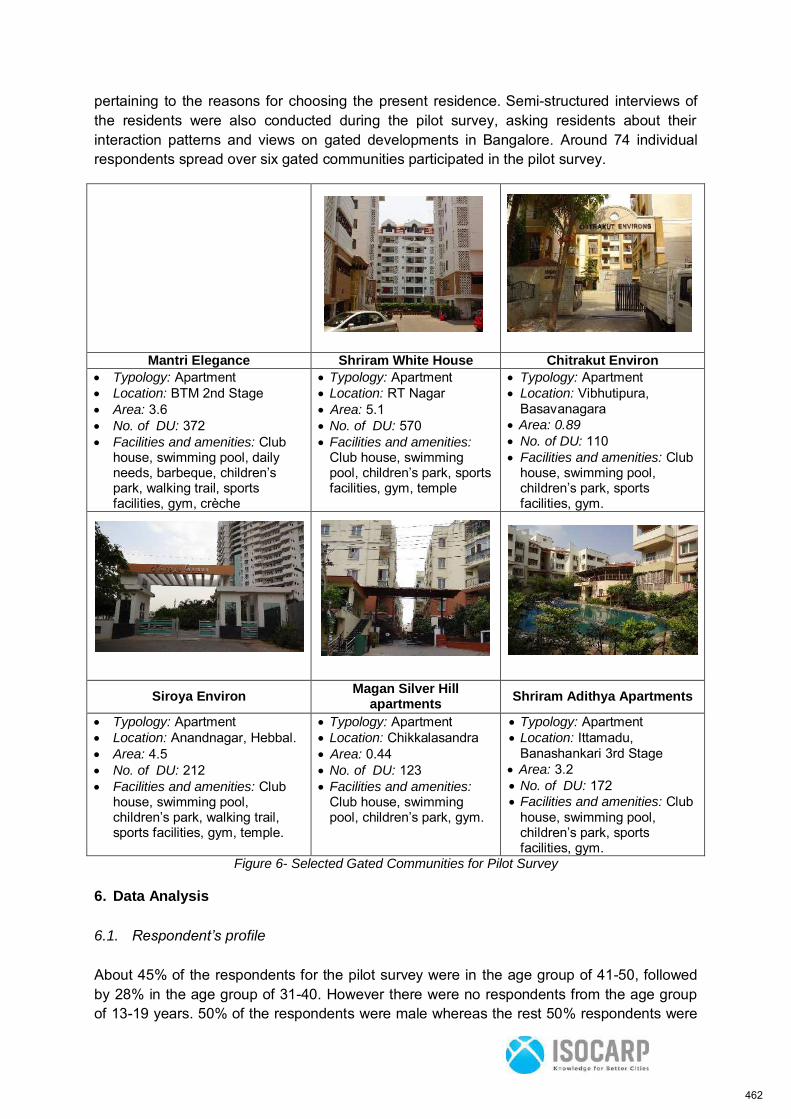
pertaining to the reasons for choosing the present residence. Semi-structured interviews of the residents were also conducted during the pilot survey, asking residents about their interaction patterns and views on gated developments in Bangalore. Around 74 individual respondents spread over six gated communities participated in the pilot survey.
Mantri Elegance Shriram White House Chitrakut Environ
Typology: Apartment Location: BTM 2nd Stage Area: 3.6
No. of DU: 372
Facilities and amenities: Club house, swimming pool, daily needs, barbeque, children’s park, walking trail, sports facilities, gym, crèche
Typology: Apartment Location: RT Nagar Area: 5.1
No. of DU: 570
Facilities and amenities: Club house, swimming pool, children’s park, sports facilities, gym, temple
Typology: Apartment Location: Vibhutipura,
Basavanagara Area: 0.89
No. of DU: 110 Facilities and amenities: Club
house, swimming pool, children’s park, sports facilities, gym.
Siroya Environ Magan Silver Hill
apartments Shriram Adithya Apartments
Typology: Apartment Location: Anandnagar, Hebbal. Area: 4.5
No. of DU: 212
Facilities and amenities: Club house, swimming pool, children’s park, walking trail, sports facilities, gym, temple.
Typology: Apartment Location: Chikkalasandra Area: 0.44
No. of DU: 123
Facilities and amenities: Club house, swimming pool, children’s park, gym.
Typology: Apartment Location: Ittamadu,
Banashankari 3rd Stage Area: 3.2
No. of DU: 172 Facilities and amenities: Club
house, swimming pool, children’s park, sports facilities, gym.
Figure 6- Selected Gated Communities for Pilot Survey
6. Data Analysis
6.1. Respondent’s profile
About 45% of the respondents for the pilot survey were in the age group of 41-50, followed by 28% in the age group of 31-40. However there were no respondents from the age group of 13-19 years. 50% of the respondents were male whereas the rest 50% respondents were
462
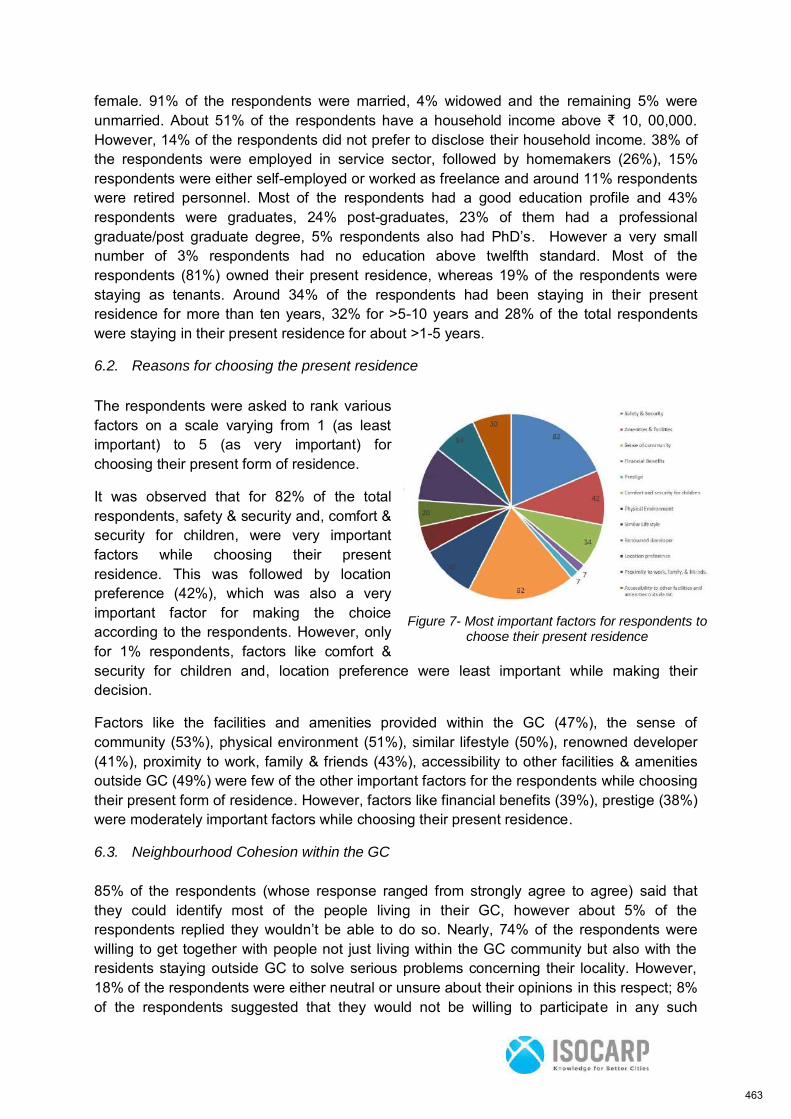
female. 91% of the respondents were married, 4% widowed and the remaining 5% were unmarried. About 51% of the respondents have a household income above ₹ 10, 00,000. However, 14% of the respondents did not prefer to disclose their household income. 38% of the respondents were employed in service sector, followed by homemakers (26%), 15% respondents were either self-employed or worked as freelance and around 11% respondents were retired personnel. Most of the respondents had a good education profile and 43% respondents were graduates, 24% post-graduates, 23% of them had a professional graduate/post graduate degree, 5% respondents also had PhD’s. However a very small number of 3% respondents had no education above twelfth standard. Most of the respondents (81%) owned their present residence, whereas 19% of the respondents were staying as tenants. Around 34% of the respondents had been staying in their present residence for more than ten years, 32% for >5-10 years and 28% of the total respondents were staying in their present residence for about >1-5 years.
6.2. Reasons for choosing the present residence
The respondents were asked to rank various factors on a scale varying from 1 (as least important) to 5 (as very important) for choosing their present form of residence.
It was observed that for 82% of the total respondents, safety & security and, comfort & security for children, were very important factors while choosing their present residence. This was followed by location preference (42%), which was also a very important factor for making the choice according to the respondents. However, only for 1% respondents, factors like comfort & security for children and, location preference were least important while making their decision.
Factors like the facilities and amenities provided within the GC (47%), the sense of community (53%), physical environment (51%), similar lifestyle (50%), renowned developer (41%), proximity to work, family & friends (43%), accessibility to other facilities & amenities outside GC (49%) were few of the other important factors for the respondents while choosing their present form of residence. However, factors like financial benefits (39%), prestige (38%) were moderately important factors while choosing their present residence.
6.3. Neighbourhood Cohesion within the GC
85% of the respondents (whose response ranged from strongly agree to agree) said that they could identify most of the people living in their GC, however about 5% of the respondents replied they wouldn’t be able to do so. Nearly, 74% of the respondents were willing to get together with people not just living within the GC community but also with the residents staying outside GC to solve serious problems concerning their locality. However, 18% of the respondents were either neutral or unsure about their opinions in this respect; 8% of the respondents suggested that they would not be willing to participate in any such
Figure 7- Most important factors for respondents to choose their present residence
463
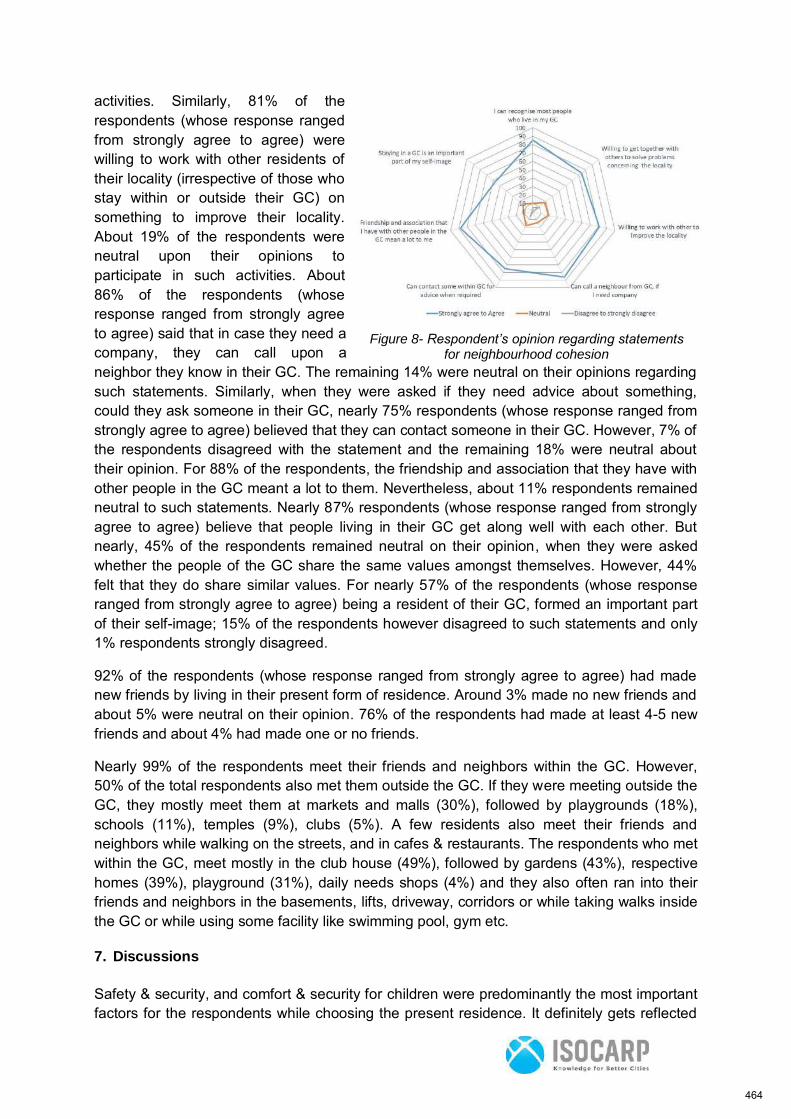
activities. Similarly, 81% of the respondents (whose response ranged from strongly agree to agree) were willing to work with other residents of their locality (irrespective of those who stay within or outside their GC) on something to improve their locality. About 19% of the respondents were neutral upon their opinions to participate in such activities. About 86% of the respondents (whose response ranged from strongly agree to agree) said that in case they need a company, they can call upon a neighbor they know in their GC. The remaining 14% were neutral on their opinions regarding such statements. Similarly, when they were asked if they need advice about something, could they ask someone in their GC, nearly 75% respondents (whose response ranged from strongly agree to agree) believed that they can contact someone in their GC. However, 7% of the respondents disagreed with the statement and the remaining 18% were neutral about their opinion. For 88% of the respondents, the friendship and association that they have with other people in the GC meant a lot to them. Nevertheless, about 11% respondents remained neutral to such statements. Nearly 87% respondents (whose response ranged from strongly agree to agree) believe that people living in their GC get along well with each other. But nearly, 45% of the respondents remained neutral on their opinion, when they were asked whether the people of the GC share the same values amongst themselves. However, 44% felt that they do share similar values. For nearly 57% of the respondents (whose response ranged from strongly agree to agree) being a resident of their GC, formed an important part of their self-image; 15% of the respondents however disagreed to such statements and only 1% respondents strongly disagreed.
92% of the respondents (whose response ranged from strongly agree to agree) had made new friends by living in their present form of residence. Around 3% made no new friends and about 5% were neutral on their opinion. 76% of the respondents had made at least 4-5 new friends and about 4% had made one or no friends.
Nearly 99% of the respondents meet their friends and neighbors within the GC. However, 50% of the total respondents also met them outside the GC. If they were meeting outside the GC, they mostly meet them at markets and malls (30%), followed by playgrounds (18%), schools (11%), temples (9%), clubs (5%). A few residents also meet their friends and neighbors while walking on the streets, and in cafes & restaurants. The respondents who met within the GC, meet mostly in the club house (49%), followed by gardens (43%), respective homes (39%), playground (31%), daily needs shops (4%) and they also often ran into their friends and neighbors in the basements, lifts, driveway, corridors or while taking walks inside the GC or while using some facility like swimming pool, gym etc.
7. Discussions
Safety & security, and comfort & security for children were predominantly the most important factors for the respondents while choosing the present residence. It definitely gets reflected
Figure 8- Respondent’s opinion regarding statements for neighbourhood cohesion
464
in the fact that all the gated communities studied in the pilot survey were monitored through hi-tech security systems like CCTV and surveillance cameras, except one. All the GCs had 24/7 private security guards at the entrance and also inside the GCs. The entrance to all the GCs was restricted either by gates, boom gates, guard house and/or a combination of all of the above. Each resident was issued with stickers for the vehicles so that the guard does not stop them each time at the entrance. Common areas were also under constant surveillance with the help of CCTV. No outsider was allowed without the permission of the residents he/she intends to visit. Intercom facilities were used for the same. The visitor had to enter the details of the person he intends to visit eg. Apartment no, name of the person, followed by the purpose of his visit, and the time. In the semi structured interview one of the respondents said:
“My husband is posted in Mumbai and I stay with my 12 year old son. I feel very safe and
secure within the Gated Community as there are guards 24/7 at the entrance and no outsider
can enter the premises without permission, also there are surveillance cameras installed in
the common areas, so I do not have to worry about the safety.”
Thus, the presence of hi-tech security like CCTV, intercom facilities in addition to the presence of guards definitely ensured a real sense of security and safety to the residents. Also, each of the GC had facilities like children’s park, swimming pool, sports facilities, crèche etc. for the children. Since the survey was conducted in the month of April, and the vacation period for schools had already begun, it was observed that most of the GCs had taken initiatives to organise various workshops on drawing, music, art & craft etc. for kids of various age groups, however these activities was only available for the kids of the residents.
Each of the GC studied has a Residents or a Home Owners’ Association which governs and regulates the code of conduct of the residents, and is responsible for the maintenance and well-being of the gated community. Through semi-structured interviews with the some of the respondents and the committee members of these Home Owners Association, it was observed that each of the gated community has e-mail groups to discuss issues concerning the maintenance, regulation, security etc. of the GC. Along with these mail groups, they also have what’s app groups and use other social media, messaging apps to disseminate information faster regarding certain urgent issues like water supply, load shedding etc. In the semi-structured interview one of the committee member of Shriram Aditya Apartment mentioned:
“We have a what’s app group, so that we can inform the residents about emergencies. For
eg. we had some water supply issues today, we informed the residents about it in the
morning through what’s app. We also suggested them to store a few buckets of water as we
were not sure when would the supply normalise.…just about an hour ago, the water supply is
back and we have informed the residents about the same on the group and also asked them
not to throw away and waste the stored water, but to utilise it.”
In gated communities like Shriram Aditya Apartments the Home Owners’ Association also took initiative to record the details of each resident in the form of Google spread sheet containing information about their occupation, place of work and other personal details like blood group etc. for the convenience of the residents in case of emergencies. Thus, technology has made the governance of such communities simpler. Moreover, it has made it
465
easier to reach out to all the people in lesser time ensuring participation from maximum residents in times of crisis.
Through the semi-structured interviews it was observed that some Gated Communities like Chitrakut environ, Shriram Aditya Apartments had joined hands with the residents outside, for the development of the overall neighbourhood. GC like Chitrakut Environ also has a what’s app group just for the female residents of the GC known as “Chitrakut Mahila Morcha” (translated ‘Chitrakut Women Organisation’) to discuss various issues related not only to the GC but also the overall neighbourhood. This group extensively participated and had conversation with the residents outside GC in order to conserve a lake in their locality. The committee members of the Home Owners’ Association of Shriram Aditya Apartment and the committee members of the Arehalli Residents Welfare Association (which is a residents association of the neighbourhood outside Shriram Adithya Apartments) have also formed what’s app group to discuss and take actions on problems related to the larger neighbourhood. This group also has participation of few other committee member from the residents association of the other GCs in the locality. These events and initiatives corroborates the response of the majority of the residents’ willingness to participate in activities for the general good of their locality as seen in the above section. However, it is the technology in the form of social media apps and messaging apps that has made it easier for the residents to get in touch with each other to solve their issues. Such initiatives have helped them to solve various issues even though face to face interaction amongst all the participants is quite limited.
Also, with the availability of high speed internet facilities, most of the younger generation employed in the service sector or working as free-lance preferred working from home, because of the tranquil surrounding provided by these GCs.
It was noted during the semi-structured interviews, that some of the respondents suggested that, with home-delivery options made available by chains like Big Basket, Urban Tailor etc. they prefer buying groceries online, saving time and energy. But still a majority of the people meet their neighbours or friends in markets or malls as seen in the above section, indicating that though technology has made it convenient to buy groceries online, the residents are not entirely dependent on such service and do prefer to move out of their GC to buys supplies and other goods.
Thus it can be seen that though technology has made life simpler, easier and secure for the residents of the gated community, the face to face interaction still predominantly remains the part of their lives and in spite of having various social media and messaging apps, residents do often meet each other and interact with each other when using the common facilities provided within the GC as seen in the section above. These findings also indicate a possibility of using new modes of communication as a medium to address local issues and an opportunity to establish a connect amongst residents of a larger neighbourhood.
8. Conclusions
The pilot survey has brought into picture, the role technology plays, in changing the patterns of interaction amongst people today. The use of technology in the form of CCTV, intercom facilities has helped the residents gain a real sense of security, which they were looking for while choosing their present residence. The use of social media apps and messaging apps
466
may have changed the patterns of interaction amongst the residents, but this has also ensured participation of maximum number of residents in discussions concerning their GC and the surrounding neighbourhoods. Thus in the area of social contacts and communication, we also need to factor in opportunities brought in by digital technology as means for communication as well as facilitating group formation that transcends physical proximity and barrier.
The survey has also shown that the high end technology, which has become a part of everyday life, may have obliterated the need of physical proximity, day to day facial contact as availability of high speed internet combined with the tranquil environment provided by the GCs has made it easier for the urban population working in the service sector or working as free-lance to choose options to work from home when required. However, though the everyday needs can now be managed online and has become more convenient for the residents, it has not made them solely dependent on these services, nor has it limited their levels of interaction. Reaching to large number of residents through digital technology in case of emergencies has made governance much simpler and easier ensuring the participation of maximum residents.
This study thus has brought into picture the need for a deeper understanding of the role that technology plays in the area of social contacts and communication at a neighbourhood level and has also highlighted the need to thoroughly investigate whether the gated-ness of a residential area is actually creating exclusive, reactionary and socially isolating places. How networking and new technology can play a role in creating more cohesive groups beyond the gated communities seems to be a promising field of further research.
9. References
Adler, I., 2013. How Our Digital Devices Are Affecting Our Personal Relationships. [Online] Available at: http://legacy.wbur.org/2013/01/17/digital-lives-i [Accessed 15 June 2017].
Authority, B. D., 2007-2015. Planning District Report- Volume 4, Bangalore: Bangalore Development Authority.
Bouma, J., Poelman, W. & Voorbij, A., 2010. Supporting social contact design principles in common areas of cohousing communities.
Bouma, J. & Voorbij, L., 2009. Factors in social interaction in cohousing communities. Include London.
Brosius, C., 2012. India’s Middle Class: New Forms of Urban Leisure, Consumption and
Prosperity. New Delhi: Routledge.
Buckner, J. C., 1988. The Development of An Instrument to Measure Neighbourhood Cohesion. American Journal of Community Psychology, 16(6).
Chacko, E. & Varghese, P., 2009. Identity and Representation of Gated Communities in Banglore, India. open house international Vol 34, no.3, September, pp. 57-64.
Crang, M., Crosbie, T. & Graham, S., 2007. Technology, time- space, and the remediation of neighbourhood life. Environment and Planning, Volume 39, pp. 2450-2422.
467
Drago, E., 2015. The effect of technology on face-to-face communication. Journal of
Undergraduate Reserach in Communications, 6(1).
EMBARQ, 2014. Relationship between Built Form, Travel Behavior and Energy Use in Gated
Communities in Bangalore, Banglore: EMBARQ India.
Grant, J., 2005. Planning the (dis)connected city: Why gated projects get approved. Cahiers
de géographie du Québec, 49(138), pp. 363-376.
Grant, J. & Mittelsteadt, L., 2004. Types of Gated Communities. Environment and Planning
Volume 31, pp. 913-930.
King, A., 1998. Writing the Transnational: The Distant Spaces of the Indian City. In: City
Space + Globalization: An International Perspective. Ann Arbor: University of Michigan, pp. 25-31.
Knight Frank India Pvt. Ltd, January-June 2016. India Real Estate: Residential and Office,
s.l.: Knight Frank India.
KPMG India, 2015. Challenging the Tides: Indian real estate, s.l.: KPMG.
Mahadevia, D., 2013. Segmentation and Enclavisation in Urban Development – The. In: Building Sustainable Communities: A Global Urban Context. Michigan: Michigan State University Press, pp. 199-226.
Musyoka, M. C., Gakuu, C. & Kyalo, D. N., 2017. Influence of Technological Environment on Performance of Gated Community Housing Projects in Nairobi County, Kenya. European
Scientific Journal, 13(11), pp. 43-74.
Srivastava, S., 2015. Entangled urbanism: slum, gated community, and shopping mall in
Delhi and Gurgaon. Delhi: Oxford Unversity Press.
Vestian and Assetz Property Group, n.d. Social Infrastructure & Communities in Bangalore,
Bangalore: Vestian and Assetz Property Group.
Wissink, B., 2013. Enclave Urbanism in Mumbai: An Actor-Network-Theory analysis of urban (dis)connection. Geoforum, pp. 1-11.
www.commonfloor.com, 2015. India Real Estate in 2015. [Online] Available at: https://www.commonfloor.com/india-annual-realestate-report-2015 [Accessed April 2016].
Xu, M., 2009. Gated Communities in China:Urban Design Concerns, s.l.: School of City and Regional Planning, Cradiff University.
468
CHEN Haining, WANG Jianguo Coping with "Online Urbanization" Joint OAPA-ISOCARP Conference 2017/53rd ISOCARP Congress 2017
1
Coping with "Online Urbanization": Envision the Big Data Industry's Effects on Urban Patterns CHEN Haining, School of Architecture, Southeast University, China WANG Jianguo, School of Architecture, Southeast University, China Abstract The paper mainly elaborates the research on big data industry's effects with understanding of relevant planning context to analyze the development trends and strategies in the industry. It will also try to foresee how this emerging field will affect the urban patterns in the new era which we can identify as the era of big data under the background of "online urbanization" or "network urbanization". Big data industry development actions in Nanjing, China will be explicated as the research case. 1. Introduction Technology has become one of the most important urban development engines global wide. The historic new era is filled with emerging technologies and industries, for instance, information and communication technologies (ICTs), Internet of things (IOT), big data industries, e-commerce and Internet finance industries incorporating cloud computing, and etc. We are embracing the unprecedented urbanization process, or from a new perspective, we can identify it as the era of "online urbanization" or "network urbanization". Such trends have redefined the boundaries between communities and the relationships between urban and rural areas. Under the circumstances of "online urbanization" or "network urbanization", how to cope with the changing conditions to achieve smart cities or smart communities with initiatives towards inclusive societies in the framework of governance has become the issue.
In the specific context of China, big data industry is one of the rising and booming areas in just a decade. As a brand-new power in urban construction and development, there is still much "indeterminate" space. Therefore in the governance context that big data industry development has been promoted to the national strategic level, it has certain significance to focus on big data industry's effects to witness and foresee how this emerging industry is affecting and will affect the urban patterns in comparison with the traditional urban development routes through the typical planning ways in contemporary China. 2. Coping with "Online Urbanization" and "Network Urbanization" 2.1 "Online Urbanization" and "Network Urbanization" The structural transitions of regional spaces along the coastal area, especially in the Yangtze River Delta in Eastern China have rapidly emerged since the end of 1978, which represented the great turning point driven by reform and opening up (China Daily, 2011). What we could witness were the massive urban construction in the past three decades. However urban spaces definitely associated with the society, and urban development has its internal dynamics and mechanisms (Harvey, 2005). In the global expansion reality of capitalism, the liquidity of contemporary capitalism interacts with Chinese urban societies (Yang, 2011). As a chance in historical geography, the coastal area in Eastern China took participate in international division of labor in the first instance, and has become an inseparable important part in production and reproduction of global capital. But this is only a beginning, Castells (2010) states that China is a huge consumer market with enormous potential even more so, and capital tries to spread all over the local societies to build its own circulation network (Catells, 2010; Yang, 2011). Some city like Hangzhou has rised as a new global center of e-
469
CHEN Haining, WANG Jianguo Coping with "Online Urbanization" Joint OAPA-ISOCARP Conference 2017/53rd ISOCARP Congress 2017
2
commerce. Just in the e-shopping festival on November 11th, 2016, based on the data surveyed by Syntun (2016) on 16 platforms, 1,526 categories, 39,487 brands, and 8.34 million goods, the total amount of sales on Internet reached 177.04 billion Chinese yuan (about 22.55 billion US dollars), and there were 1.07 billion packages delivered trough Internet of things (IOT). The incredible data indicated that the "e-shopping festival" had become a ceremony of merchandising, or in another word, a capital carnival beyond boundaries (Xia, 2017).
Under such an unprecedented urban development background, there are many emerging things that have redefined the surrounding environment we are living in. For example, "Taobao villages" and "Taobao towns". As defined by Alibaba Group's research institution AliResearch (2014), a "Taobao village" is "a cluster of rural e-tailers within an administrative village" defined by following characteristics: i) the residents in the village spontaneously started e-commerce through the platform of Taobao Marketplace; ii) the total annual transaction volume in e-commerce is at least 10 million Chinese yuan (about 1.5 million US dollars); and iii) at least 10% of the village households actively engage in ecommerce or at least 100 online shops opened by villagers (AliResearch, 2014; Alizila, 2016). Another good example is "Suichang ganjie". Suichang is the name of a county in the southwestern area of Zhejiang Province in China, while "ganjie" literally means "going to the market". "Suichang ganjie" is actually an e-commerce service station especially for rural areas. It finds a villager in every village with a certain size to establish cooperation relationship, and this villager will help other villagers to do deals on the website platform of "Suichang ganjie". This action has already become a model which can offer e-shopping service to the villagers, while in the meantime, can help them to sell agricultural products to the outside world. The model opens "new high-speed trains" linking between urban and rural areas.
Consequently, the new relationships with great changes between cities and cities, or between urban areas and rural areas in the new process of urbanization have already reshaped our cities, communities and societies. Such a new process of urbanization is so different from the traditional urban development routes made by typical planning ways, thus we may define this as "online urbanization" or "network urbanization". 2.2 The Era of Big Data The urban patterns have been dynamically and tremendously changed within the process of "online urbanization" and "network urbanization". We are now living in a world that has become "digital", which shows the rise of the network society driven by information technology revolution (Castells, 2000). From one side, the new world incorporating new communities has formed on the online dimension. In these new communities, there are many "netizens". Their historical roots, mental conditions and values, their organizations or associations, as well as their relationships with local governments all worth being deeply cognized and understood by us (Xia, 2017). From the other side, The new era is coming with new structures, ways or models on economy, society, culture, planning and etc. The distinct characteristics of the new era mainly include globalization, informationalism and networking. Castells elaborated the grand map illustrating interrelations between technology, society and historical change as:
...technology does not determine society. Nor does society script the course of technological change, since many factors, including individual inventiveness and entrepreneurialism, intervene in the process of scientific discovery, technological innovation, and social applications, so that the final outcome depends on a complex pattern of interaction. Indeed, the dilemma of technological determinism is probably a false problem, since technology is society, and society cannot be understood or represented without its technological tools (2000, p. 5).
Surfing the tide of globalization and informationization, the modes of development and the modes of production are vary from the past. Not only the developing countries like China, India or Brazil are "going to melted in the global pot of informational capitalism by continuing
470
CHEN Haining, WANG Jianguo Coping with "Online Urbanization" Joint OAPA-ISOCARP Conference 2017/53rd ISOCARP Congress 2017
3
their current high-speed developmental path", but also the United States, Japan, Spain, etc., are and "will be more so in the future" (Castells, 2000).
...informational societies, in the sense that the core processes of knowledge generation, economic productivity, political/military power, and media communication are already deeply transformed by the informational paradigm, and are connected to global networks of wealth, power and symbols working under such a logic. Thus, all societies are affected by capitalism and informationalism, and many societies (certainly all major societies) are already informational, although of different kinds, in different settings, and with specific cultural/institutional expressions (Castells, 2000, pp. 20-21).
There is no doubt that a new round of technology revolution which is closely related to ICTs is happening. What features this technology revolution is "not the centrality of knowledge and information, but the application of such knowledge and information to knowledge generation and information processing/communication devices, in a cumulative feedback loop between innovation and the uses of innovation" (Castells, 2000). Generally speaking, networks along with ICTs reshape the economic, social and cultural morphology of our cities and communities. The concrete meanings of the articulation "between the capitalist mode of production and the informational mode of development" are also highlighted by Castells in the further explanation:
...the diffusion of networking logic substantially modifies the operation and outcomes in processes of production, experience, power, and culture. While the networking form of social organization has existed in other times and spaces, the new information technology paradigm provides the material basis for its pervasive expansion throughout the entire social structure..Financial capital needs, however, to rely for its operation and competition on knowledge and information generated and enhanced by information technology (2000, pp. 500-503).
In the "digital" world with the rise of network society driven by information technology revolution, use of data resources is the product of the development of ICTs. Especially accompanying with progresses made in computing technology led by IOT and cloud computing, there is always a huge amount of data that increases at a stunning rapidity, while at the same time marking the entry of the era of "big data" (Xu, 2012). Some major findings come out from a study conducted by International Data Corporation (IDC) show the forecast of worldwide big data technology and services market during the period from 2016 to 2020, mainly predict that:
● In aggregate, the big data technology and services market is estimated to grow at a CAGR of 22.6% from 2015 to 2020 and reach $58.9 billion in 2020. ● Revenue for big data infrastructure is estimated to grow at a CAGR of 20.3% from 2015 to 2020 and reach $27.7 billion in 2020. ● Revenue for big data software is estimated to grow at a CAGR of 25.7% from 2015 to 2020 and reach $15.9 billion in 2020. ● Revenue for big data services, which consists of professional and support services, is estimated to grow at a CAGR of 23.9% from 2015 to 2020 and reach $15.2 billion in 2020 (Nadkarni and Vesset, 2016).
All in all, "big data" will become the very important carrier to lead future technology development and social progress. In the new millennium, no matter individuals or governments and enterprises all need to face immense amounts of data in every day of daily life. Since in the future more and more decisions will be made base on scientific analysis of data, the process of quantification for these data not only brings influences to people's daily life, but also affects the decisions and developmental strategies made by governments and enterprises. 2.3 Development Trends and Strategies in the Big Data Era The further meaning of why "big data" is "big" more comes from that people can find out new information and new knowledge through exchanging, integrating and analyzing immense amounts of data, and eventually create new values to bring along "big technology" and "big development", or not accurately, we can call it "intelligence" (Xu, 2012; Tu, 2014). There is a
471
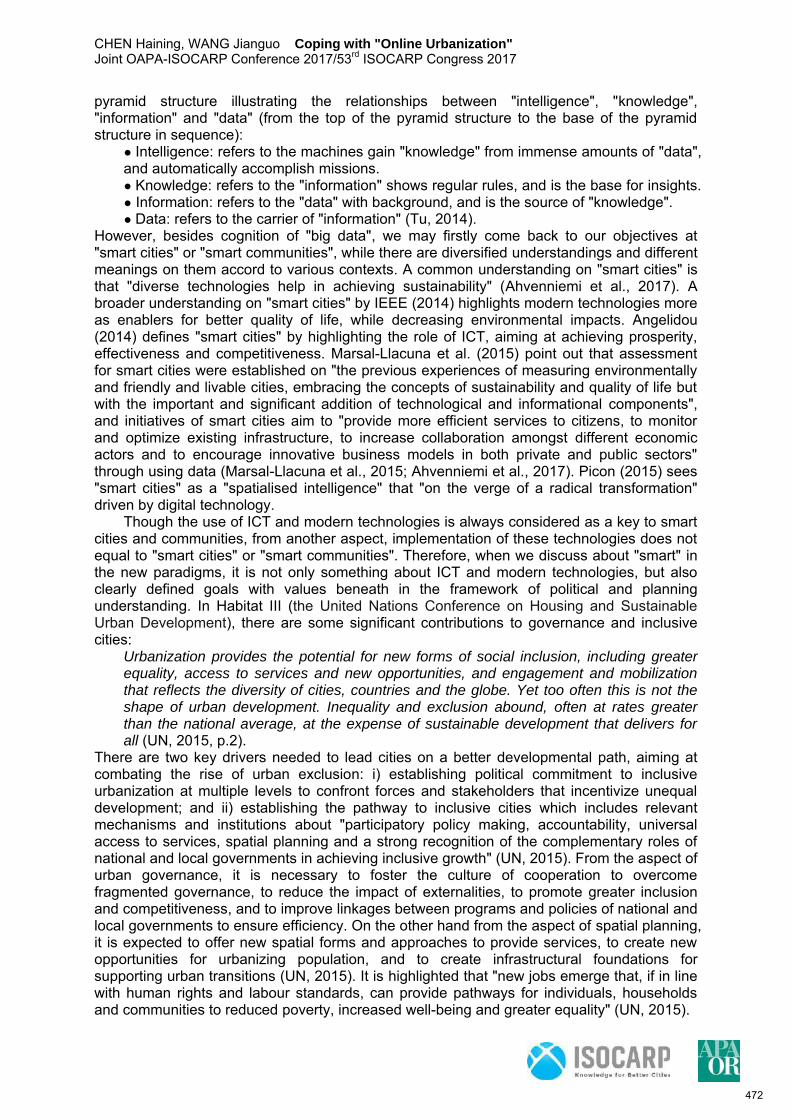
CHEN Haining, WANG Jianguo Coping with "Online Urbanization" Joint OAPA-ISOCARP Conference 2017/53rd ISOCARP Congress 2017
4
pyramid structure illustrating the relationships between "intelligence", "knowledge", "information" and "data" (from the top of the pyramid structure to the base of the pyramid structure in sequence):
● Intelligence: refers to the machines gain "knowledge" from immense amounts of "data", and automatically accomplish missions. ● Knowledge: refers to the "information" shows regular rules, and is the base for insights. ● Information: refers to the "data" with background, and is the source of "knowledge". ● Data: refers to the carrier of "information" (Tu, 2014).
However, besides cognition of "big data", we may firstly come back to our objectives at "smart cities" or "smart communities", while there are diversified understandings and different meanings on them accord to various contexts. A common understanding on "smart cities" is that "diverse technologies help in achieving sustainability" (Ahvenniemi et al., 2017). A broader understanding on "smart cities" by IEEE (2014) highlights modern technologies more as enablers for better quality of life, while decreasing environmental impacts. Angelidou (2014) defines "smart cities" by highlighting the role of ICT, aiming at achieving prosperity, effectiveness and competitiveness. Marsal-Llacuna et al. (2015) point out that assessment for smart cities were established on "the previous experiences of measuring environmentally and friendly and livable cities, embracing the concepts of sustainability and quality of life but with the important and significant addition of technological and informational components", and initiatives of smart cities aim to "provide more efficient services to citizens, to monitor and optimize existing infrastructure, to increase collaboration amongst different economic actors and to encourage innovative business models in both private and public sectors" through using data (Marsal-Llacuna et al., 2015; Ahvenniemi et al., 2017). Picon (2015) sees "smart cities" as a "spatialised intelligence" that "on the verge of a radical transformation" driven by digital technology.
Though the use of ICT and modern technologies is always considered as a key to smart cities and communities, from another aspect, implementation of these technologies does not equal to "smart cities" or "smart communities". Therefore, when we discuss about "smart" in the new paradigms, it is not only something about ICT and modern technologies, but also clearly defined goals with values beneath in the framework of political and planning understanding. In Habitat III (the United Nations Conference on Housing and Sustainable Urban Development), there are some significant contributions to governance and inclusive cities:
Urbanization provides the potential for new forms of social inclusion, including greater equality, access to services and new opportunities, and engagement and mobilization that reflects the diversity of cities, countries and the globe. Yet too often this is not the shape of urban development. Inequality and exclusion abound, often at rates greater than the national average, at the expense of sustainable development that delivers for all (UN, 2015, p.2).
There are two key drivers needed to lead cities on a better developmental path, aiming at combating the rise of urban exclusion: i) establishing political commitment to inclusive urbanization at multiple levels to confront forces and stakeholders that incentivize unequal development; and ii) establishing the pathway to inclusive cities which includes relevant mechanisms and institutions about "participatory policy making, accountability, universal access to services, spatial planning and a strong recognition of the complementary roles of national and local governments in achieving inclusive growth" (UN, 2015). From the aspect of urban governance, it is necessary to foster the culture of cooperation to overcome fragmented governance, to reduce the impact of externalities, to promote greater inclusion and competitiveness, and to improve linkages between programs and policies of national and local governments to ensure efficiency. On the other hand from the aspect of spatial planning, it is expected to offer new spatial forms and approaches to provide services, to create new opportunities for urbanizing population, and to create infrastructural foundations for supporting urban transitions (UN, 2015). It is highlighted that "new jobs emerge that, if in line with human rights and labour standards, can provide pathways for individuals, households and communities to reduced poverty, increased well-being and greater equality" (UN, 2015).
472
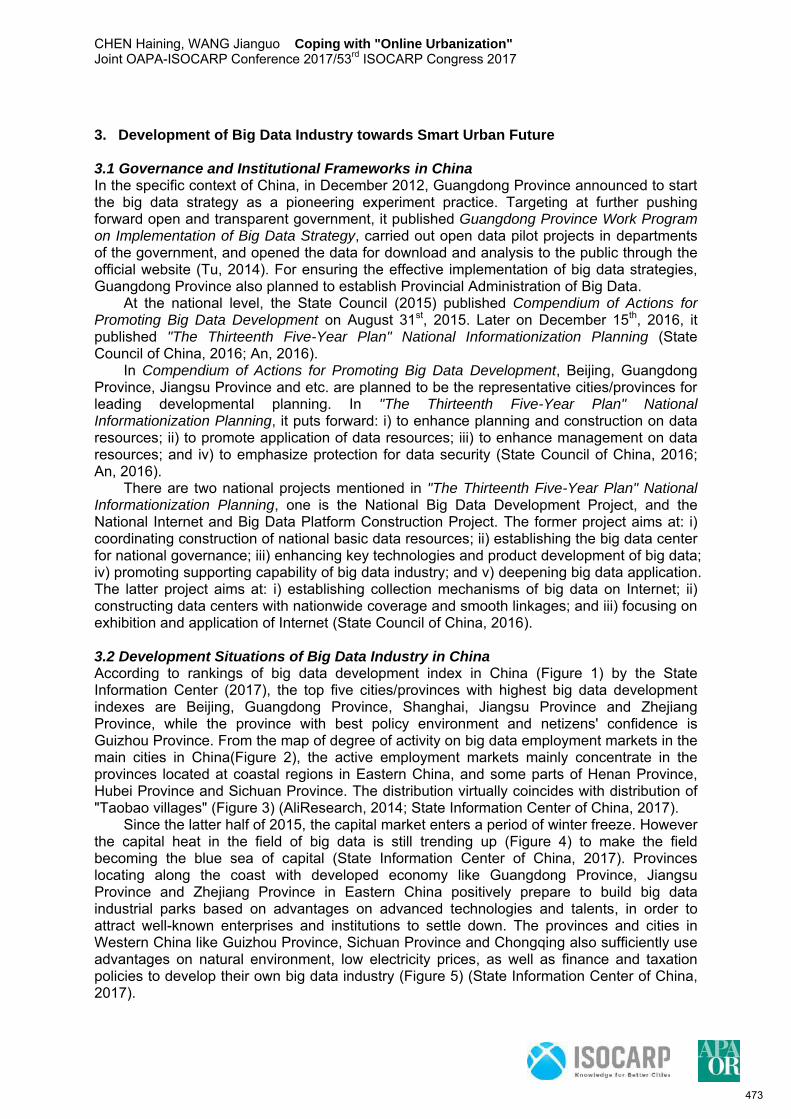
CHEN Haining, WANG Jianguo Coping with "Online Urbanization" Joint OAPA-ISOCARP Conference 2017/53rd ISOCARP Congress 2017
5
3. Development of Big Data Industry towards Smart Urban Future 3.1 Governance and Institutional Frameworks in China In the specific context of China, in December 2012, Guangdong Province announced to start the big data strategy as a pioneering experiment practice. Targeting at further pushing forward open and transparent government, it published Guangdong Province Work Program on Implementation of Big Data Strategy, carried out open data pilot projects in departments of the government, and opened the data for download and analysis to the public through the official website (Tu, 2014). For ensuring the effective implementation of big data strategies, Guangdong Province also planned to establish Provincial Administration of Big Data.
At the national level, the State Council (2015) published Compendium of Actions for Promoting Big Data Development on August 31st, 2015. Later on December 15th, 2016, it published "The Thirteenth Five-Year Plan" National Informationization Planning (State Council of China, 2016; An, 2016).
In Compendium of Actions for Promoting Big Data Development, Beijing, Guangdong Province, Jiangsu Province and etc. are planned to be the representative cities/provinces for leading developmental planning. In "The Thirteenth Five-Year Plan" National Informationization Planning, it puts forward: i) to enhance planning and construction on data resources; ii) to promote application of data resources; iii) to enhance management on data resources; and iv) to emphasize protection for data security (State Council of China, 2016; An, 2016).
There are two national projects mentioned in "The Thirteenth Five-Year Plan" National Informationization Planning, one is the National Big Data Development Project, and the National Internet and Big Data Platform Construction Project. The former project aims at: i) coordinating construction of national basic data resources; ii) establishing the big data center for national governance; iii) enhancing key technologies and product development of big data; iv) promoting supporting capability of big data industry; and v) deepening big data application. The latter project aims at: i) establishing collection mechanisms of big data on Internet; ii) constructing data centers with nationwide coverage and smooth linkages; and iii) focusing on exhibition and application of Internet (State Council of China, 2016). 3.2 Development Situations of Big Data Industry in China According to rankings of big data development index in China (Figure 1) by the State Information Center (2017), the top five cities/provinces with highest big data development indexes are Beijing, Guangdong Province, Shanghai, Jiangsu Province and Zhejiang Province, while the province with best policy environment and netizens' confidence is Guizhou Province. From the map of degree of activity on big data employment markets in the main cities in China(Figure 2), the active employment markets mainly concentrate in the provinces located at coastal regions in Eastern China, and some parts of Henan Province, Hubei Province and Sichuan Province. The distribution virtually coincides with distribution of "Taobao villages" (Figure 3) (AliResearch, 2014; State Information Center of China, 2017).
Since the latter half of 2015, the capital market enters a period of winter freeze. However the capital heat in the field of big data is still trending up (Figure 4) to make the field becoming the blue sea of capital (State Information Center of China, 2017). Provinces locating along the coast with developed economy like Guangdong Province, Jiangsu Province and Zhejiang Province in Eastern China positively prepare to build big data industrial parks based on advantages on advanced technologies and talents, in order to attract well-known enterprises and institutions to settle down. The provinces and cities in Western China like Guizhou Province, Sichuan Province and Chongqing also sufficiently use advantages on natural environment, low electricity prices, as well as finance and taxation policies to develop their own big data industry (Figure 5) (State Information Center of China, 2017).
473
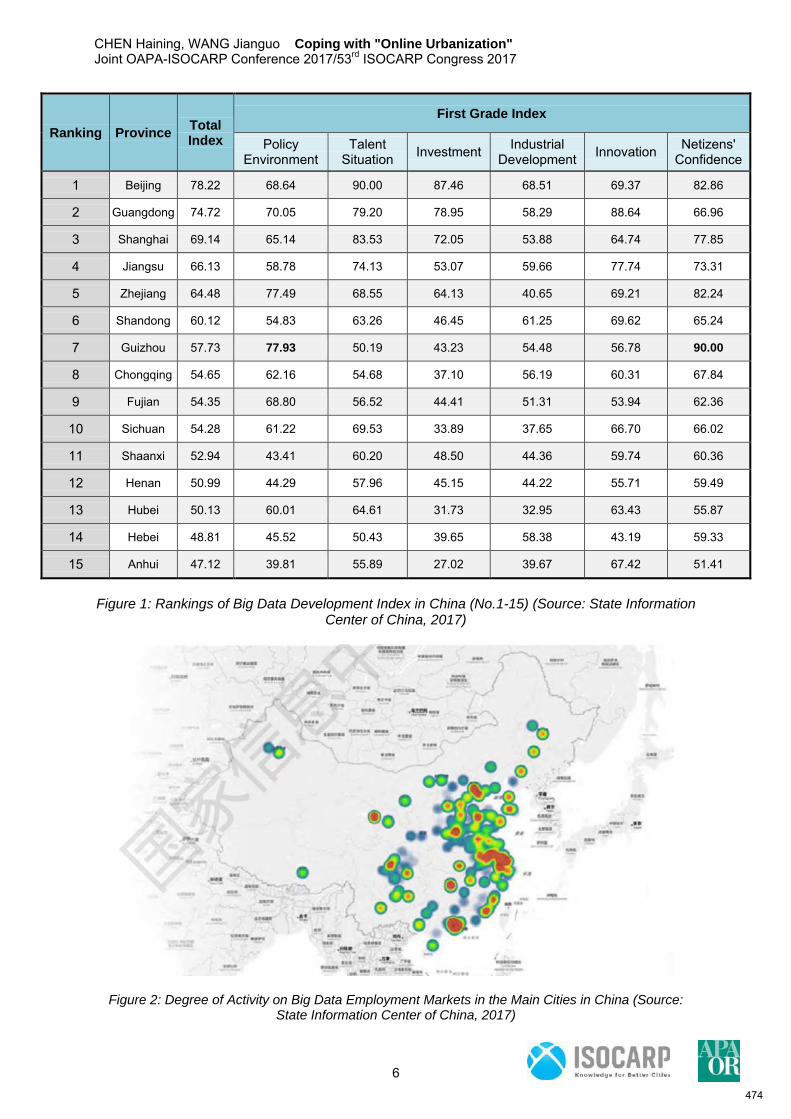
CHEN Haining, WANG Jianguo Coping with "Online Urbanization" Joint OAPA-ISOCARP Conference 2017/53rd ISOCARP Congress 2017
6
Ranking Province Total Index
First Grade Index
Policy Environment
Talent Situation Investment Industrial
Development Innovation Netizens' Confidence
1 Beijing 78.22 68.64 90.00 87.46 68.51 69.37 82.86
2 Guangdong 74.72 70.05 79.20 78.95 58.29 88.64 66.96
3 Shanghai 69.14 65.14 83.53 72.05 53.88 64.74 77.85
4 Jiangsu 66.13 58.78 74.13 53.07 59.66 77.74 73.31
5 Zhejiang 64.48 77.49 68.55 64.13 40.65 69.21 82.24
6 Shandong 60.12 54.83 63.26 46.45 61.25 69.62 65.24
7 Guizhou 57.73 77.93 50.19 43.23 54.48 56.78 90.00
8 Chongqing 54.65 62.16 54.68 37.10 56.19 60.31 67.84
9 Fujian 54.35 68.80 56.52 44.41 51.31 53.94 62.36
10 Sichuan 54.28 61.22 69.53 33.89 37.65 66.70 66.02
11 Shaanxi 52.94 43.41 60.20 48.50 44.36 59.74 60.36
12 Henan 50.99 44.29 57.96 45.15 44.22 55.71 59.49
13 Hubei 50.13 60.01 64.61 31.73 32.95 63.43 55.87
14 Hebei 48.81 45.52 50.43 39.65 58.38 43.19 59.33
15 Anhui 47.12 39.81 55.89 27.02 39.67 67.42 51.41
Figure 1: Rankings of Big Data Development Index in China (No.1-15) (Source: State Information
Center of China, 2017)
Figure 2: Degree of Activity on Big Data Employment Markets in the Main Cities in China (Source: State Information Center of China, 2017)
474
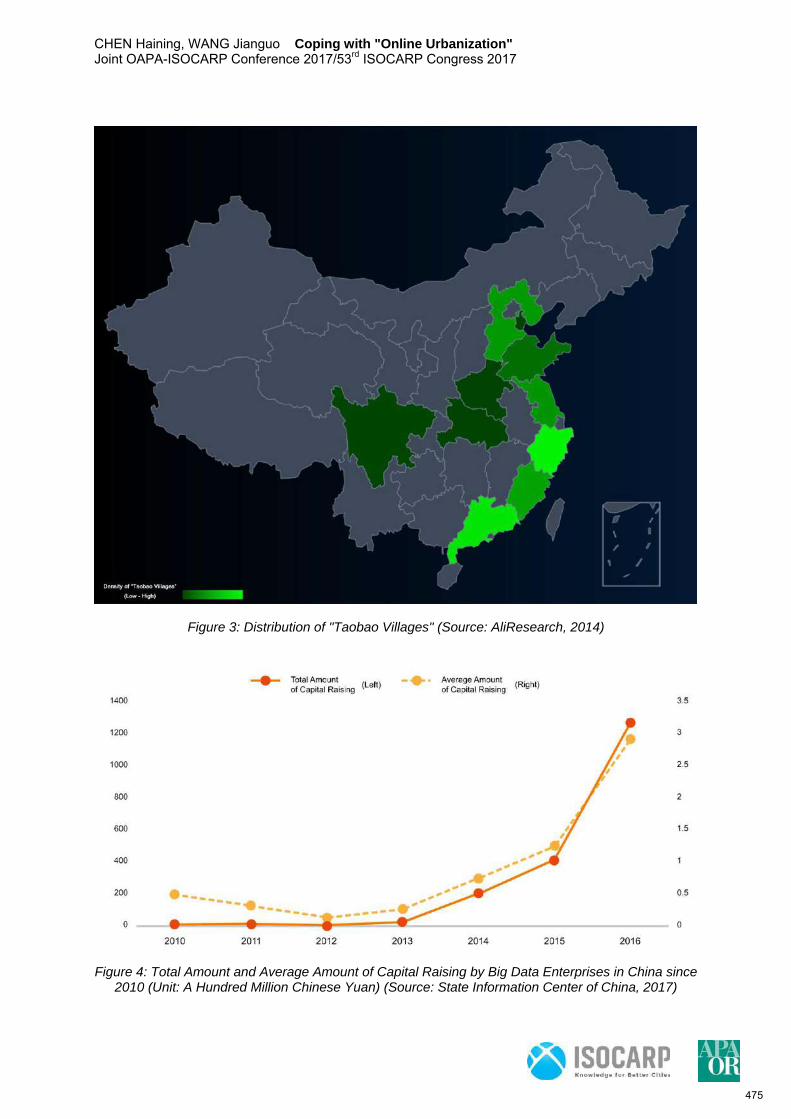
CHEN Haining, WANG Jianguo Coping with "Online Urbanization" Joint OAPA-ISOCARP Conference 2017/53rd ISOCARP Congress 2017
7
Figure 3: Distribution of "Taobao Villages" (Source: AliResearch, 2014)
Figure 4: Total Amount and Average Amount of Capital Raising by Big Data Enterprises in China since 2010 (Unit: A Hundred Million Chinese Yuan) (Source: State Information Center of China, 2017)
475
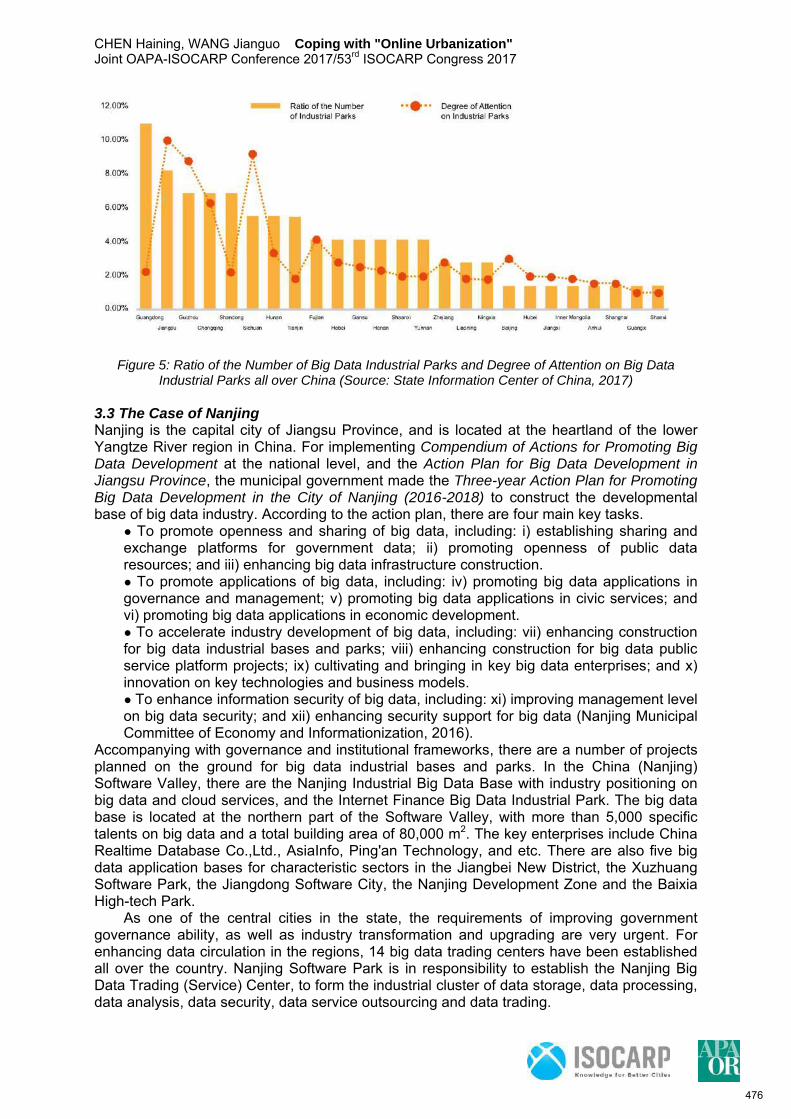
CHEN Haining, WANG Jianguo Coping with "Online Urbanization" Joint OAPA-ISOCARP Conference 2017/53rd ISOCARP Congress 2017
8
Figure 5: Ratio of the Number of Big Data Industrial Parks and Degree of Attention on Big Data Industrial Parks all over China (Source: State Information Center of China, 2017)
3.3 The Case of Nanjing Nanjing is the capital city of Jiangsu Province, and is located at the heartland of the lower Yangtze River region in China. For implementing Compendium of Actions for Promoting Big Data Development at the national level, and the Action Plan for Big Data Development in Jiangsu Province, the municipal government made the Three-year Action Plan for Promoting Big Data Development in the City of Nanjing (2016-2018) to construct the developmental base of big data industry. According to the action plan, there are four main key tasks.
● To promote openness and sharing of big data, including: i) establishing sharing and exchange platforms for government data; ii) promoting openness of public data resources; and iii) enhancing big data infrastructure construction. ● To promote applications of big data, including: iv) promoting big data applications in governance and management; v) promoting big data applications in civic services; and vi) promoting big data applications in economic development. ● To accelerate industry development of big data, including: vii) enhancing construction for big data industrial bases and parks; viii) enhancing construction for big data public service platform projects; ix) cultivating and bringing in key big data enterprises; and x) innovation on key technologies and business models. ● To enhance information security of big data, including: xi) improving management level on big data security; and xii) enhancing security support for big data (Nanjing Municipal Committee of Economy and Informationization, 2016).
Accompanying with governance and institutional frameworks, there are a number of projects planned on the ground for big data industrial bases and parks. In the China (Nanjing) Software Valley, there are the Nanjing Industrial Big Data Base with industry positioning on big data and cloud services, and the Internet Finance Big Data Industrial Park. The big data base is located at the northern part of the Software Valley, with more than 5,000 specific talents on big data and a total building area of 80,000 m2. The key enterprises include China Realtime Database Co.,Ltd., AsiaInfo, Ping'an Technology, and etc. There are also five big data application bases for characteristic sectors in the Jiangbei New District, the Xuzhuang Software Park, the Jiangdong Software City, the Nanjing Development Zone and the Baixia High-tech Park.
As one of the central cities in the state, the requirements of improving government governance ability, as well as industry transformation and upgrading are very urgent. For enhancing data circulation in the regions, 14 big data trading centers have been established all over the country. Nanjing Software Park is in responsibility to establish the Nanjing Big Data Trading (Service) Center, to form the industrial cluster of data storage, data processing, data analysis, data security, data service outsourcing and data trading.
476
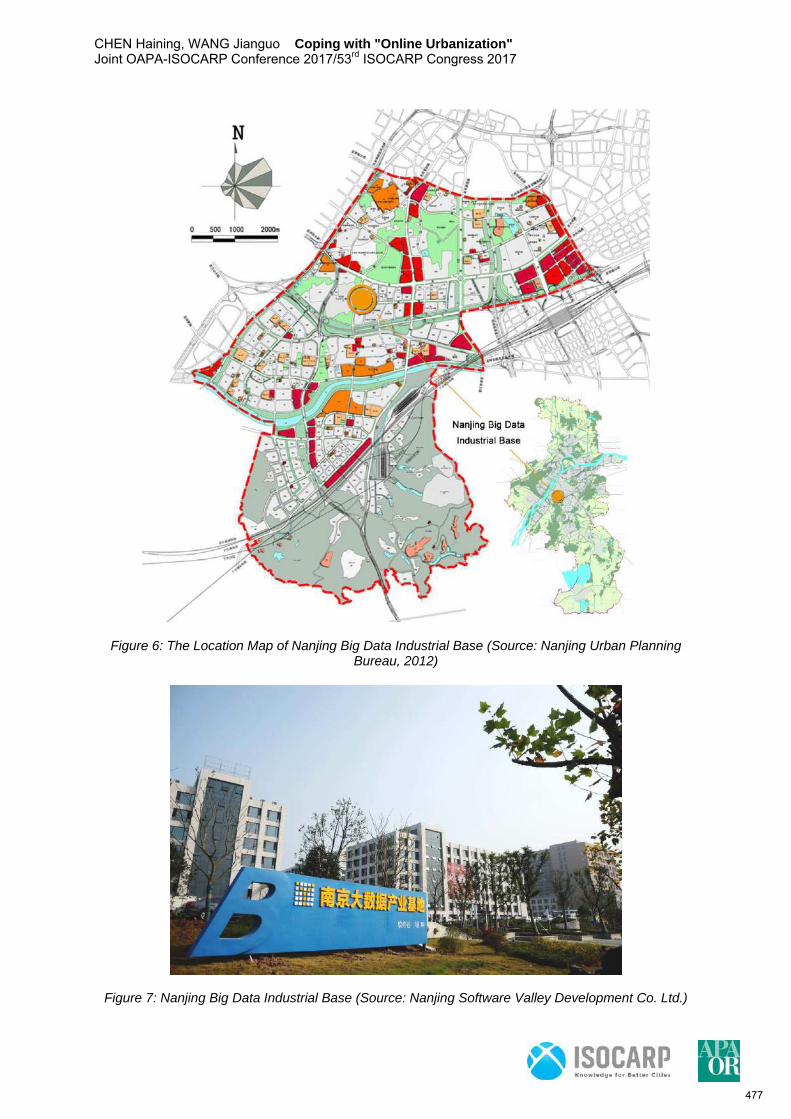
CHEN Haining, WANG Jianguo Coping with "Online Urbanization" Joint OAPA-ISOCARP Conference 2017/53rd ISOCARP Congress 2017
9
Figure 6: The Location Map of Nanjing Big Data Industrial Base (Source: Nanjing Urban Planning Bureau, 2012)
Figure 7: Nanjing Big Data Industrial Base (Source: Nanjing Software Valley Development Co. Ltd.)
477
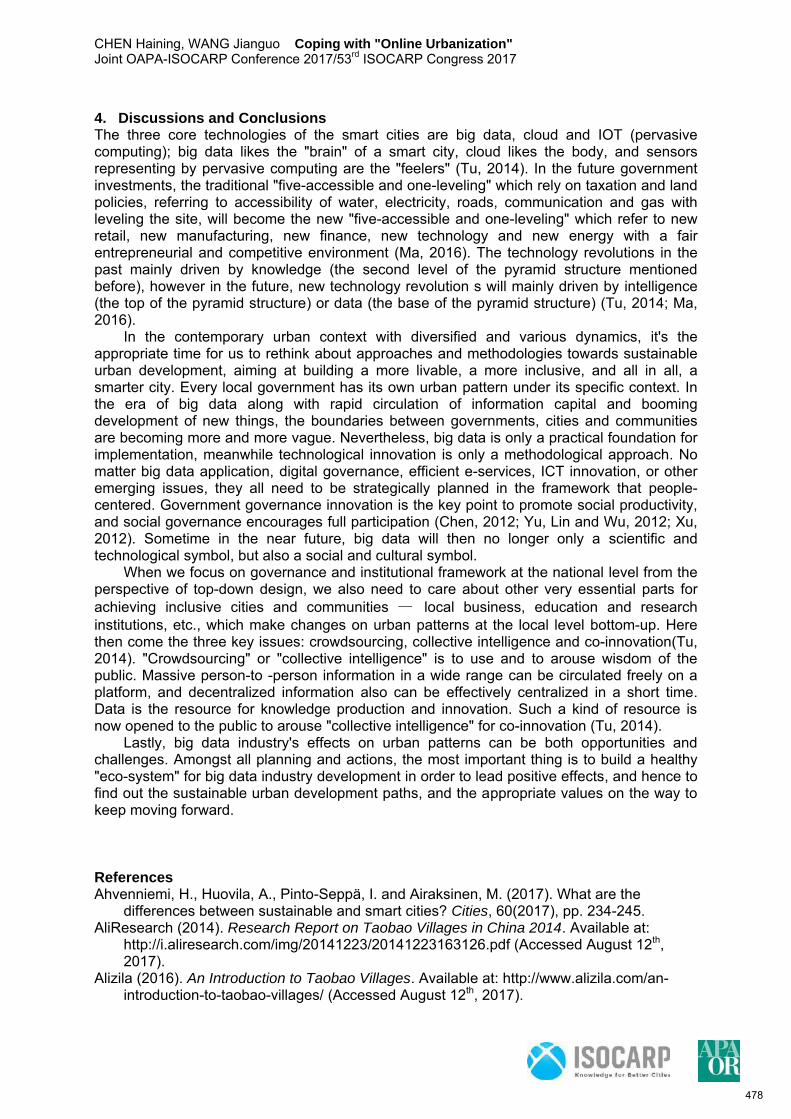
CHEN Haining, WANG Jianguo Coping with "Online Urbanization" Joint OAPA-ISOCARP Conference 2017/53rd ISOCARP Congress 2017
10
4. Discussions and Conclusions The three core technologies of the smart cities are big data, cloud and IOT (pervasive computing); big data likes the "brain" of a smart city, cloud likes the body, and sensors representing by pervasive computing are the "feelers" (Tu, 2014). In the future government investments, the traditional "five-accessible and one-leveling" which rely on taxation and land policies, referring to accessibility of water, electricity, roads, communication and gas with leveling the site, will become the new "five-accessible and one-leveling" which refer to new retail, new manufacturing, new finance, new technology and new energy with a fair entrepreneurial and competitive environment (Ma, 2016). The technology revolutions in the past mainly driven by knowledge (the second level of the pyramid structure mentioned before), however in the future, new technology revolution s will mainly driven by intelligence (the top of the pyramid structure) or data (the base of the pyramid structure) (Tu, 2014; Ma, 2016).
In the contemporary urban context with diversified and various dynamics, it's the appropriate time for us to rethink about approaches and methodologies towards sustainable urban development, aiming at building a more livable, a more inclusive, and all in all, a smarter city. Every local government has its own urban pattern under its specific context. In the era of big data along with rapid circulation of information capital and booming development of new things, the boundaries between governments, cities and communities are becoming more and more vague. Nevertheless, big data is only a practical foundation for implementation, meanwhile technological innovation is only a methodological approach. No matter big data application, digital governance, efficient e-services, ICT innovation, or other emerging issues, they all need to be strategically planned in the framework that people-centered. Government governance innovation is the key point to promote social productivity, and social governance encourages full participation (Chen, 2012; Yu, Lin and Wu, 2012; Xu, 2012). Sometime in the near future, big data will then no longer only a scientific and technological symbol, but also a social and cultural symbol.
When we focus on governance and institutional framework at the national level from the perspective of top-down design, we also need to care about other very essential parts for achieving inclusive cities and communities — local business, education and research institutions, etc., which make changes on urban patterns at the local level bottom-up. Here then come the three key issues: crowdsourcing, collective intelligence and co-innovation(Tu, 2014). "Crowdsourcing" or "collective intelligence" is to use and to arouse wisdom of the public. Massive person-to -person information in a wide range can be circulated freely on a platform, and decentralized information also can be effectively centralized in a short time. Data is the resource for knowledge production and innovation. Such a kind of resource is now opened to the public to arouse "collective intelligence" for co-innovation (Tu, 2014).
Lastly, big data industry's effects on urban patterns can be both opportunities and challenges. Amongst all planning and actions, the most important thing is to build a healthy "eco-system" for big data industry development in order to lead positive effects, and hence to find out the sustainable urban development paths, and the appropriate values on the way to keep moving forward. References Ahvenniemi, H., Huovila, A., Pinto-Seppä, I. and Airaksinen, M. (2017). What are the
differences between sustainable and smart cities? Cities, 60(2017), pp. 234-245. AliResearch (2014). Research Report on Taobao Villages in China 2014. Available at:
http://i.aliresearch.com/img/20141223/20141223163126.pdf (Accessed August 12th, 2017).
Alizila (2016). An Introduction to Taobao Villages. Available at: http://www.alizila.com/an-introduction-to-taobao-villages/ (Accessed August 12th, 2017).
478
CHEN Haining, WANG Jianguo Coping with "Online Urbanization" Joint OAPA-ISOCARP Conference 2017/53rd ISOCARP Congress 2017
11
An, Hui (2016) Interpretation on National Big Data Policies and development Directions. Available at: http://www.sohu.com/a/123564193_354988 (Accessed August 4th, 2017).
Angelidou, M. (2014). Smart City Policies: A Spatial Approach. Cities, 41(S1), S1-S11. Castells, Manuel (2000). The Rise of the Network Society (The Information Age: Economy,
Society, and Culture). 2nd ed. Hoboken: Wiley-Blackwell. Castells, Manuel (2010). End of Millennium (The Information Age: Economy, Society, and
Culture). 2nd ed. Hoboken: Wiley-Blackwell. Chen, L. (2012). From Efficiency First to Integration of Pluralistic Values: Value Proposition in
Transformation of Social Governance. Journal of Liaoning Administration College, 14(6), pp. 7-9.
Chinadaily.com.cn (2011). Reform and Opening-up. Available at: http://www.chinadaily.com.cn/china/cpc2011/2011-05/10/content_12480513.htm (Accessed August 12th, 2017).
Harvey, David (2005). Paris, Capital of Modernity. 1st ed. London: Routledge. IEEE (the Institute of Electrical and Electronics Engineers) (2014). IEEE Smart Cities.
Available at: https://smartcities.ieee.org/about.html (Accessed July 15th, 2017). Ma, Y. (2016) E-commerce will disappear, new "five-accessible and one-leveling" will lead
the future. Available at: https://yq.aliyun.com/articles/61583 (Accessed August 10th, 2017).
Marsal-Llacuna, M.-L., Colomer-Llinàs, J. and Meléndez-Frigola, J. (2015). Lessons in Urban Monitoring Taken from Sustainable and Livable Cities to Better Address the Smart Cities Initiative. Technological Forecasting and Social Change, 90(B), 611-622.
Nadkarni, A. and Vesset, D. (2016). Worldwide Big Data Technology and Services Forecast, 2016-2020. International Data Corporation. Available at: http://www.idc.com/getdoc.jsp?containerId=US40803116 (Accessed July 12th, 2017).
Nanjing Municipal Committee of Economy and Informationization (2016). The Three-year Action Plan for Promoting Big Data Development in the City of Nanjing (2016-2018). Available at: http://cbdio.com/BigData/2016-11/18/content_5382130.htm (Accessed July 15th, 2017).
Nanjing Urban Planning Bureau (2012) . Regulatory Detailed Planning of the Eastern Area in China (Nanjing) Software Valley (Accessed July 15th, 2017).
Picon, Antoine (2015). Smart Cities: A Spatialised Intelligence. 1st ed. Hoboken: Wiley. State Council of China (2015) Compendium of Actions for Promoting Big Data Development.
Available at: http://www.gov.cn/zhengce/content/2015-09/05/content_10137.htm (Accessed July 23rd, 2017).
State Council of China (2016). "The Thirteenth Five-Year Plan" National Informationization Planning. Available at: http://www.gov.cn/zhengce/content/2016-12/27/content_5153411.htm (Accessed July 25th, 2017).
State Information Center of China (2017). Report of the Big Data Development in China 2017. Available at: http://www.sic.gov.cn/archiver/SIC/UpFile/Files/Default/20170301105857384102.pdf (Accessed July 23rd, 2017).
Syntun (2016). Big Data Analysis Report on 11.11 E-shopping Festival. Available at: http://syntun.com.cn/xing-tu-shu-ju1112-shuang-shi-yi-wang-gou-da-shu-ju-fen-xi-bao-gao.html (Accessed July 18th, 2017).
Tu, Z. (2014). Big Data: History, Reality an d Future. Beijing: China Citic Press. UN (the United Nations) (2015). Habitat III Issue Papers: 1-Inclusive Cities. Available at:
https://unhabitat.org/wp-content/uploads/2015/04/Habitat-III-Issue-Paper-1_Inclusive-Cities-2.0.pdf (Accessed August 4th, 2017).
UN (the United Nations) (2015). Habitat III Issue Papers: 6-Urban Governance. Available at: https://unhabitat.org/wp-content/uploads/2015/04/Habitat-III-Issue-Paper-6_Urban-Governance-2.0.pdf (Accessed August 4th, 2017).
Xia, Z. (2017). "Online Urbanization" and "Network Urbanization".
479

CHEN Haining, WANG Jianguo Coping with "Online Urbanization" Joint OAPA-ISOCARP Conference 2017/53rd ISOCARP Congress 2017
12
Xu, Z. (2012). Leapfrog Development in China in the Era of "Big Data" —— Reconsider the Uniqueness of Chinese Society and Economy. People's Tribune·Frontiers, 1(14), pp 13-18.
Yang, Y. (2011). The Myth of Paris as Mirror of Contemporary Chinese Cities: Book Review on "Paris: Capital of Modernity" by David Harvey. Urban Planning International, 26(2), pp. 111-115.
Yu, W., Lin, T. and Wu, W. (2012). Improving the Governance Capacity, Forging Service-oriented Government — 2011 Lien Chinese Service-oriented Government Index and Survey Report. East China Economic Management, 26(7), pp. 26-30+38.
480
Equitablegrowthpoliciesandcommunitypartnershipsdriveacity'shousingstrategyalongamajortransitcorridor
Moderator: Ryan CURREN, City of Portland, Portland, USA
Speakers: Matthew TSCHABOLD, Portland Housing Bureau, USA; Rachael DUKE, Community Partners for Affordable Housing, USA
This session will be a panel presentation and discussion on one equitable TOD planning process from
the perspective of city planning and policy staff and the community‐based organizations
participating in the process. We’ll describe how a set of shared goals, accountable working
relationships, resourcing of community organizations, and agreed upon roles based on each other’s
strengths effectively furthers equitable growth policies in the context of new light rail investment.
We will share how we came to understand that a lack of affordable housing and effective tenant
protections leads to the displacement of low‐income households. And how while transit investments
improve residents’ mobility and improve health outcomes, it also spurs gentrification and increases
displacement pressures.
We’ll describe how the City of Portland and its partners are developing an Equitable Housing
Strategy (EHS) in anticipation of a major regional investment in light rail. We’ll discuss the tradeoffs
of investing in transit in highly desirable neighborhoods with many existing amenities and a large
stock of naturally occurring affordable housing vulnerable to displacement pressures.
Community based nonprofits will describe how they are funded through the City’s community grants
program to ensure race and social equity considerations are integrated in all aspects of the EHS and
the process is informed by the lived experiences of low‐income households and communities of
color. We’ll describe how the strategies to engage and organize low‐income tenants is driving the
planning process while also building lasting community capacity.
City of Portland staff will describe how in consultation with community, we are setting affordable
housing targets, advancing local land use and housing policies and financial tools to increase housing
choices, and growing the City’s organizational capacity to implement the community’s vision of an
equitable future. We’ll also share the tools we are using to acquire land and market rate affordable
housing now before speculation and displacement occurs.
481
A Comparative study of satisfaction level for Middle-Income Group
Residents of Government housings and Public-Private Partnership
housings
Amit KAUR; Indian Institute of Technology (IIT) Kharagpur; India Sumana GUPTA; Indian Institute of Technology (IIT) Kharagpur; India
Abstract
This study conducted a comparative assessment of the satisfaction level of the Middle-Income Group (MIG) residents in relation to the costs incurred. West Bengal Housing Board (WBHB) had adopted the provision of government group housings and Public-Private Partnership (PPP) model to overcome the affordable housing shortage in West Bengal, India. Group housings provided under both the models were selected from the similar location in south eastern fringe of Kolkata, India. Comparison of the satisfaction levels was conducted at premises level in relation to costs incurred. Mean and median satisfaction scores were computed for costs incurred and investment made from recorded satisfaction values on a five-point Likert scale. Exploratory factor analysis was conducted in STATA using polychoric correlation to identify the significant attributes from the within premises level in case of both the housing models. Further "monetary benefits" were computed from housing to validate the computed satisfaction scores with costs incurred. These were computed as savings based upon the Neo Classical School of Thought which propounded the idea that investment made leads to savings. Savings were measured as deviations of the actual expenditure incurred on housing from the recommended standard of 12% to be incurred on housing by a MIG household. The findings of the study revealed that the PPP model is more successful despite of higher costs incurred identified from higher satisfaction level of the residents. Thus it can be concluded that the involvement of the private partners has led to successfully overcome the affordable housing shortage and if the affordability of the buyers permits, PPP model should be opted over the government group housing model.
Keywords
Middle-Income Group (MIG), Affordable Housing, Group Housings, Public-Private Partnership (PPP) Model, Exploratory Factor Analysis, Monetary Benefits
1. Introduction and background of study
The requirement of shelter is a basic need of mankind. However the lower and middle income groups of the Indian population are still devoid of this necessity. This section of the population when moves towards the cities in search of employment and better living opportunities, reside in the peripheral areas due to constraints of further development within city cores. This leads to peripheral expansion regardless of the shortage of basic infrastructure and housing. The present study, however, focuses on the housing shortage encountered by the Middle-Income Group (MIG) as it comprises of 19% of the total Indian population and is the fastest growing section (Kannan and Raveendran, 2011). Precisely above 60 percent of the Indian population belonged to the MIG category when considered with respect to 31 percent of the urban population (Census of India, 2011). The paucity of affordable housing, limitations from the affordability perspective had led the government authorities to get involved and create new housing stock for this income group. The state of West Bengal, India also encountered a similar situation following the increased demand for affordable housing posed by the new job seekers in the state which followed as a consequence of urbanisation. West Bengal Housing Board (WBHB) since its inception in 1972, emerged as the sole government agency responsible to cater to the rising demand of affordable housing. However, Kolkata Metropolitan Development Authority (KMDA) and other State construction and urban development departments later also got involved in the construction of public housing along with WBHB (Sengupta, 2006). WBHB in order to overcome this excessive demand adopted the provision of group housings. Group housings refers to housing with more than one dwelling unit, where ownership of the land is on a joint basis but the construction is undertaken by a sole agency (National Building Code of India, 2005). Further it also refers to mass housing, as it combines the initiatives and responsibility
482

of provision of all factors related to a housing program. These range from procuring the land to the provision of finished quality housing stock. The low and middle income groups prefer such collective initiatives as the burden of initial investments and later maintenance costs are collectively shared and reduced (Chattopadhyay, 2010) also found in a similar study by Ganju et al. 1989. A number of group housings developed in and around Kolkata and a total of 31,000 dwelling units were constructed by WBHB (Sengupta, 2006). But overtime WBHB was incapable of solely catering to the rising demands. Moreover due to financial constraints, the pace of provision and quality of housing stock provided was deteriorating. Hence, WBHB adopted the Public-Private Partnership (PPP) model in the year 1993, "to address the cleavage between the demand and supply of housing making West Bengal the first state in India to implement this model for affordable housing delivery" (Sengupta, 2006). This model refers to an arrangement between the two parties with the intention of reaping the benefits of each one of them. The joint venture company "Bengal Ambuja Housing Development Limited" between WBHB and Gujarat Ambuja Cements was formed subsequently. Furthermore, eight joint venture companies were formed in response to the adoption of this model. This model assured the government agencies that housing provision was viable to the poorest section of the society (Sengupta, 2006). The new "business" model so adopted followed a cross subsidy approach which was an incentive given to the private sector to invest in housing. The dwelling units of the low-middle income groups were to be disposed of at lower prices as compared to the higher price of the High- Income Group (HIG) which were to be sold according to the discretion of the private agency to gain back the economic rent. Further it was also mandatory under the model to reserve 10-15% of the total construction for Lower-Income Group (LIG) and MIG housing. The standards for the price, size, location of the dwelling units, the construction quality, provision of attributes within premises were also prescribed by the government agencies. The administrative structure of the joint venture companies was such that share of the public partners ranged between 11% and 49.5% depending upon the social content of the project. Further the chairman of the joint venture companies should be nominated by the State government (Sengupta, 2006). Hence it is clearly evident that two models of housing delivery are operational in the city of Kolkata and the housing requirement has been dealt with through the provision of group housings. Both the models so adopted, provided adequate attributes at the within premises level along with the dwelling unit considering buyers cost constraints. Therefore, carrying out a comparative assessment of the satisfaction levels of the residents between both the housing models in relation to the costs incurred is important as this merits further exploration and hence comprises of the major objective of this paper. The present study however, addresses the assessment of the satisfaction level of the residents in relation to the costs incurred at the within premises level as these are group housings where required attributes are provided within the boundaries. The major significant attributes from within premises level contributing significantly towards satisfaction level were also identified for each of the housing models. Further satisfaction level has also been assessed with the investment made to buy the dwelling unit. Moreover to validate the reported satisfaction scores with the costs incurred, the "monetary benefits" gained from housing were also computed. These were computed as "savings" based upon the Neo Classical School of Thought, where Keynes the major proponent, propounded the idea that savings are the result of the initial investment made, without investing in the house, savings would not have been generated. Based upon this, the "monetary benefits-savings" are computed as deviations of the actual percentage expended on housing from the recommended national standards of expenditure to be incurred on housing. The recommended national expenditure standard of 12% on housing for a MIG household has been identified from the study of Mukherjee and Das, (2012) and their study was compiled based on the findings of the McKinsey Global Institute Report (2007). Hence the main objective of the paper is to compare the satisfaction levels in relation to the costs incurred at the within premises level,
483
with the investment made and validating it with the monetary benefits computed. This leads to the identification of the more successful model in terms of its outreach to the intended beneficiaries. 2. Identification of the attributes to be included for the present study
2.1 Review for identification of attributes
Researches on the assessment of satisfaction level of the residents in different kinds of urban settings have been conducted by different researchers across the globe. However while assessing the satisfaction level of the residents the major thrust was laid upon the neighbourhood characteristics which were mostly related to the physical presence of attributes and facilities, social attributes like interaction with the other residents, friendliness, safety level and others. Besides these socio economic attributes of the residents like age, sex, gender composition, income and educational levels was also stressed upon. Further the internal and external household characteristics related to building size, orientation, number of rooms and others were also considered. Some of the mentionable researchers in this line include those of Lee (1968) on study of Cambridge where the relevance of neighbourhood was emphasised upon focussing on social and socio-economic attributes like social class, natives or immigrants in the neighbourhood, the length of residence, location of the workplace. Others researchers like Sulaiman and Yahaya (1981) study in low-income households of Kuala Lumpur Malaysia, found that the physical presence of neighbourhood facilities affected satisfaction level more than housing related attributes. Some other studies in similar lines include those of assessment of residential satisfaction at Cork, Ireland by Hourihan (1981); assessment of neighbourhood satisfaction in three housing types of North Carolina by Gruber and Shelton (1987); assessment of residents satisfaction in Tokyo by Savasdisara (1988); assessment of residential satisfaction in private low-cost housing estate of Bangkok by Savasdisara et al. (1989); assessment of residential satisfaction in low socio-economic status peripheral neighbourhoods of Madrid by Amerigo and Aragoni (1990). During 1990s' some of the other like studies on assessment of residents satisfaction where emphasis was laid upon physical attributes of similar nature included those of Ukoha and Beamish (1997) in Public housing of Nigeria; Djebarni and Al-Abed (2000) in the low-income public housing of Yemen. Post 2000 till present date some of the other researchers conducting studies on assessment of residents satisfaction considering like attributes include those of Parkes et al. (2002) on English Housings; Shields and Wooden (2003) in housings of Melbourne; Chapman and Lombard (2006) research in US gated and non-gated fee-based neighbourhoods; Kellecki and Berkoz (2007) in Istanbul Turkey; Adriaanse (2007) for assessing residential satisfaction of Dutch residents; Zehner (2007) research in new towns and suburbs of Reston and Columbia for assessing neighbourhood and community satisfaction; Salleh (2008) in low-cost housing in states of Penang and Terengganu; Howley et al. (2009) in apartment developments of Dublin; Oktay et al. (2009) in four identical neighbourhoods of North Cyprus. Amongst a few of the recent researchers considering similar attributes included are Baum et al. (2010) in Australia; Mohit et al. (2010) in public low cost housing of Malaysia; Permentier et al. (2011) in identification of the determinants of neighbourhood satisfaction in Utrecht; Garip and Sener (2012) in gated settlements in Istanbul; Buys and Miller (2012) in Australia. Further McGirr et al. (2015) in neighbourhoods of Toronto; Addo (2016) in the Greater Accra Region of Ghana considered similar attributes related to the physical, social and socio-economic attributes of the neighbourhood and similar results were obtained. Further in a study conducted by Ghasrodasti et al. (2017), in assessing the residential satisfaction of the residents of Mehr Housing Scheme, Iran emphasis has been laid upon the physical characteristics of the housing unit along with the social attributes such as social cohesion and participation. The above review of literature clearly highlights that, in the assessment of satisfaction level of the residents in different kinds of urban settings the researchers have focussed mainly
484
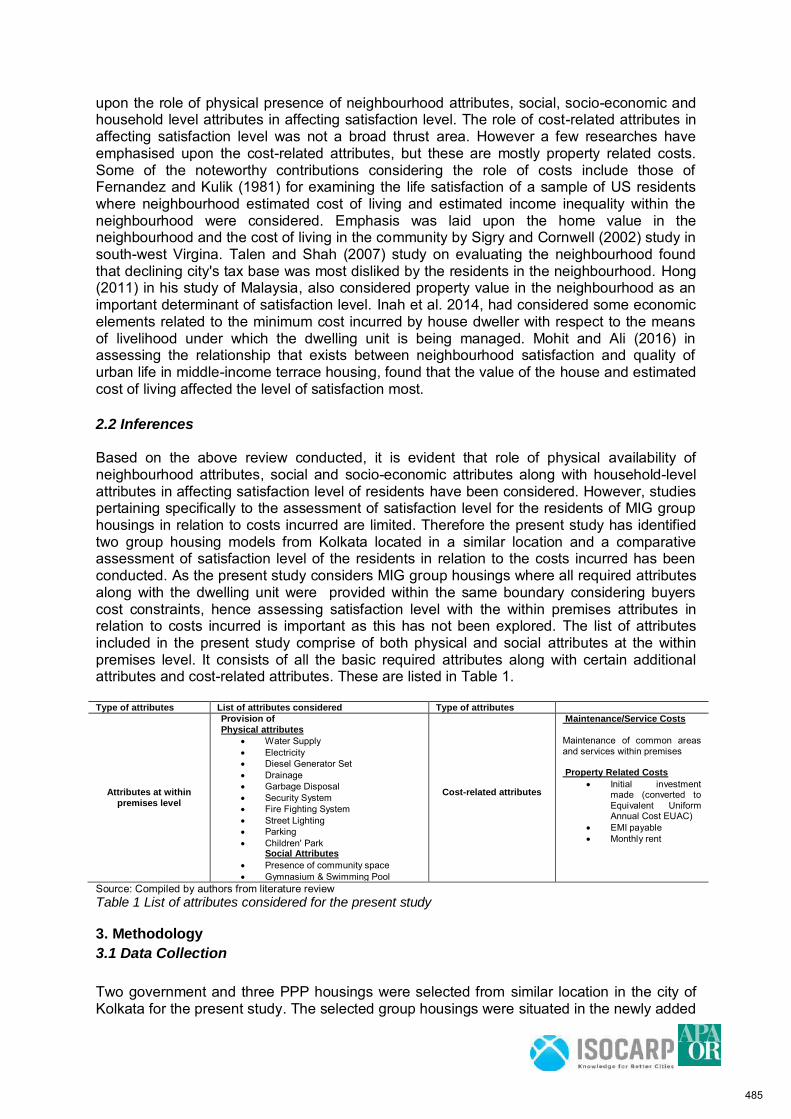
upon the role of physical presence of neighbourhood attributes, social, socio-economic and household level attributes in affecting satisfaction level. The role of cost-related attributes in affecting satisfaction level was not a broad thrust area. However a few researches have emphasised upon the cost-related attributes, but these are mostly property related costs. Some of the noteworthy contributions considering the role of costs include those of Fernandez and Kulik (1981) for examining the life satisfaction of a sample of US residents where neighbourhood estimated cost of living and estimated income inequality within the neighbourhood were considered. Emphasis was laid upon the home value in the neighbourhood and the cost of living in the community by Sigry and Cornwell (2002) study in south-west Virgina. Talen and Shah (2007) study on evaluating the neighbourhood found that declining city's tax base was most disliked by the residents in the neighbourhood. Hong (2011) in his study of Malaysia, also considered property value in the neighbourhood as an important determinant of satisfaction level. Inah et al. 2014, had considered some economic elements related to the minimum cost incurred by house dweller with respect to the means of livelihood under which the dwelling unit is being managed. Mohit and Ali (2016) in assessing the relationship that exists between neighbourhood satisfaction and quality of urban life in middle-income terrace housing, found that the value of the house and estimated cost of living affected the level of satisfaction most. 2.2 Inferences Based on the above review conducted, it is evident that role of physical availability of neighbourhood attributes, social and socio-economic attributes along with household-level attributes in affecting satisfaction level of residents have been considered. However, studies pertaining specifically to the assessment of satisfaction level for the residents of MIG group housings in relation to costs incurred are limited. Therefore the present study has identified two group housing models from Kolkata located in a similar location and a comparative assessment of satisfaction level of the residents in relation to the costs incurred has been conducted. As the present study considers MIG group housings where all required attributes along with the dwelling unit were provided within the same boundary considering buyers cost constraints, hence assessing satisfaction level with the within premises attributes in relation to costs incurred is important as this has not been explored. The list of attributes included in the present study comprise of both physical and social attributes at the within premises level. It consists of all the basic required attributes along with certain additional attributes and cost-related attributes. These are listed in Table 1. Type of attributes List of attributes considered Type of attributes
Attributes at within premises level
Provision of
Physical attributes
Water Supply Electricity Diesel Generator Set Drainage Garbage Disposal Security System Fire Fighting System Street Lighting Parking Children' Park
Social Attributes
Presence of community space Gymnasium & Swimming Pool
Cost-related attributes
Maintenance/Service Costs
Maintenance of common areas and services within premises Property Related Costs
Initial investment made (converted to Equivalent Uniform Annual Cost EUAC)
EMI payable Monthly rent
Source: Compiled by authors from literature review Table 1 List of attributes considered for the present study
3. Methodology
3.1 Data Collection
Two government and three PPP housings were selected from similar location in the city of Kolkata for the present study. The selected group housings were situated in the newly added
485
wards of Kolkata Municipal Corporation (KMC) along the Eatern Metropolitan Bypass (E. M. Bypass) in the south eastern fringe area of the city. This area has witnessed a major population growth since 1991. As both the housings types were in the vicinity of each other, hence these were selected for comparative assessment of satisfaction level of the MIG residents. East Calcutta Township Project Phase II and Phase IV (1993 and 1996) and Calcutta Greens Phase I and Phase II (2001 and 2003) including MIG category were the selected government housings. Household survey was conducted and 75 samples were chosen randomly. Utsarg-Utsav Housing (1998), Avshikta Phase I and Phase II (2005) and Upohar- The Condoville (2012) were amongst the selected PPP housings. Similar data collection method was adopted and 76 samples were chosen randomly from these three housings. Figure 1 shows the spatial location of these group housings within the KMC limits. 3.2 Questionnaire design and conduct of survey
Structured questionnaires were designed for data collection. It consisted of a section of questions on basic details related to age, sex, household size, income, vehicular possession, length of stay, tenure status. Further based upon the tenure status, questions related to cost attributes towards enjoying the property were also framed. For assessment of satisfaction level with the within premises attributes, questions on the availability and satisfaction level for each of the attributes were also recorded. Satisfaction with cost incurred for availing these attributes along with the investment made for buying the house were also recorded. All satisfaction responses were recorded on a five-point Likert scale varying from 1= Poor to 5= Very Good. To avoid incomplete questionnaires primary survey was conducted by first author and trained surveyors who questioned one adult respondent, preferably head of the household face to face. They were surveyed to assure the accuracy of the data collected and also to ensure completeness. Further, the survey responses were recorded depending upon the willingness of the residents to take part in the interviews.
3.3 Computation of satisfaction scores
Mean and median satisfaction scores were computed from the recorded satisfaction values on a five-point Likert scale with available attributes at the within premises level and costs incurred for availing them. Satisfaction scores were also computed with the investment made for buying the house. As the value of the median satisfaction scores was same, mean satisfaction scores were also computed to highlight the variations in case of each of the housing models. The computed satisfaction scores with costs incurred provided an understanding regarding the fact that the satisfaction level for residents of which housing model is higher with respect to the costs incurred and investment made.
3.4 Identification of the significant attributes using exploratory factor analysis in STATA
As already reported in section 3.2 that questions related to satisfaction level for each of the available attributes at the within premises level were also recorded on a five-point Likert scale. Hence from amongst all the attributes available, in order to identify the significant ones, exploratory factor analysis was conducted in STATA using polychoric correlation based upon the categorical nature of these attributes (i.e. satisfaction responses recorded for each of the available attributes on a five-point Likert scale). The exploratory factor analysis conducted has helped in the identification of the significant contributing attributes in case of each of the housing models.
486
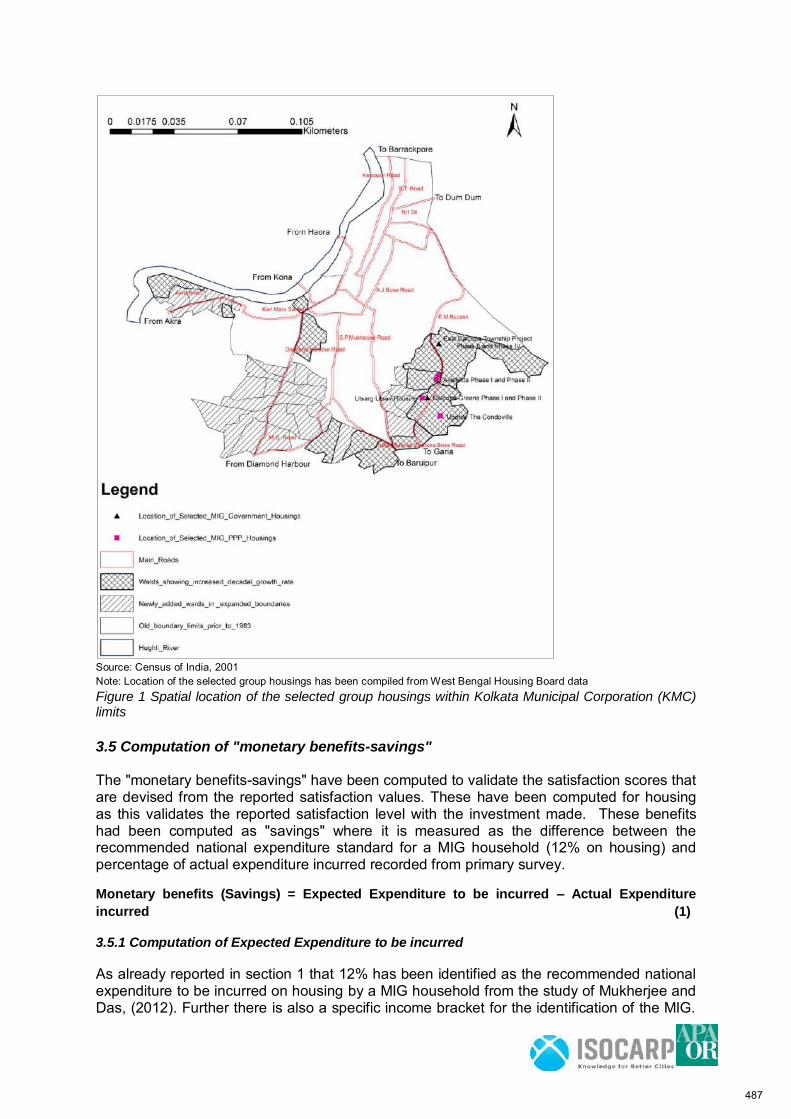
Source: Census of India, 2001 Note: Location of the selected group housings has been compiled from West Bengal Housing Board data Figure 1 Spatial location of the selected group housings within Kolkata Municipal Corporation (KMC) limits
3.5 Computation of "monetary benefits-savings" The "monetary benefits-savings" have been computed to validate the satisfaction scores that are devised from the reported satisfaction values. These have been computed for housing as this validates the reported satisfaction level with the investment made. These benefits had been computed as "savings" where it is measured as the difference between the recommended national expenditure standard for a MIG household (12% on housing) and percentage of actual expenditure incurred recorded from primary survey. Monetary benefits (Savings) = Expected Expenditure to be incurred – Actual Expenditure
incurred (1)
3.5.1 Computation of Expected Expenditure to be incurred
As already reported in section 1 that 12% has been identified as the recommended national expenditure to be incurred on housing by a MIG household from the study of Mukherjee and Das, (2012). Further there is also a specific income bracket for the identification of the MIG.
487
In case of the state of West Bengal (as the study specifically focuses on two different housing models of West Bengal), KMDA had classified the households within CMA (Calcutta Metropolitan Area) on the basis of the income into four categories of Economically Weaker Section (EWS), LIG, MIG and HIG (Sengupta 2006) in the year 2000. From here the income bracket for a MIG household was identified (ranging between INR 5000- 9999). The average income for a MIG household was computed using this as INR 7499.50. The present value of this income (as in year 2000) was projected for 2010 using an average Consumer Price Index (CPI) decadal inflation rate of 6.12% (calculated for year 2000 to 2010). As the Dearness Allowance (DA)i of 1.86 was implemented since the fifth pay commission in West Bengal, 2009, therefore an increment of 1.86 times in the income was witnessed. Hence this multiplicative factor was multiplied to the projected income as on 2010. This gave the value of the enhanced income for the year 2010 considering the DA factor. Further the increased income was again projected for the year 2016 considering a average CPI decadal inflation rate of 7.84% (calculated from 2011 to 2016). The projected value of stated MIG income (INR 7499.50) in the year 2016 was INR 42192.87. The expected expenditure to be incurred on housing was computed as 12% of this income respectively which is INR 5063.14. The income for a MIG household has been projected till 2016, as the primary survey was conducted during the year 2015-2016.
Average income of a MIG household = INR 7499.5 (based upon KMDA classification, 2000)
Projected value of this income for the year 2010 = (7.449.5*(1+0.612)^11) = INR 14421.37 (2)
Computation of Dearness Allowance (DA) = INR 14421.37*1.86 = INR 26823.75 (3)
Projected value of the enhanced income for the year 2016 = (26823.75 *(1+0.784)^6) = INR 42192.87 (4)
3.5.2 Computation of Actual Expenditure to be incurred
The actual expenditure incurred on housing is a summation of the monthly Equivalent Uniform Annual Cost (EUMC) (for owners), Equated Monthly Instalment (EMI) (if any) payable and monthly rent (for renters). The Equivalent Uniform Annual Cost (EUAC) is a method of expressing the cost of a lump sum investment in annual or periodic terms (Steiner, 1992). This is calculated using the present value of the investment made for buying the house after deducting the depreciation amount. The depreciation amount is calculated by assuming a depreciation rate of 1.58% for RCC (Reinforced Cement Concrete) building in India with the assumed life of a building to be 60 years (Schedule C of Companies Act, 2013 of India). Further the EUAC is calculated based upon the capital recovery factor (A/P, i%, n). The formula for computing the EUAC is shown in equation 5. The capital recovery factor is further calculated using the formula given equation 6. EUAC = P*(A/P, i%, n) (5)
Where, P = Present Value (A/P, i%, n) = Capital Recovery Factor Capital Recovery Factor = i*(1+i)n/(1+i)n - 1 (6)
Where, i= decadal Consumer Price Index (CPI) inflation rateii inflation rate starting from year 1970 up to 2016 (8.051%) n= Assumed Life of building (60 years)
The EUAC was converted to a monthly value termed as EUMC and was added to the actual expenditure incurred on housing. The computation of EUMC is shown in equation 7. EUMC = EUAC/(remaining age of building * 12) (7)
488
4. Results 4.1 Characteristics of sample The general and economic details of the samples collected from each of the housing model is listed in Table 2 and 3. General Characteristics of Sample Govt Housings (75 samples) PPP Housings (76 samples)
Variable Number Percentage Number Percentage
Household Size 1 5 6.67 1 2 29 38.67 20 1.32 3 24 32.00 35 26.32 4 12 16.00 16 46.05 5 4 5.33 3 21.05 >5 1 1.33 1 3.95 Sex 1.32 Male 74 98.67 76 Female 71 94.67 75 100 Children Present 44 58.67 48 98.68 Children Absent 31 41.33 28 63.156 Length of Stay <5 years 26 34.67 15 19.73 5-10 years 46 61.33 33 43.42 10-15 years 3 4.00 9 11.84 >15 years 0 0.00 19 25.00 Previous Place of Stay Within city 65 86.67 50 65.79 Suburbs 2 2.67 13 17.11 Another city 8 10.67 13 17.11 Tenure Status Owned 50 66.67 67 88.16 Rented 25 33.33 9 11.84 Vehicular Possession None 16 21.33 17 22.37 Two Wheeler 30 40.00 5 6.57 Four Wheeler 26 34.67 48 63.16 Both 2 2.67 6 7.89 Average Dwelling Unit Area (Carpet Area in sq ft)
554 (approx)
659 (approx)
Possession of DU (for owners) Lottery 48 96.00 61 91.04 Others 2 4.00 11 16.42 Source: Primary Survey conducted by first author and trained surveyors, 2015-2016 Table 2 General characteristics of sample Economic Characteristics of Sample
Govt Housings (75 samples) PPP Housings (76 samples)
Variable Number Percentage Number Percentage
No. of Earning members Males 0 38 50.66 17 22.37 1 36 48.00 58 76.32 2 1 1.33 3 3.95 Females 1 21 28.00 16 21.05 Average Income (INR) 24746.70 41552.63 Occupation Service 42 56.00 45 59.21 Business 22 29.33 11 14.47 Self Employed 0 0.00 2 2.63 Retired 11 14.67 17 22.37 Source: Primary Survey conducted by first author and trained surveyors, 2015-2016 Table 3 Economic characteristics of sample
4.2 Computed Satisfaction Scores
The mean and median satisfaction scores were computed from the satisfaction responses recorded on a five-point Likert scale for each of the attributes available at the within premises level, with costs incurred for availing them and with the investment made for buying the house/ rent charges paid. The following Table 4 highlights the summary of the mean and median satisfaction scores for both the housing models.
489
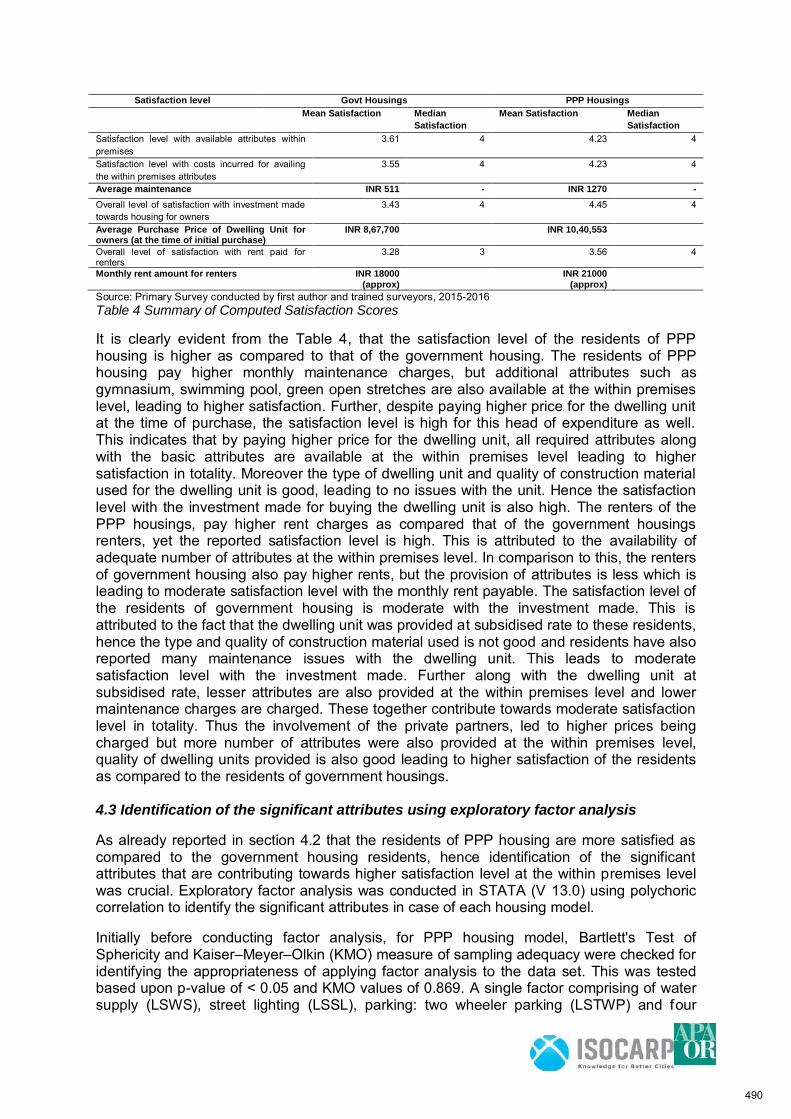
Satisfaction level Govt Housings PPP Housings
Mean Satisfaction Median
Satisfaction
Mean Satisfaction Median
Satisfaction
Satisfaction level with available attributes within premises
3.61
4 4.23 4
Satisfaction level with costs incurred for availing the within premises attributes
3.55 4 4.23 4
Average maintenance INR 511 - INR 1270 -
Overall level of satisfaction with investment made towards housing for owners
3.43 4 4.45 4
Average Purchase Price of Dwelling Unit for owners (at the time of initial purchase)
INR 8,67,700
INR 10,40,553
Overall level of satisfaction with rent paid for renters
3.28 3 3.56 4
Monthly rent amount for renters INR 18000 (approx)
INR 21000 (approx)
Source: Primary Survey conducted by first author and trained surveyors, 2015-2016 Table 4 Summary of Computed Satisfaction Scores It is clearly evident from the Table 4, that the satisfaction level of the residents of PPP housing is higher as compared to that of the government housing. The residents of PPP housing pay higher monthly maintenance charges, but additional attributes such as gymnasium, swimming pool, green open stretches are also available at the within premises level, leading to higher satisfaction. Further, despite paying higher price for the dwelling unit at the time of purchase, the satisfaction level is high for this head of expenditure as well. This indicates that by paying higher price for the dwelling unit, all required attributes along with the basic attributes are available at the within premises level leading to higher satisfaction in totality. Moreover the type of dwelling unit and quality of construction material used for the dwelling unit is good, leading to no issues with the unit. Hence the satisfaction level with the investment made for buying the dwelling unit is also high. The renters of the PPP housings, pay higher rent charges as compared that of the government housings renters, yet the reported satisfaction level is high. This is attributed to the availability of adequate number of attributes at the within premises level. In comparison to this, the renters of government housing also pay higher rents, but the provision of attributes is less which is leading to moderate satisfaction level with the monthly rent payable. The satisfaction level of the residents of government housing is moderate with the investment made. This is attributed to the fact that the dwelling unit was provided at subsidised rate to these residents, hence the type and quality of construction material used is not good and residents have also reported many maintenance issues with the dwelling unit. This leads to moderate satisfaction level with the investment made. Further along with the dwelling unit at subsidised rate, lesser attributes are also provided at the within premises level and lower maintenance charges are charged. These together contribute towards moderate satisfaction level in totality. Thus the involvement of the private partners, led to higher prices being charged but more number of attributes were also provided at the within premises level, quality of dwelling units provided is also good leading to higher satisfaction of the residents as compared to the residents of government housings. 4.3 Identification of the significant attributes using exploratory factor analysis
As already reported in section 4.2 that the residents of PPP housing are more satisfied as compared to the government housing residents, hence identification of the significant attributes that are contributing towards higher satisfaction level at the within premises level was crucial. Exploratory factor analysis was conducted in STATA (V 13.0) using polychoric correlation to identify the significant attributes in case of each housing model.
Initially before conducting factor analysis, for PPP housing model, Bartlett's Test of Sphericity and Kaiser–Meyer–Olkin (KMO) measure of sampling adequacy were checked for identifying the appropriateness of applying factor analysis to the data set. This was tested based upon p-value of < 0.05 and KMO values of 0.869. A single factor comprising of water supply (LSWS), street lighting (LSSL), parking: two wheeler parking (LSTWP) and four
490
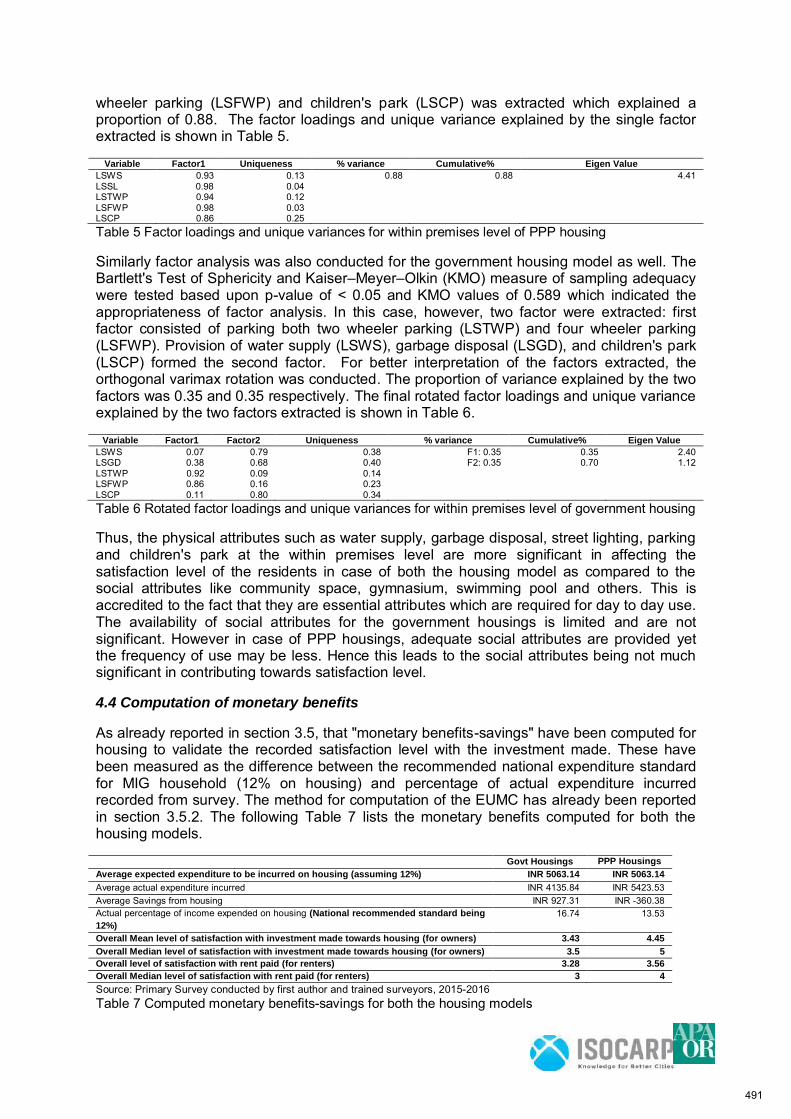
wheeler parking (LSFWP) and children's park (LSCP) was extracted which explained a proportion of 0.88. The factor loadings and unique variance explained by the single factor extracted is shown in Table 5.
Variable Factor1 Uniqueness % variance Cumulative% Eigen Value
LSWS 0.93 0.13 0.88 0.88 4.41 LSSL 0.98 0.04 LSTWP 0.94 0.12 LSFWP 0.98 0.03 LSCP 0.86 0.25 Table 5 Factor loadings and unique variances for within premises level of PPP housing
Similarly factor analysis was also conducted for the government housing model as well. The Bartlett's Test of Sphericity and Kaiser–Meyer–Olkin (KMO) measure of sampling adequacy were tested based upon p-value of < 0.05 and KMO values of 0.589 which indicated the appropriateness of factor analysis. In this case, however, two factor were extracted: first factor consisted of parking both two wheeler parking (LSTWP) and four wheeler parking (LSFWP). Provision of water supply (LSWS), garbage disposal (LSGD), and children's park (LSCP) formed the second factor. For better interpretation of the factors extracted, the orthogonal varimax rotation was conducted. The proportion of variance explained by the two factors was 0.35 and 0.35 respectively. The final rotated factor loadings and unique variance explained by the two factors extracted is shown in Table 6.
Variable Factor1 Factor2 Uniqueness % variance Cumulative% Eigen Value
LSWS 0.07 0.79 0.38 F1: 0.35 0.35 2.40 LSGD 0.38 0.68 0.40 F2: 0.35 0.70 1.12 LSTWP 0.92 0.09 0.14 LSFWP 0.86 0.16 0.23 LSCP 0.11 0.80 0.34 Table 6 Rotated factor loadings and unique variances for within premises level of government housing Thus, the physical attributes such as water supply, garbage disposal, street lighting, parking and children's park at the within premises level are more significant in affecting the satisfaction level of the residents in case of both the housing model as compared to the social attributes like community space, gymnasium, swimming pool and others. This is accredited to the fact that they are essential attributes which are required for day to day use. The availability of social attributes for the government housings is limited and are not significant. However in case of PPP housings, adequate social attributes are provided yet the frequency of use may be less. Hence this leads to the social attributes being not much significant in contributing towards satisfaction level.
4.4 Computation of monetary benefits
As already reported in section 3.5, that "monetary benefits-savings" have been computed for housing to validate the recorded satisfaction level with the investment made. These have been measured as the difference between the recommended national expenditure standard for MIG household (12% on housing) and percentage of actual expenditure incurred recorded from survey. The method for computation of the EUMC has already been reported in section 3.5.2. The following Table 7 lists the monetary benefits computed for both the housing models.
Govt Housings PPP Housings
Average expected expenditure to be incurred on housing (assuming 12%) INR 5063.14 INR 5063.14
Average actual expenditure incurred INR 4135.84 INR 5423.53 Average Savings from housing INR 927.31 INR -360.38 Actual percentage of income expended on housing (National recommended standard being
12%) 16.74 13.53
Overall Mean level of satisfaction with investment made towards housing (for owners) 3.43 4.45 Overall Median level of satisfaction with investment made towards housing (for owners) 3.5 5 Overall level of satisfaction with rent paid (for renters) 3.28 3.56 Overall Median level of satisfaction with rent paid (for renters) 3 4 Source: Primary Survey conducted by first author and trained surveyors, 2015-2016 Table 7 Computed monetary benefits-savings for both the housing models
491
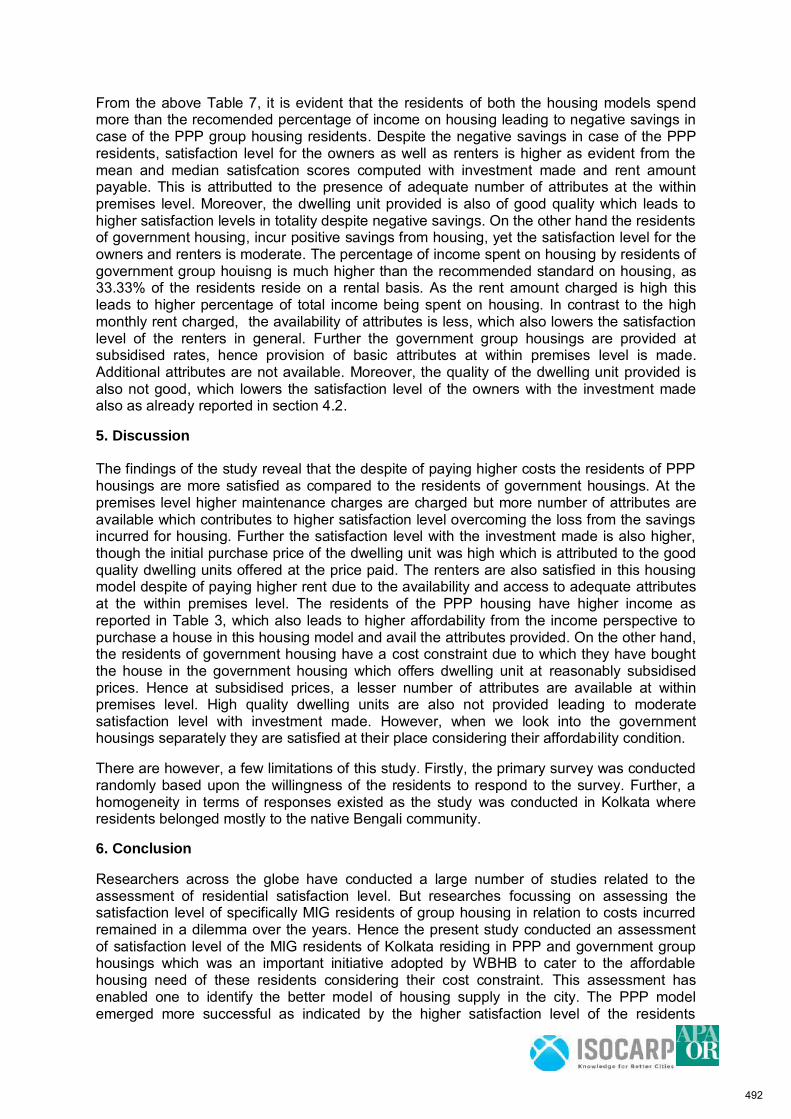
From the above Table 7, it is evident that the residents of both the housing models spend more than the recomended percentage of income on housing leading to negative savings in case of the PPP group housing residents. Despite the negative savings in case of the PPP residents, satisfaction level for the owners as well as renters is higher as evident from the mean and median satisfcation scores computed with investment made and rent amount payable. This is attributted to the presence of adequate number of attributes at the within premises level. Moreover, the dwelling unit provided is also of good quality which leads to higher satisfaction levels in totality despite negative savings. On the other hand the residents of government housing, incur positive savings from housing, yet the satisfaction level for the owners and renters is moderate. The percentage of income spent on housing by residents of government group houisng is much higher than the recommended standard on housing, as 33.33% of the residents reside on a rental basis. As the rent amount charged is high this leads to higher percentage of total income being spent on housing. In contrast to the high monthly rent charged, the availability of attributes is less, which also lowers the satisfaction level of the renters in general. Further the government group housings are provided at subsidised rates, hence provision of basic attributes at within premises level is made. Additional attributes are not available. Moreover, the quality of the dwelling unit provided is also not good, which lowers the satisfaction level of the owners with the investment made also as already reported in section 4.2. 5. Discussion
The findings of the study reveal that the despite of paying higher costs the residents of PPP housings are more satisfied as compared to the residents of government housings. At the premises level higher maintenance charges are charged but more number of attributes are available which contributes to higher satisfaction level overcoming the loss from the savings incurred for housing. Further the satisfaction level with the investment made is also higher, though the initial purchase price of the dwelling unit was high which is attributed to the good quality dwelling units offered at the price paid. The renters are also satisfied in this housing model despite of paying higher rent due to the availability and access to adequate attributes at the within premises level. The residents of the PPP housing have higher income as reported in Table 3, which also leads to higher affordability from the income perspective to purchase a house in this housing model and avail the attributes provided. On the other hand, the residents of government housing have a cost constraint due to which they have bought the house in the government housing which offers dwelling unit at reasonably subsidised prices. Hence at subsidised prices, a lesser number of attributes are available at within premises level. High quality dwelling units are also not provided leading to moderate satisfaction level with investment made. However, when we look into the government housings separately they are satisfied at their place considering their affordability condition.
There are however, a few limitations of this study. Firstly, the primary survey was conducted randomly based upon the willingness of the residents to respond to the survey. Further, a homogeneity in terms of responses existed as the study was conducted in Kolkata where residents belonged mostly to the native Bengali community.
6. Conclusion
Researchers across the globe have conducted a large number of studies related to the assessment of residential satisfaction level. But researches focussing on assessing the satisfaction level of specifically MIG residents of group housing in relation to costs incurred remained in a dilemma over the years. Hence the present study conducted an assessment of satisfaction level of the MIG residents of Kolkata residing in PPP and government group housings which was an important initiative adopted by WBHB to cater to the affordable housing need of these residents considering their cost constraint. This assessment has enabled one to identify the better model of housing supply in the city. The PPP model emerged more successful as indicated by the higher satisfaction level of the residents
492
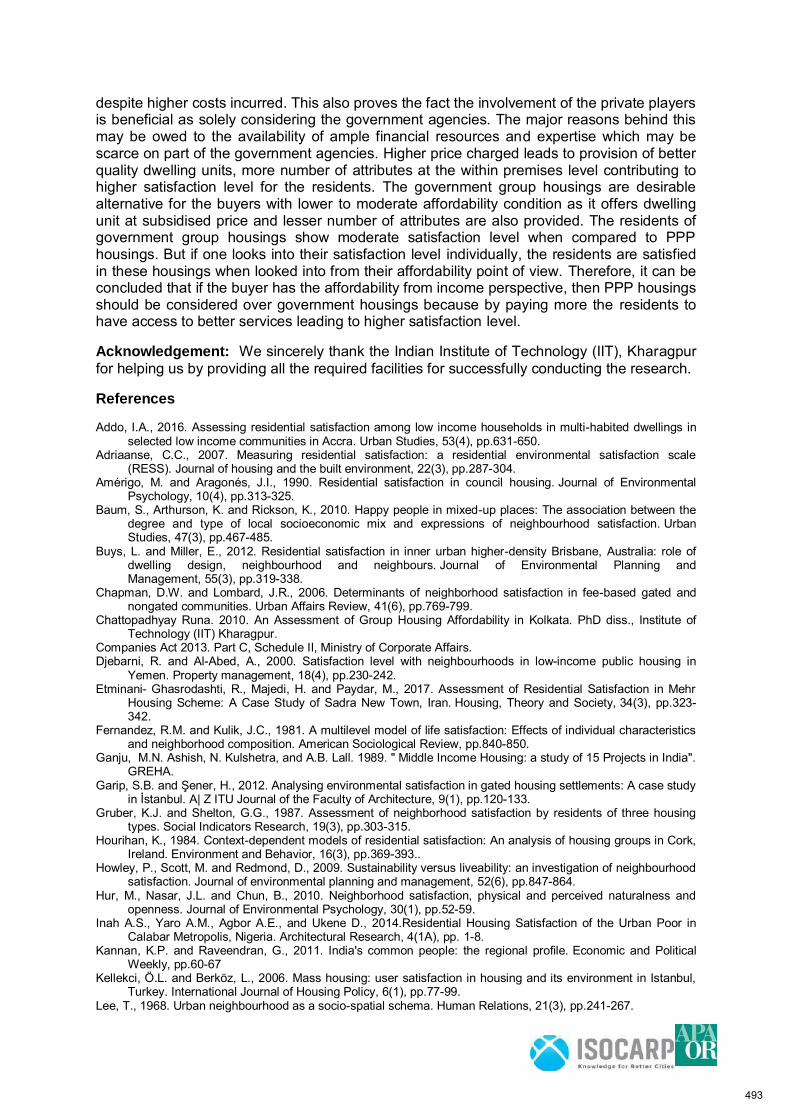
despite higher costs incurred. This also proves the fact the involvement of the private players is beneficial as solely considering the government agencies. The major reasons behind this may be owed to the availability of ample financial resources and expertise which may be scarce on part of the government agencies. Higher price charged leads to provision of better quality dwelling units, more number of attributes at the within premises level contributing to higher satisfaction level for the residents. The government group housings are desirable alternative for the buyers with lower to moderate affordability condition as it offers dwelling unit at subsidised price and lesser number of attributes are also provided. The residents of government group housings show moderate satisfaction level when compared to PPP housings. But if one looks into their satisfaction level individually, the residents are satisfied in these housings when looked into from their affordability point of view. Therefore, it can be concluded that if the buyer has the affordability from income perspective, then PPP housings should be considered over government housings because by paying more the residents to have access to better services leading to higher satisfaction level.
Acknowledgement: We sincerely thank the Indian Institute of Technology (IIT), Kharagpur for helping us by providing all the required facilities for successfully conducting the research. References
Addo, I.A., 2016. Assessing residential satisfaction among low income households in multi-habited dwellings in selected low income communities in Accra. Urban Studies, 53(4), pp.631-650.
Adriaanse, C.C., 2007. Measuring residential satisfaction: a residential environmental satisfaction scale (RESS). Journal of housing and the built environment, 22(3), pp.287-304.
Amérigo, M. and Aragonés, J.I., 1990. Residential satisfaction in council housing. Journal of Environmental Psychology, 10(4), pp.313-325.
Baum, S., Arthurson, K. and Rickson, K., 2010. Happy people in mixed-up places: The association between the degree and type of local socioeconomic mix and expressions of neighbourhood satisfaction. Urban Studies, 47(3), pp.467-485.
Buys, L. and Miller, E., 2012. Residential satisfaction in inner urban higher-density Brisbane, Australia: role of dwelling design, neighbourhood and neighbours. Journal of Environmental Planning and Management, 55(3), pp.319-338.
Chapman, D.W. and Lombard, J.R., 2006. Determinants of neighborhood satisfaction in fee-based gated and nongated communities. Urban Affairs Review, 41(6), pp.769-799.
Chattopadhyay Runa. 2010. An Assessment of Group Housing Affordability in Kolkata. PhD diss., Institute of Technology (IIT) Kharagpur.
Companies Act 2013. Part C, Schedule II, Ministry of Corporate Affairs. Djebarni, R. and Al-Abed, A., 2000. Satisfaction level with neighbourhoods in low-income public housing in
Yemen. Property management, 18(4), pp.230-242. Etminani- Ghasrodashti, R., Majedi, H. and Paydar, M., 2017. Assessment of Residential Satisfaction in Mehr
Housing Scheme: A Case Study of Sadra New Town, Iran. Housing, Theory and Society, 34(3), pp.323-342.
Fernandez, R.M. and Kulik, J.C., 1981. A multilevel model of life satisfaction: Effects of individual characteristics and neighborhood composition. American Sociological Review, pp.840-850.
Ganju, M.N. Ashish, N. Kulshetra, and A.B. Lall. 1989. " Middle Income Housing: a study of 15 Projects in India". GREHA.
Garip, S.B. and Şener, H., 2012. Analysing environmental satisfaction in gated housing settlements: A case study in İstanbul. A| Z ITU Journal of the Faculty of Architecture, 9(1), pp.120-133.
Gruber, K.J. and Shelton, G.G., 1987. Assessment of neighborhood satisfaction by residents of three housing types. Social Indicators Research, 19(3), pp.303-315.
Hourihan, K., 1984. Context-dependent models of residential satisfaction: An analysis of housing groups in Cork, Ireland. Environment and Behavior, 16(3), pp.369-393..
Howley, P., Scott, M. and Redmond, D., 2009. Sustainability versus liveability: an investigation of neighbourhood satisfaction. Journal of environmental planning and management, 52(6), pp.847-864.
Hur, M., Nasar, J.L. and Chun, B., 2010. Neighborhood satisfaction, physical and perceived naturalness and openness. Journal of Environmental Psychology, 30(1), pp.52-59.
Inah A.S., Yaro A.M., Agbor A.E., and Ukene D., 2014.Residential Housing Satisfaction of the Urban Poor in Calabar Metropolis, Nigeria. Architectural Research, 4(1A), pp. 1-8.
Kannan, K.P. and Raveendran, G., 2011. India's common people: the regional profile. Economic and Political Weekly, pp.60-67
Kellekci, Ö.L. and Berköz, L., 2006. Mass housing: user satisfaction in housing and its environment in Istanbul, Turkey. International Journal of Housing Policy, 6(1), pp.77-99.
Lee, T., 1968. Urban neighbourhood as a socio-spatial schema. Human Relations, 21(3), pp.241-267.
493
Lovejoy, K., Handy, S. and Mokhtarian, P., 2010. Neighborhood satisfaction in suburban versus traditional environments: An evaluation of contributing characteristics in eight California neighborhoods. Landscape and Urban Planning, 97(1), pp.37-48.
McGirr, E., Skaburskis, A. and Donegani, T.S., 2015. Expectations, preferences and satisfaction levels among new and long-term residents in a gentrifying Toronto neighbourhood. Urban Studies, 52(1), pp.3-19.
Mohit, M.A. and M.S. Ali. 2016. "Neighbourhood satisfaction and QOUL in Middle Income Housing in Kuala Lumpur City, Malaysia", Planning Malaysia Journal, 14(5), pp. 81-94.
Mohit, M.A., Ibrahim, M. and Rashid, Y.R., 2010. Assessment of residential satisfaction in newly designed public low-cost housing in Kuala Lumpur, Malaysia. Habitat international, 34(1), pp.18-27.
Mukherjee, A. and Satija, D., 2012. The consumption pattern of the rising middle class in India. Indian Council for Research on International Economic Relations.
National Building Code of India (2005) Ogu, V.I., 2002. Urban residential satisfaction and the planning implications in a developing world context: The
example of Benin City, Nigeria. International Planning Studies, 7(1), pp.37-53. Oktay, D., Rüstemli, A. and Marans, R.W., 2009. Neighborhood satisfaction, sense of community, and
attachment: Initial findings from Famagusta quality of urban life study. ITU A/Z Journal, 6(1), pp.6-20. Parkes, A., Kearns, A. and Atkinson, R., 2002. What makes people dissatisfied with their
neighbourhoods?. Urban Studies, 39(13), pp.2413-2438. Permentier, M., Bolt, G. and Van Ham, M., 2011. Determinants of neighbourhood satisfaction and perception of
neighbourhood reputation. Urban studies, 48(5), pp.977-996. Salleh, A.G., 2008. Neighbourhood factors in private low-cost housing in Malaysia. Habitat International, 32(4),
pp.485-493. Savasdisara, T., 1988. Resident's satisfaction and neighbourhood characteristics in Japanese urban
communities. Landscape and Urban Planning, 15(3-4), pp.201-210. Savasdisara, T., Tips, W.E. and Suwannodom, S., 1989. Residential satisfaction in private estates in Bangkok: A
comparison of low-cost housing estates and determinant factors∗. Habitat International, 13(1), pp.65-73. Sengupta, U., 2006. Government intervention and public–private partnerships in housing delivery in
Kolkata. Habitat International, 30(3), pp.448-461. Shields, M. and Wooden, M., 2003. Investigating the role of neighbourhood characteristics in determining life
satisfaction. Melbourne Institute of Applied Economic and Social Research. Sirgy, M.J. and Cornwell, T., 2002. How neighborhood features affect quality of life. Social indicators
research, 59(1), pp.79-114 Steiner, H.M. 1992. Engineering Economic Principles. New York McGraw-Hill. Sulaiman, H. and Yahaya, N., 1987. Housing provision and satisfaction of low-income households in Kuala
Lumpur. Habitat international, 11(4), pp.27-38. Talen, E. and Shah, S., 2007. Neighborhood evaluation using GIS: An exploratory study. Environment and
Behavior, 39(5), pp.583-615. Tan, T.H., 2011. Determinants of housing satisfaction in Klang Valley, Malaysia. Ukoha, O.M. and Beamish, J.O., 1997. Assessment of residents' satisfaction with public housing in Abuja,
Nigeria. Habitat international, 21(4), pp.445-460. Wadhwa, K., 2009. Affordable housing for urban poor. New Delhi: National Resource Centre, School of Planning
and Architecture, New Delhi. Retrieved January, 3, p.2015. West Bengal Services (Revision of Pay and Allowance) Rules, 2009, Memorandum issued thereon and related
orders, Government Of West Bengal Finance Department Audit Branch. Zehner, R.B., 1971. Neighborhood and community satisfaction in new towns and less planned suburbs. Journal
of the American Institute of Planners, 37(6), pp.379-385.
i Dearness Allowance (DA) refers to the relief provided to the employees and pensioners to neutralise the impact of inflation on their earnings (Source:http://timesofindia.indiatimes.com/india/dearness-allowance-cabinet-approves-2-per-cent-hike/articleshow/57653563.cms). iihttp://www.inflation.eu/inflation-rates/india/historic-inflation/cpi-inflation-india-2000.aspx
494
An Inclusive Study on the Renewal of Urban Fringe Area - A Case
Study of the Four Villages in Hangzhou Shiqiao Sub-district
Xiao CHEN, Xingping WANG, Southeast university, China
1. Background
Habitat III passed the New Urban Agenda in October 2016, in which the inclusion was proposed as an important keyword, and in which to build a more compact, inclusive, harmonious and interconnected city and region was viewed as one objective. The concept of inclusion stresses on the sustainability of development process including the sustainability of nature and society, reduction and elimination of injustice, and the emphasis on social equity and sharing.
As a "heterogeneous form" in the development of city, the marginal community has become an unstable factor in our urban renewal context. In our society, with the continuous development of new urbanization, a large number of people are concentrated in big cities, and major center urban areas in city face pressure of scale up and space sprawls, forming more edge fusion areas between urban and rural areas. The mixed use of urban and rural areas is still existed in these areas which are most complex and changeable places in urban and rural construction, as well as unique regional entities with transition, ambiguity, dynamics and complexity. Compared with urban community in general sense, it is always in intermediate zone of urban and the rural areas, showing a dilemma of "two non-independence". Residents in these communities are often excluded from mainstream economy, politics, culture and social activities, and live in the bottom of the urban society because of such a dilemma.
In the process of urban renewal and innovation where "humanization" is fundamental value orientation, the social fault and the group isolation in the marginal community constitute a serious challenge to the public value of the modern renewal paradigm. The renewal results are not obvious because there are transfer and deprivation of renewal costs, insecure protection of rights of the vulnerable groups, and demolition conflict caused by unequal benefits distribution during renewal, as well as gentrification established by residents, living space differentiation and history and culture missing caused by large-scale reestablishment after renewal.
The theory of inclusion offers a better idea for urban renewal of urban marginal community, and urban renewal based on this concept does not depends on the utilitarian orientation for the single economic interest purpose anymore, but starts from social progress and social justice perspectives with more inclusion to emphasize fair social rights and interests distribution in the process of updating, fully guarantee the overall interests of the city and reflect the public policy, comprehensively realize legitimate rights and interests of most residents and property rights, meet their reasonable demands as far as possible, and achieve a general balance between economic and environmental benefits, local and overall interests, and individual and collective interests in the overall pattern of interests.
2. Research Overview
495
In recent years, China's urban planning faces adjustment and seeks for direction of transformation (Shi Nan, 2016) under the inclusive context, and the inclusion-based urban planning begins to prevail (Wu Zhiqiang, 2015). Serving as an important part of urban regional structure, the urban fringe area has been the focus in academic circle as a result of its unique spatial location, population composition, management system and sensitive, differentiation and unstable non-inclusive characteristics.
The existing researches on the inclusion of urban fringe areas are mainly in spatial separation1-2 (Jiang Kefang, 2016) (Li Shifeng, 2005), social governance, institutional reform 3-4 (Li Kaiyu, 2010) (Hu Xueqian, 2014) and the fairness of public services. They are about population living apart, poor social orders5-6 (Chen Fengyun, 2003; Min Min, 2003), and other social problems, as well as employment, social security and protection of rights and interests of peasants in urban fringe areas7-8 (Yang Zhen, 2005; Jiang Ying, 2005). These researches propose transforming functions of government, propelling economy, cultivating development of social organizations and breaking urban and rural dual system9-10 (Jin Taijun, 2017; Xu Qian, 2015).
The existing inclusive urban renewal methods are divided into two: a "bottom-up" public participation model and a "top-down" system reform model. In the former model, the self-transformation model of villagers or village collective11 (Wei Lihua,2005) is proposed, a model which focuses on policy, capital, community government, aboriginal and external forces model12-13 (Guan Juan, 2008) (Chen Xuan, 2009).
The "top-down" renewal model introduces legitimate living and healthy living of non-resident resident population into transformation concept of village in the city in the reforming schemes by starting from the transformation concept and planning methods14 (Ye Yumin, 2015). It proposes there should be decentralization for government in system and timely guidance through planning so as to make old city renewal operate in the "market" harmoniously15 (Chen Pei, 2014). This model discusses transformation of "village in the city" from the perspective of coordinating urban - rural relations16 (Yan Xiaopei, 2014).
Moreover, it also pays attention to coordination made by planning to conflict of interests (Ren Shaobin, 2011), and explores domestic inclusive renewal theories (He Huiwen, Zhang Jingxiang, 2016; Peng Jiandong, 2014) through studies on foreign inclusive urban renewal cases (Li Heping, 2014).
The existing inclusive urban renewal orientation emphasizes more on cooperative means of planning, focuses on market mechanisms and distribution of benefits, stresses on economic, social and institutional reform, and concerns about current renewal. It is insufficient for continuous researches on inclusion after renewal, and there is still a long way to go to promote the studies on endogenous, cooperative and inclusive development of marginal communities.
3. Problems about Renewal in Existing Fringe Area
3.1 Characteristics of Fringe Area
Serving as the forefront and leading area of urban diffusion, the urban fringe refers the most complicated and changing area in urban construction; it is a transitional zone between urban and rural area in land utilization, society and population characteristics, and a pure agricultural hinterland in center city connecting built up area, peripheral residence without urban residents and non-agricultural land use.
The development of cities attaches great importance to the promotion of social equity and growth sharing through reducing and eliminating inequality opportunities in the process of increase from the perspective of inclusion; it focuses more on equal opportunities, participating in economic growth, sharing of social and political rights, and emphasizes
496
inclusive and sharing development. Many incompatible problems will be faced by urban fringe in this angle.
3.1.1 Complexity of Staff Composition
The marginality of remote cities not only refers to margin in physical space, but also the margin in social class and functional sense. Most residents living in fringe area are migrant workers; foreign resident population quickly gathered in large cities from 2000 to 2010, for instance, extramural inflow population among resident population in Hangzhou city is 2,354,400, accounting for 27.06%; the fringe areas away from city center for 10-15 km are especially main entrance regions of external population across the city. On the other hand, a situation that is concurrent with influx of external population is local rural residents and urban relocated population.
3.1.2 Multiplicity of Management Systems
It is ambiguous for the nature of urban fringe area itself, which is neither city in a strict sense nor an extension of rural society; and large areas of rural areas are transformed into city as a result of district withdrawal for county, and fringe area is nearly covered by urbanization after experiencing the rapid urbanization in the 1990s. The villages in original suburbs become villages in city, and mixed pattern of urban and rural areas still adopts urban and rural management system featuring in administrating of city-countryside uniformly; towns located in the urban fringe still witness two sets of management systems at the same time: city - district - street - neighborhood committee" and "city - district - town - village". Besides, the nature of land is also in the dynamic changes, and the density of land development is between the central city and rural areas, with complicated land ownership and chaotic land market and management.
3.1.3 Separation of Space
The spatial structure changes with the migration of population due to the mobility of population and instability of its development, and the spatial form of urban fringe also presents continuous and compact characteristics. The functions are various and far from controllable, bringing about extensive urbanization situations including extensive construction as a whole, unclear regional management, unreasonable functional grouping and unordered development.
3.1.4 Dependence of Industry and Public Services
There is a close relationship between city center, and technology, capital, talent, information and market closely rely on the central city; urban service function is obvious in infiltration, however the public service facilities are far from perfect, and as an important part of urban space, it is subject to administrative system, and is incapable of managing population, economy and society17. It is extremely difficult to rationally allocate construction funds and resources in urban fringe area as a result of conflict of economic interests and administrative management in urban and suburb. Meanwhile, residents are unable to enjoy public services equal to those in central city because they live in informal housing in urban fringe area.
3.2 Problems about Renewal in Fringe Area
The "incompatibility" in the fringe area is amplified in the process of urban renewal, and then a series of "incompatible" social problems and contradictions occur, such as transfer and deprivation of renewal costs, intense living space differentiation, history and culture missing caused by large-scale reestablishment, insecure protection of rights of the vulnerable groups, and demolition conflict caused by unequal benefits distribution. These issues put fringe area renewal into intersection of various social contradictions at current stage.
There are three types of renewal for existing fringe area according to the main body of transformation: government-led, developer-led and village collective renewal. Several basic
497
prerequisites are needed for the development of inclusive renewal: the public nature of the subject, the willingness for cooperation, and social integration.
1) Government-led renewal: it is usually in larger cities with powerful government financial and administrative capacity for government to bear construction investment, such as the renewal and transformation of "Dawangjing" in Beijing. The advantage is that residents shall get higher compensation, with strong resource management and integration, powerful renewal controlling, high efficiency, and fast transformation process. However the incompatible issues are that the government needs to bear huge investment on renewal, capital operation is difficult to continue, and violent demolition leads to dilemma for "tartar" and floating population problems, which tends to cause social conflicts. Besides, community collective economy develops without protection as a result of requisition of government to collective property, reducing income of community residents.
2) Developer-led renewal: it is usually led by experienced and rich developers in order to ease the cost of government investment. However, the incompatible issue is that this model tends to cause transfer of renewal costs, and demolition conflicts caused by unfair distribution of interests. Developers compete with villagers in terms of compensation schemes with the purpose of maximizing profits, which is difficult to reach a consensus, hurts the aborigines and their interests, and ignores interests of external population. It tends to lead to toll breakdown and intensify social contradictions. An observation to development results will show that the developer-led model is easy to retain parts difficult for transformation, intensify spatial differentiation, ignore local history and culture and lack public space, causing serious rent-seeking issue and follow-up management crisis. For instance, the land auction has reached RMB 1.5 million / mu ~ 4 million / mu due to commercial development and transfer in Guangzhou Pazhou area, while compensation for landless farmers is only RMB 250,000 / mu; intermediaries or local governments obtain most huge land value-added benefits between costs and the transfer price, and landless peasants are excluded from participating in sharing the huge benefit, bringing about social conflicts.
3) Residents (village collective, social organization) spontaneous -led renewal: it is a renewal based on village collective, social organizations and other aboriginal spontaneous organizations, for instance the "village collective joint-stock company model" in Shenzhen. It is outstanding in improving living environment, improving treatment of residents, and obtaining economic interests, therefore the residents are extremely enthusiastic. It is not difficult to reach a consensus between demolition schemes and compensation measures, and to protect interests of residents farthest as a result of little resistance in transformation, fewer social conflicts, and high efficiency in renewal. However, the incompatible issue is that the spontaneous organizations are insufficient in capital, and incapable of controlling future and forward-looking, which causes low-end renewal, low-level development after renewal, problems accumulation in land utilization efficiency and non-household resident population, therefore, higher costs are needed for transformation.
The three models for renewal boasts of advantages and disadvantages, and other "incompatible" issues occur although some are solved in renewal. Firstly, interests of external population are ignored in the process of renewal; second, attention to space renewal ignores maintenance and follow-up management of community population; third, the focus on immediate problems ignores incompatibility of future development after renewal. The "incompatible" issues are not solved fundamentally in the process of renewal and after renewal in fringe area, and therefore, the problem of space transfer and regional accumulation is caused.
498
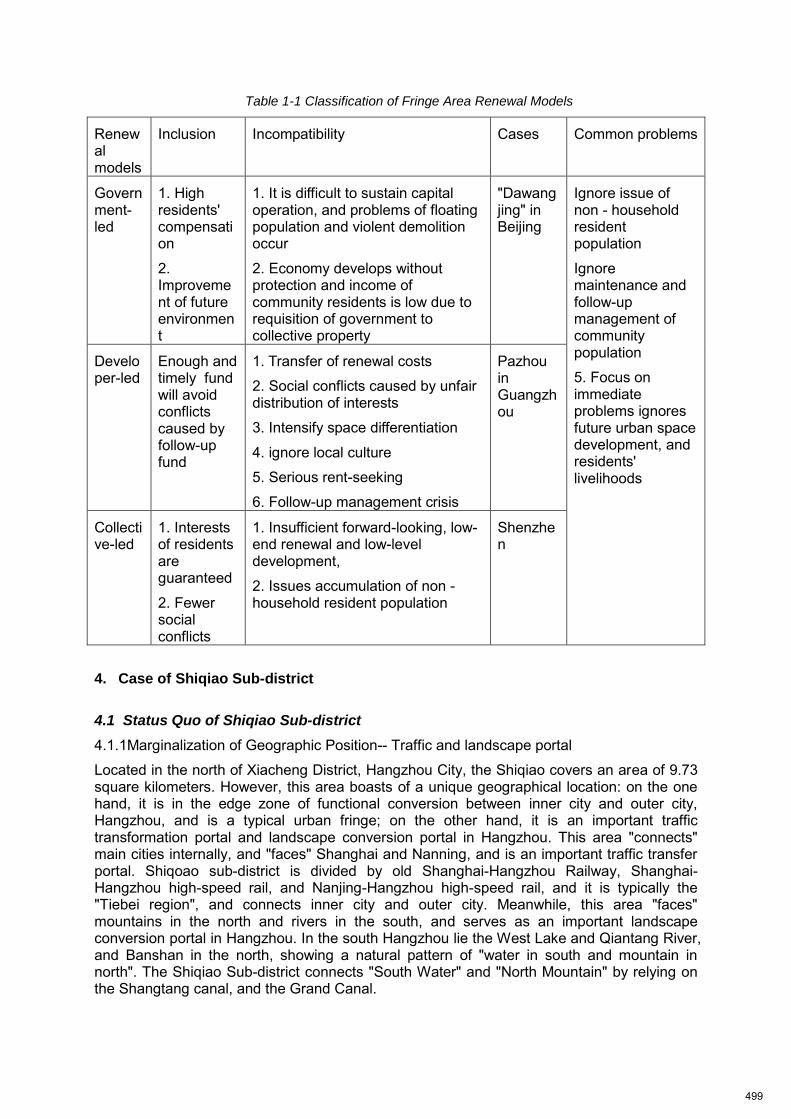
Table 1-1 Classification of Fringe Area Renewal Models
Renewal models
Inclusion Incompatibility Cases Common problems
Government-led
1. High residents' compensation
2. Improvement of future environment
1. It is difficult to sustain capital operation, and problems of floating population and violent demolition occur
2. Economy develops without protection and income of community residents is low due to requisition of government to collective property
"Dawangjing" in Beijing
Ignore issue of non - household resident population
Ignore maintenance and follow-up management of community population
5. Focus on immediate problems ignores future urban space development, and residents' livelihoods
Developer-led
Enough and timely fund will avoid conflicts caused by follow-up fund
1. Transfer of renewal costs
2. Social conflicts caused by unfair distribution of interests
3. Intensify space differentiation
4. ignore local culture
5. Serious rent-seeking
6. Follow-up management crisis
Pazhou in Guangzhou
Collective-led
1. Interests of residents are guaranteed
2. Fewer social conflicts
1. Insufficient forward-looking, low-end renewal and low-level development,
2. Issues accumulation of non - household resident population
Shenzhen
4. Case of Shiqiao Sub-district
4.1 Status Quo of Shiqiao Sub-district
4.1.1Marginalization of Geographic Position-- Traffic and landscape portal
Located in the north of Xiacheng District, Hangzhou City, the Shiqiao covers an area of 9.73 square kilometers. However, this area boasts of a unique geographical location: on the one hand, it is in the edge zone of functional conversion between inner city and outer city, Hangzhou, and is a typical urban fringe; on the other hand, it is an important traffic transformation portal and landscape conversion portal in Hangzhou. This area "connects" main cities internally, and "faces" Shanghai and Nanning, and is an important traffic transfer portal. Shiqoao sub-district is divided by old Shanghai-Hangzhou Railway, Shanghai-Hangzhou high-speed rail, and Nanjing-Hangzhou high-speed rail, and it is typically the "Tiebei region", and connects inner city and outer city. Meanwhile, this area "faces" mountains in the north and rivers in the south, and serves as an important landscape conversion portal in Hangzhou. In the south Hangzhou lie the West Lake and Qiantang River, and Banshan in the north, showing a natural pattern of "water in south and mountain in north". The Shiqiao Sub-district connects "South Water" and "North Mountain" by relying on the Shangtang canal, and the Grand Canal.
499
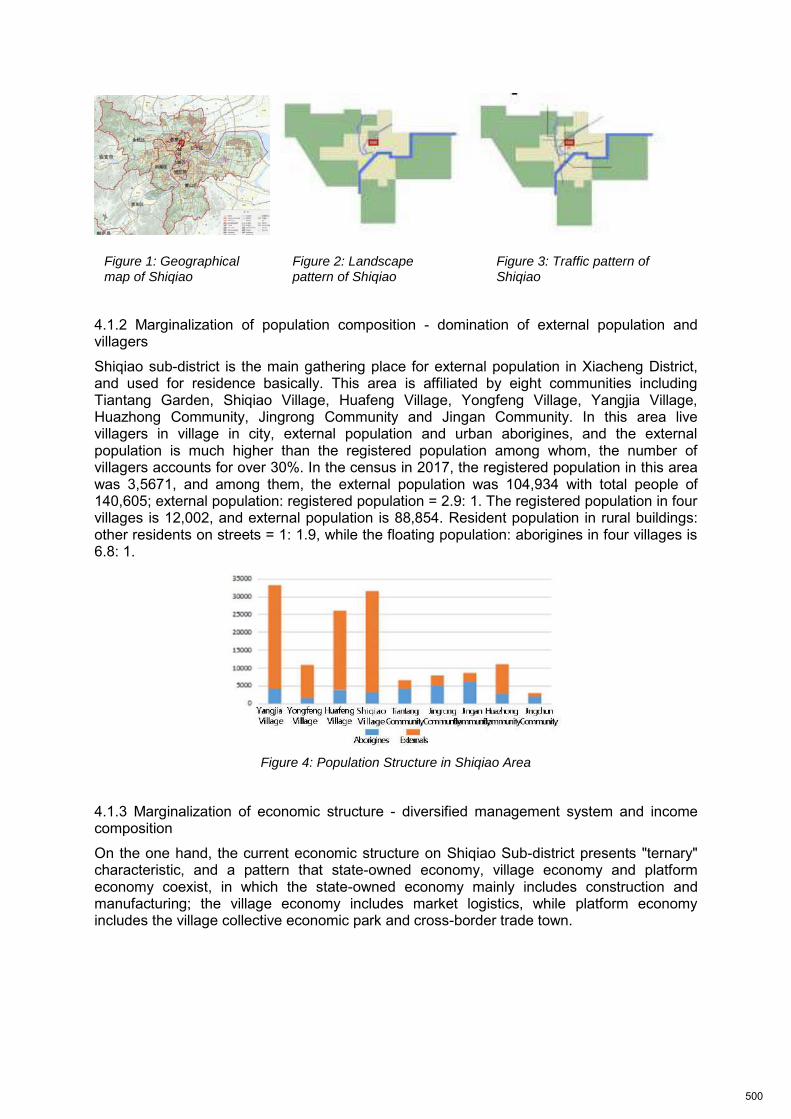
4.1.2 Marginalization of population composition - domination of external population and villagers
Shiqiao sub-district is the main gathering place for external population in Xiacheng District, and used for residence basically. This area is affiliated by eight communities including Tiantang Garden, Shiqiao Village, Huafeng Village, Yongfeng Village, Yangjia Village, Huazhong Community, Jingrong Community and Jingan Community. In this area live villagers in village in city, external population and urban aborigines, and the external population is much higher than the registered population among whom, the number of villagers accounts for over 30%. In the census in 2017, the registered population in this area was 3,5671, and among them, the external population was 104,934 with total people of 140,605; external population: registered population = 2.9: 1. The registered population in four villages is 12,002, and external population is 88,854. Resident population in rural buildings: other residents on streets = 1: 1.9, while the floating population: aborigines in four villages is 6.8: 1.
Figure 4: Population Structure in Shiqiao Area
4.1.3 Marginalization of economic structure - diversified management system and income composition
On the one hand, the current economic structure on Shiqiao Sub-district presents "ternary" characteristic, and a pattern that state-owned economy, village economy and platform economy coexist, in which the state-owned economy mainly includes construction and manufacturing; the village economy includes market logistics, while platform economy includes the village collective economic park and cross-border trade town.
Figure 1: Geographical map of Shiqiao
Figure 2: Landscape pattern of Shiqiao
Figure 3: Traffic pattern of Shiqiao
500
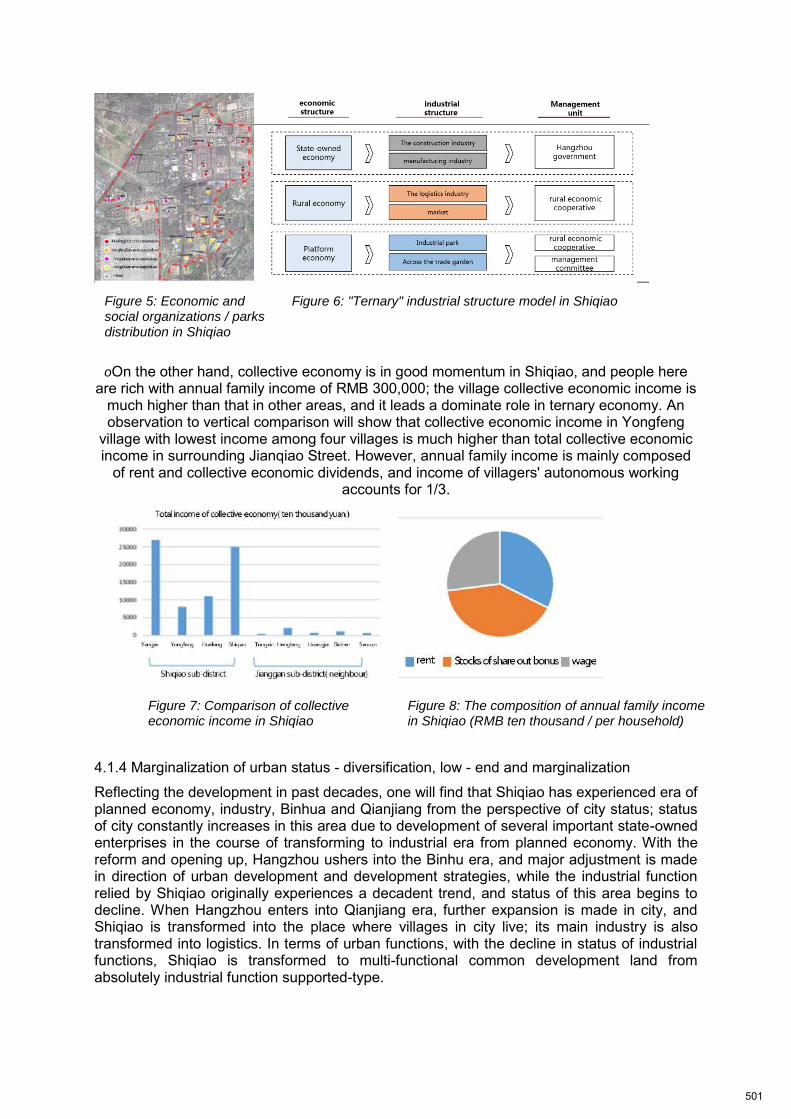
oOn the other hand, collective economy is in good momentum in Shiqiao, and people here are rich with annual family income of RMB 300,000; the village collective economic income is
much higher than that in other areas, and it leads a dominate role in ternary economy. An observation to vertical comparison will show that collective economic income in Yongfeng
village with lowest income among four villages is much higher than total collective economic income in surrounding Jianqiao Street. However, annual family income is mainly composed
of rent and collective economic dividends, and income of villagers' autonomous working accounts for 1/3.
4.1.4 Marginalization of urban status - diversification, low - end and marginalization
Reflecting the development in past decades, one will find that Shiqiao has experienced era of planned economy, industry, Binhua and Qianjiang from the perspective of city status; status of city constantly increases in this area due to development of several important state-owned enterprises in the course of transforming to industrial era from planned economy. With the reform and opening up, Hangzhou ushers into the Binhu era, and major adjustment is made in direction of urban development and development strategies, while the industrial function relied by Shiqiao originally experiences a decadent trend, and status of this area begins to decline. When Hangzhou enters into Qianjiang era, further expansion is made in city, and Shiqiao is transformed into the place where villages in city live; its main industry is also transformed into logistics. In terms of urban functions, with the decline in status of industrial functions, Shiqiao is transformed to multi-functional common development land from absolutely industrial function supported-type.
Figure 5: Economic and social organizations / parks distribution in Shiqiao
Figure 6: "Ternary" industrial structure model in Shiqiao
Figure 7: Comparison of collective economic income in Shiqiao
Figure 8: The composition of annual family income in Shiqiao (RMB ten thousand / per household)
501

There is fluctuation in city status in Shiqiao Sub-district, but it declines as a whole; the urban functions are in a trend featuring in diversification, low-end and marginalization. Located in the fringe area, Shiqiao initially completes urban and rural conversion in space, and it is necessary to further carry out conversion in connotation so as to integrate into city quickly.
Figure 11: Sketch map for development by stages in Shiqiao Sub-district
4.1.5 Industrial marginalization - strong industry dependence and insufficient public service.
It shows from number of enterprises and income in existing industries in Shiqiao that industrial dominance is poor and boasts of a certain degree of dependence. The retail and wholesale industry is in particular with proportion of 53% of the total. Warehouse-based retail is the main way in retail industry and value-added is lower. In terms of scales of enterprises, among14,000 enterprises, 8,000 enterprises or so are operated by individuals, and for the remaining 6,000 enterprises, the registered capital is over 5 million in only 1,000 enterprises.
Figure 12: Comparison of income in different industries in Shqiao Street
Figure 9: The concept figure of urban status evolution in Shiqiao Sub-district
Figure 10: The concept figure of internal functions evolution in Shiqiao Sub-district
502
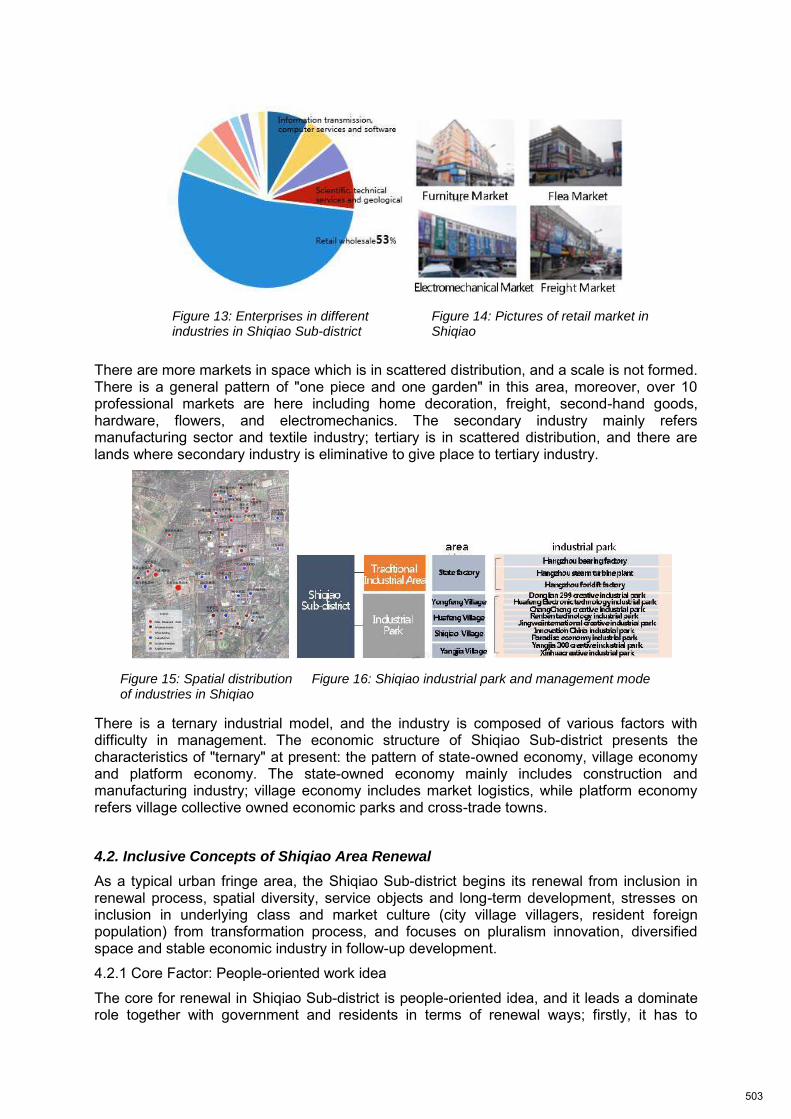
There are more markets in space which is in scattered distribution, and a scale is not formed. There is a general pattern of "one piece and one garden" in this area, moreover, over 10 professional markets are here including home decoration, freight, second-hand goods, hardware, flowers, and electromechanics. The secondary industry mainly refers manufacturing sector and textile industry; tertiary is in scattered distribution, and there are lands where secondary industry is eliminative to give place to tertiary industry.
There is a ternary industrial model, and the industry is composed of various factors with difficulty in management. The economic structure of Shiqiao Sub-district presents the characteristics of "ternary" at present: the pattern of state-owned economy, village economy and platform economy. The state-owned economy mainly includes construction and manufacturing industry; village economy includes market logistics, while platform economy refers village collective owned economic parks and cross-trade towns.
4.2. Inclusive Concepts of Shiqiao Area Renewal
As a typical urban fringe area, the Shiqiao Sub-district begins its renewal from inclusion in renewal process, spatial diversity, service objects and long-term development, stresses on inclusion in underlying class and market culture (city village villagers, resident foreign population) from transformation process, and focuses on pluralism innovation, diversified space and stable economic industry in follow-up development.
4.2.1 Core Factor: People-oriented work idea
The core for renewal in Shiqiao Sub-district is people-oriented idea, and it leads a dominate role together with government and residents in terms of renewal ways; firstly, it has to
Figure 13: Enterprises in different industries in Shiqiao Sub-district
Figure 14: Pictures of retail market in Shiqiao
Figure 15: Spatial distribution of industries in Shiqiao
Figure 16: Shiqiao industrial park and management mode
503
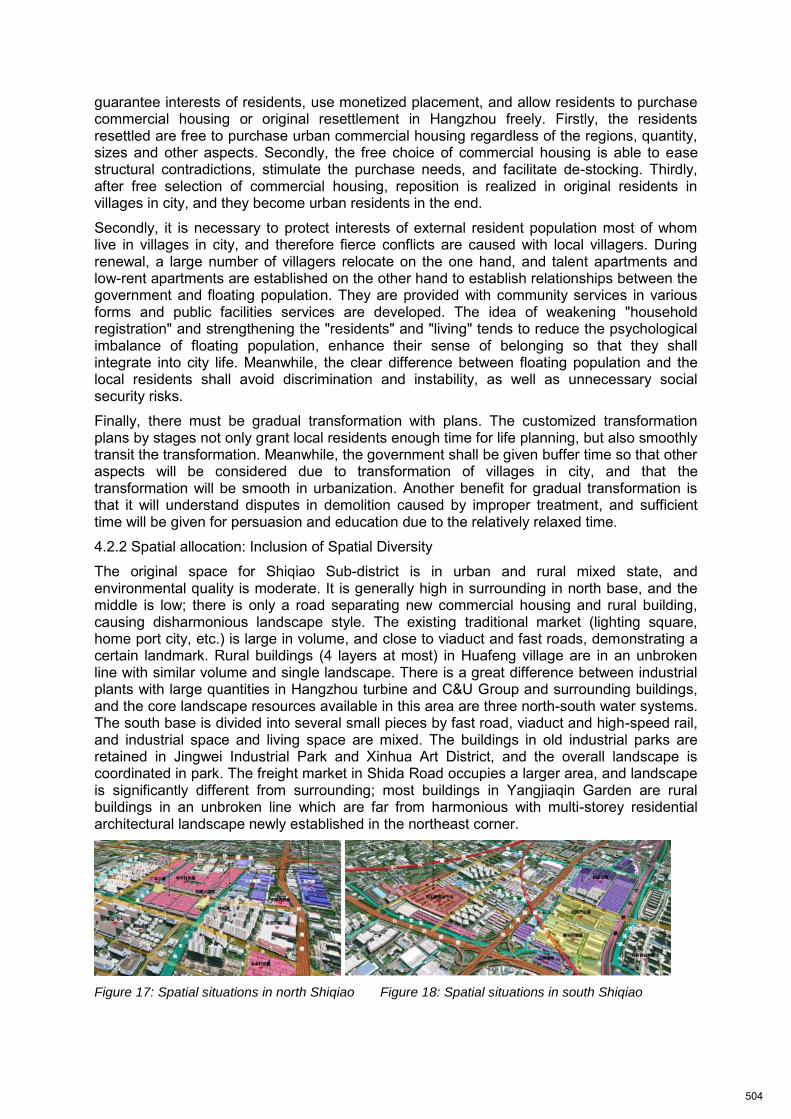
guarantee interests of residents, use monetized placement, and allow residents to purchase commercial housing or original resettlement in Hangzhou freely. Firstly, the residents resettled are free to purchase urban commercial housing regardless of the regions, quantity, sizes and other aspects. Secondly, the free choice of commercial housing is able to ease structural contradictions, stimulate the purchase needs, and facilitate de-stocking. Thirdly, after free selection of commercial housing, reposition is realized in original residents in villages in city, and they become urban residents in the end.
Secondly, it is necessary to protect interests of external resident population most of whom live in villages in city, and therefore fierce conflicts are caused with local villagers. During renewal, a large number of villagers relocate on the one hand, and talent apartments and low-rent apartments are established on the other hand to establish relationships between the government and floating population. They are provided with community services in various forms and public facilities services are developed. The idea of weakening "household registration" and strengthening the "residents" and "living" tends to reduce the psychological imbalance of floating population, enhance their sense of belonging so that they shall integrate into city life. Meanwhile, the clear difference between floating population and the local residents shall avoid discrimination and instability, as well as unnecessary social security risks.
Finally, there must be gradual transformation with plans. The customized transformation plans by stages not only grant local residents enough time for life planning, but also smoothly transit the transformation. Meanwhile, the government shall be given buffer time so that other aspects will be considered due to transformation of villages in city, and that the transformation will be smooth in urbanization. Another benefit for gradual transformation is that it will understand disputes in demolition caused by improper treatment, and sufficient time will be given for persuasion and education due to the relatively relaxed time.
4.2.2 Spatial allocation: Inclusion of Spatial Diversity
The original space for Shiqiao Sub-district is in urban and rural mixed state, and environmental quality is moderate. It is generally high in surrounding in north base, and the middle is low; there is only a road separating new commercial housing and rural building, causing disharmonious landscape style. The existing traditional market (lighting square, home port city, etc.) is large in volume, and close to viaduct and fast roads, demonstrating a certain landmark. Rural buildings (4 layers at most) in Huafeng village are in an unbroken line with similar volume and single landscape. There is a great difference between industrial plants with large quantities in Hangzhou turbine and C&U Group and surrounding buildings, and the core landscape resources available in this area are three north-south water systems. The south base is divided into several small pieces by fast road, viaduct and high-speed rail, and industrial space and living space are mixed. The buildings in old industrial parks are retained in Jingwei Industrial Park and Xinhua Art District, and the overall landscape is coordinated in park. The freight market in Shida Road occupies a larger area, and landscape is significantly different from surrounding; most buildings in Yangjiaqin Garden are rural buildings in an unbroken line which are far from harmonious with multi-storey residential architectural landscape newly established in the northeast corner.
Figure 17: Spatial situations in north Shiqiao Figure 18: Spatial situations in south Shiqiao
504
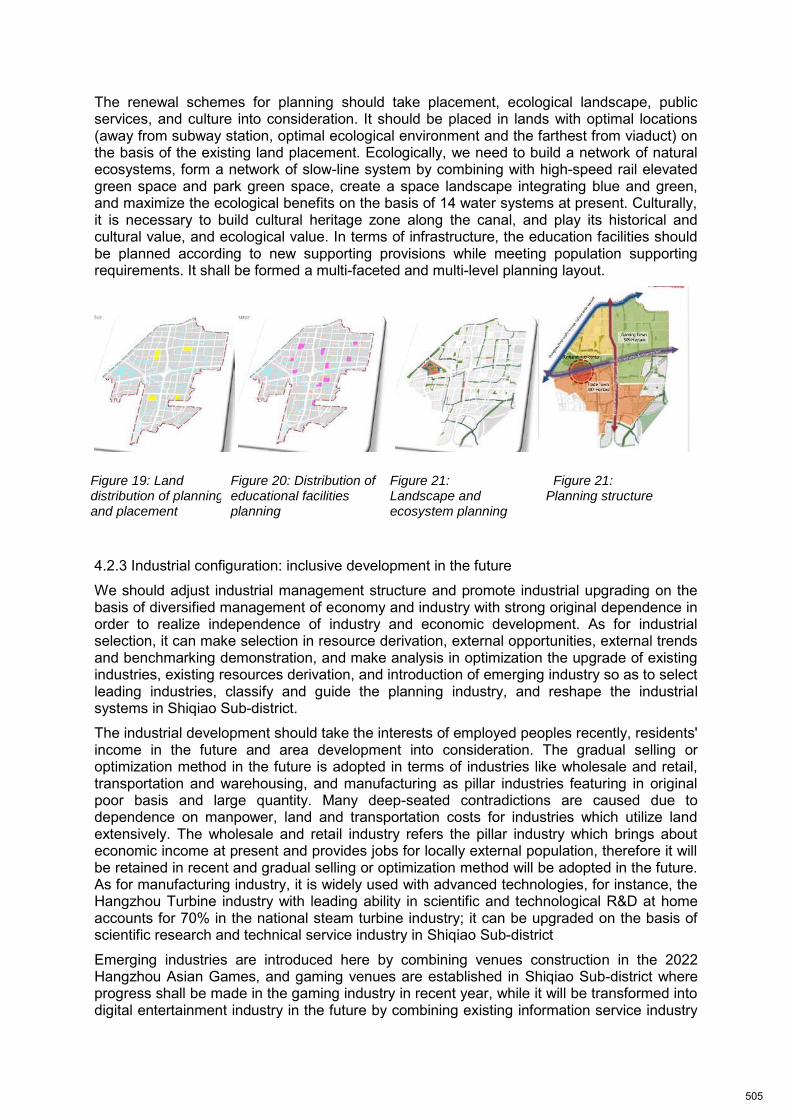
The renewal schemes for planning should take placement, ecological landscape, public services, and culture into consideration. It should be placed in lands with optimal locations (away from subway station, optimal ecological environment and the farthest from viaduct) on the basis of the existing land placement. Ecologically, we need to build a network of natural ecosystems, form a network of slow-line system by combining with high-speed rail elevated green space and park green space, create a space landscape integrating blue and green, and maximize the ecological benefits on the basis of 14 water systems at present. Culturally, it is necessary to build cultural heritage zone along the canal, and play its historical and cultural value, and ecological value. In terms of infrastructure, the education facilities should be planned according to new supporting provisions while meeting population supporting requirements. It shall be formed a multi-faceted and multi-level planning layout.
4.2.3 Industrial configuration: inclusive development in the future
We should adjust industrial management structure and promote industrial upgrading on the basis of diversified management of economy and industry with strong original dependence in order to realize independence of industry and economic development. As for industrial selection, it can make selection in resource derivation, external opportunities, external trends and benchmarking demonstration, and make analysis in optimization the upgrade of existing industries, existing resources derivation, and introduction of emerging industry so as to select leading industries, classify and guide the planning industry, and reshape the industrial systems in Shiqiao Sub-district.
The industrial development should take the interests of employed peoples recently, residents' income in the future and area development into consideration. The gradual selling or optimization method in the future is adopted in terms of industries like wholesale and retail, transportation and warehousing, and manufacturing as pillar industries featuring in original poor basis and large quantity. Many deep-seated contradictions are caused due to dependence on manpower, land and transportation costs for industries which utilize land extensively. The wholesale and retail industry refers the pillar industry which brings about economic income at present and provides jobs for locally external population, therefore it will be retained in recent and gradual selling or optimization method will be adopted in the future. As for manufacturing industry, it is widely used with advanced technologies, for instance, the Hangzhou Turbine industry with leading ability in scientific and technological R&D at home accounts for 70% in the national steam turbine industry; it can be upgraded on the basis of scientific research and technical service industry in Shiqiao Sub-district
Emerging industries are introduced here by combining venues construction in the 2022 Hangzhou Asian Games, and gaming venues are established in Shiqiao Sub-district where progress shall be made in the gaming industry in recent year, while it will be transformed into digital entertainment industry in the future by combining existing information service industry
Figure 19: Land distribution of planning and placement
Figure 20: Distribution of educational facilities planning
Figure 21: Landscape and ecosystem planning
Figure 21: Planning structure
505
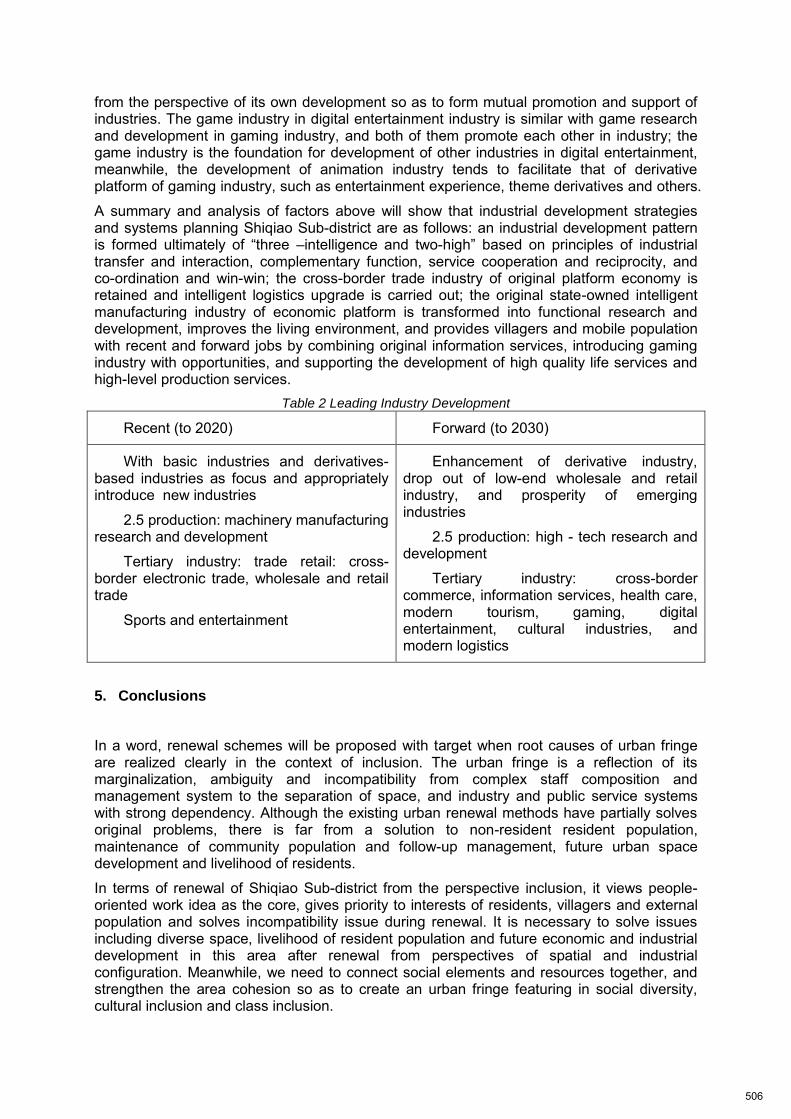
from the perspective of its own development so as to form mutual promotion and support of industries. The game industry in digital entertainment industry is similar with game research and development in gaming industry, and both of them promote each other in industry; the game industry is the foundation for development of other industries in digital entertainment, meanwhile, the development of animation industry tends to facilitate that of derivative platform of gaming industry, such as entertainment experience, theme derivatives and others.
A summary and analysis of factors above will show that industrial development strategies and systems planning Shiqiao Sub-district are as follows: an industrial development pattern is formed ultimately of “three –intelligence and two-high” based on principles of industrial transfer and interaction, complementary function, service cooperation and reciprocity, and co-ordination and win-win; the cross-border trade industry of original platform economy is retained and intelligent logistics upgrade is carried out; the original state-owned intelligent manufacturing industry of economic platform is transformed into functional research and development, improves the living environment, and provides villagers and mobile population with recent and forward jobs by combining original information services, introducing gaming industry with opportunities, and supporting the development of high quality life services and high-level production services.
Table 2 Leading Industry Development
Recent (to 2020) Forward (to 2030)
With basic industries and derivatives-based industries as focus and appropriately introduce new industries
2.5 production: machinery manufacturing research and development
Tertiary industry: trade retail: cross-border electronic trade, wholesale and retail trade
Sports and entertainment
Enhancement of derivative industry, drop out of low-end wholesale and retail industry, and prosperity of emerging industries
2.5 production: high - tech research and development
Tertiary industry: cross-border commerce, information services, health care, modern tourism, gaming, digital entertainment, cultural industries, and modern logistics
5. Conclusions
In a word, renewal schemes will be proposed with target when root causes of urban fringe are realized clearly in the context of inclusion. The urban fringe is a reflection of its marginalization, ambiguity and incompatibility from complex staff composition and management system to the separation of space, and industry and public service systems with strong dependency. Although the existing urban renewal methods have partially solves original problems, there is far from a solution to non-resident resident population, maintenance of community population and follow-up management, future urban space development and livelihood of residents.
In terms of renewal of Shiqiao Sub-district from the perspective inclusion, it views people-oriented work idea as the core, gives priority to interests of residents, villagers and external population and solves incompatibility issue during renewal. It is necessary to solve issues including diverse space, livelihood of resident population and future economic and industrial development in this area after renewal from perspectives of spatial and industrial configuration. Meanwhile, we need to connect social elements and resources together, and strengthen the area cohesion so as to create an urban fringe featuring in social diversity, cultural inclusion and class inclusion.
506

It is a long time process for urban renewal of the urban fringe area, and there must be an objective understanding of its complexity. It is a major change in urban development mode and in overall urban-rural management to promote inclusive urban renewal with heavy responsibilities.
References:
[1] Jiang Kefang, Zhang Jingxiang, Luo Zhendong, Geng Lei. Differentiation and Multiplicity: Study on the Spatial Pattern of Urbanization in the Urban Fringe of Metropolis - Based on the Empirical Study of Caidian District in Wuhan [J]. Human Geography, 2016,31(04):87-94. [2017-08-04]. DOI:10.13959/j.issn.1003-2398.2016.04.012 [2] Li Shifeng. Study on the Formation Mechanism and Development Strategy of the Metropolitan Fringe[D]. Master Thesis of China Agricultural University, 2005 [3] Li Kaiyu, Cao tianyan. Research on the Urbanization and Urban Spatial Expansion of the Marginal Area of Metropolitan Cities- A case study of Panyu district, Guangzhou [J]. Journal of Northwest University (natural science edition), 2010, 40(03):523-526. [2017-08-04]. DOI:10.16152/j.cnki.xdxbzr.2010.03.027 [4] Hu Xueqian, Xie Ya, Wu Di, Wang Xingping. Study on the Family Urbanization of the Marginal Area of Metropolitan Cities in the Context of Rapid Urbanization-- A case study of Lukou, Nanjing [J]. Modern Urban Research, 2014,29(12):110-116. [5] Chen Fengyun, Min Min, Yin Xudong. An Analysis of Influence of Environment on Crime in Urban Fringe Area[J]. Urban Problems, 2003, (2): 45-4 7. [6] Min Min, Xiong Naixue. An Analysis of the Environment Affecting Crime in Urban and Rural Fringe[J]. Modern Urban Research, 2003, (5): 25-28. [7] Yang Zhen. An Analysis of Interests Protection of Landless Peasants in urban fringe area[J]. Research on Development, 2005, (1): 46-49. [8] Jiang Ying. Study on Protection of Deficiency of Rights and Interests for Urban Farmers in the Process of Urbanization[J]. Journal of Beijing University of Agriculture, 2005. (2): 55-58. [9] Jin Taijun, Liu Peigong. Inclusive Governance: Governance Innovation of Marginal Community [10] Xu Qian. Inclusive Governance: New Ideas of Social Governance [J]. Jiangsu Social Sciences, 2015, (4): 17 - 25. [11] Wei Lihua. "Village in the city": The Transformation under Existence[J]. City Planning Review 2005, (7): 9-13. [12] Guan Juan. Study on the Evolution Mechanism of Urban Renewal in Shanghai Central City - Taking Xintiandi, No.8 Bridge and Tianzifang as Examples(D). Shanghai: Tongji University, 2008 [13] Chen Xuan. Study on the Roles of Local Government, Developers and People in the Process of Urban Renewal - Taking Hanzheng Street, Wuhan as an Example(D). Wuhan: Huazhong University of Science and Technology, 2009 [14] Ye Yumin. Theoretical Framework and Mechanism Innovation of Inclusive Urban Village Reconstruction in Chinese Megacities – Study and Reflections on Beijing and Guangzhou [15] Li Junfu. Study on Reconstruction of the Village in the City[M]. Beijing: Science Press, 2004 [16] Yan XiaoPei. Research on the Coordination between Urban and Rural Area in the Rapid Urbanization with the Redevelopment of Guangzhou Village-amid-the-City as a Case[J]. Urban Planning Review, 2004, (3): 30-38. [17] Guo Siwei, Rong Yuefang, Zhang Yunfeng, et al. Research on City marginal zone [J]. planner, 2012, 28 (7): 57-62.
507
An Integrated Assessment of the effectiveness of Multiple Level Water Governance Structure; case study of Kenya water sector
Authors: Kent A. Mukoya- (Planning, monitoring and Evaluation officer, Member ISOCARP) –Planning Monitoring and Evaluation Department And Beldina Owade (Sociologist) - Informal Settlement Region Nairobi City Water and Sewerage Company, Nairobi (Kenya)
508
1. Abstract
Water governance and stakeholders’ participation can no longer be ignored in addressing challenges that are synonymous to provision of water services globally, formulating and implementing the world’s critical water challenges. Indeed, (UNESCO 2003) report acknowledges that, “the tragedy of water crisis is not simply a result of lack of water but is essentially motivated to a larger extent by poor water governance”. Joyeeta Gupta (2011), postulates that, the water crises of the 21st century are in many ways a crisis of governance; a crisis of failure of institutions to manage resources for well-being of human and ecosystems. Hitherto, the role of water governance and stakeholder engagement in influencing solutions to challenges that are encountered in water sector is receiving increasing attention world over. Effective management and access to water resources is vital to sustainable development and good governance. In realization of this, governments across the world have spent considerable efforts and resources to move towards this goal.
Kenya is classified as a water scarce country with a per capita water availability of 643 cubic meters which is far below the United Nations recommendation of 1,000 cubic meters. This is expected to get worse by the year 2025 when per capita water availability is projected to negatively slide to 235 cubic meters; (WRMA 2009). This notwithstanding, the inclusion of right to water and sanitation in the Kenyan constitution puts demand on all actors to deliver on their obligations. In 2002, the Water Sector Reforms momentum in Kenya culminated in the enactment of the Water Act 2002. To align this act to the new Kenya Constitution 2010, the country has Water Act 2016 in place. This Act offers legal framework of water sector operations in the country. An essential aspect of the reform in the water sector in Kenya, as outlined in the Water Act 2016 is the creation of multiple level governance structures.
Key words: Governance, water sector, reforms water act, water resources water services
2. Introduction
In September 2015, world leaders adopted an ambitious 15 years blueprint; Sustainable Development Goals (SDGs), with a focus of bettering the world. The SDGs are broad, universal and potentially transformative. They envision nothing less than saving our planet for future generations, ending extreme poverty and hunger and creating a healthier, safer, more inclusive world. Specifically SDG goal number 6 emphasizes the commitment by the global community to ensuring availability and sustainable management of water and sanitation for all. The success of these goals is highly dependent on coordination of the implementation efforts through public governance. Governance is described as the exercise of economic, political and administrative authority to manage a country’s affairs at all levels. It comprises the mechanism, process and institutions through which citizens and groups articulate their interests, exercise their legal rights meet their obligations and mediate their differences (Roger, Peter Hall and Allan 2003). From this definition, the concept of governance can be applied to a country as a whole as well as to individual institutions and sub sectors within them. According to United Nations Development Programme (UNDP 2004), water sector governance is defined as the range of political, social economic and administrative systems that are in place to develop and manage water resources at different levels of the society. On the other hand, Organization for Economic Co-operation and Development (OECD) delineates water governance as set of rules, practices, and processes through which decisions for the management of water resources and services are taken and implemented and decision makers are held accountable. Grounding on these definitions, it suffices to postulate that improving governance in water sector goes beyond the legal demand from the government systems to accomplish service delivery to citizens. It encompasses a much broader range of factors, including engaging civil societies, non-state agencies and their relationships to the government.
509
Indeed, UNDP and Stockholm International Water Institute (SIWI 2016) acknowledges water governance as one of the most critical areas through which sustainable development of water resources and services can be improved. How societies choose to govern their water resources and services has profound impact on people’s livelihood and sustainability of resources. Further, SIWI identifies four fundamental dimensions of water governance which provide a basis of analyzing governance dynamics in water sector. The four are social, economic, political and environmental dimensions. The social aspect entails equitable distribution of water resources and services among various socio-economic groups and its effect to the society. The economic dimension focuses on the efficiency of water allocation, use and the role of water in the overall economic growth, the political dimension examines on provision of equal rights and opportunities for water stakeholders to take part in decision making processes while the environmental dimensions explores on sustainability of use of water and related ecosystem services.
The Africa Ministers’ council on water observes that governance in water sector is a cross cutting issue that affects all aspects of water sector. For long time water resources have been managed in a centralized manner in most Africa countries. Delivery of a full range of water resource management activities was usually provided by national governments. Many problems have been associated with the decentralized management approach. Inequality to access of water, limited financial and technical capacity at national and technical capacity at national and basin levels, poor infrastructure and services delivery, decaying quality of river basin natural resources, limited stakeholders involvement in decision making, institutional fragmentation, uncoordinated sector policies and increasing number of conflicts among stakeholders are examples of such problems (Easter and Heame 1993, Swatuk 2005). To address these challenges most of Africa states reformed their water laws and restructured their governance framework to create, legalize and accommodate wider participation of stakeholders in policy formulation in water resources and services management. For instance, South Africa voted for its National Water Act leading to the development of National Water Strategy in 2002, in the same year, Tanzania approved their national water policies and in 2004 Namibia approved a water resource management act. The ambitious water sector reforms in Kenya commenced in 2002 after the enactment of the water act 2002 bill into law.
3. Methodology
The study employs the governance assessment framework (GAF) to synthesize data collected from a variety of sources. These sources includes Key informant interview, focus groups discussions, desk literature and report reviews. The key informant interviews typically made up much of the fieldwork that targeted officials of Water Services Regulatory Board, Water Services Providers, Water Action Groups, Civil Society Organizations, and Community Based Organizations. Focus group discussions were conducted among a small groups of stakeholders and consumers of water services. The data obtained from these discussions offered perceptions that provided triangulation with other data collected.
4.0 Water Governance in Kenya
In recent past, the discussions of governance in water sector have received greater attention in many countries. These debates, to a greater extent have played a pivotal role in influencing the design of water sector reforms. At the beginning of the millennium, the government of Kenya launched an ambitious programme of reforms in water sector. These, reforms were aimed at responding to deficiencies in water resource management, with an ultimate goal of addressing challenges in the sector hitherto experienced and particularly
510
focus on the projected fear of depletion of water resource the country faces. With an estimated population of 45 million people, Kenya is classified as a water scarce country with a per capita water availability of 643 cubic meters which is far below the United Nations recommendation of 1,000 cubic meters. This is expected to get worse by the year 2025 when per capita water availability is predicted to negatively slide to 235 cubic meters; (WRMA 2009). In the year 2002, the government passed an enabling legislation assigning clear roles and responsibilities of key water institutions henceforth opening an all-inclusive participatory approach window in water resource management.
Prior to the enactment of water act 2002, the legal milieu for the management of water resource management in the country was anchored in chapter 372 of the laws of Kenya (Cap 372). Broadly, this act (Cap 372), established a centralized approach to water services and water resources management. The role and involvement of non-state agents and consumers of water services in the management and making decision on issues pertaining to the provided services was obscure. The water act 2002 introduced comprehensive changes to the legal framework for the management of the water sector in Kenya. Of significance, the act recognizes and promulgates provisions for the involvement of non-governmental entities in both the management of water resources and the delivery of water services. Moreover, the act alienates the management of water resources from the provision of water services, establishes institutions and provides specific role to these institutions in overseeing the entire spectrum of water sector in the country and finally decentralizes these functions to lower levels of state organs.
Away from water act 2002, in the year 2010, Kenya adopted a new constitution. Matters in regard to governance are central in this constitution. For instance, the constitution provides for public participation as a function of inclusive, accountability and transparent governance. Article 1(1) provides all sovereign power to the people of Kenya while Article 10 (12) (a), provides participation of the people as a national value and principle of governance. Principles of integrity, transparency and accountability are core values that bind all public officers at all times. Indeed, article 43(b) of this constitution holds that “Every person has the right to safe drinking water.” Further, the constitution assigns the responsibility for water supply services to the established 47 counties. In light of these constitutional demands, it is appreciated that the passage of this constitution has a wide range of implications on governance. This, therefore, necessitated the review of water act 2002 which consequently has led to the enactment of the water act 2016. The purpose of water act 2016 is to align the water sector with the constitution’s primary objective of devolution. The act recognizes that water related functions are a shared responsibility between the national government and the devolved county governments.
The water act 2016 recognizes that for water is to be governed effectively and sustainably, national standards have to be set at resources and service subsectors. Independent national regulators are given the mandate to monitor the implementation of the national water resources and the national water services strategies. Moreover, this act recognizes that water services has to be paid for but consumers have to be protected throughout the water tariff implementation there should be a consultative process for all parties to foster understanding and minimize disputes. To sustain water resources protection and water services provision, this act saves the good practice especially in the water services sector on commercial viability, ring-fencing of water services revenue, mechanism of consumer complaints and good governance at Water Services Providers level and expects regulators to clearly uphold their mandates as envisaged in the act.
4.1 Water sector Governance institutional Framework in Kenya
Kenya provides a relevant case for applying governance in the water sector. Water resources in Kenya are vested in the state. The ministry of water and Irrigation is responsible
511
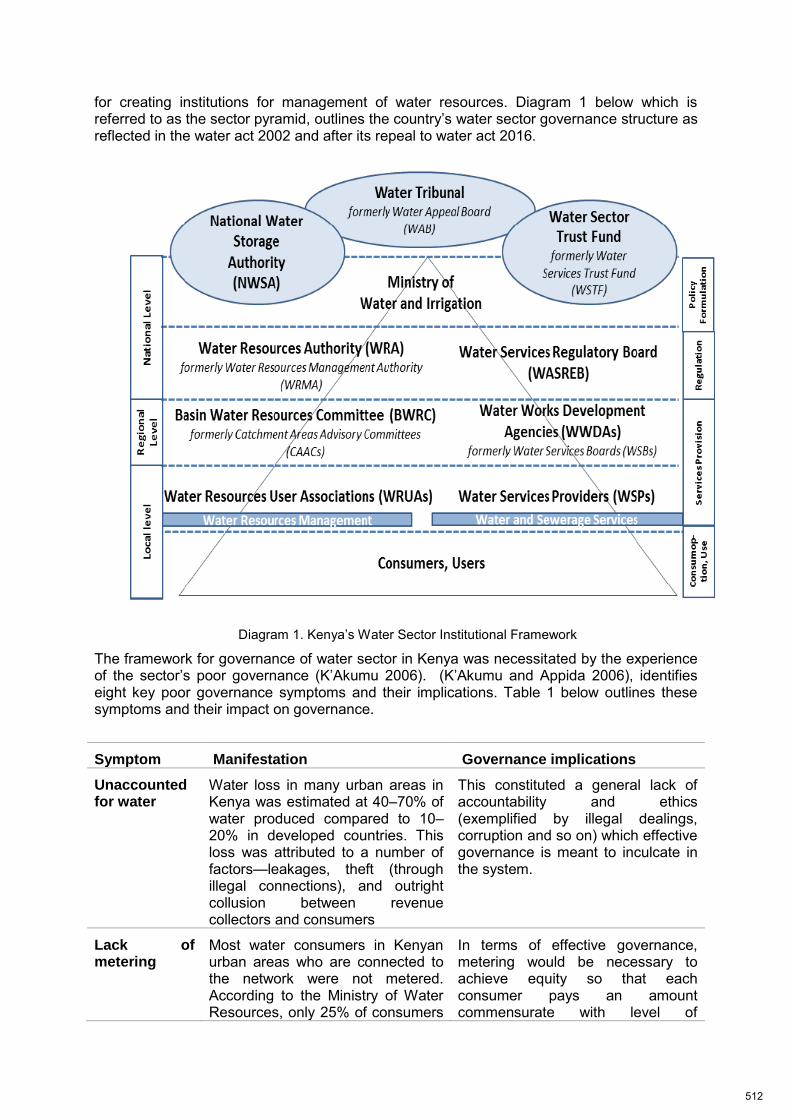
for creating institutions for management of water resources. Diagram 1 below which is referred to as the sector pyramid, outlines the country’s water sector governance structure as reflected in the water act 2002 and after its repeal to water act 2016.
Diagram 1. Kenya’s Water Sector Institutional Framework
The framework for governance of water sector in Kenya was necessitated by the experience of the sector’s poor governance (K’Akumu 2006). (K’Akumu and Appida 2006), identifies eight key poor governance symptoms and their implications. Table 1 below outlines these symptoms and their impact on governance.
Symptom Manifestation Governance implications
Unaccounted for water
Water loss in many urban areas in Kenya was estimated at 40–70% of water produced compared to 10–20% in developed countries. This loss was attributed to a number of factors—leakages, theft (through illegal connections), and outright collusion between revenue collectors and consumers
This constituted a general lack of accountability and ethics (exemplified by illegal dealings, corruption and so on) which effective governance is meant to inculcate in the system.
Lack of metering
Most water consumers in Kenyan urban areas who are connected to the network were not metered. According to the Ministry of Water Resources, only 25% of consumers
In terms of effective governance, metering would be necessary to achieve equity so that each consumer pays an amount commensurate with level of
512
in Nairobi were properly metered and this translated into irregularity in consumer charges as well as loss of revenue that is due to service providers.
consumption. Metering is also necessary for an open and transparent billing system that is the hallmark of effective governance.
Ineffective collection of
water revenue
Poor keeping of water consumer records, coupled with inefficient billing and revenue collection practices contributed to huge losses in terms of revenue. Only about 60% of revenue due on the 50% of the water that reached the consumer on average was actually collected (Republic of Kenya, 2000a).
The loss of revenue was responsible for the sustained lack of funds needed to expand service or to maintain the water system.
This is also a mark of lack of financial accountability which would lead to non-sustainability of water services, contrary to the objectives of effective governance. It is also redolent of corruption and lack of ethics in the water management framework
Uneconomic tariffs
Urban water undertakers charged low tariffs on water provided to consumers.
This had implications for the efficiency of service provision. The level of tariffs was not in consonance with the economic cost of providing the service. The tariff policy was a major contributor to financial problems which faced water undertakers in the urban areas. Uneconomic tariffs also have implications for social equity where the rich pay for water at the same rate as the poor but the former derive more benefit from it as a public good. This was mainly because the capital for expansion of the service and also for the maintenance was derived from user charges. Uneconomic tariffs also means excluding self-sustain ability of services
Exclusion of the poor
from the service
The poor are usually left out of service either because their geographical location is away from the nearest network or because of apathy shown towards them by the water service providers who view them as commercially unattractive, owing to their low income.
This implies lack of inclusiveness. It is a case of lack of social equity. It also implies non-sustainability especially in the light of the principles of sustainable development.
However, this is unfair to the poor because they end up buying water from vendors at prices that are higher than if they were connected. This behavior by water service providers also go counter the norm of social justice as it entails discrimination of a section of the society.
513
Excess staff of water
service providers
Urban water provision in Kenya is characterized by excess staff ratios. 25–50 employees per 1000 water connections are common (Republic of Kenya, 2000b).
This has implications for efficiency, accountability and sustainability of the system.
Conflict of roles in
water management
There used to be no clear definition of roles in urban water management system in Kenya.
This has implications for coherence and integration, openness and transparency. The Ministry of Water Resources was expected to play the role of a regulator and to leave other players to provide the service. But the Ministry got involved in the provision of the service and there are quite a number of water schemes that are still being run in this format, which has seriously compromised its regulatory role. It also challenged the efficiency of the system and jeopardized its sustainability.
Low connection to
the municipal
sewerage network
Only 28% of urban dwellers were connected to the municipal sewerage system. The other urban dwellers dispose of their wastes through pit latrines, cesspools, septic tanks and streams. This method of waste disposal could lead to contamination of shallow ground water aquifers, which are also a source of water for many urban dwellers.
This compromised social equity and sustainability. It also implied social inefficiency in hydro-environmental management.
Table1: Symptoms of poor governance of water services in Kenya
Source: compiled from K’Akumu and Appida(2006)
4.2 Water Sector Governance institutions and their Roles in Kenya
The water act 2016 adopts a multilevel water sector governance structure model by giving provision for creation of five distinct but interrelated segments through which governance institutions are formed as indicated in diagram 1. A key feature of this model is the separation between water resources management on the left side of the pyramid and water services on the right side. Rampa (2011) observes that, these two completely different systems are underpinned by different governance dimensions and characteristics, with different stakeholders bearing different interests, specific organizations responding to different logic, as well as very different accountability arrangements and dynamics. It could be argued that dealing with the water sector in Kenya means facing a dual governance system were of course resources management and service provision are strictly interlinked but institutional, political and accountability arrangements and stakeholder’s relationship may differ substantially
514

4.3 Mandates of Governance Institution in Water sector In Kenya
The management of water resources and service provision in Kenya has gone through transformation since the enactment of the water act 2002. The reform process identified, established and gave autonomy to a set of institutions to ensure effectiveness and efficiency in the management of water resources and provision of water services. These opened avenues for independent and participatory management of water resource management and service provision by the stakeholders. Table 2 below outlines water sector institutions as envisaged in the repealed water act 2016 and an overview of their mandate.
Institution Mandate
Ministry of Water and Irrigation Policy formulation, sector coordination, monitoring and supervision
Water Resource Authority protect, conserve, control and regulate use of
water resources
Water Services Regulatory Board to approve tariffs, monitor and enforce water services standards and issue licenses to water service providers
National Water Storage Authority development and management of national public water works for water resource management and flood control
Water Tribunal Source financing for development of water services from national budget, county government, and equalization fund, donations and grant.
Water Sector Trust Fund Source of funds for development of water services providers projects from national budget, county government donations and grants
Basin water Resource Committee manage catchments, to facilitate establishment of Water Resource User Associations and to play an advisory role to the Water Resource Authority
Water Works Development Agencies development, operation, maintenance and management of national public works provision of water services
Water Resources Users Association management of water resources and resolution of conflicts concerning the use of water resources at community level
Water Services providers provision of water services within the area specified in their licenses
Table 2: Water Sector governance Institutions as envisaged in Water Act 2016
515
5. Assessing Performance of Water Sector Governance Institutions in Kenya
The decision about how water resources and services are protected, managed, used, allocated and conserved are governance decisions. It is widely believed that the “water crisis” is a “governance crisis”. Good governance in the water sector is about accountability and participation. It focuses on results and transparency in the management of water resources and water services provision. In order to assess and gauge the performance of governance institutions in water sector in Kenya, it is critical to demystify the scope of governance principles and formulate a basis on which this analysis finds anchorage. Perhaps the most comprehensive set of governance principles in water sector emerges from the OECD Water Governance Initiative (WGI). WGI, identifies twelve principles for good water governance that promote effectiveness, efficiency, trust and engagement. According to Kenya’s Water Services Regulatory Board (WASREB), developed corporate governance guidelines for water services, acknowledges that Cost effective and efficient management and operation of water services can only be realized if the leadership in the water sector institutions is guided by the tenets of good governance. In the institutional set up, good governance is embedded in the tenets of corporate governance. When corporate governance is embraced it essentially defines leadership at board level so as to attain the organizational objectives. By incorporating all these dimensions the focus of the assessment will be based exclusively on the six principles of good water governance and their scope as provided by United Nations Economic and Social Commission for Asia and Pacific (UNESCA 2009) as indicated in the table 3 below
Principle Definition
Transparency Processes, Institutions, and information on water resource and services are directly accessible and can be monitored
Accountability Decision makers in water sector institutions and companies are accountable and responsive to public and stakeholders
Participation Citizens (i.e. consumers and water users) have an opportunity to influence processes and decisions in a meaningful way.
Nondiscrimination/equity All citizens have an opportunity to improve their wellbeing through equitable access to water resources
Rule of law/access to justice
Legal framework are fair and are enforced impartially
Performance /efficiency Institutions and processes serve all stakeholders and produce results that meet needs which make the best user of resources
Table 3. Principles of good water governance: Source, UNSCAP 2009
Changing and creating institutions is easy but are the objectives of policy makers and sector players in general in line with the needs and aspirations of the sector? To answer this question, this paper approaches this analysis solely on how, one, water resources management and two, water services provision configure the principles of good water in the context of UNSAP 2009 outline in attempt to actualize the basic governance principles towards water sector efficacy as envisaged in water sector reform policies in the country.
Water Resources Authority (WRA) aims to ensure that water resources are protected and water is shared equitably by users. Water Resources Authority has endeavored to publish regular reports on its activities, achievements, revenues and budget. These reports are distributed to Water Resources Users Associations and posted on their website to be accessed easily by any interested party. In an effort to ensure equitable and sustainable
516
allocation of water resources, WRA supports the establishment and operations of sub-catchment management plans.
Towards restricting wastage of scarce water resources, WRA approves and provides permits levies for water abstraction. This safeguards and mitigates conflicts among water users and enhances financial autonomy. The Authority also sets standards for the performance of water basin organization and reports to the public on their monitoring of raw water abstraction and pollution control.
Water Services Regulatory Board (WASREB) plays a key role in ensuring better governance in water services. Public hearings at the community level, clear provisions on access to information and WASREB-stipulated public reporting by the utilities all improve the flow of information to consumers. Devolved complaints handling centers and follow-up on complaints ensures social accountability on the part of Water Services Providers (WSPs). The nationwide rollout of civil-society-based Water Action Groups (WAGs) is a powerful tool to expose the inadequate practices of WSPs and their boards, and to ensure transparency in fulfilling the rights of consumers and underserved communities. WAGs are community based volunteer organizations which act as a consumer representatives and provide a platform for engagement with stakeholders in water sector. The goal of WAGs is to ensure that consumers views are taken into account on matters related to provision of water services. The initiative aims at improving understanding of roles and obligation of consumers and sector institutions by disseminating information to communities that they represent, objective engagement with sector institutions, and provide feedback on water services offered.
Public consultation for water and sewerage tariff review is a legal requirement. WASREB water tariff review guidelines demands that before submitting the tariff adjustment proposal for consideration each WSP should undertake a public consultation. Main stakeholders and the public should be informed about the planned tariff adjustment and allowed to give feedback to the WSP. This processes is usually documented and the proceedings forwarded to WASREB as a requirement.
Water Services Providers (WSPs) have a critical role in realizing the right to water as provided in the Kenya constitution. The owners of effectiveness and efficiency of provision of these services squarely lands on their shoulders, as it is them who ultimately provide these services to consumers. The success of WSPs reflect on the way decisions are made, the quality and reliability of information disclosed to the public, and the involvement of stakeholders. The mandate of WASREB is to regulate the water services sub-sector. One of the key regulatory tasks is to gather, collate and disseminate information in the water services sub-sector. The report therefore serves as the comparative competition report as envisaged in the National Water Services Strategy of 2007-2015. This, in turn, improves transparency and accountability to the public and consumers.
6. Conclusion
Politics and governance are intertwine when it comes to management of water resources and provision of water services. Lack of access to water and sanitation services for the urban and rural poor and the increasing degradation of water resources are above all a result of poor governance. It could be prudent for sensitization programmes to be initiated towards empowering the stakeholders in understanding ,demanding and sustaining pressure on quality of services, and for meaningful engagement between them(stakeholders) and the management of water governance institutions in the country.
However, governance should be impressed from the symbiotic context. Just as much as the stakeholders’ spectrum persistently pressure for accountability and transparency on delivery
517

of water services, similar efforts should be applied in addressing challenges associated with unacceptable levels of Non-Revenue Water (NRW) in the country that stands at an average of 45% translating to an annual loss of ksh 10 billion(US$ 97 million). High level of NRW water infringe on human right to water, structured reporting mechanisms for illegal connections and leaking pipes should be developed, incentives should be given an option for those who volunteer such information. Further, prompt settlement of invoices arising from consumption of water and sewerage services should be encouraged for sustained improvement and expansion coverage of water services.
518
References
Albert Muma. Kenya new Water laws: an Analysis of the Implications of Kenya Water Act 2002
Chapter 372of law of Kenya; Water Act
Easter, W.K. and R.R. Heame. 1993. Decentralizing Water Resource Management: Economic Incentives, Accountability & Assurance. The World Bank (Policy Research Working Paper 1219), Washington DC: The World Bank
Francesco Rampa. (2011) Analyzing governance in water sector in Kenya: European Centre for Development Policy Management. Discussion paper No. 124
Government of Kenya (2010): The Kenya Constitution
Government of Kenya 2002: Water Act 2002
Government of Kenya 2016: Water Act 2016
Government of Kenya National Water Strategy 2007-2015
K’Akumu(2006). Towards effective governance of water services in Kenya: Water policy 9 pages 529-543
K’Akumu, O. A. & Appida, P. O. (2006). Privatization of urban water service provision: the Kenyan experiment. Water Policy, 8(4), 313–324.
Roger, Peter Hall and Allan (2003): Effective Water Governance
Swatuk, L.A. 2005. Political Challenges to Implementing IWRM in Southern Africa. Physics and Chemistry of the Earth 30: 872-880.
United Nations Economic and Social Commission for Asia and the Pacific (UNESCAP 2009), what is Good Governance?
UNDP (2004): water governance for poverty reduction
Water Act 2002: Government of Kenya
Water Act 2016; Government of Kenya
Water Resource Management Authority (2009)
519
VAILLANT Philippe Organic Earth’s Planning. Exemplification : ISOCARP-OAPA POELINA Anne, PERDRISAT Ian From Mardoowarra to Meuse Conference 2017
1
“City Policy” in the 7 underprivileged districts of Ardenne
Metropole: comparaison of solution with other places Toward an organic Earth Planning ? Exemplification : From Mardoowarra to the Meuse
VAILLANT Philippe, University of Lorraine, Loterr EA7304, France, In collaboration with POELINA Anne, PERDRISAT Ian, ONG-Majulla INC, Australia,
ABSTRACT
This text is the synthesis of 16 years of research on the definition of an organic urbanism allowing dialogue and encounter with all the peoples of the world, to learn how to progressively form an international political community (a globalism, not a globalization). This organic urbanism is exemplified on the territories of the Ardennes Metropolis crossed by the Meuse, and the Nyikina Country crossed by the Mardoowarra / Fitzroy River. 1. Introduction This paper is a synthesis of 16 years of research from 2001 to 2017, in three phases:
Definition of a field of competence and an organic urbanism in a geography thesis (Ref.1), supported on 13 December 2008 at the University of Lorraine, Loterr Laboratory (EA 1135, which has since become EA 7304). See www.convivialregion.org (FR). This work is base on Bill Twitchett theses (Ref.2) and papers in ISOCARP’s Congress 2003, 2004, 2005 and 2010 (Ref. 3). See http://www.twitchett.org/isocarp-congresses
Post-Doctorate on Integrated Water Resource Management (IWRM) in Australia, in collaboration with International Water Center, Brisbane, and the Nyikina People, Kimberley, northwestern Western Australia (Ref.4), see www.organicsocieties.org (EN). 49th ISOCARP Congress in Brisbane, 2013.
Return of the IWRM theme to the theme of organic planning and planning. 51st Congress of ISOCARP, Delft, 2015 (Ref.5),
The expression is therefore deliberately synthetic, based on two synthetic schemes using intuition as well as concept, developed in close collaboration with Anne Poelina and Ian Perdrisat, representatives of the Nyikina People of Kimberley-Australia (Ref.6). These schemes are applied to the theme of inclusiveness, and exemplified by two territories in dialogue by their respective rivers: Ardenne Métropole and the Meuse in Europe, Pays Nyikina and Mardoowarra-Fitroy River in Kimberley-Australia.
2. A "new" synthesis between science, philosophy and culture, as a basis for organic planning
A "new" synthesis: an organic naturalism (Ref.7: GRIFFIN, 2004) Organic naturalism is the 8th synthesis of science, philosophy and culture. The 7 previous syntheses were platonic Naturalism (N.) (1st and 2nd centuries), supernaturalist N. (3rd to 11th century), rational N. (XIIth and XIIIth), magic N. (XIXth and XVIth century), cartesian dualistic N. (XVIIth century), deist N. (XVIIIth and XIXth century), sensualist-atheist-materialistic N. (20th century). Organic naturalism, the 8th synthesis, is panexperialistic (“drops of experiences”), panentheistic and prehensive (tangible and intangible perception). It is a cosmology that enables organic planning with all the peoples of the world.
Organic planning : Organic naturalism has been described in the field of architecture and town planning by Joseph Grange through two books: Nature, City (Ref.8). It defines the "new" vocabulary to (re) learn to conjugate the City and the Environment. It is now a unified cosmology (Ref.9: Whitehead) that underlies urban planning and planning, and opens a dialogue with the first peoples, for the safeguarding of the common house (Ref.10, Laudate Si) . Nyikina people we agree and emphasize safeguarding their "commons" for the greater common good.
520
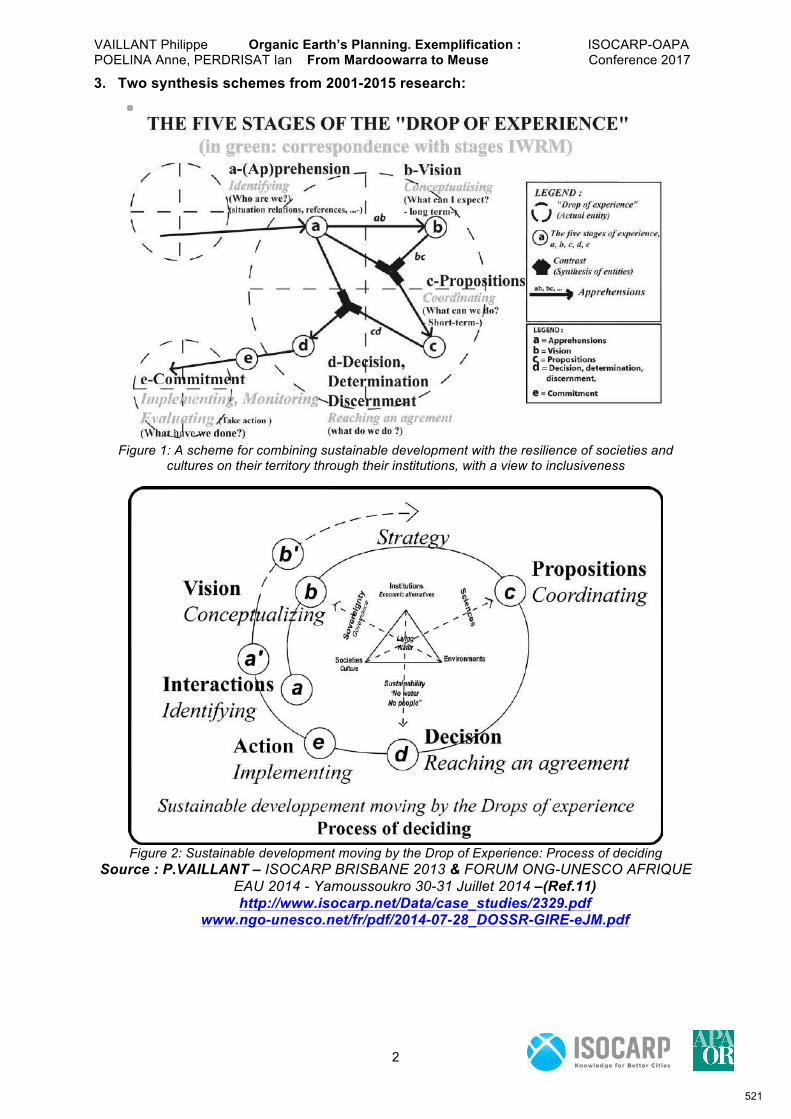
VAILLANT Philippe Organic Earth’s Planning. Exemplification : ISOCARP-OAPA POELINA Anne, PERDRISAT Ian From Mardoowarra to Meuse Conference 2017
2
3. Two synthesis schemes from 2001-2015 research:
Figure 1: A scheme for combining sustainable development with the resilience of societies and
cultures on their territory through their institutions, with a view to inclusiveness
Figure 2: Sustainable development moving by the Drop of Experience: Process of deciding
Source : P.VAILLANT – ISOCARP BRISBANE 2013 & FORUM ONG-UNESCO AFRIQUE EAU 2014 - Yamoussoukro 30-31 Juillet 2014 –(Ref.11) http://www.isocarp.net/Data/case_studies/2329.pdf
www.ngo-unesco.net/fr/pdf/2014-07-28_DOSSR-GIRE-eJM.pdf
521
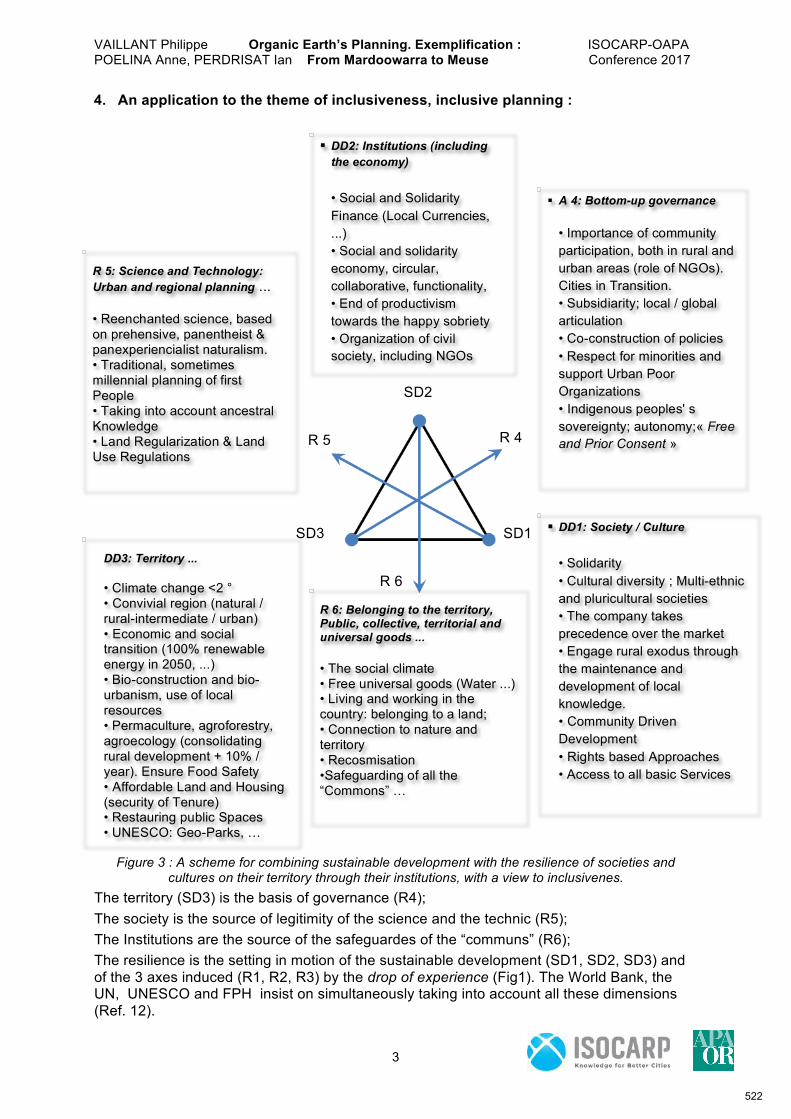
VAILLANT Philippe Organic Earth’s Planning. Exemplification : ISOCARP-OAPA POELINA Anne, PERDRISAT Ian From Mardoowarra to Meuse Conference 2017
3
4. An application to the theme of inclusiveness, inclusive planning :
Figure 3 : A scheme for combining sustainable development with the resilience of societies and
cultures on their territory through their institutions, with a view to inclusivenes. The territory (SD3) is the basis of governance (R4); The society is the source of legitimity of the science and the technic (R5); The Institutions are the source of the safeguardes of the “communs” (R6); The resilience is the setting in motion of the sustainable development (SD1, SD2, SD3) and of the 3 axes induced (R1, R2, R3) by the drop of experience (Fig1). The World Bank, the UN, UNESCO and FPH insist on simultaneously taking into account all these dimensions (Ref. 12).
R 4 R 5
SD2
SD1 SD3
R 6
§ DD1: Society / Culture • Solidarity • Cultural diversity ; Multi-ethnic and pluricultural societies • The company takes precedence over the market • Engage rural exodus through the maintenance and development of local knowledge. • Community Driven Development • Rights based Approaches • Access to all basic Services
§ DD2: Institutions (including the economy) • Social and Solidarity Finance (Local Currencies, ...) • Social and solidarity economy, circular, collaborative, functionality, • End of productivism towards the happy sobriety • Organization of civil society, including NGOs
DD3: Territory ... • Climate change <2 ° • Convivial region (natural / rural-intermediate / urban) • Economic and social transition (100% renewable energy in 2050, ...) • Bio-construction and bio-urbanism, use of local resources • Permaculture, agroforestry, agroecology (consolidating rural development + 10% / year). Ensure Food Safety • Affordable Land and Housing (security of Tenure) • Restauring public Spaces • UNESCO: Geo-Parks, …
§ A 4: Bottom-up governance • Importance of community participation, both in rural and urban areas (role of NGOs). Cities in Transition. • Subsidiarity; local / global articulation • Co-construction of policies • Respect for minorities and support Urban Poor Organizations • Indigenous peoples' s sovereignty; autonomy;« Free and Prior Consent »
R 5: Science and Technology: Urban and regional planning ... • Reenchanted science, based on prehensive, panentheist & panexperiencialist naturalism. • Traditional, sometimes millennial planning of first People • Taking into account ancestral Knowledge • Land Regularization & Land Use Regulations
R 6: Belonging to the territory, Public, collective, territorial and universal goods ... • The social climate • Free universal goods (Water ...) • Living and working in the country: belonging to a land; • Connection to nature and territory • Recosmisation •Safeguarding of all the “Commons” …
522

VAILLANT Philippe Organic Earth’s Planning. Exemplification : ISOCARP-OAPA POELINA Anne, PERDRISAT Ian From Mardoowarra to Meuse Conference 2017
4
5. Example of the Nyikina Country, crossed by the Mardoowarra (Nyikina aboriginal name of the Fitzroy River, Kimberley, Western Australia) :
Traditional Owners, First nations and Aboriginal people from the Fitzroy River catchment area met on the 2nd and 3rd of November 2016 in Fitzroy Crossing. Participants from that meeting developed the below statement: Fitzroy River Declaration (Ref. 13) Traditional Owners of the Kimberley region of Western Australia are concerned by the extensive development proposals facing the Fitzroy River and its catchment and the potential for cumulative impacts on its unique cultural and environmental values.
The unique cultural and environmental values of the Fitzroy River and its catchment are of national and international significance. The Fitzroy River is a living ancestral being and has a right to life. It must be protected for current and future generations, and managed jointly by the Traditional Owners of the river.
Traditional Owners of the Fitzroy catchment agree investment is need to work together to:
• Action a process for joint cultural governance decision making on activities in the Fitzroy catchment;
• Reach a joint position between ALL of the Aboriginal people connected and living along the Fitzroy River on fracking in the Fitzroy catchment;
• Create a buffer zone for no mining, oil, gas, irrigation and dams in the Fitzroy catchment;
• Research, Develop and Fund an agreed Integrated Water Resource Management Plan for the entire Fitzroy Catchment, based on traditional and environmental values;
• Develop a Fitzroy River Management Body for the Fitzroy Catchment, founded on cultural governance;
• Complement these with a joint Indigenous Protected Area or a Geo Park over the Fitzroy River;
• Engage with local and state government to communicate concerns and ensure they follow the agreed joint process;
• Investigate legal options to support the above, including: 1) Strengthen protections under the Federal Government Environmental Protection and Biodiversity Act (EPBC) Act National Heritage Listing; 2) Strengthen protections under the Aboriginal Heritage Act; and 3) Develop Legislation to protect the Fitzroy catchment and its unique cultural and natural values.
The Fitzroy River Declaration 2016 sets a national standard for native title (land title), as well as enshrining the UN Declaration on the Rights of Indigenous Peoples for self-determining our responsibilities as guardians of the Fitzroy River as being fundamental to the management of this globally unique river system. The Declaration sends a strong message to the Federal Government to endorse the Federal Government Environmental Protection and Biodiversity Act (EPBC 1999, Ref.14) Draft Referral Guidelines for the West Kimberley National Heritage Places (2012, Ref.15) as the Guiding Principles for Planning and Development within the Fitzroy Catchment. A 10 minute film Mardoowarra’s Right To Life can be seen at https://vimeo.com/205996720 (Password: Kimberley)
Website: www.majala.com.au
Phone: +61 408922155
Email: [email protected]
523
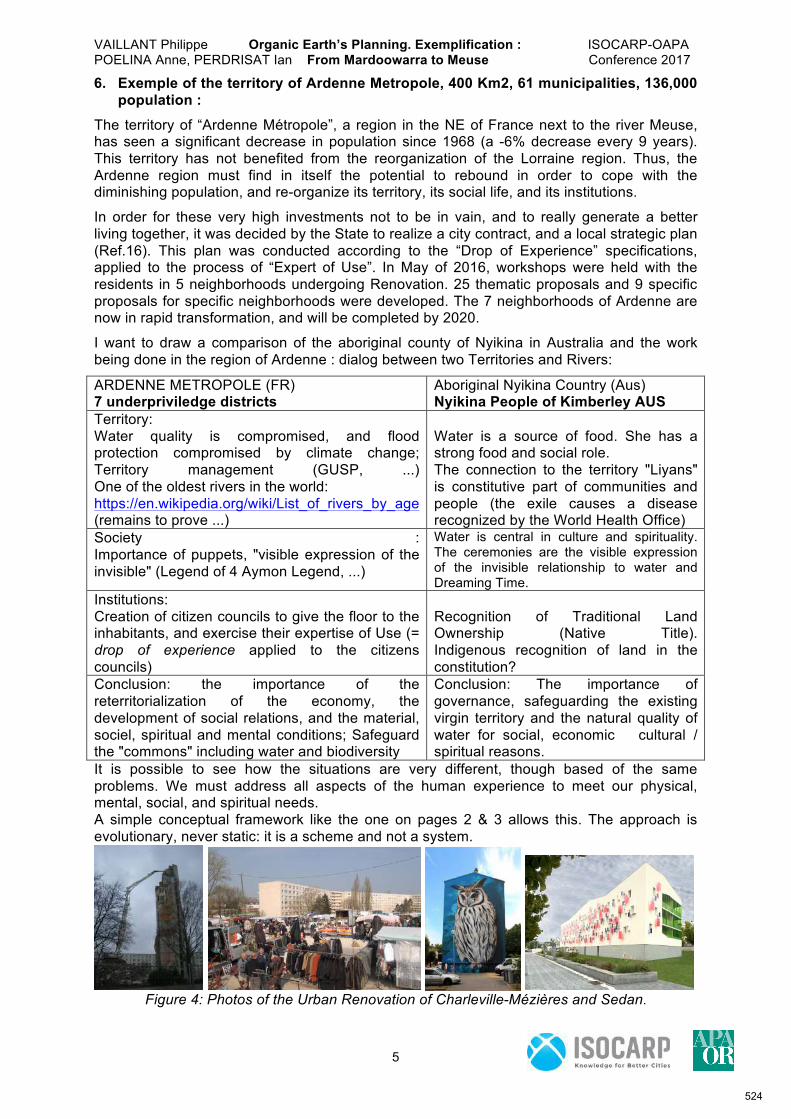
VAILLANT Philippe Organic Earth’s Planning. Exemplification : ISOCARP-OAPA POELINA Anne, PERDRISAT Ian From Mardoowarra to Meuse Conference 2017
5
6. Exemple of the territory of Ardenne Metropole, 400 Km2, 61 municipalities, 136,000 population :
The territory of “Ardenne Métropole”, a region in the NE of France next to the river Meuse, has seen a significant decrease in population since 1968 (a -6% decrease every 9 years). This territory has not benefited from the reorganization of the Lorraine region. Thus, the Ardenne region must find in itself the potential to rebound in order to cope with the diminishing population, and re-organize its territory, its social life, and its institutions.
In order for these very high investments not to be in vain, and to really generate a better living together, it was decided by the State to realize a city contract, and a local strategic plan (Ref.16). This plan was conducted according to the “Drop of Experience” specifications, applied to the process of “Expert of Use”. In May of 2016, workshops were held with the residents in 5 neighborhoods undergoing Renovation. 25 thematic proposals and 9 specific proposals for specific neighborhoods were developed. The 7 neighborhoods of Ardenne are now in rapid transformation, and will be completed by 2020.
I want to draw a comparison of the aboriginal county of Nyikina in Australia and the work being done in the region of Ardenne : dialog between two Territories and Rivers:
ARDENNE METROPOLE (FR) 7 underpriviledge districts
Aboriginal Nyikina Country (Aus) Nyikina People of Kimberley AUS
Territory: Water quality is compromised, and flood protection compromised by climate change; Territory management (GUSP, ...) One of the oldest rivers in the world: https://en.wikipedia.org/wiki/List_of_rivers_by_age (remains to prove ...)
Water is a source of food. She has a strong food and social role. The connection to the territory "Liyans" is constitutive part of communities and people (the exile causes a disease recognized by the World Health Office)
Society : Importance of puppets, "visible expression of the invisible" (Legend of 4 Aymon Legend, ...)
Water is central in culture and spirituality. The ceremonies are the visible expression of the invisible relationship to water and Dreaming Time.
Institutions: Creation of citizen councils to give the floor to the inhabitants, and exercise their expertise of Use (= drop of experience applied to the citizens councils)
Recognition of Traditional Land Ownership (Native Title). Indigenous recognition of land in the constitution?
Conclusion: the importance of the reterritorialization of the economy, the development of social relations, and the material, sociel, spiritual and mental conditions; Safeguard the "commons" including water and biodiversity
Conclusion: The importance of governance, safeguarding the existing virgin territory and the natural quality of water for social, economic cultural / spiritual reasons.
It is possible to see how the situations are very different, though based of the same problems. We must address all aspects of the human experience to meet our physical, mental, social, and spiritual needs. A simple conceptual framework like the one on pages 2 & 3 allows this. The approach is evolutionary, never static: it is a scheme and not a system.
Figure 4: Photos of the Urban Renovation of Charleville-Mézières and Sedan.
524
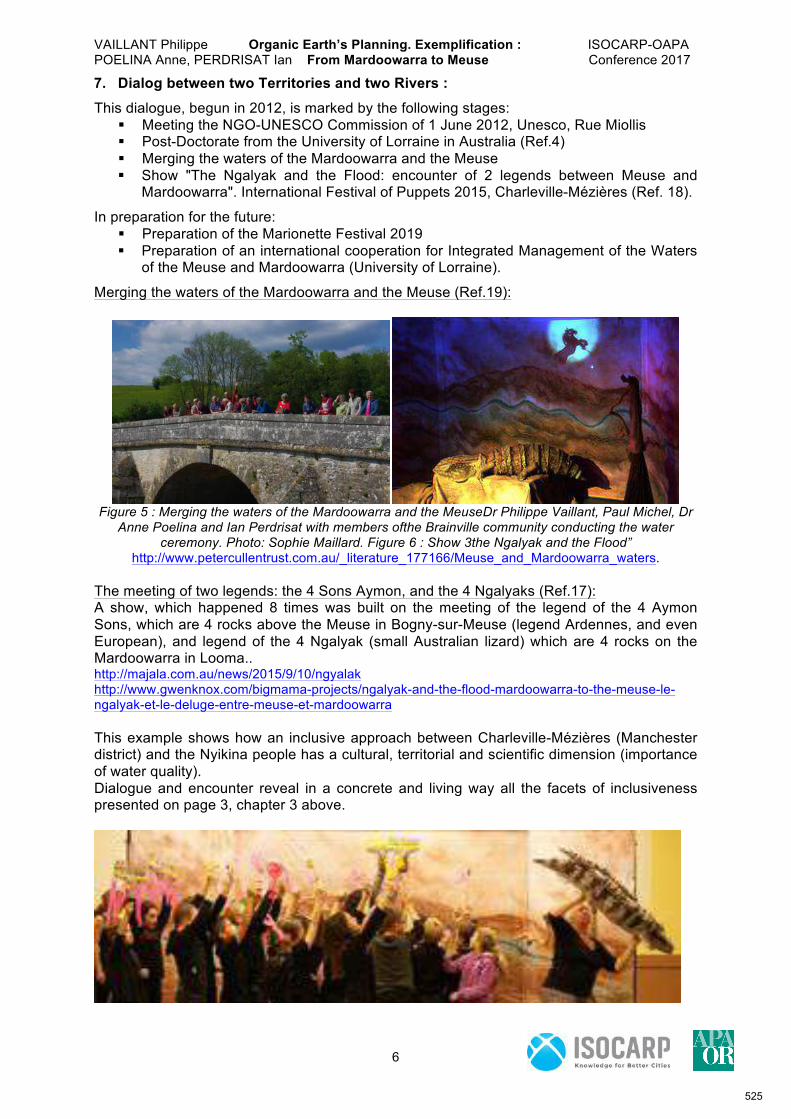
VAILLANT Philippe Organic Earth’s Planning. Exemplification : ISOCARP-OAPA POELINA Anne, PERDRISAT Ian From Mardoowarra to Meuse Conference 2017
6
7. Dialog between two Territories and two Rivers : This dialogue, begun in 2012, is marked by the following stages:
Meeting the NGO-UNESCO Commission of 1 June 2012, Unesco, Rue Miollis Post-Doctorate from the University of Lorraine in Australia (Ref.4) Merging the waters of the Mardoowarra and the Meuse Show "The Ngalyak and the Flood: encounter of 2 legends between Meuse and
Mardoowarra". International Festival of Puppets 2015, Charleville-Mézières (Ref. 18).
In preparation for the future: Preparation of the Marionette Festival 2019 Preparation of an international cooperation for Integrated Management of the Waters
of the Meuse and Mardoowarra (University of Lorraine).
Merging the waters of the Mardoowarra and the Meuse (Ref.19):
Figure 5 : Merging the waters of the Mardoowarra and the MeuseDr Philippe Vaillant, Paul Michel, Dr Anne Poelina and Ian Perdrisat with members ofthe Brainville community conducting the water
ceremony. Photo: Sophie Maillard. Figure 6 : Show 3the Ngalyak and the Flood” http://www.petercullentrust.com.au/_literature_177166/Meuse_and_Mardoowarra_waters.
The meeting of two legends: the 4 Sons Aymon, and the 4 Ngalyaks (Ref.17): A show, which happened 8 times was built on the meeting of the legend of the 4 Aymon Sons, which are 4 rocks above the Meuse in Bogny-sur-Meuse (legend Ardennes, and even European), and legend of the 4 Ngalyak (small Australian lizard) which are 4 rocks on the Mardoowarra in Looma.. http://majala.com.au/news/2015/9/10/ngyalak http://www.gwenknox.com/bigmama-projects/ngalyak-and-the-flood-mardoowarra-to-the-meuse-le-ngalyak-et-le-deluge-entre-meuse-et-mardoowarra This example shows how an inclusive approach between Charleville-Mézières (Manchester district) and the Nyikina people has a cultural, territorial and scientific dimension (importance of water quality). Dialogue and encounter reveal in a concrete and living way all the facets of inclusiveness presented on page 3, chapter 3 above.
525
VAILLANT Philippe Organic Earth’s Planning. Exemplification : ISOCARP-OAPA POELINA Anne, PERDRISAT Ian From Mardoowarra to Meuse Conference 2017
7
References: Ref.1 : VAILLANT, Philippe (2008) Territorial experience enlightened by A.N. Whitehead Thought: Convivial regions’ potentiality and applications to the region "between the Vosges and Ardennes", 611 p. Online at: http://docnum.univ-lorraine.fr/public/DDOC_T_2008_NAN21_019_VAILLANT.pdf www.convivialregion.org Ref.2 : TWITCHETT, Bill (William) (1995), The urban site: potentialities: reflections on the responsible and balanced development of human settlements from six French, Egyptian and Australian examples, Éditions du Septentrion, Lille, Thèse, Directeur de recherche : Paul CLAVAL, mai 1997, 420 pp. Ref.3 : TWITCHETT William *, « The convivial region : a fundamental entity within the world pattern of development". Association Internationale des Urbanistes / ISoCaRP : Congrès 2003 Cairo (Planning in a more globalised and competetive world), 12 pages. Included in published book of congress proceedings, Planning in a more Globalized and Competitive Worl, Edited by Paolo La Greca, Proceedings of XXXIX International ISoCaRP Congress, Gangemi Editore, 2005, 351 pp., pages 135 à 146 Ref.4 : VAILANT Philippe (20015), Mining projects and quantitative / qualitative evaluation of water really mobilized, enlightened by whiteheadian organic approach. Strategies for prevention and control (Kimberley, Canning Basin, Australia), 213p. Laboratoire LOTERR, Lorraine’s University, unpublished. See online: http://organicsocieties.org/index.php/1-b-the-territory-in-question/?lang=en Ref.5 : VAILLANT P. (2015) ISOCARP : “Let's reinvent convivial regions: in the memory of Bill Twitchett”, https://www.eventure-online.com/parthen-uploads/95/15ROT/add_1_270838_IJ7UNKcKmY.pdf Ref.6 : VAILLANT P. (2013), ISOCARP, Mining, environment and society: Contribution of the thought of Whitehead to the methodology of assessing the water that can really be mobilized in the Kimberley and Canning Basin, Australia. http://www.isocarp.net/Data/case_studies/2329.pdf Ref.7 : GRIFFIN David Ray (2004), Two Great Truths : A New Synthesis of Scientific Naturalism and Christian Faith, Westminster John Knox Press Ref.8 : GRANGE (1997) Nature : An Environmental Cosmology, State University of New York Press, New York, 1997, 272 pp. ; GRANGE Joseph, The City : An Urban Cosmology, State University of New York Press, New York, 1999, 267 pp. Ref.9 : WHITEHEAD Alfred North , Process and Reality. An essay in cosmology. Gifford Lectures delivered in the University of Edinburg during the session 1927-28 (PR), The Macmillan Co., New York, 1929, xii, 547 pp. Published in England by the Cambridge University Press, 1929, xxiii, 509 pp. Ref.10 : HOLY FATHER FRANCIS (2015), Encyclical Letter LAUDATO SI’ ON CARE FOR OUR COMMON HOME, 182p. http://w2.vatican.va/content/dam/francesco/pdf/encyclicals/documents/papa-francesco_20150524_enciclica-laudato-si_en.pdf Ref.11 : MARIN Janine (2002), “Poverty and development of social relations in the urban environment », World Federation of UNESCO Clubs, Centres and Associations (WFUCA), in Changing the Outlook, Eradication of Poverty in Urban Areas, Report of the UNESCO-NGO Joint Programme Commission on Poverty, page 26-39. Ref.12 : Worldbank (2015), Inclusive Cities ; UNESCO; UN (2015), Towards Green and inclusive Prosperity, ; FPH. Ref.13 : Fitroy River Declaration: http://www.klc.org.au/news-media/newsroom/news-detail/2016/11/15/kimberley-traditional-owners-unite-for-the-fitzroy-river Ref.14 : Federal Government Environmental Protection and Biodiversity Act (EPBC 1999, Ref.14) Ref.15 : Draft Referral Guidelines for the West Kimberley National Heritage Places (2012, Ref.15) www.majala.com.au/mardoowarra/ Ref.16 : Ardenne Metropole (2015), http://www.ardenne-metropole.fr/Politique-de-la-Ville Ref.17 : Ardenne Metropole: Loi LAMY of Citizen Councils and New City Policy: LOI n° 2014-173 du 21 février 2014 : planning for cities and urban cohesion. Ref.18 : Show "The Ngalyak and the Deluge: https://www.facebook.com/partenariatfrancoaustralien/ Ref.19: http://www.petercullentrust.com.au/_literature_177166/Meuse_and_Mardoowarra_waters Site Chenaie: http://www.hommesetfemmesdanslacite.net/index.php
526

VAILLANT Philippe Organic Earth’s Planning. Exemplification : ISOCARP-OAPA POELINA Anne, PERDRISAT Ian From Mardoowarra to Meuse Conference 2017
8
Annexe : Definition of the drop of experience • The drops of experiences are called in organic technical language « Actual entities »
Reference: SHERBURNE Donald W., (Edited by) A Key to Whitehead’s “Process and Reality” (PR), The Macmillan Company, New York, 1966, 263 pp. translation by H Vaillant, Keys for Process and reality by Whitehead, 1993, H.Vaillant, 358 pages, including a glossary of 64 pages.
Actual entity :
“Actual entities – also called actual opportunities – are the ultimate realities of which the world is composed” (PR 18).
As with Democritus’s atoms, they are micro-cosmic entities, whose aggregates, called companies or nexus, are macroscopic entities of our daily experience — trees, houses, people. But while Democritus atoms are an inert, unalterable material substance, Whitehead’s actual entities are “drops of experience, which are complex and interdependent” (PR 18), vital, and transient. To support that the ultimate realities which the world is composed of, are drops of experience is not to say that consciousness enters the inanimate nature, because conscience can only characterize extremely complex existing entities, and actual entities have the potential of productive complexification of consciousness only when they are members of extremely complex societies such as the one we call the human brain. Whitehead’s intuition is to see that if it’s a unique thing to take seriously the doctrine of evolution and to support that the creatures endowed with sensitivity and intentionality emerge from the primordial magma, then this magma should be understood in such a way that the emergence from it of animals and beings human is intelligible. He defends consequently a neutral monism in which actual entities are not fragments of a material stuff or leibnizian souls, but rather units of process that may be linked to other existing entities to form temporal veins of material, or may be related to other complex actual entities, all entangled in a complex society such as the brain, to form a road of inheritance that we identify with the conscious soul of a person that lasts. (See structured society for more details)
Actual entities are thus units of process and the title Process and reality intends to indicate that these units of microcosmic processes are for Whitehead last realities: “you cannot go behind the current entities to find there some reality which is more important’ (PR 18). On the other hand, to make the mistake of regarding an aggregate of existing entities as a last reality, is to fall into the sophism of badly placed concrete. Descartes has been guilty of this sophism when he characterized the mind and the matter as being two kinds of separate realities.
An actual entity is “the unity to attribute in special case of concrescence” (PR 212). A concrescence is a joint growth of the remains of the decaying past in the vibrant immediacy of a new present unit. An actual entity lasts only a moment – the moment of his becoming, of hisactive trial of self-creation from the elements of the past which perish – then it also perishes, and, once thus objectively immortal, becomes a datum dead for successive generations of existing entities. The concrescence of an actual entity begins with a receptive, passive, moment when the given-being of the past is projected onto it; it then completes its fate with a series of creative supplementales phases that adjust, integrate, and perhaps modify the given data. In simple actual entities, there is a simple reiteration of the given: they are ” vehicles designed to receive, store, and restore without gain or loss ” (PR 177). The complex actual entities enjoy a complex succession which is the result of their social involvement, and this complexity of succession creates an originality in the supplementales phases which are the means to complete the integration and unity”.
**************************************
527
Evaluation of the Situation in Greater Cairo with Regards to Citizen
Participation in Urban Governance Through the Emerging Information and Communication Technologies
Ghada MOURAD, Department of Architectural Engineering, Cairo University, Egypt
Heba Allah KHALIL, Department of Architectural Engineering, Cairo University, Egypt Mohamed ZAYED, Department of Architectural Engineering, Cairo University, Egypt
Synopsis The paper evaluates citizen participation in urban governance through the emerging information and communication technologies in Greater Cairo. It explores one of the local cases that took advantage of the emerging technologies for participation, and measures readiness of Greater Cairo inhabitants to participate through these technologies using a questionnaire survey.
1. Introduction Greater Cairo is witnessing a great deterioration in its built environment and the inhabitants are the ones facing these urban challenges on a daily basis; inadequate sidewalks force pedestrians to walk in the middle of the streets and risk their own lives; potholes spread along the streets cause driving discomfort and damage cars; poor rainwater drainage systems cause more traffic jams than there already are; citizens can hardly find adequate public open spaces or green spaces for recreation; passers-by are disturbed from the smell and the look of garbage spread all over the place. Any decision taken regarding the built environment directly affects citizens' everyday lives. Therefore, they should be at least informed, consulted or empowered to actively participate in the urban governance process. For decades, Greater Cairo has been managed through a highly centralized governance system. There is a lack of transparency and citizens are not allowed to take part in any decision affecting them. Even the elected Local Popular Councils LPCs that hardly represent the citizens have no real power in the decisions taken. Not only is the governance system centralized, but it also follows a very complicated and inefficient system. Given that Greater Cairo consists of three independent administrative units: Cairo, Giza and Qalyubia governorates, each governorate consists of multiple districts, which are governed through the Council of Local Civil Servants with the governor on top and the LPC. It is very difficult to coordinate between these different administrative entities and make any decision in Greater Cairo (Nefissa, 2009). Within this governance system, the inhabitants are excluded and in best cases poorly represented in any decision that directly affects their lives. Even though LPCs are the only elected body in local governance, since the 2011 revolution, LPCs have been annulled pending the issuance of a new local administration law. Furthermore, there is a lack of proper communication channels between different governing bodies and the society hindering inhabitants to participate in urban governance. Consequently, inhabitants have limited options to follow. They can either become frustrated from the lack of appropriate channels to voice their concerns, or feel indifferent behaving negatively towards their built environment to satisfy their own needs, or become detached relying on the government to deal with the whole situation. Regardless of this complicated situation apparent in Greater Cairo, the emerging information and communication technologies (ICTs) are believed to facilitate citizen participation in urban governance. According to the ICT Indicators report of October 2016 (Arab Republic of Egypt
528
Ministry of Communications and Information Technology, October 2016), almost 63% of the total population in Greater Cairo have access to the internet. The internet and famous social media sites have attracted a large number of users over the past decade, as they facilitate communication and social interactions. Moreover, the geo-visualization interfaces, like Google Maps, and GPS equipped mobile devices, enabled inhabitants to deal with and share information that is connected to a particular geographic location. The aim of this research is to evaluate the situation of Greater Cairo with regards to citizen participation in urban governance through the emerging ICTs. The paper starts with a theoretical study of three levels of citizen participation in spatial knowledge management, as proper building of knowledge is one of the key factors for a successful urban governance process. Then it highlights the trending technologies for citizen participation in urban governance. The paper then explores El-Nargis Neighborhood Development Association groups on Facebook and WhatsApp, as a local case study, to understand how the emerging technologies had been used in participatory urban governance practices in Greater Cairo. Finally, through a questionnaire survey, the paper measures willingness and readiness of Greater Cairo inhabitants to participate in the urban governance process through the emerging technologies.
2. Participatory Spatial Knowledge Management In urban development practices, proper building of knowledge is one of the key factors for success (Eversole, 2015). Citizen participation in spatial knowledge management is not only important for effective decision-making and problem solving, but it is also important to build stronger citizens (Hanna, 2000). This paper focuses on three levels of citizen participation in spatial knowledge management: (1) citizens’ right to information; (2) citizens as producers of knowledge; and (3) knowledge partnerships. 2.1 Citizens’ Right to Information The right to information is the right of citizens to freely access public information. It is a call for transparency and accountability in governance. Joshi (2013) defined transparency as, “any attempts (by states or citizens) to place information or processes that were previously opaque in the public domain, accessible for use by citizen groups, providers or policy makers.” However, making information available for the public is not enough; it has to be analyzed and clearly presented in order for the public to have a comprehensive understanding of the ongoing events and decisions taken, and accordingly express their opinions and concerns (Bailur & Longley, 2014; Kumar & Morris, 2009). There is a limited benefit out of transparency if there is no accountability (Bailur & Longley, 2014). According to Schedler (1999), there are two main characteristics of accountability: “answerability” and “enforcement”. Public officials are required to clarify and explain their actions, and penalties should be imposed for any unacceptable behavior. Answerability is not necessarily when the public asks for explanation, but it can be a regular practice associated with any action carried out by public officials (Kumar & Morris, 2009). The question here is, how to move from transparency to accountability? According to Bailur and Longley (2014), citizen participation is considered one of the main factors that can support this transformation. Citizen participation in this context means having access to information and regularly question actions of public officials, and consequently have the power to enforce penalties for any unacceptable behavior (Bailur & Longley, 2014). This level of participation is essential for better urban governance. It can help educate citizens and raise their awareness about the current governance system, projects, issues and resources (Holdar & Zakharchenko, 2002; TADAMUN, 2013). It is an essential requirement for higher levels of participation. It empowers the poor and marginalized. Furthermore, it can be an effective approach to fight corruption (UNDP, 2004; Transparency International & UN-HABITAT, 2004; TADAMUN,
529
2013). However, according to UN-Habitat (2004) information “must be timely, relevant, accurate and complete for it to be used effectively.” 2.2 Citizens as Producers of Knowledge Inviting the public to access and use information motivates them to become more involved in urban governance process. It encourages them to contribute with their knowledge in order to upgrade their own communities. Local knowledge as Eversole (2015) defined: “is grounded, situated, and ultimately tied to a particular context. Whether it is cognitively ‘known’ or physically ‘performed’, whether it can be explained in words or not, whether it is known by the whole community or only a few individuals, local knowledge is embedded in the local context.” What distinguishes local knowledge from other kinds of knowledge is its strong connection to a specific physical, social and cultural context; it cannot be universally applied like expert knowledge. Community members living in a specific urban context (a neighborhood for example) are those who hold local knowledge. Therefore, it is particularly beneficial to local development projects (Eversole, 2015; Corburn, 2003). Citizens can contribute with their own knowledge in the urban governance process through defining their needs (VLGA, 2001; VLGA, 2007; Western Australian Government, 2002), suggesting appropriate actions (Western Australian Government, 2002; Meskell, 2009), and providing feedback on current urban projects and services (Corburn, 2003; UN-HABITAT, 2001; Western Australian Government, 2002). Citizens in this case are not only considered as producers of knowledge, but also as controllers of governmental performances (Cavill & Sohail, 2004). They can enforce discipline through monitoring, assessing and evaluating governmental performances (Holdar & Zakharchenko, 2002). In order for citizens to carry out their role and contribute with their knowledge in decision-making, the government should play the role of an enabler and a facilitator. This requires public officials to change their attitudes towards citizens. Public officials should be more open and responsive to citizens’ knowledge contributions, and citizens should be treated with the consideration and respect they deserve (Eversole, 2015; Thomas, 2010). 2.3 Knowledge Partnerships Knowledge partnerships can take place between public and private sectors, community individuals and professionals, members of the same community or organization, or between several involved organizations. It can take place within a particular context or across borders (Eversole, 2015). Here, the focus will be on knowledge partnerships involving community individuals; either through bringing together different members in a certain community, or through bringing community individuals together with professionals, public officials, researchers, or any other involved organizations. Community individuals hold different kinds of knowledge; local knowledge can be technical, cultural, or experiential. They can also have opposing points of views and different ways of doing things. It is necessary to bring together the different community members in order to learn from each other and develop a deeper understanding of their communities. It helps build stronger communities where individuals collaborate in shaping their own lives (Eversole, 2015; Evans, 2004). According to Baud et al., (2014) Knowledge can be found with community individuals, professionals, politicians, and academics. Everyone holds valuable knowledge that can support development. Each type of knowledge is not only important by itself, but also when combined with other types of knowledge. Therefore, it is necessary to search for the different stakeholders and equally enable them to take part in an interactive dialogue. Integrating different types of knowledge in decision-making will lead to the formation of new kinds of knowledge and consequently more innovative decisions (Innes & Booher, 2004; Eversole, 2015). Knowledge partnerships can also result in building new networks. It can strengthen relationships between the different actors leading to further collaborations (Innes & Booher, 2004). However, knowledge partnerships should not be carried out without a purpose, or else, it will be a waste of time for everybody. Moreover, it is necessary for the process to be well prepared and organized in order to reach effective outcomes (NCDD, 2010; St Clair, 2006).
530
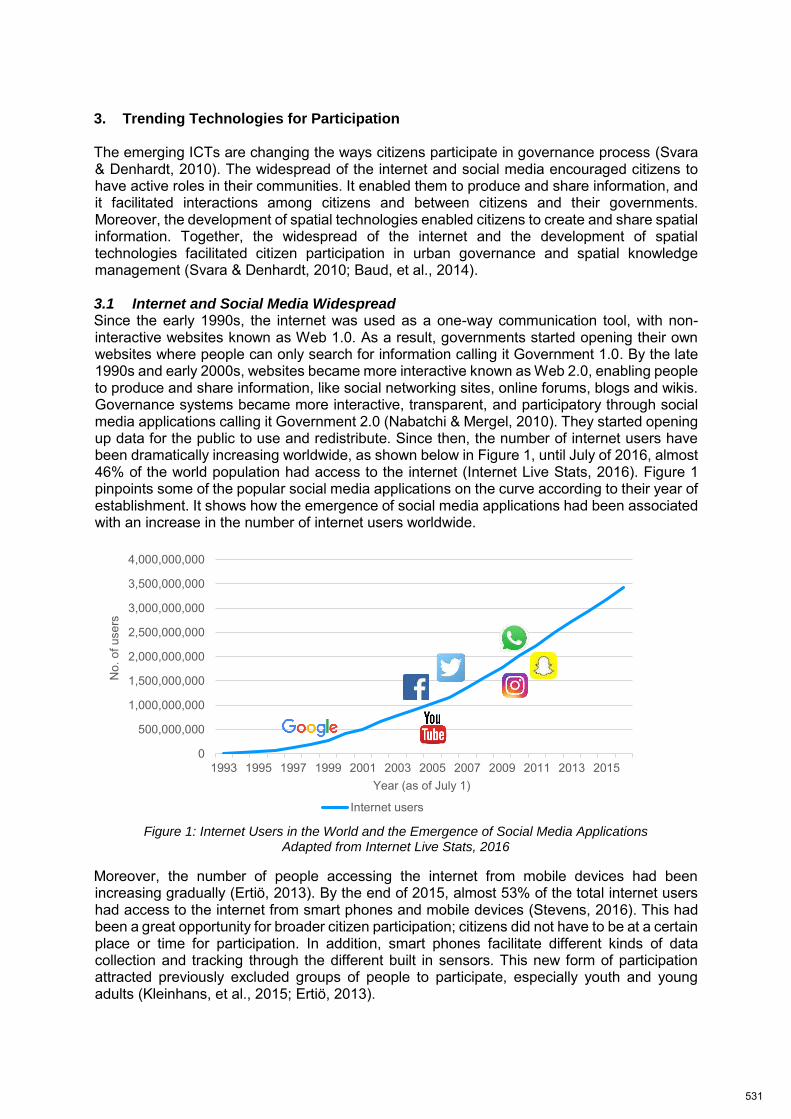
3. Trending Technologies for Participation The emerging ICTs are changing the ways citizens participate in governance process (Svara & Denhardt, 2010). The widespread of the internet and social media encouraged citizens to have active roles in their communities. It enabled them to produce and share information, and it facilitated interactions among citizens and between citizens and their governments. Moreover, the development of spatial technologies enabled citizens to create and share spatial information. Together, the widespread of the internet and the development of spatial technologies facilitated citizen participation in urban governance and spatial knowledge management (Svara & Denhardt, 2010; Baud, et al., 2014). 3.1 Internet and Social Media Widespread Since the early 1990s, the internet was used as a one-way communication tool, with non-interactive websites known as Web 1.0. As a result, governments started opening their own websites where people can only search for information calling it Government 1.0. By the late 1990s and early 2000s, websites became more interactive known as Web 2.0, enabling people to produce and share information, like social networking sites, online forums, blogs and wikis. Governance systems became more interactive, transparent, and participatory through social media applications calling it Government 2.0 (Nabatchi & Mergel, 2010). They started opening up data for the public to use and redistribute. Since then, the number of internet users have been dramatically increasing worldwide, as shown below in Figure 1, until July of 2016, almost 46% of the world population had access to the internet (Internet Live Stats, 2016). Figure 1 pinpoints some of the popular social media applications on the curve according to their year of establishment. It shows how the emergence of social media applications had been associated with an increase in the number of internet users worldwide.
Figure 1: Internet Users in the World and the Emergence of Social Media Applications
Adapted from Internet Live Stats, 2016
Moreover, the number of people accessing the internet from mobile devices had been increasing gradually (Ertiö, 2013). By the end of 2015, almost 53% of the total internet users had access to the internet from smart phones and mobile devices (Stevens, 2016). This had been a great opportunity for broader citizen participation; citizens did not have to be at a certain place or time for participation. In addition, smart phones facilitate different kinds of data collection and tracking through the different built in sensors. This new form of participation attracted previously excluded groups of people to participate, especially youth and young adults (Kleinhans, et al., 2015; Ertiö, 2013).
0
500,000,000
1,000,000,000
1,500,000,000
2,000,000,000
2,500,000,000
3,000,000,000
3,500,000,000
4,000,000,000
1993 1995 1997 1999 2001 2003 2005 2007 2009 2011 2013 2015
No.
of u
sers
Year (as of July 1)
Internet users
531
3.2 Spatial Technologies In addition to the widespread of the internet and social media sites, the late 1990s also witnessed a breakthrough in geographic information systems (GIS). Geographic Information Systems enabled planners and policy makers to collect, analyze, and visualize different kinds of spatial information on maps. It made spatial information easier to understand and facilitated decision-making (Relhan, et al., 2011; Kleinhans, et al., 2015). Then, Public Participatory Geographic Information Systems (PPGIS) was developed for gathering spatial information from the public. PPGIS enabled the public to access information, and consequently have enough information to effectively participate in planning and policy-making (Kleinhans, et al., 2015; Ertiö, 2013). Finally, over the past 10 years, the public had been able to create and share maps and spatial information online on their own, calling these kinds of information Volunteered Geographic Information (VGI). This was made possible through the emerging geo-visualization interfaces, such as Google Maps, and GPS enabled smart phones and mobile devices. Not only did these spatial technologies enable the public to complement experts’ knowledge, but also enabled collaborative production and exchange of knowledge by different groups of people (Baud, et al., 2014; Kleinhans, et al., 2015).
4. El-Nargis Neighborhood Development Association El-Nargis Neighborhood Development Association is a local civil organization under official recognition that empowers residents to make positive change in their neighborhood. Residents of El-Nargis through this local civil organization created a closed Facebook group in 2011 to discuss the growing problems that residents had been facing in El-Nargis neighborhood. By the end of 2015, community leaders created WhatsApp groups as well, to organize and direct efforts towards more effective results. This section starts with a qualitative description of the participatory platforms, then a deduction of the key factors for their success and the main challenges that require further attention. Since the platforms were closed to residents of the neighborhood and local officials, data were gathered through one of the active members in that platform. The aim of this study is to understand how the emerging technologies had been used in participatory urban governance practices in Greater Cairo. 4.1 Inhabitants Online Participatory Experience The three levels of participation were found in the group on Facebook; residents of El-Nargis had access to information, contributed with their own knowledge, and worked together to upgrade their neighborhood. Residents used Facebook group to ask questions about neighborhood services, or about suspicious actions in their neighborhood. Both inhabitants and local officials made important announcements on this group. They posted updates about ongoing development projects in the neighborhood. There were also regular posts summarizing meetings held between residents and local officials, and summarizing the group’s main achievements. Residents also used this group to report and discuss problems regarding the built environment. Group admins then reported problems to the city administration or simply tagged helpful local officials in a comment in order to fix these problems. Finally, residents of El-Nargis used Facebook group to plan for actions, like the peaceful protests they made to remove the head of city administration. Community leaders also created WhatsApp groups in order to organize and direct efforts towards more effective results. They created five groups where volunteers from around the neighborhood monitor and discuss the following issues: (1) cleanliness, (2) roads, (3) lighting, (4) building violations, and (5) gardens. Each group included around 25 members. In addition to a sixth main group, where volunteers from the different groups coordinated their work and discussed neighborhood issues all together. Community leaders set regular targets for the things they want to accomplish through these WhatsApp groups. They set targets in the main WhatsApp group for all the other groups to work on. Then volunteers in each subgroup collect
532
information in the district they live in, according to the targets set. At the end, they can have detailed information about the different problems in the whole neighborhood, and consequently make more effective decisions. Like the group on Facebook, residents used WhatsApp groups to report and discuss problems. They also posted updates about ongoing development projects. Finally, they made regular announcements about the achievements of each group, and regular posts summarizing their meetings with the city administration. 4.2 How Inhabitants Work with Local Authorities Supportive and trusted members from city administration were added to El-Nargis Facebook group so that they can directly interact with residents and understand the problems faced in the neighborhood. Some of the members of the WhatsApp groups directly contacted local officials for support. Offline meetings had also been regularly held between residents and city administration in order to discuss problems and collaboratively make decisions. In the end, the city administration carries the responsibility of implementing and funding these collaborative development projects. However, not everyone working in the city administration was cooperative and supportive all the way, and with the growing efforts from residents, the city administration became lazier in doing their own jobs. Therefore, residents made attempts to remove the head of city administration, and discussed the possibility of changing the existing administrative system with an independent one similar to those managing the gated communities. 4.3 Key Findings According to an announcement made on Facebook group on April 13, 2016, residents’ collaborative work with the city administration resulted in great achievements in El-Nargis neighborhood since they first created WhatsApp groups in September 18, 2015, such as paving roads, fixing street lights, enhancing public greenery, and garbage removal. The key factors for their success were found to be as follows: (1) the use of Facebook attracted large numbers of residents to the participatory process, (2) distributing responsibilities among a number of volunteers led to more effective results, (3) keeping residents updated with the latest news and achievements helped in sustaining the participatory practices, and (4) using traditional tools besides their main online platforms helped in reaching out for local officials and discussing development projects with neighbors and officials. However, some of the main challenges that required further attention were as follows: (1) the weak support from the government, (2) the poor organization of the participatory process through Facebook as the different forms of participation occurred at the same place, (3) the difficulty in using Facebook and WhatsApp as they are not ready for such participatory practices, and (4) the lack of a proper financial plan to support this participatory practice.
5. Questionnaire for Greater Cairo Inhabitants A questionnaire had been carried out to measure readiness of Greater Cairo inhabitants to participate in shaping their own neighborhoods through the emerging ICTs. It focused on three levels of citizen participation; (1) access to information; (2) knowledge production; and (3) knowledge partnerships with community individuals and entities. This section starts with a brief description of the questionnaire and the study sample. Then, it presents a statistical description of the questionnaire results. In the end, it highlights some of the key findings from the overall study. 5.1 Questionnaire Description The questionnaire was divided into seven main sections, with a total of 42 questions. Participants did not go through all questions; they skipped questions based on their answers. Both open and closed ended questions were used. Some of the questions were associated with clarifying examples to make sure that participants fully understood them.
533
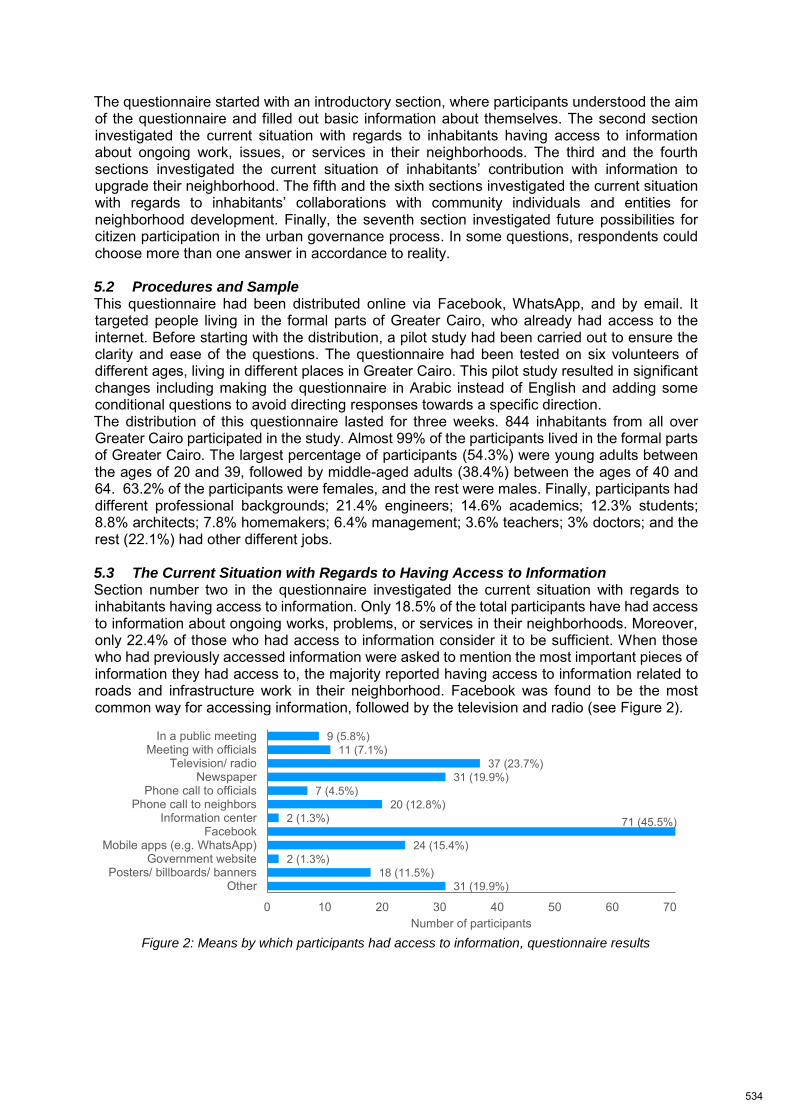
The questionnaire started with an introductory section, where participants understood the aim of the questionnaire and filled out basic information about themselves. The second section investigated the current situation with regards to inhabitants having access to information about ongoing work, issues, or services in their neighborhoods. The third and the fourth sections investigated the current situation of inhabitants’ contribution with information to upgrade their neighborhood. The fifth and the sixth sections investigated the current situation with regards to inhabitants’ collaborations with community individuals and entities for neighborhood development. Finally, the seventh section investigated future possibilities for citizen participation in the urban governance process. In some questions, respondents could choose more than one answer in accordance to reality. 5.2 Procedures and Sample This questionnaire had been distributed online via Facebook, WhatsApp, and by email. It targeted people living in the formal parts of Greater Cairo, who already had access to the internet. Before starting with the distribution, a pilot study had been carried out to ensure the clarity and ease of the questions. The questionnaire had been tested on six volunteers of different ages, living in different places in Greater Cairo. This pilot study resulted in significant changes including making the questionnaire in Arabic instead of English and adding some conditional questions to avoid directing responses towards a specific direction. The distribution of this questionnaire lasted for three weeks. 844 inhabitants from all over Greater Cairo participated in the study. Almost 99% of the participants lived in the formal parts of Greater Cairo. The largest percentage of participants (54.3%) were young adults between the ages of 20 and 39, followed by middle-aged adults (38.4%) between the ages of 40 and 64. 63.2% of the participants were females, and the rest were males. Finally, participants had different professional backgrounds; 21.4% engineers; 14.6% academics; 12.3% students; 8.8% architects; 7.8% homemakers; 6.4% management; 3.6% teachers; 3% doctors; and the rest (22.1%) had other different jobs. 5.3 The Current Situation with Regards to Having Access to Information Section number two in the questionnaire investigated the current situation with regards to inhabitants having access to information. Only 18.5% of the total participants have had access to information about ongoing works, problems, or services in their neighborhoods. Moreover, only 22.4% of those who had access to information consider it to be sufficient. When those who had previously accessed information were asked to mention the most important pieces of information they had access to, the majority reported having access to information related to roads and infrastructure work in their neighborhood. Facebook was found to be the most common way for accessing information, followed by the television and radio (see Figure 2).
Figure 2: Means by which participants had access to information, questionnaire results
31 (19.9%)18 (11.5%)
2 (1.3%)24 (15.4%)
71 (45.5%)2 (1.3%)20 (12.8%)
7 (4.5%)31 (19.9%)
37 (23.7%)11 (7.1%)
9 (5.8%)
0 10 20 30 40 50 60 70
OtherPosters/ billboards/ banners
Government websiteMobile apps (e.g. WhatsApp)
FacebookInformation center
Phone call to neighborsPhone call to officials
NewspaperTelevision/ radio
Meeting with officialsIn a public meeting
Number of participants
534
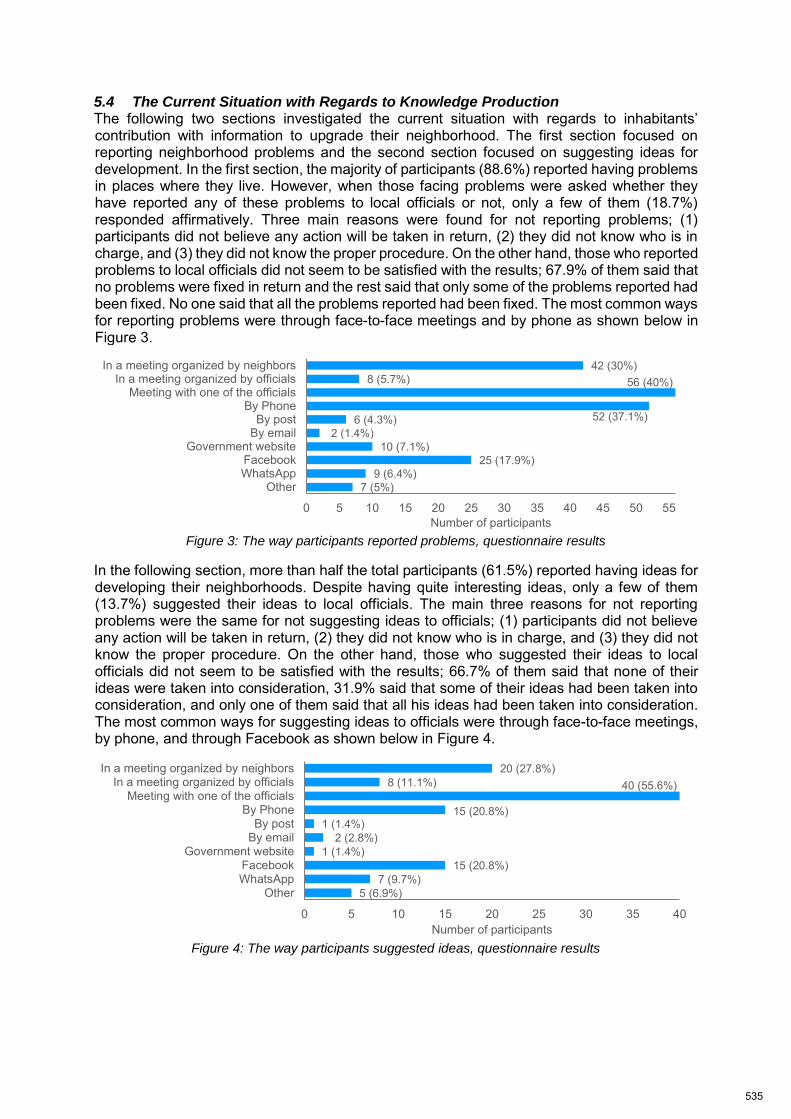
5.4 The Current Situation with Regards to Knowledge Production The following two sections investigated the current situation with regards to inhabitants’ contribution with information to upgrade their neighborhood. The first section focused on reporting neighborhood problems and the second section focused on suggesting ideas for development. In the first section, the majority of participants (88.6%) reported having problems in places where they live. However, when those facing problems were asked whether they have reported any of these problems to local officials or not, only a few of them (18.7%) responded affirmatively. Three main reasons were found for not reporting problems; (1) participants did not believe any action will be taken in return, (2) they did not know who is in charge, and (3) they did not know the proper procedure. On the other hand, those who reported problems to local officials did not seem to be satisfied with the results; 67.9% of them said that no problems were fixed in return and the rest said that only some of the problems reported had been fixed. No one said that all the problems reported had been fixed. The most common ways for reporting problems were through face-to-face meetings and by phone as shown below in Figure 3.
Figure 3: The way participants reported problems, questionnaire results
In the following section, more than half the total participants (61.5%) reported having ideas for developing their neighborhoods. Despite having quite interesting ideas, only a few of them (13.7%) suggested their ideas to local officials. The main three reasons for not reporting problems were the same for not suggesting ideas to officials; (1) participants did not believe any action will be taken in return, (2) they did not know who is in charge, and (3) they did not know the proper procedure. On the other hand, those who suggested their ideas to local officials did not seem to be satisfied with the results; 66.7% of them said that none of their ideas were taken into consideration, 31.9% said that some of their ideas had been taken into consideration, and only one of them said that all his ideas had been taken into consideration. The most common ways for suggesting ideas to officials were through face-to-face meetings, by phone, and through Facebook as shown below in Figure 4.
Figure 4: The way participants suggested ideas, questionnaire results
7 (5%)9 (6.4%)
25 (17.9%)10 (7.1%)
2 (1.4%)6 (4.3%) 52 (37.1%)
56 (40%)8 (5.7%)42 (30%)
0 5 10 15 20 25 30 35 40 45 50 55
OtherWhatsAppFacebook
Government websiteBy emailBy post
By PhoneMeeting with one of the officials
In a meeting organized by officialsIn a meeting organized by neighbors
Number of participants
5 (6.9%)7 (9.7%)
15 (20.8%)1 (1.4%)
2 (2.8%)1 (1.4%)
15 (20.8%)
40 (55.6%)8 (11.1%)20 (27.8%)
0 5 10 15 20 25 30 35 40
OtherWhatsAppFacebook
Government websiteBy emailBy post
By PhoneMeeting with one of the officials
In a meeting organized by officialsIn a meeting organized by neighbors
Number of participants
535
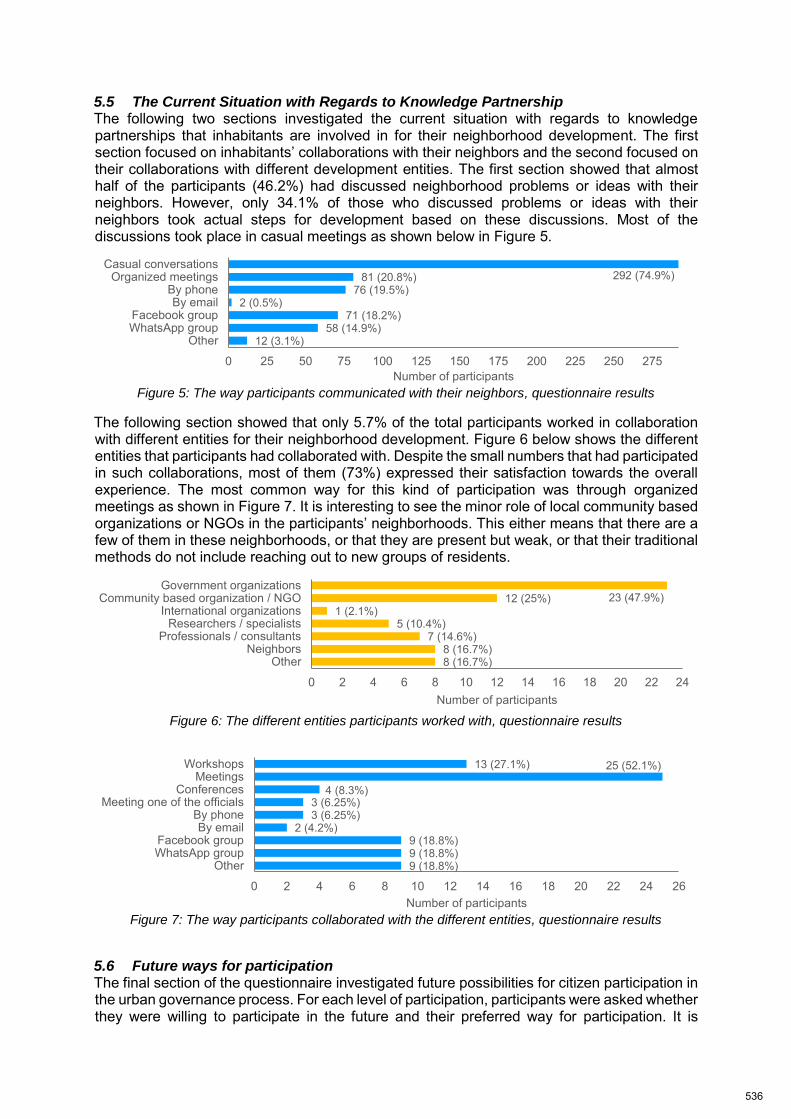
5.5 The Current Situation with Regards to Knowledge Partnership The following two sections investigated the current situation with regards to knowledge partnerships that inhabitants are involved in for their neighborhood development. The first section focused on inhabitants’ collaborations with their neighbors and the second focused on their collaborations with different development entities. The first section showed that almost half of the participants (46.2%) had discussed neighborhood problems or ideas with their neighbors. However, only 34.1% of those who discussed problems or ideas with their neighbors took actual steps for development based on these discussions. Most of the discussions took place in casual meetings as shown below in Figure 5.
Figure 5: The way participants communicated with their neighbors, questionnaire results
The following section showed that only 5.7% of the total participants worked in collaboration with different entities for their neighborhood development. Figure 6 below shows the different entities that participants had collaborated with. Despite the small numbers that had participated in such collaborations, most of them (73%) expressed their satisfaction towards the overall experience. The most common way for this kind of participation was through organized meetings as shown in Figure 7. It is interesting to see the minor role of local community based organizations or NGOs in the participants’ neighborhoods. This either means that there are a few of them in these neighborhoods, or that they are present but weak, or that their traditional methods do not include reaching out to new groups of residents.
Figure 6: The different entities participants worked with, questionnaire results
Figure 7: The way participants collaborated with the different entities, questionnaire results
5.6 Future ways for participation The final section of the questionnaire investigated future possibilities for citizen participation in the urban governance process. For each level of participation, participants were asked whether they were willing to participate in the future and their preferred way for participation. It is
12 (3.1%)58 (14.9%)
71 (18.2%)2 (0.5%)
76 (19.5%)81 (20.8%) 292 (74.9%)
0 25 50 75 100 125 150 175 200 225 250 275
OtherWhatsApp groupFacebook group
By emailBy phone
Organized meetingsCasual conversations
Number of participants
8 (16.7%)8 (16.7%)
7 (14.6%)5 (10.4%)
1 (2.1%)12 (25%) 23 (47.9%)
0 2 4 6 8 10 12 14 16 18 20 22 24
OtherNeighbors
Professionals / consultantsResearchers / specialists
International organizationsCommunity based organization / NGO
Government organizations
Number of participants
9 (18.8%)9 (18.8%)9 (18.8%)
2 (4.2%)3 (6.25%)3 (6.25%)
4 (8.3%)
25 (52.1%)13 (27.1%)
0 2 4 6 8 10 12 14 16 18 20 22 24 26
OtherWhatsApp groupFacebook group
By emailBy phone
Meeting one of the officialsConferences
MeetingsWorkshops
Number of participants
536
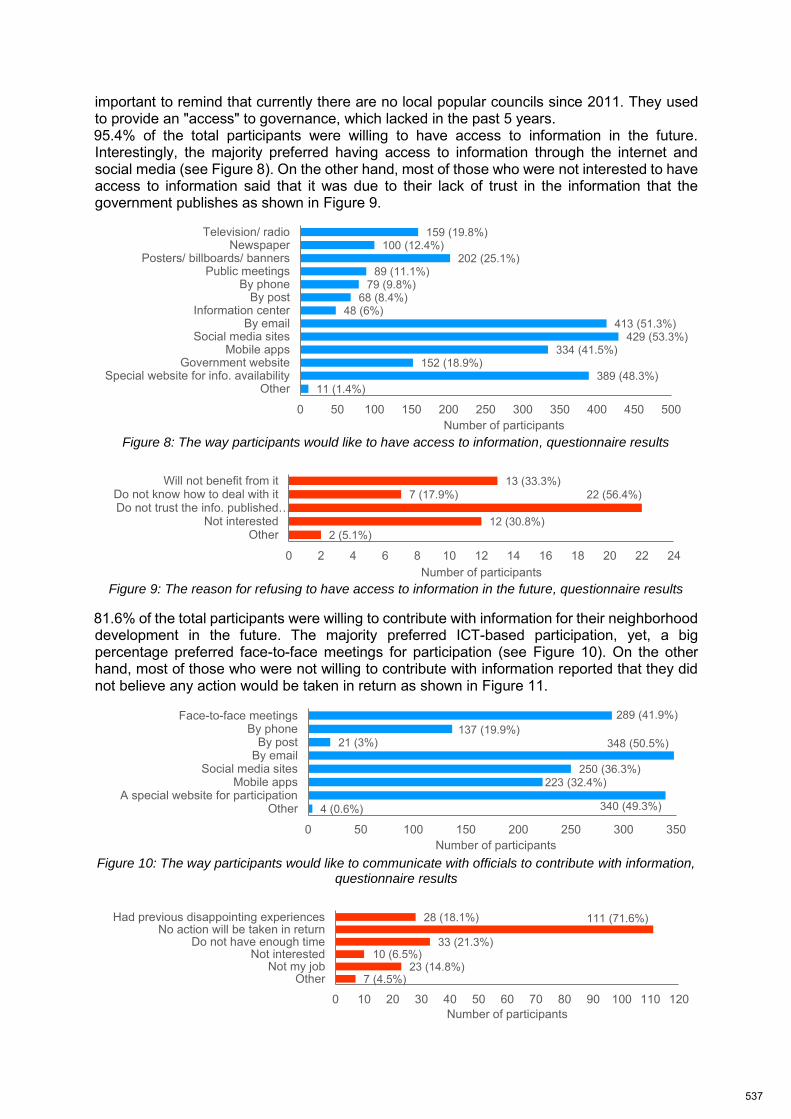
important to remind that currently there are no local popular councils since 2011. They used to provide an "access" to governance, which lacked in the past 5 years. 95.4% of the total participants were willing to have access to information in the future. Interestingly, the majority preferred having access to information through the internet and social media (see Figure 8). On the other hand, most of those who were not interested to have access to information said that it was due to their lack of trust in the information that the government publishes as shown in Figure 9.
Figure 8: The way participants would like to have access to information, questionnaire results
Figure 9: The reason for refusing to have access to information in the future, questionnaire results
81.6% of the total participants were willing to contribute with information for their neighborhood development in the future. The majority preferred ICT-based participation, yet, a big percentage preferred face-to-face meetings for participation (see Figure 10). On the other hand, most of those who were not willing to contribute with information reported that they did not believe any action would be taken in return as shown in Figure 11.
Figure 10: The way participants would like to communicate with officials to contribute with information,
questionnaire results
11 (1.4%)389 (48.3%)
152 (18.9%)334 (41.5%)
429 (53.3%)413 (51.3%)
48 (6%)68 (8.4%)
79 (9.8%)89 (11.1%)
202 (25.1%)100 (12.4%)
159 (19.8%)
0 50 100 150 200 250 300 350 400 450 500
OtherSpecial website for info. availability
Government websiteMobile apps
Social media sitesBy email
Information centerBy post
By phonePublic meetings
Posters/ billboards/ bannersNewspaper
Television/ radio
Number of participants
2 (5.1%)12 (30.8%)
22 (56.4%)7 (17.9%)13 (33.3%)
0 2 4 6 8 10 12 14 16 18 20 22 24
OtherNot interested
Do not trust the info. published…Do not know how to deal with it
Will not benefit from it
Number of participants
4 (0.6%) 340 (49.3%)
223 (32.4%)250 (36.3%)
348 (50.5%)21 (3%)137 (19.9%)
289 (41.9%)
0 50 100 150 200 250 300 350
OtherA special website for participation
Mobile appsSocial media sites
By emailBy post
By phoneFace-to-face meetings
Number of participants
7 (4.5%)23 (14.8%)
10 (6.5%)33 (21.3%)
111 (71.6%)28 (18.1%)
0 10 20 30 40 50 60 70 80 90 100 110 120
OtherNot my job
Not interestedDo not have enough time
No action will be taken in returnHad previous disappointing experiences
Number of participants
537
Figure 11: The reason for refusing to contribute with information in the future, questionnaire results
The majority of participants were willing to participate in knowledge partnerships. 87.8% were willing to collaborate with their neighbors and 80.9% were willing to collaborate with different entities for their neighborhood development. Unlike the previous forms of participation, most of the participants preferred face-to-face meetings and workshops for knowledge partnerships (see Figure 12 and Figure 13). On the other hand, most of those who were not willing to collaborate reported that they did not believe any suitable action would be taken in return and that they did not have enough time for that (see Figure 14 and Figure 15).
Figure 12: The way participants would like to collaborate with their neighbors for development,
questionnaire results
Figure 13: The way participants would like to collaborate with different entities for development,
questionnaire results
Figure 14: The reason for refusing to collaborate with neighbors in the future, questionnaire results
Figure 15: The reason for refusing to collaborate with different entities in the future, questionnaire
results
5.7 Key Findings from Questionnaire Together these results show how a small percentage of the total participants had already been engaged in their neighborhood governance; either through having access to information, or
6 (0.8%)244 (32.9%)
278 (37.5%)276 (37.2%)
185 (25%)355 (45.2%)
374 (50.5%)
0 50 100 150 200 250 300 350 400
OtherA special website for participation
Mobile appSocial media sites
By emailWorkshops
Face-to-face meetings
Number of participants
6 (0.9%)294 (43%)
228 (33.4%)261 (38.2%)
250 (36.6%)308 (45.1%)
296 (43.3%)
0 50 100 150 200 250 300 350
OtherA special website for participation
Mobile appSocial media sites
By emailWorkshops
Face-to-face meetings
Number of participants
8 (7.8%)8 (7.8%)
14 (13.6%) 36 (35%)
39 (37.9%)18 (17.5%)22 (21.4%)
0 5 10 15 20 25 30 35 40
OtherNot our responsibility
Not interestedDo not have enough time
Do not think they will take suitable actionThey will not listen to my ideas
Had previous disappointing experiences
Number of participants
8 (5%)17 (10.6%) 74 (46%)
70 (43.5%)42 (26.1%)18 (11.2%)
0 10 20 30 40 50 60 70 80
OtherNot interested
Do not have enough timeNo action will be taken in returnThey will not listen to my ideas
Had previous disappointing experiences
Number of participants
538
contributing with information, or working in collaboration with their neighbors and different entities for their neighborhood development. One of the main reasons that prevented participants from participating was the lack of trust in government officials. Facebook was found to be the most common way for accessing information, while more traditional tools prevailed in the other two levels of participation. However, the percentage of those using Facebook and WhatsApp for knowledge production and partnerships cannot be neglected. On the other hand, the majority of participants expressed their willingness to participate and have active roles in their neighborhoods in the future. Interestingly, a correlation appeared between the level of participation and the preferred way for participation. The lowest level of participation (access to information) corresponded the highest percentage of those willing to use the emerging ICTs. Participants were less inclined towards the emerging ICTs for knowledge contributions (the middle level of participation), however, the percentage of those interested in traditional tools was still lower than those interested in the emerging ICTs. Finally, in the highest level of participation (knowledge partnerships with neighbors or different entities), those willing to use traditional tools outnumbered those willing to use the emerging ICTs. One of the interesting findings was the large numbers of those willing to participate through websites that are developed especially for participation.
6. Conclusion This paper evaluated the situation of Greater Cairo with regards to ICT-based participation. The study of El-Nargis Neighborhood Development Association showed how residents of El-Nargis used Facebook and WhatsApp to participate in upgrading their own neighborhoods. The group on Facebook attracted large numbers of the neighborhood inhabitants to participate, and the groups on WhatsApp helped in organizing efforts and distributing tasks among a number of volunteers. Traditional participatory tools had been used in addition to these online platforms to reach out for local officials and to discuss development projects with neighbors and officials. Keeping residents updated with the progress and the achievements done, was one of the key factors that sustained this participatory process. Great achievements had been accomplished through this collaborative work. However, one of the main challenges that had been faced was the lack of support from some members of the city administration. Finally, the questionnaire showed that a few participatory practices already existed. The main reason for such low participatory practices was found to be the lack of trust in the government. It also showed that the internet and social media had been rarely used for participatory purposes except for having access to information. Despite the low numbers of those already participating, the majority expressed their willingness to participate and have active roles in their neighborhoods in the future. Most of them preferred to use the emerging ICTs for future participation, except for knowledge partnerships (the highest level of participation) where participants were more inclined towards traditional tools. The results of this study indicate that the emerging ICTs are currently complementing the traditional ways for participation in Greater Cairo. The potentials of ICTs are not fully exploited despite the willingness of Greater Cairo inhabitants to make use of them in participation. A possible explanation for this might be that there is no clear system for ICT-based participation. Another possible explanation might be the poor usage of the emerging ICTs in governance. With 30%, and growing, of current mobile users in Egypt using smart phones, ICT becomes an important vehicle to facilitate participation in local governance. It could serve as a starting point for access to knowledge as well as an organizing tool for further traditional participatory methods. Additionally, it can serve as a monitoring and feedback tool to report back to the wider community and enhance trust in the possibility of achieving progress and implementing change.
539
References: Arab Republic of Egypt Ministry of Communications and Information Technology (October 2016) ICT Indicators in Brief, Egypt: Ministry of Communications and Information Technology. Bailur , S. & Longley, T. (2014) Part 1: Literature review. In: The impact of online Freedom of Information tools: What is the evidence?, London: mySociety. Baud, I. et al. (2014) Participatory ‘Spatial’ Knowledge Management Configurations in Metropolitan Governance Networks for SD, Bonn: Chance2Sustain EADI. Cavill, S. & Sohail, M. (2004) “Strengthening accountability for urban services”, Environment & Urbanization, April, Vol. 16 No. 1 pp. 155-170. Corburn, J. (2003) “Bringing Local Knowledge into Environmental Decision Making : Improving Urban Planning for Communities at Risk”, Journal of Planning Education and Research, Vol. 22 No. 4 pp. 420-433. Ertiö, T. (2013) M-participation: the emergence of participatory planning applications, Turku: Turku Urban Research Programme's Research Briefings. Evans, K. F. (2004) Maintaining Community in the Information Age: The Importance of Trust, Place and Situated Know, Basingstoke(UK): Palgrave Macmillan. Eversole, R. (2015) Knowledge Partnering for Community Development. In: Community Development Research and Practice Series, London and New York: Routledge. Hanna, K. S. (2000) “The Paradox of Participation and the Hidden Role of Information: A Case Study”, Journal of the American Planning Association, Vol. 4 No. 66 pp. 398-410. Holdar, G. G. & Zakharchenko, O. (2002) Citizen Participation Handbook, Kyiv: People’s Voice Project, International Centre for Policy Studies. Innes, J. E. & Booher, D. E. (2004) “Reframing Public Participation: Strategies for the 21st Century”, Planning Theory & Practice, Vol. 5 No. 4 p. 419-436 (December). Internet Live Stats (2016) No, of Internet Users (2016): Internet Live Stats. [Online] Available at: http://www.internetlivestats.com/internet-users/ [Accessed 29 July 2016]. Joshi, A. (2013) “Do They Work? Assessing the Impact of Transparency and Accountability Initiatives in Service Delivery”, Development Policy Review, Vol. 31 No. s1. Kleinhans, R., Van Ham, M. & Evan, J. (2015) “Using Social Media and Mobile Technologies to Foster Engagement and Self-Organization in Participatory Urban Planning and Neighbourhood Governance”, Planning Practice & Research, Vol. 30 No.3 pp. 237–247. Kumar , A. & Morris, A. (2009) Civic Engagemnet for Urban Development, Ahmedabad: UNNATI – Organisation for Development Education. Meskell, D. (2009) Intergovernmental Solutions Newsletter: Engaging Citizens in Government, Washington, DC: U.S. General Services Administration Office of Citizen Services and Communications. Nabatchi, T. & Mergel, I. (2010) Participation 2.0: Using Internet and Social Media: Technologies to Promote Distributed Democracy and Create Digital Neighborhoods. In: J. Svara & J. Denhardt, eds. The Connected Community: Local Governments as Partners in Citizen Engagement and Community Building, Arizona: Alliance for Innovation, pp. 80-87. NCDD (2010) Resource Guide on Public Engagemnet, Pennsylvania: National Coalition for Dialogue and Deliberation (NCDD). Nefissa, S. B. (2009) Cairo's City Government The Crisis of Local Administration and the Refusal of Urban Citizenship. In: D. Singerman, ed. Cairo Contested: Governance, Urban Space, and Global Modernity, Cairo: The American University in Cairo Press, pp. 177-198. Relhan, G., Ionkova, K. & Huque, R. (2011) Good Urban Governance through ICT: Issues, Analysis and Strategies, Washington, DC: The World Bank. Schedler, A. (1999) Conceptualizing Accountability. In: A. Schedler, L. Diamond & M. F. Plattner, eds. The Self Restraining State: Power and Accountability in New Democracies,. Boulder and London: Lynne Rienner Publishers, pp. 13-28. St Clair, A. L. (2006) “Global Poverty: The Co-Production of Knowledge and Politics”, Global Social Policy, Vol. 6 No.1 pp. 57-77. Stevens, J., (2016) Internet stats & facts for 2016: Hosting Facts. [Online] Available at: https://hostingfacts.com/internet-facts-stats-2016/ [Accessed 31 July 2016].
540
Svara, J. H. & Denhardt, J. eds. (2010) The Connected Community: Local Governments as Partners in Citizen Engagement and Community Building, Washington, DC: Alliance for Innovation. TADAMUN (2013) Constitution Campaign: The Right to Information in the Egyptian Constitution. [Online] Available at: http://www.tadamun.co/2013/12/05/the-right-to-information/?lang=en#.VjHY8LcrJD8 [Accessed 29 October 2015]. Thomas, J. C. (2010) Citizen, Customer, Partner: Thinking about Local Governance with and for the Public. In: J. H. Svara & J. Denhardt, eds. The Connected Community: Local Governments as Partners in Citizen Engagement and Community Building, Washington, DC: Alliance for Innovation, pp. 57-61. Transparency International & UN-HABITAT (2004) Tools to Support Transparency in Local Governance, Nairobi: United Nations Human Settlements Programme (UN-HABITAT). UNDP (2004) Right to Information Practical Guidance Note, New York:United Nations Development Programme, Bureau for Policy Development, Democratic Governance Group. UN-HABITAT (2001) Tools to Support Participatory Urban Decision Making, Nairobi: United Nations Human Settlements Programme (UN-HABITAT). VLGA (2001) Best Value Victoria: Community Consultation Resource Guide, Melbourne: Local Government Division of the Department of Infrastructure and the Victorian Local Governance Association. VLGA (2007) Let's talk: A consultation framework, Melbourne: Victorian Local Governance Association. Western Australian Government (2002) Consulting Citizens: A Resource Guide, Perth: Citizens and Civics Unit, Department of the Premier and Cabinet.
541
Zhang, Ying EC Community Facilities in China ISOCARP-OAPA Conference 2017
1
Early Childhood Community Facilities in China
--Gap and Prospect
Ying Zhang, Tongji University, China (Supported by the International Exchange Program for Graduate Students, Tongji University)
Abstract
The significance of early childhood development, supported by empirical studies, has been emphasized all around the world. In china, attention to early childhood development is growing in recent years, but mostly in traditional areas. There are relatively few researches in the space policy or planning disciplines. Moreover, community facilities for young children are inadequate. To improve this situation, the paper aims to present the significance and reveal the insufficiency of facility provision in China, and to find the directions of the development in the future. Accordingly, descriptive analysis of the country data and case study on three different-type communities were conducted, supported by questionnaire surveys. The findings suggest that the contemporary level of China’s community facilities for ECD shows to be basically supporting but not good. The basic service facilities of education and health services need be enhanced by quality, while the developmental facilities of culture and sports need a large improvement to get out of shortage. Further, there are blank points for certain type facilities. The government should input more resources on early education and give more support and supervision to nun-government kindergartens. Key words: Early Childhood Development, Community Facilities, China
1. Introduction
Over the past several decades, ensuring the children’s rights has been considered as an important responsibility of the governments since the Convention on the Rights of the Child (CRC) (UNICEF, 1989)got ratified by increasing numbers of nations. The CRC converges the provisions indicated in the Geneva Declaration of the Rights of the Child in 1924, the Declaration of the Rights of the Child in 1959 and other relevant statutes of agencies and international organizations concerned with the welfare of children. What is more, CRC binds and monitors the compliance governments by international law. Meanwhile, the Millennium Development Goals set priorities for children.(UN, 2000) Child Friendly Cities Initiative (CFCI) was launched in 1996, which focuses on fulfilling children’s rights in local level. Besides, the International Secretariat of CFCI was established by UNICEF in 2000. ((UN, 2009)
In the new century, the progress of neuroscience, psychology and economics of human development revealed the crucial importance of the period of early childhood to the human life cycle, which led to a rational reflection to the emphasis of the children policies. According to the United Nations International Children's Emergency Fund (UNICEF) and most organizations and countries , early childhood development(ECD)policies engage in holistic development of children from 0 to 8 years old.
Owing greatly to imaging technology, neurobiology elaborated the essential information respecting the development of the human brain. It is proved that the early
542

Zhang, Ying EC Community Facilities in China ISOCARP-OAPA Conference 2017
2
years of postnatal life experienced a high speed of brain development and the brain size reaches approximately 90% of adult volume by age 6.(Iwasaki et al., 1997; Courchesne et al., 2000; Kennedy et al., 2002) Further, brain development is not merely the result of genes regulation, but rather a complex interplay between genes and environment experiences, which come to pass with the axons hook up with dendrites, forming connections named synapses.(Greenough et al., 1987; Shore, 1997) That finding accords with the evidence that enriched environments affects the development of brain structures and functions.(Markham and Greenough, 2004) Looking into the first few years of life, there are peaks of synaptic overproduction with different brain function regions on different times.(Huttenlocher and Dabholkar, 1997) These are instances called of critical or sensitive periods, during which positive experiences result in positive outcomes, while negative experiences induce regresses. (Nelson, 1999)
Psychologists have always emphasized the childhood experiences to the human cycle, from Freud, Piaget, Erikson to Vygotsky, Heinz Kohut and many others. Developmental psychology examines the the process of human development with original concerns on infants and children periods. According to the cultural psychologists views, the parents’ beliefs, behaviors and parent-child relations in early childhood influence the child development outcomes to a great extent.(Kağıtçıbaşı, 2007) On the contrary, poverty and psychological stresses produce worse.( McConnell, 1998; Leventhal and Brooks-Gunn, 2001; Goleman, 2006)
On the other hand, researches on economics of human development brought new stimulus on attention to ECD. The Perry Preschool study lasting over 4 decades has identified both the short- and long-term effects of a high-quality preschool education program for young children living in poverty. The contributions span from the intellectual and social development in childhood to school success, economic performance, crime prevention, family relationships, and health in adulthood. (Schweinhart, 2004; Heckman and Carneiro, 2003) found the highest rate of economic returns comes from the earliest investments in children, which is formatted into a graphic as “Heckman Curve”, illustrating the profound meaning of investing in the young people.
Beside the strong indications of scientific results, a new trend of social investment policies sprang up, on the reflection of welfare state and its market-liberal successor.(Van Kersbergen and Hemerijck, 2012) This important transformation of social policies implies increased attention to and investment in children, human capital and making work pay.(Jenson, 2009) Under the new paradigm, developmental policy approach promote early childhood care the development, enhances the capacities of families and communities, differing significantly from the traditional residual mode.(Conley, 2010) ECD programs and policies have been carried out in many countries and areas, such as ECEC programs among OECD countries, the EPIC platform of EU, The action of UN in developing countries, the further emphasis in the traditional child welfare counties like United Kingdom, Nordic countries, Germany, Japan etc. and great transformation policies in United States, Canada, Australia, New Zealand and so on. Meanwhile, there are abundant empirical studies which proved the relevant policies to be effective.
As regards the community facilities which provide important physical resources of the community, they obviously play an indispensable role in the ECD support to the children and their families. The research literature offers a diversity of services and
543
Zhang, Ying EC Community Facilities in China ISOCARP-OAPA Conference 2017
3
policies concerning child development. (Albers et al., 2017) reviewed 138 papers out of a total of 8541 studies about implementation frameworks that are central to the child, youth and family services, and summarized eight distinct implementation frameworks. Among the practice and study approaches, facility issues are often implied in the integrate discussions. The mainstream facilities go with early childhood care and education, (UNESCO, 2005; OECD, 2013) community health centers (Hoilette et al., 2013; Jenni and Sennhauser, 2016; Fairbrother et al., 2017), parenting interventions(Medlow et al., 2016), play grounds(Czalczynska-Podolska, 2014), green spaces(Jansson et al., 2016; Feng and Astell-Burt, 2017), public libraries(Celano and Neuman, 2001) and out-of-home care welfare system(Bell and Romano, 2015) et. Related to this, child-friendly and healthy cities/communities are widely regarded(Gleeson and Sipe, 2006; Tranter and Freeman, 2011; WVI,2016), together with the persistent built environment themes like safety, variety of activity settings, independent mobility, active socialization or “neighbourliness”, and integration of children into decision-making processes. (Broberg et al., 2013)
In china, attention to early childhood development and social investment policies is growing in recent years. Studies about early childhood development theory has witnessed a significant increase since 2004, as can be found through the CNKI publishing annual trends under the search of this subject. This happened just after the Chinese government put forward the Scientific Outlook on Development. Among the publications, most research issues focused on education, healthcare, psychology and influencing factors. In recent years, some new concerns on migrant and left-behind children appeared. Despite all the concerns, there are relatively few researches on ECD in the space policy or planning disciplines. Although many studies on community facilities have taken all the people, including children, into account, specialized researches on ECD are obviously in a shortage. Moreover, no matter in rural or urban areas, community facilities for ECD are not adequate. Take the all four core Chinese journals of planning discipline in CSSCI for illustration, (i.e. China City Planning Review; Urban Planning Forum; Urban Planning International and Planners) When making subject searches with 4 child-related topic words in Chinese for all-years in CNKI, only 20 results sum up, which was an extremely small number comparing with the total amount of literature. In comparison, the results of searching with 4 elder-related topic words in Chinese turned out to be 85.1
To reveal the problems and call for improvement actions for ECD in China, the paper focused on community facilities that support the 0-8 age children development and their family parenting needs. The community facilities include public or semi-public physical places and buildings that assist meeting the child and family needs in the community. The goal of this study was to investigate the contemporary status of community facilities for ECD in China and the users’ evaluation and requirements, moreover, to reveal the demand-supply gap. The results will allow the government, organizations, policy implementers and the researcher to recognize significance of ECD facilities and the existence of problems and expectations, so as to advocate practical improvement to facilitating young child development.
Accordingly, the research questions were: 1. What is the realistic situation of the community facilities for ECD in China? 2. How do the families evaluate the community child facilities? 3. What do the families need about community facilities for ECD?
544
Zhang, Ying EC Community Facilities in China ISOCARP-OAPA Conference 2017
4
2. Methods
To answer the research questions, mixed methods of qualitative and quantitative approaches were used. Descriptive study was firstly carried out to examine the overall situation of young children and the services in the country, utilizing elements of quantitative and qualitative both. Qualitative method was mainly adopted, with case study forming the frame structure. Specifically, the techniques of field investigation, open interview and questionnaire were employed to obtain an in-depth understanding of the cases, understanding of the realistic situation of the community ECD facilities, and finding about the families’ views. Meanwhile, quantitative method was also applied in the descriptive statistical study of administrative data to reveal the basic features of the country circumstances. Then, statistical analysis of the caregivers’ questionnaire data was carried out to explore the facts of evaluation and requirement. 2.1 General descriptive study of the country
To begin with an overall understanding of the whole country, statistics of the population were illustrated. Since early education and care service played a most important role among the ECD services all around the world, we took pre-school education as a key clue to reveal the emphasis and coping strategies on ECD in China. 2.2 Case study of 3 different-type Communities
In the empirical case study part, three different geographically located and city size typed communities were chosen as cases, which are Xianxia community in Shanghai, a typical eastern metropolis; the Hubin community of Sanmenxia, a mid-sized city in central region of China; and the central town of Jianshui county, a small town in southwest China. All the three communities are located in the central urban area of the cities, developed for a relatively long-time and suited for general examples of the city types.
The spatial boundaries of the field investigation followed the administrative boundaries, for the convenience of synchronous survey and the coincidence with the data and information collected from the government departments. Open interview to the relative government officials and professionals were conducted to learn about situations, practices and problems about EDC. In total, 22 government officials were interviewed, who came from planning, education, culture, health, sports, civil affairs, development and reform authorities, local governments, Women’s Federations (Women and Children's Committee). 5 professionals were consulted, who were engaged in planning, pediatrics and education. 2.3 questionnaires of caregivers
A structured questionnaire was developed specifically for collecting information about families’ evaluation and needs about community ECD facilities. The survey was restricted in three communities through pushing in the WeChat groups and sifting by question items on residence location. For content validity, the items were reviewed by two planning professors and two market survey experts. The pre-test interviewed 10 participants in Jianshui County. The observation results helped modifying the sequencing question part. The final version of the questionnaire contained 12 items, consisting of three parts: 1) demographic characteristics; 2) evaluation of the facilities; 3) requires for facility type sorting and sequencing. The survey was carried out by internet questionnaire using social network.
545
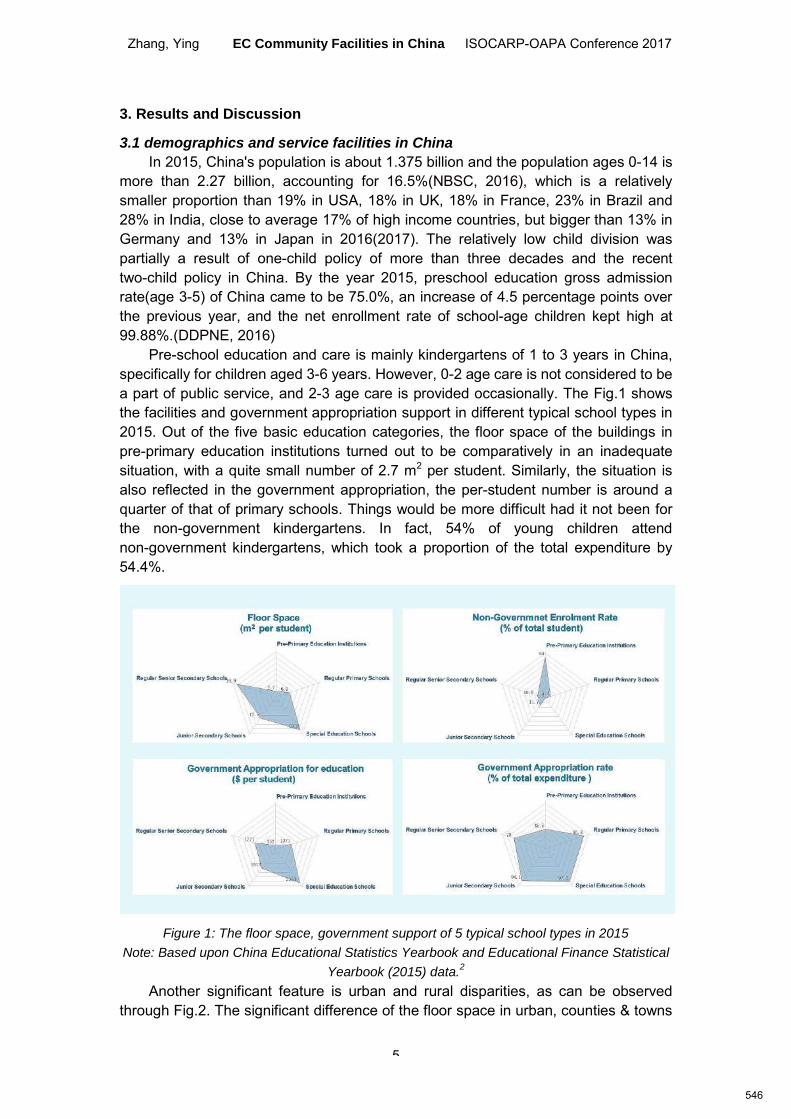
Zhang, Ying EC Community Facilities in China ISOCARP-OAPA Conference 2017
5
3. Results and Discussion
3.1 demographics and service facilities in China
In 2015, China's population is about 1.375 billion and the population ages 0-14 is more than 2.27 billion, accounting for 16.5%(NBSC, 2016), which is a relatively smaller proportion than 19% in USA, 18% in UK, 18% in France, 23% in Brazil and 28% in India, close to average 17% of high income countries, but bigger than 13% in Germany and 13% in Japan in 2016(2017). The relatively low child division was partially a result of one-child policy of more than three decades and the recent two-child policy in China. By the year 2015, preschool education gross admission rate(age 3-5) of China came to be 75.0%, an increase of 4.5 percentage points over the previous year, and the net enrollment rate of school-age children kept high at 99.88%.(DDPNE, 2016)
Pre-school education and care is mainly kindergartens of 1 to 3 years in China, specifically for children aged 3-6 years. However, 0-2 age care is not considered to be a part of public service, and 2-3 age care is provided occasionally. The Fig.1 shows the facilities and government appropriation support in different typical school types in 2015. Out of the five basic education categories, the floor space of the buildings in pre-primary education institutions turned out to be comparatively in an inadequate situation, with a quite small number of 2.7 m2 per student. Similarly, the situation is also reflected in the government appropriation, the per-student number is around a quarter of that of primary schools. Things would be more difficult had it not been for the non-government kindergartens. In fact, 54% of young children attend non-government kindergartens, which took a proportion of the total expenditure by 54.4%.
Figure 1: The floor space, government support of 5 typical school types in 2015
Note: Based upon China Educational Statistics Yearbook and Educational Finance Statistical
Yearbook (2015) data.2
Another significant feature is urban and rural disparities, as can be observed through Fig.2. The significant difference of the floor space in urban, counties & towns
546
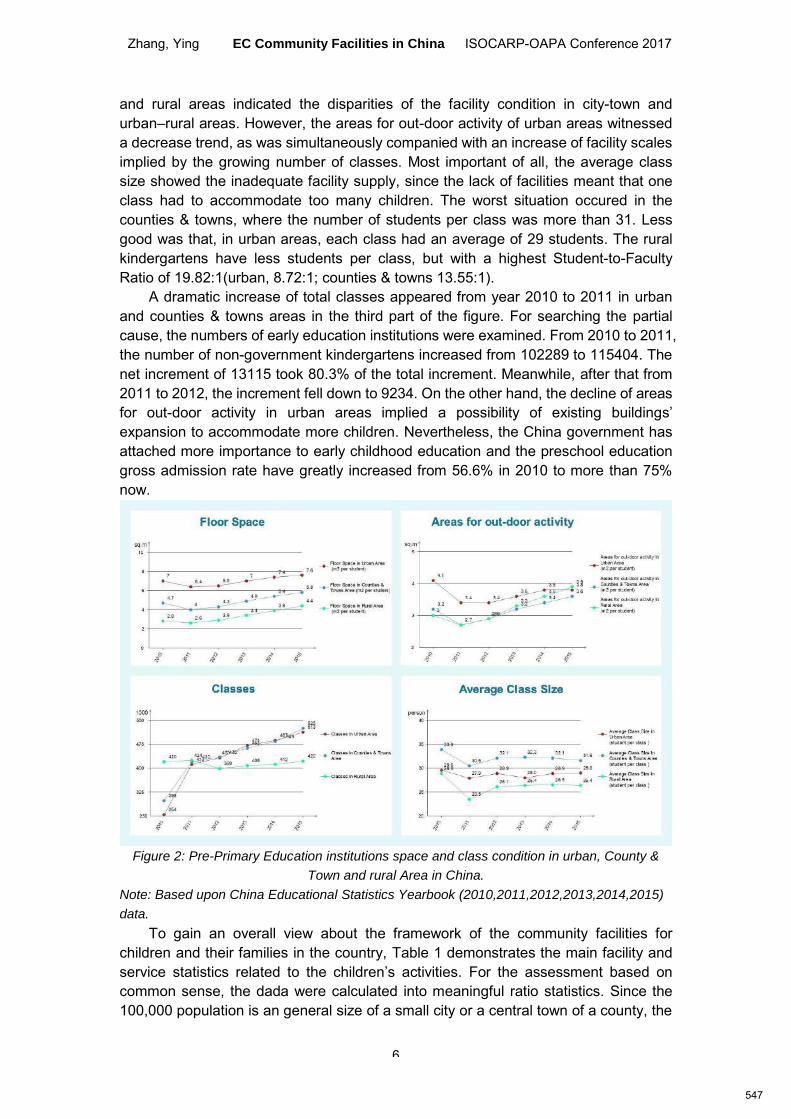
Zhang, Ying EC Community Facilities in China ISOCARP-OAPA Conference 2017
6
and rural areas indicated the disparities of the facility condition in city-town and urban–rural areas. However, the areas for out-door activity of urban areas witnessed a decrease trend, as was simultaneously companied with an increase of facility scales implied by the growing number of classes. Most important of all, the average class size showed the inadequate facility supply, since the lack of facilities meant that one class had to accommodate too many children. The worst situation occured in the counties & towns, where the number of students per class was more than 31. Less good was that, in urban areas, each class had an average of 29 students. The rural kindergartens have less students per class, but with a highest Student-to-Faculty Ratio of 19.82:1(urban, 8.72:1; counties & towns 13.55:1).
A dramatic increase of total classes appeared from year 2010 to 2011 in urban and counties & towns areas in the third part of the figure. For searching the partial cause, the numbers of early education institutions were examined. From 2010 to 2011, the number of non-government kindergartens increased from 102289 to 115404. The net increment of 13115 took 80.3% of the total increment. Meanwhile, after that from 2011 to 2012, the increment fell down to 9234. On the other hand, the decline of areas for out-door activity in urban areas implied a possibility of existing buildings’ expansion to accommodate more children. Nevertheless, the China government has attached more importance to early childhood education and the preschool education gross admission rate have greatly increased from 56.6% in 2010 to more than 75% now.
Figure 2: Pre-Primary Education institutions space and class condition in urban, County &
Town and rural Area in China.
Note: Based upon China Educational Statistics Yearbook (2010,2011,2012,2013,2014,2015)
data.
To gain an overall view about the framework of the community facilities for children and their families in the country, Table 1 demonstrates the main facility and service statistics related to the children’s activities. For the assessment based on common sense, the dada were calculated into meaningful ratio statistics. Since the 100,000 population is an general size of a small city or a central town of a county, the
547
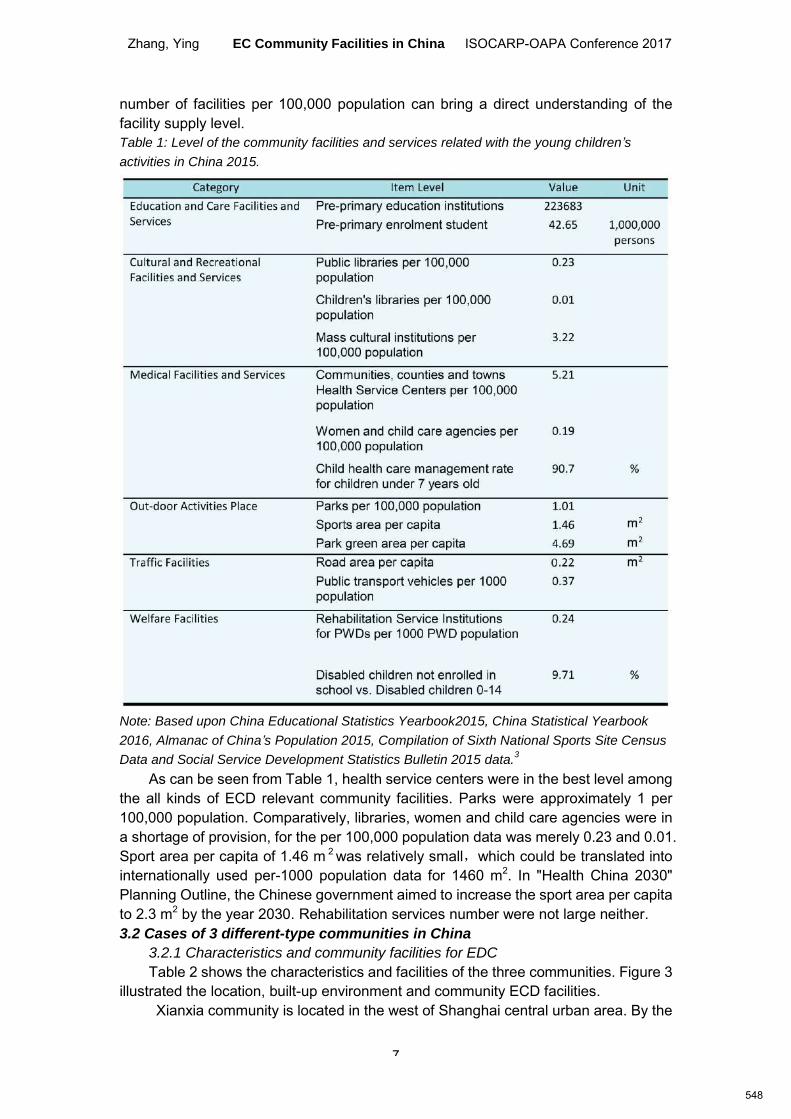
Zhang, Ying EC Community Facilities in China ISOCARP-OAPA Conference 2017
7
number of facilities per 100,000 population can bring a direct understanding of the facility supply level. Table 1: Level of the community facilities and services related with the young children’s
activities in China 2015.
Note: Based upon China Educational Statistics Yearbook2015, China Statistical Yearbook
2016, Almanac of China’s Population 2015, Compilation of Sixth National Sports Site Census
Data and Social Service Development Statistics Bulletin 2015 data.3
As can be seen from Table 1, health service centers were in the best level among the all kinds of ECD relevant community facilities. Parks were approximately 1 per 100,000 population. Comparatively, libraries, women and child care agencies were in a shortage of provision, for the per 100,000 population data was merely 0.23 and 0.01. Sport area per capita of 1.46 m 2 was relatively small,which could be translated into internationally used per-1000 population data for 1460 m2. In "Health China 2030" Planning Outline, the Chinese government aimed to increase the sport area per capita to 2.3 m2 by the year 2030. Rehabilitation services number were not large neither. 3.2 Cases of 3 different-type communities in China
3.2.1 Characteristics and community facilities for EDC
Table 2 shows the characteristics and facilities of the three communities. Figure 3 illustrated the location, built-up environment and community ECD facilities.
Xianxia community is located in the west of Shanghai central urban area. By the
548
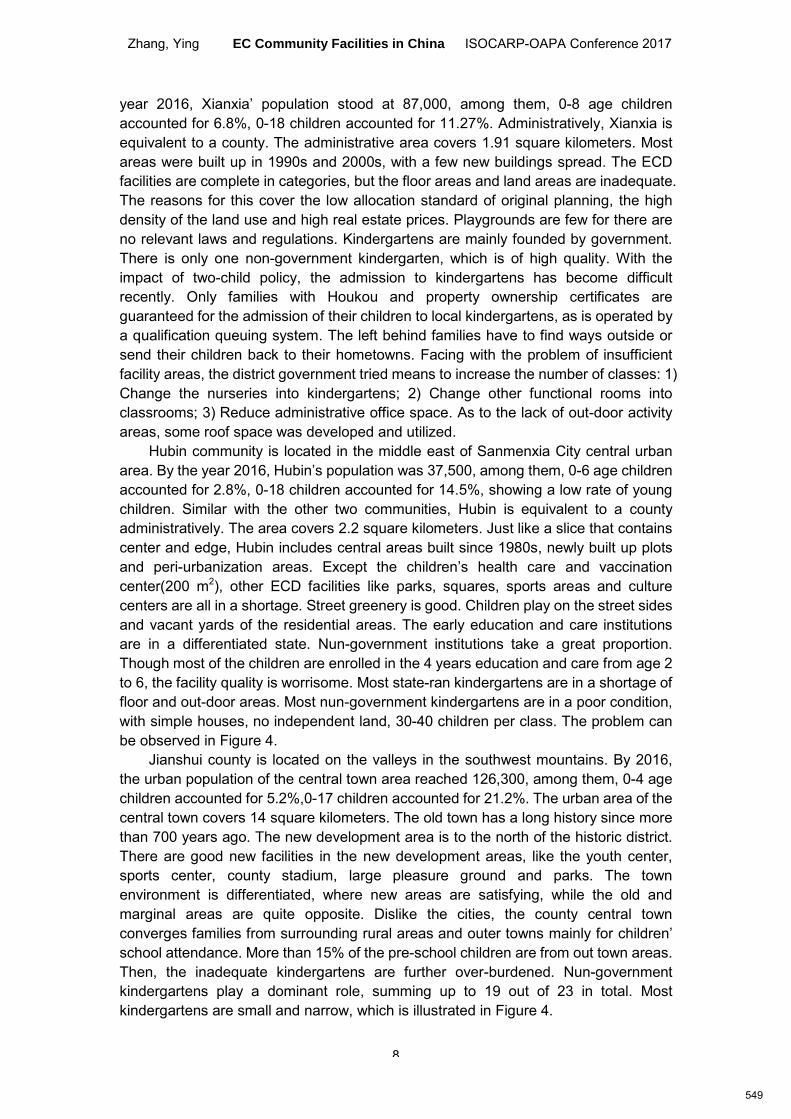
Zhang, Ying EC Community Facilities in China ISOCARP-OAPA Conference 2017
8
year 2016, Xianxia’ population stood at 87,000, among them, 0-8 age children accounted for 6.8%, 0-18 children accounted for 11.27%. Administratively, Xianxia is equivalent to a county. The administrative area covers 1.91 square kilometers. Most areas were built up in 1990s and 2000s, with a few new buildings spread. The ECD facilities are complete in categories, but the floor areas and land areas are inadequate. The reasons for this cover the low allocation standard of original planning, the high density of the land use and high real estate prices. Playgrounds are few for there are no relevant laws and regulations. Kindergartens are mainly founded by government. There is only one non-government kindergarten, which is of high quality. With the impact of two-child policy, the admission to kindergartens has become difficult recently. Only families with Houkou and property ownership certificates are guaranteed for the admission of their children to local kindergartens, as is operated by a qualification queuing system. The left behind families have to find ways outside or send their children back to their hometowns. Facing with the problem of insufficient facility areas, the district government tried means to increase the number of classes: 1) Change the nurseries into kindergartens; 2) Change other functional rooms into classrooms; 3) Reduce administrative office space. As to the lack of out-door activity areas, some roof space was developed and utilized.
Hubin community is located in the middle east of Sanmenxia City central urban area. By the year 2016, Hubin’s population was 37,500, among them, 0-6 age children accounted for 2.8%, 0-18 children accounted for 14.5%, showing a low rate of young children. Similar with the other two communities, Hubin is equivalent to a county administratively. The area covers 2.2 square kilometers. Just like a slice that contains center and edge, Hubin includes central areas built since 1980s, newly built up plots and peri-urbanization areas. Except the children’s health care and vaccination center(200 m2), other ECD facilities like parks, squares, sports areas and culture centers are all in a shortage. Street greenery is good. Children play on the street sides and vacant yards of the residential areas. The early education and care institutions are in a differentiated state. Nun-government institutions take a great proportion. Though most of the children are enrolled in the 4 years education and care from age 2 to 6, the facility quality is worrisome. Most state-ran kindergartens are in a shortage of floor and out-door areas. Most nun-government kindergartens are in a poor condition, with simple houses, no independent land, 30-40 children per class. The problem can be observed in Figure 4.
Jianshui county is located on the valleys in the southwest mountains. By 2016, the urban population of the central town area reached 126,300, among them, 0-4 age children accounted for 5.2%,0-17 children accounted for 21.2%. The urban area of the central town covers 14 square kilometers. The old town has a long history since more than 700 years ago. The new development area is to the north of the historic district. There are good new facilities in the new development areas, like the youth center, sports center, county stadium, large pleasure ground and parks. The town environment is differentiated, where new areas are satisfying, while the old and marginal areas are quite opposite. Dislike the cities, the county central town converges families from surrounding rural areas and outer towns mainly for children’ school attendance. More than 15% of the pre-school children are from out town areas. Then, the inadequate kindergartens are further over-burdened. Nun-government kindergartens play a dominant role, summing up to 19 out of 23 in total. Most kindergartens are small and narrow, which is illustrated in Figure 4.
549
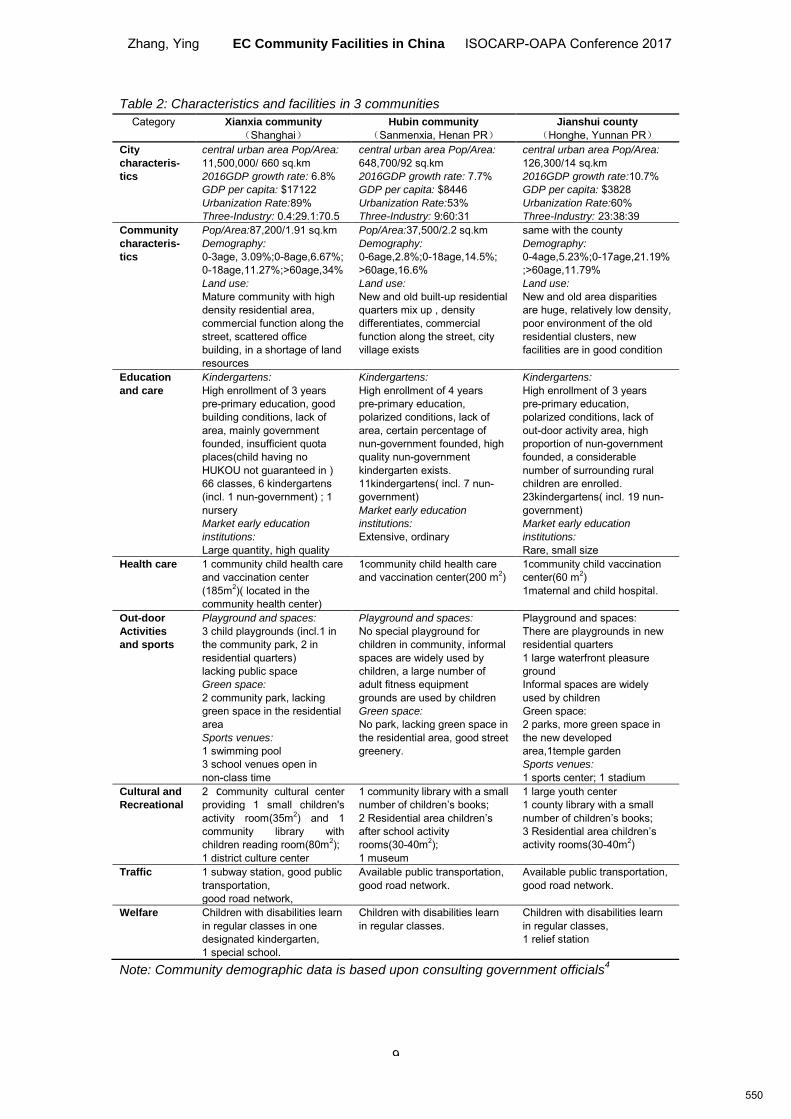
Zhang, Ying EC Community Facilities in China ISOCARP-OAPA Conference 2017
9
Table 2: Characteristics and facilities in 3 communities Category Xianxia community
(Shanghai) Hubin community
(Sanmenxia, Henan PR) Jianshui county
(Honghe, Yunnan PR) City
characteris-
tics
central urban area Pop/Area:
11,500,000/ 660 sq.km 2016GDP growth rate: 6.8% GDP per capita: $17122 Urbanization Rate:89% Three-Industry: 0.4:29.1:70.5
central urban area Pop/Area:
648,700/92 sq.km 2016GDP growth rate: 7.7% GDP per capita: $8446 Urbanization Rate:53% Three-Industry: 9:60:31
central urban area Pop/Area:
126,300/14 sq.km 2016GDP growth rate:10.7% GDP per capita: $3828 Urbanization Rate:60% Three-Industry: 23:38:39
Community
characteris-
tics
Pop/Area:87,200/1.91 sq.km Demography:
0-3age, 3.09%;0-8age,6.67%; 0-18age,11.27%;>60age,34% Land use:
Mature community with high density residential area, commercial function along the street, scattered office building, in a shortage of land resources
Pop/Area:37,500/2.2 sq.km Demography:
0-6age,2.8%;0-18age,14.5%; >60age,16.6% Land use:
New and old built-up residential quarters mix up , density differentiates, commercial function along the street, city village exists
same with the county Demography:
0-4age,5.23%;0-17age,21.19%;>60age,11.79% Land use:
New and old area disparities are huge, relatively low density, poor environment of the old residential clusters, new facilities are in good condition
Education
and care
Kindergartens:
High enrollment of 3 years pre-primary education, good building conditions, lack of area, mainly government founded, insufficient quota places(child having no HUKOU not guaranteed in ) 66 classes, 6 kindergartens (incl. 1 nun-government) ; 1 nursery Market early education
institutions:
Large quantity, high quality
Kindergartens:
High enrollment of 4 years pre-primary education, polarized conditions, lack of area, certain percentage of nun-government founded, high quality nun-government kindergarten exists. 11kindergartens( incl. 7 nun- government) Market early education
institutions:
Extensive, ordinary
Kindergartens:
High enrollment of 3 years pre-primary education, polarized conditions, lack of out-door activity area, high proportion of nun-government founded, a considerable number of surrounding rural children are enrolled. 23kindergartens( incl. 19 nun- government) Market early education
institutions:
Rare, small size Health care 1 community child health care
and vaccination center (185m2)( located in the community health center)
1community child health care and vaccination center(200 m2)
1community child vaccination center(60 m2) 1maternal and child hospital.
Out-door
Activities
and sports
Playground and spaces:
3 child playgrounds (incl.1 in the community park, 2 in residential quarters) lacking public space Green space:
2 community park, lacking green space in the residential area Sports venues:
1 swimming pool 3 school venues open in non-class time
Playground and spaces:
No special playground for children in community, informal spaces are widely used by children, a large number of adult fitness equipment grounds are used by children Green space:
No park, lacking green space in the residential area, good street greenery.
Playground and spaces: There are playgrounds in new residential quarters 1 large waterfront pleasure ground Informal spaces are widely used by children Green space: 2 parks, more green space in the new developed area,1temple garden Sports venues:
1 sports center; 1 stadium Cultural and
Recreational
2 community cultural center providing 1 small children's activity room(35m2) and 1 community library with children reading room(80m2); 1 district culture center
1 community library with a small number of children’s books; 2 Residential area children’s after school activity rooms(30-40m2); 1 museum
1 large youth center 1 county library with a small number of children’s books; 3 Residential area children’s activity rooms(30-40m2)
Traffic 1 subway station, good public transportation, good road network,
Available public transportation, good road network.
Available public transportation, good road network.
Welfare Children with disabilities learn in regular classes in one designated kindergarten, 1 special school.
Children with disabilities learn in regular classes.
Children with disabilities learn in regular classes, 1 relief station
Note: Community demographic data is based upon consulting government officials4
550
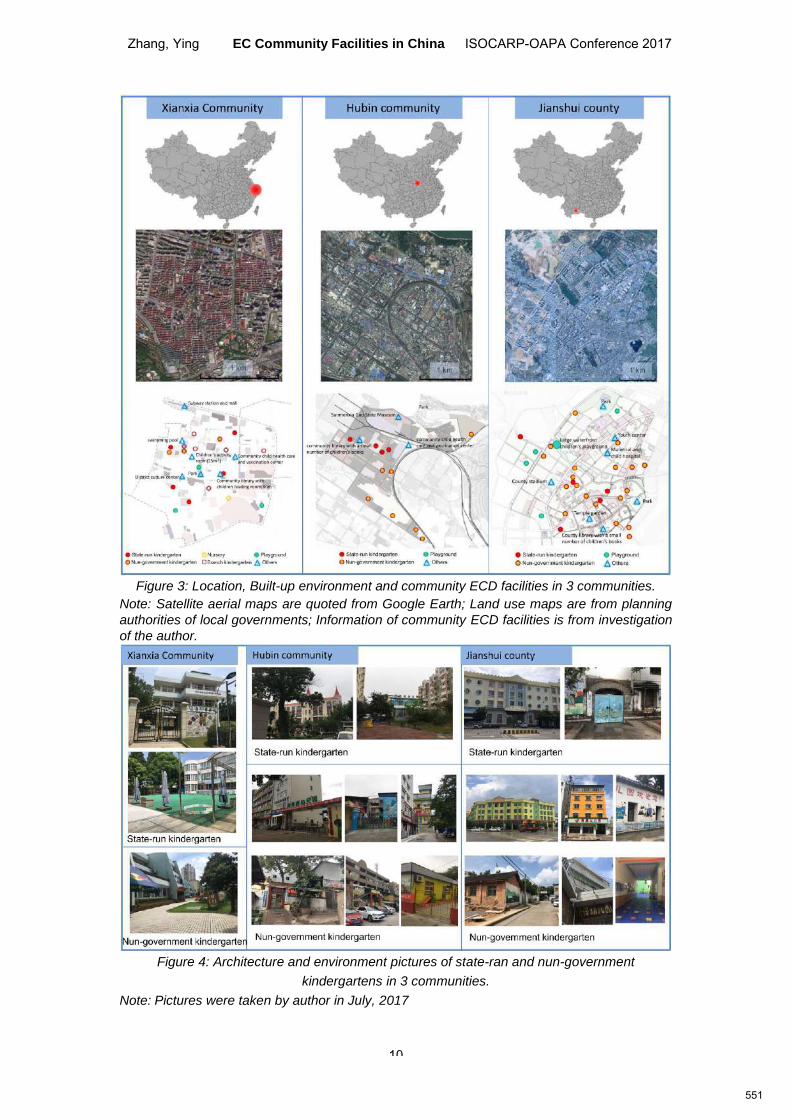
Zhang, Ying EC Community Facilities in China ISOCARP-OAPA Conference 2017
10
Figure 3: Location, Built-up environment and community ECD facilities in 3 communities.
Note: Satellite aerial maps are quoted from Google Earth; Land use maps are from planning
authorities of local governments; Information of community ECD facilities is from investigation
of the author.
Figure 4: Architecture and environment pictures of state-ran and nun-government
kindergartens in 3 communities.
Note: Pictures were taken by author in July, 2017
551
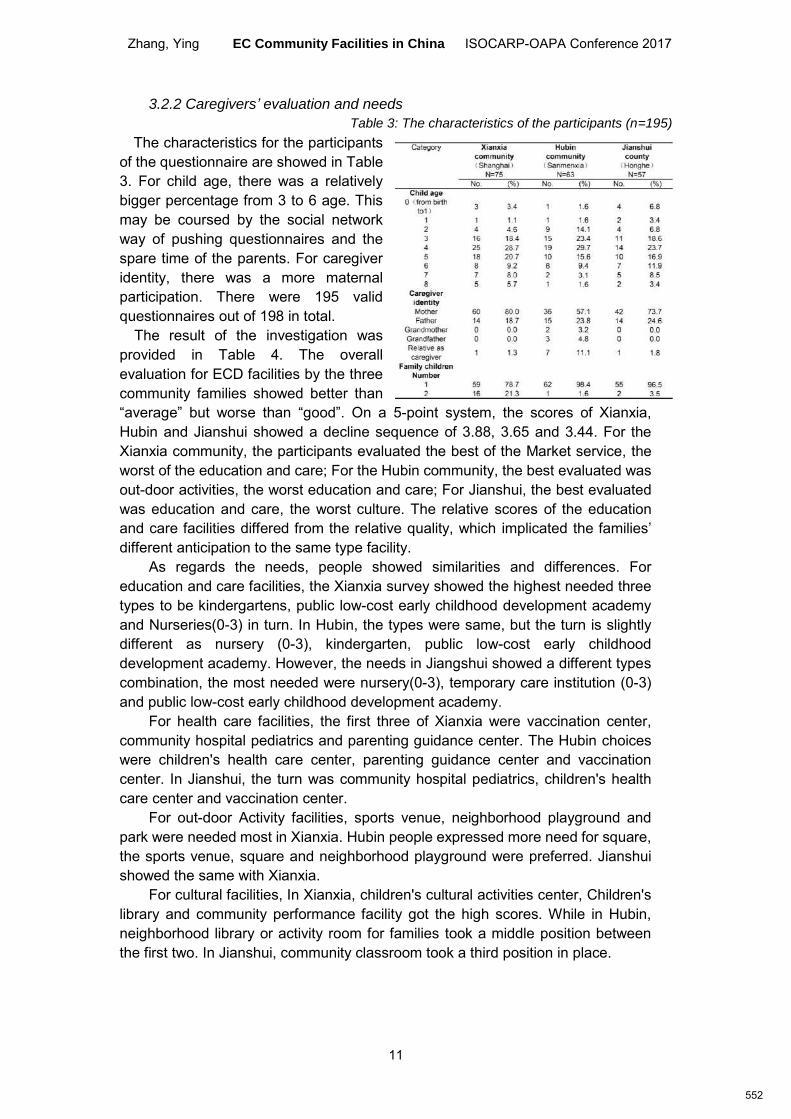
Zhang, Ying EC Community Facilities in China ISOCARP-OAPA Conference 2017
11
3.2.2 Caregivers’ evaluation and needs
Table 3: The characteristics of the participants (n=195)
The characteristics for the participants of the questionnaire are showed in Table 3. For child age, there was a relatively bigger percentage from 3 to 6 age. This may be coursed by the social network way of pushing questionnaires and the spare time of the parents. For caregiver identity, there was a more maternal participation. There were 195 valid questionnaires out of 198 in total.
The result of the investigation was provided in Table 4. The overall evaluation for ECD facilities by the three community families showed better than “average” but worse than “good”. On a 5-point system, the scores of Xianxia, Hubin and Jianshui showed a decline sequence of 3.88, 3.65 and 3.44. For the Xianxia community, the participants evaluated the best of the Market service, the worst of the education and care; For the Hubin community, the best evaluated was out-door activities, the worst education and care; For Jianshui, the best evaluated was education and care, the worst culture. The relative scores of the education and care facilities differed from the relative quality, which implicated the families’ different anticipation to the same type facility.
As regards the needs, people showed similarities and differences. For education and care facilities, the Xianxia survey showed the highest needed three types to be kindergartens, public low-cost early childhood development academy and Nurseries(0-3) in turn. In Hubin, the types were same, but the turn is slightly different as nursery (0-3), kindergarten, public low-cost early childhood development academy. However, the needs in Jiangshui showed a different types combination, the most needed were nursery(0-3), temporary care institution (0-3) and public low-cost early childhood development academy.
For health care facilities, the first three of Xianxia were vaccination center, community hospital pediatrics and parenting guidance center. The Hubin choices were children's health care center, parenting guidance center and vaccination center. In Jianshui, the turn was community hospital pediatrics, children's health care center and vaccination center.
For out-door Activity facilities, sports venue, neighborhood playground and park were needed most in Xianxia. Hubin people expressed more need for square, the sports venue, square and neighborhood playground were preferred. Jianshui showed the same with Xianxia.
For cultural facilities, In Xianxia, children's cultural activities center, Children's library and community performance facility got the high scores. While in Hubin, neighborhood library or activity room for families took a middle position between the first two. In Jianshui, community classroom took a third position in place.
552
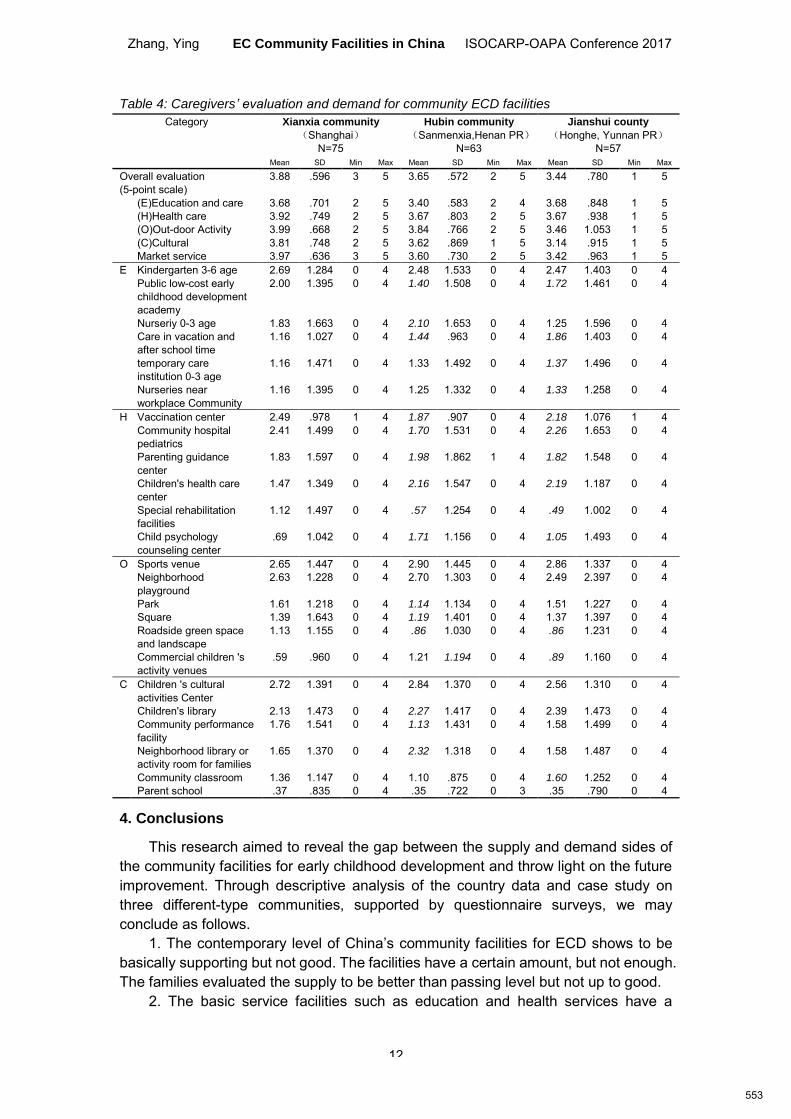
Zhang, Ying EC Community Facilities in China ISOCARP-OAPA Conference 2017
12
Table 4: Caregivers’ evaluation and demand for community ECD facilities
Category Xianxia community
(Shanghai) N=75
Hubin community
(Sanmenxia,Henan PR) N=63
Jianshui county
(Honghe, Yunnan PR) N=57
Mean SD Min Max Mean SD Min Max Mean SD Min Max
Overall evaluation (5-point scale)
3.88 .596 3 5 3.65 .572 2 5 3.44 .780 1 5
(E)Education and care 3.68 .701 2 5 3.40 .583 2 4 3.68 .848 1 5 (H)Health care 3.92 .749 2 5 3.67 .803 2 5 3.67 .938 1 5 (O)Out-door Activity 3.99 .668 2 5 3.84 .766 2 5 3.46 1.053 1 5 (C)Cultural 3.81 .748 2 5 3.62 .869 1 5 3.14 .915 1 5 Market service 3.97 .636 3 5 3.60 .730 2 5 3.42 .963 1 5
E Kindergarten 3-6 age 2.69 1.284 0 4 2.48 1.533 0 4 2.47 1.403 0 4 Public low-cost early childhood development academy
2.00 1.395 0 4 1.40 1.508 0 4 1.72 1.461 0 4
Nurseriy 0-3 age 1.83 1.663 0 4 2.10 1.653 0 4 1.25 1.596 0 4 Care in vacation and after school time
1.16 1.027 0 4 1.44 .963 0 4 1.86 1.403 0 4
temporary care institution 0-3 age
1.16 1.471 0 4 1.33 1.492 0 4 1.37 1.496 0 4
Nurseries near workplace Community
1.16 1.395 0 4 1.25 1.332 0 4 1.33 1.258 0 4
H Vaccination center 2.49 .978 1 4 1.87 .907 0 4 2.18 1.076 1 4 Community hospital pediatrics
2.41 1.499 0 4 1.70 1.531 0 4 2.26 1.653 0 4
Parenting guidance center
1.83 1.597 0 4 1.98 1.862 1 4 1.82 1.548 0 4
Children's health care center
1.47 1.349 0 4 2.16 1.547 0 4 2.19 1.187 0 4
Special rehabilitation facilities
1.12 1.497 0 4 .57 1.254 0 4 .49 1.002 0 4
Child psychology counseling center
.69 1.042 0 4 1.71 1.156 0 4 1.05 1.493 0 4
O Sports venue 2.65 1.447 0 4 2.90 1.445 0 4 2.86 1.337 0 4 Neighborhood playground
2.63 1.228 0 4 2.70 1.303 0 4 2.49 2.397 0 4
Park 1.61 1.218 0 4 1.14 1.134 0 4 1.51 1.227 0 4 Square 1.39 1.643 0 4 1.19 1.401 0 4 1.37 1.397 0 4 Roadside green space and landscape
1.13 1.155 0 4 .86 1.030 0 4 .86 1.231 0 4
Commercial children 's activity venues
.59 .960 0 4 1.21 1.194 0 4 .89 1.160 0 4
C Children 's cultural activities Center
2.72 1.391 0 4 2.84 1.370 0 4 2.56 1.310 0 4
Children's library 2.13 1.473 0 4 2.27 1.417 0 4 2.39 1.473 0 4 Community performance facility
1.76 1.541 0 4 1.13 1.431 0 4 1.58 1.499 0 4
Neighborhood library or activity room for families
1.65 1.370 0 4 2.32 1.318 0 4 1.58 1.487 0 4
Community classroom 1.36 1.147 0 4 1.10 .875 0 4 1.60 1.252 0 4 Parent school .37 .835 0 4 .35 .722 0 3 .35 .790 0 4
4. Conclusions
This research aimed to reveal the gap between the supply and demand sides of the community facilities for early childhood development and throw light on the future improvement. Through descriptive analysis of the country data and case study on three different-type communities, supported by questionnaire surveys, we may conclude as follows.
1. The contemporary level of China’s community facilities for ECD shows to be basically supporting but not good. The facilities have a certain amount, but not enough. The families evaluated the supply to be better than passing level but not up to good.
2. The basic service facilities such as education and health services have a
553
Zhang, Ying EC Community Facilities in China ISOCARP-OAPA Conference 2017
13
considerable foundation, while the quality needs to be enhanced. The inequality of early childhood education is significant. The lack of land areas and poor quality of buildings can not meet the needs of children’s development. At the same time, pediatrics and parenting guidance place need to be strengthened.
3. Developmental facilities of culture and sports are in a shortage. Children 's cultural activities centers, community libraries, sports venues and playgrounds are widely and urgently needed.
4. There are blank points for the provision of certain type facilities, which happen to be what people need urgently. The blank points include no regulations for the playground allocation, no neighborhood libraries or activity rooms for families with children, no public low-cost early childhood development academies.
5. The government should input more resources on early education. Nun-government kindergartens make up for the lack of financial resources in small and medium-sized cities, and meet the needs of families. The government should provide more support to them. Meanwhile, supervision and guidance are necessary.
In this paper, the macro data was analyzed and questionnaire surveys were conducted. Due to the data resources, questionnaire method and sample size limitation, more quantitative evidence is needed for the research on ECD. The study is expected be a standpoint for understanding the problems and calling for further actions.
Reference
Albers, B., Mildon, R., Lyon, A.R., and Shlonsky, A. (2017). Implementation frameworks in child, youth and family services-Results from a scoping review. Children and Youth Services Review 81, 101-116(10).
Bell, T., and Romano, E. (2015). Child resilience in out-of-home care: Child welfare worker perspectives. Children and Youth Services Review 48, 49-59(1).
Broberg, A., Kyttä, M., and Fagerholm, N. (2013). Child-friendly urban structures: Bullerby revisited. Journal of Environmental Psychology 35, 110-120 (9).
Celano, D., and Neuman, S.B. (2001). The Role of Public Libraries in Children's Literacy Development An Evaluation.
U.N. Committees (2009). CHILD FRIENDLY CITIES—Fact sheet. . Conley, A. (2010). Social Development, Social Investment, and Child Welfare. In Social Work and
Social Development: Theories and Skills for Developmental Social Work, J. Midgley, and A. Conley, eds. Online: Oxford University Press.
Courchesne, E., Chisum, H.J., Townsend, J., Cowles, A., Covington, J., Egaas, B., Harwood, M., Hinds, S., and Press, G.A. (2000). Normal brain development and aging: Quantitative analysis at in vivo MR imaging in healthy volunteers. RADIOLOGY 216, 672-682.
Czalczynska-Podolska, M. (2014). The impact of playground spatial features on children's play and activity forms: An evaluation of contemporary playgrounds' play and social value. Journal of Environmental Psychology 38, 132-142(6).
DDPNE (2016). Educational Statistics Yearbook of China 2015, Beijing: China Statistics Press. Fairbrother, G., Dougherty, D., Pradhananga, R., and Simpson, L.A. (2017). Road to the Future:
Priorities for Child Health Services Research. ACAD PEDIATR. Online. Feng, X., and Astell-Burt, T. (2017). Do greener areas promote more equitable child health?
HEALTH PLACE 46, 267-273(7). Gleeson, B., and Sipe, N. (2006). Creating Child Friendly Cities: Reinstating Kids in the City, London:
Routledge. Goleman, D. (2006). Social intelligence: The new science of human relationships, New York:
Bantam Dell. Greenough, W.T., Black, J.E., and Wallace, C.S. (1987). Early experience and brain development.
Child Development 58, 539-559(10). Heckman, J., and Carneiro, P. (2003). Human Capital Policy. In Inequality in America: What Role for
Human Capital Policy? J. Heckman, and A. Krueger, eds. Boston: MIT Press. Hoilette, L.K., Blumkin, A.K., Baldwin, C.D., Fiscella, K., and Szilagyi, P.G. (2013). Community
health centers: medical homes for children? ACAD PEDIATR 13, 436(10).
554
Zhang, Ying EC Community Facilities in China ISOCARP-OAPA Conference 2017
14
Huttenlocher, P.R., and Dabholkar, A.S. (1997). Regional differences in synaptogenesis in human cerebral cortex. J COMP NEUROL 387, 167-178(10).
Iwasaki, N., Hamano, K., Okada, Y., Horigome, Y., and Nakayama, J. (1997). Volumetric quantification of brain development using MRI. NEURORADIOLOGY 39, 841-846.
Jansson, M., Sundevall, E., and Wales, M. (2016). The role of green spaces and their management in a child-friendly urban village. URBAN FOR URBAN GREE 18, 228-236.
Jenni, O.G., and Sennhauser, F.H. (2016). Child Health Care in Switzerland. The Journal of Pediatrics 177, S203-S212(10).
Jenson, J. (2009). Redesigning citizenship regimes after neoliberalism: moving towards social investment. In What Future for Social Investment? N. Morel, B. Palier, and J. Palme, eds. Stockholm: Institute for Future Studies, pp. 27-44.
Kağıtçıbaşı, C. (2007). Family, Self and Human Development across Cultures: Theory and Applications, New York: Psychology Press.
Kennedy, D.N., Makris, N., Herbert, M.R., Takahashi, T., and Caviness, V.S. (2002). Basic principles of MRI and morphometry studies of human brain development. Developmental Science 5, 268-278(10).
Leventhal, T., and Brooks-Gunn, J. (2001). Poverty and Child Development. In International Encyclopedia of the Social & Behavioral Sciences, N.J. Smelser, and P.B. Baltes, eds. Elsevier Ltd., pp. 11889-11894.
Markham, J.A., and Greenough, W.T. (2004). Experience-driven brain plasticity: beyond the synapse. NEURON GLIA BIOL 1, 351-363(5).
McConnell, S.R. (1998). Meaningful differences in the everyday experience of young American children. SCHOOL PSYCHOLOGY QUARTERLY 13, 351-357.
Medlow, S., Klineberg, E., Jarrett, C., and Steinbeck, K. (2016). A systematic review of community-based parenting interventions for adolescents with challenging behaviours. Journal of Adolescence 52, 60-71(10).
NBSC (2016). China Stastical Yearbook 2016, Beijing: China Stastics Press. Nelson, C.A. (1999). Change and continuity in neurobehavioral development: lessons from the study
of neurobiology and neural plasticity. INFANT BEHAVIOR & DEVELOPMENT 22, 415-429. OECD (2013). How do early childhood education and care (ECEC) policies, systems and quality
vary across OECD countries. . Schweinhart, L.J. (2004). The High/Scope Perry Preschool Study Through Age 40: Summary,
Conclusions, and Frequently Asked Questions. (High/Scope Educational Research Foundation). Shore, R. (1997). Rethinking the brain : new insights into early development, New York, Families
and Work Institute. Tranter, P., and Freeman, C. (2011). Children and their Urban Environment, London:Routledge. UN (2000). Millennium Development Goals (MDGs.) . UNESCO (2005). Monitoring early childhood care and education. In EFA Global Monitoring Report
(Paris: UNESCO Publishing), pp. 82-139. UNICEF (1989). Convention on the Rights of the Child. 41, 28. Van Kersbergen, K., and Hemerijck, A. (2012). Two Decades of Change in Europe: The Emergence
of the Social Investment State. JOURNAL OF SOCIAL POLICY 41, 475-492(1). World Bank(2017). World Development Indicators 2016. WVI (World Vision International) (2016). Cities for Children Framework: A Strategic Framework for
Urban Programming.
Notes
1 The both groups searching date was May 26
th, 2017.
2 1$=6.2284CNY 3 Sports area per capita is 2013 data. 4 1$=6.6423CNY
555
Abstract title Inclusive Urban Design Based on the Shared waterfront:A Project of Nantong Nine-
Rivers
Author Lu, Xiaobo, Southeast University, NANJING, China (Presenting author)
Co-author(s) Prof Dr Yang, Junyan
Abstract
Issues facing urban waterfront spaces in the content of China's rapid urbanization include
inaccessibility, isolation, water pollution and destructive exploration, which derive the rugged
environment, less neighborhood communication and low sense of social identity. Effective use of
public areas in waterfront spaces should be ensured and inclusive communities should be built, so as
to throw off reserve and improve social and economic benefits, which is the subject of the Nantong
Nine-rivers Urban Design project.
Nantong City lies on the Yangtze River Delta plain with low and flat terrain, densely covered rivers
and dense residents in its riverfront area. The current problem is that its river system fails to be
effectively used despite its deep access to the city hinterland, and that green land, water front banks
and open spaces are lacked. The planning approach of the Nantong Nine-rivers Urban Design project
is to build a waterfront open space suitable for walking with high accessibility, beautiful environment
and diversified activities. As the earliest Chinese city to put the planning concept of Garden City into
practice, Nantong is gradually integrating into the Shanghai metropolitan area with the rapid
development of the economy. And it has more close relation with Suzhou, Wuxi and Changzhou and
enters into the bridge and port development period. Based on the Garden City theory and the
decentralized development concept, the city space structure of “One Mountain and Nine Rivers, One
City and more Towns" is put forward in Nantong's urban master plan. Moreover, the idea of
constructing the waterfront space along the nine river systems to enhance the vitality of the
community is put forward in Nantong's spatial characteristics planning.
In the Nantong Nine-rivers Urban Design project, it proposes an inclusive urban design: to create an
environment for walking through space accessibility design; to enhance the vitality of public space
through mixing functions and organizing various activities; and to improve the quality of the
environment through ecological restoration and constructions of water affinity and revetment
facilities. The implementation of the project will be divided into 4 stages in the next 20 years: in the
first phase, finishing the industrial relocation and conducting environmental management to attract
investment to develop waterfront greenways for walking and biking; in the second phase, bringing in
profitable commercial projects to build parks and squares to promote people's walking activities; in
the third phase, developing and constructing houses with mixed ownerships to enhance exchanges
between groups of different incomes, different ages and different races; in the last phase,
constructing non-profitable cultural and educational exhibition facilities to help share waterfront
resources and promote social cohesion. The results of the project include a detailed urban design
guideline which contains controlling the indicators of building density, floor area ratio, greening rate,
building volume and others. Also, the design of the shoreline and the organization of public activities
are included in the guideline. This project is trying to help Nantong develop in a way that is inclusive,
with proposing a development mode from riverfronts to hinterlands, while currently supported by
the government and recognized by the public. For cities with a dense river network in the plain area,
556

where the waterfront spaces are considered as important shared resources, the inclusive urban
design is of universal reference significance.
557
Alagappan, Valliappan Accessibility Index and mobility impaired ISOCARP-OAPA Conference 2017
1
Are accessibility indices, a smart decision support system (DSS) tool for measuring access of mobility impaired in public spaces? A comprehensive review of literature.
Valliappan ALAGAPPAN, School of Planning and Architecture, Vijayawada, India
1. Introduction
Since time immemorial, most of the built spaces/environment are made inaccessible through out the world for the disabled. The thought/design/spatial planning process since ancient times the planning is only for the able bodied and the rest of the physical and social spaces is inaccessible and this is rightly stressed as “transformed spaces for the disabled”. (Gleeson, 1993). Accessibility generally defined as moving / movement from one origin to multiple destinations from multiple origins to destination with ease, comfort and minimal frustration. Accessibility is a buzz word/umbrella term; it cut across social, economic, physical, medical, technological and communication. Accessibility is generally of two types one is visual accessibility and another one physical accessibility. Physical accessibility details out indoor and outdoor accessibility measures. The authors have developed indicators to measure quantitatively the accessibility measures. Accessibility measures are generally falling into four categories, landuse, temporal, transportation and time space measures.
2. Measuring Accessibility
Accessibility measures in most of the contexts, the author attempts to measure, time, distance, cost factors, which is influenced by physical, social and economic factors. Measuring accessibility measures started with Hansen (1959), time space geography-Hagerstrand (1970) search for operational form by Ingram (1971), Space Syntax measures -social logic of space by Hillier and Hanson (1984). The authors researched through out the world in support of infrastructure, cumulative and gravity-based measures, as one group and the second group as utility based measures and third group focused by activity based measures. Accessibility measures like time space measures accounts the behavior element of the individual his time schedules, constraints/potentials in the activity space and develop the accessible locations in space. The accessibility measures generally are of two categories one is aggregated accessibility measures (distance, gravity measures) and another one disaggregates measures (utility and activity based measures). The impedance in the network like distance, time, number of turns, traffic (all physical features that affects the movements and make delays in reaching from one origin to multiple destinations). The distance decay factors / impedances like power, exponential negative function, Gaussian and their co-efficient developed by Ingram is used extensively in accessibility studies.
Paez et al. (2012) categorizes accessibility measures into two types; normative and positive accessibility measures. The accessibility studies after extensive literature studies it has found that it falls into categories/activities, 1) accessing recreational activities like parks, playgrounds, physical activity in gyms, stadiums, 2) accessibility to health clinics 3) accessibility from home to work place 4) accessibility to restaurants and food deserts. 5) accessibility to bus Terminals, airports and railway Terminals. The place based on location based accessibility measures takes the location / centroid (i) of neighbourhoods, census blocks or zones and measures the destination (restaurants and shopping malls) through cumulative/contour measures. The activity-based measures are developed by further
558
Alagappan, Valliappan Accessibility Index and mobility impaired ISOCARP-OAPA Conference 2017
2
location based on cut off value or threshold measures (distance and time). These measures used Euclidean, network, Manhattan measures for measuring the distance, time across the network. For example restaurants (j) from a specified origin (i) within 15 minutes or within three kilometers.
Ai=∑ j= 1 to n OPj Tij
where
Ai= accessibility of a place i
OPj= opportunities found at place j
Tij= 1 if (time/distance is within threshold)
Tij=0 if (Time, Distance and cost is more than threshold)
The placed based, location based, accessibility added into its enclosure gravity measure to understand the burden / impedance of traveling from one location to destination and the attraction of an opportunity. The impedance values measured with a help of distance/decay factors / co-efficient. Distance based accessibility measures may be measured in terms of cost and distance.
Ai=∑ j=1 to n (dij / n)
Individual/person accessibility measures developed by Lenntrop (1976), Kwan (1998) and Miller (1999) through their studies identified the anchors and space-time constraints of the individuals. The location based accessibility measures have been refined to study space-time constraints and anchor of the individual. Casas Irene (2007) through her study in buffalo in Niagara region demonstrated the social exclusion to the opportunity for the disabled and non-disabled individuals using location based accessibility measures and identified the differences in urban opportunities in the landscape. But in her study the number of opportunities discussed at length and not the physical space related constraints in the network for accessing these opportunities by the disabled. Kwan (1999) highlights “gender bias” in accessing the urban opportunities in comparison to the men using the travel diary data of Franklin County, Ohio, using the concept space-time accessibility measures. The space-time accessibility measures have strong theoretical underpinning but lack of implementing operational algorithms in practice. Kwan (1998) expresses that spatial pattern of the individual’s accessibility for men have strong relationship with locations/place accessibility than it does for women.
3. Methods
Searches were carried out in Science Direct, Taylor and Francis, Springer online websites, NCBI databases, California University e-portals, unpublished Doctor of Philosophy thesis, Google scholar using the keywords built environment, mobility, barriers, walkability, wheelchairs, disabled, public buildings, public spaces, elderly, accessibility, universal design, Barrier free environment, seniors, sidewalks, environment, accessibility index, inclusive design, inclusive design, inclusive planning, physical activity, relative accessibility, movement, paths, mobility impaired etc. through identified articles reference lists and access directly contact with the authors, experts, the extensive spaces has been identified. The inclusion criteria include; (i) Qualitative and quantitative way of assessing the (perceived and measurable) barriers in public spaces/buildings. (ii) Mobility impaired /limitation persons of age above nine years. (iii) Persons using assistive devices like Canes, walkers, prosthetics, and wheelchairs. (iv) Control group studies which includes non disabled persons (Comparison of disabled and non disabled individuals to identify the social exclusion) (v)
559

Alagappan, Valliappan Accessibility Index and mobility impaired ISOCARP-OAPA Conference 2017
3
Performance measuring tools or Decision support tools to measure the accessibility service levels. (vi) Studies conducted in urban areas. The exclusion criteria include the studies, which are review of accessibility measures, design of assistive devices for mobility impaired, walkability studies, visually, speech and mentally impaired studies are not included for literature review. Specific accessibility studies related to parks, playgrounds, gyms, swimming pools etc.
The studies identified in the United States of America, European union, United Kingdom, Middle East and in the sub continent. The review of literature included studies across infrastructure, location based, persons based accessibility measures particularly focusing on mobility impaired persons in the public spaces, considering all age groups from children above nine years, adults, midlife adults, older people above 60 to 80 years. The studies, which are carried out at various geographic scales are examined starting from building/site level, university / institutional levels, urban/suburban neighbourhoods, city levels, across cities and Regional level for understanding the capabilities of the Decision support tools to understand the access conditions and opportunities available for the mobility impaired users. Some papers, which are not directly relevant to the study but very essential before developing a decision support tool / index. One study which highlights gender inequalities in access to urban opportunities, not directly related to mobility impaired, but in order to understand the social and physical exclusionary aspects related to women. 4. Detailed Literature Review of Studies
At Building and Institutional Level Studies:
Church and Marston (2003) discusses about absolute and relative access. The author argue that absolute access is provided in buildings should be accompanied by relative access measurement in order to provide greatest improvement in access. An accessibility measure estimates the level of activity from a starting location to one or multiple locations given a travel mode, distance, time and cost constraints. He narrates an illustration that explains how people with disability access obstacle-ridden space. He considers two people; one is ambulatory and another one is wheel chair user each leaving the office at the second floor closest to staircase. The ambulatory person exits the office through stairs reaches the coffee shop. The wheel chair person heads to the elevator and then take it to the ground floor and heads towards coffee shop. For both people the coffee shop is available in terms of absolute measure. The time taken for ambulatory person is 40 seconds and for wheel chair user it is 3min. 30 seconds. The effort taken in terms of time spent is 5.25 times of ambulatory person. The difference in accessibility in terms of person using wheel chair l relative to ambulatory person m leaving adjacent offices is expressed as Riklm=dikl/dikm where k represents the activity of getting a coffee. Riklm=Relative accessibility of activity k from location I for person tlype l relative to person of type m. Riklm=5.25. The method adopted in this article is time space measure of accessibility. Relative access is a good measure for determining the impact of barrier removal across the landscape or network. The paper discusses another example to underscore the importance of accessibility at university of California Santa Barbara campus. In both the examples the author uses the parameter time, distance factors for elaborating the illustration. The author stresses the relative access measure be used in conjunction with the traditional measure of absolute access to make decisions.
Neela Thapar et al (2004) examined the functional access to thirty public buildings and facilities in Boston between people with different types of impairment as well as without impairments. The study assessed generic (enter building, use restroom, use drinking fountain, use telephone, access seating) and site specific tasks and analyzed the percentage
560
Alagappan, Valliappan Accessibility Index and mobility impaired ISOCARP-OAPA Conference 2017
4
of tasks performed, time, distance, barriers and facilitators. Comparison between control and three team members and between impaired team members. Task performance test was carried out using Mann-Whitney U-Test and barriers and facilitators, Fischer's exact test was conducted for statistical significance. The findings suggest that wheelchair users reported a lower task performance (81%) in comparison with the control (100%) and persons with mobility and visual impairment (97-98%). Nikkos Sakkas et al (2006) developed a DSS tool using location based accessibility methodology and transposed it in building domain to assess the accessibility barriers in an institutional building (university building, school of applied technology, Institute of Crete). The authors developed relative accessibility equations based on importance of building services, frequency and quality and distance decay variables. The tool does not demonstrate in a spatial campus layout, the link wise inaccessible elements. The reliability and validity of the tool is not scientifically assessed. The quality of route, distance and decay factors is highly debated in accessibility research. The perception of wheelchair users is not utilized for developing decision-making tool.
Ferreira Marcus A.G. and Sanches (2007) prepared an accessibility index tool to evaluate the performance of the infrastructure of sidewalks and public spaces. The equations developed with the help of technical experts and perception of wheel chair users in the city of Sao Carlos, Brazil. The variables like longitudinal profile, surface of side walk, material used, effective width and intersection of the street were assessed by the experts in the scale of 0-5 and weighting of the variables based on perception of 45 wheel chair (classified the variable in order of importance) using the technique of method of successive intervals.
After development of index, it has been tested with ten wheelchair users using it along the stretches, evaluated by the technical experts. The research concluded that the stretches evaluation by technical experts is not very different from user evaluation. The elements in the side walk like curb cuts (slope), cross slopes, co-efficient of friction for various materials, surface types, lighting, signage’s, peak time crowd congestion, location of barriers, twists and turns (impedances), visibility, surface resistance, the disturbance of cyclists, mobility impaired sub types not considered for Index. The study comes under the typology of infrastructure based (service levels) accessibility measures and takes into consideration the objective and subjective aspects of accessibility. The tool is not integrated with GIS tools for representing spatially, the elements, which act as barrier for movement from an origin to a destination.
Bendel Judith (2006) developed an audit tool and a decision support system model for evaluating the accessibility of existing public facilities for mobility impaired and its types, visual and auditory impairments in eight major categories of building in Israel using a questionnaire based on standards of accessible design. The DSS tool highlights the item in the facility required for adaptation or upgrading to the user needs and priorities for implementation. Two types of equations developed for assessment, one to grade accessibility of specific elements and spaces, weighted grade of overall facility. The output of DSS tool is in the form of full detailed report that aid the architects, therapists and professional regarding priorities of implementation. Reliability and validity of the model through consumer satisfaction and not been scientifically ascertained. The DSS tool not spatially integrated to identify barriers / items was improvement and adaptation is necessary. The study addresses the interaction between individual and environment and possible combination between different elements and design.
The Al-Zoabi (2001) developed an evacuation performance index (EPI) to assess the safety levels in a given building for mobility impaired individuals with range of disability aid combination during the fire emergency in a building and the Index provides a mechanism for determining insurance premiums. This index is prepared by dividing the evacuation routes into elemental sections with a range of disability and mobility aid combination with the average evacuation speed of able-bodied person. The index calculates the evacuation time
561
Alagappan, Valliappan Accessibility Index and mobility impaired ISOCARP-OAPA Conference 2017
5
demonstrated by disability mobility aid combination in relative to evacuation speed of able bodied person. the authors used the qualitative and quantitative methods of research. The variables like safety criterion, loading strength (tenability), touch, smell, sight, ambient temperatures, presence of strobe light, smoke are not demonstrated using the computation methodology. The index developed might be interesting, if authors might have been applied the index in reality for assessing the performance. the tool has been validated by the practicing architects and the application has not been simulated in the virtual environment to understand the pro and cons of the tools.
Jayne Renee (2010) developed a methodology for identifying the barriers in schools. The study conducted in 29 schools with student participation with disabilities and twenty-two schools with student participation without disabilities. The students aged nine and above, special education resource teachers (SERT) and principals of identified schools were taken as samples for identifying the barriers in entrance ways, ramps, doors, passageways, washrooms, signage’s and safety, water fountains, elevators, classrooms, stairs, libraries and recreational facilities. Walk through method of assessment conducted for barrier identification. T-Test were conducted for groups with study 1 and study 2 to understand the stakeholders group differences on the total number of barriers identified. Paired T-test indicated significant differences between principal and students report t (21)=4.1 P< 0.001. The student identified mostly the barrier related to mobility disability in comparison with principal and SERT. The principals, SERT identified more barriers associated with vision and hearing impairment. This methodology indirectly helps decision makers in identifying the barriers; the affected individuals (mobility disabled) will identify more barriers than the able bodied students, principals and SERTS.
Pereira (2014) evaluated the access conditions for wheelchair users in sporting mega events. The attribute has been chosen based on the frequency in using the attribute in various studies like accessibility, attractiveness, comfort, convenience, urban and traffic security. Using random selected wheel chair users the access conditions of Marcana stadium has been evaluated. The variables are evaluated in the scale of Great, Good, Regular, Bad and Very Bad. The analysis found the most critical points in the study were greatest need of assistance (unevenness, sidewalks plantings and distance and general visibility) and most critical points are corrections of unevenness, plantings and sidewalks and adequacy of crossings.
Mohammed Mariana et al (2015) identified user level satisfaction and issues, problems of the disabled (82% vision disability and 12% physical impairment) with the existing barrier free provision in the campus of Malaya University, Kuala Lumpur. The conditions of barrier free facilities evaluated in the scale of 1-5 like very poor, poor, average, good and excellent. Mean score calculated for highest and lowest) for facilities and overall mean calculated across six areas. The findings suggest that intervention related to barrier free provision are needed in cafeteria, sport centre, lecture hall because of low mean score value. Issues of disabled category wise and what type of design intervention to be carried out in selected areas not discussed.
City Level Studies:
Linda Beale et al (2006) developed a network based GIS based decision support tool for wheelchair users (manually assisted, manually self propelled, motorized, scooter) to navigate around the barriers in urban spaces in Northampton, UK. The model uses parameters/variables like slope angle, surface type and dropped kerbs and provide assessments based on type of wheelchair users and fitness of the user and impedance factors (based on number of factors like age, sex and wheelchair types) along six route types. The study brought out the differences between able bodied and disabled in term of number of routes available for them. The limitations of the study it is not addressed the other types of disabled users (mobility impaired using crutches, walkers and prosthetics, vision impaired). The surface type, slope and dropped kerbs, may hinder the movement of other
562
Alagappan, Valliappan Accessibility Index and mobility impaired ISOCARP-OAPA Conference 2017
6
disabled groups. A comprehensive tool which takes into account the barriers and facilitators of disabled will address the issues faced by all categories of disabled but it was unable to accommodate fitness level or wheelchair type in calculation of route selection.
Vale David et.al (2017) developed a methodology to quantify the impact that features of built environment have on accessibility by disabled persons compared with accessibility by a non-disabled in the city of Lisbon. The study highlights the exclusion for wheelchair users in comparison with able-bodied persons. The methodology shall be used as planning tool to identify critical areas for wheelchair access to make it inclusive. The variables used for the study are pedestrian network, accessible network length, number of buildings reached and number of activities to be reached. The accessibility disparity/gap index was developed by the authors to understand the amount of disparity between able-bodied individual and disabled/wheel chair users. The case study reveals high accessibility with mean value of 0.57 to 0.60. The center area of study is more inclusive and it is a pedestrian street. High correlation found between number of buildings reached and number of activities. The study fails to address the accessibility of networks in terms of surface types, curbs, ramps, barriers, impedances, type of disabilities or sub types of movement disability, multiple activity potential of the network etc.
Wennberg et al (2010) examined the effects of improved accessibility in municipality of Hasselholm, on older people satisfaction in the outdoor environment (with five usability categories like physical barriers, orientation and warning, bus stops, orderliness, benches and stairs). The tools used for the study includes qualitative content analysis, rating in the scale of 1-5 for identifying the views and measuring satisfaction of municipal planners and of older people after implementing accessibility measures. A city level study to understand the perceptions and satisfaction` levels of older people and planners view at municipality before and after implementation of accessibility conditions. Increased satisfaction was observed in the category of orderliness (removal of graffiti and litter) and clear separation between cyclists and pedestrian (P=0.0017). Decreased satisfaction with no kerbs at Zebra crossings (P=0.000) and no commercial signs and baskets (P=0.047). Municipal employees expressed their views that lighting and more benches shall be further improved and the shortest route is available after lowering the kerbs. significant improvement observed in outdoor environment by removing physical barriers for people with functional limitations and mobility devices.
The study by Hanna Wennberg and others in 2009 investigates how accessibility issues are currently treated in Swedish municipalities in order to examine how the accessibility needs of older people are met in daily practice. There are three categories, which are taken for implementing accessibility measures like static factors, directives and recommendations and 21 statements (regarding how accessibility is treated in municipalities). Through responses from 290 municipality regarding 21 statements through factor analysis it has been made into five statement sub components. Relationship between static factors and 21 statements, and between directives and recommendations and 21 statements and between 21 statements and five sub components were examined using Mann-Whitney U Test and the significance of the Test is P<0.05.
The number of positive answers each municipality was given for calculation of three indices measuring the level of implemented accessibility. Municipality having accessibility plan treat the accessibility issue in a positive manner and policy documents improve the process of implementing accessibility in municipal planning. The role of accessibility advisor improves the municipality to develop co-operation with interest organization. A summarized index all the three categories not developed due to difficulties in comparability between three categories. The categories relationship does not have any considerable knowledge in implementing accessibility issues. The index method is indirect way of measuring the implementation of accessibility than actual conditions in the sample of municipalities.
Rosenberg (2013) assessed through qualitative study (perception based) the barriers and facilitators to activity among midlife and older adults with mobility disability, aged above 50
563
Alagappan, Valliappan Accessibility Index and mobility impaired ISOCARP-OAPA Conference 2017
7
using assistive devices in urban and suburban neighbourhood in king county, Washington US. The study assessed built environment themes like curb ramps, parking, lighting, weather, street crossings, sidewalks, amenities and traffic. The study fails to distinguish the barriers and facilitators between two groups. the difference between the groups were not extricately discussed.
A study assessed the physical access barriers to services in four town/city centres like Edinburgh, Cardiff, Leeds, Hitchin. Four services sector and thirty-two premises and one disabled person identified to assess the barriers to services. Audit tools that assessed the technical and user involvements on barriers encountered. Physical access barrier are found in small market town (Hitchin) and historic town (Hertfordshire) and in terms of services retail services (most) and leisure provider (pubs and restaurants) less access barrier. Large service providers have least number of barriers. (Lewis 2005)
The access barriers encountered in various premises are not discussed in a spatial layout in retail and recreational services and what type of disability not discussed. What type of barriers, user feedback, access auditor comments, in 32 premises, individually not discussed elaborately in any part of the paper. The analysis techniques not discussed in detail. The methodology is very weak for measuring physical access barriers to services.
Poldma et.al (2014) understood the peoples accessibility need in Alexis Nihon mall (Canada) through two studies and walk through method of assessment. Three objectives are studied through the study; (1) to assess the physical environment from a design perspective (2) to understand the experiences people have on the environment (3) to compare visual, physical environment of the users and issues that are revealed. Study one has 11 participants (one person with visual impairment assisted by guide dog and one person with visual impairment but with relative independent movement and three persons with severe disability in wheel chairs) and study two has nine participants (three in wheel chairs, one research collaborator with disabilities) and all studies included researcher with disability, principal researcher, student users/stakeholders.
The major elements studied are circulation areas, materials, finishes, lighting, signage's, mall activities at various times of the day (visibility and access). The content analysis of both visual and narrative data followed by comparative analysis to confirm the experiences of the space as described by participants. The findings include (1) issues of time and displacement on types of disability (low vision persons reaches in two minutes, but 45 minutes for wheelchair persons from the subway (2) wheel chair persons cannot persons cannot see the signage's but identify placement and low vision cannot place the signage due to visual noise. (3) The spatial design can intentionally or unintentionally support or hinder access to the mall. The study fails to highlights the barriers in the buildings in the form of illustrations (drawings), how social participation is measured and how social experiences enhance positive physical access not discussed.
Sapawi Roslina and Ismail Said (2012) reveals from a pilot study assessed the environmental attributes required by researchers in acquiring significant indices of walk able environment. The sample of 26 respondents in the mosque from Bandar Bara Uda (Urban Neighbourhood) at Johar Baru, Malayasia selected to answer the survey questions. Two research questions were tested in the study 1) Does the physical attributes listed valid and reliable to be used as walking indices particularly in case area? 2) Does the listed attribute perceived differently according to different groups of gender, age, educational background and health condition? 36 environmental attributes from four variables (accessibility, safety, comfort and pleasurability) are assessed using Rasch model to examine both validity and reliability of the attribute listed. The Rasch model used to eliminate the items based on t-value and differential measure. Differential item functioning between male and female group, educational background groups, health and non-health groups. Item fit Index analysis done across persons/items. There are sixteen items (2 misfit items together with DIF item, 4 misfit items and 10 DIF items) needs to be dropped for constructing indices that support walking in
564
Alagappan, Valliappan Accessibility Index and mobility impaired ISOCARP-OAPA Conference 2017
8
urban neighbourhood. The study gives insights and methodology to identify the relevant attributes which are most significant for construction of decision support tools or indices construction.
At Regional Level Studies:
Irene Casas (2007) assessed the number of opportunities in the urban area (Greater Buffalo, Niagara Region) western New York in an individual activity space and compared the level of access between disabled and non-disabled groups. To determine if individuals disabilities and other characteristics are contributing factors to their exclusion. Tiger network file, which contains street network and attributes. One day travel diary data (for 24hrs) for persons who are five years and older of age (all members of household) which covers activity and travel information for a weekday. 111 individuals in four categories of disabled such as wheelchair/cane, difficulty standing/walking, Deaf/blind and mental disability and 111 non-disabled individuals are taken as samples. The variable/opportunities considered for analysis include dining, entertainment, shopping and personal errands, distance measure, age, gender, license, jobs, student status, occupation, household income, own/rent status, mode, household size, number of vehicle and three dummy variables such as urbanity, destination and disability.
Mann-Whitney Test conducted to understand (i) significant difference between non-disabled random and deaf/blind when comparing dining and entertainment opportunities. (ii) Significant differences between mentally disabled and non-disabled random at 95% level. (iii) No significant differences between disabled living along and those living with others (iv) Number of opportunities available between groups, which is an indication of exclusion of disabled people. To identify the indicator of exclusion, poison and negative binomial regression (with scale and without scale parameter) was conducted. The poison regression results indicate that (i) people who drive alone has more number of opportunities when compared to other modes of transport (ii) A male person from small household, having driving license, high income and not disabled have more number of opportunities. (iii) High Income and close to average has more number of opportunities. (iv) By introducing scale parameter, the change in income favours lower income categories (less than 25000 $) to increase the number of opportunities, because of available public transport.
To control over dispersion, the negative binomial regression is used to understand the results in a statistically significant manner. The result suggest that (i) household size, mode (walk, auto passenger, school bus), number of jobs in household, income and urban environment most significant in number of opportunities. (ii) Individual small household, fewer vehicles, income of 15,000-24,999$ who own rather rent and live in urban areas, increase number of opportunities. The limitation of the study is that it does not include multi-stop journey, multipurpose trips and time space constraints not taken into accessibility measures. Individual desires, feelings, perception are required to understand social exclusion, long distance travelled by a mode and weighting of opportunities not considered. Complexity of relationship and lack of spatial clustering of disabled persons and lack of significance of income in the models.
The regression results indicate and favour the non-disabled random significantly. The number of opportunities is more for non-disabled and the majority of variables/factors indicate the same. The results indicate the social exclusion of opportunities for disabled in the urban landscape. The methodology clearly demonstrates the availability of opportunity differentials and the amount of exclusion between disabled and non-disabled individuals in the regional settings.
5. Results and Discussion
There are 20 studies, which are directly, or indirectly measuring accessibility in public spaces for mobility impaired. The decision support tools of may types and it is based on the absolute measures and relative based accessibility measures. Some DST are developed with quantitative (experts auditing it technically) and qualitative (perceptions of disabled users)
565
Alagappan, Valliappan Accessibility Index and mobility impaired ISOCARP-OAPA Conference 2017
9
and in some papers it is purely technical and comparing it with legal directives (bye-laws guidelines). The DSS tools mostly developed to assess the present conditions of the built environment for the experts/decision makers, but some DST tools are developed for the users to assess the existing conditions of the routes before traversing the pedestrian networks. These tools provide information to the users to take decisions for reaching the desired opportunities. The disaggregated measures with the help of time space geography approach (constraints and potential) for disabled users is very limited and not explored in the urban landscape.
DST tools are developed for the experts / architects to assess the accessibility in the design stage and rectify the constraints to make it inclusive. Most of the paper discusses the concept of absolute access based on standards; guidelines (ADA, DDA, CPWD, Canadian, Australian and European Guidelines) and some authors discuss the relative accessibility / accessibility disparity / gap (Church, Sakkas, Casas, Vale David, Ahmad Y Zoabi). Decision support tools for mobility impaired are developed during emergency situations (fire related) in a building. The standard, which are developed in western and eastern countries, is based on the ergonomics of wheel chair and not based on sub classification of people with crutches, prosthetics, and walkers and without mobility aid. The assumptions that the standard make for wheelchair is one size for all and it will fit other categories of disabled and the mobility impaired and differences in mobility aspect is not explored.
There are studies, which assess the user pre, and post implementation of accessibility measures and some studies assesses the satisfaction levels of the implemented accessibility measures. The decision support tools brought out the social / physical exclusion in spaces between disabled and non-disabled users and highlight the exclusion in the public spaces for Decision makers. The DST tools developed in outdoor environment highlights the barriers in the urban landscape with the help of GIS tools and some tools generate only reports and priority of implementation. DSS tools developed at building level does not use software tools for representing spatially the barriers in reaching the opportunities.
Most of the studies undertaken in accessibility are the methodologies, which indirectly helps the decision makers in understanding the barriers in the public spaces. Functional access had been evaluated for disabled users based on generic and site specific tasks, in assessing the barriers and required facilitation. The words like index, indicator are used in studies to understand the amount of opportunities available in barrier/obstacle ridden public spaces. Most of the decision support tools are developed based on experts opinion, suggestions and users perspective and developed equations/formulae’s and applied in real world to understand the reliability and validity of the tools. There are inherent limitations with the tools developed at various contexts. The papers are silent on the scientific validity and reliability of the tools developed.
There are some papers understand the knowledge of accessibility measures (like existing decision support tools pro and cons, legislative measures/guidelines) in the perspective of municipal planners, accessibility specialist. Agent based approaches are used in studies to assess the accessibility potential and constraints in space. There are some papers, which talk about space syntax (visual accessibility) in public spaces, which addresses the configuration of geometric spaces, in terms of depth perception, impedances etc from origin to destination. The various methods of assessing the built environment for accessibility barriers for mobility impaired like walk through method, perception based, standards/guidelines with users based and virtual reality based assessments.
6. Conclusion
Accessibility studies focuses on design level (buildings), side walk conditions and some studies focuses on wheel chair ergonomics, measuring technically the surface conditions, types, when travelling on slope surfaces, hand rim loading, the amount of force required by the facilitator while pushing wheelchairs using front, back wheels and impedances has been studied. The decision support tool to measure accessibility has been developed using only
566
Alagappan, Valliappan Accessibility Index and mobility impaired ISOCARP-OAPA Conference 2017
10
quantitative and qualitative approach, but in some cases mixed approach is adopted. The earlier studies assessment had been done only at evaluating the buildings / space with architectural / accessibility guidelines and some studies focused purely on perception based and after UN legislation after 2002, the authors had start focusing on person and built environment relationship studies.
The Decision support tool developed at many contexts does not take the temporal aspects, barriers, facilitators associated with accessibility measures The Access levels, varies during day and night time in urban landscape and buildings. Some facilities and services are required for 24hrs period. The Decision support tools developed at public spaces/buildings reaching opportunities does not distinguish based on age groups and DSS tool is not comprehensive in nature. The barriers and facilitators experienced by different disabled age groups vary across urban areas.
The variables associated with facilitators are not included in preparation of decision-making tools. The DSS tools must not look into availabilities of a built environment feature but also the condition of the feature to be assessed. The time and distance measure are taken for assessment of DSS tools, but also each feature of the built environment to be assessed for understanding the barriers to the destination. Few of the variables are taken for DSS tools and it is difficult for a DSS tool to perform in a better way to include all categories of disabled people. Both objective (measureable) and subjective (perception) based measures are needed to understand the accessibility issues in an area and targeted interventions to achieve the desired outcomes (Pacione, 1982, Stanley j & Vella Brodrick, 2009).
References
Al-Zoabi, A. Y. (2001). A Strategic Design of Accessible Buildings for People with a Disability in Jordan. Architectural Science Review, Volume 44, pp. 181-186. Beale, L. et al. (2006). Mapping for Wheelchair Users: Route Navigation in Urban Spaces. The Cartographic Journal & The World of Mapping, 43(1). Bendel, J. (2006). Decision Support System for Evaluating Accessibility of Facilities. The Israel Journal of Occupational Therapy, 15(3).
Casas, I. (2007). Social Exclusion and the Disabled: An Accessibility Approach. The Professional Geographer, 59(4), pp. 463-477.
Church, R.C. & Marston, J.R. (2003). Measuring accessibility for people with disability. Geographical Analysis. 35(1)
Ferreira, M. A. & Penha Sanches, S. d.(2009). Proposal of a Sidewalk Accessibility Index. Journal of Urban and Environmental, 1(1), pp. 1-9.
Gleeson, B. (1999). ‘Can Technology overcome the disabling city?’ in Mind and Body Spaces, ed.by Butler, r and Parr, H., pp.98-118, Routledge, London.
Hägerstrand, Torsten (1970). "What about people in regional science?". Papers of the Regional Science Association. 24 (1): 6–21. doi:10.1007/BF01936872
Hansen W G.(1959). How accessibility shapes land use” Journal of the American Institute of Planners, Volume 25, pp.73-76.
Hillier, B., & Hanson, J. (1984). The social logic of space. Cambridge University Press. London.
Ingram D R. (1971). The concept of accessibility: a search for an operational form. Regional Studies. Volume 5, pp.101-107.
Kwan, M.P. (1998). Space time and integral measures of individual accessibility: A comparative analysis using a point-based framework. Geographical analysis 35(3): 191-216.
567
Alagappan, Valliappan Accessibility Index and mobility impaired ISOCARP-OAPA Conference 2017
11
Kwan, M.P. (1999). Gender and Individual Access to Urban Opportunities; A Study using Space-time Measures. Professional Geographer 51(2): 210-227.
Miller, H.J.(1999). Measuring space-time accessibility benefits within transporation networks: Basic Theory and computational procedures. Geographical Analysis 31:1-26.
Mohammed M et al. (2015). Barrier free campus: University Malaya, Kuala Lampur. Procedia-Social and Behavioral Sciences, 168, pp:134-144.
Lenntorp B. (1976). Paths in space-time environments: a time-geographic study of movement possibilities of individuals. Lund studies in Geography B 44(Gleerup, Lund).
Lewis, C., McQuade, and Thomas C. (2005). Measuring Physical Access Barriers to Services: Snapshot research in 4 town/city centres in Britain, International Congress Series, 1282, pp.1034-1037. Osman, M. M., Radzi, F. H. M., Bakri, N. I. M. & Ibrahim, M. (2015). Barrier-Free Campus: University Malaya, Kuala Lumpur. Procedia - Social and Behavioral Sciences, Volume 168, pp. 134-144.
Pacione, M. (1982). The Use of Objective and Subjective Measures of Quality of Life in Human Geography. Progress in Human Geography, 6(4), 495-514.
Paez, A.,D.M.Scott, and C.Morency. (2012). Measuring accessibility: Positive and normative implementations of various accessibility indicators. Journal of Transport Geography 25: 141-153. Doi:10.1016/j.jtrangeo.2012.03.016. Pereira, L. d. F. & Albuquerque, M. S. d. (2014). Access of wheelchair users in sportive mega events: the case of Confederation Cup. Procedia - Social and Behavioral Sciences, Volume 162, pp. 148-157. Pivik, J. (2010). The perspective of children and youth: How different stakeholders identify architectural barriers for inclusion in schools. Journal of Environmental Psychology, Volume 10, pp. 510-517. Poldma, T. et al. (2014). Understanding people’s needs in a commercial public space: About accessibility and lived experience in social settings. ALTER, European Journal of Disability Research, Volume 8, pp. 206-216. Rosenberg, D. et al. (2013). Outdoor Built Environment Barriers and Facilitators to Activity among Midlife and Older Adults with Mobility Disabilities. Gerontologist, 53(2), pp. 268-279. Sakkas, N., Perez,C.Lemmen, and P.van Oosterom.(2006). Elaborating metrics for the accessibiilty of buildings. Computers, Environment and Urban Systems. Volume 30, pp:661-685. Sapawi, R. & Said, I. (2012). Constructing indices representing physical attributes for walking in urban neighborhood area. Procedia Soc. Behav. Sci., Volume 50, pp. 179-191. Stanley, J & Vella-Brodric, D. (2009). The usefulness of social exclusion to inform social policy in transport. Transport Policy, 16(3), 90-96. Thapar , N. et al. (2004). A pilot study of functional access to public buildings and facilities for persons with impairments.. Disabil Rehabil., 26(5), pp. 280-289. Vale, D. S., Ascensão, F., Raposo, N. & Figueiredo, A. P. (2017). Comparing access for all: disability-induced accessibility disparity in Lisbon. Journal of Geographical Systems, 19(1), pp. 43-64. Wennberg, H., Ståhl, A. & Hydén, C. (2009). Implementing accessibility in municipal planning—Planners’ view. Journal of Transport and Land Use, 2(2), pp. 3-21. Wennberg, H., Hydén, C. & Ståhl, A. (2010). Barrier-free outdoor environments: Older peoples’ perceptions before and after implementation of legislative directives. Transport Policy, 17(6), pp. 464-474.
568

Makinggoodgreat:transforming20thcenturyindustrialdistrictintoanextgenerationemploymentcenter
Moderator: Amy KOSKI, City of Milwaukie, USA
Speakers: Alex DUPEY, MIG Inc. Portland, USA; Matthew CRAIGIE, ECONorthwest, USA
The North Milwaukie Industrial Area (NMIA) Plan provides a vision and incremental implementation
strategy to create an employment‐oriented, vibrant, mixed‐use urban area where light industrial,
manufacturing, commercial and residential uses are developed in strategic and compatible ways.
The NMIA’s strategic location makes it an attractive employment center for the next generation of
makers and doers, traded sector employment, and manufacturing.
So why focus on a district that is already successful? Location is only one factor that makes an area
desirable – industry needs are rapidly changing, tenant needs and desires are evolving and the NMIA
is well positioned to identify these opportunities and adapt to emerging trends. The Plan provides
recommendations and strategies to increase employment opportunities and support existing
businesses, founded on in‐depth technical analysis, development feasibility, open space,
transportation and infrastructure and extensive public input, from vision and concept development
to project prioritization.
Session participants will gain an understanding of the importance of an economic development
strategy to implement an eco‐industrial district in an already highly‐developed area. City staff and
consultant from MIG, Inc. will identify the tools used to assess the area’s potential, incorporate
green infrastructure, and using natural resources as branding elements to attract a burgeoning
employment market with economic development and land use strategies that foster innovation
through a near‐, mid‐, and long‐term vision.
The objective is to gain increased knowledge about development of an approach to industrial land
use, transportation, infrastructure, and economic development through an ecodistrict lens.
569
Track 3: Smart culture, urban experience and shared economy
570
Let’s Be Smart and Reduce Our Energy!
Rumeysa CEYLAN, Yıldız Technical University, Faculty of Architecture, Dept. of City and Regional Planning; Turkey.
Ayşegül OZBAKIR, Yıldız Technical University, Faculty of Architecture, Dept. of City and Regional Planning; Turkey.
Zeynep MEREY ENLIL, Yıldız Technical University, Faculty of Architecture, Dept. of City and Regional Planning; Turkey.
ABSTRACT
Today’s cities are increasingly converging into networked physical spaces experienced by the ‘shared culture’ of the society. Addressing social and environmental problems through ‘smart,’ ’technological and social innovation’ takes a pivotal role in creating such a society. Among technological innovations, network systems and smart phones emerge as foremost platforms that enable citizens to reinvent cities in accordance with their shared values regarding social, economic and environmental problems within cities. It is generally agreed that one of the most significant problems of many cities, especially megacities, is overdose energy consumption. If these cities do not implement policies for energy-efficient lifestyles, these cities will continue to be resource hungry. For this reason, this paper focuses on how individuals learn to reduce their energy consumption towards an energy efficient lifestyle with technological innovation tools, in two domains: dwelling and mobility. The research is an attempt to propose an individual learning feedback mechanism to reduce energy use through a web based platform (CODALoop) which is compatible with smart phones. The platform consists of three main functionalities: individual energy use calculation, a learning mechanism (forum and psychological questionnaire) and a GIS based mapping tool. The neighbourhoods in Kadıköy District of Istanbul Metropolitan Area in Turkey provide the test-beds for the platform. Volunteer citizens from selected neighborhoods are asked to create an account in CODAloop web platform and enter their individual energy consumption data together with the behavioural questionnaire replies. Preliminary data results regarding with the dwelling energy consumption indicates that a significant difference exists among different gender and occupation groups.
Since this paper is part of an ongoing research project, future steps are also organized through a comprehensive methodology framework on behavioral change through the design, implementation and assessment of learning feedback loops towards becoming a 'smart citizen and society’ .
Acknowledgement: This paper is part of a EU-ERANET Co-fund (Smart City) consortium project titled: Community Data-Loops for energy-efficient urban lifestyles (CODALoop) and supported by The Scientific and Technological Research Council of Turkey (TUBITAK), 116K011.
Key words: Smart Citizens, Smart Society, Energy Efficient Lifestyles, Learning Society, CODALoop Web-Based Platform.
1. Introduction Increasingly, more and more people live in urban areas in the globalizing world. For the first time in history, after the urban population exceeded the rural population, the world population was predominantly urban in 2007. In particular, urbanization has progressed rapidly over the past 60 years. Although, 30% of the world's population lives in urban settlements in 1950,
571
54% of the world's population lives in urban settlements in 2014. According to the analysis, it is estimated that in 2050, 66% of the world population will live in urban areas. North America (82%), Latin America and Caribbean (80%) and Europe (73%) are the most urbanized regions in the world. 40% and 48% of the population of Africa and Asia live in urban areas (this ratio is expected to increase to 56% and 64% respectively in 2050). It is estimated that between 2014 and 2050, the global urban population will grow in 2.5 billion urban settlements and about 90% of this increase will be concentrated in Asia and Africa (UNPD, 2015). According to Global Report on Human Settlements by UN-Habitat (2011), the total energy consumption of cities is more than two-thirds of world's energy. Also, cities account for more than 70% of global greenhouse gas emissions. As urbanization in the world continues rapidly, urban settlements face many important problems such as the climate change, urban sprawl, excessive motorized vehicle usage, pollution, inefficient use of natural resources, production and consumption problems, increased social and economic inequalities, biodiversity loss and ecosystem loss. The concepts of 'Sustainability' and 'Sustainable Development', which are put forward due to such economic, social and environmental concerns, are increasingly at the center of the global agenda (Beatley, 2000, Meadows, Randers and Meadows, 2004, Wheeler and Beatley, 2014, McLaren and Agyeman, 2015). At the end of 1990s, among scholars, politicians, and media groups about sustainability at global, regional and local scales emerged. As a result of these discussions, new movements such as New Urbanism, Transit Oriented Development, Smart Growth, and Compact City have been put forward to improve ‘urban environment’ (Hall, 2006 and Beatley, 2000). In the past years, many different visions discussed such as 'just city,’ 'the global city,’ 'digital cities,’ 'creative city,’ 'network society’, 'sharing cities' and ‘smart city’. With the development of modern technologies, one of these concepts, the concept of 'Smart City' plays an important role in sustainability and solution of social, economic and environmental problems in cities by using Information and Communication Technologies (ICT) (Townsend, 2013, McLaren and Agyeman, 2015). It is important to emphasize that although ‘smart’ part of the city is not only about the technology, smart cities tends to be highly technology-centric. Therefore, the essential focus point is the ‘human factor’ should not be back side in the smart city vision. All of smart city designs and solutions that consider improve the quality of life of citizen. In addition to this, these solutions aim to create vital, livable and sustainable cities for citizens. Accordingly, smart society is one of the integral parts of a smart city due to the human and social capital. But, to become a truly ‘smart society’, the policies and practices that citizens place at the 'center' are necessary. In the philosophy of smart society, 'open data' is crucial in enabling citizens to empower and create value (Araya, 2015, Stimmel, 2015, Valkenburg, den Ouden and Schreurs, 2016). With the new tools and new services developed in the Digital Age compared to previous times, citizens can communicate, share information, and discuss opinions with a greater number of individuals. Thus, empowering bottom-up democracy through virtual platforms that provide electronic participation of individuals is one of the most innovative ways. Citizens who realize and use technological power can find direct participation opportunities in many areas, especially political, social, economic and environmental issues, and they can often have the power to intervene and create change (Castells, 1996, Tufekci and Wilson, 2012, Van Djik, 2016). For this reason, this paper focuses on how individuals learn to reduce their energy consumption towards an energy efficient lifestyle with technological innovation tools, in two domains: dwelling and mobility. Because, one of the most significant problems of many cities is overdose energy consumption and if these cities do not implement policies for energy-efficient lifestyles, these cities will continue to be resource hungry. The research is an attempt to propose an individual learning feedback mechanism to reduce energy use through a web based platform (CODALoop) which is compatible with smart phones. This platform consists of three main functionalities: behavioral energy use calculation, a learning mechanism through forum and psychological questionnaire (developed by Graz University of Technology Team) and a GIS based mapping tool. The neighbourhoods in Kadıköy District of Istanbul Metropolitan Area in Turkey provide the test-beds for the platform. Volunteer citizens from different neighborhoods
572
are asked to create an account in CODAloop web platform and enter their individual energy consumption data together with the behavioural questionnaire replies. Preliminary data results regarding with the dwelling energy consumption indicates that a significant difference exists among different gender and occupation groups. Since this paper is part of an ongoing research project, future steps are also organized through a comprehensive methodology framework on behavioral change through the design, implementation and assessment of learning feedback loops towards becoming a 'smart citizen and society’ .
2. Smart Communites Through Sharing Paradigm
Every people have power to shape the future, therefore each smart community member a natural part of the mind of the smart city. Every day, people are solving their global, regional or local problems through the internet, using increasingly cheap technology such as smart devices. But, all of the smart technologies in smart cities must be evaluated in terms of how they enable human rights and freedoms. It should not be forgotten that smart cities have a great potential for bottom-up civic engagement, especially a part of communication, data sharing, and application development. The new kind of civic movement in smart cities takes place primarily in cyberspace through numerous platforms, mobile applications, and websites, and then spreads to the physical space (Townsend, 2013, Araya, 2015). This smart network is a way to capture these collective movements affect and continuous learning that it generates. Also, the concept of smart community means the place where these networked culture is embedded ( Coe, Paquet and Roy, 2001). Especially, with the increase of the rapid urbanization, more people sharing of urban space and consumed to use limited resources, infrastructure, services, experiences, and capabilities. Under these conditions, cities need good governance, a collective civilian structure, and regulations for the effective and fair distribution of resources and opportunities for them to achieve goal of 'sustainability'. But at the same time, people as a ‘natural sharer’ have to learn to share the city's resources fairly and equitably instead of selfishly over consuming (McLaren and Agyeman, 2015). All of these issues explain why people should focus on smart city approach. Furthermore, this new ‘sharing’ paradigm leads to create a new way of urban infrastructure, research and services of the today’s cities such as Smart Community Infrastructure. According to Riva Sanseverino, Riva Sanseverino and Vaccaro (2017), new possibilities of Information and Communication Technology (ICT) can be used to optimize urban infrastructures such as energy and urban services such as mobility. Besides, not only in the theory but also in the practice of smart city concept, traditional infrastructures are changing due to the community and citizens needs such as high energy efficiency, low environmental impact and high quality of services in the long term. Next, social and technological innovation, two of the most important features of this new approach, give clue to the excessive interest in the Smart Community Infrastructure, especially in sharing resources. For instance; the Smart Community Infrastructures using ICT like sensors networks and the Internet of Things technology, minimize environmental impact, increase resource efficiency and provide services that improve the quality of life of citizens. (Riva Sanseverino, Riva Sanseverino and Vaccaro, 2017). Therefore, one of the main objectives of the study is to collect and analyze data that will guide for an individual energy-efficient lifestyle in the context of the "individual to community feedback loops". 3. Data And Methodology: Operational Modeling Of Individual To Community
Feedback Loops And Individual Energy Consumption
The methodology of this paper is based on the extensive literature review carried by the Codaloop International Project Team: University of Amsterdam (UvA), Yildiz Technical University (YTU) and Graz University (GU) where four domains of energy efficient lifestyle is
573
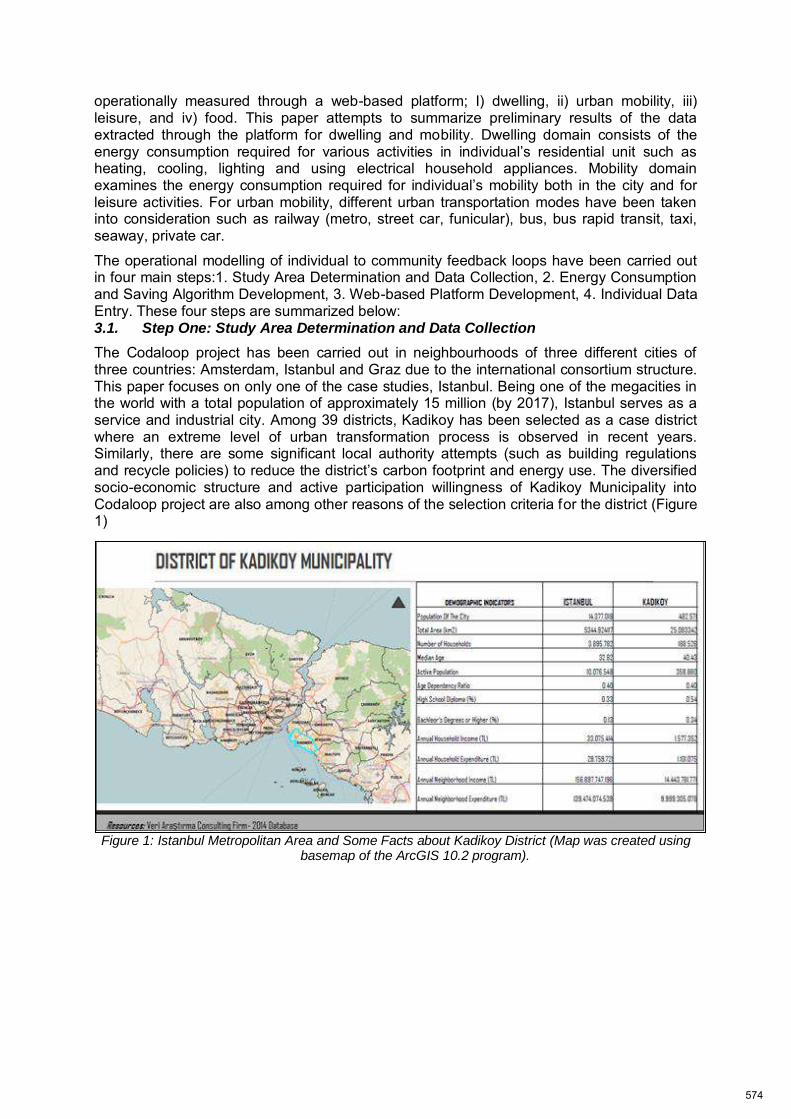
operationally measured through a web-based platform; I) dwelling, ii) urban mobility, iii) leisure, and iv) food. This paper attempts to summarize preliminary results of the data extracted through the platform for dwelling and mobility. Dwelling domain consists of the energy consumption required for various activities in individual’s residential unit such as heating, cooling, lighting and using electrical household appliances. Mobility domain examines the energy consumption required for individual’s mobility both in the city and for leisure activities. For urban mobility, different urban transportation modes have been taken into consideration such as railway (metro, street car, funicular), bus, bus rapid transit, taxi, seaway, private car.
The operational modelling of individual to community feedback loops have been carried out in four main steps:1. Study Area Determination and Data Collection, 2. Energy Consumption and Saving Algorithm Development, 3. Web-based Platform Development, 4. Individual Data Entry. These four steps are summarized below: 3.1. Step One: Study Area Determination and Data Collection
The Codaloop project has been carried out in neighbourhoods of three different cities of three countries: Amsterdam, Istanbul and Graz due to the international consortium structure. This paper focuses on only one of the case studies, Istanbul. Being one of the megacities in the world with a total population of approximately 15 million (by 2017), Istanbul serves as a service and industrial city. Among 39 districts, Kadikoy has been selected as a case district where an extreme level of urban transformation process is observed in recent years. Similarly, there are some significant local authority attempts (such as building regulations and recycle policies) to reduce the district’s carbon footprint and energy use. The diversified socio-economic structure and active participation willingness of Kadikoy Municipality into Codaloop project are also among other reasons of the selection criteria for the district (Figure 1)
Figure 1: Istanbul Metropolitan Area and Some Facts about Kadikoy District (Map was created using basemap of the ArcGIS 10.2 program).
574
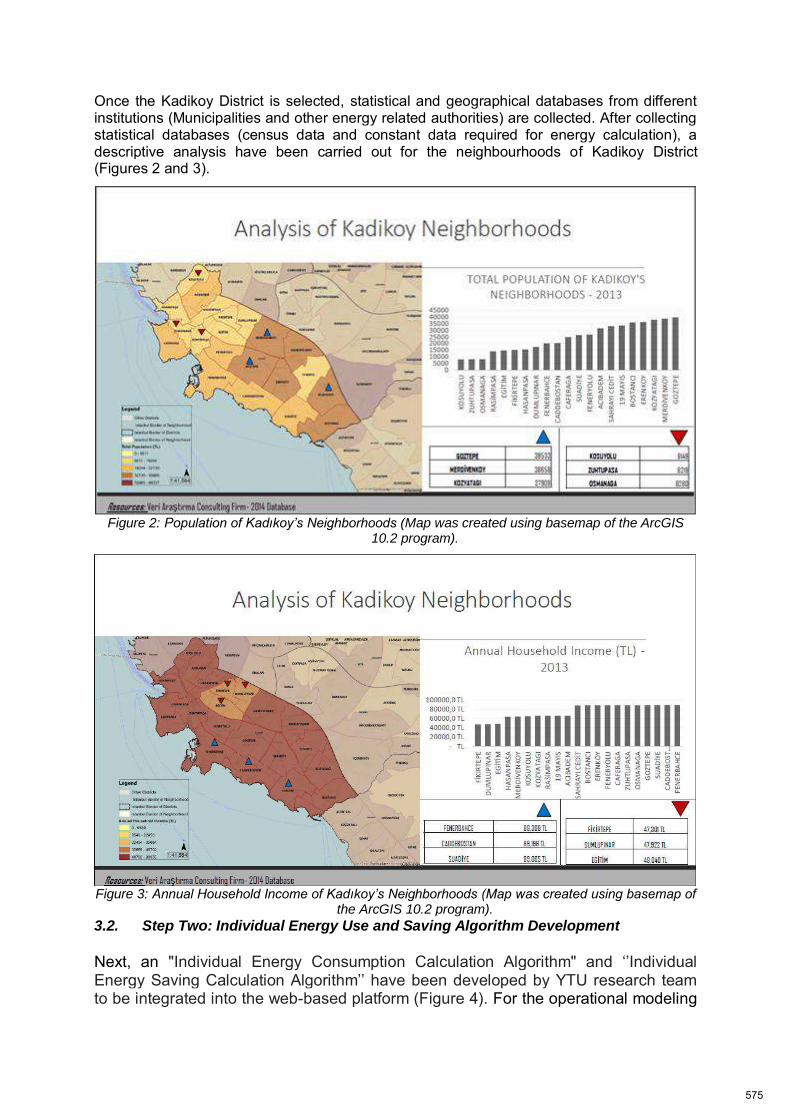
Once the Kadikoy District is selected, statistical and geographical databases from different institutions (Municipalities and other energy related authorities) are collected. After collecting statistical databases (census data and constant data required for energy calculation), a descriptive analysis have been carried out for the neighbourhoods of Kadikoy District (Figures 2 and 3).
Figure 2: Population of Kadıkoy’s Neighborhoods (Map was created using basemap of the ArcGIS 10.2 program).
Figure 3: Annual Household Income of Kadıkoy’s Neighborhoods (Map was created using basemap of
the ArcGIS 10.2 program).
3.2. Step Two: Individual Energy Use and Saving Algorithm Development
Next, an "Individual Energy Consumption Calculation Algorithm" and ‘’Individual Energy Saving Calculation Algorithm’’ have been developed by YTU research team to be integrated into the web-based platform (Figure 4). For the operational modeling
575
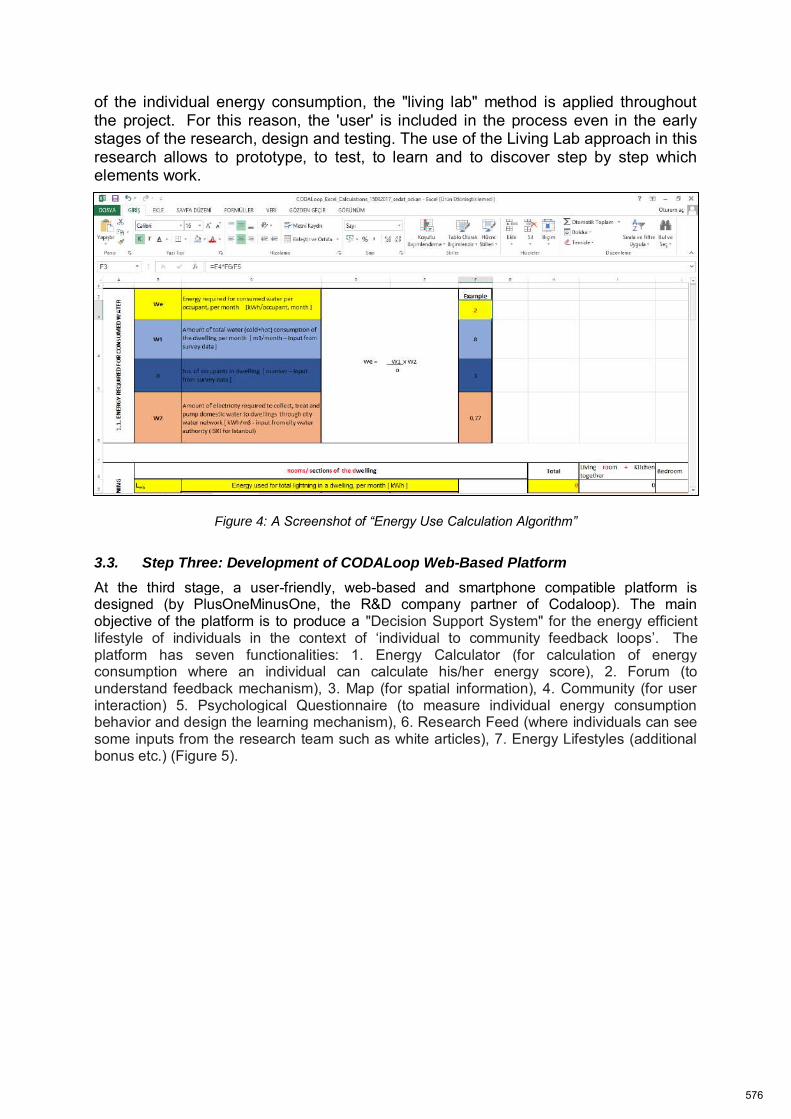
of the individual energy consumption, the "living lab" method is applied throughout the project. For this reason, the 'user' is included in the process even in the early stages of the research, design and testing. The use of the Living Lab approach in this research allows to prototype, to test, to learn and to discover step by step which elements work.
Figure 4: A Screenshot of “Energy Use Calculation Algorithm”
3.3. Step Three: Development of CODALoop Web-Based Platform
At the third stage, a user-friendly, web-based and smartphone compatible platform is designed (by PlusOneMinusOne, the R&D company partner of Codaloop). The main objective of the platform is to produce a "Decision Support System" for the energy efficient lifestyle of individuals in the context of ‘individual to community feedback loops’. The platform has seven functionalities: 1. Energy Calculator (for calculation of energy consumption where an individual can calculate his/her energy score), 2. Forum (to understand feedback mechanism), 3. Map (for spatial information), 4. Community (for user interaction) 5. Psychological Questionnaire (to measure individual energy consumption behavior and design the learning mechanism), 6. Research Feed (where individuals can see some inputs from the research team such as white articles), 7. Energy Lifestyles (additional bonus etc.) (Figure 5).
576
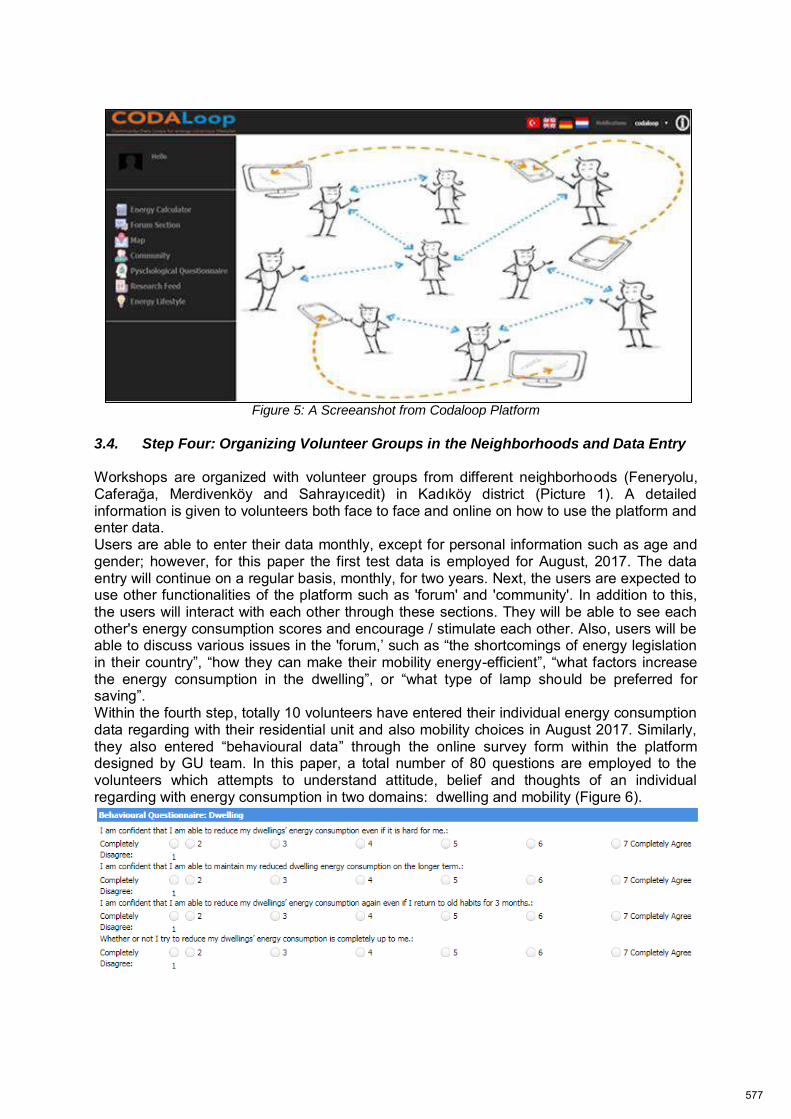
Figure 5: A Screeanshot from Codaloop Platform
3.4. Step Four: Organizing Volunteer Groups in the Neighborhoods and Data Entry Workshops are organized with volunteer groups from different neighborhoods (Feneryolu, Caferağa, Merdivenköy and Sahrayıcedit) in Kadıköy district (Picture 1). A detailed information is given to volunteers both face to face and online on how to use the platform and enter data. Users are able to enter their data monthly, except for personal information such as age and gender; however, for this paper the first test data is employed for August, 2017. The data entry will continue on a regular basis, monthly, for two years. Next, the users are expected to use other functionalities of the platform such as 'forum' and 'community'. In addition to this, the users will interact with each other through these sections. They will be able to see each other's energy consumption scores and encourage / stimulate each other. Also, users will be able to discuss various issues in the 'forum,’ such as “the shortcomings of energy legislation in their country”, “how they can make their mobility energy-efficient”, “what factors increase the energy consumption in the dwelling”, or “what type of lamp should be preferred for saving”. Within the fourth step, totally 10 volunteers have entered their individual energy consumption data regarding with their residential unit and also mobility choices in August 2017. Similarly, they also entered “behavioural data” through the online survey form within the platform designed by GU team. In this paper, a total number of 80 questions are employed to the volunteers which attempts to understand attitude, belief and thoughts of an individual regarding with energy consumption in two domains: dwelling and mobility (Figure 6).
577
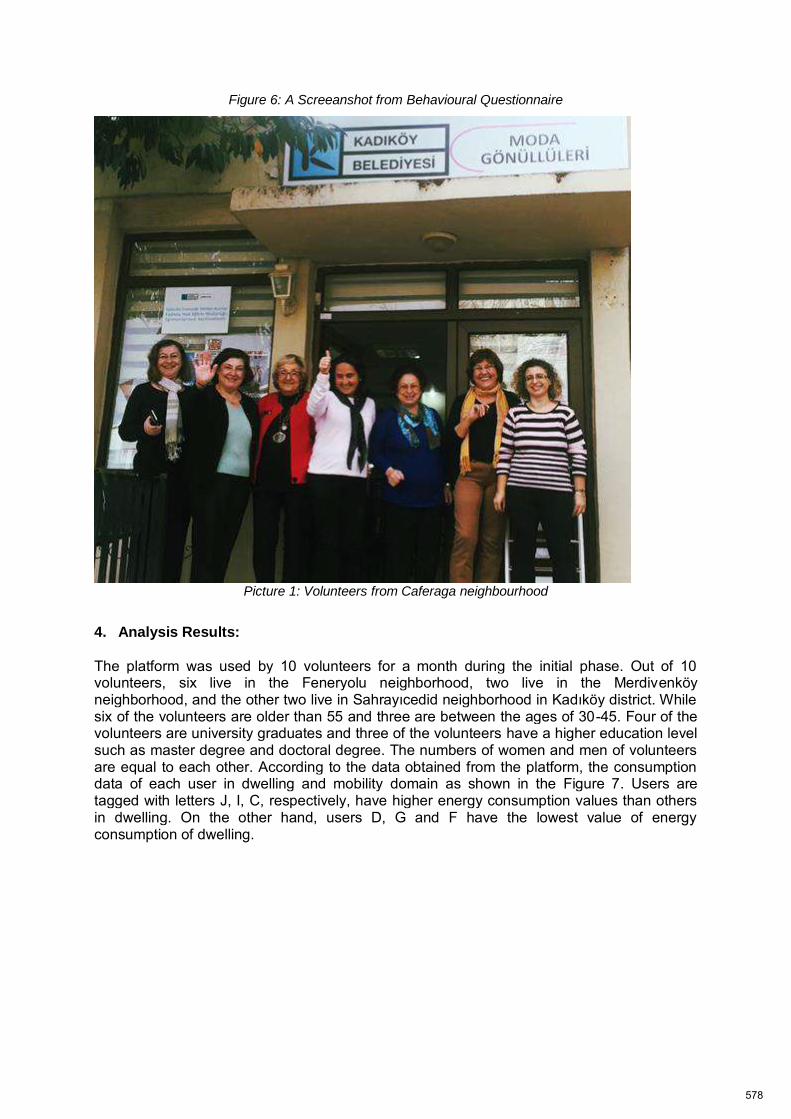
Figure 6: A Screeanshot from Behavioural Questionnaire
Picture 1: Volunteers from Caferaga neighbourhood
4. Analysis Results:
The platform was used by 10 volunteers for a month during the initial phase. Out of 10 volunteers, six live in the Feneryolu neighborhood, two live in the Merdivenköy neighborhood, and the other two live in Sahrayıcedid neighborhood in Kadıköy district. While six of the volunteers are older than 55 and three are between the ages of 30-45. Four of the volunteers are university graduates and three of the volunteers have a higher education level such as master degree and doctoral degree. The numbers of women and men of volunteers are equal to each other. According to the data obtained from the platform, the consumption data of each user in dwelling and mobility domain as shown in the Figure 7. Users are tagged with letters J, I, C, respectively, have higher energy consumption values than others in dwelling. On the other hand, users D, G and F have the lowest value of energy consumption of dwelling.
578
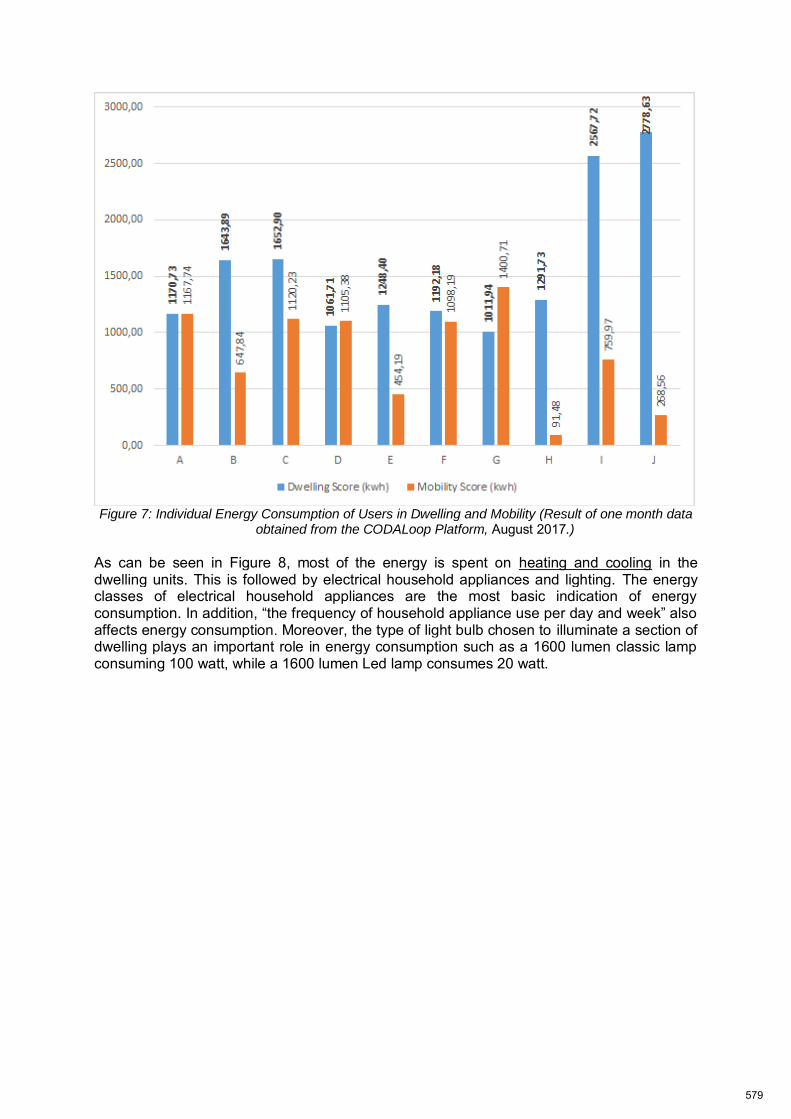
Figure 7: Individual Energy Consumption of Users in Dwelling and Mobility (Result of one month data
obtained from the CODALoop Platform, August 2017.)
As can be seen in Figure 8, most of the energy is spent on heating and cooling in the dwelling units. This is followed by electrical household appliances and lighting. The energy classes of electrical household appliances are the most basic indication of energy consumption. In addition, “the frequency of household appliance use per day and week” also affects energy consumption. Moreover, the type of light bulb chosen to illuminate a section of dwelling plays an important role in energy consumption such as a 1600 lumen classic lamp consuming 100 watt, while a 1600 lumen Led lamp consumes 20 watt.
579
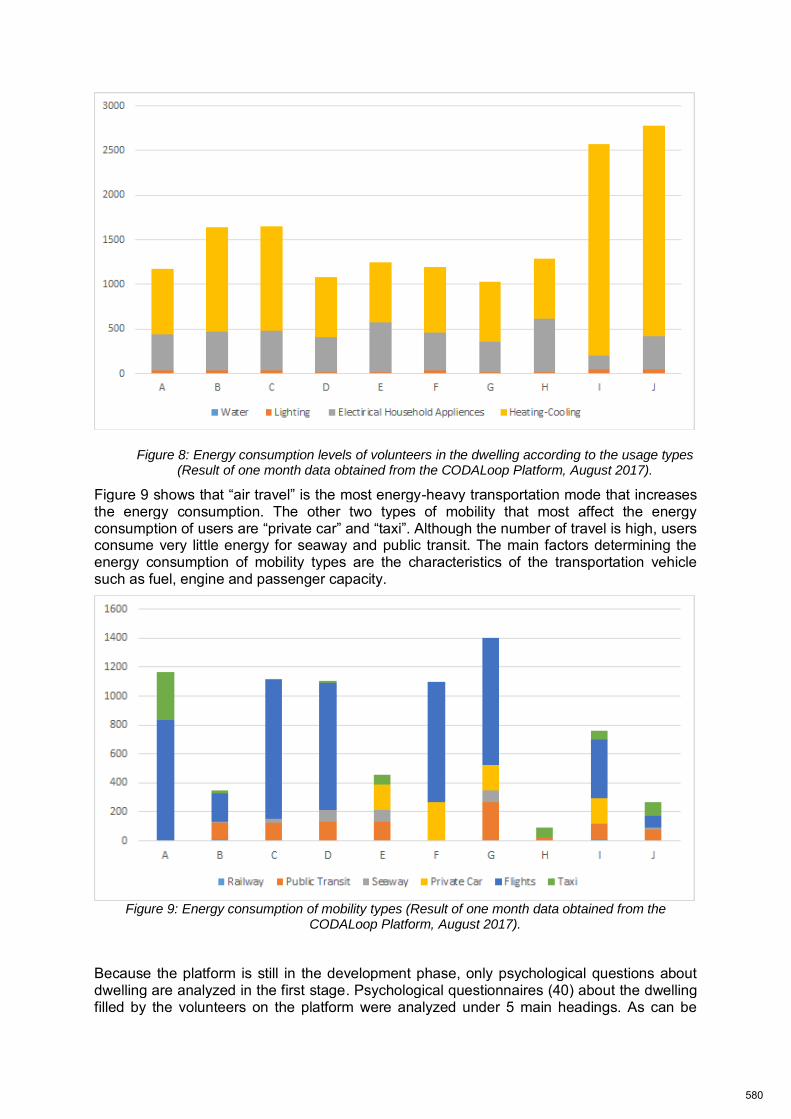
Figure 8: Energy consumption levels of volunteers in the dwelling according to the usage types (Result of one month data obtained from the CODALoop Platform, August 2017).
Figure 9 shows that “air travel” is the most energy-heavy transportation mode that increases the energy consumption. The other two types of mobility that most affect the energy consumption of users are “private car” and “taxi”. Although the number of travel is high, users consume very little energy for seaway and public transit. The main factors determining the energy consumption of mobility types are the characteristics of the transportation vehicle such as fuel, engine and passenger capacity.
Figure 9: Energy consumption of mobility types (Result of one month data obtained from the
CODALoop Platform, August 2017).
Because the platform is still in the development phase, only psychological questions about dwelling are analyzed in the first stage. Psychological questionnaires (40) about the dwelling filled by the volunteers on the platform were analyzed under 5 main headings. As can be
580
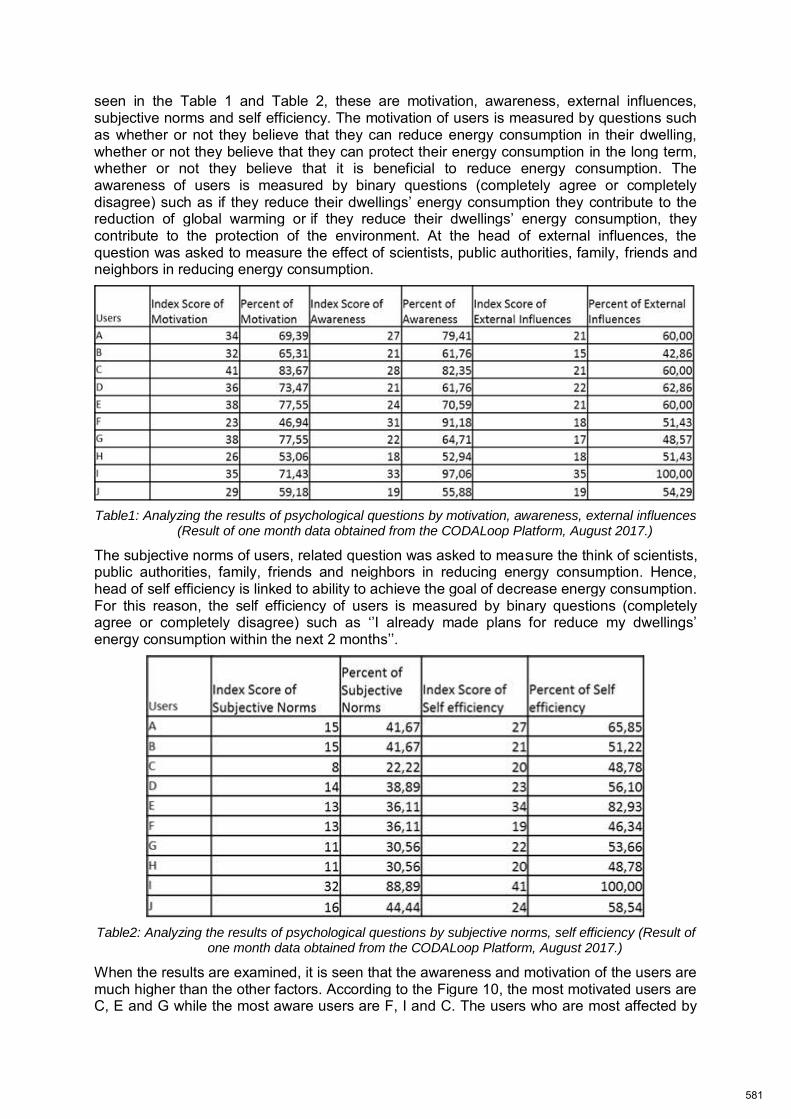
seen in the Table 1 and Table 2, these are motivation, awareness, external influences, subjective norms and self efficiency. The motivation of users is measured by questions such as whether or not they believe that they can reduce energy consumption in their dwelling, whether or not they believe that they can protect their energy consumption in the long term, whether or not they believe that it is beneficial to reduce energy consumption. The awareness of users is measured by binary questions (completely agree or completely disagree) such as if they reduce their dwellings’ energy consumption they contribute to the reduction of global warming or if they reduce their dwellings’ energy consumption, they contribute to the protection of the environment. At the head of external influences, the question was asked to measure the effect of scientists, public authorities, family, friends and neighbors in reducing energy consumption.
Table1: Analyzing the results of psychological questions by motivation, awareness, external influences
(Result of one month data obtained from the CODALoop Platform, August 2017.)
The subjective norms of users, related question was asked to measure the think of scientists, public authorities, family, friends and neighbors in reducing energy consumption. Hence, head of self efficiency is linked to ability to achieve the goal of decrease energy consumption. For this reason, the self efficiency of users is measured by binary questions (completely agree or completely disagree) such as ‘’I already made plans for reduce my dwellings’ energy consumption within the next 2 months’’.
Table2: Analyzing the results of psychological questions by subjective norms, self efficiency (Result of
one month data obtained from the CODALoop Platform, August 2017.)
When the results are examined, it is seen that the awareness and motivation of the users are much higher than the other factors. According to the Figure 10, the most motivated users are C, E and G while the most aware users are F, I and C. The users who are most affected by
581
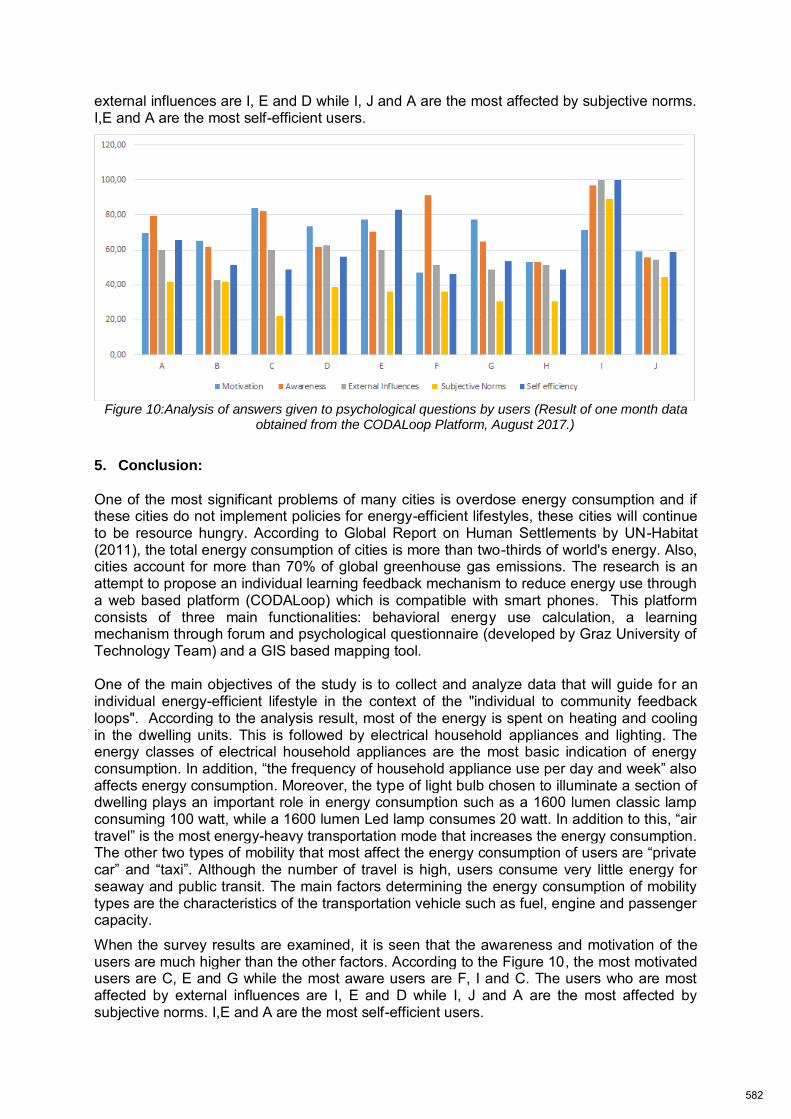
external influences are I, E and D while I, J and A are the most affected by subjective norms. I,E and A are the most self-efficient users.
Figure 10:Analysis of answers given to psychological questions by users (Result of one month data
obtained from the CODALoop Platform, August 2017.)
5. Conclusion:
One of the most significant problems of many cities is overdose energy consumption and if these cities do not implement policies for energy-efficient lifestyles, these cities will continue to be resource hungry. According to Global Report on Human Settlements by UN-Habitat (2011), the total energy consumption of cities is more than two-thirds of world's energy. Also, cities account for more than 70% of global greenhouse gas emissions. The research is an attempt to propose an individual learning feedback mechanism to reduce energy use through a web based platform (CODALoop) which is compatible with smart phones. This platform consists of three main functionalities: behavioral energy use calculation, a learning mechanism through forum and psychological questionnaire (developed by Graz University of Technology Team) and a GIS based mapping tool. One of the main objectives of the study is to collect and analyze data that will guide for an individual energy-efficient lifestyle in the context of the "individual to community feedback loops". According to the analysis result, most of the energy is spent on heating and cooling in the dwelling units. This is followed by electrical household appliances and lighting. The energy classes of electrical household appliances are the most basic indication of energy consumption. In addition, “the frequency of household appliance use per day and week” also affects energy consumption. Moreover, the type of light bulb chosen to illuminate a section of dwelling plays an important role in energy consumption such as a 1600 lumen classic lamp consuming 100 watt, while a 1600 lumen Led lamp consumes 20 watt. In addition to this, “air travel” is the most energy-heavy transportation mode that increases the energy consumption. The other two types of mobility that most affect the energy consumption of users are “private car” and “taxi”. Although the number of travel is high, users consume very little energy for seaway and public transit. The main factors determining the energy consumption of mobility types are the characteristics of the transportation vehicle such as fuel, engine and passenger capacity.
When the survey results are examined, it is seen that the awareness and motivation of the users are much higher than the other factors. According to the Figure 10, the most motivated users are C, E and G while the most aware users are F, I and C. The users who are most affected by external influences are I, E and D while I, J and A are the most affected by subjective norms. I,E and A are the most self-efficient users.
582
References
Araya, D. (2015). Smart Cities and the Network Society: Toward Commons-Driven Governance. In Smart Cities as Democratic Ecologies (pp. 11-22). Palgrave Macmillan UK.
Beatley, T. (2000). Green Urbanism: Learning From European Cities, Island Press, USA.
Castells,M.,(1996), The İnfomation Age: Economoy,Society and Culture. Vol 1: The Rise of the Network Society, Blackwell,Oxford.
Coe, A., Paquet, G., and Roy, J. (2001). E-governance and smart communities: a social learning challenge. Social science computer review, 19(1), 80-93.
Habitat, U. N. (2011). Cities and climate change. Global report on human settlements.
Hall, T. (2006). Urban Geography : 3rd edition, Routledge Contemporary Human Geography Series,Londan ve New York.
McLaren, D., ve Agyeman, J. (2015). Sharing cities: a case for truly smart and sustainable cities. MIT Press.
Riva Sanseverino, E., Riva Sanseverino, R., and Vaccaro, V. (2017). Smart Cities Atlas. Springer International Publishing.
Stimmel, C. L. (2015). Building Smart Cities: Analytics, ICT, and Design Thinking. CRC Press.
Townsend, A. M. (2013). Smart cities: Big data, civic hackers, and the quest for a new utopia. WW Norton & Company.
Tufekci, Z. ve Wilson,C.,(2012),Social Media and the Decision to Participate in Political Protest: Observations From Tahrir Square, Journal of Communication,s. 363-379.
UNPD (United Nations Department of Economic and Social Affairs, Population Division). (2015). World Urbanization Prospects: The 2014 Revision, United Nations New York.
Valkenburg, A. C., den Ouden, P. H., and Schreurs, M. A. (2016). Designing a smart society. Open Innovation, 2, 87-92.
Van Dijk, J. (2012). The network society. Sage Publications.
Wheeler, S. M. ve Beatley, T. (Eds.). (2014). Sustainable urban development reader. Routledge.
583
Stephan Reiss-Schmidt, Digital Transformation - Case Study Munich, Germany Joint OAPA-ISOCARP Conference/53rd ISOCARP Congress 2017
1
Digital Transformation: Cities between Reaction and Integrated
Strategies - Case Study Munich, Germany
Stephan REISS-SCHMIDT, Germany
Abstract
Digital transformation is a fundamental challenge (not only) for cities and their policies of
planning, utilities and administration. The ICT- and infrastructure industries often promote
simplified business- and technology-driven visions of “Smart Cities”, based on exploiting “Big
Data” from private and public sources. But digital transformation does mean much more for
cities and their citizens: it goes along with multiple, accelerating and disruptive developments
and new risks for technology, business, society, democracy and everyday life.
In Germany until recent digitalisation was nearly neglected as a driving force and a challenge
for sustainable urban development. Only few months ago German Federal Government
published the “Smart City Charter – Making digital transformation at the local level
sustainable” as result of a discussion and research-process with experts from cities,
universities, research institutes and business. Munich, more than 1.5 million inhabitants, is
the third and most prosperous German city. Strategies, guidelines and projects of digital
transformation are considered there as an integrated part of the urban development strategy
PERSPECTIVE MUNICH. Together with Lyon and Vienna Munich started in 2016 a project
funded by the European Commission: “SMARTER TOGETHER - Smart and Inclusive
Solutions for a Better Life in Urban Districts”. The project’s overarching vision is to find the
right balance between smart technologies, their social and cultural dimensions and
participative governance to deliver smart and inclusive solutions which improve citizen’s
quality of life.
The case study shows, how cities can be successfully proactive in the process of digital
transformation. Success factors seem to be an integrated approach, co-creation and
experiments in urban living labs. Will the final result of digitalisation be a kind of completely
data- and market-driven, post-democratic “digital dictatorship”? Or is the final result an
integrated innovation strategy without social digital divide, based on democratic decision
processes?
1. Smart cities – marketing claim or challenge for planning?
Scientific, cultural, economic and social change has tremendously accelerated since turn of the century. Looking back on the changes of the last fifty years, presumably the same change rate will be reached in twenty years ahead of now. Digitalisation in an urban context means industry 4.0, online shopping, autonomous driving, consumer-tailored services and efficient use of resources like space, time, energy or water. A flexible temporary and intermediate use of built structures, multi modal and sharing based mobility or smart grids for energy supply with renewables may be quick wins. The digital global economy seems “space-less” and nearly independent from urban environments and infrastructures. Distances and time are reduced to zero. The urban fabric is rather permanent; its transformation needs a lot of time and space. And not at least: democratic deliberation and decision-making are slow, analogue and long term. From a business point of view digital transformation of cities is
584
Stephan Reiss-Schmidt, Digital Transformation - Case Study Munich, Germany Joint OAPA-ISOCARP Conference/53rd ISOCARP Congress 2017
2
a combination of advanced technology and successful marketing. From a planners perspective cui bono? and the public good are relevant criteria for socially useful innovations.
Concerning urban planning digital transformation is in fact inconsistent. Since the 1990ies the accelerating digitalisation of everyday life is a driving force of a change of “classical”
planning approaches (see RAUTERBERG 2013). Research and design face an enormous growth of information, the collection and analysing of planning-data is considerably accelerated. Emotion, intuition, subjective approaches of urban planning have been replaced more and more by routines, standardisation and algorithms. Decisions seem to be treated as a problem of data mining and information-management rather than a question of values and normative political specifications. “Smart” planning tools insist on their ability to analyse an unlimited amount of data and to create uncountable alternatives. Complexity and contradiction of urban problems often hinder pure rational answers and easy decisions despite the smart tools and processes. Digitalisation in fact changes the profession and process of planning itself: the core content of planning as a discerned, scientific based and integrated practice disappears in the haze of an increasingly complex setting, missing political support and suffering from fragmentation into innumerable special disciplines (REISS-SCHMIDT 2015a).
2. Digitalisation and urban development: the German debate
In Germany still five years ago digital transformation was nearly neglected as a driving force for a sustainable urban development. Only few German cities like Munich, Berlin, Hamburg, Leipzig, Ludwigsburg, Cologne or Vienna in Austria started since 2013 to shape specific policies and strategies for digital transformation integrated into urban development concepts. For the debate among German cities especially the definition of Vienna was stimulating:
“Smart City Wien defines the development of a city that assigns priority to, and interlinks, the issues of energy, mobility, buildings and infrastructure. In this, the following premises apply: • radical resource preservation • development and productive use of innovations/new technologies • high and socially balanced quality of life. This is to safeguard the city’s ability to withstand future challenges in a comprehensive
fashion. The elementary trait of Smart City Wien lies in the holistic approach pursued, which comprises novel mechanisms of action and co-ordination in politics and administration as well as a wider leeway of action assigned to citizens” (CITY OF VIENNA 2014, p.2).
585
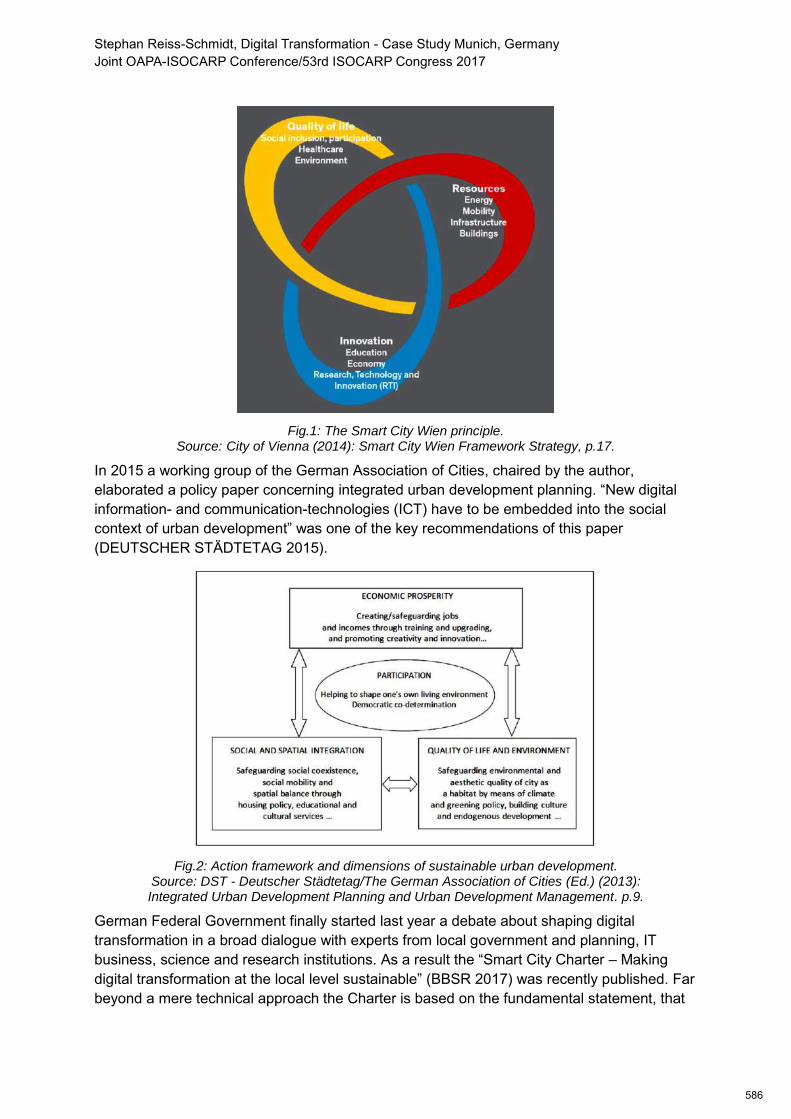
Stephan Reiss-Schmidt, Digital Transformation - Case Study Munich, Germany Joint OAPA-ISOCARP Conference/53rd ISOCARP Congress 2017
3
Fig.1: The Smart City Wien principle.
Source: City of Vienna (2014): Smart City Wien Framework Strategy, p.17.
In 2015 a working group of the German Association of Cities, chaired by the author, elaborated a policy paper concerning integrated urban development planning. “New digital
information- and communication-technologies (ICT) have to be embedded into the social context of urban development” was one of the key recommendations of this paper (DEUTSCHER STÄDTETAG 2015).
Fig.2: Action framework and dimensions of sustainable urban development.
Source: DST - Deutscher Städtetag/The German Association of Cities (Ed.) (2013): Integrated Urban Development Planning and Urban Development Management. p.9.
German Federal Government finally started last year a debate about shaping digital transformation in a broad dialogue with experts from local government and planning, IT business, science and research institutions. As a result the “Smart City Charter – Making digital transformation at the local level sustainable” (BBSR 2017) was recently published. Far beyond a mere technical approach the Charter is based on the fundamental statement, that
586
Stephan Reiss-Schmidt, Digital Transformation - Case Study Munich, Germany Joint OAPA-ISOCARP Conference/53rd ISOCARP Congress 2017
4
smart cities are committed to sustainable and integrated urban development. In so far, the Smart City Charter recognizes the Leipzig Charter on Sustainable European Cities (BMVBS 2007), the Urban Agenda for the European Union (EU 2016a) and the New Urban Agenda of the United Nations as approved by Habitat III in Quito 2016 (UN 2016). The charter based on four key guidelines for a sustainable local digital transformation:
1. Digital transformation requires goals, strategies and structures. 2. Digital transformation requires transparency, participation and co-creation. 3. Digital transformation requires infrastructures, data and services. 4. Digital transformation requires resources, skills and cooperation.
An important message of the charter is the serving function of smart city tools for a more sustainable urban development. Cities should actively shape digital transformation and not only react on impulses by business or civil society. The independency and self-determination of cities should not be undermined by business driven use cases of digital technologies. This sounds good – but how can cities achieve self-determination in a global process of technological and social transformation, driven by few big players like Google, Facebook, Oracle and Microsoft? The charter tries to give some structural answers like “identify fields of
application and strategic areas”, “anticipate and evaluate the spatial and social effects of
smart city tools”, “adapt organizational structures by an integrated, inter-sectoral Smart City Board, a Chief Technology Officer or some other form of overwhelming collaborative organization beside the single use cases in general administration, mobility, energy supply or data administration. Especially the stakeholder-specific recommendations for action in the Smart City Charter may help cities to find and strengthen their specific local position:
Cities shall establish a social debate about smart city strategies and actively shape the dialogue with business, research and civil society.
Digital and analogue participation processes shall be interconnected. Municipalities, businesses and research institutions shall expand the possibilities for
co-creation in urban development. The state/federal level is responsible for a suitable regulatory framework (public
procurement, data security etc.) and shall test new regulations in living labs. State and municipalities shall secure adequate financing for digital transformation:
technical infrastructure, staff, education etc. Research institutions shall trace cross-sectoral and spatial effects, i.e. examine the
social, spatial and ecological impact of digital technologies (for example the impact on land and energy consumption and emissions, regarding rebound effects).
Cities shall develop their competencies, using exchange of experiences and cooperation (BBSR 2017, p. 30-33).
Not at least the protection of personal data plays a big role in the German debate about digitalisation. It is no wonder, that people more and more reclaim regulations and mechanisms to accompany the use of Big Data and smart technologies. Political control, citizen participation and a high level of transparency is required. On the other hand, an evidence-based local democracy beyond populistic approaches and alternative facts can profit from accessible, inclusive tools of information and deliberation via internet. The risk of the emergence of new power structures, automated administration algorithms and artificial intelligence beyond democratic control can only be excluded by strengthening the responsibility of democracy and elected politicians as decision makers on the local level.
587

Stephan Reiss-Schmidt, Digital Transformation - Case Study Munich, Germany Joint OAPA-ISOCARP Conference/53rd ISOCARP Congress 2017
5
3. Why local strategies – and which?
Structurally, cities have a rather weak position compared with national, supranational and global regulation agencies - and primarily with the global ICT-industry. But strategically cities are strong by bundling and articulating the aims of their citizens. Cities are places where problems occur and they are competing about quality of life to attract people. Not at least cities have formal and informal instruments to create solutions meeting better special local demands.
All business is local will be also true in the digital future. Consumers, voters and active citizens have a strong (multi)local commitment to the places where they live, work and spend their leisure time. It seems that local strategies, concrete projects and implementation steps for a sustainable way of digitalisation are closely linked to everyday life and the physical environment. Hopes and expectations of people are contradictory or at least ambivalent. Industry 4.0 for instance opens the door for more decentralised production in micro-factories, but reduces the work force probably by 20-30 percent. Digital services and online shopping reduce physical mobility for the individual and make tailor-made products for every target group possible. But the increase of small good logistics endangers the quality of public spaces. Despite the crucial question of power, local strategies for digital transformation are necessary and useful for the “digital resilience” of civil society. Without local acceptance and spatial links a digital platform-economy and the utilities will not work in real life.
On all levels between the individuals and global organisations the sovereignty over and the access to data as a resource becomes the key factor. One possible solution is an offensive open data strategy, which is very much discussed and critically annotated in Germany. Which data should be published by local authorities under what conditions and rules for use? Should a commercial use of public data be possible - against a fee or generally open? Which data of single private companies about their customers (for instance in public transport, online retail or health services) should be accessible for free by local authorities for planning and service purposes?
Especially for big cities with their growing multi ethnic population and social polarisation the risk of a digital divide and unequal access to digital information or public utilities is crucial. To avoid unjust and unequal accessibility for a long time also analogue alternatives will be necessary. Local policy is responsible to guarantee alternative accesses by a variety of formats including analogue ones. Not at least a systematically organized life-long digital education is a precondition for balancing unequal accessibility of digital tools. A systematic participation and co-creation in urban living labs is necessary for a broad and fair urban innovation-culture. Concerning digital education and the necessary equipment in schools, Germany is quite behind the standards in other developed countries. An initiative of the Federal Ministry for Education and Research for a five billion Euro-“DigitalPakt#D” recently failed so far because of difficulties in fund raising and conflicts between the federal and the state level, where the original responsibility for education is situated.
A basic technical precondition for an effective digital transformation is a high-performance broad-bent supply, which is by far not yet accessible in all German regions - especially beyond the agglomeration areas. To guarantee security and resilience of the hardware infrastructure (glass-fiber-cables, servers, routers and network controllers) is a very important challenge, which can only partly be managed on the local level. The resilience and safety of digital infrastructures is above all a task for national states and supranational organisations.
588
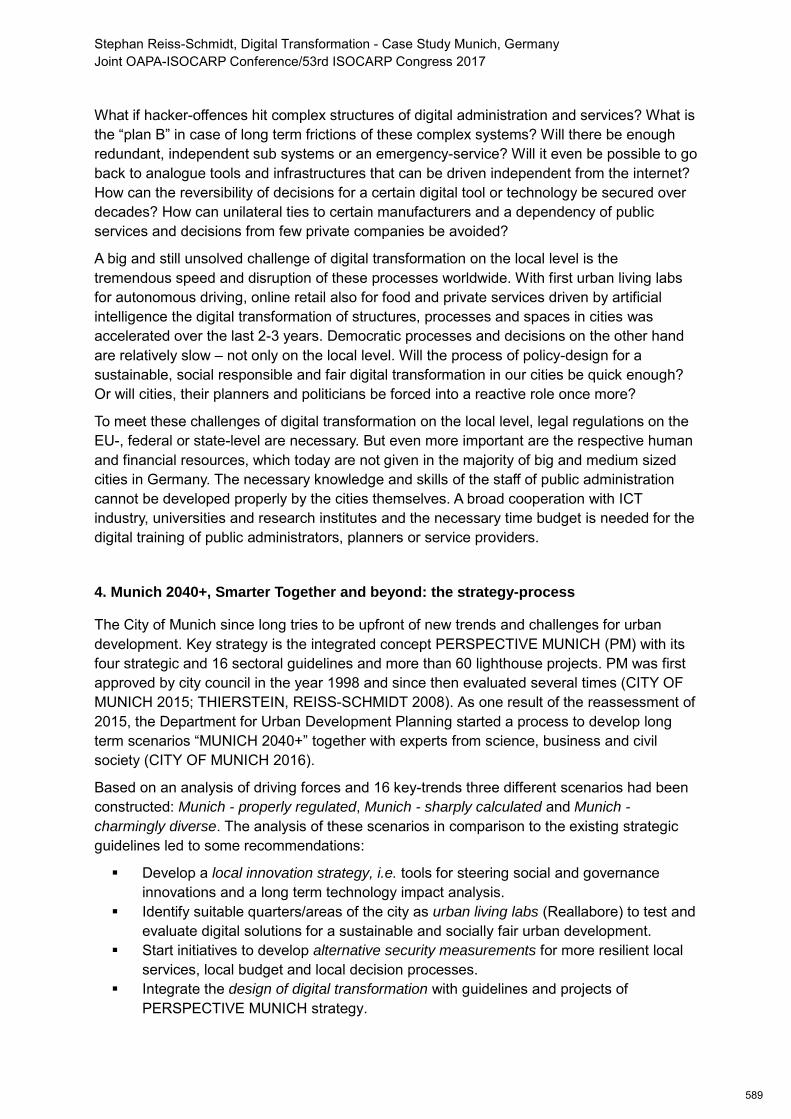
Stephan Reiss-Schmidt, Digital Transformation - Case Study Munich, Germany Joint OAPA-ISOCARP Conference/53rd ISOCARP Congress 2017
6
What if hacker-offences hit complex structures of digital administration and services? What is the “plan B” in case of long term frictions of these complex systems? Will there be enough redundant, independent sub systems or an emergency-service? Will it even be possible to go back to analogue tools and infrastructures that can be driven independent from the internet? How can the reversibility of decisions for a certain digital tool or technology be secured over decades? How can unilateral ties to certain manufacturers and a dependency of public services and decisions from few private companies be avoided?
A big and still unsolved challenge of digital transformation on the local level is the tremendous speed and disruption of these processes worldwide. With first urban living labs for autonomous driving, online retail also for food and private services driven by artificial intelligence the digital transformation of structures, processes and spaces in cities was accelerated over the last 2-3 years. Democratic processes and decisions on the other hand are relatively slow – not only on the local level. Will the process of policy-design for a sustainable, social responsible and fair digital transformation in our cities be quick enough? Or will cities, their planners and politicians be forced into a reactive role once more?
To meet these challenges of digital transformation on the local level, legal regulations on the EU-, federal or state-level are necessary. But even more important are the respective human and financial resources, which today are not given in the majority of big and medium sized cities in Germany. The necessary knowledge and skills of the staff of public administration cannot be developed properly by the cities themselves. A broad cooperation with ICT industry, universities and research institutes and the necessary time budget is needed for the digital training of public administrators, planners or service providers.
4. Munich 2040+, Smarter Together and beyond: the strategy-process
The City of Munich since long tries to be upfront of new trends and challenges for urban development. Key strategy is the integrated concept PERSPECTIVE MUNICH (PM) with its four strategic and 16 sectoral guidelines and more than 60 lighthouse projects. PM was first approved by city council in the year 1998 and since then evaluated several times (CITY OF MUNICH 2015; THIERSTEIN, REISS-SCHMIDT 2008). As one result of the reassessment of 2015, the Department for Urban Development Planning started a process to develop long term scenarios “MUNICH 2040+” together with experts from science, business and civil society (CITY OF MUNICH 2016).
Based on an analysis of driving forces and 16 key-trends three different scenarios had been constructed: Munich - properly regulated, Munich - sharply calculated and Munich -
charmingly diverse. The analysis of these scenarios in comparison to the existing strategic guidelines led to some recommendations:
Develop a local innovation strategy, i.e. tools for steering social and governance innovations and a long term technology impact analysis.
Identify suitable quarters/areas of the city as urban living labs (Reallabore) to test and evaluate digital solutions for a sustainable and socially fair urban development.
Start initiatives to develop alternative security measurements for more resilient local services, local budget and local decision processes.
Integrate the design of digital transformation with guidelines and projects of PERSPECTIVE MUNICH strategy.
589

Stephan Reiss-Schmidt, Digital Transformation - Case Study Munich, Germany Joint OAPA-ISOCARP Conference/53rd ISOCARP Congress 2017
7
Develop spatial visions on urban and regional level complementary to strategic guidelines.
Following these recommendations the City of Munich started to develop guidelines and lighthouse-projects aiming at a socially acceptable and inclusive digital transformation. Three main fields of action had been identified:
From analogue to digital - service-/application-innovations
New technologies - technological innovations/new tools Artificial intelligence and more - 360°-innovation.
Within this structural framework a recently inaugurated inter-departmental working group agreed on the following principles:
Develop the digital transformation strategy as an integrated part of PM – innovation as a social, cultural and permanent process
Enhance city-wide ICT-strategy – E-Government 4.0 Introduce new digital utilities – O-Government Adopt co-creation - design-thinking Replicate lighthouse-projects Evidence-based planning - monitoring.
Together with Lyon and Vienna the City of Munich started in 2015 a project funded by the European Commission in the program Horizon 2020: “SMARTER TOGETHER - Smart and Inclusive Solutions for a Better Life in Urban Districts” (EU 2016b). The project’s overarching
vision is to find the right balance between smart technologies, organisational and governance dimensions in order to deliver smart and inclusive solutions and to improve citizen’s quality of
life. The vision is to use smart technologies as serving tools for a sustainable social development and economic transformation, combined with the spatial qualities of a future oriented lively urbanity.
The project gathers the European lighthouse cities Lyon, Munich, Vienna, the follower cities Santiago de Compostela, Sofia, Venice and not at least Kyiv and Yokohama as observer
cities. SMARTER TOGETHER delivers five clusters of smart and integrated solutions in large-scale demonstration areas, for instance:
Citizen engagement – co-creation, district living lab District heating and renewable energy sources (geothermal and solar energy) Holistic refurbishment for low energy districts addressing public and private
housing Smart data management platform, smart services - smart neighbourhood app
and E-mobility solutions for sustainable mobility, decentralised mobility hubs.
The pilot projects in the demonstration areas shall be replicable and scalable not only in the participating cities, but in cities all over Europe and beyond. The participating cities committed to deliver more than 150.000 m² of refurbished housing with improved energy-efficiency, saving 60% of the CO2-emissions, 15 new mobility solutions saving nearly 100 T/year of CO2-emissions, 14,6 MW of newly installed renewable capacity in urban districts and 130 million € investment in the lighthouse cities.
590
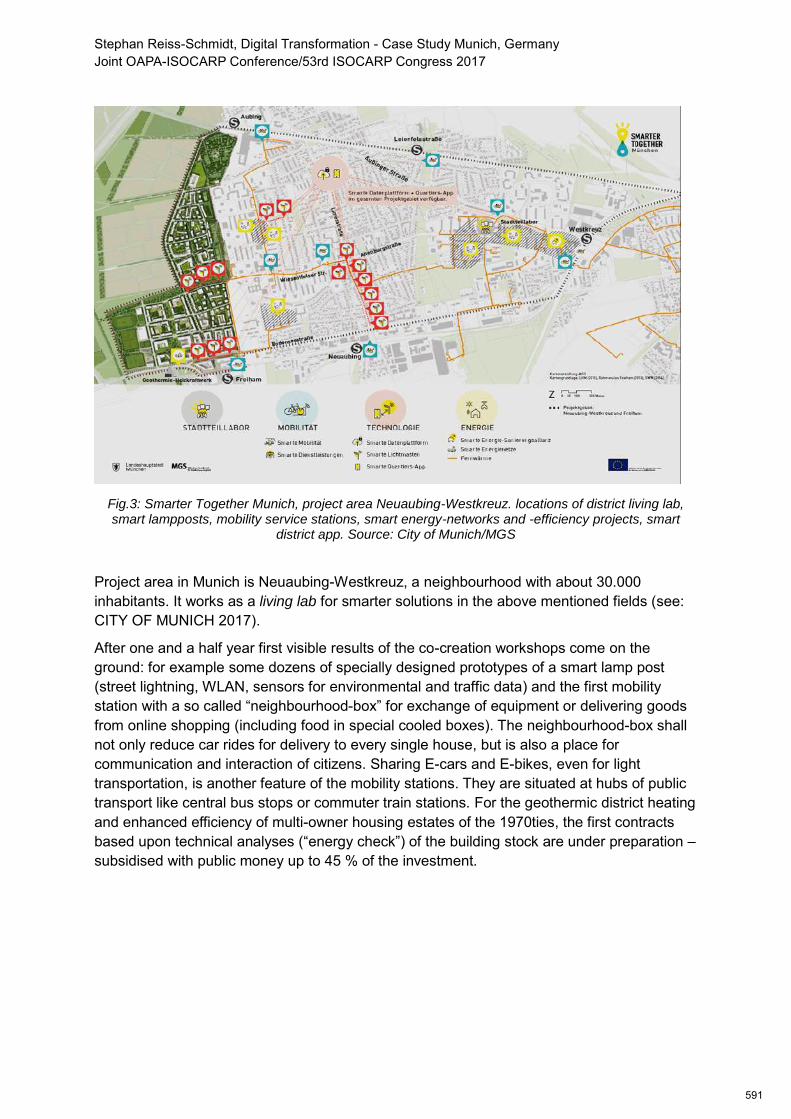
Stephan Reiss-Schmidt, Digital Transformation - Case Study Munich, Germany Joint OAPA-ISOCARP Conference/53rd ISOCARP Congress 2017
8
Fig.3: Smarter Together Munich, project area Neuaubing-Westkreuz. locations of district living lab, smart lampposts, mobility service stations, smart energy-networks and -efficiency projects, smart
district app. Source: City of Munich/MGS
Project area in Munich is Neuaubing-Westkreuz, a neighbourhood with about 30.000 inhabitants. It works as a living lab for smarter solutions in the above mentioned fields (see: CITY OF MUNICH 2017).
After one and a half year first visible results of the co-creation workshops come on the ground: for example some dozens of specially designed prototypes of a smart lamp post (street lightning, WLAN, sensors for environmental and traffic data) and the first mobility station with a so called “neighbourhood-box” for exchange of equipment or delivering goods from online shopping (including food in special cooled boxes). The neighbourhood-box shall not only reduce car rides for delivery to every single house, but is also a place for communication and interaction of citizens. Sharing E-cars and E-bikes, even for light transportation, is another feature of the mobility stations. They are situated at hubs of public transport like central bus stops or commuter train stations. For the geothermic district heating and enhanced efficiency of multi-owner housing estates of the 1970ties, the first contracts based upon technical analyses (“energy check”) of the building stock are under preparation – subsidised with public money up to 45 % of the investment.
591
Stephan Reiss-Schmidt, Digital Transformation - Case Study Munich, Germany Joint OAPA-ISOCARP Conference/53rd ISOCARP Congress 2017
9
Fig.4: Smarter Together Munich. Living lab Neuaubing-Westkreuz., impression of the co-creation
workshop with preliminary design-ideas for smart lamp posts. Source: City of Munich/MGS.
For acceptance and dissemination of new technologies in everyday life the personalised and permanent information flow with opportunities to discuss and to participate is crucial. The process is managed by a local project-team, which is regularly present in the area, especially in the Smarter Together district living lab (“Stadtteillabor”), located inside the main shopping center.
5. Lessons learnt, open questions
Innovation is a precondition of urban development – and cities are the places were innovations emerge. Innovation cycles became faster and faster in the last hundred years – which means more disruptive change than soft transformation, going aside with increasing social and cultural risks. Cities are very complex technical, physical, spatial, social and political systems. Innovations therefore must be complex and multidimensional too. Technical innovations like ICT have a serving, not a guiding function for urban development and they must closely be linked with social innovations. If cultural and social dimensions are neglected, for instance rebound effects resulting from user-behaviour can easily counteract the increased efficiency of technical innovations by waste of resources and intensified consumption.
Digital transformation is one of the biggest innovations and a crucial megatrend of urban development in the 21st century. It is not only a technical or economic issue, but a challenge for urban societies in all their dimensions (REISS-SCHMIDT 2016). The big promise of Smart
Cities: a more energy efficient, more sustainable, safer and more socially adequate urban
592
Stephan Reiss-Schmidt, Digital Transformation - Case Study Munich, Germany Joint OAPA-ISOCARP Conference/53rd ISOCARP Congress 2017
10
development for all citizens can only be fulfilled if people of every age, social status and level of education have opportunities to use, understand and control digital tools. Even as planners we should get during our education and later vocational training a deeper knowledge of innovation processes, digital transformation and their social, spatial and cultural impact (SCHOLL 2012). Concerning digitalisation not only nationwide or international rules and regulations are necessary. An active innovation policy and a strategy to guide and adapt digital transformation on a municipal level is urgently required. Cities must become learning systems in themselves. For this purpose, especially urban living labs are suitable as a productive practice to bridge the gap between research and local practice.
Cities in Germany, compared even with other European cities, became rather late aware of the importance of digitalisation for urban development. The German Federal Smart City Charter and the various activities in Munich try to guide a way on which state, public institutions and local authorities can play an active and creative role in the big smart-cities-
game. There is no alternative to an integrated approach, including new forms of local and regional governance to become a more successful player.
After first steps of curating digital transformation on a municipal level, there remain more questions open than answered. They should be discussed among civil society as well as with research and business communities:
How can democracy and urban identity be defended against global interlinked, data- and market-driven, post-democratic “digital governance” with urban life standarised
by algorithms? How can the rather remnant urban fabric and slow democratic decisions become
compatible with ever faster, often disruptive digital innovations? How can the resilience of local infrastructures and the independency from certain
suppliers of ICT-products be secured? How cities can keep (or get back) political influence on the use of data and algorithms
in the public domain? May public data be used free of costs also for commercial use, or shall they become
sources of income for local authorities as well as for every citizen – data as currency
of the future? Will public spaces in the city loose social qualities and become quantified,
monetarized commercial areas with omnipresent sensors and geo-referenced commercial adverts?
References and further reading
BBSR – Bundesinstitut für Bau- Stadt- und Raumforschung/Federal Institute for Building- City- and Territorial-Research (Ed.) (2017): Smart City Charter – Making digital transformation at the local level sustainable. Bonn.
BMVBS - Bundesministerium für Verkehr, Bau und Stadtentwicklung/Federal Ministery of Traffic, Building and Urban Development (Ed.) (2007): Leipzig Charta zur nachhaltigen Europäischen Stadt. Angenommen anlässlich des informellen Ministertreffens zur Stadtentwicklung und zum territorialen Zusammenhalt in Leipzig am 24./25. Mai 2007. Berlin.
593
Stephan Reiss-Schmidt, Digital Transformation - Case Study Munich, Germany Joint OAPA-ISOCARP Conference/53rd ISOCARP Congress 2017
11
BMVBS - Bundesministerium für Verkehr, Bau und Stadtentwicklung/Federal Ministery of Traffic, Building and Urban Development (Ed.) (2012): 5 Jahre LEIPZIG CHARTA – Integrierte Stadtentwicklung als Erfolgsbedingung einer nachhaltigen Stadt. Integrierte Stadtentwicklung in den 27 Mitgliedstaaten der EU und ihren Beitrittskandidaten. Berlin.
CITY OF MUNICH, Department of Urban Planning and Building Regulations/City Museum/City Archive (Ed.) (2004): München wie geplant – Die Entwicklung der Stadt von 1158 bis 2008. English Summary: Munich as planned. The development of the city 1158 to 2008. Munich.
CITY OF MUNICH, Department of Urban Planning and Building Regulations (Ed.) (2007): Perspective Munich. Evaluation report 2007. Munich. (www.muenchen.de)
CITY OF MUNICH, Department of Urban Planning and Building Regulations (Ed.) (2012a): Perspektive München. Fortschreibung 2012. Munich. (www.muenchen.de/rathaus/Stadtverwaltung/Referat-fuer-Stadtplanung-und-Bauordnung/Stadtentwicklung/Perspektive-Muenchen.html)
CITY OF MUNICH, Department of Urban Planning and Building Regulations (Ed.) (2012b): Langfristige Siedlungsentwicklung. Kongressinformation. Munich. (www.muenchen.de/Rathaus/plan/projekte/lasie_index/356324/index.html).
CITY OF MUNICH, Department of Urban Planning and Building Regulations (Ed.) (2015): Munich: Future Perspectives. Strategies, Guidelines, Projects. Munich. (www.muenchen.de/rathaus/.../PM_Magazin_en_web.pdf)
CITY OF MUNICH, Department of Urban Planning and Building Regulations (Ed.) (2016): Zukunftsschau München 2040+. Ergebnisse eines Szenario-Prozesses. Munich
CITY OF MUNICH (2017): Smarter Together. Web-page: muenchen.de/rathaus/Stadtverwaltung/Referat-fuer-Arbeit-und-Wirtschaft/Europa/Smart-Cities
CITY OF VIENNA (Ed.) (2014): Smart City Wien. Framework Strategy. Vienna.
DST - Deutscher Städtetag/The German Association of Cities (Ed.) (2013): Integrated Urban Development Planning and Urban Development Management. Strategies and Instruments for Sustainable Urban Development. Berlin und Köln.
DST - Deutscher Städtetag/The German Association of Cities (Ed.) (2015): Integrierte Stadtentwicklungsplanung und Stadtentwicklungsmanagement. Positionspapier des Deutschen Städtetages, Berlin und Köln.
EU – European Commission (Ed.) (2016a): Urban Agenda for the EU – Contract of Amsterdam. Brussels.
EU – European Commission (Ed.) (2016b): Horizon 2020. Web-page: ec.europa.eu/inea/en/horizon-2020/projects/H2020-Energy/SMARTER-TOGETHER
KUNZMANN, Klaus R.; KOLL-SCHRETZENMAYR, Martina (2015): The State of the Art of Planning in Europe. In disP-The Planning Review. Volume 200/51.1, p. 86, 87. Zürich.
RAUTERBERG, Hanno (2013): Wir sind die Stadt! Urbanes Leben in der Digitalmoderne. Berlin.
594
Stephan Reiss-Schmidt, Digital Transformation - Case Study Munich, Germany Joint OAPA-ISOCARP Conference/53rd ISOCARP Congress 2017
12
REISS-SCHMIDT, Stephan (2006): Stadtentwicklungsmanagement als Instrument der Qualitätssicherung. In Deutsche Zeitschrift für Kommunalwissenschaften (DfK), p. 80-98. Berlin.
REISS-SCHMIDT, Stephan (2012): München “kompakt, urban, grün”. Strategien nachhaltiger
Raumentwicklung in einer wachsenden Stadtregion. In Scholl, Bernd (Ed.): Grenzen der Innenentwicklung?. ETH Zürich, Professur für Raumentwicklung, p. 8-33. Zürich.
REISS-SCHMIDT, Stephan (2015a): City Planning between Decline and Regeneration - Perspectives for a “Communicative Turn” of Planning. Paper for the 51st ISOCARP World Planning Congress in Rotterdam (The Netherlands). Den Haag. (www.isocarp.org)
REISS-SCHMIDT, Stephan (2015b): The state of the Art of Planning in Europe – Germany. In
disP-The Planning Review. Volume 200/51.1, p. 40, 41. Zürich.
REISS-SCHMIDT, Stephan (2016): Städte brauchen Innovationen – aber welche? In: Transforming Cities, Vol. 1, 2016. Munich.
SCHOLL, Bernd (Ed.) (2012): HESP – Higher Education in Spatial Planning. Positions and Reflections. Zürich.
THIERSTEIN, Alain; REISS-SCHMIDT, Stephan (2008): Urban Development Management in Munich, Germany: Integrated Strategy, Impacts, Learning from External Evaluation. Paper for the 44th ISOCARP World Planning Congress in Dalian (China). Den Haag. (www.isocarp.org)
UN – United Nations (Ed.) (2016): New Urban Agenda. United Nations Conference on Housing and Sustainable Urban Development HABITAT III. 21st October 2016. Quito.
Author
Stephan REISS-SCHMIDT, born 1952, studied architecture and town planning at Aachen Technical University (RWTH), Germany. After his diploma (Dipl.-Ing.) 1976 he continued his studies with a special two year training course for town- and regional planners in public administration with a state examination (Bauassessor) 1978. After 13 years as a regional and town planner in the Ruhr district, since 1980 as Director of the Planning Department at the Regional Association of Local Authorities of the Ruhr District (RVR), Stephan Reiss-Schmidt works since 1996 as Director of the Department for Urban Development Planning of the City of Munich. He is responsible for European and metropolitan planning issues, public relations, integrated strategic planning, mobility planning, spatial development and land use planning for the City of Munich.
Among other memberships and functions, Stephan Reiss-Schmidt was chairman of the Bavarian chapter of the German Academy of Urbanism and Territorial Planning (DASL) from 2008-13 and chairman of the Commission for Urban Development Planning of the German Association of Cities (Deutscher Städtetag) 2000-2017
Dipl.-Ing. Stephan Reiss-Schmidt ISOCARP/DASL/SRL Director of the Department for Urban Development Planning, City of Munich, Germany Contact: Landeshauptstadt München, Blumenstraße 31, 80331 München, Deutschland phone: +49/89/233-22980, fax: -21559, e-mail: [email protected]
595
Smart communities: the coexisting of the intelligent future and the intimate neighborhoods past
(Built Heritage Communities' Future)
Xiaomin Zhu, Shibing Dai, Key Laboratory of Ecology and Energy Saving Study of Dense Habitat (Tongji University), Ministry of Education, China
1. Introduction
Residential community heritage, reused adaptively as the renewal district, is also facing the demands of turning into the smart community. The smart historical buildings are tending to connect needed habitual living and intelligent future. During the regeneration of historical residential communities, improvements on noise levels, energy saving, drainage system as well as electric net or natural gas line etc, face challenges due to the conservation principle of authenticity and integrity and complex multiple stakeholders. Common residential districts however are facing the indifferent neighborhoods, which generate the background for ubiquitous nostalgia. Whether the more intelligent technologies are adopted, the neighborhoods are less intimate, which will be discussed in this paper. 1.1 Background Smart house has been developing for several decades. Many intelligent technologies made breakthrough in the practical use of communities and were used through the promotion by the cooperation of practitioner, authorities and academia. After first concept of "people-oriented" just for comfortable spaces, the eco environment are shaping the future living concept. Built heritage as the vital part of the city's regeneration also demands intelligent technologies such as IoT(internet of things), ITC(information and telecommunication). The promotion brings not just about the comfortable green lives, more importantly, great prospects for the industry. Historical buildings have been protected not as a single building but the whole historical community. The increasing resistance to gentrification of regeneration demands versatile strategies such as nostalgia economy involvement. This paper redefine nostalgia and communities. Nostalgia is not only for the countryside but also for the urban regeneration. Communities' revitalization can combine nostalgia economy with both villages like Taomi in Taichung and urban communities such as Bugaoli in Shanghai, coupled with intelligent technologies and optimum planning for the improvement of facilities. Historical communities revitalization is under principles of intelligent urbanism, which also requires strengthening of infrastructure, public space, appropriate intelligent technologies, integration of institutions, community empowerment and nostalgia economy basis. 1.2 Method Being in the theoretical phase and case studies process, the paper outlines the general framework, redefining concepts about nostalgia and communities and preparing the basis for further investigations. In this research, the data can be categorized on the firsthand primary information coming from the field and secondary data derived from papers. Field data is consisted of physical elements of the building and around environment and non-physical data like questionnaires to involved people including owners, occupants etc. The questionnaire involved worldview, ideology and social system, especially relating to the management and arrangement of space and activities conducted openly and unstructured. Data were dug out from several sources, cross checked with other data, thus obtained data base. Case studies are selected according to the nostalgia economy's affection on the
596
historical communities' prosperity and the residents' reflection to the refurbishment environment in Taiwan and Shanghai which were typically restored with different strategies and methods. Compared with the different cases, this paper tends to get the possible integrity strategies and possible research fields in future. 2. Smart communities Although the conservation principle limits some advanced technologies to historical buildings, the modern logistic, smart app, applied service still provide partly intelligent life. Therefore, the overlapping of concepts in historical communities and non -historical communities involves many aspects like the eco-friendly, management and training people. The smart communities are the bonding between smart city and intelligent buildings. The tangible part of intelligent buildings and the intangible management towards IoT, ITC and neighborhood etc, connect into the smart communities, and then smart city with other elements. 2.1 Intelligent buildings(IBs) The concept of intelligent buildings has changed during several decades from a conceptual framework for the representation of future buildings to the inherent constituents of influential policies for design and development. IBs in definition, networks, data processing equipment, automation, ITC and building management systems (BMS) characterize the main constituents of IBs[1]. Overlapping notion of IBs and ener gy-oriented features are clearly demonstrated in the environmentally friendly and s ustainable strategies, based on the incorporation of the ancient and the modern socio-cultural dimension and design techniques like using local materials and natural ventilation etc. Considering interdisciplinary of IBs, they should be the product of an integrated team including clients, consultants, architects, contractors, and managers. It is crucial to stress the role of innovation as an enabler with cloud computing, sensors, smart materials, self-healing, robotics, using chaos and network science etc[1]. Heritage buildings may also demand greater reliance on technologies like person centric mobile sensors, since they are less intrusive, and potentially less damaging to the heritage structure, and may capture data in places unavailable to networks directly[2,3]. This above review shows how definitions of IBs have changed over time. The Chinese Code(GB/T50314-2000) describes IBs as those which 'provide buildings automation, ICT and an optimal composition integrated with the system, service, management and provide users with high efficiency, comfort and safety. But recent tendency is the coexistence of 'smartness' and 'sustainability' embedded in the concept. This means that environmental soundness become a crucial part. Moreover, the sustainability is now beyond the one-dimensional focus on energy-oriented aspects and refers to people-oriented issues involving life quality and the economy's sustainability. These changes tend to combine the single intelligent building together as a sustainable communities which are the effective unites. 2.2 Smart city Cities, it is argued, will have become ‘smart’ “when investments in human and social capital, traditional (transport) and modern ICT (first uses of the term at the end of 20th century) and infrastructure fuel sustainable economic growth and a high quality of life, with a w ise management of natural resources, through participatory governance”[3]. The availability of big data and ubiquitous collection of data in the smart city and existence of sophisticated analytical systems are also the 'smart' concept covering. Saunders & Bedeck claim there are five elements necessary to achieve the goals of a smart city. These are to establish: ‘a civic innovation lab using collaborative technologies; open data and platforms to mobilize collective knowledge; that human behavior; investment also in smart people; collaborative technologies for all parts of society.’ Finally, enhanced possibilities for business and human communication are increasingly gaining prominence as one of the major hallmarks of smart city. For this, education inherently play a dominant role. Citizens need institutional education, lifelong learning paradigm and matching services, attitudes to gain mastery over advanced possibilities and requirements posed by emerging smart city concepts based on cutting edge
597
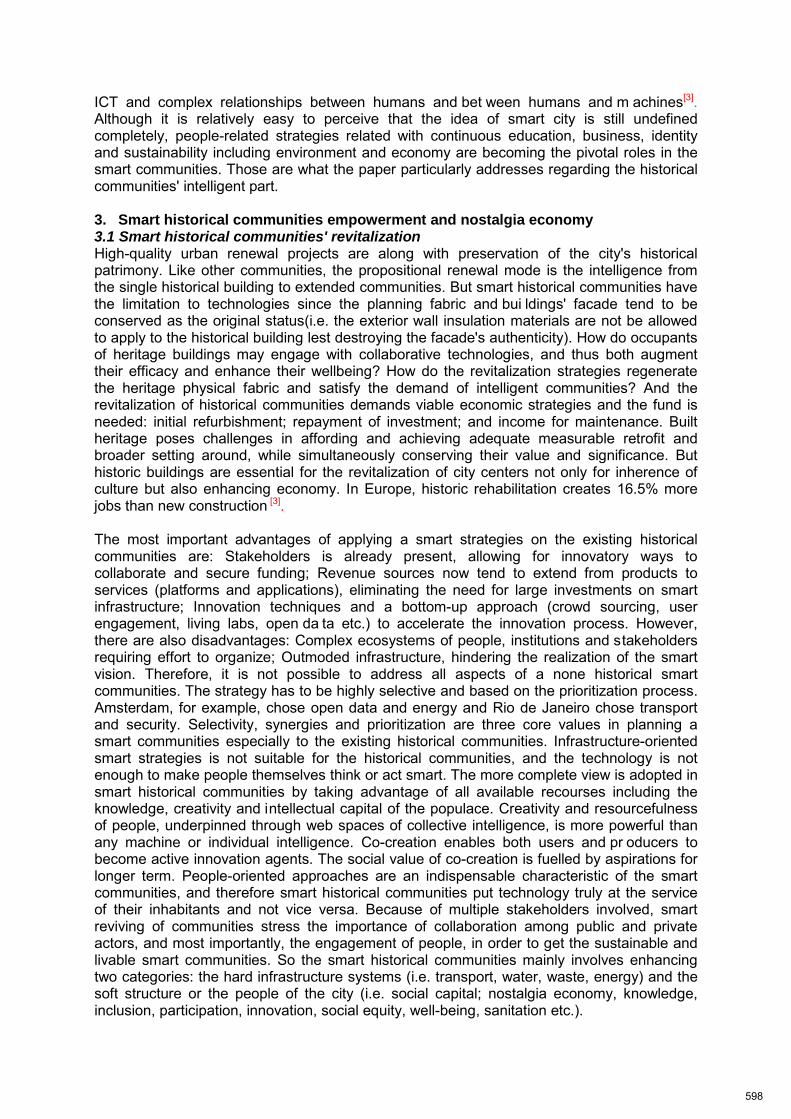
ICT and complex relationships between humans and bet ween humans and m achines[3]. Although it is relatively easy to perceive that the idea of smart city is still undefined completely, people-related strategies related with continuous education, business, identity and sustainability including environment and economy are becoming the pivotal roles in the smart communities. Those are what the paper particularly addresses regarding the historical communities' intelligent part. 3. Smart historical communities empowerment and nostalgia economy 3.1 Smart historical communities' revitalization High-quality urban renewal projects are along with preservation of the city's historical patrimony. Like other communities, the propositional renewal mode is the intelligence from the single historical building to extended communities. But smart historical communities have the limitation to technologies since the planning fabric and bui ldings' facade tend to be conserved as the original status(i.e. the exterior wall insulation materials are not be allowed to apply to the historical building lest destroying the facade's authenticity). How do occupants of heritage buildings may engage with collaborative technologies, and thus both augment their efficacy and enhance their wellbeing? How do the revitalization strategies regenerate the heritage physical fabric and satisfy the demand of intelligent communities? And the revitalization of historical communities demands viable economic strategies and the fund is needed: initial refurbishment; repayment of investment; and income for maintenance. Built heritage poses challenges in affording and achieving adequate measurable retrofit and broader setting around, while simultaneously conserving their value and significance. But historic buildings are essential for the revitalization of city centers not only for inherence of culture but also enhancing economy. In Europe, historic rehabilitation creates 16.5% more jobs than new construction [3]. The most important advantages of applying a smart strategies on the existing historical communities are: Stakeholders is already present, allowing for innovatory ways to collaborate and secure funding; Revenue sources now tend to extend from products to services (platforms and applications), eliminating the need for large investments on smart infrastructure; Innovation techniques and a bottom-up approach (crowd sourcing, user engagement, living labs, open da ta etc.) to accelerate the innovation process. However, there are also disadvantages: Complex ecosystems of people, institutions and stakeholders requiring effort to organize; Outmoded infrastructure, hindering the realization of the smart vision. Therefore, it is not possible to address all aspects of a none historical smart communities. The strategy has to be highly selective and based on the prioritization process. Amsterdam, for example, chose open data and energy and Rio de Janeiro chose transport and security. Selectivity, synergies and prioritization are three core values in planning a smart communities especially to the existing historical communities. Infrastructure-oriented smart strategies is not suitable for the historical communities, and the technology is not enough to make people themselves think or act smart. The more complete view is adopted in smart historical communities by taking advantage of all available recourses including the knowledge, creativity and intellectual capital of the populace. Creativity and resourcefulness of people, underpinned through web spaces of collective intelligence, is more powerful than any machine or individual intelligence. Co-creation enables both users and pr oducers to become active innovation agents. The social value of co-creation is fuelled by aspirations for longer term. People-oriented approaches are an indispensable characteristic of the smart communities, and therefore smart historical communities put technology truly at the service of their inhabitants and not vice versa. Because of multiple stakeholders involved, smart reviving of communities stress the importance of collaboration among public and private actors, and most importantly, the engagement of people, in order to get the sustainable and livable smart communities. So the smart historical communities mainly involves enhancing two categories: the hard infrastructure systems (i.e. transport, water, waste, energy) and the soft structure or the people of the city (i.e. social capital; nostalgia economy, knowledge, inclusion, participation, innovation, social equity, well-being, sanitation etc.).
598
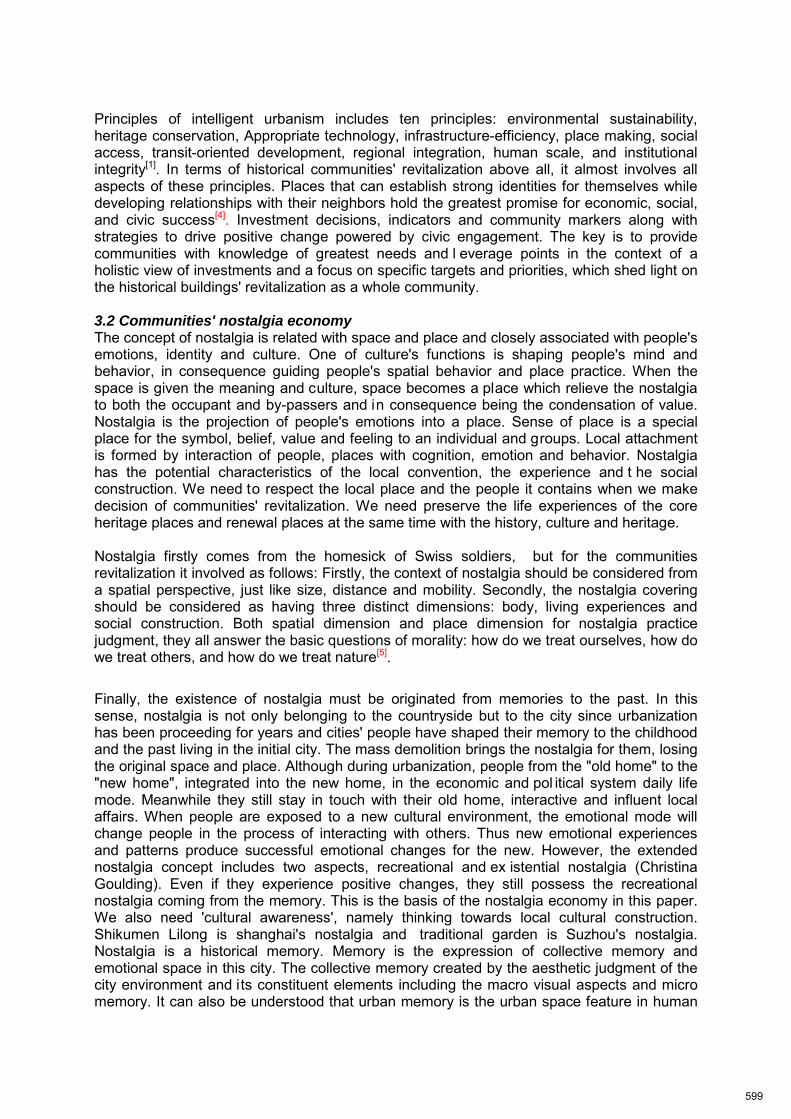
Principles of intelligent urbanism includes ten principles: environmental sustainability, heritage conservation, Appropriate technology, infrastructure-efficiency, place making, social access, transit-oriented development, regional integration, human scale, and institutional integrity[1]. In terms of historical communities' revitalization above all, it almost involves all aspects of these principles. Places that can establish strong identities for themselves while developing relationships with their neighbors hold the greatest promise for economic, social, and civic success[4]. Investment decisions, indicators and community markers along with strategies to drive positive change powered by civic engagement. The key is to provide communities with knowledge of greatest needs and l everage points in the context of a holistic view of investments and a focus on specific targets and priorities, which shed light on the historical buildings' revitalization as a whole community. 3.2 Communities' nostalgia economy The concept of nostalgia is related with space and place and closely associated with people's emotions, identity and culture. One of culture's functions is shaping people's mind and behavior, in consequence guiding people's spatial behavior and place practice. When the space is given the meaning and culture, space becomes a place which relieve the nostalgia to both the occupant and by-passers and in consequence being the condensation of value. Nostalgia is the projection of people's emotions into a place. Sense of place is a special place for the symbol, belief, value and feeling to an individual and groups. Local attachment is formed by interaction of people, places with cognition, emotion and behavior. Nostalgia has the potential characteristics of the local convention, the experience and t he social construction. We need to respect the local place and the people it contains when we make decision of communities' revitalization. We need preserve the life experiences of the core heritage places and renewal places at the same time with the history, culture and heritage. Nostalgia firstly comes from the homesick of Swiss soldiers, but for the communities revitalization it involved as follows: Firstly, the context of nostalgia should be considered from a spatial perspective, just like size, distance and mobility. Secondly, the nostalgia covering should be considered as having three distinct dimensions: body, living experiences and social construction. Both spatial dimension and place dimension for nostalgia practice judgment, they all answer the basic questions of morality: how do we treat ourselves, how do we treat others, and how do we treat nature[5].
Finally, the existence of nostalgia must be originated from memories to the past. In this sense, nostalgia is not only belonging to the countryside but to the city since urbanization has been proceeding for years and cities' people have shaped their memory to the childhood and the past living in the initial city. The mass demolition brings the nostalgia for them, losing the original space and place. Although during urbanization, people from the "old home" to the "new home", integrated into the new home, in the economic and pol itical system daily life mode. Meanwhile they still stay in touch with their old home, interactive and influent local affairs. When people are exposed to a new cultural environment, the emotional mode will change people in the process of interacting with others. Thus new emotional experiences and patterns produce successful emotional changes for the new. However, the extended nostalgia concept includes two aspects, recreational and ex istential nostalgia (Christina Goulding). Even if they experience positive changes, they still possess the recreational nostalgia coming from the memory. This is the basis of the nostalgia economy in this paper. We also need 'cultural awareness', namely thinking towards local cultural construction. Shikumen Lilong is shanghai's nostalgia and traditional garden is Suzhou's nostalgia. Nostalgia is a historical memory. Memory is the expression of collective memory and emotional space in this city. The collective memory created by the aesthetic judgment of the city environment and its constituent elements including the macro visual aspects and micro memory. It can also be understood that urban memory is the urban space feature in human
599
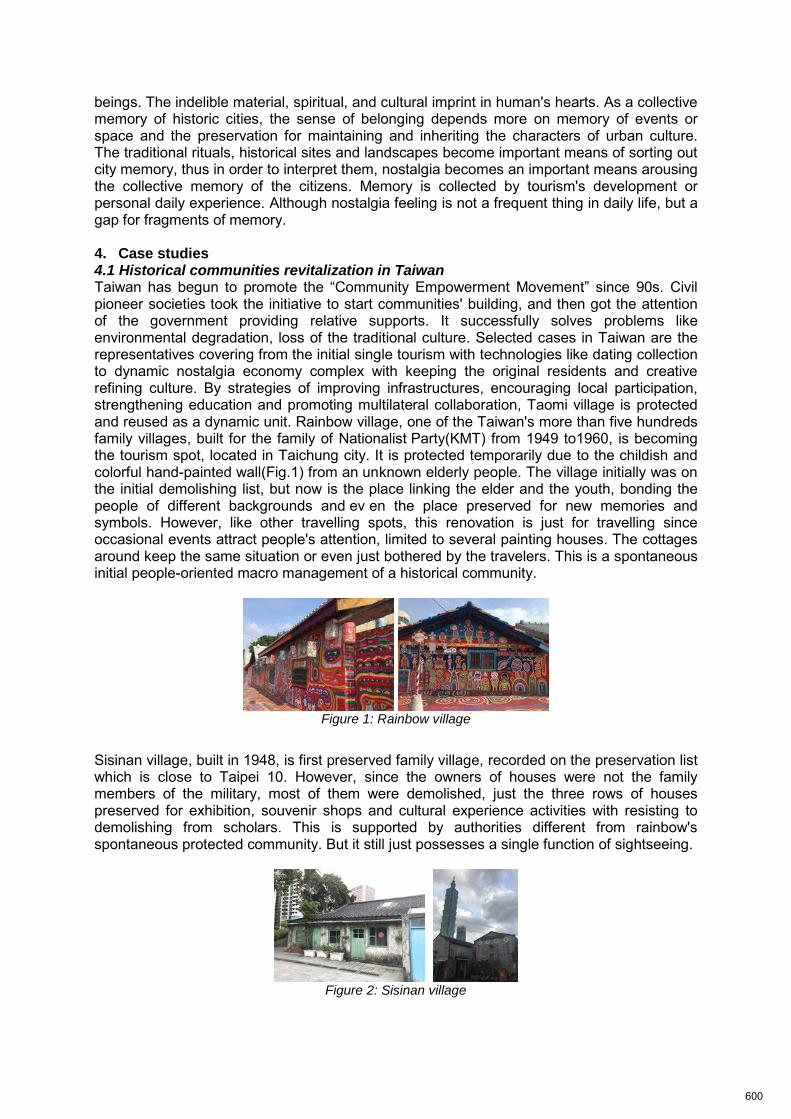
beings. The indelible material, spiritual, and cultural imprint in human's hearts. As a collective memory of historic cities, the sense of belonging depends more on memory of events or space and the preservation for maintaining and inheriting the characters of urban culture. The traditional rituals, historical sites and landscapes become important means of sorting out city memory, thus in order to interpret them, nostalgia becomes an important means arousing the collective memory of the citizens. Memory is collected by tourism's development or personal daily experience. Although nostalgia feeling is not a frequent thing in daily life, but a gap for fragments of memory. 4. Case studies 4.1 Historical communities revitalization in Taiwan Taiwan has begun to promote the “Community Empowerment Movement” since 90s. Civil pioneer societies took the initiative to start communities' building, and then got the attention of the government providing relative supports. It successfully solves problems like environmental degradation, loss of the traditional culture. Selected cases in Taiwan are the representatives covering from the initial single tourism with technologies like dating collection to dynamic nostalgia economy complex with keeping the original residents and creative refining culture. By strategies of improving infrastructures, encouraging local participation, strengthening education and promoting multilateral collaboration, Taomi village is protected and reused as a dynamic unit. Rainbow village, one of the Taiwan's more than five hundreds family villages, built for the family of Nationalist Party(KMT) from 1949 to1960, is becoming the tourism spot, located in Taichung city. It is protected temporarily due to the childish and colorful hand-painted wall(Fig.1) from an unknown elderly people. The village initially was on the initial demolishing list, but now is the place linking the elder and the youth, bonding the people of different backgrounds and ev en the place preserved for new memories and symbols. However, like other travelling spots, this renovation is just for travelling since occasional events attract people's attention, limited to several painting houses. The cottages around keep the same situation or even just bothered by the travelers. This is a spontaneous initial people-oriented macro management of a historical community.
Figure 1: Rainbow village
Sisinan village, built in 1948, is first preserved family village, recorded on the preservation list which is close to Taipei 10. However, since the owners of houses were not the family members of the military, most of them were demolished, just the three rows of houses preserved for exhibition, souvenir shops and cultural experience activities with resisting to demolishing from scholars. This is supported by authorities different from rainbow's spontaneous protected community. But it still just possesses a single function of sightseeing.
Figure 2: Sisinan village
600
Taomi village, namely frog hometown is an successful example of combination the tourism and original residents different from the aforementioned cases, which embody the nostalgia economy. It has developed with the communities empowerment policies coupled with the nostalgia and local culture after the earthquake in 1999. During post-disaster reconstruction, with the help from 'New hometown culture and education foundation' and 'special biology center', Taomi village had dug existing resources such as humanity history, local natural environment and social power and all parts involved by rebuilding of environment, repairing of house, restoring local ecological habitats like frog as well as training related knowledge and management measure. The work for restoring life and the community covering many years by technologies and people training, created jobs to assist the reconstruction of post-disaster. Therefore, until 2000, the government provided a lot of resources to the community recovery. And the community empower policy is also officially promoted to one of the main urban and rural development policies. With the good harnessing from the local culture and ecological habitat's resource, Taomi village provides the appealing B&B management approach attracting a great number of tourists and every owner is also the good tour guide who is still living where they had lived in the past. They are not only in a good relationships with neighbors but erecting their community with intelligent technologies. This case is the "Bottom-up" development of a historic district and the government responsiveness play the vital role. Participation are not stopped in discussion about rationality, but involved in make-decision. It also covers the definition of IB with learning ability as well as self-adjustability.
Figure 3: Taomi village
To sum up, the investment cannot do without the whole community empowerment. Through the course of revitalization of historical villages, the bottom up mode with support of authorities is more dynamic. To begin with the community participation mode, villagers was invited together to create their own home, even if the family doubt that in the beginning, but in the end occupants and owners get benefits from the community both economy and inherited tradition. The community process will inevitably be bumps, stumbled, but only with enough patience and unremitting consultation and communication, can the common ground be gotten in different ground on the basis of mutual supports and mutual benefits, building a better home together. This communities empowerment policies relive the capital pressure and embody the characters of smart people-oriented in smart city. It's not only about the capital of society, organization but also the whole village's participation, the public affairs and the public space of the village together. The following data collecting and sensor is practiced with better maintain for the Taomi village. Due to occupants involving, the collection of data about the activity monitoring and other wearable sensors are prone to be more available. 4.2 Historical residential Communities in Shanghai Some communities in Shanghai have experienced restoration for adaptive reuse, among which, Xintiandi and Tianzifang were developed by different commercial forms served mainly for tourism through the up-bottom and bottom-up strategies respectively. As the typical regeneration case for protecting original residents is the Bugao Lane(CITE BOURGOGNE) which was refurbished with modern sanitary ways such as flush toilets and natural gas pipeline. According to the in-depth interview based on t he phenomenology, essences of people’s lived experiences was dug. One of the elderly owner gave up the chance to remove out of the house but selected to live here. The factors like the convenient health care and the good neighborhoods contribute to staying here for almost 70 years. This is the simple nostalgia. However, the preserved original road couldn't allow the double lane for the cars,
601
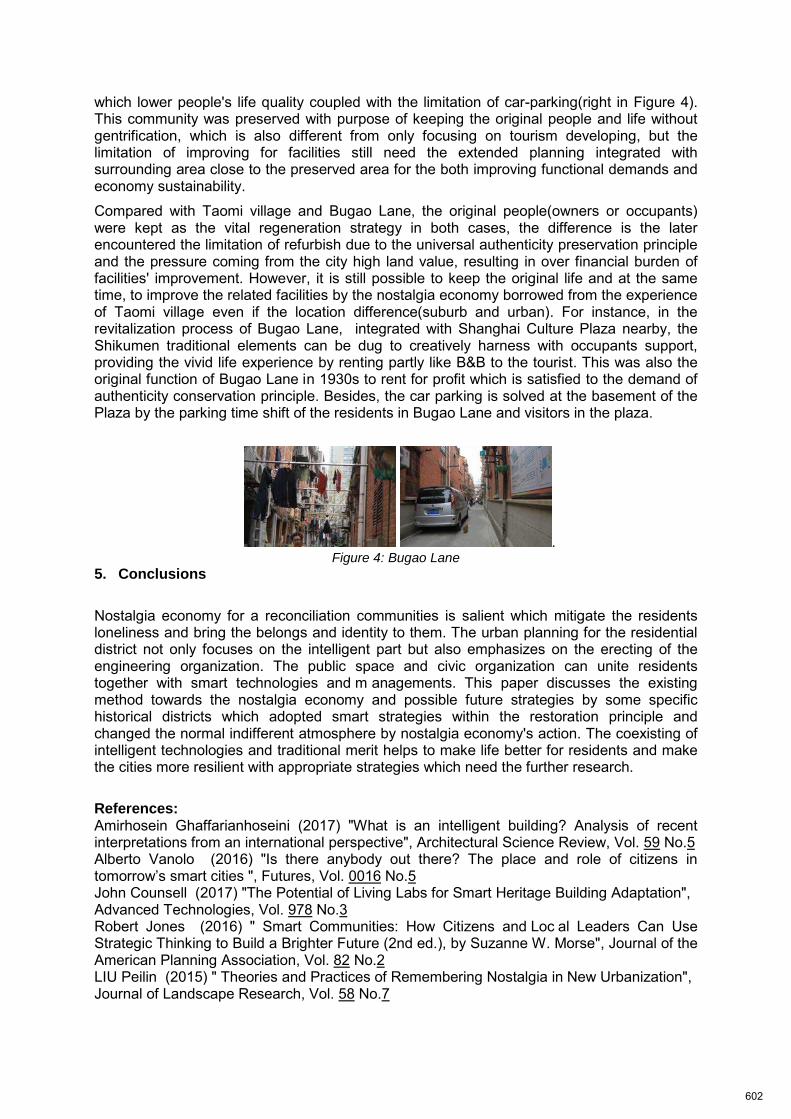
which lower people's life quality coupled with the limitation of car-parking(right in Figure 4). This community was preserved with purpose of keeping the original people and life without gentrification, which is also different from only focusing on tourism developing, but the limitation of improving for facilities still need the extended planning integrated with surrounding area close to the preserved area for the both improving functional demands and economy sustainability.
Compared with Taomi village and Bugao Lane, the original people(owners or occupants) were kept as the vital regeneration strategy in both cases, the difference is the later encountered the limitation of refurbish due to the universal authenticity preservation principle and the pressure coming from the city high land value, resulting in over financial burden of facilities' improvement. However, it is still possible to keep the original life and at the same time, to improve the related facilities by the nostalgia economy borrowed from the experience of Taomi village even if the location difference(suburb and urban). For instance, in the revitalization process of Bugao Lane, integrated with Shanghai Culture Plaza nearby, the Shikumen traditional elements can be dug to creatively harness with occupants support, providing the vivid life experience by renting partly like B&B to the tourist. This was also the original function of Bugao Lane in 1930s to rent for profit which is satisfied to the demand of authenticity conservation principle. Besides, the car parking is solved at the basement of the Plaza by the parking time shift of the residents in Bugao Lane and visitors in the plaza.
. Figure 4: Bugao Lane
5. Conclusions
Nostalgia economy for a reconciliation communities is salient which mitigate the residents loneliness and bring the belongs and identity to them. The urban planning for the residential district not only focuses on the intelligent part but also emphasizes on the erecting of the engineering organization. The public space and civic organization can unite residents together with smart technologies and m anagements. This paper discusses the existing method towards the nostalgia economy and possible future strategies by some specific historical districts which adopted smart strategies within the restoration principle and changed the normal indifferent atmosphere by nostalgia economy's action. The coexisting of intelligent technologies and traditional merit helps to make life better for residents and make the cities more resilient with appropriate strategies which need the further research.
References: Amirhosein Ghaffarianhoseini (2017) "What is an intelligent building? Analysis of recent interpretations from an international perspective", Architectural Science Review, Vol. 59 No.5 Alberto Vanolo (2016) "Is there anybody out there? The place and role of citizens in tomorrow’s smart cities ", Futures, Vol. 0016 No.5 John Counsell (2017) "The Potential of Living Labs for Smart Heritage Building Adaptation", Advanced Technologies, Vol. 978 No.3 Robert Jones (2016) " Smart Communities: How Citizens and Loc al Leaders Can Use Strategic Thinking to Build a Brighter Future (2nd ed.), by Suzanne W. Morse", Journal of the American Planning Association, Vol. 82 No.2 LIU Peilin (2015) " Theories and Practices of Remembering Nostalgia in New Urbanization", Journal of Landscape Research, Vol. 58 No.7
602
Zhao, Ning Reconsideration of Conservation and Regeneration of Suburban Historic Village ISOCARP-OAPA Conference 2017
1
Reconsideration of Conservation and Regeneration of Suburban Historic Village: Case Study of Banghu Xu in Guangzhou, China (A Practice of Conservation and Regeneration Plan of Suburban Historic Village in South
China)
Ning Zhao, Jianjun Wang, Yongsheng Sun, Zhenhua, Zhang, Yao Hu
1. Introduction
Over the past few decades of rapid development in China, lots of villages in and around cities were replaced as a result of the urban sprawl. In the same period, countless brilliant traditional buildings and culture vanished and were replaced by new skyscrapers because of the compensation for high land cost in the regeneration. The traditional village is a kind of non-renewable precious resources and cultural heritage. This kind of replacements are irreversible. And it makes the local characteristic and culture get lost. In December 2012, the central government officially proposed to protect the various traditional villages which have historic and artistic value [1,2]. However, it cannot stop the deterioration of traditional villages over the whole of China. What is more, the remaining Chinese villages are in danger of hollowing out. More and more villagers go out for jobs in the cities, and much of the farmland is left uncultivated.
Recently, the objective of building a thousand towns by 2020 with distinctive industries, harmonious livable environment, traditional culture as well as vital mechanism, was proposed in the China central government. Since then a series of supporting polices and regulations have been formulated in the different levels of central, provincial, and municipal government. Because of that, many practices of conservation and regeneration for traditional villages over China have begun to explore their proper ways in different context and regions. This program tries to explore a whole process of conservation and regeneration schemes which contain industry planning, town planning, and mechanism construction to promote the implementation among the government, enterprises, and farmers' collective organizations.
2. Methodology 2.1 Objective and Principle
We tried to build a coordination mechanism of conservation and development, focusing on three aspects: heritage conservation, activation strategy, and supporting system. Firstly, we tried to refine the characteristics and value of cultural heritage, and sort out conservation objects and natural and cultural resources, in order to make requirements of protection and control much clearer. Secondly, according to the analyses on local resources, conditions, opportunities and challenges, the development orientation was outlined, and some new functions and industries were introduced in. Finally, the possible model of development was proposed, and a mechanism which coordinates the contradiction between conservation and development was established to achieve the planning goal.
2.2 Technique flow
The whole working progress could be divided into three stages - preparations, research, and planning. In the stage of preparation, both interior and field work need to be done carefully. Interior work covers historic literature research, related planning research and similar case studies. Field work contains surveys on existing buildings, surveys on culture resource, interviews with departments and villagers, and questionnaires. The value and characteristics,
603
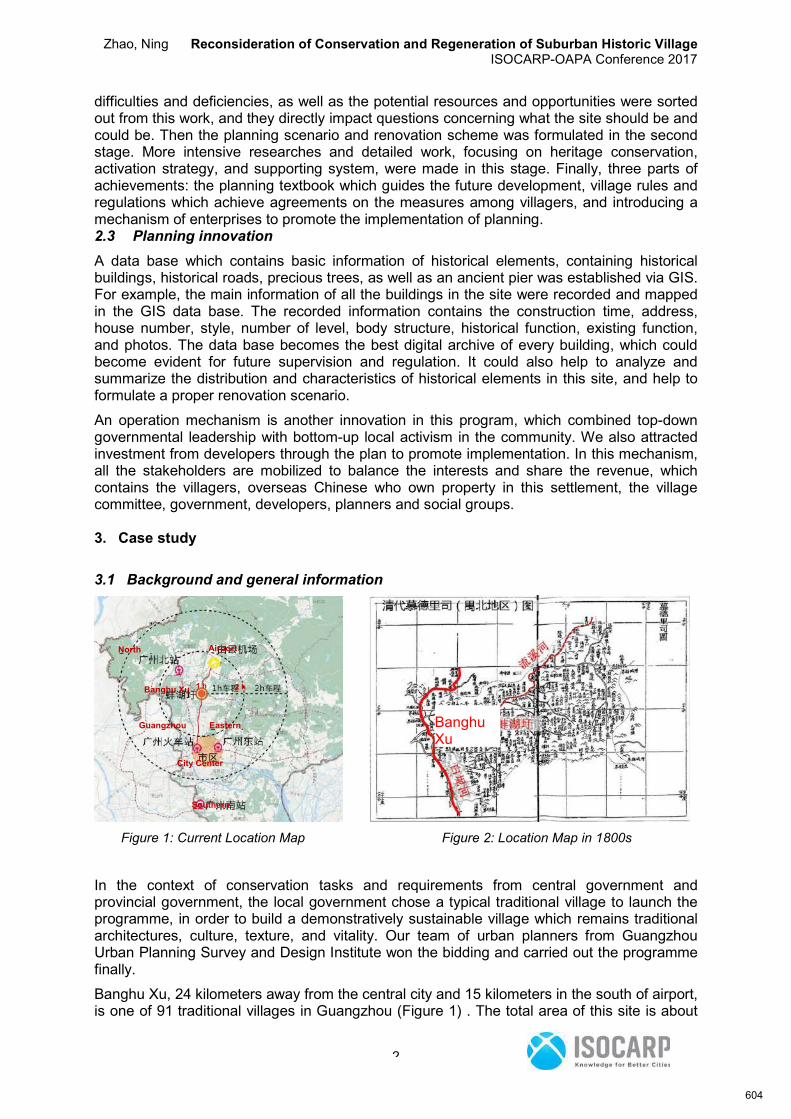
Zhao, Ning Reconsideration of Conservation and Regeneration of Suburban Historic Village ISOCARP-OAPA Conference 2017
2
difficulties and deficiencies, as well as the potential resources and opportunities were sorted out from this work, and they directly impact questions concerning what the site should be and could be. Then the planning scenario and renovation scheme was formulated in the second stage. More intensive researches and detailed work, focusing on heritage conservation, activation strategy, and supporting system, were made in this stage. Finally, three parts of achievements: the planning textbook which guides the future development, village rules and regulations which achieve agreements on the measures among villagers, and introducing a mechanism of enterprises to promote the implementation of planning. 2.3 Planning innovation
A data base which contains basic information of historical elements, containing historical buildings, historical roads, precious trees, as well as an ancient pier was established via GIS. For example, the main information of all the buildings in the site were recorded and mapped in the GIS data base. The recorded information contains the construction time, address, house number, style, number of level, body structure, historical function, existing function, and photos. The data base becomes the best digital archive of every building, which could become evident for future supervision and regulation. It could also help to analyze and summarize the distribution and characteristics of historical elements in this site, and help to formulate a proper renovation scenario.
An operation mechanism is another innovation in this program, which combined top-down governmental leadership with bottom-up local activism in the community. We also attracted investment from developers through the plan to promote implementation. In this mechanism, all the stakeholders are mobilized to balance the interests and share the revenue, which contains the villagers, overseas Chinese who own property in this settlement, the village committee, government, developers, planners and social groups. 3. Case study
3.1 Background and general information
Figure 1: Current Location Map Figure 2: Location Map in 1800s
In the context of conservation tasks and requirements from central government and provincial government, the local government chose a typical traditional village to launch the programme, in order to build a demonstratively sustainable village which remains traditional architectures, culture, texture, and vitality. Our team of urban planners from Guangzhou Urban Planning Survey and Design Institute won the bidding and carried out the programme finally.
Banghu Xu, 24 kilometers away from the central city and 15 kilometers in the south of airport, is one of 91 traditional villages in Guangzhou (Figure 1) . The total area of this site is about
North Guangzhou
Airport
Banghu Xu 1 h Drive
2 h Drive
Guangzhou Eastern Guangzhou
Southern Guangzhou
City Center
Banghu Xu
604
Zhao, Ning Reconsideration of Conservation and Regeneration of Suburban Historic Village ISOCARP-OAPA Conference 2017
3
19 hectares. Most of the historic buildings in the site remained, most of which were built by oversea Chinese in 100 years ago. They were the specimen of typical traditional commercial cluster which were rare even in that time. However, they have been left vacant for nearly 30 years since the modern road traffic mode took the place of water traffic. Besides the vast farmland and poor-environment residential housings, a main river is adjacent to this site, which has been an important water-pass from the ancient Guangzhou to the north residential area for 19 centuries. This made Banghu Xu a prosperous commercial cluster around this region for quite a long time (Figure 2). 3.2 Historical research
We carried out historical research of this site from its initial state to the declined state. The 120-year history of Banghu Xu nearly coincides with China’s modem history; thus it is a live specimen of traditional commercial cluster in the agriculture society (Figure 3). Tangible and intangible cultural heritage in this site were sorted out through a careful field survey (Figure 4 and Figure 5), and they are divided into several protection levels to meet different conservation requirements.
After the specific historical research, the general historical value of Banghu Xu was outlined, which contains an important waterway trade fair along the Liuxi River, one of the important town center in north Guangzhou during the past hundred years, and a typical town scape constructed by overseas Chinese.
605
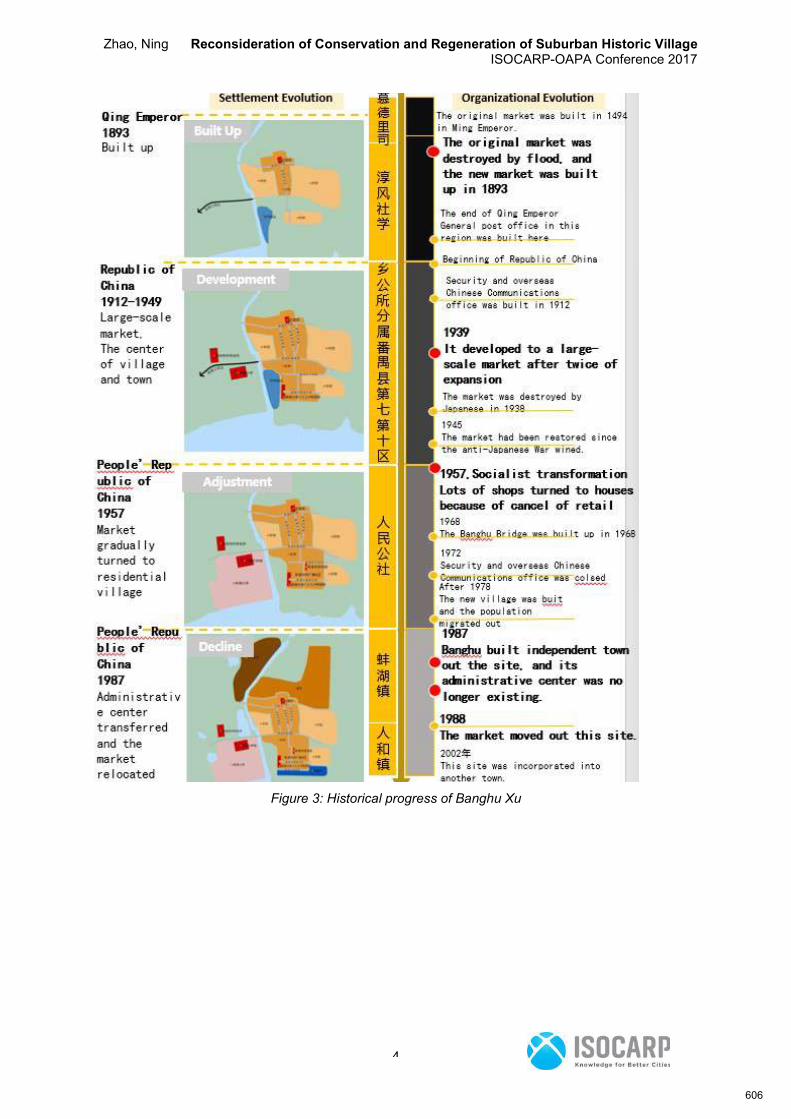
Zhao, Ning Reconsideration of Conservation and Regeneration of Suburban Historic Village ISOCARP-OAPA Conference 2017
4
Figure 3: Historical progress of Banghu Xu
606
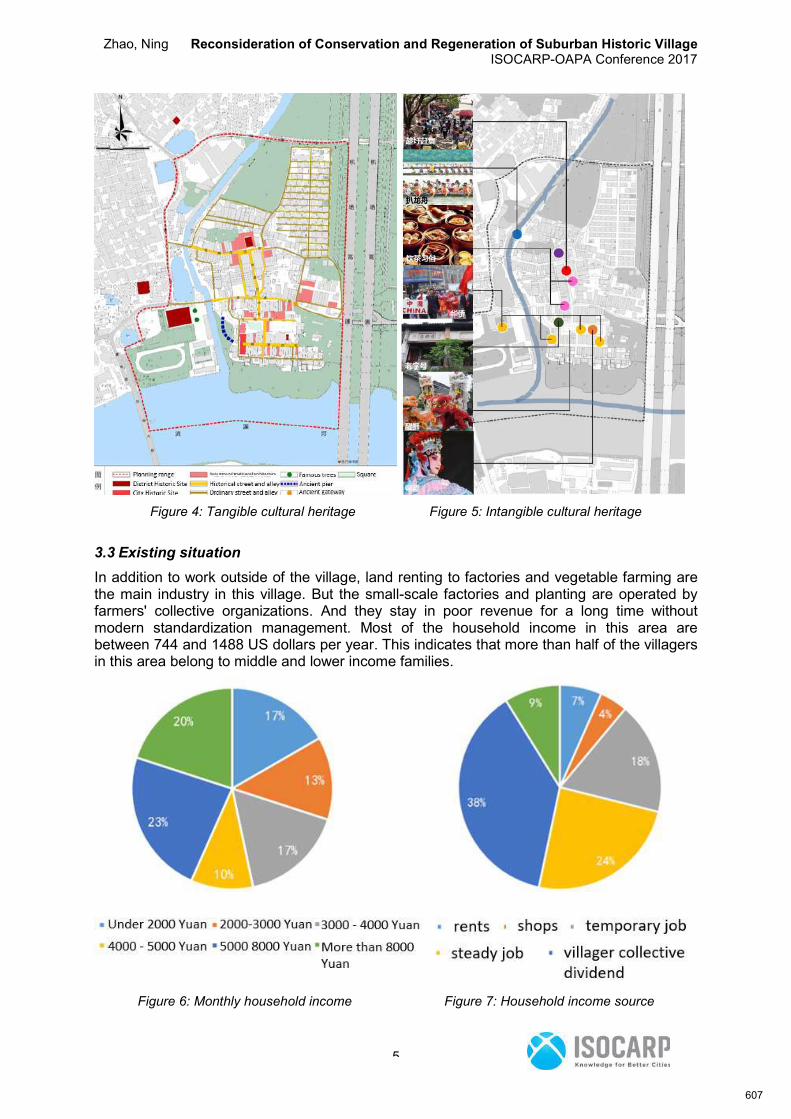
Zhao, Ning Reconsideration of Conservation and Regeneration of Suburban Historic Village ISOCARP-OAPA Conference 2017
5
Figure 4: Tangible cultural heritage Figure 5: Intangible cultural heritage
3.3 Existing situation
In addition to work outside of the village, land renting to factories and vegetable farming are the main industry in this village. But the small-scale factories and planting are operated by farmers' collective organizations. And they stay in poor revenue for a long time without modern standardization management. Most of the household income in this area are between 744 and 1488 US dollars per year. This indicates that more than half of the villagers in this area belong to middle and lower income families.
Figure 6: Monthly household income Figure 7: Household income source
607
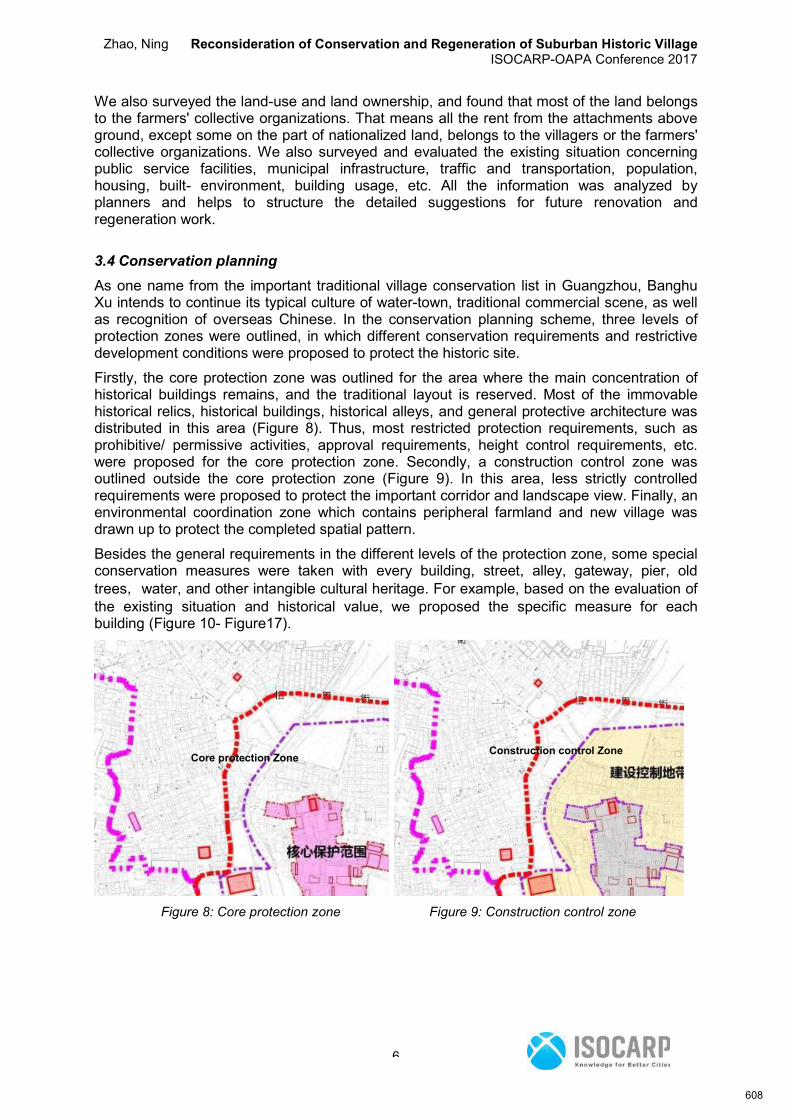
Zhao, Ning Reconsideration of Conservation and Regeneration of Suburban Historic Village ISOCARP-OAPA Conference 2017
6
We also surveyed the land-use and land ownership, and found that most of the land belongs to the farmers' collective organizations. That means all the rent from the attachments above ground, except some on the part of nationalized land, belongs to the villagers or the farmers' collective organizations. We also surveyed and evaluated the existing situation concerning public service facilities, municipal infrastructure, traffic and transportation, population, housing, built- environment, building usage, etc. All the information was analyzed by planners and helps to structure the detailed suggestions for future renovation and regeneration work.
3.4 Conservation planning
As one name from the important traditional village conservation list in Guangzhou, Banghu Xu intends to continue its typical culture of water-town, traditional commercial scene, as well as recognition of overseas Chinese. In the conservation planning scheme, three levels of protection zones were outlined, in which different conservation requirements and restrictive development conditions were proposed to protect the historic site.
Firstly, the core protection zone was outlined for the area where the main concentration of historical buildings remains, and the traditional layout is reserved. Most of the immovable historical relics, historical buildings, historical alleys, and general protective architecture was distributed in this area (Figure 8). Thus, most restricted protection requirements, such as prohibitive/ permissive activities, approval requirements, height control requirements, etc. were proposed for the core protection zone. Secondly, a construction control zone was outlined outside the core protection zone (Figure 9). In this area, less strictly controlled requirements were proposed to protect the important corridor and landscape view. Finally, an environmental coordination zone which contains peripheral farmland and new village was drawn up to protect the completed spatial pattern.
Besides the general requirements in the different levels of the protection zone, some special conservation measures were taken with every building, street, alley, gateway, pier, old trees,water, and other intangible cultural heritage. For example, based on the evaluation of the existing situation and historical value, we proposed the specific measure for each building (Figure 10- Figure17).
Figure 8: Core protection zone Figure 9: Construction control zone
Core protection Zone Construction control Zone
608
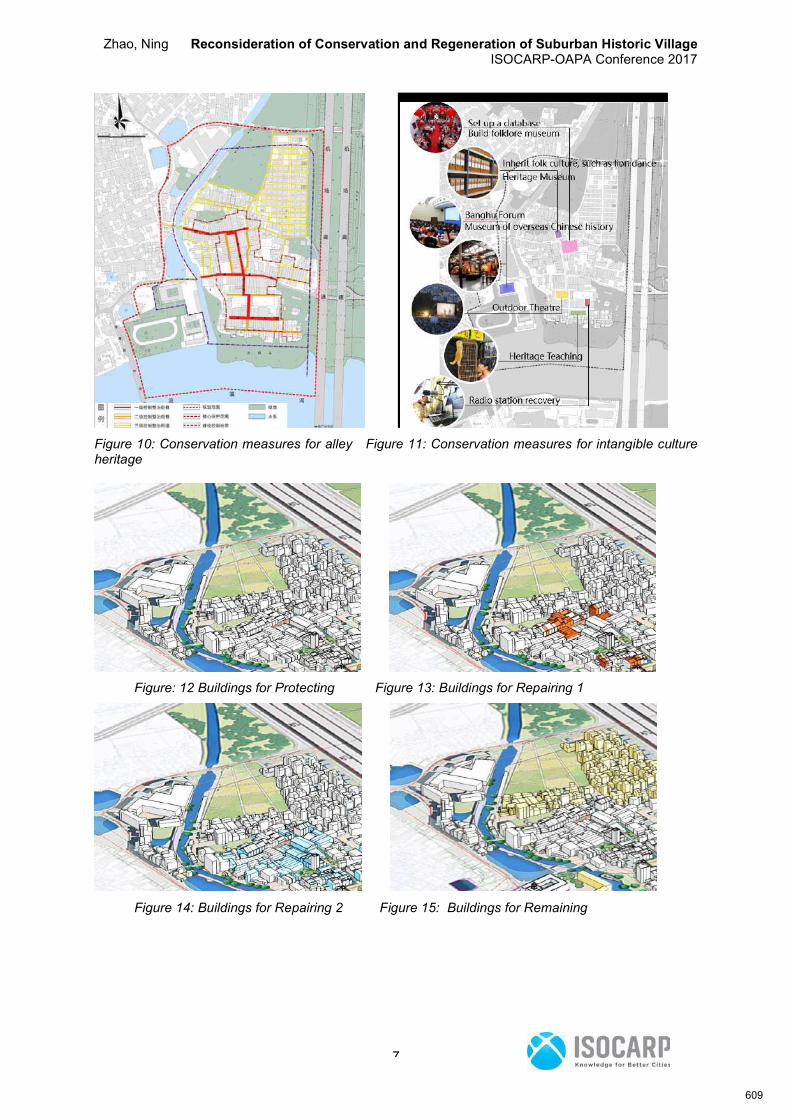
Zhao, Ning Reconsideration of Conservation and Regeneration of Suburban Historic Village ISOCARP-OAPA Conference 2017
7
Figure 10: Conservation measures for alley Figure 11: Conservation measures for intangible culture heritage
Figure: 12 Buildings for Protecting Figure 13: Buildings for Repairing 1
Figure 14: Buildings for Repairing 2 Figure 15: Buildings for Remaining
609
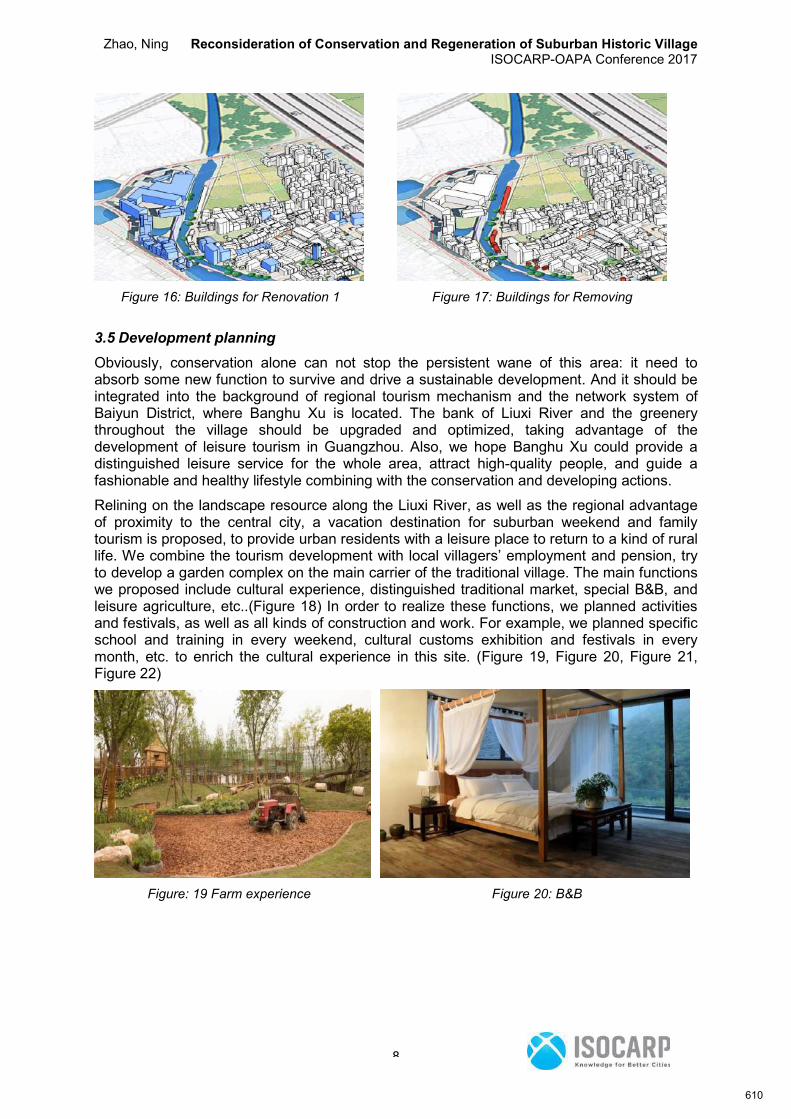
Zhao, Ning Reconsideration of Conservation and Regeneration of Suburban Historic Village ISOCARP-OAPA Conference 2017
8
Figure 16: Buildings for Renovation 1 Figure 17: Buildings for Removing
3.5 Development planning
Obviously, conservation alone can not stop the persistent wane of this area: it need to absorb some new function to survive and drive a sustainable development. And it should be integrated into the background of regional tourism mechanism and the network system of Baiyun District, where Banghu Xu is located. The bank of Liuxi River and the greenery throughout the village should be upgraded and optimized, taking advantage of the development of leisure tourism in Guangzhou. Also, we hope Banghu Xu could provide a distinguished leisure service for the whole area, attract high-quality people, and guide a fashionable and healthy lifestyle combining with the conservation and developing actions.
Relining on the landscape resource along the Liuxi River, as well as the regional advantage of proximity to the central city, a vacation destination for suburban weekend and family tourism is proposed, to provide urban residents with a leisure place to return to a kind of rural life. We combine the tourism development with local villagers’ employment and pension, try to develop a garden complex on the main carrier of the traditional village. The main functions we proposed include cultural experience, distinguished traditional market, special B&B, and leisure agriculture, etc..(Figure 18) In order to realize these functions, we planned activities and festivals, as well as all kinds of construction and work. For example, we planned specific school and training in every weekend, cultural customs exhibition and festivals in every month, etc. to enrich the cultural experience in this site. (Figure 19, Figure 20, Figure 21, Figure 22)
Figure: 19 Farm experience Figure 20: B&B
610
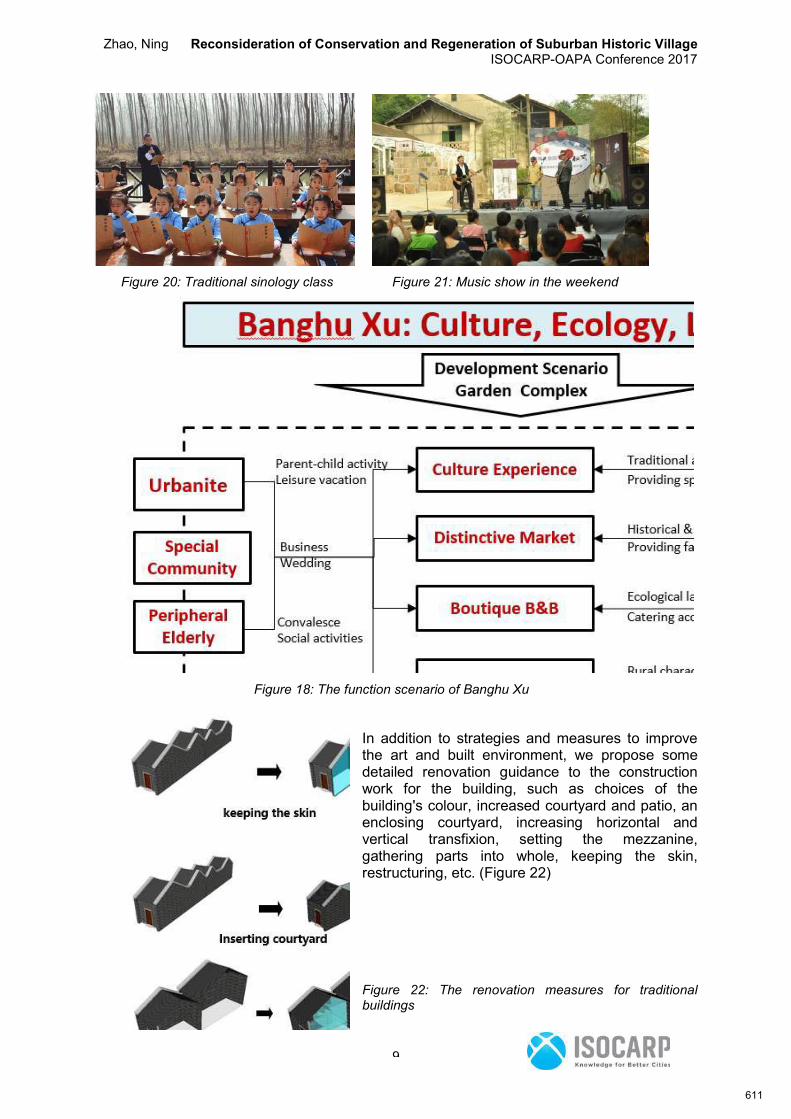
Zhao, Ning Reconsideration of Conservation and Regeneration of Suburban Historic Village ISOCARP-OAPA Conference 2017
9
Figure 20: Traditional sinology class Figure 21: Music show in the weekend
Figure 18: The function scenario of Banghu Xu
In addition to strategies and measures to improve the art and built environment, we propose some detailed renovation guidance to the construction work for the building, such as choices of the building's colour, increased courtyard and patio, an enclosing courtyard, increasing horizontal and vertical transfixion, setting the mezzanine, gathering parts into whole, keeping the skin, restructuring, etc. (Figure 22)
Figure 22: The renovation measures for traditional buildings
611

Zhao, Ning Reconsideration of Conservation and Regeneration of Suburban Historic Village ISOCARP-OAPA Conference 2017
10
3.6 Implementation sequence
However, considering the difficult process of implementation, we suggested that the scheme can be carried out in two steps. (Figure 23) Thus a series of recent renovation strategy and guidance are proposed to gradually improve the quality of the built environment. In the same time, we suggested providing some space and platform for the industrial incubation here in the use of the existing buildings to activate the local industry. In addition, the residential buildings in the northeast with the contemporary fabric built in 2010, which do not match the control planning, will be removed in the long term. So will the buildings which damage the scene seriously, but with difficulties to be removed in the short term.
Figure 23: The plan in Step1 and Step2
Much more detailed sequence was made out in the working schedule. For the renovation work, we suggested renovating the state ownership buildings based on the government investment in the first step because of their clear ownership and financial support, then starting the private houses via the form of public-private partnership for the next step. For the infrastructure construction, we proposed to start the parts underground first, such as the underground municipal pipe network and facilities, and then boot up the parts on the ground, such as the roads and traffic service facilities. For the projects, we encouraged development of the public projects first, and then development of the business projects. For example, the government is encouraged to sponsor the public housing owned by the government, and rent all the available private space to do some demonstration projects. Also, we suggested the local government formulates some policies and guidance to incite the starting of business and cultivate the market forces. For the development, we tried to cultivate the market force and attract investment in the short term, and then start the regeneration work for larger area to support the large-size business project. (Figure 24)
612
Zhao, Ning Reconsideration of Conservation and Regeneration of Suburban Historic Village ISOCARP-OAPA Conference 2017
11
Figure 24: Implementation sequence
4. Conclusion
In this study, the urban planning team approaches the project from the perspective of both protection and utilization of cultural heritage. We emphasize the systematic construction of supporting facilities to promote the sustainable development of culture, industry, and built environment.
Firstly, a GIS database was built to store and visualize the basic information of each historic building, and a mechanism of bottom line protection was also established to track and monitor possible usage in the future. Secondly, several investigations and interviews of the villagers and related departments were carried out to understand the needs and the possible contribution of each stakeholder. Thirdly, this project stresses gradual renewal, industrial implantation, and persistent operations. In the concept of sustainable operation on the combination of life, production and ecology, the sustainable development of Banghu Xu is promoted eventually. Fourthly, we made a conservation and regeneration plan to activate this area and create revenue, and outlined an operation mechanism, which combined top-down governmental leadership with bottom-up local activism in the community. Also, various public participations and festivals are planned all through the year in order to improve the cohesion of communities and attraction to the tourists. Finally, we also attracted investment from developers through the plan to promote implementation. In this mechanism, all the stakeholders are mobilized to balance the interests and share the revenue, which contains the villagers, overseas Chinese who own property in this settlement, the village committee, government, developers, planners, and social groups.
References:
1. 住房城乡建设部 文化部 财政部关于加强传统村落保护发展工作的指导意见 [EB/OL].
[2012-12-12] http://www.mohurd.gov.cn/wjfb/201212/t20121219_212337.html
2. 中共中央 国务院关于加快发展现代农业 进一步增强农村发展活力的若意见 [EB/OL].
[2013-1-31].http://news.xinhuanet.com/2013-01/31/c_124307774.html
613
Evaluation of Japanese residential area from the perspective of
living with companion animals -A case study in Japan’s Hanshin-area
Kasumi SUSAKI, Ryukoku University, Japan
Abstract
In Japan, assessment are conducted in limited fields in the urban planning department. There are no academic discussions regarding the quality of urban residential areas and no indicators to evaluate these areas. This paper reviews indicators from the UNICEF and the UNESCO that are prepared for children and indicators from the WHO that are prepared for aged people. Subsequently, the living conditions of companion animal owners in Japanese urban areas are revealed. Several similar issues such as the indicators for children and aged people are evaluated. Using these common indicators, Japanese urban areas are evaluated and the results presented. 1. Introduction
1.1 Background and objectives
In Japan, planning departments are limited to specific fields of study when carrying out assessments, such that they carry out, for instance, only environmental assessments. Urban populations have significant impacts on residential areas; however, assessments of residential areas have been limited to universal designs for people with disabilities. In Japan, there are almost no indicators with which housing and residential areas can be evaluated, except for those indicators related to the comfort of people with disabilities. Moreover, social systems also lack indicators for evaluating people’s comfort. Though there exist feature articles that rank cities in order of resident comfort, academic discussions about comfortable cities are nonexistent.
Recently, Japan’s population has been shrinking due to decreasing numbers of births and increasing numbers of aged people. Both of which have become political matters.
Policies responding to these matters include the provision of social services for aged people and an increase in the number of children’s daycare centers. These daycare centers benefit not only the children but also their parents. Although these programs have been set established, the quality of the social services and daycare centers are not carefully considered. In addition, there are almost no policies that can actually control the quality of residential areas.
1.2 The research method
In this paper, first the assessment indicators for residential areas with regard to children and aged people are reviewed and subsequently the results of this review are explained. The UNICEF and the UNESCO have prepared assessment indicators related to children, and the WHO has prepared those related to aged people. Although discussions and case studies related to these matters are prevalent in Europe, the U.S., and elsewhere, in Japan, there are almost none.
Next, results of a survey—conducted in the residential area of the Hanshin region of Japan (between Osaka and Kobe) and completed by people who have dogs and cats as companion animals—are presented. These results are compared to the results of a similar study from a residential area in the UK. The survey results reveal aspects of the daily lives of people who
614

have dogs or cats as companion animals. The results of people with dogs as companion animals, in particular, reveal the inadequacy of residential infrastructure as their dog-walking allows them to observe the infrastructure.
According to the reports, some of the assessment indicators for children, the aged, and those who keep companion animals are the same. Thus, by applying those common indicators, an evaluation of Japanese urban residential areas was conducted.
1.3 Preceding studies Many documents, reports, and academic papers reveal that Japanese residential areas, as they currently exist, are not beneficial for children. Some people believe that Japanese residential areas are insufficient for supporting children’s health and growth. There are many children’s activities developed to compensate for the inadequacies of the residential areas. Some people recognize the fact that children do not play in natural spaces, to remedy this problem, they organize activities to visit natural spaces and encourage outdoor play with the children. Although these activities allow children to experience nature, these activities are not daily occurrences and, often times, the cost of these activities are not affordable.
In Japan, aged people experience, among other inadequacies, a lack of housing and a lack of public transportation. However, there are no academic discussions regarding assessments and indicators to evaluate the experiences of aged people.
There are, however, several books for people who keep companion animals. Those books, written by architects, teach people how to design houses suitable for companion animals. Despite the presence of these books, there are few studies that focus on dogs in the larger context of a residential area. And, though there are several studies that focus on walking dogs in parks, only limited themes are investigated.
2. Indicators for children and aged people
2.1 Indicators for children
The UNICEF created a proposal for how to build a Child Friendly City. Characteristics of a Child Friendly City are stated as follows (Malone, 2006, p.21).
1) Good access for all children to affordable, quality basic health services, clean water, adequate sanitation and solid waste removal;
2) Local authorities to ensure that policies, resources allocations and governance actions are made in a manner that is in the best interest of the children and their constituencies;
3) Safe environments and conditions that nurture the development of children of all ages with opportunities for recreation, learning, social interaction, psychological development and cultural expression;
4) A sustainable future under equitable social and economic conditions, and protection from the effects of environmental hazards and natural disasters;
5) Children have the right to participate in making decisions that affect their lives and are offered opportunities to express their opinions;
6) Special attention is given to disadvantaged children, such as those who are living or working on the streets, sexually exploited, living with disabilities or without adequate family support
7) Non-discrimination based on gender, ethnic background or social or economic status.
615
Of these seven indicators, 1) and 3) are matters of urban planning directly and 5) is necessary for making plans of adaptation. The UNESCO provide more specific indicators related to these matters (Freeman, 2006, p.71). The indicators that relate directly to residential areas are shown as follows.
Positive indicators:
1) Safety and freedom of movement
2) Peer meeting places
3) Green areas
Negative indicators:
1) Fear of harassment and crime
2) Heavy traffic
3) Lack of basic service
According to Freeman and Tranter (2011, p.77), additional indicators are necessary. Those indicators include the existence of a neighborhood as well as a place to be able to observe and enjoy nature. The definition of neighborhood in Freeman and Tranter (2011, p.77) is as follows.
What is a Neighbourhood? Neighbourhood at its simplest, the physical space or locality in which people live: it provides the houses, shops, roads, parks, services, schools and other facilities upon which its residents depend. ‘Community’, which is often used interchangeably with ‘neighbourhood’, is a social group connected in some way, but who may or may not live in the same geographic location.
Housing is also important. Freeman and Tranter (2011, p.41) listed children’s housing needs as follows.
Safe outdoor play area (not needing constant parental supervision);
Safe from traffic and pollution;
Natural spaces (places with flexible, malleable materials);
Private open space that is linked to communal open space;
Communal spaces for adults and children to meet each other;
Private play spaces;
Good management and maintenance regimes;
House identity and variety in buildings;
Street linkage and access to a wider environment that encourages independence
These indicators show the importance of safety, green space, open space, safety from traffic, and independent movement.
Japanese municipalities have attempted to implement The UNICEF’s Child Friendly City policy; however, Japan’s main focus are those characteristics that have no direct relation to urban planning (UNICEF Japan, 2017).
2.2 Indicators for aged people
The WHO proposed indicators for an Age-Friendly City. The WHO’s indicators, of course, include indicators for social matters such as “Consultation of older people,” “Access to information in the media,” “Age-sensitiveness of contents broadcasted by the media,” “Service delivery and staff,” “Health and social care services availability.” Indicators of Age-
616
Friendly Cities have direct relation to urban planning are listed below (Lopes, Pinto and Lemos, 2016, p.262).
1) Outside space in general and greenspaces
2) Sidewalks
3) Crossing streets
4) Public buildings physical characteristics
5) Toilet facilities in public places
6) Public transportation frequency and coverage
7) Traffic and roads
8) Bus stops location and characteristics
9) Housing comfort and characteristics
10) Housing and adaptation to special needs
11) Location of services
12) Leisure and events venues
These indicators show that aged people also needs public open space, green space, safety from traffic, and independent movement on foot or using public transportation.
Japan has a large percentage of aged people, and the percentage has increased year-by-year. Adapting to this demographic shift, both socially and physically, is a significant political issue.
The current state of public transportation is far from ideal. There are many aged people who do not drive, and, therefore, certain daily activities, like shopping and going to the hospital, are difficult for them. This has developed into a social problem referred to as “Kaimono Nanminn.”
There are almost no public open spaces or green spaces.
It is necessary to allow aged people to participate in the development of an Age-Friendly City plan. In Japan, aged people are prioritized over children.
Currently, the main topics in the realm of politics in Japan are housing and nursing care for aged people. There are also plans for active aged people to make their communities more active. The physical adaptation of residential areas has converged with the policies for people with disabilities as the actual implementation of policies for people with disabilities have progressed slowly in a step-by-step manner.
3. Person living with companion animals 3.1 Housing
Only owners of detached houses have no constraints to keeping companion animals. Few landlords give their tenants permission to keep companion animals. Most condominium homeowners’ associations did not allow residents to keep companion animals until about 15 years ago. A report by the Ministry of Land, Infrastructure, Transport and Tourism (2013) said that in 2012, 92% of condominium homeowners’ associations allow residents to keep companion animals. Previously in Japan, dogs and cats were kept outdoors. In the UK, most housing providers allow residents to keep dogs and cats indoors, while Maisonettes or flats have their own access and gardens. In other words, for rental houses (Maisonettes and flats) that have their own access and gardens, the owner of the properties allow their tenants to keep dogs or cats; even when the property owner is a municipality (A Pathway & Pet
617
Advisory Committee, 2007). Obviously, there is a significant difference between Japan and the UK when it comes to the ability to have indoor companion animals.
3.2 Troubles related to keeping companion animals
The top three social problems related to companion animals are said to be barking, odors, and dog feces in public and private areas. In Japan, there is no legislation to control these problems at a national level. Several municipalities have enacted and reinforced regulations related to dog feces. However, barking and odors cannot be similarly regulated. This is why in the UK, barking is dealt with as noise and odor is dealt with as a nuisance, and they are both regulated by the “Clean Neighbourhoods and Environment Act 2005.” Dog feces are also regulated by the same act.
In Japan, the Ministry of Environment has declared that owners of dogs should make their dogs use toilets inside their houses to eliminate dog defecation in public. This regulation also requires owners of cats to keep their cats indoors at all time. However, Cats Protection in the UK provides that to become a foster parent of a cat, the cat must be able to go outdoors. This means that cat owners should live in Maisonettes or detached houses and should have backyards without pavement.
Another difference between Japan and the UK, is that dogs do not typically use toilets indoors. Instead, in the UK, dogs should be trained to defecate outside (mostly in backyards). The result of the 2016 field survey revealed that there are no dog toilets or toilet sheets in pet shops in London as there are in Japan.
A Pathway & Pet Advisory Committee (2007, p.7) recommends to housing providers that they “consider setting up sanitary areas on and near housing estates.” In Japan, homeowners’ associations’ pet policies prohibit the use of outdoor space outside the condominium buildings as sanitary areas. In Japan this space is typically used for parking or landscaping. This is yet another significant difference between Japan and the UK.
4. Actual situations in which dog owners live with their dogs 4.1 The survey method
The questionnaire sheets were distributed by homeowners’ associations in condominiums in Hanshin-area (between Osaka and Kobe). Thirteen homeowners’ associations agreed to distribute the questionnaire sheet. Distributed sheets were sent back by post directly from the dog owners. One hundred twenty-five sheets were returned. This survey was conducted from the beginning of January 2017 through the end of February 2017.
Sixty percent of dog owners got their dogs from pet stores; 21% from breeders; and only 2% from shelters. The majority of dogs (78%) were small-sized breeds. Only 18% of the dog owners had medium-sized breeds. The breeds of dogs in the small-sized category in Japan includes Chihuahuas, Toy Poodles, and Miniature Dachshunds. Small–sized breeds are common in Japan because the pet policies formulated by homeowners’ associations in condominiums set limitations on the size of the dog.
4.2 Toilet
As mentioned before, the Ministry of Environment has declared that dog owners should make their dogs use toilets inside their homes. Figures 1 and 2 show the survey results. Figure 1 shows that 77% of dog owners have dog toilets inside their houses. Figure 2 reveals that dogs actually use indoor toilet, and also defecate during walks. Thus, although, dogs are trained to use the toilets inside their homes, they still defecate on walks.
618
Figure: 1 Do you have dog toilet inside the house
Figure 2: The place where your dog defecates
4.3 Dog-walking
According to Figures 3 and 4, 77% of dog owners walk their dogs every day, 29% do so once a day, 59% do so twice a day, and 12% do so more than twice. However, 23% of dog owners keep their dogs inside all day and some of them walk their dogs only occasionally.
Figure 3: How often do you walk your dog?
According to the Dog Owner’s Handbooks published both in the UK and in Japan, after dogs receive their initial vaccinations, it is necessary for them to go outside—not only for exercise but also for socialization. Socialization is one of the important steps in dog training.
77%
12%
11%
Every day
Not every day
Other
23%
77%
Yes
No
6
84
96
0 20 40 60 80 100 120
Others
Inside the house
During a walk
619
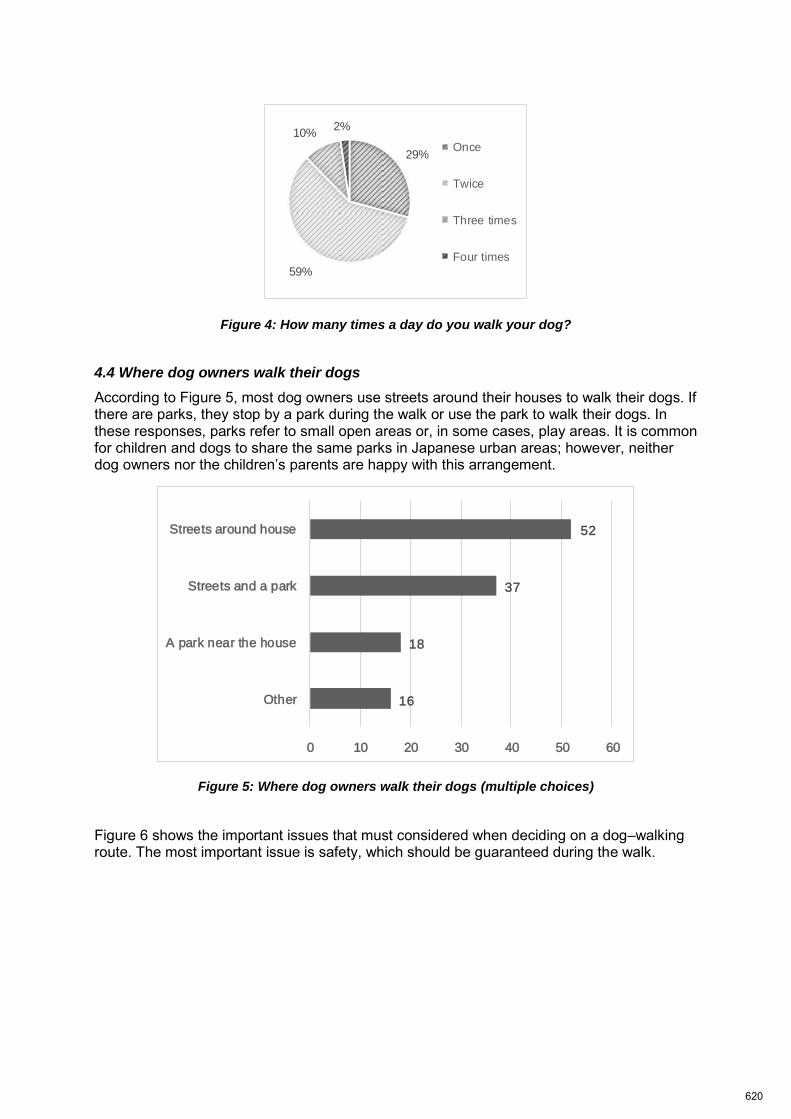
Figure 4: How many times a day do you walk your dog?
4.4 Where dog owners walk their dogs
According to Figure 5, most dog owners use streets around their houses to walk their dogs. If there are parks, they stop by a park during the walk or use the park to walk their dogs. In these responses, parks refer to small open areas or, in some cases, play areas. It is common for children and dogs to share the same parks in Japanese urban areas; however, neither dog owners nor the children’s parents are happy with this arrangement.
Figure 5: Where dog owners walk their dogs (multiple choices)
Figure 6 shows the important issues that must considered when deciding on a dog–walking route. The most important issue is safety, which should be guaranteed during the walk.
29%
59%
10%2%
Once
Twice
Three times
Four times
16
18
37
52
0 10 20 30 40 50 60
Other
A park near the house
Streets and a park
Streets around house
620
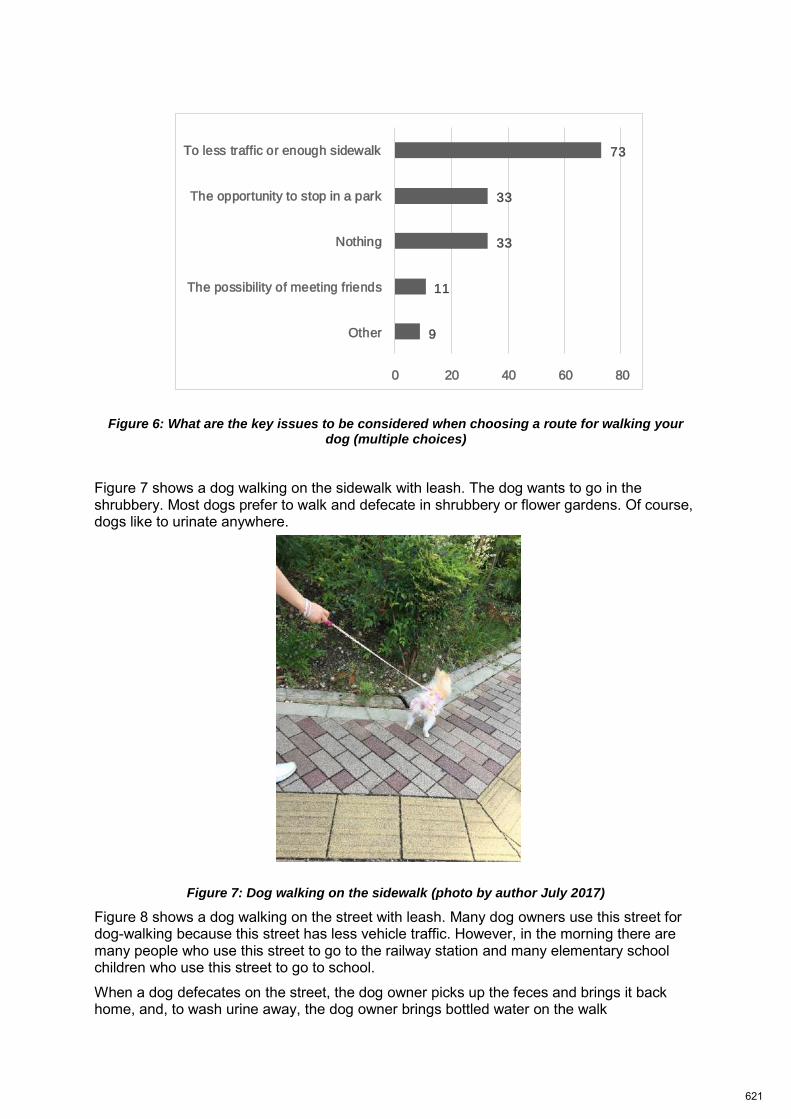
Figure 6: What are the key issues to be considered when choosing a route for walking your
dog (multiple choices)
Figure 7 shows a dog walking on the sidewalk with leash. The dog wants to go in the shrubbery. Most dogs prefer to walk and defecate in shrubbery or flower gardens. Of course, dogs like to urinate anywhere.
Figure 7: Dog walking on the sidewalk (photo by author July 2017)
Figure 8 shows a dog walking on the street with leash. Many dog owners use this street for dog-walking because this street has less vehicle traffic. However, in the morning there are many people who use this street to go to the railway station and many elementary school children who use this street to go to school.
When a dog defecates on the street, the dog owner picks up the feces and brings it back home, and, to wash urine away, the dog owner brings bottled water on the walk
9
11
33
33
73
0 20 40 60 80
Other
The possibility of meeting friends
Nothing
The opportunity to stop in a park
To less traffic or enough sidewalk
621
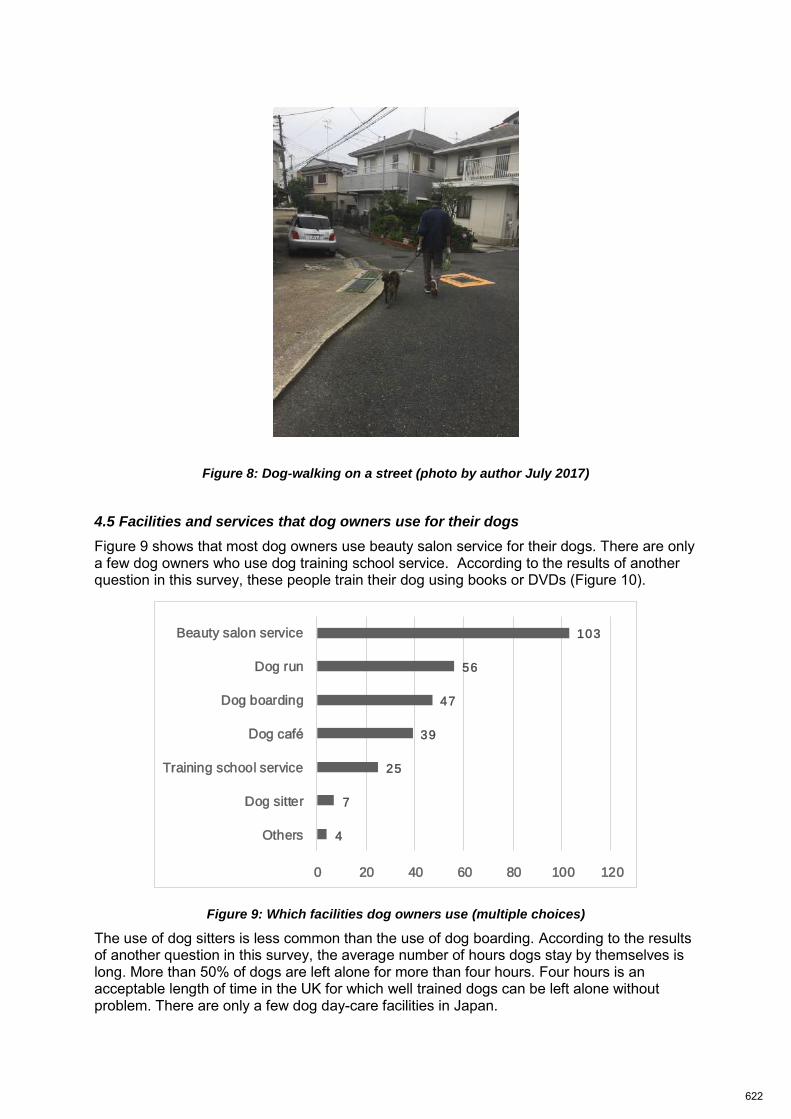
Figure 8: Dog-walking on a street (photo by author July 2017)
4.5 Facilities and services that dog owners use for their dogs
Figure 9 shows that most dog owners use beauty salon service for their dogs. There are only a few dog owners who use dog training school service. According to the results of another question in this survey, these people train their dog using books or DVDs (Figure 10).
Figure 9: Which facilities dog owners use (multiple choices)
The use of dog sitters is less common than the use of dog boarding. According to the results of another question in this survey, the average number of hours dogs stay by themselves is long. More than 50% of dogs are left alone for more than four hours. Four hours is an acceptable length of time in the UK for which well trained dogs can be left alone without problem. There are only a few dog day-care facilities in Japan.
4
7
25
39
47
56
103
0 20 40 60 80 100 120
Others
Dog sitter
Training school service
Dog café
Dog boarding
Dog run
Beauty salon service
622
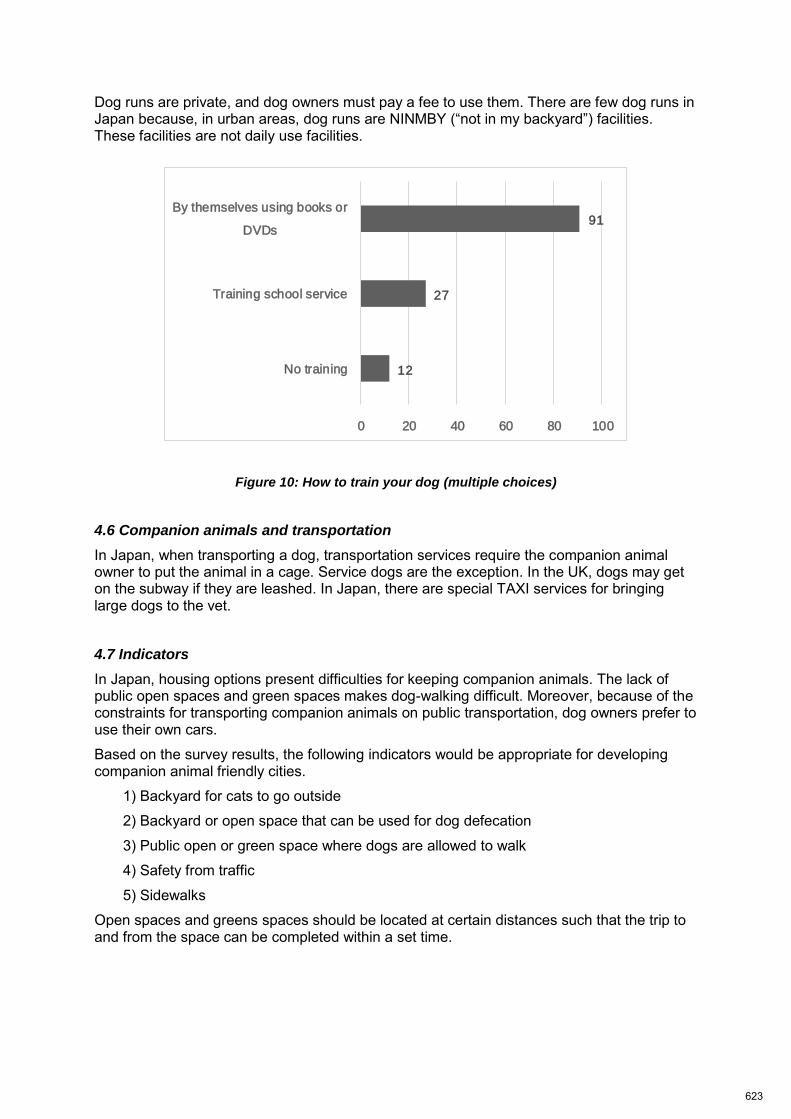
Dog runs are private, and dog owners must pay a fee to use them. There are few dog runs in Japan because, in urban areas, dog runs are NINMBY (“not in my backyard”) facilities. These facilities are not daily use facilities.
Figure 10: How to train your dog (multiple choices)
4.6 Companion animals and transportation
In Japan, when transporting a dog, transportation services require the companion animal owner to put the animal in a cage. Service dogs are the exception. In the UK, dogs may get on the subway if they are leashed. In Japan, there are special TAXI services for bringing large dogs to the vet.
4.7 Indicators
In Japan, housing options present difficulties for keeping companion animals. The lack of public open spaces and green spaces makes dog-walking difficult. Moreover, because of the constraints for transporting companion animals on public transportation, dog owners prefer to use their own cars.
Based on the survey results, the following indicators would be appropriate for developing companion animal friendly cities.
1) Backyard for cats to go outside
2) Backyard or open space that can be used for dog defecation
3) Public open or green space where dogs are allowed to walk
4) Safety from traffic
5) Sidewalks
Open spaces and greens spaces should be located at certain distances such that the trip to and from the space can be completed within a set time.
12
27
91
0 20 40 60 80 100
No training
Training school service
By themselves using books or
DVDs
623
5. Conclusion
After reviewing indicators for children and aged people and introducing indicators for people who keep companion animals, common indicators among all three groups were discovered. Those common indicators are as flows.
1) Public open spaces and green space
2) Backyard or something that is private open space without pavement
3) Safety from traffic
4) Walkable neighborhood
The survey of companion animal owners demonstrates an obvious absence of these spaces in Japanese residential areas. Retaining open space inside developed areas is a basic element in urban planning. However, in Japan, it is difficult to implement such a reguallation because of the City Planning Act.
In Japan, the declining population has created additional social problems related to unoccupied houses and open land. To resolve this problem and to improve the living situation of children, aged people, and companion animal owners, the use of these spaces as open public areas should be considered.
Acknowledgements
Surveys and field works were supported by the Japan Society of Lifology in 2015 and 2016. References: A Pathway & Pet Advisory Committee, (2007), Housing Provider Resource – Practical Guidelines on Pet Management for Housing Providers, [PDF] A Pathway & Pet Advisory Committee Publication, London: Available at: http://homelesshub.ca/sites/default/files/factsheetpetsandhousing09.pdf, [Accessed 10 Aug 2017] Freeman, C., (2006), Colliding worlds: Planning with children and young people for better cities, In: Gleeson, B. and Sipe, N., ed, CREATING CHILD FRIENDLY CITIES reinstating kids in the city, 1st ed. New York: Routledge, pp.69-85 Freeman, C. and Tranter, P., (2011), CHILDREN & THEIR URBAN ENVIRONMENT CHANGING WORLDS, London: Earthscan Lopes, A., Pinto, T. and Lemos, R., (2016), Age-Friendly Cities and the WHO Checklist In: Caro, F. G. and Fitzgerald, K. G., ed, International Perspectives on Age-Friendly Cities, 1st ed. New York: Routledge, pp.256-273 Malone, K., (2006), United Nations: A key player in a global movement for child friendly cities, In: Gleeson, B. and Sipe, N., ed, CREATING CHILD FRIENDLY CITIES reinstating kids in the city, 1st ed. New York: Routledge, pp.13-32 The Mistry of Land, Infrastructure, Transport and Tourism, (2013), A report of comprehensive survey of Japanese dwellings 2013, [PDF] The Mistry of Land, Infrastructure, Transport and Tourism, Tokyo: Available at: http://www.mlit.go.jp/statistics/details/jutaku_list.html, [Accessed 1 June 2017] UNICEF Japan, (2017), Reports of UNICEF Children friendly City Project, [on line] Available at: https://www.unicef.or.jp/cfc/ [Accessed 8 July 2017]
624

SmartCityplacemakinginKashiwa‐no‐ha,Japan
Moderator: Charles KELLEY, ZGF Architects LLP, Portland, USA
Speakers: Amy JARVIS, ZGF Architects LLP, Portland, USA; Mitsu YAMAZAKI, Ziba Design
Mitsui Fudosan, one of Asia’s largest developers, engaged advisors and urban planners to improve
Kashiwa‐no‐ha using smart city placemaking techniques. Located 18 miles north of Tokyo, transit‐
oriented development Kashiwa‐no‐ha Smart City pioneers an urban planning approach for a resilient
neighborhood with an active and vital community. Since 2004, it has been refined to include
community aspirations, respond to disasters and support environmental and social initiatives. In
2016 Kashiwa‐no‐ha Smart City became the largest LEED® Neighborhood Development Plan
Platinum‐certified smart city in the world.
This session will demonstrate how through smart city placemaking, from policy to urban design,
Kashiwa‐no‐ha has become a model of a technologically integrated, advanced mixed‐use
development establishing neighborhood facilities that support a variety of generations, lifestyles,
and uses for a resilient community. Specific learning objectives include:
1. Understand how community engagement can be a tool to leverage and to build trust during a continuous conversation that is organized around important community values.
2. Understand how to adapt and incorporate ecodistrict principles into an existing transit‐oriented development.
3. Understand how the spatial arrangement of neighborhoods serve communities to solidify enduring partnerships that develop and sustain a neighborhood and activate the streetscape.
4. Learn how the LEED ND v4 process created accountability around collective neighborhood action to allow for LEED ND Plan v4 Platinum certification and for a sustainable and resilient community over time.
625
Gunay, Z. et al. How smart is my planning education? ISOCARP-OAPA Conference 2017
1
How smart is my planning education?
Experiential reflections from first year studio
Zeynep GUNAY, Ervin SEZGIN, Eda BEYAZIT, Gorsev ARGIN Istanbul Technical University, Turkey
1. Introduction
Emerging challenges in urbanisation framed by brutally changing political conjuncture, technologies and socio-economic conditions introduce timely requirements to re-evaluate and re-contextualise planning profession and education. They, at the same time, cater for a creative, critical and ‘smart’ platform to think through new opportunities in reshaping our understanding of the planning contexts, methods and actors. Today, it is apparent more than ever that the tackling with the challenges of the 21st century city is only effective through responsive, participatory and inclusive frameworks, and an interactive, experiential and reflexive learning environment. This is also the goal of the planning studios, exemplified in this paper, as the cornerstone of planning pedagogy, education, and that of the planning profession. The current pedagogical and curricular advancements made in the first-year Planning Studio of the Istanbul Technical University (ITU)’s Department of Urban and Regional Planning provides new perspectives to explore the following questions: How the ideal of smartness is reflected in our planning pedagogy? How smart is our planning education? What are the pedagogical tools and methodologies for becoming smart? How does it affect our responses to create a transformative change in our human settlements? Decoding and intervening the everyday life is one of the modules of this new experiential and reflexive pedagogical approach –conducted in 2016-2017 academic year with the collaboration of professional NGOs and practitioners– to bring into view how a planning studio transforms itself into a manifestation to conceptualize and intervene in the everyday life, while reducing the distance between the planner, or the designer and the real world to empower interdisciplinary, reflexive, critical and creative thinking and education. 2. Planning Studio Pedagogic Model in Istanbul Technical University
Since the beginning of the 2015-2016 academic year, the studios of the first three semesters within the undergraduate programmes of five departments, including Architecture, Urban and Regional Planning, Industrial Design, Interior Architecture and Landscape Architecture, are conducted collaboratively within the frame of Foundation Studio (TES) under the coordination of the ITU Faculty of Architecture. TES has a complex curriculum, spanning on three semesters and six interdependent courses including ‘Project Studio’, ‘Visual Communication’ and ‘Basic Design and Visual Arts’. These complementary courses aims to deliver topics and concepts that students would use throughout their undergraduate education in the Faculty within an integrated systematic model 1 . In this regard, students are expected to work, think and produce in an interdisciplinary media, which is crucial for modern education in all departments of the Faculty. The curriculum also aims to increase the level of integrity and collaborative work among five disciplines.
626
Gunay, Z. et al. How smart is my planning education? ISOCARP-OAPA Conference 2017
2
Within the framework of 2016-2017 academic year, first two Studios as the subject of this paper introduce the main topics and concepts that frame design and planning education within an integrated and interdisciplinary model. Being managed collaboratively under a number of sections 2 of professors and students from different disciplines, the learning outcomes are defined briefly at the Faculty level, while curriculum and open studio pedagogy offers diversity depending on the sections. What follows is the experience of Section 5. Studio 1 aims at helping students to develop knowledge, skills and values for questioning, reading, understanding, interpreting and reproducing the space, while increasing design and planning skills based on analytical and critical thinking. Regarding the pedagogical model and curriculum of the Section 5, the Studio focuses not only on contrasting and complementary concepts such as ‘voids’, ‘dominance/recessiveness’, ‘inclusion/exclusion’ and ‘sense-scape’ to uncover the meanings of space, but also on social interactions and how they influence the formation of space and the place the individual (the designer) takes in these relations under the themes of ‘memory/ continuity’ and ‘everyday life/market place’. By using Istanbul as a laboratory, students acquire the knowledge of the city they live in and also find the opportunity to examine the above-mentioned concepts in urban context. In addition to the excursions to museums, exhibitions and as well as Istanbul Biennale, the curricular activities also include movie screenings and seminars that take place throughout the semester. Studio 2, on the other hand, is an introduction to (urban and architectural) design. The focus is to understand and interpret urban space, as well as to experience and understand the processes and dynamics of design by comprehending disciplinary issues critically. For this purpose, the Studio of Section 5 is organised within a structure of disciplinary division and cohesion within two parts. During the first part, urban planning students work on disciplinary issues and techniques – as Entwistle (2009: 3) claims: “university teaching depends, first and foremost, on understanding one’s discipline in a sufficiently broad and deep way to be able to make that understanding clear to students”. The second part, on the other hand, is structured as a ‘common site - common design workshop’ under the title of Alternative Imaginaries on Urban Space and Life allowing urban planning professors and students collaborate with that of architecture, interior design and landscape architecture. This module includes kick off explorational design studies equipped with strategies and scenarios that set-up in interdisciplinary student groups and later evolving into individual design proposals that perform as integral elements of the group proposal. The remainder of the paper focuses on the products of the first part of the second semester in particular, to further elaborate the new approach on first year planning studio education.
3. Experiential Reflections: ‘Decoding and Intervening the Everyday Life in Kadikoy’
The planning module conveyed in the academic year of 2016-2017, under the theme of Decoding and intervening the everyday life in Kadikoy, introduced the basic notions and principles of urbanism to planning students, while teaching different techniques of understanding urban space and its dynamics; and guided them to develop intervention proposals that change the ways in which the socio-spatial and spatio-economic relationships embedded within these urban spaces are structured. Critical thinking on planning as a profession of design of cities is expanded by using Istanbul as a laboratory – with the motto of “learning by doing” or “knowing in action” (see Schon, 1983; Kolb, 1984; Lang, 1983). The studio process is structured through lecture series, discussion sessions, fieldworks, presentations and exhibitions. Based on Kadikoy, Yeldegirmeni and Moda neighbourhoods of Istanbul, this first part of the Studio 2 consists of three modules. Each module is designed to encourage critical thinking, while understanding and interpreting the space and its contradictory and complementary relations framed by everyday life, politics, economy and actors; to question problems analytically as well as to explore solutions through hands-on
627
Gunay, Z. et al. How smart is my planning education? ISOCARP-OAPA Conference 2017
3
interventions and small-scale focused design proposals. Major attention is given to help students develop and improve their critical and abstract thinking skills throughout the learning process; their independent problem definition and solving capacities, and team-working and collaboration experience together with developing their individual creative pursuit. The motto for ‘urban decoders’ is simple (as much as it is complex):
“How many maps, in the descriptive or geographical sense, might be needed to deal exhaustively with a given space, to code and decode all its meanings and contents? It is doubtful whether a finite number can ever be given in answer to this sort of question. What we are most likely confronted with here is a sort of instant infinity, a situation reminiscent of a Mondrian painting. It is not only the codes –the map's legend, the conventional signs of map-making and map-reading– that are liable to change, but also the objects represented, the lens through which they are viewed, and the scale used. The idea that a small number of map, or even a single (and singular) map might be sufficient can only apply in a specialized area of study whose own self-affirmation depends on isolation from its context”. (Lefebvre, 1992: 85-86).
The first module, Decoding Urban Physical Structure and its Interaction with Urban Mobilities, focused on the urban physical infrastructure to discuss how mobilities are formed and how meanings are attached to the functions and characteristics of these infrastructures. Students were expected to unfold these relationships by doing an ethnographic field research in Kadikoy, Yeldegirmeni and Moda neighbourhoods (see Figure 1). They also searched for spatial reflections of some concepts (as well as their counter-parts) such as ‘continuity’, ‘proximity’, ‘transparency’, ‘entrance’ and ‘passage’. A diverse selection of techniques of visualisation was employed including graphic novels, fanzines, infographics and video documentaries among others to introduce ‘playfulness’, ‘creativity’ and even ‘informality’ in addition to the conventional mediums. The second module, Decoding Spaces of Urban Dwellers & Passers by, focused on a different level of interactions. This time the students were expected to investigate whether different places in Kadikoy, Yeldegirmeni and Moda meet the needs of certain demographic and/or socio-economic groups, and therefore become spaces of these groups. In order to advance the module, students were encouraged to use participatory and interactive methods such as on-site interviews, walking interviews (and/or other ‘on the move’ methods) and surveys designed by themselves (Figure 2). Interactive survey boards, semi-structured interviews and cognitive mapping built the essence of our research tools in this module, inspired by previous projects such as Sehrine Ses Ver group project Duslerinle Gel (Come with your Dreams) and Dorota Grabkowska and Kuba Kolec’s installation What Made Me. The students were asked to develop a detailed insight of the area, from their experiences and perceptions, and explain hows and whys of daily interactions based on narratives. They communicated a holistic picture of experiences and attached meanings, classified and identified themes and patterns. Interviews and cognitive maps were used to represent the space and layout a setting through the clues, and to examine how local society experiences the settlement, and what kind of problems they encounter. The process and results of fieldworks were instantly documented in diverse social media platforms including Web Blogs, Twitter and Instagram as part of ‘instant urbanism’ in embodying information and communication technologies (ICTs) as a medium in increasing the ability of active and reflective learning processes based on social interaction and mobility, as well as the dialogue between students and professors (Figure 3). To create an interactive platform of action, interactive fieldwork process and particularly interactive survey boards were designed and managed with the contribution of civil society organizations and design studios of practice such as Kot0 and Tasarim Atolyesi Kadikoy (TAK) 3.
628
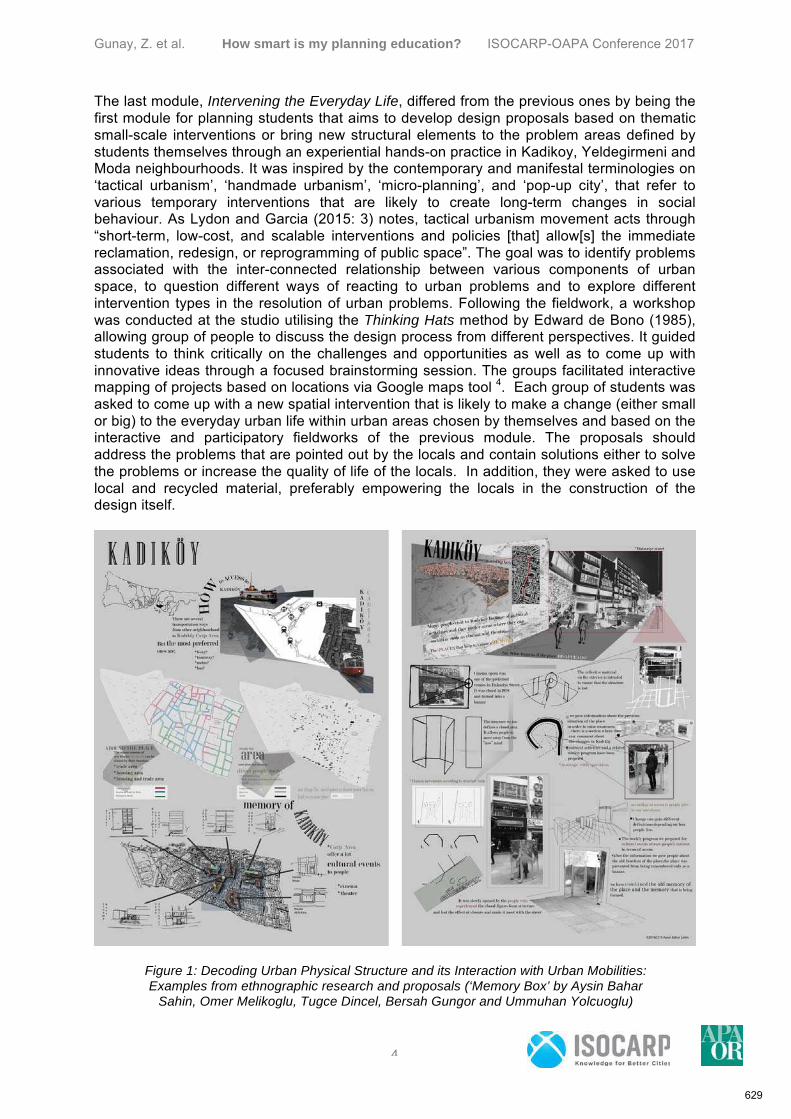
Gunay, Z. et al. How smart is my planning education? ISOCARP-OAPA Conference 2017
4
The last module, Intervening the Everyday Life, differed from the previous ones by being the first module for planning students that aims to develop design proposals based on thematic small-scale interventions or bring new structural elements to the problem areas defined by students themselves through an experiential hands-on practice in Kadikoy, Yeldegirmeni and Moda neighbourhoods. It was inspired by the contemporary and manifestal terminologies on ‘tactical urbanism’, ‘handmade urbanism’, ‘micro-planning’, and ‘pop-up city’, that refer to various temporary interventions that are likely to create long-term changes in social behaviour. As Lydon and Garcia (2015: 3) notes, tactical urbanism movement acts through “short-term, low-cost, and scalable interventions and policies [that] allow[s] the immediate reclamation, redesign, or reprogramming of public space”. The goal was to identify problems associated with the inter-connected relationship between various components of urban space, to question different ways of reacting to urban problems and to explore different intervention types in the resolution of urban problems. Following the fieldwork, a workshop was conducted at the studio utilising the Thinking Hats method by Edward de Bono (1985), allowing group of people to discuss the design process from different perspectives. It guided students to think critically on the challenges and opportunities as well as to come up with innovative ideas through a focused brainstorming session. The groups facilitated interactive mapping of projects based on locations via Google maps tool 4. Each group of students was asked to come up with a new spatial intervention that is likely to make a change (either small or big) to the everyday urban life within urban areas chosen by themselves and based on the interactive and participatory fieldworks of the previous module. The proposals should address the problems that are pointed out by the locals and contain solutions either to solve the problems or increase the quality of life of the locals. In addition, they were asked to use local and recycled material, preferably empowering the locals in the construction of the design itself.
Figure 1: Decoding Urban Physical Structure and its Interaction with Urban Mobilities: Examples from ethnographic research and proposals (‘Memory Box’ by Aysin Bahar
Sahin, Omer Melikoglu, Tugce Dincel, Bersah Gungor and Ummuhan Yolcuoglu)
629
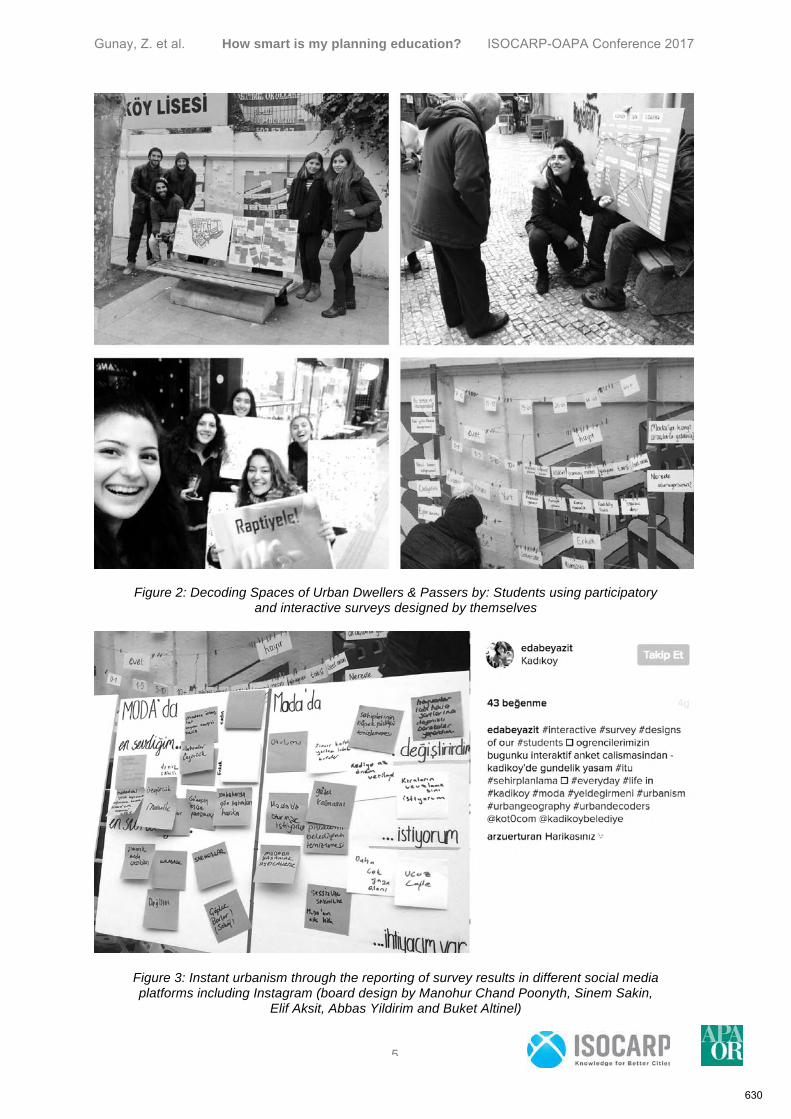
Gunay, Z. et al. How smart is my planning education? ISOCARP-OAPA Conference 2017
5
Figure 2: Decoding Spaces of Urban Dwellers & Passers by: Students using participatory and interactive surveys designed by themselves
Figure 3: Instant urbanism through the reporting of survey results in different social media platforms including Instagram (board design by Manohur Chand Poonyth, Sinem Sakin,
Elif Aksit, Abbas Yildirim and Buket Altinel)
630
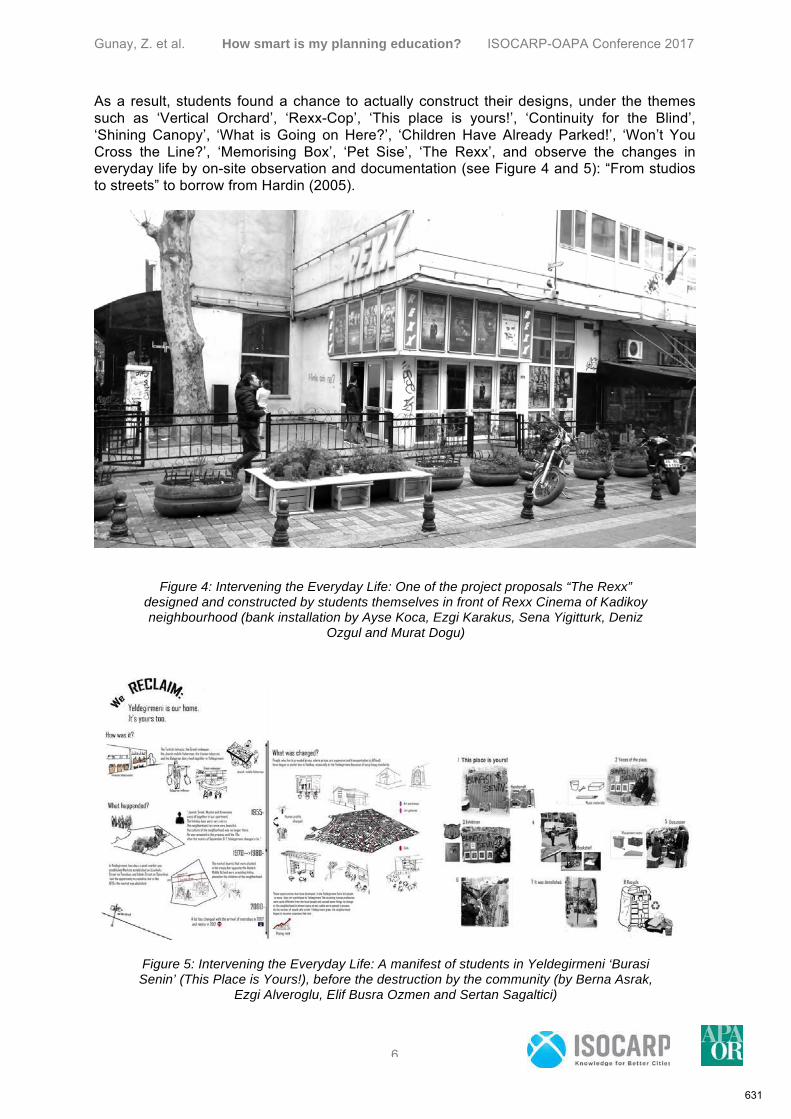
Gunay, Z. et al. How smart is my planning education? ISOCARP-OAPA Conference 2017
6
As a result, students found a chance to actually construct their designs, under the themes such as ‘Vertical Orchard’, ‘Rexx-Cop’, ‘This place is yours!’, ‘Continuity for the Blind’, ‘Shining Canopy’, ‘What is Going on Here?’, ‘Children Have Already Parked!’, ‘Won’t You Cross the Line?’, ‘Memorising Box’, ‘Pet Sise’, ‘The Rexx’, and observe the changes in everyday life by on-site observation and documentation (see Figure 4 and 5): “From studios to streets” to borrow from Hardin (2005).
Figure 4: Intervening the Everyday Life: One of the project proposals “The Rexx” designed and constructed by students themselves in front of Rexx Cinema of Kadikoy neighbourhood (bank installation by Ayse Koca, Ezgi Karakus, Sena Yigitturk, Deniz
Ozgul and Murat Dogu)
Figure 5: Intervening the Everyday Life: A manifest of students in Yeldegirmeni ‘Burasi Senin’ (This Place is Yours!), before the destruction by the community (by Berna Asrak,
Ezgi Alveroglu, Elif Busra Ozmen and Sertan Sagaltici)
631

Gunay, Z. et al. How smart is my planning education? ISOCARP-OAPA Conference 2017
7
Although some of the projects were welcomed negatively by the local community and even destroyed (see Figure 5), students were encouraged to welcome these results critically as part of the education and more importantly real word experience by focusing on the process rather than the product itself. At the core of all these lie the principles of the studio of urban decoders, as shared in Syllabus of 2016-2017 academic year:
“REMEMBER! Studio-work at the studio! Use your lecture time efficiently; try to finish your work at the studio. This will allow you to spend less time for homework. Team-work is a must! For improving your design skills, you have to work hard by your own. But remember, to successfully accomplish your tasks, you have to rely on your team. Team-work allows division of labour, provides new and different perspectives and keeps you away from isolation. Good team-work brings success in the class, in work and life. Be flexible, open to communicate and responsible. Cooperation instead of competition! As a part of the team-work strategy, TES studio encourages solidarity and cooperation between students. Thinking and learning is not a race but a collective and interactive act. Share your data and knowledge with other students, discuss and interact. We are working as a class! You’ll be able to interact with all of the instructors. They will bring their own experience, knowledge and point of view in their comments regarding your work. Try to learn from all of them, but be critical. Elaborate their critics and reasoning; then transform it to your unique work. While presenting it, be consistent and open to criticism.”
4. Concluding Remarks: How Smart is My Planning Education?
Based on the experiential Planning Studio of the ITU, the paper has tried to introduce a smart platform to rethink planning education as a science and art for building responsive, participatory and inclusive human settlements. Being aware of the reality that tackling with the challenges of the 21st century city is only effective through responsive, participatory and inclusive frameworks and an interactive learning environment, it should not be wrong to claim that studios –which were once abandoned as a pedagogical device in planning curricula during the late 1960s (Lang, 1983)– have an essential role in building a smart framework for urban planning and design education, as they bridge the gap between theory and practice through ‘a process-centred’ and ‘practice-driven’ approach. While exploring the language of thought surrounding this frame, it is important to take into consideration the claims of two learning theorists Donald Alan Schon and David Kolb. Kolb (1984: xviii) states that: “The most important […] spirals of learning is a continuing inquiry into the nature of experience and the process of learning from it”. “Experiential learning”, in that sense, defines a particular form of learning from life experience; as “learning to adapt new rules of game is becoming critical as performing well under the old rules” (p.2). According to him,
• Learning is best conceived as a process, not in terms of outcomes • Learning is a continuous process grounded in experience • The process of learning requires the resolution of conflicts between dialectically
opposed modes of adaptation to the world • Learning is an holistic process of adaptation to the world
632
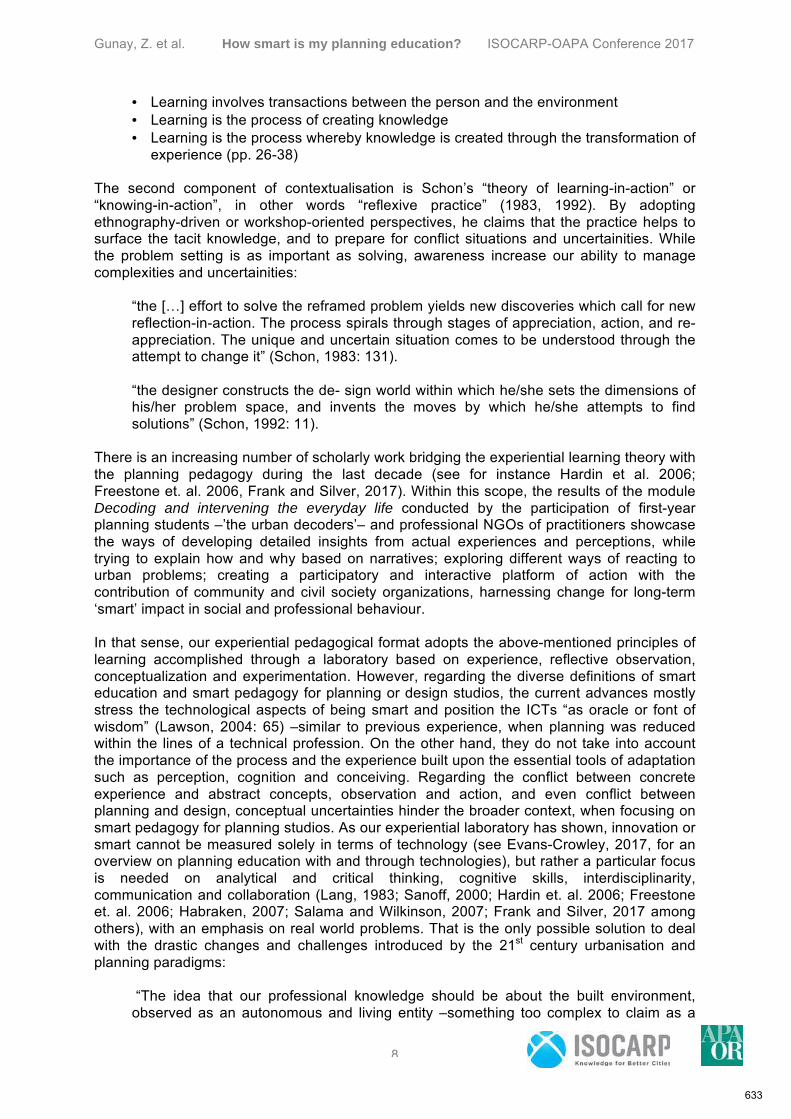
Gunay, Z. et al. How smart is my planning education? ISOCARP-OAPA Conference 2017
8
• Learning involves transactions between the person and the environment • Learning is the process of creating knowledge • Learning is the process whereby knowledge is created through the transformation of
experience (pp. 26-38)
The second component of contextualisation is Schon’s “theory of learning-in-action” or “knowing-in-action”, in other words “reflexive practice” (1983, 1992). By adopting ethnography-driven or workshop-oriented perspectives, he claims that the practice helps to surface the tacit knowledge, and to prepare for conflict situations and uncertainities. While the problem setting is as important as solving, awareness increase our ability to manage complexities and uncertainities:
“the […] effort to solve the reframed problem yields new discoveries which call for new reflection-in-action. The process spirals through stages of appreciation, action, and re- appreciation. The unique and uncertain situation comes to be understood through the attempt to change it” (Schon, 1983: 131). “the designer constructs the de- sign world within which he/she sets the dimensions of his/her problem space, and invents the moves by which he/she attempts to find solutions” (Schon, 1992: 11).
There is an increasing number of scholarly work bridging the experiential learning theory with the planning pedagogy during the last decade (see for instance Hardin et al. 2006; Freestone et. al. 2006, Frank and Silver, 2017). Within this scope, the results of the module Decoding and intervening the everyday life conducted by the participation of first-year planning students –’the urban decoders’– and professional NGOs of practitioners showcase the ways of developing detailed insights from actual experiences and perceptions, while trying to explain how and why based on narratives; exploring different ways of reacting to urban problems; creating a participatory and interactive platform of action with the contribution of community and civil society organizations, harnessing change for long-term ‘smart’ impact in social and professional behaviour. In that sense, our experiential pedagogical format adopts the above-mentioned principles of learning accomplished through a laboratory based on experience, reflective observation, conceptualization and experimentation. However, regarding the diverse definitions of smart education and smart pedagogy for planning or design studios, the current advances mostly stress the technological aspects of being smart and position the ICTs “as oracle or font of wisdom” (Lawson, 2004: 65) –similar to previous experience, when planning was reduced within the lines of a technical profession. On the other hand, they do not take into account the importance of the process and the experience built upon the essential tools of adaptation such as perception, cognition and conceiving. Regarding the conflict between concrete experience and abstract concepts, observation and action, and even conflict between planning and design, conceptual uncertainties hinder the broader context, when focusing on smart pedagogy for planning studios. As our experiential laboratory has shown, innovation or smart cannot be measured solely in terms of technology (see Evans-Crowley, 2017, for an overview on planning education with and through technologies), but rather a particular focus is needed on analytical and critical thinking, cognitive skills, interdisciplinarity, communication and collaboration (Lang, 1983; Sanoff, 2000; Hardin et. al. 2006; Freestone et. al. 2006; Habraken, 2007; Salama and Wilkinson, 2007; Frank and Silver, 2017 among others), with an emphasis on real world problems. That is the only possible solution to deal with the drastic changes and challenges introduced by the 21st century urbanisation and planning paradigms:
“The idea that our professional knowledge should be about the built environment, observed as an autonomous and living entity –something too complex to claim as a
633
Gunay, Z. et al. How smart is my planning education? ISOCARP-OAPA Conference 2017
9
product, but subject to our cultivation– seems to me sound and promising. Such knowledge may, eventually, allow us to decide with confidence what can be taught in studio and what is best conveyed and learned in another way” (Habraken, 2007: 17).
Thus, the components of smart education include not only outcomes or information and communication technologies, but also have an organisational dimension –as planning is the profession of shaping human settlements. While educational outcomes covers fast, critical and cognitive knowledge delivery and training with new skills, knowledge and values; the technology dimension deals with smart educational materials, smart technologies, smart media to increase ability of active learning processes based on social interaction and mobility (Salama and Wilkinson, 2007; Evans-Crowley, 2017). At the core lies the process that the management of such smart planning pedagogy necessitates flexibility and diversity with the facilitation of self-organisation, leadership, analytical thinking and independence to introduce “democracy and collective decision making” (Sanoff, 2000) in the studio environments. Constructed upon the previous scholarly work and the deployed pedagogical model and planning studio experience, the following remarks build the basis for the lessons learned for future ‘smart’ success:
• Contributing to broaden opportunities for rethinking planning education and even profession for the young professionals.
• Positioning the planning studio within a broader spatial, economic, social and political context.
• Being aware on the fact that there is no particular ‘perfect’ method or tool in planning studio education; they are dependent on the location, the context and the actors.
• Paying equal importance to the ‘what’ and ‘how’ of urban planning and design. • Strengthening awareness on participation, collaboration, communication and
leadership to create transformative change in our human settlements. • Facilitating critical and analytical standing to increase awareness on complex
mechanisms surrounding the profession. • Encouraging students not only for collective research but also for individual creative
pursuit to facilitate intellect on urban planning and design as a process. • Encouraging students to lead research on the components of urban space and on
the meanings attached, rather than traditional pre-determined set of conventional spatial analysis.
• Engaging students in collective research and individual creative pursuit through focused tasks and workshop-based creative thinking.
• Empowering students to interact with the community through the use of practical participatory and interactive methods.
• Developing a detailed insight from actual experiences and perceptions, while trying to explain how and why based on narratives to communicate a holistic picture of experiences and attached meanings.
• Facilitating a medium of knowledge transfer and joint-learning process through the interdisciplinary and interconnected approach via collaboration between university, practitioners, civil society organizations and community.
• Using diverse tools and technologies in diverse stages of learning process to meet with the prerequisites of the rapidly changing advancements of 21st century city.
• Promoting new technologies and innovative methods to engage young planners in a common language between generations and cultures.
• Promoting interactive teaching and learning through the facilitation of ICTs without over-emphasising on technology that risks developing critical thinking skills.
634
Gunay, Z. et al. How smart is my planning education? ISOCARP-OAPA Conference 2017
10
• Sharing the results of the programme through different digital media (via webpages, social media, etc.) to bring an improved perspective on urban challenges and solutions
• Facilitate students with the skills to manage their specific strengths, to express themselves and to lead the process.
• Allowing students to become the real agents of a collective action through hands-on experiences as part of community design processes; thus meeting with real life and real community makes them better understand the contexts.
• Hence, taking the studio education out of studio. The experiential pedagogical format of the first-year experience, in that sense, provides a platform to question how a planning studio transforms itself into a manifestation to conceptualize and intervene in the everyday life of its community, while decreasing the distance from the real world and the actors of the real world as medium to increase interdisciplinary, reflexive, experiential, critical and creative thinking and education. The new curriculum and pedagogical format of the first-year planning studio –which has been driven for many years within a pedagogic interval between a focus on technical subjects such as spatial analysis or technical drawing and a focus on gestalt rules of basic design due to the conflict between planning and design (procedure and creativity)– achieved significant progress in transforming planning education to take a lead to torn away from technical, method-centric and outcome-driven formations. According to Gunay (2007), planning is already the art of designing cities (emphasising the difference between ‘city design’ and ‘design of cities’). Thus, the phenomenon of smartness lies at the core of positioning understanding, questioning, perceiving, intervening, conceiving, rather than reducing the notion of space into a purely two-dimensional physical product or a blue-print, with an emphasis on understanding the concepts, ‘Subjects’, processes and interactions that constitute the essence of the planning profession in between science, art and design. Endnotes 1 For an overview of the Foundation Studio (TES), please see respective documents in the TES
Knowledge Hub <http://tesfoundationstudio.wordpress.com>. 2 Project Studio of the Foundation Studio (TES) conveys 5 sections/teams. The studio addressed here
in this paper is through the ‘Section 5’ with the tutors Demet Dincay, Eda Beyazit, Elif Belkis Oksuz, Ervin Sezgin, Gorsev Argin, İpek Sen, Muhammed Ali Ornek and Zeynep Gunay (Coordinator) for the 1st semester, and Bahadır Numan, Eda Beyazit, Elif Belkis Oksuz, Ervin Sezgin, Gorsev Argin, Muhammed Ali Ornek, Yuksel Demir (Coordinator) and Zeynep Gunay (Coordinator) for the 2nd semester. The Planning Module of the 2nd semester, which is the focus of this research on the other hand, included tutors of Eda Beyazit, Ervin Sezgin, Gorsev Argin, and Zeynep Gunay (Coordinator). For detailed information on the Planning Module, please see, TES Knowledge Hub <http://itutes2.wordpress.com/category/course-sections/section-56/> and Urban Decoders Blog <http://urbandecoders.wordpress.com/urbandecoders/>
3 We are deeply thankful for the support and contribution of Gubse Korkmaz and Ozgur Gok from Kot0, and Onur Atay from Tasarim Atolyesi Kadikoy (TAK). For more information on these design platforms, please see the following: Kot0 <http://kot0.com> and Tasarim Atolyesi Kadikoy (TAK) <http://takortak.org>.
4 Interactive mapping of projects based on locations via googlemaps tool can be found via the following link: URL <http://www.google.com/maps/d/edit?mid=1ZUGYL4OX8jhtSqw1QGcqq1s1 S4Y& ll=40.988043644697925%2C29.025953999999956&z=15>
635
Gunay, Z. et al. How smart is my planning education? ISOCARP-OAPA Conference 2017
11
References
Entwistle, N. (2009) Teaching for Understanding at University: Deep Approaches and Distinctive Ways of Thinking, London: Palgrave Macmillan.
Evans-Crowley, J.S. (2017) “Planning education with and through technologies”, in: A.I. Frank, C. Silver (eds) Urban Planning Education: Beginnings, Global Movement and Future Prospects, pp. 293-306, Springer.
Frank, A.I., Silver, C. (2017) “Envisioning the future of planning and planning education”, in: A.I. Frank, C. Silver (eds) Urban Planning Education: Beginnings, Global Movement and Future Prospects, pp. 235-250, Springer.
Freestone, R., Thompson, S., Williams, P. (2006) “Student experiences of work-based learning in planning education”, Journal of Planning Education and Research, 26 (2), 237-249.
Gunay, B. (2007) “Gestalt theory and city planning education”, METU Journal of Faculty of Architecture, 24 (1) 93-113.
Gunay, Z. (2009) “My city vs. your city: Interdisciplinary battles in urban studies”, in: B. Yigit Turan, D. Aslan (eds) Landscape Architecture, Multiculturality, Education, pp. 69-80, Ankara: TUBITAK.
Habraken, N.J. (2007) “Introductory invited visionary essay to tend a garden-thoughts on the strengths and limits of studio pedagogy”, in: A.M. Salama and N. Wilkinson (eds) Design Studio Pedagogy: Horizons for the Future, pp. 11-20, Gateshead: The Urban International Press.
Hardin, M.C., Eribes, R., Poster, C. (eds) (2006) From the Studio to the Streets: Service-Learning in Planning and Architecture, Stirling: Stylus.
Kolb, D.A. (1984) Experiential Learning: Experience as the Source of Learning and Development, New Jersey: Prentice Hall.
Lang, J. (1983) “Teaching planning to city planning students: An argument for the studio/workshop approach”, Journal of Planning Education and Research, 2 (2), 122-129.
Lawson, B. (2004) What Designers Know, Oxford: Architectural Press. Lefebvre, H. (1992) Production of Space, Blackwell: Oxford. Lydon, M. and Garcia, A. (2015) Tactical Urbanism Short-term Action for Long-term Change.
Washington, Covelo and London: Island Press. Salama, A.M., Wilkinson, N. (2007) “Introduction: Legacies for the future of design studio
pedagogy”, in: A.M. Salama and N. Wilkinson (eds) Design Studio Pedagogy: Horizons for the Future, pp. 3-10, Gateshead: The Urban International Press.
Sanoff, H. (2000) Community Participation Methods in Design and Planning, New York: John Wiley.
Schon, D.A. (1983) The Reflective Practitioner: How Professionals Think in Action, New York: Basic books.
Schon, D.A. (1992) “Designing as reflective conversation with the materials of a design situation”, Knowledge-Based Systems, 5 (1), 3-14.
Shepherd, A., Cosgrif, B. (1998) “Problem-based learning: A bridge between planning education and planning practice”, Journal of Planning Education and Research, 17 (4), 348-357.
636

Exploring the Real Smartness in an Urban Context through a deductive meta-synthesis approach
(Title of Presentation: Quest to the Real Urban Smartness)
Mani DHINGRA; Indian Institute of Technology, Kharagpur; India Subrata CHATTOPADHYAY; Indian Institute of Technology, Kharagpur; India
1. Abstract The study applies a deductive meta-synthesis approach to conceptualize ‘Smart Cities’ ideal. The critical review of the selective literature shows that despite being so popular, the term ‘Smart City' is vague, multi-dimensional and fuzzy. There are several research gaps in the existing Smart Urban Development Framework (SUDF) such as lack of integrative urban planning techniques and missing focus on traditional communities. The main issue with conflating and the self-congratulatory Smart Cities are its market-led urban agenda and underlying domination of neoliberal urban spaces, leading to entrepreneurial urban forms and ignoring the cultural industries (R. Hollands, 2015). A community-oriented, holistic and contextual definition of Smart City is proposed based on a detailed definition analysis. The three-pronged objectives of urban smartness are to promote a sustainable, livable and equitable urban development. There are six existing urban dimensions covered in majority of the literature on SUDF, viz. Economic, Social, Environmental, Living, Mobility and Governance aspects. Based on the urban dimensions’ analysis, three factors are missing, despite having high relevance in the SUDF. These are Physical, Spatial, and Cultural dimensions which are not only unique for a particular city but are also different for different parts and places within a city. These can be collectively referred as place based or territorial Urban Attributes of a Smart Community. The research concludes that a Real Smart Urban Landscape is shaped by the local characteristics, priorities, and needs of cities and its citizens (Yigitcanlar, 2015) and hence should be integrative in approach. 2. Introduction The notion of Smart Cities has become significantly popular among the international agencies as well as academics to tackle grave urban issues such as socioeconomic inequality and climate change. The term ‘Smart' has succeeded the other urban science disciplines to foster intelligent, responsive and sustainable urban development (Neirotti, et al., 2014). Yigitcanlar (2015) in his article on Smart Cities cited Halpern’s discussion that whether the ‘Smart City’ ideal is a result of ‘Smart Communities’ through the use of smart technology or vice versa. He firmly claimed that the current global process is nothing but self-branding approach being adopted by cities and till now a fully-fledged smart city doesn’t exist. In fact, Hollands (2008) stated that the latent urban issues such as social inequality, urban gentrification, and conflict between environmental sustainability and economic growth may develop behind this Smart City label. He strongly condemned the increasing tendency to focus on urban place-marketing instead of urban place-making resulting in a disastrous urban form. Though many research articles have put ICT and urban innovations at the core of the smart city, but authors have strongly felt that smartness can’t be attributed to the technology alone (Yigitcanlar, 2015) and need not necessarily be the most critical factor for defining smart city (R. G. Hollands, 2008). Margarita (2014) in her study concluded that strategic planning is still a missing component from present SUDF and is an abstract idea with a single belief that innovative technological solutions can transform a city into a smart one. A high-tech variant of smart cities may just apply some short-term spatial fixes neglecting the needs of the traditional communities and poorer residents (R. Hollands, 2015) rarely viewing the urban ethnic minorities and migrants as a social and cultural resource. The current SUDF is of self-
637
promoting, self-congratulatory and self-branding nature to fulfill market ambitions. The over-emphasis of ICT component may lead to underplay of critical urban issues (Gaffney & Robertson, 2016) (as cited in Hollands, 2008); exposing the local people and society to high risks and making them vulnerable. Similarly, Angelidou (2014, 2015) discussed the need to adopt human-centered approaches to the problems of the urban environment as an essential feature of the smart city and thus, technology should be at the service of its people and not vice versa. Ideas which have been developed for Masdar or Songdo may not translate correctly into the local socio-economic and spatial context of traditional cities in India or Europe. In fact, within a city, the planned interventions might give internally differentiated results, privileging some places, people, and activities over others (Taylor, et al., 2014). Shapiro (2006) and Hollands (2008) argue that the ‘smart-er’ cities begin with their human capital rather than blindly believing that ICT can automatically create a smart city. The aim of this research is to derive a comprehensive and community-oriented definition of Smart Cities and identify the gaps in existing SUDF. The study explores the missing links in the present concept of Smart Cities by applying a deductive meta synthesis approach on the systematically selected literature. Expert Opinion Surveys are also carried out to substantiate the findings from the critical literature analysis. Authors realize that it is highly possible that an existing urban system functions smartly by harnessing the natural setting and local planning models in a given context; without employing any of the modern digital technologies. The social and ecological dimensions are more critical and hence, ICT is considered as an enabler and not the sole objective of urban development in this study. 3. Conceptual understanding of Smart Cities ideal 3.1. Origin and Evolution
The term ‘Smart City’ was first time used by Van Bastelaer in 1998 (Anthopoulos, 2015) but still, it appears vague in its meaning and context. The problem lies in the scale and complexity of its domain and that’s why different schools of thought such as Smart Growth, Living Labs, and Creative Industry offer different approaches to this fuzzy concept. Over the years, the term ‘Smart’ is used interchangeably with connected as well as inter-connected wireless communication and has already become a global brand; ranging from anything like smart water and smart boards to smart villages and smart cities. The United Nation’s Focus Group on Smart Sustainable Cities defines them as the one which harnesses the ICT for improvement of their citizen’s quality of life and standard of living; while addressing local sustainability issues (The International Telecommunication Union (ITU) - Focus Group on Smart Sustainable Cities, 2014). Dhingra & Chattopadhyay (2016) discussed a phase wise evolution of the concept of Smartness in an urban context. It developed during the 1980s industrialization when negative impacts of urban migration became profound on the city resources. With pressing urban challenges, the idea progressed further through Kyoto Protocol in 1997 with major thrust on the environmental issues. However, the focus was shifted towards innovation and smart technology after the digital boom in 2000; but it is noticed that the scale of this concept was primarily limited to small-scale townships and infrastructure up-gradation projects. The main Smart city market is grounded in the USA followed by emerging Asian economies such as India and Korea. Anthopoulos (2015) identified three primary economic sectors associated with the Smart Cities viz. IT (IBM, Infosys etc), Electronics (Siemens, Cisco etc) and Construction (POSCO etc). Over the last few decades, many global initiatives are undertaken to address urban issues such as environmental degradation, inequitable economic growth and social development of urban communities. The multitude of challenges has led to several urban movements, bringing different city types in the global policy-making and discourses (De Jong, et al., 2015) such as creative cities, green cities, low carbon cities, eco-cities and smart cities. However, in practice, these terms have overlapping objectives and are used interchangeably by many
638
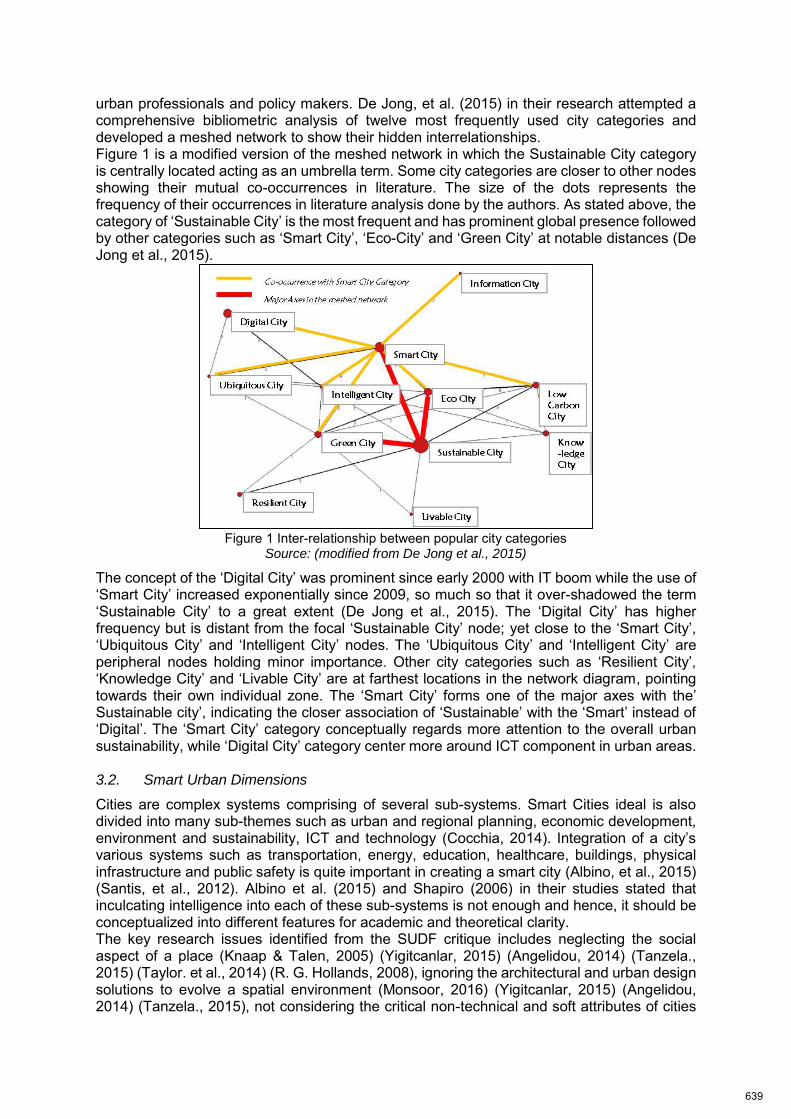
urban professionals and policy makers. De Jong, et al. (2015) in their research attempted a comprehensive bibliometric analysis of twelve most frequently used city categories and developed a meshed network to show their hidden interrelationships. Figure 1 is a modified version of the meshed network in which the Sustainable City category is centrally located acting as an umbrella term. Some city categories are closer to other nodes showing their mutual co-occurrences in literature. The size of the dots represents the frequency of their occurrences in literature analysis done by the authors. As stated above, the category of ‘Sustainable City’ is the most frequent and has prominent global presence followed by other categories such as ‘Smart City’, ‘Eco-City’ and ‘Green City’ at notable distances (De Jong et al., 2015).
Figure 1 Inter-relationship between popular city categories
Source: (modified from De Jong et al., 2015)
The concept of the ‘Digital City’ was prominent since early 2000 with IT boom while the use of ‘Smart City’ increased exponentially since 2009, so much so that it over-shadowed the term ‘Sustainable City’ to a great extent (De Jong et al., 2015). The ‘Digital City’ has higher frequency but is distant from the focal ‘Sustainable City’ node; yet close to the ‘Smart City’, ‘Ubiquitous City’ and ‘Intelligent City’ nodes. The ‘Ubiquitous City’ and ‘Intelligent City’ are peripheral nodes holding minor importance. Other city categories such as ‘Resilient City’, ‘Knowledge City’ and ‘Livable City’ are at farthest locations in the network diagram, pointing towards their own individual zone. The ‘Smart City’ forms one of the major axes with the’ Sustainable city’, indicating the closer association of ‘Sustainable’ with the ‘Smart’ instead of ‘Digital’. The ‘Smart City’ category conceptually regards more attention to the overall urban sustainability, while ‘Digital City’ category center more around ICT component in urban areas. 3.2. Smart Urban Dimensions
Cities are complex systems comprising of several sub-systems. Smart Cities ideal is also divided into many sub-themes such as urban and regional planning, economic development, environment and sustainability, ICT and technology (Cocchia, 2014). Integration of a city’s various systems such as transportation, energy, education, healthcare, buildings, physical infrastructure and public safety is quite important in creating a smart city (Albino, et al., 2015) (Santis, et al., 2012). Albino et al. (2015) and Shapiro (2006) in their studies stated that inculcating intelligence into each of these sub-systems is not enough and hence, it should be conceptualized into different features for academic and theoretical clarity. The key research issues identified from the SUDF critique includes neglecting the social aspect of a place (Knaap & Talen, 2005) (Yigitcanlar, 2015) (Angelidou, 2014) (Tanzela., 2015) (Taylor. et al., 2014) (R. G. Hollands, 2008), ignoring the architectural and urban design solutions to evolve a spatial environment (Monsoor, 2016) (Yigitcanlar, 2015) (Angelidou, 2014) (Tanzela., 2015), not considering the critical non-technical and soft attributes of cities
639
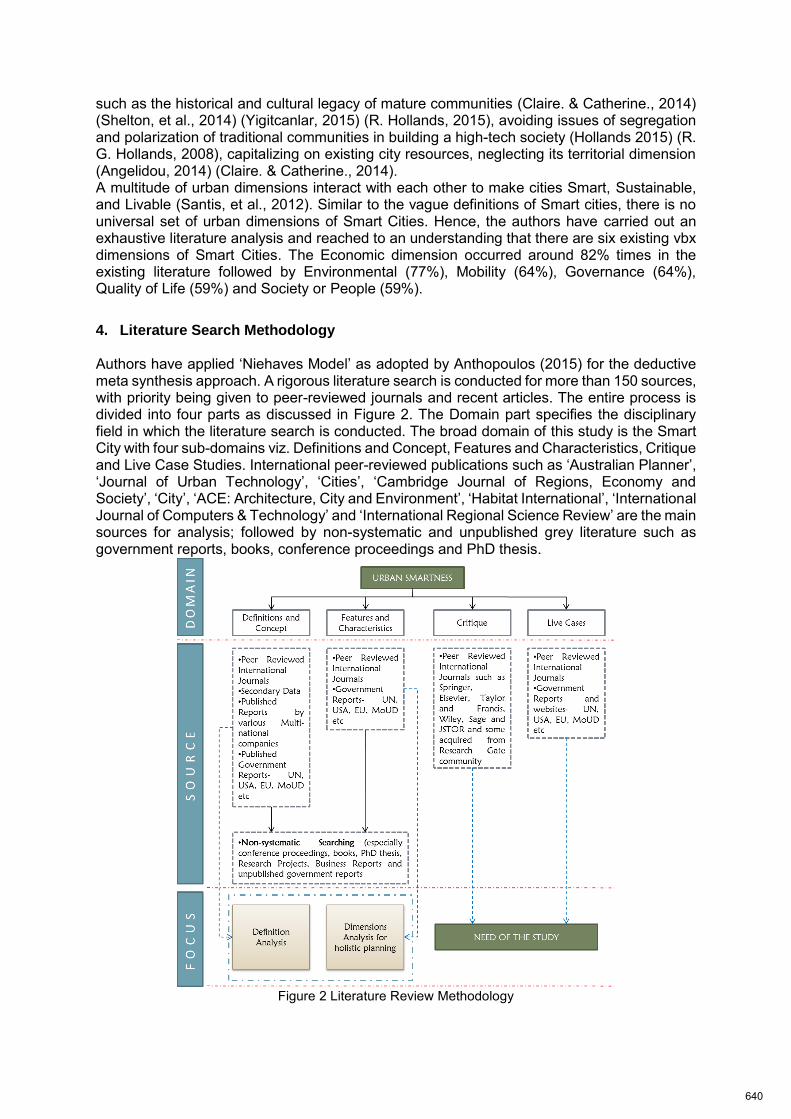
such as the historical and cultural legacy of mature communities (Claire. & Catherine., 2014) (Shelton, et al., 2014) (Yigitcanlar, 2015) (R. Hollands, 2015), avoiding issues of segregation and polarization of traditional communities in building a high-tech society (Hollands 2015) (R. G. Hollands, 2008), capitalizing on existing city resources, neglecting its territorial dimension (Angelidou, 2014) (Claire. & Catherine., 2014). A multitude of urban dimensions interact with each other to make cities Smart, Sustainable, and Livable (Santis, et al., 2012). Similar to the vague definitions of Smart cities, there is no universal set of urban dimensions of Smart Cities. Hence, the authors have carried out an exhaustive literature analysis and reached to an understanding that there are six existing vbx dimensions of Smart Cities. The Economic dimension occurred around 82% times in the existing literature followed by Environmental (77%), Mobility (64%), Governance (64%), Quality of Life (59%) and Society or People (59%).
4. Literature Search Methodology Authors have applied ‘Niehaves Model’ as adopted by Anthopoulos (2015) for the deductive meta synthesis approach. A rigorous literature search is conducted for more than 150 sources, with priority being given to peer-reviewed journals and recent articles. The entire process is divided into four parts as discussed in Figure 2. The Domain part specifies the disciplinary field in which the literature search is conducted. The broad domain of this study is the Smart City with four sub-domains viz. Definitions and Concept, Features and Characteristics, Critique and Live Case Studies. International peer-reviewed publications such as ‘Australian Planner’, ‘Journal of Urban Technology’, ‘Cities’, ‘Cambridge Journal of Regions, Economy and Society’, ‘City’, ‘ACE: Architecture, City and Environment’, ‘Habitat International’, ‘International Journal of Computers & Technology’ and ‘International Regional Science Review’ are the main sources for analysis; followed by non-systematic and unpublished grey literature such as government reports, books, conference proceedings and PhD thesis.
Figure 2 Literature Review Methodology
640
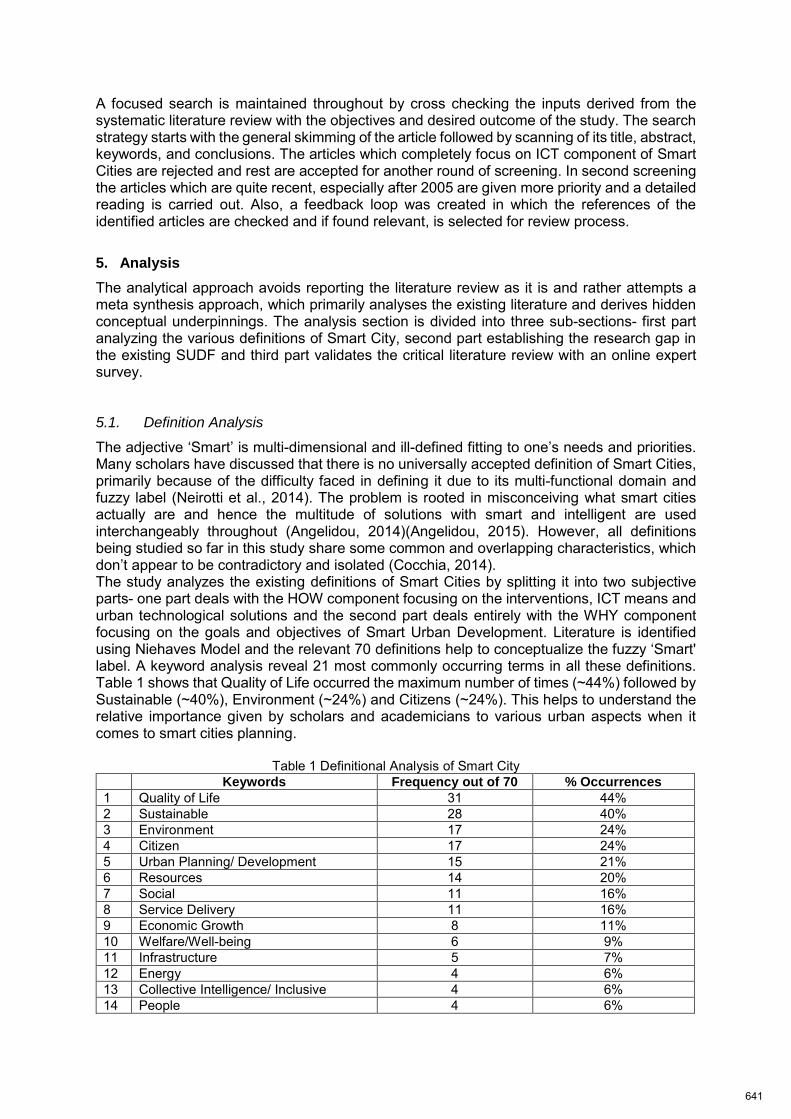
A focused search is maintained throughout by cross checking the inputs derived from the systematic literature review with the objectives and desired outcome of the study. The search strategy starts with the general skimming of the article followed by scanning of its title, abstract, keywords, and conclusions. The articles which completely focus on ICT component of Smart Cities are rejected and rest are accepted for another round of screening. In second screening the articles which are quite recent, especially after 2005 are given more priority and a detailed reading is carried out. Also, a feedback loop was created in which the references of the identified articles are checked and if found relevant, is selected for review process.
5. Analysis
The analytical approach avoids reporting the literature review as it is and rather attempts a meta synthesis approach, which primarily analyses the existing literature and derives hidden conceptual underpinnings. The analysis section is divided into three sub-sections- first part analyzing the various definitions of Smart City, second part establishing the research gap in the existing SUDF and third part validates the critical literature review with an online expert survey. 5.1. Definition Analysis
The adjective ‘Smart’ is multi-dimensional and ill-defined fitting to one’s needs and priorities. Many scholars have discussed that there is no universally accepted definition of Smart Cities, primarily because of the difficulty faced in defining it due to its multi-functional domain and fuzzy label (Neirotti et al., 2014). The problem is rooted in misconceiving what smart cities actually are and hence the multitude of solutions with smart and intelligent are used interchangeably throughout (Angelidou, 2014)(Angelidou, 2015). However, all definitions being studied so far in this study share some common and overlapping characteristics, which don’t appear to be contradictory and isolated (Cocchia, 2014). The study analyzes the existing definitions of Smart Cities by splitting it into two subjective parts- one part deals with the HOW component focusing on the interventions, ICT means and urban technological solutions and the second part deals entirely with the WHY component focusing on the goals and objectives of Smart Urban Development. Literature is identified using Niehaves Model and the relevant 70 definitions help to conceptualize the fuzzy ‘Smart' label. A keyword analysis reveal 21 most commonly occurring terms in all these definitions. Table 1 shows that Quality of Life occurred the maximum number of times (~44%) followed by Sustainable (~40%), Environment (~24%) and Citizens (~24%). This helps to understand the relative importance given by scholars and academicians to various urban aspects when it comes to smart cities planning.
Table 1 Definitional Analysis of Smart City Keywords Frequency out of 70 % Occurrences
1 Quality of Life 31 44% 2 Sustainable 28 40% 3 Environment 17 24% 4 Citizen 17 24% 5 Urban Planning/ Development 15 21% 6 Resources 14 20% 7 Social 11 16% 8 Service Delivery 11 16% 9 Economic Growth 8 11% 10 Welfare/Well-being 6 9% 11 Infrastructure 5 7% 12 Energy 4 6% 13 Collective Intelligence/ Inclusive 4 6% 14 People 4 6%
641
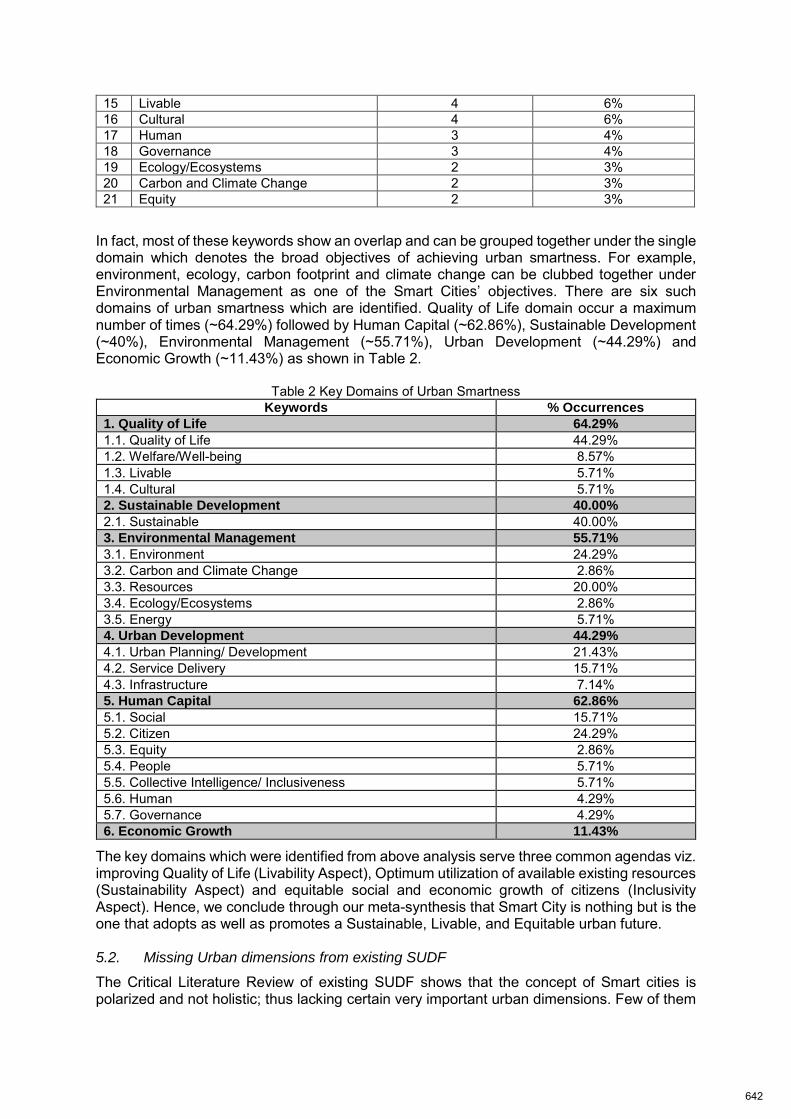
15 Livable 4 6% 16 Cultural 4 6% 17 Human 3 4% 18 Governance 3 4% 19 Ecology/Ecosystems 2 3% 20 Carbon and Climate Change 2 3% 21 Equity 2 3%
In fact, most of these keywords show an overlap and can be grouped together under the single domain which denotes the broad objectives of achieving urban smartness. For example, environment, ecology, carbon footprint and climate change can be clubbed together under Environmental Management as one of the Smart Cities’ objectives. There are six such domains of urban smartness which are identified. Quality of Life domain occur a maximum number of times (~64.29%) followed by Human Capital (~62.86%), Sustainable Development (~40%), Environmental Management (~55.71%), Urban Development (~44.29%) and Economic Growth (~11.43%) as shown in Table 2.
Table 2 Key Domains of Urban Smartness Keywords % Occurrences
1. Quality of Life 64.29%
1.1. Quality of Life 44.29% 1.2. Welfare/Well-being 8.57% 1.3. Livable 5.71% 1.4. Cultural 5.71% 2. Sustainable Development 40.00%
2.1. Sustainable 40.00% 3. Environmental Management 55.71%
3.1. Environment 24.29% 3.2. Carbon and Climate Change 2.86% 3.3. Resources 20.00% 3.4. Ecology/Ecosystems 2.86% 3.5. Energy 5.71% 4. Urban Development 44.29%
4.1. Urban Planning/ Development 21.43% 4.2. Service Delivery 15.71% 4.3. Infrastructure 7.14% 5. Human Capital 62.86%
5.1. Social 15.71% 5.2. Citizen 24.29% 5.3. Equity 2.86% 5.4. People 5.71% 5.5. Collective Intelligence/ Inclusiveness 5.71% 5.6. Human 4.29% 5.7. Governance 4.29% 6. Economic Growth 11.43%
The key domains which were identified from above analysis serve three common agendas viz. improving Quality of Life (Livability Aspect), Optimum utilization of available existing resources (Sustainability Aspect) and equitable social and economic growth of citizens (Inclusivity Aspect). Hence, we conclude through our meta-synthesis that Smart City is nothing but is the one that adopts as well as promotes a Sustainable, Livable, and Equitable urban future. 5.2. Missing Urban dimensions from existing SUDF
The Critical Literature Review of existing SUDF shows that the concept of Smart cities is polarized and not holistic; thus lacking certain very important urban dimensions. Few of them
642
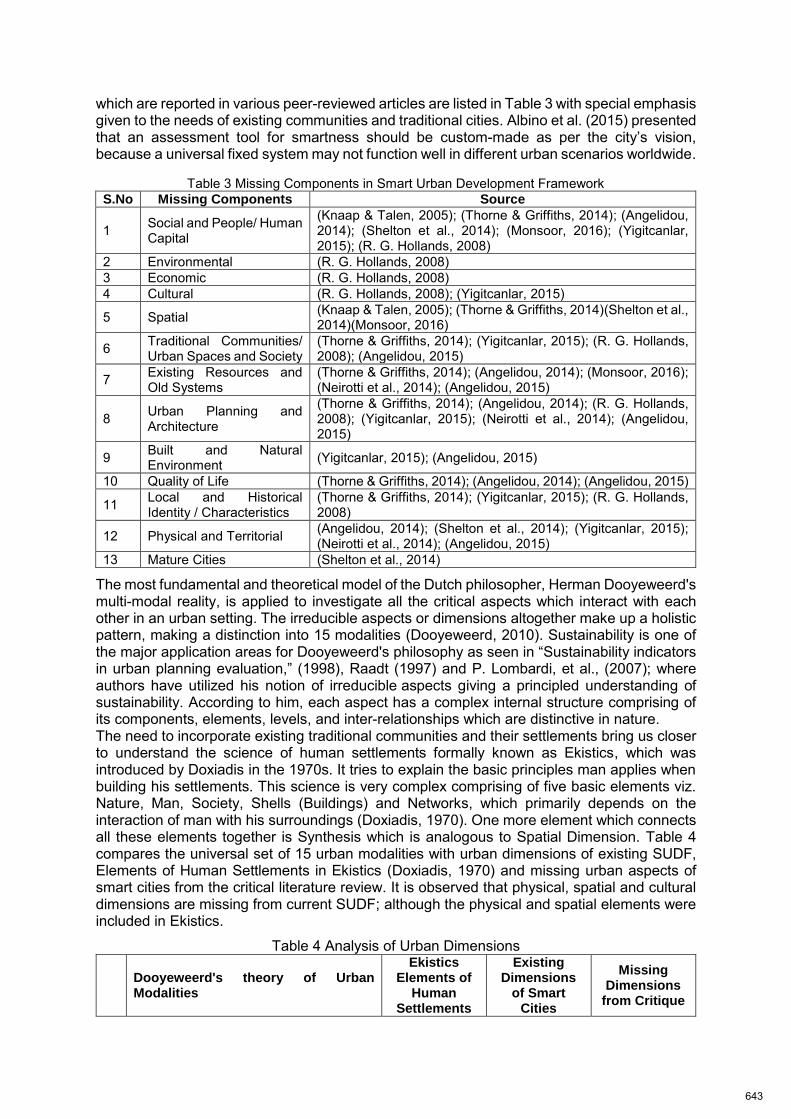
which are reported in various peer-reviewed articles are listed in Table 3 with special emphasis given to the needs of existing communities and traditional cities. Albino et al. (2015) presented that an assessment tool for smartness should be custom-made as per the city’s vision, because a universal fixed system may not function well in different urban scenarios worldwide.
Table 3 Missing Components in Smart Urban Development Framework S.No Missing Components Source
1 Social and People/ Human Capital
(Knaap & Talen, 2005); (Thorne & Griffiths, 2014); (Angelidou, 2014); (Shelton et al., 2014); (Monsoor, 2016); (Yigitcanlar, 2015); (R. G. Hollands, 2008)
2 Environmental (R. G. Hollands, 2008) 3 Economic (R. G. Hollands, 2008) 4 Cultural (R. G. Hollands, 2008); (Yigitcanlar, 2015)
5 Spatial (Knaap & Talen, 2005); (Thorne & Griffiths, 2014)(Shelton et al., 2014)(Monsoor, 2016)
6 Traditional Communities/ Urban Spaces and Society
(Thorne & Griffiths, 2014); (Yigitcanlar, 2015); (R. G. Hollands, 2008); (Angelidou, 2015)
7 Existing Resources and Old Systems
(Thorne & Griffiths, 2014); (Angelidou, 2014); (Monsoor, 2016); (Neirotti et al., 2014); (Angelidou, 2015)
8 Urban Planning and Architecture
(Thorne & Griffiths, 2014); (Angelidou, 2014); (R. G. Hollands, 2008); (Yigitcanlar, 2015); (Neirotti et al., 2014); (Angelidou, 2015)
9 Built and Natural Environment (Yigitcanlar, 2015); (Angelidou, 2015)
10 Quality of Life (Thorne & Griffiths, 2014); (Angelidou, 2014); (Angelidou, 2015)
11 Local and Historical Identity / Characteristics
(Thorne & Griffiths, 2014); (Yigitcanlar, 2015); (R. G. Hollands, 2008)
12 Physical and Territorial (Angelidou, 2014); (Shelton et al., 2014); (Yigitcanlar, 2015); (Neirotti et al., 2014); (Angelidou, 2015)
13 Mature Cities (Shelton et al., 2014)
The most fundamental and theoretical model of the Dutch philosopher, Herman Dooyeweerd's multi-modal reality, is applied to investigate all the critical aspects which interact with each other in an urban setting. The irreducible aspects or dimensions altogether make up a holistic pattern, making a distinction into 15 modalities (Dooyeweerd, 2010). Sustainability is one of the major application areas for Dooyeweerd's philosophy as seen in “Sustainability indicators in urban planning evaluation,” (1998), Raadt (1997) and P. Lombardi, et al., (2007); where authors have utilized his notion of irreducible aspects giving a principled understanding of sustainability. According to him, each aspect has a complex internal structure comprising of its components, elements, levels, and inter-relationships which are distinctive in nature. The need to incorporate existing traditional communities and their settlements bring us closer to understand the science of human settlements formally known as Ekistics, which was introduced by Doxiadis in the 1970s. It tries to explain the basic principles man applies when building his settlements. This science is very complex comprising of five basic elements viz. Nature, Man, Society, Shells (Buildings) and Networks, which primarily depends on the interaction of man with his surroundings (Doxiadis, 1970). One more element which connects all these elements together is Synthesis which is analogous to Spatial Dimension. Table 4 compares the universal set of 15 urban modalities with urban dimensions of existing SUDF, Elements of Human Settlements in Ekistics (Doxiadis, 1970) and missing urban aspects of smart cities from the critical literature review. It is observed that physical, spatial and cultural dimensions are missing from current SUDF; although the physical and spatial elements were included in Ekistics.
Table 4 Analysis of Urban Dimensions
Dooyeweerd's theory of Urban Modalities
Ekistics Elements of
Human Settlements
Existing Dimensions
of Smart Cities
Missing Dimensions
from Critique
643
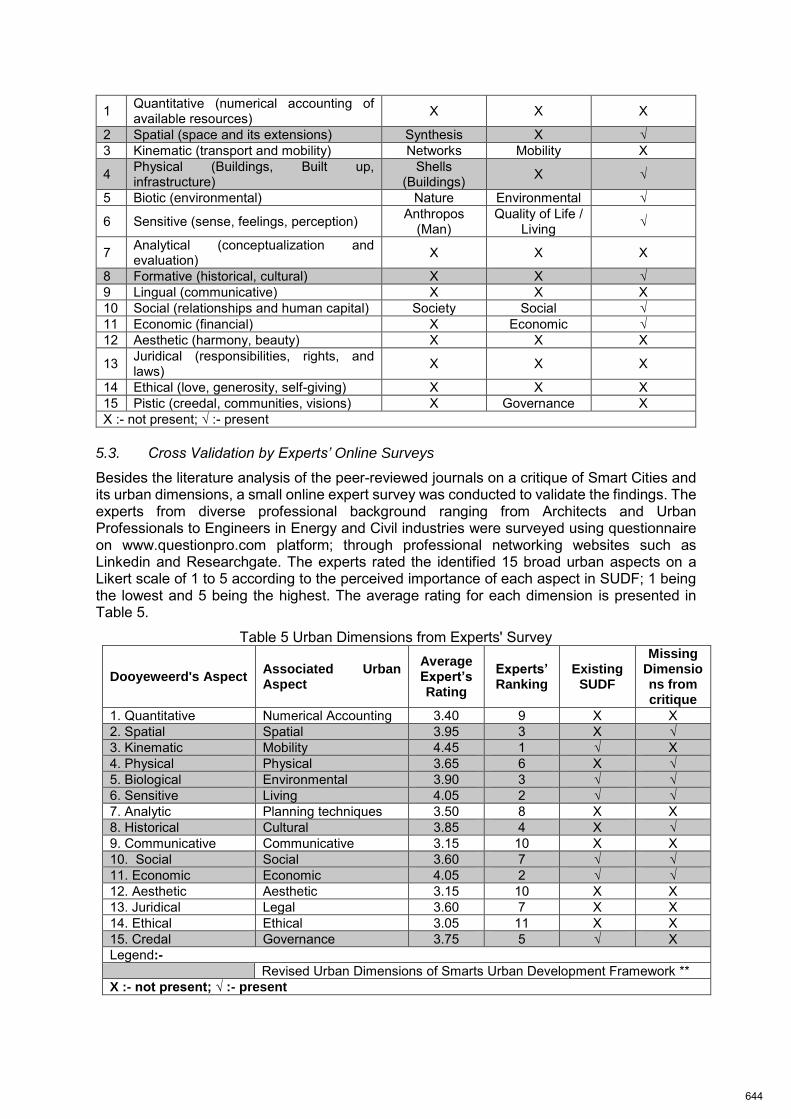
1 Quantitative (numerical accounting of available resources) X X X
2 Spatial (space and its extensions) Synthesis X √ 3 Kinematic (transport and mobility) Networks Mobility X
4 Physical (Buildings, Built up, infrastructure)
Shells (Buildings) X √
5 Biotic (environmental) Nature Environmental √
6 Sensitive (sense, feelings, perception) Anthropos (Man)
Quality of Life / Living √
7 Analytical (conceptualization and evaluation) X X X
8 Formative (historical, cultural) X X √ 9 Lingual (communicative) X X X 10 Social (relationships and human capital) Society Social √ 11 Economic (financial) X Economic √ 12 Aesthetic (harmony, beauty) X X X
13 Juridical (responsibilities, rights, and laws) X X X
14 Ethical (love, generosity, self-giving) X X X 15 Pistic (creedal, communities, visions) X Governance X X :- not present; √ :- present
5.3. Cross Validation by Experts’ Online Surveys
Besides the literature analysis of the peer-reviewed journals on a critique of Smart Cities and its urban dimensions, a small online expert survey was conducted to validate the findings. The experts from diverse professional background ranging from Architects and Urban Professionals to Engineers in Energy and Civil industries were surveyed using questionnaire on www.questionpro.com platform; through professional networking websites such as Linkedin and Researchgate. The experts rated the identified 15 broad urban aspects on a Likert scale of 1 to 5 according to the perceived importance of each aspect in SUDF; 1 being the lowest and 5 being the highest. The average rating for each dimension is presented in Table 5.
Table 5 Urban Dimensions from Experts' Survey
Dooyeweerd's Aspect Associated Urban Aspect
Average Expert’s Rating
Experts’ Ranking
Existing SUDF
Missing Dimensions from critique
1. Quantitative Numerical Accounting 3.40 9 X X 2. Spatial Spatial 3.95 3 X √ 3. Kinematic Mobility 4.45 1 √ X 4. Physical Physical 3.65 6 X √ 5. Biological Environmental 3.90 3 √ √ 6. Sensitive Living 4.05 2 √ √ 7. Analytic Planning techniques 3.50 8 X X 8. Historical Cultural 3.85 4 X √ 9. Communicative Communicative 3.15 10 X X 10. Social Social 3.60 7 √ √ 11. Economic Economic 4.05 2 √ √ 12. Aesthetic Aesthetic 3.15 10 X X 13. Juridical Legal 3.60 7 X X 14. Ethical Ethical 3.05 11 X X 15. Credal Governance 3.75 5 √ X Legend:-
Revised Urban Dimensions of Smarts Urban Development Framework ** X :- not present; √ :- present
644
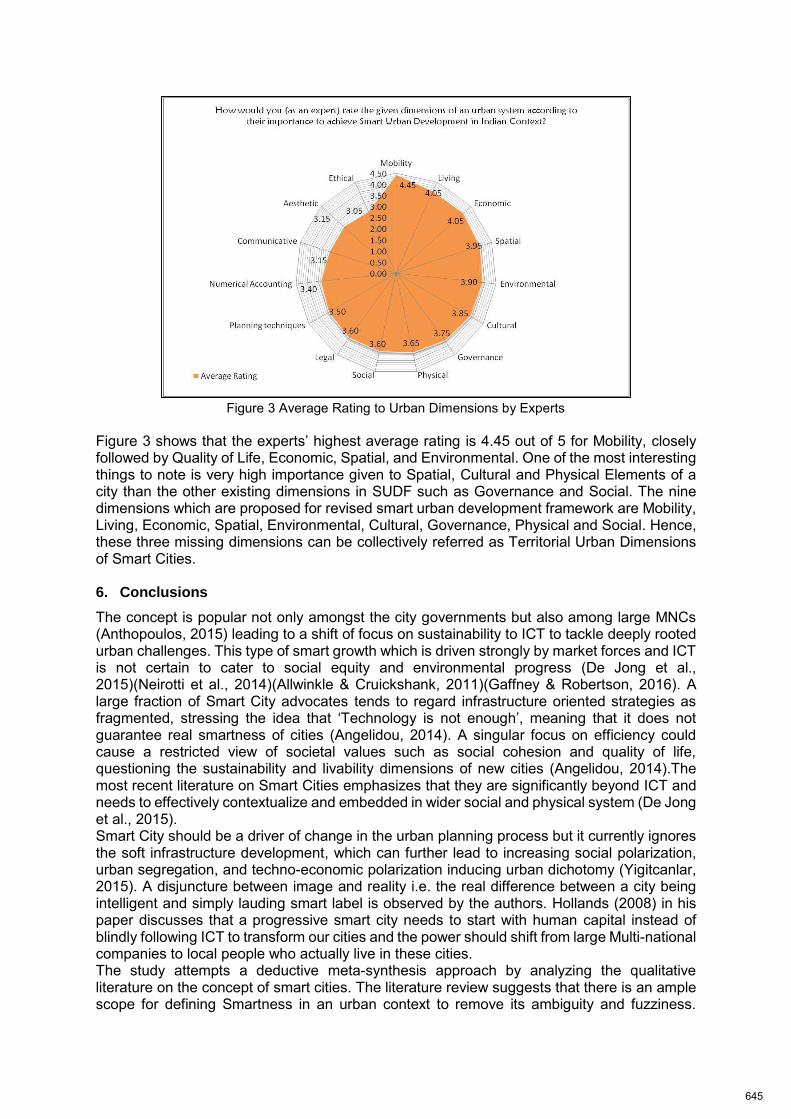
Figure 3 Average Rating to Urban Dimensions by Experts
Figure 3 shows that the experts’ highest average rating is 4.45 out of 5 for Mobility, closely followed by Quality of Life, Economic, Spatial, and Environmental. One of the most interesting things to note is very high importance given to Spatial, Cultural and Physical Elements of a city than the other existing dimensions in SUDF such as Governance and Social. The nine dimensions which are proposed for revised smart urban development framework are Mobility, Living, Economic, Spatial, Environmental, Cultural, Governance, Physical and Social. Hence, these three missing dimensions can be collectively referred as Territorial Urban Dimensions of Smart Cities. 6. Conclusions
The concept is popular not only amongst the city governments but also among large MNCs (Anthopoulos, 2015) leading to a shift of focus on sustainability to ICT to tackle deeply rooted urban challenges. This type of smart growth which is driven strongly by market forces and ICT is not certain to cater to social equity and environmental progress (De Jong et al., 2015)(Neirotti et al., 2014)(Allwinkle & Cruickshank, 2011)(Gaffney & Robertson, 2016). A large fraction of Smart City advocates tends to regard infrastructure oriented strategies as fragmented, stressing the idea that ‘Technology is not enough’, meaning that it does not guarantee real smartness of cities (Angelidou, 2014). A singular focus on efficiency could cause a restricted view of societal values such as social cohesion and quality of life, questioning the sustainability and livability dimensions of new cities (Angelidou, 2014).The most recent literature on Smart Cities emphasizes that they are significantly beyond ICT and needs to effectively contextualize and embedded in wider social and physical system (De Jong et al., 2015). Smart City should be a driver of change in the urban planning process but it currently ignores the soft infrastructure development, which can further lead to increasing social polarization, urban segregation, and techno-economic polarization inducing urban dichotomy (Yigitcanlar, 2015). A disjuncture between image and reality i.e. the real difference between a city being intelligent and simply lauding smart label is observed by the authors. Hollands (2008) in his paper discusses that a progressive smart city needs to start with human capital instead of blindly following ICT to transform our cities and the power should shift from large Multi-national companies to local people who actually live in these cities. The study attempts a deductive meta-synthesis approach by analyzing the qualitative literature on the concept of smart cities. The literature review suggests that there is an ample scope for defining Smartness in an urban context to remove its ambiguity and fuzziness.
645
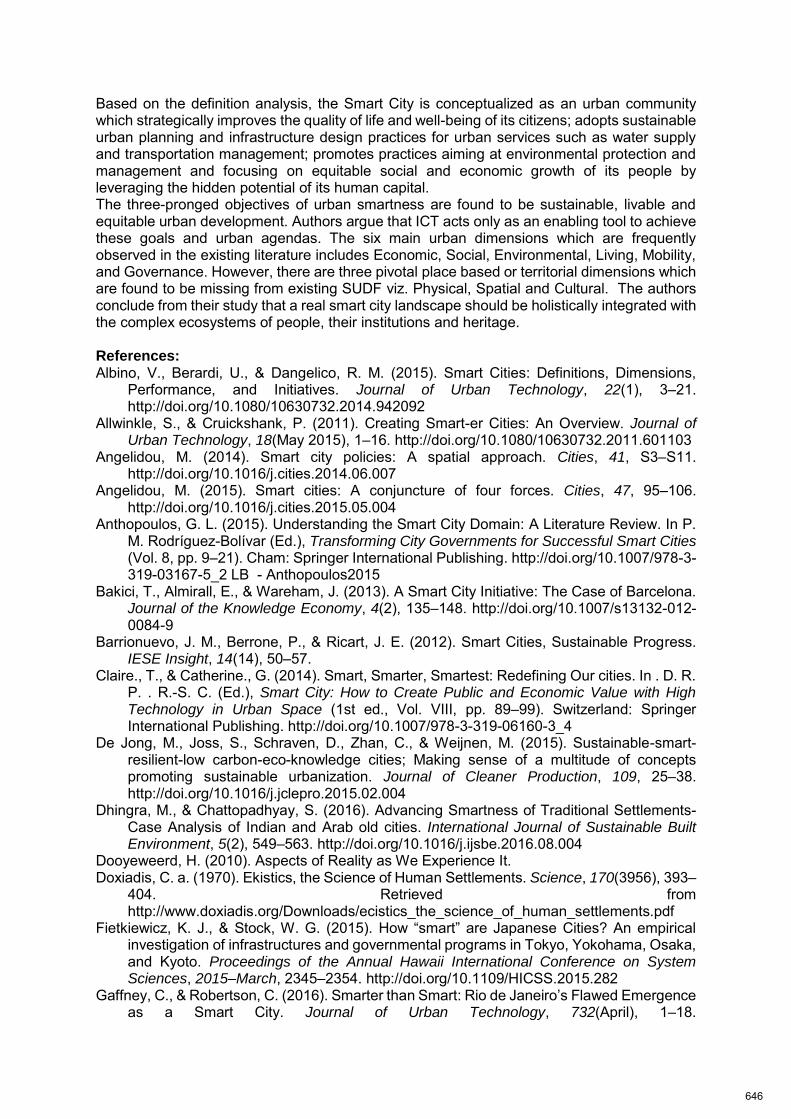
Based on the definition analysis, the Smart City is conceptualized as an urban community which strategically improves the quality of life and well-being of its citizens; adopts sustainable urban planning and infrastructure design practices for urban services such as water supply and transportation management; promotes practices aiming at environmental protection and management and focusing on equitable social and economic growth of its people by leveraging the hidden potential of its human capital. The three-pronged objectives of urban smartness are found to be sustainable, livable and equitable urban development. Authors argue that ICT acts only as an enabling tool to achieve these goals and urban agendas. The six main urban dimensions which are frequently observed in the existing literature includes Economic, Social, Environmental, Living, Mobility, and Governance. However, there are three pivotal place based or territorial dimensions which are found to be missing from existing SUDF viz. Physical, Spatial and Cultural. The authors conclude from their study that a real smart city landscape should be holistically integrated with the complex ecosystems of people, their institutions and heritage. References: Albino, V., Berardi, U., & Dangelico, R. M. (2015). Smart Cities: Definitions, Dimensions,
Performance, and Initiatives. Journal of Urban Technology, 22(1), 3–21. http://doi.org/10.1080/10630732.2014.942092
Allwinkle, S., & Cruickshank, P. (2011). Creating Smart-er Cities: An Overview. Journal of Urban Technology, 18(May 2015), 1–16. http://doi.org/10.1080/10630732.2011.601103
Angelidou, M. (2014). Smart city policies: A spatial approach. Cities, 41, S3–S11. http://doi.org/10.1016/j.cities.2014.06.007
Angelidou, M. (2015). Smart cities: A conjuncture of four forces. Cities, 47, 95–106. http://doi.org/10.1016/j.cities.2015.05.004
Anthopoulos, G. L. (2015). Understanding the Smart City Domain: A Literature Review. In P. M. Rodríguez-Bolívar (Ed.), Transforming City Governments for Successful Smart Cities (Vol. 8, pp. 9–21). Cham: Springer International Publishing. http://doi.org/10.1007/978-3-319-03167-5_2 LB - Anthopoulos2015
Bakici, T., Almirall, E., & Wareham, J. (2013). A Smart City Initiative: The Case of Barcelona. Journal of the Knowledge Economy, 4(2), 135–148. http://doi.org/10.1007/s13132-012-0084-9
Barrionuevo, J. M., Berrone, P., & Ricart, J. E. (2012). Smart Cities, Sustainable Progress. IESE Insight, 14(14), 50–57.
Claire., T., & Catherine., G. (2014). Smart, Smarter, Smartest: Redefining Our cities. In . D. R. P. . R.-S. C. (Ed.), Smart City: How to Create Public and Economic Value with High Technology in Urban Space (1st ed., Vol. VIII, pp. 89–99). Switzerland: Springer International Publishing. http://doi.org/10.1007/978-3-319-06160-3_4
De Jong, M., Joss, S., Schraven, D., Zhan, C., & Weijnen, M. (2015). Sustainable-smart-resilient-low carbon-eco-knowledge cities; Making sense of a multitude of concepts promoting sustainable urbanization. Journal of Cleaner Production, 109, 25–38. http://doi.org/10.1016/j.jclepro.2015.02.004
Dhingra, M., & Chattopadhyay, S. (2016). Advancing Smartness of Traditional Settlements- Case Analysis of Indian and Arab old cities. International Journal of Sustainable Built Environment, 5(2), 549–563. http://doi.org/10.1016/j.ijsbe.2016.08.004
Dooyeweerd, H. (2010). Aspects of Reality as We Experience It. Doxiadis, C. a. (1970). Ekistics, the Science of Human Settlements. Science, 170(3956), 393–
404. Retrieved from http://www.doxiadis.org/Downloads/ecistics_the_science_of_human_settlements.pdf
Fietkiewicz, K. J., & Stock, W. G. (2015). How “smart” are Japanese Cities? An empirical investigation of infrastructures and governmental programs in Tokyo, Yokohama, Osaka, and Kyoto. Proceedings of the Annual Hawaii International Conference on System Sciences, 2015–March, 2345–2354. http://doi.org/10.1109/HICSS.2015.282
Gaffney, C., & Robertson, C. (2016). Smarter than Smart: Rio de Janeiro’s Flawed Emergence as a Smart City. Journal of Urban Technology, 732(April), 1–18.
646
http://doi.org/10.1080/10630732.2015.1102423 Hollands, R. (2015). Will the Real Smart City Please Stand Up ? City, 12(May), 303–320.
http://doi.org/10.1080/13604810802479126 Hollands, R. G. (2008). Will the real smart city please stand up? City, 12(3), 303–320.
http://doi.org/10.1080/13604810802479126 Ishida, T. (2005). Activities and Technologies in Digital City Kyoto. Lecture Notes in Computer
Science, 3081, 166–187. http://doi.org/10.1007/11407546_8 Jaffe, E. (2016). 4 lessons from Rio’s “flawed” smart cities initiative. Retrieved from
https://medium.com/sidewalk-talk/4-lessons-from-rios-flawed-smart-cities-initiative-31cbf4e54b72#.kaobtxl58
Knaap, G., & Talen, E. (2005). New Urbanism and Smart Growth: A Few Words from the Academy. International Regional Science Review, 28(2), 107–118. http://doi.org/10.1177/0160017604273621
Lombardi, P. L. (1998). SUST AINABILITY INDICATORS IN URBAN PLANNING EVALUATION A new classification system based on multimodal thinking, 177–192.
Lombardi, P., Lami, I., Bottero, M., & Grasso, C. (2007). Application of the analytic network process and the multi-modal framework to an urban upgrading case study. International Conference on Whole Life Urban Sustainability and Its Assessment. Retrieved from http://download.sue-mot.org/Conference-2007/Papers/Lombardi1.pdf
Monsoor, T. (2016). Rethinking the Smart City : Towards a People- Centric Urbanism Rethinking the Smart City : Towards a People-Centric Urbanism, (August). http://doi.org/10.13140/RG.2.1.2767.1202
Neirotti, P., De Marco, A., Cagliano, A. C., Mangano, G., & Scorrano, F. (2014). Current trends in smart city initiatives: Some stylised facts. Cities, 38, 25–36. http://doi.org/10.1016/j.cities.2013.12.010
Raadt, J. D. R. (1997). A sketch for humane operational research in a technological society. Systems Practice, 10(4), 421–441. http://doi.org/10.1007/BF02557890
Santis, R. De, Fasano, A., Mignolli, N., & Villa, A. (2012). Smart City: Fact and Fiction. Innovation: The European Journal of Social Science Research, 25(2), 137–149. http://doi.org/10.1080/13511610.2012.660325
Shapiro, J. M. (2006). Smart Cities: Quality of Life, Productivity, and the Growth Effects of Human Capital. The Review of Economics and Statistics, 88(May), 324–335. http://doi.org/10.1162/rest.88.2.324
Shelton, T., Zook, M., & Wiig, A. (2014). The “ actually existing smart city ” Forthcoming in Cambridge Journal of Regions , Economy and Society.
Tanzela., M. (2015). Rethinking the Smart City: Towards a People-Centric Urbanism (Housing and Urbanism Programme, 2014-15). (H. Hugo. & B. Nick., Eds.), Shaping the Modern City 2. Architectural Association School of Architecture.
Taylor., S., Matthew., Z., & Alan., W. (2014). The “actually existing smart city.” Cambridge Journal of Regions, Economy and Society. http://doi.org/10.1093/cjres/rsu026
The International Telecommunication Union (ITU) - Focus Group on Smart Sustainable Cities. (2014). Definition Analysis.
Thorne, C., & Griffiths, C. (2014). Smart, Smarter, Smartest: Redefining Our cities, 89–99. http://doi.org/10.1007/978-3-319-06160-3
Yigitcanlar, T. (2015). Smart cities: an effective urban development and management model? Australian Planner, 52(1), 27–34. http://doi.org/10.1080/07293682.2015.1019752
647
Hanzl, Małgorzata; Ledwoń, Sławomir Analyses of human behaviour ISOCARP-OAPA 2017
1
Analyses of human behaviour in public spaces
Małgorzata HANZL, Lodz University of Technology, Poland
Sławomir LEDWOŃ, Ministry of Municipality and Environment, Qatar
1. Introduction The now evolving studies of human behaviour and body movement, including research in kinesics and proxemics, video analyses and more contemporary methods of tracing human behaviour, thanks to big data sets, e.g., GPS and Wi-Fi signals, should be drawn together and contribute to the larger picture of human behaviour analysis for urban design applications. While researchers in this rapidly emerging field are contributing valuable insights to the study of human behaviour, their investigations are dispersed and refer to variegated and unrelated topics. The analyses, conducted for several distinct purposes, overlap to some extent, at the same time leaving many other possible applications behind. While a design framework is often cited as the reason for conducting these analyses, a still more systematic way to approach behaviour analyses in urban design is required with the potential to supplement and extend the classic methods with new layers referring to temporary and spatial behaviour. In order to introduce a useful tool for the design of urban space, the correct methodology needs to be established. The very first step is an examination of the state-of-the-art behaviour analyses conducted in the current paper, with the focus on the urban design scale. The survey which follows starts with a summary of classical methods applied in urban design workshop. Furthermore, we briefly review the possibilities of the application of automated methods, starting from video motion analyses, through small group conversation analyses to Location Based Services (LBS) and experimental methods which combine several tools. Both the pros and cons of the available methods are discussed. Assessment of the usability of the discussed methods is conducted and discussed with a focus on the applicability in the urban design workshop. Finally, I conclude by indicating the possible future research paths.
2. The conventional methods of analyses of human behaviour in outdoor space The criteria, which refer to the design objectives, were established based on the experience of the analysis of pedestrian behaviour conducted by Whyte (2009, first published in 1980) in order to assess the functioning of small plazas in New York. The methodology was later developed by his followers, including the experience of such organisations as Project for Public Spaces and firms such as the Gehl Architects, and may be further extended based on practical experience. The main method used in these analyses is the direct observation of human behaviour in urban spaces. In addition, interviews with people surveyed? are also conducted. Direct observation, accompanied by graphical notation in the form of plans and graphs showing the actual use of physical space, is also complemented with video recording and photographs made with time-lapse cameras at a range of time frequencies. In the study by Whyte (2009), a part of the focus on walking behaviour, the majority of the observation is concentrated on the social situations happening in a given place. People, in this case, were counted, described and photographed. A study was conducted to count people walking, standing and sitting in various parts of the plaza, based on the collected photographs. Then the densities were derived from this data taking into account the time framework and spatial location (Whyte 2009, pp. 70-71). The method has been adopted by the Project for Public Spaces and several other urban design practitioners.
648
Hanzl, Małgorzata; Ledwoń, Sławomir Analyses of human behaviour ISOCARP-OAPA 2017
2
A very similar methodology is also used in the analyses performed by Gehl (Gehl and Svarre 2013) and his firm, as a background study for their urban design projects in various locations all over the world. Activities taking place in outdoor spaces may be classified into several categories based on different criteria: (1) purpose: recreational and purposeful activities, (2) repetition pattern: single events, repetitive activities, chains of events and continuous change. Two main types may be distinguished with regard to location attributes: (1) moving - walking, running, and (2) stationary activities: sitting and standing, as well as other occupations connected with staying in one place, e.g. playing. The external conditions influencing human behaviour which should be carefully registered in order to enable similar studies at a later date, include: weather, season, time of day, day of the week and month. Also the specific local climate, able to influence human comfort, should be taken into account. Measuring “city life” involves qualitative assessment of how many activities are performed and how different people perform them. Some qualitative classification referring to such features as age, sex and physical disabilities are noticeable based on observations. Others, like: job, education, ethnicity or economic situation may be assessed only after conducting a survey. According to Gehl and Svarre (2013), there are several types of measure used in the observation of humans in public space: counting, tracing, tracking, looking for traces, mapping, photographing, test walks and keeping a diary. (1) Counting is usually conducted over an extended period of time to compare various seasons, as well as times of day or week. It is essential to register sample pictures in fixed, repetitive moments of time. The minimum time to conduct the count being 10 minutes, in sites which are thinly attended a longer interval is necessary to reduce uncertainty. (2) Mapping that serves to collect a subject’s locations in a delimited space provides essential information where people stay: on the edges, in the middle, or their distributed in the space. Another classification of location distinguishes public, semipublic or private zones. (3) Tracing, which means drawing people’s movements inside or crossing the limited space as lines of movement on a plan, gathers information such as: walking sequence, choice of direction, flow, the most and the least used entrances, etc. (4) Tracking (shadowing) involves following people and measuring: average speed of pedestrians, time required to cover a certain distance, and duration of activities. Walking speed is not a constant feature, on the contrary, it is influenced by factors such as: weather, age, mobility, health, errands, being alone or being in a company, etc. Tracking assumes following randomly chosen pedestrians for a given time or distance, or voluntary subjects may consciously agree to be followed. On a larger scale consent is not necessary, as technology allows one to anonymise information in publicly or commercially available sources of data on human subjects’ movements. The requirement to make precise and comparable registrations is a springboard to use automated methods, for example the counting may be enhanced with the use of a pedometer. In general, the difference between performing registration by human subjects and automatic registrars is in the interpretation of the collected information. In the case of automatic acquisition of data, careful and time-consuming evaluation is later required. In terms of the usage of a public space, there are three main categories of activities: necessary, optional and social (Gehl and Svarre 2013). Necessary ones include shopping, walking to and from work, school or the bus stop, etc. Optional activities such as strolling, jogging or sitting if there is a convenient spot, resting, and the like, happen when people have time and find pleasure spending time outdoors. Social activities may accompany both and may assume contact with people whom a person already knows or strangers. The last type of encounter is rare, and often takes the form of a triangulation - a situation when people who do not know each other start talking due to an external catalyst, such as street art or some unexpected conditions, e.g., power failure or strange weather. Another kind of social contact is passive observation.
649
Hanzl, Małgorzata; Ledwoń, Sławomir Analyses of human behaviour ISOCARP-OAPA 2017
3
In the studies of urban places conducted on the background of anthropology (e.g., by Low 2000 or Richardson 2009), the focus is on human behaviour in urban places with the use of methods similar to those outlined above, and on the various social situations which take place there. All the above discussed methods, used as a background study in urban design, are based on time consuming and strictly manual analyses of gathered materials and data. Nevertheless, they provide the basic framework which should serve as a reference when looking for tools for computer enhanced analyses for urban design.
3. Methodology The proposed classification scheme is based on an evaluation matrix that compares various methods of analyses of pedestrian behaviour in outdoor spaces from the standpoint of its usefulness for the requirements of urban design (Table 1). The proposed list of criteria refers first to the current objectives of analyses as well as to the basic characteristics of data: (1) purpose of collecting the data, (2) method of gathering the data, (3) quantity and quality of gathered data, percentage of the gathered crowd, author of the review or case study, and other properties defining the data. The evaluation also includes the potential application of data gathered with the use of a given method, based on the method’s typology defined by Gehl and Svarre (2013). A similar comparison of the available methods for the purpose of monitoring pedestrian movement was also done by Millonig at al (2008, 2009). In those studies the focus being rather on larger scales, however, the explanation of the technology applied is worth mentioning. In contrast, this current study concentrates on the analyses of human behaviour in general, not only walking, in the scale of urban design, thus focusing on outdoor urban spaces. Reviewing the methods, we will first of all start from the three major fields dealing with the analyses, simulation and representation of crowds: computer vision, computer graphics and pedestrian evacuation dynamics. The efforts to develop a common platform of research observed recently (Ali et al. 2013, Moeslund et al. 2006, Millonig et al. 2009), may provide a good opportunity to initiate studies on automated analysis of human behaviour for the purposes of urban design. The computer vision specialists develop methods aiming at: (1) crowd representation by means of visual methods, (2) tracking of groups and individuals, (3) detection of abnormal behaviour, (4) classification of motion patterns, and interaction modelling (Ali et al. 2013). The computer graphics deal with broadly understood modelling and simulation of crowd and group behaviour at various scales. The evacuation dynamics develops pedestrian simulations and analyses evacuation, with the emphasis on the validation of results. Secondly, we will review small group behaviour analyses, which, partly overlapping with the vision studies, focuses on communication situations. Although this is a part of this study which has not been discussed so far as part of the automated methods of data acquisition for urban design, its objectives and emphasis on the communication situations are of interest, especially when dealing with urban design scales. Next, another important field whose research objectives party overlap with the current one is transportation, and especially analyses of pedestrian mobility (Millonig et al 2008, 2009). This field has observed an important development recently thanks to the Location Based Services (LBS) development. Finally, we will review some experimental methods answering more directly the objectives of urban design as well as mention the attempts undertaken in social studies and anthropology, where the observation of human behaviour remains the traditional subject of interest. The current review used the most significant review papers published recently in the above mentioned specific disciplines. In some cases, in order to fully explain the available methods, we refer to more detailed case study analyses.
650
Hanzl, Małgorzata; Ledwoń, Sławomir Analyses of human behaviour ISOCARP-OAPA 2017
4
4. Video motion analyses Moeslund (2011) distinguishes three main types of application of video analyses: (1) surveillance, (2) control and (3) analysis. While surveillance applications automatically monitor large human gatherings, analytical ones use various tools for, e.g., annotation of video or content based retrieval. Control applications assume using parameters derived from motion or pose as a base for simulations. In the process of the video motion analyses, Moeslund (2011) discerns the following steps: (1) initialisation - detection of humans, (2) tracking, (3) pose estimation, and (4) recognition. Conventional video motion analyses offer several ways to detect human subjects. In the simplest one, a model of a human shape is found (Zhao et al. 2008). More sophisticated methods apply a voting scheme to the contours around each individual (Rodriguez and Shah 2007) or distinguish just the torso of a pedestrian (Leibe et al. 2005). Another procedure is based on the assumption that each individual exhibits a unique motion (Brostow and Cipolla 2006). In further analytical steps, objects are tracked either based on the interaction among detected interest points or with the use of data association methods (e.g., Betke et al. 2007). The first method allows for an improvement of the tracking of each object. The last is particularly useful in cluttered scenes, thanks to their ability to associate detection results of consecutive frames or even to track partially occluded pedestrians by detecting body parts, rather than the full individuals (Wu and Nevatia 2006). More in depth reviews of the currently available methods are provided by Ali et al (2013) and Moeslund et al. (2006, 2011). They are intensively developed with the objective of making group behaviour analyses efficient and fully automatic. When dealing with the visual representation of crowds, the common research path emerges as follows. After tracking individuals and groups (Izadinia et al. 2012; Dehghan et al. 2014), interactions among the pedestrians in the crowd are mathematically modelled. These two analyses serve to seperate and classify motion patterns (Mehran et al. 2010), and allow for the detection of normal and abnormal behaviour (Kratz and Nishino 2009). In computer graphics, crowd modelling refers to the representation of virtual humans at various scales and levels of detail and covers group behaviour and agent-based motion simulation, aggregate flow, motion planning for large scale crowds and obstacle and collision avoidance (Ali et al, 2013). The evacuation dynamics deals with analyses of motion, interaction and the self-organisation of crowds. Assuming that “a crowd is any collection of individuals or pedestrians where the behaviour of one individual is influenced by another” (Ali et al, 2013, p.3), many of the methods conceived for its analyses are useful from the point of view of urban studies as well. The current study excludes however the holistic methods of analyses, i.e., dynamic textures or particle based representations, while focusing on the tracking of group behaviour, motion patterns and human interactions in the scale of public, outdoor spaces. 5. Small group behaviour analyses In a comprehensive review discussing the automatic methods of analyses of small group behaviour, Gatica-Perez (2009) explores the experiments coming from several scientific communities, i.e.: multimodal processing, machine learning, human-computer interaction, ubiquitous computing, computer vision and speech and language processing. He examines the possibilities of pattern recognition in multiparty interaction, with regard to the following observable behaviours: turntaking, addressing, social relationships in small groups, including roles, and group members’ emotions. The last covers perceived interest and attraction and such individual personality traits as dominance and extraversion. The observation takes into account nonverbal signals that are perceived both as aural, such as tone of a voice and its prosody, and visual: posture, body gestures and more detailed: eye gaze and facial
651
Hanzl, Małgorzata; Ledwoń, Sławomir Analyses of human behaviour ISOCARP-OAPA 2017
5
expressions. The definition of a small group (Jovanovic, Akker 2004) assumes the size of a gathering up to seven participants and conversations occurring between all of the members, of whom any may initiate the communication. In larger group discussions these usually consists of a series of conversations between a group leader and changing interlocutors. The current synopsis focuses on methods using visual exploration, more appropriate for studying human behaviour in outdoor spaces. The addressing and turn taking patterns are the subject of research of social psychology and nonverbal communication. Addressee identification research (Jovanovic, Akker 2004) distinguishes a few separate groups of conversation participants, firstly dividing them into (1) active participants and (2) non participants. Among active participants the authors further discern: (1) a speaker, (2) an addressee and (3) side-participants. While in the group of non-participants there are listeners who may be further divided into bystanders and eavesdroppers. The main sources of analysed information in this case are speech, gaze direction, gesture and context. The last one is of special interest to our research. The categories of context listed by Jovanovic and Akker (2004), as contributing to addressee detection, are: the history of interaction and meeting action, user context and spatial context, which covers: “participants’ location, locations of the environmental objects, distance between participants, participants’ visible area”. The turn taking patterns are automatically recorded with the use of such tools as: a multisensor room, multiple cameras and microphones, including lapel microphones and a microphone array. Despite the attempts to develop more automatic analysis, the most reliable method of recognition, however costly, is still the manual labelling of acquired data. The visual cues are extracted from tracing the participants’ body motion and pose as well as the motion and location of heads, represented by skincolour blobs (Gatica-Perez 2009). In multistream and multi layered systems, layers describing the individual and group activities are overlapped, thus providing more reliable results. Based on an analysis of conscious or unconscious nonverbal behaviour, the computational modelling researchers automatically identify a person’s internal state in small group conversations. Gatica-Perez (2009) lists the following states: “nervousness, anxiety, embarrassment, frustration, anger, joy, attraction, confusion, consistency, boredom, and interest”. Interest - the most significant behaviour for the current research - means the degree of engagement during the interaction and is examined based on speech modality. The researchers of the wearable computing community (Pentland 2008), in the well-received study on the perceived interest levels, used the following methods: manual estimation, automatic computing from a number of acoustic cues, and the estimation of body motion from accelerometers. Among the studies on personality traits, namely: dominance, locus-of-control and extroversion, only the first one seem in the scope of our interest in the current research. Given the abundance of research in social psychology and sociology on roles in small groups, computational models addressing this topic reflect the multiplicity of perspectives and refer to disparate cases. Hare (1994) classified roles into: (1) functional: control, access to resources, status and group identification; (2) sociometric: central, friendly, or isolated position within a group; and (3) emotional. The last group is further divided into prototypical: hero, clown, and scapegoat, and dramaturgical roles: protagonists, antagonists and audience members. Pianesi et al. (2008) explored functional role recognition in small groups, starting from a definition of the coding scheme. The two classification systems applied (1) task-based roles: orienteer, giver, seeker, recorder, and follower, and (2) socioemotional-based roles: gatekeeper, protagonist, supporter, attacker, and neutral. The first division was based on the distribution of tasks related to the coordination and mission of the group, the second one referred to the carrying on of the relationships between the group members. The information was derived from the semi-automatic audio cues and automatic visual cues, the last one extracted from two measures - one for the body and one for the
652
Hanzl, Małgorzata; Ledwoń, Sławomir Analyses of human behaviour ISOCARP-OAPA 2017
6
hand - with the use of the motion features computed on skin regions. The majority of the automated small group exploration addressed teamwork situations and was conducted indoors. The recorded conversations discussed by Gatica-Perez (2009) come, with a few exceptions, from the collections recorded and designed with the goal of studying group interaction. 6. Pedestrian mobility studies Mobility studies employ several methods of tracing and tracking human subjects at various scales. Apart from video-based technologies, which have already been discussed above, they cover the range of methods of the so called Position Determination Technologies (PDT), which comprise technologies tracking the location of human subjects with the use of wireless devices (Millonig et al. 2009). The main techniques in this group include: (1) GPS data collection, (2) mobile phone data, (3) WLAN data. Social media and card transaction analyses, similarly to research on Bluetooth and RFID data are going through an intensive period of development, however in all cases the issues of privacy and maintenance of proper anonymity are essential (Resch 2013). The issues of privacy protection should take into account the variegated legal environment of different countries as well as ethical concerns. From the point of view of community planning, the involvement of participants seems the most appropriate solution, which will be further addressed in the Discussion section of this paper. Among the experimental methods which are more suitable for smaller scales, laser scanning and sensor floors are briefly overviewed at the end of this section. 6.1 GPS GPS data signals, with the highest accuracy values up to 3m (which could be enhanced locally with the use of augmentation services, compare the site gps.gov) and a precision decrease in locations surrounded with highrise buildings due to signal reflection and multiple occlusions, are not sufficient for the purposes of the observation of pedestrian behaviour in outdoor spaces. Although attempts have been made to use GPS to track people in urban areas for the purposes of tracking pedestrian mobility, e.g., the study by Van der Spek et al. (2013) in the town centre of Delft or studies by Hovgesen and Nielsen (2004) or Shoval (2008), since the precision of the signal is limited, such observations may pertain to larger urban areas and are not suitable for the analysis of a single street or square. Not applicable to direct tracking or shadowing in urban design scale, Global Positioning Services are however useful in the process of video motion analyses for the calibration of gathered video data to the unified coordination system. 6.2 GSM/UMTS Mobile phone data acquisition relies on GSM/UMTS positioning. The cell coverage’s inherent properties determining the correct signal supply significantly limit the accuracy of the available location of users’ coordinates (for details consult Millonig et al 2009). The growing market of Localisation Based Services (LBS) is one of reasons for the increasing availability of location information. However, the available precision still needs to be amended. While some mobile systems record location data in a permanent way, others note only users’ activities, such as calling, starting data transfer, etc., data acquired is not complete. All in all, mobile phone data location accuracy is not sufficient for tracking human subjects in outdoor spaces (Hoteit et al. 2014). 6.3 WLAN networks More details may be obtained while using LAN access analyses, as discussed below. Users’ signals in WLAN networks may be another potential source of data on human behaviour (Santi 2012). The basic assumption in this kind of analysis is that the change of a user’s AP in a WLAN network means a change of the user’s location. This assumption is considered true except for, so called, pingpong transitions, which may be filtered out. The lack of continuity in the tracing of a user’s signals means however that mobility is not explicitly
653
Hanzl, Małgorzata; Ledwoń, Sławomir Analyses of human behaviour ISOCARP-OAPA 2017
7
characterised in terms of location and trajectory. Instead, it may be implicitly described through the analysis of migration patterns between APs in the networks, with the artificial APs introduced to the model to emulate the inactive periods (Santi 2012). It should be noted however that WLAN traces do not allow continuous tracking of a user’s position over a period of time, but just a user’s AP association pattern. Hence, the statement on the limited degree of user mobility in a WLAN refers to the users’ repetitive WLAN access pattern exploring a small portion of APs in the network (Santi 2012). WLAN environments may be classified into two categories (Santi 2012): (a) models firmly reflecting user AP/registration patterns in WLAN traces, which may also serve to predict the user’s next association (e.g., Jain et al. 2005), and (b) models aimed at modelling a user’s physical mobility (Kim et al. 2006). Taking into account prolonged periods of associations with a single AP, the users’ behaviour in the WLAN networks may be described as ‘nomadic’ rather than as ‘mobile’. The growing popularity of VoIP networks creates the opportunities for more exact tracing of physical location. 6.4 Bluetooth analyses Patterns in human activities may be analysed and registered thanks to largescale datasets, however, the limited accuracy of data measurements (Miller 2005) constrains their applications to city scale analyses. Other sources of data, such as social media or bank card transactions (Yoshimura et al. 2014), are also more suitable for greater scales. More potential lies in Bluetooth proximity-detection analyses of human behaviour, in which (1) the detecting scale is fine-grained. Yoshimura et al. (2014) list the further advantages of the Bluetooth proximity-detection approach to small scale analysis: (2) previous registration not necessary, which enables collection of large data sets over an extended time, (3) the unobtrusive character of Bluetooth, (4) accuracy inside or in the proximity of high structures. There are also constraints of this method of observation, i.e. the actual share of people using Bluetooth technology: for example, in the exploratory study conducted in the Louvre Museum a limited number of approximately 8,2% of visitors had Bluetooth signal turned on (Yoshimura et al. 2014), which would make the information required for urban design purposes fragmented. 6.5 Laser scanning Automated methods of data acquisition may use the full electromagnetic wave spectrum, including those which lie outside the visible range, e.g., thermal waves. The limitations result from the need to make data acquisition eye-safe. Instead of standard cameras, laser scanning, both visible and invisible, may be applied. In the research conducted in the Pedestrian Accessibility and Movement Environment Laboratory (PAMELA) UCL (Bauer and Kitazawa 2008), the initial tracking experiments were performed with the use of two laser range scanners for the sake of pedestrian motion model calibration. The scanners, with a frequency of 10 Hertz, located in two opposite corners of the platform at a height of 1m, emitted and grabbed reflected infrared beams, which were synchronised and combined in a joint coordinate system to provide a two-dimensional plan of the scene. The range of scanning did not exceed 30m and some occlusion problems persisted. A point cloud derived from the laser scanning may be further processed in order to detect individual objects and track them over time, e.g., with the use of a Hidden Markov Model tracking. Other researchers try to put scanners at foot level - ca 20 cm above the floor, e.g., Zhao and Shibasaki (2005) or Shao et al (2007). In newer research from the same research group (Cui et al. 2008), the combination of multiple laser scanners and video camera allowed for more reliable acquisition of data. 6.6 A sensing floor The market offers multiple commercial products both for counting and surveillance as well as for detecting the movement of people. Most tools are designed for indoor environments but there are also devices which may be used outdoors. Apart from cameras and laser scanners operating in all the available frequencies (thermal, infrared, visible, etc.), enabling both
654
Hanzl, Małgorzata; Ledwoń, Sławomir Analyses of human behaviour ISOCARP-OAPA 2017
8
detection and counting of subjects as well as tracking, there are also tools such as sensor equipped floors or mats. The last, being a recent invention, are designed in a way which makes indoor applications more appropriate. Two types of floor systems based on different methods of step detection are available: the first one using capacitive proximity sensors (1), and the second one based on pressure sensitive floors (2). While floor pressure sensors, reacting to the external pressure, are more suitable for indoor applications, the capacity proximity sensors enable tracking regardless of the type of flooring, including, e.g., stone tiles, with the exception however of conductive materials (Sousa et al. 2013). Representative for the first type, the SensFloor system combines microelectronic modules and capacitive proximity sensors in the form of a grid (typically 0,5x0,5 m) with a textile roll (max length 50 m) (Sousa et al. 2013, Lauterbach et al. 2012). In addition, as the maximum outer layer thickness should not exceed 5 cm, some outdoor applications seem possible, however, the areas of important traffic must be carefully rethought. The sensing events evoked by people walking are transmitted wirelessly (868 MHz) to the transceiver, which then analyses the time series and reconstructs the movement trajectories. The experiments are conducted on walking pattern analyses with the use of devices such as pedometers in order to detect individual pedestrians (Sousa et al. 2013). Sensing floors, offering solutions eliminating some problems the computer vision methods deal with, i.e. angular observation occlusion, require planning of the observation strategy at the stage of design and construction of a site. On the one hand this condition excludes many possible urban design analytical cases, on the other it may become an effective and efficient part of the actual design proposal itself, providing opportunities to create more flexible design solutions 6.7 Radio Frequency Identification (RFID) Radio Frequency Identification (RFID) is a well-established technology that enables identification of objects. RFID tags, classified into two categories, active and passive, differ due to the presence of an internal power supply and, consequently, cost, size and available signal range. Passive tags may be only read from direct proximity, which limits tracking possibilities to larger scale or indoor applications, with a track consisting of a series of points acquired when a subject passes next to the RFID reader, e.g. when moving through several rooms or passing next to gates. In single space solutions, multiple trials were conducted to track objects using mobile antenna and passive RFID tags distributed at regular distances all over the area. Recently, researchers started examining other options, with passive RFID tag moving and stable antennae (Choi et al. 2015), which could be useful as a method of tracking people in open, outdoor spaces.. 7. Experimental methods The objectives of collecting data from automatic analyses are to provide the framework for successful urban design. In this case successful means fulfilling the needs of users, shaping the environment that enhances encounters and making social situations happen. Successful in this sense also means the way of use that does not create unnecessary obstacles, which answers the requirement of comfort and which makes use of public space more intuitive. At the same time an examination of people’s behaviour in outdoor situations may help make the settings more flexible. In recent times, some attempts to solve the above defined problem were undertaken by Nielsen et al (2014), who tracked and recorded pedestrian behaviour and dynamics with a system based on the use of Computer Vision methods enhanced with thermal cameras and Geographic Information Systems (GIS). This study is particularly interesting as it was done with the recognition of the objectives of urban design. Referring to the methodology applied, researchers used two thermal cameras with a fixed field of view in order to constantly monitor the area of interest: (1) from a point close to a nadir view, in order to eliminate occlusions, (2) from a more oblique angle. The people with equipment were differentiated
655
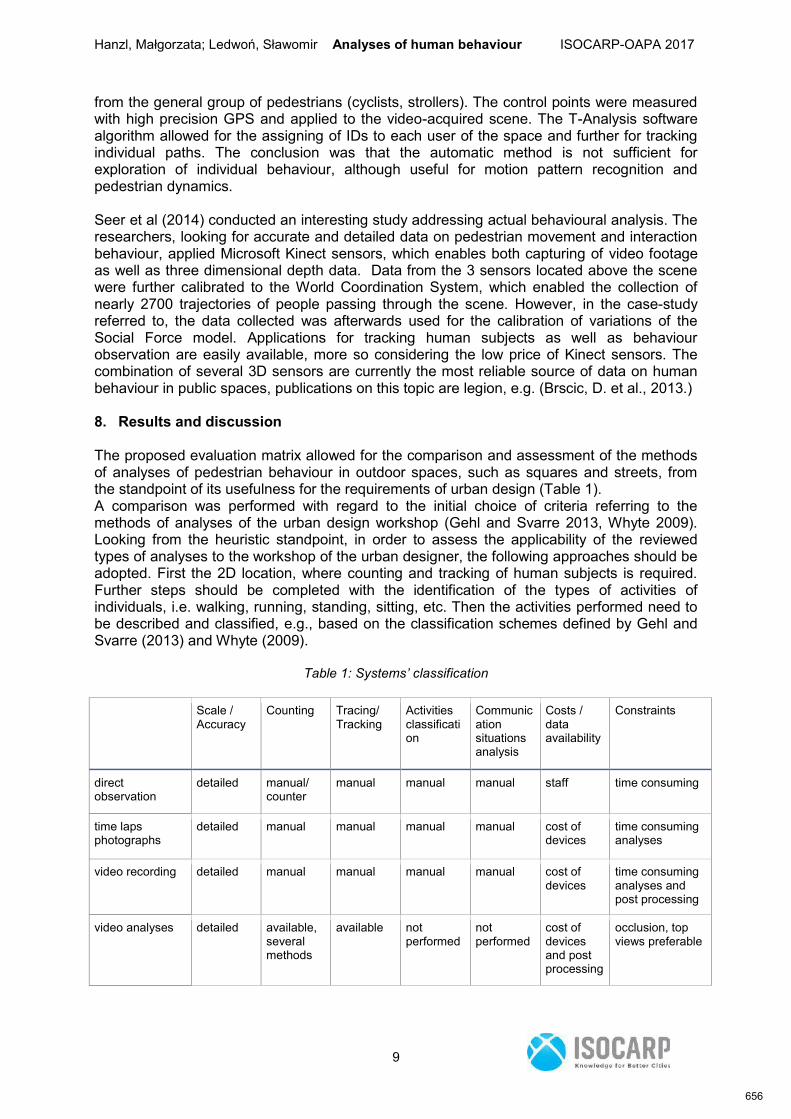
Hanzl, Małgorzata; Ledwoń, Sławomir Analyses of human behaviour ISOCARP-OAPA 2017
9
from the general group of pedestrians (cyclists, strollers). The control points were measured with high precision GPS and applied to the video-acquired scene. The T-Analysis software algorithm allowed for the assigning of IDs to each user of the space and further for tracking individual paths. The conclusion was that the automatic method is not sufficient for exploration of individual behaviour, although useful for motion pattern recognition and pedestrian dynamics. Seer et al (2014) conducted an interesting study addressing actual behavioural analysis. The researchers, looking for accurate and detailed data on pedestrian movement and interaction behaviour, applied Microsoft Kinect sensors, which enables both capturing of video footage as well as three dimensional depth data. Data from the 3 sensors located above the scene were further calibrated to the World Coordination System, which enabled the collection of nearly 2700 trajectories of people passing through the scene. However, in the case-study referred to, the data collected was afterwards used for the calibration of variations of the Social Force model. Applications for tracking human subjects as well as behaviour observation are easily available, more so considering the low price of Kinect sensors. The combination of several 3D sensors are currently the most reliable source of data on human behaviour in public spaces, publications on this topic are legion, e.g. (Brscic, D. et al., 2013.) 8. Results and discussion The proposed evaluation matrix allowed for the comparison and assessment of the methods of analyses of pedestrian behaviour in outdoor spaces, such as squares and streets, from the standpoint of its usefulness for the requirements of urban design (Table 1). A comparison was performed with regard to the initial choice of criteria referring to the methods of analyses of the urban design workshop (Gehl and Svarre 2013, Whyte 2009). Looking from the heuristic standpoint, in order to assess the applicability of the reviewed types of analyses to the workshop of the urban designer, the following approaches should be adopted. First the 2D location, where counting and tracking of human subjects is required. Further steps should be completed with the identification of the types of activities of individuals, i.e. walking, running, standing, sitting, etc. Then the activities performed need to be described and classified, e.g., based on the classification schemes defined by Gehl and Svarre (2013) and Whyte (2009).
Table 1: Systems’ classification
Scale / Accuracy
Counting Tracing/ Tracking
Activities classification
Communication situations analysis
Costs / data availability
Constraints
direct observation
detailed manual/ counter
manual manual manual staff time consuming
time laps photographs
detailed manual manual manual manual cost of devices
time consuming analyses
video recording detailed manual manual manual manual cost of devices
time consuming analyses and post processing
video analyses detailed available, several methods
available not performed
not performed
cost of devices and post processing
occlusion, top views preferable
656
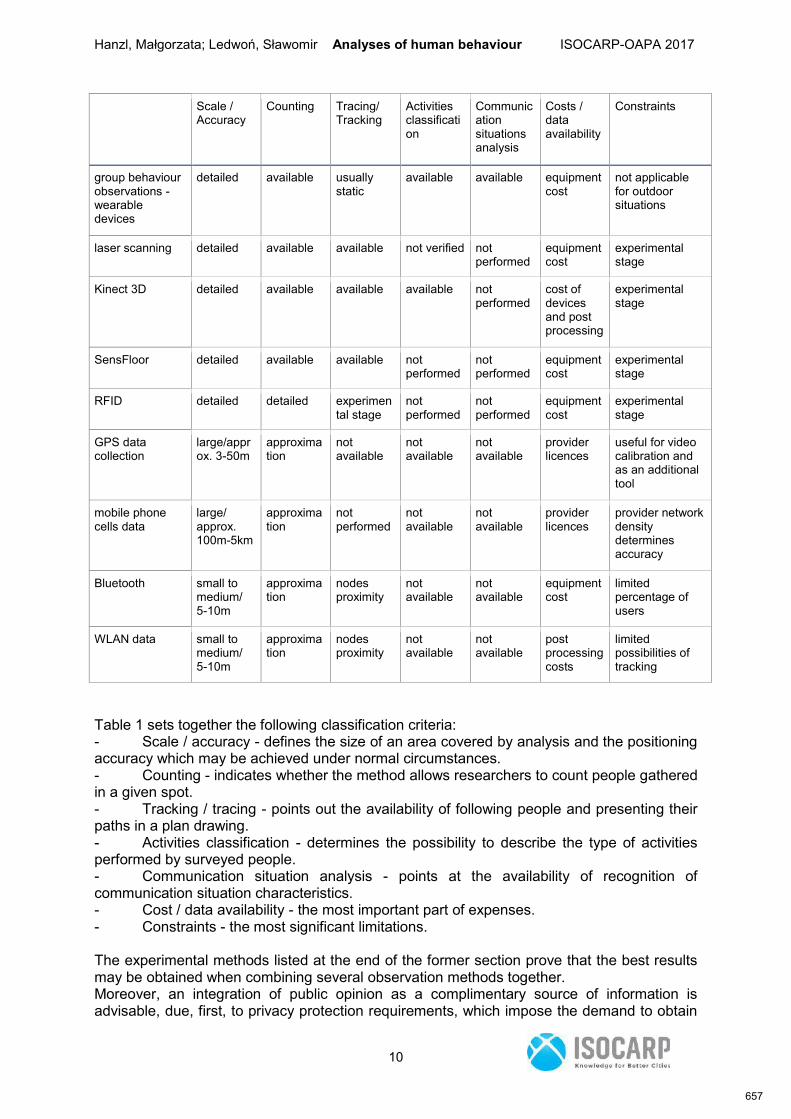
Hanzl, Małgorzata; Ledwoń, Sławomir Analyses of human behaviour ISOCARP-OAPA 2017
10
Scale / Accuracy
Counting Tracing/ Tracking
Activities classification
Communication situations analysis
Costs / data availability
Constraints
group behaviour observations - wearable devices
detailed available usually static
available available equipment cost
not applicable for outdoor situations
laser scanning detailed available available not verified not performed
equipment cost
experimental stage
Kinect 3D detailed available available available not performed
cost of devices and post processing
experimental stage
SensFloor detailed available available not performed
not performed
equipment cost
experimental stage
RFID detailed detailed experimental stage
not performed
not performed
equipment cost
experimental stage
GPS data collection
large/approx. 3-50m
approximation
not available
not available
not available
provider licences
useful for video calibration and as an additional tool
mobile phone cells data
large/ approx. 100m-5km
approximation
not performed
not available
not available
provider licences
provider network density determines accuracy
Bluetooth small to medium/ 5-10m
approximation
nodes proximity
not available
not available
equipment cost
limited percentage of users
WLAN data small to medium/ 5-10m
approximation
nodes proximity
not available
not available
post processing costs
limited possibilities of tracking
Table 1 sets together the following classification criteria: - Scale / accuracy - defines the size of an area covered by analysis and the positioning accuracy which may be achieved under normal circumstances. - Counting - indicates whether the method allows researchers to count people gathered in a given spot. - Tracking / tracing - points out the availability of following people and presenting their paths in a plan drawing. - Activities classification - determines the possibility to describe the type of activities performed by surveyed people. - Communication situation analysis - points at the availability of recognition of communication situation characteristics. - Cost / data availability - the most important part of expenses. - Constraints - the most significant limitations. The experimental methods listed at the end of the former section prove that the best results may be obtained when combining several observation methods together. Moreover, an integration of public opinion as a complimentary source of information is advisable, due, first, to privacy protection requirements, which impose the demand to obtain
657
Hanzl, Małgorzata; Ledwoń, Sławomir Analyses of human behaviour ISOCARP-OAPA 2017
11
consent for data acquisition. Second, the inherent objectives of urban design analyses, which, by definition, serve the improvements of the functioning of outdoor spaces, suggest that voluntary sharing of data may supply a better answer to the various needs of the users of the space. The research on the way people use a given place first uncovers its sociometric layout both inside and with regard to the connections with the larger neighbourhood where it is located. Second, it allows us to recognise the basic types of activities which happen there, thus giving some insights on both the current as well as the potential culture of usage of the space. The recognition of common habits with regard to a designed space as well as other locations in the proximity of similar social preconditions and of a function resembling the one to be introduced in a place may give some design guidance. As, usually, the culture of the usage of space remains constant for a given social group and character of activities, spatial constraints of the actual human behaviour become much easier to define., None of the methods discussed above take into account the relation between the environment and human behaviour. In most cases discussed in computer vision studies, the observation was performed to further calibrate the model, the simulation of behaviour considered the actual method in urban design. While modelling and simulations are useful, also knowledge on the actual way people use space is salient itself. Designers are first interested in the connections of the site with its direct neighbourhood to avoid destroying the sociometric layout in an unintentional way. Second, certain types of behaviour, specific for a given community and for a defined type of social situation, convey into the larger picture of the culture of usage of space. Recognition of the typical behaviour common for variegated situations may be crucial in the design of new spaces encouraging social and communication situations. The defined catalogue of preferable ways of using outdoor spaces constitutes a valuable manual for designing new spaces in a way which increases the social acceptance of a neighbourhood. In most cases, habits do not change easily, interventions should be thus introduced in a cautious way, answering the real needs of a given community. In a nutshell, learning about the current use of space is one of the possible methods, next to the public involvement methods, and surveys, which may give designers an insight into what formal solutions will answer the actual needs of a given community, framing various social situations in a successful, thus accepted, way. In a more futuristic approach, we may also discuss the settings which adapt formally to the situation which takes place in a given space, providing truly flexible formal solutions for various activities. Recognition of the patterns of usage of space is also crucial for design and implementation strategy. Usually, gradual or more conscious planning of a sequence of consecutive activities may lead to greater public acceptance. People, being and feeling involved in the process, marking their presence and demonstrating various social situations, may obtain an opportunity to directly influence the final design of a site with regard to their own comfort and actual needs. Observation in urban design applications should be conducted parallel with a participatory process, this way making acquisition of data a voluntary activity done on purpose to influence the resulting design. 9. Conclusions The results of the survey prove that the current state-of-the-art automated acquisition of data for design is not sufficient. Most data gathering activities must be completed manually or require important and time consuming interpretation. Whereas networking and computing technology, along with the miniaturisation of sensors and popularisation of smartphones, opens a range of new ways to capture data that may and should be further developed. The questions which should be answered include those on the actual culture of usage of a space proper for a given social group as well as mobility patterns of a given site, with an emphasis on pedestrian behaviour. The main objectives of studies of human behaviour in the urban design scale: 1. count, 2. displacement 3. tracking, 4. tracing, 5. behaviour analysis, 6.
658
Hanzl, Małgorzata; Ledwoń, Sławomir Analyses of human behaviour ISOCARP-OAPA 2017
12
communication situations analysis. Among the currently available methods of automatic behaviour analyses the most successful are those which unite various tools and media, including 3D sensors and laser scanning. Significant constraints result from the small scale of urban design analyses, which reduces the applicability of GPS and mobile phone data. The continuous nature of most outdoor locations as well as atmospheric conditions further limit the possibilities to use some methods, e.g., sense floor or RFID. Moreover, the objectives to collect data from automatic analyses are to provide the framework for successful urban design. All the above mentioned studies neglect the role of the situational context, concentrating on verbal communication and body motion or mobility patterns. Providing that for urban design purposes the observation serves to fulfil the needs of the users and shapes the environment so that it enhances encounters and makes social situations happen, then success in this sense means the way of use which does not create unnecessary obstacles, which answers the requirement of comfort and which makes use of public space more intuitive. At the same time, examination of people’s behaviour in outdoor situations may help make the settings more flexible. In recent times some attempts to solve the above defined problem were undertaken and the directions of this research should be further pursued. References: Ali, S., Nishino, K., Manocha, D., & Shah, M. (2013). Modeling, Simulation and Visual Analysis of Crowds: A Multidisciplinary Perspective. In S. Ali, K. Nishino, D. Manocha, & M. Shah (Eds.), Simulation and Visual Analysis of Crowds (pp. 1–19). New York Heidelberg Dor-drecht London: Springer. Bauer, D., & Kitazawa, K. (2010). Using Laser Scanner Data to Calibrate Certain Aspects of Microscopic Pedestrian Motion Models. In W. F. Rogsch, A. Schadschneider, & M. Schreckenberg (Eds.), Pedestrian and Evacuation Dynamics 2008 (Vol. 83–94). Heidelberg Dodrecht London New York: Springer. Betke, M., Hirsh, D. E., Bagchi, A., Hristov, N. I., Makris, N. C., & Kunz, T. H. (2007). Tracking Large Variable Numbers of Objects in Clutter. In IEEE Conference on Computer Vision and Pattern Recognition (pp. 1–8). Brostow, G. J., & Cipolla, R. (2006). Unsupervised Bayesian Detection of Independent Motion in Crowds. In IEEE Computer Society Conference on Computer Vision and Pattern Recognition - Volume 1 (CVPR’06) (Vol. 1, pp. 594–601). Brscic, D., Kanda, T., Ikeda, T., & Miyashita, T. (2013). Person Tracking in Large Public Spaces Using 3-D Range Sensors. IEEE Transactions on Human-Machine Systems, 43(6), 522–534. Choi, J. S., Kang, W. S., Son, C. S., Son, B. R., & Lee, D. H. (2015). Tag Interference Based Mobile Object Tracking with Passive UHF RFID System. Computer Science and Its Applications. Lecture Notes in Electrical Engineering, 203, 421–428. Cui, J., Zha, H., Zhao, H., & Shibasaki, R. (2008). Multimodal tracking of people using laser scanners and video camera. Image and Vision Computing, 26(2), 240–252. Gatica-Perez, D. (2009). Automatic nonverbal analysis of social interaction in small groups: A review. Image and Vision Computing, 27(12), 1775–1787. Gehl, J., & Svarre, B. (2013). How to Study Public Life. Washington, Covelo, London: IslandPress. Hare, A. P. (1994). Types of Roles in Small Groups A Bit of History and a Current Perspective. Small Group Research, 25(3), 433–448. Hoteit, S., Secci, S., Sobolevsky, S., Pujolle, G., & Ratti, C. (2013). Estimating Real Human Trajectories through Mobile Phone Data. 2013 IEEE 14th International Conference on Mobile Data Management, 148–153. Hovgesen, H. H. , & Nielsen, T. S. (2004). GPS in pedestrian and spatial behaviour surveys . In Cities for People, The Fifth International Conference on Walking in the 21st Century (pp. 1–13).
659
Hanzl, Małgorzata; Ledwoń, Sławomir Analyses of human behaviour ISOCARP-OAPA 2017
13
Izadinia, H., Saleemi, I., Li, W., & Shah, M. (2012). ( MP ) 2 T : Multiple People Multiple Parts Tracker. Computer Vision – ECCV. Lecture Notes in Computer Science, 7577, 100–114. Jovanovic, N., & Akker, R. op den. (2004). Towards automatic addressee identification in multiparty dialogues. In Proc. of the SIGDial Workshop on Discourse and Dialogue. Boston. Kratz, L., & Nishino, K. (2009). Anomaly detection in extremely crowded scenes using spatio-temporal motion pattern models. In 2009 IEEE Conference on Computer Vision and Pattern Recognition (pp. 1446–1453). Kratz, L., & Nishino, K. (2010). Tracking with local spatio-temporal motion patterns in extremely crowded scenes. In 2010 IEEE Computer Society Conference on Computer Vision and Pattern Recognition (pp. 693–700). Lauterbach, C., Steinhage, A., & Techmer, A. (2012). Large-area wireless sensor system based on smart textiles textiles. In 9th International Multi-Conference on Systems, Signals and Devices (pp. 6–7). Leibe, B., Seemann, E., & Schiele, B. (2005). Pedestrian Detection in Crowded Scenes. In IEEE Computer Society Conference on Computer Vision and Pattern Recognition (pp. 20–25). Lelescu, D., Kozat, C., Jain, R., & Balakrishnan, M. (2005). Model T ++ : An Empirical Joint Space-Time Registration Model Categories and Subject Descriptors. In Proceedings of the 11th Annual International Conference on Mobile Computing and Networking (pp. 170–184). Low, S. M. (2000). On the plaza : the politics of public space and culture. Austin: University of Texas Press. Mehran, R., Moore, B. E., & Shah, M. (2010). A Streakline Representation of Flow in Crowded Scenes. European Conference on Computer Vision (ECCV 2010). Lecture Notes in Computer Science, 6313, 439–452. Miller, H. J. (2005). A measurement theory for time geography. Geographical Analysis, 37(1), 17–45. Millonig, A., Brandle, N., Ray, M., Bauer, D., & Van Der Spek, S. (2009). Pedestrian Behaviour Monitoring : Methods and Experiences. In Proceedings of the Behaviour Monitoring and Interpretation-BMI: Smart Environments Conference, 3, 11. Millonig, A., & Gartner, G. (2008). Shadowing – Tracking – Interviewing How to Explore Human Spatio-Temporal Behaviour Patterns. In Proceedings of the 2nd Workshop on Behaviour Monitoring and Interpretation, BMI’o8 (pp. 1–14). Kaiserslautern, Germany. Moeslund, T. B., Hilton, A., & Krüger, V. (2006). A survey of advances in vision-based human motion capture and analysis. Computer Vision and Image Understanding, 104(2-3), 90–126. Moeslund, T. B. (2011). Is There Anybody Out There? In T. B. Moeslund, A. Hilton, V. Krüger, & L. Sigal (Eds.), Visual Analysis of Humans: Looking at People (pp. 3–10). London, Dordrecht, Heidelberg, New York: Springer. Nielsen, S. Z., Gade, R., Moeslund, T. B., & Skov-Petersen, H. (2014). Taking the Temperature of Pedestrian Movement in Public Spaces. Transportation Research Procedia, 2, 660–668. Pentland, A. S. (2008). Honest Signals, How They Shape Our World. Cambridge, London: MIT Press. Pianesi, F., Zancanaro, M., Lepri, B., & Cappelletti, A. (2008). A multimodal annotated corpus of consensus decision making meetings. Language Resources and Evaluation, 41(3-4), 409–429. Resch, B. (2013). People as Sensors and Collective Sensing- Contextual Observations Complementing GeoSensor Network Measurements. Progress in Location-Based Services Lecture Notes in Geoinformation and Cartography, 391–406. Richardson, M. (2009). Being-in-the-Market Versus Being-in-the-Plaza: Material Culture and the Construction of Social Reality in Spanish America. In S. M. Low & D. L. Lawrence-Zuniga (Eds.), The Anthroplogy of Space and Place. Locating Culture (Vol. 9, pp. 74–91). Blackwell Publishing. Rodriguez, M. D., & Shah, M. (2007). Detecting and segmenting humans in crowded scenes. In Proceedings of the 15th international conference on Multimedia - MULTIMEDIA ’07 (pp. 353–356). New York, New York, USA: ACM Press.
660
Hanzl, Małgorzata; Ledwoń, Sławomir Analyses of human behaviour ISOCARP-OAPA 2017
14
Santi, P. (2012). Mobility Models for Next Generation Wireless Networks: Ad Hoc, Vehicular and Mesh Networks. John Wiley & Sons. Seer, S., Brändle, N., & Ratti, C. (2014). Kinects and human kinetics: A new approach for studying pedestrian behavior. Transportation Research Part C: Emerging Technologies, 48, 212–228. Shao, X. S. X., Zhao, H. Z. H., Nakamura, K., Katabira, K., Shibasaki, R., & Nakagawa, Y. (2007). Detection and tracking of multiple pedestrians by using laser range scanners. 2007 IEEE/RSJ International Conference on Intelligent Robots and Systems, (1), 2174–2179. Shoval, N. (2008). Tracking technologies and urban analysis. Cities, 25(2008), 21–28. Sousa, M., Techmer, A., Steinhage, A., Lauterbach, C., & Lukowicz, P. (2013). Human Tracking and Identification using a Sensitive Floor and Wearable Accelerometers. In IEEE International Conference on Pervasive Computing and Communications (PerCom) (pp. 166–171). San Diego. Van Der Spek, S., Van Langelaar, C., & Kickert, C. C. (2013). Evidence-based design : satellite positioning studies of city centre user groups. Urban Design and Planning, 166(DP4), 206–216. Whyte, W. (2009). The Social Life of Small Urban Places. New York: Project for Public Spaces. Wu, B., & Nevatia, R. (2006). Tracking of Multiple , Partially Occluded Humans based on Static Body Part Detection. In Proceedings of IEEE International Conference on Computer Vision and Pattern Recognition (Vol. 00, pp. 951–958). Yoshimura, Y., Sobolevsky, S., Ratti, C., Girardin, F., Carrascal, J. P., Blat, J., & Sinatra, R. (2014). An analysis of visitors’ behavior in The Louvre Museum: a study using Bluetooth data. Environment and Planning B: Planning and Design, 41(6), 1113–1131. Zhao, H., & Shibasaki, R. (2005). A novel system for tracking pedestrians using multiple single-row laser-range scanners. IEEE Transactions on Systems, Man, and Cybernetics Part A:Systems and Humans., 35(2), 283–291. Zhao, T., Nevatia, R., Wu, B., & Member, S. (2008). Segmentation and Tracking of Multiple Humans in Crowded Environments. IEEE Transactions on Pattern Analysis and Machine Intelligence, 30(7), 1198–1211.
661
Abstract title Residential property price barometers: a reliable tool for smart citizens? First evidences
from Italy
Author Urb. Bisello PhD, Adriano, Eurac research, PADOVA, Italy (Presenting author)
Co-author(s) Prof Marella, Giuliano ; Urb. Vettorato, Daniele
Abstract
Deciding to buy a house or an apartment is always a crucial moment in a person’s life. By remaining in
the same city or in the same neighborhood where one grew up, there is the advantage to precisely know
the context: where the most important services are, the noisy streets, the green areas, the bus stops,
etc. In this case, the crucial steps are: (i) to define the desired features of the property that it is intended
to buy (the so-called intrinsic characteristics), and (ii) to start scanning the local market, in order to check
if the investment is affordable, given the budget. By moving to another district or a different city, a third
key issue emerges: (iii) having a clear picture of the context surrounding the property (what the experts
in the field call the extrinsic characteristics).
Searching for a residential property is today easier for “smart citizens” through specialized web services,
which collect advertisements from several real estate agencies in a single database. Due to the
integration with web map services, they are very helpful in localizing, more or less precisely, where the
properties are located as well as for describing their characteristics in a homogenous way. This is already
a progress in the real estate market, usually known for its lack of transparency. Nevertheless, in most of
the cases, an open question remains for the ordinary people: is it the asking price adequate? More
precisely: have all the key characteristics been considered in the definition of the asking price? Above-
mentioned web services try to answer this point or at least to offer a rough estimation of a likely market
value, at a low fare or even free. Such “property price barometers” often benefit from very large
databases and spatialized information through the integration of web map services. Unfortunately, they
lack a robust appraisal method or are based on an unclear mix of data sources. Thus, they are prone to
bias by outliers or to systematic errors.
This paper aims to provide a better understanding of already existing “property price barometers” in the
Italian real estate market, suggesting solutions for an improvement of reliability of these tools. In
particular by analyzing a large real estate advertisement database through a hedonic price model (HP)
and introducing a spatial effects consideration. The HP is a well-rooted economic evaluation technique,
frequently used by professionals of real estate appraisal. It identifies price factors (referring to
transactions as well as asking prices) according to the premise that an asset’s price is determined both by
the intrinsic characteristics of the good being sold and extrinsic ones. Thus, HP is suitable for assessing
the value of non-market goods or the marginal contribution of a specific non-market characteristic (e.g.
the energy performance class of the building, or the proximity to public services or environmental
amenities) in a heterogeneous good, as the real estate property is. The model is typically solved using
the ordinary least-squares method, even though the presence of spatial autocorrelation could lead to
biased results. By introducing the spatial dimension, we expect to improve the model accuracy and
reliability and to deliver a more accurate estimation at the single property level.
662
A Spark of Change: Awareness on Energy Consumption through
the Mobility Choicesi
Gonca Nurgül AKGUL, Ayşegül OZBAKIR, Zeynep MEREY ENLIL, Yıldız Technical University, Faculty of Architecture, Dept. of City and Regional Planning; Turkey.
Abstract
Demand for energy and conspicuous consumption are at the center of recent debates. Considering the increasing world population and limited resources, it is apparent that there is tremendous urgency for reducing cities’ energy footprint through behavioral change. This paper focuses on individual’s choices on urban mobility, and aims to understand how learning platforms affect individual behavior on mobility towards sustainability. Within the framework of this paper, citizen’s real-life experiments on urban mobility are analyzed in urban neighborhoods of Kadikoy, a central district of 500.000 inhabitants within the Istanbul Metropolitan Area in Turkey.
An interactive web-based platform developed within a TUBITAK/ERA-NET Smart Cities and Communities project, titled “Community Data-Loops for energy-efficient urban lifestyles (CODALoop)”, is used to analyze individual’s energy consumption patterns on urban mobility depending on energy consumption and behavioral data are collected through the platform.
This paper consists of an ongoing project data and the first results of the project test group’s, which is collected for 10 volunteer citizens, a monthly mobility related data which shows that individual’s mobility consumption habits, attitudes and first steps of being learning community towards energy savings targets. 1. Introduction
According to World Bank, worldwide energy use per capita increased by approximately 18 per cent in the last decade. When the energy use rates are examined by sectors, it is observed that transportation is one of the significant sectors that accounts for roughly 27 per cent of the total world energy consumption. Furthermore, it is the second largest emitter of carbon dioxide emissions after power generation. Factors such as housing, mobility, and recreation both affect environmental pressures. Lifestyles and consumption patterns play important role to reduce emissions and energy use. To this end, households are generally target groups in most of the energy conservation discussions.
Food, mobility and housing are the three areas with the highest environmental impact at the household level (Mont, 2007). Backhaus and others (Backhaus et. al., 2011) add to the three aforementioned dimensions tourism. As mentioned Axsen and others (Axsen et. al., 2012) Giddens (1991) considered these four areas as ‘lifestyle sectors’, which can be defined as “sets of activities that are perceived as coherent by a community of society”.
Individuals engage in multiple lifestyle sectors and consequently in multiple activities that are more or less energy intensive. These sets of activities contribute to build their own identity while also helping them to participate into certain groups or communities. The current challenge is to find alternative ways, which are less energy and resource intensive to allow individuals to continue to fulfill their personal needs and aspirations and develop their social
663
self (Mont, 2007). Gordon and Richardson (2007) states that underlying ideas of sustainable transport are three different visions. The first of this visions centers on changing people and the way they live, the second on changing technology, and the third on changing prices.
This paper provides knowledge on sustainable mobility through behavioral change and community learning while it tries to analyze citizen’s real-life experiments on urban mobility in a testbed and understand their predictions on their mobility behavior and choices for achieving more energy-efficient lifestyle.
2. Background
Achieving Sustainable Mobility
Transport facilities, infrastructure and services play a substantial role at economic development and community activities at the local, regional, national, and international levels (Ebinger, 2015) while it works as a as a significant growth engine for other industries, including the automotive, civil engineering, energy, technology, and telecom sectors (McKinsey and Co., 2016). Daly (Daly, 1992), who has been associated mainly the concept of a “steady state economy”, does not define what he means by sustainability, but he specifies certain parameters for any sector to be considered sustainable. Within this context, transport sector need to satisfy three conditions. First, the rate at which it uses renewable resources does not exceed the rate of regeneration. Second, the rate at which it uses nonrenewable resources does not exceed the rate at which sustainable renewable substitutes can be developed. Third, its rate of pollution emission does not exceed the assimilative capacity of the environment.
The World Business Council for Sustainable Development defines sustainable mobility which is also mentioned in the Mobility 2001 report as “…the ability to meet the needs of society to move freely, gain access, communicate, trade, and establish relationships without sacrificing other essential human or ecological values today or in the future.” . This means that any assessment of mobility’s sustainability must also include judgment and preventions on any associated disruptions in social, environmental, or economic wellbeing besides its effectiveness in improving accessibility (MIT & CRA, 2001).
Increasing awareness that travel behavior generates positive and negative effects on individual and common wealth, health and well-being extended the researches on travel behavior to a wider context (Chapman, 2007). The challenge when looking at mobility, within an energy-efficient lifestyle framework, is to explore how to reduce people’s need for mobility and how to switch to sustainable mobility options that, fulfill people’s needs and aspirations, within the limited carrying capacity of the planet (Backhaus et. al., 2011).
Behavioral Change through Community Learning
Reviews of behavior change theories and strategies reveal a wide range of theories and assumptions. These theories differ according to the variables they focus on such as internal (micro-sociological) or external (macro-sociological). Internal variables are defined that influence or shape what is related person’s mind such as awareness, knowledge, values, attitudes, behavior, rational thought processes, emotional states and entrenched habits and external variables are defined as physical, social and discursive environments in which a person lives. (Moloney, 2010).
Human behavior is the product of a multitude of interrelated factors. Given the complexity of factors it is not possible to identify exactly what is known about those factors and how they interact. However influences on behavior characterized broadly as comprising: genetics, individual thoughts and feelings, the physical environment, social interaction (with other individuals), social identity (interaction within and between groups), and the macro-social environment (House of Lords, 2011). As noted by Heiskanen and others (Heiskanen et. al., 2010) there are basically four types of instruments to change behavior in relation to
664
environmental problems (i) regulations and incentives (ii) education and awareness raising (iii) community management of environmental resources; and (iv) reference to moral religious or ethical principles. In the case of energy consumption, the first two types are used almost exclusively in the societies with little success. Most of the behavioral change programs to reduce energy consumption, and more recently to reduce the carbon intensity of lifestyles, have focused on individual behavior.
Behavior‐based energy efficiency strategies use non‐economic incentives to change how people perceive their energy use for achieve energy savings through affecting their energy use behaviors. Energy feedback, a subset of the broader category of behavior‐based energy efficiency, provides consumers with detailed, timely and contextual information than typical bills about their energy use (EEE, 2011). There are two types of energy feedback those are defined by Darby (Darby, 2006), one is direct feedback, which provides energy consumption information in real‐time (or near real‐time) through the meter or in‐home display, and the other is indirect feedback, which provides energy consumption information to the customer at some later point in time. The success of a feedback severely depends on how the information is displayed and how consumers are motivated to interact within usage of information provided (Fisher, 2008). There are three main approaches to engage with consumers to affect behavior (1) target an individual’s specific consumption habits in the home (2) make normative comparisons with peer groups, and (3) target the community (EEE, 2011).
3. Methodology and the Study Area
Lifestyles play important role to reduce consumption patterns and the emissions. To this end, households are important target groups in most of the energy conservation discussions. In addition to policy and infrastructural improvements on mobility, changing individual travel behavior is certainly a step forward in ensuring sustainability. Within the scope of this study, a small test group is created within the neighborhoods of Kadıköy district. The reason of selection of Kadıkoy district lies on different urban dynamics such as high levels of urban transformation activities, diverse socio-economic composition and availability of different transportation modes. Furthermore, initiatives on energy efficiency and willingness of Kadıkoy Municipality to actively participate in Codaloop Project have been other important factors to select the district. Kadıkoy is one of the 39 districts of Istanbul Metropolitan Area with a population of approximately 500,000 (Figure 1).
665
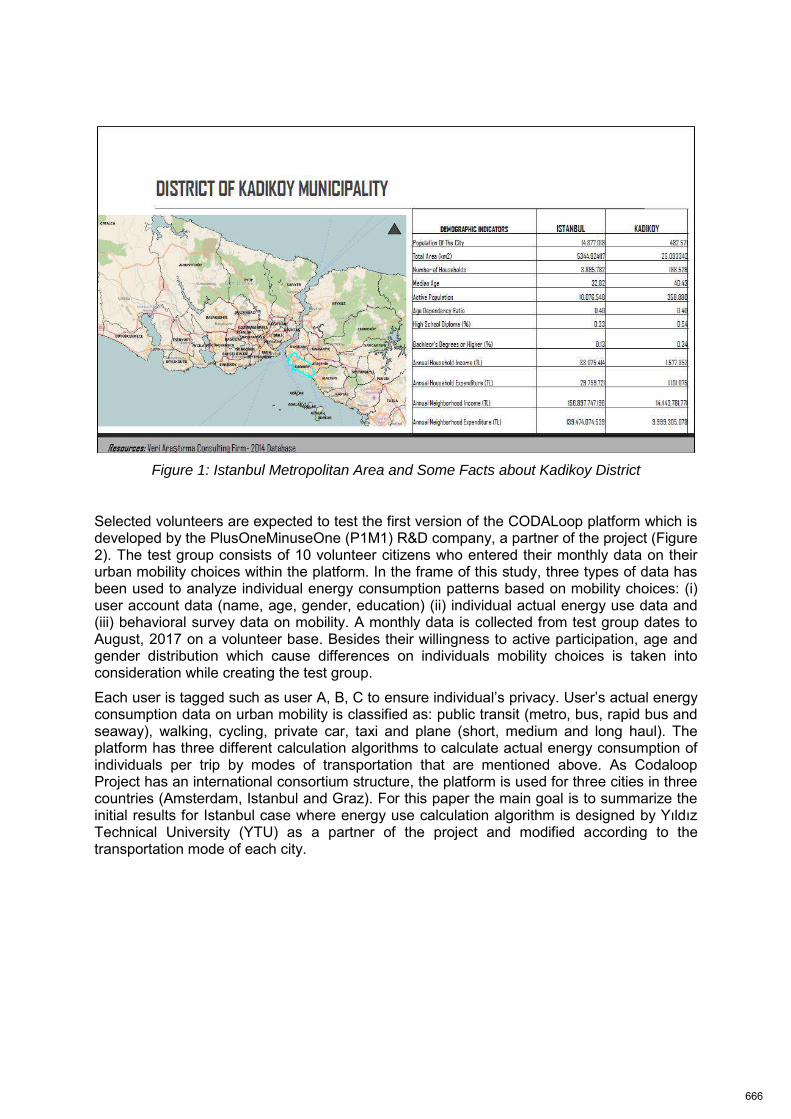
Figure 1: Istanbul Metropolitan Area and Some Facts about Kadikoy District
Selected volunteers are expected to test the first version of the CODALoop platform which is developed by the PlusOneMinuseOne (P1M1) R&D company, a partner of the project (Figure 2). The test group consists of 10 volunteer citizens who entered their monthly data on their urban mobility choices within the platform. In the frame of this study, three types of data has been used to analyze individual energy consumption patterns based on mobility choices: (i) user account data (name, age, gender, education) (ii) individual actual energy use data and (iii) behavioral survey data on mobility. A monthly data is collected from test group dates to August, 2017 on a volunteer base. Besides their willingness to active participation, age and gender distribution which cause differences on individuals mobility choices is taken into consideration while creating the test group.
Each user is tagged such as user A, B, C to ensure individual’s privacy. User’s actual energy consumption data on urban mobility is classified as: public transit (metro, bus, rapid bus and seaway), walking, cycling, private car, taxi and plane (short, medium and long haul). The platform has three different calculation algorithms to calculate actual energy consumption of individuals per trip by modes of transportation that are mentioned above. As Codaloop Project has an international consortium structure, the platform is used for three cities in three countries (Amsterdam, Istanbul and Graz). For this paper the main goal is to summarize the initial results for Istanbul case where energy use calculation algorithm is designed by Yıldız Technical University (YTU) as a partner of the project and modified according to the transportation mode of each city.
666
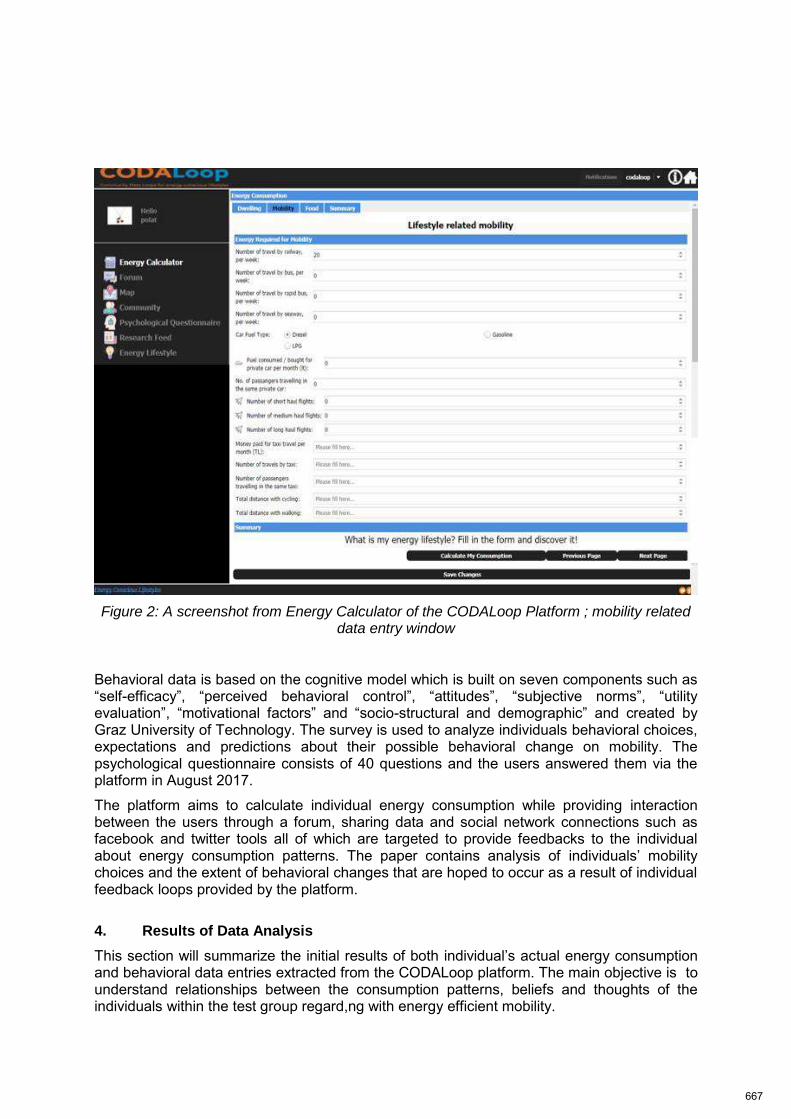
Figure 2: A screenshot from Energy Calculator of the CODALoop Platform ; mobility related data entry window
Behavioral data is based on the cognitive model which is built on seven components such as “self-efficacy”, “perceived behavioral control”, “attitudes”, “subjective norms”, “utility evaluation”, “motivational factors” and “socio-structural and demographic” and created by Graz University of Technology. The survey is used to analyze individuals behavioral choices, expectations and predictions about their possible behavioral change on mobility. The psychological questionnaire consists of 40 questions and the users answered them via the platform in August 2017.
The platform aims to calculate individual energy consumption while providing interaction between the users through a forum, sharing data and social network connections such as facebook and twitter tools all of which are targeted to provide feedbacks to the individual about energy consumption patterns. The paper contains analysis of individuals’ mobility choices and the extent of behavioral changes that are hoped to occur as a result of individual feedback loops provided by the platform.
4. Results of Data Analysis
This section will summarize the initial results of both individual’s actual energy consumption and behavioral data entries extracted from the CODALoop platform. The main objective is to understand relationships between the consumption patterns, beliefs and thoughts of the individuals within the test group regard,ng with energy efficient mobility.
667
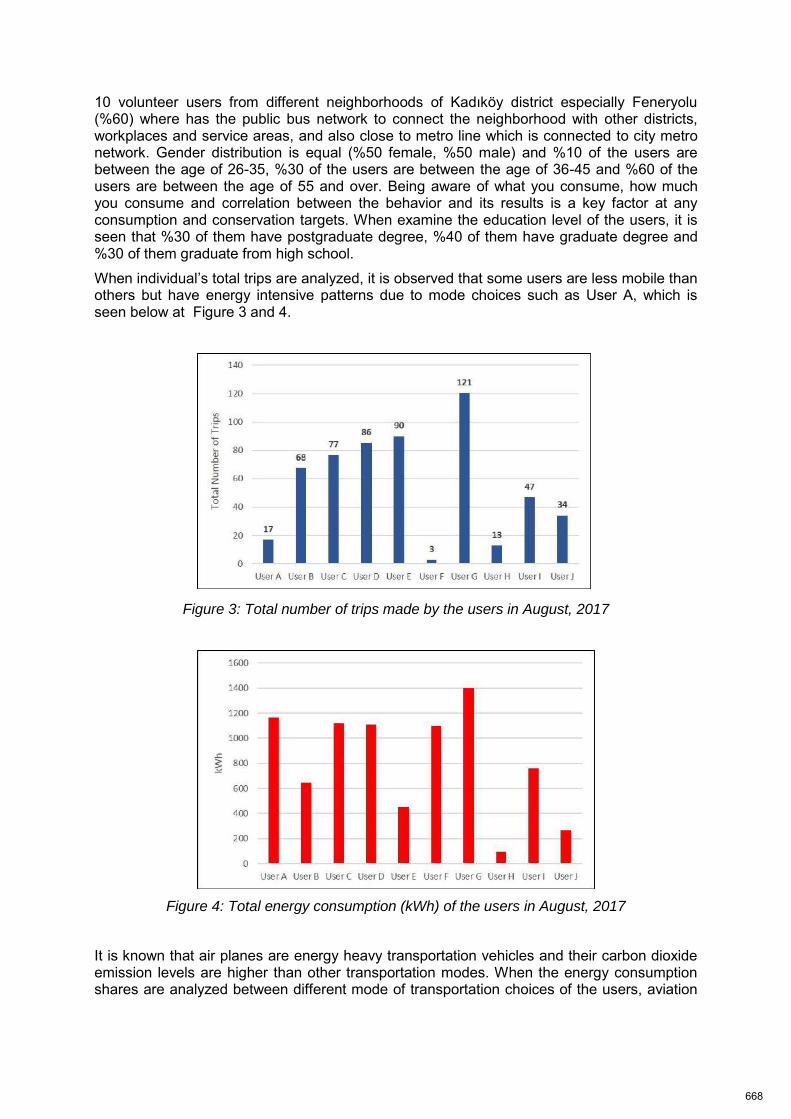
10 volunteer users from different neighborhoods of Kadıköy district especially Feneryolu (%60) where has the public bus network to connect the neighborhood with other districts, workplaces and service areas, and also close to metro line which is connected to city metro network. Gender distribution is equal (%50 female, %50 male) and %10 of the users are between the age of 26-35, %30 of the users are between the age of 36-45 and %60 of the users are between the age of 55 and over. Being aware of what you consume, how much you consume and correlation between the behavior and its results is a key factor at any consumption and conservation targets. When examine the education level of the users, it is seen that %30 of them have postgraduate degree, %40 of them have graduate degree and %30 of them graduate from high school.
When individual’s total trips are analyzed, it is observed that some users are less mobile than others but have energy intensive patterns due to mode choices such as User A, which is seen below at Figure 3 and 4.
Figure 3: Total number of trips made by the users in August, 2017
Figure 4: Total energy consumption (kWh) of the users in August, 2017
It is known that air planes are energy heavy transportation vehicles and their carbon dioxide emission levels are higher than other transportation modes. When the energy consumption shares are analyzed between different mode of transportation choices of the users, aviation
668
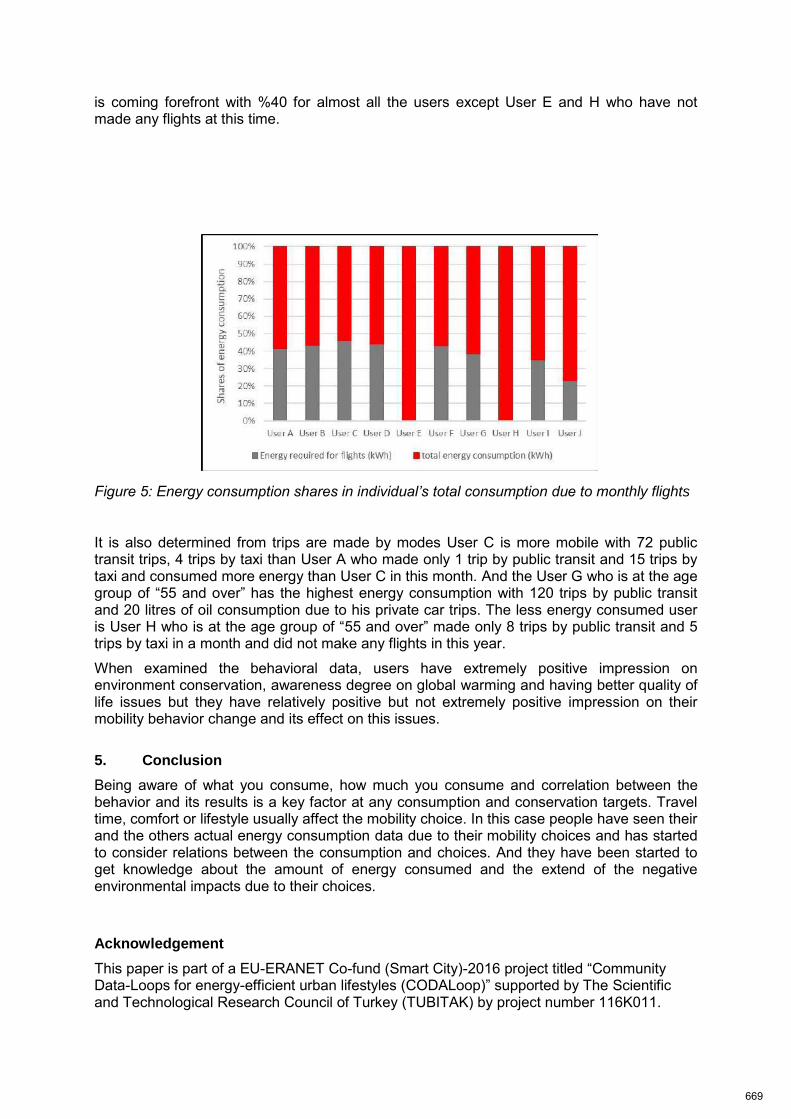
is coming forefront with %40 for almost all the users except User E and H who have not made any flights at this time.
Figure 5: Energy consumption shares in individual’s total consumption due to monthly flights
It is also determined from trips are made by modes User C is more mobile with 72 public transit trips, 4 trips by taxi than User A who made only 1 trip by public transit and 15 trips by taxi and consumed more energy than User C in this month. And the User G who is at the age group of “55 and over” has the highest energy consumption with 120 trips by public transit and 20 litres of oil consumption due to his private car trips. The less energy consumed user is User H who is at the age group of “55 and over” made only 8 trips by public transit and 5 trips by taxi in a month and did not make any flights in this year.
When examined the behavioral data, users have extremely positive impression on environment conservation, awareness degree on global warming and having better quality of life issues but they have relatively positive but not extremely positive impression on their mobility behavior change and its effect on this issues.
5. Conclusion
Being aware of what you consume, how much you consume and correlation between the behavior and its results is a key factor at any consumption and conservation targets. Travel time, comfort or lifestyle usually affect the mobility choice. In this case people have seen their and the others actual energy consumption data due to their mobility choices and has started to consider relations between the consumption and choices. And they have been started to get knowledge about the amount of energy consumed and the extend of the negative environmental impacts due to their choices.
Acknowledgement
This paper is part of a EU-ERANET Co-fund (Smart City)-2016 project titled “Community Data-Loops for energy-efficient urban lifestyles (CODALoop)” supported by The Scientific and Technological Research Council of Turkey (TUBITAK) by project number 116K011.
669
References
Axsen, J. TyreeHageman, J. Lentz, A. (2012). Lifestyle practices and pro-environmental technology. Ecological Economics, 82: 64–74.
Backhaus, J. Breukers S. Mont, O. Paukovic, M. Ruth, M. (2011). Sustainable lifestyles: Today’s facts & tomorrow’s trends, Centre on Sustainable Consumption and Production (CSCP)
Chapman, L. (2007). Transport and climate change: a review, Journal of Transport Geography, 15: 354–367
Daly Herman E. (1992). Steady state economics, Island Press, Washington
Darby, S. (2006). The effectiveness of feedback on energy consumption, Environmental Change Institute, Oxford University
Ebinger J. O. Vandycke N. (2015). Moving toward climate-resilient transport, Transport & ICT Global Practice, The World Bank Group
Energy Environmental Economics (EEE) (2011). Overview of residential energy feedback and behavior‐based energy efficiency, San Francisco
Fischer, C. (2008). Feedback on household electricity consumption: a tool for saving energy?, Energy Efficiency, 1:79–104
Gordon P. Richardson H. W. (1997). Are compact cities a desirable planning goal, Journal of the American Planning Association, 63: 95-106
Heiskanen, E. Johnson, M. Robinson, S. Vadovics, E. Saastamoinen, M. (2010). Low-carbon communities as a context for individual behavioral change, Energy Policy, 38(12): 7586–95
McKinsey and Company (2016). An integrated perspective on the future of mobility, October
Massachusetts Institute of Technology (MIT), Charles River Associated (CRA) (2001). Mobility 2001: World mobility at the end of the twentieth century and its sustainability, August.
Moloney, S. Horne, R. E. Fien, J. (2010) ‘Transitioning to low carbon communities – from behaviour change to systemic change: Lessons from Australia’, Energy Policy, 38(12): 7614–23
Mont, O. (2007). Concept paper for the International Task Force on Sustainable Lifestyles. Third International Expert Meeting on Sustainable Consumption and Production, Stockholm
The Authority of the House of Lords (Science and Technology Select Committee) (2011). Behaviour Change, London
i This paper is part of a EU-ERANET Co-fund (Smart City)-2016 project titled “Community Data-Loops for energy-efficient urban lifestyles (CODALoop)” supported by The Scientific and Technological Research Council of Turkey (TUBITAK) by project number 116K011
670
StoryofPlace:Aframeworkforregenerativeplanning
Moderator: Timothy MURPHY, Regenesis Group, Santa Fe, USA
Speakers: Timothy MURPHY , Ray LUCCHESI, Regenesis Group, Santa Fe, USA
This session will deliver a baseline understanding of how the unique ecological patterns of a
particular place give rise to other systemic phenomena related to economy and culture that we
typically think of as being human‐created. It will guide participants in generating reflections about
the places where they live and work in order to better understand how planning might be
undertaken in ways that work with, rather than against, the unique patterns of place. And it will
inspire dialogue about the potential for members of the planning professions to catalyze a paradigm
shift to enable place‐specific regenerative planning to become an industry standard.
.
671
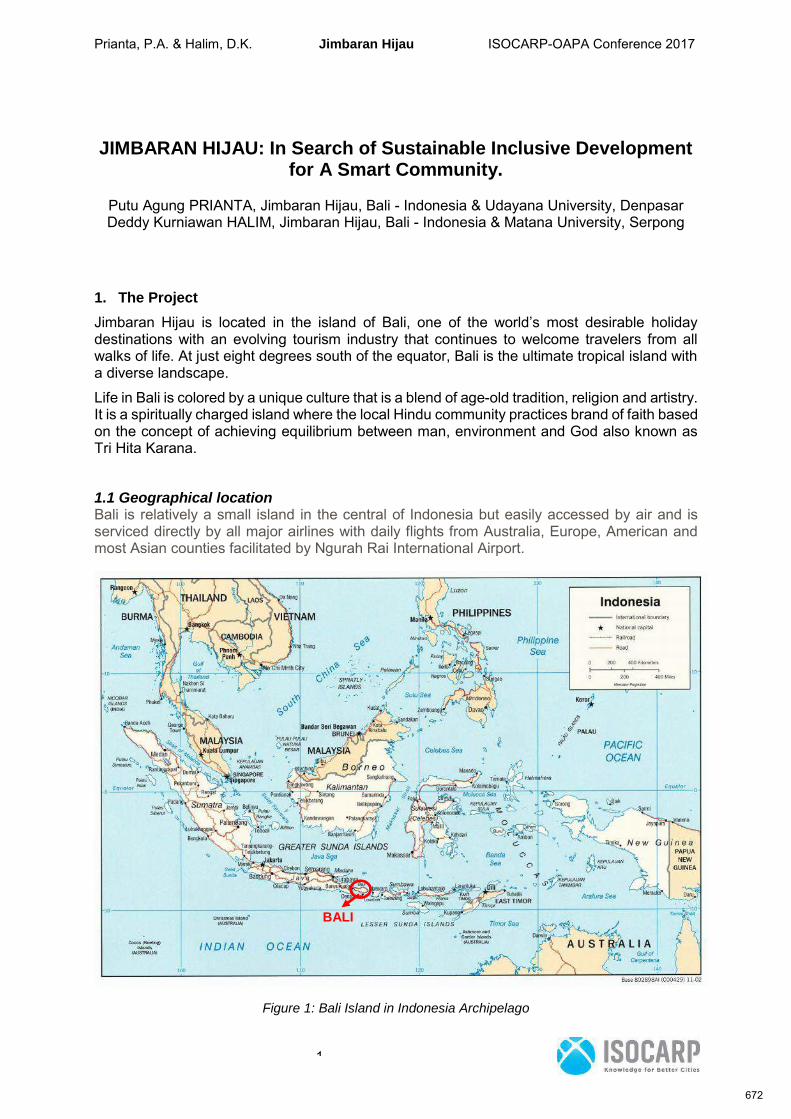
Prianta, P.A. & Halim, D.K. Jimbaran Hijau ISOCARP-OAPA Conference 2017
1
JIMBARAN HIJAU: In Search of Sustainable Inclusive Developmentfor A Smart Community.
Putu Agung PRIANTA, Jimbaran Hijau, Bali - Indonesia & Udayana University, DenpasarDeddy Kurniawan HALIM, Jimbaran Hijau, Bali - Indonesia & Matana University, Serpong
1. The Project
Jimbaran Hijau is located in the island of Bali, one of the world’s most desirable holidaydestinations with an evolving tourism industry that continues to welcome travelers from allwalks of life. At just eight degrees south of the equator, Bali is the ultimate tropical island witha diverse landscape.
Life in Bali is colored by a unique culture that is a blend of age-old tradition, religion and artistry.It is a spiritually charged island where the local Hindu community practices brand of faith basedon the concept of achieving equilibrium between man, environment and God also known asTri Hita Karana.
1.1 Geographical locationBali is relatively a small island in the central of Indonesia but easily accessed by air and isserviced directly by all major airlines with daily flights from Australia, Europe, American andmost Asian counties facilitated by Ngurah Rai International Airport.
Figure 1: Bali Island in Indonesia Archipelago
BALI
672
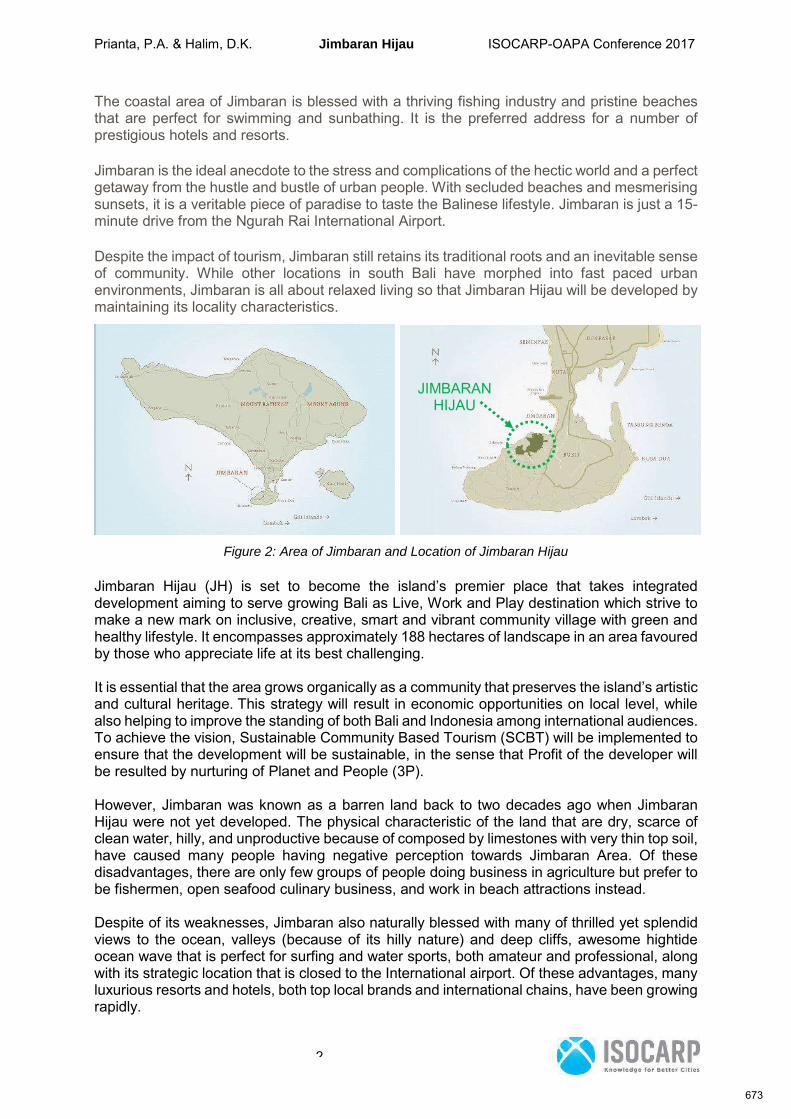
Prianta, P.A. & Halim, D.K. Jimbaran Hijau ISOCARP-OAPA Conference 2017
2
The coastal area of Jimbaran is blessed with a thriving fishing industry and pristine beachesthat are perfect for swimming and sunbathing. It is the preferred address for a number ofprestigious hotels and resorts.
Jimbaran is the ideal anecdote to the stress and complications of the hectic world and a perfectgetaway from the hustle and bustle of urban people. With secluded beaches and mesmerisingsunsets, it is a veritable piece of paradise to taste the Balinese lifestyle. Jimbaran is just a 15-minute drive from the Ngurah Rai International Airport.
Despite the impact of tourism, Jimbaran still retains its traditional roots and an inevitable senseof community. While other locations in south Bali have morphed into fast paced urbanenvironments, Jimbaran is all about relaxed living so that Jimbaran Hijau will be developed bymaintaining its locality characteristics.
Figure 2: Area of Jimbaran and Location of Jimbaran Hijau
Jimbaran Hijau (JH) is set to become the island’s premier place that takes integrateddevelopment aiming to serve growing Bali as Live, Work and Play destination which strive tomake a new mark on inclusive, creative, smart and vibrant community village with green andhealthy lifestyle. It encompasses approximately 188 hectares of landscape in an area favouredby those who appreciate life at its best challenging.
It is essential that the area grows organically as a community that preserves the island’s artisticand cultural heritage. This strategy will result in economic opportunities on local level, whilealso helping to improve the standing of both Bali and Indonesia among international audiences.To achieve the vision, Sustainable Community Based Tourism (SCBT) will be implemented toensure that the development will be sustainable, in the sense that Profit of the developer willbe resulted by nurturing of Planet and People (3P).
However, Jimbaran was known as a barren land back to two decades ago when JimbaranHijau were not yet developed. The physical characteristic of the land that are dry, scarce ofclean water, hilly, and unproductive because of composed by limestones with very thin top soil,have caused many people having negative perception towards Jimbaran Area. Of thesedisadvantages, there are only few groups of people doing business in agriculture but prefer tobe fishermen, open seafood culinary business, and work in beach attractions instead.
Despite of its weaknesses, Jimbaran also naturally blessed with many of thrilled yet splendidviews to the ocean, valleys (because of its hilly nature) and deep cliffs, awesome hightideocean wave that is perfect for surfing and water sports, both amateur and professional, alongwith its strategic location that is closed to the International airport. Of these advantages, manyluxurious resorts and hotels, both top local brands and international chains, have been growingrapidly.
JIMBARANHIJAU
673
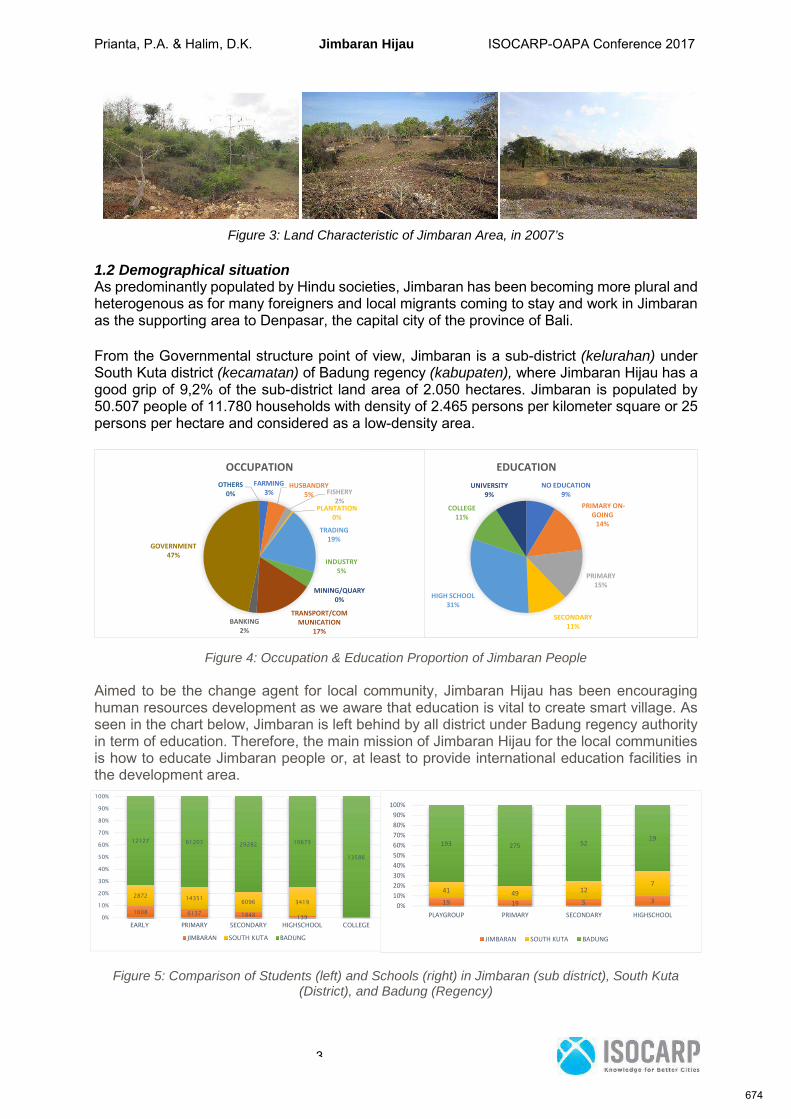
Prianta, P.A. & Halim, D.K. Jimbaran Hijau ISOCARP-OAPA Conference 2017
3
Figure 3: Land Characteristic of Jimbaran Area, in 2007’s
1.2 Demographical situationAs predominantly populated by Hindu societies, Jimbaran has been becoming more plural andheterogenous as for many foreigners and local migrants coming to stay and work in Jimbaranas the supporting area to Denpasar, the capital city of the province of Bali.
From the Governmental structure point of view, Jimbaran is a sub-district (kelurahan) underSouth Kuta district (kecamatan) of Badung regency (kabupaten), where Jimbaran Hijau has agood grip of 9,2% of the sub-district land area of 2.050 hectares. Jimbaran is populated by50.507 people of 11.780 households with density of 2.465 persons per kilometer square or 25persons per hectare and considered as a low-density area.
Figure 4: Occupation & Education Proportion of Jimbaran People
Aimed to be the change agent for local community, Jimbaran Hijau has been encouraginghuman resources development as we aware that education is vital to create smart village. Asseen in the chart below, Jimbaran is left behind by all district under Badung regency authorityin term of education. Therefore, the main mission of Jimbaran Hijau for the local communitiesis how to educate Jimbaran people or, at least to provide international education facilities inthe development area.
Figure 5: Comparison of Students (left) and Schools (right) in Jimbaran (sub district), South Kuta(District), and Badung (Regency)
NO EDUCATION9%
PRIMARY ON-GOING
14%
PRIMARY15%
SECONDARY11%
HIGH SCHOOL31%
COLLEGE11%
UNIVERSITY9%
EDUCATIONFARMING
3%HUSBANDRY
5% FISHERY2%
PLANTATION0%
TRADING19%
INDUSTRY5%
MINING/QUARY0%
TRANSPORT/COMMUNICATION
17%BANKING
2%
GOVERNMENT47%
OTHERS0%
OCCUPATION
1608 6137 1848 139
2872 143516096 3419
12127 61203 29282 10673
13586
0%
10%
20%
30%
40%
50%
60%
70%
80%
90%
100%
EARLY PRIMARY SECONDARY HIGHSCHOOL COLLEGE
JIMBARAN SOUTH KUTA BADUNG
19 19 5 341 49 12
7
193 275 5219
0%10%20%30%40%50%60%70%80%90%
100%
PLAYGROUP PRIMARY SECONDARY HIGHSCHOOL
JIMBARAN SOUTH KUTA BADUNG
674
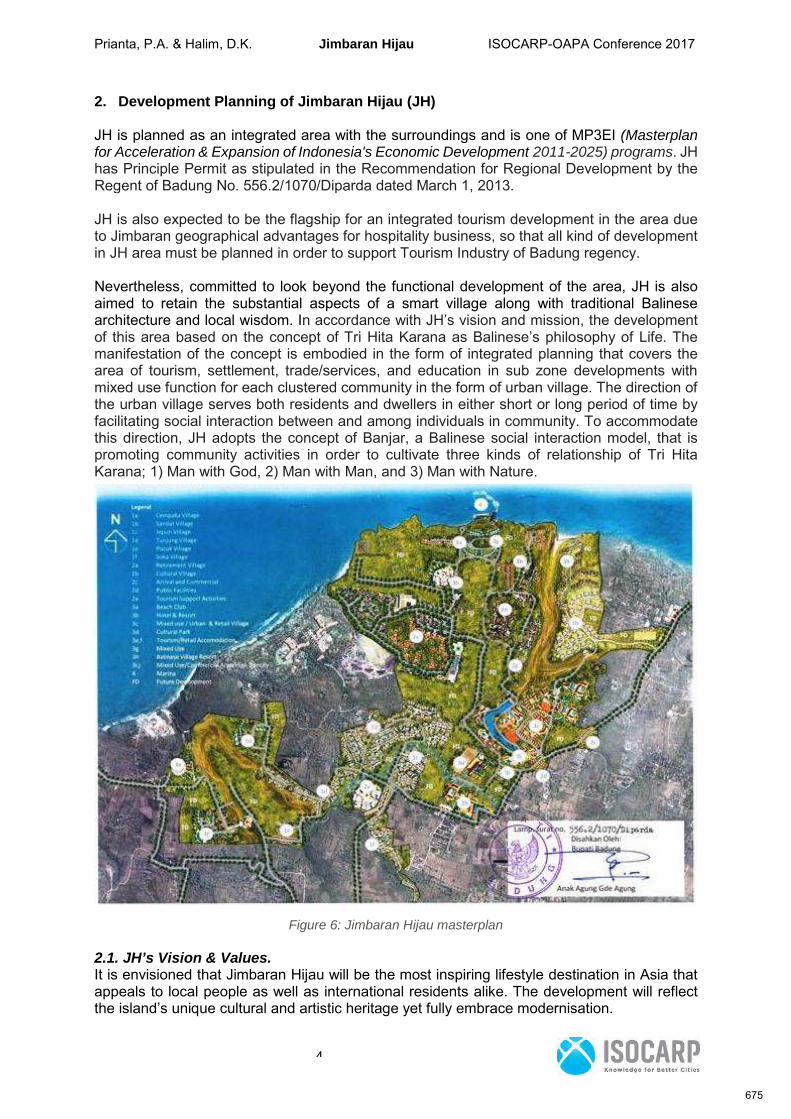
Prianta, P.A. & Halim, D.K. Jimbaran Hijau ISOCARP-OAPA Conference 2017
4
2. Development Planning of Jimbaran Hijau (JH)
JH is planned as an integrated area with the surroundings and is one of MP3EI (Masterplanfor Acceleration & Expansion of Indonesia's Economic Development 2011-2025) programs. JHhas Principle Permit as stipulated in the Recommendation for Regional Development by theRegent of Badung No. 556.2/1070/Diparda dated March 1, 2013.
JH is also expected to be the flagship for an integrated tourism development in the area dueto Jimbaran geographical advantages for hospitality business, so that all kind of developmentin JH area must be planned in order to support Tourism Industry of Badung regency.
Nevertheless, committed to look beyond the functional development of the area, JH is alsoaimed to retain the substantial aspects of a smart village along with traditional Balinesearchitecture and local wisdom. In accordance with JH’s vision and mission, the developmentof this area based on the concept of Tri Hita Karana as Balinese’s philosophy of Life. Themanifestation of the concept is embodied in the form of integrated planning that covers thearea of tourism, settlement, trade/services, and education in sub zone developments withmixed use function for each clustered community in the form of urban village. The direction ofthe urban village serves both residents and dwellers in either short or long period of time byfacilitating social interaction between and among individuals in community. To accommodatethis direction, JH adopts the concept of Banjar, a Balinese social interaction model, that ispromoting community activities in order to cultivate three kinds of relationship of Tri HitaKarana; 1) Man with God, 2) Man with Man, and 3) Man with Nature.
Figure 6: Jimbaran Hijau masterplan
2.1. JH’s Vision & Values.It is envisioned that Jimbaran Hijau will be the most inspiring lifestyle destination in Asia thatappeals to local people as well as international residents alike. The development will reflectthe island’s unique cultural and artistic heritage yet fully embrace modernisation.
675
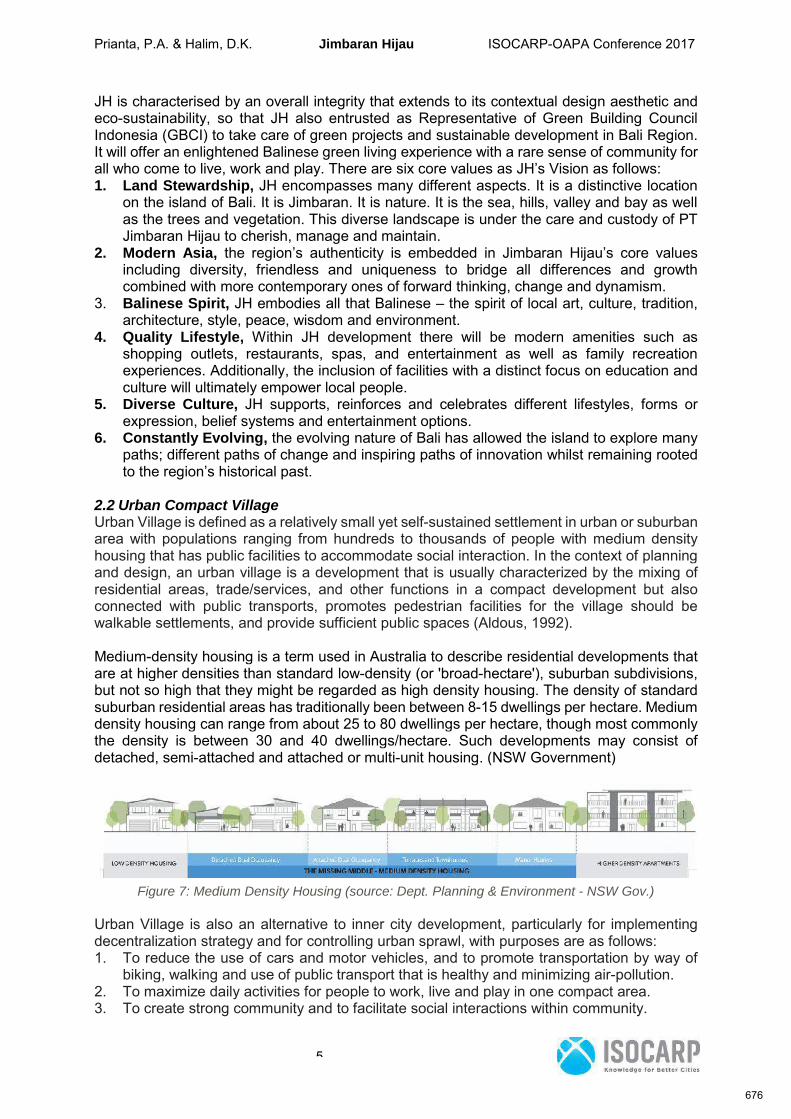
Prianta, P.A. & Halim, D.K. Jimbaran Hijau ISOCARP-OAPA Conference 2017
5
JH is characterised by an overall integrity that extends to its contextual design aesthetic andeco-sustainability, so that JH also entrusted as Representative of Green Building CouncilIndonesia (GBCI) to take care of green projects and sustainable development in Bali Region.It will offer an enlightened Balinese green living experience with a rare sense of community forall who come to live, work and play. There are six core values as JH’s Vision as follows:1. Land Stewardship, JH encompasses many different aspects. It is a distinctive location
on the island of Bali. It is Jimbaran. It is nature. It is the sea, hills, valley and bay as wellas the trees and vegetation. This diverse landscape is under the care and custody of PTJimbaran Hijau to cherish, manage and maintain.
2. Modern Asia, the region’s authenticity is embedded in Jimbaran Hijau’s core valuesincluding diversity, friendless and uniqueness to bridge all differences and growthcombined with more contemporary ones of forward thinking, change and dynamism.
3. Balinese Spirit, JH embodies all that Balinese – the spirit of local art, culture, tradition,architecture, style, peace, wisdom and environment.
4. Quality Lifestyle, Within JH development there will be modern amenities such asshopping outlets, restaurants, spas, and entertainment as well as family recreationexperiences. Additionally, the inclusion of facilities with a distinct focus on education andculture will ultimately empower local people.
5. Diverse Culture, JH supports, reinforces and celebrates different lifestyles, forms orexpression, belief systems and entertainment options.
6. Constantly Evolving, the evolving nature of Bali has allowed the island to explore manypaths; different paths of change and inspiring paths of innovation whilst remaining rootedto the region’s historical past.
2.2 Urban Compact VillageUrban Village is defined as a relatively small yet self-sustained settlement in urban or suburbanarea with populations ranging from hundreds to thousands of people with medium densityhousing that has public facilities to accommodate social interaction. In the context of planningand design, an urban village is a development that is usually characterized by the mixing ofresidential areas, trade/services, and other functions in a compact development but alsoconnected with public transports, promotes pedestrian facilities for the village should bewalkable settlements, and provide sufficient public spaces (Aldous, 1992).
Medium-density housing is a term used in Australia to describe residential developments thatare at higher densities than standard low-density (or 'broad-hectare'), suburban subdivisions,but not so high that they might be regarded as high density housing. The density of standardsuburban residential areas has traditionally been between 8-15 dwellings per hectare. Mediumdensity housing can range from about 25 to 80 dwellings per hectare, though most commonlythe density is between 30 and 40 dwellings/hectare. Such developments may consist ofdetached, semi-attached and attached or multi-unit housing. (NSW Government)
Figure 7: Medium Density Housing (source: Dept. Planning & Environment - NSW Gov.)
Urban Village is also an alternative to inner city development, particularly for implementingdecentralization strategy and for controlling urban sprawl, with purposes are as follows:1. To reduce the use of cars and motor vehicles, and to promote transportation by way of
biking, walking and use of public transport that is healthy and minimizing air-pollution.2. To maximize daily activities for people to work, live and play in one compact area.3. To create strong community and to facilitate social interactions within community.
676
Prianta, P.A. & Halim, D.K. Jimbaran Hijau ISOCARP-OAPA Conference 2017
6
2.3 Mixed Use parcel developmentAs characterized by mixed use development, an urban village is designed as an integratedneighborhood, with medium-density of buildings and combination of land-use zonings, wherethe most important key for its success is the functioning of the control mechanism of theregulation. To facilitate a good social interaction, some zonings of housing, education, health,trade/services, office, recreations/hospitality, are essential to be developed. In short, thecharacteristics of mixed-use development in JH are as follows:1. Consists of three or more land-use zonings in one parcel (or sub development) that is
mutually supportive, related one another and generates economical profits to sustain(such as retail, office, hotel, and recreational facilities within).
2. The physical and functional integration of building components in a parcel developmentmust be relevant to the intensification of its land-use function that is stipulated in DesignDevelopment Guide (DDG) and connected with uninterrupted pedestrian pathway.
3. Construction must be based on logical development that must have planning references(type and scale of function, density, etc.)
3. Sustainable Community Based Tourism (SCBT)
As mentioned above, JH is expected to be the flagship for integrated tourism development inJimbaran and has special development permit issued by Tourism Office of Badung RegencyGovernment to make a new settlement that promotes Tourism in the area. Therefore, twoconcepts of Tourism Development is utilized that fit to the condition applied.
CBT (Community Based Tourism) is the concept of developing a tourist destination throughthe empowerment of local communities, where people participate in the planning,management, and voting in decisions making for its development process. There are threetourism activities that can support the concept of CBT namely the exploration (adventuretravel), cultural tourism (cultural tourism), ecotourism (ecotourism).
CBT commonly known as a ecotourism business owned, managed and supervised by localcommunity. The community plays an active role in ecotourism development activities fromplanning, implementation, monitoring and evaluation. The results of ecotourism activities asmuch as possible enjoyed by local communities. In this sense, the communities have sufficientaccess to be involved in ecotourism activities. (i.e. Nugroho, 2011)
Sustainable Tourism (ST) defined as a sub-set of sustainable development declared by UnitedNation that bring a tourism destination into a more global context, so that JH will assure tobring International networks in the development. In short, ST lies on macro perspective whileCBT focus on locality in micro level. JH use the term “Glocalization” for this tourismdevelopment spirit.
In JH, the word “sustainable” added to make sure that the concept will be sustained with adevoted leader of the communities involved as we know that although the more the merrier butmore parties involved can also create more problems since each party has their own interestand different perspective over one same issue.
There is also a definition introduced by Dangi & Jamal (2016) that is closed to what JH hasbeen doing with the development. Basically, they combine the concept of sustainable tourism(ST) and community-based tourism (CBT) where they emphasis the role of a quasi-governmental body, that in this case is JH as the master developer. Their study reveals notjust common ground and differences that might be anticipated, but also important sustainabilitydimensions that are lagging or require much greater attention, such as equity, justice, ethicaland governance issues.
677

Prianta, P.A. & Halim, D.K. Jimbaran Hijau ISOCARP-OAPA Conference 2017
7
3.1. Tri Hita Karana, 3P and Sustainable Tourism DevelopmentThree elements in Tri Hita Karana (Man, God, Environment) and 3P (Planet, People, Profit) isdefinitely align with Sustainable Tourism Development delivered by the United Nation.
Two UN bodies, United Nation Environment Program and (United Nation) World TourismOrganization documented a comprehensive policy that described 12 aims of sustainabletourism development related to three “pillars” of sustainability: (UNEP-UNWTO, 2016)1. Economic sustainability, generating prosperity at different levels of society and addressing
the cost effectiveness of all economic activity. Crucially, it is about the viability ofenterprises and activities and their ability to be maintained in the long term.
2. Social sustainability, respecting human rights and equal opportunities for all in society. Itrequires an equitable distribution of benefits, with a focus on alleviating poverty. There isan emphasis on local communities, maintaining and strengthening their life supportsystems, recognizing/respecting different cultures and avoiding any form of exploitation.
3. Environmental sustainability, conserving and managing resources, especially those thatare not renewable or are precious in terms of life support. It requires action to minimizepollution of air, land and water and to conserve biological diversity and natural heritage.
JH believes the 3P philosophy in running the business, which means if we take care of Planet(environment sustainability) and People (social sustainability) then Profit (economicsustainability) will come along the way. As for the planet, JH is designed with sensitivitytowards surrounding environments, both natural and socio-cultural. It incorporates residentialproperties, retail outlets, hotels and resorts, entertainment attractions and other necessarypublic services with green village development concept for the land stewardship, and topromote Balinese lifestyle that are unique for its community oriented. And for the people, JH isdedicated to be a melting pot for local people and global citizens so that JH is also dedicatedfor the millennials with their startups businesses. With the rise of global digital nomads and thecharacters of the millennials who have a highly environmental awareness and prefer to mixwork and play, JH is expected to be a Silicon Bali where business costs and living expensesare much lower than the Silicon Valley and get greener working environment at the same time.
3.2. JH’s Corporate Social Responsibility programPreserving native vegetations is JH’s primary mission so that JH has been developing CSR(Corporate Social Responsibility) programs that is strongly related to greeneries. JH is not onlyengaged with hundreds of schools in Jimbaran area by providing extracurricular farmingprograms for the students in the JH farm but also encouraging the locals to collect their wasteand household garbage to the farm to be organically recycled as raw materials for compost orfertilizer. In return, the locals are rewarded by vegetables and fruits harvested in JH Farm, astrategic corporate unit to ensure sustainable development commitment.
JH has been initiating social entrepreneurship program through its green initiatives, educatingand encouraging stakeholders in the community, both local workers and employees, to beentrepreneurs by having share ownership in JH farming packages such as raising catfish,breeding edible mushroom, planting tomato, growing vegetables, etc. The program, facilitatedby JH, distributes the revenue, expenses, and profit according to the participation in ownership.This will enable stakeholders to receive amicable profit on harvest time. Each stakeholder willhave the right to participate according to the regulation set by JH ensuring equality and fairnessspirit in socio and economic sustainability, to limit any excessive ownership by any or few partyand to give better opportunity to the under-privileged, especially farm employees and dailyworkers. For those who cannot afford to contribute in form of money, JH also facilitates profit-share program for the worker and/or employee to get the money needed.
JH is also active in enacting local talents through Art and Culture festival, JIMBAFEST,providing opportunity for primary students to present their talents on stage, while continuouslypromoting the importance of preserving the environment through such events.
678
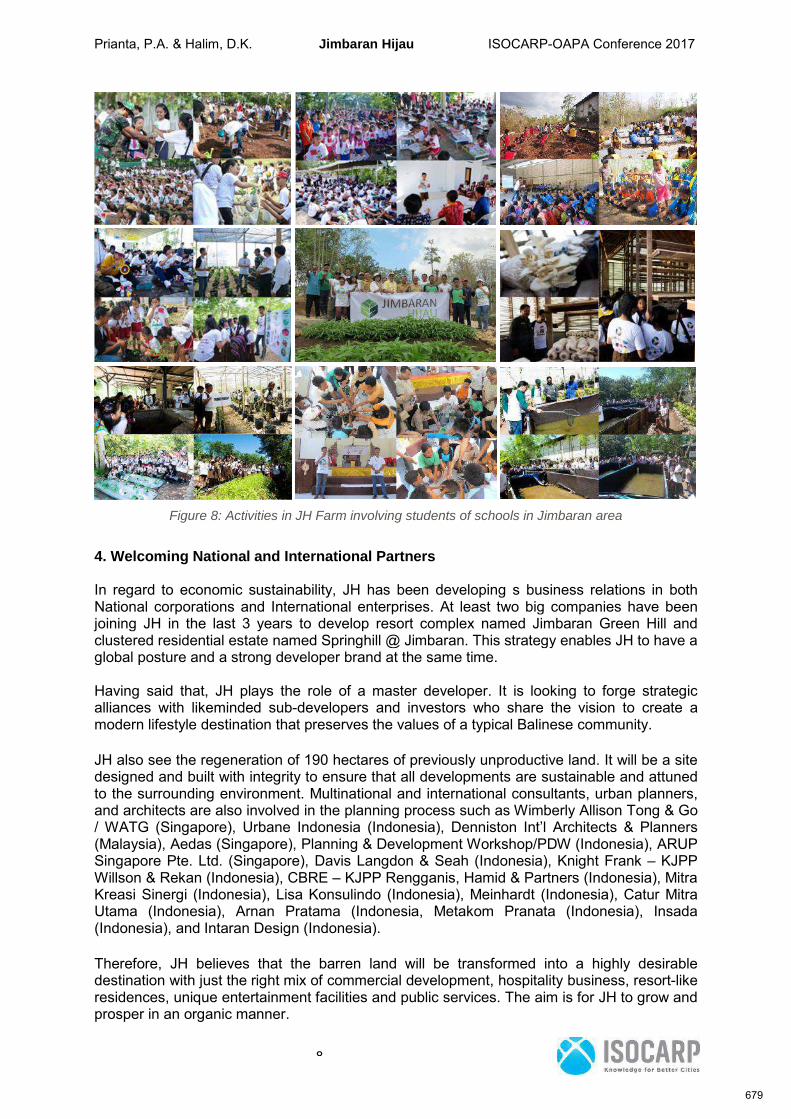
Prianta, P.A. & Halim, D.K. Jimbaran Hijau ISOCARP-OAPA Conference 2017
8
Figure 8: Activities in JH Farm involving students of schools in Jimbaran area
4. Welcoming National and International Partners
In regard to economic sustainability, JH has been developing s business relations in bothNational corporations and International enterprises. At least two big companies have beenjoining JH in the last 3 years to develop resort complex named Jimbaran Green Hill andclustered residential estate named Springhill @ Jimbaran. This strategy enables JH to have aglobal posture and a strong developer brand at the same time.
Having said that, JH plays the role of a master developer. It is looking to forge strategicalliances with likeminded sub-developers and investors who share the vision to create amodern lifestyle destination that preserves the values of a typical Balinese community.
JH also see the regeneration of 190 hectares of previously unproductive land. It will be a sitedesigned and built with integrity to ensure that all developments are sustainable and attunedto the surrounding environment. Multinational and international consultants, urban planners,and architects are also involved in the planning process such as Wimberly Allison Tong & Go/ WATG (Singapore), Urbane Indonesia (Indonesia), Denniston Int’l Architects & Planners(Malaysia), Aedas (Singapore), Planning & Development Workshop/PDW (Indonesia), ARUPSingapore Pte. Ltd. (Singapore), Davis Langdon & Seah (Indonesia), Knight Frank – KJPPWillson & Rekan (Indonesia), CBRE – KJPP Rengganis, Hamid & Partners (Indonesia), MitraKreasi Sinergi (Indonesia), Lisa Konsulindo (Indonesia), Meinhardt (Indonesia), Catur MitraUtama (Indonesia), Arnan Pratama (Indonesia, Metakom Pranata (Indonesia), Insada(Indonesia), and Intaran Design (Indonesia).
Therefore, JH believes that the barren land will be transformed into a highly desirabledestination with just the right mix of commercial development, hospitality business, resort-likeresidences, unique entertainment facilities and public services. The aim is for JH to grow andprosper in an organic manner.
679
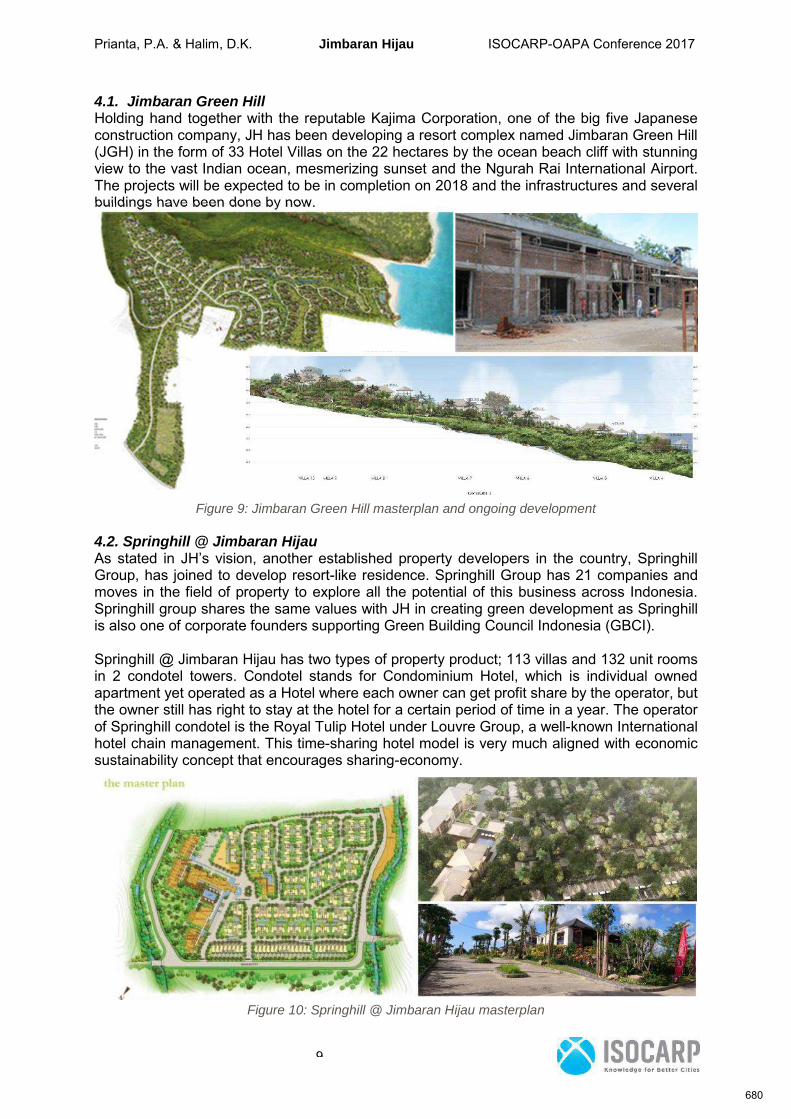
Prianta, P.A. & Halim, D.K. Jimbaran Hijau ISOCARP-OAPA Conference 2017
9
4.1. Jimbaran Green HillHolding hand together with the reputable Kajima Corporation, one of the big five Japaneseconstruction company, JH has been developing a resort complex named Jimbaran Green Hill(JGH) in the form of 33 Hotel Villas on the 22 hectares by the ocean beach cliff with stunningview to the vast Indian ocean, mesmerizing sunset and the Ngurah Rai International Airport.The projects will be expected to be in completion on 2018 and the infrastructures and severalbuildings have been done by now.
Figure 9: Jimbaran Green Hill masterplan and ongoing development
4.2. Springhill @ Jimbaran HijauAs stated in JH’s vision, another established property developers in the country, SpringhillGroup, has joined to develop resort-like residence. Springhill Group has 21 companies andmoves in the field of property to explore all the potential of this business across Indonesia.Springhill group shares the same values with JH in creating green development as Springhillis also one of corporate founders supporting Green Building Council Indonesia (GBCI).
Springhill @ Jimbaran Hijau has two types of property product; 113 villas and 132 unit roomsin 2 condotel towers. Condotel stands for Condominium Hotel, which is individual ownedapartment yet operated as a Hotel where each owner can get profit share by the operator, butthe owner still has right to stay at the hotel for a certain period of time in a year. The operatorof Springhill condotel is the Royal Tulip Hotel under Louvre Group, a well-known Internationalhotel chain management. This time-sharing hotel model is very much aligned with economicsustainability concept that encourages sharing-economy.
Figure 10: Springhill @ Jimbaran Hijau masterplan
680
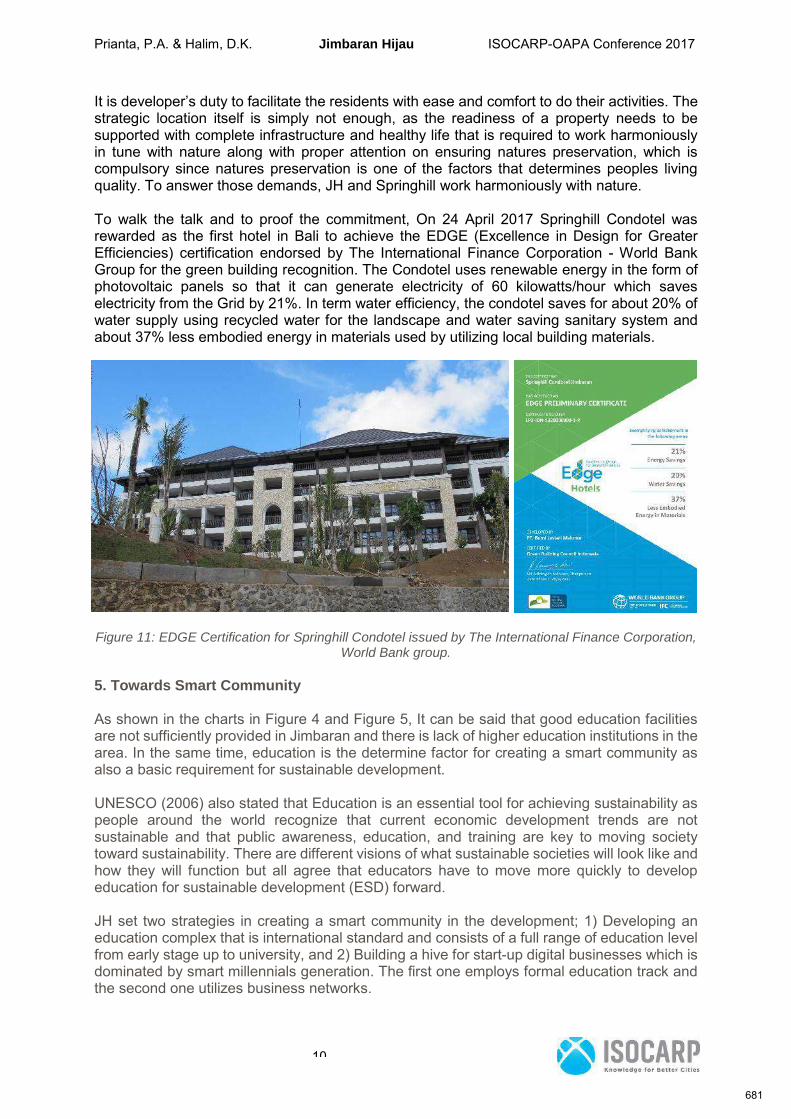
Prianta, P.A. & Halim, D.K. Jimbaran Hijau ISOCARP-OAPA Conference 2017
10
It is developer’s duty to facilitate the residents with ease and comfort to do their activities. Thestrategic location itself is simply not enough, as the readiness of a property needs to besupported with complete infrastructure and healthy life that is required to work harmoniouslyin tune with nature along with proper attention on ensuring natures preservation, which iscompulsory since natures preservation is one of the factors that determines peoples livingquality. To answer those demands, JH and Springhill work harmoniously with nature.
To walk the talk and to proof the commitment, On 24 April 2017 Springhill Condotel wasrewarded as the first hotel in Bali to achieve the EDGE (Excellence in Design for GreaterEfficiencies) certification endorsed by The International Finance Corporation - World BankGroup for the green building recognition. The Condotel uses renewable energy in the form ofphotovoltaic panels so that it can generate electricity of 60 kilowatts/hour which saveselectricity from the Grid by 21%. In term water efficiency, the condotel saves for about 20% ofwater supply using recycled water for the landscape and water saving sanitary system andabout 37% less embodied energy in materials used by utilizing local building materials.
Figure 11: EDGE Certification for Springhill Condotel issued by The International Finance Corporation,World Bank group.
5. Towards Smart Community
As shown in the charts in Figure 4 and Figure 5, It can be said that good education facilitiesare not sufficiently provided in Jimbaran and there is lack of higher education institutions in thearea. In the same time, education is the determine factor for creating a smart community asalso a basic requirement for sustainable development.
UNESCO (2006) also stated that Education is an essential tool for achieving sustainability aspeople around the world recognize that current economic development trends are notsustainable and that public awareness, education, and training are key to moving societytoward sustainability. There are different visions of what sustainable societies will look like andhow they will function but all agree that educators have to move more quickly to developeducation for sustainable development (ESD) forward.
JH set two strategies in creating a smart community in the development; 1) Developing aneducation complex that is international standard and consists of a full range of education levelfrom early stage up to university, and 2) Building a hive for start-up digital businesses which isdominated by smart millennials generation. The first one employs formal education track andthe second one utilizes business networks.
681
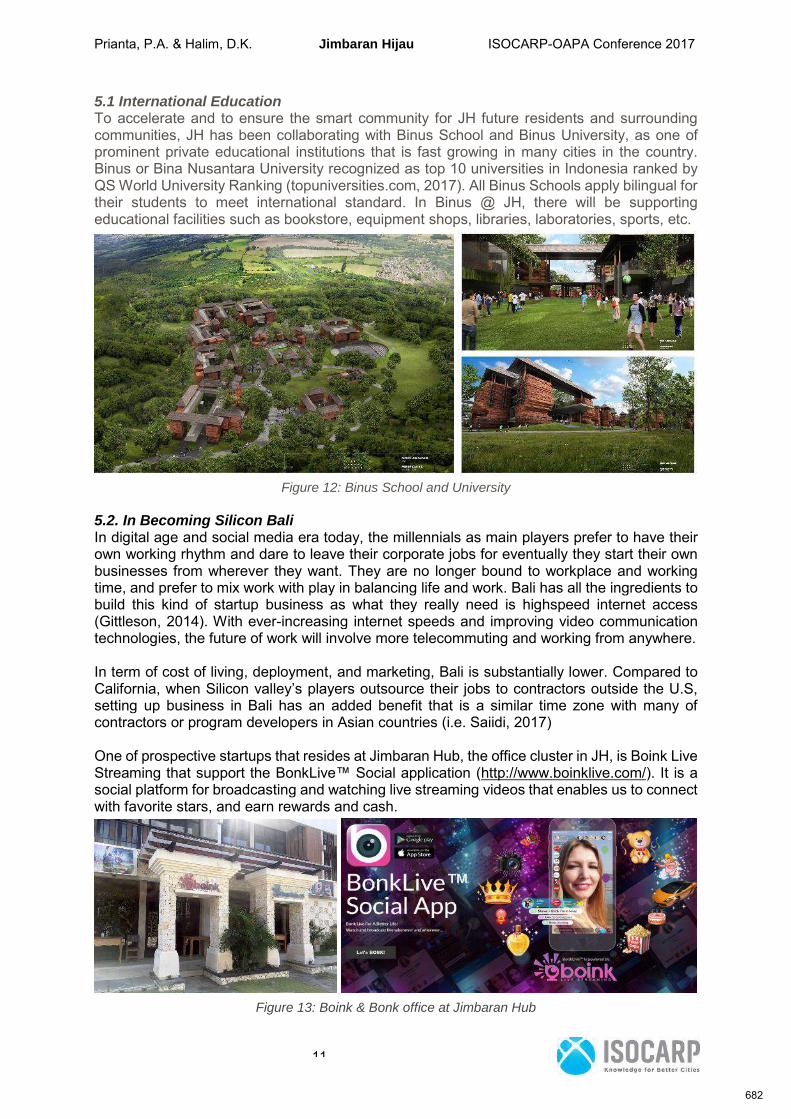
Prianta, P.A. & Halim, D.K. Jimbaran Hijau ISOCARP-OAPA Conference 2017
11
5.1 International EducationTo accelerate and to ensure the smart community for JH future residents and surroundingcommunities, JH has been collaborating with Binus School and Binus University, as one ofprominent private educational institutions that is fast growing in many cities in the country.Binus or Bina Nusantara University recognized as top 10 universities in Indonesia ranked byQS World University Ranking (topuniversities.com, 2017). All Binus Schools apply bilingual fortheir students to meet international standard. In Binus @ JH, there will be supportingeducational facilities such as bookstore, equipment shops, libraries, laboratories, sports, etc.
Figure 12: Binus School and University
5.2. In Becoming Silicon BaliIn digital age and social media era today, the millennials as main players prefer to have theirown working rhythm and dare to leave their corporate jobs for eventually they start their ownbusinesses from wherever they want. They are no longer bound to workplace and workingtime, and prefer to mix work with play in balancing life and work. Bali has all the ingredients tobuild this kind of startup business as what they really need is highspeed internet access(Gittleson, 2014). With ever-increasing internet speeds and improving video communicationtechnologies, the future of work will involve more telecommuting and working from anywhere.
In term of cost of living, deployment, and marketing, Bali is substantially lower. Compared toCalifornia, when Silicon valley’s players outsource their jobs to contractors outside the U.S,setting up business in Bali has an added benefit that is a similar time zone with many ofcontractors or program developers in Asian countries (i.e. Saiidi, 2017)
One of prospective startups that resides at Jimbaran Hub, the office cluster in JH, is Boink LiveStreaming that support the BonkLive™ Social application (http://www.boinklive.com/). It is asocial platform for broadcasting and watching live streaming videos that enables us to connectwith favorite stars, and earn rewards and cash.
Figure 13: Boink & Bonk office at Jimbaran Hub
682
Prianta, P.A. & Halim, D.K. Jimbaran Hijau ISOCARP-OAPA Conference 2017
12
This kind of business tendency and the dawn of Social Media has urged a new model ofeconomy that is also called as Social Capitalism. Robels (2014) defines Social Capitalismrefers to the economic and social system in which the means of production are social, creative,and intellectual assets.
Social capitalism is not socialism or social engineering. To understand social capitalism is tocontrast it to classic capitalism. Companies that operate on the premise of classic capitalismbelieve that it is the role of owners (or investors) in the organization to build a machine ofbusiness that creates profit that is then returned to owners, known as shareholders. Socialcapitalism companies believe that is the role of leadership to create a culture that considers allof its constituencies, known as stakeholders. A stakeholder is anyone coming into contact withthe product/service. Therefore, partners, suppliers, employees, customers, shareholders aswell as the community, society, and environment are all stakeholders in the organization.
6. The Village of Tomorrow
Mercer’s annual Quality of Living survey published the ranking of liveable cities with the top 10for 2017 are: 1) Vienna-Austria, 2) Zurich-Switzerland, 3) Auckland-New Zealand, 4) Munich-Germany, 5) Vancouver-Canada, 6) Dusseldorf-Germany, 7) Frankfurt-Germany, 8) Geneva-Switzerland, 9) Copenhagen-Denmark, 10) Basel-Switzerland. As we can see in the tablebelow those cities have density of 42,618 (divided by area) up to 62,472 persons/km² (dividedby 10) in average. Therefore, JH plans to have the density level of 50 persons/ha.
No. City Country TypeArea Population
(person)Density
(person/ha)km² ha
1 Vienna Austria Capital City 414,65 41465 1.867.960 45,052 Zurich Switzerland City 87,88 8788 401.144 45,653 Auckland New Zealand Urban 559,20 55920 1.495.000 26,734 Munich Germany City 310,43 31043 1.450.381 46,725 Vancouver Canada City 114,97 11497 631.486 54,936 Dusseldorf Germany City 217,41 21741 612.178 28,167 Frankfurt Germany City 248,31 24831 732.688 29,518 Geneva Switzerland City 15,93 1593 198.072 124,349 Copenhagen Denmark Municipal 86,39 8639 1.295.686 149,9810 Basel Switzerland City 23,91 2391 176.117 73,66
Total 207908 8.860.712 624,72
The projected population in JH which has an area of about 188 hectares and a density of 50persons/ha (or 1 person/200 m²) is about 9,400 residents. For visitors, since JH is not only aresidential development but a compact urban village and a place for Tourism Destination aswell, the projection will be 100% - 200% of total residents or about 9,400-18,800 visitors.
As mentioned earlier that JH is also expected to be the flagship for an integrated tourismdevelopment in the area therefore JH will be acting as Destination Management Organization(DMO) alike. Stange, et.al (2012) stated that DMO advocates a holistic tourism industry in aplace; and in this role, they ensure the mitigation of tourism’s negative impacts to theenvironment and local communities as well as the sharing of opportunities for a vibrantexchange of people. In fact, a DMO may best serve to facilitate dialogue among the privatesector, public sector, and other stakeholders that may otherwise never collaborate orunderstand how their decisions reverberate down a destination’s long tourism value chain.
Because of this unique capability, JH has important role for supporting tourism developmentin Badung regency, especially in developing destinations where tourism is an importanteconomic driver and mechanism for equitable social capacity building. In short, JH is destinedto be a village of tomorrow where the new smart generation of globalized world can begathered to make JH an excellent destination for living, work and play.
683

Prianta, P.A. & Halim, D.K. Jimbaran Hijau ISOCARP-OAPA Conference 2017
13
References:
Aldous, Tony (1992). Urban villages: a concept for creating mixed-use urbandevelopments on a sustainable scale, London: Urban Villages Group, pp. 11-13
Dangi, Tek. B. and Jamal, Tazim (2016), An Integrated Approach to Sustainable Community -Based Tourism, Sustainability, Vo. 8, No. 475 (MDPI)
Gittleson, Kim (2014), Forget Silicon Valley, meet Silicon Bali, Bali: BBC News. Retrievedon 24 April 2014 from http://www.bbc.com/news/business-27043778
Mercer (2017). Vienna tops Mercer’s 19th Quality of Living Ranking. Retrieved on 4 July2017 from https://www.mercer.com/newsroom/2017-quality-of-living-survey.html
Nugroho, Iwan (2011). Ekowisata dan pembangunan berkelanjutan, Jakarta: PustakaPelajar.
QS University Ranking (2017). Study in Indonesia. Retrieved on 4 July 2017 fromhttps://www.topuniversities.com/where-to-study/asia/indonesia/guide
Robels, Dan (2014). The New Definition Of Social Capitalism. Retrieved on 4 July 2017from http://www.ingenesist.com/the-new-definition-of-social-capitalism/
Saiidi, Uptin (2017). Here's why some start-ups are leaving Silicon Valley. CNBC News.Retrieved on 12 May 2017 from http://www.cnbc.com/2017/05/12/heres-why-some-start-ups-are-leaving-silicon-valley.html
Stange, Jennifer, Brown, David, HIlbruner, Roberta, and Hawkins, Donald E. (2013). TourismDestination Management: Achieving Sustainable and Competitive Results. WashingtonDC: International Institute for Tourism Studies and United States Agency for InternationalDevelopment (USAID)
The Department of Planning and Environment - New South Wales Government, MediumDensity Housing. Retrieved on 1 July 2017 from http://www.planning.nsw.gov.au/Policy-and-Legislation/Housing/Medium-Density-Housing
United Nations Educational, Scientific, and Cultural Organization (2006), Education forSustainable Development Toolkit, Paris: UNESCO
United Nations Environment Program and (United Nations) World Tourism Organization(UNEP-UNWTO, 2005). Making Tourism more Sustainable-A Guide for Policy Makers.Madrid, Spain : UNWTO. Retrieved on 28 January 2016 Fromhttp://www.unep.fr/shared/publications/pdf/DTIx0592xPA-TourismPolicyEN.pdf
684
Geng, Hong; Shi, Erpeng The Influence of Bicycle Sharing on Chinese University Community and the Guidance of Planning ISOCARP-OAPA Conference 2017
1
The Influence of Bicycle Sharing on Chinese University Community
and the Guidance of Planning——A Case Study of Huazhong
University of Science and Technology
(1) Hong GENG, Department of Urban Planning, School of Architecture and Urban Planning, Huazhong University of Science and Technology; Deputy Director of Academic Committee of China Small Town Planning, China (2) Erpeng SHI, Ph.D. candidate of Huazhong University of Science and Technology, School of Architecture and Urban Planning, China Abstract: In the context of sharing economy, shared transport which ties closely to people’s daily lives emerges as a new area of sharing economy research. Being a kind of shared transport, bicycle sharing aims to solve "the last mile problem" with the basic features of convenience, high flexibility, and low price, conforming to the concept of low-carbon traveling. Because of its open space, self-sufficient living and social harmony, Chinese university community has become the appealing marketplace of some bicycle sharing brands. It is of great significance to study the bicycle sharing system in the university community to save travel costs of teachers and students, to improve the life efficiency, to promote the construction of green transportation, to build a harmonious society and to reconstruct the campus space. Based on the case study of Huazhong University of Science and Technology in China, research methods such as field investigation and APP data collection are used to analyze and evaluate specific situations on using shared bikes by teachers and students. Findings show that shared bikes are more frequently used in hot spots with core functions, and its spatial distribution varies; daily using frequency of shared bikes in a week differentiates subtly, while at different time in a day, the curve of using frequency undulates obviously; bicycle sharing are well recognized in promoting traveling efficiency and convenience, having received high reputation after being frequent used. Thus it can be concluded that bicycle sharing stimulates adaptive construction and perfection of the slow traffic system in the case study community, promotes the micro-adjustment of campus traffic layout and refinement of management, strengthens communication and connection between internal and external areas of the community, realizes further harmony of the community under the popularization of green traveling concept. Finally, adopting the concept of regional service differentiation, this paper proposes three guiding strategies from the perspective of planning: coupling between cycling points and community structure space based on refinement of management; promoting the design of road network optimization and road sharing; improving and optimizing the layout of the slow traffic facilities. Keywords: bicycle sharing; China; university community; influence; guidance of planning 1. Introduction
685
Geng, Hong; Shi, Erpeng The Influence of Bicycle Sharing on Chinese University Community and the Guidance of Planning ISOCARP-OAPA Conference 2017
2
The arrival of global sharing economy is now changing the structure of global economy1. China, the second largest economy in the world, advocates innovative, coordinated, green, open and sharing developing concepts in an all-round way, enjoying rapid development in sharing economy: In 2016, the market scale of sharing economy in China has reached 3945 trillion yuan, with an increase of 76.4%. It has offered services to about 60 million people, increasing 10 million people than that of last year2. Being an essential part of sharing economy, shared transport is closely related to people’s daily lives. Bicycle sharing, one kind of shared transport, aims to solve "the last mile problem" with the basic features of convenience, high flexibility, and low price, conforming to the concept of low-carbon traveling3. Because of its relatively open space, basic self-sufficient living and social cultural harmony, which is different from general living community, Chinese university community has become an appealing marketplace of some bicycle sharing brands. This paper aims to identify the involvement of bicycle sharing in Chinese university community and the possible effects it may impose in many aspects, make adaptations and feedbacks, and realize harmonious operation of Chinese university community in the end. 2. Background
2.1 Concept and Development of Bicycle Sharing
Bicycle sharing is a system where enterprises provide internet-controlled bicycles for users in public areas while the users are required to pay for and return them through operating on their mobile phones4. It works through the combination of APP, GPS, and QR Scanning. The concept of bicycle sharing originates from international "docked" public bike. In 2014, OFO, a Chinese company, put the first stock of "dockless" shared bikes which is more free, flexible and convenient into use in Peking University, breaking the obstacles of popularizing "docked" public bikes which is deficient in management. In 2016, shared bikes were put in cities, well received by the public: Chinese rental market scale of bicycle sharing had reached 54 million yuan in 2016, with its users amounting to 4.2516 million. In terms of the bicycle sharing brand, over 30 brands (Table 1) above the designated scale led by OFO and Mobike are now prevailing in China. Among them, OFO has always focused on the market of university, now boasting over 3 million users in cities and universities, 160 thousand shared bikes and 40 million orders altogether, which are mainly from university market5.
1. Huang, Jun (2016) “A Study on Sharing Economy in China”, Manager’ Journal, No.02 (January)
2. (2017) “Report on Chinese Sharing Economy, China Chain Store, No. 06 (June)
3. Zhou, Simeng (2017) “A Study on Users’ Satisfaction in Bicycle Sharing------ A Case Study of
Kunming City”, Logistics Technology, No. 04 (April)
4. Wang, Guangrong (2017) “The Transportation Value and Developing Methods of Bicycle Sharing”,
City, No. 04 (April)
5. http://www.ofo.so/event/news-3.html OFO Official website of OFO bicycle sharing
686
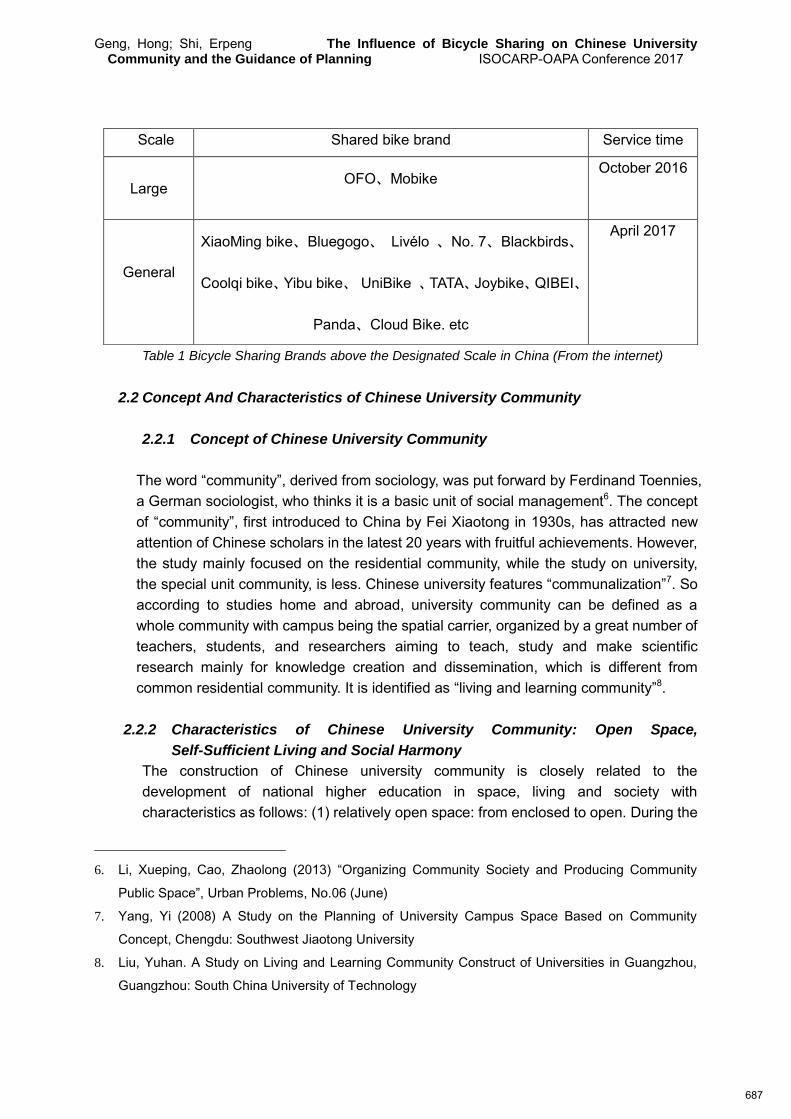
Geng, Hong; Shi, Erpeng The Influence of Bicycle Sharing on Chinese University Community and the Guidance of Planning ISOCARP-OAPA Conference 2017
3
Table 1 Bicycle Sharing Brands above the Designated Scale in China (From the internet)
2.2 Concept And Characteristics of Chinese University Community
2.2.1 Concept of Chinese University Community
The word “community”, derived from sociology, was put forward by Ferdinand Toennies, a German sociologist, who thinks it is a basic unit of social management6. The concept of “community”, first introduced to China by Fei Xiaotong in 1930s, has attracted new attention of Chinese scholars in the latest 20 years with fruitful achievements. However, the study mainly focused on the residential community, while the study on university, the special unit community, is less. Chinese university features “communalization”7. So according to studies home and abroad, university community can be defined as a whole community with campus being the spatial carrier, organized by a great number of teachers, students, and researchers aiming to teach, study and make scientific research mainly for knowledge creation and dissemination, which is different from common residential community. It is identified as “living and learning community”8.
2.2.2 Characteristics of Chinese University Community: Open Space,
Self-Sufficient Living and Social Harmony
The construction of Chinese university community is closely related to the development of national higher education in space, living and society with characteristics as follows: (1) relatively open space: from enclosed to open. During the
6. Li, Xueping, Cao, Zhaolong (2013) “Organizing Community Society and Producing Community
Public Space”, Urban Problems, No.06 (June)
7. Yang, Yi (2008) A Study on the Planning of University Campus Space Based on Community
Concept, Chengdu: Southwest Jiaotong University
8. Liu, Yuhan. A Study on Living and Learning Community Construct of Universities in Guangzhou,
Guangzhou: South China University of Technology
Scale Shared bike brand Service time
Large
OFO、Mobike October 2016
General
XiaoMing bike、Bluegogo、 Livélo 、No. 7、Blackbirds、
Coolqi bike、Yibu bike、 UniBike 、TATA、Joybike、QIBEI、
Panda、Cloud Bike. etc
April 2017
687
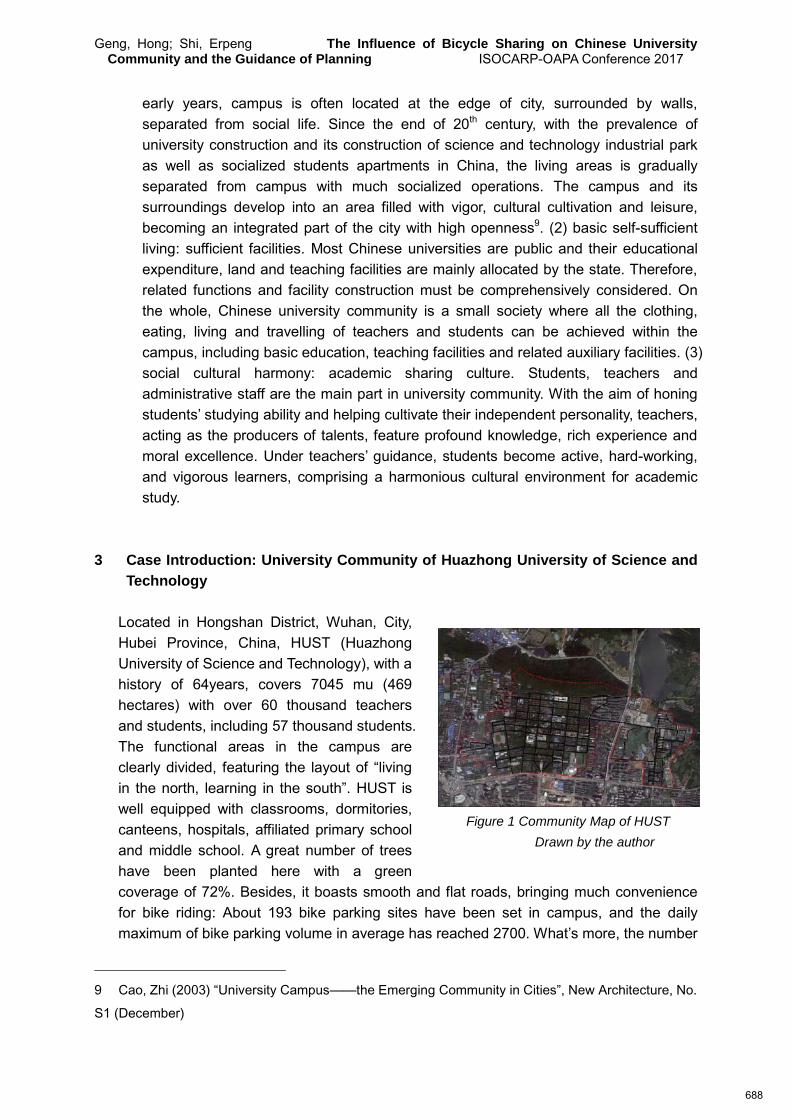
Geng, Hong; Shi, Erpeng The Influence of Bicycle Sharing on Chinese University Community and the Guidance of Planning ISOCARP-OAPA Conference 2017
4
early years, campus is often located at the edge of city, surrounded by walls, separated from social life. Since the end of 20th century, with the prevalence of university construction and its construction of science and technology industrial park as well as socialized students apartments in China, the living areas is gradually separated from campus with much socialized operations. The campus and its surroundings develop into an area filled with vigor, cultural cultivation and leisure, becoming an integrated part of the city with high openness9. (2) basic self-sufficient living: sufficient facilities. Most Chinese universities are public and their educational expenditure, land and teaching facilities are mainly allocated by the state. Therefore, related functions and facility construction must be comprehensively considered. On the whole, Chinese university community is a small society where all the clothing, eating, living and travelling of teachers and students can be achieved within the campus, including basic education, teaching facilities and related auxiliary facilities. (3) social cultural harmony: academic sharing culture. Students, teachers and administrative staff are the main part in university community. With the aim of honing students’ studying ability and helping cultivate their independent personality, teachers, acting as the producers of talents, feature profound knowledge, rich experience and moral excellence. Under teachers’ guidance, students become active, hard-working, and vigorous learners, comprising a harmonious cultural environment for academic study.
3 Case Introduction: University Community of Huazhong University of Science and
Technology
Located in Hongshan District, Wuhan, City, Hubei Province, China, HUST (Huazhong University of Science and Technology), with a history of 64years, covers 7045 mu (469 hectares) with over 60 thousand teachers and students, including 57 thousand students. The functional areas in the campus are clearly divided, featuring the layout of “living in the north, learning in the south”. HUST is well equipped with classrooms, dormitories, canteens, hospitals, affiliated primary school and middle school. A great number of trees have been planted here with a green coverage of 72%. Besides, it boasts smooth and flat roads, bringing much convenience for bike riding: About 193 bike parking sites have been set in campus, and the daily maximum of bike parking volume in average has reached 2700. What’s more, the number
9 Cao, Zhi (2003) “University Campus——the Emerging Community in Cities”, New Architecture, No.
S1 (December)
Figure 1 Community Map of HUST
Drawn by the author
Drawn by the author
688
Geng, Hong; Shi, Erpeng The Influence of Bicycle Sharing on Chinese University Community and the Guidance of Planning ISOCARP-OAPA Conference 2017
5
of shared bikes on the major roads in campus can reach 1600 per minute10. As we can see, shared bikes are frequently used in the case community, which is representative with good research value. Due to the fact that the target research object in this paper is OFO, the only bicycle sharing brand in the case community, which has been introduced into the campus, the first university it gets popularized in Wuhan since the beginning of 2015, other bicycle sharing brands, which are brought from outside the campus with only a few numbers, are not within our research.
4 Research Methods: Micro-Data and Empirical Investigation
4.2 Field Investigation
Investigation methods such as questionnaire, spot investigation and interview were adopted in this process. From May 1, 200 questionnaires were given out in random in east, middle and west of the campus, among which 182 are valid. The targets of the questionnaire and interview are teachers and students in this community, and we’ve collected 12 questionnaires from teachers, and 170 from students, including doctors, masters and undergraduates. The questions in the questionnaire include basic information, frequency of using shared bikes, starting site, destination, hot spot of commuting, aim, destination after transferring transportation, riding time, satisfaction, influence it imposes, existing problems, prospect and suggestions of those being interviewed. Then qualitative and quantitative data analysis was made through SPSS. Besides, we had made irregular investigations, surveys, photo-takings and then made comparative analysis on the use of shared bikes in the campus.
4.3 APP Data Collection
Owing to the unavailability of data from outside OFO Company, web crawling is inaccessible for us. However, the location and number of the shared bikes in a certain time can be dynamically and constantly found on the APP of OFO. Therefore, this study adopts APP data collection, that is, the researcher downloads the APP of OFO on his mobile phone, and after getting registered and paying the deposit, he turns on the Bluetooth, GPS, enters into the rental interface, search and collect related information of the shared bikes. The research went on for 90 days from May 1 to July 30, making irregular observations and counting from 6:30 to 22:30 every day, then counting and analyzing the vectorized data with GIS.
5 Research Results
5.2 Related Characteristics of Using Shared Bikes
10 http://zsb.hust.edu.cn/video/content7.html Undergraduate enrollment information network of HUST
689
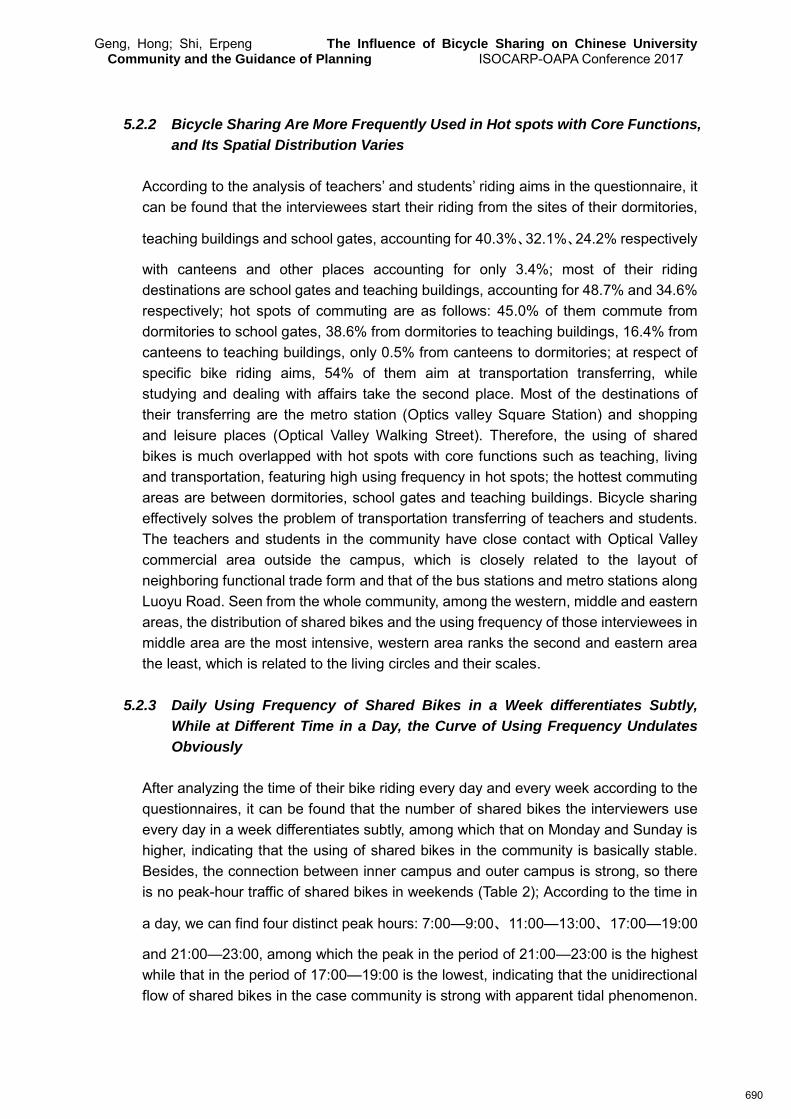
Geng, Hong; Shi, Erpeng The Influence of Bicycle Sharing on Chinese University Community and the Guidance of Planning ISOCARP-OAPA Conference 2017
6
5.2.2 Bicycle Sharing Are More Frequently Used in Hot spots with Core Functions,
and Its Spatial Distribution Varies
According to the analysis of teachers’ and students’ riding aims in the questionnaire, it can be found that the interviewees start their riding from the sites of their dormitories,
teaching buildings and school gates, accounting for 40.3%、32.1%、24.2% respectively
with canteens and other places accounting for only 3.4%; most of their riding destinations are school gates and teaching buildings, accounting for 48.7% and 34.6% respectively; hot spots of commuting are as follows: 45.0% of them commute from dormitories to school gates, 38.6% from dormitories to teaching buildings, 16.4% from canteens to teaching buildings, only 0.5% from canteens to dormitories; at respect of specific bike riding aims, 54% of them aim at transportation transferring, while studying and dealing with affairs take the second place. Most of the destinations of their transferring are the metro station (Optics valley Square Station) and shopping and leisure places (Optical Valley Walking Street). Therefore, the using of shared bikes is much overlapped with hot spots with core functions such as teaching, living and transportation, featuring high using frequency in hot spots; the hottest commuting areas are between dormitories, school gates and teaching buildings. Bicycle sharing effectively solves the problem of transportation transferring of teachers and students. The teachers and students in the community have close contact with Optical Valley commercial area outside the campus, which is closely related to the layout of neighboring functional trade form and that of the bus stations and metro stations along Luoyu Road. Seen from the whole community, among the western, middle and eastern areas, the distribution of shared bikes and the using frequency of those interviewees in middle area are the most intensive, western area ranks the second and eastern area the least, which is related to the living circles and their scales.
5.2.3 Daily Using Frequency of Shared Bikes in a Week differentiates Subtly,
While at Different Time in a Day, the Curve of Using Frequency Undulates
Obviously
After analyzing the time of their bike riding every day and every week according to the questionnaires, it can be found that the number of shared bikes the interviewers use every day in a week differentiates subtly, among which that on Monday and Sunday is higher, indicating that the using of shared bikes in the community is basically stable. Besides, the connection between inner campus and outer campus is strong, so there is no peak-hour traffic of shared bikes in weekends (Table 2); According to the time in
a day, we can find four distinct peak hours: 7:00—9:00、11:00—13:00、17:00—19:00
and 21:00—23:00, among which the peak in the period of 21:00—23:00 is the highest while that in the period of 17:00—19:00 is the lowest, indicating that the unidirectional flow of shared bikes in the case community is strong with apparent tidal phenomenon.
690
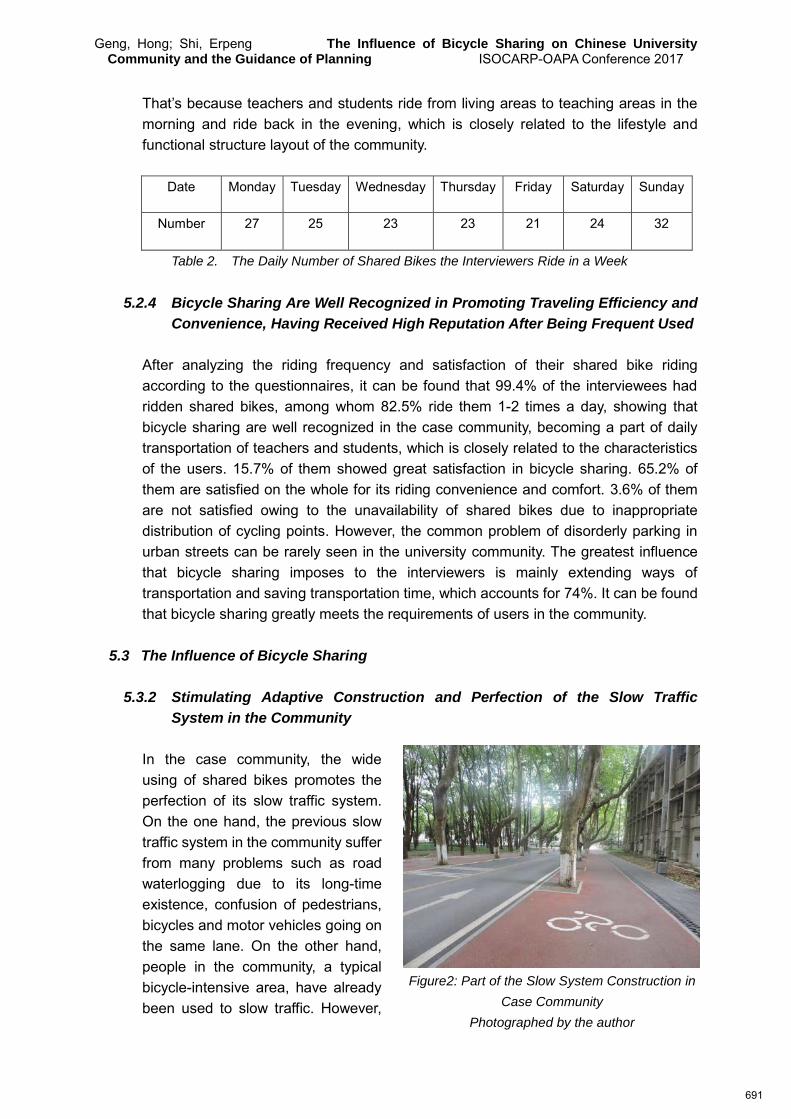
Geng, Hong; Shi, Erpeng The Influence of Bicycle Sharing on Chinese University Community and the Guidance of Planning ISOCARP-OAPA Conference 2017
7
That’s because teachers and students ride from living areas to teaching areas in the morning and ride back in the evening, which is closely related to the lifestyle and functional structure layout of the community.
Date Monday Tuesday Wednesday Thursday Friday Saturday Sunday
Number 27 25 23 23 21 24 32
Table 2. The Daily Number of Shared Bikes the Interviewers Ride in a Week
5.2.4 Bicycle Sharing Are Well Recognized in Promoting Traveling Efficiency and
Convenience, Having Received High Reputation After Being Frequent Used
After analyzing the riding frequency and satisfaction of their shared bike riding according to the questionnaires, it can be found that 99.4% of the interviewees had ridden shared bikes, among whom 82.5% ride them 1-2 times a day, showing that bicycle sharing are well recognized in the case community, becoming a part of daily transportation of teachers and students, which is closely related to the characteristics of the users. 15.7% of them showed great satisfaction in bicycle sharing. 65.2% of them are satisfied on the whole for its riding convenience and comfort. 3.6% of them are not satisfied owing to the unavailability of shared bikes due to inappropriate distribution of cycling points. However, the common problem of disorderly parking in urban streets can be rarely seen in the university community. The greatest influence that bicycle sharing imposes to the interviewers is mainly extending ways of transportation and saving transportation time, which accounts for 74%. It can be found that bicycle sharing greatly meets the requirements of users in the community.
5.3 The Influence of Bicycle Sharing
5.3.2 Stimulating Adaptive Construction and Perfection of the Slow Traffic
System in the Community
In the case community, the wide using of shared bikes promotes the perfection of its slow traffic system. On the one hand, the previous slow traffic system in the community suffer from many problems such as road waterlogging due to its long-time existence, confusion of pedestrians, bicycles and motor vehicles going on the same lane. On the other hand, people in the community, a typical bicycle-intensive area, have already been used to slow traffic. However,
Figure2: Part of the Slow System Construction in
Case Community
Photographed by the author
691
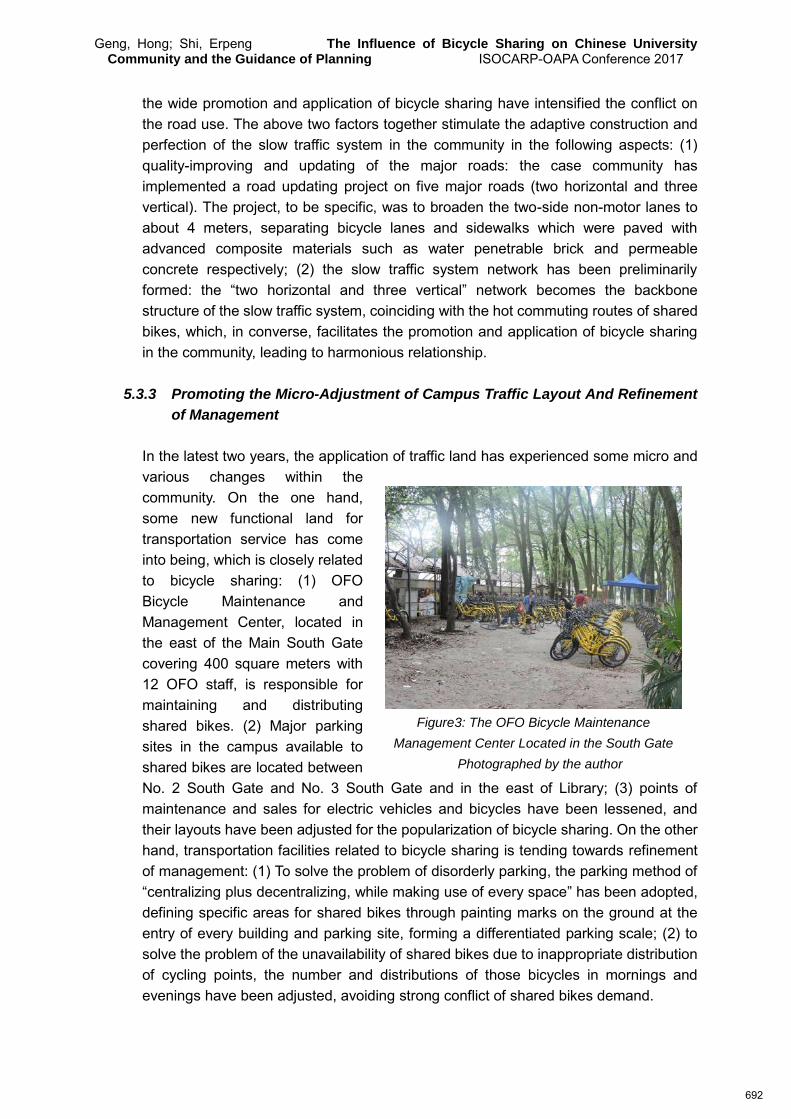
Geng, Hong; Shi, Erpeng The Influence of Bicycle Sharing on Chinese University Community and the Guidance of Planning ISOCARP-OAPA Conference 2017
8
the wide promotion and application of bicycle sharing have intensified the conflict on the road use. The above two factors together stimulate the adaptive construction and perfection of the slow traffic system in the community in the following aspects: (1) quality-improving and updating of the major roads: the case community has implemented a road updating project on five major roads (two horizontal and three vertical). The project, to be specific, was to broaden the two-side non-motor lanes to about 4 meters, separating bicycle lanes and sidewalks which were paved with advanced composite materials such as water penetrable brick and permeable concrete respectively; (2) the slow traffic system network has been preliminarily formed: the “two horizontal and three vertical” network becomes the backbone structure of the slow traffic system, coinciding with the hot commuting routes of shared bikes, which, in converse, facilitates the promotion and application of bicycle sharing in the community, leading to harmonious relationship.
5.3.3 Promoting the Micro-Adjustment of Campus Traffic Layout And Refinement
of Management
In the latest two years, the application of traffic land has experienced some micro and various changes within the community. On the one hand, some new functional land for transportation service has come into being, which is closely related to bicycle sharing: (1) OFO Bicycle Maintenance and Management Center, located in the east of the Main South Gate covering 400 square meters with 12 OFO staff, is responsible for maintaining and distributing shared bikes. (2) Major parking sites in the campus available to shared bikes are located between No. 2 South Gate and No. 3 South Gate and in the east of Library; (3) points of maintenance and sales for electric vehicles and bicycles have been lessened, and their layouts have been adjusted for the popularization of bicycle sharing. On the other hand, transportation facilities related to bicycle sharing is tending towards refinement of management: (1) To solve the problem of disorderly parking, the parking method of “centralizing plus decentralizing, while making use of every space” has been adopted, defining specific areas for shared bikes through painting marks on the ground at the entry of every building and parking site, forming a differentiated parking scale; (2) to solve the problem of the unavailability of shared bikes due to inappropriate distribution of cycling points, the number and distributions of those bicycles in mornings and evenings have been adjusted, avoiding strong conflict of shared bikes demand.
Figure3: The OFO Bicycle Maintenance
Management Center Located in the South Gate
Photographed by the author
692
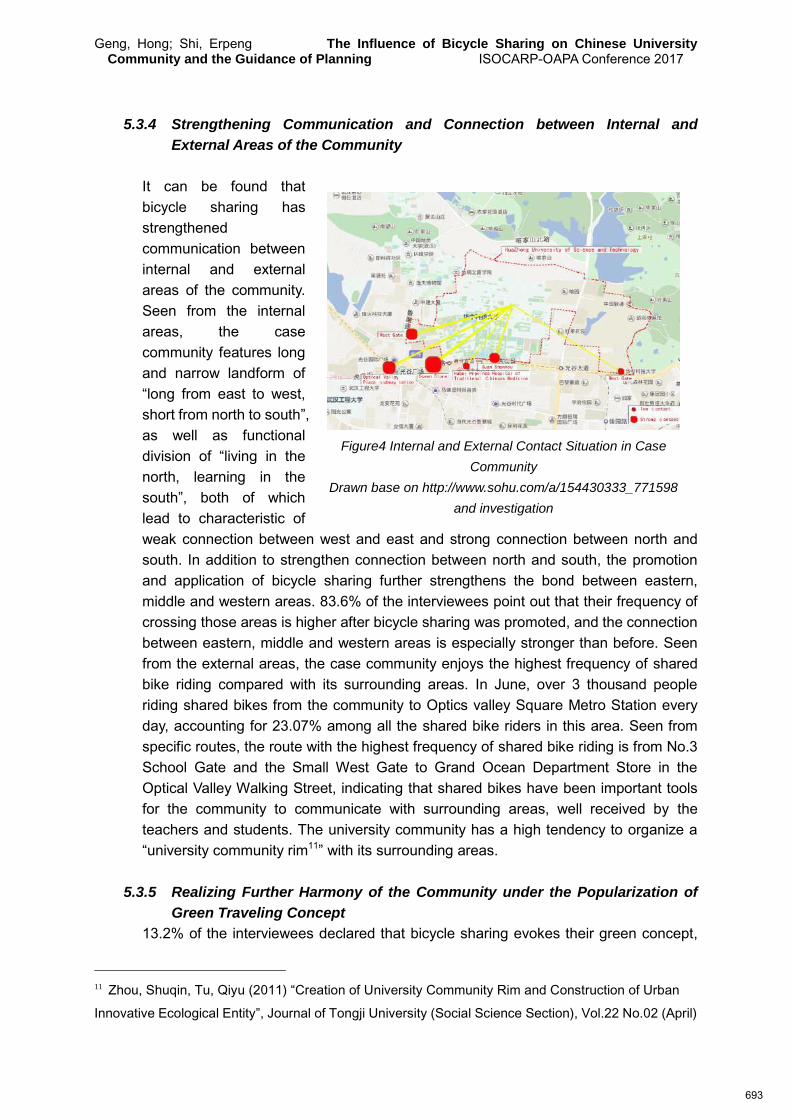
Geng, Hong; Shi, Erpeng The Influence of Bicycle Sharing on Chinese University Community and the Guidance of Planning ISOCARP-OAPA Conference 2017
9
5.3.4 Strengthening Communication and Connection between Internal and
External Areas of the Community
It can be found that bicycle sharing has strengthened communication between internal and external areas of the community. Seen from the internal areas, the case community features long and narrow landform of “long from east to west, short from north to south”, as well as functional division of “living in the north, learning in the south”, both of which lead to characteristic of weak connection between west and east and strong connection between north and south. In addition to strengthen connection between north and south, the promotion and application of bicycle sharing further strengthens the bond between eastern, middle and western areas. 83.6% of the interviewees point out that their frequency of crossing those areas is higher after bicycle sharing was promoted, and the connection between eastern, middle and western areas is especially stronger than before. Seen from the external areas, the case community enjoys the highest frequency of shared bike riding compared with its surrounding areas. In June, over 3 thousand people riding shared bikes from the community to Optics valley Square Metro Station every day, accounting for 23.07% among all the shared bike riders in this area. Seen from specific routes, the route with the highest frequency of shared bike riding is from No.3 School Gate and the Small West Gate to Grand Ocean Department Store in the Optical Valley Walking Street, indicating that shared bikes have been important tools for the community to communicate with surrounding areas, well received by the teachers and students. The university community has a high tendency to organize a “university community rim11” with its surrounding areas.
5.3.5 Realizing Further Harmony of the Community under the Popularization of
Green Traveling Concept
13.2% of the interviewees declared that bicycle sharing evokes their green concept,
11 Zhou, Shuqin, Tu, Qiyu (2011) “Creation of University Community Rim and Construction of Urban
Innovative Ecological Entity”, Journal of Tongji University (Social Science Section), Vol.22 No.02 (April)
Figure4 Internal and External Contact Situation in Case
Community
Drawn base on http://www.sohu.com/a/154430333_771598
and investigation
693
Geng, Hong; Shi, Erpeng The Influence of Bicycle Sharing on Chinese University Community and the Guidance of Planning ISOCARP-OAPA Conference 2017
10
which shows it intensifies green traveling concept of teachers and students in a sense. Traveling with bikes has already become a habit of teachers and students, especially on the roads between dormitories, school gates and teaching buildings. With the green travelling concept, for one thing, shared bikes have already been bright scenery in campus, where those bicycles can be parked in every parking site in campus so the accessibility and openness within the community are strengthened, the blind angle is lessened, and the public security is developing steadily. For another, the relationship between teachers and students, inner personnel and outside personnel will be more harmonious. Through asking for directions, inquiring facility applications when they enter into the campus with those bicycles, the shared bikes can be the media of communication. As personnel outside the community come in, social relationship can be more harmonious.
6. Discussion: Guidance of Planning Analysis Based on Its Characteristics and
Influence
Based on the above analysis of characteristics and influence of bicycle sharing in the case community, guidance of planning has been put forward in the following three aspects: bicycle sharing and community structure space, road network and its forms, supporting facilities of slow traffic system, in order to guide the shared bike users to use them in a more scientific way.
6.1 Coupling between Cycling Points and Community Structure Space Based on
Refinement of Management
At present, the major conflict of using shared bikes in Chinese university community is the dynamic unbalance between supply and demand in time and scale, leading to a waste of resources. The basic reason lies in coupling between cycling points and community structure space. The essence is to solve this problem by adopting refinement of management: (1) to better understand and conclude the demand and characteristics of users, including destinations, hot spots, and peaks studied above, in order to realize the coupling between cycling points and community structure space by putting adequate shared bikes in the right places at right time; (2) to strengthen refined and constant monitoring on bicycle sharing operation, keeping a close eye on its application in order to realize precise and dynamic management by adopting modernized managing technologies, and appropriately arrange staff for bicycle distributing and reserving; (3) to achieve specialized management in surrounding areas of hot spots and buildings such as dormitories, teaching buildings, libraries and school gates based on whole structure of the community.
6.2 Promoting the Design of Road Network Optimization and Road Sharing
Road system optimization, concerned with its network structure and specific patterns,
694
Geng, Hong; Shi, Erpeng The Influence of Bicycle Sharing on Chinese University Community and the Guidance of Planning ISOCARP-OAPA Conference 2017
11
can be strengthened based on updated road system. According to current road network structure where the connection between north and south is strong while that between east and west is weak, it is proposed as follows: further update the road construction into a more intensified slow traffic system; optimize end roads and damaged roads, achieving “riding available when it is needed with every place well linked”. According to specific road patterns, sharing and people-oriented principles should be advocated to construct high standard bicycle lanes whose width should be over 3 meters. Related index such as gradient should be “people-oriented”. Modern technology such as eco-permeable and seeping materials should be adopted to create better environment for slow traffic system.
6.3 Improving and Optimizing the Layout of the Slow Traffic Facilities
Being the guarantee of using shared bikes, the layout of related traffic facilities should be improved in following three aspects. First, to solve the problem of disorderly parking, the layout for shared bike parking should be arranged rationally and intensively, such as setting dockless parking sites in crossroads within the service range of major functional buildings, and the education on using and parking shared bikes should be popularized to gradually achieve civilized using habit of teacher and students. Second, adding related signs of using bikes to campus public sign system based on public service facility, such as guiding sign of parking lot, dynamic demonstration of the number and location of shared bikes, and guide lines for bicycles. Third, advocating participatory management of bicycle utility, guiding all the teachers, students and personnel from outside to participate in the utility and management of shared bikes, organizing an operation team with inner organizations such as Students’ Union for regular inspection, malfunctioning declaration and bicycle distribution.
7 Conclusion
The utility of shared bikes in Chinese university community features greatly in social nature and regional characteristics. Through researching on the influence over transportation system, transportation land, internal and external communication and social relationship imposed by bicycle sharing, related guidance of planning put forward by Urban and Rural Planning is greatly supported. This research has practical value in the promotion of green transportation, popularization of sharing economy, and community construction. It can be said that bicycle riding is changing Chinese universities, so bicycle sharing is needed by Chinese university communities; bicycle sharing is also changing Chinese university communities and their traveling ways, improving the slow traffic environment in university communities. However, this paper is based on a special case community which enjoys flatness and smoothness with a large area and a well-organized road network, not practical enough for communities with complex terrain, which remains to be studied later. Besides, micro-data and empirical investigation are adopted in this research, so the results may not be systematic enough. Therefore, finding other types of case communities and new research methods will be
695
Geng, Hong; Shi, Erpeng The Influence of Bicycle Sharing on Chinese University Community and the Guidance of Planning ISOCARP-OAPA Conference 2017
12
the next step in studying the influence imposed by bicycle sharing on university communities.
References:
1. Huang, Jun (2016) “A Study on Sharing Economy in China”, Manager’ Journal, No.02 (January) 2. (2017) “Report on Chinese Sharing Economy, China Chain Store, No. 06 (June) 3. Zhou, Simeng (2017) “A Study on Users’ Satisfaction in Bicycle Sharing------ A Case Study of Kunming City”, Logistics Technology, No. 04 (April) 4. Wang, Guangrong (2017) “The Transportation Value and Developing Methods of Bicycle Sharing”, City, No. 04 (April) 5. http://www.ofo.so/event/news-3.html OFO Official website of OFO bicycle sharing 6. Li, Xueping, Cao, Zhaolong (2013) “Organizing Community Society and Producing Community Public Space”, Urban Problems, No.06 (June) 7. Yang, Yi (2008) A Study on the Planning of University Campus Space Based on Community Concept, Chengdu: Southwest Jiaotong University 8. Liu, Yuhan. A Study on Living and Learning Community Construct of Universities in Guangzhou, Guangzhou: South China University of Technology 9. Cao, Zhi (2003) “University Campus——the Emerging Community in Cities”, New Architecture, No. S1 (December) 10. http://zsb.hust.edu.cn/video/content7.html Undergraduate enrollment information network of HUST 11. Zhou, Shuqin, Tu, Qiyu (2011) “Creation of University Community Rim and Construction of Urban Innovative Ecological Entity”, Journal of Tongji University (Social Science Section), Vol.22 No.02 (April)
696
Wei Jiabin; Li Xiang; Tang Siyuan Practice and Analysis of Sharing Sports Facilities in China ISOCARP-OAPA Conference 2017
1
Practice and Analysis of Sharing Sports Facilities in China –
A Comparative Study of Government-led and Internet-led Sharing
Modes
Jiabin WEI; Xiang LI (Corresponding author); Siyuan TANG, College of Architecture and Urban Planning of Tongji University, China 1. Introduction
Over the past ten years, the Chinese people's enthusiasm for health gradually increased. Residents have a higher demand for community sport facilities and even professional private trainers and facilities. However, the poor accessibility and lack of public sports facilities in Chinese cities is a widespread problem and many of the built sports facilities have very low utilization rate. Thus, how to effectively and smartly open and share these sports facilities has become a matter of concern to residents.
This paper summarizes the cases of different cities, the sharing of sports facilities in China can be divided into two models: the top-down government-led and the bottom-up Internet-led. In the first model, The government introduces policies and allocates financial expenditure to open and share the sports facilities of schools and institutions. For example, in Hangzhou the residents around the primary and middle school can use the school's sports facilities after school and on weekends. In the other model, through development of the C2B and O2O sports facilities sharing APPs, some Internet entrepreneurial teams play a protagonist in guiding the big companies and private owners to open and share sports facilities to the public. JH sports, Netsports are all these kind of APPs that help residents find the closest facilities they want conveniently. These two modes realize the sharing of idle sports facilities in Chinese cities from different angles and aspects. This paper is dedicated to comparing the two kinds of sharing models in China from the aspects of the main participants, the main types of sports, the scope of services, the main body of investment and so on and based on the analysis, this paper puts forward a combination way to improve the two existing models.
2. Background
2.1 ‘Fitness for all era’ is approaching
With the rapid economic development of China, Chinese people nowadays pay more attention on health issues than ever before, indeed, „Healthy Life‟ is becoming the priority of majority people. Followed by the so called Leisure Era is at the corner, it is believed that in the near future, after finished the rapid economic development phase, this country will enter into a new economic pattern which is mainly driven by servicing sectors, the leisure economy is one
697

Wei Jiabin; Li Xiang; Tang Siyuan Practice and Analysis of Sharing Sports Facilities in China ISOCARP-OAPA Conference 2017
2
of most important contributors. Simultaneously, Chinese people's attitudes towards life and daily consumption are undergoing tremendous changes, from „money first to health first‟. Moreover, the accelerating pace of urban life and increasingly working and living pressure bought negative impact on people. These factors are all led the residents‟ urgent needs on sports fitness, recreation and neighborhood communication. Because the residents‟ awareness of fitness enhanced, consequently result in their demand for fitness and leisure places are increasing. In addition, the top national policy regarding to residents‟ fitness issues, „The Guiding Opinions of the
State Council on Accelerating the Development of Sports Industry to Promote Sports
Consumption‟ issued in 2014 by central government, also raised the „Fitness For All‟ issue to the national strategic level. In this context, the construction of the sports fitness facilities which are within the proper range of the community is an important choice for upgrading the urban public service level, transforming the urban living environment, improving the quality of life of the residents and facilitating the participation of the residents in the sports and fitness activities. 3. Top-down approach, government-led community sports
Currently, the concept of lifelong fitness and doing sports within community are step by step dominating the daily life of people. The lifelong fitness indeed is considered as the core value of society in the form of the whole society‟s enthusiasm is changing from „economy first‟ to „health first‟. This social trend requiring enthusiasm supported by people, is based on the fact that people could access to sports opportunities freely, whenever they are, wherever they are. As a result, the „community sports‟ as a newly introduced concept from western world, has become the new focus of mass sports, suggesting a potentially massive market and a bright future in China. In addition, with the implementation of the „Five-Day Working Day‟ policy since 1995, which means people's leisure time is increased to two days a week by law, people only had one day-off a week before 1995. Also, with the continuous improvement of people's living standards, people began to pursue the quality of life by means of various sports. In terms of sports places, main sports places are more diversifying, began to switch from schools, working units to residential communities. The community sports which has various advantages is becoming an ideal way to meet the people's fitness and health needs.
3.1 Major national policies supporting community sports
The appropriate sports for all people is believed contributing great benefit to people's health, there are numerous national level policies dedicated to perfect the community sports field. The policy „The Guiding Opinions of the State Council on strengthening school sports to
promote the comprehensive development of physical and mental health of students’ issued by China‟s State Council proposed to actively encourage the school sports venues and facilities open to public, therefore, to ease the supply shortage of sports venues and facilities
698

Wei Jiabin; Li Xiang; Tang Siyuan Practice and Analysis of Sharing Sports Facilities in China ISOCARP-OAPA Conference 2017
3
resources caused by people‟s growing fitness needs. Similar policies also pointing out the importance of opening up campus sports venues to society, include the „The implementation
Opinions of Ministry of Education and General Administration of Sport on the promotion of
school sports venues to the community‟, „National Fitness Programme (2016-2020)‟, „Healthy
China 2030 Plan’, etc.
3.2 A brief history of community sports in China
Over the years, the definition, organization and management structure, places, forms of community sports have experienced tremendous changes in China. The phenomenon of community sports activities in China first began in the 1960s and 1970s in the form of Danwei or Working Units. At that period, the community actually not means residential community but working community. In some provinces and cities, almost all urban working force were employed by the State Owned Enterprises, as workers, people‟s sports activities were organized by big and small scale State Owned Enterprises (SOEs) in the form of District Sports Associations. The District Sports Associations were often have loose and unstable organization structure. In early 1970s, urban parks and open spaces became the popular areas for scattered and small scale morning exercise activities used by middle ages and elderly. Later, people‟s enthusiasm for daily exercises were expanded further to nation-wide, in the form of ubiquitous morning and evening exercises in this country. At that period, the pattern sports organized by working units began to take apart, the scattered and small scale sports organized volunteered by individuals were about to developing. In the mid-1980s, sports activities organized by sub-district authority in mega-cities, for instance, Beijing, Tianjin, Shanghai, Guangzhou and other big cities appeared. Therefore, the Sub-District Sports Association for the first time established, since then, people‟s daily sports network divided by different work units or different industries has been broken, people could do sports nearby in their communities, no longer confined in their working units. This marked the beginning of real community sports, sports networks are organized by communities. When entered into 1990s, with the wave of large scale construction of residential communities, there appeared Community Sports Association. In April 1997, the former National Sports Commission, the former National Education Commission, the Ministry of Civil Affairs, the former Ministry of Construction and the Ministry of Culture jointly issued the document „The
Guiding Opinions on the strengthening of urban community sports‟, marked the official approval of community sports, leading the community sports into the new era. 3.3 The problems of community sports in China
Over the years, benefiting from the improvement of people's living standards and the implementation of „National Fitness Programme‟, the whole society experienced an unprecedented fitness enthusiasm. In sharp contrast, the public sports facilities supplied by
699

Wei Jiabin; Li Xiang; Tang Siyuan Practice and Analysis of Sharing Sports Facilities in China ISOCARP-OAPA Conference 2017
4
government are still in a slow pace development, consequently largely lag behind the demand of users. It is predictable, with the continues deepening participation of community sports activities, some of the incomplete facets of community sports in China could gradually exposed to the public which could be great challenges in front of all levels of authorities. The problems of community sports supplied by government could be concluded as follows: 1. Monotonous and boring sports choices for people; 2. Imperfect community sports service system; 3. Severely shortage of sports facilities and venues, both in the total number and per capita; 4. Nationwide inequity distribution of community facilities and venues; 5. Imperfect community sports legal system; 6. Lack of an integration platform that can integrate schools sports, work place sports and
residential sports together. Due to above mentioned problems, as a result, current development of community sports featuring in blind and unarranged way, the advantages of community sports therefore might not be fully developed. Therefore, how to solve these problems properly and fully exert the advantages of community sports has long been the biggest problem faced by scholars and governments. Numerous surveys have been conducted in different cities in the purpose of understanding the current development states of community sports. For instance: a recent survey featuring in public sports facilities conducted in Shanghai showed that 67.42% of residents believed that the number of small and medium public sports facilities is insufficient, unable to meet the needs of people‟s demands. 24.68% of residents believed that the existing category of facilities are incomplete. For the comments of public responded to the „Open School Sports Facilities To Public Policy‟, 76.24% of the residents are dissatisfied of the current states of school sports facilities which committed to fully open to public during after-school period, in addition, 67.83% of residents complained that public sports facilities are far away from residential communities, suggested uneven distribution of community sports opportunities. 4. Bottom-up approach, sharing sports facilities
4.1 Share economy policy
In present, China's sharing economy is almost ubiquitous and has strong government support. Sharing is emerging as a phenomenon in present, almost everything, from cars, bicycles, to umbrellas, basketball, even apartments are on the sharing list, and it is believed there are more to share in the future with the help of ICT and mushrooming sharing industry. In fact, the concept of sharing economy could date back to as early as the 1980s, until now, with the emergence of the Internet, cost of communicative information reduced dramatically, Internet solved the „last mile‟ problem, and made the sharing economy become a gigantic and thriving industry. After 2013, sharing economy became a part of mainstream business. Since
700
Wei Jiabin; Li Xiang; Tang Siyuan Practice and Analysis of Sharing Sports Facilities in China ISOCARP-OAPA Conference 2017
5
then, China's sharing economy entered fast development stage. The sharing economy is playing an increasingly important role in raising resources use efficiency, creating employment opportunities and promoting industrial upgrading, considered as the potential economic Growth Pole of China, and a potential economic revolution could occur led by sharing economy in the means of transforming the conventional economy to innovative economy. At current stage, especially after the 18th CPC National Congress, China's economy is in a period of dramatic transformation, while the emergence of sharing economy is of great significance by enabling greater efficiency in the use of resources, creating employment opportunities and promoting the transformation of economy. The sharing economy is enjoying an unprecedented opportunity for development, under the general banner of „encourage people to start their own businesses and make innovations‟ proposed by central government, with the support of „Internet Plus action plan‟, in keeping with the principle of encouraging innovation and conducting regulation in a tolerant and prudent way, the sharing economy has ushered in unprecedented opportunities for development. It could be said that with the gradual deepening of economic reform, the emergence and development of sharing economy is inevitable and possible. According to an estimate from the Sharing Economy Research Center of State Information Center in 2016, China's sharing economy market transactions amounted to about 3452 billion RMB (US$ 509 billion), increased 103% compared to the 2015. The total number of participants involved in sharing economy reached 60 million people, an increase of about 10 million people over the previous year. Among them, the official workforce of sharing service platform is about 5.85 million people, an increase of 850,000 people over the previous year. 4.2 Share economy policy
In 2016, the term „sharing economy‟ was first time written into the annual Government Work Report, in 2017, the „sharing economy‟ was once again written into the Government Work Report, the consecutive mentioned in the top governmental annual report clearly showed the confidence and resolution of government to develop the sharing industry. The 2017 report referred: „We will continue to support and guide the development of the sharing economy to enable greater efficiency in the use of resources and bring greater convenience to our people. We will formulate regulatory rules for emerging industries in keeping with the principle of encouraging innovation and conducting regulation in a tolerant and prudent way, and guide and promote the healthy development of emerging industries.‟ Early this year (2017), ‟The Guiding Opinions on Promoting the healthy and orderly
development of mobile internet‟ introduced by State Council clearly stated that the sharing economy would be included in the list of government for priority investment and support. Recently, the National Development and Reform Commission asked for public advice on sharing economy policy by proposed the „The guidance on development of sharing economy‟. At present, the sharing economy continues to grow rapidly with the accelerating understanding and support of government. It is predicted that by 2020, the sharing economy
701
Wei Jiabin; Li Xiang; Tang Siyuan Practice and Analysis of Sharing Sports Facilities in China ISOCARP-OAPA Conference 2017
6
will account for more than 10% of the country‟s GDP. 4.3 Sharing sports
The sharing economy has already successfully penetrated into the various aspects of people‟s daily life, whether in eating, wearing, living or transporting, etc. In terms of sports, the sharing economy could also play an important role in better facilitating sports resources use efficiency, increasing the use of idle sports resources. For instance, the fitness facilities and venues could fulfill maximum utilization by connecting them together in a sharing platform, making sports more convenient and efficient, as well as creating considerable employment opportunities. 4.4 Policy of public sharing sports
The national fitness target proposed by „National Fitness Program (2016-2020)‟ is, by 2020, the people‟s general awareness of fitness improved, the number of people participate in physical exercise increased significantly, more than 700 million people routinely participate in physical exercise more than once a week by 2020. The number of people routinely participate in physical exercise will reach to 435 million by 2020. In terms of physical sports venues areas, by 2020, the target per capita sports venues area is set at 1.8 square meters. For the places of fitness, the „National Fitness Program (2016-2020)‟ suggested to actively build new sports facilities and venues, and at same time, effectively use and renovate current spaces. Required effectively expand the sports resources, in the way of focusing on the construction of a number of small and medium-sized sports venues which could benefit people's fitness behaviors. Further upgrade and manage the current resources, properly use, manage and upgrade the existing fitness facilities and venues, especially encourage the social forces to get involved in the management and operations of existing facilities and spaces. Further improve the free or low-cost of use policy of large-scale public sports venues, and encourage to implement the same policy to small and medium-sized sports venues. To ensure that all public sports facilities and venues, sports facilities and venues of private sectors which in line with open conditions, as well as school sports facilities, are required to open to the public. All levels of governments are encouraged to carry out „The Implementation Opinions of
Ministry of Education and General Administration of Sport on The Promotion of School Sports
Venues to The Community‟ policy. Some best experiences and practices are encouraged to be promoted as modal cases, so that the openness level of school facilities and its efficiency will be generally improved.
4.5 Policy of supporting the development of sharing sports industry
In the context of fast growing internet industry, in accordance with the national strategy, China put forward the full use of advanced technologies, such as „Internet Plus, Cloud Computing, Big Data, Internet of Things (IoT) and other modern information technology‟, to build a national fitness management resource library, service resource library and public service
702
Wei Jiabin; Li Xiang; Tang Siyuan Practice and Analysis of Sharing Sports Facilities in China ISOCARP-OAPA Conference 2017
7
information platform, in order to make the national fitness service more convenient, efficient and accurate. For example, by integrating the big data technology to sharing sports industry, people could analyzing and predicting the overall information of current community sports, include the over participation rate, the fitness behaviors of people, sports facilities utilization rate, even different people‟s choices and/or comments. Furthermore, with the help of advanced technologies, up-to-date comprehensive evaluation of public sports fitness nationwide could be established. In conclusion, the policies introduced by either central or local government, are all dedicating to improve the overall level of national fitness, upgrading national fitness facilities regulatory efficiency, providing the people with more convenient, scientific, safe, flexible, barrier-free fitness facilities. In 2017, the National Mass Sports Video Telephone Conference held in Beijing. This is the first time that China has held a national sports conference that covering all levels of government, from national, provincial, municipal to county-level, a record high number, more than 49,000 people attended this conference. This is also the first time national group work conference held after the State Council promulgated the „National Fitness Program
(2016-2020)‟ earlier in 2016. The meeting put forward the establishment of a comprehensive fitness service platform, the establishment a sharing mechanism for better allocation of sports resources. 4.6 The benefits of sharing sports
Sharing sports facilities and venues have a lot of benefits, one of the most important benefit is create economic benefits by fully utilizing idle sports resources. For example, opening campus site of educational units can generate benefits for schools. According to the „National
Fitness Regulations‟, the schools which open their sport facilities to public could charge from the users.
5. Case study analysis
In this part, the author took case studies from different cities as examples, after a series of comparison, the author found that the sharing patterns of sports facilities in China might be concluded into two models: the top-down government-led and the bottom-up Internet-led. These two modes both have realized the sharing of idle sports facilities in Chinese cities from different angles and aspects. This part is dedicated to comparing the two kinds of sharing models in China from the aspects of the main participants, the main types of sports, the scope of services, the main body of investment and so on and based on the analysis, this paper puts forward a combination way to improve the two existing models. 5.1 Top-down sports facilities sharing model in China
With the raising enthusiasm for the sports and fitness of Chinese people, the Chinese government is paying more and more attention to the national fitness cause. „National Fitness
Regulations’ has promulgated different kinds of laws and regulations, hoping to meet the
703

Wei Jiabin; Li Xiang; Tang Siyuan Practice and Analysis of Sharing Sports Facilities in China ISOCARP-OAPA Conference 2017
8
public's daily fitness for sports facilities needs through opening the existing social and spatial sports resources to the society . China's resources for mass sports are mainly distributed in the school system and enterprise system. The sports system occupies only 2.34% of the total sports resources, while the school system occupies about 65% and other systems occupy 16.56%. The living community is serious shortage of public resources. However, it is a pity that the sport facilities in these schools are only used in school days as teaching and training field, while most of the facilities are left unused at the weekends and the holidays. Thus, the „National Fitness Regulations‟ promulgated in 2009 made it clear that "schools should open sport facilities to students in their spare time and holidays, and public schools should actively create conditions to open sports facilities to the public". The opening of the school sports facilities in primary and secondary schools is the most important initiative in recent years and local governments responded positively and implemented the policy actively. After investigation, we found that most of the secondary schools open to the public in the form of free of charge and mainly open to students and teachers of the school as well as the nearby residents. Free open schools only provide open space for jogging and running, but doesn‟t provide professional sport equipments or guidance. At the same time, some schools open their gyms and professional facilities to society for charge. Finally, we sum up four types of opening school sports resources to society and list them below.
704
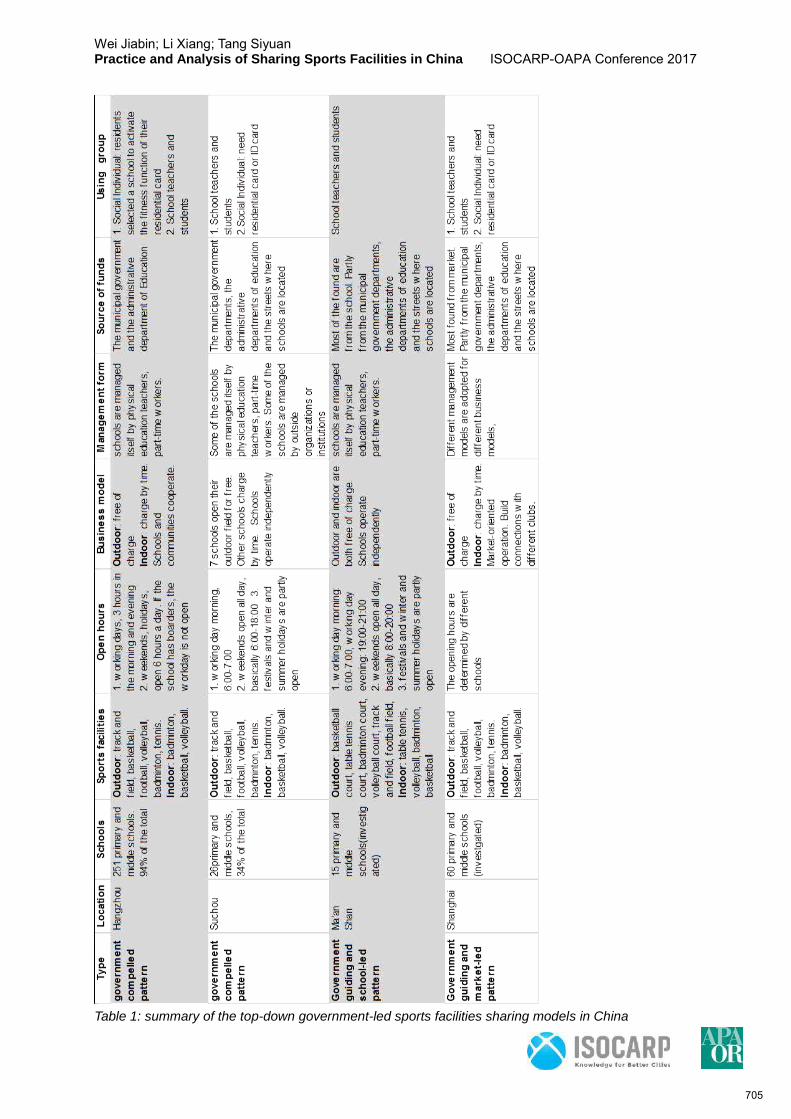
Wei Jiabin; Li Xiang; Tang Siyuan Practice and Analysis of Sharing Sports Facilities in China ISOCARP-OAPA Conference 2017
9
Table 1: summary of the top-down government-led sports facilities sharing models in China
705
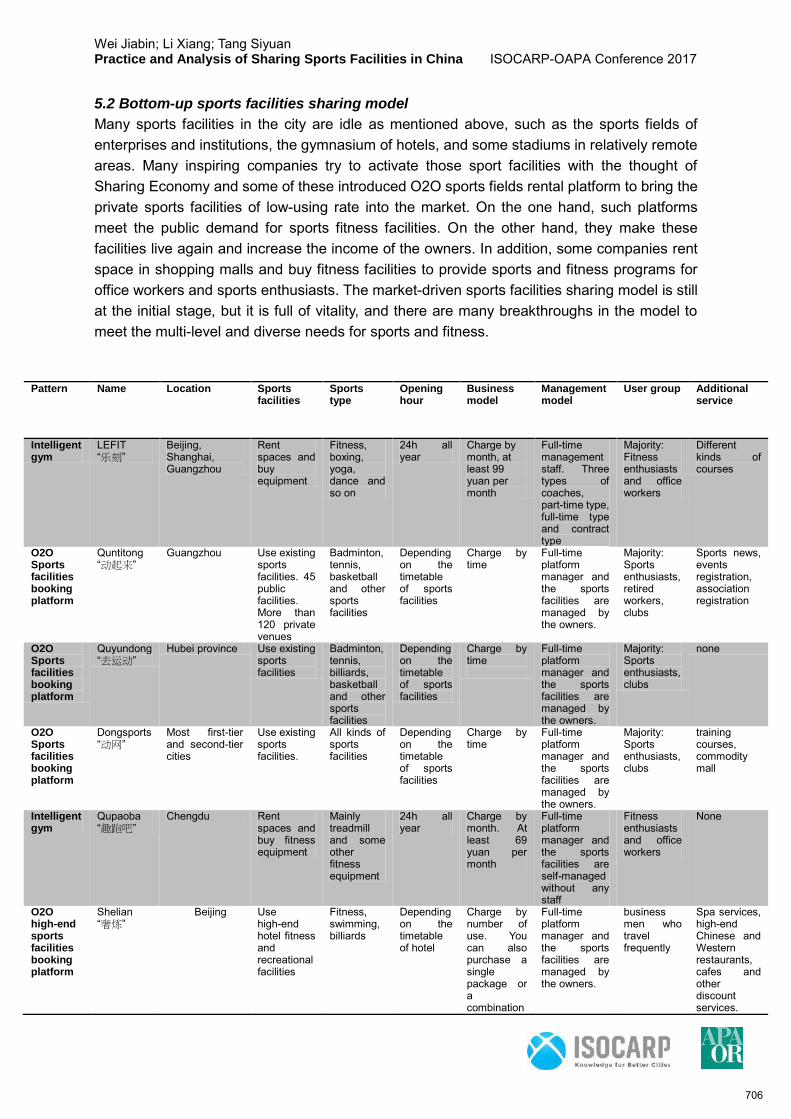
Wei Jiabin; Li Xiang; Tang Siyuan Practice and Analysis of Sharing Sports Facilities in China ISOCARP-OAPA Conference 2017
10
5.2 Bottom-up sports facilities sharing model
Many sports facilities in the city are idle as mentioned above, such as the sports fields of enterprises and institutions, the gymnasium of hotels, and some stadiums in relatively remote areas. Many inspiring companies try to activate those sport facilities with the thought of Sharing Economy and some of these introduced O2O sports fields rental platform to bring the private sports facilities of low-using rate into the market. On the one hand, such platforms meet the public demand for sports fitness facilities. On the other hand, they make these facilities live again and increase the income of the owners. In addition, some companies rent space in shopping malls and buy fitness facilities to provide sports and fitness programs for office workers and sports enthusiasts. The market-driven sports facilities sharing model is still at the initial stage, but it is full of vitality, and there are many breakthroughs in the model to meet the multi-level and diverse needs for sports and fitness.
Pattern Name Location Sports facilities
Sports type
Opening hour
Business model
Management model
User group Additional service
Intelligent gym
LEFIT “乐刻”
Beijing, Shanghai, Guangzhou
Rent spaces and buy equipment
Fitness, boxing, yoga, dance and so on
24h all year
Charge by month, at least 99 yuan per month
Full-time management staff. Three types of coaches, part-time type, full-time type and contract type
Majority: Fitness enthusiasts and office workers
Different kinds of courses
O2O Sports facilities booking platform
Quntitong “动起来”
Guangzhou Use existing sports facilities. 45 public facilities. More than 120 private venues
Badminton, tennis, basketball and other sports facilities
Depending on the timetable of sports facilities
Charge by time
Full-time platform manager and the sports facilities are managed by the owners.
Majority: Sports enthusiasts, retired workers, clubs
Sports news, events registration, association registration
O2O Sports facilities booking platform
Quyundong “去运动”
Hubei province Use existing sports facilities
Badminton, tennis, billiards, basketball and other sports facilities
Depending on the timetable of sports facilities
Charge by time
Full-time platform manager and the sports facilities are managed by the owners.
Majority: Sports enthusiasts, clubs
none
O2O Sports facilities booking platform
Dongsports “动网”
Most first-tier and second-tier cities
Use existing sports facilities.
All kinds of sports facilities
Depending on the timetable of sports facilities
Charge by time
Full-time platform manager and the sports facilities are managed by the owners.
Majority: Sports enthusiasts, clubs
training courses, commodity mall
Intelligent gym
Qupaoba “趣跑吧”
Chengdu Rent spaces and buy fitness equipment
Mainly treadmill and some other fitness equipment
24h all year
Charge by month. At least 69 yuan per month
Full-time platform manager and the sports facilities are self-managed without any staff
Fitness enthusiasts and office workers
None
O2O high-end sports facilities booking platform
Shelian “奢炼”
Beijing Use high-end hotel fitness and recreational facilities
Fitness, swimming, billiards
Depending on the timetable of hotel
Charge by number of use. You can also purchase a single package or a combination
Full-time platform manager and the sports facilities are managed by the owners.
business men who travel frequently
Spa services, high-end Chinese and Western restaurants, cafes and other discount services.
706
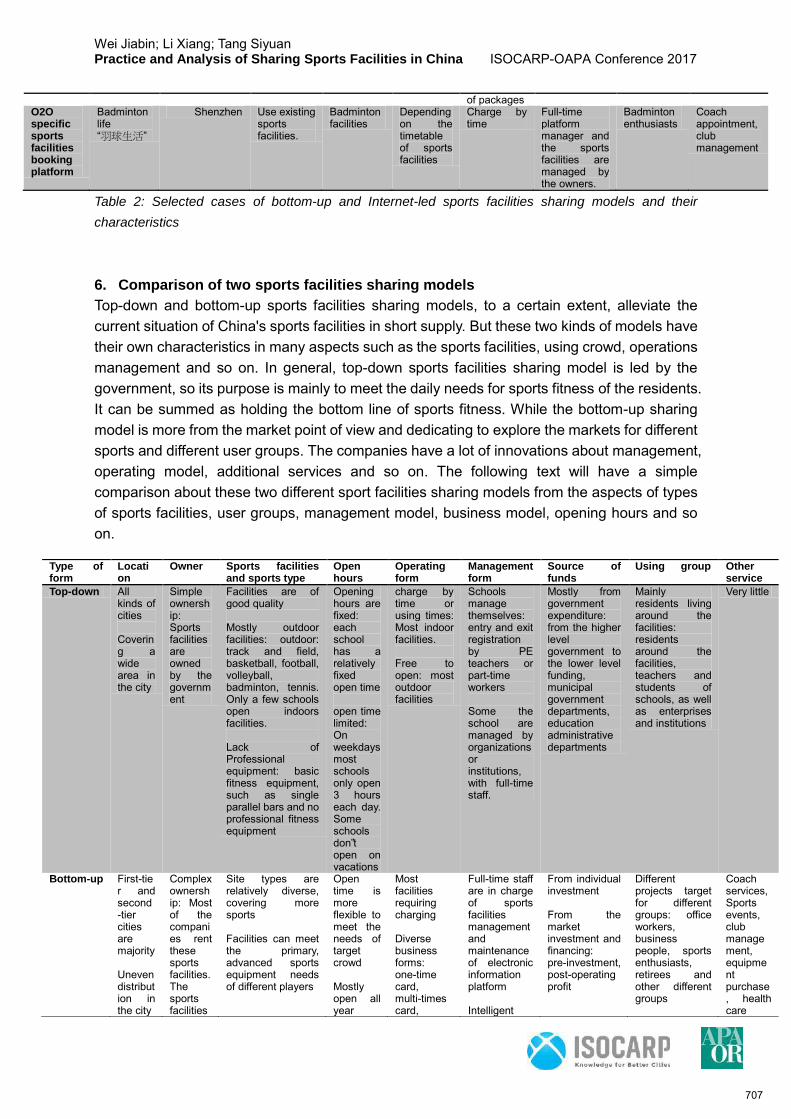
Wei Jiabin; Li Xiang; Tang Siyuan Practice and Analysis of Sharing Sports Facilities in China ISOCARP-OAPA Conference 2017
11
Table 2: Selected cases of bottom-up and Internet-led sports facilities sharing models and their
characteristics
6. Comparison of two sports facilities sharing models
Top-down and bottom-up sports facilities sharing models, to a certain extent, alleviate the current situation of China's sports facilities in short supply. But these two kinds of models have their own characteristics in many aspects such as the sports facilities, using crowd, operations management and so on. In general, top-down sports facilities sharing model is led by the government, so its purpose is mainly to meet the daily needs for sports fitness of the residents. It can be summed as holding the bottom line of sports fitness. While the bottom-up sharing model is more from the market point of view and dedicating to explore the markets for different sports and different user groups. The companies have a lot of innovations about management, operating model, additional services and so on. The following text will have a simple comparison about these two different sport facilities sharing models from the aspects of types of sports facilities, user groups, management model, business model, opening hours and so on.
of packages O2O specific sports facilities booking platform
Badminton life “羽球生活”
Shenzhen Use existing sports facilities.
Badminton facilities
Depending on the timetable of sports facilities
Charge by time
Full-time platform manager and the sports facilities are managed by the owners.
Badminton enthusiasts
Coach appointment, club management
Type of form
Location
Owner Sports facilities and sports type
Open hours
Operating form
Management form
Source of funds
Using group Other service
Top-down All kinds of cities Covering a wide area in the city
Simple ownership: Sports facilities are owned by the government
Facilities are of good quality Mostly outdoor facilities: outdoor: track and field, basketball, football, volleyball, badminton, tennis. Only a few schools open indoors facilities. Lack of Professional equipment: basic fitness equipment, such as single parallel bars and no professional fitness equipment
Opening hours are fixed: each school has a relatively fixed open time open time limited: On weekdays most schools only open 3 hours each day. Some schools don‟t open on vacations
charge by time or using times: Most indoor facilities. Free to open: most outdoor facilities
Schools manage themselves: entry and exit registration by PE teachers or part-time workers Some the school are managed by organizations or institutions, with full-time staff.
Mostly from government expenditure: from the higher level government to the lower level funding, municipal government departments, education administrative departments
Mainly residents living around the facilities: residents around the facilities, teachers and students of schools, as well as enterprises and institutions
Very little
Bottom-up First-tier and second-tier cities are majority Uneven distribution in the city
Complex ownership: Most of the companies rent these sports facilities. The sports facilities
Site types are relatively diverse, covering more sports Facilities can meet the primary, advanced sports equipment needs of different players
Open time is more flexible to meet the needs of target crowd Mostly open all year
Most facilities requiring charging Diverse business forms: one-time card, multi-times card,
Full-time staff are in charge of sports facilities management and maintenance of electronic information platform Intelligent
From individual investment From the market investment and financing: pre-investment, post-operating profit
Different projects target for different groups: office workers, business people, sports enthusiasts, retirees and other different groups
Coach services, Sports events, club management, equipment purchase, health care
707

Wei Jiabin; Li Xiang; Tang Siyuan Practice and Analysis of Sharing Sports Facilities in China ISOCARP-OAPA Conference 2017
12
Table 3: Comparison between two sports facilities sharing models
7. Problems and Improvements
In China, the top-down sharing model is mainly led by the government. Many large sports facilities and schools are basically built up by the government, and the government enjoys the highest management rights. Therefore, the sharing sports facilities in the top-down policy are often good-quality and evenly distributed in the city. But top-down policies are often too strategic, so that they cannot be specific to the implementation level. In addition, due to deficiency of education budget and incompleteness and inconsistency of implementation, its implementation effects are influenced. Although the school is open, there are many limitations for the usage of the facilities and some institutional management deficiencies, both resulting in inefficient use and poor use experience. In contrast, bottom-up approaches are often difficult to obtain good sports facilities. As the city land is very expensive, the cost of the fitness field and courses is relatively high and the user group is very limited. But because of the market orientation, the design of service and function always pursues higher efficiency and quality, so the user experience is much better. It can be seen that the advantages and problems of the two models can be complementary. The top-down policy needs to be further refined in conjunction with the market, targeting for better and more efficient use of the site. As for the bottom-up sharing model, if it can be supported by the policy and build relationship with a large number of sports facilities resources with better quality and low cost, it will be able to become more popular, and provides better quality sports services for the wider user groups. According to the specific problems and characteristics talked above, We proposed three improvement directions for both of the sharing models : a. A more mixed business model: combine the advantages of government-led sharing model with the advantages of market-oriented sharing model. b. Construction of sports human resources platform: In addition to the sharing of sports facilities , try to construct a network of human resources to meet the different levels of needs for coaches, trainers, managers and so on. c. Management system informationization: through advanced information technology, building the network of people and sports facilities to reduce management costs and increase the efficiency of use.
are owner by governments and private person.
round one-month card, etc Membership card, binding and courses or activities。
management forms: some projects can be self-managed without human
services
708
Wei Jiabin; Li Xiang; Tang Siyuan Practice and Analysis of Sharing Sports Facilities in China ISOCARP-OAPA Conference 2017
13
Reference
State Council (2014). The Guiding Opinions of the State Council on Accelerating the
Development of Sports Industry to Promote Sports Consumption. Available at: http://www.gov.cn/zhengce/content/2014-10/20/content_9152.htm Wang, K. (2004). Community Sports. Beijing: Higher Education Press. Qu, Z. (2001). 21 Century Community Sports in China. Beijing: Beijing Sport University Press.
Wang, K. (2004). Reflections on the Development of Urban Community Sports in China in the New Century. Journal of Beijing Sport University, 27(2), pp.166-167.
State Council (2016). The Guiding Opinions of the State Council on strengthening school
sports to promote the comprehensive development of physical and mental health of students. Available at: http://www.gov.cn/zhengce/content/2016-05/06/content_5070778.htm
Ministry of Education and General Administration of Sport (2017). The implementation
Opinions of Ministry of Education and General Administration of Sport on the promotion of
school sports venues to the community. Available at: http://www.gov.cn/xinwen/2017-03/08/content_5175010.htm State Council (2016). National Fitness Programme (2016-2020). Available at: http://www.gov.cn/zhengce/content/2016-06/23/content_5084564.htm National Health and Family Planning Commission of PRC. Healthy China 2030 Plan.
Available at: http://en.nhfpc.gov.cn/2016-11/07/c_70520.htm Fan, B. (2003). Community Sports Theory. Beijing: Beijing Sport University Press.
Xu, Q. (2005). China‟s community sports management system status and development countermeasures. Journal of Sports Culture, (3), pp.39-41. Qu, X. (2010). The Study of Community sports development from the Perspective of School
Community Sports Integration. Master Thesis. Shandong Normal University.
Liu Kemei, Architectural Magazine. (2017). Sharing sports venues should be fitness new
landmarks. [online] Available at: https://mp.weixin.qq.com/s/QcekXoWZ9mf6Ncro_eSXcw.
China National Radio News. (2017). Five Years of Economic Reform: Sharing Economy
Provides New Paths for Economic Transformation. [online] Available at: http://finance.cnr.cn/gundong/20170705/t20170705_523834749.shtml.
709

Wei Jiabin; Li Xiang; Tang Siyuan Practice and Analysis of Sharing Sports Facilities in China ISOCARP-OAPA Conference 2017
14
Hong, T. (2013). Investigation and Analysis on the Current Situation of School Sports Facilities Opening to the Public in Shangcheng District of Hangzhou. Journal of Sports
Education, 2013 (9).
710
The “Sharing Economy with Chinese Characteristics” and its
impact on Urban Space
Shu DU, China Center for Urban Development, China Martin TZOU, EDF, China
1. The "Sharing Economy with Chinese Characteristics" - SECC
1.1 A controversial definition
The concept of “Sharing Economy” is sometimes referred to as “Collaborative Economy” or “Collaborative Consumption” (Felson & Spaeth, 1978). Rachel Botsman & Roo Rogers (2010) argue that shared economy is the transfer of ownership to the right to use, and ultimately forms the pattern of collaborative consumption. Belk (2014) points out that in the Internet era, the shared economy is used by people to obtain economic or other compensation, by coordinating the acquisition or distribution of resources. Therefore, the shared economy should not rely on the large-scale supply of commodities and services by private enterprises, but a loose supply of personal goods based on personal choice enabled by Internet technology. The latter definition is what Belk calls a “pseudo-sharing” economy, less stable for the supply side. Sharing economy should be indeed a supplement to traditional economy, not a substitute.
In China, the sharing economy has been elevated to an honorably status, with high expectations by the government. As indicated in this official remark in a state-run newspaper: "At this stage, [it] is a new type of economy that uses Internet technology to optimize the use of decentralized resources, hence improving the efficiency of these new forms of economic activities. Sharing economy has created a lot of new forms of economies in China that can resolve the excess of production and bring a large amount of employment." Vigorously developing the sharing economy "will help optimize the allocation of resources, promote efficiently the balance between supply and demand, and enhance economic growth." (Zhou,2017). These expectations seem to go beyond the inherent scope and definition of the sharing economy.
In this context, the understanding of the concept is also quite controversial among the academic community in China. Some scholars insist on keeping the original definition of sharing economy (Qiu, 2016), hence pointing out that the current “new forms of economy” observed are not a shared economy (Dong, 2016). Other scholars are tempted to twist the definition of the concept by expanding it or even modifying it (Zhu & She, 2017), to match the new economic phenomena happening in China and to be in line with the official chorus.
1.2 The business model
There are five key elements of the sharing economy: underused assets, right to use, connections, information, and mobility of the commodity (Wang & Zhou, 2016). In China, the so-called sharing economy companies are often only able to fulfill four of the five requirements: the use of underused assets is often ineffective, even non-existent.
Unlike commercial transactions in the traditional economy which are guaranteed by a legal framework, the exchange and use of underused assets in the sharing economy are based on trust. It implicitly generates an “asymmetry of information” between the buyer and the owner,
711
with the owner withholding obviously more information about the goods being exchanged. Although many people in China want to believe that Chinese society holds stronger moral standards than Western countries, interpersonal trust in China now seems weaker than in the United States or in Japan (Wang & Yamagishi, 1999). This lack of trust constitutes an inherent cultural obstacle of the development of China’s sharing economy, making it difficult to exploit the potential of underused assets. The strong information asymmetry in China also reflects the lack of an effective and trusted system; companies find it difficult to obtain shared resources from the hands of individual owners.
Facing the lack of underused resources, there are two ways that Chinese sharing economy companies can address the problem: either by bundling underused assets with human resources through the active participation of owners to balance the information asymmetry, or by creating “new resources” and making them available on the market through commercial distribution channels. The latter model has become China's most popular form of sharing economy, and remains the current model. We name it “Sharing Economy with Chinese Characteristics”, referred to in our text as SECC.
With the lack of underused assets resolved, this second form of sharing economy has greatly been expanded in China, becoming the reference model. Under the showcase effect of some leading companies, these “artificial” unused resources and their subsequent needs have been constantly fabricated, in almost any imaginable field of application: cars, bicycles, umbrellas, basketballs or even rechargeable batteries. Although it has demonstrated potential to be successful economically1, from the perspective of resource utilization and sustainable urban development, the SECC model is likely to be a failure.
1.3 Uneven and polarized development of SECC
After seeing Airbnb, Uber and other sharing economy companies having achieved great success in the United States, China's Internet companies quickly jumped in as well, relying on China's huge market and the unique specificity of a relatively closed-up Internet culture, and hoping to copy and reach the same success in business.
However, there is a noticeable difference in the business environment of the Chinese companies compared to their American counterparts. Airbnb value is currently estimated at 25.5 billion USD and Uber’s evaluation at about 68 billion USD: the difference is not that disparate. Tujia, a real estate startup in China raised 300 million USD in August 2015 and is now valued at 1 billion USD, while the short-term rental company Xiao Zhu (meaning Piggy) following the Airbnb model raised 60 million USD in July 2015 and is valued at 300 million USD. In the past two years, Tujia and Xiao Zhu have not been able to raise more investments, and China's first company to copy Airbnb’s short-term rental model, Airizu (meaning Lovely day rent), has already closed. In contrast, companies in the field of transportation have developed considerably. On April 28, 2017, the “Chinese Uber” Didi Chuxing announced that the company had raised 5.5 billion USD in investments, reaching a valuation of 50 billion USD.
The unequal and polarized success of the sharing economy in different business fields underline the obstacles and paradoxes of the concept, which can be explained first by the inherent limitations of the economic model itself and also by its acclimatization in the Chinese context. he SECC model has especially met tremendous success in the field of urban transportation, making also the strongest impact on the urban space.
1.4 Sharing Transportation with Chinese Characteristics
Transportation is one of the key challenges of sustainable urban development. Major cities in China are facing serious transportation issues such as traffic congestion, length of commuting time for residents, and air pollution due to vehicle emissions that are far above
712
acceptable limits, all of which are impacting strongly on the efficiency of urban operations and on the quality of life. The increase of urban transportation needs and its predicaments has led to the development of diverse means of transportation. In this context, the development of "sharing transportation" in Chinese cities has been important, serving as relatively successful examples of SECC and witnessing the emergence of companies with high and unprecedented market value gathered in a very short time. However, given the inherent shortcomings of the SECC model, while solving some of the existing urban transportation problems, these enterprises have also created new traffic and social problems at the same time.
2. Car sharing in China: the Didi model
2.1 Car sharing development in China
In the field of urban mobility, Didi Chuxing (hereafter named Didi) is currently the champion, the leading company of the SECC model. Founded in 2012, it started with an Internet booking platform for a traditional taxi. Standing out from the fierce competition among 40 similar enterprises, Didi became in the second half of 2014 a platform of more than 100 million users, achieving more than 5 million booking orders daily. Almost at the same time, Didi jumped into the sharing economy, rapidly developing a car sharing business aside from the taxi platform activity. At the beginning of 2015, Didi made a strategic merge with his biggest competitor in China, Kuaidi. Then, in mid-2016, Didi and Uber Global reached a strategic agreement, with the acquisition of Uber China's brand, business, data, other assets and operations in mainland China. Didi had become the absolute monopolistic urban transportation company, and the nation’s best illustration of the SECC model.
2.2 The business model of Didi
At the beginning of its establishment, Didi was not involved with the sharing economy but was focusing on developing an Internet platform model for the traditional taxi. The market strategy was to implement a large subsidies system2 which allowed Didi to quickly gather a massive quantity of subscribers, facing at the same time a high cost of deployment 3 . Traditionally, taxi drivers have a relatively stable income, resulting from the existing and longtime established pricing system between the municipal governments, taxi companies and taxi drivers. As a platform providing a new service to taxi drivers, Didi failed in getting a share of the revenue coming from the personal income of taxi drivers, who are very sensitive and protective of the standard price of a ride.
This resulted in a pressure for Didi to continue, on one hand to attract investments, and on the other hand, to urgently develop new markets. In August 2014, under the concept of the sharing economy, Didi launched an internet car booking service called Zhuanche (meaning Private car) which is closer to a private limousine service: this became the new axis of growth for the company. The strategy is still using subsidies as the main model of development4, even for car sharing. Didi started to increase its subsidies to “Private car” drivers and to decrease the number of traditional taxi drivers. As the demand remained roughly unchanged, “Private car” and taxi businesses started a competitive relationship, resulting in conflicts. In number of cities, the large-scale phenomenon of “anti-Zhuanche” protests were led by taxi drivers5.
In 2015, during the competition with Uber, Didi launched another car sharing offer called “Fast car” which is less expensive than “Private car”6. Gradually, several other services appeared on the Didi platform, such as the “Hitchhiking”, “Bus sharing”, “Driver service” and other businesses.
713
2.3 The Didi model and its impact on urban space
The main effect of the car ordering platform offered by Didi is to ease the difficulty of getting a taxi at peak times and in suburban areas. But as the intrinsic demand is limited, resolving this part of the demand cannot generate a large profit: the goal of Didi and its investors is therefore to receive a sizable share of the taxis’ main revenues. In practice, it seems Didi did achieve this goal, as is evidenced in the taxi industry’s large-scale resistance.
Under the high subsidy system, full-time “Private car” drivers in Beijing can earn 20,000 to 30,000 RMB per month, about 6 to 8 times the average income of taxi drivers, and 3 to 4 times more than the average income. The cars used for internet booking saw a huge growth in a short period of time, with some people buying cars to become full-time “Private cars” drivers. As the clients are mainly users of the taxi, the increase in the number of “Private cars” cannot reduce the number of taxis, nor can they replace the needs of private vehicles. Instead, the “Private cars” have increased the traffic, burdened road network operations, and caused even more congestion. After the cancellation of the subsidies, some drivers have chosen to withdraw from the internet booking industry, but the vehicle is still an additional car in the city, increasing the pressure on the roads and parking space.
For some time, the Didi software allowed drivers and passengers to bargain the payment, resulting in some taxi drivers starting to only pick up clients who booked via the platform during peak hours. The phenomenon of refusing to take clients has worsened the difficulty of getting a taxi. Later, the government carried out some remediation; most cities have now forced the company to cancel the bargaining function on their ordering platform, resolving some of the difficulty.
Besides, Didi’s monopoly position has eventually exacerbated inconvenience among vulnerable groups such as the elderly and children; non-smart phone users also have more difficulty to book Didi services.
2.4 The sustainability of the Didi model
Engaging transportation business activities with a personal private car is illegal in China, as a business license is needed in order to operate7. Hence, the rapid development of the internet car booking system also meant a rapid development in the “gray areas” of the law (Tang, 2015). Despite some controversial cases of violations of the law8, overall there was not a severe control of the industry and its outbreaks. In practice, establishing a “Four Party Agreement” 9 was an easy way to get around the law. In July 2016, the Ministry of Transportation, Ministry of Industry and Information, and seven other ministries and commissions issued the "Internet booking taxi management and services interim measures" and subsequently, many municipalities launched associated "implementation rules". Didi’s Internet booking system was significantly affected.
Most municipalities’ "implementation rules" require local household registration and local vehicle license plates, as well as restrictions on emissions. This means that the vast majority of drivers and most vehicles do not meet the regulation requirements. Didi has stated that in the Shanghai area alone, only 10,000 of the 400,000 registered drivers hold a Shanghai household registration.
In a hardly profitable taxi market, with strengthening regulations on internet car booking systems, and uncertainty in the attempts of newly launched businesses, the future development of Didi is undoubtedly cast by a shadow. Didi’s current market value is based on the large amount of investment capital accumulated: the company has not created any innovative timely product or service of rupture, it lacks sufficient profitability, and is still relying on continuous financing to continue to operate.
714
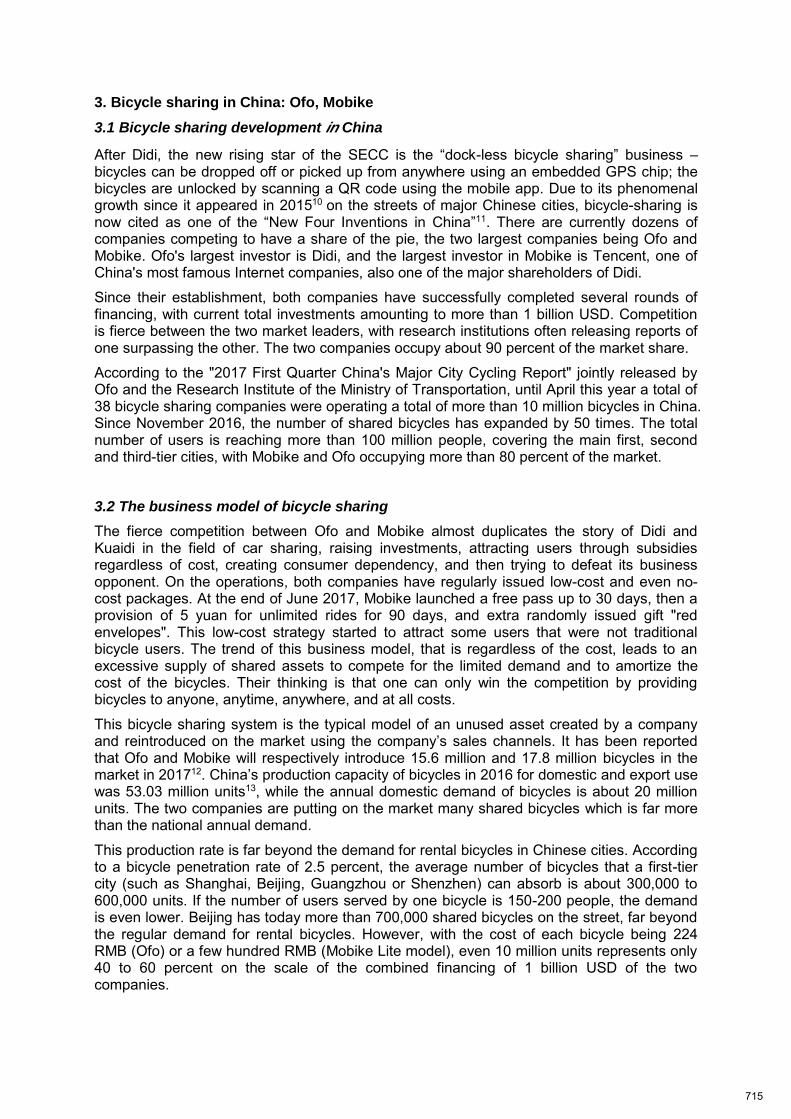
3. Bicycle sharing in China: Ofo, Mobike
3.1 Bicycle sharing development in China
After Didi, the new rising star of the SECC is the “dock-less bicycle sharing” business – bicycles can be dropped off or picked up from anywhere using an embedded GPS chip; the bicycles are unlocked by scanning a QR code using the mobile app. Due to its phenomenal growth since it appeared in 201510 on the streets of major Chinese cities, bicycle-sharing is now cited as one of the “New Four Inventions in China”11. There are currently dozens of companies competing to have a share of the pie, the two largest companies being Ofo and Mobike. Ofo's largest investor is Didi, and the largest investor in Mobike is Tencent, one of China's most famous Internet companies, also one of the major shareholders of Didi.
Since their establishment, both companies have successfully completed several rounds of financing, with current total investments amounting to more than 1 billion USD. Competition is fierce between the two market leaders, with research institutions often releasing reports of one surpassing the other. The two companies occupy about 90 percent of the market share.
According to the "2017 First Quarter China's Major City Cycling Report" jointly released by Ofo and the Research Institute of the Ministry of Transportation, until April this year a total of 38 bicycle sharing companies were operating a total of more than 10 million bicycles in China. Since November 2016, the number of shared bicycles has expanded by 50 times. The total number of users is reaching more than 100 million people, covering the main first, second and third-tier cities, with Mobike and Ofo occupying more than 80 percent of the market.
3.2 The business model of bicycle sharing
The fierce competition between Ofo and Mobike almost duplicates the story of Didi and Kuaidi in the field of car sharing, raising investments, attracting users through subsidies regardless of cost, creating consumer dependency, and then trying to defeat its business opponent. On the operations, both companies have regularly issued low-cost and even no-cost packages. At the end of June 2017, Mobike launched a free pass up to 30 days, then a provision of 5 yuan for unlimited rides for 90 days, and extra randomly issued gift "red envelopes". This low-cost strategy started to attract some users that were not traditional bicycle users. The trend of this business model, that is regardless of the cost, leads to an excessive supply of shared assets to compete for the limited demand and to amortize the cost of the bicycles. Their thinking is that one can only win the competition by providing bicycles to anyone, anytime, anywhere, and at all costs.
This bicycle sharing system is the typical model of an unused asset created by a company and reintroduced on the market using the company’s sales channels. It has been reported that Ofo and Mobike will respectively introduce 15.6 million and 17.8 million bicycles in the market in 201712. China’s production capacity of bicycles in 2016 for domestic and export use was 53.03 million units13, while the annual domestic demand of bicycles is about 20 million units. The two companies are putting on the market many shared bicycles which is far more than the national annual demand.
This production rate is far beyond the demand for rental bicycles in Chinese cities. According to a bicycle penetration rate of 2.5 percent, the average number of bicycles that a first-tier city (such as Shanghai, Beijing, Guangzhou or Shenzhen) can absorb is about 300,000 to 600,000 units. If the number of users served by one bicycle is 150-200 people, the demand is even lower. Beijing has today more than 700,000 shared bicycles on the street, far beyond the regular demand for rental bicycles. However, with the cost of each bicycle being 224 RMB (Ofo) or a few hundred RMB (Mobike Lite model), even 10 million units represents only 40 to 60 percent on the scale of the combined financing of 1 billion USD of the two companies.
715
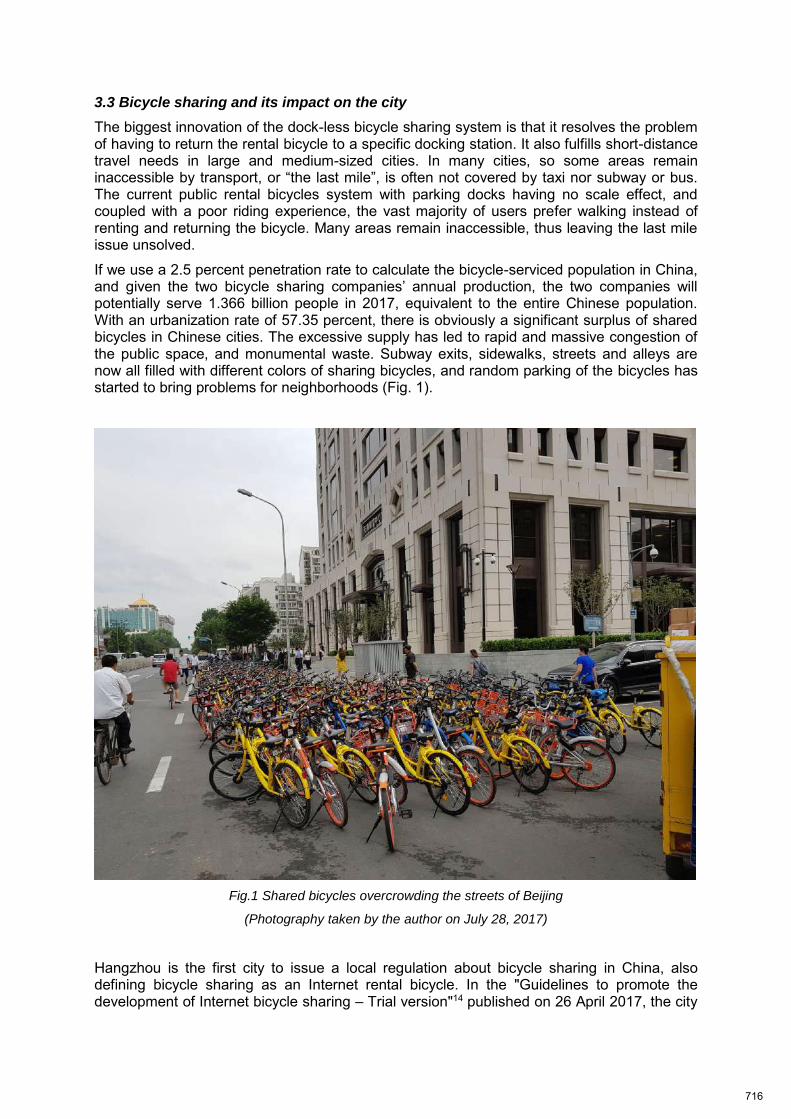
3.3 Bicycle sharing and its impact on the city
The biggest innovation of the dock-less bicycle sharing system is that it resolves the problem of having to return the rental bicycle to a specific docking station. It also fulfills short-distance travel needs in large and medium-sized cities. In many cities, so some areas remain inaccessible by transport, or “the last mile”, is often not covered by taxi nor subway or bus. The current public rental bicycles system with parking docks having no scale effect, and coupled with a poor riding experience, the vast majority of users prefer walking instead of renting and returning the bicycle. Many areas remain inaccessible, thus leaving the last mile issue unsolved.
If we use a 2.5 percent penetration rate to calculate the bicycle-serviced population in China, and given the two bicycle sharing companies’ annual production, the two companies will potentially serve 1.366 billion people in 2017, equivalent to the entire Chinese population. With an urbanization rate of 57.35 percent, there is obviously a significant surplus of shared bicycles in Chinese cities. The excessive supply has led to rapid and massive congestion of the public space, and monumental waste. Subway exits, sidewalks, streets and alleys are now all filled with different colors of sharing bicycles, and random parking of the bicycles has started to bring problems for neighborhoods (Fig. 1).
Fig.1 Shared bicycles overcrowding the streets of Beijing
(Photography taken by the author on July 28, 2017)
Hangzhou is the first city to issue a local regulation about bicycle sharing in China, also defining bicycle sharing as an Internet rental bicycle. In the "Guidelines to promote the development of Internet bicycle sharing – Trial version"14 published on 26 April 2017, the city
716
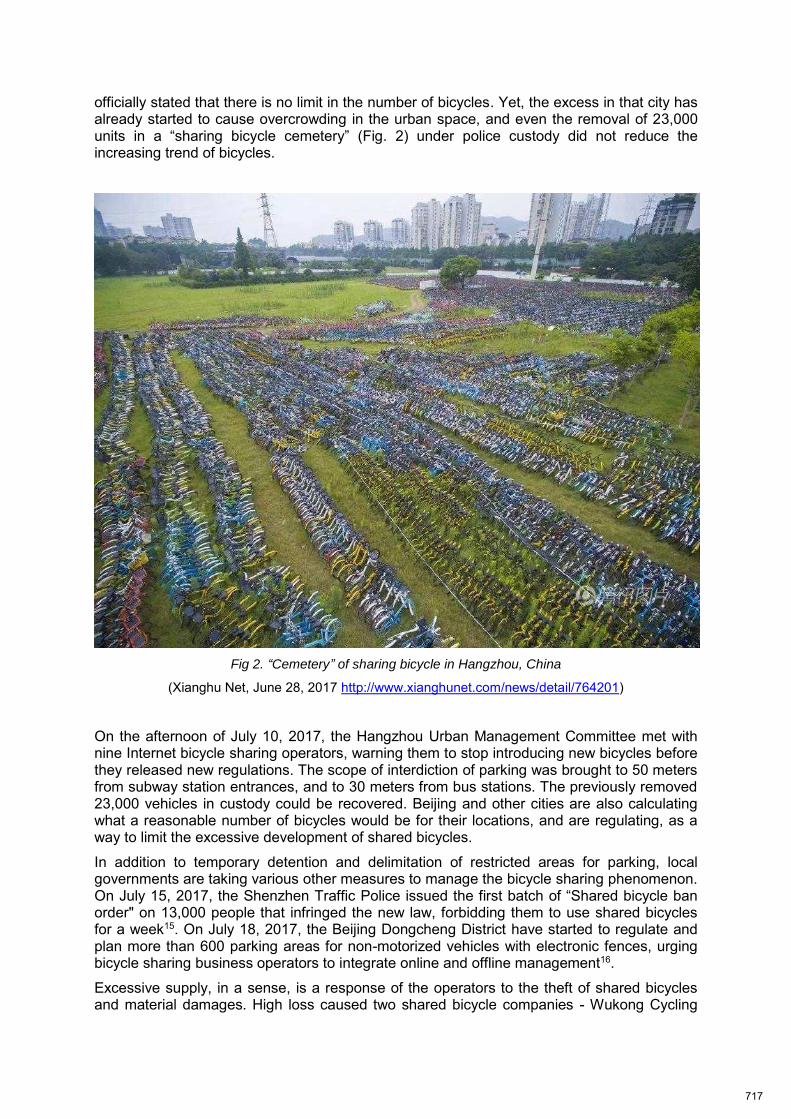
officially stated that there is no limit in the number of bicycles. Yet, the excess in that city has already started to cause overcrowding in the urban space, and even the removal of 23,000 units in a “sharing bicycle cemetery” (Fig. 2) under police custody did not reduce the increasing trend of bicycles.
Fig 2. “Cemetery” of sharing bicycle in Hangzhou, China
(Xianghu Net, June 28, 2017 http://www.xianghunet.com/news/detail/764201)
On the afternoon of July 10, 2017, the Hangzhou Urban Management Committee met with nine Internet bicycle sharing operators, warning them to stop introducing new bicycles before they released new regulations. The scope of interdiction of parking was brought to 50 meters from subway station entrances, and to 30 meters from bus stations. The previously removed 23,000 vehicles in custody could be recovered. Beijing and other cities are also calculating what a reasonable number of bicycles would be for their locations, and are regulating, as a way to limit the excessive development of shared bicycles.
In addition to temporary detention and delimitation of restricted areas for parking, local governments are taking various other measures to manage the bicycle sharing phenomenon. On July 15, 2017, the Shenzhen Traffic Police issued the first batch of “Shared bicycle ban order" on 13,000 people that infringed the new law, forbidding them to use shared bicycles for a week15. On July 18, 2017, the Beijing Dongcheng District have started to regulate and plan more than 600 parking areas for non-motorized vehicles with electronic fences, urging bicycle sharing business operators to integrate online and offline management16.
Excessive supply, in a sense, is a response of the operators to the theft of shared bicycles and material damages. High loss caused two shared bicycle companies - Wukong Cycling
717
and 3Vbike - to announce their withdrawal from the market. In early June 2017, the six-month-old shared bicycle company Wukong Cycling closed, founder Lei Houyi said, with the loss of 1,050 of its 1,200 shared bicycles. Only 150 bicycles were returned intact. The financial loss was more than 100 million RMB. Similar scenarios have occurred for the shared bicycle platform 3Vbike, the company had to announce the closure of its business.
Aside from the excessive supply issue, bicycle sharing is also facing the problem of low profitability in the use of public resources. The bicycle sharing system requires the use of a parking place which is on public amenities, yet the public slace is a common resource of the whole society. Bicycle sharing companies do not pay for the use of the land, which can be a significant amount of space: it is obviously unfair.
There is another more serious issue that can easily be ignored, which is the fact that bicycle sharing is not that environmental friendly. Shared bicycles are considered to be low carbon and green, because they promote cycling as a non-polluting means of urban mobility. Yet, in fact, bicycle sharing for less accessible areas replaces walking and bus travel. Compared to walking, bicycle sharing is not more environmentally friendly. And as for an alternative to bus travel, since it does not reduce the number of bus services, it not only does not reduce carbon emissions but also makes the bus transportation system less efficient, which will generate extra government subsidies. Besides, the growth of shared bicycles is also adding another travelling method on the limited road capacity, enhancing competition. Also, for the bicycles to be lighter in weight, shared bicycles are mostly made of aluminum, and producing aluminum requires a lot of energy which increases global environmental costs.
3.4 The internationalization of China’s bicycle sharing companies
Chinese bicycle sharing quickly made an impact abroad. The over-production of bicycles also occurred overseas, under the Chinese government’s policy of "One Belt, One Road". Mobike has started to supply its orange devices in Singapore, Manchester, London, Fukuoka, Sapporo, Florence, and Milan. Ofo also plans to run in Silicon Valley and London. Yet in contrast, cities in Europe and the United States do not have the scale effect to generate population dividends like in the Chinese cities. In European and American countries, car ownership rates are higher than in China while to a certain extent, urban congestion rates are generally lower, which makes the car commuter the mainstream user. In Mobike’s market analysis of Singapore, the proportion of cycling commuters is only 1.5 percent. At the mobility level, cycling to commute is more of a lifestyle choice, a substitute for using the car; the user might be tired of driving, or chooses the bicycle for environmental beliefs, often coupled with healthy and sportive motivation. In fact, in developed countries, many commuters who cycle have jobs at least at the semi-professional level. Not many people cycle purely for commuting.
On August 1, 2017, the municipality of Amsterdam in the Netherlands issued on its Facebook page a document that the city will be cleared of shared bicycle in the next few months. The cleanup will begin within the city center of Amsterdam and in the East of Amsterdam. The city government believes that users have the right to park their bicycles in public spaces, but it is not legal for companies to store and rent their bicycles in public spaces. Differences in regulatory rules outside of China make the success of overseas expansion of Chinese bicycle sharing model less optimistic.
3.5 The sustainability of the bicycle sharing model
As with Didi, the bicycle sharing business has not yet found a stable profit structure and business model. Ofo founder Dai Wei said that the current vehicle usage of Ofo is high, the daily income is relatively stable, and that while "last year [2016] did not generate profits but was close to even, 2017 will certainly be profitable."17 Ofo said that the rental costs are the main source of revenue. Mobike, while having higher costs for hardware, has stated several
718
times that it is still too early to talk about profit. Founder Hu Weiwei even said that: “If at the end [Mobike] fails, then let’s take it as an act of philanthropy”18.
Although the two companies have not found a profitable model and the war on “burning money” has been ongoing for some time, there is still no winner, and no plans for a merger. The trend seems to go on producing at even lower costs and renting at even cheaper prices to keep their customers, which implies an even more violent “burning money” war, ending up probably with even more tragic results: more environmental degradation, over-consumerism, and excessive landfill.
The development of official regulations has had less impact on the bicycle sharing business than it has had on car sharing. Currently, the most stringent terms for regulating bicycle sharing are expressed as: "Each city, based on its local characteristics, public travel needs and the development of Internet bicycle sharing services, shall study and build a vehicle supply mechanism adapted to its urban space carrying capacity, parking facilities, public travel needs, in order to provide guidance to the Internet bicycle sharing operators to supply vehicles reasonably and in an orderly manner, insuring a healthy and orderly development of the industry along with safe and stable operation.”19
The number of bicycles supplied directly affects the convenience of the service and the loyalty of the user, but the power to determine the access and delivery of the bicycle stays in the hands of the local government. So, the standards that local governments use to choose bicycle sharing companies become critical. Whether the selection of shared bicycles is fair determines not only the best ratio of operators, but also provides an adequate competitive space for future entrants. Even not considering future competition, in cities already saturated by shared bicycles, how to reallocate the existing resources is also a challenge.
Some of the bicycle sharing companies have begun to deal with the downsides and flaws of the "Sharing Economy with Chinese Characteristics". In November 2016, Ofo launched its "City Big Sharing" program through which global bicycle manufacturers – and their products and accessories – can access the Ofo platform, providing different users with a wide range of personalized bicycle services. In parallel, the same "City Big Sharing" program is also open to ordinary urban users, encouraging them to share their own bicycle on the sharing platform, with the reward being free lifetime use. So far, the Ofo platform for individuals to share their own bicycle interface has not been operational. The official attitude is somewhat vague and ambiguous: on one hand, bicycle sharing is defined as an Internet bicycle rental service, yet on the other, they state that the Internet rental bicycle is a typical business of the sharing economy1. What is more confusing is that, on many occasions, the government and the public still call the actual Internet rental bicycles as shared bicycles, linking the sharing economy to a commercial model. A shared cycling model based on a true sharing economy concept is still far from reality.
Different from the Didi platform, in the bicycle sharing business, after deducting labor costs, most of the capital left is transferred into products. Once the operating model or product is restrained and limited, the bicycle sharing business will have difficulties even more quickly than the car sharing. Its exit from urban areas would only leave the city with a large number of bicycles that cannot be used.
4. Conclusions
Due to the particularity of the shared economy, the old regulatory framework for businesses cannot be fully applied, hence there has been an emergence of a large gray area. China is eager to see more efficiency in the allocation of resources through the sharing economy, bringing economic development. To date, the governments’ attitude has been pretty loose in
719
regulating sharing economy businesses, even supporting their expansion in many ways. Yet, as snacks cannot replace dinner, the sharing economy cannot replace the traditional economic model: it can only be an alternative and a supplement. In the absence of clear regulations, sharing economy companies are tending to abandon or disregard the initial concept of sharing, to attract more investments or to find more profitable business models.
The new modes of operation have not been able to find a balance between real demand and supply, because in the "Sharing Economy with Chinese Characteristics", the large demand is artificially made up, and then made believable by creating an excess of supply, regardless of cost. To meet the so-called additional needs, additional capital is required. The tragedy is that once this non-economic model is terminated, Chinese cities will be left with a large excess of wasted products.
The supply of goods made for satisfying an unnecessary demand has already caused confusion, congestion, and even protests in the urban space. These illusory "shared economies" have not only failed to prove that they can be economically viable; they have also provided an unsustainable model of services in the city. Such ups and downs are forcing users and local governments to make difficult extreme choices, either by adopting a vague supervision on the attempts of development, or through a strict ban to end the sharing economy operators. In reality, both alternatives are likely to happen, gradually.
720
References: Felson, M., Spaeth, JL. (1978). Community Structure and Collaborative Consumption: A Routine Activity Approach. American Behavioral Scientist, Vol. 21 No. 4: 614-624. Botsman, R., Rogers, R. (2010). What’s Mine Is Yours: The Rise of Collaborative Consumption. New York, Harper Business. Belk, R. (2014). Sharing versus pseudo-sharing in Web 2.0. The Anthropologist, Vol.18 No. 1: 7-23. Zhou, L (2017) Improve Supporting Policies to Promote the Healthy Development of Economy, Economic Daily 003. Qiu, C. (2016) Is Sharing Bicycle Really Sharing Economy? Modern Business, Vol.16 No.35: 190-191. Dong, C. (2016) Sharing Economy: Theory and Reality. Journal of Guangdong University of Finance & Economics, Vol.31 No.5: 4-15. Zhu,D., She, Y. (2017) From Possession to Use: An Interview with Dajian Zhu on Sharing Economy and Sharing City. Landscape Architecture Frontiers, Vol.22 No.3: 32-39. Wang, W., Zhou, Y. (2016) Research on the Application of Sharing Economy in Garment Field, Chemical Fiber & Textile Technology, Vol. 45 No. 4:27-31. Wang, F., Yamagishi,T. (1999). A Comparative Study of Trust in China, Japan and America, Sociological Studies, Vol.14 No.2: 67-82. Tang, Q. (2015) "Zhuanche" type sharing economy regulation path, Chinese Law Studies, Vol. 4 No.4: 286 End notes:
1 Although there is no proof of corporate profits available, several leading companies are still raising significant investments, and new leading companies continuing to emerge. 2 In January 2014, Didi stated to give subsidies to both passengers and drivers, increasing from 10 RMB to 20 RMB (compared to the starting price of Beijing taxi which is only 13 RMB). This subsidy gradually declined on May and August respectively, to eventually being cancelled both to passengers and to drivers. It evolved into a system of a red envelope bonus, carrying on the implementation of subsidies. 3 Cheng Wei, the CEO of Didi, declared spending 15 billion RMB of subsidies in the second half year of 2014, in Amazing inside news: why the more money raised, the more money Didi is making? China Webmaster, May 22, 2017. Available from: http://www.chinaz.com/news/2015/0522/408646.shtml [Aug 15, 2017] 4 Didi spending 340 million USD a year on subsidies? Revelation from Uber CEO, Huxiu News, January 11, 2016. Available from: https://www.huxiu.com/article/136762/1.html [Aug 15,
721
2017] 5 Large scale incidents in 16 cities in a wave of protesting against Zhuanche, Sohu News, May 25, 2015, Available from: http://news.sohu.com/20150525/n413696271.shtml [Aug 15, 2017] 6 The rates of the “Fast car” are cheaper than the” Private car” both on the starting price and the per kilometer price 7 According to the Article 64 of the "Road Transport Regulations of the People’s Republic of China (2016)": "If the road transport business license has not been obtained, and business is engaged in road transport without authorization, the road transport administrative organ at or above the county level shall order it to cease to operate; if there is any illegal income, the illegal gains shall be confiscated and a fine is imposed at 2 to 10 times the income; legal or illegal income of less than 20,000 RMB shall be imposed a fine of 30,000 to 100,000 RMB.” Available from: http://www.gov.cn/gongbao/content/2016/content_5139501.htm [Aug 15, 2017] 8 On January 7, 2015, M. Chen Chao, user of Didi “Private car” software in Jinan, Jinan West Station, was identified by law enforcement officers as doing illegal operations, with a fine of 20,000 RMB. Quoted as the “First Zhuanche lawsuit case in China”, the “Private car” driver won the case at the end, with the cancelling of his administrative punishment. Didi driver wins first Zhuanche case, administrative punishment cancelled, Sina Law news, February 22, 2017. Available from: http://news.sina.com.cn/sf/news/ajjj/2017-02-22/doc-ifyarrcc8562233.shtml [Aug 15, 2017] 9 Meaning the "Private car" booking platform first puts a personal car under the name of the car leasing company, then through another labor dispatch company to hire owners, signing a "Four party agreement" between the booking platform, the car leasing companies, the labor dispatch companies, and drivers. 10 Ofo was the first to appear in the Beijing University Campus on June 2015 11 Along with the High-Speed Rail, Zhifubao (Chinese mobile payment system) and online shopping, bicycle-sharing was quoted as the “New Four Inventions” in China, a slogan issued from a survey made by the Beijing Foreign Language University among foreign students from 20 countries, and released during the “One Belt, One Road Conference” in Beijing in May 2017. The new four inventions" make foreign students fascinated by China, Sina News, May 19, 2017. Available from: http://news.sina.com.cn/c/2017-05-19/doc-ifyfkqwe0259801.shtml [Aug 15, 2017] 12 Mobike and Ofo both to increase financing to seize the global market, Sina Tech Channel, June 14, 2017. Available from: http://tech.sina.com.cn/roll/2017-06-14/doc-ifyfzhpq6966429.shtml [Aug 15, 2017] 13 Statistics of the total production of China's Bicycle Industry in 2017, China Industry Information, April 6, 2017.
722
Available from: http://www.chyxx.com/industry/201704/511167.html [Aug 15, 2017] 14 Release of the “Hangzhou shared bicycle management guidelines” draft version, Hangzhou City Government, April 26, 2017. Available from: http://www.hangzhou.gov.cn/art/2017/4/27/art_812269_6796829.html [Aug 15, 2017] 15 Shenzhen issuing the first batch of “Shared bicycles ban order" 1.3 million people banned for a week, Sohu news, July 14, 2017. Available from: http://www.sohu.com/a/157046359_120809 [Aug 15, 2017] 16 Dongcheng District enabled shared bicycle "electronic fence" pilot, Beijing Business Today, July 19, 2017. Available from: http://www.bbtnews.com.cn/2017/0719/202369.shtml [Aug 15, 2017] 17 Profit for shared bicycle has a long way to go, Sohu news, March 9, 2017. Available from: http://mt.sohu.com/business/p/128357945_605712 [Aug 15, 2017] 18 Yixi talks 2016, Hu Weiwei, Speaker n. 429, Youtube video, December 20, 2016. Available from: https://www.youtube.com/watch?v=G5-LKYs6y94 [Aug 15, 2017] 19 Guidance on Encouraging and Regulating the Development of Internet Rental Bicycle, Joint release from the Ministry of Transportation, Central Propaganda Department, Central Internet Office, National Development and Reform Commission, Ministry of Industry and Information Technology, Ministry of Public Security, Ministry of Urban and Rural Development, People's Bank of China, General Administration of Quality Supervision, Inspection and Quarantine of the People's Republic of China. Ministry of Transportation, August 3, 2017. Available from: http://zizhan.mot.gov.cn/zfxxgk/bnssj/dlyss/201708/t20170802_2803351.html [Aug 15, 2017]
723
Urban Village Vs. Slum: Boon for Indian City Development RAJENDRA KUMAR, Sushant School of Art & Architecture,Ansal University, Gurgaon, India
Abstract: In Rapid globalizations, today every towns and m etropolis are depending more and more on workforce coming from developing countries, smaller cities, villages, Rural areas. Be it, Western countries looking towards China, India, South America for outsourcing their works to help their economy or any Metropolitan City’s working class people are coming from neighbor towns, villages. But Cities are not able to provide better life style and sufficient livelihoods to our working class people who are immigrating from Rural to Cities. That results issues of Urban Slum and this problem is widely spreading across the globe.
Indian Cities are growing very rapid and immigrations from rural areas to Urban Cities are generating slums in Metros and B Town Cities. Urban Slums dwellers are very integral part for city development. Any civilized neighborhood cannot sustain without people coming from neighborhood’s slums. In all major Indian Cities and Metros, every prosperous locality has one Urban Slum nearby. These slums are illegal and almost impossible to relocate. Most of Slum Rehabilitations projects and Government policy for slum developments of India are failing.
Proposed paper is attempt to address few important issues and suggestions for urban designers and pol icy makers to take into considerations of City Design which has same facility of basic infrastructure and need of Waters, Sanitations, Transportations for Urbanized area well as Slums.
Key Words : Globalizations, Metropolis, Urban Slum, Government Policy, City Design.
-------------------------------------------------------------------------------------------------------------------------
Introduction: Slums are an urban phenomenon which comes into existence on account of industrialization in and around cities thereby attracting in migration of population from country side. Though slums are a rich source of un-skilled and semi-skilled manpower, they tend to result in burden on the existing civic amenities. Government agencies and NGOs have flung into action and initiated several measures to improve the plight of slum dwellers and make the slum areas livable for the habitants as of late they are viewed as effective agents in the process of urban development rather than burden on urban infrastructure.
Though previous studies have examined how formalising land tenure affects housing improvements in informal settlements, the role of tenure security and its long-term influence remain unclear. In response, this paper quantitatively examines the extent to which formalising land tenure by way of slum declaration has stimulated housing improvements during the last three decades in the slums of Pune, India. Since slum declaration guarantees residents occupancy but not full property rights, this study focuses on how tenure security contributes to housing outcomes, such as materials, size, the number of floors and the amount of money spent for the improvements. Using original household survey data, analysis involving propensity score matching and difference-in-differences methods reveals that slum declaration has tripled a household’s likelihood of having added a second floor and, albeit less clear, increased the average amount of money spent on housing improvements. At the same time, slum declaration has not induced any improvement in housing materials, largely since many residents of non-formalised slums have also replaced materials. These results indicate that slum declaration, even in the long run, has continued to influence housing investments in Pune’s slums, in terms of both type and am ount spent, though residents of non-formalised slums have also come to enjoy certain de facto tenure security. Among other implications for policy, these findings underscore that governments should at least provide legal assurance of occupancy rights in informal settlements, even if active interventions such as slum upgrading and titling are currently difficult.
724

Reasons for development of slums: Slums are not a new phenomenon. They have been part of the history of most cities, particularly in the ea rly years of urbanization and Industrialization as populations boomed. Slums are generally the only type of settlement affordable and accessible to the poor in cities, where competition for land and profits is intense.
There are two main reasons why slums develop: population growth and governance.
1- Population Growth
Countries around the world are urbanizing rapidly as more people migrate from rural areas to the cities and natural population growth continues to occur. Today, more than half the world’s population resides in urban areas. More than 90 percent of this urban growth is taking place in the developing world.
- Urban migration happens for a number of reasons:- The pushing and pulling forces of migration. Some peoplemigrate because they are ushed out of their place of origin by factors such as natural disasters or sustained ecological changes. Others are pulled to a new destination by better job prospects, education, health facilities, or freedom from restrictive social or cultural realities.
- Low incomes from agriculture. Most people in rural areas work in the agricultural sector, which is highly dependent on weather. Also, rural land is limited, its fertility sometimes low
or declining, land holdings are small, farm debts are high, and many households have become landless. As a result, overall rural incomes are low • B etter job prospects. In comparison with rural areas, urban areas offer dramatically increased job opportunities. In addition, because urban cultures are often less constrained than those in villages, cities can also offer greater prospects of upward social mobility.
People know what cities can offer them. Most migrants make a del iberate choice to stay or leave in rural areas. Improved transport, communications and links with earlier migrants have all made rural populations much more aware of the advantages and disadvantages of urban life, especially regarding job opportunities and housing. Urban migration is often a survival strategy for rural households. Sometimes, rural households split into several groups located in different places—rural areas, small towns, and big cities—in order to diversify their sources of income and be less vulnerable to economic downturns.
2- Governance
Another reason slums develop is bad governance. Governments often fail to recognize the rights of the urban poor and incorporate them into urban planning, thereby contributing to the
growth of slums. In addition, many countries simply cannot respond to rapid urbanization quickly enough. People are coming to cities far faster than the planning process can incorporate them. Often, they find their own land and build a shack before the government has a chance to learn of their existence.
The attitude of a government towards urbanization is also an important component. Some governments take a hostile approach to urbanization. They believe that if they provide urban services to the poor, it will attract urbanization and cause the slums to grow. The problem with this view is that very few people come to the city for water or services—they come looking for work. In other cases, governments take more of a pa ssive approach to urbanization. They either do not have the planning tools to deal with the rapid urbanization that is happening, or the tools in place are not sufficiently responsive to the reality on t he ground.
Location of slum development
Location of slums development in the city is anywhere and everywhere. Mainly it is directly related to workforce. Slum dwellers firstly prefer the location of land is nearer to the workplace and within the city. Then they prefer the land where basic amenities such as water
725
are available and i t should be nea r to the main transport network. That is why slums generally develop near the industries, wholesale-markets, godowns, railway stations and even in residential areas. They generally use public-transport or slow moving vehicles such as cycle, rickshaws etc. because it is economical.
Primary indicators of slums:
1. Population density – Population density of that area
2. Infrastructure – Accessibility to public services such as road, water supply, sewerage in that area
3. Income – Income of the residents living in that area
4. Social status – Social status of the residents living in that area
5. Construction material of houses – Construction materials used in the houses of that area
6. Legal aspect – Land ownership status in that area
7. Health and sanitation – Health and sanitation status of the houses in that area.
Roll of slums in the city: All cities have their slums and their informal settlements. Their extent, proportion and character vary not merely with income level but also with the socio-political or legislative environment and law enforcement system. Ironically, it is not so much the absence of a legal framework and its application that leads to slums and informal settlements; its very presence can frustrate efforts to pre-empt and prevent their formation and growth.
Slums are not only unavoidable; they are a mark of success of a city. The formation of slums is an integral part of the process of growth and development of a city. Only in a static (stagnant?) city does the state and status of its constituent parts remain unchanged.
This is not to say that each part of a city must go through a cycle of development, deterioration and renewal, but that at any given moment of time, there are parts that have seen better days, and parts that are being newly developed or renovated. The extent of deterioration is, of course, relative, and the worst "slums" of a c ity may still be bet ter than most parts of many. The decline and renovation of some cities may be piecemeal and hardly visible on the outside or to outsiders, and an area may continue to be held in esteem even as properties within it are gutted and remodeled, while retaining their facades.
Need of slums
Just as slums and slum dwellers need cities to survive, so do cities need slums to flourish. With large numbers competing for work in cities, it is easier to pay low wages. However, a worker still needs to live, and without the informal settlements, the minimal acceptable salary would really hit the pockets and the profits of the rich.
Measures to prevent the development of new slums :
There are two main measures by which we can prevent the development of new slums.
1. Legislative measure.
2. Planning measure.
Legislative measure: There are basic things a government can do to prevent new slums from developing. One is to recognize that urbanization is going to happen. Sometimes governments believe that adopting alternative policies, such as focusing on rural development, will stop urbanization. This approach is rarely effective.
726
Planning measure: Once governments accept the reality of urban growth, the next step is to plan for it and determine where the new residents will live. Authorities should identify land and plan for its settlement even if money is not available for urban services. Once people settle on that land and feel that they have a right to live there, they will begin investing in it. Over time, the area will upgrade incrementally.
Character of Slum in Indian Context:
For this paper, only slums in urban areas of New Delhi , India were considered.
Notified Slum: Areas notified as slums by the concerned State Governments/UTs, Municipalities, Corporations, Local Bodies or Development Authorities were termed as “Notified Slums”.
Non-Notified Slum: Such a settlement, if not notified as slum, is called a non-notified slum while a non -notified slum must consist of at least 20 households, no such restriction is imposed in case of notified slum.
Part Slum: When the slum lies only partly with in the sample urban block, the part of the slum which falls within the block was considered a par t slum. In such cases all the slum particulars recorded were related to only the part slum unless the relevant item in schedule 0.21 mentions that the information is to given for the “whole slum”. Such ‘part slums’ were surveyed even if the approximate number of households in the part slum (i.e. the part of the slum within the sample block) is less than 20. This differs from the procedure followed in previous survey, where a par t slum qualified for survey only if it contained 20 or more households.
House: Every structure, tent, shelter, etc. was considered as a house irrespective of the nature of its use. It might be used for residential or nonresidential purpose or both or even might be vacant.
Pucca Structure: A pucca structure was one having walls and r oofs made of “Concrete, Brick materials”.
Pucca and Non-pucca Materials: Cement, concrete, oven burnt bricks, hollow cement/ash bricks, stone, stone blocks,jack boards (cement plastered reeds), iron, zinc or other metal sheets,timber, tiles, slate, corrugated iron, asbestos cement sheet, veneer,plywood, artificial wood of synthetic material and polyvinyl chloride (PVC) material constituted the list of pucca materials. All other materials wereclassified as “non-pucca materials”. Non-pucca materials included unburntbricks, bamboo, mud, grass, leaves, reeds, thatch, etc.
Katcha Structure: A structure having both roof and walls made of non-pucca materials was called a katcha structure. Katcha structures could be of the following two types:
(a) ‘Unserviceable katcha,’ which included all structures with thatch walls and thatch roof i.e. walls made of grass, leaves,reeds etc. and roof of a similar material, and
(b) ‘Serviceable katcha’, which included all katcha structures other than unserviceable katcha structures.
Semi-pucca Structure: The term was used for a structure that had either the walls or the roof, but not both, made of pucca materials.
Type of latrine: Latrines serviced by scavengers were called “service latrines”. A latrine connected to an underground sewerage system was called a “flush system latrine”. A latrine connected to underground septic chambers was called a “septic tank latrine”. A latrine connected to a pit dug in earth was called a “pit latrine”. Information on type of latrine was recorded for the slum as a whole, which means that the type used most commonly by the slum dwellers, was recorded.
Underground Sewerage system: This means a system of underground pipes or conduits for carrying off drainage water, discharge from water closets, etc.
727
Drainage system: This means a system for carrying off waste water and liquid wastes of the area.
Garbage disposal: In the urban areas, some arrangements usually exist to carry away the refuse and waste of households to some dumping place away from the residential areas. In some places, the public bodies collect the garbage from the premises of the household or from some fixed points in the locality where the residents put their garbage. In some places,a body of residents themselves makes the arrangement of carrying the garbage to the dumping place away from residential areas without participation of any public body till the final disposal.
Case Study of New Delhi City: A slum is a compact settlement with a collection of poorly built tenements, mostly of temporary nature, crowded together usually with inadequate sanitary and drinking water facilities in unhygienic conditions in that compact area (commonly known as “Jhuggi Jhopri”). Such an area, for the purpose of this paper , was considered as a “slum pocket” if at least 20 households lived in that area.
New Delhi is all about the glitz and the glamour─ what with the fast-emerging metro networks, malls, multiplexes, restaurants and brands however the underbelly shows the other side too where a large number of people live in inhuman conditions and are seen fighting for survival. We discuss such habitats in and around Delhi.
Madanpur Khadar : Located about a kilometre away from the Sarita Vihar Metro Station, Madanpur Khadar is a resettlement colony on the outskirts of Delhi. It was selected by the govt as the site to relocate large groups of slum-dwellers from different parts of the city back then in the year 2000. The majority of residents found here are rag-pickers. On entering this area, the scenery you will come across, is dominated by mud and b rick houses, narrow streets, trash/second-hand material selling markets and a sewer line running through the slum. While the slum-dwellers here suffer from the lack of safe drinking water and sanitation problems, care has been taken in some departments, as many NGOs for Women Welfare or HIV affected have opened in the area.
Sangam Vihar: Sangam Vihar is a slum colony and is known to be one of the biggest ones in India that has been around since the late 70s housing people migrating from the neighbouring states, mainly U.P. and Bihar. It has no water supply in many of its areas and the people here struggle day & night for the basic amenities of life including a shortage of communal toilets resulting to open defecation causing sanitation and hygiene issues in the locality.
Paharganj Slums: Paharganj Street, located in the vicinity of the New Delhi Railway Station, other than being a backpacker’s zone houses a large slum community. It is one of the more developed slums of Delhi due to revenue flowing in from cheap guesthouses for train passengers deboarding at the Paharganj side of the New Delhi Railway Station. Most of the dwellers here do menial jobs or are pickpockets. It is largely an Old Delhi-style settlement, with narrow streets and 2-3 floor buildings and shops. On entering, you will see the lanes are mostly untidy and ex tremely crowded and buzzing with activity with streets surrounded by small brick houses on both sides. Women can be seeing washing dishes and clothes, sewing garments or simply chit-chatting away to glory.
Kusumpur Pahari: The largest slum in New Delhi and hous ing around more than 10,000 slums, Kusumpur Pahari is home mostly to poor migrants from UP, Bihar, Orissa and Assam etc. Located in Vasant Vihar, one of the most posh areas in Delhi, this slum gives a tough contrast to the area’s posh bungalows. The majority of this slum has servants, drivers, gardeners, sweepers who work for the wealthy people living in Vasant Vihar.
728
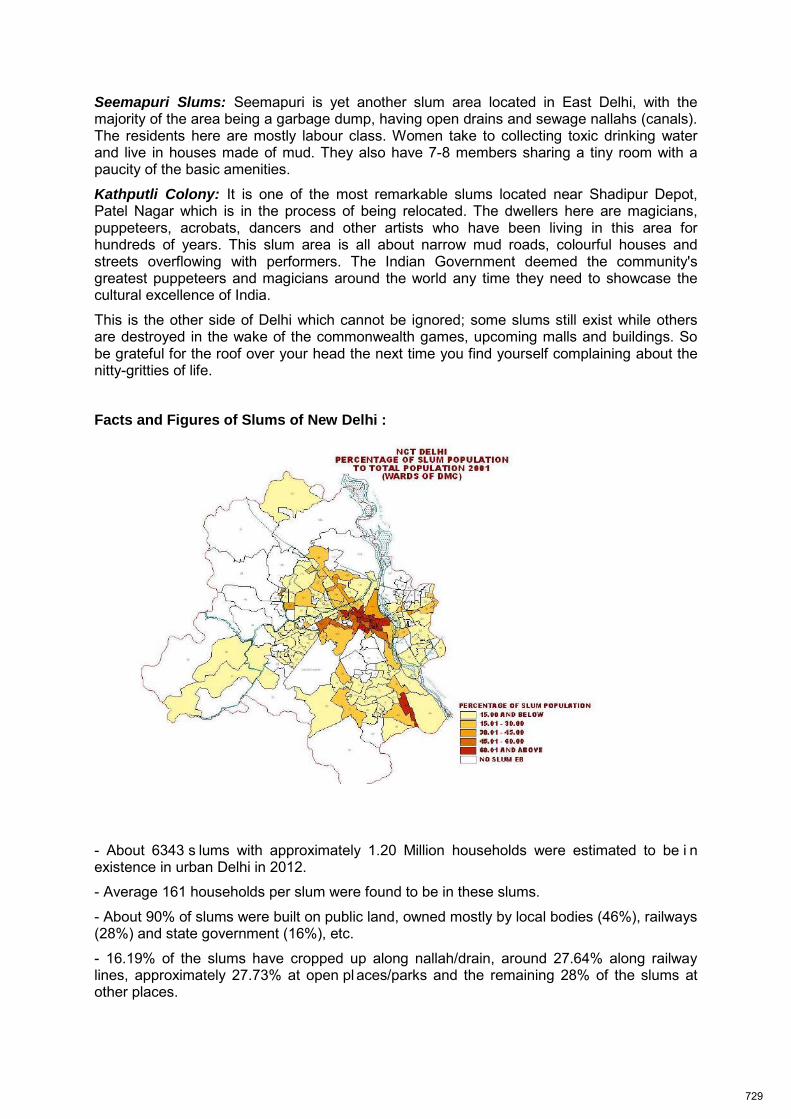
Seemapuri Slums: Seemapuri is yet another slum area located in East Delhi, with the majority of the area being a garbage dump, having open drains and sewage nallahs (canals). The residents here are mostly labour class. Women take to collecting toxic drinking water and live in houses made of mud. They also have 7-8 members sharing a tiny room with a paucity of the basic amenities.
Kathputli Colony: It is one of the most remarkable slums located near Shadipur Depot, Patel Nagar which is in the process of being relocated. The dwellers here are magicians, puppeteers, acrobats, dancers and other artists who have been living in this area for hundreds of years. This slum area is all about narrow mud roads, colourful houses and streets overflowing with performers. The Indian Government deemed the community's greatest puppeteers and magicians around the world any time they need to showcase the cultural excellence of India.
This is the other side of Delhi which cannot be ignored; some slums still exist while others are destroyed in the wake of the commonwealth games, upcoming malls and buildings. So be grateful for the roof over your head the next time you find yourself complaining about the nitty-gritties of life.
Facts and Figures of Slums of New Delhi :
- About 6343 s lums with approximately 1.20 Million households were estimated to be i n existence in urban Delhi in 2012.
- Average 161 households per slum were found to be in these slums.
- About 90% of slums were built on public land, owned mostly by local bodies (46%), railways (28%) and state government (16%), etc.
- 16.19% of the slums have cropped up along nallah/drain, around 27.64% along railway lines, approximately 27.73% at open pl aces/parks and the remaining 28% of the slums at other places.
729
- About 74.46% slums are surrounded by residential areas, 3.36% by industrial areas, 0.66% by commercial areas and rest by other type of areas.
- 54.91% of slums are composed of pucca structure, 29.47% semi pucca and only 15.62% of slums were having unserviceable katcha structure.
- For 86.50% of slums, the major source of drinking water was either tap or hand pump.
- The most of the residents of about 30% of the slums are using septic tank/flush type of latrine facility. At the other extreme, 22% slums did not have any latrine facility at all.
- Underground sewerage existed in only about 16.30% slums.
- About 98.38% of the slums were having underground/covered pucca/open pucca open katcha drainage system. Only 1.62% of the slums were having no drainage system.
- Local bodies were collecting garbage from 31.45% of slums. Out of the slums in which garbage collection is done by local bodies, the frequency of the collection was 37% on daily basis, while in 32% of slums garbage was collected atleast once in two days, once in 3 to 7 days in 29% slums and once in 8 days to 15 days in 0.68% of slums and remaining 2% falls in other category having no regular mechanism for garbage disposal.
- About 48% of the slums had a motorable (Pucca/Kutcha) approach road.
- About 77% of slums were having pucca road/lane/path within the slum.
-About 16.76% of slums were electrified with both street light and household use, 23.90% for household use only, 58.96% for street light only, while in 0.38% of slums there was no electricity.
- About 86.74% of the slums were having primary schools in the proximity of less than 0.5 km.
- About 19.28% of the slum clusters were having the government hospital within a distance of 0.5 km, 28.33% in the distance 0.5-1 km, 36.31% in the distance 1-2 km, 14.27% in the range of 2-5 km and 1.81% slum clusters are covered by government hospitals in the distance of 5 km and above.
- About 9.30% of the slums were usually affected by water logging (inside of slum as well as approach road also) during monsoon.
-About 4% of the slums in Delhi were having associations either formal/informal for improving the condition of the slums formed by the slum dwellers themselves.
Slum Redevelopment of New Delhi: Case Study of Kathputli Colony-
Kathputili (means Puppet ) Slum is New Delhi's largest slum which is residence of makers of traditional Kathputli (Puppets) . Delhi Development Authority (DDA) for the first time has launched the "In-Situ Slum Rehabilitation Scheme" to rehabilitate slum dwellers. This is a departure from the earlier re-settlement schemes wherein they were shifted and s ettled in far-off places of occupation and residence leading to unemployment.
Under the scheme, re-settlement will be done on the land occupied by jhuggi-jhonpri clusters with private partnership. The land will be sold through the tender process to a private partner for construction of multi-storey houses. The number of storey’s will depend on the availability of land.
DDA in the year 2004 ran schemes for rehabilitating such slum dwellers through re-development/ up gradation of the existing areas of Delhi like Narela, Dwarka etc. in order to make Delhi slum free and provide these people a house with hygienic conditions. Unfortunately such schemes did not take off because there were no jobs available nearby. These slum dwellers used to come back again and again as they had no choice of getting jobs around. DDA finally came out with in-situ slum rehabilitation policy under PPP mode and
730
in 2008, tenders were invited from private developers. Eight developers qualified for the bid. The first tender was floated to rehabilitate Kathputli Colony which is one of Delhi's largest slum clusters and was won in a competitive open tender process by a Delhi based developer, Raheja developers Ltd.
Under this scheme, the 2800 families of Kathputli shall be given a ne w lease of life by providing them the latest modern apartments with high-end amenities like attached Bath, Toilets & Kitchens, Tiled flooring, Advanced Fire Detection & Fire Sprinter Systems.
This is apart from centralized amenities like large Green Parks, Schools for Children's Education, Religious Structures, Exhibition Spaces for local Arts & Crafts, open Air Theatres for Performance Storage Spaces for Artifacts, Police Station, Fire Station, Parking Facilities, Shops for daily conveniences. Each Apartment shall be over 30 sq. meters in size with a living/ dining area, bedroom area, kitchen, toilet, bath, large 4.5 sq. meter terrace area.
Till the time these structures are built on s ite the Kathputli colony residents shall be rehabilitated in a Transit Camp facility at Anand Parbat barely, 1.8 kms away from the Kathputli Colony. This shall be only for 2-3 years by which time the buildings shall be ready. The Transit camp is also a ultra modern complex with all modern facilities.
All this is being allotted to the Kathputli residents and the costs are borne by the private developer, who in lieu of this will get a small portion of site for a private development which he can sell in open market to recover the massive construction costs of 2800 apartments at Kathputli colony and another 2800 independent houses at Transit Camp. It is due to the Delhi Government and DDA's commitment towards service to the society and N ation that such schemes are becoming possible and giving a fresh face to the city, moving towards a slum free Delhi.
Case Study : Indore's Habitat Improvement Project- One of India's largest slum upgrading effort so far in Indore City Slum Redevelopment – a million plus city in central India – and one of the largest in India was implemented during 1990-97. This was the Indore Habitat Improvement Project, which was funded by the British Government’s Department for International Development (DfID) (the erstwhile Overseas Development Administration (ODA)). The project used the highly acclaimed concept of Slum Networking as the approach to infrastructure provision alongside health and community development inputs. In 1993 Indore’s slum project was visited by the British Prime Minister. In 1994 it was honored with the ’93 World Habitat Award. In 1995 it was visited by an international study group. In 1996 it was included in the Global Best Practices in the Habitat II Conference. In 1997 the project ended. In 1998 it was honored with the Aga Khan Award for Architecture.
Obviously this was a spectacularly successful improvement project, or was it? In 1997 the DfID funded an impact assessment study of its city-wide slum upgrading projects for which its projects in three cities, including Indore, were taken up.
This paper begins by describing two different views of this project. The first is the “on paper” view. This is the one that most professionals working in the field of urban slum interventions and following award-winning projects already know and is described only briefly. The second is the “on ground” view. This is the one that all those who live in, work in or walk through slums in Indore know. It is introduced in the form of the findings that emerged from the impact study conducted in 1997. The difference between these two snapshot views of Indore’s slum project are then explained in terms of some inferences on flawed and failed assumptions.
Next this paper tries to piece together the process of Indore’s slum project. Since the assumption is that the projected picture is not the real picture, the stated processes (in project intentions or in monitoring reports) could not have been the source for this part and are not referred to. This part of the paper draws, instead, on a less professional source of information - archives of the local print media. The project history so pieced together makes rather interesting reading. It also affords a clearer insight into why the two snapshots
731
described earlier continue to co-exist. Unfortunately it shows the urban slum related professions in extremely poor light.
Finally in this paper some comments are made on inadvertent, but nevertheless worrying, wider impacts that have been t riggered of by the process of Indore’s slum project. These affect not only the people in the project slums but also institutions within as well as outside Indore. Since the processes that have occurred in the Indore slum project are unlikely to be unique, it is suspected that these impacts are quite common in a project of this type. Thus the paper will explore what seems to be a barely acknowledged dimension of slum interventions.
Indore Habitat Improvement Project: By the time the planning of the Indore slum project was finalised in 1988, the ODA had been working on similar projects elsewhere in India and a fairly well defined formulation of ODA slum projects had evolved, consisting of three in-slum components: physical infrastructure, health and community development. The physical infrastructure component invariably included individual or community water supply, individual or community toilets and paving of streets. Street lighting and some amount of solid waste management were additionally included in many cases. The health component focussed on preventive health care and environmental health awareness, though primary health services were also provided in many projects. The community development component included creation of neighborhood groups, vocational training (especially for women), adult literacy and pre-school and non-formal education. Later development of community saving mechanisms also became a part of the community development activities. Community halls were constructed for all slums in all the projects. The institutional mechanisms for implementation had also by then fallen into a set pattern. The projects were implemented through local bodies – either the municipal corporation or the development authority with monitoring and steering committees at the state level. Institutional capacity building through staff training and study visits to other project cities and abroad had become an integral part of the ODA slum projects. In many cases the ODA also funded some improvement of city infrastructure in support of the operation and sustenance of in-slum infrastructure provided under its projects.
The Indore slum project had all these features of an ODA slum project. There was, however, one significant difference – the project used the Slum Networking concept as the approach to infrastructure provision. Indore was the first place where the Slum Networking concept was tried and, in fact, is so far the only one since, in both Baroda and Ahmadabad, the two cities that took it up subsequently, the experiment has not yet progressed beyond a single slum intervention to a networking intervention at the time of writing this paper.
The Slum Networking System: Slum Networking is a hol istic approach to urban improvement in which slums are seen as an integral part of the city – a settlement network that presents an opportunity for change rather than a problem for the city.
The concept of slum networking works at two broad levels – slums and the city
At the level of slums it aims at substantive up-gradation in the quality of life through engineering innovations, notably the creation of individual infrastructure and improvement in the overall ambience of the slum environment. These are combined with community development interventions for sustainability of impacts.
At the level of the city, the concept aims at making sustainable improvements to the city infrastructure and environment. Instead of upgrading slums on a slum-by-slum basis, it envisages networking of slums so that the matrix of slums becomes an opportunity for augmenting city infrastructure. This is based on the fact that watercourses, which are major locations of slum settlements, also represent the most efficient lines for infrastructure provision. Through concerted improvements in slums, sustainable improvements to city environment can thus be secured in a cost-effective manner.
732
With the inclusion of the Slum Networking concept into the project the details of the infrastructure component became quite different from those in other projects. The Indore slum project envisaged individual toilets connected to underground sewage, individual water supply connected to a piped network, an innovative design of roads as storm water drains, and soft landscaping. Main features of these infrastructure components were as follows:
Toilets: The project envisaged individual toilets for the entire slum population covered by the project (about 80000 families). This was on the assumption that individual toilets allow for dignity in use and responsibility in maintenance that community toilets cannot match.4 Underground sewage lines were laid under the project. This was done in a cost-effective manner through careful design that maximised gravity flow opportunities5 so that pumping was avoided and expensive items like drop manholes and vent shafts could be omitted. On the whole, cost per household came to a figure that compared favorably with, say, the UNDP twin-pit latrine option.6 Households were expected to take Gully Trap7 connections to discharge sewage from toilets as well as sullage from kitchens and bathrooms into the underground drainage.
Water Supply: The project had provision for individual water connections for slum households.8 A network of water mains was laid under the project and efforts were made to integrate existing sources so as to keep costs low.9 People were expected to take water connections from the municipal corporation. Good quality and adequate quantity of water were thus envisaged for all slum dwellers. Citywide benefits in terms of equalising water pressure were also expected.10
Roads as Storm Water Drains: Since sullage and sewage would be taken care of through the underground drainage, surface drainage was required only for storm-water. Through the innovative concept of roads as storm water drains11, the slum-networking approach dispenses with the need for squalid, conventional open d rains12 and, at the same time, achieves major cost savings on road building13 and better living environment14.
Soft landscaping: The project envisaged a substantial amount of soft landscaping. Only part of the right-of-way within the slum was to be paved and the rest left for landscaping at the initiative of the community, supported by the project. Soft landscaping was expected to improve the general ambience in slums in terms of attractiveness and microclimate and to contribute to the urban environment by allowing for ground water recharge. It was also expected to work as an engineering tool to realise the innovative and cost effective design of roads as drains.15
Claimed Citywide Impacts of Slum Networking in Indore:
Roads and Drains: Out of 360 km of roads provided in the slums, approximately 80 km on the slum peripheries were linked up at the city level to reduce traffic congestion on existing city trunk roads. Given that natural watercourses passing through cities define ideal gravity paths and that slums are located along these water courses, it has been possible to develop a piped sewage network linking the slums. These links were located along the river banks and by using larger pipe diameters than needed just for the slums, the capacity of the main sewers installed was increased sufficiently to accept the larger city load.
River Cleaning: As stretches of the rivers passing through the city centre were cleaned of sewage, they were turned into fresh water lakes and the banks were landscaped. 4 km of bank has been improved to date. Improvement of the riverbank has now become a continuous process. A further 1-km stretch was taken up in 1996. The old temples and stone steps along the banks were painstakingly restored. The riverbed was dredged to a grade and the surplus earth used to widen the banks. The slopes were stabilised by cutting the sides to the natural angle of soil repose and extensively planted… Pedestrian paths and gardens were laid on the banks. As the earthworks and landscaping stabilised short bund walls were
733
built across the bed to retain the water. Thus in the monsoon times water flows freely over the walls but in dry summer months water is retained in the lake formed by the bunds. The city centre has thus been transformed into a major recreational area… a beautiful and popular picnic spot for local people. Surveys have shown that groundwater quality in wells near the improved stretches of the river is now significantly better than in those near stretches still to be improved. The cost of carrying out this work has been met from those wishing to provide commercial and recreational facilities on the riverbanks and has placed no additional financial burden on t he project. Fountains and l ights are being installed and maintained in the lake by industrial and commercial companies. A plan for extending the improvement of the riverbanks to cover the entire city has been developed.
The slum networking approach is claimed to have benefited, besides about 450,000 slum dwellers in the project slums, an equal number of non-slum citizens.
Conclusion: Competing interests in urban resources make planned development a fundamental need of urbanites, calling for a high degree of responsibility on the part of those in charge of urban governance. Unfortunately, the vast majority of our public servants and public representatives seem to consider the vast majority of urbanites ‘inferior’ and not worthy of serving and representing. Whatever they do for the people increasingly seems to be purely incidental to what they happen t o be doing for themselves, even though it is invariably given the flavor of a favor. It is as though the school of urban governance drama were left with only two roles in its repertoire—the feudal patron and the stubborn ostrich. Unfortunately, a royal bird with long legs is a singularly inappropriate mascot for the type of urban governance system necessary to meet the fundamental needs of planned urban development in order to save our cities from slumming.
• Countries need to recognize that the urban poor are active agents and not just beneficiaries of development.
• Developing cities requires local solutions. Local authorities need to be empowered with financial and human resources to deliver services and infrastructure to the urban poor.
Cities should draw up local long-term strategies for improving the lives of slum dwellers.
• Local governments should develop strategies to prevent the formation of new slums. These should include access to affordable land, reasonably priced materials, employment opportunities, and basic infrastructure and social services.
• Public investments must focus on providing access to basic services and infrastructure. Working with the urban poor, cities need to invest in housing, water, sanitation, energy, and urban services, such as garbage disposal. These services and infrastructure must reach the poor living in informal settlements.
• The transportation needs and safety concerns of a city’s poorest residents should be a high priority in planning urban transportation systems, which can expand the choices people have regarding where to live and work.
• Building codes and regulations should be realistic and enforceable and reflect the lifestyle and needs of the local community. This means, for example, that they may have to be flexible enough to allow housing that is built incrementally, out of low-cost materials and on small plots of land.
734

Reference:
- Agrawal Vandana, 2014, "Slums: Affects on Environment"
- Survey: Government of National Capital Territory of Delhi, February 2015, "Urban Slums in Delhi"
- www.architexturez.net/doc
- www.so.city/#!/delhi
- www.kathputlicolonydda.com/dda-scheme.asp
---------------------------------------------------------------------------------------------------------------------------
About The Author: Rajendra Kumar is practicing architect based in New Delhi, India. He is graduated from Chandigarh College of Architecture, India and Post graduation from Politecnico Di Milano, Italy. He has worked in Spain, Italy, China, UAE. He is awarded as “Indian Young Achievers Award” in 2009. His project experiences include Housing, Hotel, Township, Private Residences. Some of project experiences are Kolkata Twin Tower, Bangalore Township, Shanghai Medical City, for
Shanghai, Spanish Pavilion, World expo 2010. His interests are environmentally sensitive architecture and ecological projects. He delivered lecture on many national and international forums on various issues related to cities, social issues, sustainable environment etc. His articles are published in newspapers, magazines in India, Italy, Spain. He is actively involved in academics. He has been a jury member of many competitions. He is Ex. Dean of Savera College of Architecture, Gurgaon, India and at present Associate Professor at Sushant School of Architecture, Ansal University, Gurgaon, India.
He travelled extensively in many part of globe and keen photographer. His works have been exhibited in many exhibitions and event.
[email protected] +91 9891433584
735

WhatcanwelearnfromPortland'surbaneconomy?
Moderator: Jan ZAMAN, Regional government of Flanders, Brussels, Belgium
This session consists of two parts. 1. a few days prior to the conference a small group of people go
for a 1 day walk in Portland. The walk will take the group from the convention centre, through
industrial areas around the Willamette, Pearl District and downtown. Each participant prepares a
short story about urban economy in his/her homeland, and shares this with the group when he/she
feels the moment fit. After the walk, each participant makes notes on a map of Portland. 2. during
the conference a 60 min session is organised. The session starts with an introduction about the
importance of a flourishing urban economy, followed by a short presentation of the walk. From what
we find in Portland, and how this contrasts with the stories that were told during the walk, we start
a debate. The debate addresses the following questions: ‐ what does the urban economy in Portland
look like? ‐ what can we learn from Portland? ‐ how does this relates to experiences and practices
elsewhere in the world? ‐ how important is it to walk through the city, to see and feel its economy
and industry? ‐ can you get a fair idea about the urban economy of a city without knowing the full
history and statistics? ‐ what can Portland learn from some foreigners walking through the city? The
key to success for this session, is to get a good group together some days before the conference to
do the walk. If some people who live in Portland could join the walk, it would make both the walk
and the debate more interesting. We assume that the participants of the walk will most likely
participate in the debate.
736
Track 4: Resilience, adaptation and disaster mitigation
737
Yu Tingting landscape vulnerability assessment ISOCARP-OAPA Conference 2017
1
Spatial modeling for landscape vulnerability assessment with climate change through TACA and GIS in Heilongjiang, China
(Integrating climate change into landscape planning: Modeling the impact of climate change
on species vulnerability) Tingting YU1, Department of Architecture, Heilongjiang Cold Region Urban-Rural Human Settlements Science Key Laboratory, Harbin Institute of Technology, P.R. China Qing YUAN2*, Department of Architecture, Heilongjiang Cold Region Urban-Rural Human Settlements Science Key Laboratory, Harbin Institute of Technology, P.R. China Kevin.WALSH3, Department of Earth Sciences, University of Melbourne, Australia Craig. Nitschke4, School of Ecosystem and Forest Sciences, University of Melbourne, Australia
Abstract
The achievement of sustainable landscape planning requires the incorporation of vulnerability and regeneration into long-term planning, except foundational elements. Climatic variability has significant impact on natural environment, especially on species regeneration potential, closely linking to the landscape influenced by ecosystem vulnerability. The trend of plant growth to environment change makes regeneration a crucial step for understanding species response to climate change. In this study, the utility of the developed model, tree and climate assessment (TACA), was modeled for a 47,300,000 ha landscape in Heilongjiang, China. TACA modeled current incorporating germination processes to evaluate 5 key species, with high accuracy and simulated significant responses amongst plant species to different climate scenarios. The simulation results from TACA were used to guide plant zoning, develop landscape planning strategies and formulate a climate-oriented landscape planning framework based on a better understanding of landscape vulnerability to future climatic change.
Keywords: climate change, landscape planning, modeling, landscape vulnerability, climate-oriented framework
1. Introduction
Many experts have proposed landscape and urban planning strategies response to climate change, to seek a sustainable planning framework or to support for policy management1;2. Though some advances have been made, most focus on adaptation planning, which means the use of acquired climate information to review the suitability of current and planned practices, policies and infrastructure 3 , 4 . Existing planning strategies are mostly biased towards universal suggestion rather than landscape decision-making, as they provide limited assistance to identify vulnerability at the scale which direct management actions are undertaken 5 . Therefore, a climate-oriented framework is the vital connection between quantification simulation and decision-making, aiming to provide a top-down approach6. For example, the Local Climate Change Visioning Project (LCCVP) has created a framework, attempting to combine science, planning and decision-making on climate scenarios 7 , although it only provided a research direction without experiments or simulations.
738
Yu Tingting landscape vulnerability assessment ISOCARP-OAPA Conference 2017
2
To integrate adaptive and sustainable strategies into landscape planning at large scales, an understanding of landscape vulnerabilities is obviously necessary as the biophysical implications directly guide management actions8 . This required an evolution mechanism which could quantitatively simulate landscape vulnerabilities based on biophysics, to plan landscape in a sustainable manner9. With regional climatic change recently and observed over the last decade, species are subject to be in a climate regime that exceeds their environmental tolerance10. This means species abundance and distributions may change with it. For species, changes in temperature, precipitation, soil moisture and other conditions not only drive species distribution and regeneration at biophysical aspect but reflect the landscape vulnerabilities at the macro-scale 11 . For plants, species are more sensitive response to climate changes than mature trees across spatial and temporal scales, which means species germination and regeneration directly influence on landscape vulnerability evaluation12. To assess species vulnerabilities under climatic change, modeling can be used to simulate relative responses of species at a variety of scales, and predict threatened species13. Many models can be used in species vulnerability evaluation. Broadly, models can be divided into two approaches: statistical models and mechanistic models. Statistical models, also referred to equilibrium models, tend to integrate climate information into species empirically14. These types of models had limited assistant to explain the mechanism of species vulnerability change under climatic change, and are poor to simulate species changes in different climate scenarios15 . The limitations of these models focus on the uncertainty that exists in the assumption that the future relationship between species distributions and climate change will be the same as in the past. Compare to statistical models, mechanistic models may be a type of more rough choices for simulating species regeneration due to identify changes at the macro-scale. The foundation of these models is not based on the key processes governing regeneration, but on the requirements of species regeneration, including growing degree days (GDD), soil moisture and light availability16. For example, Gap models simulate the regeneration, growth and mortality of individual trees based on the sum of GDD, soil moisture and light availability, which do better in the accuracy of species simulation results, overcoming empirically derived parameters17. Currently, little study focus on the impact of climate change on species regeneration 18 , which can directly support the species vulnerability assessment response to climate change, being of great importance to landscape vulnerability research and climate adaptation planning. In this paper, a spatial model, tree and climate assessment (TACA), was chosen to evaluate the species vulnerabilities and the resistance and resilience of ecosystems to climate change19. TACA analyses the species response to predicted changes in climate by examining change in the breadth of a species regeneration niche, which is designed to assess species vulnerabilities to climate change when they are in their crucial stage of life cycle, regeneration20. It is essential to integrate Model results into landscape planning, as a scientific support for the selection of vulnerability variables used to evaluate the landscape and ecosystem with the climate change and the creation of the climate-oriented planning framework. Given the specific climate conditions and change trends, it is impossible to identify a method or rule that is suitable for all cases, although the Model can simulate a particular result in each of them. Consequently, a climate-oriented framework is of importance that connect species vulnerability evaluation results, planning strategies and policy response to climate changes. Hollenstein developed a framework in forest planning with the following structure: (1) define the system; (2) select risk variables; (3) select analysis technique; (4) calculate the risk for each variable; (5) aggregation of risk variables; (6) select management action21. Based on Hollenstein frameworks, Craig developed a framework to characterize landscape vulnerability and propose a decision-making process from which management decisions according to the assessment under the uncertainty of predicted climate change, with the following structure: (1) definition of the system; (2) Selection of assessment variables; (3) development of a conceptual model; (4) selection of an analysis technique; (5) calculating
739
Yu Tingting landscape vulnerability assessment ISOCARP-OAPA Conference 2017
3
the vulnerability of variables; (6) development of management framework20. The frameworks developed by Hollenstein and Craig were congruent with each other with some of Craig’s steps transforming plants vulnerability research into a more macro study containing vulnerability evaluation and decision-making management. In this study, the phases and steps of Hollenstein frameworks and Craig frameworks were used as references to develop a climate-oriented framework that could integrate species vulnerability evaluation into landscape planning strategies and climate-oriented planning management system. The framework was then tested on a 47,300,000 ha landscape in Heilongjiang, China, with the forest coverage reaching 43.6%, where landscape was largely impacted by species vulnerability. The phases and steps used in this research are as follows: Phase 1. Problem formulation (Materials and Methods) Step 1. Definition of the object Step 2: Selection of research methods Step 3: Collection of relative parameterization Phase 2. Species vulnerability evaluation (Results) Step 4. Mapping species regeneration potential at the landscape-level Step 5. Landscape vulnerability analysis: changes in regeneration potential Phase 3. Planning framework development (Discussion)
2. Materials and Methods
2.1 Step 1: Definition of the object Heilongjiang is one of the most forested province in China, where forest areas account for 1/7 of the total in China, containing approximately 23 million hectares of forest land. Forest mainly includes two types: coniferous forest in the North Temperate Zone, distributed in the North of Da Hinggan Mountains (mainly Larix); coniferous and mixed forest in the Middle Temperate Zone, spread in Xiao Hinggan Mountains and Eastern Mountains. The annual average temperature is -4°—5°in Heilongjiang, belonging to continental monsoon climate. The temperature generally drops from southeast to northwest, with a around 10 °temperature differences. In Heilongjiang, elevation ranges from 30 to 1665m above sea level and annual rainfall ranges between 400 and 650mm22. Comparing the statistics data of land use in Heilongjiang, forest cover represented a decreasing trend from 54.86% in 1993 to 46.14% in 2009, more obviously than other land use types. From the view of Landscape Pattern23, mean size of forest patches reduced 78.00km2, with the average density increasing by 0.11, although Largest Patch Index (LPI) remained unchanged. This revealed forest landscape fragmentation. Forest patches exhibited more complicated patterns, meantime were subjected to disturbances from human activities and natural changes, like climate. Due to the forest landscape fragmentation, biodiversity fell and species were reducing even extinct, with the instability of forest ecosystem. Forest was hard to self-recovery once ecological balance has been broken, which also means the forest landscape presented obvious vulnerability. For reasonable and scientific planning strategies and management, biodiversity conservation and societal demands should be introduced in this research besides traditional landscape pattern analysis24. The implementation of this plan involves the distribution of the forest landscape through triad zoning, with different management objectives including a production (intensive) zone, an extensive (multiple use) zone and an ecological (reserves) zone 25 . Combined with landscape pattern, triad system should be redefined as interlocking forest ecosystem, clearing definitions of research objects. Production zone is the exterior of the timber reservation, which is vulnerable to external changing, hence it is valid to develop into
740
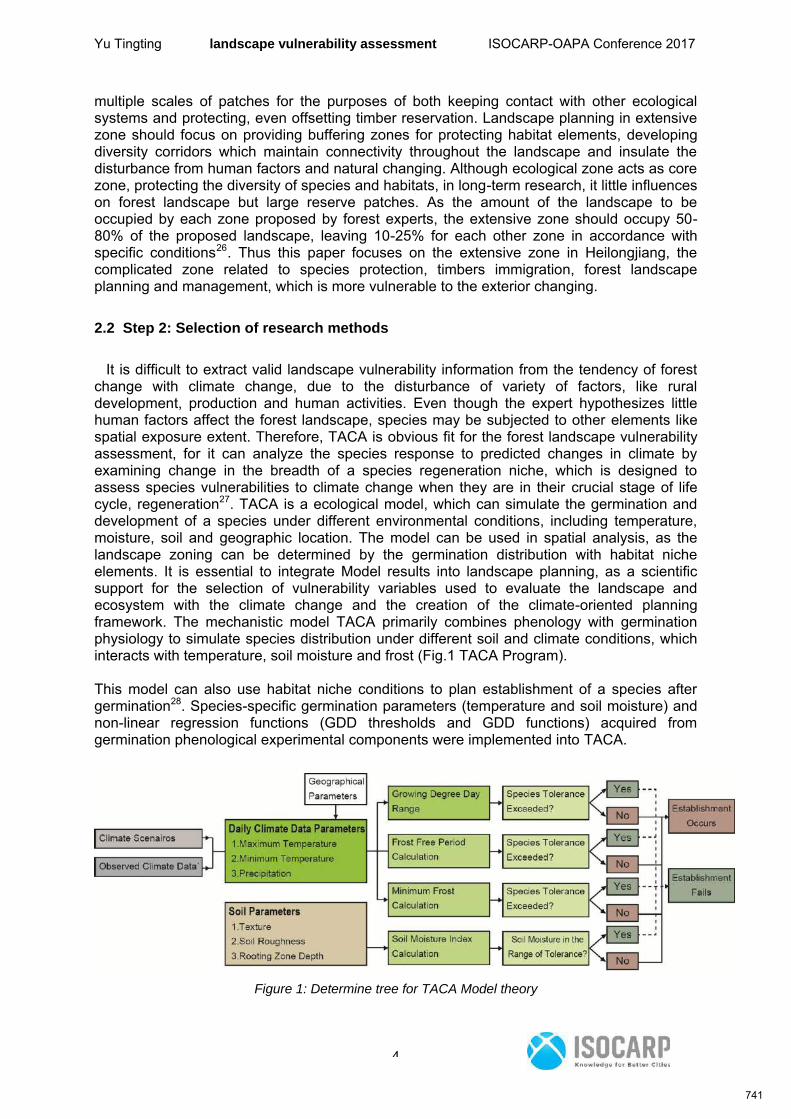
Yu Tingting landscape vulnerability assessment ISOCARP-OAPA Conference 2017
4
multiple scales of patches for the purposes of both keeping contact with other ecological systems and protecting, even offsetting timber reservation. Landscape planning in extensive zone should focus on providing buffering zones for protecting habitat elements, developing diversity corridors which maintain connectivity throughout the landscape and insulate the disturbance from human factors and natural changing. Although ecological zone acts as core zone, protecting the diversity of species and habitats, in long-term research, it little influences on forest landscape but large reserve patches. As the amount of the landscape to be occupied by each zone proposed by forest experts, the extensive zone should occupy 50-80% of the proposed landscape, leaving 10-25% for each other zone in accordance with specific conditions26. Thus this paper focuses on the extensive zone in Heilongjiang, the complicated zone related to species protection, timbers immigration, forest landscape planning and management, which is more vulnerable to the exterior changing.
2.2 Step 2: Selection of research methods
It is difficult to extract valid landscape vulnerability information from the tendency of forest change with climate change, due to the disturbance of variety of factors, like rural development, production and human activities. Even though the expert hypothesizes little human factors affect the forest landscape, species may be subjected to other elements like spatial exposure extent. Therefore, TACA is obvious fit for the forest landscape vulnerability assessment, for it can analyze the species response to predicted changes in climate by examining change in the breadth of a species regeneration niche, which is designed to assess species vulnerabilities to climate change when they are in their crucial stage of life cycle, regeneration27. TACA is a ecological model, which can simulate the germination and development of a species under different environmental conditions, including temperature, moisture, soil and geographic location. The model can be used in spatial analysis, as the landscape zoning can be determined by the germination distribution with habitat niche elements. It is essential to integrate Model results into landscape planning, as a scientific support for the selection of vulnerability variables used to evaluate the landscape and ecosystem with the climate change and the creation of the climate-oriented planning framework. The mechanistic model TACA primarily combines phenology with germination physiology to simulate species distribution under different soil and climate conditions, which interacts with temperature, soil moisture and frost (Fig.1 TACA Program). This model can also use habitat niche conditions to plan establishment of a species after germination28. Species-specific germination parameters (temperature and soil moisture) and non-linear regression functions (GDD thresholds and GDD functions) acquired from germination phenological experimental components were implemented into TACA.
Figure 1: Determine tree for TACA Model theory
741
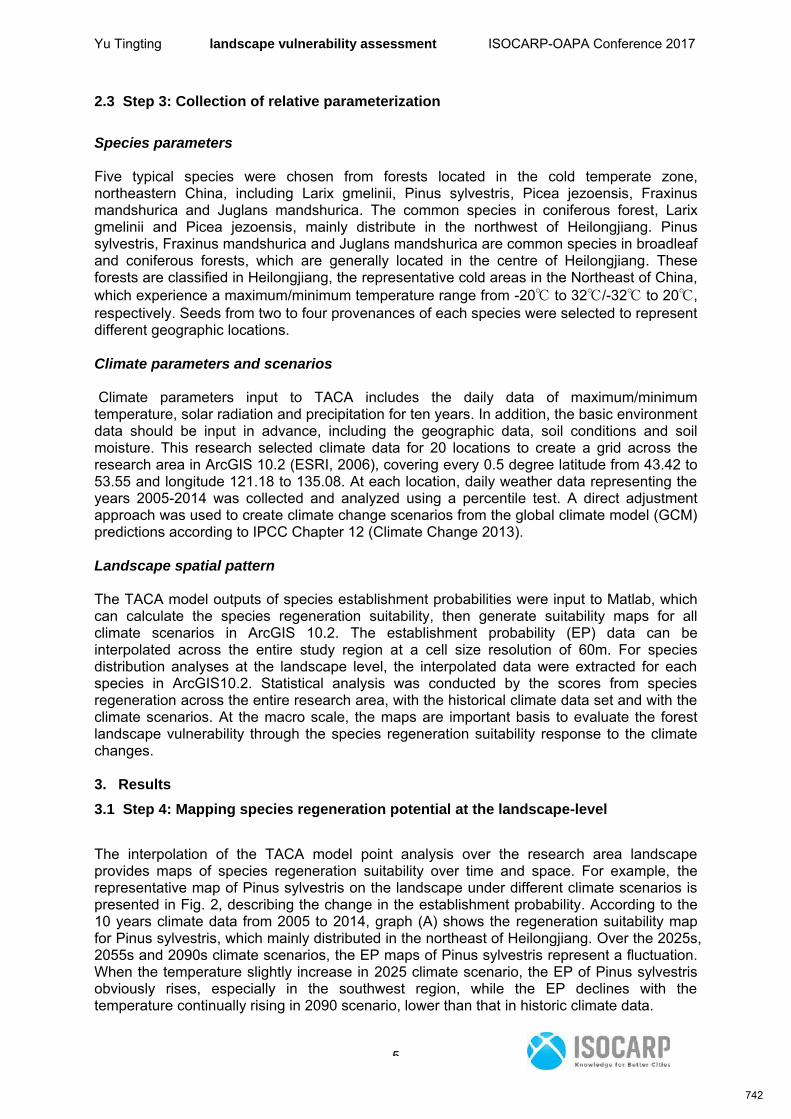
Yu Tingting landscape vulnerability assessment ISOCARP-OAPA Conference 2017
5
2.3 Step 3: Collection of relative parameterization
Species parameters Five typical species were chosen from forests located in the cold temperate zone, northeastern China, including Larix gmelinii, Pinus sylvestris, Picea jezoensis, Fraxinus mandshurica and Juglans mandshurica. The common species in coniferous forest, Larix gmelinii and Picea jezoensis, mainly distribute in the northwest of Heilongjiang. Pinus sylvestris, Fraxinus mandshurica and Juglans mandshurica are common species in broadleaf and coniferous forests, which are generally located in the centre of Heilongjiang. These forests are classified in Heilongjiang, the representative cold areas in the Northeast of China, which experience a maximum/minimum temperature range from -20℃ to 32℃/-32℃ to 20℃, respectively. Seeds from two to four provenances of each species were selected to represent different geographic locations. Climate parameters and scenarios Climate parameters input to TACA includes the daily data of maximum/minimum temperature, solar radiation and precipitation for ten years. In addition, the basic environment data should be input in advance, including the geographic data, soil conditions and soil moisture. This research selected climate data for 20 locations to create a grid across the research area in ArcGIS 10.2 (ESRI, 2006), covering every 0.5 degree latitude from 43.42 to 53.55 and longitude 121.18 to 135.08. At each location, daily weather data representing the years 2005-2014 was collected and analyzed using a percentile test. A direct adjustment approach was used to create climate change scenarios from the global climate model (GCM) predictions according to IPCC Chapter 12 (Climate Change 2013). Landscape spatial pattern
The TACA model outputs of species establishment probabilities were input to Matlab, which can calculate the species regeneration suitability, then generate suitability maps for all climate scenarios in ArcGIS 10.2. The establishment probability (EP) data can be interpolated across the entire study region at a cell size resolution of 60m. For species distribution analyses at the landscape level, the interpolated data were extracted for each species in ArcGIS10.2. Statistical analysis was conducted by the scores from species regeneration across the entire research area, with the historical climate data set and with the climate scenarios. At the macro scale, the maps are important basis to evaluate the forest landscape vulnerability through the species regeneration suitability response to the climate changes. 3. Results
3.1 Step 4: Mapping species regeneration potential at the landscape-level
The interpolation of the TACA model point analysis over the research area landscape provides maps of species regeneration suitability over time and space. For example, the representative map of Pinus sylvestris on the landscape under different climate scenarios is presented in Fig. 2, describing the change in the establishment probability. According to the 10 years climate data from 2005 to 2014, graph (A) shows the regeneration suitability map for Pinus sylvestris, which mainly distributed in the northeast of Heilongjiang. Over the 2025s, 2055s and 2090s climate scenarios, the EP maps of Pinus sylvestris represent a fluctuation. When the temperature slightly increase in 2025 climate scenario, the EP of Pinus sylvestris obviously rises, especially in the southwest region, while the EP declines with the temperature continually rising in 2090 scenario, lower than that in historic climate data.
742
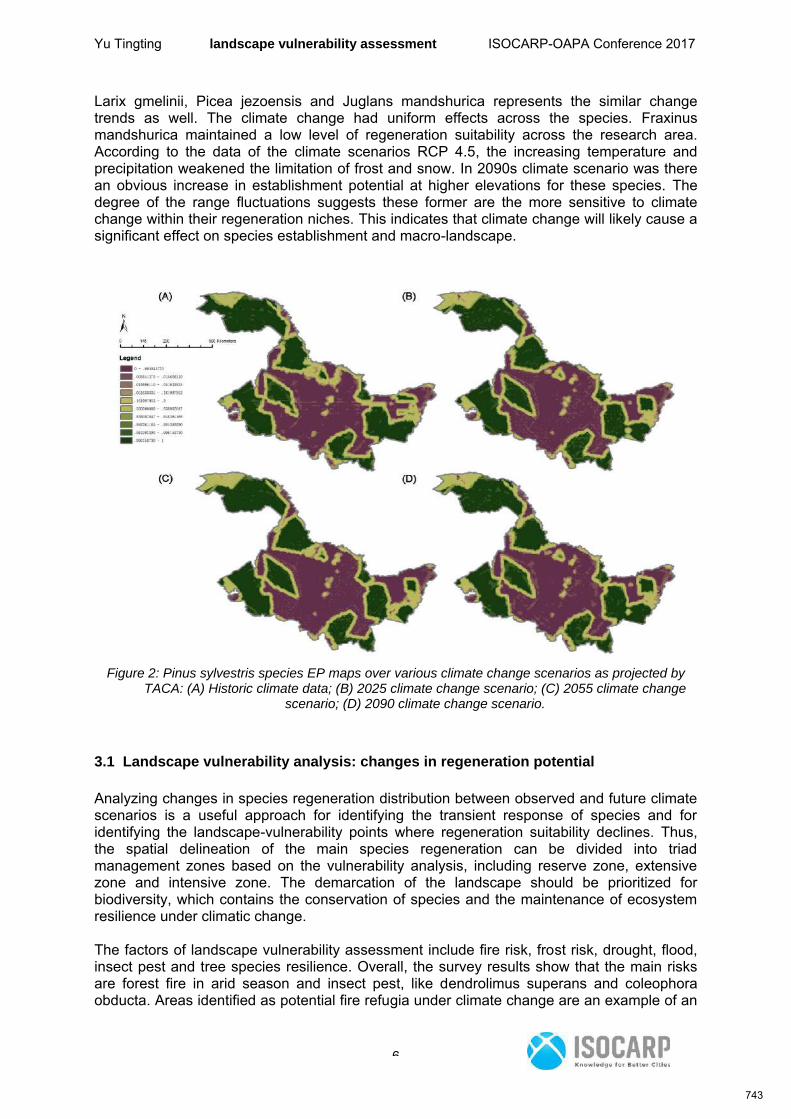
Yu Tingting landscape vulnerability assessment ISOCARP-OAPA Conference 2017
6
Larix gmelinii, Picea jezoensis and Juglans mandshurica represents the similar change trends as well. The climate change had uniform effects across the species. Fraxinus mandshurica maintained a low level of regeneration suitability across the research area. According to the data of the climate scenarios RCP 4.5, the increasing temperature and precipitation weakened the limitation of frost and snow. In 2090s climate scenario was there an obvious increase in establishment potential at higher elevations for these species. The degree of the range fluctuations suggests these former are the more sensitive to climate change within their regeneration niches. This indicates that climate change will likely cause a significant effect on species establishment and macro-landscape.
Figure 2: Pinus sylvestris species EP maps over various climate change scenarios as projected by
TACA: (A) Historic climate data; (B) 2025 climate change scenario; (C) 2055 climate change scenario; (D) 2090 climate change scenario.
3.1 Landscape vulnerability analysis: changes in regeneration potential
Analyzing changes in species regeneration distribution between observed and future climate scenarios is a useful approach for identifying the transient response of species and for identifying the landscape-vulnerability points where regeneration suitability declines. Thus, the spatial delineation of the main species regeneration can be divided into triad management zones based on the vulnerability analysis, including reserve zone, extensive zone and intensive zone. The demarcation of the landscape should be prioritized for biodiversity, which contains the conservation of species and the maintenance of ecosystem resilience under climatic change. The factors of landscape vulnerability assessment include fire risk, frost risk, drought, flood, insect pest and tree species resilience. Overall, the survey results show that the main risks are forest fire in arid season and insect pest, like dendrolimus superans and coleophora obducta. Areas identified as potential fire refugia under climate change are an example of an
743
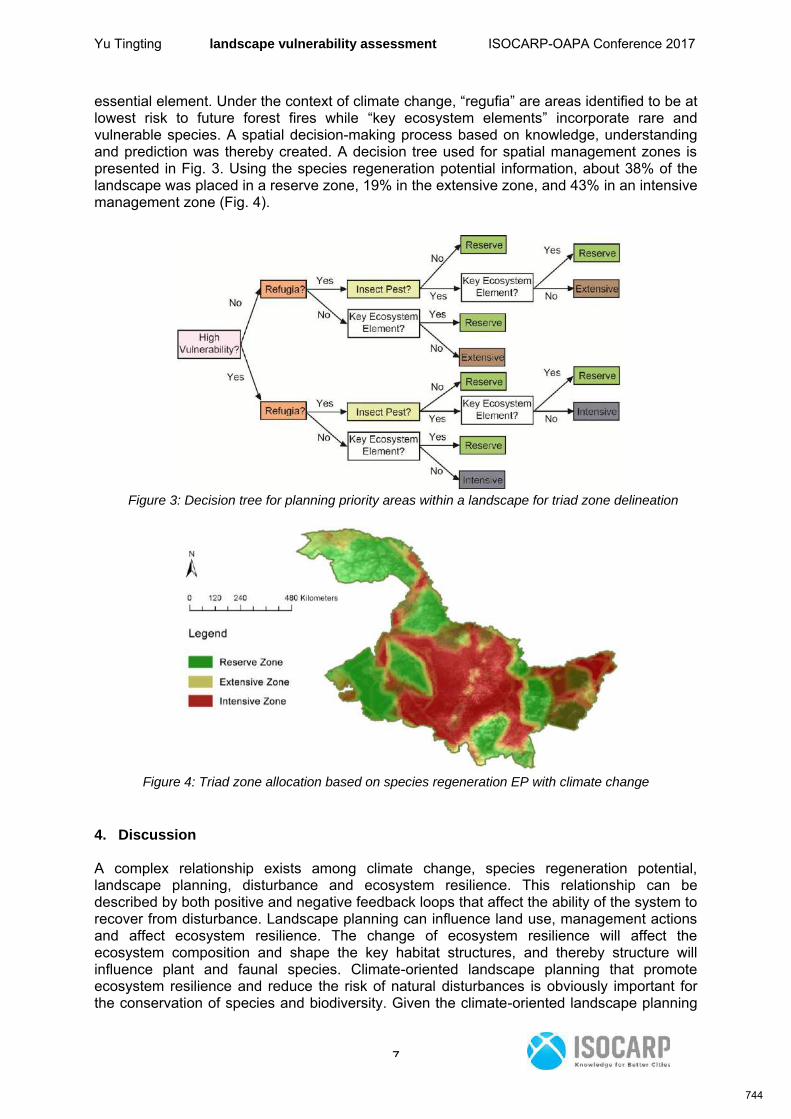
Yu Tingting landscape vulnerability assessment ISOCARP-OAPA Conference 2017
7
essential element. Under the context of climate change, “regufia” are areas identified to be at lowest risk to future forest fires while “key ecosystem elements” incorporate rare and vulnerable species. A spatial decision-making process based on knowledge, understanding and prediction was thereby created. A decision tree used for spatial management zones is presented in Fig. 3. Using the species regeneration potential information, about 38% of the landscape was placed in a reserve zone, 19% in the extensive zone, and 43% in an intensive management zone (Fig. 4).
Figure 3: Decision tree for planning priority areas within a landscape for triad zone delineation
Figure 4: Triad zone allocation based on species regeneration EP with climate change
4. Discussion
A complex relationship exists among climate change, species regeneration potential, landscape planning, disturbance and ecosystem resilience. This relationship can be described by both positive and negative feedback loops that affect the ability of the system to recover from disturbance. Landscape planning can influence land use, management actions and affect ecosystem resilience. The change of ecosystem resilience will affect the ecosystem composition and shape the key habitat structures, and thereby structure will influence plant and faunal species. Climate-oriented landscape planning that promote ecosystem resilience and reduce the risk of natural disturbances is obviously important for the conservation of species and biodiversity. Given the climate-oriented landscape planning
744
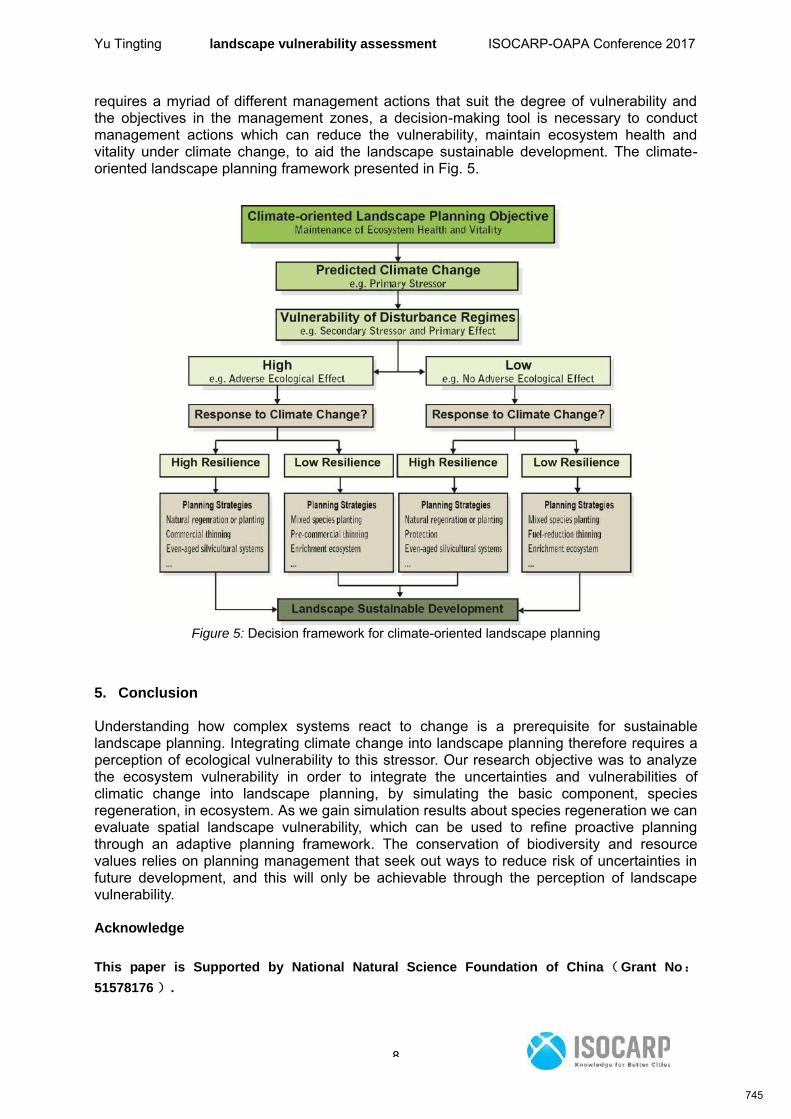
Yu Tingting landscape vulnerability assessment ISOCARP-OAPA Conference 2017
8
requires a myriad of different management actions that suit the degree of vulnerability and the objectives in the management zones, a decision-making tool is necessary to conduct management actions which can reduce the vulnerability, maintain ecosystem health and vitality under climate change, to aid the landscape sustainable development. The climate-oriented landscape planning framework presented in Fig. 5.
Figure 5: Decision framework for climate-oriented landscape planning
5. Conclusion Understanding how complex systems react to change is a prerequisite for sustainable landscape planning. Integrating climate change into landscape planning therefore requires a perception of ecological vulnerability to this stressor. Our research objective was to analyze the ecosystem vulnerability in order to integrate the uncertainties and vulnerabilities of climatic change into landscape planning, by simulating the basic component, species regeneration, in ecosystem. As we gain simulation results about species regeneration we can evaluate spatial landscape vulnerability, which can be used to refine proactive planning through an adaptive planning framework. The conservation of biodiversity and resource values relies on planning management that seek out ways to reduce risk of uncertainties in future development, and this will only be achievable through the perception of landscape vulnerability. Acknowledge
This paper is Supported by National Natural Science Foundation of China(Grant No:
51578176 ).
745
Yu Tingting landscape vulnerability assessment ISOCARP-OAPA Conference 2017
9
References: 1 Albert C, Zimmermann T, Knieling J, et al. Social learning can benefit decision-making in landscape planning: Gartow case study on climate change adaptation, Elbe valley biosphere reserve[J]. Landscape and Urban Planning, 2012, 105(4): 347-360. 2 Kok, M. T. J., & de Coninck, H. C. (2007). Widening the scope of policies to address climate change: Directions for mainstreaming. nvironmental Science & Policy,10(7–8), 587–599. 3 Füssel H M. Adaptation planning for climate change: concepts, assessment approaches, and key lessons[J]. Sustainability science, 2007, 2(2): 265-275. 4 Harvey C A, Chacón M, Donatti C I, et al. Climate‐Smart Landscapes: Opportunities and Challenges for Integrating Adaptation and Mitigation in Tropical Agriculture[J]. Conservation Letters, 2014, 7(2): 77-90. 5 Nitschke C R, Innes J L. Integrating climate change into forest management in South-Central British Columbia: an assessment of landscape vulnerability and development of a climate-smart framework[J]. Forest Ecology and Management, 2008, 256(3): 313-327. 6 Ohlson, D.W., McKinnon, G.A., Hirsch, K.G., 2005. A structured decision-making approach to climate change adaptation in the forest sector. For. Chron. 81 (1),97–103. 7 Sheppard S R J, Shaw A, Flanders D, et al. Future visioning of local climate change: a framework for community engagement and planning with scenarios and visualisation[J]. Futures, 2011, 43(4): 400-412. 8 Gill S E, Handley J F, Ennos A R, et al. Adapting cities for climate change: the role of the green infrastructure[J]. Built Environment (1978-), 2007: 115-133. 9 Manning, M., Petit, M., Easterling, D., Murphy, J., Patwardhan, A., Rogner, H.-H.,Swart, R., Yohe, G., 2004. Describing Scientific Uncertainties in Climate Change to Support Analysis of Risk and of Options. IPCC Workshop Report. NationalUniversity of Ireland, Maynooth, Co. Kildare, Ireland, May 11–13, 2004. 10 Parry M L, Canziani O F, Palutikof J P, et al. Contribution of working group II to the fourth assessment report of the intergovernmental panel on climate change, 2007[J]. Climate Change 2007: Working Group II: Impacts, Adaptation and Vulnerability, 2007. 11 Walck J L, Hidayati S N, Dixon K W, et al. Climate change and plant regeneration from seed[J]. Global Change Biology, 2011, 17(6): 2145-2161. 12 Holtmeier F K, Broll G. Sensitivity and response of northern hemisphere altitudinal and polar treelines to environmental change at landscape and local scales[J]. Global ecology and Biogeography, 2005, 14(5): 395-410. 13 Bakkenes M, Alkemade J R M, Ihle F, et al. Assessing effects of forecasted climate change on the diversity and distribution of European higher plants for 2050[J]. Global Change Biology, 2002, 8(4): 390-407. 14 Epperson, B.K., 2003. Geographical Genetics, vol. 38. Princeton University Press, Princeton, NJ. 15 Kimmins J P. Forest Ecology; A foundation for Sustainable Forest Management and Environmental Ethics in Forestry. Thired Edition[J]. 2004. 16 Bugmann H (2001) A review of gap models. Climatic Change, 51, 259–305. 17 Botkin, J.B., 1993. Forest Dynamics: An Ecological Model. Oxford University Press, Oxford, UK. 18 Walck JL, Hidayati SN, Dixon KW, Thompson K, Poschlod P (2011) Climate change and plant regeneration from seed. Global Change Biology, 17, 2145–2161. 19 Gunderson, L.H., Holling, C.S., Pritchard Jr., L., Peterson, G.D., 2002. Resilience of large-scale resource systems. In: Gunderson, L.H., Pritchard Jr., L. (Eds.), SCOPE 60: Resilience and Behaviour of Large-Scale Systems. Island Press, Washington, USA, pp. 3–20. 20 Nitschke C R, Innes J L. A tree and climate assessment tool for modelling ecosystem response to climate change[J]. Ecological modelling, 2008, 210(3): 263-277. 21 Hollenstein, K., 2001. Risk analysis as a tool for policy evaluation: a multi-levelcomparison example. In: Risk Analysis in Forest Management, Kluwer Academic Press, The Netherlands, pp. 75–112.
746
Yu Tingting landscape vulnerability assessment ISOCARP-OAPA Conference 2017
10
22 Bing L I, YUAN Ye. Application of LDAP directory service in uniform identity authentication system [J]. Information Technology, 2005(01):320-322. 23 He Peng, Zhang Huiru. Study on Factor Analysis and Selection of Common Landscape Metrics[J]. Forest Research, 2009, 22(4): 470-474. (何鹏, 张会儒. 常用景观指数的因子分析和筛选方法研究 [J]. 林业科学研究, 2009, 22(4): 470-474.) 24 Sample, V.A., 2005. Sustainable forestry and biodiversity conservation: toward a new consensus. J. Sustain. For. 21 (4), 137–150. 25 Seymour, R.S., Hunter Jr., M.L., 1992. New forestry in eastern spruce-fir forests: principles and applications in Maine. Maine Agriculture and Forestry Experiment Station Miscellaneous Publication 716. 26 Nitschke, C.R., Innes, J.L., 2005. The application of forest zoning as an alternative to multiple use forestry. In: Forestry and Environmental Change: Socioeconomic and Political Dimensions, CAB International, Oxford, pp. 97–124. 27 Nitschke C R, Innes J L. A tree and climate assessment tool for modelling ecosystem response to climate change[J]. Ecological modelling, 2008, 210(3): 263-277. 28 Mok H-F, Arndt SK, Nitschke CR (2012)Modelling the potential impact of climate variability and change on species regeneration potential in the temperate forests of south-eastern Australia. Global Change Biol 18:1053–1072.
747
Effects of Climate Change on Lagos Coastal Communities –
Case Study of Selected Lagos Coastal Communities in Eti-Osa LGA
of Lagos State, Nigeria
Aliu OGUNFOWORA
Abstract
This study examined the effects of climate change on Lagos coastal communities using selected communities (Okun-Alfa, Lafiaji Village, Okun-Ajah and Mopo-Akinlade) in Eti-Osa Local Government Area as case study. The research proposed that the effects of climate change have a significant impact on the livelihood of residents and the environment at large. Hence, it determined the extent of vulnerability of Eti-Osa coastal communities to effects of climate change. It examined its effects on socio-economic characteristics of people in the study area. It also examined the extent of change in land cover over time in the coastal communities and also proffer mitigation measures to climate change effects.
A qualitative research approaches was adopted in this study with relevant primary data gotten through the use of interviews and personal observation. Secondary data used were extracted from research works on coastal areas, remotely sensed data taken from 50m Landsat and Google Earth imageries, processed with Environment for Visualizing Images (ENVI) and analysed through the use of ArcGIS.
Findings from the research revealed that these coastal communities in Eti-Osa Local Government are highly vulnerable to effects of climate change which includes flooding, coastal erosion, loss of vegetation, loss of wetland, environmental degradation etc. It was also found that there has been a visible change in land cover between 1984 and 2014 with 19.23sq km loss of wetland and 11.94sq km increased in built-up area. This wetland loss have been attributed to the effects of climate change, uncontrolled development and urbanization in the coastal communities. Findings also showed that persistent ocean surge over the last couple of years have increased erosion rate with over 76% loss of land along the shoreline at Okun-Alfa and 11% land loss at Okun-Ajah end of the study area. Possible accretion was also noticed in Lafiaji which amounts to 18meters gained seawards. This study recommends mitigation measures to climate change which follow a process, this includes: to ensure the design and implementation of a sustainable master plan for coastal communities in Lagos and also provide effective policy framework to guide development in all coastal zones.; reforestation by planting of trees and mangroves to serve as carbon sink and curb coastal erosion; inculcate the use of renewable energy and lastly increase awareness and education of people.
Introduction
The Lagos coast is one that is significantly undergoing changes as a result of activities which are enhanced by the effect of climate change. Also, subsidence could make the incidence of sea level rise more serious along the Lagos Shoreline and thus have an impact on the coastal communities. The Lagos coasts is changing in form at an alarming rate. This infer that the undergoing changes which is as a result of different factors, thus coastal land, adjoining coastal uses and activities are in great danger and these is already taking effect on the livelihood and development in coastal areas in Lagos. Cowell et al., (2003) posits that the
748
coasts are dynamic systems, undergoing adjustments of form and process (morphodynamics) at different time and space scales in response to geomorphological and oceanographic factors. Also Human activities in coastal area adds more pressures which may dominate over natural processes.
According to Mary et al (2011), coastal communities are those located close or surrounded by the rivers, ocean or characterised by their nearness to it (e.g. estuary towns, seaside resorts, port and island communities). Coastal areas and their surrounding communities face an increasing number of threats to the health of their environments and ways of life, including loss of marine habitat, water pollution and impacts from climate change (EBM Network, 2010). Adjoining these coastal plains, zones etc. are Riparian zones which could be described as an interphase between land (where we have the coastal communities) and the ocean. Within the riparian zone there are constant ocean processes which involve regular movement of water over land and this brings about exchange and movement of sediments along the shoreline.
Extreme susceptibility of the Lagos shoreline or riparian zones means that all component part or activities located in these areas are also likely to be affected by climate change. This to a great extent is visible in the case for those activities that depend on weather for their existence, such as agriculture, tourism, recreation etc. Lagos coastal zones (i.e. communities and other area around the zone) are highly sensitive and exposed to climate change and will, therefore, be significantly impacted and affected by it. It is pertinent to point out that the UNWTO (2008) identified coastal zones among the most vulnerable tourist destinations and the Mediterranean coast as one of the main vulnerability hotspots.
According to African Ministerial Conference on Environment (2011), Climate change poses a big threat to Africa’s economic growth (as a result in change in resources and eco system), distant future prosperity, as well as the survival of the already vulnerable populations. McCarthy as quoted by Ann O. (2013), Climate change refers to any change in climate overtime, whether due to natural variability or as a result of human activity .It can also be seen as: “a change of climate which is attributed directly or indirectly to human activity that alters the composition of the global atmosphere and which is in addition to natural climate variability observed over comparable time periods (Parry 2007: 9).
The Intergovernmental Panel on Climate Change (IPCC, 2007) estimated that 40% of the population of West Africa live in coastal cities and are vulnerable to the consequence of climate change. According to IPCC (1990), the coastal nations of west and central Africa (e.g. Angola, Benin, Cameroon, Gabon, Gambia, Ghana, Nigeria, Senegal, Sierra Leone, etc.) are susceptible to flooding and erosion as a result of low lying coastal zones. This infers that with a few meters in sea level rise, a greater population of these countries are threatened because they are developing countries with rapid expanding cities along the coast. Furthermore, the Nigerian coast notably Lagos coast is one of the low lying ones in Western Africa, which is likely to experience severe effects from erosion, flooding as a result of rising sea levels enhanced by climate change. Therefore Lagos with about 180km of shoreline is in grave danger of climate change effects. Climate change will worsen the present socioeconomic, physical and ecological pattern of the Lagos coastal environment.
Most climate change studies have discussed more on its effect with regards to greenhouse gases emission as a result of human activities and also sea-level rise, flooding, erosion and not taking it along with real issue of loss of resources, economic implication and mitigations against the effect of climate change on coastal area. Climate change is expected to have effects on the overall economy of poor countries, thus hampering potential for economic
749
growth. In addition poor adaptation will increase the impacts of extreme events, increasing the costs of rehabilitation and diverting funds from longer term development purposes. Current extreme weather events are already taking their toll on developing countries’ economies, leading to loss of human and economic capital (Deborah, 2010).
This study examines the effect of climate change on the Lagos coastal area with a view to proffer mitigation measures that will curtail its effect on the resources and socio-economy of Lagos coastal communities thus determining the extent of vulnerability to climate change, its effects on socio economy and livelihood and also determine the loss of asset i.e. both natural and man-made resources.
Literature review
For Africa, the climate change debate has primarily focused on adaptation rather than mitigation as historically Africa’s contribution to global GHG emissions has been small - approximately 1.75% of global energy CO2 emissions from 1950-2000; and 3.85% of annual GHG emissions in 2000 (Winkler et.al, 2009) whereas the African continent has been identified to be the worst affected by the impacts from climate change (AR4 IPCC, 2007). Climate change is projected to have wide-ranging influence on economic, physical environment, resources, ecology and societal systems. Climate Change Mitigation relates to technological, economic, and social changes and substitutions that lead to reductions in GHG emissions (Simpson et al., 2008). It can be achieved by introducing environmental concepts that guards against possible climate effects which are socio-economically oriented.
Livelihood and Climate Change
The interaction of livelihoods and climate change usually depends on interplay of climatic parameters and the societal background of the environment. The location and characteristics of the environment give rise to various types of climates ranging from tropical rainforest along the coasts to savannah climate in northern Nigeria (Ogundiran, 2005). The relatively large inter-annual variability of rainfall in northern Nigeria usually results in hazards from floods and droughts, with their devastating effects on livelihoods. From an understanding of water balance, a variation in evapo- transpiration and evaporation, Nigeria as a nation have a temporal variation and large spatial experience in rainfall. These has revealed that socio-economic, agricultural and agro-allied activities are been affected by any form of variation in climate. Sea-level rise, pests and disease incidents, crop growth, soil fertility/ acidity, soil erosion and soil water availability could determine the implications of climate change either positive or negative.
Akinwale (2010) explains that Livelihood is a holistic phenomenon, connecting different aspects of social life with resources and their utilization. Essentially, the discourse on livelihood cannot be disconnected from an understanding of environmental and socio-cultural societal context. Environmental factors influences livelihood, including rainfall and other natural resources, as well as socio-cultural factors, such as economy, politics, and kinship networks. Conversely, these factors influence the extent to which people manage or mismanage the environment.
Climate Change and Vulnerability of Coastal Settlement.
The IPCC-CZMS (1992) defines vulnerability of coastal communities as the degree to which they are incapable of coping with the impact of climate change and accelerated sea level rise. Over-exploitation of fisheries resources, followed by agriculture, transport sources, and poorly
750
planned and managed coastal developments, have led to rapid degradation of vulnerable coastal and offshore habitats (Churcher, 2006). Also, depletion of biodiversity has aided climate change, which threatens human survival (Ajetomobi et. al., 2010). Climate change, through extreme temperature, frequent flooding, drought, and increased salinity of water used for irrigation, has become a recurrent environmental problem in Nigeria. Although climate change is a threat to general socioeconomic development, agricultural activities are generally more vulnerable to climate change than other sectors (Ajetomobi et. al., 2010). The agricultural sector also constitutes an arena of threats to climate change in Nigeria.
In an attempt to provide a comprehensive definition for vulnerability to climate change, Patwardhan (2006), enumerated a five-part definition which relates to the issues and objectives of a vulnerability assessment. “In his view vulnerability may be defined as:
a) The degree of exposure: a measure of the possible hazards to human economic systems, such as the outcomes of future sea level changes.
b) Degree of effects: a measure of the physical impacts caused by hazards, such as changes in beach width or a shift in the flood-frequency statistics for a coastal location.
c) The degree of loss: a measure of the change in benefits from economic goods and services caused by climate change, in a ‘do-nothing’ situation.
d) The degree of least loss: a measure of the changes in benefits from economic goods and services caused by hazards, in a situation where the optional policy response is adapted.
e) The opportunity cost of inaction: the difference between the loss for a ‘do-nothing’ situation and a situation where the optional policy response is considered”.
United Nations Framework Convention on Climate Change (2007) Climate change will have wide-ranging effects on the environment, and on socio-economic and related sectors, including water resources, agriculture and food security, human health, terrestrial ecosystems and biodiversity and coastal zones. Changes in rainfall pattern are likely to lead to severe water shortages and/or flooding. Melting of glaciers can cause flooding and soil erosion. Rising temperatures will cause shifts in crop growing seasons which affects food security and changes in the distribution of disease vectors putting more people at risk from diseases such as malaria and dengue fever. Temperature increases will potentially severely increase rates of extinction for many habitats and species (up to 30 per cent with a 2° C rise in temperature).
NEST (2011) noted that Nigeria is vulnerable to the impacts of climate change largely because about 70% of Nigerians are engaged in small holder rain-fed agriculture. For Nigeria, agriculture is important because about 42% of the country’s GDP comes from agriculture and related activities. The impact of climate change is very visible in most communities in Nigeria, from the Sahel in the north to the rainforest and coastal zone in the south. The high population coupled with high poverty levels and rapid economic growth, are making huge demands on Nigeria's natural resources. Climate change impacts compound existing pressures on these resources (NEST, 2011).
The Study Area.
Lagos the commercial nerve centre of Nigeria with a total land area of approximately 3,345 sq km and population of about 20 million people according to UN HABITAT is one of the fastest
751
growing mega city in the world. This coastal city has an approximate of 180 sq km of coastline with lowland areas and as pointed out by Olajide and Lawanson (2014), is characterized by water bodies and wetlands cover over 40% of the total land area of Lagos and an additional 12% is subject to seasonal flooding.
Lagos is a group of several large islands separated by creeks on a vast lagoon on the Bight of Benin, bordered by the Atlantic Ocean. Lagos has a population density of 4906.78 persons per square kilometre Olajide and Lawanson (2014). Of the 20 local government area in lagos, Nigeria, the metropolis constitute and covers 16 local government area of urbanized area. Thirty seven percent (37%) of the landmass of Lagos state which is covered by the metropolis (Eti-Osa LGA included) accommodates 80% of state’s population. Olajide and Lawanson (2014), in the heavily built-up area of the metropolis, average population density is as high as 20,000 per sq km. The occupancy ratio ranges between 8 and 10 persons per room, with 72.5% of households occupying one-room apartment. The topographic characteristics of Lagos State with about 80m at its highest point above sea level slopes down from north to south, which accommodated the major coastline communities (Mopo Akinlade, Okun Ajah, Lafiaji and Okun Alfa) of the study in Eti-Osa LG of the state. There is a grave threat to the livelihood and assets of these communities which have built up areas within 1m above sea level with a significant increase in it. According to IPCC and Nigerian Meteorological Agency it has been proven that hazards stimulated climate change, predominantly flooding and sea level rise, envisages that Lagos is likely to be one of the most negatively impacted urban area in Nigeria as a result of its low-lying and costal location with a high concentration of population and economic activities (Spurgeon et al. 2009).
Adelekan (2010) stated that 50% and 79% of the inhabitants live within 500 m of the coastline, often on unstable in-fill land created by sand filling. There has been a growing awareness of and concern for the problems of shoreline erosion around Lagos, and several other locations along the entire coastal line in Nigeria (Abegunde 1988, Sogbon 2005). The erosion effects among others pose threat to property and lives (Ojo, 2001). The severity of shoreline erosion, other environmental issues and storms as enunciated Adelekan (2010) has increased over the years and has had devastating effects on the residents’ livelihoods, particularly the low income.
Methodology
Majorly a qualitative research approach was used to conduct this research. The study also integrates remote sensing of data with geographic information system whereby information on floods, erosion, desertification, vulnerability and other natural hazards, can be acquired. The analysis of a maximum of 15 documents was decided after the scanning of possibly relevant resources as an appropriate number of documents for the scope of this research. Data used for this research are from Primary and Secondary sources. The primary data was obtained through Field visits, Field mapping, and key informant interviews such as heads of communities, community chiefs, elders and other opinion leaders within the study area and through reconnaissance survey. This was done in a bid to locate and assess area vulnerable in the communities. This also helped in obtaining land cover samples which was used for the purpose of training the computer to recognize the pixels relating to each class when processing for land cover of the area. Secondary data was obtained from a census of all publications on the Lagos coastal area since Year 2000 and documentation from relevant government bodies and media houses related on coastal area and environment. Satellite imagery of relevant dataset of the area was also acquired, processed and analysed to
752
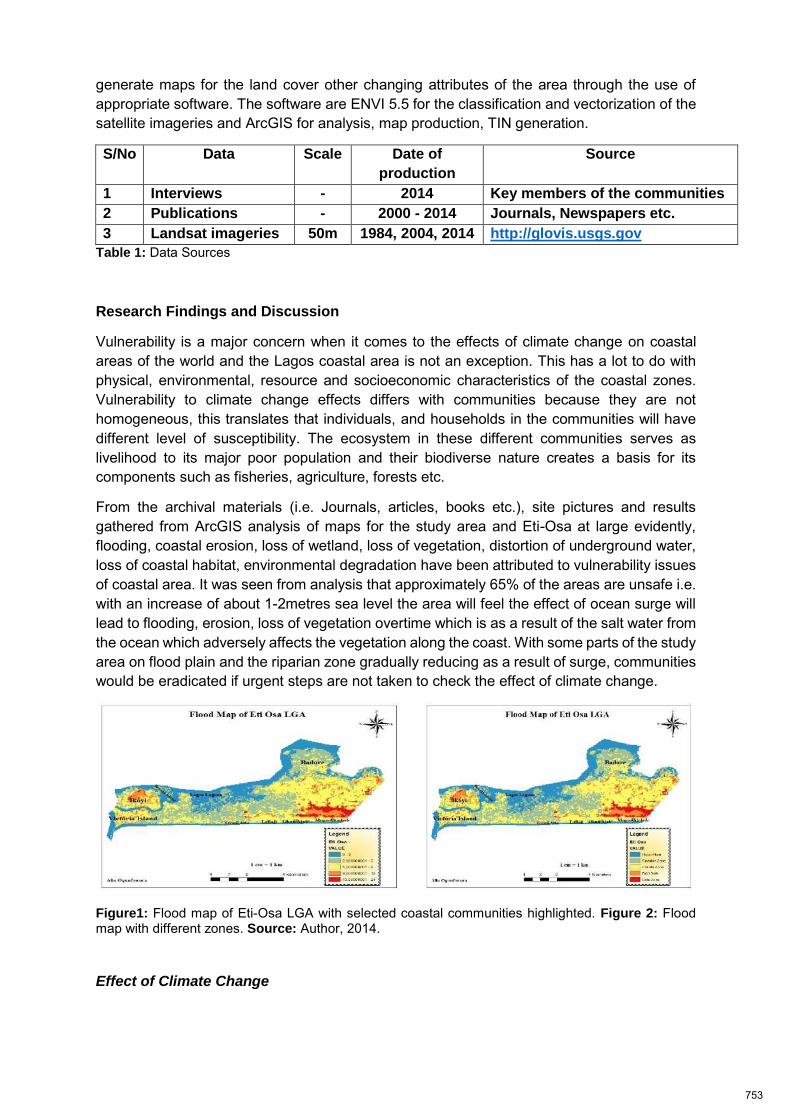
generate maps for the land cover other changing attributes of the area through the use of appropriate software. The software are ENVI 5.5 for the classification and vectorization of the satellite imageries and ArcGIS for analysis, map production, TIN generation.
S/No Data Scale Date of
production
Source
1 Interviews - 2014 Key members of the communities
2 Publications - 2000 - 2014 Journals, Newspapers etc.
3 Landsat imageries 50m 1984, 2004, 2014 http://glovis.usgs.gov
Table 1: Data Sources
Research Findings and Discussion
Vulnerability is a major concern when it comes to the effects of climate change on coastal areas of the world and the Lagos coastal area is not an exception. This has a lot to do with physical, environmental, resource and socioeconomic characteristics of the coastal zones. Vulnerability to climate change effects differs with communities because they are not homogeneous, this translates that individuals, and households in the communities will have different level of susceptibility. The ecosystem in these different communities serves as livelihood to its major poor population and their biodiverse nature creates a basis for its components such as fisheries, agriculture, forests etc.
From the archival materials (i.e. Journals, articles, books etc.), site pictures and results gathered from ArcGIS analysis of maps for the study area and Eti-Osa at large evidently, flooding, coastal erosion, loss of wetland, loss of vegetation, distortion of underground water, loss of coastal habitat, environmental degradation have been attributed to vulnerability issues of coastal area. It was seen from analysis that approximately 65% of the areas are unsafe i.e. with an increase of about 1-2metres sea level the area will feel the effect of ocean surge will lead to flooding, erosion, loss of vegetation overtime which is as a result of the salt water from the ocean which adversely affects the vegetation along the coast. With some parts of the study area on flood plain and the riparian zone gradually reducing as a result of surge, communities would be eradicated if urgent steps are not taken to check the effect of climate change.
Figure1: Flood map of Eti-Osa LGA with selected coastal communities highlighted. Figure 2: Flood map with different zones. Source: Author, 2014.
Effect of Climate Change
753
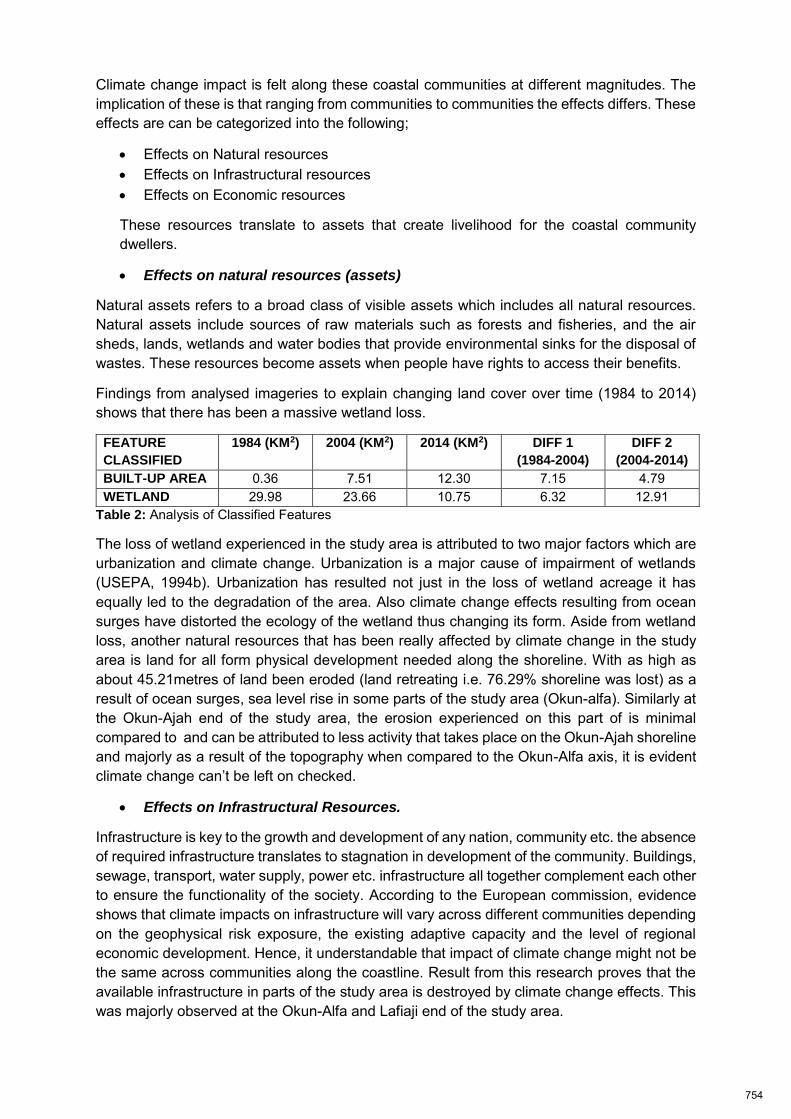
Climate change impact is felt along these coastal communities at different magnitudes. The implication of these is that ranging from communities to communities the effects differs. These effects are can be categorized into the following;
Effects on Natural resources Effects on Infrastructural resources Effects on Economic resources
These resources translate to assets that create livelihood for the coastal community dwellers.
Effects on natural resources (assets)
Natural assets refers to a broad class of visible assets which includes all natural resources. Natural assets include sources of raw materials such as forests and fisheries, and the air sheds, lands, wetlands and water bodies that provide environmental sinks for the disposal of wastes. These resources become assets when people have rights to access their benefits.
Findings from analysed imageries to explain changing land cover over time (1984 to 2014) shows that there has been a massive wetland loss.
FEATURE
CLASSIFIED
1984 (KM2) 2004 (KM2) 2014 (KM2) DIFF 1
(1984-2004)
DIFF 2
(2004-2014)
BUILT-UP AREA 0.36 7.51 12.30 7.15 4.79 WETLAND 29.98 23.66 10.75 6.32 12.91
Table 2: Analysis of Classified Features
The loss of wetland experienced in the study area is attributed to two major factors which are urbanization and climate change. Urbanization is a major cause of impairment of wetlands (USEPA, 1994b). Urbanization has resulted not just in the loss of wetland acreage it has equally led to the degradation of the area. Also climate change effects resulting from ocean surges have distorted the ecology of the wetland thus changing its form. Aside from wetland loss, another natural resources that has been really affected by climate change in the study area is land for all form physical development needed along the shoreline. With as high as about 45.21metres of land been eroded (land retreating i.e. 76.29% shoreline was lost) as a result of ocean surges, sea level rise in some parts of the study area (Okun-alfa). Similarly at the Okun-Ajah end of the study area, the erosion experienced on this part of is minimal compared to and can be attributed to less activity that takes place on the Okun-Ajah shoreline and majorly as a result of the topography when compared to the Okun-Alfa axis, it is evident climate change can’t be left on checked.
Effects on Infrastructural Resources.
Infrastructure is key to the growth and development of any nation, community etc. the absence of required infrastructure translates to stagnation in development of the community. Buildings, sewage, transport, water supply, power etc. infrastructure all together complement each other to ensure the functionality of the society. According to the European commission, evidence shows that climate impacts on infrastructure will vary across different communities depending on the geophysical risk exposure, the existing adaptive capacity and the level of regional economic development. Hence, it understandable that impact of climate change might not be the same across communities along the coastline. Result from this research proves that the available infrastructure in parts of the study area is destroyed by climate change effects. This was majorly observed at the Okun-Alfa and Lafiaji end of the study area.
754
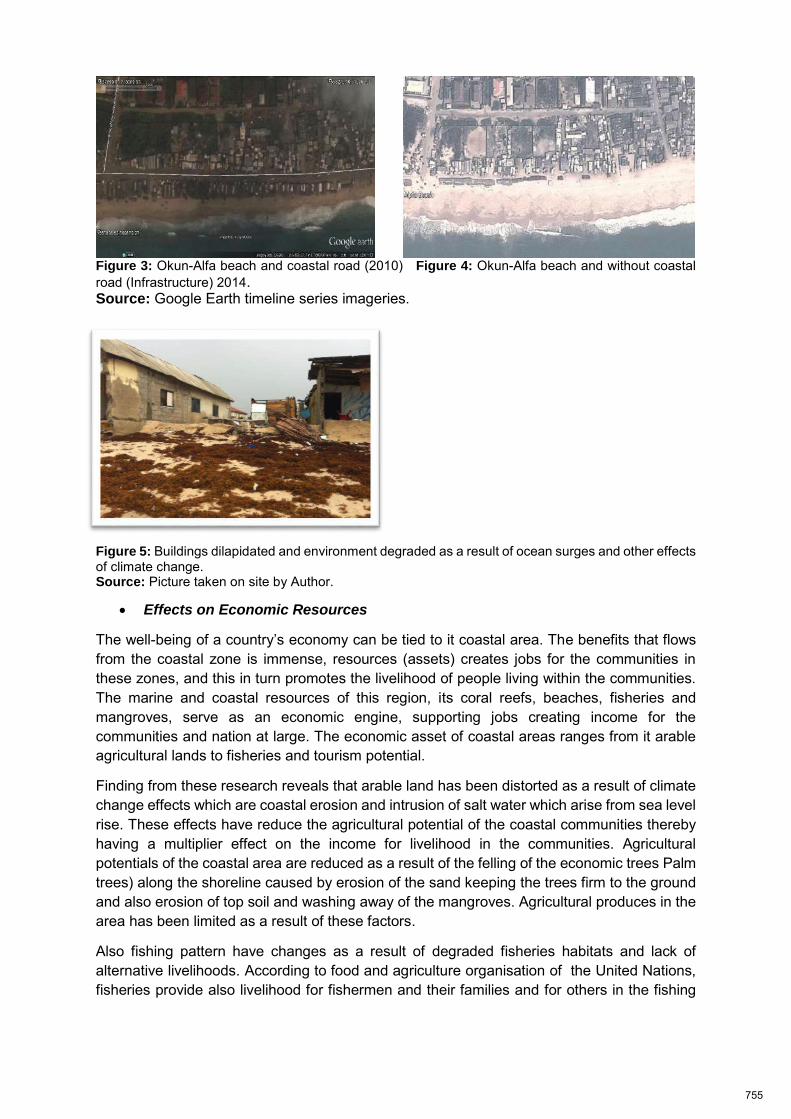
Figure 3: Okun-Alfa beach and coastal road (2010) Figure 4: Okun-Alfa beach and without coastal road (Infrastructure) 2014. Source: Google Earth timeline series imageries.
Figure 5: Buildings dilapidated and environment degraded as a result of ocean surges and other effects of climate change. Source: Picture taken on site by Author.
Effects on Economic Resources
The well-being of a country’s economy can be tied to it coastal area. The benefits that flows from the coastal zone is immense, resources (assets) creates jobs for the communities in these zones, and this in turn promotes the livelihood of people living within the communities. The marine and coastal resources of this region, its coral reefs, beaches, fisheries and mangroves, serve as an economic engine, supporting jobs creating income for the communities and nation at large. The economic asset of coastal areas ranges from it arable agricultural lands to fisheries and tourism potential.
Finding from these research reveals that arable land has been distorted as a result of climate change effects which are coastal erosion and intrusion of salt water which arise from sea level rise. These effects have reduce the agricultural potential of the coastal communities thereby having a multiplier effect on the income for livelihood in the communities. Agricultural potentials of the coastal area are reduced as a result of the felling of the economic trees Palm trees) along the shoreline caused by erosion of the sand keeping the trees firm to the ground and also erosion of top soil and washing away of the mangroves. Agricultural produces in the area has been limited as a result of these factors.
Also fishing pattern have changes as a result of degraded fisheries habitats and lack of alternative livelihoods. According to food and agriculture organisation of the United Nations, fisheries provide also livelihood for fishermen and their families and for others in the fishing
755
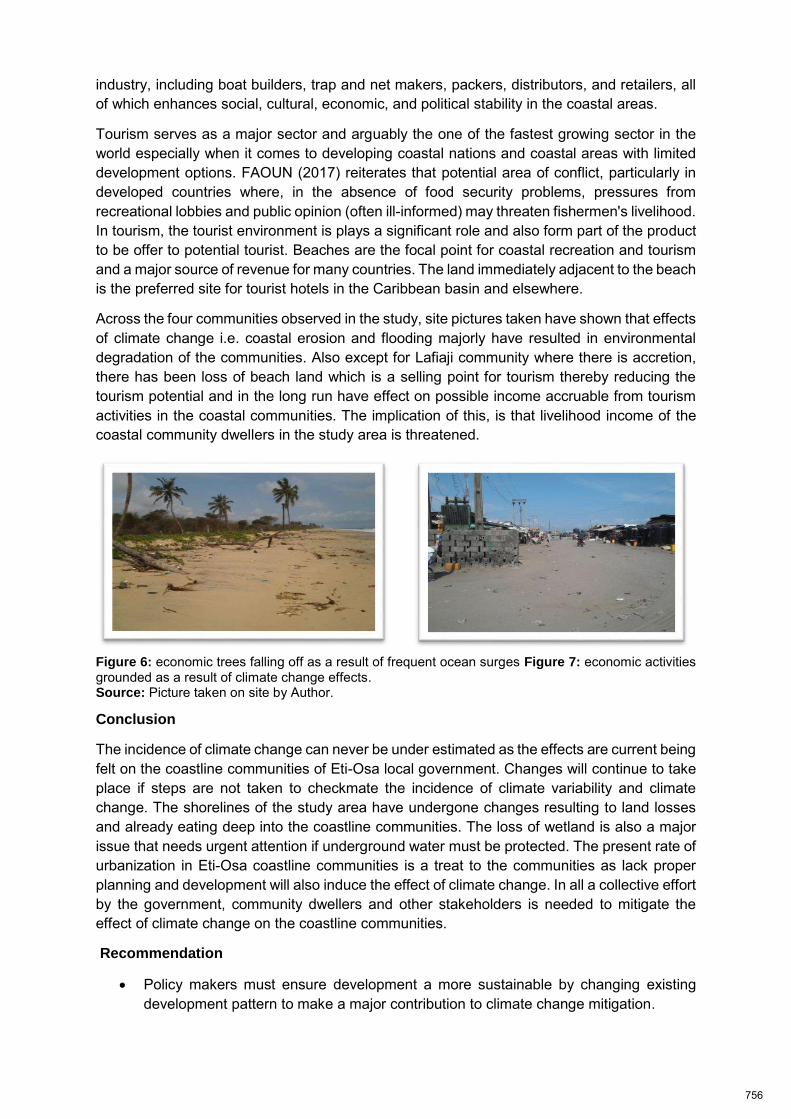
industry, including boat builders, trap and net makers, packers, distributors, and retailers, all of which enhances social, cultural, economic, and political stability in the coastal areas.
Tourism serves as a major sector and arguably the one of the fastest growing sector in the world especially when it comes to developing coastal nations and coastal areas with limited development options. FAOUN (2017) reiterates that potential area of conflict, particularly in developed countries where, in the absence of food security problems, pressures from recreational lobbies and public opinion (often ill-informed) may threaten fishermen's livelihood. In tourism, the tourist environment is plays a significant role and also form part of the product to be offer to potential tourist. Beaches are the focal point for coastal recreation and tourism and a major source of revenue for many countries. The land immediately adjacent to the beach is the preferred site for tourist hotels in the Caribbean basin and elsewhere.
Across the four communities observed in the study, site pictures taken have shown that effects of climate change i.e. coastal erosion and flooding majorly have resulted in environmental degradation of the communities. Also except for Lafiaji community where there is accretion, there has been loss of beach land which is a selling point for tourism thereby reducing the tourism potential and in the long run have effect on possible income accruable from tourism activities in the coastal communities. The implication of this, is that livelihood income of the coastal community dwellers in the study area is threatened.
Figure 6: economic trees falling off as a result of frequent ocean surges Figure 7: economic activities grounded as a result of climate change effects. Source: Picture taken on site by Author.
Conclusion
The incidence of climate change can never be under estimated as the effects are current being felt on the coastline communities of Eti-Osa local government. Changes will continue to take place if steps are not taken to checkmate the incidence of climate variability and climate change. The shorelines of the study area have undergone changes resulting to land losses and already eating deep into the coastline communities. The loss of wetland is also a major issue that needs urgent attention if underground water must be protected. The present rate of urbanization in Eti-Osa coastline communities is a treat to the communities as lack proper planning and development will also induce the effect of climate change. In all a collective effort by the government, community dwellers and other stakeholders is needed to mitigate the effect of climate change on the coastline communities.
Recommendation
Policy makers must ensure development a more sustainable by changing existing development pattern to make a major contribution to climate change mitigation.
756
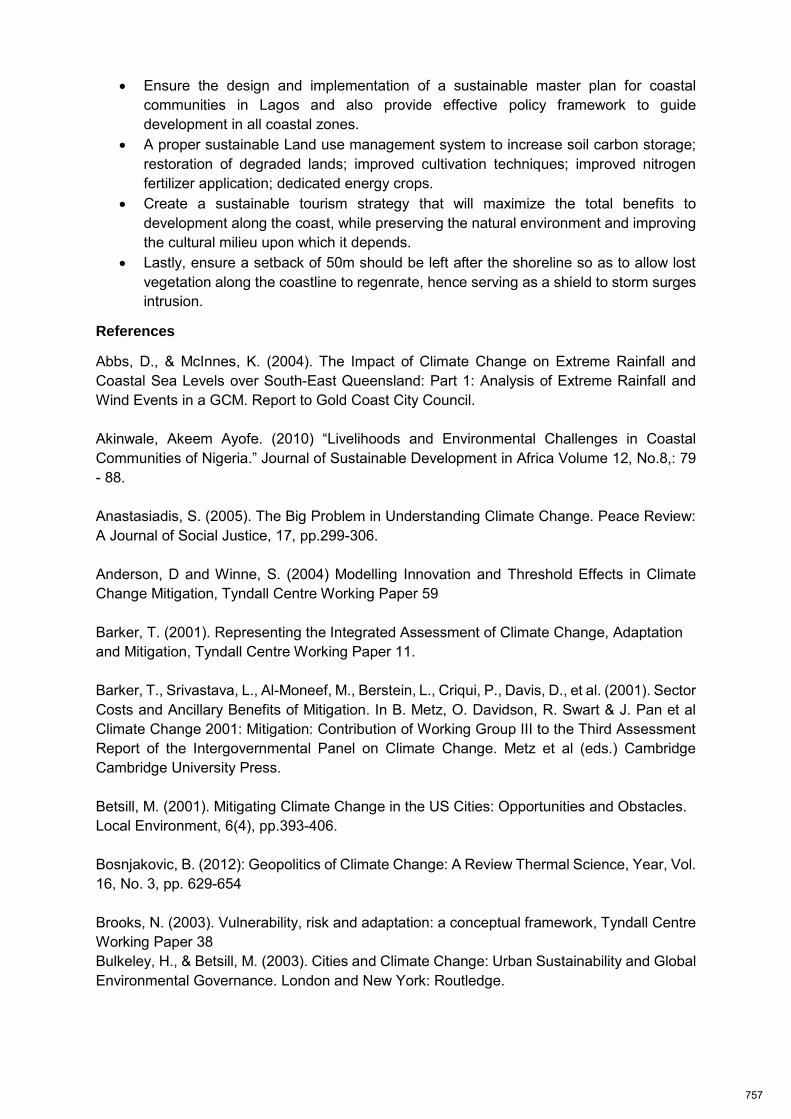
Ensure the design and implementation of a sustainable master plan for coastal communities in Lagos and also provide effective policy framework to guide development in all coastal zones.
A proper sustainable Land use management system to increase soil carbon storage; restoration of degraded lands; improved cultivation techniques; improved nitrogen fertilizer application; dedicated energy crops.
Create a sustainable tourism strategy that will maximize the total benefits to development along the coast, while preserving the natural environment and improving the cultural milieu upon which it depends.
Lastly, ensure a setback of 50m should be left after the shoreline so as to allow lost vegetation along the coastline to regenrate, hence serving as a shield to storm surges intrusion.
References
Abbs, D., & McInnes, K. (2004). The Impact of Climate Change on Extreme Rainfall and Coastal Sea Levels over South-East Queensland: Part 1: Analysis of Extreme Rainfall and Wind Events in a GCM. Report to Gold Coast City Council. Akinwale, Akeem Ayofe. (2010) “Livelihoods and Environmental Challenges in Coastal Communities of Nigeria.” Journal of Sustainable Development in Africa Volume 12, No.8,: 79 - 88. Anastasiadis, S. (2005). The Big Problem in Understanding Climate Change. Peace Review: A Journal of Social Justice, 17, pp.299-306. Anderson, D and Winne, S. (2004) Modelling Innovation and Threshold Effects in Climate Change Mitigation, Tyndall Centre Working Paper 59 Barker, T. (2001). Representing the Integrated Assessment of Climate Change, Adaptation and Mitigation, Tyndall Centre Working Paper 11. Barker, T., Srivastava, L., Al-Moneef, M., Berstein, L., Criqui, P., Davis, D., et al. (2001). Sector Costs and Ancillary Benefits of Mitigation. In B. Metz, O. Davidson, R. Swart & J. Pan et al Climate Change 2001: Mitigation: Contribution of Working Group III to the Third Assessment Report of the Intergovernmental Panel on Climate Change. Metz et al (eds.) Cambridge Cambridge University Press. Betsill, M. (2001). Mitigating Climate Change in the US Cities: Opportunities and Obstacles. Local Environment, 6(4), pp.393-406. Bosnjakovic, B. (2012): Geopolitics of Climate Change: A Review Thermal Science, Year, Vol. 16, No. 3, pp. 629-654 Brooks, N. (2003). Vulnerability, risk and adaptation: a conceptual framework, Tyndall Centre Working Paper 38 Bulkeley, H., & Betsill, M. (2003). Cities and Climate Change: Urban Sustainability and Global Environmental Governance. London and New York: Routledge.
757
Bulkeley, H., & Betsill, M. (2005). Rethinking Sustainable Cities: Multilevel Governance and the ‘Urban’ Politics of Climate Change. Environmental Politics, 14(1), pp.42-63. Burns, W. (2000). The impact of climate change on Pacific Island developing countries in the 21st century. In A. Gillespie & W. Burns (Eds.), Climate change in the South Pacific: Impacts and responses in Australia, New Zealand, and small island states (pp. 233-250). Dordrecht: Kluwer. Carter, T.R., Jones, R.N., Lu, X., Bhadwal, S., Conde, C., Mearns, L.O., O’Neill, B.C.,Rounsevell, M.D.A., Zurek, M.B., 2007. New assessment methods and the characterisation of future conditions. Chapin, F. S., G. R. Shaver, A. E. Giblin, K. J. Nadelhoffer, and J. A. Laundre. 1995. Responses of arctic tundra to experimental and observed changes in climate. Ecology 76: 694-711. Davies, A (2005) Local Action for Climate Change: Transnational Networks and the Irish Experience. Local Environment. 10(1), pp.21-40 Davidson O et al (2003b) ‘South African energy futures: visions, driving factors and sustainable development indicators.’ Internal project report for Phase I of the sustainable development and climate change project. Energy & Development Research Centre, University of Cape Town, South Africa. Dolan, A H and I J Walker (2004), “Understanding vulnerability of coastal communities to climate change-related risks”, Journal of Coastal Research Vol 39, pages 1317–1324 Evans, P. R., and P. J. Dugan. 1984. Coastal birds: Numbers in relation to food resources. In: P. R. Evans, J. D. Goss- Custard and W. G. Hale, editors. Coastal waders and wildfowl in winter. cambridge: Cambridge University Press. Gollier, C., Treich, N., 2003. Decision-making under scientific uncertainty: the economics of the precautionary principle. Journal of Risk and Uncertainty 27 (1), 77–103. Hassal, S. J., Arctic (2005) Climate Impact Assessment: Impacts of a Warming Arctic – Highlights, Cambridge University Press, New York, USA. Hepburn, C., Stern, N., (2009) The Global Deal on Climate Change, in: The Economics and Politics of Climate Change (Eds. D. Helm, C. Hepburn), Oxford University Press, Oxford, UK, pp. 36-57 IPCC (2001a) Climate change 2001: Vulnerability and Adaptation. Contribution of working group II to the third assessment report of the intergovernmental panel on climate change, Cambridge University Press IPCC (2001b) Climate change 2001: Mitigation. Contribution of working group III to the third assessment report of the intergovernmental panel on climate change, Cambridge University Press IPCC (2002) Climate change 2001: Synthesis report. Cambridge University Press
758
IPCC, 2007. In: Solomon, S., Qin, D., Manning, M., Chen, Z., Marquis, M., Averyt, K.B., Tignor, M., Miller, H.L. (Eds.), Climate Change 2007: The Physical Science Basis. Contribution of Working Group I to the Fourth Assessment Report of the Intergovernmental Panel on Climate Change. Cambridge University Press, Cambridge, United Kingdom and New York, NY, USA, 996 pp. Jasper Faber et al., (April 2012), Behavioural Climate Change Mitigation Options and Their Appropriate Inclusion in Quantitative Longer Term Policy Scenarios, Main Report Delft, CE Delft, Behaviour / Climate change / Mitigation / Model research / Analysis / Policy, Publication code: 12.7316.05 Langner J, Bergstom R, Foltescu V. (2005) Impact of Climate Change on Surface Ozone and Deposition of Sulphur and Nitrogen in Europe. Atmos Environ; 39:1129–41. Lecocq, F., Shalizi, Z., 2007. Balancing Expenditures on Mitigation and Adaptation to Climate Change: An Exploration of Issues Relevant to Developing Countries. Policy Research Working Paper 4299. The World Bank. Mitchell, T.D. Carter, T.R., Jones, .P.D, Hulme, M. and New, M. (2004) A comprehensive set of high-resolution grids of monthly climate for Europe and the globe: the observed record (1901-2000) and 16 scenarios (2001-2100), Tyndall Centre Working Paper 55 M.L. Parry, O.F. Canziani, J.P. Palutikof, P.J. van der Linden, C.E. Hanson (Eds.), (2007), Climate Change: Impacts, Adaptation and Vulnerability. Contribution of Working Group II to the Fourth Assessment Report of the Intergovernmental Panel on Climate Change. Cambridge University Press, Cambridge, UK, pp. 133–171. NEST (2011). Reports of Research Projects on Impacts and Adaptation. Building Nigeria’s Response to Climate Change (BNRCC). Ibadan, Nigeria: Nigerian Environmental Study/Action Team (NEST). Nurse, L., McLean, R., Suarez, A., with Ali, M., Hay, J., Maul, G, & Sem, G. (1998). Small Island States. In T. Watson, M. Zinyowera & R. Moss (Eds.), The regional impacts of climate change: An assessment of vulnerability, (pp 333-354). Cambridge: Cambridge University Press. Olsthoorn, A., Maunder, W., & Tol, R. (1999). Tropical cyclones in the Southwest Pacific: Impacts on Pacific Island Countries with particular reference to Fiji. In T. Downing, A. Olsthoorn & R. Tol (Eds.), Climate, change and risk, (pp221-244). London and New York: Routledge. Oluwafemi Olajide & Taibat Lawanson, International Journal of Urban Sustainable Development (2014): Climate change and livelihood vulnerabilities of low-income coastal communities in Lagos, Nigeria, International Journal of Urban Sustainable Development, DOI: 10.1080/19463138.2013.878348 Sedjo, R (2001) Forest ‘Sinks’ as a Tool for Climate-Change Policymaking: A Look at the Advantages and Challenges. Resources, 143, pp.21-24
759
Turnpenny, J., Carney, S., Haxeltine, A., & O’Riordan, T. (2004) Developing Regional and Local Scenarios for Climate Change Mitigation and Adaptation, Part 1: A framing of the East of England, Tyndall Centre Working Paper 54 Simpson et al. (2008), Climate Change Adaptation and Mitigation in the Tourism Sector: Frameworks, Tools and Practices. UNEP, University of Oxford, WTO, WMO: Paris, France. Stern N (2006) Stern Review on the Economics of Climate Change. HM Treasury, accessed at 10 December 2006, available at http://www.hm-treasury.gov.uk/independent_reviews/stern_review_economics_climate_change/stern_review_report.cfm United Nations. (1994b). Article 3 of the United Nations Framework Convention on Climate Change. Retrieved 1 March, 2006, from http://unfccc.int/essential_background/convention/background/items/1355.php Vermont, 1989. Executive Order #79-89: Development of Comprehensive Energy Plan and Creation and Duties of State Agency Task Force on Energy. October 23, 1989. Victor, D.G., House, J.C., Joy, S., (2005) A Madisonian Approach to Climate Policy. Science 309, 1820–1821. Vincent, K. (2004) Creating an Index of Social Vulnerability to Climate Change for Africa, Tyndall Centre Working Paper 56 Weiner, J.B., Stewart, R.B., Hammitt, J.K., Hourcade, J.-C., 2006. Madison and Climate Change Policy. Science 311, 335–336. West Coast Governors (WCG), 2004. West Coast Governors’ Global Warming Initiative /http://www.ef.org/westcoastclimate/S. Accessed April 14, 2007. WHO. The world health report 2002: Reducing Risks and Promoting Healthy Life. Geneva. WHO; 2002. Yohe, G. and R.J.S. Tol. 2006. Indicators for social and economic coping capacity: moving toward a working definition of adaptive capacity. Global Environmental Change 12: 25-40. Yohe, G., E. Malone, A. Brenkert, M.E. Schlesinger, H. Meij, X. Xing, and D. Lee. 2006, Global Distributions of Vulnerability to Climate Change. Integrated Assessment Journal 6: 35-44. Yohe G, Moss R (2000) Economic Sustainability, Indicators and Climate Change. In: Munasinghe M, Swart R (eds) Climate change and its linkages with development, equity and sustainability. Proceedings of the IPCC Expert Meeting in Columbo, Sri Lanka 27–29 April 1999, IPCC and WMO Geneva
760
Niel, L. and Otter, H. Adaptation Support Tool for implementing the New Urban Agenda in cities ‘Joint OAPA-ISOCARP Conference/53rd ISOCARP Congress 2017’
1
ADAPTATION SUPPORT TOOL for implementing the New Urban Agenda in cities
Lena NIEL and Henriëtte OTTER (Deltares, the Netherlands) Contact details: [email protected]
ABSTRACT In January 2017 the New Urban Agenda was adopted, after being drafted by numerous stakeholders at Habitat III in Quito. One of the main objectives of the New Urban Agenda is to make cities more livable and resilient to changes in the future. The agenda however, remains a policy document on a global level and this has started a discussion among urban planning professionals about how objectives can be reached on a local city level. In this paper the city is is approached as a dynamic urban ecosystem that consists of different layers and flows of people, food, energy, waste, transport, water and biodiversity, each with their own spatial characteristics. When planners and designers better understand the functioning of this complex ecosystem on different scales, the city can become more resilient through ecosystem based urban planning and design. This paper introduces an ecosystem based approach using the Adaptation Support Tool to help implement the New Urban Agenda on a local level in order to make cities more resilient. The tool makes use of both design and engineering elements of urban nature-based solutions. It shows how these green, blue and grey solutions can improve the level of urban resilience and thus translate the New Urban Agenda into practice. The paper consists of two parts. Firstly, a typology of urban nature-based solutions will be given. Secondly, links will be made between the design and engineering world of nature-based design in cities, using the participatory touch table-based Adaptation Support Tool. This tool was developed in collaboration between research institutes, academics, consultants, local governments, planners and designers. The usefulness of the tool will be explained using two case studies located in the Netherlands (Utrecht) and Mozambique (Beira). To conclude, this paper shows that urban nature-based solutions can be applied to improve the level of resiliency of cities using the Adaptation Support Tool. The tool facilitates discussions between stakeholders by providing information on the effectiveness, benefits and costs of nature-based solutions. Incorporating design and engineering elements of nature-based solutions in planning processes can facilitate cities to contribute on a local level to the global policy of the New Urban Agenda.
INTRODUCTION In January 2017 the New Urban Agenda was adopted at Habitat III in Quito after being drafted by numerous stakeholders (United Nations, 2017). One of the main objectives is to make cities more livable and resilient to changes in the future. The agenda however, remains a policy document on global level. This has caused a discussion among urban planning professionals on how the city could be made more resilient regarding biophysical, social and economic improvement of cities on city level. Hence, this paper is focusing on the objective of designing resilient cities on local level.
Nowadays, more and more pressure is put on cities since most of the population growth is expected to happen within our cities. Additionally, the dense concentration of the built environment within cities is exacerbating the negative effects of climate-related problems like heat stress, flooding and air pollution. A multi-scale approach to mitigate the effects of these issues is ecosystem-based urban planning and design. This type of planning uses (existing) environmental qualities combined with soft engineered constructions for the design of a more resilient urban fabric.
761
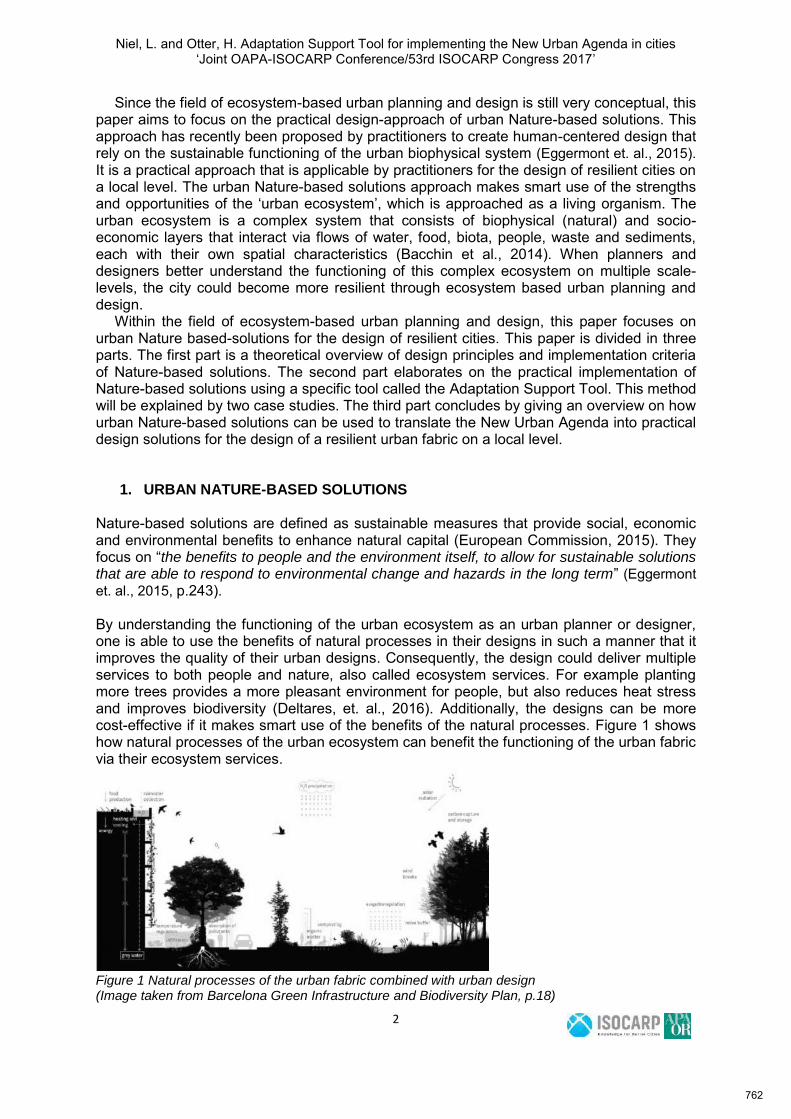
Niel, L. and Otter, H. Adaptation Support Tool for implementing the New Urban Agenda in cities ‘Joint OAPA-ISOCARP Conference/53rd ISOCARP Congress 2017’
2
Since the field of ecosystem-based urban planning and design is still very conceptual, this paper aims to focus on the practical design-approach of urban Nature-based solutions. This approach has recently been proposed by practitioners to create human-centered design that rely on the sustainable functioning of the urban biophysical system (Eggermont et. al., 2015). It is a practical approach that is applicable by practitioners for the design of resilient cities on a local level. The urban Nature-based solutions approach makes smart use of the strengths and opportunities of the ‘urban ecosystem’, which is approached as a living organism. The urban ecosystem is a complex system that consists of biophysical (natural) and socio-economic layers that interact via flows of water, food, biota, people, waste and sediments, each with their own spatial characteristics (Bacchin et al., 2014). When planners and designers better understand the functioning of this complex ecosystem on multiple scale-levels, the city could become more resilient through ecosystem based urban planning and design.
Within the field of ecosystem-based urban planning and design, this paper focuses on urban Nature based-solutions for the design of resilient cities. This paper is divided in three parts. The first part is a theoretical overview of design principles and implementation criteria of Nature-based solutions. The second part elaborates on the practical implementation of Nature-based solutions using a specific tool called the Adaptation Support Tool. This method will be explained by two case studies. The third part concludes by giving an overview on how urban Nature-based solutions can be used to translate the New Urban Agenda into practical design solutions for the design of a resilient urban fabric on a local level.
1. URBAN NATURE-BASED SOLUTIONS Nature-based solutions are defined as sustainable measures that provide social, economic and environmental benefits to enhance natural capital (European Commission, 2015). They focus on “the benefits to people and the environment itself, to allow for sustainable solutions that are able to respond to environmental change and hazards in the long term” (Eggermont et. al., 2015, p.243). By understanding the functioning of the urban ecosystem as an urban planner or designer, one is able to use the benefits of natural processes in their designs in such a manner that it improves the quality of their urban designs. Consequently, the design could deliver multiple services to both people and nature, also called ecosystem services. For example planting more trees provides a more pleasant environment for people, but also reduces heat stress and improves biodiversity (Deltares, et. al., 2016). Additionally, the designs can be more cost-effective if it makes smart use of the benefits of the natural processes. Figure 1 shows how natural processes of the urban ecosystem can benefit the functioning of the urban fabric via their ecosystem services.
Figure 1 Natural processes of the urban fabric combined with urban design (Image taken from Barcelona Green Infrastructure and Biodiversity Plan, p.18)
762
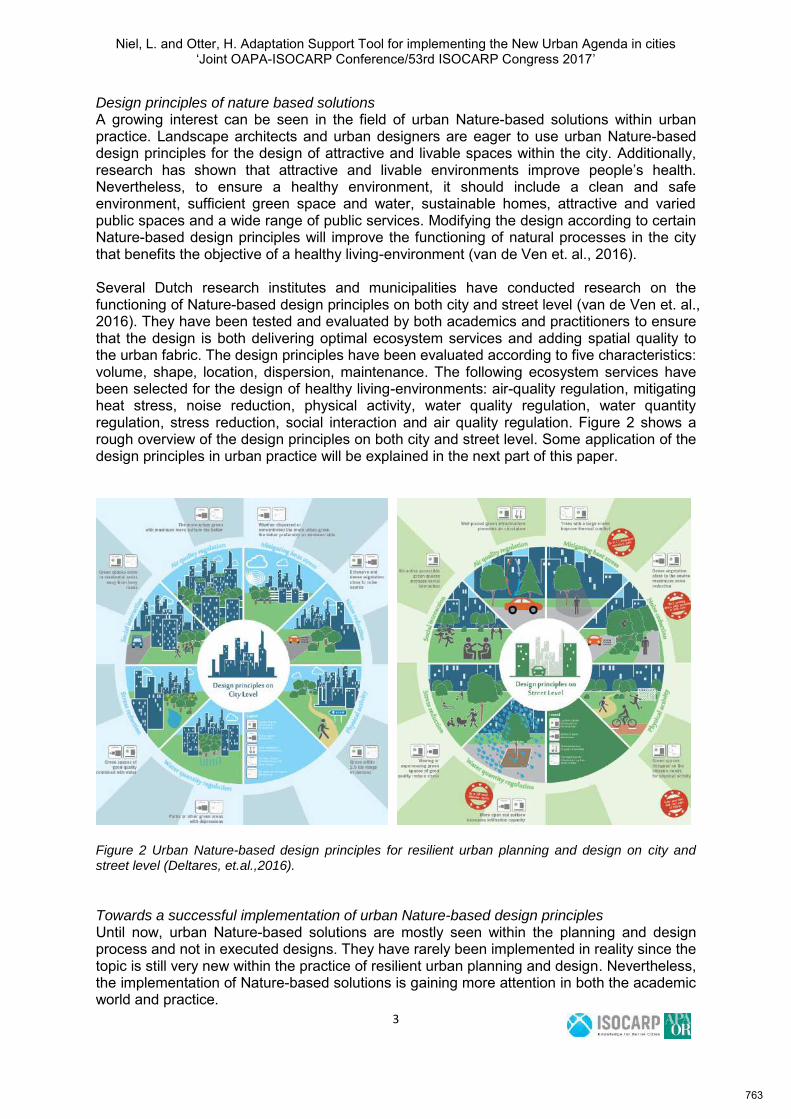
Niel, L. and Otter, H. Adaptation Support Tool for implementing the New Urban Agenda in cities ‘Joint OAPA-ISOCARP Conference/53rd ISOCARP Congress 2017’
3
Design principles of nature based solutions A growing interest can be seen in the field of urban Nature-based solutions within urban practice. Landscape architects and urban designers are eager to use urban Nature-based design principles for the design of attractive and livable spaces within the city. Additionally, research has shown that attractive and livable environments improve people’s health. Nevertheless, to ensure a healthy environment, it should include a clean and safe environment, sufficient green space and water, sustainable homes, attractive and varied public spaces and a wide range of public services. Modifying the design according to certain Nature-based design principles will improve the functioning of natural processes in the city that benefits the objective of a healthy living-environment (van de Ven et. al., 2016). Several Dutch research institutes and municipalities have conducted research on the functioning of Nature-based design principles on both city and street level (van de Ven et. al., 2016). They have been tested and evaluated by both academics and practitioners to ensure that the design is both delivering optimal ecosystem services and adding spatial quality to the urban fabric. The design principles have been evaluated according to five characteristics: volume, shape, location, dispersion, maintenance. The following ecosystem services have been selected for the design of healthy living-environments: air-quality regulation, mitigating heat stress, noise reduction, physical activity, water quality regulation, water quantity regulation, stress reduction, social interaction and air quality regulation. Figure 2 shows a rough overview of the design principles on both city and street level. Some application of the design principles in urban practice will be explained in the next part of this paper.
Figure 2 Urban Nature-based design principles for resilient urban planning and design on city and street level (Deltares, et.al.,2016). Towards a successful implementation of urban Nature-based design principles Until now, urban Nature-based solutions are mostly seen within the planning and design process and not in executed designs. They have rarely been implemented in reality since the topic is still very new within the practice of resilient urban planning and design. Nevertheless, the implementation of Nature-based solutions is gaining more attention in both the academic world and practice.
763
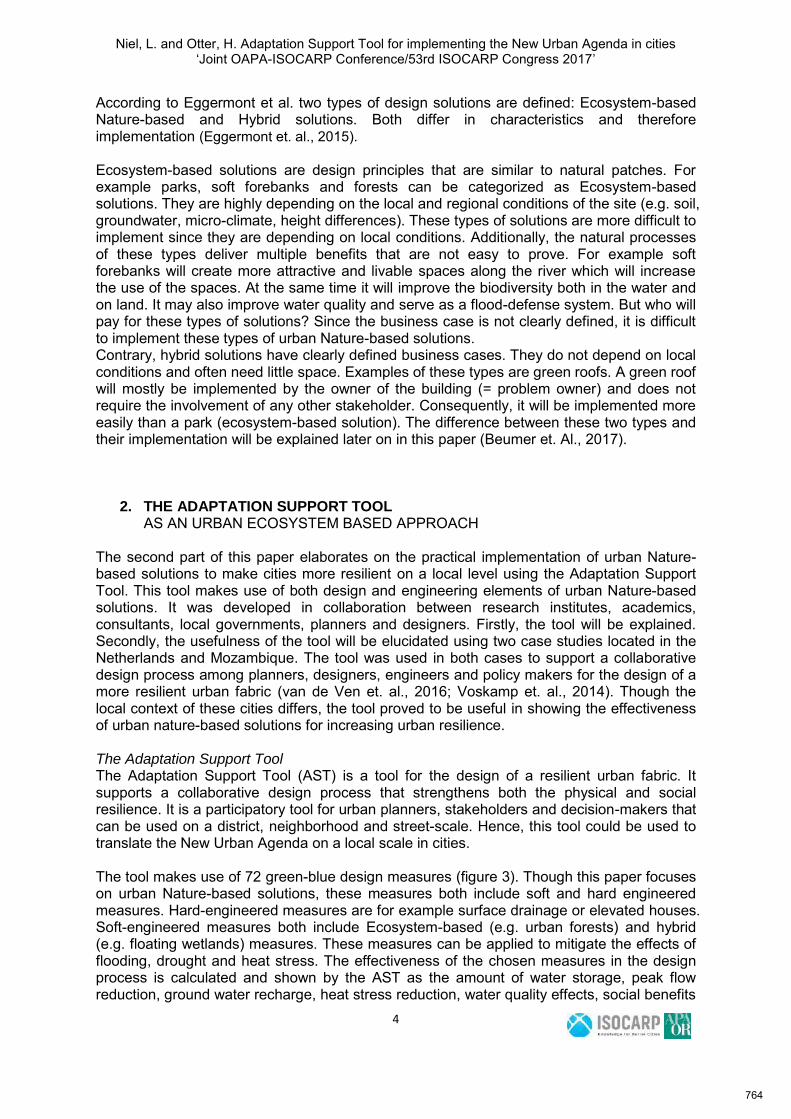
Niel, L. and Otter, H. Adaptation Support Tool for implementing the New Urban Agenda in cities ‘Joint OAPA-ISOCARP Conference/53rd ISOCARP Congress 2017’
4
According to Eggermont et al. two types of design solutions are defined: Ecosystem-based Nature-based and Hybrid solutions. Both differ in characteristics and therefore implementation (Eggermont et. al., 2015). Ecosystem-based solutions are design principles that are similar to natural patches. For example parks, soft forebanks and forests can be categorized as Ecosystem-based solutions. They are highly depending on the local and regional conditions of the site (e.g. soil, groundwater, micro-climate, height differences). These types of solutions are more difficult to implement since they are depending on local conditions. Additionally, the natural processes of these types deliver multiple benefits that are not easy to prove. For example soft forebanks will create more attractive and livable spaces along the river which will increase the use of the spaces. At the same time it will improve the biodiversity both in the water and on land. It may also improve water quality and serve as a flood-defense system. But who will pay for these types of solutions? Since the business case is not clearly defined, it is difficult to implement these types of urban Nature-based solutions. Contrary, hybrid solutions have clearly defined business cases. They do not depend on local conditions and often need little space. Examples of these types are green roofs. A green roof will mostly be implemented by the owner of the building (= problem owner) and does not require the involvement of any other stakeholder. Consequently, it will be implemented more easily than a park (ecosystem-based solution). The difference between these two types and their implementation will be explained later on in this paper (Beumer et. Al., 2017).
2. THE ADAPTATION SUPPORT TOOL AS AN URBAN ECOSYSTEM BASED APPROACH
The second part of this paper elaborates on the practical implementation of urban Nature-based solutions to make cities more resilient on a local level using the Adaptation Support Tool. This tool makes use of both design and engineering elements of urban Nature-based solutions. It was developed in collaboration between research institutes, academics, consultants, local governments, planners and designers. Firstly, the tool will be explained. Secondly, the usefulness of the tool will be elucidated using two case studies located in the Netherlands and Mozambique. The tool was used in both cases to support a collaborative design process among planners, designers, engineers and policy makers for the design of a more resilient urban fabric (van de Ven et. al., 2016; Voskamp et. al., 2014). Though the local context of these cities differs, the tool proved to be useful in showing the effectiveness of urban nature-based solutions for increasing urban resilience. The Adaptation Support Tool The Adaptation Support Tool (AST) is a tool for the design of a resilient urban fabric. It supports a collaborative design process that strengthens both the physical and social resilience. It is a participatory tool for urban planners, stakeholders and decision-makers that can be used on a district, neighborhood and street-scale. Hence, this tool could be used to translate the New Urban Agenda on a local scale in cities. The tool makes use of 72 green-blue design measures (figure 3). Though this paper focuses on urban Nature-based solutions, these measures both include soft and hard engineered measures. Hard-engineered measures are for example surface drainage or elevated houses. Soft-engineered measures both include Ecosystem-based (e.g. urban forests) and hybrid (e.g. floating wetlands) measures. These measures can be applied to mitigate the effects of flooding, drought and heat stress. The effectiveness of the chosen measures in the design process is calculated and shown by the AST as the amount of water storage, peak flow reduction, ground water recharge, heat stress reduction, water quality effects, social benefits
764
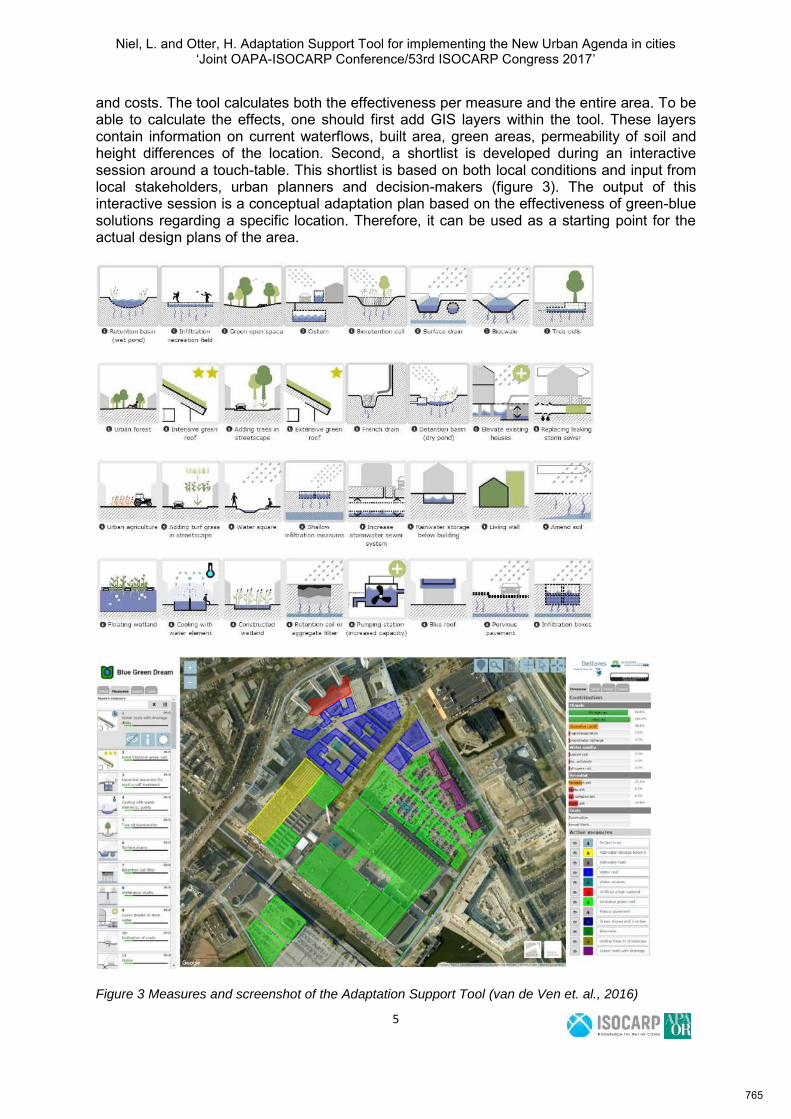
Niel, L. and Otter, H. Adaptation Support Tool for implementing the New Urban Agenda in cities ‘Joint OAPA-ISOCARP Conference/53rd ISOCARP Congress 2017’
5
and costs. The tool calculates both the effectiveness per measure and the entire area. To be able to calculate the effects, one should first add GIS layers within the tool. These layers contain information on current waterflows, built area, green areas, permeability of soil and height differences of the location. Second, a shortlist is developed during an interactive session around a touch-table. This shortlist is based on both local conditions and input from local stakeholders, urban planners and decision-makers (figure 3). The output of this interactive session is a conceptual adaptation plan based on the effectiveness of green-blue solutions regarding a specific location. Therefore, it can be used as a starting point for the actual design plans of the area.
Figure 3 Measures and screenshot of the Adaptation Support Tool (van de Ven et. al., 2016)
765
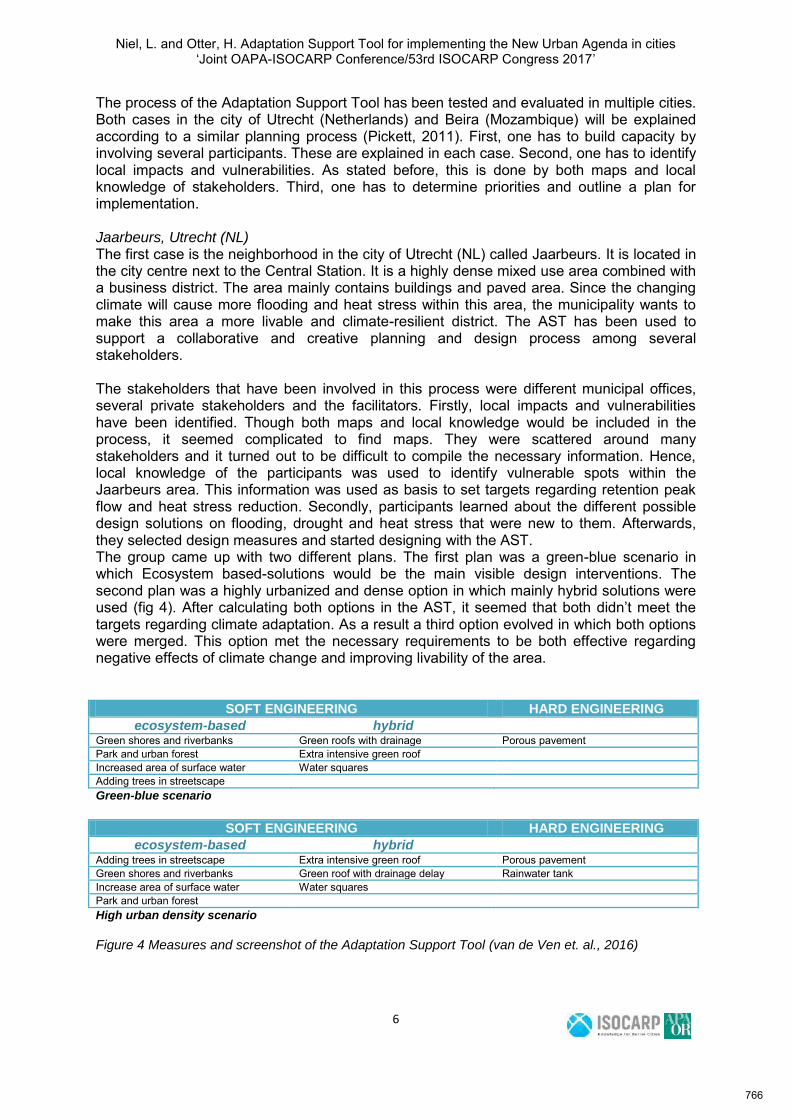
Niel, L. and Otter, H. Adaptation Support Tool for implementing the New Urban Agenda in cities ‘Joint OAPA-ISOCARP Conference/53rd ISOCARP Congress 2017’
6
The process of the Adaptation Support Tool has been tested and evaluated in multiple cities. Both cases in the city of Utrecht (Netherlands) and Beira (Mozambique) will be explained according to a similar planning process (Pickett, 2011). First, one has to build capacity by involving several participants. These are explained in each case. Second, one has to identify local impacts and vulnerabilities. As stated before, this is done by both maps and local knowledge of stakeholders. Third, one has to determine priorities and outline a plan for implementation. Jaarbeurs, Utrecht (NL) The first case is the neighborhood in the city of Utrecht (NL) called Jaarbeurs. It is located in the city centre next to the Central Station. It is a highly dense mixed use area combined with a business district. The area mainly contains buildings and paved area. Since the changing climate will cause more flooding and heat stress within this area, the municipality wants to make this area a more livable and climate-resilient district. The AST has been used to support a collaborative and creative planning and design process among several stakeholders. The stakeholders that have been involved in this process were different municipal offices, several private stakeholders and the facilitators. Firstly, local impacts and vulnerabilities have been identified. Though both maps and local knowledge would be included in the process, it seemed complicated to find maps. They were scattered around many stakeholders and it turned out to be difficult to compile the necessary information. Hence, local knowledge of the participants was used to identify vulnerable spots within the Jaarbeurs area. This information was used as basis to set targets regarding retention peak flow and heat stress reduction. Secondly, participants learned about the different possible design solutions on flooding, drought and heat stress that were new to them. Afterwards, they selected design measures and started designing with the AST. The group came up with two different plans. The first plan was a green-blue scenario in which Ecosystem based-solutions would be the main visible design interventions. The second plan was a highly urbanized and dense option in which mainly hybrid solutions were used (fig 4). After calculating both options in the AST, it seemed that both didn’t meet the targets regarding climate adaptation. As a result a third option evolved in which both options were merged. This option met the necessary requirements to be both effective regarding negative effects of climate change and improving livability of the area.
SOFT ENGINEERING HARD ENGINEERING
ecosystem-based hybrid Green shores and riverbanks Green roofs with drainage Porous pavement Park and urban forest Extra intensive green roof Increased area of surface water Water squares Adding trees in streetscape Green-blue scenario
SOFT ENGINEERING HARD ENGINEERING
ecosystem-based hybrid Adding trees in streetscape Extra intensive green roof Porous pavement Green shores and riverbanks Green roof with drainage delay Rainwater tank Increase area of surface water Water squares Park and urban forest High urban density scenario
Figure 4 Measures and screenshot of the Adaptation Support Tool (van de Ven et. al., 2016)
766
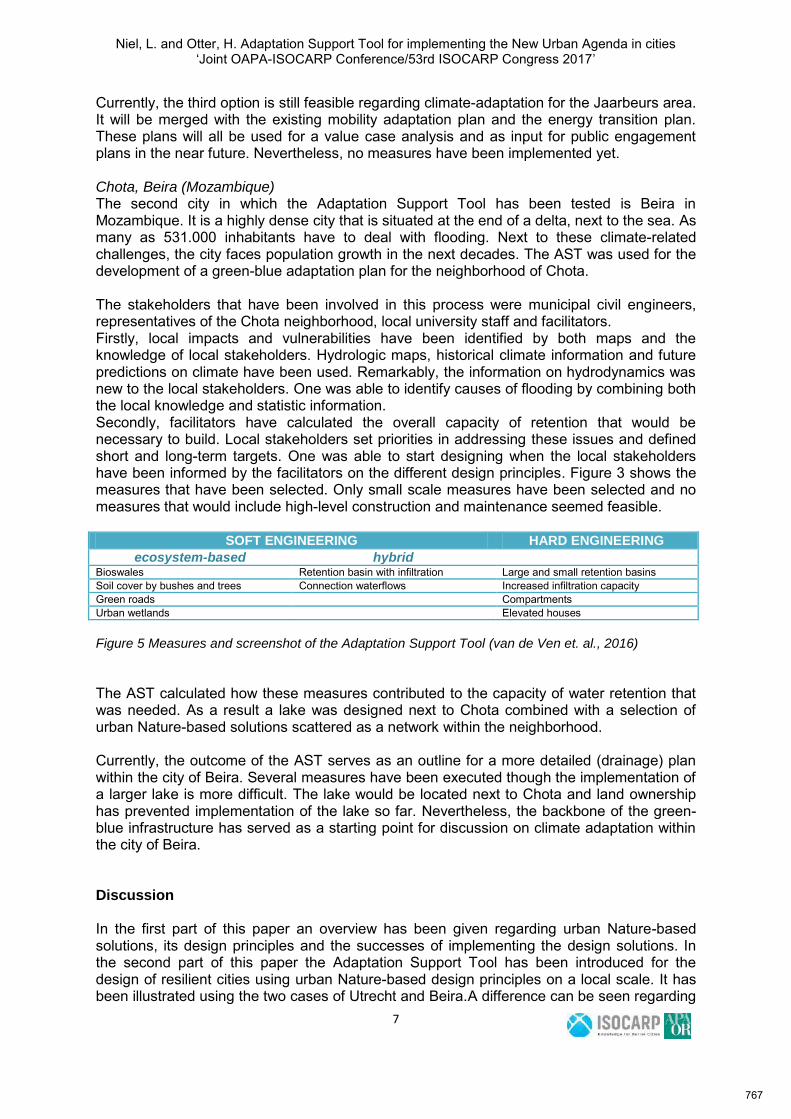
Niel, L. and Otter, H. Adaptation Support Tool for implementing the New Urban Agenda in cities ‘Joint OAPA-ISOCARP Conference/53rd ISOCARP Congress 2017’
7
Currently, the third option is still feasible regarding climate-adaptation for the Jaarbeurs area. It will be merged with the existing mobility adaptation plan and the energy transition plan. These plans will all be used for a value case analysis and as input for public engagement plans in the near future. Nevertheless, no measures have been implemented yet. Chota, Beira (Mozambique) The second city in which the Adaptation Support Tool has been tested is Beira in Mozambique. It is a highly dense city that is situated at the end of a delta, next to the sea. As many as 531.000 inhabitants have to deal with flooding. Next to these climate-related challenges, the city faces population growth in the next decades. The AST was used for the development of a green-blue adaptation plan for the neighborhood of Chota. The stakeholders that have been involved in this process were municipal civil engineers, representatives of the Chota neighborhood, local university staff and facilitators. Firstly, local impacts and vulnerabilities have been identified by both maps and the knowledge of local stakeholders. Hydrologic maps, historical climate information and future predictions on climate have been used. Remarkably, the information on hydrodynamics was new to the local stakeholders. One was able to identify causes of flooding by combining both the local knowledge and statistic information. Secondly, facilitators have calculated the overall capacity of retention that would be necessary to build. Local stakeholders set priorities in addressing these issues and defined short and long-term targets. One was able to start designing when the local stakeholders have been informed by the facilitators on the different design principles. Figure 3 shows the measures that have been selected. Only small scale measures have been selected and no measures that would include high-level construction and maintenance seemed feasible.
SOFT ENGINEERING HARD ENGINEERING
ecosystem-based hybrid Bioswales Retention basin with infiltration Large and small retention basins Soil cover by bushes and trees Connection waterflows Increased infiltration capacity Green roads Compartments Urban wetlands Elevated houses Figure 5 Measures and screenshot of the Adaptation Support Tool (van de Ven et. al., 2016) The AST calculated how these measures contributed to the capacity of water retention that was needed. As a result a lake was designed next to Chota combined with a selection of urban Nature-based solutions scattered as a network within the neighborhood. Currently, the outcome of the AST serves as an outline for a more detailed (drainage) plan within the city of Beira. Several measures have been executed though the implementation of a larger lake is more difficult. The lake would be located next to Chota and land ownership has prevented implementation of the lake so far. Nevertheless, the backbone of the green-blue infrastructure has served as a starting point for discussion on climate adaptation within the city of Beira. Discussion In the first part of this paper an overview has been given regarding urban Nature-based solutions, its design principles and the successes of implementing the design solutions. In the second part of this paper the Adaptation Support Tool has been introduced for the design of resilient cities using urban Nature-based design principles on a local scale. It has been illustrated using the two cases of Utrecht and Beira.A difference can be seen regarding
767
Niel, L. and Otter, H. Adaptation Support Tool for implementing the New Urban Agenda in cities ‘Joint OAPA-ISOCARP Conference/53rd ISOCARP Congress 2017’
8
the types of urban Nature-based design solutions that have been chosen in the two cases. Both cases differ in location, cultural, social and economic context. The choice of different design solutions could be explained by the difference of both cases in local climate, social and economic conditions. The differences could possibly be explained by these aspects, but it has not been investigated within the research project. Consequently, it is difficult to determine if these local conditions also influence the successes of implementation as stated in the first part of this paper. To ensure that urban Nature-based solutions function well on a local scale, the involvement of local stakeholders proved to be necessary. Both in the case of Utrecht en Beira local knowledge was used to identify critical locations regarding climate risk and adaptation. Additionally, maps and GIS information has been used in the case of Beira. Regarding the case of Utrecht it seemed too difficult to gather all the necessary information since it was scattered around several stakeholders. This paper shows that the objectives of the New Urban Agenda could be translated towards a design on a small scale using urban Nature-based solutions. Nevertheless, this has mostly been investigated in planning and design phases. The functioning of these types of solutions has not been tested in reality yet. Hence, urban Nature-based solutions could hypothetically be used for the design of resilient cities, but it still it should be investigated how urban Nature-based solutions function proved in practice under all (climate) circumstances. Both hard-engineering and soft-engineering solutions are used in the case of Beira and Utrecht for the design of a resilient urban fabric. Over the past decades hard-engineering solutions like dams, levees and pumping stations have been easily applied by urban planners and designers. Consequently, one is more confident in using these types of regular approaches. Urban Nature-based solutions are relatively new to our planning profession. Their effectiveness is poorly quantified and they are more difficult to use in the design process. The need for an Adaptation Support Tool for the design of these soft-engineering solutions shows us that this type of urban planning and design needs more effort than the common planning approach. Not only the design principles are relatively new, also the planning process is changing from a top-down towards a collaborative approach. The Adaptation Support tool could be used to support this new planning process. Though the AST could be used for the design of more climate-sensitive cities the design solutions should not be used as common language within different local contexts. Consequently, the Adaptation Support Tool should be used as a method and should not be seen as a ready-made solution. Conclusion The New Urban agenda remains a policy document on a global level. This has started a discussion among urban planning professionals about how urban resilience can be reached on a local city level. The topic of urban resilience is still very broad, so this paper specifically focused on urban Nature-based solutions. To conclude, this paper shows that urban Nature-based solutions can be used in urban planning and design to improve the level of resiliency of cities using the Adaptation Support Tool. Additionally, this paper states the importance of setting a collective objective, quantifying ‘improving the level of resiliency and livability’, from the beginning of the project. This should be a shared objective between the different stakeholders in the city, including planners, designers, engineers, scientists and policy makers. The Adaptation Support Tool
768
Niel, L. and Otter, H. Adaptation Support Tool for implementing the New Urban Agenda in cities ‘Joint OAPA-ISOCARP Conference/53rd ISOCARP Congress 2017’
9
facilitates discussions between stakeholders by providing information on the effectiveness, benefits and costs of nature-based solutions. Incorporating design- and engineering elements of nature-based solutions in planning processes can facilitate cities to contribute on a local level to the global policy of the New Urban Agenda. If planners and designers are able to understand and incorporate the functioning of the urban ecosystem on different scale levels, the use of urban Nature-based solutions can improve the level of resiliency on a local scale for both people and nature.
References Bacchin, T.K. et al., 2014. Green-blue multifunctional infrastructure: an urban landscape system design new approach., pp.7–12. Beumer, V., Van Ham, C., 2017. Nature based solutions in urban areas: showcasing success stories from Europe and beyond. Outcome conference working session at Green in Urbs. Eggermont, H. et al., 2015. Nature-based Solutions: New Influence for Environmental Management and Research in Europe. GAIA 24/4, 243 – 248. http://dx.doi.org/10.14512/gaia.24.4.9. European Commission. 2015. Towards an EU Research and Innovation policy agenda for nature-based solutions & re-naturing cities. Final Report of the Horizon2020 expert group on nature-based solutions and re-naturing cities. Brussels: European Commission. Pickett ST a, Cadenasso ML, Grove JM, Boone CG, Groffman PM, Irwin E, et al. (2011) Urban ecological systems: scientific foundations and a decade of progress. J Environ Manage 2011;92:331e62. United Nations, The New Urban Agenda, 2017. https://habitat3.org/the-new-urban-agenda. TO2 Federatie, Juni 2016. Designing green and blue infrastructure to support healthy urban living. Work package in the Adaptive Circular Cities project. Deltares, TNO, WUR, ECN. http://www.adaptivecircularcities.com/wp-content/uploads/2016/07/T02-ACC-WP3-Green-Blue-infrastructure-for-Healthy-Urban-Living-Final-report-160701.pdf Van de Ven, FHM, et al., 2016. Green, comfortable, attractive and climate resilient Utrecht Centre-West area. Deltares report 1220357-001, Deltares, Utrecht Van de Ven, F.H.M., 2016. Adaptation Planning Support Toolbox: Measurable performance information based tools for co-creation of resilient, ecosystem-based urban plans with urban designers, decision-makers and stakeholders. Environ. Sci. Policy. 66, 427-436. http://doi.org/10.1016/j.envsci.2016.06.010. Voskamp, I.M., Van de Ven, F.H.M., 2015. Planning support system for climate adaptation: composing effective sets of blue-green measures to reduce urban vulnerability to extreme weather events. Build. Environ. 83, 159–167. http:// dx.doi.org/10.1016/j.buildenv.2014.07.018.
769
Mahak Agrawal, Climate Resilient Urban Development Strategies for a Mega city, Joint OAPA-ISOCARP Conference 2017
1
Climate Resilient Urban Development Strategies for a Mega city:
A Case of NCT of Delhi
Mahak AGRAWAL, Urban Planner, India
Abstract
Climate change is an acid bath and an undeniable global phenomena. In the past decade the onus of climate change discourse has shifted from global to urban level. Between 1970 to 2010 world’s population increased from 4 billion to 7 billion, an increase of 75 per cent, while the greenhouse gas emissions increased by 82 per cent, with an annual increase of 2.2 per cent in the last decade alone (IPCC 2015). Cities became critical for two reasons. First, they account for over 70 per cent of global greenhouse gas emissions. Second, they house over 50 per cent of the global population. Hence, cities and their activities are both victims as well as primary reason for climate change.
Statistical data estimates population growth of Delhi from 0.4 million in 1901 to over 18 million in 2016 with an increase of 10 million since 1991. Simultaneously, the urban area of the city increased from 685 square kilometers in 1991 to over 1200 square kilometers by engulfing its rural counterparts and declining the annual agriculture production by 0.5 per cent. Also, the period saw a marked increase in its developed area density from 130 persons per hectare in 1991 to over 190 persons per hectare in 2011 (Census of India. 1981. 1991. 2001. 2011).
Accompanying this population and spatial change in city’s urban expanse, climate of the city in terms of its temperature and precipitation has also changed. From 1901, the city’s annual average temperature has increased by 1.4 ºC, with an increase of 0.93 ºC in the past four decades. During the same period, the city’s precipitation pattern has changed with summers getting wetter, number of rainy days reducing by 11 days and an increasing rainfall intensity. This trend of urbanization and climate variability in Delhi is further interlinked with the urban environment or loss of it and the three form a vicious cycle whereby urbanization is leading to loss or destruction of environmental resources and the combined forces of the two are adding up to the natural climate variability of the city.
This paper attempts to highlight the impact of urbanization and urban planning on the climate variability and environment for a mega city of Delhi. The analysis in paper reveals that from 1986 to 2016, the city lost its heat sinks at an annual rate of 1.4 per cent with an increase in built up area by 1.4 per cent and simultaneous increase in air and surface temperature by 0.3 per cent. The cumulative effect of these interactions is displayed using energy consumption, the sale of consumer products that help regulate thermal comfort, such as air conditioners, as well as on the health of citizens of Delhi. Keeping in view the imminent climate change expected owing to urbanization patterns in Delhi, this paper looks into the need to adopt climate resilient strategies in the future planning efforts of Delhi.
1. INTRODUCTION
Climate Change is a global phenomenon and variability of climate over decades is attributed, directly or indirectly, to human activity which alters the composition of atmosphere contributing to natural climate variability observed over comparable time periods. Emerging trends of climate change indicate a global rise in human induced warming, higher than the natural
770
Mahak Agrawal, Climate Resilient Urban Development Strategies for a Mega city, Joint OAPA-ISOCARP Conference 2017
2
warming of Earth; which will continue to increase at a much rapid rate. The IPCC 2014 report highlights that although the population grew from 4 billion to 7 billion which is a 75 per cent increase post 1970, the greenhouse gas emissions increased by 82 per cent.
The recently ratified Paris Climate Agreement 2015 supports the cause of climate change from a global scale issues to urban scale development. This is not a new finding. In 2008 urban development became central to the international discourse on climate change, when the global urban population increase of 50 per cent mark occurred during the same time that there was a 70 per cent of total GHG emissions. Four cases for this situation were identified including land use land cover change, transportation, building construction and pollution problems related to industry. These four categories of activities coincide with areas where the role of urban planner and urban planning fits in- in terms of planned development, adapting to climate impacts and mitigating future risks. Essentially, cities and climate change are intertwined and urban planning plays a vital role in this equation.
2007-08 also saw the publication of a tremendous amount of literature and research works on cities and climate change. In India a plethora of research has been produced which studies the impacts of climate change, the spatial distribution of greenhouse gas emissions, and urban drainage in relation to changing intensities of precipitation. But only a few try to think beyond these topics and assess climate change in terms of urban development pattern. The need for studying climate change and the impact of urban development on climate change becomes more important today since cities cover less than 3 per cent of the Earth’s surface but contribute over 70 per cent of GHG emissions and account for 75 per cent of global energy consumption (UN-Habitat. 2011). Moreover, this trend of urban growth is forecast to continue as rural population decline.
This paper is therefore, a documentation of climate change and its relationship with urban development in Delhi during the time period 1986 to 2016. It is structured into three broad sections. In the first section, urban development trend exhibited by Delhi is described in terms of increase in built up areas, loss of heat sinks and loss of flood plains. In the second section, climate change is assessed in terms of natural climate variability and human induced climate variability. Climate variability is examined and reflected through temperature and precipitation variables. In the last section, this climate variability is examined in light of urban development and a relationship is developed between the two. The section also highlights the vicious cycle Delhi has entered into and concludes by identifying the dire need for climate resilient urban strategies for a sustainable urban future of the city.
2. URBAN DEVELOPMENT PATTERN OF DELHI, 1986-2016
Delhi, a cosmopolitan administrative center of India, is testimony to numerous changes and cumulative challenges. This section is a documentation of the changes alone and underscores the trend of urban development in the city. The trend is assessed using the LandSat imagery and digital elevation models. With raw imagery obtained from the online portal of the United States of Geological Survey, the land cover and land use pattern of Delhi has been classified with the help of GIS software, for 1986, 1996, 2006 and 2016. The spatio-temporal analysis based on digital elevation model is used to assess built up on natural drainage and thereby the loss of flood plains.
771
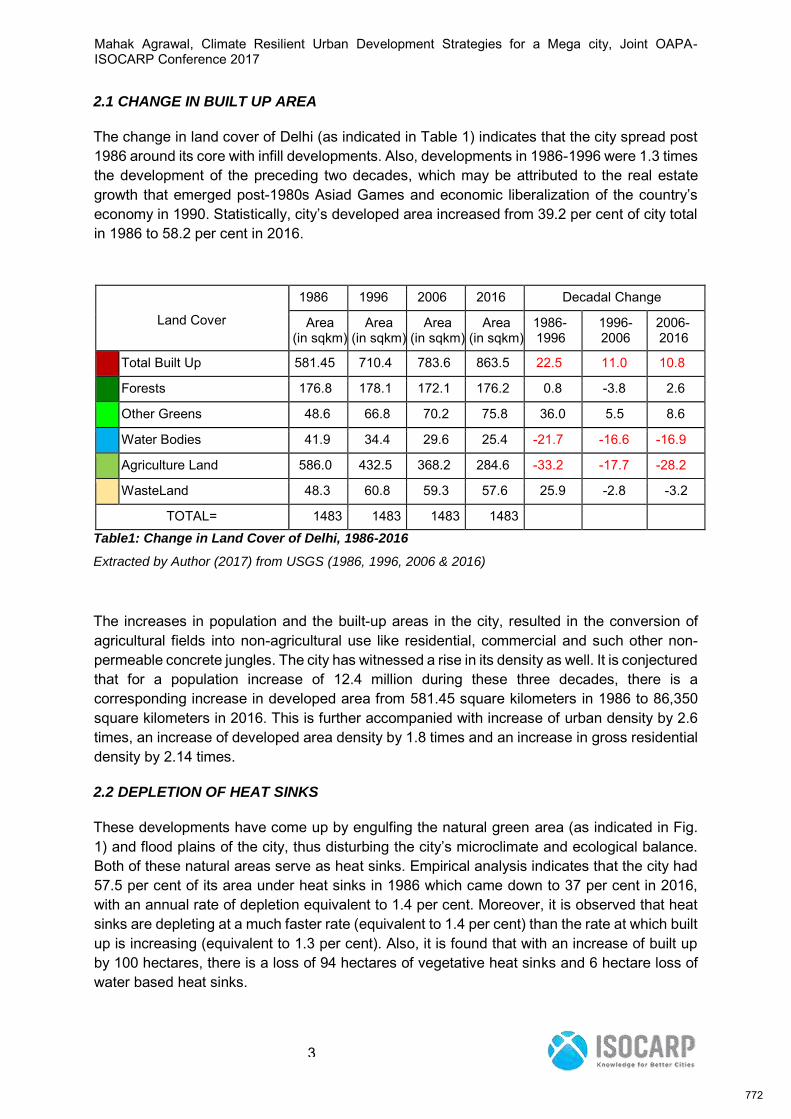
Mahak Agrawal, Climate Resilient Urban Development Strategies for a Mega city, Joint OAPA-ISOCARP Conference 2017
3
2.1 CHANGE IN BUILT UP AREA
The change in land cover of Delhi (as indicated in Table 1) indicates that the city spread post 1986 around its core with infill developments. Also, developments in 1986-1996 were 1.3 times the development of the preceding two decades, which may be attributed to the real estate growth that emerged post-1980s Asiad Games and economic liberalization of the country’s economy in 1990. Statistically, city’s developed area increased from 39.2 per cent of city total in 1986 to 58.2 per cent in 2016.
Land Cover
1986 1996 2006 2016 Decadal Change
Area (in sqkm)
Area (in sqkm)
Area (in sqkm)
Area (in sqkm)
1986-1996
1996-2006
2006-2016
Total Built Up 581.45 710.4 783.6 863.5 22.5 11.0 10.8
Forests 176.8 178.1 172.1 176.2 0.8 -3.8 2.6
Other Greens 48.6 66.8 70.2 75.8 36.0 5.5 8.6
Water Bodies 41.9 34.4 29.6 25.4 -21.7 -16.6 -16.9
Agriculture Land 586.0 432.5 368.2 284.6 -33.2 -17.7 -28.2
WasteLand 48.3 60.8 59.3 57.6 25.9 -2.8 -3.2
TOTAL= 1483 1483 1483 1483
Table1: Change in Land Cover of Delhi, 1986-2016
Extracted by Author (2017) from USGS (1986, 1996, 2006 & 2016)
The increases in population and the built-up areas in the city, resulted in the conversion of agricultural fields into non-agricultural use like residential, commercial and such other non-permeable concrete jungles. The city has witnessed a rise in its density as well. It is conjectured that for a population increase of 12.4 million during these three decades, there is a corresponding increase in developed area from 581.45 square kilometers in 1986 to 86,350 square kilometers in 2016. This is further accompanied with increase of urban density by 2.6 times, an increase of developed area density by 1.8 times and an increase in gross residential density by 2.14 times.
2.2 DEPLETION OF HEAT SINKS
These developments have come up by engulfing the natural green area (as indicated in Fig. 1) and flood plains of the city, thus disturbing the city’s microclimate and ecological balance. Both of these natural areas serve as heat sinks. Empirical analysis indicates that the city had 57.5 per cent of its area under heat sinks in 1986 which came down to 37 per cent in 2016, with an annual rate of depletion equivalent to 1.4 per cent. Moreover, it is observed that heat sinks are depleting at a much faster rate (equivalent to 1.4 per cent) than the rate at which built up is increasing (equivalent to 1.3 per cent). Also, it is found that with an increase of built up by 100 hectares, there is a loss of 94 hectares of vegetative heat sinks and 6 hectare loss of water based heat sinks.
772
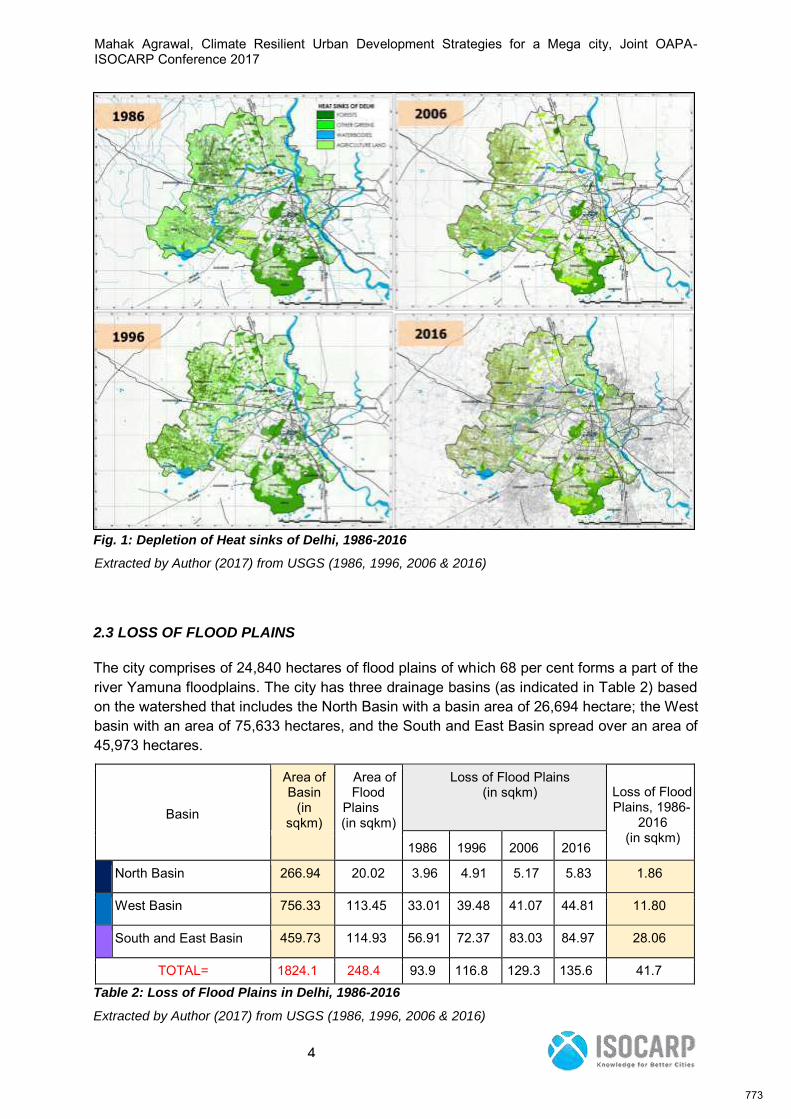
Mahak Agrawal, Climate Resilient Urban Development Strategies for a Mega city, Joint OAPA-ISOCARP Conference 2017
4
Fig. 1: Depletion of Heat sinks of Delhi, 1986-2016 Extracted by Author (2017) from USGS (1986, 1996, 2006 & 2016)
2.3 LOSS OF FLOOD PLAINS
The city comprises of 24,840 hectares of flood plains of which 68 per cent forms a part of the river Yamuna floodplains. The city has three drainage basins (as indicated in Table 2) based on the watershed that includes the North Basin with a basin area of 26,694 hectare; the West basin with an area of 75,633 hectares, and the South and East Basin spread over an area of 45,973 hectares.
Basin
Area of Basin
(in sqkm)
Area of Flood
Plains (in sqkm)
Loss of Flood Plains (in sqkm) Loss of Flood
Plains, 1986- 2016
(in sqkm) 1986 1996 2006 2016
North Basin 266.94 20.02 3.96 4.91 5.17 5.83 1.86
West Basin 756.33 113.45 33.01 39.48 41.07 44.81 11.80
South and East Basin 459.73 114.93 56.91 72.37 83.03 84.97 28.06
TOTAL= 1824.1 248.4 93.9 116.8 129.3 135.6 41.7 Table 2: Loss of Flood Plains in Delhi, 1986-2016
Extracted by Author (2017) from USGS (1986, 1996, 2006 & 2016)
773
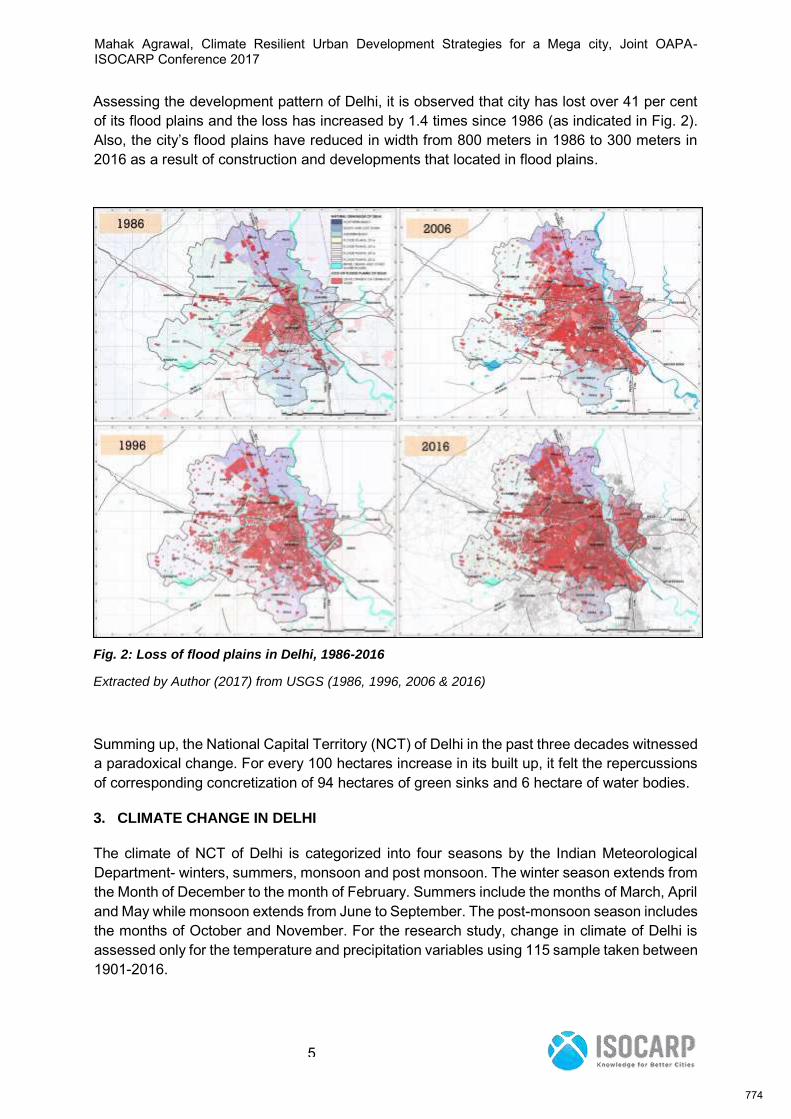
Mahak Agrawal, Climate Resilient Urban Development Strategies for a Mega city, Joint OAPA-ISOCARP Conference 2017
5
Assessing the development pattern of Delhi, it is observed that city has lost over 41 per cent of its flood plains and the loss has increased by 1.4 times since 1986 (as indicated in Fig. 2). Also, the city’s flood plains have reduced in width from 800 meters in 1986 to 300 meters in 2016 as a result of construction and developments that located in flood plains.
Fig. 2: Loss of flood plains in Delhi, 1986-2016
Extracted by Author (2017) from USGS (1986, 1996, 2006 & 2016)
Summing up, the National Capital Territory (NCT) of Delhi in the past three decades witnessed a paradoxical change. For every 100 hectares increase in its built up, it felt the repercussions of corresponding concretization of 94 hectares of green sinks and 6 hectare of water bodies.
3. CLIMATE CHANGE IN DELHI
The climate of NCT of Delhi is categorized into four seasons by the Indian Meteorological Department- winters, summers, monsoon and post monsoon. The winter season extends from the Month of December to the month of February. Summers include the months of March, April and May while monsoon extends from June to September. The post-monsoon season includes the months of October and November. For the research study, change in climate of Delhi is assessed only for the temperature and precipitation variables using 115 sample taken between 1901-2016.
774
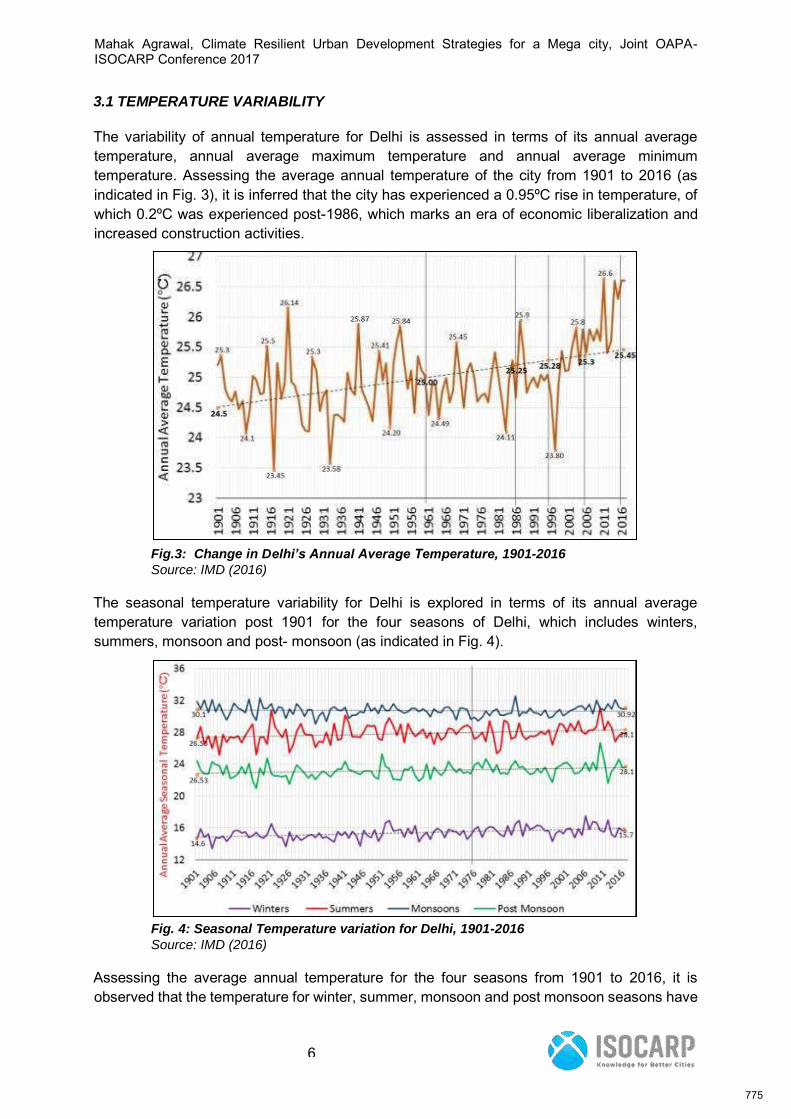
Mahak Agrawal, Climate Resilient Urban Development Strategies for a Mega city, Joint OAPA-ISOCARP Conference 2017
6
3.1 TEMPERATURE VARIABILITY
The variability of annual temperature for Delhi is assessed in terms of its annual average temperature, annual average maximum temperature and annual average minimum temperature. Assessing the average annual temperature of the city from 1901 to 2016 (as indicated in Fig. 3), it is inferred that the city has experienced a 0.95ºC rise in temperature, of which 0.2ºC was experienced post-1986, which marks an era of economic liberalization and increased construction activities.
Fig.3: Change in Delhi’s Annual Average Temperature, 1901-2016
Source: IMD (2016)
The seasonal temperature variability for Delhi is explored in terms of its annual average temperature variation post 1901 for the four seasons of Delhi, which includes winters, summers, monsoon and post- monsoon (as indicated in Fig. 4).
Fig. 4: Seasonal Temperature variation for Delhi, 1901-2016
Source: IMD (2016)
Assessing the average annual temperature for the four seasons from 1901 to 2016, it is observed that the temperature for winter, summer, monsoon and post monsoon seasons have
775
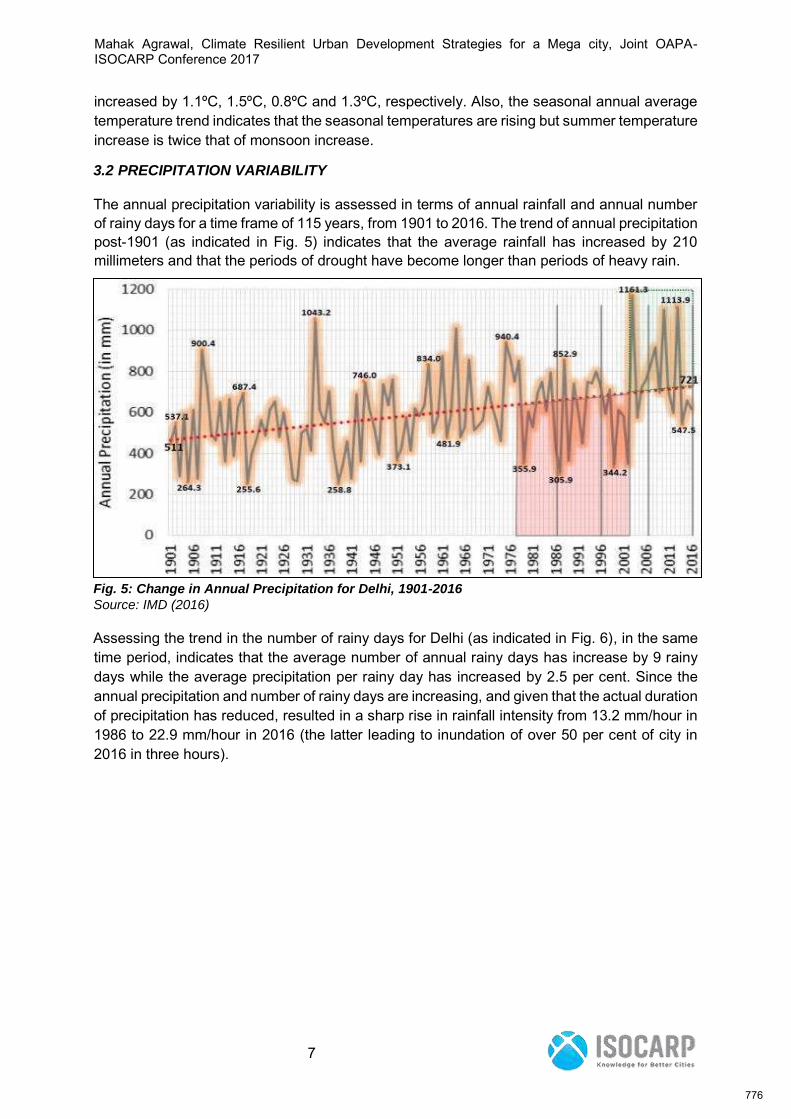
Mahak Agrawal, Climate Resilient Urban Development Strategies for a Mega city, Joint OAPA-ISOCARP Conference 2017
7
increased by 1.1ºC, 1.5ºC, 0.8ºC and 1.3ºC, respectively. Also, the seasonal annual average temperature trend indicates that the seasonal temperatures are rising but summer temperature increase is twice that of monsoon increase.
3.2 PRECIPITATION VARIABILITY
The annual precipitation variability is assessed in terms of annual rainfall and annual number of rainy days for a time frame of 115 years, from 1901 to 2016. The trend of annual precipitation post-1901 (as indicated in Fig. 5) indicates that the average rainfall has increased by 210 millimeters and that the periods of drought have become longer than periods of heavy rain.
Fig. 5: Change in Annual Precipitation for Delhi, 1901-2016
Source: IMD (2016)
Assessing the trend in the number of rainy days for Delhi (as indicated in Fig. 6), in the same time period, indicates that the average number of annual rainy days has increase by 9 rainy days while the average precipitation per rainy day has increased by 2.5 per cent. Since the annual precipitation and number of rainy days are increasing, and given that the actual duration of precipitation has reduced, resulted in a sharp rise in rainfall intensity from 13.2 mm/hour in 1986 to 22.9 mm/hour in 2016 (the latter leading to inundation of over 50 per cent of city in 2016 in three hours).
776
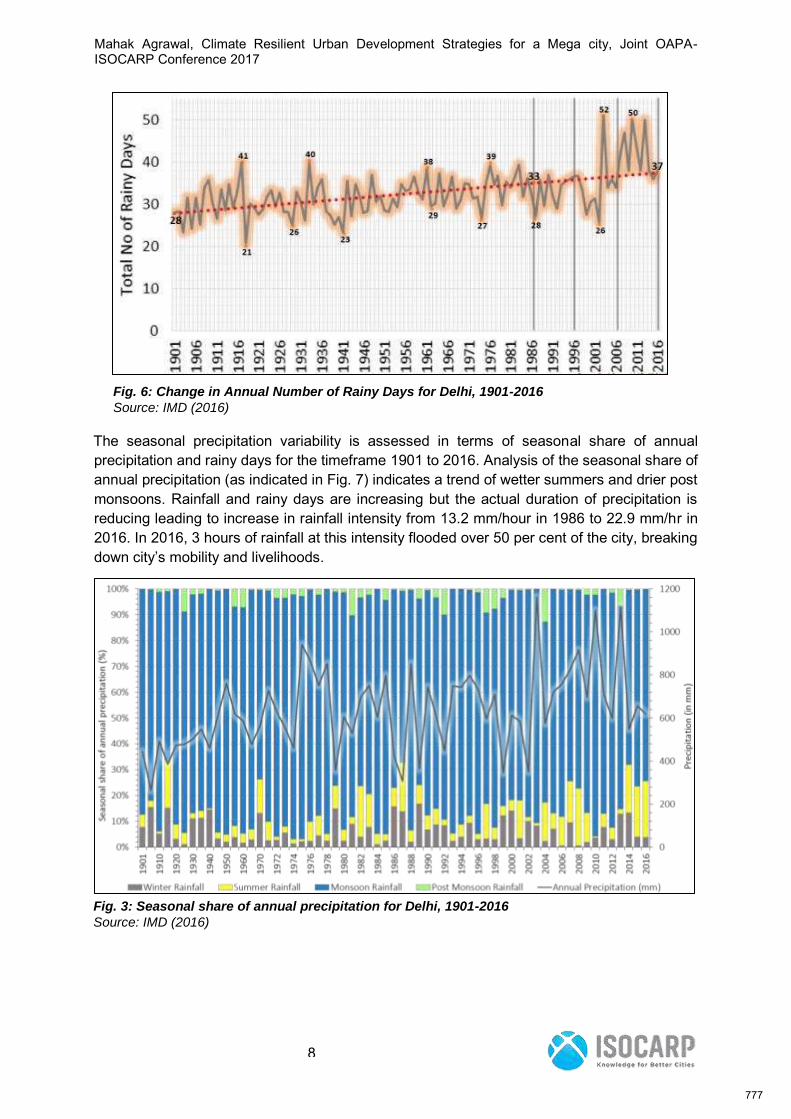
Mahak Agrawal, Climate Resilient Urban Development Strategies for a Mega city, Joint OAPA-ISOCARP Conference 2017
8
Fig. 6: Change in Annual Number of Rainy Days for Delhi, 1901-2016 Source: IMD (2016)
The seasonal precipitation variability is assessed in terms of seasonal share of annual precipitation and rainy days for the timeframe 1901 to 2016. Analysis of the seasonal share of annual precipitation (as indicated in Fig. 7) indicates a trend of wetter summers and drier post monsoons. Rainfall and rainy days are increasing but the actual duration of precipitation is reducing leading to increase in rainfall intensity from 13.2 mm/hour in 1986 to 22.9 mm/hr in 2016. In 2016, 3 hours of rainfall at this intensity flooded over 50 per cent of the city, breaking down city’s mobility and livelihoods.
Fig. 3: Seasonal share of annual precipitation for Delhi, 1901-2016
Source: IMD (2016)
777
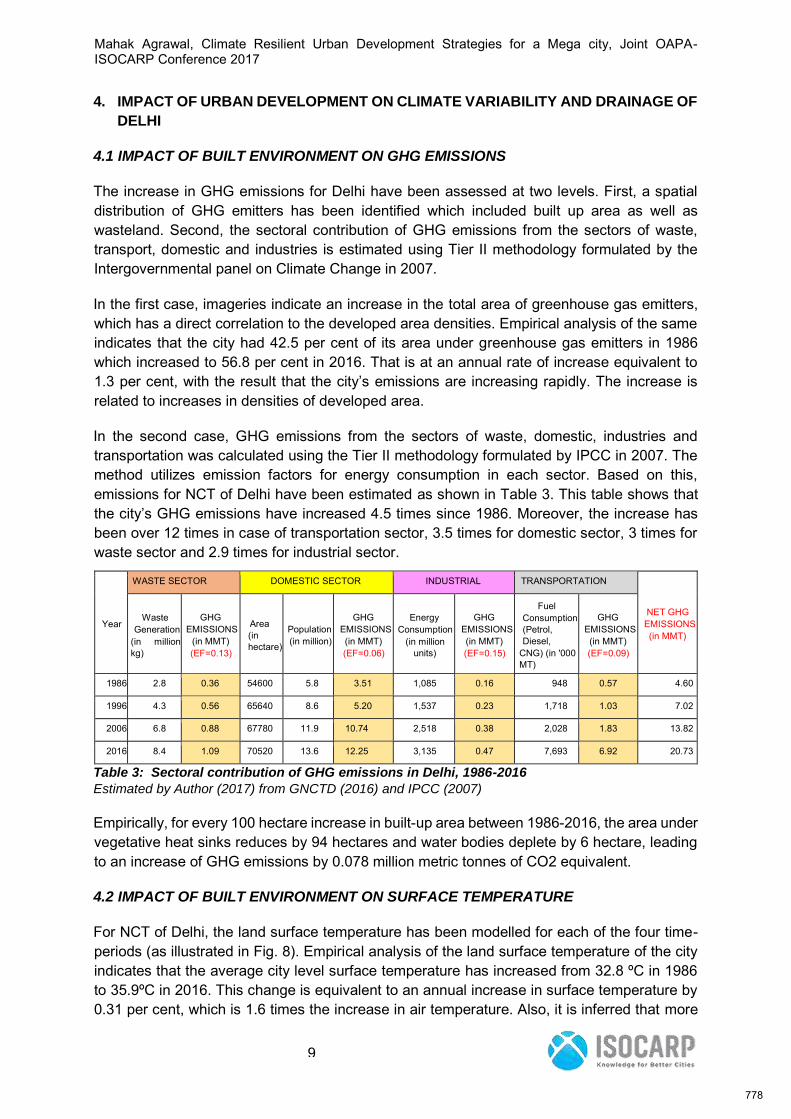
Mahak Agrawal, Climate Resilient Urban Development Strategies for a Mega city, Joint OAPA-ISOCARP Conference 2017
9
4. IMPACT OF URBAN DEVELOPMENT ON CLIMATE VARIABILITY AND DRAINAGE OF
DELHI
4.1 IMPACT OF BUILT ENVIRONMENT ON GHG EMISSIONS
The increase in GHG emissions for Delhi have been assessed at two levels. First, a spatial distribution of GHG emitters has been identified which included built up area as well as wasteland. Second, the sectoral contribution of GHG emissions from the sectors of waste, transport, domestic and industries is estimated using Tier II methodology formulated by the Intergovernmental panel on Climate Change in 2007.
In the first case, imageries indicate an increase in the total area of greenhouse gas emitters, which has a direct correlation to the developed area densities. Empirical analysis of the same indicates that the city had 42.5 per cent of its area under greenhouse gas emitters in 1986 which increased to 56.8 per cent in 2016. That is at an annual rate of increase equivalent to 1.3 per cent, with the result that the city’s emissions are increasing rapidly. The increase is related to increases in densities of developed area.
In the second case, GHG emissions from the sectors of waste, domestic, industries and transportation was calculated using the Tier II methodology formulated by IPCC in 2007. The method utilizes emission factors for energy consumption in each sector. Based on this, emissions for NCT of Delhi have been estimated as shown in Table 3. This table shows that the city’s GHG emissions have increased 4.5 times since 1986. Moreover, the increase has been over 12 times in case of transportation sector, 3.5 times for domestic sector, 3 times for waste sector and 2.9 times for industrial sector.
Year
WASTE SECTOR DOMESTIC SECTOR INDUSTRIAL TRANSPORTATION
NET GHG EMISSIONS (in MMT)
Waste Generation
(in million kg)
GHG EMISSIONS
(in MMT) (EF=0.13)
Area (in hectare)
Population (in million)
GHG EMISSIONS (in MMT) (EF=0.06)
Energy Consumption
(in million units)
GHG EMISSIONS (in MMT) (EF=0.15)
Fuel Consumption (Petrol, Diesel,
CNG) (in '000 MT)
GHG EMISSIONS (in MMT) (EF=0.09)
1986 2.8 0.36 54600 5.8 3.51 1,085 0.16 948 0.57 4.60
1996 4.3 0.56 65640 8.6 5.20 1,537 0.23 1,718 1.03 7.02
2006 6.8 0.88 67780 11.9 10.74 2,518 0.38 2,028 1.83 13.82
2016 8.4 1.09 70520 13.6 12.25 3,135 0.47 7,693 6.92 20.73
Table 3: Sectoral contribution of GHG emissions in Delhi, 1986-2016
Estimated by Author (2017) from GNCTD (2016) and IPCC (2007)
Empirically, for every 100 hectare increase in built-up area between 1986-2016, the area under vegetative heat sinks reduces by 94 hectares and water bodies deplete by 6 hectare, leading to an increase of GHG emissions by 0.078 million metric tonnes of CO2 equivalent.
4.2 IMPACT OF BUILT ENVIRONMENT ON SURFACE TEMPERATURE
For NCT of Delhi, the land surface temperature has been modelled for each of the four time-periods (as illustrated in Fig. 8). Empirical analysis of the land surface temperature of the city indicates that the average city level surface temperature has increased from 32.8 ºC in 1986 to 35.9ºC in 2016. This change is equivalent to an annual increase in surface temperature by 0.31 per cent, which is 1.6 times the increase in air temperature. Also, it is inferred that more
778
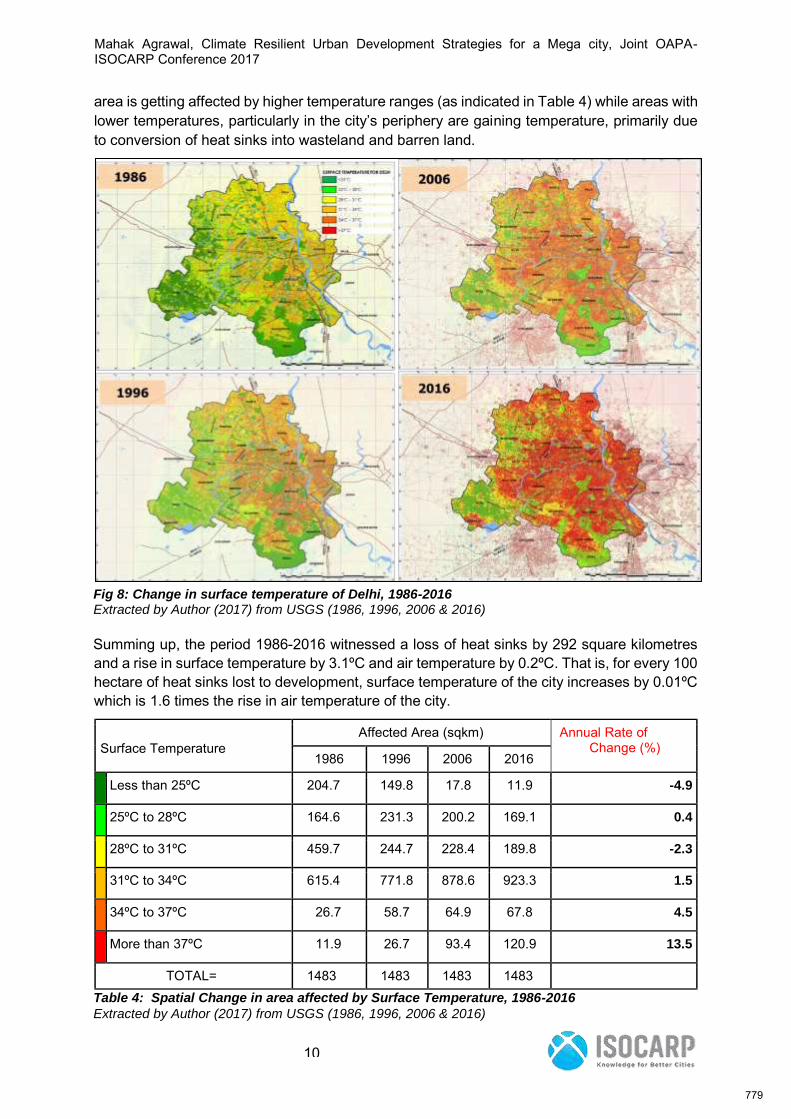
Mahak Agrawal, Climate Resilient Urban Development Strategies for a Mega city, Joint OAPA-ISOCARP Conference 2017
10
area is getting affected by higher temperature ranges (as indicated in Table 4) while areas with lower temperatures, particularly in the city’s periphery are gaining temperature, primarily due to conversion of heat sinks into wasteland and barren land.
Fig 8: Change in surface temperature of Delhi, 1986-2016 Extracted by Author (2017) from USGS (1986, 1996, 2006 & 2016)
Summing up, the period 1986-2016 witnessed a loss of heat sinks by 292 square kilometres and a rise in surface temperature by 3.1ºC and air temperature by 0.2ºC. That is, for every 100 hectare of heat sinks lost to development, surface temperature of the city increases by 0.01ºC which is 1.6 times the rise in air temperature of the city.
Surface Temperature Affected Area (sqkm) Annual Rate of
Change (%) 1986 1996 2006 2016
Less than 25ºC 204.7 149.8 17.8 11.9 -4.9
25ºC to 28ºC 164.6 231.3 200.2 169.1 0.4
28ºC to 31ºC 459.7 244.7 228.4 189.8 -2.3
31ºC to 34ºC 615.4 771.8 878.6 923.3 1.5
34ºC to 37ºC 26.7 58.7 64.9 67.8 4.5
More than 37ºC 11.9 26.7 93.4 120.9 13.5
TOTAL= 1483 1483 1483 1483 Table 4: Spatial Change in area affected by Surface Temperature, 1986-2016 Extracted by Author (2017) from USGS (1986, 1996, 2006 & 2016)
779
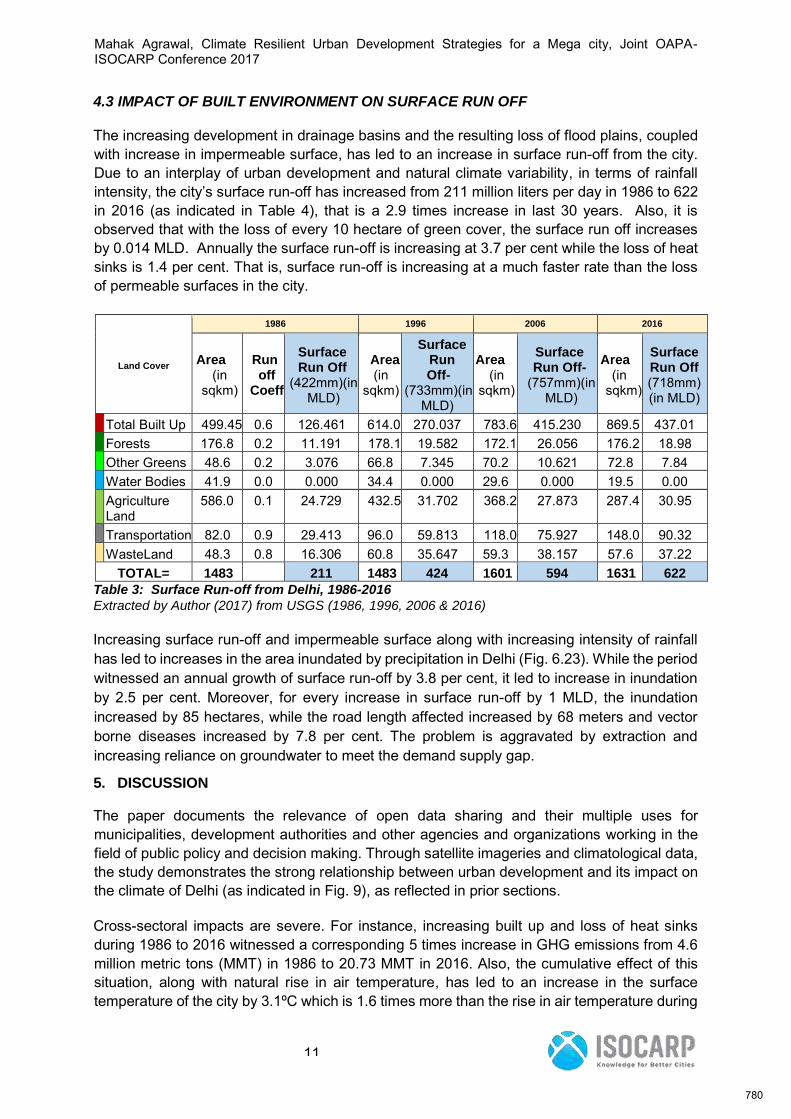
Mahak Agrawal, Climate Resilient Urban Development Strategies for a Mega city, Joint OAPA-ISOCARP Conference 2017
11
4.3 IMPACT OF BUILT ENVIRONMENT ON SURFACE RUN OFF
The increasing development in drainage basins and the resulting loss of flood plains, coupled with increase in impermeable surface, has led to an increase in surface run-off from the city. Due to an interplay of urban development and natural climate variability, in terms of rainfall intensity, the city’s surface run-off has increased from 211 million liters per day in 1986 to 622 in 2016 (as indicated in Table 4), that is a 2.9 times increase in last 30 years. Also, it is observed that with the loss of every 10 hectare of green cover, the surface run off increases by 0.014 MLD. Annually the surface run-off is increasing at 3.7 per cent while the loss of heat sinks is 1.4 per cent. That is, surface run-off is increasing at a much faster rate than the loss of permeable surfaces in the city.
Land Cover
1986 1996 2006 2016
Area (in
sqkm)
Run off
Coeff
Surface Run Off
(422mm)(in MLD)
Area (in
sqkm)
Surface Run Off-
(733mm)(in MLD)
Area (in
sqkm)
Surface Run Off-
(757mm)(in MLD)
Area (in
sqkm)
Surface Run Off (718mm) (in MLD)
Total Built Up 499.45 0.6 126.461 614.0 270.037 783.6 415.230 869.5 437.01 Forests 176.8 0.2 11.191 178.1 19.582 172.1 26.056 176.2 18.98 Other Greens 48.6 0.2 3.076 66.8 7.345 70.2 10.621 72.8 7.84 Water Bodies 41.9 0.0 0.000 34.4 0.000 29.6 0.000 19.5 0.00 Agriculture
Land 586.0 0.1 24.729 432.5 31.702 368.2 27.873 287.4 30.95
Transportation 82.0 0.9 29.413 96.0 59.813 118.0 75.927 148.0 90.32 WasteLand 48.3 0.8 16.306 60.8 35.647 59.3 38.157 57.6 37.22
TOTAL= 1483 211 1483 424 1601 594 1631 622 Table 3: Surface Run-off from Delhi, 1986-2016
Extracted by Author (2017) from USGS (1986, 1996, 2006 & 2016)
Increasing surface run-off and impermeable surface along with increasing intensity of rainfall has led to increases in the area inundated by precipitation in Delhi (Fig. 6.23). While the period witnessed an annual growth of surface run-off by 3.8 per cent, it led to increase in inundation by 2.5 per cent. Moreover, for every increase in surface run-off by 1 MLD, the inundation increased by 85 hectares, while the road length affected increased by 68 meters and vector borne diseases increased by 7.8 per cent. The problem is aggravated by extraction and increasing reliance on groundwater to meet the demand supply gap.
5. DISCUSSION
The paper documents the relevance of open data sharing and their multiple uses for municipalities, development authorities and other agencies and organizations working in the field of public policy and decision making. Through satellite imageries and climatological data, the study demonstrates the strong relationship between urban development and its impact on the climate of Delhi (as indicated in Fig. 9), as reflected in prior sections.
Cross-sectoral impacts are severe. For instance, increasing built up and loss of heat sinks during 1986 to 2016 witnessed a corresponding 5 times increase in GHG emissions from 4.6 million metric tons (MMT) in 1986 to 20.73 MMT in 2016. Also, the cumulative effect of this situation, along with natural rise in air temperature, has led to an increase in the surface temperature of the city by 3.1ºC which is 1.6 times more than the rise in air temperature during
780
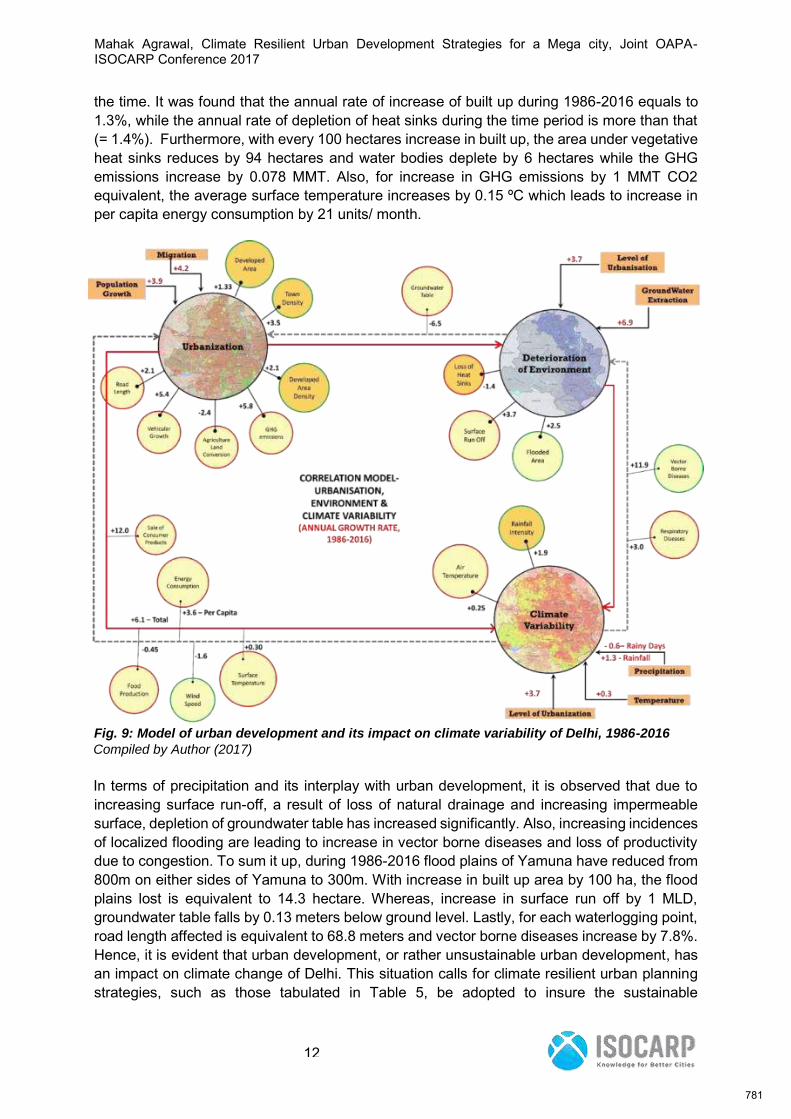
Mahak Agrawal, Climate Resilient Urban Development Strategies for a Mega city, Joint OAPA-ISOCARP Conference 2017
12
the time. It was found that the annual rate of increase of built up during 1986-2016 equals to 1.3%, while the annual rate of depletion of heat sinks during the time period is more than that (= 1.4%). Furthermore, with every 100 hectares increase in built up, the area under vegetative heat sinks reduces by 94 hectares and water bodies deplete by 6 hectares while the GHG emissions increase by 0.078 MMT. Also, for increase in GHG emissions by 1 MMT CO2 equivalent, the average surface temperature increases by 0.15 ºC which leads to increase in per capita energy consumption by 21 units/ month.
Fig. 9: Model of urban development and its impact on climate variability of Delhi, 1986-2016 Compiled by Author (2017) In terms of precipitation and its interplay with urban development, it is observed that due to increasing surface run-off, a result of loss of natural drainage and increasing impermeable surface, depletion of groundwater table has increased significantly. Also, increasing incidences of localized flooding are leading to increase in vector borne diseases and loss of productivity due to congestion. To sum it up, during 1986-2016 flood plains of Yamuna have reduced from 800m on either sides of Yamuna to 300m. With increase in built up area by 100 ha, the flood plains lost is equivalent to 14.3 hectare. Whereas, increase in surface run off by 1 MLD, groundwater table falls by 0.13 meters below ground level. Lastly, for each waterlogging point, road length affected is equivalent to 68.8 meters and vector borne diseases increase by 7.8%. Hence, it is evident that urban development, or rather unsustainable urban development, has an impact on climate change of Delhi. This situation calls for climate resilient urban planning strategies, such as those tabulated in Table 5, be adopted to insure the sustainable
781
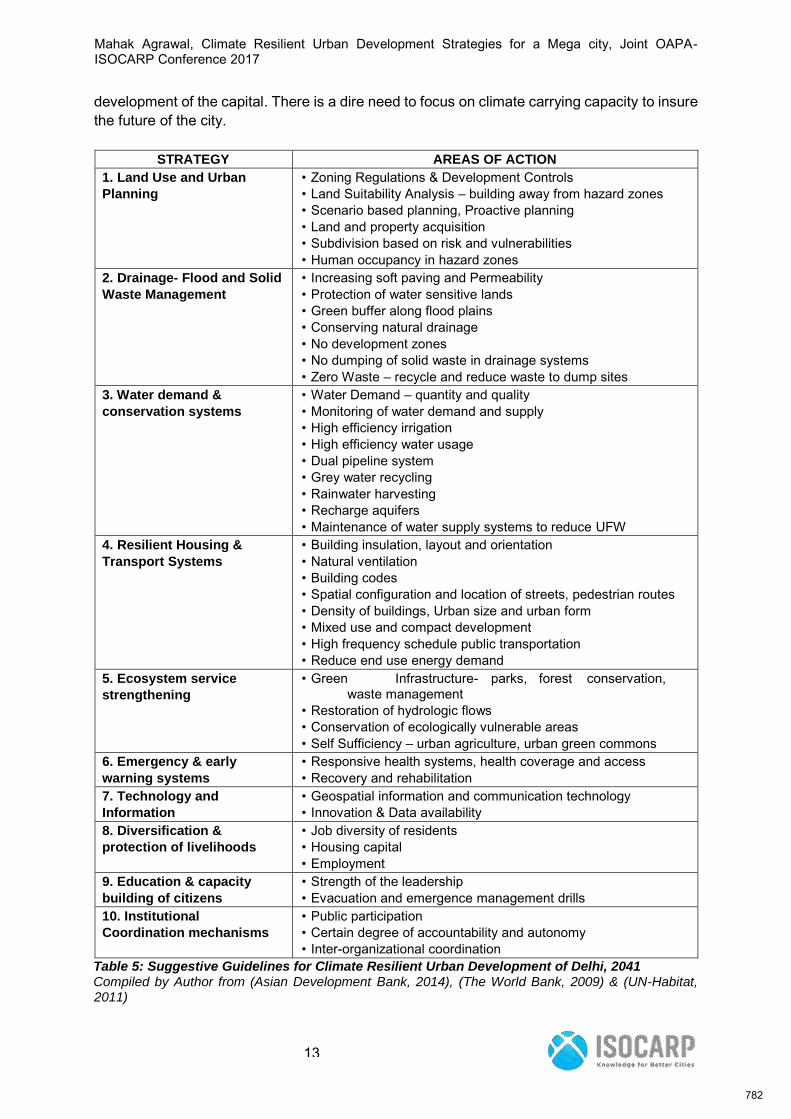
Mahak Agrawal, Climate Resilient Urban Development Strategies for a Mega city, Joint OAPA-ISOCARP Conference 2017
13
development of the capital. There is a dire need to focus on climate carrying capacity to insure the future of the city.
STRATEGY AREAS OF ACTION 1. Land Use and Urban Planning
• Zoning Regulations & Development Controls • Land Suitability Analysis – building away from hazard zones • Scenario based planning, Proactive planning • Land and property acquisition • Subdivision based on risk and vulnerabilities • Human occupancy in hazard zones
2. Drainage- Flood and Solid Waste Management
• Increasing soft paving and Permeability • Protection of water sensitive lands • Green buffer along flood plains • Conserving natural drainage • No development zones • No dumping of solid waste in drainage systems • Zero Waste – recycle and reduce waste to dump sites
3. Water demand &
conservation systems • Water Demand – quantity and quality • Monitoring of water demand and supply • High efficiency irrigation • High efficiency water usage • Dual pipeline system • Grey water recycling • Rainwater harvesting • Recharge aquifers • Maintenance of water supply systems to reduce UFW
4. Resilient Housing & Transport Systems
• Building insulation, layout and orientation • Natural ventilation • Building codes • Spatial configuration and location of streets, pedestrian routes • Density of buildings, Urban size and urban form • Mixed use and compact development • High frequency schedule public transportation • Reduce end use energy demand
5. Ecosystem service
strengthening • Green Infrastructure- parks, forest conservation,
waste management • Restoration of hydrologic flows • Conservation of ecologically vulnerable areas • Self Sufficiency – urban agriculture, urban green commons
6. Emergency & early
warning systems • Responsive health systems, health coverage and access • Recovery and rehabilitation
7. Technology and Information
• Geospatial information and communication technology • Innovation & Data availability
8. Diversification &
protection of livelihoods • Job diversity of residents • Housing capital • Employment
9. Education & capacity
building of citizens • Strength of the leadership • Evacuation and emergence management drills
10. Institutional Coordination mechanisms
• Public participation • Certain degree of accountability and autonomy • Inter-organizational coordination
Table 5: Suggestive Guidelines for Climate Resilient Urban Development of Delhi, 2041 Compiled by Author from (Asian Development Bank, 2014), (The World Bank, 2009) & (UN-Habitat, 2011)
782
Mahak Agrawal, Climate Resilient Urban Development Strategies for a Mega city, Joint OAPA-ISOCARP Conference 2017
14
6. REFERENCES
[1] Alankar, 2015. India’s Megacities and Climate Change: Explorations from Delhi and Mumbai, Brighton: STEPS.
[2] Albrecht, J., Marcotullio, P. & Sarzynski, A., 2011. The geography of greenhouse gas emissions from within urban areas of India. Resources, Energy, and Development, 8(1), pp. 11-35.
[3] Asian Development Bank, 2014. Urban Climate Change Resilience- A Synopsis, Metro Manila : Asian Development Bank.
[4] BS Reporter, 2015. Government data reveal serious climate change threat to India. Business Standard, 28 November.
[5] Calthorpe, P., 2011. Urbanism in the age of climate change. First ed. Washington DC: Island Press.
[6] Cannon, T. & Mahn, D. M., 2010. Vulnerability, resilience and development discourse in context of climate change. Natural Hazards, December, 55(3), pp. 621-635.
[7] Dodman, D., 2009. Blaming cities for climate change? An analysis of urban greenhouse gas emissions inventories. Environment and Urbanisation, 21(1), pp. 185-201.
[8] GNCTD , 2009. Climate Change Agenda for Delhi, 2009-12, New Delhi : Government of National Capital Territory of Delhi .
[9] GNCTD, 2009. Delhi Climate Change Action Plan, New Delhi: Government of National Capital
Territory of Delhi .
[10] Jabareen, Y., 2013. Planning the resilient city: Concepts and strategies for coping with climate change and environmental risk. Cities, Volume 31, pp. 220-229.
[11] Kaur, J., 2013. Climate Change: Policy and Program Integration- A Case Study of Delhi, New Delhi: Department of Physical Planning, School of Planning and Architecture, New Delhi.
[12] KPMG & Shakti Sustainable Energy Foundation, 2015. India Climate Report, New Delhi: Shakti Sustainable Energy Foundation.
[13] Lisa, E., Schipper, F. & Langston, L., 2015. A Comparative Overview of resilience measurement frameworks- Analysing indicators and approaches , London: Overseas Development Institute.
[14] Padma, T., 2016. Will India’s ‘Smart Cities’ Be Climate-Resilient?. The Wire, 05 February.
[15] Phansalkar, A., 2016. Climate change and cities: It's not too late to bring green buildings in policy making. FirstPost, 29 October.
[16] Pratt, S. E., 2012. Carbon and the city: Tracking emissions from megacities. [Online] Available at: http://www.earthmagazine.org/article/carbon-and-city-tracking-emissions-megacities [Accessed 16 December 2016].
[17] Satterthwaite, D., Bicknell, J. & Dodman, D., 2009. Adapting Cities to Climate Change: Understanding and Addressing the Development Challenges. London: Earthscan.
[18] Sharifi, A. & Yamagata, Y., 2014. Resilient urban planning: Major principles and criteria. Elsevier, pp. 1491-1495.
[19] Sharma, D., Singh, R. & Singh, R., 2013. Urban Climate Resilience: A review of the methodologies adopted under the ACCCRN initiative in Indian cities, London: Asian Cities Climate Resilience Network.
[20] The World Bank, 2009. Climate Resilient Cities- A Primer on Reducing Vulnerabilities to Disasters, Washington DC: The World Bank.
[21] UN-Habitat, 2011. Global Report on Human Settlements: Cities and Climate Change, Nairobi, Kenya: UN-Habitat.
[22] UN-Habitat, 2011. Hot Cities: Battle Ground for Climate Change , London: UN-Habitat. 15
783
Urban Underground Potential in Dakar, Senegal Reversing the Paradigm of ‘Needs to Resources’
Michael R. DOYLE, PhD
Deep City Project Laboratory for Environmental and Urban Economics (LEURE)
École polytechnique fédérale de Lausanne (EPFL), Switzerland Abstract This article presents a mapping method that seeks to provide urban planning with a general overview of the underground resources of an urban area. Resource potentials (for buildable space, groundwater or geomaterial extraction and geothermal energy) tend to be investigated on a needs-only basis, once a project or plan is already on the boards. This paradigm of ‘needs to resources’ risks favoring single-use rather than multi-use underground development, leading to unforeseen conflicts between possible uses (e.g. pollution of an aquifer or congestion of infrastructure) or the irreversible loss of potential synergies (e.g. geothermal collectors on building foundations). The Deep City project at the EPFL in Switzerland promotes an alternative paradigm of ‘resources to needs’, a holistic approach addressing the underground as a source of opportunity in synergy with surface development for curtailing urban sprawl while preserving public places or parks. The method, which combines geological and surface urban data, produces maps of individual and combined resource potentials without prioritizing any particular planning objective. This communication will present the method and the resulting maps through a case study conducted in 2016 in the city of Dakar, Senegal. After first summarizing the Deep City project and the mapping method, the urban and geological conditions of Dakar will be presented, followed by the application and results of the Deep City method. The calculation of the combined potentials map is an opportunity to compare two alternative methods of combination, the Analytic Hierarchy Process and Self-Organizing Maps (SOM). Although the mapping method does not require complicated data collection or analysis, the SOM may be better suited both for dealing with larger quantities of data as well as for providing a more meaningful mappings of geological and urban data in three dimensions. 1. Introduction: An alternate paradigm for planning underground resources 1.1. Towards a Paradigm of ‘Resources to Needs’
The geological conditions of the urban underground tend to be addressed as an afterthought in urban planning and to be oriented towards single-function infrastructure. This lack of a holistic approach in the planning phase and of a monofunctionality in application has proven problematic. Groundwater extraction in the region of Mexico and Paris has led to subsidence in both cities (Blunier, 2009; Ortiz-Zamora and Ortega-Guerrero, 2010). The moratorium placed by the French capital on pumping for industrial reasons caused the groundwater table to rise and to flood basements. The gradual increase in metro lines and underground spaces and infrastructure makes it difficult for cities to add additional infrastructure or link existing ones. Although cities like Toronto and Montreal are cited as exemplary for the successful integration of underground spaces in their urban fabric (Bélanger, 2007; Boisvert, 2011; El-Geneidy et al., 2011), their emergence has been facilitated by unique geological and hydrogeological conditions, making their model difficult to export elsewhere without accounting for the geological (and urban) heterogeneity of each city.
Cities tend to investigate their underground conditions on a needs-only basis and to rarely consult geological maps or sections during the early stages of the planning process. The geology of an urban area may be suitable not only for underground construction, but also for passive heating and cooling systems using geothermal, the local extraction of groundwater for irrigation and flood control and the use of extracted geomaterials on or off site. As part of a
784
drive toward sustainability, the underground can assist in increasing urban density without building upwards, but also in protecting open and green spaces on the surface by building underneath (International Tunnelling and Underground Space Association, 2012). The Deep City project at the EPFL in Switzerland has, since 2005, been reviewing existing scientific literature and strategies for application in order to develop a mapping method for providing the planning process with an overview of an urban area’s multi-resource underground potential (Parriaux et al., 2010, 2004). In contrast to recent underground potential maps or methods produced by cities like Helsinki (Vähäaho, 2016), Hong Kong (Wallace and Ng, 2016) and in mainland China (Zhao et al., 2016), the Deep City method does not focus only on underground space potential, but also on geothermal, groundwater and geomaterial potentials as well. These four resources, particularly where they overlap, are possible sources of both conflict and synergy for the future transformation of an urban area.
By producing maps that are not oriented towards a particular planning objective, the Deep City project hopes to promote a reversal of the ‘needs to resources’ paradigm to one of ‘resources to needs’ in which necessity plays no role in the diagnostic process. This alternative paradigm questions the adequacy of considering all innovative uses of the resource potentials to have been decided in advance and of mapping in order to simply identify the most adequate ‘use’ for an area. Such an approach precludes the opportunity for other solutions to emerge during the elaboration of urban plans or particular projects (Doyle, 2017). T he mapping method has been refined and tested in cities like Geneva (Blunier, 2009), Suzhou, China (Li et al., 2013), San Antonio, Texas (Doyle, 2016a, chap. 3.1), Hong Kong, China and most recently in Dakar, Senegal (Doyle, 2016b, chap. 3.2-3.3.). With these last three, a spatial analysis of the geometry of the existing street network and buildings, distributions of activities or population was added to the method to account for the role of centrality in underground space potential. Dakar is an interesting case, because not only has no extensive research been done on urban underground potential in Africa, Dakar is facing important population growth on a t opography characterized by heterogeneous geological conditions and regular flooding as well as limited land for continued expansion. As a city with little to no existing underground construction, it has a unique opportunity to address its underground resources while avoiding the errors of European or North American cities. Furthermore, Dakar was a case where the Deep City project could most extensively explore the practical implications of the resources to needs paradigm, which poses a particular challenge for the legibility and interpretation of resulting visualizations. 1.2. Deep City Method: Data to GIS to Aggregation and Indexing
The Deep City method involves three main steps: 1) the collection and compilation of data into a spatial data model; 2) the intermediate evaluation of resource potentials by local experts; and 3) the transformation of the data into individual and combined potential maps. The spatial information model is compiled in a geographical information system software like ArcGIS using a common spatial unit that captures the smallest resolution of the data (e.g. 25x25m or 50x50m). The common grid has the advantage of being able to account for different types of data collected at different scales. In order to simplify the geological descriptions for ease of use by non-geologists and geologists, Parriaux and Turberg (2007) proposed a classification system by which geological formations are grouped into ‘geotypes’ according to their genealogy (geological era) and sedimentology (petrographic/mineral qualities).
As described in greater detail elsewhere (Doyle, 2016a, 2016b, chap. 3.0) and demonstrated later in this article, the relative resource potentials of each geotype are quantified using the Analytic Hierarchy Process (Saaty, 1990), a multi-criteria decision-making aid. Local geologists conduct pairwise comparisons of the geotypes for each resource (ease of construction, use of excavated materials, tendency to contain groundwater and geothermal potential) using a common comparison scale of 1 to 9 (per the reasoning described in Saaty, 1980). The individual scores for each comparison are averaged among the geologists and inserted into a matrix, the reduction of which results in a small set of vectors and a principal
785
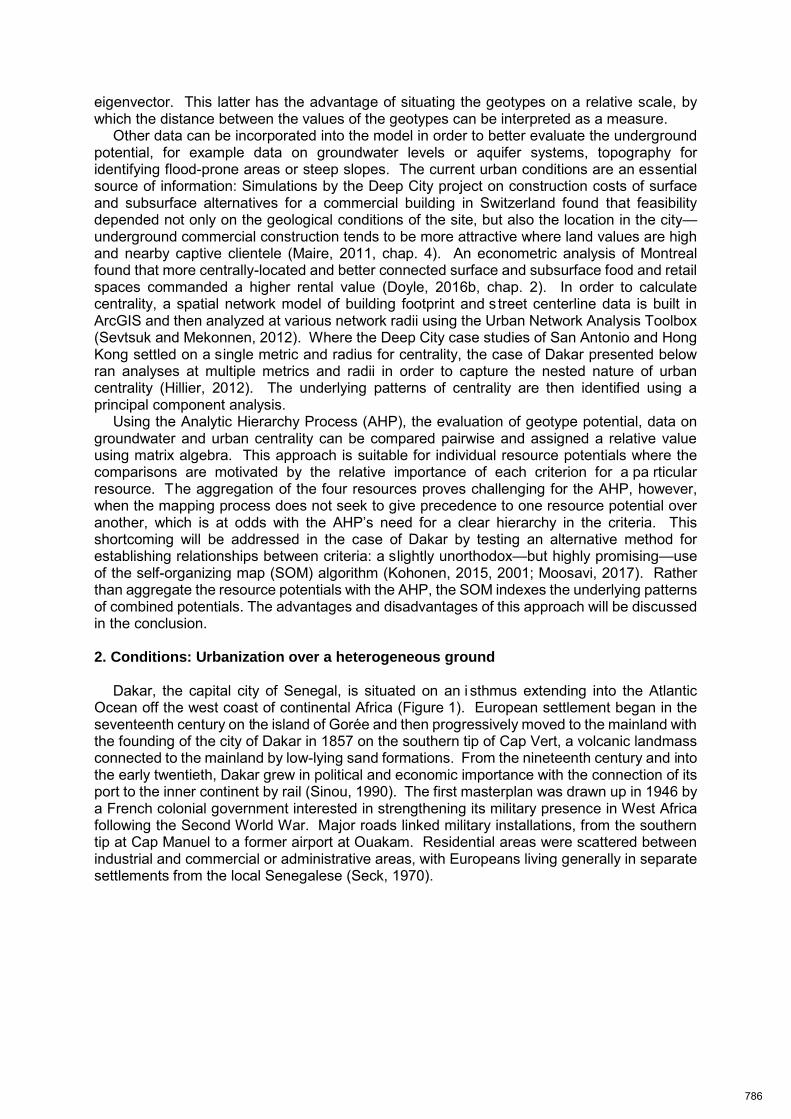
eigenvector. This latter has the advantage of situating the geotypes on a relative scale, by which the distance between the values of the geotypes can be interpreted as a measure.
Other data can be incorporated into the model in order to better evaluate the underground potential, for example data on groundwater levels or aquifer systems, topography for identifying flood-prone areas or steep slopes. The current urban conditions are an essential source of information: Simulations by the Deep City project on construction costs of surface and subsurface alternatives for a commercial building in Switzerland found that feasibility depended not only on the geological conditions of the site, but also the location in the city—underground commercial construction tends to be more attractive where land values are high and nearby captive clientele (Maire, 2011, chap. 4). An econometric analysis of Montreal found that more centrally-located and better connected surface and subsurface food and retail spaces commanded a higher rental value (Doyle, 2016b, chap. 2). In order to calculate centrality, a spatial network model of building footprint and s treet centerline data is built in ArcGIS and then analyzed at various network radii using the Urban Network Analysis Toolbox (Sevtsuk and Mekonnen, 2012). Where the Deep City case studies of San Antonio and Hong Kong settled on a single metric and radius for centrality, the case of Dakar presented below ran analyses at multiple metrics and radii in order to capture the nested nature of urban centrality (Hillier, 2012). The underlying patterns of centrality are then identified using a principal component analysis.
Using the Analytic Hierarchy Process (AHP), the evaluation of geotype potential, data on groundwater and urban centrality can be compared pairwise and assigned a relative value using matrix algebra. This approach is suitable for individual resource potentials where the comparisons are motivated by the relative importance of each criterion for a pa rticular resource. The aggregation of the four resources proves challenging for the AHP, however, when the mapping process does not seek to give precedence to one resource potential over another, which is at odds with the AHP’s need for a clear hierarchy in the criteria. This shortcoming will be addressed in the case of Dakar by testing an alternative method for establishing relationships between criteria: a slightly unorthodox—but highly promising—use of the self-organizing map (SOM) algorithm (Kohonen, 2015, 2001; Moosavi, 2017). Rather than aggregate the resource potentials with the AHP, the SOM indexes the underlying patterns of combined potentials. The advantages and disadvantages of this approach will be discussed in the conclusion. 2. Conditions: Urbanization over a heterogeneous ground
Dakar, the capital city of Senegal, is situated on an i sthmus extending into the Atlantic Ocean off the west coast of continental Africa (Figure 1). European settlement began in the seventeenth century on the island of Gorée and then progressively moved to the mainland with the founding of the city of Dakar in 1857 on the southern tip of Cap Vert, a volcanic landmass connected to the mainland by low-lying sand formations. From the nineteenth century and into the early twentieth, Dakar grew in political and economic importance with the connection of its port to the inner continent by rail (Sinou, 1990). The first masterplan was drawn up in 1946 by a French colonial government interested in strengthening its military presence in West Africa following the Second World War. Major roads linked military installations, from the southern tip at Cap Manuel to a former airport at Ouakam. Residential areas were scattered between industrial and commercial or administrative areas, with Europeans living generally in separate settlements from the local Senegalese (Seck, 1970).
786
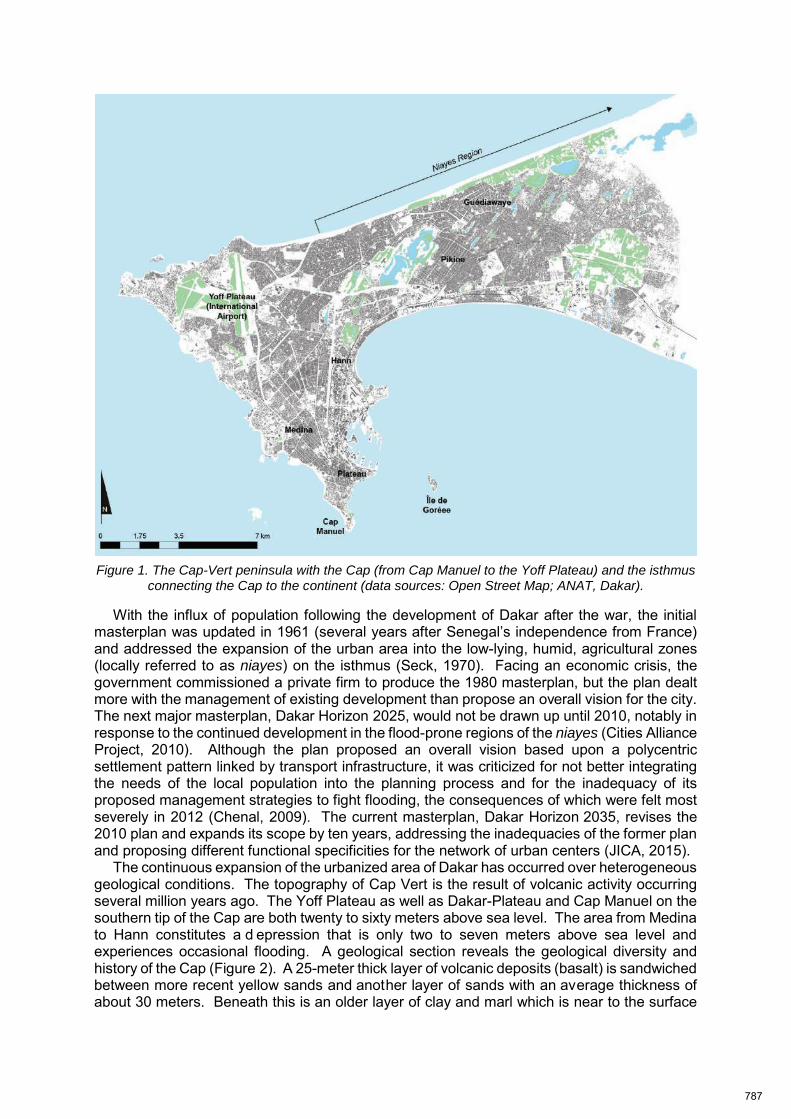
With the influx of population following the development of Dakar after the war, the initial masterplan was updated in 1961 (several years after Senegal’s independence from France) and addressed the expansion of the urban area into the low-lying, humid, agricultural zones (locally referred to as niayes) on the isthmus (Seck, 1970). Facing an economic crisis, the government commissioned a private firm to produce the 1980 masterplan, but the plan dealt more with the management of existing development than propose an overall vision for the city. The next major masterplan, Dakar Horizon 2025, would not be drawn up until 2010, notably in response to the continued development in the flood-prone regions of the niayes (Cities Alliance Project, 2010). Although the plan proposed an overall vision based upon a polycentric settlement pattern linked by transport infrastructure, it was criticized for not better integrating the needs of the local population into the planning process and for the inadequacy of its proposed management strategies to fight flooding, the consequences of which were felt most severely in 2012 (Chenal, 2009). The current masterplan, Dakar Horizon 2035, revises the 2010 plan and expands its scope by ten years, addressing the inadequacies of the former plan and proposing different functional specificities for the network of urban centers (JICA, 2015).
The continuous expansion of the urbanized area of Dakar has occurred over heterogeneous geological conditions. The topography of Cap Vert is the result of volcanic activity occurring several million years ago. The Yoff Plateau as well as Dakar-Plateau and Cap Manuel on the southern tip of the Cap are both twenty to sixty meters above sea level. The area from Medina to Hann constitutes a d epression that is only two to seven meters above sea level and experiences occasional flooding. A geological section reveals the geological diversity and history of the Cap (Figure 2). A 25-meter thick layer of volcanic deposits (basalt) is sandwiched between more recent yellow sands and another layer of sands with an average thickness of about 30 meters. Beneath this is an older layer of clay and marl which is near to the surface
Figure 1. The Cap-Vert peninsula with the Cap (from Cap Manuel to the Yoff Plateau) and the isthmus connecting the Cap to the continent (data sources: Open Street Map; ANAT, Dakar).
787
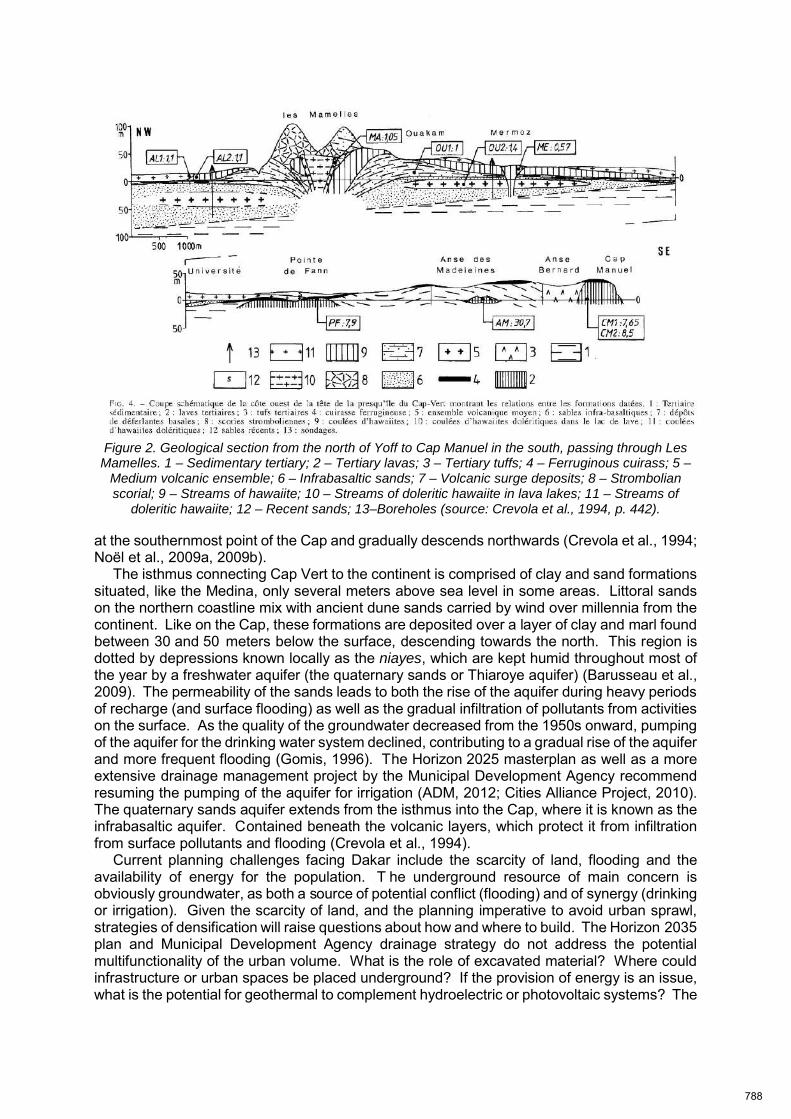
at the southernmost point of the Cap and gradually descends northwards (Crevola et al., 1994; Noël et al., 2009a, 2009b).
The isthmus connecting Cap Vert to the continent is comprised of clay and sand formations situated, like the Medina, only several meters above sea level in some areas. Littoral sands on the northern coastline mix with ancient dune sands carried by wind over millennia from the continent. Like on the Cap, these formations are deposited over a layer of clay and marl found between 30 and 50 meters below the surface, descending towards the north. This region is dotted by depressions known locally as the niayes, which are kept humid throughout most of the year by a freshwater aquifer (the quaternary sands or Thiaroye aquifer) (Barusseau et al., 2009). The permeability of the sands leads to both the rise of the aquifer during heavy periods of recharge (and surface flooding) as well as the gradual infiltration of pollutants from activities on the surface. As the quality of the groundwater decreased from the 1950s onward, pumping of the aquifer for the drinking water system declined, contributing to a gradual rise of the aquifer and more frequent flooding (Gomis, 1996). The Horizon 2025 masterplan as well as a more extensive drainage management project by the Municipal Development Agency recommend resuming the pumping of the aquifer for irrigation (ADM, 2012; Cities Alliance Project, 2010). The quaternary sands aquifer extends from the isthmus into the Cap, where it is known as the infrabasaltic aquifer. Contained beneath the volcanic layers, which protect it from infiltration from surface pollutants and flooding (Crevola et al., 1994).
Current planning challenges facing Dakar include the scarcity of land, flooding and the availability of energy for the population. T he underground resource of main concern is obviously groundwater, as both a source of potential conflict (flooding) and of synergy (drinking or irrigation). Given the scarcity of land, and the planning imperative to avoid urban sprawl, strategies of densification will raise questions about how and where to build. The Horizon 2035 plan and Municipal Development Agency drainage strategy do not address the potential multifunctionality of the urban volume. What is the role of excavated material? Where could infrastructure or urban spaces be placed underground? If the provision of energy is an issue, what is the potential for geothermal to complement hydroelectric or photovoltaic systems? The
Figure 2. Geological section from the north of Yoff to Cap Manuel in the south, passing through Les Mamelles. 1 – Sedimentary tertiary; 2 – Tertiary lavas; 3 – Tertiary tuffs; 4 – Ferruginous cuirass; 5 –
Medium volcanic ensemble; 6 – Infrabasaltic sands; 7 – Volcanic surge deposits; 8 – Strombolian scorial; 9 – Streams of hawaiite; 10 – Streams of doleritic hawaiite in lava lakes; 11 – Streams of
doleritic hawaiite; 12 – Recent sands; 13–Boreholes (source: Crevola et al., 1994, p. 442).
788
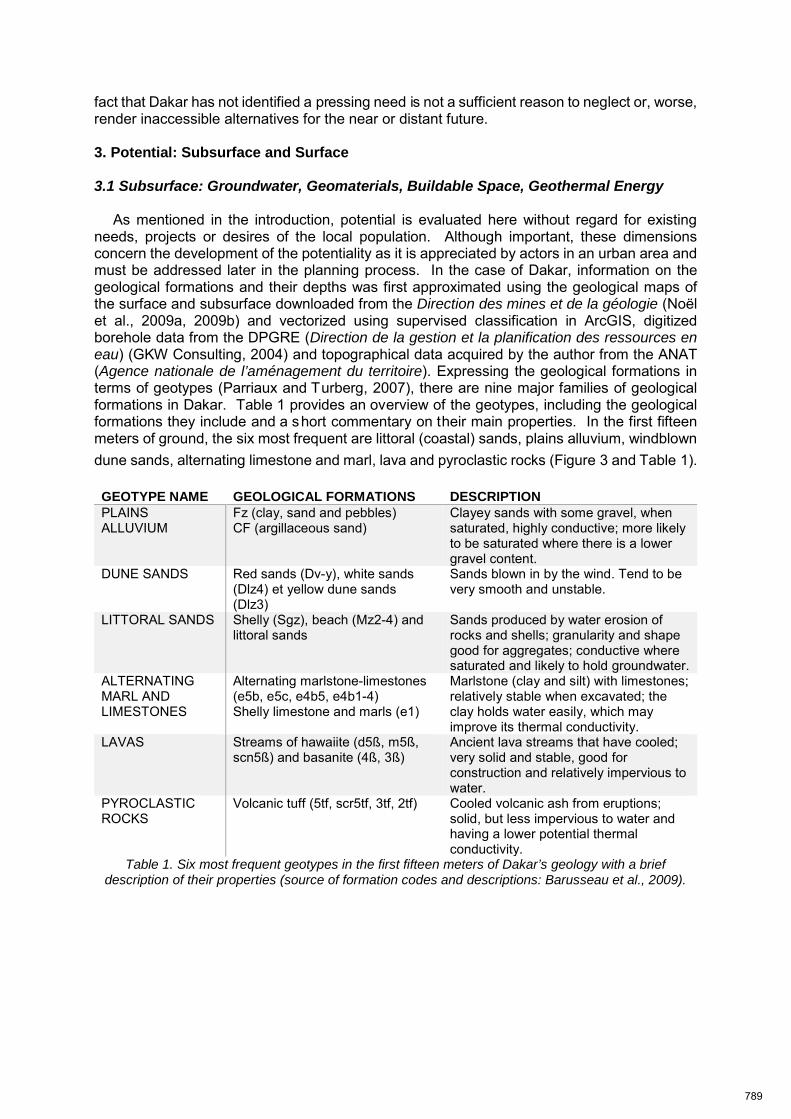
fact that Dakar has not identified a pressing need is not a sufficient reason to neglect or, worse, render inaccessible alternatives for the near or distant future. 3. Potential: Subsurface and Surface 3.1 Subsurface: Groundwater, Geomaterials, Buildable Space, Geothermal Energy
As mentioned in the introduction, potential is evaluated here without regard for existing needs, projects or desires of the local population. Although important, these dimensions concern the development of the potentiality as it is appreciated by actors in an urban area and must be addressed later in the planning process. In the case of Dakar, information on the geological formations and their depths was first approximated using the geological maps of the surface and subsurface downloaded from the Direction des mines et de la géologie (Noël et al., 2009a, 2009b) and vectorized using supervised classification in ArcGIS, digitized borehole data from the DPGRE (Direction de la gestion et la planification des ressources en eau) (GKW Consulting, 2004) and topographical data acquired by the author from the ANAT (Agence nationale de l’aménagement du territoire). Expressing the geological formations in terms of geotypes (Parriaux and Turberg, 2007), there are nine major families of geological formations in Dakar. Table 1 provides an overview of the geotypes, including the geological formations they include and a short commentary on their main properties. In the first fifteen meters of ground, the six most frequent are littoral (coastal) sands, plains alluvium, windblown dune sands, alternating limestone and marl, lava and pyroclastic rocks (Figure 3 and Table 1). GEOTYPE NAME GEOLOGICAL FORMATIONS DESCRIPTION
PLAINS ALLUVIUM
Fz (clay, sand and pebbles) CF (argillaceous sand)
Clayey sands with some gravel, when saturated, highly conductive; more likely to be saturated where there is a lower gravel content.
DUNE SANDS Red sands (Dv-y), white sands (Dlz4) et yellow dune sands (Dlz3)
Sands blown in by the wind. Tend to be very smooth and unstable.
LITTORAL SANDS Shelly (Sgz), beach (Mz2-4) and littoral sands
Sands produced by water erosion of rocks and shells; granularity and shape good for aggregates; conductive where saturated and likely to hold groundwater.
ALTERNATING MARL AND LIMESTONES
Alternating marlstone-limestones (e5b, e5c, e4b5, e4b1-4) Shelly limestone and marls (e1)
Marlstone (clay and silt) with limestones; relatively stable when excavated; the clay holds water easily, which may improve its thermal conductivity.
LAVAS Streams of hawaiite (d5ß, m5ß, scn5ß) and basanite (4ß, 3ß)
Ancient lava streams that have cooled; very solid and stable, good for construction and relatively impervious to water.
PYROCLASTIC ROCKS
Volcanic tuff (5tf, scr5tf, 3tf, 2tf) Cooled volcanic ash from eruptions; solid, but less impervious to water and having a lower potential thermal conductivity.
Table 1. Six most frequent geotypes in the first fifteen meters of Dakar’s geology with a brief description of their properties (source of formation codes and descriptions: Barusseau et al., 2009).
789
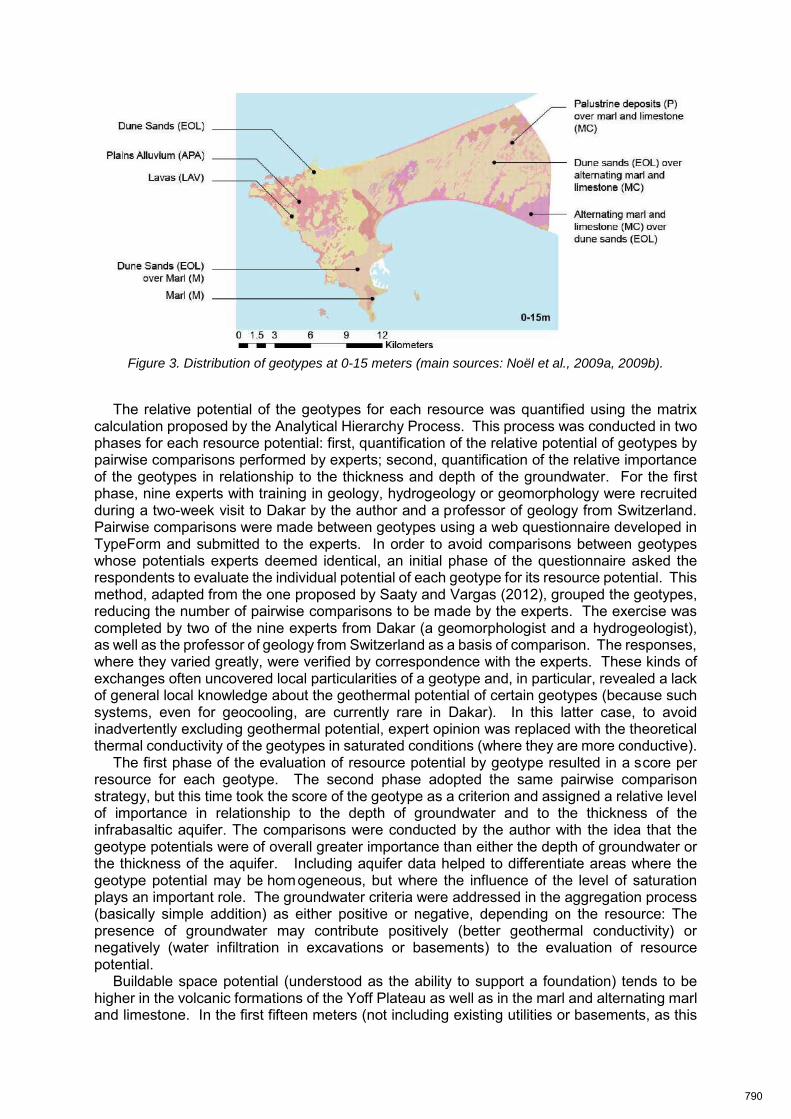
The relative potential of the geotypes for each resource was quantified using the matrix
calculation proposed by the Analytical Hierarchy Process. This process was conducted in two phases for each resource potential: first, quantification of the relative potential of geotypes by pairwise comparisons performed by experts; second, quantification of the relative importance of the geotypes in relationship to the thickness and depth of the groundwater. For the first phase, nine experts with training in geology, hydrogeology or geomorphology were recruited during a two-week visit to Dakar by the author and a professor of geology from Switzerland. Pairwise comparisons were made between geotypes using a web questionnaire developed in TypeForm and submitted to the experts. In order to avoid comparisons between geotypes whose potentials experts deemed identical, an initial phase of the questionnaire asked the respondents to evaluate the individual potential of each geotype for its resource potential. This method, adapted from the one proposed by Saaty and Vargas (2012), grouped the geotypes, reducing the number of pairwise comparisons to be made by the experts. The exercise was completed by two of the nine experts from Dakar (a geomorphologist and a hydrogeologist), as well as the professor of geology from Switzerland as a basis of comparison. The responses, where they varied greatly, were verified by correspondence with the experts. These kinds of exchanges often uncovered local particularities of a geotype and, in particular, revealed a lack of general local knowledge about the geothermal potential of certain geotypes (because such systems, even for geocooling, are currently rare in Dakar). In this latter case, to avoid inadvertently excluding geothermal potential, expert opinion was replaced with the theoretical thermal conductivity of the geotypes in saturated conditions (where they are more conductive).
The first phase of the evaluation of resource potential by geotype resulted in a score per resource for each geotype. The second phase adopted the same pairwise comparison strategy, but this time took the score of the geotype as a criterion and assigned a relative level of importance in relationship to the depth of groundwater and to the thickness of the infrabasaltic aquifer. The comparisons were conducted by the author with the idea that the geotype potentials were of overall greater importance than either the depth of groundwater or the thickness of the aquifer. Including aquifer data helped to differentiate areas where the geotype potential may be homogeneous, but where the influence of the level of saturation plays an important role. The groundwater criteria were addressed in the aggregation process (basically simple addition) as either positive or negative, depending on the resource: The presence of groundwater may contribute positively (better geothermal conductivity) or negatively (water infiltration in excavations or basements) to the evaluation of resource potential.
Buildable space potential (understood as the ability to support a foundation) tends to be higher in the volcanic formations of the Yoff Plateau as well as in the marl and alternating marl and limestone. In the first fifteen meters (not including existing utilities or basements, as this
Figure 3. Distribution of geotypes at 0-15 meters (main sources: Noël et al., 2009a, 2009b).
790
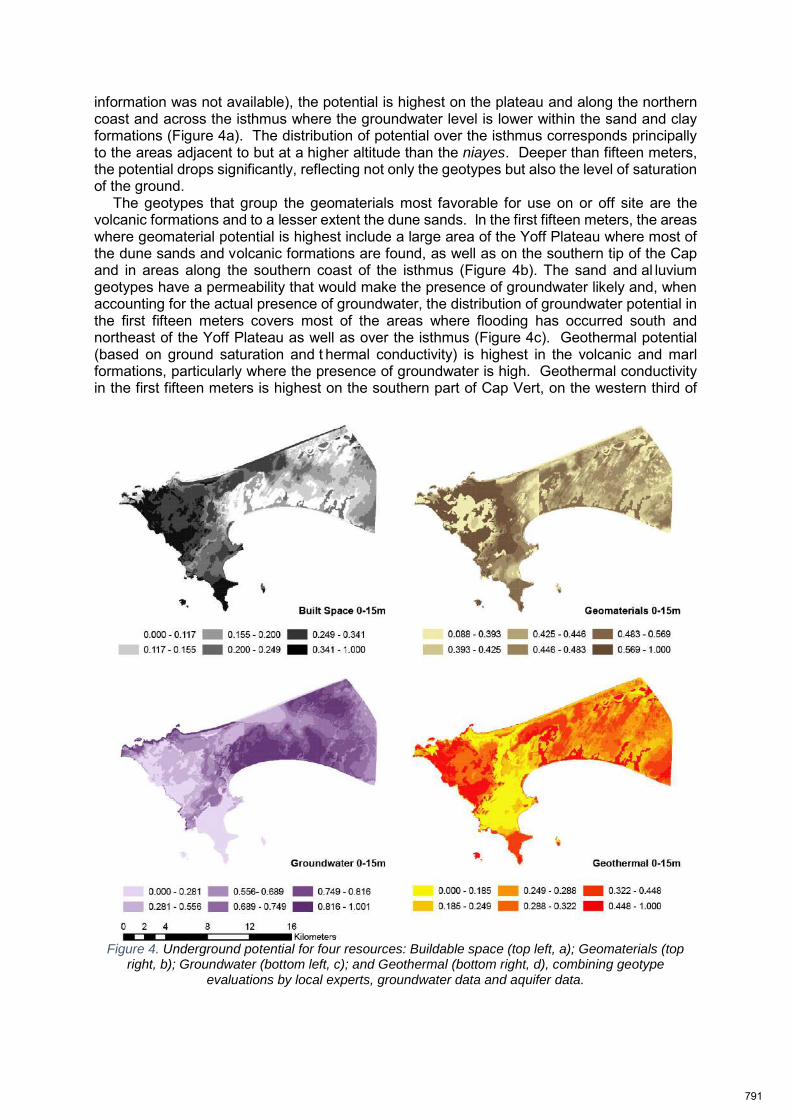
information was not available), the potential is highest on the plateau and along the northern coast and across the isthmus where the groundwater level is lower within the sand and clay formations (Figure 4a). The distribution of potential over the isthmus corresponds principally to the areas adjacent to but at a higher altitude than the niayes. Deeper than fifteen meters, the potential drops significantly, reflecting not only the geotypes but also the level of saturation of the ground.
The geotypes that group the geomaterials most favorable for use on or off site are the volcanic formations and to a lesser extent the dune sands. In the first fifteen meters, the areas where geomaterial potential is highest include a large area of the Yoff Plateau where most of the dune sands and volcanic formations are found, as well as on the southern tip of the Cap and in areas along the southern coast of the isthmus (Figure 4b). The sand and al luvium geotypes have a permeability that would make the presence of groundwater likely and, when accounting for the actual presence of groundwater, the distribution of groundwater potential in the first fifteen meters covers most of the areas where flooding has occurred south and northeast of the Yoff Plateau as well as over the isthmus (Figure 4c). Geothermal potential (based on ground saturation and t hermal conductivity) is highest in the volcanic and marl formations, particularly where the presence of groundwater is high. Geothermal conductivity in the first fifteen meters is highest on the southern part of Cap Vert, on the western third of
Figure 4. Underground potential for four resources: Buildable space (top left, a); Geomaterials (top right, b); Groundwater (bottom left, c); and Geothermal (bottom right, d), combining geotype
evaluations by local experts, groundwater data and aquifer data.
791
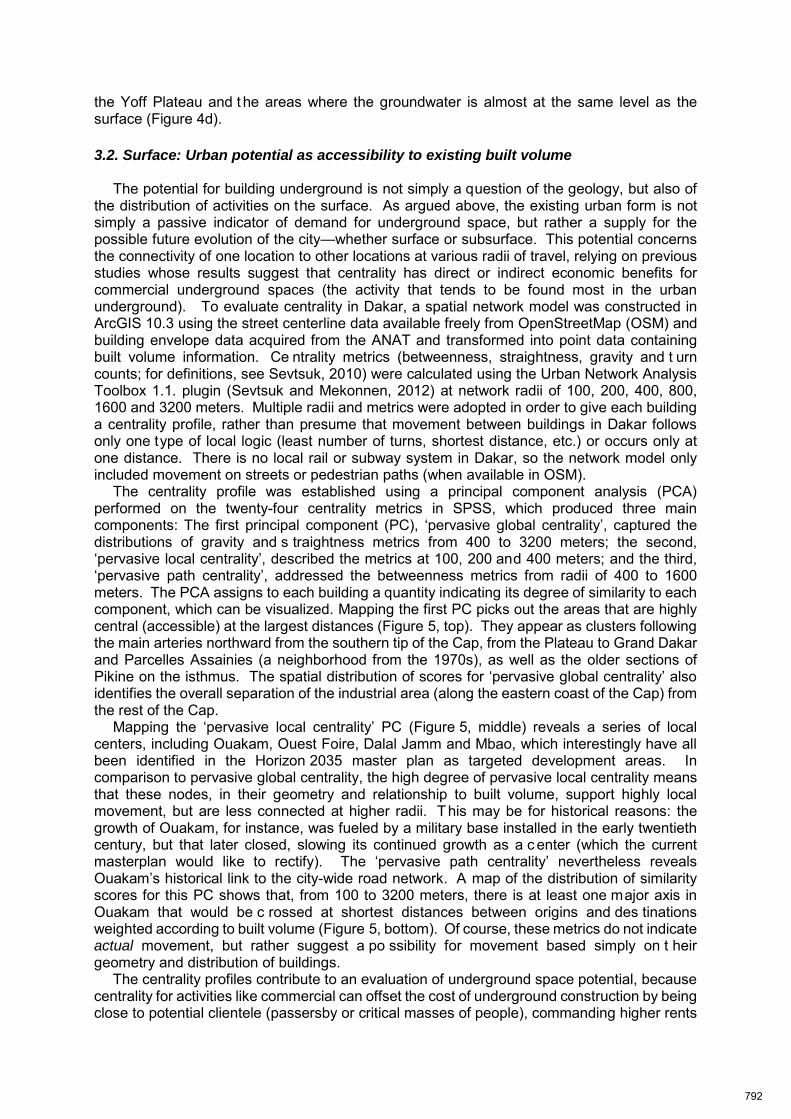
the Yoff Plateau and t he areas where the groundwater is almost at the same level as the surface (Figure 4d). 3.2. Surface: Urban potential as accessibility to existing built volume
The potential for building underground is not simply a question of the geology, but also of the distribution of activities on the surface. As argued above, the existing urban form is not simply a passive indicator of demand for underground space, but rather a supply for the possible future evolution of the city—whether surface or subsurface. This potential concerns the connectivity of one location to other locations at various radii of travel, relying on previous studies whose results suggest that centrality has direct or indirect economic benefits for commercial underground spaces (the activity that tends to be found most in the urban underground). To evaluate centrality in Dakar, a spatial network model was constructed in ArcGIS 10.3 using the street centerline data available freely from OpenStreetMap (OSM) and building envelope data acquired from the ANAT and transformed into point data containing built volume information. Ce ntrality metrics (betweenness, straightness, gravity and t urn counts; for definitions, see Sevtsuk, 2010) were calculated using the Urban Network Analysis Toolbox 1.1. plugin (Sevtsuk and Mekonnen, 2012) at network radii of 100, 200, 400, 800, 1600 and 3200 meters. Multiple radii and metrics were adopted in order to give each building a centrality profile, rather than presume that movement between buildings in Dakar follows only one type of local logic (least number of turns, shortest distance, etc.) or occurs only at one distance. There is no local rail or subway system in Dakar, so the network model only included movement on streets or pedestrian paths (when available in OSM).
The centrality profile was established using a principal component analysis (PCA) performed on the twenty-four centrality metrics in SPSS, which produced three main components: The first principal component (PC), ‘pervasive global centrality’, captured the distributions of gravity and s traightness metrics from 400 to 3200 meters; the second, ‘pervasive local centrality’, described the metrics at 100, 200 and 400 meters; and the third, ‘pervasive path centrality’, addressed the betweenness metrics from radii of 400 to 1600 meters. The PCA assigns to each building a quantity indicating its degree of similarity to each component, which can be visualized. Mapping the first PC picks out the areas that are highly central (accessible) at the largest distances (Figure 5, top). They appear as clusters following the main arteries northward from the southern tip of the Cap, from the Plateau to Grand Dakar and Parcelles Assainies (a neighborhood from the 1970s), as well as the older sections of Pikine on the isthmus. The spatial distribution of scores for ‘pervasive global centrality’ also identifies the overall separation of the industrial area (along the eastern coast of the Cap) from the rest of the Cap.
Mapping the ‘pervasive local centrality’ PC (Figure 5, middle) reveals a series of local centers, including Ouakam, Ouest Foire, Dalal Jamm and Mbao, which interestingly have all been identified in the Horizon 2035 master plan as targeted development areas. In comparison to pervasive global centrality, the high degree of pervasive local centrality means that these nodes, in their geometry and relationship to built volume, support highly local movement, but are less connected at higher radii. This may be for historical reasons: the growth of Ouakam, for instance, was fueled by a military base installed in the early twentieth century, but that later closed, slowing its continued growth as a c enter (which the current masterplan would like to rectify). The ‘pervasive path centrality’ nevertheless reveals Ouakam’s historical link to the city-wide road network. A map of the distribution of similarity scores for this PC shows that, from 100 to 3200 meters, there is at least one major axis in Ouakam that would be c rossed at shortest distances between origins and des tinations weighted according to built volume (Figure 5, bottom). Of course, these metrics do not indicate actual movement, but rather suggest a po ssibility for movement based simply on t heir geometry and distribution of buildings.
The centrality profiles contribute to an evaluation of underground space potential, because centrality for activities like commercial can offset the cost of underground construction by being close to potential clientele (passersby or critical masses of people), commanding higher rents
792
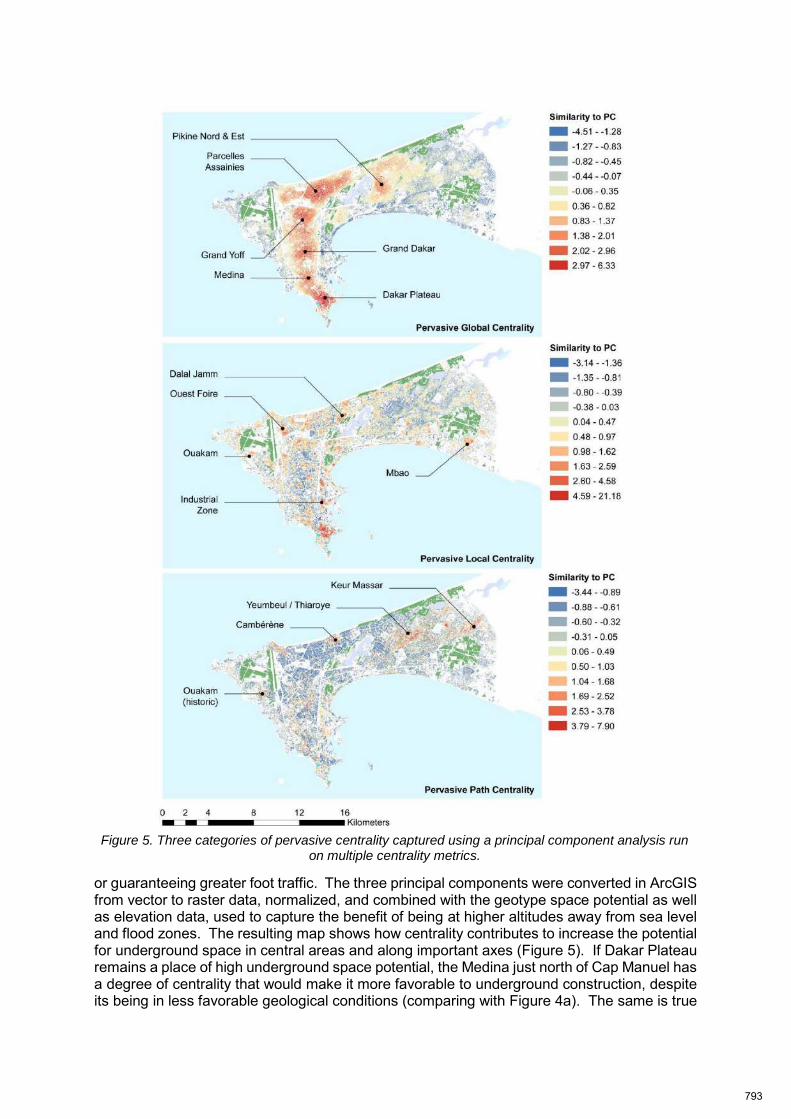
or guaranteeing greater foot traffic. The three principal components were converted in ArcGIS from vector to raster data, normalized, and combined with the geotype space potential as well as elevation data, used to capture the benefit of being at higher altitudes away from sea level and flood zones. The resulting map shows how centrality contributes to increase the potential for underground space in central areas and along important axes (Figure 5). If Dakar Plateau remains a place of high underground space potential, the Medina just north of Cap Manuel has a degree of centrality that would make it more favorable to underground construction, despite its being in less favorable geological conditions (comparing with Figure 4a). The same is true
Figure 5. Three categories of pervasive centrality captured using a principal component analysis run on multiple centrality metrics.
793
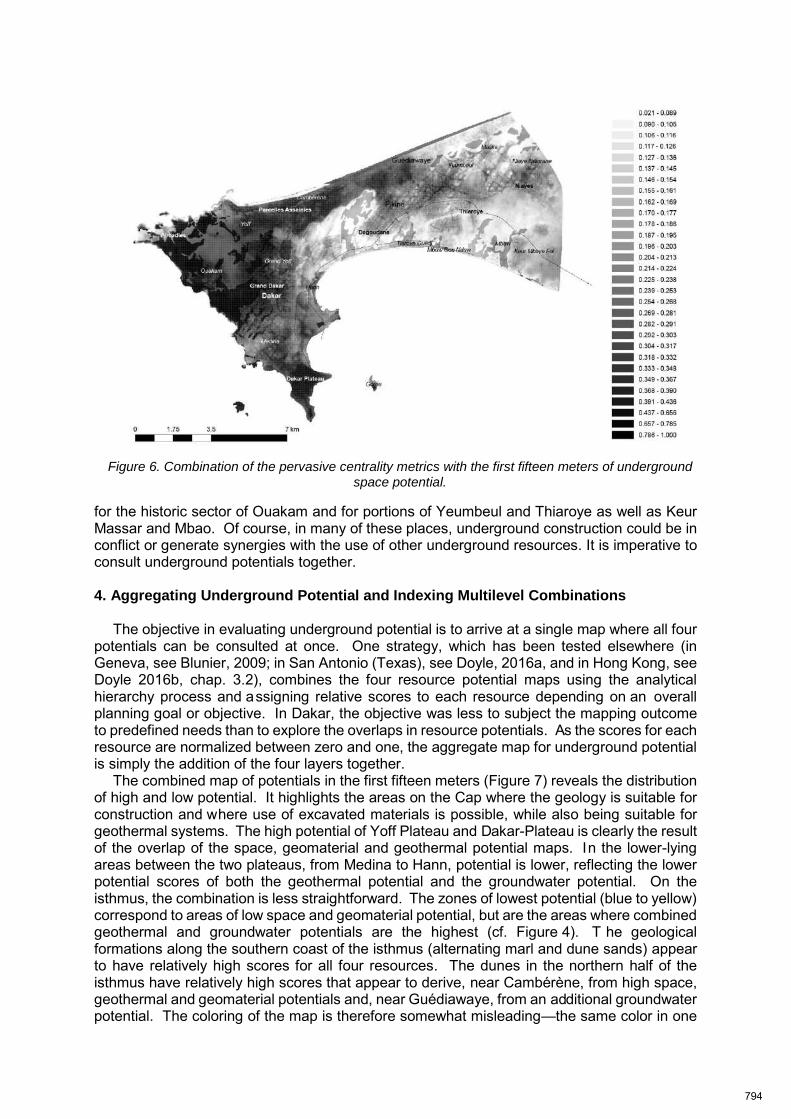
for the historic sector of Ouakam and for portions of Yeumbeul and Thiaroye as well as Keur Massar and Mbao. Of course, in many of these places, underground construction could be in conflict or generate synergies with the use of other underground resources. It is imperative to consult underground potentials together. 4. Aggregating Underground Potential and Indexing Multilevel Combinations
The objective in evaluating underground potential is to arrive at a single map where all four potentials can be consulted at once. One strategy, which has been tested elsewhere (in Geneva, see Blunier, 2009; in San Antonio (Texas), see Doyle, 2016a, and in Hong Kong, see Doyle 2016b, chap. 3.2), combines the four resource potential maps using the analytical hierarchy process and assigning relative scores to each resource depending on an overall planning goal or objective. In Dakar, the objective was less to subject the mapping outcome to predefined needs than to explore the overlaps in resource potentials. As the scores for each resource are normalized between zero and one, the aggregate map for underground potential is simply the addition of the four layers together.
The combined map of potentials in the first fifteen meters (Figure 7) reveals the distribution of high and low potential. It highlights the areas on the Cap where the geology is suitable for construction and where use of excavated materials is possible, while also being suitable for geothermal systems. The high potential of Yoff Plateau and Dakar-Plateau is clearly the result of the overlap of the space, geomaterial and geothermal potential maps. In the lower-lying areas between the two plateaus, from Medina to Hann, potential is lower, reflecting the lower potential scores of both the geothermal potential and the groundwater potential. On the isthmus, the combination is less straightforward. The zones of lowest potential (blue to yellow) correspond to areas of low space and geomaterial potential, but are the areas where combined geothermal and groundwater potentials are the highest (cf. Figure 4). T he geological formations along the southern coast of the isthmus (alternating marl and dune sands) appear to have relatively high scores for all four resources. The dunes in the northern half of the isthmus have relatively high scores that appear to derive, near Cambérène, from high space, geothermal and geomaterial potentials and, near Guédiawaye, from an additional groundwater potential. The coloring of the map is therefore somewhat misleading—the same color in one
Figure 6. Combination of the pervasive centrality metrics with the first fifteen meters of underground space potential.
794
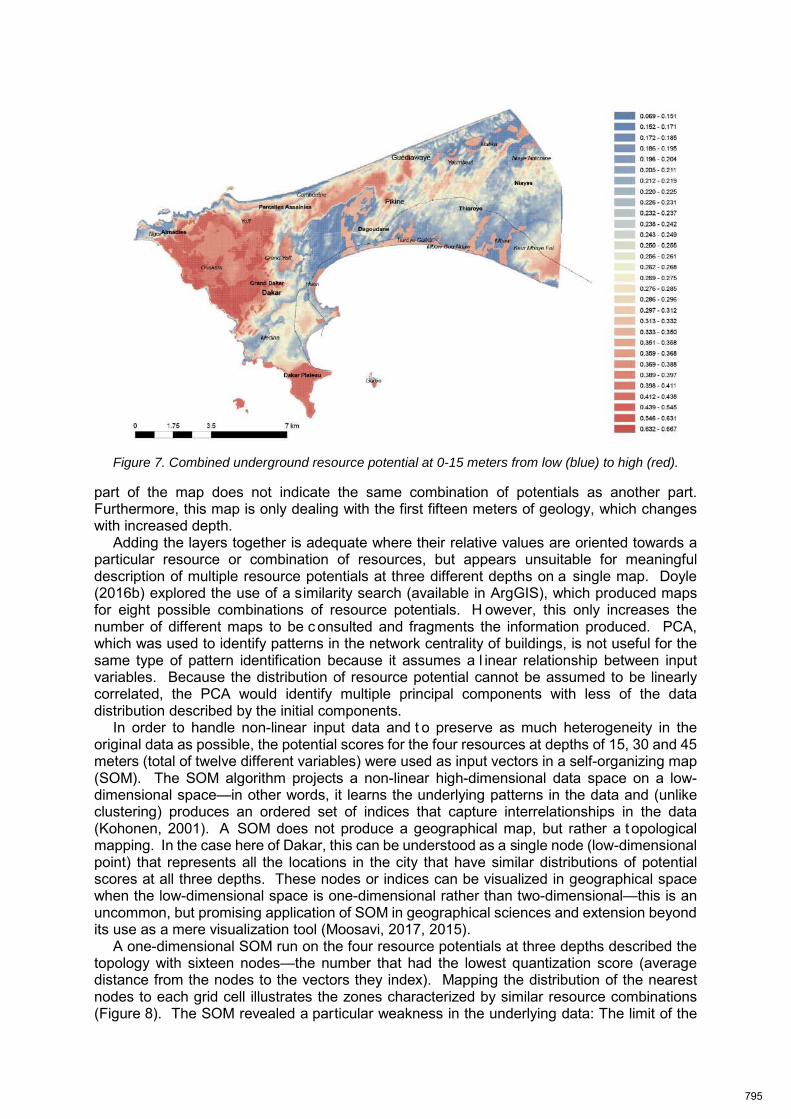
part of the map does not indicate the same combination of potentials as another part. Furthermore, this map is only dealing with the first fifteen meters of geology, which changes with increased depth.
Adding the layers together is adequate where their relative values are oriented towards a particular resource or combination of resources, but appears unsuitable for meaningful description of multiple resource potentials at three different depths on a single map. Doyle (2016b) explored the use of a similarity search (available in ArgGIS), which produced maps for eight possible combinations of resource potentials. H owever, this only increases the number of different maps to be c onsulted and fragments the information produced. PCA, which was used to identify patterns in the network centrality of buildings, is not useful for the same type of pattern identification because it assumes a l inear relationship between input variables. Because the distribution of resource potential cannot be assumed to be linearly correlated, the PCA would identify multiple principal components with less of the data distribution described by the initial components.
In order to handle non-linear input data and t o preserve as much heterogeneity in the original data as possible, the potential scores for the four resources at depths of 15, 30 and 45 meters (total of twelve different variables) were used as input vectors in a self-organizing map (SOM). The SOM algorithm projects a non-linear high-dimensional data space on a low-dimensional space—in other words, it learns the underlying patterns in the data and (unlike clustering) produces an ordered set of indices that capture interrelationships in the data (Kohonen, 2001). A SOM does not produce a geographical map, but rather a t opological mapping. In the case here of Dakar, this can be understood as a single node (low-dimensional point) that represents all the locations in the city that have similar distributions of potential scores at all three depths. These nodes or indices can be visualized in geographical space when the low-dimensional space is one-dimensional rather than two-dimensional—this is an uncommon, but promising application of SOM in geographical sciences and extension beyond its use as a mere visualization tool (Moosavi, 2017, 2015).
A one-dimensional SOM run on the four resource potentials at three depths described the topology with sixteen nodes—the number that had the lowest quantization score (average distance from the nodes to the vectors they index). Mapping the distribution of the nearest nodes to each grid cell illustrates the zones characterized by similar resource combinations (Figure 8). The SOM revealed a particular weakness in the underlying data: The limit of the
Figure 7. Combined underground resource potential at 0-15 meters from low (blue) to high (red).
795
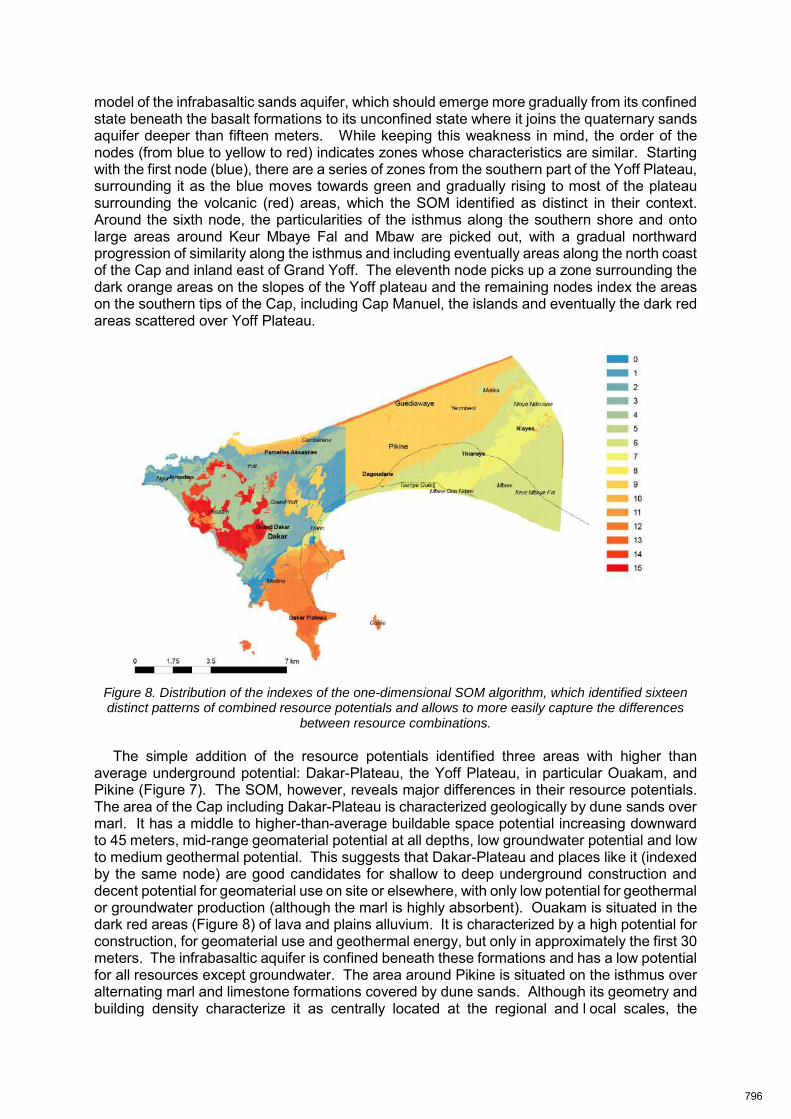
model of the infrabasaltic sands aquifer, which should emerge more gradually from its confined state beneath the basalt formations to its unconfined state where it joins the quaternary sands aquifer deeper than fifteen meters. While keeping this weakness in mind, the order of the nodes (from blue to yellow to red) indicates zones whose characteristics are similar. Starting with the first node (blue), there are a series of zones from the southern part of the Yoff Plateau, surrounding it as the blue moves towards green and gradually rising to most of the plateau surrounding the volcanic (red) areas, which the SOM identified as distinct in their context. Around the sixth node, the particularities of the isthmus along the southern shore and onto large areas around Keur Mbaye Fal and Mbaw are picked out, with a gradual northward progression of similarity along the isthmus and including eventually areas along the north coast of the Cap and inland east of Grand Yoff. The eleventh node picks up a zone surrounding the dark orange areas on the slopes of the Yoff plateau and the remaining nodes index the areas on the southern tips of the Cap, including Cap Manuel, the islands and eventually the dark red areas scattered over Yoff Plateau.
Figure 8. Distribution of the indexes of the one-dimensional SOM algorithm, which identified sixteen distinct patterns of combined resource potentials and allows to more easily capture the differences
between resource combinations.
The simple addition of the resource potentials identified three areas with higher than average underground potential: Dakar-Plateau, the Yoff Plateau, in particular Ouakam, and Pikine (Figure 7). The SOM, however, reveals major differences in their resource potentials. The area of the Cap including Dakar-Plateau is characterized geologically by dune sands over marl. It has a middle to higher-than-average buildable space potential increasing downward to 45 meters, mid-range geomaterial potential at all depths, low groundwater potential and low to medium geothermal potential. This suggests that Dakar-Plateau and places like it (indexed by the same node) are good candidates for shallow to deep underground construction and decent potential for geomaterial use on site or elsewhere, with only low potential for geothermal or groundwater production (although the marl is highly absorbent). Ouakam is situated in the dark red areas (Figure 8) of lava and plains alluvium. It is characterized by a high potential for construction, for geomaterial use and geothermal energy, but only in approximately the first 30 meters. The infrabasaltic aquifer is confined beneath these formations and has a low potential for all resources except groundwater. The area around Pikine is situated on the isthmus over alternating marl and limestone formations covered by dune sands. Although its geometry and building density characterize it as centrally located at the regional and l ocal scales, the
796
tendency for the marl to expand and contract during the rise and fall of the aquifer means that in general the part of the isthmus sharing the same index as Pikine has low potential for underground construction. The possibility to use extracted geomaterials is medium to low and depends on the quality and ease of separation of the dune sands. The potential for geothermal is about the same in the first fifteen meters, but increases as the level of saturation increases. The highest potential, which is unsurprising given the presence of the aquifer and the proximity to sea level, is for groundwater.
This study has not yet, unfortunately, had the opportunity to share the resulting maps with the local experts consulted. Possibilities for application can only be formulated hypothetically or in terms of a series of questions. The indexing of the four resource potentials at various depths using the SOM algorithm (versus a simple aggregation by addition) has the advantage of producing a single geographical map for consultation by decision makers, planners or experts. It has the disadvantage of not providing a stable characterization—that is, if data is updated or added, then the number of optimal nodes may change. O f course, the actual significance of this change may be quite small and would have to be tested. If, for instance, geographical data on the movement of the aquifer was added, the model would have to learn these changes over time and perhaps in real time. With such time-series data, the characterizations (assigned nodes) would stabilize around repetitive patterns in time, but might shift suddenly in the case of a sudden change in the underlying data. Such an application may be beneficial for identifying measures to apply locally or regionally by city authorities when one area suddenly changes categories (as in a flood or a sudden, unusual, rise in groundwater levels). These are possible investigations for future research. 5. Conclusion: Resources to Needs, From Data-Poor to Data-Rich Settings
The Dakar case study was an opportunity to examine urban underground potential on a continent that has received little attention from research on the underground in an urban context and to test the Deep City methodology in a context where digital geographical data was limited. This limitation, although pointing out the necessity for improvement, is understandable in a city where the production of data has been limited to the groundwater resource. It is less a disadvantage than an advantage: Dakar still has the opportunity to coordinate the planning of its underground resources in a sustainable fashion. As the maps produced by the study show, the city is characterized by zones of different combinations of resource potentials from the surface to 45 meters deep. Of course, the evaluation presented here should be followed up with more detailed local investigations. It provides only a general overview for the planning process.
This study is not only about the city of Dakar, but also about the continued improvement of a mapping method developed by the Deep City project. One of the major challenges facing a cartographical method such as this one is the ability to present data of different geographical and measurement scales on a single map. The approach using geotypes, combined with the Analytic Hierarchy Process (AHP), proves effective for translating the relationships between individual criteria into quantitative measures. This approach falls short, however, in the combination of potentials where no single objective can orient the relationship between criteria. As demonstrated here, this is the possible benefit of the self-organizing map (SOM). The SOM does not establish metrical, but topological relationships between the criteria—the underlying patterns in their structure, independent of measure. Further testing is needed, of course, to explore the limits of this approach.
Every city should take stock of its underground resources—even if the result is protection rather than exploitation, prevention rather than intervention. The mapping method proposed here provides a strategy for cities to gain a quick overview of their resource potentials, without needing a large amount of data. In principle, more data is better, but this poses challenges in practice. As the number of criteria increases, so does the difficulty of establishing the relationship between them. Where only one r esource potential (or a predetermined combination of potentials) is of interest, multi-criteria decision-making methods like the AHP can respond without problem. They fall short, however, when there is no desired outcome—
797
when the multiuse potential of the resources is still at their maximum. The study presented here is only a first step to confront some of the difficulties faced by these methods and to explore the SOM as a possible alternative. Although the area of application here was the urban underground, the questions it raises are a concern for the ability of urban planning in general to respond to increasing amounts of multidimensional spatial information. Bibliography ADM, 2012. Plan directeur de drainage pluvial (Final Report No. 3), Étude de plan directeur
de drainage (PDD) des eaux pluviales de la région périurbaine de Dakar. Agence de développement municipal, Dakar.
Barusseau, J.-P., Castaigne, P., Duvail, C., Noël, B.J., Nehlig, P., Roger, J., Serrano, O., Banton, O., Comte, J.-C., Travi, Y., 2009. Notice explicative de la cartographie multi-couches à 1/50000 et 1/20000 de la zone d’activité Cap-Vert. Ministère des Mines, de l’industrie et des PME, Direction des Mines et de la Géologie, Dakar.
Bélanger, P., 2007. Underground landscape: The urbanism and infrastructure of Toronto’s downtown pedestrian network. Tunnelling and Underground Space Technology 22, 272–292. doi:10.1016/j.tust.2006.07.005
Blunier, P., 2009. Méthodologie de gestion durable des ressources du sous-sol urbain (Doctoral Dissertation). EPFL, Lausanne.
Boisvert, M.A., 2011. Montréal et Toronto : villes intérieures. Presses de l’Université de Montréal, Montréal.
Chenal, J., 2009. Urbanisation, planification urbaine et modèles de ville en Afrique de l’Ouest: jeux et enjeux de l’espace public (PhD in Architecture, City, History). École polytechnique fédérale de Lausanne, Lausanne, Switzerland.
Cities Alliance Project, 2010. Stratégie de développement urbain du Grand Dakar (Horizon 2025) (Urban Masterplan No. P099673).
Crevola, G., Cantagrel, J.-M., Moreau, C., 1994. Le volcanisme cénozoïque de la presqu’île du Cap-Vert (Sénégal): cadre chronologique et géodynamique. Bulletin de la Société Géologique de France 165, 437–446.
Doyle, M.R., 2017. “Resources to Needs”: A Paradigm for Addressing the Potentiality of the Urban Volume. Urban Planning 2, 6. doi:10.17645/up.v2i1.759
Doyle, M.R., 2016a. From hydro/geology to the streetscape: Evaluating urban underground resource potential. Tunnelling and Underground Space Technology 55, 83–95. doi:10.1016/j.tust.2016.01.021
Doyle, M.R., 2016b. Potentialities of the Urban Volume: Mapping underground resource potential and deciphering spatial economies and configurations of multi-level urban spaces (PhD in Architecture and the Sciences of the City). Swiss Federal Institute of Technology Lausanne (EPFL), Lausanne, Switzerland.
El-Geneidy, A., Kastelberger, L., Abdelhamid, H.T., 2011. Montréal’s Roots: Exploring the Growth of Montréal’s Indoor City. Journal of Transport and Land Use 4, 33–46. doi:10.5198/jtlu.v4i2.176
GKW Consulting, 2004. Projet Eau à Long Terme -- Études hydrogéologiques complémentaires (Intervention report). Ministère de l’Agriculture, de l’Élevage et de l’Hydraulique, Dakar.
Gomis, R., 1996. L’aquifère des sables quaternaires au nord de la presqu’île du Cap-Vert (Sénégal): Morphologie déduite des données hydrogéologiques et géophysiques (sondages électriques). Analyse de la vulnérabilité de la nappe à l’invasion saline dans la zone de Pikine. (Master’s Thesis). Cheikh Anta Diop University, Dakar.
Hillier, B., 2012. The Genetic Code for Cities: Is It Simpler than We Think?, in: Portugali, J., Meyer, H., Stolk, E., Tan, E. (Eds.), Complexity Theories of Cities Have Come of Age. Springer Berlin Heidelberg, Berlin, Heidelberg, pp. 129–152.
International Tunnelling and Underground Space Association, 2012. Report on Underground Solutions for Urban Problems (No. 011).
798
JICA, 2015. Projet du plan directeur d’urbanisme de Dakar et ses environs Horizon 2035 (Interim report). Ministère du Renouveau Urbain de l’Habitat et du Cadre de Vie, République du Sénégal, Dakar.
Kohonen, T., 2015. What makes the self-organizing maps (SOM) so particular among learning algorithms?, in: Bühlmann, V., Hovestadt, L., Moosavi, V. (Eds.), Coding as Literacy: Metalithikum IV, Applied Virtuality Book Series. Birkhäuser, Part of Walter de Gruyter GmbH, Berlin, Basel, Switzerland, pp. 22–25.
Kohonen, T., 2001. Self-organizing maps, 3rd ed. ed, Springer series in information sciences. Springer, Berlin ; New York.
Li, H., Parriaux, A., Thalmann, P., Li, X., 2013. An integrated planning concept for the emerging underground urbanism: Deep City Method Part 1 concept, process and application. Tunnelling and Underground Space Technology 38, 559–568. doi:10.1016/j.tust.2013.04.010
Maire, P., 2011. Étude multidisciplinaire d’un développement durable du sous-sol urbain. Aspects socio-économiques, juridiques et de politique urbaine (Doctoral Dissertation). Swiss Federal Institute of Technology Lausanne (EPFL), Lausanne.
Moosavi, V., 2017. Contextual mapping: Visualization of high-dimensional spatial patterns in a single geo-map. Computers, Environment and Urban Systems 61, 1–12. doi:10.1016/j.compenvurbsys.2016.08.005
Moosavi, V., 2015. Pre-Specific Modeling: Computational Machines in a Coexistence with Concrete Universals and Data Streams, in: Bühlmann, V., Hovestadt, L., Moosavi, V. (Eds.), Metalithikum IV, Coding as Literacy. Birkhäuser, Vienna, pp. 132–166.
Noël, B.J., Roger, J., Nehlig, P., Serrano, O., Dabo, B., Seck, D., Duvail, C., 2009a. Carte géologique de la zone d’activité du Cap-Vert à 1/50000. Formations du substratum.
Noël, B.J., Serrano, O., Duvail, C., Barusseau, J.-P., Diagne, É., Seck, D., 2009b. Carte géologique de la zone d’activité du Cap-Vert à 1/50000. Formations superficielles.
Ortiz-Zamora, D., Ortega-Guerrero, A., 2010. Evolution of long-term land subsidence near Mexico City: Review, field investigations, and predictive simulations: Long-term Land Subsidence. Water Resources Research 46. doi:10.1029/2008WR007398
Parriaux, A., Blunier, P., Maire, P., Dekkil, G., Tacher, L., 2010. Projet Deep city : ressources du sous-sol et développement durable des espaces urbains. vdf Hochschulverlag AG an der ETH Zürich, Lausanne.
Parriaux, A., Tacher, L., Joliquin, P., 2004. The hidden side of cities—towards three-dimensional land planning. Energy and Buildings 36, 335–341. doi:10.1016/j.enbuild.2004.01.026
Parriaux, A., Turberg, P., 2007. Les géotypes, pour une représentation géologique du territoire. Tracés 133, 11–17. doi:10.5169/seals-99593
Saaty, T.L., 1990. How to make a decision: The analytic hierarchy process. European Journal of Operational Research 48, 9–26. doi:10.1016/0377-2217(90)90057-I
Saaty, T.L., 1980. The analytic hierarchy process: planning, priority setting, resource allocation. McGraw-Hill International Book Co, New York ; London.
Saaty, T.L., Vargas, L.G., 2012. Models, methods, concepts & applications of the analytic hierarchy process, 2. ed. ed, International series in operations research & management science. Springer, New York.
Seck, A., 1970. Dakar, métropole ouest-africaine. Mémoires de l’Institut fondamental d’Afrique noire 1–516.
Sevtsuk, A., 2010. Path and place: a study of urban geometry and retail activity in Cambridge and Somerville, MA (Doctoral Dissertation). Massachusetts Institute of Technology, Dept of Urban Studies and Planning, Cambridge, MA.
Sevtsuk, A., Mekonnen, M., 2012. Urban network analysis. A new toolbox for ArcGIS. Revue internationale de géomatique 22, 287–305. doi:10.3166/rig.22.287-305
Sinou, A., 1990. Dakar. Bulletin d’information Architecturales. Vähäaho, I., 2016. An introduction to the development for urban underground space in
Helsinki. Tunnelling and Underground Space Technology 55, 324–328. doi:10.1016/j.tust.2015.10.001
799

Wallace, M.I., Ng, K.C., 2016. Development and application of underground space use in Hong Kong. Tunnelling and Underground Space Technology 55, 257–279. doi:10.1016/j.tust.2015.11.024
Zhao, J.-W., Peng, F.-L., Wang, T.-Q., Zhang, X.-Y., Jiang, B.-N., 2016. Advances in master planning of urban underground space (UUS) in China. Tunnelling and Underground Space Technology 55, 290–307. doi:10.1016/j.tust.2015.11.011
800
Research on green infrastructure construction in mountainous
watershed cities——with Guangyuan city as an example MAO FENG*1 ,ZHAO WANMIN2, TAO ZHANG3,
1,2 Faculty of Architecture and Urban Planning, Chongqing University, 400044, China 3,College of Architecture and Urban Planning, Tongji University, Shanghai , 200092, China
Abstract
Mountainous watershed cities are more complicated than plain cities in terms of ecological pattern and service, Land use characteristics, natural disaster. Expansive planning lack of respect for nature lead to the problems of ecological system imbalance, increasing landscape fragmentation, deterioration of living environment, frequent natural disasters. “Habitat III” put forward The New Urban Agenda witch proposed the construction of resilience city In view of the problems and challenges faced by human settlement. As a result building resilience cities in mountainous watershed is extremely urgent. Through a large number of practice Green infrastructure has been proved an important measure to build resilience city due to its versatility, connectivity, multi-scale network structure characteristics. The research of green infrastructure has made significant achievements in building basin scale ecological pattern, however the research about planning path for green infrastructure construction in mountainous watershed cities and the methods coupling green infrastructure into urban infrastructures are still at an early stage. This paper based on full consideration landscape features in mountainous watershed cities, through the method of hydrology analysis and minimum cumulative resistance analysis , taking Guangyuan city of Sichuan province in China as an case study, put forward the planning path and framework of green infrastructure construction in mountainous watershed cities: firstly proposing the target framework based on ecological philosophy and the demand of urban development, secondly identifying ecological patch based on remote sensing data and calculating potential corridor through minimum cumulative resistance analysis, thirdly delimiting the Landscape sensitive control areas through Digital Elevation Models and Hydrology Models, establishing green infrastructure network system In combination with the patches and corridors obtained above, at last determining the priority according to the urban land use planning, ecosystem services, cultural characteristics and landscape value. Based on the case study of Guangyuan City in Sichuan Province, this paper constructs Guangyuan recreational greenway system and ecological security pattern, which provides a framework for the development of urban toughness. Key words: mountainous watershed cities green infrastructure resilience city 1. Introduction:
1.1Characteristics of mountainous watershed city:
From the broad sense to understand the concept of mountain, that is, the relative height of more than 200 meters is collectively referred to as the mountain, it includes not only low mountains, middle mountains, high mountains, but also the plateau, hills, the valley and many other natural types [1]. Some scholars proposed mountain city refers to the site and the
801
construction of the mountain area, different from the plains of the city in the spatial form and environmental characteristics. Because the origin of cities is often combined with the water source, the scenic system formed by the combination of rivers and mountains become the cradle of urban civilization. So the mountainous watershed city is an important type of mountain city and needs to study further. Mountainous watershed system compared with the plain system, there are obvious mountainous characterizations. For instance, the river conforms to the terrain of the height difference resulting in high water head, high water flow rate, easily forming waterfall and other characteristics of the landscape. The upper reaches of the river tend to be narrow and deep, and cover densely multi-rapids falls, while the middle and lower reaches of the river show the natural geographical features such as river valley spreading widely, river floodplain development, the formation of delta or delta port at the estuary. Therefore, the mountainous watershed cities with mountain and water features are characterized by ecologically sensitive fragility, three-dimensional urban space utilization, intensive compact land layout, and urban morphology diversity. 1.2 Ecologically critical issues of mountainous watershed city in the process of
urbanization
1) Hydrological process blocked: Mountainous watershed city has the diverse types of rivers, broken water plaques and complex ecological corridors. In the process of urbanization, the obstruction of runoff channel, landfill pond, straight river, increasing hard ground and a series of measures seriously damage the hydrological process, causing the water system to be fragmented, broken and serious water ecological environment damage. In the city, due to the steep terrain, the large slope and the fast surface runoff, the river inside and outside the city is easy to form a peak during the storm. The rapid accumulation of surface runoff in the riverside, hillside, shallow hill and valley bottom whose geological conditions are relatively relaxed, will lead to flash floods, mudslides, landslides, and other natural disasters causing damage to people and property. 2) Land use and habitat fragmentation The terrain and ecological environment of the mountainous area have a great influence on the layout structure, open space composition and landscape planning of urban space. Suitable land for constructing is often separated by mountains, rivers, gully and other landforms, and the terrain is complex and changeable. Therefore most mountain town exists at the foot of the mountain, forming a group, tandem, constellation layout. The lack of integrated management of the decentralized layout mode can easily lead to fragmentation of construction land, causing habitat degradation, split animal and plant survival channel. Large-scale habitat is divided into mutually isolated small habitats, will greatly weaken the ecological environment carrying capacity, threatening the survival of native species (figure 1).
802
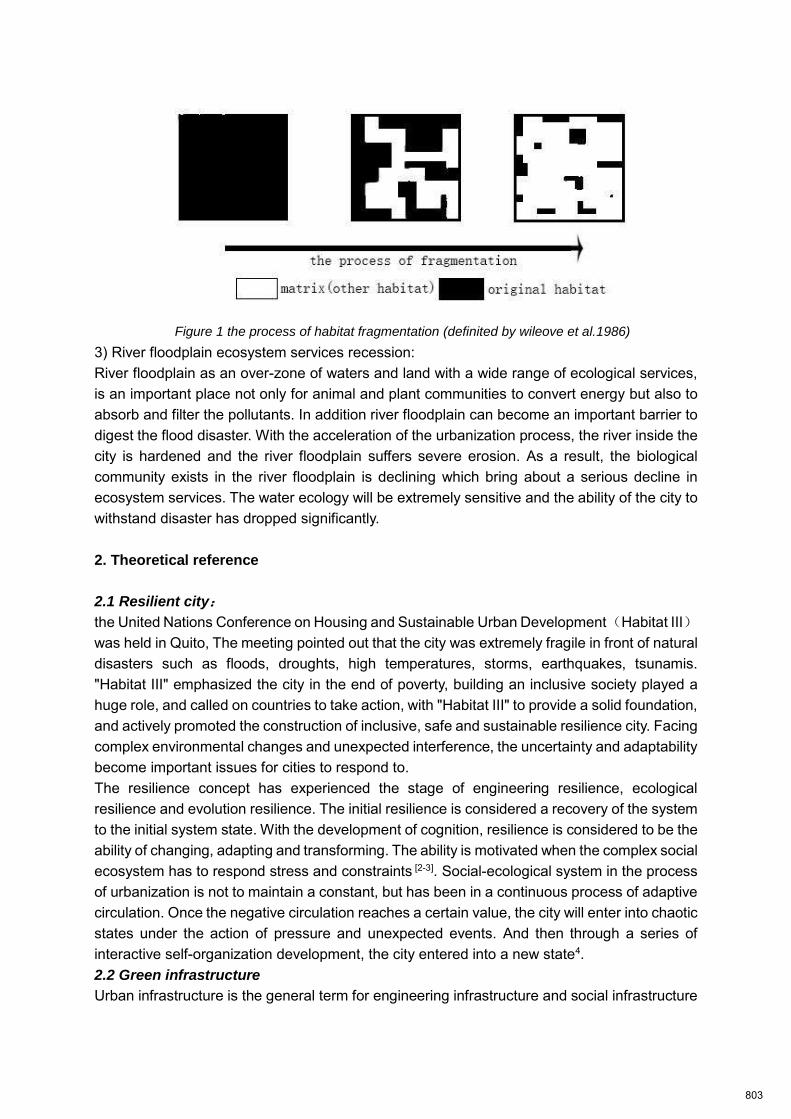
Figure 1 the process of habitat fragmentation (definited by wileove et al.1986)
3) River floodplain ecosystem services recession: River floodplain as an over-zone of waters and land with a wide range of ecological services, is an important place not only for animal and plant communities to convert energy but also to absorb and filter the pollutants. In addition river floodplain can become an important barrier to digest the flood disaster. With the acceleration of the urbanization process, the river inside the city is hardened and the river floodplain suffers severe erosion. As a result, the biological community exists in the river floodplain is declining which bring about a serious decline in ecosystem services. The water ecology will be extremely sensitive and the ability of the city to withstand disaster has dropped significantly.
2. Theoretical reference
2.1 Resilient city:
the United Nations Conference on Housing and Sustainable Urban Development (Habitat III) was held in Quito, The meeting pointed out that the city was extremely fragile in front of natural disasters such as floods, droughts, high temperatures, storms, earthquakes, tsunamis. "Habitat III" emphasized the city in the end of poverty, building an inclusive society played a huge role, and called on countries to take action, with "Habitat III" to provide a solid foundation, and actively promoted the construction of inclusive, safe and sustainable resilience city. Facing complex environmental changes and unexpected interference, the uncertainty and adaptability become important issues for cities to respond to. The resilience concept has experienced the stage of engineering resilience, ecological resilience and evolution resilience. The initial resilience is considered a recovery of the system to the initial system state. With the development of cognition, resilience is considered to be the ability of changing, adapting and transforming. The ability is motivated when the complex social ecosystem has to respond stress and constraints [2-3]. Social-ecological system in the process of urbanization is not to maintain a constant, but has been in a continuous process of adaptive circulation. Once the negative circulation reaches a certain value, the city will enter into chaotic states under the action of pressure and unexpected events. And then through a series of interactive self-organization development, the city entered into a new state4. 2.2 Green infrastructure
Urban infrastructure is the general term for engineering infrastructure and social infrastructure
803
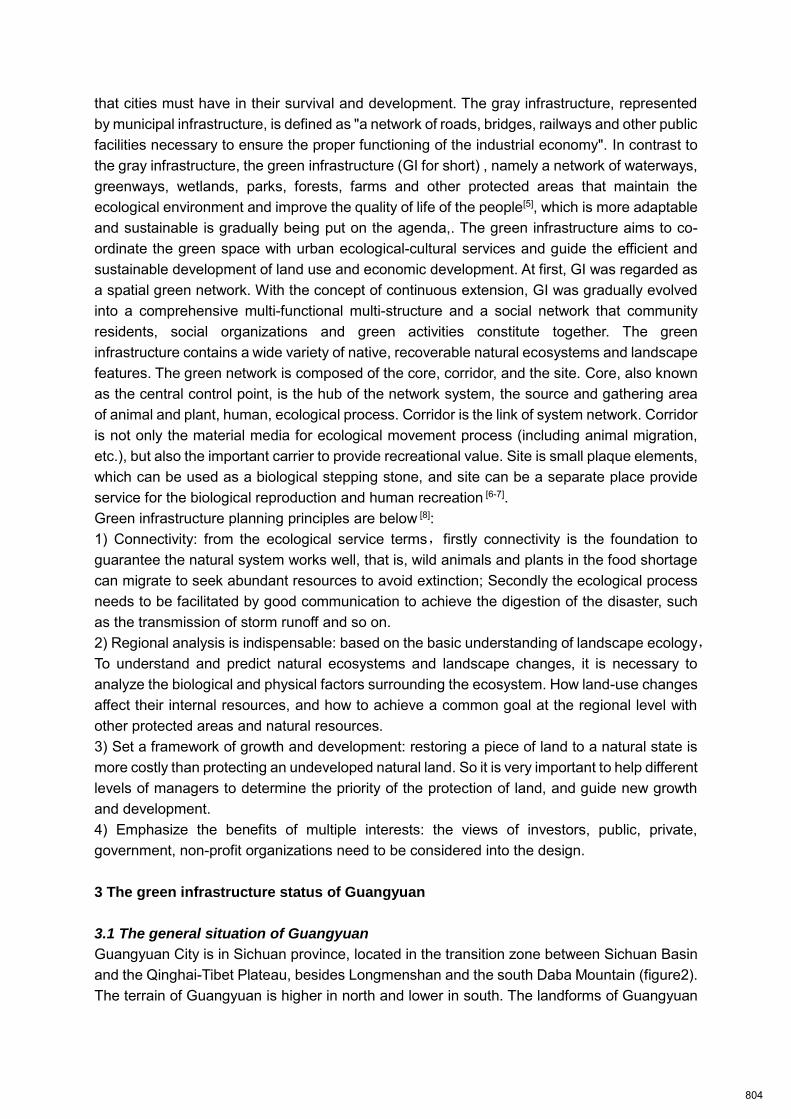
that cities must have in their survival and development. The gray infrastructure, represented by municipal infrastructure, is defined as "a network of roads, bridges, railways and other public facilities necessary to ensure the proper functioning of the industrial economy". In contrast to the gray infrastructure, the green infrastructure (GI for short) , namely a network of waterways, greenways, wetlands, parks, forests, farms and other protected areas that maintain the ecological environment and improve the quality of life of the people[5], which is more adaptable and sustainable is gradually being put on the agenda,. The green infrastructure aims to co-ordinate the green space with urban ecological-cultural services and guide the efficient and sustainable development of land use and economic development. At first, GI was regarded as a spatial green network. With the concept of continuous extension, GI was gradually evolved into a comprehensive multi-functional multi-structure and a social network that community residents, social organizations and green activities constitute together. The green infrastructure contains a wide variety of native, recoverable natural ecosystems and landscape features. The green network is composed of the core, corridor, and the site. Core, also known as the central control point, is the hub of the network system, the source and gathering area of animal and plant, human, ecological process. Corridor is the link of system network. Corridor is not only the material media for ecological movement process (including animal migration, etc.), but also the important carrier to provide recreational value. Site is small plaque elements, which can be used as a biological stepping stone, and site can be a separate place provide service for the biological reproduction and human recreation [6-7]. Green infrastructure planning principles are below [8]: 1) Connectivity: from the ecological service terms,firstly connectivity is the foundation to guarantee the natural system works well, that is, wild animals and plants in the food shortage can migrate to seek abundant resources to avoid extinction; Secondly the ecological process needs to be facilitated by good communication to achieve the digestion of the disaster, such as the transmission of storm runoff and so on. 2) Regional analysis is indispensable: based on the basic understanding of landscape ecology,To understand and predict natural ecosystems and landscape changes, it is necessary to analyze the biological and physical factors surrounding the ecosystem. How land-use changes affect their internal resources, and how to achieve a common goal at the regional level with other protected areas and natural resources. 3) Set a framework of growth and development: restoring a piece of land to a natural state is more costly than protecting an undeveloped natural land. So it is very important to help different levels of managers to determine the priority of the protection of land, and guide new growth and development. 4) Emphasize the benefits of multiple interests: the views of investors, public, private, government, non-profit organizations need to be considered into the design.
3 The green infrastructure status of Guangyuan
3.1 The general situation of Guangyuan
Guangyuan City is in Sichuan province, located in the transition zone between Sichuan Basin and the Qinghai-Tibet Plateau, besides Longmenshan and the south Daba Mountain (figure2). The terrain of Guangyuan is higher in north and lower in south. The landforms of Guangyuan
804
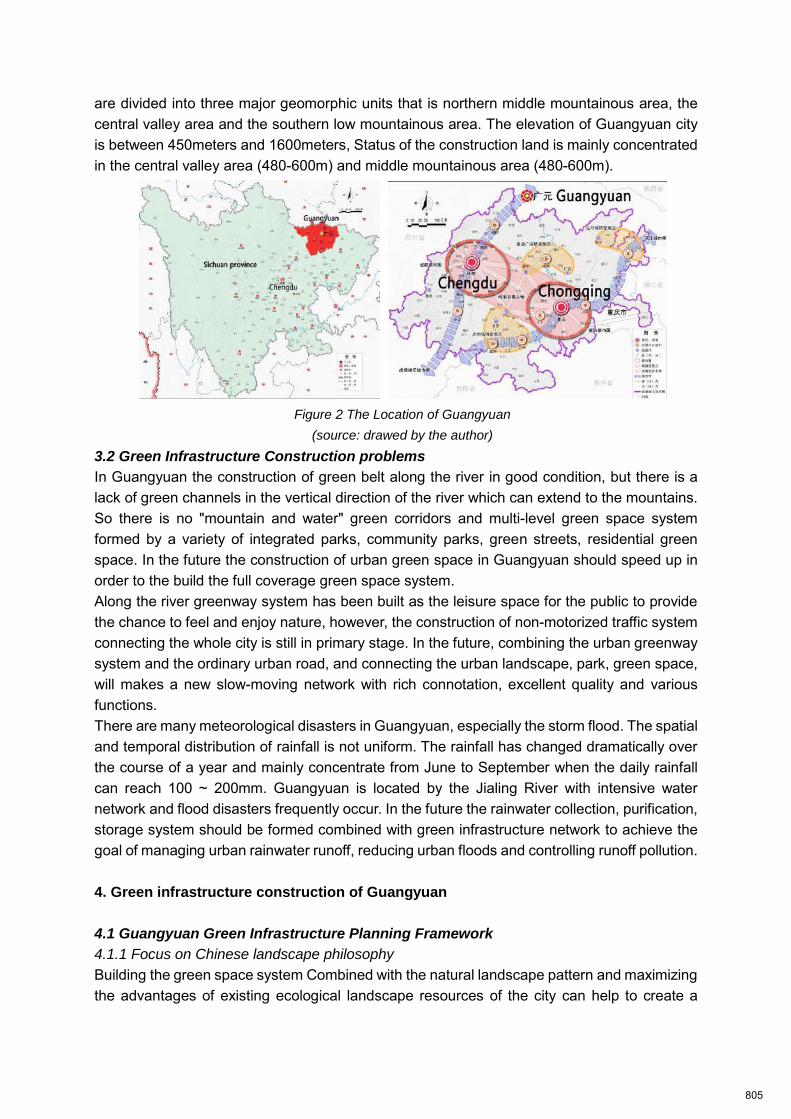
are divided into three major geomorphic units that is northern middle mountainous area, the central valley area and the southern low mountainous area. The elevation of Guangyuan city is between 450meters and 1600meters, Status of the construction land is mainly concentrated in the central valley area (480-600m) and middle mountainous area (480-600m).
Figure 2 The Location of Guangyuan
(source: drawed by the author)
3.2 Green Infrastructure Construction problems
In Guangyuan the construction of green belt along the river in good condition, but there is a lack of green channels in the vertical direction of the river which can extend to the mountains. So there is no "mountain and water" green corridors and multi-level green space system formed by a variety of integrated parks, community parks, green streets, residential green space. In the future the construction of urban green space in Guangyuan should speed up in order to the build the full coverage green space system. Along the river greenway system has been built as the leisure space for the public to provide the chance to feel and enjoy nature, however, the construction of non-motorized traffic system connecting the whole city is still in primary stage. In the future, combining the urban greenway system and the ordinary urban road, and connecting the urban landscape, park, green space, will makes a new slow-moving network with rich connotation, excellent quality and various functions. There are many meteorological disasters in Guangyuan, especially the storm flood. The spatial and temporal distribution of rainfall is not uniform. The rainfall has changed dramatically over the course of a year and mainly concentrate from June to September when the daily rainfall can reach 100 ~ 200mm. Guangyuan is located by the Jialing River with intensive water network and flood disasters frequently occur. In the future the rainwater collection, purification, storage system should be formed combined with green infrastructure network to achieve the goal of managing urban rainwater runoff, reducing urban floods and controlling runoff pollution. 4. Green infrastructure construction of Guangyuan
4.1 Guangyuan Green Infrastructure Planning Framework
4.1.1 Focus on Chinese landscape philosophy
Building the green space system Combined with the natural landscape pattern and maximizing the advantages of existing ecological landscape resources of the city can help to create a
805
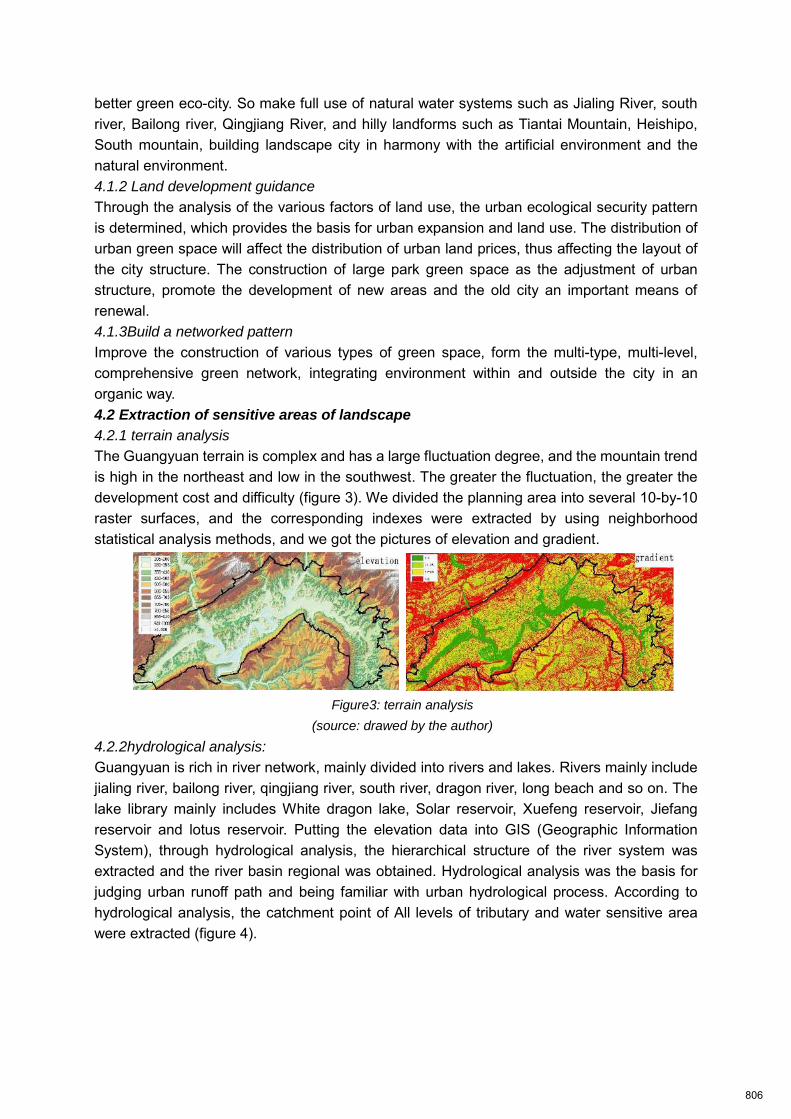
better green eco-city. So make full use of natural water systems such as Jialing River, south river, Bailong river, Qingjiang River, and hilly landforms such as Tiantai Mountain, Heishipo, South mountain, building landscape city in harmony with the artificial environment and the natural environment. 4.1.2 Land development guidance
Through the analysis of the various factors of land use, the urban ecological security pattern is determined, which provides the basis for urban expansion and land use. The distribution of urban green space will affect the distribution of urban land prices, thus affecting the layout of the city structure. The construction of large park green space as the adjustment of urban structure, promote the development of new areas and the old city an important means of renewal. 4.1.3Build a networked pattern
Improve the construction of various types of green space, form the multi-type, multi-level, comprehensive green network, integrating environment within and outside the city in an organic way. 4.2 Extraction of sensitive areas of landscape
4.2.1 terrain analysis
The Guangyuan terrain is complex and has a large fluctuation degree, and the mountain trend is high in the northeast and low in the southwest. The greater the fluctuation, the greater the development cost and difficulty (figure 3). We divided the planning area into several 10-by-10 raster surfaces, and the corresponding indexes were extracted by using neighborhood statistical analysis methods, and we got the pictures of elevation and gradient.
Figure3: terrain analysis
(source: drawed by the author)
4.2.2hydrological analysis:
Guangyuan is rich in river network, mainly divided into rivers and lakes. Rivers mainly include jialing river, bailong river, qingjiang river, south river, dragon river, long beach and so on. The lake library mainly includes White dragon lake, Solar reservoir, Xuefeng reservoir, Jiefang reservoir and lotus reservoir. Putting the elevation data into GIS (Geographic Information System), through hydrological analysis, the hierarchical structure of the river system was extracted and the river basin regional was obtained. Hydrological analysis was the basis for judging urban runoff path and being familiar with urban hydrological process. According to hydrological analysis, the catchment point of All levels of tributary and water sensitive area were extracted (figure 4).
806
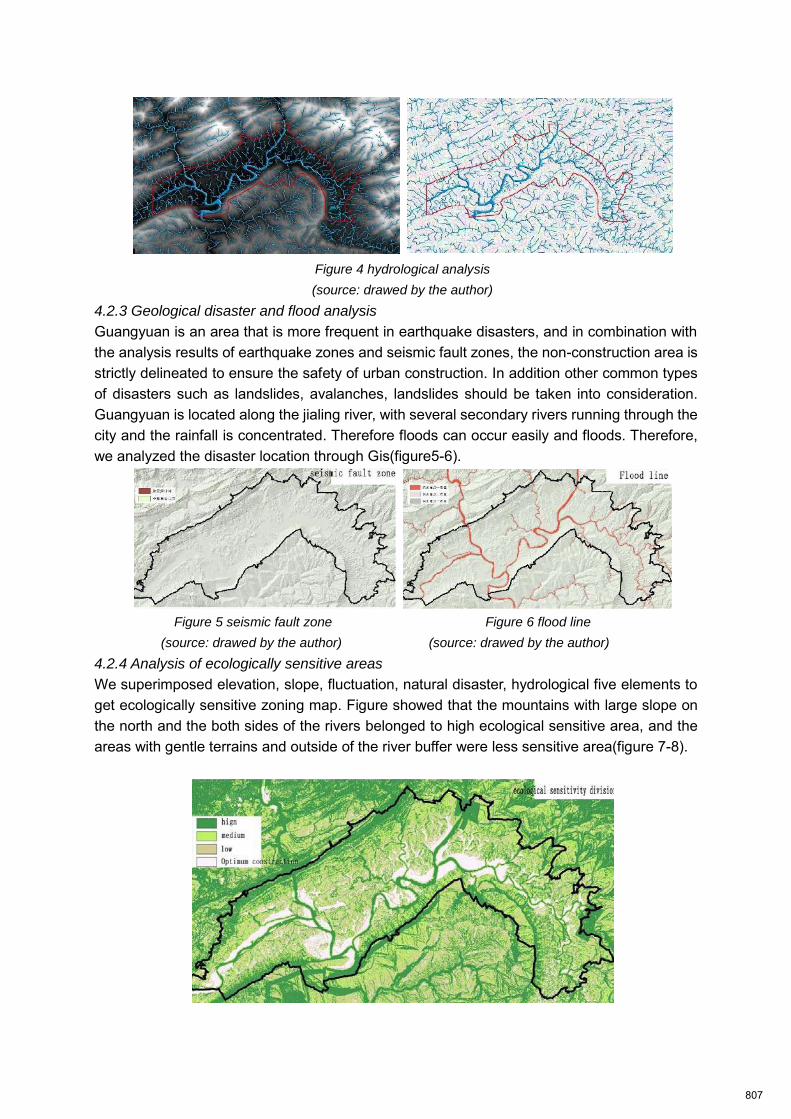
Figure 4 hydrological analysis
(source: drawed by the author)
4.2.3 Geological disaster and flood analysis
Guangyuan is an area that is more frequent in earthquake disasters, and in combination with the analysis results of earthquake zones and seismic fault zones, the non-construction area is strictly delineated to ensure the safety of urban construction. In addition other common types of disasters such as landslides, avalanches, landslides should be taken into consideration. Guangyuan is located along the jialing river, with several secondary rivers running through the city and the rainfall is concentrated. Therefore floods can occur easily and floods. Therefore, we analyzed the disaster location through Gis(figure5-6).
Figure 5 seismic fault zone Figure 6 flood line
(source: drawed by the author) (source: drawed by the author)
4.2.4 Analysis of ecologically sensitive areas
We superimposed elevation, slope, fluctuation, natural disaster, hydrological five elements to get ecologically sensitive zoning map. Figure showed that the mountains with large slope on the north and the both sides of the rivers belonged to high ecological sensitive area, and the areas with gentle terrains and outside of the river buffer were less sensitive area(figure 7-8).
807
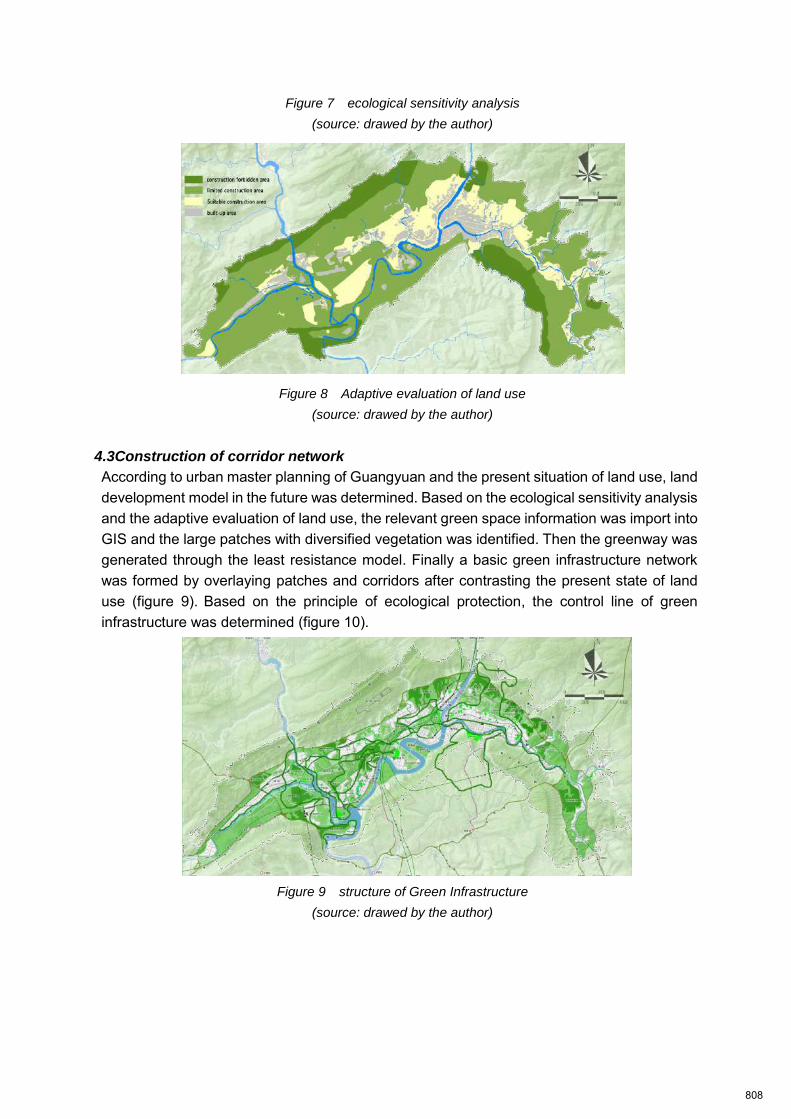
Figure 7 ecological sensitivity analysis
(source: drawed by the author)
Figure 8 Adaptive evaluation of land use
(source: drawed by the author)
4.3Construction of corridor network
According to urban master planning of Guangyuan and the present situation of land use, land development model in the future was determined. Based on the ecological sensitivity analysis and the adaptive evaluation of land use, the relevant green space information was import into GIS and the large patches with diversified vegetation was identified. Then the greenway was generated through the least resistance model. Finally a basic green infrastructure network was formed by overlaying patches and corridors after contrasting the present state of land use (figure 9). Based on the principle of ecological protection, the control line of green infrastructure was determined (figure 10).
Figure 9 structure of Green Infrastructure
(source: drawed by the author)
808
Figure 10 the control line of Green Infrastructure
(source: drawed by the author)
4.4Compound recreation network
The cultural tourism resources in Guangyuan mainly include the ancient towns, ancient tomb, the old temples and old post roads and the cultural resources mainly distribute along the river in the southwest region and the northern part of the city (figure 11).
Figure 10 The cultural tourism resources
(source: these photos were taken by the author)
At the same time, Guangyuan has important hot spring geothermal resources which are mainly located in the west wing of the city and the northern part of the city. This paper designed several different types of recreation corridors, combing the cultural tourism resources and the traffic routes and formed a composite green infrastructure network overlaying the patches and corridors above(figure11-12).
809
Figure 11 The main recreation greenway Figure 12 The secondary recreation greenway
(source: drawed by the author) (source: drawed by the author)
4.5 Develop guidelines for land development
1)based on the analysis of disaster analysis, the ecological sensitive areas, such as green corridors, woodlands and habitats, should be used as the base of urban planning layout. 2)the land of Guangyuan is scarce, the development space is limited, and the expansion of the urban subject is restricted by the narrow and long terrain of the valley. It is necessary to take a positive approach to make the best use of the land and realize the maximization of land value and utilization. 5. Conclusion
This paper based on full consideration landscape features in mountainous watershed cities, through the method of hydrology analysis, terrain analysis and minimum cumulative resistance analysis, by using the geographic Information system as an analytical tool, taking Guangyuan city of Sichuan province in China as an case study, built the green infrastructure structure and the recreational network of Guangyuan, providing ideas for construction of green infrastructure in mountainous watershed cities.
Reference [1]Huang Guangyu. Principle of mountain city learning[M]. Beijing, China construction industry press, 2006 [2]Ahern J. Planning and Design for Sustainable and Resilient Cities: Theories, Strategies and Best Practices for Green Infrastructure[M]//Novotny V, Ahern J, Brown P, eds. Water-centric Sustainable Communities. Hoboken: John Wiley and Sons, 2010: 135-176. [3]Botkin D. Discordant Harmonies: A New Ecology for the Twenty-first Century[M]. New York: Oxford University Press, 1990. [4]Holling C S. Adaptive Environmental Assessment and Management[J]. International Series on Applied Systems Analysis, 1978, 3. [5] Lynch S L. Urban green infrastructure//Watson D, ed. time-Saver Standards for Urban Design. New York: McGrave-Hill Education, 2003
810

[6]Benedict M A, McMahon E T, Green infrastructure: Smart Conservation for the 21st Century//Sprawl Watch Clearinghouse Monograph Series Washington, D C: Sprawl Watch Clearinghouse, 2000. [7]Ahem J. Greenway planning strategy. Landscape and urban Planning, 1995,33(1/3):131-155 [8] Pakzad P, Osmond P. Developing a sustainability indicator set for measuring green infrastructure performance. Procedia-Social and Behaviral Sciences, 2016,216:68-79
811
Zhang Tao Multi-Scale Urban Flood Control ISOCARP-OAPA Conference 2017
1
The Research on Multi-Scale Urban Flood Control and StormDrainage Based on Economical Security of River Basin
TAO ZHANG*,1, MAO FENG2
1 College of Architecture and Urban Planning, Tongji University, Shanghai , 200092, China2 Faculty of Architecture and Urban Planning, Chongqing University, 400044, China
Abstract
During rapid urbanization, the balance between humankind and nature, especially in the
mountainous watershed, where the land-use conditions are broken and the ecological
environment is fragile. Hence, its terrain, landform, runoff producing and convergence of
rivers, and the water quality of river basins undergo significant changes, thus leading to the
frequent occurrence of flood disasters in the cities along the river basins. The losses are
heavy. Currently, towards the flood disasters in the cities of mountainous watershed, the flood
control system engineering is set store by, but little emphasis is laid on the macro factors in
the entire water basin during the formation of flood disasters. Due to the lack of systematic
flood control and relief regulation method, the research on the nature, features and inherent
laws of urban flood disasters is not deep enough. Furthermore, the author starts from the
overall angle of the comprehensive flood disaster in the river basin and integrates the
ecological security pattern theory, urban hydrology and BP neural network analysis method, to
analyze the intervention of land hardening and artificial water courses on the landscape
structure and morphological characteristics of the water basin, thus resulting in the complex
landscape ecological mechanism, water system morphological characteristics, landscape
terrain and spatial structure leading to the occurrence of urban flood disasters. On this basis,
the author puts forward the quantized regulation and management mode for the flood control
in the river basin, that is, to realize rational development and utilization by scientific regulation
and management, to reduce disasters and create multi-functional river basin system
integrating flood control, ecological aesthetics and landscape aesthetics. In addition, the
analysis is conducted towards the specific flood control and storm drainage planning cases in
the macro, medium and micro scales in Jialing River Basin, each river within the river basin
and urban area are abstracted into one sub-system (small river basin) in the entire river basin
system in the periphery. These small river basins interlinks with other peripheral river basins
within Jialing River Basin, thus forming an entire river basin system. By the analysis on the
changes in the overall water-cycling system in Jialing River Basin and the occurrence
mechanism in urban flood disasters, to discuss the three-level flood control and storm
drainage strategy to protect the stability of the ecological system in the river basin, maintain
water natural cycling in the city and utilize the rainstorm to make the landscape design on site,
thus presenting corresponding planning and construction measures to improve the flood
control and storm drainage capacity in the cities within Jialing River Basin.
812
Zhang Tao Multi-Scale Urban Flood Control ISOCARP-OAPA Conference 2017
2
Keywords:
Ecological Safety, Urban Flood and Waterlogging Control, Dynamic Simulation,
Ecological Restoration, Jialing River Basin.
1 Introduction
The development of cities in river basin should mainly consider the coordination between
the overall landscape pattern and the urban construction and development. The change of
macroscopic landscape pattern can directly reflect the hidden danger of the river basin
construction to a certain extent[1]. Soil and water conservation can achieve effective
interception of precipitation, so that rainwater can infiltrate rapidly, and become underground
runoff, thus achieving the targets of water conservation and flood mitigation[2]. Floods caused
by rainstorms decreased during the flood season, and underground water can supplement the
river base flow. Rivers are still full of water in non flood season, which meets the needs of
water resources, and reduces the cost of water intake. The water depth of a navigable river
during the non flood season also ensures smooth water transport. River water resources are
closely related to soil and water conservation[3]. In semi-arid or arid areas, water and soil
conservation has significant water retention and water storage effects. Even in non flood
season, the runoff may also decrease[4]. Therefore, water and soil conservation should not be
analyzed combined with the corresponding period and drainage basin. Generally speaking,
soil and water conservation, water regulation, storage and conservation include the following
effects, namely, water supplementation and flood increase in non flood seasons[5]. The
process of forming river runoff mainly involves accumulation seepage and confluence of river
network. Moreover, climate, human, natural, and many other factors also exert influence on
the process[6]. The reconstruction of vegetation and the construction of reservoirs all belong to
human activities[7]. In the corresponding stage, a particular basin is considered to have
relatively stable basic hydrogeological landforms[8]. As a result, changes in river runoff occur
mainly because of climate and underlying surface changes caused by human activities[9]. For
the planning of a watershed city, the rational layout of its macro watershed and urban
construction, that is, the actual distribution of regional landscape patterns, will greatly affect
the ecological environment in the region[10].
To solve the problem of frequent floods in Jialing River Basin, the corresponding planning
and strategy layout should be carried out from three aspects, namely, macro basin, meso city
and micro site. Based on the flood disaster characteristics, disaster-inducing factors and
disaster inducing environment in Jialing River analyzed in Chapter 3, flood prevention and
drainage planning in the three aspects are further analyzed to propose the corresponding
813
Zhang Tao Multi-Scale Urban Flood Control ISOCARP-OAPA Conference 2017
3
flood control and drainage strategies.
2 Planning and analysis of basin scale flood control and drainage based on remotesensing dynamic simulation
2.1 Selection of technical modelThe previous research on flood control and drainage of river basins mostly focuses on
the macroscopic analysis, and fails to summarize the corresponding impact of flood disasters
in the urban basin when the environmental factors changed. Therefore, in the improvement of
the study area, the direction of improvement is often more experienced, and the improvement
conditions can not be absolutely objective.
The research on TM remote sensing images has made great achievements. Therefore,
this paper is based on the feature extraction of TM remote sensing image, and combines the
difference of landscape ecological pattern. The relevant feature indexes are used as input and
output information of BP neural network so as to establish prediction and identification system
for flood control and drainage of urban watershed. Finally, the system is used to simulate and
analyze the specific changes of the impact value of flood disaster in the watershed when the
landscape pattern is found to change.
2.2 Landscape ecological pattern and remote sensing image feature extraction1) Landscape ecological pattern index extraction
A series of landscape elements composed of human and nature in different
arrangements, shapes and sizes interact and jointly form the landscape pattern. This is the
result of the combined effects of society, biology and physical factors. After a variety of factors
interfere with each other, the number, type and spatial combination of patches are formed. In
recent years, landscape pattern analysis has been used in the process of urbanization to
analyze and simulate urban land use changes. With the rapid urbanization process, the
stability and process of the ecological pattern have also been greatly disturbed. Many indirect,
direct and negative effects are also reflected in the lack of management in the early stages of
urbanization.
With the increase of population and the acceleration of urbanization process, the
landscape pattern has changed remarkably, leading to the deterioration of the ecological
environment and soil erosion, etc. The drainage basin as a complete natural geographical unit
has formed the watershed landscape pattern in the process of human and natural interaction.
The relevant analysis is an important means to reveal the ecological status of the basin and
the relevant regional resource and environmental problems. Therefore, the change of regional
landscape ecological pattern and its structure is of great significance to the study of
watershed cities.
814
Zhang Tao Multi-Scale Urban Flood Control ISOCARP-OAPA Conference 2017
4
From the macro scale perspective, the landscape pattern can also be called the
landscape spatial pattern, and it indicates the landscape patches arranged in the space with
different shapes and sizes. This is resulted from all kinds of ecological processes, and
involves the non spatial and spatial characteristics of the landscape element area and the
shape of the landscape component. As a product of long-term landscape, the landscape
pattern will have a direct impact on the landscape process. Various landscape patterns also
have different effects on landscape population and individuals.
The purpose of analyzing landscape pattern is to discover the potential law on the
landscape with plaque so as to deeply understand the basic features of the landscape spatial
structure. Combined with the pattern analysis, the factors and action mechanism that
generate and control spatial patterns are determined, and the changes and characteristics of
landscape patches are compared so as to analyze scale features and spatial patterns. This
lays the theoretical foundation for scientific management.
2) Calculation of correlation index based on TM remote sensing image
TM remote sensing images actually extract information from the local areas which are
studied by different band characteristics. At present, the source of TM remote sensing images
is the Landsat 8 satellite, so it is also called the Landsat 8 type TM remote sensing map. The
band of each Landsat 8 type is as shown in Table 1.
Table 1 Band characteristics of Landsat 8
No. Band range/ um Band name Ground
resolution/m
1
2
3
4
5
6
7
8
9
10
11
0.43~0.45
0.45~0.51
0.53~0.59
0.64~0.67
0.85~0.88
1.57~1.65
2.11~2.29
0.50~0.68
1.36~1.38
10.6~11.19
11.5~12.51
Coastal
Blue
Green
Red
NIR
SWIR 1
SWIR 2
Pan
Cirrus
TIRS 1
TIRS 2
30
30
30
30
30
30
30
15
30
100
100
Data source: prepared by the author
In Table1, the images obtained from different wave bands are significantly varied
reflected in the different ground features. In other words, the reflection rate of different ground
815
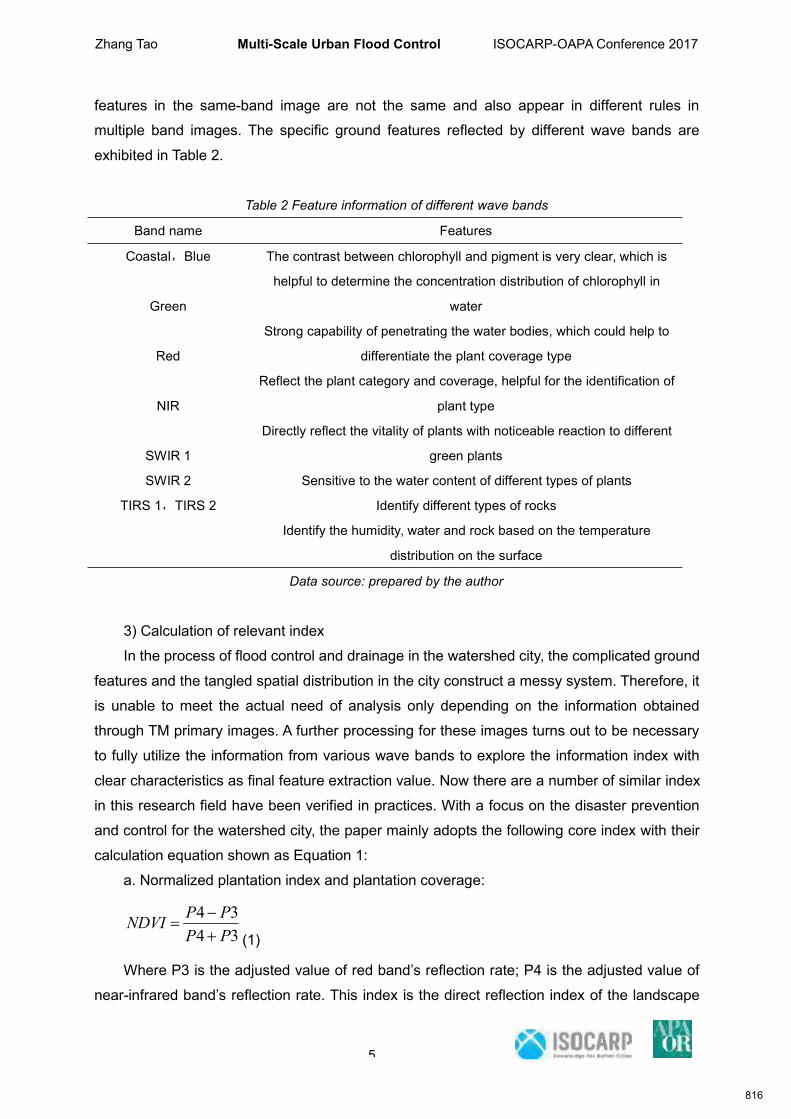
Zhang Tao Multi-Scale Urban Flood Control ISOCARP-OAPA Conference 2017
5
features in the same-band image are not the same and also appear in different rules in
multiple band images. The specific ground features reflected by different wave bands are
exhibited in Table 2.
Table 2 Feature information of different wave bands
Band name Features
Coastal,Blue
Green
Red
NIR
SWIR 1
SWIR 2
TIRS 1,TIRS 2
The contrast between chlorophyll and pigment is very clear, which is
helpful to determine the concentration distribution of chlorophyll in
water
Strong capability of penetrating the water bodies, which could help to
differentiate the plant coverage type
Reflect the plant category and coverage, helpful for the identification of
plant type
Directly reflect the vitality of plants with noticeable reaction to different
green plants
Sensitive to the water content of different types of plants
Identify different types of rocks
Identify the humidity, water and rock based on the temperature
distribution on the surface
Data source: prepared by the author
3) Calculation of relevant index
In the process of flood control and drainage in the watershed city, the complicated ground
features and the tangled spatial distribution in the city construct a messy system. Therefore, it
is unable to meet the actual need of analysis only depending on the information obtained
through TM primary images. A further processing for these images turns out to be necessary
to fully utilize the information from various wave bands to explore the information index with
clear characteristics as final feature extraction value. Now there are a number of similar index
in this research field have been verified in practices. With a focus on the disaster prevention
and control for the watershed city, the paper mainly adopts the following core index with their
calculation equation shown as Equation 1:
a. Normalized plantation index and plantation coverage:
3434PPPPNDVI
(1)
Where P3 is the adjusted value of red band’s reflection rate; P4 is the adjusted value of
near-infrared band’s reflection rate. This index is the direct reflection index of the landscape
816
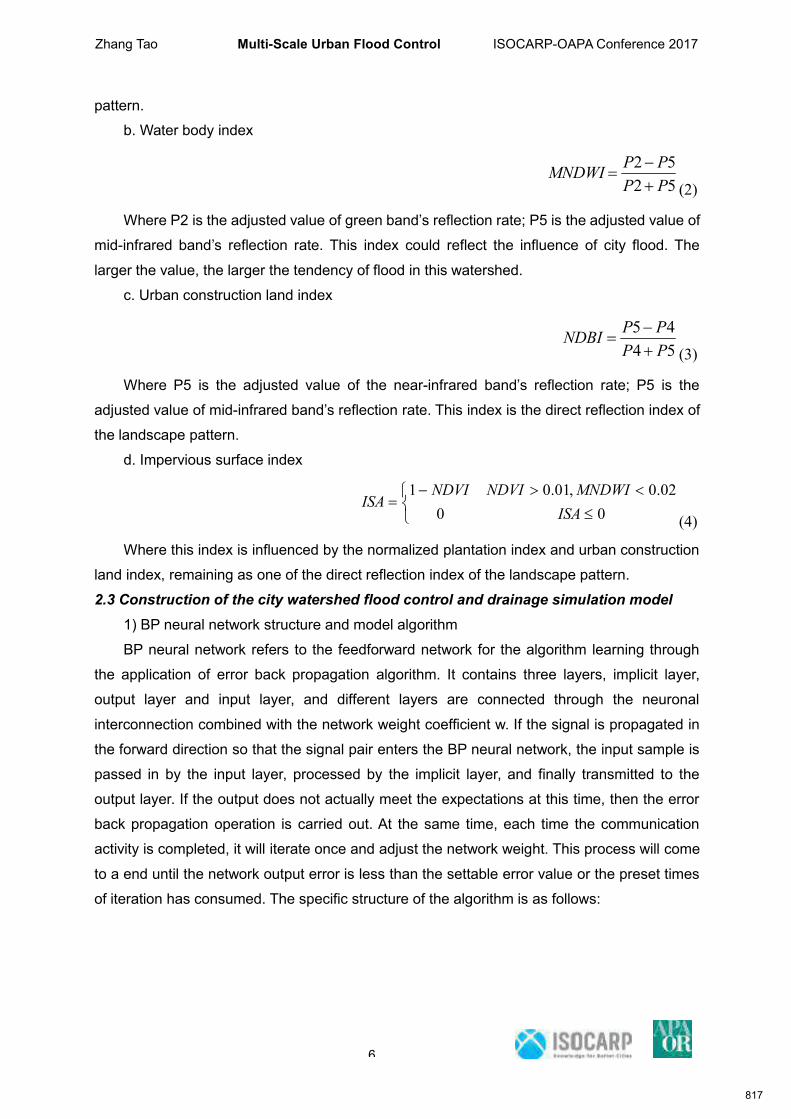
Zhang Tao Multi-Scale Urban Flood Control ISOCARP-OAPA Conference 2017
6
pattern.
b. Water body index
5252PPPPMNDWI
(2)
Where P2 is the adjusted value of green band’s reflection rate; P5 is the adjusted value of
mid-infrared band’s reflection rate. This index could reflect the influence of city flood. The
larger the value, the larger the tendency of flood in this watershed.
c. Urban construction land index
5445PPPPNDBI
(3)
Where P5 is the adjusted value of the near-infrared band’s reflection rate; P5 is the
adjusted value of mid-infrared band’s reflection rate. This index is the direct reflection index of
the landscape pattern.
d. Impervious surface index
00
02.0,01.01ISAMNDWINDVINDVI
ISA(4)
Where this index is influenced by the normalized plantation index and urban construction
land index, remaining as one of the direct reflection index of the landscape pattern.
2.3 Construction of the city watershed flood control and drainage simulation model1) BP neural network structure and model algorithm
BP neural network refers to the feedforward network for the algorithm learning through
the application of error back propagation algorithm. It contains three layers, implicit layer,
output layer and input layer, and different layers are connected through the neuronal
interconnection combined with the network weight coefficient w. If the signal is propagated in
the forward direction so that the signal pair enters the BP neural network, the input sample is
passed in by the input layer, processed by the implicit layer, and finally transmitted to the
output layer. If the output does not actually meet the expectations at this time, then the error
back propagation operation is carried out. At the same time, each time the communication
activity is completed, it will iterate once and adjust the network weight. This process will come
to a end until the network output error is less than the settable error value or the preset times
of iteration has consumed. The specific structure of the algorithm is as follows:
817

Zhang Tao Multi-Scale Urban Flood Control ISOCARP-OAPA Conference 2017
7
1a1
k iwijw
La
ka
q
i
…
………
……
1x
jx
Mx
1o
ko
Lo
OutputVariables
InputVariables
HiddenLayer
Output
Fig.1 Structure of BP neural network model
(Data source: prepared by the author)
Where jx represents the input information at j-th node of the input layer, j=1, …, M; ijw
represents the weight values from the i-th node of the implicit layer to the j-th node of the input
layer; i represents the threshold of the i-thnode of the implicit layer; ( )x represents the
excitation function of the implicit layer; kiw represents the weight value between the k-th
node of the output layer and the i-th node of the implicit layer, i = 1, ..., q; ka represents the
threshold of the k-th node of the output layer, k = 1 ..., L; ( )x represents the output layer of
the excitation function; ko represents the output of k-th node at the output layer.
It could be seen from the above BP network structure that if in a simple three-layer BP
network, assuming that the input vector isT
nxxxX ),...,,( 21 , the output layer output vector is
TnoooO ),...,,( 21 , the implicit layer output vector
TnyyyY ),...,,( 21 , the target output vector
isT
nDDDD ),...,,( 21 , the the connection weight value from the input layer to the implicit
layer isT
nvvvV ),...,,( 21 and the connection weight value from theimplicit layer to the
output layer isT
nwwwW ),...,,( 21 , the corresponding network iteration step is as follows.
Step 1: Initialize the weight matrix W and V of the network in a random manner and set
the corresponding learning rate and target error value minE ; set the sample mode counter p
Input Layer
818
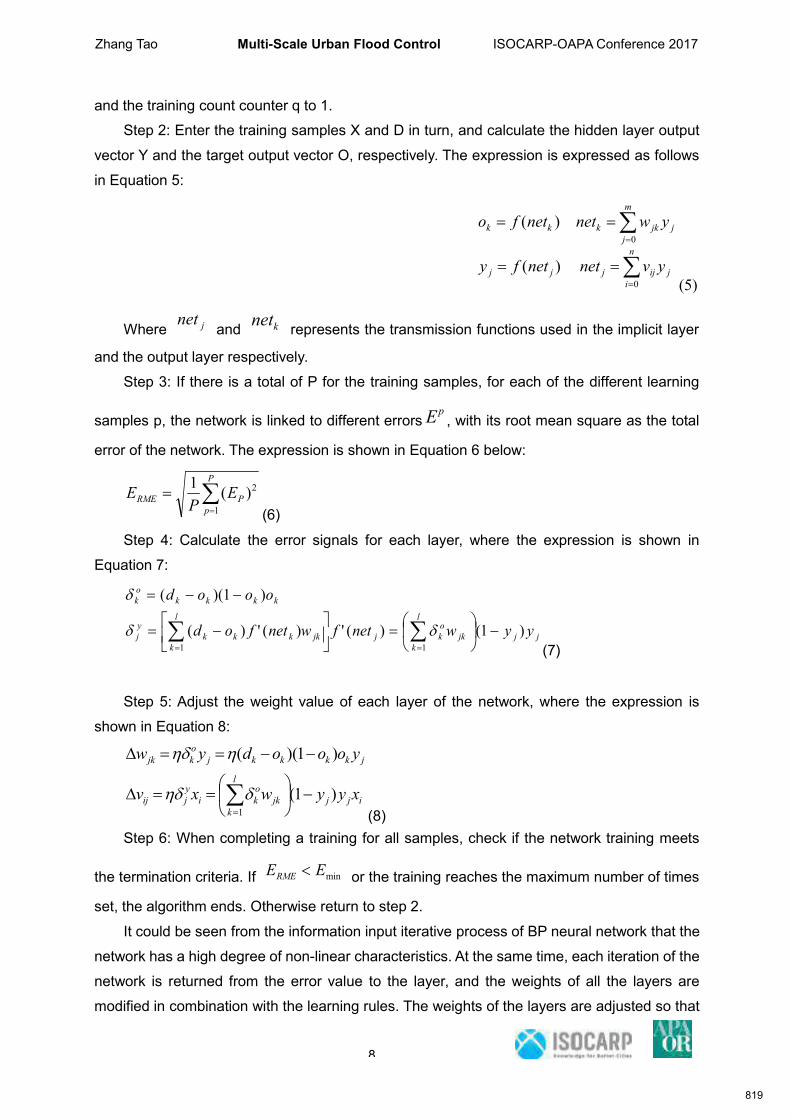
Zhang Tao Multi-Scale Urban Flood Control ISOCARP-OAPA Conference 2017
8
and the training count counter q to 1.
Step 2: Enter the training samples X and D in turn, and calculate the hidden layer output
vector Y and the target output vector O, respectively. The expression is expressed as follows
in Equation 5:
n
ijijjjj
m
jjjkkkk
yvnetnetfy
ywnetnetfo
0
0
)(
)(
(5)
Where jnetand knet represents the transmission functions used in the implicit layer
and the output layer respectively.
Step 3: If there is a total of P for the training samples, for each of the different learning
samples p, the network is linked to different errorspE , with its root mean square as the total
error of the network. The expression is shown in Equation 6 below:
P
pPRME E
PE
1
2)(1
(6)
Step 4: Calculate the error signals for each layer, where the expression is shown in
Equation 7:
jj
l
kjk
okjjk
l
kkkk
yj
kkkkok
yywnetfwnetfod
oood
)1()(')(')(
)1)((
11
(7)
Step 5: Adjust the weight value of each layer of the network, where the expression is
shown in Equation 8:
ijj
l
kjk
oki
yjij
jkkkkjokjk
xyywxv
yooodyw
)1(
)1)((
1
(8)Step 6: When completing a training for all samples, check if the network training meets
the termination criteria. If minEERME or the training reaches the maximum number of times
set, the algorithm ends. Otherwise return to step 2.
It could be seen from the information input iterative process of BP neural network that the
network has a high degree of non-linear characteristics. At the same time, each iteration of the
network is returned from the error value to the layer, and the weights of all the layers are
modified in combination with the learning rules. The weights of the layers are adjusted so that
819
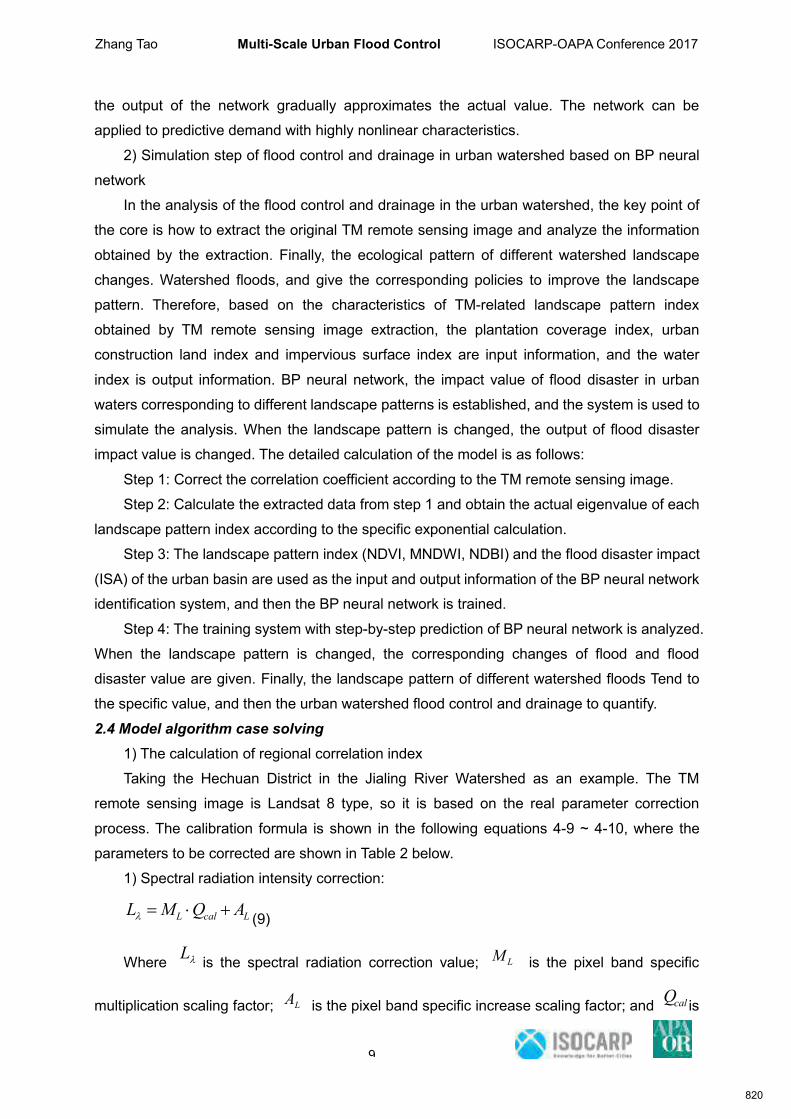
Zhang Tao Multi-Scale Urban Flood Control ISOCARP-OAPA Conference 2017
9
the output of the network gradually approximates the actual value. The network can be
applied to predictive demand with highly nonlinear characteristics.
2) Simulation step of flood control and drainage in urban watershed based on BP neural
network
In the analysis of the flood control and drainage in the urban watershed, the key point of
the core is how to extract the original TM remote sensing image and analyze the information
obtained by the extraction. Finally, the ecological pattern of different watershed landscape
changes. Watershed floods, and give the corresponding policies to improve the landscape
pattern. Therefore, based on the characteristics of TM-related landscape pattern index
obtained by TM remote sensing image extraction, the plantation coverage index, urban
construction land index and impervious surface index are input information, and the water
index is output information. BP neural network, the impact value of flood disaster in urban
waters corresponding to different landscape patterns is established, and the system is used to
simulate the analysis. When the landscape pattern is changed, the output of flood disaster
impact value is changed. The detailed calculation of the model is as follows:
Step 1: Correct the correlation coefficient according to the TM remote sensing image.
Step 2: Calculate the extracted data from step 1 and obtain the actual eigenvalue of each
landscape pattern index according to the specific exponential calculation.
Step 3: The landscape pattern index (NDVI, MNDWI, NDBI) and the flood disaster impact
(ISA) of the urban basin are used as the input and output information of the BP neural network
identification system, and then the BP neural network is trained.
Step 4: The training system with step-by-step prediction of BP neural network is analyzed.
When the landscape pattern is changed, the corresponding changes of flood and flood
disaster value are given. Finally, the landscape pattern of different watershed floods Tend to
the specific value, and then the urban watershed flood control and drainage to quantify.
2.4 Model algorithm case solving1) The calculation of regional correlation index
Taking the Hechuan District in the Jialing River Watershed as an example. The TM
remote sensing image is Landsat 8 type, so it is based on the real parameter correction
process. The calibration formula is shown in the following equations 4-9 ~ 4-10, where the
parameters to be corrected are shown in Table 2 below.
1) Spectral radiation intensity correction:
LcalL AQML (9)
Where L is the spectral radiation correction value; LM is the pixel band specific
multiplication scaling factor; LA is the pixel band specific increase scaling factor; and calQ is
820
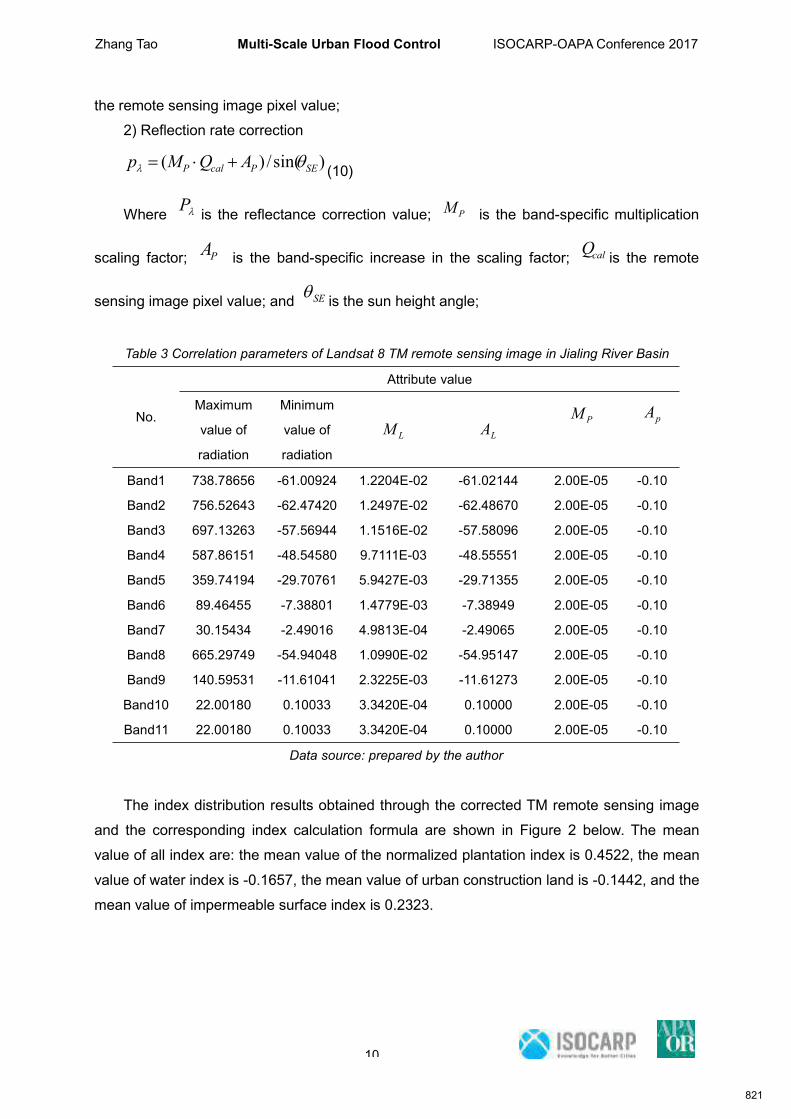
Zhang Tao Multi-Scale Urban Flood Control ISOCARP-OAPA Conference 2017
10
the remote sensing image pixel value;
2) Reflection rate correction
)sin(/)( SEPcalP AQMp (10)
Where P is the reflectance correction value; PM is the band-specific multiplication
scaling factor; PA is the band-specific increase in the scaling factor; calQ is the remote
sensing image pixel value; and SE is the sun height angle;
Table 3 Correlation parameters of Landsat 8 TM remote sensing image in Jialing River Basin
No.
Attribute value
Maximum
value of
radiation
Minimum
value of
radiationLM LA
PM pA
Band1
Band2
Band3
Band4
Band5
Band6
Band7
Band8
Band9
Band10
Band11
738.78656
756.52643
697.13263
587.86151
359.74194
89.46455
30.15434
665.29749
140.59531
22.00180
22.00180
-61.00924
-62.47420
-57.56944
-48.54580
-29.70761
-7.38801
-2.49016
-54.94048
-11.61041
0.10033
0.10033
1.2204E-02
1.2497E-02
1.1516E-02
9.7111E-03
5.9427E-03
1.4779E-03
4.9813E-04
1.0990E-02
2.3225E-03
3.3420E-04
3.3420E-04
-61.02144
-62.48670
-57.58096
-48.55551
-29.71355
-7.38949
-2.49065
-54.95147
-11.61273
0.10000
0.10000
2.00E-05
2.00E-05
2.00E-05
2.00E-05
2.00E-05
2.00E-05
2.00E-05
2.00E-05
2.00E-05
2.00E-05
2.00E-05
-0.10
-0.10
-0.10
-0.10
-0.10
-0.10
-0.10
-0.10
-0.10
-0.10
-0.10
Data source: prepared by the author
The index distribution results obtained through the corrected TM remote sensing image
and the corresponding index calculation formula are shown in Figure 2 below. The mean
value of all index are: the mean value of the normalized plantation index is 0.4522, the mean
value of water index is -0.1657, the mean value of urban construction land is -0.1442, and the
mean value of impermeable surface index is 0.2323.
821
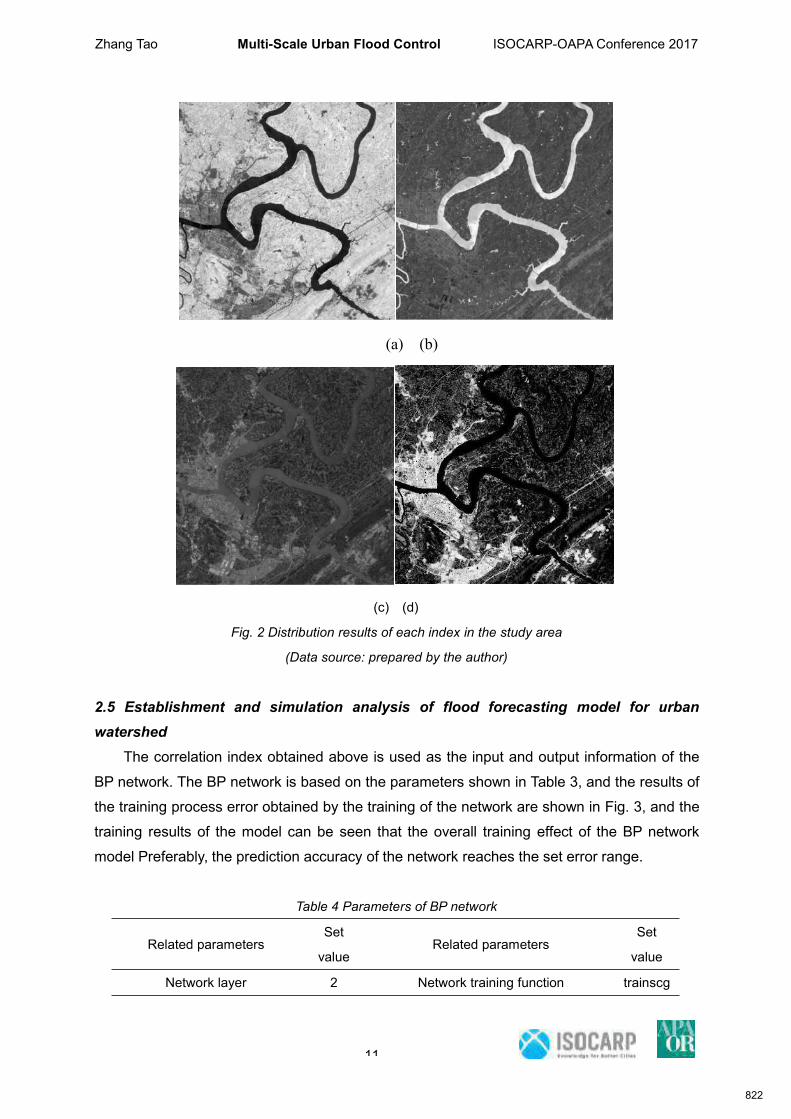
Zhang Tao Multi-Scale Urban Flood Control ISOCARP-OAPA Conference 2017
11
(a) (b)
(c) (d)
Fig. 2 Distribution results of each index in the study area
(Data source: prepared by the author)
2.5 Establishment and simulation analysis of flood forecasting model for urbanwatershed
The correlation index obtained above is used as the input and output information of the
BP network. The BP network is based on the parameters shown in Table 3, and the results of
the training process error obtained by the training of the network are shown in Fig. 3, and the
training results of the model can be seen that the overall training effect of the BP network
model Preferably, the prediction accuracy of the network reaches the set error range.
Table 4 Parameters of BP network
Related parametersSet
valueRelated parameters
Set
value
Network layer 2 Network training function trainscg
822
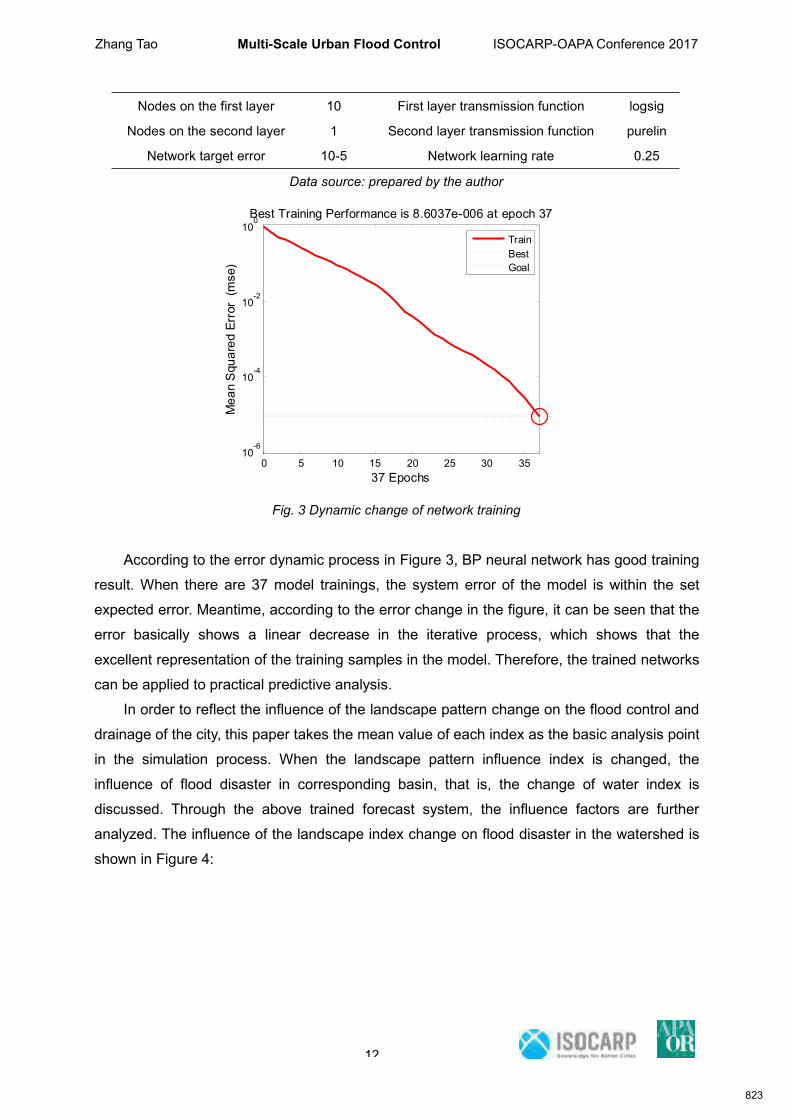
Zhang Tao Multi-Scale Urban Flood Control ISOCARP-OAPA Conference 2017
12
Nodes on the first layer
Nodes on the second layer
Network target error
10
1
10-5
First layer transmission function
Second layer transmission function
Network learning rate
logsig
purelin
0.25
Data source: prepared by the author
0 5 10 15 20 25 30 3510
-6
10-4
10-2
100
Best Training Performance is 8.6037e-006 at epoch 37M
ean
Squ
ared
Err
or (
mse
)
37 Epochs
TrainBestGoal
Fig. 3 Dynamic change of network training
According to the error dynamic process in Figure 3, BP neural network has good training
result. When there are 37 model trainings, the system error of the model is within the set
expected error. Meantime, according to the error change in the figure, it can be seen that the
error basically shows a linear decrease in the iterative process, which shows that the
excellent representation of the training samples in the model. Therefore, the trained networks
can be applied to practical predictive analysis.
In order to reflect the influence of the landscape pattern change on the flood control and
drainage of the city, this paper takes the mean value of each index as the basic analysis point
in the simulation process. When the landscape pattern influence index is changed, the
influence of flood disaster in corresponding basin, that is, the change of water index is
discussed. Through the above trained forecast system, the influence factors are further
analyzed. The influence of the landscape index change on flood disaster in the watershed is
shown in Figure 4:
823
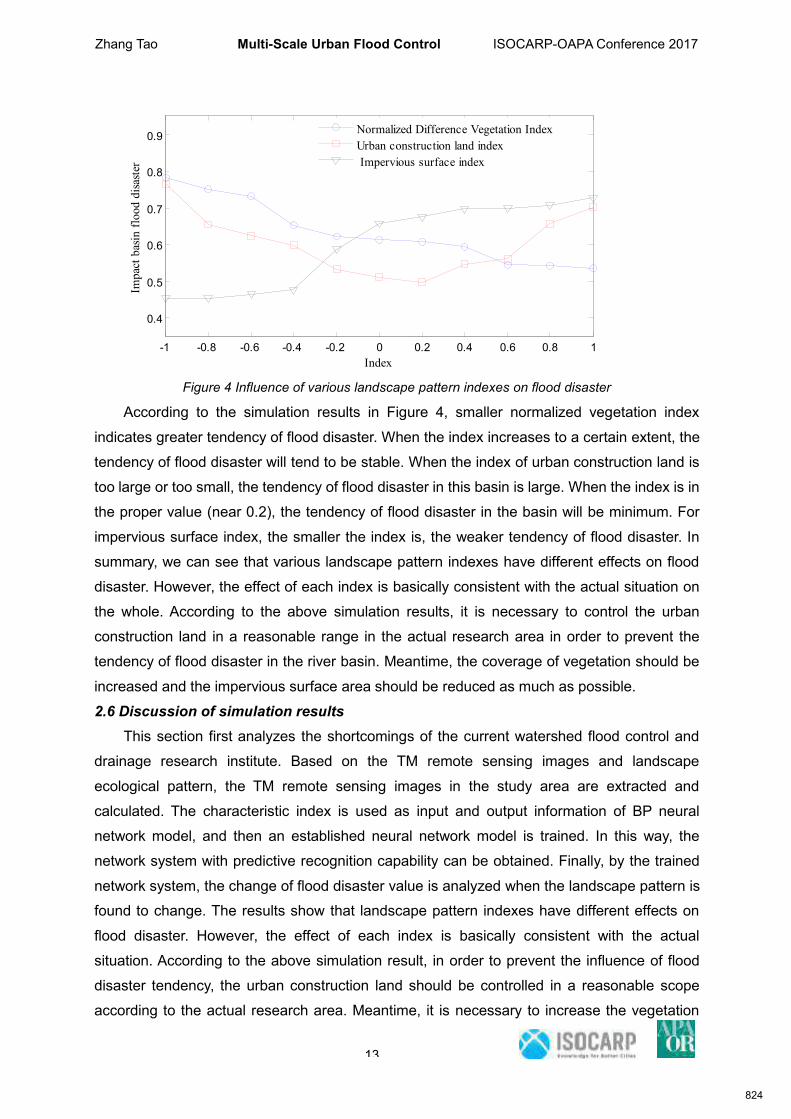
Zhang Tao Multi-Scale Urban Flood Control ISOCARP-OAPA Conference 2017
13
-1 -0.8 -0.6 -0.4 -0.2 0 0.2 0.4 0.6 0.8 1
0.4
0.5
0.6
0.7
0.8
0.9
Index
Impa
ct b
asin
floo
d di
saste
r
Normalized Difference Vegetation IndexUrban construction land index Impervious surface index
Figure 4 Influence of various landscape pattern indexes on flood disaster
According to the simulation results in Figure 4, smaller normalized vegetation index
indicates greater tendency of flood disaster. When the index increases to a certain extent, the
tendency of flood disaster will tend to be stable. When the index of urban construction land is
too large or too small, the tendency of flood disaster in this basin is large. When the index is in
the proper value (near 0.2), the tendency of flood disaster in the basin will be minimum. For
impervious surface index, the smaller the index is, the weaker tendency of flood disaster. In
summary, we can see that various landscape pattern indexes have different effects on flood
disaster. However, the effect of each index is basically consistent with the actual situation on
the whole. According to the above simulation results, it is necessary to control the urban
construction land in a reasonable range in the actual research area in order to prevent the
tendency of flood disaster in the river basin. Meantime, the coverage of vegetation should be
increased and the impervious surface area should be reduced as much as possible.
2.6 Discussion of simulation resultsThis section first analyzes the shortcomings of the current watershed flood control and
drainage research institute. Based on the TM remote sensing images and landscape
ecological pattern, the TM remote sensing images in the study area are extracted and
calculated. The characteristic index is used as input and output information of BP neural
network model, and then an established neural network model is trained. In this way, the
network system with predictive recognition capability can be obtained. Finally, by the trained
network system, the change of flood disaster value is analyzed when the landscape pattern is
found to change. The results show that landscape pattern indexes have different effects on
flood disaster. However, the effect of each index is basically consistent with the actual
situation. According to the above simulation result, in order to prevent the influence of flood
disaster tendency, the urban construction land should be controlled in a reasonable scope
according to the actual research area. Meantime, it is necessary to increase the vegetation
824
Zhang Tao Multi-Scale Urban Flood Control ISOCARP-OAPA Conference 2017
14
coverage rate and reduce the rate of impervious surface area. Since the deterioration of
watershed ecological security pattern will lead to the disappear of wetland and forest land,
decline in water storage capacity and flood discharge capacity, the loss of these “natural
sponge” functions directly increases the frequency of peak elevation, and even leads to the
phenomenon of small rain resulting into flood. The flood peak in upper reaches increases the
floodwater drainage in the downstream cities. When the flood carrying capacity exceeds the
urban water system, it will cause floods in the inner basin of the city. On the contrary, if the
ecological security pattern in the basin is optimized and improved, natural sponge such as
wetlands and forest land in the river basin will have powerful water storage function. Even if
storm and flood occur, most of the flood will be absorbed. The flood that can transmit to the
inner water system of the city is less and the flood peak will be reduced. On the premise of not
improving the construction standards of flood control projects, the city has greatly improved its
ability to withstand rare flood and rainfall.
3 Urban scale flood control and drainage planning analysis based on drainageecological restoration
Because of the urbanization and curve cut-off river channel hardening, the whole
ecosystem of river system in a city is often seriously damaged. River connectivity, ecosystem
stability and diversity are greatly reduced, which decreases the flood discharge and water
storage capacity of river. Therefore, it is urgent to make a comprehensive ecological
restoration of urban water ecosystem so as to enhance the ecological service functions of the
urban water system (including flood control, drainage, water and soil conservation, and
landscape recreation). In urban water ecosystem, urban water system is an important
component. To solve the problems of flood control, drainage and ecological restoration, the
natural hydrological process and structure of the city should be summarized based on the
ecological process of urban water natural system. Combined with the layout of land use and
the construction of water related land use, the ecological function of urban water system
should be fully restored and upgraded.
3.1 Strategy of Water Network System OrganizationRiver morphology is mainly decided by river landscape process, and it also has a certain
impact on the biological habitat structure of the river. Restructuring drainage pattern and
structure, and completing the construction of ecological water system structure is the main
work content of urban water system planning.
1) Teasing drainage structure based on the natural water cycle in river basin
Natural water cycle, as the system process includes urban water system. Thus, the
natural hydrological processes should be followed to reduce interference. If human improperly
825
Zhang Tao Multi-Scale Urban Flood Control ISOCARP-OAPA Conference 2017
15
build water conservancy project in natural water system for the interest, or damage natural
water cycle, such behavior is bound to lead to deterioration of water quality, drought and flood
and other disasters, and even complete disappearance of river water system.
Although the protection of the natural river system structure dominates in terms of
drainage structure, the overall continuity of water system needs to be enhanced in terms of
the planning process. It is advisable to combine with the connection of ponds, and lakes, and
then build up the river system structure using the natural river system structure as main frame
and corridor, and connecting nature with artificial lakes, and wetlands.
2) Implementation of water system planning with many regulation functions
To ensure the healthy development of the urban water system, it is advisable to build lack,
reservoir, pit and pond with many regulating and storing functions, in which teasing the urban
river network system is one of the key operations.
As a complete system, it has many functions. For example, pits, lakes and other low-lying
areas can store and adjust rain flood; aquatic plants, such as calamus, can improve water
quality, and block sewage and realize water purification; wetland and other related landscape
not only can improve flood control and drainage capability of river basin water system and
other ecological efficiency, but also can create good city landscape, and improve the quality of
life.
3) Construction of urban drainage ecological network based on greenway network
As for the planning of urban green corridor, green represents not only green belt, instead
it is the generalized expansion of the concept. In the natural green corridor, one extremely
important element is ecological corridor. Water system, as an important natural elements, also
plays a role in the construction of the urban ecological network. The construction of water
network system must also be based on the ecological network system. The combination of
corridor and green way not only makes landscape set each other off, but also realizes the
connection of historical and cultural context and other resources endowment (Figure 4.10).
4 Analysis of Field Scale Flood Control and Drainage Planning Based on NumericalCalculation of Rain Flood
4.1 The thought of proposing rain flood numerical calculationIn view of the “lack of planning” or “too much planning” in current urban flood control and
drainage planning, and sponge city construction, this paper takes “smart growth” and “fine
design” as the principle. In the opinion of the author, it is wise to carry out targeted numerical
calculation of rain flood in specific field rain flood facilities planning and design, consider some
constants such as regional rainfall, runoff, runoff coefficient, water consumption of landscape
plants, compare with the water seepage speed of rain and flood control facilities, water
826
Zhang Tao Multi-Scale Urban Flood Control ISOCARP-OAPA Conference 2017
16
capacity, and evaporation capacity, accurately calculate rain flood engineering facilities
quantity and position required by the specific site, and achieve the goal of zero excessive
construction on the basis of guaranteed effect of flood control and drainage through scientific
method and accurate calculation.
To study the flood control and drainage based on the numerical calculation of rain flood
the ground level, the whole data of many related databases including map, satellite image,
DEM topography, climate, and soil type database needed being collected[11].The the input
parameters fro the numerical calculation of rain flood include terrain, geography, climate
change and the application of LID facilities. In general, to figure out the type of soil of certain
areas, geotechnical engineering experts need to survey, and also need to collect terrain,
climate change and other data with the combination of the same way.
As for the calculation of the general rain flood, only measures area need inputting, and
the default value is mostly used as the value of other parameters. Rain garden, permeable
pavement, and other related GSI-LID measures parameters include the way of calculation by
default; all measures involve four parts, including parameter selection, and measure
principle[11]. For the numerical calculation of rain flood, specialty parameter capture ratio in LID
measures parameters can be designed to simplify planning and design. Capture ratio refers to
the ratio of LID measure area and rainwater area collecting area (catchment area). Several
common GSI-LID facilities are described below.
Concave type side ditch: such box structure is made of concrete. The cultivation and
engineering soil inside can support plant growth; pebble layer is below the soil, and it is used
for the storage of rain. Its edges tend to be higher 3~12 inches than the soil, which allows for
surface water level ponding; the soil fro the soil layer often leads to 6~24 inches, and pebble
bed is usually 6~18 inches.
Rain garden: it belongs to low-lying planting area, is filled inside through soil land filling
for vegetation growth. It is often built within individual family for rainwater collection. Soil is
often 6~18 inches in thickness. Preset parameters involve capture ratio and water depth, etc.
Infiltration pond: it belongs to concave planting area of vegetation and grass so as to
collect surrounding rain, and soil completes infiltration. In the process of calculation, it is
thought that soil and environment the soil have the same permeability coefficient; capture
ratio and water depth belong to the preset parameters.
Permeable pavement: the original surface is first hollowed out, and large gap is filled with
gravel; then, the permeable asphalt mixture is paved. The difference from permeable
pavement brick lies in surface paving stone. In general, rain enters pavement structure, rather
than form surface runoff; after passing rubble, the rain infiltrates to the natural soil. Permeable
surface is 4~6 inches in thickness, while the big gap of gravel is 6~18 inches. It needs noting
that the lower waterproof drainage pavement does not fall within the scope of permeable
827
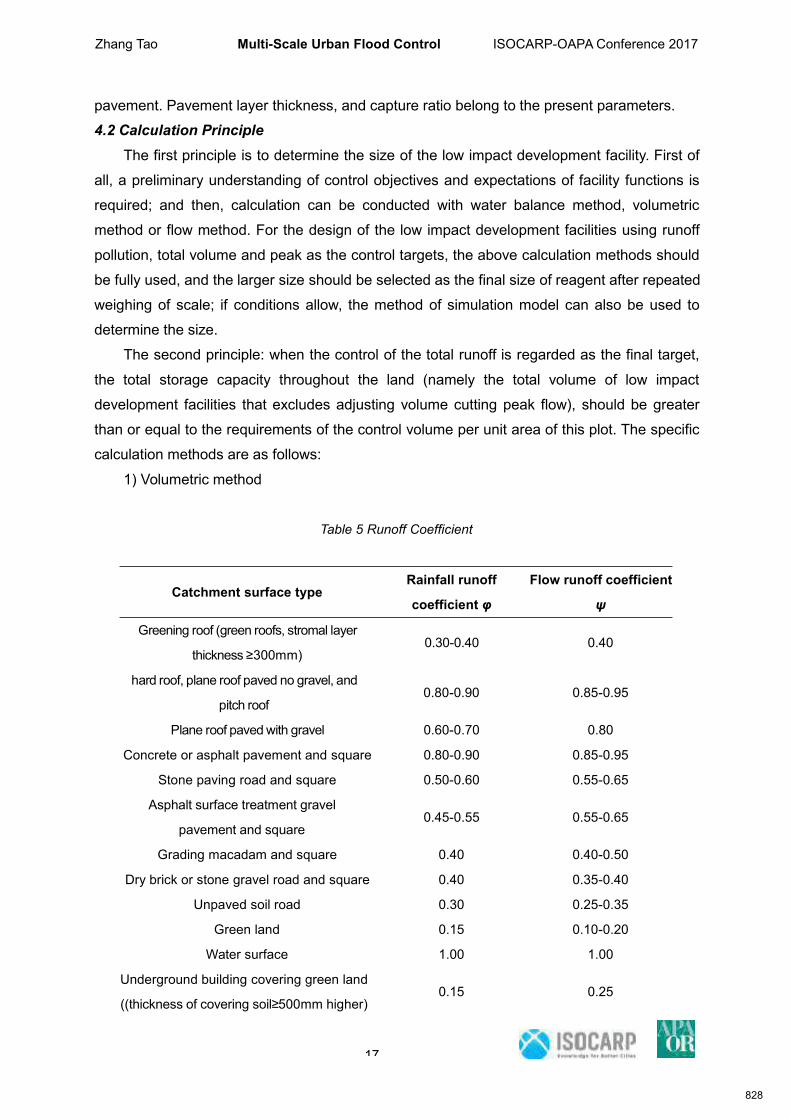
Zhang Tao Multi-Scale Urban Flood Control ISOCARP-OAPA Conference 2017
17
pavement. Pavement layer thickness, and capture ratio belong to the present parameters.
4.2 Calculation PrincipleThe first principle is to determine the size of the low impact development facility. First of
all, a preliminary understanding of control objectives and expectations of facility functions is
required; and then, calculation can be conducted with water balance method, volumetric
method or flow method. For the design of the low impact development facilities using runoff
pollution, total volume and peak as the control targets, the above calculation methods should
be fully used, and the larger size should be selected as the final size of reagent after repeated
weighing of scale; if conditions allow, the method of simulation model can also be used to
determine the size.
The second principle: when the control of the total runoff is regarded as the final target,
the total storage capacity throughout the land (namely the total volume of low impact
development facilities that excludes adjusting volume cutting peak flow), should be greater
than or equal to the requirements of the control volume per unit area of this plot. The specific
calculation methods are as follows:
1) Volumetric method
Table 5 Runoff Coefficient
Catchment surface typeRainfall runoff
coefficient φ
Flow runoff coefficient
ψ
Greening roof (green roofs, stromal layer
thickness ≥300mm)0.30-0.40 0.40
hard roof, plane roof paved no gravel, and
pitch roof0.80-0.90 0.85-0.95
Plane roof paved with gravel 0.60-0.70 0.80
Concrete or asphalt pavement and square 0.80-0.90 0.85-0.95
Stone paving road and square 0.50-0.60 0.55-0.65
Asphalt surface treatment gravel
pavement and square0.45-0.55 0.55-0.65
Grading macadam and square 0.40 0.40-0.50
Dry brick or stone gravel road and square 0.40 0.35-0.40
Unpaved soil road 0.30 0.25-0.35
Green land 0.15 0.10-0.20
Water surface 1.00 1.00
Underground building covering green land
((thickness of covering soil≥500mm higher)0.15 0.25
828
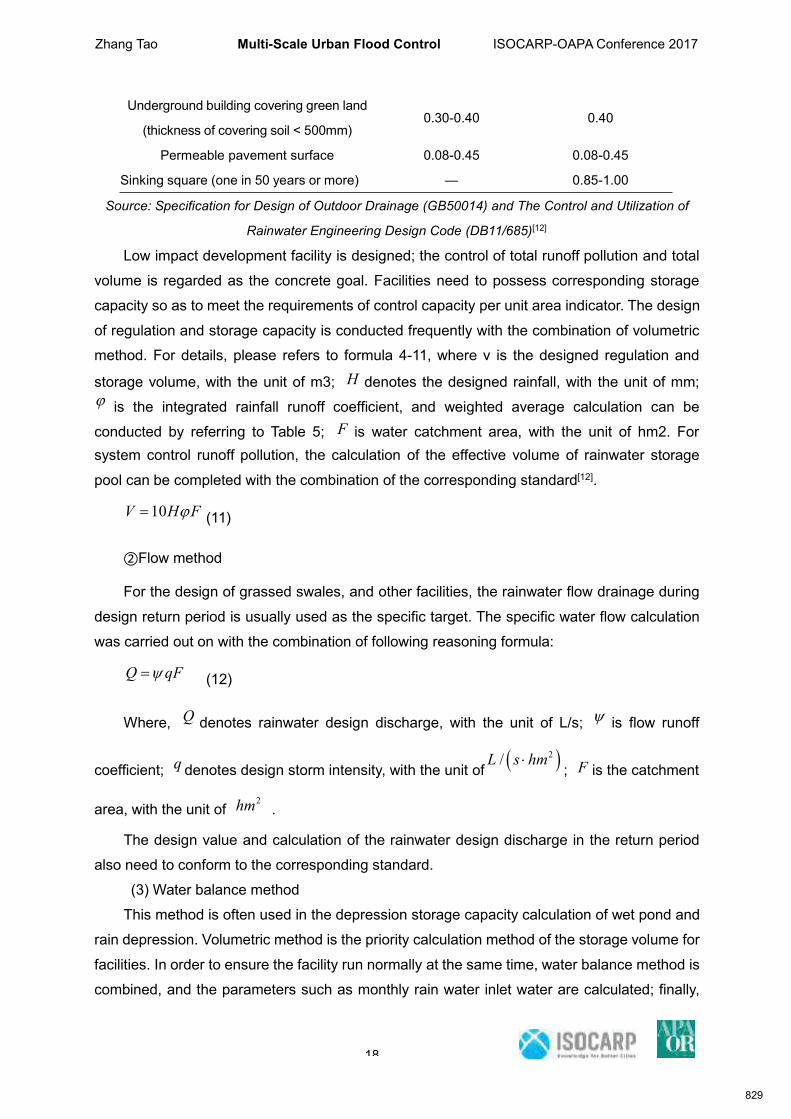
Zhang Tao Multi-Scale Urban Flood Control ISOCARP-OAPA Conference 2017
18
Underground building covering green land
(thickness of covering soil < 500mm)0.30-0.40 0.40
Permeable pavement surface 0.08-0.45 0.08-0.45
Sinking square (one in 50 years or more) — 0.85-1.00
Source: Specification for Design of Outdoor Drainage (GB50014) and The Control and Utilization of
Rainwater Engineering Design Code (DB11/685)[12]
Low impact development facility is designed; the control of total runoff pollution and total
volume is regarded as the concrete goal. Facilities need to possess corresponding storage
capacity so as to meet the requirements of control capacity per unit area indicator. The design
of regulation and storage capacity is conducted frequently with the combination of volumetric
method. For details, please refers to formula 4-11, where v is the designed regulation and
storage volume, with the unit of m3; H denotes the designed rainfall, with the unit of mm; is the integrated rainfall runoff coefficient, and weighted average calculation can be
conducted by referring to Table 5; F is water catchment area, with the unit of hm2. Forsystem control runoff pollution, the calculation of the effective volume of rainwater storage
pool can be completed with the combination of the corresponding standard[12].
10V H F (11)
②Flow method
For the design of grassed swales, and other facilities, the rainwater flow drainage during
design return period is usually used as the specific target. The specific water flow calculation
was carried out on with the combination of following reasoning formula:
Q qF (12)
Where, Q denotes rainwater design discharge, with the unit of L/s; is flow runoff
coefficient; q denotes design storm intensity, with the unit of 2/L s hm; F is the catchment
area, with the unit of2hm .
The design value and calculation of the rainwater design discharge in the return period
also need to conform to the corresponding standard.
(3) Water balance method
This method is often used in the depression storage capacity calculation of wet pond and
rain depression. Volumetric method is the priority calculation method of the storage volume for
facilities. In order to ensure the facility run normally at the same time, water balance method is
combined, and the parameters such as monthly rain water inlet water are calculated; finally,
829
Zhang Tao Multi-Scale Urban Flood Control ISOCARP-OAPA Conference 2017
19
by combining with the economic analysis, the rationality of the designed volume is determined,
and adjusted[12].
The author eventually hopes to make the GSI-LID and other sponge city water storage,
and water seepage measures capacity be larger than the retention value of surface runoff
produced by rainfall and fundamentally solve the problem of rainstorm waterlogging through
the field level planning strategy based on the accurate numerical calculation of rain flood, and
after excluding the residual value of factors such as evaporation and plant irrigation water.
5.Conclusion
This study combines the specific flood control and drainage planning cases of Jialing
River basin from the macro, meso, and micro perspectives, and abstracts each riverway in the
basin and the urban area into a subsystem (small watershed) of peripheral whole basin
system. These small watershed and other peripheral river waters in the Jialing River basin are
interconnected to form a whole basin system. Through analyzing the changes of the Jialing
River basin integrated water cycle system and the mechanism of urban flood, the author
discusses level 3 flood control and drainage strategy (namely, protecting river basin
ecosystem stability, maintaining urban natural water cycle, and using the rain flood site for
landscape design, and puts forward corresponding planning and construction measures so as
to improve urban flood control and drainage in Jialing River basin.
The main conclusions of this paper are as follows:
(1) Flood disasters happen more frequently in the cities in the Jialing River basin, and
main influencing factors include global climate change, ecological change of valley stream
and large-scale superposition of the continuous progress of urbanization. Besides, the other
factor also include very old traditional concept of water conservancy and engineering
measures, messed planning scale and incomplete coverage, unreasonable planning structure,
and ineffective flood control facilities and aging resistance construction for the needs of the
future urban development.
(2) The deterioration of ecological security pattern of river basin water system outside
the city has a direct influence on urban internal watershed flood, and tends to cause urban
internal watershed flood, etc.
(3) Applying the research of river basin ecological security pattern in the urban flood
control and drainage, analyzing the changes of the whole water cycle system and mechanism
of urban flood, and adopting the level 3 flood control and drainage strategy (protecting macro
river basin ecosystem stability, maintaining medium city natural water cycle, and using micro
area for water flood microcirculation design can effectively prevent and dissolve the urban
flood disaster.
830
Zhang Tao Multi-Scale Urban Flood Control ISOCARP-OAPA Conference 2017
20
Reference[1] Birgani Y T, Yazdandoost F. A framework for evaluating the persistence of urban drainage
risk management systems[J]. Journal of Hydro-environment Research, 2014, 8(4):330-342.
[2] Li F, Duan H F, Yan H, et al. Multi-Objective Optimal Design of Detention Tanks in the
Urban Stormwater Drainage System: Framework Development and Case Study[J]. Water
Resources Management, 2015, 29(7):2125-2137.
[3] Bank W. The Zambezi River Basin : A Multi-Sector Investment Opportunities Analysis -
State of the Basin[J]. European Geriatric Medicine, 2010, 29(7):1305–1316.
[4] Clayton J A, Kean J W. Establishing a Multi-scale Stream Gaging Network in the
Whitewater River Basin, Kansas, USA[J]. Water Resources Management, 2010,
24(13):3641-3664.
[5] Chen C F, Liu C M. The definition of urban stormwater tolerance threshold and its
conceptual estimation: an example from Taiwan[J]. Natural Hazards, 2014, 73(2):173-190.
[6] Povinec P P, Ogrinc N, Breier R. Radiocarbon and Stable Isotopes as Groundwater
Tracers in the Danube River Basin of SW Slovakia[J]. Radiocarbon, 2013, 55(2):1017-1028.
[7] Janaun J, Ellis N. Perspectives on biodiesel as a sustainable fuel[J]. Renewable &
Sustainable Energy Reviews, 2010, 14(4):1312-1320.
[8] Vidic R D, Brantley S L, Vandenbossche J M, et al. Impact of shale gas development on
regional water quality.[J]. Science, 2013, 340(6134):1235009.
[9] Mohr S H, Evans G M. Long term prediction of unconventional oil production[J]. Energy
Policy, 2010, 38(1):265-276.
[10] Durand J F. The impact of gold mining on the Witwatersrand on the rivers and karst
system of Gauteng and North West Province, South Africa[J]. Journal of African Earth
Sciences, 2012, 68(4):24-43.
[11] Dai Yiqing. Street design research based on low impact development [D].Southeast
University, 2016
[12] Ministry of housing and urban rural development of the People's Republic of
China.Technical guideline for sponge City Construction -- Construction of rainwater system
with low impact development[M].China Building Industry Press, 2015.
831
��������� ������ ��������������������������������������������������� �������� !""��#$���%��&� �!�!�$���� �����
������ ��������������������������������������������������� �������� !""��#$���%��&� �!�!�$���� ����� ���'())*+,+-.
**/0��123456.,76*8,6,3456.,76*696)- :����* ��������*��*;�����* ���*������3(6<=. >�����?*@A�:*�*B&B�CD?*@����?*E����%��*FE�������%*������GH=I,(6<=.J5KL=+97 M�*N��������?*���������*���*������*����%�����O-PQ=.853456.,76*6-R6E���*B����*����*����*�����* ���������*����*�����%����*�����;�*D��*����������*����%�*��*����?*��*����������������*���*��*��1�*���*���*�������%�*��*���*��S����;*��� ���*����*���* �����*D��*�����* ���������*������*�������*�������������*���*����������*����* ���*������%* ���*�������*����%�*���*��*����T�������������%?*��*�����*���?*����?*������?*����*D�*����*���*�������%�*����%��*�;*�������*������*E���*B����*�����T�����*��*������*����*�������������*���*�����%��*��*�������*�������*������*���*������*��1�D��*�� *�����%�*���*���*���*������;*����*��*���;*��*�*��������*�����%��* ���*�������*��*���* ���������?�����*���*�S�����*��*������*�������*����*�������*�*;�����* ���*�����*�������*����������*D�*����%���*��1�������*�;*���*�S��������*%�� ��*��*�������*������?* ���������*����*���*�������*�����*����������*D�����������*��*����������*����*�����*��*���*�������������*��*�� *�����%��*����*����%����*�����S*;������*����* �;*��*�����*C� *���������%��*���*����%*��������*�;*��������������;*����*��*���%�*�������%�����*���*�������*��* ���������*��������;*����%������D��*�����*�������*��%�����%*���*������;*��*�����*��*����%�����*���*���������*����������*���*���*�����������*��*���������*���*���*������;*��*��������*���*���*�����*�������*��������%*��*A��;���?*������������*��*���*����������*�*�������*�;*� �*����*�������*UVWX*YZV[VW\*W]*YZX]̂Z*_̀Yabc*Yad*dVXWêZYa_cf*Yad*ẀcgĉXVXWca_c*]h*X\XWciX*j̀ V[c*̂cWYVaVab*VWX*ZYXV_*hea_WV]aX*Yad*XŴe_Wêcklmn*o����*p���%���*��%��*����*��*�*�����*��* ����*���*���;*�*����������;*����%��%*qrcXV[Vca_c*VX*ŴYaXh]̂iYWVscf*Yad*Va*cY_̀*ŴYaXh]̂iYWV]af*ŴVcXW]*_̂cYWc*Y*XŴ]abĉf*Viĝ]scd*_VW\klmmn*D�*������*��*��*��������?*��%��*���*��*��*��*�����*����*D���������*���*�����*����*��������*���*�*���%�*��*�������*����*�������*�� *����*���*��%�*����?*�� *���%�����*�S�����*��������������D��*��������*��*���*�����*Va_[edcX*]Ẁĉ*��������t*���*�*���*�������������*��*���* �;*��*������%* �������������*�������%��*�;*�������*����%��*D�*������*���*�����*��*���������*���*�������*������*������������t*���*��������*��*;���u*������;*���*���*���������*�������������*��*�����*D��*���*�*����������* ���*�*���*��1��;*��*������*���*T������*��* ����*�S����*�*���������*���������%;*���*��*���������� �����D��*�����* ���*����������*���*�*���;*��*1�� ���%�*��*���*�������*����*����*������*��*������*��������������*���*���*����������*��*���*�����*������������*D�*������*�*����%��*�������*���;*���*�������*���%�����*�����%��*��*�*������;*��*���������*���*�����*v������;*����*��* ���*��*�����*��*�S����%�*1�� ���%����*�� *�������*��* ���������*����������*����*�����*�*;�����* ���*�������/�2*��*A��;���?*qN��������*D���1��%w*���*E������%?*��*rcXV[Vca_c*x̀VayVab*Va*ẑZYa*{[YaaVab?*��#*F|��������?}���%��?*���!G/��2*p�*~���1���?*v�*~���;���*FA�G?*qE������w*��*ẑZYa*rcXV[Vca_cf*�*x̂YaXh]̂iYWVsc*�gĝ]Y_̀f*F} ���������?}���%��?*���"G **/0��12832
Rouf, Abdur TRBM for Smart Communities ISOCARP-OAPA Conference 2017
1
Tidal River Basin Management for Building up Smart Communities:
A Case Study in the Southwest Coastal Zone of Bangladesh
Md Abdur ROUF, Bangladesh University of Engineering and Technology, Bangladesh.
Synopsis:
Tidal River Basin Management (TRBM) is a unique technological innovation that favours
building up smart communities in tidal coastal zones providing resilience in agriculture,
rehabilitating drainage congestions, enhancing adaptability with sea-level rise and so on.
However, implementation of a TRBM has emerged as a challenging task over time due to
some anthropogenic factors. This study looks into these factors and formulates a strategic
planning towards easing implementation of TRBM. Facts from focus group discussion,
findings from study reports and expert opinions are synthesised before considering a point.
1. Introduction
From the dawn of civilization, men have been struggling to make their settlements safe,
secure and habitable. Time to time, men have invented as well as innovated ways and
means to ward off unwanted and harmful happenings considering the environs and
locations. Tidal river basin management (TRBM) is such an innovation that protects the
coastal areas particularly the tidal coastal zones from natural hazards such as flooding,
salinity intrusion and waterlogging in an environmentally friendly way providing the coastal
communities a sustainable habitat and livelihood (CEGIS, 1998, 2008; ADB, 2007). TRBM
functions in a way that helps boost up agricultural productivity, improve communication
network and most importantly, counteract the relative sea-level rise in an effective way which
paves the way for building up 'smart communities' in the coastal areas (Rouf, 2016).
The word 'smart' refers to certain qualities that are highly desirable and most people
appreciate them while these qualities vary with respect to space, place and time. When an
entity achieves these qualities, it is modified with the word 'smart'. For example, if a city
attains certain qualities, it is termed as a 'smart city'; by the same token, when a community
achieves almost the same qualities it is said to be a 'smart community'. In fact, the concept
of a smart community can be conceived of a smart city since communities and cities are very
similar in terms of most of their characteristics. In the literature, a smart city has been viewed
from different perspectives making it a fuzzy concept (Tranos and Gertner, 2012); at the
same time, use of similar words, like intelligent city, knowledge based city, digital city etc
have added to the conceptual confusion (Schaffers et al., 2011). The academic, business
and government literature is largely divided in conceptualising a smart city in terms of
ideological rhetoric and theoretical orientation. The academia often takes pragmatic and
non-ideological views in developing smart city development technologies and policy
formulation; the business appear with the vision which is reasonable and inclusive with
respect to city administration and economic policies, while the governments support the
smart city concept as a route to achieve socio-economic progress and more liveable,
functional, secure and sustainable cities (Kitchin, 2014). However, whatever perspective is
taken to view smartness of a city or a community, at the end it comes down to some
common achievements including liveability, prosperity and sustainability.
833
Rouf, Abdur TRBM for Smart Communities ISOCARP-OAPA Conference 2017
2
Considering the choice and implementation of appropriate technological interventions
according to different geographic locations, making a smart community is a way to
challenging than making a smart city. Comparing to most communities around the world, the
development of cities is initiated in a very planned way. While almost common approaches
are applicable to smart cities, different types of interventions are required for smart
communities considering their diverse locations and topography. Tidal river Basin
Management (TRBM) is such an intervention that makes the coastal communities smart
providing them with a liveable, prosperous and sustainable environment. However, there are
some obstacles that appear when implementing a TRBM, and this study examines these
obstacles for formulating a strategic planning towards smooth implementation of TRBMs.
2. Evolution of TRBM as a Unique Approach to Smart Communities:
The coastal zone of Bangladesh is very susceptible to flooding and salinity intrusion because
of its geographical position and topographic setup (Choudhury et al., 2004; Mirza, 2002).
The coastal communities have been struggling to overcome the problems of flooding and
salinity using past experience and wisdom. In the past, they used to build earthen dykes
around floodplains or beels to protect them from tidal flooding, and wooden sluices to let out
surplus rain water. These dykes and sluices would be dismantled after harvesting and
people would graze cattle and capture fisheries in these floodplains until the next cropping
year comes. This sort of protection proved to be unreliable to save crops particularly in the
events of big floods like those occurred in the years of 1953 and 1954. Considering the issue
of food security for the growing population in the coastal communities, the then Government
of East Pakistan (now Bangladesh) undertook the Coastal Embankment Project (CEP) in the
sixties to build up embankments on the banks of the rivers and encircle the low-lying areas
i.e., the floodplains/beels (ADB, 1993 and 2007; CEGIS, 1998). In other words, the coastal
areas were converted into many polders1. This polderisation project gave a short run (10 to
15 years ) limited success and eventually emerged with devastating consequences
particularly in the Southwest coastal zone of Bangladesh. Under the polder system the tides
are confined to the rivers and not allowed to travel in the floodplains/beels, so, the rivers get
silted up by the sediment left by the tides; while the low-lying floodplains go further down due
to drainage of runoff water and natural subsidence. As a result, the river beds go up but the
beel beds go down and these two opposite processes end up in gravitational drainage
problem (Rouf, 2016; Tutu, 2005).
However, due to the adverse impact of polderisation the Southwest coastal zone of
Bangladesh began to experience drainage channel blockage and waterlogging in the early
eighties (ADB, 2007; CEGIS, 1998 and 2001; Tutu, 2005). The waterlogging problem had
aggravated gradually and the coastal communities fell in anxiety by the mid-eighties.
Suspension of agricultural activities, disruption of the road network, high unemployment and
deteriorated sanitary condition lead to a humanitarian crisis. The overall socioeconomic and
environmental condition was so critical that many people migrated to other areas (Uddin and
Yasmin, 2005; Islam and Kibria, 2006). However, to mitigate this problem the Bangladesh
Water Development Board (BWDB), the apex body of the Government in the water
management sector adopted some projects in the eighties and early nineties based on top
down approach. Unfortunately, these projects emerged with very poor performance; not only
this, one of these projects had to abandon in the face of protests from the coastal
communities. People pleaded for the TRBM approach realising its potential for building
834
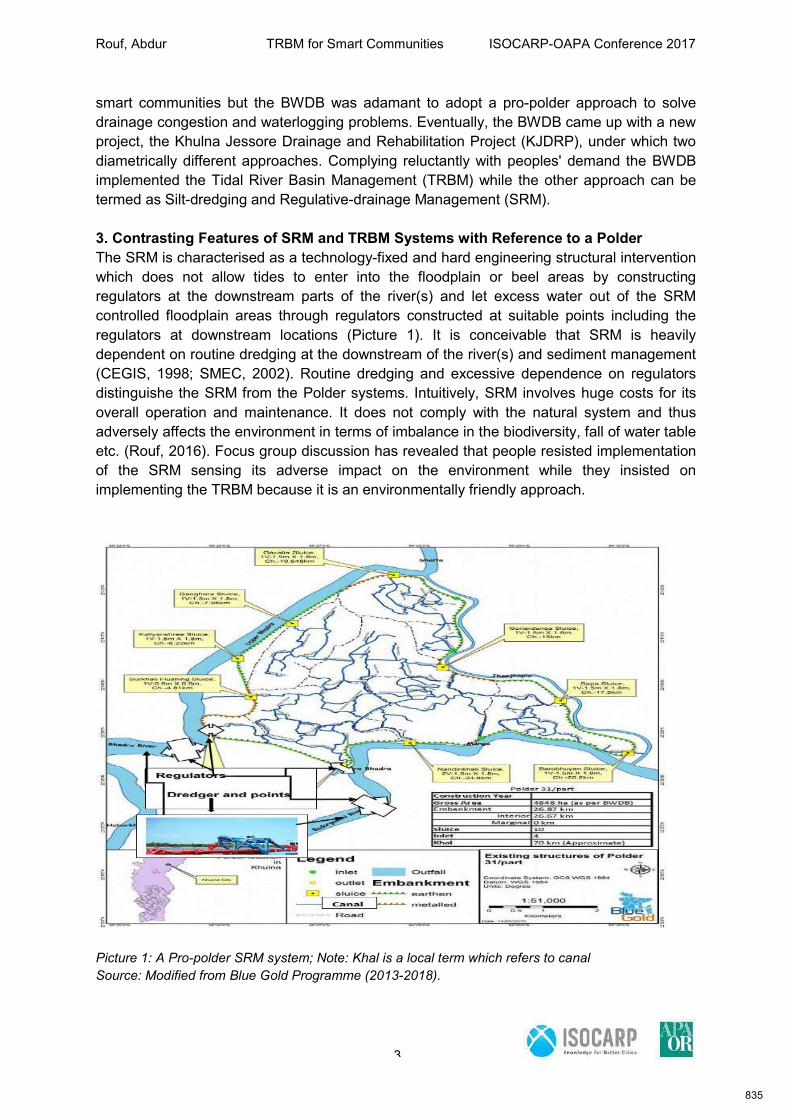
Rouf, Abdur TRBM for Smart Communities ISOCARP-OAPA Conference 2017
3
smart communities but the BWDB was adamant to adopt a pro-polder approach to solve
drainage congestion and waterlogging problems. Eventually, the BWDB came up with a new
project, the Khulna Jessore Drainage and Rehabilitation Project (KJDRP), under which two
diametrically different approaches. Complying reluctantly with peoples' demand the BWDB
implemented the Tidal River Basin Management (TRBM) while the other approach can be
termed as Silt-dredging and Regulative-drainage Management (SRM).
3. Contrasting Features of SRM and TRBM Systems with Reference to a Polder
The SRM is characterised as a technology-fixed and hard engineering structural intervention
which does not allow tides to enter into the floodplain or beel areas by constructing
regulators at the downstream parts of the river(s) and let excess water out of the SRM
controlled floodplain areas through regulators constructed at suitable points including the
regulators at downstream locations (Picture 1). It is conceivable that SRM is heavily
dependent on routine dredging at the downstream of the river(s) and sediment management
(CEGIS, 1998; SMEC, 2002). Routine dredging and excessive dependence on regulators
distinguishe the SRM from the Polder systems. Intuitively, SRM involves huge costs for its
overall operation and maintenance. It does not comply with the natural system and thus
adversely affects the environment in terms of imbalance in the biodiversity, fall of water table
etc. (Rouf, 2016). Focus group discussion has revealed that people resisted implementation
of the SRM sensing its adverse impact on the environment while they insisted on
implementing the TRBM because it is an environmentally friendly approach.
Picture 1: A Pro-polder SRM system; Note: Khal is a local term which refers to canal
Source: Modified from Blue Gold Programme (2013-2018).
835
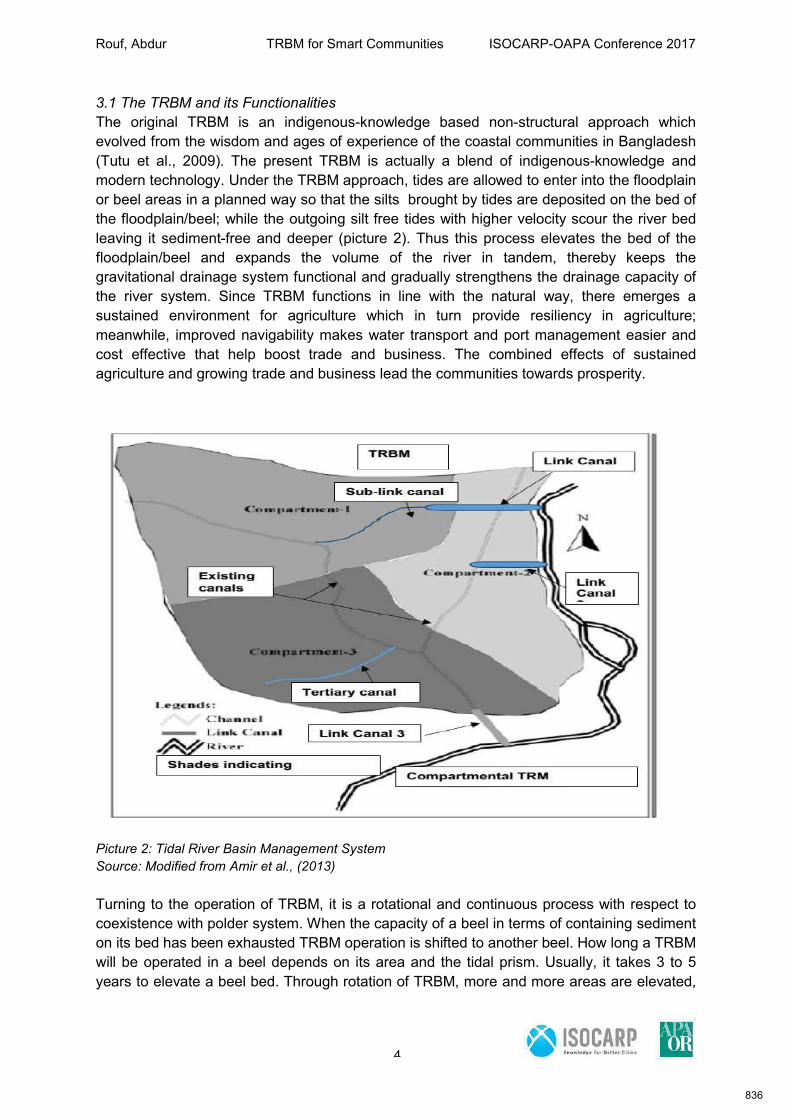
Rouf, Abdur TRBM for Smart Communities ISOCARP-OAPA Conference 2017
4
3.1 The TRBM and its Functionalities
The original TRBM is an indigenous-knowledge based non-structural approach which
evolved from the wisdom and ages of experience of the coastal communities in Bangladesh
(Tutu et al., 2009). The present TRBM is actually a blend of indigenous-knowledge and
modern technology. Under the TRBM approach, tides are allowed to enter into the floodplain
or beel areas in a planned way so that the silts brought by tides are deposited on the bed of
the floodplain/beel; while the outgoing silt free tides with higher velocity scour the river bed
leaving it sediment-free and deeper (picture 2). Thus this process elevates the bed of the
floodplain/beel and expands the volume of the river in tandem, thereby keeps the
gravitational drainage system functional and gradually strengthens the drainage capacity of
the river system. Since TRBM functions in line with the natural way, there emerges a
sustained environment for agriculture which in turn provide resiliency in agriculture;
meanwhile, improved navigability makes water transport and port management easier and
cost effective that help boost trade and business. The combined effects of sustained
agriculture and growing trade and business lead the communities towards prosperity.
Picture 2: Tidal River Basin Management System
Source: Modified from Amir et al., (2013)
Turning to the operation of TRBM, it is a rotational and continuous process with respect to
coexistence with polder system. When the capacity of a beel in terms of containing sediment
on its bed has been exhausted TRBM operation is shifted to another beel. How long a TRBM
will be operated in a beel depends on its area and the tidal prism. Usually, it takes 3 to 5
years to elevate a beel bed. Through rotation of TRBM, more and more areas are elevated,
836
Rouf, Abdur TRBM for Smart Communities ISOCARP-OAPA Conference 2017
5
side by side the capacity of the river system is expanded; these positive changes enhance
the power of adaptability of the coastal communities.
4 Smart Communities and TRBM
4.1 Higher Agricultural Productivity and Prosperity of Communities
The original soil in the Southwest coastal zone of Bangladesh is mostly peaty since it was
actually part of the Sundarbans in the past (Uddin and Yasmin, 2005). There are studies
which report that mixed soil in the coastal areas is more favourable for rice production (see
CEGIS 2001; Rouf 2016). However, TRBM provides scope for blending original soil with the
silts and bringing a balance in nutrient contents which contribute to higher productivity in
agriculture. Higher productivity means higher income which is the precondition for a smart
community.
4.2 Effective Protection from Sea-level-rise
The rise of relative sea-level due to the combined effects of global warming and land
subsidence is an undeniable fact. The communities in low-lying coastal areas bear the brunt
of the impact (see Brammer, 2014; Syvitski et al., 2009). TRBM effectively counteracts the
rise of relative sea-level elevating the low-lying areas through the vertical accretion of
sediments, thereby strengthens resilience in agriculture, enhances adaptability with climate
change and leads to building up smart communities. Water management experts (Rahman
2017; Ullah 2017) have opined that there is no other safe and cost effective means other
than TRBM to protect the coastal communities against the relative sea-level rise.
4.3 Maintaining a Balance in the Environment
The SRM approach adversely affects the open water fisheries and the biodiversity since it
involves regulators for flood control and drainage management (CEGIS, 1998). Regulators
disturb the free movement of fisheries, disconnect fish habitats, reduce the length of the
migration route and so on. In contrast, TRBM does not affect the open water fisheries and
the biodiversity as such since there is no provision for regulators with a TRBM in principle.
There is evidence that TRBM promotes open water fisheries and biodiversity. It was known
from the focus group discussion (FGD) that during TRBM in Beel Bhaina and East Beel
Khuksia, a large amount of open water fisheries would be captured every day; meanwhile,
there was no sign of imbalance in biodiversity of the area. Indeed, TRBM favours the
biodiversity that helps to maintain a balance in the environment.
5. Obstacles to implementing TRBM
Hitherto three TRBMs had been implemented in the Southwest coastal zone of Bangladesh.
The first TRBM can be characterised as spontaneous and unplanned that took place in Beel
Bhaina during the period of 1997 to 2001; the second and third ones are termed as
government sponsored and planned, and these were implemented in Beel Kedaria (2002-
2004) and East Beel Khuksia (2006-2013) respectively. It is noteworthy here that the
stipulated duration of TRBM in East Beel Khuksia was three years, and it was proposed that
the next (i.e., the fourth) TRBM will be implemented in Beel Kapalia from 2009.
Unfortunately, it has not yet been possible to implement a TRBM in Beel Kapalia due
apparently to the opposition from the stakeholders. The primary reason behind this
opposition as elicited from the focus group discussion (FGD) is the uncertainty of getting
crop compensation. As a matter of fact, many people who forgo their lands for TRBM in East
837

Rouf, Abdur TRBM for Smart Communities ISOCARP-OAPA Conference 2017
6
Beel Khuksia did not get their rightful crop compensation. It is reported that the clumsy
compensation mechanism is the main culprit here. However, the bitter experience of the
affected farmers of East Beel Khuksia dissuaded the farmers of Beel Kapalia from forgoing
their Beel for TRBM. Another big issue here is the existence of a considerable amount of
khas lands in the beel. Except these two other important factors include the petty interest of
the gher2 (fish) farmers, lack of employment opportunities during TRBM, lack of confidence
in the BWDB and inundation of localities by breaching of TRBM embankment.
5.1 Crop Compensation Mechanism
The beel under TRBM operation becomes inundated twice a day which prevents the
cultivation of land in the beel. So the land owners forfeit their income; hence the affected
land owners must be compensated for crop losses. Focus group discussion has revealed
that the existing crop compensation mechanism is very stringent in terms of producing
different types of up-to-date ownership documents, while the collection of these documents
involves hassles because of inefficient and backdated official procedures. Many affected
farmers failed to produce these documents, as a result, they were not given any
compensation, although they are the rightful owners. People in general, are very much
indignant about the present crop compensation mechanism.
5.2 Petty Interest of the Gher (Fish) Farmers
Fish culture and flooded land go together, so the gher (fish) farmers prefer low-lying lands as
they remain flooded round the year. Fish farmers feel that TRBM would bring no benefit to
them. Besides, fish culture is much more profitable than rice farming, so they do not agree to
forgo their earnings for the sake of TRBM.
5.3 The existence of 'Khas' land
Strictly speaking, khas lands are state-owned and nobody has a property right on it. In the
floodplain areas of Bangladesh, a good proportion of land falls into khas category. Those
who control these khas lands cannot legally claim any compensation against these lands.
Naturally, this group of people stands against the implementation of a TRBM. In fact, the
nexus between the fish farmers and khas land occupiers is a big factor here.
5.4 Lack of confidence in BWDB
On a number of occasions, the BWDB, as the implementing agency, failed to respond
stakeholders rightful demands, while it (BWDB) showed negligence to meet their rightful
claims in many cases. For example, in the case of East Beel Khuksia, the BWDB lingered on
the operation of TRBM more than four years beyond the stipulated period of three years, i.e.,
the beel was more than seven years under TRBM operation in a row. Not only this, BWDB
did not close the cut point despite persistent requests from the affected people. Lastly,
people became organised, raised a fund and closed the cut point themselves. People took
these matters very seriously.
5.5 Lack of employment opportunities During TRBM
A large number of people whose livelihoods are associated with the beel under TRBM
become unemployed since agricultural activities remain suspended for a long time. People in
the low-income brackets, particularly the landless, day labourers and fisher folk become the
838
Rouf, Abdur TRBM for Smart Communities ISOCARP-OAPA Conference 2017
7
worst sufferers, so they do not welcome TRBM. The gher (fish) farmers who are rich and
influential take this opportunity and mobilise these people against TRBM.
5.6 Breach of Peripheral Embankment
Inundation of homestead by breaching the peripheral embankment for TRBM is a matter of
great concern for the people living outside the embankment. Focus group discussion has
expressed that the implementing agency, i.e., the BWDB, often overlooks this serious issue.
The loss of confidence in BWDB leads to the assumption that in the event of embankment
breach, the BWDB would not take prompt measure in this regard. Therefore, people who are
vulnerable to the breach of peripheral embankment usually stand against implementation of
TRBM.
6. Strategic Planning for Overcoming the Obstacles
6.1 Easing Compensation Mechanism
It is widely believed that an effective mechanism for crop compensation would reduce the
opposition from the stakeholders to a great extent and facilitate smooth implementation of
TRBM. This study, however, starts with the seven options proposed by the CEGIS (2008) to
compensate the affected people. These are: (i) compensation in cash for crops (ii)
compensation in cash for crops and open access to fishing (iii) compensation through open
access fishing only (iv) cooperative culture of fisheries (v) compensation through leasing out
the beel for fisheries culture to the fish farmers (vi) compensation through leasing out the
beel for fisheries cultivation to fisher folks (vii) compensation by distributing gain tax
collected from the stakeholders of other benefitted beel.
Arguably, of these seven options only two i.e., (i) and (ii), can be considered given the reality
of the coastal area. The first option can effectively be practiced, albeit after some
modifications including simplification of the rules. This option could be made easier if
physical occupation on a farmland is considered as the basis of claiming compensation
against the farmland; if there is any dispute over the land, then the concerned authority will
ask for supporting documents in favour of its ownership. In fact, the number of plots that are
in ownership dispute is negligible. In the case of 'Khas' lands, the same principle can be
applied that people who have been cultivating these lands (i.e., established physical
possession on these lands) would receive the compensation. It is reported that the amount
of khas land varies from one beel to another.
The second option is not recommendable as it is since open access to fishing has many
disadvantages. At the first place, it is almost impossible to ensure fair shares to the rightful
stakeholders; influential people would dominate over the ordinary stakeholders; people
having no property right to the beel will take advantage from fishing and so on. The use of
different types of fishing gears and human movements would seriously hamper effective
sedimentation on beel bed which would jeopardise the main purpose of TRBM. Even
restricted fishing more or less affects the sedimentation, let alone open access fishing.
Again, it is argued that open access fishing should not be considered as an option as it
would generate more disparity. However, a regulated fishing provision can be considered
with some provisions. Hence the whole beel to be segregated into two, three or four blocks
depending on its size and location, and each block to be leased out through open bidding to
the specially formed cooperative societies. It would be pragmatic if a block is leased out to
839
Rouf, Abdur TRBM for Smart Communities ISOCARP-OAPA Conference 2017
8
the cooperative society whose members live adjacent to the respective block of the beel. It is
expected that this provision would ensure good control and better management. At the same
time, the lease contact to be designed in such a way that would ensure minimum
disturbance to sedimentation.
6.2 Motivating the gher (fish) farmers
Focus group discussion has expressed that the vast majority of people in the KJDRP area
realise that TRBM is the only way to get rid of drainage and waterlogging problem and the
ensuring a sustained environment for agriculture. Even the gher (fish) farmers feel that there
is no alternative to TRBM, but they oppose it only for the sake of their petty interest. Hence
proper measures need be taken to motivate the gher (fish) farmers. The number of gher
(fish) farmers is negligible and they make their ghers taking land from ordinary farmers (who
are positive to TRBM). The motivational scheme to be designed in such a way that the pro-
TRBM ordinary farmers can exert their influence.
6.3 Creation of Employment Opportunities for the Affected People
Programmes to be explored considering the socioeconomic condition of the area, particularly
the TRBM-affected people in order to create employment opportunities for them. The
following programmes are expected to be effective in this regard.
6.3.1 Soft Loan Programme: Soft loan can be given to the landless and poor people for self-
employment; in fact, this option can be made open for all affected people, if the situation
allows.
6.3.2 Liaison with the Local Industries: There are a good number of industries in the nearby
towns where the affected people can be employed during the operation period of a TRBM.
The Government can make an arrangement so that people relating to a beel with ongoing
TRBM will get priority in getting jobs in the local industries against the temporary posts.
Besides, there are government projects around the year where a good proportion of the
affected people can be employed.
6.3.3 Industries for the Target Group: TRBM is a continuous process and to be continued as
long as the polders are present in the coastal region of Bangladesh. It is, in fact, an
important component of integrated coastal zone management (ICZM). Hence, the
Government can set up some industries keeping in mind the employment of the affected
people relating to TRBM and other similar projects.
6.4 Creation of an Independent Commission for TRBM
It is evident from the past experience that a high powered commission is necessary for
smooth implementation, monitoring and evaluation of TRBMs in the coastal areas of
Bangladesh. Actually, it is not possible for the BWDB to deal with all the aspects of a TRBM
particularly, the socioeconomic, environmental and management sides since these are
beyond their scope. However, this commission would work in collaboration with the BWDB
and other agencies of the Government relating to water resources management and
planning and ensure a bottom-up planning approach in the entire process of TRBM and
related projects.
840
Rouf, Abdur TRBM for Smart Communities ISOCARP-OAPA Conference 2017
9
7. Conclusion
Compensation for the affected people is the crux of the obstacles to implementing a TRBM
in the coastal area of Bangladesh. Besides, issues like unemployment during a TRBM
operation, suspicion and mistrust between the stakeholders and implementing agency,
powerful vested interests often play an important role against TRBM. In fact, several factors
are intertwined and their collective impact prevents implementation as well as smooth
operation of a TRBM. In order to overcome these obstacles, a strategic planning is
recommended that includes developing an easy mechanism for crop compensation, creating
job opportunities for the most affected people, redressing mistrust and fear between the
parties involved, arranging motivational programmes and so on. It is expected that
successful implementation of the strategic planning paves the way for exploiting full benefit
from TRBMs which in turn facilitate building up smart communities. At the same time, a
holistic strategic planning is indispensable for maintaining smart communities, because of
the interconnectivity, interdependence and complexity of the river system in the coastal area.
TRBM system must be continued as long as coastal communities coexist with the polder
system; hence, formation of an independent commission to oversee overall planning,
implementation, operation and evaluation of TRBM system cannot be denied.
Endnotes: 1 A polder is a man-made hydrological area encircled by dykes that protect the area from
outside water, tides in particular.
2 'Gher' is a local Bengali word which refers to an enclosed area surrounded by earthen
dykes giving it a pond-like shape, within which mainly fisheries are cultured (Rouf 2016),
although rice can be cultivated but (it) is not usually practiced in big ghers.
References ADB, Asian Development Bank, 1993. ‘Report and recommendation of the president to the
board of directors on a proposed loan and technical assistance grant to the Peoples Republic of Bangladesh for Khulna-Jessore Drainage Rehabilitation Project. Asian Development Bank.
ADB, Asian Development Bank, 2007. ‘Performance Evaluation Report in Bangladesh,
Khulna-Jessore Drainage Rehabilitation Project. Operation Evaluation Department, Asian Development Bank.
Amir, M.S.I.I., Khan, M.S.A., Khan, M.M.K., Rasul, M.G. and Akram, F., 2013. 'Tidal River
Sediment Management–A Case Study in Southwestern Bangladesh', International Journal of Civil, Environmental, Structural, Construction and Architectural Engineering Vol:7, No:3.
Blue Gold Programme, 2013-2018. 'A Development Programme in the coastal area of
Bangladesh', jointly funded by the Government of the Netherlands and the Government of Bangladesh.
URL: http://bluegoldbd.org/more-information/maps-structures/ Brammer, H., 2014. 'Bangladesh’s dynamic coastal regions and sea-level rise', Climate
Risk Management, 1, pp. 51-62.
841
Rouf, Abdur TRBM for Smart Communities ISOCARP-OAPA Conference 2017
10
CEGIS, Centre for Environmental and Geographic Information Services, 1998. Environmental and Social Impact Assessment of Khulna–Jessore Drainage Rehabilitation Project. Environmental and GIS Support for Water Sector Planning, House # 49, Road # 27, Banani, Dhaka 1213, Bangladesh.
CEGIS, Centre for Environmental and Geographic Information Services, 2001.
'Environmental and Social Management Plan for Khulna-Jessore Drainage Rehabilitation Project'. Bangladesh Water Development Board (BWDB), Ministry of Water Resources, Government of Bangladesh.
CEGIS, Centre for Environmental and Geographic Information Services, 2007.
'Environmental and Social Impact Assessment (EIA/SIA) and Development of Compensation Mechanism for Tidal River Management under KJDRP'. Bangladesh Water Development Board (BWDB), Ministry of Water Resources, Government of Bangladesh.
Choudhury, N.Y., Paul, A. and Paul, B.K., 2004. 'Impact of costal embankment on the flash
flood in Bangladesh: a case study', Applied Geography, 24(3), pp. 241-258. Islam, S. and Kibria Z., 2006. 'Unravelling KJDRP: ADB Financed Project of Mass
Destruction in the Southwest Coastal Region of Bangladesh'. Uttaran, Satmasjid Road, Dhanmondi, Dhaka 1209, Bangladesh
Kitchin, R., 2015. Making sense of smart cities: addressing present shortcomings.
Cambridge Journal of Regions, Economy and Society, 8(1), pp.131-136. Mirza, M.M.Q., 2002. 'Global warming and changes in the probability of occurrence of
floods in Bangladesh and implications', Global environmental change, 12(2), pp. 127-138. Rahman, M.R., 2017. Personal communication, July 5, 2017, Dhaka. The interview was
held at the interviewee's office. (The interviewee is a Professor, Institute of Water and Flood Management, Bangladesh University of Engineering and Technology, Dhaka).
Rouf, M.A., 2016. 'Evaluating flood control and drainage management systems from a
productive efficiency perspective: a case study of the Southwest coastal zone of Bangladesh' - A PhD dissertation submitted to the faculty of Humanities and Social Sciences, University of Newcastle upon Tyne, UK.
Schaffers, H.; Komninos, N.; Pallot, M.; Trousse, B.; Nilsson, M. and Oliveira, A.,
2011. Smart Cities and the Future Internet: Towards Cooperation Frameworks for Open Innovation. In: J. Domingue et al. (Eds.): Future Internet Assembly, LNCS 6656, pp. 431–446.
SMEC, Snowy Mountains Engineering Corporation, 2002. ‘Operation & Maintenance
Manual (Final), Khulna-Jessore Drainage Rehabilitation Project, Bangladesh Water Development Board (BWDB), Dhaka.
Syvitski, J.P.M., Kettner, A.J., Overeem, I., Hutton, E.W.H., Hannon, M.T., Brakenridge,
G.R., Day, J., Vörösmarty, C., Saito, Y. and Giosan, L., 2009. 'Sinking deltas due to human activities', Nature Geoscience, 2(10), pp. 681-686.
Tranos, E. and Gertner, D., 2012. Smart networked cities?. Innovation: The European
Journal of Social Science Research, 25 (2), 175-190.
842
Rouf, Abdur TRBM for Smart Communities ISOCARP-OAPA Conference 2017
11
Tutu, A.A., Masum, S.J.H., Tipu, M.A.R. and Hasan M.M.M., 2009. 'Tidal river management in Bangladesh - People’s Initiative on Coastal River Basin Management to Solve Waterlogging in the Southwest Coastal Region of Bangladesh', in Water for the People Network, Tujan, Antonio Jr. (ed), IBON Center, 114 Timog Avenue, Quezon City, 1103, Philippines.
URL: http://w4pn.org/downloads/PAWRM_Water_for_the_People.pdf Uddin, A.M.K and Yasmin, A., 2005. Zila Tathya: Khulna (In Bengali), Integrated Coastal
Zone Management Plan (ICZMP) project, Water Resources Planning Organisation, Government of the People’s Republic of Bangladesh, Dhaka 1212.
URL: http://www.warpo.gov.bd/pdf/khulna.pdf
Ullah, M. W., 2017. Personal communication, July 6, 2017, Dhaka. The interview was held at the interviewee's office, Dhaka. (The interviewee is the Executive Director, Centre for Environmental and Geographic Information Services, Dhaka, Bangladesh).
------------------------------------------------
843
Rizzi, Paola et Al. From fragile to resilient territories. ISOCARP-OAPA Conference 2017
1
From fragile to resilient territories: the reconstruction after
earthquakes in Central Italy
Paola RIZZI, DICEAA University of L'Aquila, Italy
Federico D'ASCANIO, DICEAA University of L'Aquila, Italy
Luana DI LODOVICO, DICEAA University of L'Aquila, Italy
Increasing resilience is a necessary part of the risk coping and management strategies; it may involve vulnerability reduction, including disaster prevention and mitigation measures at community levels. It can also be regarded as one of the most stressful and frustrating tasks for both community members and urban planners. The later, along with local administration representatives, are working under great stress as long as emergency management is concerned. It makes it either neglected or insufficient. Communities, on the other hand, hardly ever perceive the risk they are facing by living in disaster-prone areas. In this context, the paper presents a multidisciplinary approach and cross-sectional collaboration that allow successful reconstruction process. The importance of risk information, communication and management in order to help communities to utilize their urban spaces in a more playful and proactive way in an emergency are highlighted. The approach is primarily the one of a self-experience reflection, and the case studies are introduced in order to expand the discussion on disaster-resilient communities and how to build them.
1. Reshaping consideration of disaster recovery
The history of human settlement in Italy dates back to the period of the Roman civilization. Many Italian cities are rich with priceless world heritage sites. However, the geography of this country located in the earthquake-prone zone makes dwellers and the heritage sites at risk of earthquakes that could lead to another consequent disaster, such as landslides and volcano eruptions. In addition, this risk is increased by an uncontrolled urban expansion into areas vulnerable to disaster, thus making disaster risk management even harder to achieve. Failures and successes of recent urban restoration from multi-hazard events should become a lesson to be learned for setting a code of conduct for disaster risk managers and urban planners.
Nevertheless, best practices from the other countries may not be suitable to adapt in Italian cases due to complexity of multi-hazard risk along with different context of social structure. Nowadays, Italy faces challenges of ageing society, silver economy and a great deal of investment in conservation and restoration of heritage sites leading to a slowdown in urban development, in another word: “urban decay”. Surprisingly, disaster recovery caused by unusual circumstance opens a way out to urban restoration and revitalization after a disaster. Thus, urban developers and planners are entering to a new era of transforming vulnerable spaces, spatial features and urban infrastructure to be more resilience. Disaster recovery should not focus merely on a conventional reconstruction plan taken literally as “rebuilding as it was”, but it should rather be reframed with a consideration of “transforming a fragile urban fabric into a better place to live with a risk”. Therefore, it is necessary for an urban planner to work under the disaster risk management framework, turning disaster recovery in a sense of reconstruction to a sense of restoration and revitalization.
844
Rizzi, Paola et Al. From fragile to resilient territories. ISOCARP-OAPA Conference 2017
2
Ambiguities of key term: resilience However reducing urban vulnerability and increasing resilience are crucial for this discourse, the very concepts of vulnerability and resilience are hard to define. We are facing ambiguities and doubtfulness on connotation of those key terms. It seems that over the time, risk management has moved from „reaction" resulting from vulnerability reduction schemes towards „adaptation” through increasing resilience. However, what does it mean to increase resilience remains unclear for the concept itself is ambiguous as interpretation of resilience must not be reduced to surviving a catastrophe. But the controversial issue of this shift is rooted in the ambiguity in determining resilience: either the concept of urban resilience has a generalized output and definite urban forms as a final product transferable to another case, or it is a progressive process of urban transformation without a definite final form to pursue. The early idea of definite form is generalized by a misconception that “increasing resilience decreases vulnerability” where resilience assessment is limited by a technical definition and a narrow set of indicators, which is the reverse of the fragility or vulnerability index – a restrictive approach focusing on ability to withstand a shock. To define resilience using only static parameters and static criteria is more than presumptuous: it is inefficient. The concept of urban resilience is wider than a focus on physical characteristic as it focuses on qualities of functional interaction between physical elements of human settlement and social structure that builds the city. Therefore, the resilience is not only about ability to resist shock, but also a capability to keep the essential urban activities operational and to recover in a timely manner. (Promsaka and Rizzi, 2013, 2014)
This should be acknowledged that “to rebuild as it was” does not necessarily indicate the success of a disaster recovery based on an urban resilience aspect. It is important to note that even resilience does acknowledge vulnerability in a sense of steadiness of physical elements and that increasing resilience does not always mean to decrease vulnerability. Similarly to a non-resilient urban system doesn’t have to be vulnerable. A restoration and revitalization process of a disaster recovery rooted in the principles of resilience requires both self-organising and re-organising capacities in order to allow adaptation to stress and changes. As long as communities in a disaster-prone area perceive their risk and keep increasing their adaptability, their risk awareness will foster them to stimulate innovative strategies to live with risk. Such innovative restoration strategies shall increase resilience without losing the traces of the past. The future city depends on how well we take this situation as an opportunity to re-shape it.
2. The conceptual model of urban resilience to disaster
A conceptual model of urban resilience to protect against disaster risk is interpreted as both an outcome, and a process of disaster preparedness and recovery. This recovery should be considered a restoration process rather than a regular reconstruction. Whereas urban resilience to natural disaster means that components of urban system - built and natural environment, human capital, and socio-economic activities - are able to withstand disaster impacts without qualitatively losing its basic functionalities and physical structures that are necessary to maintain livelihood of their users. Urban resilience as considered here is the dynamic process that shifts urban systems from vulnerable to resilient, and then advances into innovative urban transformation. Nevertheless, this active movement requires sufficient adaptive capacities and a better social learning process as a set of catalysts to a resilient urban transformation
845

Rizzi, Paola et Al. From fragile to resilient territories. ISOCARP-OAPA Conference 2017
3
Figure 1: A model of interaction between urban system transformability and risk (Promsaka S. and Rizzi P., 2015)
846
Rizzi, Paola et Al. From fragile to resilient territories. ISOCARP-OAPA Conference 2017
4
- This susceptibility is an outcome of the interaction among natural hazards, exposure elements, and exogenous drivers, which contributes to human pressures experienced as vulnerability and sensitivity to the disaster impact.
- The disaster sensitivity of the system can be mitigated. The structure that is able to absorb impacts of hazard events will enable the urban system to re-generate resources to maintain its infrastructure as well as to reserve standard livelihood of its residents (towards adaptive capacities of each individual system in the changed structure)
- After a disaster, the resilience depends on how quick and how well the urban system recovers from the hazard events. In this case, social learning processes become a crucial key in strengthening rapid recovery and enabling desirable adaptive capacities (towards development of self-organization processes).(Rizzi, Denti, Marcia, Promsaka, 2016) 2.1 The spatial planning for disaster resilience In this study, the need of enhancing institutional capabilities to self-organize and create innovative urban planning measures is highlighted. To enhance those capabilities, a process of social learning can be conducted in a way that supports the integration between disaster mitigation measures and spatial policy formulation and implementation. This integration is, in short, named “spatial planning for disaster resilience”. The spatial planning for disaster resilience addresses three crucial characteristics of resilient systems:
1) stability and the transformability of physical infrastructure;
2) institutional capabilities to self-organize and to bounce back;
3) social learning capabilities to create adaptive measures for coping with risk.
Addressing disaster resilience having considered these three abovementioned characteristics in spatial planning provides an alternative to frame problems in order to respond to uncertainty of disaster risk and vulnerability of urban fabrics.
Urban resilience to disasters is a board concept, covering a wide range of elements. For this study, the concept of spatial planning for disaster resilience focuses mainly on the essence of social learning and self-organization, which constitute the evolving institutional resilience of spatial planning authorities. However, the urban resilience to disasters consists of both physical infrastructure and social structures.
847
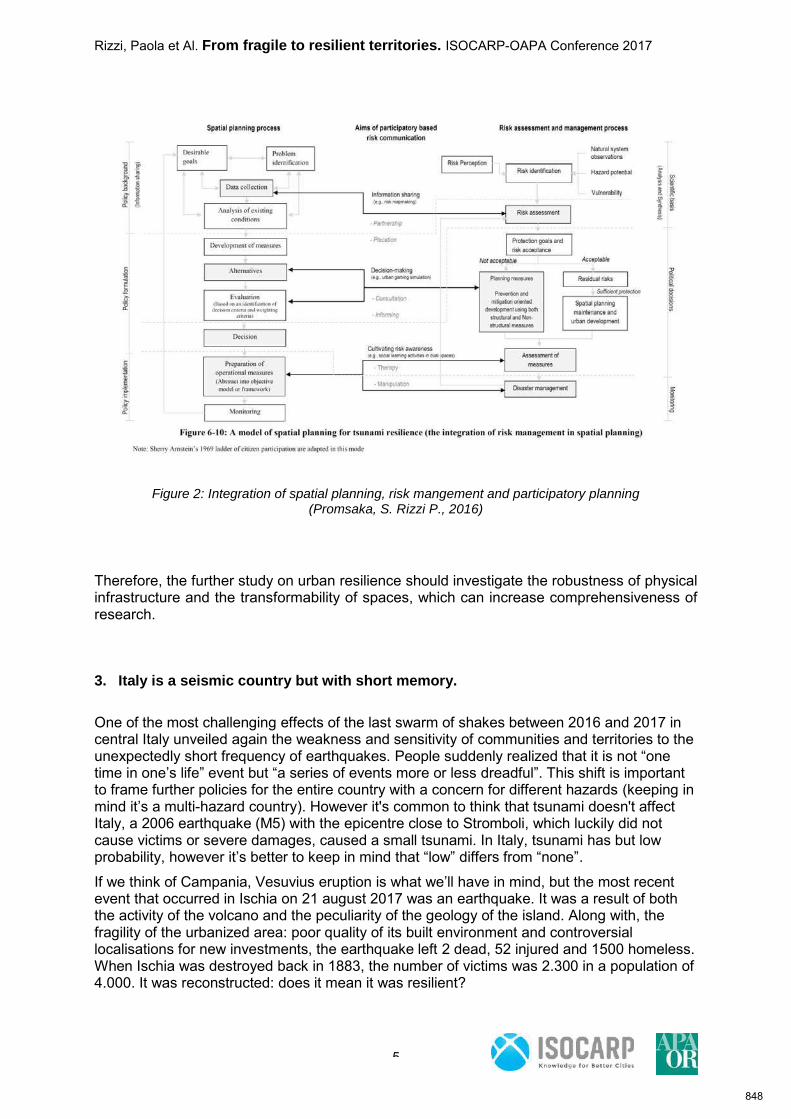
Rizzi, Paola et Al. From fragile to resilient territories. ISOCARP-OAPA Conference 2017
5
Figure 2: Integration of spatial planning, risk mangement and participatory planning (Promsaka, S. Rizzi P., 2016)
Therefore, the further study on urban resilience should investigate the robustness of physical infrastructure and the transformability of spaces, which can increase comprehensiveness of research.
3. Italy is a seismic country but with short memory.
One of the most challenging effects of the last swarm of shakes between 2016 and 2017 in central Italy unveiled again the weakness and sensitivity of communities and territories to the unexpectedly short frequency of earthquakes. People suddenly realized that it is not “one time in one’s life” event but “a series of events more or less dreadful”. This shift is important to frame further policies for the entire country with a concern for different hazards (keeping in mind it’s a multi-hazard country). However it's common to think that tsunami doesn't affect Italy, a 2006 earthquake (M5) with the epicentre close to Stromboli, which luckily did not cause victims or severe damages, caused a small tsunami. In Italy, tsunami has but low probability, however it’s better to keep in mind that “low” differs from “none”.
If we think of Campania, Vesuvius eruption is what we’ll have in mind, but the most recent event that occurred in Ischia on 21 august 2017 was an earthquake. It was a result of both the activity of the volcano and the peculiarity of the geology of the island. Along with, the fragility of the urbanized area: poor quality of its built environment and controversial localisations for new investments, the earthquake left 2 dead, 52 injured and 1500 homeless. When Ischia was destroyed back in 1883, the number of victims was 2.300 in a population of 4.000. It was reconstructed: does it mean it was resilient?
848
Rizzi, Paola et Al. From fragile to resilient territories. ISOCARP-OAPA Conference 2017
6
Resilience is a result of how systems cope with the “day after” but it cannot be achieved if we do not think about the innovation stimulated and/or introduced, level of participation, and cooperation among different scale of planning and decision making policies and, last but not least, impossible without setting the state of art at the moment of the dramatic event. A brief overview of general data and history of the most severe Italian earthquake could offer a key. 3.1 Overview of the last most severe earthquakes in Italy itle In the second millennium the Central Mediterranean area suffered of 1300 severe earthquakes. 500 of them occurred in Italy: more than 30 between 1900 and 2017, 8 of which between 1968 and 2017. Analysing the cases we prefer to use the term “process/project” rather than the one of “model” as often can be found in literature (for instance “Friuli or Emilia or Abruzzo Model”).
by Paola Rizzi, Sources: ISTAT, INGV, DCP, Centro Studi CNI su dati Ufficio Studi Camera dei Deputati, Regione Emilia Romagna, Commissario delegato per la ricostruzione Presidente della Regione Abruzzo
The case studies were selected as representative for the evolution of the approach of institutions dealing with risk and disasters.
Place
Belice Friuli Irpinia Umbria/Marche Abruzzo Emilia Center Italy
Date 1968 06.05.1976
11.09.1976
15.09.1976
23.11.1980 23.09.1997 2009 20.05.2012
27.05.2012
24.08.2016
30.10.2016
18.01.2017
Magnitudo 6.1 6.5
5.9
6.0
6.9 6 6.3 5.9
5.8
6.0 Amatrice (RI)
6.5 Norcia (PG)
5.5 Capitignano (AQ)
Homeless* 57.000 80.000 280.000 22.000 67.500 41.000 17.000
Buildings damaged/Da
destroyed/De
Da+De
9.000 De 31.000 Da+De
75.000 De
275.000 Da
20.000 Da+De 35.736 Da+De
7.700 De 21.000 Da+De
Affected Population
1.300.000 500.000 6.000.000 165.000 144.415 552.312 25.000
Victims 352 dead
576 injured
993 dead
2.400 injured
2.914 dead
8.848 injured
11 dead
100 injured
309 dead
1.500 injured
29 dead 298 dead / 2016
34 dead / 2017
Affected area 5.500 km2
5.000 km2 5.000 km2 strip of 50 km between the two regions
2.375km2 2.700 km2 1.728 km2
Industry damaged/Da
destroyed/De
450 (50%) severe Da+De
1.186 business Da+De
2.000 business/Da
1277 supported
606 industries
469 service
Da+De
190 industries
372 building
1.356 service
Da+De
Agriculture 90% severely damaged or destroyed
20.000 animal died
no record 1.194 damaged
902 now in function
1.143
940 supported
1.894
849
Rizzi, Paola et Al. From fragile to resilient territories. ISOCARP-OAPA Conference 2017
7
As pointed out there are no models that could be applied top down to all situations and cases and not only for the different effects of the earthquake related to magnitude, casualties, damages, losses etc. (c.f. a short resume of the result and process of reconstruction in the mentioned cases below).
by Paola Rizzi, sources: ISTAT, INGV, DCP, Centro Studi CNI su dati Ufficio Studi Camera dei Deputati, Regione Emilia Romagna, Commissario delegato per la ricostruzione Presidente della Regione Abruzzo
[1] data analysed by Luana Di Lodovico
PIAT Piano Integrato di sviluppo delle aree maggiormente colpite dal terremoto
MUDE Modello Unico Digitale per l'Edilizia
Accordi di programma
Multilevel: State, Region, Province, Municipality...
The dynamics of the reconstruction is a timeline where, with all the constrains of political situation, economical trends, social challenges and incidences of corruption as well as long hands of organized crime, some key aspects, approaches and issues are included and developed: the site and temporary/permanent and/or physical/geographical location; the future perspective of communities; prevention, emergency and reconstruction management, the parallel paths of policies and urban planning, the future of Italian landscape (Tacconi, 2016), and, last but not least, the total cost of earthquakes.
1_ physical/geographical and temporary/permanent is the issue of "reconstruction: where and how?". The answer is multi-faceted: where it was as it was, where it was but new, new and in a different place.
Place Belice Friuli Irpinia Umbria / Marche
Abruzzo Emilia Center Italy
Investments
Mln €
9.179 18.540 52.026 13.463 13.700 13.300 ______
Site of reconstruction
relocated in situ mixed in situ mixed in situ mixed
Period of reconstruction
1968-2028 1976-2006 1980-2023 1997-2024 2009-2029 2012- 2016-
State of reconstruction
on-going ended in 1986 on-going ended in 2004 on-going on-going on-going
Participation
Y/N
_____ Yes
no structured / spontaneous
_____ _____ No
Movements
/ spontaneous
Yes
regional law
Not yet
Governance of reconstruction
state multi-level state multi-level state multi-level state
Regulation/law (number)[1]
27 7 24 16 224 4 17 (on-going)
Regular intervention tool[1]
_____ ______ _____ PIAT / Integrated Plan of Development of Affected Areas
_____ MUDE / General Digital Model for Buildings
MUDE / General Digital Model for Buildings
Special intervention tool[1]
_____
AdP / Program Agreements
_____ _____ Reconstruction / Plan
AdP / Program Agreements
AdP / Program Agreements
_____
850
Rizzi, Paola et Al. From fragile to resilient territories. ISOCARP-OAPA Conference 2017
8
A_Where it was as it was. This is the approach of reconstruction after disaster in Friuli, Umbria and Marche, Emilia. It maintains the identity and sense of place but it's difficult to follow: the former built environment and/or construction technology and material do not match the new building code, the housing standards is poor according to the current standards of comfort, it requires an ad hoc process that is difficult to standardize. The most well known example is Friuli: a long process executed site by site and case by case, based on damages and characteristics of a territory for which technicians decided where to build, according what typology and using what type of materials. The success of the process was related to the high level of awareness and involvement of population.
B_Where it was as a new town/new town re-located (1) the reconstruction “ex novo” applies for economically depressed or environmentally at risk areas. It is usually unsuccessful unless followed by adequate political actions in the conducive circumstances, as in the case of Gibellina. The most famous examples are the 33 cities built or re-built after the earthquake of 1783 in Calabria and Campania. The king Ferdinand IV took the chance to re-shape the form and functions of the destroyed cities. Most recent example is the "New Towns" built as temporary houses after 2009 earthquake. In the first case the new town is not necessarily an engine to develop a depressed area, in the latter, the new towns are not temporary and will be used once people will go back to their restored homes. Still some unanswered questions rise, though: ownership, management and maintenance or dismantle of abovementioned houses.
2_ The future perspective of communities: decision of "where and how" to reconstruct is always linked with the society, economy, history, demography and culture of the people and communities living in that area. The previous economical trends influence the future development: in Friuli but also in Umbria and Marche after 1997 earthquake small centres in the mountains which already suffered for a depopulation after reconstruction were left and all the small traditional, agricultural, family-owned commercial and handicraft enterprises disappeared.
3_ Prevention, emergency and reconstruction management: disaster events are often if not always followed by an evolution of protocols, codes and procedures. In Italy there were at least some turning points after Irpinia (1980) that followed Friuli's event: the Civil Protection was created and developed, but at the same time a comparison between the two cases shows that meanwhile Friuli was and still is the only one case of a complete reconstruction, Irpinia is the still the most disastrous one. As for the prevention and its management, it was not after the Puglia-Molise (2)event had occurred that new approach, criteria and method for risk mapping and evaluation were created. The event also showned the weakness of school and educational infrastructure and a new set of norms about retrofitting and construction of new school buildings was issued.
4_Policies and planning: when a disaster hits a place, for a city or a country it's not only a problem of destruction, but also a problem of disruption of the flows of decisions, issues, previous plans, visions etc. These are slow process and it requires time to apply them. The first concern is the urgent need of quick recovery and reconstruction. And here the crucial issue lies: the continuity. The reconstruction's main criteria are: be quick, improve safety, comfort and quality of life, increase services and infrastructure looking for a positive trend for the economy. The issue is: what about a previous state of a territory that is poor, in decay and moreover without or with bad plans and strategic vision of the future evolution?
4. First conclusions
The history has shown that the cases where the reconstruction was successful are the cases where an equilibrium was created between the spatial planning and the risk assessment and management processes: in Friuli, Umbria / Marche and Emilia cases. The multilevel
851
Rizzi, Paola et Al. From fragile to resilient territories. ISOCARP-OAPA Conference 2017
9
governance decreased the number of laws and regulations. However, it requires negotiations and co-ordination processes in which many and often very heterogeneous parties are involved. It increases the time needed to start the reconstruction but, once started, it accelerates the process. Participatory processes allow to avoid conflicts and keep the solutions realistic while decisions made and executed at the central level, however fast and, as a result, apparently efficient, in the long term perspective lead to conflicts as well as under- and over-estimations. In L’Aquila, for instance, one of the regulation introduced the concept of unità equivalente: the owners of the houses destroyed in the 2009 earthquake ceded their properties to the local authorities receiving a generous equivalent in order to purchase a new estate. The aim of the concept worth 170,000,000 euro was to allow the authorities to administer and control properly the process of reconstruction as formal owner. It was presupposed that people will re-buy their homes once reconstructed, but only 50% of the 600 families, that received the subsidies, did. Others bought houses in other parts of the region or as far as Rome, Cagliari, or Courmayeur. The only lesson the central government learned from this resulted in abolishing the norm in the new tranche of financial aid for the central Italy.
4.1 About the Central Italy earthquake
It's important to underline some issues related to demography, society, geography and economy of the Central Italy struck by earthquake in 2016-17.
According to the data offer by ISTAT (2016) (3), an area divided into three regions (Abruzzo, Lazio and Umbria) is ageing: 28,3% of population is over 65 years old (+6,3 % of national average) and 10,2 % under 14 (-3.5 % of national average) and the average income pro capita is 78% of the national average and is an economy based on agriculture (7 farms/100 inhabitants vs 2,7 farms/100 inhabitants of national average), the 50% of the area is included in Natural Protected Zone and it is low density (around 14 ab/km2). Last but not least, the buildings are dated prior to 1971, before the new building code was applied. The approach is to rely on the central driven but the history has shown on how delicate is to balance the top down and bottom up approaches. Emilia is showing how to govern the reconstruction dealing with the process: engaging community in the disaster recovery process mutually build disaster recovery plan.
Nowadays, a sort of a Meta-Plan (Strategic Agenda) that includes spatial planning process (multilevel), multidisciplinary approach-to control science, political decisions and monitoring the risk assessment and management process and participatory processes (see Fig 2) is necessary.
5. Is still an on-going process...
The effects of extreme natural phenomena are indeed amplified by political and planning choices that drove to high land usage and building in vulnerable and risk areas, to fast progressive degradation of buildings ,urban and territorial infrastructure, to disrupting progressively the urban functions without a strategic vision of the city. Now, it’s fundamental to work out a system/frame which includes and updates all the local skills and data, often already set by several Regions, but with the specific view on disaster mitigation and sustainable development. This is the first step: to create a digital network platform. It will be accessible for administrations, institutions and professionals and it will have a double goal: to create a dynamic knowledge of the territory and help and support decision makers in generate efficient policies and plans which support a sustainable development and increase resilience of the territories.
This M-Plan (Strategic Agenda) supports the design and updating of General City Plan. The Plan will frame the main point of the development model of the territories trough the conservation/promotion of local identity and feature, the safeguard of the area, the control of land consumption, increasing the criteria standards of services and environment, and last but not least to create a proper relationship among energy-environment-landscape.
852
Rizzi, Paola et Al. From fragile to resilient territories. ISOCARP-OAPA Conference 2017
10
Re-define or define a model of evolution and development, which is going to shift the vulnerability and fragility of these territories to resilience. The reconstruction is not only a mere process of re-building but its aim is to recreate and improve the chance for the future evolution of a city, a territory and its inhabitants. To enhance the development we need to remove all the obstacles related to the poor state of anthropic (houses, infrastructures, monuments, heritages, etc.) landscape and natural resources. These are barriers caused by lack of knowledge of the nature and state of territory and lack of prevention of disaster, of state of neglect and decay. There is a need to overcame the reconstruction/restoration plan as synonymous of “what it was as it was” but trough the M-Plan enhance a new perspective of development and safeguard of the city. The M-Plan is a tool that in one hand enables the planners to state properly the problems and, on the other hand, to tune, regardless the participatory processes, the map of shared goals (strategy agenda), the topic of urban safety (including in the system the mandate of Civil protection Plan, of Sismic MicroZoning, of CLE etc) and the development model
(1) It is a principle that it must be followed for the high risk still in the place (Portis after Friuli earthquake in 1976) or it's a decision taken to stimulate a new re-birth (after 1783 earthquake in Calabria), or an ambiguous action to recover quickly (New Towns after Abruzzo earthquake in 2009). (2) Puglia-Molise is the case not included in this study: it was an M 5.7 earthquake which caused 28 victims for the collapse of a school. All the area was considered the low risk area. After the event a new classification of vulnerability to earthquake was studied and applied. (3)Focus statistiche, Caratteristiche dei territori colpiti dal sisma del 24 agosto 2016, ISTAT www.istat.it References: (“Harvard style” of references) Cacciaguerra, Sebastiano (1986) Le esperienze e gli esiti in campo urbanistico della ricostruzione del Friuli, Fabbro Sandro, 1976-1986 La ricostruzione del Friuli, Udine: Ires 5 D’Ascanio Federico (2013) “La rigenerazione urbana come modello di sviluppo. Il laboratorio aquilano.” Planum. The Journal of Urbanism, No. 25 Di Lodovico Luana (2013) “Una legge per i disastri naturali. Creare un nuovo modello di gestione dell’emergenza, di prevenzione e di sviluppo”, Planum, Vol. 2 , No.7 Fabbro Sandro, (1986) 1976-1986 La ricostruzione del Friuli, Udine: Ires 5 Focus statistiche, Caratteristiche dei territori colpiti dal sisma del 24 agosto 2016, ISTAT www.istat.it Nimis Giovanni Pietro, (2009), Terre mobili, Dal Belice al Friuli, dall'Umbria all'Abruzzo Roma: Donzelli Editore Promsaka Na Sakonnakron S, Rizzi P (2014). Urban Gaming Simulation for Enhancing Disaster Resilience . TEMA, Promsaka Na Sakonnakron S, Rizzi P (2013). Urban resilience to disaster: a new challenging paradigm for modern urbanization. In: Urbanization - Ecopolis XXI Century": theory, practice, scenarios, models (Урбанизация – Экополис XXI века»: теория, практика, сценарии, модели). Moscow:DN Kavtaradze, ISBN: 978-5-9904587-2-7, Moscow, May 31 - June 1, 2013 Rizzi Paola, Barbara Denti, Alessia Marcia, Sarunwit Promsaka Na Sakronnakron, (2016) “Dual Space_Resilient Spaces: Risk Awareness and Responsibility”, International conference Risk reduction for resilient cities - RRRC: Bucharest, 2016: Abstracts, Bucharest: “ION MINCU” Publishing House Bucharest Regione Emilia-Romagna (2017) 2012-2017 L’Emilia dopo il sisma. Report su cinque anni di ricostruzione, http://www.regione.emilia-romagna.it/terremoto Inforum, (2015) Regione Emilia-Romagna, No.48 Tacconi, Giorgio, (2016) “La ricostruzione post sisma in Italia: dal com’era dov’era alle ‘new towns’. Ingegeneri.info http://www.ingegneri.info/news/urbanistica/la-ricostruzione-post-sisma-in-italia-dal-comera-dovera-alle-new-cities/
853
Ozawa, Shmueli & Kaufman: Joint OAPA-ISOCARP Conference 2017 Collaborative Planning for Disaster Preparedness
1
Mining Collaborative Planning for
Disaster Preparedness and Response
Deborah SHMUELI1, Sanda KAUFMAN2 Connie OZAWA34
Abstract
Natural and technological hazards (e.g. earthquakes, nuclear facility malfunctions or sea level rise, toxic chemical leaks) have immediate and long-term consequences of a scale and severity far exceeding most human experience. Planning in the context of such events is challenging because of the high uncertainty levels affecting natural built and social systems involved, and consequences of actions. Moreover, in cases where communities have not experienced such natural or human-made colossal events, decisions to invest in mitigation, preparation or recovery in the face of other urgent, current needs can seem unreasonable and even a waste of scarce resources.
Recent hazard mitigation literature, both academic and professional, has stressed the importance of community and stakeholder involvement before, during and after disaster. The push is to involve the community in disaster management, actively include citizens in government work and decision-making, as well as impel regulatory agencies to operate in networks (Mosselmans et al., 2011; Cutter et al, 2008, 2016; FEMA 2011, 2013). In the literature on disaster management, this set of strategies is sometimes referred to as a “whole community” or “whole-of-society” approach.
FEMA’s guide, “A Whole Community Approach to Emergency Management: Principles, Themes and Pathways for Action,” identifies the principles undergirding this approach: understanding and meeting community needs, engaging and empowering all sectors, and strengthening what works well on a daily basis in the community. Involving the community in disaster management reflects the broader perspective of new governance, which seeks to actively include citizens in government work and decision-making (Bingham et al, 2005), as well the need for regulatory agencies to operate in networks (Levi-Faur, 2011). The question of whether communities should be engaged has morphed into how to effectively engage the public and the numerous stakeholders in the disaster management process (Pearce, 2003).
Although no means a simple task, engaging communities in disaster recovery is compelling. More challenging is how we can engage before a disaster happens, to lessen the impact or at the very least respond more rapidly and efficiently than in the absence of preparedness. Collaborative planning processes have something to contribute in this area. They often entail convening an array of stakeholders, building trust among various sectors, and helping to strengthen social relationships.
This paper brings knowledge from collaborative planning to disaster management planning, to build community resilience in the face of an uncertain, future calamitous event. Specifically, we
• explore the elements of resilience that should be incorporated into ongoing collaborative planning processes to harness people’s self-interest as it is reflected in the planning process in which they are already involved;
1 Deborah F. Shmueli, Department of Geography and Environmental Studies, University of Haifa, Israel; email:
2 Sanda Kaufman, Levin College of Urban Affairs, Cleveland State University: email: [email protected]
3 Connie P. Ozawa, Toulan School of Urban Studies and Planning, Portland State University; email:
854

Ozawa, Shmueli & Kaufman: Joint OAPA-ISOCARP Conference 2017 Collaborative Planning for Disaster Preparedness
2
• identify key elements that make collaboration effective - weaving in negotiation concepts/techniques, such as understanding each party's interests and motivations, dealing with expertise and local knowledge, and using temporal differences in priorities to come to agreement on solutions.
• perform a decision- and temporally-sensitive stakeholder analysis that addresses (a)who (of the three groups of actors: the planning team, stakeholders, and the larger community) should be involved; (b) in which decisions and (c) at what critical points.
855
Ozawa, Shmueli & Kaufman: Joint OAPA-ISOCARP Conference 2017 Collaborative Planning for Disaster Preparedness
3
Introduction
Natural and technological hazards (e.g. earthquakes, nuclear facility malfunctions, toxic
chemical leaks, or sea level rise as a consequence of climate change), have immediate and
long-term consequences of a scale and severity far exceeding most human experience. In
the context of such events, planning is necessary but challenging because of the high levels
of uncertainty affecting natural, built and social systems, as well as the costs and
consequences of various mitigation and response actions. Moreover, in cases where
communities have not experienced such natural or human-made colossal events (at least not
within the memory of the current generations), decisions to invest in hazard mitigation,
preparation for catastrophic events or recovery can seem an unreasonable use, and even
waste of scarce resources in the face of other urgent, current needs.
Consequently, communities rarely prepare adequately. For example, 2016 rains led
the Seine River in the city of Paris to rise to a level not seen since 1910; it took many days to
subside. The flooding caused extensive damage, and forced the closure of metro lines and of
museums whose precious collections, stored in basements, were threatened. It appeared
that the memory of the 1910 flood, whose level could be seen on markers along the river
channel, had faded sufficiently to take any urgency out of the need for preparedness, thus
jeopardizing main means of public transportation and cultural treasures. In contrast, a 2003
European heat wave that caused about 70,000 people to die for lack of preparedness was
sufficiently vivid to have prompted plans that sprang into action during the heat wave of
2017. Similarly, the ‘usual suspect’ threatening life and well-being in the Middle East is war
and terrorism. A much less salient threat, though with consequences of equal or greater
magnitude, is a destructive earthquake waiting to happen in the eastern Mediterranean,
threatening countries in proximity to the Jordan Rift Valley, including Syria, Lebanon, Jordan,
Israel and the Palestinian Authority. The last major earthquake occurred in 1927. Statistical
predictions of similar-level earthquakes about every 90 years put them well outside the
memory of the vast majority of the population, which based on direct experience may think of
its homelands as an earthquake-free zone. This relatively low frequency of earthquakes in
the Eastern Mediterranean region places them rather low on the public and political agendas,
and as a result efforts for readiness are insufficient. However, low frequency may be
associated with deadlier earthquakes.
Communities rarely plan for low-frequency but potentially devastating events which
may prove deadlier due to poor readiness at all governance levels (Shmueli et.al, 2017).
Another reason for the lack of planning is the reluctance of politicians with limited terms in
office to invest scarce resources in preparedness for low-likelihood events, whose benefits
may accrue long after they have left office. In general, for reasons related to limited
856
Ozawa, Shmueli & Kaufman: Joint OAPA-ISOCARP Conference 2017 Collaborative Planning for Disaster Preparedness
4
resources and salience of needs, it is very difficult to engage the public when the threat does
not appear imminent.
Noting this inherent resistance to invest resources and plan for recovery of low–
frequency events but the benefits of doing so, academic and professional hazard mitigation
literature continues to stress the importance of community and stakeholder involvement
before, during and after disaster. The push is to involve the community in disaster
management, actively include citizens in government work and decision-making, as well as
encourage regulatory agencies to operate in networks, both horizontally across specialties
and vertically across scales (Mosselmans et al., 2011; Cutter et al, 2008, 2016; FEMA 2011,
2013a, 2013b; Levi-Faur, 2011). For instance, contending that government-centric
approaches are generally inadequate in crises, the FEMA (2013a) mitigation handbook
recommends utilizing all societal capital in emergency management. While bureaucracy may
be well suited for routine tasks, the unfolding dynamics of an emergency require out-of-the-
box institutional arrangements, thinking and actions, which can quickly overwhelm
government capacity (Farazmand, 2007). Similarly, in its conclusion, the United Nations
Development Programme’s guide, titled “Reducing Disaster Risk: A Challenge for
Development,” (Pelling et al. 2004) recommends a model of governance for risk
management whereby “institutional systems and administrative arrangements…link public,
private and civil society sectors and build vertical ties between local, district, national and
global scale actors.”
The literature on disaster management sometimes refers to as a “whole community”
or “whole-of-society” approach. This call to involve the public/community in disaster
management specifically reflects the broader perspective of new governance, which seeks to
actively include citizens in government work and decision-making (Bingham et al, 2005). The
question of whether communities should be engaged is now the question of how to
effectively engage the public and the numerous stakeholders in the disaster management
process (Pearce, 2003).
Of the four stages of disaster management – mitigation and preparation (before),
immediate response (during) and recovery (after), engaging communities at the recovery
stage is most compelling because needs are obvious to everyone. By the same token, the
most challenging stage is before a disaster happens, when the need for involvement is far
less evident to community members. However, engagement at this stage can be the most
impactful, lessening destruction or increasing the speed and efficiency of responses,
reducing the number of human lives lost and relieving huge expenses on welfare and
property. We propose explicitly integrating collaborative planning principles and processes in
anticipating natural and technological disasters. Collaborative planning entails an array of
stakeholders, developing shared goals, building trust among various sectors, and
857
Ozawa, Shmueli & Kaufman: Joint OAPA-ISOCARP Conference 2017 Collaborative Planning for Disaster Preparedness
5
strengthening social communal relationships. We bring here what we know from
collaborative planning processes and negotiation principles embedded within it to disaster
management, to build community resilience in the face of a future potentially calamitous
event. After making the case for applying collaborative planning principles to the pre-disaster
stage, we emphasize the parallel need to include disaster preparedness in 'regular'
collaborative and ongoing planning processes. This inclusion ties well into resilience
arguments: when regular planning gives thought to the possibility for some disaster (and how
the community would respond to it) we enhance resilience, we promote adaptation and even
transformation at a time when we are not pressed by the need to respond to a disaster in real
time. In this manner we also address the challenge of how to engage communities when the
need is apparently not 'ripe' – by weaving community resilience and disaster planning with
the everyday planning decisions, within collaborative planning processes.
Specifically,
• We begin by exploring the elements of resilience that can strengthen ongoing
disaster management and planning processes and increase the capacity of
communities to withstand and recover from disastrous events;
• Then, we identify and focus on key elements that make collaboration effective -
weaving in negotiation concepts/techniques, such as understanding each party's
interests and motivations, dealing with expertise and local knowledge, and using
temporal differences in priorities to come to agreement on solutions.
• Lastly, we suggest performing a decision- and temporally-sensitive stakeholder
analysis that addresses (a) who among three groups of actors - the planning team,
stakeholders, and the larger community - should be involved; (b) in which decisions
and (c) at what critical points.
Resilience and Engaging the Community
Cutter et al. (2008) developed the Disaster Resilience of Place (DROP) model which
was refined and implemented as BRIC, baseline resilience index for communities (Cutter et
al. 2010) in the FEMA's region IV serving the southeastern US states. The basic tenet of this
approach is that
disaster impacts may be reduced through improved social and organizational factors such as increased wealth, widespread provision of disaster insurance, the improvement of social networks, increased community engagement and participation, and the local understanding of risk (Cutter et al., 2008) as well as through improving resilience within natural systems (Cutter et al., 2010, 5). (Italics added.)
Our focus is on the italicized portion of Cutter’s model, which emphasizes social elements of
the community in addressing disasters.
858
Ozawa, Shmueli & Kaufman: Joint OAPA-ISOCARP Conference 2017 Collaborative Planning for Disaster Preparedness
6
Community resilience is currently a popular topic (e.g., Goldstein 2012). However, it is
worth unpacking the term 'resilience'. Its broadest usage refers to the ability of an entity (such
as a community) to bounce back to its previous state after a disturbance (such as a disaster).
However, the social-ecological literature offers a more nuanced understanding of meaning
that offers alternatives worth considering, especially for the kinds of disasters we do not see
coming. Instead of the 'bounce-back' notion, we may benefit from considering the full range
of possible responses to a disturbance, from mitigation to adaptation to transformation.
Mitigation remains desirable under specific circumstances. However, in the face of slow-
unfolding, low-feedback phenomena such as climate change, preparedness may entail a
combination of adaptation and transformation options that require public engagement
(Susskind et al., 2015; Susskind, 2013).
Adaptation requires considering a slow or rare threat as a factor in current community
decisions and initiatives. This may become a modus operandi for government and
community, entailing relatively small additional costs in time rather than one-time high
expenditure layouts that are more difficult to secure especially at short notice. For example,
building codes may be strengthened to include resistance to earthquakes; zoning might
prevent building in flood plains and close to the water edge in coastal areas that expect slow
sea level rises. New infrastructure construction might also take potential disasters into
account. This is especially important because repairs ex-post disasters tend to be much
more expensive than gradual adaptation. One example is the slow deterioration of the
Oroville dam in California, whose necessary repairs had been repeatedly postponed to avoid
the costs. The sudden 2017 breach, a “predictable surprise” (Bazerman & Watkins 2004)
caused the evacuation of almost 200,000 people (Park & McLaughlin, 2017) and now
requires repairs that will be much more costly than the maintenance that could have averted
the spill.
At the other end of the continuum of strategies to prepare and respond to disasters is
transformation. Unlike mitigation and adaptation, which either return a system to the status
quo ante or make small, incremental modifications to meet new demands, transformation
entails changing the system. The effort to move from fossil to renewable fuels is
transformative to a large extent, requiring different methods and spatial layouts of the storing
and distributing of energy. Arguably, owing to technological advances and disruptive
technologies, communication and transportation systems are undergoing transformation at
unprecedented speed, in turn transforming the production and distribution of goods, people’s
habits around their acquisition and disposal and even needs. Such transformations, if
planned with adequate community participation, could also lessen the impacts of disasters as
well as improve the ways in which we respond to them.
859
Ozawa, Shmueli & Kaufman: Joint OAPA-ISOCARP Conference 2017 Collaborative Planning for Disaster Preparedness
7
A notion of 'resilience' that includes mitigation, adaptation and transformation is
consistent with the literature encouraging communities to “build back better” (Kim &
Olshansky, 2014). However, as noted earlier, adequately preparing for, responding to, and
recovering from natural disasters proves challenging for the governments of disaster-prone
regions throughout the world. Kettl (2006) identifies three factors that complicate, and at
times paralyze, a government’s ability to prepare for, and respond to disasters: catastrophes
pose a “wicked” policy problem; (in the absence of thorough preparation) they give
governments little time to react; and the cost of failure to prepare and respond to
catastrophes is also sizable.
Rittel and Webber (1973) coined the term “wicked problems” to describe situations
that are difficult to pin down because there is no agreement even on the problem to be
solved, and often the problem is not defined until a solution is found. Such problems defy
efforts to delineate their boundaries and identify their causes or map consequences of
decisions. Today, 45 years later, we identify such problems with the complexity that
characterizes social-ecological systems, which is the context of disasters. In such contexts,
issues that require attention and response cross the affected systems, in terms of social
organization, and in terms of the information and knowledge required for effective policy
decisions. O’Toole (1997) observed that typical government hierarchy is often ineffective in
addressing wicked problems.
Catastrophic events are “wicked problems” in that they generally defy political,
regional, jurisdictional, and bureaucratic boundaries. Additionally, decision makers prepare
for and respond to catastrophes with inadequate intellectual capital, often approaching such
situations based mostly on past experience when, despite shared elements, no two
catastrophes are exactly the same, nor are their contexts. Therefore, surprise conditions or
circumstances are likely to complicate policies that are not tailored to a specific situation. For
example, post 9/11 analyses have pinpointed “lack of imagination” as a fatal misstep, for
both catastrophe planners and responders (e.g., Welsh 2014). So using experience with a
past disaster to prepare for the next has perils, unless thought through very carefully.
Given the myriad difficulties of devising effective policies for catastrophic events, we
return to the mantra that community participation is critical in order to mitigate damages,
adapt or transform. Including the stakeholders and the public in disaster planning, although
difficult, can yield effective solutions, whereas not working with the public may result in rifts
and unforeseen obstructions (OECD, 2001; Pearce, 2003). Partnership is not only key in
designing viable solutions, but also for successful implementation of policies and programs
(OECD, 2001). These efforts are only as successful as their ability to change the behavior of
the public (O’Brien et al., 2006).
860
Ozawa, Shmueli & Kaufman: Joint OAPA-ISOCARP Conference 2017 Collaborative Planning for Disaster Preparedness
8
The FEMA (2013) local mitigation handbook dedicates one section to the
development of an outreach strategy. According to the manual, an emergency planning team
should develop a general approach for eliciting the participation of the public and other
important stakeholders. This strategy must address the differing characteristics of the target
group. FEMA and others also write about networking and educating as critical means of
ensuring community participation throughout the disaster process. This includes establishing
ties with volunteer groups, maintaining ongoing communication with the public, hiring a
diverse staff that is representative of the community, using social media applications for a
two-way exchange of information with the public, and considering the special needs of
various segments of the population when organizing community meetings. All these methods
increase public participation and the efficacy of policy through all stages of a disaster such as
an earthquake. It is also important for governments to self-educate about the communities at
risk. This requires teaching emergency staff and decision makers about the community’s
demographics, culture, methods of communicating, and methods of decision-making (FEMA,
2011). These prescriptions strengthen our rationale for incorporating disaster planning needs
into ongoing collaborative planning processes to harness people’s self-interest as it is
reflected in the planning process in which they are already involved.
Conditions and Characteristics of Successful Community Engagement
Citizen involvement in public decisions, especially in urban planning, has a long
history. Among the earliest public participation models was Arnstein’s (1969) “ladder” that
distinguished eight levels of public involvement, ranging from manipulation - tantamount to
“non-participation” - to citizen control, deemed “citizen power.” This model privileged the
power dynamic (e.g. Tritter and McCallum, 2006), merged an empirical with a normative
scale, and despite its notoriety, has been deemed outdated (Fung, 2006) with respect to
current practices.
Since Arnstein’s (1969) pioneering work, there have been several other efforts at
typologies of public participation. For example, Rowe and Frewer (2005) classified public
engagement, as enabled by various mechanisms and initiatives, according to the direction of
the information flow: public communication, whereby the sponsor or agency conveys
information to the public; public consultation, whereby information flows from the public to the
sponsor or agency who elicits it; and public participation, entailing two-directional flow of
information between the public and the sponsor. Only the latter amounts to a dialogue
between the public and the government. An OECD (2001) report produced similar
participation categories, although using a process dimension. It divided public involvement in
government decision making into: information, whereby the government either disseminates
information to citizens or makes it available to them upon demand (as in Rowe and Frewer’s
861
Ozawa, Shmueli & Kaufman: Joint OAPA-ISOCARP Conference 2017 Collaborative Planning for Disaster Preparedness
9
conveyance of information to the public); consultation, whereby the government elicits
information and feedback from citizens and then incorporates it (or not) into policy-making
(corresponding to Rowe and Frewer’s information flow from public to government); and
active participation, whereby citizens actively engage in policy-making (analogous to Rowe
and Frewer’s two-directional information flow).
Fung’s (2006) typology adds two other dimensions of public participation in decision making:
which actors participate and the degree to which their discussion is linked to actual policies
and outcomes. For example, while some engagement mechanisms leave public participation
open to all interested, others are limited to elite stakeholders. Additionally, while in some
cases the citizens’ decision become policy, in other cases citizens have no expectation to
actually influence policy. These two aspects, together with how participants exchange
information and come to decisions, form a three-dimensional “democracy cube” for
assessing public engagement mechanisms. Kaufman (2006) also proposed a “collective
decisions cube,” placing public participation and intervention modes in a space whose three
dimensions are: the extent of the gaps among stakeholders’ interests (ranging from almost
none to polarized), the scope of the decision process (ranging from an exchange of
perspectives to a decision) and the level of formality of the process (ranging from informal to
formal).
These typologies are helpful in highlighting the various levels of stakeholder
involvement in public decisions, and key aspects that make a difference to the quality of
participation. Although it is often implied that some are lesser modalities in terms of the
extent and quality of public input, they could also be viewed as choices differentially suitable
to various specific situations. Thus, depending on interests and perceived consequences,
stakeholders may wish at times to only be informed of impending public decisions, or
communicate some concerns. In other cases where consequences are very serious,
immediate, or directly affecting individuals, they may want a say. We look more closely at the
latter category, because it is the one that matches disaster situations. It also matches the
various literature recommendations for involving communities in decisions regarding disaster
preparedness, response and recovery.
Many conditions facilitate or impede effective partnerships between the government
and the public. Governmental decision makers can strongly influence some of these. For
instance, building the public’s trust in governance (decision makers and decision-making
bodies) is critical (O’Brien et al, 2008) to collaborative processes. On the other hand,
policymakers may have less of a hand in shaping factors other than trust. For instance,
O’Brien and Mileti (1992) find that the strongest predictor of an individual’s emergency
response involvement is the amount of main shock damage experienced. However, even in
this case, it is likely that the degree to which decision makers can cultivate a feeling of
862
Ozawa, Shmueli & Kaufman: Joint OAPA-ISOCARP Conference 2017 Collaborative Planning for Disaster Preparedness
10
collective identification may increase individual response involvement. In general,
governance is deemed good when it is participatory, transparent, accountable, equitable, and
efficient (Redlener and Bermanr, 2006). To trigger public involvement in the different stages
of a disaster, decision makers can capitalize on the nature of the disaster at hand. For
instance, earthquakes create a situation of 'shared risk' throughout society, which lends itself
to cultivating a sense of shared responsibility for assessing, mitigating and responding to that
risk (Comfort, 2002).
Professional and academic literature on public engagement describes principles and
characteristics of effective citizen participation directly relevant to community resilience. To
summarize, we highlight here some recommendations, many of which are featured among
the principles and strategic themes outlined in FEMA’s (2011) manual, “A Whole Community
Approach to Emergency Management: Principles, Themes, and Pathways for Action.” They
match well prescriptions for participatory planning processes.
Build and Strengthen Networks: Government representatives who nurture
relationships with community leaders bolster their mutual understanding of the community
and foster trust. These relationships come into play in times of disaster, where the difference
between successful and failed planning and response hinges on a community’s resilience.
To build and nurture it, policy makers need to strengthen the community’s economic, social
and political infrastructure and any already-successful existing programs (FEMA, 2011).
Existing networks, structure, and relationships in the community can then, and should, be
leveraged during and after a disaster.
Include all segments of the population: Decision makers must be sure to include a
representative range of diverse citizens (FEMA, 2011; King et al, 1998). It is particularly
important to include disadvantaged populations in decision processes (Berke and
Campanella, 2006). Failure to do so has compounded the effects of natural hazards in the
past, as for example in the case of recovery efforts after Hurricane Katrina. This prescription
is at times difficult to implement because disadvantaged populations face multiple obstacles
to participation including language barriers, lack of time, and attention focused on coping with
other daily challenges that do not leave much room for direct participation in public decisions.
However, there are ways lessening the burden of inclusion.
Understand the community: To be effective, policy makers need to understand the
values, needs and complexity of the community (FEMA, 2013; FEMA, 2011). Identifying and
mapping out various community sub-groups, assessing community capacity, and listening to
the community as they define values and priorities (FEMA, 2011) are some of the ways in
which this can be accomplished.
Empower citizens: To give meaning to citizen participation governments must
genuinely include citizens’ input in decisions. Depending on the specifics of a disaster
863
Ozawa, Shmueli & Kaufman: Joint OAPA-ISOCARP Conference 2017 Collaborative Planning for Disaster Preparedness
11
situation, citizens may be willing, given the opportunity, to lead earthquake preparedness
efforts and contribute to policy decisions. Citizens can determine priorities, help in
implementing decisions, and in monitoring and assessing their outcomes (FEMA, 2011).
Make participation outcomes meaningful: Successful participation processes have
visible outcomes. From the outset, citizens can fully realize their potential impact (King et al,
1998). Thus, after eliciting public input, it is incumbent on the government to incorporate it in
actual plans and programs (FEMA, 2013). Failure to make participation meaningful in this
manner is likely to result in public frustration and may lead to backlash if the public perceives
participation to have been pro forma (Pearce, 2003).
The Intersection: Collaborative Planning and Disaster Management
At a general level, the proposition for widespread community involvement is
unobjectionable. However, all these otherwise compelling suggestions fail to address the
contextual obstacles and practical constraints that prevent their implementation. Individuals
in a community are torn at all times between competing interests and commitments of more
immediacy, calls to participate in a variety of public decisions, and limited time availability.
Any individual must choose his/her battles and low-likelihood events do not usually make that
list. Thus it is necessary to find some ways to minimize the participatory burden and develop
effective models for participating through representatives. Were it not easier said than done,
we might see a lot more governments and communities following the recommendations. That
it is not happening as often as it should suggests that we must devise some ways to address
the obstacles.
We note consistency between the need, and prescriptions for public inclusion in
decisions regarding preparedness, response and recovery from disasters, and theoretical
arguments and best practices of collaborative planning. We outline in what follows how these
two decision making domains could benefit from each other’s experience and wisdom. We
also note that besides the prescriptive similarities for public participation, the two domains –
planning and disaster management – also share many of the same decision making
professionals and policy makers. Thus it is common that elected officials, administrators and
planners working with various aspects of a community’s physical and social environment are
also those who have to prepare, respond to, and help recover from disasters. They likely
have already built some of the community relationships necessary for their ongoing
governance activities, and have a nuanced understanding of the community both as a whole
and its subpopulations.
Key Elements that Make Collaboration Effective
The value of close, working relationships between government and all sectors of the
community parallel those that are expected to yield good community plans in general.
864
Ozawa, Shmueli & Kaufman: Joint OAPA-ISOCARP Conference 2017 Collaborative Planning for Disaster Preparedness
12
Moreover, the complex social-ecological systems affected by disasters are also involved in
planning endeavors. These observations led us to the quest to ’mine‘ collaborative planning
theory and practices for how to engage the public in disaster-related decisions. In this
section, we discuss key elements of collaborative processes of particular relevance to
planning for low-frequency, calamitous events.
Collaborative planning developed as a derivative of public dispute resolution.
Scholars and practitioners began to recognize the similarity between these processes more
than three decades ago (Susskind and Cruikshank, 1987; Susskind and Ozawa, 1984) and
refined the application of negotiation theory to participatory planning processes (Forester
1989, 1994; Innes and Booher 2010; Shmueli et al, 2008). The first tenet of collaborative
processes is to include the ’right‘ people in the process. Identifying who should be engaged
entails conducting a ’conflict assessment‘ or ‘convenor’s report,’ which consists essentially of
inventorying who, on any given issue, will be directly affected by a decision. Susskind and
Cruikshank offered four categories of affected individuals and groups:
…those with the necessary standing to claim legal protection; those with sufficient political clout to draw elected and appointed officials in to the dispute; those with the power to block implementation of a negotiated agreement; and those with sufficient moral claim. (Susskind & Cruikshank, 1987, 103)
In the case of recovery planning, the first two criteria are self-explanatory; the third
should be expanded to include not only those with the power to block implementation of a
plan, but those with the ability and capacity to implement what has been agreed upon. That is,
those in command of critical resources (physical and knowledge-wise), such as emergency
response professionals, ought to be included in the collaborative planning process since their
practical skills and knowledge can help to identify typical recovery issues that might be
avoided through better physical designs (of structures and infrastructure). The fourth criterion,
referring to those with sufficient moral claim, simply acknowledges that our legal system is
continually evolving and those whom a community believes will be sufficiently impacted by a
decision ought to have representation in a collaborative planning process despite what the law
currently states. We point specifically to highly vulnerable populations, such as the elderly, the
physically impaired, or culturally distanced (due to language differences, etc.) For example,
thousands are 'house-less' in cities around the globe. Without a home address, these persons
seem essentially non-existent and are not represented in otherwise democratic systems.
However, lacking the most basic shelter, water and medical care they are likely to be severely
impacted during a calamitous event. Moreover, some of the homeless population will survive
and be willing and able to help others. Ought not a recovery plan include attending to the
needs of the entire community?
865
Ozawa, Shmueli & Kaufman: Joint OAPA-ISOCARP Conference 2017 Collaborative Planning for Disaster Preparedness
13
Innes and Booher (2010) contributed to collaborative planning theory through their
DIAD model (Diversity, Interdependence, Authentic Dialogue). They made the case that
inclusion of anyone who wants to participate is wise, because exclusion of vocally
oppositional individuals could fuel distracting or destructive dynamics and threaten any
agreement. Perhaps this recommendation is even more valuable in considering disaster
recovery, when without knowing who will be hurt and who will be helpful post-calamity,
including a diverse array of a community makes sense.
Exploiting Self-Interest for Mutual Gain and Community Well-Being
Effective collaborative processes aim to take advantage of participants’ primary
concern with their own welfare and self-interest. Borrowing from “principled negotiation” and
“mutual gains” negotiation theory (Fisher, Ury & Patton, 1991; Susskind and Cruikshank,
1987), stakeholders are motivated to participate in decision making processes when they
perceive they have something to lose or gain from a decision. Uncertain future events pose a
barrier to participation precisely because of the ambiguity of what each person has at risk.
Who will gain or lose what at how near or distant a point in the future simply may be
insufficient to motivate participation. Asking participants what they are most concerned about
today, however, might open doors to creative decision making.
In their seminal work, Getting to Yes, Fisher and Ury (1981) stressed the paradoxical
idea that advocating for one’s self-interest is not antithetical to creating analytically robust
agreements. Their method of “principled negotiation” was intended as an alternative for “soft”
negotiators, those who simply yield their ground to their negotiating counterpart. Of the four
main tenets of principled negotiations, interests and creative options are particularly relevant
to disaster preparedness. Collaborative planning based on negotiation theory echoes these
elements (Innes and Booher, 2010).
How can these concepts be used to create resilient communities, better prepared for
infrequent but calamitous events?
Rather than focusing on how to mitigate or respond to an event forecasted for some
unknown point in the future, one might choose to consider the interests of residents and the
interests of local governments and emergency responders. While local government and
emergency responders might stress the construction of preventive structures or equipment
needed for a speedy response, residents might be more concerned about affordable housing
or adequate, accessible health care today. At face value, these views may be seen as
competing. Appreciating residents’ priorities, although different from what might be the main
objective of recovery planning, is nonetheless critical to ensuring participation. How can both
seemingly competing objectives be achieved?
866
Ozawa, Shmueli & Kaufman: Joint OAPA-ISOCARP Conference 2017 Collaborative Planning for Disaster Preparedness
14
Local government might choose to explore options for addressing those present
needs with actions that will help to mitigate harms from a calamitous event. For example,
many communities rely on larger, nearby cities for emergency responses and hospitals.
Instead of such service hubs, a distributed, larger number or variety of health care
professionals (and the relevant facilities) locally would serve today’s needs as well as be
extremely helpful in the case of a natural hazard. Affordable housing would enable public
service employees (who are often priced out of wealthier neighborhoods) to live closer to
work and therefore be available when a disaster occurs. After all, a devastating earthquake is
more likely outside of regular business hours than during the day. This approach builds on
principled negotiation and mutual gains theory by focusing on shared interests and creating
joint gains not between or among stakeholders, but by identifying interests that can be met
today and after a devastating event, or by taking advantage of the temporal characteristics
of different priorities among stakeholders. (Lax and Sebenius,1986). To wit:
Generating mutual gains is a direct contrast to the classic “split-the-difference” approach to settling disagreements. Mutual gains analysis requires a consideration of interests rather than positions, and seeks to develop options that honor the priorities of each party. Collaborative processes that successfully generate mutual gains create benefits for all parties, and provide a substantive explanation for why participants choose to sustain a collaborative effort (Shmueli et al., 2008, 361).
Integrating Different Knowledge Bases to Increase Credibility
Another important element of collaborative planning that borrows heavily from the
negotiation literature is dealing with different epistemologies, especially integrating local and
expert knowledge. Oftentimes, local communities perceive scientists and technical experts to
be insensitive to their perspectives as they wield their sophisticated geological or
hydrological models and propose expensive technological solutions to mitigate potential
harms. Local residents may even be skeptical of the motivations of local politicians known to
have relationships with large engineering firms with relevant capabilities. Modeling of future
events is imbued with uncertainty, both methodological and statistical (Ozawa, 1991).
The negotiation field has developed methods not only for reducing the skepticism of
expertise but also for making the most of all forms of knowledge. ’Joint fact finding,’ an
elaborate method of jointly formulating critical questions, collecting relevant information, and
conducting appropriate analysis, has been shown to reduce “judgmental biases and other
problems that afflict individual thinking, allay concerns about “advocacy science,” or the
strategic manipulation of information” (Shmueli et al, 2008). Moreover, forthrightness about
uncertainty creates a natural foundation for reconvening if assumptions turn out to be
incorrect, or if future conditions diverge from expectations, as they so often do (Innes and
Booher, 2010; Matsuura and Schenk, 2016; Shmueli et al, 2008). Other practices and
techniques to defuse the tension between local knowledge and expertise include regular
867
Ozawa, Shmueli & Kaufman: Joint OAPA-ISOCARP Conference 2017 Collaborative Planning for Disaster Preparedness
15
dissemination of information in highly accessible formats; workshops, panels, and other
opportunities to disclose and explain discretional elements of research and analysis; public
statements by resource managers and elected official acknowledging the incomplete state of
knowledge and the role of surprise; public explanations of discrepancies between or among
different expert advice by resource managers; commitments for ongoing monitoring and data
collection and periodic revisiting of decisions (Ozawa 2005).
Developing Trust
Finally, working together well requires a certain level of trust. However, trust is a tricky
concept, especially when considering 'trust' between residents and institutions, rather than
the individuals who staff the institutions. Negotiation scholars have advised, as is often
repeated in the words of former President Ronald Reagan in reference to working on nuclear
disarmament, “Trust, but verify!” In collaborative planning, scholars have gone a step further
claiming that although collaboration can occur without trust by carefully constructing a series
of interdependent agreements or “self-enforcing agreements” (Bacow & Wheeler),
“collaboration often ends up building trust nonetheless” (Innes & Booher, 2010, 114). Trust
develops as participants see over time four key behaviors in their partners: consistency,
predictability, competency and commitment (Ozawa 2012). Put simply, in collaborative
processes trust among participants is built as they see each other following through on tasks
from the trivial to the substantial, and as they see evidence of competency and commitment
to the agreed upon course of action. As these interactions become routinized and
procedures established, expectations along these four dimensions are ensured and trust
between individuals becomes generalized and transferred to the institutions involved. When
a calamitous event strikes--and no amount of science or preparation could account for every
situation--the need for trust in both other individuals and institutions becomes critical. Hence,
consciously creating a structure and patterns of interactions among the entire community (i.e.
through collaborative planning) can yield huge benefits in the event of a natural or
technological disaster.
Broad Stakeholder Participation
Consistent with the “whole community” approach to disaster management,
collaborative planning with its roots in negotiation theory emphasizes the benefits of broad
participation in terms of both information sharing and social learning. As noted above, a
wider information base is likely to be wiser than a narrow one. More importantly, a planning
process that educates stakeholders about the reasoning behind decisions (from both
technical and a political perspectives) is more likely to be implemented without objection or
obstruction, and modifications needed along the way due to changing conditions can be
undertaken. And, when a natural or technological disaster occurs, a broader group of actors
868
Ozawa, Shmueli & Kaufman: Joint OAPA-ISOCARP Conference 2017 Collaborative Planning for Disaster Preparedness
16
will be available to respond with a common strategy, thus potentially more quickly and
efficiently.
Stratified Engagement
We return now to a consideration of Cutter et al. (2008)’s DROP model, later refined
as indicators for benchmarking baseline conditions of a community's resilience (BRIC). They
include physical, social, institutional, economic and ecological dimensions of place (with the
ability to scale up from community, to metropolitan region, state, country etc.). Social
resilience indicators include age, transportation access, communication capacity, language
competency, special needs, health coverage; Economic resilience refers to housing capital,
employment, income and equality, single sector employment dependence (% of population
not employed in farming, fishing, forestry and extractive industries); business size and health
access; Institutional resilience includes a number of mitigation markers such as insurance
and plan coverage for various natural disasters, municipal services, previous disaster
experience; Infrastructure resilience relates to housing types, rental vs. ownership, medical
capacity, access evacuation potential, housing age, hotels/motels per square mile, public
schools per square mile; Community capital includes place attachment (years residing),
political engagement, social capital – religion, civic involvement, advocacy, innovation (%
creative class occupation) (Cutter et al., 2010, 7, Table 1).
Indicators such as BRIC are indispensable for assessing progress towards a level of
community resilience that allows it to recover after a disaster hits it. They should be
accompanied by decision process steps and indicators of the extent of implementation
progress. However, this framework does not address one obstacle to effective preparedness
and response to disasters noted in the literature: people’s general resistance to think about
and act when disasters do not appear imminent, which they often do not. Lack of
preparedness can have severe community consequences. Obstacles include: lack of
sufficient salience (related to the specific type of disaster); lack of will to expend resources
(governance and public-related); and process design, including a prioritization of participation
demands (decision process-related).
As we argued from the outset, public attention is difficult to harness on behalf of
uncertain events. This is true for sudden events such as earthquakes and floods, as it is for
slow-unfolding threats such as desertification, pollution in all media, or climate change
effects. Even when, as surveys show, there is broad public awareness of certain threats such
as climate change, there is also public survey evidence of broad unwillingness to prioritize
either mitigation or adaptive actions. People have difficulty processing risk and uncertainty-
laden information and may hope that someone else is taking care of the threats. There is
also individual reluctance to act unless everyone is mandated by some law to do it (a
Commons effect of sorts).
869
Ozawa, Shmueli & Kaufman: Joint OAPA-ISOCARP Conference 2017 Collaborative Planning for Disaster Preparedness
17
The unwillingness to expend resources on preparedness for an uncertain event is
shared by public and government. In addition to integrating with ongoing collaborative
planning processes, another way to counter this reluctance is to devise preparedness
measures that carry some immediate side benefits, or combine such measure with others
that carry a payoff whether the disaster materializes or not. There are likely other
possibilities, but the principle behind them should be the same: incentivize attention and
resources allocation to preparedness in ways that carry other desirable benefits non-
contingent on the disaster.
Participatory schemes could be designed to address reluctance to participate in
public decisions stemming from lack of time and too many demands on it. To do that, it is
necessary to scrupulously avoid squandering public time and attention. For example,
perhaps not everybody needs be involved at every step of a preparedness effort. Cutting
down to only the really necessary participation might make it more feasible and more
effective. But then, how do we decide who gets involved when? We would need to link the
nature of public decisions to the extent of their consequences for various stakeholder groups
in time and for specific types of disasters, qualifying them by level of urgency.
In Table 1, we suggest how decision makers might think about the need and extent of
public involvement in the various decisions they have to make regarding disaster
preparedness. For example, climate change progresses relatively slowly (especially
compared to sudden emergencies such as a toxic spill or a hurricane). Nevertheless, local
decision makers can take it into account as they budget for, and implement in the short term
various maintenance tasks on infrastructure (such as sewer and energy supply lines, or
management of riparian corridors to minimize flood damage) that will eventually be affected
by climate change effects. Such decisions do not necessarily require public participation
efforts. We would classify them as ‘minor’ (Table 1), entailing fairly routine actions that can
be tweaked to take into account what might happen down the line.
Decisions that require reallocation of resources can be more consequential for the
public. They may be needed in the short and medium term. Some of these decisions may
require public participation especially if they regard a realignment of regional priorities and
expenditures. For example, rebalancing the mix of travel modes or imposing some
restrictions on land uses and on the siting of certain facilities to increase safety in case of an
emergency may need public input. Other such decisions may well be handled through
interagency collaboration, especially if they regard technically complicated issues the public
may be ill-equipped to handle.
Lastly, some decisions require changes in behavior patterns, profoundly different
reallocation of resources with serious losses to some portion of the public, or the need to
870

Ozawa, Shmueli & Kaufman: Joint OAPA-ISOCARP Conference 2017 Collaborative Planning for Disaster Preparedness
18
reconsider collective values in order to meet both sudden and long-brewing disasters. Such
decisions with long horizons need public input.
Table 1 illustrates mileposts of a range of possibilities. Each cell would have to be
modified in specific cases to take into account such features as geographic scale, extent of
damage (to lives/structures), duration, predictability, and time span until a disaster hits.
Previous community experience with similar events is also a consideration.
871
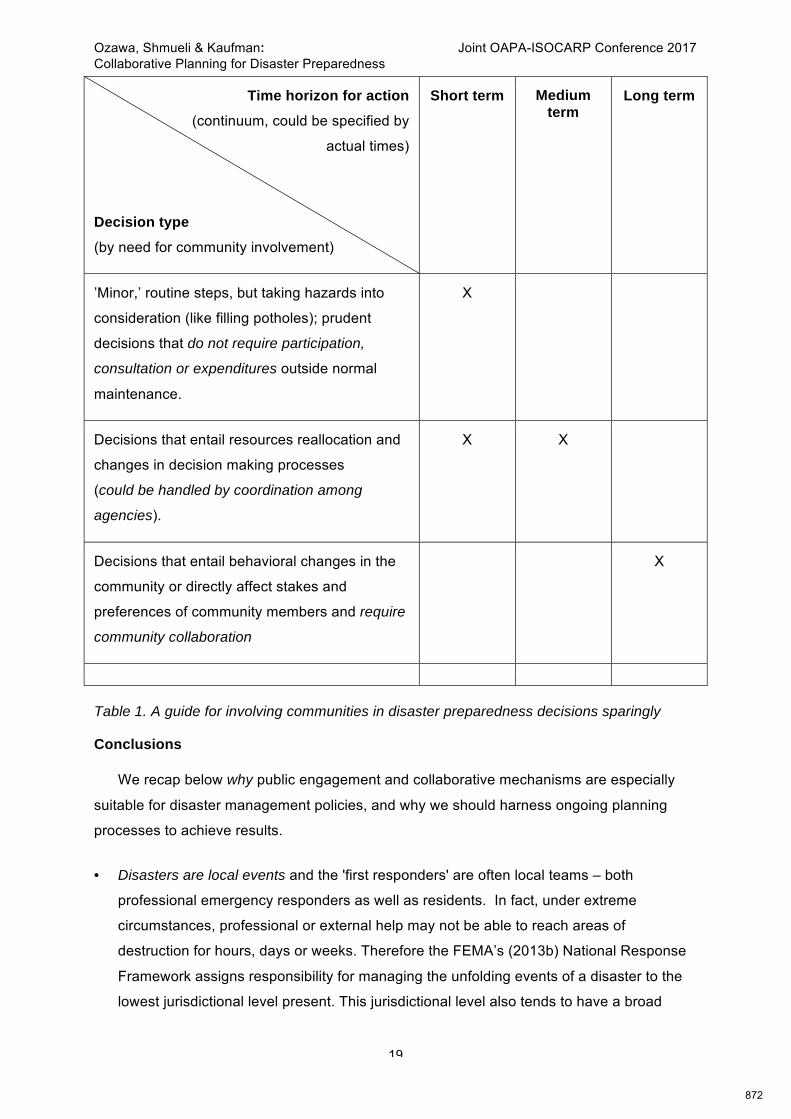
Ozawa, Shmueli & Kaufman: Joint OAPA-ISOCARP Conference 2017 Collaborative Planning for Disaster Preparedness
19
Time horizon for action
(continuum, could be specified by
actual times)
Decision type
(by need for community involvement)
Short term Medium
term Long term
’Minor,’ routine steps, but taking hazards into
consideration (like filling potholes); prudent
decisions that do not require participation,
consultation or expenditures outside normal
maintenance.
X
Decisions that entail resources reallocation and
changes in decision making processes
(could be handled by coordination among
agencies).
X X
Decisions that entail behavioral changes in the
community or directly affect stakes and
preferences of community members and require
community collaboration
X
Table 1. A guide for involving communities in disaster preparedness decisions sparingly
Conclusions
We recap below why public engagement and collaborative mechanisms are especially
suitable for disaster management policies, and why we should harness ongoing planning
processes to achieve results.
• Disasters are local events and the 'first responders' are often local teams – both
professional emergency responders as well as residents. In fact, under extreme
circumstances, professional or external help may not be able to reach areas of
destruction for hours, days or weeks. Therefore the FEMA’s (2013b) National Response
Framework assigns responsibility for managing the unfolding events of a disaster to the
lowest jurisdictional level present. This jurisdictional level also tends to have a broad
872
Ozawa, Shmueli & Kaufman: Joint OAPA-ISOCARP Conference 2017 Collaborative Planning for Disaster Preparedness
20
public interface. Thus, the success of policies and actions is likely dependent on the
quality of interactions with the community.
• Flow of Information: Community involvement in the making and implementation of plans
and policies is a way of securing and preserving effective communication channels and
an undisrupted flow of information. Communities and governments need information from
each other. On the one hand, if the government fails to effectively communicate with the
public about hazards prior to their occurrence, the public may be exposed to higher risk
(O’Brien et al, 2008) and increased vulnerability (King, 2000; 2008). On the other hand,
governments need local knowledge, experience, and an understanding of local capacity
in order to shape effective mitigation and preparation programs (O’Brien et al, 2008).
Similarly, during a disaster, ineffective government-community communication can
prevent a proper emergency response (Comfort, 2002; Ozawa, 2005). Otherwise, at
critical moments difficulties communicating relevant life-saving information to the public
may crop up (Quarantelli, 1988). The resulting isolation during a hazard exacerbates
community vulnerability (King, 2000). This may also lead to inefficient, frustrating and
even counterproductive reactions, such as members of the public bombarding agencies
with calls, tying up communication channels (Quarantelli, 1988). The recovery process
also requires an uninterrupted flow of information, as local knowledge and a local
perspective are needed in order to design appropriate and efficient recovery programs
(Berke and Campanella, 2006).
• Tailoring Programs to the Community: Including the public in disaster-related decisions
can increase the likelihood that programs and policies are tailored to the needs and
characteristics of specific communities. Disaster plans that accurately reflect the
community’s values and priorities are likely to acquire legitimacy in the public eye,
contributing to successful implementation (FEMA, 2013a). Planning policies and
programs around the community’s structure, needs and capabilities also lead to efficient
use of available resources and allows for integration of the community’s resources and
capacity (FEMA, 2011). Plans should take into account both the character of the broad
public and of the direct stakeholders. Their participation in decisions can help the
government take full advantage of the community’s resources (Steward et al, 2009), as
well as mitigate opposition by including their preferences at early planning stages
(Pearce, 2005).
• Building Community Resilience: In recent years, disaster planners have widely agreed to
shift the focus of disaster preparation onto building resilient communities having the
capability to help themselves (Cutter et al, 2008; O’Brien et al, 2008; Britton and Clark,
2000). According to Norris et al. (2008) resilience is “a process linking a set of adaptive
capabilities to a positive trajectory of functioning and adaptation after a disturbance.” The
873
Ozawa, Shmueli & Kaufman: Joint OAPA-ISOCARP Conference 2017 Collaborative Planning for Disaster Preparedness
21
stakeholders in resilient communities are able to withstand and respond to adverse
conditions created by natural hazards (Steward et al, 2009). Building community
resilience requires strengthening a community’s networks and capacities in order to allow
it to absorb the shock of disaster while continuing to function. Mileti (1999) argues that
fostering local resilience and responsibility, improving quality of life, preserving and
enhancing environmental quality, and bolstering local economies are all essential parts of
effective and sustainable hazard mitigation. This requires engaging the public, integrating
disaster planning into community planning (Pearce, 2003), and generally working with the
community to enhance the social and economic quality of life.
Adapting collaborative planning concepts, tools and techniques can help to overcome
the resistance to effective disaster recovery planning and management at the earliest stages,
before an event occurs. Collaborative planning brings together a range of knowledge and
skills, and helps to generate a collective understanding of the community and its assets.
Perhaps most importantly, it can lay the groundwork for solid social relationships and trust
between and among community members and public institutions. Weaving community
resilience and disaster planning into everyday collaborative planning processes ties in well
with resilience arguments. Given the inherent uncertainty of sudden and calamitous natural
and technological hazards, engaging as wide a public as is willing and able is critical
because the resultant conditions and who is able to respond is as uncertain as the timing of
the event itself.
874
Ozawa, Shmueli & Kaufman: Joint OAPA-ISOCARP Conference 2017 Collaborative Planning for Disaster Preparedness
22
References
Sherry R. Arnstein. A Ladder of Citizen Participation. 35(4) JOURNAL OF THE AMERICAN INSTITUTE OF PLANNERS, 216-224 (1969).
LAWRENCE S. BACOW & MICHAEL WHEELER. ENVIRONMENTAL DISPUTE RESOLUTION. New York: Plenum Press (1984).
MAX H. BAZERMAN, & MICHAEL WATKINS, PREDICTABLE SURPRISES: THE DISASTERS YOU SHOULD HAVE SEEN COMING, AND HOW TO PREVENT THEM. Cambridge, MA: Harvard Business Press (2004).
Philip J. Berke & Thomas J. Campanella, Planning for Post Disaster Resiliency. 604(1) THE ANNALS OF THE AMERICAN ACADEMY OF POLITICAL AND SOCIAL SCIENCE, 192-207 (2006)
Lisa B. Bingham, Tina Nabatchi & Rosemary O'Leary. The New Governance: Practices and Processes for Stakeholder and Citizen Participation in the Work of Government, 65(5) PUBLIC ADMINISTRATION REVIEW, 547-558 (2005).
Neil R. Britton & Gerald J. Clark, From Response to Resilience: Emergency Management Reform in New Zealand. 1(3) NATURAL HAZARDS REVIEW, 145-150 (2000).
Louise K. Comfort, Rethinking Security: Organizational Fragility in Extreme Events, 62 (s1) PUBLIC ADMINISTRATION REVIEW, 98-107 (2002).
Susan L. Cutter, Lindsey Barnes, Melissa Berry, Christopher Burton, Elijah Evans, Eric Tate, & Jennifer Webb, A Place-based Model for Understanding Community Resilience to Natural Disasters, 18(4) GLOBAL ENVIRONMENTAL CHANGE, 598-606 (2008).
Susan L. Cutter, Christopher G. Burton & Christopher T. Emrich. Disaster Resilience Indicators for Benchmarking Baseline Conditions. 7(1) JOURNAL OF HOMELAND SECURITY AND EMERGENCY MANAGEMENT, Article 51 (2010).
Susan L. Cutter, Ash, K.D., and Christopher T. Emrich, Urban-rural Differences in Disaster Resilience. 106(6) ANNALS OF THE AMERICAN ASSOCIATION OF GEOGRAPHERS, 1236-1252 (2016).
Ali Farazmand, Learning from the Katrina Crisis: A Global and International Perspective with Implications for Future Crisis Management, 67 (s1) PUBLIC ADMINISTRATION REVIEW, 149-159 (2007).
FEMA, A WHOLE COMMUNITY APPROACH TO EMERGENCY MANAGEMENT: PRINCIPLES, THEMES AND PATHWAYS FOR ACTION. Washington, DC: Federal Emergency Management Agency (2011).
FEMA, LOCAL MITIGATION PLANNING HANDBOOK, Washington, DC: Federal Emergency Management Agency, (2013a)
FEMA, NATIONAL RESPONSE FRAMEWORK, Washington, DC: Federal Emergency Management Agency (2013b).
ROGER FISHER & WILLIAM URY, GETTING TO YES. Boston, Massachusetts: Houghton Mifflin Company (1981).
ROGER FISHER & WILLIAM URY WITH BRUCE PATTON (EDITOR), GETTING TO YES: NEGOTIATING AN AGREEMENT WITHOUT GIVING IN. Boston, Massachusetts: Houghton Mifflin Company (1991).
JOHN FORESTER, "PLANNING IN THE FACE OF POWER. Berkeley, California: University of California Press. (1989).
Archon Fung, Varieties of Participation in Complex Governance, 66(s1) PUBLIC ADMINISTRATION REVIEW, 66-75 (2006).
875
Ozawa, Shmueli & Kaufman: Joint OAPA-ISOCARP Conference 2017 Collaborative Planning for Disaster Preparedness
23
BRUCE E. GOLDSTEIN, COLLABORATIVE RESILIENCE: MOVING THROUGH CRISIS TO OPPORTUNITY, Cambridge, MA: MIT Press, 61-98 (2012).
JUDITH INNES & DAVID BOOHER, PLANNING WITH COMPLEXITY: AN INTRODUCTION TO COLLABORATIVE RATIONALITY FOR PUBLIC POLICY, London and New York: Routledge (2010).
Sanda Kaufman, Complex Systems, Anticipation, and Collaborative Planning for Resilience, In BRUCE E. GOLDSTEIN, COLLABORATIVE RESILIENCE: MOVING THROUGH CRISIS TO OPPORTUNITY, Cambridge, Massachusetts: MIT Press, 61-98 (2012).
Sanda Kaufman, Processus et Dispositifs d'intervention dans les Décisions Publiques aux États-Unis. 2 NÉGOCIATIONS, 29-40 (2006).
DONALD F. KETTL, THE GLOBAL PUBLIC MANAGEMENT REVOLUTION, Brookings Institution Press. (2006).
Karl Kim & Robert B. Olshansky. The Theory and Practice of Building Back Better. 80(4) JOURNAL OF THE AMERICAN PLANNING ASSOCIATION, 289-292 (2014).
Cheryl S. King, Kathryn, M. Feltey & Bridget O. Susel. The Question of Participation: Toward Authentic Public Participation in Public Administration. 58(4) PUBLIC ADMINSTRATION REVIEW, 317-326 (1998).
David King, Reducing Hazard Vulnerability through Local Government Engagement and Action. 47(3) NATURAL HAZARDS, 497-508 (2008).
David King, You’re on Your Own: Community Vulnerability and the Need for Awareness and Education for Predictable Natural Disasters, 8(4) JOURNAL OF CONTINGENCIES AND CRISIS MANAGEMENT, 223-229 (2000).
DAVID A. LAX & JAMES R. SEBENIUS, THE MANAGER AS NEGOTIATOR: BARGAINING FOR COOPERATION AND COMPETITIVE GAIN. New York: The Free Press (1986).
David Levi-Faur, Regulation and Regulatory Governance, 1(1) HANDBOOK ON THE POLITICS OF REGULATION, 1-25 (2011).
MASUHIRO MATSUURA & TODD SCHENK (EDS.) JOINT FACT-FINDING IN URBAN PLANNING AND ENVIRONMENTAL DISPUTES. London and New York: Routledge (2016)
DENNIS S. MILETI, DISASTER BY DESIGN, Washington, DC: Joseph Henry Press (1999).
MICHAEL MOSSELMANS, RONALD WALDMAN, CINDY CISEK, EILEEN HANKIN & CINDY ARCIAGA, BEYOND PANDEMICS: A WHOLE-OF-SOCIETY APPROACH TO DISASTER PREPAREDNESS, USAID, UN World Food Programme, (2011).
Fran H. Norris, Susan P. Stevens, Betty Pfefferbaum, Karen F. Wyche & Rose L. Pfefferbaum, Community Resilience as a Metaphor, Theory, Set of Capacities, and Strategy for Disaster Readiness, 41 (1-2) AMERICAN JOURNAL OF COMMUNITY PSYCHOLOGY, 127-150 (2008).
Geoff O'Brien, Phil O'Keefe, Joanne Rose, & Ben Wisner, Climate Change and Disaster Management. 30(1) DISASTERS, 64-80 (2006).
KAREN O’BRIEN, LINDA SYGNA, ROBIN LEICHENKO, W. NEIL ADGER, JON BARNETT, TOM MITCHELL, LISA SCHIPPER, THOMAS TANNER, COLEEN VOGEL & COLETTE MORTREUX, DISASTER RISK REDUCTION, CLIMATE CHANGE ADAPTATION AND HUMAN SECURITY. Report prepared for the Royal Norwegian Ministry of Foreign Affairs by the Global Environmental Change and Human Security Project, GECHS Report, 3 (2008).
Paul W. O'Brien & Dennis S. Mileti. Citizen Participation in Emergency Response Following the Loma Prieta Earthquake. 10(1) INTERNATIONAL JOURNAL OF MASS EMERGENCY DISASTERS, 71-89 (1992).
876
Ozawa, Shmueli & Kaufman: Joint OAPA-ISOCARP Conference 2017 Collaborative Planning for Disaster Preparedness
24
OECD, CITIZENS AS PARTNERS: OECD HANDBOOK ON INFORMATION, CONSULTATION AND PUBLIC PARTICIPATION IN POLICY MAKING. Paris, France: Organization for Economic Cooperation and Development (2001).
Laurence J. O’Toole, JR., Treating Networks Seriously: Practical and Research-Based Agendas in Public Administration, 57(1) PUBLIC ADMINISTRATION REVIEW, 45-47 (1997).
Connie P. Ozawa, Science in Environmental Conflicts, 39(2) SOCIOLOGICAL PERSPECTIVES, 219-230 (1991)
Connie P. Ozawa, Putting science in its place. In JOHN T. SCHOLZ & BRUCE STIFTEL (EDS), ADAPTIVE GOVERNANCE AND WATER CONFLICT: NEW INSTITUTIONS FOR COLLABORATIVE PLANNING, Washington D.C.: Resources for the Future (2005).
Connie P. Ozawa. Planning resilient communities: Insights from experiences with risky technologies. In BRUCE E. GOLDSTEIN, COLLABORATIVE RESILIENCE: MOVING THROUGH CRISIS TO OPPORTUNITY, Cambridge, MA: MIT Press, 19-38 (2012).
Madison Park & Eliott C. McLaughlin. Evacuations Ordered over Concerns at California Dam System. CNN, February 13, 2017 http://edition.cnn.com/2017/02/12/us/california-oroville-dam-failure/index.html, last visited on 6.20.2017.
Laurie Pearce, Disaster Management and Community Planning, and Public Participation: How to Achieve Sustainable Hazard Mitigation, 28(2) NATURAL HAZARDS, 211-228 (2003).
Laurie Pearce, The Value of Public Participation During A Hazard, Impact, Risk and Vulnerability (HIRV) Analysis, 10 MITIGATION AND ADAPTION STRATEGIES FOR GLOBAL CHANGE, 411-41 (2005).
MARK PELLING (ED) , ANDREW MASKREY, PABLO RUIZ, LISA HALL … REDUCING DISASTER RISK: A CHALLENGE FOR DEVELOPMENT, New York: United Nations Development Programme (2004).
Enrico L. Quarantelli, Disaster Crisis Management: A Summary of Research Findings, 25(4) JOURNAL OF MANAGEMENT (1988)
Irwin Redlener & David A. Berman, National preparedness planning: the historical context and current state of the US public’s readiness, 1940-2005, 59(2) JOURNAL OF INTERNATIONAL AFFAIRS, 87-103 (2006).
Horst W. J. Rittel & Melvin M. Webber, Dilemmas in a General Theory of Planning. 4(2) POLICY SCIENCES, 155-169 (1973).
Gene Rowe & Lynn J. Frewer, A Typology of Public Engagement Mechanisms, 30(2) SCIENCE, TECHNOLOGY, & HUMAN VALUES, 251-290 (2005).
DEBORAH F. SHMUELI, ERAN FEITELSON, AMNON REICHMAN, MICHAL BEN GAL, EHUD SEGAL, GAD BARZILAI, AND ELI SALZBERGER, EVALUATING ISRAEL'S REGULATORY FRAMEWORK FOR EARTHQUAKE PREPAREDNESS, RESPONSE AND RECOVERY, submitted to the Israeli Ministry of Science and Technology, project 3-10813, plus interactive appendices (2017), (Hebrew).
Deborah F Shmueli, Sanda Kaufman & Connie Ozawa, Mining Negotiation Theory for Planning Insight, 27(3) JOURNAL OF PLANNING EDUCATION AND RESEARCH, 359-364 (2008).
Geoffrey T. Stewart, Ramesh Kolluru & Mark Smith, Leveraging Public-private Partnerships to Improve Community Resilience in Times of Disaster, 39(5) INTERNATIONAL JOURNAL OF PHYSICAL DISTRIBUTION AND LOGISTICS MANAGEMENT, 343–364 (2009).
Lawrence Susskind. Risk Perception. Risk Management and Public Engagement. Lecture: Minerva Center for the Rule of Law under Extreme Conditions, Regulating Disasters through Private and Public Law: Compensation and Policy. Haifa, Israel: July 16-17, 2013
877
Ozawa, Shmueli & Kaufman: Joint OAPA-ISOCARP Conference 2017 Collaborative Planning for Disaster Preparedness
25
LAWRENCE SUSSKIND & JEFFREY CRUIKSHANK, BREAKING THE IMPASSE: CONSENSUAL APPROACHES TO RESOLVING PUBLIC DISPUTES, New York: Basic Books, Inc. (1987).
Lawrence Susskind and Connie Ozawa. Mediated Negotiation in the Public Sector: The Planner as Mediator. 4(1) JOURNAL OF PLANNING EDUCATION AND RESEARCH, 5-15 (1984).
LAWRENCE SUSSKIND, DANYA L. RUMORE, CARRI HULET, PATRICK FIELD. MANAGING CLIMATE RISKS IN COASTAL COMMUNITIES: STRATEGIES FOR ENGAGEMENT, READINESS AND ADAPTATION. New York: Anthem Press (2015)
Jonathan Q. Tritter & Alison McCallum, The Snakes and Ladders of User Involvement: Moving beyond Arnstein, 76(2) HEALTH POLICY, 156-168 (2006)
GENT WELSH, AVOIDING THE NEXT FAILURE OF IMAGINATION: HIGHLIGHTING OPPORTUNITIES FOR NATIONAL GUARD CYBER CIVIL SUPPORT TEAMS THROUGH AN ANALYSIS OF THE NATIONAL CYBER RESPONSE CAPACITY GAP USING 9/11 COMMISSION REPORT METHODOLOGIES. Air War College Air University Maxwell AFB United States (2014).
878
Special Purpose District Woes, State Land Use Goals, and Land Behind Levees in Oregon
Author Rowan, Colin, Levee Ready Columbia, PORTLAND, United States of America (Presenting
author)
Abstract
In Oregon, there are over 333 miles of levees identified in the US Army Corps of Engineers’ (USACE)
National Levee Database (NLD) (with nearly 2,000 additional miles of other levees, embankments,
and other flood risk reduction structures identified in a recent study). Half of the NLD levee miles are
operated by special purpose districts that typically have limited professional, technical, and financial
resources and limited, if any, regulatory authority. What’s more, Oregon’s levee networks are tired.
Currently, only 45 miles of levees in the state are accredited by FEMA. Through PL84‐99, USACE rates
35% of these levee miles as unacceptable, 43% as minimally acceptable, and have not inspected the
remaining 22%.
Special purpose districts, such as drainage districts, are often local sponsors of federally constructed
flood damage reduction structures such as levees and are faced with complex governance
challenges. In many cases, the maintenance and operation of a sound levee system is the
responsibility of the special district while communities often dissociate zoning and development
decisions from said district. Due to the presence of levees and many interrelated considerations (or
lack of consideration), communities with land use authority often continue to permit development in
these areas, creating operation and maintenance challenges.
This presentation explores the topic of development in leveed areas from the perspective of land use
planning and statutory authority in Oregon. The presenter will explore issues faced by special
districts, the interplay between various agencies in comprehensive planning, and the limitations of
statutory and regulatory authority confronted by levee operators.
This presentation will also provide a closer look at the Portland Metropolitan region’s collaborative
solutions‐focused multi‐stakeholder program, Levee Ready Columbia (LRC). While focused on levee
accreditation and remaining active in PL84‐99, LRC builds capacity and raises the profile of the
various challenges within the leveed area. Currently, the partnership is engaged in weighing the
manifold risks associated with flood damage through developing a risk‐informed decision‐making
framework for levee investments. Importantly, the partnership is involved in a comprehensive
governance project to determine the long‐term governance and oversight of the levees and leveed
land to better coordinate planning behind the levees. The partnership is an excellent example of
potential capacity building avenues available in Oregon.
879
Strategy of improving urban resilience in urban comprehensive
disaster mitigation Ma Chao, Wang Shanchao, Ren Lijian, Yun Yingxia, School of Architecture, Tianjin
University, China
Abstract:China started to formulate national comprehensive disaster prevention and reduction plan in 1998 so as to construct comprehensive disaster prevention and reduction system and reinforce comprehensive ability of disaster prevention and reduction. With the increase of population scale and urban built-up area, city resilience encountered new challenged in the planning of disaster prevention (how to improve city resilience so as to reinforce ability of disaster prevention and reduction, and efficiency of resuming after disaster are the key points of urban disaster prevention and reduction plan in the future). At present, Chinese economy entered into the new normalcy of low-speed development and population aging, thus, the disaster prevention plan formulated during economic upward period cannot totally adapt to the new situation. By summarizing the disadvantages of former disaster handling and post-disaster reconstruction, this article proposed to recover post-disaster city resilience: ① To evaluate the components of the QOL (quality of life) during disaster; to partition the victims’ demands in each stage such as in-disaster response, post-disaster recovery and post-disaster renaissance; to satisfy supply at one time aimed at the different hierarchical demands in the living environment in various period. ② To partition several disaster support hubs according to city size and population density by taking community as unit. Usually, this disaster support hub is the place of neighbourhood support and community organization for executing soft measures of disaster prevention; in disaster, it is used as refuge for distributing relief materials, and obtains post-disaster information as well as public service. ③ By taking Smart Shrink as thinking, and slowing down the disorder expansion of residences around urban and village to keep the control of residence scope within certain region, reinforce relationship among crowds, and exclude the infrastructures that are unnecessary to disorder residential district. ④ To introduce the catastrophe insurance aimed at the residences that are easily to be attacked by disaster or have weaker disaster resistance so as to shorten the financial support oriented reconstruction aging of relief fund and recover QOL quickly. Key words: Disaster Prevention;resilience;Mitigation
1. Introduction China is a large country with vast territory. The climate and geographical conditions are complex and many cities in China face the threats of natural disasters such as typhoon, flood, earthquake, waterlogging, geological and marine disasters. The disasters frequently occur in the country causing massive damages and losses and making China one of the country with most severe natural disasters. On July 28th of 1976, a violent earthquake, registering 7.8 Richter scale, in Tangshan city of Hebei province occurred 242 thousand deaths and 164 thousand injuries and 10 billion financial losses. In 1988, the floods· along Yangtze river affected 2.316 million people’s life and made 1526 people die, and caused 200 billion yuan losses. Mudslides in Dujiangyan and Wenchuan of Sichuan province took dozens of people’s life and the earthquake in Wenchuan in 2008 took 69 thousand people’s life, caused 845 billion yuan economic losses and 370 thousand people were injured. In 2010, 28 provinces in China suffered from flood disaster and 1072 people died from it and 619 people were missing. A great number of houses and buildings collapsed and there was economic loss of 210 billion yuan. In addition, large and medium cities face not only traditional natural disasters but also non-traditional disasters including fire accidents, explosion, storm, hail, terrorist attack, urban congestion,
880
greenhouse effect, heat island effect, environmental pollution and infectious diseases which would cause serious impact to human life and society. These disasters disclose China’s insufficiency in urban disaster resistance and comprehensive disaster resistance capability. In the context of globalization, urbanization and transformation of economy and society, large and medium cities in China have the following characteristics. Firstly, there is a high frequency and large types of disasters. Secondly, the cities’ structure is fragile and they have weak disaster prevention ability. Due to the two reasons, natural disasters such as floods and earthquake tend to have the characteristics of concealment, uncertainty, contingency and sudden which emphasize the destructiveness of disasters. Early in 1998, China began to establish national comprehensive disaster prevention and reduction plan, build comprehensive system for disaster prevention and reduction, improve the overall ability of disaster prevention and reduction. As time goes on and changes of domestic economic situation, our economy has entered a New Normal, and subjectively, the national plan that established in 1998 is not suitable for the requirements in the new era. Thus, it is of great emergency to publish new policies in disaster prevention and reduction and to adjust the direction and philosophy for disaster prevention planning so as to carry out the work under the context of New Normal. At the same time, the disaster prevention and reduction work should be carried out according to different situations, so we should set new strategies and guidance in compiling the new version of comprehensive disaster prevention and reduction plan. Therefore, we need an approach to better deal with urban disasters and improve city’s capability of resisting different types of disasters. Under this context, flexible urban planning idea emerges as the time requires. Flexible city is considered to be the new planning philosophy, and the corresponding planning approach is scenario planning methods which require plan makers to recognize the external environment of cities and city’s development driving force so as to establish different disaster prevention methods to different types of disasters, adjust or perfect development driving force and improve city’s planning policy to handle different shocks and enhance the capability of infrastructure in coping with shocks. So far, the research on flexible philosophy includes ecological flexibility, engineering flexibility, economy flexibility and social flexibility. According to our specific national conditions and the New Normal, the author proposes the following suggestions to realize the improvement of people’s living standard and security and reduce the disaster-happening factors, push forward the construction of flexible cities and improve cities’ comprehensive disaster prevention ability: 1) To improve organization and institute’s ability in disaster prevention and strengthen legislation; 2) To perfect standards; 3) To set up disaster prevention work organizations; 4) To build technical support system; 5) To establish disaster insurance system.
2. Research on strategies to build flexible cities
2.1 To improve organization and institute’s ability in disaster prevention and to strengthen legislation
A full-fledged organization is the premise of carrying out any kind of work. Establishing perfect disaster prevention and reduction guarantee organization ensures the work of constructing flexible city. Disaster prevention and reduction guarantee organization includes not only the governmental organizations, but also academic institutes making up of research institute and university. The cooperation between these organizations will enhance the comprehensive disaster prevention work in urban construction. Therefore, to improve organization and institute’s ability in disaster prevention is key to realizing the goal of constructing future flexible cities. Good and efficient disaster prevention organizations can guarantee the establishment, implement and supervision of disaster prevention laws and regulations.
881
China has published a series of disaster prevention laws and regulations since 1980s such as Water Law of People’s Republic of China, Law of The People's Republic of China on Water and Soil Conservation, Law of the People's Republic of China on Flood Control, Fire Control Law of the People's Republic of China, Meteorology Law of the People's Republic of China, Regulations on Grassland Fire Prevention, Earthquake Prediction Management Regulation, Regulation on Emergency Management of Nuclear Accidents at Nuclear Power Plants, Regulation on Reponses to Public Health Emergencies and so on. The publication of laws and regulations improves the disaster management work’s level and greatly enhance legal system of disaster management. However, currently in China the laws and regulations in disaster prevention of flexible city are not full-fledged, thus we need to establish a comprehensive disaster prevention legal system by which we can regulate the disaster prevention work of city construction, definite the responsibility and obligation of construction body and ensure the implementation of disaster prevention work. The legislation of disaster prevention law refers to immobilize, systemize, authorize the comprehensive disaster management which is the basis and security of disaster prevention work and the ground of disaster prevention activity. Disaster prevention management is based on laws and regulations and it can guarantee the realization of comprehensive disaster prevention goal in urban construction. The disaster prevention organizations are responsible for the establishment and perfection of laws and regulations and they can ensure the effectiveness of these laws. Without a good disaster prevention system and organization, the disaster prevention work can not be well implemented and disaster prevention laws and regulations will lose their effectiveness. 2.2 To set up disaster prevention work organizations Comprehensive disaster prevention work needs the cooperation of lots of departments and requires a unified disaster prevention organization system. Comprehensive disaster prevention in urban construction is a systematic engineer with the characteristics of multidiscipline and multi-department. Currently, our disaster prevention work in urban and rural construction is conducted through the disaster prevention system of many departments. In the area of flood and storm prevention, we have established three-layered flood prevention and disaster reduction system including regular flood and storm prevention system for combating general floods and storms, specific flood prevention project for preventing sudden accidents and flood disaster security system for estimating water-related disasters. In the area of earthquake relief and prevention, we have built earthquake prediction system with Seismological Bureau as the main body and two-way earthquake relief system leading by Ministry of Housing and Urban-rural Development. In terms of fire prevention, there is a fire prevention system implementing by Ministry of Security and Ministry of Housing and fire prevention standard system involving urban planning and building design and a disaster relief system of fire extinguishing and fire fighting command. In terms of meteorological disaster prevention, we have made great achievements in urban and rural meteorological prediction and emergency response with the cooperation and coordination between China Meteorological Administration and relevant departments. Those systems successfully reduced our losses in comprehensive disaster prevention in urban construction and secured the sustainable development in rural and urban areas. However, comprehensive disaster prevention work especially the prediction control and management of major disasters involves the cooperation of a wide range of areas, for example, the infrastructure construction, resources allocation, integration and relocation. For an instance, in the area of basic information construction, People’s Air Defense, Department of Health, Ministry of Public Security, Department of Communications and so on participate in developing their own information system, establishing monitoring system and control system. However, there is a lack of communication among those organizations, thus information resource cannot be fully integrated and used.
882
Therefore, there is a necessity to build a leading and coordinating mechanism in a higher level based on the former mechanism so as to break up the situation of industry segmentation and passive prevention. The overall benefits and sustainable development will be the top requirements to achieve the goal of institutional innovation and to establish classified management system. We should strengthen infrastructure construction and specific precaution work before the disaster, mobilize and integrate social forces according to the scale of disasters or accidents during the disaster and implement post-disaster reconstruction work. In conclusion, to perfect disaster prevention organizations is a impetus for comprehensive disaster control work. Suggestions: out flexible city comprehensive disaster prevention construction should be arranged by superior leaders and coordinately carried out by every department in a hierarchical way. A national comprehensive disaster prevention committee should be set up and led by State Council which can ensure that we have powerful and effective ability to cope with severe disasters. In the future, every province and city should set up such organization to accomplish the comprehensive disaster prevention strategic disposition, modern systematic construction, R&D planning and talents education. 2.3 To perfect standards
Good standards are technical basis for extending comprehensive disaster prevention work in urban construction and are basis and guidance for people’s participant in different activities. We have to follow the rules and regulations and set a full-fledged standard in carrying out disaster prevention work. The establishment of a standard system can effectively enhance the reform and development of our work, improve standard management level, maintain the orders in compiling standards and reduce the contradiction and repetition among standards set by different organizations. We have not set up a full-fledged standard in this area and the existing standards are not comprehensive, what’s more, different types of disasters impact the development of cities, thus it is imperative to establish a perfect comprehensive disaster prevention standard system and enrich single standard in the system. Gladly, we have published some technical standards in the area of not only urban disaster prevention but also emergency rescue. For example, in terms of earthquake prevention and relief, we have published Standard for Classification of Seismic Protection of Building Constructions, Design Code for Anti-seismic of Special Structure, Standard for Urban Planning on Earthquake Resistance and Hazardous Prevention, Standard for Seismic Appraiser of Buildings, Technical Specification for Seismic Strengthening of Buildings and so on. In terms of flood control and disaster reduction, we have set up Standard for Flood Control, Code for Design of Levee Project, Code for Design of Irrigation and Drainage Engineering, Code for Design of Urban Flood Control Project. In the area of preventing geological disaster, we have established national standards such as Code for Investigation of Geotechnical Engineering. Also, we have compiled National Emergency Response Plan for Urban Subway Accidents, Emergency Plan for Destructive Earthquake, Emergency Plan for Major Water Supply Accident in Cities, Emergency Plan for Major Gas Supply Accident in Cities, Emergency Plan for Major Bridge Accidents in Cities and Emergency Plan for Major Security Accidents of Construction Project. However, these standards and codes are not perfect and they are all specific standards for certain areas or standards for engineering design. What’s more, the standards are not coordinated but separated and not well related. The standards focus on engineering, so they cannot provide regulations in a comprehensive way in improving cities’ disaster prevention flexibility and recovery. 2.4 To build and improve the technical support system
The construction of flexible city need a complete technical support system. In conducting urban construction comprehensive disaster prevention work, strengthening technical support
883

is the primary task, also, enhancing scientific and technical level is the basis for building flexible city. Our current disaster prevention technical support system has achieved initial success in combating earthquake, fire and disaster caused by windstorm. In the 1990s, National Natural Science Foundation of China initiated a project of basic research on city and project disaster reduction which is included in the Ninth-Five-Year-Plan and Tenth-Five-Year-Plan’s science and technology program and the project has conducted pilot research in urban disasters such as floods, earthquake, landslide and mudslide and has achieved fruitful results. However, comparing with developed countries, we have relatively outdated science and technology in urban disaster prevention and emergency response support. Most cities in Europe and America have established multi-layered disaster prevention remote sensing computer network and earthquake relief decision making system which are included in their comprehensive disaster prevention system. UN countries have applied satellite remote sensing technology in estimation and management of forming process, early warning and disaster reduction. Australian’s disaster remote sensing system has played an important role in national disaster prevention planning and management. But in China, we have not transformed security technology into productivity or established perfect urban disaster risk estimation system, disaster warning system and post-disaster emergency response system. Developed countries have used modern computer technology, communication, network, satellite, remote sensing, geological information and biological technology and other high-techs in reducing and preventing disasters, but China needs to do more to catch up with developed countries. In addition, our efforts in the research on comprehensive disaster prevention and reduction are lagged behind and the work is in lack of solid theoretical support. The research is not focused and disaster prevention technology focuses on monotechnics and lacks of comprehensiveness. Many academic institutes in China have conducted research on specific disasters and risks, but those research activity is separately implemented by different institutes and is mainly about disaster research and risk control in specific areas rather than over all studies. To sum up, there is a lack of systematic basic research. Also, we have no efficient mechanism to secure and enhance the city’s comprehensive scientific and technical development and insufficient research fund in this area which slow the development of technical development in disaster prevention. Thus, the country and governments at all levels should establish and improve the technical support system based on modern high technology, put more efforts and fund into the scientific research on comprehensive disaster prevention, strengthen the support towards scientific and technological innovation, integrate the current research force in universities and R&D institutes, tackle key problems in science and technology and improve flexible city’s scientific level in disaster prevention.
2.5 To establish disaster insurance system For different areas and communities built in different times, we should estimate the flexibility of communities and improve their capital flexibility after the disasters through buying business or social insurance of major disasters and catastrophes. The government should provide the service by introducing insurance industry into disaster prevention and relief areas so as to highlight the role of risk transformation, loss compensation of commercial insurance and to establish market-driven disaster and accident compensation mechanism as well as to help government with major disaster accidents and establish flexible capital mechanism of government support, insurance security, social relief and self and mutual rescue. When suffering from disasters, the residents who bought insurance can get compensation money paid by insurance company. This will greatly reduce community residents’ economic burden in rebuilding their ruined houses and it is of great significance to stabilize post-disaster situation. The policy will relief the economic burden of government in post-disaster
884
reconstruction. There are two ways to acquire capital support: one is the reinsurance of earthquake insurance and help insurance company to conduct compensation work according to standard and supervise the compensation process through law; the second way that can effectively improve capital flexibility is to provide more aid to society. Besides the social rescue groups such as the Red Cross, financial organizations can also enhance public attention to social aid. We could also improve the motive power of society for reconstruction and reduce people’s economic burden through delaying the due loan and loosen lending the post-disaster reconstruction project guaranteed by the government. We should draw up laws and regulations against disaster-affected areas. Our neighboring country Japan is a place prone to natural disasters, thus it attaches great importance in compiling relative laws and regulations to deal with all types of disasters. Among all laws and regulations, Law on Promoting Earthquake Resistance Ability, Regulation on Special Financial Aid of Major Disasters, Law on Restoring Disaster Affected Streets and Communities, Earthquake Insurance Law, Law on National Treasury’s Responsibility in Paying the Project Fee of Public Facility Reconstruction, Disaster Compensation Payment Law and other 18 laws or regulations are directly related to post-earthquake areas’ reconstruction and restoration. According to China’s specific national condition, the author holds that in order to secure disaster affected areas’ stability and steady, government should provide emergent drinking water, food, clothes and other necessary terms freely to people living in disaster affected areas after the occurrence of disasters. Also, government should provide temporary shelters for people whose houses are destroyed or unlivable because of the disaster meanwhile they do not have enough capital and money to rebuild their home. In the process of post-disaster reconstruction, government should set up Reconstruction Committee to plan the overall construction work, arrange post-disaster rescue, repair the disaster-affected infrastructure and restore the disaster affected areas and regions. Professional urban planners representing the benefit of public led by the government should participate into the reconstruction work. Reconstruction Fund should be set up for bettering conducting post-disaster reconstruction work. It will be supported by both government and investors to conduct infrastructure construction and public facility construction work jointly. The whole country and all people should provide their efforts to rebuild their home. Therefore, financial and law areas play significant roles in improving cities’ and communities rebuilding flexibility. 2.6 To build community disaster psychological aid and support center
We should pay attention to disaster victims’ psychological condition and psychological aid. In the process of reconstruction, one thing that cannot be ignored is to carry out psychological aid and support to disaster victims. Practical and theoretical research both demonstrate that severe sudden disasters will imprint huge psychological injury and harm to people who witness the occurrence of disasters, specifically, old aged people and children need more psychological comfort, care and attention. That is to say, when disasters happen, psychological consultant should also come to disaster affected areas at the first time with disaster rescue teams. The government should send specialists to conduct free psychological consulting and psychology knowledge lectures for disaster survivors at regular intervals. What’s more, the government should set up a group of professional workers to assist the people who cannot live by themselves and to the old people; there should also be work teams to visit old aged people and satisfy their needs and requirements. It could be seen that restoring the confidence and faith to live their lives is difficult for people who suffered from disasters and it is a systematic work and needs a long period of time. This kind of restoration is much harder and takes more time than the reconstruction of houses, roads or facilities.
885
2.7 To build pilot flexible city, flexible community and flexible project In the period of “New Normal”, in order to improve cities’ disaster resistance flexibility and post disaster restoration flexibility, we should carry out a pilot project of constructing comprehensive disaster prevention and reduction in cities and establish pilot of large and medium cities’ overall disaster prevention design and construction. At the same time, we should found disaster prevention and support center with the principle of “one community one unit” according to population scale and based on this foundation, we should push forward comprehensive disaster prevention in cities and important urban areas step by step. The author suggests that the construction of pilots can be carried out through the following three steps: (1) Flexible city’s comprehensive disaster prevention and reduction: Flexible city’s comprehensive disaster prevention aims at improving city’s ability of disaster prediction. In this period, we should figure out disaster prevention factors, perfectly allocate disaster prevention resources and ensure these resources are well used in urban areas. In a city, we can not ensure that every inch of soil and every house are well protected because of limited resources and the problem of economic and material losses will never be prevented. Thus, the primary task of planning flexible city’s comprehensive disaster prevention work is to provide the maximum emergent protection. In constructing comprehensive disaster prevention flexible city, we should take into consideration cities’ practical conditions and compare the differences of disaster prevention characteristics and resources among cities so as to find technical support for flexible city’s construction. Also, disasters are unpredictable and the flexible city’s anti disaster capability is quite limited. When suffering from severe and major disasters, flexible cities might lose their flexibility, so at this time, having emergent plan is a great necessity. Setting up department of emergent plan can help the government to quickly answer to major disasters, rapidly allocate disaster resistance resources and reduce the destruction of cities at a maximum scale. (2) Comprehensive disaster prevention and reduction in flexible communities: Flexible communities have limited scale, highlighted disaster prevention topic and definite disaster prevention subject, so we can realize the full-fledged construction of flexible communities once we pay attention to community’s building upgradation inside the community, improve infrastructure’s emergent disaster response ability and implement disaster prevention education towards community residents. In terms of the construction problems of flexible community, we should not conduct large-scale construction in the pilot area, but should put emphasis on estimating the flexibility against disaster of new and old communities and make a design of the community construction according to the result of estimation and the practical condition of the community. The estimation results show vulnerability of community against disasters and we should arrange relative hedge places in responding to disasters, update or rebuild disaster prevention infrastructures in the community. The practical effect of community’s ability of comprehensive disaster prevention can serve as a reference for city’s promotion and extension on comprehensive disaster prevention plan. Meanwhile, we should improve community residents’ awareness toward disaster prevention and reduction through education so as to promote their ability to response to emergent conditions. Improving the propaganda and education of disaster prevention and reduction knowledge refers to give publicity to the public the guidelines and policies about disaster prevention and reduction, spread disaster knowledge, disaster prevention knowledge, approaches about disaster relief and rescue and restoration and reconstruction knowledge, in this way, we can promote the overall awareness of disaster prevention and reduction of the society. Though setting up relative regulations, conducting all types of disaster prevention and reduction propaganda activities and disaster prevention education, we can help the public to improve their disaster prevention awareness and give right knowledge to them so as to enhance their self rescue ability and reduce the risk of losing lives and properties due to disasters. (3) Comprehensive disaster prevention of flexible project
886
The concept of “flexible” here is different from that of flexible city and community. It emphases the implementation of comprehensive disaster prevention technology in an individual project. Currently, the prediction of disasters such as earthquake, windstorm and so on in an individual project has made some achievements, however, resilience to major and huge disasters such as violent earthquake, tsunami, explosion and so on is quite limited, but the outcomes and damages of these huge disasters can not be ignored, thus, in the future disaster prevention work in terms of flexible project, we should estimate the capability of disaster prevention of a project under certain standards, conduct coupling disaster prevention design and plan and promote new and innovated technologies as much as possible in order to push forward individual project’s flexible disaster prevention ability. Comprehensive disaster prevention on the basis of flexible theory is the fundamental approach to cope with all kinds of natural disasters in urban cities. City’s comprehensive disaster prevention and reduction work should break through the traditional mono-disaster prevention pattern which is widely used in the past disaster prevention system. Also, we should develop the unilateral and partial security awareness into a comprehensive security outlook of disaster prevention and reduction. Therefore, in order to establish the city’s comprehensive disaster prevention plan and standard system, we should firstly come up with an overall conceive of the construction of disaster prevention system, conduct a whole and systematic plan to guide city’s comprehensive disaster prevention work. We should not only establish a secure disaster prevention system aiming at guiding all levels of administration: nation, province, city, county and village, but also set up regional comprehensive disaster prevention system in provinces and cities and comprehensive systems in urban and rural areas. What’s more, we should not only carry out comprehensive disaster prevention plan standard taking into consideration city’s response to all kinds of disasters and relative mono disaster prevention standard, but also establish a system that includes the requirements of disaster prevention plan and technical indexes in urban areas.
3. Conclusion
As the acceleration of the process of urbanization in China, our social and economic development has
entered the period of “New Normal”. The material well-being life and cultural activity have been
greatly improved, and people’s requirements for the city’s security level have increased in recent
years. However, the impact and effect of disaster on society have not been released which boosts the
urgent demand of their safety and security living in the cities and of urban comprehensive disaster
prevention work. Under this circumstance, the paper proposes several suggestions on promoting the
construction of flexible city and improving comprehensive disaster prevention and reduction work
with “perfecting the disaster prevention organization, strengthen the foundation of disaster prevention
work, push forward the operation of pilot and improve standards of disaster prevention work” as the
main points and with an attempt to provide guidance and reference for the construction work of
flexible cities in the period of “New Normal”.
References:
[1]. Measuring Social Vulnerability to Natural Hazards in Beijing-Tianjin-Hebei Region,China[J].
HUANG Jianyi,SU Fei,ZHANG Pingyu. Chinese Geographical Science. 2015(04)
[2]. Revitalizing Old Industrial Base of Northeast China:Process, Policy and Challenge[J]. ZHANG
Pingyu (Northeast Institute of Geography and Agroecology, Chinese Academy of Sciences,
Changchun 130012, China). Chinese Geographical Science. 2008(02)
[3]. The Resilience of Employment in Wales: Through Recession and into Recovery[J] . Marianne
Sensier,Michael Artis. Regional Studies . 2016 (4)
[4]. Economic transformation of mining cities in transition economies: lessons from Daqing,
Northeast China[J] . Li, He,Lo, Kevin,Wang, Mark. International Development Planning Review
. 2015 (3)
887

[5]. Towards an Evolutionary Perspective on Regional Resilience[J] . Ron Boschma. Regional
Studies . 2015 (5)
[6]. Resilience thinking: a renewed system approach for sustainability science[J] . Li Xu,Dora
Marinova,Xiumei Guo. Sustainability Science . 2015 (1)
[7]. Evolutionary Resilience and Strategies for Climate Adaptation[J] . Simin Davoudi,Elizabeth
Brooks,Abid Mehmood. Planning Practice & Research . 2013 (3)
[8]. Economic Diversity and Regional Socioeconomic Performance: An Empirical Analysis of the
Western Australian Grain Belt[J] . AMANDADAVIES,MATTHEWTONTS. Geographical
Research . 2010 (3)
888

Centralcityscenicresourcesprotectionplan
Moderator: Mindy BROOKS, City of Portland, Portland, USA
Speakers: Mindy BROOKS, City of Portland; Neil LOEHLEIN, City of Portland, Portland, USA
Portland’s Central City has some of the most iconic views in the region. As the urban core develops,
we are seeing taller and taller buildings. These buildings can block views from tourists’ centers like
the Rose Garden.
Through the Central City 2035 Plan, staff worked with a diversity of stakeholders to protect scenic
resources in order to support tourism, maintain Portland iconic views, preserve neighborhood
identity, support economic development in the downtown core and protecting and enhance natural
resources particularly in areas susceptible to natural hazards.
The results of the work are proposed adjustments to allowed building heights in the downtown,
requirements for shade analysis and application of scenic (s) overlay zones to facilitate vegetation
management to preserve the views.
Staff used new approaches with GIS tools used to develop the Scenic Resources Protection Plan.
The presentation will provide an overview of the Central City 2035 Plan and how scenic resources
because one of the most testified about topics during the hearing process. Staff will present on how
GIS was an integral part of understanding the relationship between views and building heights and
was used to reduce allowed building height in some cases. Finally, staff will cover the most
controversial views and the considerations discussed when determining whether or not to protect
the view.
889
Mis-Romanticism of intermediary cities and participation: The case of Moroni KALMAKOFF, Jacob; University of Oxford, UN-Habitat; Kenya Participatory planning, community engagement and public consultations are mandatory parts of many planning processes. Both vulnerable to the effects of climate change while relatively self-sustaining, smaller communities may hold the key to better resilience strategies. Can participation in planning be an effective method to promote more resilience in areas of limited capacity?
1. Introduction
Participatory planning, community engagement and public consultations are mandatory parts of many allegedly sustainable urban planning processes the world over. Although many jurisdictions are legally mandated to include such processes as part of any urban development activities, no clear definition of this inclusion of multiple stakeholders exists, and this means that there is also no commonly agreed upon way to measure and evaluate the effectiveness and relevance of public participation. Much of the contemporary discourse cites participatory research as a way of drawing endogenous lessons for urban resilience, while at the same time building capacity in communities most vulnerable to the effects of climate change (Betsill & Bulkeley 2017, ; 471–493; Malunga & Holcombe 2014, ; 615–622). On the surface, this is a noble pursuit, yet is participation inherently an equitable means of inclusion as it is so often purported to be? Often criticism of participation in practice stems from a lack of acknowledgement of diversity within the local context, as many approaches tend to relegate entire populations to groups depending on socio-economic status or role (Samuel Hickey & Mohan 2004). On the other hand, participation is touted to deliver better designed projects, target better the benefits of certain interventions, increase the efficiency of inputs, and distribute the benefits of a project more equitably (Mansuri & Rao 2004). One of the alleged goals of participation is to provide opportunities for disenfranchised groups to have a level of ownership over their locale and contribute to improving their environment. Despite these expectations, projects do not always manifest these results in a way that is immediately identifiable to all participants and stakeholders, sparking calls for alternative models of local innovation (Moulaert et al. 2005, ; 1969–1990). This paper therefore aims to analyse stakeholder perceptions as a way of determining how a specific case of Participatory Resilience Planning (PRP) affects placemaking. This will be accomplished by analysing the objectives & underlying assumptions of PRP as perceived by its stakeholders.
This research follows the course of the 8-week implementation process of the CityRAP1 Tool—a joint project of UN-Habitat and DiMSUR (Disaster Risk Management, Sustainability and Urban Resilience). The 4 phase CityRAP tool aims to build capacity by partnering with key local institutions, develop the skills and experience of local young leaders while providing an opportunity for contextually relevant interventions to be prioritised. The tool has one phases that includes participatory processes, which formed the bulk of the in situ analysis. Rather than being led by UN-Habitat, municipal focal points (MFPs) are trained in the methodology and carry it out independently, with limited external intervention. The MFPs are led by a coordinator and the implementation of the CityRAP tool provides the opportunity for them to gain experience in data collection, analysis and a better understanding of both the institutional and realised context of their locality. The larger objective of this research is to evaluate the participatory aspects of this process—which has been developed over years of practical experience in PRP—and determine whether it may be an effective mechanism to catalyse more sustainable urban development.
1 The CityRAP tool (the City Resilience Action Planning tool) initially resulted in a Resilience Action Plan. Because of the implications of the word ‘plan’, the resulting document is now called a Resilience Framework for Action (RFA).
890
2. Context History
In Africa, there are 7 officially-recognized SIDS, of which Comoros is one. Comoros is a volcanic archipelago between Tanzania and Madagascar. The first evidence of inhabitants on the islands was found on Ndzuwani (Anjouan) and dates from the 6th Century CE. A series of sultanates from the 11th Century and migrations of Bantu populations from the area of contemporary Mozambique, made the archipelago a diverse ‘melting pot’ of populations. This may have also included certain Malayo-Indonesian groups (Country Watch 2017), giving more diversity of influences in the culture of each island. There is a long history of French influence in the islands; in 1841, King Andriantsouli, the self-declared sultan of Mayotte, ceded the islands to France. This caused a series of scuffles culminating in France’s formal annexation of the islands 1909 (Country Watch 2017, ; 1–388). Presently the almost entirely Sunni Muslim country contains Arab, Swahili, and French cultural influences, and the local official language contains aspects of all. The government structures that exist are mostly left over from the French colonial period, and laws are French mixed with Islamic Law (Sharia) (Abdou 2017).
Participation
Comoros is one of the poorest countries in the world by traditional measures of wealth such as GDP, with a GDP of USD 620 Million in 2016 (World Bank 2017, ; 2017). Many people are unemployed, or seek employment in ‘informal sectors’. Social life is centred around the Mosque, which also serves as a gathering place for discussions on local issues. It is also known as one of the most gender-equal Muslim countries. By 2004, it was one of the only nations to ratify the African Charter on Human and Peoples’ Rights on the Rights of Women in Africa (Oxfam 2009). Women participate in various functions of government and are encouraged to take on different types of leadership roles within the state and associated agencies. In Comoros public participation is not officially mandated in development processes, and there is no legal recourse in place to ensure its uptake. After becoming a member of the United Nations in 1975, Comoros signed several UN declarations touting the benefits of public participation, indicating that on a macro-governance level, it is not a completely new concept. These included The Khartoum Declaration: Towards a Human-Focused Approach to Socio-Economic Recover and Development in Africa (1988), and the African Common Position on Human and Social Development in Africa (1994). Each discusses how popular participation was a key mechanism for social development in Africa. Despite also being signatory to the African Charter for Popular Participation in Development and Transformation in 1990, this did not translate to any national policy on popular participation/engagement or appear to influence the role of participation in governance mechanisms. According to interviews with the Director of the Ministry of Territorial Management and Urbanism, Mr Mohammed Abdou, there are no statutes, policies or bills that mandate public participation at any level of government (2017). Moreover, participation is not seen as a priority when so many people face financial challenges that dictate their free time. Because of the absence of any mandated internally-mandated participatory processes in governance, Comoros is an excellent case to investigate PRP. It can seen as a test-bed for new approaches to PRP; concepts of both participation and resilience have had limited visibility in Comoros until quite recently. This means that the implementation of such a process as the CityRAP tool implementation is an opportunity to encourage discourse amongst people and elicit responses as to how it could be better implemented and have a greater effect on policy. Second, the size of Comoros, means that ultimately any tangible interventions incited by a participatory process have the potential to be realised on a scale that can affect more of the population more rapidly. While the overall level of urbanisation is quite low (28.3%), on Ngazidja where Moroni is located, 58% of the population lives in metropolitan or urban areas (areas with 2000 or more people per square kilometre) (World Bank 2016). The overall population density of all three islands is relatively high at 422 people/km2 (CIA Factbook 2017). Thirdly, most areas of Comoros are at significantly high risk of multiple kinds of natural disasters. Tropical cyclones are the most prevalent, causing
891
annually roughly USD 3.6 Million in damages, which is followed closely in numbers by inland flooding (World Bank 2016). Not only requiring significant intervention in the areas of resilience, natural disasters affect the everyday reality of every single inhabitant of Comoros and the combination that PRP offers should provide a significant response to these issues.
3. Literature Review
During what many have called the ‘height of participation discourse’ in the 1970s, the majority of projects focused on ‘integrated rural development schemes’ rather than urban schemes, and it is suggested this may have been the result of urban bias in the international aid community on eliminating abject rural poverty (Mansuri & Rao 2004; Mosse 1994, ; 497–526; Lipton 1977). Others understand this focus on the rural as the by-product of post-colonial nationalist policies in many African states that saw rural development as the basis for development (Beall & Fox 2016). Although some of the discussions in this review focus uniquely on rural interventions, in line with current discourse on urban-rural linkages, this paper will not treat participation in urban and rural contexts distinctly (Tacoli 1998, ; 147; Sietchiping et al. 2014, ; 219–234). Rather, the literature review traces the history of participation through the lenses of three disciplines in which participation has been examined: 1) as a political process, 2) as a way of planning, and 3) as a method of international development. This siloed way participation has been approached provides insights into the stratification of disciplines and the power dynamics that inform stakeholder perceptions in a decision-making process (Watson 2014, ; 62–76). Within each of these disciplines, three aspects of participation are highlighted; the stakeholders, its scope, and its contribution to resilience. Academically, participatory approaches to decision-making must be perceived through the lens of all three disciplines, which are inextricably interlinked. At the same time, this literature review should make clear that how participation may be perceived by various stakeholders as emanating from a certain discipline. Political Lens
From a political lens, participation has been included in discourse on the challenges of democracy from the beginning of the 20th century. Many scholars of democracy describe participation in the democratic process as heavily politicised (Head 2007, ; 441–454), while many attest to it being a fundamental right for all societies whether democratic (Dewey 1927) or otherwise (Cornwall 2008, ; 269–283; Day 1997, ; 421–434; Stivers 1990, ; 86–105). This has led to one of the most significant critiques of participation, namely the question of what constitutes the participants including ‘civil society’. Among academic analysis of participation, engagement emerges more prominently than macro-level government interventions in the context of local governance issues (Gaventa & Valderrama 1999). Increasingly this was challenged during the height of the communist era by those whose faith in democracy had led them to contend that loss of freedom for some implies greater shared benefits by others (Rawls 1971). Rawls’ self-equalizing theory touting the benefits of democracy was appropriate for post-WWII America, but did not sit well with post-structuralists like Edward Soja (1995) who assert that engaged citizen participation is the only way to have a just society regardless of political regime. Some describe environmental decision-making as an essential part of democracy (Beierle 2010; Chess & Purcell 1999, ; 2685) as it pertains to the physical aspects of human existence. For many political scientists operating within a democratic system, participation is a natural progression from allegedly ‘top-down’ approaches towards prioritizing inclusion (Head 2007, ; 441–454; White 1999). Once the use of the word ‘participation’ became en vogue in the 1990s, many defended it as part of what became known as ‘normative’ international development strategies, specifically in local governance (Mwiru 2015; Van Empel 2007; Watson 2002, ; 27–52). More recently, however, the political focus of participation has shifted levels, from the rural to the local where some argue that a dialectic must be formed between citizens and the administrative state, where both have the power to influence one another (Stivers 1990, ; 86–105). Others, such as Gaventa & Valderrama, suggest that linking the spheres of political participation and strengthening and enhancing public involvement may
892
be best placed at the local level, where the concerns of the grassroots or locality intersect most directly with those of governance and the state (1999). As such, many scholars such as Grant (1994) and Fischer (1993) assert that no consensus exists on the role of participation in democratic community building. Those who perceive it to be a new process, may know nothing of the centuries of history in certain political contexts. Those who speak a different language, may have a different way of defining it, with connotations that go beyond the iterations of discourse that other aspects of democracy such as ballot-casting have had (Baum 1994, ; 251–262). This is one way that such abstract political aspects of planning, can be localised; i.e. By iterative systematic interventions that target the inclusion of a specific group in order to achieve a very specific goal. Planning Lens
The idea of participation as a way of planning was at the pinnacle of debate in discussions on consensus building in the 1990s. The role of planners as advocates for issues of political economy was debated at length by avant-garde planners of the 1960s, such as Davidoff (1965). In general, the literature specifically on participatory planning approaches was spearheaded by Arnstein (1969), who first suggested the roles of different actors involved in a hierarchy of citizen control, placing the control of citizens at the top. This in parallel with the discourse on participation as an active form of research (or co-optive inquiry) (Heron 1971) led to several attempts to codify the political difficulties faced by planners. Rittel and Webber first described planning itself as a ‘wicked problem’ which raised many questions on the validity of a process that cannot satisfy the values of all stakeholders (1973). Along with discussions on advocacy planning in the 1970s, participation in the planning process was seen as a possible antidote for such a conundrum, even though many did not address the problems sought to be accounted for by planning (Baum 1994, ; 251–262; Innes & Booher 1999, ; 9–26). Many silver-bullet methodologies have been proposed for participatory processes in planning, and yet planning scholars have often assumed that participation in both the majority and minority world (developing, developed world) manifests itself in similar ways. Cornwall (2008), for example puts forth several models of citizen participation and attempts to collate their relevancy to participation using global case studies. Yet the complex dynamics of the relationships of community groups with external agencies—including private sector actors and NGOs—is not understood as relating to the context of different cultural dynamics. Others have suggested that creativity plays a key role in the ability for a participatory process to empower those involved in being more involved in the development of local spaces (Cilliers & Timmermans 2014, ; 413–429; Moulaert et al. 2005, ; 1969–1990). Such a humanist approach it is suggested puts everyday publics at the centre of planning decisions, yet tends again towards lumping citizens into artificial groups (Andres 2012, ; 759–775; Moulaert et al. 2005, ; 1969–1990). Yet this notion that participation is rather informed by the acknowledgement of the value of this diversity and difference within cities has been explored by other scholars who understand participation as an essential component of urban expression (Fincher & Jacobs 1998). This can be understood as a form a place-making, which will be further discussed later on. Participation has now become ubiquitous with urban development so much that no precise definition of participation in planning exists, instead defaulting to a European understanding of normative planning (Burke 1979). This is a problem as it gives preference to planning institutions reflecting one specific tradition. Healey (1997) takes the view that planning institutions must be reorganized to encourage more collaboration between multiple stakeholders in planning, while these same ‘normative’ institutions must be supplanted in order to achieve equitable planning. Participation in Development (PID)
Part of the international development discourse since the 1960s, participation has continued to evade empirical analysis and hence the establishment of reliable indicators to measure such processes. From those who question the very reasons we strive for ‘development’ (Rist 2008), to those who contend that giving citizens a voice through democratic means can help to mend the ills of colonial histories (Escobar 1988, ; 428–443),
893
there is an inherent assumption that ‘better development’ can be achieved. This is echoed by many scholars who argue participation alone may not be a necessary, but nevertheless important factor in economic empowerment (Botes & van Rensburg 2000, ; 41–58; Goulet 1989, ; 165–178; Gaventa & Valderrama 1999). Some have argued for a ‘de-professionalization’, critiquing the follies of so-called ‘experts’ in the development world (Illich 1973; Easterly 2014), while abstaining from any meaningful attempt to qualify the impetus for ‘bottom-up’ or ‘grass-roots’ practices (Miraftab 2016, ; 480–498; Watson 2014, ; 62–76). Much of this impetus for participation, however comes from an understanding of citizen control as a central tenet of democracy, which emerges from one specific tradition—European notions of agency (Escobar 1988, ; 428–443; Peet & Hartwick 2009). Citizen participation has now come to be understood by many as an inherently positive aspect of development—although it has been suggested that this is the direct result of engagement schemes limited to democratic political environments (S Hickey & Mohan 2004).
White (1999) identifies a first, second and third wave of discourse on participation—the third wave associated in particular with Non-Governmental Organisations (NGOs) and International Organisations (IOs) who have through international networks, made aid of various kinds conditional on countries making participation in decision-making mandatory (Peet & Hartwick 2009). Before this, in international development circles donor agency aid conditional on participation schemes was de rigueur. Some claim the first example of this was the establishment of Community Development advisors in the 1950s—an under reported initiative by USAID—and marked a faddism of development discourse, which many still believe is occurring today (White 1999). It also highlighted the inability of development agencies to learn from past failures, as the approach was almost universally aborted. It can therefore be seen that a bottom-up approach embedded in IOs has existed in the past, and has since been abandoned. In the 1980s, in parallel to the rise in discourse on participation in urban planning initiatives, the United Nations began to introduce mandates within member countries of including multiple stakeholders in any projects or development activities. The African Charter for Popular Participation in Development was created in concert with several governments from around Africa, and adopted in February 1990 in Arusha, Tanzania. It promotes the idea that participation of many ‘publics’ is effectively empowerment:
‘We believe strongly that popular participation is, in essence, the empowerment of the people to effectively involve themselves in creating the structures and in designing policies and programmes that serve the interests of all as well as to effectively contribute to the development process and share equitably in its benefits.’
The Charter also highlights specifically how the outcomes of such participatory processes could include structures, policies and programmes—broadening the scope they could contain, whilst lessening the need for countries to provide monitoring and evaluation on these newly-minted programmes. Many argue, however that this has led to the agglomeration of all participatory activities of donor agencies and IOs, giving many involved unclear expectations as to outcomes and likely tangible changes (Hobart 1993; Peet & Hartwick 2009). This brings to light the power that large-international organizations have over the perceptions of participants as the instigators of such processes. Resilience
Although there are many standardized definitions of resilience that exist, the literature that brings together all aspects of this research is sparse—there is an inconsequential amount of literature that focuses directly on participatory resilience planning in intermediary cites or SIDS. Urban resilience has been brought to the forefront of much of the discourse on future cities by such organisations as 100 Resilient Cities. They define urban resilience as the capacity of individuals, communities, institutions, businesses, and systems within a city to survive, adapt, and grow no matter what kinds of chronic stresses and acute shocks they experience (100 Resilient Cities 2017). For others, resilience still indicates specifically a human ability to resist the ill-effects of natural disasters and hazards on one’s community. A focus on vulnerability is often seen as providing reason for a participatory process specifically with DDR projects (Parrott 2011). Much has also been written on the ability for participation in urban
894
climate change planning to enable marginalised communities to understand better the ecosystem in which they play a vital role (Spaliviero et al. 2011; Weijschedé et al. 2011). Yet still, the relationships between actors and the perceived challenges and dynamics of this interaction have not been fully codified. Specifically with respect to the CityRAP tool, Boyd & Ensor (2015) directly critique the outcomes of the tool’s implementation in Maputo, Mozambique insofar as the framework developed enabled luxury homes to be built in highly desirable areas which also happens to be habitat for mangroves. What all these definitions have in common is a placing of humans at the centre of resilience, an ‘us against them’ mentality.
Contemporary approaches to PRP outlined above all fall somewhere between strictly methodological, and participatory action research (Lewin 2001, ; 6–11). Most participation in development work today is highly political, involves certain aspects of spatial planning, discusses issues of climate resilience and results in a process that could be equated with an inquiry or research typology. Community-led planning is described as one approach to participatory planning that accounts for this through a practice of multiculturalism (Umemoto 2001). The cultural aspect of development planning has been debated at length, specifically by Escobar (1995) who contends that development planning is ‘ontologically cultural’ because of the power relationship it imposes on the recipients of aid. Development still assumes the realities and values of those in the majority world by prescribing a specific reality. It still appears however that most approaches that try and bring all three silos together end up over analysing the effect participation has on most the world who perceive their time for work as more important than civic involvement.
4. Methodological Approach Research Sample
The CityRAP tool is divided into 4 phases of implementation, which are described in detail in the tool description in Annex I. This investigation has a limited discussion including only phase 1 and 2 of implementation, as these two phases included contain aspects of participatory planning, and allowed established expectations to be understood. Research participants were identified according to their delegated roles in the process. The first sample identified for this research included the local trainees in the methodology (MFPs) which in Comoros consisted initially of 7 individuals (3 women and 4 men). By the end of the process, only 5 remained and carried out the bulk of the work. These are key stakeholders as they are recommended by the municipality, and work both on a voluntary basis and to gain personal experience. The MFPs were selected by purposeful sampling. The second sample identified were the participants in the mapping component of the tool (MPs). These individuals consisted of neighbourhood residents in one of the 4 neighbourhoods of Moroni identified. This group was selected by snowball sampling. The third stakeholder group that was identified included the neighbourhood leaders. Only three of the four neighbourhoods where the participatory mapping took place could be sampled. Finally, one unforeseen actor whose views were important to include was the Treasurer of the Union of Youth Associations of Moroni, and the President of the Youth Association of his neighbourhood, Bodoni. Neighbourhood associations are a significant part of urban and cultural life in Moroni (Issihaka Ali et al. 2015, ; 786–800; Hauzer et al. 2013, ; 346–354). This individual was a vocal presence at the sensitisation workshop in his neighbourhood and provided one perspective of the associations that had not been encapsulated by other samples. An equal sample of all actors was challenging to obtain, so different numbers of individuals were included in each stakeholder group. All participants are referred to as a member of the group to which they belong; individual names are not used unless the researcher was given express permission to do so. Analysis
The participants in the research, whom, it could also be said, were ‘participants’ in the tool development process, were asked standardized questions. These questions were developed in accordance with existing literature specifically to garner information on participant
895
perceptions of other actors in the process, the scope of the process and what resilience meant to them. Analysis consisted of interview transcription, followed by coding and translation (French to English). The codes, which consisted of thematic statements and gerunds, allowed for possibilities to be suggested by the data (Charmaz 2006). Thus words used reflected action and feelings of the participants garnering perceptions which are likely to inform further action and attitude (Riley & Basson 2011, ; 1–10; You et al. 2014, ; 296–307). Keywords appearing in the literature and those that emerged from themes in the data were compared and contrasted to determine where there was overlap. The second phase of the data collection allowed the initial themes to be expanded upon and for participants to be posthumously asked about their experience in the process.
5. Analysis
Participation especially in development is an inherently divisive and politically charged process. Governments are at times weary of ascribing responsibility either to other levels of government or to the citizenry. The themes that emerged showed however, that rather than a government involved in the process, one distancing themselves from the process. Instead of ideologically based notions of resilience, this garnered unique perspectives from a variety of marginalised groups. Upon reviewing the data in detail, it is evident that they share certain characteristics and expressions which are common threads, while also expressing diversity in their perceptions of how the participatory process should be approached, and their expected outcomes. Rather than the topics being about the specific stakeholders, the topics that emerged discussed both issues of coordination and thematic understanding. The first section of analysis discusses two themes that were followed-up on during the second round of interviews. During this phase, questions were purposefully asked in the past-tense, to elucidate responses of a reflective nature. Actors
Both visual and verbal engagement of multi-level actors was one of the biggest challenges identified by participants in the CityRAP tool implementation, as well as one of the markers of success of a participatory process defined in the literature. Such communication between the various actors of a process can make or break its perceived effectiveness. The first communication challenge common among most actors was the identification of other actors, their perceived roles in the CityRAP tool, and expectations that went mostly unfulfilled. Mutual understandings between different actors involved in a process are said to be one of the most significant factors of measuring the effectiveness of a process (Slocum 2003; Umemoto 2001, ; 17–31; Van Empel 2007). Groups Discussions with participants and instigators alike yielded an understanding of five major stakeholder groups between whom communication resulted in challenges identified in the process. Some such as the mapping participants were arbitrary groups, others such as the instigator, municipalities and focal points were pre-defined, and the associations were emerged as an important from the inherent flexibility of the process (El-gaili El-Gack 2007). Grouping actors is arguably an ineffective way to increase inclusion of participants in a process (Villamor et al. 2014, ; 22), and yet when reflecting on coordination, interviewees tended to self-relegate to groups. The groups identified by participants, including initial groups known to the researcher are shown below in table 3.
Type Group Name Perceived role / responsibilities Perceived outputs / Process outcomes / Expectations
Initial Instigator o UN-Habitat as large institution working in/coordinating activities in many different fields
o Knowledge brought by experts
o UN has come to the realization that decisions are taken at the bottom
896
o Does not provide concrete results; Projects stay on paper
o Will build roads, implement physical aspects identified by MP
Initial Municipality o Should provide a way to source
ideas from the bottom / gather new information
o Instead of instigator should coordinate process
o Payment to other actors (not instigator)
o Dissatisfaction that not taking 100% responsibility for this
o Payment for participants o Ability to implement and
extend to other municipalities
Initial Municipal Focal Points + Coordinator
o Should contain representatives from municipality
o Facilitation, organisation, coordination, communication
o Sensitisation of the participants and associations
o Establish long-term plan for implementation
o Participate in implementation of processes
o Contribute time without remuneration
Initial Mapping Participants
o Self-organisation o Contribute knowledge and
understanding of local context o Build own knowledge of
resilience
o Self-implement resilience activities that come out of the tool
o Contribute time without remuneration
Additional Associations o Mobilise MPs o Outreach and sensitisation to
neighbourhood members o Bound to the neighbourhood in
which they operate and its identity
o Self-implement the resilience activities that come out of the tool
o Contribute to body of knowledge on resilience at the neighbourhood level
o Quality of involvement based on identity
Table 1 – Bilateral stakeholder perceptions
In the data matrix presented, the identity of the actor describing the name, responsibilities and expectations of the others are not taken into account. Rather, this was to present in an unbiased manner the perceptions of all actors without suggesting rifts between any two groups. It also allowed the researcher to place themselves in the position of all actor groups, each with limited knowledge of the others. Instigator Most interviewees understood UN-Habitat, or at least the United Nations as the instigating institution. Criticism directed at the UN specifically stemmed from the impression that projects typically stay on paper, the ‘experts’ simply sit at their desks churning out documents. Yet when asked why the UN has begun working with cities, respondents were clear that they believe the UN has begun to realise that decisions are made at the bottom levels of governance. One impression that was given was how the UN could if they wanted to implement the physical aspects of the projects, and if desired, could assist with the construction of roads. Municipalities The municipality of Moroni is resented by the majority of interviewees. Many see them as having distanced or even removed themselves from the process. Others expect them to coordinate certain aspects of the process, including participating in even some minimal financing or coordination of transport activities. As the City of Moroni’s finances are not publically available, it is difficult to confirm whether or not this could be even feasible for the city. All interviewees express hope that the municipality would eventually take on a larger role, and focus on how to action the interventions prioritised by the CityRAP tool. MFPs + coordinator
897
According to the tool implementation directive, the coordinator is the local consultant hired by UN-Habitat whose job it is to facilitate the process, organize the MFPs, and liaise with local government officials. This individual was not interviewed because his busy schedule did not allow. Four MFPs express challenges they had with this coordinator, and his perceived inaction or absence during important organisational sessions. Although this individual has several functions that he was balancing at the time, the researcher also observed examples of his absence on multiple occasions. The dynamic is one that dictated the perceptions of the MFPs and their ability to rely on consistent leadership to inform them of their role and duty. Mapping participants Originally in the CityRAP process (see Annex I) the role of the MPs is a simple one, yet it became clear that there a bias existed depending on the neighbourhood of origin of the participants. Not only was the neighbourhood of Coulée already the most sensitised to the natural disasters for which they were keen to plan, but they were able to mobilise the most number of participants. One of the MFPs describes the neighbourhood leader of Coulée as ‘courageous’, and very positive about the whole process. This undoubtedly coloured the view of certain key actors.
Neighbourhood Female / Male Total
Madjadjou 6 / 11 17 Bodoni 3 / 12 15 Medina 2 / 12 14 Coulée 8 / 14 22
Table 2 – Mapping participants
Visual Another communication challenge that emerged repeatedly was the absence of high quality maps from which to base the participatory activities. Participatory mapping techniques differ and sometimes involve the participants using image association to draw the maps by hand themselves (Gonzalez 2014). This process did not feature such an approach, yet the base maps that were provided were printed from google maps and combined on several smaller sheets. This was left to the MFPs, all of whom expressed difficulty both in finding appropriate facilities to print the maps, as well as having challenges on the printed maps referencing the location of different features in order for participants to orient themselves. The MFPs also described how because many of the participants were illiterate, they had never before been required to read a map, and therefore were significantly challenged. Two of the interviewed MPs reported a difficulty in obtaining maps with sufficient clarity as a significant impediment to their ability to contribute meaningful information to the process. The other two MPs described it as more of an annoyance. Overall this led to difficulties in visual communication for the participants, yet was not expressed as a priority for either the MFPs or instigating agency. Differing priorities between actors are often emphasized as a key challenge to effective communication among those involved in participatory processes (Wilson in Gupta 1999). Visual communication being at the heart of this brand of participatory mapping, instigator involvement could be assumed to be insignificant and the majority of logistics handled by the local team. This is not unique to this process, yet shows how the hiccups that are constant in a process that engages multiple types of participation. Verbal
Three inadequate aspects of verbal communication that emerged over the course of the process were explained by the MFPs. One was the absence of the sense of an exchange of information between both people and institutions. As multiple actors were involved in the process, some were decidedly more apt to communicate with others and take a leadership role on both informing and facilitating the process outcomes. From a practical perspective, this meant that of all groups was described as ‘essential’ by all MFPs. Yet the frustration had more to do with the absence of institutional support. Inherently the MFPs knew that their work would be translated and taken to the institutional level to attempt to make tangible changes. This was
898
however, not explicitly communicated on behalf of the institution. It was also lacking in communication from the municipality.
The second, was the lack of next-steps after the finalisation of the process that had been communicated. ‘Accumulation of knowledge is useless without the goal of sharing it,’ stated one MFP. MFPs expressed reservations that once the RFA is ratified by the local government, it would simply end up in a file not be shared with the relevant parties who could make it a reality. MPs also expressed what they claim was a typical pattern they saw with development agencies, that their contributions would be placed in a vault, never to be opened. The MFPs were unable to quell these worries as they were not provided with any information on the next stages of the plan to convey. Communicating the results of the process was identified as the most relevant detail that could have the potential to impact realised results.
The third identified inadequacy was the limited work that was carried on the ground. Only the sensitisation workshops and the participatory mapping took place in the settings where the effects of natural disasters are most greatly felt. Repeatedly, MFP interviewees emphasized that it was far superior to be on the ground, than to be in an office making plans for cities. This emphasized the relevancy they saw in their role, while bolstering their repeated critique of IOs such as the UN for plans that it makes merely staying on paper. Showing physically where objects or features/problems exist is key to understanding their relevance and determining the environmental influence on the lifestyles of participants (Trapero et al. 2014). The mobility to carry out such associated activities was stated to be limited by the absence of organisation and coordination to procure transport. Although walking across the city (roughly 1 hour from one neighbourhood to another) was seen as impossible. In order to improve these aspects of communication, MFPs and the association leaders identified the necessity of a clearly defined stakeholder analysis in accordance with all associated parties. One MFP claimed is important to list associations, know their own responsibilities, what exists, what projects they have, who is involved. This was said to contribute to a ‘sensitisation’ was necessary for participants; i.e. in order to extract relevant and useful data from MPs, basic connections between resident actions and their surrounding natural environment had to be made. Hassenforder et al. describes this ‘institutional bricolage’ as requiring clear facilitators but also as requiring participatory processes to develop its approach (Hassenforder 2015). According to MPs, not only would this eliminate duplications of work, but it would also bring all actors in the process (as identified in the actor diagram) closer to the participants, around whom the process was centred.
6. Conclusion The idea of this research was really to find a process that was current, and
contemporary, and analyse its effectiveness in situ. It is rare to be privy to the details of a process, and to be able to study it as it is going on. Witnessing a transformative process. Can participation indeed get urban residents to think more about their cities and become better equipped to solve challenges of their daily lives? Discovery that participation is not only about those who are implicated directly in the participatory mapping… but is a capacity-building exercise (MFPs as the real benefactors in this process). Giving responsibility to local focal points that do not bear the flag of the ordering (instigating) institution is an effective way to divert criticism. Financial coordination as enabling within the neoliberal system. Coordination seems to be one of the biggest impediments to physical. Perceptions range, but coordination does not. What are markers of success for such a process? With this many thematic outputs, systems thinking must be used when understanding the effectiveness of a participatory process. Inherent political challenges with a process either being deemed effective or ineffective. References Andres L (2012) Differential Spaces, Power Hierarchy And Collaborative Planning: A Critique
Of The Role Of Temporary Uses In Shaping And Making Places. Urban Studies, 50(March), 759–775.
Baum HS (1994) Community And Consensus: Reality And Fantasy In Planning. Journal of
899
Planning Education and Research, 13(4), 251–262. Beall J & Fox S (2016) Cities And Development. London: Routledge. Beierle TC (2010) Democracy In Practice: Public Participation In Environmental Decisions.
Taylor & Francis. Betsill MM & Bulkeley H (2017) Transnational Networks And Global Environmental
Governance : The Cities For Climate Protection Program. International Studies Quarterly, 48(2), 471–493.
Botes L & van Rensburg D (2000) Participation In Development: Nine Plagues And Twelve Commandments. Oxford University Press and Community Development Journal, 35(1), 41–58.
Charmaz K (2006) Constructing Grounded Theory: A Practical Guide Through Qualitative Analysis. London: SAGE Publications.
Chess C & Purcell K (1999) Public Participation And The Environment: Do We Know What Works? Environmental Science & Technology, 33(16), 2685.
Cilliers EJ & Timmermans W (2014) The Importance Of Creative Participatory Planning In The Public Place-making Process. Environment and Planning B: Planning and Design, 41, 413–429.
Cornwall A (2008) Unpacking “Participation” Models, Meanings And Practices. Community Development Journal, 43(3), 269–283.
Country Watch (2017) Comoros Country Review. , 1–388. Davidoff P (1965) Advocacy And Pluralism In Planning. Journal of the American Institute of
Planners, 427–442. Day D (1997) Citizen Participation In The Planning Process: An Essentially Contested
Concept? CPL bibliography, 11(3), 421–434. Dewey J (1927) The Public And Its Problems. Denver: Henry Holt and Company. Easterly W (2014) The Tyranny Of Experts: Economists, Dictators, And The Forgotten Rights
Of The Poor. Basic Books. El-gaili El-Gack N (2007) Participatory Approaches To Development: An Analysis Of The
Experiences Of Development Projects In Sudan. Massey University. Van Empel C (2007) The Effectiveness Of Community Participation In Planning And Urban
Developments. Massey University. Escobar A (1988) Power And Visibility: Development And The Invention And Management Of
The Third World. Cultural Antrhopology, 3(4), 428–443. Fincher R & Jacobs JM (1998) Cities Of Difference. Guilford Press. Gaventa J & Valderrama C (1999) Participation, Citizenship And Local Governance. Gonzalez ANM (2014) A Transaction Costs Approach To Community Participatory
Development: Orthodox Theory Vs Reality In Traditional Communities In Mexico. The London School of Economics.
Goulet D (1989) Participation In Development: New Avenues. World Development, 17(2), 165–178.
Gupta KL (1999) Foreign Aid: New Perspectives. Spring Science+Business Media. Hassenforder E (2015) Participatory Planning, Evaluation And Institutional Dynamics In
African Natural Resource Management (NRM). Australian National University. Hauzer MDearden P& Murray G (2013) The Effectiveness Of Community-based Governance
Of Small-scale Fisheries, Ngazidja Island Comoros. Marine Policy, 38, 346–354. Head BW (2007) Community Engagement: Participation On Whose Terms? Australian
Journal of Political Science, 42(3), 441–454. Heron J (1971) Experience And Method. Surrey: Human Potential Research Project
Department of Educational Studies. Hickey S & Mohan G (2004) Participation--From Tyranny To Transformation?: Exploring New
Approaches To Participation In Development. Zed Books. Hickey S & Mohan G (2004) Participation From Tyranny To Transformation? London: Zed
Books. Hobart M (1993) An Anthropological Critique Of Development: The Growth Of Ignorance.
London: Routledge.
900
Illich I (1973) Tools For Conviviality. Innes JE & Booher DE (1999) Consensus Building As Role Playing And Bricolage. Journal of
the American Planning Association, 65:1, 9–26. Issihaka Ali A et al. (2015) Contribution À L’amélioration De La Gestion Des Déchets
Ménagers Aux Comores. International Journal of Innovation and Applied Studies, 12(No. 4), 786–800.
Lewin K (2001) Participatory Action Research As A Methodology Of Rural Development. , (May 1997), 6–11.
Lipton M (1977) Why Poor People Stay Poor: Urban Bias In World Development. Harvard University Press.
Malunga C & Holcombe SH (2014) Development In Practice Endogenous Development : Naïve Romanticism Or Practical Route To Sustainable African Development ? Development in Practice, 24(5–6), 615–622.
Mansuri G & Rao V (2004) Community-Based And -Driven Development: A Critical Review. Miraftab F (2016) Insurgent Planning: Situating Radical Planning In The Global South.
Readings in Planning Theory: Fourth Edition, 8(1), 480–498. Mosse D (1994) Authority, Gender And Knowledge: Theoretical Reflections On The Practice
Of Participatory Rural Appraisal. Development and Change, 25(3), 497–526. Moulaert FMartinelli F& Swyngedouw E (2005) Towards Alternative Model(s) Of Local
Innovation. Urban Studies, 42(11), 1969–1990. Mwiru MN (2015) The Importance Of Community Participation In Development Projects At
Local Level A Case Of Dodoma Municipal Council. Mzumbe University. Oxfam (2009) Strengthening Popular Participation In The African Union. Parrott L (2011) Translating Participatory Theory Into Practice: Insights From Honduras On
Relationships Between International Aid Organizations, Communities, And The Government Within The Setting Of Disaster Related Projects. Lund University.
Peet R & Hartwick E (2009) Theories Of Development. New York: The Guilford Press. Rawls J (1971) A Theory Of Justice. Oxford: University of Oxford Press. Riley S & Basson M (2011) Stakeholder Perceptions Of The Impact Of The Declaration Of
An Urban Development Area In Moranbah – How Sustainable Will The Outcomes Be ? Planning Institute Australia, 1–10.
Rist G (2008) The History Of Development: From Western Origins To Global Faith. London: Zed Books.
Sietchiping R et al. (2014) Role Of Urban–Rural Linkages In Promoting Sustainable Urbanization. Environment and Urbanization ASIA, 5(2), 219–234.
Slocum N (2003) Participatory Methods Toolkit: A Practitioner’s Manual. Spaliviero M et al. (2011) Participatory Approach For Integrated Basin Planning With Focus
On Disaster Risk Reduction: The Case Of The Limpopo River. Stivers C (1990) The Public Agency As Polis: Active Citizenship In The Administrative State.
Administration & Society, 22(1), 86–105. Tacoli C (1998) Rural-urban Interactions: A Guide To The Literature. Environment and
Urbanization, 10(1), 147. Trapero ESSanz IM& De Ureña Francés JM (2014) Global Metropolitan-Regional Scale In
Evolution: Metropolitan Intermediary Cities And Metropolitan Cities. European Planning Studies, 4313(January 2015), 1–29.
Umemoto K (2001) Walking In Another’s Shoes: Epistemological Challenges In Participatory Planning. Journal of Planning Education and Research, 21, 17–31.
Villamor GB et al. (2014) Assessing Stakeholders’ Perceptions And Values Towards Social-ecological Systems Using Participatory Methods. Ecological Processes, 3(1), 22.
Watson V (2014) Co-production And Collaboration In Planning – The Difference. Planning Theory & Practice, 15(1), 62–76.
Watson V (2002) The Usefulness Of Normative Planning Theories In The Context Of Sub-Saharan Africa. , 1(1), 27–52.
Weijschedé TBuijs A& Menzel S (2011) Ecossytem Services And Participatory Planning. World Bank (2017) Comoros Country Profile , 2017.
901
Chang, Hsueh-Sheng Increase resilience in right community ISOCARP-OAPA Conference 2017 Chen, Tzu-Ling
1
Increase Resilience in Right Community under Potential
Earthquake Risk
HSUEH-SHENG CHANG* and TZU-LING CHEN** *Professor, Urban Planning Department, National Cheng Kung University, Taiwan
**Postdoctoral Fellow, Urban Planning Department, National Cheng Kung University, Taiwan
Abstract During major earthquake disasters, a lack of preparedness on the part of both officials and citizens can result in serious injuries and fatalities. Indeed, due to the unequal distribution of responsibility, decision-making processes differ sharply between disaster management planners and the general population. Although the potential relationship between earthquake risk perception and adjustment behavior remains under debate, humans are indeed capable of responding to disasters and further reducing their risk. Previously, many discussions emphasized engineering or seismological efforts to mitigate earthquake disaster while attributing less responsibility to governmental preparedness and individual earthquake risk perception, both of which might place people at greater risk to damaging earthquakes. Therefore, the purpose of this study is to explore and compare the spatial patterns of earthquake disaster probability, earthquake risk perception, and governmental preparedness. The results show that there are significantly unequal distributions of both earthquake risk perception and governmental preparedness and that such low risk perception on the part of citizens and low preparedness on the part of officials might result in serious impacts in a future earthquake disaster. Particularly, it is urgent that earthquake risk perception and governmental preparedness be increased in the north and south regions along the Houchiali Fault. Keywords: earthquake disaster probability, earthquake risk perception, governmental preparedness 1. Introduction
Earthquakes are unpredictable and infrequent disasters that can result in major injuries and fatalities (James 2008; CRED 2011). Losses of lives and assets during an earthquake disaster depend on several factors, including the energy released by the earthquake, the duration, the depth of and the distance from the epicenter and others (Palm and Carroll 1998; Parker et al. 2011; Wei et al. 2013; Xu et al. 2015; Solberg et al. 2016). Among the factors, lack of preparedness on the part of both officials and citizenry has had serious consequences, as seen in the Kobe Earthquake of 1995, which revealed misplaced confidence in the city’s ability to withstand such a disaster (EERI 1995; Miyamoto 1996). Humans are capable of responding to their environments and reducing risk by learning from past experiences (Slovic 1987). Over the past decades, multiple studies have used questionnaires to appraise individuals’ perceptions of earthquake risk (Lindell and Perry 2000; Whitney et al. 2004). Although no specific relationship between earthquake risk perception and adjustment behavior has been documented, some studies have implied that certain risk perceptions make people more capable of responding to earthquake disasters (Perry and Lindell 2008) and thus increase their likelihood of survival (Becker 2012). However, some studies have found that few people are willing to adopt disaster mitigation measures even after suffering through multiple disaster experiences (Palm et al. 1990). Much attention has been paid to engineering and seismological efforts to mitigate earthquake disaster. However, less emphasis has been placed on how governmental preparedness and individual earthquake risk perception might place people at greater risk from damaging earthquakes (Palm and Hodgson 1992). An individual’s assessment of disaster risk may be
902
Chang, Hsueh-Sheng Increase resilience in right community ISOCARP-OAPA Conference 2017 Chen, Tzu-Ling
2
limited by a lack of choices due to a deficiency of cultural, legal and other knowledge, denial of the potential severity of disasters, and denial of the potential recurrence of disasters (Gifford 2014). In addition, due to their disparate levels of responsibility for disaster preparedness, there is a sharp contrast in decision-making processes between disaster management planners and individuals (Fischer 2000; Paleo 2015). The purpose of this study is to explore the spatial association between earthquake disaster probability, earthquake risk perception, and governmental preparedness. First, to explore spatial patterns, this paper applies a spatial autocorrelation coefficient to earthquake disaster probability and earthquake risk perceptions. Next, the bivariate local indicator of spatial association (bivariate LISA) is applied to pair-analysis of earthquake disaster probability and disaster risk perception, disaster risk perception and governmental preparedness, and earthquake disaster probability and governmental preparedness. Section 2 describes the data and methodology, including the study area, data set, and methods applied in this study. Section 3 presents the results of our analysis of earthquake risk perception, spatial autocorrelation analysis, and bivariate LISA. The final section offers some conclusions.
2. Data and methodology 2.1 Study area According to the Central Weather Bureau (2016), a large magnitude earthquake occurs once every thirty years in southern Taiwan. In Tainan, where our study area is located, earthquakes above the magnitude of 6.0 on the Richter scale occurred in 1862 and 1964. The shallow one, in 1964, caused hundreds of deaths and damaged tens of thousands of buildings. An active fault called the Houchiali Fault trends north to south across the study area, and another five active faults are nearby, including the Muchiliao Fault, Liuchia Fault, Chukou Fault, Hsinhua Fault, and Tsochen Fault. Consequently, the study area is earthquake-prone. The Chukou Fault and the Hsinhua Fault have been identified as Holocene active faults. Although the other faults are concealed, it can be inferred that the Liuchia Fault is a Holocene active fault and that the Houchiali Fault, Muchiliao Fault, and Tsochen Fault are Late Pleistocene active faults (See Figure 1a). The study area is exposed to earthquake hazards, as most active faults were confirmed after the city had already been built upon them. The area’s population and development are clustered in the central area to the south, right above the Houchiali Fault. According to 2016 population statistics, there are approximately 252,000 people in the study area (Bureau of Civil Affairs of the Tainan City Government 2016) (See Figure 1b). Although there is an industrial park located in the northeastern region, most areas in the east are still used for agriculture. According to a land use investigation in 2011, building and agriculture are the major land use types in this area, accounting for 16,278 ha and 10,126 ha, respectively. On the land used for building, residential and mixed land uses are the major building types clustered in the southwestern region (See Figure 1c). According to the Building Act, seismic designs were improved in the building requirements of 1974, 1982, 1999, and 2005. Therefore, in this article, building years have been divided into five categories: before 1974, 1974-1982, 1982-1999, 1999-2005, and after 2005. A higher proportion of buildings constructed before 1974 are located in the southeastern region, and a higher proportion of buildings constructed before 1982 are located along the Houchiali Fault in the southern region. Most of the buildings in the study area were constructed between 1982-1999 and should therefore have better seismic designs (See Figure 1d). As for construction, most of the buildings are constructed using reinforced concrete (RC) and corrugated metal. In the north, most of the corrugated metal is made for industrial uses. Brick, wood, and rock buildings are of weaker construction and are located in the south along the Houchiali Fault. However, low-rise buildings (fewer than five stories) are common in the study area, and such buildings are not required to have any certification from professional engineers with expertise related to buildings (See Figure 1e).
903
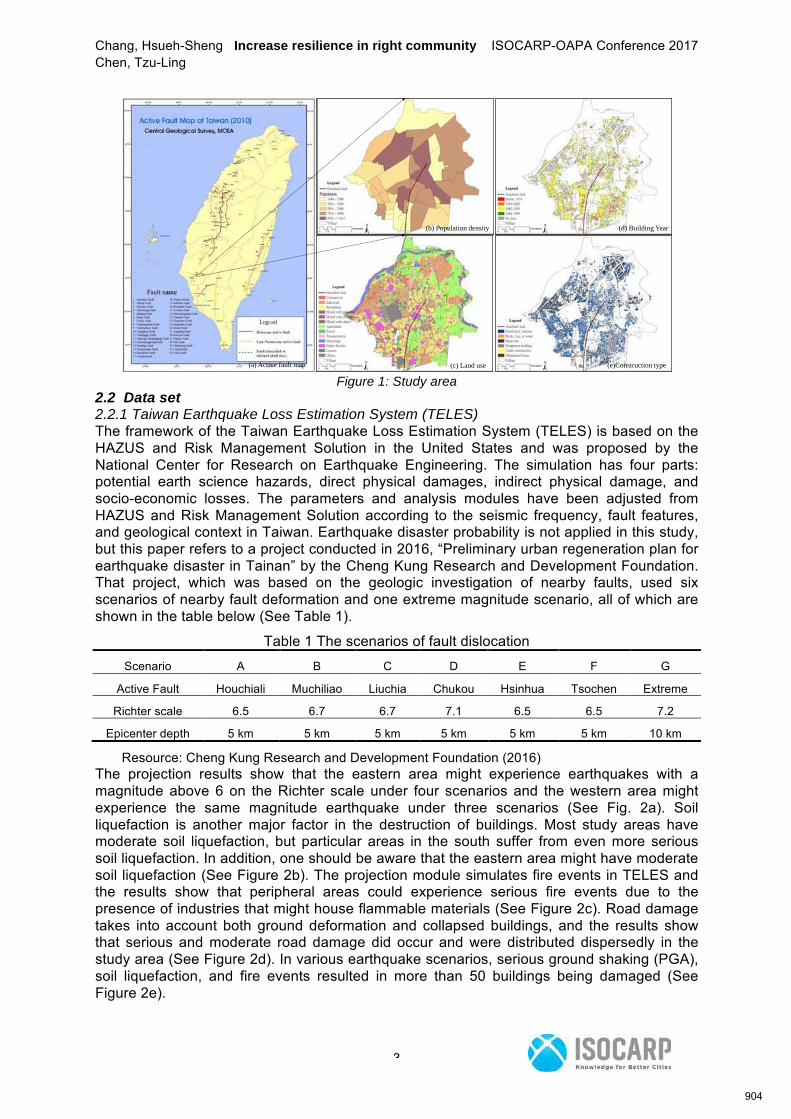
Chang, Hsueh-Sheng Increase resilience in right community ISOCARP-OAPA Conference 2017 Chen, Tzu-Ling
3
(b) Population density (d) Building Year
(e)Construction type(c) Land use (a) Active fault map Figure 1: Study area
2.2 Data set 2.2.1 Taiwan Earthquake Loss Estimation System (TELES) The framework of the Taiwan Earthquake Loss Estimation System (TELES) is based on the HAZUS and Risk Management Solution in the United States and was proposed by the National Center for Research on Earthquake Engineering. The simulation has four parts: potential earth science hazards, direct physical damages, indirect physical damage, and socio-economic losses. The parameters and analysis modules have been adjusted from HAZUS and Risk Management Solution according to the seismic frequency, fault features, and geological context in Taiwan. Earthquake disaster probability is not applied in this study, but this paper refers to a project conducted in 2016, “Preliminary urban regeneration plan for earthquake disaster in Tainan” by the Cheng Kung Research and Development Foundation. That project, which was based on the geologic investigation of nearby faults, used six scenarios of nearby fault deformation and one extreme magnitude scenario, all of which are shown in the table below (See Table 1).
Table 1 The scenarios of fault dislocation
Scenario A B C D E F G
Active Fault Houchiali Muchiliao Liuchia Chukou Hsinhua Tsochen Extreme
Richter scale 6.5 6.7 6.7 7.1 6.5 6.5 7.2
Epicenter depth 5 km 5 km 5 km 5 km 5 km 5 km 10 km
Resource: Cheng Kung Research and Development Foundation (2016) The projection results show that the eastern area might experience earthquakes with a magnitude above 6 on the Richter scale under four scenarios and the western area might experience the same magnitude earthquake under three scenarios (See Fig. 2a). Soil liquefaction is another major factor in the destruction of buildings. Most study areas have moderate soil liquefaction, but particular areas in the south suffer from even more serious soil liquefaction. In addition, one should be aware that the eastern area might have moderate soil liquefaction (See Figure 2b). The projection module simulates fire events in TELES and the results show that peripheral areas could experience serious fire events due to the presence of industries that might house flammable materials (See Figure 2c). Road damage takes into account both ground deformation and collapsed buildings, and the results show that serious and moderate road damage did occur and were distributed dispersedly in the study area (See Figure 2d). In various earthquake scenarios, serious ground shaking (PGA), soil liquefaction, and fire events resulted in more than 50 buildings being damaged (See Figure 2e).
904
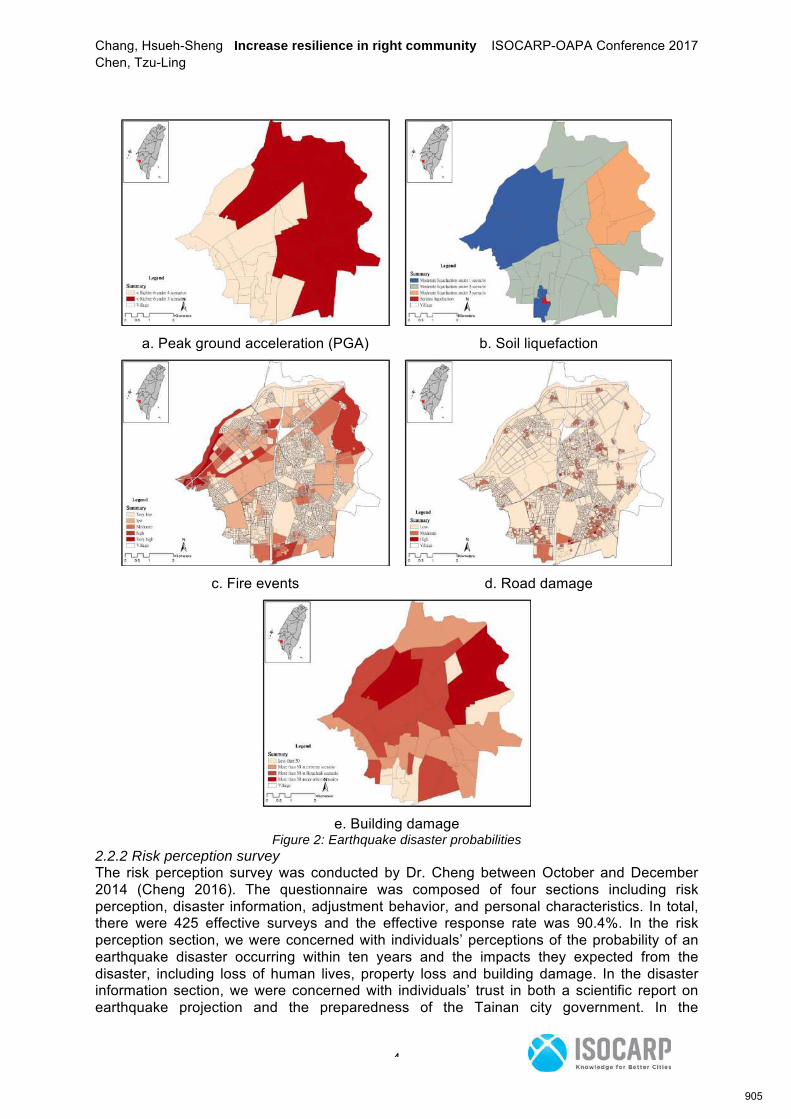
Chang, Hsueh-Sheng Increase resilience in right community ISOCARP-OAPA Conference 2017 Chen, Tzu-Ling
4
a. Peak ground acceleration (PGA) b. Soil liquefaction
c. Fire events d. Road damage
e. Building damage
Figure 2: Earthquake disaster probabilities 2.2.2 Risk perception survey The risk perception survey was conducted by Dr. Cheng between October and December 2014 (Cheng 2016). The questionnaire was composed of four sections including risk perception, disaster information, adjustment behavior, and personal characteristics. In total, there were 425 effective surveys and the effective response rate was 90.4%. In the risk perception section, we were concerned with individuals’ perceptions of the probability of an earthquake disaster occurring within ten years and the impacts they expected from the disaster, including loss of human lives, property loss and building damage. In the disaster information section, we were concerned with individuals’ trust in both a scientific report on earthquake projection and the preparedness of the Tainan city government. In the
905
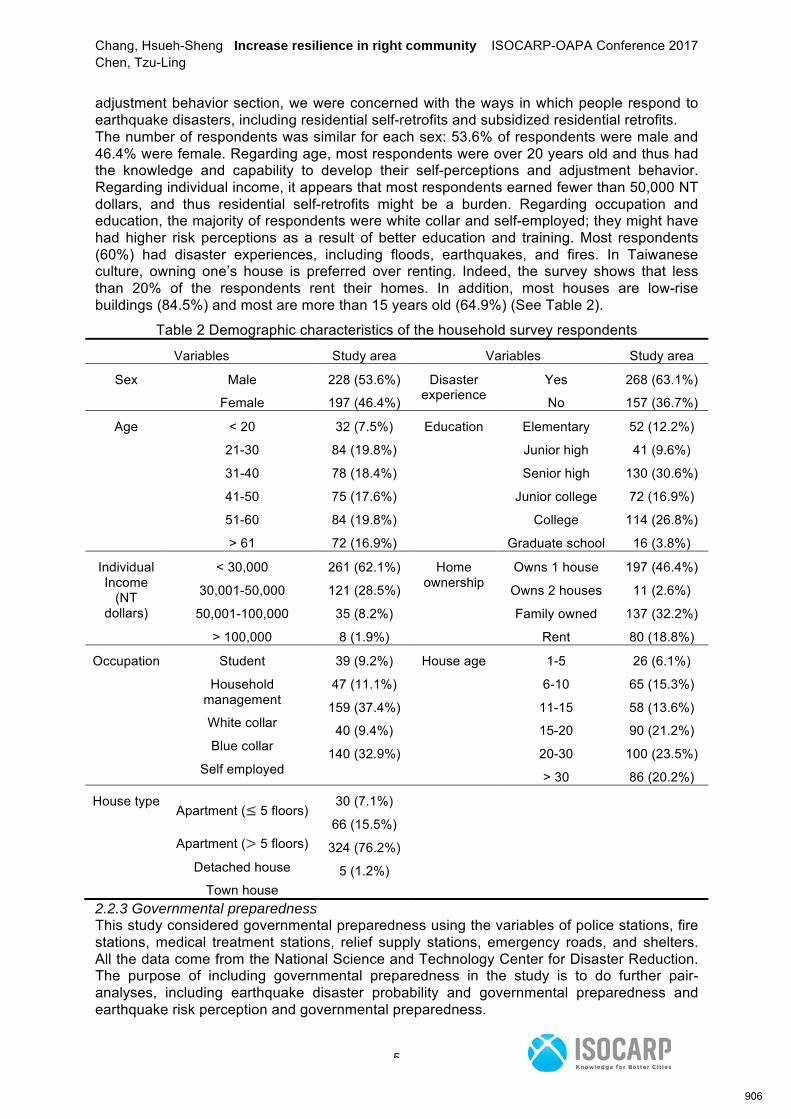
Chang, Hsueh-Sheng Increase resilience in right community ISOCARP-OAPA Conference 2017 Chen, Tzu-Ling
5
adjustment behavior section, we were concerned with the ways in which people respond to earthquake disasters, including residential self-retrofits and subsidized residential retrofits. The number of respondents was similar for each sex: 53.6% of respondents were male and 46.4% were female. Regarding age, most respondents were over 20 years old and thus had the knowledge and capability to develop their self-perceptions and adjustment behavior. Regarding individual income, it appears that most respondents earned fewer than 50,000 NT dollars, and thus residential self-retrofits might be a burden. Regarding occupation and education, the majority of respondents were white collar and self-employed; they might have had higher risk perceptions as a result of better education and training. Most respondents (60%) had disaster experiences, including floods, earthquakes, and fires. In Taiwanese culture, owning one’s house is preferred over renting. Indeed, the survey shows that less than 20% of the respondents rent their homes. In addition, most houses are low-rise buildings (84.5%) and most are more than 15 years old (64.9%) (See Table 2).
Table 2 Demographic characteristics of the household survey respondents
Variables Study area Variables Study area
Sex Male
Female
228 (53.6%)
197 (46.4%)
Disaster experience
Yes
No
268 (63.1%)
157 (36.7%)
Age < 20
21-30
31-40
41-50
51-60
> 61
32 (7.5%)
84 (19.8%)
78 (18.4%)
75 (17.6%)
84 (19.8%)
72 (16.9%)
Education Elementary
Junior high
Senior high
Junior college
College
Graduate school
52 (12.2%)
41 (9.6%)
130 (30.6%)
72 (16.9%)
114 (26.8%)
16 (3.8%)
Individual Income
(NT dollars)
< 30,000
30,001-50,000
50,001-100,000
> 100,000
261 (62.1%)
121 (28.5%)
35 (8.2%)
8 (1.9%)
Home ownership
Owns 1 house
Owns 2 houses
Family owned
Rent
197 (46.4%)
11 (2.6%)
137 (32.2%)
80 (18.8%)
Occupation Student
Household management
White collar
Blue collar
Self employed
39 (9.2%)
47 (11.1%)
159 (37.4%)
40 (9.4%)
140 (32.9%)
House age 1-5
6-10
11-15
15-20
20-30
> 30
26 (6.1%)
65 (15.3%)
58 (13.6%)
90 (21.2%)
100 (23.5%)
86 (20.2%)
House type Apartment ( 5 floors)
Apartment ( 5 floors)
Detached house
Town house
30 (7.1%)
66 (15.5%)
324 (76.2%)
5 (1.2%)
2.2.3 Governmental preparedness This study considered governmental preparedness using the variables of police stations, fire stations, medical treatment stations, relief supply stations, emergency roads, and shelters. All the data come from the National Science and Technology Center for Disaster Reduction. The purpose of including governmental preparedness in the study is to do further pair-analyses, including earthquake disaster probability and governmental preparedness and earthquake risk perception and governmental preparedness.
906
Chang, Hsueh-Sheng Increase resilience in right community ISOCARP-OAPA Conference 2017 Chen, Tzu-Ling
6
2.3 Methods 2.2.1 Spatial autocorrelation coefficient In analyzing the spatial pattern of earthquake disaster probability and earthquake risk perception, the spatial autocorrelation coefficient analyzes both geographical features and the attributes of polygons. This approach measures and tests how clustered/dispersed the spatial units are with respect to certain attributes. This approach is particularly powerful because there are no identical features in different geographic spaces. According to Tobler’s (1970) statement of the “first law of geography,” everything is related, but things near each other are more related (Cliff and Ord 1981; Goodchild 1986; Griffith et al. 2003). Spatial autocorrelation of a set of spatial units refers to the similarity between the spatial units in nearby locations, and similar features tend to be close to each other. Based on the concept of the spatial autocorrelation coefficient, there are two common measures, Geary’s C ratio and Moran’s I index. Because to Geary’s C ratio is inconsistent with the conventional expression of the correlation coefficient of the (-1,1) scale, this study applies Moran’s I index to explore spatial patterns. The scale of Moran’s I index is similar to the conventional impression of the correlation coefficient, but there are two exceptions: the value of a random pattern is not zero but -1/(n-1), and the values of Moran’s I index are not limited by (-1, 1) (Wong and Lee 2005). Moran’s I index defines the similarity of attribute values based on the difference between each value and the mean of all attribute values. The equation of Moran’s I index is the following:
……(1)
Where is the Moran’s I value of the spatial correlation of earthquake disaster probability and
earthquake risk perception; n is the number of spatial units; and are earthquake disaster
probability and earthquake risk perception in units i and j, respectively; and is the mean
earthquake disaster probability and earthquake risk perception in all spatial units. Finally, is the spatial weights matrix (the number of ways in which two corresponding spatial units can be connected to each other is 1; otherwise 0) 2.2.2 Bivariate local indicator of spatial association (Bivariate LISA) Bivariate spatial autocorrelation is suggested by Lee (2001) and combines both Pearson’s correlation coefficient and Moran’s I to estimate the spatial autocorrelation between two variables. The equation of bivariate spatial autocorrelation is:
……………..(2)
The first component can be regarded as the scaling factor. In the second component, the denominator is the sum of deviations of x and y, and the mean deviations of x and y in spatial
unit j are multiplied together. is the spatial weight, which is determined from the spatial relationship between i and j. Conceptually, bivariate spatial autocorrelation compares each xi with the mean of x and each yi with the mean of y. When x and y correlate strongly, both x and y are associated with large values, and vice versa. 3. Results
In this section, this study applies spatial autocorrelation analysis to earthquake disaster probability, earthquake risk perception and governmental preparedness. Both earthquake disaster probability and governmental preparedness show significant clustered patterns for Moran’s I index, which is larger than the expected value of Moran’s I. However, earthquake risk perception shows the opposite spatial pattern. Moran’s I index of risk perception is lower
907
Chang, Hsueh-Sheng Increase resilience in right community ISOCARP-OAPA Conference 2017 Chen, Tzu-Ling
7
than the expected value of Moran’s I, indicating a dispersed pattern, and disaster information and adjustment behavior are distributed randomly in the study area (See Table 3).
Table 3 Global Moran’s I summary
Moran’s I E(I) z-score Pattern
Peak ground acceleration (PGA) 0.598 -0.0238 6.3692 Clustered
Soil liquefaction 0.2825 -0.0238 4.0012 Clustered
Fire event 0.3986 -0.0004 88.6349 Clustered
Building damage 0.3138 -0.0238 3.4843 Clustered
Road damage 0.2197 -0.0004 48.8769 Clustered
Governmental preparedness 0.2785 -0.0004 62.2089 Clustered
Risk perception -0.1539 -0.0303 -1.7077 Dispersed
Disaster information -0.0525 -0.0303 -0.3031 Random
Adjustment behavior -0.1095 -0.0303 -1.0464 Random According to spatial autocorrelation analysis, both earthquake disaster probability and governmental preparedness appear in clustered patterns in which adjacent units show similar characteristics. On the other hand, earthquake risk perception is distributed in a rather dispersed or random way. To explore potential spatial relationships among earthquake disaster probability, earthquake risk perception, and governmental preparedness, this study applies bivariate LISA to pair analyses. In this section, this study standardizes PGA, soil liquefaction, fire events, building damage, and road damage and further summarizes all five values into one that represents earthquake disaster probability. 3.1 Earthquake disaster probability and earthquake risk perception The bivariate LISA has been applied to earthquake disaster probability and risk perception, disaster information, and adjustment behavior. The bivariate Moran’s I index of earthquake disaster probability and risk perception is 0.2553, indicating a similar trend in both variables; 235 units appear as significant clusters (high-high and low-low) and 166 spatial units appear as spatial outliers (high-low and low-high). Among them, the high-low spatial outliers are located in the north and south, and such areas might suffer serious earthquake impacts due to their relatively lower risk perception (See Figure 3a). The bivariate Moran’s I index of earthquake disaster probability and disaster information is -0.2158, indicating an opposite trend in both variables; 84 units appear as significant spatial clusters and 291 units appear as spatial outliers. Among them, 43 units are low-low clusters located in the northwest of the central areas. As the two variables have opposite trends, the low-low spatial clusters indicate higher disaster probability and lower awareness of disaster information; they might therefore suffer serious earthquake impacts (See Figure 3b). The bivariate Moran’s I index of earthquake disaster probability and adjustment behavior is 0.2409, indicating a similar trend between them; 102 units appear as significant spatial clusters and 580 units appear as spatial outliers. Among the spatial outliers, 484 units of low-high outliers are located in the east, indicating that residents are willing to improve the seismic design of their houses even though their earthquake risk is relatively low. Overall, seismic design improvements are acceptable when they are affordable and subsidized, and only a few areas in the north are reluctant to retrofit their houses (See Figure 3c).
908
Chang, Hsueh-Sheng Increase resilience in right community ISOCARP-OAPA Conference 2017 Chen, Tzu-Ling
8
a. Disaster cognition b. Disaster information c. Disaster behavior
Figure 3: Bivariate LISA maps of earthquake disaster risk and disaster risk perception1 3.2 Governmental preparedness and earthquake risk perception In this section, this study applies bivariate LISA to governmental preparedness and risk perception, disaster information, and adjustment behavior. The bivariate Moran’s I index of governmental preparedness and risk perception is -0.1241, indicating a moderately opposite trend between the two variables; 235 units appear as significant spatial clusters and 288 units appear as spatial outliers. Among them, although 234 units of low-low spatial clusters located in the east region show that higher risk perception is able to account for such lower governmental preparedness, fundamental governmental preparedness should be improved in the future. In addition, the low-high spatial outliers located in the west region indicate both lower governmental preparedness and risk perception (See Figure 4a). The bivariate Moran’s I of governmental preparedness and disaster information is -0.1168, indicating a moderately opposite trend between the two; 146 units appear as significant clusters and 211 units appear as spatial outliers. Among them, although 139 units of low-low spatial clusters located in the west and the east separately indicate that higher awareness of disaster information is able to address lower governmental preparedness, essential governmental preparedness should be improved. The 161 units of low-high spatial outliers indicate both lower governmental preparedness and awareness of disaster information (See Figure 4b). The bivariate Moran’s I of governmental preparedness and adjustment behavior is 0.023, indicating a slightly similar trend between the two variables; 124 units appear as significant spatial clusters and 920 units appear as spatial outliers. Both low-low spatial clusters and low-high outliers indicate relatively lower governmental preparedness, but low-low spatial clusters have higher adjustment behaviors. Many more units are low-high spatial outliers, showing that house retrofits are necessary in these areas (See Figure 4c).
a. Disaster cognition b. Disaster information c. Disaster behavior
1 high-high: high values of earthquake disaster risk surrounded by high values of disaster perception; low-low:
low values of earthquake disaster risk surrounded by low values of disaster perception; high-low: high values of
earthquake disaster risk surrounded by low values of disaster perception; low-high: low values of earthquake
disaster risk surrounded by high values of disaster perception
909
Chang, Hsueh-Sheng Increase resilience in right community ISOCARP-OAPA Conference 2017 Chen, Tzu-Ling
9
Figure 4: Bivariate LISA map of governmental preparedness and earthquake risk perception 3.3 Earthquake disaster probability and governmental preparedness In the last section, the study applies bivariate LISA to earthquake risk perception and governmental preparedness. The bivariate Moran’s I index is 0.0469, indicating a slightly similar trend between earthquake risk perception and governmental preparedness. The results show that 46 units are significant spatial clusters and 512 units are spatial outliers. Only 36 units of high-high spatial clusters located in the south have higher governmental preparedness to address high earthquake probability. However, 496 units of high-low spatial outliers in the central area indicate relatively lower physical governmental preparedness under higher earthquake probability (See Figure 5).
Figure 5: Bivariate LISA map of earthquake disaster probability and governmental
preparedness 4. Conclusion
Despite earthquake risk perception not appearing as spatially clustered in the Global Moran’s Index, the bivariate LISA results show significant spatial clusters and spatial outliers. Inequalities in earthquake disaster probability, earthquake risk perception, and governmental preparedness might have serious impacts in future earthquake disasters. Given these inequalities, some areas in the north and south along the Houchiali Fault might suffer serious impacts due to their low risk perception and low confidence in disaster information. In addition, most governmental preparedness is distributed in the south region, and such unequal spatial distribution of governmental preparedness might result in serious impacts due to delays in rescuing people from the corrugated metal, brick and wood buildings located along the fault and in the north region. Overall, given that the study area is overdue for a repeat of an earthquake above 6 on the Richter scale, both individual earthquake risk perception and governmental preparedness should be improved in the near future, especially in areas in the north and south along the Houchiali Fault. References: (“Harvard style” of references) Becker, JS (2012) “Increasing household preparedness for earthquakes: understanding how individuals make meaning of earthquake information and how this related to preparedness”, PhD diss. Massey University, Wellington Berkes, F (1999) Sacred ecology, traditional ecological knowledge and resource management, Philadelphia: Taylor and Francis. Berkes, F and Folke, C (2002) Back to the future: ecosystem dynamics and local knowledge, In: Gunderson, LH and Holling, CS (ed) Panarchy: understanding transformations in human and natural systems. Washington DC: Island Press, pp 121-146 Bureau of Civil Affairs of the Tainan City Government (2016) Retrieved at http://culture.tainan.gov.tw/english/content/index.php?m2=111. Central Weather Bureau (2016) Retrieved at http://www.cwb.gov.tw/V7/index.htm. Cheng, HT (2016) Behavioral intention of personal decision making toward residential seismic strengthening in high-risk seismic zones: a case study in Yongkang District of Tainan. Ph.D. Dissertation. Department of Urban Planning In National Cheng Kung University
910
Chang, Hsueh-Sheng Increase resilience in right community ISOCARP-OAPA Conference 2017 Chen, Tzu-Ling
10
Cheng Kung Research and Development Foundation (2016) Preliminary Urban Regeneration Plan to Earthquake Disaster in Tainan: Tainan Cliff, AD and Ord, JK (1981) Spatial processes: models and applications. London: Pion. CRED (2011) Annual disaster statistical review 2011: the numbers and trends Ciaco Imprimerie, Bulgium: Louvain-la-Neuve. Earthquake Engineering Research Institute (EERI) (1995) The Hyogo-Ken Nambu earthquake January 17, 1995. Preliminary reconnaissance report. Report 9504. Oakland, CA: Earthquake Engineering Research Institute. Fischer, F (2000) Citizens, experts, and the environment: the politics of local knowledge. Durham, NC: Duke University Press. Gifford, R (2014) Environmental psychology principles and practice. Coville, WA: Optimal Books. Goodchild, MF (1986) Spatial autocorrelation. CATMMOG 47. GeoBooks, Norwich: University of East Angolia. Griffith, DA, Wong, DWS and Whitfield, T (2003) “Exploring relationships between the global and regional measures of spatial autocorrelation”, Journal of Regional Science, Vol. 43 No. 4: 683-710. James, E (2008) “Getting ahead of the next disaster: recent preparedness efforts in Indonesia”, Dev Pract, Vol: 18:424-429. Lindell, MK and Perry, RW (2000) “Household adjustment to earthquake hazard: a review of research”, Environ Behav, 32:461-500. Miyamoto, K (1996) “Learning the lessons of disaster”, Japan Quarterly, Vol. 42:6-19 Paleo, U (2015). Risk governance: the articulation of hazard, politics and ecology. Dordrecht: Springer. Palm, R and Carroll, J (1998) Illusions of safety: culture and earthquake hazard response in California and Japan. Boulder, CO: Westview Press. Palm, R and Hodgson, ME (1992) After a California earthquake: attitude and behavior change. Chicago: University of Chicago Press. Palm, R, Michael, H, Denise, B and Donald, L (1990) Earthquake insurance in California: environmnetal policy and individual decision-making. Boulder: Westview Press. Parker, RN, Densmore, AL, Rosser, NJ, de Michele, M, Li, Y, Huang, R, Whadcoat, S and Petley, DN (2011) “Mass wasting triggered by the 2008 Wenchuan earthquake is greater than orogenic growth”, Nat Geosci Vol. 4:449-452. Perry, RW and Lindell, MK (2008) “Volcanic risk perception and adjustment in a multi-hazard environment”, J Volcanol Geother Res, Vol. 172:170-178. Slovic, P (1987) “Perception of risk”, Science, Vol: 236:280-285. Solberg, JM, Hossain, Q and Mseis, G (2016) “Nonlinear time-domain soil-structure interaction analysis of embedded reactor structures subjected to earthquake loads”, Nucl Eng Des, Vol. 304:100-124. Wei, Z, He, H and Shi, F (2013) “Weathering history of an exposed bedrock fault surface interpreted from its topography”, J Struct Geol, 56:34-44. Whitney, KA, Fastenau, PS, Evans, JD and Lysaker, PH (2004) “Comparative neuropsychological function in obsessive-compulsive disorder and schizophrenia with and without obsessive-compulsive symptoms”, Schizophr Res, 69:75-83. Xu, C, Xu, X and Shyu, JBH (2015) “Database and spatial distribution of landslides triggered by the Lushan, China Mw 6.6 earthquake of 20 April 2013”, Geomorphology, Vol. 248:77–92.
911
Deng, Yang Ecological Ways of Settlement Construction ISOCARP-OAPA Conference 2017
1
The Exploration on the Ecological Ways of Traditional Chinese
Settlement Construction
Yang Deng, Beijing Forestry University, China
1. Background
Severe situations China’s water resources are faced with, including water shortage, water pollution, urban flood crisis and other issues, have become increasingly prominent, and have become a major bottleneck restricting the sustainable development of economy and society. However, many of China’s traditional settlements have run well until today, which cannot do without the ancients’ ecological construction of water environment that contains the wisdom of the ancients, and is worth pondering. Almost all of the traditional settlements originated in natural water systems, and around the settlements, various rivers, creeks, ditches, ponds and wells form a network, which effectively solves the problem of water taking, water control, drainage and water storage of settlements, and effectively guarantees agricultural irrigation at the same time. The construction of settlements in areas rich in water is characterized by "water control" and pays great attention to diversion, and that in little water areas and water-deficient areas is characterized by "retaining water" and pays great attention to the collection. To study and summarize the excellent ideas and methods of the ancients, study the ecological wisdom contained therein and study and popularize them according to local conditions will have great influence on the ecological construction of modern settlements – cities and villages.
2. Main research area
China has a vast territory, and due to the different natural environment and social conditions, the traditional settlements are presented in different forms. Located on the west bank of Pacific Ocean, China has very significant monsoon climate, and water resources are distributed more unevenly as space and time vary. The overall distribution of water resources in China is characterized by the fact that the South has a lot of water resources, while the North has little water resources , the East has a lot of water resources, while the West has little water resources, and the precipitation is increasing from the inland Northwest to the Southeast coast. According to the distribution of water resources (Figure 1), China is divided into: regions short of water resources , regions with limited water resources , transition regions with water resources , regions with considerably rich water resources , regions with rich water resources. Qin Ling Mountain-Huaihe River line is the watershed dividing the North and the South. Water potential is determined by the mountain shape and terrain, so Chinese mountains’ terrains and trends directly affect the trend of surface water and climate change. China’s overall terrain is high in the West and low in the East (Figure 2), which facilitates the flow of humid air on the ocean to inland and the formation of rainfall finally. In
912
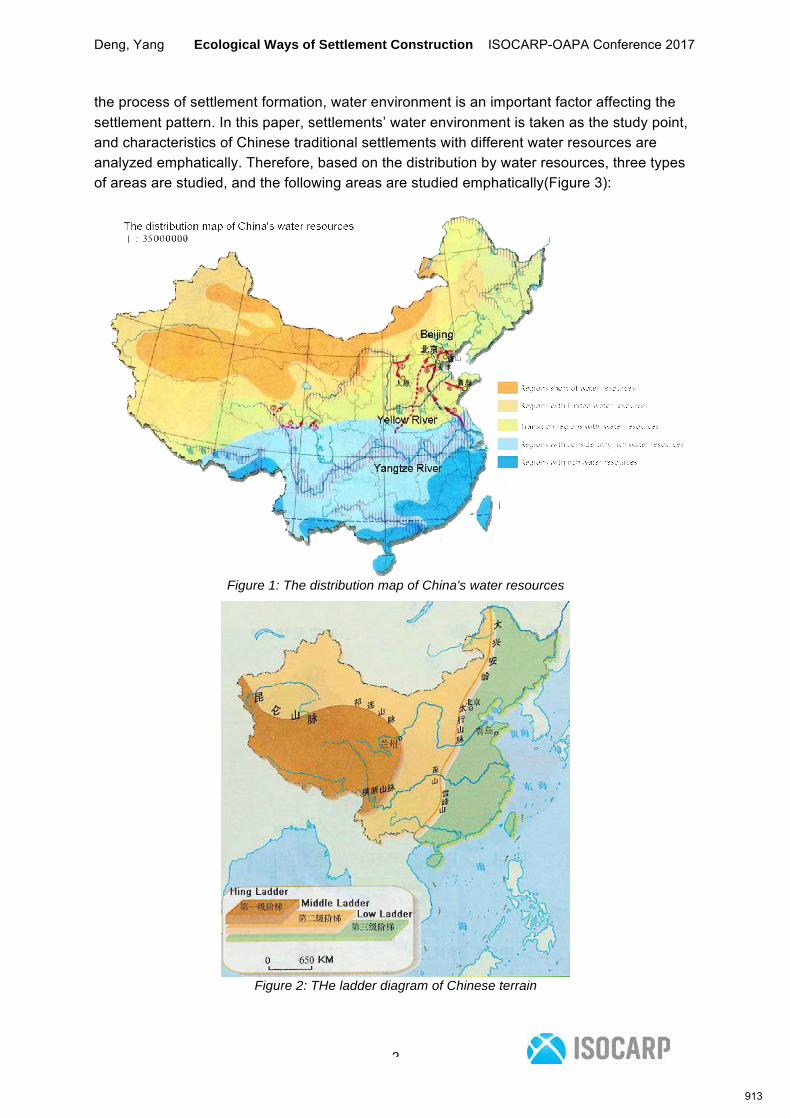
Deng, Yang Ecological Ways of Settlement Construction ISOCARP-OAPA Conference 2017
2
the process of settlement formation, water environment is an important factor affecting the settlement pattern. In this paper, settlements’ water environment is taken as the study point, and characteristics of Chinese traditional settlements with different water resources are analyzed emphatically. Therefore, based on the distribution by water resources, three types of areas are studied, and the following areas are studied emphatically(Figure 3):
Figure 1: The distribution map of China's water resources
Figure 2: THe ladder diagram of Chinese terrain
913

Deng, Yang Ecological Ways of Settlement Construction ISOCARP-OAPA Conference 2017
3
Figure 3: The location of studied areas
2.1 Regions with rich water resources: Fujian Tulou Settlement and Residential Settlement in Huizhou, Anhui
2.1.1 Fujian Tulou Settlement
The famous earth building research scholar Huang Hanmin defines earth buildings in Fujian Earth Buildings as large-scale building residences (Figure 4) with rammed earth wall bearing load. Earth building settlements are located in the hilly areas of Fujian Province in Southeast China, and are mainly distributed in southern and southwest part of Fujian. Yongding has the most earth buildings, about 23,000 buildings. Yongding earth buildings are located in Yongding County (Figure 5), Longgang City, Fujian Province, which is located at the mountain area of Bopingling Mountain and Daimaoshan Mountain, and the area where Jiulong River and Hanjiang River flow through. On the two banks of Yongding River, Jinfeng Creek and Huangtan River between the two mountains, the landform consisting of high mountain areas and low mountain areas accounting for 40%, hills accounting for 15%, and valley basins and intermountain basins accounting for 45%, forms.
This area is located in Southeast China’s water-rich belt, which is rich in water resources, has an average rainfall of 1606.9 mm, and 159 rainfall days on average per year. Its extreme maximum annual rainfall is 2,479.8 mm. Its rainfall is concentrated from March to September and reaches the maximum in June. Rivers around the earth buildings are mostly seasonal rivers, which rise up and down rapidly. Greatly affected by the terrain and the climate, these rivers are characterized by large river slope, rapid and short convergence time. The earth buildings emerged in the Song Dynasty, became mature in the Ming and Qing Dynasties, and have been used so far. Abundant rain and surface water provide a good life and a guarantee of water for production purpose for people living in the earth building settlement.
914
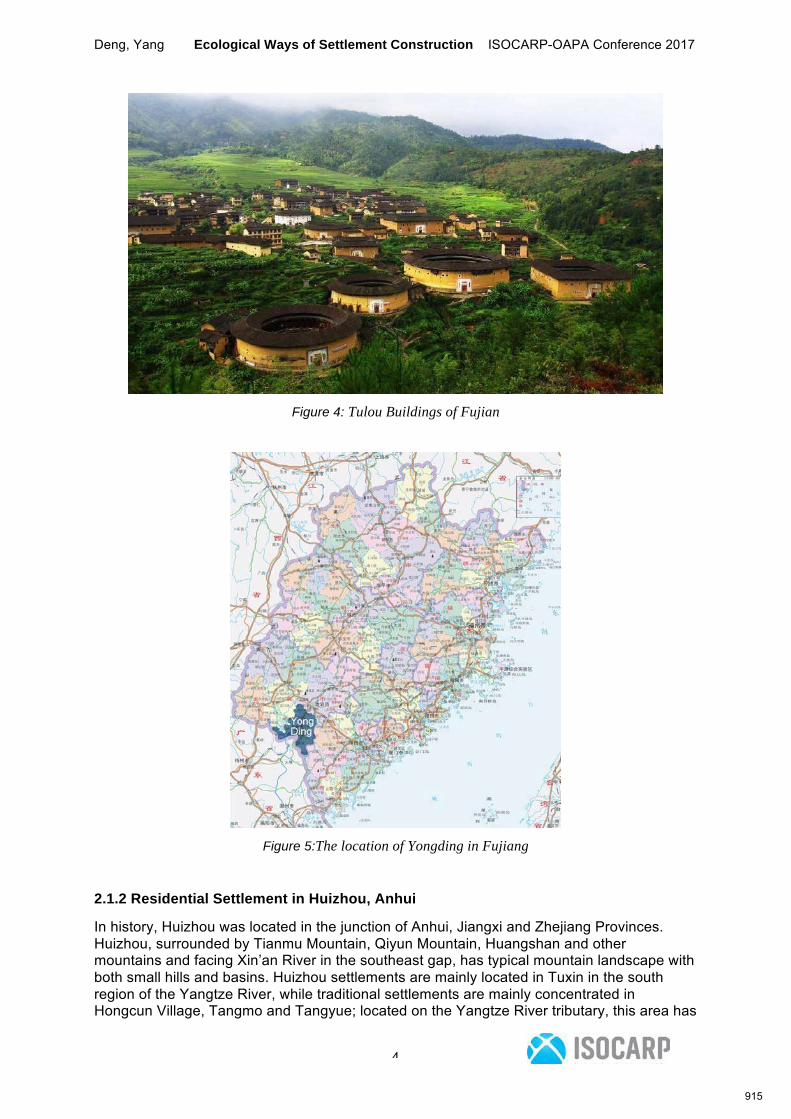
Deng, Yang Ecological Ways of Settlement Construction ISOCARP-OAPA Conference 2017
4
Figure 4: Tulou Buildings of Fujian
Figure 5:The location of Yongding in Fujiang
2.1.2 Residential Settlement in Huizhou, Anhui
In history, Huizhou was located in the junction of Anhui, Jiangxi and Zhejiang Provinces. Huizhou, surrounded by Tianmu Mountain, Qiyun Mountain, Huangshan and other mountains and facing Xin’an River in the southeast gap, has typical mountain landscape with both small hills and basins. Huizhou settlements are mainly located in Tuxin in the south region of the Yangtze River, while traditional settlements are mainly concentrated in Hongcun Village, Tangmo and Tangyue; located on the Yangtze River tributary, this area has
915
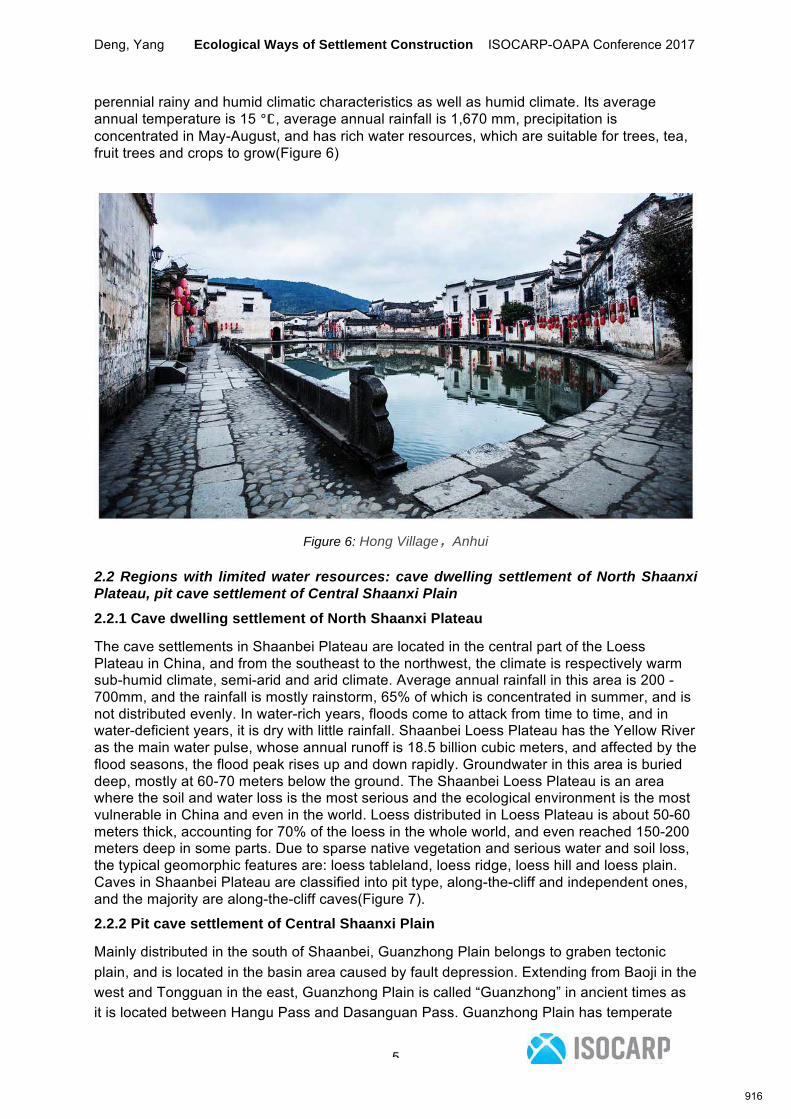
Deng, Yang Ecological Ways of Settlement Construction ISOCARP-OAPA Conference 2017
5
perennial rainy and humid climatic characteristics as well as humid climate. Its average annual temperature is 15 ℃, average annual rainfall is 1,670 mm, precipitation is concentrated in May-August, and has rich water resources, which are suitable for trees, tea, fruit trees and crops to grow(Figure 6)
Figure 6: Hong Village,Anhui
2.2 Regions with limited water resources: cave dwelling settlement of North Shaanxi Plateau, pit cave settlement of Central Shaanxi Plain
2.2.1 Cave dwelling settlement of North Shaanxi Plateau
The cave settlements in Shaanbei Plateau are located in the central part of the Loess Plateau in China, and from the southeast to the northwest, the climate is respectively warm sub-humid climate, semi-arid and arid climate. Average annual rainfall in this area is 200 - 700mm, and the rainfall is mostly rainstorm, 65% of which is concentrated in summer, and is not distributed evenly. In water-rich years, floods come to attack from time to time, and in water-deficient years, it is dry with little rainfall. Shaanbei Loess Plateau has the Yellow River as the main water pulse, whose annual runoff is 18.5 billion cubic meters, and affected by the flood seasons, the flood peak rises up and down rapidly. Groundwater in this area is buried deep, mostly at 60-70 meters below the ground. The Shaanbei Loess Plateau is an area where the soil and water loss is the most serious and the ecological environment is the most vulnerable in China and even in the world. Loess distributed in Loess Plateau is about 50-60 meters thick, accounting for 70% of the loess in the whole world, and even reached 150-200 meters deep in some parts. Due to sparse native vegetation and serious water and soil loss, the typical geomorphic features are: loess tableland, loess ridge, loess hill and loess plain. Caves in Shaanbei Plateau are classified into pit type, along-the-cliff and independent ones, and the majority are along-the-cliff caves(Figure 7).
2.2.2 Pit cave settlement of Central Shaanxi Plain
Mainly distributed in the south of Shaanbei, Guanzhong Plain belongs to graben tectonic plain, and is located in the basin area caused by fault depression. Extending from Baoji in the west and Tongguan in the east, Guanzhong Plain is called “Guanzhong” in ancient times as it is located between Hangu Pass and Dasanguan Pass. Guanzhong Plain has temperate
916
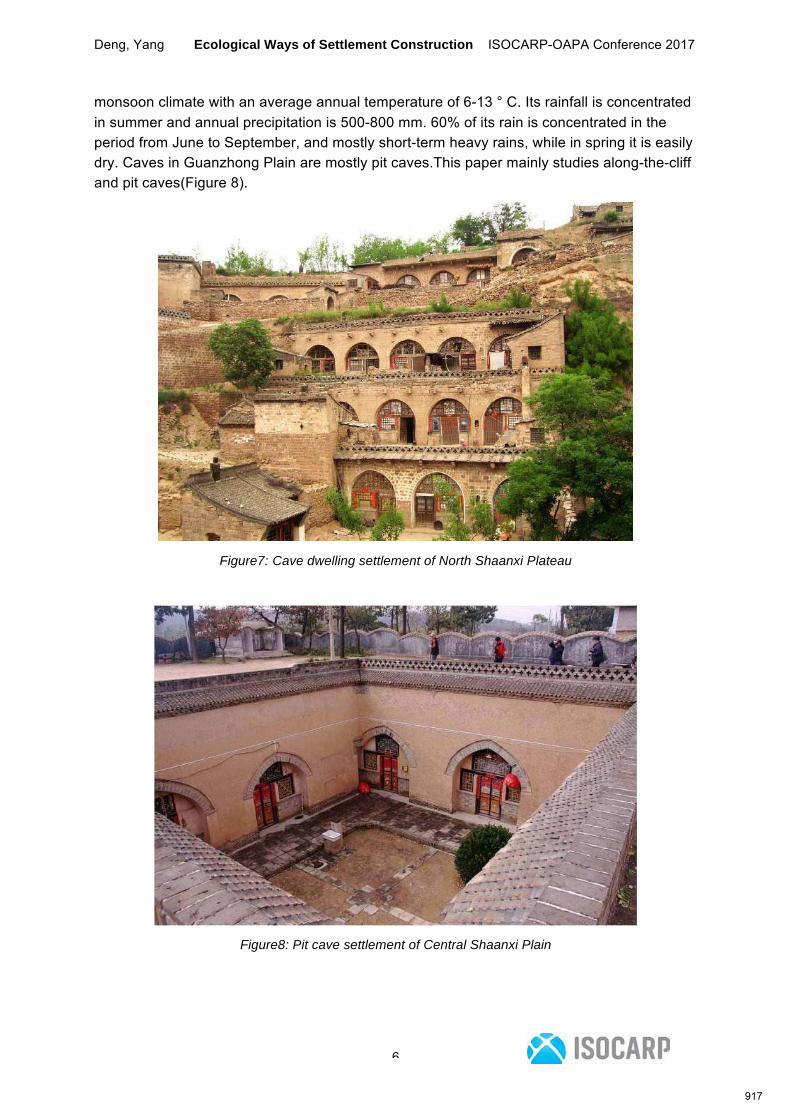
Deng, Yang Ecological Ways of Settlement Construction ISOCARP-OAPA Conference 2017
6
monsoon climate with an average annual temperature of 6-13 ° C. Its rainfall is concentrated in summer and annual precipitation is 500-800 mm. 60% of its rain is concentrated in the period from June to September, and mostly short-term heavy rains, while in spring it is easily dry. Caves in Guanzhong Plain are mostly pit caves.This paper mainly studies along-the-cliff and pit caves(Figure 8).
Figure7: Cave dwelling settlement of North Shaanxi Plateau
Figure8: Pit cave settlement of Central Shaanxi Plain
917
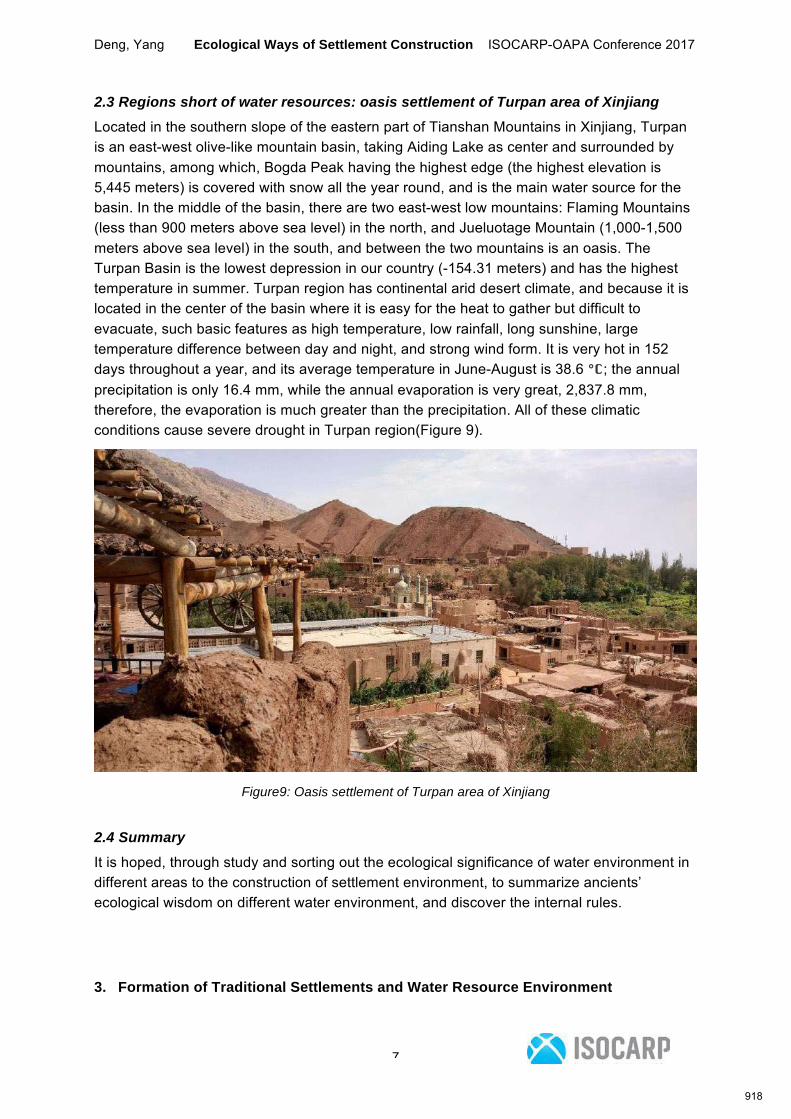
Deng, Yang Ecological Ways of Settlement Construction ISOCARP-OAPA Conference 2017
7
2.3 Regions short of water resources: oasis settlement of Turpan area of Xinjiang
Located in the southern slope of the eastern part of Tianshan Mountains in Xinjiang, Turpan is an east-west olive-like mountain basin, taking Aiding Lake as center and surrounded by mountains, among which, Bogda Peak having the highest edge (the highest elevation is 5,445 meters) is covered with snow all the year round, and is the main water source for the basin. In the middle of the basin, there are two east-west low mountains: Flaming Mountains (less than 900 meters above sea level) in the north, and Jueluotage Mountain (1,000-1,500 meters above sea level) in the south, and between the two mountains is an oasis. The Turpan Basin is the lowest depression in our country (-154.31 meters) and has the highest temperature in summer. Turpan region has continental arid desert climate, and because it is located in the center of the basin where it is easy for the heat to gather but difficult to evacuate, such basic features as high temperature, low rainfall, long sunshine, large temperature difference between day and night, and strong wind form. It is very hot in 152 days throughout a year, and its average temperature in June-August is 38.6 ℃; the annual precipitation is only 16.4 mm, while the annual evaporation is very great, 2,837.8 mm, therefore, the evaporation is much greater than the precipitation. All of these climatic conditions cause severe drought in Turpan region(Figure 9).
Figure9: Oasis settlement of Turpan area of Xinjiang
2.4 Summary
It is hoped, through study and sorting out the ecological significance of water environment in different areas to the construction of settlement environment, to summarize ancients’ ecological wisdom on different water environment, and discover the internal rules.
3. Formation of Traditional Settlements and Water Resource Environment
918
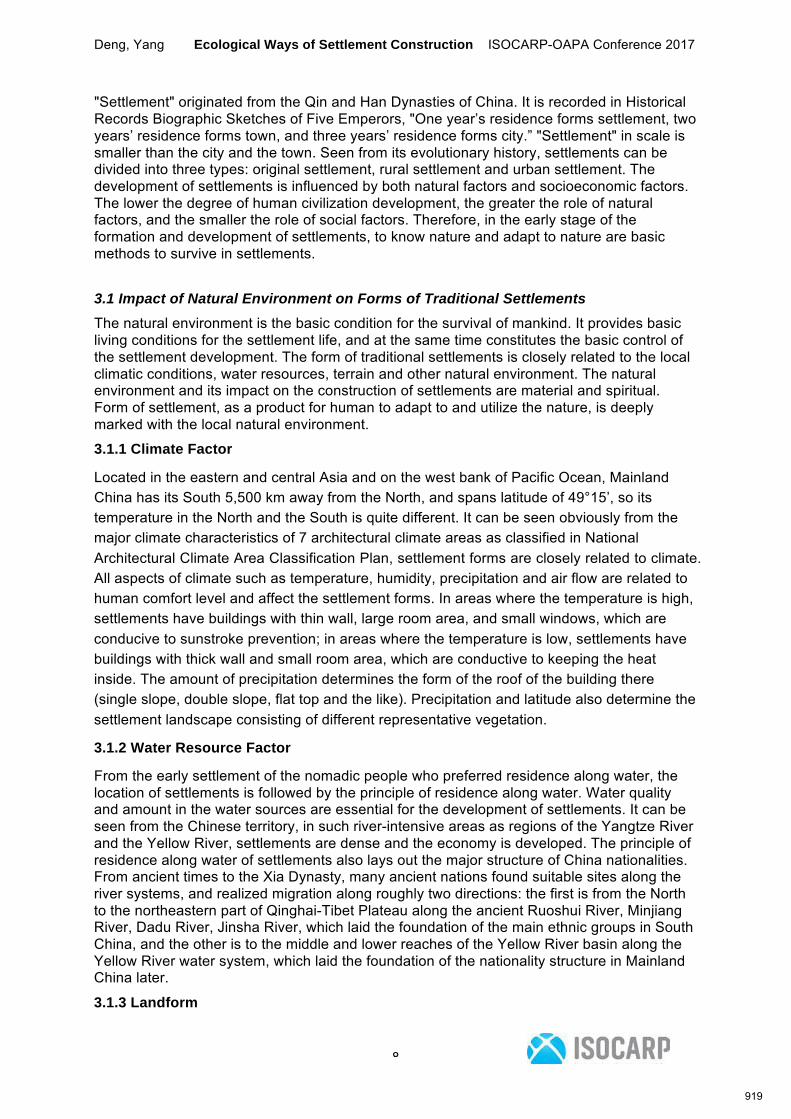
Deng, Yang Ecological Ways of Settlement Construction ISOCARP-OAPA Conference 2017
8
"Settlement" originated from the Qin and Han Dynasties of China. It is recorded in Historical Records Biographic Sketches of Five Emperors, "One year’s residence forms settlement, two years’ residence forms town, and three years’ residence forms city.” "Settlement" in scale is smaller than the city and the town. Seen from its evolutionary history, settlements can be divided into three types: original settlement, rural settlement and urban settlement. The development of settlements is influenced by both natural factors and socioeconomic factors. The lower the degree of human civilization development, the greater the role of natural factors, and the smaller the role of social factors. Therefore, in the early stage of the formation and development of settlements, to know nature and adapt to nature are basic methods to survive in settlements.
3.1 Impact of Natural Environment on Forms of Traditional Settlements
The natural environment is the basic condition for the survival of mankind. It provides basic living conditions for the settlement life, and at the same time constitutes the basic control of the settlement development. The form of traditional settlements is closely related to the local climatic conditions, water resources, terrain and other natural environment. The natural environment and its impact on the construction of settlements are material and spiritual. Form of settlement, as a product for human to adapt to and utilize the nature, is deeply marked with the local natural environment.
3.1.1 Climate Factor
Located in the eastern and central Asia and on the west bank of Pacific Ocean, Mainland China has its South 5,500 km away from the North, and spans latitude of 49°15’, so its temperature in the North and the South is quite different. It can be seen obviously from the major climate characteristics of 7 architectural climate areas as classified in National Architectural Climate Area Classification Plan, settlement forms are closely related to climate. All aspects of climate such as temperature, humidity, precipitation and air flow are related to human comfort level and affect the settlement forms. In areas where the temperature is high, settlements have buildings with thin wall, large room area, and small windows, which are conducive to sunstroke prevention; in areas where the temperature is low, settlements have buildings with thick wall and small room area, which are conductive to keeping the heat inside. The amount of precipitation determines the form of the roof of the building there (single slope, double slope, flat top and the like). Precipitation and latitude also determine the settlement landscape consisting of different representative vegetation.
3.1.2 Water Resource Factor
From the early settlement of the nomadic people who preferred residence along water, the location of settlements is followed by the principle of residence along water. Water quality and amount in the water sources are essential for the development of settlements. It can be seen from the Chinese territory, in such river-intensive areas as regions of the Yangtze River and the Yellow River, settlements are dense and the economy is developed. The principle of residence along water of settlements also lays out the major structure of China nationalities. From ancient times to the Xia Dynasty, many ancient nations found suitable sites along the river systems, and realized migration along roughly two directions: the first is from the North to the northeastern part of Qinghai-Tibet Plateau along the ancient Ruoshui River, Minjiang River, Dadu River, Jinsha River, which laid the foundation of the main ethnic groups in South China, and the other is to the middle and lower reaches of the Yellow River basin along the Yellow River water system, which laid the foundation of the nationality structure in Mainland China later.
3.1.3 Landform
919
Deng, Yang Ecological Ways of Settlement Construction ISOCARP-OAPA Conference 2017
9
Landform is related to the definition of the scope of settlement, and conformity to the lie of mountain and surrounding by water are basic principles for site selection of traditional settlements. The landform where a settlement is located becomes a key factor determining the settlement form and image.
Through the analysis of the above natural factors, for climate, water source and terrain, water is one of the important factors, the rainfall and humiture in climate are a form of water resources, and landform and water system trend are interrelated. Thus, water is the core of living matter among natural factors that affect the formation of settlements.
3.2 Water Environment, an Important Material Basis of Settlement Formation
Human history is roughly divided into three stages - the collection and hunting stage, farming stage and modern times, which respectively lasted for about 200,000 years, about 10,000 years, and only 250 years. Known for its rich diversity, the farming age is more abundant than the collection of hunting times and modern societies, as new technologies (such as agricultural technology and animal husbandry technology) create new lifestyles, but the limitations and backward situation of communication technology ensure the effective isolation of different parts of the world, so that all localities can realize independent development following their own orbits.
The farming stage made it possible to settle, and the settlements formed accordingly. The purpose of settlement development is to expand the agricultural production, make people live and work in peace and contentment, multiply the descendants and consolidate the ethnic groups. As the ancient said, “Agriculture is the foundation of the country”, the prosperity of settlements must be based on the agricultural prosperity, while the development of farming civilization depends on fertile land and abundant water resources. Therefore, water resource is an important material basis for the settlement development, and is the lifeblood of farming civilization.
Different water resource conditions produce different types of agriculture: the Central Plains farming in the Yellow River basin with proper water resources, the Jiangnan agriculture and fishery in Yangtze River basin with abundant water resources and animal husbandry in North arid areas. To choose the environment conducive to the development of agriculture is an important principle of settlements. The basin of the mother river – the Yellow River is the birthplace of China’s agricultural civilization, to which Weihe River, Jinghe River, Luohe River and other rivers provided good water resource conditions, and the development of agriculture caused a large number of settlements to settle here, and gathered ancient emperors.
From the historical point of view, in the farming process, people in the farming age had ecological subconsciousness, found that the rise and fall of settlements were closely related to the changes to the water environment, and deemed that people could only build a beautiful home if they conformed to nature, coordinated the relationship between settlements and water environment. That is the embryonic form of traditional ecological wisdom.
4. Settlement Prototype and Geographical Origin
4.1 Edge of Settlement Prototype
The Western scholar - American geologist Davis put forward the "geomorphic reincarnation theory", which, from the perspective of geography, scientifically explains the relationship between rivers and mountains. Each uplift of the terrain will cause new denudation planes of rivers to form; the gradual sink of the terrain eventually presents a quasi-plain. Along with the interaction between rivers and mountains, a river is subject to changes constantly in three
920

Deng, Yang Ecological Ways of Settlement Construction ISOCARP-OAPA Conference 2017
10
stages (Figure 10): in the first stage, V-shaped valley forms, because rainfall and melt snow gather on surface to form a ravine, which often takes the shape of V as the catchment area is small; in the second stage, S-shaped river valley forms, and because of lateral erosion effect, curvilinear motion of water, especially at the twist of the river valley, produces centrifugal force, forms circulating flow in bend, and finally causes concave bank erosion and convex bank accumulation, which lead to S-shaped river valley; in the third stage, along with the curve of the river expands gradually, the river steps its stage of mature, and the river rally is eroded to be the shape of U. Articles carried by the river water are precipitated down, form fan-shaped accumulation body, and become an alluvial plain with fertile soil, adequate water and flat terrain, which is fertile soil suitable for agricultural production.
Through the above analysis, we can see that as rivers erode mountains, space structures with more sense of suitability form, mountains become reliance of settlements, and at the junctions of mountains and rivers, fertile land suitable for agricultural production forms. Therefore, the edge zones at the junctions of mountains and rivers become zones suitable for the construction of settlement prototypes. The site selection of settlements at edge zones along water is also the basic characteristics of settlement prototypes. The edge is seen at the junctions of different landforms such as the junction of mountain and water and the injection of plain and river valley. Key areas for study chosen in this paper represent the edge of settlement prototypes.
Figure10: The three periods of the river change schematic
921
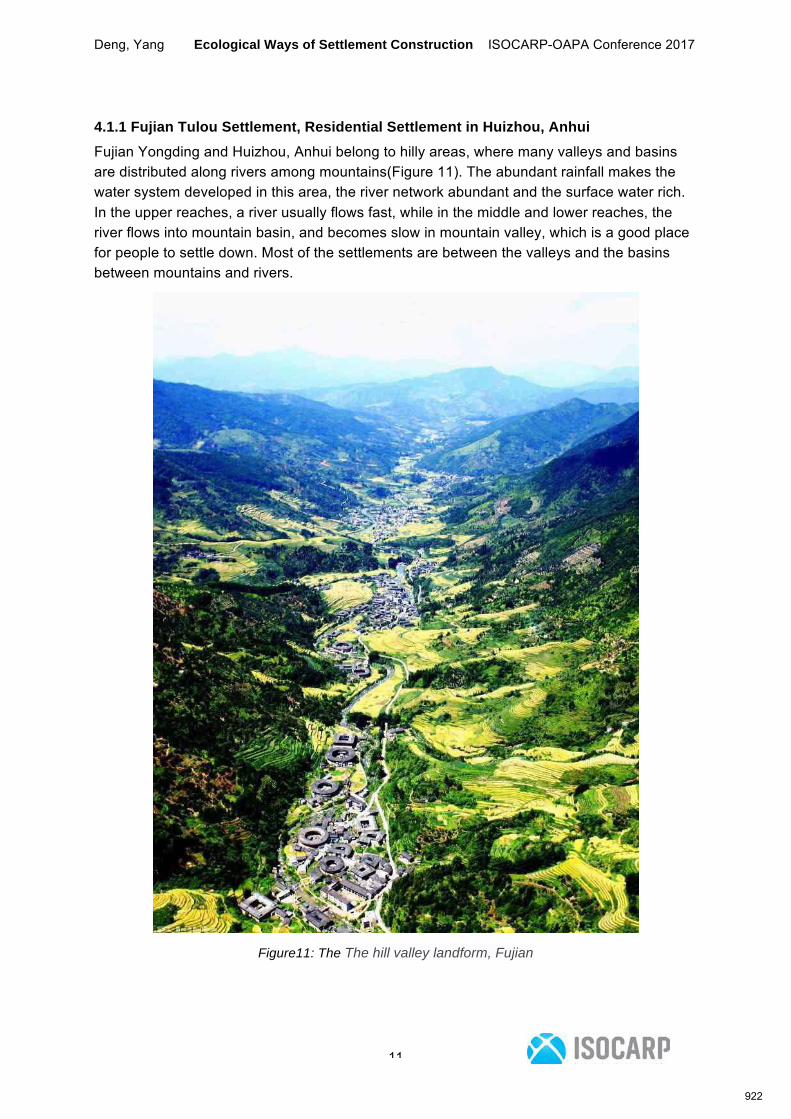
Deng, Yang Ecological Ways of Settlement Construction ISOCARP-OAPA Conference 2017
11
4.1.1 Fujian Tulou Settlement, Residential Settlement in Huizhou, Anhui
Fujian Yongding and Huizhou, Anhui belong to hilly areas, where many valleys and basins are distributed along rivers among mountains(Figure 11). The abundant rainfall makes the water system developed in this area, the river network abundant and the surface water rich. In the upper reaches, a river usually flows fast, while in the middle and lower reaches, the river flows into mountain basin, and becomes slow in mountain valley, which is a good place for people to settle down. Most of the settlements are between the valleys and the basins between mountains and rivers.
Figure11: The The hill valley landform, Fujian
922
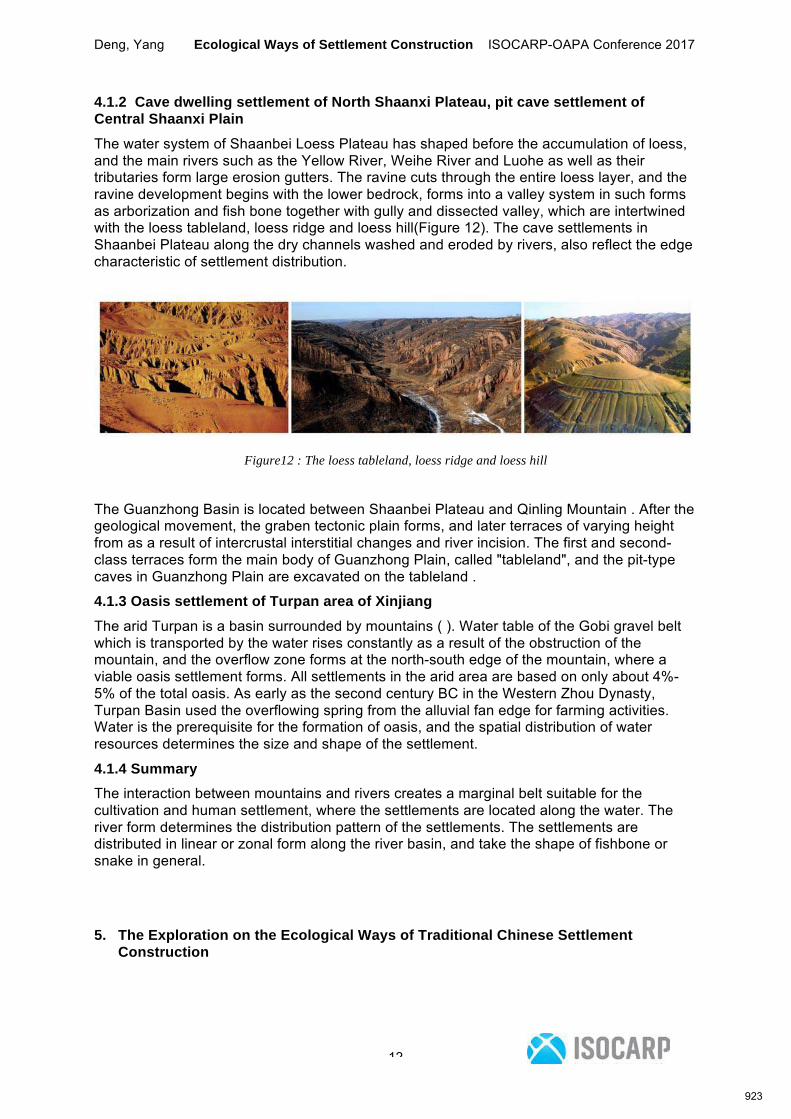
Deng, Yang Ecological Ways of Settlement Construction ISOCARP-OAPA Conference 2017
12
4.1.2 Cave dwelling settlement of North Shaanxi Plateau, pit cave settlement of
Central Shaanxi Plain
The water system of Shaanbei Loess Plateau has shaped before the accumulation of loess, and the main rivers such as the Yellow River, Weihe River and Luohe as well as their tributaries form large erosion gutters. The ravine cuts through the entire loess layer, and the ravine development begins with the lower bedrock, forms into a valley system in such forms as arborization and fish bone together with gully and dissected valley, which are intertwined with the loess tableland, loess ridge and loess hill(Figure 12). The cave settlements in Shaanbei Plateau along the dry channels washed and eroded by rivers, also reflect the edge characteristic of settlement distribution.
Figure12 : The loess tableland, loess ridge and loess hill
The Guanzhong Basin is located between Shaanbei Plateau and Qinling Mountain . After the geological movement, the graben tectonic plain forms, and later terraces of varying height from as a result of intercrustal interstitial changes and river incision. The first and second-class terraces form the main body of Guanzhong Plain, called "tableland", and the pit-type caves in Guanzhong Plain are excavated on the tableland .
4.1.3 Oasis settlement of Turpan area of Xinjiang
The arid Turpan is a basin surrounded by mountains ( ). Water table of the Gobi gravel belt which is transported by the water rises constantly as a result of the obstruction of the mountain, and the overflow zone forms at the north-south edge of the mountain, where a viable oasis settlement forms. All settlements in the arid area are based on only about 4%-5% of the total oasis. As early as the second century BC in the Western Zhou Dynasty, Turpan Basin used the overflowing spring from the alluvial fan edge for farming activities. Water is the prerequisite for the formation of oasis, and the spatial distribution of water resources determines the size and shape of the settlement.
4.1.4 Summary
The interaction between mountains and rivers creates a marginal belt suitable for the cultivation and human settlement, where the settlements are located along the water. The river form determines the distribution pattern of the settlements. The settlements are distributed in linear or zonal form along the river basin, and take the shape of fishbone or snake in general.
5. The Exploration on the Ecological Ways of Traditional Chinese Settlement
Construction
923
Deng, Yang Ecological Ways of Settlement Construction ISOCARP-OAPA Conference 2017
13
5.1 Features of settlement space in the context of water resource difference
Different parts of China have different water resources. Distribution of precipitation and river systems determines the volume of surface water resources in a region, which is an important precondition for settlement establishment. From south to north, precipitation decreases significantly while evaporation increases. The northern region is facing two problems: water shortage and poor water retentivity, while the southern region is prone to floods due to the high precipitation. Therefore, a “prevention”-based dredging-oriented consciousness in ecological construction of water environment has been developed in the south, while a “retention”-based collection-oriented consciousness developed in the north. In line with the consciousness, people in the south established their settlements in raised positive space with nests as their original form, so as to avoid rainwater, floods, and dampness; by contrast, people in the north established their settlements in sunken negative space with caves as their original form, to stay away from the wind, gather luck, and retain water. In addition, residential forms in the arid zone are also different from each other due to different characteristics of precipitation. Turpan receives almost no rain at all throughout the year, so it is unnecessary to consider the drainage system in the design of courtyard space; there are seasonally concentrated rainfalls in northern Shaanxi, so both the drainage system and water collection should be considered should also considered. Thus, water environment determines the spatial features of settlements.
5.2 Hydrological ecological patterns of settlements
From the ecological perspective, the organic relationship between water and space can be roughly divided into the following two forms:
(a) Main path, which connects environment and settlements:
Water source —— runoff —— reservoir (purifying) —— roadside open channel (ditch) or blind ditch —— pool (reservoir) —— farmland —— river (cofferdam)
(b) Branches, which connect buildings and settlements:
Rainfall on the roof —— patio or courtyard —— natural percolation
Rainfall on the roof —— patio or courtyard —— open channel or blind ditch —— roadside canal —— outfall —— river
5.2.1 Fujian tulou settlements
Fujian tulou buildings were mostly built by the river, so it is very easy for the residents to get water, process food, and wash clothes. Although they were built by the river, they hardly suffer from floods. That’s because the buildings have high bases that were built of large river pebbles. The hills surrounding the settlements form a large village space and limit it to a certain scope. River passing through the settlements is conducive to water getting and flood prevention, and the slope is conducive to sewage discharge.
5.2.2 Huizhou settlements
Huizhou settlements are directly related to water in terms of location, layout, and village landscape. It can be said that they are ancient villages with rigorous and precise planning. Among them, Hongcun village is an excellent example, and its water system was originally built in Yongle period of the Ming Dynasty. According to folklore, the water system functions like the digestive system of cattle. Clear spring is drawn into ditches that are likened to the “cattle intestine”, flows by the gates of families in the village, and then converges into the Moon Pool, which is likened to the “cattle stomach”. After being filtered, the spring water flows through the houses again towards the Southern Lake (known as the “cattle tripe”) (Figure 13) outside the village, and finally flows into the river. In this way, the ancients combined natural water system with living environment, and the settlement can be regarded
924
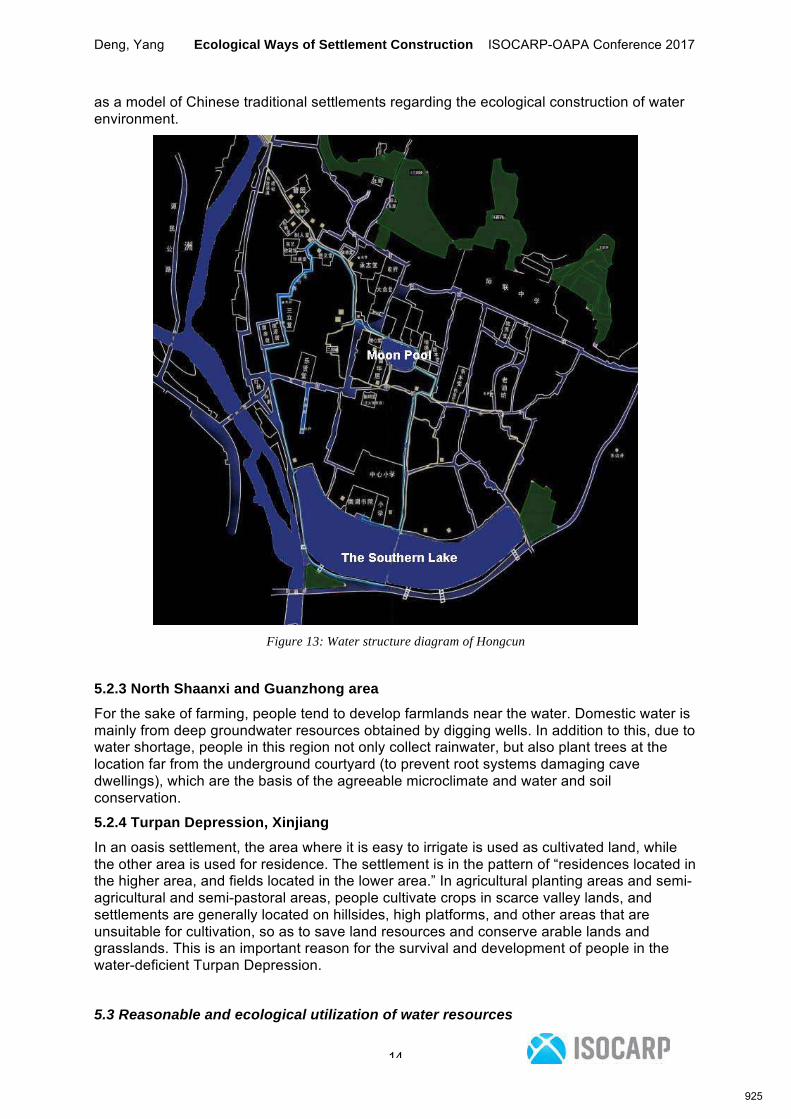
Deng, Yang Ecological Ways of Settlement Construction ISOCARP-OAPA Conference 2017
14
as a model of Chinese traditional settlements regarding the ecological construction of water environment.
Figure 13: Water structure diagram of Hongcun
5.2.3 North Shaanxi and Guanzhong area
For the sake of farming, people tend to develop farmlands near the water. Domestic water is mainly from deep groundwater resources obtained by digging wells. In addition to this, due to water shortage, people in this region not only collect rainwater, but also plant trees at the location far from the underground courtyard (to prevent root systems damaging cave dwellings), which are the basis of the agreeable microclimate and water and soil conservation.
5.2.4 Turpan Depression, Xinjiang
In an oasis settlement, the area where it is easy to irrigate is used as cultivated land, while the other area is used for residence. The settlement is in the pattern of “residences located in the higher area, and fields located in the lower area.” In agricultural planting areas and semi-agricultural and semi-pastoral areas, people cultivate crops in scarce valley lands, and settlements are generally located on hillsides, high platforms, and other areas that are unsuitable for cultivation, so as to save land resources and conserve arable lands and grasslands. This is an important reason for the survival and development of people in the water-deficient Turpan Depression.
5.3 Reasonable and ecological utilization of water resources
925
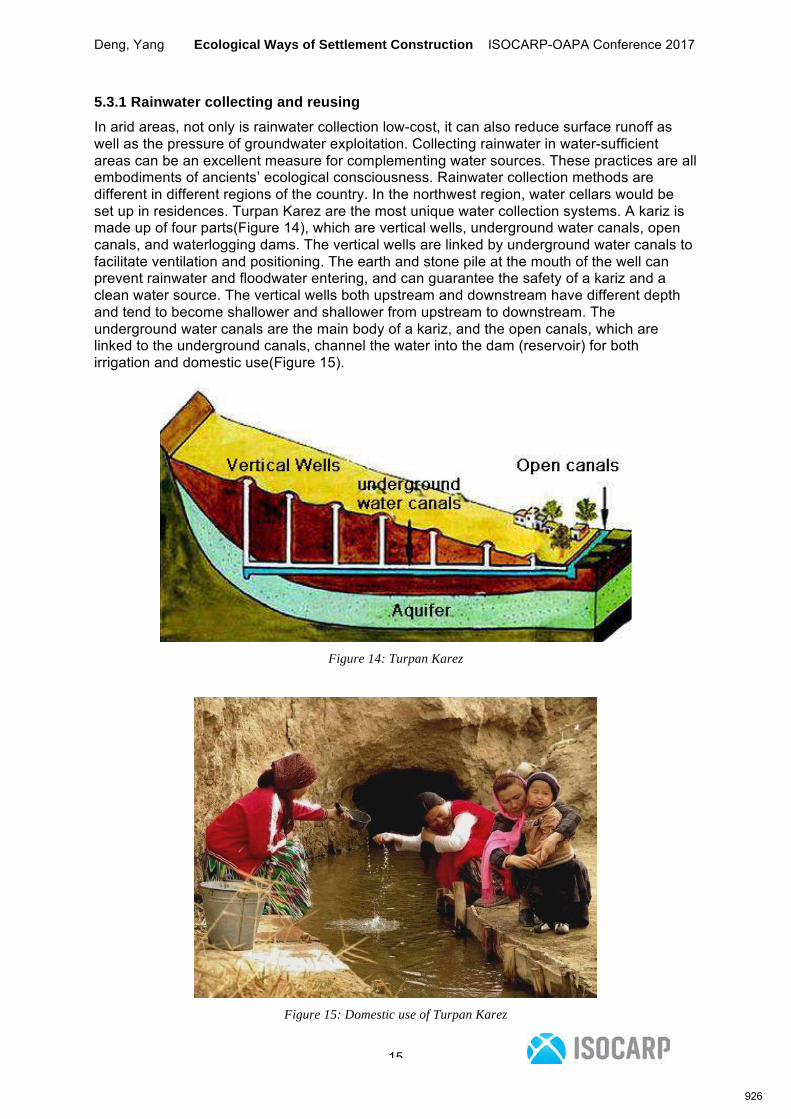
Deng, Yang Ecological Ways of Settlement Construction ISOCARP-OAPA Conference 2017
15
5.3.1 Rainwater collecting and reusing
In arid areas, not only is rainwater collection low-cost, it can also reduce surface runoff as well as the pressure of groundwater exploitation. Collecting rainwater in water-sufficient areas can be an excellent measure for complementing water sources. These practices are all embodiments of ancients’ ecological consciousness. Rainwater collection methods are different in different regions of the country. In the northwest region, water cellars would be set up in residences. Turpan Karez are the most unique water collection systems. A kariz is made up of four parts(Figure 14), which are vertical wells, underground water canals, open canals, and waterlogging dams. The vertical wells are linked by underground water canals to facilitate ventilation and positioning. The earth and stone pile at the mouth of the well can prevent rainwater and floodwater entering, and can guarantee the safety of a kariz and a clean water source. The vertical wells both upstream and downstream have different depth and tend to become shallower and shallower from upstream to downstream. The underground water canals are the main body of a kariz, and the open canals, which are linked to the underground canals, channel the water into the dam (reservoir) for both irrigation and domestic use(Figure 15).
Figure 14: Turpan Karez
Figure 15: Domestic use of Turpan Karez
926
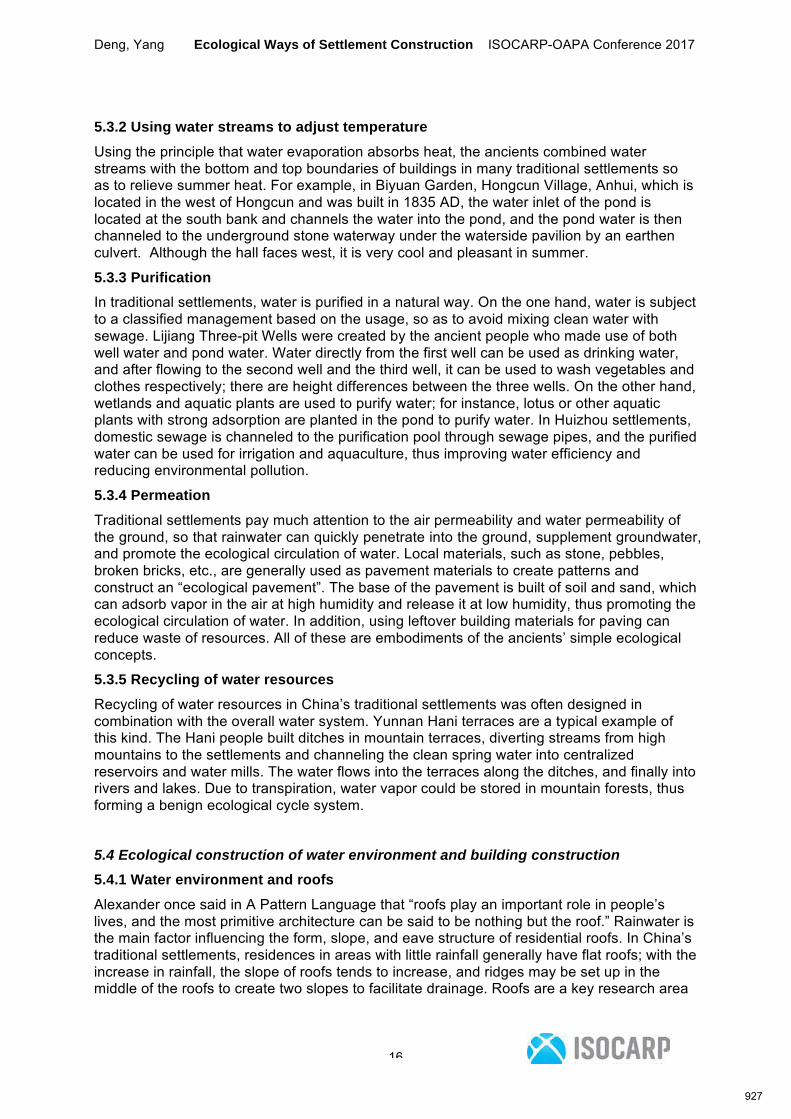
Deng, Yang Ecological Ways of Settlement Construction ISOCARP-OAPA Conference 2017
16
5.3.2 Using water streams to adjust temperature
Using the principle that water evaporation absorbs heat, the ancients combined water streams with the bottom and top boundaries of buildings in many traditional settlements so as to relieve summer heat. For example, in Biyuan Garden, Hongcun Village, Anhui, which is located in the west of Hongcun and was built in 1835 AD, the water inlet of the pond is located at the south bank and channels the water into the pond, and the pond water is then channeled to the underground stone waterway under the waterside pavilion by an earthen culvert. Although the hall faces west, it is very cool and pleasant in summer.
5.3.3 Purification
In traditional settlements, water is purified in a natural way. On the one hand, water is subject to a classified management based on the usage, so as to avoid mixing clean water with sewage. Lijiang Three-pit Wells were created by the ancient people who made use of both well water and pond water. Water directly from the first well can be used as drinking water, and after flowing to the second well and the third well, it can be used to wash vegetables and clothes respectively; there are height differences between the three wells. On the other hand, wetlands and aquatic plants are used to purify water; for instance, lotus or other aquatic plants with strong adsorption are planted in the pond to purify water. In Huizhou settlements, domestic sewage is channeled to the purification pool through sewage pipes, and the purified water can be used for irrigation and aquaculture, thus improving water efficiency and reducing environmental pollution.
5.3.4 Permeation
Traditional settlements pay much attention to the air permeability and water permeability of the ground, so that rainwater can quickly penetrate into the ground, supplement groundwater, and promote the ecological circulation of water. Local materials, such as stone, pebbles, broken bricks, etc., are generally used as pavement materials to create patterns and construct an “ecological pavement”. The base of the pavement is built of soil and sand, which can adsorb vapor in the air at high humidity and release it at low humidity, thus promoting the ecological circulation of water. In addition, using leftover building materials for paving can reduce waste of resources. All of these are embodiments of the ancients’ simple ecological concepts.
5.3.5 Recycling of water resources
Recycling of water resources in China’s traditional settlements was often designed in combination with the overall water system. Yunnan Hani terraces are a typical example of this kind. The Hani people built ditches in mountain terraces, diverting streams from high mountains to the settlements and channeling the clean spring water into centralized reservoirs and water mills. The water flows into the terraces along the ditches, and finally into rivers and lakes. Due to transpiration, water vapor could be stored in mountain forests, thus forming a benign ecological cycle system.
5.4 Ecological construction of water environment and building construction
5.4.1 Water environment and roofs
Alexander once said in A Pattern Language that “roofs play an important role in people’s lives, and the most primitive architecture can be said to be nothing but the roof.” Rainwater is the main factor influencing the form, slope, and eave structure of residential roofs. In China’s traditional settlements, residences in areas with little rainfall generally have flat roofs; with the increase in rainfall, the slope of roofs tends to increase, and ridges may be set up in the middle of the roofs to create two slopes to facilitate drainage. Roofs are a key research area
927
Deng, Yang Ecological Ways of Settlement Construction ISOCARP-OAPA Conference 2017
17
of this paper, and they show different typical geographical characteristics in terms of form, material, and eave structure.
5.4.1.1 Fujian tulou
A tulou is a large collective residence, and the great charm of its round roof lies in the graceful and harmonious proportion between the huge eave and high earth walls. The roof has a relatively steep slope. For example, the roof slope of Yongding Yijinglou is as high as 26o. Because Fujian has abundant rainfall, all the roofs of tulou buildings have two slopes with great eaves on both sides. The eaves are not the same with the outer eave greater than the inner eave, so that the earth walls are safe from rain wash and aisles can be built under the inner eave. However, tulou buildings in the coastal area almost have no eaves on the roof, but some tiles protruding for only a few centimeters to cover the wall crown. In some cases, parapet walls were constructed directly at the top. This is because huge eaves cannot withstand the invasion of typhoons. In a same area, changes in roof form are the result of adaptation to the local natural environment. Fujian tulou buildings also use hanging wooden fish as decorative items, and the most common ones are those with a herringbone head and the Yin-yang Taiji Diagram and Eight Trigrams, which are intended to express the worship of water gods.
5.4.1.2 Huizhou settlements
Timberwork is generally used in roofs of Huizhou residential buildings. To avoid rainwater getting into the rooms during heavy rains, the roofs are mostly sloping roofs with timber structure. Small grey tiles, which are made locally, are paved on the roofs, and the dark gray tiles can absorb solar heat in winter and transfer it to the rooms, thus playing a role of heat preservation.
5.4.1.3 Cave dwellings in northern Shaanxi
As the outer walls of the cave dwellings are mostly rammed earth walls or adobe walls, there are two or three water eaves made of small grey tiles in the upper part of the wall to prevent rain wash, which also have some decorative effect. Because of the little rainfall in the region, eaves are very narrow, only about 20 mm in width.
There are parapet walls made of grey bricks around the top of the underground courtyard, which are commonly known as “horse stopping walls”. In addition to their decorative effect, the walls, 30-50cm in height, are mainly used to prevent rainwater eroding the underground caves and walls and prevent pedestrians from falling into the courtyard accidentally.
5.4.1.4 Turpan area
Flat roof is one of the oldest styles of buildings in Turpan settlements. The locals use flat roofs as terraces and multi-functional outdoor spaces, which are like modern roof gardens. In summer, the roofs are used as dry rooms, and become cool bedrooms at night. Roofs of families in a village can be linked together, and constitute a unique space for social contact.
5.5 Water environment and courtyard culture
Courtyards are the basic unit of all the traditional settlements in China. A courtyard is the place where public activities are conducted, serving as the spiritual center of a residence. From the ecological point of view, courtyards also serve as the temperature adjusting space in residential buildings, and the ecological effect of water cycle has a direct influence on the comfortableness of living.
Due to the difference between north and south climate conditions and precipitation levels, different forms of courtyards, namely patio courtyards in the south and quadrangle courtyards in the north, have been developed. Water in fengshui theory means “wealth”, so courtyards are regarded as the place where wealth gathers. Patio courtyards in the south always have the reputation of “water from four directions gathering in the hall”, which means
928

Deng, Yang Ecological Ways of Settlement Construction ISOCARP-OAPA Conference 2017
18
wealth from all around the world gathers in the courtyard as rainwater flowing into the house unceasingly. The north region has less rainfall, so rainwater is gathered into a seepage pit in the courtyard to represent the accumulation of wealth.
5.5.1 Fujian tulou settlements
A tulou is a vertical building consisting of continuously repeated units with the exactly same bedroom and room width. The courtyard of a tulou is in a centripetal arrangement with the ancestral hall as the center. Due to the abundant rainfall in the locality, there is a corridor on every floor of a tulou, making walking inside the building more convenient. The ground drainage system is a multi-level ring-shaped drainage system, centered at the ancestral hall and corresponding to layers of the corridors. The drainage system can collect the rainwater from the eaves of the corridors. When it rains, layers of rain curtains will fall from the eaves into the open ditches on the ground. Kitchens of all the households are set in the ground floor, and villagers discharge their kitchen sewage into the corresponding outer ring ditch, which carries the sewage out of the tulou directly. Through drops and purification in the external open ditch, the sewage finally flows into the river. There are two wells at the center of the patio, providing water for washing and drinking.
When building a tulou, the ancients took into full consideration the micro-airflow effect of air in the space. The main door and side doors of most tulou buildings are sheltered by walls, and the arc walls can guide the wind into the main space layer by layer, thus generating a comfortable breezing microenvironment.
5.5.2 Huizhou settlements
The saying of “water from four directions gathering in the hall” was originally made for Huizhou houses, and is the architectural embodiment of Huizhou merchants’ concept of “gathering luck in making big money”. The ground floor of a Huizhou residence is the main activity space. The opening of the middle hall is half-open and links with the patio as a whole, so people can observe stars at night while sitting in the hall. The patio’s aspect ratio is generally 5: 1, and the light is mostly secondary refraction light. Huizhou area gets much rain, and has a humid climate. Buildings would easily go moldy if ventilation is poor. For this reason, the main structure of Huizhou residences is wooden frame, and stone is used as the column base to prevent the wood column from being rotten.
The patio can effectively adjust the temperature and humidity inside the house. Before laying the foundation, the builders would first dig out drains in the patio or at the hallway, which can be used for both water drainage and storage. The drains are covered by slabstones, and there are gaps between the slabs. In summer, the continuous flow of water in the underdrains can take away the ground heat, and reduce 2-3 degrees in temperature. In winter, the water in the underdrains has higher temperature than that of the ground. In this way, water is used as the medium of energy exchange, thus keeping the temperature of the patio constant and achieving air circulation among the indoor space, patio, and underground space. Rainwater on the roof falls down into the patio, and is taken out by underdrains. In order to purify the rainwater, prevent the underdrains being blocked, and reduce dirt, the residents often raise some turtles in their underdrains to clear off the sewage.
In addition, a water courtyard, which is connected with the water system of the settlement, is often set up in a Huizhou traditional residence. Thanks to the courtyard, the water level in a house is always same as that of the water system of the settlement, so that there will not be waterlogging caused by rains and other reasons, and the indoor humidity can be kept constant.
5.5.3 Settlements in northern Shaanxi
In northern Shaanxi, the most commonly used method for rainwater collection is seepage well technology. Most of the cave courtyards have seepage pits and wells, which are located at the lowest point of the courtyard. The well is a 1-2 meters deep cellar with a diameter of more than 1 meter, covered with a slate, at the center of which there is a small mouth to let
929
Deng, Yang Ecological Ways of Settlement Construction ISOCARP-OAPA Conference 2017
19
rainwater flow into the pit and then permeate into the ground. There are ventilation holes in the cave dwellings, which are connected to the ground layer, enabling air exchange between the indoor and outdoor spaces and thus realizing air ventilation.
5.5.4 Turpan area
Turpan, located in the eastern part of Sinkiang, is a political, economic and cultural center in western China. Residences in this region are concentrated high-shed courtyards, and the semi-underground and ground housing is built with the earthen arch kiln. A high shed is set up in the courtyard to shade it. In order to reduce room temperature, the indoor space extends to the underground, and the building is semi-underground. During the day, the residents can enjoy the natural light and keep the air in circulation, and they can rest in the underground space at night. The gray space under the high shed is the main place in daily life. The high shed is generally 50-150 cm above the roof, and grapes grow on the shed to block the sun. The local residents live in doors only in winter throughout a year, and live and receive guests under the shed in all the other seasons. This manner is an embodiment of the local residents’ ecological wisdom in adapting to the natural environment. The courtyard becomes a second living room, and the boundary between indoor space and outdoor space becomes blurred. This extension of indoor space and internalization of outdoor space has become a major feature of Turpan residences.
6. Conclusion
According to the contemporary consumption-led social values, water is more viewed as a resource. However, in traditional Chinese settlements, water is regarded as an important and beautiful life element, and establishment of the settlements was based on the eco-ethic consciousness, the world outlook with the unity between men and the nature as the core, and the pursuit of ecological beauty. The traditional settlements have been standing the test of time for hundreds of years, and may be called real “Intelligent Communities”.
Water environment refers to not only water resources, but the sum of settlements, environment, and buildings, which are established in the context of water. Based on the studies and analysis of ecological construction of settlements from different perspectives of ecology, anthropology, geography, architecture and landscape science, it can be seen that the traditional Chinese ecological consciousness stems from the natural view of the heaven-earth-men system. Ancient Chinese people initially had a separate understanding of mountains, and thought that waters come from mountains, and mountains themselves can be used for regional division. With their understanding of waters going deep, they believed mountains and waters are not independent from each other, and have the same core. “Mountains” and “Waters” were the two key elements the ancients considered in their initial establishment of settlements. Therefore, through the natural changes, people gradually realized the relevance of mountains and waters to life, and thus developed the holistic and organic view of the heaven-earth-men system.
The wisdom reflected by the traditional settlements lies in three aspects: ecological consciousness, holistic view of life, and ecological participation. China’s traditional settlements are the product of farming civilization. Both agricultural production and settlement life are inseparable from water that is the basis and spiritual support of survival and development of the settlements. Settlements are thus the product of the ancestors seeking to live in harmony with the nature. From the ecological point of view, water in the nature constitutes a complete circulation system, and exists in the forms of vapor, rain, surface water, groundwater, and so on. The ancients’ understanding of this overall circulation was embodied in their establishment of traditional settlements in an intelligent manner, and is also one of the goals of ecological aesthetics in China.
930
Deng, Yang Ecological Ways of Settlement Construction ISOCARP-OAPA Conference 2017
20
References:
1. Sun,Da Zhang (2010) Research on Chinese residential buildings, Beijing: China Architecture & Building Press
2. Zeng, Fanren (2010) Introduction to ecological aesthetics, Beijing: The Commercial Press
3. Huang, Renyu (2012) 1587, a Year of No Significance, Beijing: Zhonghua Book Company
4. Li, Yunhe (2005) Cathay’s Idea- Design Theory of Chinese Classical Architecture, Tianjin: Tianjin University Press
5.Peng, Yigang (1992) Analysis of Landscape of Traditional Villages and Towns in China, Beijing: China Architecture & Building Press
6.Wu, Liangyong (2001) Introduction of Sciences of Human Settlements, Beijing: China Architecture & Building Press
7. Peng, Yigang (2001) Analysis of Traditional Chinese Garden, Beijing: China Architecture & Building Press
8.Xiang, Baisong (1999) The worship for water in China, Shanghai: Joint Publishing Company
9. Zhu, Daoqing (2010) Chinese water system, Qingdao: Qingdao Press
10. Li, Xiaodong (2007) Chinese Space, Beijing: China Architecture & Building Press
11. Huang, Renyu (1997) China: a Macro History, Beijing: Joint Publishing Company
12. Han, Baode (2014) Image and Mood: Chinese Garden, Beijing: Joint Publishing Company
13. Kevin Lynch (2001) The Image of the City, Beijing: Huangxia Publishing House
14. Ian Lennox McHarg (2008) Design with Nature, Tianjin: Tianjin University Press
15. Christian Norberg-Schulz (2010) Towards a Phenomenology of Architecture, Tianjin: Tianjin University Press
16. Hong-KeyYoon(1982) “Environmental Determinism and Geomancy”, Geomancy Vol. 1.6.No.1
931
Strengtheningthedisasterresilienceoftheacademicbiomedicalresearchcommunity
Moderator: Kirk PAWLOWSKI, ESD 112’s Construction Services Group (CSG), Vancouver, Washington,
USA
Speakers: Lisa BROWN, National Academies of Sciences, Engineering, and Medicine, Washington DC,
USA; Andre LEDUC, University of Oregon, Eugene, OR, USA
Created by President Abraham Lincoln in March 1863, the National Academy of Sciences (the
National Academies) was charged to provide scientific analysis and advice to the United State
Government and to help plan new federal agencies whose capabilities would be needed by the
nation. 154 years later the National Academies of Sciences, Engineering, and Medicine has evolved
and grown as science as progressed and as the nation and the world have become ever more
dependent on the role of science to enhance the vitality of the scientific enterprise; to guide public
policy with science; and to communicate the nature, values, and judgements of science to
government and the public.
In response to the devastating impacts of Hurricane Sandy on New York City, the National Academies
was asked to form a committee of subject matter experts in the scientific, technical, and medical
professions for a consensus study titled “Strengthening the Disaster Resilience of the Academic
Biomedical Research Community.”
Global innovation today is in large part driven by academic research. The academic biomedical
research community and the knowledge products, workforce, and financial benefits it produces
serve communities and states, and, by extension, the nation and the world. The enormity of the
investment of the U.S. federal government and that of many other entities that sponsor academic
research is a reflection of this reality. And yet, these investments are not uniformly secure. They are
vulnerable to disasters natural and manmade. Local, regional, national, and global resilience is an
imperative that should be sought throughout all sectors of our society, and the academic biomedical
research community’s contribution to global resilience is critical.
The committee explored the effects of natural and man‐made disasters on the academic biomedical
research community and produced a report, publically released in August 2017. This report describes
the extent of the impact of prior disasters on the academic biomedical research community in the
United States and their partner‐local communities. Additionally, the report examines the actions,
opportunities, and resources that are necessary to achieve a resilient academic biomedical research
community. Resilience involves a long‐term commitment that requires every stakeholder of the
academic biomedical research community to accept responsibility and act on it, from the individual
researcher all the way up to the institutional leadership and the research sponsor. The report offers
recommendations that, if implemented, would help the academic biomedical research community
protect human life, protect research animals, protect property and environment, and maintain the
integrity and continuity of the research.
The session presentation – guided by committee member, Kirk Pawlowksi, study director, Lisa
Brown, and key stakeholder, Andre LeDuc – will share the committee’s critical findings which are
932

anticipated to have critical national impact in determining a more effective and integrated approach
to resilience planning among the current multiple federal agencies, state, local planning agencies,
NGOs and nonprofits. The session will focus on the committee’s recommendations and findings
specific to the key tools required to support disaster response and recovery planning, the
development of a more resilient built environment, and the capital financial considerations in
funding a more resilient academic biomedical research community. Furthermore, this session will
touch on the work being conducted at the University of Oregon around this issue as well as two key
initiatives discussed in the report, the Disaster Resilient Universities Network and the National
Higher Education Emergency Management Program Needs Assessment.
The shift to resilience planning has been recognized as having strong similarity to the gradual
adoption of “sustainable design standards” that has occurred over the past 20 years. Resilience to
disasters is on the same path and with time, will likely become commonplace. One recent risk
management industry publication cites the strong relationship between institutional/community
strategic planning, developing building‐performance rating systems to compare capital investments
with community/economic continuity risks and creating “resilience management” tools:
“Resilience is the natural evolution of sustainability. Events like Hurricane Katrina and Superstorm
Sandy have made it painfully clear that it is not enough for our buildings to be a low impact on the
environment – the environment must also have a low impact on our buildings and infrastructure”.
(Reis)
933

Track 5: Technology and small communities
934
Improvingmulti‐agencyprogramtransparencyandaccountabilityviaascalablewebplatformforperformancemeasuretracking
Moderator: Matt DENISTON, Sitka Technology Group, Portland, USA
Speakers: John BURNS, Sitka Technology Group, Portland, USA; Jeanne MCNAMARA, Tahoe Regional
Planning Agency, Stateline, USA; Brittany JENSEN, Gold Ridge Resource Conservation District, USA.
Launched in 1997, the Lake Tahoe Environmental Improvement Program (EIP) is a partnership of
federal, state and local agencies, private interests, and the Washoe Tribe. The EIP includes over 50
different agencies working together under one program, and they account for all program
expenditures and accomplishments together. The Tahoe Regional Planning Agency (TRPA) serves as
the coordinator of the EIP data collection, performance measure reporting, and program
accountability.
Prior to the launch of the EIP Project Tracker website in 2014, it was challenging for the public and
national and state legislators to learn about the various taxpayer‐funded EIP projects underway in
the region. After the launch, the online platform quickly proved invaluable in improving data
coordination, increasing transparency, and showcasing progress towards attaining compliance with
environmental threshold standards.
Attendees of this talk will:
‐ Gain behind‐the‐scenes information about what it took to launch this groundbreaking online
resource.
‐ Learn how California Resource Conservation Districts and a local coalition of Oregon
watershed councils are leveraging significant EPA and TRPA investment to benefit their multi‐agency
programs.
‐ Understand how other organizations can increase data collection efficiency and program
transparency through shared open‐source reporting tools.
TRPA currently tracks $2 billion in funding and over 700 cross‐agency projects with the EIP Project
Tracker website. To date, EIP partners have completed more than 450 projects. An analysis of
performance measures using the EIP Project Tracker calculated that these projects have restored
more than 16,000 acres of wildlife habitat; improved public access to 2,770 feet of Lake Tahoe
shoreline; built or improved 152 miles of bike and pedestrian trails; and inspected more than 46,853
boats and treated 927 acres for invasive species. This performance measure analysis is updated
annually by agency partners using web‐based workflows.
TRPA granted an open source license for the platform so other organizations can leverage the
system to enhance the reporting and analysis capability of their own cross‐agency programs. In
March of 2017, Clackamas Partnership officially launched their instance of the platform at
www.clackamaspartnership.org. The Partnership is a collaboration of watershed councils and
government agencies that are committed to improving watershed health and fish population in the
Portland metropolitan area. While Clackamas Partnership is in the formative stages of their
conservation planning program, their successful implementation demonstrates the scalability and
reusability of the web platform among both established and newly formed agencies.
935
Abstract title Study on the eco-village planning in Yangtze River Delta
Author Assoc. Prof Guoping, XIONG, Southeast University, NANJING, China (Presenting author)
Abstract
The Yangtze River Delta is the alluvial plain, Fertile soil, mild climate, many lakes and rivers, dense
water, good water features, Yangtze river delta region is the most developed agriculture area in
China, The village in this region has been the first to enter the new stage of production space, living
space , ecological space and social and economic structure transformation. Aiming at the realistic and
widespread problems in Yangtze river delta Village ,such as the village distribution density, small
size, loose structure; empty courtyard, tall residential space, land waste and inefficient use of space;
garbage spreads from part to whole, fertilizer and pesticides brings Non-point source pollution;
disorderly domestic sewage ,runoff water pollution and so on. Research on the technology of eco-
village planning and design, include green courtyard design, livable residential design, village style
protection, village clean energy utilization, garbage collect and recycling use, sewage and runoff
village governance, water system planning and water purification, organic waste and animal manure
harmless dispose. Through formulate Guidelines for ecological village planning, rural livable
residential design, energy saving and high efficiency application guide, develop and promote the
standardization of rural sewage treatment device, low power directional guide aeration device,
organic garbage and animal excrement fermentation device and other equipment. Jiang village is
located in Nanjing international slow city, o Gucheng Lake east, Jin hill and Jiang hill south, 4 square
kilometers, 3100 people,Taking JiangShan Village of Nanjing international slow city as an example, it
will provide comprehensive technical support for beautiful village planning and the ecological
environment improvement of. the Yangtze River Delta. At the same time , Respect local, highlighting
the characteristics ;Protect low mountains and slow waters;blend Water and green, Maintain
ecological space, green space and natural mountain landscape, respect the life custom and the
traditional village layout pattern; combined the topography, vegetation, water and other natural
factors, form regional Delta water features, achieve water ecological civilization.
This work was supported by the [National Natural Science Foundation of China]; under Grant
[51578129];[ The Key Technology R&D Program of Jiangsu Province] under Grant [BE2014706];
and[The National Key Technology R&D Program] under Grant [2015BAL02B01]
936
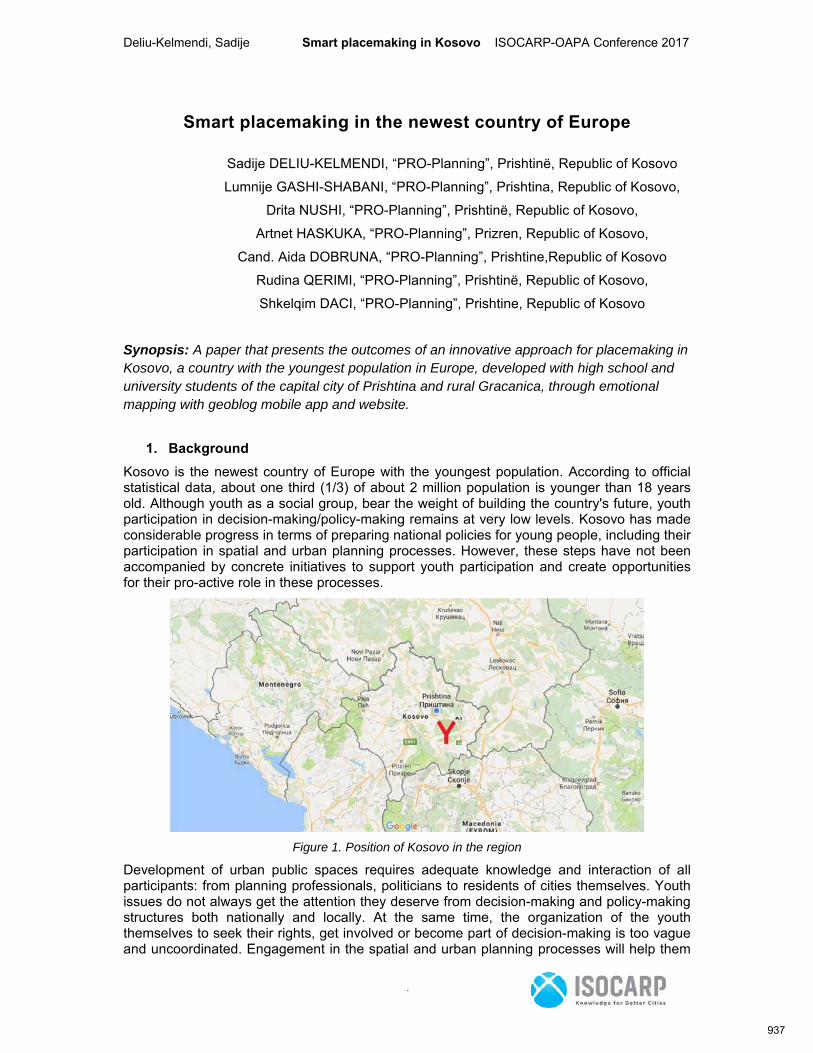
Deliu-Kelmendi, Sadije Smart placemaking in Kosovo ISOCARP-OAPA Conference 2017
1
Smart placemaking in the newest country of Europe
Sadije DELIU-KELMENDI, “PRO-Planning”, Prishtinë, Republic of Kosovo Lumnije GASHI-SHABANI, “PRO-Planning”, Prishtina, Republic of Kosovo,
Drita NUSHI, “PRO-Planning”, Prishtinë, Republic of Kosovo, Artnet HASKUKA, “PRO-Planning”, Prizren, Republic of Kosovo,
Cand. Aida DOBRUNA, “PRO-Planning”, Prishtine,Republic of Kosovo Rudina QERIMI, “PRO-Planning”, Prishtinë, Republic of Kosovo, Shkelqim DACI, “PRO-Planning”, Prishtine, Republic of Kosovo
Synopsis: A paper that presents the outcomes of an innovative approach for placemaking in Kosovo, a country with the youngest population in Europe, developed with high school and university students of the capital city of Prishtina and rural Gracanica, through emotional mapping with geoblog mobile app and website.
1. Background
Kosovo is the newest country of Europe with the youngest population. According to official statistical data, about one third (1/3) of about 2 million population is younger than 18 years old. Although youth as a social group, bear the weight of building the country's future, youth participation in decision-making/policy-making remains at very low levels. Kosovo has made considerable progress in terms of preparing national policies for young people, including their participation in spatial and urban planning processes. However, these steps have not been accompanied by concrete initiatives to support youth participation and create opportunities for their pro-active role in these processes.
Figure 1. Position of Kosovo in the region
Development of urban public spaces requires adequate knowledge and interaction of all participants: from planning professionals, politicians to residents of cities themselves. Youth issues do not always get the attention they deserve from decision-making and policy-making structures both nationally and locally. At the same time, the organization of the youth themselves to seek their rights, get involved or become part of decision-making is too vague and uncoordinated. Engagement in the spatial and urban planning processes will help them
937
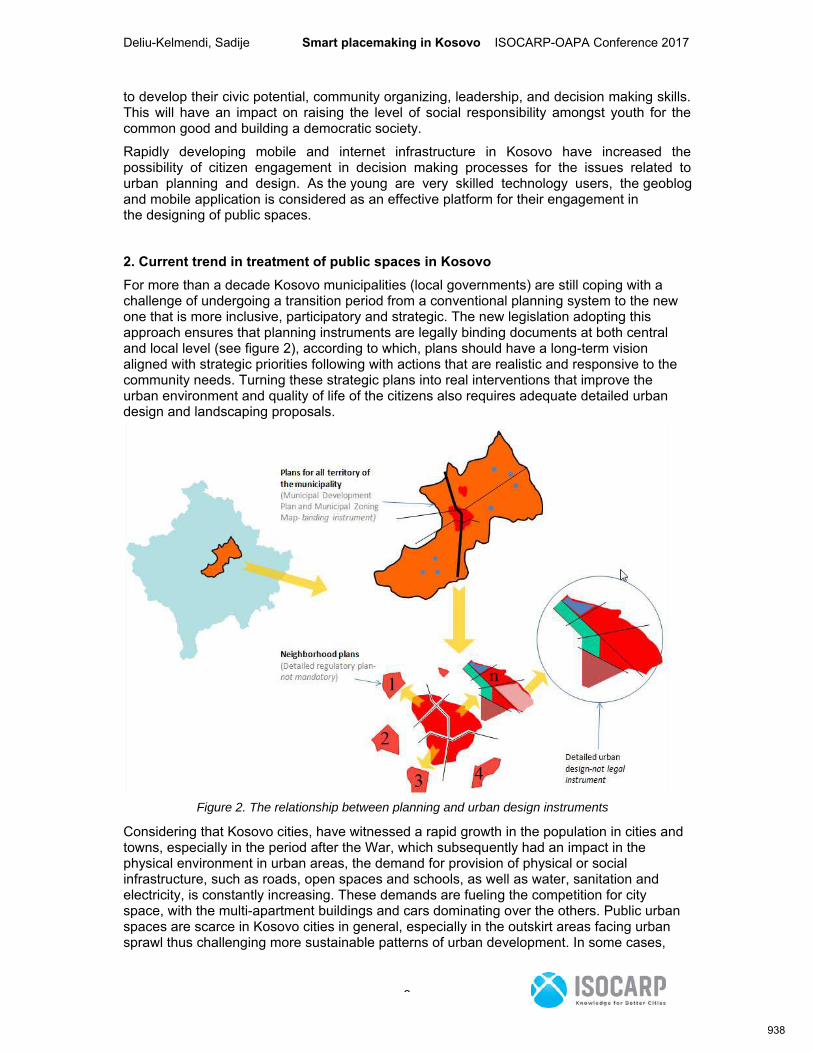
Deliu-Kelmendi, Sadije Smart placemaking in Kosovo ISOCARP-OAPA Conference 2017
2
Figure 2. The relationship between planning and urban design instruments
to develop their civic potential, community organizing, leadership, and decision making skills. This will have an impact on raising the level of social responsibility amongst youth for the common good and building a democratic society. Rapidly developing mobile and internet infrastructure in Kosovo have increased the possibility of citizen engagement in decision making processes for the issues related to urban planning and design. As the young are very skilled technology users, the geoblog and mobile application is considered as an effective platform for their engagement in the designing of public spaces.
2. Current trend in treatment of public spaces in Kosovo
For more than a decade Kosovo municipalities (local governments) are still coping with a challenge of undergoing a transition period from a conventional planning system to the new one that is more inclusive, participatory and strategic. The new legislation adopting this approach ensures that planning instruments are legally binding documents at both central and local level (see figure 2), according to which, plans should have a long-term vision aligned with strategic priorities following with actions that are realistic and responsive to the community needs. Turning these strategic plans into real interventions that improve the urban environment and quality of life of the citizens also requires adequate detailed urban design and landscaping proposals.
Considering that Kosovo cities, have witnessed a rapid growth in the population in cities and towns, especially in the period after the War, which subsequently had an impact in the physical environment in urban areas, the demand for provision of physical or social infrastructure, such as roads, open spaces and schools, as well as water, sanitation and electricity, is constantly increasing. These demands are fueling the competition for city space, with the multi-apartment buildings and cars dominating over the others. Public urban spaces are scarce in Kosovo cities in general, especially in the outskirt areas facing urban sprawl thus challenging more sustainable patterns of urban development. In some cases,
938
Deliu-Kelmendi, Sadije Smart placemaking in Kosovo ISOCARP-OAPA Conference 2017
3
even the new planning instruments failed to incorporate a system of public spaces, allowing for ad-hoc interventions that are unlikely to respond adequately to the current needs and enable people to get more from their surroundings. The importance of the public spaces have received worldwide recognition, reflected in the Sustainable Development Goals (SDGs)i, calling for the provision of “Universal access to safe, inclusive and accessible, green, and public spaces, in particular for women and children, older persons, and persons with disabilities,” by 2030. Such global policies are starting to influence the country’s policies, acknowledging the importance of public space. In the case of Kosovo, this has been more reflected at the local level governments. The elected leaders are understanding more and more the benefits of urban planning and urban design as a way to make a positive difference to improve the quality of life and urban prosperity. Despite the challenges of the lack of human resources and limited budgets they have, in partnership with donor’s support, have been able to turn uncared and unusable spaces into places which maximize the aesthetic and functional qualities of public spaces. Inspired by best practice public space designs, and using varoius community involvement techniques including those of modern technology, such projects contributed not only to changing the physical environment, but also in building a sense of ownership of the ones involved and their responsibility for the management of these facilities. A space becomes a place when it has significance and quality that extends beyond its basic usesii. In this respect, a good design is only one among various means for improving the public space. Perhaps, more important than the design, is the ability to create a civic culture of public space and build awareness of the commons and of sustainable urban design during the design process thus contributing to development of smart communities and sustainable urban solutions. This paper considers this from the perspective of Kosovo- by providing outcomes of the project “Young place-makers initiative-YPLAN-KS”. The project aims to create the first generation of Young Place-makers in Kosovo, enabling them to gain insight into how public space is to be analyzed, planned and designed, applying creative techniques for public participation through the use of modern technology.
2.1. PRO-Planning approach to place-making PRO-Planning, the Kosovo Center for Urban Research is the first think tank in Kosovo that deals with spatial and urban planning from the civil society point of view. It strives to improve the living environment by working with community and institutions to contribute to the people-centered and research-based sustainable spatial development. Research, publications and analysis of spatial/urban developments, urban design and housing are one of the main activities. PRO-Planning provides advice, legal professional support and technical assistance to municipalities in strategic and sustainable spatial and urban development and management. In the framework of community based urban design projects, it has conceived and successfully developed YPLAN-KS project.
3 Case study-YPLAN-KS
What is YPLAN-KS
YPLAN-KS is a place-making project of innovative approach in Kosovo, a country with the youngest population in Europe, developed with high school and university students of the capital city of Prishtina and rural Gracanica, through emotional mapping with geoblog mobile app and website. It was developed in the span of 9 months, 2016-2017. The project locations were chosen in agreement with the municipal authorities and in accordance with planning documents.
Figure 3. Logo and slogan of YPLAN-KS in Albanian and Serbian
939
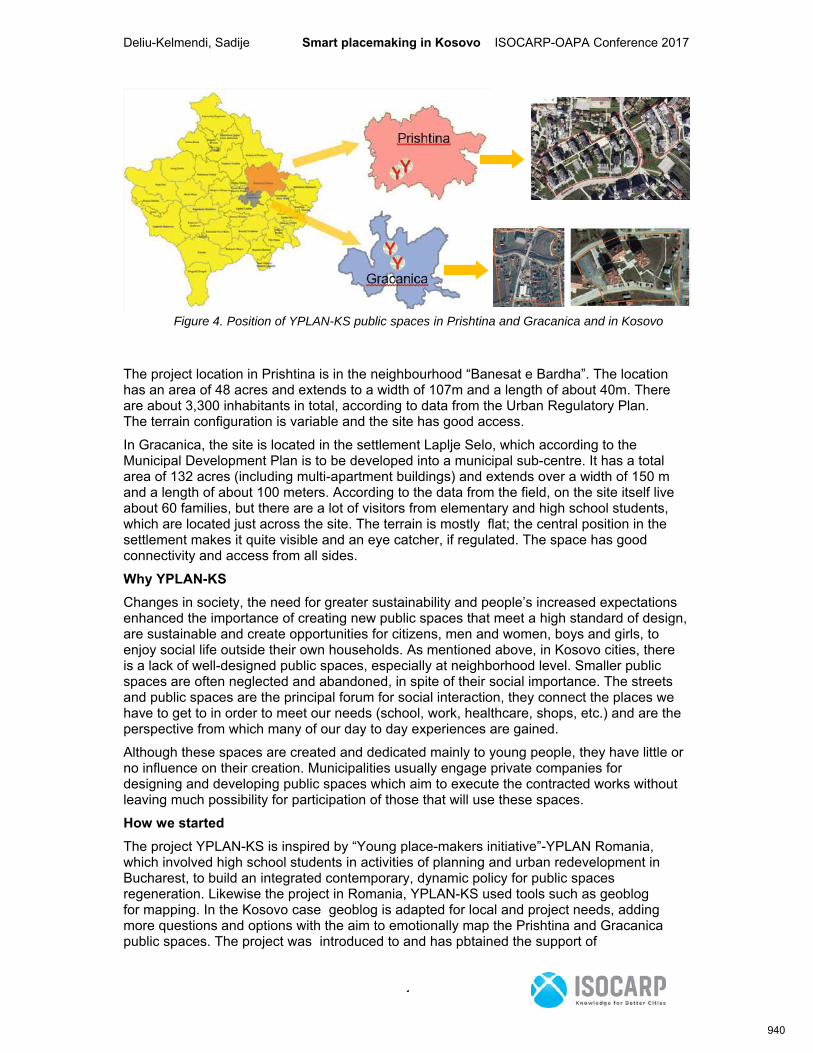
Deliu-Kelmendi, Sadije Smart placemaking in Kosovo ISOCARP-OAPA Conference 2017
4
Figure 4. Position of YPLAN-KS public spaces in Prishtina and Gracanica and in Kosovo
The project location in Prishtina is in the neighbourhood “Banesat e Bardha”. The location has an area of 48 acres and extends to a width of 107m and a length of about 40m. There are about 3,300 inhabitants in total, according to data from the Urban Regulatory Plan. The terrain configuration is variable and the site has good access. In Gracanica, the site is located in the settlement Laplje Selo, which according to the Municipal Development Plan is to be developed into a municipal sub-centre. It has a total area of 132 acres (including multi-apartment buildings) and extends over a width of 150 m and a length of about 100 meters. According to the data from the field, on the site itself live about 60 families, but there are a lot of visitors from elementary and high school students, which are located just across the site. The terrain is mostly flat; the central position in the settlement makes it quite visible and an eye catcher, if regulated. The space has good connectivity and access from all sides. Why YPLAN-KS
Changes in society, the need for greater sustainability and people’s increased expectations enhanced the importance of creating new public spaces that meet a high standard of design, are sustainable and create opportunities for citizens, men and women, boys and girls, to enjoy social life outside their own households. As mentioned above, in Kosovo cities, there is a lack of well-designed public spaces, especially at neighborhood level. Smaller public spaces are often neglected and abandoned, in spite of their social importance. The streets and public spaces are the principal forum for social interaction, they connect the places we have to get to in order to meet our needs (school, work, healthcare, shops, etc.) and are the perspective from which many of our day to day experiences are gained. Although these spaces are created and dedicated mainly to young people, they have little or no influence on their creation. Municipalities usually engage private companies for designing and developing public spaces which aim to execute the contracted works without leaving much possibility for participation of those that will use these spaces. How we started The project YPLAN-KS is inspired by “Young place-makers initiative”-YPLAN Romania, which involved high school students in activities of planning and urban redevelopment in Bucharest, to build an integrated contemporary, dynamic policy for public spaces regeneration. Likewise the project in Romania, YPLAN-KS used tools such as geoblog for mapping. In the Kosovo case geoblog is adapted for local and project needs, adding more questions and options with the aim to emotionally map the Prishtina and Gracanica public spaces. The project was introduced to and has pbtained the support of
940
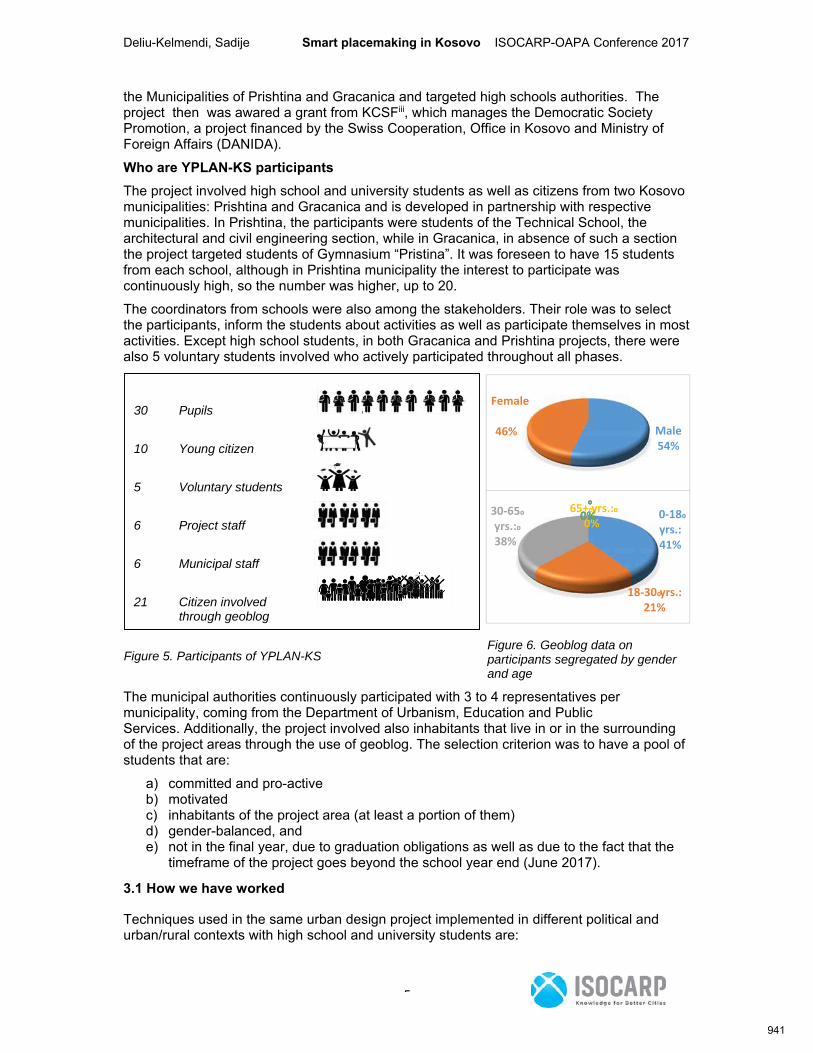
Deliu-Kelmendi, Sadije Smart placemaking in Kosovo ISOCARP-OAPA Conference 2017
5
the Municipalities of Prishtina and Gracanica and targeted high schools authorities. The project then was awared a grant from KCSFiii, which manages the Democratic Society Promotion, a project financed by the Swiss Cooperation, Office in Kosovo and Ministry of Foreign Affairs (DANIDA). Who are YPLAN-KS participants The project involved high school and university students as well as citizens from two Kosovo municipalities: Prishtina and Gracanica and is developed in partnership with respective municipalities. In Prishtina, the participants were students of the Technical School, the architectural and civil engineering section, while in Gracanica, in absence of such a section the project targeted students of Gymnasium “Pristina”. It was foreseen to have 15 students from each school, although in Prishtina municipality the interest to participate was continuously high, so the number was higher, up to 20. The coordinators from schools were also among the stakeholders. Their role was to select the participants, inform the students about activities as well as participate themselves in most activities. Except high school students, in both Gracanica and Prishtina projects, there were also 5 voluntary students involved who actively participated throughout all phases.
The municipal authorities continuously participated with 3 to 4 representatives per municipality, coming from the Department of Urbanism, Education and Public Services. Additionally, the project involved also inhabitants that live in or in the surrounding of the project areas through the use of geoblog. The selection criterion was to have a pool of students that are:
a) committed and pro-activeb) motivatedc) inhabitants of the project area (at least a portion of them)d) gender-balanced, ande) not in the final year, due to graduation obligations as well as due to the fact that the
timeframe of the project goes beyond the school year end (June 2017).
3.1 How we have worked
Techniques used in the same urban design project implemented in different political and urban/rural contexts with high school and university students are:
Male54%
Female
46%
0‐18 yrs.:41%
18‐30 yrs.:21%
30‐65 yrs.: 38%
65+ yrs.: 0%
0%
0%
Figure 5. Participants of YPLAN-KS Figure 6. Geoblog data on participants segregated by gender and age
30 Pupils
10 Young citizen
5 Voluntary students
6 Project staff
6 Municipal staff
21 Citizen involved through geoblog
941
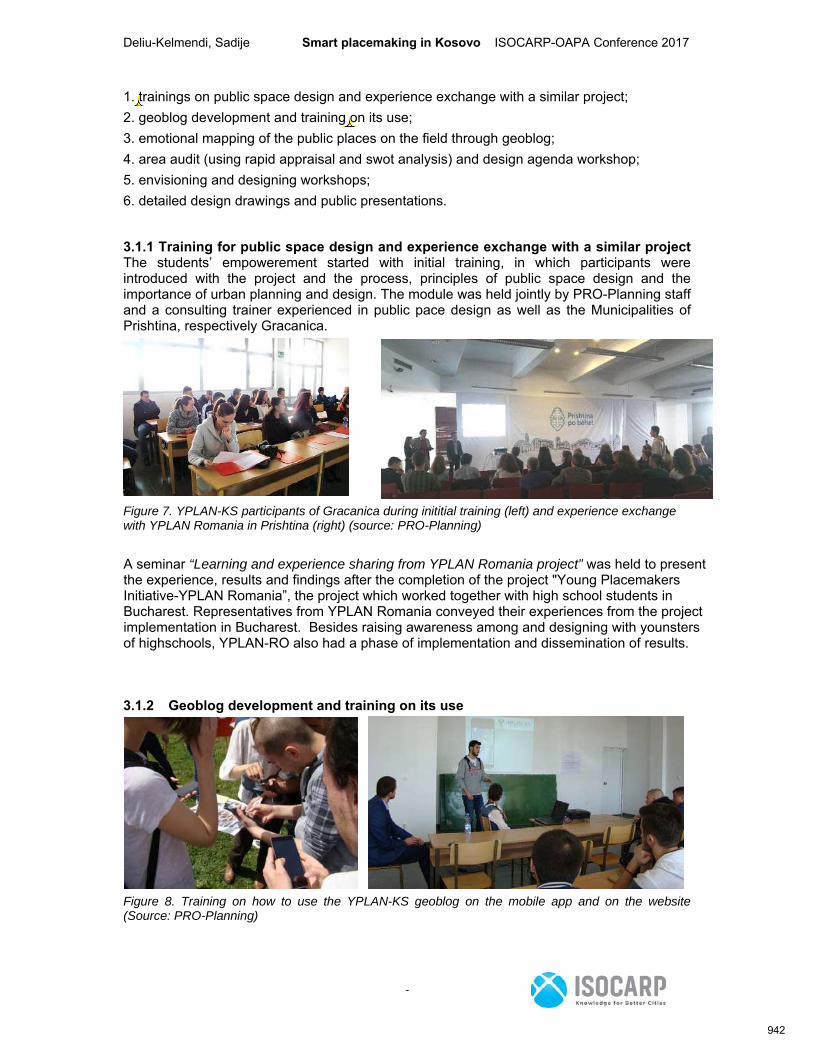
Deliu-Kelmendi, Sadije Smart placemaking in Kosovo ISOCARP-OAPA Conference 2017
6
1. trainings on public space design and experience exchange with a similar project;2. geoblog development and training on its use;3. emotional mapping of the public places on the field through geoblog;4. area audit (using rapid appraisal and swot analysis) and design agenda workshop;5. envisioning and designing workshops;6. detailed design drawings and public presentations.
3.1.1 Training for public space design and experience exchange with a similar project The students’ empowerement started with initial training, in which participants were introduced with the project and the process, principles of public space design and the importance of urban planning and design. The module was held jointly by PRO-Planning staff and a consulting trainer experienced in public pace design as well as the Municipalities of Prishtina, respectively Gracanica.
Figure 7. YPLAN-KS participants of Gracanica during inititial training (left) and experience exchange with YPLAN Romania in Prishtina (right) (source: PRO-Planning)
A seminar “Learning and experience sharing from YPLAN Romania project” was held to present the experience, results and findings after the completion of the project "Young Placemakers Initiative-YPLAN Romania”, the project which worked together with high school students in Bucharest. Representatives from YPLAN Romania conveyed their experiences from the project implementation in Bucharest. Besides raising awareness among and designing with younsters of highschools, YPLAN-RO also had a phase of implementation and dissemination of results.
3.1.2 Geoblog development and training on its use
Figure 8. Training on how to use the YPLAN-KS geoblog on the mobile app and on the website (Source: PRO-Planning)
942
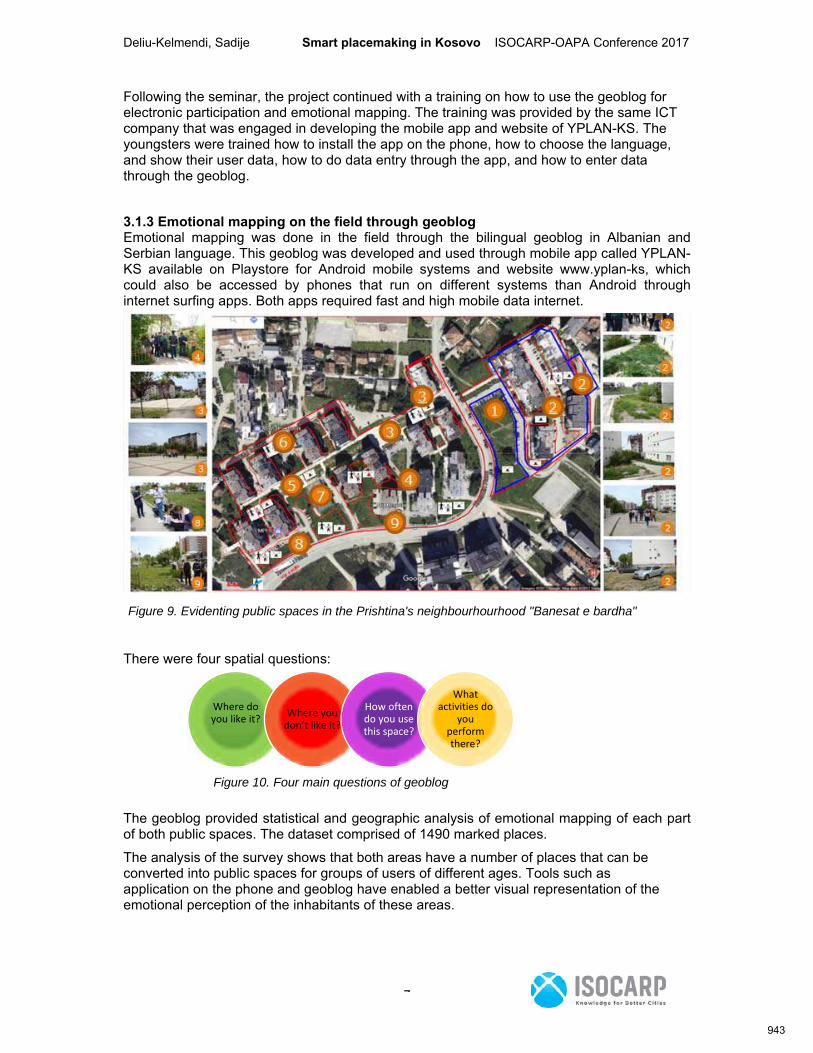
Deliu-Kelmendi, Sadije Smart placemaking in Kosovo ISOCARP-OAPA Conference 2017
7
Following the seminar, the project continued with a training on how to use the geoblog for electronic participation and emotional mapping. The training was provided by the same ICT company that was engaged in developing the mobile app and website of YPLAN-KS. The youngsters were trained how to install the app on the phone, how to choose the language, and show their user data, how to do data entry through the app, and how to enter data through the geoblog.
3.1.3 Emotional mapping on the field through geoblog Emotional mapping was done in the field through the bilingual geoblog in Albanian and Serbian language. This geoblog was developed and used through mobile app called YPLAN-KS available on Playstore for Android mobile systems and website www.yplan-ks, which could also be accessed by phones that run on different systems than Android through internet surfing apps. Both apps required fast and high mobile data internet.
There were four spatial questions:
Figure 10. Four main questions of geoblog
The geoblog provided statistical and geographic analysis of emotional mapping of each part of both public spaces. The dataset comprised of 1490 marked places. The analysis of the survey shows that both areas have a number of places that can be converted into public spaces for groups of users of different ages. Tools such as application on the phone and geoblog have enabled a better visual representation of the emotional perception of the inhabitants of these areas.
Where do you like it?
Where you don’t like it?
How often do you use this space?
What activities do
you perform there?
Figure 9. Evidenting public spaces in the Prishtina's neighbourhourhood "Banesat e bardha"
943
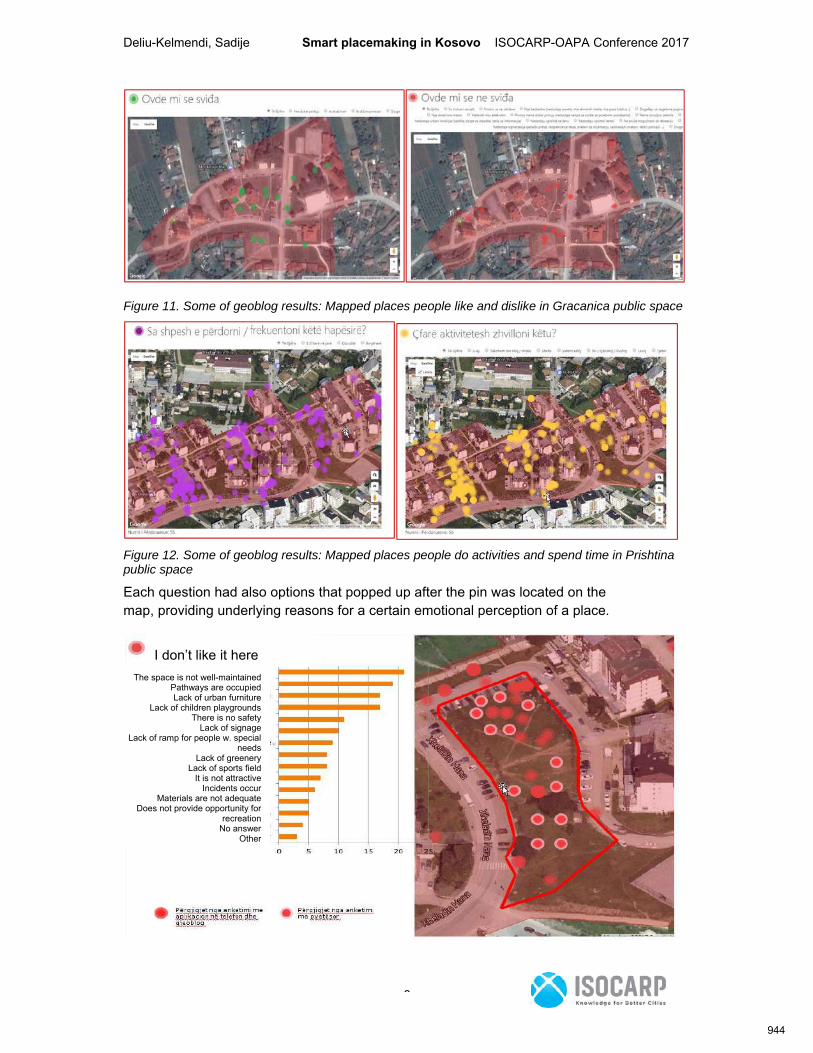
Deliu-Kelmendi, Sadije Smart placemaking in Kosovo ISOCARP-OAPA Conference 2017
8
Figure 11. Some of geoblog results: Mapped places people like and dislike in Gracanica public space
Figure 12. Some of geoblog results: Mapped places people do activities and spend time in Prishtina public space
Each question had also options that popped up after the pin was located on the map, providing underlying reasons for a certain emotional perception of a place.
I don’t like it here The space is not well-maintained
Pathways are occupied Lack of urban furniture
Lack of children playgrounds There is no safety
Lack of signage Lack of ramp for people w. special
needs Lack of greenery
Lack of sports field It is not attractive
Incidents occur Materials are not adequate
Does not provide opportunity for recreation
No answer Other
944

Deliu-Kelmendi, Sadije Smart placemaking in Kosovo ISOCARP-OAPA Conference 2017
9
Places that inhabitants like were identified, be it because they have better access to them or are well connected, safer, and so on; most reasons why citizens do not like certain places are due to lack of maintenance, lack of safety because in some of them incidents occur, lack of greenery, playgrounds, urban furniture, and the like. They also identified the places that they often visit and use, showing the activities that take place in them, the most numerous of which are: meeting with friends and playing various games. Types of uses that are mostly asked for to complement these spaces are: greenery, providing urban furniture, children's playgrounds, walking paths, tiling arrangements and pedestrian paths, and so on.
3.1.4 Area audit (using rapid appraisal and swot analysis) and design agenda workshop
An area audit with participants of both selected sites was conducted with the purpose to provide a detailed assessment and analysis of existing urban environment qualities, features and characteristics of the sites according to the placemaking principles through simple techniques such as rapid appraisal and SWOT analysis. These provided insights for the development of a design agenda for the public spaces design.
3.1.5 Envisioning and designing workshops
After recalling the results of the area audit and design agenda, the workshop provided training on using the envisioning technique for developing a spatial concept for public space design. The participants were also given insights on how to respect the principles for designing public spaces accompanied by practical examples. This knowledge was practiced afterwards during group work, when participants were localizing and connected the uses and contents from the design agenda. The youngsters also formulated a vision of the public space, expressed by a slogan and a logo. This exercise triggered lively discussions, which required a lot of negotiations facilitation by the project staff members. After presenting the scenarios, all participants agreed on the common contents and locations of contents in the integrated scenario, which will be detailed through urban design.
3.1.6 Detailed design drawings and public presentations Following the concept design completion, the project continued with detailed design drawings. Careful consideration in this step is given to putting forward a shared vision and reflecting on the qualities agreed of the design concept. However not all community and participant’s
Figure 13. Youngsters and municipal authorities designing the selected public space in Prishtina(left) and Gracanica (right)
945
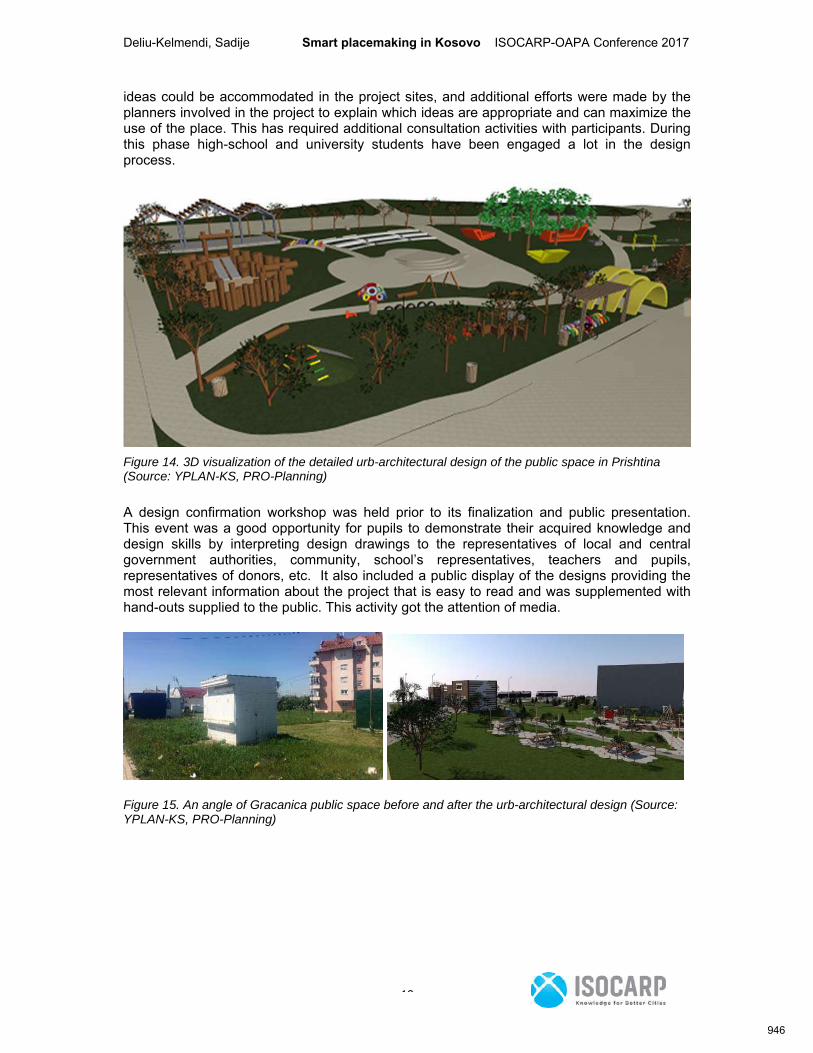
Deliu-Kelmendi, Sadije Smart placemaking in Kosovo ISOCARP-OAPA Conference 2017
10
ideas could be accommodated in the project sites, and additional efforts were made by the planners involved in the project to explain which ideas are appropriate and can maximize the use of the place. This has required additional consultation activities with participants. During this phase high-school and university students have been engaged a lot in the design process.
Figure 14. 3D visualization of the detailed urb-architectural design of the public space in Prishtina (Source: YPLAN-KS, PRO-Planning)
A design confirmation workshop was held prior to its finalization and public presentation. This event was a good opportunity for pupils to demonstrate their acquired knowledge and design skills by interpreting design drawings to the representatives of local and central government authorities, community, school’s representatives, teachers and pupils, representatives of donors, etc. It also included a public display of the designs providing the most relevant information about the project that is easy to read and was supplemented with hand-outs supplied to the public. This activity got the attention of media.
Figure 15. An angle of Gracanica public space before and after the urb-architectural design (Source: YPLAN-KS, PRO-Planning)
946
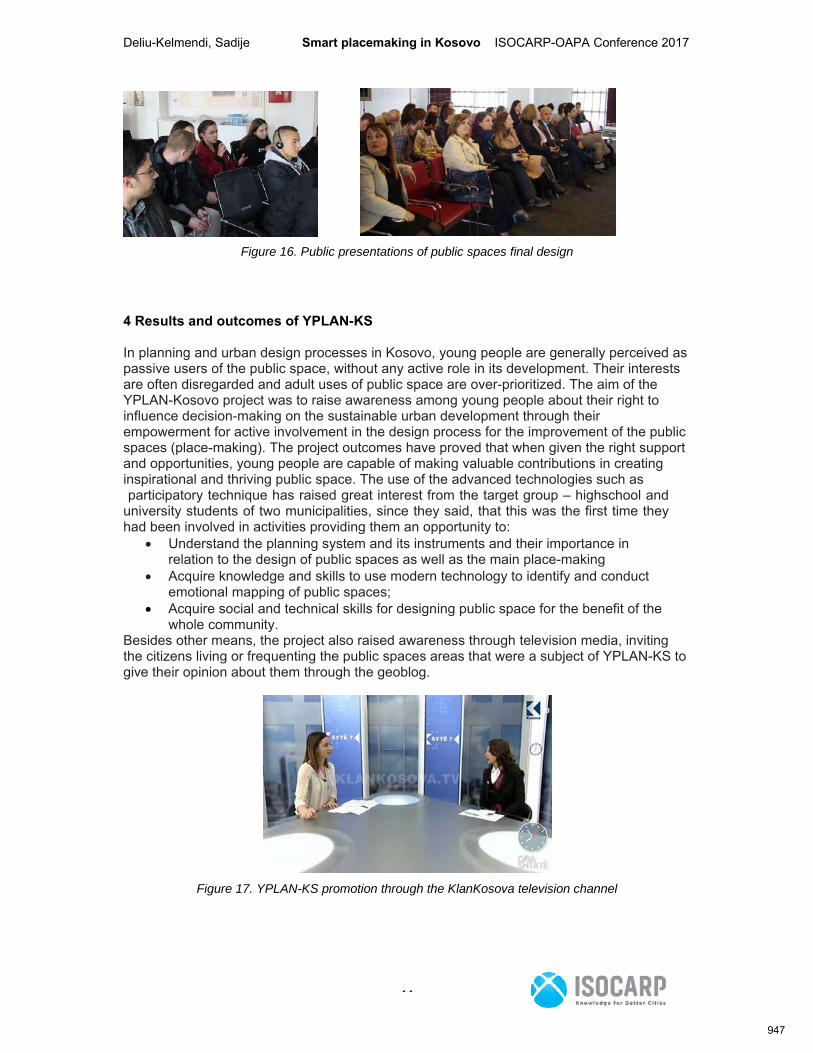
Deliu-Kelmendi, Sadije Smart placemaking in Kosovo ISOCARP-OAPA Conference 2017
11
Figure 16. Public presentations of public spaces final design
4 Results and outcomes of YPLAN-KS
In planning and urban design processes in Kosovo, young people are generally perceived as passive users of the public space, without any active role in its development. Their interests are often disregarded and adult uses of public space are over-prioritized. The aim of the YPLAN-Kosovo project was to raise awareness among young people about their right to influence decision-making on the sustainable urban development through their empowerment for active involvement in the design process for the improvement of the public spaces (place-making). The project outcomes have proved that when given the right support and opportunities, young people are capable of making valuable contributions in creating inspirational and thriving public space. The use of the advanced technologies such as Geoblog and mobile app., as a participatory technique has raised great interest from the target group – highschool and university students of two municipalities, since they said, that this was the first time they had been involved in activities providing them an opportunity to:
Understand the planning system and its instruments and their importance in relation to the design of public spaces as well as the main place-making principles; Acquire knowledge and skills to use modern technology to identify and conduct emotional mapping of public spaces;
Acquire social and technical skills for designing public space for the benefit of thewhole community.
Besides other means, the project also raised awareness through television media, inviting the citizens living or frequenting the public spaces areas that were a subject of YPLAN-KS to give their opinion about them through the geoblog.
Figure 17. YPLAN-KS promotion through the KlanKosova television channel
947

Deliu-Kelmendi, Sadije Smart placemaking in Kosovo ISOCARP-OAPA Conference 2017
12
Findings and lessons learned
The findings of this project and the lessons learned that would help, should the project be expanded or replicated elsewhere are:
Inclusion of qualitative and subjective data can bring valuable inputs for analysing existing situations of public spaces. Such data are giving spatial and real time indication;
Emotional maps allow users to get involved in the process of city planning anddecision-making;
The issue of ensuring internet coverage for each participant on the site has to be wellplanned and tested upfront;
The developed application only for Android operating system prevents users of iOS orother ones to use the mobile app;
There was a lack of participation from elderly people in the geoblog, which shows thatthey should be involved differently, probably through paper survey;
The impact of the project would have been higher if implementation would have beenpart of YPLAN-KS project;
Coordinating different stakeholders, such as school represenatives, high schoolstudents, municipal representatives and university students was quite challengingdue to their obligations and it required additional effort
Timing is very important. In case of YPLAN-KS, national and local elections have decreased the interest of the municipal high representatives to participate in the project activities
Working with minorities was considerably challenging keeping in mind that the war effects are still fresh
References: 1. UN-Habitat Office in Kosovo, March 2008, MuSPP Bulletin: The need for Urban
Design in Kosovo, accessible at: http://www.unhabitat-kosovo.org/repository/docs/USD_eng.pdf
2. UN-Habitat Office in Kosovo-MuSPP, 2013, Turning Spaces into Places, accessibleat: http://www.unhabitat-kosovo.org/repository/docs/Turning_Spaces_ENG_web1_917770.pdf
3. YPLAN-KS geoblog, accessible at: www.yplanks.com4. YPLAN-KS official Facebook page, accessible at:
https://www.facebook.com/YplanKosovoProject/
i The Sustainable Development Goal 11, Target 7 iiii MuSPP (2004): The need for urban design in Kosovo: Turning spaces into places iii Kosovar Civil Society Foundation
948
Smart(er) Local Communities
Author Dr Ledwon, Ministry of Municipality and Environment, Doha, Qatar (Presenting author)
Abstract
The way modern technology has opened any interaction over distance is unprecedented. So far the
cities were evolving based on the forces that put physical proximity as the driving and binding force.
Exchange of goods, thoughts, knowledge and relations was only possible when objects were close to
one another.
Now the innovation of global network has enabled free flow of thoughts, contacts, products and
interactions. People can immediately communicate over email, chats and calls. They organise over
social media. Everyone can choose where they
People are more eager to contribute, even anonymously, to describe the world they see. This means
creation of Google Earth models with SketchUp, adding information on wikimapia or any other
similar service. Others will fund proposals that they feel to care about through crowd funding
projects. Services such as Uber and AirBnB use the resources of global community, but only in the
local context. These two are services that manage the most resources, without owning any of them.
Local communities also get engaged with the government by saying – and designing – about what the
public money should be spent on. Also there are many applications that add another, virtual layers to
the space around people. Strava keeps amateur athletes virtually compete with each other.
Geocatching and other urban games help to explore the environment around with the use of smart
technologies.
This paper discusses the issues of implementing global trends and services at local levels. There are
many applications and tools that can be successfully implemented to aid for the local communities
and allow them for smarter use of the local resources. In the summary paper argues on the following
issues: How can municipalities best benefit from this new phenomena and bring the virtual
interaction to the local scale? How can we better use the universal tools to plan for small
communities and bring them back in today’s world?15:23 17-10-2017
949
Abstract title A data guide smart-transformation of traditional housing in urban context. The case
study of Sandaoguai traditional community in China.
Author Dr zhao, yizhou, Tsinghua University, BEIJING, China (Presenting author)
Co-author(s) Dr Lian, Lu ; Dr Du, Dikang
AbstractAlong with the development of new technologies and data application, as well as the
demands of Chinese rapid urbanization, the conception of “Smart” has become one of the essential
topics in China. Compared to the majority researches and practices that concerned about IoT, ICT, Big
data, new-type of intelligent communities and other complicated systems in various macro-scale, hi-
tech realms, however, this paper proposes another considerable direction of Smart communities: a
data guide smart-transformation of traditional communities in urban context.
On one hand, given the context of rapid urbanization and urban renewal in China, the preservation
and transformation of traditional housing and communities in city regions face various problems and
challenges, where new perspective and methods are needed to be explored, especially in the
framework of Smart City. On the other hand, focusing on the micro-urban unit – the traditional
housing transformation with its urban, historical, social and cultural context in smart ways should
also be a fundamental component of Smart City, which gives the insight of urban daily life with
traditional culture and urban sustainable development that reflects one of the ultimate goals of
Smart City. Under this circumstance, this paper focuses on the smart-transformation of traditional
community and take Sandaoguai as case study, in order to explore comprehensive analysis and
scientific methods that could provide references to similar issues.
Sandaoguai, located in Chongqing city area, China, is one of the “Chinese famous historical and
cultural Street/Community”, owning the typical traditional housing and unique space pattern with
local environment. With systematic overview and case study in Sandaoguai, this paper put forwards a
data guide method of the transformation of traditional housing in urban context, which coheres a
Two-way interaction study. One way is from space to data, which illustrates the simulation of
traditional space performance and focuses on the data records. In this way, based on certain
measurement devices and fundamental aspects of the housing performance data records, such as
temperature, humidity, illumination, CO2, PM2.5, and so on , this paper presents a multi-level of
data, which including data collection, data processing, data integration and data reasoning that could
give the scientific assessment of traditional space performance. Meanwhile, the other way is from
data to space, which indicates the strategies of renewal space design and focuses on the data
references. In this way, based on the simulation and data reference, this paper propose multi-
strategy of renewal design, which in terms of different space typology.
The results show that the data guide renewal of traditional housing in urban area with its two-way
strategies could lead reasonable thinking for a better understanding of the traditional space typology
with its architectural performance, and propose a sustainable development of traditional housing
transformation in the pursuit of inhabitants’ satisfaction as well. Furthermore, unlike the majority
researches, this paper try to raise the possibilities for thinking Smart City from micro-scale as a basic
point for high-level thoughts and actions, fulfilling Smart City from interactive connection between
basic data and daily space, pursuing Smart City from traditional housing transformation and urban
life, which indicate a significant and valuable direction of smart city both for research and practice.
950

Abstract title Local Government Policy in Response to Car sharing Innovation- Case of Melbourne
‘the most liveable city’
Author Jain, Taru, Monash University , MALVERN EAST, Australia (Presenting author)
Co-author(s) Prof Rose, Geoffrey ; Dr Johnson, Marilyn
Abstract
Since the early 2000’s Melbourne has seen a sharp rise in the availability of car sharing options. Car
sharing refers to a system where users can access a fleet of cars offered by an operator and book one
on an hourly basis, using online systems. As of November 2016, there were over 400 operational
shared cars in Melbourne, much less when compared to other similar sized cities in the west.
However, most of the shared cars are concentrated in inner Melbourne. Initial analysis suggested
that some of the neighborhoods on the fringes of Inner Melbourne have high car share membership
levels but hardly any new shared cars. Hence, there is a lag between demand and supply, with the
latter being dependent on local government policy and initiative.
The aim of this study is to understand how local governments are responding to a growing demand
for car sharing in Melbourne. A survey of the local councils in Melbourne will be conducted to
determine the current level of understanding about car sharing. The survey will also ask the councils
about the number of car sharing requests they received from operators in the past years and the
number of shared cars actually installed in the council area/ The survey will also solicit responses
regarding formal local policy on car sharing and key challenges faced during implementation (such as
resistance from certain parts of community and traders) and barriers to introduction of more shared
vehicles in the council area.
The survey questionnaire has been designed and will be administered online to the relevant
transport officers in the 31 local councils in Greater Melbourne. It is expected that the survey will
highlight the key challenges that local governments face in keeping up with the rise in demand of
shared modes. It will also potentially highlight how local policy is responding to innovation.
951
Challenges of Integrating Rural Community into the Teletopia World:
The Case of Gbedun and Alabidun Villages of Ona-Ara LGA, Nigeria.
Umar JIMOH and Ayodeji OBAYOMI
Department of Urban and Regional Planning,
University of Ibadan, Ibadan, Nigeria
Abstract
Globally, the world population was projected to be 66 percent urban residents by 2050, which
necessitated planning activities to focus on building an intelligent city that promotes positive
liveability. Meanwhile, the existing symbiotic relationship between the rural and urban economy
in Africa and Nigeria in particular makes rural studies key in realizing an intelligent city goal.
While research efforts have focused its argument more in favour of planning for the urban, the
rural area which services the urban in terms of human and material resources have not been
adequately attended to in literature. This study therefore is designed to examine the challenges
of integrating rural community into ‘teletopia’ world at Gbedun and Alabidun villages in Ona-ara
LGA, Nigeria.
A case study research design was utilized for the study. A combination of economic base theory
and concept of smart city was adopted, while both primary and secondary data were sourced.
Relying on multi-stage sampling technique, the LGA was divided into both urban and rural. The
two villages which were predominantly rural (Gbedun and Alabidun villages) were purposively
selected. From the two villages, 180 respondents were randomly selected, being 90
respondents from each village. Questionnaire containing variables such as awareness of the
use of information and communication technology (ICT) facilities, attitudes towards the use of
internet facilities, factors responsible for the backwardness of the respondents in the area, the
challenges of smart city project in the area were subsequently administered to all the
respondents that were above 18 years of age. FGD was also conducted as well as in-depth
interview. Both descriptive and inferential statistics (chi square) were used in analyzing the data
collected while the qualitative data were content analyzed.
Major findings revealed that there was no much awareness of the use of internet in the area.
Attitude of respondents if ICT was introduced was positive. Illiteracy due to lack of education,
poverty, sickness were factors militating against the inclusion of smart city approach. Lack of
basic infrastructure, illiteracy, remoteness, and lack participation in the governance were also
952
key factors working against the approach. There were no significant differences in the variables
investigated between the two villages.
The study concluded that ‘teletopia’ was very strange to people due to disconnect in
governance from the local people. Therefore, infrastructural provision, citizens’ participation as
well as resources utilization should be enforced to enhance the use of ICT.
Key words: Teletopia, Rural community, Urban, Challenges of smart city, Gbedun and
Alabidun, Ona-Ara LGA, ICT
1.0 Introduction
Globally, the world population was projected to be 66 percent urban residents by 2050, which
necessitated planning activities to focus on building an intelligent city that promotes positive
liveability for the both the rural centres. The concept of “smart communities” is attracting
considerable attention in the context of rural development policies. The Internet and broadband
network technologies as enablers of e-services become more and more important for small
community development, as the communities are increasingly assuming a critical role of
livelihood supporting framework to the urban centres.
Information and Communication suggests a widespread adoption of greater connectivity being
facilitated by new technology (Tapscott and Agnew, 1999), aided by proximity and the
application of the new information and communications technologies (NICT), which locally leads
to economic, social and political transformations encapsulated by the new smart community
movement (Coe et al., 2001). However, the internet with the development of the World Wide
Web and browser technology is among the major driving forces of the smart or cyber community
movement, which has blossomed few decades ago from an arcane tool used by academics and
government researchers into a worldwide mass of communications medium, and now poising to
becoming the leading carrier of all communications, which will consequently affect life and work
in the 21st Century (Coe et al., 2001).
These new technologies have permeated into human environmental application of intelligent-
acting products and services, artificial intelligence, and thinking machines (Knight and Weedon,
1995; Moser, 2001). Smartness in the technology context, implies the automatic computing
principle like self-configuration, self-healing, self-protection, self-optimization (Spangler et al.
2010), and self-mobility. The Information and Communication Technology (ICT) is literally
changing every aspect of our life as citizens, employees, employers, parents, friends, academia,
953
and as members of any type of community. We are gradually changing the patterns of our
professional and social lives. It is in light of this, there has been great emphasis put on the
possibilities that this new technological development can offer for local communities, urban
communities, and the governments, quality of life of education, governance, markets, job
opportunities and general prosperity. As networks increasingly take hold and reshape the way
people live, communicate and work, such opportunities are raising the question of what kind of
life rural people need leading to have a sustainable livelihood?
The emergence of teletopia world offers a significant intervention with the potential to ensure
that knowledge and information are easily accessible. The relevance of this revolution is
supported by Balit et al. (1996) who points out that the least expensive input for rural
development is knowledge, and that knowledge and information are basic factors that make one
to be self-reliant and are essential for facilitating rural development and bringing about social
and economic change. Cohen (1987) believes that the purpose of rural development is to
improve the standard of living of the rural people, which requires multi-sectoral approach that
may include; agriculture, industry and social facilities. In the same vein, Munyua (2000) opines
that rural communities require information on supply of inputs, market their outputs, apply new
technologies to production, get early warning systems about drought, pests, and diseases,
credit, market prices, their competitors, communicate with the outer world, among others. Also,
uncertainties brought about by global events and the evolution and complexity of the
technology, greatly influence the agricultural sector. As a result, the need of farmers to access
information, is also increasing (Amponsah, 1995). Nowadays a growing number of farmers
adopt and use the PC for farm managerial applications, as well as for market research and for
obtaining marketing services. In the digital age, the cost of obtaining, producing, and delivering
information has decreased, while the quantity and speed of information flow has increased. (Hall
et al., 2003). The Internet has been recognized as a tool that improves the efficiency and
effectiveness in the primary production of the rural sector. Potential uses of the Internet for
businesses include: access to market prices and products’ information, access to government
and academic reports and research results, interaction with other primary producers, purchase
inputs, sell production, communicate with suppliers and buyers, and access to software
applications (Gloy & Akridge, 2000; Ferrer, Schroder & Ortmann, 2003). Likewise, the Internet
can be used as a tool to market their products to a much broader set of consumers (Mishra,
Williams & Detre, 2009). ICT enable farmers, traders, and other primary producers to overcome
the geographical and other barriers to access information, to pursue education, to communicate
954
effectively within the supply-chain, to promote and sell products directly to consumers, et cetera.
The information transfer using telecommunication facilities, could enhance the rural marketing
strategy and increase the possibilities for more profitable rural businesses (Hall et al., 2003) and
increase rural public participation in decision making.
1.1 Statement of Problem
Integrating the rural communities into the ‘teletopia’ arena is perceived to face many upheavals
ranging from governance exclusion, epileptic power supply, illiteracy, remoteness, poverty,
corruption and so on. Access to various technological services has become more difficult, with
the victims of these developments basically the rural people. They lack access to individual
means of becoming literate, due to them being too illiterate, too neglected, too remote, too poor
or too primitive, resulting from economic and information poverty.
Rural communities in Africa constitutes the larger percentage of the population whose
information and developmental needs are not adequately met, but are consequently not been
able to productively participate in the development process and enjoy the benefits thereof
(Chester & Neelameghan, 2006). For long, the public aspect of governance (rural people) in
Africa has suffered neglect from enjoying any meaningful development, largely because of their
exclusion from policy formulation and implementation. The consequence of these neglects
resulted in rural communities lacking access to basic needs such as water, telecommunication
facilities, food, education, health care, sanitation, information and security. This has
consequently led to low life expectancy, urban-rural drifts, rural underdevelopment, and among
others.
Education is among the major problems facing the rural communities, as it is quite low.
Meanwhile, education has since been established to be a catalyst of meaningful development,
without which no nation can propel itself into the modern era of technology and development.
The poor education background of the rural people in Africa is the major cause of the ignorance
about what information technology entails (Rosenberg, 1993).
There is paucity of data available from attempts made by researchers to study and proffer
solutions to the problems of the rural areas, especially in the contemporary digital age.
Meanwhile, this research looks to fill this gap in the literature as it attempts to integrate the rural
spaces, specifically Gbedun and Alabidun communities, Ona Ara Local Government Area, Oyo
State, Nigeria, into the teletopia world (electronic world), with a view to proffer solutions to the
955
challenges the rural communities face from benefitting from the new movement of smartness.
However, the objectives to achieve the aforementioned goal are to take the inventory of the;
socio-economic characteristics of the people in the area, awareness of the use of internet and
communication facilities, attitude of the respondents towards the use of information and
telecommunication facilities, factors responsible for the backwardness of the respondents, and
challenges of smart city’s projects in the communities.
1.2 Study Area
The study area-Ona-Ara Local Government Area (LGA) of Oyo State, has it’s headquarter in
Akanran. The LGA has eleven districts (wards) (Adedeji et al., 2013). Primary production like
agriculture, lumbering is the mainstay of the inhabitants, although few engaged in non-primary
activities, and their major language is Yoruba. It has an area of 290km2 and a population of
265,059 as at 2006 National Population.
956
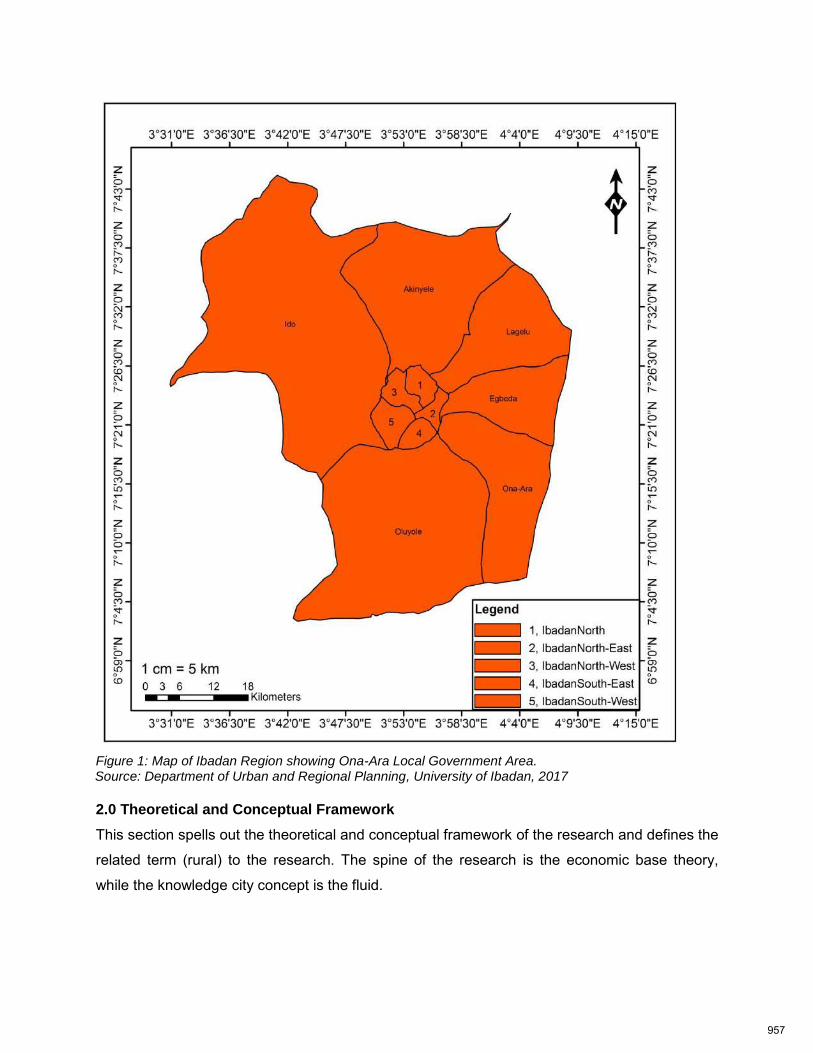
Figure 1: Map of Ibadan Region showing Ona-Ara Local Government Area.
Source: Department of Urban and Regional Planning, University of Ibadan, 2017
2.0 Theoretical and Conceptual Framework
This section spells out the theoretical and conceptual framework of the research and defines the
related term (rural) to the research. The spine of the research is the economic base theory,
while the knowledge city concept is the fluid.
957
2.1 Defining ‘Rural’
Demarcating the rural communities differ from country to country, due to differences in criteria
for defining them. Individual definitions for rural areas are abundant, but a general definition is
yet to evolve. Olujimi (2011) believes that people know when they are rural, particularly as
reflected in the backwardness of their behaviour, but such perception does not sufficiently
satisfy the needs of community planners, demographers, policy makers, academia, and among
others. Furthermore, rural as a concept, goes beyond mere definition, it mean diverse thing to
different people, depending on their backgrounds.
‘Rural’ was first used by the United State (US) Bureau of the Census in 1874, when it was
defined as indicating the population of a country exclusive of any city or town with 8,000 or more
inhabitants (Whitaker, 1982). Modified over the years by the 1980 census, a specific definition of
rural had been dropped as opposite of urban. The urban population is defined as all persons
living in urbanized areas and places of 2,500 or more located outside rural areas; all population
not classified as urban constitutes the rural population (US Bureau of Census, 1983).
Meanwhile, in Nigeria, the Federal Office of Statistics defines a community with less than
20,000 people rural (Ocheni.and Nwankwo, 2012).
Generally speaking, according to Afolayan (1995), rural areas are easily identified by other
various criteria, apart from population. Such criteria include: level of infrastructural development
like; road networks, educational institutions, water supply, electricity, health facilities,
communication, among others. The rural area lacks most if not all of these infrastructures, and
where they are available, the quality, as well as quantity, is usually below desirable standard
(Ocheni.and Nwankwo, 2012). Other criteria are: occupational differentiation−most rural
dwellers earn their living by engaging in subsistent agriculture production; Housing−housing in
rural areas are generally below the standard an average person will be proud of; Extent of
community planning−community development activities in the rural areas are often carried out
with little or no planning at all, such that future development activities cannot be undertaken
without interfering with the existing structures; Education−most rural dwellers lack the access to
quality education. Arising from the combination of the aforementioned factors is the poverty
characteristic of rural areas when related to the economic buoyancy of urban centers
(Ocheni.and Nwankwo, 2012).
958
2.2 Economic Base Theory
The economic base theory was developed during the twentieth century and may now be
considered a basic tool in urban and rural economics (Thulin, 2014). The model is built on the
observation that production is either sold locally or exported to other regions or countries.
Economic activity can therefore be categorized as either belonging to the basic or the non-basic
sector, where the former label is used for sectors primarily producing for the export market and
the latter for sectors producing for the local market. Export draws new income and purchasing
power into the local area, which gives rise to higher demand for non-traded goods and services
in the region. Expanding the basic sector is therefore considered to be crucial for the region’s
overall economic development (Thulin, 2014).
Economic base theory and its close relative, export base theory, can be used to explain the
development of a city or region in terms of economic activities satisfying external demand,
which assumes a dependence on broader markets (Domański and Gwosdz, 2010). The defining
assumptions of the economic base theory are that all economic activity can either be classified
as basic or non-basic in nature, and that the non-basic sector is dependent on economic activity
in the base sector. It is the theoretically motivated duality of regional economic activity that
enables us to characterize a region according to its exporting–non-exporting behavior and to
estimate its future development by implementing multiplier analysis. Unfortunately, the
distribution of economic activities into two mutually exclusive sectors is not an easy task to do
empirically. In fact, it is the most difficult task in performing an economic base analysis and is
riddled by several complicating factors. For instance, firms belonging to a particular industry
might sell their goods and services to customers both within the region as well as to customers
in other regions (Thulin, 2014).
In the same vein, Sombart (1916), a German economist, expanded the theory to include what
he called the ‘town builders and town fillers’. Town builders are those who earn their income
from outside the city, while the town fillers refer to those serving the local market. It is the town
builders who draw income into the city and used it to purchase goods and services from the
town fillers. Hence, the town fillers depended on the town builders for their livelihoods. However,
analyzing a town’s economic base, it is important to note the level of the town builders and the
town fillers. For an economy to be positive and sustainable, the number of town builders in that
economy must exceed that of town fillers. Meanwhile, to achieve this objective, the creation of
959
electronic (online) market is paramount, and that is what the smart city concept attempts to
achieve.
Economic base analyses are highly dependent on the choice of regional delimitation. The
choice of regional delimitation is to decide where the local market ends and the export market
begins (Thulin, 2014). In fact, the very phenomena of basic and non-basic activity can be
viewed as endogenous with respect to the regional borders – a basic economic activity might
very well become non-basic as we expand the geographical area. Since larger regions are more
self-sustainable and consequently less dependent on trade across regional and national
borders, they are also more likely to have relatively smaller basic sectors than smaller regions.
In effect, the ratio of overall regional activity to activity in the basic sector – the multiplier – will
tend to be larger in larger regions and vice versa all else equal (Sirkin, 1959; Lane, 1966).
2.3 The Smart City Concept
The smart city concept in the literature has being used synonymously and interchangeably with
the following concepts depending on the premise or dimension of the research. In technology
dimension, it has being used as the digital city concept, intelligent city concept, ubiquitous city
concept, hybrid city concept, wired city concept, or information city concept, while in people
dimension, it has being used as the knowledge city concept, creative city concept, humane city
or learning city concept. However, considering the community dimension, it has being applied
as the smart city concept– which is the basis of this research.
Tracing the genealogy of the word smart in the label smart city, can contribute to an
understanding of how the term smart, is being loaded (Nam and Pardo, 2011). In the early
1990s the phrase "smart city" was coined to signify how urban development was turning
towards technology, innovation and globalization (Gibson et al., 1992). The World Foundation
for Smart Communities advocated the use of information technology to meet the challenges of
communities within a global knowledge economy (WFSC, n.d). However, the more recent
interest in smart cities can be attributed to the strong concern for sustainability, and to the rise of
new internet technologies, such as mobile devices (e.g. smart phones), the semantic web, cloud
computing, and the Internet of Things (IoT) promoting real world user interfaces.
Smartness is required to adapt itself to the user needs and to provide customized interfaces
(Marsa-Maestre et al., 2008). In the urban planning field, the smartness in smart growth is
960
treated as a normative claim and ideological dimension, which entails strategic directions (Nam
and Pardo, 2011). According to Center on Governance (2003), governments and public
agencies at all levels are embracing the notion of smartness to distinguish their new policies,
strategies, and programs for targeting sustainable development, sound economic growth, and
better quality of life for their citizens (Nam and Pardo, 2011).
Washburn et al. (2010) conceptualize smart city by laying an explicit emphasis on the use of
smart computing technologies. They view current urban crises as an imperative of a smart city
initiative. Deteriorating conditions of cities in a crisis include scarcity of resources, inadequate
and poor infrastructure, energy shortages and price instability, global environmental concerns,
and human health concerns. Giffinger et al. (2007) highlight the performance of smart city in
economy, people, governance, mobility, environment, and living.
Smartness in communities has focuses on the latest advancements in mobile and pervasive
computing, wireless networks, middleware, and agent technologies as they become embedded
into the physical spaces of communities. The emphasis on smart embedded devices represents
a distinctive characteristic of smart cities, which create territorial innovation systems combining
knowledge-intensive activities, institutions for cooperation and learning, and web-based
applications of collective intelligence (Komninos, 2002; Komninos, (2008). Smart and intelligent
cities have this modernization potential, because they are not events in the cyber-sphere, but
integrated social, physical, institutional, and digital spaces, in which digital components improve
the functioning of socio-economic activities, and the management of physical infrastructures of
cities, while also enhancing the problem solving capacities of communities.
The focus of a smart city is the adoption of Information Communication Technologies to
enhance city functions and promote economic growth, by connecting people locally and
internationally without the need to travel and embark on face-to-face engagement (Nam &
Pardo, 2011). Backhouse (2015) believes that there is a notion that smart cities apply human
intelligence to the problems of city living, so as to achieve better end results. Nowadays, most of
a city’s transactions are done electronically via ICTs, welcoming a multiplication of transactions
within a fraction of the time compared to those done before the dawn of the ‘information age’
(Erwee, 2016). This is a milestone of progress for smart cities as the increased frequency of
transactions ultimately increases economic growth and concurrently, in theory, enhances the
quality of life for all who are engaged with the smart city (Erwee, 2016). In the lieu to this, the
961
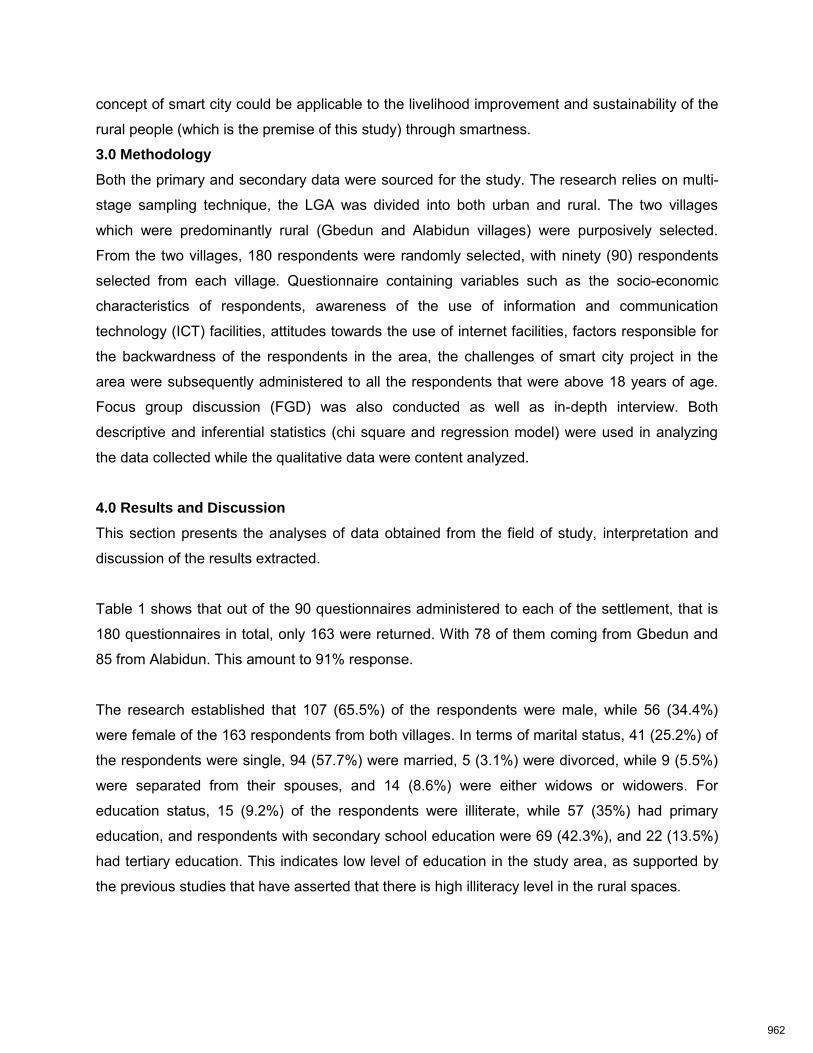
concept of smart city could be applicable to the livelihood improvement and sustainability of the
rural people (which is the premise of this study) through smartness.
3.0 Methodology
Both the primary and secondary data were sourced for the study. The research relies on multi-
stage sampling technique, the LGA was divided into both urban and rural. The two villages
which were predominantly rural (Gbedun and Alabidun villages) were purposively selected.
From the two villages, 180 respondents were randomly selected, with ninety (90) respondents
selected from each village. Questionnaire containing variables such as the socio-economic
characteristics of respondents, awareness of the use of information and communication
technology (ICT) facilities, attitudes towards the use of internet facilities, factors responsible for
the backwardness of the respondents in the area, the challenges of smart city project in the
area were subsequently administered to all the respondents that were above 18 years of age.
Focus group discussion (FGD) was also conducted as well as in-depth interview. Both
descriptive and inferential statistics (chi square and regression model) were used in analyzing
the data collected while the qualitative data were content analyzed.
4.0 Results and Discussion
This section presents the analyses of data obtained from the field of study, interpretation and
discussion of the results extracted.
Table 1 shows that out of the 90 questionnaires administered to each of the settlement, that is
180 questionnaires in total, only 163 were returned. With 78 of them coming from Gbedun and
85 from Alabidun. This amount to 91% response.
The research established that 107 (65.5%) of the respondents were male, while 56 (34.4%)
were female of the 163 respondents from both villages. In terms of marital status, 41 (25.2%) of
the respondents were single, 94 (57.7%) were married, 5 (3.1%) were divorced, while 9 (5.5%)
were separated from their spouses, and 14 (8.6%) were either widows or widowers. For
education status, 15 (9.2%) of the respondents were illiterate, while 57 (35%) had primary
education, and respondents with secondary school education were 69 (42.3%), and 22 (13.5%)
had tertiary education. This indicates low level of education in the study area, as supported by
the previous studies that have asserted that there is high illiteracy level in the rural spaces.
962
In terms of occupation, 85 (52.1%) of the respondents were farmers, 47 (28.8%) were traders
and only 31(19%) respondents had formal employment. This indicates high level of primary
production in the areas. Concerning the annual income earned by the respondents, 83 (50.9%)
of the respondents earned less than #200,000 annually. 39 (23.9%) earned between #200,000-
#300,000 annually. While 28 (17.2%) of the respondents earned between #300,000-#400,000
annually, and only 13 (8%) earned more than #400,000 annually. This is also an indication of
high poverty level in the study area.
Frequency Percent Valid Percent Cumulative
Percent
Valid Gbedun 78 47.9 47.9 47.9
Alabidun 85 52.1 52.1 100.0
Total 163 100.0 100.0
Table 1: Location of the respondents Source: Authors’ Field Survey, 2017 Table 2 shows the results of the awareness of telecommunication by the respondents. 54
(33.1%) of the respondents defined telecommunication as speaking to one another on phone
only, 42 (25.8%) said it is interacting with one another on social media, while 38 (23.3%)
described it as communicating via internet means only, and only 29 (17.8%) defined it as the
science and technology of communication of messages over long distance using electronic and
magnetic impulses. When asked if they had surfed the internet before, 64 (39.3%) of the
respondents responded ‘yes’, while 99 (60.7%) responded ‘no’. The result is an evidence of low
level of awareness and consequently low level of internet usage in the area.
963
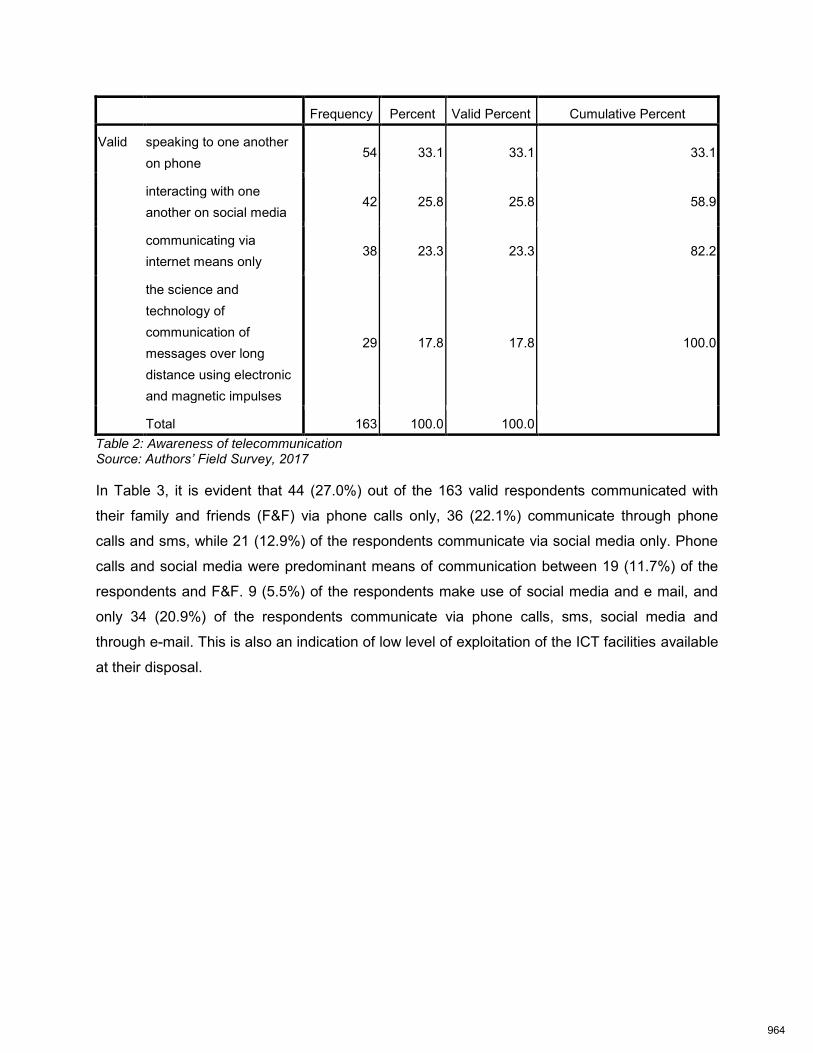
Frequency Percent Valid Percent Cumulative Percent
Valid speaking to one another on phone
54 33.1 33.1 33.1
interacting with one another on social media
42 25.8 25.8 58.9
communicating via internet means only
38 23.3 23.3 82.2
the science and technology of communication of messages over long distance using electronic and magnetic impulses
29 17.8 17.8 100.0
Total 163 100.0 100.0
Table 2: Awareness of telecommunication Source: Authors’ Field Survey, 2017
In Table 3, it is evident that 44 (27.0%) out of the 163 valid respondents communicated with
their family and friends (F&F) via phone calls only, 36 (22.1%) communicate through phone
calls and sms, while 21 (12.9%) of the respondents communicate via social media only. Phone
calls and social media were predominant means of communication between 19 (11.7%) of the
respondents and F&F. 9 (5.5%) of the respondents make use of social media and e mail, and
only 34 (20.9%) of the respondents communicate via phone calls, sms, social media and
through e-mail. This is also an indication of low level of exploitation of the ICT facilities available
at their disposal.
964
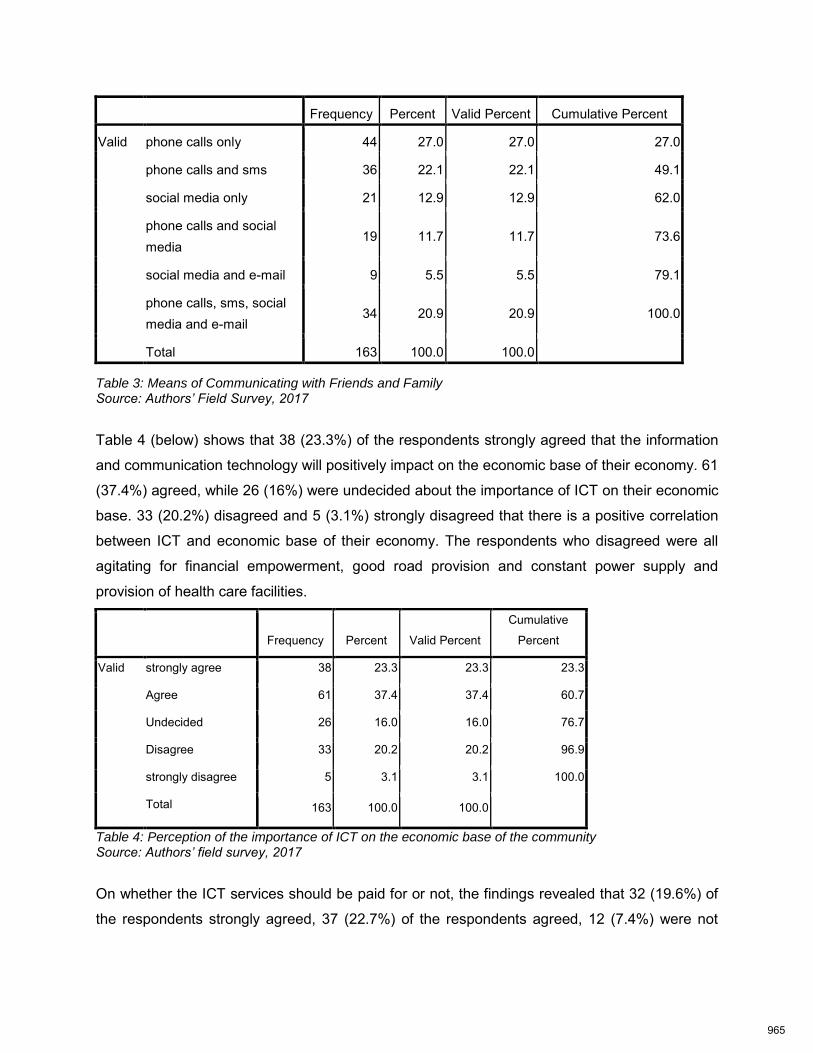
Frequency Percent Valid Percent Cumulative Percent
Valid phone calls only 44 27.0 27.0 27.0
phone calls and sms 36 22.1 22.1 49.1
social media only 21 12.9 12.9 62.0
phone calls and social media
19 11.7 11.7 73.6
social media and e-mail 9 5.5 5.5 79.1
phone calls, sms, social media and e-mail
34 20.9 20.9 100.0
Total 163 100.0 100.0
Table 3: Means of Communicating with Friends and Family Source: Authors’ Field Survey, 2017
Table 4 (below) shows that 38 (23.3%) of the respondents strongly agreed that the information
and communication technology will positively impact on the economic base of their economy. 61
(37.4%) agreed, while 26 (16%) were undecided about the importance of ICT on their economic
base. 33 (20.2%) disagreed and 5 (3.1%) strongly disagreed that there is a positive correlation
between ICT and economic base of their economy. The respondents who disagreed were all
agitating for financial empowerment, good road provision and constant power supply and
provision of health care facilities.
Frequency Percent Valid Percent
Cumulative
Percent
Valid strongly agree 38 23.3 23.3 23.3
Agree 61 37.4 37.4 60.7
Undecided 26 16.0 16.0 76.7
Disagree 33 20.2 20.2 96.9
strongly disagree 5 3.1 3.1 100.0
Total 163 100.0 100.0
Table 4: Perception of the importance of ICT on the economic base of the community Source: Authors’ field survey, 2017
On whether the ICT services should be paid for or not, the findings revealed that 32 (19.6%) of
the respondents strongly agreed, 37 (22.7%) of the respondents agreed, 12 (7.4%) were not
965
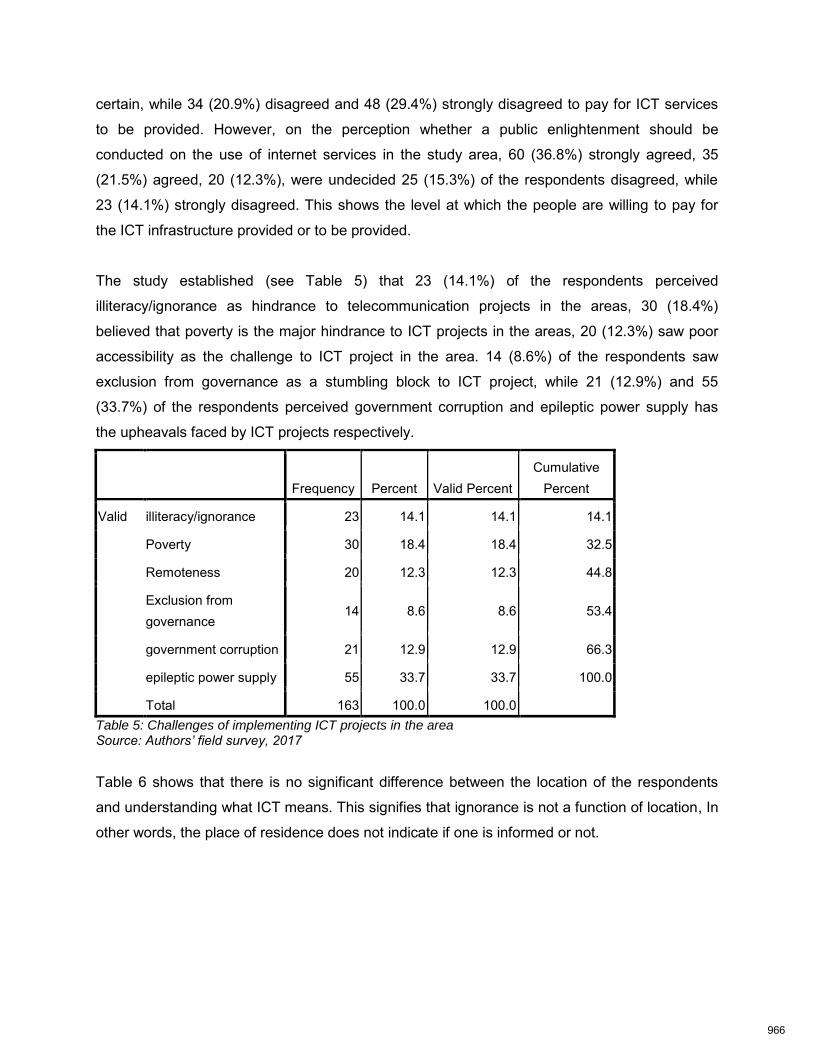
certain, while 34 (20.9%) disagreed and 48 (29.4%) strongly disagreed to pay for ICT services
to be provided. However, on the perception whether a public enlightenment should be
conducted on the use of internet services in the study area, 60 (36.8%) strongly agreed, 35
(21.5%) agreed, 20 (12.3%), were undecided 25 (15.3%) of the respondents disagreed, while
23 (14.1%) strongly disagreed. This shows the level at which the people are willing to pay for
the ICT infrastructure provided or to be provided.
The study established (see Table 5) that 23 (14.1%) of the respondents perceived
illiteracy/ignorance as hindrance to telecommunication projects in the areas, 30 (18.4%)
believed that poverty is the major hindrance to ICT projects in the areas, 20 (12.3%) saw poor
accessibility as the challenge to ICT project in the area. 14 (8.6%) of the respondents saw
exclusion from governance as a stumbling block to ICT project, while 21 (12.9%) and 55
(33.7%) of the respondents perceived government corruption and epileptic power supply has
the upheavals faced by ICT projects respectively.
Frequency Percent Valid Percent Cumulative
Percent
Valid illiteracy/ignorance 23 14.1 14.1 14.1
Poverty 30 18.4 18.4 32.5
Remoteness 20 12.3 12.3 44.8
Exclusion from governance
14 8.6 8.6 53.4
government corruption 21 12.9 12.9 66.3
epileptic power supply 55 33.7 33.7 100.0
Total 163 100.0 100.0
Table 5: Challenges of implementing ICT projects in the area
Source: Authors’ field survey, 2017
Table 6 shows that there is no significant difference between the location of the respondents
and understanding what ICT means. This signifies that ignorance is not a function of location, In
other words, the place of residence does not indicate if one is informed or not.
966
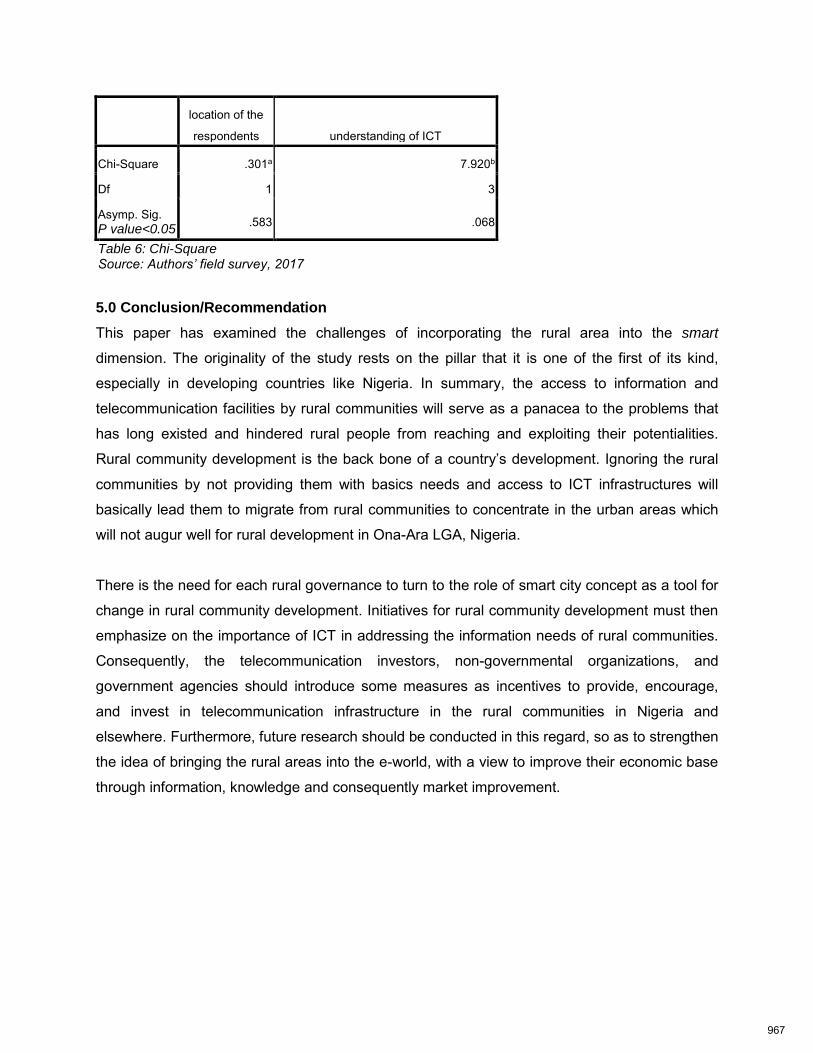
location of the
respondents understanding of ICT
Chi-Square .301a 7.920b
Df 1 3
Asymp. Sig. P value<0.05
.583 .068
Table 6: Chi-Square Source: Authors’ field survey, 2017
5.0 Conclusion/Recommendation
This paper has examined the challenges of incorporating the rural area into the smart
dimension. The originality of the study rests on the pillar that it is one of the first of its kind,
especially in developing countries like Nigeria. In summary, the access to information and
telecommunication facilities by rural communities will serve as a panacea to the problems that
has long existed and hindered rural people from reaching and exploiting their potentialities.
Rural community development is the back bone of a country’s development. Ignoring the rural
communities by not providing them with basics needs and access to ICT infrastructures will
basically lead them to migrate from rural communities to concentrate in the urban areas which
will not augur well for rural development in Ona-Ara LGA, Nigeria.
There is the need for each rural governance to turn to the role of smart city concept as a tool for
change in rural community development. Initiatives for rural community development must then
emphasize on the importance of ICT in addressing the information needs of rural communities.
Consequently, the telecommunication investors, non-governmental organizations, and
government agencies should introduce some measures as incentives to provide, encourage,
and invest in telecommunication infrastructure in the rural communities in Nigeria and
elsewhere. Furthermore, future research should be conducted in this regard, so as to strengthen
the idea of bringing the rural areas into the e-world, with a view to improve their economic base
through information, knowledge and consequently market improvement.
967
References
Adedeji, S.O. Akande, T.O., Akinwumi, A.O., Okunlola, D.O. and Shittu, M.D. (2013). Ethnoveterinary practices among sheep rearers in Ona-Ara Local Government of Oyo state, Nigeria. Sokoto Journal of Veterinary Sciences, Vol. 11 (1).
Afolayan, S. O. (1995). Community Mobilization for Rural Development in Bangladesh: Lessons
for Nigeria. Ilorin: Agricultural and Rural Management Training Institute, ARMTI. Amponsah, W. (1995). Computer Adoption and Use of Information Services by North Carolina
Commercial Farmers. Journal of Agricultural and Applied Economics, vol. 27, pp. 565- 576.
Backhouse, J. (2015) ‘Smart city agendas of African cities. University of the Witwatersrand,
Johannesburg, South Africa. Balit, S., Calvelo-Rios, M. and Masias, L. (1996). Communication for development for Latin
America: a regional experience. FAO, Rome Italy. Centre on Governance (2003) www.governance.unottawa.ca. Accessed on 12th July, 2017. Chester, G. and Neelameghan, A. (2006). "Information Professional: Knowledge and Skills
Development for Serving Marginalized and Rural Communities." Webology, 3(3), Article 29. Available at: http://www.webology.ir/2006/v3n3/a29.html. Accessed on 12th June, 2017.
Coe, A., Paquet, G. and Roy, J. (2001). E-governance and smart communities: A social learning
challenge. Social Science Computer Review, 19(1), 80-93. Cohen, J.M. (1987). Integrated rural development: the Ethiopian experience and the debate.
Scandinavian Institute of African Studies, Uppsala, Sweden. Erwee, C. (2016). Rebranding Umhlanga as an intelligent city. In ‘Cities we have vs Cities we
need’ 52nd ISOCARP Conference, held at Durban, South Africa, 12th- 16th September, 2016
Ferrer, S.R., Schroder, D.H. and Ortmann, G.F. (2003). Internet use and factors affecting
adoption of the internet applications by sugarcane farm businesses in the Kwazulunatal- Midlands. 41st Annual Conference of the Agricultural Economics Association of South Africa (AEASA).
Gibson, D.V., Kozmetsky, G. and Smilor, R.W. (1992). The Technopolis Phenomenon: Smart
Cities, Fast Systems, Global Networks. Rowman and Littlefield, New York. Giffinger, R. et al. (2007). Smart Cities: Ranking of European Medium-Sized Cities. Centre of
Regional Science (SRF), Vienna University of Technology, Vienna, Austria. Gloy, B. and Akridge, J. (2000). Computer and internet adoption on large U.S. farms.
International Food and Agribusiness Management Review, vol. 3, pp. 323-338. Hall, L., Dunkelberger, J., Ferreira, W., Prevatt, J. and Martin, N. (2003). Diffusion-adoption of
968
personal computers and the internet in farm business decisions: Southeastern beef and peanut farmers. Journal of Extension, vol. 41(3).
Knight, J. and Weedon, A. (1995). Editorial. Convergence. The Journal of Research into New
Media Technologies, 1(1), 5-8. Komninos, N. (2002). Intelligent Cities: Innovation, knowledge systems and digital spaces.
Taylor & Francis, London and New York. Komninos, N. (2008). Intelligent Cities and Globalization of Innovation Networks. Routledge,
London and New York. Lane, T. (1966). The Urban Base Multiplier: An Evaluation of the State of the Art. Land
Economics, 42(3), pp. 339–347. Mishra, A.K., Williams, R.R. and Detre, J.D. (2009). Internet Access and Internet Purchasing
Patterns of Farm Households. Moser, M. A. (2001). What is smart about the smart communities movement? EJournal,
10/11(1). Available at http://www.ucalgary.ca/ejournal/archive/v10-11/v10- 11n1Moser- print.html.
Munyua, H. (2000). Information and Communication Technologies for rural development and
food security: Lessons from field experiences in developing countries. SD Knowledge: communication for development available at www.google.com. Accessed 22nd July 2017.
Nam, T. and Pardo, T.A. (2011). Conceptualizing Smart City with Dimensions of Technology,
People, and Institutions. The Proceedings of the 12th Annual International Conference on Digital Government Research June 12–15, 2011, College Park, MD, USA.
Ocheni and Nwankwo (2012). Analysis and Critical Review of Rural Development Efforts in
Nigeria, 1960-2010. Studies in Sociology of Science Vol. 3(3), pp. 48-56 Olujimi, J.A.B (2011). From Rural to Urban: The Nigerian Physical Planning Dilemma.
Inaugural Lecture Series 63, Delivered at the Federal University of Technology, Akure, Nigeria, On 20th Tuesday, September, 2011.
Rosenberg, D. (1993). Rural community resource centres: a sustainable option for Africa?
Information development, vol. 9(1-2), pp 29-35. Spangler, W. S., Kreulen, J. T., Chen, Y., Proctor, L., Alba, A., Lelescu, A., & Behal, A. (2010).
A smarter process for sensing the information space. IBM Journal of Research and Development, 54(4). DOI: 10.1147/JRD.2010.2050541.
Sirkin, G. (1959). The Theory of the Regional Economic Base. Review of Economics and
Statistics, 41(4), 426–429. Sombart, W. (1916). Der Moderne Kapitalismus, Erster Band: Die Vorkapitalistische Wirtschaft
(2d. rev. ed.). Munich, Germany: Duncker & C. Humblot.
969
Tapscott, D. and Agnew, D. (1999). “Governance in the Digital Economy” Finance and Development. pp. 84-87.
Thulin, P. (2014). Local Multiplier and Economic Base Analysis. Working Papers Series from
Swedish Entrepreneurship Forum. http://entreprenorskapsforum.se/wp content/uploads/2014/11/WP_29.pdf. Accessed on the 24th, July, 2017.
Washburn, D., Sindhu, U., Balaouras, S., Dines, R. A., Hayes, N. M., & Nelson, L. E. (2010).
Helping CIOs Understand “Smart City” Initiatives: Defining the Smart City, Its Drivers, and the Role of the CIO. Cambridge, MA: Forrester Research, Inc. Available at http://public.dhe.ibm.com/partnerworld/pub/smb/smarterplan et/forr_help_cios_und_smart_city_initiatives.pdf. Accessed on 11th, July, 2017.
WFSC (not dated) Smart Communities, http://www.smartcommunities.org/about.htm. Accessed
on 2nd August, 2017. Whitaker, W.H. (1982), ‘The Many Faces of Ephraim in Search of a Functional Typology of
Rural Areas’, State Education Dept. Publication, New York.
970
The Role of Spatial Technology In Shaping Qatar’s Urban Future.
MARYAM ZAINAL
Spatial Information Specialist, Coordinator - QNMP Project, MME, Doha, Qatar
Email: [email protected]
YASSER HAMMAM (PhD)
Senior GIS Specialist, Spatial Information Team, MME, Doha, Qatar
Email: [email protected]
Abstract Starting from early sixties, Qatar has witnessed its first urbanization period, which was
linked to the discovery of oil and then the rapid increase in associated revenues. From
the 1950s to 1970 Doha’s population grew from around 14,000 inhabitants to over
83,000, with foreign immigrants instituting about 67%. Consequently, Doha, the Capital
of Qatar, has witnessed its rise from being a small humble fishing village in the middle
of the 20th century to an emerging regional and influential urban center with more than
2.5 million inhabitants. In this first period of Doha’s urban transformation developments
were generally rather uncoordinated. This paper offers an exploratory analysis of the
urban planning evolution of Qatar and Doha with a stress on the role of spatial
technology and spatial data infrastructure. The first documented planning era in Qatar
was based on number of planning schemes generated by foreign consultants. While
such schemes claimed to provide a blue print for the urban planning but the
fundamental shortcoming was related to data accumulation and analysis. The new era
in Doha’s planning was generated from the planning concept suggesting the
inevitability of moving from a one-center urbanism towards multi centers urbanity. Such
approach encourages the emergence of small communities. At the same time, creates
971
a challenge regarding how to better distribute housing, facilities, infrastructure and
community needs in a balanced way that can sustain the lives of small communities in
Qatar’ sub centers.
In this paper, an explanation of the necessity for establishing knowledge based spatial
technological infrastructure will be provided. The main objective is to better inform
urban planners in Qatar and create an informative base for their different decision and
interventions. The paper illustrates the main features of the spatial technological
approach used in Qatar and how it is assisting the generation of Qatar National Master
Plan (QNMP). The paper concludes by relating the knowledge-based planning process
of the future of Doha and the rest of Qatari cities to the challenges facing its urban
environment so that approachable strategies for liveability and quality of urban life can
be and implemented. A focus on challenges like decentralization, community facilities
distribution and allocation, hierarchy of urban centers, transit oriented development
and efficient transportation and infrastructure will be analyzed.
Keywords:
Computer Agent, GIS, Decision Support System, Multiple-Criteria Evaluation, SDI,
Geographic Agent, Spatial Decision-Making, Sustainable Development.
1. Introduction
Administrators and politicians are beginning to recognize spatial information as a
national resources as well as a part of the basic infrastructure that needs to be
efficiently coordinated and managed in the interest of the nation. It is very important to
develop policies for standardization, legal aspects, pricing, distribution, etc.
Spatial Data Infrastructure (SDI) is conceived to be: an umbrella of policies, standards
and procedures under which organizations and technologies interact to foster more
efficient use, management, production and utilization of spatial data (Nebert, 2004).
Spatial data is dynamic with the time parameter being part of the individual data
collection. Spatial Data is generated from different sources and it may be in different
level of accuracy. One precondition for successful implementation of spatial data in
society is the establishment of a Spatial Data infrastructure. Another is comprehensive
972
knowledge on organizational structures, technological developments and data-
collection methods.
Spatial Data and Information is an indispensable part of the basic infrastructure in the
individual country, and experiences from the rich countries shows that spatial
information affects 80% of human decision making. In addition, the use of spatial
information produces a direct or indirect possibility of increased efficiency in all sectors
of public administration, in the political decision-making process as well as in the
private sector.
In such, it consists of organizations and individuals who generate and / or use spatial
data, the technologies that facilitate use and transfer of spatial data and the actual
spatial data. SDI is not all about networks and technology; it will not function if the data
has not been generated, neither if communication channels, standards, procedures,
and partnership models have not been developed. SDI provides a basis for spatial data
discovery, evaluation and application for users and procedures within all levels of
Government, the commercial sectors, the non-profit sectors, academia and private
individuals.
An estimated 95% of all information used by national governments has spatial
characteristics or attributes (Mavima and Noongo, 2004). It is thus not surprising that
the focus has lately shifted to the challenges associated with integrating broadly
sourced spatial data as an effort to create manageable frameworks. The concept of
SDI therefore, has evolved in response to a growing recognition of the importance of
spatial data, and the increasing needs of society to use shared spatial data. A SDI is
about facilitation and coordination of the exchange, sharing, accessibility and use of
spatial data within the spatial data community through standardization and repetitive
process and routines.
In this paper the implementation of SDI are investigated, with a look at the positions
taken by current SDI initiatives, particularly through the State of Qatar. The authors
analyze the current National Spatial Data Infrastructure (NSDI) in Qatar, and the
development of Urban-SDI to improve decision-making through facilitating integrated
applications of Multiple Criteria Evaluation (MCE) to support the objectives of urban
development. In addition, extended the Urban-SDI with MCE technique through Spatial
Agent will be discussed.
973
2. Spatial Data Infrastructure (SDI)
The SDI phenomena emerged around the early 1990 (Masser, 2005). Since then
development of SDIs have become an important subject and platform in geo-
information science to facilitate and coordinate the exchange and sharing of spatial
data between stakeholders in the spatial data community.
SDI is an initiative that is defined in many different ways. However, its common intent
is to create an environment in which all stakeholders can cooperate with each other
and interact with technology to better achieve their objectives at different
political/administrative levels. SDI have emerged in response to the need for
cooperation between users and producers of spatial data to foster the environment for
spatial data sharing and development (Rajabifard et al., 2002). The ultimate objectives
of these initiatives are to promote economic development, to motivate better
government and to encourage environmental sustainability (Masser, 1998).
SDI is fundamentally about facilitation and coordination of the exchange and sharing
of spatial data between stakeholders in the spatial data community. The principal
objective for developing SDI is to achieve better outcomes at all levels through
improved decision-making. SDIs have become very important in determining the way
in which spatial data are used through an organization, state or province, a nation,
different regions and the world. In this regard, as suggested in the SDI Cookbook,
without a comprehensible and consistent SDI in place, there are incompetence and
lost opportunities in the use of geographic information to solve problems (Nebert,
2004). In principle, SDIs allow the sharing of data, which extremely useful, as it enables
users to save resources, time and effort when trying to acquire new datasets by
avoiding duplication of data and getting the best integration with other datasets. By
reducing duplication and facilitating integration, SDIs can produce significant human
and resources savings and returns.
The design and implementation of an SDI is not only a matter of technology but also
one of designing institutions, the legislative frameworks and acquiring new skills (Groot
et al., 2000). Balancing these elements to develop an SDI enables intra-and inter-rules
dynamics of spatial data sharing (Rajabifard and Williamson, 2002). Moreover, SDI
development requires new relationships and partnerships among different levels of
government and between public and private sector entities to be established.
974
3. Spatial Data Infrastructure in Developed and Developing
Countries
Spatial data and spatial data products are becoming a consumer good in countries
throughout the world, especially when utilizing a range of communications networks
(e.g. Internet or Wi-Fi applications). The key driver in the public use of spatial data is
the ready availability of spatial datasets at medium to large scales, showing for
instance road networks, the land parcel, street address, topography, etc. The use of
these datasets for government and private sector is expanding rapidly as societies are
becoming more spatially enabled enhanced by the availability of technology to assist
in the use of spatial information to support decision-making (Williamson et. al., 2003).
The reality is that every country is at a different point in the SDI development. In
developing countries, spatial data provides a strategic advantage to many businesses.
The use of spatial data and the rapid expansion of spatial data applications are driving
the need for setting policies surrounding the creation, maintenance, custodianship and
use of spatial data-in other word the development of SDI concept. As fast as
information technology is changing, the SDI concept is evolving and adapting to
capitalize on new technologies and to meet the changing needs of society. This
situation however is very different in many developing countries, which are just starting
SDI development, or those countries where the SDI concept is not even under
consideration.
The push towards a spatially enabled society and the need for rules-wide spatial data
policies in developed countries has resulted in major institutional changes. This is
reflected by a world trend for spatial data and land related information activities to come
together in one organization. The re-engineering of the institutional arrangements in
developed countries has not been easy and has resulted in many political,
administrative and professional challenges.
Many developed countries still have fragmented institutional arrangements in the
spatial data and land information area. It is not uncommon to find a range of different
government departments, often in different ministries, responsible for different aspects
of the management of spatial data. The result is that spatial data is held independently
with often little contact between them. Examples of different government agencies
include those for land registration, cadastral surveying, planning, land valuation and
administration of state lands.
975
On the other hand, these difficulties and circumstances places on developing countries
to those are moving to establish an information society. While the developing countries
focus on SDI development in a spatially enabled information society, there are many
countries are not ready or in a position to build an SDI in this technological
environment. However, even the poorest and least developing countries can still adopt
SDI principles and implement strategies, which can lead them to develop SDI in the
future, such as the creation of a common base map and reforming institutional
arrangements for spatial data.
4. The SDI Concept and Components
The design of any SDI requires understanding the nature of the concept, the
contributing components, the impact of national and/or global drivers and the need of
the user community. The interaction of the spatial data users and suppliers drives the
development of any SDI. These present significant influences on the changing spatial
data relationships within the context of SDI jurisdictions (Rajabifard et al., 2001). For
this reason, the formation of cross-partnerships has been the foundation of SDI
development.
There has been a trend for countries to expand their effort in developing SDIs through
partnerships. In the 1990s different countries’ national SDI development took a broad-
based approach to encourage cooperation among stakeholders to pool their data
assets. Based on this approach, an ideal SDI should have all datasets to be fully
integrated. From this popular approach to SDI development in the 1990s that focused
on defined data and partnership objective, it was an emerged idea that the approach
to SDI development in future needs to facilitate more concrete interactions between
people, data and emerging technologies (Ting and Williamson, 2000; Chan et al.,
2001), in order to achieve the flexibility to meet user decision-making requirements
and to support sustainable development objectives.
On this basis, the evolution of the SDI concepts has paralleled the development of
complete digital datasets. As a result of the availability of spatial data policy and the
many opportunities present to both the government and private sectors. The common
approach to spatial information infrastructure is to focus on the technical aspects, and
976
to treat the social as the context in which SDI development takes place (Nangolo,
2011). It is essential that SDI developers understand the significance of human and
social issues as much as technical issues, which all of these contribute to the success
of SDI construction.
Key issues of the SDI construction include overall information policies, maintenance of
sharing, clarifying the business objectives where the SDI is expected to achieve and
enlisting the cooperation of all members of the spatial data community. However, it can
be argued, this social approach must rely on technical foundation.
The term “Spatial Data Infrastructure” (SDI) is often used to denote the relevant base
collection of technologies, policies and institutional arrangements that facilitate the
availability of and access to spatial data. The SDI provides a basis for spatial data
discovery, evaluation and application for users and providers within all levels of
government, the commercial sectors, the non-profit sector and academia.
The word “infrastructure” is used to promote the concept of a reliable, supporting
environment and facilitating the access to geographically related information using a
set of standard practices, protocols and specifications. The computer application that
run on such an infrastructure facilitates unlimited virtual packages of geographic
information.
An SDI must be more than a single dataset or database. The SDI must include
geographic data and attributes, sufficient documentation (“metadata”) to provide ab
additional information about the data per se. In addition, a sharing policy among users
of such data sets must be defined to make the SDI functional, which includes the
organizational agreements needed to coordinate and administer it on a local, national
and/or trans-national scale. Beyond this are additional services or software to discover,
visualize and evaluate the data. The creation of specific organizations or program for
developing or overseeing the development of SDI, particularly by government at
various scales can be seen as the logical extension of the long practice of coordinating
the construction of other infrastructures necessary for ongoing development, such as
transportation or telecommunication network. To this end, the word “infrastructure” of
the SDI has emerged.
Furthermore, an important and fundamental part of any National Spatial Data
Infrastructure is the spatial referencing system that ensures all datasets conform one
datum. The spatial referencing part of the national SDI includes geodetic reference
marks as well as horizontal datum to enable accurate and unified the SDI’s datasets.
977
5. Spatial Data Infrastructure (SDI) to Support Decision-
Making for Sustainable Development
Sustainable development requires the resolution of many spatial decision problems in
regard to managing the rights, restrictions and responsibilities between people and
land. Most spatial decision problems are multi-criteria in nature, involving economic,
social, environmental and political dimensions and competing weights and values.
However, the process of multi-criteria decision-making is not effectively integrated into
an existing framework of the SDI and in turn into spatial analysis.
The need to support decision-making to address the multiple issues concerning
sustainable development creates a growing need to organize data across disciplines
and organizations through development of SDI. The principle objective for developing
SDI is to achieve better outcomes of sustainable development decision-making from
spatially multiple-criteria. To this end, there has been limited contributions in the
approaches taken to implement and support frameworks for SDI utilization. Most of
these approaches emphasis in data domain management and automating the
availability, access and integration of spatial information. These approaches have
limited contributions toward the means of utilizing the SDI as a spatial analysis domain
to support multi-criteria decision-making. Decision-makers face challenges to
establishing linkages between data, information and decision-support technologies in
many existing SDI initiatives. Significant advantage stands to be gained from
developing SDIs to support the means for the discovery and access to decision-
support technologies, facilitated by the SDI, spatial multi-criteria and technologies in
one domain.
Decision-makers require technological support for complex forms of spatial decision-
making in order to establish linkages between data, information and Decision Support
Systems (DSS) in SDI domain. DSS are geo-computational systems developed to
access and utilize domain knowledge bases to support decision-making by the
generation of alternative solution scenarios between multiple-criteria. In addition,
spatial representations of these scenarios are often visualized through maps and
cartographic tools.
978
5.1. Decision-making for Sustainable Development
Decision-making may be defined to include any choice or selection of alternative
course of action (Malczewski, 1999). A preliminary step toward achieving decision-
making for sustainable development has been increasing recognition of the role of
Geographic Information Systems (GIS) to generate knowledge-base that provides
added value to identify problems, assist in proposing alternatives and defining a course
of action with spatial awareness. The importance of spatial information to support
decision-making and management of growing regional, national and global issues,
such as environmental problems (e.g. deforestation, pollution, etc.) or sustainable
urban development (e.g. urban growth, land use change, etc.), was specifically cited
in the Rio Declaration on Environment and Development (Ting and Williamson, 2000).
In turn, the spatial theme has been made one of the key themes to the meeting of the
2001 Commission on Sustainable Development.
5.2. Spatial Decision-making and Multi-Criteria Evaluation
Decision problems that involve geographical data and information are referred to as
Spatial Decision Problems. Spatial decision problems often require that a large number
of feasible alternatives be evaluated based on multiple criteria, thus spatial decisions
are multi-criteria in nature (Massam, 1988).
Multi-criteria decision-making is more complex than that based on a single criterion.
Such complexity is emerged because of the difficulty finding an alternative that
dominates all criteria. The number of people involved in the decision-making process
influences the complexity of spatial decision problems. They may be characterized by
different preferences with respect to the decision consequences and the relative
importance of the evaluation criteria. The incorporation of values and preferences into
decision-making models is an important function of multi-criteria analysis in complex
decision problems.
The need for sustainable development to link social, economic, urban and
environmental issues, and examine the use of land in an integrated manner to
minimize conflicts, requires multi-criteria decision-making. The need for reliable
information infrastructure to record environmental, social, economic and urban
restrictions affect in turn the resulting spatial data industry environment and SDI vision.
979
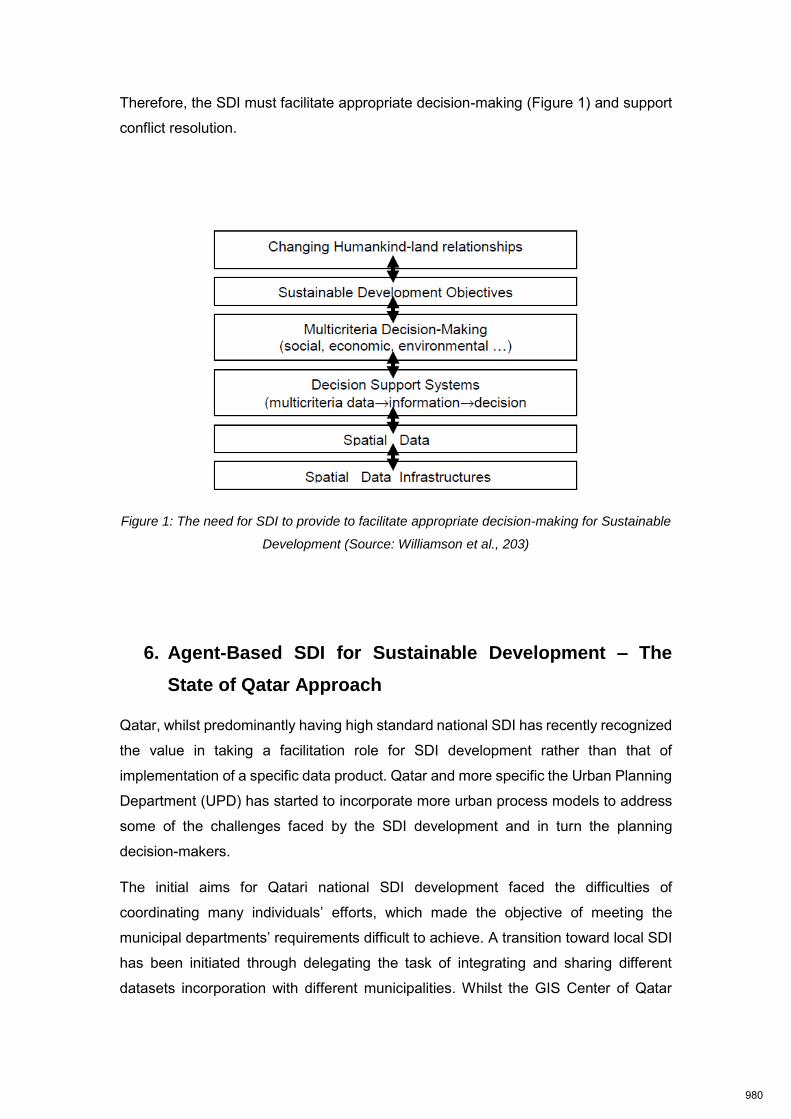
Therefore, the SDI must facilitate appropriate decision-making (Figure 1) and support
conflict resolution.
Figure 1: The need for SDI to provide to facilitate appropriate decision-making for Sustainable
Development (Source: Williamson et al., 203)
6. Agent-Based SDI for Sustainable Development – The
State of Qatar Approach
Qatar, whilst predominantly having high standard national SDI has recently recognized
the value in taking a facilitation role for SDI development rather than that of
implementation of a specific data product. Qatar and more specific the Urban Planning
Department (UPD) has started to incorporate more urban process models to address
some of the challenges faced by the SDI development and in turn the planning
decision-makers.
The initial aims for Qatari national SDI development faced the difficulties of
coordinating many individuals’ efforts, which made the objective of meeting the
municipal departments’ requirements difficult to achieve. A transition toward local SDI
has been initiated through delegating the task of integrating and sharing different
datasets incorporation with different municipalities. Whilst the GIS Center of Qatar
980
(CGIS) is responsible for holding and sharing the national spatial datasets, more than
forty-five governmental agencies are sharing such nation SDI through secured server.
However, in local level and more specific in urban planning department, such national
SDI has been a challenge to planning decision-makers. Firstly, the national SDI does
not meet their satisfaction in planning decision-making. Many datasets are not
available for portraying different spatial criteria for sustainable development decision-
making. Secondly, the lack of using and retrieving information from current SDI is
problematic.
The first attempt to tackle these challenges was the initiation of spatial data desktop
viewer – “Plan Map”. The viewer allows the planner to browse and display different
spatial information from different datasets, which are sourced within the national SDI.
The lack of manipulating, extracting and assigning different weight scores within a
group of criteria regarded the application to be utilized as non-decision support system.
Same issue has been raised when most of spatial data user community moved to the
latest technology of GIS web-based applications.
It is with these gaps of considering multi-criteria, which is essential for any planning
decision-making and sustainable development (see paragraph 5.2), urban planning
department has started the first initiation of what we called an Agent-based SDI for
sustainable development. The agent intends to overcome limitations addressed by
current applications and can be used as spatial decision-support system for urban
development.
6.1. Computer Agent-based model
There is no common agreement for the definition of the term agent. Broadly, the agent
is anything can be viewed as perceiving its environment through “sensors” and acting
upon that environment through “effectors” (Russell and Norvig, 1995). The agent-
based approach is more akin to reality than other computer modelling approach. As
an entity, an agent operates flexibly and rationally in a variety of environmental
circumstances given its perceptual and effectual equipment (Weiss, 1999). Flexible
behavior is achieved by an agent on the basis of key processes such as problem
solving, planning and decision-making. As an interacting entity, the agent can be
affected in its activities by other agents. Goal and task-oriented coordination are the
key rules in any agent system. The main goal is to develop mechanisms and methods
981
that enable agents to interact, and to understand interaction among other entities.
Therefore, agents must be capable of flexible actions. Flexibility means that an agent
reacts to the current situation in the environment, exhibits goal-directed behavior, has
some sort of social ability – it can communicate with other agents in the environment,
and is structured by a set of rules (Weiss, 1999). This is achieved on a basis of problem
solving, planning and decision-making processes.
In general, agents are independent entities or objects which act upon various
conditions that are displayed by other agents or the environment in which they exist
(Franklin and Graesser, 1997). A computer agent can be implemented in different
ways, depending on how the decision-making of the agent is realized. Possible
realizations are based on logical deduction, through direct mapping from situation to
action. They can be influenced by internal and external rules, and intention of the
agent, and they can be implanted through various layers. These layers can be sourced
from any spatial datasets, through SDI or can be described as a class in an object-
Oriented programming paradigm.
6.2. Spatial Agent and Urban Simulation
Agents with spatial awareness are relatively old concept (Rodrigues et al., 1995).
There are many agent development toolkits, which are spatially-explicit; Swarm,
NetLogo, MASON. All these toolkits have been developed based upon urban
simulation environment, which has been designed as an agent software integrated with
GIS to handle spatial problem. However, all these toolkits have been developed to the
purpose of research and artificial simulation. Therefore, the need for developing a tool
or a computer agent has a spatial-awareness, integration with current local urban SDI
and can sense and act upon different criteria and user action has been raised
Hammam et al., 2007)
6.3. The Integration of Agent, SDI and Multi-criteria for Qatar Municipal
Spatial Development Plan – MSDP
The Municipal Spatial Development Plan (MSDP) is the city level in urban development
palming. This stage of re-development has come next to the initiation of Qatar National
982
Development framework - QNDF 2032. QNDF is a spatial framework at the national
level of the State of Qatar. As any national development outcomes, most of the spatial
recommendation outputs have to be considered and refined in a city level. Most of the
challenges faced by city planners was the transition of these spatial recommendations
from scale to another. In addition, applying these spatial recommendations in city level
requires many criteria to be tackled and a spatial decision support system. Therefore,
SDI must be functional not only as data sharing among users but also as a driver in
the decision-making process.
Components of a functional SDI can be broken down into two groups based on the
different nature of the interactions within the SDI. Given the substantial translations
and fundamental roles between planners and data, these two components can form
one group. In this regard, the any viewer application can satisfy this group of users
(see paragraph 6). Where the users do not need to perform any kind of decision-
making based on multi-criteria evaluation. Data sharing, security and access define
the relationships between users and spatial data. The second group can be considered
consisting of the main technical components: the integration between technology,
current SDI and the planning multi-criteria need to be evaluated against any required
development.
The initiation of computer agent with SDI has made the spatial decision-making
processes an easy toolkit to planners. The first attempt for such integration was tested
in the process for shaping the Municipal Centers. QNDF has defined different level of
Centers beneath the Transit Oriented Development approach (TOD). Those centers
are mainly mixed-use development with different type of residential along with public
facilities and open space areas. However, the difficulties and complexity in translating
these centers location to the city level was problematic. Many criteria had to be
considered and evaluated regarding the allocation of the center within the existing
urban form (e.g. commercial concentration, population density, traffic model for
existing road network, the availability of lands, etc.). also, these centers as an outcome
from the QNDF are divided into four groups: Metropolitan City Center, Capital city
Center, Town City Center and district City Center. With different level and function of
each type of center, different criteria can be added or removed in the process of
allocation and shaping the center.
Therefore, the computer agent has been designed with some objectives:
- The agent must have the capability to move through the urban SDI,
983
- The agent can function as a mediator between planners and the spatial
datasets to define the relevant data layers that represents a certain criterion,
and
- The agent must be developed with friendly-user interface to overcome the
complexity of manipulating the spatial information.
With these objectives in mind, the urban Agent SDI has been developed and tested in
mentioned municipal centers allocation process. The agent was able to receive
multiple-criteria in each type of center, move and extract the relevant layer that maps
each criterion and display a number of potential locations where the center can be
accommodate. However, these type of spatial decision support system needs refining
process to its results. The planner must have the capability to evaluate the results and
perform a site-based analysis in terms of defining the final shape of the center.
Another test for such technology was performed in producing what is called “Suitability
Index Map”. This map is a production of multiple-criteria evaluation in defining the
suitability index areas for allocating some of urban activity site (e.g. health facility,
education facility, etc.). The result is ranked based on the preferences received from
user and is usually in the rank of “Most Suitable” to “Less Suitable”. The integration of
computer agent technology and SDI was crucial. Such index map is usually performed
using Cell-based modelling technique, which is high in complexity to any non-spatial
information expert. Therefore, the agent algorithm was built to hide this complexity
while the system is performing the spatial analysis and representing the results.
7. Conclusion
The need to support decision-making to address the multiple issues concerning
sustainable development creates a growing need to develop urban-specific spatial
data infrastructure (SDI). The principle objective for developing SDI is to achieve better
outcomes from spatially related urban development decision-making.
It has been claimed that most of existing SDI users are facing challenges to
establishing the operational linkages between data, information and decision support.
The SDI cannot fulfill the multiple criteria, which are crucial in any of urban
development decision-making process.
984
The integration between computer agent and SDI has been proposed with high
complex algorithm. By demonstrating such integration in Municipal Spatial
Development Plan (MSDP) for the State of Qatar, this paper addresses the benefit of
moving towards an analytical SDI rather than static datasets. This technology has been
tested in the linkage between some of the outcomes of Qatar National Development
Framework (QNDF) and the MSDP, such as shaping and allocating urban centers in
a city level and producing the suitability index map for site analysis for some of the
urban activities.
Finally, the aim of agent and SDI integration is to impose multiple-criteria and spatial
decision support system upon sustainable development decision-making process. The
construction and implementation of that approach is intended to help city planners in
performing a variety of urban development issues underlying multiple-criteria involved.
985
Refrences
Chan, T. O., Feeney, M., Rajabifard, A. and Williamson, I. P. (2001), The Dynamic
Nature of Spatial data Infrastructure: A Method of Descriptive Classification,
GEOMATICA, Vol. 55(1), pp. 451-462.
Franklin, S. and Graesser, A. (1997), Is it an agent or just a program, In Wooldridge,
M. J. and Jennings, N. R. (Eds.) Intelligent Agent III: Agent Theories, Architecture and
Languages, Springer-Verlag, Berlin.
Groot, R. and McLaughlin, J. D. (Eds.) (2000), Geospatial data infrastructure:
Concepts, Cases and Good Practice, Oxford University Press, Oxford, UK.
Hammam, Y., Moore, A., Whigham, P. (2007), The Dynamic Geometry of
Geographical Vector Agents, Computer, Environment and Urban System, Vol. 31, pp.
502-519.
Malczewski, J. (1999), GIS and Multicriteria Decision Analysis, John Wiley & Sons,
New York.
Massam, B. H. (1988), Multi-Criteria Decision Making (MCDM) Techniques in
Planning, Progress in Planning, Vol. 30(1).
Masser, I. (1998), The First Generation of National Geographic Information Strategies,
Proceeding of Selected Conference Papers of the Third Global Spatial data
Infrastructure Conference.
Masser, I. (2005), GIS Worlds: Creating Spatial Data Infrastructures, Redlands, ESRI.
Mavima, R. and Noongo, E. N. (2004), Spatial Data infrastructures in SADC Countries:
Status and Future Directions, In the Proceeding of Spatial Information Research
Center (SIRC), Dunedin, New Zealand.
Nangolo, E. N. (2011), Balancing the Technical and Social Contexts of Spatial Data
Infrastructure (SDI), PROGRESS Multidisciplinary Research Journal, Vol. 1, Issue 1.
Nebert, D. D. (Ed) (2004), Developing Spatial Data Infrastructures GSDI, The SDI
Cookbook: version 2.0.
Rajabifard, A. and Williamson, I. P. (2002), Spatial Data Infrastructures: an Initiative to
Facilitate Spatial Data Sharing, In Global Environmental Databases-Present Situation
and Future directions, By Tateishi, R. and Hastings, D. (Eds.), International Society for
986
Photogrammetry and Remote Sensing (ISPRS-WG IV/8), Vol. 2, pp. 108-136, Hong
Kong: GeoCarto International Centre).
Rajabifard, A., Feeney, M. and Williamson, I. P. (2001), Future Directions for the
Development of Spatial Data Infrastructure, Journal of the International Institute for
Aerospace Survey and Earth Sciences (ITC), The Netherlands.
Rajabifard, A., Feeney, M., and Williamson, I. P. (2002), Future Directions for SDI
Development, International Journal of Applied Earth observation and Geoinformation,
Vol. 4, No. 1, pp. 11-12.
Rodrigues, M. A., Raper, J. and Capitao, M. (1995), Development of Spatial Agents,
1st International Conference on Spatial Multimedia and Virtual Reality, Lisbon,
Portugal.
Russel, S. and Norvig, P. (1995), Artificial Intelligence: a Modern Approach, Prentice
Hall International Inc., New Jersey.
Ting, L. and Williamson, I. P. (2000), Spatial Data infrastructures and Good
Governance: Frameworks for Land Administration Reform to Support Sustainable
Development, Proceedings of the 4th Global Spatial Data Infrastructure Conference,
Cape Town, South Africa.
Weiss, G. (1999), Multiagent Systems: a Modern Approach to Distributed Artificial
Intelligence, The MIT Press, England.
Williamson, I. P., Rajabifard, A. and Feeney, M. F. (Eds.) (2003), Developing Spatial
Data Infrastructures: from Concept to Reality, Taylor & Francis, London.
987

Melchiorri, Michele Urban and Rural Remote Sensing ISOCARP-OAPA Conference 2017
1
Analyzing Urban and Rural Settlements with Remote Sensing:
comparing national trends of rural growth with the Global Human Settlement Layer
40 Years of Urban and Rural Development Explained with Remote Sensing: a comparative analysis of 210 countries with the Global Human Settlement Layer
Michele MELCHIORRI, Urban Habitat Lab, Italy
Contemporary technological assets allow an unprecedented opportunity to analyze the growth of human settlements at global level. The Global Human Settlements Layer (GHSL), produced at the European Commission Joint Research Centre offers unique opportunities to analyze the process of settlements expansion. The GHSL contains remotely sensed and automatically processed geospatial data which account population and built-up areas in different years: 1975-1990-2000-2015 and has a global coverage. The Human Planet Atlas 2016 (Pesaresi, Melchiorri et.al. 2016) showcased a preliminary analysis of the GHSL data focusing on global urbanization dynamics. The Atlas relies on the agreed definitions of urban center, the dense urban areas, urban cluster (with lower population density and degree of soil coverage in built-up areas) and rural settlements where population is below 5 thousand inhabitants; this allows globally consistent analytics. This paper takes the national statistics of built-up areas and urban-rural population to propose a comparative analysis of the dynamics of expansion of rural settlements in countries and continents. The Human Planet Atlas 2016 reports that Europe and Northern America are the least urbanized continents where less than 74 in 100 people live in urban clusters, this figure is below global average (85 in 100 in 2015). This key finding sheds lights on the relevance of smaller human settlements in these two continents vis-à-vis the global narrative of urbanization. The paper proposes an analysis of national trends of rural settlements in 210 countries and reviews the scenarios of development between 1990 and 2015. The relevance of this research, supported by premier evidences and data, can help in understanding the processes of suburbanization, sprawl and urban-rural population shifts which are taking place all around the globe. On the basis of this framework contribution it is possible to develop research at subnational level in more than 200 countries where the GHSL contains multitemporal data. 1. Introduction
The narrative of global development has been increasingly associated with the process of urbanization, both in research and policymaking. Urbanization has also entered the agenda of the global governance which recognized the majority of global population lives in cities. The momentum has surged in the world polity, while the United Nations Department for Economic and Social Affairs (UNDESA) started releasing the World Urbanization Prospect which accounts global population living in cities. The series of reports released by UNDESA (2014) provided statistics about the majority of global population to live in cities since around the beginning of the XXI century. The process of urbanization is multisectoral in nature and effects. It has distinctive economic (Capello and Camagni, 2000; Davis and Enderson, 2003) and sociological connotations (Wirth, 1938; Molotch, 1976). These two principal determinants identify cities as the key drivers for the development of societies and economies: the transition of population from rural to urban areas has been described mostly trough economic motives (Fields, 1975; Lucas, 2004) as a shift towards the opportunities urban areas offer, especially in developing countries and in the global south since the 1950s. The process of urbanization is common to most countries of the globe: The Human Planet Atlas 2016 (Pesaresi, Melchiorri et.al. 2106) reports 85 in 100 people
988
Melchiorri, Michele Urban and Rural Remote Sensing ISOCARP-OAPA Conference 2017
2
in the globe live in urban clusters, and that urbanization (the ratio between population in urban clusters and the national population) has increased over the last 25 years in all regions of the world apart from Europe (p.48, ibid.). From a statistical analysis standpoint, this paper analyses the global trends of urban and rural settlements development in terms of population and built-up areas on a country basis. it presents the results of data analysis made possible by the data extracted from the Global Human Settlement Layer – GHSL. The GHSL is a multitemporal database obtained trough automatic machine learning data processing. The GHSL team, at the European Commission Directorate General Joint Research Centre has combined satellite imagery and census data (in cooperation with CIESIN) to release a global layer containing geospatial data about built-up areas and population for the years 1975-1990-2000 and 2015. The room for this research article is both on methodological grounds and on the global application of the OECD-DG Regio settlement model to analyze at national levels the dynamics of urban-rural development. The methodological component attempts to provide a contribution to the challenges of comparative analysis in urbanization studies. Data driven research depend on the quality and consistency of input data, that in the case of population are extremely subject to national disparities: across border the factors which determine whether a settlement is to be considered “urban” or a “city” are rather variable, often they depend on administrative or census criteria, and might even be arbitrary. This study proposes the analysis of population and built-up areas dynamics for the epochs contained in the GHSL. It also includes some findings related to urbanization and agglomeration –share of built-up in urban clusters. The paper first presents the methodology used for the data analysis, explaining the content of the database and the ways in which data have been analyzed. Second, it provides the results dividing the population and built-up categories. Two additional sections present the result of urbanization and agglomeration analysis. The last part discusses the findings proposing scenarios which combine urbanization and agglomeration phenomena to describe the development of urban and rural areas in 210 countries of the globe. 2. Methodology
The methodological component of this research contains elements of big data analysis applied to territorial studies, and in particular to the OECD-DG Regio Settlement Model (DG Regio, 2014). The aforementioned difficulty to carry out rigorous comparative analysis about urbanization at a fine scale and with global coverage is challenged by adopting the grid based GHSL in combination with the OECD- DG Regio Settlement Model. The GHSL divides the earth surface in 1km grid cells. For each cell the GHSL accounts the percentage of built-up coverage (with remote sensing Landsat information as input) and its modelled population through the globally harmonized geospatial statistics for national national population (developed by CIESIN). On the basis of this information it has been possible to identify three settlement classes:
• urban centers, compounds of contiguous grid cells with at least 1500 inhabitants per square kilometer –or per cell, and at least 50 thousand inhabitants per compound;
• urban clusters, compounds of at least 300 inhabitants per cell, and with at least 5 thousand inhabitants per compound;
• rural grid cells, all cells outside urban clusters;
oftentimes in rural grid cells built-up and population are identified, but these settlements do not qualify in neither of the two classes being thinly populated areas. The OECD-DG Regio model therefore is determined by population and population density factors, that are commonly applied to the grid, and so to the global earth surface: this excludes the limitation of inconsistent classification and accounting across national borders.
989
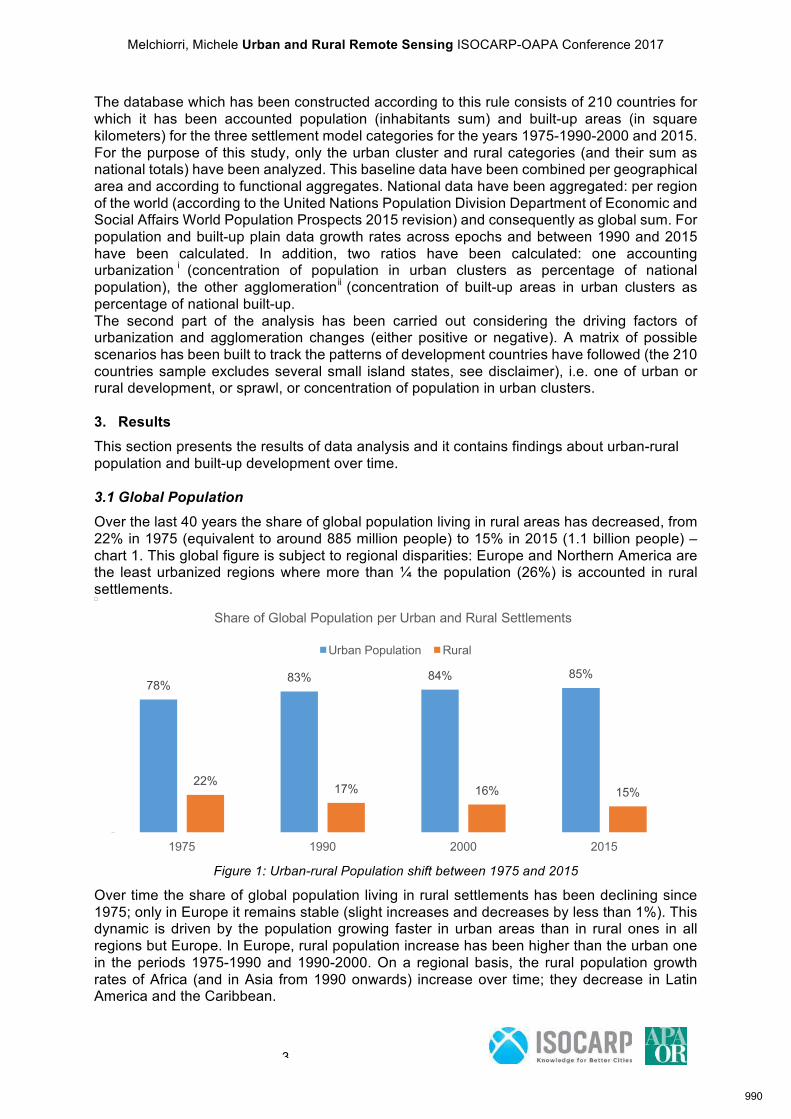
Melchiorri, Michele Urban and Rural Remote Sensing ISOCARP-OAPA Conference 2017
3
The database which has been constructed according to this rule consists of 210 countries for which it has been accounted population (inhabitants sum) and built-up areas (in square kilometers) for the three settlement model categories for the years 1975-1990-2000 and 2015. For the purpose of this study, only the urban cluster and rural categories (and their sum as national totals) have been analyzed. This baseline data have been combined per geographical area and according to functional aggregates. National data have been aggregated: per region of the world (according to the United Nations Population Division Department of Economic and Social Affairs World Population Prospects 2015 revision) and consequently as global sum. For population and built-up plain data growth rates across epochs and between 1990 and 2015 have been calculated. In addition, two ratios have been calculated: one accounting urbanization i (concentration of population in urban clusters as percentage of national population), the other agglomerationii (concentration of built-up areas in urban clusters as percentage of national built-up. The second part of the analysis has been carried out considering the driving factors of urbanization and agglomeration changes (either positive or negative). A matrix of possible scenarios has been built to track the patterns of development countries have followed (the 210 countries sample excludes several small island states, see disclaimer), i.e. one of urban or rural development, or sprawl, or concentration of population in urban clusters. 3. Results
This section presents the results of data analysis and it contains findings about urban-rural population and built-up development over time. 3.1 Global Population
Over the last 40 years the share of global population living in rural areas has decreased, from 22% in 1975 (equivalent to around 885 million people) to 15% in 2015 (1.1 billion people) –chart 1. This global figure is subject to regional disparities: Europe and Northern America are the least urbanized regions where more than ¼ the population (26%) is accounted in rural settlements.
Figure 1: Urban-rural Population shift between 1975 and 2015
Over time the share of global population living in rural settlements has been declining since 1975; only in Europe it remains stable (slight increases and decreases by less than 1%). This dynamic is driven by the population growing faster in urban areas than in rural ones in all regions but Europe. In Europe, rural population increase has been higher than the urban one in the periods 1975-1990 and 1990-2000. On a regional basis, the rural population growth rates of Africa (and in Asia from 1990 onwards) increase over time; they decrease in Latin America and the Caribbean.
78%83% 84% 85%
22%17% 16% 15%
1975 1990 2000 2015
Share of Global Population per Urban and Rural Settlements
Urban Population Rural
990
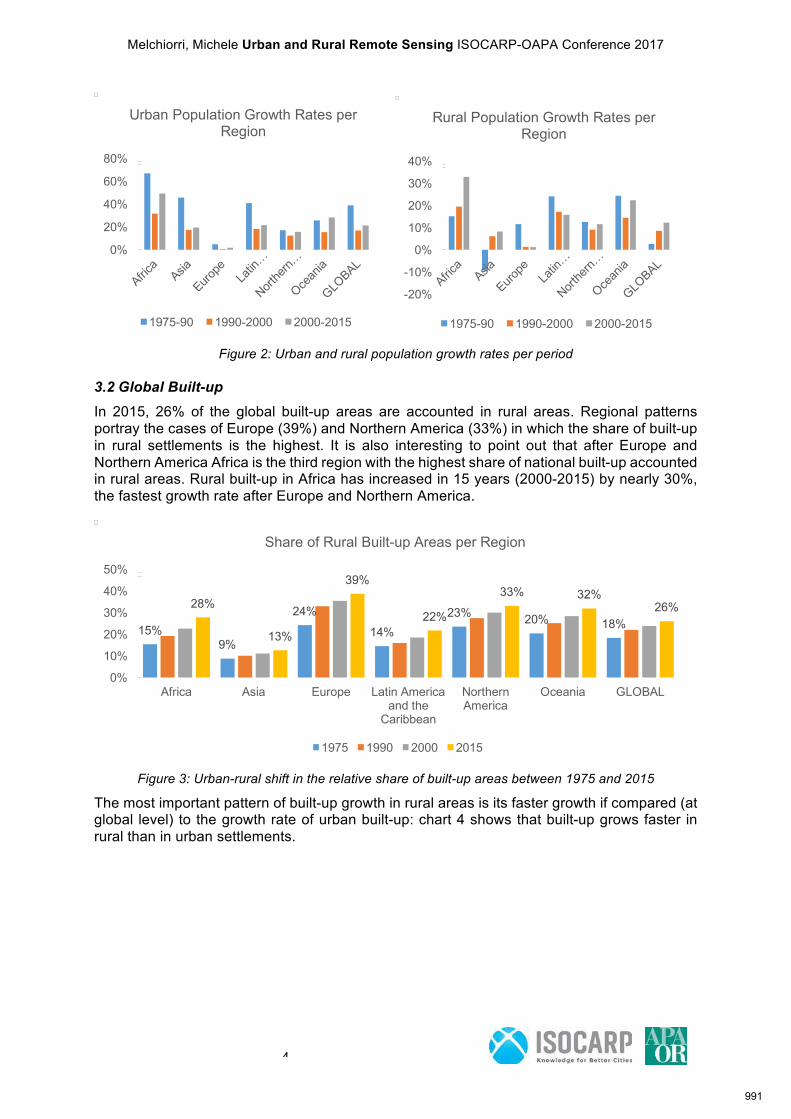
Melchiorri, Michele Urban and Rural Remote Sensing ISOCARP-OAPA Conference 2017
4
Figure 2: Urban and rural population growth rates per period
3.2 Global Built-up
In 2015, 26% of the global built-up areas are accounted in rural areas. Regional patterns portray the cases of Europe (39%) and Northern America (33%) in which the share of built-up in rural settlements is the highest. It is also interesting to point out that after Europe and Northern America Africa is the third region with the highest share of national built-up accounted in rural areas. Rural built-up in Africa has increased in 15 years (2000-2015) by nearly 30%, the fastest growth rate after Europe and Northern America.
Figure 3: Urban-rural shift in the relative share of built-up areas between 1975 and 2015
The most important pattern of built-up growth in rural areas is its faster growth if compared (at global level) to the growth rate of urban built-up: chart 4 shows that built-up grows faster in rural than in urban settlements.
0%
20%
40%
60%
80%
Urban Population Growth Rates per Region
1975-90 1990-2000 2000-2015
-20%
-10%
0%
10%
20%
30%
40%
Rural Population Growth Rates per Region
1975-90 1990-2000 2000-2015
15%9%
24%
14%
23%20% 18%
28%
13%
39%
22%
33% 32%26%
0%
10%
20%
30%
40%
50%
Africa Asia Europe Latin America and the
Caribbean
Northern America
Oceania GLOBAL
Share of Rural Built-up Areas per Region
1975 1990 2000 2015
991
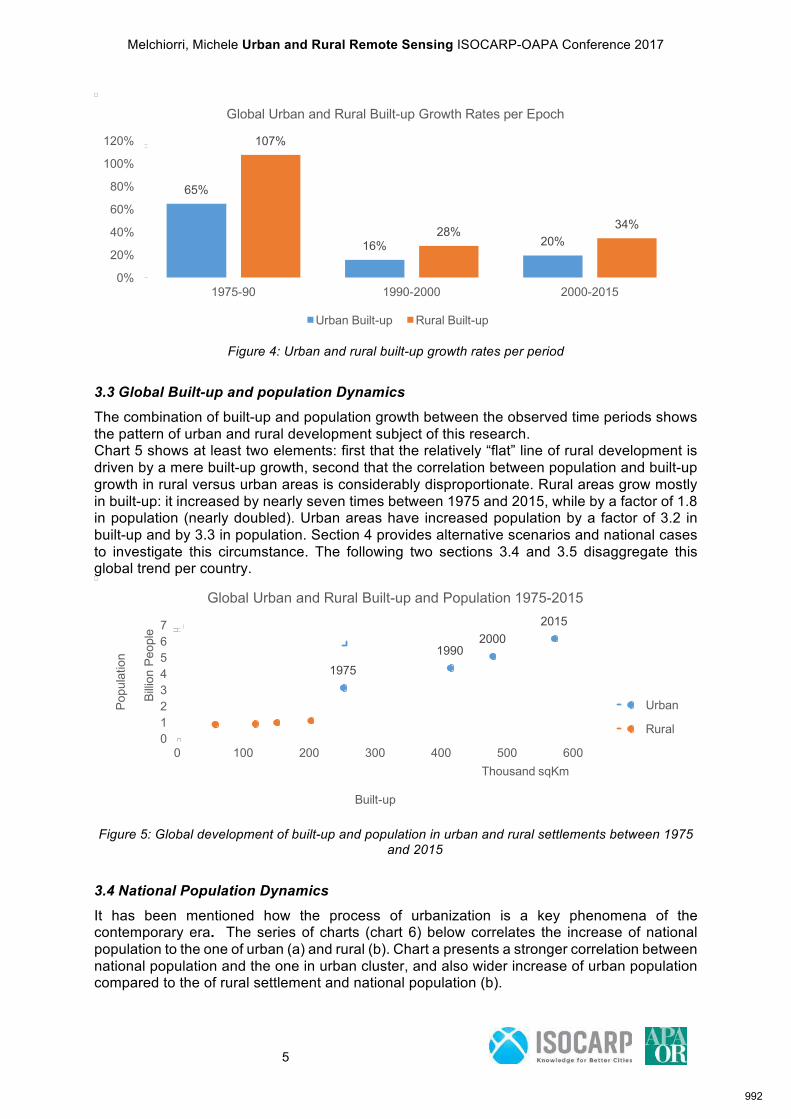
Melchiorri, Michele Urban and Rural Remote Sensing ISOCARP-OAPA Conference 2017
5
Figure 4: Urban and rural built-up growth rates per period
3.3 Global Built-up and population Dynamics
The combination of built-up and population growth between the observed time periods shows the pattern of urban and rural development subject of this research. Chart 5 shows at least two elements: first that the relatively “flat” line of rural development is driven by a mere built-up growth, second that the correlation between population and built-up growth in rural versus urban areas is considerably disproportionate. Rural areas grow mostly in built-up: it increased by nearly seven times between 1975 and 2015, while by a factor of 1.8 in population (nearly doubled). Urban areas have increased population by a factor of 3.2 in built-up and by 3.3 in population. Section 4 provides alternative scenarios and national cases to investigate this circumstance. The following two sections 3.4 and 3.5 disaggregate this global trend per country.
Figure 5: Global development of built-up and population in urban and rural settlements between 1975
and 2015
3.4 National Population Dynamics
It has been mentioned how the process of urbanization is a key phenomena of the contemporary era. The series of charts (chart 6) below correlates the increase of national population to the one of urban (a) and rural (b). Chart a presents a stronger correlation between national population and the one in urban cluster, and also wider increase of urban population compared to the of rural settlement and national population (b).
65%
16% 20%
107%
28%34%
0%
20%
40%
60%
80%
100%
120%
1975-90 1990-2000 2000-2015
Global Urban and Rural Built-up Growth Rates per Epoch
Urban Built-up Rural Built-up
1975
19902000
2015
0
1
2
3
4
5
6
7
0 100 200 300 400 500 600
Popula
tion
Bill
ion P
eople
Built-up
Thousand sqKm
Global Urban and Rural Built-up and Population 1975-2015
Urban
Rural
992
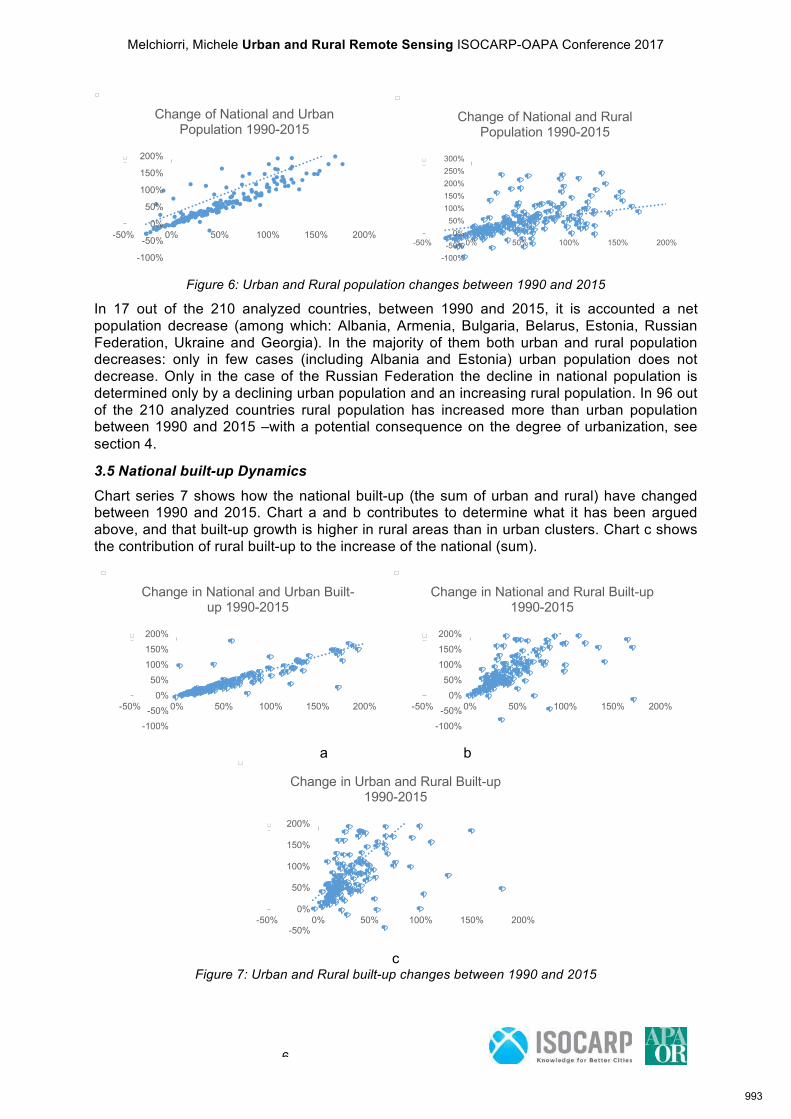
Melchiorri, Michele Urban and Rural Remote Sensing ISOCARP-OAPA Conference 2017
6
Figure 6: Urban and Rural population changes between 1990 and 2015
In 17 out of the 210 analyzed countries, between 1990 and 2015, it is accounted a net population decrease (among which: Albania, Armenia, Bulgaria, Belarus, Estonia, Russian Federation, Ukraine and Georgia). In the majority of them both urban and rural population decreases: only in few cases (including Albania and Estonia) urban population does not decrease. Only in the case of the Russian Federation the decline in national population is determined only by a declining urban population and an increasing rural population. In 96 out of the 210 analyzed countries rural population has increased more than urban population between 1990 and 2015 –with a potential consequence on the degree of urbanization, see section 4.
3.5 National built-up Dynamics
Chart series 7 shows how the national built-up (the sum of urban and rural) have changed between 1990 and 2015. Chart a and b contributes to determine what it has been argued above, and that built-up growth is higher in rural areas than in urban clusters. Chart c shows the contribution of rural built-up to the increase of the national (sum).
a b
c
Figure 7: Urban and Rural built-up changes between 1990 and 2015
-100%
-50%
0%
50%
100%
150%
200%
-50% 0% 50% 100% 150% 200%
Change of National and Urban Population 1990-2015
-100%
-50%
0%
50%
100%
150%
200%
250%
300%
-50% 0% 50% 100% 150% 200%
Change of National and Rural Population 1990-2015
-100%
-50%
0%
50%
100%
150%
200%
-50% 0% 50% 100% 150% 200%
Change in National and Urban Built-up 1990-2015
-100%
-50%
0%
50%
100%
150%
200%
-50% 0% 50% 100% 150% 200%
Change in National and Rural Built-up 1990-2015
-50%
0%
50%
100%
150%
200%
-50% 0% 50% 100% 150% 200%
Change in Urban and Rural Built-up 1990-2015
993
Melchiorri, Michele Urban and Rural Remote Sensing ISOCARP-OAPA Conference 2017
7
3.6 Urbanization
A relevant amount of urbanization analysis at the national level with the GHSL is contained in the Human Planet Atlas 2016, which reports global urbanization reaching in 2015 85% (topping nearly 90% in Asia), while it is below 50% in only 11 countries (including Bhutan and Namibia) – Pesaresi, Melchiorri et.al, 2016). While the global tendency of urbanization is about increases, in 59 countries urbanization has decreasediii. The table below shows the six cases of urbanization change (a to g) with the associated drivers. The first three (a, b, c) are associated to an increase of the degree of urbanization of the country. In case a, both national and urban population increase but urban increase is dominant; in case b, both urban and national population decline but the national decline is greater; in case c, there is a decline of rural population but an increase of urban population. Cases e, f, g, correspond to a decrease of the degree of urbanization; they follow the same logic of driver and dominance. Chart 8 shows four conditions of change of urban and national population. In the majority of countries there is a clear situation of positive population change both in urban areas and at national level.
case
National Population Change
Urban Population Change
Number of cases
urbanization increase
a + + & Dominant 147
b - & Dominant - 0
c - + 2
urbanization decline
e + & Dominant + 39
f - - & Dominant 14
g + + 5
Figure 8: Changes in national and urban population between 1990 and 2015
The most frequent case is a, which combines demographic growth in urban and rural areas, but with a greater population growth in cities. Example can be picked evenly across regions of the world, the main difference is in the rate of growth: in Austria and Denmark national and urban population grow respectively by 3 and around 15%; over the same period growth rates in other parts of the world are radically different: in Brazil urban population increases by 24% and national one by 42%, in Bolivia by 66 and 33% respectively, in Tunisia by 37 and 29%. Condition c is verified only in Albania where urban population increases by 26% and population at national level declines by nearly 50%. Considering now cases of urbanization decline,
994
Melchiorri, Michele Urban and Rural Remote Sensing ISOCARP-OAPA Conference 2017
8
condition e is accounted in 39 countries among which Argentina where national population increases by 33% while urban population by 30%, Indonesia 42 and 38% respectively, Ireland 24 and 32% respectively, and Venezuela 46 and 57% respectively. Cases of condition f is frequent in countries in Eastern Europe and Western Asia for example: in Georgia population decreases in cities by nearly 30% while at national level by 27%, in Lithuania by 24% and 22% respectively. 3.7 Agglomeration
Agglomeration accounts for the share of national built-up concentrated in urban areas and the total built-up areas detected in a country; on a global aggregate it is declining from 82% in 1975 to 74% in 2015 (Pesaresi, Melchiorri et.al. 2016). Only in few countries agglomeration of built-up in urban clusters is below 50%, these cases include 23 countries (including Bhutan, Benin, Bulgaria and Slovakia). Agglomeration is the highest (above 90%) in countries like: United Arab Emirates, Kuwait, Qatar, India, Indonesia, the Philippines; while it is the lowest (below 40%) in counties including: Russia, Norway, Congo and Namibia. The most common dynamic, observed in 195 countries, consists in the growth of built-up in rural areas at greater rates than in urban areas. This generates a widespread case of agglomeration decline (a’); while fewer (10) are the cases of agglomeration increase (b’). 3.8 Scenario of Development
The six urbanization cases (a,b,c of urbanization increase and e,f,g of urbanization decrease) have been combined to the dynamic of agglomeration increase (b’) and decrease (a’). The combination provides 12 scenarios of development, which consider national and urban dynamics of urbanization (and its drivers) and agglomeration changes for the period 1990-2015. Data analysis provided national cases of development in only 8 out of the 12 possible scenarios. The national dynamic accounts both the urban and rural settlement statistics. Scenarios are synthetized in table 2iv. Scenarios η and θ are only accounted in island state, and therefore are not investigated.
urbanization & agglomeration cases scenario
number of countries
a-a' α 139 b-a' 0
c-a' β 2
e-a' γ 38
f-a' δ 14
g-a' ε 4
a-b' ζ 8 b-b' 0 c-b' 0
e-b' η 1 f-b' 0
g-b' θ 1 3.9 Scenarios
α. Scenario α considers the case in which urbanization increases led by a dominant growth of the urban population in a context of demographic growth at national level (therefore with rural population growth). In this case agglomeration declines as a consequence of the more rapid expansion of built-up areas in rural areas. In this scenario both urban and rural settlements
995
Melchiorri, Michele Urban and Rural Remote Sensing ISOCARP-OAPA Conference 2017
9
develop: urban ones more in population, rural ones more in built-up. This scenario is the most common on global basis. Subject to further investigation this pattern can be related to sprawl phenomena where both urban and rural areas develop, but in rural areas population grows less then in cities but its built-up grows more. β. Scenario β presents a situation in which urbanization increases due to a net loss of rural population and an increase of urban population. Despite the net decline in rural population, the increase of built-up areas takes place mostly in rural settlements, therefore agglomeration declines. The pull of built-up in rural areas is not accompanied by a population push factor. This scenario reports the pattern of development which occurred in Albania between 1990 and 2015. γ. In the γ scenario the country is confronted with a decline of the degree of urbanization, due to a faster growing population in rural settlements, also built-up areas grow more in rural settlements leading to a decrease in agglomeration. γ can be a case of rural development in which rural settlements push both population and built-up areas expansion, nevertheless the demographic balance in urban clusters remains positive. This condition is accounted in 38 countries among which Argentina, Chile, Congo, Finland, France, Indonesia, Kazakhstan, Venezuela and Zimbabwe. δ. In scenario δ the country encompasses a net population decline both affecting urban areas and rural settlements. Urbanization declines due to a dominant population decline in urban areas. Built-up areas increase more in rural settlements (declining agglomeration) than in urban areas. In this scenario cities are unable to enforce their catalyst role, despite the national decline, built-up areas in rural areas increase. This pattern is accounted in 14 countries, all between Europe or West Asia, among which: Armenia, Bulgaria, Belarus, Georgia, Croatia, Hungary, Lithuania, Latvia, Romania, Russian Federation, Serbia and Ukraine. Under the factors described above, this scenario may be associated with territorial consumption whereas despite a net loss of population taking place both in urban areas and in rural settlement, built-up areas increase in rural areas. ε. Scenario ε is associated to an urban-rural transition, whereas urbanization declines as consequence of a net population loss in urban clusters, and a decrease in agglomeration driven by rural built-up expansion. Rural development, both in terms of built-up and population takes place at the expenses of urban areas. This rural development dynamic is accounted in four countries, among which Czech Republic, Poland and Slovakia. ζ. Scenario ζ presents urbanization increase led by a dominant growth of urban population over rural one. Also agglomeration increases: this is a scenario is of urban development. It is accounted in 8 countries among which Benin, Bahrain, Bhutan and Western Sahara. 4. Discussion
Data analysis has provided a series of important findings. First, the broad dynamic at global proves that rural and urban areas have rather distinct patterns of development per driver and proportion, as shown in table 3 (below). It synthetizes the factors of growth of built-up and population in rural settlements and in urban clusters between 1975 and 2015 (factor of 1975 values). Remarkably built-up increased in 40 years by 7 times in rural areas while population
996
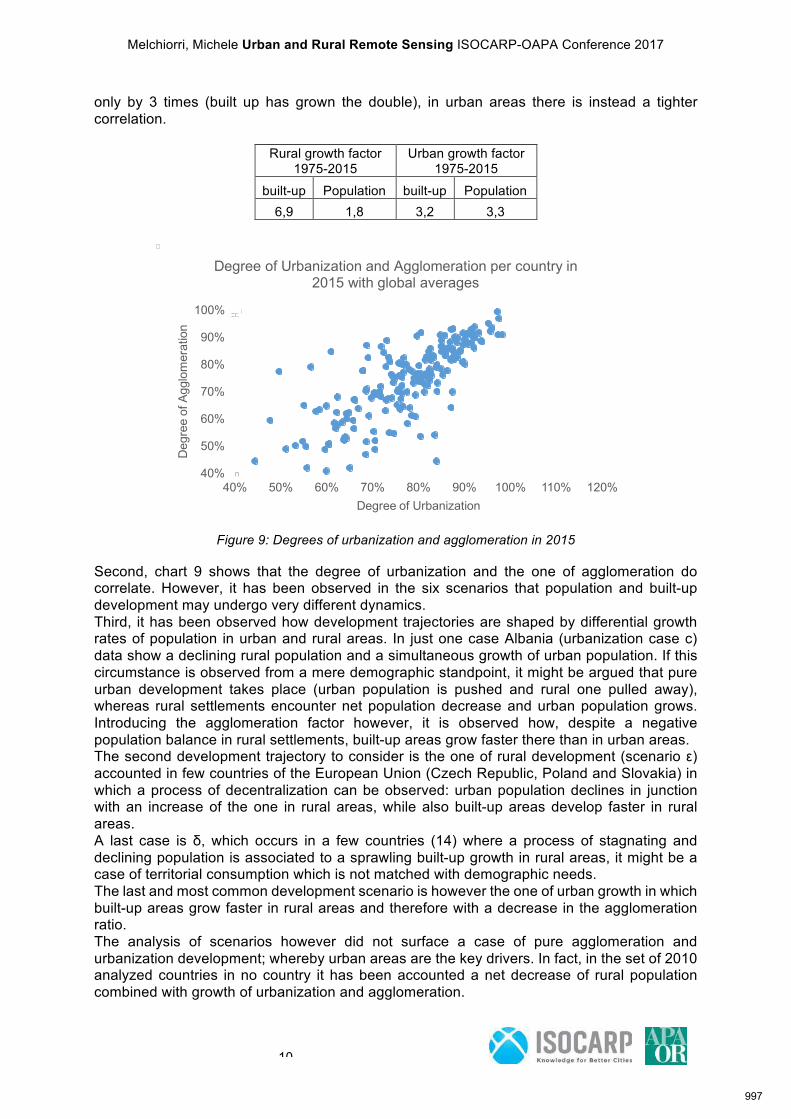
Melchiorri, Michele Urban and Rural Remote Sensing ISOCARP-OAPA Conference 2017
10
only by 3 times (built up has grown the double), in urban areas there is instead a tighter correlation.
Rural growth factor 1975-2015
Urban growth factor 1975-2015
built-up Population built-up Population
6,9 1,8 3,2 3,3
Figure 9: Degrees of urbanization and agglomeration in 2015
Second, chart 9 shows that the degree of urbanization and the one of agglomeration do correlate. However, it has been observed in the six scenarios that population and built-up development may undergo very different dynamics. Third, it has been observed how development trajectories are shaped by differential growth rates of population in urban and rural areas. In just one case Albania (urbanization case c) data show a declining rural population and a simultaneous growth of urban population. If this circumstance is observed from a mere demographic standpoint, it might be argued that pure urban development takes place (urban population is pushed and rural one pulled away), whereas rural settlements encounter net population decrease and urban population grows. Introducing the agglomeration factor however, it is observed how, despite a negative population balance in rural settlements, built-up areas grow faster there than in urban areas. The second development trajectory to consider is the one of rural development (scenario ε) accounted in few countries of the European Union (Czech Republic, Poland and Slovakia) in which a process of decentralization can be observed: urban population declines in junction with an increase of the one in rural areas, while also built-up areas develop faster in rural areas. A last case is δ, which occurs in a few countries (14) where a process of stagnating and declining population is associated to a sprawling built-up growth in rural areas, it might be a case of territorial consumption which is not matched with demographic needs. The last and most common development scenario is however the one of urban growth in which built-up areas grow faster in rural areas and therefore with a decrease in the agglomeration ratio. The analysis of scenarios however did not surface a case of pure agglomeration and urbanization development; whereby urban areas are the key drivers. In fact, in the set of 2010 analyzed countries in no country it has been accounted a net decrease of rural population combined with growth of urbanization and agglomeration.
40%
50%
60%
70%
80%
90%
100%
40% 50% 60% 70% 80% 90% 100% 110% 120%
Degre
e o
f A
gglo
mera
tion
Degree of Urbanization
Degree of Urbanization and Agglomeration per country in 2015 with global averages
997
Melchiorri, Michele Urban and Rural Remote Sensing ISOCARP-OAPA Conference 2017
11
5. Conclusion
This article has presented the findings and comments about territorial data. The GHSL has offered the opportunity to analyze in a globally consistent way in 210 countries the dynamics of population and built-up change between 1975 and 2015. Using the GHSL it has been possible to analyze 40 years of human settlements development in urban and rural areas, adopting the same criteria worldwide. Next to the plain input data about built-up areas (remotely sensed with Landsat imagery) and population (automatically modelled with the JRC-CIESIN methodology) it has been possible to calculate more sophisticated and descriptive features of human settlements: the degree of urbanization (concentration of population in urban areas) and the degree of agglomeration (concentration of built-up areas in urban areas) and their change between 1990 and 2015. The global narrative of urbanization, while being confirmed, it is confronted with a process of rural development which is not linear in built up and population. The growth of built-up in rural areas by a factor of nearly 7 times shall cast some concerns about the use of the territory and the ways in which new development are conceived and regulated. The consumption of available land is a key principle for which the planning professionals can act, both in the public and private sectors. The room for further development is wide. Next research steps include the disaggregation of national statistics into functional areas (i.e. at federal level where possible or into other regional disaggregation). This allows a finer understanding of settlements development paths. It is crucial to introduce the findings of GHSL like tools and related scientific analysis into policymaking. Planners can contribute both in the analytical and decision making phase. References - Capello, R., & Camagni, R. (2000). Beyond optimal city size: an evaluation of alternative urban
growth patterns. Urban Studies, 37(9), 1479-1496. - Davis, J. C., & Henderson, J. V. (2003). Evidence on the political economy of the urbanization
process. Journal of urban economics, 53(1), 98-125. - Djikstra, L., & Poleman, H. (2014). A harmonized definition of cities and rural areas: the new
degree of urbanisation. DG Regional and Urban Policy. WP 01/2014 - Fields, G. S. (1975). Rural-urban migration, urban unemployment and underemployment, and
job-search activity in LDCs. Journal of development economics, 2(2), 165-187. - Lucas, Jr, R. E. (2004). Life earnings and rural-urban migration. Journal of Political
Economy, 112(S1), S29-S59. - Molotch, H. (1976). The city as a growth machine: Toward a political economy of place. American
journal of sociology, 82(2), 309-332. - Pesaresi, M., Ehrlich, D., Ferri, S., Florczyk, A., Freire, S., Halkia, M., ... & Syrris, V. (2016).
Operating procedure for the production of the Global Human Settlement Layer from Landsat data of the epochs 1975, 1990, 2000, and 2014. Publ. Off. Eur. Union.
- Pesaresi, M., Melchiorri, M., Siragusa, A., Kemper, T. (2016). Atlas of the Human Planet 2016. Publication Office of the European Union
Datasets: GHS Built-up grid; GHS Population Grid; GHS Settlement Grid http://ghsl.jrc.ec.europa.eu/datasets.php Disclaimer
The specific reference for input data to the GHSL are contained in Pesaresi (2016). The database prepared for this study does not necessarily include statistics for the following countries (ISO Country Codes): ATF, BES, BLM, BVT, CCK, COK, CXR, FLK, FRO, GIB, HKG, HMD, IOT, KIR, LIE, MAC, MAF, MCO, MSR, NFK, NIU, NRU, PCN, PIS, PSE, PYF, SGP, SGS, SHN, SJM, SMR, SP-, SXM, TCA, TKL, TUV, UMI, VAT, VGB, VIR, WLF, XAD, XCA, XCL, XNC
998

Melchiorri, Michele Urban and Rural Remote Sensing ISOCARP-OAPA Conference 2017
12
i !"#$%&'$(&)% = +,-./12345.672/ 89:;<.672/.512345.672/ 89:;
]
ii A==>)?@"$(&)% = +,-./A4756B43 89:;<.672/.5A4756B43 89:;
]
iii Countries include (ISO A3 Country Codes): AND, ARG, ARM, ASM, BDI, BGR, BIH, BLR, BLZ, BRB, BWA, CAF, CHL, COG, COL, CUB, CZE, DJI, EST, FIN, FRA, GAB, GEO, GGY, GUF, GUY, HRV, HUN, IDN, IRN, JAM, JPN, KAZ, LCA, LTU, LVA, MDA, MMR, MNE, MNP, NIC, PLW, POL, PRY, QAT, ROU, RUS, SEN, SLV, SRB, SUR, SVK, TLS, TON, UKR, VCT, VEN, ZMB, ZWE
iv few island countries have been excluded from the analyzed set
999
TONG, Xin Relationship of TOD Factors ISOCARP-OAPA Conference 2017
1
Relationship of Characteristic Factors in Transit-oriented
Development Communities based on Point of Interests and Metro Ridership Data – a Case Study of Shenzhen
Xin TONG, School of Architecture and Urban Planning, Harbin Institute of Technology, Shenzhen, China; Department of Building & Real Estate, Hong Kong Polytechnic
University, China YaoWu WANG, School of Architecture and Urban Planning, Harbin Institute of Technology,
Shenzhen, China DongHui DAI, School of Architecture and Urban Planning, Harbin Institute of Technology,
Shenzhen, China QingFeng ZHOU, School of Architecture and Urban Planning, Harbin Institute of
Technology, Shenzhen, China
1. Introduction
Transit-oriented development (TOD), as a strategy of smart growth and combat urban sprawl, has been discussed and implemented throughout the world. There are many successful cases in the developed and developing countries. Since the first concept of TOD (Calthorpe, 1993), the research on this topic is never stopped, and mainly focused on US cases. However, as this planning mode has been applied for many Chinese cities, the results were not as same as in the US. TOD originated from America, but the guidelines and planning standards are different from Asian context. The features in developing countries need more in-depth research and a case from Chinese first-tier cities will provide a good starting point.
1.1 TOD in Shenzhen
Shenzhen is one of the four largest and advanced cities of China. It is located immediately to the north of Hong Kong, holds sub provincial administrative status. In 1979, it was promoted to be China’s first special economic zone. The population surged from 30 thousand to 12 million during 40 years. It was one of the fastest-growing cities in the world so the transportation also experienced a rapid development process from nothing to advanced world levels.
Shenzhen metro system is the fourth biggest railway system in China (after Beijing, Shanghai and Guangzhou) and connected six out of twelve districts. It has developed in three phrases. The first phrase (No.1 and 2 lines) was planned in 1996 and operated in 2004 with a length of 22km and investment of 1.85 billion US dollar. In the second phrase, the systems added three new lines (No.3-5 lines) and extend the existing two lines with fourteen more stations. In 2011, all five lines with 118 stations have operated. The overall length is 178km and the investment is 13.1 billion US dollar.
Shenzhen TOD planning guideline and design factors all come from western countries, especially from US. But these exiting successful experiences cannot be fully exploited in Shenzhen because that there are many differences about institutional mechanisms and development conditions between western and eastern countries. In China, population density and land-use mix level are higher than American cities. People travel habits are also different from western countries.
1000
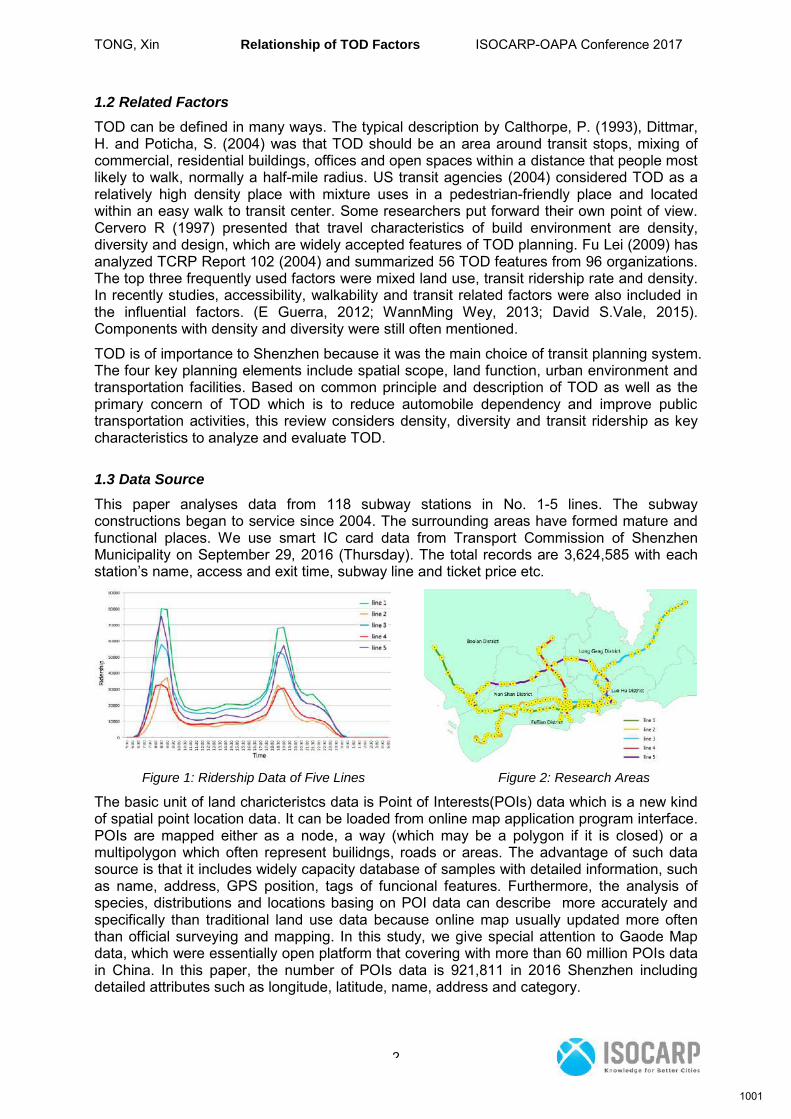
TONG, Xin Relationship of TOD Factors ISOCARP-OAPA Conference 2017
2
1.2 Related Factors
TOD can be defined in many ways. The typical description by Calthorpe, P. (1993), Dittmar, H. and Poticha, S. (2004) was that TOD should be an area around transit stops, mixing of commercial, residential buildings, offices and open spaces within a distance that people most likely to walk, normally a half-mile radius. US transit agencies (2004) considered TOD as a relatively high density place with mixture uses in a pedestrian-friendly place and located within an easy walk to transit center. Some researchers put forward their own point of view. Cervero R (1997) presented that travel characteristics of build environment are density, diversity and design, which are widely accepted features of TOD planning. Fu Lei (2009) has analyzed TCRP Report 102 (2004) and summarized 56 TOD features from 96 organizations. The top three frequently used factors were mixed land use, transit ridership rate and density. In recently studies, accessibility, walkability and transit related factors were also included in the influential factors. (E Guerra, 2012; WannMing Wey, 2013; David S.Vale, 2015). Components with density and diversity were still often mentioned.
TOD is of importance to Shenzhen because it was the main choice of transit planning system. The four key planning elements include spatial scope, land function, urban environment and transportation facilities. Based on common principle and description of TOD as well as the primary concern of TOD which is to reduce automobile dependency and improve public transportation activities, this review considers density, diversity and transit ridership as key characteristics to analyze and evaluate TOD.
1.3 Data Source
This paper analyses data from 118 subway stations in No. 1-5 lines. The subway constructions began to service since 2004. The surrounding areas have formed mature and functional places. We use smart IC card data from Transport Commission of Shenzhen Municipality on September 29, 2016 (Thursday). The total records are 3,624,585 with each station’s name, access and exit time, subway line and ticket price etc.
Figure 1: Ridership Data of Five Lines Figure 2: Research Areas
The basic unit of land charicteristcs data is Point of Interests(POIs) data which is a new kind of spatial point location data. It can be loaded from online map application program interface. POIs are mapped either as a node, a way (which may be a polygon if it is closed) or a multipolygon which often represent builidngs, roads or areas. The advantage of such data source is that it includes widely capacity database of samples with detailed information, such as name, address, GPS position, tags of funcional features. Furthermore, the analysis of species, distributions and locations basing on POI data can describe more accurately and specifically than traditional land use data because online map usually updated more often than official surveying and mapping. In this study, we give special attention to Gaode Map data, which were essentially open platform that covering with more than 60 million POIs data in China. In this paper, the number of POIs data is 921,811 in 2016 Shenzhen including detailed attributes such as longitude, latitude, name, address and category.
1001
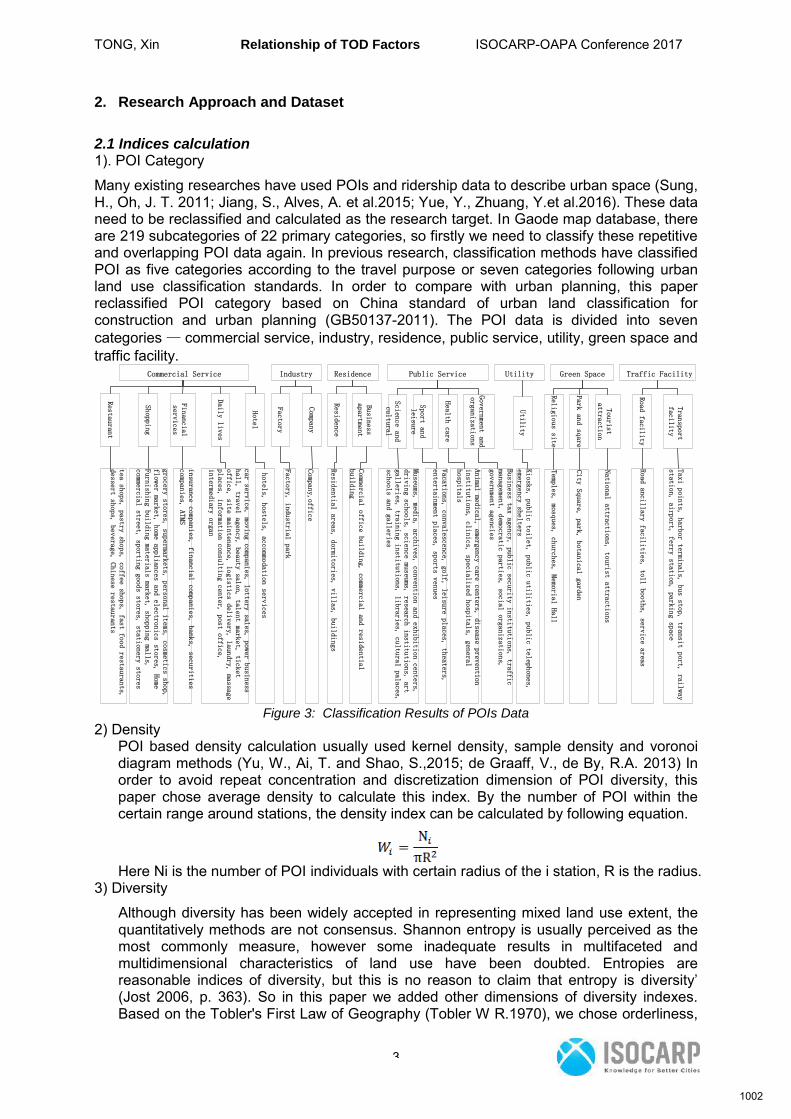
TONG, Xin Relationship of TOD Factors ISOCARP-OAPA Conference 2017
3
2. Research Approach and Dataset
2.1 Indices calculation 1). POI Category
Many existing researches have used POIs and ridership data to describe urban space (Sung, H., Oh, J. T. 2011; Jiang, S., Alves, A. et al.2015; Yue, Y., Zhuang, Y.et al.2016). These data need to be reclassified and calculated as the research target. In Gaode map database, there are 219 subcategories of 22 primary categories, so firstly we need to classify these repetitive and overlapping POI data again. In previous research, classification methods have classified POI as five categories according to the travel purpose or seven categories following urban land use classification standards. In order to compare with urban planning, this paper reclassified POI category based on China standard of urban land classification for construction and urban planning (GB50137-2011). The POI data is divided into seven categories — commercial service, industry, residence, public service, utility, green space and traffic facility.
Commercial Service Industry Residence Public Service Utility Green Space Traffic Facility
Road facility
Transport
facility
Road ancillary facilities, toll booths,
service areas
Taxi points,
harbor terminals,
bus stop,
transit port,
railway
station, airport, ferry station,
parking space
Factory
Company
Factory, industrial park
Company,office
Residence
Business
apartment
Residential areas, dormitories,
villas, buildings
Science and
cultural
Sport and
leisure
Health care
Government and
organizations
Utility
Park and sqare
Tourist
attraction
Religious site
Restaurant
Shopping
Financial
services
Daily lives
Hotel
Museums, media, archives, convention and exhibition centers,
driving schools,
science museums,
research institutions, art
galleries,
training institutions, libraries,
cultural palaces,
schools and galleries
Vacations,
convalescence,
golf, leisure places,
theaters,
entertainment places, sports venues
Animal medical,
emergency care centers, disease prevention
institutions,
clinics, specialized hospitals, general
hospitals
Business tax agency, public security institutions, traffic
management,
democratic parties, social organizations,
government agencies
Kiosks, public toilet,
public utilities,
public telephones,
emergency shelters
Temples, mosques, churches, Memorial Hall
City Square,
park, botanical garden
National attractions, tourist attractions
tea shops,
pastry shops,
coffee shops,
fast food restaurants,
dessert shops,
beverage, Chinese restaurants
grocery stores,
supermarkets,
personal items,
cosmetics shop,
flower market,
home appliances and electronics stores, Home
Furnishing building materials market, shopping malls,
commercial street, sporting goods stores, stationery stores
insurance companies, financial companies, banks, securities
companies,
ATMS
car service,
moving companies,
lottery sales,
power business
hall, travel agency,
beauty salon,
talent market,
ticket
office, site maintenance,
logistics delivery, laundry, massage
places, information consulting center, post office,
intermediary organ
hotels, hostels, accommodation services
Commercial office building, commercial and residential
building
Figure 3: Classification Results of POIs Data
2) Density POI based density calculation usually used kernel density, sample density and voronoi diagram methods (Yu, W., Ai, T. and Shao, S.,2015; de Graaff, V., de By, R.A. 2013) In order to avoid repeat concentration and discretization dimension of POI diversity, this paper chose average density to calculate this index. By the number of POI within the certain range around stations, the density index can be calculated by following equation.
Here Ni is the number of POI individuals with certain radius of the i station, R is the radius.
3) Diversity
Although diversity has been widely accepted in representing mixed land use extent, the quantitatively methods are not consensus. Shannon entropy is usually perceived as the most commonly measure, however some inadequate results in multifaceted and multidimensional characteristics of land use have been doubted. Entropies are reasonable indices of diversity, but this is no reason to claim that entropy is diversity’ (Jost 2006, p. 363). So in this paper we added other dimensions of diversity indexes. Based on the Tobler's First Law of Geography (Tobler W R.1970), we chose orderliness,
1002
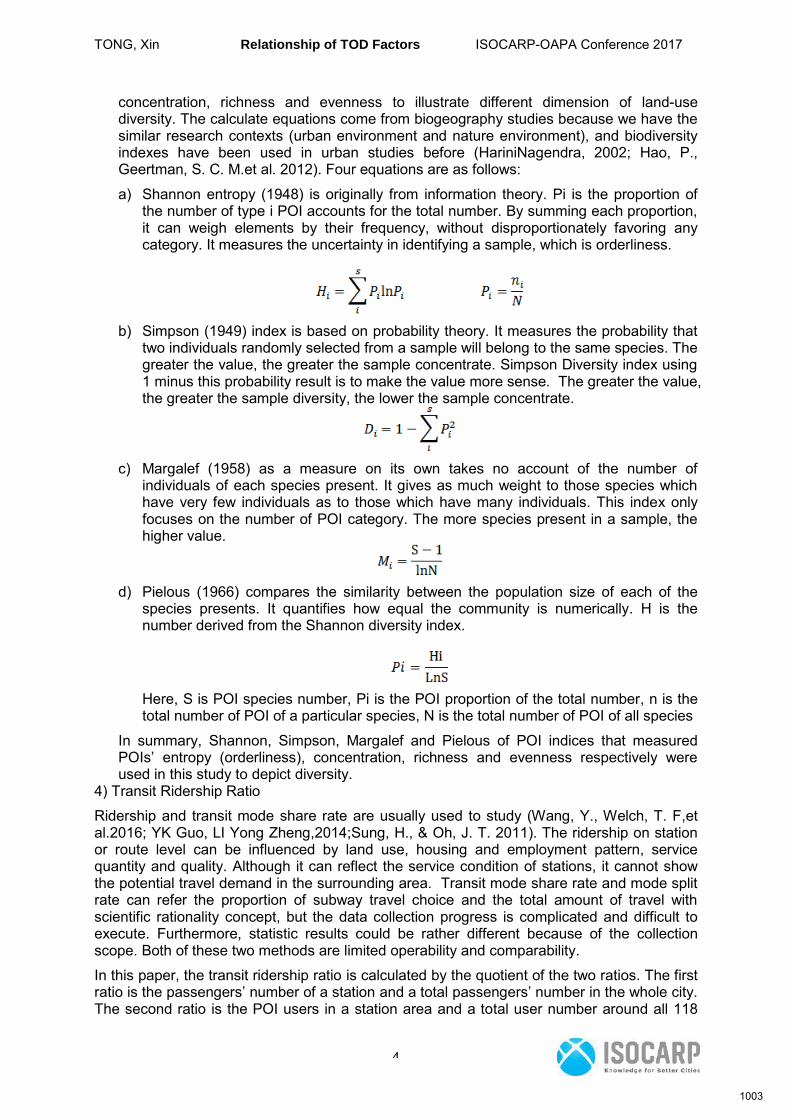
TONG, Xin Relationship of TOD Factors ISOCARP-OAPA Conference 2017
4
concentration, richness and evenness to illustrate different dimension of land-use diversity. The calculate equations come from biogeography studies because we have the similar research contexts (urban environment and nature environment), and biodiversity indexes have been used in urban studies before (HariniNagendra, 2002; Hao, P., Geertman, S. C. M.et al. 2012). Four equations are as follows:
a) Shannon entropy (1948) is originally from information theory. Pi is the proportion of the number of type i POI accounts for the total number. By summing each proportion, it can weigh elements by their frequency, without disproportionately favoring any category. It measures the uncertainty in identifying a sample, which is orderliness.
b) Simpson (1949) index is based on probability theory. It measures the probability that
two individuals randomly selected from a sample will belong to the same species. The greater the value, the greater the sample concentrate. Simpson Diversity index using 1 minus this probability result is to make the value more sense. The greater the value, the greater the sample diversity, the lower the sample concentrate.
c) Margalef (1958) as a measure on its own takes no account of the number of individuals of each species present. It gives as much weight to those species which have very few individuals as to those which have many individuals. This index only focuses on the number of POI category. The more species present in a sample, the higher value.
d) Pielous (1966) compares the similarity between the population size of each of the species presents. It quantifies how equal the community is numerically. H is the number derived from the Shannon diversity index.
Here, S is POI species number, Pi is the POI proportion of the total number, n is the total number of POI of a particular species, N is the total number of POI of all species
In summary, Shannon, Simpson, Margalef and Pielous of POI indices that measured POIs’ entropy (orderliness), concentration, richness and evenness respectively were used in this study to depict diversity.
4) Transit Ridership Ratio
Ridership and transit mode share rate are usually used to study (Wang, Y., Welch, T. F,et al.2016; YK Guo, LI Yong Zheng,2014;Sung, H., & Oh, J. T. 2011). The ridership on station or route level can be influenced by land use, housing and employment pattern, service quantity and quality. Although it can reflect the service condition of stations, it cannot show the potential travel demand in the surrounding area. Transit mode share rate and mode split rate can refer the proportion of subway travel choice and the total amount of travel with scientific rationality concept, but the data collection progress is complicated and difficult to execute. Furthermore, statistic results could be rather different because of the collection scope. Both of these two methods are limited operability and comparability.
In this paper, the transit ridership ratio is calculated by the quotient of the two ratios. The first ratio is the passengers’ number of a station and a total passengers’ number in the whole city. The second ratio is the POI users in a station area and a total user number around all 118
1003
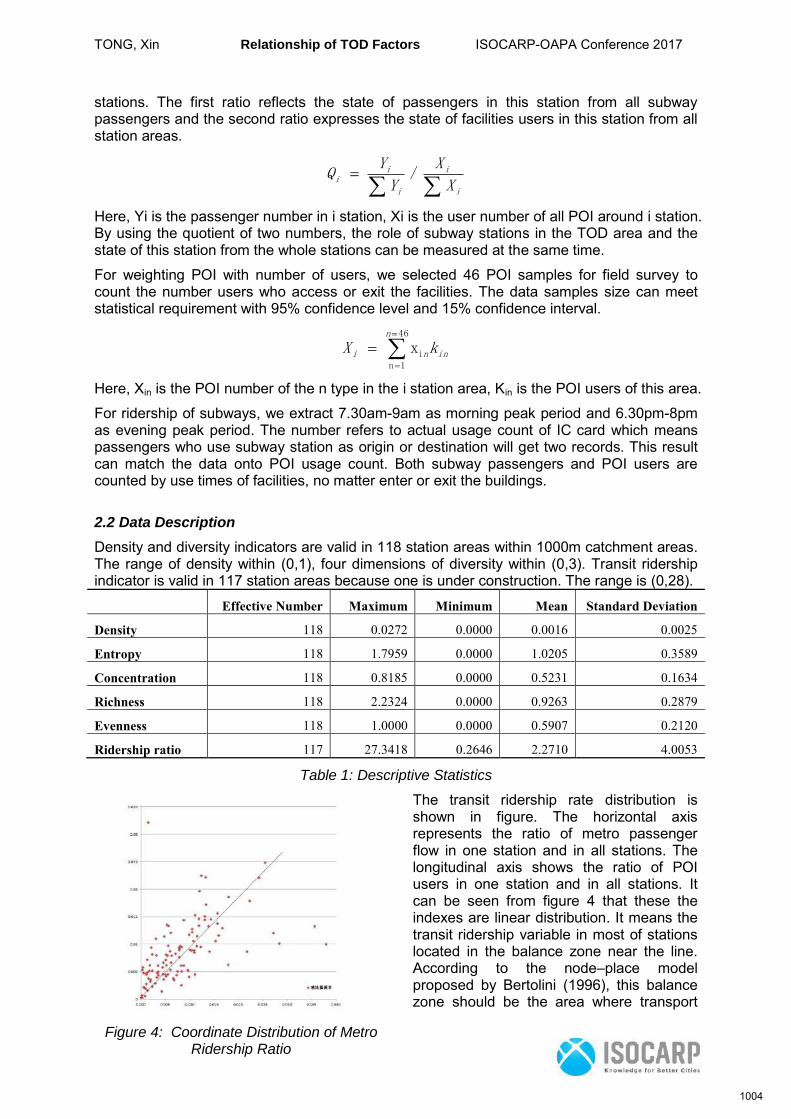
TONG, Xin Relationship of TOD Factors ISOCARP-OAPA Conference 2017
5
stations. The first ratio reflects the state of passengers in this station from all subway passengers and the second ratio expresses the state of facilities users in this station from all station areas.
i
i
i
ii X
X
Y
YQ /
Here, Yi is the passenger number in i station, Xi is the user number of all POI around i station. By using the quotient of two numbers, the role of subway stations in the TOD area and the state of this station from the whole stations can be measured at the same time.
For weighting POI with number of users, we selected 46 POI samples for field survey to count the number users who access or exit the facilities. The data samples size can meet statistical requirement with 95% confidence level and 15% confidence interval.
46
1nix
n
inni kX
Here, Xin is the POI number of the n type in the i station area, Kin is the POI users of this area.
For ridership of subways, we extract 7.30am-9am as morning peak period and 6.30pm-8pm as evening peak period. The number refers to actual usage count of IC card which means passengers who use subway station as origin or destination will get two records. This result can match the data onto POI usage count. Both subway passengers and POI users are counted by use times of facilities, no matter enter or exit the buildings.
2.2 Data Description
Density and diversity indicators are valid in 118 station areas within 1000m catchment areas. The range of density within (0,1), four dimensions of diversity within (0,3). Transit ridership indicator is valid in 117 station areas because one is under construction. The range is (0,28).
Effective Number Maximum Minimum Mean Standard Deviation
Density 118 0.0272 0.0000 0.0016 0.0025
Entropy 118 1.7959 0.0000 1.0205 0.3589
Concentration 118 0.8185 0.0000 0.5231 0.1634
Richness 118 2.2324 0.0000 0.9263 0.2879
Evenness 118 1.0000 0.0000 0.5907 0.2120
Ridership ratio 117 27.3418 0.2646 2.2710 4.0053
Table 1: Descriptive Statistics
The transit ridership rate distribution is shown in figure. The horizontal axis represents the ratio of metro passenger flow in one station and in all stations. The longitudinal axis shows the ratio of POI users in one station and in all stations. It can be seen from figure 4 that these the indexes are linear distribution. It means the transit ridership variable in most of stations located in the balance zone near the line. According to the node–place model proposed by Bertolini (1996), this balance zone should be the area where transport
Figure 4: Coordinate Distribution of Metro Ridership Ratio
1004
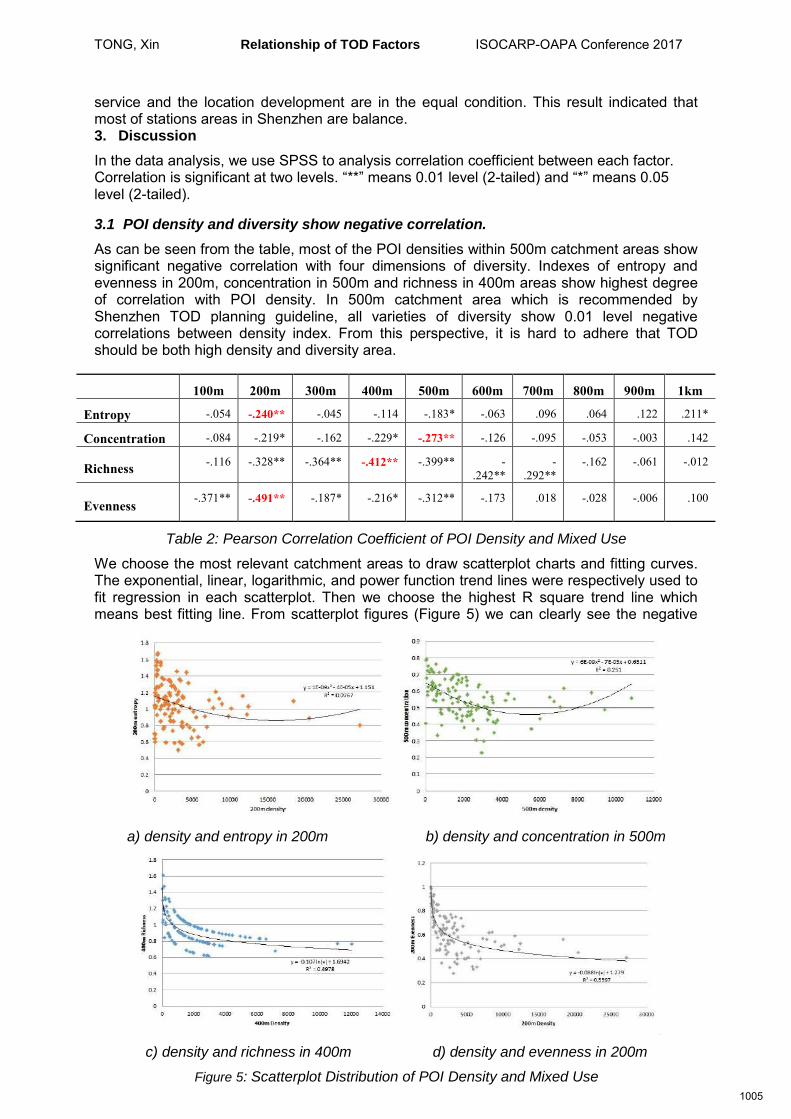
TONG, Xin Relationship of TOD Factors ISOCARP-OAPA Conference 2017
6
service and the location development are in the equal condition. This result indicated that most of stations areas in Shenzhen are balance. 3. Discussion
In the data analysis, we use SPSS to analysis correlation coefficient between each factor. Correlation is significant at two levels. “**” means 0.01 level (2-tailed) and “*” means 0.05 level (2-tailed).
3.1 POI density and diversity show negative correlation.
As can be seen from the table, most of the POI densities within 500m catchment areas show significant negative correlation with four dimensions of diversity. Indexes of entropy and evenness in 200m, concentration in 500m and richness in 400m areas show highest degree of correlation with POI density. In 500m catchment area which is recommended by Shenzhen TOD planning guideline, all varieties of diversity show 0.01 level negative correlations between density index. From this perspective, it is hard to adhere that TOD should be both high density and diversity area.
100m 200m 300m 400m 500m 600m 700m 800m 900m 1km
Entropy -.054 -.240** -.045 -.114 -.183* -.063 .096 .064 .122 .211*
Concentration -.084 -.219* -.162 -.229* -.273** -.126 -.095 -.053 -.003 .142
Richness -.116 -.328** -.364** -.412** -.399** -
.242**
-
.292**
-.162 -.061 -.012
Evenness -.371** -.491** -.187* -.216* -.312** -.173 .018 -.028 -.006 .100
Table 2: Pearson Correlation Coefficient of POI Density and Mixed Use
We choose the most relevant catchment areas to draw scatterplot charts and fitting curves. The exponential, linear, logarithmic, and power function trend lines were respectively used to fit regression in each scatterplot. Then we choose the highest R square trend line which means best fitting line. From scatterplot figures (Figure 5) we can clearly see the negative
a) density and entropy in 200m b) density and concentration in 500m
c) density and richness in 400m d) density and evenness in 200m
Figure 5: Scatterplot Distribution of POI Density and Mixed Use
1005
TONG, Xin Relationship of TOD Factors ISOCARP-OAPA Conference 2017
7
correlation between density and every dimension of land mixed use. But in the first two figures, entropy and concentration distribution slightly increased with density growing at last. This change can also be found in the other catchment areas. The changing point is around 15000 POI/km2 in 200m area and 6000 POI/km2 in 500m area. According to diversity and compete theory, this value could be the milestone of competitive rate disequilibrium caused by facility diversity pattern.
3.2 Transit ridership ratio is negatively correlated with density and positively with mixed use
200m and 500m area has most significant correlations between indexes. Since 500m was recommended as pedestrian catchment area according to Shenzhen TOD planning guideline. So we choose 500m area to conduct further analysis.
Density Entropy Concentration Richness Evenness
Ridership Ratio -.342** .172 .201* .538** .345**
Table 3: Pearson Correlation Coefficient of POI Density, Mixed Use and Ridership Ratio
Table 3 shows the correlation coefficient result between density, mixed use and transit ridership ratio on 0.01 level and 0.05 level. It reflects the dependency of ridership on density and diversity. Although four dimensions of mixed use have significant correlation with ridership ratio, considering relation between mixed use and density, we separate density and mixed use into high level and low level to control the interaction between two factors.
In the density controlling group (table 4.1), the correlation between ridership ratio and mixed use has decreased distinctly. Entropy, concentration and evenness show no relation with ridership ratio. Only richness has significant correlation. But after controlling mixed use indicator (table 4.2), the correlation between ridership ratio and density are still high.
Entropy Concentration Richness Evenness
High
density
Low
density
High
density
Low
density
High
density
Low
density
High
density
Low
density
Ridership Ratio .161 -.080 .094 -.005 .393* .726** .147 .173
Ridership .121 -.074 .128 -.046 -.037 -.018 .095 -.230
a) POI mixed use and ridership ratio correlation controlling density
Density
High
Entropy
Low
Entrop
y
High
Concentra
tion
Low
Concentration
High
Richness
Low
Richness
High
Evennes
s
Low
Evennes
s
Ridership
Ratio
-.492** -.291 -.459** -.290 -.496** -.526** -.456** -.441**
Ridership .653** .452** .306 .501** .252 .426** .694** .426**
b) POI density and ridership ratio correlation controlling diversity
Table 4: Pearson Correlation Coefficient
These results reflect that subway ridership ratio is related to both density and mixed use. However considering the influence between density and mixed use, only density is the main effect factor on ridership ratio. It can be proved because once we control density indicator, it has hardly any relationship between ridership and mixed use (Table 4.a), but when we control mixed use indicator, the relationship between density and ridership is still high (Table 4.b). In the previous studies we often think that land mixed use may have great effect on transit ridership. But based on findings from this study, mixed use should be peeled off the
1006
TONG, Xin Relationship of TOD Factors ISOCARP-OAPA Conference 2017
8
density effect first. Without considering the influence of density acting on diversity first, the result may be prone.
3.3 Density and richness has the most significant influence on ridership.
From the above correlation analysis, we can see that density and richness has most strong effect with transit ridership ratio and ridership, which means the number and kind of facilities have the most significant relationship with ridership. Density and ridership ratio are negatively power functional related (Figure 6.a). The ridership ratio dramatically decreased with the increase of density when density is less than 500POI/km2. Coefficient of richness is stronger than other three diversity index. In low density stations, the relation is higher than in dense stations. From scatter plot, the ridership ratio is power function related to richness index (Figure 6.b). The greater the richness index, the higher the ridership ratio. The other three dimensions – entropy, concentration and evenness – are weak correlated with ridership ratio (Figure 6.c, 6.d, 6.e).
Although the rate of metro passengers and facility users are decreasing with density, the ridership is still growing with density (Figure 7.a). That maybe because high density brings more people, and also bring more other transportation modes. For example, in residential station like Hua Qiao Cheng station and Tang Lang station, although the number passengers per day were similar (19445 and 18204 respectively), the difference of two rate of riding metro is highly significant (2% and 30% respectively). That’s because Hua Qiao Cheng station, public transportations like taxis, buses and sharing bicycles are much more than Tang Lang station. There are few people live in Tang Lang, so buses and taxis barely drive there and most of residents have to choose subway.
a) ridership ratio and density b) ridership ratio and richness
c) ridership ratio and entropy d) ridership ratio and concentration e) ridership ratio and evenness
Figure 6: Scatterplot distribution of ridership ratio, density and mixed use
1007
TONG, Xin Relationship of TOD Factors ISOCARP-OAPA Conference 2017
9
4. Conclusion
For building a thorough understanding of all station areas, ward method was used to cluster TOD according to above characteristics. It is a criterion applied in hierarchical cluster analysis emphasizing minimum variance in the same group. At last, five groups have been created based on these characteristics of TOD.
Figure 8 clearly shows the cluster result of geographical distribution. Red stations are the densest areas and green stations are the lowest density areas. The red cluster area is the commercial center of Shenzhen. From the indicators table, stations with high density, diversity and ridership ratio do not exist. Due to the synergistic relationship between density
a) ridership and density b) ridership and richness
c) ridership and entropy d) ridership and concentration e) ridership and evenness
Figure 7: Scatterplot Distribution of Ridership Ratio, Density and Mixed Use
Figure 8: Distribution of clustering results (Note: the indicators are the average number)
1008
TONG, Xin Relationship of TOD Factors ISOCARP-OAPA Conference 2017
10
and diversity, station functions show highly aggregation in most of dense stations. So low density stations show highly mixed use and ridership ratio, and vice versa. In high density station areas, most of them are commercial centers or dense residential communities. High concentration of single function leads other functions hardly grow. So diversity indexes of these areas are relatively low. Public transportations like buses and shared bicycles prefer to set stops for moving large number of passengers rapidly. So metro provides only a small part of transit. On the other hand, low density station areas are near city parks or public service places. Because of a low number of facilities and users, those areas provide fewer transportation options. The high metro ridership ratio is the result of passive selection because people have no choice. To increase TOD ridership, density and the kind of facilities available should be the first concern. It is better to include commercial service, industry, residence, public service, utility, green space and traffic facility features to prevent unitary station function.
Acknowledgements
The authors would like to thank the support received from Shenzhen Key Laboratory of Urban Planning and Decision Making, China and Department of Building& Real Estate, the Hong Kong Polytechnic University, Hong Kong.
References:
Bertolini, L. (1996). Nodes and places: complexities of railway station redevelopment. European Planning Studies, 4(3), 331-345. Calthorpe, P., (1993). The next American metropolis: Ecology, community, and the American dream. Princeton architectural press. Cervero, R., & Kockelman, K. (1997). Travel demand and the 3Ds: density, diversity, and design. Transportation Research Part D: Transport and Environment, 2(3), 199-219. Cervero, R., (2004). Transit-oriented development in the United States: Experiences, challenges, and prospects Vol. 102. Transportation Research Board. de Graaff, V., de By, R. A., van Keulen, M., & Flokstra, J. (2013). Point of interest to region of interest conversion. In Proceedings of the 21st ACM SIGSPATIAL International Conference on Advances in Geographic Information Systems (pp. 388-391). ACM. (November) Dittmar, H., & Poticha, S. (2004). Defining transit-oriented development: the new regional building block. The new transit town: Best practices in transit-oriented development, 19-40. Fu L, (2009). Studies on the TOD Mode in Urban Mass Rail Transit Station Areas.Southwest Jiao Tong University. Guerra, E., Cervero, R., & Tischler, D. (2011). The half-mile circle: does it represent transit station catchments?. Transportation Research Record Journal of the Transportation Research Board, 2276(2276), 101-109. Guo, Y. K., & Yong-Zheng, L. I. (2014). Research review on foreign TOD urban development:based on the perspective of influences on transit ridership by built environment. Urban Problems. H Nagendra,. (2002). Opposite trends in response for the shannon and simpson indices of landscape diversity. Applied Geography, 22(2), 175-186. Hao, P., Geertman, S. C. M., Hooimeijer, P., & Sliuzas, R. (2012). The land use diversity of urban villages in shenzhen. Environment & Planning A, 44(11). Huston, M. (1979). A general hypothesis of species diversity. The American Naturalist, 113(1), 81-101. Jiang, S., Alves, A., Rodrigues, F., Jr, J. F., & Pereira, F. C. (2015). Mining point-of-interest
1009
TONG, Xin Relationship of TOD Factors ISOCARP-OAPA Conference 2017
11
data from social networks for urban land use classification and disaggregation. Computers Environment & Urban Systems, 53, 36-46. Margalef, R. (1958). Information theory in ecology. General systems, 3, 36-71. Shannon, C. E. (1948). A mathematical theory of communication, Part I, Part II. Bell Syst. Tech. J., 27, 623-656. Simpson, E. H. (1949). Measurement of diversity. Nature. Sung, H., & Oh, J. T. (2011). Transit-oriented development in a high-density city: Identifying its association with transit ridership in Seoul, Korea. Cities, 28(1), 70-82. Tobler, W. R. (1970). A computer movie simulating urban growth in the Detroit region. Economic geography, 46(sup1), 234-240. Pielou, E. C. (1966). The measurement of diversity in different types of biological collections. Journal of theoretical biology, 13, 131-144. Vale, D. S. (2015). Transit-oriented development, integration of land use and transport, and pedestrian accessibility: Combining node-place model with pedestrian shed ratio to evaluate and classify station areas in Lisbon. Journal of transport geography, 45, 70-80. Wang, Y., Welch, T. F., Wu, B., Ye, X., & Ducca, F. W. (2016). Impact of transit-oriented development policy scenarios on travel demand measures of mode share, trip distance and highway usage in maryland. Ksce Journal of Civil Engineering, 20(3), 1006-1016. Wey, W. M., & Chiu, Y. H. (2013). Assessing the walkability of pedestrian environment under the transit-oriented development. Habitat International, 38, 106-118. Yu, W., Ai, T., & Shao, S. (2015). The analysis and delimitation of Central Business District using network kernel density estimation. Journal of Transport Geography, 45, 32-47. Yue, Y., Zhuang, Y., Yeh, A. G. O., Xie, J. Y., Ma, C. L., & Li, Q. Q. (2016). Measurements of poi-based mixed use and their relationships with neighbourhood vibrancy. International Journal of Geographical Information Science, 1-18.
1010

Abstract title Creating user friendly transportation data
Author Currier, Ellen, Lane Council of Governments , EUGENE, United States of America (Presenting
author)
Abstract
The Central Lane Metropolitan Planning Organization (MPO) in partnership with Oregon Department
of Transportation(ODOT) recently developed a common data visualization approach for crash data
that can be shared with Metropolitan Planning Organizations (MPO) and counties throughout
Oregon. The data portal was designed to both address the MPO’s federally required core safety
measures and the MPO’s desire to provide the public and partner agencies better access to relevant
regional transportation data. The original pilot included a partnership with the Bend MPO to develop
a similar data portal for their region and to test transferability of the visualization work. The MPO has
created a series of data visualizations using the Tableau software package that allows for simple
sharing of workbook visualization schemes.
As the MPO moves towards fully implementing performance based planning, this data portal will
serve as a tool to track progress over time. This tool has also provided a simple way for partner
agencies to access the most current data for project level and planning work. In addition to the core
safety measures, the data portal includes a breadth transportation data including summaries of
commutes, transit boarding, bike counts, and support data for the Lane County and Central Lane
MPO’s safety planning process. While the pilot project focused on the MPO boundary, the shared
planning process with Lane County allowed for the same technology to be applied to rural data.
Crash data for all of rural Lane County is also accessible through the data portal.
Using ArcGIS, SQL, and Tableau visualization software staff created an integrated database and web
portal that displays the most current available data. The data portal has improved communication
and coordination between local planning staff and greatly improved the MPO’s capacity to visualize
data for the public.
This presentation will describe the pilot project, development process of the databases and Tableau,
and the application to other plans and programs in Metropolitan Planning Organization. The data
portal can be viewed at http://thempo.org/887/Data-Portal
1011
Onlineinteractivemapping:Tips&toolsforsmallcommunities
Moderator: Rebecca HEWITT, Angelo Planning Group, Portland, USA
Speakers: Marty STOCKTON, City of Portland, USA; Kalin SCHMOLDT; JLA Public Involvement; Matt
HUGHART, Kittelson Associates; Kyra SCHNEIDER, Angelo Planning Group, USA
This panel session will feature speakers from the City of Portland as well as planners who have
worked with smaller jurisdictions on building and using online interactive maps to present and
obtain information as part of a public outreach strategy. It will introduce attendees to a range of
available options and cover the pros and cons of each, using example applications. While it will
identify the technical requirements needed to implement the various examples, it is intended for a
broad planning audience, with or without a GIS or web development background. It will also cover
the deployment side of building and using an online tool: how to integrate it into an outreach
program to get the most from the tool and ensure it reaches a broad and diverse audience.
1012
Neighborhoods,parks,andfoodaccess‐CreativeapproachestocommunityoutreachinSalemOR
Moderator: Lisa ANDERSON‐OGILVIE, Deputy Community Development, City of Salem, USA
Speakers: Eunice KIM, NESCA; Annie GORSKI; Toni WHITLER, City of Salem, USA
Plans and public outreach guide our work in Salem. In this panel session, hear three case studies that
highlight creative approaches to community outreach, including methods used, results, and lessons
learned. We will talk about community outreach that went beyond traditional methods to help
shape planning for three unique projects within the City of Salem:
Minto‐Brown Island Master Plan ‐ Regional focus
Minto‐Brown Island Park is a 1,205‐acre natural area next to downtown Salem. Its close proximity to
the downtown and high visibility along the Willamette River make it very important to Salem
residents. A new pedestrian bridge links 19 miles of soft surface and multi‐use trails to the
downtown core on both sides of the Willamette River. Active and passive uses and an ecologically
complex system of natural resource elements made it necessary to reach out to a diverse group of
stakeholders when updating the master plan for the park to ensure the needs of the community
were met.
Urban renewal area strategic plan and Community Food Study ‐ City and neighborhood focus
The North Gateway Urban Renewal Area (URA) is one of seven urban renewal areas in Salem.
Created in 1990, the North Gateway area consists of a mix of industrial, commercial, and residential
uses as well as major transportation corridors. The area also includes a significant Latino population
and many of the City’s lower‐income neighborhoods. Outreach occurred from 2014 to 2016 to
identify updated funding priorities for the URA, culminating in an action plan and work on a
Community Food Study. Outreach involved new partnerships with Latino organizations,
neighborhood groups, business surveys, local farms, and workforce organizations. This work will
continue into 2018 and serve as the basis for citywide efforts to increase engagement with Latino
residents.
NESCA‐Lansing Neighborhood Plan ‐ Neighborhood focus
The NESCA‐Lansing Neighborhood Plan project focuses on two adjacent neighborhoods in northeast
Salem that have diverse populations and many lower‐income families. The neighborhood plan aims
to capture the two neighborhoods’ long‐term goals and priorities across a broad range of issues such
as housing development and transportation improvements. Therefore to ensure the plan reflects the
desires of the whole neighborhood, as opposed to just the vocal few, traditional outreach efforts
were augmented to include partnerships with local organizations and schools and interactive events
in the two neighborhoods. This new approach emphasized engagement with Latino families,
parents, and students in addition to those regularly involved in neighborhood associations.
In all three projects, the City of Salem worked to improve livability and engage a broad group of
stakeholders, including populations that have not typically participated to a large extent in our
planning projects. This includes our growing Latino population, lower‐income residents, and niche
stakeholders with very distinct interests. In each case study, we will show how we shifted our
1013

outreach approaches in response to the specific needs of the people we were trying to engage. We
will describe the new approaches we tried, how successful they were, and what we learned in the
process. We will also talk about citywide efforts to increase engagement with Latino residents and
expand our use of technology and social media to become a more inclusive community.
1014
Lightingupthediscoverycorridor–theportofRidgefield’sdarkfiberopticsinfrastructure
Moderator: Scott KEILLOR, BergerABAM, Vancouver, Washington, USA
Speakers: Nelson HOLMBERG, Port of Ridgefield, Ridgefield, USA; Mike BOMAR, Columbia River
Economic Development Council, USA; Jeff NITEN, City of Ridgefield, USA; Melissa ULAND,
BergerABAM, Vancouver, USA
The Port of Ridgefield is proposing to invest in dark fiber‐optic infrastructure to support economic
development in the Port District. This session will present the findings of the Port’s needs
assessment, completed in July 2017. The needs assessment identified the qualitative and
quantitative need for fiber optic infrastructure in Ridgefield. Session attendees will be given an
overview of the planning process for the needs assessment and learn from case study examples of
successfully implemented dark fiber projects. Attendees will also hear from the Port about some of
the challenges and opportunities that have arisen from their coordination with other Washington
ports and the State Legislature.
The existing broadband services in the Ridgefield area do not support the public safety, education, or
economic development needs of the growing community. This puts the Port, the City, and
Washington State University Vancouver at a disadvantage in delivering reliable, high‐quality services
and programs that require improved, redundant broadband. Fiber optic infrastructure is a key
component of a 21st century city and will enable the city and the Port to attract and develop new
and next‐generation businesses.
This session will be presented as a panel discussion and aims to highlight the economic development
implications of investment in fiber‐optic infrastructure, which is applicable to many small
communities lacking the technology and broadband service to support growth and development.
1015

Track 6: Post-smart communities and the new frontiers
1016
Citiesleadingthroughenergyanalysis&planning
Moderator: Kale ROBERTS, ICLEI‐Local Governments for Sustainability, USA
Speakers: Kale ROBERTS, ICLEI‐Local Governments for Sustainability, USA; Andrea MARTIN, Senior Associate, Cascadia Consulting GroupSeattle, WA
Since the mid‐1990s, local governments have engaged in periodic inventories of municipal and
community greenhouse gas (GHG) emissions with the ultimate goal of achieving emission
reductions. The field has matured with documented protocols for performing and reporting
inventories, and many communities are now conducting inventory updates to establish trends. The
Cities Leading through Energy Analysis and Planning (C‐LEAP) project, managed by the U.S.
Department of Energy in collaboration with ICLEI USA and participating local governments, enhances
the GHG inventory practice by creating methods and tools to attribute changes between two
inventories to the impacts of policies and programs along with other external drivers, such as
economic activity and weather. This framework will support planners and policy‐makers in using
data to better communicate about their progress and refine their policy approaches.
Specifically, ICLEI has developed a “contribution analysis” that is now in testing by a set of
participating communities: Aspen, Santa Monica, King County WA, the Metropolitan Washington
(D.C.) Council of Governments, and the Delaware Valley Regional Planning Commission. The
approach includes normalization of inventories for heating and cooling degree days, economic
activity and other factors. By eliminating as much uncertainty as possible through normalizing for
factors like weather and economic activity that isolate out the “noise” of external factors, the
impact of actions or programs can be reasonably inferred.
Upon completion of the testing, ICLEI will produce a “replication toolkit” to describe the steps in the
process, provide guidance on interpretation of the results, and visual and narrative templates for
communities to adopt and take forward. This toolkit will support local governments nationwide in
making better, more cost‐effective policy decisions by providing a data‐driven framework and
associated tools for evaluating the contributions of various factors to observed changes in GHG
emissions over time.
1017
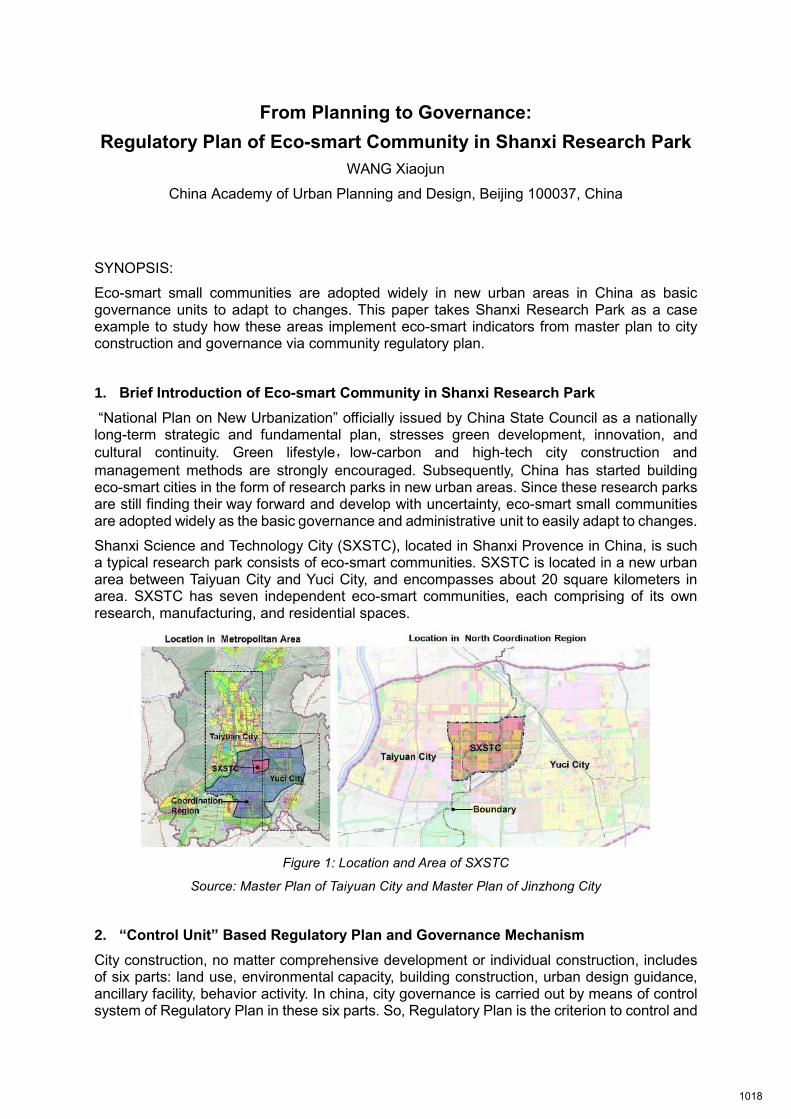
From Planning to Governance:
Regulatory Plan of Eco-smart Community in Shanxi Research Park
WANG Xiaojun
China Academy of Urban Planning and Design, Beijing 100037, China
SYNOPSIS:
Eco-smart small communities are adopted widely in new urban areas in China as basic governance units to adapt to changes. This paper takes Shanxi Research Park as a case example to study how these areas implement eco-smart indicators from master plan to city construction and governance via community regulatory plan.
1. Brief Introduction of Eco-smart Community in Shanxi Research Park
“National Plan on New Urbanization” officially issued by China State Council as a nationally long-term strategic and fundamental plan, stresses green development, innovation, and cultural continuity. Green lifestyle,low-carbon and high-tech city construction and management methods are strongly encouraged. Subsequently, China has started building eco-smart cities in the form of research parks in new urban areas. Since these research parks are still finding their way forward and develop with uncertainty, eco-smart small communities are adopted widely as the basic governance and administrative unit to easily adapt to changes.
Shanxi Science and Technology City (SXSTC), located in Shanxi Provence in China, is such a typical research park consists of eco-smart communities. SXSTC is located in a new urban area between Taiyuan City and Yuci City, and encompasses about 20 square kilometers in area. SXSTC has seven independent eco-smart communities, each comprising of its own research, manufacturing, and residential spaces.
Figure 1: Location and Area of SXSTC
Source: Master Plan of Taiyuan City and Master Plan of Jinzhong City
2. “Control Unit” Based Regulatory Plan and Governance Mechanism
City construction, no matter comprehensive development or individual construction, includes of six parts: land use, environmental capacity, building construction, urban design guidance, ancillary facility, behavior activity. In china, city governance is carried out by means of control system of Regulatory Plan in these six parts. So, Regulatory Plan is the criterion to control and
1018
guide city construction towards the development goals of City Master Plan.
The national policy “Measures for the Preparation, Examination and Approval of Detailed Control Plans on Cities and Towns” promotes “control unit” based regulatory plan and management mechanism. The size of control units in different cities could be diverse. Guangzhou sets up a supervisory system of development units to accelerate the interaction of master plan and regulatory plan (Sun Xiang, Yao Yanhua, 2010). Beijing has built up regulatory plan system at two levels: block and plot (Lei Xuan, 2016). SXSTC takes eco-smart community as control unit. Innovation value chain is complete inside of each one. Community Regulatory Plan plays an important role in the implementation of ecological and smart indicators from SXSTC Master Plan. Rational community regulatory plan is pivotal issue for SXSTC’s sustainable development.
3. Research Method
The author participated in the SXSTC Master Plan Project in 2012 and the Regulatory Plan Project of SXSTC Community I and V (Starting Area) in 2014, and currently oversees Regulatory Plan Project of SXSTC Community VII (Central Zone). On the basis of the above projects, this paper takes SXSTC as the research object, to study how eco-smart research parks implement eco-smart indicators from master plan to city construction and governance by means of community regulatory plan.
Data from SXSTC Administrative Committee and government departments of Shanxi Provence is used for demographic, economic, political, technological, ecological and spatial analysis. Based on above research, the paper elaborates on the eco-smart development conception of SXSTC in space design, innovation service system, green traffic system, and eco-smart techniques. The relevant low-carbon, high-tech and people-oriented indicators from SXSTC Master Plan are decomposed into seven communities via regulation plans. The paper then presents a set of control models for the community in order to ensure the realization of eco-smart development conception and requirements during city construction and governance.
4. Eco-smart Development Conception from SXSTC Master Plan
Eco-smart development conception are fully implemented in innovation service system, green traffic system, low-carbon energy supply system, low impact development and green architecture. SXSTC’s overall goal is to build an ecological city, keeping 0.25 ton of carbon emission per 10,000 yuan GDP in 2030.
4.1 Innovation Service System
SXSTC has three levels of innovation space: City Center, Community, and Neighborhood Unit. Accordingly, innovation services are divided into three levels of city, community, and neighborhood to increase the accessibility for researchers and inhabitants.
City Center provides abundant municipal public service, with Innovation Incubator Center, Intelligence Management Center, Knowledge Share Center, and Healthy Life Center surrounding the City Central Park, and leads the whole city to a virtuous cycle of livable environment and efficient innovation.
SXSTC has six independent Eco-smart Communities, each comprising of its own research, manufacturing, and residential spaces. Innovation value chain is complete inside of each one. Community Service Center provides various kinds of public services, such as library, enterprise accelerator and incubator, community hospital and school.
Neighborhood Unit is the basic governance unit with complete functions and independency.
1019
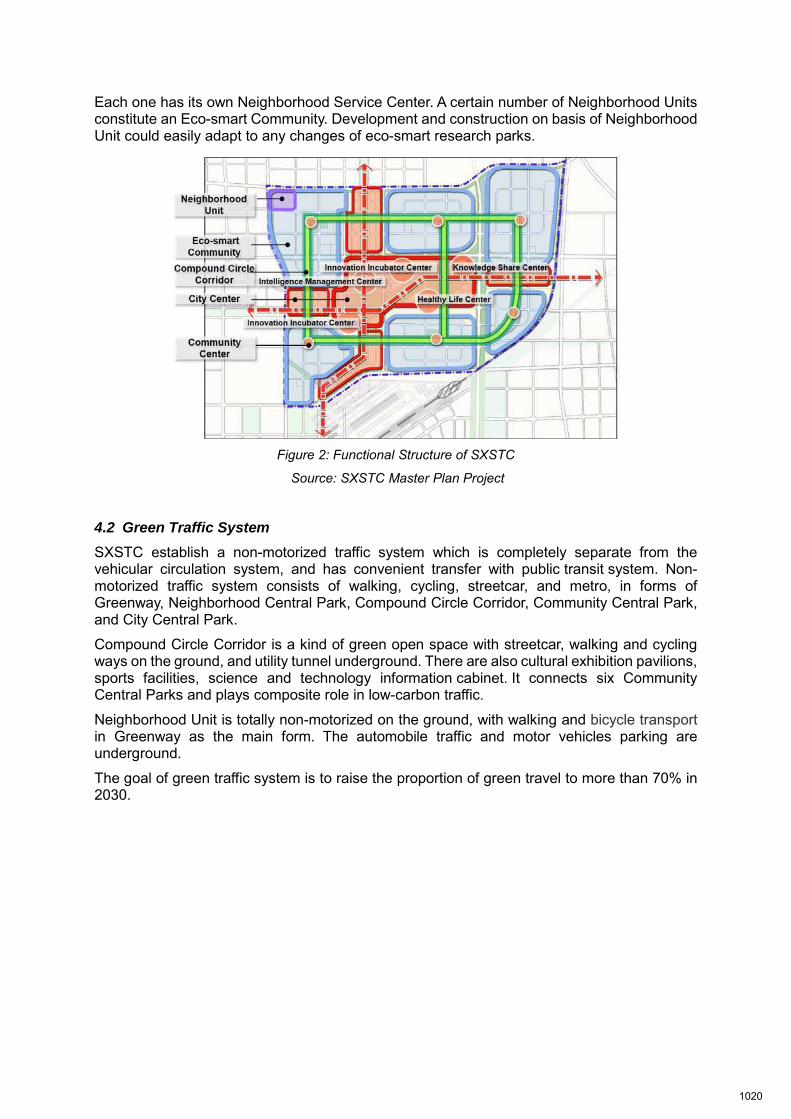
Each one has its own Neighborhood Service Center. A certain number of Neighborhood Units constitute an Eco-smart Community. Development and construction on basis of Neighborhood Unit could easily adapt to any changes of eco-smart research parks.
Figure 2: Functional Structure of SXSTC
Source: SXSTC Master Plan Project
4.2 Green Traffic System
SXSTC establish a non-motorized traffic system which is completely separate from the vehicular circulation system, and has convenient transfer with public transit system. Non-motorized traffic system consists of walking, cycling, streetcar, and metro, in forms of Greenway, Neighborhood Central Park, Compound Circle Corridor, Community Central Park, and City Central Park.
Compound Circle Corridor is a kind of green open space with streetcar, walking and cycling ways on the ground, and utility tunnel underground. There are also cultural exhibition pavilions, sports facilities, science and technology information cabinet. It connects six Community Central Parks and plays composite role in low-carbon traffic.
Neighborhood Unit is totally non-motorized on the ground, with walking and bicycle transport in Greenway as the main form. The automobile traffic and motor vehicles parking are underground.
The goal of green traffic system is to raise the proportion of green travel to more than 70% in 2030.
1020
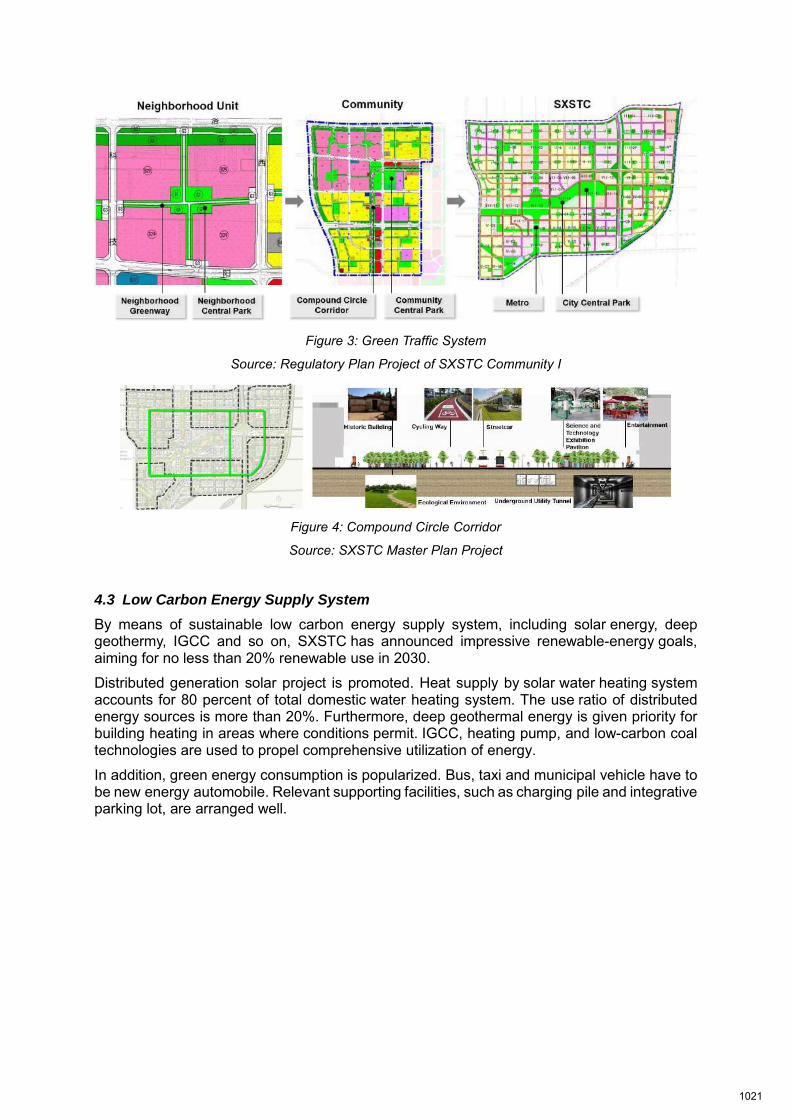
Figure 3: Green Traffic System
Source: Regulatory Plan Project of SXSTC Community I
Figure 4: Compound Circle Corridor
Source: SXSTC Master Plan Project
4.3 Low Carbon Energy Supply System
By means of sustainable low carbon energy supply system, including solar energy, deep geothermy, IGCC and so on, SXSTC has announced impressive renewable-energy goals, aiming for no less than 20% renewable use in 2030.
Distributed generation solar project is promoted. Heat supply by solar water heating system accounts for 80 percent of total domestic water heating system. The use ratio of distributed energy sources is more than 20%. Furthermore, deep geothermal energy is given priority for building heating in areas where conditions permit. IGCC, heating pump, and low-carbon coal technologies are used to propel comprehensive utilization of energy.
In addition, green energy consumption is popularized. Bus, taxi and municipal vehicle have to be new energy automobile. Relevant supporting facilities, such as charging pile and integrative parking lot, are arranged well.
1021
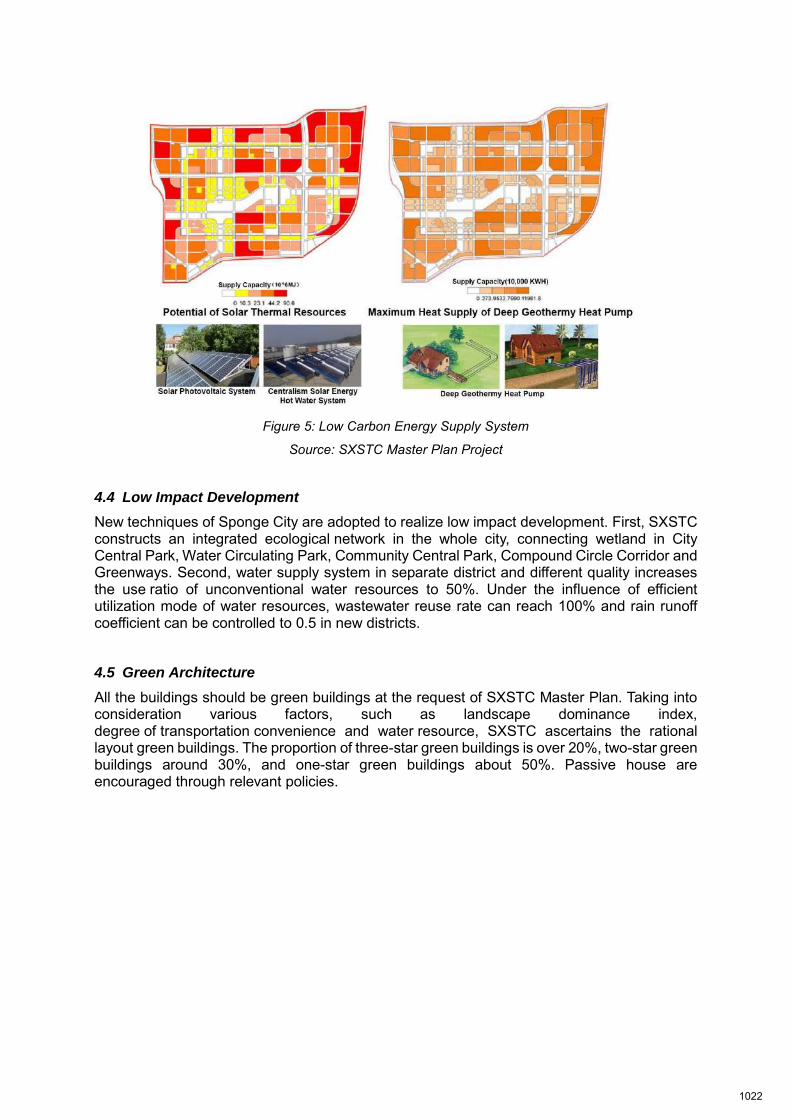
Figure 5: Low Carbon Energy Supply System
Source: SXSTC Master Plan Project
4.4 Low Impact Development
New techniques of Sponge City are adopted to realize low impact development. First, SXSTC constructs an integrated ecological network in the whole city, connecting wetland in City Central Park, Water Circulating Park, Community Central Park, Compound Circle Corridor and Greenways. Second, water supply system in separate district and different quality increases the use ratio of unconventional water resources to 50%. Under the influence of efficient utilization mode of water resources, wastewater reuse rate can reach 100% and rain runoff coefficient can be controlled to 0.5 in new districts.
4.5 Green Architecture
All the buildings should be green buildings at the request of SXSTC Master Plan. Taking into consideration various factors, such as landscape dominance index, degree of transportation convenience and water resource, SXSTC ascertains the rational layout green buildings. The proportion of three-star green buildings is over 20%, two-star green buildings around 30%, and one-star green buildings about 50%. Passive house are encouraged through relevant policies.
1022
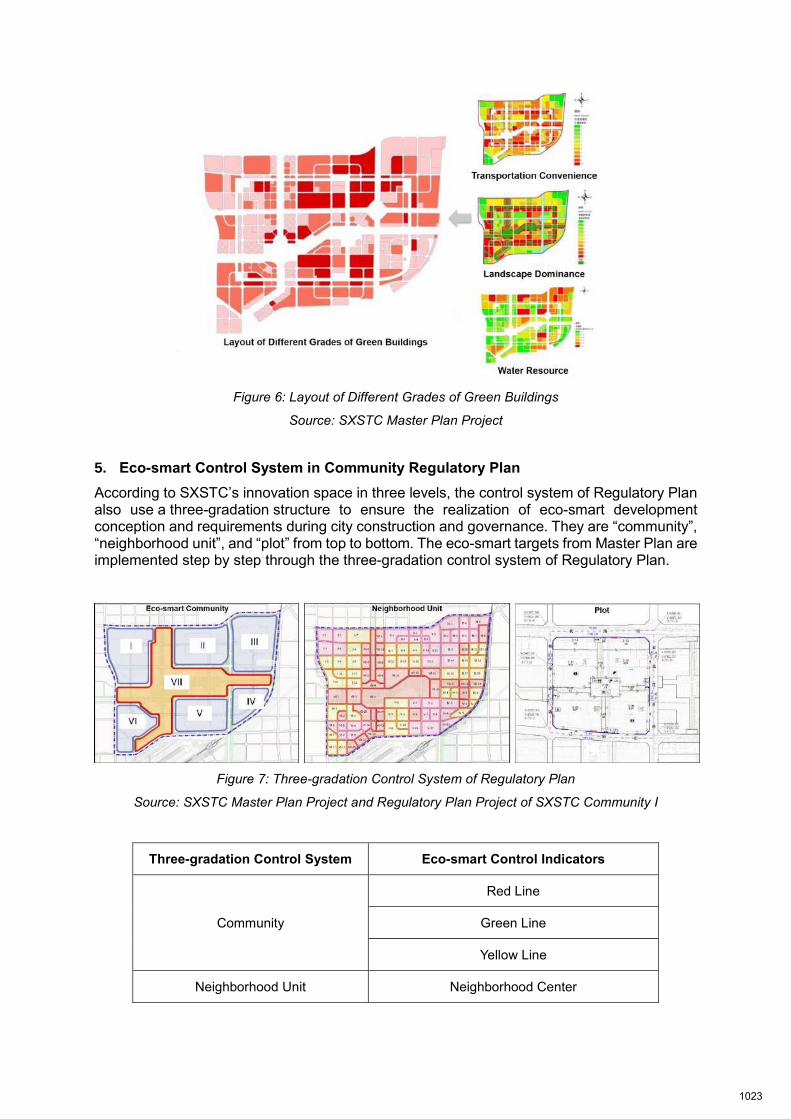
Figure 6: Layout of Different Grades of Green Buildings
Source: SXSTC Master Plan Project
5. Eco-smart Control System in Community Regulatory Plan
According to SXSTC’s innovation space in three levels, the control system of Regulatory Plan also use a three-gradation structure to ensure the realization of eco-smart development conception and requirements during city construction and governance. They are “community”, “neighborhood unit”, and “plot” from top to bottom. The eco-smart targets from Master Plan are implemented step by step through the three-gradation control system of Regulatory Plan.
Figure 7: Three-gradation Control System of Regulatory Plan
Source: SXSTC Master Plan Project and Regulatory Plan Project of SXSTC Community I
Three-gradation Control System Eco-smart Control Indicators
Community
Red Line
Green Line
Yellow Line
Neighborhood Unit Neighborhood Center
1023
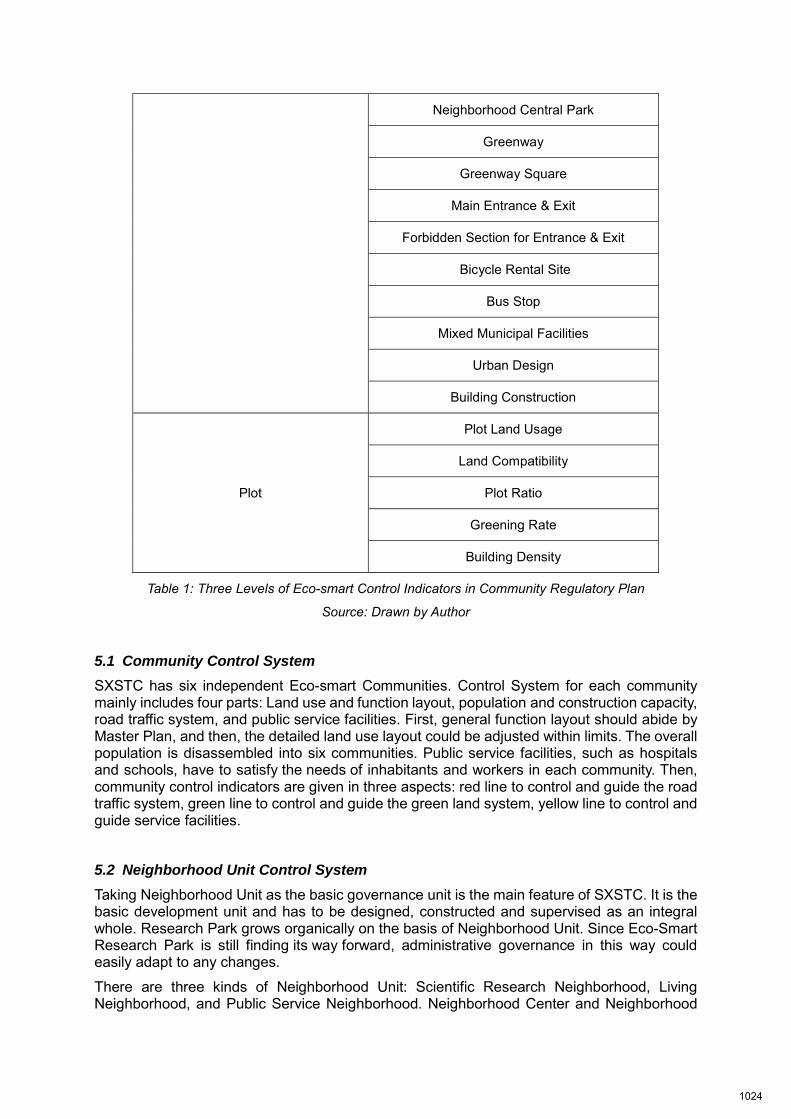
Neighborhood Central Park
Greenway
Greenway Square
Main Entrance & Exit
Forbidden Section for Entrance & Exit
Bicycle Rental Site
Bus Stop
Mixed Municipal Facilities
Urban Design
Building Construction
Plot
Plot Land Usage
Land Compatibility
Plot Ratio
Greening Rate
Building Density
Table 1: Three Levels of Eco-smart Control Indicators in Community Regulatory Plan
Source: Drawn by Author
5.1 Community Control System
SXSTC has six independent Eco-smart Communities. Control System for each community mainly includes four parts: Land use and function layout, population and construction capacity, road traffic system, and public service facilities. First, general function layout should abide by Master Plan, and then, the detailed land use layout could be adjusted within limits. The overall population is disassembled into six communities. Public service facilities, such as hospitals and schools, have to satisfy the needs of inhabitants and workers in each community. Then, community control indicators are given in three aspects: red line to control and guide the road traffic system, green line to control and guide the green land system, yellow line to control and guide service facilities.
5.2 Neighborhood Unit Control System
Taking Neighborhood Unit as the basic governance unit is the main feature of SXSTC. It is the basic development unit and has to be designed, constructed and supervised as an integral whole. Research Park grows organically on the basis of Neighborhood Unit. Since Eco-Smart Research Park is still finding its way forward, administrative governance in this way could easily adapt to any changes.
There are three kinds of Neighborhood Unit: Scientific Research Neighborhood, Living Neighborhood, and Public Service Neighborhood. Neighborhood Center and Neighborhood
1024
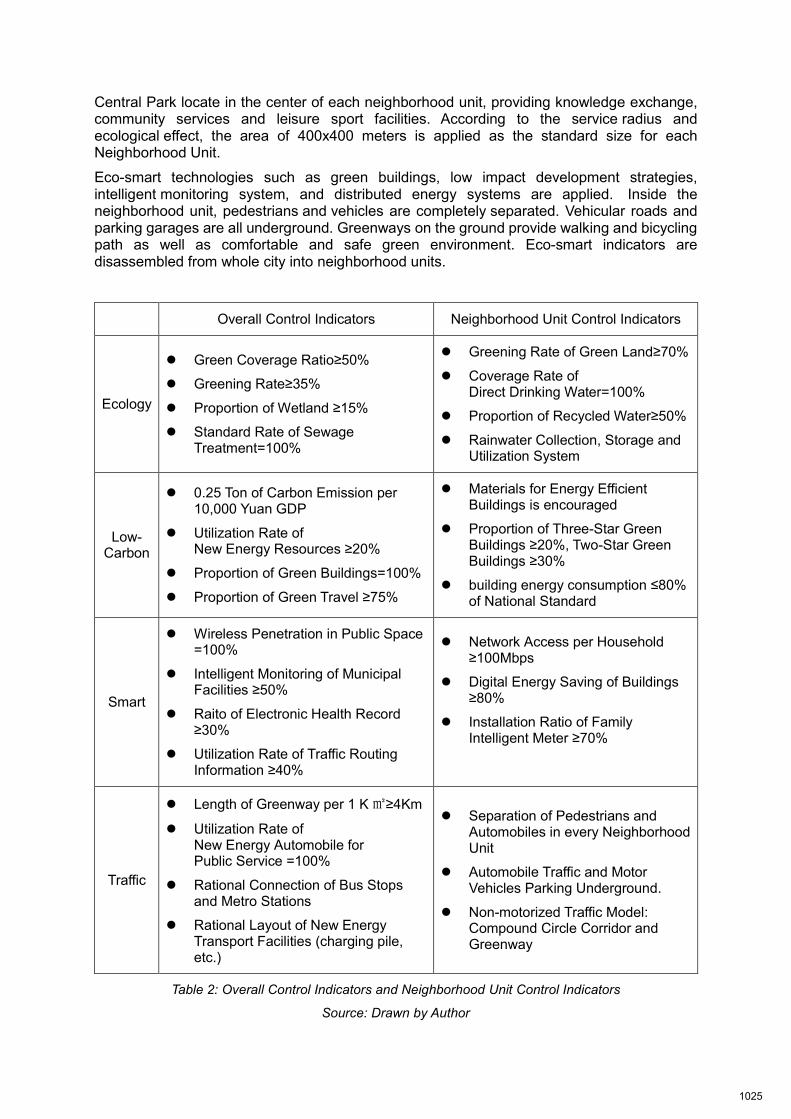
Central Park locate in the center of each neighborhood unit, providing knowledge exchange, community services and leisure sport facilities. According to the service radius and ecological effect, the area of 400x400 meters is applied as the standard size for each Neighborhood Unit.
Eco-smart technologies such as green buildings, low impact development strategies, intelligent monitoring system, and distributed energy systems are applied. Inside the neighborhood unit, pedestrians and vehicles are completely separated. Vehicular roads and parking garages are all underground. Greenways on the ground provide walking and bicycling path as well as comfortable and safe green environment. Eco-smart indicators are disassembled from whole city into neighborhood units.
Overall Control Indicators Neighborhood Unit Control Indicators
Ecology
Green Coverage Ratio≥50%
Greening Rate≥35%
Proportion of Wetland ≥15%
Standard Rate of Sewage Treatment=100%
Greening Rate of Green Land≥70%
Coverage Rate of Direct Drinking Water=100%
Proportion of Recycled Water≥50%
Rainwater Collection, Storage and Utilization System
Low-Carbon
0.25 Ton of Carbon Emission per 10,000 Yuan GDP
Utilization Rate of New Energy Resources ≥20%
Proportion of Green Buildings=100%
Proportion of Green Travel ≥75%
Materials for Energy Efficient Buildings is encouraged
Proportion of Three-Star Green Buildings ≥20%, Two-Star Green Buildings ≥30%
building energy consumption ≤80% of National Standard
Smart
Wireless Penetration in Public Space =100%
Intelligent Monitoring of Municipal Facilities ≥50%
Raito of Electronic Health Record ≥30%
Utilization Rate of Traffic Routing Information ≥40%
Network Access per Household ≥100Mbps
Digital Energy Saving of Buildings ≥80%
Installation Ratio of Family Intelligent Meter ≥70%
Traffic
Length of Greenway per 1 K ㎡≥4Km
Utilization Rate of New Energy Automobile for Public Service =100%
Rational Connection of Bus Stops and Metro Stations
Rational Layout of New Energy Transport Facilities (charging pile, etc.)
Separation of Pedestrians and Automobiles in every Neighborhood Unit
Automobile Traffic and Motor Vehicles Parking Underground.
Non-motorized Traffic Model: Compound Circle Corridor and Greenway
Table 2: Overall Control Indicators and Neighborhood Unit Control Indicators
Source: Drawn by Author
1025
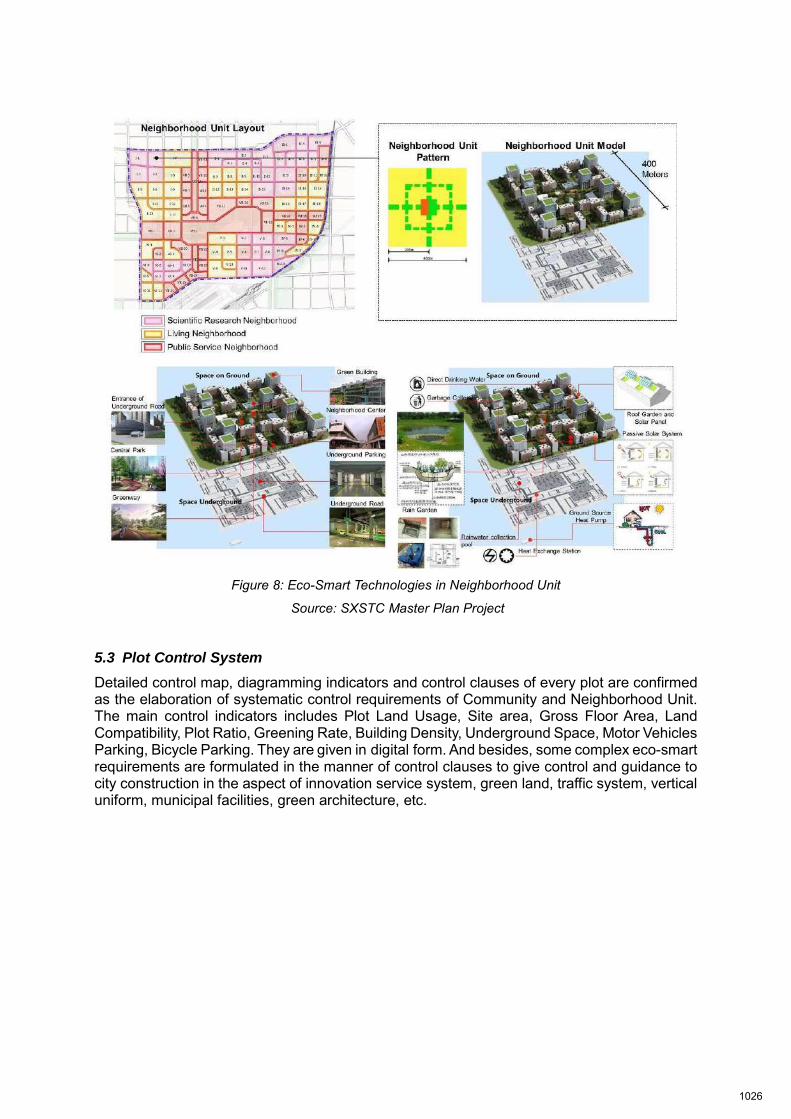
Figure 8: Eco-Smart Technologies in Neighborhood Unit
Source: SXSTC Master Plan Project
5.3 Plot Control System
Detailed control map, diagramming indicators and control clauses of every plot are confirmed as the elaboration of systematic control requirements of Community and Neighborhood Unit. The main control indicators includes Plot Land Usage, Site area, Gross Floor Area, Land Compatibility, Plot Ratio, Greening Rate, Building Density, Underground Space, Motor Vehicles Parking, Bicycle Parking. They are given in digital form. And besides, some complex eco-smart requirements are formulated in the manner of control clauses to give control and guidance to city construction in the aspect of innovation service system, green land, traffic system, vertical uniform, municipal facilities, green architecture, etc.
1026
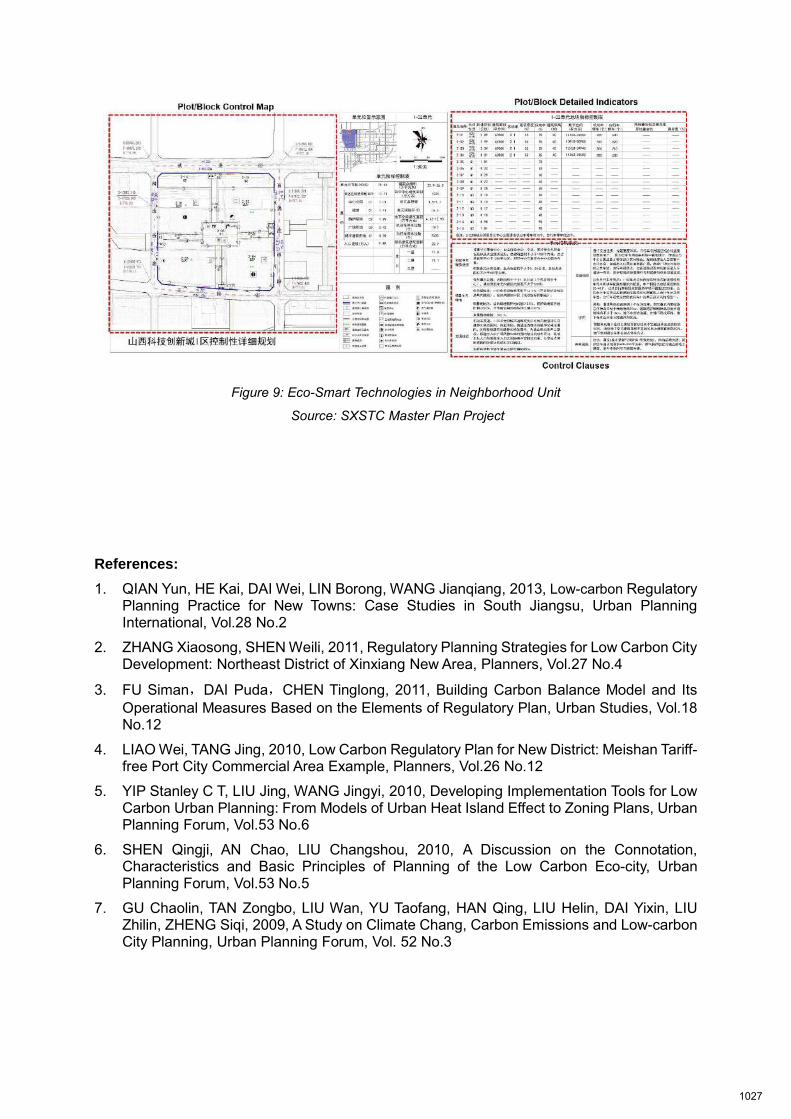
Figure 9: Eco-Smart Technologies in Neighborhood Unit
Source: SXSTC Master Plan Project
References: 1. QIAN Yun, HE Kai, DAI Wei, LIN Borong, WANG Jianqiang, 2013, Low-carbon Regulatory
Planning Practice for New Towns: Case Studies in South Jiangsu, Urban Planning International, Vol.28 No.2
2. ZHANG Xiaosong, SHEN Weili, 2011, Regulatory Planning Strategies for Low Carbon City Development: Northeast District of Xinxiang New Area, Planners, Vol.27 No.4
3. FU Siman,DAI Puda,CHEN Tinglong, 2011, Building Carbon Balance Model and Its Operational Measures Based on the Elements of Regulatory Plan, Urban Studies, Vol.18 No.12
4. LIAO Wei, TANG Jing, 2010, Low Carbon Regulatory Plan for New District: Meishan Tariff-free Port City Commercial Area Example, Planners, Vol.26 No.12
5. YIP Stanley C T, LIU Jing, WANG Jingyi, 2010, Developing Implementation Tools for Low Carbon Urban Planning: From Models of Urban Heat Island Effect to Zoning Plans, Urban Planning Forum, Vol.53 No.6
6. SHEN Qingji, AN Chao, LIU Changshou, 2010, A Discussion on the Connotation, Characteristics and Basic Principles of Planning of the Low Carbon Eco-city, Urban Planning Forum, Vol.53 No.5
7. GU Chaolin, TAN Zongbo, LIU Wan, YU Taofang, HAN Qing, LIU Helin, DAI Yixin, LIU Zhilin, ZHENG Siqi, 2009, A Study on Climate Chang, Carbon Emissions and Low-carbon City Planning, Urban Planning Forum, Vol. 52 No.3
1027
Evaluation on Transformation of urban traditional
commercial blocks under new data frame
Chengkang YE, Min Wu, China Academy of urban planning & design, China
Abstract:
The traditional top-down planning organization followed certain norms and standards to ensure the fairness of resource allocation, but ignored the more unique needs of different citizens as users of these different city blocks in different time. The research takes the traditional commercial street renovation and block vitality as clue, selected three traditional commercial blocks in the downtown area of Chengdu as the research objects. Using mobile phone CDRs data, POI data and planning data, combined with the GIS tool to explore the influence of different degrees of transformation in street space to neighborhood vitality and the preference of the residents to the use of public space, to develop the renovation of traditional blocks to a more humanity and reasonable space. Key word: Transformation of traditional commercial blocks, Space vitality, Big data analysis 1 Background
The traditional commercial blocks represent the urban culture and regional style of urban characteristics, which attracting more and more attentions in china. The business district is a city's public area and portal area, often get the focus of local government and society. Meantime, the interests of all parties involved in the transformation of commercial district is small relatively, which leads to an easily raised funds and a convenient implement. As a result, many old city commercial blocks have been extensively renovated. Through the renewal of the space environment, social economy and humane environment of the old commercial street, the Commercial Street building and its environmental quality will be promoted, and the vitality of the commercial district of the old city will be maintained and extended.
However, there are many problems in the renovation of traditional commercial blocks. One of the typical problems is that many traditional commercial blocks have a strong commercial atmosphere and spatial vitality, which have been weakened or lost after the transformation. The main reason concludes the lack of awareness of the background of regional commercial development, the ignorance of its geographical and cultural characteristics, the misconduct of the relationship between protection and use and the excessive pursuit of commercial capacity, which makes the traditional commercial street design still cannot get rid of the transformation from prosperity to decline.
On the other hand, the vitality of neighborhoods is the unique charm of the city, which is also the ideal of community integration and multi-participation advocated by contemporary urban planners. Vibrant streets can promote community safety and
1028
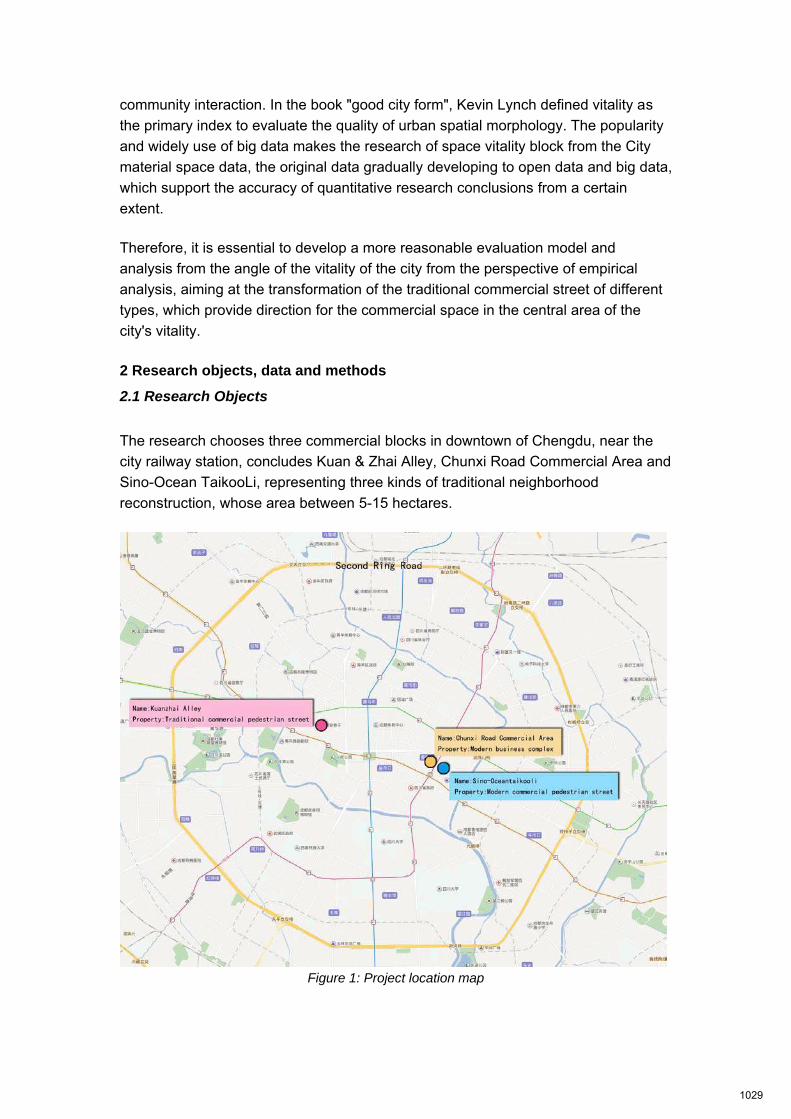
community interaction. In the book "good city form", Kevin Lynch defined vitality as the primary index to evaluate the quality of urban spatial morphology. The popularity and widely use of big data makes the research of space vitality block from the City material space data, the original data gradually developing to open data and big data, which support the accuracy of quantitative research conclusions from a certain extent.
Therefore, it is essential to develop a more reasonable evaluation model and analysis from the angle of the vitality of the city from the perspective of empirical analysis, aiming at the transformation of the traditional commercial street of different types, which provide direction for the commercial space in the central area of the city's vitality.
2 Research objects, data and methods
2.1 Research Objects
The research chooses three commercial blocks in downtown of Chengdu, near the city railway station, concludes Kuan & Zhai Alley, Chunxi Road Commercial Area and Sino-Ocean TaikooLi, representing three kinds of traditional neighborhood reconstruction, whose area between 5-15 hectares.
Figure 1: Project location map
1029
2.2 Research Data
The research data includes mobile phone CDRs data, POI data and urban spatial data, within three blocks. The urban spatial data include the red line of the road and the distribution of buildings and public spaces in each block. Mobile phone CDRs data concludes statistical users’ data in the city space, including anonymous mobile phone encryption terminal ID, signaling time, signaling occurs when the service station and other information in December 8th, 2015 (a typical working day) and December 12th (a typical weekend). The number of user’s daily statistics is about 300,000. The POI data is crawled and screened from some specialized service sites. As a whole, the research data is relatively reliable, which is in line with the research target of the renewal evaluation of the traditional commercial blocks in this city.
2.3 Research Methods
Vitality evaluation is an intuitive description of the operation effect of commercial blocks, and the most direct external representation is the intensity of human activities. Based on this premise, the research analysis the typical transformation mode of traditional commercial street in the central area of the city. At the same time, explore the relationship between spatial pattern and neighborhood commercial district transformation activity through the evaluation of blocks of space activity and commercial activity by using mobile phone CDRs data and POI data, concludes a more reasonable transformation mode of the traditional business block.
3 The interpretation of the traditional commercial district reform
3.1 Brief Introduction of Research Objects
Kuan & Zhai Alley, located 1 kilometer west of the central axis of Chengdu, built in 1948. It was transformed into a traditional commercial pedestrian street with the traditional courtyard pattern in 2008 through the protective transformation of historic blocks.
Sino-Ocean TaikooLi is located 1.7 kilometers east of the central axis of Chengdu, its construction time be traced back to the year 300-400. In 2014 it becomes an open, low density shopping center overall, through the demolition and the interpretation of its traditional characteristics, retained the original Daci Temple.
The Chunxi Road commercial area located 1.2 kilometers east of the central axis of Chengdu. It was built in 1924, demolished and rebuilt in 2002 and became a modern commercial center.
3.2 Characteristics of space transformation
1030
In this case, three blocks all have a long history and convenient traffic location, all obsess high visibility and vitality in the city, and city card of attracting foreign tourists. According to the way of protection and utilization, it is divided into two ways, namely, protective transformation and demolition-reconstruction, forming three different blocks, namely, traditional commercial Pedestrian Street, block shape shopping center and modern commercial center.
Table 1: Comparison of three commercial district transformation methods
Evaluation content Kuan & Zhai Alley Sino-Ocean TaikooLi Chunxi Road
Commercial Area
Profile
Historical
trace A.D. 1948 A.D. 300-400 A.D. 1924
Construction
update Time A.D. 2008 A.D. 2014 A.D. 2002
Traffic
Within inner highway
ring, metro line 4
station
Within inner highway
ring, near the junction
station of line 2 and
line 3
Within inner highway
ring, near the junction
station of line 2 and
line 3
Transf
ormati
on
mode
Type traditional commercial
pedestrian street
block shape shopping
center
modern commercial
center
Transformati
on method
protective
transformation Update deduction
demolition-
reconstruction
Spatial
characteristic
s
Semi open
High density
Open
low density
Semi open
High density
Block height
width ratio D:H=1:1 D:H=1:1 D:H=1:2-1:5
functions Leisure business,
traditional culture
Leisure shopping,
traditional culture
Business, leisure,
shopping, office,
catering
Construction
style
Traditional courtyard
pattern, preserved
original architecture
form
Traditional courtyard
pattern, modern and
regional style
deduction
Modern fashion style,
cultural clues
Traditional commercial pedestrian street carries out protective transformation on the block with the renovation idea of "building authenticity protection", like Kuan & Zhai Alley. The design focus on the protection of the streets and alleys and the appearance of style, including the door, wall decorations, trees, while preserving the original courtyard, and the whole block is still in accordance with the original pattern of distribution. The essence of Kuan & Zhai Alley lies in the pattern of streets and alleys and courtyard space, the spatial scale is pleasant, and the block height ratio is 1:1.
1031
Figure 2: Plan and photos of Kuan & Zhai Alley
Sino-Ocean TaikooLi is a typical block shape shopping center, preserved the old streets, lanes and historical buildings in the planning, and has integrated the western style elements to design the modern regional architecture. The space scale is pleasant, and the block width ratio is 1:1. Around the Daci Temple, building are based on the two floors, so the whole style contributes to the formation of low high, a large area with gray tiles color contrast and the slope of the roof and the temple walls. In addition, the southeast of the block have great area of residential areas and even the old house, keeping an open block, quite friendly to the surrounding residents, tall buildings, the air corridor and sinking space are ingenious combined, becoming a natural leisure and gathering place in a pleasant square and street scale.
1032
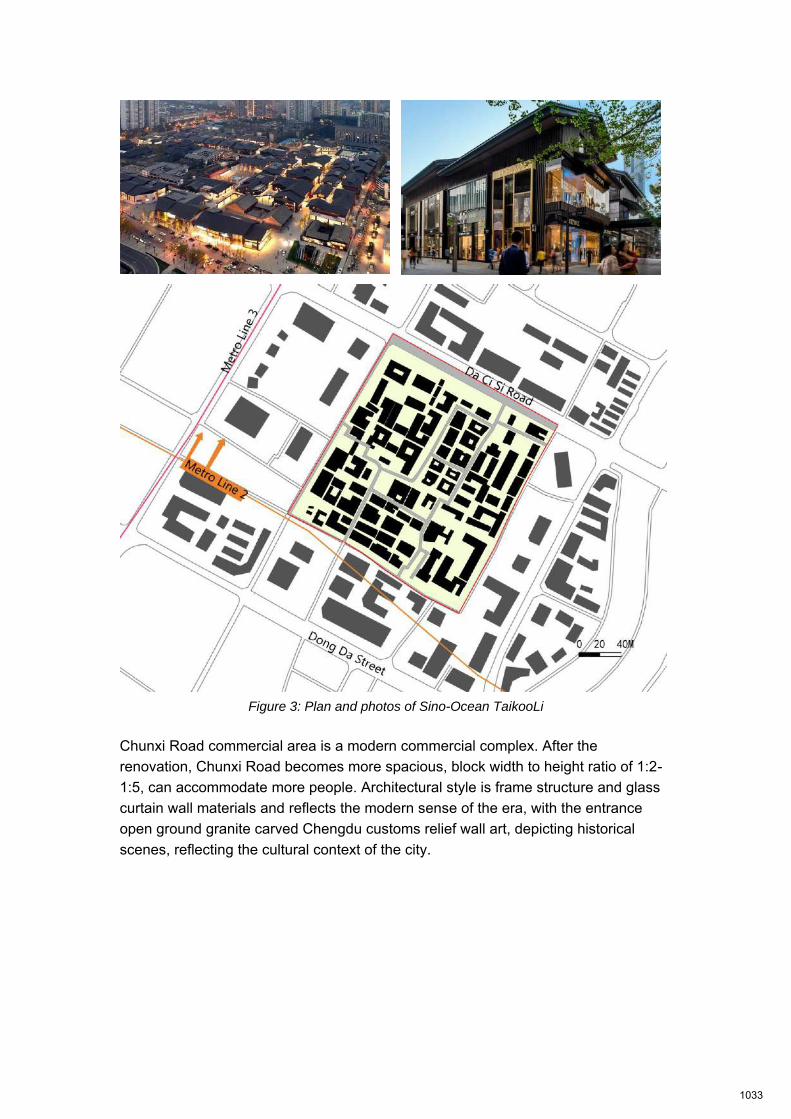
Figure 3: Plan and photos of Sino-Ocean TaikooLi
Chunxi Road commercial area is a modern commercial complex. After the renovation, Chunxi Road becomes more spacious, block width to height ratio of 1:2-1:5, can accommodate more people. Architectural style is frame structure and glass curtain wall materials and reflects the modern sense of the era, with the entrance open ground granite carved Chengdu customs relief wall art, depicting historical scenes, reflecting the cultural context of the city.
1033
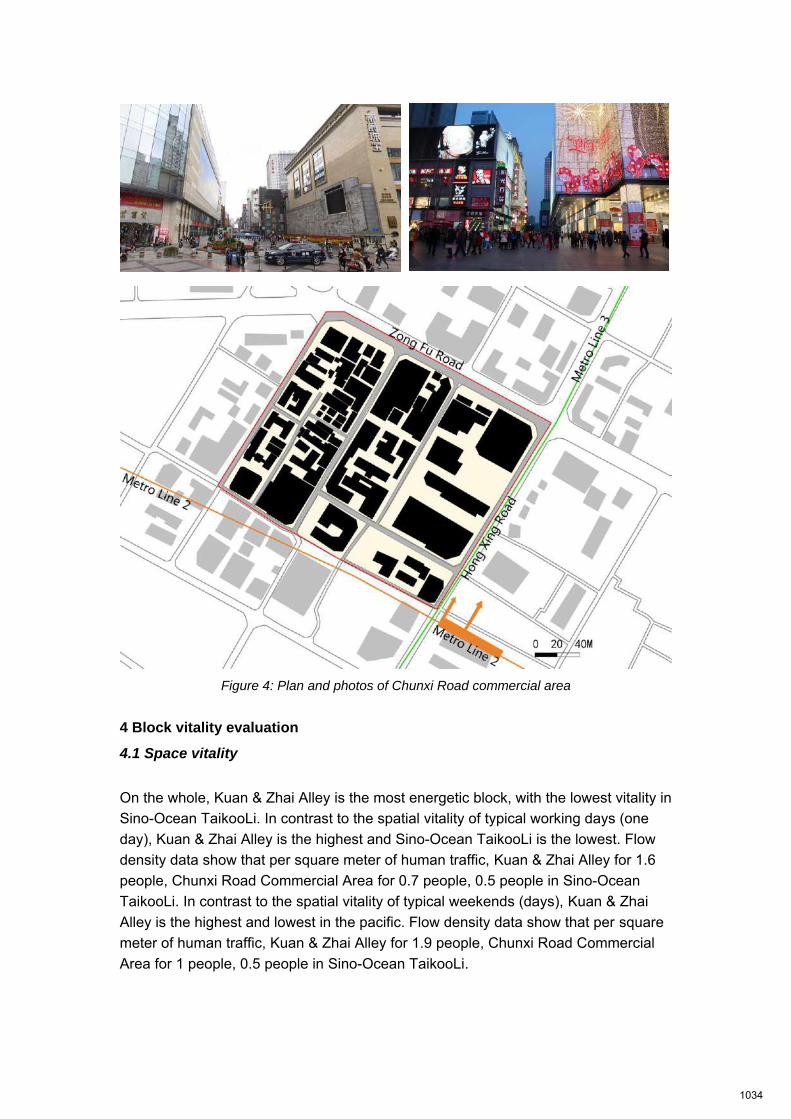
Figure 4: Plan and photos of Chunxi Road commercial area
4 Block vitality evaluation
4.1 Space vitality
On the whole, Kuan & Zhai Alley is the most energetic block, with the lowest vitality in Sino-Ocean TaikooLi. In contrast to the spatial vitality of typical working days (one day), Kuan & Zhai Alley is the highest and Sino-Ocean TaikooLi is the lowest. Flow density data show that per square meter of human traffic, Kuan & Zhai Alley for 1.6 people, Chunxi Road Commercial Area for 0.7 people, 0.5 people in Sino-Ocean TaikooLi. In contrast to the spatial vitality of typical weekends (days), Kuan & Zhai Alley is the highest and lowest in the pacific. Flow density data show that per square meter of human traffic, Kuan & Zhai Alley for 1.9 people, Chunxi Road Commercial Area for 1 people, 0.5 people in Sino-Ocean TaikooLi.
1034
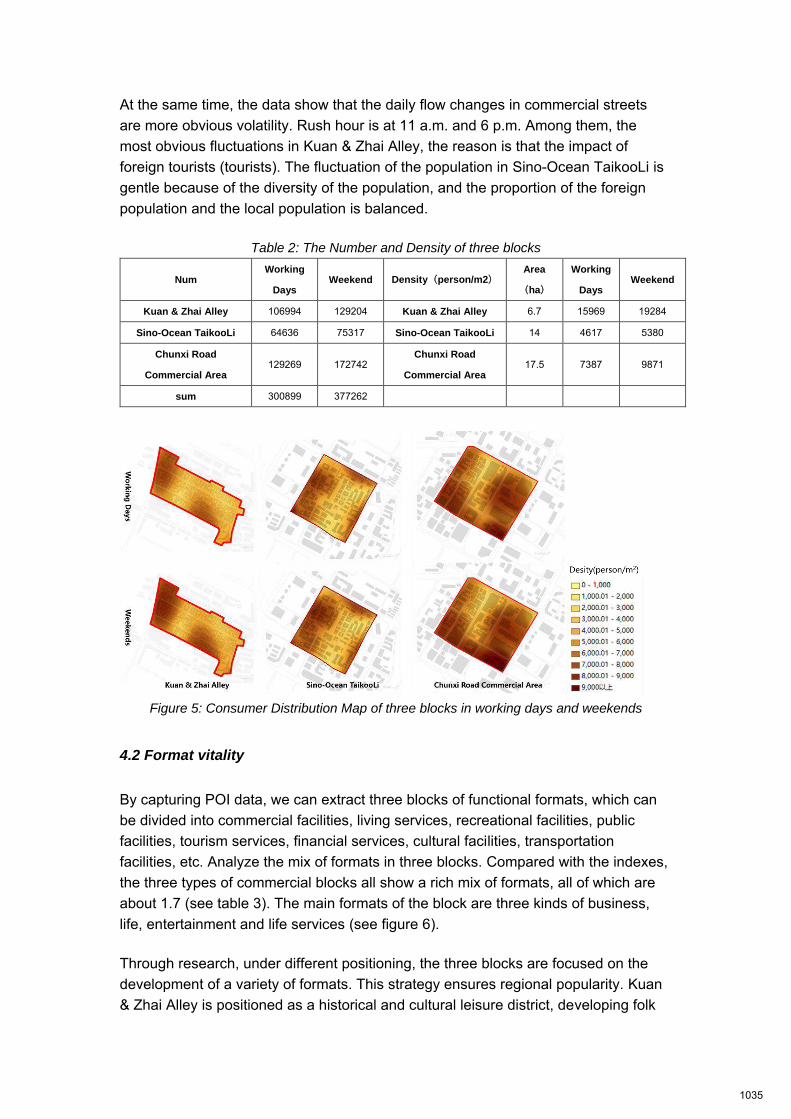
At the same time, the data show that the daily flow changes in commercial streets are more obvious volatility. Rush hour is at 11 a.m. and 6 p.m. Among them, the most obvious fluctuations in Kuan & Zhai Alley, the reason is that the impact of foreign tourists (tourists). The fluctuation of the population in Sino-Ocean TaikooLi is gentle because of the diversity of the population, and the proportion of the foreign population and the local population is balanced.
Table 2: The Number and Density of three blocks
Num Working
Days Weekend Density(person/m2)
Area
(ha)
Working
Days Weekend
Kuan & Zhai Alley 106994 129204 Kuan & Zhai Alley 6.7 15969 19284
Sino-Ocean TaikooLi 64636 75317 Sino-Ocean TaikooLi 14 4617 5380
Chunxi Road
Commercial Area 129269 172742
Chunxi Road
Commercial Area 17.5 7387 9871
sum 300899 377262
Figure 5: Consumer Distribution Map of three blocks in working days and weekends
4.2 Format vitality
By capturing POI data, we can extract three blocks of functional formats, which can be divided into commercial facilities, living services, recreational facilities, public facilities, tourism services, financial services, cultural facilities, transportation facilities, etc. Analyze the mix of formats in three blocks. Compared with the indexes, the three types of commercial blocks all show a rich mix of formats, all of which are about 1.7 (see table 3). The main formats of the block are three kinds of business, life, entertainment and life services (see figure 6).
Through research, under different positioning, the three blocks are focused on the development of a variety of formats. This strategy ensures regional popularity. Kuan & Zhai Alley is positioned as a historical and cultural leisure district, developing folk
1035
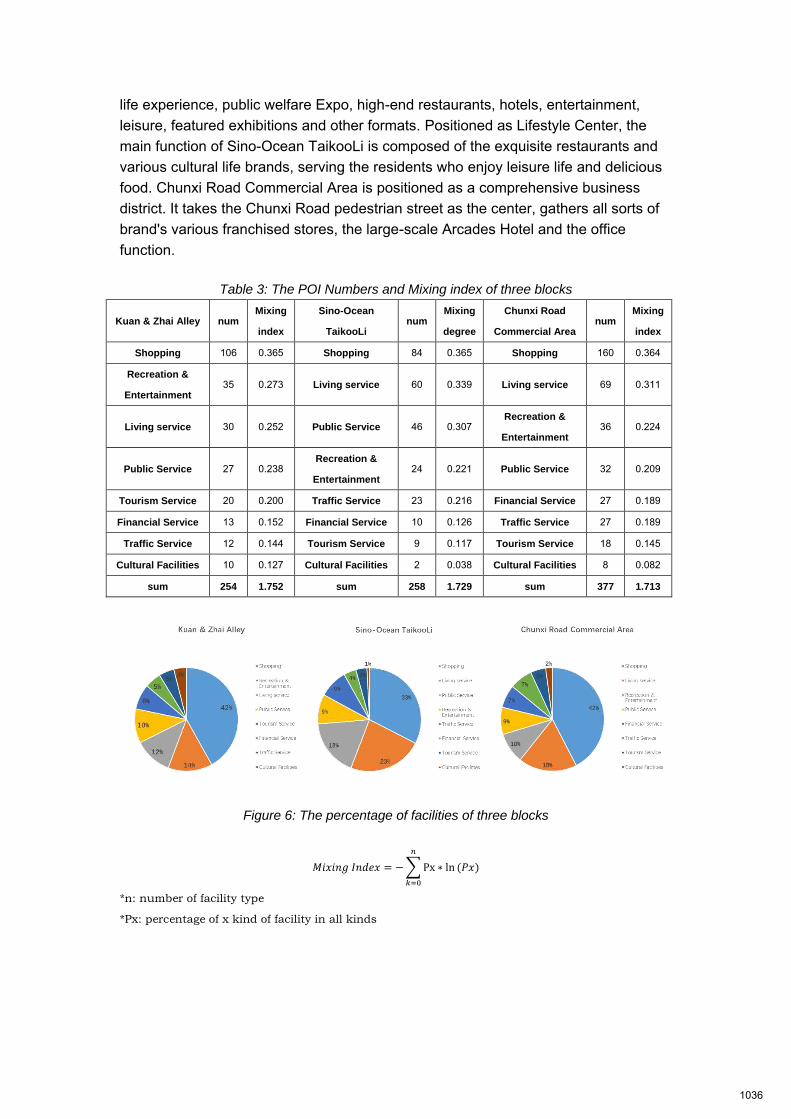
life experience, public welfare Expo, high-end restaurants, hotels, entertainment, leisure, featured exhibitions and other formats. Positioned as Lifestyle Center, the main function of Sino-Ocean TaikooLi is composed of the exquisite restaurants and various cultural life brands, serving the residents who enjoy leisure life and delicious food. Chunxi Road Commercial Area is positioned as a comprehensive business district. It takes the Chunxi Road pedestrian street as the center, gathers all sorts of brand's various franchised stores, the large-scale Arcades Hotel and the office function.
Table 3: The POI Numbers and Mixing index of three blocks
Kuan & Zhai Alley num Mixing
index
Sino-Ocean
TaikooLi num
Mixing
degree
Chunxi Road
Commercial Area num
Mixing
index
Shopping 106 0.365 Shopping 84 0.365 Shopping 160 0.364
Recreation &
Entertainment 35 0.273 Living service 60 0.339 Living service 69 0.311
Living service 30 0.252 Public Service 46 0.307 Recreation &
Entertainment 36 0.224
Public Service 27 0.238 Recreation &
Entertainment 24 0.221 Public Service 32 0.209
Tourism Service 20 0.200 Traffic Service 23 0.216 Financial Service 27 0.189
Financial Service 13 0.152 Financial Service 10 0.126 Traffic Service 27 0.189
Traffic Service 12 0.144 Tourism Service 9 0.117 Tourism Service 18 0.145
Cultural Facilities 10 0.127 Cultural Facilities 2 0.038 Cultural Facilities 8 0.082
sum 254 1.752 sum 258 1.729 sum 377 1.713
Figure 6: The percentage of facilities of three blocks
𝑀𝑖𝑥𝑖𝑛𝑔 𝐼𝑛𝑑𝑒𝑥 = − ∑ Px ∗ ln
𝑛
𝑘=0
(𝑃𝑥)
*n: number of facility type
*Px: percentage of x kind of facility in all kinds
1036
5 Conclusion and Prospect
The renovation of the traditional commercial district is divided into three kinds of blocks, according to different ways of protection and reconstruction. They are traditional commercial pedestrian street, street shopping center and modern business center. These transformations have improved the spatial quality of the blocks and increased the richness and vitality of the formats. By comparing the activity of street space and format, it can be found that, the protection of cultural characteristics has enhanced the attraction of commercial blocks and gained new and strong vitality.
In traditional commercial blocks, we can find the catalytic elements which can stimulate the vitality, and make the whole block show a new form of vitality. Here, the diversity of human life behavior and functional needs is particularly important. Through big data platform, can effectively and intuitively capture the dynamic changes, provide more reliable basis for the transformation and upgrading direction of traditional Commercial Street, showing new vigor and vitality.
6 Reference
Jacobs. The death and life of great American cities: the failure of town planning Reprinted[R]. 1974.
Life between buildings: using public space Jan Gehl; translated by Jo Koch VanNostrand Reinhold[R]. 1987.
Zukin S., Naked city: the death and life of authentic urban places [M]. Oxford: Oxford University Press, 2010.
Hillier B. and Hanson J. Social Logic of Space [M].London, Cambridge University Press, 1984.
Peponis J. Space, Culture and Urban Design in Late Modernism and After [J]. Ekistics, 1989( 56): 334-355.
David W. Allen. GIS Tutorial II. ESRI Press. Redlands, California, 2009.
1037
SymbioCity Approach – from What to How
Author Dixelius, Paul, STOCKHOLM, Sweden (Presenting author)
Abstract
The SymbioCity Approach is an integrated and holistic approach to sustainable urban development,
based on experience from Sweden and developing countries. The approach integrates spatial,
environmental, socio‐cultural and economic dimensions with urban systems and institutional
perspectives in ways that are mutually supportive or synergistic. In various ongoing projects in
developing or transition countries, the approach supports the implementation of the New Urban
Agenda in bridging the gap between sectors and stakeholders.
Cities are the drivers of political, economic and cultural development, and making them attractive,
safe, healthy and livable is therefore crucial for a more sustainable future. Climate change is a global
concern, but its effects are local, and local mitigation and adaptation measures are essential. Elected
local representatives have a key role in promoting policies and programmes that improve economic,
socio‐cultural and environmental conditions for the citizens.
Urbanisation and urban development are complex and dynamic processes, not least in the
developing world. The challenge is to develop more equitable, environmentally sustainable and
economically viable cities, in order to alleviate poverty. An inclusive and multidisciplinary approach
to sustainable urban development can contribute to poverty reduction by addressing the
perspectives of different interest groups and stakeholders in the urban environment. The SymbioCity
Approach has been developed to contribute to a better quality of life for all urban citizens.
From a practical implementation perspective, the reality of the urban environments in most
developing countries presents numerous challenges. These include i.a.: lack of long‐term visions,
structural inefficiencies, limited involvement of citizens in decision‐making processes, lack of
coordination between different departments and tiers of government as well as between different
urban systems, legal obstacles, limited resources and funds etc. The SymbioCity Approach addresses
these challenges and puts emphasis on making a concrete change on the ground.
Swedish local governments work with urban development from a holistic perspective and contribute
with the perspective of how to create conducive environments for innovation and change. Our
international experience shows that local leadership and ownership are key factors to succeed in
transforming an urban environment in a positive direction. Governance and development of cities
entails guiding society and its organizations towards long‐term visions and goals, as well as balancing
needs, demands and priorities. This requires leadership that goes beyond the management of plans,
people and resources. Urban planning is often left to planners and engineers but sustainable
development requires public participation. Successful city leaders understand and communicate the
needs of the city, develop long‐term visions and facilitate processes that involve all stakeholders. But
being a leader and following a vision is also about taking uncomfortable decisions.
The SymbioCity Approach functions as a vehicle to stimulate dialogue with different interest groups
at local level to help local stakeholders raise awareness and understanding of the key challenges
facing the city. Another important feature is helping cities to work “vision‐based” instead of
“problem‐based” by looking at the assets the city can leverage in addressing the identified
1038

challenges. Cities are supported to find different kinds of solutions and thereby helped to turn
problems into solutions.
The presentation, SymbioCity Approach – from What to How, presents concrete ways to implement
the New Urban Agenda and provides examples of methods used in urban development projects as
well as testimonies from the field. This includes project examples from Africa, Asia, Latin America and
Europe. We take as a point of departure the local reality affecting the implementation of the New
Urban Agenda and explore solutions and new ways forward with the goal of improving life quality for
all.
1039
Big Data as opportunity to enhance design sustainability
Author Kamrowska_Zaluska Kamrowska‐Zalus, Dorota, Gdansk University of Technology, GDANSK,
Poland (Presenting author)
Abstract
With rapidly developing new technologies and instruments based on Big Data, a great amount of
information is being collected, allowing to analyze more precisely the processes shaping
contemporary cities. However, possibilities for urban planners and designers, appearing with the
increasing popularity of social media, aren't still completely recognized. With today's processes of
globalization and digitization of the data, the range and precision of analysis of urban structures is
increasing. Open access to large datasets allows for a broader understanding of phenomena that
determine the development of cities and the way they influence ecosystems and well being of their
inhabitances. At the same time, with increasing connectivity and with the rising knowledge of the
causes of climate change, numerous communities are adopting various ‘smart’ and innovative
solutions to strengthen sustainability and resilience of urban fabric. These phenomena provoke new
questions important for the future planning and design of the cities:
� Can use of Big Data be an opportunity to enhance design sustainability?
� On what conditions can Big Data be integrated in regenerative design and sustainable
planning?
� Can Big Data, when related to the ecosystem and human activities, helps shaping policies
and support the development of the cities?
The aim of the poster is to introduce Big Data based instrument as an useful tool supporting
restorative design for practitioners working both in public and private sector. To achieve it is vital to
integrate instruments based on Big Data in regenerative design by focusing on newer
interdisciplinary processes and digital tools.
Proposed research is conducted in frame of COST Action RESTORE Rethinking sustainability toward a
regenerative economy which aim is to advocate, mentor and influence restorative built environment.
The RESTORE action is investigating how a new focus of sustainable built environment can be a
driving force for changing the status quo of today's practice beyond legislation and client
requirements. Sustainability targets (such as SDG Goals) are forcing designers to, embrace forward
thinking, access and implement multidisciplinary knowledge, and multiple tools that simulate
dynamic and complex future scenarios. The RESTORE aim is to affect paradigm shift from
understanding sustainability in design and planning from narrow focus on building energy
performance and minimization of environment impacts to broader framework that enriches places,
people, ecology, culture and climate at the core of design task, with particular emphasis on the
benefits towards health. Designing new urban environments, sustainable buildings and improving
existing buildings, requires a paradigm shift. The challenge is to operate at scales that are greater and
smaller than that of the city and the buildings, requiring a deeper the understanding of ecosystems
and the human.
1040
Alraouf & Alkarrani Smart, Resilient & Just Communities in Qatar ISOCARP-OAPA Conference 2017
1
Smart, Resilient and Just Communities: Interrogating the Urbanity of Contemporary Qatari and Gulf Cities.
Abdulla AL-KARRANI, B.Eng.
Director of Urban Planning Head of QNMP Project
Urban Planning Dept., MME. Doha, Qatar
Ali A. ALRAOUF, Ph.D.
Prof. of Architecture and Urbanism Head of CB, Training & Development
Urban Planning Dept., MME. Doha, Qatar
Abstract Observing the status of a good number of cities around the world would reveal a new kind of urban competition towards being labeled as Smart Cities. The focus of the paper will be on how to improve quality of life in Qatari and Gulf cities by using "Smart Planning" not only “Smart Technologies”, with a special focus on urban and transport planning. Therefore, questioning the hypothesis that information technology can improve the performance of cities is legitimate. Can using these technologies actually make the city smarter, and make human life better? How to become and how to stay a smart city, and does this improve quality of life? More critically, we need a thorough examination of the concept smart cities to assess their actual impact on quality of life, especially human social divide. Contemporary Gulf and Qatari cities aspire for the new identity of smart cities without substantial assessment that would explore the impact on the holistic aspects of life not only the technological dimension. Can we "Plan it Smart" and find clever solutions for smart cities? The paper problematizes the need for going beyond the common misconception of smart cities. The paper argues for a different perception of the concept smart city. It might therefore be wrong to describe the city as smart while it is creating a situation of separation, fragmentation and individualism among communities. Alternatively, we might be more proud of a less smart city which allows its community to interact and integrate. The paper aims to revise the authenticity of smart cities conceptual premises and the future of contemporary cities. The paper conducts a number of comparative analyses and provides cases from the regional and international context to argue for a more holistic understanding of the swiftly emerging concept “Smart City”. 1. Introduction The smart city concept has emerged more than a decade ago. It was first appeared in the literature of architecture and planning around 1999-2000. The concept has emerged due to collective effort from digital designers, economists and planners, for the purpose of obtaining physical changes based on new technologies used in cities (Song, 2017). The most accepted definition of smart city states that it is the ability to exploit digital technologies, information and communication knowledges to improve the quality and performance of the physical urban services, to reduce costs and resource consumption, and more effective and engaging with its citizens. The smart city in its current vision makes communication and human interaction not essential or even required. This is a real crisis that some analysts and writers, specialists narrowed the concept of smart cities to the use of information technology, smart phones or smart cards, or smart homes or any "thing" labeled as smart. Obviously, there is no discussion on how using all these smart devices can contribute to the improvement of urban life and the sustainable future of cities. "Smart Cities" has become a widely used term for the implementation of information and communication technologies (ICT) into the processes of cities and the built environment, aiming to improve the integration of the physical assets as well as social and environmental capital. Fired by several rankings there seems to be a competition for the title of the "Smartest City". This kind of hype raises a lot of questions that the paper will deal with.
1041
Alraouf & Alkarrani Smart, Resilient & Just Communities in Qatar ISOCARP-OAPA Conference 2017
2
2. On Defining Smart Cities: The Current Limitations Most of the literature on smart cities focuses on either specific types of ICT (e.g. eservices or travel planners), specific opportunities and challenges (e.g. big data), or specific domains of application (e.g. smart transportation or smart land use planning). To a great extent, Smart Cities is today a concept advanced by the business sector. It is a catchword that draws enormous interest from companies involved in ICT and infrastructure(Hojer and Wngel, 2014). The origin of the concept of Smart Cities can be traced back to at least the Smart Growth Movement of the late 1990s (Neirotti). Gabrys (2014) find the roots of the concept earlier, namely from what they call the “cybernetically planned cities” of the 1960s, in proposals for networked or computable cities in urban development plans from the 1980s onwards. One of the problematic issues about the Definition of Smart Cities is related to how the word smart is seen. It is limited to being instrumental rather than a normative concept. This means that the opposite of “smart” is the status of cities without the use of advanced information and communication technology”. In most of the published literature “Smart Cities” were defined as places characterized by a pervasive use of Information and Communication Technologies (ICT), which help cities make better use of their resources and provide innovative services to citizens in order to improve the overall quality of their life. In some situations, the definition is so optimistic as it suggests that it is a city seeking to address public issues via ICT-based solutions (Hojer and Wngel, 2014). Another point of view focused on transforming any city into a smart one when the traditional networks and services are made more efficient with the use of digital and telecommunication technologies. 3. Challenging the Smart Cities Concept: Smart? City?
“Cities have the capability of providing something for everybody, only because, and only when, they are created by everybody.” Jane Jacobs, The Death and Life of Great American Cities.
Our cities are gradually becoming "smarter". Sensors are proliferating, measuring everything from traffic flow and power usage to environmental conditions, and it’s this data which is giving city administrations the opportunity to tackle problems in a more incisive, timely way. Smart cities were mainly implemented through technology-led logic, very much influenced by big technology providers. One of the well-received arguments regarding Building Smart Cities suggests Three Pillars: Smart Investment, Smart Policy and Smart Technology. The argument was introduced in the early 2000s with the hope of structuring a new era in city planning and development. Therefore, the applicability of smart cities would have to adhere and Confined to Hi Tech ICT support systems, remote – centrally controlled and sectorial monitoring and control significantly in water, energy and transport.
Figure 1: Concepts of smart city.
1042
Alraouf & Alkarrani Smart, Resilient & Just Communities in Qatar ISOCARP-OAPA Conference 2017
3
Smart cities are emerging as a priority for urban planners and decision makers across the world. Provides the foundations and principles needed for addressing the various challenges of developing smart cities. An assessment of how the concept of smart cities open up significant opportunities in several areas, such as economic growth, health, wellness, energy efficiency, and transportation, to promote the sustainable development of cities. Some recent literature include (Song, 2017) consider smart city as a technological product and provides the basics of smart cities, and it examines the possible future trends of this technology. Hence, it focuses on the foundations and principles needed for advancing the science, engineering, and technology of smart cities—including system design, system verification, real-time control and adaptation, Internet of Things, and test beds. It also covers smart city theory modeling, simulation, intelligent transportation systems and safety. 4. Interrogating the Concept of the Smart City: Smart City or Simply “CITY” The promise that smart cities as explained in the previous section needs to be interrogated. We would start with a number of crucial questions include: Are smart cities improving the quality of life? Does notion of smart city vary over time and space? What are their contradictions or incompatibilities? What city would like to be “Unsmart”? Fired by several rankings there seems to be a competition for the title of the "Smartest City". The fallacy of the competition between cities to focus on tools and technologies that would satisfy the current criteria for labeling cities as smart. As Campbell (2012) argues How are cities transforming themselves to meet the challenges this rapid growth entails? Those that thrive will have innovated across all their social and technological systems to improve their environmental and human quality of life. the important role of networks in transferring knowledge within and beyond city boundaries. Emerging economies, consistent with other technological advances of the recent past, are presented with the opportunity to leapfrog straight into the digital cities of the future. Yet, the perception of digital cities is crucial as it is still relevant to examine the value of human interactions, social coherence and the spatial existential presence in the city. Hence, countries with excellent development rates like Qatar should consider a broader meaning of smart and digital cities which include and rely on the actual interaction between people in spaces and places. While, The city itself must be reimagined as a matrix of functions and information, with digitized networks harnessing and multiplying the power of data, but we need to acknowledge that this is not the future; this is today. Consequently, the challenge, particularly for Cities like Doha and other emerging Gulf cities with so diversified social mosaic is how to fully comprehend and implement such holistic view of smart cities. As Herzberg (2017) argues that discussing smart cities can’t be only from the perspective of technology, but also from a cultural, social, economic, and ecosystem point of view. 4.1. A Blurred Smart Future Observing how the new smart devices particularly phones and tablets have affected the social behavior of people in city spaces and places, is alarming. Social scientists paused the question: why are millions of healthy people choosing to live their lives online. Such behavior was referred to as “The Second Life”. Disruptive observations that will give us an image about the future that we might face if we limit our conceptual understanding of smart cities. Smart cities as some researchers argue replaced the concept of sustainable cities while other argue for a smart sustainable city (Hojer and Wngel, 2014). Yet, the question is Smart is the new sustainable! But does smart city really lead to sustainable outcomes? The definition used for the newly coined expression smart sustainable cities suggest that:
“A smart sustainable city is an innovative city that uses ICTs and other means
1043
Alraouf & Alkarrani Smart, Resilient & Just Communities in Qatar ISOCARP-OAPA Conference 2017
4
to improve the quality of life, efficiency of urban operations and services and competitiveness, while ensuring that it meets the needs of present and future generations with respect to economic, social, envieonmental, as well as cultural aspects”. (ITU & UNECE, 2016,p:2).
International Telecommunication Union (ITU) and United Nations Economic Commission (UNECE) launched "United for Smart Sustainable Cities" (U4SSC). U4SSC advocates for public policy to encourage the use of ICTs to facilitate and ease the transition to smart sustainable cities. Again, even with the commitment towards connecting smartness with sustainability, yet the suggested approach is still focusing on the role of ICTs as clearly stated in the previous definition. The Digital Agenda for Europe - "About Smart Cities" (European Commission, 2013) sees the smart city concept as including six axes or types of action: smart economy, smart mobility, smart environment, smart people, smart living and smart governance. Interrogating the notion of smart people is important in this discourse as we see more and more how people are separated, isolated and immersed in their second digital life via social media platforms. Digital connectivity triumphs social connectivity and this is alarming for the future of human-centered urbanism.
Figure 2&3: The impact of relaying on smart phones and second life practices in the fragmentation of
spatial experiences in contemporary cities.
5. An Alternative Understanding of Smart City If the current understanding of smart cities might lead to individualism, antisocial places, fragmentation, and absence of communal activities, then a call for “Stupid Cities” might be worth considering (Alraouf, 2016). There are numerous cases from around the world that illustrate the vibrancy and livability is not related to the current ICT and technology-based definition of smart places and cities. The case of an open public space like the Old Market in Leuven city, Belgium is very informative in this sense. The space witnessed a number of crucial transformations from an old marker to a fully destroyed place after WWII to a cars roundabout and finally to the most vibrant people-friendly space in the whole city. Another case is the transformations of parking lots in the city of Portland to places for people after activating its edges by placing food carts. Nothing is smarter than then transforming the most antisocial place into a vibrant one. Inspiring case without any technological interventions but rather a commitment towards a more fulfilling spatial experiences for city dwellers and visitors.
1044
Alraouf & Alkarrani Smart, Resilient & Just Communities in Qatar ISOCARP-OAPA Conference 2017
5
Figure 4&5: The Old Market in Leuven city, Belgium and Portland City: Transforming the most antisocial
spaces into vibrant places.
The notion of looking at the smartness of cities not only from a technological perspective but rather, human and social is usually overlooked due to the triumph of technological advances and the assumption that the more technological the city, the more it is successful. I want to shed light on a crucial component of any city’s urbanism; streets. The image which is constructed before our eyes is how future smart cities will be full of autonomous vehicles or driverless cars. Yet as Schwartz (2015) scrutinizes the principle suggesting that they are not the solution that so many people think they are, that is, without effective integrated transit systems to collaborate alongside them. Schwartz (2015) argues that The future isn't on four wheels and If we want our cities to attract young people, entrepreneurs, and capital, we have to make it walkable. This is an interesting aspect of city smartens. Another aspect in constructing an alternative view of smart cities is embedded in examining the city’s ability to maintain and flourish a culture of learning, innovation, creativity and knowledge sharing. The promise of competitiveness and economic growth in so-called smart cities is widely advertised in Europe and the US. The promise is focused on global talent and knowledge economies and not on learning and innovation. But to really achieve smart cities – that is to create the conditions of continuous learning and innovation – this book argues that there is a need to understand what is below the surface and to examine the mechanisms which affect the way cities learn and then connect together. Campbell (2012) illustrates how networks already operating in cities are used to foster and strengthen connections in order to achieve breakthroughs in learning and innovation. Going beyond smart cities means understanding how cities construct, convert and manipulate relationships that grow in urban environments. Cities like Barcelona, Bilbao, Charlotte, Portland, Seattle and Turin have achieved important transformations and learning has played a key role, one that has been largely ignored in academic circles and practice concerning competitiveness and innovation as Campbell argues (2012). The features of the suggested alternative model is based on the following principles:
• Socio-cultural – with people in mind • Behavior change • Adaptation
• Co-design and Public participation • Social inclusion • Social and spatial justice
5.1. The Need For Citizen-Led Smart Cities For smart cities to reach their full potential, they need to focus on the citizens living in them, not just technology. Traditionally, smart cities have emphasized hardware - the internet of things, 'big data' and advanced computing - over the needs of people and the challenges they face living in cities.
“The word citizen has to do with cities, and the ideal city is organized around citizenship--around participation in public life.”
1045
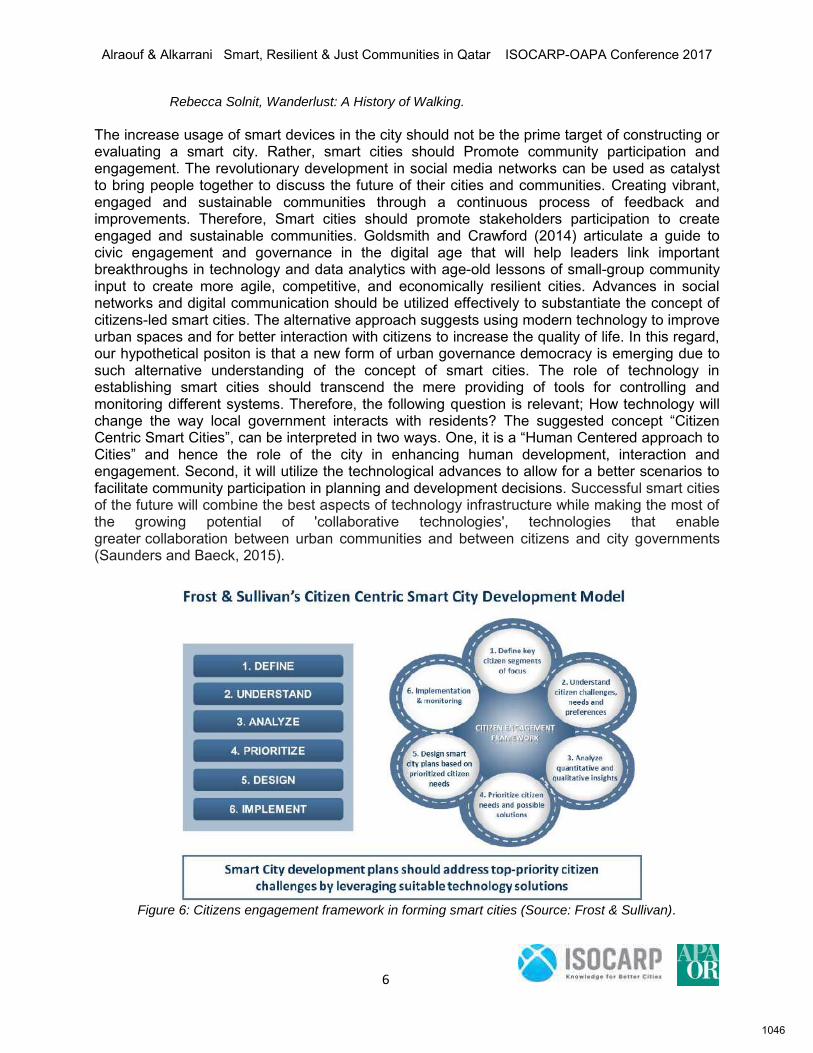
Alraouf & Alkarrani Smart, Resilient & Just Communities in Qatar ISOCARP-OAPA Conference 2017
6
Rebecca Solnit, Wanderlust: A History of Walking. The increase usage of smart devices in the city should not be the prime target of constructing or evaluating a smart city. Rather, smart cities should Promote community participation and engagement. The revolutionary development in social media networks can be used as catalyst to bring people together to discuss the future of their cities and communities. Creating vibrant, engaged and sustainable communities through a continuous process of feedback and improvements. Therefore, Smart cities should promote stakeholders participation to create engaged and sustainable communities. Goldsmith and Crawford (2014) articulate a guide to civic engagement and governance in the digital age that will help leaders link important breakthroughs in technology and data analytics with age-old lessons of small-group community input to create more agile, competitive, and economically resilient cities. Advances in social networks and digital communication should be utilized effectively to substantiate the concept of citizens-led smart cities. The alternative approach suggests using modern technology to improve urban spaces and for better interaction with citizens to increase the quality of life. In this regard, our hypothetical positon is that a new form of urban governance democracy is emerging due to such alternative understanding of the concept of smart cities. The role of technology in establishing smart cities should transcend the mere providing of tools for controlling and monitoring different systems. Therefore, the following question is relevant; How technology will change the way local government interacts with residents? The suggested concept “Citizen Centric Smart Cities”, can be interpreted in two ways. One, it is a “Human Centered approach to Cities” and hence the role of the city in enhancing human development, interaction and engagement. Second, it will utilize the technological advances to allow for a better scenarios to facilitate community participation in planning and development decisions. Successful smart cities of the future will combine the best aspects of technology infrastructure while making the most of the growing potential of 'collaborative technologies', technologies that enable greater collaboration between urban communities and between citizens and city governments (Saunders and Baeck, 2015).
Figure 6: Citizens engagement framework in forming smart cities (Source: Frost & Sullivan).
1046
Alraouf & Alkarrani Smart, Resilient & Just Communities in Qatar ISOCARP-OAPA Conference 2017
7
5.2. Empowering Cities Transforming into Smart. Smart Cities or Smart About Cities An important concern while discussing the transformational process towards smart cities is related to the differentiation of cities with fragmented innovation hubs versus considering the holistic concept of smart city as a new identity for cities around the world. Hence, the question is Are Cities of the Future Connected or Just Innovation Hubs? It is also crucial within the context of the future holistic smart city to promote digital urban equality by making ICT products and services available and practically accessible to all segments of the population. The suggested holistic understanding of smart city concept Catalyzing the Evolution of ICT Based Urban Growth Ecosystems in Cities. It calls for using such unprecedented development in ICT to facilitate Implementing an integrated design and planning process. Consequently, having the ability of Transforming any city through a well-integrated land use and infrastructure development framework. Additionally, Enhancing development as an interconnected city with sustainable planning initiatives. Campbell (2012) emphasizes the need to pay attention to the dynamic process of achieving urban renewal/urban planning--to learning, in his view. He explains what he means by learning, offers useful observations on the degree to which various urban renewal/planning experiences involved learning, as well as a helpful chapter on how cities might go about improving their learning. In such an alternative approach to holistic comprehension of smart cities concept. An emphasize should be placed on the significance of dynamic processes. Hence, being a smart city is not an objective that you can reach via applying a number of systems but rather it is a continuous process. 6. Gulf Cities Context: Smart Cities of the Gulf Region The countries in the Gulf region who form the Gulf Cooperating Council (GCC) share several common features, such as a high per capita GDP, monarchical rule and abundant financial wealth generated from their dependence on oil and gas (Khodr, 2012, 150). The abundant wealth has contributed to the “introduction of comprehensive administration reform and the need to provide more public services” (2012, 151). The public policies have been formulated and implemented in different sectors. The Smart Cities, or the Specialized Cities as named by Khdor, in the region are “important sources of [policy] innovation and economic growth, as well as vehicles for globalization” (2012, 152). There is a diffusion of smart cities phenomena occurring in the Gulf region (2012, 149). Although there are several projects around the world similar to the smart cities in the Gulf, Silicon Valley and Kerala’s Smart City for instance, smart cities in the GCC are built from the ground up and rapidly (2012, 152). There are many projects in the region, such as Education City in Qatar, Healthcare City in Dubai and Masdar City in Abu Dhabi. The precedents which claim attempts to construct smart cities in the Middle east and particularly in the Gulf raised questions and fundamental concerns. Controversially, some smart cities’ initiatives were faced with a number of obstacles when declared in Gulf cities. The case of Masdar city in Abu Dhabi proved t be a prime example of the degradation of a utopian idea to merely a research institute and real-estate project. Saudi Arabia selected to deal with smart cities as a form of gated community as it is the case in King Abdul Aziz scientific and technological hub. The reason is basically related to the inability to apply the same standards of freedom. Tolerance and liberalism in the rest of the country. In the case of Dubai, a “Smart Dubai Strategy 2021”, was formed with the declared objective of “Towards Becoming the Happiest City on Earth”1. Such examples showed clearly the limited understanding of the holistic concept of smart cities and the reliance on shallow rhetorical slogans.
1 See Smart Dubai 2021 Strategy: Towards Becoming the Happiest City on Earth. Dr. Okan Geray, Strategy Planning Advisor, Smart Dubai Office, UAE.
1047
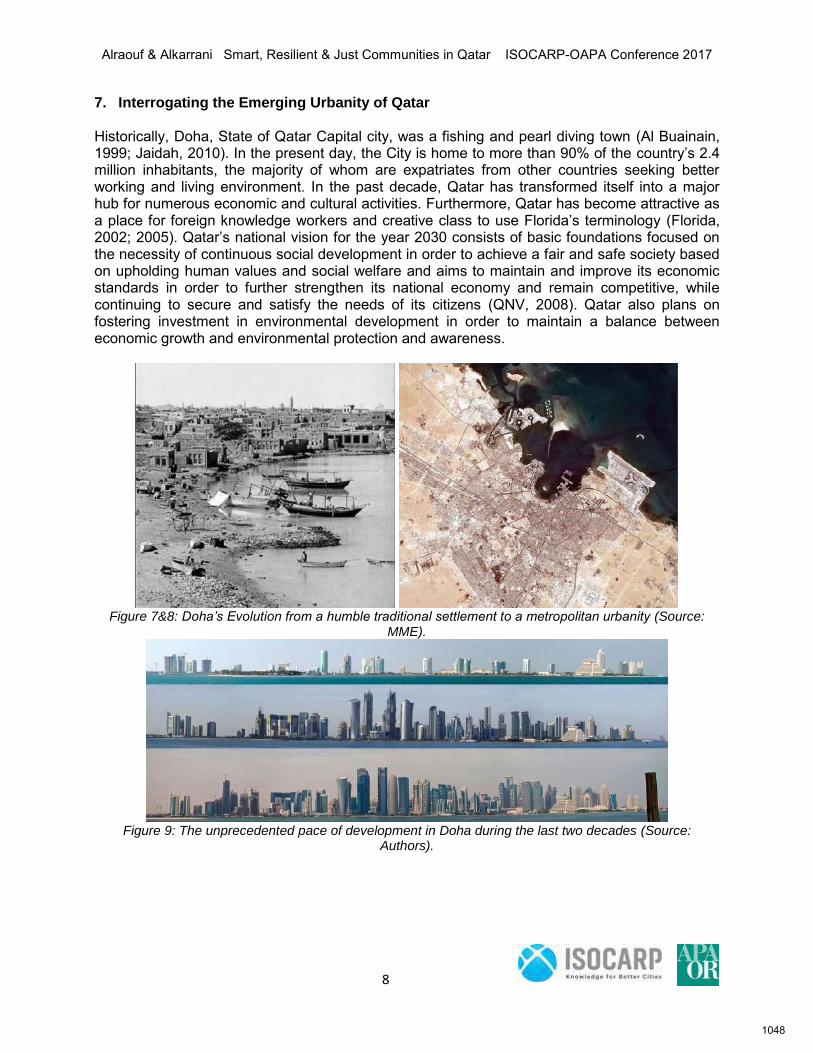
Alraouf & Alkarrani Smart, Resilient & Just Communities in Qatar ISOCARP-OAPA Conference 2017
8
7. Interrogating the Emerging Urbanity of Qatar
Historically, Doha, State of Qatar Capital city, was a fishing and pearl diving town (Al Buainain, 1999; Jaidah, 2010). In the present day, the City is home to more than 90% of the country’s 2.4 million inhabitants, the majority of whom are expatriates from other countries seeking better working and living environment. In the past decade, Qatar has transformed itself into a major hub for numerous economic and cultural activities. Furthermore, Qatar has become attractive as a place for foreign knowledge workers and creative class to use Florida’s terminology (Florida, 2002; 2005). Qatar’s national vision for the year 2030 consists of basic foundations focused on the necessity of continuous social development in order to achieve a fair and safe society based on upholding human values and social welfare and aims to maintain and improve its economic standards in order to further strengthen its national economy and remain competitive, while continuing to secure and satisfy the needs of its citizens (QNV, 2008). Qatar also plans on fostering investment in environmental development in order to maintain a balance between economic growth and environmental protection and awareness.
Figure 7&8: Doha’s Evolution from a humble traditional settlement to a metropolitan urbanity (Source:
MME).
Figure 9: The unprecedented pace of development in Doha during the last two decades (Source:
Authors).
1048

Alraouf & Alkarrani Smart, Resilient & Just Communities in Qatar ISOCARP-OAPA Conference 2017
9
Figure 10: Main Shifts in Qatar’s Economical Development (Source: Authors).
7.1. From Concept to Reality: Doha Transformed Qatar leaders are convinced that post oil paradigm is becoming a reality. Hence, moving from industrial economy to knowledge economy is a global and inevitable transformation which requires understanding and better engagement (Thierstein, 2008). The State of Qatar is taking great strides in promoting sustainable development and pursuing long-term policy in this regard. In order for this pursuit to be successful, economic development must take place within the context of social and environmental development. Sustainable development has become the focus of Qatar National Vision 2030 (QNV). The vision outlines the development of Qatar over the next twenty years. The QNV 2030 is based on four supporting themes: human development, social development, economic development and environmental development. In order to facilitate the realization of QNV, Qatar is positioning itself as a knowledge-based society, principally in the fields of education, research, energy and technology. The country is becoming a magnet for a growing external workforce in the last five years.
Figure 11&12: The Spatial Strategy Concept for 2032 as suggested in QNDF and Doha Municipality
Structure Plan 2032 (Source: QNDF, 2016).
7.2. Contemporary Doha: An Attempt to Construct Holistic a Smart City Doha’s regional and global importance has amplified significantly over the last decade. the city of Doha is experiencing continual rapid growth. Maintaining the current growth of its urban population and fostering quality of life is seen as critical to the future development of the country, as indicated in the national development strategy 2011–2016 (QSDP, 2011). Doha city’s current and future development plans are based on such a holistic approach to construct smart cities.
Resources Economy
Industrial Economy
Knowledge Economy
1049
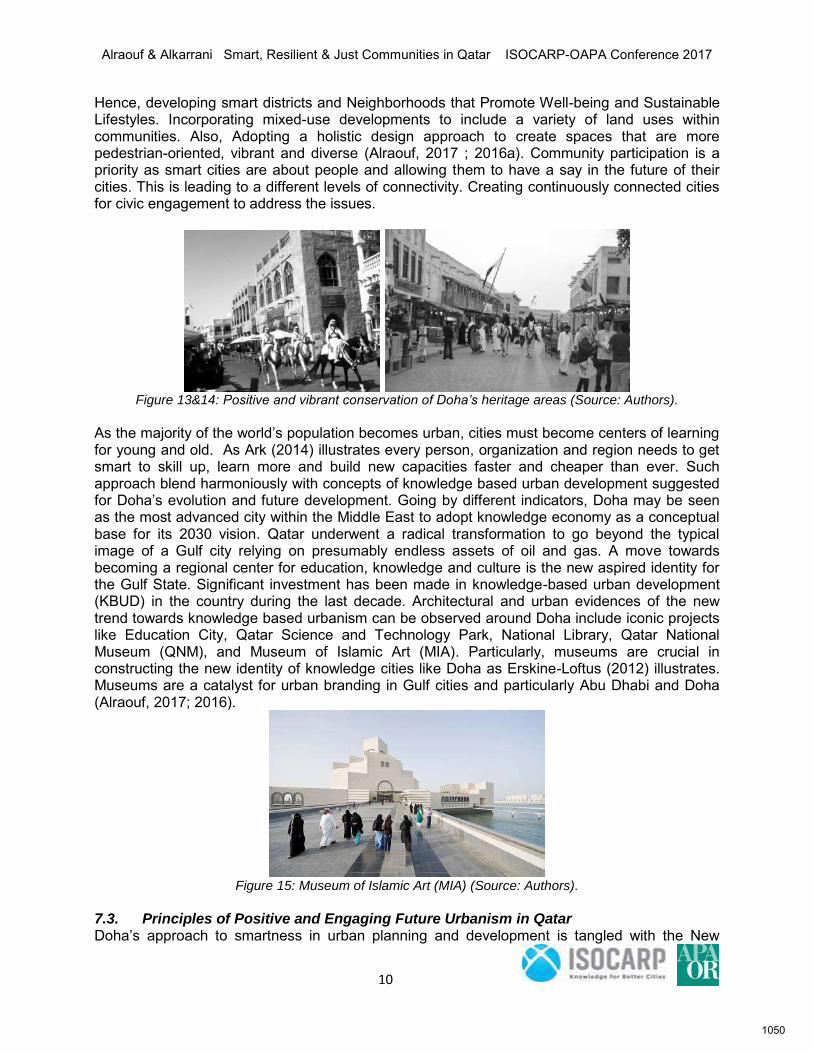
Alraouf & Alkarrani Smart, Resilient & Just Communities in Qatar ISOCARP-OAPA Conference 2017
10
Hence, developing smart districts and Neighborhoods that Promote Well-being and Sustainable Lifestyles. Incorporating mixed-use developments to include a variety of land uses within communities. Also, Adopting a holistic design approach to create spaces that are more pedestrian-oriented, vibrant and diverse (Alraouf, 2017 ; 2016a). Community participation is a priority as smart cities are about people and allowing them to have a say in the future of their cities. This is leading to a different levels of connectivity. Creating continuously connected cities for civic engagement to address the issues.
Figure 13&14: Positive and vibrant conservation of Doha’s heritage areas (Source: Authors).
As the majority of the world’s population becomes urban, cities must become centers of learning for young and old. As Ark (2014) illustrates every person, organization and region needs to get smart to skill up, learn more and build new capacities faster and cheaper than ever. Such approach blend harmoniously with concepts of knowledge based urban development suggested for Doha’s evolution and future development. Going by different indicators, Doha may be seen as the most advanced city within the Middle East to adopt knowledge economy as a conceptual base for its 2030 vision. Qatar underwent a radical transformation to go beyond the typical image of a Gulf city relying on presumably endless assets of oil and gas. A move towards becoming a regional center for education, knowledge and culture is the new aspired identity for the Gulf State. Significant investment has been made in knowledge-based urban development (KBUD) in the country during the last decade. Architectural and urban evidences of the new trend towards knowledge based urbanism can be observed around Doha include iconic projects like Education City, Qatar Science and Technology Park, National Library, Qatar National Museum (QNM), and Museum of Islamic Art (MIA). Particularly, museums are crucial in constructing the new identity of knowledge cities like Doha as Erskine-Loftus (2012) illustrates. Museums are a catalyst for urban branding in Gulf cities and particularly Abu Dhabi and Doha (Alraouf, 2017; 2016).
Figure 15: Museum of Islamic Art (MIA) (Source: Authors).
7.3. Principles of Positive and Engaging Future Urbanism in Qatar Doha’s approach to smartness in urban planning and development is tangled with the New
1050
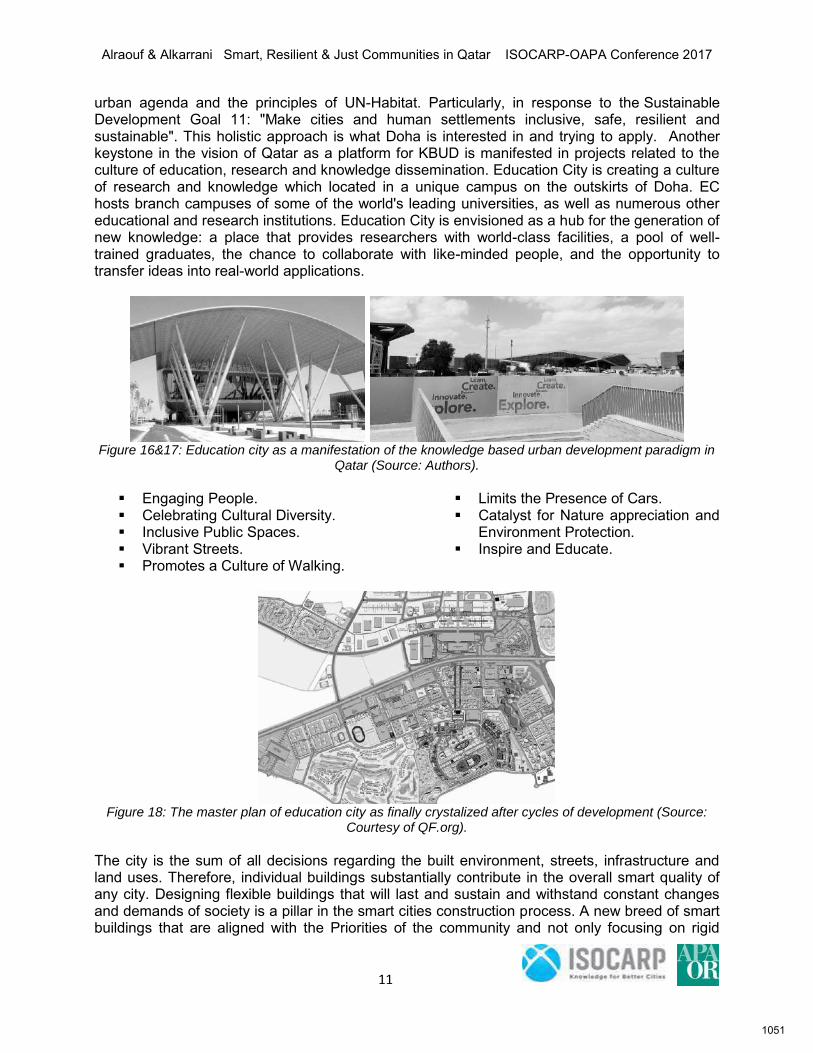
Alraouf & Alkarrani Smart, Resilient & Just Communities in Qatar ISOCARP-OAPA Conference 2017
11
urban agenda and the principles of UN-Habitat. Particularly, in response to the Sustainable Development Goal 11: "Make cities and human settlements inclusive, safe, resilient and sustainable". This holistic approach is what Doha is interested in and trying to apply. Another keystone in the vision of Qatar as a platform for KBUD is manifested in projects related to the culture of education, research and knowledge dissemination. Education City is creating a culture of research and knowledge which located in a unique campus on the outskirts of Doha. EC hosts branch campuses of some of the world's leading universities, as well as numerous other educational and research institutions. Education City is envisioned as a hub for the generation of new knowledge: a place that provides researchers with world-class facilities, a pool of well-trained graduates, the chance to collaborate with like-minded people, and the opportunity to transfer ideas into real-world applications.
Figure 16&17: Education city as a manifestation of the knowledge based urban development paradigm in
Qatar (Source: Authors).
Engaging People. Celebrating Cultural Diversity. Inclusive Public Spaces. Vibrant Streets. Promotes a Culture of Walking.
Limits the Presence of Cars. Catalyst for Nature appreciation and
Environment Protection. Inspire and Educate.
Figure 18: The master plan of education city as finally crystalized after cycles of development (Source:
Courtesy of QF.org).
The city is the sum of all decisions regarding the built environment, streets, infrastructure and land uses. Therefore, individual buildings substantially contribute in the overall smart quality of any city. Designing flexible buildings that will last and sustain and withstand constant changes and demands of society is a pillar in the smart cities construction process. A new breed of smart buildings that are aligned with the Priorities of the community and not only focusing on rigid
1051
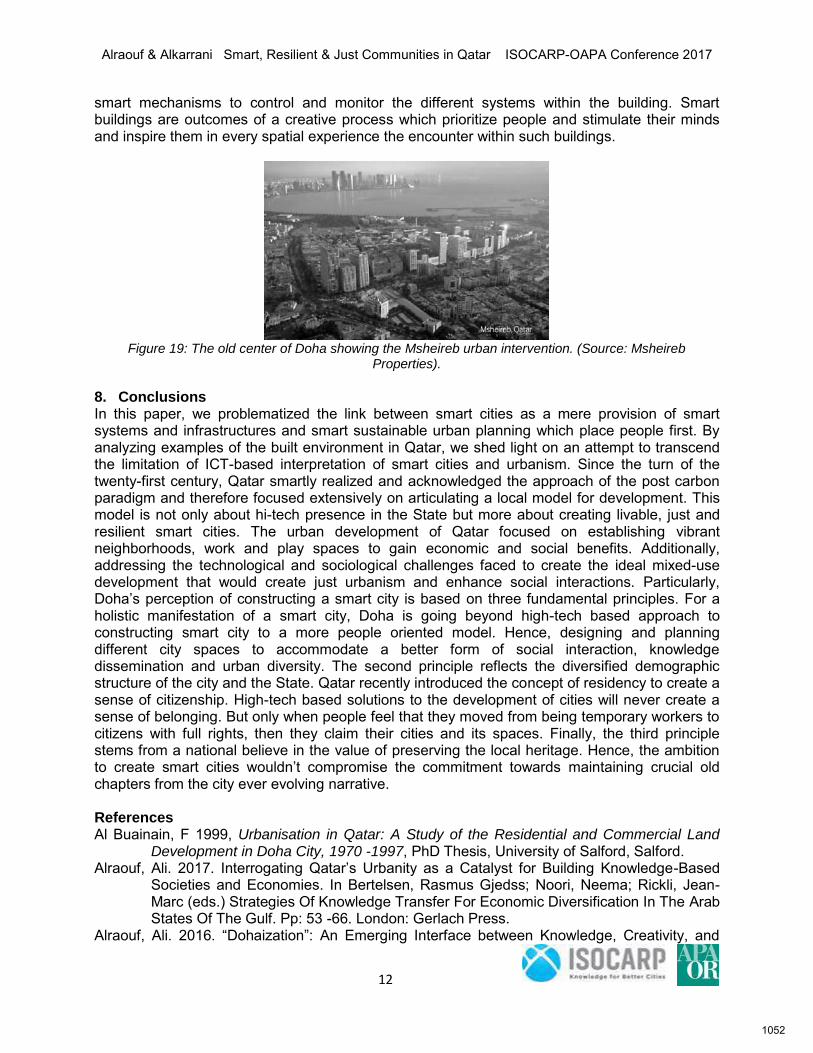
Alraouf & Alkarrani Smart, Resilient & Just Communities in Qatar ISOCARP-OAPA Conference 2017
12
smart mechanisms to control and monitor the different systems within the building. Smart buildings are outcomes of a creative process which prioritize people and stimulate their minds and inspire them in every spatial experience the encounter within such buildings.
Figure 19: The old center of Doha showing the Msheireb urban intervention. (Source: Msheireb
Properties).
8. Conclusions In this paper, we problematized the link between smart cities as a mere provision of smart systems and infrastructures and smart sustainable urban planning which place people first. By analyzing examples of the built environment in Qatar, we shed light on an attempt to transcend the limitation of ICT-based interpretation of smart cities and urbanism. Since the turn of the twenty-first century, Qatar smartly realized and acknowledged the approach of the post carbon paradigm and therefore focused extensively on articulating a local model for development. This model is not only about hi-tech presence in the State but more about creating livable, just and resilient smart cities. The urban development of Qatar focused on establishing vibrant neighborhoods, work and play spaces to gain economic and social benefits. Additionally, addressing the technological and sociological challenges faced to create the ideal mixed-use development that would create just urbanism and enhance social interactions. Particularly, Doha’s perception of constructing a smart city is based on three fundamental principles. For a holistic manifestation of a smart city, Doha is going beyond high-tech based approach to constructing smart city to a more people oriented model. Hence, designing and planning different city spaces to accommodate a better form of social interaction, knowledge dissemination and urban diversity. The second principle reflects the diversified demographic structure of the city and the State. Qatar recently introduced the concept of residency to create a sense of citizenship. High-tech based solutions to the development of cities will never create a sense of belonging. But only when people feel that they moved from being temporary workers to citizens with full rights, then they claim their cities and its spaces. Finally, the third principle stems from a national believe in the value of preserving the local heritage. Hence, the ambition to create smart cities wouldn’t compromise the commitment towards maintaining crucial old chapters from the city ever evolving narrative. References Al Buainain, F 1999, Urbanisation in Qatar: A Study of the Residential and Commercial Land
Development in Doha City, 1970 -1997, PhD Thesis, University of Salford, Salford. Alraouf, Ali. 2017. Interrogating Qatar’s Urbanity as a Catalyst for Building Knowledge-Based
Societies and Economies. In Bertelsen, Rasmus Gjedss; Noori, Neema; Rickli, Jean-Marc (eds.) Strategies Of Knowledge Transfer For Economic Diversification In The Arab States Of The Gulf. Pp: 53 -66. London: Gerlach Press.
Alraouf, Ali. 2016. “Dohaization”: An Emerging Interface between Knowledge, Creativity, and
1052
Alraouf & Alkarrani Smart, Resilient & Just Communities in Qatar ISOCARP-OAPA Conference 2017
13
Gulf Urbanity. Pp.: 47-68. In Katodrytis, George and Syed, Sharmeen. Gulf Cities as Interfaces. Cambridge: Gulf Research Centre Cambridge.
Alraouf, Ali A. 2008. Emerging Middle Eastern Knowledge Cities: the Unfolding Story. In Knowledge Based Urban Development: Planning and Application in the Information Era. Edited by Tan Yigitcaular& V. Koray. USA: IGI Global Publishing.
Ark, Tom Vander. 2014. Smart Cities that Work for Everyone: 7 Keys to Education & Employment. Getting Smart Publishers.
Campbell, Tim. 2012. Beyond Smart Cities: How Cities Network, Learn and Innovate. London: Routledge.
Erskine‐Loftus, Pamela. 2012 Displaying in/the Peninsula: Museums as creators of a visual identity. 3rd Gulf Research Meeting. Workshop 9: Visual Culture in the GCC. Gulf Research Centre, University of Cambridge, UK.
Evans, G. (2009). Creative Cities, Creative Spaces and Urban Policy. Urban Studies, 46 (5-6). Florida, R. (2002). The Rise of the Creative Class. New York: Basic Books. Florida, R. (2005). Cities and the Creative Class. New York: Routledge. Florida, R. (2008). Who’s your city? New York: Basic Books. Gabrys, J.: Programming environments – environmentality and citizen sensing in the smart city. Environment and Planning D: Society and Space 32, 30-48 (2014). Goldsmith, Stephen and Crawford, Susan. 2014. The Responsive City: Engaging Communities
Through Data-Smart Governance. New York: Jossey-Bass. Hassan, A. 1994. Urban planning in the state of Qatar. Doha: Dar Al-Oloum, Doha Publications. Herzberg, Caspar. 2017. Smart Cities, Digital Nations: Building Smart Cities in Emerging
Countries and Beyond. Roundtree Press. Höjer, M., Wangel, J. 2014. Smart Sustainable Cities: Definition and Challenges. In: Hilty, L.M.,
Aebischer, B. (eds.) ICT Innovations for Sustainability. Advances in Intelligent Systems and Computing 310. Springer International Publishing .
ITU and UNECE. 2016. "United for Smart Sustainable Cities" (U4SSC). Jaidah, I. and M. Bourennane (2010). The History of Qatari Architecture 1800-1950. Italy, Skira. Kamrava, Mehran. 2013. Qatar: Small State, Big Politics. New York: Cornell University Press. Khodr, H. 2012. The Specialized Cities of the Gulf Cooperation Council: A Case Study of a
Distinct Type of Policy Innovation and Diffusiondome. Digest of Middle East Studies, 21 (Number 1), p. 149–177.
Nagy, S 2000, ‘Dressing Up Downtown: urban development and government public image in Qatar’, City & Society, 12, 125-147.
Neirotti, P., De Marco, A., Cagliano, A. C., Mangano, G., Scorrano, F.: Current trends in Smart City initiatives – Some stylised facts. Cities 38, 25–36 (2014). Roberts, David B. 2015. Qatar: Securing the Global Ambitions of a City-state. London: C Hurst &
Co Publishers Ltd . Qatar National Development Framework (QNDF). 2016. The Ministry of Municipality and
Environment. QSDP (Qatar General Secretariat of Development Planning) (2011) National Development
Strategy 2011–2016. Gulf Publishing and Printing Company, Doha, Qatar. Saunders, T. and Baeck, P. 2015. Rethinking Smart Cities From Ground UP.
http://www.nesta.org.uk/ Schwartz, Samuel I. and Rosen, William. 2015. Street Smart: The Rise of Cities and the Fall of
Cars. Public Affairs. Song, Houbing & El. 2017. Smart Cities: Foundations, Principles, and Applications. Wiely. Thierstein, A & Schein, E 2008, ‘Emerging cities on the Arabian Peninsula: urban space in the
knowledge economy context’ International Journal of Architectural Research, Volume. 2, Issue 2, Archnet- MIT Design Media Lab, Cambridge, USA, PP. 178-195.
1053
Stephen Goldie The Jobless City ISOCARP-OAPA Conference 2017
1
The Jobless City – Revolution or Paradise?
E. Stephen GOLDIE, RFD, BTP, MPIA, CPP City Planning Advisor, Abu Dhabi Department of Municipal Affairs, UAE
Synopsis The 4th Industrial Revolution is changing the nature of work. Around 80% of existing jobs will be automated. If these are not replaced by new, as yet unthought-of, un-automatable work, then there are only two possible futures: revolution or paradise. But, how will we plan and build the jobless city? 1. Past Revolutions in Urban Planning Strangely, urban planners and designers spend a lot of time examining the past and worrying about the present, but put little effort into studying the future – and I am as guilty as most. We enjoy reading about and visiting delightful examples of our predecessors’ work around the world, usually from Hippodamus of Miletus (498 – 408 BC) onwards, and bemoan that our “urban tradition has yielded to banal and monotonous development, humdrum in design and dominated by traffic. [and that] We have repeated standard housing types and layouts, retail boxes and road layouts so many times, with little or no regard for local context, until we find that now almost everywhere looks like everywhere else.”1. When we do think about tomorrow it is as an almost automatic part of the planning process and usually assumes a continuation of current trends: extant growth rates are projected forward, current land use budgets are, more or less, the same in every plan and are assumed to be valid for decades to come (see figure 1) and so on. One useful aspect of planners’ excellent knowledge of urban history is that it allows me to quickly highlight, in the following paragraphs, those past technologic and scientific revolutions that have led to parallel revolutions in urban planning. The Agricultural Revolution (10-12 millennia BCE2) may have resulted in a gradual domestication of grains, vegetables and livestock, leading to the development of cities3 or could have originated from accidental crops that sprang up around the animal yards of the first, trade-based settlements, creating a positive feedback loop that led to the development of the first cities.4 Jane Jacobs, the originator of this second hypothesis, also identified the wrong-thinking of the earlier theory: “The fallacy is to mistake the results of city economic development for the preconditions to city economic development” [my emphasis].5 Unless there is a major breakthrough in archaeology, we are unlikely to be able to resolve this “chicken and egg” dispute, but either way, the result was the first revolution in urban planning, the one that brought our profession into existence. This necessarily brief overview must skim past the first cities of Egypt and the Indus, Greece and the effects of democracy, Rome and its military efficiency, and even the fall of Constantinople and the Dark Ages. They and other events in that long span of time all influenced the planning of cities, or lack of it, but – planned by the line and the level, or by the easiest track for a pack animal – these cities were small and their cores defined by “a walled precinct, a citadel, made of durable materials, even if the rest of the town lacks a wall or permanent structures. This holds from Uruk to Harrapa.”6
1054
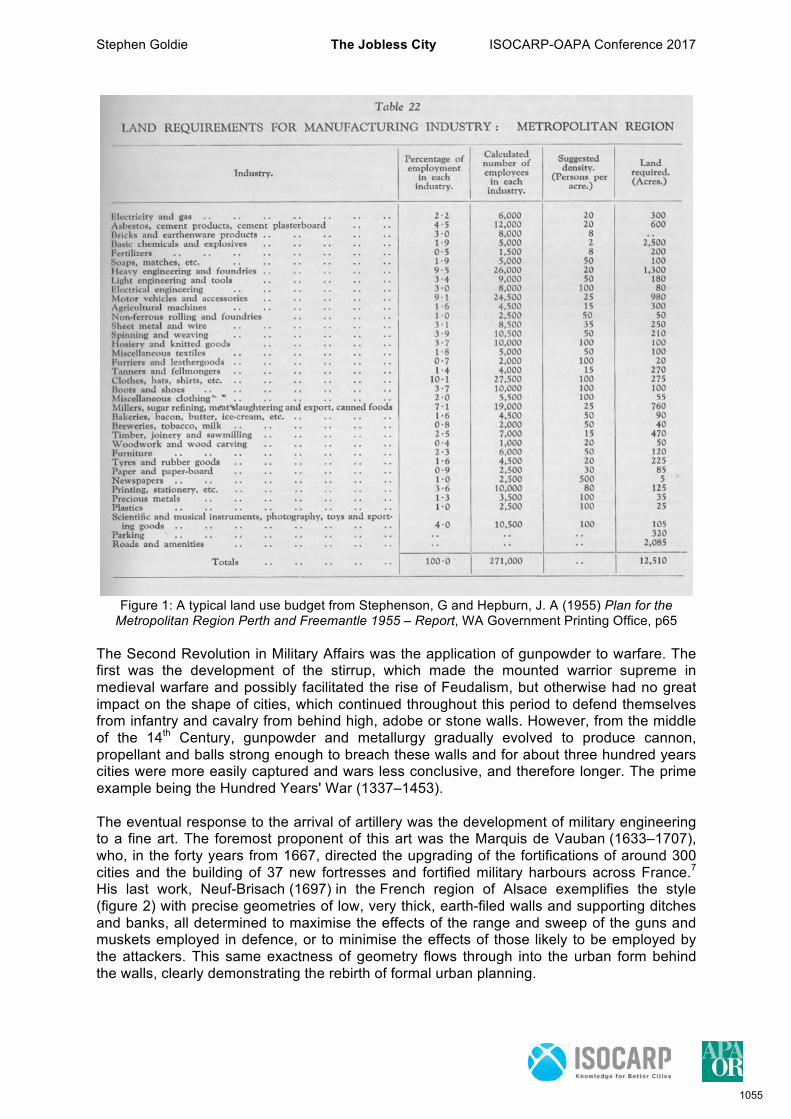
Stephen Goldie The Jobless City ISOCARP-OAPA Conference 2017
2
Figure 1: A typical land use budget from Stephenson, G and Hepburn, J. A (1955) Plan for the
Metropolitan Region Perth and Freemantle 1955 – Report, WA Government Printing Office, p65 The Second Revolution in Military Affairs was the application of gunpowder to warfare. The first was the development of the stirrup, which made the mounted warrior supreme in medieval warfare and possibly facilitated the rise of Feudalism, but otherwise had no great impact on the shape of cities, which continued throughout this period to defend themselves from infantry and cavalry from behind high, adobe or stone walls. However, from the middle of the 14th Century, gunpowder and metallurgy gradually evolved to produce cannon, propellant and balls strong enough to breach these walls and for about three hundred years cities were more easily captured and wars less conclusive, and therefore longer. The prime example being the Hundred Years' War (1337–1453). The eventual response to the arrival of artillery was the development of military engineering to a fine art. The foremost proponent of this art was the Marquis de Vauban (1633–1707), who, in the forty years from 1667, directed the upgrading of the fortifications of around 300 cities and the building of 37 new fortresses and fortified military harbours across France.7 His last work, Neuf-Brisach (1697) in the French region of Alsace exemplifies the style (figure 2) with precise geometries of low, very thick, earth-filed walls and supporting ditches and banks, all determined to maximise the effects of the range and sweep of the guns and muskets employed in defence, or to minimise the effects of those likely to be employed by the attackers. This same exactness of geometry flows through into the urban form behind the walls, clearly demonstrating the rebirth of formal urban planning.
1055
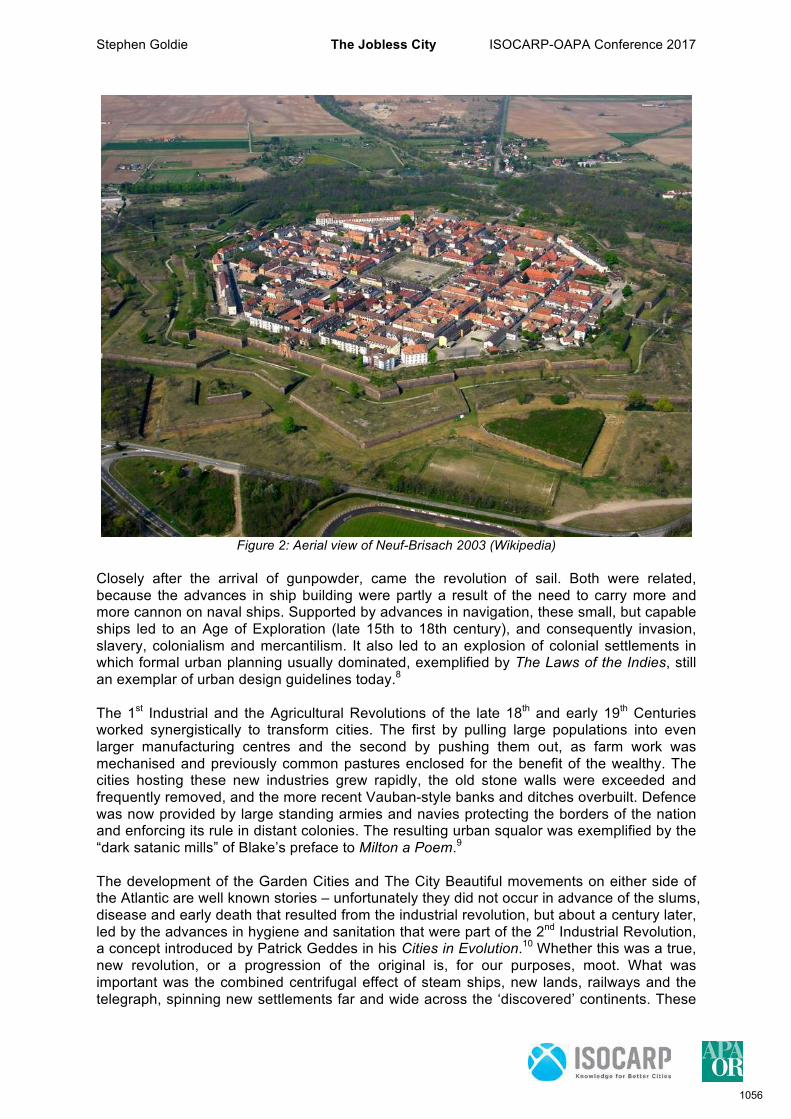
Stephen Goldie The Jobless City ISOCARP-OAPA Conference 2017
3
Figure 2: Aerial view of Neuf-Brisach 2003 (Wikipedia)
Closely after the arrival of gunpowder, came the revolution of sail. Both were related, because the advances in ship building were partly a result of the need to carry more and more cannon on naval ships. Supported by advances in navigation, these small, but capable ships led to an Age of Exploration (late 15th to 18th century), and consequently invasion, slavery, colonialism and mercantilism. It also led to an explosion of colonial settlements in which formal urban planning usually dominated, exemplified by The Laws of the Indies, still an exemplar of urban design guidelines today.8 The 1st Industrial and the Agricultural Revolutions of the late 18th and early 19th Centuries worked synergistically to transform cities. The first by pulling large populations into even larger manufacturing centres and the second by pushing them out, as farm work was mechanised and previously common pastures enclosed for the benefit of the wealthy. The cities hosting these new industries grew rapidly, the old stone walls were exceeded and frequently removed, and the more recent Vauban-style banks and ditches overbuilt. Defence was now provided by large standing armies and navies protecting the borders of the nation and enforcing its rule in distant colonies. The resulting urban squalor was exemplified by the “dark satanic mills” of Blake’s preface to Milton a Poem.9 The development of the Garden Cities and The City Beautiful movements on either side of the Atlantic are well known stories – unfortunately they did not occur in advance of the slums, disease and early death that resulted from the industrial revolution, but about a century later, led by the advances in hygiene and sanitation that were part of the 2nd Industrial Revolution, a concept introduced by Patrick Geddes in his Cities in Evolution.10 Whether this was a true, new revolution, or a progression of the original is, for our purposes, moot. What was important was the combined centrifugal effect of steam ships, new lands, railways and the telegraph, spinning new settlements far and wide across the ‘discovered’ continents. These
1056
Stephen Goldie The Jobless City ISOCARP-OAPA Conference 2017
4
colonial settlements were invariably planned, and the planners eventually developed a body of knowledge that enabled the Garden Cities and the City Beautiful movements and their equivalents elsewhere. “The Second Industrial Revolution continued into the 20th century with early factory electrification and the production line, and ended at the start of World War I”,11 providing the preconditions for one of the many impacts of the Great War on urbanism: the internal combustion engine. The Great War accelerated the refinement of the car, the lorry and the airplane, and trained many thousands of men to drive or fly them, but the impact of the automobile on cities was delayed by the Great Depression and the 2nd World War. However, by the 1950’s it was clear that another revolution in urban planning was underway. As with agriculture, artillery, sail and steam, the technology was unstoppable and the detrimental effects obvious (to those who wanted to see), but, just as the pace of change has speeded up, the response to addressing the resulting inefficiencies of each revolution affecting the planning of cities has happened faster, from millennia to centuries and recently to decades. It took only about thirty years before the more advanced planners, architects and designers banded together and responded to auto-dominated urban sprawl with practical solutions. In the United States this took the name “The New Urbanism”, which has more than a passing similarity to City Beautiful: “Like New Urbanism, the 19th century [City Beautiful] movement redeemed city planning principles whose influence had waned, and recognized that the design of physical space is important to the identity and cohesiveness of a community.”12 In the United Kingdom it does not have a clear name, and is perhaps more a loose alliance of the Prince's Foundation for Building Community, English Partnerships, the now superseded Commission for Architecture and the Built Environment (CABE) and the still active Town and Country Planning Association (TCPA), founded by Sir Ebenezer Howard himself, in 1899. New Urbanist practice is also strong in parts of Australia and New Zealand.13 The New Urbanism, and its overseas cousins have led a gradual roll back of decades of auto-dependent sprawl while simultaneously (and necessarily) developing a practice that has progressed rapidly from rediscovering the techniques behind the delightful works of past urbanist planners, architects and designers, such as Camillo Sitte, Raymond Unwin and John Nolan, to a body of knowledge and skills that is now well able to plan, design and build sustainable towns and cities: but is it ready for the Digital Revolution or has humanity reached its final limits? 2. The Limits to Growth Whether history will refer to our current era as the 4th Industrial Revolution, the Digital Revolution, the Information Age or something else is not our concern. What is important is that there will continue to be a civilisation with historians and philosophers with the time and energy to argue about such things, because the alternatives are most likely:
• Mutually assured destruction by nuclear weapons; • Mismanagement of the environment, leading to a sixth great extinction (that will
eventually include homo sapiens sapiens);14 and/or • Mass migration, revolution and war through inadequate responses to rapid 3rd World
urbanisation. Collectively, we can refer to these as the “Limits to Growth” which have long been forecast to reach criticality in the middle of this century15, and which, if not overcome will lead to either no human civilization, no humans, or no planet at all, an experiment in survival that is clearly not one that any sane person would want to see played out on their own species and on their own planet.
1057
Stephen Goldie The Jobless City ISOCARP-OAPA Conference 2017
5
While the first two of humanity’s limits to growth are well understood, the third is probably only common knowledge amongst urban planners, and some staff of the United Nations and related agencies. “In 1950 three quarters of a billion people lived in large towns and cities, or 30% of the total world population of over 2.5 billion. In 2009 this had grown to 3.42 billion, just over half of a total population of over 6.8 billion. The United Nations Secretariat forecasts … that by 2050 6.4 billion, 67% of a total of almost 9.6 billion people will live in urban areas. “Just over a third of that growth is expected to be in China, India and Nigeria, but the remaining two-thirds will be in the countries around those countries: a massive arc stretching from North Africa through the Middle East, across Asia and into the Pacific. “An additional 3 billion urban residents in forty years translates into a need to build a new city for a population of one million people, complete with hospitals, schools, workplaces, recreation and all the rest, at a rate of six a month”16 It is a sorry testimony to the accuracy of the analysis conducted by Donella H. Meadows, Dennis L. Meadows, Jørgen Randers, and William W. Behrens III in Limits to Growth that 2050, the rapidly approaching middle of this century, is the date of the demise of our civilisation that they warned us of almost five decades ago. To add the challenges of the Digital Revolution to this very scary list of existential issues might seem trivial, or superfluous, but I suspect that our response to this issue has the potential for significant mitigation of the three threats listed above. Of course, any attempt to address how urban planning might contribute to solutions to any of these challenges reveals a very sane reason for not looking too intently into the future: inevitably the discussion that follows will be taken as a prediction, instead of what is intended, which is a discussion of possibilities. It is only when given an actual commission that a planner must commit to predictions. 3. The Digital Revolution The Digital Revolution has been defined as “the change from mechanical and analogue electronic technology to digital electronics which began anywhere from the late 1950s to the late 1970s with the adoption and proliferation of digital computers and digital record keeping that continues to the present day. … Central to this revolution is the mass production and widespread use of digital logic circuits, and its derived technologies, including the computer, digital cellular phone, and the Internet.”17 According to the authors of The City of Tomorrow “Traditional urban patterns cannot coexist with cyberspace”, and “To pursue this agenda effectively, we must extend the definition of architecture and urban design to encompass virtual places as well as physical ones, software as well as hardware”. The authors explain, “rather than the network subsuming and replacing space, the two are becoming increasingly enmeshed.” And “The new city is a fundamentally different space–one where digital systems have a very real impact on how we experience navigate and socialise.”18 I have recently taken issue with some aspects of this thesis19, but, whatever the effects of so called “Smart City” technologies on the layouts of our towns and cities, it is undoubtedly clear that these same digital systems will have a very real impact on how we are employed – or not! However, before looking at the impact of the Digital Revolution on employment, it is necessary to quickly overview its impact on our profession.
1058
Stephen Goldie The Jobless City ISOCARP-OAPA Conference 2017
6
4. The Revolution in Urban Planning “Current planning systems struggle to produce quality plans for new urban areas at anything like that rate [i.e. six new one-million person cities a month]. Notwithstanding geographic information systems, on-line lodgement and word processing, plan making techniques and approvals processes have barely changed over the last hundred years: start with a metropolitan planning strategy, convert this to local statutory ‘land use zoning’ plans, prepare detailed master plans for new or regenerating areas and then pass these to surveyors and civil engineers for implementation (engineering design, procurement and construction). But each step takes two to five years. Typically, planning takes something like ten years from initiation to a significant level of development on the ground, but only if each plan in the chain is good enough to achieve political support and be implementable. If not, twenty years is still a ‘good’ result. “After the planning is done and the infrastructure is underway the planning approvals process kicks in, a process so fraught with complexity and value judgements that development application delays are the bane of every architect and developer. In some places all aspects of urban planning and design are subservient to the statutory process, when it should be the reverse. “The one advantage of this slow grind is that it allows for extensive community, peer, political and judicial review: a net of safeguards against dangerous and inappropriate development. “However, to house an additional 3 billion people in cities by 2050 administrations seeking to manage urban development and population growth in a resource efficient and environmentally sensitive manner will increasingly turn to recent innovations that are already being deployed piecemeal around the world, e.g.:
• Daily satellite imagery; • Drones; • Big data, powerful algorithms and deep learning; • Transect based planning; • Form based codes; and • Automated applications approvals software.
“These and other technologies, if properly integrated, promise plans for new cities in months and planning permits in an instant, revolutionising the relationship between the national or provincial legal framework and more local integrated planning, but at the cost of many existing safeguards. Combined, they will create a revolution in urban planning, but will the outcome be “garbage in, garbage out”?20 5. Artificial Intelligence, Automation and the Economy The technologies listed above, are those that have the potential to assist in urban planning, but this discussion requires us to add to the list all of the technologies that are likely to impact on employment. Those that appear to be most significant, at the time of writing, include:
• Autonomous vehicles, not just self-driving cars and trucks, but also warehouse picking and delivery robots, home delivery robots and the like;
• 3-D printing, not just of plastics, but of metals, food and microscopic organic structures, including DNA;
• Automated agriculture, both in the field and in the factory;21 • Quantum computing: in May 2017, IBM announced that “it has successfully built and
tested its most powerful universal quantum computing processors.” The first is a 16 qubit (quantum bits) processor that will allow for more complex experimentation than
1059
Stephen Goldie The Jobless City ISOCARP-OAPA Conference 2017
7
the previously available 5 qubit processor. The second is a first prototype commercial processor with 17 qubits and leverages significant materials, device, and architecture improvements to make it the most powerful quantum processor created to date by IBM.22 It has been suggested that it will require a quantum computer with a processor of at least 100 qubits to be useful, but if Moore’s Law holds, and it looks like it will, that device should arrive in around 2022 and with it a computer that can handle a whole new range of mathematical problems.
The possibility of economic disruption from such technologies has not been lost on governments. In December 2016, only a few weeks before the expiry of President Obama’s term in office, the Executive Office of the President issued a report on Artificial Intelligence, Automation, and the Economy.23 It included a case study of the occupations threatened by the introduction of automated vehicles, mainly bus, truck and taxi drivers. It estimated that between 2.2 and 3.1 of 3.7 million jobs would be lost to automation,24 a range of 59 to 84% of all existing transport jobs in the United States, and a pattern likely to be repeated in many industries and professions, even medicine and law. A year earlier, in June 2015, the Committee for Economic Development of Australia (CEDA) issued a report titled Australia’s Future Workforce,25 which similarly concludes that “The nature of employment – the type of work humans do – is going to change dramatically in the coming decades. For many, this change will lead to disruption of their current work and a drop in demand for traditional skills. For others it may mean new opportunities in new fields and industries, but we do not yet have an understanding of what new jobs, and in what number, will be created to facilitate or nurture this change. Given the rate of change of technology, preparation for dealing with this disruption must begin now.”26 However, if we “set aside the self-empowerment and belief that employment can provide people (as it may be generationally dependent), we can also conclude on a more optimistic note. If we assume that the purpose of employment is purely to meet our needs as defined by the bottom two layers of Maslow’s hierarchy of needs (physiological and safety), then it is anticipated the machines will take care of those needs, leaving humans free to pursue the upper layers of Maslow’s hierarchy. The change could result in a new generation free of poverty and the burden of labour, thereby unleashing the next wave of human innovation and creativity in directions we can never imagine” [my emphasis].27 These are but two of many reports on this topic, all arriving at similar conclusions, that I will summarise as either “there will be a massive loss of jobs, of the order of 80%, but it will be okay, because new jobs will be created from somewhere”, or “there will be a massive loss of jobs, of the order of 80%, but it will be great, because we will be free of poverty and the burden of labour”. The problem with the first conclusion is that hope is only a strategy for politicians, not for urban planners, and if hope turns to hopelessness then revolution will surely follow, as many a political leader has discovered in the past, usually too late. The challenge of the second conclusion is that a city where no one works has never been built before. 6. Cities for the Citizen No one works! It sounds shocking and a little extreme, because there will presumably be a few jobs that computers cannot do well (nursing babies, teaching infants and comedy, perhaps?), but there are historic parallels in which even these things were not done by the citizens. Parallels, that is, if we equate the human slaves of the ancient world to the robots and other automata of today. Clearly I am referring to the ancient Greeks, where the elite lived a life of leisure and the slaves did everything else. However, while the ancient Greeks could be a useful case study, because their economic and social arrangements were so clearly reflected in the plans and designs of their cities, it is not clear that slavery and automation are economically equivalent (and they are certainly not socially equal) and direct
1060
Stephen Goldie The Jobless City ISOCARP-OAPA Conference 2017
8
democracy of a few thousand citizens is not the same as representative democracy of tens or hundreds of millions. Of course, the aristocracy of the past few hundred years have some similarities with the ancient Greeks. The aristocracy, as opposed to the merely wealthy, can be defined by the condition of not having to do anything. The decision as to whether such lives are worthwhile is then a matter for philosophical discussion and individual choice, but the aristocrats of the past who engaged in good works or achieved great things did not do so under the imperative of generating an income, and could also spend time on conversation, entertainment, sports, handicrafts, etc., as they wished. They were, and continue to be, a leisured class. However, they are few and rarely group together in densities sufficient to demonstrate any urbanism of note, so there is little to be learnt that is relevant, except perhaps that the elites of all cultures have lived such lives for centuries, without complaint, demonstrating that a lack of income is a much bigger problem than having nothing to do. A more useful parallel is Sir Ebenezer Howard’s Garden Cities Movement. As planners we remember the “Three Magnets Diagram” of town, country and town-country and the exquisite and practical urban design, but we forget that Howard knew all about the fundamentals of sustainability (environment, economy and equity) long before that science was even born. The enterprises that became Letchworth (established in 1903, architects and town planners Barry Parker and Raymond Unwin, current population approximately 35,000) and Welwyn Garden City (established in 1920, architect and town planner, Louis de Soissons, current population approximately 50,000) were premised on a new social order and a new economic model: in Howard’s own words, “Among the essential differences between the Garden City and other municipalities, one of the chief is its method of raising its revenue. Its entire revenue is derived from rents.”28 Essentially, the town earned income by owning its own estate, containing farms, factories, shops and offices and used the rent from these to provide municipal services, including education, enabling municipal rates (a.k.a. property taxes) to be kept to a minimum and thereby increasing affordability. One important principal of such an arrangement appears to be that the usual local government functions and the “development corporation” be kept separate. At Letchworth the original local government was the Letchworth (Civil) Parish Council (1908-19) and the First Garden City Ltd. (1903-63) owned the entire estate. The local government functions are now provided by the North Hertfordshire District Council (1974 to date), and the Letchworth Garden City Heritage Foundation (1995 to date) owns and manages the 5,300-acre (21 km2) Garden City estate – including offices, factories, shops, houses, community amenities, farms and land. This includes powers related to planning applications (which would normally be the preserve of the local council) in order to safeguard the character of the Garden City. It has assets of over £127m. No dividend payments are made to the residents, but instead, the profit of £7m a year is invested into the local economy.29 £7m a year, if divided between around 10,000 households (35,000 people at, say, 3.5 persons per household), would be £700 per household per year, which is a significant benefit to the community of Letchworth, but not sufficient to maintain the town and render 10,000 pay packets unnecessary. Nonetheless, the Digital Revolution combined with an increase in scale, perhaps to a population of one million, could make this a model one worth reworking for our future jobless cities. The Digital Revolution increases profits by decreasing labour, but there is no evidence yet that it decreases floor space. What will decrease is the need for worker transport, including
1061
Stephen Goldie The Jobless City ISOCARP-OAPA Conference 2017
9
parking. Therefore, robotised industrial land requirements might decrease by around 50% as parking areas are turned to more productive uses, but the roads and railways will probably be retained for the movement of raw materials and finished product. As the volume of production rises the value of the land rises and therefore rents can rise. There is no reason why a modern version of Howard’s co-operatives could not capture that value. Equally, urban and indoor agriculture reduces the agricultural hinterland required thereby reducing land costs for a new city and transport costs in bringing that produce to town. Areas of saving that could also be captured by a well-planned co-operative. Vivek Wadha, writing in the Washington Post30 said that “We need a new version of capitalism for the jobless future”. Perhaps a revival of co-operative ownership could be part of that model, an economy where:
• The citizens own the city; • The city consists of all of the usual land uses (residential, schools, hospitals, etc.)
renting these out, or operating them itself, as the citizens decide; • The city owns the land of production (mining, agricultural and industrial); • The city receives rents from the business owners or in-kind food and products; • The city maintains itself and provides for the needs of its citizens in the form of food
and clothing rations, access to education, health, recreation, entertainment, etc.; and • The city distributes any surplus income to the citizens as a dividend and/or special
purpose grants. Of course this raises considerable issues of local democracy that I cannot hope to cover here, except to note that the CEDA report quoted above, rightly points out that such issues “may be generationally dependent”, that is they change over time, and that democracy at all levels evolves in response to the changes of the societies that it serves and so local democracy will no doubt rise to the challenge caused by these changes to the growth and changing patterns of cities. 7. The Planning, Architecture & Design of Jobless Cities So, most jobs will disappear and they may or may not be replaced and there may be a self-financing model for jobless cities, but what about the planning, architecture and design options for jobless cities. Clearly, the responsible professions should, at least as a contingency, explore some options with the intent of ensuring that outcomes are much closer to paradise than to revolution. Of course, artists, philosophers and prophets have considered these possibilities already. Pieter Bruegel the Elder painted The Tower of Babel (figure 3) circa 1563, possibly, and with eerie prescience, to express the futility of much of human endeavour. It also clearly provides us with a Renaissance image of an archology. Philosopher-architect Buckminster Fuller advanced the concept further in his unbuilt Old Man River's City project; a circular multi-terraced dome building for 125,000 occupants (East St. Louis, Illinois, 1971) while modern prophet Raël talks of archologies in which no one works, but where the citizens do not get bored “because we provide them with numerous activities. The individual’s true value is recognized, and everyone wants to show that they have worth. Whether it be in art, in science or in sports, each person wants to shine in order to become eternal, or simply to be admired by the community - or by a [prospective partner]. Some people like to take risks, and to deprive them of the risk of dying would take away their joy of living, and that is why dangerous sports are very popular.”31 While the expression is very different, the confluence of thought with “unleashing the next wave of human innovation and creativity in directions we can never imagine” from the report on Australia’s Future Workforce, quoted earlier, is remarkable.
1062
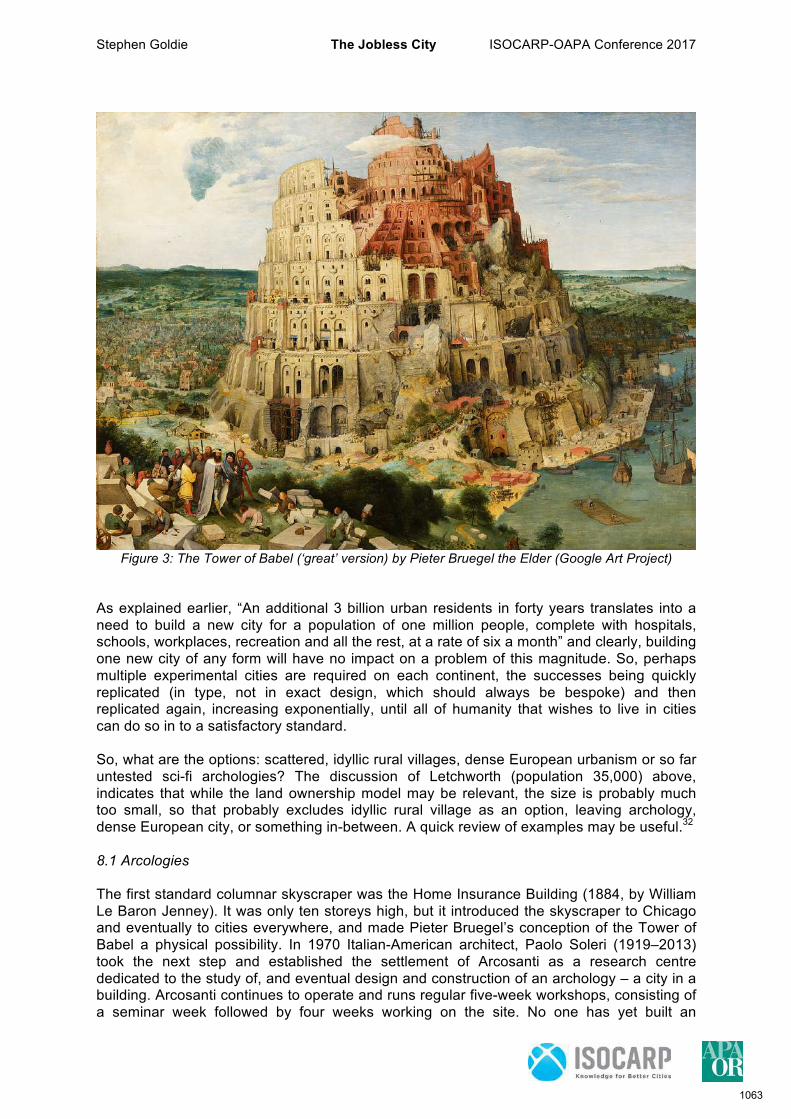
Stephen Goldie The Jobless City ISOCARP-OAPA Conference 2017
10
Figure 3: The Tower of Babel (‘great’ version) by Pieter Bruegel the Elder (Google Art Project)
As explained earlier, “An additional 3 billion urban residents in forty years translates into a need to build a new city for a population of one million people, complete with hospitals, schools, workplaces, recreation and all the rest, at a rate of six a month” and clearly, building one new city of any form will have no impact on a problem of this magnitude. So, perhaps multiple experimental cities are required on each continent, the successes being quickly replicated (in type, not in exact design, which should always be bespoke) and then replicated again, increasing exponentially, until all of humanity that wishes to live in cities can do so in to a satisfactory standard. So, what are the options: scattered, idyllic rural villages, dense European urbanism or so far untested sci-fi archologies? The discussion of Letchworth (population 35,000) above, indicates that while the land ownership model may be relevant, the size is probably much too small, so that probably excludes idyllic rural village as an option, leaving archology, dense European city, or something in-between. A quick review of examples may be useful.32 8.1 Arcologies The first standard columnar skyscraper was the Home Insurance Building (1884, by William Le Baron Jenney). It was only ten storeys high, but it introduced the skyscraper to Chicago and eventually to cities everywhere, and made Pieter Bruegel’s conception of the Tower of Babel a physical possibility. In 1970 Italian-American architect, Paolo Soleri (1919–2013) took the next step and established the settlement of Arcosanti as a research centre dedicated to the study of, and eventual design and construction of an archology – a city in a building. Arcosanti continues to operate and runs regular five-week workshops, consisting of a seminar week followed by four weeks working on the site. No one has yet built an
1063
Stephen Goldie The Jobless City ISOCARP-OAPA Conference 2017
11
archology, but there are some structures that demonstrate that the possibility is not too far away (but please note that the sustainability requirements mean that a true archology is more than just a very big building). 8.2 Largest and Densest Currently, the largest buildings are:
• By useable volume: Boeing Everett Factory (Everett, Washington, USA) with a gross floor area (GFA) of 398,000 m2 and a volume of 13.3 million m3;
• By footprint: Aalsmeer Flower Auction (Aalsmeer, North Holland, Netherlands) 518,000 m2 (740 m x 700 m);
• By floor area: New Century Global Center (Tianfu New Area, Chengdu, China) with a GFA of 1,760,000 m2. Just under one-third of the floor space is devoted to shopping, with the rest providing for offices, conference rooms, a university complex, two commercial centres, hotels, an IMAX cinema, a "Mediterranean village", a pirate ship and skating rink, and a water park containing a 5,000 m2 artificial beach.
• By height: Burj Khalifa (Dubai, UAE) consisting of 334,000 m² GFA spread over 163 floors and rising to a height of 828 m.
Currently, at 41,515 p/Km2, central Manila is the densest settlement on the planet, but is hardly a model worth emulating. However, there are a number of places with densities of around 25,000 p/Ha that provide excellent living standards, including the Parisian suburbs of Levallois-Perret, Le Pré-Saint-Gervais, Vincennes and Saint-Mandé, and Neapoli, a suburb of Thessaloniki, Greece. While some of the above incorporate new construction they are generally mid-rise mixed-use districts, so I will refer to them collectively as “traditional European urbanism”. Theoretically, less than half a square kilometre of building in this form would house one million people. Allowing for manufacturing, civic and cultural functions, and recreation perhaps a city of one million in one square kilometre is feasible, surrounded of course by the required agricultural hinterland and parklands. Although, even this area may be significantly reduced by the automation of agriculture. Not that a city of one million in one square kilometre is a target of any sort, just that it is likely that the more compact the city the more sustainable it will be, at least environmentally and economically. 8.3 Other Notable Buildings Galaxy Towers, New Jersey, USA (1976, by Gruzon and Partners) contains 1,075 residential units, shopping and entertainment in three 44-story towers and two 16-story connecting structures. Shanghai Tower, Lujiazui, Pudong, Shanghai, China (2015 by Gensler) is currently the world's tallest building by height to highest usable floor. It is the world's second-tallest building by height to architectural top (behind Dubai's Burj Khalifa, 828 m) and the world's third-tallest structure (behind Tokyo Skytree, 634 m). It has a GFA of 380,000 m2 above ground and 170 m2 below ground and cost US$2.4 billion. It is an office building with shopping and entertainment with a maximum capacity of 16,000 workers and visitors per day. It has a double glass façade, giving it very high levels of energy efficiency.
1064
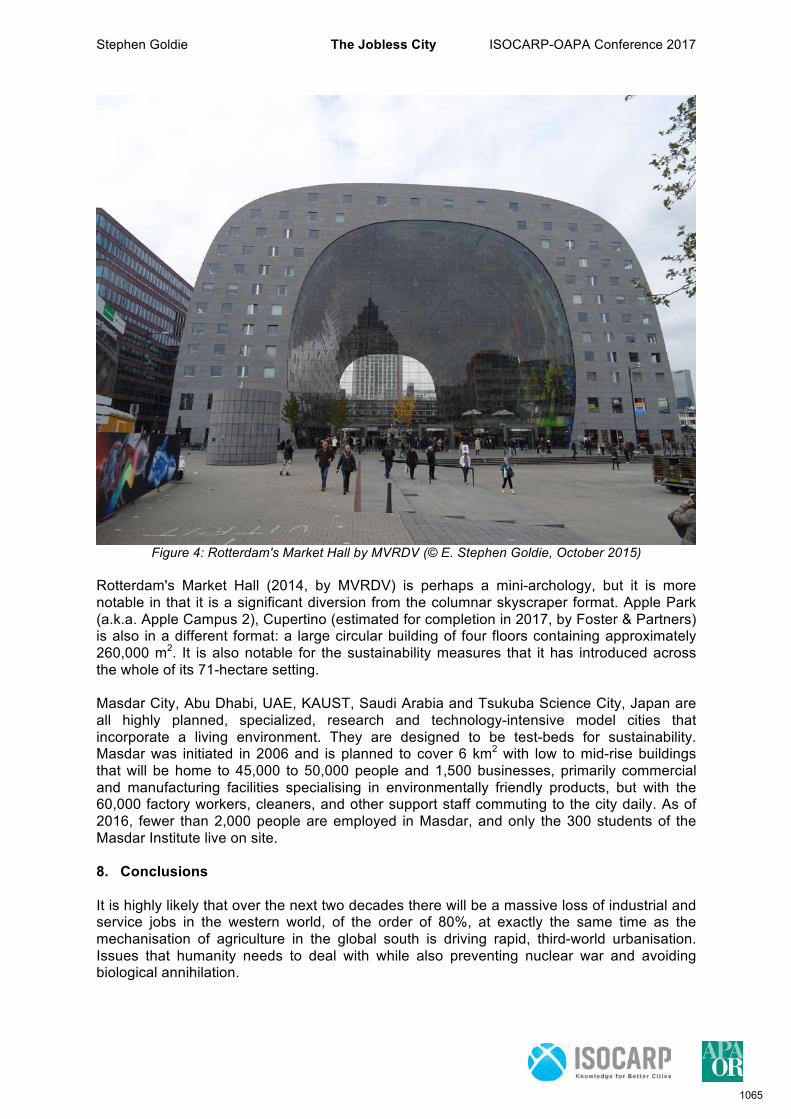
Stephen Goldie The Jobless City ISOCARP-OAPA Conference 2017
12
Figure 4: Rotterdam's Market Hall by MVRDV (© E. Stephen Goldie, October 2015)
Rotterdam's Market Hall (2014, by MVRDV) is perhaps a mini-archology, but it is more notable in that it is a significant diversion from the columnar skyscraper format. Apple Park (a.k.a. Apple Campus 2), Cupertino (estimated for completion in 2017, by Foster & Partners) is also in a different format: a large circular building of four floors containing approximately 260,000 m2. It is also notable for the sustainability measures that it has introduced across the whole of its 71-hectare setting. Masdar City, Abu Dhabi, UAE, KAUST, Saudi Arabia and Tsukuba Science City, Japan are all highly planned, specialized, research and technology-intensive model cities that incorporate a living environment. They are designed to be test-beds for sustainability. Masdar was initiated in 2006 and is planned to cover 6 km2 with low to mid-rise buildings that will be home to 45,000 to 50,000 people and 1,500 businesses, primarily commercial and manufacturing facilities specialising in environmentally friendly products, but with the 60,000 factory workers, cleaners, and other support staff commuting to the city daily. As of 2016, fewer than 2,000 people are employed in Masdar, and only the 300 students of the Masdar Institute live on site. 8. Conclusions It is highly likely that over the next two decades there will be a massive loss of industrial and service jobs in the western world, of the order of 80%, at exactly the same time as the mechanisation of agriculture in the global south is driving rapid, third-world urbanisation. Issues that humanity needs to deal with while also preventing nuclear war and avoiding biological annihilation.
1065
Stephen Goldie The Jobless City ISOCARP-OAPA Conference 2017
13
This quick review indicates that both traditional European urbanism or a city-in-a-building archology could provide the physical models for the jobless cities that we should have started to build yesterday. Which of these will work best is likely to be determined by the degree to which each city’s planning and design minimises environmental impact, maximises sustainability and, most critically, supports a functioning economic model that will “meet our needs as defined by the bottom two layers of Maslow’s hierarchy of needs (physiological and safety) … thereby unleashing the next wave of human innovation and creativity in directions we can never imagine.”34 REFERENCES
1. Llewelyn-Davies, London for (2007) Urban Design Compendium, 2nd edition, London: English Partnerships and the Housing Corporation, p10.
2. Mumford, Lewis (1966) The City in History, London: Pelican, p19
3. Mumford (1966) pp19-30.
4. Jacobs, Jane (1969) The Economy of Cities, New York: Vintage Books, Chap. 1.
5. Jacobs (1969) p48.
6. Mumford (1966) p49.
7. Chisholm, Hugh, ed. (1911). “Vauban, Sébastien Le Prestre de". Encyclopædia Britannica Vol 27 (11th ed.), Cambridge: University Press, pp. 951–953.
8. Mumford (1966) p379.
9. William Blake, Milton a Poem, 1808.
10. Patrick Geddes, Cities in Evolution, 1910.
11. Second Industrial Revolution, Wikipedia as at 13 August 2017, “Introduction”.
12. “CNU XII brings New Urbanism home to a city of urban innovation” A Public Square: A CNU Journal, January 1st 2004. (https://www.cnu.org/publicsquare/cnu-xii-brings-new-urbanism-home-city-urban-innovation ).
13. Author’s personal experience.
14. Ceballos, Gerado, Ehrlich, Paul R. and Dirzo, Rodolfo (2017) Biological annihilation via the ongoing sixth mass extinction signalled by vertebrate population loses and declines, PNAS Plus July 10, 2017, p7.
15. Meadows, D H, Meadows, D L, Randers, J & Behrens W W III, (1972) Limits to Growth, Universe Books, p183.
16. Goldie, E. Stephen (2015) “The Impending Revolution in Urban Planning Practice: Intelligent and automated, but will it be garbage in, garbage out?” 51st ISOCARP Congress Proceedings ISOCARP 2015, p746.
17. Digital Revolution, Wikipedia as at 13 August 2017, “Introduction”.
1066
Stephen Goldie The Jobless City ISOCARP-OAPA Conference 2017
14
18. Ratti, Carlo and Claudel, Matthew (2016) The City of Tomorrow: Sensors, Networks, Hackers, and the Future of Urban Life, Yale: University Press, p21.
19. Goldie, E. Stephen (2017) “Smart Planning for Smart Cities” presented at Marcus Evans’ 3rd Annual City Development, 13-15 March 2017, Cape Town and the Planning Institute of Australia Annual Planning Congress 3-5 May 2017, Sydney, unpublished.
20. Goldie (2015)
21. Belton, Padraigh (2016) “In the future, will farming be fully automated?” BBC, 26 Nov 2016.
22. IBM press release, Yorktown Heights, N.Y., 17 May 2017 (see https://www-03.ibm.com/press/us/en/pressrelease/52403.wss ).
23. Furman, Jason, Holdren, John P, Muñoz, Cecilia, Smith, Megan and Zients, Jeffrey (2016) Artificial Intelligence, Automation, and the Economy, Executive Office of the President, December 2016.
24. Furman & ors. (2016) p17.
25. CEDA (2015) Australia’s Future Workforce, Committee for Economic Development of Australia (CEDA), 16 June 2015.
26. CEDA (2015) p46.
27. CEDA (2015)
28. Howard, Ebenezer (1965) Garden Cities of To-Morrow Faber & Faber, p58.
29. Letchworth, Wikipedia as at 13 August 2017, section 1.3.2.3 “1995-date: Letchworth Garden City Heritage Foundation”.
30. Wadha, Vivek (2015) “We need a new version of Capitalism for the jobless future” The Washington Post, July 20th, 2015.
31. Raël (2006) Intelligent Design: Message from the Designers, Nova Distribution, (NB: a compilation of earlier works published in 1973, 1975, and 1979), pp 111-112.
32. All building and city facts in this section are courtesy of Wikipedia.
33. CEDA (2015) p46
1067
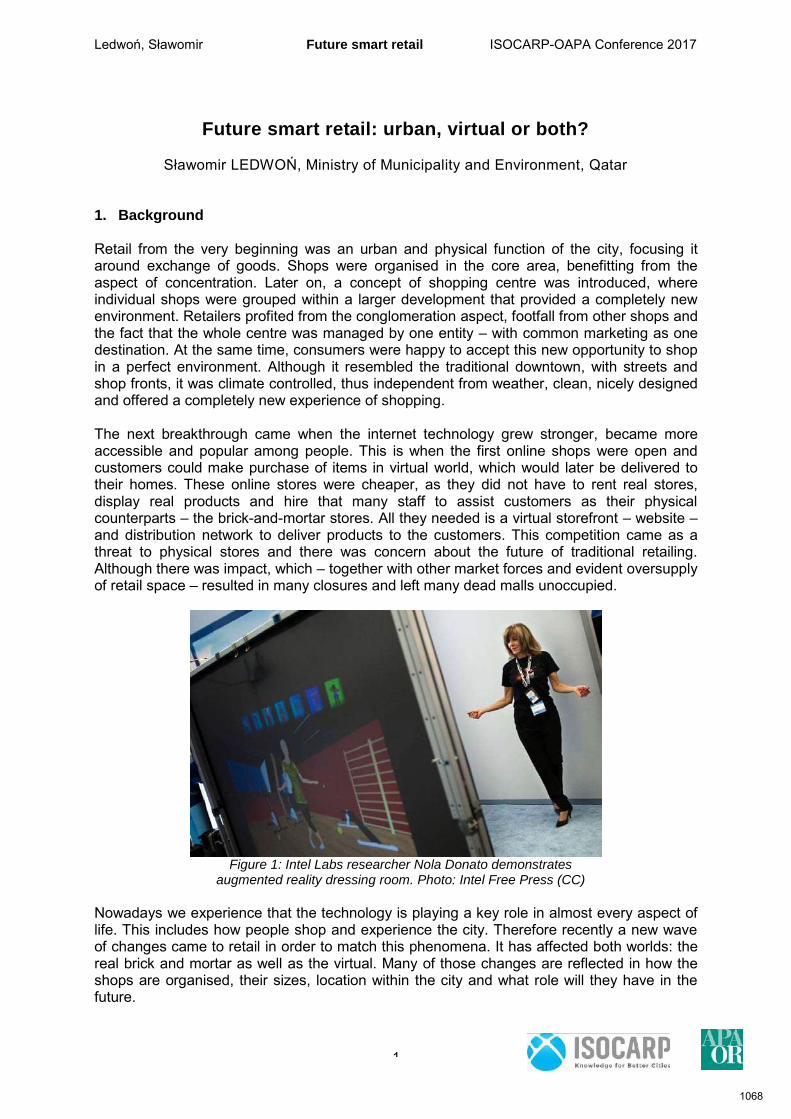
Ledwoń, Sławomir Future smart retail ISOCARP-OAPA Conference 2017
1
Future smart retail: urban, virtual or both?
Sławomir LEDWOŃ, Ministry of Municipality and Environment, Qatar
1. Background Retail from the very beginning was an urban and physical function of the city, focusing it around exchange of goods. Shops were organised in the core area, benefitting from the aspect of concentration. Later on, a concept of shopping centre was introduced, where individual shops were grouped within a larger development that provided a completely new environment. Retailers profited from the conglomeration aspect, footfall from other shops and the fact that the whole centre was managed by one entity – with common marketing as one destination. At the same time, consumers were happy to accept this new opportunity to shop in a perfect environment. Although it resembled the traditional downtown, with streets and shop fronts, it was climate controlled, thus independent from weather, clean, nicely designed and offered a completely new experience of shopping. The next breakthrough came when the internet technology grew stronger, became more accessible and popular among people. This is when the first online shops were open and customers could make purchase of items in virtual world, which would later be delivered to their homes. These online stores were cheaper, as they did not have to rent real stores, display real products and hire that many staff to assist customers as their physical counterparts – the brick-and-mortar stores. All they needed is a virtual storefront – website – and distribution network to deliver products to the customers. This competition came as a threat to physical stores and there was concern about the future of traditional retailing. Although there was impact, which – together with other market forces and evident oversupply of retail space – resulted in many closures and left many dead malls unoccupied.
Figure 1: Intel Labs researcher Nola Donato demonstrates
augmented reality dressing room. Photo: Intel Free Press (CC)
Nowadays we experience that the technology is playing a key role in almost every aspect of life. This includes how people shop and experience the city. Therefore recently a new wave of changes came to retail in order to match this phenomena. It has affected both worlds: the real brick and mortar as well as the virtual. Many of those changes are reflected in how the shops are organised, their sizes, location within the city and what role will they have in the future.
1068
Ledwoń, Sławomir Future smart retail ISOCARP-OAPA Conference 2017
2
2. Modern tends in retailing 2.1 Showrooming and webrooming One of the first impacts of internet shops was taking away sales from the brick and mortar outlets as customers were making the purchases online. However, at the same time another trend came into being – it is called showrooming. Reasons for this is in the main difference between the brick and mortar shop and internet based one is that in the latter the customer cannot touch, see, try out and manipulate with the products. All they see is an image representation and description. Whereas this is a crucial experience for many people to be able to decide on what they want to buy. As many products are the same, no matter where one buys them, customers started to use the physical shops as showrooms, where they could experience the item for real, and then place an order in a virtual store for a lower price. Showrooming puts all the purchasing display items, showroom and staff on the side of brick and mortar stores, while the sales revenue comes to their virtual competitors. On top of that, the competition is not only between the real and virtual, but also between online-based retailers. With the quick emergence of Comparison Shopping Engines (Google Shopping, Shopping.com, Nextag, PriceGrabber and many others in different countries), it is easy to look up and compare prices between many virtual stores. Therefore, the customer does not have to walk from one shop to the other at a high street, but can do all the comparison shopping by just using web browser. Interestingly enough, there was rise to an opposite trend called “reverse showrooming” or “webrooming” (Adler 2014, Khan 2016). This is when the customer is researching for a product online and then making the purchase in a real store. The benefit is that the customer comes prepared and finally decides on the product in the shop. It is convenient for the client, as the product is already there, they do not have to wait for delivery and there is an easier way of returning the product. What is observed nowadays is that more customers “webroom” (69%) rather than “showroom” (46%) (Adler 2014). 2.2 Omni-channel retailing Once the competition from online stores has emerged, the traditional stores also increased presence in virtual worlds. Using both channels help them to be competitive and fight for customers. This is called omni-channel retailing. At the beginning, it was more about basic online presence, but with time, the concept was developed further. The stores realised that they can compete with delivery prices once the product was delivered to the store, not customer, who would pick it up from the brick outlet. This meant that the delivery would be part of bulk delivery to store, not individual. Going further there has been a development of four types of purchase, all offered by the same company. The customer can choose to (1) do shopping online and have home delivery (just like other ecommerce shops), (2) shop online and pick up at store (limiting the time to wait for delivery and its cost), (3) shop at store and have the product delivered home or (4) shop and take the merchandise right away (the classic way). This trend lets shops capitalise on both showrooming and webrooming, by allowing them to exist in both worlds at a time. With the virtual technologies, there is also impact on the floor space needed for reorganised shops. With significant increase of the internet sales there will be oversupply of physical space. For example in the UK it is estimated that up to 20% of retail space is already a surplus to the current needs (Jones Lang LaSalle 2012). In the Netherlands, with the estimate of online sales shares growth from 9% to 27% by 2020, there will be an excess of 2.0 to 2.5 million square metres of retail space (Kesteloo, Hoogenberg 2013). This will mean
1069
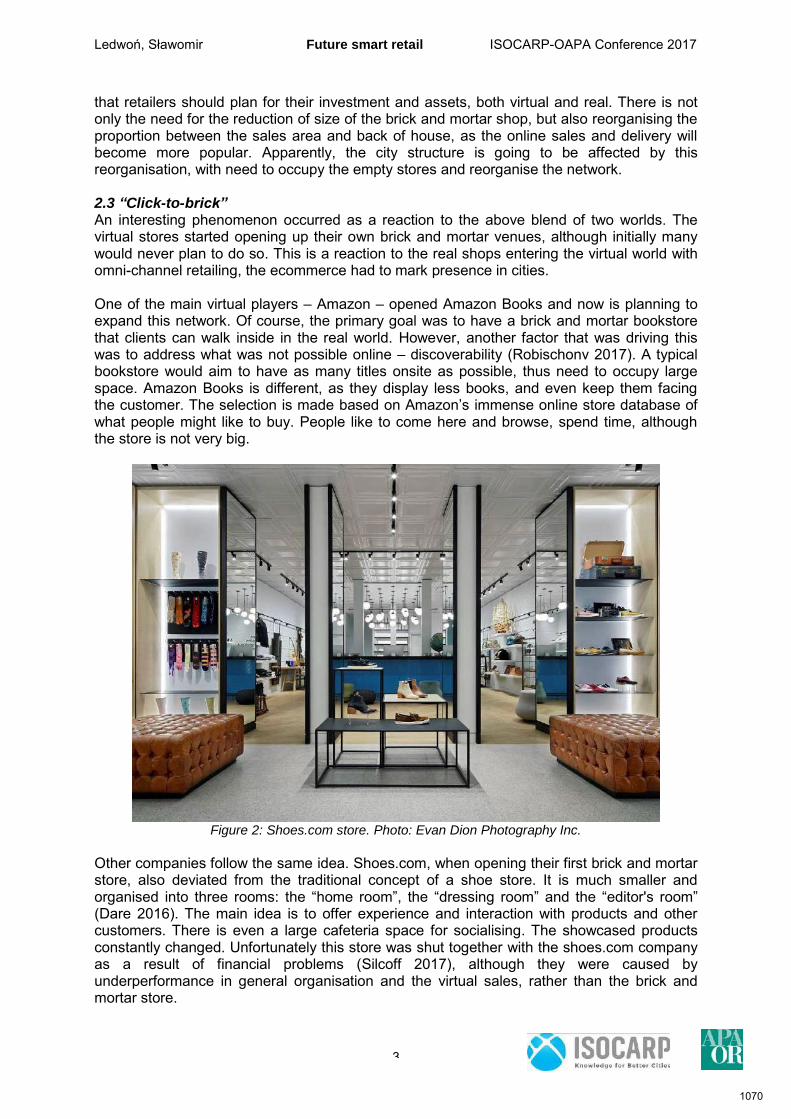
Ledwoń, Sławomir Future smart retail ISOCARP-OAPA Conference 2017
3
that retailers should plan for their investment and assets, both virtual and real. There is not only the need for the reduction of size of the brick and mortar shop, but also reorganising the proportion between the sales area and back of house, as the online sales and delivery will become more popular. Apparently, the city structure is going to be affected by this reorganisation, with need to occupy the empty stores and reorganise the network. 2.3 “Click-to-brick” An interesting phenomenon occurred as a reaction to the above blend of two worlds. The virtual stores started opening up their own brick and mortar venues, although initially many would never plan to do so. This is a reaction to the real shops entering the virtual world with omni-channel retailing, the ecommerce had to mark presence in cities. One of the main virtual players – Amazon – opened Amazon Books and now is planning to expand this network. Of course, the primary goal was to have a brick and mortar bookstore that clients can walk inside in the real world. However, another factor that was driving this was to address what was not possible online – discoverability (Robischonv 2017). A typical bookstore would aim to have as many titles onsite as possible, thus need to occupy large space. Amazon Books is different, as they display less books, and even keep them facing the customer. The selection is made based on Amazon’s immense online store database of what people might like to buy. People like to come here and browse, spend time, although the store is not very big.
Figure 2: Shoes.com store. Photo: Evan Dion Photography Inc.
Other companies follow the same idea. Shoes.com, when opening their first brick and mortar store, also deviated from the traditional concept of a shoe store. It is much smaller and organised into three rooms: the “home room”, the “dressing room” and the “editor's room” (Dare 2016). The main idea is to offer experience and interaction with products and other customers. There is even a large cafeteria space for socialising. The showcased products constantly changed. Unfortunately this store was shut together with the shoes.com company as a result of financial problems (Silcoff 2017), although they were caused by underperformance in general organisation and the virtual sales, rather than the brick and mortar store.
1070
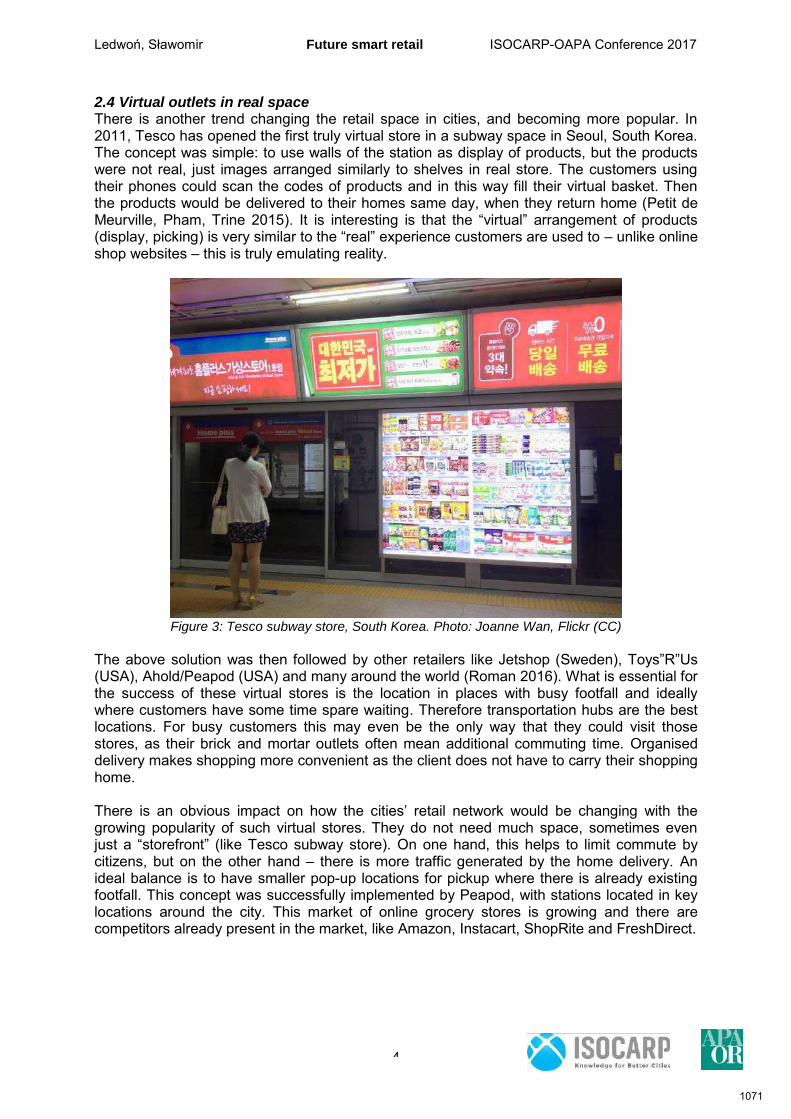
Ledwoń, Sławomir Future smart retail ISOCARP-OAPA Conference 2017
4
2.4 Virtual outlets in real space There is another trend changing the retail space in cities, and becoming more popular. In 2011, Tesco has opened the first truly virtual store in a subway space in Seoul, South Korea. The concept was simple: to use walls of the station as display of products, but the products were not real, just images arranged similarly to shelves in real store. The customers using their phones could scan the codes of products and in this way fill their virtual basket. Then the products would be delivered to their homes same day, when they return home (Petit de Meurville, Pham, Trine 2015). It is interesting is that the “virtual” arrangement of products (display, picking) is very similar to the “real” experience customers are used to – unlike online shop websites – this is truly emulating reality.
Figure 3: Tesco subway store, South Korea. Photo: Joanne Wan, Flickr (CC)
The above solution was then followed by other retailers like Jetshop (Sweden), Toys”R”Us (USA), Ahold/Peapod (USA) and many around the world (Roman 2016). What is essential for the success of these virtual stores is the location in places with busy footfall and ideally where customers have some time spare waiting. Therefore transportation hubs are the best locations. For busy customers this may even be the only way that they could visit those stores, as their brick and mortar outlets often mean additional commuting time. Organised delivery makes shopping more convenient as the client does not have to carry their shopping home. There is an obvious impact on how the cities’ retail network would be changing with the growing popularity of such virtual stores. They do not need much space, sometimes even just a “storefront” (like Tesco subway store). On one hand, this helps to limit commute by citizens, but on the other hand – there is more traffic generated by the home delivery. An ideal balance is to have smaller pop-up locations for pickup where there is already existing footfall. This concept was successfully implemented by Peapod, with stations located in key locations around the city. This market of online grocery stores is growing and there are competitors already present in the market, like Amazon, Instacart, ShopRite and FreshDirect.
1071
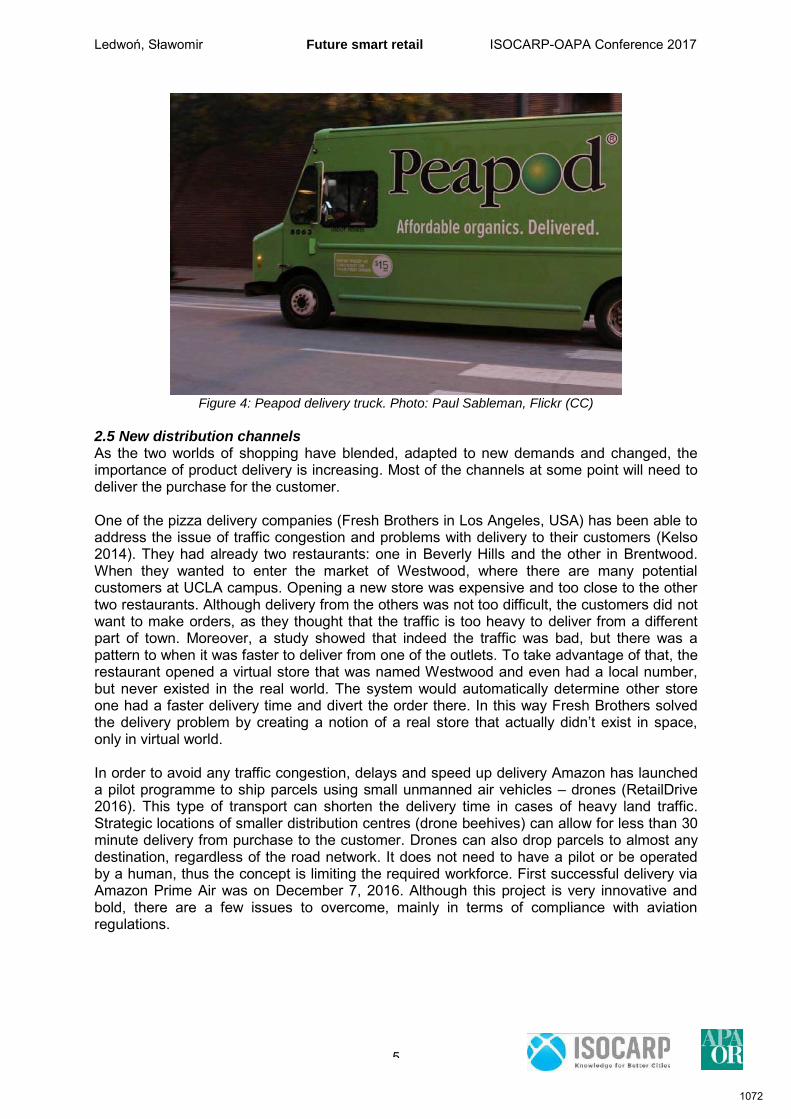
Ledwoń, Sławomir Future smart retail ISOCARP-OAPA Conference 2017
5
Figure 4: Peapod delivery truck. Photo: Paul Sableman, Flickr (CC)
2.5 New distribution channels As the two worlds of shopping have blended, adapted to new demands and changed, the importance of product delivery is increasing. Most of the channels at some point will need to deliver the purchase for the customer. One of the pizza delivery companies (Fresh Brothers in Los Angeles, USA) has been able to address the issue of traffic congestion and problems with delivery to their customers (Kelso 2014). They had already two restaurants: one in Beverly Hills and the other in Brentwood. When they wanted to enter the market of Westwood, where there are many potential customers at UCLA campus. Opening a new store was expensive and too close to the other two restaurants. Although delivery from the others was not too difficult, the customers did not want to make orders, as they thought that the traffic is too heavy to deliver from a different part of town. Moreover, a study showed that indeed the traffic was bad, but there was a pattern to when it was faster to deliver from one of the outlets. To take advantage of that, the restaurant opened a virtual store that was named Westwood and even had a local number, but never existed in the real world. The system would automatically determine other store one had a faster delivery time and divert the order there. In this way Fresh Brothers solved the delivery problem by creating a notion of a real store that actually didn’t exist in space, only in virtual world. In order to avoid any traffic congestion, delays and speed up delivery Amazon has launched a pilot programme to ship parcels using small unmanned air vehicles – drones (RetailDrive 2016). This type of transport can shorten the delivery time in cases of heavy land traffic. Strategic locations of smaller distribution centres (drone beehives) can allow for less than 30 minute delivery from purchase to the customer. Drones can also drop parcels to almost any destination, regardless of the road network. It does not need to have a pilot or be operated by a human, thus the concept is limiting the required workforce. First successful delivery via Amazon Prime Air was on December 7, 2016. Although this project is very innovative and bold, there are a few issues to overcome, mainly in terms of compliance with aviation regulations.
1072
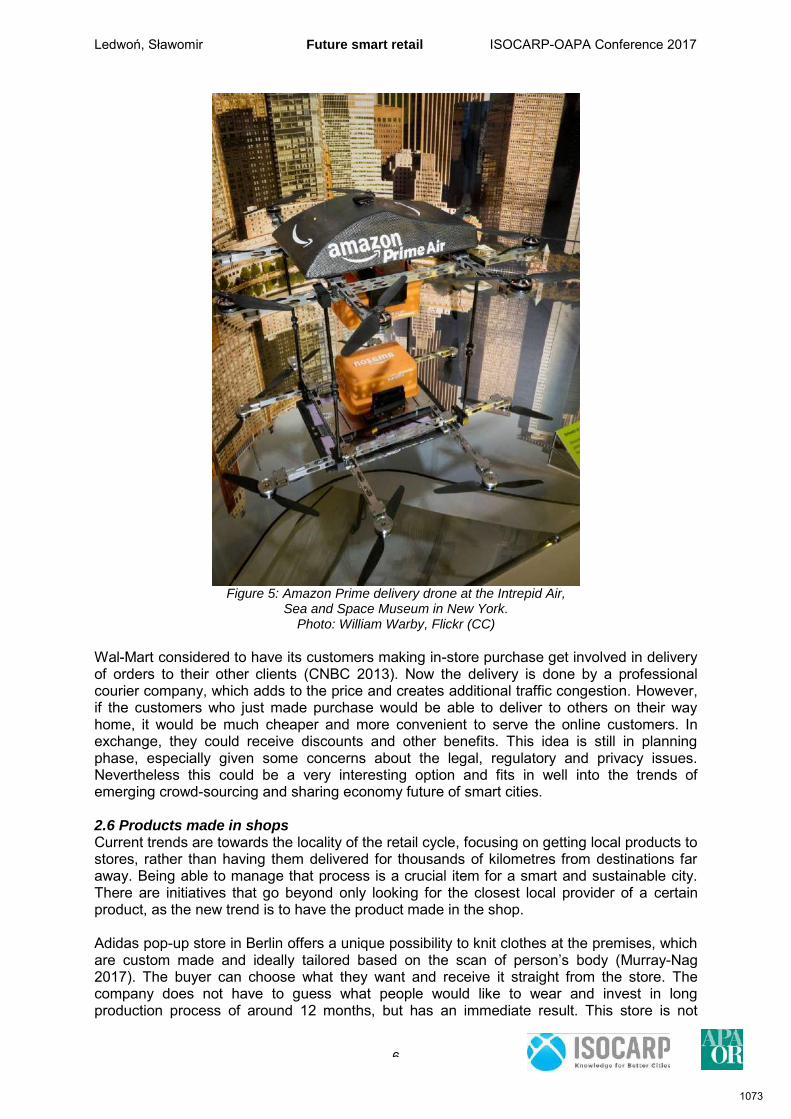
Ledwoń, Sławomir Future smart retail ISOCARP-OAPA Conference 2017
6
Figure 5: Amazon Prime delivery drone at the Intrepid Air,
Sea and Space Museum in New York. Photo: William Warby, Flickr (CC)
Wal-Mart considered to have its customers making in-store purchase get involved in delivery of orders to their other clients (CNBC 2013). Now the delivery is done by a professional courier company, which adds to the price and creates additional traffic congestion. However, if the customers who just made purchase would be able to deliver to others on their way home, it would be much cheaper and more convenient to serve the online customers. In exchange, they could receive discounts and other benefits. This idea is still in planning phase, especially given some concerns about the legal, regulatory and privacy issues. Nevertheless this could be a very interesting option and fits in well into the trends of emerging crowd-sourcing and sharing economy future of smart cities. 2.6 Products made in shops Current trends are towards the locality of the retail cycle, focusing on getting local products to stores, rather than having them delivered for thousands of kilometres from destinations far away. Being able to manage that process is a crucial item for a smart and sustainable city. There are initiatives that go beyond only looking for the closest local provider of a certain product, as the new trend is to have the product made in the shop. Adidas pop-up store in Berlin offers a unique possibility to knit clothes at the premises, which are custom made and ideally tailored based on the scan of person’s body (Murray-Nag 2017). The buyer can choose what they want and receive it straight from the store. The company does not have to guess what people would like to wear and invest in long production process of around 12 months, but has an immediate result. This store is not
1073
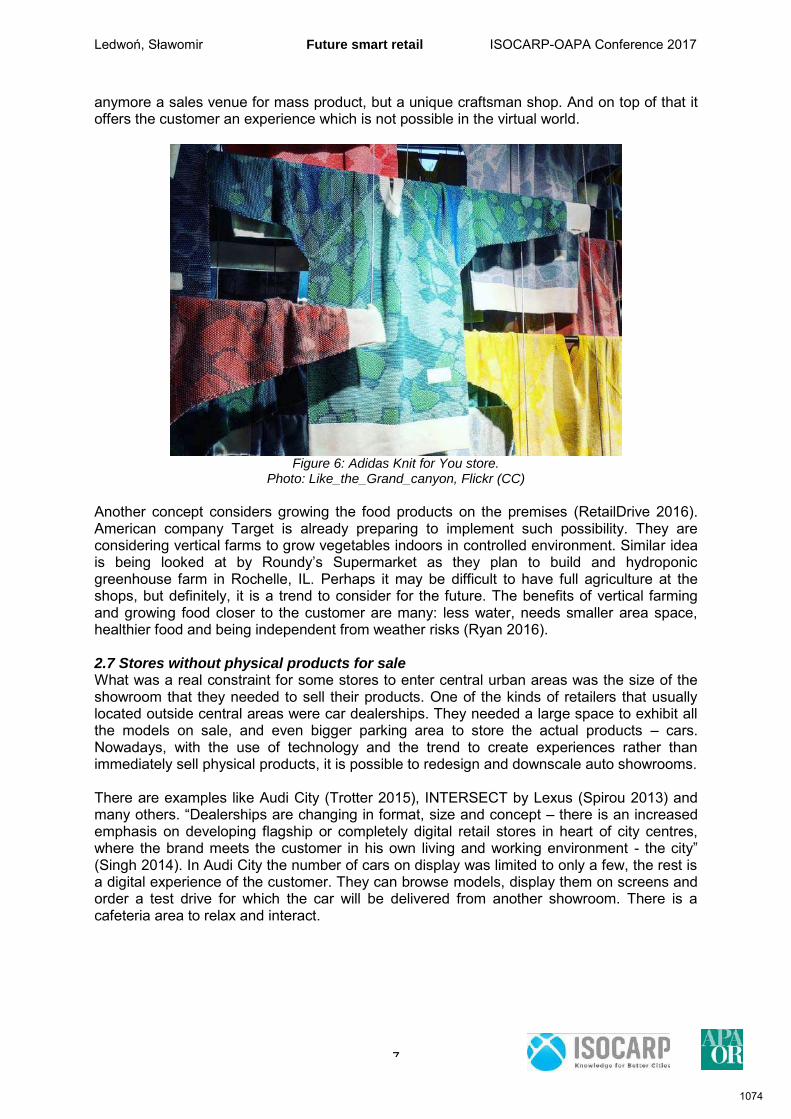
Ledwoń, Sławomir Future smart retail ISOCARP-OAPA Conference 2017
7
anymore a sales venue for mass product, but a unique craftsman shop. And on top of that it offers the customer an experience which is not possible in the virtual world.
Figure 6: Adidas Knit for You store.
Photo: Like_the_Grand_canyon, Flickr (CC)
Another concept considers growing the food products on the premises (RetailDrive 2016). American company Target is already preparing to implement such possibility. They are considering vertical farms to grow vegetables indoors in controlled environment. Similar idea is being looked at by Roundy’s Supermarket as they plan to build and hydroponic greenhouse farm in Rochelle, IL. Perhaps it may be difficult to have full agriculture at the shops, but definitely, it is a trend to consider for the future. The benefits of vertical farming and growing food closer to the customer are many: less water, needs smaller area space, healthier food and being independent from weather risks (Ryan 2016). 2.7 Stores without physical products for sale What was a real constraint for some stores to enter central urban areas was the size of the showroom that they needed to sell their products. One of the kinds of retailers that usually located outside central areas were car dealerships. They needed a large space to exhibit all the models on sale, and even bigger parking area to store the actual products – cars. Nowadays, with the use of technology and the trend to create experiences rather than immediately sell physical products, it is possible to redesign and downscale auto showrooms. There are examples like Audi City (Trotter 2015), INTERSECT by Lexus (Spirou 2013) and many others. “Dealerships are changing in format, size and concept – there is an increased emphasis on developing flagship or completely digital retail stores in heart of city centres, where the brand meets the customer in his own living and working environment - the city” (Singh 2014). In Audi City the number of cars on display was limited to only a few, the rest is a digital experience of the customer. They can browse models, display them on screens and order a test drive for which the car will be delivered from another showroom. There is a cafeteria area to relax and interact.
1074
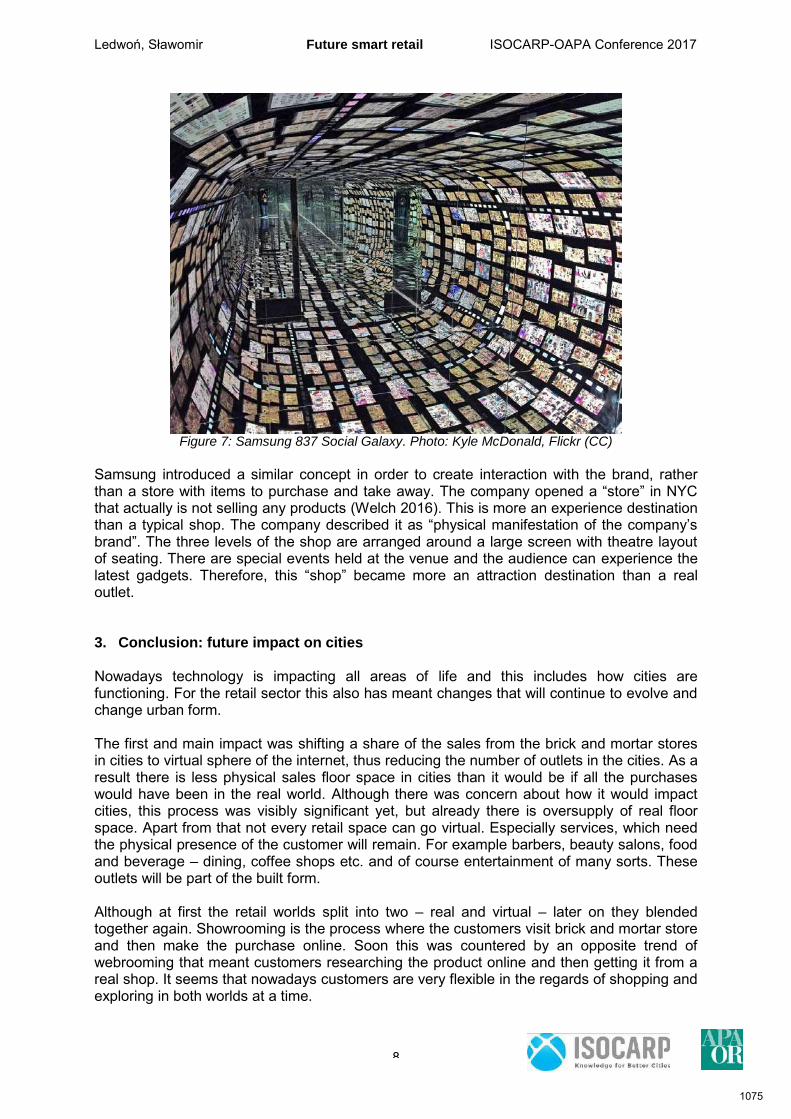
Ledwoń, Sławomir Future smart retail ISOCARP-OAPA Conference 2017
8
Figure 7: Samsung 837 Social Galaxy. Photo: Kyle McDonald, Flickr (CC)
Samsung introduced a similar concept in order to create interaction with the brand, rather than a store with items to purchase and take away. The company opened a “store” in NYC that actually is not selling any products (Welch 2016). This is more an experience destination than a typical shop. The company described it as “physical manifestation of the company’s brand”. The three levels of the shop are arranged around a large screen with theatre layout of seating. There are special events held at the venue and the audience can experience the latest gadgets. Therefore, this “shop” became more an attraction destination than a real outlet. 3. Conclusion: future impact on cities Nowadays technology is impacting all areas of life and this includes how cities are functioning. For the retail sector this also has meant changes that will continue to evolve and change urban form. The first and main impact was shifting a share of the sales from the brick and mortar stores in cities to virtual sphere of the internet, thus reducing the number of outlets in the cities. As a result there is less physical sales floor space in cities than it would be if all the purchases would have been in the real world. Although there was concern about how it would impact cities, this process was visibly significant yet, but already there is oversupply of real floor space. Apart from that not every retail space can go virtual. Especially services, which need the physical presence of the customer will remain. For example barbers, beauty salons, food and beverage – dining, coffee shops etc. and of course entertainment of many sorts. These outlets will be part of the built form. Although at first the retail worlds split into two – real and virtual – later on they blended together again. Showrooming is the process where the customers visit brick and mortar store and then make the purchase online. Soon this was countered by an opposite trend of webrooming that meant customers researching the product online and then getting it from a real shop. It seems that nowadays customers are very flexible in the regards of shopping and exploring in both worlds at a time.
1075
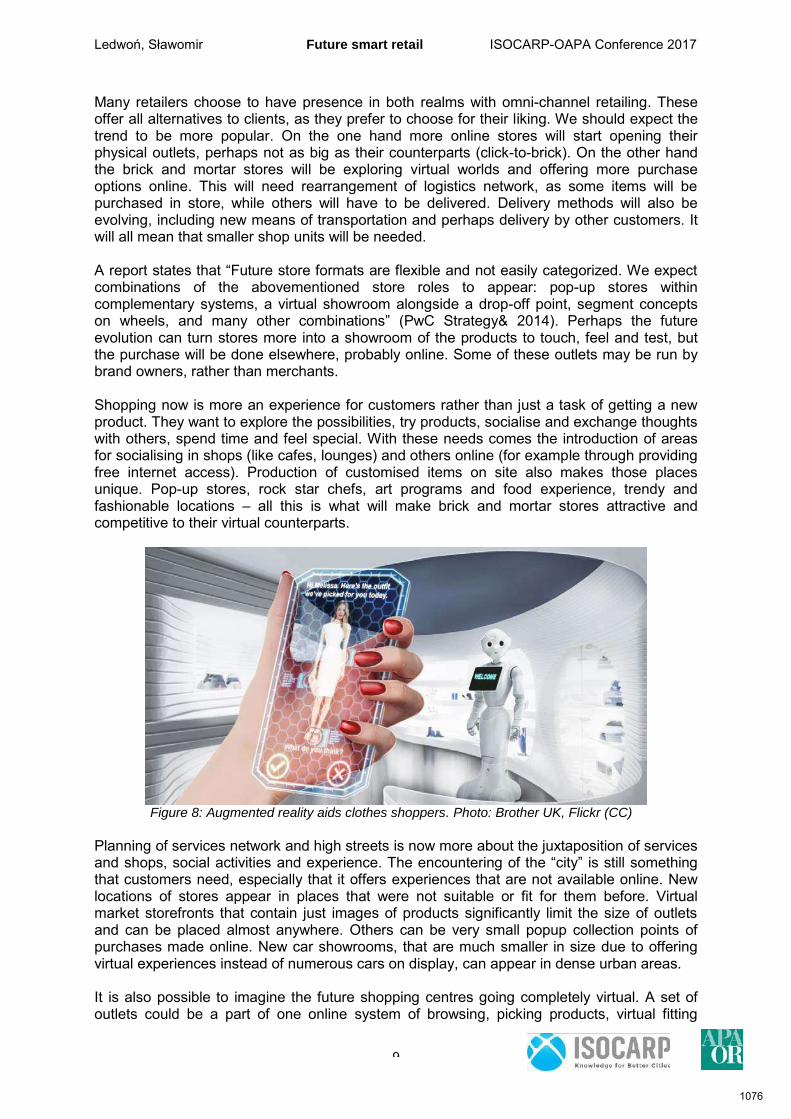
Ledwoń, Sławomir Future smart retail ISOCARP-OAPA Conference 2017
9
Many retailers choose to have presence in both realms with omni-channel retailing. These offer all alternatives to clients, as they prefer to choose for their liking. We should expect the trend to be more popular. On the one hand more online stores will start opening their physical outlets, perhaps not as big as their counterparts (click-to-brick). On the other hand the brick and mortar stores will be exploring virtual worlds and offering more purchase options online. This will need rearrangement of logistics network, as some items will be purchased in store, while others will have to be delivered. Delivery methods will also be evolving, including new means of transportation and perhaps delivery by other customers. It will all mean that smaller shop units will be needed. A report states that “Future store formats are flexible and not easily categorized. We expect combinations of the abovementioned store roles to appear: pop-up stores within complementary systems, a virtual showroom alongside a drop-off point, segment concepts on wheels, and many other combinations” (PwC Strategy& 2014). Perhaps the future evolution can turn stores more into a showroom of the products to touch, feel and test, but the purchase will be done elsewhere, probably online. Some of these outlets may be run by brand owners, rather than merchants. Shopping now is more an experience for customers rather than just a task of getting a new product. They want to explore the possibilities, try products, socialise and exchange thoughts with others, spend time and feel special. With these needs comes the introduction of areas for socialising in shops (like cafes, lounges) and others online (for example through providing free internet access). Production of customised items on site also makes those places unique. Pop-up stores, rock star chefs, art programs and food experience, trendy and fashionable locations – all this is what will make brick and mortar stores attractive and competitive to their virtual counterparts.
Figure 8: Augmented reality aids clothes shoppers. Photo: Brother UK, Flickr (CC)
Planning of services network and high streets is now more about the juxtaposition of services and shops, social activities and experience. The encountering of the “city” is still something that customers need, especially that it offers experiences that are not available online. New locations of stores appear in places that were not suitable or fit for them before. Virtual market storefronts that contain just images of products significantly limit the size of outlets and can be placed almost anywhere. Others can be very small popup collection points of purchases made online. New car showrooms, that are much smaller in size due to offering virtual experiences instead of numerous cars on display, can appear in dense urban areas. It is also possible to imagine the future shopping centres going completely virtual. A set of outlets could be a part of one online system of browsing, picking products, virtual fitting
1076
Ledwoń, Sławomir Future smart retail ISOCARP-OAPA Conference 2017
10
rooms (allowing to try on together items from different stores) with one joint payment and delivery system. Some of the challenges for cities to overcome is be to be able to adapt to the trend of scaling down the size of retail outlets (Haasch 2014, Kohlstedt 2016). There is need for more consideration how to redevelop existing big spaces that may not be suitable for future retailers. Breaking them up into smaller units is one of the options. The other is redevelopment into different uses (residential, educational, community etc.). The other future trends will include individualised sales experience, that put the client into special position. Niche retailing, very local products or services, innovative approaches, signature items should be the future differentiating it from the others. “In the future this ‘halo effect’ of technology will impact the shop floor, turning stores into inspiration house, service centre, showroom or fulfilment point” (PwC Strategy& 2014). The abovementioned trends will be shaping the smart retail services in cities. We should also expect that new technologies will bring different, yet unforeseen innovations as well. References:
Adler, Emily (2014) “'Reverse Showrooming': Bricks-And-Mortar Retailers Fight Back”, online: http://www.businessinsider.com/reverse-showrooming-bricks-and-mortar-retailers-fight-back-2-2014-2
CNBC (2013) “Wal-Mart May Tap Customers to Deliver Online Orders” Online https://www.cnbc.com/id/100599890
Dare Christian (2016) “Shoes.com Opens Their First Brick-and-Mortar Store in Toronto”, online: http://ca.complex.com/sneakers/2016/08/shoes.com-opens-toronto-store-2016
Haasch, Karianna (2014) “Why Big Box Stores Are Getting Small” online http://www.mechtron.com/blog/why-big-box-stores-are-getting-small/
Jones Lang LaSalle (2012) “The Rise and Rise of Multi-Channel Retailing”, BCSC: London.
Kelso, Alicia (2014) “Fresh Brothers solves heavy traffic delivery problem with virtual store”, online: https://www.pizzamarketplace.com/articles/fresh-brothers-solves-heavy-traffic-delivery-problem-with-virtual-store/
Kesteloo Marco, Hoogenberg Marc (2013) “Footprint 2020: Offline retail in an online world” Booz & Company.
Khan, Humayun (2016) “Consumers Are Showrooming and Webrooming Your Business, Here's What That Means and What You Can Do About It”, online: https://www.shopify.com/retail/119920451-consumers-are-showrooming-and-webrooming-your-business-heres-what-that-means-and-what-you-can-do-about-it
Kohlstedt Kurt (2016) “Ghost Boxes: Reusing Abandoned Big-Box Superstores Across America” online: http://99percentinvisible.org/article/ghost-boxes-reusing-abandoned-big-box-superstores-across-america/
Murray-Nag Beatrice (2017) “Adidas Pop-up Store Knits Bespoke Garments Based on a Scan of Your Body” online: https://www.designboom.com/technology/adidas-knit-for-you-03-22-2017/
Petit de Meurville Martin, Pham Kimberley, Trine Courtney (2015) “Shop on the Go”, online: http://www.businesstoday.in/magazine/lbs-case-study/case-study-tesco-virtually-created-new-market-based-on-country-lifestyle/story/214998.html
1077
Ledwoń, Sławomir Future smart retail ISOCARP-OAPA Conference 2017
11
PwC Strategy& (2014) “Footprint 2020 Offline retail in an online world”, online: https://www.strategyand.pwc.com/media/file/Strategyand_Footprint-2020.pdf
RetailDrive (2016) “10 innovations that could disrupt grocery in 2017” Online: http://www.retaildive.com/news/10-innovations-that-could-disrupt-grocery-in-2017/432309/
Robischonv Noah (2017) “With Amazon Books, Jeff Bezos Is Solving Digital Retail’s Biggest Design Flaw”, online: https://www.fastcodesign.com/3067020/with-amazon-books-jeff-bezos-is-solving-digital-retails-biggest-design-flaw
Roman (2016) “Top 10 QR Code Store examples”, online: http://www.shop2mobi.com/virtual-qr-code-store-examples/
Ryan Tom (2016) “Will Target's In-Store Farms Be Sustainable?“ online: https://www.forbes.com/sites/retailwire/2016/10/19/will-targets-in-store-farms-be-sustainable/#7c5eecbc7f53
Silcoff Sean (2017) “Vancouver's Shoes.com shuts down operations”, online https://sec.theglobeandmail.com/report-on-business/shoescom-shuts-down-operations/article33808013/
Singh, Sarwant (2014) “The Future of Car Retailing”, online: https://www.forbes.com/sites/sarwantsingh/2014/02/05/the-future-of-car-retailing
Spirou, Kiriakos (2013) “The First INTERSECT by Lexus Flagship Store In Tokyo, Japan”, online: https://www.yatzer.com/intersect-lexus-tokyo
Trotter, Cate (2015) “Retail Innovation Factfile: Audi City”, online: http://www.insider-trends.com/retail-innovation-factfile-audi-city/
Welch, Chris (2016) “Samsung's new flagship NYC building isn't a retail store at all”, online https://www.theverge.com/2016/2/23/11099014/samsung-837-nyc-walkthrough
1078
Abstract title Avoiding the Nightmare: How a Dynamic VMT Tax for Automated Vehicles can
Achieve Public Policy Goals
Author Biddle, DKS Associates, Portland, United States of America (Presenting author)
Abstract
This paper will discuss the challenges of deploying automated vehicles and suggests a dynamic
vehicle miles traveled (VMT) based tax to meet those challenges. Benefits of this tax will also be
discussed in its capacity to shape traveler behavior and achieve diverse public policy outcomes that
benefit equity, public health, the economy, and the environment.
First, the paper will outline the historical funding challenges that accompany our current gas tax.
These problems stem from the static tax rate along with the improving efficiency of vehicles. With
the rise of automated vehicles and the likelihood that they will be fully electric, the bottom could
drop out of our already troubled transportation infrastructure’s finance system. Without tax reform
in the transportation industry, the deployment of autonomous vehicles could fall short of the safety
improvements that are expected to come with automated vehicles.
Second, the paper will outline Oregon and California’s pilot projects for reforming the gas tax
through a VMT based tax. The paper will describe the logistical and political barriers to the adoption
of these programs including tracking miles, inter-state travel, security, privacy and government
surveillance.
Third, I will argue that a VMT based tax is well suited to apply to the automated vehicle sphere. This
new technology will present opportunities to overcome the challenges of adopting this technology
because it can be delivered through partnerships with already trusted private telecommunications
services. I will outline research that discusses public perception of regulation and taxation of new
technology as compared to a change in existing tax policy.
Finally, the benefits of this technology offer some of the strongest policy tools that could steer our
automated future towards ideal scenarios that benefit equity, public health, the economy, and the
environment. Through a VMT tax that can vary by time of day, location, and whether the vehicle is
being shared, jurisdictions will be able to shape outcomes that make cities more livable, efficient,
and safe. This tax could also be implemented with an integrated payment platform for transit. If the
tax is dramatically less for travelers who are willing to use transit with automated vehicles serving as
the first/last mile solution, the VMT tax could help solve the fundamental geometry problem that will
continue to make mass transit necessary in dense urban areas.
1079
Communityengagement&thePortlandGreenLoop
Moderator: Mark RAGGETT, City of Portland, Oregon, Bureau of Planning and Sustainability,
Portland, USA
Speakers: Linda GINENTHAL, City of Portland, Oregon, Bureau of Transportation; Shelley MIDTHUN,
Oregon Storyboard; Rachel CODDINGTON, Design Week Portland; Lora LILLARD, City of Portland,
Oregon, Bureau of Planning and Sustainability, USA
This session will focus on urban placemaking, the evolution of a planning/urban design concept or
“big idea,” and community engagement.
The Green Loop is a 6‐mile linear park concept that was developed through community
conversations during the Central City 2035 Plan process. It was conceived by a committee of Central
City stakeholders as a primary new way to help support the growth of the Central City, estimated to
accommodate 30% of Portland’s growth over the next 25 years. It is a signature piece of public
infrastructure that will repurpose existing street space into places for gathering, community
interaction, walking, jogging, rolling and bicycling, additional tree canopy and expanded habitat
areas. The concept could serve as a development catalyst and the framework for 21st Century
resilience in Portland – building social capital and opportunities for safer, healthier communities
through increased connection and interaction.
The Green Loop resonates with a broad public audience for different reasons, cultivating a
grassroots base of support that propels the concept toward implementation. Some are drawn to the
loop’s ability to create new open spaces, others to its easy walking and bicycling appeal, and others
still to its catalytic potential for economic development.
Staff from the Urban Design Studio at the Bureau of Planning and Sustainability would present first
at this session, describing the origins of the Green Loop concept, its key features, proposed
alignment and envisioned design character. Representatives from selected organizations would then
present on their respective missions and the aspects of the Green Loop that support their vision
and/or how their organizations have collaborated in building momentum for the Green Loop.
A question and answer period would follow the presentations, allowing for interplay between the
panelists/presenters and interested audience members. Each presentation would be roughly 10
minutes, creating a session that is 45 – 50 minutes of presentation and 40 minutes or so of question
and answer period, for a total of 90 minutes.
Beyond the City of Portland, potential organizations for this session proposal include:
• Sunday Parkways Program – interest: repurposing of existing street space for open space,
active transportation
• Design Week Portland – interest: engaging the community through design
• Oregon Storyboard – interest: using new technologies to break down barriers and connect
with different people.
1080
Urbanismnext:howautonomousvehicles,thesharingeconomy,&e‐commercewillimpactcities
Moderator: Becky STECKLER, University of Oregon, Eugene, USA
Speakers: Nico LARCO, University of Oregon, USA; Benjamin CLARK, University of Oregon, Eugene,
USA; Peter Hurley, Portland Bureau of Transportation, USA; Andrew DICK, Oregon Department of
Transportation, USA
This session highlights a framework for examining the secondary impacts of Urbanism Next: how the
sharing economy, e‐commerce, and autonomous vehicles are changing land use, urban design and
transportation within cities. Nico Larco will present the Urbanism Next framework. Ben Clark will
highlight research on the budgetary impacts of autonomous vehicles. Peter Hurley will discuss the
City of Portland’s approach to planning for autonomous vehicles. Andrew Dick will discuss the State
of Oregon’s approach to planning for autonomous vehicles. Attendees will learn about potential
regulatory approaches to anticipating and responding to autonomous vehicles at the city and state
level.
1081

Abstract title The community activation strategy of an atypical characteristic town urban fringe on "Symbiosis Theory": Case study of Shenzhen Gankeng characteristic town
Author GUO, Xiaofeng, Peking University, 518055 SHENZHEN, China (Presenting author)
Co-author(s)
Topic 6. Post-smart communities and the new frontiers
Keywords
Abstract text
Old village is the Root of Chinese agricultural civilization, and also the most important unit of spatial organization in traditional society. In recent years, more and more traditional villages in China are protected and were built into characteristic towns for heritage tourism in full swing, but the focus of academia and society generally concentrated in traditional villages that have a rich historical and cultural value, while ignoring the large number of "atypical village", which located in the urban fringe, and having some historical and cultural values between the traditional villages and countryside between ordinary.
The historical and cultural value of this village is usually lower than the historical and cultural value of the traditional villages UNESCO identified. Because of this type of village located on the edge of urban areas, and therefore tend to have services in urban and rural areas, and assume the function of urban and rural factor mobility.
At the same time, urban sprawl makes these villages are facing contradictory choice between protection and development.
Symbiosis theory of biology, has been used in many disciplines, by introducing the symbiosis theory to construct the cogeneration system between village and urban, will be conducive to coordinated development of urban and village, effective solution to the Middle Kingdom development of contradictions.
In our view, such the type of "atypical Characteristic town " in Urban Fringe can not apply the traditional village and ordinary village update mode, We need to introduce symbiosis theory, basic features, and the three symbiotic elements of the ecosystems (symbiotic unit, symbiotic environment, symbiotic model) for the Practical problems, then analyzes the necessity and suitability of introduction into the "atypical Characteristic town " in urban fringe; Thereafter thesis combines symbiosis theory and village protection and updates research and practice, analysis the various symbiotic elements between the "atypical village" in fringe and center of city. Therefore, we propose a theory to build the town and urban symbiotic system, proposed urban fringe "atypical Characteristic town " activation system update strategy based on the theory of symbiotic ,including establish symbiosis mode, symbiotic
coordination unit ,and optimize symbiotic environment.
Based on the theoretical research, Our research topic taking the old town of Gankeng activation Case Update empirical research. First, the paper analyzes the current situation and problems of three symbiotic elements Gankeng old village and Gankeng communities. Then, address these issues three symbiotic strategy, namely, establish symbiosis modes, including economic and cultural symbiosis; coordination symbiosis unit, including functional format adjustment between village and communities, and create cultural features, enhance environmental facilities, formulation staging symbiotic strategy; ptimization symbiotic environment, including cultural events to increase awareness, optimize contact with the city, and actively guide social participation.
Through our research, hoping to construct the protection and renewal strategies of "atypical village" in urban fringe, improve theoretical research Village activation update, and provides reference to similar "atypical village".
1082

52
The International Society of City and Regional Planners (ISOCARP) is a global association of experienced professional planners. It was founded in 1965 in a bid to bring together recognised and highly-qualified planners in an international network. The ISOCARP network brings together individual and
institutional members from more than 80 countries worldwide.
The wealth and diversity of professional expertise, knowledge, and experience in the ISOCARP membership is unmatched in the planning field. Although ISOCARP members work in many different fields they share a common interest in the spatial and environmental dimensions of urbanisation.
They advise key decision-makers, proposing and supporting projects for intervention in a spatial context through general or specific actions.
ISOCARP encourages the exchange of professional knowledge between planners, promotes the planning profession in all its forms, stimulates and improves planning research, training and education and enhances public awareness and understanding of major planning issues at a global level. The association‘s main event is the annual ISOCARP Congress, which focuses on a globally-significant planning theme and which takes place in a different
country each year.
The Chapter’s mission is to carry out the objectives of the American Planning Association (APA) and to promote the art and science of planning in Oregon.
The Mission of the Oregon Chapter of the American Planning Association is to:- Promote the art and science of planning
- Helping planners in professional development- Advance the practice of planning at all levels of experience
- Emphasize the importance of achieving the final vision or goal over mere procedure- Protect the legacy of our state’s natural environment
- Promote sustainable development objectives through comprehensive planning for economic development, social and environmental objectives- Foster social and environmental equity, and
- Advocate for every citizen’s opportunity to participate.
1083


