Embed Size (px)
Citation preview

18th International Conferenceon Microwave and High Frequency Applications
AMPERE 2021Proceedings
VIRTUAL CONFERENCE13-16 September 2021
18th International Conference on Microwave and High Frequency Applications
AMPERE 2021, a successful virtual conference.
The planning of the 18th International Conference on Microwave and High-Frequency Applications started already when we arrived back from Valencia and AMPERE 2019. We made reservations of conference venue, hotel rooms, restaurants, and networking events. Gothenburg is a nice city for visitors, and we were happy to let you experience some of the best parts of Sweden.
When 2020 threw a wet blanket of pandemic with travel restrictions and social distancing, we followed the progress of vaccines with interest, hoping that the world would recover before the conference dates. Finally, we had to make the tough decision of changing the event to fully digital. All planning had to be remade and new solutions for each part of the meeting. Speakers had to connect from all over the world, with no need to travel but for the non-Europeans partly at awkward times of day. This made the conference to something different from all the previous ones. It also moved us to the first meeting of the future. We are getting used to video-calls and online meetings, and we will manage to adapt to this as well.
The program had a focus based on Gothenburg strengths in microwave technologies. We do have food processing, automotive and communication, but also MedTech and pharmaceuticals, and a world leading education at Chalmers. With RISE, who also serves as the National Metrology Institute of Sweden, as local organizers we also lift the topics of metrology. Quality of measured data, traceability and uncertainty calculations are increasingly important as technology moves towards the limits of physics.
More than 100 participants enjoyed the AMPERE 2021 conference even though we only could interact digitally. All presenters (oral as well as poster) were offered to write a full paper on their results. The papers are published in this report of proceedings but can also be uploaded by the authors to the Zenodo platform www.zenodo.org, in the Ampere2021 community. Needless to say, all papers are published as Open Access under CC-NC-BY-ND license, the same conditions as papers in AMPERE 2019.
With this proceedings report, we close the books of AMPERE2021. We appreciate all researchers who chose this forum to present their work.
Birgitta Raaholt and Per Olof Hedekvist, RISE
Conference chair and co-chair.

AMPERE 2021 Platinum Sponsor
Silver sponsors
i
AMPERE 2021 Proceedings
Table of Contents
TITLE Author Page A COMPACT QUARTER WAVELENGTH FILTER FOR 3D MICORWAE PRINTING OF CONTINUOUS FIBER REINFORCED POLYMERS
Li, Nanya 1
A COMPARATIVE ANALYSIS OF MICROWAVE-ASSISTED REGENERATION AGAINST CONVENTIONAL REGENERATION FOR POST-COMBUSTION CARBON CAPTURE
Biti, Simba 2
A FLEXIBLE, MODULAR AND DIGITAL MICROWAVE SYSTEM FOR FOOD PASTEURIZATION AT ATMOSPHERIC PRESSURE
Schneider, Joachim
3
A NEW ON-LINE MICROWAVE DIAGNOSE ATMOSPHERIC PRESSURE AIR PLASMA WITH ARTIFICIAL NEURAL NETWORK
Chen, Wenqi 4
A NOVEL METHOD FOR OPTIMIZING THE WORKING PARAMETERS OF AR+N2 MICROWAVE LIGHT EMITTING PLASMA BASED ON NEURAL NETWORK
Zhong, Yu 5
A PERMITTIVITY MEASUREMENT APPARATUS BASED ON RIDGE SUBSTRATE INTEGRATED WAVEGUIDE
Chen, Qian 6
A TIME-REVERSAL IMAGING ALGORITHM FOR LOCALIZATION AND MOISTURE LEVEL DETECTION IN THE POLYMER FOAM IN AN INDUSTRIAL MICROWAVE DRYING SYSTEM
Omrani, Adel 7
ADDITIVE FABRICATION OF HYDROXYAPATITE CERAMICS USING MILLIMETER-WAVE AND SUB-TERAHERTZ RADIATION
Rybakov, Kirill 14
APPLICATIONS OF DUAL MODE MICROWAVE RESONATORS IN ELECTRON PARAMAGNETIC RESONANCE (EPR) SPECTROSCOPY
Andrea Folli 19
ASSESSMENT OF COAXIAL FILTERS FOR METALLIC MODE STIRRER INSTALATION IN MULTIMODE MICROWAVE OVENS
Monzó-Cabrera, Juan
20
ASSESSEMENT OF REFRACTORY MATERIALS IN HIGH TEMPERATURE MICROWAVE APPLICATIONS
Grimm, Valerie 21
ATMOSPHERIC MICROWAVE PLASMA SOURCE AND DOWNSTREAM SOURCE: CHARACTERISTICS AND INDUSTRIAL APPLICATIONS
Schneider, Joachim
29
BEHAVIOR FOR BOILING AND SURFACTANT ADSORPTION THROUGH DIMENSIONLESS NUMBER OF MICROWAVE LOCAL HEATING
Asakuma, Yusuke
30
BREAD PROPERTIES AND BAKING TECHNOLOGY – PREPARATIONS FOR AN IN-SITU TIME-RESOLVED 4D SYNCHROTRON X-RAY TOMOGRAPHY STUDY USING A COMBINATION MICROWAVE OVEN
Isaksson, Sven 31
BUILD THE BRIDGE BETWEEN MICROWAVE AND POWDER MATERIALS Zhang, Yi 32 COAXIAL MAGNETRON LAUNCHER FOR 2.45 GHZ ISM BAND Bilik, Vladimir 33 COMPARATIVE STUDY OF MECHANICAL AND MICROESTRUCTURAL PROPERTIES OF LSM CERAMICS OBTAINED BY E-FIELD AND H-FIELD
Penaranda-Foix. Felipe
41
COMPLEX-PERMITTIVITY ESTIMATION OF A POLYMER FOAM USING MICROWAVE TOMOGRAPHY FOR THE APPLICATION OF MICROWAVE DRYING
Yadav, Rahul 42
COMPUTATIONAL CHARACTERIZATION OF MICROWAVE-ENHANCED CVI PRODUCTION OF SICF/SIC COMPOSITES
Yakovlev, Vadim 48
CONTINUOUS AND ONLINE MONITORING OF CHEMICAL SYNTHESIS VIA DIELECTRIC SPECTROSCOPY
Dimitrakis, Georgios
56
CONTINUOUS HEATING OF FOULING-SENSITIVE MILK PRODUCTS - MICROWAVE TECHNOLOGY AS NEW APPROACH?
Graf, Britta 57
CONTINUOUS PASTEURIZATION OF READY MEALS WITH MICROWAVE TECHNOLOGY
Mallah, Marcel 64
DEMONSTRATION OF A COMBINED ACTIVE-PASSIVE METHODOLOGY FOR THE DESIGN OF SOLID-STATE-FED MICROWAVE OVENS
Olszewska-Placha, Marzena
69
DEVELOPMENT OF AN EPR CAVITY RESONATOR WITH HEATING CAPABILITES Harari, Jaafar 77
ii
DIELECTRIC BEHAVIOUR OF METAL SULFIDES DURING MICROWAVE TREATMENT
Lopez-Buendia, Angel
78
DIELECTRIC PROPERTIES OF TYPICAL SOLVENT EXTRACTION EMULSIONS CERINO, Clélio 79 DIRECTIONAL ANTENNA DESIGN AND ITS APPLICATION TO THZ COMMUNICATION SYSTEM
Cahyono, Dwi 87
EFFECT OF A NEW ORANGE FIBRE INGREDIENT AND MICROWAVE TECHNOLOGY ON QUALITY OF GLUTEN-FREE MUFFINS
Rodriguez, Raquel
95
EFFECT OF ABSORBED POWER AND TEMPERATURE NON-UNIFORMITY ON THE RAPID MICROWAVE SINTERING OF VARISTOR CERAMICS
Rybakov, Kirill 96
EFFECT OF INITIAL PARTICLE SIZE OF THE HEMATITE ON MICROWAVE SINTERING KINETICS AT 30 GHZ
Magro Togashi, Marina
102
EFFECT OF ISOPROPANOL CO-PRODUCT ON THE LONG-TERM STABILITY OF TIO2 NANOPARTICLE SUSPENSIONS PRODUCED BY MICROWAVE-ASSISTED SYNTHESIS
Leonelli, Cristina 103
ELECTROMAGNETIC MODELLING OF MICROWAVE HEATING USING FDTD METHOD
Dhar, Piyali 104
ENHANCED MICROWAVE ABSORPTION IN GLASS BATCH THROUGH BATCH PRETREATMENT AND ALTERNATIVE RAW MATERIALS
Behrend, Ralph 109
ENHANCEMENT OF MICROWAVE-ASSISTED NANOPARTICLE SYNTHESIS BY ADDITION OF SURFACTANT
Asakuma, Yusuke
117
FAST PYROLYSIS OF LIGNOCELLULOSIC BIOMASS USING A FREQUENCY-AUTO-TRACKING SOLID-STATE MICROWAVE GENERATOR
Tsubaki, Shuntaro
118
FIELD ASSISTED PROCESSING OF NANOSTRUCTURED CERAMICS Vaidhyanathan, Bala
119
GREEN HYDROGEN AND ACETYLENE CHEMISTRY RENAISSANCE ENABLED BY HIGHLY EFFICIENT CONVERSION OF HYDROCARBONS VIA MICROWAVE PLASMA REACTOR
Ashcraft, Nathan
120
GROWTH AND SPORE FORMATION OF BACILLUS NATTO BY MICROWAVE ASSISTED CULTIVATION AT OPTIMUM TEMPERATURE AND THE EFFECT OF MICROWAVE POWER
Ohuchi, Shokichi
126
HIGH TEMPERATURE DIELECTRIC PROPERTIES MEASUREMENT OF COALS THROUGH CAVITY PERTURBATION METHOD
Soni, Abhinav Kumar
132
HOW MICROWAVE IMPACT ON PORCELAIN DIELECTRIC PROPERTIES Jermolovicius, Luiz Alberto
140
IMPROVED CONTROL ON THE MICROWAVE DEVULCANIZING OF GROUND TIRE RUBBER BY MEANS OF SULPHUR GAS SENSORS
Perez-Campos, Rafael
146
INACTIVATION OF POD AND LOX ENZYMES IN YELLOW PEAS BY MICROWAVE PROCESSING
Radoiu, Marilena
154
INFLUENCE OF CAVITY SIZE AND MATERIAL PROPERTIES ON THE UNIFORMITY OF DIELECTRIC HEATING USING DISTRIBUTED SOURCES AND NOVEL SOLID-STATE MICROWAVE AMPLIFIERS
Neumaier, Dominik
155
INFLUENCE OF MICROWAVE FREQUENCY AND GAS HUMIDITY ON THE VITRO BLOOD COAGULATION WITH A COLD ATMOSPHERIC PRESSURE PLASMA
Wu, Li 156
INTERESTING PHENOMENA OF INFLUENCE OF NEARBY CONDUCTOR ON MICROWAVE PLASMA JET
Yu, Yutian 157
INVESTIGATION OF MICROWAVE ASSISTED PULTRUSION (MAP) AND RESIN TRANSFER MOULDING (RTM) WITH THERMOPLASTIC RESIN AND CURE MONITORING
Emmerich, Rudolf
158
INVESTIGATION OF MICROWAVE HEATING OF IRON-BASED CATALYSTS IN THE MAGNETIC FIELD
Morgan, Alex 165
LARGE SCALE/HIGH DENSITY PLASMA SURFACES GENERATED BY DISTRIBUTED ELEMENTARY PLASMA SOURCES POWERED BY SOLID STATE MICROWAVE GENERATORS
Zoubian, Fadi 169
MATERIALS THERMAL PROPERTIES INVESTIGATION BY INVERSE MODELING TECHNIQUE
Tao, Junwu 170
iii
METAL BULK MELTING BY DC INTENSIFIED MICROWAVE-HEATING AND ITS APPLICATION FOR IRON-REBAR CUTTING
Shoshani, Yoav 175
MICROBIAL CHEMICAL STERILIZATION AND STAINING BY MICROWAVE ASSISTED CHEMISTRY
Ohuchi, Shokichi
176
MICROWAVE AND CONVENTIONAL PYROLYSIS TO PRODUCE VALUABLE PRODUCTS FROM DIGESTATE
Perez, Nidia Diaz
177
MICROWAVE AND ULTRASOUND TOGETHER -- WHY AND HOW ! Calinescu, Ioan 178 MICROWAVE ASSISTED EXTRACTION OF PHENOLIC FROM CACAO POD HUSKS - AN ALTERNATIVE FOR VALORISATION
Dewi, Shinta Rosalia
179
MICROWAVE ASSISTED LEACHING APPROACHES TO RECOVER PLATINUM GROUP METALS FROM WASTE AND INTERMEDIATE STREAMS
Spooren, Jeroen 187
MICROWAVE ASSISTED METALLURGY - CASE STUDY ON MICROWAVE ROASTING OF STAINLESS STEEL SLAG
Kaipia, Lena 195
MICROWAVE ASSISTED POLYMERASE CHAIN REACTION AND PHENOMENON OF MICROWAVE DENATURATION OF DNA POLYMERASES
Ohuchi, Shokichi
203
MICROWAVE HEATING OF LOW-LOSS DIELECTRIC FOOD PRODUCTS Curet, Sebastien 204 MICROWAVE HEATING SIMULATION OF THIN-WALLED VESSELS BASED ON TRANSFORMATION OPTICS
Yang, Fengming 212
MICROWAVE MATERIALS CHARACTERISATION WITH SIMULTANEOUS STRUCTURAL TECHNIQUES
Barter, Michael 213
MICROWAVE PLASMA CONVERSION OF METHANE FOR HYDROGEN PRODUCTION
Radoiu, Marilena
214
MICROWAVE REGENERATION OF SPENT SULPHUROUS ACTIVATED CARBON Powell, Christopher
219
MICROWAVE SINTERABILITY OF NANOSTRUCTURED ZNO MACROPOROUS CERAMIC FOAMS PRODUCED BY BIOINSPIRED REPLICA TECHNIQUE
Cardoso, Andre 220
MICROWAVE SINTERING OF SODIUM-B -ALUMINA: EXPERIMENTAL AND NUMERICAL SIMULATION RESULTS
Rosa, Roberto 227
MICROWAVE SURFACE RESISTANCE OF AS-GROWN AND POST- PROCESSED ADDITIVE MANUFACURED METAL PARTS
Batson, Robert 228
MICROWAVE-ASSISTED OBTAINMENT AND CHARACTERIZATION OF NOVEL BIOACTIVE SCAFFOLDS FOR BONE TISSUE REGENERATION
Piatkowski, Marek
229
MICROWAVE-ASSISTED SYNTHESIS OF SOLID EPOXY RESINS: STUDY OF MOLECULAR WEIGHTS BY GPC AND MALDI-TOF/MS.
Bogdal, Dariusz 230
MICROWAVE-ENABLED FABRICATION OF A CATHODE MATERIAL FOR HIGH-TEMPERATURE NA-ION BATTERY
Zhou, Yanping 231
MICROWAVE-SYNTHESIZED CZTS NANOPARTICLES FOR PRINTING AND HYBRID PHOTOVOLTAIC DEVICES
Matras-Postolek Katarzyna
232
MODELLING OF DIELECTRIC PROPERTIES OF FOOD WITH RESPECT TO MOISTURE CONTENT USING ADAPTED WATER ACTIVITY EQUATIONS
Renshaw, Ryan 233
MODELLING THE THERMAL RUNAWAY DURING THE STABILIZATION PHASE OF THE CARBON FIBER PRODUCTION USING MICROWAVE HEATING
Hofele, Julia 234
MOLECULAR COLLISION UNDER MICROWAVE IRRADIATION AND REVITALIZATION OF MICROWAVE NON-THERMAL EFFECT
Huang, Kama 235
MULTIPHYSICS MODELING OF THE THAWING AND TEMPERING PROCESS OF BEEF MEAT IN A SOLID-STATE BASED MICROWAVE CAVITY
Santon, Pablo 236
NEW APPLICATORS FOR THE PROJECT SIMPLIFY: SONICATION AND MICROWAVE PROCESSING OF MATERIAL FEEDSTOCK
Veronesi, Paolo 244
NEW CLASS OF CHITOSAN-DERIVED HEMOSTATIC AGENTS OBTAINED UNDER MICROWAVE-ASSISTED CONDITIONS
Radwan-Praglowska, Julia
245
NOVEL APPROACHES FOR MICROWAVE ASSISTED GLASS MELTING Behrend, Ralph 246 NOVEL MICROWAVE MEASUREMENT SYSTEM FOR DIRECT TUMOR DETECTION INSIDE A HUMAN BREAST
Salomon, Christoph
254
iv
ON THE ENERGY EFFICIENCY OF CURING CARBON FIBER COMPOSITES WITH MICROWAVES GENERATED BY SOLID STATE POWER AMPLIFIERS
Dragos Dancila 262
ON-LINE POWER MEASUREMENTS WITH DIRECTIONAL COUPLER Penaranda-Foix. Felipe
263
POSSIBILITY OF USING MICROWAVE ENERGY FOR STEELMAKING WASTES RECYCLING
Omran, Mamdouh
264
PRODUCTION OF CERAMIC PIGMENTS USING MICROWAVE HEATING — AN EFFICIENCY AND MODELLING PARAMETRIC STUDY
Ramos, Pedro 265
RADIO FREQUENCY SENSING ARRAY ON A ROBOTIC PLATFORM FOR NEURODEGENERATIVE DISEASE MONITORING
Zhao , Minghui 266
RADIO WAVE TREATMENT OF SOIL FOR PATHOGEN INACTIVATION Sturm, Guido 272 SIMULATION AND EXPERIMENTAL STUDIES ON EFFECTS OF MICROWAVE HEATING ON PROCESSING OF METAL MATRIX BIOCOMPOSITES
Sharma, Apurbba Kumar
273
SOFTWARE-DRIVEN SOLID-STATE GENERATORS ARRAY Fiore, Marco 274 TEMPERATURE INDUCED DIFFUSION -- A NEW MICROWAVE EFFECT? Robinson, John 281 THE INFLUENCE OF MICROWAVE FREQUENCY ON HEATING UNIFORMITY Tang,
Zhengming 282
ULTRA-BROADBAND CHARACTERISATION SYSTEM OF DIELECTRIC PROPERTIES OF FOOD MATERIALS
Hamilton, Joshua
283
UNDERSTANDING MICROWAVE DEPOLYMERISATION OF SYNTHETIC POLYMERS
Adam, Mohamed
292
USE OF MICROWAVES IN THE AGRICULTURAL SECTOR – FROM HEAT TREATMENT TO SENSING APPLICATIONS
Brodie, Graham 300
A COMPACT QUARTER WAVELENGTH FILTER FOR 3D MICORWAE PRINTING OF CONTINUOUS FIBER REINFORCED POLYMERS
Nanya Li, Guido Link, John Jelonnek
Institute for Pulsed Power and Microwave Technology, Karlsruhe Institute of Technology, Eggenstein-Leopoldshafen, 76344, Germany
Keywords (choose minimum two): Modelling, S-parameter, Material interaction.
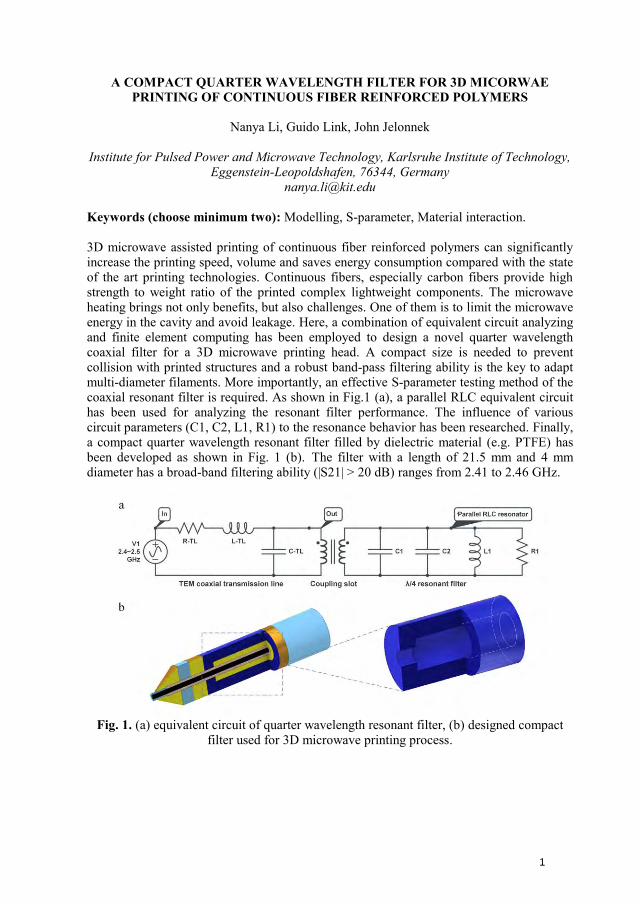
3D microwave assisted printing of continuous fiber reinforced polymers can significantly increase the printing speed, volume and saves energy consumption compared with the state of the art printing technologies. Continuous fibers, especially carbon fibers provide high strength to weight ratio of the printed complex lightweight components. The microwave heating brings not only benefits, but also challenges. One of them is to limit the microwave energy in the cavity and avoid leakage. Here, a combination of equivalent circuit analyzing and finite element computing has been employed to design a novel quarter wavelength coaxial filter for a 3D microwave printing head. A compact size is needed to prevent collision with printed structures and a robust band-pass filtering ability is the key to adapt multi-diameter filaments. More importantly, an effective S-parameter testing method of the coaxial resonant filter is required. As shown in Fig.1 (a), a parallel RLC equivalent circuit has been used for analyzing the resonant filter performance. The influence of various circuit parameters (C1, C2, L1, R1) to the resonance behavior has been researched. Finally, a compact quarter wavelength resonant filter filled by dielectric material (e.g. PTFE) has been developed as shown in Fig. 1 (b). The filter with a length of 21.5 mm and 4 mm diameter has a broad-band filtering ability (|S21| > 20 dB) ranges from 2.41 to 2.46 GHz.
Fig. 1. (a) equivalent circuit of quarter wavelength resonant filter, (b) designed compact filter used for 3D microwave printing process.
1
A COMPARATIVE ANALYSIS OF MICROWAVE-ASSISTED REGENERATION AGAINST CONVENTIONAL REGENERATION FOR POST-COMBUSTION CARBON CAPTURE M. Yassin, S. Biti, W. Afzal, C. Fernandez Martin*
University of Aberdeen, School of Engineering, Fraser Noble Building, King’s College, Aberdeen AB24 3UE, Scotland, United Kingdom
Keywords: microwave heating, process intensification, industrial applications, modelling, dielectric properties, material interaction
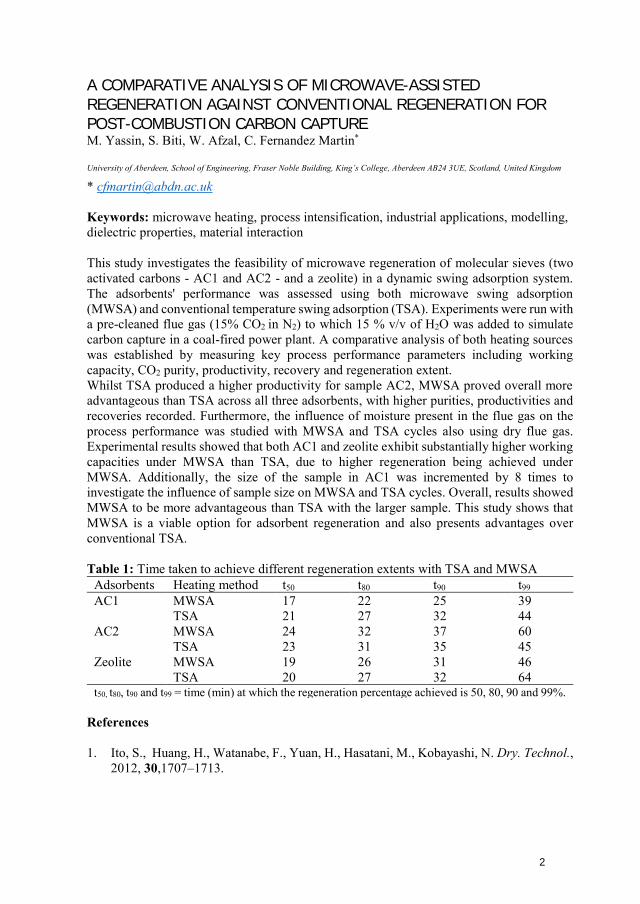
This study investigates the feasibility of microwave regeneration of molecular sieves (two activated carbons - AC1 and AC2 - and a zeolite) in a dynamic swing adsorption system. The adsorbents' performance was assessed using both microwave swing adsorption (MWSA) and conventional temperature swing adsorption (TSA). Experiments were run with a pre-cleaned flue gas (15% CO2 in N2) to which 15 % v/v of H2O was added to simulate carbon capture in a coal-fired power plant. A comparative analysis of both heating sources was established by measuring key process performance parameters including working capacity, CO2 purity, productivity, recovery and regeneration extent. Whilst TSA produced a higher productivity for sample AC2, MWSA proved overall more advantageous than TSA across all three adsorbents, with higher purities, productivities and recoveries recorded. Furthermore, the influence of moisture present in the flue gas on the process performance was studied with MWSA and TSA cycles also using dry flue gas. Experimental results showed that both AC1 and zeolite exhibit substantially higher working capacities under MWSA than TSA, due to higher regeneration being achieved under MWSA. Additionally, the size of the sample in AC1 was incremented by 8 times to investigate the influence of sample size on MWSA and TSA cycles. Overall, results showed MWSA to be more advantageous than TSA with the larger sample. This study shows that MWSA is a viable option for adsorbent regeneration and also presents advantages over conventional TSA.
Table 1: Time taken to achieve different regeneration extents with TSA and MWSA Adsorbents Heating method t50 t80 t90 t99 AC1 MWSA 17 22 25 39
TSA 21 27 32 44 AC2 MWSA 24 32 37 60
TSA 23 31 35 45 Zeolite MWSA 19 26 31 46
TSA 20 27 32 64 t50, t80, t90 and t99 = time (min) at which the regeneration percentage achieved is 50, 80, 90 and 99%.
References
1. Ito, S., Huang, H., Watanabe, F., Yuan, H., Hasatani, M., Kobayashi, N. Dry. Technol.,2012, 30,1707–1713.
2
18th International Conference on Microwave and High Frequency Applications
AMPERE 2021, Gothenburg, Sweden, September 13-16, 2021
A FLEXIBLE, MODULAR AND DIGITAL MICROWAVE SYSTEM FOR FOOD PASTEURIZATION AT ATMOSPHERIC PRESSURE
M. Gorath, D. Baars, G. Kassel, M. Dingeldein, K.-M. Baumgärtner
MUEGGE GmbH, Hochstrasse 4-6, D-64385 Reichelsheim (Odenwald), Germany
Keywords: Microwave, Food applications, Equipment, Processing, Food, Safety
Trend studies show a continuing change in consumer behavior and eating habits in relation
to ready-to-eat food. This is due to strong drivers like personal health, environment
protection and sustainability. In order to meet these changing consumer demands, it is
essential to offer high-quality food products with nutritional value, taste, flavor, texture and
appearance of fresh food products. Additional benefit can be generated in extending shelf
life, e.g. by pasteurization, thus reducing food waste to a considerable amount and
protecting environment by efficient use of existing crop area of biodynamic agriculture.
Pasteurization in food industry is increasingly performed by microwave heating. Common
industrial microwave heating systems require excess pressure and rely on microwave
coupling into the processing chamber by horn antennas. In contrast to existing microwave
pasteurization systems designed for applications in food industry, the novel microwave
pasteurization system developed by MUEGGE works at ambient pressure and uses coaxial
antennas with customized reflectors for targeted deposition of microwave energy. Thus, the
distance of this tailored microwave launching system to the food products to be pasteurized is much shorter, and less microwave energy is required. In addition, microwave injection via the novel microwave launching system of MUEGGE can be specifically adapted to various kinds of food components to be processed at the same time, having different dielectric constants ε and dielectric loss factors ε. ε determines the ability to store electric energy, whereas ε specifies the particular conversion of microwave energy to thermal energy [1]. Consequently, the exposure time can be significantly reduced, which helps maintaining the nutritional value of the food products in particular. The novel microwave pasteurization system combines several advantages. It works at ambient pressure, i.e. no excess pressure is required. Due to its modular setup and individually controllable microwave antennas, the microwave pasteurization system is suited for pasteurization of different kinds of food products, e.g. bread, meat, nuts, dates, tea, spices and even packaged ready meals. The combination of in-situ temperature monitoring, microwave generators showing response times in the range of milliseconds, adaptable microwave antennas and smart control system provides for “digital cooking”, resulting in homogeneous heating of different food products without local overheating. Various microwave pasteurization experiments with the novel microwave pasteurization
system from MUEGGE have been performed on packaged ready meals composed of different main and side dishes in trays of customized design. Despite even extremely diverging dielectric properties of the different food components in the ready meals tested,
results proved homogeneous tempering of all edibles in the same tray within an extremely
narrow temperature zone between 90°C and 93°C, being prerequisite for maintaining nutrient content. These experiments not only focused on proving homogeneity of the microwave heating process, but also showed unchanged taste, flavor, texture and
appearance of the food products by tasting.
References 1. Tang, J., Journal of Food Science, 2015, 80, E1776–E1793.
3
18th International Conference on Microwave and High Frequency ApplicationsAMPERE 2021, Gothenburg, Sweden, September 13-16, 2021
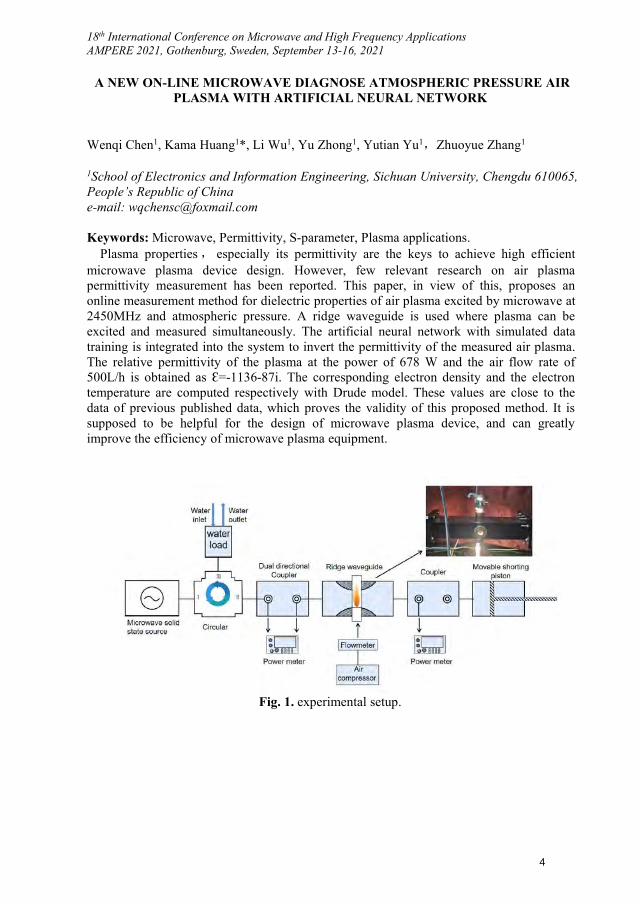
A NEW ON-LINE MICROWAVE DIAGNOSE ATMOSPHERIC PRESSURE AIRPLASMA WITH ARTIFICIAL NEURAL NETWORK
Wenqi Chen1, Kama Huang1*, Li Wu1, Yu Zhong1, Yutian Yu1,Zhuoyue Zhang1
1School of Electronics and Information Engineering, Sichuan University, Chengdu 610065,People’s Republic of Chinae-mail: [email protected]
Keywords: Microwave, Permittivity, S-parameter, Plasma applications.Plasma properties , especially its permittivity are the keys to achieve high efficient
microwave plasma device design. However, few relevant research on air plasmapermittivity measurement has been reported. This paper, in view of this, proposes anonline measurement method for dielectric properties of air plasma excited by microwave at2450MHz and atmospheric pressure. A ridge waveguide is used where plasma can beexcited and measured simultaneously. The artificial neural network with simulated datatraining is integrated into the system to invert the permittivity of the measured air plasma.The relative permittivity of the plasma at the power of 678 W and the air flow rate of500L/h is obtained as Ɛ=-1136-87i. The corresponding electron density and the electrontemperature are computed respectively with Drude model. These values are close to thedata of previous published data, which proves the validity of this proposed method. It issupposed to be helpful for the design of microwave plasma device, and can greatlyimprove the efficiency of microwave plasma equipment.
Fig. 1. experimental setup.
4
18th International Conference on Microwave and High Frequency ApplicationsAMPERE 2021, Gothenburg, Sweden, September 13-16, 2021
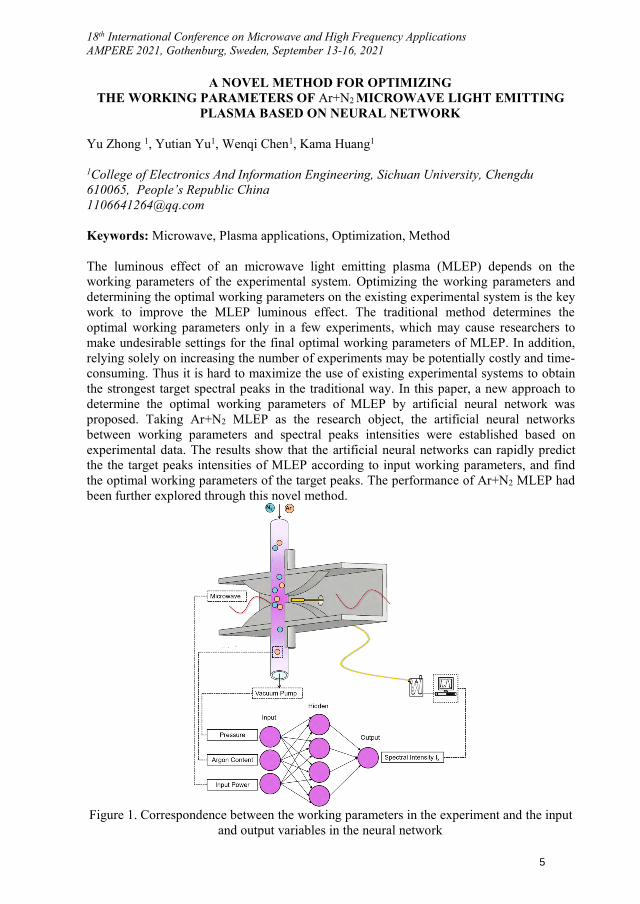
A NOVEL METHOD FOR OPTIMIZINGTHE WORKING PARAMETERS OF Ar+N2 MICROWAVE LIGHT EMITTING
PLASMA BASED ON NEURAL NETWORK
Yu Zhong 1, Yutian Yu1, Wenqi Chen1, Kama Huang1
1College of Electronics And Information Engineering, Sichuan University, Chengdu610065, People’s Republic [email protected]
Keywords: Microwave, Plasma applications, Optimization, Method
The luminous effect of an microwave light emitting plasma (MLEP) depends on theworking parameters of the experimental system. Optimizing the working parameters anddetermining the optimal working parameters on the existing experimental system is the keywork to improve the MLEP luminous effect. The traditional method determines theoptimal working parameters only in a few experiments, which may cause researchers tomake undesirable settings for the final optimal working parameters of MLEP. In addition,relying solely on increasing the number of experiments may be potentially costly and time-consuming. Thus it is hard to maximize the use of existing experimental systems to obtainthe strongest target spectral peaks in the traditional way. In this paper, a new approach todetermine the optimal working parameters of MLEP by artificial neural network wasproposed. Taking Ar+N2 MLEP as the research object, the artificial neural networksbetween working parameters and spectral peaks intensities were established based onexperimental data. The results show that the artificial neural networks can rapidly predictthe the target peaks intensities of MLEP according to input working parameters, and findthe optimal working parameters of the target peaks. The performance of Ar+N2 MLEP hadbeen further explored through this novel method.
Figure 1. Correspondence between the working parameters in the experiment and the inputand output variables in the neural network
5
18th International Conference on Microwave and High Frequency ApplicationsAMPERE 2021, Gothenburg, Sweden, September 13-16, 2021
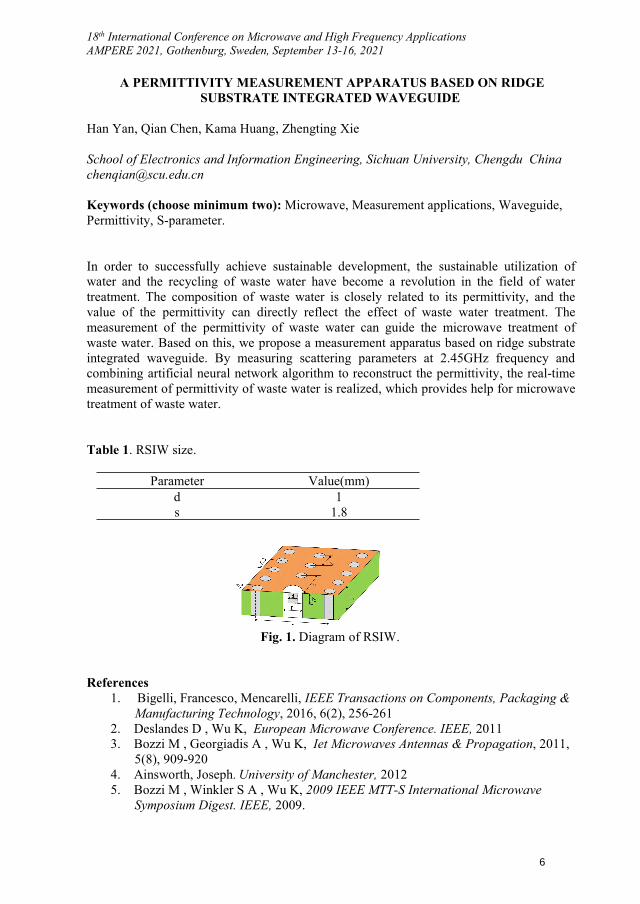
A PERMITTIVITY MEASUREMENT APPARATUS BASED ON RIDGESUBSTRATE INTEGRATED WAVEGUIDE
Han Yan, Qian Chen, Kama Huang, Zhengting Xie
School of Electronics and Information Engineering, Sichuan University, Chengdu [email protected]
Keywords (choose minimum two): Microwave, Measurement applications, Waveguide,Permittivity, S-parameter.
In order to successfully achieve sustainable development, the sustainable utilization ofwater and the recycling of waste water have become a revolution in the field of watertreatment. The composition of waste water is closely related to its permittivity, and thevalue of the permittivity can directly reflect the effect of waste water treatment. Themeasurement of the permittivity of waste water can guide the microwave treatment ofwaste water. Based on this, we propose a measurement apparatus based on ridge substrateintegrated waveguide. By measuring scattering parameters at 2.45GHz frequency andcombining artificial neural network algorithm to reconstruct the permittivity, the real-timemeasurement of permittivity of waste water is realized, which provides help for microwavetreatment of waste water.
Table 1. RSIW size.
Parameter Value(mm)d 1s 1.8
Fig. 1. Diagram of RSIW.
References1. Bigelli, Francesco, Mencarelli, IEEE Transactions on Components, Packaging &
Manufacturing Technology, 2016, 6(2), 256-2612. Deslandes D , Wu K, European Microwave Conference. IEEE, 20113. Bozzi M , Georgiadis A , Wu K, Iet Microwaves Antennas & Propagation, 2011,
5(8), 909-9204. Ainsworth, Joseph. University of Manchester, 20125. Bozzi M , Winkler S A , Wu K, 2009 IEEE MTT-S International Microwave
Symposium Digest. IEEE, 2009.
6
A Time-Reversal Imaging Algorithm for Localization and Moisture Level Detection in the Polymer Foam in an Industrial Microwave Drying System
Adel Omrani1, Rahul Yadav2, Guido Link1, John Jelonnek1
1Karlsruhe Institute of Technology, Karlsruhe, Germany 2University of Eastern Finland, Kuopio, Finland [email protected]
Keywords: Microwave drying, Microwave tomography, moisture measurement
Abstract A microwave tomography (MWT) system has been integrated in an industrial microwave drying system named HEPHAISTOS to obtaining the location and level of the moisture inside a polymer foam. This information is demanded as an input for an intelligent controller. Herein, a time-reversal imaging (TRI) algorithm with a proper Green’s function is proposed for MWT in the X-band frequency range (8 GHz to 12 GHz) to obtain the moisture distribution inside a polymer foam in an industrial microwave drying system. The effective permittivity (which correlates with the moisture level) of the detected moisture level is retrieved by evaluating the largest eigenvalue associated with the multi-static data matrix and using a minimization problem. Simulation results show the performance of the proposed method.
I. IntroductionDrying by microwaves has been widely used, especially in the industry, for different applications and purposes. Microwaves can penetrate into the material and provides volumetric heating in contrast to the conventional one. In microwave drying applications, providing sufficient uniformity of heating distribution is an imperative task especially in industrial-scale production [1]. Intelligent control [2] of distributed microwave sources (magnetrons) is a novel idea to increase the efficiency of the drying system, having high-quality processing, reducing the drying time which are important terms for the industry. During the drying process, it is only possible to adjust the amplitude and pulse duration of the magnetrons. The decision for controlling these parameters is chosen based on the input information that is the moisture location and concentration inside the sample. The microwave drying system which we are presently working is named HEPHAISTOS. This industrial microwave applicator has a patented hexagonal [3,4] cross-section design delivering high electromagnetic field homogeneity. The system is equipped with a conveyor belt and convective heating that enables the continuous drying process. Its principal areas of applications are in material processing, for example, thermal curing of fiber composites and expansion or drying of porous foams. A microwave tomography (MWT) system [5] is designed and integrated with the HEPHAISTOS to recover the volumetric information of the moisture location and its level before or after the drying process of the polymer foam. The power level and pulse duration of the magnetrons will be adjusted based on the input information from MWT. IR cameras installed allow recording of temperature distribution on the foam surface . Fiber optic sensors are not applicable in a running belt process. A microwave tomography (MWT) system is designed and integrated with the HEPHAISTOS to recover the volumetric information of the moisture location and its level before or after the drying process of the polymer foam. The power level and pulse duration of the magnetrons will be adjusted based on the input information from MWT. Some applications of the MWT in the industry for
7
inspection, monitoring purposes, quality control of the goods, and safety issues, are listed in [6-8]. Here, we use qualitative time-reversal (TR) imaging for detecting the moisture location inside the polymer foam. Time-reversal imaging has been applied in numerous practical applications of electromagnetics (EMs). Some applications in EMs are: through-the-wall imaging (TWI) [9-11], ground-penetrating radar (GPR) [12,13], and random media [14] for detecting the hidden targets. Further, this method is employed in non-destructive testing, such as detection of the defects in pipelines [15] and solids [16], and retrieving the permittivity of a hidden dielectric target in a cylindrical multilayered structure [17]. To apply the TR imaging, an exact or approximation of dyadic Green's function (DGF) of the medium is required [18]. Therefore, we construct an approximate expression of the DGF by incorporating only the transmission part of the multilayered media. Then, stationary phase approximation (SPA) is applied to obtain the closed-form representation of the DGF. The paper is organized as follows: Section II provides an overview of the formulation for the TRI decomposition of the time-reversal operator (DORT). Furthermore, an approximate expression for the DGF of a three-layer medium is obtained using the SPA method in this Section. In Section III, the numerical scenario is investigated, and Section IV the permittivity of the detected wet-spot is obtained. Finally, conclusion is provided in Section V.
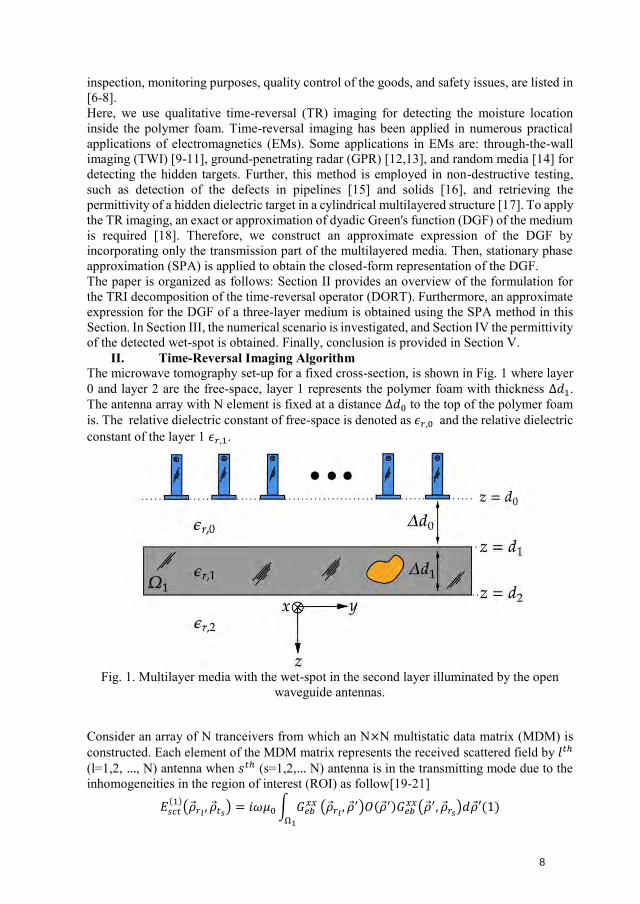
II. Time-Reversal Imaging AlgorithmThe microwave tomography set-up for a fixed cross-section, is shown in Fig. 1 where layer 0 and layer 2 are the free-space, layer 1 represents the polymer foam with thickness Δ𝑑1.The antenna array with N element is fixed at a distance Δ𝑑0 to the top of the polymer foamis. The relative dielectric constant of free-space is denoted as 𝜖𝑟,0 and the relative dielectricconstant of the layer 1 𝜖𝑟,1.
Fig. 1. Multilayer media with the wet-spot in the second layer illuminated by the open waveguide antennas.
Consider an array of N tranceivers from which an N×N multistatic data matrix (MDM) is constructed. Each element of the MDM matrix represents the received scattered field by 𝑙𝑡ℎ
(l=1,2, …, N) antenna when 𝑠𝑡ℎ (s=1,2,… N) antenna is in the transmitting mode due to theinhomogeneities in the region of interest (ROI) as follow[19-21]
𝐸𝑠𝑐𝑡(1)
(��𝑟𝑙, ��𝑡𝑠
) = 𝑖𝜔𝜇0 ∫ 𝐺𝑒𝑏𝑥𝑥
Ω1
(��𝑟𝑙, ��′)𝑂(��′)𝐺𝑒𝑏
𝑥𝑥(��′, ��𝑟𝑠)𝑑��′(1)
8
where it is assumed the medium is excited by a point source and Born approximation is employed to replace the total field in layer 1 by the background Green’s function. In the above equation, 𝐸𝑠𝑐𝑡
(1)(��𝑟𝑙
, ��𝑡𝑠) is the scattered field received by the 𝑙𝑡ℎ antenna. 𝑂(��′) =
−𝑖𝜔𝜖0(𝜖Ω1 − 𝜖𝑟,1) is the object function where 𝜖Ω1
denotes the target relative dielectricconstants in the domain Ω1, and 𝜇0 and 𝜖0 denote free-space permeability and permittivity,respectively. Here, time convention of 𝑒−𝑖𝜔𝑡 is assumed and suppressed where 𝜔 is theangular frequency. In (1), the ��𝑟 and ��𝑡 represent source and observation points while ��′ =(𝑦′, 𝑧′) is the location of the pixel point in the ROI. 𝐺𝑒𝑏
𝑥𝑥 is the background (multilayer mediawithout any inhomogeneities) dyadic Green's function (DGF).In deriving (1) the symmetry property of the DGF is used and furthermore, it is assumed thatboth transmitting and receiving antennas are x-polarized and equivalent currents arepredominant by x-polarized, so the xx term of the DGF is employed.The MDM can be expressed in the compact form in the angular frequency domain 𝜔 as
𝐾(𝜔) = 𝑖𝜔𝜇0 ∫ 𝑂(��′)Ω1
𝑔𝑏𝜌𝑙(��′, 𝜔)𝑔𝑏𝜌𝑠
⊤ (��′, 𝜔)𝑑��′ (2)
where 𝑔𝑏𝜌 = [𝐺𝑒𝑏𝑥𝑥(𝜌, 𝜌1), 𝐺𝑒𝑏
𝑥𝑥(𝜌, 𝜌2), . . . , 𝐺𝑒𝑏𝑥𝑥(𝜌, 𝜌𝑁)]𝑁×1
⊤ is the frequency-domain steering vector of the xx components of the background DGF and ( . )⊤is the transpose operator.DORT can be applied to selectively focus on the inhomogeneities in the medium using singular value decomposition (SVD) of the MDM matrix [22]. The SVD of the matrix 𝐾(𝜔) is expressed in terms of the eigenvalues via the equation 𝐾(𝜔) = 𝑈(𝜔)Λ(𝜔)𝑉⊤(𝜔), whereΛ (diag(Λ) = [λ1, λ2, . . . , 𝜆𝑁]) is a real diagonal matrix consisting of eigenvalues, while𝑈 (𝑢𝑙(𝜔), 𝑙 = 1,2, . . . , 𝑁) and V (𝑣𝑙(𝜔), 𝑙 = 1,2, . . . , 𝑁) are the left and right matricesconsisting of normalized eigenvectors. The number of nonzero significant eigenvalues denotes the number of dominant inhomogeneities present in the background medium and the remaining eigenvalues form the noise subspace. For focusing on the 𝑝𝑡ℎ scatterer, weemploy 𝑒𝑝(𝜔) = 𝜆𝑝𝑢𝑝(𝜔) as a new excitation for the transmitting antennas and calculatethe propagated fields using the xx component of the background DGF. Here, 𝜆𝑝is the 𝑝𝑡ℎ
eigenvalue and 𝑢𝑝 is the 𝑝𝑡ℎ left singular vector. As a result the location of 𝑝𝑡ℎ scatterer issynthetically obtained by the following imaging function
𝐷𝑝(𝜌) = ∫ 𝑒𝑝𝑇(𝜔)𝑔𝑏𝜌(𝜌, 𝜔)𝑑𝜔,
𝜔
(3)
where 𝜌 is any arbitrary point in the ROI. In the next section, we obtain Green's function of the multilayered media for image reconstruction using TR-DORT. Here, we obtain an asymptotic expression for the xx term of the DGF of the multilayered media. As mentioned earlier, we assume an x-polarized line source residing in layer 0 is illuminating the media. In this case, the spectral representation of the Green's function in the first layer is given by [19]
𝐺𝑒𝑏(10)(��, ��𝑡) =
1
𝜋∫
1
𝑘𝑧0
𝑇𝑛𝑇𝑀(𝑘𝑦)𝑒−𝑖𝑘𝑧1(𝑧−𝑑0) 𝑒−𝑖𝑘𝑦(𝑦−𝑦𝑡)
+∞
−∞
𝑑𝑘𝑦 (4)
By considering only the first-order reflection and transmission coefficient inside each layer and after some straightforward calculations and using stationary phase approximation [23], a closed-form expression of the Green's function with the source point in layer 0 and observation point in layer 0 can be derived as follow
9
𝐺𝑒𝑏(10)(��, ��𝑡)
=1
𝜋𝑇01
𝑇𝑀(𝑘𝑦 , 𝑠𝑝1) |2𝜋
Φ′′(𝑘𝑦, 𝑠𝑝1)|
12
𝑒−𝑖[𝑘𝑦,𝑠𝑝1(𝑦−𝑦𝑡)+��𝑧1(𝑧−𝑑0−Δ𝑑0)+��𝑧0Δ𝑑0]𝑒
−𝑖(𝛽2
−𝜋4
) (5)
where
Φ′′(𝑘𝑦, 𝑠𝑝1) = −𝑘1
2
𝑘𝑧13
(𝑧 − 𝑑0 − Δ𝑑0) +𝑘0
2
𝑘𝑧03 Δ𝑑0 (6)
Φ′′(𝑘𝑦 , 𝑠𝑝1) = |Φ′′(𝑘𝑦 , 𝑠𝑝1)|𝑒−𝑗𝛽 (7) where 𝑘𝑦 , 𝑠𝑝1 is the stationary point and is the solution of the following equation
��𝑦, 𝑠𝑝1 =𝑦 − 𝑦𝑡
Δ𝑑0
𝑘𝑧0+
1𝑘𝑧0
(𝑧 − 𝑑0 − Δ𝑑0) (8)
��𝑧1 = √𝑘12 − 𝑘𝑦,𝑠𝑝1
2 (9)
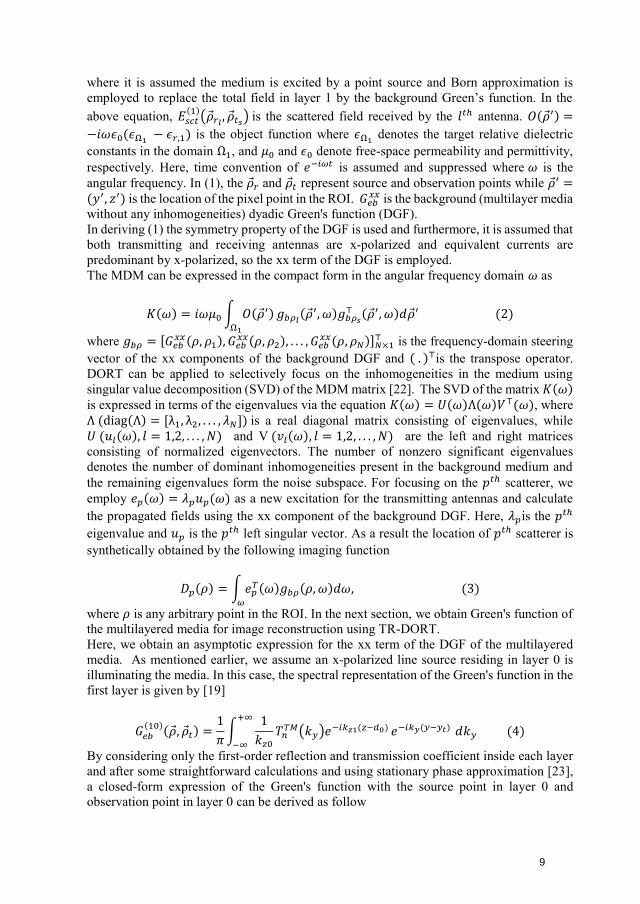
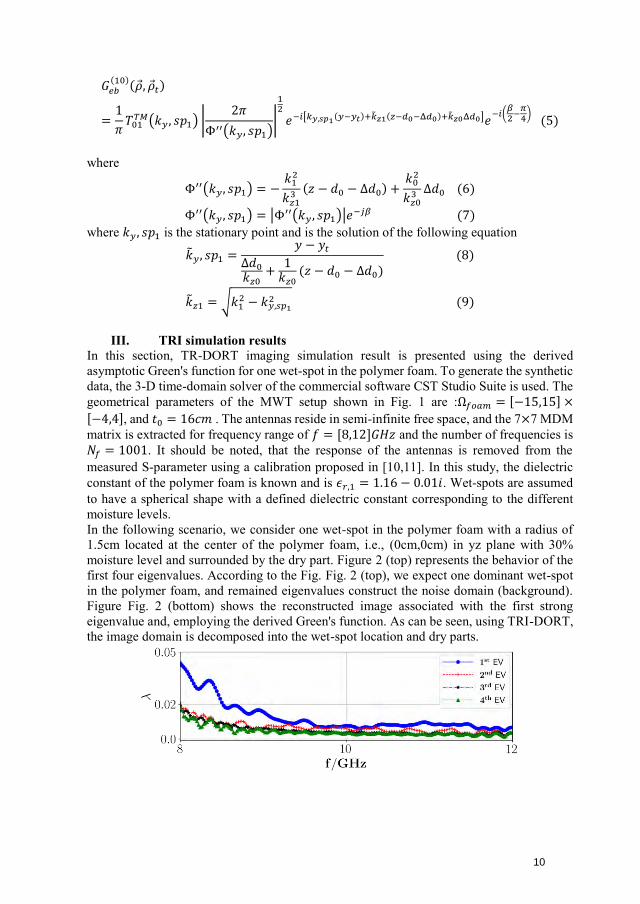
III. TRI simulation resultsIn this section, TR-DORT imaging simulation result is presented using the derived asymptotic Green's function for one wet-spot in the polymer foam. To generate the synthetic data, the 3-D time-domain solver of the commercial software CST Studio Suite is used. The geometrical parameters of the MWT setup shown in Fig. 1 are :Ω𝑓𝑜𝑎𝑚 = [−15,15] ×[−4,4], and 𝑡0 = 16𝑐𝑚 . The antennas reside in semi-infinite free space, and the 7×7 MDMmatrix is extracted for frequency range of 𝑓 = [8,12]𝐺𝐻𝑧 and the number of frequencies is 𝑁𝑓 = 1001. It should be noted, that the response of the antennas is removed from themeasured S-parameter using a calibration proposed in [10,11]. In this study, the dielectric constant of the polymer foam is known and is 𝜖𝑟,1 = 1.16 − 0.01𝑖. Wet-spots are assumedto have a spherical shape with a defined dielectric constant corresponding to the different moisture levels. In the following scenario, we consider one wet-spot in the polymer foam with a radius of 1.5cm located at the center of the polymer foam, i.e., (0cm,0cm) in yz plane with 30% moisture level and surrounded by the dry part. Figure 2 (top) represents the behavior of the first four eigenvalues. According to the Fig. Fig. 2 (top), we expect one dominant wet-spot in the polymer foam, and remained eigenvalues construct the noise domain (background). Figure Fig. 2 (bottom) shows the reconstructed image associated with the first strong eigenvalue and, employing the derived Green's function. As can be seen, using TRI-DORT, the image domain is decomposed into the wet-spot location and dry parts.
10
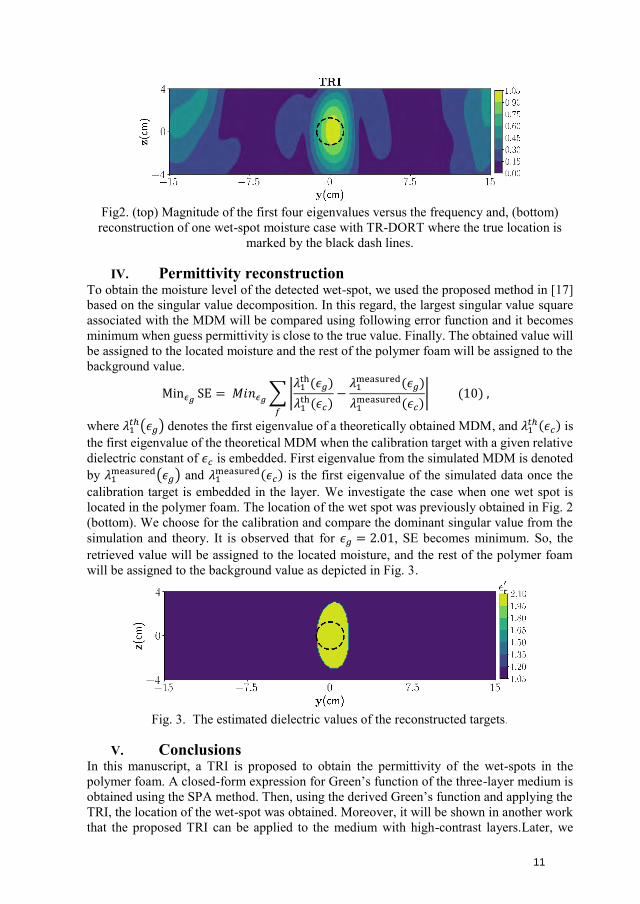
Fig2. (top) Magnitude of the first four eigenvalues versus the frequency and, (bottom) reconstruction of one wet-spot moisture case with TR-DORT where the true location is
marked by the black dash lines.
IV. Permittivity reconstructionTo obtain the moisture level of the detected wet-spot, we used the proposed method in [17] based on the singular value decomposition. In this regard, the largest singular value square associated with the MDM will be compared using following error function and it becomes minimum when guess permittivity is close to the true value. Finally. The obtained value will be assigned to the located moisture and the rest of the polymer foam will be assigned to the background value.
Min𝜖𝑔SE = 𝑀𝑖𝑛𝜖𝑔
∑ |𝜆1
th(𝜖𝑔)
𝜆1th(𝜖𝑐)
−𝜆1
measured(𝜖𝑔)
𝜆1measured(𝜖𝑐)
| (10)
𝑓
,
where 𝜆1𝑡ℎ(𝜖𝑔) denotes the first eigenvalue of a theoretically obtained MDM, and 𝜆1
𝑡ℎ(𝜖𝑐) isthe first eigenvalue of the theoretical MDM when the calibration target with a given relative dielectric constant of 𝜖𝑐 is embedded. First eigenvalue from the simulated MDM is denotedby 𝜆1
measured(𝜖𝑔) and 𝜆1measured(𝜖𝑐) is the first eigenvalue of the simulated data once the
calibration target is embedded in the layer. We investigate the case when one wet spot is located in the polymer foam. The location of the wet spot was previously obtained in Fig. 2 (bottom). We choose for the calibration and compare the dominant singular value from the simulation and theory. It is observed that for 𝜖𝑔 = 2.01, SE becomes minimum. So, theretrieved value will be assigned to the located moisture, and the rest of the polymer foam will be assigned to the background value as depicted in Fig. 3.
Fig. 3. The estimated dielectric values of the reconstructed targets.
V. ConclusionsIn this manuscript, a TRI is proposed to obtain the permittivity of the wet-spots in the polymer foam. A closed-form expression for Green’s function of the three-layer medium is obtained using the SPA method. Then, using the derived Green’s function and applying the TRI, the location of the wet-spot was obtained. Moreover, it will be shown in another work that the proposed TRI can be applied to the medium with high-contrast layers.Later, we
11
compared the largest singular value from theory and simulation from the MDM matrix and retrieved the permittivity of the detected wet-spot.
References
[1] Roussy, G.; Bennani, A.; Thiebaut, J. Temperature runaway of microwaveirradiated materials. Journal of Applied Physics 1987, 62, 1167–1170.doi:10.1063/1.339666
[2] Sun, Y. Adaptive and Intelligent Temperature Control of Microwave HeatingSystems with Multiple Sources. PhD thesis, KIT Scientific Publishing, Karlsruhe,2016.
[3] Link et al., G. Faserverbund-Leichtbau mit AutomatisierterMikrowellenprozesstechnik hoher Energieeffizienz (FLAME) : Schlussbericht desBMBF-Verbundprojektes (KIT Scientific Reports ; 7701). Technical report,Karlsruher Institut für Technologie (KIT), 2015. 34.12.01; LK 01,doi:10.5445/KSP/1000047509.
[4] Bykov, Y.V.; Rybakov, K.I.; Semenov, V.E. High-temperature microwaveprocessing of materials. Journal of Physics D: Applied Physics 2001, 34, R55–R75.doi:10.1088/0022-3727/34/13/201.
[5] Omrani, A.; Link, G.; Jelonnek, J. A Multistatic Uniform Diffraction TomographicAlgorithm for Real-Time Moisture Detection. 2020 IEEE Asia-Pacific MicrowaveConference (APMC), 2020, pp. 437–439.doi:10.1109/APMC47863.2020.9331603.
[6] Wu, Z.; Wang, H. Microwave Tomography for Industrial Process Imaging:Example Applications and Experimental Results. IEEE Antennas and PropagationMagazine 2017, 59, 61–71. doi:10.1109/MAP.2017.2731201.
[7] Tobon Vasquez, J.A.; Scapaticci, R.; Turvani, G.; Ricci, M.; Farina, L.; Litman,A.; Casu,M.R.; Crocco, L.; Vipiana, F. Noninvasive Inline Food Inspection via MicrowaveImagingTechnology: An Application Example in the Food Industry. IEEE Antennas andPropagation Magazine 2020, 62, 18–32. doi:10.1109/MAP.2020.3012898.
[8] Becker, F.; Schwabig, C.; Krause, J.; Leuchs, S.; Krebs, C.; Gruna, R.; Kuter, A.;Langle, T.; Nuessler, D.; Beyerer, J. From Visual Spectrum to Millimeter Wave: ABroad Spectrum of Solutions for Food Inspection. IEEE Antennas and PropagationMagazine 2020, 62, 55–63. doi: 10.1109/MAP.2020.3003225.
[9] Sadeghi, S.; Mohammadpour-Aghdam, K.; Faraji-Dana, R.; Burkholder, R.J. ADORTUniform Diffraction Tomography Algorithm for Through-the-WallImaging. IEEE Transactions on Antennas and Propagation 2020, 68, 3176–3183.doi:10.1109/TAP.2019.2952002.
[10] Sadeghi, S.; Mohammadpour-Aghdam, K.; Ren, K.; Faraji-Dana, R.; Burkholder,R.J. A PoleExtraction Algorithm for Wall Characterization in Through-the-WallImaging Systems. IEEE Transactions on Antennas and Propagation 2019, 67,7106–7113. doi:10.1109/TAP.2019.2927870.
[11] Sadeghi, S.; Mohammadpour-Aghdam, K.; Faraji-Dana, R.; Burkholder, R.J. ANovel Algorithm for Wall Characterization in Through the wall Imaging based onSpectral Analysis. 2018 18th International Symposium on Antenna Technologyand Applied Electromagnetics (ANTEM), 2018, pp. 1–2.doi:10.1109/ANTEM.2018.8572991.
12
[12] Moghadasi, S.M.; Dehmollaian, M.; Rashed-Mohassel, J. Time Reversal Imagingof Deeply Buried Targets Under Moderately Rough Surfaces Using ApproximateTransmitted Fields. IEEE Transactions on Geoscience and Remote Sensing 2015,53, 3897–3905. doi: 10.1109/TGRS.2014.2387280
[13] Moghadasi, S.M.; Dehmollaian, M.; Rashed-Mohassel, J. Time Reversal Imagingof Deeply Buried Targets Under Moderately Rough Surfaces Using ApproximateTransmitted Fields. IEEE Transactions on Geoscience and Remote Sensing 2015,53, 3897–3905
[14] Moss, C.; Teixeira, F.; Yang, Y.; Kong, J.A. Finite-difference time-domainsimulation of scattering from objects in continuous random media. IEEETransactions on Geoscience and Remote Sensing 2002, 40, 178–186.doi:10.1109/36.981359.
[15] Ebrahimi-Zadeh, J.; Dehmollaian, M.; Mohammadpour-Aghdam, K.Electromagnetic TimeReversal Imaging of Pinholes in Pipes. IEEE Transactionson Antennas and Propagation 2016, 64, 1356–1363.doi:10.1109/TAP.2016.2526043
[16] Bas, P.L.; Abeele, K.V.D.; Santos, S.D.; Goursolle, T.; Matar, O. ExperimentalAnalysis for Nonlinear Time Reversal Imaging of Damaged Materials. 2006.
[17] Omrani, A.; Moghadasi, M.; Dehmollaian, M. Localisation and permittivityextraction of an embedded cylinder using decomposition of the time reversaloperator. IET Microwaves, Antennas Propagation 2020, 14, 851–859(8).
[18] Liu, D.; Kang, G.; Li, L.; Chen, Y.; Vasudevan, S.; Joines, W.; Liu, Q.H.; Krolik,J.; Carin, L. Electromagnetic time-reversal imaging of a target in a clutteredenvironment. IEEE Transactions on Antennas and Propagation 2005, 53, 3058–3066. doi:10.1109/TAP.2005.854563.
[19] Chew, W.C. Waves and Fields in Inhomogenous Media; IEEE Press, 1995.[20] Chew, W.; Wang, Y. Reconstruction of two-dimensional permittivity distribution
using the distorted Born iterative method. IEEE Transactions on Medical Imaging1990, 9, 218–225. doi: 10.1109/42.56334.
[21] Tai, C.T. Dyadic Green’s functions in electromagnetic theory; IEEE Press, 1994.[22] Yavuz, M.E.; Teixeira, F.L. Space–Frequency Ultrawideband Time-Reversal
Imaging. IEEE Transactions on Geoscience and Remote Sensing 2008, 46, 1115–1124. doi:10.1109/TGRS.2008.915755.
[23] Bender, C.M.; Orszag, S.A., Asymptotic Expansion of Integrals. In AdvancedMathematical Methods for Scientists and Engineers I: Asymptotic Methods andPerturbation Theory; Springer New York: New York, NY, 1999; pp. 247–316.
13
18th International Conference on Microwave and High Frequency Applications AMPERE 2021, Online, September 13-16, 2021
ADDITIVE FABRICATION OF HYDROXYAPATITE CERAMICS
USING MILLIMETER-WAVE AND SUB-TERAHERTZ RADIATION
S. V. Egorov1, A. G. Eremeev1, V. V. Kholoptsev1, I. V. Plotnikov1, K. I. Rybakov1,A. A. Sorokin1, S. S. Balabanov2, E. Ye. Rostokina2,1, Yu. V. Bykov1,
1Institute of Applied Physics, Russian Academy of Sciences, Nizhny Novgorod, Russia
2 G.G. Devyatykh Institute of Chemistry of High-Purity Substances, Russian Academy of
Sciences, Nizhny Novgorod, Russia [email protected]
Keywords: millimeter waves, terahertz, additive manufacturing, hydroxyapatite
Additive manufacturing of ceramic products is a challenging task in today’s materials science and technology. Two basically different approaches are being pursued in the implementation of this task: (1) additive production of a green ceramic part followed by sintering, and (2) localized sintering of a powder composition by a concentrated energy flow according to a 3D model of the final product. This paper reports recent results on the use of millimeter-wave and sub-terahertz electromagnetic radiation in the implementation of additive fabrication methods of ceramic products. The material under study was hydroxyapatite, Са10(РО4)6(ОН)2, which is a promising candidate for biomedical applications. The experiments were carried out with the hydroxyapatite powder GAP-85d (Polistom, Russia). The particle size of the powder was 0.7 – 2 μm, and the specific surface area was 3 – 10 m2/g. The powder compositions for the experiments on layer-by-layer millimeter-wave sintering were prepared by colloidal processing. It was found that the optimal concentration of the dispersed phase of hydroxyapatite in an aqueous solution, required for the deposition of sufficiently dense, fracture-free homogeneous layers, was close to 35 wt. %. About 1 wt. % of surfactant (ammonium polyacrylate) was added to the suspension to improve the stability against aggregation. Sintered hydroxyapatite disks with a diameter of 8 mm and a density of 70% of the theoretical density were used as scaffolds. The disperse hydroxyapatite suspension layers were applied to the scaffolds by the doctor blade method. The thickness of each applied layer was 0.1 - 0.15 mm. The millimeter-wave sintering was carried out in the workchamber of the gyrotron system for high-temperature millimeter-wave processing of materials operating at a frequency of 24 GHz with a maximum output power of 5 kW [1]. For improved uniformity of the temperature distribution within the heated body, the sample was placed in a cylindrical zirconia crucible which was built into the heat-insulating container made of a highly porous alumina-based material. The sample temperature was measured using a B-type thermocouple brought in direct contact with the powder layer. The accuracy of temperature measurements was no worse than ± 5 °C in the temperature range 1000 – 1450 °C. The sintering process was carried out at a residual air pressure of about 1 Pa. At the initial stage, the sample was heated to 800 ° C at a relatively slow rate of 10 °C/min in order to remove the surfactant and water vapor adsorbed on the particles of the powder material. Then the heating rate was increased to 20 °C/min, and the sample was heated to a temperature of 1150 °C with no isothermal hold. The millimeter-wave power required for heating did not exceed 400 W. To create a multi-layer sample, application of a hydroxyapatite suspension layer and the sintering procedure was repeated. A more detailed description of the experimental procedure can be found elsewhere [2].
14
18th International Conference on Microwave and High Frequency Applications AMPERE 2021, Online, September 13-16, 2021
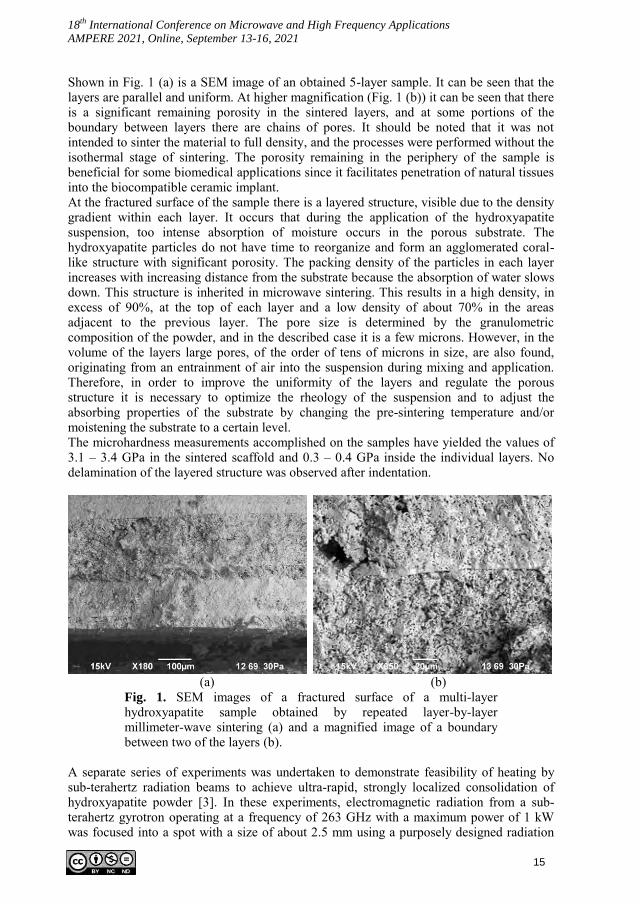
Shown in Fig. 1 (a) is a SEM image of an obtained 5-layer sample. It can be seen that the layers are parallel and uniform. At higher magnification (Fig. 1 (b)) it can be seen that there is a significant remaining porosity in the sintered layers, and at some portions of the boundary between layers there are chains of pores. It should be noted that it was not intended to sinter the material to full density, and the processes were performed without the isothermal stage of sintering. The porosity remaining in the periphery of the sample is beneficial for some biomedical applications since it facilitates penetration of natural tissues into the biocompatible ceramic implant. At the fractured surface of the sample there is a layered structure, visible due to the density gradient within each layer. It occurs that during the application of the hydroxyapatite suspension, too intense absorption of moisture occurs in the porous substrate. The hydroxyapatite particles do not have time to reorganize and form an agglomerated coral-like structure with significant porosity. The packing density of the particles in each layer increases with increasing distance from the substrate because the absorption of water slows down. This structure is inherited in microwave sintering. This results in a high density, in excess of 90%, at the top of each layer and a low density of about 70% in the areas adjacent to the previous layer. The pore size is determined by the granulometric composition of the powder, and in the described case it is a few microns. However, in the volume of the layers large pores, of the order of tens of microns in size, are also found, originating from an entrainment of air into the suspension during mixing and application. Therefore, in order to improve the uniformity of the layers and regulate the porous structure it is necessary to optimize the rheology of the suspension and to adjust the absorbing properties of the substrate by changing the pre-sintering temperature and/or moistening the substrate to a certain level. The microhardness measurements accomplished on the samples have yielded the values of 3.1 – 3.4 GPa in the sintered scaffold and 0.3 – 0.4 GPa inside the individual layers. No delamination of the layered structure was observed after indentation.
(a) (b) Fig. 1. SEM images of a fractured surface of a multi-layer hydroxyapatite sample obtained by repeated layer-by-layer millimeter-wave sintering (a) and a magnified image of a boundary between two of the layers (b).
A separate series of experiments was undertaken to demonstrate feasibility of heating by sub-terahertz radiation beams to achieve ultra-rapid, strongly localized consolidation of hydroxyapatite powder [3]. In these experiments, electromagnetic radiation from a sub-terahertz gyrotron operating at a frequency of 263 GHz with a maximum power of 1 kW was focused into a spot with a size of about 2.5 mm using a purposely designed radiation
15
18th International Conference on Microwave and High Frequency Applications AMPERE 2021, Online, September 13-16, 2021
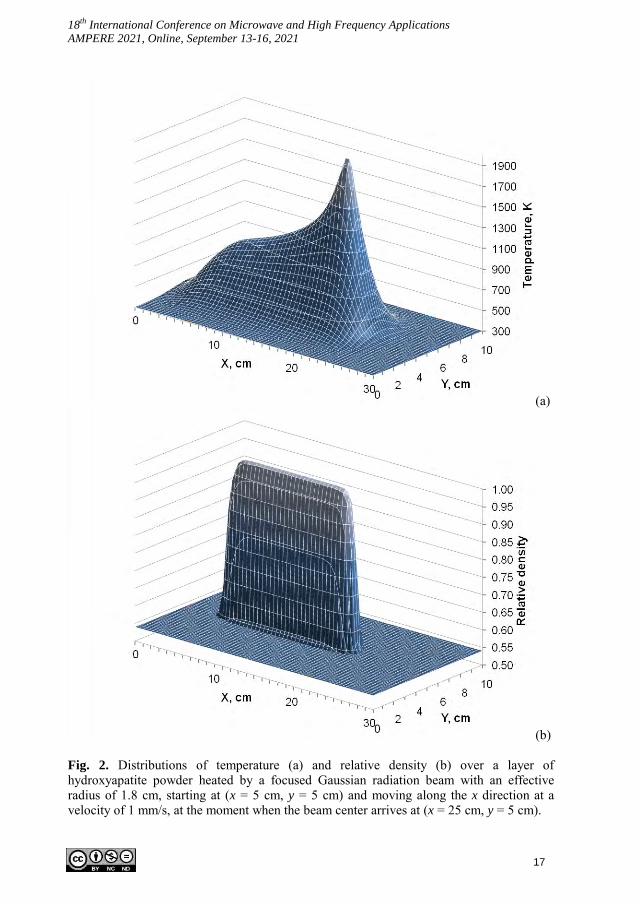
transmission line [4]. The hydroxyapatite powder was placed in a rectangular crucible made of porous alumina to from a powder layer with a length of 57 mm, a width of 12 mm and a thickness of 2.5 mm. The crucible with the powder was positioned under the sub-terahertz radiation beam at such a level that the focal point was slightly beneath the surface of the powder layer. Upon turning the gyrotron power on, the crucible was held still for about 5 s to provide initial heating of the powder at the starting point. Then the crucible was displaced relative to the beam at a velocity of about 0.5 mm/s, which was adjusted continuously so that uniform glowing of the heated powder could be observed. The gyrotron output power required to implement this heating regime was found to be about 100 W, which provided a radiation intensity of about 2 kW/cm2 in the focal spot. As a result of processing, localized consolidation has been achieved in a strip with a width of 3–5 mm over the entire depth of the powder layer. These first experimental results indicate that the use of focused beams of millimeter-wave / sub-terahertz radiation can be a promising approach in developing additive methods of ceramic products fabrication based on localized consolidation. In a similar manner, lower-frequency millimeter-wave radiation can be used for the same purpose, with a corresponding increase of the focal spot size. Densification of a layer of hydroxyapatite powder under localized heating by a Gaussian beam of 24 GHz millimeter-wave radiation was simulated within a quasi-3D model: a two-dimensional heat transfer equation with respect to transversal coordinates was complemented by heat removal conditions on the top and bottom surfaces of the layer. The heat removal was via thermal radiation which corresponds to the processing in vacuum. The absorbed microwave power was calculated at each time step using the experimentally obtained temperature dependencies of the complex dielectric permittivity of hydroxyapatite [5]. The dependency of the complex dielectric permittivity on density was accounted for using the effective medium approximation. The dependency of thermal conductivity of hydroxyapatite on temperature and density was taken into account in a similar manner using the data from [6]. The evolution of density during sintering was simulated using the master sintering curve approach [7]. The master sintering curve was constructed using the optical dilatometry data obtained in purposely designed millimeter-wave sintering experiments carried out at constant heating rates. The change in density was calculated at each time step of the simulation after computing the temperature distribution, assuming that the material is supplied to the zone of intense densification from the surrounding regions. The stresses associated with that were neglected. Shown in Fig. 2 are the simulation results for the case when a 24 GHz Gaussian millimeter-wave beam with an effective radius of 1.8 cm moves at a velocity of 1 mm/s along a compacted hydroxyapatite workpiece with an initial relative density of about 0.54. The millimeter-wave power was chosen at such a level that an almost full density of the sintered material was achieved at the beam axis. The total radiation power absorbed in the workpiece in the steady state was about 945 W in this example. It can be seen from a comparison of Figs. 2a and 2b that the width of the region in which a high density of the sintered material is achieved is significantly less than the characteristic width of the temperature distribution, and even less than the effective width of the Gaussian beam.
16
18th International Conference on Microwave and High Frequency Applications AMPERE 2021, Online, September 13-16, 2021
(a)
(b)
Fig. 2. Distributions of temperature (a) and relative density (b) over a layer of hydroxyapatite powder heated by a focused Gaussian radiation beam with an effective radius of 1.8 cm, starting at (x = 5 cm, y = 5 cm) and moving along the x direction at a velocity of 1 mm/s, at the moment when the beam center arrives at (x = 25 cm, y = 5 cm).
17
18th International Conference on Microwave and High Frequency Applications AMPERE 2021, Online, September 13-16, 2021
In conclusion, this work demonstrates the potential of utilizing millimeter-wave and sub-terahertz radiation in the development of additive fabrication methods of ceramic products. The concentration of the radiation energy in the radiation beam is determined by the power of the radiation source and the electromagnetic wavelength, varying from 1.5 to 25 kW/cm2 in the frequency range 24 – 263 GHz. In particular, this makes it possible to develop applications aimed on creating ceramic products with graded porous structures of different scale for enhanced biocompatibility.
This research was supported by Russian Foundation for Basic Research, grant # 18-29-11045.
References [1] Bykov, Yu.V., A.G. Eremeev, M.Yu. Glyavin, G.G. Denisov, G.I. Kalynova, E.A.
Kopelovich, A.G. Luchinin, I.V. Plotnikov, M.D. Proyavin, M.M. Troitskiy, V.V.Kholoptsev, Radiophys. Quantum Electron., 2019, 61, 752–762,DOI 10.1007/s11141-019-09933-6
[2] Egorov, S.V., A.G. Eremeev, I.V. Plotnikov, K.I. Rybakov, A.A. Sorokin, V.V.Kholoptsev, S.S. Balabanov, E.E. Rostokina, Yu.V. Bykov, Radiophys. Quantum
Electron., 2020, 63, 522–529, DOI 10.1007/s11141-021-10076-w[3] Egorov, S.V., A.G. Eremeev, V.V. Kholoptsev, I.V. Plotnikov, K.I. Rybakov,
A.A. Sorokin, Yu.V. Bykov, IOP Conf. Series: Mater. Sci. & Eng. 2019, 678,012022, DOI 10.1088/1757-899X/678/1/012022
[4] Vodopyanov, A.V., A.V. Samokhin, N.V. Alexeev, M.A. Sinayskiy, A.I.Tsvetkov, M.Yu. Glyavin, Vacuum, 2017, 145, 340–346,DOI 10.1016/j.vacuum.2017.09.018
[5] Eremeev, A., S. Egorov, V. Kholoptsev, Proc. 17th Int. Conf. on Microwave andHigh Frequency Heating (AMPERE 2019). Valencia: Universitat Politèchnica deValència, 2019. pp. 310–317, DOI 10.4995/Ampere2019.2019.9754
[6] Kijima, T., M. Tsutsumi, J. Am. Ceram. Soc., 1979, 62, 455-460,DOI 10.1111/j.1151-2916.1979.tb19104.x
[7] Su, H., D. L. Johnson, J. Am. Ceram. Soc., 1996, 79, 3211–3217,DOI 10.1111/j.1151-2916.1996.tb08097.x
18
APPLICATIONS OF DUAL MODE MICROWAVE RESONATORS IN ELECTRON PARAMAGNETIC RESONANCE (EPR) SPECTROSCOPY
A. Folli1, G. Magri1, M. Barter2, J. Harari2, H. Choi2, E. Richards1, D. Slocombe2, A.Porch2, D. M. Murphy1
1EPR and ENDOR Research Group, School of Chemistry, Cardiff University, Cardiff CF10 3AT, U.K. [email protected]
2Centre for High Frequency Engineering, School of Engineering, Cardiff University, Cardiff CF24 3AA, U.K.
Keywords: Microwave, Chemistry, Electron Paramagnetic Resonance (EPR), Dual Mode, T-jump, Reaction Kinetics, Reaction Dynamics, Paramagnetic, Free Radicals.
Electron Paramagnetic Resonance (EPR), or electron spin resonance (ESR), spectroscopy is a technique used to study free radicals or materials containing unpaired electrons (paramagnetic). The fundamental principles of EPR are similar to those of Nuclear Magnetic Resonance (NMR), with the main difference that it is electron spins that are probed rather than the spins of atomic nuclei. The larger energy gap between the electron spin states, compared to the nuclear spin states, requires the use of microwave (MW) frequencies for spin excitation rather than radio frequencies as is typical in NMR. Most of the EPR detection methods, in particular at X-band frequencies, involve the use of resonant cavities where the magnetic component of the MW is used for spin excitation.
Here we show that dual mode MW resonant cavities, using a ca. 9.5 GHz frequency for EPR detection and a ca. 6.1 GHz frequency for sample perturbation [1], offers new and exciting opportunities for sample interrogation and method development that are not possible with ordinary single mode resonant cavities, opening up exciting avenues for chemists and materials scientists.
Firstly, the electric field of the 6.1 GHz MW can be used to induce rapid, volumetric heating of a solution via electric dipole absorption, whilst the 9.5 GHz frequency simultaneously detects EPR spectra of the sampled paramagnetic species. Generating a short MW pulse at 6.1 GHz can in theory result in a rapid T-jump which, for instance, can lead to populate non-equilibrium reactive intermediate states for the study of reaction kinetics. Furthermore, it offers the possibility of using EPR resonators as MW reactors, and thus accelerating reaction times during EPR detection. Secondly, such dual mode resonators offer possibilities to interrogate molecular dynamics (as well as spin exchange phenomena) over much faster time frames when compared to conventional heating methods. This is exemplified here by probing the temperature-induced variation of rotational dynamics of the 16-doxyl stearic acid methyl ester (16-DSE) spin probe grafted on the surface of sodium dodecyl sulphate (SDS) micelles [2].
References
1. D. Slocombe, A. Folli, H. Choi, M. Barter, J. Harari, E. Richards, D. M. Murphy,A. Porch, AMPERE Newsletter, 2020, 102, 1–8. ISSN 1361-8598.
2. A. Folli, H. Choi, M. Barter, J. Harari, E. Richards, D. Slocombe, A. Porch, D. M.Murphy, J. Magn. Reson. 2020, 310, 106644. DOI: 10.1016/j.jmr.2019.106644.
19
18th International Conference on Microwave and High Frequency Applications AMPERE 2021, Gothenburg, Sweden, September 13-16, 2021
ASSESSMENT OF COAXIAL FILTERS FOR METALLIC MODE STIRRER INSTALLATION IN MULTIMODE MICROWAVE OVENS
Juan Monzo-Cabrera1*, Alejandro Díaz-Morcillo1, Antonio Martínez-Gonzalez1, Antonio Lozano-Guerrero1, José Fayos-Fernández1 and Rafael Pérez-Campos1 1Universidad Politécnica de Cartagena, ETSI de Telecomunicación, Plaza del Hospital, 1, E-30319 Cartagena, Spain;*email: [email protected]
Keywords: Modelling, Applicator, Component, Safety, Standards, Design, Evaluation.
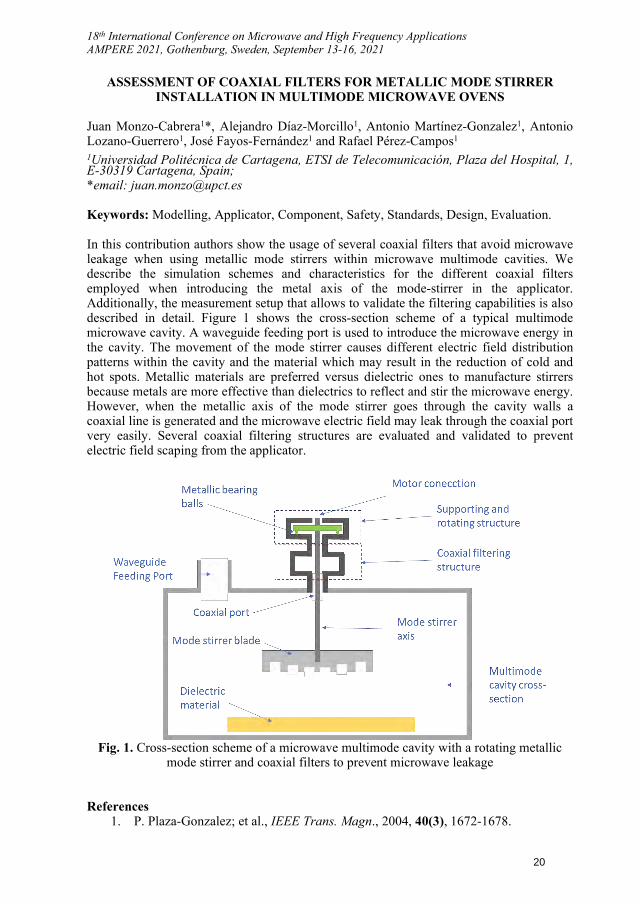
In this contribution authors show the usage of several coaxial filters that avoid microwave leakage when using metallic mode stirrers within microwave multimode cavities. We describe the simulation schemes and characteristics for the different coaxial filters employed when introducing the metal axis of the mode-stirrer in the applicator. Additionally, the measurement setup that allows to validate the filtering capabilities is also described in detail. Figure 1 shows the cross-section scheme of a typical multimode microwave cavity. A waveguide feeding port is used to introduce the microwave energy in the cavity. The movement of the mode stirrer causes different electric field distribution patterns within the cavity and the material which may result in the reduction of cold and hot spots. Metallic materials are preferred versus dielectric ones to manufacture stirrers because metals are more effective than dielectrics to reflect and stir the microwave energy. However, when the metallic axis of the mode stirrer goes through the cavity walls a coaxial line is generated and the microwave electric field may leak through the coaxial port very easily. Several coaxial filtering structures are evaluated and validated to prevent electric field scaping from the applicator.
Fig. 1. Cross-section scheme of a microwave multimode cavity with a rotating metallic mode stirrer and coaxial filters to prevent microwave leakage
References 1. P. Plaza-Gonzalez; et al., IEEE Trans. Magn., 2004, 40(3), 1672-1678.
20
ASSESSEMENT OF REFRACTORY MATERIALS IN HIGH TEMPERATURE MICROWAVE APPLICATIONS
V. Grimm1, R. Behrend1, K. Al-Hamdan2, W. Wintzer3, S. Wiltzsch4, H. Krause1
1TU Bergakademie Freiberg, Institute of thermal engineering, Professorship of Gas and Heat systems, Gustav-Zeuner-Straße 7, 09599 Freiberg, Germany 2TU Bergakademie Freiberg, Institute of glas science and technology, Professorship of glass and enamel technology, Leipziger Straße 28, 09599 Freiberg, Germany 3JSJ Jodeit GmbH, Am Naßtal 10, 07751 Jena, Germany 4Technische Hochschule Nürnberg Georg Simon Ohm, Faculty of Materials Engineering, Wassertorstraße 10, 90489 Nürnberg, Germany [email protected]
Keywords: microwave, power applications, refractories, absorption, high temperature
Abstract
High temperature microwave applications (>800 °C) have become more relevant in the past 20 years. Applications in glass melting and ceramic sintering have since reached the market. These market applications require reliable information about long term stability of used materials, especially refractory materials with microwave interaction. Microwave interaction, in particular absorption and transmission, strongly depends on material composition, density and so on. Available data is scarce for temperatures above 800 °C. Within this paper, we present a simple apparatus for qualitative determination of microwave absorption, reflection and transmission, based on modified WR340 waveguide with a magnetron and a pyrometer. Input power and reflected power were measured using a 6-port reflectometer, transmitted power was measured using a directional detector. The materials were tested regarding the absorption behavior under worst case conditions (moving short and adjusted impedance) and under near perfect transmission, with the moving short replaced with an absorber. Material temperature over time was measured while applying 600 W microwave power to predefined samples. We present results for refractory materials commonly used in glass melting applications (e.g. silica, alumina and alumina-zirconia-silica). Most refractory materials will heat rapidly until material failure under worst case conditions like 100% absorption, with the exception of silica. Under transmission conditions most refractories won’t show a significant temperature rise, only alumina showed significant heating, but all stones remained undamaged. The results imply some material combinations from conventional glass melting furnaces to be usable in microwave heated systems.
1. Introduction
For the use of refractory lining in microwave ovens, not only the properties of resistance are of great importance. The behaviour under the influence of electromagnetic waves is also important. In the literature there are only a few reliable values. Therefore, selected refractory materials (Table 1) were examined more closely.
The literature sources show that the values increase with increasing density and temperature [1–5]. This means that a greater absorption is to be expected. It should be taken into account that these figures do not give any information with regard to the reflection and transmission
21
of a brick. In addition, the temperatures given are usually lower than the ranges relevant for the kiln. Therefore, only a rough estimate would be possible. In addition, in many works the values are given in other frequencies than the 2.45 GHz used in the investigations. However, it is clear from frequency curve data, such as that of the quartz and the aluminium silicate, that the values are strongly frequency-dependent [6, 7]. Therefore, extrapolation is difficult. The greatest difficulty for the transferability of the literature values to the intended experiments lies in the material available. Refractory bricks can, for example, be pressed or fused cast [8]. As a result, the samples have very different structures in their microstructure. Moreover, it is difficult to estimate how the percentage composition and combination of the individual components (Al2O3, SiO2, ZrO2, Fe2O3 and Na2O) affect the behaviour under microwave influence.
1. Experimental set-up and execution
Two methods were used to investigate the refractory lining. One was the absorption measurement and the other the transmission measurement.
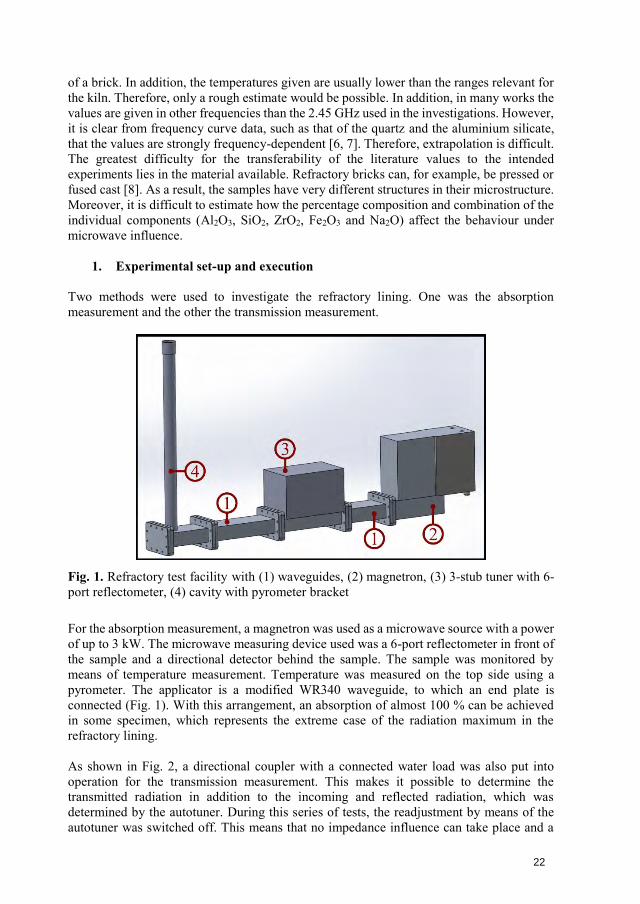
Fig. 1. Refractory test facility with (1) waveguides, (2) magnetron, (3) 3-stub tuner with 6-port reflectometer, (4) cavity with pyrometer bracket
For the absorption measurement, a magnetron was used as a microwave source with a power of up to 3 kW. The microwave measuring device used was a 6-port reflectometer in front of the sample and a directional detector behind the sample. The sample was monitored by means of temperature measurement. Temperature was measured on the top side using a pyrometer. The applicator is a modified WR340 waveguide, to which an end plate is connected (Fig. 1). With this arrangement, an absorption of almost 100 % can be achieved in some specimen, which represents the extreme case of the radiation maximum in the refractory lining.
As shown in Fig. 2, a directional coupler with a connected water load was also put into operation for the transmission measurement. This makes it possible to determine the transmitted radiation in addition to the incoming and reflected radiation, which was determined by the autotuner. During this series of tests, the readjustment by means of the autotuner was switched off. This means that no impedance influence can take place and a
22
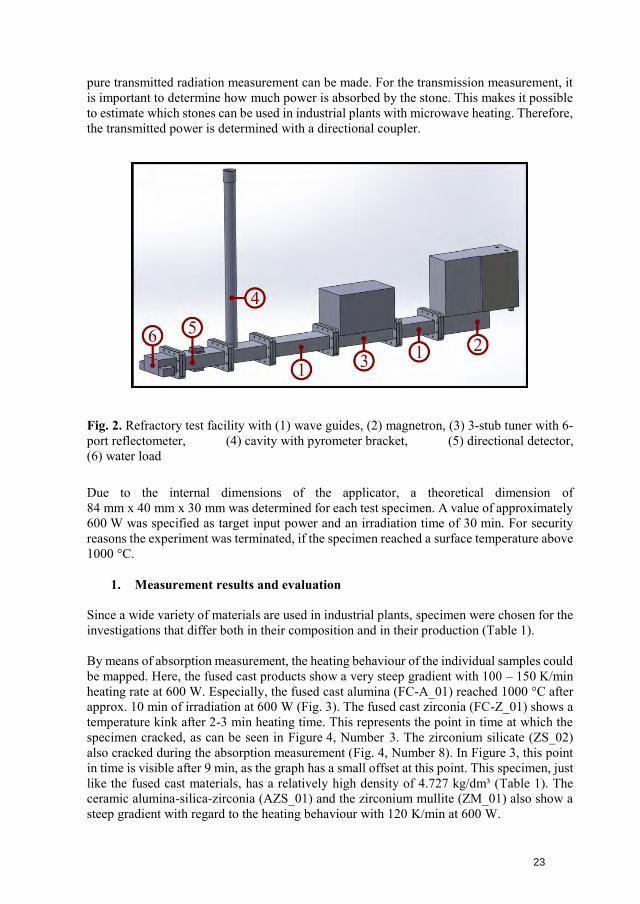
pure transmitted radiation measurement can be made. For the transmission measurement, it is important to determine how much power is absorbed by the stone. This makes it possible to estimate which stones can be used in industrial plants with microwave heating. Therefore, the transmitted power is determined with a directional coupler.
Fig. 2. Refractory test facility with (1) wave guides, (2) magnetron, (3) 3-stub tuner with 6-port reflectometer, (4) cavity with pyrometer bracket, (5) directional detector, (6) water load
Due to the internal dimensions of the applicator, a theoretical dimension of 84 mm x 40 mm x 30 mm was determined for each test specimen. A value of approximately 600 W was specified as target input power and an irradiation time of 30 min. For security reasons the experiment was terminated, if the specimen reached a surface temperature above 1000 °C.
1. Measurement results and evaluation
Since a wide variety of materials are used in industrial plants, specimen were chosen for the investigations that differ both in their composition and in their production (Table 1).
By means of absorption measurement, the heating behaviour of the individual samples could be mapped. Here, the fused cast products show a very steep gradient with 100 – 150 K/min heating rate at 600 W. Especially, the fused cast alumina (FC-A_01) reached 1000 °C after approx. 10 min of irradiation at 600 W (Fig. 3). The fused cast zirconia (FC-Z_01) shows a temperature kink after 2-3 min heating time. This represents the point in time at which the specimen cracked, as can be seen in Figure 4, Number 3. The zirconium silicate (ZS_02) also cracked during the absorption measurement (Fig. 4, Number 8). In Figure 3, this point in time is visible after 9 min, as the graph has a small offset at this point. This specimen, just like the fused cast materials, has a relatively high density of 4.727 kg/dm³ (Table 1). The ceramic alumina-silica-zirconia (AZS_01) and the zirconium mullite (ZM_01) also show a steep gradient with regard to the heating behaviour with 120 K/min at 600 W.
23
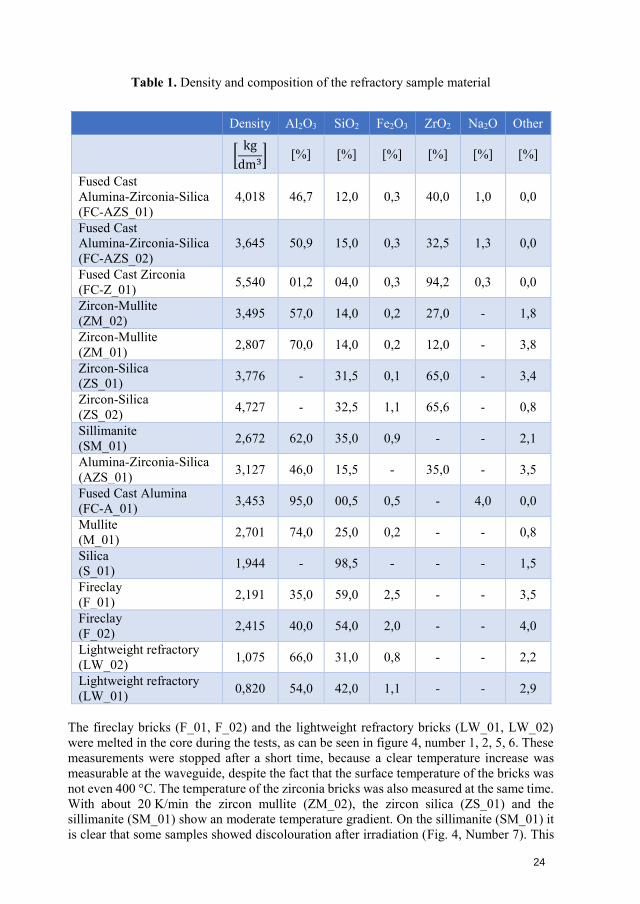
Table 1. Density and composition of the refractory sample material
Density Al2O3 SiO2 Fe2O3 ZrO2 Na2O Other
[kg
dm3] [%] [%] [%] [%] [%] [%]
Fused Cast Alumina-Zirconia-Silica (FC-AZS_01)
4,018 46,7 12,0 0,3 40,0 1,0 0,0
Fused Cast Alumina-Zirconia-Silica (FC-AZS_02)
3,645 50,9 15,0 0,3 32,5 1,3 0,0
Fused Cast Zirconia (FC-Z_01) 5,540 01,2 04,0 0,3 94,2 0,3 0,0
Zircon-Mullite (ZM_02) 3,495 57,0 14,0 0,2 27,0 - 1,8
Zircon-Mullite (ZM_01) 2,807 70,0 14,0 0,2 12,0 - 3,8
Zircon-Silica (ZS_01) 3,776 - 31,5 0,1 65,0 - 3,4
Zircon-Silica (ZS_02) 4,727 - 32,5 1,1 65,6 - 0,8
Sillimanite (SM_01) 2,672 62,0 35,0 0,9 - - 2,1
Alumina-Zirconia-Silica (AZS_01) 3,127 46,0 15,5 - 35,0 - 3,5
Fused Cast Alumina (FC-A_01) 3,453 95,0 00,5 0,5 - 4,0 0,0
Mullite (M_01) 2,701 74,0 25,0 0,2 - - 0,8
Silica (S_01) 1,944 - 98,5 - - - 1,5
Fireclay (F_01) 2,191 35,0 59,0 2,5 - - 3,5
Fireclay (F_02) 2,415 40,0 54,0 2,0 - - 4,0
Lightweight refractory (LW_02) 1,075 66,0 31,0 0,8 - - 2,2
Lightweight refractory (LW_01) 0,820 54,0 42,0 1,1 - - 2,9
The fireclay bricks (F_01, F_02) and the lightweight refractory bricks (LW_01, LW_02) were melted in the core during the tests, as can be seen in figure 4, number 1, 2, 5, 6. These measurements were stopped after a short time, because a clear temperature increase was measurable at the waveguide, despite the fact that the surface temperature of the bricks was not even 400 °C. The temperature of the zirconia bricks was also measured at the same time. With about 20 K/min the zircon mullite (ZM_02), the zircon silica (ZS_01) and the sillimanite (SM_01) show an moderate temperature gradient. On the sillimanite (SM_01) it is clear that some samples showed discolouration after irradiation (Fig. 4, Number 7). This
24
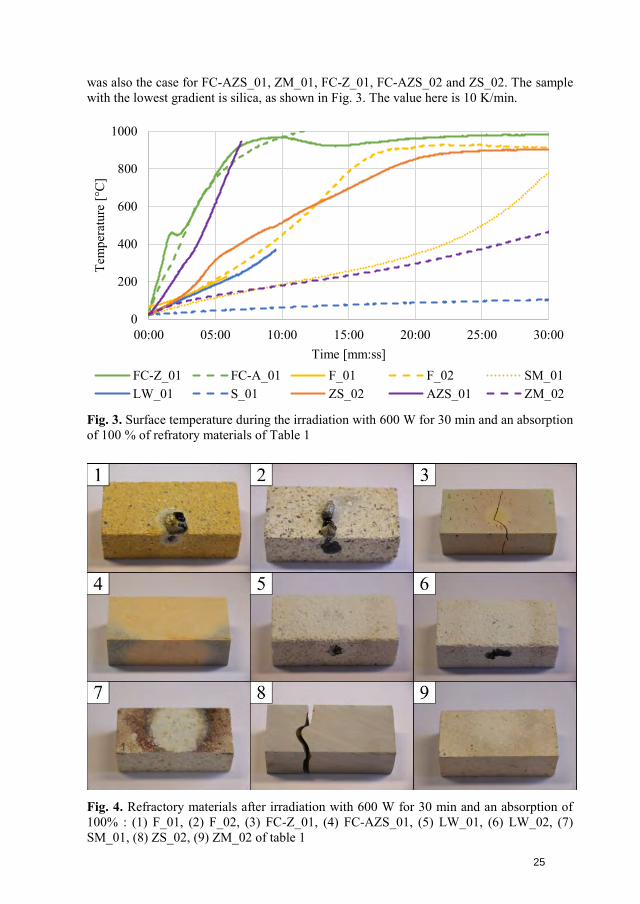
was also the case for FC-AZS_01, ZM_01, FC-Z_01, FC-AZS_02 and ZS_02. The sample with the lowest gradient is silica, as shown in Fig. 3. The value here is 10 K/min.
Fig. 3. Surface temperature during the irradiation with 600 W for 30 min and an absorption of 100 % of refratory materials of Table 1
Fig. 4. Refractory materials after irradiation with 600 W for 30 min and an absorption of 100% : (1) F_01, (2) F_02, (3) FC-Z_01, (4) FC-AZS_01, (5) LW_01, (6) LW_02, (7) SM_01, (8) ZS_02, (9) ZM_02 of table 1
0
200
400
600
800
1000
00:00 05:00 10:00 15:00 20:00 25:00 30:00
Tem
pera
ture
[°C
]
Time [mm:ss]FC-Z_01 FC-A_01 F_01 F_02 SM_01LW_01 S_01 ZS_02 AZS_01 ZM_02
25
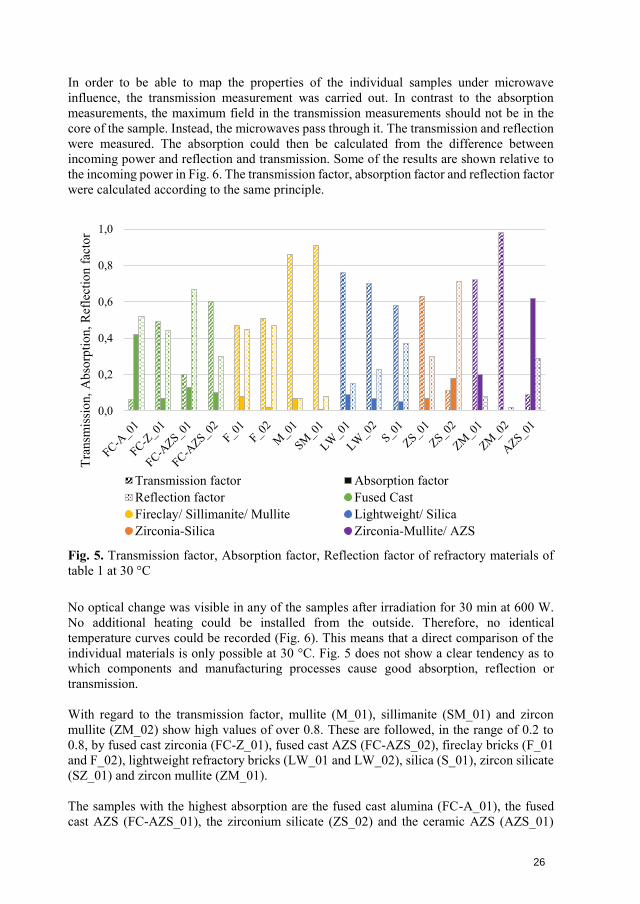
In order to be able to map the properties of the individual samples under microwave influence, the transmission measurement was carried out. In contrast to the absorption measurements, the maximum field in the transmission measurements should not be in the core of the sample. Instead, the microwaves pass through it. The transmission and reflection were measured. The absorption could then be calculated from the difference between incoming power and reflection and transmission. Some of the results are shown relative to the incoming power in Fig. 6. The transmission factor, absorption factor and reflection factor were calculated according to the same principle.
Fig. 5. Transmission factor, Absorption factor, Reflection factor of refractory materials of table 1 at 30 °C
No optical change was visible in any of the samples after irradiation for 30 min at 600 W. No additional heating could be installed from the outside. Therefore, no identical temperature curves could be recorded (Fig. 6). This means that a direct comparison of the individual materials is only possible at 30 °C. Fig. 5 does not show a clear tendency as to which components and manufacturing processes cause good absorption, reflection or transmission.
With regard to the transmission factor, mullite (M_01), sillimanite (SM_01) and zircon mullite (ZM_02) show high values of over 0.8. These are followed, in the range of 0.2 to 0.8, by fused cast zirconia (FC-Z_01), fused cast AZS (FC-AZS_02), fireclay bricks (F_01 and F_02), lightweight refractory bricks (LW_01 and LW_02), silica (S_01), zircon silicate (SZ_01) and zircon mullite (ZM_01).
The samples with the highest absorption are the fused cast alumina (FC-A_01), the fused cast AZS (FC-AZS_01), the zirconium silicate (ZS_02) and the ceramic AZS (AZS_01)
0,0
0,2
0,4
0,6
0,8
1,0
Tran
smis
sion
, Abs
orpt
ion,
Ref
lect
ion
fact
or
Transmission factor Absorption factorReflection factor Fused CastFireclay/ Sillimanite/ Mullite Lightweight/ SilicaZirconia-Silica Zirconia-Mullite/ AZS
26
have a very low transmission factor, below 0.2. Overall the absorption factor was below 0.2 for most samples.
With regard to reflection, the fused cast AZS (FC-AZS_01) and the zircon silicate (ZS_02) have very high values of over 0.6. The lowest reflection factors, below 0.1, are found in the mullite (M_01), the sillimanite (SM_01) and the zircon mullite samples (ZM_01 and ZM_02). The other samples listed in table 1 have a reflection factor of 0.1 to 0.6.
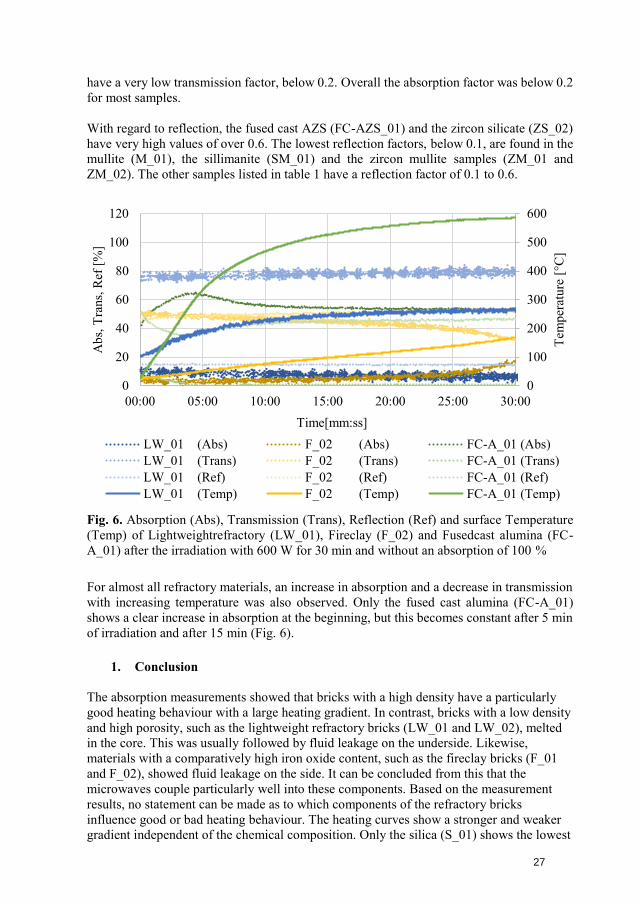
Fig. 6. Absorption (Abs), Transmission (Trans), Reflection (Ref) and surface Temperature (Temp) of Lightweightrefractory (LW_01), Fireclay (F_02) and Fusedcast alumina (FC-A_01) after the irradiation with 600 W for 30 min and without an absorption of 100 %
For almost all refractory materials, an increase in absorption and a decrease in transmission with increasing temperature was also observed. Only the fused cast alumina (FC-A_01) shows a clear increase in absorption at the beginning, but this becomes constant after 5 min of irradiation and after 15 min (Fig. 6).
1. Conclusion
The absorption measurements showed that bricks with a high density have a particularly good heating behaviour with a large heating gradient. In contrast, bricks with a low density and high porosity, such as the lightweight refractory bricks (LW_01 and LW_02), melted in the core. This was usually followed by fluid leakage on the underside. Likewise, materials with a comparatively high iron oxide content, such as the fireclay bricks (F_01 and F_02), showed fluid leakage on the side. It can be concluded from this that the microwaves couple particularly well into these components. Based on the measurement results, no statement can be made as to which components of the refractory bricks influence good or bad heating behaviour. The heating curves show a stronger and weaker gradient independent of the chemical composition. Only the silica (S_01) shows the lowest
0
100
200
300
400
500
600
0
20
40
60
80
100
120
00:00 05:00 10:00 15:00 20:00 25:00 30:00
Tem
pera
ture
[°C
]
Abs
, Tra
ns, R
ef [%
]
Time[mm:ss]LW_01 (Abs) F_02 (Abs) FC-A_01 (Abs)LW_01 (Trans) F_02 (Trans) FC-A_01 (Trans)LW_01 (Ref) F_02 (Ref) FC-A_01 (Ref)LW_01 (Temp) F_02 (Temp) FC-A_01 (Temp)
27
heating. This sample has the highest proportion of silicon oxide, of all the sample materials examined. This suggests that this component contributes to a low heating.
According to the transmission measurements, no clear statement can be made on which material values the absorption, transmission and reflection depend. It is a combination of many material properties. These are the chemical composition, the type of processing (fused cast or pressed), the density and porosity, as well as the thermal conductivity and specific heat capacity. Furthermore, the structure of a refractory material could have an influence on its behaviour under microwave irradiation.
Nevertheless, it can be assumed that a high proportion of aluminium oxide results in good transmission. This also applies to bricks with a high proportion of silicon oxide, where there is also a relatively high reflection. It was also found that lightweight refractory bricks with a low density and high porosity transmit microwaves very well.
References
[1] SHANG, Xiaobiao ; DI ZHAI ; ZHANG, Fucheng ; WEI, Cong ; CHEN, Junruo ; LIU,Meihong ; PENG, Jinhui: Electromagnetic waves transmission performance ofalumina refractory ceramics in 2.45 GHz microwave heating. In: CeramicsInternational 45 (2019), Nr. 17, S. 23493–23500
[2] DI ZHAI ; ZHANG, Fucheng ; WEI, Cong ; BAI, Yongzhen ; ZHU, Liyue ; LI,Guangchao ; SHANG, Xiaobiao ; SUN, Junfeng ; CHEN, Junruo ; LIU, Meihong ;PENG, Jinhui ; GU, Huabin: Dielectric properties and electromagnetic wavetransmission performance of polycrystalline mullite fiberboard at 2.45 GHz. In:Ceramics International 46 (2020), Nr. 6, S. 7362–7373
[3] ARTHUR VON HIPPEL: Dielectric Materials and Applications England (1954)
[4] NELSON, S. ; LINDROTH, D. ; BLAKE, R.: Dielectric properties of selected minerals at1 to 22 GHz (1989)
[5] MIN KYU PARK ; NA NEUL KIM ; SEUNG SU BAEK ; EUL SON KANG ; YONG KEEBAEK ; DO KYUNG KIM: Dielectric properties of alumina ceramica in the microwavefrequenzy at high tmperature : Solid State Phenomena, 2007
[6] SHANG, Xiaobiao ; DI ZHAI ; LIU, Meihong ; CHEN, Junruo ; ZHANG, Fucheng ; WEI,Cong ; BAI, Yongzhen ; LI, Guangchao: Dielectric properties and electromagneticwave transmission performance of aluminium silicate fibreboard at 915 MHz and2450 MHz. In: Ceramics International 47 (2021), Nr. 6, S. 7539–7557
[7] W. B. WESTPHAL ; A. SILS: Dielectric Constant and Loss Data : Technical ReportAFML-TR-72-39 (1972)
[8] GERALD ROUTSCHKA ; HARTMUT WUTHNOW: Taschenbuch Feuerfeste Werkstoffe(2007)
28
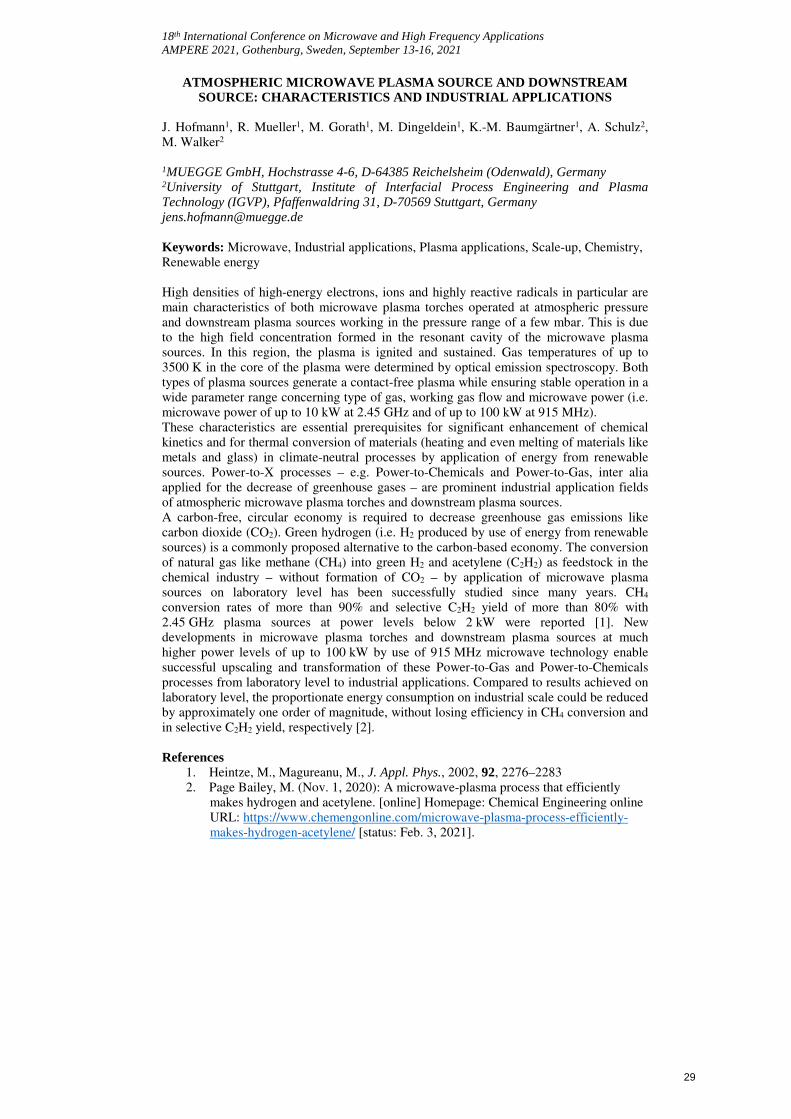
18th International Conference on Microwave and High Frequency Applications
AMPERE 2021, Gothenburg, Sweden, September 13-16, 2021
ATMOSPHERIC MICROWAVE PLASMA SOURCE AND DOWNSTREAM SOURCE: CHARACTERISTICS AND INDUSTRIAL APPLICATIONS
J. Hofmann1, R. Mueller1, M. Gorath1, M. Dingeldein1, K.-M. Baumgärtner1, A. Schulz2,
M. Walker2
1MUEGGE GmbH, Hochstrasse 4-6, D-64385 Reichelsheim (Odenwald), Germany 2University of Stuttgart, Institute of Interfacial Process Engineering and Plasma
Technology (IGVP), Pfaffenwaldring 31, D-70569 Stuttgart, Germany
Keywords: Microwave, Industrial applications, Plasma applications, Scale-up, Chemistry,
Renewable energy
High densities of high-energy electrons, ions and highly reactive radicals in particular are
main characteristics of both microwave plasma torches operated at atmospheric pressure
and downstream plasma sources working in the pressure range of a few mbar. This is due
to the high field concentration formed in the resonant cavity of the microwave plasma
sources. In this region, the plasma is ignited and sustained. Gas temperatures of up to
3500 K in the core of the plasma were determined by optical emission spectroscopy. Both
types of plasma sources generate a contact-free plasma while ensuring stable operation in a
wide parameter range concerning type of gas, working gas flow and microwave power (i.e.
microwave power of up to 10 kW at 2.45 GHz and of up to 100 kW at 915 MHz).
These characteristics are essential prerequisites for significant enhancement of chemical kinetics and for thermal conversion of materials (heating and even melting of materials like metals and glass) in climate-neutral processes by application of energy from renewable sources. Power-to-X processes – e.g. Power-to-Chemicals and Power-to-Gas, inter alia applied for the decrease of greenhouse gases – are prominent industrial application fields of atmospheric microwave plasma torches and downstream plasma sources. A carbon-free, circular economy is required to decrease greenhouse gas emissions like carbon dioxide (CO2). Green hydrogen (i.e. H2 produced by use of energy from renewable sources) is a commonly proposed alternative to the carbon-based economy. The conversion of natural gas like methane (CH4) into green H2 and acetylene (C2H2) as feedstock in the chemical industry – without formation of CO2 – by application of microwave plasma sources on laboratory level has been successfully studied since many years. CH4 conversion rates of more than 90% and selective C2H2 yield of more than 80% with 2.45 GHz plasma sources at power levels below 2 kW were reported [1]. New developments in microwave plasma torches and downstream plasma sources at much higher power levels of up to 100 kW by use of 915 MHz microwave technology enable successful upscaling and transformation of these Power-to-Gas and Power-to-Chemicals processes from laboratory level to industrial applications. Compared to results achieved on
laboratory level, the proportionate energy consumption on industrial scale could be reduced
by approximately one order of magnitude, without losing efficiency in CH4 conversion and in selective C2H2 yield, respectively [2].
References 1. Heintze, M., Magureanu, M., J. Appl. Phys., 2002, 92, 2276–22832. Page Bailey, M. (Nov. 1, 2020): A microwave-plasma process that efficiently
makes hydrogen and acetylene. [online] Homepage: Chemical Engineering online
URL: https://www.chemengonline.com/microwave-plasma-process-efficiently-makes-hydrogen-acetylene/ [status: Feb. 3, 2021].
29
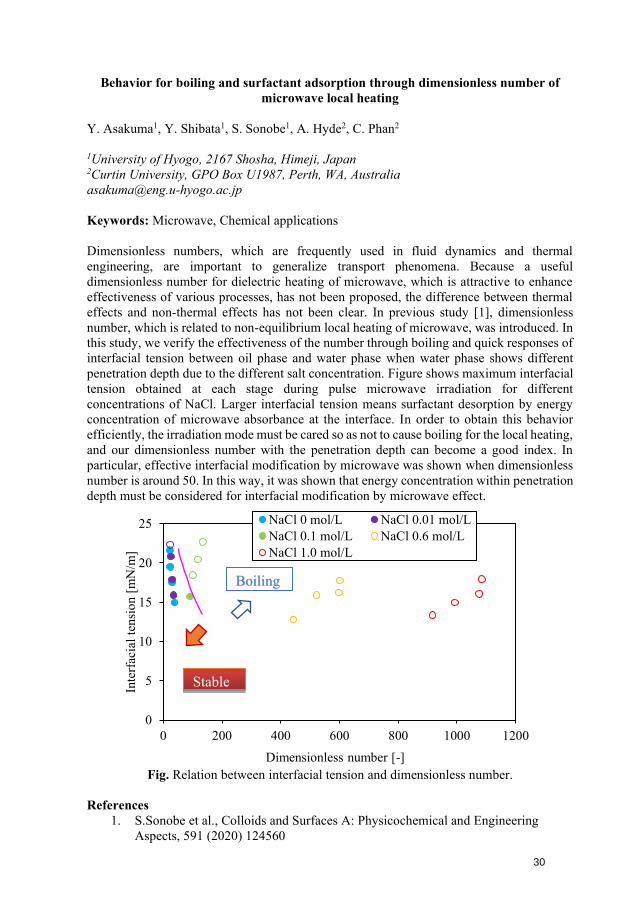
Behavior for boiling and surfactant adsorption through dimensionless number of microwave local heating
Y. Asakuma1, Y. Shibata1, S. Sonobe1, A. Hyde2, C. Phan2
1University of Hyogo, 2167 Shosha, Himeji, Japan 2Curtin University, GPO Box U1987, Perth, WA, Australia [email protected]
Keywords: Microwave, Chemical applications
Dimensionless numbers, which are frequently used in fluid dynamics and thermal engineering, are important to generalize transport phenomena. Because a useful dimensionless number for dielectric heating of microwave, which is attractive to enhance effectiveness of various processes, has not been proposed, the difference between thermal effects and non-thermal effects has not been clear. In previous study [1], dimensionless number, which is related to non-equilibrium local heating of microwave, was introduced. In this study, we verify the effectiveness of the number through boiling and quick responses of interfacial tension between oil phase and water phase when water phase shows different penetration depth due to the different salt concentration. Figure shows maximum interfacial tension obtained at each stage during pulse microwave irradiation for different concentrations of NaCl. Larger interfacial tension means surfactant desorption by energy concentration of microwave absorbance at the interface. In order to obtain this behavior efficiently, the irradiation mode must be cared so as not to cause boiling for the local heating, and our dimensionless number with the penetration depth can become a good index. In particular, effective interfacial modification by microwave was shown when dimensionless number is around 50. In this way, it was shown that energy concentration within penetration depth must be considered for interfacial modification by microwave effect.
Fig. Relation between interfacial tension and dimensionless number.
References 1. S.Sonobe et al., Colloids and Surfaces A: Physicochemical and Engineering
Aspects, 591 (2020) 124560
0
5
10
15
20
25
0 200 400 600 800 1000 1200
Inte
rfac
ial t
ensi
on [m
N/m
]
Dimensionless number [-]
NaCl 0 mol/L NaCl 0.01 mol/LNaCl 0.1 mol/L NaCl 0.6 mol/LNaCl 1.0 mol/L
Stable
Boiling
30
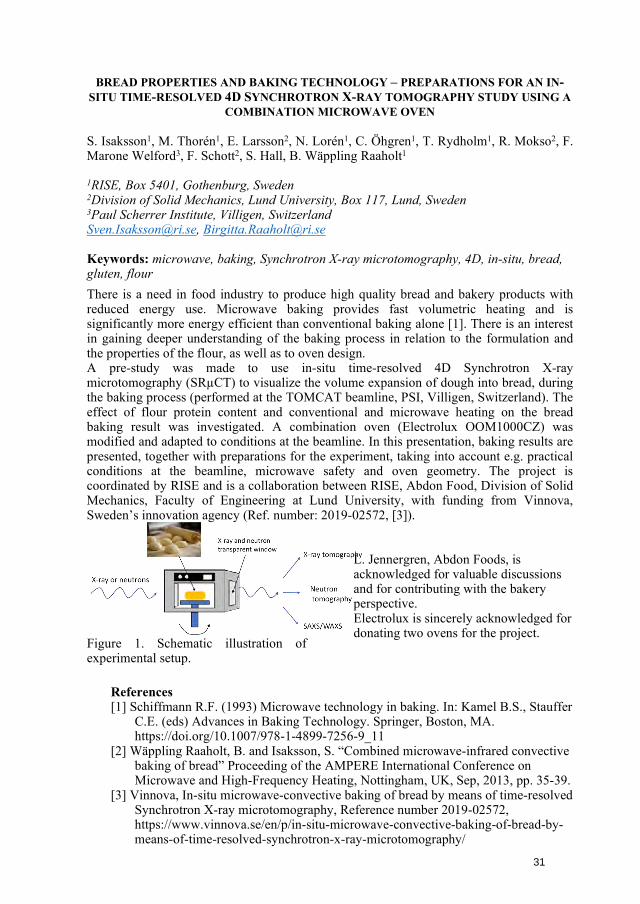
BREAD PROPERTIES AND BAKING TECHNOLOGY – PREPARATIONS FOR AN IN-SITU TIME-RESOLVED 4D SYNCHROTRON X-RAY TOMOGRAPHY STUDY USING A
COMBINATION MICROWAVE OVEN
S. Isaksson1, M. Thorén1, E. Larsson2, N. Lorén1, C. Öhgren1, T. Rydholm1, R. Mokso2, F.Marone Welford3, F. Schott2, S. Hall, B. Wäppling Raaholt1
1RISE, Box 5401, Gothenburg, Sweden 2Division of Solid Mechanics, Lund University, Box 117, Lund, Sweden 3Paul Scherrer Institute, Villigen, Switzerland [email protected], [email protected]
Keywords: microwave, baking, Synchrotron X-ray microtomography, 4D, in-situ, bread, gluten, flour There is a need in food industry to produce high quality bread and bakery products with reduced energy use. Microwave baking provides fast volumetric heating and is significantly more energy efficient than conventional baking alone [1]. There is an interest in gaining deeper understanding of the baking process in relation to the formulation and the properties of the flour, as well as to oven design. A pre-study was made to use in-situ time-resolved 4D Synchrotron X-ray microtomography (SRµCT) to visualize the volume expansion of dough into bread, during the baking process (performed at the TOMCAT beamline, PSI, Villigen, Switzerland). The effect of flour protein content and conventional and microwave heating on the bread baking result was investigated. A combination oven (Electrolux OOM1000CZ) was modified and adapted to conditions at the beamline. In this presentation, baking results are presented, together with preparations for the experiment, taking into account e.g. practical conditions at the beamline, microwave safety and oven geometry. The project is coordinated by RISE and is a collaboration between RISE, Abdon Food, Division of Solid Mechanics, Faculty of Engineering at Lund University, with funding from Vinnova, Sweden’s innovation agency (Ref. number: 2019-02572, [3]).
Figure 1. Schematic illustration of experimental setup.
L. Jennergren, Abdon Foods, isacknowledged for valuable discussionsand for contributing with the bakeryperspective.Electrolux is sincerely acknowledged fordonating two ovens for the project.
References [1] Schiffmann R.F. (1993) Microwave technology in baking. In: Kamel B.S., Stauffer
C.E. (eds) Advances in Baking Technology. Springer, Boston, MA.https://doi.org/10.1007/978-1-4899-7256-9_11
[2] Wäppling Raaholt, B. and Isaksson, S. “Combined microwave-infrared convectivebaking of bread” Proceeding of the AMPERE International Conference onMicrowave and High-Frequency Heating, Nottingham, UK, Sep, 2013, pp. 35-39.
[3] Vinnova, In-situ microwave-convective baking of bread by means of time-resolvedSynchrotron X-ray microtomography, Reference number 2019-02572,https://www.vinnova.se/en/p/in-situ-microwave-convective-baking-of-bread-by-means-of-time-resolved-synchrotron-x-ray-microtomography/
31
Build the Bridge Between Microwave and Powder Materials
Yi Zhang, Chaoxia Zhao, Danli Cai, Chao Lai, Chuan Peng, Siyao Qi, Yao Liu, and Kama Huang
College of Electronics and Information Engineering, Sichuan University, Chengdu 610064, China. [email protected]
Keywords: Microwave, Material interaction.
The interdisciplinary problems between microwave and materials have attracted extensive attractions nowadays because of the fast development of microwave materials processing and novel RF/microwave components using advanced materials. Herein, we are going to focus on the interaction between microwave and powder materials/ultra-small particles.
Microwave heating bulk materials has been widely researched. However, microwave heating ultra-small particles has been barely researched. But it becomes more and more important in areas including microwave processing nanomaterials, microwave decontaminating respirator, etc. For simplification, uniform plane microwave heating a single sphere was analyzed here. The scattering and absorption performance of the sphere follows the Mie theory. When the radius of the sphere is way smaller than the wavelength of the electromagnetic wave, Rayleigh approximation can be applied to calculate the scattered and absorbed microwave energy. Then we found that the absorbed microwave energy is in direct proportion to the volume of the sphere. Thus, the temperature rise would be a constant (without varying with the size of the sphere) under ideal thermal isolation boundary condition. But practically, thermal convection and emission occur if temperature gradient exists. Then a single ultra-small sphere in air with smaller size would be harder to be heated by microwave because of the larger surface to volume ratio.
Microwave heating compressed powder samples would be another situation since a compressed powder samples consists of tremendous numbers of ultra-small particles. These particles cause large numbers of pores and the whole sample has very large collective surface areas. Consequently, the powder sample and bulk sample of the same material may have distinctive performance in microwave heating. For example, the reason why metallic powders absorb microwave while bulk metal reflect microwave is that the surface current on the large collective surface of powder sample generates high amount of heat.
Besides microwave processing materials, the powder samples can also be used to build novel microwave devices. Recently, we build an isolating bandpass filter by placing a plane ferrite on two parallel microstrip lines. After loading a compressed powder sample consisting of Cu+CuO, the isolation of the nonreciprocal filter can be improved by 3dB, without degradation on other parameters, such as the insertion loss.
References 1. Y. Zhang, D. Agrawal, J. Cheng, and T. Slawecki, IEEE Trans. Microw. Theory
Techn., 2018, 66, 2107–2115.2. Y. Zhang, D. Cai, C. Zhao, M. Zhu, Y. Gao, Y. Chen, X. Liang, H. Chen, J. Wang,
Y. Wei, Y. He, C. Dong, N. Sun, M. Zaeimbashi, Y. Yang, H. Zhu, B. Zhang, K.Huang, and N. Sun, IEEE Trans. Microw. Theory Techn., 2020, 68, 5307-5316.
32
COAXIAL MAGNETRON LAUNCHER FOR 2.45 GHZ ISM BAND
V. Bilik
Faculty of Electrical Engineering and Information Technology, Slovak University of Technology, Ilkovicova 3, 81219 Bratislava, Slovak Republic [email protected]
Keywords: microwave industrial applications, microwave components, magnetron launcher, S-parameters.
Introduction The emergence in recent years of high-power solid-state microwave generators has resulted in increased interest in applicators with coaxial inputs. Such applicators can also be fed from a cheaper alternative – the magnetron. Traditionally, magnetrons are coupled to rectangular waveguides using waveguide launchers. Magnetron Rieke diagrams published in the datasheets are with respect to a specific reference launcher, the dimensions of which are provided in the datasheets. A generally accepted reference launcher for low-power 2.45 GHz magnetrons has been standardized by the EIAJ. To feed a coaxial applicator using a waveguide launcher, an additional waveguide-to-coaxial adapter is needed, making the whole system clumsy and unnecessarily bulky. An alternative is a coaxial launcher (CL), where the magnetron is coupled directly to a coaxial line. It is particularly appealing because the magnetron antenna is inherently a coaxial structure. In this paper, we present the design procedure and experimental results (Rieke diagram) of a noncontacting CL with 7/8'' EIA coaxial output, appropriate for a class of 2.45-GHz magnetrons with powers up to about 1.5 kW. We have designed the CL for the Panasonic 2M244 magnetron, a good representative of this class. We carried out the design using electromagnetic simulation.
Magnetron Launcher A magnetron launcher is a microwave component used to establish an optimal coupling between the magnetron’s internal resonator system and an external load. There are two conflicting design criteria: (a) for a matched external load, a highest possible magnetron efficiency should be attained; and (b) for mismatched loads with varying phase, the variation of the generated frequency (frequency pulling) should be as small as possible. The first requirement generally calls for a strong coupling, i.e., a heavily loaded internal resonator, while the second requirement demands a weak coupling [1, 2]. A reasonable compromise has been established by magnetron developers when designing waveguide reference launchers (RL), to which magnetron performance charts and Rieke diagrams are related. While designing a launcher from scratch would be practically impossible for an application engineer, a more feasible method is to ensure that a magnetron installed in a new launcher behaves the same as when installed in an existing RL. This is the basic idea behind the design of our CL.
Extended Launcher Because magnetron antennas physically intrude into launchers, the launchers cannot be treated per se but only in conjunction with at least an antenna portion of the magnetrons. We will refer to such a conjunction as to an extended launcher. Electrically, an extended launcher is a linear two-port network that transforms a conveniently defined and
33
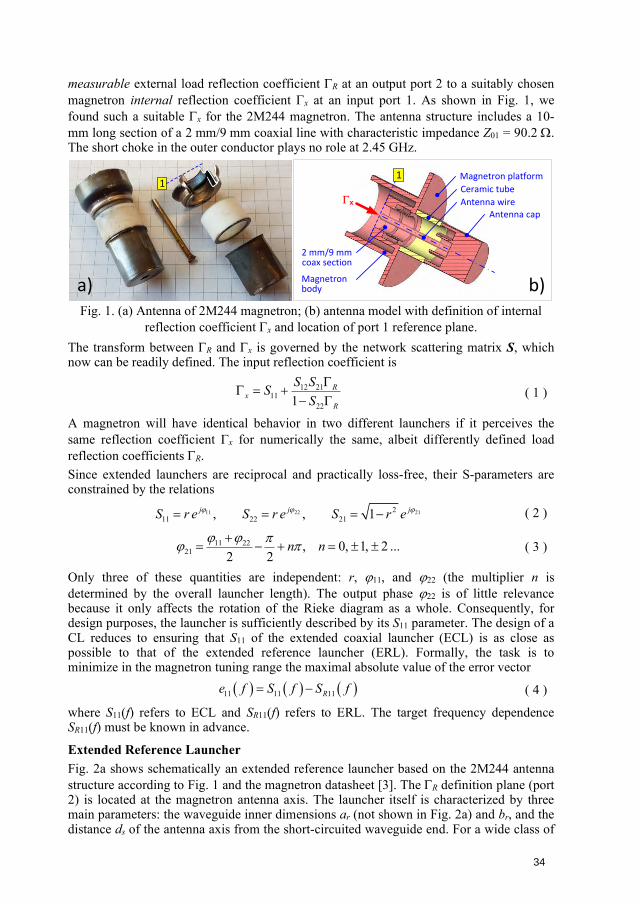
measurable external load reflection coefficient R at an output port 2 to a suitably chosen magnetron internal reflection coefficient x at an input port 1. As shown in Fig. 1, we found such a suitable x for the 2M244 magnetron. The antenna structure includes a 10-mm long section of a 2 mm/9 mm coaxial line with characteristic impedance Z01 = 90.2 . The short choke in the outer conductor plays no role at 2.45 GHz.
a)
Magnetron platform1
x
Antenna cap
Ceramic tube
2 mm/9 mm coax section
Magnetron body
Antenna wire
b)
1
Fig. 1. (a) Antenna of 2M244 magnetron; (b) antenna model with definition of internal reflection coefficient x and location of port 1 reference plane.
The transform between R and x is governed by the network scattering matrix S, which now can be readily defined. The input reflection coefficient is
12 2111
221R
xR
S SSS
= +
− ( 1 )
A magnetron will have identical behavior in two different launchers if it perceives the same reflection coefficient x for numerically the same, albeit differently defined load reflection coefficients R. Since extended launchers are reciprocal and practically loss-free, their S-parameters are constrained by the relations
11 22 21211 22 21, , 1j j jS r e S r e S r e = = = − ( 2 )
11 2221 , 0, 1, 2 ...
2 2n n
+
= − + = ( 3 )
Only three of these quantities are independent: r, 11, and 22 (the multiplier n is determined by the overall launcher length). The output phase 22 is of little relevance because it only affects the rotation of the Rieke diagram as a whole. Consequently, for design purposes, the launcher is sufficiently described by its S11 parameter. The design of a CL reduces to ensuring that S11 of the extended coaxial launcher (ECL) is as close as possible to that of the extended reference launcher (ERL). Formally, the task is to minimize in the magnetron tuning range the maximal absolute value of the error vector
( ) ( ) ( )11 11 11Re f S f S f= − ( 4 )
where S11(f) refers to ECL and SR11(f) refers to ERL. The target frequency dependence SR11(f) must be known in advance.
Extended Reference Launcher Fig. 2a shows schematically an extended reference launcher based on the 2M244 antenna structure according to Fig. 1 and the magnetron datasheet [3]. The R definition plane (port 2) is located at the magnetron antenna axis. The launcher itself is characterized by threemain parameters: the waveguide inner dimensions ar (not shown in Fig. 2a) and br, and thedistance ds of the antenna axis from the short-circuited waveguide end. For a wide class of
34
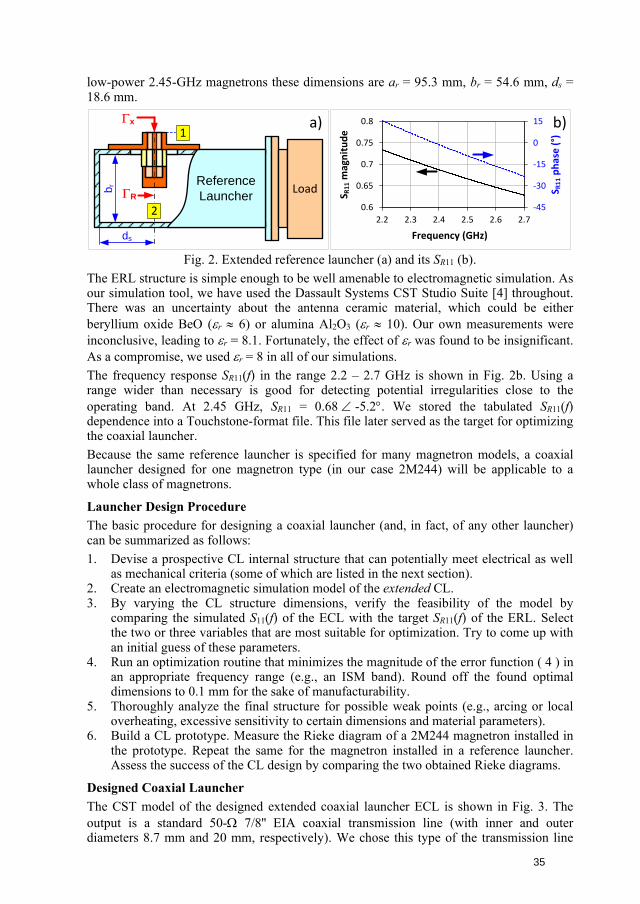
low-power 2.45-GHz magnetrons these dimensions are ar = 95.3 mm, br = 54.6 mm, ds = 18.6 mm.
LoadReference Launcherb r
ds
1
2
R
x a)
-45
-30
-15
0
15
0.6
0.65
0.7
0.75
0.8
2.2 2.3 2.4 2.5 2.6 2.7
S R1
1 m
agn
itu
de
S R1
1 p
has
e (
°)
Frequency (GHz)
b)
Fig. 2. Extended reference launcher (a) and its SR11 (b). The ERL structure is simple enough to be well amenable to electromagnetic simulation. As our simulation tool, we have used the Dassault Systems CST Studio Suite [4] throughout. There was an uncertainty about the antenna ceramic material, which could be either beryllium oxide BeO (r 6) or alumina Al2O3 (r 10). Our own measurements were inconclusive, leading to r = 8.1. Fortunately, the effect of r was found to be insignificant. As a compromise, we used r = 8 in all of our simulations. The frequency response SR11(f) in the range 2.2 – 2.7 GHz is shown in Fig. 2b. Using a range wider than necessary is good for detecting potential irregularities close to the operating band. At 2.45 GHz, SR11 = 0.68 -5.2. We stored the tabulated SR11(f) dependence into a Touchstone-format file. This file later served as the target for optimizing the coaxial launcher. Because the same reference launcher is specified for many magnetron models, a coaxial launcher designed for one magnetron type (in our case 2M244) will be applicable to a whole class of magnetrons.
Launcher Design Procedure The basic procedure for designing a coaxial launcher (and, in fact, of any other launcher) can be summarized as follows: 1. Devise a prospective CL internal structure that can potentially meet electrical as well
as mechanical criteria (some of which are listed in the next section).2. Create an electromagnetic simulation model of the extended CL.3. By varying the CL structure dimensions, verify the feasibility of the model by
comparing the simulated S11(f) of the ECL with the target SR11(f) of the ERL. Selectthe two or three variables that are most suitable for optimization. Try to come up withan initial guess of these parameters.
4. Run an optimization routine that minimizes the magnitude of the error function ( 4 ) inan appropriate frequency range (e.g., an ISM band). Round off the found optimaldimensions to 0.1 mm for the sake of manufacturability.
5. Thoroughly analyze the final structure for possible weak points (e.g., arcing or localoverheating, excessive sensitivity to certain dimensions and material parameters).
6. Build a CL prototype. Measure the Rieke diagram of a 2M244 magnetron installed inthe prototype. Repeat the same for the magnetron installed in a reference launcher.Assess the success of the CL design by comparing the two obtained Rieke diagrams.
Designed Coaxial Launcher The CST model of the designed extended coaxial launcher ECL is shown in Fig. 3. The output is a standard 50- 7/8'' EIA coaxial transmission line (with inner and outer diameters 8.7 mm and 20 mm, respectively). We chose this type of the transmission line
35
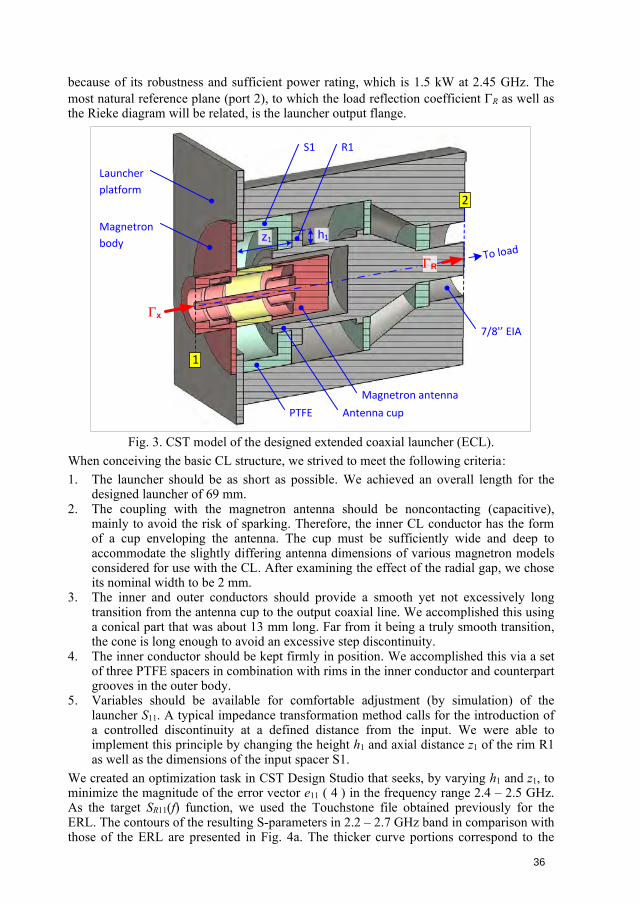
because of its robustness and sufficient power rating, which is 1.5 kW at 2.45 GHz. The most natural reference plane (port 2), to which the load reflection coefficient R as well as the Rieke diagram will be related, is the launcher output flange.
x
1
2
R
Magnetron
bodyTo load
7/8'’ EIA
Antenna cup
Magnetron antenna
PTFE
Launcher
platform
R1S1
h1 z1
Fig. 3. CST model of the designed extended coaxial launcher (ECL). When conceiving the basic CL structure, we strived to meet the following criteria: 1. The launcher should be as short as possible. We achieved an overall length for the
designed launcher of 69 mm.2. The coupling with the magnetron antenna should be noncontacting (capacitive),
mainly to avoid the risk of sparking. Therefore, the inner CL conductor has the formof a cup enveloping the antenna. The cup must be sufficiently wide and deep toaccommodate the slightly differing antenna dimensions of various magnetron modelsconsidered for use with the CL. After examining the effect of the radial gap, we choseits nominal width to be 2 mm.
3. The inner and outer conductors should provide a smooth yet not excessively longtransition from the antenna cup to the output coaxial line. We accomplished this usinga conical part that was about 13 mm long. Far from it being a truly smooth transition,the cone is long enough to avoid an excessive step discontinuity.
4. The inner conductor should be kept firmly in position. We accomplished this via a setof three PTFE spacers in combination with rims in the inner conductor and counterpartgrooves in the outer body.
5. Variables should be available for comfortable adjustment (by simulation) of thelauncher S11. A typical impedance transformation method calls for the introduction ofa controlled discontinuity at a defined distance from the input. We were able toimplement this principle by changing the height h1 and axial distance z1 of the rim R1as well as the dimensions of the input spacer S1.
We created an optimization task in CST Design Studio that seeks, by varying h1 and z1, to minimize the magnitude of the error vector e11 ( 4 ) in the frequency range 2.4 – 2.5 GHz. As the target SR11(f) function, we used the Touchstone file obtained previously for the ERL. The contours of the resulting S-parameters in 2.2 – 2.7 GHz band in comparison with those of the ERL are presented in Fig. 4a. The thicker curve portions correspond to the
36
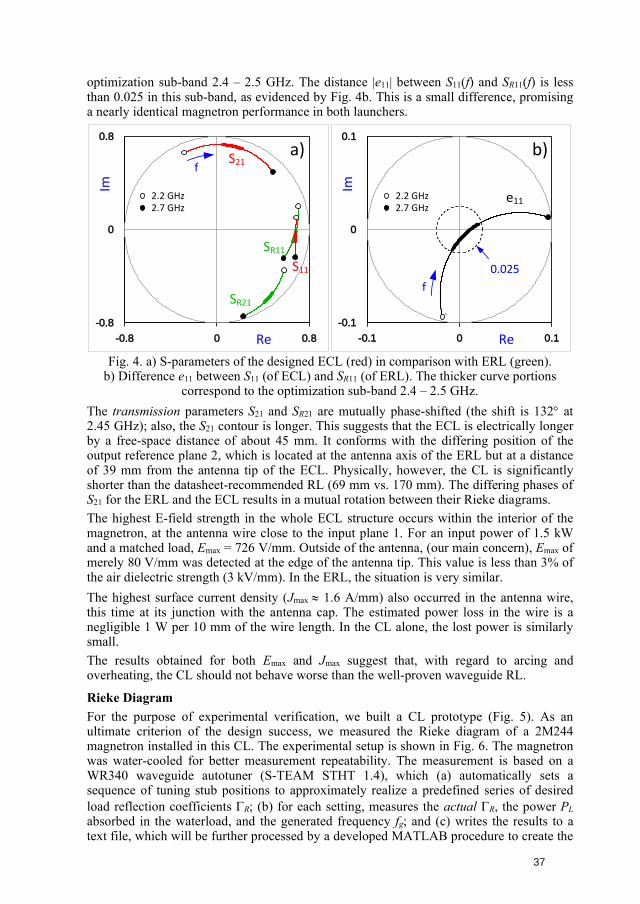
optimization sub-band 2.4 – 2.5 GHz. The distance |e11| between S11(f) and SR11(f) is less than 0.025 in this sub-band, as evidenced by Fig. 4b. This is a small difference, promising a nearly identical magnetron performance in both launchers.
-0.8
0
0.8
-0.8 0 0.8
Im
Re
SR21
SR11
S21
S11
2.2 GHz2.7 GHz
f
a)
-0.1
0
0.1
-0.1 0 0.1ReIm
e112.2 GHz2.7 GHz
`
f
0.025
b)
Fig. 4. a) S-parameters of the designed ECL (red) in comparison with ERL (green). b) Difference e11 between S11 (of ECL) and SR11 (of ERL). The thicker curve portions
correspond to the optimization sub-band 2.4 – 2.5 GHz. The transmission parameters S21 and SR21 are mutually phase-shifted (the shift is 132 at 2.45 GHz); also, the S21 contour is longer. This suggests that the ECL is electrically longer by a free-space distance of about 45 mm. It conforms with the differing position of the output reference plane 2, which is located at the antenna axis of the ERL but at a distance of 39 mm from the antenna tip of the ECL. Physically, however, the CL is significantly shorter than the datasheet-recommended RL (69 mm vs. 170 mm). The differing phases of S21 for the ERL and the ECL results in a mutual rotation between their Rieke diagrams. The highest E-field strength in the whole ECL structure occurs within the interior of the magnetron, at the antenna wire close to the input plane 1. For an input power of 1.5 kW and a matched load, Emax = 726 V/mm. Outside of the antenna, (our main concern), Emax of merely 80 V/mm was detected at the edge of the antenna tip. This value is less than 3% of the air dielectric strength (3 kV/mm). In the ERL, the situation is very similar. The highest surface current density (Jmax 1.6 A/mm) also occurred in the antenna wire, this time at its junction with the antenna cap. The estimated power loss in the wire is a negligible 1 W per 10 mm of the wire length. In the CL alone, the lost power is similarly small. The results obtained for both Emax and Jmax suggest that, with regard to arcing and overheating, the CL should not behave worse than the well-proven waveguide RL.
Rieke Diagram For the purpose of experimental verification, we built a CL prototype (Fig. 5). As an ultimate criterion of the design success, we measured the Rieke diagram of a 2M244 magnetron installed in this CL. The experimental setup is shown in Fig. 6. The magnetron was water-cooled for better measurement repeatability. The measurement is based on a WR340 waveguide autotuner (S-TEAM STHT 1.4), which (a) automatically sets a sequence of tuning stub positions to approximately realize a predefined series of desired load reflection coefficients R; (b) for each setting, measures the actual R, the power PL absorbed in the waterload, and the generated frequency fg; and (c) writes the results to a text file, which will be further processed by a developed MATLAB procedure to create the
37
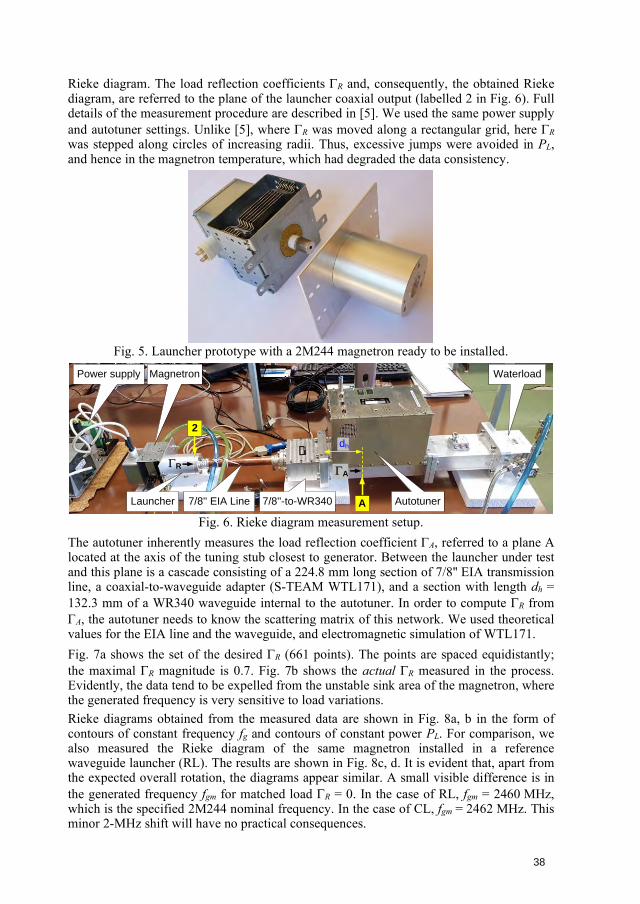
Rieke diagram. The load reflection coefficients R and, consequently, the obtained Rieke diagram, are referred to the plane of the launcher coaxial output (labelled 2 in Fig. 6). Full details of the measurement procedure are described in [5]. We used the same power supply and autotuner settings. Unlike [5], where R was moved along a rectangular grid, here R was stepped along circles of increasing radii. Thus, excessive jumps were avoided in PL, and hence in the magnetron temperature, which had degraded the data consistency.
Fig. 5. Launcher prototype with a 2M244 magnetron ready to be installed.
Magnetron
Launcher Autotuner
Power supply Waterload
7/8''-to-WR340 7/8'' EIA Line
2
A
R
dh
A
Fig. 6. Rieke diagram measurement setup. The autotuner inherently measures the load reflection coefficient A, referred to a plane A located at the axis of the tuning stub closest to generator. Between the launcher under test and this plane is a cascade consisting of a 224.8 mm long section of 7/8'' EIA transmission line, a coaxial-to-waveguide adapter (S-TEAM WTL171), and a section with length dh = 132.3 mm of a WR340 waveguide internal to the autotuner. In order to compute R from A, the autotuner needs to know the scattering matrix of this network. We used theoretical values for the EIA line and the waveguide, and electromagnetic simulation of WTL171. Fig. 7a shows the set of the desired R (661 points). The points are spaced equidistantly; the maximal R magnitude is 0.7. Fig. 7b shows the actual R measured in the process. Evidently, the data tend to be expelled from the unstable sink area of the magnetron, where the generated frequency is very sensitive to load variations. Rieke diagrams obtained from the measured data are shown in Fig. 8a, b in the form of contours of constant frequency fg and contours of constant power PL. For comparison, we also measured the Rieke diagram of the same magnetron installed in a reference waveguide launcher (RL). The results are shown in Fig. 8c, d. It is evident that, apart from the expected overall rotation, the diagrams appear similar. A small visible difference is in the generated frequency fgm for matched load R = 0. In the case of RL, fgm = 2460 MHz, which is the specified 2M244 nominal frequency. In the case of CL, fgm = 2462 MHz. This minor 2-MHz shift will have no practical consequences.
38
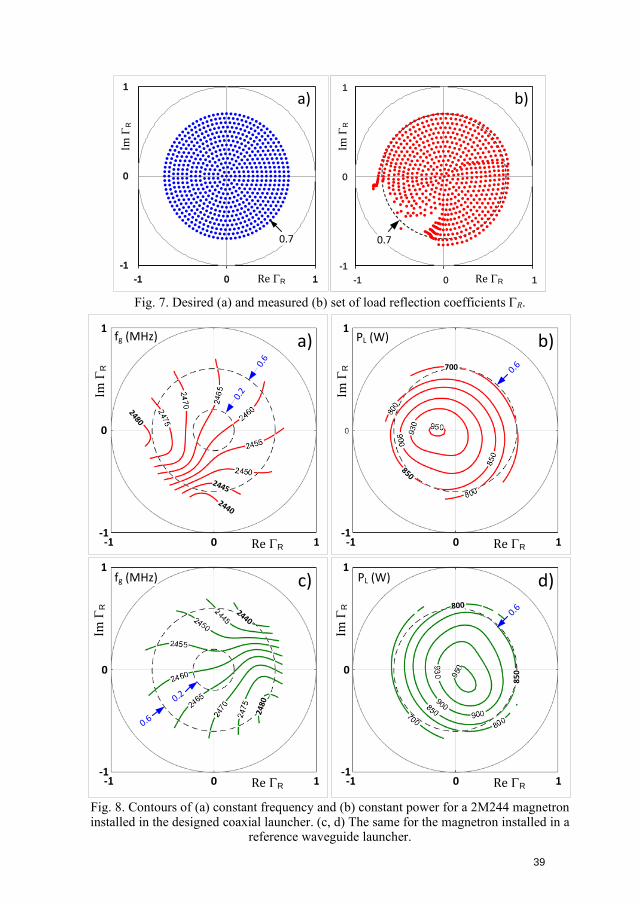
-1
0
1
-1 0 1
-1
0
1
-1 0 1
a) b)
Im
R
Im
R
Re RRe R
0.70.7
Fig. 7. Desired (a) and measured (b) set of load reflection coefficients R.
0.6
0.2
2440
2445
2480
0
Im
R
Re R-1-1
1
1
0
a)fg (MHz)Im
R
Re R-1-1
1
1
0
0.6700
850
b)PL (W)
2440
2480
c)fg (MHz)
0.6800
85
0
d)PL (W)
0
Im
R
Re R-1-1
1
1
0
0
Im
R
Re R-1-1
1
1
0
0.2
0.6
Fig. 8. Contours of (a) constant frequency and (b) constant power for a 2M244 magnetron installed in the designed coaxial launcher. (c, d) The same for the magnetron installed in a
reference waveguide launcher.
39
The peak generated power is about 950 W in both cases. It is somewhat less than the 1010 W specified in the datasheet. The reason is that the power supply available for our experiments provided lower anode voltage than the specified 4.35 kV. The circles with radius 0.2 are used for determining the frequency pulling figure fp, which is defined as the maximal frequency difference observed when varying the phase of a load reflection coefficient with |R| = 0.2 (VSWR = 1.5). For both launchers, fp 12 MHz. The datasheet [3] specifies it nominally as 10 MHz, with a maximum of 15 MHz. The circles with radius 0.6 represent the maximal permitted load reflection coefficient magnitude (VSWR = 4). In both launchers, the lowest generated power for this case is nearly the same (about 700 W). This means that in both launchers the power dissipated within the magnetron, and therefore the risk of its overheating, will also be the same.
Conclusions We have developed a noncontacting coaxial magnetron launcher that is appropriate for a class of 2.45-GHz magnetrons with powers up to about 1.5 kW, with 7/8'' EIA coaxial output. The design was focused on the Panasonic 2M244 magnetron, a good representative of this class. We completed the whole design using electromagnetic simulation. We verified the performance of the developed coaxial launcher by measuring the Rieke diagram of a 2M244 magnetron installed in a launcher prototype and in a standard waveguide reference launcher, stipulated by magnetron manufacturers. The comparison proved practically equal magnetron behavior in both launcher types. The developed coaxial launcher, thanks to its small dimensions and straightforward signal flow, will be beneficial in installations with coaxial inputs.
Acknowledgement The author wishes to thank Dr. Shankar Rao for completing most of the Rieke diagram measurements, and for careful reviewing of the manuscript.
References [1] Smith, G., Ed., Microwave Magnetrons (MIT RadLab Series, Vol. 6). New York:
McGraw-Hill, 1948.[2] Meredith, R. J., Engineers' Handbook of Industrial Microwave Heating. London: The
IEE, 1998, DOI https://doi.org/10.1049/pbpo025e.[3] Panasonic: Continuous Wave Magnetron 2M244-M12, Datasheet, Oct. 30, 2003.[4] Dassault Systems: CST Studio Suite, https://www.3ds.com/products-
services/simulia/products/cst-studio-suite/.[5] Bilik, V, “Automatic Measurement of Magnetron Rieke Diagrams,” in Proc.
AMPERE 2019: 17th Int. Conf. on Microwave and High Frequency Heating,Valencia, 2019, pp. 478–486, DOI https://doi.org/10.4995/ampere2019.2019.9782.
40
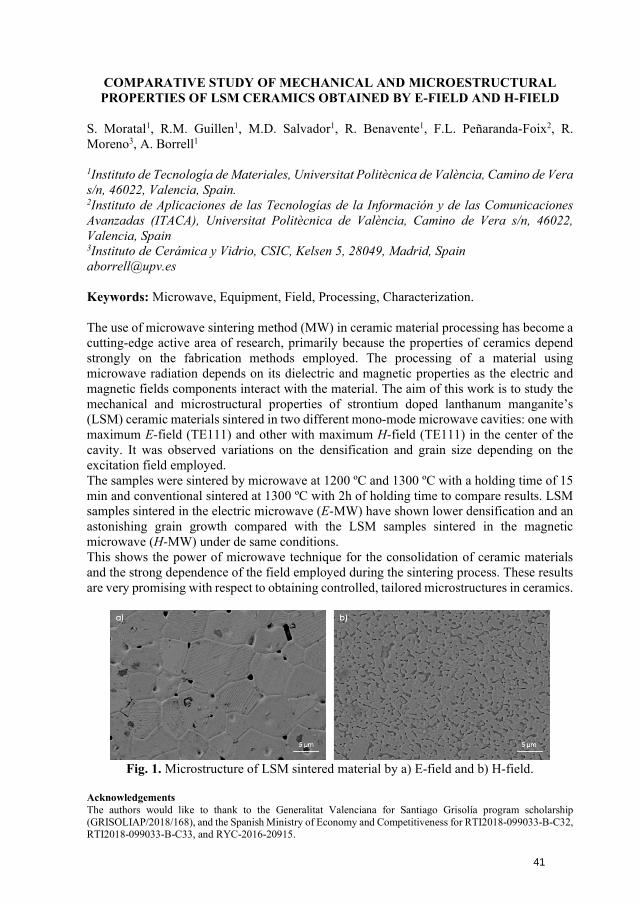
COMPARATIVE STUDY OF MECHANICAL AND MICROESTRUCTURAL PROPERTIES OF LSM CERAMICS OBTAINED BY E-FIELD AND H-FIELD
S. Moratal1, R.M. Guillen1, M.D. Salvador1, R. Benavente1, F.L. Peñaranda-Foix2, R.Moreno3, A. Borrell1
1Instituto de Tecnología de Materiales, Universitat Politècnica de València, Camino de Vera s/n, 46022, Valencia, Spain. 2Instituto de Aplicaciones de las Tecnologías de la Información y de las Comunicaciones Avanzadas (ITACA), Universitat Politècnica de València, Camino de Vera s/n, 46022, Valencia, Spain 3Instituto de Cerámica y Vidrio, CSIC, Kelsen 5, 28049, Madrid, Spain [email protected]
Keywords: Microwave, Equipment, Field, Processing, Characterization.
The use of microwave sintering method (MW) in ceramic material processing has become a cutting-edge active area of research, primarily because the properties of ceramics depend strongly on the fabrication methods employed. The processing of a material using microwave radiation depends on its dielectric and magnetic properties as the electric and magnetic fields components interact with the material. The aim of this work is to study the mechanical and microstructural properties of strontium doped lanthanum manganite’s (LSM) ceramic materials sintered in two different mono-mode microwave cavities: one with maximum E-field (TE111) and other with maximum H-field (TE111) in the center of the cavity. It was observed variations on the densification and grain size depending on the excitation field employed. The samples were sintered by microwave at 1200 ºC and 1300 ºC with a holding time of 15 min and conventional sintered at 1300 ºC with 2h of holding time to compare results. LSM samples sintered in the electric microwave (E-MW) have shown lower densification and an astonishing grain growth compared with the LSM samples sintered in the magnetic microwave (H-MW) under de same conditions. This shows the power of microwave technique for the consolidation of ceramic materials and the strong dependence of the field employed during the sintering process. These results are very promising with respect to obtaining controlled, tailored microstructures in ceramics.
Fig. 1. Microstructure of LSM sintered material by a) E-field and b) H-field.
Acknowledgements The authors would like to thank to the Generalitat Valenciana for Santiago Grisolía program scholarship (GRISOLIAP/2018/168), and the Spanish Ministry of Economy and Competitiveness for RTI2018-099033-B-C32, RTI2018-099033-B-C33, and RYC-2016-20915.
41
Complex-permittivity estimation of a polymer foam using microwave tomography for the application of microwave drying
Rahul Yadav1, Adel Omrani2, Marko Vauhkonen1, Guido Link2, and Timo Lähivaara1 1University of Eastern Finland, Kuopio, Finland 2Karlsruhe Institute of Technology, Karlsruhe, Germany [email protected]
Keywords: Microwave drying, microwave tomography, complex-permittivity
Abstract A new kind of intelligent control for industrial microwave heating system for drying applications is under implementation in the TOMOCON [1] project network. The idea is to control the amount of total microwave power inside the applicator based on available volumetric moisture distribution inside the material. To achieve this goal a microwave tomography (MWT) imaging module is integrated with the industrial heating system. The MWT is applied to reconstruct the moisture content distribution (in terms of complex permittivity) in a polymer foam of large cross-section during its continuous processing. For the reconstruction algorithm, we use a statistical inversion framework. Generally, in this framework, the real and imaginary parts are treated as statistically independent quantities in the prior formulation. Thus, often it is found that the reconstructed real and imaginary parts are spatially imbalanced. As a result, when mapping the respective reconstructed parts of complex-permittivity to the available dielectric charaterization of the foam, conflicting and incorrect moisture distributions can be obtained. Therefore, we present a sample-based prior model in the statistical inversion framework to improve overall reconstruction accuracy and spatially balance the real and imaginary parts. The method is demonstrated with 2-D numerical MWT data at 8.2 GHz for different moisture scenarios.
1. IntroductionControlled/localized heating in industrial microwave oven [2, 3] is paramount to addresshot-spot formation and thermal runaway issues . Therefore, system efficiency and processedproduct quality may improve. Presently, we are working on a microwave oven technologycalled HEPHAISTOS. The system is characterized by hexagonal geometry for the cavitythat supports a very high electromagnetic field homogeneity. Specifically, during drying ofa porous polymer foam, thermal runaway and hot-spot formation occur [4]. Such situationslead to low-quality processing and may even damage the industrial unit. Therefore,automatic online control of power sources (magnetrons) to obtain a selective heating rate ateach stage of the drying process is one option to eliminate these problems. To apply suchprecise control of power sources, non-invasive in-situ measurement of the unknowndistribution of moisture, especially dominant wet-spots, inside the material is required. Thus,integration of microwave tomography (MWT) imaging modality operating in X-band range[5] (from 8 GHz to 12 GHz) with the drying system is proposed to estimate the moisturecontent distribution in a polymer foam. Based on the MWT tomographic output, anintelligent control strategy for power sources can be derived. Microwave tomography (MWT) applications in the industry are mostly for inspection and monitoring purposes, as reported in [6]. In the X-band frequency range, performing quantitative MWT imaging is challenging especially when detecting the moisture levels in a porous material with a large cross-sectional dimension. Some prior information on the moisture levels and corresponding dielectric behavior of the foam is available. To integrate this prior information in the imaging algorithm, a statistical inversion approach based on the
42
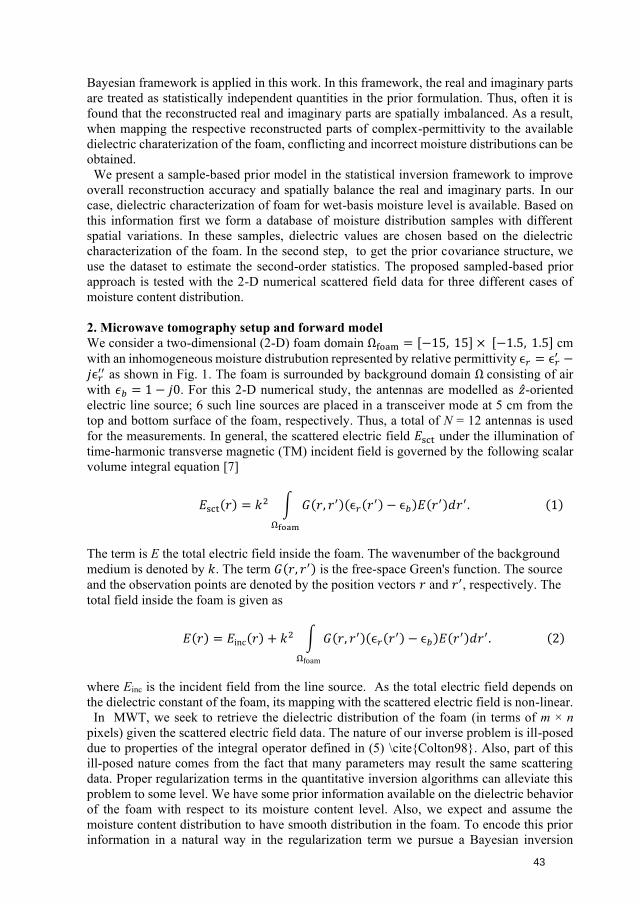
Bayesian framework is applied in this work. In this framework, the real and imaginary parts are treated as statistically independent quantities in the prior formulation. Thus, often it is found that the reconstructed real and imaginary parts are spatially imbalanced. As a result, when mapping the respective reconstructed parts of complex-permittivity to the available dielectric charaterization of the foam, conflicting and incorrect moisture distributions can be obtained. We present a sample-based prior model in the statistical inversion framework to improve overall reconstruction accuracy and spatially balance the real and imaginary parts. In our case, dielectric characterization of foam for wet-basis moisture level is available. Based on this information first we form a database of moisture distribution samples with different spatial variations. In these samples, dielectric values are chosen based on the dielectric characterization of the foam. In the second step, to get the prior covariance structure, we use the dataset to estimate the second-order statistics. The proposed sampled-based prior approach is tested with the 2-D numerical scattered field data for three different cases of moisture content distribution.
2. Microwave tomography setup and forward modelWe consider a two-dimensional (2-D) foam domain Ωfoam = [−15, 15] × [−1.5, 1.5] cmwith an inhomogeneous moisture distrubution represented by relative permittivity ϵ𝑟 = ϵ𝑟
′ −𝑗ϵ𝑟
′′ as shown in Fig. 1. The foam is surrounded by background domain Ω consisting of airwith 𝜖𝑏 = 1 − 𝑗0. For this 2-D numerical study, the antennas are modelled as ��-orientedelectric line source; 6 such line sources are placed in a transceiver mode at 5 cm from the top and bottom surface of the foam, respectively. Thus, a total of N = 12 antennas is used for the measurements. In general, the scattered electric field 𝐸sct under the illumination oftime-harmonic transverse magnetic (TM) incident field is governed by the following scalar volume integral equation [7]
𝐸sct(𝑟) = 𝑘2 ∫ 𝐺(𝑟, 𝑟′)(ϵ𝑟(𝑟′) − ϵ𝑏)𝐸(𝑟′)𝑑𝑟′.
Ωfoam
(1)
The term is E the total electric field inside the foam. The wavenumber of the background medium is denoted by 𝑘. The term 𝐺(𝑟, 𝑟′) is the free-space Green's function. The sourceand the observation points are denoted by the position vectors 𝑟 and 𝑟′, respectively. Thetotal field inside the foam is given as
𝐸(𝑟) = 𝐸inc(𝑟) + 𝑘2 ∫ 𝐺(𝑟, 𝑟′)(ϵ𝑟(𝑟′) − ϵ𝑏)𝐸(𝑟′)𝑑𝑟′. (2)
Ωfoam
where Einc is the incident field from the line source. As the total electric field depends on the dielectric constant of the foam, its mapping with the scattered electric field is non-linear. In MWT, we seek to retrieve the dielectric distribution of the foam (in terms of m × n pixels) given the scattered electric field data. The nature of our inverse problem is ill-posed due to properties of the integral operator defined in (5) \cite{Colton98}. Also, part of this ill-posed nature comes from the fact that many parameters may result the same scattering data. Proper regularization terms in the quantitative inversion algorithms can alleviate this problem to some level. We have some prior information available on the dielectric behavior of the foam with respect to its moisture content level. Also, we expect and assume the moisture content distribution to have smooth distribution in the foam. To encode this prior information in a natural way in the regularization term we pursue a Bayesian inversion
43
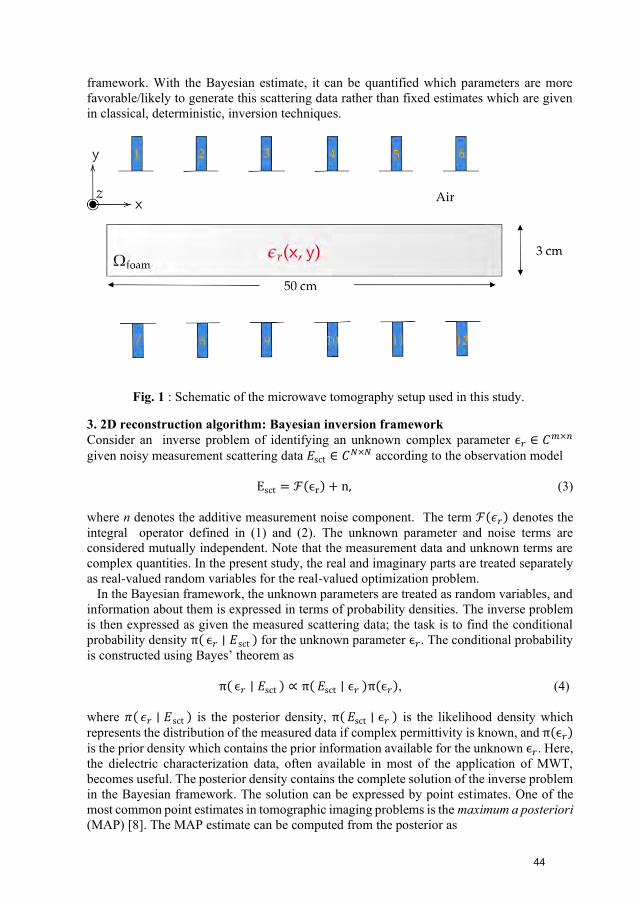
framework. With the Bayesian estimate, it can be quantified which parameters are more favorable/likely to generate this scattering data rather than fixed estimates which are given in classical, deterministic, inversion techniques.
3. 2D reconstruction algorithm: Bayesian inversion frameworkConsider an inverse problem of identifying an unknown complex parameter ϵ𝑟 ∈ 𝐶𝑚×𝑛
given noisy measurement scattering data 𝐸sct ∈ 𝐶𝑁×𝑁 according to the observation model
Esct = ℱ(ϵr) + n, (3)
where n denotes the additive measurement noise component. The term ℱ(𝜖𝑟) denotes theintegral operator defined in (1) and (2). The unknown parameter and noise terms are considered mutually independent. Note that the measurement data and unknown terms are complex quantities. In the present study, the real and imaginary parts are treated separately as real-valued random variables for the real-valued optimization problem. In the Bayesian framework, the unknown parameters are treated as random variables, and information about them is expressed in terms of probability densities. The inverse problem is then expressed as given the measured scattering data; the task is to find the conditional probability density π( ϵ𝑟 ∣∣ 𝐸sct ) for the unknown parameter ϵ𝑟. The conditional probabilityis constructed using Bayes’ theorem as
π( ϵ𝑟 ∣∣ 𝐸sct ) ∝ π( 𝐸sct ∣∣ ϵ𝑟 )π(ϵ𝑟), (4)
where 𝜋( 𝜖𝑟 ∣∣ 𝐸sct ) is the posterior density, π( 𝐸sct ∣∣ ϵ𝑟 ) is the likelihood density whichrepresents the distribution of the measured data if complex permittivity is known, and π(ϵ𝑟)is the prior density which contains the prior information available for the unknown ϵ𝑟. Here,the dielectric characterization data, often available in most of the application of MWT, becomes useful. The posterior density contains the complete solution of the inverse problem in the Bayesian framework. The solution can be expressed by point estimates. One of the most common point estimates in tomographic imaging problems is the maximum a posteriori (MAP) [8]. The MAP estimate can be computed from the posterior as
Fig. 1 : Schematic of the microwave tomography setup used in this study.
44
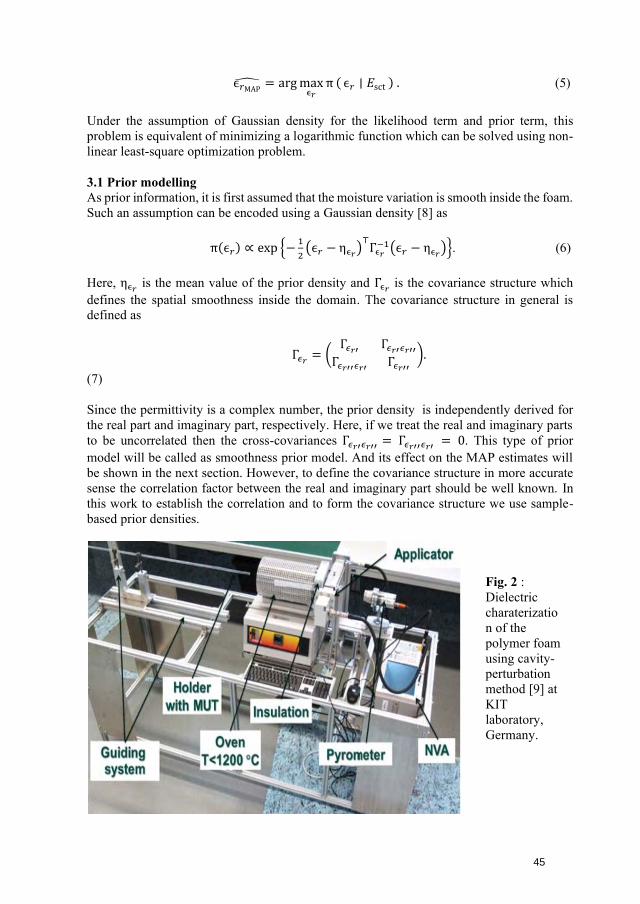
ϵ𝑟MAP= arg max
ϵ𝑟
π ( ϵ𝑟 ∣∣ 𝐸sct ) . (5)
Under the assumption of Gaussian density for the likelihood term and prior term, this problem is equivalent of minimizing a logarithmic function which can be solved using non-linear least-square optimization problem.
3.1 Prior modelling As prior information, it is first assumed that the moisture variation is smooth inside the foam. Such an assumption can be encoded using a Gaussian density [8] as
π(ϵ𝑟) ∝ exp {−1
2(ϵ𝑟 − ηϵ𝑟
)⊤
Γϵ𝑟−1(ϵ𝑟 − ηϵ𝑟
)}. (6)
Here, ηϵ𝑟 is the mean value of the prior density and Γϵ𝑟
is the covariance structure whichdefines the spatial smoothness inside the domain. The covariance structure in general is defined as
Γ𝜖𝑟= (
Γ𝜖𝑟′Γ𝜖𝑟′𝜖𝑟′′
Γ𝜖𝑟′′𝜖𝑟′Γ𝜖𝑟′′
).
(7)
Since the permittivity is a complex number, the prior density is independently derived for the real part and imaginary part, respectively. Here, if we treat the real and imaginary parts to be uncorrelated then the cross-covariances Γ𝜖𝑟′𝜖𝑟′′
= Γ𝜖𝑟′′𝜖𝑟′ = 0. This type of prior
model will be called as smoothness prior model. And its effect on the MAP estimates will be shown in the next section. However, to define the covariance structure in more accurate sense the correlation factor between the real and imaginary part should be well known. In this work to establish the correlation and to form the covariance structure we use sample-based prior densities.
Fig. 2 : Dielectric charaterization of the polymer foam using cavity-perturbation method [9] at KIT laboratory, Germany.
45
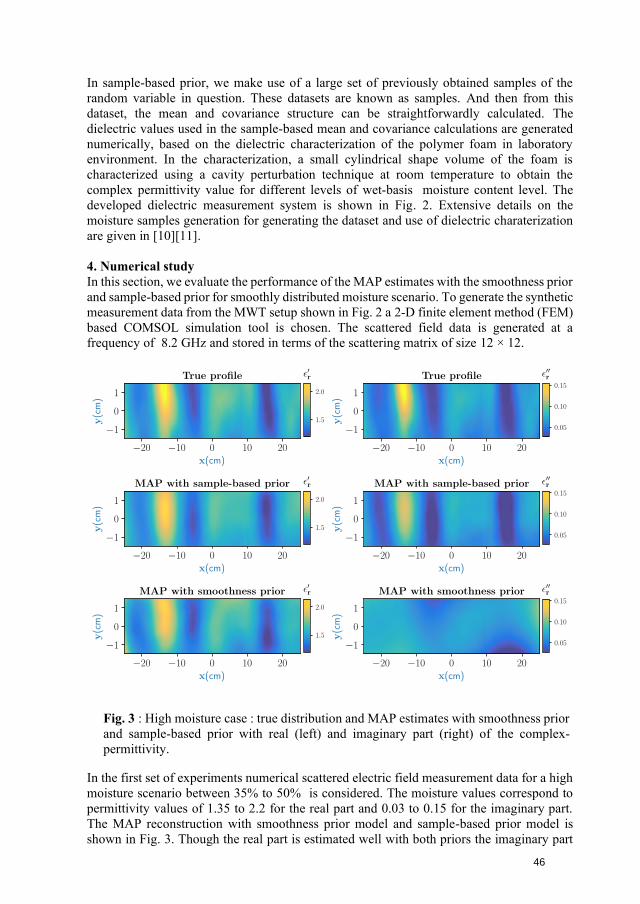
In sample-based prior, we make use of a large set of previously obtained samples of the random variable in question. These datasets are known as samples. And then from this dataset, the mean and covariance structure can be straightforwardly calculated. The dielectric values used in the sample-based mean and covariance calculations are generated numerically, based on the dielectric characterization of the polymer foam in laboratory environment. In the characterization, a small cylindrical shape volume of the foam is characterized using a cavity perturbation technique at room temperature to obtain the complex permittivity value for different levels of wet-basis moisture content level. The developed dielectric measurement system is shown in Fig. 2. Extensive details on the moisture samples generation for generating the dataset and use of dielectric charaterization are given in [10][11].
4. Numerical studyIn this section, we evaluate the performance of the MAP estimates with the smoothness priorand sample-based prior for smoothly distributed moisture scenario. To generate the syntheticmeasurement data from the MWT setup shown in Fig. 2 a 2-D finite element method (FEM)based COMSOL simulation tool is chosen. The scattered field data is generated at afrequency of 8.2 GHz and stored in terms of the scattering matrix of size 12 × 12.
In the first set of experiments numerical scattered electric field measurement data for a high moisture scenario between 35% to 50% is considered. The moisture values correspond to permittivity values of 1.35 to 2.2 for the real part and 0.03 to 0.15 for the imaginary part. The MAP reconstruction with smoothness prior model and sample-based prior model is shown in Fig. 3. Though the real part is estimated well with both priors the imaginary part
Fig. 3 : High moisture case : true distribution and MAP estimates with smoothness prior and sample-based prior with real (left) and imaginary part (right) of the complex-permittivity.
46
is much more accurate with the sample-based prior model. Notice that the certain moisture regions are much more clearly indicated in the estimated imaginary part with the sample-based prior model.
5. ConclusionIn this work, we used a microwave tomography to estimate the moisture distribution (interms of complex permittivity) in a polymer foam using the Bayesian inversion framework.The imaging modality will be integrated with an industrial microwave drying system toderive approaches for the intelligent control. It is shown that when real and imaginary partsare treated uncorrelated in the smoothness-based prior model, reconstructed values areconflicting and incorrect. Thus, we proposed a sample-based prior model to preserve thespatial correlation in the reconstructed real and imaginary parts of the complex permittivity.The results presented show the efficacy of the sample-based prior model in spatiallycorrelating the real and imaginary parts. A significant improvement in the reconstructionaccuracy is achieved with sample-based prior in comparison to the smoothness prior model.
References [1] TOMOCON-www.tomocon.eu.[2] J. M. Osepchuk, "A History of Microwave Heating Applications," in IEEE
Transactions on Microwave Theory and Techniques, vol. 32, no. 9, pp. 1200-1224,September 1984.
[3] Metaxas, A.C. Industrial Microwave Heating; Power and Energy, Institution ofEngineering and Technology, 1988.
[4] Sun, Y. Adaptive and Intelligent Temperature Control of Microwave HeatingSystems with Multiple Sources. PhD thesis, KIT Scientific Publishing, Karlsruhe,2016.
[5] Z. Wu and H. Wang, "Microwave Tomography for Industrial Process Imaging :Example Applications and Expérimental Results.," in IEEE Antennas andPropagation Magazine, vol. 59, no. 5, pp. 61-71, Oct. 2017.
[6] A. Omrani, G. Link and J. Jelonnek, "A Multistatic Uniform DiffractionTomographic Algorithm for Real-Time Moisture Detection," 2020 IEEE Asia-Pacific Microwave Conference (APMC), 2020, pp. 437-439.
[7] W. C. Chew and Y. M. Wang, "Reconstruction of two-dimensional permittivitydistribution using the distorted Born iterative method," in IEEE Transactions onMedical Imaging, vol. 9, no. 2, pp. 218-225, June 1990.
[8] J. Kaipio and E. Somersalo, Statistical and Computational Inverse problems.Springer-Verlag, 2005.
[9] S. Soldatov, T. Kayser, G. Link, T. Seitz, S. Layer and J. Jelonnek, "Microwavecavity perturbation technique for high-temperature dielectric measurement," 2013IEEE MTT-S International Microwave Symposium Digest (MTT), 2013.
[10] R. Yadav, A. Omrani, M. Vauhkonen, G. Link and T. Lähivaara, "MicrowaveTomography for Moisture Level Estimation Using Bayesian Framework," 202115th European Conference on Antennas and Propagation (EuCAP), 2021.
[11] A. Omrani, R. Yadav, G. Link, M. Vauhkonen, T. Lähivaara and J. Jelonnek, "ACombined Microwave Imaging Algorithm for Localization and Moisture LevelEstimation in Multilayered Media," 2021 15th European Conference on Antennasand Propagation (EuCAP), 2021, pp. 1-5.
47
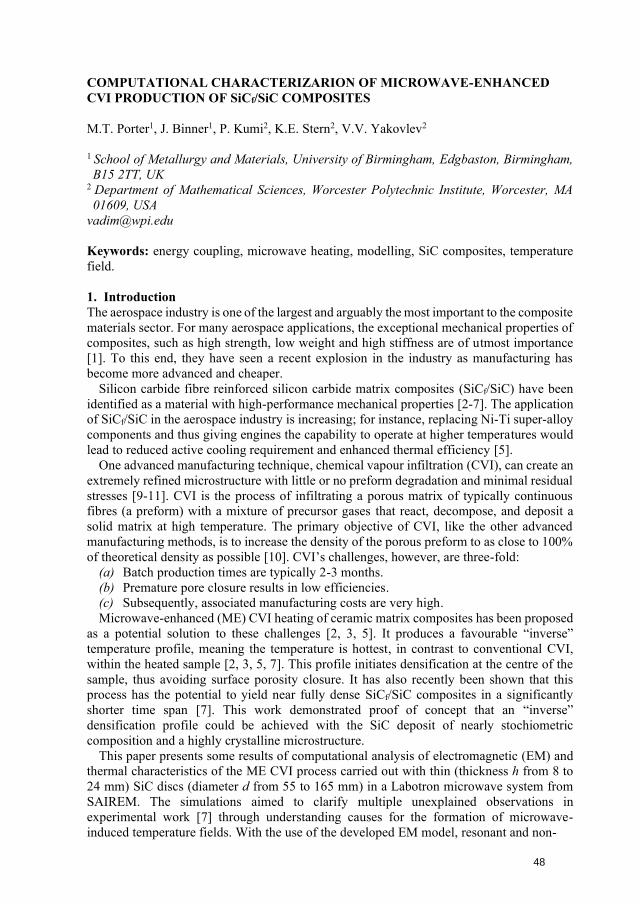
COMPUTATIONAL CHARACTERIZARION OF MICROWAVE-ENHANCED CVI PRODUCTION OF SiCf/SiC COMPOSITES
M.T. Porter1, J. Binner1, P. Kumi2, K.E. Stern2, V.V. Yakovlev2
1 School of Metallurgy and Materials, University of Birmingham, Edgbaston, Birmingham, B15 2TT, UK
2 Department of Mathematical Sciences, Worcester Polytechnic Institute, Worcester, MA 01609, USA
Keywords: energy coupling, microwave heating, modelling, SiC composites, temperature field.
1. IntroductionThe aerospace industry is one of the largest and arguably the most important to the compositematerials sector. For many aerospace applications, the exceptional mechanical properties ofcomposites, such as high strength, low weight and high stiffness are of utmost importance[1]. To this end, they have seen a recent explosion in the industry as manufacturing hasbecome more advanced and cheaper.
Silicon carbide fibre reinforced silicon carbide matrix composites (SiCf/SiC) have been identified as a material with high-performance mechanical properties [2-7]. The application of SiCf/SiC in the aerospace industry is increasing; for instance, replacing Ni-Ti super-alloy components and thus giving engines the capability to operate at higher temperatures would lead to reduced active cooling requirement and enhanced thermal efficiency [5].
One advanced manufacturing technique, chemical vapour infiltration (CVI), can create an extremely refined microstructure with little or no preform degradation and minimal residual stresses [9-11]. CVI is the process of infiltrating a porous matrix of typically continuous fibres (a preform) with a mixture of precursor gases that react, decompose, and deposit a solid matrix at high temperature. The primary objective of CVI, like the other advanced manufacturing methods, is to increase the density of the porous preform to as close to 100% of theoretical density as possible [10]. CVI’s challenges, however, are three-fold:
(a) Batch production times are typically 2-3 months.(b) Premature pore closure results in low efficiencies.(c) Subsequently, associated manufacturing costs are very high.Microwave-enhanced (ME) CVI heating of ceramic matrix composites has been proposed
as a potential solution to these challenges [2, 3, 5]. It produces a favourable “inverse” temperature profile, meaning the temperature is hottest, in contrast to conventional CVI, within the heated sample [2, 3, 5, 7]. This profile initiates densification at the centre of the sample, thus avoiding surface porosity closure. It has also recently been shown that this process has the potential to yield near fully dense SiCf/SiC composites in a significantly shorter time span [7]. This work demonstrated proof of concept that an “inverse” densification profile could be achieved with the SiC deposit of nearly stochiometric composition and a highly crystalline microstructure.
This paper presents some results of computational analysis of electromagnetic (EM) and thermal characteristics of the ME CVI process carried out with thin (thickness h from 8 to 24 mm) SiC discs (diameter d from 55 to 165 mm) in a Labotron microwave system from SAIREM. The simulations aimed to clarify multiple unexplained observations in experimental work [7] through understanding causes for the formation of microwave-induced temperature fields. With the use of the developed EM model, resonant and non-
48
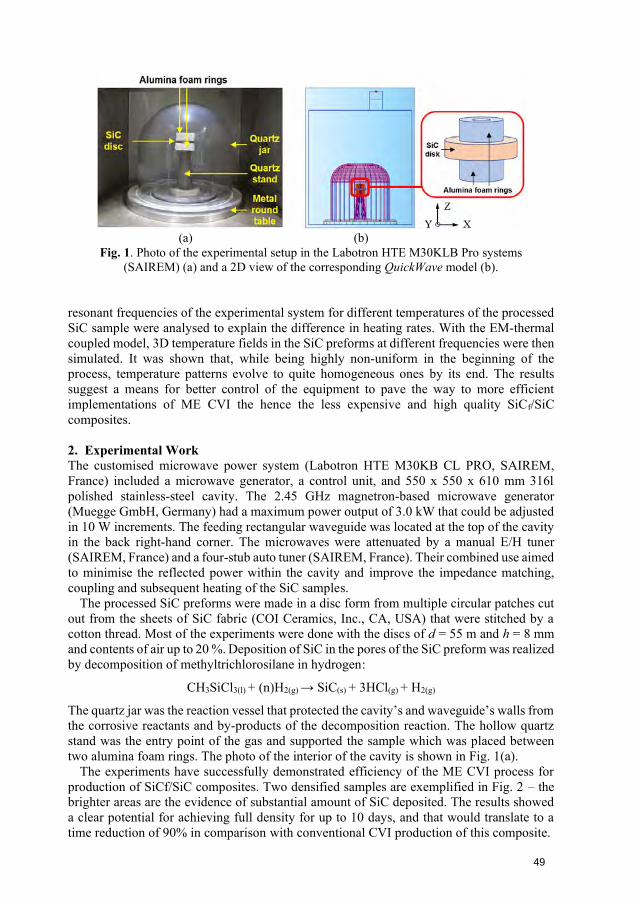
(a) (b) Fig. 1. Photo of the experimental setup in the Labotron HTE M30KLB Pro systems
(SAIREM) (a) and a 2D view of the corresponding QuickWave model (b).
resonant frequencies of the experimental system for different temperatures of the processed SiC sample were analysed to explain the difference in heating rates. With the EM-thermal coupled model, 3D temperature fields in the SiC preforms at different frequencies were then simulated. It was shown that, while being highly non-uniform in the beginning of the process, temperature patterns evolve to quite homogeneous ones by its end. The results suggest a means for better control of the equipment to pave the way to more efficient implementations of ME CVI the hence the less expensive and high quality SiCf/SiC composites.
2. Experimental WorkThe customised microwave power system (Labotron HTE M30KB CL PRO, SAIREM,France) included a microwave generator, a control unit, and 550 x 550 x 610 mm 316lpolished stainless-steel cavity. The 2.45 GHz magnetron-based microwave generator(Muegge GmbH, Germany) had a maximum power output of 3.0 kW that could be adjustedin 10 W increments. The feeding rectangular waveguide was located at the top of the cavityin the back right-hand corner. The microwaves were attenuated by a manual E/H tuner(SAIREM, France) and a four-stub auto tuner (SAIREM, France). Their combined use aimedto minimise the reflected power within the cavity and improve the impedance matching,coupling and subsequent heating of the SiC samples.
The processed SiC preforms were made in a disc form from multiple circular patches cut out from the sheets of SiC fabric (COI Ceramics, Inc., CA, USA) that were stitched by a cotton thread. Most of the experiments were done with the discs of d = 55 m and h = 8 mm and contents of air up to 20 %. Deposition of SiC in the pores of the SiC preform was realized by decomposition of methyltrichlorosilane in hydrogen:
CH3SiCl3(l) + (n)H2(g) → SiC(s) + 3HCl(g) + H2(g)
The quartz jar was the reaction vessel that protected the cavity’s and waveguide’s walls from the corrosive reactants and by-products of the decomposition reaction. The hollow quartz stand was the entry point of the gas and supported the sample which was placed between two alumina foam rings. The photo of the interior of the cavity is shown in Fig. 1(a).
The experiments have successfully demonstrated efficiency of the ME CVI process for production of SiCf/SiC composites. Two densified samples are exemplified in Fig. 2 – the brighter areas are the evidence of substantial amount of SiC deposited. The results showed a clear potential for achieving full density for up to 10 days, and that would translate to a time reduction of 90% in comparison with conventional CVI production of this composite.
49
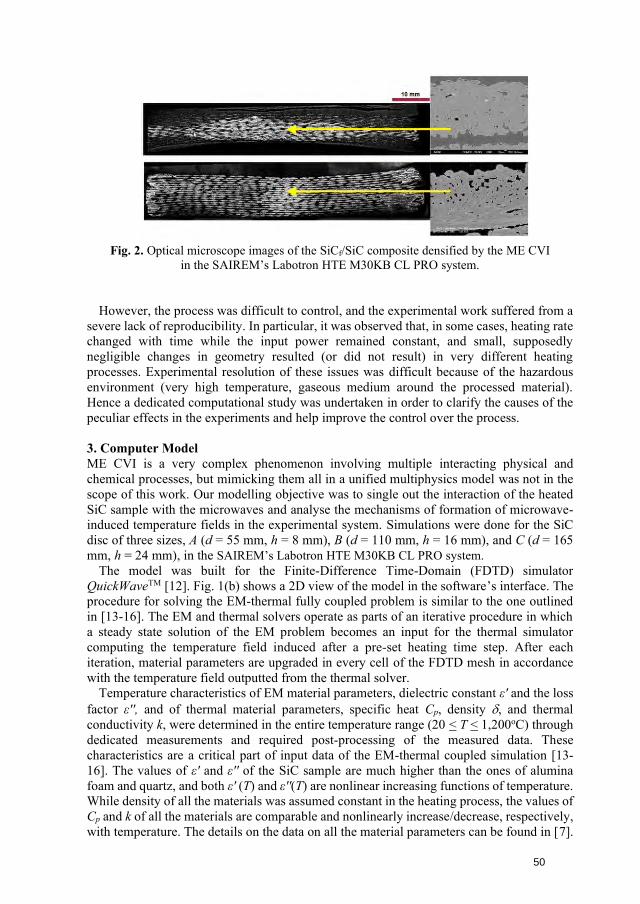
Fig. 2. Optical microscope images of the SiCf/SiC composite densified by the ME CVI in the SAIREM’s Labotron HTE M30KB CL PRO system.
However, the process was difficult to control, and the experimental work suffered from a severe lack of reproducibility. In particular, it was observed that, in some cases, heating rate changed with time while the input power remained constant, and small, supposedly negligible changes in geometry resulted (or did not result) in very different heating processes. Experimental resolution of these issues was difficult because of the hazardous environment (very high temperature, gaseous medium around the processed material). Hence a dedicated computational study was undertaken in order to clarify the causes of the peculiar effects in the experiments and help improve the control over the process.
3. Computer ModelME CVI is a very complex phenomenon involving multiple interacting physical andchemical processes, but mimicking them all in a unified multiphysics model was not in thescope of this work. Our modelling objective was to single out the interaction of the heatedSiC sample with the microwaves and analyse the mechanisms of formation of microwave-induced temperature fields in the experimental system. Simulations were done for the SiCdisc of three sizes, A (d = 55 mm, h = 8 mm), B (d = 110 mm, h = 16 mm), and C (d = 165mm, h = 24 mm), in the SAIREM’s Labotron HTE M30KB CL PRO system.
The model was built for the Finite-Difference Time-Domain (FDTD) simulator QuickWaveTM [12]. Fig. 1(b) shows a 2D view of the model in the software’s interface. The procedure for solving the EM-thermal fully coupled problem is similar to the one outlined in [13-16]. The EM and thermal solvers operate as parts of an iterative procedure in which a steady state solution of the EM problem becomes an input for the thermal simulator computing the temperature field induced after a pre-set heating time step. After each iteration, material parameters are upgraded in every cell of the FDTD mesh in accordance with the temperature field outputted from the thermal solver.
Temperature characteristics of EM material parameters, dielectric constant ε' and the loss factor ε'', and of thermal material parameters, specific heat Cp, density , and thermal conductivity k, were determined in the entire temperature range (20 < T < 1,200oC) through dedicated measurements and required post-processing of the measured data. These characteristics are a critical part of input data of the EM-thermal coupled simulation [13-16]. The values of ε' and ε'' of the SiC sample are much higher than the ones of alumina foam and quartz, and both ε' (T) and ε''(T) are nonlinear increasing functions of temperature. While density of all the materials was assumed constant in the heating process, the values of Cp and k of all the materials are comparable and nonlinearly increase/decrease, respectively, with temperature. The details on the data on all the material parameters can be found in [7].
50
(a)
(b)
Fig. 3. Frequency characteristics of the reflection coefficient characteristics in the process of heating of disc B in the IMS range of 2.45 GHz (a) and in its three subintervals containing
frequencies at which |S11| is high (green frame), low (orange frame), increasing (blue frame), and decreasing (red frame) (b).
4. Computational ResultsSimulations were performed on a Windows 10 workstation with two Intel Xeon Gold 5120processors with a base/peak frequency of 2.2/3.2 GHz and the GPU NVIDIA Quadro P5000.
Since the microwave heating rate is conditioned by energy coupling, at the first stage of our modelling effort, the EM part of the model was used to determine frequency characteristics of the reflection coefficient (|S11|) of the microwave system. For each disc, these characteristics were obtained for several temperature values spread across the entire temperature range of the heating process. Temperature in the EM problem was represented through corresponding values of ε' and ε''.
Simulated |S11|(f) curves allowed us to see the impact made by the dielectric properties changing while heating on the reflection coefficient (and thus energy coupling). Six typical frequency characteristics are shown in Fig. 3. It turned out that, depending on frequency, |S11| may behave differently with temperature going up: with frequency kept constant, it may remain low, or high, or increase, or decrease. In Fig. 3, these behaviours of |S11| are associated with particular highlighted frequencies. Also, due to the presence of multiple narrow resonances, a large difference in reflection may result from very small frequency changes. The obtained |S11|(f) curves, therefore, provide significant evidence for unpredictable changes in the heating rate in the experiments with constant input power. They are also consistent with the results of [17] concluded, through an applicable sensitivity analysis, that frequency was the most critical factor in stability of MW CVI process.
51
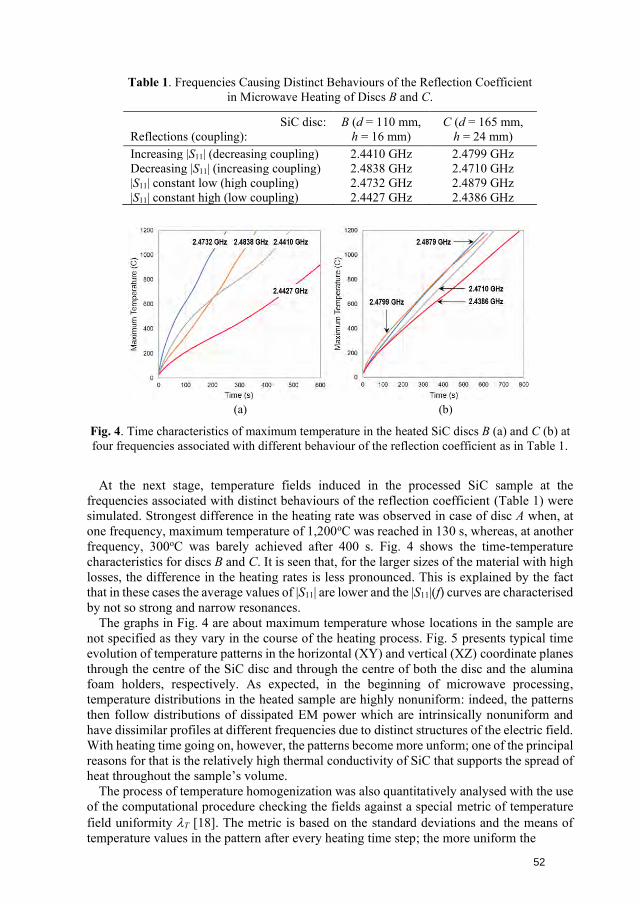
Table 1. Frequencies Causing Distinct Behaviours of the Reflection Coefficient in Microwave Heating of Discs B and C.
SiC disc: Reflections (coupling):
B (d = 110 mm, h = 16 mm)
C (d = 165 mm, h = 24 mm)
Increasing |S11| (decreasing coupling) 2.4410 GHz 2.4799 GHz Decreasing |S11| (increasing coupling) 2.4838 GHz 2.4710 GHz |S11| constant low (high coupling) 2.4732 GHz 2.4879 GHz |S11| constant high (low coupling) 2.4427 GHz 2.4386 GHz
(a) (b)
Fig. 4. Time characteristics of maximum temperature in the heated SiC discs B (a) and C (b) at four frequencies associated with different behaviour of the reflection coefficient as in Table 1.
At the next stage, temperature fields induced in the processed SiC sample at the frequencies associated with distinct behaviours of the reflection coefficient (Table 1) were simulated. Strongest difference in the heating rate was observed in case of disc A when, at one frequency, maximum temperature of 1,200oC was reached in 130 s, whereas, at another frequency, 300oC was barely achieved after 400 s. Fig. 4 shows the time-temperature characteristics for discs B and C. It is seen that, for the larger sizes of the material with high losses, the difference in the heating rates is less pronounced. This is explained by the fact that in these cases the average values of |S11| are lower and the |S11|(f) curves are characterised by not so strong and narrow resonances.
The graphs in Fig. 4 are about maximum temperature whose locations in the sample are not specified as they vary in the course of the heating process. Fig. 5 presents typical time evolution of temperature patterns in the horizontal (XY) and vertical (XZ) coordinate planes through the centre of the SiC disc and through the centre of both the disc and the alumina foam holders, respectively. As expected, in the beginning of microwave processing, temperature distributions in the heated sample are highly nonuniform: indeed, the patterns then follow distributions of dissipated EM power which are intrinsically nonuniform and have dissimilar profiles at different frequencies due to distinct structures of the electric field. With heating time going on, however, the patterns become more unform; one of the principal reasons for that is the relatively high thermal conductivity of SiC that supports the spread of heat throughout the sample’s volume.
The process of temperature homogenization was also quantitatively analysed with the use of the computational procedure checking the fields against a special metric of temperature field uniformity T [18]. The metric is based on the standard deviations and the means of temperature values in the pattern after every heating time step; the more uniform the
52
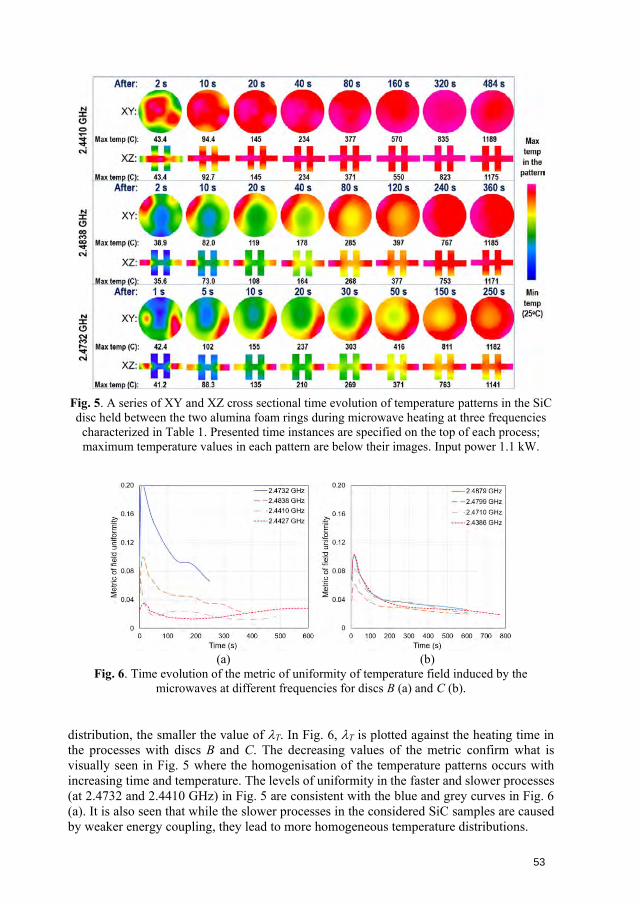
Fig. 5. A series of XY and XZ cross sectional time evolution of temperature patterns in the SiC disc held between the two alumina foam rings during microwave heating at three frequencies
characterized in Table 1. Presented time instances are specified on the top of each process; maximum temperature values in each pattern are below their images. Input power 1.1 kW.
(a) (b) Fig. 6. Time evolution of the metric of uniformity of temperature field induced by the
microwaves at different frequencies for discs B (a) and C (b).
distribution, the smaller the value of T. In Fig. 6, T is plotted against the heating time in the processes with discs B and C. The decreasing values of the metric confirm what is visually seen in Fig. 5 where the homogenisation of the temperature patterns occurs with increasing time and temperature. The levels of uniformity in the faster and slower processes (at 2.4732 and 2.4410 GHz) in Fig. 5 are consistent with the blue and grey curves in Fig. 6 (a). It is also seen that while the slower processes in the considered SiC samples are caused by weaker energy coupling, they lead to more homogeneous temperature distributions.
53
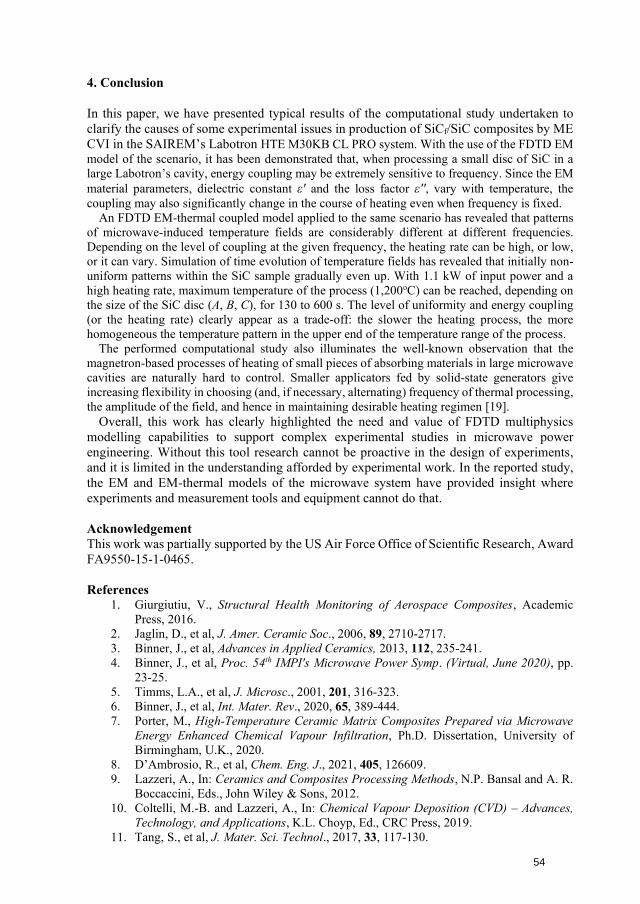
4. Conclusion
In this paper, we have presented typical results of the computational study undertaken to clarify the causes of some experimental issues in production of SiCf/SiC composites by ME CVI in the SAIREM’s Labotron HTE M30KB CL PRO system. With the use of the FDTD EM model of the scenario, it has been demonstrated that, when processing a small disc of SiC in a large Labotron’s cavity, energy coupling may be extremely sensitive to frequency. Since the EM material parameters, dielectric constant ε' and the loss factor ε'', vary with temperature, the coupling may also significantly change in the course of heating even when frequency is fixed.
An FDTD EM-thermal coupled model applied to the same scenario has revealed that patterns of microwave-induced temperature fields are considerably different at different frequencies. Depending on the level of coupling at the given frequency, the heating rate can be high, or low, or it can vary. Simulation of time evolution of temperature fields has revealed that initially non-uniform patterns within the SiC sample gradually even up. With 1.1 kW of input power and a high heating rate, maximum temperature of the process (1,200oC) can be reached, depending on the size of the SiC disc (A, B, C), for 130 to 600 s. The level of uniformity and energy coupling (or the heating rate) clearly appear as a trade-off: the slower the heating process, the more homogeneous the temperature pattern in the upper end of the temperature range of the process.
The performed computational study also illuminates the well-known observation that the magnetron-based processes of heating of small pieces of absorbing materials in large microwave cavities are naturally hard to control. Smaller applicators fed by solid-state generators give increasing flexibility in choosing (and, if necessary, alternating) frequency of thermal processing, the amplitude of the field, and hence in maintaining desirable heating regimen [19].
Overall, this work has clearly highlighted the need and value of FDTD multiphysics modelling capabilities to support complex experimental studies in microwave power engineering. Without this tool research cannot be proactive in the design of experiments, and it is limited in the understanding afforded by experimental work. In the reported study, the EM and EM-thermal models of the microwave system have provided insight where experiments and measurement tools and equipment cannot do that.
Acknowledgement This work was partially supported by the US Air Force Office of Scientific Research, Award FA9550-15-1-0465.
References 1. Giurgiutiu, V., Structural Health Monitoring of Aerospace Composites, Academic
Press, 2016.2. Jaglin, D., et al, J. Amer. Ceramic Soc., 2006, 89, 2710-2717.3. Binner, J., et al, Advances in Applied Ceramics, 2013, 112, 235-241.4. Binner, J., et al, Proc. 54th IMPI's Microwave Power Symp. (Virtual, June 2020), pp.
23-25.5. Timms, L.A., et al, J. Microsc., 2001, 201, 316-323.6. Binner, J., et al, Int. Mater. Rev., 2020, 65, 389-444.7. Porter, M., High-Temperature Ceramic Matrix Composites Prepared via Microwave
Energy Enhanced Chemical Vapour Infiltration, Ph.D. Dissertation, University ofBirmingham, U.K., 2020.
8. D’Ambrosio, R., et al, Chem. Eng. J., 2021, 405, 126609.9. Lazzeri, A., In: Ceramics and Composites Processing Methods, N.P. Bansal and A. R.
Boccaccini, Eds., John Wiley & Sons, 2012.10. Coltelli, M.-B. and Lazzeri, A., In: Chemical Vapour Deposition (CVD) – Advances,
Technology, and Applications, K.L. Choyp, Ed., CRC Press, 2019.11. Tang, S., et al, J. Mater. Sci. Technol., 2017, 33, 117-130.
54
12. QuickWaveTM, 1998-2021, QWED Sp. Z.o.o., https://www.qwed.com.pl.13. Kopyt, P. and M. Celuch, J. Microwave Power & Electroman. Energy, 2007, 41, 18-
29.14. Celuch, M. and P. Kopyt, In: Development of Packaging and Products for Use in
Microwave Ovens, M. Lorence and P. Pesheck, Eds., Woodhead Publishing, 2009, pp.305–348.
15. Koutchma, T.V. and V.V. Yakovlev, In: Mathem. Analysis of Food Processing, M.Farid, Ed., 2010, pp. 625-657.
16. Yakovlev, V.V., et al, In: Microwave and RF Power Applications, J. Tao, Ed., CépaduèsÉditions, 2011, pp. 303-306.
17. Maizza, G. and M. Longhin, Proc. of the COMSOL Conference (Milan, 2009), 7 p.18. Kumi, P. and V.V. Yakovlev, Proc. 53rd IMPI's Microwave Power Symp. (Las Vegas,
NV, June 2019), pp. 123-125.19. Yakovlev, V.V., J. Microwave Power & Electromag. Energy, 2018, 52, 31-44.
55
18th International Conference on Microwave and High Frequency ApplicationsAMPERE 2021, Gothenburg, Sweden, September 13-16, 2021
CONTINUOUS AND ONLINE MONITORING OF CHEMICAL SYNTHESIS VIADIELECTRIC SPECTROSCOPY
D. Dalligos1, L. T. Ball1, M. Pilling3, G. Dimitrakis2
1School of Chemistry, University of Nottingham, University Park, Nottingham, NG72RD,UK2Department of Chemical and Environmental Engineering, University of Nottingham,University Park, Nottingham, NG72RD, UK3Chemical Development, Pharmaceutical Technology & Development, Operations,AstraZeneca, Macclesfield, [email protected]
Keywords (choose minimum two): Microwave, Sensor technology, Chemistry, Dielectricproperties, Characterisation
Off-line monitoring is the most commonly used methods for determining reaction progressin research and manufacturing processes. However, it is very time consuming, inefficientand challenging for reactions that use toxic reagents and high temperature / pressureconditions in addition to the problems related to the waste production and the safety of theoperators. While continuous, in situ reaction monitoring addresses these issues, no singleanalytical technique can be applied to every system.Dielectric spectroscopy (DS) measures the bulk dielectric properties of a material. It isrelatively cheap, fast, non-destructive, easy to operate and maintain. This technique has awide range of applications in biological systems1, agriculture2 and polymers3, and has beenused to monitor polymerisation reaction continuously in real time.4 DS was used tocontinuously monitor an SN2 reaction and validated by off-line Nuclear MagneticResonance (NMR) spectroscopy. The results showed that the dielectric constant could beused to follow the conversion of the starting material to the product with goodcomparability to the off-line NMR data and demonstrated the viability of DS to be used inmonitoring organic reactions in which there is a change in dielectric properties as a resultof a chemical transformation. Because of its non-destructive measurement characteristicsand ease of operation, DS has the potential to be implemented as a Process AnalyticalTechnology tool as part of the framework outlined by the Food and Drug Administrationfor the development, design and control of processes in the pharmaceutical industry whichaims to increase efficiency, minimise rejects, reduce over-processing, and produce highquality products.5
References1. Gioia A. L., Porter E., Merunka I., Shahzad A., Salahuddin S., Jones M.,
O’Halloran M., Diagnostics, 2018, 8, 40.2. Khaled D. E., Castellano N. N., J. A. Gasquez J. A., Perea-Moreno A., Manzano-
Agugliaro F., Materials, 2016, 9, 310.3. Schultz J.W. Encyclopedia of Analytical Chemistry, 2006, DOI:
10.1002/9780470027318.a204. Kalamiotis A., Ilchev A., Irvine D. J., Dimitrakis G., Sensor Actuat B Chem,
2019, 290, 34-40.5. FDA, Guidance for Industry PAT – A Framework for Innovative, Pharmaceutical
Development, Manufacturing and Quality Assurance, 2004.
56
CONTINUOUS HEATING OF FOULING-SENSITIVE MILK PRODUCTS – MICROWAVE TECHNOLOGY AS NEW APPROACH?
B. Graf1 and J. Hinrichs1
1Department of Soft Matter Science and Dairy Technology, Institute of Food Science and Biotechnology, University of Hohenheim, Garbenstrasse 21, 70599 Stuttgart, Germany. [email protected]
Keywords: Microwave, Food applications, Dairy
Abstract During processing of milk concentrates the microbiological load especially of thermophilic spore formers and their endospores may increase. Thus, not only the concentrate but also the thereof produced powder can contain high amounts of thermophilic spores that survive transport and storage and finally germinate upon reconstitution. High temperature treatments of milk concentrate prior to the evaporation process reduce the count of thermophilic spores (> 100 °C). However, such a treatment in the existing indirect heating plants is limited due to extended deposit formation, so called fouling. Only intensive cleaning procedures with heavy cleaning agents remove fouling from the plant. It is hypothesized that through the lack of hot walls continuous microwave heating of milk concentrates induces less fouling, retains the product properties, and diminishes the microbiological load of thermophilic spores. Skim milk concentrates (31.1 g/100 g dry matter, obtained via reverse osmosis) were heated in a continuously operated microwave heating plant in pilot scale (f = 2450 MHz, volume flow = 150 L/h). Temperatures ranging from 85 to 115 °C were applied with holding time t = 5 s. The concentrates were analyzed by means of L*a*b* colour space and particle size by static light scattering. Direct heating by microwave technology of skim milk concentrate within the designed process window was feasible, while product properties were maintained. Except yellowing of the samples, colour changes (browning) were not found. Particle formation was significantly reduced and low in comparison to indirect heating. The experimental results allow to set a process window for microwave heating of milk concentrates with minimal product changes. Thus, microwave technology presents a new method to heat fouling-sensitive milk products.
57
Introduction Various food processing applications like drying, heating, thawing, blanching, baking, and sterilization can be realized by direct heating through microwave technology [1–3]. Microwaves induce a temporary reorientation of polarized molecules in a dielectric material that is exposed to an electromagnetic field. Through internal friction and the vibration of neighboring molecules heat is induced in the material [1, 4]. The frequencies of microwaves range from 300 MHz to 300 GHz, whereby frequencies of 915 MHz and 2.45 GHz are typically used for microwave ovens and industrial purposes worldwide [1, 3]. Microwave heating retains flavour and nutritional values of food products as it lacks heat transfer surfaces and involves short heat transfer with high heating rates, thereby allowing gentle heating (in comparison to indirect heating methods) [4, 5]. It has recently been demonstrated that continuous microwave heating of milk products reduces deposit formation by 90 % in comparison to indirect heating via tubular heat exchangers [6]. Concentrated milk products like skim milk concentrate are prone to aggregate and deposit formation upon heating, as they contain high amounts of dry matter, including minerals and (whey) proteins [7, 8]. The latter are heat-sensitive and denature with subsequent aggregate formation if they are evolved to high temperatures (≥ 80 °C). Together with minerals, a deposit is formed at hot heat transfer surfaces in indirect heat exchangers, so called fouling [9]. However, the heating step is crucial as heating of skim milk concentrate before powder manufacture represents one approach to reduce high amounts of thermophilic endospores in milk powders [10]. This issue is challenging for milk powder manufacturers as spores were shown to persist in processing plants, were thus found in milk powders, what finally decreased their acceptance [11, 12]. Moreover, heat preservation of milk concentrates favours their direct distribution and skips energy-consuming drying processes [13]. Direct heating methods like steam injection have been successfully proven as heating methods for skim milk concentrate in pilot scale [7]. However, this method dilutes the concentrate by steam addition and the energy recovery is poor. Moreover, continuous microwave heating has been shown to be suitable for heating reconstituted skim milk concentrates up to 125 °C [6, 10]. This study aims to demonstrate the feasibility of continuous microwave heating for skim milk concentrate in terms of colour changes, deposit, and particle formation.
1. Material and Methods1.1. Production of skim milk concentrate
Skim milk concentrate was produced by reverse osmosis (MMS Membrane Systems, Urdorf, Switzerland equipped with a spiral wound module 3839 KMS HRX 14.2 m2 Koch Industries Inc. Lenntech B.V. Delfgauw, Netherlands) of pasteurized skim milk at 50 °C and 150 L/h until a trans membrane pressure (TMP) of TPM ≈ 4 MPa was reached. The following values represent the final product properties: dry matter 31.10 ± 0.26 g/100 g, pH 6.30 ± 0.09, and electrical conductivity 7.72 ± 0.08 mS/cm.
1.2. Microwave heating of skim milk concentrate A continuously operated pilot scale microwave heating plant (µWaveFlow 0620hp, Pueschner GmbH & Co KG, Schwanewede, Germany) has been set up as shown by Graf et al. [6]. The power outputs of the single-mode applicator were 0.6 – 6 kW at f = 2450 MHz, while a quartz glass tube (di = 3 · 10-3 m, l = 0.5 m) resembled the microwave heating section. A PT100 was used to measure the product outlet temperature directly after the heating section, representing the temperature the heating experiments were referred to. In order to pre-heat and cool the product, the microwave heating plant was connected to a pilot heating plant (tubular heat exchanger, 03T210, MSR 03210, Asepto GmbH, Dinkelscherben, Germany).
58

All heating experiments were performed according to a previously presented procedure [6], with a volume flow of V = 150 L/h, an over pressure of p ≈ 0.3 MPa, a pre-heating temperature of 80 °C, a single-staged homogenization between pre-heater one and two at 15 MPa, a heat holding section of length l = 2.2 m (inner diameter 3·10-3 m) after the heating, realizing 5 s heat holding time, and a cooling temperature of 15 °C. Within each experiment, the temperatures 85, 90, 95, 100, 105, 110, and 115 °C were set and held for 5 min, respectively, before samples were taken for further analyses. All heating experiments were performed in duplicate.
1.3. Analyses 1.3.1. L*a*b* colour space
The colour of heated and unheated skim milk concentrate was determined based on the CIE L*a*b* colour space with a Chroma meter CR-400 (Konica Minolta, Chiyoda, Japan), where L* represents the lightness (0 = black, 100 = white) and b* the shift from blue (-) to yellow (+). The instrument was calibrated as described by the manufacturer with a white calibration plate each day prior to the measurements. 10 mL sample was filled into a petri dish (ø 30 mm) that was placed on a white background to ensure equal light conditions. For analysis, the yellow index (YI), representing the browning of a product, was calculated according to Equation 1 [14].
YI = 142.86 · b*/L* (1) 1.3.2. Particle size distribution
The particle size of skim milk concentrate was determined by static light scattering with a particle size analyser (LS 13 320, Beckman Coulter Corp., Brea, USA). The refractive index of the surrounding medium (distilled water) was set to 1.33 while the refractive index of the sample was set to 1.57, representing casein micelles. For data evaluation, the d90,3 was chosen, representing the value to which 90 % of the particles are equal to or smaller, based on a volumetric particle size distribution
1.3.3. Statistical analyses The arithmetic mean and standard error have been calculated for all analyses. If values are given, they have been rounded to two significant digits of the standard error. To evaluate significant differences, a two-sided t-test in Sigma Plot 12.5 (Systat Software Inc., San Jose, California, USA) with p = 0.05 was performed. All pilot plant trials were performed in duplicate, whereas all analyses were performed in triplicate.
2. Results and DiscussionIn a first approach, skim milk concentrate was heated in a) the pre-heater to 80 °C, b) in anindirect heater (tubular heat exchanger, pilot heating plant) at 110 °C, and c) in themicrowave heating plant at 110 °C in order to test the feasibility and evaluate the effect ofthe pre-heater on the product properties. The resulting particle sizes (d90,3) are shown inTable 1. While the pre-heater (d90,3 = 0.21 ± 0.01 µm) had no impact on the particle size,heating through microwave technology (d90,3 = 0.40 ± 0.04 µm) caused a significant increase.However, the particle size is still acceptable and low in comparison to indirect heating thatcaused a 60-fold increase in particle size (d90,3 = 14.4 ± 2.0 µm). Moreover, the pressure inthe indirect heating plant increased immediately, indicating that heating of native skim milkconcentrate in a tubular heat exchanger to ϑ ≥ 110 °C causes deposit formation and is thusnot feasible. All continuing experiments were performed using solely the microwave heatingplant connected to the tubular pre-heater und cooler.
59
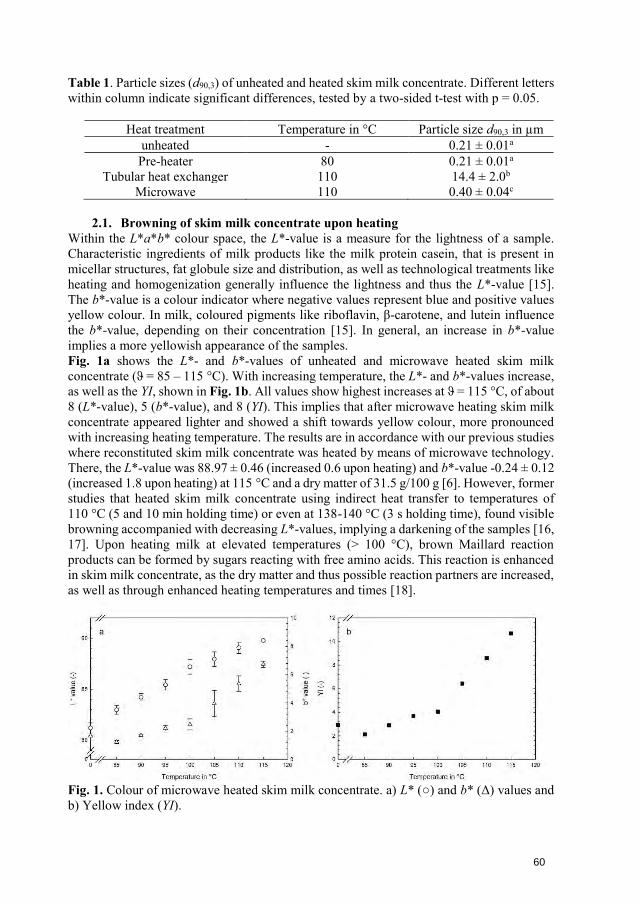
Table 1. Particle sizes (d90,3) of unheated and heated skim milk concentrate. Different letters within column indicate significant differences, tested by a two-sided t-test with p = 0.05.
Heat treatment Temperature in °C Particle size d90,3 in µm unheated - 0.21 ± 0.01a Pre-heater 80 0.21 ± 0.01a
Tubular heat exchanger 110 14.4 ± 2.0b Microwave 110 0.40 ± 0.04c
2.1. Browning of skim milk concentrate upon heating Within the L*a*b* colour space, the L*-value is a measure for the lightness of a sample. Characteristic ingredients of milk products like the milk protein casein, that is present in micellar structures, fat globule size and distribution, as well as technological treatments like heating and homogenization generally influence the lightness and thus the L*-value [15]. The b*-value is a colour indicator where negative values represent blue and positive values yellow colour. In milk, coloured pigments like riboflavin, β-carotene, and lutein influence the b*-value, depending on their concentration [15]. In general, an increase in b*-value implies a more yellowish appearance of the samples. Fig. 1a shows the L*- and b*-values of unheated and microwave heated skim milk concentrate (ϑ = 85 – 115 °C). With increasing temperature, the L*- and b*-values increase, as well as the YI, shown in Fig. 1b. All values show highest increases at ϑ = 115 °C, of about 8 (L*-value), 5 (b*-value), and 8 (YI). This implies that after microwave heating skim milk concentrate appeared lighter and showed a shift towards yellow colour, more pronounced with increasing heating temperature. The results are in accordance with our previous studies where reconstituted skim milk concentrate was heated by means of microwave technology. There, the L*-value was 88.97 ± 0.46 (increased 0.6 upon heating) and b*-value -0.24 ± 0.12 (increased 1.8 upon heating) at 115 °C and a dry matter of 31.5 g/100 g [6]. However, former studies that heated skim milk concentrate using indirect heat transfer to temperatures of 110 °C (5 and 10 min holding time) or even at 138-140 °C (3 s holding time), found visible browning accompanied with decreasing L*-values, implying a darkening of the samples [16, 17]. Upon heating milk at elevated temperatures (> 100 °C), brown Maillard reaction products can be formed by sugars reacting with free amino acids. This reaction is enhanced in skim milk concentrate, as the dry matter and thus possible reaction partners are increased, as well as through enhanced heating temperatures and times [18].
Fig. 1. Colour of microwave heated skim milk concentrate. a) L* (○) and b* (Δ) values and b) Yellow index (YI).
60
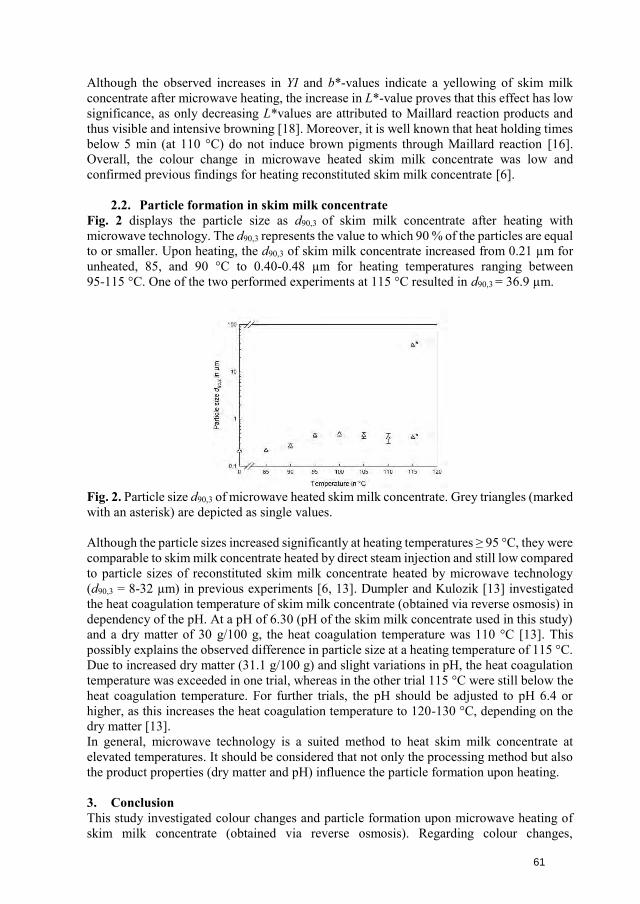
Although the observed increases in YI and b*-values indicate a yellowing of skim milk concentrate after microwave heating, the increase in L*-value proves that this effect has low significance, as only decreasing L*values are attributed to Maillard reaction products and thus visible and intensive browning [18]. Moreover, it is well known that heat holding times below 5 min (at 110 °C) do not induce brown pigments through Maillard reaction [16]. Overall, the colour change in microwave heated skim milk concentrate was low and confirmed previous findings for heating reconstituted skim milk concentrate [6].
2.2. Particle formation in skim milk concentrate Fig. 2 displays the particle size as d90,3 of skim milk concentrate after heating with microwave technology. The d90,3 represents the value to which 90 % of the particles are equal to or smaller. Upon heating, the d90,3 of skim milk concentrate increased from 0.21 µm for unheated, 85, and 90 °C to 0.40-0.48 µm for heating temperatures ranging between 95-115 °C. One of the two performed experiments at 115 °C resulted in d90,3 = 36.9 µm.
Fig. 2. Particle size d90,3 of microwave heated skim milk concentrate. Grey triangles (marked with an asterisk) are depicted as single values.
Although the particle sizes increased significantly at heating temperatures ≥ 95 °C, they were comparable to skim milk concentrate heated by direct steam injection and still low compared to particle sizes of reconstituted skim milk concentrate heated by microwave technology (d90,3 = 8-32 µm) in previous experiments [6, 13]. Dumpler and Kulozik [13] investigated the heat coagulation temperature of skim milk concentrate (obtained via reverse osmosis) in dependency of the pH. At a pH of 6.30 (pH of the skim milk concentrate used in this study) and a dry matter of 30 g/100 g, the heat coagulation temperature was 110 °C [13]. This possibly explains the observed difference in particle size at a heating temperature of 115 °C. Due to increased dry matter (31.1 g/100 g) and slight variations in pH, the heat coagulation temperature was exceeded in one trial, whereas in the other trial 115 °C were still below the heat coagulation temperature. For further trials, the pH should be adjusted to pH 6.4 or higher, as this increases the heat coagulation temperature to 120-130 °C, depending on the dry matter [13]. In general, microwave technology is a suited method to heat skim milk concentrate at elevated temperatures. It should be considered that not only the processing method but also the product properties (dry matter and pH) influence the particle formation upon heating.
3. ConclusionThis study investigated colour changes and particle formation upon microwave heating ofskim milk concentrate (obtained via reverse osmosis). Regarding colour changes,
61
microwave technology is suited to heat skim milk concentrate without visible browning. Moreover, deposit formation and enhanced particle formation were not detected. However, besides the processing method, the product properties play an important role concerning particle formation, as they e.g., influence the heat coagulation temperature of skim milk concentrate. Further experiments will focus on pH adjustment of skim milk concentrate prior to heating. Moreover, overheating in the microwave section should be prevented. Therefore, a temperature profile of the microwave heating section will be recorded with a height-adjustable fiber optic temperature sensor directly in the product, in order to gain deeper knowledge about the temperature profile upon heating.
Acknowledgements The authors kindly thank Nina Rieger for performing the laboratory analyses as well as Luc Mertz and Nabil Chaib for assistance during filtration and heating experiments. This Industrial Collective Research (IGF) project of the FEI was supported via AiF within the program for promoting the IGF of the German Ministry of Economics and Energy (BMWi), based on a resolution of the German parliament (Project AiF 19633 N).
References [1] A. C. Metaxas and R. J. Meredith, Industrial microwave heating. London: The Institution
of Engineering and Technology, 2008.[2] V. Orsat, G. Raghavan, and K. Krishnaswamy, “Microwave technology for food
processing,” in The Microwave Processing of Foods: Elsevier, 2017, pp. 100–116.[3] M. Rother, “Über das Konkurrenzverhalten von Dielektrika bei der
Mikrowellenerwärmung,” Dissertation, Fakultät für Chemieingenieurwesen undVerfahrenstechnik, Karlsruher Institut für Technologie, Karlsruhe, Germany, 2010.
[4] S. Chandrasekaran, S. Ramanathan, and T. Basak, “Microwave food processing—Areview,” Food Research International, vol. 52, no. 1, pp. 243–261, 2013, doi:10.1016/j.foodres.2013.02.033.
[5] C. Salazar-González, M. F. San Martín-González, A. López-Malo, and M. E. Sosa-Morales, “Recent Studies Related to Microwave Processing of Fluid Foods,” FoodBioprocess Technol, vol. 5, no. 1, pp. 31–46, 2012, doi: 10.1007/s11947-011-0639-y.
[6] B. Graf, T. Kapfer, F. Ostertag, and J. Hinrichs, “New experimental set-up for testingmicrowave technology to continuously heat fouling-sensitive food products like milkconcentrates,” Innovative Food Science & Emerging Technologies, vol. 65, p. 102453, 2020, doi: 10.1016/j.ifset.2020.102453.
[7] J. Dumpler and U. Kulozik, “Heat-induced coagulation of concentrated skim milk heatedby direct steam injection,” International Dairy Journal, vol. 59, pp. 62–71, 2016, doi:10.1016/j.idairyj.2016.03.009.
[8] J. Hinrichs, “UHT processed milk concentrates,” Lait, vol. 80, no. 1, pp. 15–23, 2000,doi: 10.1051/lait:2000102.
[9] P. de Jong, “Impact and control of fouling in milk processing,” (in English;en), Trendsin Food Science & Technology, vol. 12, no. 8, pp. 401–405, 1997.
[10] B. Graf, S. Hehnke, M. Neuwirth, and J. Hinrichs, “Continuous microwave heating toinactivate thermophilic spores in heating-sensitive skim milk concentrate,”International Dairy Journal, vol. 113, p. 104894, 2021, doi:10.1016/j.idairyj.2020.104894.
[11] A. Dettling, E. Doll, C. Wedel, J. Hinrichs, S. Scherer, and M. Wenning, “Accuratequantification of thermophilic spores in dairy powders,” International Dairy Journal,vol. 98, pp. 64–71, 2019, doi: 10.1016/j.idairyj.2019.07.003.
62
[12] F. A. Sadiq et al., “The heat resistance and spoilage potential of aerobic mesophilicand thermophilic spore forming bacteria isolated from Chinese milk powders,”International Journal of Food Microbiology, vol. 238, pp. 193–201, 2016, doi:10.1016/j.ijfoodmicro.2016.09.009.
[13] J. Dumpler and U. Kulozik, “Heat stability of concentrated skim milk as a function ofheating time and temperature on a laboratory scale – Improved methodology andkinetic relationship,” International Dairy Journal, vol. 49, pp. 111–117, 2015, doi:10.1016/j.idairyj.2015.05.005.
[14] I. Seiquer, C. Delgado-Andrade, A. Haro, and M. P. Navarro, “Assessing the effectsof severe heat treatment of milk on calcium bioavailability: in vitro and in vivostudies,” Journal of Dairy Science, vol. 93, no. 12, pp. 5635–5643, 2010, doi:10.3168/jds.2010-3469.
[15] L. Dufossé and P. Galaup, “Chapter 27: Color,” in Handbook of Dairy Food Analysis,L. M. L. Nollet and F. Toldrá, Eds., Boca Raton, Florida, USA: CRC Press, 2010, pp.581–601.
[16] C. Wedel et al., “Thermal treatment of skim milk concentrates in a novel shear-heatingdevice: Reduction of thermophilic spores and physical properties,” Food ResearchInternational (Ottawa, Ont.), vol. 107, pp. 19–26, 2018, doi:10.1016/j.foodres.2018.02.005.
[17] E. L. Celestino, M. Iyer, and H. Roginski, “Reconstituted UHT-treated milk: Effectsof raw milk, powder quality and storage conditions of UHT milk on its physico-hemical attributes and flavour,” International Dairy Journal, vol. 7, 2-3, pp. 129–140,1997, doi: 10.1016/S0958-6946(96)00042-8.
[18] C. P. C. Martins et al., “Microwave Processing: Current Background and Effects onthe Physicochemical and Microbiological Aspects of Dairy Products,” ComprehensiveReviews in Food Science and Food Safety, vol. 18, no. 1, pp. 67–83, 2019, doi:10.1111/1541-4337.12409.
63
CONTINUOUS PASTEURIZATION OF READY MEALS WITH MICROWAVE TECHNOLOGY
Authors: Dr. Ettore Lorenzo Firrao, Dipl.-Ing. Marcel Mallah
Fricke und Mallah Microwave Technology GmbH
Fricke und Mallah Microwave Technology GmbH Werner-Nordmeyer-Straße 25
31226 Peine, Germany [email protected]
Keywords: radio-frequency heating, power applications, pasteurization, cooking, sterilization, no holes, solid-state technology,
Introduction
In the ready-meals sector, frozen products dominated the range for a long time. But with the changing demands of customers, a lot has changed on the market. Today, consumers of convenience products are more interested in sophisticated quality. The younger generation is more informed about ingredients and has a different attitude towards healthy products than a few years ago. The demand for better ingredients and nutrition-conscious concepts is constantly increasing. The demand for organic, vegetarian or vegan products is becoming more and more important. However, there is one crucial catch. Production and filling can be highly automated and continuous up to a certain point. When it comes to the final stage of quality assurance, things get complicated. The necessary pasteurization process is carried out in a conservative method in a water bath, which kills off the harmful germs in the food. However, this process has the disadvantage that it is time-consuming and important nutrients are lost. For the pasteurization of ready-meal trays up to now with the more energy-efficient process with microwaves, the perforation of the film and the use of a non-return valve were essential to prevent the trays from bursting due to the overpressure. However, this also creates the risk that new germs from the ambient air are drawn into the product again during cooling and the resulting vacuum. In addition, grease residues are formed around the hole, which makes subsequent process-safe sealing of the film impossible.
Solution
In the common pasteurization processes, the trays are pasteurized in an autoclave with steam and pressure. This process has the disadvantage that it is not a continuous inline process. In addition, energy consumption is very high due to the build-up of pressure and cavity heating. For a continuous process, water bath systems are used, but these are also very energy-intensive, as the water bath must be kept at a constant pasteurization temperature. To maintain sterility, the products must be packed airtight throughout the process. However, the relatively rapid energy input into the food creates an overpressure in the tray which will cause the sealing foil to burst if it is not controlled. To ensure this, there are various systems on the market that use valves or seals to release the pressure to the outside.
64
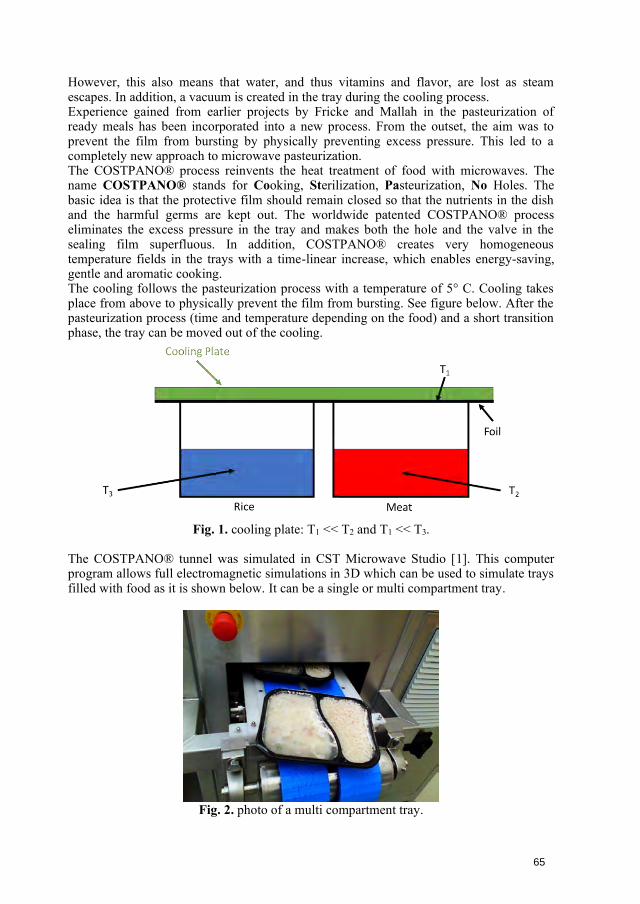
However, this also means that water, and thus vitamins and flavor, are lost as steam escapes. In addition, a vacuum is created in the tray during the cooling process. Experience gained from earlier projects by Fricke and Mallah in the pasteurization of ready meals has been incorporated into a new process. From the outset, the aim was to prevent the film from bursting by physically preventing excess pressure. This led to a completely new approach to microwave pasteurization. The COSTPANO® process reinvents the heat treatment of food with microwaves. The name COSTPANO® stands for Cooking, Sterilization, Pasteurization, No Holes. The basic idea is that the protective film should remain closed so that the nutrients in the dish and the harmful germs are kept out. The worldwide patented COSTPANO® process eliminates the excess pressure in the tray and makes both the hole and the valve in the sealing film superfluous. In addition, COSTPANO® creates very homogeneous temperature fields in the trays with a time-linear increase, which enables energy-saving, gentle and aromatic cooking. The cooling follows the pasteurization process with a temperature of 5° C. Cooling takes place from above to physically prevent the film from bursting. See figure below. After the pasteurization process (time and temperature depending on the food) and a short transition phase, the tray can be moved out of the cooling.
Fig. 1. cooling plate: T1 << T2 and T1 << T3.
The COSTPANO® tunnel was simulated in CST Microwave Studio [1]. This computer program allows full electromagnetic simulations in 3D which can be used to simulate trays filled with food as it is shown below. It can be a single or multi compartment tray.
Fig. 2. photo of a multi compartment tray.
65
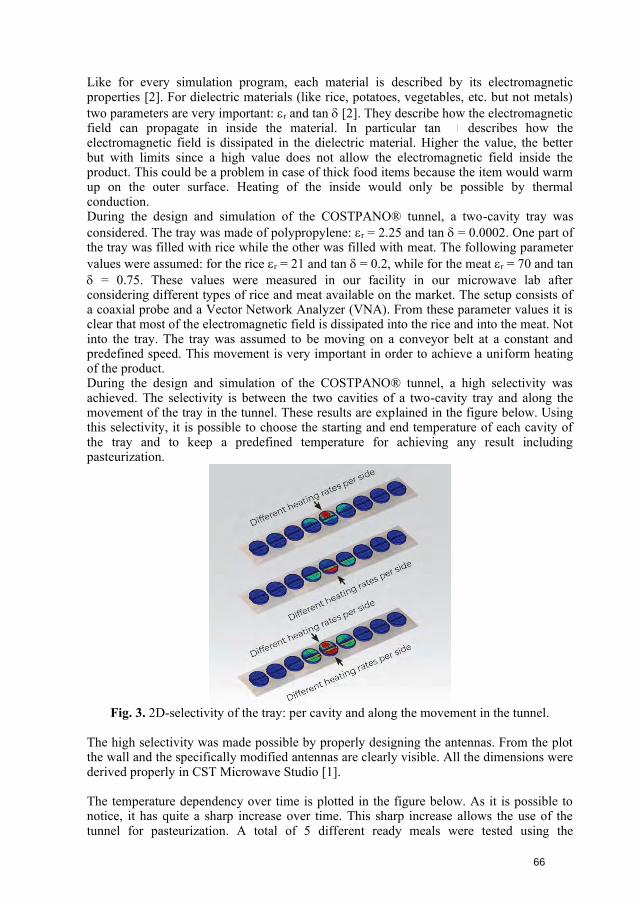
Like for every simulation program, each material is described by its electromagnetic properties [2]. For dielectric materials (like rice, potatoes, vegetables, etc. but not metals) two parameters are very important: r and tan [2]. They describe how the electromagnetic field can propagate in inside the material. In particular tan describes how the electromagnetic field is dissipated in the dielectric material. Higher the value, the better but with limits since a high value does not allow the electromagnetic field inside the product. This could be a problem in case of thick food items because the item would warm up on the outer surface. Heating of the inside would only be possible by thermal conduction. During the design and simulation of the COSTPANO® tunnel, a two-cavity tray was considered. The tray was made of polypropylene: r = 2.25 and tan = 0.0002. One part of the tray was filled with rice while the other was filled with meat. The following parameter values were assumed: for the rice r = 21 and tan = 0.2, while for the meat r = 70 and tan = 0.75. These values were measured in our facility in our microwave lab after considering different types of rice and meat available on the market. The setup consists of a coaxial probe and a Vector Network Analyzer (VNA). From these parameter values it is clear that most of the electromagnetic field is dissipated into the rice and into the meat. Not into the tray. The tray was assumed to be moving on a conveyor belt at a constant and predefined speed. This movement is very important in order to achieve a uniform heating of the product. During the design and simulation of the COSTPANO® tunnel, a high selectivity was achieved. The selectivity is between the two cavities of a two-cavity tray and along the movement of the tray in the tunnel. These results are explained in the figure below. Using this selectivity, it is possible to choose the starting and end temperature of each cavity of the tray and to keep a predefined temperature for achieving any result including pasteurization.
Fig. 3. 2D-selectivity of the tray: per cavity and along the movement in the tunnel.
The high selectivity was made possible by properly designing the antennas. From the plot the wall and the specifically modified antennas are clearly visible. All the dimensions were derived properly in CST Microwave Studio [1].
The temperature dependency over time is plotted in the figure below. As it is possible to notice, it has quite a sharp increase over time. This sharp increase allows the use of the tunnel for pasteurization. A total of 5 different ready meals were tested using the
66
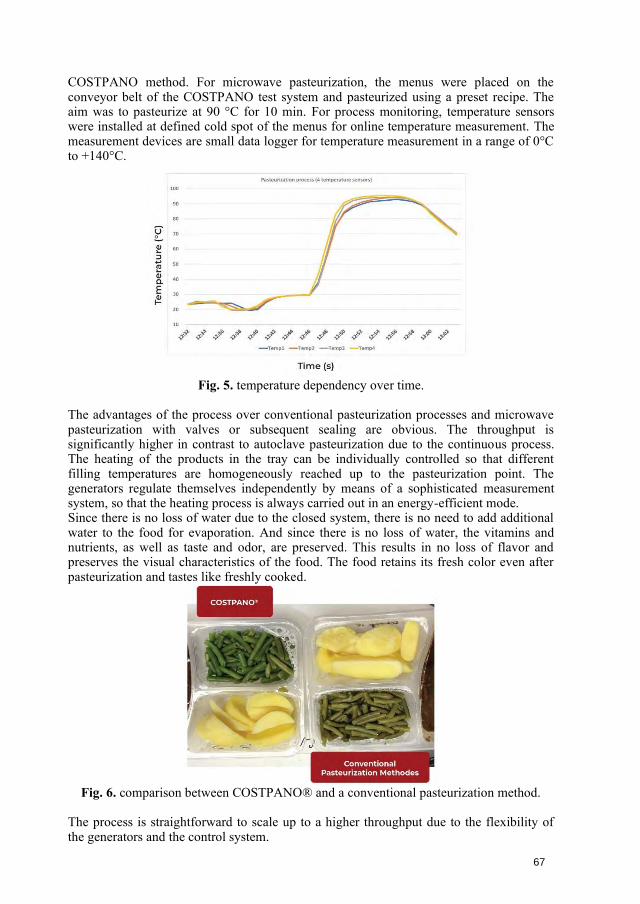
COSTPANO method. For microwave pasteurization, the menus were placed on the conveyor belt of the COSTPANO test system and pasteurized using a preset recipe. The aim was to pasteurize at 90 °C for 10 min. For process monitoring, temperature sensors were installed at defined cold spot of the menus for online temperature measurement. The measurement devices are small data logger for temperature measurement in a range of 0°C to +140°C.
Fig. 5. temperature dependency over time.
The advantages of the process over conventional pasteurization processes and microwave pasteurization with valves or subsequent sealing are obvious. The throughput is significantly higher in contrast to autoclave pasteurization due to the continuous process. The heating of the products in the tray can be individually controlled so that different filling temperatures are homogeneously reached up to the pasteurization point. The generators regulate themselves independently by means of a sophisticated measurement system, so that the heating process is always carried out in an energy-efficient mode. Since there is no loss of water due to the closed system, there is no need to add additional water to the food for evaporation. And since there is no loss of water, the vitamins and nutrients, as well as taste and odor, are preserved. This results in no loss of flavor and preserves the visual characteristics of the food. The food retains its fresh color even after pasteurization and tastes like freshly cooked.
Fig. 6. comparison between COSTPANO® and a conventional pasteurization method.
The process is straightforward to scale up to a higher throughput due to the flexibility of the generators and the control system.
67
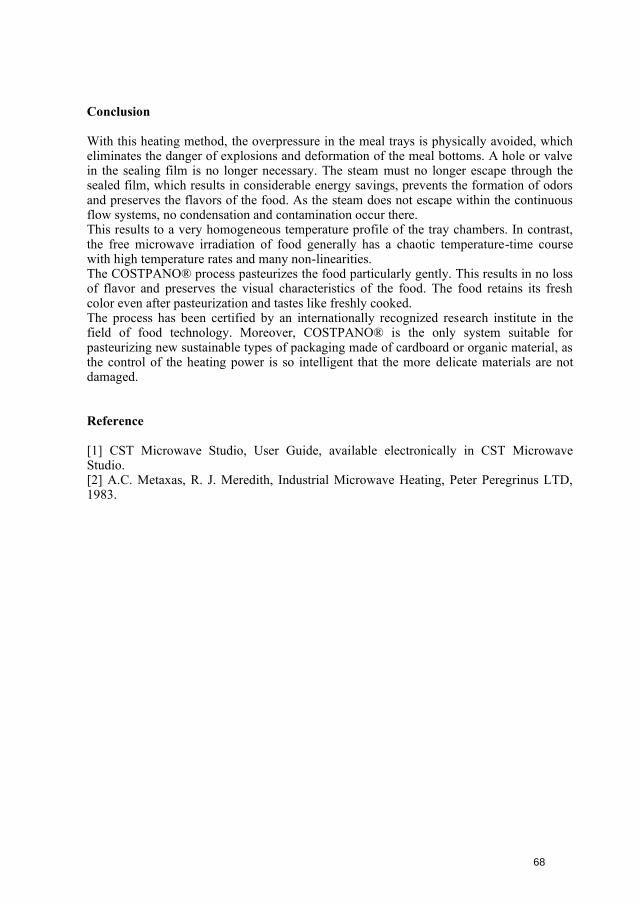
Conclusion
With this heating method, the overpressure in the meal trays is physically avoided, which eliminates the danger of explosions and deformation of the meal bottoms. A hole or valve in the sealing film is no longer necessary. The steam must no longer escape through the sealed film, which results in considerable energy savings, prevents the formation of odors and preserves the flavors of the food. As the steam does not escape within the continuous flow systems, no condensation and contamination occur there. This results to a very homogeneous temperature profile of the tray chambers. In contrast, the free microwave irradiation of food generally has a chaotic temperature-time course with high temperature rates and many non-linearities. The COSTPANO® process pasteurizes the food particularly gently. This results in no loss of flavor and preserves the visual characteristics of the food. The food retains its fresh color even after pasteurization and tastes like freshly cooked. The process has been certified by an internationally recognized research institute in the field of food technology. Moreover, COSTPANO® is the only system suitable for pasteurizing new sustainable types of packaging made of cardboard or organic material, as the control of the heating power is so intelligent that the more delicate materials are not damaged.
Reference
[1] CST Microwave Studio, User Guide, available electronically in CST MicrowaveStudio.[2] A.C. Metaxas, R. J. Meredith, Industrial Microwave Heating, Peter Peregrinus LTD,1983.
68
DEMONSTRATION OF A COMBINED ACTIVE-PASSIVE METHODOLOGY FOR THE DESIGN OF SOLID-STATE-FED MICROWAVE OVENS
M.Olszewska-Placha1, D. Gryglewski2, W. Wojtasiak2, M. Celuch1
1QWED Sp. z o.o., ul.Krzywickiego 12 lok.1, 02-078 Warsaw, Poland 2Inst. of Radioelectronics and Multimedia Tech., Warsaw Univ. Tech., Warsaw, Poland [email protected]
Keywords: Microwave, Modelling, Numerical techniques, Solid-state, Frequency sources, Design.
Abstract – This paper discusses a combined methodology for the design of solid-state-fed microwave ovens. The presented approach joins the design methodologies of both, active and passive component of the microwave oven to deliver to the heating system designers and manufacturers a full advantage of the opportunities brought by the solid-state technology. For the passive component design, new electromagnetic simulation regime is developed to accurately mimic the solid-state source operation and decrease computer effort required for the analysis, making the process more efficient. The combined active and passive methodology is experimentally validated in the industrial laboratory environment for dual-aperture microwave oven prototype and the results are discussed.
I. Motivation and background
The 21st century is marked by a paradigmatic shift in the design strategies for domestic microwave ovens. Interests are devoted to the ovens fed by solid-state energy sources, facilitating control of power level, frequency, and relative phases [1]. This paves the way for higher quality cooking, e.g., enhanced energy efficiency as demonstrated in [2], where iterative electromagnetic (EM) simulations were run for multiple random source settings. To take full advantage of the opportunities brought by the solid-state technology, novel design methodologies are needed, in respect of both the active and passive component of the microwave oven. Continuously growing interest in solid-state power sources observed among the heating systems’ designers and manufacturers brings the need for a dedicated design methodology allowing for enhancing not only source output parameters but also its reliability. On the other hand, employing new type of microwave power sources in heating systems enforces the practical need for dedicated simulation regimes, allowing for modelling the physical behaviour of sources and therefore, higher practical and physical relevance of multiphysics design and analysis of a heating system. Herein, we report such a combined methodology composed of two steps: 1. Following our early research [3], two-stage solid-state amplifiers based on GaN HEMT
transistors by CREE are designed. The output stage of amplifiers is based on a balancedconfiguration [4]. The proposed design delivers 53.9 dBm of output power overthe 2.4 GHz to 2.5 GHz frequency range with power-added efficiency (PAE) exceeding55%.
2. New FDTD simulation regimes are developed, which allow for dynamic switching ofsignal parameters of multiple sources, at predefined time-instants or in response to themonitored system behaviour. The heating patterns are accumulated without the need tore-run each simulation from EM zero state. The algorithms are implemented inQuickWave software, well-established in the AMPERE community [5][6].
Experimental validation of the combined active (1) and passive (2) methodology will be discussed based on the industrial laboratory prototype of a dual-aperture microwave oven after [6].
69
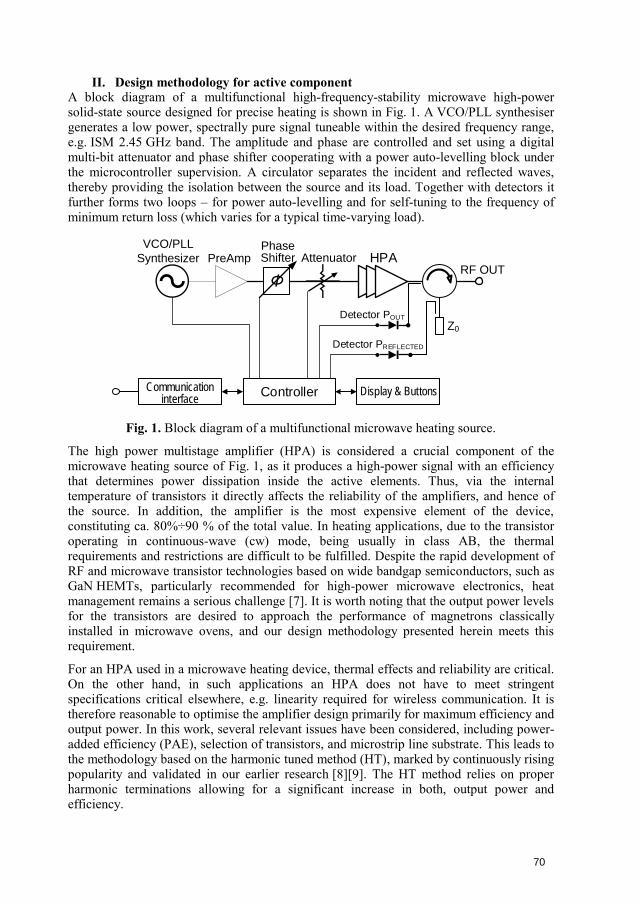
II. Design methodology for active componentA block diagram of a multifunctional high-frequency-stability microwave high-power solid-state source designed for precise heating is shown in Fig. 1. A VCO/PLL synthesiser generates a low power, spectrally pure signal tuneable within the desired frequency range, e.g. ISM 2.45 GHz band. The amplitude and phase are controlled and set using a digitalmulti-bit attenuator and phase shifter cooperating with a power auto-levelling block underthe microcontroller supervision. A circulator separates the incident and reflected waves,thereby providing the isolation between the source and its load. Together with detectors itfurther forms two loops – for power auto-levelling and for self-tuning to the frequency ofminimum return loss (which varies for a typical time-varying load).
VCO/PLL
Synthesizer PreAmp Attenuator
Φ
Phase Shifter HPA
RF OUT
Detector POUT
Detector PREFLECTED
ControllerCommunication interface
Display & Buttons
Z0
Fig. 1. Block diagram of a multifunctional microwave heating source.
The high power multistage amplifier (HPA) is considered a crucial component of the microwave heating source of Fig. 1, as it produces a high-power signal with an efficiency that determines power dissipation inside the active elements. Thus, via the internal temperature of transistors it directly affects the reliability of the amplifiers, and hence of the source. In addition, the amplifier is the most expensive element of the device, constituting ca. 80%÷90 % of the total value. In heating applications, due to the transistor operating in continuous-wave (cw) mode, being usually in class AB, the thermal requirements and restrictions are difficult to be fulfilled. Despite the rapid development of RF and microwave transistor technologies based on wide bandgap semiconductors, such as GaN HEMTs, particularly recommended for high-power microwave electronics, heat management remains a serious challenge [7]. It is worth noting that the output power levels for the transistors are desired to approach the performance of magnetrons classically installed in microwave ovens, and our design methodology presented herein meets this requirement.
For an HPA used in a microwave heating device, thermal effects and reliability are critical. On the other hand, in such applications an HPA does not have to meet stringent specifications critical elsewhere, e.g. linearity required for wireless communication. It is therefore reasonable to optimise the amplifier design primarily for maximum efficiency and output power. In this work, several relevant issues have been considered, including power-added efficiency (PAE), selection of transistors, and microstrip line substrate. This leads to the methodology based on the harmonic tuned method (HT), marked by continuously rising popularity and validated in our earlier research [8][9]. The HT method relies on proper harmonic terminations allowing for a significant increase in both, output power and efficiency.
70
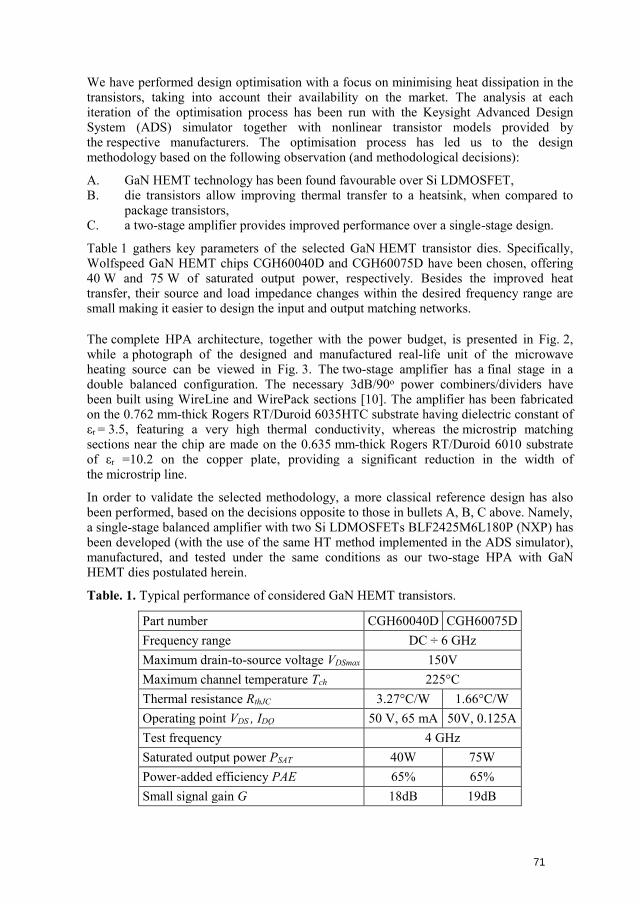
We have performed design optimisation with a focus on minimising heat dissipation in the transistors, taking into account their availability on the market. The analysis at each iteration of the optimisation process has been run with the Keysight Advanced Design System (ADS) simulator together with nonlinear transistor models provided by the respective manufacturers. The optimisation process has led us to the design methodology based on the following observation (and methodological decisions):
A. GaN HEMT technology has been found favourable over Si LDMOSFET,B. die transistors allow improving thermal transfer to a heatsink, when compared to
package transistors,C. a two-stage amplifier provides improved performance over a single-stage design.
Table 1 gathers key parameters of the selected GaN HEMT transistor dies. Specifically, Wolfspeed GaN HEMT chips CGH60040D and CGH60075D have been chosen, offering 40 W and 75 W of saturated output power, respectively. Besides the improved heat transfer, their source and load impedance changes within the desired frequency range are small making it easier to design the input and output matching networks.
The complete HPA architecture, together with the power budget, is presented in Fig. 2, while a photograph of the designed and manufactured real-life unit of the microwave heating source can be viewed in Fig. 3. The two-stage amplifier has a final stage in a double balanced configuration. The necessary 3dB/90o power combiners/dividers have been built using WireLine and WirePack sections [10]. The amplifier has been fabricated on the 0.762 mm-thick Rogers RT/Duroid 6035HTC substrate having dielectric constant of εr = 3.5, featuring a very high thermal conductivity, whereas the microstrip matching sections near the chip are made on the 0.635 mm-thick Rogers RT/Duroid 6010 substrate of εr =10.2 on the copper plate, providing a significant reduction in the width of the microstrip line.
In order to validate the selected methodology, a more classical reference design has also been performed, based on the decisions opposite to those in bullets A, B, C above. Namely, a single-stage balanced amplifier with two Si LDMOSFETs BLF2425M6L180P (NXP) has been developed (with the use of the same HT method implemented in the ADS simulator), manufactured, and tested under the same conditions as our two-stage HPA with GaN HEMT dies postulated herein.
Table. 1. Typical performance of considered GaN HEMT transistors.
Part number CGH60040D CGH60075D Frequency range DC ÷ 6 GHz Maximum drain-to-source voltage VDSmax 150V Maximum channel temperature Tch 225°C Thermal resistance RthJC 3.27°C/W 1.66°C/W Operating point VDS , IDQ 50 V, 65 mA 50V, 0.125A Test frequency 4 GHz Saturated output power PSAT 40W 75W Power-added efficiency PAE 65% 65% Small signal gain G 18dB 19dB
71
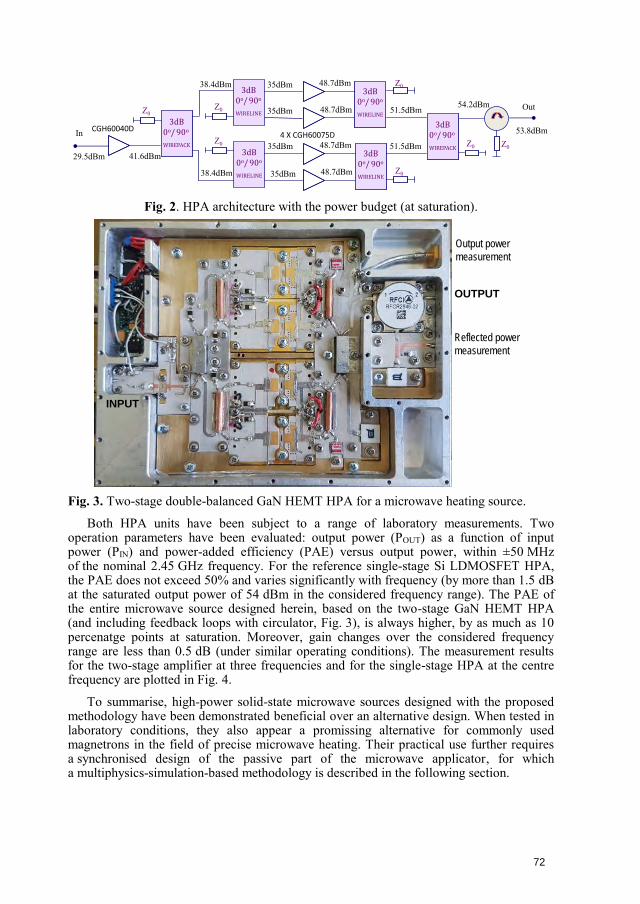
3dB0o/90o
WIRELINE
53.8dBm
Out
3dB0o/90o
WIRELINE
Z0Z0 48.7dBm
48.7dBm38.4dBm Z0
3dB0o/90o
WIRELINE
3dB0o/90o
WIRELINEZ0
In
54.2dBm
48.7dBm
48.7dBm
35dBm
41.6dBm
4 X CGH60075D
Z0
3dB0o/90o
WIREPACKZ0
51.5dBm
51.5dBm
3dB0o/90o
WIREPACK
Z0
38.4dBm
35dBm
35dBm
35dBm
29.5dBm
CGH60040D
Fig. 2. HPA architecture with the power budget (at saturation).
OUTPUT
INPUT
Output power
measurement
Reflected power
measurement
Fig. 3. Two-stage double-balanced GaN HEMT HPA for a microwave heating source.
Both HPA units have been subject to a range of laboratory measurements. Two operation parameters have been evaluated: output power (POUT) as a function of input power (PIN) and power-added efficiency (PAE) versus output power, within ±50 MHz of the nominal 2.45 GHz frequency. For the reference single-stage Si LDMOSFET HPA, the PAE does not exceed 50% and varies significantly with frequency (by more than 1.5 dB at the saturated output power of 54 dBm in the considered frequency range). The PAE of the entire microwave source designed herein, based on the two-stage GaN HEMT HPA (and including feedback loops with circulator, Fig. 3), is always higher, by as much as 10 percenatge points at saturation. Moreover, gain changes over the considered frequency range are less than 0.5 dB (under similar operating conditions). The measurement results for the two-stage amplifier at three frequencies and for the single-stage HPA at the centre frequency are plotted in Fig. 4.
To summarise, high-power solid-state microwave sources designed with the proposed methodology have been demonstrated beneficial over an alternative design. When tested in laboratory conditions, they also appear a promissing alternative for commonly used magnetrons in the field of precise microwave heating. Their practical use further requires a synchronised design of the passive part of the microwave applicator, for which a multiphysics-simulation-based methodology is described in the following section.
72
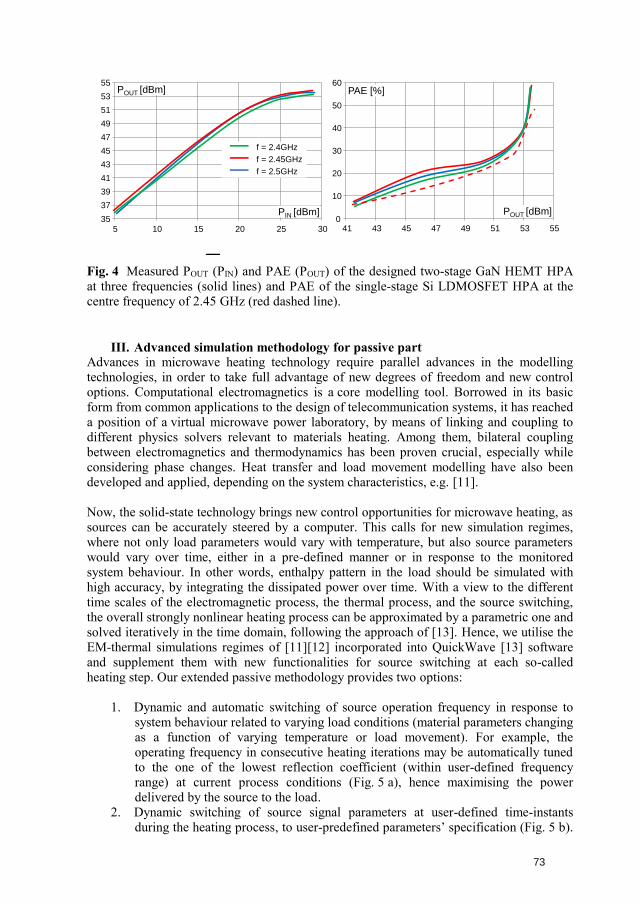
0
10
20
30
40
50
60
41 43 45 47 49 51 53 55
PAE [%]
35
37
39
41
43
45
47
49
51
53
55
5 10 15 20 25 30
PIN [dBm]
POUT [dBm]
POUT [dBm]
f = 2.4GHz
f = 2.5GHz
f = 2.45GHz
Fig. 4 Measured POUT (PIN) and PAE (POUT) of the designed two-stage GaN HEMT HPA at three frequencies (solid lines) and PAE of the single-stage Si LDMOSFET HPA at the centre frequency of 2.45 GHz (red dashed line).
III. Advanced simulation methodology for passive partAdvances in microwave heating technology require parallel advances in the modelling technologies, in order to take full advantage of new degrees of freedom and new control options. Computational electromagnetics is a core modelling tool. Borrowed in its basic form from common applications to the design of telecommunication systems, it has reached a position of a virtual microwave power laboratory, by means of linking and coupling to different physics solvers relevant to materials heating. Among them, bilateral coupling between electromagnetics and thermodynamics has been proven crucial, especially while considering phase changes. Heat transfer and load movement modelling have also been developed and applied, depending on the system characteristics, e.g. [11].
Now, the solid-state technology brings new control opportunities for microwave heating, as sources can be accurately steered by a computer. This calls for new simulation regimes, where not only load parameters would vary with temperature, but also source parameters would vary over time, either in a pre-defined manner or in response to the monitored system behaviour. In other words, enthalpy pattern in the load should be simulated with high accuracy, by integrating the dissipated power over time. With a view to the different time scales of the electromagnetic process, the thermal process, and the source switching, the overall strongly nonlinear heating process can be approximated by a parametric one and solved iteratively in the time domain, following the approach of [13]. Hence, we utilise the EM-thermal simulations regimes of [11][12] incorporated into QuickWave [13] software and supplement them with new functionalities for source switching at each so-called heating step. Our extended passive methodology provides two options:
1. Dynamic and automatic switching of source operation frequency in response tosystem behaviour related to varying load conditions (material parameters changingas a function of varying temperature or load movement). For example, theoperating frequency in consecutive heating iterations may be automatically tunedto the one of the lowest reflection coefficient (within user-defined frequencyrange) at current process conditions (Fig. 5 a), hence maximising the powerdelivered by the source to the load.
2. Dynamic switching of source signal parameters at user-defined time-instantsduring the heating process, to user-predefined parameters’ specification (Fig. 5 b).
73
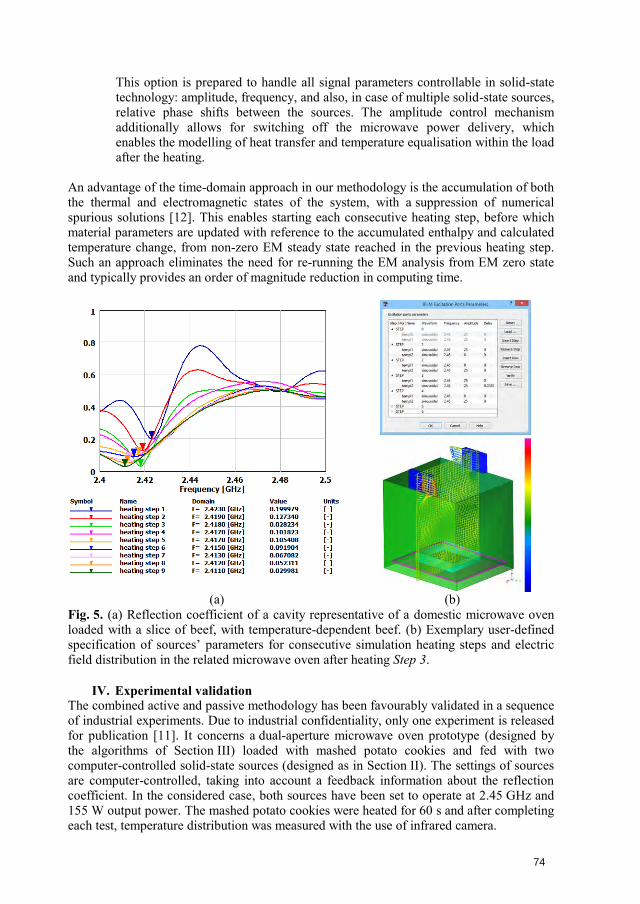
This option is prepared to handle all signal parameters controllable in solid-state technology: amplitude, frequency, and also, in case of multiple solid-state sources, relative phase shifts between the sources. The amplitude control mechanism additionally allows for switching off the microwave power delivery, which enables the modelling of heat transfer and temperature equalisation within the load after the heating.
An advantage of the time-domain approach in our methodology is the accumulation of both the thermal and electromagnetic states of the system, with a suppression of numerical spurious solutions [12]. This enables starting each consecutive heating step, before which material parameters are updated with reference to the accumulated enthalpy and calculated temperature change, from non-zero EM steady state reached in the previous heating step. Such an approach eliminates the need for re-running the EM analysis from EM zero state and typically provides an order of magnitude reduction in computing time.
(a) (b) Fig. 5. (a) Reflection coefficient of a cavity representative of a domestic microwave oven loaded with a slice of beef, with temperature-dependent beef. (b) Exemplary user-defined specification of sources’ parameters for consecutive simulation heating steps and electric field distribution in the related microwave oven after heating Step 3.
IV. Experimental validationThe combined active and passive methodology has been favourably validated in a sequence of industrial experiments. Due to industrial confidentiality, only one experiment is released for publication [11]. It concerns a dual-aperture microwave oven prototype (designed by the algorithms of Section III) loaded with mashed potato cookies and fed with two computer-controlled solid-state sources (designed as in Section II). The settings of sources are computer-controlled, taking into account a feedback information about the reflection coefficient. In the considered case, both sources have been set to operate at 2.45 GHz and 155 W output power. The mashed potato cookies were heated for 60 s and after completing each test, temperature distribution was measured with the use of infrared camera.
74
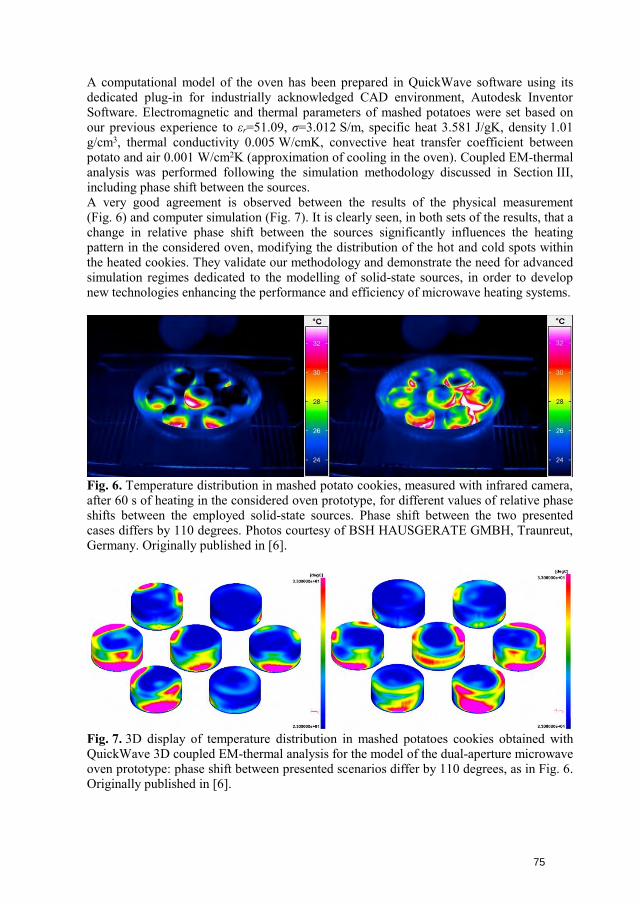
A computational model of the oven has been prepared in QuickWave software using its dedicated plug-in for industrially acknowledged CAD environment, Autodesk Inventor Software. Electromagnetic and thermal parameters of mashed potatoes were set based on our previous experience to εr=51.09, σ=3.012 S/m, specific heat 3.581 J/gK, density 1.01 g/cm3, thermal conductivity 0.005 W/cmK, convective heat transfer coefficient between potato and air 0.001 W/cm2K (approximation of cooling in the oven). Coupled EM-thermal analysis was performed following the simulation methodology discussed in Section III, including phase shift between the sources. A very good agreement is observed between the results of the physical measurement (Fig. 6) and computer simulation (Fig. 7). It is clearly seen, in both sets of the results, that a change in relative phase shift between the sources significantly influences the heating pattern in the considered oven, modifying the distribution of the hot and cold spots within the heated cookies. They validate our methodology and demonstrate the need for advanced simulation regimes dedicated to the modelling of solid-state sources, in order to develop new technologies enhancing the performance and efficiency of microwave heating systems.
Fig. 6. Temperature distribution in mashed potato cookies, measured with infrared camera, after 60 s of heating in the considered oven prototype, for different values of relative phase shifts between the employed solid-state sources. Phase shift between the two presented cases differs by 110 degrees. Photos courtesy of BSH HAUSGERATE GMBH, Traunreut, Germany. Originally published in [6].
Fig. 7. 3D display of temperature distribution in mashed potatoes cookies obtained with QuickWave 3D coupled EM-thermal analysis for the model of the dual-aperture microwave oven prototype: phase shift between presented scenarios differ by 110 degrees, as in Fig. 6. Originally published in [6].
75
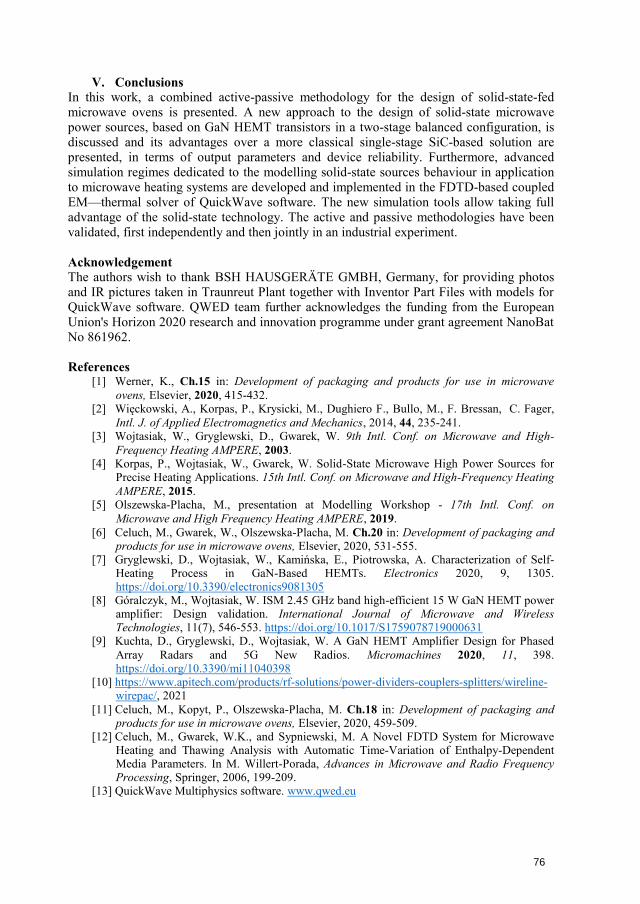
V. ConclusionsIn this work, a combined active-passive methodology for the design of solid-state-fed microwave ovens is presented. A new approach to the design of solid-state microwave power sources, based on GaN HEMT transistors in a two-stage balanced configuration, is discussed and its advantages over a more classical single-stage SiC-based solution are presented, in terms of output parameters and device reliability. Furthermore, advanced simulation regimes dedicated to the modelling solid-state sources behaviour in application to microwave heating systems are developed and implemented in the FDTD-based coupled EM—thermal solver of QuickWave software. The new simulation tools allow taking full advantage of the solid-state technology. The active and passive methodologies have been validated, first independently and then jointly in an industrial experiment.
Acknowledgement The authors wish to thank BSH HAUSGERÄTE GMBH, Germany, for providing photos and IR pictures taken in Traunreut Plant together with Inventor Part Files with models for QuickWave software. QWED team further acknowledges the funding from the European Union's Horizon 2020 research and innovation programme under grant agreement NanoBat No 861962.
References [1] Werner, K., Ch.15 in: Development of packaging and products for use in microwave
ovens, Elsevier, 2020, 415-432.[2] Więckowski, A., Korpas, P., Krysicki, M., Dughiero F., Bullo, M., F. Bressan, C. Fager,
Intl. J. of Applied Electromagnetics and Mechanics, 2014, 44, 235-241.[3] Wojtasiak, W., Gryglewski, D., Gwarek, W. 9th Intl. Conf. on Microwave and High-
Frequency Heating AMPERE, 2003.[4] Korpas, P., Wojtasiak, W., Gwarek, W. Solid-State Microwave High Power Sources for
Precise Heating Applications. 15th Intl. Conf. on Microwave and High-Frequency HeatingAMPERE, 2015.
[5] Olszewska-Placha, M., presentation at Modelling Workshop - 17th Intl. Conf. onMicrowave and High Frequency Heating AMPERE, 2019.
[6] Celuch, M., Gwarek, W., Olszewska-Placha, M. Ch.20 in: Development of packaging andproducts for use in microwave ovens, Elsevier, 2020, 531-555.
[7] Gryglewski, D., Wojtasiak, W., Kamińska, E., Piotrowska, A. Characterization of Self-Heating Process in GaN-Based HEMTs. Electronics 2020, 9, 1305.https://doi.org/10.3390/electronics9081305
[8] Góralczyk, M., Wojtasiak, W. ISM 2.45 GHz band high-efficient 15 W GaN HEMT poweramplifier: Design validation. International Journal of Microwave and WirelessTechnologies, 11(7), 546-553. https://doi.org/10.1017/S1759078719000631
[9] Kuchta, D., Gryglewski, D., Wojtasiak, W. A GaN HEMT Amplifier Design for PhasedArray Radars and 5G New Radios. Micromachines 2020, 11, 398.https://doi.org/10.3390/mi11040398
[10] https://www.apitech.com/products/rf-solutions/power-dividers-couplers-splitters/wireline-wirepac/, 2021
[11] Celuch, M., Kopyt, P., Olszewska-Placha, M. Ch.18 in: Development of packaging andproducts for use in microwave ovens, Elsevier, 2020, 459-509.
[12] Celuch, M., Gwarek, W.K., and Sypniewski, M. A Novel FDTD System for MicrowaveHeating and Thawing Analysis with Automatic Time-Variation of Enthalpy-DependentMedia Parameters. In M. Willert-Porada, Advances in Microwave and Radio FrequencyProcessing, Springer, 2006, 199-209.
[13] QuickWave Multiphysics software. www.qwed.eu
76
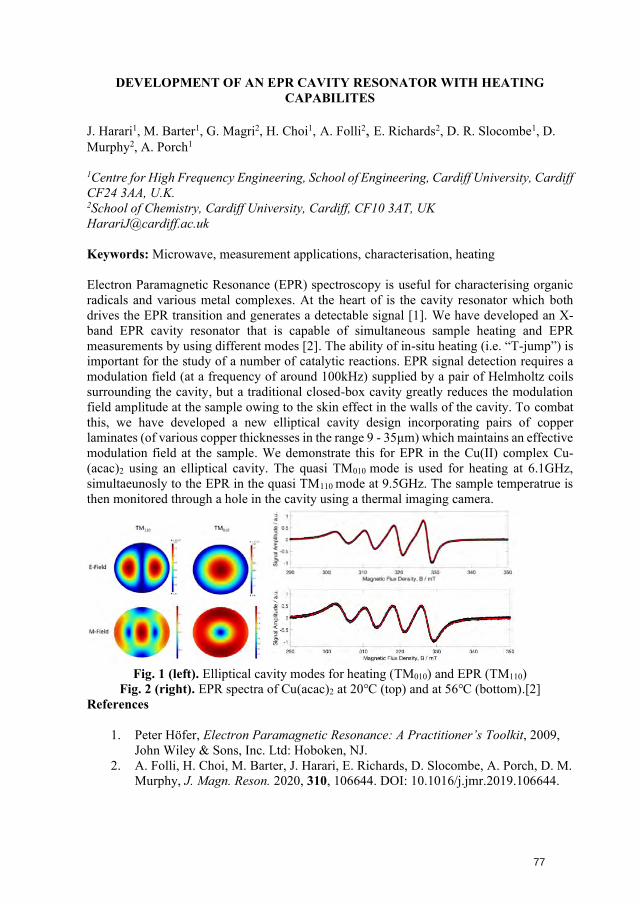
DEVELOPMENT OF AN EPR CAVITY RESONATOR WITH HEATING CAPABILITES
J. Harari1, M. Barter1, G. Magri2, H. Choi1, A. Folli2, E. Richards2, D. R. Slocombe1, D.Murphy2, A. Porch1
1Centre for High Frequency Engineering, School of Engineering, Cardiff University, Cardiff CF24 3AA, U.K. 2School of Chemistry, Cardiff University, Cardiff, CF10 3AT, UK [email protected]
Keywords: Microwave, measurement applications, characterisation, heating
Electron Paramagnetic Resonance (EPR) spectroscopy is useful for characterising organic radicals and various metal complexes. At the heart of is the cavity resonator which both drives the EPR transition and generates a detectable signal [1]. We have developed an X-band EPR cavity resonator that is capable of simultaneous sample heating and EPR measurements by using different modes [2]. The ability of in-situ heating (i.e. “T-jump”) is important for the study of a number of catalytic reactions. EPR signal detection requires a modulation field (at a frequency of around 100kHz) supplied by a pair of Helmholtz coils surrounding the cavity, but a traditional closed-box cavity greatly reduces the modulation field amplitude at the sample owing to the skin effect in the walls of the cavity. To combat this, we have developed a new elliptical cavity design incorporating pairs of copper laminates (of various copper thicknesses in the range 9 - 35µm) which maintains an effective modulation field at the sample. We demonstrate this for EPR in the Cu(II) complex Cu-(acac)2 using an elliptical cavity. The quasi TM010 mode is used for heating at 6.1GHz, simultaeunosly to the EPR in the quasi TM110 mode at 9.5GHz. The sample temperatrue is then monitored through a hole in the cavity using a thermal imaging camera.
Fig. 1 (left). Elliptical cavity modes for heating (TM010) and EPR (TM110) Fig. 2 (right). EPR spectra of Cu(acac)2 at 20℃ (top) and at 56℃ (bottom).[2]
References
1. Peter Höfer, Electron Paramagnetic Resonance: A Practitioner’s Toolkit, 2009,John Wiley & Sons, Inc. Ltd: Hoboken, NJ.
2. A. Folli, H. Choi, M. Barter, J. Harari, E. Richards, D. Slocombe, A. Porch, D. M.Murphy, J. Magn. Reson. 2020, 310, 106644. DOI: 10.1016/j.jmr.2019.106644.
77
DIELECTRIC BEHAVIOUR OF METAL SULFIDES DURING MICROWAVE TREATMENT
Angel M. López-Buendía1, M:Mar Urquiola1, Pablo Botella1, Beatriz García-Baños2, José M. Catalá-Civera2
A. Author1, B. Author2, C. Author1,
1CEINNMAT Innovación (INNCEINNMAT, SL); PCUV, C/ C.A. Escardino, 9, 46980 Paterna (Spain); e-mail: [email protected]; [email protected]; [email protected] 2Instituto ITACA, Universitat Politècnica de València; Camino de Vera, s/n; 46022-Valencia (Spain); e-mail: [email protected]; [email protected].
Keywords: Microwave, Processing, Dielectric properties.
Metal sulfides are a major group of minerals with economic importance as metal ores. Many base metals are extracted from sulfides, such as zinc, copper, lead, iron, and secondary metals (e.g., antimuonium, mercury, silver, arsenic), but also are associated other metals with very high added value (e.g., cobalt, nickel, gold and many others).
The treatment with microwaves has demonstrated many advantages and good performance as technology for extractive metallurgical process.
In this work, it has been analyzed the dielectric properties of several sulfide metal ores during microwave heating at room temperature, as well as the dielectric thermal analysis during microwave (MW-DETA, or DETAM) at high temperature under different conditions of the atmosphere and analyzing the resultant gases. Additionally, secondary physical effects derived from the microwave treatment has been also analyzed. Sulfide mineral shown complex behavior, with physical and mineral transformation that were analyses using X-ray powder diffraction, as well as the dielectric constant (ε’) and loss factor (ε”) during heating, as well as the magnetic behavior was correlated with the mineralogical transformation and alteration.
78
DIELECTRIC PROPERTIES OF TYPICAL SOLVENT EXTRACTION EMULSIONS
C. CERINO1,2, H. ROUSSEL2, L. ESTEL1, S. CHARTON2, I. POLAERT1(*)
1Normandie Univ, UNIROUEN, INSA Rouen, LSPC, Laboratoire de Sécurité des Procédés Chimiques 76000 Rouen, France. 2CEA, DES, ISEC, DMRC, Univ. Montpellier, Marcoule, France (*) corresponding author: [email protected]
Keywords: microwave, chemical applications, dielectric properties, process intensification
Introduction: During solvent extraction operations, liquid-liquid dispersions are formed in order to facilitate the interfacial mass transfer between two non-miscible phases. Once mass transfer is achieved, phase separation is needed. Phase separation usually takes place in a large settling zone, where drops are given time to coalesce. Pollutions in the feed, as well as elevated agitation rates, can lead to finely dispersed and excessively stable emulsions, leading to decrease in the process efficiency by phase entrainment and/or flooding of the equipment. Multiple solutions to this problem have been proposed over time, such as centrifugation, chemical demulsifiers and so on (see Frising et al. [3] for a review of phase separation and means to intensify separation). Among them, thermal treatment is of particular interest. Application of microwave heating provides a non-intrusive, potentially volumetric method to implement this solution. During the last decades, permittivity measurements on so called “macro” emulsions (for which particles are resolvable by visible light microscopy) have been made, most notably by Perl et al. [5], and later by Thomas et al. [4]. Studying emulsions of paraffin oil and water with surfactant concentrations up to 10%, they demonstrated that dielectric measurements made in the microwave range of frequencies (2.45 GHz up to 23.45 GHz) could be used to discriminate water-in-oil (w/o) from oil-in-water (o/w) emulsions. The absence of interfacial polarization effects at such frequencies was also pointed out, for emulsions having a nonconductive water phase.
Conclusions of the aforementioned groups could be summed up as follows: i) Permittivity of the studied emulsions are controlled by their type (o/w or w/o) and by their water content. Corollary, permittivity measurements at microwave frequencies can be used as a quality control and for water content estimation. ii) Relaxation of o/w emulsions occurs at typical frequencies of water alone, whereas relaxation for w/o emulsions occurs at considerably larger frequencies. We carried out permittivity measurements of emulsions consisting of an ion solution as an aqueous phase (potassium nitrate, 1M), as well as an extracting molecule (tri-butyl-phosphate) in the organic phase on a wide band of the microwave spectrum (from 0.5 to 20 GHz). Indeed, the application of microwave heating to enhance demulsification in metal ion solvent extraction devices will be carried out with such phases.
We will first discuss the experimental means used in our work, after which the results obtained on dense packed emulsions (that is to say emulsions for which the sedimentation step is completed, and the drops are static and in close contact) will be presented and discussed. Finally, limitations of our current results will be discussed as well and ongoing work briefly introduced.
79
Methods, Apparatuses and Materials: Materials, Emulsion production: In order to be representative of the dielectric behavior of some industrial solvent extraction systems, the aqueous phase was loaded with an electrolyte (K+ NO3
-, 1 mol/L). The organic phase was either a mixture of tri-butyl-phosphate (TBP, extracting molecule) in a kerosene-like alkane mixture (Isane IP 175, Total Fluids), or said alkane mixture alone. Potassium nitrate was chosen as an ionic loading because it is not extracted when contacted with TBP. In order to simulate problematic phase separation, emulsions were stabilized with commercially available surfactants, namely Tween 20 for oil-in-water emulsions and Span 80 for water-in-oil emulsions. Concentrations employed were respectively of 5.10 -5 and 10 -4, expressed as volume fraction of the continuous phase. When the resulting stability was not sufficient, surfactant concentration in the continuous phase was increased and/or a co-surfactant was added to the dispersed phase. This will be mentioned where applicable.
The permittivities of the surfactant solutions were also measured, with surfactant concentrations of 1% in volume. The observed deviations from the pure solvent values were within the measurement error (5% of read value or 0.01 for low permittivities), proving that surfactant addition can be disregarded when measuring the permittivity of each phase separately.
Emulsions were produced with a modified commercially available membrane emulsification tool from Micropore, U.K., namely the LDC-1 (see Figure 1). Modifications were made in order to employ the LDC-1 in a continuous mode. Emulsification is achieved by pumping dispersed phase through a membrane while simultaneously a rotating blade applies a shear strain/stress on the continuous phase side. Two stainless steel membranes were used as provided by the manufacturer, both membranes having 40 µm pores, one being treated with a hydrophobic coating for w/o emulsion production. Volume or throughput achieved with this apparatus was limited by the low dispersed phase flowrate achievable through the membrane. In addition, continuous phase flowrate was limited by the pump operation. These limitations constrained the dispersed phase fraction to 0.40, with continuous phase flowrate being 22mL/min and dispersed phase flowrate being 15mL/min. Lower phase fraction were possible, but of no interest to the study. Measurements were also performed on emulsions whose organic phase was the diluent alone (Isane IP 175) and/or whose aqueous phase was distilled water with no ionic loading, in order to acquire data with different emulsion compositions.
Although no drop size measurement was made on the emulsions during permittivities measurements, a previous use of this setup led to the measurement of a drop diameter of around 200 µm, a few second after the emulsion was formed.
80
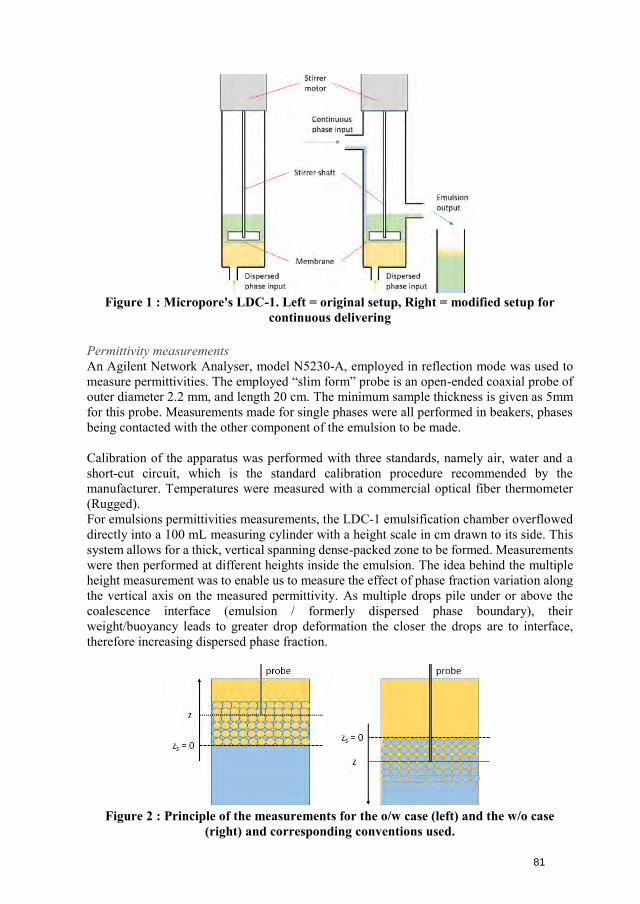
Figure 1 : Micropore's LDC-1. Left = original setup, Right = modified setup for continuous delivering
Permittivity measurements An Agilent Network Analyser, model N5230-A, employed in reflection mode was used to measure permittivities. The employed “slim form” probe is an open-ended coaxial probe of outer diameter 2.2 mm, and length 20 cm. The minimum sample thickness is given as 5mm for this probe. Measurements made for single phases were all performed in beakers, phases being contacted with the other component of the emulsion to be made.
Calibration of the apparatus was performed with three standards, namely air, water and a short-cut circuit, which is the standard calibration procedure recommended by the manufacturer. Temperatures were measured with a commercial optical fiber thermometer (Rugged). For emulsions permittivities measurements, the LDC-1 emulsification chamber overflowed directly into a 100 mL measuring cylinder with a height scale in cm drawn to its side. This system allows for a thick, vertical spanning dense-packed zone to be formed. Measurements were then performed at different heights inside the emulsion. The idea behind the multiple height measurement was to enable us to measure the effect of phase fraction variation along the vertical axis on the measured permittivity. As multiple drops pile under or above the coalescence interface (emulsion / formerly dispersed phase boundary), their weight/buoyancy leads to greater drop deformation the closer the drops are to interface, therefore increasing dispersed phase fraction.
Figure 2 : Principle of the measurements for the o/w case (left) and the w/o case (right) and corresponding conventions used.
81
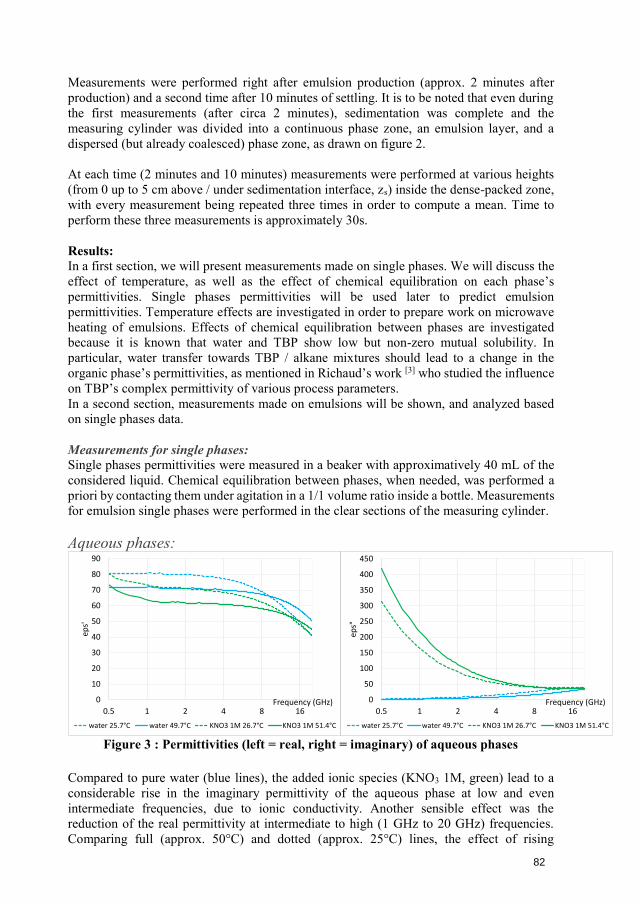
Measurements were performed right after emulsion production (approx. 2 minutes after production) and a second time after 10 minutes of settling. It is to be noted that even during the first measurements (after circa 2 minutes), sedimentation was complete and the measuring cylinder was divided into a continuous phase zone, an emulsion layer, and a dispersed (but already coalesced) phase zone, as drawn on figure 2.
At each time (2 minutes and 10 minutes) measurements were performed at various heights (from 0 up to 5 cm above / under sedimentation interface, zs) inside the dense-packed zone, with every measurement being repeated three times in order to compute a mean. Time to perform these three measurements is approximately 30s.
Results: In a first section, we will present measurements made on single phases. We will discuss the effect of temperature, as well as the effect of chemical equilibration on each phase’s permittivities. Single phases permittivities will be used later to predict emulsion permittivities. Temperature effects are investigated in order to prepare work on microwave heating of emulsions. Effects of chemical equilibration between phases are investigated because it is known that water and TBP show low but non-zero mutual solubility. In particular, water transfer towards TBP / alkane mixtures should lead to a change in the organic phase’s permittivities, as mentioned in Richaud’s work [3] who studied the influence on TBP’s complex permittivity of various process parameters. In a second section, measurements made on emulsions will be shown, and analyzed based on single phases data.
Measurements for single phases: Single phases permittivities were measured in a beaker with approximatively 40 mL of the considered liquid. Chemical equilibration between phases, when needed, was performed a priori by contacting them under agitation in a 1/1 volume ratio inside a bottle. Measurements for emulsion single phases were performed in the clear sections of the measuring cylinder.
Aqueous phases:
Figure 3 : Permittivities (left = real, right = imaginary) of aqueous phases
Compared to pure water (blue lines), the added ionic species (KNO3 1M, green) lead to a considerable rise in the imaginary permittivity of the aqueous phase at low and even intermediate frequencies, due to ionic conductivity. Another sensible effect was the reduction of the real permittivity at intermediate to high (1 GHz to 20 GHz) frequencies. Comparing full (approx. 50°C) and dotted (approx. 25°C) lines, the effect of rising
0
50
100
150
200
250
300
350
400
450
0.5 1 2 4 8 16
eps"
Frequency (GHz)
water 25.7°C water 49.7°C KNO3 1M 26.7°C KNO3 1M 51.4°C
0
10
20
30
40
50
60
70
80
90
0.5 1 2 4 8 16
eps'
Frequency (GHz)
water 25.7°C water 49.7°C KNO3 1M 26.7°C KNO3 1M 51.4°C
82
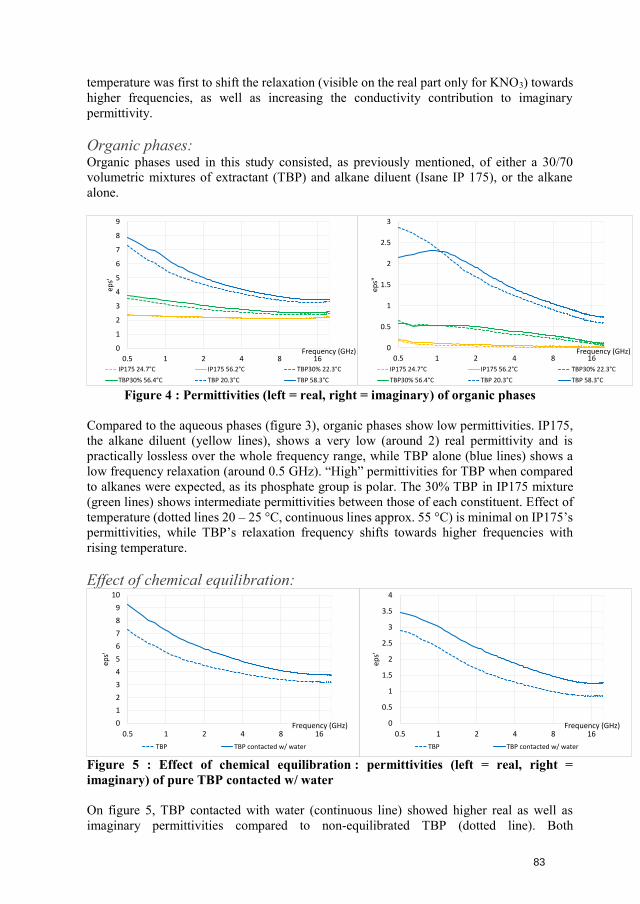
temperature was first to shift the relaxation (visible on the real part only for KNO3) towards higher frequencies, as well as increasing the conductivity contribution to imaginary permittivity.
Organic phases: Organic phases used in this study consisted, as previously mentioned, of either a 30/70 volumetric mixtures of extractant (TBP) and alkane diluent (Isane IP 175), or the alkane alone.
Figure 4 : Permittivities (left = real, right = imaginary) of organic phases
Compared to the aqueous phases (figure 3), organic phases show low permittivities. IP175, the alkane diluent (yellow lines), shows a very low (around 2) real permittivity and is practically lossless over the whole frequency range, while TBP alone (blue lines) shows a low frequency relaxation (around 0.5 GHz). “High” permittivities for TBP when compared to alkanes were expected, as its phosphate group is polar. The 30% TBP in IP175 mixture (green lines) shows intermediate permittivities between those of each constituent. Effect of temperature (dotted lines 20 – 25 °C, continuous lines approx. 55 °C) is minimal on IP175’s permittivities, while TBP’s relaxation frequency shifts towards higher frequencies with rising temperature.
Effect of chemical equilibration:
Figure 5 : Effect of chemical equilibration : permittivities (left = real, right = imaginary) of pure TBP contacted w/ water
On figure 5, TBP contacted with water (continuous line) showed higher real as well as imaginary permittivities compared to non-equilibrated TBP (dotted line). Both
0
0.5
1
1.5
2
2.5
3
0.5 1 2 4 8 16
eps"
Frequency (GHz)
IP175 24.7°C IP175 56.2°C TBP30% 22.3°C
TBP30% 56.4°C TBP 20.3°C TBP 58.3°C
0
1
2
3
4
5
6
7
8
9
0.5 1 2 4 8 16
eps'
Frequency (GHz)
IP175 24.7°C IP175 56.2°C TBP30% 22.3°C
TBP30% 56.4°C TBP 20.3°C TBP 58.3°C
0
0.5
1
1.5
2
2.5
3
3.5
4
0.5 1 2 4 8 16
eps'
Frequency (GHz)
TBP TBP contacted w/ water
0
1
2
3
4
5
6
7
8
9
10
0.5 1 2 4 8 16
eps'
Frequency (GHz)
TBP TBP contacted w/ water
83
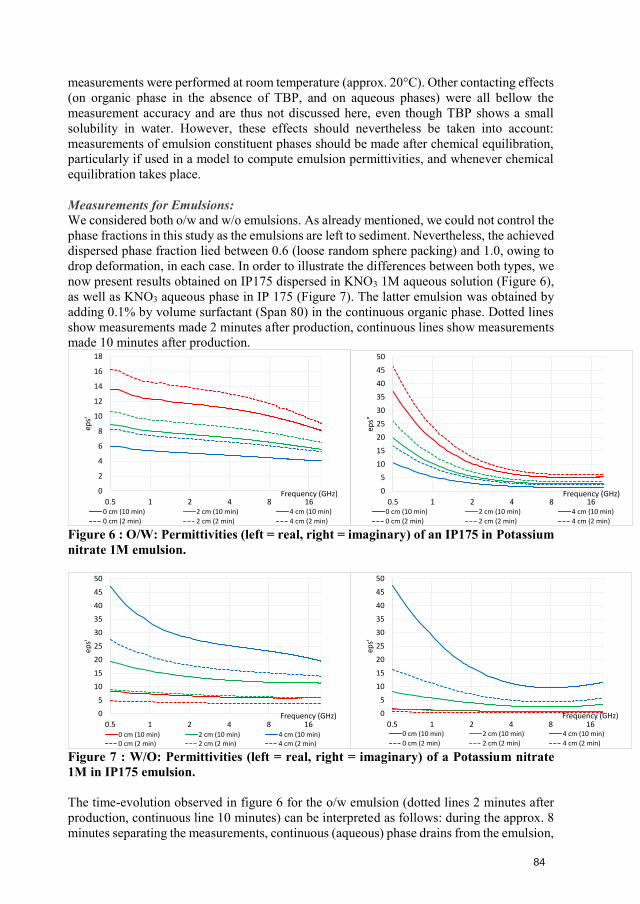
measurements were performed at room temperature (approx. 20°C). Other contacting effects (on organic phase in the absence of TBP, and on aqueous phases) were all bellow the measurement accuracy and are thus not discussed here, even though TBP shows a small solubility in water. However, these effects should nevertheless be taken into account: measurements of emulsion constituent phases should be made after chemical equilibration, particularly if used in a model to compute emulsion permittivities, and whenever chemical equilibration takes place.
Measurements for Emulsions: We considered both o/w and w/o emulsions. As already mentioned, we could not control the phase fractions in this study as the emulsions are left to sediment. Nevertheless, the achieved dispersed phase fraction lied between 0.6 (loose random sphere packing) and 1.0, owing to drop deformation, in each case. In order to illustrate the differences between both types, we now present results obtained on IP175 dispersed in KNO3 1M aqueous solution (Figure 6), as well as KNO3 aqueous phase in IP 175 (Figure 7). The latter emulsion was obtained by adding 0.1% by volume surfactant (Span 80) in the continuous organic phase. Dotted lines show measurements made 2 minutes after production, continuous lines show measurements made 10 minutes after production.
Figure 6 : O/W: Permittivities (left = real, right = imaginary) of an IP175 in Potassium nitrate 1M emulsion.
Figure 7 : W/O: Permittivities (left = real, right = imaginary) of a Potassium nitrate 1M in IP175 emulsion.
The time-evolution observed in figure 6 for the o/w emulsion (dotted lines 2 minutes after production, continuous line 10 minutes) can be interpreted as follows: during the approx. 8 minutes separating the measurements, continuous (aqueous) phase drains from the emulsion,
0
2
4
6
8
10
12
14
16
18
0.5 1 2 4 8 16
eps'
Frequency (GHz)
0 cm (10 min) 2 cm (10 min) 4 cm (10 min)
0 cm (2 min) 2 cm (2 min) 4 cm (2 min)
0
5
10
15
20
25
30
35
40
45
50
0.5 1 2 4 8 16
eps"
Frequency (GHz)
0 cm (10 min) 2 cm (10 min) 4 cm (10 min)
0 cm (2 min) 2 cm (2 min) 4 cm (2 min)
0
5
10
15
20
25
30
35
40
45
50
0.5 1 2 4 8 16
eps'
Frequency (GHz)
0 cm (10 min) 2 cm (10 min) 4 cm (10 min)0 cm (2 min) 2 cm (2 min) 4 cm (2 min)
0
5
10
15
20
25
30
35
40
45
50
0.5 1 2 4 8 16
eps'
Frequency (GHz)
0 cm (10 min) 2 cm (10 min) 4 cm (10 min)
0 cm (2 min) 2 cm (2 min) 4 cm (2 min)
84
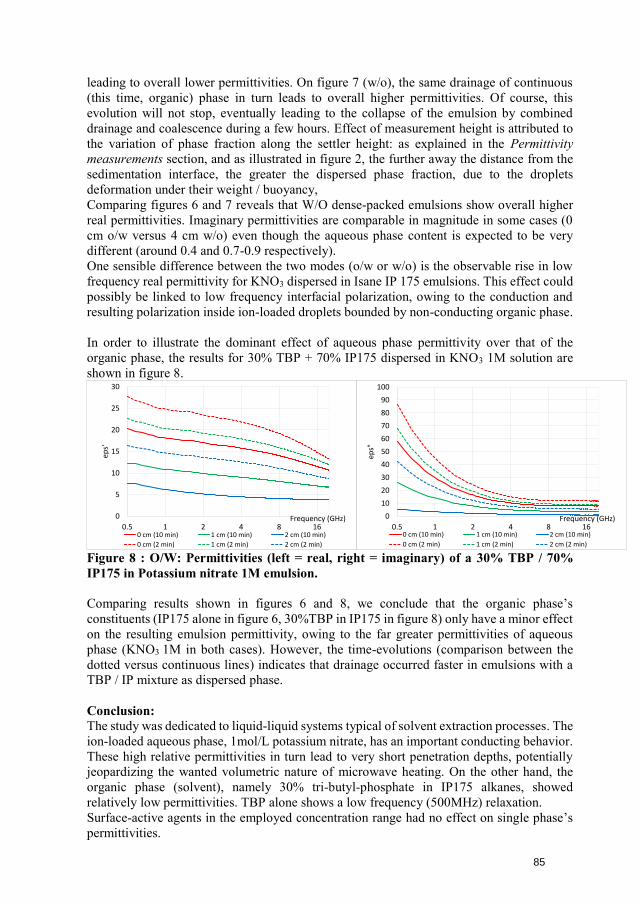
leading to overall lower permittivities. On figure 7 (w/o), the same drainage of continuous (this time, organic) phase in turn leads to overall higher permittivities. Of course, this evolution will not stop, eventually leading to the collapse of the emulsion by combined drainage and coalescence during a few hours. Effect of measurement height is attributed to the variation of phase fraction along the settler height: as explained in the Permittivity measurements section, and as illustrated in figure 2, the further away the distance from the sedimentation interface, the greater the dispersed phase fraction, due to the droplets deformation under their weight / buoyancy, Comparing figures 6 and 7 reveals that W/O dense-packed emulsions show overall higher real permittivities. Imaginary permittivities are comparable in magnitude in some cases (0 cm o/w versus 4 cm w/o) even though the aqueous phase content is expected to be very different (around 0.4 and 0.7-0.9 respectively). One sensible difference between the two modes (o/w or w/o) is the observable rise in low frequency real permittivity for KNO3 dispersed in Isane IP 175 emulsions. This effect could possibly be linked to low frequency interfacial polarization, owing to the conduction and resulting polarization inside ion-loaded droplets bounded by non-conducting organic phase.
In order to illustrate the dominant effect of aqueous phase permittivity over that of the organic phase, the results for 30% TBP + 70% IP175 dispersed in KNO3 1M solution are shown in figure 8.
Figure 8 : O/W: Permittivities (left = real, right = imaginary) of a 30% TBP / 70% IP175 in Potassium nitrate 1M emulsion.
Comparing results shown in figures 6 and 8, we conclude that the organic phase’s constituents (IP175 alone in figure 6, 30%TBP in IP175 in figure 8) only have a minor effect on the resulting emulsion permittivity, owing to the far greater permittivities of aqueous phase (KNO3 1M in both cases). However, the time-evolutions (comparison between the dotted versus continuous lines) indicates that drainage occurred faster in emulsions with a TBP / IP mixture as dispersed phase.
Conclusion: The study was dedicated to liquid-liquid systems typical of solvent extraction processes. The ion-loaded aqueous phase, 1mol/L potassium nitrate, has an important conducting behavior. These high relative permittivities in turn lead to very short penetration depths, potentially jeopardizing the wanted volumetric nature of microwave heating. On the other hand, the organic phase (solvent), namely 30% tri-butyl-phosphate in IP175 alkanes, showed relatively low permittivities. TBP alone shows a low frequency (500MHz) relaxation. Surface-active agents in the employed concentration range had no effect on single phase’s permittivities.
0
5
10
15
20
25
30
0.5 1 2 4 8 16
eps'
Frequency (GHz)
0 cm (10 min) 1 cm (10 min) 2 cm (10 min)
0 cm (2 min) 1 cm (2 min) 2 cm (2 min)
0
10
20
30
40
50
60
70
80
90
100
0.5 1 2 4 8 16
eps"
Frequency (GHz)
0 cm (10 min) 1 cm (10 min) 2 cm (10 min)
0 cm (2 min) 1 cm (2 min) 2 cm (2 min)
85
Not only single phase’s permittivities and phase fractions, but also emulsion type (o/w or w/o) has an effect on the emulsions permittivity, as was clearly mentioned in previous studies on pure water/organics emulsions[4][5]. This complex behavior of emulsion permittivities requires models, some of which are discussed in Thomas’ work[4]
The effect of height in the dense-packed zone, corresponding to the effect of phase fraction variation, could be summed-up as follows:
- For o/w emulsion: displacing the measurement point towards dispersed(organic) phase led to a drop in emulsion permittivity.
- For w/o: displacing measurement point towards dispersed (aqueous) phase ledto a rise in emulsion permittivity.
Both of these effects can be qualitatively related to a rise in the dispersed phase fraction when displacing the probe away from the sedimentation interface (continuous phase / emulsion boundary) and towards the coalescence interface (emulsion / dispersed phase boundary). For both operating modes (o/w or w/o), displacing the probe upwards lead to a drop in permittivity, displacing it downwards led to a rise in permittivity.
From a process engineering perspective, the differences between the two types of emulsions should be taken into account in order to apply microwave heating as a demulsification strategy. Of course, permittivity variations caused by phase fraction evolving with time, or along the settler’s length, clearly has to be considered.
Further work: Phase fraction measurement has to be done in the dense packed zones, but for the moment, our attempts have been unfruitful owing to the visco-elastic behavior of the produced emulsions, preventing a representative sample to be taken. Work is still in progress. Modeling can be helpful to solve this issue: phase fraction for such emulsions can indeed be estimated from permittivity measurements performed on agitated emulsions for which the phase fraction is known. Several models from the literature are under evaluation, in particular Hanai’s model [1], and its proposed resolution by Thomas [4]. Differences between the two modes (w/o, o/w), even when composed of the same relative volume of organic/aqueous phases, were already a central theme in Thomas’s and Perl’s[5] work, and is currently investigated further.
[1] T. Hanai, «Theory of the dielectric dispersion due to the interfacial polarization and itsapplication to emulsions» Kolloid-Zeitschrift, vol. 171, p. 23-31, 1960.
[2] T. Frising, C. Noïk et C. Dalmazonne, «The liquid/liquid sedimentation process, from dropletcoalescence to technologically enhanced water/oil emulsion gravity separator: a review» Journal of dispersion science and technology vol. 27 issue 7, p. 1035-1057, 2006.
[3] G. Richaud, «Measure of the complex dielectric constant of tributyl phosphate (TBP).Application to continuous control of TBP concentration» International Nuclear InformationSystem Volume 51, 1978.
[4] C. Thomas, J. P. Perl et D. T. Wasan, «Complex dielectric properties of macroemulsions in themicrowave region» Journal of colloid and interface science vol. 139 no. 2, pp. 1-13, 1990.
[5] J. P. Perl, H. E. Bussey et D. T. Wasan, «Complex Dielectric Properties of Macroemulsionsusing a Calibrated Microwave Resonance Dielectrometer,» Journal of Colloids and InterfaceScience vol. 108 no. 2, pp. 528-540, 1985.
86
18th International Conference on Microwave and High Frequency Applications AMPERE 2021, Gothenburg, Sweden, September 13-16, 2021
DIRECTIONAL ANTENNA DESIGN AND ITS APPLICATION TO THZ COMMUNICATION SYSTEM
Dwi Cahyono1
1AKKA EMC GmbH, Kopernikusstr.19, Kösching-Ingolstadt, Germany
Keywords: THz, Antenna, Design, Digitalization
The terahertz (THz) communications are predicted to be the next generation of wireless communication networks in the coming five to ten years. Both transmitter and receiver parts are using highly accurate and directive antennas to overcome the problem of high propagation as well as reflection losses in THz band. One of the primary objectives of this paper is to investigate the directive antennas designed to compare with ideal antenna Gaussian beam model which at the main lobe is described by a circular symmetrical Gaussian function in terms of gain and beam-width of a typical open-ended waveguide, standard gain horn (SGH), and additional SGH with a customized lens antenna. All antenna simulations are performed by CST Microwave Studio at frequency of 350 GHz. The gain and HPBW of simulated SGH antenna achieve exactly as expected in the Gaussian beam model.
1. Introduction
Gigabits communication requires antennas of light weight, low fabrication cost, small footprint and are easy to install. Terahertz (THz) band antennas should have narrow beamwidth, low side and low level in order to minimize the risk of interferences. Recently, many antennas have been designed and proposed at THz band (beyond 300 GHz). The frequencies around 350 GHz are especially interesting, as they lay in a low absorption atmospheric window with 47 GHz of available unregulated bandwidth and secondly, it can be expected that fast technological progress will soon allow for relatively cost-efficient components [1, 2, 3].
In this paper some kinds of antennas are proposed [5] to model the needs of
directivity and gain for each case. An open-ended waveguide can be employed as it may be usually implemented in a short range communication which does not require an accurate alignment due to its applications, e.g. external hard-drive to computer or laptopor small download stations (kiosk), etc. Eventhough, recently the integrated circuits (ICs)technology has mostly replaced a waveguidetechnology in the commercial devices.Furthermore, a more accurate alignment hasto be fulfilled in high accuracy requiredcommunication purposes. The horn antennashave been used for quite a while as a highgain radiator in many applications due to it’sability to attain longer ranges. Additionally,a horn antenna with lens may be employed tohave higher gain and narrower beamwidth[7].
87
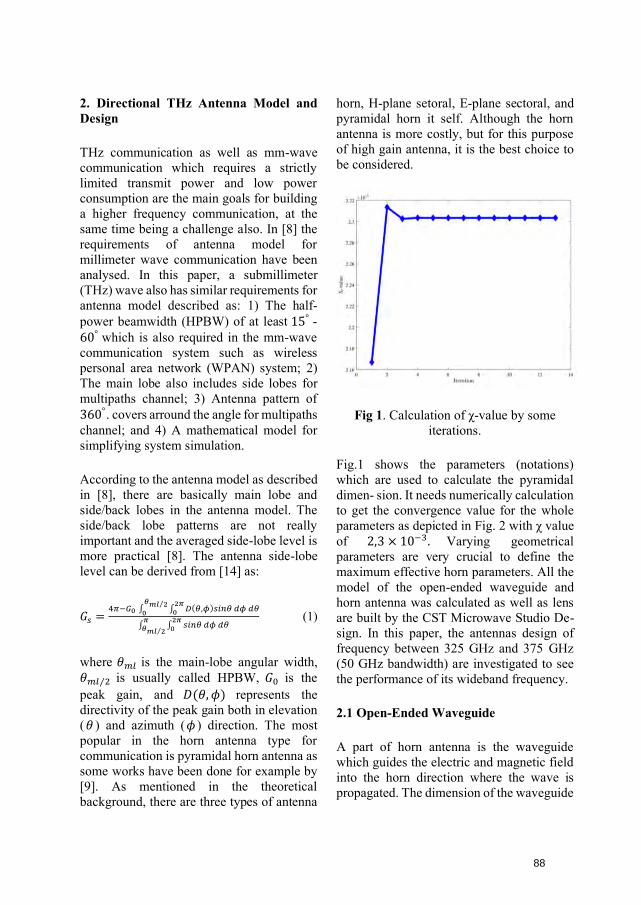
2. Directional THz Antenna Model andDesign
THz communication as well as mm-wave communication which requires a strictly limited transmit power and low power consumption are the main goals for building a higher frequency communication, at the same time being a challenge also. In [8] the requirements of antenna model for millimeter wave communication have been analysed. In this paper, a submillimeter (THz) wave also has similar requirements for antenna model described as: 1) The half-power beamwidth (HPBW) of at least 15° -60° which is also required in the mm-wavecommunication system such as wireless personal area network (WPAN) system; 2) The main lobe also includes side lobes for multipaths channel; 3) Antenna pattern of 360°. covers arround the angle for multipathschannel; and 4) A mathematical model for simplifying system simulation.
According to the antenna model as described in [8], there are basically main lobe and side/back lobes in the antenna model. The side/back lobe patterns are not really important and the averaged side-lobe level is more practical [8]. The antenna side-lobe level can be derived from [14] as:
𝐺𝑠 =4𝜋−𝐺0 ∫ ∫ 𝐷(𝜃,𝜙)𝑠𝑖𝑛𝜃 𝑑𝜙 𝑑𝜃
2𝜋0
𝜃𝑚𝑙 2⁄
0
∫ ∫ 𝑠𝑖𝑛𝜃 𝑑𝜙 𝑑𝜃2𝜋
0𝜋
𝜃𝑚𝑙 2⁄
(1)
where 𝜃𝑚𝑙 is the main-lobe angular width, 𝜃𝑚𝑙 2⁄ is usually called HPBW, 𝐺0 is the peak gain, and 𝐷(𝜃, 𝜙) represents the directivity of the peak gain both in elevation (𝜃 ) and azimuth (𝜙 ) direction. The most popular in the horn antenna type for communication is pyramidal horn antenna as some works have been done for example by [9]. As mentioned in the theoretical background, there are three types of antenna
horn, H-plane setoral, E-plane sectoral, and pyramidal horn it self. Although the horn antenna is more costly, but for this purpose of high gain antenna, it is the best choice to be considered.
Fig 1. Calculation of χ-value by some iterations.
Fig.1 shows the parameters (notations) which are used to calculate the pyramidal dimen- sion. It needs numerically calculation to get the convergence value for the whole parameters as depicted in Fig. 2 with χ value of 2,3 × 10⁻³. Varying geometricalparameters are very crucial to define the maximum effective horn parameters. All the model of the open-ended waveguide and horn antenna was calculated as well as lens are built by the CST Microwave Studio De- sign. In this paper, the antennas design of frequency between 325 GHz and 375 GHz (50 GHz bandwidth) are investigated to see the performance of its wideband frequency.
2.1 Open-Ended Waveguide
A part of horn antenna is the waveguide which guides the electric and magnetic field into the horn direction where the wave is propagated. The dimension of the waveguide
88
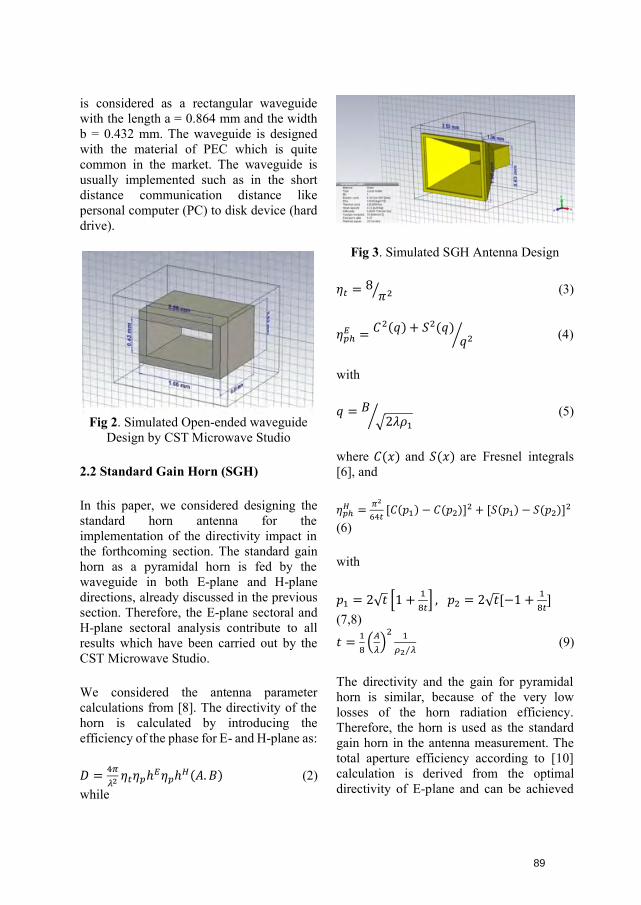
is considered as a rectangular waveguide with the length a = 0.864 mm and the width b = 0.432 mm. The waveguide is designed with the material of PEC which is quite common in the market. The waveguide is usually implemented such as in the short distance communication distance like personal computer (PC) to disk device (hard drive).
Fig 2. Simulated Open-ended waveguide Design by CST Microwave Studio
2.2 Standard Gain Horn (SGH)
In this paper, we considered designing the standard horn antenna for the implementation of the directivity impact in the forthcoming section. The standard gain horn as a pyramidal horn is fed by the waveguide in both E-plane and H-plane directions, already discussed in the previous section. Therefore, the E-plane sectoral and H-plane sectoral analysis contribute to allresults which have been carried out by theCST Microwave Studio.
We considered the antenna parameter calculations from [8]. The directivity of the horn is calculated by introducing the efficiency of the phase for E- and H-plane as:
𝐷 =4𝜋
𝜆2 𝜂𝑡𝜂𝑝ℎ𝐸𝜂𝑝ℎ𝐻(𝐴. 𝐵) (2) while
Fig 3. Simulated SGH Antenna Design
𝜂𝑡 = 8𝜋2⁄ (3)
𝜂𝑝ℎ𝐸 =
𝐶2(𝑞) + 𝑆2(𝑞)𝑞2⁄ (4)
with
𝑞 = 𝐵√2𝜆𝜌1
⁄ (5)
where 𝐶(𝑥) and 𝑆(𝑥) are Fresnel integrals [6], and
𝜂𝑝ℎ𝐻 =
𝜋2
64𝑡[𝐶(𝑝1) − 𝐶(𝑝2)]2 + [𝑆(𝑝1) − 𝑆(𝑝2)]2
(6)
with
𝑝1 = 2√𝑡 [1 +1
8𝑡] , 𝑝2 = 2√𝑡[−1 +
1
8𝑡]
(7,8)
𝑡 =1
8(
𝐴
𝜆)
2 1
𝜌2 𝜆⁄(9)
The directivity and the gain for pyramidal horn is similar, because of the very low losses of the horn radiation efficiency. Therefore, the horn is used as the standard gain horn in the antenna measurement. The total aperture efficiency according to [10] calculation is derived from the optimal directivity of E-plane and can be achieved
89
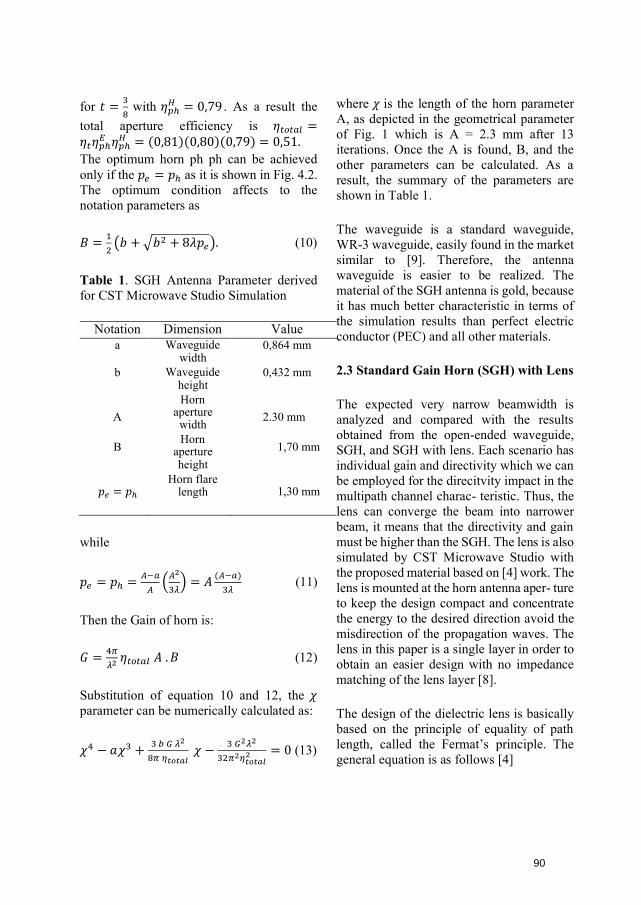
for 𝑡 =3
8with 𝜂𝑝ℎ
𝐻 = 0,79 . As a result thetotal aperture efficiency is 𝜂𝑡𝑜𝑡𝑎𝑙 =𝜂𝑡𝜂𝑝ℎ
𝐸 𝜂𝑝ℎ𝐻 = (0,81)(0,80)(0,79) = 0,51.
The optimum horn ph ph can be achieved only if the 𝑝𝑒 = 𝑝ℎ as it is shown in Fig. 4.2. The optimum condition affects to the notation parameters as
𝐵 =1
2(𝑏 + √𝑏2 + 8𝜆𝑝𝑒). (10)
Table 1. SGH Antenna Parameter derived for CST Microwave Studio Simulation
Notation Dimension Value a Waveguide
width 0,864 mm
b
A
B
𝑝𝑒 = 𝑝ℎ
Waveguide height Horn
aperture width Horn
aperture height
Horn flare length
0,432 mm
2.30 mm
1,70 mm
1,30 mm
while
𝑝𝑒 = 𝑝ℎ =𝐴−𝑎
𝐴(
𝐴2
3𝜆) = 𝐴
(𝐴−𝑎)
3𝜆 (11)
Then the Gain of horn is:
𝐺 =4𝜋
𝜆2 𝜂𝑡𝑜𝑡𝑎𝑙 𝐴 . 𝐵 (12)
Substitution of equation 10 and 12, the 𝜒 parameter can be numerically calculated as:
𝜒4 − 𝑎𝜒3 +3 𝑏 𝐺 𝜆2
8𝜋 𝜂𝑡𝑜𝑡𝑎𝑙 𝜒 −
3 𝐺2𝜆2
32𝜋2𝜂𝑡𝑜𝑡𝑎𝑙2 = 0 (13)
where 𝜒 is the length of the horn parameter A, as depicted in the geometrical parameter of Fig. 1 which is A = 2.3 mm after 13 iterations. Once the A is found, B, and the other parameters can be calculated. As a result, the summary of the parameters are shown in Table 1.
The waveguide is a standard waveguide, WR-3 waveguide, easily found in the market similar to [9]. Therefore, the antenna waveguide is easier to be realized. The material of the SGH antenna is gold, because it has much better characteristic in terms of the simulation results than perfect electric conductor (PEC) and all other materials.
2.3 Standard Gain Horn (SGH) with Lens
The expected very narrow beamwidth is analyzed and compared with the results obtained from the open-ended waveguide, SGH, and SGH with lens. Each scenario has individual gain and directivity which we can be employed for the direcitvity impact in the multipath channel charac- teristic. Thus, the lens can converge the beam into narrower beam, it means that the directivity and gain must be higher than the SGH. The lens is also simulated by CST Microwave Studio with the proposed material based on [4] work. The lens is mounted at the horn antenna aper- ture to keep the design compact and concentrate the energy to the desired direction avoid the misdirection of the propagation waves. The lens in this paper is a single layer in order to obtain an easier design with no impedance matching of the lens layer [8].
The design of the dielectric lens is basically based on the principle of equality of path length, called the Fermat’s principle. The general equation is as follows [4]
90
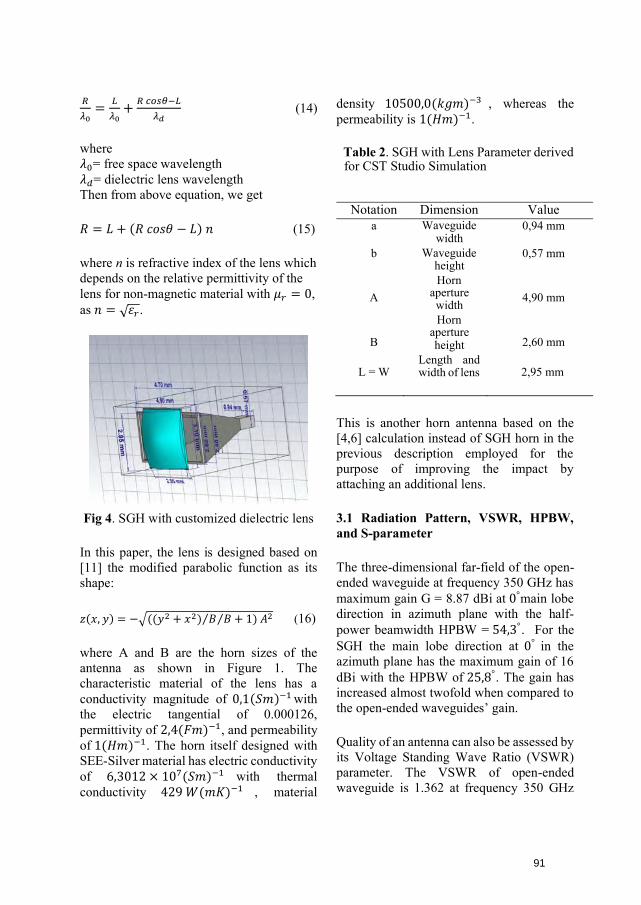
𝑅
𝜆0=
𝐿
𝜆0+
𝑅 𝑐𝑜𝑠𝜃−𝐿
𝜆𝑑 (14)
where 𝜆0= free space wavelength 𝜆𝑑= dielectric lens wavelength Then from above equation, we get
𝑅 = 𝐿 + (𝑅 𝑐𝑜𝑠𝜃 − 𝐿) 𝑛 (15)
where n is refractive index of the lens which depends on the relative permittivity of the lens for non-magnetic material with 𝜇𝑟 = 0, as 𝑛 = √𝜀𝑟 .
Fig 4. SGH with customized dielectric lens
In this paper, the lens is designed based on [11] the modified parabolic function as itsshape:
𝑧(𝑥, 𝑦) = −√((𝑦2 + 𝑥2) 𝐵 𝐵 + 1⁄⁄ ) 𝐴2 (16)
where A and B are the horn sizes of the antenna as shown in Figure 1. The characteristic material of the lens has a conductivity magnitude of 0,1(𝑆𝑚)−1 withthe electric tangential of 0.000126, permittivity of 2,4(𝐹𝑚)−1, and permeabilityof 1(𝐻𝑚)−1. The horn itself designed withSEE-Silver material has electric conductivity of 6,3012 × 10⁷(𝑆𝑚)−1 with thermalconductivity 429 𝑊(𝑚𝐾)−1 , material
density 10500,0(𝑘𝑔𝑚)−3 , whereas thepermeability is 1(𝐻𝑚)−1.
Table 2. SGH with Lens Parameter derived for CST Studio Simulation
Notation Dimension Value a Waveguide
width 0,94 mm
b
A
B
L = W
Waveguide height Horn
aperture width Horn
aperture height
Length and width of lens
0,57 mm
4,90 mm
2,60 mm
2,95 mm
This is another horn antenna based on the [4,6] calculation instead of SGH horn in the previous description employed for the purpose of improving the impact by attaching an additional lens.
3.1 Radiation Pattern, VSWR, HPBW, and S-parameter
The three-dimensional far-field of the open-ended waveguide at frequency 350 GHz has maximum gain G = 8.87 dBi at 0°main lobedirection in azimuth plane with the half-power beamwidth HPBW = 54,3°. For theSGH the main lobe direction at 0° in theazimuth plane has the maximum gain of 16 dBi with the HPBW of 25,8°. The gain hasincreased almost twofold when compared to the open-ended waveguides’ gain.
Quality of an antenna can also be assessed by its Voltage Standing Wave Ratio (VSWR) parameter. The VSWR of open-ended waveguide is 1.362 at frequency 350 GHz
91
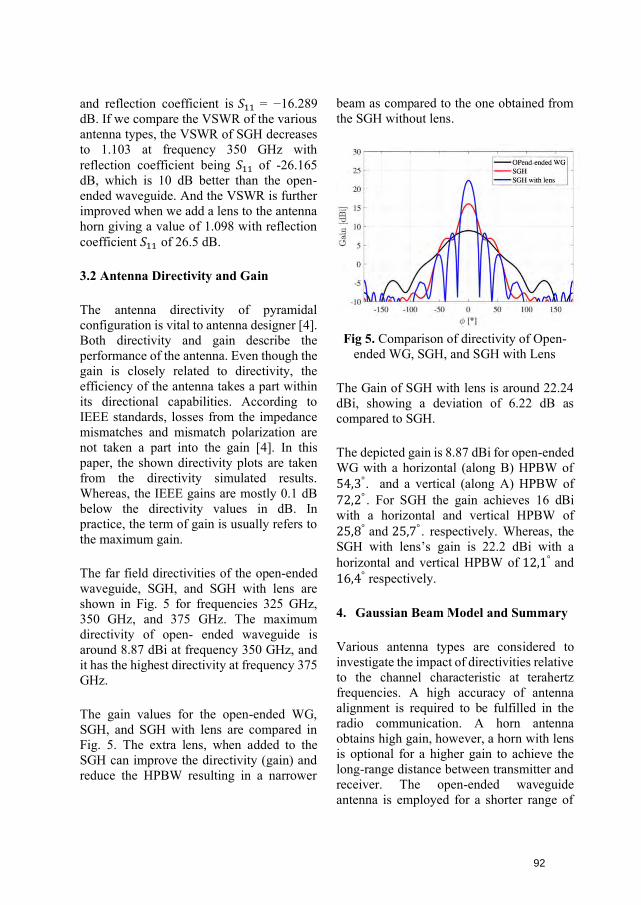
and reflection coefficient is 𝑆11 = −16.289 dB. If we compare the VSWR of the various antenna types, the VSWR of SGH decreases to 1.103 at frequency 350 GHz with reflection coefficient being 𝑆11 of -26.165 dB, which is 10 dB better than the open-ended waveguide. And the VSWR is further improved when we add a lens to the antenna horn giving a value of 1.098 with reflection coefficient 𝑆11 of 26.5 dB.
3.2 Antenna Directivity and Gain
The antenna directivity of pyramidal configuration is vital to antenna designer [4]. Both directivity and gain describe the performance of the antenna. Even though the gain is closely related to directivity, the efficiency of the antenna takes a part within its directional capabilities. According to IEEE standards, losses from the impedance mismatches and mismatch polarization are not taken a part into the gain [4]. In this paper, the shown directivity plots are taken from the directivity simulated results. Whereas, the IEEE gains are mostly 0.1 dB below the directivity values in dB. In practice, the term of gain is usually refers to the maximum gain.
The far field directivities of the open-ended waveguide, SGH, and SGH with lens are shown in Fig. 5 for frequencies 325 GHz, 350 GHz, and 375 GHz. The maximum directivity of open- ended waveguide is around 8.87 dBi at frequency 350 GHz, and it has the highest directivity at frequency 375 GHz.
The gain values for the open-ended WG, SGH, and SGH with lens are compared in Fig. 5. The extra lens, when added to the SGH can improve the directivity (gain) and reduce the HPBW resulting in a narrower
beam as compared to the one obtained from the SGH without lens.
Fig 5. Comparison of directivity of Open-ended WG, SGH, and SGH with Lens
The Gain of SGH with lens is around 22.24 dBi, showing a deviation of 6.22 dB as compared to SGH.
The depicted gain is 8.87 dBi for open-ended WG with a horizontal (along B) HPBW of 54,3°. and a vertical (along A) HPBW of72,2° . For SGH the gain achieves 16 dBiwith a horizontal and vertical HPBW of 25,8° and 25,7° . respectively. Whereas, theSGH with lens’s gain is 22.2 dBi with a horizontal and vertical HPBW of 12,1° and16,4° respectively.
4. Gaussian Beam Model and Summary
Various antenna types are considered to investigate the impact of directivities relative to the channel characteristic at terahertz frequencies. A high accuracy of antenna alignment is required to be fulfilled in the radio communication. A horn antenna obtains high gain, however, a horn with lens is optional for a higher gain to achieve the long-range distance between transmitter and receiver. The open-ended waveguide antenna is employed for a shorter range of
92
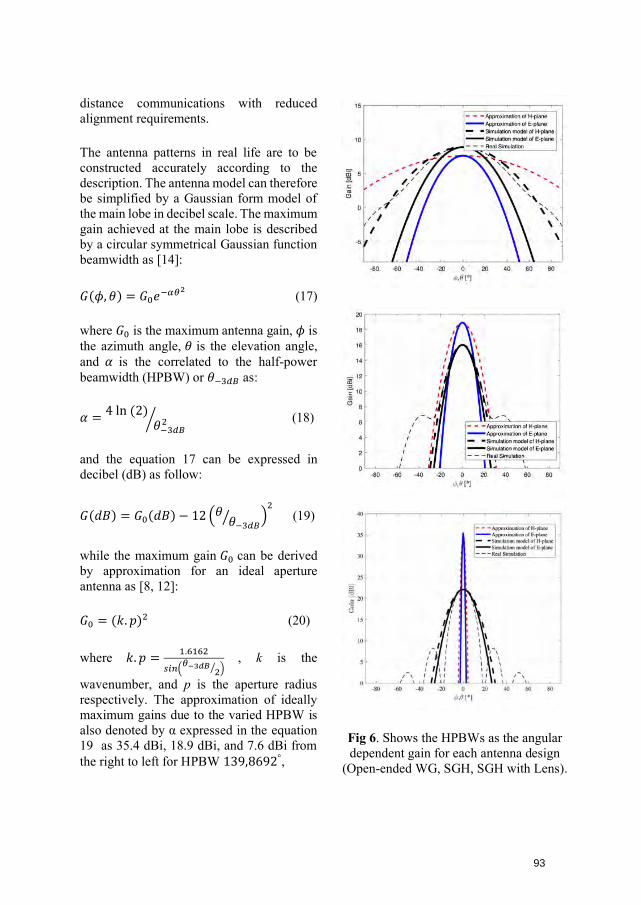
distance communications with reduced alignment requirements.
The antenna patterns in real life are to be constructed accurately according to the description. The antenna model can therefore be simplified by a Gaussian form model of the main lobe in decibel scale. The maximum gain achieved at the main lobe is described by a circular symmetrical Gaussian function beamwidth as [14]:
𝐺(𝜙, 𝜃) = 𝐺0𝑒−𝛼𝜃2 (17)
where 𝐺0 is the maximum antenna gain, 𝜙 is the azimuth angle, 𝜃 is the elevation angle, and 𝛼 is the correlated to the half-power beamwidth (HPBW) or 𝜃−3𝑑𝐵 as:
𝛼 =4 ln (2)
𝜃−3𝑑𝐵2⁄ (18)
and the equation 17 can be expressed in decibel (dB) as follow:
𝐺(𝑑𝐵) = 𝐺0(𝑑𝐵) − 12 (𝜃𝜃−3𝑑𝐵
⁄ )2 (19)
while the maximum gain 𝐺0 can be derived by approximation for an ideal aperture antenna as [8, 12]:
𝐺0 = (𝑘. 𝑝)2 (20)
where 𝑘. 𝑝 =1.6162
𝑠𝑖𝑛(𝜃−3𝑑𝐵
2⁄ )
, k is the
wavenumber, and p is the aperture radius respectively. The approximation of ideally maximum gains due to the varied HPBW is also denoted by α expressed in the equation 19 as 35.4 dBi, 18.9 dBi, and 7.6 dBi from the right to left for HPBW 139,8692°,
Fig 6. Shows the HPBWs as the angular dependent gain for each antenna design
(Open-ended WG, SGH, SGH with Lens).
93
24,9766°, 2,5976° in the azimuth plane andHPBW 44,9579° , 16,6511° , 1,5985° in theelevation plane respectively.
As conclusion, the Gaussian beam model is constructed according to the aforementioned antenna measurements. However, we have not carried out any actual antenna measurements in this paper. Hence, the simulation results are compared exactly the same with these approximations for future constructions.
Acknowledgement
The research work presented in this paper has been supported by DSV Institute, Duisburg-Essen University.
References
[1] Peter H. Siegel, “Terahertz Technology.”IEEE Transaction on Microwave Theory andTech- niques, 2002, pp. 910-928, IEEE,2002.[2] Thomas Kuerner and Sebastian Priebe,“Towards THz Communications - Status inRe- search, Standardization and Regulation.”Journal Infrared Millimeter TerahertzWaves, 2013, Springer, 25 August 2013. [3] Fawad Sheikh, Mohamed El-Hadidy andThomas Kaiser, “Terahertz Band: IndoorRay- Tracing Channel Model ConsideringAtmospheric Attenuation.” IEEE, pp.1782-1783, 2015.[4] Constantine A. Balanis, Antenna TheoryAnalysis and Design, 3rd. edition. Canada:John Willey and Sons, 2005.[5] Sebastian Priebe, M. Jacob, and T.
Kuerner, “The Impact of Antenna Directivities on THz Indoor Channel Characteristics.” 6th European Conference on Antennas and Propagation (EUCAP), pp.478-482, 2011. [6] Rodney Vaughan and Jorgen BachAndersen, Channels, propagation, andAntennas for Mobile Communications.London: The Institutions of ElectricalEngineers,2003.[7] Wu Pan, Way Zeng, Xuan Yu, and JunZhang, “A Novel High-Gain DirectionalLens Antenna for Terahertz Band.” Progressin Electromagnetic Research, Vol 68,pp.107-116,2016.[8] Ichihiko Toyoda and Tomohiro Seki,“Antenna Model and Its Application toSystem Design in the Millimeter-waveWireless Personal Area Networks Standard”. NTT Technical Review (Regular articles),Vol.9 No.3, 2011.[9] Sebastian Rey, Thomas Merkle, AxelTessmann and Thomas Krner, “A Phased Ar-ray Antenna with Horn Elements for 300GHz Communications”. Proceeding of ISAP- 2016,pp.122-123, 2016. [10] Natalia K. Nikolova, Horn Antennas(Rectangular horn antennas. Circularapertures), Lec- ture 18 . Canada: McMasterUniversity, 2016.[11] Zhengyu Peng, “11-15GHz HornAntenna.” Available athttps://www.zpeng.me/.[12] Sebastian Rey, David Ulm, ThomasKleine-Ostmann, and Thomas Kuerner,“Performance Evaluation of a first PhasedArray operating at 300 GHz with HornElements”. European Conference onAntennas and Propagation (EUCAP),pp.1629-1633, 2017.
94
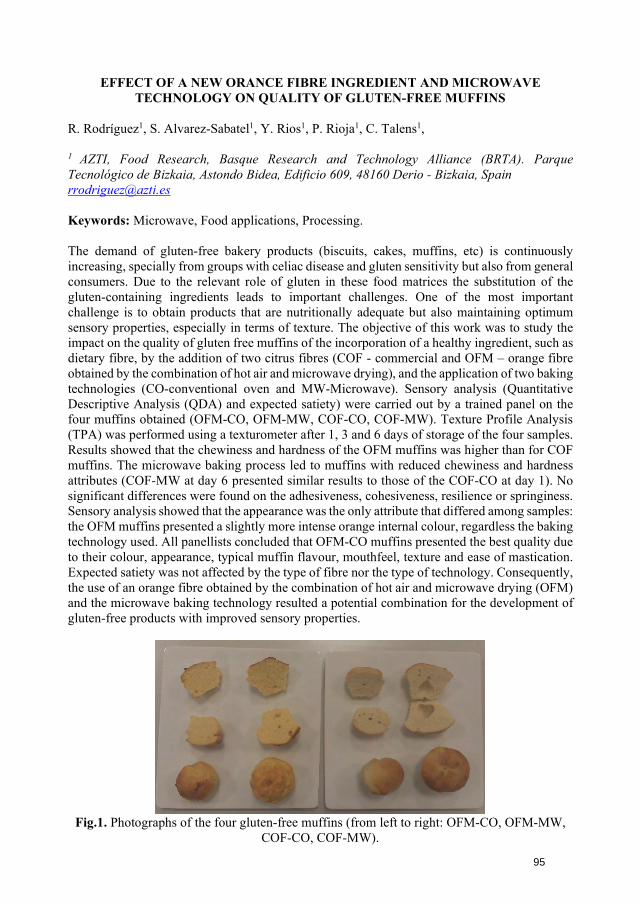
EFFECT OF A NEW ORANCE FIBRE INGREDIENT AND MICROWAVE TECHNOLOGY ON QUALITY OF GLUTEN-FREE MUFFINS
R. Rodríguez1, S. Alvarez-Sabatel1, Y. Rios1, P. Rioja1, C. Talens1,
1 AZTI, Food Research, Basque Research and Technology Alliance (BRTA). Parque Tecnológico de Bizkaia, Astondo Bidea, Edificio 609, 48160 Derio - Bizkaia, Spain [email protected]
Keywords: Microwave, Food applications, Processing.
The demand of gluten-free bakery products (biscuits, cakes, muffins, etc) is continuously increasing, specially from groups with celiac disease and gluten sensitivity but also from general consumers. Due to the relevant role of gluten in these food matrices the substitution of the gluten-containing ingredients leads to important challenges. One of the most important challenge is to obtain products that are nutritionally adequate but also maintaining optimum sensory properties, especially in terms of texture. The objective of this work was to study the impact on the quality of gluten free muffins of the incorporation of a healthy ingredient, such as dietary fibre, by the addition of two citrus fibres (COF - commercial and OFM – orange fibre obtained by the combination of hot air and microwave drying), and the application of two baking technologies (CO-conventional oven and MW-Microwave). Sensory analysis (Quantitative Descriptive Analysis (QDA) and expected satiety) were carried out by a trained panel on the four muffins obtained (OFM-CO, OFM-MW, COF-CO, COF-MW). Texture Profile Analysis (TPA) was performed using a texturometer after 1, 3 and 6 days of storage of the four samples. Results showed that the chewiness and hardness of the OFM muffins was higher than for COF muffins. The microwave baking process led to muffins with reduced chewiness and hardness attributes (COF-MW at day 6 presented similar results to those of the COF-CO at day 1). No significant differences were found on the adhesiveness, cohesiveness, resilience or springiness. Sensory analysis showed that the appearance was the only attribute that differed among samples: the OFM muffins presented a slightly more intense orange internal colour, regardless the baking technology used. All panellists concluded that OFM-CO muffins presented the best quality due to their colour, appearance, typical muffin flavour, mouthfeel, texture and ease of mastication. Expected satiety was not affected by the type of fibre nor the type of technology. Consequently, the use of an orange fibre obtained by the combination of hot air and microwave drying (OFM) and the microwave baking technology resulted a potential combination for the development of gluten-free products with improved sensory properties.
Fig.1. Photographs of the four gluten-free muffins (from left to right: OFM-CO, OFM-MW, COF-CO, COF-MW).
95
18th International Conference on Microwave and High Frequency Applications AMPERE 2021, Online, September 13-16, 2021
EFFECT OF ABSORBED POWER AND TEMPERATURE NON-UNIFORMITY
ON THE RAPID MICROWAVE SINTERING OF VARISTOR CERAMICS
S. V. Egorov, A. G. Eremeev, V. V. Kholoptsev, I. V. Plotnikov, K. I. Rybakov,A. A. Sorokin, Yu. V. Bykov,
Institute of Applied Physics, Russian Academy of Sciences, Nizhny Novgorod, Russia [email protected]
Keywords: rapid microwave sintering, flash sintering, thermal instability, varistor ceramics.
This paper reports the results of a study of microwave sintering of ZnO-based varistor ceramics in rapid processing regimes. The study has established correlation of enhanced densification with the development of thermal instability at elevated levels of the absorbed microwave power density. Based on an analysis of the experimental data, a mechanism underlying rapid densification in different field-assisted processes with volumetric energy release is discussed. The samples for the study were compacted from a ZnO + 1.5 mol. % Bi2O3 + 1 mol. % Sb2O3 powder mixture with an average particle size of 0.5 – 1 µm. The samples were pressed uniaxially into pellets 10 mm in diameter and about 3 mm in thickness. The density of the compacted samples was about 55 % of the theoretical value. Microwave sintering was carried out on a 24 GHz / 5 kW gyrotron system for high-temperature processing of materials [1]. The gyrotron output power was regulated continuously by the computer control system to implement the specified heating regimes. After an initial slow heating needed to remove the adsorbed water, starting from a temperature of 500 °C the samples were heated at a constant heating rate, 10 – 130 °C/min, up to a temperature of 1100 – 1300 °C with no isothermal hold. The temperature of the samples was measured by two type B thermocouples, one installed in a hole drilled to the center of the sample and the other touching the surface of the sample at a distance of 1 mm from its edge. The reading of the former thermocouple was used as a driving signal for the power control system. The thermal insulation assembly comprised a block of porous alumina (AL-30, Zircar Ceramics, USA) with an 11 mm dia. cylindrical channel drilled through it to make the sample visible for the optical dilatometry unit [2]. In some experiments, a SiC susceptor ring was built in the assembly around the sample to improve the temperature uniformity. Higher heating rate experiments (75 – 130 °C/min) were carried out using a closed thermal insulation assembly without the use of optical dilatometry. For purposes of comparison, some samples were sintered conventionally in a resistive furnace with a heating rate of 3 °C/min and an isothermal hold for 30 min. The relative densities of the sintered samples and the mass loss are plotted in Fig. 1 for different maximum sintering temperatures as a function of the heating rate. It can be seen that under direct microwave sintering the highest final densities, about 96 % of the theoretical value, were achieved at a maximum sintering temperature of 1150 – 1200 °C using rather high heating rates: 50 and 75 °C/min. Using a SiC susceptor, a similar density was achieved at a heating rate of 30 °C/min. The mass loss of the samples increased when the heating rate was below 50 °C/min or when the maximum sintering temperature was raised to 1300 °C. The conventionally sintered samples exhibited a one percentage point lower density and a twofold increase in the mass loss compared to the samples sintered in the optimal microwave processing regimes.
96
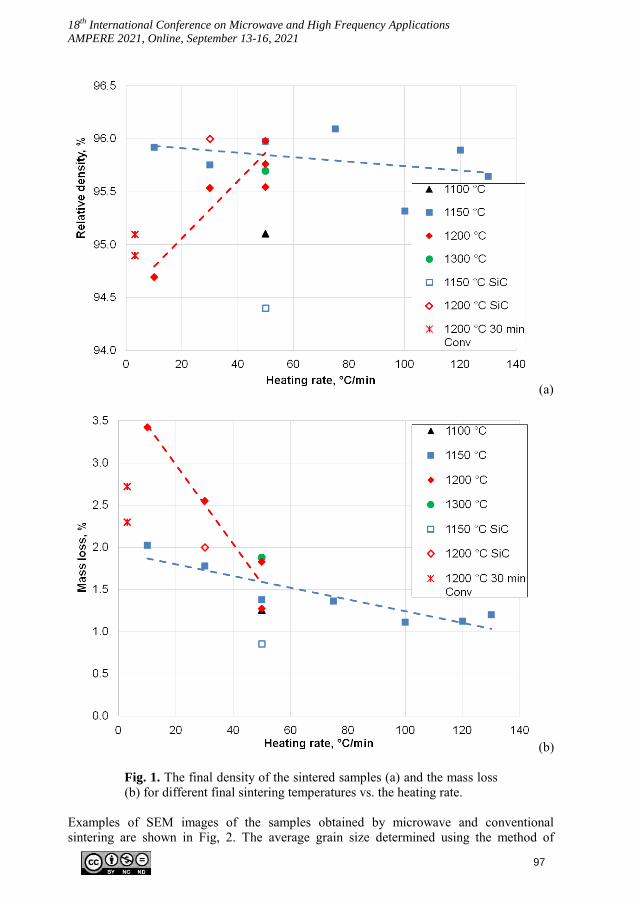
18th International Conference on Microwave and High Frequency Applications AMPERE 2021, Online, September 13-16, 2021
(a)
(b)
Fig. 1. The final density of the sintered samples (a) and the mass loss (b) for different final sintering temperatures vs. the heating rate.
Examples of SEM images of the samples obtained by microwave and conventional sintering are shown in Fig, 2. The average grain size determined using the method of
97
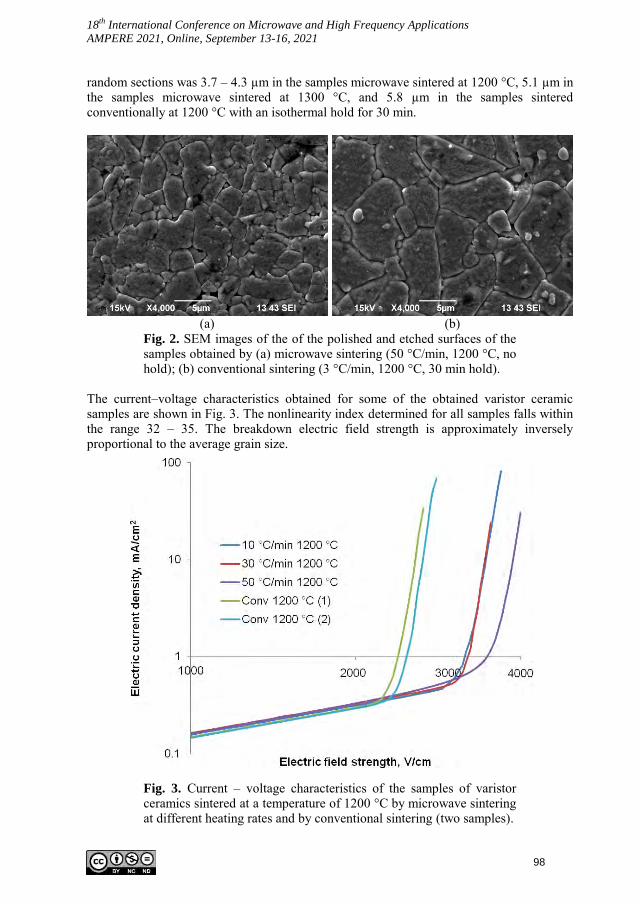
18th International Conference on Microwave and High Frequency Applications AMPERE 2021, Online, September 13-16, 2021
random sections was 3.7 – 4.3 µm in the samples microwave sintered at 1200 °C, 5.1 µm in the samples microwave sintered at 1300 °C, and 5.8 µm in the samples sintered conventionally at 1200 °C with an isothermal hold for 30 min.
(a) (b) Fig. 2. SEM images of the of the polished and etched surfaces of the samples obtained by (a) microwave sintering (50 °C/min, 1200 °C, no hold); (b) conventional sintering (3 °C/min, 1200 °C, 30 min hold).
The current–voltage characteristics obtained for some of the obtained varistor ceramic samples are shown in Fig. 3. The nonlinearity index determined for all samples falls within the range 32 – 35. The breakdown electric field strength is approximately inversely proportional to the average grain size.
Fig. 3. Current – voltage characteristics of the samples of varistor ceramics sintered at a temperature of 1200 °C by microwave sintering at different heating rates and by conventional sintering (two samples).
98
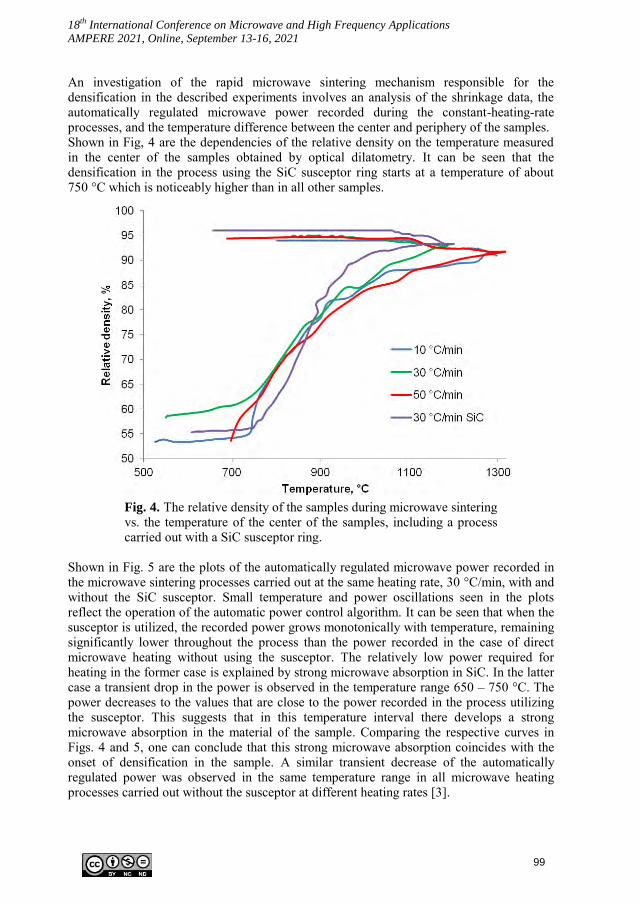
18th International Conference on Microwave and High Frequency Applications AMPERE 2021, Online, September 13-16, 2021
An investigation of the rapid microwave sintering mechanism responsible for the densification in the described experiments involves an analysis of the shrinkage data, the automatically regulated microwave power recorded during the constant-heating-rate processes, and the temperature difference between the center and periphery of the samples. Shown in Fig, 4 are the dependencies of the relative density on the temperature measured in the center of the samples obtained by optical dilatometry. It can be seen that the densification in the process using the SiC susceptor ring starts at a temperature of about 750 °C which is noticeably higher than in all other samples.
Fig. 4. The relative density of the samples during microwave sintering vs. the temperature of the center of the samples, including a process carried out with a SiC susceptor ring.
Shown in Fig. 5 are the plots of the automatically regulated microwave power recorded in the microwave sintering processes carried out at the same heating rate, 30 °C/min, with and without the SiC susceptor. Small temperature and power oscillations seen in the plots reflect the operation of the automatic power control algorithm. It can be seen that when the susceptor is utilized, the recorded power grows monotonically with temperature, remaining significantly lower throughout the process than the power recorded in the case of direct microwave heating without using the susceptor. The relatively low power required for heating in the former case is explained by strong microwave absorption in SiC. In the latter case a transient drop in the power is observed in the temperature range 650 – 750 °C. The power decreases to the values that are close to the power recorded in the process utilizing the susceptor. This suggests that in this temperature interval there develops a strong microwave absorption in the material of the sample. Comparing the respective curves in Figs. 4 and 5, one can conclude that this strong microwave absorption coincides with the onset of densification in the sample. A similar transient decrease of the automatically regulated power was observed in the same temperature range in all microwave heating processes carried out without the susceptor at different heating rates [3].
99
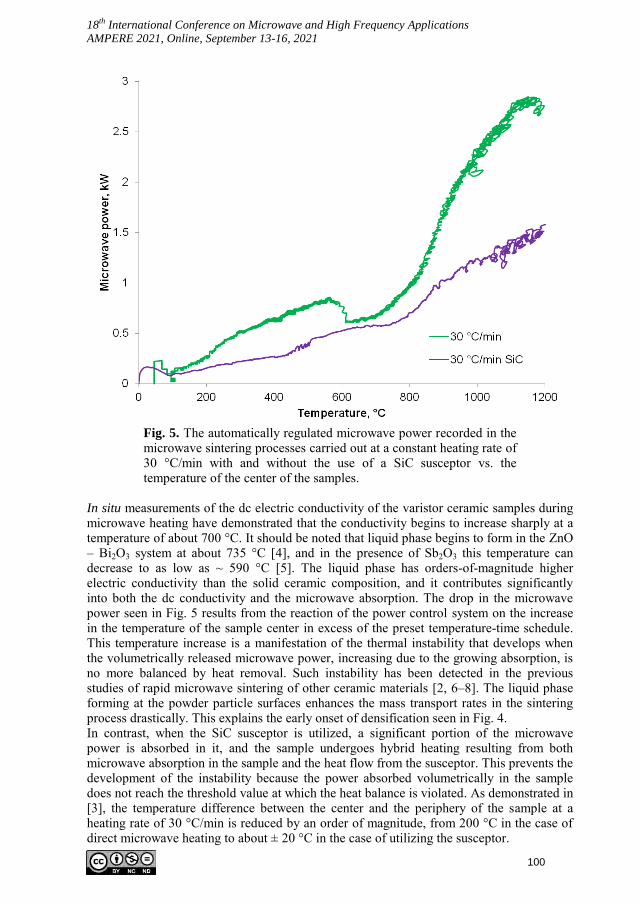
18th International Conference on Microwave and High Frequency Applications AMPERE 2021, Online, September 13-16, 2021
Fig. 5. The automatically regulated microwave power recorded in the microwave sintering processes carried out at a constant heating rate of 30 °C/min with and without the use of a SiC susceptor vs. the temperature of the center of the samples.
In situ measurements of the dc electric conductivity of the varistor ceramic samples during microwave heating have demonstrated that the conductivity begins to increase sharply at a temperature of about 700 °C. It should be noted that liquid phase begins to form in the ZnO – Bi2O3 system at about 735 °C [4], and in the presence of Sb2O3 this temperature candecrease to as low as ~ 590 °C [5]. The liquid phase has orders-of-magnitude higherelectric conductivity than the solid ceramic composition, and it contributes significantlyinto both the dc conductivity and the microwave absorption. The drop in the microwavepower seen in Fig. 5 results from the reaction of the power control system on the increasein the temperature of the sample center in excess of the preset temperature-time schedule.This temperature increase is a manifestation of the thermal instability that develops whenthe volumetrically released microwave power, increasing due to the growing absorption, isno more balanced by heat removal. Such instability has been detected in the previousstudies of rapid microwave sintering of other ceramic materials [2, 6–8]. The liquid phaseforming at the powder particle surfaces enhances the mass transport rates in the sinteringprocess drastically. This explains the early onset of densification seen in Fig. 4.In contrast, when the SiC susceptor is utilized, a significant portion of the microwavepower is absorbed in it, and the sample undergoes hybrid heating resulting from bothmicrowave absorption in the sample and the heat flow from the susceptor. This prevents thedevelopment of the instability because the power absorbed volumetrically in the sampledoes not reach the threshold value at which the heat balance is violated. As demonstrated in[3], the temperature difference between the center and the periphery of the sample at aheating rate of 30 °C/min is reduced by an order of magnitude, from 200 °C in the case ofdirect microwave heating to about ± 20 °C in the case of utilizing the susceptor.
100
18th International Conference on Microwave and High Frequency Applications AMPERE 2021, Online, September 13-16, 2021
As can be seen from Fig. 4, the onset of densification and the maximum of the densification rate are shifted by about 80 – 100 °C towards lower temperatures in the case of direct microwave heating. A possible reason for this is the thermal stress arising in the non-uniform temperature field, which can provide an additional driving force for densification [9]. In conclusion, samples of ZnO + Bi2O3 + Sb2O3 varistor ceramics have been sintered to 95 – 96 % of the theoretical density in rapid microwave heating processes with no isothermalhold. The elevated microwave heating rates make it possible to restrict the grain growthand limit the mass losses of the samples. The total duration of the high-temperaturesintering stage is reduced by more than an order of magnitude compared to theconventional sintering process. The controlled thermal instability arising in the samplesenhances the densification due to early liquid phase formation. High density of thevolumetrically absorbed microwave power causes significant temperature gradients andappreciable thermal stresses in the sample. Finally, it can be argued that the describedmechanism of rapid densification associated with the development of thermal instabilityand formation of liquid or softened phases at particle surfaces is applicable to differentfield-assisted sintering processes involving volumetric heat deposition, including flashsintering.
This research was supported by Russian Science Foundation, grant # 20-19-00685. The authors are grateful to S.S. Balabanov for the preparation of compacted samples.
References [1] Bykov, Yu.V., A.G. Eremeev, M.Yu. Glyavin, G.G. Denisov, G.I. Kalynova,
E.A. Kopelovich, A.G. Luchinin, I.V. Plotnikov, M.D. Proyavin, M.M. Troitskiy,V.V. Kholoptsev, Radiophys. Quantum Electron., 2019, 61, 752–762,DOI 10.1007/s11141-019-09933-6
[2] Egorov, S.V., A.G. Eremeev, V.V. Kholoptsev, I.V. Plotnikov, K.I. Rybakov,A.A. Sorokin, Yu.V. Bykov, Scripta Mater., 2020, 174, 68–71,DOI 10.1016/j.scriptamat.2019.08.032
[3] Egorov, S.V., A.G. Eremeev, V.V. Kholoptsev, I.V. Plotnikov, K.I. Rybakov,A.A. Sorokin, S.S. Balabanov, E.Ye. Rostokina, Yu.V. Bykov, J. Eur. Ceram.Soc., 2021, DOI 10.1016/j.jeurceramsoc.2021.06.028
[4] Clarke, D.R., J. Am. Ceram. Soc., 1999, 82, 485–502, DOI 10.1111/j.1151-2916.1999.tb01793.x
[5] Arefin, M.L., F. Raether, D. Dolejs, A. Klimera, Ceram. Int., 2009, 35, 3313–3320, DOI 10.1016/j.ceramint.2009.05.030
[6] Bykov, Yu.V., S.V. Egorov, A.G. Eremeev, V.V. Kholoptsev, K.I. Rybakov,A.A. Sorokin, J. Am. Ceram. Soc., 2015, 98, 3518–3524,DOI 10.1111/jace.13809
[7] Bykov, Yu.V., S.V. Egorov, A.G. Eremeev, V.V. Kholoptsev, I.V. Plotnikov, K.I.Rybakov, A.A. Sorokin, Materials, 2016, 9, 684, DOI 10.3390/ma9080684
[8] Bykov, Yu.V., S.V. Egorov, A.G. Eremeev, V.V. Kholoptsev, I.V. Plotnikov,K.I. Rybakov, A.A. Sorokin, S.S. Balabanov, A.V. Belyaev, J. Am. Ceram. Soc.,2019, 102, 559–568, DOI 10.1111/jace.15788
[9] Rybakov, K.I., V.E. Semenov, Philos. Mag. A, 1996, 73, 295–307,DOI 10.1080/01418619608244384
101
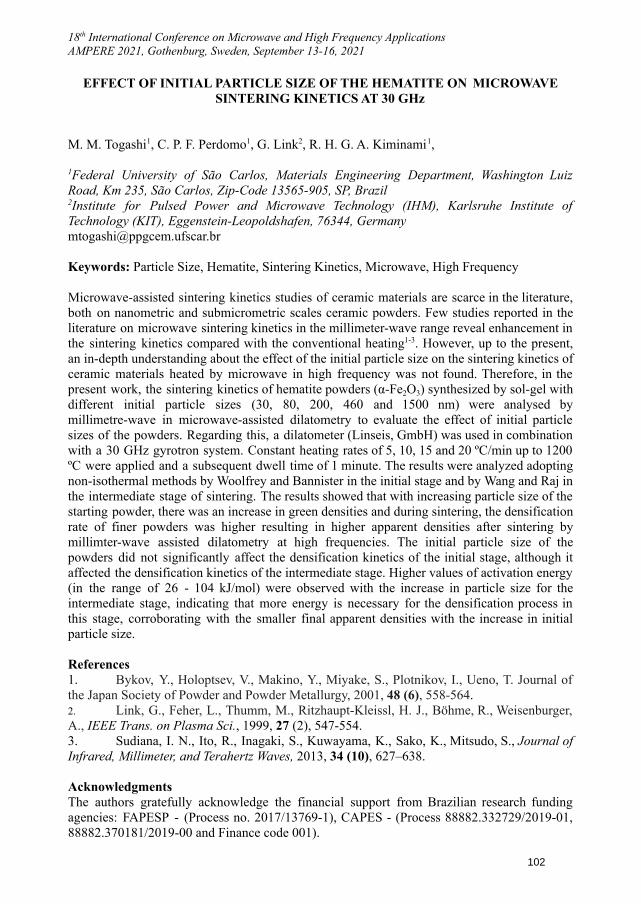
18th International Conference on Microwave and High Frequency ApplicationsAMPERE 2021, Gothenburg, Sweden, September 13-16, 2021
EFFECT OF INITIAL PARTICLE SIZE OF THE HEMATITE ON MICROWAVESINTERING KINETICS AT 30 GHz
M. M. Togashi1, C. P. F. Perdomo1, G. Link2, R. H. G. A. Kiminami1,
1Federal University of São Carlos, Materials Engineering Department, Washington LuizRoad, Km 235, São Carlos, Zip-Code 13565-905, SP, Brazil2Institute for Pulsed Power and Microwave Technology (IHM), Karlsruhe Institute ofTechnology (KIT), Eggenstein-Leopoldshafen, 76344, [email protected]
Keywords: Particle Size, Hematite, Sintering Kinetics, Microwave, High Frequency
Microwave-assisted sintering kinetics studies of ceramic materials are scarce in the literature,both on nanometric and submicrometric scales ceramic powders. Few studies reported in theliterature on microwave sintering kinetics in the millimeter-wave range reveal enhancement inthe sintering kinetics compared with the conventional heating1-3. However, up to the present,an in-depth understanding about the effect of the initial particle size on the sintering kinetics ofceramic materials heated by microwave in high frequency was not found. Therefore, in thepresent work, the sintering kinetics of hematite powders (α-Fe2O3) synthesized by sol-gel withdifferent initial particle sizes (30, 80, 200, 460 and 1500 nm) were analysed bymillimetre-wave in microwave-assisted dilatometry to evaluate the effect of initial particlesizes of the powders. Regarding this, a dilatometer (Linseis, GmbH) was used in combinationwith a 30 GHz gyrotron system. Constant heating rates of 5, 10, 15 and 20 ºC/min up to 1200ºC were applied and a subsequent dwell time of 1 minute. The results were analyzed adoptingnon-isothermal methods by Woolfrey and Bannister in the initial stage and by Wang and Raj inthe intermediate stage of sintering. The results showed that with increasing particle size of thestarting powder, there was an increase in green densities and during sintering, the densificationrate of finer powders was higher resulting in higher apparent densities after sintering bymillimter-wave assisted dilatometry at high frequencies. The initial particle size of thepowders did not significantly affect the densification kinetics of the initial stage, although itaffected the densification kinetics of the intermediate stage. Higher values of activation energy(in the range of 26 - 104 kJ/mol) were observed with the increase in particle size for theintermediate stage, indicating that more energy is necessary for the densification process inthis stage, corroborating with the smaller final apparent densities with the increase in initialparticle size.
References1. Bykov, Y., Holoptsev, V., Makino, Y., Miyake, S., Plotnikov, I., Ueno, T. Journal ofthe Japan Society of Powder and Powder Metallurgy, 2001, 48 (6), 558-564.2. Link, G., Feher, L., Thumm, M., Ritzhaupt-Kleissl, H. J., Böhme, R., Weisenburger,A., IEEE Trans. on Plasma Sci., 1999, 27 (2), 547-554.3. Sudiana, I. N., Ito, R., Inagaki, S., Kuwayama, K., Sako, K., Mitsudo, S., Journal ofInfrared, Millimeter, and Terahertz Waves, 2013, 34 (10), 627–638.
AcknowledgmentsThe authors gratefully acknowledge the financial support from Brazilian research fundingagencies: FAPESP - (Process no. 2017/13769-1), CAPES - (Process 88882.332729/2019-01,88882.370181/2019-00 and Finance code 001).
102
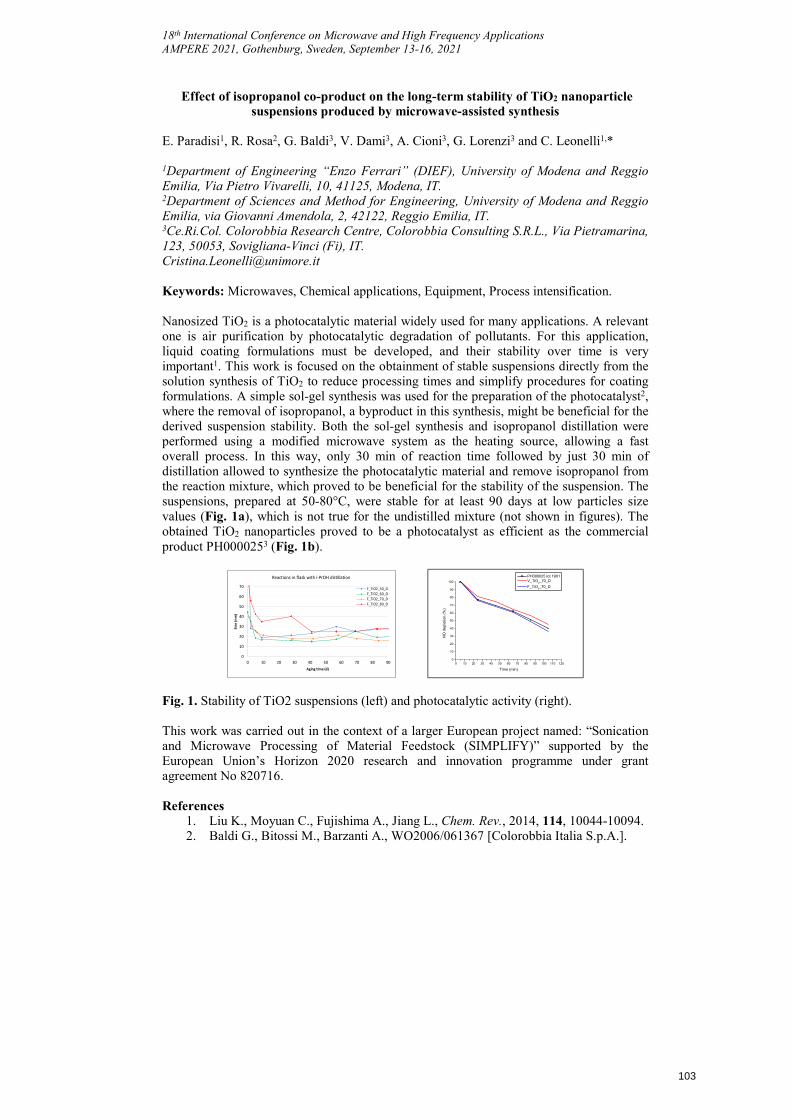
18th International Conference on Microwave and High Frequency Applications AMPERE 2021, Gothenburg, Sweden, September 13-16, 2021
Effect of isopropanol co-product on the long-term stability of TiO2 nanoparticle suspensions produced by microwave-assisted synthesis
E. Paradisi1, R. Rosa2, G. Baldi3, V. Dami3, A. Cioni3, G. Lorenzi3 and C. Leonelli1,*
1Department of Engineering “Enzo Ferrari” (DIEF), University of Modena and Reggio Emilia, Via Pietro Vivarelli, 10, 41125, Modena, IT. 2Department of Sciences and Method for Engineering, University of Modena and Reggio Emilia, via Giovanni Amendola, 2, 42122, Reggio Emilia, IT. 3Ce.Ri.Col. Colorobbia Research Centre, Colorobbia Consulting S.R.L., Via Pietramarina, 123, 50053, Sovigliana-Vinci (Fi), IT. [email protected]
Keywords: Microwaves, Chemical applications, Equipment, Process intensification.
Nanosized TiO2 is a photocatalytic material widely used for many applications. A relevant one is air purification by photocatalytic degradation of pollutants. For this application, liquid coating formulations must be developed, and their stability over time is very important1. This work is focused on the obtainment of stable suspensions directly from the solution synthesis of TiO2 to reduce processing times and simplify procedures for coating formulations. A simple sol-gel synthesis was used for the preparation of the photocatalyst2, where the removal of isopropanol, a byproduct in this synthesis, might be beneficial for the derived suspension stability. Both the sol-gel synthesis and isopropanol distillation were performed using a modified microwave system as the heating source, allowing a fast overall process. In this way, only 30 min of reaction time followed by just 30 min of distillation allowed to synthesize the photocatalytic material and remove isopropanol from the reaction mixture, which proved to be beneficial for the stability of the suspension. The suspensions, prepared at 50-80°C, were stable for at least 90 days at low particles size values (Fig. 1a), which is not true for the undistilled mixture (not shown in figures). The obtained TiO2 nanoparticles proved to be a photocatalyst as efficient as the commercial product PH0000253 (Fig. 1b).
0
10
20
30
40
50
60
70
0 10 20 30 40 50 60 70 80 90
Size
(nm
)
Aging time (d)
Reactions in flask with i-PrOH distillation
F_TiO2_50_DF_TiO2_60_DF_TiO2_70_DF_TiO2_80_D
0 10 20 30 40 50 60 70 80 90 100 110 1200
10
20
30
40
50
60
70
80
90
100
NO
de
plet
ion
(%
)
Time (min)
PH000025 lot 1901V_TiO
2_70_D
F_TiO2_70_D
Fig. 1. Stability of TiO2 suspensions (left) and photocatalytic activity (right).
This work was carried out in the context of a larger European project named: “Sonication and Microwave Processing of Material Feedstock (SIMPLIFY)” supported by the European Union’s Horizon 2020 research and innovation programme under grant agreement No 820716.
References 1. Liu K., Moyuan C., Fujishima A., Jiang L., Chem. Rev., 2014, 114, 10044-10094.2. Baldi G., Bitossi M., Barzanti A., WO2006/061367 [Colorobbia Italia S.p.A.].
103
ELECTROMAGNETIC MODELLING OF MICROWAVE HEATING USING
FDTD METHOD
P. Dhar1, B. Das1, P.S Dash1,1Tata Steel Limited, Jamshedpur, India
[email protected], [email protected]
Keywords: Microwave, Modelling, Cavity, Waveguide, Dielectric properties, Permittivity, Field, Electromagnetic, Material interaction
Abstract
Microwave heating occurs through the interaction of a material with the alternating electric and magnetic fields of the microwave [1]. The degree of heating of each material depends upon its dielectric properties such as permittivity (ε’) and dielectric loss (ε”). The difference in material properties results in non-uniform heating and gives rise to unexpected physical behavior, such as the formation of hot spots [2]. Electromagnetic modelling can give us insights by predicting the heating behavior of materials and occurrence of such phenomena which is otherwise difficult to obtain by direct measurement. Finite Difference Time Domain (FDTD) is a method that can suitably model non-homogeneous materials with arbitrarily shaped geometries [3]. It also helps in carrying out both time and frequency domain analyses to study field distribution, scattering parameters and power distribution during microwave heating [4]. In this study, a model was developed to solve coupled electromagnetic and heat transfer equations using FDTD method in Quickwave software. The model was used to describe the heating of a material for 30 s in a 1200W microwave oven with a single waveguide. The position of the waveguide and dimensions of the sample were varied to study their effect on power dissipation and temperature profile. The composition of the material was also varied to study the effect of dielectric properties on the average power delivery in the sample and cavity. The different modeling parameters such as cell size, heating time step, and number of iterations for steady state electromagnetic field were optimized.
1. Introduction
Microwave energy is a form of radiation that is transported by the force fields of electromagnetic waves. These waves can propagate through perfect vacuum and do not require any medium to transfer energy from one object to another [5]. Electromagnetic waves are characterized by their frequency, velocity, and electric field strength. Maxwell discovered that electromagnetic waves are composed of electric and magnetic field components that are aligned perpendicular to one another [6]. The components (E and B) vary in time and space as they propagate through any medium. As with other electromagnetic wave such as radio waves, microwaves are also prone to reflection, refraction, and polarization [7].
Microwave heating occurs through the interaction of a material with the alternating electric and magnetic fields of the microwave. The two fundamental properties which measure the response of the material to an electric field are the permittivity or dielectric constant (ε’) and dielectric loss (ε”) [8]. The permittivity or dielectric constant (ε’) determines the ability of a material to store electric energy, while the dielectric loss (ε”) determines the ability of the material to convert the electric energy to heat [9].
104
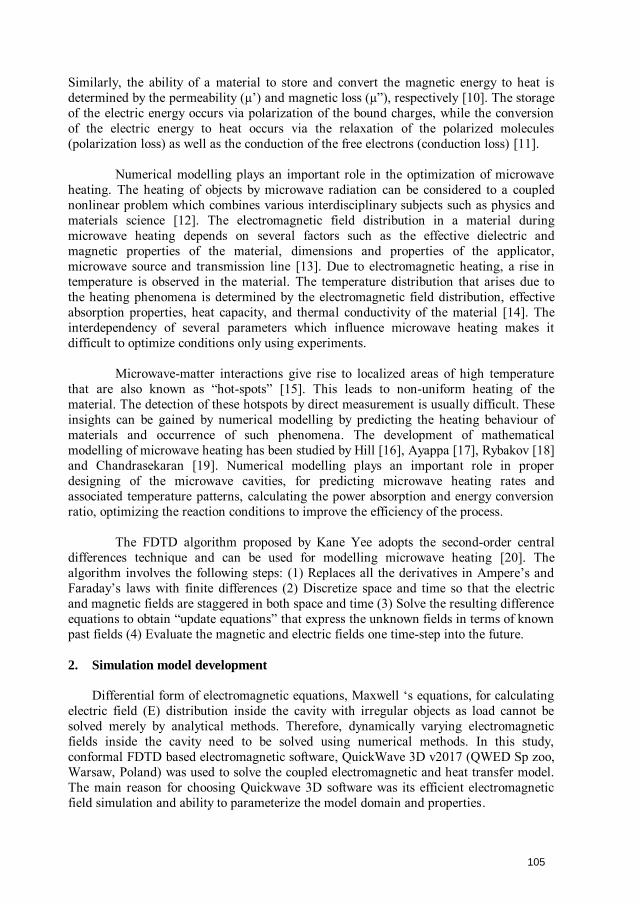
Similarly, the ability of a material to store and convert the magnetic energy to heat is determined by the permeability (µ’) and magnetic loss (µ”), respectively [10]. The storage of the electric energy occurs via polarization of the bound charges, while the conversion of the electric energy to heat occurs via the relaxation of the polarized molecules (polarization loss) as well as the conduction of the free electrons (conduction loss) [11].
Numerical modelling plays an important role in the optimization of microwave heating. The heating of objects by microwave radiation can be considered to a coupled nonlinear problem which combines various interdisciplinary subjects such as physics and materials science [12]. The electromagnetic field distribution in a material during microwave heating depends on several factors such as the effective dielectric and magnetic properties of the material, dimensions and properties of the applicator, microwave source and transmission line [13]. Due to electromagnetic heating, a rise in temperature is observed in the material. The temperature distribution that arises due to the heating phenomena is determined by the electromagnetic field distribution, effective absorption properties, heat capacity, and thermal conductivity of the material [14]. The interdependency of several parameters which influence microwave heating makes it difficult to optimize conditions only using experiments.
Microwave-matter interactions give rise to localized areas of high temperature that are also known as “hot-spots” [15]. This leads to non-uniform heating of the material. The detection of these hotspots by direct measurement is usually difficult. These insights can be gained by numerical modelling by predicting the heating behaviour of materials and occurrence of such phenomena. The development of mathematical modelling of microwave heating has been studied by Hill [16], Ayappa [17], Rybakov [18] and Chandrasekaran [19]. Numerical modelling plays an important role in proper designing of the microwave cavities, for predicting microwave heating rates and associated temperature patterns, calculating the power absorption and energy conversion ratio, optimizing the reaction conditions to improve the efficiency of the process.
The FDTD algorithm proposed by Kane Yee adopts the second-order central differences technique and can be used for modelling microwave heating [20]. The algorithm involves the following steps: (1) Replaces all the derivatives in Ampere’s and Faraday’s laws with finite differences (2) Discretize space and time so that the electric and magnetic fields are staggered in both space and time (3) Solve the resulting difference equations to obtain “update equations” that express the unknown fields in terms of known past fields (4) Evaluate the magnetic and electric fields one time-step into the future.
2. Simulation model development
Differential form of electromagnetic equations, Maxwell ‘s equations, for calculating electric field (E) distribution inside the cavity with irregular objects as load cannot be solved merely by analytical methods. Therefore, dynamically varying electromagnetic fields inside the cavity need to be solved using numerical methods. In this study, conformal FDTD based electromagnetic software, QuickWave 3D v2017 (QWED Sp zoo, Warsaw, Poland) was used to solve the coupled electromagnetic and heat transfer model. The main reason for choosing Quickwave 3D software was its efficient electromagnetic field simulation and ability to parameterize the model domain and properties.
105
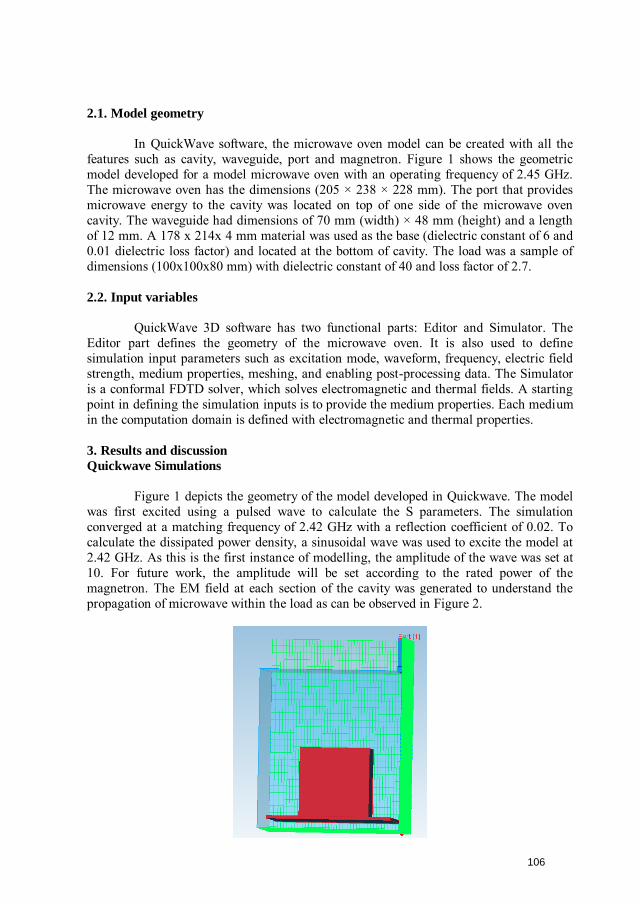
2.1. Model geometry
In QuickWave software, the microwave oven model can be created with all the features such as cavity, waveguide, port and magnetron. Figure 1 shows the geometric model developed for a model microwave oven with an operating frequency of 2.45 GHz. The microwave oven has the dimensions (205 × 238 × 228 mm). The port that provides microwave energy to the cavity was located on top of one side of the microwave oven cavity. The waveguide had dimensions of 70 mm (width) × 48 mm (height) and a length of 12 mm. A 178 x 214x 4 mm material was used as the base (dielectric constant of 6 and 0.01 dielectric loss factor) and located at the bottom of cavity. The load was a sample of dimensions (100x100x80 mm) with dielectric constant of 40 and loss factor of 2.7.
2.2. Input variables
QuickWave 3D software has two functional parts: Editor and Simulator. The Editor part defines the geometry of the microwave oven. It is also used to define simulation input parameters such as excitation mode, waveform, frequency, electric field strength, medium properties, meshing, and enabling post-processing data. The Simulator is a conformal FDTD solver, which solves electromagnetic and thermal fields. A starting point in defining the simulation inputs is to provide the medium properties. Each medium in the computation domain is defined with electromagnetic and thermal properties.
3. Results and discussion
Quickwave Simulations
Figure 1 depicts the geometry of the model developed in Quickwave. The model was first excited using a pulsed wave to calculate the S parameters. The simulation converged at a matching frequency of 2.42 GHz with a reflection coefficient of 0.02. To calculate the dissipated power density, a sinusoidal wave was used to excite the model at 2.42 GHz. As this is the first instance of modelling, the amplitude of the wave was set at 10. For future work, the amplitude will be set according to the rated power of themagnetron. The EM field at each section of the cavity was generated to understand thepropagation of microwave within the load as can be observed in Figure 2.
106
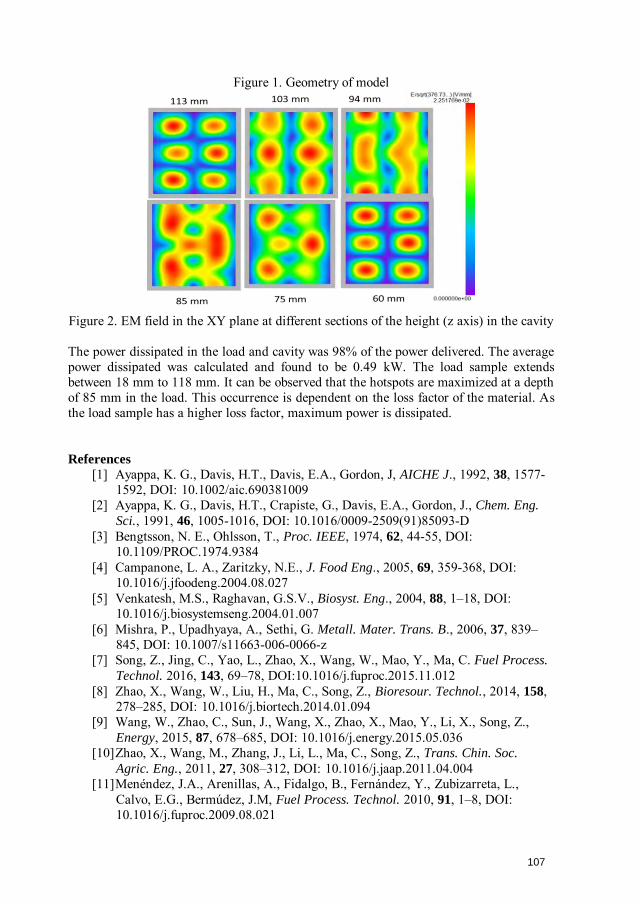
Figure 1. Geometry of model
Figure 2. EM field in the XY plane at different sections of the height (z axis) in the cavity
The power dissipated in the load and cavity was 98% of the power delivered. The average power dissipated was calculated and found to be 0.49 kW. The load sample extends between 18 mm to 118 mm. It can be observed that the hotspots are maximized at a depth of 85 mm in the load. This occurrence is dependent on the loss factor of the material. As the load sample has a higher loss factor, maximum power is dissipated.
References
[1] Ayappa, K. G., Davis, H.T., Davis, E.A., Gordon, J, AICHE J., 1992, 38, 1577-1592, DOI: 10.1002/aic.690381009
[2] Ayappa, K. G., Davis, H.T., Crapiste, G., Davis, E.A., Gordon, J., Chem. Eng.
Sci., 1991, 46, 1005-1016, DOI: 10.1016/0009-2509(91)85093-D[3] Bengtsson, N. E., Ohlsson, T., Proc. IEEE, 1974, 62, 44-55, DOI:
10.1109/PROC.1974.9384[4] Campanone, L. A., Zaritzky, N.E., J. Food Eng., 2005, 69, 359-368, DOI:
10.1016/j.jfoodeng.2004.08.027[5] Venkatesh, M.S., Raghavan, G.S.V., Biosyst. Eng., 2004, 88, 1–18, DOI:
10.1016/j.biosystemseng.2004.01.007[6] Mishra, P., Upadhyaya, A., Sethi, G. Metall. Mater. Trans. B., 2006, 37, 839–
845, DOI: 10.1007/s11663-006-0066-z[7] Song, Z., Jing, C., Yao, L., Zhao, X., Wang, W., Mao, Y., Ma, C. Fuel Process.
Technol. 2016, 143, 69–78, DOI:10.1016/j.fuproc.2015.11.012[8] Zhao, X., Wang, W., Liu, H., Ma, C., Song, Z., Bioresour. Technol., 2014, 158,
278–285, DOI: 10.1016/j.biortech.2014.01.094[9] Wang, W., Zhao, C., Sun, J., Wang, X., Zhao, X., Mao, Y., Li, X., Song, Z.,
Energy, 2015, 87, 678–685, DOI: 10.1016/j.energy.2015.05.036[10] Zhao, X., Wang, M., Zhang, J., Li, L., Ma, C., Song, Z., Trans. Chin. Soc.
Agric. Eng., 2011, 27, 308–312, DOI: 10.1016/j.jaap.2011.04.004[11] Menéndez, J.A., Arenillas, A., Fidalgo, B., Fernández, Y., Zubizarreta, L.,
Calvo, E.G., Bermúdez, J.M, Fuel Process. Technol. 2010, 91, 1–8, DOI:10.1016/j.fuproc.2009.08.021
107
[12] Haque, K.E., Int. J. Miner. Process. 1999, 57, 1–24, DOI: 10.1016/S0301-7516(99)00009-5.
[13] Araszkiewicz, M., Koziol, A., Lupinska, A., Lupinski, M., Dry. Technol., 2007,25, 569–574, DOI: 10.1080/07373930701226989
[14] Upadhyaya, D.D., Ghosh, A., Dey, G.K., Prasad, R., Suri, A.K., J. Mater. Sci.,2001, 36, 4707–4710, DOI: 10.1023/A:1017966703650
[15] Hesas, R.H., Daud, W., Sahu, J.N., Arami-Niya, A., J. Anal. Appl. Pyrolysis,2013, 100, 1–11, DOI: 10.1016/j.jaap.2012.12.019
[16] Hill J.M., Marchant T.R., Appl. Math. Model, 1996, 20, 3–15, DOI:10.1016/0307-904X (95)00107-U
[17] Ayappa K.G., Rev. Chem. Eng., 1997, 13, 1–63, DOI:10.1515/REVCE.1997.13.2.1
[18] Rybakov K.I., Olevsky E.A., Krikun, E.V., J. Am. Ceram. Soc., 2013, 96, 1003–1020, DOI: 10.1111/jace.12278
[19] Chandrasekaran S., Ramanathan, S., Basak, T., AICHE J., 2012, 58, 330–363,DOI:10.1002/aic.12766
[20] Yee, K.S., Chen, J.S., IEEE T ANTENN PROPAG, 1997, 45, 354-363, DOI:10.1109/8.558651.
108
Enhanced Microwave Absorption in Glass Batch through Batch Pretreatment and Alternative Raw Materials
K. Al-Hamdan1, V. Grimm2, J. S. Wiltzsch3, R. Behrend2, W. Wintzer4, H. Krause2
1TU Bergakademie Freiberg, Institute of glas science and technology, Professorship of glass and enamel technology, Leipziger Straße 28, 09599 Freiberg, Germany 2TU Bergakademie Freiberg, Institute of thermal engineering, Professorship of Gas and Heat systems, Gustav- Zeuner-Straße 7, 09599 Freiberg, Germany 3Technical University of Nuremberg Georg Simon Ohm, Faculty of Materials Technology 4JSJ Jodeit GmbH, Am Naßtal 10, 07751 Jena, Germany
Keywords: microwave, glass melting, power applications
Abstract
Microwave heated glass melting has been under considerable research and development in the past 10 years [1]. The ongoing research shows significant advantages in both energy consumption and melting time. However, many technical problems remain, one being the low microwave absorption of standard glass batch. Low microwave absorption stems mostly from two primary factors: Low microwave absorption of most of the raw materials (e.g. silica) and low material density. Within this project, we developed several methods for the improvement of microwave absorption and subsequent melting. These methods divide in batch pretreatment and replacement of raw materials. For batch treatment, we studied pelletisation and briquetting of the batch with several techniques. This included variations in agglomeration size from 5 mm to 50 mm and water content from 3% to 13%. Components of glass batches can be replaced for better microwave absorption, as long as the glass quality is not affected. The effects of such replacement has been studied for white glass be replacing Na2CO3 with NaOH and CaCO3 with CaO and MgCO3 with MgO in varying proportions. Prepared glass batches were heated in a mono-mode applicator in corundum and boron nitride crucibles. Temperature was measured with a pyrometer; microwave power was supplied by a 3 kW 2.45 GHz magnetron. The effect of batch preparation and alternative raw materials was evaluated qualitatively by measuring time until primary melting was achieved. In addition, a choice of glass batches was molten in a demonstrator scale microwave heated furnace Laboratory results clearly show positive effects of pelletisation and usage for alternative raw materials. Small pellets significantly reduced melting time, but the higher water content impacts specific energy consumption. On demonstrator scale alternative raw materials yield better results, especially the usage of NaOH. A positive side effect of pellet use was reduced dusting and thus reduced plasma formation.
1. Introduction
The question of the efficient use of resources and the reduction of emissions in industrial processes is a main goal of environmental policy and of strategic interest for the glass industry. Currently, the process heat in glass melting furnaces is predominantly obtained from the combustion of natural gas. This contrasts with the goals of the energy transition, according to which 100% of Germany’s primary energy supply is to be covered by
109
renewable energy sources by 2045. In conclusion, a vision for the future is "That currently the process heat in glass melting tanks is mainly covered with electrical energy." Glasses are made with a wide variety of compositions (so-called batches). The glasses that are industrially produced in large quantities today are silicate glasses with the main component SiO2. The most important silicate glasses can be divided into five groups (glass types) [2]:
- Alkali-earth-alkali-silicate glasses (window and container glasses),- Borosilicate glasses (laboratory glass, medical glass),- Lead silicate glasses (lead crystal),- Alumosilicate glasses (ECR glass fiber) and- Alumo- borosilicate glasses (E-glass fiber).
The raw materials used for glass production are oxides (e.g. SiO2, B2O3) or salts (e.g. Na2CO3, CaCO3) and cullet [3]. The batch is made from these raw materials, which is placed in a furnace and melted at temperatures of 1450 to 1700 ° C. Glass production includes the following technological process steps [4]:
1. The primary melting of the main raw material components (cullet, lime, sodaand part of the sand),
2. The secondary melting / dissolving of not yet melted sand components inthe glass melt,
3. The removal of the bubbles from the melt (the so-called refining) and4. The cooling of the melt to the moulding temperature.
The energy requirement for melting glass is considerable and depends heavily on the tonnage and the type of glass; for example, the energy requirement for the production of one ton container glass (use of 50% cullet) is around 5 GJ. In glass production, the most energy-intensive step is the primary melting of the main raw material components, which, according to our own work at the institute for Glass and Enamel Technology, amounts to 70-90% of the total theoretical energy requirement.A more efficient use of electrical heat on a larger scale to heat the batch can be useful usingmicrowave heating. Microwaves can penetrate the bulk batch and heat it from the insideout, thus accelerating the batch heating. After primary melting is complete, the use of themicrowave is seen as less advantageous compared to conventional methods, since themicrowave only penetrates electrically conductive media to a limited extent and thusmainly heats the area near the surface. Therefore A distinction must be made between meltand batch. According to our measurements, batch shows penetration depths in the rangebetween 0.4 m and 4 m, depending on the temperature and composition. In the case ofglass melts, the depth of penetration of the electromagnetic radiation is very small and is amaximum of 1 cm. In the case of melting of the batch, the microwave loses its effect for themajority part as soon as a molten phase develops on the surface of the batch heap and, dueto its relatively high electrical conductivity, prevents the microwaves from penetrating. Inthis case, most of the microwave is reflected.To achieve this goal, a glass melting furnace with a deliberately structurally separate batchinsert (melting on an inclined plane) should be developed and microwave technologyshould preferably be used in this insert area, since this is where the energy-intensivemelting process takes place.
110
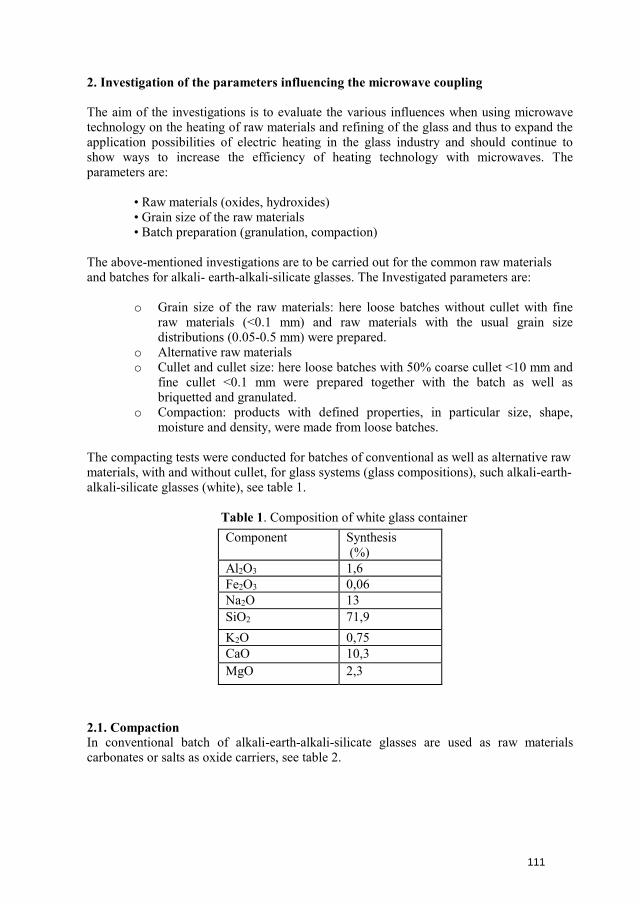
2. Investigation of the parameters influencing the microwave coupling
The aim of the investigations is to evaluate the various influences when using microwave technology on the heating of raw materials and refining of the glass and thus to expand the application possibilities of electric heating in the glass industry and should continue to show ways to increase the efficiency of heating technology with microwaves. The parameters are:
• Raw materials (oxides, hydroxides)• Grain size of the raw materials• Batch preparation (granulation, compaction)
The above-mentioned investigations are to be carried out for the common raw materials and batches for alkali- earth-alkali-silicate glasses. The Investigated parameters are:
o Grain size of the raw materials: here loose batches without cullet with fineraw materials (<0.1 mm) and raw materials with the usual grain sizedistributions (0.05-0.5 mm) were prepared.
o Alternative raw materialso Cullet and cullet size: here loose batches with 50% coarse cullet <10 mm and
fine cullet <0.1 mm were prepared together with the batch as well asbriquetted and granulated.
o Compaction: products with defined properties, in particular size, shape,moisture and density, were made from loose batches.
The compacting tests were conducted for batches of conventional as well as alternative raw materials, with and without cullet, for glass systems (glass compositions), such alkali-earth-alkali-silicate glasses (white), see table 1.
Table 1. Composition of white glass container
2.1. Compaction In conventional batch of alkali-earth-alkali-silicate glasses are used as raw materials carbonates or salts as oxide carriers, see table 2.
Component Synthesis (%)
Al2O3 1,6 Fe2O3 0,06 Na2O 13 SiO2 71,9 K2O 0,75 CaO 10,3 MgO 2,3
111
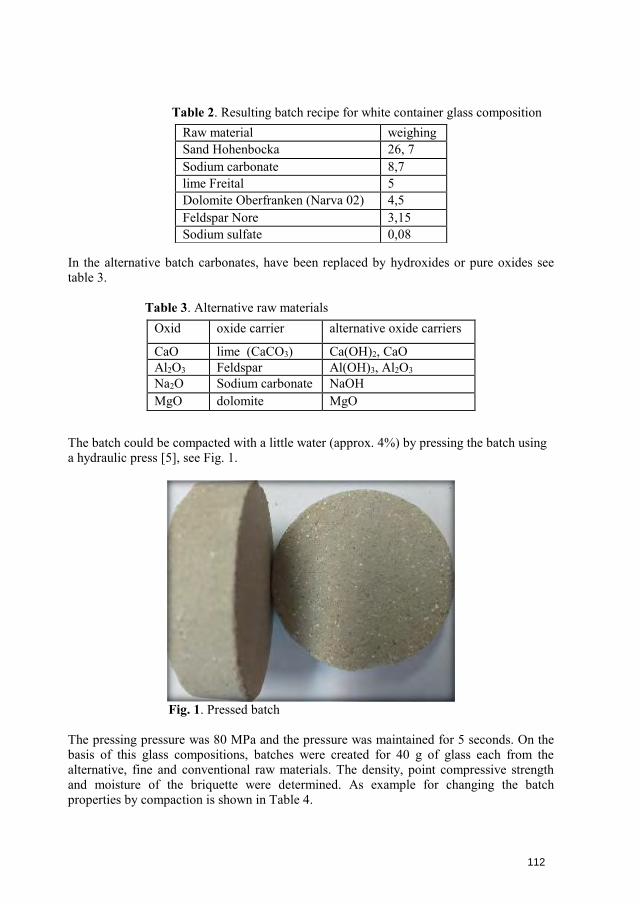
Table 2. Resulting batch recipe for white container glass composition
In the alternative batch carbonates, have been replaced by hydroxides or pure oxides see table 3.
Table 3. Alternative raw materials
The batch could be compacted with a little water (approx. 4%) by pressing the batch using a hydraulic press [5], see Fig. 1.
Fig. 1. Pressed batch
The pressing pressure was 80 MPa and the pressure was maintained for 5 seconds. On the basis of this glass compositions, batches were created for 40 g of glass each from the alternative, fine and conventional raw materials. The density, point compressive strength and moisture of the briquette were determined. As example for changing the batch properties by compaction is shown in Table 4.
Raw material weighing Sand Hohenbocka 26, 7 Sodium carbonate 8,7 lime Freital 5 Dolomite Oberfranken (Narva 02) 4,5 Feldspar Nore 3,15 Sodium sulfate 0,08
Oxid oxide carrier alternative oxide carriers
CaO lime (CaCO3) Ca(OH)2, CaO Al2O3 Feldspar Al(OH)3, Al2O3 Na2O Sodium carbonate NaOH MgO dolomite MgO
112
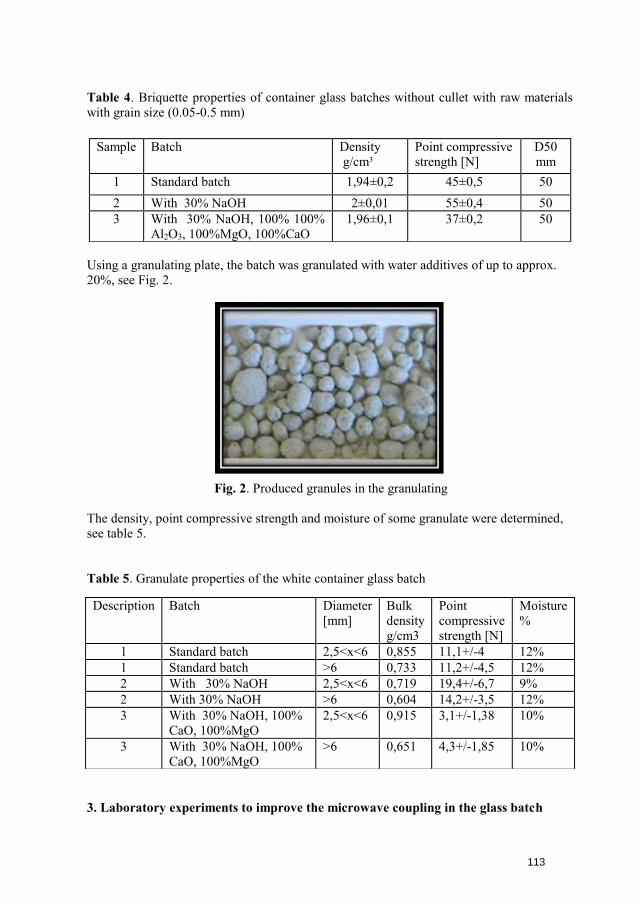
Table 4. Briquette properties of container glass batches without cullet with raw materials with grain size (0.05-0.5 mm)
Using a granulating plate, the batch was granulated with water additives of up to approx. 20%, see Fig. 2.
Fig. 2. Produced granules in the granulating
The density, point compressive strength and moisture of some granulate were determined, see table 5.
Table 5. Granulate properties of the white container glass batch
3. Laboratory experiments to improve the microwave coupling in the glass batch
Sample Batch Density g/cm³
Point compressive strength [N]
D50 mm
1 Standard batch 1,94±0,2 45±0,5 50 2 With 30% NaOH 2±0,01 55±0,4 50 3 With 30% NaOH, 100% 100%
Al2O3, 100%MgO, 100%CaO 1,96±0,1 37±0,2 50
Description Batch Diameter [mm]
Bulk density g/cm3
Point compressive strength [N]
Moisture %
1 Standard batch 2,5<x<6 0,855 11,1+/-4 12% 1 Standard batch >6 0,733 11,2+/-4,5 12% 2 With 30% NaOH 2,5<x<6 0,719 19,4+/-6,7 9% 2 With 30% NaOH >6 0,604 14,2+/-3,5 12% 3 With 30% NaOH, 100%
CaO, 100%MgO 2,5<x<6 0,915 3,1+/-1,38 10%
3 With 30% NaOH, 100% CaO, 100%MgO
>6 0,651 4,3+/-1,85 10%
113
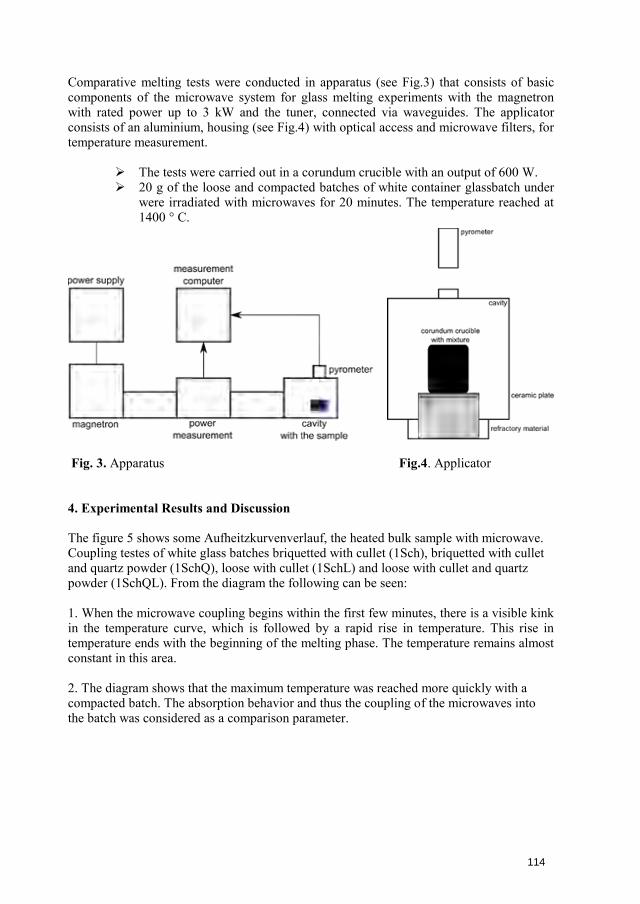
Comparative melting tests were conducted in apparatus (see Fig.3) that consists of basic components of the microwave system for glass melting experiments with the magnetron with rated power up to 3 kW and the tuner, connected via waveguides. The applicator consists of an aluminium, housing (see Fig.4) with optical access and microwave filters, for temperature measurement.
The tests were carried out in a corundum crucible with an output of 600 W. 20 g of the loose and compacted batches of white container glassbatch under
were irradiated with microwaves for 20 minutes. The temperature reached at1400 ° C.
Fig. 3. Apparatus Fig.4. Applicator
4. Experimental Results and Discussion
The figure 5 shows some Aufheitzkurvenverlauf, the heated bulk sample with microwave. Coupling testes of white glass batches briquetted with cullet (1Sch), briquetted with cullet and quartz powder (1SchQ), loose with cullet (1SchL) and loose with cullet and quartz powder (1SchQL). From the diagram the following can be seen:
1. When the microwave coupling begins within the first few minutes, there is a visible kinkin the temperature curve, which is followed by a rapid rise in temperature. This rise intemperature ends with the beginning of the melting phase. The temperature remains almostconstant in this area.
2. The diagram shows that the maximum temperature was reached more quickly with acompacted batch. The absorption behavior and thus the coupling of the microwaves intothe batch was considered as a comparison parameter.
114
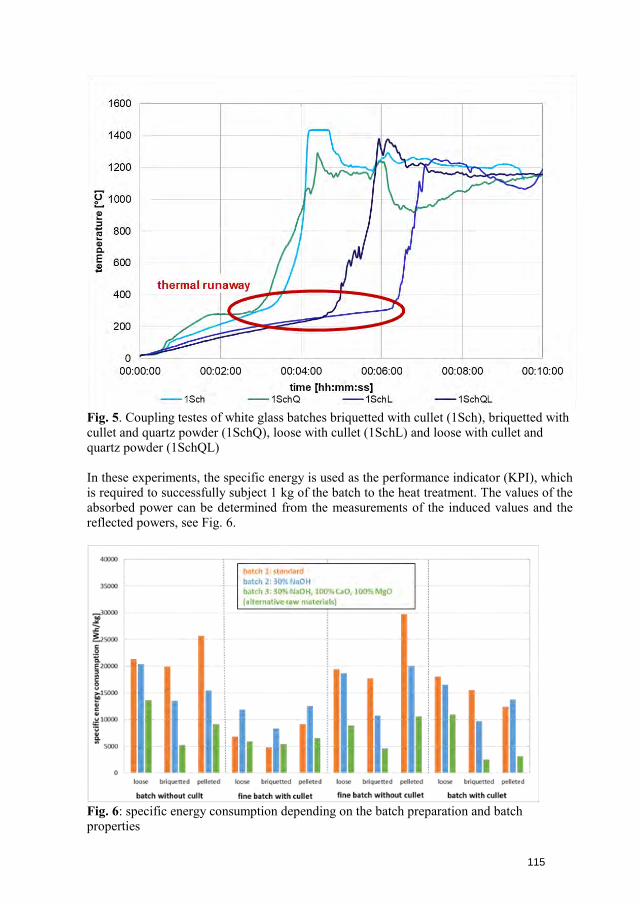
Fig. 5. Coupling testes of white glass batches briquetted with cullet (1Sch), briquetted with cullet and quartz powder (1SchQ), loose with cullet (1SchL) and loose with cullet and quartz powder (1SchQL)
In these experiments, the specific energy is used as the performance indicator (KPI), which is required to successfully subject 1 kg of the batch to the heat treatment. The values of the absorbed power can be determined from the measurements of the induced values and the reflected powers, see Fig. 6.
Fig. 6: specific energy consumption depending on the batch preparation and batch properties
115
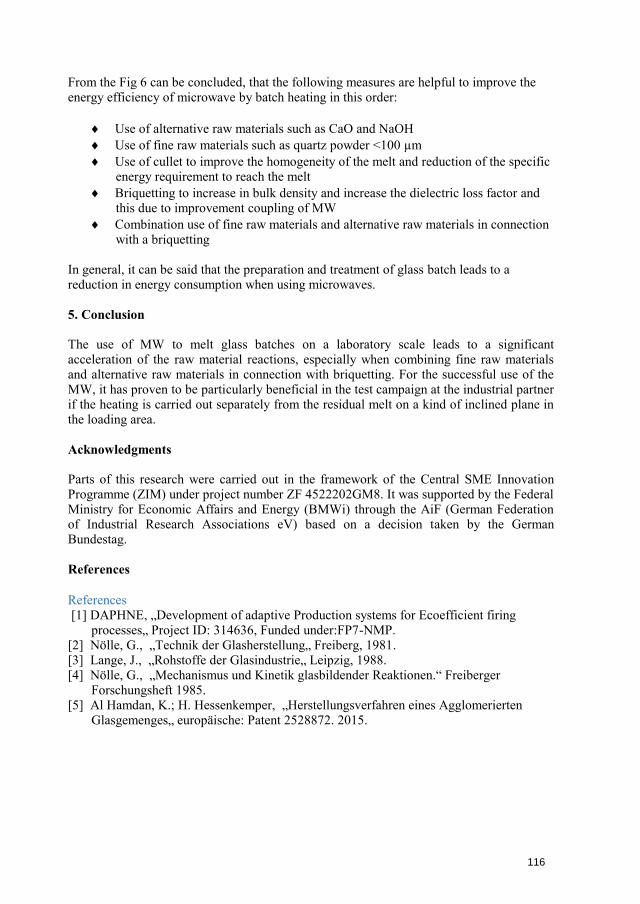
From the Fig 6 can be concluded, that the following measures are helpful to improve the energy efficiency of microwave by batch heating in this order:
Use of alternative raw materials such as CaO and NaOH Use of fine raw materials such as quartz powder <100 µm Use of cullet to improve the homogeneity of the melt and reduction of the specific
energy requirement to reach the melt Briquetting to increase in bulk density and increase the dielectric loss factor and
this due to improvement coupling of MW Combination use of fine raw materials and alternative raw materials in connection
with a briquetting
In general, it can be said that the preparation and treatment of glass batch leads to a reduction in energy consumption when using microwaves.
5. Conclusion
The use of MW to melt glass batches on a laboratory scale leads to a significant acceleration of the raw material reactions, especially when combining fine raw materials and alternative raw materials in connection with briquetting. For the successful use of the MW, it has proven to be particularly beneficial in the test campaign at the industrial partner if the heating is carried out separately from the residual melt on a kind of inclined plane in the loading area.
Acknowledgments
Parts of this research were carried out in the framework of the Central SME Innovation Programme (ZIM) under project number ZF 4522202GM8. It was supported by the Federal Ministry for Economic Affairs and Energy (BMWi) through the AiF (German Federation of Industrial Research Associations eV) based on a decision taken by the German Bundestag.
References
References [1] DAPHNE, „Development of adaptive Production systems for Ecoefficient firing
processes„ Project ID: 314636, Funded under:FP7-NMP.[2] Nölle, G., „Technik der Glasherstellung„ Freiberg, 1981.[3] Lange, J., „Rohstoffe der Glasindustrie„ Leipzig, 1988.[4] Nölle, G., „Mechanismus und Kinetik glasbildender Reaktionen.“ Freiberger
Forschungsheft 1985.[5] Al Hamdan, K.; H. Hessenkemper, „Herstellungsverfahren eines Agglomerierten
Glasgemenges„ europäische: Patent 2528872. 2015.
116
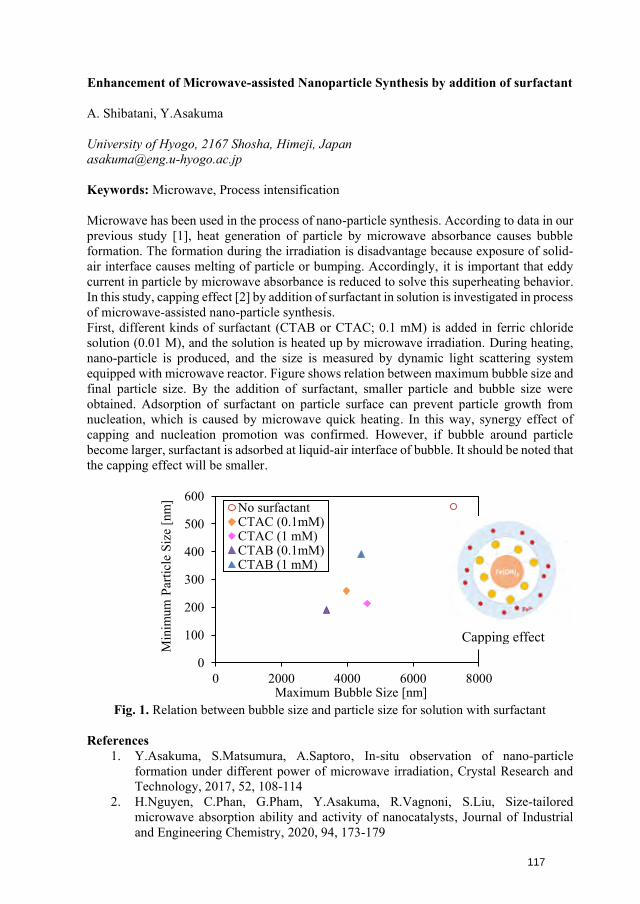
Enhancement of Microwave-assisted Nanoparticle Synthesis by addition of surfactant
A. Shibatani, Y.Asakuma
University of Hyogo, 2167 Shosha, Himeji, Japan [email protected]
Keywords: Microwave, Process intensification
Microwave has been used in the process of nano-particle synthesis. According to data in our previous study [1], heat generation of particle by microwave absorbance causes bubble formation. The formation during the irradiation is disadvantage because exposure of solid-air interface causes melting of particle or bumping. Accordingly, it is important that eddy current in particle by microwave absorbance is reduced to solve this superheating behavior. In this study, capping effect [2] by addition of surfactant in solution is investigated in process of microwave-assisted nano-particle synthesis. First, different kinds of surfactant (CTAB or CTAC; 0.1 mM) is added in ferric chloride solution (0.01 M), and the solution is heated up by microwave irradiation. During heating, nano-particle is produced, and the size is measured by dynamic light scattering system equipped with microwave reactor. Figure shows relation between maximum bubble size and final particle size. By the addition of surfactant, smaller particle and bubble size were obtained. Adsorption of surfactant on particle surface can prevent particle growth from nucleation, which is caused by microwave quick heating. In this way, synergy effect of capping and nucleation promotion was confirmed. However, if bubble around particle become larger, surfactant is adsorbed at liquid-air interface of bubble. It should be noted that the capping effect will be smaller.
Fig. 1. Relation between bubble size and particle size for solution with surfactant
References 1. Y.Asakuma, S.Matsumura, A.Saptoro, In-situ observation of nano-particle
formation under different power of microwave irradiation, Crystal Research andTechnology, 2017, 52, 108-114
2. H.Nguyen, C.Phan, G.Pham, Y.Asakuma, R.Vagnoni, S.Liu, Size-tailoredmicrowave absorption ability and activity of nanocatalysts, Journal of Industrialand Engineering Chemistry, 2020, 94, 173-179
0
100
200
300
400
500
600
0 2000 4000 6000 8000
Min
imum
Par
ticle
Siz
e [n
m]
Maximum Bubble Size [nm]
No surfactantCTAC (0.1mM)CTAC (1 mM)CTAB (0.1mM)CTAB (1 mM)
Capping effect
117
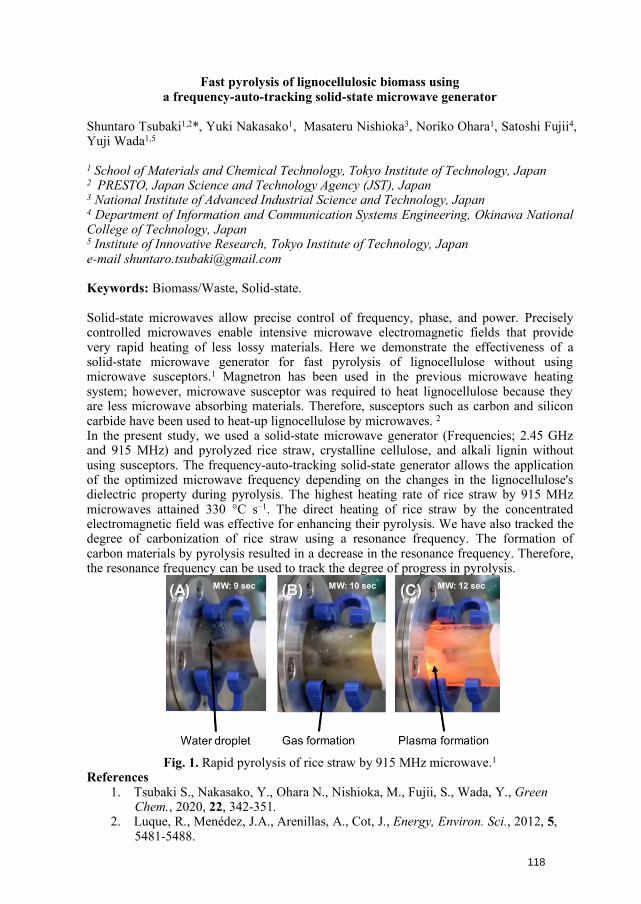
Fast pyrolysis of lignocellulosic biomass using a frequency-auto-tracking solid-state microwave generator
Shuntaro Tsubaki1,2*, Yuki Nakasako1, Masateru Nishioka3, Noriko Ohara1, Satoshi Fujii4, Yuji Wada1,5
1 School of Materials and Chemical Technology, Tokyo Institute of Technology, Japan 2 PRESTO, Japan Science and Technology Agency (JST), Japan 3 National Institute of Advanced Industrial Science and Technology, Japan 4 Department of Information and Communication Systems Engineering, Okinawa National College of Technology, Japan
5 Institute of Innovative Research, Tokyo Institute of Technology, Japan e-mail [email protected]
Keywords: Biomass/Waste, Solid-state.
Solid-state microwaves allow precise control of frequency, phase, and power. Precisely controlled microwaves enable intensive microwave electromagnetic fields that provide very rapid heating of less lossy materials. Here we demonstrate the effectiveness of a solid-state microwave generator for fast pyrolysis of lignocellulose without using microwave susceptors.1 Magnetron has been used in the previous microwave heating system; however, microwave susceptor was required to heat lignocellulose because they are less microwave absorbing materials. Therefore, susceptors such as carbon and silicon carbide have been used to heat-up lignocellulose by microwaves. 2 In the present study, we used a solid-state microwave generator (Frequencies; 2.45 GHz and 915 MHz) and pyrolyzed rice straw, crystalline cellulose, and alkali lignin without using susceptors. The frequency-auto-tracking solid-state generator allows the application of the optimized microwave frequency depending on the changes in the lignocellulose's dielectric property during pyrolysis. The highest heating rate of rice straw by 915 MHz microwaves attained 330 °C s−1. The direct heating of rice straw by the concentrated electromagnetic field was effective for enhancing their pyrolysis. We have also tracked the degree of carbonization of rice straw using a resonance frequency. The formation of carbon materials by pyrolysis resulted in a decrease in the resonance frequency. Therefore, the resonance frequency can be used to track the degree of progress in pyrolysis.
Fig. 1. Rapid pyrolysis of rice straw by 915 MHz microwave.1 References
1. Tsubaki S., Nakasako, Y., Ohara N., Nishioka, M., Fujii, S., Wada, Y., GreenChem., 2020, 22, 342-351.
2. Luque, R., Menédez, J.A., Arenillas, A., Cot, J., Energy, Environ. Sci., 2012, 5,5481-5488.
118
FIELD ASSISTED PROCESSING OF NANOSTRUCTURED CERAMICS
B. Vaidhyanathan*Department of Materials, Loughborough University, Loughborough, [email protected]
Keywords: Microwave, Processing
Abstract
The processing of nanocrystalline ceramic powders and suspensions into useful engineering components has been investigated via a series of research projects each focusing on a different stage of the manufacturing route viz., (i) the ability to control the agglomerates present in the powder resulting in the production of a free-flowing and crushable powder for die pressing, (ii) the formation of a low viscosity but high solids content nano suspensions suitable for slip casting, additive manufacturing (AM: 3D printing) and (iii) the use of novel field assisted sintering techniques. This holistic approach helped to transfer the developments achieved in each stage of the manufacturing process to the next and resulted in the ability to form fully dense advanced ceramic components whilst restricting the grain growth to a minimum.
The methodology has been employed to develop various nanostructured zirconia based ceramic components exhibiting vastly superior hydrothermal ageing resistance and mechanical performance suitable for use in biomedical implants (eg., hip/knee prosthesis, finger joints, dental and jaw repairs), surgical tools, petro-chemical valve parts as well as for ballistic armour applications. Significant advantages were noted with AM compared to conventional subtractive manufacturing methods and the 3D printing of hydrothermally immune nanostructured dental implants was considered as one of the six best modern technological developments in materials science by a recent BBC documentary (Materials for the Modern Age: The Secret Story of Stuff). These novel advancements are covered by a series of patents and papers and this talk will provide an overview of some of these developments.
*Presenting Author: Email: [email protected] ; PH: 44 1509 223152
119
GREEN HYDROGEN AND ACETYLENE CHEMISTRY RENAISSANCE ENABLED BY HIGHLY EFFICIENT CONVERSION OF HYDROCARBONS VIA MICROWAVE PLASMA REACTOR J.N. Ashcraft1, M. Leeds1, M.E. Soderholm1
1Transform Materials LLC, 7880 Central Industrial Drive, Riviera Beach, FL, USA [email protected] [email protected] [email protected]
Keywords: microwave plasma, hydrogen, acetylene, green chemistry, carbon-negative, plasma chemistry
Introduction: There is a current need for environmentally friendly and efficient methods to
produce hydrogen and acetylene as part of combatting climate change. While current technologies exist for the production of both products, established technologies are either expensive, inefficient, or generate large quantities of carbon dioxide and harmful waste products. For instance, the calcium carbide process, a leading process for the production of acetylene, emits 15kg of carbon dioxide for every 1kg of acetylene produced [2,3,4,5,6]. Natural gas is a cheap and abundant fuel gas that is also energetically stable. Current processes to convert natural gas into hydrogen or acetylene either utilize combustion or steam reforming, both of which generate copious carbon dioxide. In some cases, unreacted hydrocarbons are simply vented or flared, contributing to greenhouse gas emissions.
This paper focuses on a microwave plasma reactor, designed by Transform Materials, that utilizes a non-thermal plasma to efficiently convert methane and other light hydrocarbons into hydrogen and acetylene without the production of carbon dioxide. Key performance metrics of the reactor will be covered, including process energy efficiency, reactant conversion, product selectivity, and reactor durability. Additionally, the scale-up of the microwave reactor to pilot plant and full commercial (100 kW) scale will be highlighted.
Technology Description:
The Transform Materials (TM) reactor utilizes a non-thermal microwave plasma to convert natural gas and other light hydrocarbon feeds, such as LPG, into hydrogen and acetylene. Recycled hydrogen is co-fed into the reactor to improve product selectivity.
120
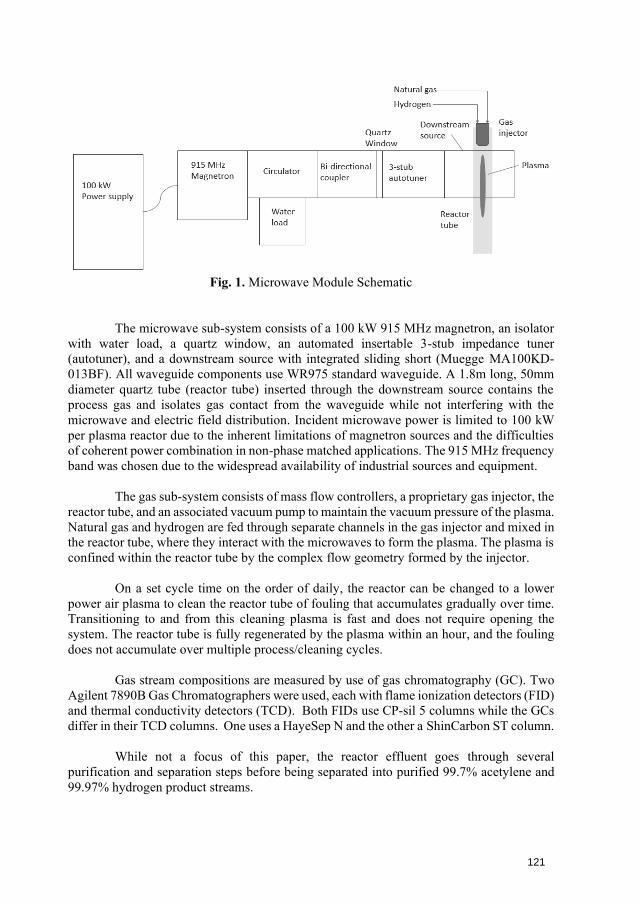
Fig. 1. Microwave Module Schematic
The microwave sub-system consists of a 100 kW 915 MHz magnetron, an isolator with water load, a quartz window, an automated insertable 3-stub impedance tuner (autotuner), and a downstream source with integrated sliding short (Muegge MA100KD-013BF). All waveguide components use WR975 standard waveguide. A 1.8m long, 50mm diameter quartz tube (reactor tube) inserted through the downstream source contains the process gas and isolates gas contact from the waveguide while not interfering with the microwave and electric field distribution. Incident microwave power is limited to 100 kW per plasma reactor due to the inherent limitations of magnetron sources and the difficulties of coherent power combination in non-phase matched applications. The 915 MHz frequency band was chosen due to the widespread availability of industrial sources and equipment.
The gas sub-system consists of mass flow controllers, a proprietary gas injector, the reactor tube, and an associated vacuum pump to maintain the vacuum pressure of the plasma. Natural gas and hydrogen are fed through separate channels in the gas injector and mixed in the reactor tube, where they interact with the microwaves to form the plasma. The plasma is confined within the reactor tube by the complex flow geometry formed by the injector.
On a set cycle time on the order of daily, the reactor can be changed to a lower power air plasma to clean the reactor tube of fouling that accumulates gradually over time. Transitioning to and from this cleaning plasma is fast and does not require opening the system. The reactor tube is fully regenerated by the plasma within an hour, and the fouling does not accumulate over multiple process/cleaning cycles.
Gas stream compositions are measured by use of gas chromatography (GC). Two Agilent 7890B Gas Chromatographers were used, each with flame ionization detectors (FID) and thermal conductivity detectors (TCD). Both FIDs use CP-sil 5 columns while the GCs differ in their TCD columns. One uses a HayeSep N and the other a ShinCarbon ST column.
While not a focus of this paper, the reactor effluent goes through several purification and separation steps before being separated into purified 99.7% acetylene and 99.97% hydrogen product streams.
121
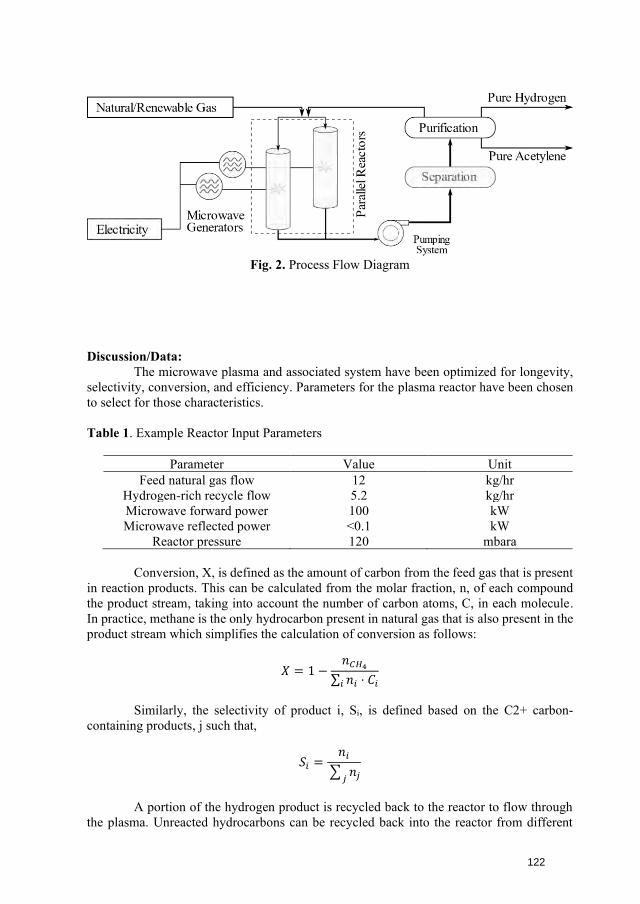
Fig. 2. Process Flow Diagram
Discussion/Data: The microwave plasma and associated system have been optimized for longevity,
selectivity, conversion, and efficiency. Parameters for the plasma reactor have been chosen to select for those characteristics.
Table 1. Example Reactor Input Parameters
Parameter Value Unit Feed natural gas flow 12 kg/hr
Hydrogen-rich recycle flow 5.2 kg/hr Microwave forward power 100 kW Microwave reflected power <0.1 kW
Reactor pressure 120 mbara
Conversion, X, is defined as the amount of carbon from the feed gas that is present in reaction products. This can be calculated from the molar fraction, n, of each compound the product stream, taking into account the number of carbon atoms, C, in each molecule. In practice, methane is the only hydrocarbon present in natural gas that is also present in the product stream which simplifies the calculation of conversion as follows:
𝑋 = 1 −𝑛𝐶𝐻4
∑ 𝑛𝑖𝑖 ⋅ 𝐶𝑖
Similarly, the selectivity of product i, Si, is defined based on the C2+ carbon-containing products, j such that,
𝑆𝑖 =𝑛𝑖
∑ 𝑛𝑗𝑗
A portion of the hydrogen product is recycled back to the reactor to flow through the plasma. Unreacted hydrocarbons can be recycled back into the reactor from different
122
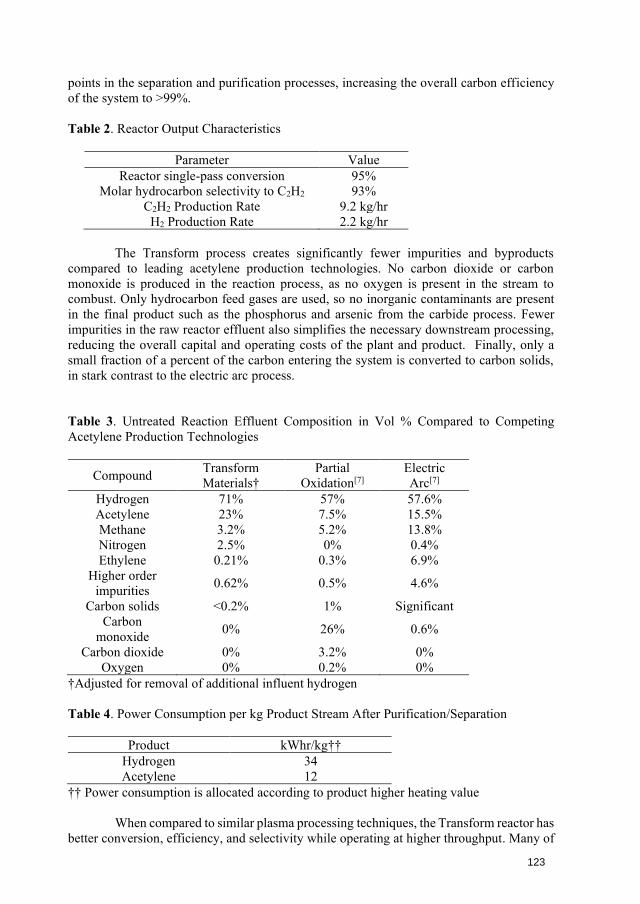
points in the separation and purification processes, increasing the overall carbon efficiency of the system to >99%.
Table 2. Reactor Output Characteristics
Parameter Value Reactor single-pass conversion 95%
Molar hydrocarbon selectivity to C2H2 93% C2H2 Production Rate 9.2 kg/hr
H2 Production Rate 2.2 kg/hr
The Transform process creates significantly fewer impurities and byproducts compared to leading acetylene production technologies. No carbon dioxide or carbon monoxide is produced in the reaction process, as no oxygen is present in the stream to combust. Only hydrocarbon feed gases are used, so no inorganic contaminants are present in the final product such as the phosphorus and arsenic from the carbide process. Fewer impurities in the raw reactor effluent also simplifies the necessary downstream processing, reducing the overall capital and operating costs of the plant and product. Finally, only a small fraction of a percent of the carbon entering the system is converted to carbon solids, in stark contrast to the electric arc process.
Table 3. Untreated Reaction Effluent Composition in Vol % Compared to Competing Acetylene Production Technologies
Compound Transform Materials†
Partial Oxidation[7]
Electric Arc[7]
Hydrogen 71% 57% 57.6% Acetylene 23% 7.5% 15.5% Methane 3.2% 5.2% 13.8% Nitrogen 2.5% 0% 0.4% Ethylene 0.21% 0.3% 6.9%
Higher order impurities 0.62% 0.5% 4.6%
Carbon solids <0.2% 1% Significant Carbon
monoxide 0% 26% 0.6%
Carbon dioxide 0% 3.2% 0% Oxygen 0% 0.2% 0%
†Adjusted for removal of additional influent hydrogen
Table 4. Power Consumption per kg Product Stream After Purification/Separation
Product kWhr/kg†† Hydrogen 34 Acetylene 12
†† Power consumption is allocated according to product higher heating value
When compared to similar plasma processing techniques, the Transform reactor has better conversion, efficiency, and selectivity while operating at higher throughput. Many of
123
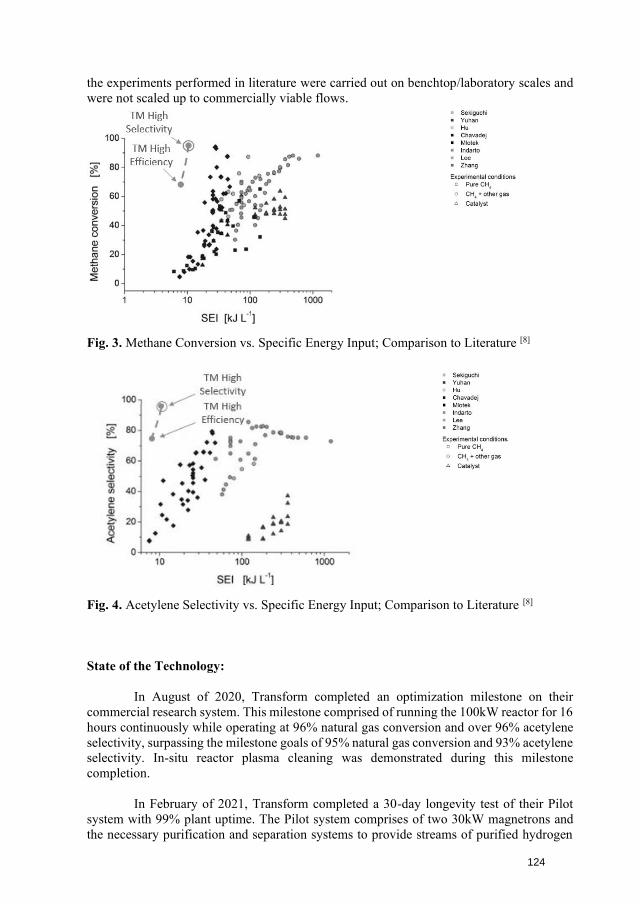
the experiments performed in literature were carried out on benchtop/laboratory scales and were not scaled up to commercially viable flows.
Fig. 3. Methane Conversion vs. Specific Energy Input; Comparison to Literature [8]
Fig. 4. Acetylene Selectivity vs. Specific Energy Input; Comparison to Literature [8]
State of the Technology:
In August of 2020, Transform completed an optimization milestone on their commercial research system. This milestone comprised of running the 100kW reactor for 16 hours continuously while operating at 96% natural gas conversion and over 96% acetylene selectivity, surpassing the milestone goals of 95% natural gas conversion and 93% acetylene selectivity. In-situ reactor plasma cleaning was demonstrated during this milestone completion.
In February of 2021, Transform completed a 30-day longevity test of their Pilot system with 99% plant uptime. The Pilot system comprises of two 30kW magnetrons and the necessary purification and separation systems to provide streams of purified hydrogen
124
and acetylene. The reactors were cycled through process and cleaning plasmas such that there was a continuous, uninterrupted flow of reactor effluent to the downstream systems.
Transform is engaging commercial partners and is designing plants to be installed around the world in 2022.
References [1] Soane, D. S., et al., U.S. Patent 10,676,353, 2020[2] Francey, S. & Tran, H. & Berglin, N.. (2011). Global survey on lime kiln operation,
energy consumption, and alternative fuel usage. Tappi Journal. 1926[3] U.S. EPA (1995, Jan.), AP 42 Fifth Edition Volume 1 Chapter 11: Mineral, 24
Products Industry, Chapter 11.4: Calcium Carbide Manufacturing[4] Ascent Supply Chain Consultants PVT. LTD., (2010, Dec. 9), Calcium Carbide:
Detailed Project Report version 1.0, 8[5] U.S. Office of Energy Efficiency & Renewable Energy (2002, Dec.), ITP Mining:
Energy and Environmental Profile of the U.S. Mining Industry, 2-17, 2-25, 9-7[6] SRI International, Yen, Yen-Chen (1981, Nov.), Process Economics Program,
Acetylene, Supp. A., 40[7] Ullmann’s Encyclopedia of Industrial Chemistry, Wiley-VCH Verlag GmbH & Co
KGaA, Weinheim (2012) 277-312[8] Scapinello, M., E. Delikonstantis, G. D. Stefanidis, Chemical Engineering &
Processing: Process Intensification, 2017, 117, 120-140.
125
GROWTH AND SPORE FORMATION OF BACILLUS NATTO BY MICROWAVE ASSISTED CULTIVATION AT OPTIMUM TEMPERATURE
AND THE EFFECT OF MICROWAVE POWER
R. Baba1, 2, W. Nagayoshi2, R. Nakama2, S. Ohuchi2*
1Department of Mechanical Information Science and Technology, Kyushu Institute of Technology, Iizuka, 820-8502, Japan 2Department of Bioscience & Bioinformatics, Kyushu Institute of Technology, Iizuka, 820-8502, Japan [email protected]
Keywords: Bacillus subtilis (natto), optimum microwave power, spore-forming bacteria
Introduction
As a high-efficiency and low-burden energy utilization method for reducing the burden on the global environment, the use of microwave energy for chemical reactions is attracting attention. In recent year, in addition to microwave effect on chemical reactions, many biological effects under microwave irradiation, including changes in microbial growth rate [1], maximum cellular mass [2], metabolic rate [1], genetic effects [3], [4], and morphological changes [5], [6] have been reported. Because the biological function, including metabolism, genetic function, and biological information transmission made happen by biomolecular interactions, namely chemical interaction, it is expected that biological effect under microwave irradiation made happen by microwave-enhanced chemistry. However, a clear conclusion has not yet been obtained. In any case, it can be said that these biological effects suggest the usefulness of microwaves for biotechnology such as high expression technology. Our group has examined the microwave effects on microbial growth by some microorganism cultivation under microwave irradiation. For example, Escherichia coli, a representative model bacterium as gram-negative bacteria, and Bacillus subtilis, a representative model bacterium as gram-positive bacteria, were cultivated under microwave irradiation by using multi-mode microwave irradiator [2]. Each Bacterium were cultivated in cultivation fluid on optimum temperature (respectively, 37°C and 50°C) by heat transmission with n-Hexane, a small permittivity liquid, using double-tube vessel. As a result, it was confirmed that the maximum cellular mass of each bacterium depends on the microwave irradiation power. Additionally, it was found that the maximum cellular mass of each bacterium showed a convex upward curve against the microwave irradiation power. It can be said that this result suggests the existence of “optimum microwave power”. This means that there are conditions of microwave power that are favorable for bacterial growth. Moreover, it is expected that the existence of dependence on other bacterial growth parameter toward some microwave conditions, such as irradiation power, spatial distribution, and frequency. Therefore, in this study, our group researched the microwave effects on microbial growth rate, maximum cellular mass, and morphological changes, using linearly traveling microwave.
Material & Methods
Bacillus natto (Bacillus subtilis subsp. subtilis NBRC16449), which is used for the production of natto (a traditional Japanese fermented food), was cultivated in LB broth (Luria – Bertani liquid cultivation medium (Miller)) at its optimum temperature (30°C) under microwave irradiation. Bacillus subtilis has the ability to change morphology,
126
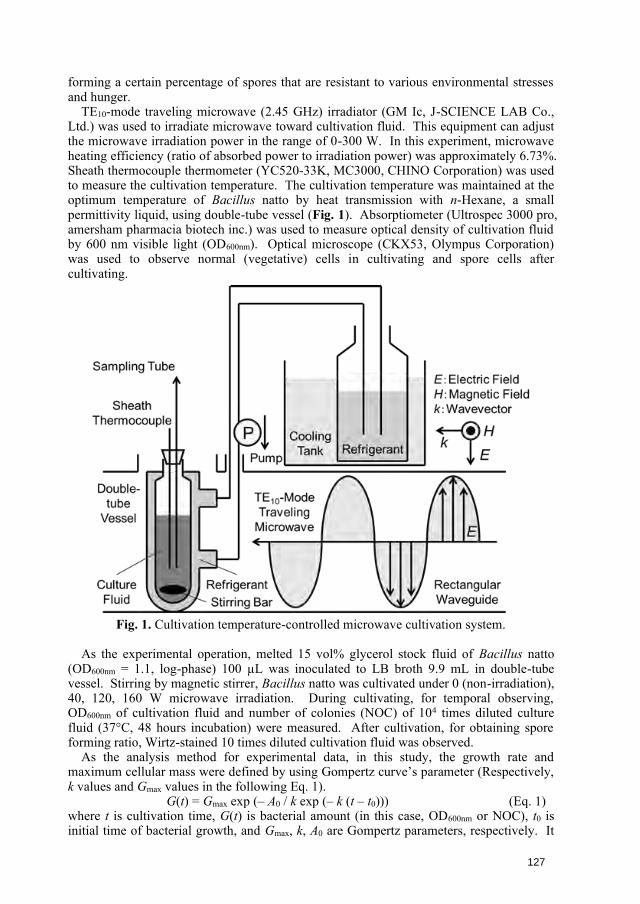
forming a certain percentage of spores that are resistant to various environmental stresses and hunger. TE10-mode traveling microwave (2.45 GHz) irradiator (GM Ic, J-SCIENCE LAB Co., Ltd.) was used to irradiate microwave toward cultivation fluid. This equipment can adjust the microwave irradiation power in the range of 0-300 W. In this experiment, microwave heating efficiency (ratio of absorbed power to irradiation power) was approximately 6.73%. Sheath thermocouple thermometer (YC520-33K, MC3000, CHINO Corporation) was used to measure the cultivation temperature. The cultivation temperature was maintained at the optimum temperature of Bacillus natto by heat transmission with n-Hexane, a small permittivity liquid, using double-tube vessel (Fig. 1). Absorptiometer (Ultrospec 3000 pro, amersham pharmacia biotech inc.) was used to measure optical density of cultivation fluid by 600 nm visible light (OD600nm). Optical microscope (CKX53, Olympus Corporation) was used to observe normal (vegetative) cells in cultivating and spore cells after cultivating.
Fig. 1. Cultivation temperature-controlled microwave cultivation system.
As the experimental operation, melted 15 vol% glycerol stock fluid of Bacillus natto (OD600nm = 1.1, log-phase) 100 µL was inoculated to LB broth 9.9 mL in double-tube vessel. Stirring by magnetic stirrer, Bacillus natto was cultivated under 0 (non-irradiation), 40, 120, 160 W microwave irradiation. During cultivating, for temporal observing, OD600nm of cultivation fluid and number of colonies (NOC) of 104 times diluted culture fluid (37°C, 48 hours incubation) were measured. After cultivation, for obtaining spore forming ratio, Wirtz-stained 10 times diluted cultivation fluid was observed. As the analysis method for experimental data, in this study, the growth rate and maximum cellular mass were defined by using Gompertz curve’s parameter (Respectively, k values and Gmax values in the following Eq. 1).
G(t) = Gmax exp (– A0 / k exp (– k (t – t0))) (Eq. 1) where t is cultivation time, G(t) is bacterial amount (in this case, OD600nm or NOC), t0 is initial time of bacterial growth, and Gmax, k, A0 are Gompertz parameters, respectively. It
127
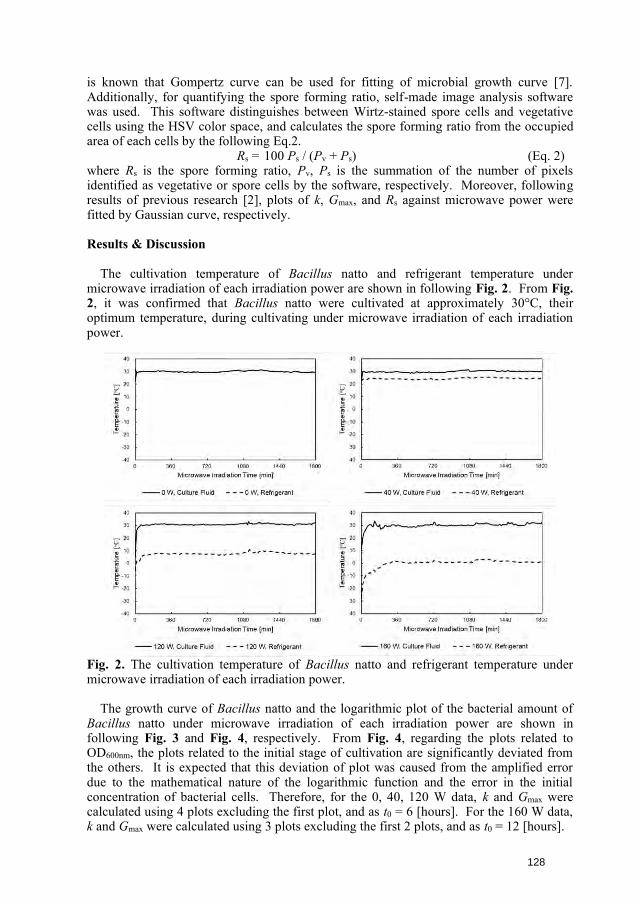
is known that Gompertz curve can be used for fitting of microbial growth curve [7]. Additionally, for quantifying the spore forming ratio, self-made image analysis software was used. This software distinguishes between Wirtz-stained spore cells and vegetative cells using the HSV color space, and calculates the spore forming ratio from the occupied area of each cells by the following Eq.2.
Rs = 100 Ps / (Pv + Ps) (Eq. 2) where Rs is the spore forming ratio, Pv, Ps is the summation of the number of pixels identified as vegetative or spore cells by the software, respectively. Moreover, following results of previous research [2], plots of k, Gmax, and Rs against microwave power were fitted by Gaussian curve, respectively.
Results & Discussion
The cultivation temperature of Bacillus natto and refrigerant temperature under microwave irradiation of each irradiation power are shown in following Fig. 2. From Fig. 2, it was confirmed that Bacillus natto were cultivated at approximately 30°C, their optimum temperature, during cultivating under microwave irradiation of each irradiation power.
Fig. 2. The cultivation temperature of Bacillus natto and refrigerant temperature under microwave irradiation of each irradiation power.
The growth curve of Bacillus natto and the logarithmic plot of the bacterial amount of Bacillus natto under microwave irradiation of each irradiation power are shown in following Fig. 3 and Fig. 4, respectively. From Fig. 4, regarding the plots related to OD600nm, the plots related to the initial stage of cultivation are significantly deviated from the others. It is expected that this deviation of plot was caused from the amplified error due to the mathematical nature of the logarithmic function and the error in the initial concentration of bacterial cells. Therefore, for the 0, 40, 120 W data, k and Gmax were calculated using 4 plots excluding the first plot, and as t0 = 6 [hours]. For the 160 W data, k and Gmax were calculated using 3 plots excluding the first 2 plots, and as t0 = 12 [hours].
128
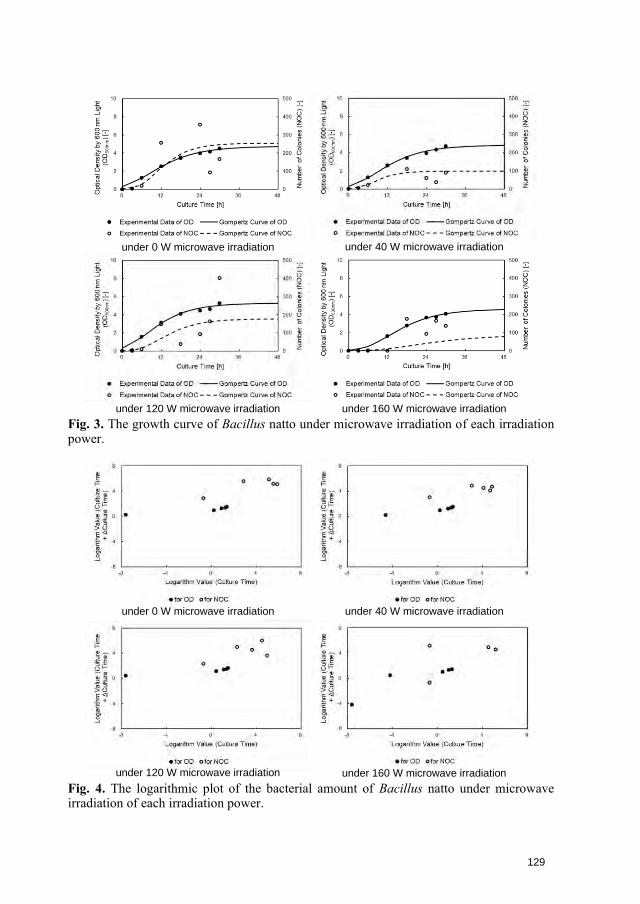
Fig. 3. The growth curve of Bacillus natto under microwave irradiation of each irradiation power.
Fig. 4. The logarithmic plot of the bacterial amount of Bacillus natto under microwave irradiation of each irradiation power.
under 0 W microwave irradiation under 40 W microwave irradiation
under 120 W microwave irradiation under 160 W microwave irradiation
under 0 W microwave irradiation under 40 W microwave irradiation
under 120 W microwave irradiation under 160 W microwave irradiation
129
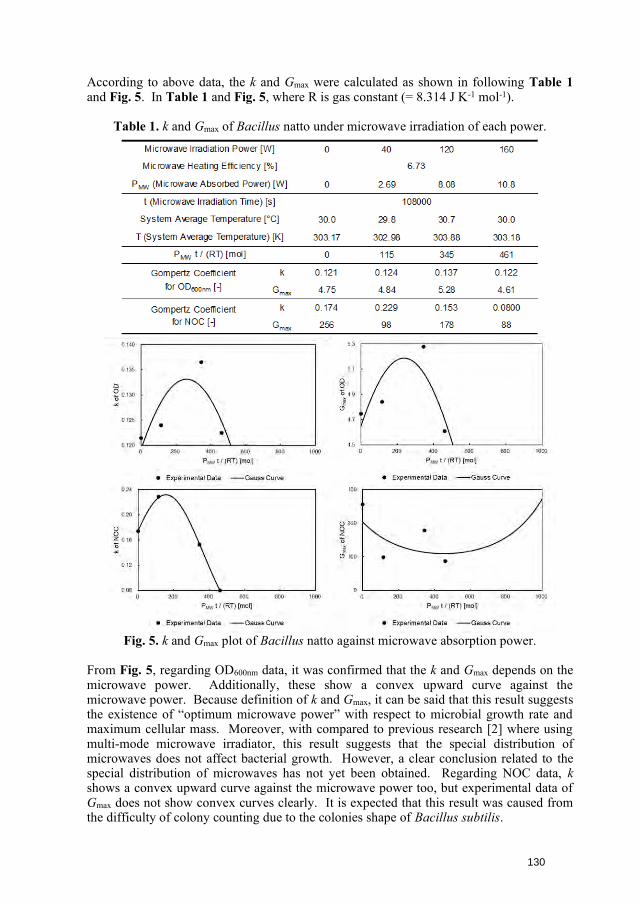
According to above data, the k and Gmax were calculated as shown in following Table 1 and Fig. 5. In Table 1 and Fig. 5, where R is gas constant (= 8.314 J K-1 mol-1).
Table 1. k and Gmax of Bacillus natto under microwave irradiation of each power.
Fig. 5. k and Gmax plot of Bacillus natto against microwave absorption power.
From Fig. 5, regarding OD600nm data, it was confirmed that the k and Gmax depends on the microwave power. Additionally, these show a convex upward curve against the microwave power. Because definition of k and Gmax, it can be said that this result suggests the existence of “optimum microwave power” with respect to microbial growth rate and maximum cellular mass. Moreover, with compared to previous research [2] where using multi-mode microwave irradiator, this result suggests that the special distribution of microwaves does not affect bacterial growth. However, a clear conclusion related to the special distribution of microwaves has not yet been obtained. Regarding NOC data, k shows a convex upward curve against the microwave power too, but experimental data of Gmax does not show convex curves clearly. It is expected that this result was caused from the difficulty of colony counting due to the colonies shape of Bacillus subtilis.
130
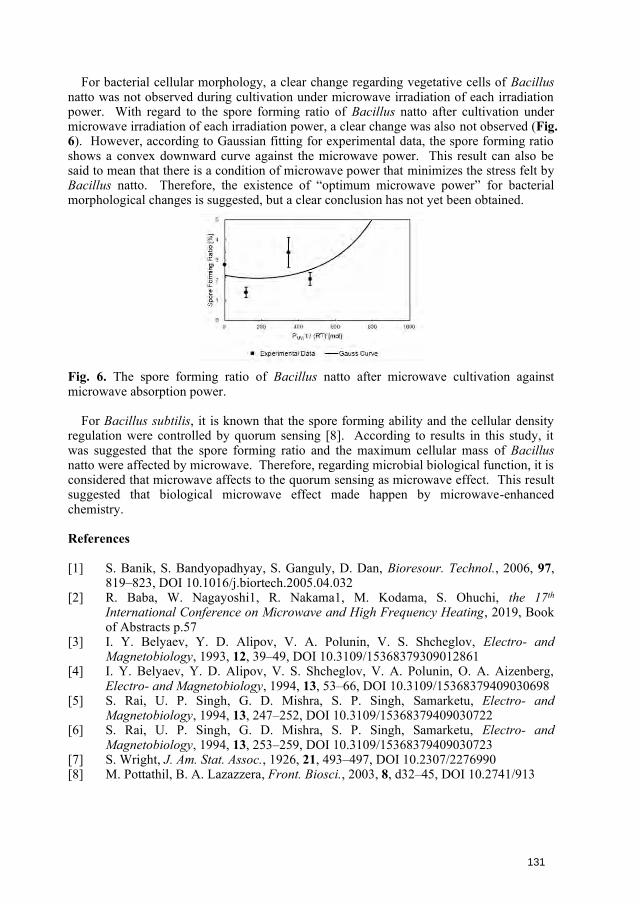
For bacterial cellular morphology, a clear change regarding vegetative cells of Bacillus natto was not observed during cultivation under microwave irradiation of each irradiation power. With regard to the spore forming ratio of Bacillus natto after cultivation under microwave irradiation of each irradiation power, a clear change was also not observed (Fig. 6). However, according to Gaussian fitting for experimental data, the spore forming ratio shows a convex downward curve against the microwave power. This result can also be said to mean that there is a condition of microwave power that minimizes the stress felt by Bacillus natto. Therefore, the existence of “optimum microwave power” for bacterial morphological changes is suggested, but a clear conclusion has not yet been obtained.
Fig. 6. The spore forming ratio of Bacillus natto after microwave cultivation against microwave absorption power.
For Bacillus subtilis, it is known that the spore forming ability and the cellular density regulation were controlled by quorum sensing [8]. According to results in this study, it was suggested that the spore forming ratio and the maximum cellular mass of Bacillus natto were affected by microwave. Therefore, regarding microbial biological function, it is considered that microwave affects to the quorum sensing as microwave effect. This result suggested that biological microwave effect made happen by microwave-enhanced chemistry.
References
[1] S. Banik, S. Bandyopadhyay, S. Ganguly, D. Dan, Bioresour. Technol., 2006, 97,819–823, DOI 10.1016/j.biortech.2005.04.032
[2] R. Baba, W. Nagayoshi1, R. Nakama1, M. Kodama, S. Ohuchi, the 17th
International Conference on Microwave and High Frequency Heating, 2019, Bookof Abstracts p.57
[3] I. Y. Belyaev, Y. D. Alipov, V. A. Polunin, V. S. Shcheglov, Electro- andMagnetobiology, 1993, 12, 39–49, DOI 10.3109/15368379309012861
[4] I. Y. Belyaev, Y. D. Alipov, V. S. Shcheglov, V. A. Polunin, O. A. Aizenberg,Electro- and Magnetobiology, 1994, 13, 53–66, DOI 10.3109/15368379409030698
[5] S. Rai, U. P. Singh, G. D. Mishra, S. P. Singh, Samarketu, Electro- andMagnetobiology, 1994, 13, 247–252, DOI 10.3109/15368379409030722
[6] S. Rai, U. P. Singh, G. D. Mishra, S. P. Singh, Samarketu, Electro- andMagnetobiology, 1994, 13, 253–259, DOI 10.3109/15368379409030723
[7] S. Wright, J. Am. Stat. Assoc., 1926, 21, 493–497, DOI 10.2307/2276990[8] M. Pottathil, B. A. Lazazzera, Front. Biosci., 2003, 8, d32–45, DOI 10.2741/913
131
HIGH TEMPERATURE DIELECTRIC PROPERTIES MEASUREMENT OF COALS THROUGH CAVITY PERTURBATION METHOD
Abhinav Kumar Soni1, Chitresh Kundu2, Bidyut Das1, Pratik Swarup Dash1, Prabal Patra2
1 Research and development, Tata Steel, Jamshedpur, India 2 Automation development center, Tata Steel, Jamshedpur, India [email protected]
Keywords: Microwave, Dielectric properties, Measurement applications, Characterisation.
Abstract
Coal can be considered as an ancient biomass factory that has a massive energy content stored within its atomic bonds. Fossil fuels always have played a critical role in accelerating worldwide industrial development. Coal has played a pivotal role in shaping the steel industry. Coke is a derivative product from coal that is necessary for producing the final steel product from hot metal production through blast furnace route. Dielectric properties of different rank of coals have been measured by cavity perturbation method. Effect on change in di-electric behaviour of coals, mixed with susceptors is also studied with this technique. Samples were heated in a furnace and tests were conducted in high purity Argon atmosphere. Six different microwave frequencies from 400 MHz to 3 GHz and temperatures up to 1000°C in steps were used for each sample. An attempt is made to correlate coals’ physical and chemical properties with microwave related properties such as dielectric constant, loss tangent and microwave transparency. Microwave heating of coals was found to increase with evolution of semi soft phases in coal up to 650°C. Beyond this temperature, heating decreased with coke formation, when microwave reflecting phases were present. Dielectric loss tangent was higher for coals with higher ranks.
1. Introduction
Microwaves (MW) are electromagnetic radiation with frequency ranging from 0.3 to 300 GHz[1]. Coals are important industrial materials primarily used in power generation and hot metal production. Use of microwaves in drying of coals before taking them in to industrial use has been explored by many researchers[2-4]. Coals used in steel making industry goes through the process of carbonization in which coal is converted in to hard porous mass called coke[5, 6]. Coke is then used as fuel in blast furnaces for iron making process[7, 8]. When coal goes through the carbonization process, its chemical and physical structure changes. It can be an interesting study to explore the variations in its dielectric properties during this process.
On application of microwave radiation, some energy gets stored in material and some energy is lost in form of heat. The ratio of lost to stored energy is known as loss tangent (tan δ).
… (1)
132
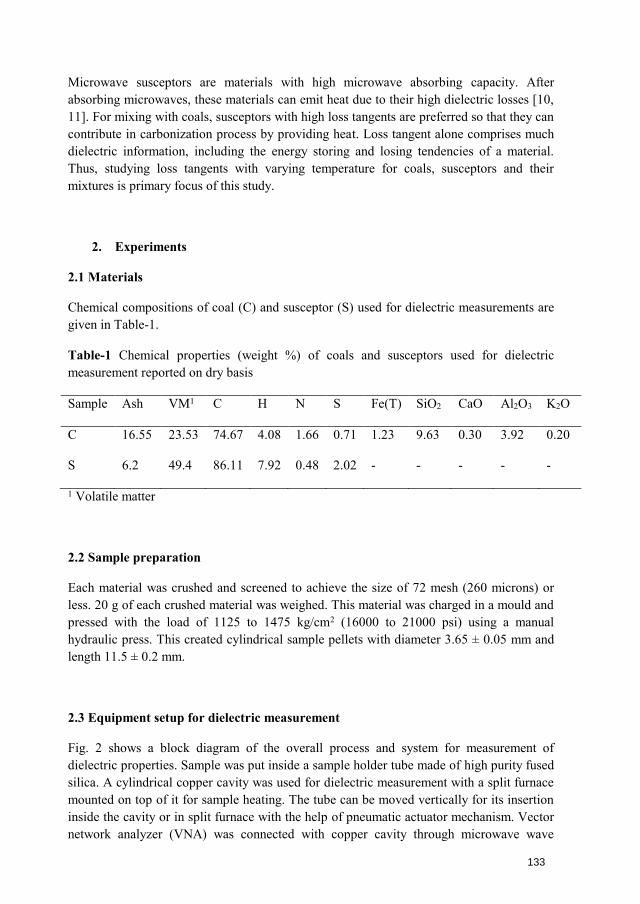
Microwave susceptors are materials with high microwave absorbing capacity. After absorbing microwaves, these materials can emit heat due to their high dielectric losses [10, 11]. For mixing with coals, susceptors with high loss tangents are preferred so that they can contribute in carbonization process by providing heat. Loss tangent alone comprises much dielectric information, including the energy storing and losing tendencies of a material. Thus, studying loss tangents with varying temperature for coals, susceptors and their mixtures is primary focus of this study.
2. Experiments
2.1 Materials
Chemical compositions of coal (C) and susceptor (S) used for dielectric measurements are given in Table-1.
Table-1 Chemical properties (weight %) of coals and susceptors used for dielectric measurement reported on dry basis
Sample Ash VM1 C H N S Fe(T) SiO2 CaO Al2O3 K2O
C 16.55 23.53 74.67 4.08 1.66 0.71 1.23 9.63 0.30 3.92 0.20
S 6.2 49.4 86.11 7.92 0.48 2.02 - - - - -
1 Volatile matter
2.2 Sample preparation
Each material was crushed and screened to achieve the size of 72 mesh (260 microns) or less. 20 g of each crushed material was weighed. This material was charged in a mould and pressed with the load of 1125 to 1475 kg/cm2 (16000 to 21000 psi) using a manual hydraulic press. This created cylindrical sample pellets with diameter 3.65 ± 0.05 mm and length 11.5 ± 0.2 mm.
2.3 Equipment setup for dielectric measurement
Fig. 2 shows a block diagram of the overall process and system for measurement of dielectric properties. Sample was put inside a sample holder tube made of high purity fused silica. A cylindrical copper cavity was used for dielectric measurement with a split furnace mounted on top of it for sample heating. The tube can be moved vertically for its insertion inside the cavity or in split furnace with the help of pneumatic actuator mechanism. Vector network analyzer (VNA) was connected with copper cavity through microwave wave
133
guides with two ports for power transmission and for receiving reflected power from cavity. A computer was used as data processor and controller for VNA, pneumatic actuator and heating/cooling cycle of split furnace.
The external diameter of cylindrical portion of copper cavity is 600 mm with wall thickness of 20 mm. Top and bottom plates of cavity also have same thickness. The internal height of cavity is 53 mm. Sample holder’s movement is calibrated to keep the sample pellet at the center of cavity or furnace. All the outer surfaces of cavity (i.e. top and bottom flat surfaces and curved surface of cylindrical portion) are insulated to avoid any heat gain from furnace or heat loss to environment.
Some of the other accessories were ultra-high purity (UHP) Argon gas cylinders (for inert environment in sample holder), gas transportation pipes, mass flow controller for gas and air (for pneumatic movement of sample holder) and copper sample for calibration before starting of test.
2.4 Test conditions
Before starting dielectric measurement of test samples, one test is run with standard copper sample and then with empty sample holder tube for calibration purpose. Then sample pellet is inserted in holder tube, which goes up in cavity with the help of vertical movement of pneumatic actuator. UHP Argon is purged in holder tube with velocity of 10 sccm (standard cubic centimeter per minute). VNA can provide microwave power and to record reflected power. First step of test is conducted at room temperature. Then sample is risen to furnace’s center and temperature is raised to 50°C. Sample is then brought back to cavity center and another round of VNA data collection in run. This cycle continues till readings are taken for temperature up to 1000°C in steps of 50°C.
After this, dielectric measurement is done in cooling cycle. Temperature of sample is brought down from 1000°C to 100°C in steps of 100°C, then one reading is taken at room temperature. All these data are generated for six different microwave frequencies- 397, 912, 1429, 1948, 2466 and 2986 MHz.
2.4 Methodology to calculate dielectric properties
The measurement of dielectric properties was done through cavity perturbation method [12]. VNA provides microwave power to cavity through one port and measures the reflected power through both ports. A sample interacts with microwave and causes perturbation in the frequency of microwave being reflected. Thus, there is a change in reflected frequency of microwave between an empty cavity and a cavity with sample. This difference in frequency (Δf) provides quality factor (Q) of the microwave circuit by the following relation:
134
… (2)
Where, f0 is the resonance frequency of the cavity. Dielectric constant of sample can be calculated by the equation:
… (3)
And loss constant is given by:
… (4)
Where, fC is Resonance frequency of empty cavity (Hz), fS is Resonance frequency of cavity with sample (Hz), VC is Volume of empty cavity (m3), VS is Volume of sample (m3), QC is Quality factor of empty cavity and QS is Quality factor of cavity with sample.
Loss tangent is finally calculated by eq. (1). The equations provided in this section (2.4) are based on the studies of Hutcheon et. al. [13-15], who have developed many equations related to dielectric measurement method. Since sample pellets are cylindrical in shape, shape correction factors are incorporated while calculating dielectric properties [16].
3. Results and discussion
The loss tangents curves of coal, susceptor and mixture are shown from Fig. 1 to Fig. 3 respectively. Legend of these curves for different frequencies are – Red diamond-solid line for 397 MHz, Blue square-solid line for 912 MHz, Black cross-solid line for 1429 MHz, Blue circle-dotted line for 1948 MHz, Red cross-dotted line for 2466 MHz and Black diamond-dotted line for 2986 MHz.
In the process of carbonization of coal, it is heated in absence of oxygen or air. From room temperature to approximately 350°C, there are no major changes in physical and chemical structures of coal. Only moisture of coal gets evaporated from the coal mass. The hydrocarbon based volatile materials (VM) of coal vaporizes in the temperature range of 350°C to 650°C, leaving behind pores in coal as the gases vent out. In approximately the same temperature range, free radicals are generated and coal starts fusing and becomes semi-soft. Thus, in this temperature range, as shown in Fig. 1, microwave absorption and heat generation of coal increases due to the presence of metaplast, enriched with free radicals.
After 650°C, resolidification of coal starts and it turns into a hard, porous mass called semi-coke. During the resolidification, atomic/molecular structure of coal becomes more arranged. In coke, there is slightly more carbon in form of graphite, as compared to large amorphous structure of coal. Since graphite is a conducting material, coke is more
135
microwave reflective as compared to coal. Thus, after 650°C, microwave absorption and heat generation reduces and the loss tangent shows a decline in curve.
Around 700-750°C, coke formation is complete and now there are larger amounts of conductive graphitic content in material. This causes more reflection of microwaves and trends of loss tangent curves are unreliable from this point onwards. During the cooling cycle, coke retains its chemical and physical structure, causing its loss tangent curve to stay almost constant.
The temperature ranges mentioned above to explain coal’s dielectric behavior may differ slightly for different coals, based on their chemical and physical properties or origin. At any given temperature, coal shows highest loss tangent for lowest frequency. This is because as the frequency increases, the penetration depth of microwave decreases. This reduces the microwave absorption and heat generation by coals and hence, the loss tangent decreases.
Loss tangent of susceptor is shown in Fig. 2. This susceptor has large amount of hydrocarbon based VM. This VM composition is different from coal, hence it evaporates at different temperature range. Initially, moisture evaporation happens, then from 150 to 250°C, VM gets evaporated showing sharp decrease in loss tangent. After which, Material gets heated at a steady rate. It can be seen that this susceptor gets heated at lower temperatures with higher loss tangents than coal.
The result for mixture of coals and susceptors is shown in Fig. 3. Here, coal is still getting heated with a similar trend as the pure coal. But due to the presence of susceptor, heating is fast as denoted by higher loss tangents at any given temperture compared to pure coal. The dip of susceptor at 250°C is not observed in mixture, because mixing of these materials causes interaction or exchange of VM during heating, causing an steady VM evaporation rate in place of sudden evaporation. The peak of pure coal at 650°C is also not visible, as the coke making is happening more staedily and faster due to presence of susceptor.
136
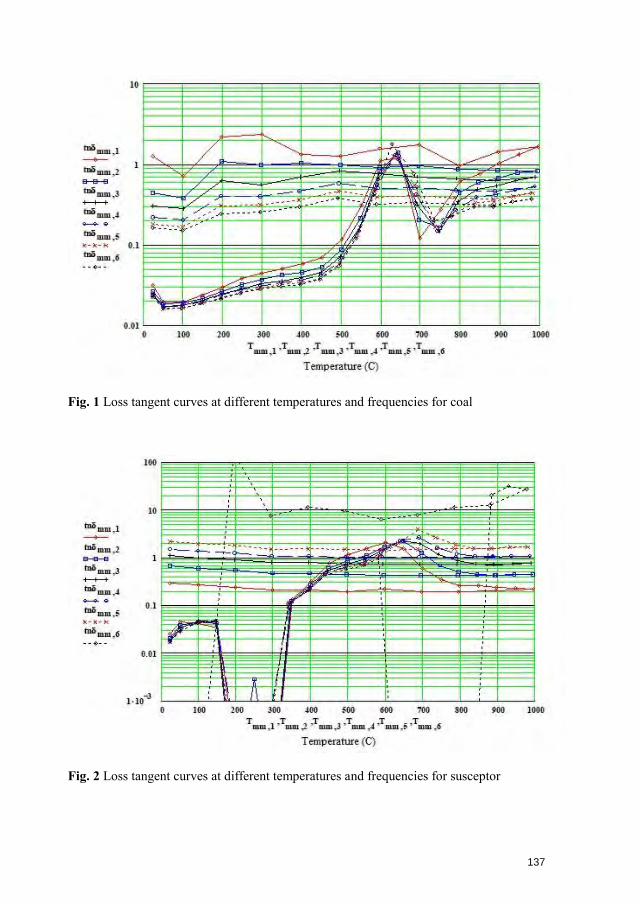
Fig. 1 Loss tangent curves at different temperatures and frequencies for coal
Fig. 2 Loss tangent curves at different temperatures and frequencies for susceptor
137
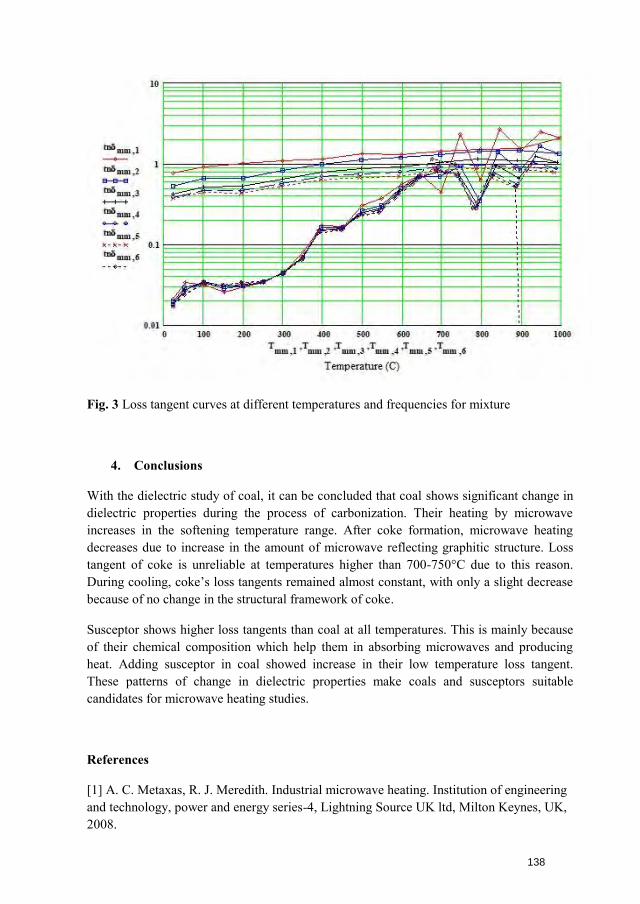
Fig. 3 Loss tangent curves at different temperatures and frequencies for mixture
4. Conclusions
With the dielectric study of coal, it can be concluded that coal shows significant change in dielectric properties during the process of carbonization. Their heating by microwave increases in the softening temperature range. After coke formation, microwave heating decreases due to increase in the amount of microwave reflecting graphitic structure. Loss tangent of coke is unreliable at temperatures higher than 700-750°C due to this reason. During cooling, coke’s loss tangents remained almost constant, with only a slight decrease because of no change in the structural framework of coke.
Susceptor shows higher loss tangents than coal at all temperatures. This is mainly because of their chemical composition which help them in absorbing microwaves and producing heat. Adding susceptor in coal showed increase in their low temperature loss tangent. These patterns of change in dielectric properties make coals and susceptors suitable candidates for microwave heating studies.
References
[1] A. C. Metaxas, R. J. Meredith. Industrial microwave heating. Institution of engineeringand technology, power and energy series-4, Lightning Source UK ltd, Milton Keynes, UK,2008.
138
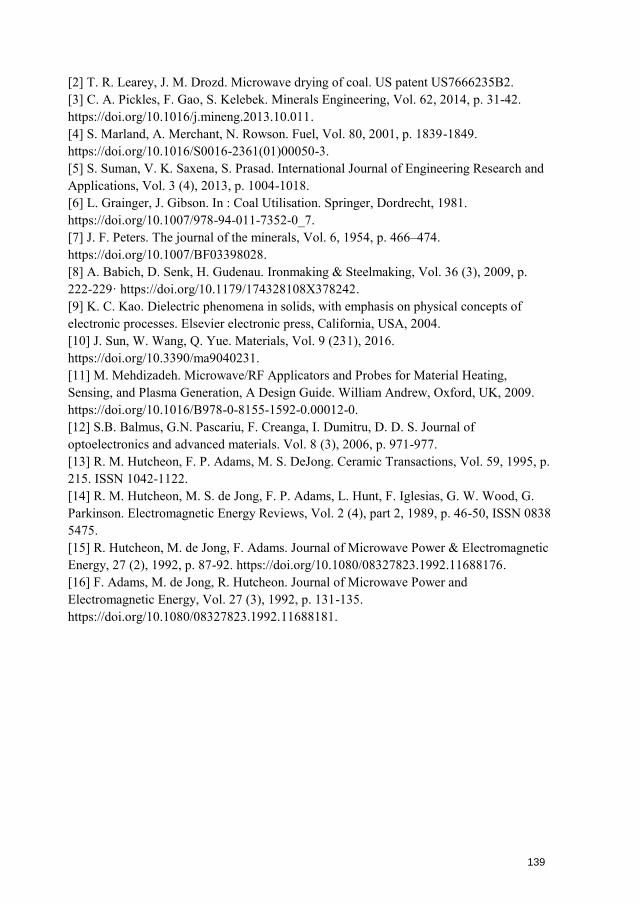
[2] T. R. Learey, J. M. Drozd. Microwave drying of coal. US patent US7666235B2.[3] C. A. Pickles, F. Gao, S. Kelebek. Minerals Engineering, Vol. 62, 2014, p. 31-42.https://doi.org/10.1016/j.mineng.2013.10.011.[4] S. Marland, A. Merchant, N. Rowson. Fuel, Vol. 80, 2001, p. 1839-1849.https://doi.org/10.1016/S0016-2361(01)00050-3.[5] S. Suman, V. K. Saxena, S. Prasad. International Journal of Engineering Research andApplications, Vol. 3 (4), 2013, p. 1004-1018.[6] L. Grainger, J. Gibson. In : Coal Utilisation. Springer, Dordrecht, 1981.https://doi.org/10.1007/978-94-011-7352-0_7.[7] J. F. Peters. The journal of the minerals, Vol. 6, 1954, p. 466–474.https://doi.org/10.1007/BF03398028.[8] A. Babich, D. Senk, H. Gudenau. Ironmaking & Steelmaking, Vol. 36 (3), 2009, p.222-229· https://doi.org/10.1179/174328108X378242.[9] K. C. Kao. Dielectric phenomena in solids, with emphasis on physical concepts ofelectronic processes. Elsevier electronic press, California, USA, 2004.[10] J. Sun, W. Wang, Q. Yue. Materials, Vol. 9 (231), 2016.https://doi.org/10.3390/ma9040231.[11] M. Mehdizadeh. Microwave/RF Applicators and Probes for Material Heating,Sensing, and Plasma Generation, A Design Guide. William Andrew, Oxford, UK, 2009.https://doi.org/10.1016/B978-0-8155-1592-0.00012-0.[12] S.B. Balmus, G.N. Pascariu, F. Creanga, I. Dumitru, D. D. S. Journal ofoptoelectronics and advanced materials. Vol. 8 (3), 2006, p. 971-977.[13] R. M. Hutcheon, F. P. Adams, M. S. DeJong. Ceramic Transactions, Vol. 59, 1995, p.215. ISSN 1042-1122.[14] R. M. Hutcheon, M. S. de Jong, F. P. Adams, L. Hunt, F. Iglesias, G. W. Wood, G.Parkinson. Electromagnetic Energy Reviews, Vol. 2 (4), part 2, 1989, p. 46-50, ISSN 08385475.[15] R. Hutcheon, M. de Jong, F. Adams. Journal of Microwave Power & ElectromagneticEnergy, 27 (2), 1992, p. 87-92. https://doi.org/10.1080/08327823.1992.11688176.[16] F. Adams, M. de Jong, R. Hutcheon. Journal of Microwave Power andElectromagnetic Energy, Vol. 27 (3), 1992, p. 131-135.https://doi.org/10.1080/08327823.1992.11688181.
139
HOW MICROWAVE IMPACT ON PORCELAIN DIELECTRIC PROPERTIES
L. A. Jermolovicius1, A. B. Jermolovicius2, E. V. S. Pouzada3, H. N. Yoshimura2
1 LARJ Consultores Associados, Al. Terracota, 21, cj. 518 - São Caetano do Sul, Brazil 2UFABC- Universidade Federal do ABC, Av. dos Estados, 5001 - Santo André, Brazil 3IMT - Instituto Mauá de Tecnologia, Praça Mauá, 1 - São Caetano do Sul, Brazil. [email protected]
Keywords: Microwave sintering, industrial applications, dielectric properties, permittivity, operational parameters)
ABSTRACT
This work deals with influence of ceramic processes parameters like moisture, compaction pressure and heating source (electric resistance and hybrid microwave) on dielectric properties of a sintered translucent porcelain. Several porcelain samples were prepared with two levels of moisture (3% and 6%) during the pressing process and two levels of hydraulic pressure (100 and 174 MPa) before drying; porcelain composition was kaolin (43%), potassic feldspar (36%), quartz (17%), bentonite (1%) and wollastonite (3%). Dielectric properties of the green porcelain were measured, and the results induced the use of a hybrid microwave furnace. Dried porcelain samples were sintered at 1200 oC with an electric furnace (7000 W) and with a microwave hybrid furnace (1600 W of microwave with silicon carbide as a susceptor). The dielectric properties of the sintered porcelain were measured. The results were statistically analyzed with Yates’ method and variance analysis; it was proved that sintering with microwaves has a significative influence on the dielectric constant and loss tangent with 99.9% of confidence. Compaction pressure level impacted loss tangent value with 99% of confidence and moisture level (at pressing) impacted dielectric constant with 90% of confidence. Multivariate regressions for the green porcelain dielectric constant and loss tangent were determined.
INTRODUCTION
Porcelains can be prepared by a reaction sintering between the raw materials, such as quartz - SiO2, kaolinite - Al2(OH)4Si2O5 and potassium feldspar – KAlSi3O8, which results in a microstructure of crystalline phases, mainly mullite – Al6Si2O13 and quartz – SiO2, dispersed in an alkali aluminosilicate vitreous phase. Usually, the raw materials with fine granulometry is mixed with water to produce a plastic mass, which is formed in different pieces. These pieces are dried and then fired at temperatures of 1200 to 1400 oC.
There are different types of sintering kilns. Traditionally, wood is used as fuel, but modernly natural gas, fuel oil and electric energy are used for sintering. Also, the microwave has potential to be used in sintering. Advantages as short dwell time and lower consumption of energy are predicted by several authors [1-5]. Exploring the concept of microwave effect, well known for microwave chemistry [6-10], now applied to sintering reactions, this paper aim to show the occurrence of microwave effect during a hybrid microwave sintering process, based on measurements of dielectric constant and loss tangent of a sintered porcelain. The effects of operational variables such as pressing moisture and compaction pressure are also studied. A series of tests planed in 23 and 22 factorial designs [11] was used to investigate the microwave effect
140
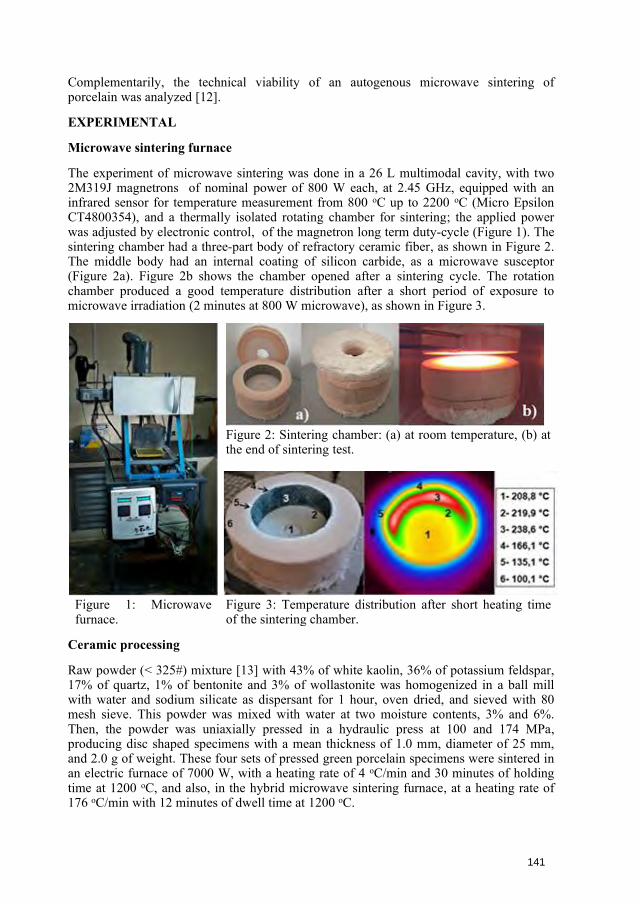
Complementarily, the technical viability of an autogenous microwave sintering of porcelain was analyzed [12].
EXPERIMENTAL
Microwave sintering furnace
The experiment of microwave sintering was done in a 26 L multimodal cavity, with two 2M319J magnetrons of nominal power of 800 W each, at 2.45 GHz, equipped with an infrared sensor for temperature measurement from 800 oC up to 2200 oC (Micro Epsilon CT4800354), and a thermally isolated rotating chamber for sintering; the applied power was adjusted by electronic control, of the magnetron long term duty-cycle (Figure 1). The sintering chamber had a three-part body of refractory ceramic fiber, as shown in Figure 2. The middle body had an internal coating of silicon carbide, as a microwave susceptor (Figure 2a). Figure 2b shows the chamber opened after a sintering cycle. The rotation chamber produced a good temperature distribution after a short period of exposure to microwave irradiation (2 minutes at 800 W microwave), as shown in Figure 3.
Figure 1: Microwave furnace.
Figure 2: Sintering chamber: (a) at room temperature, (b) at the end of sintering test.
Figure 3: Temperature distribution after short heating time of the sintering chamber.
Ceramic processing
Raw powder (< 325#) mixture [13] with 43% of white kaolin, 36% of potassium feldspar, 17% of quartz, 1% of bentonite and 3% of wollastonite was homogenized in a ball mill with water and sodium silicate as dispersant for 1 hour, oven dried, and sieved with 80 mesh sieve. This powder was mixed with water at two moisture contents, 3% and 6%. Then, the powder was uniaxially pressed in a hydraulic press at 100 and 174 MPa, producing disc shaped specimens with a mean thickness of 1.0 mm, diameter of 25 mm, and 2.0 g of weight. These four sets of pressed green porcelain specimens were sintered in an electric furnace of 7000 W, with a heating rate of 4 oC/min and 30 minutes of holding time at 1200 oC, and also, in the hybrid microwave sintering furnace, at a heating rate of 176 oC/min with 12 minutes of dwell time at 1200 oC.
141
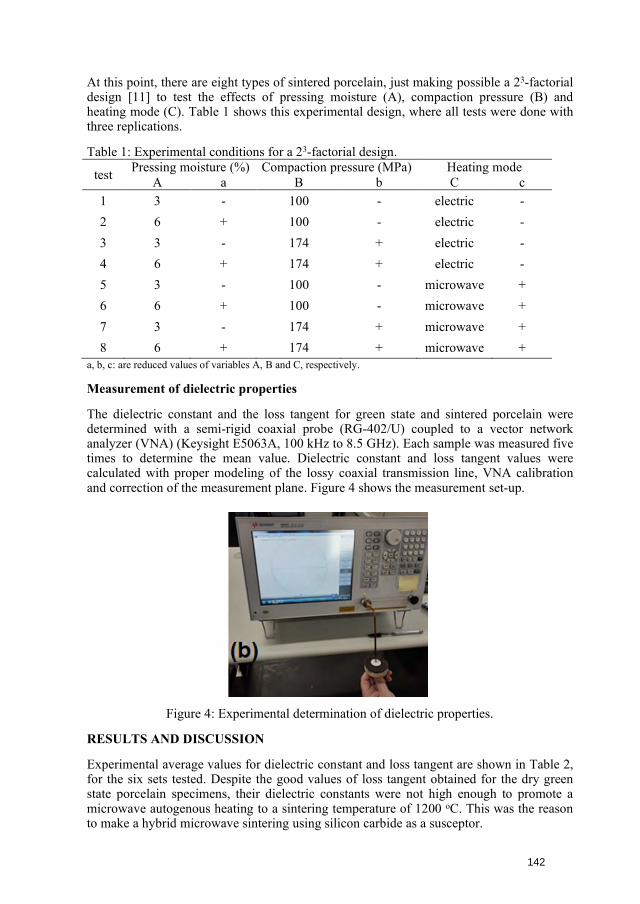
At this point, there are eight types of sintered porcelain, just making possible a 23-factorial design [11] to test the effects of pressing moisture (A), compaction pressure (B) and heating mode (C). Table 1 shows this experimental design, where all tests were done with three replications.
Table 1: Experimental conditions for a 23-factorial design.
test Pressing moisture (%) Compaction pressure (MPa) Heating mode A a B b C c
1 3 - 100 - electric - 2 6 + 100 - electric - 3 3 - 174 + electric - 4 6 + 174 + electric - 5 3 - 100 - microwave + 6 6 + 100 - microwave + 7 3 - 174 + microwave + 8 6 + 174 + microwave +
a, b, c: are reduced values of variables A, B and C, respectively.
Measurement of dielectric properties
The dielectric constant and the loss tangent for green state and sintered porcelain were determined with a semi-rigid coaxial probe (RG-402/U) coupled to a vector network analyzer (VNA) (Keysight E5063A, 100 kHz to 8.5 GHz). Each sample was measured five times to determine the mean value. Dielectric constant and loss tangent values were calculated with proper modeling of the lossy coaxial transmission line, VNA calibration and correction of the measurement plane. Figure 4 shows the measurement set-up.
Figure 4: Experimental determination of dielectric properties.
RESULTS AND DISCUSSION
Experimental average values for dielectric constant and loss tangent are shown in Table 2, for the six sets tested. Despite the good values of loss tangent obtained for the dry green state porcelain specimens, their dielectric constants were not high enough to promote a microwave autogenous heating to a sintering temperature of 1200 oC. This was the reason to make a hybrid microwave sintering using silicon carbide as a susceptor.
142
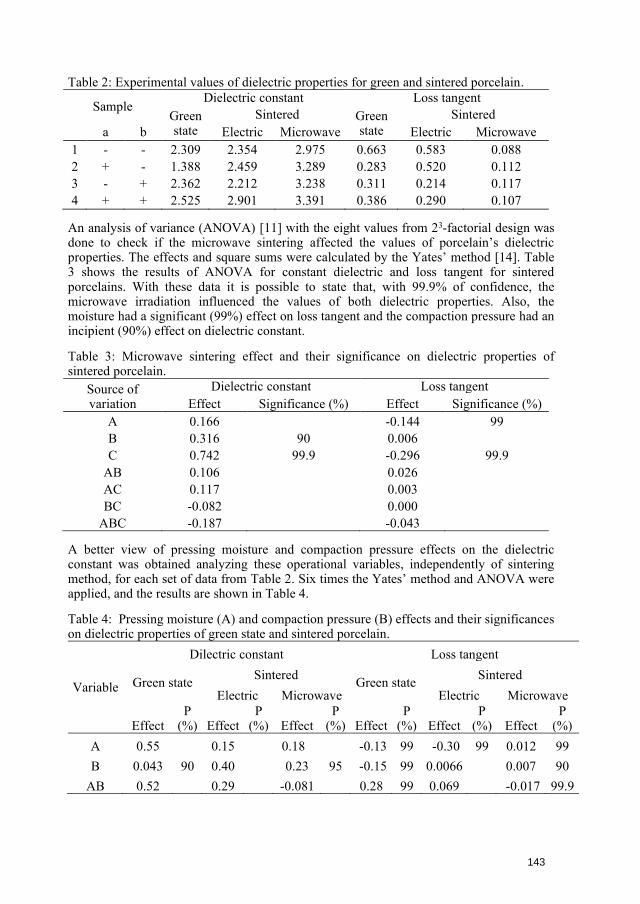
Table 2: Experimental values of dielectric properties for green and sintered porcelain.
Sample Dielectric constant Loss tangent
Green state
Sintered Green state
Sintered a b Electric Microwave Electric Microwave
1 - - 2.309 2.354 2.975 0.663 0.583 0.088 2 + - 1.388 2.459 3.289 0.283 0.520 0.112 3 - + 2.362 2.212 3.238 0.311 0.214 0.117 4 + + 2.525 2.901 3.391 0.386 0.290 0.107
An analysis of variance (ANOVA) [11] with the eight values from 23-factorial design was done to check if the microwave sintering affected the values of porcelain’s dielectric properties. The effects and square sums were calculated by the Yates’ method [14]. Table 3 shows the results of ANOVA for constant dielectric and loss tangent for sintered porcelains. With these data it is possible to state that, with 99.9% of confidence, the microwave irradiation influenced the values of both dielectric properties. Also, the moisture had a significant (99%) effect on loss tangent and the compaction pressure had an incipient (90%) effect on dielectric constant.
Table 3: Microwave sintering effect and their significance on dielectric properties of sintered porcelain.
Source of variation
Dielectric constant Loss tangent Effect Significance (%) Effect Significance (%)
A 0.166 -0.144 99 B 0.316 90 0.006C 0.742 99.9 -0.296 99.9
AB 0.106 0.026AC 0.117 0.003BC -0.082 0.000
ABC -0.187 -0.043
A better view of pressing moisture and compaction pressure effects on the dielectric constant was obtained analyzing these operational variables, independently of sintering method, for each set of data from Table 2. Six times the Yates’ method and ANOVA were applied, and the results are shown in Table 4.
Table 4: Pressing moisture (A) and compaction pressure (B) effects and their significances on dielectric properties of green state and sintered porcelain.
Variable
Dilectric constant Loss tangent
Green state Sintered Green state Sintered Electric Microwave Electric Microwave
Effect P
(%) Effect P
(%) Effect P
(%) Effect P
(%) Effect P
(%) Effect P
(%) A 0.55 0.15 0.18 -0.13 99 -0.30 99 0.012 99 B 0.043 90 0.40 0.23 95 -0.15 99 0.0066 0.007 90
AB 0.52 0.29 -0.081 0.28 99 0.069 -0.017 99.9
143
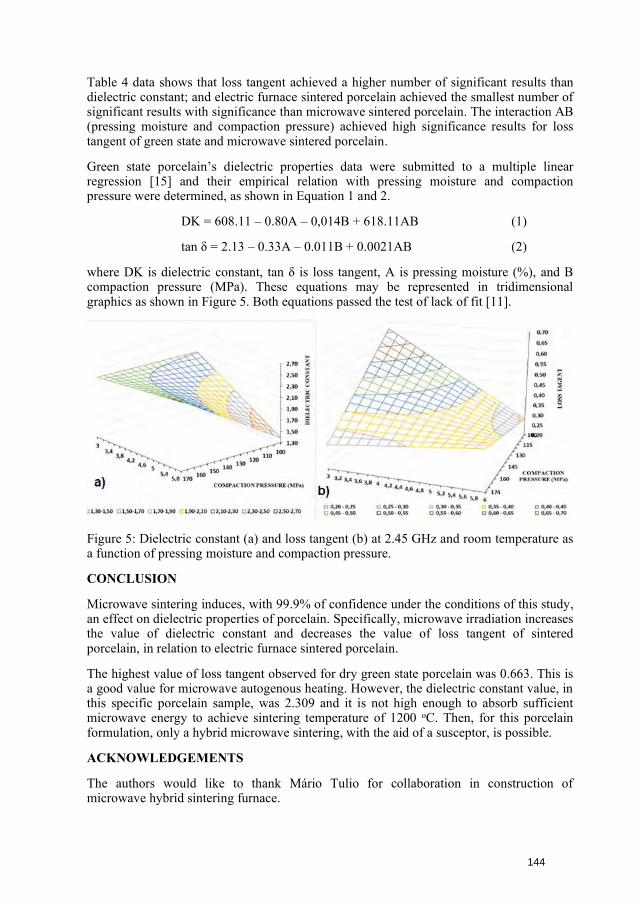
Table 4 data shows that loss tangent achieved a higher number of significant results than dielectric constant; and electric furnace sintered porcelain achieved the smallest number of significant results with significance than microwave sintered porcelain. The interaction AB (pressing moisture and compaction pressure) achieved high significance results for loss tangent of green state and microwave sintered porcelain.
Green state porcelain’s dielectric properties data were submitted to a multiple linear regression [15] and their empirical relation with pressing moisture and compaction pressure were determined, as shown in Equation 1 and 2.
DK = 608.11 – 0.80A – 0,014B + 618.11AB (1)
tan δ = 2.13 – 0.33A – 0.011B + 0.0021AB (2)
where DK is dielectric constant, tan δ is loss tangent, A is pressing moisture (%), and B compaction pressure (MPa). These equations may be represented in tridimensional graphics as shown in Figure 5. Both equations passed the test of lack of fit [11].
Figure 5: Dielectric constant (a) and loss tangent (b) at 2.45 GHz and room temperature as a function of pressing moisture and compaction pressure.
CONCLUSION
Microwave sintering induces, with 99.9% of confidence under the conditions of this study, an effect on dielectric properties of porcelain. Specifically, microwave irradiation increases the value of dielectric constant and decreases the value of loss tangent of sintered porcelain, in relation to electric furnace sintered porcelain.
The highest value of loss tangent observed for dry green state porcelain was 0.663. This is a good value for microwave autogenous heating. However, the dielectric constant value, in this specific porcelain sample, was 2.309 and it is not high enough to absorb sufficient microwave energy to achieve sintering temperature of 1200 oC. Then, for this porcelain formulation, only a hybrid microwave sintering, with the aid of a susceptor, is possible.
ACKNOWLEDGEMENTS
The authors would like to thank Mário Tulio for collaboration in construction of microwave hybrid sintering furnace.
144
REFERENCES
[1] Garnault, T.; Bouvard, D.; Chaix, J.; Marivel, S.; Harnois, C. Ceram. Int., 2021, 47,16716-16729.
[2] Biesuz, M.; Saunders, T.; Ke, D.; Reece, H. J.; Hu, C. J. Mater. Sci. Technol., 2012,69, 239-272.
[3] Lerdprom, W.; Solvas, E. Z.; Jayaseelan, D. D.; Borrell, A.; Salvador, M. D.; Lee, W.E. Ceram. Int., 2017, 43, 13765-13771.
[4] Menezes, R. R.; Souto, P. M.; Kiminami, R. H. G. A. Microwave Fast Sintering ofCeramics Materials. In: Lakshman, A. Sintering of Ceramics – New EmergingTechniques. Croatia, InTech, 2012, cap. 1.
[5] Menezes, R. R.; Souto, P. M.; Kiminami, R. H. G. A. J. Mater. Proc. Technol., 2007,190, 223-2007.
[6] Kappe, C. O. Chem. Rec., 2019, 19, 15-39.[7] Odajima, H.; Okamoto, T. Chem. Rec., 2019, 19, 204-211.[8] Stefanidis, G. D., Muñoz, A. N., Sturm, G. S. J., Stankiewicz, A. Rev. Chem. Eng.,
2014, 30, 233-259.[9] Senise, J.T., Jermolovicius, L. A. J. Microw. Optoelectron. 2004, 3, 97-112.[10] Lidström, P.; Tiernay, J.; Wathey, B.; Westman, J. Tetrahedron, 2001, 57, 9225-9283.[11] Montgomery, D. C. Design and Analysis of Experiments. 6th ed., USA, John Wiley,
2005.[12] Jermolovicius, A. B.; Jermolovicius, L. A. J.; Yoshimura, H. N.; Pouzada, E. V. S.;
Seixa, D. A. Proceedings of 64th Brazilian Congress of Ceramics, Águas de Lindoia,December 7-10, 2020.
[13] Jermolovicius, A. B.; Molisani, A. L. Cerâmica 64 (2018) 341-351.[14] Cochram,S. G.; Cox, G. M. Experimental Design, 2nd ed., USA, John Wiley, 1957.[15] Ara, A. B.; Musetti, A. V.; Schneiderman, B. Introduction to Statistics, Brazil,
Blücher, 2003.
145
IMPROVED CONTROL ON THE MICROWAVE DEVULCANIZING OF GROUND TIRE RUBBER BY MEANS OF SULPHUR GAS SENSORS
R. Pérez-Campos1, J. Fayos-Fernández1, J. Monzó-Cabrera1, A. Díaz-Morcillo1, A.Martínez-González1, A. Lozano-Guerrero1
1Universidad Politécnica de Cartagena, Plaza del Hospital 1, E-30203, Cartagena, Spain [email protected]
Abstract. The success of a Ground-Tire Rubber (GTR) devulcanization process relies on the elimination of the sulphur atoms that are crosslinking the rubber polymer. From the chemical point of view, this requires providing enough energy to break the sulphur bonds while preserving the carbon bonds, to ensure a high quality devulcanized GTR for being of interest to the rubber manufacturing industry. GTR is very responsive to microwaves due to the presence of Carbon Black (CB) in its composition, so the radiant energy is absorbed quickly in the form of thermal energy. When its temperature reaches 140°C, the breakage of sulphur bonds may happen under an exothermic reaction, but also some new links might be built under that condition. Therefore, from the physical point of view, the released sulphur in the gaseous form of SO2, H2S, and/or CS2 must be promoted to abandon the reactor to avoid its recombination. In this work, microwave devulcanization is monitored by detecting the concentration of sulphurous gases at the exhaust of the reactor. These sensors are very effective especially when pyrometer readings are degraded because of the gaseous layer on the GTR during the process.
Keywords: Microwave, Industrial applications, Measurement technology, Processing, Residue/Side-stream, Material interaction
1. Introduction
The management of the disposal of end-of-life tires (ELTs), also known as GTR, is a today’s environmental worldwide challenge. Therefore, searching for new and pro-ecological reutilization methods of used tires and other waste rubbers is one of the biggest challenges of the 21st century waste management [1]. Regarding environmental impact, the energy recovering from landfill accumulation or combustion processes is a much worse solution than the recycling process, due to the toxic gas emissions and the residue powder, which pollutes the soil [2].
Nevertheless, the consideration of GTR as a valuable rubber feedstock for the manufacturing industry, relies on its ability of being processed to produce thermoplastic elastomers and blends in composite materials, and the most suitable way is through its devulcanization [1]. This process consists of a selective crosslink cleaving i.e., the elimination of the sulphur from the crosslinked rubber polymer while preventing the damage of the elastomeric chain. Thereby, it is necessary to apply enough energy to break up the sulphur bonds [3] formed during vulcanization while preserving the carbon bonds in order to ensure a high quality devulcanized GTR.
The devulcanization process is related to the transformation of waste tire rubber using a physical (thermal, mechanical, microwave, ultrasonic), biological, or chemical energy. In terms of devulcanization uniformity, it should be considered that only the microwave and ultrasonic methods act in the GTR particle’s core, while the others do it on the surface. In addition, microwave devulcanization also offers the possibility of high productivity [4], and the regulation of microwave energy density (kJ/kg) acting on GTR, by controlling
146
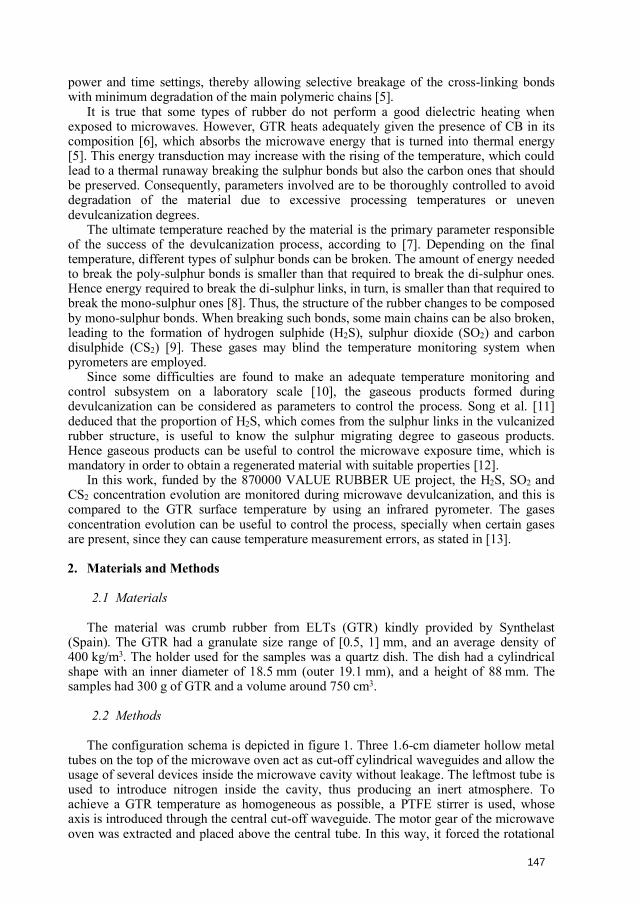
power and time settings, thereby allowing selective breakage of the cross-linking bonds with minimum degradation of the main polymeric chains [5].
It is true that some types of rubber do not perform a good dielectric heating when exposed to microwaves. However, GTR heats adequately given the presence of CB in its composition [6], which absorbs the microwave energy that is turned into thermal energy [5]. This energy transduction may increase with the rising of the temperature, which could lead to a thermal runaway breaking the sulphur bonds but also the carbon ones that should be preserved. Consequently, parameters involved are to be thoroughly controlled to avoid degradation of the material due to excessive processing temperatures or uneven devulcanization degrees.
The ultimate temperature reached by the material is the primary parameter responsible of the success of the devulcanization process, according to [7]. Depending on the final temperature, different types of sulphur bonds can be broken. The amount of energy needed to break the poly-sulphur bonds is smaller than that required to break the di-sulphur ones. Hence energy required to break the di-sulphur links, in turn, is smaller than that required to break the mono-sulphur ones [8]. Thus, the structure of the rubber changes to be composed by mono-sulphur bonds. When breaking such bonds, some main chains can be also broken, leading to the formation of hydrogen sulphide (H2S), sulphur dioxide (SO2) and carbon disulphide (CS2) [9]. These gases may blind the temperature monitoring system when pyrometers are employed.
Since some difficulties are found to make an adequate temperature monitoring and control subsystem on a laboratory scale [10], the gaseous products formed during devulcanization can be considered as parameters to control the process. Song et al. [11] deduced that the proportion of H2S, which comes from the sulphur links in the vulcanized rubber structure, is useful to know the sulphur migrating degree to gaseous products. Hence gaseous products can be useful to control the microwave exposure time, which is mandatory in order to obtain a regenerated material with suitable properties [12].
In this work, funded by the 870000 VALUE RUBBER UE project, the H2S, SO2 and CS2 concentration evolution are monitored during microwave devulcanization, and this is compared to the GTR surface temperature by using an infrared pyrometer. The gases concentration evolution can be useful to control the process, specially when certain gases are present, since they can cause temperature measurement errors, as stated in [13].
2. Materials and Methods
2.1 Materials
The material was crumb rubber from ELTs (GTR) kindly provided by Synthelast (Spain). The GTR had a granulate size range of [0.5, 1] mm, and an average density of 400 kg/m3. The holder used for the samples was a quartz dish. The dish had a cylindrical shape with an inner diameter of 18.5 mm (outer 19.1 mm), and a height of 88 mm. The samples had 300 g of GTR and a volume around 750 cm3.
2.2 Methods
The configuration schema is depicted in figure 1. Three 1.6-cm diameter hollow metal tubes on the top of the microwave oven act as cut-off cylindrical waveguides and allow the usage of several devices inside the microwave cavity without leakage. The leftmost tube is used to introduce nitrogen inside the cavity, thus producing an inert atmosphere. To achieve a GTR temperature as homogeneous as possible, a PTFE stirrer is used, whose axis is introduced through the central cut-off waveguide. The motor gear of the microwave oven was extracted and placed above the central tube. In this way, it forced the rotational
147
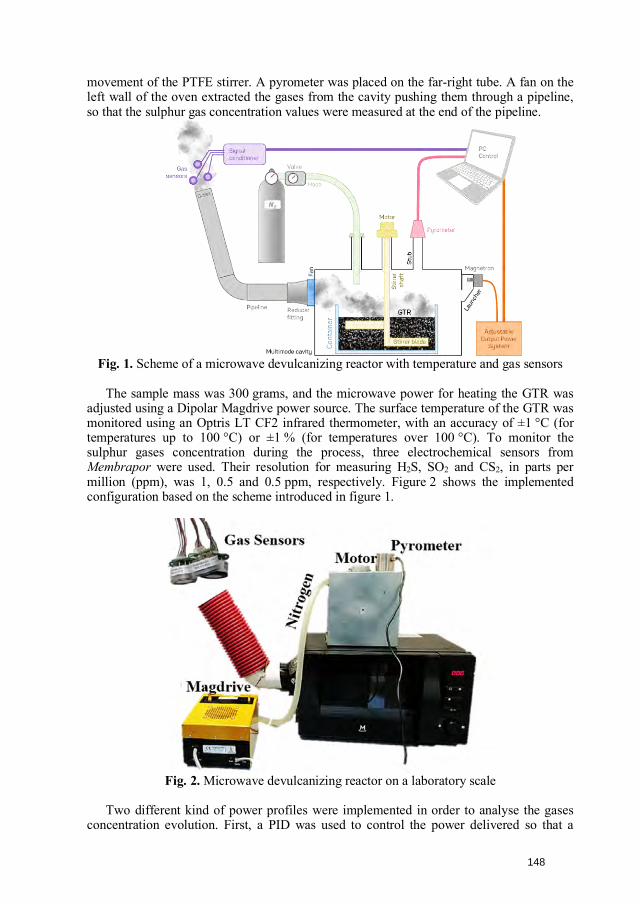
movement of the PTFE stirrer. A pyrometer was placed on the far-right tube. A fan on the left wall of the oven extracted the gases from the cavity pushing them through a pipeline, so that the sulphur gas concentration values were measured at the end of the pipeline.
Fig. 1. Scheme of a microwave devulcanizing reactor with temperature and gas sensors
The sample mass was 300 grams, and the microwave power for heating the GTR was adjusted using a Dipolar Magdrive power source. The surface temperature of the GTR was monitored using an Optris LT CF2 infrared thermometer, with an accuracy of ±1 °C (for temperatures up to 100 °C) or ±1 % (for temperatures over 100 °C). To monitor the sulphur gases concentration during the process, three electrochemical sensors from Membrapor were used. Their resolution for measuring H2S, SO2 and CS2, in parts per million (ppm), was 1, 0.5 and 0.5 ppm, respectively. Figure 2 shows the implemented configuration based on the scheme introduced in figure 1.
Fig. 2. Microwave devulcanizing reactor on a laboratory scale
Two different kind of power profiles were implemented in order to analyse the gases concentration evolution. First, a PID was used to control the power delivered so that a
148
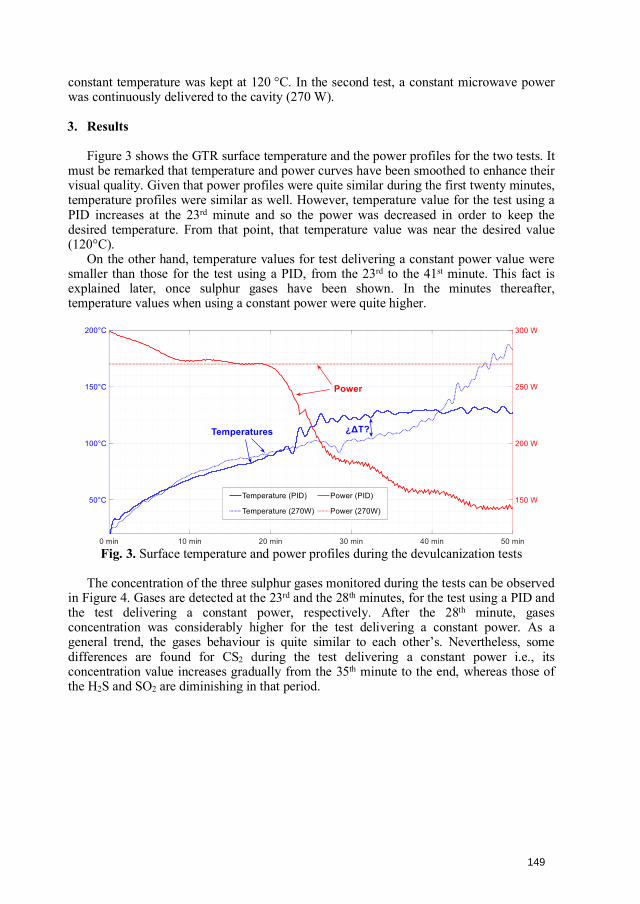
constant temperature was kept at 120 °C. In the second test, a constant microwave power was continuously delivered to the cavity (270 W).
3. Results
Figure 3 shows the GTR surface temperature and the power profiles for the two tests. It must be remarked that temperature and power curves have been smoothed to enhance their visual quality. Given that power profiles were quite similar during the first twenty minutes, temperature profiles were similar as well. However, temperature value for the test using a PID increases at the 23rd minute and so the power was decreased in order to keep the desired temperature. From that point, that temperature value was near the desired value (120°C).
On the other hand, temperature values for test delivering a constant power value were smaller than those for the test using a PID, from the 23rd to the 41st minute. This fact is explained later, once sulphur gases have been shown. In the minutes thereafter, temperature values when using a constant power were quite higher.
Fig. 3. Surface temperature and power profiles during the devulcanization tests
The concentration of the three sulphur gases monitored during the tests can be observed in Figure 4. Gases are detected at the 23rd and the 28th minutes, for the test using a PID and the test delivering a constant power, respectively. After the 28th minute, gases concentration was considerably higher for the test delivering a constant power. As a general trend, the gases behaviour is quite similar to each other’s. Nevertheless, some differences are found for CS2 during the test delivering a constant power i.e., its concentration value increases gradually from the 35th minute to the end, whereas those of the H2S and SO2 are diminishing in that period.
149
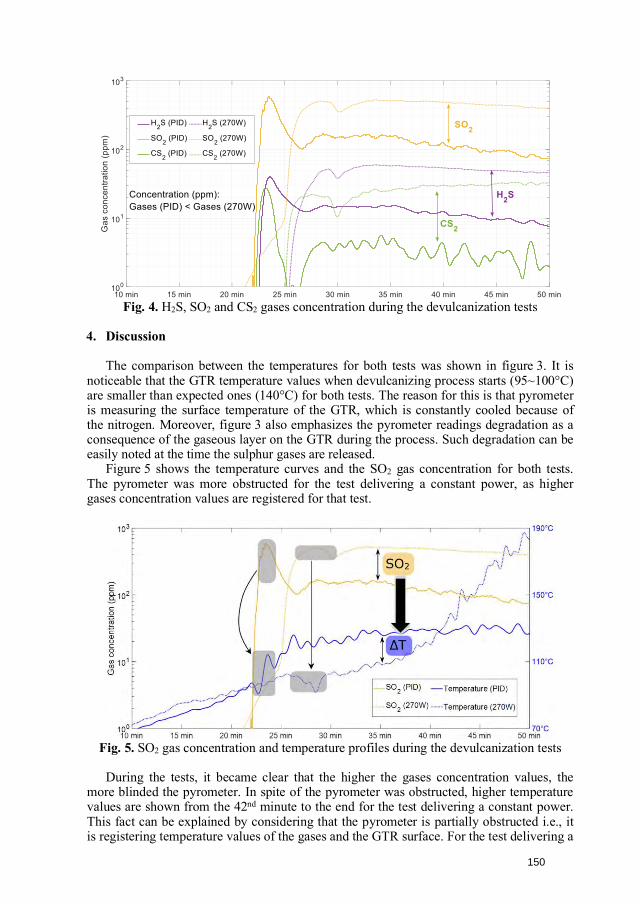
Fig. 4. H2S, SO2 and CS2 gases concentration during the devulcanization tests
4. Discussion
The comparison between the temperatures for both tests was shown in figure 3. It is noticeable that the GTR temperature values when devulcanizing process starts (95~100°C) are smaller than expected ones (140°C) for both tests. The reason for this is that pyrometer is measuring the surface temperature of the GTR, which is constantly cooled because of the nitrogen. Moreover, figure 3 also emphasizes the pyrometer readings degradation as a consequence of the gaseous layer on the GTR during the process. Such degradation can be easily noted at the time the sulphur gases are released.
Figure 5 shows the temperature curves and the SO2 gas concentration for both tests. The pyrometer was more obstructed for the test delivering a constant power, as higher gases concentration values are registered for that test.
Fig. 5. SO2 gas concentration and temperature profiles during the devulcanization tests
During the tests, it became clear that the higher the gases concentration values, the more blinded the pyrometer. In spite of the pyrometer was obstructed, higher temperature values are shown from the 42nd minute to the end for the test delivering a constant power. This fact can be explained by considering that the pyrometer is partially obstructed i.e., it is registering temperature values of the gases and the GTR surface. For the test delivering a
150
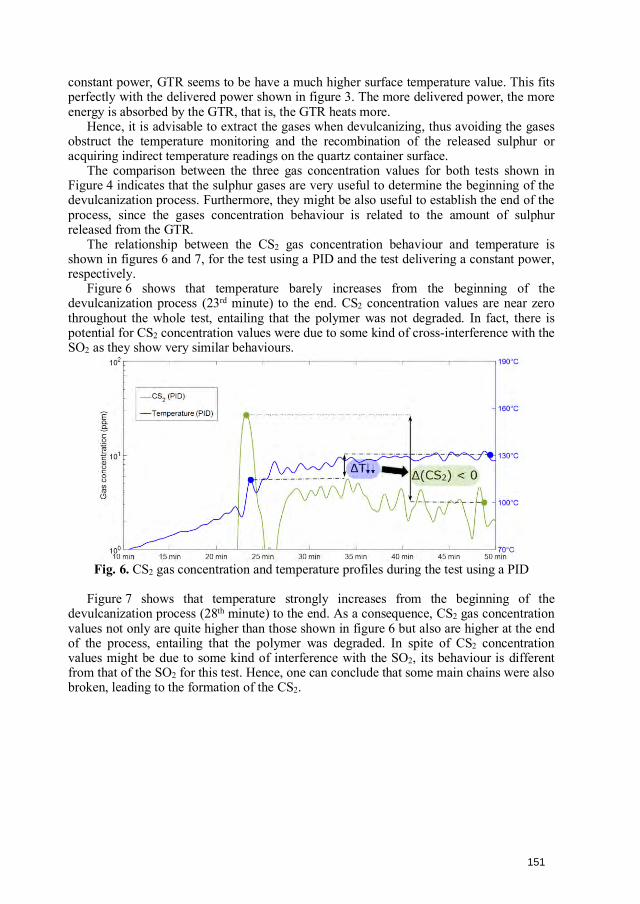
constant power, GTR seems to be have a much higher surface temperature value. This fits perfectly with the delivered power shown in figure 3. The more delivered power, the more energy is absorbed by the GTR, that is, the GTR heats more.
Hence, it is advisable to extract the gases when devulcanizing, thus avoiding the gases obstruct the temperature monitoring and the recombination of the released sulphur or acquiring indirect temperature readings on the quartz container surface.
The comparison between the three gas concentration values for both tests shown in Figure 4 indicates that the sulphur gases are very useful to determine the beginning of the devulcanization process. Furthermore, they might be also useful to establish the end of the process, since the gases concentration behaviour is related to the amount of sulphur released from the GTR.
The relationship between the CS2 gas concentration behaviour and temperature is shown in figures 6 and 7, for the test using a PID and the test delivering a constant power, respectively.
Figure 6 shows that temperature barely increases from the beginning of the devulcanization process (23rd minute) to the end. CS2 concentration values are near zero throughout the whole test, entailing that the polymer was not degraded. In fact, there is potential for CS2 concentration values were due to some kind of cross-interference with the SO2 as they show very similar behaviours.
Fig. 6. CS2 gas concentration and temperature profiles during the test using a PID
Figure 7 shows that temperature strongly increases from the beginning of the devulcanization process (28th minute) to the end. As a consequence, CS2 gas concentration values not only are quite higher than those shown in figure 6 but also are higher at the end of the process, entailing that the polymer was degraded. In spite of CS2 concentration values might be due to some kind of interference with the SO2, its behaviour is different from that of the SO2 for this test. Hence, one can conclude that some main chains were also broken, leading to the formation of the CS2.
151
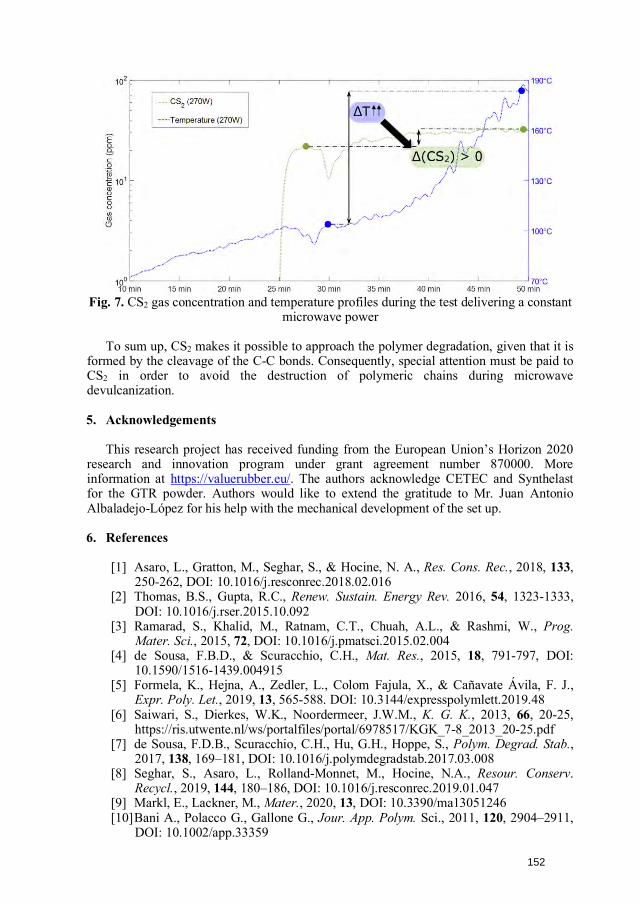
Fig. 7. CS2 gas concentration and temperature profiles during the test delivering a constant microwave power
To sum up, CS2 makes it possible to approach the polymer degradation, given that it is formed by the cleavage of the C-C bonds. Consequently, special attention must be paid to CS2 in order to avoid the destruction of polymeric chains during microwave devulcanization.
5. Acknowledgements
This research project has received funding from the European Union’s Horizon 2020 research and innovation program under grant agreement number 870000. More information at https://valuerubber.eu/. The authors acknowledge CETEC and Synthelast for the GTR powder. Authors would like to extend the gratitude to Mr. Juan Antonio Albaladejo-López for his help with the mechanical development of the set up.
6. References
[1] Asaro, L., Gratton, M., Seghar, S., & Hocine, N. A., Res. Cons. Rec., 2018, 133,250-262, DOI: 10.1016/j.resconrec.2018.02.016
[2] Thomas, B.S., Gupta, R.C., Renew. Sustain. Energy Rev. 2016, 54, 1323-1333,DOI: 10.1016/j.rser.2015.10.092
[3] Ramarad, S., Khalid, M., Ratnam, C.T., Chuah, A.L., & Rashmi, W., Prog.Mater. Sci., 2015, 72, DOI: 10.1016/j.pmatsci.2015.02.004
[4] de Sousa, F.B.D., & Scuracchio, C.H., Mat. Res., 2015, 18, 791-797, DOI:10.1590/1516-1439.004915
[5] Formela, K., Hejna, A., Zedler, L., Colom Fajula, X., & Cañavate Ávila, F. J.,Expr. Poly. Let., 2019, 13, 565-588. DOI: 10.3144/expresspolymlett.2019.48
[6] Saiwari, S., Dierkes, W.K., Noordermeer, J.W.M., K. G. K., 2013, 66, 20-25,https://ris.utwente.nl/ws/portalfiles/portal/6978517/KGK_7-8_2013_20-25.pdf
[7] de Sousa, F.D.B., Scuracchio, C.H., Hu, G.H., Hoppe, S., Polym. Degrad. Stab.,2017, 138, 169–181, DOI: 10.1016/j.polymdegradstab.2017.03.008
[8] Seghar, S., Asaro, L., Rolland-Monnet, M., Hocine, N.A., Resour. Conserv.Recycl., 2019, 144, 180–186, DOI: 10.1016/j.resconrec.2019.01.047
[9] Markl, E., Lackner, M., Mater., 2020, 13, DOI: 10.3390/ma13051246[10] Bani A., Polacco G., Gallone G., Jour. App. Polym. Sci., 2011, 120, 2904–2911,
DOI: 10.1002/app.33359
152
[11] Song, Z., Yang, Y., Zhou, L., Liu, L., & Zhao, X., Int. Jour. Hydrog. Energ.,2017, 42, 18209-18215, DOI: 10.1016/j.ijhydene.2017.04.169
[12] Garcia, P.S., de Sousa, F.D.B., de Lima, J.A., Cruz, S.A., Scuracchio, C.H.,Express Polym., 2015, 9, 1015–1026, DOI: 10.3144/expresspolymlett.2015.91
[13] Larrick, T., “Understanding modern infrared pyrometers for demanding steel millapplication”, Williamson Corp., Concord MA, USA, 2016,https://cdn2.hubspot.net/hub/297742/file-351495034-pdf/White_Paper_-_Pyrometers_for_Steel_Mills_Overview.pdf
153
INACTIVATION OF POD AND LOX ENZYMES IN YELLOW PEAS BY MICROWAVE PROCESSING
M. Radoiu1, M. A. Calvo-Carrascal2, S. Khoucha1, C. Dodds2
, E. R. Binner2
1Microwave Technologies Consulting SAS, 153 rue des colverts, 69140 Lyon, France 2Department of Chemical and Environmental Engineering, Faculty of Engineering University of Nottingham, B13 Coates Building, University Park, Nottingham, NG7 2RD, U.K. [email protected]; [email protected]
Keywords: Microwave, enzyme deactivation, POD, LOX
A key challenge in the food industry is the maintenance of the nutritional value of harvested vegetables over transport and long storage times. Freezing has long been considered the most simple and important available method to retain product quality. Although freezing successfully slows down deteriorative reactions such as senescence, chemical decay and microbial growth, it cannot prevent odour, flavour, colour and texture deterioration. The reason is the existence of enzyme systems that remain active regardless of the foodstuff temperature. Numerous enzymes such as peroxidase, lipoxygenase, polyphenololoxidase, polygalacturonase, and chlorophyllase are directly or indirectly associated with these losses in quality and nutritional properties [1]. The first two are the most commonly studied; peroxidase (POD) is one of the more thermally stable enzymes in vegetables and can serve as a general indicator of enzymatic deactivation. On the other hand, lipoxygenase (LOX) has been found responsible of undesirable changes in colour, flavour, texture and nutritional value of food products. A substantial minimisation of these enzymatic reactions comes from blanching the vegetables by applying steam or hot water (usually 100 oC) between a few minutes up to 1 h. These conditions are to be precisely applied, otherwise a more severe or prolonged blanching may reduce the nutritional value of the vegetable and lead to starch damage, i.e. gelatinisation. An alternative to the use of water in the blanching of vegetables is the utilisation of microwave energy. The aim of this research was to investigate whether whole yellow peas, with a pea market of almost 2.5 million tonnes in 2016 only in the European Union [2] can be blanched using microwave energy whilst minimising starch gelatinisation. Heating trials at 2450 MHz assessed that POD is the more temperature resistant enzyme, and below 80 oC its activity is not nearly halved. Nevertheless, beyond this point its thermal stability sharply weakens, reaching a deactivation > 90 % for 5 min at 90 oC and 100 oC. LOX is always less stable than POD, reaching a total deactivation at 100 oC. Regarding the starch gelatinisation, the enzyme kill vs. starch kill ratio appeared particularly favourable at two points. The first is 60 oC for 2 min, which provides a 17 % POD and 29 % LOX elimination for only a 3 % starch gelatinisation. The other is at 90 oC for 1 min, where 22 % and 7 % residual POD and LOX activities gelatinise 15 % of the starch.
References 1. Bahceci, K.S.; Serpen, A.; Gokmen, V.; Acar, J. Journal of Food Engineering, 2005, 66,187-192.2. EUROSTAT 2016. Crop production in national humidity. On-line athttp://appsso.eurostat.ec.europa.eu/nui/show.do?dataset=apro_cpnh1&lang=en
154
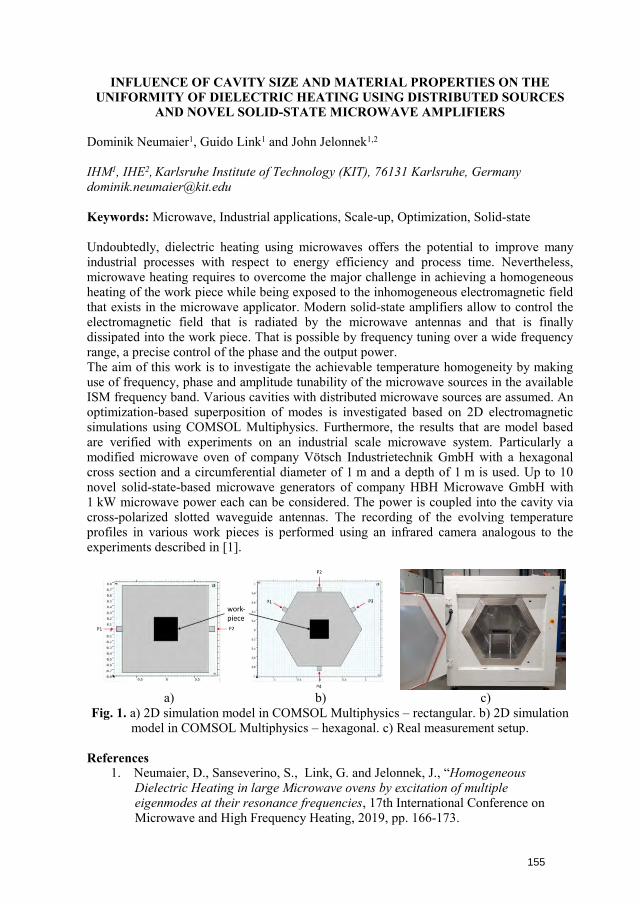
INFLUENCE OF CAVITY SIZE AND MATERIAL PROPERTIES ON THE UNIFORMITY OF DIELECTRIC HEATING USING DISTRIBUTED SOURCES
AND NOVEL SOLID-STATE MICROWAVE AMPLIFIERS
Dominik Neumaier1, Guido Link1 and John Jelonnek1,2
IHM1, IHE2, Karlsruhe Institute of Technology (KIT), 76131 Karlsruhe, Germany [email protected]
Keywords: Microwave, Industrial applications, Scale-up, Optimization, Solid-state
Undoubtedly, dielectric heating using microwaves offers the potential to improve many industrial processes with respect to energy efficiency and process time. Nevertheless, microwave heating requires to overcome the major challenge in achieving a homogeneous heating of the work piece while being exposed to the inhomogeneous electromagnetic field that exists in the microwave applicator. Modern solid-state amplifiers allow to control the electromagnetic field that is radiated by the microwave antennas and that is finally dissipated into the work piece. That is possible by frequency tuning over a wide frequency range, a precise control of the phase and the output power. The aim of this work is to investigate the achievable temperature homogeneity by making use of frequency, phase and amplitude tunability of the microwave sources in the available ISM frequency band. Various cavities with distributed microwave sources are assumed. An optimization-based superposition of modes is investigated based on 2D electromagnetic simulations using COMSOL Multiphysics. Furthermore, the results that are model based are verified with experiments on an industrial scale microwave system. Particularly a modified microwave oven of company Vötsch Industrietechnik GmbH with a hexagonal cross section and a circumferential diameter of 1 m and a depth of 1 m is used. Up to 10 novel solid-state-based microwave generators of company HBH Microwave GmbH with 1 kW microwave power each can be considered. The power is coupled into the cavity via cross-polarized slotted waveguide antennas. The recording of the evolving temperature profiles in various work pieces is performed using an infrared camera analogous to the experiments described in [1].
a) b) c) Fig. 1. a) 2D simulation model in COMSOL Multiphysics – rectangular. b) 2D simulation
model in COMSOL Multiphysics – hexagonal. c) Real measurement setup.
References 1. Neumaier, D., Sanseverino, S., Link, G. and Jelonnek, J., “Homogeneous
Dielectric Heating in large Microwave ovens by excitation of multipleeigenmodes at their resonance frequencies, 17th International Conference onMicrowave and High Frequency Heating, 2019, pp. 166-173.
155
18th International Conference on Microwave and High Frequency ApplicationsAMPERE 2021, Gothenburg, Sweden, September 13-16, 2021
INFLUENCE OF MICROWAVE FREQUENCY AND GAS HUMIDITY ON THEVITRO BLOOD COAGULATION WITH A COLD ATMOSPHERIC PRESSURE
PLASMA
L. Wu, J. Yu, K. M. Huang
1IAEM (Institute of Applied ElectroMagnetics), College of Electronics and InformationEngineering, No. 24, South Section, First Ring Road, Chengdu, P. R. [email protected]
Keywords : Microwave, Medical applications, Plasma applications, Frequency sources.
Cold atmospheric pressure plasma (CAPP) is widely used in the field of biomedicine, suchas inducing cancer cell apoptosis, sterilization, tooth whitening, skin regeneration, rapidblood clotting, and so on. Studies have shown that the types and concentrations of reactiveoxygen species (ROS) in cold plasma, such as oxygen atoms (O) and hydroxyl radicals(OH), have significant effects on plasma treatment1. Our previous researches showed thatboth the H2O content and microwave frequency play critical roles in the ROS species andtheir densities2-3. Therefore, this paper conducted experiments to investigate the influenceof microwave frequencies (2450 MHz and 5800 MHz) and the water content in the Ar-H2O mixed gas (1%, 2%, 3%, 4%, 6%, and 8%) in vitro coagulation. Blood droplets wereplaced on quartz plates and treated by the plasma jet. The exposure temperatures of alltreated blood droplets were below 55 ℃ . The spectral lines of ROS (OH, O) weremeasured by a spectrometer. Experiments revealed that increasing frequency or humiditycould raise the doses of ROS. The higher the doses of ROS, the better the coagulationeffect. In addition, the experiments also showed that blood coagulation was negativelyrelated to the exposure distance to the plasma discharge, but positively related to theexposure time of the droplets operated by the plasma. This paper proposes a newalternative, which is by adjusting microwave frequency or gas humidity, to accelerate theblood coagulation with CAPP. It may also provide a potential clinical trial for bloodcoagulation in surgery.
References1. Kuo, S. P., Chen, C. Y., IEEE T. PLASMA SCI., 2012, 40, 1117-1123.2. Yu, J., Zhang, W., AIP Advances, 2021, 11, 0251311.3. Wu, L., Zhang, W., Physics of Plasmas, 2020, 27,123508.
156
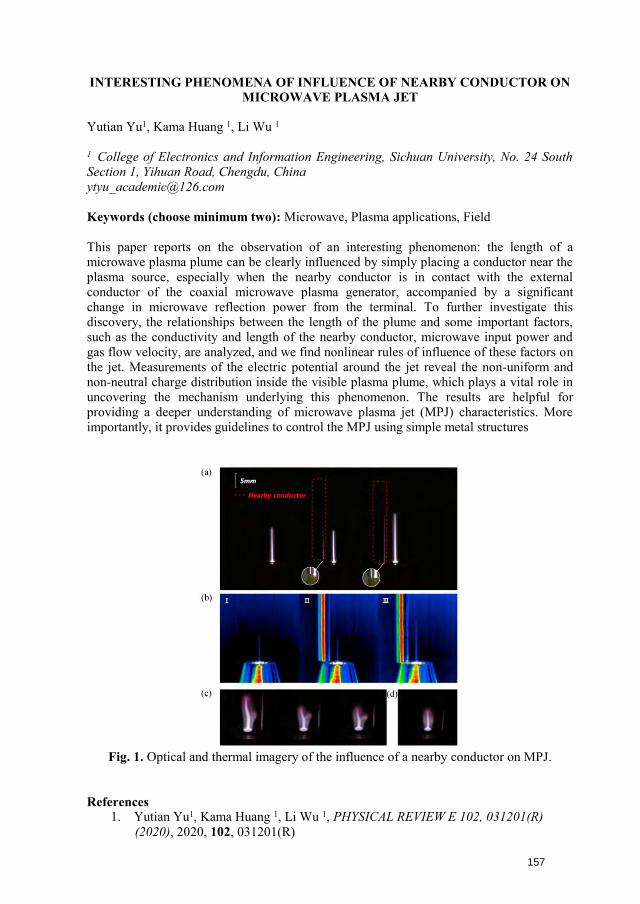
INTERESTING PHENOMENA OF INFLUENCE OF NEARBY CONDUCTOR ON MICROWAVE PLASMA JET
Yutian Yu1, Kama Huang 1, Li Wu 1
1 College of Electronics and Information Engineering, Sichuan University, No. 24 South Section 1, Yihuan Road, Chengdu, China [email protected]
Keywords (choose minimum two): Microwave, Plasma applications, Field
This paper reports on the observation of an interesting phenomenon: the length of a microwave plasma plume can be clearly influenced by simply placing a conductor near the plasma source, especially when the nearby conductor is in contact with the external conductor of the coaxial microwave plasma generator, accompanied by a significant change in microwave reflection power from the terminal. To further investigate this discovery, the relationships between the length of the plume and some important factors, such as the conductivity and length of the nearby conductor, microwave input power and gas flow velocity, are analyzed, and we find nonlinear rules of influence of these factors on the jet. Measurements of the electric potential around the jet reveal the non-uniform and non-neutral charge distribution inside the visible plasma plume, which plays a vital role in uncovering the mechanism underlying this phenomenon. The results are helpful for providing a deeper understanding of microwave plasma jet (MPJ) characteristics. More importantly, it provides guidelines to control the MPJ using simple metal structures
Fig. 1. Optical and thermal imagery of the influence of a nearby conductor on MPJ.
References 1. Yutian Yu1, Kama Huang 1, Li Wu 1, PHYSICAL REVIEW E 102, 031201(R)
(2020), 2020, 102, 031201(R)
157
18th International Conference on Microwave and High Frequency Applications AMPERE 2021, Online, September 13-16, 2021
Investigation of the microwave assisted pultrusion and resin transfer moulding (RTM) process with thermoplastic resin and cure monitoring
R. Emmerich1, C. Ress1, M. Graf1, A. Zoller2, E. Mouth2, Nikos Pantelelis3, Rocio Ruiz
Gallardo4
1Fraunhofer Institute Chemical Technology J.-v.-Fraunhofer-Str.7, D-76327 Pfinztal 2Arkema, Groupement de Recherches de Lacq, 64170 Lacq, France 3Synthesites, Piraeus, Greece4 AIMPLAS, Valencia, Spain
Keywords: Microwave, Process intensification, Industrial application, Applicator
Introduction
Fiber reinforced composites are widely used in transport and sport industries. The major benefit of composites is that these materials are about 30 to 40% lighter than metal parts having comparable properties. Nowadays the composites consist mainly out of a thermoset polymer matrix, because the uncured polymers resins have a low viscosity for a good infiltration of the fibers and short cycle time. Nevertheless, they cannot be easily recycled. Now new polymer resins like Elium® are commercial available, which cure like thermoset resins having all advantages of thermoplastic materials recyclability, the possibility of subsequent shaping, etc1. The viscosity of these new resins are low enough to ensure the necessary good infiltration of fibers, too. Recotrans project aims to enhance the processing of the reactive thermoplastic composites for transport applications. Therefore one of our main objective is to optimize the curing conditions for pultrusion and resin transfer moulding (RTM), by employing advanced technologies such as microwave assisted curing and intelligent reaction monitoring.
It has been shown that the electrical resistance of a resin is directly related to the resin’s viscosity and Tg. Based on this observation and experimenting with several resins, Synthesites developed a proprietary technology for the online estimation of the development of the Glass Transition (Tg) temperature and/or of the degree of cure valid not only in the laboratory but also during composites production. This technology has been already applied successfully to thermoset-based composites manufacturing in automotive, wind turbine blades, and aerospace while in reactive thermoplastics it was used only in lab-scale trials [12]. Following this well-established theory that has been widely proven in practice, the resistivity of a resin was directly related to its viscosity while the Tg temperature can be estimated online using Synthesites proprietary algorithms via the Online Resin State (ORS) module. This online estimation technique was extended successfully for the specific acrylic resin that is being used in the Recotrans project. The ORS module was initially developed for isothermal cure cycles and was further extended to deal with highly non-isothermal conditions i.e. high exotherms with long cooling stages. Similarly to the resistance correlation to the Tg in thermoset resins, for the reactive thermoplastic resin the correlation is with the residual of the monomer which corresponds to the degree of conversion.
158
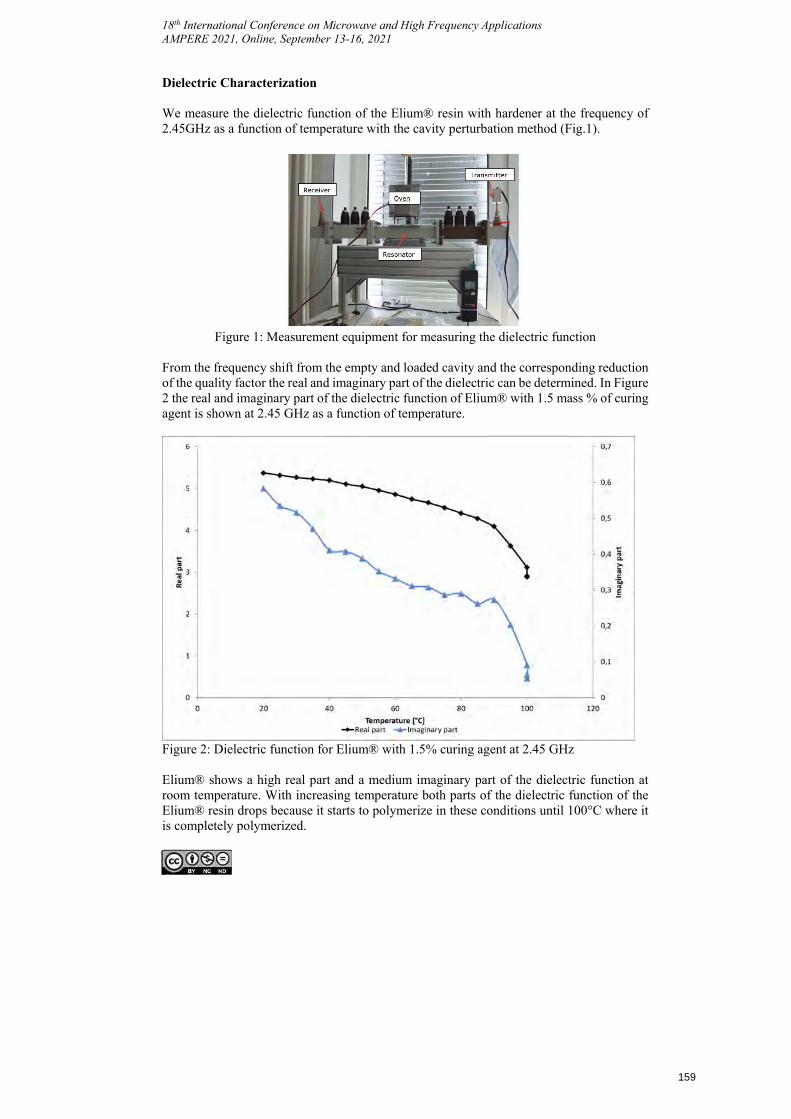
18th International Conference on Microwave and High Frequency Applications AMPERE 2021, Online, September 13-16, 2021
Dielectric Characterization
We measure the dielectric function of the Elium® resin with hardener at the frequency of 2.45GHz as a function of temperature with the cavity perturbation method (Fig.1).
Figure 1: Measurement equipment for measuring the dielectric function
From the frequency shift from the empty and loaded cavity and the corresponding reduction of the quality factor the real and imaginary part of the dielectric can be determined. In Figure 2 the real and imaginary part of the dielectric function of Elium® with 1.5 mass % of curing agent is shown at 2.45 GHz as a function of temperature.
Figure 2: Dielectric function for Elium® with 1.5% curing agent at 2.45 GHz
Elium® shows a high real part and a medium imaginary part of the dielectric function at room temperature. With increasing temperature both parts of the dielectric function of the Elium® resin drops because it starts to polymerize in these conditions until 100°C where it is completely polymerized.
159
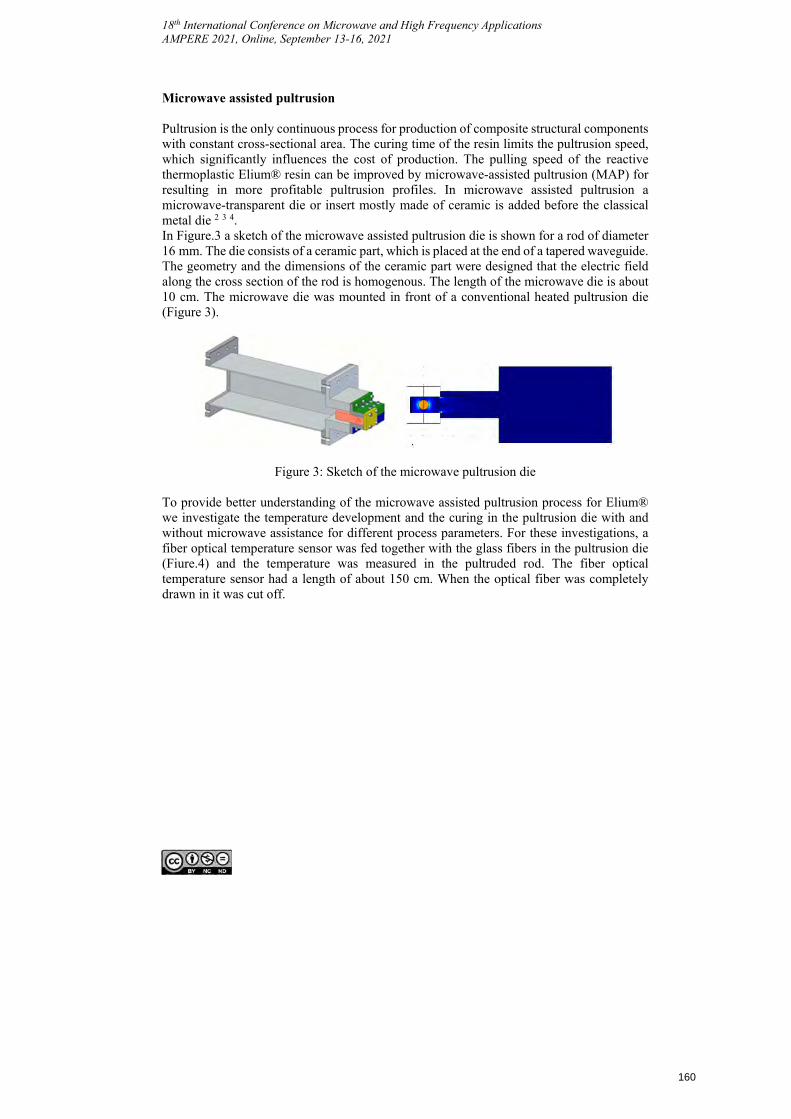
18th International Conference on Microwave and High Frequency Applications AMPERE 2021, Online, September 13-16, 2021
Microwave assisted pultrusion
Pultrusion is the only continuous process for production of composite structural components with constant cross-sectional area. The curing time of the resin limits the pultrusion speed, which significantly influences the cost of production. The pulling speed of the reactive thermoplastic Elium® resin can be improved by microwave-assisted pultrusion (MAP) for resulting in more profitable pultrusion profiles. In microwave assisted pultrusion a microwave-transparent die or insert mostly made of ceramic is added before the classical metal die 2 3 4. In Figure.3 a sketch of the microwave assisted pultrusion die is shown for a rod of diameter 16 mm. The die consists of a ceramic part, which is placed at the end of a tapered waveguide. The geometry and the dimensions of the ceramic part were designed that the electric field along the cross section of the rod is homogenous. The length of the microwave die is about 10 cm. The microwave die was mounted in front of a conventional heated pultrusion die (Figure 3).
Figure 3: Sketch of the microwave pultrusion die
To provide better understanding of the microwave assisted pultrusion process for Elium® we investigate the temperature development and the curing in the pultrusion die with and without microwave assistance for different process parameters. For these investigations, a fiber optical temperature sensor was fed together with the glass fibers in the pultrusion die (Fiure.4) and the temperature was measured in the pultruded rod. The fiber optical temperature sensor had a length of about 150 cm. When the optical fiber was completely drawn in it was cut off.
160
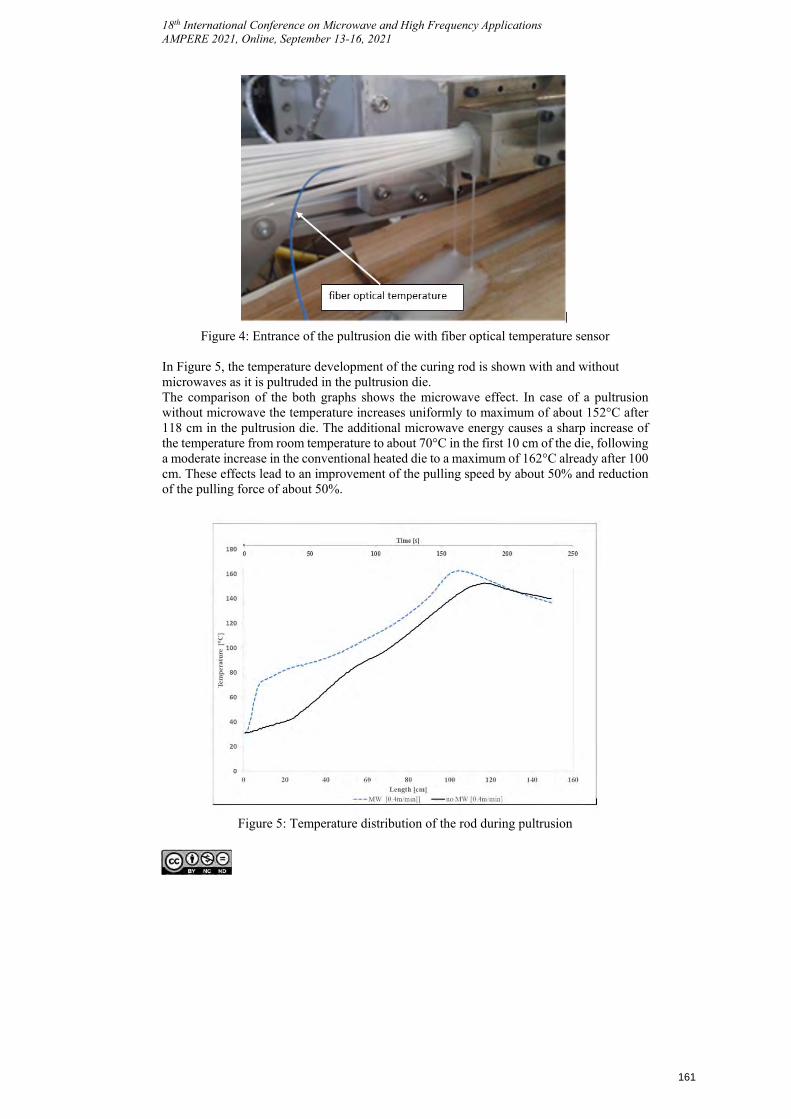
18th International Conference on Microwave and High Frequency Applications AMPERE 2021, Online, September 13-16, 2021
Figure 4: Entrance of the pultrusion die with fiber optical temperature sensor
In Figure 5, the temperature development of the curing rod is shown with and without microwaves as it is pultruded in the pultrusion die. The comparison of the both graphs shows the microwave effect. In case of a pultrusion without microwave the temperature increases uniformly to maximum of about 152°C after 118 cm in the pultrusion die. The additional microwave energy causes a sharp increase of the temperature from room temperature to about 70°C in the first 10 cm of the die, following a moderate increase in the conventional heated die to a maximum of 162°C already after 100 cm. These effects lead to an improvement of the pulling speed by about 50% and reductionof the pulling force of about 50%.
Figure 5: Temperature distribution of the rod during pultrusion
161
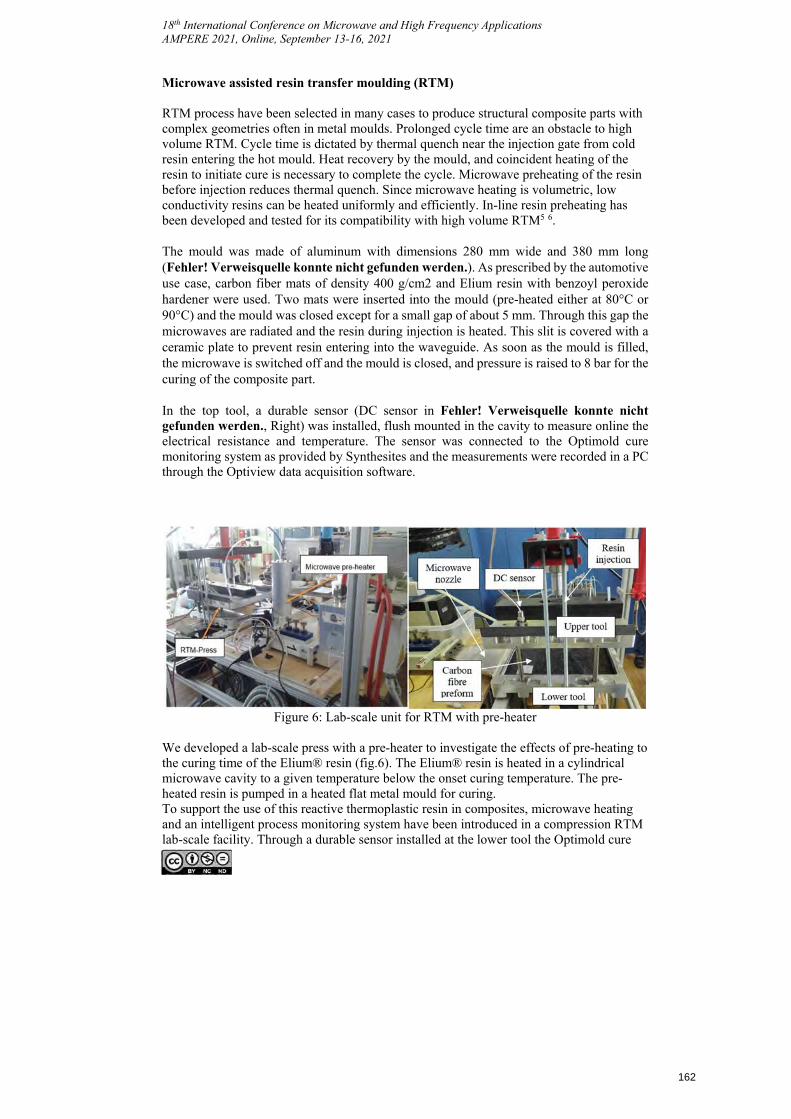
18th International Conference on Microwave and High Frequency Applications AMPERE 2021, Online, September 13-16, 2021
Microwave assisted resin transfer moulding (RTM)
RTM process have been selected in many cases to produce structural composite parts with complex geometries often in metal moulds. Prolonged cycle time are an obstacle to high volume RTM. Cycle time is dictated by thermal quench near the injection gate from cold resin entering the hot mould. Heat recovery by the mould, and coincident heating of the resin to initiate cure is necessary to complete the cycle. Microwave preheating of the resin before injection reduces thermal quench. Since microwave heating is volumetric, low conductivity resins can be heated uniformly and efficiently. In-line resin preheating has been developed and tested for its compatibility with high volume RTM5 6.
The mould was made of aluminum with dimensions 280 mm wide and 380 mm long (Fehler! Verweisquelle konnte nicht gefunden werden.). As prescribed by the automotive use case, carbon fiber mats of density 400 g/cm2 and Elium resin with benzoyl peroxide hardener were used. Two mats were inserted into the mould (pre-heated either at 80°C or 90°C) and the mould was closed except for a small gap of about 5 mm. Through this gap the microwaves are radiated and the resin during injection is heated. This slit is covered with a ceramic plate to prevent resin entering into the waveguide. As soon as the mould is filled, the microwave is switched off and the mould is closed, and pressure is raised to 8 bar for the curing of the composite part.
In the top tool, a durable sensor (DC sensor in Fehler! Verweisquelle konnte nicht gefunden werden., Right) was installed, flush mounted in the cavity to measure online the electrical resistance and temperature. The sensor was connected to the Optimold cure monitoring system as provided by Synthesites and the measurements were recorded in a PC through the Optiview data acquisition software.
Figure 6: Lab-scale unit for RTM with pre-heater
We developed a lab-scale press with a pre-heater to investigate the effects of pre-heating to the curing time of the Elium® resin (fig.6). The Elium® resin is heated in a cylindrical microwave cavity to a given temperature below the onset curing temperature. The pre-heated resin is pumped in a heated flat metal mould for curing. To support the use of this reactive thermoplastic resin in composites, microwave heating and an intelligent process monitoring system have been introduced in a compression RTM lab-scale facility. Through a durable sensor installed at the lower tool the Optimold cure
162
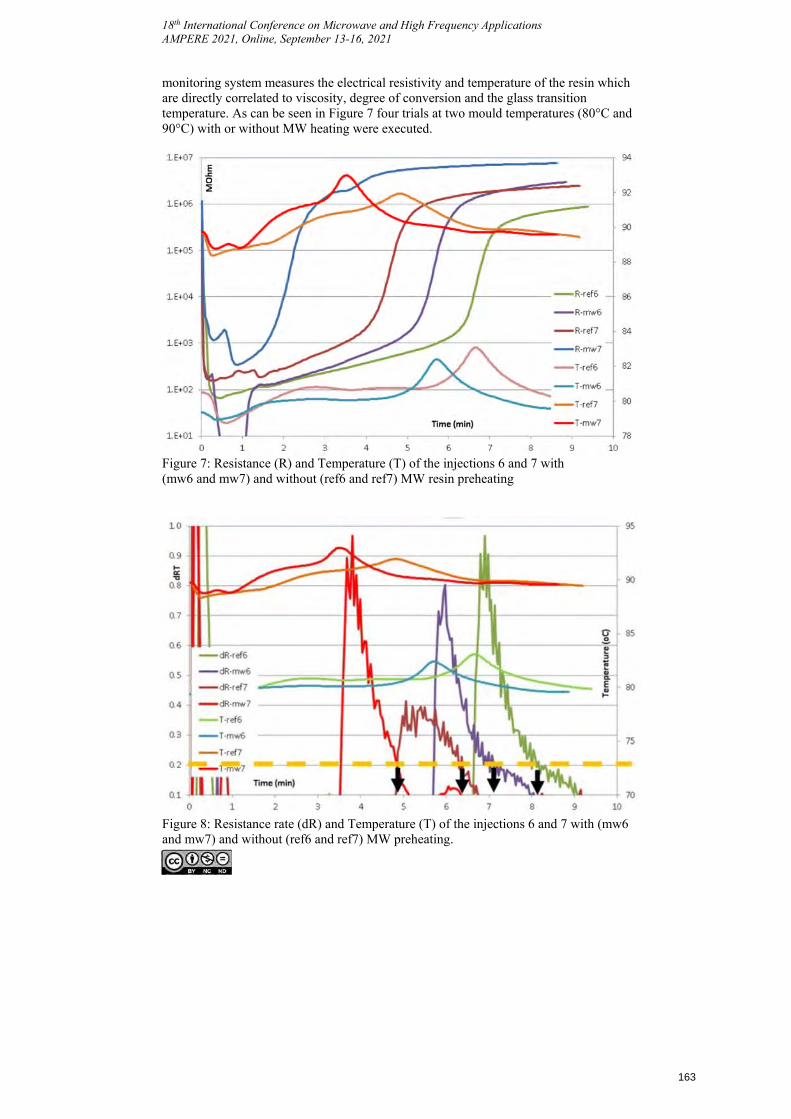
18th International Conference on Microwave and High Frequency Applications AMPERE 2021, Online, September 13-16, 2021
monitoring system measures the electrical resistivity and temperature of the resin which are directly correlated to viscosity, degree of conversion and the glass transition temperature. As can be seen in Figure 7 four trials at two mould temperatures (80°C and 90°C) with or without MW heating were executed.
Figure 7: Resistance (R) and Temperature (T) of the injections 6 and 7 with (mw6 and mw7) and without (ref6 and ref7) MW resin preheating
Figure 8: Resistance rate (dR) and Temperature (T) of the injections 6 and 7 with (mw6 and mw7) and without (ref6 and ref7) MW preheating.
163
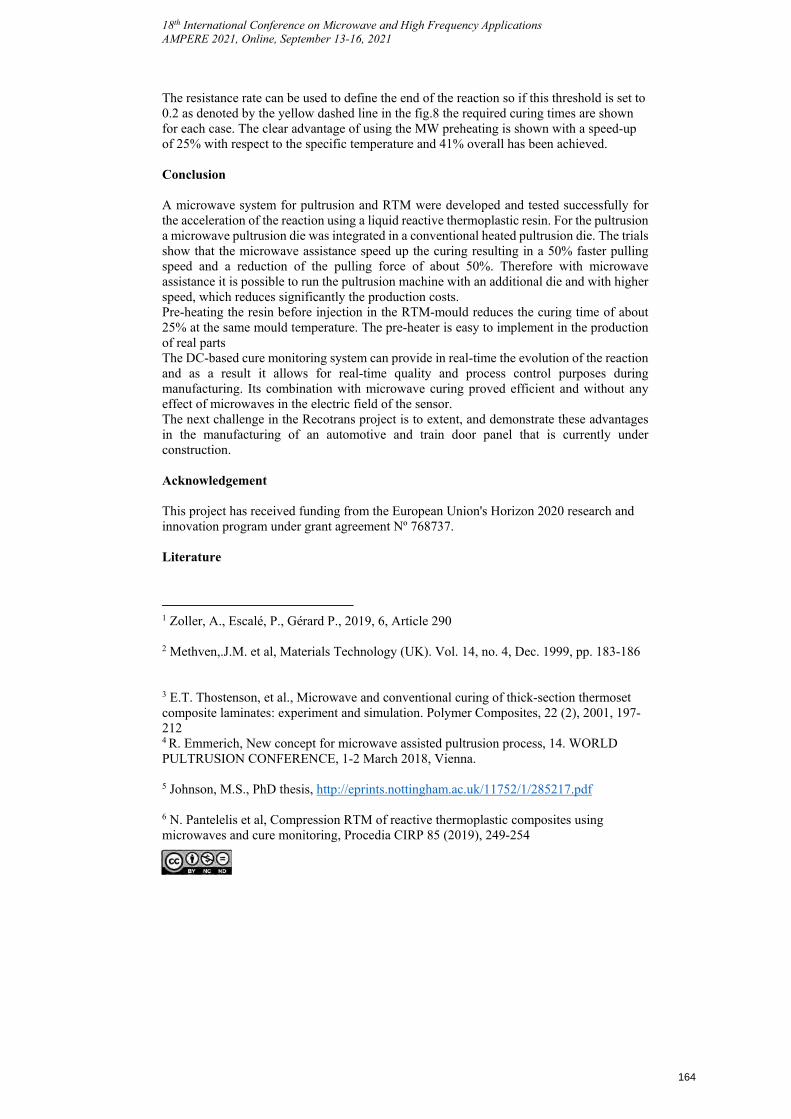
18th International Conference on Microwave and High Frequency Applications AMPERE 2021, Online, September 13-16, 2021
The resistance rate can be used to define the end of the reaction so if this threshold is set to 0.2 as denoted by the yellow dashed line in the fig.8 the required curing times are shown for each case. The clear advantage of using the MW preheating is shown with a speed-up of 25% with respect to the specific temperature and 41% overall has been achieved.
Conclusion
A microwave system for pultrusion and RTM were developed and tested successfully for the acceleration of the reaction using a liquid reactive thermoplastic resin. For the pultrusion a microwave pultrusion die was integrated in a conventional heated pultrusion die. The trials show that the microwave assistance speed up the curing resulting in a 50% faster pulling speed and a reduction of the pulling force of about 50%. Therefore with microwave assistance it is possible to run the pultrusion machine with an additional die and with higher speed, which reduces significantly the production costs. Pre-heating the resin before injection in the RTM-mould reduces the curing time of about 25% at the same mould temperature. The pre-heater is easy to implement in the production of real parts The DC-based cure monitoring system can provide in real-time the evolution of the reaction and as a result it allows for real-time quality and process control purposes during manufacturing. Its combination with microwave curing proved efficient and without any effect of microwaves in the electric field of the sensor. The next challenge in the Recotrans project is to extent, and demonstrate these advantages in the manufacturing of an automotive and train door panel that is currently under construction.
Acknowledgement
This project has received funding from the European Union's Horizon 2020 research and innovation program under grant agreement Nº 768737.
Literature
1 Zoller, A., Escalé, P., Gérard P., 2019, 6, Article 290
2 Methven,.J.M. et al, Materials Technology (UK). Vol. 14, no. 4, Dec. 1999, pp. 183-186
3 E.T. Thostenson, et al., Microwave and conventional curing of thick-section thermoset composite laminates: experiment and simulation. Polymer Composites, 22 (2), 2001, 197-212 4 R. Emmerich, New concept for microwave assisted pultrusion process, 14. WORLD PULTRUSION CONFERENCE, 1-2 March 2018, Vienna.
5 Johnson, M.S., PhD thesis, http://eprints.nottingham.ac.uk/11752/1/285217.pdf
6 N. Pantelelis et al, Compression RTM of reactive thermoplastic composites using microwaves and cure monitoring, Procedia CIRP 85 (2019), 249-254
164
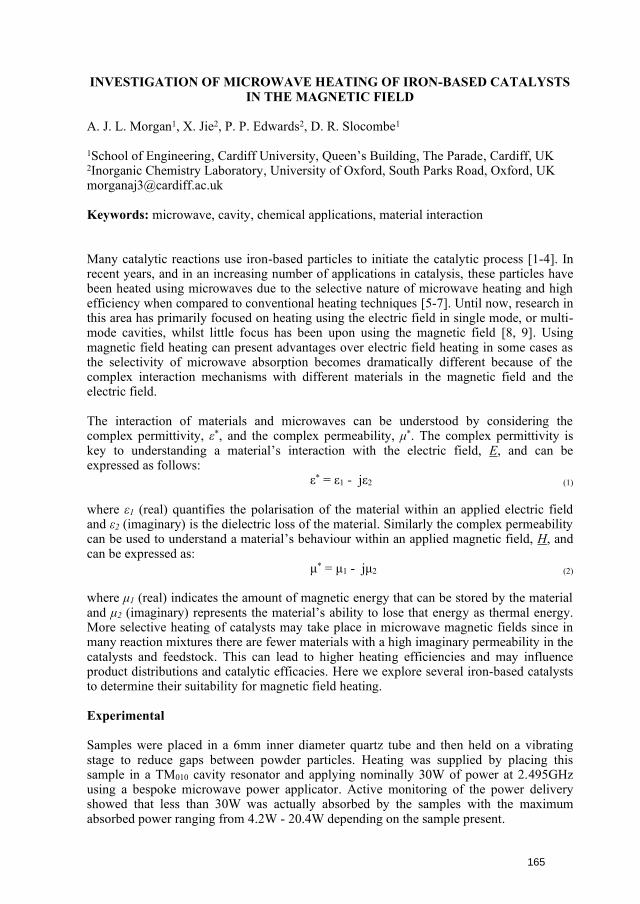
INVESTIGATION OF MICROWAVE HEATING OF IRON-BASED CATALYSTS IN THE MAGNETIC FIELD
A. J. L. Morgan1, X. Jie2, P. P. Edwards2, D. R. Slocombe1
1School of Engineering, Cardiff University, Queen’s Building, The Parade, Cardiff, UK 2Inorganic Chemistry Laboratory, University of Oxford, South Parks Road, Oxford, UK [email protected]
Keywords: microwave, cavity, chemical applications, material interaction
Many catalytic reactions use iron-based particles to initiate the catalytic process [1-4]. In recent years, and in an increasing number of applications in catalysis, these particles have been heated using microwaves due to the selective nature of microwave heating and high efficiency when compared to conventional heating techniques [5-7]. Until now, research in this area has primarily focused on heating using the electric field in single mode, or multi-mode cavities, whilst little focus has been upon using the magnetic field [8, 9]. Using magnetic field heating can present advantages over electric field heating in some cases as the selectivity of microwave absorption becomes dramatically different because of the complex interaction mechanisms with different materials in the magnetic field and the electric field.
The interaction of materials and microwaves can be understood by considering the complex permittivity, ε*, and the complex permeability, μ*. The complex permittivity is key to understanding a material’s interaction with the electric field, E, and can be expressed as follows:
ε* = ε1 - jε2 (1)
where ε1 (real) quantifies the polarisation of the material within an applied electric field and ε2 (imaginary) is the dielectric loss of the material. Similarly the complex permeability can be used to understand a material’s behaviour within an applied magnetic field, H, and can be expressed as:
μ* = μ1 - jμ2 (2)
where μ1 (real) indicates the amount of magnetic energy that can be stored by the material and μ2 (imaginary) represents the material’s ability to lose that energy as thermal energy. More selective heating of catalysts may take place in microwave magnetic fields since in many reaction mixtures there are fewer materials with a high imaginary permeability in the catalysts and feedstock. This can lead to higher heating efficiencies and may influence product distributions and catalytic efficacies. Here we explore several iron-based catalysts to determine their suitability for magnetic field heating.
Experimental
Samples were placed in a 6mm inner diameter quartz tube and then held on a vibrating stage to reduce gaps between powder particles. Heating was supplied by placing this sample in a TM010 cavity resonator and applying nominally 30W of power at 2.495GHz using a bespoke microwave power applicator. Active monitoring of the power delivery showed that less than 30W was actually absorbed by the samples with the maximum absorbed power ranging from 4.2W - 20.4W depending on the sample present.
165
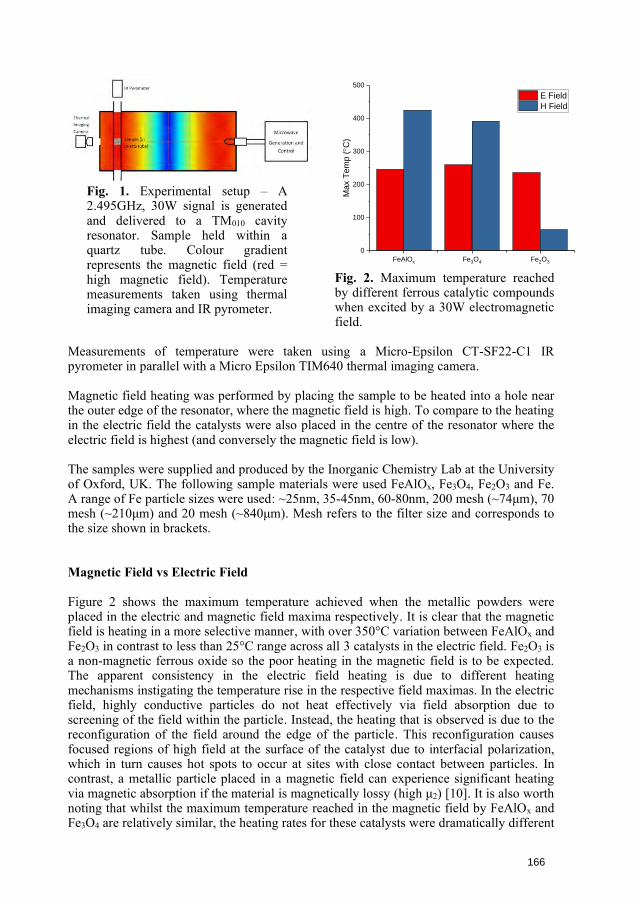
Fig. 1. Experimental setup – A 2.495GHz, 30W signal is generated and delivered to a TM010 cavity resonator. Sample held within a quartz tube. Colour gradient represents the magnetic field (red = high magnetic field). Temperature measurements taken using thermal imaging camera and IR pyrometer.
FeAlOx Fe3O4 Fe2O3
0
100
200
300
400
500
Max T
em
p (C
)
E Field
H Field
Fig. 2. Maximum temperature reached by different ferrous catalytic compounds when excited by a 30W electromagnetic field.
Measurements of temperature were taken using a Micro-Epsilon CT-SF22-C1 IR pyrometer in parallel with a Micro Epsilon TIM640 thermal imaging camera.
Magnetic field heating was performed by placing the sample to be heated into a hole near the outer edge of the resonator, where the magnetic field is high. To compare to the heating in the electric field the catalysts were also placed in the centre of the resonator where the electric field is highest (and conversely the magnetic field is low).
The samples were supplied and produced by the Inorganic Chemistry Lab at the University of Oxford, UK. The following sample materials were used FeAlOx, Fe3O4, Fe2O3 and Fe. A range of Fe particle sizes were used: ~25nm, 35-45nm, 60-80nm, 200 mesh (~74μm), 70 mesh (~210μm) and 20 mesh (~840μm). Mesh refers to the filter size and corresponds to the size shown in brackets.
Magnetic Field vs Electric Field
Figure 2 shows the maximum temperature achieved when the metallic powders were placed in the electric and magnetic field maxima respectively. It is clear that the magnetic field is heating in a more selective manner, with over 350°C variation between FeAlOx and Fe2O3 in contrast to less than 25°C range across all 3 catalysts in the electric field. Fe2O3 is a non-magnetic ferrous oxide so the poor heating in the magnetic field is to be expected. The apparent consistency in the electric field heating is due to different heating mechanisms instigating the temperature rise in the respective field maximas. In the electric field, highly conductive particles do not heat effectively via field absorption due to screening of the field within the particle. Instead, the heating that is observed is due to the reconfiguration of the field around the edge of the particle. This reconfiguration causes focused regions of high field at the surface of the catalyst due to interfacial polarization, which in turn causes hot spots to occur at sites with close contact between particles. In contrast, a metallic particle placed in a magnetic field can experience significant heating via magnetic absorption if the material is magnetically lossy (high μ2) [10]. It is also worth noting that whilst the maximum temperature reached in the magnetic field by FeAlOx and Fe3O4 are relatively similar, the heating rates for these catalysts were dramatically different
166
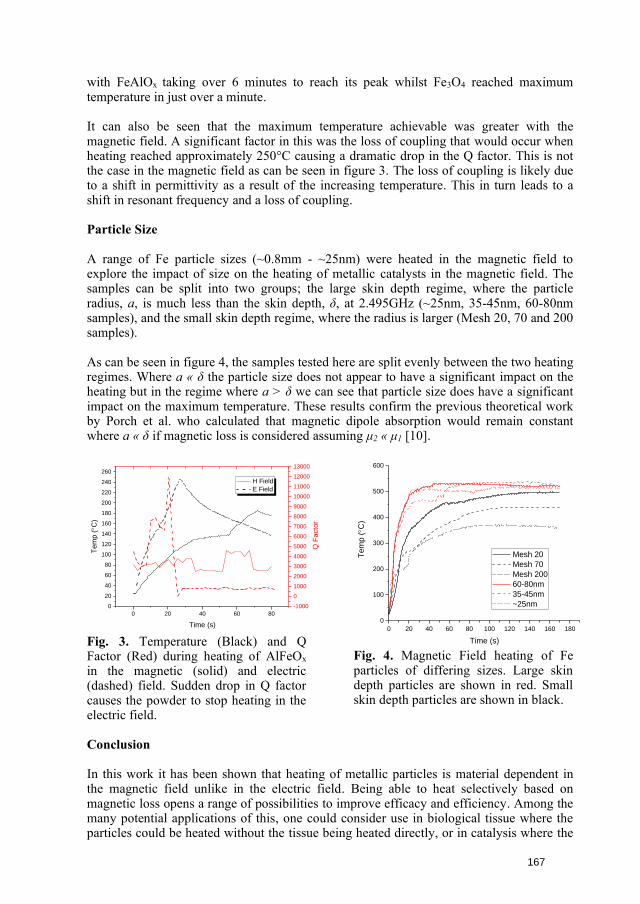
with FeAlOx taking over 6 minutes to reach its peak whilst Fe3O4 reached maximum temperature in just over a minute.
It can also be seen that the maximum temperature achievable was greater with the magnetic field. A significant factor in this was the loss of coupling that would occur when heating reached approximately 250°C causing a dramatic drop in the Q factor. This is not the case in the magnetic field as can be seen in figure 3. The loss of coupling is likely due to a shift in permittivity as a result of the increasing temperature. This in turn leads to a shift in resonant frequency and a loss of coupling.
Particle Size
A range of Fe particle sizes (~0.8mm - ~25nm) were heated in the magnetic field to explore the impact of size on the heating of metallic catalysts in the magnetic field. The samples can be split into two groups; the large skin depth regime, where the particle radius, a, is much less than the skin depth, δ, at 2.495GHz (~25nm, 35-45nm, 60-80nm samples), and the small skin depth regime, where the radius is larger (Mesh 20, 70 and 200 samples).
As can be seen in figure 4, the samples tested here are split evenly between the two heating regimes. Where a « δ the particle size does not appear to have a significant impact on the heating but in the regime where a > δ we can see that particle size does have a significant impact on the maximum temperature. These results confirm the previous theoretical work by Porch et al. who calculated that magnetic dipole absorption would remain constant where a « δ if magnetic loss is considered assuming μ2 « μ1 [10].
0 20 40 60 80
0
20
40
60
80
100
120
140
160
180
200
220
240
260
H Field
E Field
Time (s)
Tem
p (C
)
-1000
0
1000
2000
3000
4000
5000
6000
7000
8000
9000
10000
11000
12000
13000
Q F
acto
r
Fig. 3. Temperature (Black) and Q Factor (Red) during heating of AlFeOx in the magnetic (solid) and electric (dashed) field. Sudden drop in Q factor causes the powder to stop heating in the electric field.
0 20 40 60 80 100 120 140 160 180
0
100
200
300
400
500
600
Tem
p (C
)
Time (s)
Mesh 20
Mesh 70
Mesh 200
60-80nm
35-45nm
~25nm
Fig. 4. Magnetic Field heating of Fe particles of differing sizes. Large skin depth particles are shown in red. Small skin depth particles are shown in black.
Conclusion
In this work it has been shown that heating of metallic particles is material dependent in the magnetic field unlike in the electric field. Being able to heat selectively based on magnetic loss opens a range of possibilities to improve efficacy and efficiency. Among the many potential applications of this, one could consider use in biological tissue where the particles could be heated without the tissue being heated directly, or in catalysis where the
167
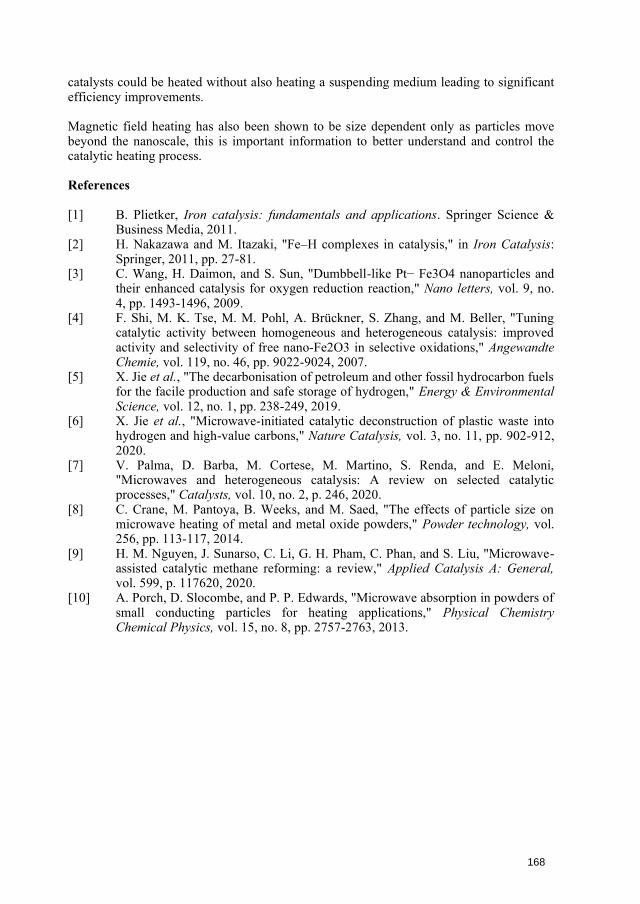
catalysts could be heated without also heating a suspending medium leading to significant efficiency improvements.
Magnetic field heating has also been shown to be size dependent only as particles move beyond the nanoscale, this is important information to better understand and control the catalytic heating process.
References
[1] B. Plietker, Iron catalysis: fundamentals and applications. Springer Science &Business Media, 2011.
[2] H. Nakazawa and M. Itazaki, "Fe–H complexes in catalysis," in Iron Catalysis:Springer, 2011, pp. 27-81.
[3] C. Wang, H. Daimon, and S. Sun, "Dumbbell-like Pt− Fe3O4 nanoparticles andtheir enhanced catalysis for oxygen reduction reaction," Nano letters, vol. 9, no.4, pp. 1493-1496, 2009.
[4] F. Shi, M. K. Tse, M. M. Pohl, A. Brückner, S. Zhang, and M. Beller, "Tuningcatalytic activity between homogeneous and heterogeneous catalysis: improvedactivity and selectivity of free nano‐Fe2O3 in selective oxidations," AngewandteChemie, vol. 119, no. 46, pp. 9022-9024, 2007.
[5] X. Jie et al., "The decarbonisation of petroleum and other fossil hydrocarbon fuelsfor the facile production and safe storage of hydrogen," Energy & EnvironmentalScience, vol. 12, no. 1, pp. 238-249, 2019.
[6] X. Jie et al., "Microwave-initiated catalytic deconstruction of plastic waste intohydrogen and high-value carbons," Nature Catalysis, vol. 3, no. 11, pp. 902-912,2020.
[7] V. Palma, D. Barba, M. Cortese, M. Martino, S. Renda, and E. Meloni,"Microwaves and heterogeneous catalysis: A review on selected catalyticprocesses," Catalysts, vol. 10, no. 2, p. 246, 2020.
[8] C. Crane, M. Pantoya, B. Weeks, and M. Saed, "The effects of particle size onmicrowave heating of metal and metal oxide powders," Powder technology, vol.256, pp. 113-117, 2014.
[9] H. M. Nguyen, J. Sunarso, C. Li, G. H. Pham, C. Phan, and S. Liu, "Microwave-assisted catalytic methane reforming: a review," Applied Catalysis A: General,vol. 599, p. 117620, 2020.
[10] A. Porch, D. Slocombe, and P. P. Edwards, "Microwave absorption in powders ofsmall conducting particles for heating applications," Physical ChemistryChemical Physics, vol. 15, no. 8, pp. 2757-2763, 2013.
168
Large scale/high density plasma surfaces generated by distributed elementary plasma sources
powered by solid state microwave generators.
Fadi ZOUBIAN, Nicolas RENAUT, Louis LATRASSE
SAIREM SAS, Decines-Charpieu, France
To meet the new requirements, in terms of plasma surface and ion density, of the new nanotechnology
industries such as microelectronic components fabrication, novel self-matched plasma sources using
micro-wave solid state generators have been developed. Thanks to the patented automatic frequency
tuning, the impedance matching system was eliminated and the use of the sources has become very
simple and precise [1]. To respond to the requirements of different applications, two sources were
developed to cover a wide working pressure range, the Aura-Wave source working between 10-2 Pa
and a few Pa, and the Hi-Wave source covering the range between 1 Pa and a few 10 Pa [2–4].
Multisource configurations were studied. Each source is powered by its own microwave solid state
generator allowing an individual control of the transmitted power with 1 watt increment. A Langmuir
probe was used to investigate the plasma density. An in-home simulation software was developed
allowing to optimize the surface uniformity by optimizing the sources distribution and the transmitted
power to every source and expect the resulting density for a given configuration. The probe
measurements allowed to validate the simulations. The effect of plasma parameters such as plasma
gas, working pressure, microwave power in addition to the distance between the probe and the
sources plane was investigated. A nitrogen plasma at 1 Pa obtained with a matrix distribution of 16
Aura-Wave sources with a lattice parameter of 110 cm generates a high-density plasma of 1.2 × 10¹¹
cm-3 with 5 % uniformity on 410 mm diameter measured at 10 cm from the sources plane [5]. The
same matrix configuration with 16 Hi-Wave sources for an argon plasma at 0.5 Pa gives a plasma
density around 1.2 × 1012 cm-3 with a 5 % uniformity at 440 mm of diameter.
References
[1] Latrasse L, Radoiu M, Jacomino J-M and Grandemenge A 2012 Facility for Microwave
Treatment of a Load, WO2012146870
[2] Latrasse L and Radoiu M 2017 Elementary Device for Applying a Microwave Energy with
Coaxial Applicator, WO2017060611
[3] Latrasse L, Radoiu M, Nelis T and Antonin O 2017 Self-matching plasma sources using 2.45
GHz solid-state generators: microwave design and operating performance J. Microw. Power
Electromagn. Energy 51 237–58
[4] Latrasse L and Radoiu M 2017 Elementary Device for Producing a Plasma, Having a Coaxial
Applicator, WO2017060612
[5] Zoubian F, Renaut N and Latrasse L 2021 Distributed elementary ECR microwave plasma
sources supplied by solid state generators for production of large area plasmas without scale
limitation: plasma density measurements and comparison with simulation Plasma Res. Express 3
025010
169
18th International Conference on Microwave and High Frequency Applications AMPERE 2021, Online, September 13-16, 2021
EDITORIAL RISE RESEARCH INSTITUTE OF SWEDEN
MATERIALS THERMAL PROPERTIES INVESTIGATION BY INVERSE MODELING TECHNIQUE
L. Estel1, C. Lafossas2, M. Poux2, J. Tao3
1Normandie University, INSA Rouen, UNIROUEN, LSPC, 76000 Rouen, France 2Laboratoire de Génie Chimique, Université de Toulouse, CNRS, INPT, UPS, France 3Toulouse University, INP-ENSEEIHT, LAPLACE, France [email protected]
Keywords: Microwave heating, Measurement applications, Inverse modelling
New materials play very important role in industrial, scientific and medical sectors. Accurate knowledge of their mechanical, electrical and thermal properties is a prerequisite for the development of novel and original applications. Many techniques were developed for the determination of these parameters, often under conditions of use of these materials [1-2]. In applications involving the use of microwave energy, the strong interaction between electromagnetic waves and materials provided a new means of investigation in addition to conventional techniques. The use of multiphysics simulation software based on the numerical resolution of coupled partial differential equations offers the possibility of simulating the dynamic system more or less close to real conditions [3-4]. Combining well-controlled and mastered experimental means, simulation tools allow us to go back to the physical properties of the system studied, including the thermal properties of the materials under test. In this article we propose to characterize the thermal properties of new materials by an inverse modeling technique. It consists in minimizing an objective function built from experimental measurements and multi-physical simulations and then in extracting the desired thermal parameters.
1. Principe
In our study we are interested in candidate materials for microwave chemistry or microwave materials processing applications. As a result, these materials will first play the role of receptor of microwave energy, transforming it into thermal energy, before returning it to a "load", the final destination of this energy. The important thermal properties for this kind of application are the thermal conductivity and the specific heat of the material to be characterized. We design an experiment setup using a microwave generator. For a chosen microwave power, a target temperature is given for the material to be heated. The generator is stopped when the target temperature is reached. The cooling phase begins until thermal equilibrium. The temperature evolution in specific point inside the material will be recorded using optical temperature probes for the heating and the cooling steps. The modeling of the entire experimental system with a commercial software COMSOL Multiphysics coupling the heat equation to Maxwell's equations provides an estimate of this same evolution as a function of the trial values of thermal conductivity and specific heat, on the two phases of the process: heating and cooling. The use of an optimization algorithm allows the extraction of thermal properties as a function of temperature.
2. Direct analysis
2.1 Physical laws
170
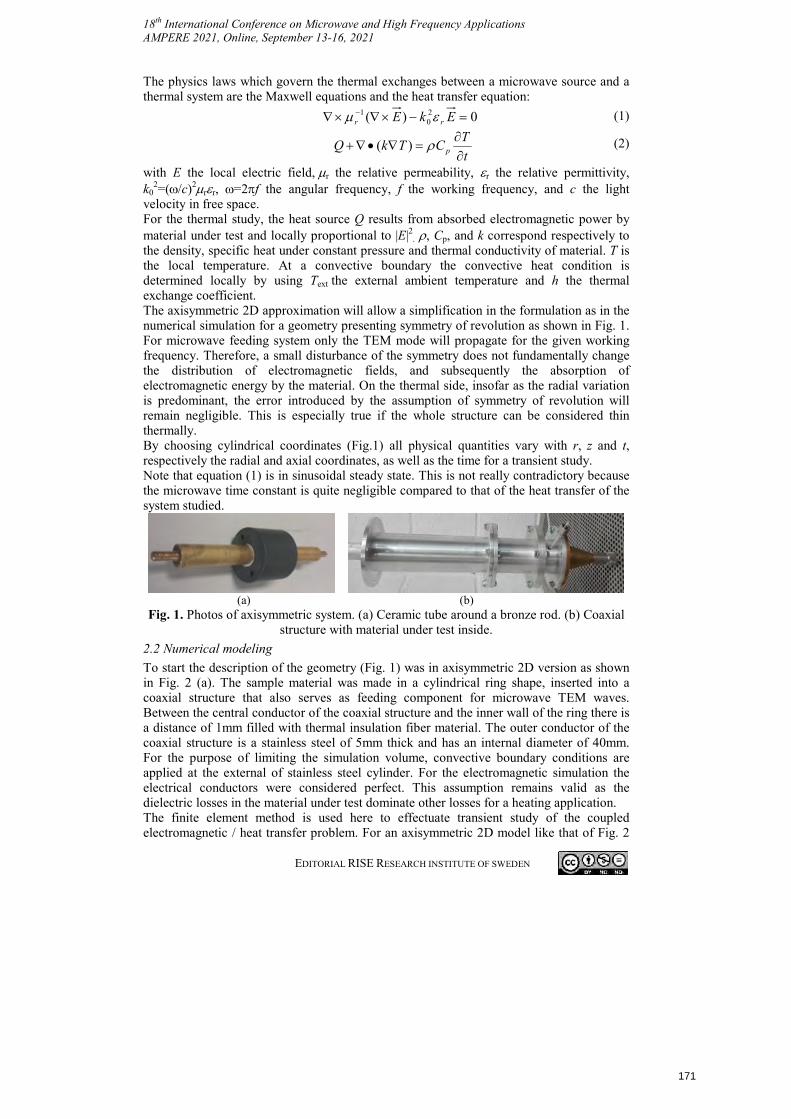
18th International Conference on Microwave and High Frequency Applications AMPERE 2021, Online, September 13-16, 2021
EDITORIAL RISE RESEARCH INSTITUTE OF SWEDEN
The physics laws which govern the thermal exchanges between a microwave source and a thermal system are the Maxwell equations and the heat transfer equation:
0)( 20
1 EkE rr (1)
( ) p
TQ k T C
t
(2)
with E the local electric field, r the relative permeability, r the relative permittivity, k0
2=(/c)2rr, =2f the angular frequency, f the working frequency, and c the light velocity in free space. For the thermal study, the heat source Q results from absorbed electromagnetic power by material under test and locally proportional to |E|2. , Cp, and k correspond respectively to the density, specific heat under constant pressure and thermal conductivity of material. T is the local temperature. At a convective boundary the convective heat condition is determined locally by using Text the external ambient temperature and h the thermal exchange coefficient. The axisymmetric 2D approximation will allow a simplification in the formulation as in the numerical simulation for a geometry presenting symmetry of revolution as shown in Fig. 1. For microwave feeding system only the TEM mode will propagate for the given working frequency. Therefore, a small disturbance of the symmetry does not fundamentally change the distribution of electromagnetic fields, and subsequently the absorption of electromagnetic energy by the material. On the thermal side, insofar as the radial variation is predominant, the error introduced by the assumption of symmetry of revolution will remain negligible. This is especially true if the whole structure can be considered thin thermally. By choosing cylindrical coordinates (Fig.1) all physical quantities vary with r, z and t, respectively the radial and axial coordinates, as well as the time for a transient study. Note that equation (1) is in sinusoidal steady state. This is not really contradictory because the microwave time constant is quite negligible compared to that of the heat transfer of the system studied.
(a) (b) Fig. 1. Photos of axisymmetric system. (a) Ceramic tube around a bronze rod. (b) Coaxial
structure with material under test inside.
2.2 Numerical modeling
To start the description of the geometry (Fig. 1) was in axisymmetric 2D version as shown in Fig. 2 (a). The sample material was made in a cylindrical ring shape, inserted into a coaxial structure that also serves as feeding component for microwave TEM waves. Between the central conductor of the coaxial structure and the inner wall of the ring there is a distance of 1mm filled with thermal insulation fiber material. The outer conductor of the coaxial structure is a stainless steel of 5mm thick and has an internal diameter of 40mm. For the purpose of limiting the simulation volume, convective boundary conditions are applied at the external of stainless steel cylinder. For the electromagnetic simulation the electrical conductors were considered perfect. This assumption remains valid as the dielectric losses in the material under test dominate other losses for a heating application. The finite element method is used here to effectuate transient study of the coupled electromagnetic / heat transfer problem. For an axisymmetric 2D model like that of Fig. 2
171
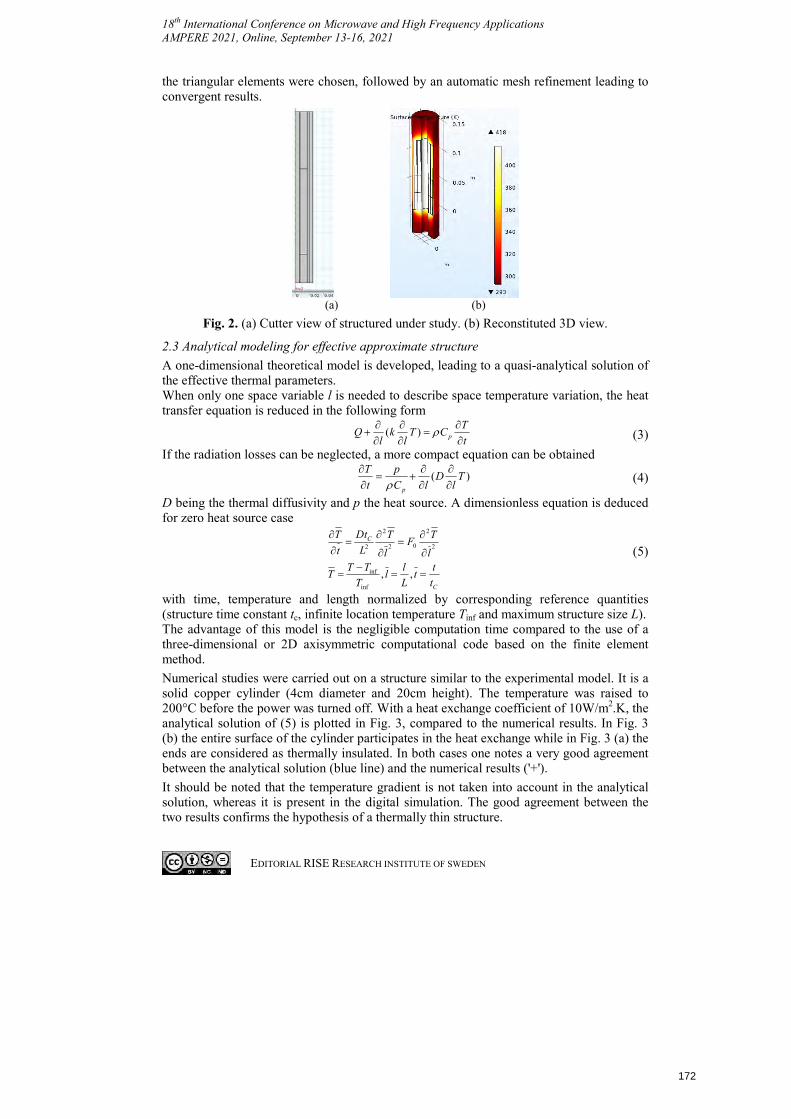
18th International Conference on Microwave and High Frequency Applications AMPERE 2021, Online, September 13-16, 2021
EDITORIAL RISE RESEARCH INSTITUTE OF SWEDEN
the triangular elements were chosen, followed by an automatic mesh refinement leading to convergent results.
(a) (b)
Fig. 2. (a) Cutter view of structured under study. (b) Reconstituted 3D view.
2.3 Analytical modeling for effective approximate structure
A one-dimensional theoretical model is developed, leading to a quasi-analytical solution of the effective thermal parameters. When only one space variable l is needed to describe space temperature variation, the heat transfer equation is reduced in the following form
( ) p
TQ k T C
l l t
(3)
If the radiation losses can be neglected, a more compact equation can be obtained
( )p
T pD T
t C l l
(4)
D being the thermal diffusivity and p the heat source. A dimensionless equation is deduced for zero heat source case
2 2
02 22
inf
inf
, ,
C
C
DtT T TF
Lt l lT T l t
T l tT L t
(5)
with time, temperature and length normalized by corresponding reference quantities (structure time constant tc, infinite location temperature Tinf and maximum structure size L). The advantage of this model is the negligible computation time compared to the use of a three-dimensional or 2D axisymmetric computational code based on the finite element method.
Numerical studies were carried out on a structure similar to the experimental model. It is a solid copper cylinder (4cm diameter and 20cm height). The temperature was raised to 200°C before the power was turned off. With a heat exchange coefficient of 10W/m2.K, the analytical solution of (5) is plotted in Fig. 3, compared to the numerical results. In Fig. 3 (b) the entire surface of the cylinder participates in the heat exchange while in Fig. 3 (a) theends are considered as thermally insulated. In both cases one notes a very good agreementbetween the analytical solution (blue line) and the numerical results ('+').
It should be noted that the temperature gradient is not taken into account in the analytical solution, whereas it is present in the digital simulation. The good agreement between the two results confirms the hypothesis of a thermally thin structure.
172
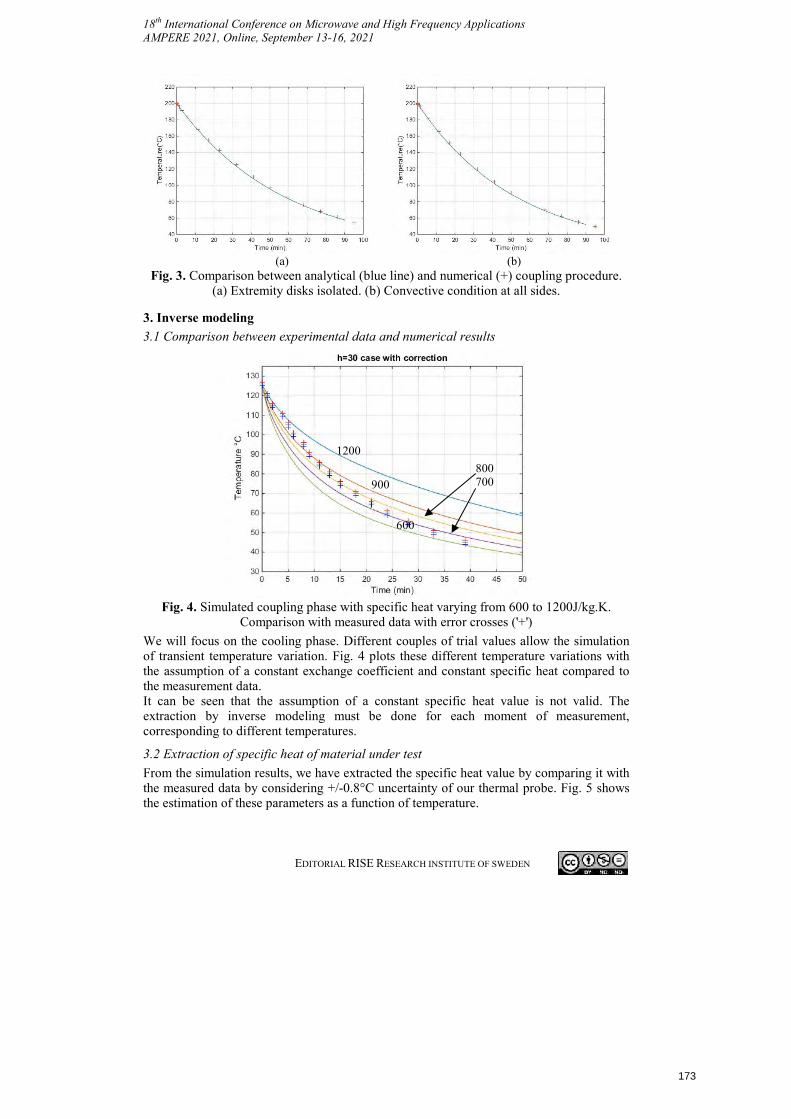
18th International Conference on Microwave and High Frequency Applications AMPERE 2021, Online, September 13-16, 2021
EDITORIAL RISE RESEARCH INSTITUTE OF SWEDEN
(a) (b) Fig. 3. Comparison between analytical (blue line) and numerical (+) coupling procedure.
(a) Extremity disks isolated. (b) Convective condition at all sides.
3. Inverse modeling
3.1 Comparison between experimental data and numerical results
Fig. 4. Simulated coupling phase with specific heat varying from 600 to 1200J/kg.K. Comparison with measured data with error crosses ('+')
We will focus on the cooling phase. Different couples of trial values allow the simulation of transient temperature variation. Fig. 4 plots these different temperature variations with the assumption of a constant exchange coefficient and constant specific heat compared to the measurement data. It can be seen that the assumption of a constant specific heat value is not valid. The extraction by inverse modeling must be done for each moment of measurement, corresponding to different temperatures.
3.2 Extraction of specific heat of material under test
From the simulation results, we have extracted the specific heat value by comparing it with the measured data by considering +/-0.8°C uncertainty of our thermal probe. Fig. 5 shows the estimation of these parameters as a function of temperature.
1200
900
600
800 700
173
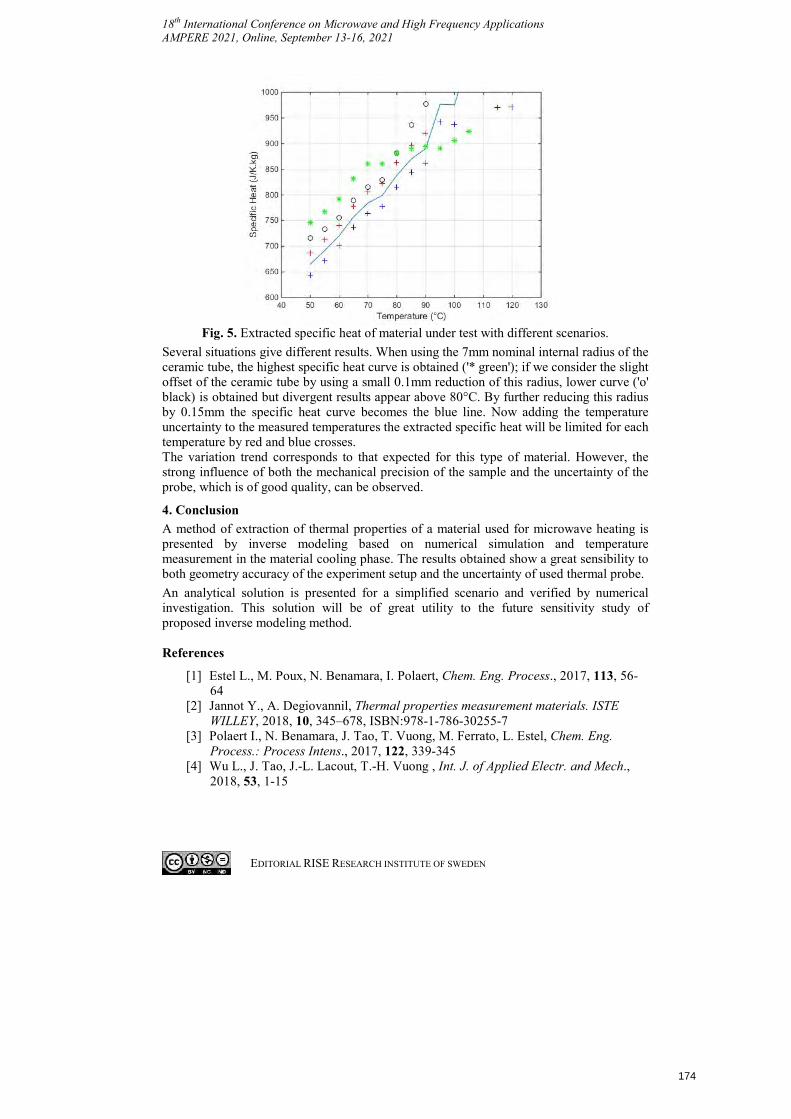
18th International Conference on Microwave and High Frequency Applications AMPERE 2021, Online, September 13-16, 2021
EDITORIAL RISE RESEARCH INSTITUTE OF SWEDEN
Fig. 5. Extracted specific heat of material under test with different scenarios.
Several situations give different results. When using the 7mm nominal internal radius of the ceramic tube, the highest specific heat curve is obtained ('* green'); if we consider the slight offset of the ceramic tube by using a small 0.1mm reduction of this radius, lower curve ('o' black) is obtained but divergent results appear above 80°C. By further reducing this radius by 0.15mm the specific heat curve becomes the blue line. Now adding the temperature uncertainty to the measured temperatures the extracted specific heat will be limited for each temperature by red and blue crosses. The variation trend corresponds to that expected for this type of material. However, the strong influence of both the mechanical precision of the sample and the uncertainty of the probe, which is of good quality, can be observed.
4. Conclusion
A method of extraction of thermal properties of a material used for microwave heating is presented by inverse modeling based on numerical simulation and temperature measurement in the material cooling phase. The results obtained show a great sensibility to both geometry accuracy of the experiment setup and the uncertainty of used thermal probe.
An analytical solution is presented for a simplified scenario and verified by numerical investigation. This solution will be of great utility to the future sensitivity study of proposed inverse modeling method.
References
[1] Estel L., M. Poux, N. Benamara, I. Polaert, Chem. Eng. Process., 2017, 113, 56-64
[2] Jannot Y., A. Degiovannil, Thermal properties measurement materials. ISTEWILLEY, 2018, 10, 345–678, ISBN:978-1-786-30255-7
[3] Polaert I., N. Benamara, J. Tao, T. Vuong, M. Ferrato, L. Estel, Chem. Eng.Process.: Process Intens., 2017, 122, 339-345
[4] Wu L., J. Tao, J.-L. Lacout, T.-H. Vuong , Int. J. of Applied Electr. and Mech.,2018, 53, 1-15
174
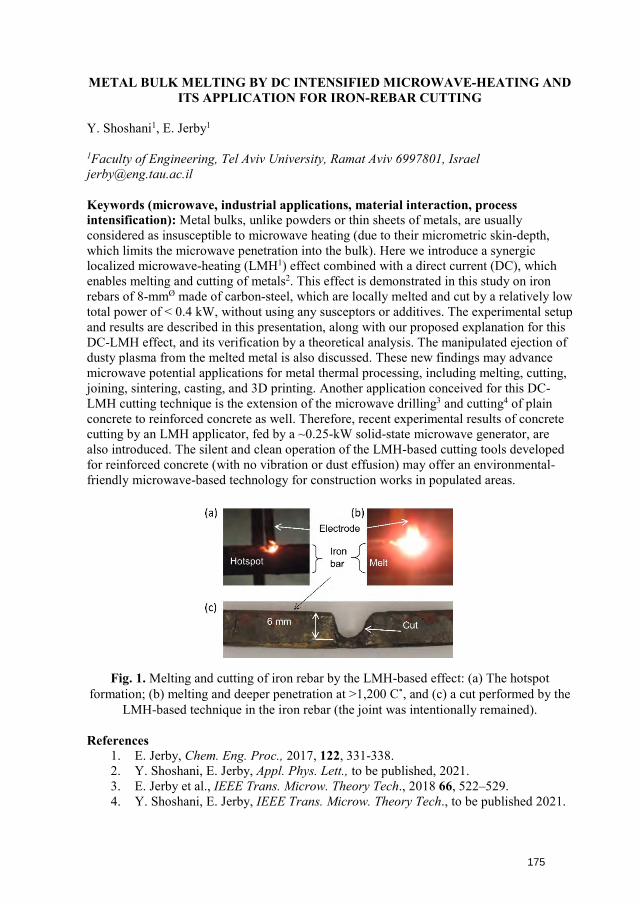
METAL BULK MELTING BY DC INTENSIFIED MICROWAVE-HEATING AND ITS APPLICATION FOR IRON-REBAR CUTTING
Y. Shoshani1, E. Jerby1
1Faculty of Engineering, Tel Aviv University, Ramat Aviv 6997801, Israel [email protected]
Keywords (microwave, industrial applications, material interaction, process intensification): Metal bulks, unlike powders or thin sheets of metals, are usually considered as insusceptible to microwave heating (due to their micrometric skin-depth, which limits the microwave penetration into the bulk). Here we introduce a synergic localized microwave-heating (LMH1) effect combined with a direct current (DC), which enables melting and cutting of metals2. This effect is demonstrated in this study on iron rebars of 8-mmØ made of carbon-steel, which are locally melted and cut by a relatively low total power of < 0.4 kW, without using any susceptors or additives. The experimental setup and results are described in this presentation, along with our proposed explanation for this DC-LMH effect, and its verification by a theoretical analysis. The manipulated ejection ofdusty plasma from the melted metal is also discussed. These new findings may advancemicrowave potential applications for metal thermal processing, including melting, cutting,joining, sintering, casting, and 3D printing. Another application conceived for this DC-LMH cutting technique is the extension of the microwave drilling3 and cutting4 of plainconcrete to reinforced concrete as well. Therefore, recent experimental results of concretecutting by an LMH applicator, fed by a ~0.25-kW solid-state microwave generator, arealso introduced. The silent and clean operation of the LMH-based cutting tools developedfor reinforced concrete (with no vibration or dust effusion) may offer an environmental-friendly microwave-based technology for construction works in populated areas.
Fig. 1. Melting and cutting of iron rebar by the LMH-based effect: (a) The hotspot formation; (b) melting and deeper penetration at >1,200 C˚, and (c) a cut performed by the
LMH-based technique in the iron rebar (the joint was intentionally remained).
References 1. E. Jerby, Chem. Eng. Proc., 2017, 122, 331-338.2. Y. Shoshani, E. Jerby, Appl. Phys. Lett., to be published, 2021.3. E. Jerby et al., IEEE Trans. Microw. Theory Tech., 2018 66, 522–529.4. Y. Shoshani, E. Jerby, IEEE Trans. Microw. Theory Tech., to be published 2021.
175
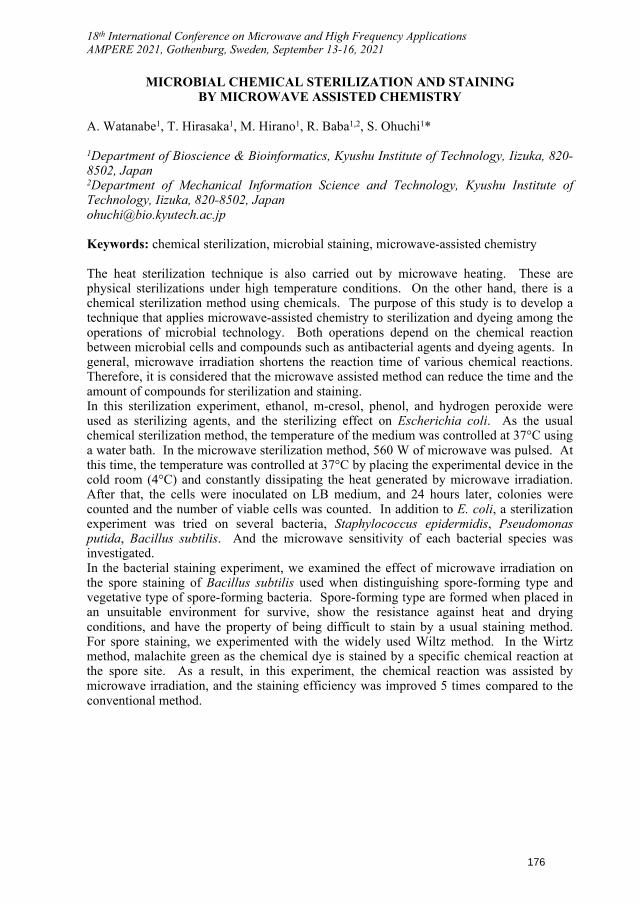
18th International Conference on Microwave and High Frequency Applications AMPERE 2021, Gothenburg, Sweden, September 13-16, 2021
MICROBIAL CHEMICAL STERILIZATION AND STAINING BY MICROWAVE ASSISTED CHEMISTRY
A. Watanabe1, T. Hirasaka1, M. Hirano1, R. Baba1,2, S. Ohuchi1*
1Department of Bioscience & Bioinformatics, Kyushu Institute of Technology, Iizuka, 820-8502, Japan 2Department of Mechanical Information Science and Technology, Kyushu Institute of Technology, Iizuka, 820-8502, Japan [email protected]
Keywords: chemical sterilization, microbial staining, microwave-assisted chemistry
The heat sterilization technique is also carried out by microwave heating. These are physical sterilizations under high temperature conditions. On the other hand, there is a chemical sterilization method using chemicals. The purpose of this study is to develop a technique that applies microwave-assisted chemistry to sterilization and dyeing among the operations of microbial technology. Both operations depend on the chemical reaction between microbial cells and compounds such as antibacterial agents and dyeing agents. In general, microwave irradiation shortens the reaction time of various chemical reactions. Therefore, it is considered that the microwave assisted method can reduce the time and the amount of compounds for sterilization and staining. In this sterilization experiment, ethanol, m-cresol, phenol, and hydrogen peroxide were used as sterilizing agents, and the sterilizing effect on Escherichia coli. As the usual chemical sterilization method, the temperature of the medium was controlled at 37°C using a water bath. In the microwave sterilization method, 560 W of microwave was pulsed. At this time, the temperature was controlled at 37°C by placing the experimental device in the cold room (4°C) and constantly dissipating the heat generated by microwave irradiation. After that, the cells were inoculated on LB medium, and 24 hours later, colonies were counted and the number of viable cells was counted. In addition to E. coli, a sterilization experiment was tried on several bacteria, Staphylococcus epidermidis, Pseudomonas putida, Bacillus subtilis. And the microwave sensitivity of each bacterial species was investigated. In the bacterial staining experiment, we examined the effect of microwave irradiation on the spore staining of Bacillus subtilis used when distinguishing spore-forming type and vegetative type of spore-forming bacteria. Spore-forming type are formed when placed in an unsuitable environment for survive, show the resistance against heat and drying conditions, and have the property of being difficult to stain by a usual staining method. For spore staining, we experimented with the widely used Wiltz method. In the Wirtz method, malachite green as the chemical dye is stained by a specific chemical reaction at the spore site. As a result, in this experiment, the chemical reaction was assisted by microwave irradiation, and the staining efficiency was improved 5 times compared to the conventional method.
176
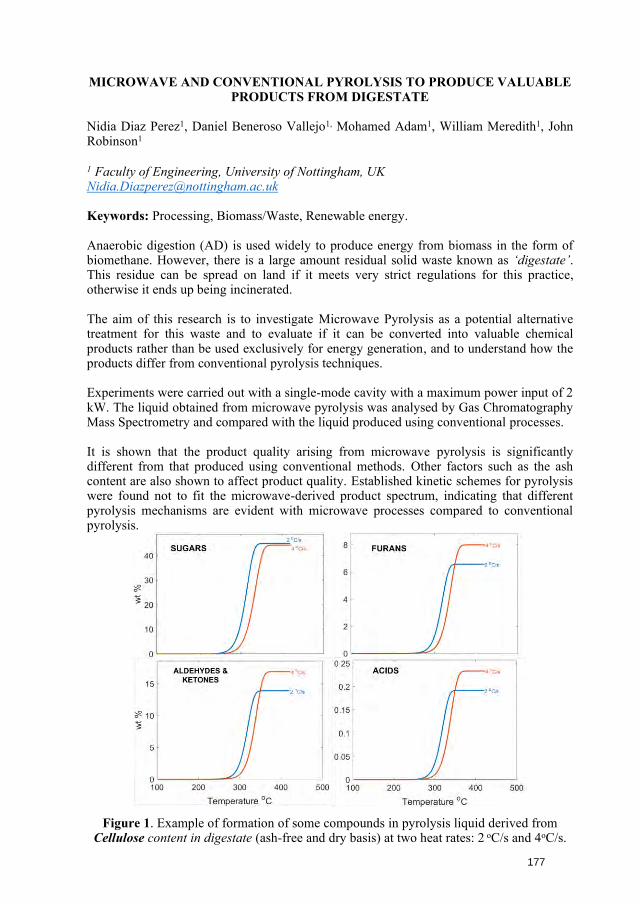
MICROWAVE AND CONVENTIONAL PYROLYSIS TO PRODUCE VALUABLE PRODUCTS FROM DIGESTATE
Nidia Diaz Perez1, Daniel Beneroso Vallejo1, Mohamed Adam1, William Meredith1, John Robinson1
1 Faculty of Engineering, University of Nottingham, UK [email protected]
Keywords: Processing, Biomass/Waste, Renewable energy.
Anaerobic digestion (AD) is used widely to produce energy from biomass in the form of biomethane. However, there is a large amount residual solid waste known as ‘digestate’. This residue can be spread on land if it meets very strict regulations for this practice, otherwise it ends up being incinerated.
The aim of this research is to investigate Microwave Pyrolysis as a potential alternative treatment for this waste and to evaluate if it can be converted into valuable chemical products rather than be used exclusively for energy generation, and to understand how the products differ from conventional pyrolysis techniques.
Experiments were carried out with a single-mode cavity with a maximum power input of 2 kW. The liquid obtained from microwave pyrolysis was analysed by Gas Chromatography Mass Spectrometry and compared with the liquid produced using conventional processes.
It is shown that the product quality arising from microwave pyrolysis is significantly different from that produced using conventional methods. Other factors such as the ash content are also shown to affect product quality. Established kinetic schemes for pyrolysis were found not to fit the microwave-derived product spectrum, indicating that different pyrolysis mechanisms are evident with microwave processes compared to conventional pyrolysis.
Figure 1. Example of formation of some compounds in pyrolysis liquid derived from Cellulose content in digestate (ash-free and dry basis) at two heat rates: 2 oC/s and 4oC/s.
177
MICROWAVE AND ULTRASOUND TOGETHER – WHY AND HOW !
I.Calinescu
University Politehnica of Bucharest, Faculty of Applied Chemistry and Materials Science, 1-7 Gh. Polizu Str., 011061, Bucharest, [email protected]
Keywords: Process intensification, Equipment, Chemical applications
Ultrasound (US) and Microwaves (MW) are effective methods for processes intensification. The combined use of MW and US in the same reactor is very visible in heterogeneous environments. In these environments, although microwaves provide rapid heating of the reaction mixture, mass transfer limits the overall rate of the process. On the other hand ultrasound, although capable of greatly increasing mass transfer at the interface, does not ensure sufficient temperature rise to increase the rate of chemical reactions as well [1]. For this reason, the idea of combining the two techniques of process intensification appeared in the literature [2]. Since both types of processes increase the reaction temperature, it is very important to design an installation in which the thermal energy is continuously removed from the system making possible the use of high power ultrasonic and microwave densities throughout the process. For this purpose, two combined installations were designed and built. The first is a laboratory installation in which US energy is transferred to the reactor using a coupling liquid that also ensures the transfer of thermal energy to the outside. The second installation contains a metal reactor connected to the US converter, in which the microwave energy is introduced by means of an INTLI antenna. US converters with different frequencies (16, 20, 24, 580, 864 or 1146 kHz) can be used in both installations, which greatly increases the flexibility of the installations and the fields of application. The installations were tested to assess the influence of US and MW both in a homogeneous environment (the conversion of p-nitrophenol into 4-nitrocatechol as a chemical dosimeter) and in heterogeneous environments (extraction of active principle from vegetal material).
References [1] Gude V.G., Resource-Efficient Technologies, 2015. 1(2): p. 116-125.[2] Lagha A., et al., Analusis, 1999. 27(5): p. 452-457.
The authors acknowledge the financial support received from the PN III, P4: Fundamental and frontier research, Project: „ A new hybrid technology for biorefining: microwaves and ultrasound in one device”, financed by contract: PCE 12/2021
178
MICROWAVE-ASSISTED EXTRACTION OF PHENOLIC FROM CACAO POD HUSKS - AN ALTERNATIVE FOR VALORISATION
Shinta Rosalia Dewi1 2*, Lee Stevens1, Derek Irvine1, Rebecca Ferrari1, Eleanor Binner1
1Department of Chemical and Environmental Engineering, University of Nottingham, NG7 2RD, Nottingham, United Kingdom 2Department of Bioprocess Engineering, Universitas Brawijaya, 65145, Malang, Indonesia *[email protected]
Keywords: Microwave, Bio-mass applications, Biomass/Waste, cacao pod huks, phenolic
Abstract
As a primary waste by-product (ca. 70-75% of total weight of cacao fruit), ten tonnes of wet cacao pod husks (CPH) are discarded to produce a tonne of dry cacao beans [1]. Although a major environmental issue in the cacao industry, CPH contains phenolic compounds that have garnered much interest due to their antioxidant activities and resulting beneficial health properties. Therefore, this study has investigated valorisation of CPH by comparing the extraction of phenolic compounds using microwave-assisted extraction (MAE) with conventional solvent extraction (CSE). Extraction time, temperature, ethanol concentration, and solvent to feed (S/F) ratio were investigated to obtain the maximum yield. The extract quality was presented as total phenolic content (TPC) which was measured by using a UV/Vis Spectrophotometer. The results showed that 50% ethanol was the most appropriate solvent for extracting total phenolics from CPH. This was attributed to the solubility, with both MAE and CSE requiring the same extraction time and solvent consumption. However, at a lower temperature (60 °C), MAE could produce higher TPC (107.3±1.4 mg GAE/g dw) than CSE at 70 °C (105.4±0.9 mg GAE/g dw) even when the same heating rate was applied. It can be believed that the high extraction yield on MAE is due to the selective heating effect. Results of this study suggest that MAE has potential to valorise CPH waste into valuable ingredients based on phenolic compounds. A future research study is proposed to investigate the potential of CPH extract as an antioxidant and food colourant.
1. IntroductionTheobroma cacao, known as food of Gods, is one of the most important tropical
plants that produce various products of chocolate and its derivates. In the cacao industry, fresh cacao beans are processed into products whilst cacao pod husks (CPH) are generally discarded as waste. Indonesia generates over four thousand tonnes of CPH yearly, creating waste and environmental problems. However, CPH contains valuable phenolic compounds which have many health benefits. The primary phenolic compounds found in CPH are gallic acid, catechin, (-)-epicatechin, quercetin, p-coumaric acid and photocatechuic acid which are promising as natural antioxidants and could be used as ingredients in functional foods [2]. The phenolic compounds in pods were reported with a value of 150.9 mg gallic acid equivalent of phenolic per gram dry CPH, which had antioxidant potential of 97.6% radical scavenging. This value has proved to delay lipid oxidation in palm olein during storage [3]. Therefore, the recovery of phenolic compounds from CPH is one way to valorise CPH into more valuable products while reducing the amount of bio-waste produced during cacao production.
179
The most common extraction methods to extract phenolic compounds from plants or biomass are maceration, Soxhlet, reflux or other conventional solvent extraction (CSE) methods. Because of their low cost and ease of use, those conventional methods are widely used. However, they were revealed to have environmental issues and were inefficient due to the huge amounts of organic solvent required and time [4]. Therefore, several novel extraction methods, such as supercritical fluid extraction (SFE) [5], ultrasound-assisted extraction (UAE) [6], [7] and microwave-assisted extraction (MAE) [6], [8]–[10] have been developed to overcome these limitations. By using supercritical fluids as the extracting solvent, SFE could produce higher phenolic yield with lower solvent and time consumptions compared with CSE [5]. UAE has also been reported to have twice higher yield than that of CSE in faster extraction time on potato peels extraction [7]. While Huma et al [6] investigated the phenolic extraction from carob kibble using MAE, UAE and CSE and reported that the high extraction yield obtained by MAE in 4.5 min were comparable to those from UAE and CSE for 30 and 120 min, respectively. MAE offers the main benefits of volumetric and selective heating effect, leading an increase in phenolic yield. Volumetric heating allows the electromagnetic energy to be transferred directly inside the system resulted in rapid heating [11], so it can significantly reduce the processing time. This direct interaction between the mixture system and microwave energy leads in the quick release of target compounds from plant matrix into the surrounding solvent [12]. On the other hand, the direct comparison of MAE and CSE studied by Galan et al [8] proved that the extraction of phenolic from sea buckthorn leaves was selectively heated above 50 °C offering an increased yield at and above 60 °C.
Based on those studies, it is clear that MAE can provide a high extraction yield in a shorter extraction time. Therefore, this work examined the phenolic extraction from CPH by using MAE and compared with CSE. The objectives of this study are to (1) compare the MAE and CSE using the same bulk heating rate to understand the advantages of MAE over CSE, (2) maximise the total phenolic content (TPC) yield of CPH extract under several extraction parameters: extraction time and temperature, solvent concentration, and solvent to feed (S/F) ratio.
2. Material and Methods2.1 Materials
Cacao was harvested from Malang, Indonesia. The cacao pod husk (CPH) was cut, sliced into small size (± 2-4 cm) and dried in a forced-air dryer at 50 oC to a final moisture content of 9.25%. The dehydrated CPH chips were ground into powder and sieved through a 38-micron screen to get CPH with uniform particle size distribution. CPH powder (≤38-micron) was brown in colour and was stored at room temperature until use. 2.2 Microwave-assisted extraction
Phenolic extraction from CPH was carried out using a Miniflow 200SS (Sairem) batch reactor at 2.45 kHz and 120 W power. CPH powder (± 1 g) was extracted using ethanol/water mixture in a Pyrex reactor (inner dia. 39 mL, height 70 mm) which was then covered with a rubber stopper. The bulk temperature inside the reactor was monitored and controlled using a temperature optical fibre at the desired temperature. An external magnetic stirrer (IKA magnetic stirrer) was placed at the bottom of the microwave reactor to stir the sample mixture and set it at 1200 rpm. The effect of extraction time and temperature, various ethanol/water concentrations, and solvent to feed (S/F) ratio were investigated. Details of experimental conditions can be seen in Table 1. The extract was then separated using centrifuge. All extractions and their total phenolic content (TPC) analysis were carried out in triplicate. 2.3 Reference procedure: Conventional solvent extraction (CSE)
CSE experiments were designed to replicate the MAE conditions. It was processed at the same parameter treatments (extraction time and temperature, solvent concentration, S/F
180
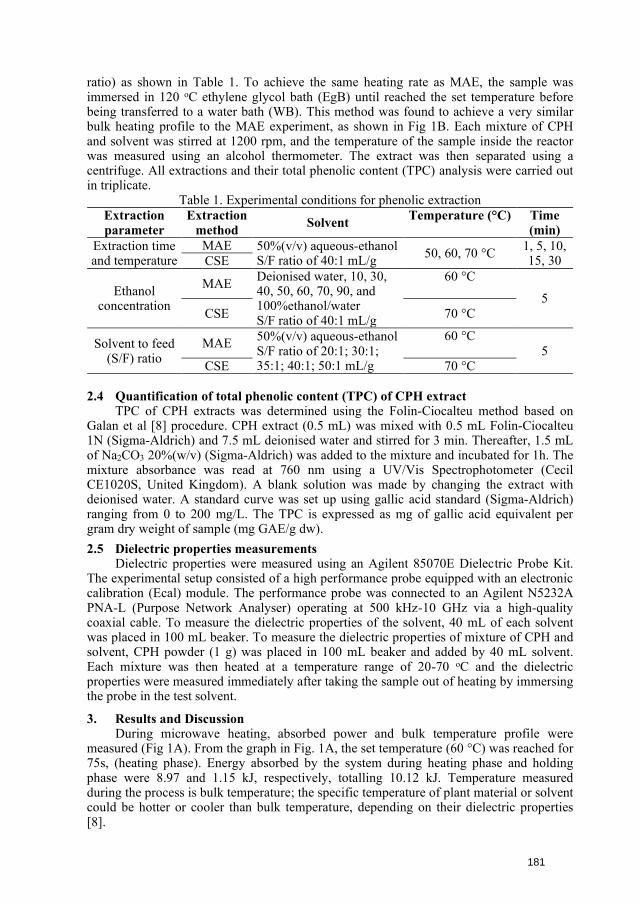
ratio) as shown in Table 1. To achieve the same heating rate as MAE, the sample was immersed in 120 oC ethylene glycol bath (EgB) until reached the set temperature before being transferred to a water bath (WB). This method was found to achieve a very similar bulk heating profile to the MAE experiment, as shown in Fig 1B. Each mixture of CPH and solvent was stirred at 1200 rpm, and the temperature of the sample inside the reactor was measured using an alcohol thermometer. The extract was then separated using a centrifuge. All extractions and their total phenolic content (TPC) analysis were carried out in triplicate.
Table 1. Experimental conditions for phenolic extraction Extraction parameter
Extraction method Solvent Temperature (°C) Time
(min) Extraction time and temperature
MAE 50%(v/v) aqueous-ethanol S/F ratio of 40:1 mL/g 50, 60, 70 °C 1, 5, 10,
15, 30 CSE
Ethanol concentration
MAE Deionised water, 10, 30, 40, 50, 60, 70, 90, and 100%ethanol/water S/F ratio of 40:1 mL/g
60 °C
5 CSE 70 °C
Solvent to feed (S/F) ratio
MAE 50%(v/v) aqueous-ethanol S/F ratio of 20:1; 30:1; 35:1; 40:1; 50:1 mL/g
60 °C 5
CSE 70 °C
2.4 Quantification of total phenolic content (TPC) of CPH extract TPC of CPH extracts was determined using the Folin-Ciocalteu method based on
Galan et al [8] procedure. CPH extract (0.5 mL) was mixed with 0.5 mL Folin-Ciocalteu 1N (Sigma-Aldrich) and 7.5 mL deionised water and stirred for 3 min. Thereafter, 1.5 mL of Na2CO3 20%(w/v) (Sigma-Aldrich) was added to the mixture and incubated for 1h. The mixture absorbance was read at 760 nm using a UV/Vis Spectrophotometer (Cecil CE1020S, United Kingdom). A blank solution was made by changing the extract with deionised water. A standard curve was set up using gallic acid standard (Sigma-Aldrich) ranging from 0 to 200 mg/L. The TPC is expressed as mg of gallic acid equivalent per gram dry weight of sample (mg GAE/g dw). 2.5 Dielectric properties measurements
Dielectric properties were measured using an Agilent 85070E Dielectric Probe Kit. The experimental setup consisted of a high performance probe equipped with an electronic calibration (Ecal) module. The performance probe was connected to an Agilent N5232A PNA-L (Purpose Network Analyser) operating at 500 kHz-10 GHz via a high-quality coaxial cable. To measure the dielectric properties of the solvent, 40 mL of each solvent was placed in 100 mL beaker. To measure the dielectric properties of mixture of CPH and solvent, CPH powder (1 g) was placed in 100 mL beaker and added by 40 mL solvent. Each mixture was then heated at a temperature range of 20-70 oC and the dielectric properties were measured immediately after taking the sample out of heating by immersing the probe in the test solvent.
3. Results and DiscussionDuring microwave heating, absorbed power and bulk temperature profile were
measured (Fig 1A). From the graph in Fig. 1A, the set temperature (60 °C) was reached for 75s, (heating phase). Energy absorbed by the system during heating phase and holding phase were 8.97 and 1.15 kJ, respectively, totalling 10.12 kJ. Temperature measured during the process is bulk temperature; the specific temperature of plant material or solvent could be hotter or cooler than bulk temperature, depending on their dielectric properties [8].
181
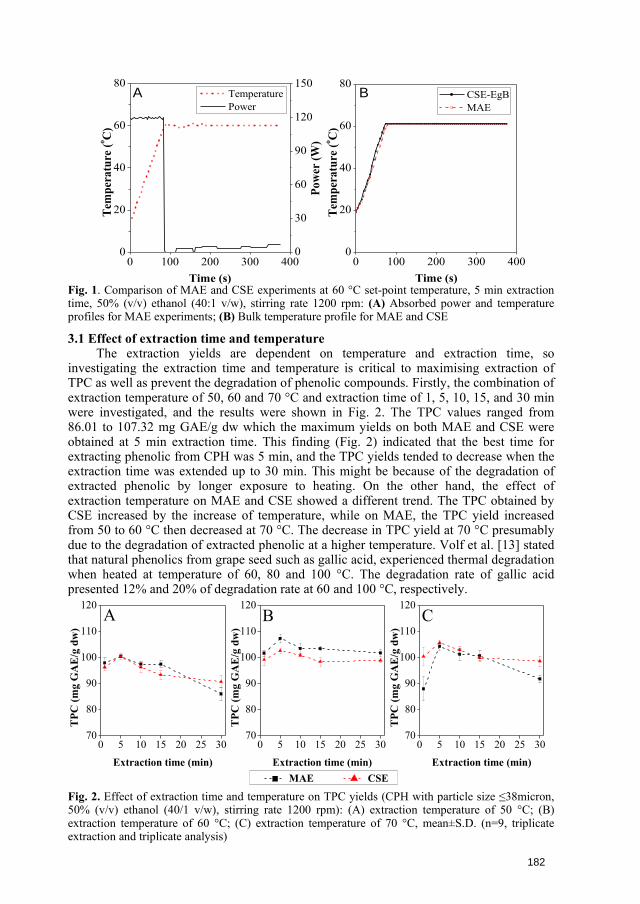
0 100 200 300 4000
20
40
60
80 Temperature Power
Time (s)
Tem
pera
ture
(o C)
A
0
30
60
90
120
150
Pow
er (W
)
0 100 200 300 4000
20
40
60
80B CSE-EgB
MAE
Time (s)
Tem
pera
ture
(o C)
Fig. 1. Comparison of MAE and CSE experiments at 60 °C set-point temperature, 5 min extraction time, 50% (v/v) ethanol (40:1 v/w), stirring rate 1200 rpm: (A) Absorbed power and temperature profiles for MAE experiments; (B) Bulk temperature profile for MAE and CSE
3.1 Effect of extraction time and temperature The extraction yields are dependent on temperature and extraction time, so
investigating the extraction time and temperature is critical to maximising extraction of TPC as well as prevent the degradation of phenolic compounds. Firstly, the combination of extraction temperature of 50, 60 and 70 °C and extraction time of 1, 5, 10, 15, and 30 min were investigated, and the results were shown in Fig. 2. The TPC values ranged from 86.01 to 107.32 mg GAE/g dw which the maximum yields on both MAE and CSE were obtained at 5 min extraction time. This finding (Fig. 2) indicated that the best time for extracting phenolic from CPH was 5 min, and the TPC yields tended to decrease when the extraction time was extended up to 30 min. This might be because of the degradation of extracted phenolic by longer exposure to heating. On the other hand, the effect of extraction temperature on MAE and CSE showed a different trend. The TPC obtained by CSE increased by the increase of temperature, while on MAE, the TPC yield increased from 50 to 60 °C then decreased at 70 °C. The decrease in TPC yield at 70 °C presumably due to the degradation of extracted phenolic at a higher temperature. Volf et al. [13] stated that natural phenolics from grape seed such as gallic acid, experienced thermal degradation when heated at temperature of 60, 80 and 100 °C. The degradation rate of gallic acid presented 12% and 20% of degradation rate at 60 and 100 °C, respectively.
0 5 10 15 20 25 3070
80
90
100
110
120
0 5 10 15 20 25 3070
80
90
100
110
120
0 5 10 15 20 25 3070
80
90
100
110
120CB
TPC
(mg
GA
E/g
dw
)
Extraction time (min) MAE CSE
A
TPC
(mg
GA
E/g
dw
)
Extraction time (min)
TPC
(mg
GA
E/g
dw
)
Extraction time (min)
Fig. 2. Effect of extraction time and temperature on TPC yields (CPH with particle size ≤38micron, 50% (v/v) ethanol (40/1 v/w), stirring rate 1200 rpm): (A) extraction temperature of 50 °C; (B) extraction temperature of 60 °C; (C) extraction temperature of 70 °C, mean±S.D. (n=9, triplicate extraction and triplicate analysis)
182
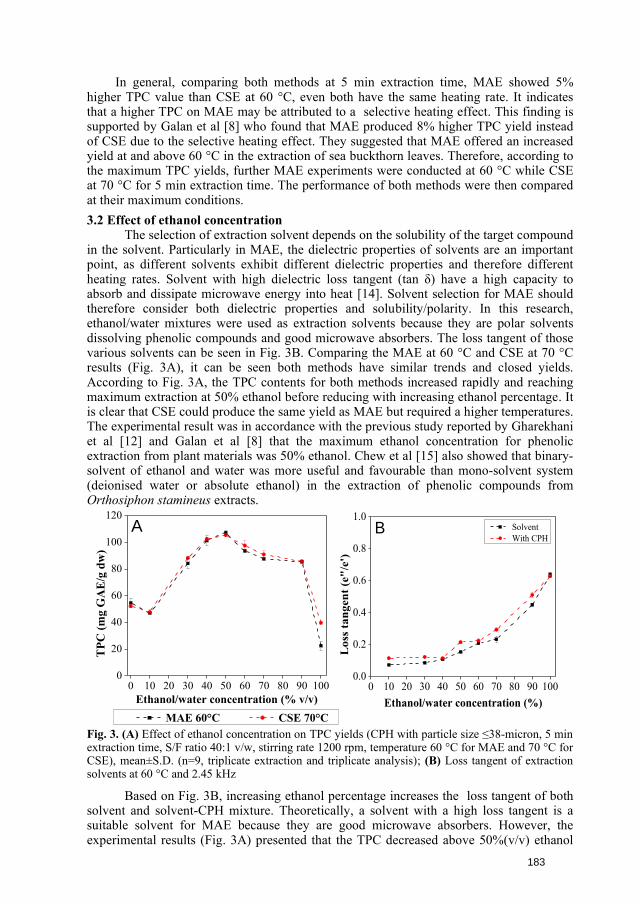
In general, comparing both methods at 5 min extraction time, MAE showed 5% higher TPC value than CSE at 60 °C, even both have the same heating rate. It indicates that a higher TPC on MAE may be attributed to a selective heating effect. This finding is supported by Galan et al [8] who found that MAE produced 8% higher TPC yield instead of CSE due to the selective heating effect. They suggested that MAE offered an increased yield at and above 60 °C in the extraction of sea buckthorn leaves. Therefore, according to the maximum TPC yields, further MAE experiments were conducted at 60 °C while CSE at 70 °C for 5 min extraction time. The performance of both methods were then compared at their maximum conditions. 3.2 Effect of ethanol concentration
The selection of extraction solvent depends on the solubility of the target compound in the solvent. Particularly in MAE, the dielectric properties of solvents are an important point, as different solvents exhibit different dielectric properties and therefore different heating rates. Solvent with high dielectric loss tangent (tan δ) have a high capacity to absorb and dissipate microwave energy into heat [14]. Solvent selection for MAE should therefore consider both dielectric properties and solubility/polarity. In this research, ethanol/water mixtures were used as extraction solvents because they are polar solvents dissolving phenolic compounds and good microwave absorbers. The loss tangent of those various solvents can be seen in Fig. 3B. Comparing the MAE at 60 °C and CSE at 70 °C results (Fig. 3A), it can be seen both methods have similar trends and closed yields. According to Fig. 3A, the TPC contents for both methods increased rapidly and reaching maximum extraction at 50% ethanol before reducing with increasing ethanol percentage. It is clear that CSE could produce the same yield as MAE but required a higher temperatures. The experimental result was in accordance with the previous study reported by Gharekhani et al [12] and Galan et al [8] that the maximum ethanol concentration for phenolic extraction from plant materials was 50% ethanol. Chew et al [15] also showed that binary-solvent of ethanol and water was more useful and favourable than mono-solvent system (deionised water or absolute ethanol) in the extraction of phenolic compounds from Orthosiphon stamineus extracts.
0 10 20 30 40 50 60 70 80 90 1000
20
40
60
80
100
120
TPC
(mg
GA
E/g
dw
)
Ethanol/water concentration (% v/v) MAE 60°C CSE 70°C
A
0 10 20 30 40 50 60 70 80 90 1000.0
0.2
0.4
0.6
0.8
1.0
Los
s ta
ngen
t (e"
/e')
Ethanol/water concentration (%)
Solvent With CPH
B
Fig. 3. (A) Effect of ethanol concentration on TPC yields (CPH with particle size ≤38-micron, 5 min extraction time, S/F ratio 40:1 v/w, stirring rate 1200 rpm, temperature 60 °C for MAE and 70 °C for CSE), mean±S.D. (n=9, triplicate extraction and triplicate analysis); (B) Loss tangent of extraction solvents at 60 °C and 2.45 kHz
Based on Fig. 3B, increasing ethanol percentage increases the loss tangent of both solvent and solvent-CPH mixture. Theoretically, a solvent with a high loss tangent is a suitable solvent for MAE because they are good microwave absorbers. However, the experimental results (Fig. 3A) presented that the TPC decreased above 50%(v/v) ethanol
183
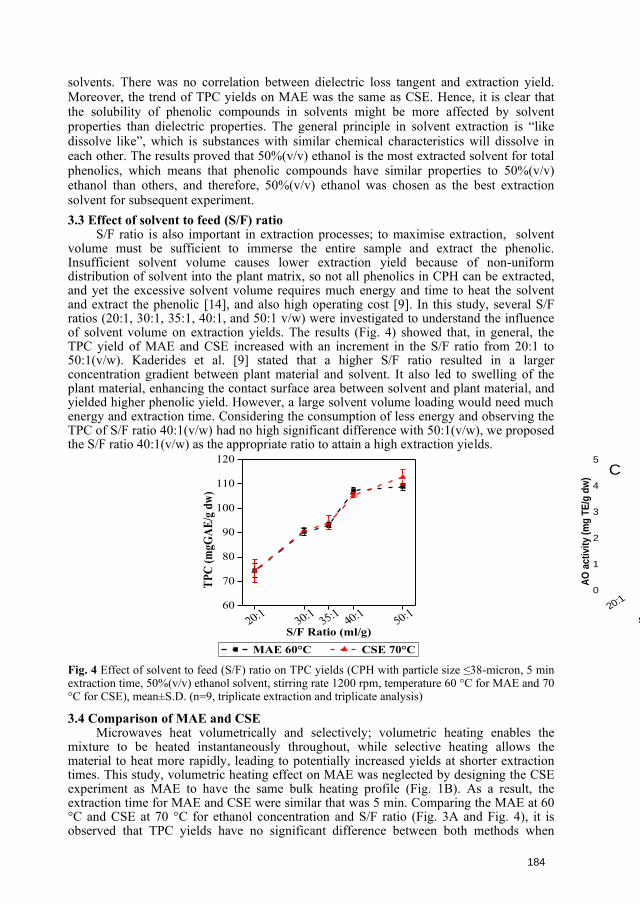
solvents. There was no correlation between dielectric loss tangent and extraction yield. Moreover, the trend of TPC yields on MAE was the same as CSE. Hence, it is clear that the solubility of phenolic compounds in solvents might be more affected by solvent properties than dielectric properties. The general principle in solvent extraction is “like dissolve like”, which is substances with similar chemical characteristics will dissolve in each other. The results proved that 50%(v/v) ethanol is the most extracted solvent for total phenolics, which means that phenolic compounds have similar properties to 50%(v/v) ethanol than others, and therefore, 50%(v/v) ethanol was chosen as the best extraction solvent for subsequent experiment. 3.3 Effect of solvent to feed (S/F) ratio
S/F ratio is also important in extraction processes; to maximise extraction, solvent volume must be sufficient to immerse the entire sample and extract the phenolic. Insufficient solvent volume causes lower extraction yield because of non-uniform distribution of solvent into the plant matrix, so not all phenolics in CPH can be extracted, and yet the excessive solvent volume requires much energy and time to heat the solvent and extract the phenolic [14], and also high operating cost [9]. In this study, several S/F ratios (20:1, 30:1, 35:1, 40:1, and 50:1 v/w) were investigated to understand the influence of solvent volume on extraction yields. The results (Fig. 4) showed that, in general, the TPC yield of MAE and CSE increased with an increment in the S/F ratio from 20:1 to 50:1(v/w). Kaderides et al. [9] stated that a higher S/F ratio resulted in a larger concentration gradient between plant material and solvent. It also led to swelling of the plant material, enhancing the contact surface area between solvent and plant material, and yielded higher phenolic yield. However, a large solvent volume loading would need much energy and extraction time. Considering the consumption of less energy and observing the TPC of S/F ratio 40:1(v/w) had no high significant difference with 50:1(v/w), we proposed the S/F ratio 40:1(v/w) as the appropriate ratio to attain a high extraction yields.
20:1 30:1 35:1 40:1 50:160
70
80
90
100
110
120
20:130:1
35:140:1
50:10
1
2
3
4
5
TPC
(mgG
AE/g
dw)
S/F Ratio (ml/g)
AO
ac
tivit
y (
mg
TE
/g d
w)
S/F Ratio (ml/g)
MAE 60°C CSE 70°C
C
Fig. 4 Effect of solvent to feed (S/F) ratio on TPC yields (CPH with particle size ≤38-micron, 5 min extraction time, 50%(v/v) ethanol solvent, stirring rate 1200 rpm, temperature 60 °C for MAE and 70 °C for CSE), mean±S.D. (n=9, triplicate extraction and triplicate analysis)
3.4 Comparison of MAE and CSE Microwaves heat volumetrically and selectively; volumetric heating enables the
mixture to be heated instantaneously throughout, while selective heating allows the material to heat more rapidly, leading to potentially increased yields at shorter extraction times. This study, volumetric heating effect on MAE was neglected by designing the CSE experiment as MAE to have the same bulk heating profile (Fig. 1B). As a result, the extraction time for MAE and CSE were similar that was 5 min. Comparing the MAE at 60 °C and CSE at 70 °C for ethanol concentration and S/F ratio (Fig. 3A and Fig. 4), it is observed that TPC yields have no significant difference between both methods when
184
volumetric heating is neglected. However, MAE can produce a high TPC at lower extraction temperature, so energy requirements can be reduced. This may be caused by the selective heating effect on MAE process which leads to an increase in TPC yield. Fig. 3B showed that the presence of CPH in solvent increased the loss tangent of system which indicated that the CPH was selectively heated during microwave heating. Overall, high extraction yields were reached using 50%(v/v) ethanol (40/1 v/w) for 5 min at 60 °C for MAE (107.3±1.4 mg GAE/g dw) and 70 °C for CSE (105.4±0.9 mg GAE/g dw). Our result showed higher TPC compared to that of CPH extract from previous studies reported using CSE by Valadez-Carmona et al.[2] (18.9 mg GAE/ g dw), Yapo et al.[16] (68.9 mg GAE/ g dw), Vriesmann et al.[17] (98.0 mg GAE/g dw), Nguyen et al [18] (12.22 mg GAE/g dw), and MAE by Nguyen et al [10] (10.97 mg GAE/g dw).
4. ConclusionThis study demonstrates the comparison of MAE and CSE based on extraction
parameters (extraction time and temperature, ethanol concentration, and S/F ratio) in terms of CPH valorisation. MAE was compared with CSE at the same bulk heating profile, stirrer speed, and solvent composition. The CSE experiments were designed by using a 120 °C ethylene glycol bath to achieve the same heating rate as MAE. It was found that by neglecting the volumetric heating, the maximum TPC for MAE and CSE can be achieved at the same time, which was 5 min. Meanwhile, the maximum conditions to reach maximum yield were using 50%ethanol at 60 °C for MAE with value 107.3±1.4 mg GAE/g dw and 60 °C for CSE with value 105.4±0.9 mg GAE/g dw. The extraction yield of TPC using MAE was similar to CSE at lower extraction temperature and 5% higher than CSE (102.6±0.9 mg GAE/g dw) at the same temperature (60 °C). It can be believed that this is due to the selective heating effect. This study suggests that MAE has potential to valorise CPH waste into valuable products through extraction of phenolic compounds. In future study, the activity of antioxidant and other valuable compounds such as anthocyanin content of CPH extract needs to be investigated.
References [1] R. Campos-Vega, K. H. Nieto-Figueroa, and B. D. Oomah, “Cocoa (Theobroma cacao L.)
pod husk: Renewable source of bioactive compounds,” Trends Food Sci. Technol., vol. 81,pp. 172–184, 2018, doi: 10.1016/j.tifs.2018.09.022.
[2] L. Valadez-Carmona et al., “Effects of microwaves, hot air and freeze-drying on thephenolic compounds, antioxidant capacity, enzyme activity and microstructure of cacao podhusks (Theobroma cacao L.),” Innov. Food Sci. Emerg. Technol., vol. 41, no. February, pp.378–386, 2017, doi: 10.1016/j.ifset.2017.04.012.
[3] G. B. Teboukeu, F. Tonfack Djikeng, M. J. Klang, S. Houketchang Ndomou, M. S. L.Karuna, and H. M. Womeni, “Polyphenol antioxidants from cocoa pods: Extractionoptimization, effect of the optimized extract, and storage time on the stability of palm oleinduring thermoxidation,” J. Food Process. Preserv., vol. 42, no. 5, pp. 1–11, 2018, doi:10.1111/jfpp.13592.
[4] O. R. Alara, N. H. Abdurahman, and C. I. Ukaegbu, “Extraction of phenolic compounds: Areview,” Curr. Res. Food Sci., vol. 4, pp. 200–214, 2021, doi: 10.1016/j.crfs.2021.03.011.
[5] A. S. Caballero, J. M. Romero-Garcia, E. Castro, and C. A. Cardona, “Supercritical fluidextraction for enhancing polyphenolic compounds production from olive waste extractsAshley S Caballero , a Juan M Romero-García , b Eulogio Castro b * and,” J Chem TechnolBiotechol, vol. 95, pp. 356–362, 2020, doi: 10.1002/jctb.5907.
[6] Z. Huma, V. Jayasena, S. M. Nasar-Abbas, M. Imran, and M. K. Khan, “Processoptimization of polyphenol extraction from carob ( Ceratonia siliqua ) kibbles usingmicrowave-assisted technique,” J. Food Process. Preserv., vol. 42, no. 2, 2018, doi:10.1111/jfpp.13450.
[7] S. Wang, A. H. Lin, Q. Han, and Q. Xu, “Evaluation of Direct Ultrasound-AssistedExtraction of Phenolic Compounds from Potato Peels,” Processes, vol. 8, no. 12, p. 1665,
185
2020. [8] A. M. Galan et al., “New insights into the role of selective and volumetric heating during
microwave extraction: Investigation of the extraction of polyphenolic compounds from seabuckthorn leaves using microwave-assisted extraction and conventional solvent extraction,”Chem. Eng. Process. - Process Intensif., vol. 116, pp. 29–39, 2017, doi:10.1016/j.cep.2017.03.006.
[9] K. Kaderides, L. Papaoikonomou, M. Serafim, and A. M. Goula, “Microwave-assistedextraction of phenolics from pomegranate peels : Optimization , kinetics , and comparisonwith ultrasounds extraction,” Chem. Eng. Process. Process Intensif., vol. 137, no. January,pp. 1–11, 2019, doi: 10.1016/j.cep.2019.01.006.
[10] V. T. Nguyen, T. D. Pham, L. B. Vu, V. H. Nguyen, and N. Le Tran, “Microwave-assistedExtraction for Maximizing the Yield of Phenolic Compounds and Antioxidant Capacityfrom Cacao Pod Husk ( Theobroma cacao L .) Abstract :,” Curr. Nutr. Food Sci., pp. 1–4,2020, doi: 10.2174/1573401316999200503032017.
[11] A. C. Metaxas and R. J. Meredith, Industrial Microwave Heating Industrial MicrowaveHeating. The Institution of Engineering and Technology, London, United Kingdom, 1983.
[12] M. Gharekhani, M. Ghorbani, and N. Rasoulnejad, “Microwave-Assisted Extraction ofPhenolic and Flavonoid Compounds From Eucalyptus camaldulensis Dehn Leaves asCompared with Ultrasound-Assisted Extraction,” Lat. Am. Appied Res., vol. 42, pp. 305–310, 2012.
[13] I. Volf, I. Ignat, M. Neamtu, and V. I. Popa, “Thermal stability, antioxidant activity, andphoto-oxidation of natural polyphenols,” Chem. Pap., vol. 68, no. 1, pp. 121–129, 2014,doi: 10.2478/s11696-013-0417-6.
[14] N. A. Ibrahim and M. A. A. Zaini, “Dielectric properties in microwave-assisted solventextraction-Present trends and future outlook,” Asia-Pacific J. Chem. Eng., vol. 13, no. 4, p.e2230, 2018, doi: 10.1002/apj.2230.
[15] K. K. Chew, M. Z. Khoo, S. Y. Ng, Y. Y. Thoo, W. M. Wan Aida, and C. W. Ho, “Effect ofethanol concentration, extraction time and extraction temperature on the recovery ofphenolic compounds and antioxidant capacity of Orthosiphon stamineus extracts,” Int. FoodRes. J., vol. 18, no. 4, pp. 1427–1435, 2011.
[16] B. M. Yapo, V. Besson, B. B. Koubala, and K. L. Koffi, “Adding Value to Cacao PodHusks as a Potential Antioxidant-Dietary Fiber Source,” Am. J. Food Nutr., vol. 1, no. 3, pp.38–46, 2013, doi: 10.12691/AJFN-1-3-4.
[17] L. C. Vriesmann, R. D. de Mello Castanho Amboni, and C. L. De Oliveira Petkowicz,“Cacao pod husks (Theobroma cacao L.): Composition and hot-water-soluble pectins,” Ind.Crops Prod., vol. 34, no. 1, pp. 1173–1181, 2011, doi: 10.1016/j.indcrop.2011.04.004.
[18] V. T. Nguyen, T. G. Tran, and N. Le Tran, “Phytochemical compound yield and antioxidantactivity of cocoa pod husk (Theobroma cacao L.) as influenced by different dehydrationconditions,” Dry. Technol., vol. 0, no. 0, pp. 1–13, 2021, doi:10.1080/07373937.2021.1913745.
186
MICROWAVE ASSISTED LEACHING APPROACHES TO RECOVER PLATINUM GROUP METALS FROM WASTE AND INTERMEDIATE STREAMS
J. Spooren1,*, T. Abo Atia1,2, F. Kukurugya1
1Waste Recycling Technologies, Flemish Institute for Technological Research, VITO N.V., Boeretang 200, B-2400 Mol, Belgium 2KU Leuven, Department of Chemistry, Celestijnenlaan 200F, P.O. box 2404, B-3001 Leuven, Belgium [email protected]
Keywords: Microwave, Chemical applications, Process intensification, Optimization, Residue/Side-stream, Chemistry, Waste.
Abstract Microwave (MW) assisted chloride leaching was studied to extract platinum group metals (PGMs) from waste and intermediate materials. Recently, we have shown that MW assisted leaching of spent ceramic car catalysts in 6 M HCl at 150 °C extracted PGMs without the need to add an oxidation agent at very fast leaching times (3-25 min). We present a similar approach to recover PGMs from three other materials: spent metallic foil car catalysts, capacitors from waste printed circuit board assemblies (PCBAs) and an industrial intermediate anode slime. These three materials contained elevated concentrations of metallic impurities, which dissolved during MW leaching in 6 M HCl at 150 °C. This caused consumption of the acid and a decrease in oxidation potential, which lowered the PGM leachability. Thus, for each material a two-step (MW) leaching process was developed. In the first leaching step, metal impurities were removed, and the reducing potential of the material was decreased. Whereas, in the second MW leaching step in 6 M HCl and 10 vol% H2O2 (30% (w/v)), the PGMs leached efficiently (>90% Pd, >97% Pt, >73% Rh). This approach increased the overall PGM extraction and their concentration inthe final leachates, which is advantageous for downstream processing.
Introduction Recent studies have shown the feasibility to apply microwave (MW) assisted processes to improve the extraction of platinum group metals (PGMs) from spent ceramic automotive catalysts. By applying a MW assisted leaching process in 6 M HCl at 150 °C a high PGM leachability (i.e. 94% Pd, 98% Pt and 71% Rh) could be reached for milled spent ceramic catalysts in short leaching times (15 min ramp to + 10 min dwell at set temperature) and without the need to add an oxidation agent [1]. Furthermore, by exploiting the possibility to heat ionic solutions, such as 6 M HCl, very fast by microwaves, the PGM extraction for non-milled catalysts could be further improved to reach a leachability of 99% Pt and 95% Rh in just 3 min (i.e. heating + dwelling time) at 220 °C [2]. Aside from ceramic catalytic converters, 5-10% of the automotive catalyst market is represented by metal carrier catalytic converters. These catalysts contain higher PGM loads than ceramic catalysts and are used in race and luxury cars due to their better performance [3]. However, in hydrometallurgical processes the metallic support dissolves preferentially, leading to inefficient PGM dissolution in most mineral acids in a single leaching stage [4]. Even the use of concentrated HCl solutions, whereby PGMs dissolve as chloro-complexes, achieved unsatisfactory PGM leaching efficiencies, unless a strong oxidant was used [5]. Monolithic ceramic capacitors, present on printed circuit board assemblies (PCBAs), are known to contain palladium. Earlier studies claimed that Pd leaching from monolithic ceramic capacitors require extremely harsh conditions, whereby Pd leached quantitatively
187
after 24 h in a pure aqua regia solution as no Pd leaching was observed in fuming (12 M) HCl solution [6]. Under these leaching conditions, large quantities of Ba (142 mM), Ni (141 mM) and other base metals co-dissolved along with Pd (1 mM). Such large quantities of impurities made subsequent Pd recovery (83%) and refining (98.8% purity) difficult [6]. Another secondary source of PGMs, as well as Ag and Au, are anode slimes [7]. In the case of copper anode slimes, the presence of metalloids, such as Te, Sb, Se and As, strongly influence the recovery of the noble metals. Therefore, several hydrometallurgical pre-treatment methods, ranging from acid to alkaline leaching, have been tested to remove such base metals prior to the extraction of the noble metals. Furthermore, it is generally assumed that in the case of HCl leaching the presence of an oxidation agent, such as NaClO, NaClO3, H2O2, HNO3 or Cl2, is necessary to dissolve Au and PGMs from anode slimes. For PGMs, H2O2 is the preferred oxidation agent [7]. As shown above, spent metallic carrier catalysts, monolithic ceramic capacitors and copper anode slime are all potential secondary PGM sources, but have challenging compositions to obtain PGM extraction in simple HCl lixiviants. This study proposes to extract PGMs from these three materials by means of two-step leaching processes, whereby in a first step base metals are removed and the second PGM extraction step occurs through microwave-assisted HCl leaching.
Materials and Methods In this work three PGM containing materials were tested as input material for microwave assisted leaching, namely (i) a representative milled sample of spent metallic foil catalysts, provided by Monolithos ltd. (Greece), (ii) milled monolith ceramic capacitors from end-of-life printed circuit board assemblies, (iii) a copper refinery intermediate from which Se and Te were removed, provided by an industrial operator. During the experiments, following chemicals were used: HCl (Merck, 37%, for analysis), H2O2 (Merck, 30% (w/v), for analysis), H2SO4 (Merck, 95-97%, for analysis), KOH (pellets, AnalR NORMAPUR, purity >85 wt%), NaOH (pellets, Merck, technical grade). During all the experiments Milli-Q water was used. Explorative MW leaching experiments were carried out in a Milestone FlexiWave digestor equipped with a spinning carousel, holding 15 pressure-sealed Teflon® lined reactors (pmax=100 bar, Tmax= 250 °C, Vmax = 100 mL). The reactor vessels were typically loaded with 3-5 g of solid sample and 30-50 mL of lixiviant to obtain a liquid to solid ratio (L/S) of 10. The cavity is irradiated in multimode by a dual magnetron system (950 W each) working at 2.45 GHz. The heating program used during all MW assisted leaching experiments was 15 min. ramp to the selected temperature (100 or 150 °C) and 10 min. dwelling at the set temperature. After cooling down to room temperature, the slurry was vacuum filtrated and the solid residue was washed with a predetermined amount of Milli-Q water. Larger scale MW leaching experiments were performed using a 1 liter single reaction chamber microwave reactor (hybrid SynthWave-UltraWave configuration with monomode microwave irradiation at 2.45 GHz, Milestone) that enables to control the leaching atmosphere (e.g. N2 flushing) and is equipped with a mechanical stirring system. This reactor was typically loaded with 50 g of solid sample and 500 mL of lixiviant. The applied heating program also consisted of 15 min heating ramp and 10 min dwell time at 150 °C. In the case of copper anode slide intermediate a first step leaching was performed in an alkaline solution of either NaOH or KOH at an L/S = 20. A weighted amount of sample was brought in a plastic beaker and the correct volume of leaching solution was added. The beaker was placed in a shaking water bath at 25 °C and shaken at 250 rpm for a set time. All experiments were performed in duplicate. After the leaching reaction, the reacted slurries were vacuum filtrated and the solid residue was washed over the filter with a known volume of Milli-Q water, which was also collected
188
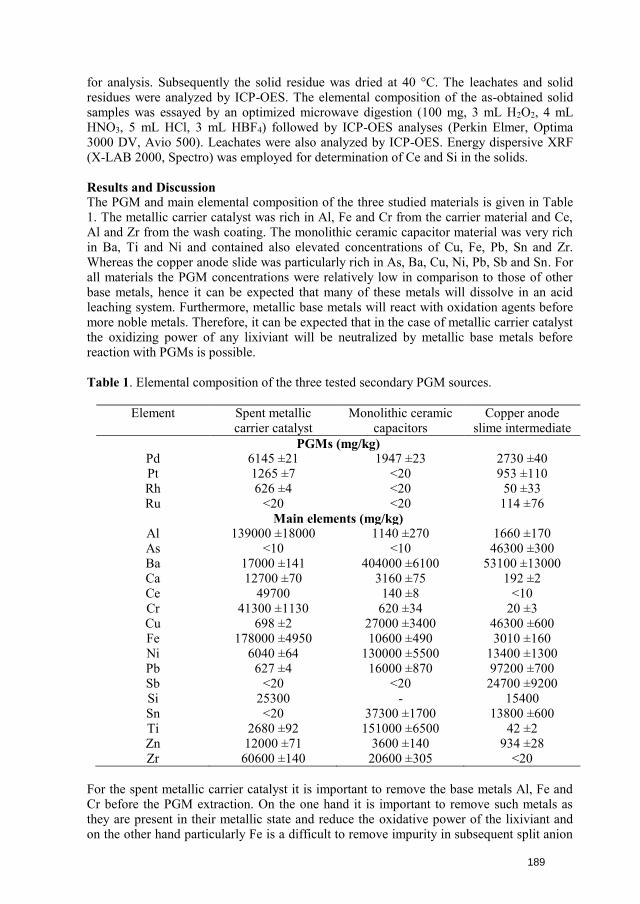
for analysis. Subsequently the solid residue was dried at 40 °C. The leachates and solid residues were analyzed by ICP-OES. The elemental composition of the as-obtained solid samples was essayed by an optimized microwave digestion (100 mg, 3 mL H2O2, 4 mL HNO3, 5 mL HCl, 3 mL HBF4) followed by ICP-OES analyses (Perkin Elmer, Optima 3000 DV, Avio 500). Leachates were also analyzed by ICP-OES. Energy dispersive XRF (X-LAB 2000, Spectro) was employed for determination of Ce and Si in the solids.
Results and Discussion The PGM and main elemental composition of the three studied materials is given in Table 1. The metallic carrier catalyst was rich in Al, Fe and Cr from the carrier material and Ce,Al and Zr from the wash coating. The monolithic ceramic capacitor material was very richin Ba, Ti and Ni and contained also elevated concentrations of Cu, Fe, Pb, Sn and Zr.Whereas the copper anode slide was particularly rich in As, Ba, Cu, Ni, Pb, Sb and Sn. Forall materials the PGM concentrations were relatively low in comparison to those of otherbase metals, hence it can be expected that many of these metals will dissolve in an acidleaching system. Furthermore, metallic base metals will react with oxidation agents beforemore noble metals. Therefore, it can be expected that in the case of metallic carrier catalystthe oxidizing power of any lixiviant will be neutralized by metallic base metals beforereaction with PGMs is possible.
Table 1. Elemental composition of the three tested secondary PGM sources.
Element Spent metallic carrier catalyst
Monolithic ceramic capacitors
Copper anode slime intermediate
PGMs (mg/kg) Pd 6145 ±21 1947 ±23 2730 ±40 Pt 1265 ±7 <20 953 ±110 Rh 626 ±4 <20 50 ±33 Ru <20 <20 114 ±76
Main elements (mg/kg) Al 139000 ±18000 1140 ±270 1660 ±170 As <10 <10 46300 ±300 Ba 17000 ±141 404000 ±6100 53100 ±13000 Ca 12700 ±70 3160 ±75 192 ±2 Ce 49700 140 ±8 <10 Cr 41300 ±1130 620 ±34 20 ±3 Cu 698 ±2 27000 ±3400 46300 ±600 Fe 178000 ±4950 10600 ±490 3010 ±160 Ni 6040 ±64 130000 ±5500 13400 ±1300 Pb 627 ±4 16000 ±870 97200 ±700 Sb <20 <20 24700 ±9200 Si 25300 - 15400 Sn <20 37300 ±1700 13800 ±600 Ti 2680 ±92 151000 ±6500 42 ±2 Zn 12000 ±71 3600 ±140 934 ±28 Zr 60600 ±140 20600 ±305 <20
For the spent metallic carrier catalyst it is important to remove the base metals Al, Fe and Cr before the PGM extraction. On the one hand it is important to remove such metals as they are present in their metallic state and reduce the oxidative power of the lixiviant and on the other hand particularly Fe is a difficult to remove impurity in subsequent split anion
189
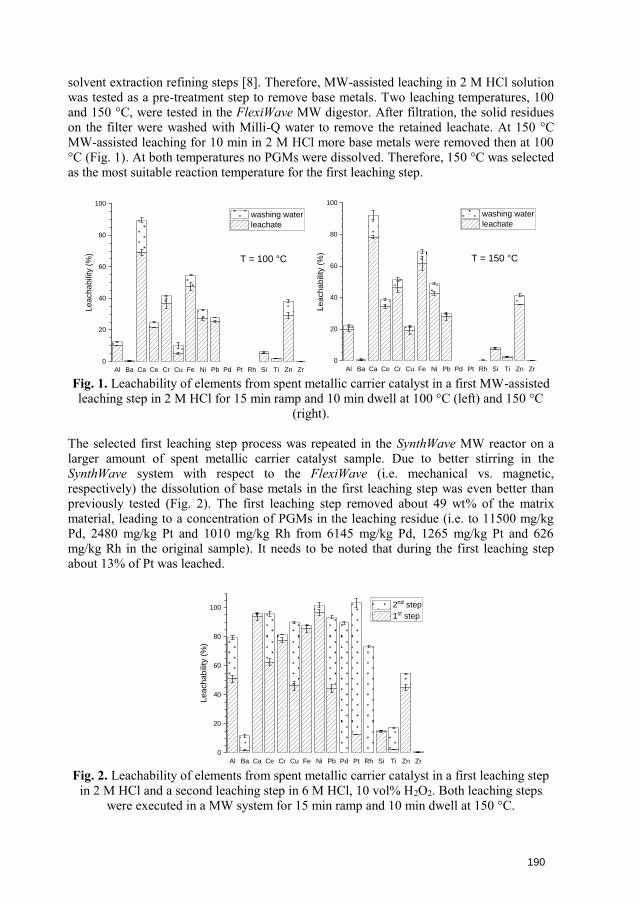
solvent extraction refining steps [8]. Therefore, MW-assisted leaching in 2 M HCl solution was tested as a pre-treatment step to remove base metals. Two leaching temperatures, 100 and 150 °C, were tested in the FlexiWave MW digestor. After filtration, the solid residues on the filter were washed with Milli-Q water to remove the retained leachate. At 150 °C MW-assisted leaching for 10 min in 2 M HCl more base metals were removed then at 100 °C (Fig. 1). At both temperatures no PGMs were dissolved. Therefore, 150 °C was selected as the most suitable reaction temperature for the first leaching step.
Al Ba Ca Ce Cr Cu Fe Ni Pb Pd Pt Rh Si Ti Zn Zr
0
20
40
60
80
100
Leachabili
ty (
%)
washing water
leachate
T = 100 °C
Al Ba Ca Ce Cr Cu Fe Ni Pb Pd Pt Rh Si Ti Zn Zr
0
20
40
60
80
100
Leachabili
ty (
%)
washing water
leachate
T = 150 °C
Fig. 1. Leachability of elements from spent metallic carrier catalyst in a first MW-assisted leaching step in 2 M HCl for 15 min ramp and 10 min dwell at 100 °C (left) and 150 °C
(right).
The selected first leaching step process was repeated in the SynthWave MW reactor on a larger amount of spent metallic carrier catalyst sample. Due to better stirring in the SynthWave system with respect to the FlexiWave (i.e. mechanical vs. magnetic, respectively) the dissolution of base metals in the first leaching step was even better than previously tested (Fig. 2). The first leaching step removed about 49 wt% of the matrix material, leading to a concentration of PGMs in the leaching residue (i.e. to 11500 mg/kg Pd, 2480 mg/kg Pt and 1010 mg/kg Rh from 6145 mg/kg Pd, 1265 mg/kg Pt and 626 mg/kg Rh in the original sample). It needs to be noted that during the first leaching step about 13% of Pt was leached.
Al Ba Ca Ce Cr Cu Fe Ni Pb Pd Pt Rh Si Ti Zn Zr
0
20
40
60
80
100
Lea
cha
bili
ty (
%)
2nd step
1st step
Fig. 2. Leachability of elements from spent metallic carrier catalyst in a first leaching step in 2 M HCl and a second leaching step in 6 M HCl, 10 vol% H2O2. Both leaching steps
were executed in a MW system for 15 min ramp and 10 min dwell at 150 °C.
190
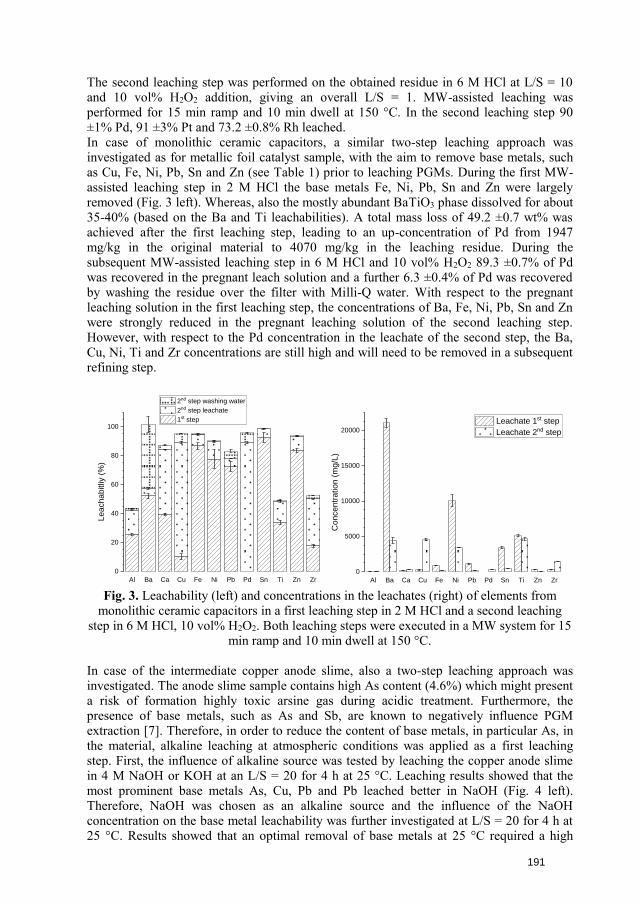
The second leaching step was performed on the obtained residue in 6 M HCl at L/S = 10 and 10 vol% H2O2 addition, giving an overall L/S = 1. MW-assisted leaching was performed for 15 min ramp and 10 min dwell at 150 °C. In the second leaching step 90 ±1% Pd, 91 ±3% Pt and 73.2 ±0.8% Rh leached. In case of monolithic ceramic capacitors, a similar two-step leaching approach was investigated as for metallic foil catalyst sample, with the aim to remove base metals, such as Cu, Fe, Ni, Pb, Sn and Zn (see Table 1) prior to leaching PGMs. During the first MW-assisted leaching step in 2 M HCl the base metals Fe, Ni, Pb, Sn and Zn were largely removed (Fig. 3 left). Whereas, also the mostly abundant BaTiO3 phase dissolved for about 35-40% (based on the Ba and Ti leachabilities). A total mass loss of 49.2 ±0.7 wt% wasachieved after the first leaching step, leading to an up-concentration of Pd from 1947mg/kg in the original material to 4070 mg/kg in the leaching residue. During thesubsequent MW-assisted leaching step in 6 M HCl and 10 vol% H2O2 89.3 ±0.7% of Pdwas recovered in the pregnant leach solution and a further 6.3 ±0.4% of Pd was recoveredby washing the residue over the filter with Milli-Q water. With respect to the pregnantleaching solution in the first leaching step, the concentrations of Ba, Fe, Ni, Pb, Sn and Znwere strongly reduced in the pregnant leaching solution of the second leaching step.However, with respect to the Pd concentration in the leachate of the second step, the Ba,Cu, Ni, Ti and Zr concentrations are still high and will need to be removed in a subsequentrefining step.
Al Ba Ca Cu Fe Ni Pb Pd Sn Ti Zn Zr
0
20
40
60
80
100
Lea
cha
bitliy
(%
)
2nd step washing water
2nd step leachate
1st step
Al Ba Ca Cu Fe Ni Pb Pd Sn Ti Zn Zr
0
5000
10000
15000
20000
Concentr
ation (
mg/L
)
Leachate 1st step
Leachate 2nd step
Fig. 3. Leachability (left) and concentrations in the leachates (right) of elements from monolithic ceramic capacitors in a first leaching step in 2 M HCl and a second leaching
step in 6 M HCl, 10 vol% H2O2. Both leaching steps were executed in a MW system for 15 min ramp and 10 min dwell at 150 °C.
In case of the intermediate copper anode slime, also a two-step leaching approach was investigated. The anode slime sample contains high As content (4.6%) which might present a risk of formation highly toxic arsine gas during acidic treatment. Furthermore, the presence of base metals, such as As and Sb, are known to negatively influence PGM extraction [7]. Therefore, in order to reduce the content of base metals, in particular As, in the material, alkaline leaching at atmospheric conditions was applied as a first leaching step. First, the influence of alkaline source was tested by leaching the copper anode slime in 4 M NaOH or KOH at an L/S = 20 for 4 h at 25 °C. Leaching results showed that the most prominent base metals As, Cu, Pb and Pb leached better in NaOH (Fig. 4 left). Therefore, NaOH was chosen as an alkaline source and the influence of the NaOH concentration on the base metal leachability was further investigated at L/S = 20 for 4 h at 25 °C. Results showed that an optimal removal of base metals at 25 °C required a high
191
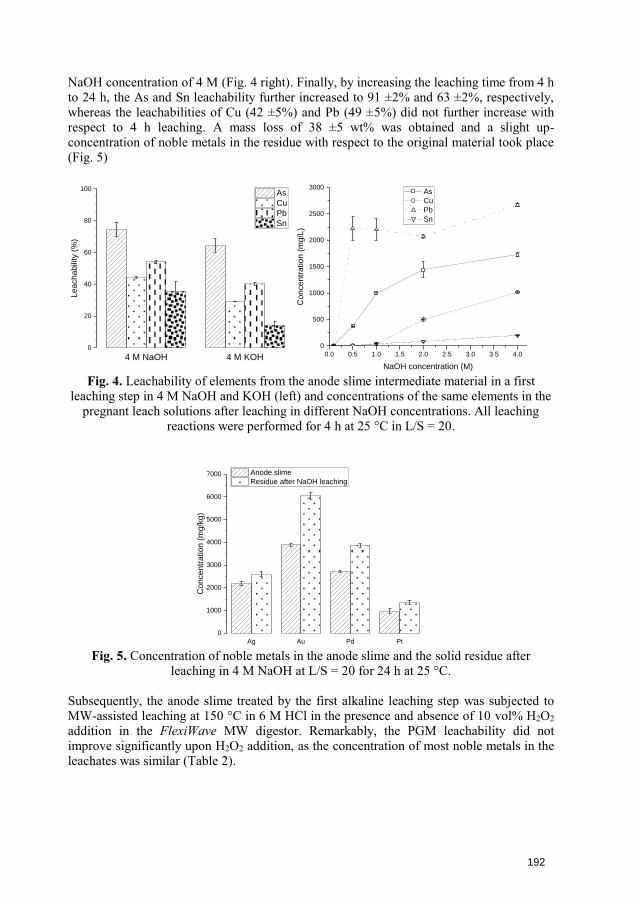
NaOH concentration of 4 M (Fig. 4 right). Finally, by increasing the leaching time from 4 h to 24 h, the As and Sn leachability further increased to 91 ±2% and 63 ±2%, respectively, whereas the leachabilities of Cu (42 ±5%) and Pb (49 ±5%) did not further increase with respect to 4 h leaching. A mass loss of 38 ±5 wt% was obtained and a slight up-concentration of noble metals in the residue with respect to the original material took place (Fig. 5)
4 M NaOH 4 M KOH0
20
40
60
80
100
Lea
cha
bili
ty (
%)
As
Cu
Pb
Sn
0.0 0.5 1.0 1.5 2.0 2.5 3.0 3.5 4.0
0
500
1000
1500
2000
2500
3000
Concentr
ation (
mg/L
)
NaOH concentration (M)
As
Cu
Pb
Sn
Fig. 4. Leachability of elements from the anode slime intermediate material in a first leaching step in 4 M NaOH and KOH (left) and concentrations of the same elements in the
pregnant leach solutions after leaching in different NaOH concentrations. All leaching reactions were performed for 4 h at 25 °C in L/S = 20.
Ag Au Pd Pt
0
1000
2000
3000
4000
5000
6000
7000
Concentr
ation (
mg/k
g)
Anode slime
Residue after NaOH leaching
Fig. 5. Concentration of noble metals in the anode slime and the solid residue after leaching in 4 M NaOH at L/S = 20 for 24 h at 25 °C.
Subsequently, the anode slime treated by the first alkaline leaching step was subjected to MW-assisted leaching at 150 °C in 6 M HCl in the presence and absence of 10 vol% H2O2 addition in the FlexiWave MW digestor. Remarkably, the PGM leachability did not improve significantly upon H2O2 addition, as the concentration of most noble metals in the leachates was similar (Table 2).
192
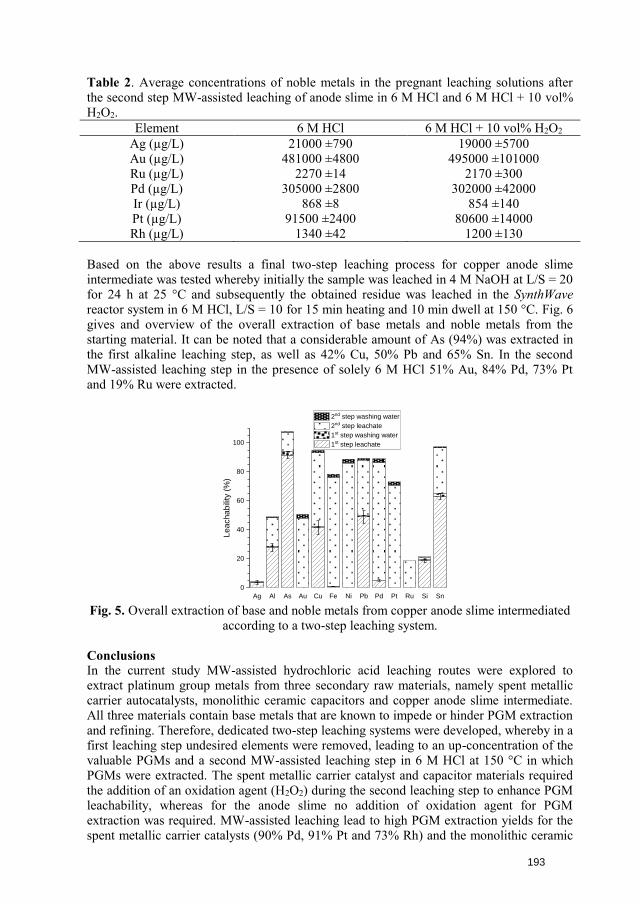
Table 2. Average concentrations of noble metals in the pregnant leaching solutions after the second step MW-assisted leaching of anode slime in 6 M HCl and 6 M HCl + 10 vol% H2O2.
Element 6 M HCl 6 M HCl + 10 vol% H2O2 Ag (µg/L) 21000 ±790 19000 ±5700 Au (µg/L) 481000 ±4800 495000 ±101000 Ru (µg/L) 2270 ±14 2170 ±300 Pd (µg/L) 305000 ±2800 302000 ±42000 Ir (µg/L) 868 ±8 854 ±140 Pt (µg/L) 91500 ±2400 80600 ±14000 Rh (µg/L) 1340 ±42 1200 ±130
Based on the above results a final two-step leaching process for copper anode slime intermediate was tested whereby initially the sample was leached in 4 M NaOH at L/S = 20 for 24 h at 25 °C and subsequently the obtained residue was leached in the SynthWave reactor system in 6 M HCl, L/S = 10 for 15 min heating and 10 min dwell at 150 °C. Fig. 6 gives and overview of the overall extraction of base metals and noble metals from the starting material. It can be noted that a considerable amount of As (94%) was extracted in the first alkaline leaching step, as well as 42% Cu, 50% Pb and 65% Sn. In the second MW-assisted leaching step in the presence of solely 6 M HCl 51% Au, 84% Pd, 73% Pt and 19% Ru were extracted.
Ag Al As Au Cu Fe Ni Pb Pd Pt Ru Si Sn
0
20
40
60
80
100
Leachabili
ty (
%)
2nd step washing water
2nd step leachate
1st step washing water
1st step leachate
Fig. 5. Overall extraction of base and noble metals from copper anode slime intermediated according to a two-step leaching system.
Conclusions In the current study MW-assisted hydrochloric acid leaching routes were explored to extract platinum group metals from three secondary raw materials, namely spent metallic carrier autocatalysts, monolithic ceramic capacitors and copper anode slime intermediate. All three materials contain base metals that are known to impede or hinder PGM extraction and refining. Therefore, dedicated two-step leaching systems were developed, whereby in a first leaching step undesired elements were removed, leading to an up-concentration of the valuable PGMs and a second MW-assisted leaching step in 6 M HCl at 150 °C in which PGMs were extracted. The spent metallic carrier catalyst and capacitor materials required the addition of an oxidation agent (H2O2) during the second leaching step to enhance PGM leachability, whereas for the anode slime no addition of oxidation agent for PGM extraction was required. MW-assisted leaching lead to high PGM extraction yields for the spent metallic carrier catalysts (90% Pd, 91% Pt and 73% Rh) and the monolithic ceramic
193
capacitors (96% Pd), whereas for the anode slime (84% Pd, 73% Pt and 19% Ru) the PGM extraction could be further improved by exploring harsher MW-assisted leaching conditions, such as the increase of leaching temperature, in future work.
Acknowledgements The presented work was executed within the PLATIRUS project, which has received funding from the European Union’s Horizon 2020 research and innovation program under grant agreement No 730224.
References [1] T. Abo Atia, W. Wouters, G. Monforte, and J. Spooren, "Microwave chloride
leaching of valuable elements from spent automotive catalysts: Understanding therole of hydrogen peroxide," Resources, Conservation and Recycling, vol. 166,2021, doi: 10.1016/j.resconrec.2020.105349.
[2] T. Abo Atia and J. Spooren, "Fast microwave leaching of platinum, rhodium andcerium from spent non-milled autocatalyst monolith," Chemical Engineering andProcessing - Process Intensification, 2021, doi: 10.1016/j.cep.2021.108378.
[3] A. Fornalczyk and M. Saternus, "Removal of Platinum Group Metals from the UsedAuto Catalytic Converter," (in English), Metalurgija, vol. 48, no. 2, pp. 133-136,Apr-Jun 2009. [Online]. Available: <Go to ISI>://WOS:000263346500016.
[4] A. Fornalczyk et al., "Dissolution of Metal Supported Spent Auto Catalysts inAcids," Archives of Metallurgy and Materials, vol. 61, no. 1, pp. 233-236, 2016,doi: 10.1515/amm-2016-0043.
[5] J. Willner and A. Fornalczyk, "Dissolution of Ceramic Monolith of Spent CatalyticConverters by Using Hydrometallurgical Methods / Rozpuszczanie MonolituCeramicznego Zużytych Katalizatorów Na Drodze Hydrometalurgicznej," Archivesof Metallurgy and Materials, vol. 60, no. 4, pp. 2945-2948, 2015, doi:10.1515/amm-2015-0470.
[6] D. Fontana, M. Pietrantonio, S. Pucciarmati, G. N. Torelli, C. Bonomi, and F. Masi,"Palladium recovery from monolithic ceramic capacitors by leaching, solventextraction and reduction," Journal of Material Cycles and Waste Management, vol.20, no. 2, pp. 1199-1206, 2017, doi: 10.1007/s10163-017-0684-3.
[7] W. D. Xing, S. H. Sohn, and M. S. Lee, "A Review on the Recovery of NobleMetals from Anode Slimes," Mineral Processing and Extractive MetallurgyReview, vol. 41, no. 2, pp. 130-143, 2019, doi: 10.1080/08827508.2019.1575211.
[8] G. Nicol et al., "Platinum Group Metals Recovery Using Secondary Raw Materials(PLATIRUS): Project Overview with a Focus on Processing Spent Autocatalyst,"Johnson Matthey Technology Review, vol. 65, no. 1, pp. 127-147, 2021, doi:10.1595/205651321x16057842276133.
194
MICROWAVE ASSISTED METALLURGY – CASE STUDY ON MICROWAVE ROASTING OF STAINLESS STEEL SLAG
L. Kaipia1, F. Kukurugya2, C. Groffils1, Liesbeth Horckmans2
1MEAM (Microwave Energy Applications Management), Centrum-Zuid 3060, Houthalen-Helchteren, Belgium 2 Waste Recycling Technologies, Sustainable Materials Management, Flemish Institute for Technological Research (VITO N.V.), Boeretang 200, 2400 Mol, Belgium
Keywords: microwave, industrial applications, processing, optimization, scale-up
Introduction
Microwave (MW) radiation is electromagnetic radiation and induces dielectric heating in materials via, for example, the interaction between the polar molecules and constantly oscillating electric field (f = 2.45 109 Hz). Due to volumetric heating and the instant transfer of radiation energy to heat by dipole rotation (material itself as the source of heat), microwave heating is in most cases more efficient and faster than conventional heating methods.
Since many studies has shown advantages in the use of microwave energy in metallurgical applications, selective recovery of chromium (Cr) from stainless steel (SS) slag by microwave assisted alkaline roasting followed by water leaching was investigated within an EU funded project named CHROMIC. By roasting with alkali (KOH or NaOH), the chromium present in different spinel phases was oxidized and converted to a form that was leachable by water.
As heating by microwave energy is material specific, and the obtained results depend on the used MW equipment and the applied conditions, the upscaling of the roasting process was performed in several steps. In this paper, the main results of the performed experiments will be presented and the variables affecting the MW heating will be discussed.
Materials and methods
Materials
The studied SS slag was provided by a slag treatment facility located in Belgium. As the material was pre-processed, it was in a form of fine powder (d90 = 150 µm) and had an initial moisture content around 18-20 wt.%. In laboratory scale testing, the material was sieved and fraction <125 µm was used (representing 93 wt.% of the initial sample). In pilot-scale roasting the SS slag was processed at its initial grain size. In all experiments the material was pre-dried before roasting.
In preliminary roasting experiments, NaOH (pellets for analysis EMSURE®, Merck) and KOH (powder for synthesis, Merck) were used. In some tests, NaNO3 (BAKER ANALYZED™ ACS Reagent) was added as an oxidizing agent. Milli-Q water was used in all experiments that required water as a solvent.
In upscaled laboratory scale roasting the used chemicals were KOH (pellets, AnalR NORMAPUR, purity >85 wt.%) and NaOH (pellets, Merck, technical grade). Before use, the pellets were grinded with mortar and pestle. In pilot scale roasting, granulated NaOH (EMPLURA®, purity >98 wt.%) was used.
195
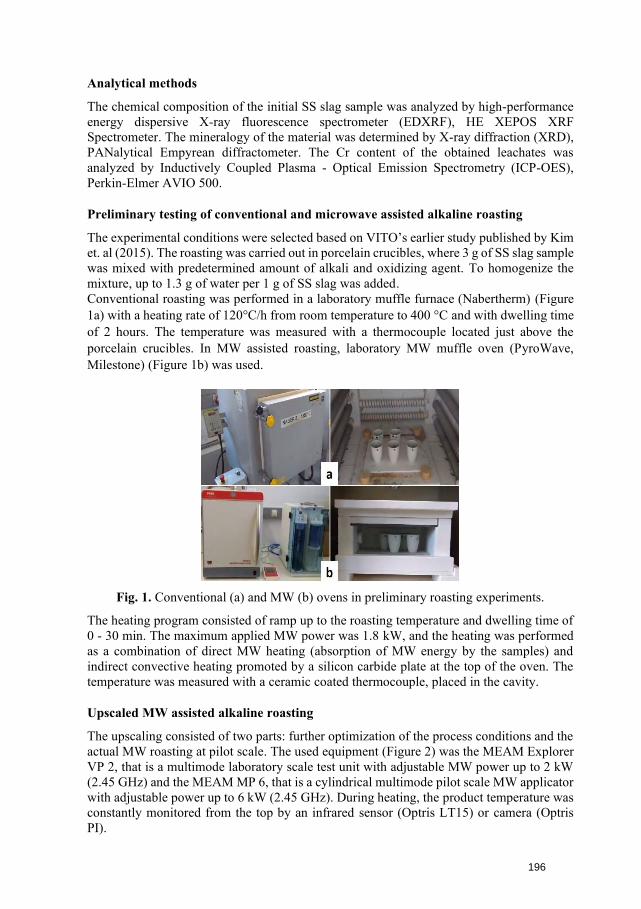
Analytical methods
The chemical composition of the initial SS slag sample was analyzed by high-performance energy dispersive X-ray fluorescence spectrometer (EDXRF), HE XEPOS XRF Spectrometer. The mineralogy of the material was determined by X-ray diffraction (XRD), PANalytical Empyrean diffractometer. The Cr content of the obtained leachates was analyzed by Inductively Coupled Plasma - Optical Emission Spectrometry (ICP-OES), Perkin-Elmer AVIO 500.
Preliminary testing of conventional and microwave assisted alkaline roasting
The experimental conditions were selected based on VITO’s earlier study published by Kim et. al (2015). The roasting was carried out in porcelain crucibles, where 3 g of SS slag sample was mixed with predetermined amount of alkali and oxidizing agent. To homogenize the mixture, up to 1.3 g of water per 1 g of SS slag was added. Conventional roasting was performed in a laboratory muffle furnace (Nabertherm) (Figure 1a) with a heating rate of 120°C/h from room temperature to 400 °C and with dwelling time of 2 hours. The temperature was measured with a thermocouple located just above the porcelain crucibles. In MW assisted roasting, laboratory MW muffle oven (PyroWave, Milestone) (Figure 1b) was used.
Fig. 1. Conventional (a) and MW (b) ovens in preliminary roasting experiments.
The heating program consisted of ramp up to the roasting temperature and dwelling time of 0 - 30 min. The maximum applied MW power was 1.8 kW, and the heating was performed as a combination of direct MW heating (absorption of MW energy by the samples) and indirect convective heating promoted by a silicon carbide plate at the top of the oven. The temperature was measured with a ceramic coated thermocouple, placed in the cavity.
Upscaled MW assisted alkaline roasting
The upscaling consisted of two parts: further optimization of the process conditions and the actual MW roasting at pilot scale. The used equipment (Figure 2) was the MEAM Explorer VP 2, that is a multimode laboratory scale test unit with adjustable MW power up to 2 kW (2.45 GHz) and the MEAM MP 6, that is a cylindrical multimode pilot scale MW applicator with adjustable power up to 6 kW (2.45 GHz). During heating, the product temperature was constantly monitored from the top by an infrared sensor (Optris LT15) or camera (Optris PI).
196
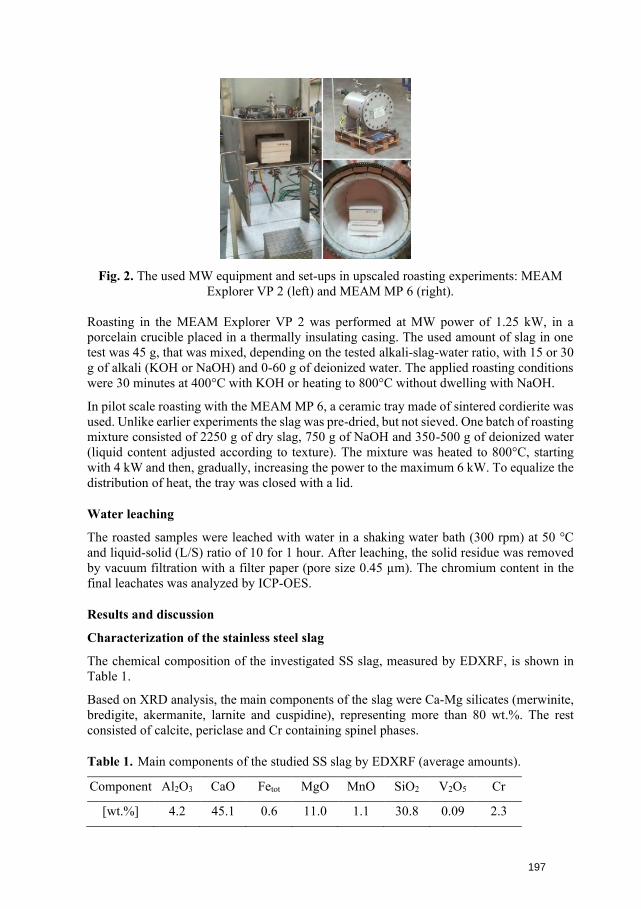
Fig. 2. The used MW equipment and set-ups in upscaled roasting experiments: MEAM Explorer VP 2 (left) and MEAM MP 6 (right).
Roasting in the MEAM Explorer VP 2 was performed at MW power of 1.25 kW, in a porcelain crucible placed in a thermally insulating casing. The used amount of slag in one test was 45 g, that was mixed, depending on the tested alkali-slag-water ratio, with 15 or 30 g of alkali (KOH or NaOH) and 0-60 g of deionized water. The applied roasting conditions were 30 minutes at 400°C with KOH or heating to 800°C without dwelling with NaOH.
In pilot scale roasting with the MEAM MP 6, a ceramic tray made of sintered cordierite was used. Unlike earlier experiments the slag was pre-dried, but not sieved. One batch of roasting mixture consisted of 2250 g of dry slag, 750 g of NaOH and 350-500 g of deionized water (liquid content adjusted according to texture). The mixture was heated to 800°C, starting with 4 kW and then, gradually, increasing the power to the maximum 6 kW. To equalize the distribution of heat, the tray was closed with a lid.
Water leaching
The roasted samples were leached with water in a shaking water bath (300 rpm) at 50 °C and liquid-solid (L/S) ratio of 10 for 1 hour. After leaching, the solid residue was removed by vacuum filtration with a filter paper (pore size 0.45 µm). The chromium content in the final leachates was analyzed by ICP-OES.
Results and discussion
Characterization of the stainless steel slag
The chemical composition of the investigated SS slag, measured by EDXRF, is shown in Table 1.
Based on XRD analysis, the main components of the slag were Ca-Mg silicates (merwinite, bredigite, akermanite, larnite and cuspidine), representing more than 80 wt.%. The rest consisted of calcite, periclase and Cr containing spinel phases.
Table 1. Main components of the studied SS slag by EDXRF (average amounts).
Component Al2O3 CaO Fetot MgO MnO SiO2 V2O5 Cr
[wt.%] 4.2 45.1 0.6 11.0 1.1 30.8 0.09 2.3
197
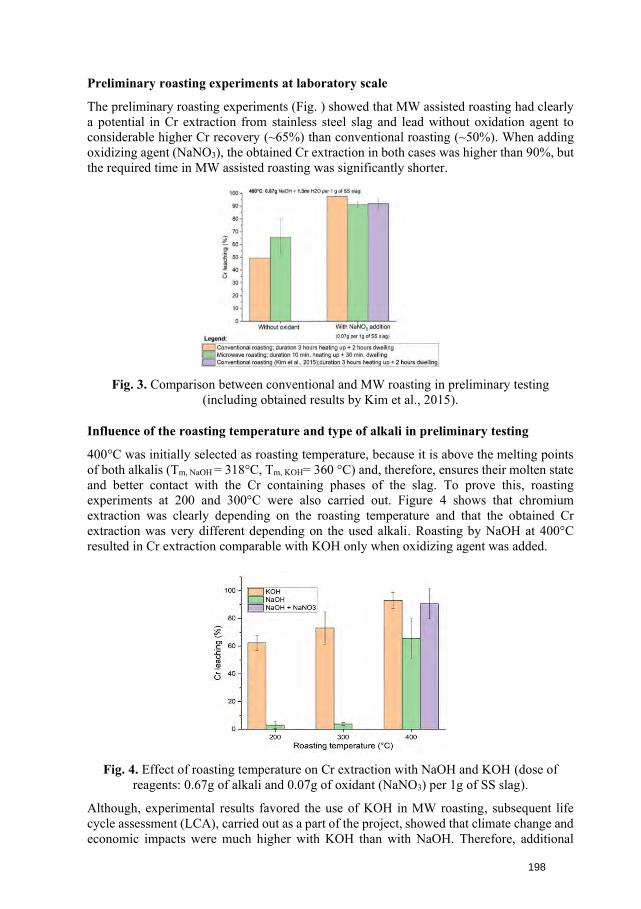
Preliminary roasting experiments at laboratory scale
The preliminary roasting experiments (Fig. ) showed that MW assisted roasting had clearly a potential in Cr extraction from stainless steel slag and lead without oxidation agent to considerable higher Cr recovery (~65%) than conventional roasting (~50%). When adding oxidizing agent (NaNO3), the obtained Cr extraction in both cases was higher than 90%, but the required time in MW assisted roasting was significantly shorter.
Fig. 3. Comparison between conventional and MW roasting in preliminary testing (including obtained results by Kim et al., 2015).
Influence of the roasting temperature and type of alkali in preliminary testing
400°C was initially selected as roasting temperature, because it is above the melting points of both alkalis (Tm, NaOH = 318°C, Tm, KOH= 360 °C) and, therefore, ensures their molten state and better contact with the Cr containing phases of the slag. To prove this, roasting experiments at 200 and 300°C were also carried out. Figure 4 shows that chromium extraction was clearly depending on the roasting temperature and that the obtained Cr extraction was very different depending on the used alkali. Roasting by NaOH at 400°C resulted in Cr extraction comparable with KOH only when oxidizing agent was added.
Fig. 4. Effect of roasting temperature on Cr extraction with NaOH and KOH (dose of reagents: 0.67g of alkali and 0.07g of oxidant (NaNO3) per 1g of SS slag).
Although, experimental results favored the use of KOH in MW roasting, subsequent life cycle assessment (LCA), carried out as a part of the project, showed that climate change and economic impacts were much higher with KOH than with NaOH. Therefore, additional
198
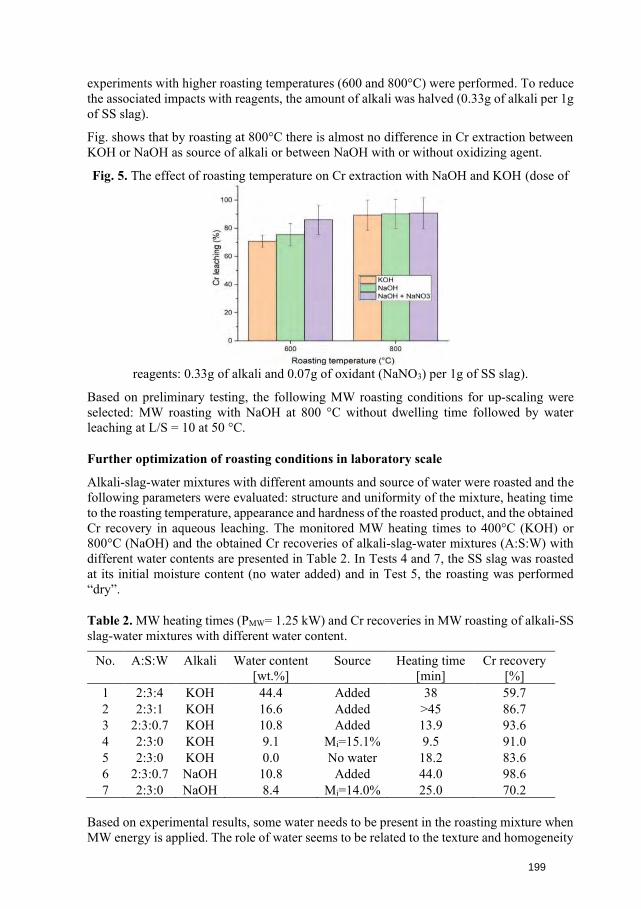
experiments with higher roasting temperatures (600 and 800°C) were performed. To reduce the associated impacts with reagents, the amount of alkali was halved (0.33g of alkali per 1g of SS slag).
Fig. shows that by roasting at 800°C there is almost no difference in Cr extraction between KOH or NaOH as source of alkali or between NaOH with or without oxidizing agent.
Fig. 5. The effect of roasting temperature on Cr extraction with NaOH and KOH (dose of
reagents: 0.33g of alkali and 0.07g of oxidant (NaNO3) per 1g of SS slag).
Based on preliminary testing, the following MW roasting conditions for up-scaling were selected: MW roasting with NaOH at 800 °C without dwelling time followed by water leaching at L/S = 10 at 50 °C.
Further optimization of roasting conditions in laboratory scale
Alkali-slag-water mixtures with different amounts and source of water were roasted and the following parameters were evaluated: structure and uniformity of the mixture, heating time to the roasting temperature, appearance and hardness of the roasted product, and the obtained Cr recovery in aqueous leaching. The monitored MW heating times to 400°C (KOH) or 800°C (NaOH) and the obtained Cr recoveries of alkali-slag-water mixtures (A:S:W) with different water contents are presented in Table 2. In Tests 4 and 7, the SS slag was roasted at its initial moisture content (no water added) and in Test 5, the roasting was performed “dry”.
Table 2. MW heating times (PMW= 1.25 kW) and Cr recoveries in MW roasting of alkali-SS slag-water mixtures with different water content.
No. A:S:W Alkali Water content [wt.%]
Source Heating time [min]
Cr recovery [%]
1 2:3:4 KOH 44.4 Added 38 59.7 2 2:3:1 KOH 16.6 Added >45 86.7 3 2:3:0.7 KOH 10.8 Added 13.9 93.6 4 2:3:0 KOH 9.1 Mi=15.1% 9.5 91.0 5 2:3:0 KOH 0.0 No water 18.2 83.6 6 2:3:0.7 NaOH 10.8 Added 44.0 98.6 7 2:3:0 NaOH 8.4 Mi=14.0% 25.0 70.2
Based on experimental results, some water needs to be present in the roasting mixture when MW energy is applied. The role of water seems to be related to the texture and homogeneity
199
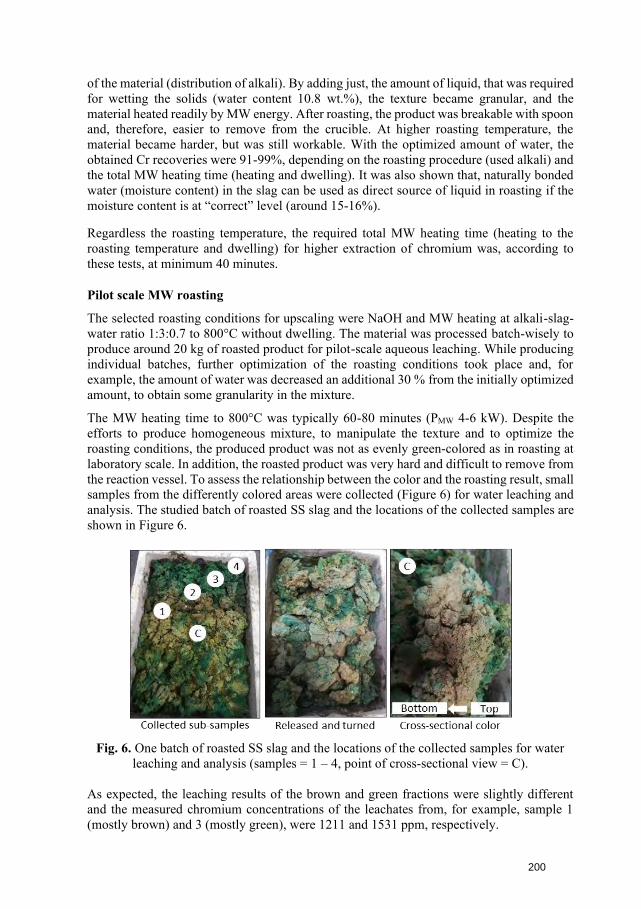
of the material (distribution of alkali). By adding just, the amount of liquid, that was required for wetting the solids (water content 10.8 wt.%), the texture became granular, and the material heated readily by MW energy. After roasting, the product was breakable with spoon and, therefore, easier to remove from the crucible. At higher roasting temperature, the material became harder, but was still workable. With the optimized amount of water, the obtained Cr recoveries were 91-99%, depending on the roasting procedure (used alkali) and the total MW heating time (heating and dwelling). It was also shown that, naturally bonded water (moisture content) in the slag can be used as direct source of liquid in roasting if the moisture content is at “correct” level (around 15-16%).
Regardless the roasting temperature, the required total MW heating time (heating to the roasting temperature and dwelling) for higher extraction of chromium was, according to these tests, at minimum 40 minutes.
Pilot scale MW roasting
The selected roasting conditions for upscaling were NaOH and MW heating at alkali-slag-water ratio 1:3:0.7 to 800°C without dwelling. The material was processed batch-wisely to produce around 20 kg of roasted product for pilot-scale aqueous leaching. While producing individual batches, further optimization of the roasting conditions took place and, for example, the amount of water was decreased an additional 30 % from the initially optimized amount, to obtain some granularity in the mixture.
The MW heating time to 800°C was typically 60-80 minutes (PMW 4-6 kW). Despite the efforts to produce homogeneous mixture, to manipulate the texture and to optimize the roasting conditions, the produced product was not as evenly green-colored as in roasting at laboratory scale. In addition, the roasted product was very hard and difficult to remove from the reaction vessel. To assess the relationship between the color and the roasting result, small samples from the differently colored areas were collected (Figure 6) for water leaching and analysis. The studied batch of roasted SS slag and the locations of the collected samples are shown in Figure 6.
Fig. 6. One batch of roasted SS slag and the locations of the collected samples for water leaching and analysis (samples = 1 – 4, point of cross-sectional view = C).
As expected, the leaching results of the brown and green fractions were slightly different and the measured chromium concentrations of the leachates from, for example, sample 1 (mostly brown) and 3 (mostly green), were 1211 and 1531 ppm, respectively.
200
The obtained Cr extraction in pilot scale leaching was only 44.4% (an average of two leaching batches). This indicates that a significant part of the Cr(III) present in spinel structures was not oxidized to water-soluble Cr(VI). The reasons for low conversion rate may be related to the total efficiency of the used MW system and the homogeneity of heating (homogeneity of the mixture). One cause may also be connected to the reaction kinetics. In parallel studies on conventional roasting, it was observed that the roasting result was depending on the geometry of the reaction vessel (In high and narrow reaction vessel the oxidation mostly limited to the outer-most surface of the layer) and the management of air ventilation (oxygen level in the oven). This may have been also the case in pilot scale MW roasting: due to dense structure, too little of oxygen was available for complete roasting reaction in the inner parts of the layer.
It was concluded that to improve the supply of oxygen, the homogeneity of MW heating and the total energy efficiency of the system, a MW rotary kiln could be a more favorable alternative than a conventional “tunnel type” MW applicator. In addition, the continuous mixing of the material by rotational movement during roasting would most probably lead to more manageable end product (loose, less hard), as well.
Conclusions
Since many studies has shown advantages in the use of microwave energy in metallurgical applications, selective recovery of chromium (Cr) from stainless steel (SS) slag by microwave assisted alkaline roasting followed by water leaching was investigated. During alkaline roasting chromium present in stable Cr(III) form in various spinel structures is oxidized to Cr(VI) that is leachable by water.
Both KOH and NaOH were tested as the source of alkali. Based on preliminary studies, KOH seemed to be superior to NaOH at lower roasting temperature (400°C). However, the LCA assessment showed that climate change and economical impacts were much higher with KOH than with NaOH. Therefore, more experiments at higher temperatures were performed. It was shown that by increasing the roasting temperature to 800°C, chromium extraction as high as 98% could be obtained with NaOH and without dwelling time. In addition, the used amount of alkali could be reduced to half (alkali-slag ratio 1:3 instead of original 2:3).
Unlike conventional roasting, some water was needed in the roasting mixture when MW energy was applied. The role of the liquid seemed to be related to the texture and the homogeneity of the mixture. Based on upscaled roasting experiments, the optimum water content in the alkali-slag mixture was around 11 wt.% (alkali-slag-water ratio 1:3:0.7). It was also shown that, naturally bonded water (moisture content) in the slag can be used as direct source of the liquid in roasting if the moisture content was at “correct” level (around 15-16% that corresponds water content 10%).
In pilot scale roasting, the aim was to produce around 20 kg of MW roasted product for pilot scale aqueous leaching. The SS slag was roasted with NaOH in batches of 2.25 kg at alkali-slag-water ratio 1:3:0.5 (water content reduced from 0.7 to 0.5 to obtain better texture) and the MW heating time to 800°C was typically 60-80 minutes (PMW 4-6 kW). According to visual inspection, the treated slag was not evenly colored and large areas were merely brown instead of green. By small-scale water leaching tests and analysis, it was confirmed, that in brown areas the roasting reaction was incomplete, and less chromium could be extracted with water (only partial conversion of Cr to the water-soluble form).
201
The obtained Cr extraction in pilot scale leaching was only 44.4% (an average of two leaching batches). This indicates that a significant part of the Cr(III) present in spinel structures was not oxidized to water-soluble Cr(VI). The possible reasons for incomplete roasting reaction may be related to the total efficiency of the used MW system and the homogeneity of heating (homogeneity of the mixture). In addition, the obtained low degree of oxidation may have been partly the result of oxygen-poor conditions within the material layer. To improve the supply of oxygen, the homogeneity of MW heating and the total energy efficiency of the system, a MW rotary kiln could be a better alternative than a conventional “tunnel type” MW applicator. Continuous mixing of the material by rotational movement during roasting would most probably lead also to more manageable end product (less hard).
Acknowledgement
The CHROMIC project was funded by European Union’s Horizon 2020 Research and Innovation program under Grant Agreement n° 730471. The author’s wish to thank all project partners for their contribution.
References
[1] Kim, E., Spooren, J., Broos, K., Horckmans, L., Quaghebeur, M., Vrancken, K.C.,Hydrometallurgy, 2015, 158, 139-148.
[2] Horckmans, L., Möckel, R., Nielsen, P., Kukurugya, F., Minerals, 2019, 9, 646.[3] Deleu, W., Goovaerts, V., Groffils, C., In Proc. 6th Int. Slag Valorization Symp.,
2019, 339-344.[4] Goovaerts, V., Groffils, C., Microwave applicator control, European Patent Appl.
3784004A1, Aug. 19, 2019.
202
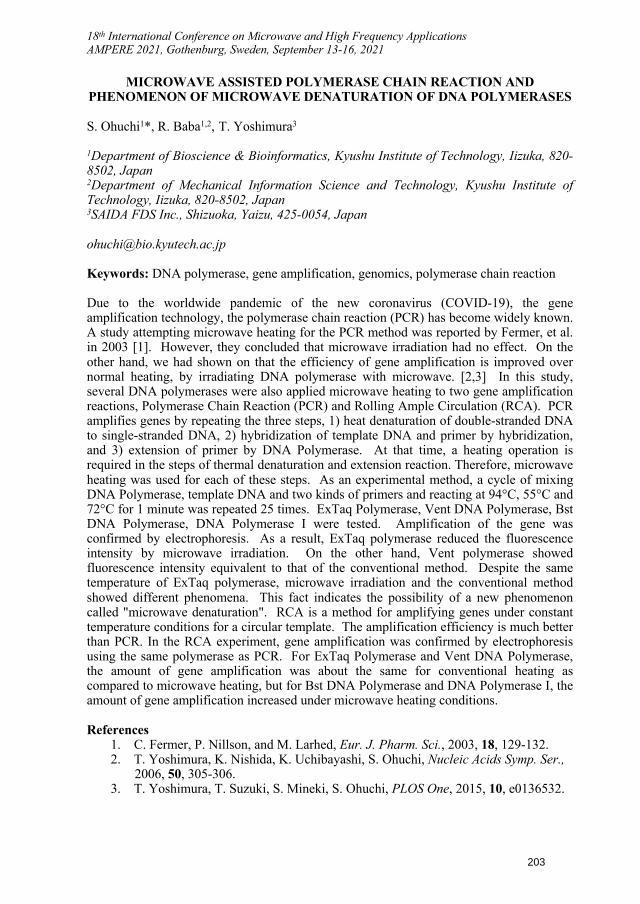
18th International Conference on Microwave and High Frequency Applications AMPERE 2021, Gothenburg, Sweden, September 13-16, 2021
MICROWAVE ASSISTED POLYMERASE CHAIN REACTION AND PHENOMENON OF MICROWAVE DENATURATION OF DNA POLYMERASES
S. Ohuchi1*, R. Baba1,2, T. Yoshimura3
1Department of Bioscience & Bioinformatics, Kyushu Institute of Technology, Iizuka, 820-8502, Japan 2Department of Mechanical Information Science and Technology, Kyushu Institute of Technology, Iizuka, 820-8502, Japan 3SAIDA FDS Inc., Shizuoka, Yaizu, 425-0054, Japan
Keywords: DNA polymerase, gene amplification, genomics, polymerase chain reaction
Due to the worldwide pandemic of the new coronavirus (COVID-19), the gene amplification technology, the polymerase chain reaction (PCR) has become widely known. A study attempting microwave heating for the PCR method was reported by Fermer, et al. in 2003 [1]. However, they concluded that microwave irradiation had no effect. On the other hand, we had shown on that the efficiency of gene amplification is improved over normal heating, by irradiating DNA polymerase with microwave. [2,3] In this study, several DNA polymerases were also applied microwave heating to two gene amplification reactions, Polymerase Chain Reaction (PCR) and Rolling Ample Circulation (RCA). PCR amplifies genes by repeating the three steps, 1) heat denaturation of double-stranded DNA to single-stranded DNA, 2) hybridization of template DNA and primer by hybridization, and 3) extension of primer by DNA Polymerase. At that time, a heating operation is required in the steps of thermal denaturation and extension reaction. Therefore, microwave heating was used for each of these steps. As an experimental method, a cycle of mixing DNA Polymerase, template DNA and two kinds of primers and reacting at 94°C, 55°C and 72°C for 1 minute was repeated 25 times. ExTaq Polymerase, Vent DNA Polymerase, Bst DNA Polymerase, DNA Polymerase I were tested. Amplification of the gene was confirmed by electrophoresis. As a result, ExTaq polymerase reduced the fluorescence intensity by microwave irradiation. On the other hand, Vent polymerase showed fluorescence intensity equivalent to that of the conventional method. Despite the same temperature of ExTaq polymerase, microwave irradiation and the conventional method showed different phenomena. This fact indicates the possibility of a new phenomenon called "microwave denaturation". RCA is a method for amplifying genes under constant temperature conditions for a circular template. The amplification efficiency is much better than PCR. In the RCA experiment, gene amplification was confirmed by electrophoresis using the same polymerase as PCR. For ExTaq Polymerase and Vent DNA Polymerase, the amount of gene amplification was about the same for conventional heating as compared to microwave heating, but for Bst DNA Polymerase and DNA Polymerase I, the amount of gene amplification increased under microwave heating conditions.
References 1. C. Fermer, P. Nillson, and M. Larhed, Eur. J. Pharm. Sci., 2003, 18, 129-132.2. T. Yoshimura, K. Nishida, K. Uchibayashi, S. Ohuchi, Nucleic Acids Symp. Ser.,
2006, 50, 305-306.3. T. Yoshimura, T. Suzuki, S. Mineki, S. Ohuchi, PLOS One, 2015, 10, e0136532.
203
MICROWAVE HEATING OF LOW-LOSS DIELECTRIC FOOD PRODUCTS
S. Curet, E. A. Norwood, K. Robert, C.D. Albuquerque, L. Boillereaux
Oniris, Université de Nantes, CNRS, GEPEA, UMR 6144, F-44000 Nantes, France [email protected]
Keywords: microwave heating, low dielectric properties, modelling, temperature distribution.
ABSTRACT
In the food industry, production of powdered materials enables to extend the shelf life of foods while preserving their intrinsic qualities. Moreover, in the case of high protein dairy powders, the application of a high temperature treatment (i.e. T ≥ 80°C) may modify proteins structure and thus their potential functionalities for further processing or incorporation within other food matrixes. This solution is particularly adapted in the context of a Clean Label approach where significant reductions of additives and other controversial ingredients are expected. In this study, a microwave heat treatment is applied to a whey proteins isolate (WPI) powder in a dry state. The thermophysical properties of the WPI powder (density, specific heat and thermal conductivity) were measured or taken from literature. A dielectric characterization using a resonant cavity perturbation technique is also presented and the measurements confirmed the low dielectric loss factor of the sample. A 3D numerical model, which includes a single mode microwave cavity working at 2.45 GHz, is also developed to understand the microwave interactions with the powdered food. Simulation results are discussed on the one hand in terms of electromagnetic field propagation within the rectangular waveguide and on the other hand by considering the temperature distribution within the powdered food. The model is experimentally validated with a pilot-scaled microwave equipment (2.45 GHz solid-state microwave emitter, impedance tuner and optical fibers probes). This study will give significant guidelines for the microwave heating optimization of low-loss dielectric products such as powdered food materials.
INTRODUCTION
In the food domain, dry heat treatments of powders are increasingly studied and used in order to improve the functional properties of food products such as dried ingredients. Several applications are classically encountered for egg products or dairy ingredients [1, 2]. Knowing that proteins are heat-sensitive components, the application of a high temperature treatment will allow to modify their structure and thus their functionalities. These modifications are of a great interest in the context of a Clean Label approach. The latter concept came from the desire to reduce additives and other controversial ingredients from the product ingredient list. In this framework, the study is aimed at exploring the potential of using microwave technology to perform dry heat treatment on dried food materials, in particular on whey protein isolate powder. Microwaves have the ability to provide a volumetric heating within the food matrix, allowing to reduce the heating time and thus the energy consumption comparing to a conventional heating process.
204
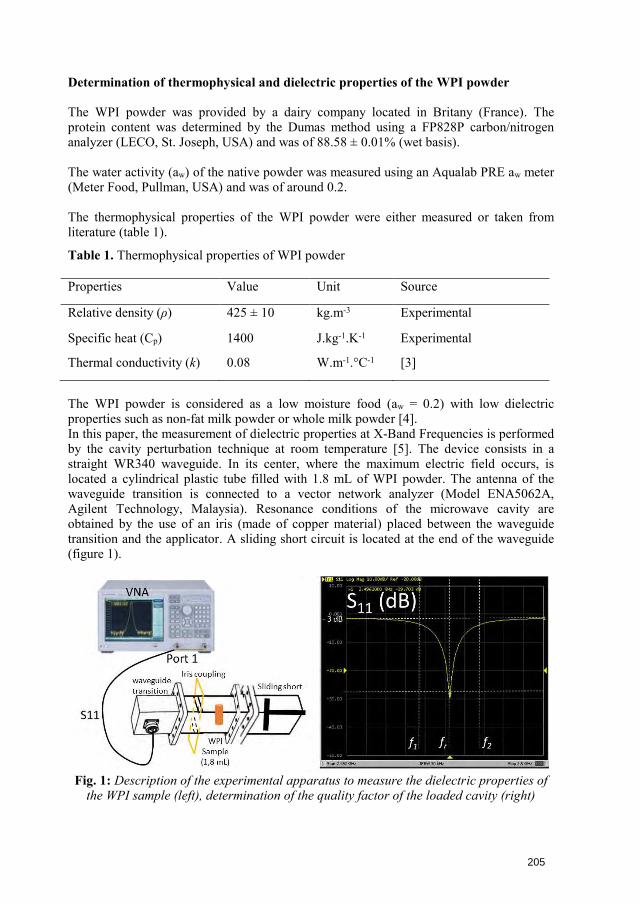
Determination of thermophysical and dielectric properties of the WPI powder
The WPI powder was provided by a dairy company located in Britany (France). The protein content was determined by the Dumas method using a FP828P carbon/nitrogen analyzer (LECO, St. Joseph, USA) and was of 88.58 ± 0.01% (wet basis).
The water activity (aw) of the native powder was measured using an Aqualab PRE aw meter (Meter Food, Pullman, USA) and was of around 0.2.
The thermophysical properties of the WPI powder were either measured or taken from literature (table 1).
Table 1. Thermophysical properties of WPI powder
Properties Value Unit Source
Relative density (ρ) 425 ± 10 kg.m-3 Experimental
Specific heat (Cp) 1400 J.kg-1.K-1 Experimental
Thermal conductivity (k) 0.08 W.m-1.°C-1 [3]
The WPI powder is considered as a low moisture food (aw = 0.2) with low dielectric properties such as non-fat milk powder or whole milk powder [4]. In this paper, the measurement of dielectric properties at X-Band Frequencies is performed by the cavity perturbation technique at room temperature [5]. The device consists in a straight WR340 waveguide. In its center, where the maximum electric field occurs, is located a cylindrical plastic tube filled with 1.8 mL of WPI powder. The antenna of the waveguide transition is connected to a vector network analyzer (Model ENA5062A, Agilent Technology, Malaysia). Resonance conditions of the microwave cavity are obtained by the use of an iris (made of copper material) placed between the waveguide transition and the applicator. A sliding short circuit is located at the end of the waveguide (figure 1).
Fig. 1: Description of the experimental apparatus to measure the dielectric properties of the WPI sample (left), determination of the quality factor of the loaded cavity (right)
205
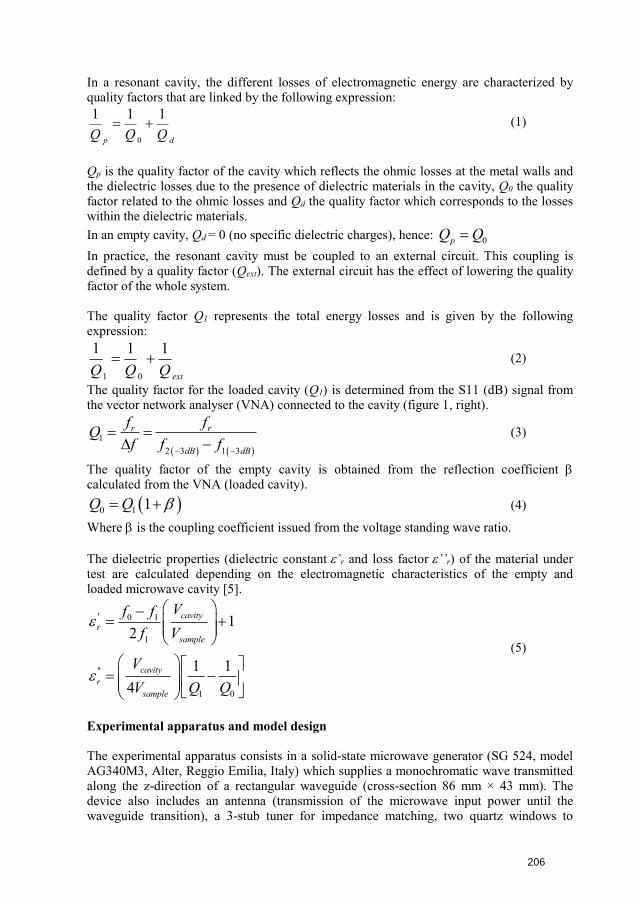
In a resonant cavity, the different losses of electromagnetic energy are characterized by quality factors that are linked by the following expression:
0
1 1 1
p dQ Q Q (1)
Qp is the quality factor of the cavity which reflects the ohmic losses at the metal walls and the dielectric losses due to the presence of dielectric materials in the cavity, Q0 the quality factor related to the ohmic losses and Qd the quality factor which corresponds to the losses within the dielectric materials. In an empty cavity, Qd = 0 (no specific dielectric charges), hence: 0pQ QIn practice, the resonant cavity must be coupled to an external circuit. This coupling is defined by a quality factor (Qext). The external circuit has the effect of lowering the quality factor of the whole system.
The quality factor Q1 represents the total energy losses and is given by the following expression:
1 0
1 1 1
extQ Q Q (2)
The quality factor for the loaded cavity (Q1) is determined from the S11 (dB) signal from the vector network analyser (VNA) connected to the cavity (figure 1, right).
1
2 3 1 3
r r
dB dB
f fQf f f
(3)
The quality factor of the empty cavity is obtained from the reflection coefficient calculated from the VNA (loaded cavity).
0 1 1Q Q (4)
Where is the coupling coefficient issued from the voltage standing wave ratio.
The dielectric properties (dielectric constant’r and loss factor’’r) of the material under test are calculated depending on the electromagnetic characteristics of the empty and loaded microwave cavity [5].
' 0 1
1
''
1 0
12
1 14
cavityr
sample
cavityr
sample
Vf ff V
VV Q Q
(5)
Experimental apparatus and model design
The experimental apparatus consists in a solid-state microwave generator (SG 524, model AG340M3, Alter, Reggio Emilia, Italy) which supplies a monochromatic wave transmitted along the z-direction of a rectangular waveguide (cross-section 86 mm × 43 mm). The device also includes an antenna (transmission of the microwave input power until the waveguide transition), a 3-stub tuner for impedance matching, two quartz windows to
206
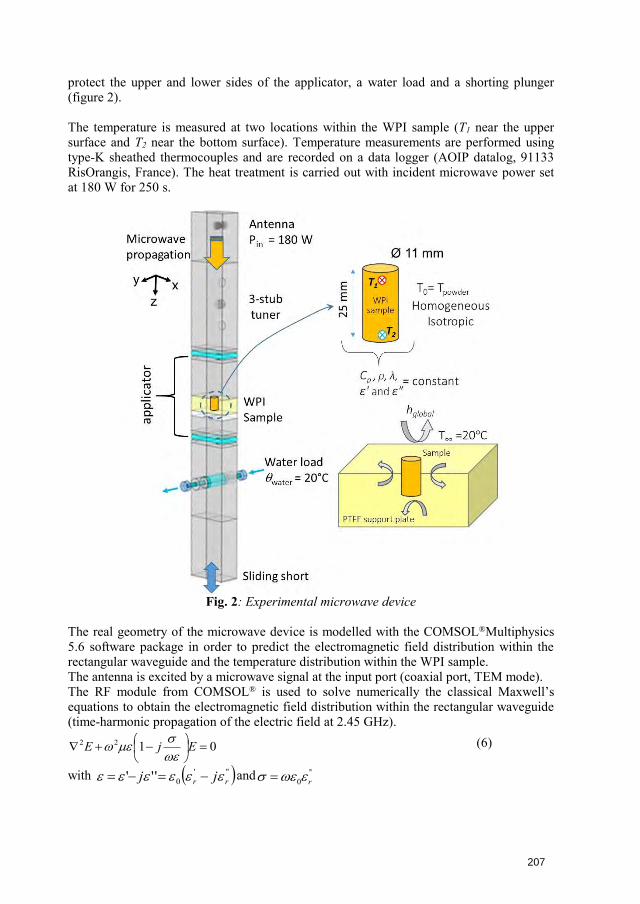
protect the upper and lower sides of the applicator, a water load and a shorting plunger (figure 2).
The temperature is measured at two locations within the WPI sample (T1 near the upper surface and T2 near the bottom surface). Temperature measurements are performed using type-K sheathed thermocouples and are recorded on a data logger (AOIP datalog, 91133 RisOrangis, France). The heat treatment is carried out with incident microwave power set at 180 W for 250 s.
Fig. 2: Experimental microwave device
The real geometry of the microwave device is modelled with the COMSOL®Multiphysics 5.6 software package in order to predict the electromagnetic field distribution within the rectangular waveguide and the temperature distribution within the WPI sample. The antenna is excited by a microwave signal at the input port (coaxial port, TEM mode). The RF module from COMSOL® is used to solve numerically the classical Maxwell’s equations to obtain the electromagnetic field distribution within the rectangular waveguide (time-harmonic propagation of the electric field at 2.45 GHz).
0122
EjE
(6)
with '''0''' rr jj and ''
0 r
207
0 is the electrical permittivity of a vacuum (8.85×10⁻¹² F/m), ’r is the relative dielectric constant, ε''r the relative dielectric loss factor. σ is the electrical conductivity of the material under consideration (S/m).
The generalized heat equation (with a source term due to microwaves) is solved to model heat transfer in a continuous medium, which depends on the thermophysical and dielectric properties of the WPI sample.
absp QTkdivtTC
)( (7)
2''02
1localrabs EQ (8)
The heat loss by convection around the sample is calculated by considering the global heat transfer coefficient which takes into account the heat losses at the boundaries [6].
RESULTS AND DISCUSSIONS
The table 2 depicts the dielectric properties of the materials under consideration within the rectangular waveguide.
Table 2. Dielectric properties of the materials at 2.45 GHz
In this work, the dielectric properties of the WPI sample confirmed its low dielectric characteristics. The values found are in agreement with a previous work that compared different dielectric measurements as a function of frequency (open-ended coaxial probe method and the parallel plate method) dedicated to low-moisture foods [4]. Figure 3 displays the electric field distribution within the rectangular waveguide. The figure indicates that the standing wave propagates from the antenna to the end of the rectangular waveguide. Local variations of electric field strength are noticed along the microwave propagation direction, with a specific electric field peak near the antenna. Based on the experimental position of the 3-stub tuner and the sliding short, the model is able to predict the impedance matching condition as observed experimentally (the microwave reflected power is close to zero). In this configuration, both the water load and the WPI sample absorb the microwave input power (dielectric losses at the wall of the waveguide are considered as negligible).
Materials Dielectric properties
Value Source
Air at 20 °C "r 0 [7]
′r 1 Dielectric material of coaxial antenna
"r 0 [6]
′r 2.25
Tap water at 20 °C (water load) "r 12.12 [8]
′r 80.10
Quartz "r 0 [6]
′r 4.2
Teflon® (sample holder) "r 3.4·10-4 [9]
′r 1.7
WPI powder "r 0.015 This work (at 20°C and 2.49 GHz) ′r 1.8
208
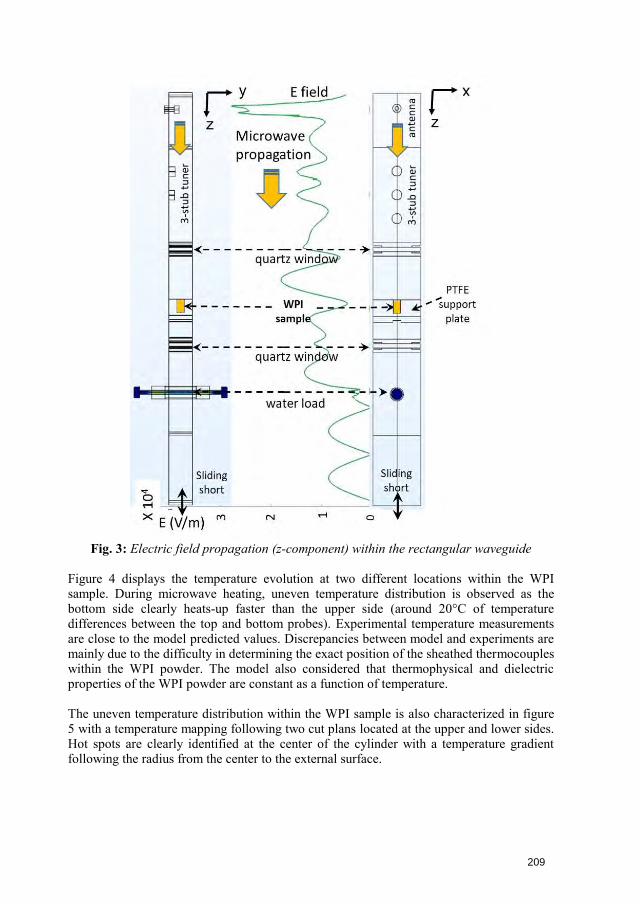
Fig. 3: Electric field propagation (z-component) within the rectangular waveguide
Figure 4 displays the temperature evolution at two different locations within the WPI sample. During microwave heating, uneven temperature distribution is observed as the bottom side clearly heats-up faster than the upper side (around 20°C of temperature differences between the top and bottom probes). Experimental temperature measurements are close to the model predicted values. Discrepancies between model and experiments are mainly due to the difficulty in determining the exact position of the sheathed thermocouples within the WPI powder. The model also considered that thermophysical and dielectric properties of the WPI powder are constant as a function of temperature.
The uneven temperature distribution within the WPI sample is also characterized in figure 5 with a temperature mapping following two cut plans located at the upper and lower sides. Hot spots are clearly identified at the center of the cylinder with a temperature gradient following the radius from the center to the external surface.
209
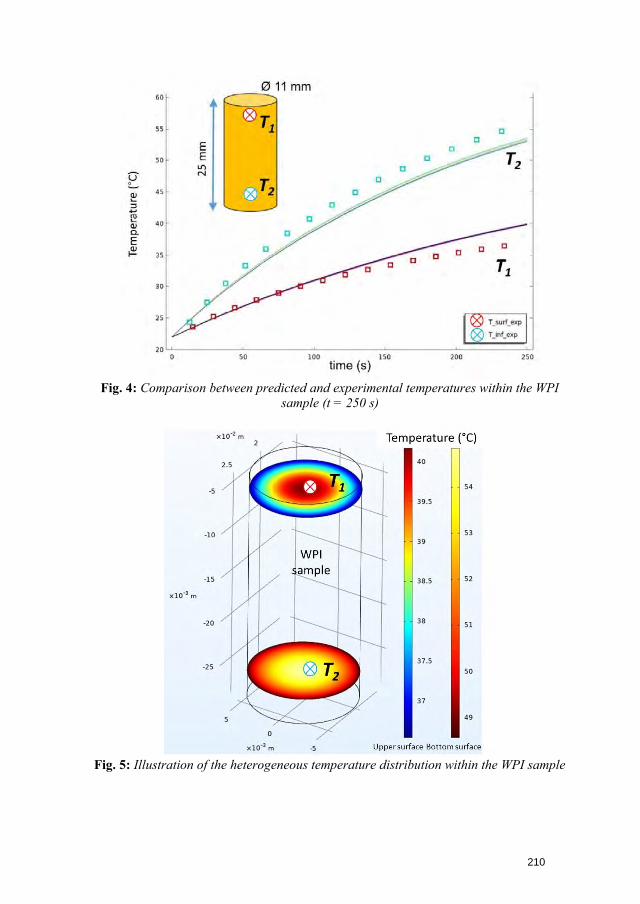
Fig. 4: Comparison between predicted and experimental temperatures within the WPI sample (t = 250 s)
Fig. 5: Illustration of the heterogeneous temperature distribution within the WPI sample
210
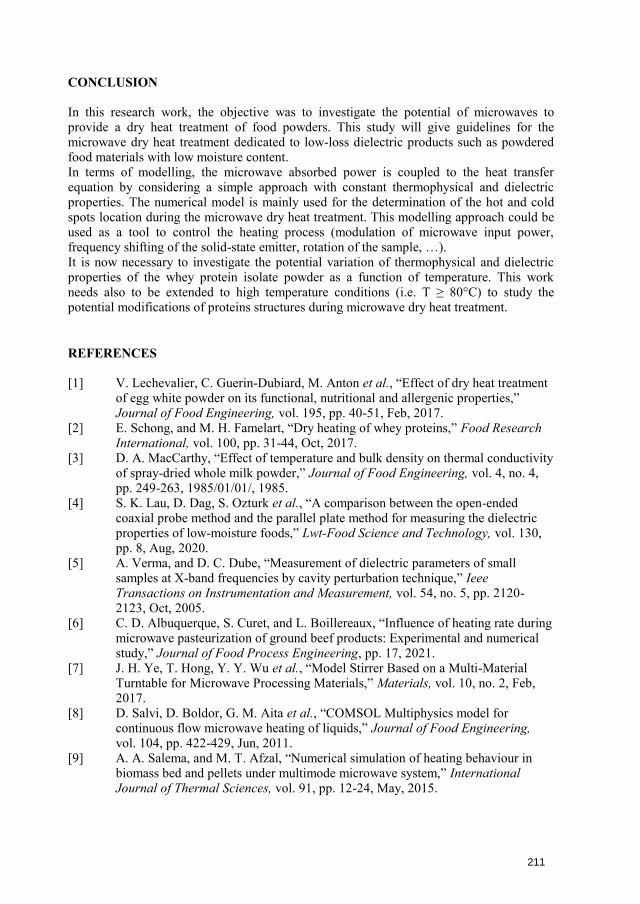
CONCLUSION
In this research work, the objective was to investigate the potential of microwaves to provide a dry heat treatment of food powders. This study will give guidelines for the microwave dry heat treatment dedicated to low-loss dielectric products such as powdered food materials with low moisture content. In terms of modelling, the microwave absorbed power is coupled to the heat transfer equation by considering a simple approach with constant thermophysical and dielectric properties. The numerical model is mainly used for the determination of the hot and cold spots location during the microwave dry heat treatment. This modelling approach could be used as a tool to control the heating process (modulation of microwave input power, frequency shifting of the solid-state emitter, rotation of the sample, …). It is now necessary to investigate the potential variation of thermophysical and dielectric properties of the whey protein isolate powder as a function of temperature. This work needs also to be extended to high temperature conditions (i.e. T ≥ 80°C) to study the potential modifications of proteins structures during microwave dry heat treatment.
REFERENCES
[1] V. Lechevalier, C. Guerin-Dubiard, M. Anton et al., “Effect of dry heat treatmentof egg white powder on its functional, nutritional and allergenic properties,”Journal of Food Engineering, vol. 195, pp. 40-51, Feb, 2017.
[2] E. Schong, and M. H. Famelart, “Dry heating of whey proteins,” Food ResearchInternational, vol. 100, pp. 31-44, Oct, 2017.
[3] D. A. MacCarthy, “Effect of temperature and bulk density on thermal conductivityof spray-dried whole milk powder,” Journal of Food Engineering, vol. 4, no. 4,pp. 249-263, 1985/01/01/, 1985.
[4] S. K. Lau, D. Dag, S. Ozturk et al., “A comparison between the open-endedcoaxial probe method and the parallel plate method for measuring the dielectricproperties of low-moisture foods,” Lwt-Food Science and Technology, vol. 130,pp. 8, Aug, 2020.
[5] A. Verma, and D. C. Dube, “Measurement of dielectric parameters of smallsamples at X-band frequencies by cavity perturbation technique,” IeeeTransactions on Instrumentation and Measurement, vol. 54, no. 5, pp. 2120-2123, Oct, 2005.
[6] C. D. Albuquerque, S. Curet, and L. Boillereaux, “Influence of heating rate duringmicrowave pasteurization of ground beef products: Experimental and numericalstudy,” Journal of Food Process Engineering, pp. 17, 2021.
[7] J. H. Ye, T. Hong, Y. Y. Wu et al., “Model Stirrer Based on a Multi-MaterialTurntable for Microwave Processing Materials,” Materials, vol. 10, no. 2, Feb,2017.
[8] D. Salvi, D. Boldor, G. M. Aita et al., “COMSOL Multiphysics model forcontinuous flow microwave heating of liquids,” Journal of Food Engineering,vol. 104, pp. 422-429, Jun, 2011.
[9] A. A. Salema, and M. T. Afzal, “Numerical simulation of heating behaviour inbiomass bed and pellets under multimode microwave system,” InternationalJournal of Thermal Sciences, vol. 91, pp. 12-24, May, 2015.
211
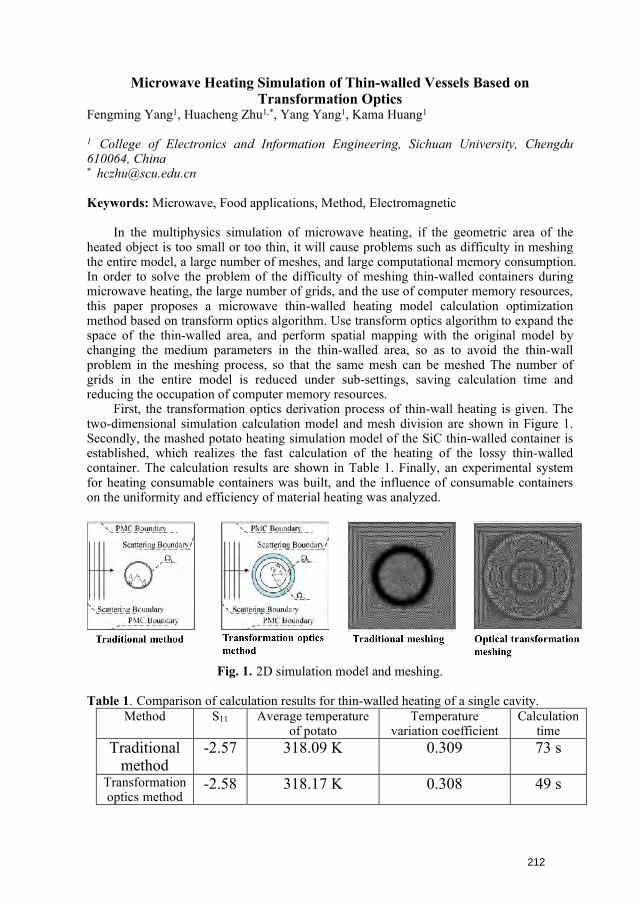
Microwave Heating Simulation of Thin-walled Vessels Based on Transformation Optics
Fengming Yang1, Huacheng Zhu1,*, Yang Yang1, Kama Huang1
1 College of Electronics and Information Engineering, Sichuan University, Chengdu 610064, China * [email protected]
Keywords: Microwave, Food applications, Method, Electromagnetic
In the multiphysics simulation of microwave heating, if the geometric area of the heated object is too small or too thin, it will cause problems such as difficulty in meshing the entire model, a large number of meshes, and large computational memory consumption. In order to solve the problem of the difficulty of meshing thin-walled containers during microwave heating, the large number of grids, and the use of computer memory resources, this paper proposes a microwave thin-walled heating model calculation optimization method based on transform optics algorithm. Use transform optics algorithm to expand the space of the thin-walled area, and perform spatial mapping with the original model by changing the medium parameters in the thin-walled area, so as to avoid the thin-wall problem in the meshing process, so that the same mesh can be meshed The number of grids in the entire model is reduced under sub-settings, saving calculation time and reducing the occupation of computer memory resources.
First, the transformation optics derivation process of thin-wall heating is given. The two-dimensional simulation calculation model and mesh division are shown in Figure 1. Secondly, the mashed potato heating simulation model of the SiC thin-walled container is established, which realizes the fast calculation of the heating of the lossy thin-walled container. The calculation results are shown in Table 1. Finally, an experimental system for heating consumable containers was built, and the influence of consumable containers on the uniformity and efficiency of material heating was analyzed.
Fig. 1. 2D simulation model and meshing.
Table 1. Comparison of calculation results for thin-walled heating of a single cavity. Method S11 Average temperature
of potato Temperature
variation coefficient Calculation
time Traditional
method -2.57 318.09 K 0.309 73 s
Transformation optics method
-2.58 318.17 K 0.308 49 s
212
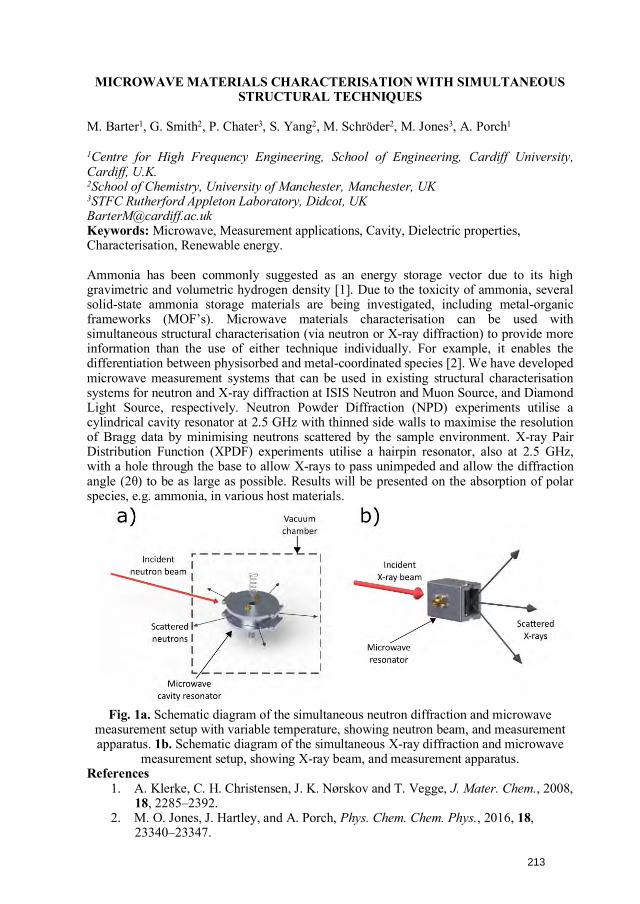
MICROWAVE MATERIALS CHARACTERISATION WITH SIMULTANEOUS STRUCTURAL TECHNIQUES
M. Barter1, G. Smith2, P. Chater3, S. Yang2, M. Schröder2, M. Jones3, A. Porch1
1Centre for High Frequency Engineering, School of Engineering, Cardiff University, Cardiff, U.K. 2School of Chemistry, University of Manchester, Manchester, UK 3STFC Rutherford Appleton Laboratory, Didcot, UK [email protected] Keywords: Microwave, Measurement applications, Cavity, Dielectric properties, Characterisation, Renewable energy.
Ammonia has been commonly suggested as an energy storage vector due to its high gravimetric and volumetric hydrogen density [1]. Due to the toxicity of ammonia, several solid-state ammonia storage materials are being investigated, including metal-organic frameworks (MOF’s). Microwave materials characterisation can be used with simultaneous structural characterisation (via neutron or X-ray diffraction) to provide more information than the use of either technique individually. For example, it enables the differentiation between physisorbed and metal-coordinated species [2]. We have developed microwave measurement systems that can be used in existing structural characterisation systems for neutron and X-ray diffraction at ISIS Neutron and Muon Source, and Diamond Light Source, respectively. Neutron Powder Diffraction (NPD) experiments utilise a cylindrical cavity resonator at 2.5 GHz with thinned side walls to maximise the resolution of Bragg data by minimising neutrons scattered by the sample environment. X-ray Pair Distribution Function (XPDF) experiments utilise a hairpin resonator, also at 2.5 GHz, with a hole through the base to allow X-rays to pass unimpeded and allow the diffraction angle (2θ) to be as large as possible. Results will be presented on the absorption of polar species, e.g. ammonia, in various host materials.
Fig. 1a. Schematic diagram of the simultaneous neutron diffraction and microwave measurement setup with variable temperature, showing neutron beam, and measurement apparatus. 1b. Schematic diagram of the simultaneous X-ray diffraction and microwave
measurement setup, showing X-ray beam, and measurement apparatus. References
1. A. Klerke, C. H. Christensen, J. K. Nørskov and T. Vegge, J. Mater. Chem., 2008,18, 2285–2392.
2. M. O. Jones, J. Hartley, and A. Porch, Phys. Chem. Chem. Phys., 2016, 18,23340–23347.
213
MICROWAVE PLASMA CONVERSION OF METHANE FOR HYDROGEN PRODUCTION
A. Martin Ortega1, G. Gatt1, G. Trimboli1, Y. George1, N. Chartrier2, A. Mello3, M.Radoiu3
1 Sakowin SAS, Fréjus, France 2 INSA Centre Val de Loire, France 3Microwave Technologies Consulting SAS, Lyon, France [email protected]
Keywords: microwave, plasma applications, processing, cavity, energy, renewable energy
Summary To reduce carbon dioxide (CO2) emissions while keeping up with the increasing demand of energy, new energy sources and new energy storage systems must be developed; hydrogen is expected to play an essential role in the transition to lesser CO2-footprint energy. Traditionally hydrogen (H2) production is based on natural gas steam reforming, which results in the associated CO2 emissions. Alternative sources of H2 production are water electrolysis and direct methane decomposition, the latter having a much smaller theoretical energy cost per unit of produced H2. This paper concerns the characterization of H2 production via methane plasmalysis in the South Beach Module prototype, a 2.45 GHz microwave reactor working at atmospheric pressure. The experimental protocol takes into consideration various gas mixture constituents and operating conditions (e.g., gas flow rate, microwave input power, as to optimize the decomposition of methane molecule into hydrogen gas and solid carbon. The economics of microwave-assisted plasma methane decomposition as a hydrogen source are taken into consideration.
I. INTRODUCTIONAt present the global society faces two related challenges: the depletion of easily accessedhydrocarbon fuels aggravated by an ever-increased energy demand, and the damagingeffects of the global climate change driven by the large amounts of CO2 that were releasedand are being released to the atmosphere from the use of those fossil fuels. Despite theknowledge that these emissions are the primary cause of the greenhouse effect driving theclimate change, the amount of CO2 released to the atmosphere has still increased in recentyears, reaching a total of ~32 billion metric tons per year [1].It is therefore essential to develop alternative ways to produce and store energy as well asnew industrial technologies that avoid the release of CO2 to the atmosphere. The mainoptions to produce this carbon-free energy are: decarbonization of fossil fuel energy,renewable energy sources, and nuclear and fusion energy [2].According to the Hydrogen Roadmap Europe [3], H2 gas will play an important role forachieving the transition to a carbon-free energy system via its industrial and transportusage.H2 is one of the most common and abundant elements on Earth, being present noy only inwater but also in almost any other compound of biological origin like biomass, biogas andfossil fuels including natural gas.Methane (CH4), the main constituent of natural gas, has been traditionally used as thereagent molecule for hydrogen production via steam reforming: CH4+H2O→CO+3H2(ΔH=206 kJ/mol), usually followed by the water-shift reaction: CO+H2O→CO2+H2 (ΔH=-41.17 kJ/mol). This process is not only highly endothermic but also results in the release offurther CO2, therefore negating its purpose for the energy transition.
214
Alternative H2 sources are water electrolysis and CH4 decomposition. Water electrolysis decomposes water into oxygen and hydrogen gases: H20→H2+½O2 (ΔH=285.82 kJ/mol). Methane decomposition relies on a similar process, which is achieved via pyrolysis in conjunction with some sort of catalyst, and which results in H2 gas and solid carbon (C): CH4→C(s)+2H2 (ΔH=-74.85 kJ/mol). From the above equations, it can be calculated that the theoretical energy cost per mol of H2 produced from CH4 is seven times lower than that of electrolysis, which indicates this reaction is a less energetically intensive alternative. The byproduct of CH4 decomposition is solid carbon, usually in the form of micron-sized particles. This carbon powder is sometimes defined as carbon black, which is mainly used in the manufacturing of tires, as a pigment in printing ink, or as a stabilizer of other mixtures. To reduce the cost of the hydrogen production, the carbon byproduct ought to be further valorized in more added value applications Incidentally, the industrial production of carbon black today is based on the partial oxidation of fossil fuels, which also releases CO2 to the atmosphere. Therefore, an efficient industrial method for CH4 decomposition would allow the removal of two current sources of CO2, while consuming less energy than H2 production by water electrolysis. At Sakowin Green Energy we are developing The South Beach Module for CH4 plasmalysis, which consists of a 2.45 GHz microwave reactor for atmospheric pressure plasma decomposition of CH4 to H2 and solid carbon. The current state-of-the-art plasmalysis technologies and the method used in the South Beach Module are discussed in section II. Section III provides the details of Sakowin’s microwave-assisted plasma alpha prototype, including the control and measurement methods used to assess/measure the various parameters of the reaction, gas flows and microwave power being the most important ones.
II. METHANE PLASMALYSISA variety of methods have been proposed in connection with the decomposition of CH4 asto form H2 and solid carbon. The most obvious process is by thermally heating the CH4molecule or the pyrolysis. However, the temperatures required to obtain CH4decompositionby pyrolysis are high. Catalysts are usually involved to reduce the required temperature forCH4 decomposition. The main drawback of the catalytical process is the catalyst poisoningby carbon deposition, which reduces the reaction efficiency over time, requiring eitherfrequent change of the catalyst or to accept reduced efficiency of the decompositionprocess.The use of plasma to promote the decomposition reaction is based on the fact that gasmolecules are ionized and broken up even when the bulk gas temperature remainsrelatively low. Not only the energy is transmitted directly from the electric circuit ( in caseof microwaves directly from the electric field) to the reacting molecules, but the collisionsbetween the free electrons created by the ionization of the gas and the neutral gasmolecules create reactive ions and radicals that would not be created by simple heating.Among the various plasma sources investigated are DC-spark discharge [4], gliding arcdischarges [5], plasma torch [6], and dielectric barrier discharges (DBD) [7,8].The main advantages of the microwave excited plasmas come from the absence ofdischarge electrodes, and the possibility of regulating independently the incidentmicrowave power/microwave energy and the gas flow in the plasma reactor. There is awide field of research on the methane plasmalysis using microwave plasma discharges,usually by means of a cylindrical dielectric chamber inserted into a waveguide, or“downstream source” [9,10,11], but also combining the microwave source with solarconcentrators [12] or with a solid phase enhancing the reaction [13].The Sakowin South Beach Module prototype integrates a plasma reactor based on amonomode resonant microwave cavity. This type of reactor has been previously developedfor the decomposition of oxygen-depleting gases generated in the semiconductor industry,
215
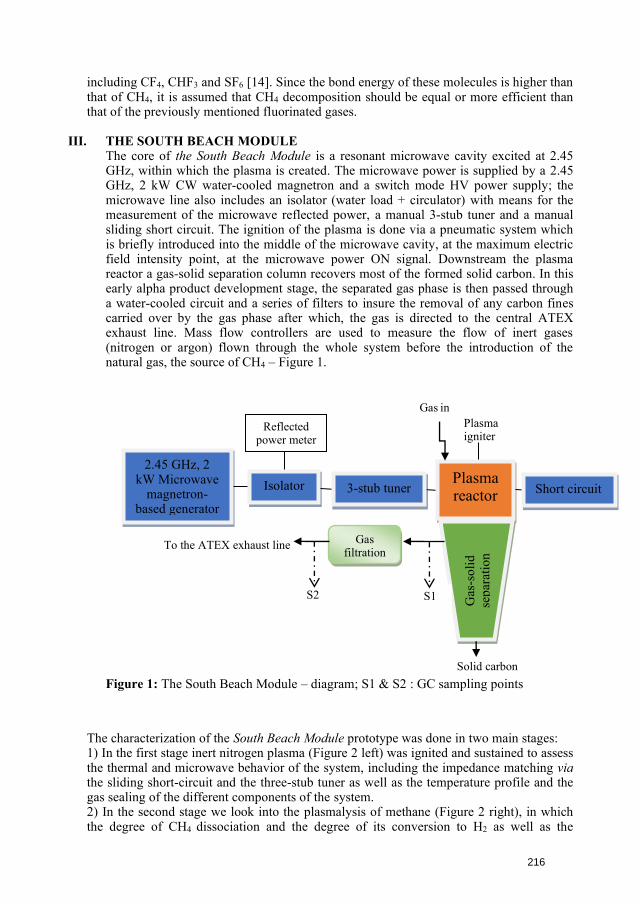
including CF4, CHF3 and SF6 [14]. Since the bond energy of these molecules is higher than that of CH4, it is assumed that CH4 decomposition should be equal or more efficient than that of the previously mentioned fluorinated gases.
III. THE SOUTH BEACH MODULEThe core of the South Beach Module is a resonant microwave cavity excited at 2.45GHz, within which the plasma is created. The microwave power is supplied by a 2.45GHz, 2 kW CW water-cooled magnetron and a switch mode HV power supply; themicrowave line also includes an isolator (water load + circulator) with means for themeasurement of the microwave reflected power, a manual 3-stub tuner and a manualsliding short circuit. The ignition of the plasma is done via a pneumatic system whichis briefly introduced into the middle of the microwave cavity, at the maximum electricfield intensity point, at the microwave power ON signal. Downstream the plasmareactor a gas-solid separation column recovers most of the formed solid carbon. In thisearly alpha product development stage, the separated gas phase is then passed througha water-cooled circuit and a series of filters to insure the removal of any carbon finescarried over by the gas phase after which, the gas is directed to the central ATEXexhaust line. Mass flow controllers are used to measure the flow of inert gases(nitrogen or argon) flown through the whole system before the introduction of thenatural gas, the source of CH4 – Figure 1.
The characterization of the South Beach Module prototype was done in two main stages: 1) In the first stage inert nitrogen plasma (Figure 2 left) was ignited and sustained to assessthe thermal and microwave behavior of the system, including the impedance matching viathe sliding short-circuit and the three-stub tuner as well as the temperature profile and thegas sealing of the different components of the system.2) In the second stage we look into the plasmalysis of methane (Figure 2 right), in whichthe degree of CH4 dissociation and the degree of its conversion to H2 as well as the
2.45 GHz, 2 kW Microwave
magnetron-based generator
Isolator
Reflected power meter
3-stub tunerPlasma reactor
Gas in
Short circuit
Plasmaigniter
Gas
-sol
id
sepa
ratio
n
Solid carbon
Gas filtration To the ATEX exhaust line
S1 S2
Figure 1: The South Beach Module – diagram; S1 & S2 : GC sampling points
216
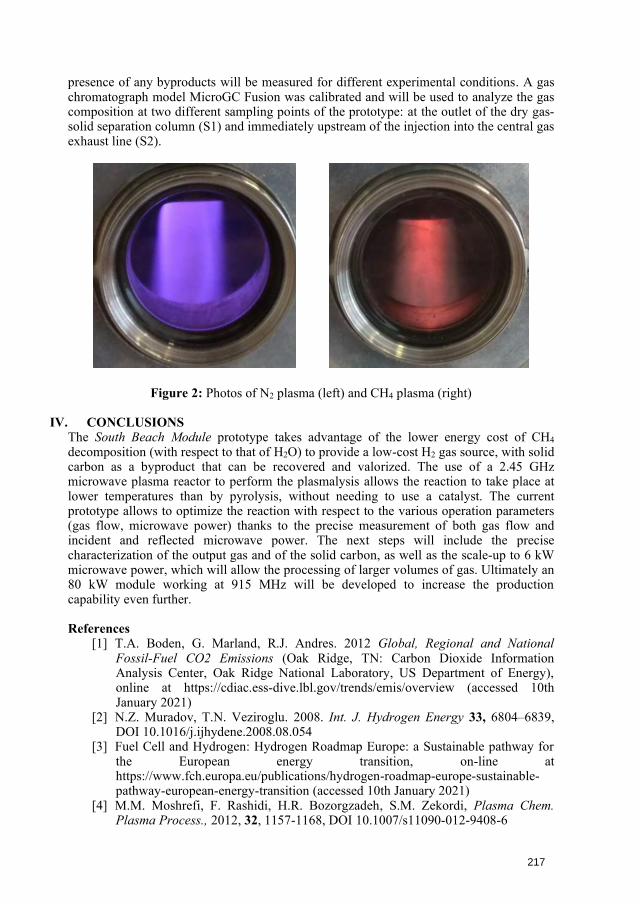
presence of any byproducts will be measured for different experimental conditions. A gas chromatograph model MicroGC Fusion was calibrated and will be used to analyze the gas composition at two different sampling points of the prototype: at the outlet of the dry gas-solid separation column (S1) and immediately upstream of the injection into the central gas exhaust line (S2).
Figure 2: Photos of N2 plasma (left) and CH4 plasma (right)
IV. CONCLUSIONSThe South Beach Module prototype takes advantage of the lower energy cost of CH4decomposition (with respect to that of H2O) to provide a low-cost H2 gas source, with solidcarbon as a byproduct that can be recovered and valorized. The use of a 2.45 GHzmicrowave plasma reactor to perform the plasmalysis allows the reaction to take place atlower temperatures than by pyrolysis, without needing to use a catalyst. The currentprototype allows to optimize the reaction with respect to the various operation parameters(gas flow, microwave power) thanks to the precise measurement of both gas flow andincident and reflected microwave power. The next steps will include the precisecharacterization of the output gas and of the solid carbon, as well as the scale-up to 6 kWmicrowave power, which will allow the processing of larger volumes of gas. Ultimately an80 kW module working at 915 MHz will be developed to increase the productioncapability even further.
References [1] T.A. Boden, G. Marland, R.J. Andres. 2012 Global, Regional and National
Fossil-Fuel CO2 Emissions (Oak Ridge, TN: Carbon Dioxide InformationAnalysis Center, Oak Ridge National Laboratory, US Department of Energy),online at https://cdiac.ess-dive.lbl.gov/trends/emis/overview (accessed 10thJanuary 2021)
[2] N.Z. Muradov, T.N. Veziroglu. 2008. Int. J. Hydrogen Energy 33, 6804–6839,DOI 10.1016/j.ijhydene.2008.08.054
[3] Fuel Cell and Hydrogen: Hydrogen Roadmap Europe: a Sustainable pathway forthe European energy transition, on-line athttps://www.fch.europa.eu/publications/hydrogen-roadmap-europe-sustainable-pathway-european-energy-transition (accessed 10th January 2021)
[4] M.M. Moshrefi, F. Rashidi, H.R. Bozorgzadeh, S.M. Zekordi, Plasma Chem.Plasma Process., 2012, 32, 1157-1168, DOI 10.1007/s11090-012-9408-6
217
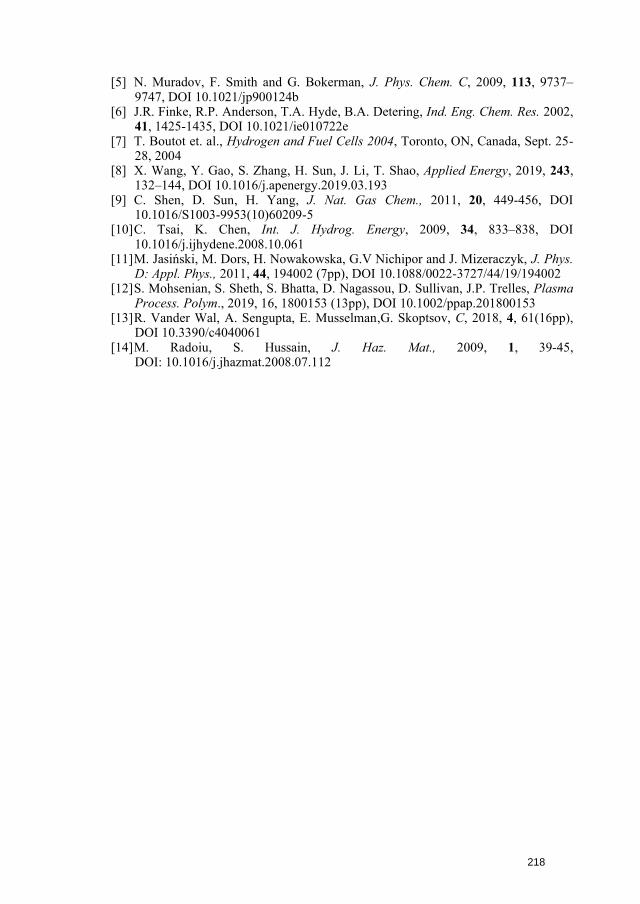
[5] N. Muradov, F. Smith and G. Bokerman, J. Phys. Chem. C, 2009, 113, 9737–9747, DOI 10.1021/jp900124b
[6] J.R. Finke, R.P. Anderson, T.A. Hyde, B.A. Detering, Ind. Eng. Chem. Res. 2002,41, 1425-1435, DOI 10.1021/ie010722e
[7] T. Boutot et. al., Hydrogen and Fuel Cells 2004, Toronto, ON, Canada, Sept. 25-28, 2004
[8] X. Wang, Y. Gao, S. Zhang, H. Sun, J. Li, T. Shao, Applied Energy, 2019, 243,132–144, DOI 10.1016/j.apenergy.2019.03.193
[9] C. Shen, D. Sun, H. Yang, J. Nat. Gas Chem., 2011, 20, 449-456, DOI10.1016/S1003-9953(10)60209-5
[10] C. Tsai, K. Chen, Int. J. Hydrog. Energy, 2009, 34, 833–838, DOI10.1016/j.ijhydene.2008.10.061
[11] M. Jasiński, M. Dors, H. Nowakowska, G.V Nichipor and J. Mizeraczyk, J. Phys.D: Appl. Phys., 2011, 44, 194002 (7pp), DOI 10.1088/0022-3727/44/19/194002
[12] S. Mohsenian, S. Sheth, S. Bhatta, D. Nagassou, D. Sullivan, J.P. Trelles, PlasmaProcess. Polym., 2019, 16, 1800153 (13pp), DOI 10.1002/ppap.201800153
[13] R. Vander Wal, A. Sengupta, E. Musselman,G. Skoptsov, C, 2018, 4, 61(16pp),DOI 10.3390/c4040061
[14] M. Radoiu, S. Hussain, J. Haz. Mat., 2009, 1, 39-45,DOI: 10.1016/j.jhazmat.2008.07.112
218
Microwave Regeneration of Spent Sulphurous Activated Carbon
C. Powell1, W. Meredith2, M. Adam2, J. Robinson2
1The Centre for Carbon Capture & Storage, and Cleaner Fossil Energy, The University of Nottingham, Triumph Rd, Lenton, Nottingham, NG7 2TU, United Kingdom, [email protected] 2Low Carbon Energy and Resources Technologies Research Group, The University of Nottingham, Triumph Rd, Lenton, Nottingham, NG7 2TU, United Kingdom [email protected] , [email protected] , [email protected]
Keywords: Microwave, Industrial Applications, Material Interaction
We introduce a new approach to the regeneration of spent activated carbon using microwave heating as opposed to traditional thermal processing methods [1] [2]. A comparative study for adsorbate removal from activated carbon using conventional and microwave regeneration methods presented, which also observe the effect of heating on the overall activated carbon structure and adsorbtivity post-regeneration. Imaging techniques were developed to show the location of adsorbate on the activated carbon pellets/granules before and after regeneration via electron probe micro analysis, indicating how movement and concentration of adsorbate species changes during regeneration and with the regeneration method. Adsorbate species were also characterised, using x-ray powder diffraction to identify chemical reactions and phase changes occurring because of the regeneration process. Microwave regeneration is shown to recover adsorption capacity in a much shorter timeframe than conventional methods, however there is a trade-off between adsorption capacity and the loss of adsorbent mass due to the heating process.
Table 1. Experimental conditions and processing time, energy input, and adsorption capacity percentage of samples.
Sample Group Processing Time, s
Adsorption Capacity, %
Base Sample - 0.58 Thermal Regeneration
Microwave Regeneration 6900 360
36.43 33.80
Fig. 1. EPMA scans of thermally regenerated spent sulphurous activated carbon.
References 1. Van Vliet, B. M. The Regeneration of Activated Carbon. Journal of the South African
Institute of Mining and Metallurgy. 1991, 91(5), 159-167.2. Ania, C., Menéndez, J., Parra, J. and Pis, J. Microwave-induced regeneration of activated
carbons polluted with phenol. A comparison with conventional thermalregeneration. Carbon, 2004, 42(7), 1383-1387
219
Microwave sinterability of pure and CuO doped ZnO macroporous ceramic foams with deposited zinc oxide nanoparticles produced by bioinspired replica technique
Cardoso, A. L. F.1 a, Maestrelli, S. C.2 Perdomo, C. P. F.1 Kiminami, R. H. G. A.1, Gunnewiek, R. F. K.1
1 Federal University of São Carlos, Post Graduate Program in Materials Science and Engineering, rod. Washington Luiz km 235, São Carlos - SP, Brazil. 13565-905 2 Institute of Science and Technology, Federal University of Alfenas, Rod. José Aurélio Vilela 11999 (BR 267), km 533, Poços de Caldas - MG, Brazil, 37715-400 a [email protected]
Abstract Macroporous open-celled ceramic foams finds applications in numerous technological fields, like particle filters, insulating coatings, porous support for catalyst and photocatalyst processes, and even photoelectrochemical applications. In latter two, a macroporous open cell structure favors photoelectrochemical and photocatalyst reactions, due to its higher surface area. Many methods are used for producing these types of ceramics, specially the replica technique. In this simple method, the samples are obtained by impregnating a highly porous polymeric foam with a high solid loading ceramic slurry. After thermal treatment, the macroporous ceramic presents the structure of the polymeric foam used as template. Exceptionally complex and regular geometries can also be found in nature, which is the case of the Luffa sp sponge, that can replace the use of synthetic polymeric foams. In this work, microwave sinterability of porous ceramics obtained by impregnation of high solid loading ceramic slurries of nanostructured zinc oxide in natural Luffa sp fibrous sponges. Carboxymethyl cellulose (CMC), xanthan gum (XG) and polyvinyl alcohol (PVA) were assessed as binder agents. Ceramic slurries were prepared by dispersing nanostructured zinc oxide in distilled water (70% wt. ratio) using ammonium polyacrilate (APA) as deflocculant, followed by mixing in a high shear mixer (IKA Ultra-Turrax T25) for 10 minutes. After homogenization, binders were added and mixed in mechanical mixer for 10 minutes. The sponges (with dimensions of 2x2x1 cm) were carefully immersed in the ceramic slurry, squeezed to remove excess and then left to dry 24h in air. The dried ceramic foams were microwave heated at 550 °C during 10 minutes with 100 °C/min heating rate, followed by microwave sintering at 1150 and 1200 °C during 15 minutes with a 100 °C/min heating rate. The microwave sintered samples were analyzed by optical and scanning electron microscopy, photocatalysis efficiency and density measurements. The advantages of microwave processing are evident. The microwave sintering temperature was reduced by at least 150 °C in comparison to the conventional.
Keywords: Microwave, Chemical applications, Processing, Characterisation.
Introduction In the recent years, many methods of producing ceramic materials have been
studied. Among these methods, for producing microporous and reticulated ceramic foams, the replica technique takes place as a promising way to produce these types of ceramics. This method is based on impregnation of ceramic slurry in a sponge (synthetic or natural) followed by heat treatment. It is a method employed in producing reticulated ceramic foams for many types of applications, including particle filters, catalysis/photocatalysis supports in gas-phase and liquid-phase reactions and insulating coatings. Moreover,
220
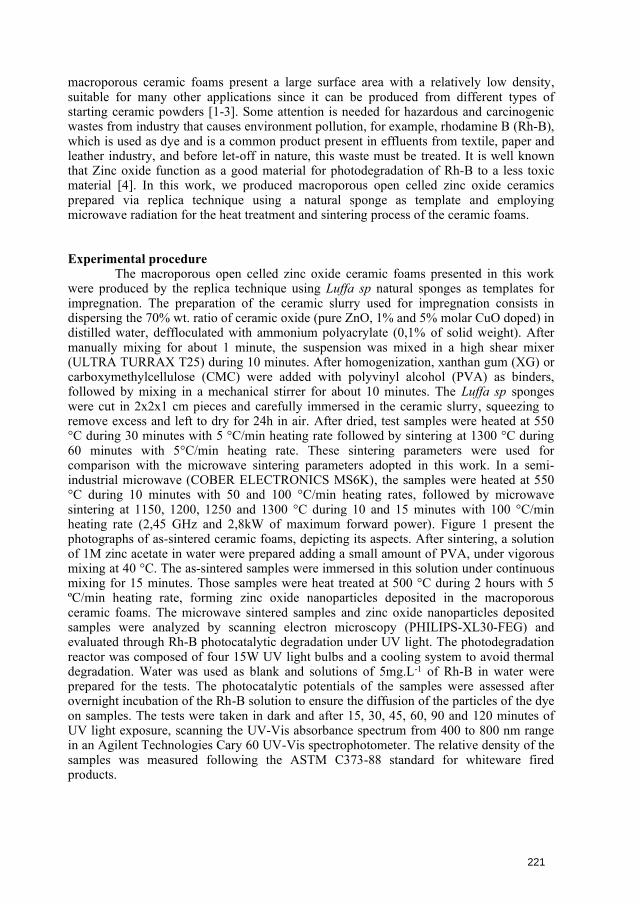
macroporous ceramic foams present a large surface area with a relatively low density, suitable for many other applications since it can be produced from different types of starting ceramic powders [1-3]. Some attention is needed for hazardous and carcinogenic wastes from industry that causes environment pollution, for example, rhodamine B (Rh-B), which is used as dye and is a common product present in effluents from textile, paper and leather industry, and before let-off in nature, this waste must be treated. It is well known that Zinc oxide function as a good material for photodegradation of Rh-B to a less toxic material [4]. In this work, we produced macroporous open celled zinc oxide ceramics prepared via replica technique using a natural sponge as template and employing microwave radiation for the heat treatment and sintering process of the ceramic foams.
Experimental procedure The macroporous open celled zinc oxide ceramic foams presented in this work
were produced by the replica technique using Luffa sp natural sponges as templates for impregnation. The preparation of the ceramic slurry used for impregnation consists in dispersing the 70% wt. ratio of ceramic oxide (pure ZnO, 1% and 5% molar CuO doped) in distilled water, deffloculated with ammonium polyacrylate (0,1% of solid weight). After manually mixing for about 1 minute, the suspension was mixed in a high shear mixer (ULTRA TURRAX T25) during 10 minutes. After homogenization, xanthan gum (XG) or carboxymethylcellulose (CMC) were added with polyvinyl alcohol (PVA) as binders, followed by mixing in a mechanical stirrer for about 10 minutes. The Luffa sp sponges were cut in 2x2x1 cm pieces and carefully immersed in the ceramic slurry, squeezing to remove excess and left to dry for 24h in air. After dried, test samples were heated at 550 °C during 30 minutes with 5 °C/min heating rate followed by sintering at 1300 °C during 60 minutes with 5°C/min heating rate. These sintering parameters were used for comparison with the microwave sintering parameters adopted in this work. In a semi-industrial microwave (COBER ELECTRONICS MS6K), the samples were heated at 550 °C during 10 minutes with 50 and 100 °C/min heating rates, followed by microwave sintering at 1150, 1200, 1250 and 1300 °C during 10 and 15 minutes with 100 °C/min heating rate (2,45 GHz and 2,8kW of maximum forward power). Figure 1 present the photographs of as-sintered ceramic foams, depicting its aspects. After sintering, a solution of 1M zinc acetate in water were prepared adding a small amount of PVA, under vigorous mixing at 40 °C. The as-sintered samples were immersed in this solution under continuous mixing for 15 minutes. Those samples were heat treated at 500 °C during 2 hours with 5 ºC/min heating rate, forming zinc oxide nanoparticles deposited in the macroporous ceramic foams. The microwave sintered samples and zinc oxide nanoparticles deposited samples were analyzed by scanning electron microscopy (PHILIPS-XL30-FEG) and evaluated through Rh-B photocatalytic degradation under UV light. The photodegradation reactor was composed of four 15W UV light bulbs and a cooling system to avoid thermal degradation. Water was used as blank and solutions of 5mg.L-1 of Rh-B in water were prepared for the tests. The photocatalytic potentials of the samples were assessed after overnight incubation of the Rh-B solution to ensure the diffusion of the particles of the dye on samples. The tests were taken in dark and after 15, 30, 45, 60, 90 and 120 minutes of UV light exposure, scanning the UV-Vis absorbance spectrum from 400 to 800 nm range in an Agilent Technologies Cary 60 UV-Vis spectrophotometer. The relative density of the samples was measured following the ASTM C373-88 standard for whiteware fired products.
221
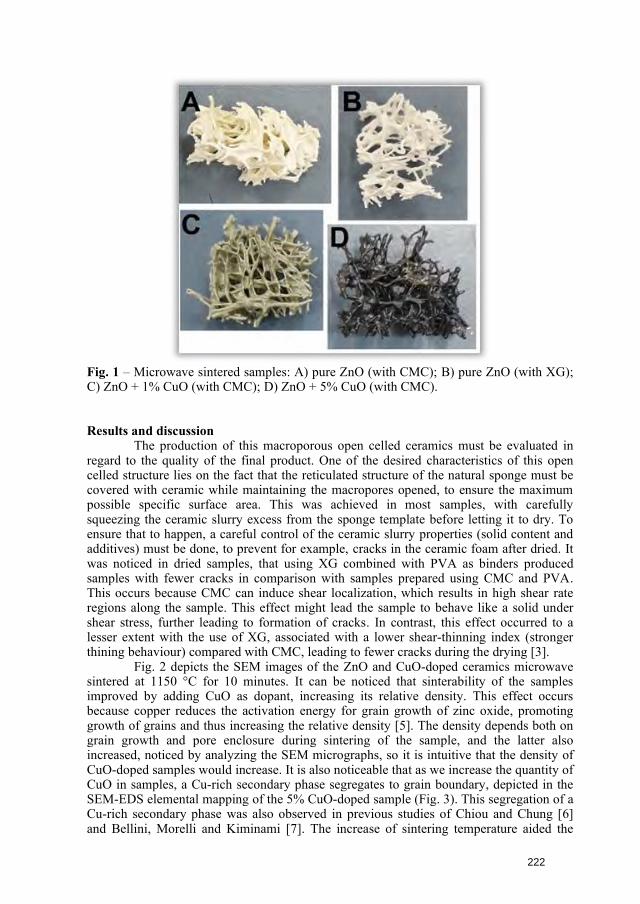
Fig. 1 – Microwave sintered samples: A) pure ZnO (with CMC); B) pure ZnO (with XG); C) ZnO + 1% CuO (with CMC); D) ZnO + 5% CuO (with CMC).
Results and discussion The production of this macroporous open celled ceramics must be evaluated in
regard to the quality of the final product. One of the desired characteristics of this open celled structure lies on the fact that the reticulated structure of the natural sponge must be covered with ceramic while maintaining the macropores opened, to ensure the maximum possible specific surface area. This was achieved in most samples, with carefully squeezing the ceramic slurry excess from the sponge template before letting it to dry. To ensure that to happen, a careful control of the ceramic slurry properties (solid content and additives) must be done, to prevent for example, cracks in the ceramic foam after dried. It was noticed in dried samples, that using XG combined with PVA as binders produced samples with fewer cracks in comparison with samples prepared using CMC and PVA. This occurs because CMC can induce shear localization, which results in high shear rate regions along the sample. This effect might lead the sample to behave like a solid under shear stress, further leading to formation of cracks. In contrast, this effect occurred to a lesser extent with the use of XG, associated with a lower shear-thinning index (stronger thining behaviour) compared with CMC, leading to fewer cracks during the drying [3].
Fig. 2 depicts the SEM images of the ZnO and CuO-doped ceramics microwave sintered at 1150 °C for 10 minutes. It can be noticed that sinterability of the samples improved by adding CuO as dopant, increasing its relative density. This effect occurs because copper reduces the activation energy for grain growth of zinc oxide, promoting growth of grains and thus increasing the relative density [5]. The density depends both on grain growth and pore enclosure during sintering of the sample, and the latter also increased, noticed by analyzing the SEM micrographs, so it is intuitive that the density of CuO-doped samples would increase. It is also noticeable that as we increase the quantity of CuO in samples, a Cu-rich secondary phase segregates to grain boundary, depicted in the SEM-EDS elemental mapping of the 5% CuO-doped sample (Fig. 3). This segregation of a Cu-rich secondary phase was also observed in previous studies of Chiou and Chung [6] and Bellini, Morelli and Kiminami [7]. The increase of sintering temperature aided the
222
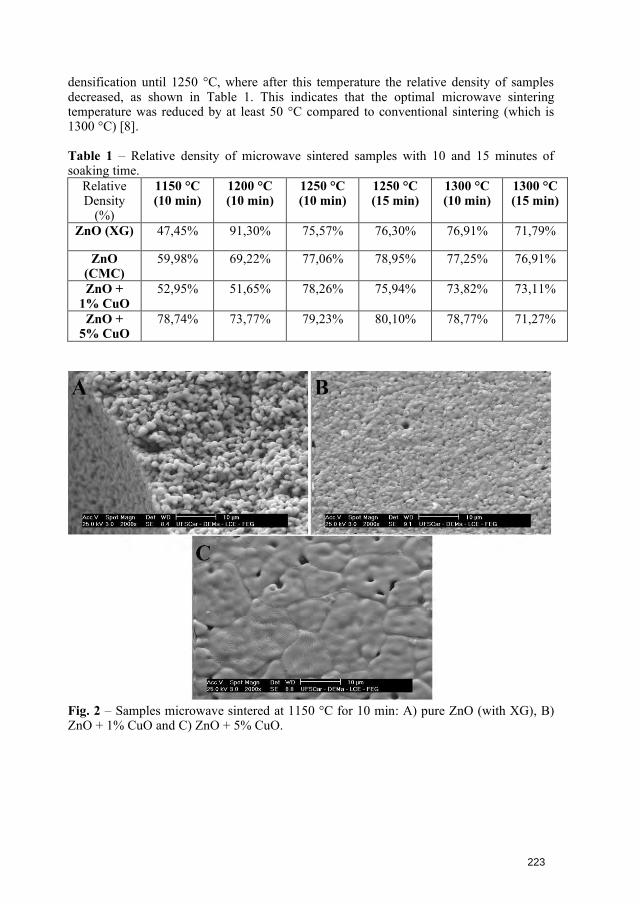
densification until 1250 °C, where after this temperature the relative density of samples decreased, as shown in Table 1. This indicates that the optimal microwave sintering temperature was reduced by at least 50 °C compared to conventional sintering (which is 1300 °C) [8].
Table 1 – Relative density of microwave sintered samples with 10 and 15 minutes of soaking time.
Relative Density
(%)
1150 °C (10 min)
1200 °C (10 min)
1250 °C (10 min)
1250 °C (15 min)
1300 °C (10 min)
1300 °C (15 min)
ZnO (XG) 47,45% 91,30% 75,57% 76,30% 76,91% 71,79%
ZnO (CMC)
59,98% 69,22% 77,06% 78,95% 77,25% 76,91%
ZnO + 1% CuO
52,95% 51,65% 78,26% 75,94% 73,82% 73,11%
ZnO + 5% CuO
78,74% 73,77% 79,23% 80,10% 78,77% 71,27%
Fig. 2 – Samples microwave sintered at 1150 °C for 10 min: A) pure ZnO (with XG), B) ZnO + 1% CuO and C) ZnO + 5% CuO.
223
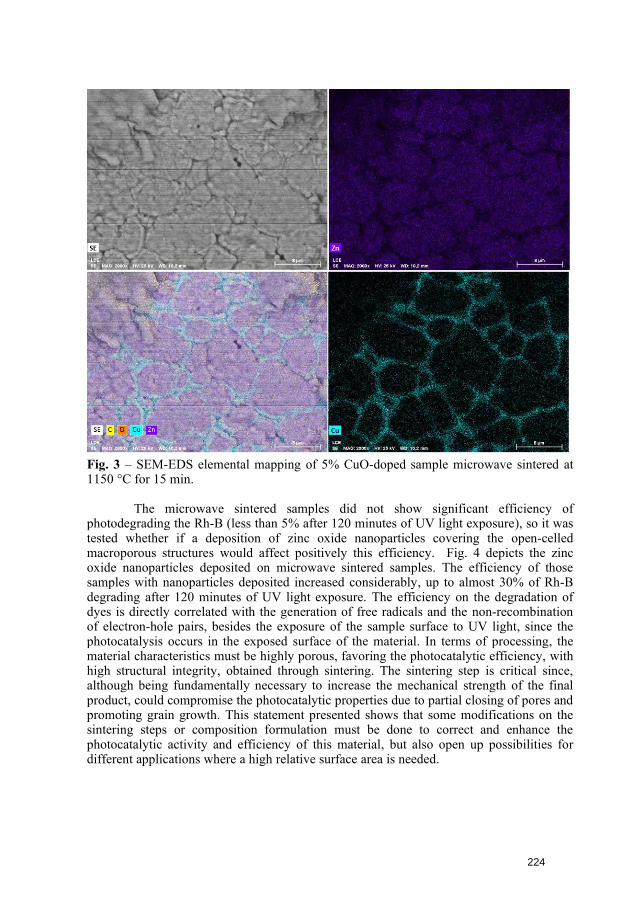
Fig. 3 – SEM-EDS elemental mapping of 5% CuO-doped sample microwave sintered at 1150 °C for 15 min.
The microwave sintered samples did not show significant efficiency of photodegrading the Rh-B (less than 5% after 120 minutes of UV light exposure), so it was tested whether if a deposition of zinc oxide nanoparticles covering the open-celled macroporous structures would affect positively this efficiency. Fig. 4 depicts the zinc oxide nanoparticles deposited on microwave sintered samples. The efficiency of those samples with nanoparticles deposited increased considerably, up to almost 30% of Rh-B degrading after 120 minutes of UV light exposure. The efficiency on the degradation of dyes is directly correlated with the generation of free radicals and the non-recombination of electron-hole pairs, besides the exposure of the sample surface to UV light, since the photocatalysis occurs in the exposed surface of the material. In terms of processing, the material characteristics must be highly porous, favoring the photocatalytic efficiency, with high structural integrity, obtained through sintering. The sintering step is critical since, although being fundamentally necessary to increase the mechanical strength of the final product, could compromise the photocatalytic properties due to partial closing of pores and promoting grain growth. This statement presented shows that some modifications on the sintering steps or composition formulation must be done to correct and enhance the photocatalytic activity and efficiency of this material, but also open up possibilities for different applications where a high relative surface area is needed.
224
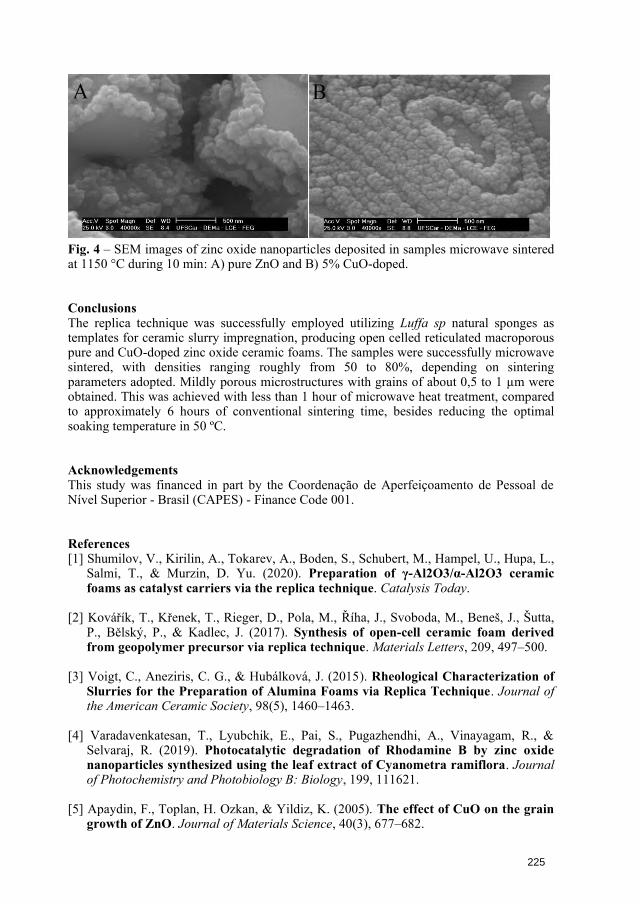
Fig. 4 – SEM images of zinc oxide nanoparticles deposited in samples microwave sintered at 1150 °C during 10 min: A) pure ZnO and B) 5% CuO-doped.
Conclusions The replica technique was successfully employed utilizing Luffa sp natural sponges as templates for ceramic slurry impregnation, producing open celled reticulated macroporous pure and CuO-doped zinc oxide ceramic foams. The samples were successfully microwave sintered, with densities ranging roughly from 50 to 80%, depending on sintering parameters adopted. Mildly porous microstructures with grains of about 0,5 to 1 µm were obtained. This was achieved with less than 1 hour of microwave heat treatment, compared to approximately 6 hours of conventional sintering time, besides reducing the optimal soaking temperature in 50 ºC.
Acknowledgements This study was financed in part by the Coordenação de Aperfeiçoamento de Pessoal de Nível Superior - Brasil (CAPES) - Finance Code 001.
References [1] Shumilov, V., Kirilin, A., Tokarev, A., Boden, S., Schubert, M., Hampel, U., Hupa, L.,
Salmi, T., & Murzin, D. Yu. (2020). Preparation of γ-Al2O3/α-Al2O3 ceramicfoams as catalyst carriers via the replica technique. Catalysis Today.
[2] Kovářík, T., Křenek, T., Rieger, D., Pola, M., Říha, J., Svoboda, M., Beneš, J., Šutta,P., Bělský, P., & Kadlec, J. (2017). Synthesis of open-cell ceramic foam derivedfrom geopolymer precursor via replica technique. Materials Letters, 209, 497–500.
[3] Voigt, C., Aneziris, C. G., & Hubálková, J. (2015). Rheological Characterization ofSlurries for the Preparation of Alumina Foams via Replica Technique. Journal ofthe American Ceramic Society, 98(5), 1460–1463.
[4] Varadavenkatesan, T., Lyubchik, E., Pai, S., Pugazhendhi, A., Vinayagam, R., &Selvaraj, R. (2019). Photocatalytic degradation of Rhodamine B by zinc oxidenanoparticles synthesized using the leaf extract of Cyanometra ramiflora. Journalof Photochemistry and Photobiology B: Biology, 199, 111621.
[5] Apaydin, F., Toplan, H. Ozkan, & Yildiz, K. (2005). The effect of CuO on the graingrowth of ZnO. Journal of Materials Science, 40(3), 677–682.
225
[6] Chiou, B.-S., & Chung, M.-C. (1992). Effect of Copper Additive on theMicrostructure and Electrical Properties of Polycrystalline Zinc Oxide. Journal ofthe American Ceramic Society, 75(12), 3363–3368.
[7] Bellini, J. V., Morelli, M. R., & Kiminami, R. H. G. A. (2002). Electrical propertiesof polycrystalline ZnO:Cu obtained from freeze-dried ZnO + copper(II) acetatepowders. Journal of Materials Science: Materials in Electronics, 13(8), 485–489.
[8] Hadi, S., Kurniawan, A., Arifin, Z., Ubaidillah, & Suyitno. (2016). The electricconductivity of Cu-doped ZnO as effect of sintering temperature. SustainableEnergy and Advanced Materials: Proceeding of the 4th International Conference andExhibition on Sustainable Energy and Advanced Materials 2015 (ICE-SEAM 2015).
226
18th International Conference on Microwave and High Frequency Applications AMPERE 2021, Gothenburg, Sweden, September 13-16, 2021
MICROWAVE SINTERING OF SODIUM-b -ALUMINA: EXPERIMENTAL AND NUMERICAL SIMULATION RESULTS
R. Rosa1, C. Mortalò2,3, P. Veronesi2, S. Fasolin3, V. Zin3, S. M. Deambrosis3, E. Miorin3,G. Dimitrakis4, M. Fabrizio3, C. Leonelli2
1Department of Sciences and Methods for Engineering, University of Modena and Reggio Emilia, v. G. Amendola 2, 42122 Reggio Emilia, Italy 2Department of Engineering Enzo Ferrari, University of Modena and Reggio Emilia, v. P. Vivarelli 10, 41125 Modena, Italy 3National Research Council, Institute of Condensed Matter Chemistry and Technologies for Energy, Corso Stati Uniti 4, 35127, Padova, Italy 4Department of Chemical and Environmental Engineering, The University of Nottingham, University Park, Nottingham NG7 2RD, United Kingdom [email protected]
Keywords: Microwave, Modelling, Processing, Dielectric properties, Characterisation, Method.
Microwave sintering of Na-b-Al2O3 was investigated by the use of single mode cavities in order to monitor the parameters affecting the sintering process, like the forward power, together with the temperature evolution, making possible to perform energy efficiency and specific energy consumption evaluations. Sintering was performed at the frequency of 2450 MHz, but preliminary results are also reported using the higher frequency of 5800 MHz, in order to study its effect on important parameters like the power density distribution as well as the penetration depth, which are responsible of the resulting heating rate and sintering outcome. Dielectric properties of loose powders were measured as a function of temperature in order to predict and support the understanding of their experimental heating behaviour. Dielectric properties also provided useful information for the multiphysics numerical simulation, which was performed in order to reach insights into the power density evolution in the specimen as sintering proceeds.
References 1. C. Mortalò, R. Rosa, P. Veronesi, S. Fasolin, V. Zin, S. M. Deambrosis, E.
Miorin, G. Dimitrakis, M. Fabrizio, C. Leonelli, Ceram. Int., 2020, 46, 28767-28777.
227
MICROWAVE SURFACE RESISTANCE OF AS-GROWN AND POST-PROCESSED ADDITIVE MANUFACURED METAL PARTS
R. Batson1, R. Gumbleton1, S. Hefford1, K. Nai2, A. Porch1
1Centre for High Frequency Engineering, School of Engineering, Cardiff University, Cardiff, CF24 3AA, U.K. 2Group Engineering Division, Renishaw PLC, Wotton-Under-Edge, GL12 8JR, U.K. [email protected]
Keywords: Microwave, measurement applications, characterisation
The free-form nature of additive layer manufacturing has opened up new and exciting possibilities for the manufacture of 3-D passive microwave devices. One such method is powder bed fusion (PBF), in which metal powders (in the size range 15 to 45 microns) are melted in consecutive 2D layers using a highly focused, high power laser. The high surface roughness that arises in as-grown PBF-manufactured parts is of particular importance for potential microwave applications owing to the surface confinement of current due to the classical skin effect; this leads to higher values of surface resistance compared with bulk parts made using traditional (subtractive) manufacturing methods. To investigate this from a fundamental perspective, we have developed two novel microwave characterisation techniques to study small-area metal plates, both operating in the C-band; namely, the lift-off dielectric resonator [1],[2] and orthogonal parallel plate [3] methods. The former drives circular surface currents in the sample, whilst the latter drives linear currents at right angles to each other, according to the mode selected, and so allows the study of surface electrical anisotropy. We demonstrate that both of these methods yield reproducible values of surface resistance with very small systematic and random errors of around 1% and 0.1%, respectively, allowing us to investigate with high confidence any small systematic changes associated with either the manufacturing or post-processing conditions. We present measurements of the surface resistance of as-grown and post-processed PBF manufactured sheets of the commonly-used alloys AlSi10Mg and Ti6Al4V, grown in a range of sample orientations within the PBF build chamber. We show that post-processing can optimise the surface resistance to values very close to those expected of the bulk metals, with negligible anisotropy as a result of the laser raster patterns. We also describe the extension of these measurements using a broadband test fixture for single PBF parts over both the X and Ku microwave bands, thus covering the important range of frequencies for passive microwave devices for satellite applications.
References
1. S. Hefford, N. Clark, R. Gumbleton, A. Porch, IEEE Trans. Instrum. Meas.,2021, 70, 8002208
2. R. Gumbleton, K. Nai, S. Hefford, A. Porch, 13th European Conf. on Antennasand Propagation (EuCAP), Kracow, Poland 31 March - 5 April 2019
3. R. Gumbleton, J.A. Cuenca, S. Hefford, K. Nai, A. Porch, IEEE Trans. Microw.Theory Tech., 2021, 69, 189–197
228
18th International Conference on Microwave and High Frequency Applications AMPERE 2021, Gothenburg, Sweden, September 13-16, 2021
MICROWAVE-ASSISTED OBTAINMENT AND CHARACTERIZATION OF NOVEL BIOACTIVE SCAFFOLDS FOR BONE TISSUE REGENERATION
M. Piątkowski1, J. Radwan-Pragłowska1, Ł. Janus1, A. Sierakowska1, P. Bąk1
1Department of Biotechnology and Physical Chemistry, Faculty of Chemical Engineeringand Technology, Cracow University of Technology, Warszawska 24 Street, 31-155Cracow, [email protected]
Keywords (choose minimum two): Microwave, Medical applications, Characterisation
Tissue engineering provides an alternative to traditional transplantation when native tissues and organs loose their functionality. One of the most commonly body parts to be replaced are bones. Development of the bioactive scaffolds enables restoration of both mechanical and biological functions of the damaged tissue. Chitosan which is a natural polymer obtained from chitin constitute a great raw material for scaffolds development due to its biodegradability and lack of cytotoxicity. Due to the hydroxyl and amino groups it may undergo certain modifications. However, presence of intramolecular hydrogen bonds decreases its reactivity. Therefore, microwave radiation is a great alternative to traditional modification routes. The aim of the following study was to obtain novel chitosan derivatives under microwave-assisted conditions followed by doping with hydroxyapatite nanoparticles to enhance their durability and biological activity and combining with PLA nanofibers. To perform chemical modification of the native chitosan, the polymer was crosslinked using dicarboxylic acid with propanodiol as high-boiling medium. The use of MW resulted in the formation of covalent bonds between free amino groups of chitosan and carboxyl moieties of the aminoacid as well as hydroxyapatite nanoparticles incorporation into the polymeric matrix as a result of hydrogen bonds formation. Ready nanocomposites were characterized over their chemical structure by FT-IR and XRD. Swelling degree in distilled water and SBF was determined. Morphology study carried out by TEM and SEM microscopy confirmed preparation of hybrid biomaterials with highly porous and spatial architecture. Further studies confirmed apatite crystals formation after incubation in simulated body liquids. The samples cytotoxicity was determined by XTT assay. Performed research confirmed a high potential of the newly-developed biomaterials in guided bone tissue regeneration procedures.
This research was supported financially by The National Centre for Research and Development grant number LIDER/42/0149/L-9/17/NCBR/2018. References
1. Radwan-Pragłowska, J., Janus, Ł., Piątkowski, M., Bogdał, D., Matysek, D. 3DHierarchical, Nanostructured Chitosan/PLA/HA Scaffolds Doped withTiO2/Au/Pt NPs with Tunable Properties for Guided Bone Tissue Engineering.Polymers 2020, 12, 792.
2. Xiao-su, Q., Jie,H., Hua-chao, G., Ze-bin, Y., Qing-hua, C., Ting-ting, Y. Fabricationand Properties of Silica Gel/Calcium Sulfate/Strontium-doped β-tricalciumPhosphate Composite Porous Scaffolds for Bone Tissue Engineering., J. Mater. Eng2018, 46, 34-40.
229
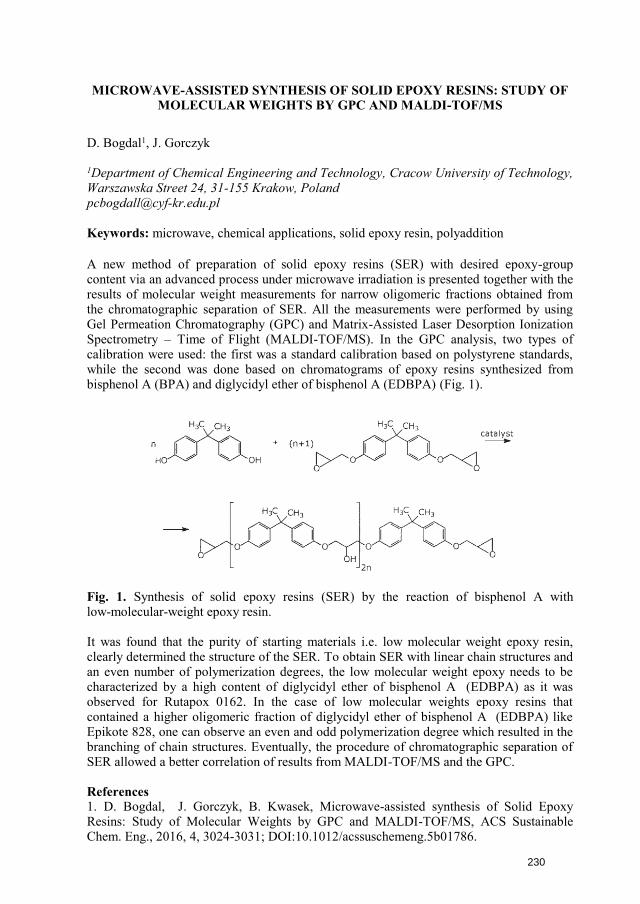
MICROWAVE-ASSISTED SYNTHESIS OF SOLID EPOXY RESINS: STUDY OF MOLECULAR WEIGHTS BY GPC AND MALDI-TOF/MS
D. Bogdal1, J. Gorczyk
1Department of Chemical Engineering and Technology, Cracow University of Technology, Warszawska Street 24, 31-155 Krakow, Poland [email protected]
Keywords: microwave, chemical applications, solid epoxy resin, polyaddition
A new method of preparation of solid epoxy resins (SER) with desired epoxy-group content via an advanced process under microwave irradiation is presented together with the results of molecular weight measurements for narrow oligomeric fractions obtained from the chromatographic separation of SER. All the measurements were performed by using Gel Permeation Chromatography (GPC) and Matrix-Assisted Laser Desorption Ionization Spectrometry – Time of Flight (MALDI-TOF/MS). In the GPC analysis, two types of calibration were used: the first was a standard calibration based on polystyrene standards, while the second was done based on chromatograms of epoxy resins synthesized from bisphenol A (BPA) and diglycidyl ether of bisphenol A (EDBPA) (Fig. 1).
Fig. 1. Synthesis of solid epoxy resins (SER) by the reaction of bisphenol A with low-molecular-weight epoxy resin.
It was found that the purity of starting materials i.e. low molecular weight epoxy resin, clearly determined the structure of the SER. To obtain SER with linear chain structures and an even number of polymerization degrees, the low molecular weight epoxy needs to be characterized by a high content of diglycidyl ether of bisphenol A (EDBPA) as it was observed for Rutapox 0162. In the case of low molecular weights epoxy resins that contained a higher oligomeric fraction of diglycidyl ether of bisphenol A (EDBPA) like Epikote 828, one can observe an even and odd polymerization degree which resulted in the branching of chain structures. Eventually, the procedure of chromatographic separation of SER allowed a better correlation of results from MALDI-TOF/MS and the GPC.
References 1. D. Bogdal, J. Gorczyk, B. Kwasek, Microwave-assisted synthesis of Solid EpoxyResins: Study of Molecular Weights by GPC and MALDI-TOF/MS, ACS SustainableChem. Eng., 2016, 4, 3024-3031; DOI:10.1012/acssuschemeng.5b01786.
230
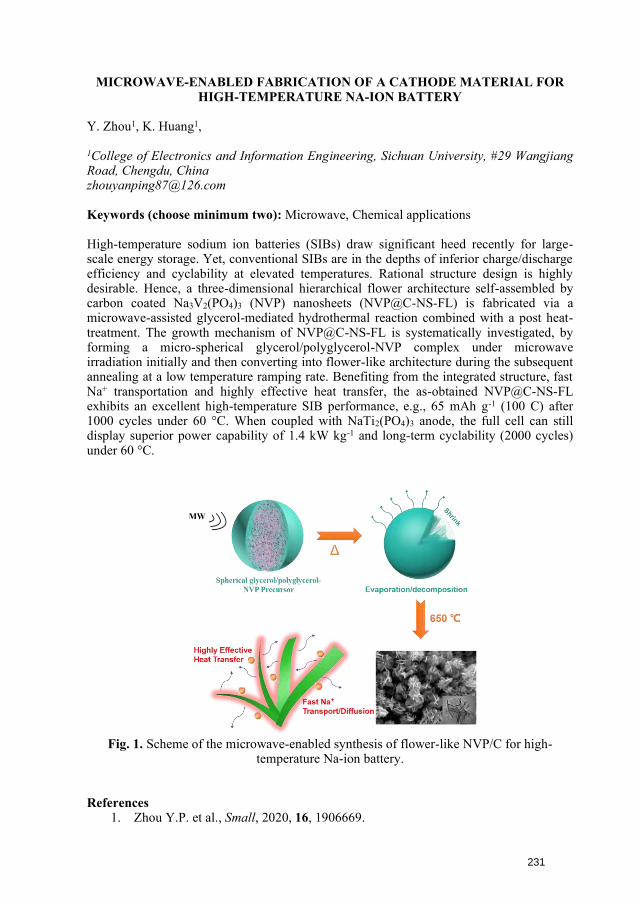
MICROWAVE-ENABLED FABRICATION OF A CATHODE MATERIAL FOR HIGH-TEMPERATURE NA-ION BATTERY
Y. Zhou1, K. Huang1,
1College of Electronics and Information Engineering, Sichuan University, #29 Wangjiang Road, Chengdu, China [email protected]
Keywords (choose minimum two): Microwave, Chemical applications
High-temperature sodium ion batteries (SIBs) draw significant heed recently for large-scale energy storage. Yet, conventional SIBs are in the depths of inferior charge/discharge efficiency and cyclability at elevated temperatures. Rational structure design is highly desirable. Hence, a three-dimensional hierarchical flower architecture self-assembled by carbon coated Na3V2(PO4)3 (NVP) nanosheets (NVP@C-NS-FL) is fabricated via a microwave-assisted glycerol-mediated hydrothermal reaction combined with a post heat-treatment. The growth mechanism of NVP@C-NS-FL is systematically investigated, by forming a micro-spherical glycerol/polyglycerol-NVP complex under microwave irradiation initially and then converting into flower-like architecture during the subsequent annealing at a low temperature ramping rate. Benefiting from the integrated structure, fast Na+ transportation and highly effective heat transfer, the as-obtained NVP@C-NS-FL exhibits an excellent high-temperature SIB performance, e.g., 65 mAh g-1 (100 C) after 1000 cycles under 60 °C. When coupled with NaTi2(PO4)3 anode, the full cell can still display superior power capability of 1.4 kW kg-1 and long-term cyclability (2000 cycles) under 60 °C.
Fig. 1. Scheme of the microwave-enabled synthesis of flower-like NVP/C for high-temperature Na-ion battery.
References 1. Zhou Y.P. et al., Small, 2020, 16, 1906669.
231
Microwave-synthesized CZTS nanoparticles for printing and hybrid photovoltaic devices
K. Matras-Postolek1, T. Kirish1, M. Lutsiv1, A. Zaba1
1Cracow University of Technology, Faculty of Chemical Engineering and Technology, Warszawska 24, 31-155 Krakow, Poland, [email protected]
Keywords: nanoparticles; microwave; CZTS, printing, hybrid photovoltaics
The CZTS (Cu2ZnSnS4) nanocrystals, due to their optical and electrical properties (e.g. relatively low band gap energy about 1.5 eV and high absorption coefficient about 104 cm-
1), are one of the most promising materials for the absorption layers in photovoltaic devices. In this study, the CZTS nanoparticles (size about 10 nm) were obtained under microwave reaction by using as stabilizing agent ethylenediamine. The obtained nanocrystals were systematically characterized in terms of structural and optical properties using X-ray diffraction (XRD), transmission electron microscopy (TEM), Fourier-transform infrared spectroscopy (FT-IR) and UV-Vis analysis. For the further formulation of a stable nanoparticle ink with rheological and wetting properties suitable for inkjet printing, a mixture of different solvent was used for ink formulation. Simultaneously, CZTS nanoparticles after surface modification were used for the production of active layers of hybrid photovoltaic devices with the maximum efficiency about 2.0 %. The distribution of nanocrystals in the polymer matrix was confirmed by secondary ion mass spectroscopy (SIMS).
This work was financially supported by the National Centre for Research and Development within the V edition LIDER program (project number LIDER/009/185/L-5/13/NCBR/2014).
232
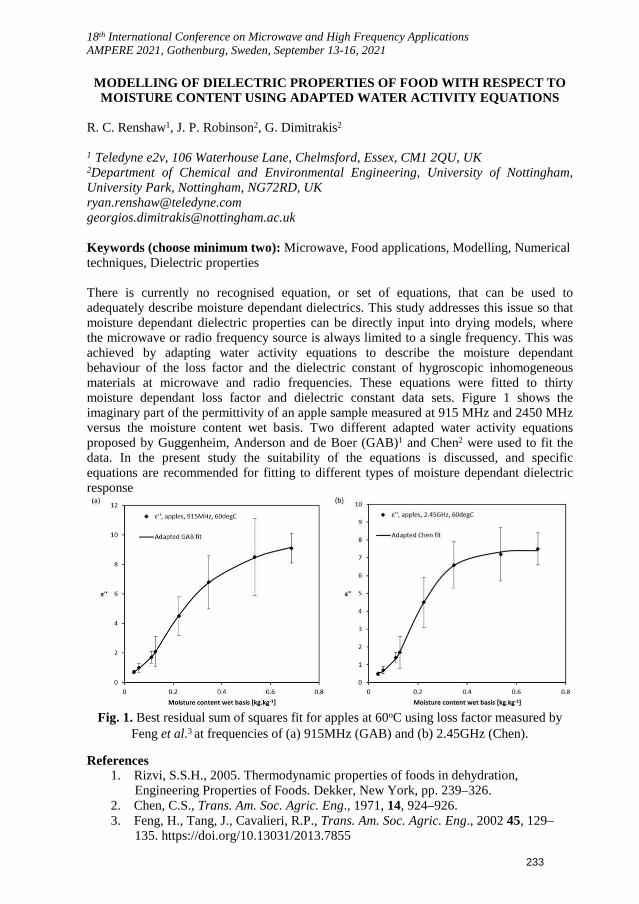
18th International Conference on Microwave and High Frequency ApplicationsAMPERE 2021, Gothenburg, Sweden, September 13-16, 2021
MODELLING OF DIELECTRIC PROPERTIES OF FOOD WITH RESPECT TOMOISTURE CONTENT USING ADAPTED WATER ACTIVITY EQUATIONS
R. C. Renshaw1, J. P. Robinson2, G. Dimitrakis2
1 Teledyne e2v, 106 Waterhouse Lane, Chelmsford, Essex, CM1 2QU, UK2Department of Chemical and Environmental Engineering, University of Nottingham,University Park, Nottingham, NG72RD, [email protected]@nottingham.ac.uk
Keywords (choose minimum two): Microwave, Food applications, Modelling, Numericaltechniques, Dielectric properties
There is currently no recognised equation, or set of equations, that can be used toadequately describe moisture dependant dielectrics. This study addresses this issue so thatmoisture dependant dielectric properties can be directly input into drying models, wherethe microwave or radio frequency source is always limited to a single frequency. This wasachieved by adapting water activity equations to describe the moisture dependantbehaviour of the loss factor and the dielectric constant of hygroscopic inhomogeneousmaterials at microwave and radio frequencies. These equations were fitted to thirtymoisture dependant loss factor and dielectric constant data sets. Figure 1 shows theimaginary part of the permittivity of an apple sample measured at 915 MHz and 2450 MHzversus the moisture content wet basis. Two different adapted water activity equationsproposed by Guggenheim, Anderson and de Boer (GAB)1 and Chen2 were used to fit thedata. In the present study the suitability of the equations is discussed, and specificequations are recommended for fitting to different types of moisture dependant dielectricresponse
Fig. 1. Best residual sum of squares fit for apples at 60oC using loss factor measured byFeng et al.3 at frequencies of (a) 915MHz (GAB) and (b) 2.45GHz (Chen).
References1. Rizvi, S.S.H., 2005. Thermodynamic properties of foods in dehydration,
Engineering Properties of Foods. Dekker, New York, pp. 239–326.2. Chen, C.S., Trans. Am. Soc. Agric. Eng., 1971, 14, 924–926.3. Feng, H., Tang, J., Cavalieri, R.P., Trans. Am. Soc. Agric. Eng., 2002 45, 129–
135. https://doi.org/10.13031/2013.7855
233
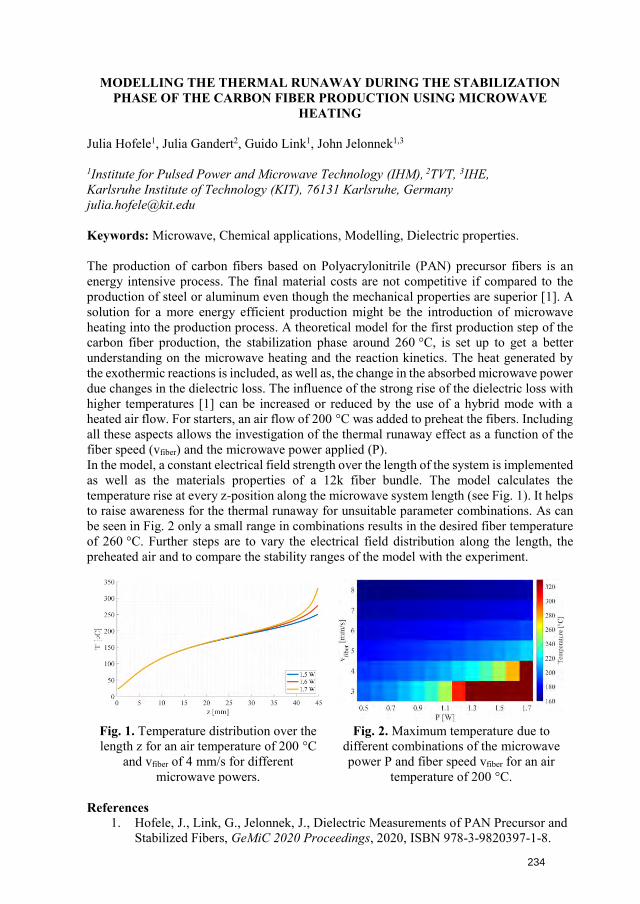
MODELLING THE THERMAL RUNAWAY DURING THE STABILIZATION PHASE OF THE CARBON FIBER PRODUCTION USING MICROWAVE
HEATING
Julia Hofele1, Julia Gandert2, Guido Link1, John Jelonnek1,3
1Institute for Pulsed Power and Microwave Technology (IHM), 2TVT, 3IHE, Karlsruhe Institute of Technology (KIT), 76131 Karlsruhe, Germany [email protected]
Keywords: Microwave, Chemical applications, Modelling, Dielectric properties.
The production of carbon fibers based on Polyacrylonitrile (PAN) precursor fibers is an energy intensive process. The final material costs are not competitive if compared to the production of steel or aluminum even though the mechanical properties are superior [1]. A solution for a more energy efficient production might be the introduction of microwave heating into the production process. A theoretical model for the first production step of the carbon fiber production, the stabilization phase around 260 °C, is set up to get a better understanding on the microwave heating and the reaction kinetics. The heat generated by the exothermic reactions is included, as well as, the change in the absorbed microwave power due changes in the dielectric loss. The influence of the strong rise of the dielectric loss with higher temperatures [1] can be increased or reduced by the use of a hybrid mode with a heated air flow. For starters, an air flow of 200 °C was added to preheat the fibers. Including all these aspects allows the investigation of the thermal runaway effect as a function of the fiber speed (vfiber) and the microwave power applied (P). In the model, a constant electrical field strength over the length of the system is implemented as well as the materials properties of a 12k fiber bundle. The model calculates the temperature rise at every z-position along the microwave system length (see Fig. 1). It helps to raise awareness for the thermal runaway for unsuitable parameter combinations. As can be seen in Fig. 2 only a small range in combinations results in the desired fiber temperature of 260 °C. Further steps are to vary the electrical field distribution along the length, the preheated air and to compare the stability ranges of the model with the experiment.
Fig. 1. Temperature distribution over the length z for an air temperature of 200 °C
and vfiber of 4 mm/s for different microwave powers.
Fig. 2. Maximum temperature due to different combinations of the microwave power P and fiber speed vfiber for an air
temperature of 200 °C.
References 1. Hofele, J., Link, G., Jelonnek, J., Dielectric Measurements of PAN Precursor and
Stabilized Fibers, GeMiC 2020 Proceedings, 2020, ISBN 978-3-9820397-1-8.
234
18th International Conference on Microwave and High Frequency Applications AMPERE 2021, Gothenburg, Sweden, September 13-16, 2021
MOLECULAR COLLISION UNDER MICROWAVE IRRADIATION AND
REVITALIZATION OF MICROWAVE NON-THERMAL EFFECT
K.M Huang1, D.Z. Gou1,
1IAEM (Institute of Applied ElectroMagnetics), College of Electronics and Information
Engineering, No. 24, South Section, First Ring Road, Chengdu, P. R. China [email protected]
Keywords: Microwave, Modelling, Material interaction
The microwave non-thermal effect is still a pendent issue. Based on this feature that the polarization of microwaves causes polar molecules to orient in the direction of the electric field, the collision orientation and energy changes of polar molecules after polarization deserve more research and attention. In this paper, we have studied the spatial collision probability and energy distribution of water molecules under microwave irradiation. Through molecular dynamics simulation, we found that the total collision number and average energy are almost unaffected by the weak microwave fields, but the polarization increases the anisotropy of spatial collision and change the energy distribution of molecules. This result can be verified by the microwave stimulates the direct formation of tertiary amines via N-alkylation of amines by alkyl halides,and would be helpful to understanding the microwave non-thermal effect at the molecular level.
235
MULTIPHYSICS MODELING OF THE THAWING AND TEMPERING PROCESS OF BEEF MEAT IN A SOLID-STATE BASED MICROWAVE CAVITY
P. Santon1, B. Wäppling Raaholt2, R. Reyes3, E. Reyes1, J.V. Balbastre1
1Institute of Information and Communication Technologies (ITACA) - UPV, C/ Vera s/n, Valencia, Spain 2RISE Research Institutes of Sweden, Box 5401, 402 29 Gothenburg, Sweden 3Research Institute of Food Engineering for Development (IIAD) - UPV, C/ Vera s/n, Valencia, Spain [email protected]
Keywords: microwave, food applications, modelling, cavity, solid-state, antennas
Abstract – This paper describes the multiphysics modeling of the thawing and tempering process of a beef meat sample in a microwave cavity fed with patch antennas and solid-state power amplifiers. It comprises a temperature range between -18ºC and 20ºC, where significant changes in both the dielectric and thermophysical parameters take place. Moreover, the challenge of this work is to develop a multi-frequency system, where the correct frequency is used in each moment of the process. For that purpose, a thorough study of the effect of the ISM (Industrial, Scientifical and Medical) frequency band for the Region 2 [1], 915 MHz , on the resulting temperature profile is performed. The information of the dielectric properties is obtained through the available data, and the thermophysical properties are obtained through approximative equations.
I. INTRODUCTION.
Microwave technology and food processing have a common long history. Several researchers stated that microwaves will eventually become a standard tool in the food industry [2], however, it will be necessary to adapt microwave heating equipment to new processes, rather than to adapt the food or the process to the microwave oven itself. With that in mind, and the rise in the development of solid-state power devices, seems interesting to make a different approach. During the last 2 years, new solid-state power amplifiers, with improved efficiency and performance, readily available at the marketplace have been tested for high-power applications.
Using semiconductor-based RF generators offer control perfection in terms of the properties of the RF signal: frequency, phase, power level, modulation, and timing of the electromagnetic microwave can be set and monitored for feedback at will. This is interesting for applications in food industry. Modelling of this kind of ovens, solutions and processes facilitates the development.
These developments present an opportunity to work easily with other ISM frequencies, for instance lower bands like 915 MHz (896 MHz in Europe) or 433 MHz. Eliminating the old difficulty related to the waveguide dimensions, by the implementation of TEM antennas capable to handle high power, it will be possible to improve the performance of both commercial and industrial microwave ovens.
236
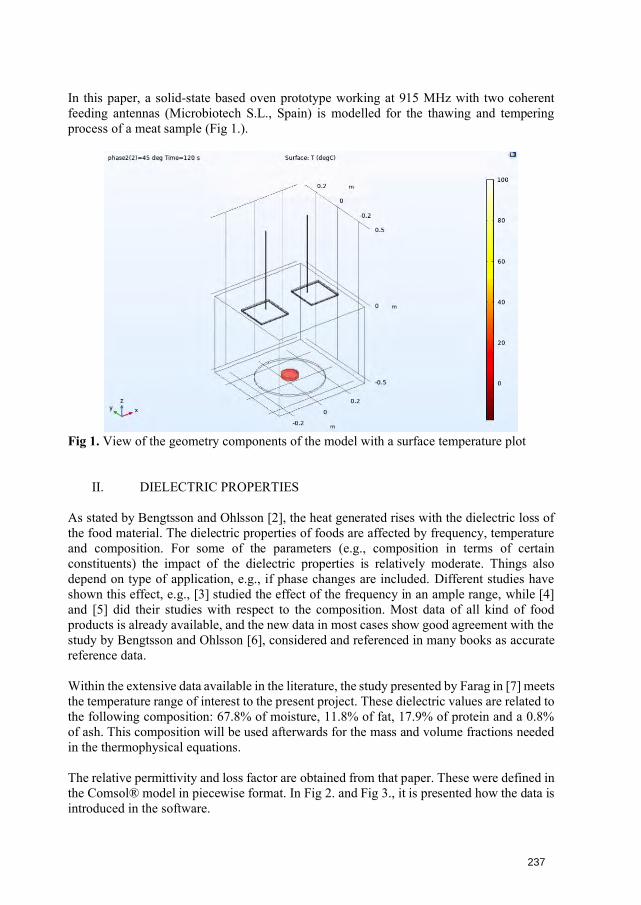
In this paper, a solid-state based oven prototype working at 915 MHz with two coherent feeding antennas (Microbiotech S.L., Spain) is modelled for the thawing and tempering process of a meat sample (Fig 1.).
Fig 1. View of the geometry components of the model with a surface temperature plot
II. DIELECTRIC PROPERTIES
As stated by Bengtsson and Ohlsson [2], the heat generated rises with the dielectric loss of the food material. The dielectric properties of foods are affected by frequency, temperature and composition. For some of the parameters (e.g., composition in terms of certain constituents) the impact of the dielectric properties is relatively moderate. Things also depend on type of application, e.g., if phase changes are included. Different studies have shown this effect, e.g., [3] studied the effect of the frequency in an ample range, while [4] and [5] did their studies with respect to the composition. Most data of all kind of food products is already available, and the new data in most cases show good agreement with the study by Bengtsson and Ohlsson [6], considered and referenced in many books as accurate reference data.
Within the extensive data available in the literature, the study presented by Farag in [7] meets the temperature range of interest to the present project. These dielectric values are related to the following composition: 67.8% of moisture, 11.8% of fat, 17.9% of protein and a 0.8% of ash. This composition will be used afterwards for the mass and volume fractions needed in the thermophysical equations.
The relative permittivity and loss factor are obtained from that paper. These were defined in the Comsol® model in piecewise format. In Fig 2. and Fig 3., it is presented how the data is introduced in the software.
237
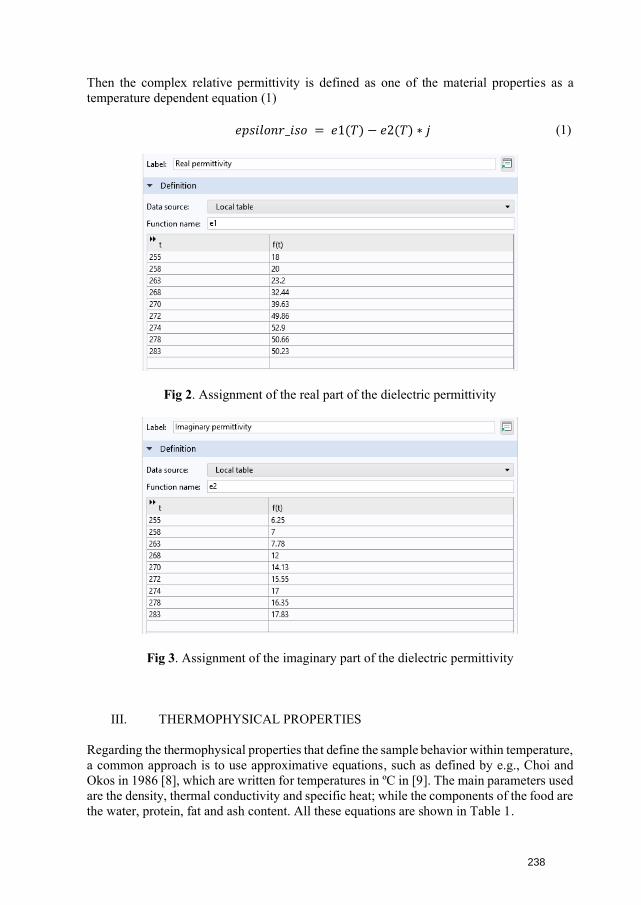
Then the complex relative permittivity is defined as one of the material properties as a temperature dependent equation (1)
𝑒𝑝𝑠𝑖𝑙𝑜𝑛𝑟_𝑖𝑠𝑜 = 𝑒1(𝑇) − 𝑒2(𝑇) ∗ 𝑗 (1)
Fig 2. Assignment of the real part of the dielectric permittivity
Fig 3. Assignment of the imaginary part of the dielectric permittivity
III. THERMOPHYSICAL PROPERTIES
Regarding the thermophysical properties that define the sample behavior within temperature, a common approach is to use approximative equations, such as defined by e.g., Choi and Okos in 1986 [8], which are written for temperatures in ºC in [9]. The main parameters used are the density, thermal conductivity and specific heat; while the components of the food are the water, protein, fat and ash content. All these equations are shown in Table 1.
238
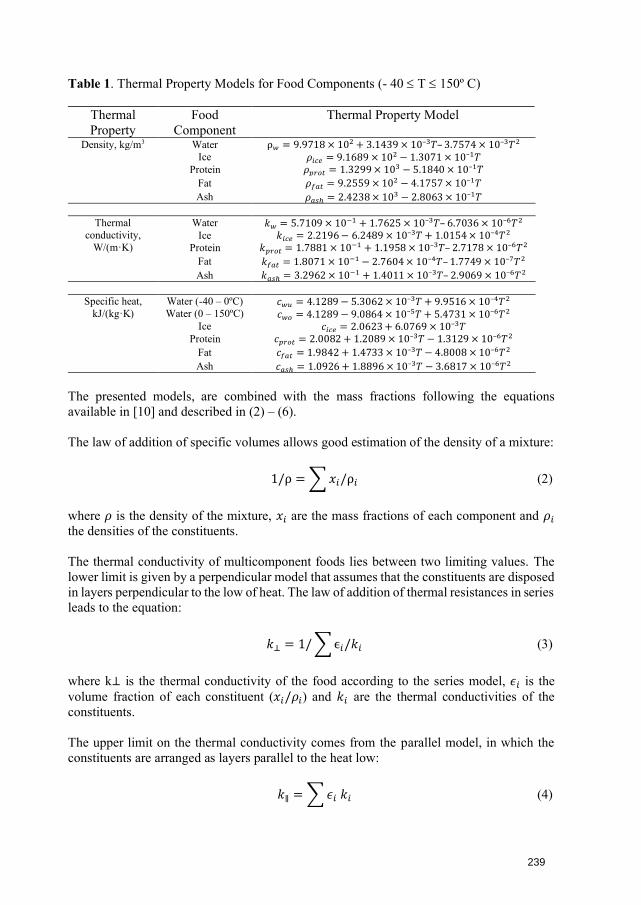
Table 1. Thermal Property Models for Food Components (- 40 T 150º C)
Thermal Property
Food Component
Thermal Property Model
Density, kg/m3 Water ρ𝑤 = 9.9718 × 10² + 3.1439 × 10⁻³𝑇– 3.7574 × 10⁻³𝑇2
Ice 𝜌𝑖𝑐𝑒 = 9.1689 × 10² − 1.3071 × 10⁻¹𝑇 Protein 𝜌𝑝𝑟𝑜𝑡 = 1.3299 × 10³ − 5.1840 × 10⁻¹𝑇
Fat 𝜌𝑓𝑎𝑡 = 9.2559 × 10² − 4.1757 × 10⁻¹𝑇 Ash 𝜌𝑎𝑠ℎ = 2.4238 × 10³ − 2.8063 × 10⁻¹𝑇
Thermal conductivity,
W/(m·K)
Water 𝑘𝑤 = 5.7109 × 10⁻¹ + 1.7625 × 10⁻³𝑇– 6.7036 × 10⁻⁶𝑇2
Ice 𝑘𝑖𝑐𝑒 = 2.2196 − 6.2489 × 10⁻³𝑇 + 1.0154 × 10⁻⁴𝑇2
Protein 𝑘𝑝𝑟𝑜𝑡 = 1.7881 × 10⁻¹ + 1.1958 × 10⁻³𝑇– 2.7178 × 10⁻⁶𝑇2
Fat 𝑘𝑓𝑎𝑡 = 1.8071 × 10⁻¹ − 2.7604 × 10⁻⁴𝑇– 1.7749 × 10⁻⁷𝑇2
Ash 𝑘𝑎𝑠ℎ = 3.2962 × 10⁻¹ + 1.4011 × 10⁻³𝑇– 2.9069 × 10⁻⁶𝑇2
Specific heat, kJ/(kg·K)
Water (-40 – 0ºC) 𝑐𝑤𝑢 = 4.1289 − 5.3062 × 10⁻³𝑇 + 9.9516 × 10⁻⁴𝑇2
Water (0 – 150ºC) 𝑐𝑤𝑜 = 4.1289 − 9.0864 × 10⁻⁵𝑇 + 5.4731 × 10⁻⁶𝑇2
Ice 𝑐𝑖𝑐𝑒 = 2.0623 + 6.0769 × 10⁻³𝑇 Protein 𝑐𝑝𝑟𝑜𝑡 = 2.0082 + 1.2089 × 10⁻³𝑇 − 1.3129 × 10⁻⁶𝑇2
Fat 𝑐𝑓𝑎𝑡 = 1.9842 + 1.4733 × 10⁻³𝑇 − 4.8008 × 10⁻⁶𝑇2
Ash 𝑐𝑎𝑠ℎ = 1.0926 + 1.8896 × 10⁻³𝑇 − 3.6817 × 10⁻⁶𝑇2
The presented models, are combined with the mass fractions following the equations available in [10] and described in (2) – (6).
The law of addition of specific volumes allows good estimation of the density of a mixture:
1/ρ = ∑ 𝑥𝑖/ρ𝑖 (2)
where 𝜌 is the density of the mixture, 𝑥𝑖 are the mass fractions of each component and 𝜌𝑖 the densities of the constituents.
The thermal conductivity of multicomponent foods lies between two limiting values. The lower limit is given by a perpendicular model that assumes that the constituents are disposed in layers perpendicular to the low of heat. The law of addition of thermal resistances in series leads to the equation:
𝑘⊥ = 1/ ∑ ϵ𝑖/𝑘𝑖 (3)
where k⊥ is the thermal conductivity of the food according to the series model, 𝜖𝑖 is the volume fraction of each constituent (𝑥𝑖/𝜌𝑖) and 𝑘𝑖 are the thermal conductivities of the constituents.
The upper limit on the thermal conductivity comes from the parallel model, in which the constituents are arranged as layers parallel to the heat low:
𝑘∥ = ∑ 𝜖𝑖 𝑘𝑖 (4)
239
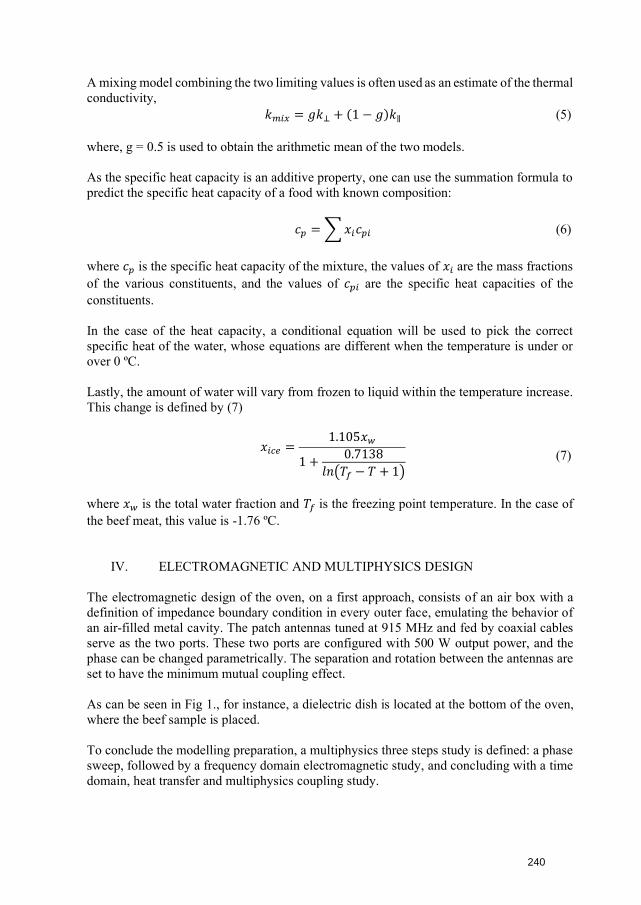
A mixing model combining the two limiting values is often used as an estimate of the thermal conductivity,
𝑘𝑚𝑖𝑥 = 𝑔𝑘⊥ + (1 − 𝑔)𝑘∥ (5)
where, g = 0.5 is used to obtain the arithmetic mean of the two models.
As the specific heat capacity is an additive property, one can use the summation formula to predict the specific heat capacity of a food with known composition:
𝑐𝑝 = ∑ 𝑥𝑖𝑐𝑝𝑖 (6)
where 𝑐𝑝 is the specific heat capacity of the mixture, the values of 𝑥𝑖 are the mass fractions of the various constituents, and the values of 𝑐𝑝𝑖 are the specific heat capacities of the constituents.
In the case of the heat capacity, a conditional equation will be used to pick the correct specific heat of the water, whose equations are different when the temperature is under or over 0 ºC.
Lastly, the amount of water will vary from frozen to liquid within the temperature increase. This change is defined by (7)
𝑥𝑖𝑐𝑒 =1.105𝑥𝑤
1 +0.7138
𝑙𝑛(𝑇𝑓 − 𝑇 + 1)(7)
where 𝑥𝑤 is the total water fraction and 𝑇𝑓 is the freezing point temperature. In the case of the beef meat, this value is -1.76 ºC.
IV. ELECTROMAGNETIC AND MULTIPHYSICS DESIGN
The electromagnetic design of the oven, on a first approach, consists of an air box with a definition of impedance boundary condition in every outer face, emulating the behavior of an air-filled metal cavity. The patch antennas tuned at 915 MHz and fed by coaxial cables serve as the two ports. These two ports are configured with 500 W output power, and the phase can be changed parametrically. The separation and rotation between the antennas are set to have the minimum mutual coupling effect.
As can be seen in Fig 1., for instance, a dielectric dish is located at the bottom of the oven, where the beef sample is placed.
To conclude the modelling preparation, a multiphysics three steps study is defined: a phase sweep, followed by a frequency domain electromagnetic study, and concluding with a time domain, heat transfer and multiphysics coupling study.
240
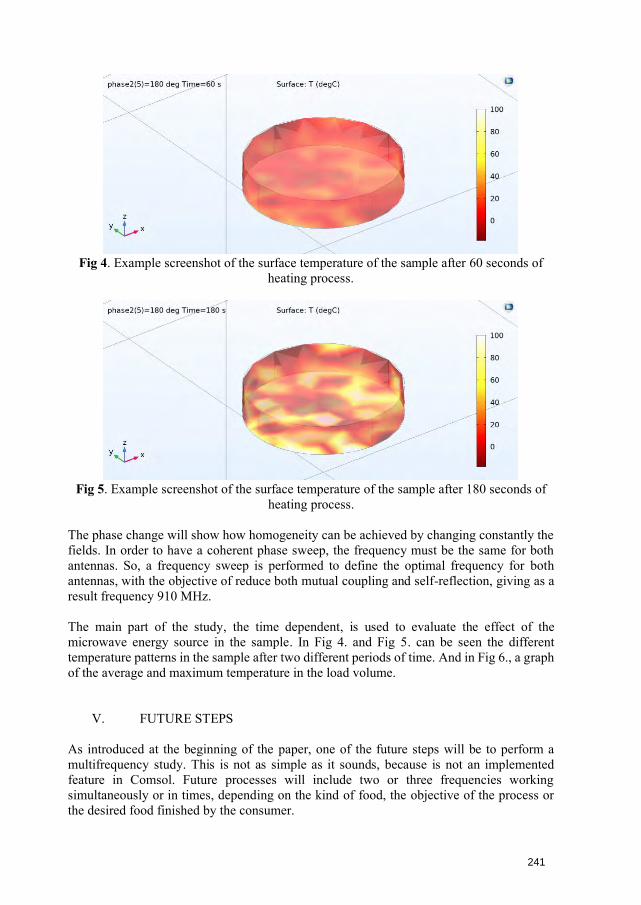
Fig 4. Example screenshot of the surface temperature of the sample after 60 seconds of heating process.
Fig 5. Example screenshot of the surface temperature of the sample after 180 seconds of heating process.
The phase change will show how homogeneity can be achieved by changing constantly the fields. In order to have a coherent phase sweep, the frequency must be the same for both antennas. So, a frequency sweep is performed to define the optimal frequency for both antennas, with the objective of reduce both mutual coupling and self-reflection, giving as a result frequency 910 MHz.
The main part of the study, the time dependent, is used to evaluate the effect of the microwave energy source in the sample. In Fig 4. and Fig 5. can be seen the different temperature patterns in the sample after two different periods of time. And in Fig 6., a graph of the average and maximum temperature in the load volume.
V. FUTURE STEPS
As introduced at the beginning of the paper, one of the future steps will be to perform a multifrequency study. This is not as simple as it sounds, because is not an implemented feature in Comsol. Future processes will include two or three frequencies working simultaneously or in times, depending on the kind of food, the objective of the process or the desired food finished by the consumer.
241
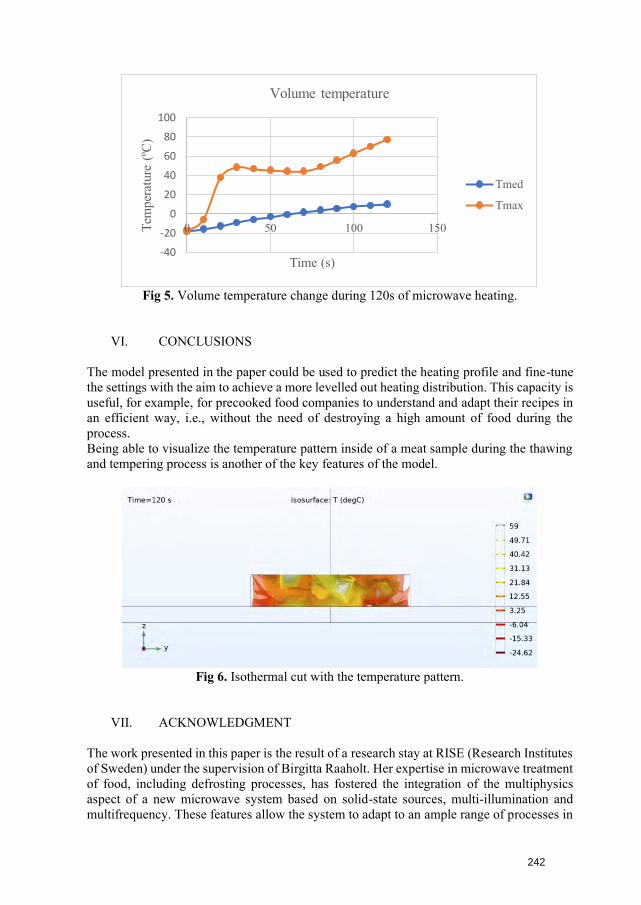
Fig 5. Volume temperature change during 120s of microwave heating.
VI. CONCLUSIONS
The model presented in the paper could be used to predict the heating profile and fine-tune the settings with the aim to achieve a more levelled out heating distribution. This capacity is useful, for example, for precooked food companies to understand and adapt their recipes in an efficient way, i.e., without the need of destroying a high amount of food during the process. Being able to visualize the temperature pattern inside of a meat sample during the thawing and tempering process is another of the key features of the model.
Fig 6. Isothermal cut with the temperature pattern.
VII. ACKNOWLEDGMENT
The work presented in this paper is the result of a research stay at RISE (Research Institutes of Sweden) under the supervision of Birgitta Raaholt. Her expertise in microwave treatment of food, including defrosting processes, has fostered the integration of the multiphysics aspect of a new microwave system based on solid-state sources, multi-illumination and multifrequency. These features allow the system to adapt to an ample range of processes in
-40
-20
0
20
40
60
80
100
0 50 100 150Tem
pera
ture
(ºC
)
Time (s)
Volume temperature
Tmed
Tmax
242
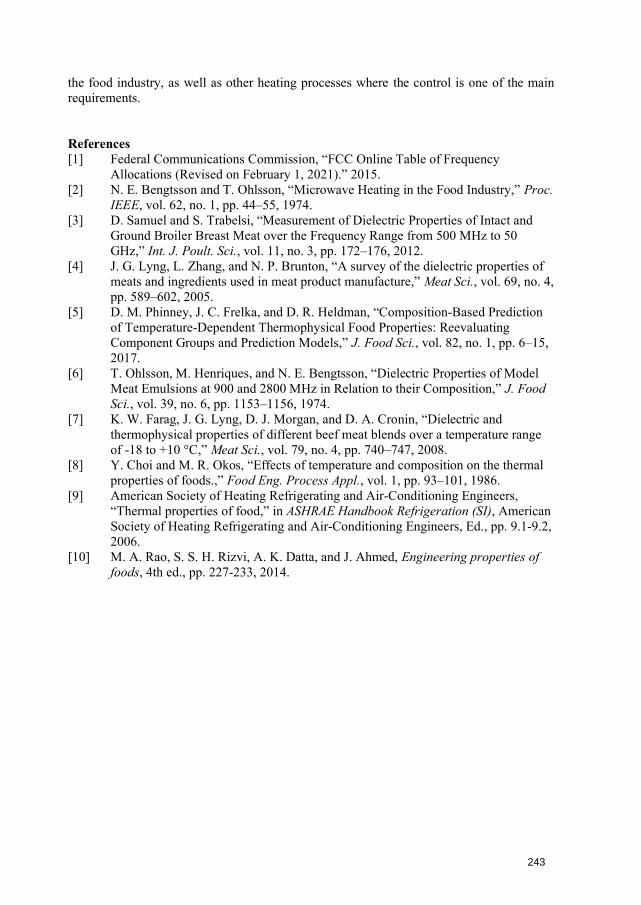
the food industry, as well as other heating processes where the control is one of the main requirements.
References [1] Federal Communications Commission, “FCC Online Table of Frequency
Allocations (Revised on February 1, 2021).” 2015.[2] N. E. Bengtsson and T. Ohlsson, “Microwave Heating in the Food Industry,” Proc.
IEEE, vol. 62, no. 1, pp. 44–55, 1974.[3] D. Samuel and S. Trabelsi, “Measurement of Dielectric Properties of Intact and
Ground Broiler Breast Meat over the Frequency Range from 500 MHz to 50GHz,” Int. J. Poult. Sci., vol. 11, no. 3, pp. 172–176, 2012.
[4] J. G. Lyng, L. Zhang, and N. P. Brunton, “A survey of the dielectric properties ofmeats and ingredients used in meat product manufacture,” Meat Sci., vol. 69, no. 4,pp. 589–602, 2005.
[5] D. M. Phinney, J. C. Frelka, and D. R. Heldman, “Composition-Based Predictionof Temperature-Dependent Thermophysical Food Properties: ReevaluatingComponent Groups and Prediction Models,” J. Food Sci., vol. 82, no. 1, pp. 6–15,2017.
[6] T. Ohlsson, M. Henriques, and N. E. Bengtsson, “Dielectric Properties of ModelMeat Emulsions at 900 and 2800 MHz in Relation to their Composition,” J. FoodSci., vol. 39, no. 6, pp. 1153–1156, 1974.
[7] K. W. Farag, J. G. Lyng, D. J. Morgan, and D. A. Cronin, “Dielectric andthermophysical properties of different beef meat blends over a temperature rangeof -18 to +10 °C,” Meat Sci., vol. 79, no. 4, pp. 740–747, 2008.
[8] Y. Choi and M. R. Okos, “Effects of temperature and composition on the thermalproperties of foods.,” Food Eng. Process Appl., vol. 1, pp. 93–101, 1986.
[9] American Society of Heating Refrigerating and Air-Conditioning Engineers,“Thermal properties of food,” in ASHRAE Handbook Refrigeration (SI), AmericanSociety of Heating Refrigerating and Air-Conditioning Engineers, Ed., pp. 9.1-9.2,2006.
[10] M. A. Rao, S. S. H. Rizvi, A. K. Datta, and J. Ahmed, Engineering properties offoods, 4th ed., pp. 227-233, 2014.
243
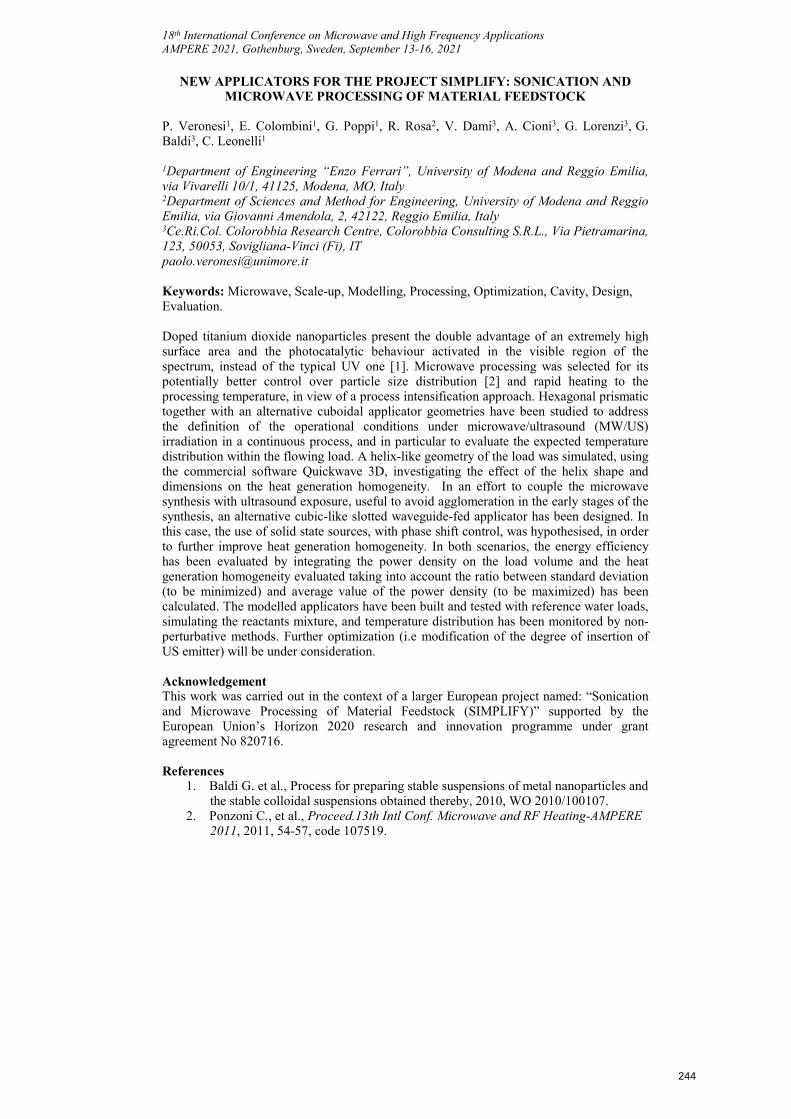
18th International Conference on Microwave and High Frequency Applications AMPERE 2021, Gothenburg, Sweden, September 13-16, 2021
NEW APPLICATORS FOR THE PROJECT SIMPLIFY: SONICATION AND MICROWAVE PROCESSING OF MATERIAL FEEDSTOCK
P. Veronesi1, E. Colombini1, G. Poppi1, R. Rosa2, V. Dami3, A. Cioni3, G. Lorenzi3, G.Baldi3, C. Leonelli1
1Department of Engineering “Enzo Ferrari”, University of Modena and Reggio Emilia, via Vivarelli 10/1, 41125, Modena, MO, Italy 2Department of Sciences and Method for Engineering, University of Modena and Reggio Emilia, via Giovanni Amendola, 2, 42122, Reggio Emilia, Italy 3Ce.Ri.Col. Colorobbia Research Centre, Colorobbia Consulting S.R.L., Via Pietramarina, 123, 50053, Sovigliana-Vinci (Fi), IT [email protected]
Keywords: Microwave, Scale-up, Modelling, Processing, Optimization, Cavity, Design, Evaluation.
Doped titanium dioxide nanoparticles present the double advantage of an extremely high surface area and the photocatalytic behaviour activated in the visible region of the spectrum, instead of the typical UV one [1]. Microwave processing was selected for its potentially better control over particle size distribution [2] and rapid heating to the processing temperature, in view of a process intensification approach. Hexagonal prismatic together with an alternative cuboidal applicator geometries have been studied to address the definition of the operational conditions under microwave/ultrasound (MW/US) irradiation in a continuous process, and in particular to evaluate the expected temperature distribution within the flowing load. A helix-like geometry of the load was simulated, using the commercial software Quickwave 3D, investigating the effect of the helix shape and dimensions on the heat generation homogeneity. In an effort to couple the microwave synthesis with ultrasound exposure, useful to avoid agglomeration in the early stages of the synthesis, an alternative cubic-like slotted waveguide-fed applicator has been designed. In this case, the use of solid state sources, with phase shift control, was hypothesised, in order to further improve heat generation homogeneity. In both scenarios, the energy efficiency has been evaluated by integrating the power density on the load volume and the heat generation homogeneity evaluated taking into account the ratio between standard deviation (to be minimized) and average value of the power density (to be maximized) has been calculated. The modelled applicators have been built and tested with reference water loads, simulating the reactants mixture, and temperature distribution has been monitored by non-perturbative methods. Further optimization (i.e modification of the degree of insertion of US emitter) will be under consideration.
Acknowledgement This work was carried out in the context of a larger European project named: “Sonication and Microwave Processing of Material Feedstock (SIMPLIFY)” supported by the European Union’s Horizon 2020 research and innovation programme under grant agreement No 820716.
References 1. Baldi G. et al., Process for preparing stable suspensions of metal nanoparticles and
the stable colloidal suspensions obtained thereby, 2010, WO 2010/100107.2. Ponzoni C., et al., Proceed.13th Intl Conf. Microwave and RF Heating-AMPERE
2011, 2011, 54-57, code 107519.
244
18th International Conference on Microwave and High Frequency Applications AMPERE 2021, Gothenburg, Sweden, September 13-16, 2021
NEW CLASS OF CHITOSAN-DERIVED HEMOSTATIC AGENTS OBTAINED UNDER MICROWAVE-ASSISTED CONDITIONS
J. Radwan-Pragłowska1, Ł. Janus1, M. Piątkowski1, A. Sierakowska1, D. Bogdał1, T.Galek2, M. Tupaj2, E. Szajna3
1Department of Biotechnology and Physical Chemistry, Faculty of Chemical Engineeringand Technology, Cracow University of Technology, Warszawska 24 Street, 31-155Cracow, Poland2Faculty of Mechanics and Technology, Rzeszow University of Technology, ul.Kwiatkowskiego, 37-450 Stalowa Wola, Poland, Poland3Nano Prime, Metalowców 25, 39-200 Dębica, [email protected]
Keywords (choose minimum two): Microwave, Medical applications, Biological applications, Biomass/Waste, Characterisation
Massive blood loss leads to thousands of deaths around the world and is responsible for the vast majority of reoperations. To prevent blood outflow from the veins, various methods can be applied. Very often, hemorrhages occur as a result of the traffic or domestic accident as well as on the battlefield. Thus, preparation of efficient biomaterials such as hemostatic agents restoring hemostasis for self-use is one of the crucial challenges for modern medicine. Such material should be hemostatic, non-toxic, biocompatible and biodegradable. Moreover, modern products should exhibit additional positive effects on wound healing process. Microwave radiation enables fast and effective natural extracts obtainment which are characterised by high bioactivity, especially in terms of antioxidant properties. The aim of this research was to develop a new type of an efficient hemostatic agent via chemical modification of hemostatic polymer – chitosan and its biological properties enhancement through the addition of Kalanchoe pinnata without its biodegradability rate deterioration. In the following studies multiple plant extracts were obtained in the field of microwave radiation using various solvents and extraction procedures. The products were further investigated over their chemical composition, spectroscopic properties and ability of free radicals’ removal. Providing MW-assisted conditions for chitosan chemical modification in purpose to prepare hydrogels with high swelling abilities enabled reduction crosslinking time up to few minutes and resulted in the obtainment of novel materials with high porosity and superior capability of blood sorption. Adjusting of microwave reactor type, MW irradiation time and power as well as a solvent enabled development of a method for innovative biomaterials preparation with high repeatability due to the limited local overheating points. Performed studies on the newly developed biomaterials confirmed their hemostatic efficiency, biocompatibility to L929 mouse fibroblasts and antioxidant properties thus proving their potential as a natural blood-clotting agent. This research was supported financially by The National Centre for Research and Development grant number LIDER/21/0120/L-10/18/NCBR/2019.
References 1. Pogorielov, V.M., Sikora, V.Z. Chitosan as a Hemostatic Agent: Current State, Eur J Med
B. 2015, 2, 24-33.2. Radwan-Pragłowska, J., Piątkowski, M., Deineka, V., Janus, Ł., Korniienko, V., Husak, E.,
Holubnycha, V., Liubchak, I., Zhurba, V., Sierakowska, A., Pogorielov, M.; Bogdał, D.Chitosan-Based Bioactive Hemostatic Agents with Antibacterial Properties—Synthesisand Characterization. Molecules 2019, 24, 2629.
245
NOVEL APPROACHES FOR MICROWAVE ASSISTED GLASS MELTING
R. Behrend1, V. Grimm1, K. Al-Hamdan2, W. Wintzer3, S. Wiltzsch4, H. Krause1
1TU Bergakademie Freiberg, Institute of thermal engineering, Professorship of Gas and Heat systems, Gustav-Zeuner-Straße 7, 09599 Freiberg, Germany 2TU Bergakademie Freiberg, Institute of glass science and technology, Professorship of glass and enamel technology, Leipziger Straße 28, 09599 Freiberg, Germany 3JSJ Jodeit GmbH, Am Naßtal 10, 07751 Jena, Germany 4Technische Hochschule Nürnberg Georg Simon Ohm, Faculty of Materials Engineering, Wassertorstraße 10, 90489 Nürnberg, Germany [email protected]
Keywords: microwave, power applications, glass melting, hybrid heating
Abstract Glass melting can profit from microwave heating in terms of melting time reduction and throughput increase. Additionally, significant energy savings might be achieved, even when considering losses for microwave generation. Within this paper, we present two approaches for continuous microwave assisted glass melting and first experimental results. The first concept considers the application of microwaves in a platinum crucible with inductive primary heating and a microwave secondary heating. The second concept considers a furnace with resistive heating and microwave assistance. Both approaches have been realised in lab-scale systems. The microwave enhanced platinum crucible melter is based on a conventional induction furnace. A microwave applicator with low microwave leakage, optical view port and material feed was designed and tested. Power was supplied with a 3 kW 2.45 GHz magnetron and measured using a 6-port reflectometer, impedance was matched by means of an automated three stub tuner. A laboratory furnace with two zones has been developed for the second concept. The primary melting zone was equipped with a water-cooled microwave power inlet via rectangular waveguide. The microwave setup was similar to the platinum crucible. Both setups were tested for a wide range of power settings, throughputs and glass compositions. Initial tests show a significant decrease in melting time (batch to primary melt) for both concepts with favourable specific energy consumption. Foam formation and dusting problems are discussed, as well as positioning of the microwave inlet. Considerations for microwave interaction with primary heating systems and refractory materials are discussed. Upgrade solutions for conventional furnaces appear feasible from these results. Measurements regarding microwave leakage show acceptable leakage for 2.45 GHz in both configurations. Microwave interaction with glass and refractory materials is in accordance with results from previous research.
1. IntroductionEnergy intensive processes like glass melting, ceramics burning and calcining processes area conventionally mainly heated with fossil fuel. They are therefore a source of CO2, whichis known for its greenhouse potential. Under the Paris Agreement from 2015 and thefollowing national legislation companies and citizens are forced to reduce CO2 emissions
246
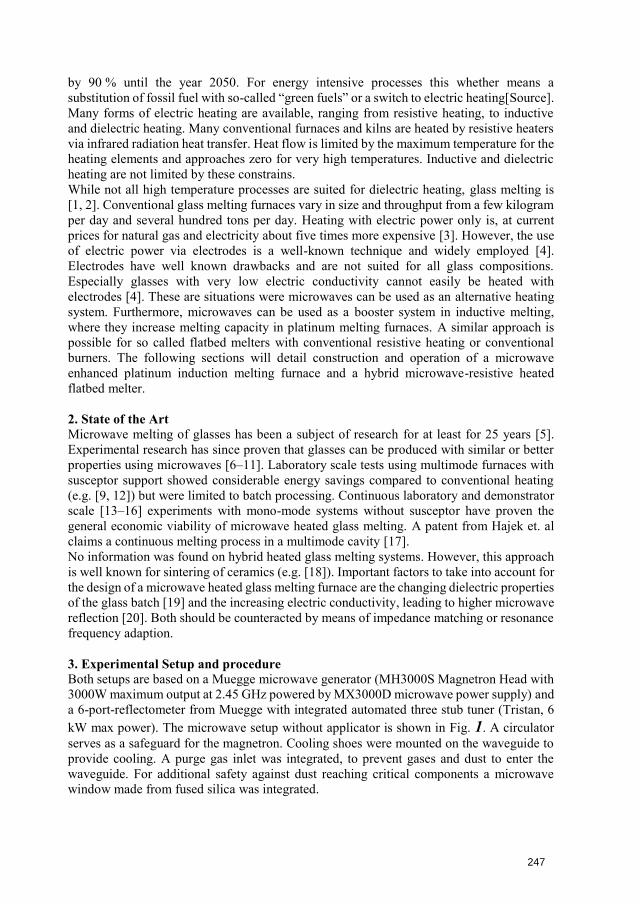
by 90 % until the year 2050. For energy intensive processes this whether means a substitution of fossil fuel with so-called “green fuels” or a switch to electric heating[Source]. Many forms of electric heating are available, ranging from resistive heating, to inductive and dielectric heating. Many conventional furnaces and kilns are heated by resistive heaters via infrared radiation heat transfer. Heat flow is limited by the maximum temperature for the heating elements and approaches zero for very high temperatures. Inductive and dielectric heating are not limited by these constrains. While not all high temperature processes are suited for dielectric heating, glass melting is [1, 2]. Conventional glass melting furnaces vary in size and throughput from a few kilogram per day and several hundred tons per day. Heating with electric power only is, at current prices for natural gas and electricity about five times more expensive [3]. However, the use of electric power via electrodes is a well-known technique and widely employed [4]. Electrodes have well known drawbacks and are not suited for all glass compositions. Especially glasses with very low electric conductivity cannot easily be heated with electrodes [4]. These are situations were microwaves can be used as an alternative heating system. Furthermore, microwaves can be used as a booster system in inductive melting, where they increase melting capacity in platinum melting furnaces. A similar approach is possible for so called flatbed melters with conventional resistive heating or conventional burners. The following sections will detail construction and operation of a microwave enhanced platinum induction melting furnace and a hybrid microwave-resistive heated flatbed melter.
2. State of the ArtMicrowave melting of glasses has been a subject of research for at least for 25 years [5].Experimental research has since proven that glasses can be produced with similar or betterproperties using microwaves [6–11]. Laboratory scale tests using multimode furnaces withsusceptor support showed considerable energy savings compared to conventional heating(e.g. [9, 12]) but were limited to batch processing. Continuous laboratory and demonstratorscale [13–16] experiments with mono-mode systems without susceptor have proven thegeneral economic viability of microwave heated glass melting. A patent from Hajek et. alclaims a continuous melting process in a multimode cavity [17].No information was found on hybrid heated glass melting systems. However, this approachis well known for sintering of ceramics (e.g. [18]). Important factors to take into account forthe design of a microwave heated glass melting furnace are the changing dielectric propertiesof the glass batch [19] and the increasing electric conductivity, leading to higher microwavereflection [20]. Both should be counteracted by means of impedance matching or resonancefrequency adaption.
3. Experimental Setup and procedureBoth setups are based on a Muegge microwave generator (MH3000S Magnetron Head with3000W maximum output at 2.45 GHz powered by MX3000D microwave power supply) anda 6-port-reflectometer from Muegge with integrated automated three stub tuner (Tristan, 6kW max power). The microwave setup without applicator is shown in Fig. 1. A circulator serves as a safeguard for the magnetron. Cooling shoes were mounted on the waveguide to provide cooling. A purge gas inlet was integrated, to prevent gases and dust to enter the waveguide. For additional safety against dust reaching critical components a microwave window made from fused silica was integrated.
247
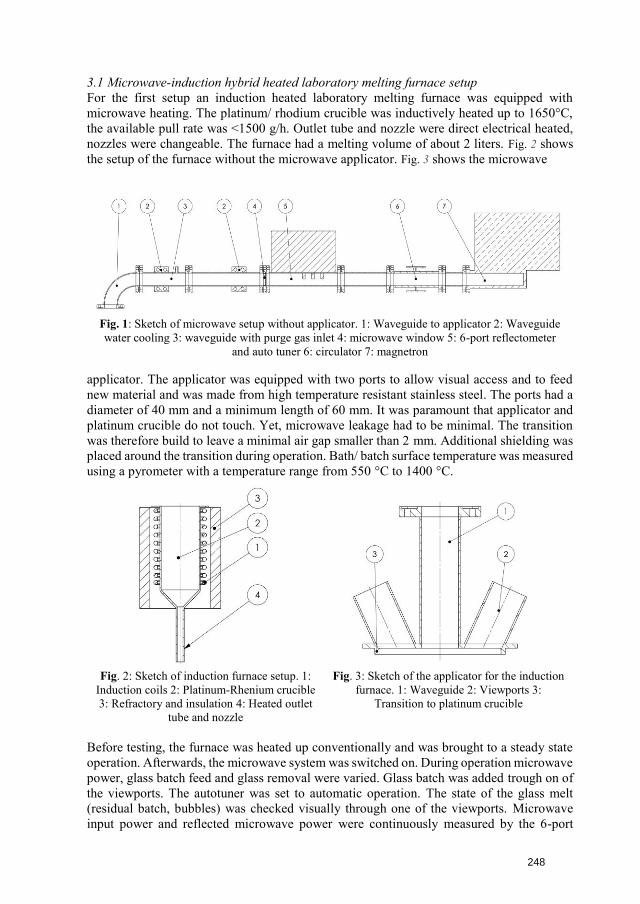
3.1 Microwave-induction hybrid heated laboratory melting furnace setup For the first setup an induction heated laboratory melting furnace was equipped with microwave heating. The platinum/ rhodium crucible was inductively heated up to 1650°C, the available pull rate was <1500 g/h. Outlet tube and nozzle were direct electrical heated, nozzles were changeable. The furnace had a melting volume of about 2 liters. Fig. 2 shows the setup of the furnace without the microwave applicator. Fig. 3 shows the microwave
applicator. The applicator was equipped with two ports to allow visual access and to feed new material and was made from high temperature resistant stainless steel. The ports had a diameter of 40 mm and a minimum length of 60 mm. It was paramount that applicator and platinum crucible do not touch. Yet, microwave leakage had to be minimal. The transition was therefore build to leave a minimal air gap smaller than 2 mm. Additional shielding was placed around the transition during operation. Bath/ batch surface temperature was measured using a pyrometer with a temperature range from 550 °C to 1400 °C.
Fig. 2: Sketch of induction furnace setup. 1: Induction coils 2: Platinum-Rhenium crucible 3: Refractory and insulation 4: Heated outlet
tube and nozzle
Fig. 3: Sketch of the applicator for the induction furnace. 1: Waveguide 2: Viewports 3:
Transition to platinum crucible
Before testing, the furnace was heated up conventionally and was brought to a steady state operation. Afterwards, the microwave system was switched on. During operation microwave power, glass batch feed and glass removal were varied. Glass batch was added trough on of the viewports. The autotuner was set to automatic operation. The state of the glass melt (residual batch, bubbles) was checked visually through one of the viewports. Microwave input power and reflected microwave power were continuously measured by the 6-port
Fig. 1: Sketch of microwave setup without applicator. 1: Waveguide to applicator 2: Waveguide water cooling 3: waveguide with purge gas inlet 4: microwave window 5: 6-port reflectometer
and auto tuner 6: circulator 7: magnetron
248
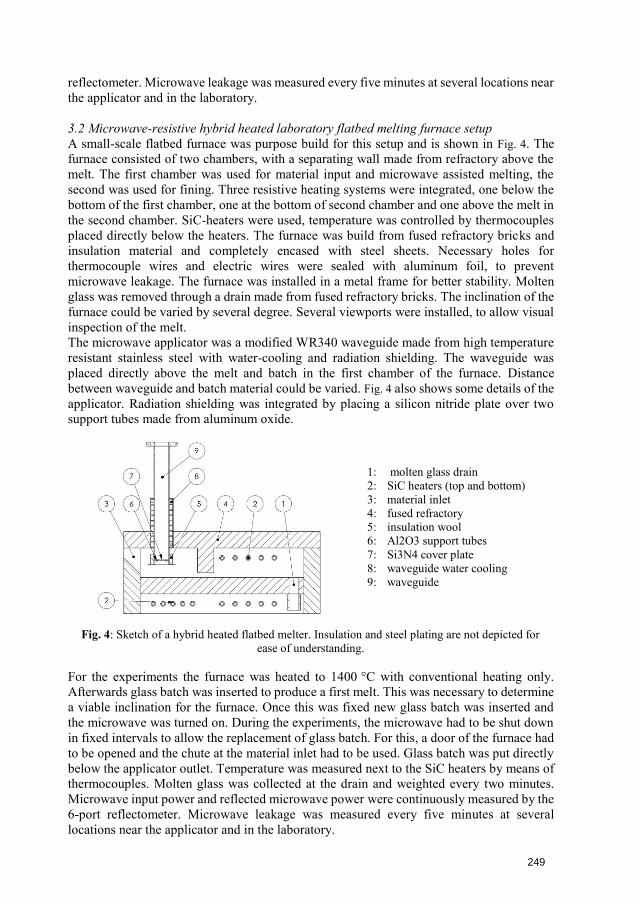
reflectometer. Microwave leakage was measured every five minutes at several locations near the applicator and in the laboratory.
3.2 Microwave-resistive hybrid heated laboratory flatbed melting furnace setup A small-scale flatbed furnace was purpose build for this setup and is shown in Fig. 4. The furnace consisted of two chambers, with a separating wall made from refractory above the melt. The first chamber was used for material input and microwave assisted melting, the second was used for fining. Three resistive heating systems were integrated, one below the bottom of the first chamber, one at the bottom of second chamber and one above the melt in the second chamber. SiC-heaters were used, temperature was controlled by thermocouples placed directly below the heaters. The furnace was build from fused refractory bricks and insulation material and completely encased with steel sheets. Necessary holes for thermocouple wires and electric wires were sealed with aluminum foil, to prevent microwave leakage. The furnace was installed in a metal frame for better stability. Molten glass was removed through a drain made from fused refractory bricks. The inclination of the furnace could be varied by several degree. Several viewports were installed, to allow visual inspection of the melt. The microwave applicator was a modified WR340 waveguide made from high temperature resistant stainless steel with water-cooling and radiation shielding. The waveguide was placed directly above the melt and batch in the first chamber of the furnace. Distance between waveguide and batch material could be varied. Fig. 4 also shows some details of the applicator. Radiation shielding was integrated by placing a silicon nitride plate over two support tubes made from aluminum oxide.
1: molten glass drain 2: SiC heaters (top and bottom) 3: material inlet 4: fused refractory 5: insulation wool 6: Al2O3 support tubes 7: Si3N4 cover plate 8: waveguide water cooling 9: waveguide
Fig. 4: Sketch of a hybrid heated flatbed melter. Insulation and steel plating are not depicted for ease of understanding.
For the experiments the furnace was heated to 1400 °C with conventional heating only. Afterwards glass batch was inserted to produce a first melt. This was necessary to determine a viable inclination for the furnace. Once this was fixed new glass batch was inserted and the microwave was turned on. During the experiments, the microwave had to be shut down in fixed intervals to allow the replacement of glass batch. For this, a door of the furnace had to be opened and the chute at the material inlet had to be used. Glass batch was put directly below the applicator outlet. Temperature was measured next to the SiC heaters by means of thermocouples. Molten glass was collected at the drain and weighted every two minutes. Microwave input power and reflected microwave power were continuously measured by the 6-port reflectometer. Microwave leakage was measured every five minutes at severallocations near the applicator and in the laboratory.
249
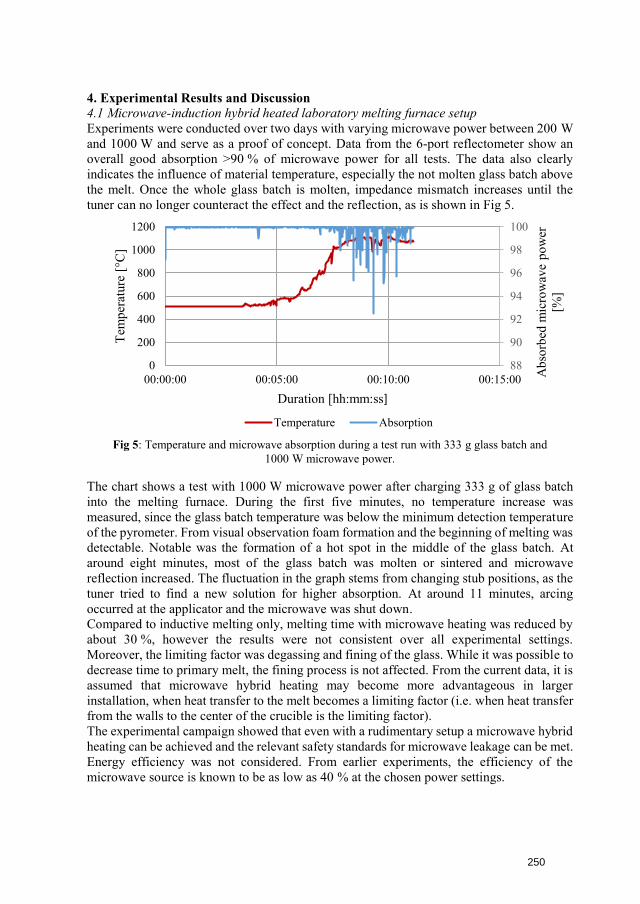
4. Experimental Results and Discussion4.1 Microwave-induction hybrid heated laboratory melting furnace setupExperiments were conducted over two days with varying microwave power between 200 Wand 1000 W and serve as a proof of concept. Data from the 6-port reflectometer show anoverall good absorption >90 % of microwave power for all tests. The data also clearlyindicates the influence of material temperature, especially the not molten glass batch abovethe melt. Once the whole glass batch is molten, impedance mismatch increases until thetuner can no longer counteract the effect and the reflection, as is shown in Fig 5.
Fig 5: Temperature and microwave absorption during a test run with 333 g glass batch and 1000 W microwave power.
The chart shows a test with 1000 W microwave power after charging 333 g of glass batch into the melting furnace. During the first five minutes, no temperature increase was measured, since the glass batch temperature was below the minimum detection temperature of the pyrometer. From visual observation foam formation and the beginning of melting was detectable. Notable was the formation of a hot spot in the middle of the glass batch. At around eight minutes, most of the glass batch was molten or sintered and microwave reflection increased. The fluctuation in the graph stems from changing stub positions, as the tuner tried to find a new solution for higher absorption. At around 11 minutes, arcing occurred at the applicator and the microwave was shut down. Compared to inductive melting only, melting time with microwave heating was reduced by about 30 %, however the results were not consistent over all experimental settings. Moreover, the limiting factor was degassing and fining of the glass. While it was possible to decrease time to primary melt, the fining process is not affected. From the current data, it is assumed that microwave hybrid heating may become more advantageous in larger installation, when heat transfer to the melt becomes a limiting factor (i.e. when heat transfer from the walls to the center of the crucible is the limiting factor). The experimental campaign showed that even with a rudimentary setup a microwave hybrid heating can be achieved and the relevant safety standards for microwave leakage can be met. Energy efficiency was not considered. From earlier experiments, the efficiency of the microwave source is known to be as low as 40 % at the chosen power settings.
88
90
92
94
96
98
100
0
200
400
600
800
1000
1200
00:00:00 00:05:00 00:10:00 00:15:00 Abs
orbe
d m
icro
wav
e po
wer
[%
]
Tem
pera
ture
[°C
]
Duration [hh:mm:ss]
Temperature Absorption
250
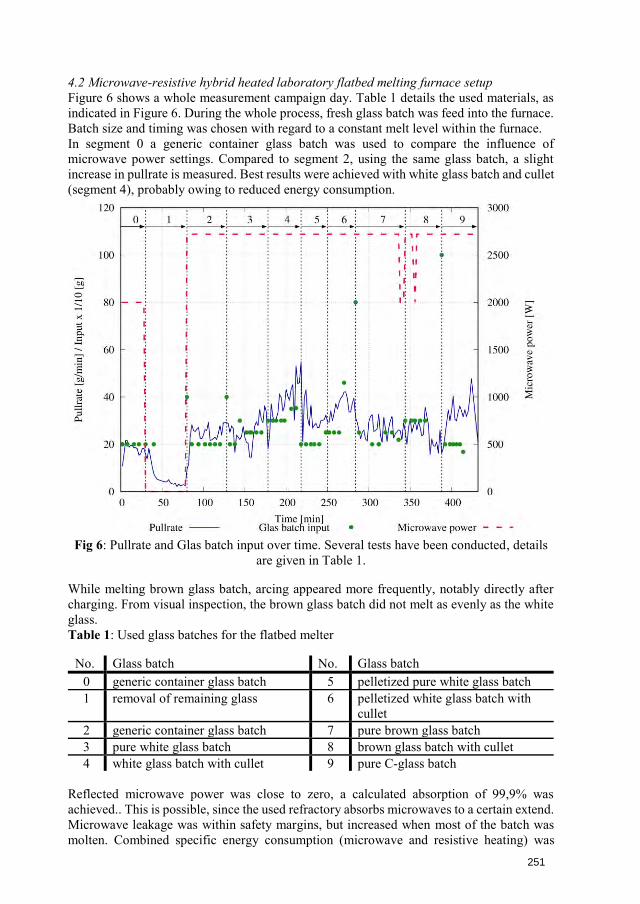
4.2 Microwave-resistive hybrid heated laboratory flatbed melting furnace setup Figure 6 shows a whole measurement campaign day. Table 1 details the used materials, as indicated in Figure 6. During the whole process, fresh glass batch was feed into the furnace. Batch size and timing was chosen with regard to a constant melt level within the furnace. In segment 0 a generic container glass batch was used to compare the influence of microwave power settings. Compared to segment 2, using the same glass batch, a slight increase in pullrate is measured. Best results were achieved with white glass batch and cullet (segment 4), probably owing to reduced energy consumption.
Fig 6: Pullrate and Glas batch input over time. Several tests have been conducted, details are given in Table 1.
While melting brown glass batch, arcing appeared more frequently, notably directly after charging. From visual inspection, the brown glass batch did not melt as evenly as the white glass. Table 1: Used glass batches for the flatbed melter
No. Glass batch No. Glass batch 0 generic container glass batch 5 pelletized pure white glass batch 1 removal of remaining glass 6 pelletized white glass batch with
cullet 2 generic container glass batch 7 pure brown glass batch 3 pure white glass batch 8 brown glass batch with cullet 4 white glass batch with cullet 9 pure C-glass batch
Reflected microwave power was close to zero, a calculated absorption of 99,9% was achieved.. This is possible, since the used refractory absorbs microwaves to a certain extend. Microwave leakage was within safety margins, but increased when most of the batch was molten. Combined specific energy consumption (microwave and resistive heating) was
251
calculated to 1.3 kWh/kg. Compared to around 1.1 kWh/kg for optimized industrial furnaces, these results are promising for a small-scale system. Once the system was in thermal equilibrium, resistive heating below the microwave port could be turned off, without affecting the system. There were no noticeable interactions between microwaves and the resistive heaters. One thermocouple was damaged during the test runs, but it was not verifiable, whether this was a microwave related damage or not.
5 Conclusion This paper highlights some novel approaches for microwave assisted glass melting. Microwave enhanced melting processes in an induction furnace and a resistive furnace have been demonstrated. Both processes could be adapted to a hybrid heating approach with relatively low effort. Operator safety and equipment safety was good. The produced glass was of similar quality as conventional glass. For the microwave-induction hybrid approach operational limitations stem from the finning process. Since the bath surface stays the same, finning rate is not increased and cannot compensate for the increased amounts of primary melt. The use of microwaves might be of greater advantage in larger systems, were heat transfer from the crucible walls limit the glass pull rate. The microwave-resistive hybrid approach worked very well and from first results, a scale-up is feasible. Since a dedicated space for finning was foreseen, melting could be increased without problems. The hybrid approaches present a viable option for the use of microwaves in glass melting and can increase throughput in existing plants.
Acknowledgments Parts of this research were carried out in the framework of the Central SME Innovation Programme (ZIM) under project number ZF 4522202GM8. It was supported by the Federal Ministry for Economic Affairs and Energy (BMWi) through the AiF (German Federation of Industrial Research Associations eV) based on a decision taken by the German Bundestag.
References [1] O. V. Kharissova, B. I. Kharisov, and J. J. R. Valdés, “Review: The Use of
Microwave Irradiation in the Processing of Glasses and Their Composites,” Ind. Eng.Chem. Res., vol. 49, no. 4, pp. 1457–1466, 2010, doi: 10.1021/ie9014765.
[2] A. K. Mandal and R. Sen, “An overview on microwave processing of material: Aspecial emphasis on glass melting,” Materials and Manufacturing Processes, vol. 32,no. 1, pp. 1–20, 2016, doi: 10.1080/10426914.2016.1151046.
[3] P. C. Torres Vega et al., “Study on energy prices, costs and their impact on industryand households,” MJ-02-20-370-EN-N, 2020. [Online]. Available:https://op.europa.eu/en/publication-detail/-publication/16e7f212-0dc5-11eb-bc07-01aa75ed71a1
[4] L. Biennek, Entwicklung neuer Schmelztechnologien für alkalifreie Erdalkali-Alumo-Borosilikatgläser. Freiberg, 2020. [Online]. Available: https://nbn-resolving.org/urn:nbn:de:bsz:105-qucosa2-366321
[5] M. P. Knox and G. J. Copley, “Use of microwave radiation for the processing ofglass,” Glass Technology, vol. 38, no. 3, pp. 91–97, 1997.
[6] B. Mandal, A. Halder, P. K. Sinha, R. Sen, and A. K. Mandal, “Investigation of ironredox ratio in zinc borate glass prepared in microwave heating and comparison withconventional glass,” Journal of Non-Crystalline Solids, vol. 450, no. 3, pp. 12–17,2016, doi: 10.1016/j.jnoncrysol.2016.07.028.
252
[7] Y. Mandal, P. K. Sinha, and A. K. Mandal, “Effect of melting time on volatility, OHin glass in microwave processing,” Materials and Manufacturing Processes, vol. 36,no. 4, pp. 426–434, 2021, doi: 10.1080/10426914.2020.1843670.
[8] A. K. Mandal, D. Agrawal, and R. Sen, “Preparation of homogeneous bariumborosilicate glass using microwave energy,” Journal of Non-Crystalline Solids, 371-372, pp. 41–46, 2013, doi: 10.1016/j.jnoncrysol.2013.04.044.
[9] A. Halder, B. Mandal, S. Mahanty, R. Sen, and A. K. Mandal, “A comparativeproperty investigation of lithium phosphate glass melted in microwave andconventional heating,” Bull Mater Sci, vol. 40, no. 5, pp. 999–1006, 2017, doi:10.1007/s12034-017-1437-6.
[10] A. Basak, L. Ramrakhiani, S. Ghosh, R. Sen, and A. K. Mandal, “Preparation ofchromium doped phosphate glass adopting microwave irradiation and comparativeanalysis of properties with conventional glass,” Journal of Non-Crystalline Solids,vol. 500, 41–42, pp. 11–17, 2018, doi: 10.1016/j.jnoncrysol.2018.04.014.
[11] A. K. Mandal, K. Biswas, K. Annapurna, C. Guha, and R. Sen, “Preparation ofalumino-phosphate glass by microwave radiation,” J. Mater. Res., vol. 28, no. 14, pp.1955–1961, 2013, doi: 10.1557/jmr.2013.168.
[12] A. K. Mandal, S. Sen, S. Mandal, C. Guha, and R. Sen, “Energy Efficient Melting ofGlass for Nuclear Waste Immobilization Using Microwave Radiation,” InternationalJournal of Green Energy, vol. 12, no. 12, pp. 1280–1287, 2015, doi:10.1080/15435075.2014.895735.
[13] J. J. Reinosa, B. García‐Baños, J. M. Catalá‐Civera, A. M. López‐Buendía, L.Guaita, and J. F. Fernández, “Feasible glass‐melting process assisted bymicrowaves,” Int J Appl Glass Sci, 2018, doi: 10.1111/ijag.13093.
[14] V. L. Guaita Delgado, “Adaptive production systems and measurement and controlequipment for optimal energy consumption and near-to-zero emissions inmanufacturing processes,” 2016. [Online]. Available:https://cordis.europa.eu/project/id/314636/reporting
[15] C. Dorn et al., “A Systematic LCA-enhanced KPI Evaluation towards SustainableManufacturing in Industrial Decision-making Processes. A Case Study in Glass andCeramic Frits Production,” Procedia CIRP, vol. 48, pp. 158–163, 2016, doi:10.1016/j.procir.2016.03.146.
[16] C. Dorn, R. Behrend, V. Uhlig, D. Trimis, and H. Krause, “A technology comparisonconcerning scale dependencies of industrial furnaces. A case study of glassproduction,” Energy Procedia, vol. 120, pp. 388–394, 2017, doi:10.1016/j.egypro.2017.07.230.
[17] M. Hajek, J. Drahos, V. Volf, and J. Vosab, “Method and apparatus for heattreatment of glass materials and natural materials specifically of volcanic origin,”WO2000078684A1, World.
[18] Dreikorn, J., Buryan, M., Leparoux, S., Krause, H., & Lampke, T., “MicrowaveHybrid Sintering of Soft Ferrites,” in Ninth International Conference on Ferrites/Proceedings of the International Conference on Ferrites (ICF-9): San Francisco,California (2004), R. F. Soohoo, Ed., Westerville, Ohio: American Ceramic Soc,2005, pp. 15–20.
[19] W. B. Westphal and A. Sils, “Dielectric constant and loss data,” Air Force SystemsCommand, Technical report (Air Force Materials Laboratory (U.S.)) AFML-TR-72-39., 1972.
[20] N. P. Bansal and R. H. Doremus, Handbook of glass properties. Orlando: Acad. Pr,1986.
253
18th International Conference on Microwave and High Frequency ApplicationsAMPERE 2021, Online, September 13-16, 2021
NOVEL MICROWAVE APPLICATOR DESIGN FOR TUMOR DETECTION INSIDE THE HUMAN BREAST
C. J. Salomon1, N. Petrovic1, P. O. Risman1
1Mälardalen University, School of Innovation, Design and Engineering, Box 883, 72123 Västerås, Sweden [email protected]
A common problem in microwave imaging of human body parts is the creation of unwanted surface waves due to permittivity mismatch between the object under test (OUT) and the surrounding space. These waves propagate more easily along the surface of the OUT and can overshadow the desired signal from an inner inhomogeneity (e.g. a tumor). Submerging the OUT into a matching bolus liquid has proven to reduce surface waves, yet also to increase the overall signal attenuation. In this paper we present a novel applicator concept that can be used to efficiently illuminate the human breast without the need for such a bolus liquid. Electromagnetic simulations show that the applicator creates almost no surface waves even if placed 1 mm away from a simplified breast model. An estimation of the applicator performance in a realistic measurement scenario is made using a detailed breast model from the UWCEM Numerical Breast Phantoms Repository in the simulation.
Keywords: Microwave, Medical applications, Sensor technology, Applicator, Antenna, Design
1 Introduction Microwave technology has been extensively used in the last two decades to detect tissue anomalies inside the human breast, with e.g. [1], [2] and [3] providing comprehensive reviews. One major difficulty in this field of research has been to effectively couple energy from the antenna into the object under test (OUT) in order to illuminate the region of interest (ROI) with electromagnetic microwave radiation. Multiple antenna types have been used in microwave imaging systems, the most common ones being monopole antennas [4], open-ended waveguides [5], Vivaldi antennas [6]–[8], and other types of patch antennas [9]. However, these antenna types were originally designed to radiate power into free space. Due to the high dielectric contrast between air and tissue, reflections will occur at the outer breast surface, limiting the overall energy transmitted into the breast. Additionally, surface waves will occur due to the contrast in dielectric loss, which propagate along the outer surface of the breast, obscuring a potential tumor response even some distance away from the transmitting antenna [10], [11]. An efficient way to reduce reflections and surface waves has been to submerge breast and antennas into a coupling medium (so-called bolus liquid) [12]. This lowers the dielectric contrast between skin tissue and surrounding medium, reducing reflections at the breast surface. Losses in the coupling liquid attenuate possible surface waves but also increase the overall signal attenuation [13]. This weakening of the wanted signal can be compensated by highly sensible measurement equipment which increases complexity and cost of the measurement system [14]. Taking this into consideration, as well as for patient comfort and hygienic reasons, contactless measurement systems without immersion liquid are desirable.
254
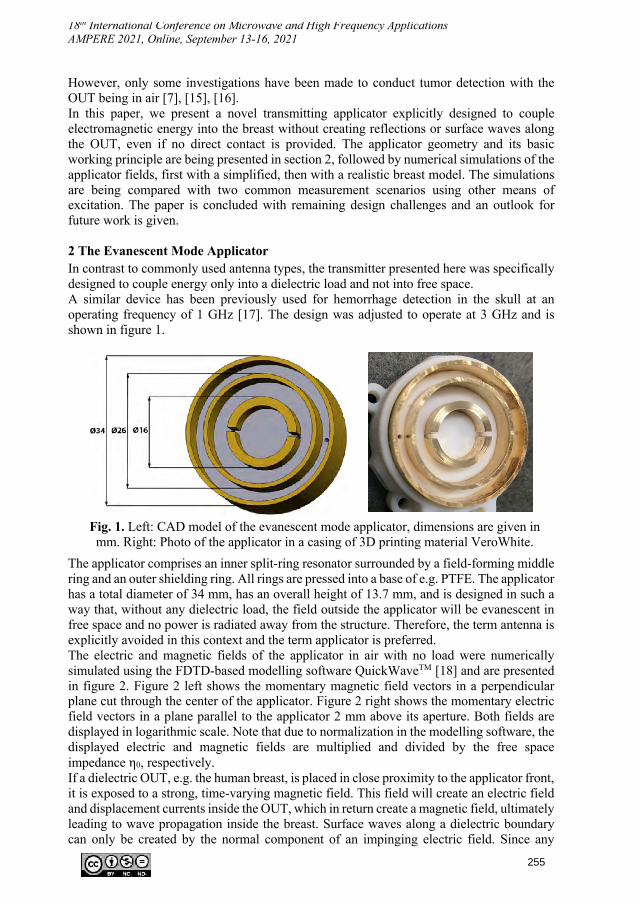
18th International Conference on Microwave and High Frequency ApplicationsAMPERE 2021, Online, September 13-16, 2021
However, only some investigations have been made to conduct tumor detection with the OUT being in air [7], [15], [16]. In this paper, we present a novel transmitting applicator explicitly designed to couple electromagnetic energy into the breast without creating reflections or surface waves along the OUT, even if no direct contact is provided. The applicator geometry and its basic working principle are being presented in section 2, followed by numerical simulations of the applicator fields, first with a simplified, then with a realistic breast model. The simulations are being compared with two common measurement scenarios using other means of excitation. The paper is concluded with remaining design challenges and an outlook for future work is given.
2 The Evanescent Mode Applicator In contrast to commonly used antenna types, the transmitter presented here was specifically designed to couple energy only into a dielectric load and not into free space. A similar device has been previously used for hemorrhage detection in the skull at an operating frequency of 1 GHz [17]. The design was adjusted to operate at 3 GHz and is shown in figure 1.
Fig. 1. Left: CAD model of the evanescent mode applicator, dimensions are given in mm. Right: Photo of the applicator in a casing of 3D printing material VeroWhite.
The applicator comprises an inner split-ring resonator surrounded by a field-forming middle ring and an outer shielding ring. All rings are pressed into a base of e.g. PTFE. The applicator has a total diameter of 34 mm, has an overall height of 13.7 mm, and is designed in such a way that, without any dielectric load, the field outside the applicator will be evanescent in free space and no power is radiated away from the structure. Therefore, the term antenna is explicitly avoided in this context and the term applicator is preferred. The electric and magnetic fields of the applicator in air with no load were numerically simulated using the FDTD-based modelling software QuickWaveTM [18] and are presented in figure 2. Figure 2 left shows the momentary magnetic field vectors in a perpendicular plane cut through the center of the applicator. Figure 2 right shows the momentary electric field vectors in a plane parallel to the applicator 2 mm above its aperture. Both fields are displayed in logarithmic scale. Note that due to normalization in the modelling software, the displayed electric and magnetic fields are multiplied and divided by the free space impedance η0, respectively. If a dielectric OUT, e.g. the human breast, is placed in close proximity to the applicator front, it is exposed to a strong, time-varying magnetic field. This field will create an electric field and displacement currents inside the OUT, which in return create a magnetic field, ultimately leading to wave propagation inside the breast. Surface waves along a dielectric boundary can only be created by the normal component of an impinging electric field. Since any
255
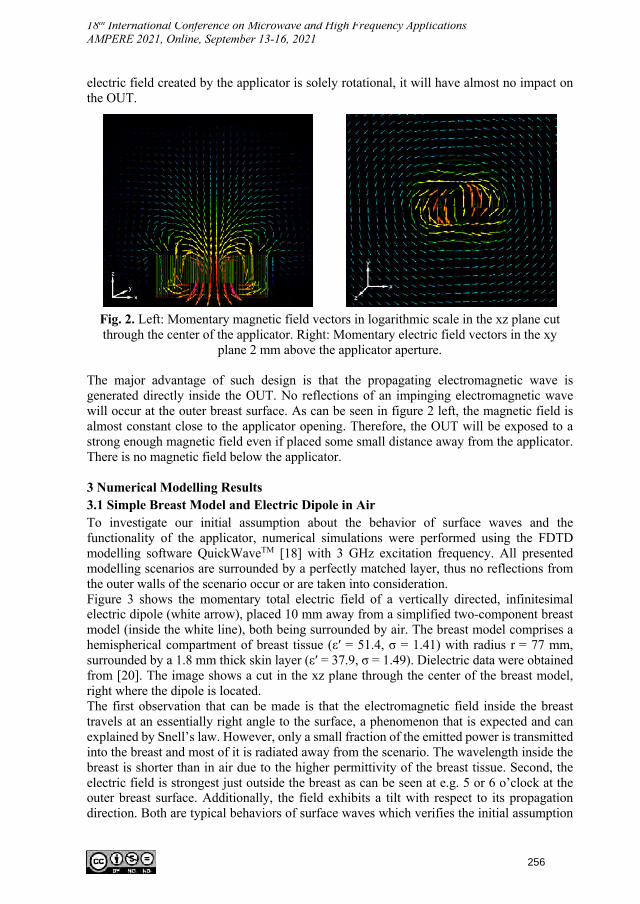
18th International Conference on Microwave and High Frequency ApplicationsAMPERE 2021, Online, September 13-16, 2021
electric field created by the applicator is solely rotational, it will have almost no impact on the OUT.
The major advantage of such design is that the propagating electromagnetic wave is generated directly inside the OUT. No reflections of an impinging electromagnetic wave will occur at the outer breast surface. As can be seen in figure 2 left, the magnetic field is almost constant close to the applicator opening. Therefore, the OUT will be exposed to a strong enough magnetic field even if placed some small distance away from the applicator. There is no magnetic field below the applicator.
3 Numerical Modelling Results 3.1 Simple Breast Model and Electric Dipole in Air To investigate our initial assumption about the behavior of surface waves and the functionality of the applicator, numerical simulations were performed using the FDTD modelling software QuickWaveTM [18] with 3 GHz excitation frequency. All presented modelling scenarios are surrounded by a perfectly matched layer, thus no reflections from the outer walls of the scenario occur or are taken into consideration. Figure 3 shows the momentary total electric field of a vertically directed, infinitesimal electric dipole (white arrow), placed 10 mm away from a simplified two-component breast model (inside the white line), both being surrounded by air. The breast model comprises a hemispherical compartment of breast tissue (ε′ = 51.4, σ = 1.41) with radius r= 77 mm, surrounded by a 1.8 mm thick skin layer (ε′ = 37.9, σ = 1.49). Dielectric data were obtained from [20]. The image shows a cut in the xz plane through the center of the breast model, right where the dipole is located. The first observation that can be made is that the electromagnetic field inside the breast travels at an essentially right angle to the surface, a phenomenon that is expected and can explained by Snell’s law. However, only a small fraction of the emitted power is transmitted into the breast and most of it is radiated away from the scenario. The wavelength inside the breast is shorter than in air due to the higher permittivity of the breast tissue. Second, the electric field is strongest just outside the breast as can be seen at e.g. 5 or 6 o’clock at the outer breast surface. Additionally, the field exhibits a tilt with respect to its propagation direction. Both are typical behaviors of surface waves which verifies the initial assumption
Fig. 2. Left: Momentary magnetic field vectors in logarithmic scale in the xz plane cut through the center of the applicator. Right: Momentary electric field vectors in the xy
plane 2 mm above the applicator aperture.
256
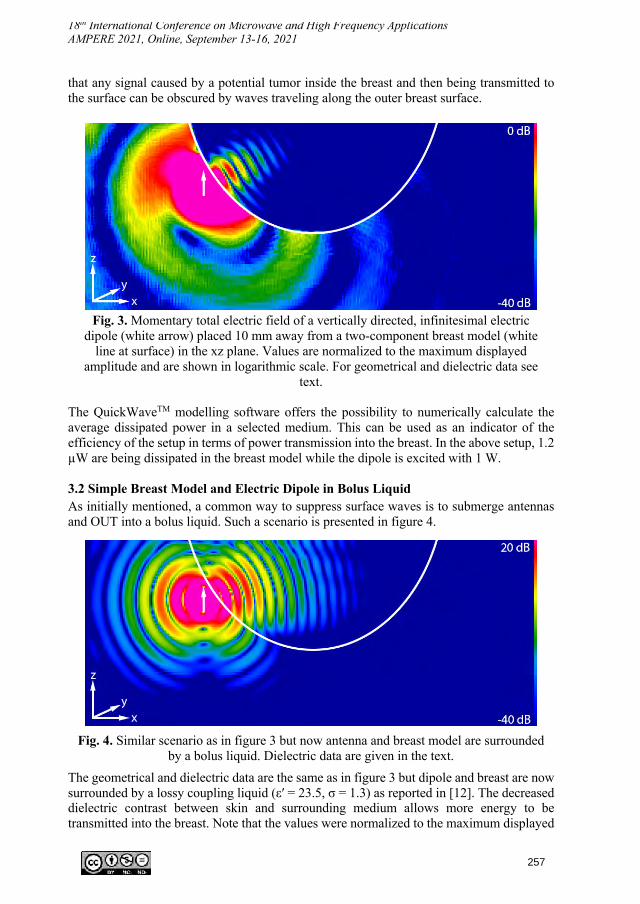
18th International Conference on Microwave and High Frequency ApplicationsAMPERE 2021, Online, September 13-16, 2021
that any signal caused by a potential tumor inside the breast and then being transmitted to the surface can be obscured by waves traveling along the outer breast surface.
Fig. 3. Momentary total electric field of a vertically directed, infinitesimal electric dipole (white arrow) placed 10 mm away from a two-component breast model (white
line at surface) in the xz plane. Values are normalized to the maximum displayed amplitude and are shown in logarithmic scale. For geometrical and dielectric data see
text.
The QuickWaveTM modelling software offers the possibility to numerically calculate the average dissipated power in a selected medium. This can be used as an indicator of the efficiency of the setup in terms of power transmission into the breast. In the above setup, 1.2 µW are being dissipated in the breast model while the dipole is excited with 1 W.
3.2 Simple Breast Model and Electric Dipole in Bolus Liquid As initially mentioned, a common way to suppress surface waves is to submerge antennas and OUT into a bolus liquid. Such a scenario is presented in figure 4.
The geometrical and dielectric data are the same as in figure 3 but dipole and breast are now surrounded by a lossy coupling liquid (ε′ = 23.5, σ = 1.3) as reported in [12]. The decreased dielectric contrast between skin and surrounding medium allows more energy to be transmitted into the breast. Note that the values were normalized to the maximum displayed
Fig. 4. Similar scenario as in figure 3 but now antenna and breast model are surrounded by a bolus liquid. Dielectric data are given in the text.
257
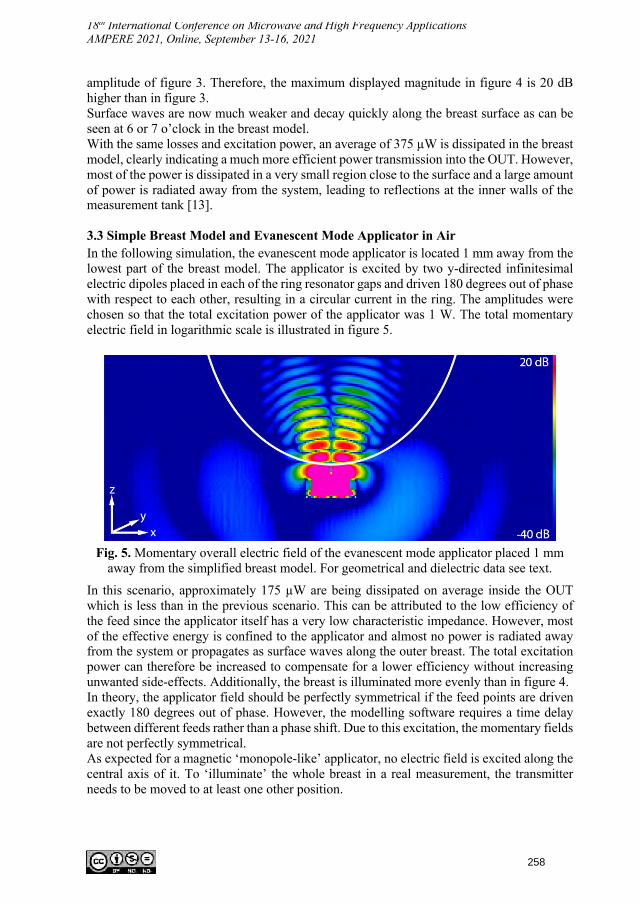
18th International Conference on Microwave and High Frequency ApplicationsAMPERE 2021, Online, September 13-16, 2021
amplitude of figure 3. Therefore, the maximum displayed magnitude in figure 4 is 20 dB higher than in figure 3. Surface waves are now much weaker and decay quickly along the breast surface as can be seen at 6 or 7 o’clock in the breast model. With the same losses and excitation power, an average of 375 µW is dissipated in the breast model, clearly indicating a much more efficient power transmission into the OUT. However, most of the power is dissipated in a very small region close to the surface and a large amount of power is radiated away from the system, leading to reflections at the inner walls of the measurement tank [13].
3.3 Simple Breast Model and Evanescent Mode Applicator in Air In the following simulation, the evanescent mode applicator is located 1 mm away from the lowest part of the breast model. The applicator is excited by two y-directed infinitesimal electric dipoles placed in each of the ring resonator gaps and driven 180 degrees out of phase with respect to each other, resulting in a circular current in the ring. The amplitudes were chosen so that the total excitation power of the applicator was 1 W. The total momentary electric field in logarithmic scale is illustrated in figure 5.
In this scenario, approximately 175 µW are being dissipated on average inside the OUT which is less than in the previous scenario. This can be attributed to the low efficiency of the feed since the applicator itself has a very low characteristic impedance. However, most of the effective energy is confined to the applicator and almost no power is radiated away from the system or propagates as surface waves along the outer breast. The total excitation power can therefore be increased to compensate for a lower efficiency without increasing unwanted side-effects. Additionally, the breast is illuminated more evenly than in figure 4. In theory, the applicator field should be perfectly symmetrical if the feed points are driven exactly 180 degrees out of phase. However, the modelling software requires a time delay between different feeds rather than a phase shift. Due to this excitation, the momentary fields are not perfectly symmetrical. As expected for a magnetic ‘monopole-like’ applicator, no electric field is excited along the central axis of it. To ‘illuminate’ the whole breast in a real measurement, the transmitter needs to be moved to at least one other position.
Fig. 5. Momentary overall electric field of the evanescent mode applicator placed 1 mm away from the simplified breast model. For geometrical and dielectric data see text.
258
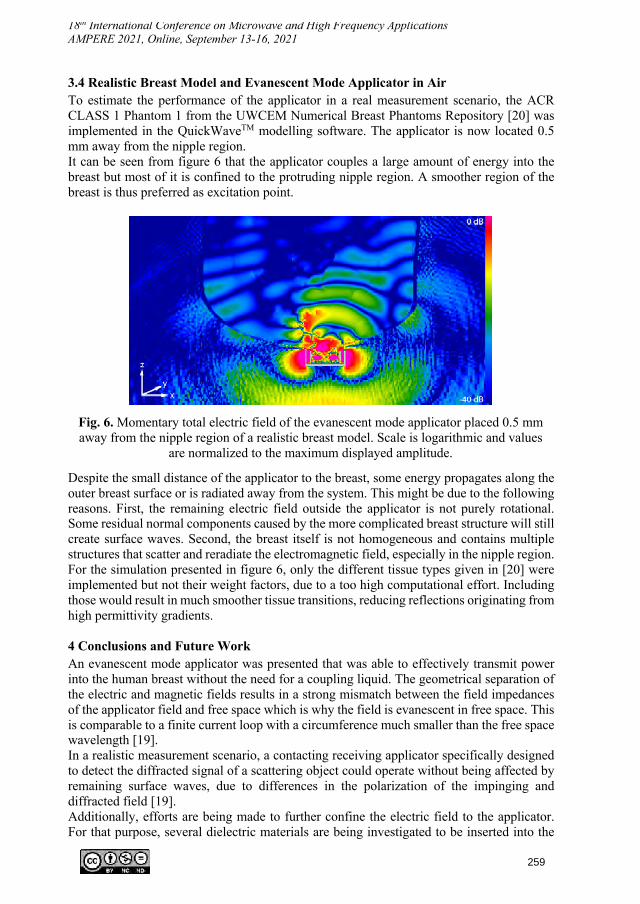
18th International Conference on Microwave and High Frequency ApplicationsAMPERE 2021, Online, September 13-16, 2021
3.4 Realistic Breast Model and Evanescent Mode Applicator in Air To estimate the performance of the applicator in a real measurement scenario, the ACR CLASS 1 Phantom 1 from the UWCEM Numerical Breast Phantoms Repository [20] was implemented in the QuickWaveTM modelling software. The applicator is now located 0.5 mm away from the nipple region. It can be seen from figure 6 that the applicator couples a large amount of energy into the breast but most of it is confined to the protruding nipple region. A smoother region of the breast is thus preferred as excitation point.
Despite the small distance of the applicator to the breast, some energy propagates along the outer breast surface or is radiated away from the system. This might be due to the following reasons. First, the remaining electric field outside the applicator is not purely rotational. Some residual normal components caused by the more complicated breast structure will still create surface waves. Second, the breast itself is not homogeneous and contains multiple structures that scatter and reradiate the electromagnetic field, especially in the nipple region. For the simulation presented in figure 6, only the different tissue types given in [20] were implemented but not their weight factors, due to a too high computational effort. Including those would result in much smoother tissue transitions, reducing reflections originating from high permittivity gradients.
4 Conclusions and Future Work An evanescent mode applicator was presented that was able to effectively transmit power into the human breast without the need for a coupling liquid. The geometrical separation of the electric and magnetic fields results in a strong mismatch between the field impedances of the applicator field and free space which is why the field is evanescent in free space. This is comparable to a finite current loop with a circumference much smaller than the free space wavelength [19]. In a realistic measurement scenario, a contacting receiving applicator specifically designed to detect the diffracted signal of a scattering object could operate without being affected by remaining surface waves, due to differences in the polarization of the impinging and diffracted field [19]. Additionally, efforts are being made to further confine the electric field to the applicator. For that purpose, several dielectric materials are being investigated to be inserted into the
Fig. 6. Momentary total electric field of the evanescent mode applicator placed 0.5 mm away from the nipple region of a realistic breast model. Scale is logarithmic and values
are normalized to the maximum displayed amplitude.
259
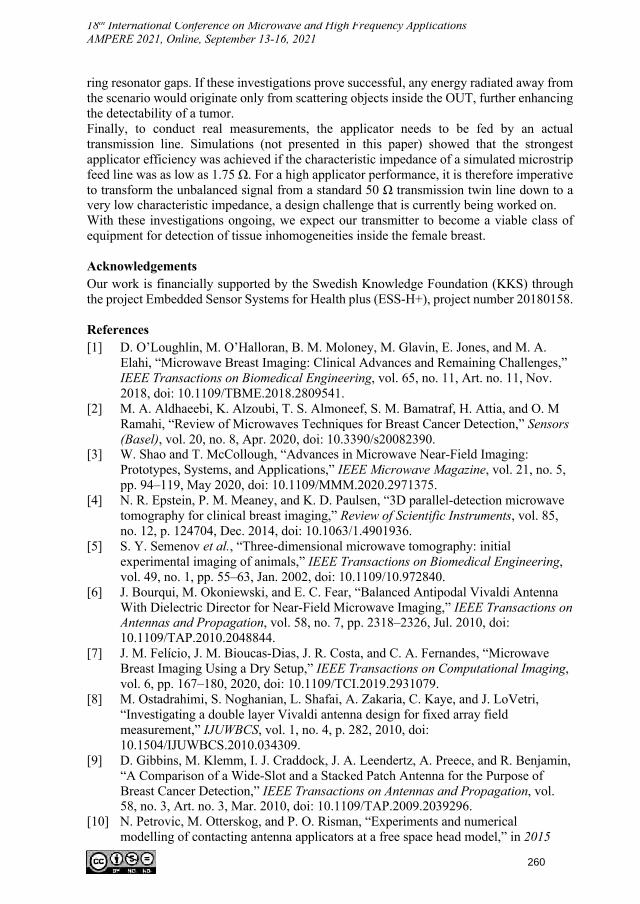
18th International Conference on Microwave and High Frequency ApplicationsAMPERE 2021, Online, September 13-16, 2021
ring resonator gaps. If these investigations prove successful, any energy radiated away from the scenario would originate only from scattering objects inside the OUT, further enhancing the detectability of a tumor. Finally, to conduct real measurements, the applicator needs to be fed by an actual transmission line. Simulations (not presented in this paper) showed that the strongest applicator efficiency was achieved if the characteristic impedance of a simulated microstrip feed line was as low as 1.75 Ω. For a high applicator performance, it is therefore imperative to transform the unbalanced signal from a standard 50 Ω transmission twin line down to a very low characteristic impedance, a design challenge that is currently being worked on. With these investigations ongoing, we expect our transmitter to become a viable class of equipment for detection of tissue inhomogeneities inside the female breast.
Acknowledgements Our work is financially supported by the Swedish Knowledge Foundation (KKS) through the project Embedded Sensor Systems for Health plus (ESS-H+), project number 20180158.
References [1] D. O’Loughlin, M. O’Halloran, B. M. Moloney, M. Glavin, E. Jones, and M. A.
Elahi, “Microwave Breast Imaging: Clinical Advances and Remaining Challenges,”IEEE Transactions on Biomedical Engineering, vol. 65, no. 11, Art. no. 11, Nov.2018, doi: 10.1109/TBME.2018.2809541.
[2] M. A. Aldhaeebi, K. Alzoubi, T. S. Almoneef, S. M. Bamatraf, H. Attia, and O. MRamahi, “Review of Microwaves Techniques for Breast Cancer Detection,” Sensors(Basel), vol. 20, no. 8, Apr. 2020, doi: 10.3390/s20082390.
[3] W. Shao and T. McCollough, “Advances in Microwave Near-Field Imaging:Prototypes, Systems, and Applications,” IEEE Microwave Magazine, vol. 21, no. 5,pp. 94–119, May 2020, doi: 10.1109/MMM.2020.2971375.
[4] N. R. Epstein, P. M. Meaney, and K. D. Paulsen, “3D parallel-detection microwavetomography for clinical breast imaging,” Review of Scientific Instruments, vol. 85,no. 12, p. 124704, Dec. 2014, doi: 10.1063/1.4901936.
[5] S. Y. Semenov et al., “Three-dimensional microwave tomography: initialexperimental imaging of animals,” IEEE Transactions on Biomedical Engineering,vol. 49, no. 1, pp. 55–63, Jan. 2002, doi: 10.1109/10.972840.
[6] J. Bourqui, M. Okoniewski, and E. C. Fear, “Balanced Antipodal Vivaldi AntennaWith Dielectric Director for Near-Field Microwave Imaging,” IEEE Transactions onAntennas and Propagation, vol. 58, no. 7, pp. 2318–2326, Jul. 2010, doi:10.1109/TAP.2010.2048844.
[7] J. M. Felício, J. M. Bioucas-Dias, J. R. Costa, and C. A. Fernandes, “MicrowaveBreast Imaging Using a Dry Setup,” IEEE Transactions on Computational Imaging,vol. 6, pp. 167–180, 2020, doi: 10.1109/TCI.2019.2931079.
[8] M. Ostadrahimi, S. Noghanian, L. Shafai, A. Zakaria, C. Kaye, and J. LoVetri,“Investigating a double layer Vivaldi antenna design for fixed array fieldmeasurement,” IJUWBCS, vol. 1, no. 4, p. 282, 2010, doi:10.1504/IJUWBCS.2010.034309.
[9] D. Gibbins, M. Klemm, I. J. Craddock, J. A. Leendertz, A. Preece, and R. Benjamin,“A Comparison of a Wide-Slot and a Stacked Patch Antenna for the Purpose ofBreast Cancer Detection,” IEEE Transactions on Antennas and Propagation, vol.58, no. 3, Art. no. 3, Mar. 2010, doi: 10.1109/TAP.2009.2039296.
[10] N. Petrovic, M. Otterskog, and P. O. Risman, “Experiments and numericalmodelling of contacting antenna applicators at a free space head model,” in 2015
260
18th International Conference on Microwave and High Frequency ApplicationsAMPERE 2021, Online, September 13-16, 2021
IEEE Conference on Antenna Measurements Applications (CAMA), Nov. 2015, pp. 1–4. doi: 10.1109/CAMA.2015.7428125.
[11] N. Petrovic, M. Otterskog, and P. O. Risman, “Breast tumour detection by twomicrowave antenna principles,” in 2017 International Conference onElectromagnetics in Advanced Applications (ICEAA), Sep. 2017, pp. 1258–1261.doi: 10.1109/ICEAA.2017.8065500.
[12] T. M. Grzegorczyk, P. M. Meaney, P. A. Kaufman, R. M. diFlorio-Alexander, andK. D. Paulsen, “Fast 3-D Tomographic Microwave Imaging for Breast CancerDetection,” IEEE Transactions on Medical Imaging, vol. 31, no. 8, Art. no. 8, Aug.2012, doi: 10.1109/TMI.2012.2197218.
[13] P. M. Meaney, F. Shubitidze, M. W. Fanning, M. Kmiec, N. R. Epstein, and K. D.Paulsen, “Surface Wave Multipath Signals in Near-Field Microwave Imaging,”International Journal of Biomedical Imaging, Apr. 10, 2012.https://www.hindawi.com/journals/ijbi/2012/697253/ (accessed Feb. 01, 2021).
[14] P. Meaney et al., “Low Cost, High Performance, 16-Channel MicrowaveMeasurement System for Tomographic Applications,” Sensors, vol. 20, no. 18, Art.no. 18, Jan. 2020, doi: 10.3390/s20185436.
[15] D. R. Herrera, T. Reimer, M. S. Nepote, and S. Pistorius, “Manufacture and testingof anthropomorphic 3D-printed breast phantoms using a microwave radar algorithmoptimized for propagation speed,” in 2017 11th European Conference on Antennasand Propagation (EUCAP), Mar. 2017, pp. 3480–3484. doi:10.23919/EuCAP.2017.7928402.
[16] K. Nemez, A. Baran, M. Asefi, and J. LoVetri, “Modeling Error and CalibrationTechniques for a Faceted Metallic Chamber for Magnetic Field MicrowaveImaging,” IEEE Transactions on Microwave Theory and Techniques, vol. 65, no.11, pp. 4347–4356, Nov. 2017, doi: 10.1109/TMTT.2017.2694823.
[17] N. Petrović, Ch. Pichot, and P. O. Risman, “Further Developments of ApplicatorConcepts for Detection of Body Part Inhomogeneities,” in 2019 IEEE Conferenceon Antenna Measurements Applications (CAMA), Oct. 2019, pp. 218–221. doi:10.1109/CAMA47423.2019.8959590.
[18] QuickWave 3D FDTD Software Package, 1998-2021. [Online]. Available:www.qwed.eu
[19] N. Petrovic, M. Otterskog, and P. O. Risman, “Antenna applicator concepts usingdiffraction phenomena for direct visualization of brain hemorrhages,” in 2016 IEEEConference on Antenna Measurements Applications (CAMA), Oct. 2016, pp. 1–4.doi: 10.1109/CAMA.2016.7815756.
[20] M. Lazebnik et al., “A large-scale study of the ultrawideband microwave dielectricproperties of normal, benign and malignant breast tissues obtained from cancersurgeries,” Phys. Med. Biol., vol. 52, no. 20, pp. 6093–6115, Oct. 2007, doi:10.1088/0031-9155/52/20/002.
261
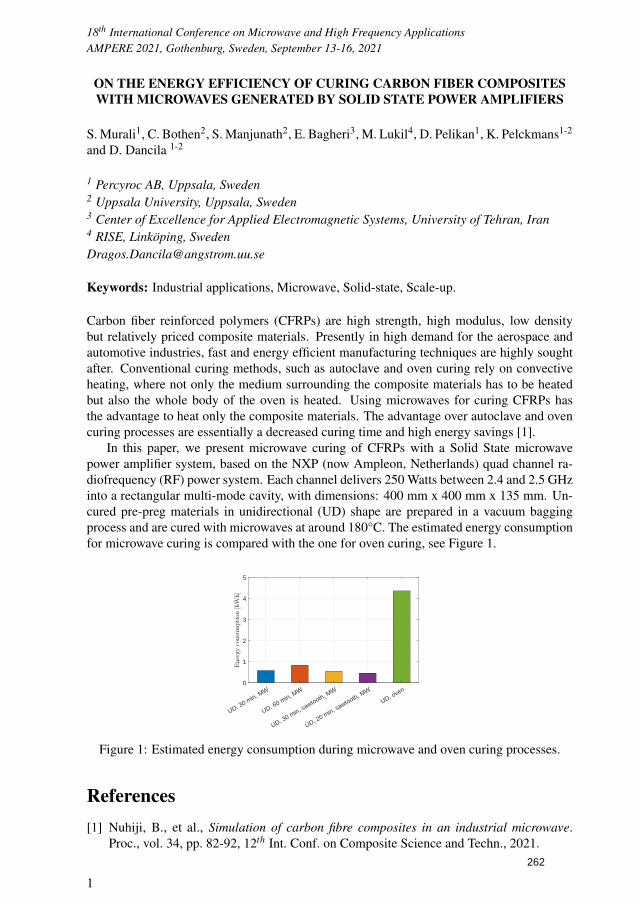
18th International Conference on Microwave and High Frequency ApplicationsAMPERE 2021, Gothenburg, Sweden, September 13-16, 2021
ON THE ENERGY EFFICIENCY OF CURING CARBON FIBER COMPOSITESWITH MICROWAVES GENERATED BY SOLID STATE POWER AMPLIFIERS
S. Murali1, C. Bothen2, S. Manjunath2, E. Bagheri3, M. Lukil4, D. Pelikan1, K. Pelckmans1-2
and D. Dancila 1-2
1 Percyroc AB, Uppsala, Sweden2 Uppsala University, Uppsala, Sweden3 Center of Excellence for Applied Electromagnetic Systems, University of Tehran, Iran4 RISE, Linkoping, [email protected]
Keywords: Industrial applications, Microwave, Solid-state, Scale-up.
Carbon fiber reinforced polymers (CFRPs) are high strength, high modulus, low densitybut relatively priced composite materials. Presently in high demand for the aerospace andautomotive industries, fast and energy efficient manufacturing techniques are highly soughtafter. Conventional curing methods, such as autoclave and oven curing rely on convectiveheating, where not only the medium surrounding the composite materials has to be heatedbut also the whole body of the oven is heated. Using microwaves for curing CFRPs hasthe advantage to heat only the composite materials. The advantage over autoclave and ovencuring processes are essentially a decreased curing time and high energy savings [1].
In this paper, we present microwave curing of CFRPs with a Solid State microwavepower amplifier system, based on the NXP (now Ampleon, Netherlands) quad channel ra-diofrequency (RF) power system. Each channel delivers 250 Watts between 2.4 and 2.5 GHzinto a rectangular multi-mode cavity, with dimensions: 400 mm x 400 mm x 135 mm. Un-cured pre-preg materials in unidirectional (UD) shape are prepared in a vacuum baggingprocess and are cured with microwaves at around 180°C. The estimated energy consumptionfor microwave curing is compared with the one for oven curing, see Figure 1.
UD, 30 m
in, MW
UD, 60 m
in, MW
UD, 30 m
in, sawtooth, M
W
UD, 20 m
in, sawtooth, M
W
UD, oven
0
1
2
3
4
5
Figure 1: Estimated energy consumption during microwave and oven curing processes.
References[1] Nuhiji, B., et al., Simulation of carbon fibre composites in an industrial microwave.
Proc., vol. 34, pp. 82-92, 12th Int. Conf. on Composite Science and Techn., 2021.
1
262
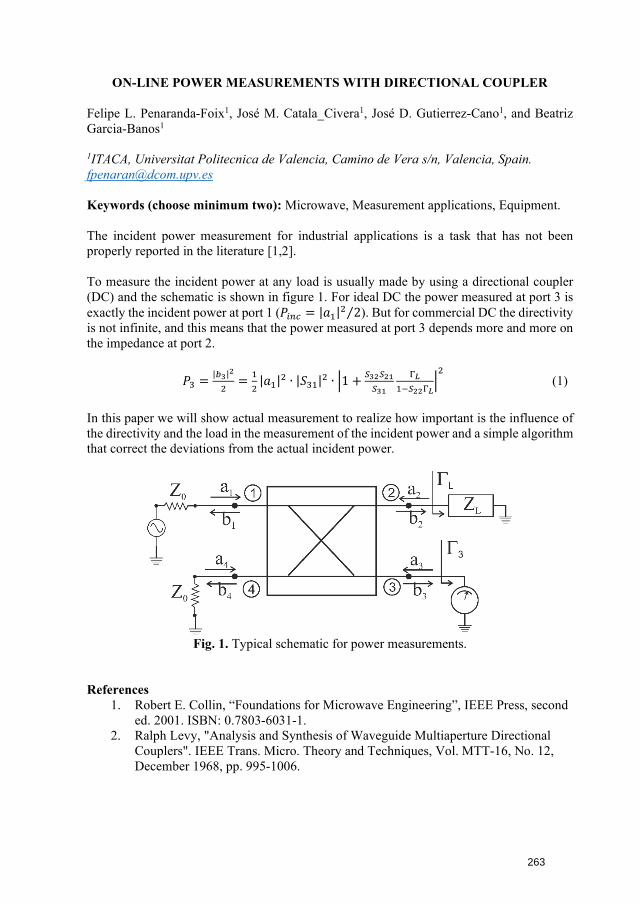
ON-LINE POWER MEASUREMENTS WITH DIRECTIONAL COUPLER
Felipe L. Penaranda-Foix1, José M. Catala_Civera1, José D. Gutierrez-Cano1, and Beatriz Garcia-Banos1
1ITACA, Universitat Politecnica de Valencia, Camino de Vera s/n, Valencia, Spain. [email protected]
Keywords (choose minimum two): Microwave, Measurement applications, Equipment.
The incident power measurement for industrial applications is a task that has not been properly reported in the literature [1,2].
To measure the incident power at any load is usually made by using a directional coupler (DC) and the schematic is shown in figure 1. For ideal DC the power measured at port 3 isexactly the incident power at port 1 (𝑃𝑃𝑖𝑖𝑖𝑖𝑖𝑖 = |𝑎𝑎1|2 2⁄ ). But for commercial DC the directivityis not infinite, and this means that the power measured at port 3 depends more and more onthe impedance at port 2.
𝑃𝑃3 = |𝑏𝑏3|2
2= 1
2|𝑎𝑎1|2 ∙ |𝑆𝑆31|2 ∙ �1 + 𝑆𝑆32𝑆𝑆21
𝑆𝑆31
Γ𝐿𝐿1−𝑆𝑆22Γ𝐿𝐿
�2
(1)
In this paper we will show actual measurement to realize how important is the influence of the directivity and the load in the measurement of the incident power and a simple algorithm that correct the deviations from the actual incident power.
Fig. 1. Typical schematic for power measurements.
References 1. Robert E. Collin, “Foundations for Microwave Engineering”, IEEE Press, second
ed. 2001. ISBN: 0.7803-6031-1.2. Ralph Levy, "Analysis and Synthesis of Waveguide Multiaperture Directional
Couplers". IEEE Trans. Micro. Theory and Techniques, Vol. MTT-16, No. 12,December 1968, pp. 995-1006.
263
Possibility of using microwave energy for steelmaking wastes recycling
Mamdouh Omran *, Timo Fabritius
Process Metallurgy Research Group, Faculty of Technology, University of Oulu, Finland. P.O. Box: 4300
Keywords (choose minimum two): Biomass/Waste, Dielectric properties.
Abstract
Recycling of solid waste generated from metallurgical industries will avoid disposal of wastes, enhance the use of secondary raw material fines and save costs. Numerous hydrometallurgical and pyrometallurgical processes, or a combination of both, have been proposed for the utilization of metallurgical waste. A growing interest in microwave heating has emerged recently. Many researchers have begun to pay attention to microwave energy as an alternative recycling method. Compared to conventional methods, microwave processing offers several advantages such as selective heating, rapid heating, and volumetric heating. The present study aims to investigate the use of microwave energy as a heat source for the recovery valuable metals from electric arc furnace (EAF) dust, blast furnace (BF), basic oxygen furnace (BOF) sludge. The objective is to recovery nonferrous metals (i.e., Zn, Cr) from the waste and recycling the remaining iron rich residue to steel making industries again. The results indicated that microwave heating is a promising and effective technique for processing steelmaking wastes.
Keywords: Microwave treatment; EAF dust, BF sludge; BOF sludge; recycling.
264
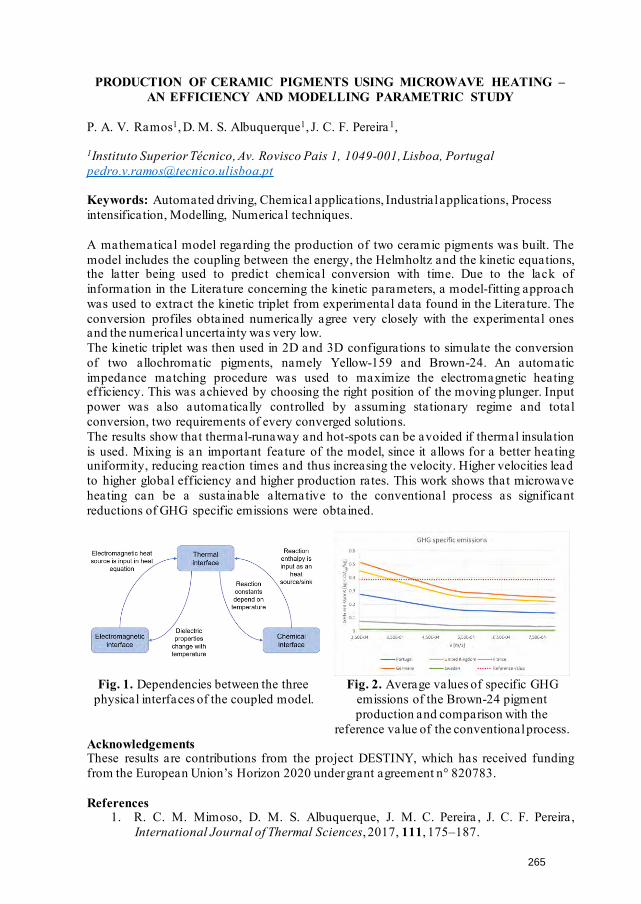
PRODUCTION OF CERAMIC PIGMENTS USING MICROWAVE HEATING – AN EFFICIENCY AND MODELLING PARAMETRIC STUDY
P. A. V. Ramos1, D. M. S. Albuquerque1, J. C. F. Pereira1,
1Instituto Superior Técnico, Av. Rovisco Pais 1, 1049-001, Lisboa, Portugal [email protected]
Keywords: Automated driving, Chemical applications, Industrial applications, Process intensification, Modelling, Numerical techniques.
A mathematical model regarding the production of two ceramic pigments was built. The model includes the coupling between the energy, the Helmholtz and the kinetic equations, the latter being used to predict chemical conversion with time. Due to the lack of information in the Literature concerning the kinetic parameters, a model-fitting approach was used to extract the kinetic triplet from experimental data found in the Literature. The conversion profiles obtained numerically agree very closely with the experimental ones and the numerical uncertainty was very low. The kinetic triplet was then used in 2D and 3D configurations to simulate the conversion of two allochromatic pigments, namely Yellow-159 and Brown-24. An automatic impedance matching procedure was used to maximize the electromagnetic heating efficiency. This was achieved by choosing the right position of the moving plunger. Input power was also automatically controlled by assuming stationary regime and total conversion, two requirements of every converged solutions. The results show that thermal-runaway and hot-spots can be avoided if thermal insulation is used. Mixing is an important feature of the model, since it allows for a better heating uniformity, reducing reaction times and thus increasing the velocity. Higher velocities lead to higher global efficiency and higher production rates. This work shows that microwave heating can be a sustainable alternative to the conventional process as significant reductions of GHG specific emissions were obtained.
Fig. 1. Dependencies between the three physical interfaces of the coupled model.
Fig. 2. Average values of specific GHG emissions of the Brown-24 pigment production and comparison with the
reference value of the conventional process. Acknowledgements These results are contributions from the project DESTINY, which has received funding from the European Union’s Horizon 2020 under grant agreement n° 820783.
References 1. R. C. M. Mimoso, D. M. S. Albuquerque, J. M. C. Pereira , J. C. F. Pereira ,
International Journal of Thermal Sciences, 2017, 111, 175–187.
265
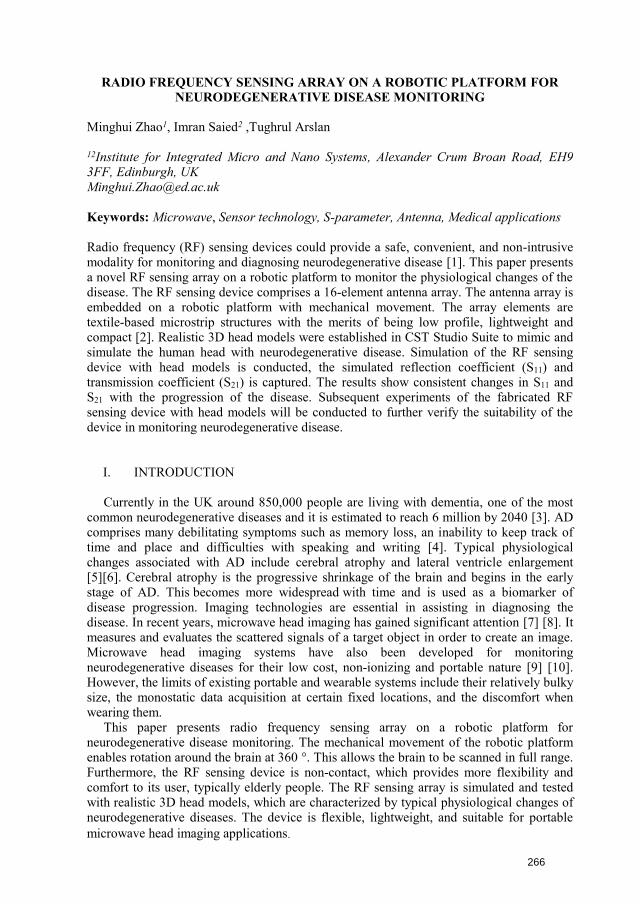
RADIO FREQUENCY SENSING ARRAY ON A ROBOTIC PLATFORM FOR NEURODEGENERATIVE DISEASE MONITORING
Minghui Zhao1, Imran Saied2 ,Tughrul Arslan
12Institute for Integrated Micro and Nano Systems, Alexander Crum Broan Road, EH9 3FF, Edinburgh, UK [email protected]
Keywords: Microwave, Sensor technology, S-parameter, Antenna, Medical applications
Radio frequency (RF) sensing devices could provide a safe, convenient, and non-intrusive modality for monitoring and diagnosing neurodegenerative disease [1]. This paper presents a novel RF sensing array on a robotic platform to monitor the physiological changes of the disease. The RF sensing device comprises a 16-element antenna array. The antenna array is embedded on a robotic platform with mechanical movement. The array elements are textile-based microstrip structures with the merits of being low profile, lightweight and compact [2]. Realistic 3D head models were established in CST Studio Suite to mimic and simulate the human head with neurodegenerative disease. Simulation of the RF sensing device with head models is conducted, the simulated reflection coefficient (S11) and transmission coefficient (S21) is captured. The results show consistent changes in S11 and S21 with the progression of the disease. Subsequent experiments of the fabricated RF sensing device with head models will be conducted to further verify the suitability of the device in monitoring neurodegenerative disease.
I. INTRODUCTION
Currently in the UK around 850,000 people are living with dementia, one of the most common neurodegenerative diseases and it is estimated to reach 6 million by 2040 [3]. AD comprises many debilitating symptoms such as memory loss, an inability to keep track of time and place and difficulties with speaking and writing [4]. Typical physiological changes associated with AD include cerebral atrophy and lateral ventricle enlargement [5][6]. Cerebral atrophy is the progressive shrinkage of the brain and begins in the early stage of AD. This becomes more widespread with time and is used as a biomarker of disease progression. Imaging technologies are essential in assisting in diagnosing the disease. In recent years, microwave head imaging has gained significant attention [7] [8]. It measures and evaluates the scattered signals of a target object in order to create an image. Microwave head imaging systems have also been developed for monitoring neurodegenerative diseases for their low cost, non-ionizing and portable nature [9] [10]. However, the limits of existing portable and wearable systems include their relatively bulky size, the monostatic data acquisition at certain fixed locations, and the discomfort when wearing them. This paper presents radio frequency sensing array on a robotic platform for neurodegenerative disease monitoring. The mechanical movement of the robotic platform enables rotation around the brain at 360 °. This allows the brain to be scanned in full range. Furthermore, the RF sensing device is non-contact, which provides more flexibility and comfort to its user, typically elderly people. The RF sensing array is simulated and tested with realistic 3D head models, which are characterized by typical physiological changes of neurodegenerative diseases. The device is flexible, lightweight, and suitable for portable microwave head imaging applications.
266
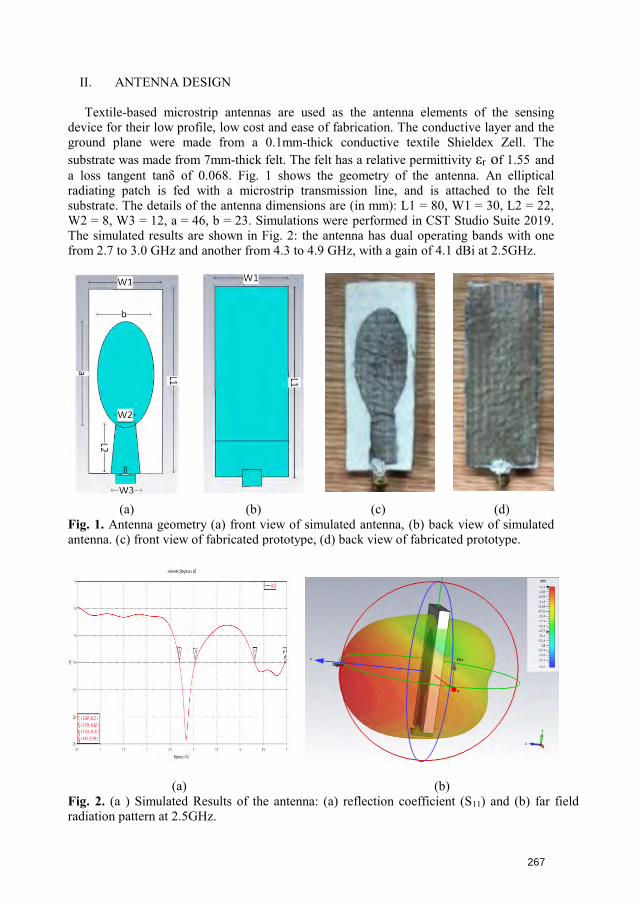
II. ANTENNA DESIGN
Textile-based microstrip antennas are used as the antenna elements of the sensing device for their low profile, low cost and ease of fabrication. The conductive layer and the ground plane were made from a 0.1mm-thick conductive textile Shieldex Zell. The substrate was made from 7mm-thick felt. The felt has a relative permittivity εr of 1.55 and a loss tangent tanδ of 0.068. Fig. 1 shows the geometry of the antenna. An elliptical radiating patch is fed with a microstrip transmission line, and is attached to the felt substrate. The details of the antenna dimensions are (in mm): L1 = 80, W1 = 30, L2 = 22, W2 = 8, W3 = 12, a = 46, b = 23. Simulations were performed in CST Studio Suite 2019. The simulated results are shown in Fig. 2: the antenna has dual operating bands with one from 2.7 to 3.0 GHz and another from 4.3 to 4.9 GHz, with a gain of 4.1 dBi at 2.5GHz.
(a) (b) (c) (d) Fig. 1. Antenna geometry (a) front view of simulated antenna, (b) back view of simulated antenna. (c) front view of fabricated prototype, (d) back view of fabricated prototype.
(a) (b) Fig. 2. (a ) Simulated Results of the antenna: (a) reflection coefficient (S11) and (b) far field radiation pattern at 2.5GHz.
267
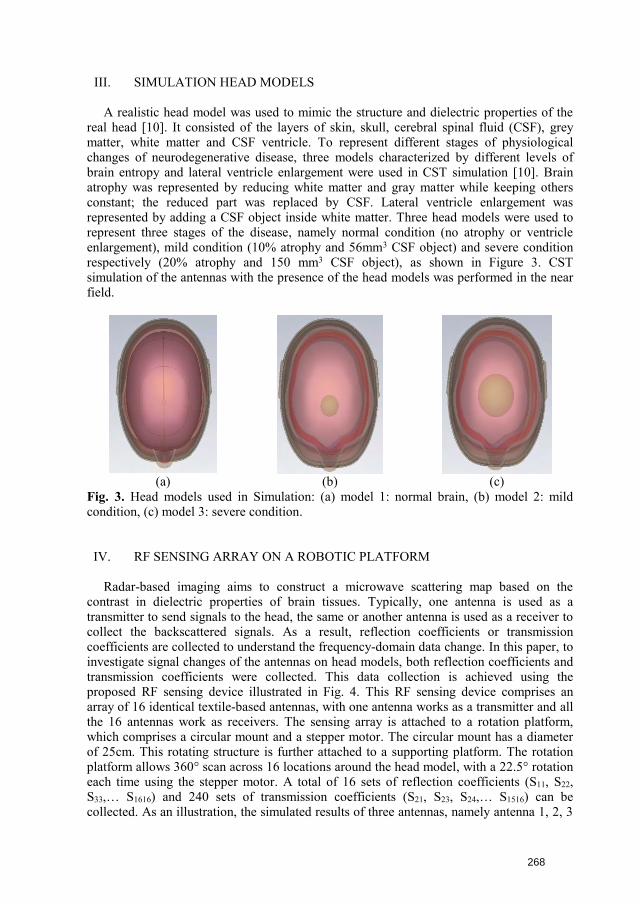
III. SIMULATION HEAD MODELS
A realistic head model was used to mimic the structure and dielectric properties of the real head [10]. It consisted of the layers of skin, skull, cerebral spinal fluid (CSF), grey matter, white matter and CSF ventricle. To represent different stages of physiological changes of neurodegenerative disease, three models characterized by different levels of brain entropy and lateral ventricle enlargement were used in CST simulation [10]. Brain atrophy was represented by reducing white matter and gray matter while keeping others constant; the reduced part was replaced by CSF. Lateral ventricle enlargement was represented by adding a CSF object inside white matter. Three head models were used to represent three stages of the disease, namely normal condition (no atrophy or ventricle enlargement), mild condition (10% atrophy and 56mm3 CSF object) and severe condition respectively (20% atrophy and 150 mm3 CSF object), as shown in Figure 3. CST simulation of the antennas with the presence of the head models was performed in the near field.
(a) (b) (c) Fig. 3. Head models used in Simulation: (a) model 1: normal brain, (b) model 2: mild condition, (c) model 3: severe condition.
IV. RF SENSING ARRAY ON A ROBOTIC PLATFORM
Radar-based imaging aims to construct a microwave scattering map based on the contrast in dielectric properties of brain tissues. Typically, one antenna is used as a transmitter to send signals to the head, the same or another antenna is used as a receiver to collect the backscattered signals. As a result, reflection coefficients or transmission coefficients are collected to understand the frequency-domain data change. In this paper, to investigate signal changes of the antennas on head models, both reflection coefficients and transmission coefficients were collected. This data collection is achieved using the proposed RF sensing device illustrated in Fig. 4. This RF sensing device comprises an array of 16 identical textile-based antennas, with one antenna works as a transmitter and all the 16 antennas work as receivers. The sensing array is attached to a rotation platform, which comprises a circular mount and a stepper motor. The circular mount has a diameter of 25cm. This rotating structure is further attached to a supporting platform. The rotation platform allows 360° scan across 16 locations around the head model, with a 22.5° rotation each time using the stepper motor. A total of 16 sets of reflection coefficients (S11, S22, S33,… S1616) and 240 sets of transmission coefficients (S21, S23, S24,… S1516) can be collected. As an illustration, the simulated results of three antennas, namely antenna 1, 2, 3
268
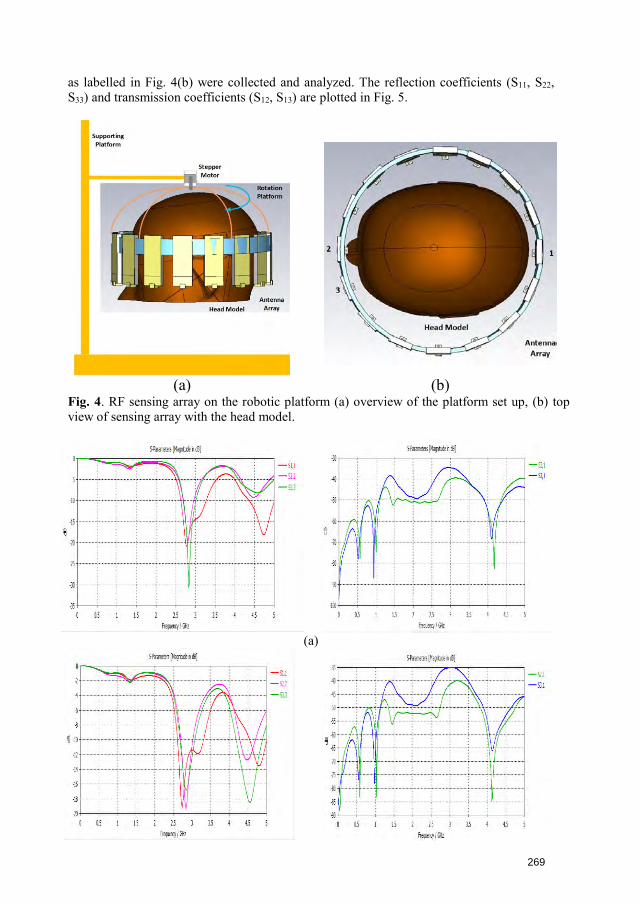
as labelled in Fig. 4(b) were collected and analyzed. The reflection coefficients (S11, S22, S33) and transmission coefficients (S12, S13) are plotted in Fig. 5.
(a) (b) Fig. 4. RF sensing array on the robotic platform (a) overview of the platform set up, (b) top view of sensing array with the head model.
(a)
269
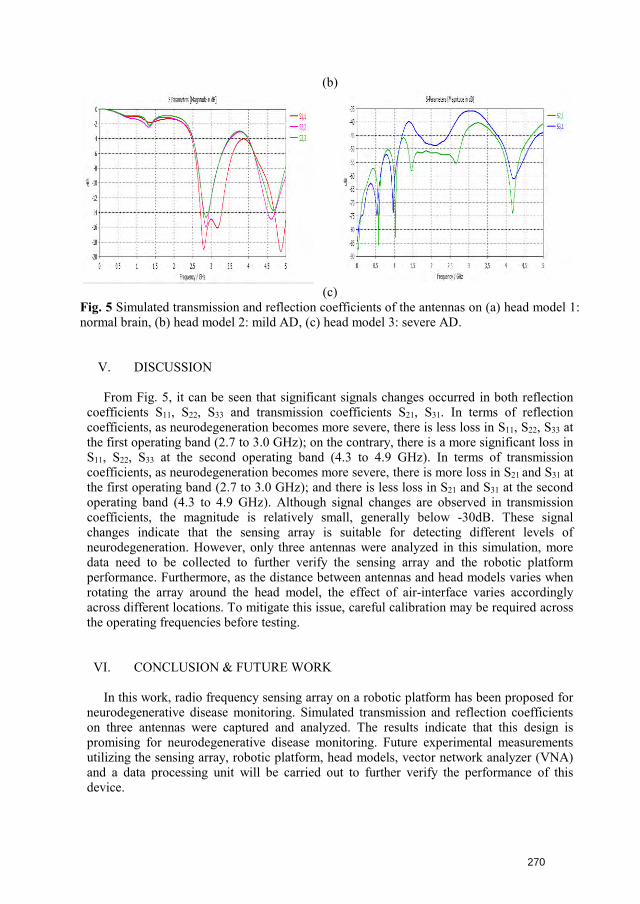
(b)
(c) Fig. 5 Simulated transmission and reflection coefficients of the antennas on (a) head model 1: normal brain, (b) head model 2: mild AD, (c) head model 3: severe AD.
V. DISCUSSION
From Fig. 5, it can be seen that significant signals changes occurred in both reflection coefficients S11, S22, S33 and transmission coefficients S21, S31. In terms of reflection coefficients, as neurodegeneration becomes more severe, there is less loss in S11, S22, S33 at the first operating band (2.7 to 3.0 GHz); on the contrary, there is a more significant loss in S11, S22, S33 at the second operating band (4.3 to 4.9 GHz). In terms of transmission coefficients, as neurodegeneration becomes more severe, there is more loss in S21 and S31 at the first operating band (2.7 to 3.0 GHz); and there is less loss in S21 and S31 at the second operating band (4.3 to 4.9 GHz). Although signal changes are observed in transmission coefficients, the magnitude is relatively small, generally below -30dB. These signal changes indicate that the sensing array is suitable for detecting different levels of neurodegeneration. However, only three antennas were analyzed in this simulation, more data need to be collected to further verify the sensing array and the robotic platform performance. Furthermore, as the distance between antennas and head models varies when rotating the array around the head model, the effect of air-interface varies accordingly across different locations. To mitigate this issue, careful calibration may be required across the operating frequencies before testing.
VI. CONCLUSION & FUTURE WORK
In this work, radio frequency sensing array on a robotic platform has been proposed for neurodegenerative disease monitoring. Simulated transmission and reflection coefficients on three antennas were captured and analyzed. The results indicate that this design is promising for neurodegenerative disease monitoring. Future experimental measurements utilizing the sensing array, robotic platform, head models, vector network analyzer (VNA) and a data processing unit will be carried out to further verify the performance of this device.
270
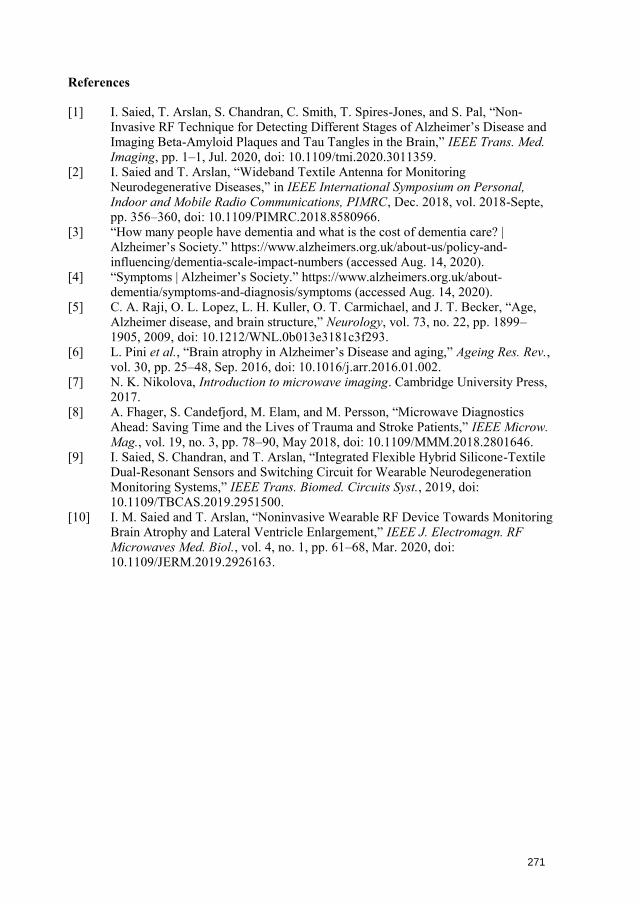
References
[1] I. Saied, T. Arslan, S. Chandran, C. Smith, T. Spires-Jones, and S. Pal, “Non-Invasive RF Technique for Detecting Different Stages of Alzheimer’s Disease andImaging Beta-Amyloid Plaques and Tau Tangles in the Brain,” IEEE Trans. Med.Imaging, pp. 1–1, Jul. 2020, doi: 10.1109/tmi.2020.3011359.
[2] I. Saied and T. Arslan, “Wideband Textile Antenna for MonitoringNeurodegenerative Diseases,” in IEEE International Symposium on Personal,Indoor and Mobile Radio Communications, PIMRC, Dec. 2018, vol. 2018-Septe,pp. 356–360, doi: 10.1109/PIMRC.2018.8580966.
[3] “How many people have dementia and what is the cost of dementia care? |Alzheimer’s Society.” https://www.alzheimers.org.uk/about-us/policy-and-influencing/dementia-scale-impact-numbers (accessed Aug. 14, 2020).
[4] “Symptoms | Alzheimer’s Society.” https://www.alzheimers.org.uk/about-dementia/symptoms-and-diagnosis/symptoms (accessed Aug. 14, 2020).
[5] C. A. Raji, O. L. Lopez, L. H. Kuller, O. T. Carmichael, and J. T. Becker, “Age,Alzheimer disease, and brain structure,” Neurology, vol. 73, no. 22, pp. 1899–1905, 2009, doi: 10.1212/WNL.0b013e3181c3f293.
[6] L. Pini et al., “Brain atrophy in Alzheimer’s Disease and aging,” Ageing Res. Rev.,vol. 30, pp. 25–48, Sep. 2016, doi: 10.1016/j.arr.2016.01.002.
[7] N. K. Nikolova, Introduction to microwave imaging. Cambridge University Press,2017.
[8] A. Fhager, S. Candefjord, M. Elam, and M. Persson, “Microwave DiagnosticsAhead: Saving Time and the Lives of Trauma and Stroke Patients,” IEEE Microw.Mag., vol. 19, no. 3, pp. 78–90, May 2018, doi: 10.1109/MMM.2018.2801646.
[9] I. Saied, S. Chandran, and T. Arslan, “Integrated Flexible Hybrid Silicone-TextileDual-Resonant Sensors and Switching Circuit for Wearable NeurodegenerationMonitoring Systems,” IEEE Trans. Biomed. Circuits Syst., 2019, doi:10.1109/TBCAS.2019.2951500.
[10] I. M. Saied and T. Arslan, “Noninvasive Wearable RF Device Towards MonitoringBrain Atrophy and Lateral Ventricle Enlargement,” IEEE J. Electromagn. RFMicrowaves Med. Biol., vol. 4, no. 1, pp. 61–68, Mar. 2020, doi:10.1109/JERM.2019.2926163.
271
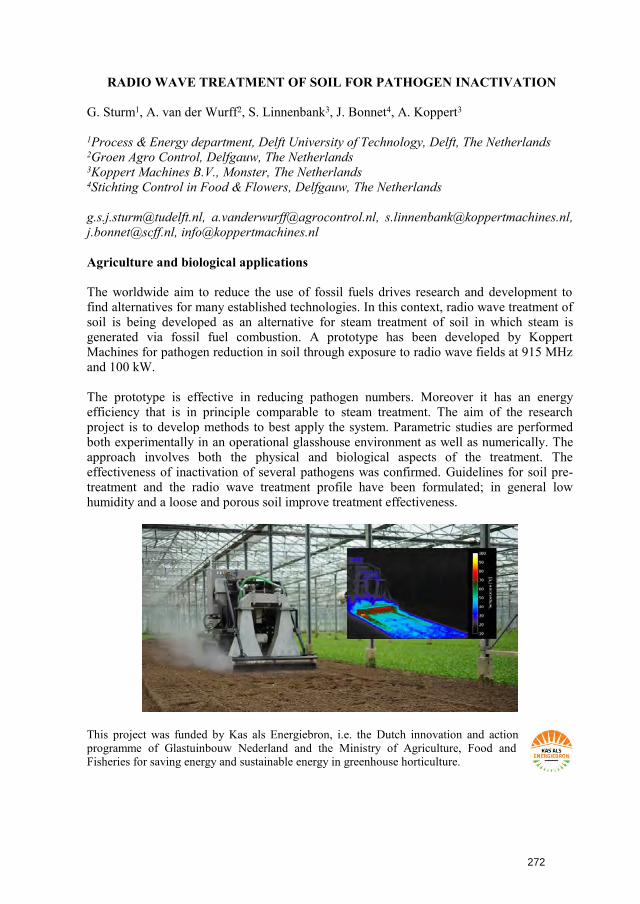
RADIO WAVE TREATMENT OF SOIL FOR PATHOGEN INACTIVATION
G. Sturm1, A. van der Wurff2, S. Linnenbank3, J. Bonnet4, A. Koppert3
1Process & Energy department, Delft University of Technology, Delft, The Netherlands 2Groen Agro Control, Delfgauw, The Netherlands 3Koppert Machines B.V., Monster, The Netherlands 4Stichting Control in Food & Flowers, Delfgauw, The Netherlands
[email protected], [email protected], [email protected],[email protected], [email protected]
Agriculture and biological applications
The worldwide aim to reduce the use of fossil fuels drives research and development to find alternatives for many established technologies. In this context, radio wave treatment of soil is being developed as an alternative for steam treatment of soil in which steam is generated via fossil fuel combustion. A prototype has been developed by Koppert Machines for pathogen reduction in soil through exposure to radio wave fields at 915 MHz and 100 kW.
The prototype is effective in reducing pathogen numbers. Moreover it has an energy efficiency that is in principle comparable to steam treatment. The aim of the research project is to develop methods to best apply the system. Parametric studies are performed both experimentally in an operational glasshouse environment as well as numerically. The approach involves both the physical and biological aspects of the treatment. The effectiveness of inactivation of several pathogens was confirmed. Guidelines for soil pre-treatment and the radio wave treatment profile have been formulated; in general low humidity and a loose and porous soil improve treatment effectiveness.
This project was funded by Kas als Energiebron, i.e. the Dutch innovation and action programme of Glastuinbouw Nederland and the Ministry of Agriculture, Food and Fisheries for saving energy and sustainable energy in greenhouse horticulture.
272
SIMULATION AND EXPERIMENTAL STUDIES ON EFFECTS OF
MICROWAVE HEATING ON PROCESSING OF METAL MATRIX
BIOCOMPOSITES
Shivani Gupta1, Apurbba Kumar Sharma1, *, Dinesh Agrawal2, and Inderdeep Singh1
1Indian Institute of Technology Roorkee, Uttrakhand, India 2The Pennsylvania State University, Pennsylvania, USA * [email protected]
Keywords: Microwave, Modelling, Processing, Material interaction and Medical applications
Abstract: In the current work, finite element models of three different biocomposites (AZ10HA, AZ15HA and AZ20HA) having different compositions were developed for understanding the effects of microwave heating on the sintering temperature and corresponding characteristics. Multi-physics simulations using COMSOL software were carried out to identify the influence of microwave energy on the different amounts of HA content at specific processing conditions tuned to microwave applicator operating at 2.45 GHz and 1.4 kW. Simulation results revealed the distribution of electromagnetic fields in different biocomposites and variations in sintering temperature at constant sintering time. The same biocomposites were developed inside the microwave applicator at 1.4 kW power in similar conditions as simulated. The variation in sintering temperature was monitored concerning the compositional variant at constant exposure time. The experimental outcomes exhibited reasonable agreement with the simulation results. The achieved sintering temperatures were 510 °C, 550 °C and 600 °C in AZ10HA, AZ15HA and AZ20HA, respectively, in 12 min exposure time in direct microwave heating. The highest sintering temperature obtained at constant exposure time in AZ20HA composition was caused due to the higher dielectric loss of HA powder particles than AZ31 alloy powder particles and resulting in isothermal heating. The study outcomes show that more HA content achieved high temperature in less exposure time and better physical, microstructural and mechanical properties than other compositions. Compressive strength was reduced in AZ20HA due to the HA phase decomposition to β-Ca3CO4 phase at high temperatures.
273
18th International Conference on Microwave and High Frequency Applications AMPERE 2021, Online, September 13-16, 2021
SOFTWARE-DRIVEN SOLID-STATE GENERATORS ARRAY
M.Fiore1, N. Di Modugno2, C. Bruno3, T. De Nicolo,4 R. Di Modugno5
1,2,3,4,5LEANFA Srl, Via C. A. Dalla Chiesa 6, Ruvo di Puglia, Italy [email protected], [email protected], [email protected], [email protected], [email protected]
Keywords: Microwave, Food applications, Medical applications, Chemical applications, Industrial applications, Plasma applications, Equipment, Scale-up, Optimization, Solid-state, Safety
Introduction Microwave processing often finds suitable applications where safe, quick and efficient volumetric heating is required. Real industrial, scientific and medical (ISM) applications often deal with time-varying dielectric properties, dynamic shift in resonance ranges and irregular matching conditions, all demanding advanced solutions. Food processing is the most well-known application in which a mild and even treatment is of utmost importance and stringent safety constraints impose very high processing accuracy despite non-uniform load conditions in both time and space domains. Even more rigorous accuracy is demanded by medical applications, where a patient’s health is strongly correlated to the capability of the applied microwave field to generate a perfectly tailored thermal profile into tissues affected by pathologies. These and other modern ISM applications all need to rely on state-of-the-art laboratory development tools for advanced research which should be capable to implement innovative methods and to turn them into reliable and replicable processes for steady future-proof commercial applications with a simple scale-up progression.
Objective The present experimentation derives from an increasing demand of advanced microwave development tools from customers operating with ISM applications, in particular often dealing with multi-feed applicators tuned for 2450MHz or 915MHz frequency bands. A typical problem to be addressed is the accurate temperature control of material samples in a scaled-down batch applicator that, after successful prototypal implementation, needs to be reproduced in a continuous-flow architecture for stable production purposes. In some cases, modern nanomaterials need homogeneous temperature profiles to reach high purity levels and regular molecular structures, in other cases mixed material samples need differentiated temperature outlines as often required by food processing, polymer composite parts manufacturing and microwave curing of materials. Another typical problem is the implementation of precision minimally invasive therapeutic treatments by means of CW or pulsed microwave fields that allow strongly confined volumetric heating where tumor masses are located, while safely keeping low temperature levels in correspondence of non-pathogenic tissues. Moreover, different microwave-assisted chemical processes or some performance-critical plasma applications heavily suffer from the potential incurring of hot spots creating irregularities and/or inappropriate reactions. The answer to these multiple calls for high accuracy in complex and time-varying ISM processes can only come from solid-state technology, currently experimenting a growing momentum thanks to a promising roadmap pledged by semiconductor devices manufacturers. An optimal solution can definitely be implemented by a modular and scalable array of solid-state microwave generators, with considerable technical advantages that all together give birth to a multi-purpose powerful development tool. First of all, the same array can be used for
274
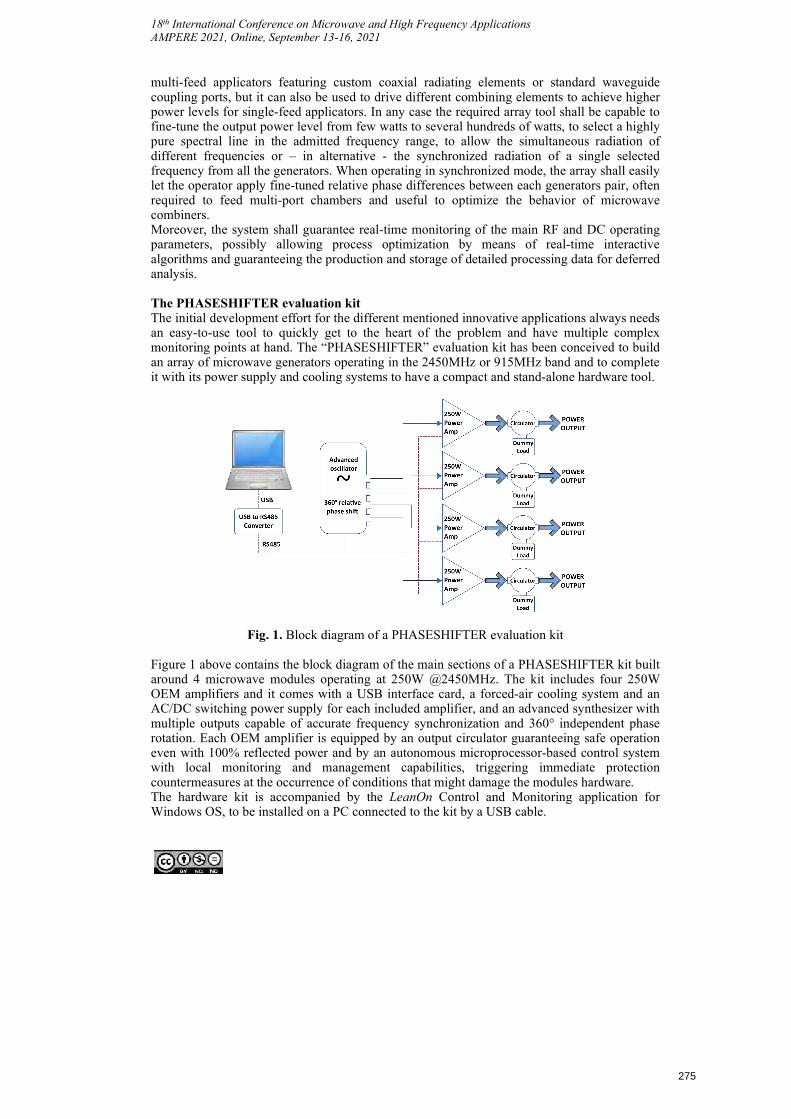
18th International Conference on Microwave and High Frequency Applications AMPERE 2021, Online, September 13-16, 2021
multi-feed applicators featuring custom coaxial radiating elements or standard waveguide coupling ports, but it can also be used to drive different combining elements to achieve higher power levels for single-feed applicators. In any case the required array tool shall be capable to fine-tune the output power level from few watts to several hundreds of watts, to select a highly pure spectral line in the admitted frequency range, to allow the simultaneous radiation of different frequencies or – in alternative - the synchronized radiation of a single selected frequency from all the generators. When operating in synchronized mode, the array shall easily let the operator apply fine-tuned relative phase differences between each generators pair, often required to feed multi-port chambers and useful to optimize the behavior of microwave combiners. Moreover, the system shall guarantee real-time monitoring of the main RF and DC operating parameters, possibly allowing process optimization by means of real-time interactive algorithms and guaranteeing the production and storage of detailed processing data for deferred analysis.
The PHASESHIFTER evaluation kit The initial development effort for the different mentioned innovative applications always needs an easy-to-use tool to quickly get to the heart of the problem and have multiple complex monitoring points at hand. The “PHASESHIFTER” evaluation kit has been conceived to build an array of microwave generators operating in the 2450MHz or 915MHz band and to complete it with its power supply and cooling systems to have a compact and stand-alone hardware tool.
Fig. 1. Block diagram of a PHASESHIFTER evaluation kit
Figure 1 above contains the block diagram of the main sections of a PHASESHIFTER kit built around 4 microwave modules operating at 250W @2450MHz. The kit includes four 250W OEM amplifiers and it comes with a USB interface card, a forced-air cooling system and an AC/DC switching power supply for each included amplifier, and an advanced synthesizer with multiple outputs capable of accurate frequency synchronization and 360° independent phase rotation. Each OEM amplifier is equipped by an output circulator guaranteeing safe operation even with 100% reflected power and by an autonomous microprocessor-based control system with local monitoring and management capabilities, triggering immediate protection countermeasures at the occurrence of conditions that might damage the modules hardware. The hardware kit is accompanied by the LeanOn Control and Monitoring application for Windows OS, to be installed on a PC connected to the kit by a USB cable.
275
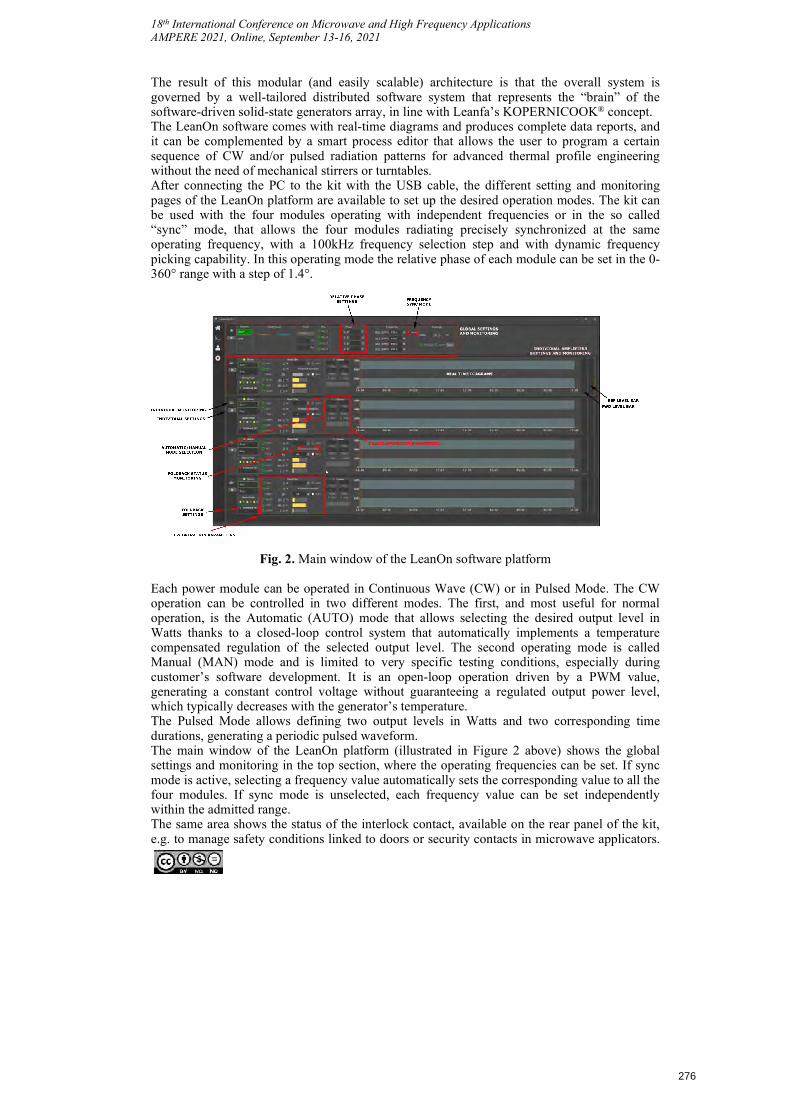
18th International Conference on Microwave and High Frequency Applications AMPERE 2021, Online, September 13-16, 2021
The result of this modular (and easily scalable) architecture is that the overall system is governed by a well-tailored distributed software system that represents the “brain” of the software-driven solid-state generators array, in line with Leanfa’s KOPERNICOOK® concept. The LeanOn software comes with real-time diagrams and produces complete data reports, and it can be complemented by a smart process editor that allows the user to program a certain sequence of CW and/or pulsed radiation patterns for advanced thermal profile engineering without the need of mechanical stirrers or turntables. After connecting the PC to the kit with the USB cable, the different setting and monitoring pages of the LeanOn platform are available to set up the desired operation modes. The kit can be used with the four modules operating with independent frequencies or in the so called “sync” mode, that allows the four modules radiating precisely synchronized at the same operating frequency, with a 100kHz frequency selection step and with dynamic frequency picking capability. In this operating mode the relative phase of each module can be set in the 0-360° range with a step of 1.4°.
Fig. 2. Main window of the LeanOn software platform
Each power module can be operated in Continuous Wave (CW) or in Pulsed Mode. The CW operation can be controlled in two different modes. The first, and most useful for normal operation, is the Automatic (AUTO) mode that allows selecting the desired output level in Watts thanks to a closed-loop control system that automatically implements a temperature compensated regulation of the selected output level. The second operating mode is called Manual (MAN) mode and is limited to very specific testing conditions, especially during customer’s software development. It is an open-loop operation driven by a PWM value, generating a constant control voltage without guaranteeing a regulated output power level, which typically decreases with the generator’s temperature. The Pulsed Mode allows defining two output levels in Watts and two corresponding time durations, generating a periodic pulsed waveform. The main window of the LeanOn platform (illustrated in Figure 2 above) shows the global settings and monitoring in the top section, where the operating frequencies can be set. If sync mode is active, selecting a frequency value automatically sets the corresponding value to all the four modules. If sync mode is unselected, each frequency value can be set independently within the admitted range. The same area shows the status of the interlock contact, available on the rear panel of the kit, e.g. to manage safety conditions linked to doors or security contacts in microwave applicators.
276
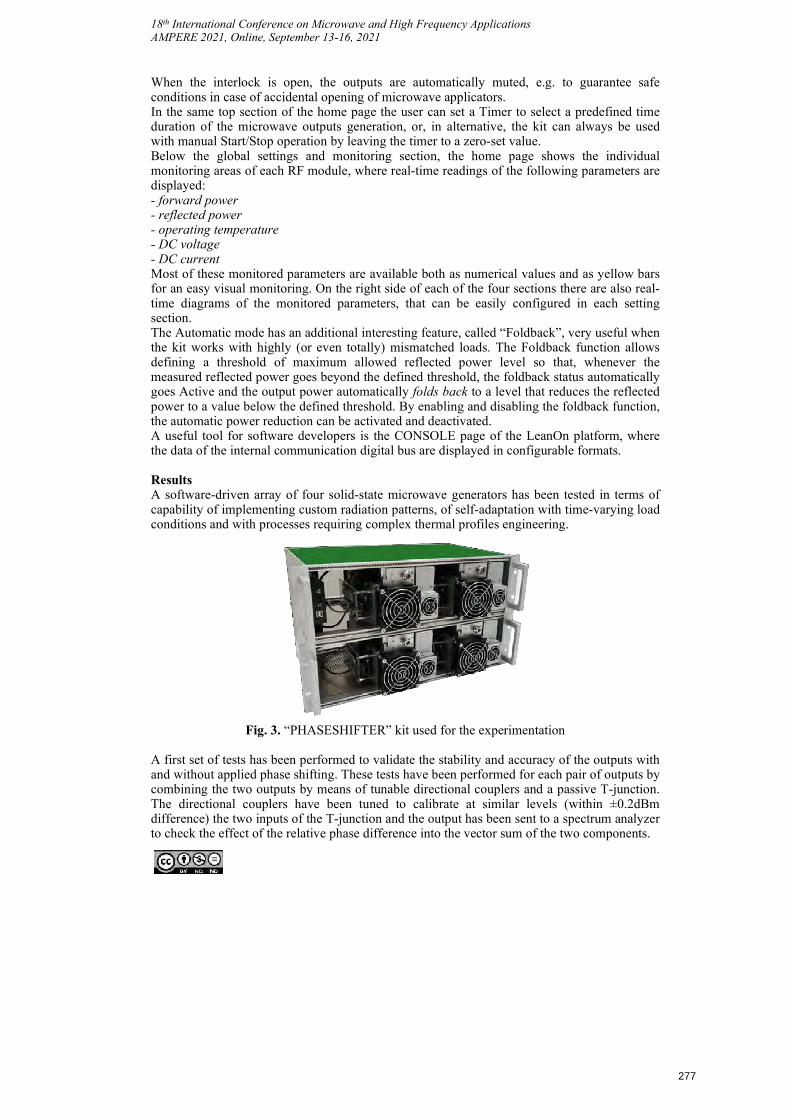
18th International Conference on Microwave and High Frequency Applications AMPERE 2021, Online, September 13-16, 2021
When the interlock is open, the outputs are automatically muted, e.g. to guarantee safe conditions in case of accidental opening of microwave applicators. In the same top section of the home page the user can set a Timer to select a predefined time duration of the microwave outputs generation, or, in alternative, the kit can always be used with manual Start/Stop operation by leaving the timer to a zero-set value. Below the global settings and monitoring section, the home page shows the individual monitoring areas of each RF module, where real-time readings of the following parameters are displayed: - forward power- reflected power- operating temperature- DC voltage- DC currentMost of these monitored parameters are available both as numerical values and as yellow barsfor an easy visual monitoring. On the right side of each of the four sections there are also real-time diagrams of the monitored parameters, that can be easily configured in each settingsection.The Automatic mode has an additional interesting feature, called “Foldback”, very useful whenthe kit works with highly (or even totally) mismatched loads. The Foldback function allowsdefining a threshold of maximum allowed reflected power level so that, whenever themeasured reflected power goes beyond the defined threshold, the foldback status automaticallygoes Active and the output power automatically folds back to a level that reduces the reflectedpower to a value below the defined threshold. By enabling and disabling the foldback function,the automatic power reduction can be activated and deactivated.A useful tool for software developers is the CONSOLE page of the LeanOn platform, wherethe data of the internal communication digital bus are displayed in configurable formats.
Results A software-driven array of four solid-state microwave generators has been tested in terms of capability of implementing custom radiation patterns, of self-adaptation with time-varying load conditions and with processes requiring complex thermal profiles engineering.
Fig. 3. “PHASESHIFTER” kit used for the experimentation
A first set of tests has been performed to validate the stability and accuracy of the outputs with and without applied phase shifting. These tests have been performed for each pair of outputs by combining the two outputs by means of tunable directional couplers and a passive T-junction. The directional couplers have been tuned to calibrate at similar levels (within ±0.2dBm difference) the two inputs of the T-junction and the output has been sent to a spectrum analyzer to check the effect of the relative phase difference into the vector sum of the two components.
277
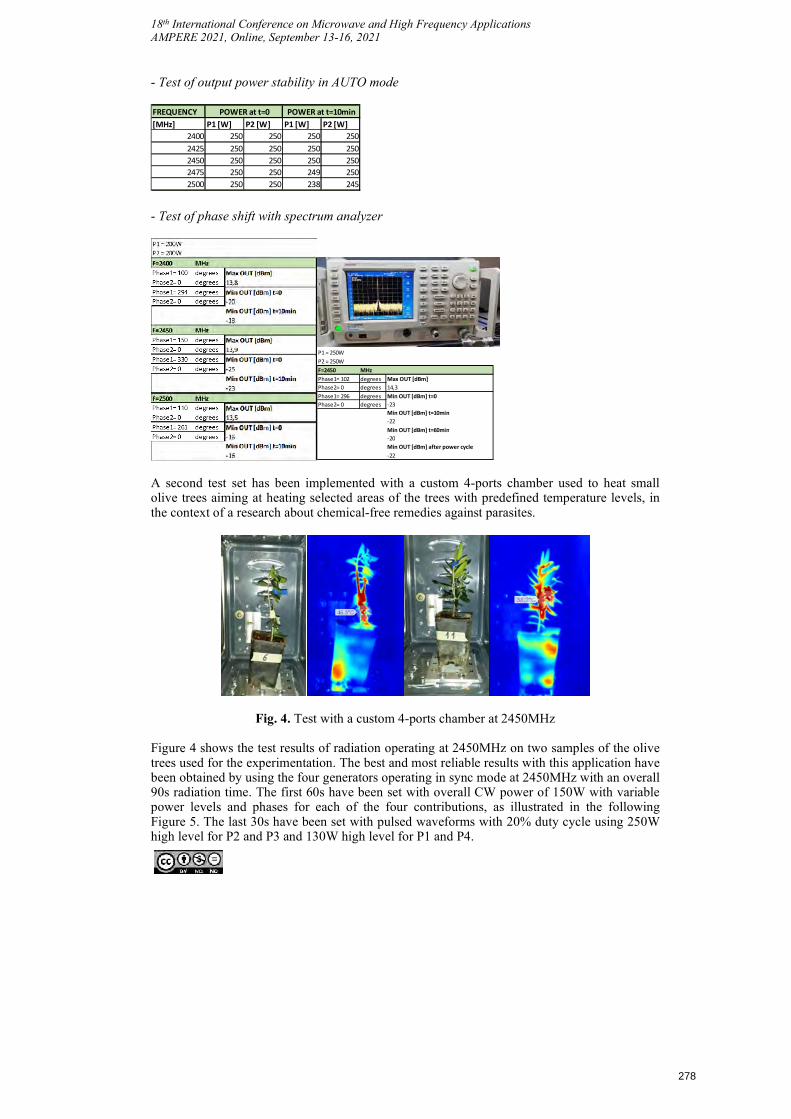
18th International Conference on Microwave and High Frequency Applications AMPERE 2021, Online, September 13-16, 2021
P1 = 250WP2 = 250WF=2450 MHzPhase1= 102 degreesPhase2= 0 degreesPhase1= 296 degreesPhase2= 0 degrees
Min OUT [dBm] t=10min
Min OUT [dBm] t=0
Max OUT [dBm]14,3
-23
-22
Min OUT [dBm] after power cycle
Min OUT [dBm] t=60min-20
-22
- Test of output power stability in AUTO mode2) Output Power stability (automatic mode)FREQUENCY[MHz] P1 [W] P2 [W] P1 [W] P2 [W]
2400 250 250 250 2502425 250 250 250 2502450 250 250 250 2502475 250 250 249 2502500 250 250 238 245
POWER at t=0 POWER at t=10min
- Test of phase shift with spectrum analyzer
A second test set has been implemented with a custom 4-ports chamber used to heat small olive trees aiming at heating selected areas of the trees with predefined temperature levels, in the context of a research about chemical-free remedies against parasites.
Fig. 4. Test with a custom 4-ports chamber at 2450MHz
Figure 4 shows the test results of radiation operating at 2450MHz on two samples of the olive trees used for the experimentation. The best and most reliable results with this application have been obtained by using the four generators operating in sync mode at 2450MHz with an overall 90s radiation time. The first 60s have been set with overall CW power of 150W with variable power levels and phases for each of the four contributions, as illustrated in the following Figure 5. The last 30s have been set with pulsed waveforms with 20% duty cycle using 250W high level for P2 and P3 and 130W high level for P1 and P4.
278
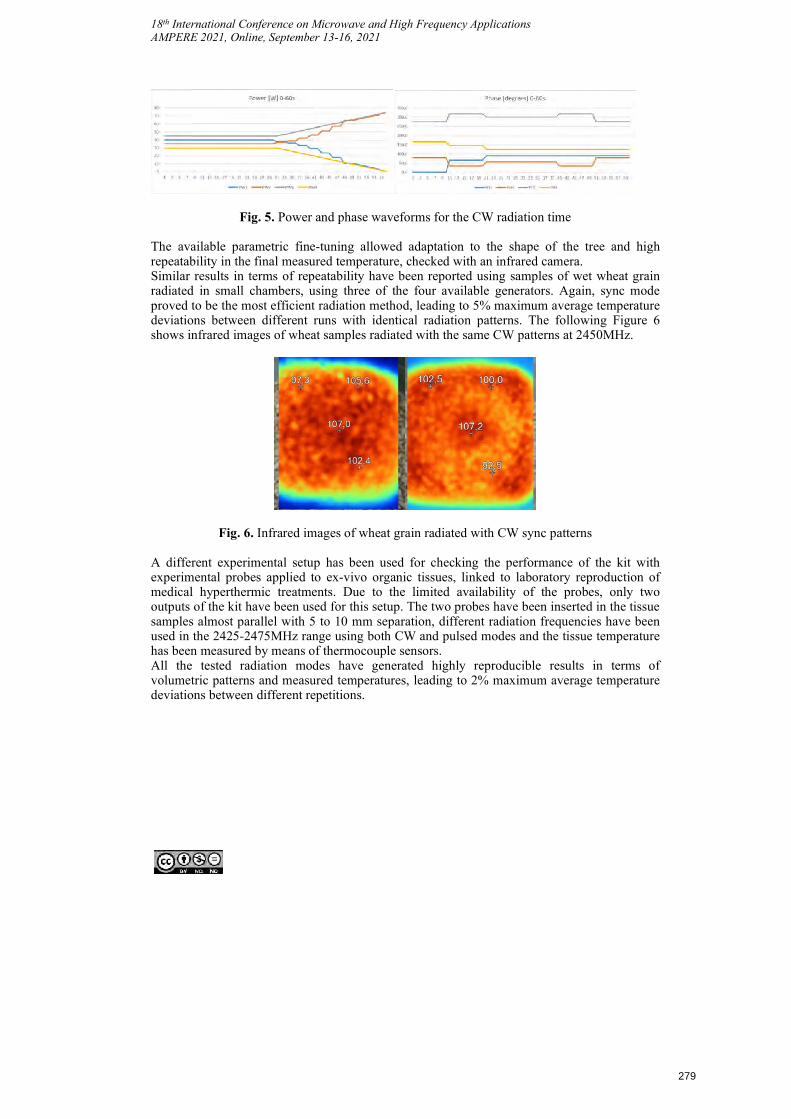
18th International Conference on Microwave and High Frequency Applications AMPERE 2021, Online, September 13-16, 2021
Fig. 5. Power and phase waveforms for the CW radiation time
The available parametric fine-tuning allowed adaptation to the shape of the tree and high repeatability in the final measured temperature, checked with an infrared camera. Similar results in terms of repeatability have been reported using samples of wet wheat grain radiated in small chambers, using three of the four available generators. Again, sync mode proved to be the most efficient radiation method, leading to 5% maximum average temperature deviations between different runs with identical radiation patterns. The following Figure 6 shows infrared images of wheat samples radiated with the same CW patterns at 2450MHz.
Fig. 6. Infrared images of wheat grain radiated with CW sync patterns
A different experimental setup has been used for checking the performance of the kit with experimental probes applied to ex-vivo organic tissues, linked to laboratory reproduction of medical hyperthermic treatments. Due to the limited availability of the probes, only two outputs of the kit have been used for this setup. The two probes have been inserted in the tissue samples almost parallel with 5 to 10 mm separation, different radiation frequencies have been used in the 2425-2475MHz range using both CW and pulsed modes and the tissue temperature has been measured by means of thermocouple sensors. All the tested radiation modes have generated highly reproducible results in terms of volumetric patterns and measured temperatures, leading to 2% maximum average temperature deviations between different repetitions.
279
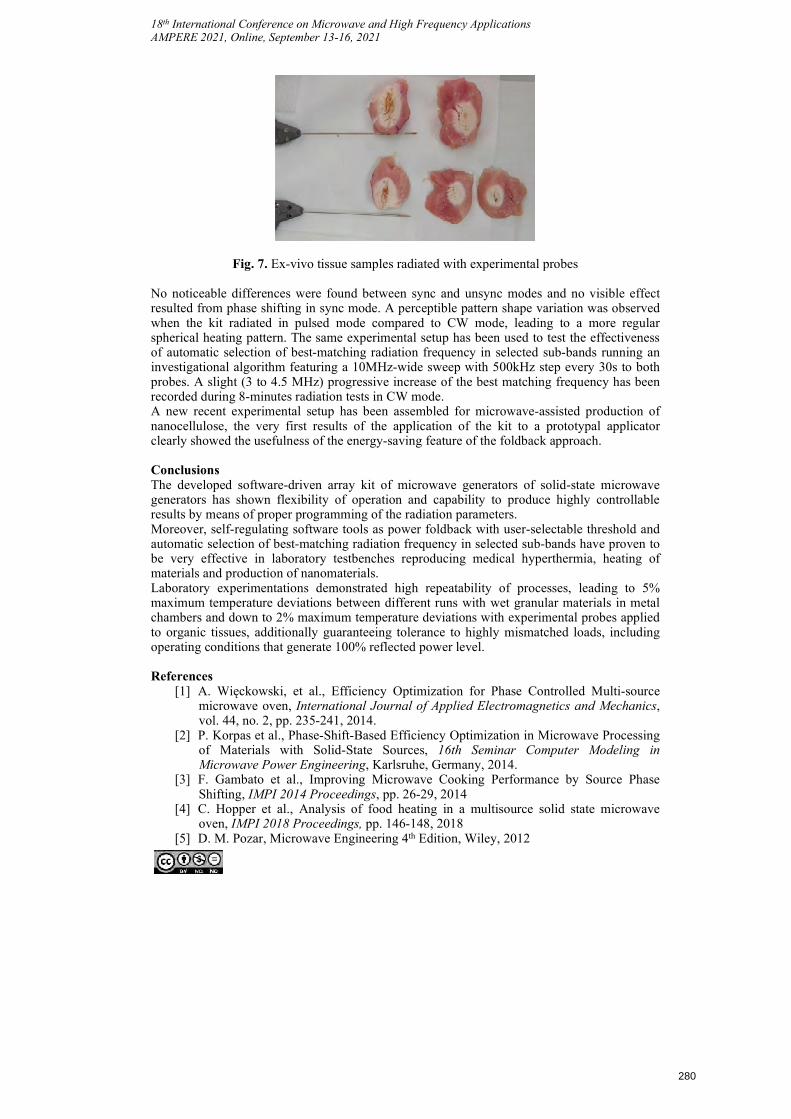
18th International Conference on Microwave and High Frequency Applications AMPERE 2021, Online, September 13-16, 2021
Fig. 7. Ex-vivo tissue samples radiated with experimental probes
No noticeable differences were found between sync and unsync modes and no visible effect resulted from phase shifting in sync mode. A perceptible pattern shape variation was observed when the kit radiated in pulsed mode compared to CW mode, leading to a more regular spherical heating pattern. The same experimental setup has been used to test the effectiveness of automatic selection of best-matching radiation frequency in selected sub-bands running an investigational algorithm featuring a 10MHz-wide sweep with 500kHz step every 30s to both probes. A slight (3 to 4.5 MHz) progressive increase of the best matching frequency has been recorded during 8-minutes radiation tests in CW mode. A new recent experimental setup has been assembled for microwave-assisted production of nanocellulose, the very first results of the application of the kit to a prototypal applicator clearly showed the usefulness of the energy-saving feature of the foldback approach.
Conclusions The developed software-driven array kit of microwave generators of solid-state microwave generators has shown flexibility of operation and capability to produce highly controllable results by means of proper programming of the radiation parameters. Moreover, self-regulating software tools as power foldback with user-selectable threshold and automatic selection of best-matching radiation frequency in selected sub-bands have proven to be very effective in laboratory testbenches reproducing medical hyperthermia, heating of materials and production of nanomaterials. Laboratory experimentations demonstrated high repeatability of processes, leading to 5% maximum temperature deviations between different runs with wet granular materials in metal chambers and down to 2% maximum temperature deviations with experimental probes applied to organic tissues, additionally guaranteeing tolerance to highly mismatched loads, including operating conditions that generate 100% reflected power level.
References [1] A. Więckowski, et al., Efficiency Optimization for Phase Controlled Multi-source
microwave oven, International Journal of Applied Electromagnetics and Mechanics,vol. 44, no. 2, pp. 235-241, 2014.
[2] P. Korpas et al., Phase-Shift-Based Efficiency Optimization in Microwave Processingof Materials with Solid-State Sources, 16th Seminar Computer Modeling inMicrowave Power Engineering, Karlsruhe, Germany, 2014.
[3] F. Gambato et al., Improving Microwave Cooking Performance by Source PhaseShifting, IMPI 2014 Proceedings, pp. 26-29, 2014
[4] C. Hopper et al., Analysis of food heating in a multisource solid state microwaveoven, IMPI 2018 Proceedings, pp. 146-148, 2018
[5] D. M. Pozar, Microwave Engineering 4th Edition, Wiley, 2012
280
Temperature Induced Diffusion – A new microwave effect?
J. Robinson*, E. Binner, A. Taqi, Y. Mao.
Faculty of Engineering, University of Nottingham, Nottingham NG7 2RD, UK.
Keywords: Microwave, Dielectric properties, Heat transfer, mechanisms.
The debate about non-thermal effects in microwave processing is well established, and in many cases such effects can be easily attributed to inaccurate temperature measurement. There are however a number of situations where the magnitude of the effect goes way beyond what can be attributed to a simple error in temperature measurement. In these cases the conclusions from the earlier debate have meant that microwave-specific effects have not been widely claimed, but as a consequence the understanding of chemical and mass transfer mechanisms in a range of microwave heating processes is poorly understood. A recent discovery has the potential to change our understanding of mass transfer in microwave heating processes. Temperature Induced Diffusion was first theorised in 2016 [1], validated experimentally in 2019 [2] and applied to microwave extraction processes in 2020 [3]. The key characteristic of Temperature Induced Diffusion is that mass transfer takes place against a temperature gradient. This counter-intuitive but ultimately proven effect means that the temperature gradient has a more dominant effect on mass transfer than the magnitude of the temperature itself. The ability of microwave heating to sustain a temperature gradient results in a magnitude and direction of mass transfer which in many cases are impossible with conventional heating approaches. This work outlines the theory, gives examples of the mechanism in action and discusses the implications for both the scientific and industrial processing communities.
References
[1] Lee et al. Chemical Engineering Science 149 (2016) 97[2] Robinson et al. Desalination 464 (2019) 1[3] Taqi et al. Chemical Engineering Journal 393 (2020) 124741
281
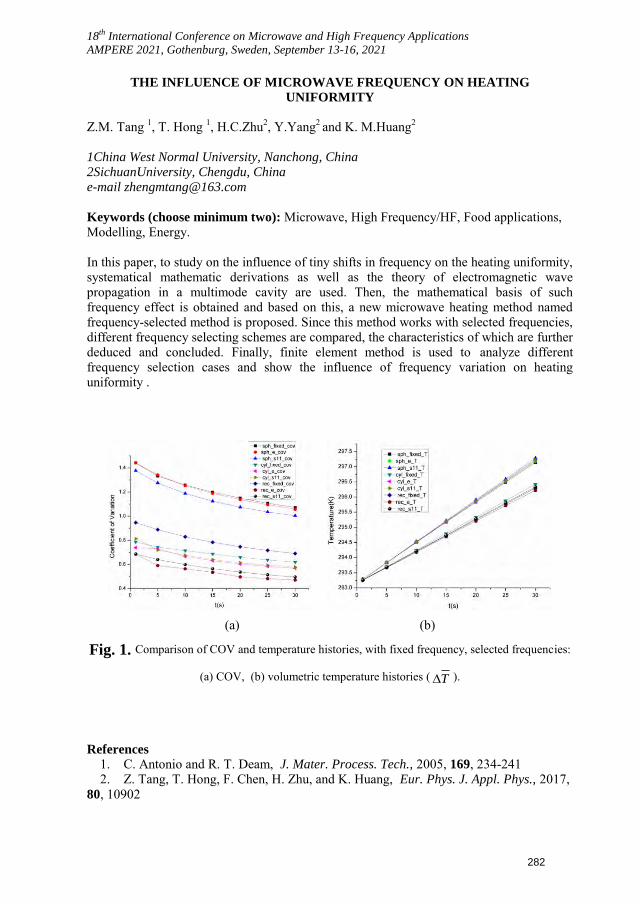
18th International Conference on Microwave and High Frequency Applications AMPERE 2021, Gothenburg, Sweden, September 13-16, 2021
THE INFLUENCE OF MICROWAVE FREQUENCY ON HEATING
UNIFORMITY
Z.M. Tang 1, T. Hong 1, H.C.Zhu2, Y.Yang2 and K. M.Huang2
1China West Normal University, Nanchong, China 2SichuanUniversity, Chengdu, China e-mail [email protected]
Keywords (choose minimum two): Microwave, High Frequency/HF, Food applications, Modelling, Energy.
In this paper, to study on the influence of tiny shifts in frequency on the heating uniformity, systematical mathematic derivations as well as the theory of electromagnetic wave propagation in a multimode cavity are used. Then, the mathematical basis of such frequency effect is obtained and based on this, a new microwave heating method named frequency-selected method is proposed. Since this method works with selected frequencies, different frequency selecting schemes are compared, the characteristics of which are further deduced and concluded. Finally, finite element method is used to analyze different frequency selection cases and show the influence of frequency variation on heating uniformity .
(a) (b)
Fig. 1. Comparison of COV and temperature histories, with fixed frequency, selected frequencies:
(a) COV, (b) volumetric temperature histories ( T ).
References
1. C. Antonio and R. T. Deam, J. Mater. Process. Tech., 2005, 169, 234-2412. Z. Tang, T. Hong, F. Chen, H. Zhu, and K. Huang, Eur. Phys. J. Appl. Phys., 2017,
80, 10902
282
ULTRA-BROADBAND CHARACTERISATION SYSTEM FOR THE DIELECTRIC PROPERTIES OF FOOD MATERIALS
J. K. Hamilton1, C. R. Lawrence1, J. R. Bows2
1QinetiQ Ltd, Cody Technology Park, Ively Rd, Farnborough, GU14 0LX 2PepsiCo, Leicester, LE4 1ET [email protected]
Keywords: Food applications, Dielectric properties, Permittivity
Abstract: The understanding of the dielectric properties of food material is important for electromagnetic-based treatments from reheating in a domestic microwave oven to sterilization processes. This is due to aspects such as the uniformity and rate of heating of the food being highly dependent upon the dielectric constant and dielectric loss of the food material, with both parameters being intrinsically temperature-dependent. In this work, a method for ultra-broadband (1 Hz to 1.6 GHz) characterisation of food materials is described. The ease of use of this system allows for rapid testing of a food standard – in this case, instant mashed potato – with various combinations of moisture and salt content. In addition to the ultra-broadband measurements, the system also allows for automated temperature sweeps (-100℃ to 300℃). By obtaining these ultra-broadband datasets, additional understanding can be gained of the mechanisms behind the variation of the dielectric properties. One measurement system provides dielectric data covering very different heating applications: – e.g. microwave (0.4 – 5.8 GHz), radio frequency (1 – 100 MHz), ohmic (50 Hz) – as well as measurement and imaging applications.
The development and test of a dielectric measurement system is preferably conducted via the use of a standard of known properties as a calibration. Given the interest here is food, then instant mashed potato is an ideal material as key parameters can be readily manipulated (moisture, salt) which along with temperature allow measurement of repeatability and consistency; and relative ease of measurement. The heating of a food material via electromagnetic waves is controlled by its dielectric properties. The permittivity of a material is expressed by
ε∗ = ε′ − ε′′, (1)
where ϵ’ is the dielectric constant and ϵ” is the dielectric loss. The dielectric constant reflects the material’s ability to store electromagnetic energy, which relates to the penetration depth of the material,
𝐷𝑝 ≈ 4.9√′
𝑓", (2)
and the material wavelength, 𝜆𝑚 =
𝑐
𝑓√ε′, (3)
where f is the frequency and c is the speed of light (in a vacuum). The penetration depth controls the uniformity of heating within the material, whilst the material wavelength partially dictates the distance between hot and cold spots. The presence of hot and cold spots can also be affected by the shape and size of the food material. The dielectric loss measures
283
a material’s ability to dissipate electric energy as heat, therefore controlling the heating rate of the material.
Due to the importance of understanding these properties for electromagnetic-based food preparation and sterilization processes, there has been a vast amount of published research concerning measurement of the dielectric properties of various food materials [1-6]. A food standard (or model food) is desirable as it would result in a relatively flexible control over the moisture, salt and sugar content. Mashed potato is commonly used as a food standard due to it being relatively homogenous once mixed, with its properties being easily modified by varying its moisture and salt content to encompass the dielectric properties of many food materials [7]. By using instant potato powder, the parameters – moisture and salt content – of the mixture can easily be controlled. It is worth noting that Smash® has a base salt content of 0.17% by weight (Smash®, Premier Foods). Using conventional methods (for example, an open-ended coaxial dielectric probe) for determining the dielectric properties of foodstuff as a function of temperature is a relatively laborious task, typically restricted to a relatively small bandwidth [8, 9].
In this work, the dielectric properties of mashed potato were investigated for a range of temperatures over an ultra-wide frequency band. The measurements were conducted using a bespoke broadband dielectric spectrometer. This all-in-one system allows automated temperature measurements over two broad frequency ranges, the first being 1 Hz to 0.1 MHz and the second ranging from 1 MHz to 1.6 GHz. The foodstuff samples were confined within a cryostat for high-precision temperature control, ranging from 0°C to 80°C. Previous work in the field has focused on the dielectric properties of instant mashed potato (prepared to packet instructions – moisture content near 80%) [8]. It was shown that the dielectric properties of the mashed potato strongly depend on the temperature and the measurement frequency, especially at radio frequency, industrial, scientific and medical (RF ISM) bands (< 100 MHz). Interestingly, the authors of [8] concluded that there were no significant effects on the dielectric constant due to temperature, salt, and moisture at microwave frequencies (> 0.4 GHz). However, the results indicate a notable change in properties, for example, at 1.8 GHz the dielectric constant varied: 13.7% with a temperature sweep from 20℃ and 120℃; 11.0% with an increasing moisture content (81.6% to 87.8%); and 9.7% with an increasing moisture content (0.8% to 2.8%) [8].
The conventional method used for characterising dielectric properties of liquid and liquid-like materials is the open-ended coaxial probe. In this method the probe is completely inserted into the material and the surface dielectric response is measured over a typical range of 0.2 GHZ to 20 GHz at a high precision. However, this method is not without its limitations: measurement variations are possible due to the pressure forcing water from the sample, and the possibility of air bubbles forming on the end of the probe. Furthermore, for temperature measurements the process is time-consuming as the system can only measure at a single temperature in any given run.
The work presented in this paper focusses on the Novocontrol dielectric broadband spectrometer (Fig. 1a). This device measures the impedance spectrum 𝑍∗(𝑓) of a samplematerial placed between two electrodes. The bulk intrinsic electric material’s properties such as the complex permittivity,
𝜀∗(𝑓) = 𝐶∗(𝑓)
𝐶0 , (4)
are evaluated from the complex sample capacity,
𝐶∗(𝑓) = 1
𝑖2𝜋𝑓𝑍∗(𝑓), (5)
284
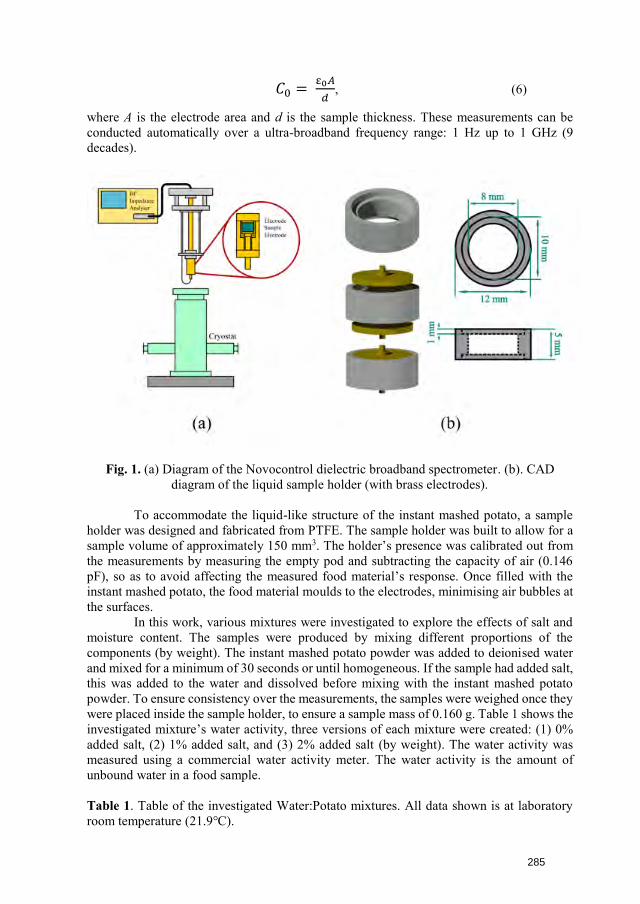
𝐶0 = ε0𝐴
𝑑, (6)
where A is the electrode area and d is the sample thickness. These measurements can be conducted automatically over a ultra-broadband frequency range: 1 Hz up to 1 GHz (9 decades).
Fig. 1. (a) Diagram of the Novocontrol dielectric broadband spectrometer. (b). CAD diagram of the liquid sample holder (with brass electrodes).
To accommodate the liquid-like structure of the instant mashed potato, a sample holder was designed and fabricated from PTFE. The sample holder was built to allow for a sample volume of approximately 150 mm3. The holder’s presence was calibrated out from the measurements by measuring the empty pod and subtracting the capacity of air (0.146 pF), so as to avoid affecting the measured food material’s response. Once filled with the instant mashed potato, the food material moulds to the electrodes, minimising air bubbles at the surfaces.
In this work, various mixtures were investigated to explore the effects of salt and moisture content. The samples were produced by mixing different proportions of the components (by weight). The instant mashed potato powder was added to deionised water and mixed for a minimum of 30 seconds or until homogeneous. If the sample had added salt, this was added to the water and dissolved before mixing with the instant mashed potato powder. To ensure consistency over the measurements, the samples were weighed once they were placed inside the sample holder, to ensure a sample mass of 0.160 g. Table 1 shows the investigated mixture’s water activity, three versions of each mixture were created: (1) 0% added salt, (2) 1% added salt, and (3) 2% added salt (by weight). The water activity was measured using a commercial water activity meter. The water activity is the amount of unbound water in a food sample.
Table 1. Table of the investigated Water:Potato mixtures. All data shown is at laboratory room temperature (21.9℃).
285
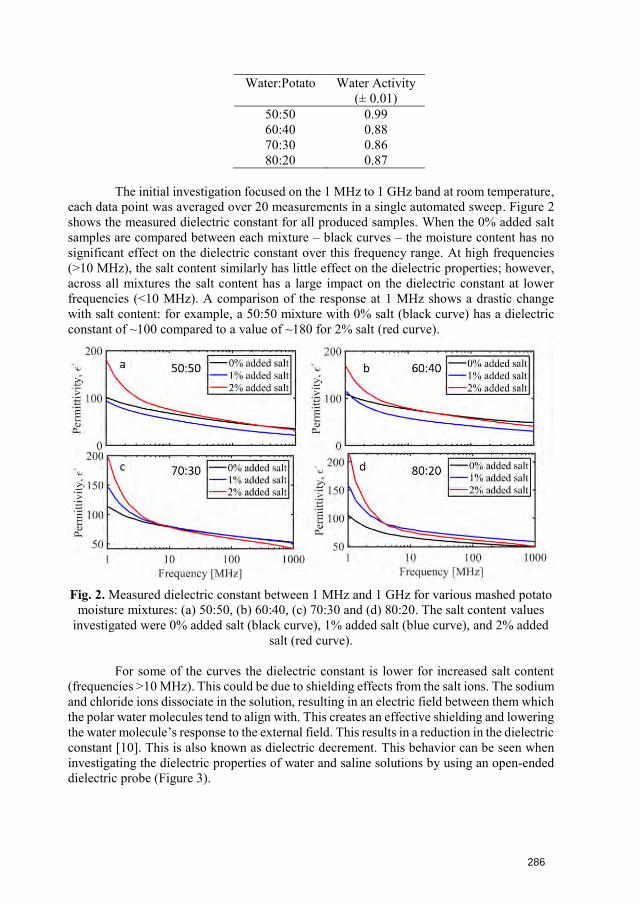
Water:Potato Water Activity (± 0.01)
50:50 0.99 60:40 0.88 70:30 0.86 80:20 0.87
The initial investigation focused on the 1 MHz to 1 GHz band at room temperature, each data point was averaged over 20 measurements in a single automated sweep. Figure 2 shows the measured dielectric constant for all produced samples. When the 0% added salt samples are compared between each mixture – black curves – the moisture content has no significant effect on the dielectric constant over this frequency range. At high frequencies (>10 MHz), the salt content similarly has little effect on the dielectric properties; however, across all mixtures the salt content has a large impact on the dielectric constant at lower frequencies (<10 MHz). A comparison of the response at 1 MHz shows a drastic change with salt content: for example, a 50:50 mixture with 0% salt (black curve) has a dielectric constant of ~100 compared to a value of ~180 for 2% salt (red curve).
Fig. 2. Measured dielectric constant between 1 MHz and 1 GHz for various mashed potato moisture mixtures: (a) 50:50, (b) 60:40, (c) 70:30 and (d) 80:20. The salt content values
investigated were 0% added salt (black curve), 1% added salt (blue curve), and 2% added salt (red curve).
For some of the curves the dielectric constant is lower for increased salt content (frequencies >10 MHz). This could be due to shielding effects from the salt ions. The sodium and chloride ions dissociate in the solution, resulting in an electric field between them which the polar water molecules tend to align with. This creates an effective shielding and lowering the water molecule’s response to the external field. This results in a reduction in the dielectric constant [10]. This is also known as dielectric decrement. This behavior can be seen when investigating the dielectric properties of water and saline solutions by using an open-ended dielectric probe (Figure 3).
286
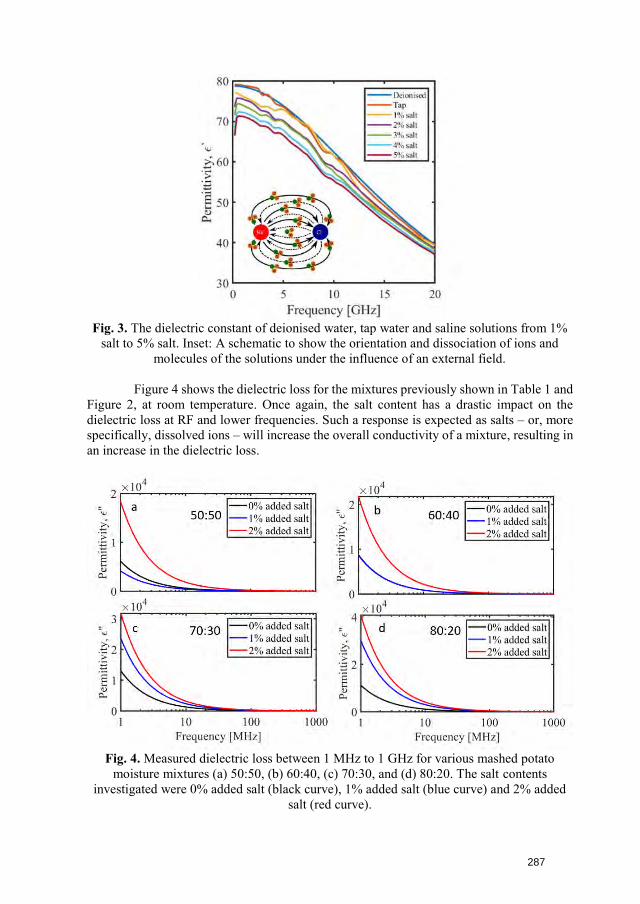
Fig. 3. The dielectric constant of deionised water, tap water and saline solutions from 1% salt to 5% salt. Inset: A schematic to show the orientation and dissociation of ions and
molecules of the solutions under the influence of an external field.
Figure 4 shows the dielectric loss for the mixtures previously shown in Table 1 and Figure 2, at room temperature. Once again, the salt content has a drastic impact on the dielectric loss at RF and lower frequencies. Such a response is expected as salts – or, more specifically, dissolved ions – will increase the overall conductivity of a mixture, resulting in an increase in the dielectric loss.
Fig. 4. Measured dielectric loss between 1 MHz to 1 GHz for various mashed potato moisture mixtures (a) 50:50, (b) 60:40, (c) 70:30, and (d) 80:20. The salt contents
investigated were 0% added salt (black curve), 1% added salt (blue curve) and 2% added salt (red curve).
287
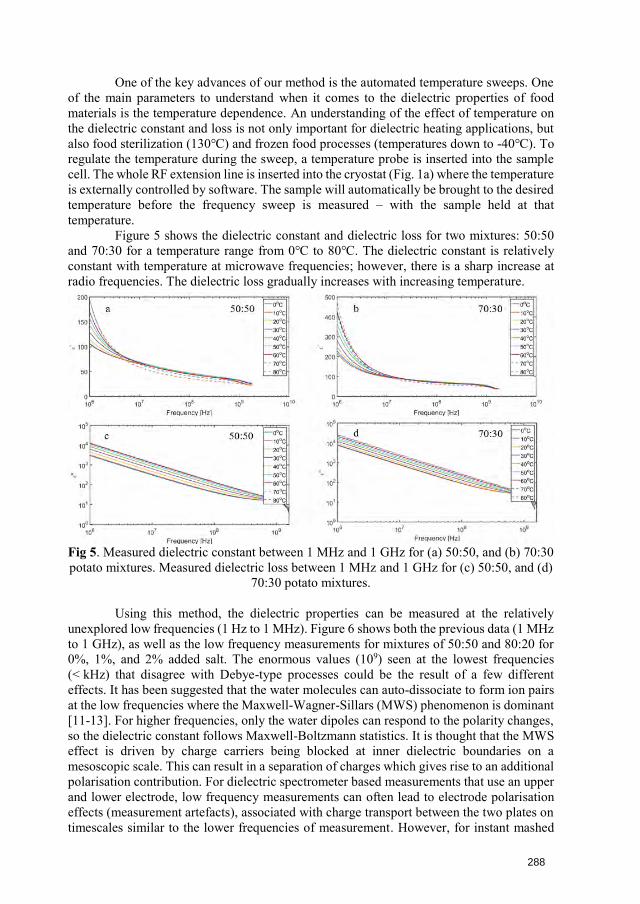
One of the key advances of our method is the automated temperature sweeps. One of the main parameters to understand when it comes to the dielectric properties of food materials is the temperature dependence. An understanding of the effect of temperature on the dielectric constant and loss is not only important for dielectric heating applications, but also food sterilization (130℃) and frozen food processes (temperatures down to -40℃). To regulate the temperature during the sweep, a temperature probe is inserted into the sample cell. The whole RF extension line is inserted into the cryostat (Fig. 1a) where the temperature is externally controlled by software. The sample will automatically be brought to the desired temperature before the frequency sweep is measured – with the sample held at that temperature.
Figure 5 shows the dielectric constant and dielectric loss for two mixtures: 50:50 and 70:30 for a temperature range from 0℃ to 80℃. The dielectric constant is relatively constant with temperature at microwave frequencies; however, there is a sharp increase at radio frequencies. The dielectric loss gradually increases with increasing temperature.
Fig 5. Measured dielectric constant between 1 MHz and 1 GHz for (a) 50:50, and (b) 70:30 potato mixtures. Measured dielectric loss between 1 MHz and 1 GHz for (c) 50:50, and (d)
70:30 potato mixtures.
Using this method, the dielectric properties can be measured at the relatively unexplored low frequencies (1 Hz to 1 MHz). Figure 6 shows both the previous data (1 MHz to 1 GHz), as well as the low frequency measurements for mixtures of 50:50 and 80:20 for 0%, 1%, and 2% added salt. The enormous values (109) seen at the lowest frequencies (< kHz) that disagree with Debye-type processes could be the result of a few different effects. It has been suggested that the water molecules can auto-dissociate to form ion pairs at the low frequencies where the Maxwell-Wagner-Sillars (MWS) phenomenon is dominant [11-13]. For higher frequencies, only the water dipoles can respond to the polarity changes, so the dielectric constant follows Maxwell-Boltzmann statistics. It is thought that the MWS effect is driven by charge carriers being blocked at inner dielectric boundaries on a mesoscopic scale. This can result in a separation of charges which gives rise to an additional polarisation contribution. For dielectric spectrometer based measurements that use an upper and lower electrode, low frequency measurements can often lead to electrode polarisation effects (measurement artefacts), associated with charge transport between the two plates on timescales similar to the lower frequencies of measurement. However, for instant mashed
288
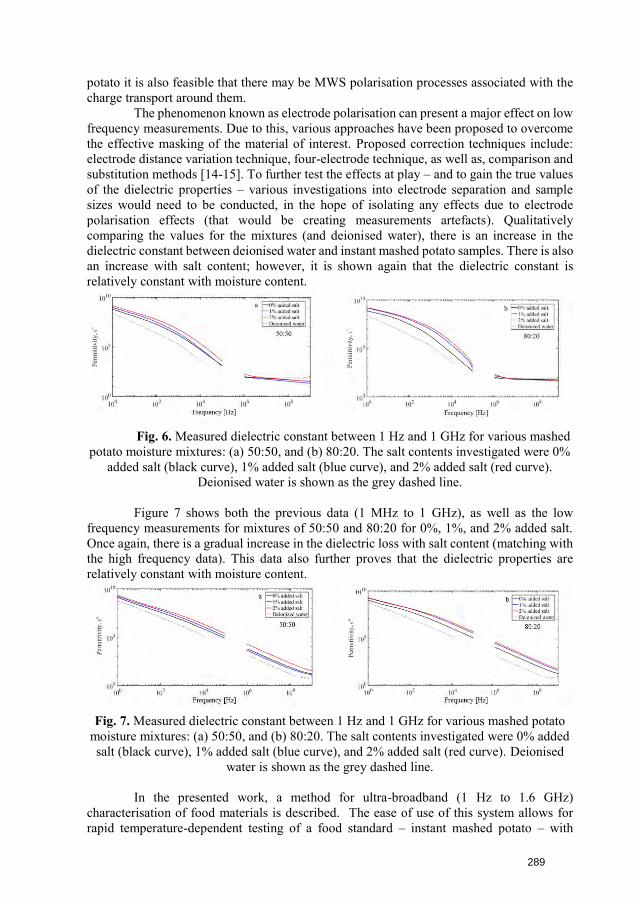
potato it is also feasible that there may be MWS polarisation processes associated with the charge transport around them.
The phenomenon known as electrode polarisation can present a major effect on low frequency measurements. Due to this, various approaches have been proposed to overcome the effective masking of the material of interest. Proposed correction techniques include: electrode distance variation technique, four-electrode technique, as well as, comparison and substitution methods [14-15]. To further test the effects at play – and to gain the true values of the dielectric properties – various investigations into electrode separation and sample sizes would need to be conducted, in the hope of isolating any effects due to electrode polarisation effects (that would be creating measurements artefacts). Qualitatively comparing the values for the mixtures (and deionised water), there is an increase in the dielectric constant between deionised water and instant mashed potato samples. There is also an increase with salt content; however, it is shown again that the dielectric constant is relatively constant with moisture content.
Fig. 6. Measured dielectric constant between 1 Hz and 1 GHz for various mashed potato moisture mixtures: (a) 50:50, and (b) 80:20. The salt contents investigated were 0%
added salt (black curve), 1% added salt (blue curve), and 2% added salt (red curve). Deionised water is shown as the grey dashed line.
Figure 7 shows both the previous data (1 MHz to 1 GHz), as well as the low frequency measurements for mixtures of 50:50 and 80:20 for 0%, 1%, and 2% added salt. Once again, there is a gradual increase in the dielectric loss with salt content (matching with the high frequency data). This data also further proves that the dielectric properties are relatively constant with moisture content.
Fig. 7. Measured dielectric constant between 1 Hz and 1 GHz for various mashed potato moisture mixtures: (a) 50:50, and (b) 80:20. The salt contents investigated were 0% added salt (black curve), 1% added salt (blue curve), and 2% added salt (red curve). Deionised
water is shown as the grey dashed line.
In the presented work, a method for ultra-broadband (1 Hz to 1.6 GHz) characterisation of food materials is described. The ease of use of this system allows for rapid temperature-dependent testing of a food standard – instant mashed potato – with
289
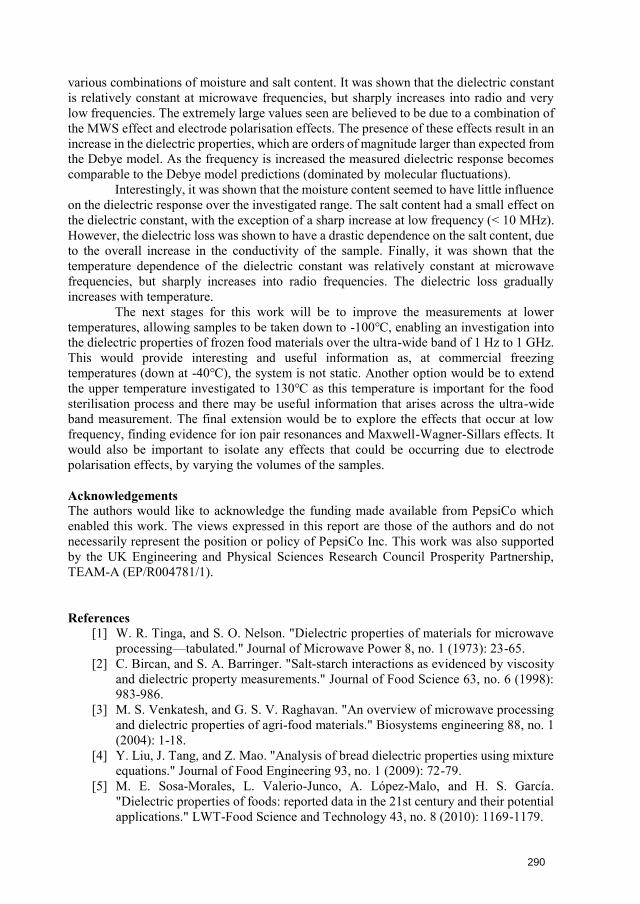
various combinations of moisture and salt content. It was shown that the dielectric constant is relatively constant at microwave frequencies, but sharply increases into radio and very low frequencies. The extremely large values seen are believed to be due to a combination of the MWS effect and electrode polarisation effects. The presence of these effects result in an increase in the dielectric properties, which are orders of magnitude larger than expected from the Debye model. As the frequency is increased the measured dielectric response becomes comparable to the Debye model predictions (dominated by molecular fluctuations).
Interestingly, it was shown that the moisture content seemed to have little influence on the dielectric response over the investigated range. The salt content had a small effect on the dielectric constant, with the exception of a sharp increase at low frequency (< 10 MHz). However, the dielectric loss was shown to have a drastic dependence on the salt content, due to the overall increase in the conductivity of the sample. Finally, it was shown that the temperature dependence of the dielectric constant was relatively constant at microwave frequencies, but sharply increases into radio frequencies. The dielectric loss gradually increases with temperature.
The next stages for this work will be to improve the measurements at lower temperatures, allowing samples to be taken down to -100℃, enabling an investigation into the dielectric properties of frozen food materials over the ultra-wide band of 1 Hz to 1 GHz. This would provide interesting and useful information as, at commercial freezing temperatures (down at -40℃), the system is not static. Another option would be to extend the upper temperature investigated to 130℃ as this temperature is important for the food sterilisation process and there may be useful information that arises across the ultra-wide band measurement. The final extension would be to explore the effects that occur at low frequency, finding evidence for ion pair resonances and Maxwell-Wagner-Sillars effects. It would also be important to isolate any effects that could be occurring due to electrode polarisation effects, by varying the volumes of the samples.
Acknowledgements The authors would like to acknowledge the funding made available from PepsiCo which enabled this work. The views expressed in this report are those of the authors and do not necessarily represent the position or policy of PepsiCo Inc. This work was also supported by the UK Engineering and Physical Sciences Research Council Prosperity Partnership, TEAM-A (EP/R004781/1).
References [1] W. R. Tinga, and S. O. Nelson. "Dielectric properties of materials for microwave
processing—tabulated." Journal of Microwave Power 8, no. 1 (1973): 23-65.[2] C. Bircan, and S. A. Barringer. "Salt‐starch interactions as evidenced by viscosity
and dielectric property measurements." Journal of Food Science 63, no. 6 (1998):983-986.
[3] M. S. Venkatesh, and G. S. V. Raghavan. "An overview of microwave processingand dielectric properties of agri-food materials." Biosystems engineering 88, no. 1(2004): 1-18.
[4] Y. Liu, J. Tang, and Z. Mao. "Analysis of bread dielectric properties using mixtureequations." Journal of Food Engineering 93, no. 1 (2009): 72-79.
[5] M. E. Sosa-Morales, L. Valerio-Junco, A. López-Malo, and H. S. García."Dielectric properties of foods: reported data in the 21st century and their potentialapplications." LWT-Food Science and Technology 43, no. 8 (2010): 1169-1179.
290
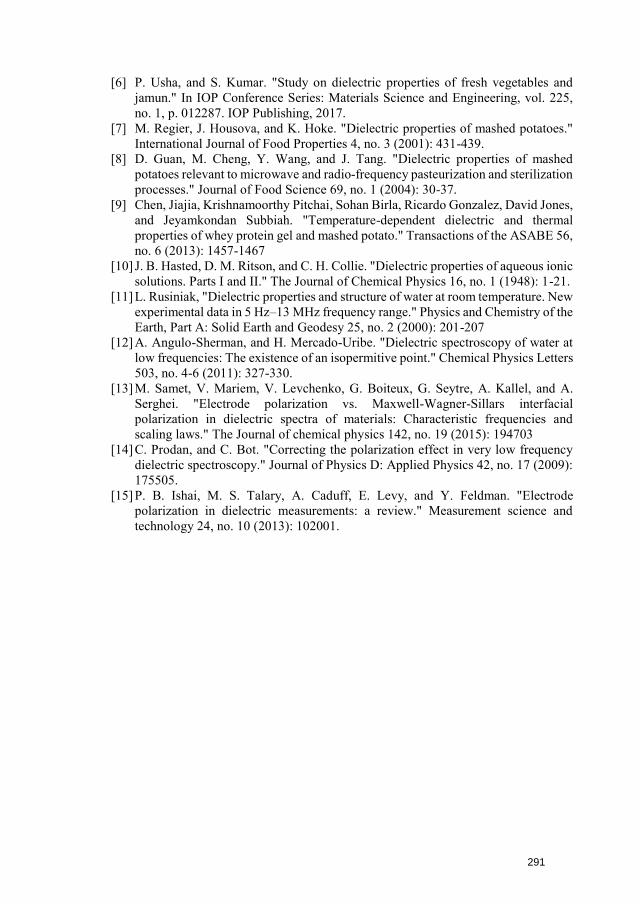
[6] P. Usha, and S. Kumar. "Study on dielectric properties of fresh vegetables andjamun." In IOP Conference Series: Materials Science and Engineering, vol. 225,no. 1, p. 012287. IOP Publishing, 2017.
[7] M. Regier, J. Housova, and K. Hoke. "Dielectric properties of mashed potatoes."International Journal of Food Properties 4, no. 3 (2001): 431-439.
[8] D. Guan, M. Cheng, Y. Wang, and J. Tang. "Dielectric properties of mashedpotatoes relevant to microwave and radio‐frequency pasteurization and sterilizationprocesses." Journal of Food Science 69, no. 1 (2004): 30-37.
[9] Chen, Jiajia, Krishnamoorthy Pitchai, Sohan Birla, Ricardo Gonzalez, David Jones,and Jeyamkondan Subbiah. "Temperature-dependent dielectric and thermalproperties of whey protein gel and mashed potato." Transactions of the ASABE 56,no. 6 (2013): 1457-1467
[10] J. B. Hasted, D. M. Ritson, and C. H. Collie. "Dielectric properties of aqueous ionicsolutions. Parts I and II." The Journal of Chemical Physics 16, no. 1 (1948): 1-21.
[11] L. Rusiniak, "Dielectric properties and structure of water at room temperature. Newexperimental data in 5 Hz–13 MHz frequency range." Physics and Chemistry of theEarth, Part A: Solid Earth and Geodesy 25, no. 2 (2000): 201-207
[12] A. Angulo-Sherman, and H. Mercado-Uribe. "Dielectric spectroscopy of water atlow frequencies: The existence of an isopermitive point." Chemical Physics Letters503, no. 4-6 (2011): 327-330.
[13] M. Samet, V. Mariem, V. Levchenko, G. Boiteux, G. Seytre, A. Kallel, and A.Serghei. "Electrode polarization vs. Maxwell-Wagner-Sillars interfacialpolarization in dielectric spectra of materials: Characteristic frequencies andscaling laws." The Journal of chemical physics 142, no. 19 (2015): 194703
[14] C. Prodan, and C. Bot. "Correcting the polarization effect in very low frequencydielectric spectroscopy." Journal of Physics D: Applied Physics 42, no. 17 (2009):175505.
[15] P. B. Ishai, M. S. Talary, A. Caduff, E. Levy, and Y. Feldman. "Electrodepolarization in dielectric measurements: a review." Measurement science andtechnology 24, no. 10 (2013): 102001.
291

USE OF MICROWAVES IN THE AGRICULTURAL SECTOR – FROM HEAT TREATMENT TO SENSING APPLICATIONS
G. Brodie1
1Dookie Campus, The University of Melbourne, 940 Nalinga Rd., Dookie, Australia [email protected]
Keywords: agriculture, microwave, microwave heating, microwave plasma, dielectrics, sensing
Most materials, which are associated with agriculture, such as soil, crops, weeds, timber, fruits, vegetables, seeds, and animal products, are a heterogeneous mixture of solids, liquids, and gasses. The substrate for soils is composed of various inorganic minerals, organic compounds from dead and decaying life forms, and living micro- and macro-organisms. Vegetable-based materials, including timber, are a combination of various cellulosic and ligneous polymers, while animal-based materials have carbohydrates, fats, and proteins, along with some mineral components (i.e., calcium in bone and teeth), as their dominant substrate materials. In their dry state, most of these substrates are relatively transparent to microwave and radio frequency energy [1-4].
Water is one of the most common liquids in these materials and it exists in both bound and free forms. From an electromagnetic perspective, bound water, and ice, have a relatively slow relaxation period; however, the relaxation period depends on the number of molecular layers of water overlaying the substrate material [5, 6]. The relaxation period approaches that of free water when the bound water film thickness approaches ten molecular diameters [5, 6]. The dielectric properties of free water have been extensively studied [7-9] and a paper on the very wide frequency response of free water was presented at the 2019 AMPERE conference [10].
The dielectric properties of all agricultural materials are strongly linked to moisture content [2, 11]. For example, based on work done by El-Rayes and Ulaby [1, 12], Figure 1 shows the dielectric response of vegetation as a function of frequency and moisture content. Similarly, the dielectric properties of soils and other agriculturally related materials are frequency, moisture and temperature dependent. This strong relationship between moisture content, dielectric behaviour, and the interactions of electromagnetic waves naturally leads to many applications of RF and microwave energy for sensing and heating purposes in agriculture. This paper will outline several of these applications.
Heating Applications
Crop Drying
Many studies have investigated radio frequency (RF) and microwave crop, hay, and wood drying [13, 14]. The high dielectric properties of water, compared with dry organic molecules, yields stronger absorption of the electromagnetic energy and therefore higher temperatures in moist grain, hay, or wood, compared with dry materials. Evaporating water requires high energy input; therefore, complete drying with electromagnetic energy is prohibitively expensive for commercial applications.
292
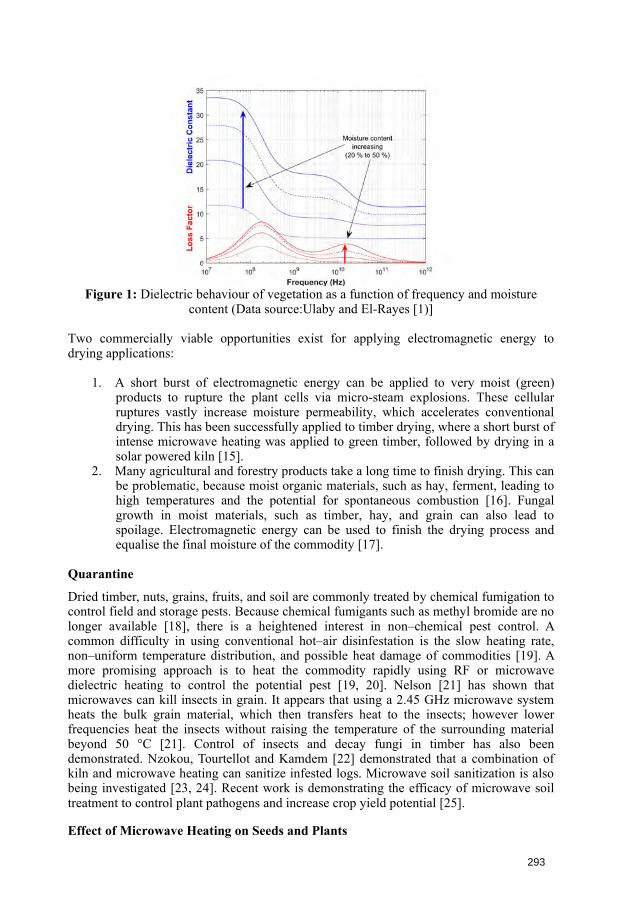
Figure 1: Dielectric behaviour of vegetation as a function of frequency and moisture content (Data source:Ulaby and El-Rayes [1)]
Two commercially viable opportunities exist for applying electromagnetic energy to drying applications:
1. A short burst of electromagnetic energy can be applied to very moist (green)products to rupture the plant cells via micro-steam explosions. These cellularruptures vastly increase moisture permeability, which accelerates conventionaldrying. This has been successfully applied to timber drying, where a short burst ofintense microwave heating was applied to green timber, followed by drying in asolar powered kiln [15].
2. Many agricultural and forestry products take a long time to finish drying. This canbe problematic, because moist organic materials, such as hay, ferment, leading tohigh temperatures and the potential for spontaneous combustion [16]. Fungalgrowth in moist materials, such as timber, hay, and grain can also lead tospoilage. Electromagnetic energy can be used to finish the drying process andequalise the final moisture of the commodity [17].
Quarantine
Dried timber, nuts, grains, fruits, and soil are commonly treated by chemical fumigation to control field and storage pests. Because chemical fumigants such as methyl bromide are no longer available [18], there is a heightened interest in non–chemical pest control. A common difficulty in using conventional hot–air disinfestation is the slow heating rate, non–uniform temperature distribution, and possible heat damage of commodities [19]. A more promising approach is to heat the commodity rapidly using RF or microwave dielectric heating to control the potential pest [19, 20]. Nelson [21] has shown that microwaves can kill insects in grain. It appears that using a 2.45 GHz microwave system heats the bulk grain material, which then transfers heat to the insects; however lower frequencies heat the insects without raising the temperature of the surrounding material beyond 50 °C [21]. Control of insects and decay fungi in timber has also been demonstrated. Nzokou, Tourtellot and Kamdem [22] demonstrated that a combination of kiln and microwave heating can sanitize infested logs. Microwave soil sanitization is also being investigated [23, 24]. Recent work is demonstrating the efficacy of microwave soil treatment to control plant pathogens and increase crop yield potential [25].
Effect of Microwave Heating on Seeds and Plants
293
Interest in the effects of high frequency electromagnetic waves on biological materials dates to the late 19th century, while interest in the effect of high frequency electromagnetic fields on plant material began in the 1920’s [26]. In many cases, exposure of seeds to low doses of radio frequency and microwave radiation resulted in increased germination and vigour of the emerging seedlings [27, 28]; however, exposure to high doses results in seed death [29, 30]. Microwaves can kill a wide range of weed seeds in the soil [30, 31].
As with seeds, the application of mild doses of microwave energy to seedlings can greatly enhance growth [32]; however, high doses are lethal and can be applied as a weed control technology [33]. In weed control, microwave radiation is not affected by wind, which extends the application periods compared with conventional herbicide spraying. Energy can also be focused onto individual plants without affecting adjacent plants [34]. This would be very useful for in-crop or spot weed control activities.
Microwave Treatment of Animal Fodder
Dong, Long, Zhang, Hu and Pu [35] discovered that organic matter degradability of wheat straw in the rumen of yaks was increased by around 20% after 4 min of treatment in a 750 W, 2.54 GHz, microwave oven. Sadeghi and Shawrang [36] showed that microwave treatment of canola meal increased in vitro dry matter disappearance, including substances that were deemed to be ruminally undegradable. Sadeghi and Shawrang [37] also showed that microwave treatment reduced the rumen degradable starch fraction of corn grain and decreased crude protein degradation of soya-bean meal compared with untreated samples. Small scale in vitro pepsin-cellulase digestion experiments [38] demonstrated that microwave treatment: increased dry matter percentage with increasing microwave treatment time; increased in vitro dry matter disappearance with increasing microwave treatment time; but had no significant effect on post-digestion crude protein content. Live animal trials, using microwave treated lucerne hay showed an 8.1 % higher increase in body weight, compared with animals fed with untreated hay [38].
Microwave Assisted Extraction
During microwave assisted extraction (MAE), plant materials such as wood, seeds, and leaves are suspended in solvents and the mixture is exposed to microwave heating instead of conventional heating. Chen and Spiro [39] examined the extraction of the essential oils of peppermint and rosemary in hexane and ethanol mixtures and found that yields were more than one third greater in the MAE treatments. Saoud, Yunus and Aziz [40] studied MAE of essential oils from tea leaves and achieved higher yields (26.8 mg/g) than conventional steam distillation (24 mg/g). Industrial scale microwave assisted extraction systems have been developed and used in several countries. Several approaches to industrial microwave-assisted extraction techniques have been developed. These include: continuous-flow reactors; small-scale batch stop-flow protocols; or large-scale single-batch reactors [41]. One of the limitations of microwave scale-up technology is the restricted penetration depth of microwave irradiation into absorbing materials [41]. This means that solvent or reagents in the centre of large reaction vessel are heated by convection and not by direct ‘in core’ microwave dielectric heating [42].
Although less well described in the literature, an alternative approach for utilizing microwave heating of plant based materials has been to treat the materials with microwave energy prior to conventional extraction processes [43]. Microwave preconditioning of sugar cane prior to juice diffusion studies led to significant decreases in colour and significant increases in juice yield, Brix %, purity and Pol % [44]. Microwave treatment
294
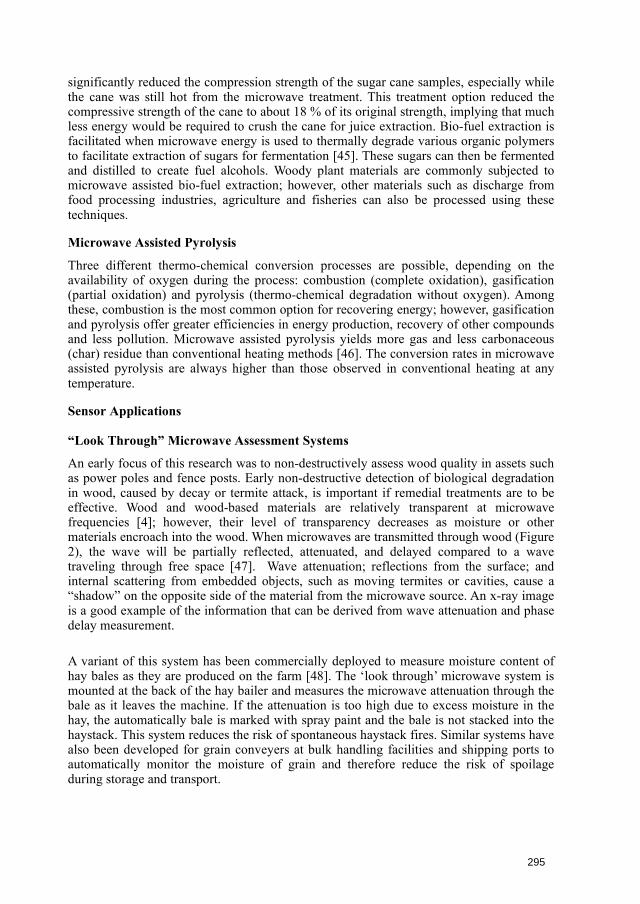
significantly reduced the compression strength of the sugar cane samples, especially while the cane was still hot from the microwave treatment. This treatment option reduced the compressive strength of the cane to about 18 % of its original strength, implying that much less energy would be required to crush the cane for juice extraction. Bio-fuel extraction is facilitated when microwave energy is used to thermally degrade various organic polymers to facilitate extraction of sugars for fermentation [45]. These sugars can then be fermented and distilled to create fuel alcohols. Woody plant materials are commonly subjected to microwave assisted bio-fuel extraction; however, other materials such as discharge from food processing industries, agriculture and fisheries can also be processed using these techniques.
Microwave Assisted Pyrolysis
Three different thermo-chemical conversion processes are possible, depending on the availability of oxygen during the process: combustion (complete oxidation), gasification (partial oxidation) and pyrolysis (thermo-chemical degradation without oxygen). Among these, combustion is the most common option for recovering energy; however, gasification and pyrolysis offer greater efficiencies in energy production, recovery of other compounds and less pollution. Microwave assisted pyrolysis yields more gas and less carbonaceous (char) residue than conventional heating methods [46]. The conversion rates in microwave assisted pyrolysis are always higher than those observed in conventional heating at any temperature.
Sensor Applications
“Look Through” Microwave Assessment Systems
An early focus of this research was to non-destructively assess wood quality in assets such as power poles and fence posts. Early non-destructive detection of biological degradation in wood, caused by decay or termite attack, is important if remedial treatments are to be effective. Wood and wood-based materials are relatively transparent at microwave frequencies [4]; however, their level of transparency decreases as moisture or other materials encroach into the wood. When microwaves are transmitted through wood (Figure 2), the wave will be partially reflected, attenuated, and delayed compared to a wave traveling through free space [47]. Wave attenuation; reflections from the surface; and internal scattering from embedded objects, such as moving termites or cavities, cause a “shadow” on the opposite side of the material from the microwave source. An x-ray image is a good example of the information that can be derived from wave attenuation and phase delay measurement.
A variant of this system has been commercially deployed to measure moisture content of hay bales as they are produced on the farm [48]. The ‘look through’ microwave system is mounted at the back of the hay bailer and measures the microwave attenuation through the bale as it leaves the machine. If the attenuation is too high due to excess moisture in the hay, the automatically bale is marked with spray paint and the bale is not stacked into the haystack. This system reduces the risk of spontaneous haystack fires. Similar systems have also been developed for grain conveyers at bulk handling facilities and shipping ports to automatically monitor the moisture of grain and therefore reduce the risk of spoilage during storage and transport.
295
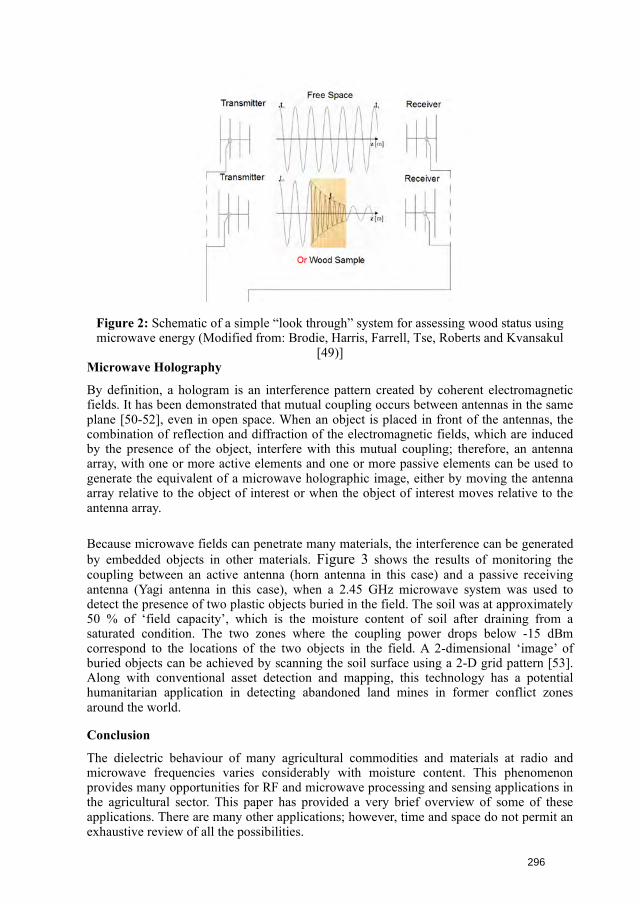
Figure 2: Schematic of a simple “look through” system for assessing wood status using microwave energy (Modified from: Brodie, Harris, Farrell, Tse, Roberts and Kvansakul
[49)] Microwave Holography
By definition, a hologram is an interference pattern created by coherent electromagnetic fields. It has been demonstrated that mutual coupling occurs between antennas in the same plane [50-52], even in open space. When an object is placed in front of the antennas, the combination of reflection and diffraction of the electromagnetic fields, which are induced by the presence of the object, interfere with this mutual coupling; therefore, an antenna array, with one or more active elements and one or more passive elements can be used to generate the equivalent of a microwave holographic image, either by moving the antenna array relative to the object of interest or when the object of interest moves relative to the antenna array.
Because microwave fields can penetrate many materials, the interference can be generated by embedded objects in other materials. Figure 3 shows the results of monitoring the coupling between an active antenna (horn antenna in this case) and a passive receiving antenna (Yagi antenna in this case), when a 2.45 GHz microwave system was used to detect the presence of two plastic objects buried in the field. The soil was at approximately 50 % of ‘field capacity’, which is the moisture content of soil after draining from a saturated condition. The two zones where the coupling power drops below -15 dBm correspond to the locations of the two objects in the field. A 2-dimensional ‘image’ of buried objects can be achieved by scanning the soil surface using a 2-D grid pattern [53]. Along with conventional asset detection and mapping, this technology has a potential humanitarian application in detecting abandoned land mines in former conflict zones around the world.
Conclusion
The dielectric behaviour of many agricultural commodities and materials at radio and microwave frequencies varies considerably with moisture content. This phenomenon provides many opportunities for RF and microwave processing and sensing applications in the agricultural sector. This paper has provided a very brief overview of some of these applications. There are many other applications; however, time and space do not permit an exhaustive review of all the possibilities.
296
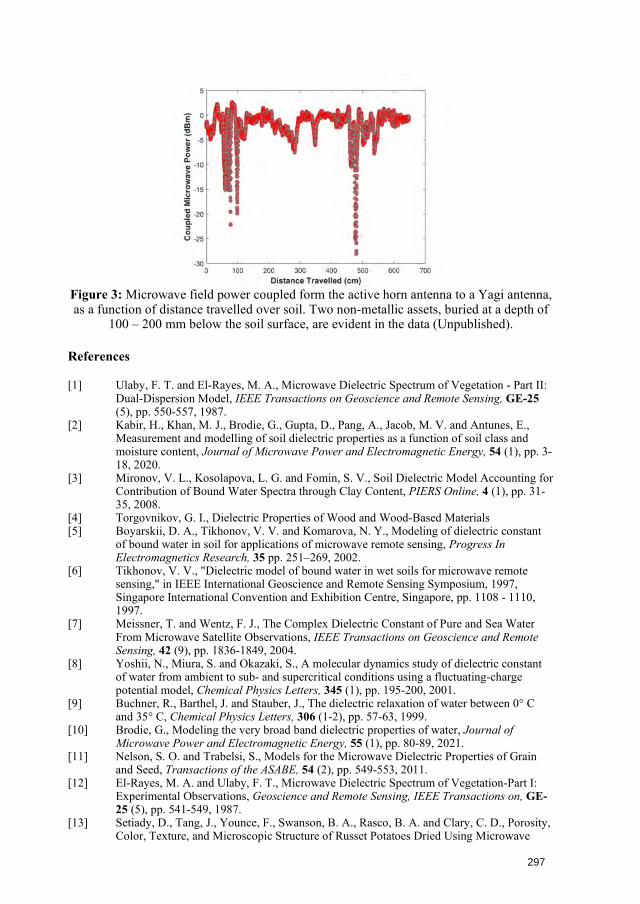
Figure 3: Microwave field power coupled form the active horn antenna to a Yagi antenna, as a function of distance travelled over soil. Two non-metallic assets, buried at a depth of
100 – 200 mm below the soil surface, are evident in the data (Unpublished).
References
[1] Ulaby, F. T. and El-Rayes, M. A., Microwave Dielectric Spectrum of Vegetation - Part II:Dual-Dispersion Model, IEEE Transactions on Geoscience and Remote Sensing, GE-25(5), pp. 550-557, 1987.
[2] Kabir, H., Khan, M. J., Brodie, G., Gupta, D., Pang, A., Jacob, M. V. and Antunes, E.,Measurement and modelling of soil dielectric properties as a function of soil class andmoisture content, Journal of Microwave Power and Electromagnetic Energy, 54 (1), pp. 3-18, 2020.
[3] Mironov, V. L., Kosolapova, L. G. and Fomin, S. V., Soil Dielectric Model Accounting forContribution of Bound Water Spectra through Clay Content, PIERS Online, 4 (1), pp. 31-35, 2008.
[4] Torgovnikov, G. I., Dielectric Properties of Wood and Wood-Based Materials[5] Boyarskii, D. A., Tikhonov, V. V. and Komarova, N. Y., Modeling of dielectric constant
of bound water in soil for applications of microwave remote sensing, Progress InElectromagnetics Research, 35 pp. 251–269, 2002.
[6] Tikhonov, V. V., "Dielectric model of bound water in wet soils for microwave remotesensing," in IEEE International Geoscience and Remote Sensing Symposium, 1997,Singapore International Convention and Exhibition Centre, Singapore, pp. 1108 - 1110,1997.
[7] Meissner, T. and Wentz, F. J., The Complex Dielectric Constant of Pure and Sea WaterFrom Microwave Satellite Observations, IEEE Transactions on Geoscience and RemoteSensing, 42 (9), pp. 1836-1849, 2004.
[8] Yoshii, N., Miura, S. and Okazaki, S., A molecular dynamics study of dielectric constantof water from ambient to sub- and supercritical conditions using a fluctuating-chargepotential model, Chemical Physics Letters, 345 (1), pp. 195-200, 2001.
[9] Buchner, R., Barthel, J. and Stauber, J., The dielectric relaxation of water between 0° Cand 35° C, Chemical Physics Letters, 306 (1-2), pp. 57-63, 1999.
[10] Brodie, G., Modeling the very broad band dielectric properties of water, Journal ofMicrowave Power and Electromagnetic Energy, 55 (1), pp. 80-89, 2021.
[11] Nelson, S. O. and Trabelsi, S., Models for the Microwave Dielectric Properties of Grainand Seed, Transactions of the ASABE, 54 (2), pp. 549-553, 2011.
[12] El-Rayes, M. A. and Ulaby, F. T., Microwave Dielectric Spectrum of Vegetation-Part I:Experimental Observations, Geoscience and Remote Sensing, IEEE Transactions on, GE-25 (5), pp. 541-549, 1987.
[13] Setiady, D., Tang, J., Younce, F., Swanson, B. A., Rasco, B. A. and Clary, C. D., Porosity,Color, Texture, and Microscopic Structure of Russet Potatoes Dried Using Microwave
297
Vacuum, Heated Air, and Freeze Drying Applied Engineering in Agriculture, 25 (5), pp. 719-724, 2009.
[14] Manickavasagan, A., Jayas, D. S. and White, N. D. G., Non-uniformity of surfacetemperatures of grain after microwave treatment in an industrial microwave dryer, DryingTechnology, 24 (10--12), pp. 1559-1567, 2006.
[15] Brodie, G. I., Innovative wood drying: Applying microwave and solar technologies towood drying978-3-639-04670-0 978-3-639-04670-0.
[16] Anonymous, Spontaneous Combustion of Hay, Scientific American, 83 (18), pp. 277-277,1900.
[17] Afzal, M. T. and Thomson, F. C., "Moisture Equalization of Kiln-wet Lumber usingMicrowave Heating," in ASABE, St. Joseph, Mich., 2004.
[18] Carter, C. A., Chalfant, J. A., Goodhue, R. E., Han, F. M. and DeSantis, M., The MethylBromide Ban: Economic Impacts on the California Strawberry Industry, Review ofAgricultural Economics, 27 (2), pp. 181-197, 2005.
[19] Wang, S., Tang, J., Cavalieri, R. P. and Davis, D. C., Differential heating of insects indried nuts and fruits associated with radio frequency and microwave treatment,Transactions of the ASAE, 46 (4), pp. 1175–1182, 2003.
[20] Nelson, S. O., Radio-frequency and microwave dielectric properties of insects, Journal ofMicrowave Power and Electromagnetic Energy, 36 (1), pp. 47-56, 2001.
[21] Nelson, S. O., A review and assessment of microwave energy for soil treatment to controlpests, Transactions of the ASAE, 39 (1), pp. 281-289, 1996.
[22] Nzokou, P., Tourtellot, S. and Kamdem, D. P., Kiln and microwave heat treatment of logsinfested by the emerald ash borer (Agrilus planipennis Fairmaire) (Coleoptera:Buprestidae), Forest Products Journal, 58 (7/8), p. 68, 2008.
[23] Mahdi, W. M., Al-Badri, K. S. L. and Alqaisi, M. R. M., Effect of Microwave Radiationon Bacteria, Fungi and Some Growth Characteristics of Cowpea Vigna unguiculata L,Gesunde Pflanzen, 2020.
[24] Mahdi, W. M., Al-Badri, K. S. L. and Al-Samarrai, G. F., Use of Microwave Radiation inSoil Sterilization and Effects on the Bacteria, Fungi and Growth Characteristics ofChickpea Plant (Cicer arietinum L.), Plant Archives, 19 pp. 2064-2069, 2019.
[25] Brodie, G., Khan, M. J. and Gupta, D., Microwave Soil Treatment and Plant Growth, inSustainable Crop Production 978-1-78985-318-6 978-1-78985-318-6, 2019.
[26] Ark, P. A. and Parry, W., Application of High-Frequency Electrostatic Fields inAgriculture, The Quarterly Review of Biology, 15 (2), pp. 172-191, 1940.
[27] Tran, V. N. and Cavanagh, A. K., Effects of microwave energy on Acacia longifolia,Journal of Microwave Power, 14 (1), pp. 21-27, 1979.
[28] Tran, V. N., Effects of Microwave Energy on the Strophiole, Seed Coat and Germinationof Acacia Seeds, Australian Journal of Plant Physiology, 6 (3), pp. 277-287, 1979.
[29] Bebawi, F. F., Cooper, A. P., Brodie, G. I., Madigan, B. A., Vitelli, J. S., Worsley, K. J.and Davis, K. M., Effect of microwave radiation on seed mortality of rubber vine(Cryptostegia grandiflora R.Br.), parthenium (Parthenium hysterophorous L.) andbellyache bush (Jatropha gossypiifolia L.), Plant Protection Quarterly, 22 (4), pp. 136-142, 2007.
[30] Davis, F. S., Wayland, J. R. and Merkle, M. G., Ultrahigh-Frequency ElectromagneticFields for Weed Control: Phytotoxicity and Selectivity, Science, 173 (3996), pp. 535-537,1971.
[31] Brodie, G., Harris, G., Pasma, L., Travers, A., Leyson, D., Lancaster, C. and Woodworth,J., Microwave soil heating for controlling ryegrass seed germination, Transactions of theAmerican Society of Agricultural and Biological Engineers, 52 (1), pp. 295-302, 2009.
[32] Horikoshi, S., Hasegawa, Y. and Suzuki, N., "Benefitting of Plants Using MicrowaveGenetic Activation Method and its Applications," in IMPI’s 51st Annual MicrowavePower Symposium (IMPI 51), Miami, FL, USA, pp. 35-36, 2017.
[33] Brodie, G. and Hollins, E., The Effect of Microwave Treatment on Ryegrass and WildRadish Plants and Seeds, Global Journal of Agricultural Innovation, Research &Development, 2 (1), pp. 16-24, 2015.
[34] Brodie, G., Ryan, C. and Lancaster, C., Microwave technologies as part of an integratedweed management strategy: A Review, International Journal of Agronomy, 2012 pp. 1-14,2012.
298
[35] Dong, S., Long, R., Zhang, D., Hu, Z. and Pu, X., Effect of microwave treatment onchemical composition and in sacco digestibility of wheat straw in yak cow Asian-Australasian Journal of Animal Sciences, 18 (1), pp. 27-31, 2005.
[36] Sadeghi, A. A. and Shawrang, P., Effects of microwave irradiation on ruminaldegradability and in vitro digestibility of canola meal, Animal Feed Science andTechnology, 127 (1-2), pp. 45-54, 2006.
[37] Sadeghi, A. A. and Shawrang, P., Effects of microwave irradiation on ruminal protein andstarch degradation of corn grain, Animal Feed Science and Technology, 127 (1-2), pp. 113-123, 2006.
[38] Brodie, G., Rath, C., Devanny, M., Reeve, J., Lancaster, C., Harris, G., Chaplin, S. andLaird, C., Effect of microwave treatment on lucerne fodder, Animal Production Science, 50(2), pp. 124–129, 2010.
[39] Chen, S. S. and Spiro, M., Study of microwave extraction of essential oil constituents fromplant materials, Journal of Microwave Power and Electromagnetic Energy, 29 (4), pp.231-241, 1994.
[40] Saoud, A. A., Yunus, R. M. and Aziz, R. A., Yield study for extracted tea leaves essentialoil using microwave-assisted process, American Journal of Chemical Engineering, 6 (1),pp. 22-27, 2006.
[41] Hoz, A. D. L., Alcázar, J., Carrillo, J., Herrero, M. A., Muñoz, J. D. M., Prieto, P., Cózar,A. D. and Diaz-Ortiz, A., Reproducibility and Scalability of Microwave-AssistedReactions, in Microwave Heating 2011.
[42] Brodie, G., The influence of load geometry on temperature distribution during microwaveheating, Transactions of the American Society of Agricultural and Biological Engineers,51 (4), pp. 1401-1413, 2008.
[43] Miletic, P., Grujic, R. and Marjanovic-Balaban, Z., The application of microwaves inessential oil hydro-distillation processes, Chemical Industry and Chemical EngineeringQuarterly, 15 (1), pp. 37-39, 2009.
[44] Brodie, G., Jacob, M. V., Sheehan, M., Yin, L., Cushion, M. and Harris, G., Microwavemodification of sugar cane to enhance juice extraction during milling, Journal ofMicrowave Power and Electromagnetic Energy, 45 (4), pp. 178-187, 2011.
[45] Tsubaki, S. and Azuma, J.-i., Application of microwave technology for utilization ofrecalcitrant biomass, in Advances in Induction and Microwave Heating of Mineral andOrganic Materials 978-953-307-522-8 978-953-307-522-8, 2011.
[46] Fernandez, Y., Arenillas, A. and Menéndez, J. A., Microwave heating applied to pyrolysis,in Advances in Induction and Microwave Heating of Mineral and Organic Materials 978-953-307-522-8 978-953-307-522-8, 2011.
[47] Lundgren, N., "Modelling Microwave Measurements in Wood," Department of SkellefteåCampus, Division of Wood Science and Technology, Luleå University of Technology,2005.
[48] Anonymous, "Gazeeka Moisture Gauge", International Stock Foods, 2013[49] Brodie, G., Harris, E., Farrell, P., Tse, N. A., Roberts, A. and Kvansakul, J., "In-situ,
noninvasive investigation of an outdoor wooden sculpture," in ICOM-CC 17th TriennialConference, ICOM-CC 17th Triennial Conference Preprints, Melbourne, 15–19 September2014, pp. 1-9, 2014.
[50] Bird, T. S., Mutual coupling in arrays of coaxial waveguides and horns, IEEE Transactionson Antennas and Propagation, 52 (3), pp. 821-829, 2004.
[51] Bird, T. S., Cross-coupling between open-ended coaxial radiators, Microwaves, Antennasand Propagation, IEE Proceedings -, 143 (4), pp. 265-271, 1996.
[52] Bird, T. S., Analysis of mutual coupling in finite arrays of different-sized rectangularwaveguides, IEEE Transactions on Antennas and Propagation, 38 (2), pp. 166-172, 1990.
[53] Kumari, V., Ahmed, A., Sheoran, G. and Kanumuri, T., "Experimental Investigation ofDirective Antenna in Near Field Indirect Microwave Holography " in IEEE InternationalMicrowave and Radio Frequency Conference, Kolkata, India, 2018.
299
Understanding Microwave Depolymerisation of Synthetic Polymers‡
M. Adam1*, N. Hjalmarsson2, E. Binner1, D. Irvine1, J. Robinson1,
1Faculty of Engineering, University of Nottingham, Nottingham NG7 2RD, UK. 2Mitsubishi Chemical UK Limited, Wilton Centre, Wilton, Redcar TS10 4RF, UK.
Keywords: Microwave, Processing, Dielectric properties.
Global plastics production has risen from 2 to 380 million tons per year between 1950 and 2015 [1]. Consequently, the annual plastics solid waste production has risen to around 150 million tons, whereas recycling rate has remained low [2]. It is widely accepted that the current production and waste management trends are not sustainable, thus, development of advanced recycling strategies is urgently needed. Chemical recycling methods, which involve breaking the polymer down into its building blocks and/or other valuable chemicals, have attracted great interest as tools to boost recycling rates. Microwave heating has been suggested as one of the promising techniques to provide the heat needed for breaking down the polymeric chains. The majority of previous studies on microwave depolymerisation of plastics involved mixing them with additional microwave absorbers [3]. Polymers, in general, are not considered to be good microwave absorbers at room temperature. This is because of their high molecular weight, which restricts molecular rotation in response to the electromagnetic field, and the lack of free electrons. However, it is believed that polymers involving polar segments would have a better ability to absorb microwaves at high temperatures. The aim of this study was to understand the microwave interactions with a range of polymers and their temperature dependency as potential candidates for microwave-assisted depolymerisation. The dielectric properties of the polymers were measured as a function of temperature using the cavity perturbation technique. It was found that the loss factor of those polymers involving polar segments within their polymeric chains, such as poly(methyl methacrylate), increases with temperature. The loss factor increases more rapidly above the glass transition temperature. This was attributed to the polymeric chains having extra freedom to move in response to the applied electromagnetic field. Above 200 °C the dielectric behaviour was affected by two factors. The first is the transition in relaxation frequency which leads to a drop in the loss factor with temperature. The second is the thermal decomposition of the polymer and vaporisation of its products which results in reduction in both the dielectric constant and loss factor. Polymers with no strong polar segments such as polystyrene did not show a similar increase in the loss factor with temperature. Microwave heating experiments in a single-mode cavity supported the dielectric characterisation observations. The absorbed microwave power and the heating rate were found to increase rapidly once temperature reaches the glass transition temperature.
References 1. Geyer, R., et al., Science Advances, 2017. 3(7): p. e1700782.2. Da Ros, S., et al., J. Anal. Appl. Pyrolysis, 2019. 144: p. 104706.3. Solis, M. and S. Silveira, Waste Management, 2020. 105: p. 128-138.
‡ This work was financially supported by Mitsubishi Chemical UK Limited. 300

DOI: 10.5281/zenodo.5644776


