Embed Size (px)
Citation preview
PROCEEDINGS OF THE
48th ANNUAL MEETING FERTILIZER INDUSTRY
ROUNDTABLE 1998
N
1951
s
October 26, 27, and 28, 1998 Annapolis Marriott Hotel
Annapolis, Maryland

PROCEEDINGS OF THE 48th ANNUAL MEETING
FERTILIZER INDUSTRY ROUNDTABLE
1998
October 26, 27, and 28, 1998 Annapolis Marriott Hotel
Annapolis, Maryland

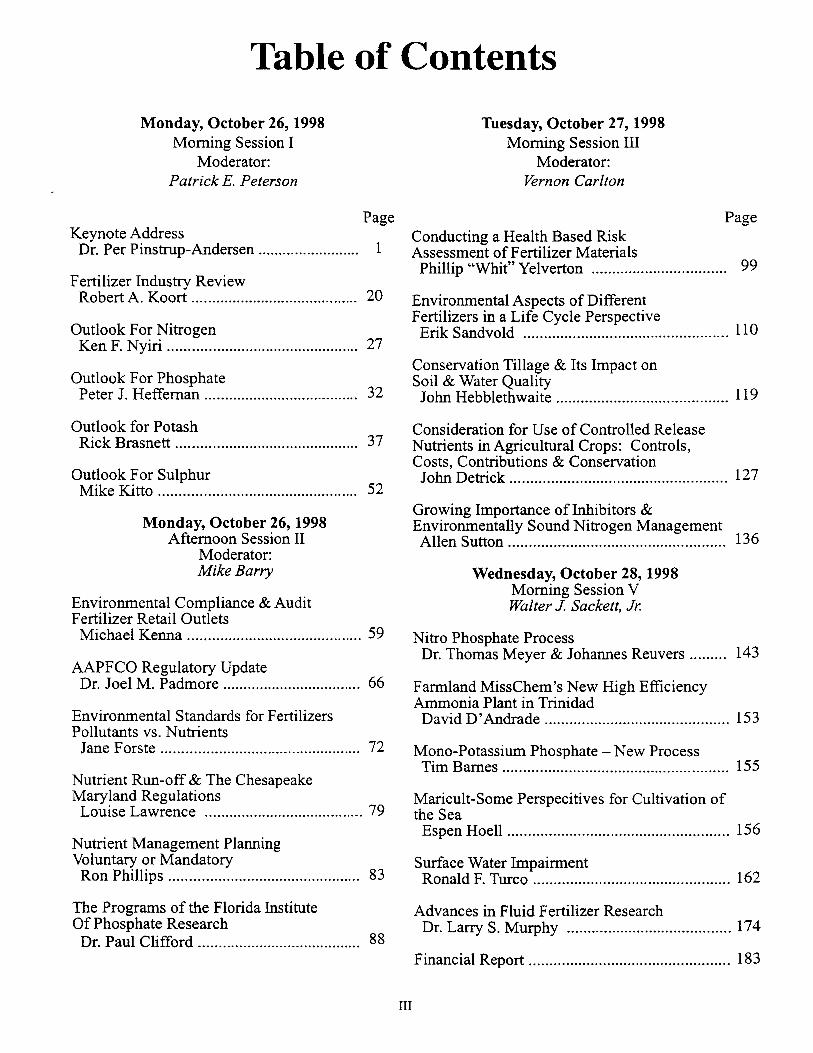
Table of Contents
Monday, October 26, 1998 Morning Session I
Moderator: Patrick E. Peterson
Keynote Address Page
Dr. Per Pinstrup-Andersen ..................... .... 1
Fertilizer Industry Review Robert A. Koort .... ................... ............ ...... 20
Outlook For Nitrogen Ken F. Nyiri ............................................... 27
Outlook For Phosphate Peter J. Heffernan ...................................... 32
Outlook for Potash Rick Brasnett ........................ ..................... 37
Outlook For Sulphur Mike Kitto ................................................. 52
Monday, October 26,1998 Afternoon Session II
Moderator: Mike Barry
Environmental Compliance & Audit Fertilizer Retail Outlets
Michael Kenna ........................................... 59
AAPFCO Regulatory Update Dr. Joel M. Padmore ...... ... ............... .......... 66
Environmental Standards for Fertilizers Pollutants vs. Nutrients
Jane Forste ................................................. 72
Nutrient Run-off & The Chesapeake Maryland Regulations
Louise Lawrence ....................................... 79
Nutrient Management Planning Voluntary or Mandatory
Ron Phillips ... ..... .... .... ....... ..... ............. ...... 83
The Programs of the Florida Institute Of Phosphate Research
Dr. Paul Clifford ............................... ......... 88
Tuesday, October 27,1998 Morning Session III
Moderator: Vernon Carlton
Conducting a Health Based Risk Assessment of Fertilizer Materials
Page
Phillip "Whit" Yelverton ................................. 99
Environmental Aspects of Different Fertilizers in a Life Cycle Perspective Erik Sandvold ....... ..... ..... ...... .................... ....... 110
Conservation Tillage & Its Impact on Soil & Water Quality John Hebblethwaite .......................................... 119
Consideration for Use of Controlled Release Nutrients in Agricultural Crops: Controls, Costs, Contributions & Conservation John Detrick ..................................................... 127
Growing Importance of Inhibitors & Environmentally Sound Nitrogen Management Allen Sutton ..................................................... 136
Wednesday, October 28, 1998 Morning Session V Walter J. Sackett, Jr.
Nitro Phosphate Process Dr. Thomas Meyer & Johannes Reuvers ......... 143
III
Farmland MissChem's New High Efficiency Ammonia Plant in Trinidad David D' Andrade ............................................. 153
Mono-Potassium Phosphate - New Process Tim Barnes ....................................................... 155
Maricult-Some Perspecitives for Cultivation of the Sea
Espen Hoell ............... .... ..... ............... .......... ..... 156
Surface Water Impairment Ronald F. Turco ................................................ 162
Advances in Fluid Fertilizer Research Dr. Larry S. Murphy ........................................ 174
Financial Report ................................................. 183
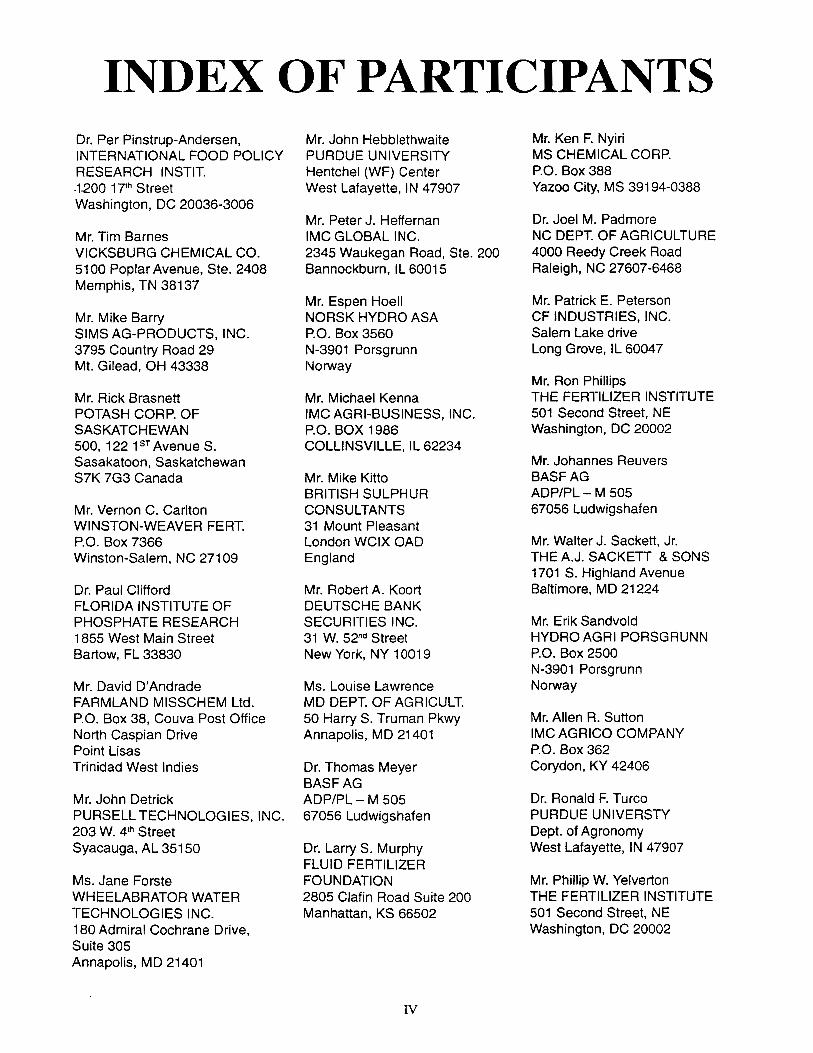
INDEX OF PARTICIPANTS Dr. Per Pinstrup-Andersen, INTERNATIONAL FOOD POLICY RESEARCH INSTIT.
-~1.200 17th Street Washington, DC 20036-3006
Mr. Tim Barnes VICKSBURG CHEMICAL CO. 5100 Poplar Avenue, Ste. 2408 Memphis, TN 38137
Mr. Mike Barry SIMS AG-PRODUCTS, INC. 3795 Country Road 29 Mt. Gilead, OH 43338
Mr. Rick Brasnett POTASH CORP. OF SASKATCHEWAN 500, 122 1ST Avenue S. Sasakatoon, Saskatchewan S7K 7G3 Canada
Mr. Vernon C. Carlton WINSTON-WEAVER FERT. P.O. Box 7366 Winston-Salem, NC 27109
Dr. Paul Clifford FLORIDA INSTITUTE OF PHOSPHATE RESEARCH 1855 West Main Street Bartow, FL 33830
Mr. David D'Andrade FARMLAND MISSCHEM Ltd. P.O. Box 38, Couva Post Office North Caspian Drive Point Lisas Trinidad West Indies
Mr. John Detrick PURSELL TECHNOLOGIES, INC. 203 W. 4th Street Syacauga, AL 35150
Ms. Jane Forste WHEELABRATOR WATER TECHNOLOGIES INC. 180 Admiral Cochrane Drive, Suite 305 Annapolis, MD 21401
Mr. John Hebblethwaite PURDUE UNIVERSITY Hentchel (WF) Center West Lafayette, IN 47907
Mr. Peter J. Heffernan IMC GLOBAL INC. 2345 Waukegan Road, Ste. 200 Bannockburn, IL 60015
Mr. Espen Hoell NORSK HYDRO ASA P.O. Box 3560 N-3901 Porsgrunn Norway
Mr. Michael Kenna IMC AGRI-BUSINESS, INC. P.O. BOX 1986 COLLINSVILLE, IL 62234
Mr. Mike Kitto BRITISH SULPHUR CONSULTANTS 31 Mount Pleasant London WC1X OAD England
Mr. Robert A. Koort DEUTSCHE BANK SECURITIES INC. 31 W. 52no Street New York, NY 10019
Ms. Louise Lawrence MD DEPT. OF AGRICULT. 50 Harry S. Truman Pkwy Annapolis, MD 21401
Dr. Thomas Meyer BASFAG ADP/PL - M 505 67056 Ludwigshafen
Dr. Larry S. Murphy FLUID FERTILIZER FOUNDATION 2805 Clafin Road Suite 200 Manhattan, KS 66502
IV
Mr. Ken F. Nyiri MS CHEMICAL CORP. P.O. Box 388 Yazoo City, MS 39194-0388
Dr. Joel M. Padmore NC DEPT. OF AGRICULTURE 4000 Reedy Creek Road Raleigh, NC 27607-6468
Mr. Patrick E. Peterson CF INDUSTRIES, INC. Salem Lake drive Long Grove, IL 60047
Mr. Ron Phillips THE FERTILIZER INSTITUTE 501 Second Street, NE Washington, DC 20002
Mr. Johannes Reuvers BASFAG ADP/PL - M 505 67056 Ludwigshafen
Mr. Walter J. Sackett, Jr. THE A.J. SACKETT & SONS 1701 S. Highland Avenue Baltimore, MD 21224
Mr. Erik Sandvold HYDRO AGRI PORSGRUNN P.O. Box 2500 N-3901 Porsgrunn Norway
Mr. Allen R. Sutton IMC AGRICO COMPANY P.O. Box 362 Corydon, KY 42406
Dr. Ronald F. Turco PURDUE UNIVERSTY Dept. of Agronomy West Lafayette, IN 47907
Mr. Phillip W. Yelverton THE FERTILIZER INSTITUTE 501 Second Street, NE Washington, DC 20002
1997 BOARD OF DIRECTORS FRANK P. ACHORN SE-ME P.O. BOX 493 FLORENCE. AL 35631
B.E.ADAMS CONSULTANT 3509 WOODLAWN STREET HOPEWELL. VA 23860
THOMAS B. ATHEY 219 HERON POINT CHESTERTOWN. MD 21620
BOBBY S. AVANT IMC AGRI-BUSINESS 1611 OAK AVENUE AMERICUS. GA 31709
MIKE BARRY SIMS AG-PRODUCTS. INC. 3795 COUNTRY ROAD 29 MT. GILEAD. OH 43338
LEOBEWER PCS SALES 1221ST AVE. S. SASAKATOON. SASKATCHEWAN S7K 7G3 CANADA
HAROLD D. BLENKHORN 525 BEACONSFIELD BEACONSFIELD. QUEBEC CANADA H9W 4C8
PATRICIA BOSTICK AGRIUM U.S .• INC. 2405 W. VASSAR ROAD REESE. MI 48757
G. CAMERON BOWEN CAMERON CHEMICAL. INC 1316 SMITH DOUGLAS CHESAPEAKE. VA 23320
JOHN A. BOYD, SR. MORRAL COMPANIES P.O. BOX 26 MORRAL, OH 43337
JAMES C. BROWN SYLVITE SALES (USA).INC 8 KEYSTONE DRIVE LEBANON. PA 17042
DOUGLAS CAINE CONSULTANT P.O. BOX 491 WHITING. IN 46394
VERNON C. CARLTON WINSTON-WEAVER FERT. P.O. BOX 7366 WINSTON-SALEM. NC 27109
DR. PAUL CLIFFORD FL INSTIT OF PHOSPHATE 1855 WEST MAIN STREET BARTOW. FL33830
KURT CONSTANT THE WORLD BANK 1818 'H' STREET NW WASHINGTON. DC 20433
DAVID CRERAR 6. WESTMORLAND ROAD FELlXSTOWE. SUFFOLK IP119TB U.K.
DONALD P. DAY PCS SALES P.O. BOX 30321 RALEIGH. NC 27622
DALE DUBBERLY FL DEPT OF AGRICULTURE 3125 CONNER BLVD TALLAHASSA. FL 32399
JOHN M. FRENCH BRITISH SULPHUR CORP. 31 MOUNT PLEASANT LONDON WCIX OAD ENGLAND
JAMES GREENE SOUTHERN STATES COOP 2582 SALISBURY HWY. STATESVILLE. NC 28677
WILLIAM L. HALL. JR. IMCVIGORO 2121 3RD STREET. SW WINTER HAVEN, FL33882
MICHAEL HANCOCK OISC. PURDUE UNIVERSITY 1154 BIOCHEMISTRY BLDG. W LAFAYETTE, IN 47907
G. CONRAD HARDIE, JR. LYKES AGRI SALES P.O. BOX 13989 FT. PIERCE, FL 34979
MR. LEE D. HOFFMANN FEECO INTERNTATIONAL 3913 ALGOMA ROAD GREEN BAY. WIS4311-9707
EDWARD HUBER, JR. THE FERTILIZER INSTITUTE 6615 PHEASANT DRIVE ELKRIDGE. MD 21227
K.C. KNUDSEN KEMIRA TOFTEVEJ9 DK-2840 HOLTE DENMARK
v
JAMES J. KUHLE LEBANON CHEMICAL CORP. P.O. BOX 180 LEBANON, PA 17042
KENNETH D. KUNZ AlllED SIGNAL INC. P.O. BOX 1559 HOPEWELL. VA 23860
DAVID W. LEYSHON JACOBs/DORRCO DIV P.O. BOX 2008 LAKELAND. FL 33803
OLE H.lIE NORSK HYDRO A.S. P.O. BOX 2594 SOlll N-OSLO 2 NORWAY
LUC M. MAENE INTERNATIONAL FERTILIZER INDUSTRY 28 RUE MARBEUF 75008 PARIS. FRANCE
DONALD L. MESSICK THE SULPHUR INSTITUTE 1140 CONNECTICUT AVE. WASHINGTON. DC 20036
G. KENNETH MOSHENEK ROYSTER-CLARK. INC. P.O. BOX 250 TARBORO. NC 27886
EO NORRIS THE ANDERSONS, INC. P.O. BOX 119 MAUMEE. OH 43537
JAMES G. PERKINS MS CHEMICAL CORP. P.O. BOX 388 YAZOO CITY. MS 39194
PATRICK E. PETERSON CF INDUSTRIES. INC. SALEM LAKE DRIVE LONG GROVE, IL 60047
GARRYPIGG FREEPORT-MCMORAN. INC 1615 POYDRAS STREET NEW ORLEANS. LA 70112
PAUL J. PROSSER. JR THE PROSSER COMPANY P.O. BOX 5036 GLEN ARM. MD 21057
JOHN RENNEBURG CONSULTANT 515 BIGHTWooD CLUB DR LUTHERVILLE. MD 21093
JOSEPH E. REYNOLDS, JR. CONSULTANT 5518 SOUTHWOOD DR. MEMPHIS, TN 38119
ROBERT E. ROBINSON ROBERT E. ROBINSON & ASSOC 111 MAPLEWOOD DRIVE _~EAVER, PA 15009
WALTER J. SACKETT, JA. A.J. SACKETT & SONS CO. 1701 S HIGHLAND AVE. BALTIMORE. MD 21224
JAMES J. SCHULTZ INTERNATIONAL FERTILZER DEVELOPEMENT CTR P.O. BOX 2040 MUSCLE SHOALS. Al 35662
WILLIAM F. SHELDRICK THE WORLD BANK 38 RAVINE ROAD CANFORD CLIFFS POOLE. BH13 7HY DORSET UNITED KINGDOM
SA. ADOLFO SISTO MESETA 200, DELA. OBREGON 01900 MEXICO, D.E
MICHAEL D. STEGMANN LANGE-STEGMANN ONE ANGELICA STREET ST. LOUIS, MO 63147
VI
DAVID J. VETERE CREST TECHNOLOGIES P.O. BOX 57 INGOMAR, PA 15127
GLEN H. WESENBERG. P.E. FEECO INTERNATIONAL 3913 ALGOMA ROAD GREEN BAY, WI 54311
PHILLIP W. YELVERTON THE FERTILIZER INSTITUTE 501 SECOND STREET WASHINGTON, DC 20002
OLE H. LIE PATRICK E. PETERSON PAUL J. PROSSER, JR.
OFFICERS
CHAIRMAN VICE CHAIRMAN SECRETARY/TREASURER
ACTIVE PAST CHAIRMEN
Joseph E. Reynolds, Jr. Rodger C. Smith Frank P. Achorn Harold D. Blenkhorn William F. Sheldrick Paul J. Prosser, Jr. David W. Leyshon Walter J. Sackett, Jr.
Past Chairman Past Chairman Past Chairman Past Chairman Past Chairman Past Chairman Past Chairman Past Chairman
COMMITTEE CHAIRMEN
Entertainment Meeting Dates & Places Finances Program-Annual Meeting Nominating Public Relations International Relations
VII
Thomas B. Athey Thomas B. Athey Paul J. Prosser, Jr. Harold D. Blenkhorn Joseph E. Reynolds, Jr. Walter J. Sackett, Jr. William F. Sheldrick

Opening Remarks
Ole H. Lie, Chairman
- Dear Friends of The Fertilizer Industry Round Table, Ladies and Gentlemen, it is with great pleasure that I welcome you all to the Forty-Eighth Annual Meeting of The Fertilizer Industry Round Table.
In these very turbulent times when the globe warms and China floods, when the economic crisis in Asia threatens to spread to the rest of the world, when impeachment discussions are taking place in Congress, and the outlook for industry in general and for the Fertilizer Industry in particular is less than ebullient, it is indeed good to see that so many of you have elected to come to the annual meeting of the Round Table in the beautiful city of Annapolis.
The excellent traditions of the Round Table live on. Also, this year knowledgeable and busy people are voluntarily and generously contributing time and effort to make up what looks to me as a most interesting program. On behalf of the Round Table, I thank them.
Many things have happened since we met in St. Pete Beach last year. The most significant event was, in my mind, the COP3 meeting in Kyoto last November which led to the signing of a protocol where the industrial nations of the world agreed to reduce their emissions of green house gases (GHGs) by about 5 percent from the 1990 level by the year 2012. The follow-up-COP4 -will take place in about two weeks in Buenos Aires. The purpose there is to convert the regulatory principles agreed upon in Kyoto-the so called flexible mechanisms-into practical operating rules.
As you are aware of, it is not certain that the Kyoto ~rotocol in its present form will be ratified and go mto effect. A prerequisite for ratification is probably greater participation by developing countries.
Whatever shape and form binding international regulations of GHG emissions ultimately will have, t~ey will strongly effect the fertilizer industry. And, smce the fertilizer industry is an energy intensive industry, this effect will most probably be negative. Many of you remember how environmental issues related to emissions to air and water moved from being non existing some years back to their present prominence of the Fertilizer Round Table agenda. I believe GHG issues and, as a consequence, the development of technology to reduce energy used in fertilizer production and methods to minimize nitrous oxide emission associated with fertilizer use, will attain the same importance in the years to come.
Fertilizers are a key to food production-"fertilizers feed the world"-and has an important role in sequestering carbon dioxide. Even though you and I know this, the fertilizer industry still has had a problem in convincing the rest of the world that is actually so. With the emergence of new GHG regulations, it becomes extremely important that this role is understood to avoid unintended effects.
We must, therefore, be present and argue our case in the arenas where issues are decided, be it through discussions with our respective national governments or in participation in intergovernmental conferences. Encouraging signs of progress are the invitation of Mr. Awasti, the president of the International Fertilizer Manufacturers Association (IFA) to speak at the Commission for Sustainable Development at the UN a year ago, and that IFA, our worldwide fertilizer industry umbrella organization is presently rethinking its strategy on this issue, which I believe will result in a more active international stance on important issues. IFA has an important role to play, beyond that of individual companies and national and regional fertilizer organizations.
IX
Let me turn to today's business.
It is my privilege and pleasure to introduce to you our keynote speaker, Dr. Per Pinstrup-Andersen.
Dr. Pinstrup-Andersen, a native of Denmark, joined the International Food Policy Research Institute (IFPRI) in Washington, DC as its director general in 1992. Prior to this, he was director of the Cornell Food and Nutrition Policy Program, professor of food economics at Cornell University, and a mem-
--ber of the Technical Advisory Committee to the CGIAR. Before taking up his teaching and research positions at Cornell, Dr. Pinstrup-Andersen served as a research fellow and director of the Food Consumption and Nutrition Policy Program at IFPRI, an agricultural economist at International Center for Tropical Agriculture (CIAT) in Columbia, and as a director of the Agro-Economic Division of the IFDC in the US.
Dr. Pinstrup-Andersen is a member of the Board of Directors of the American Agricultural Economics Association, and is on the editorial committees of several journals. Dr. Pinstrup-Andersen has a B.S. from Denmark, and a M.S. and Ph.D. from
x
Oklahoma State University. He has received many awards, including an Honorary Degree of Doctor of Technical Science at the prestigious Swiss Federal Institute of Technology for his outstanding contributions to research in nutrition economics and leadership in the effort to achieve worldwide food security, and the Charles A. Black Award for his outstanding record of research and communication awarded by the Council for Agricultural Science and Technology (CAST) in 1998.
Dr. Pinstrup-Andersen has a busy schedule today, but has been kind enough to take time out from another important meeting in Washington to come and address us on matters extremely important to agriculture and fertilizer use. He has to leave shortly after his speech, but would, I am sure, have time to answer a question or two should they come.
Please, let us welcome Dr. Per Pinstrup-Andersen.
Monday, October 26, 1998
Session I Moderator:
Patrick E. Peterson
Keynote Address The Role of Fertilizer in Future
World Food Securityl Per Pinstrup-Andersen and Marc J. Cohen 2
Can the world meet food needs, reduce poverty, and protect the environment over the next two decades? This paper will examine the current world food situation and the likely prospects over the next 20 years. It will explore the policies and actions needed to assure sustainable food security, and discuss the role of fertilizer in achieving this.
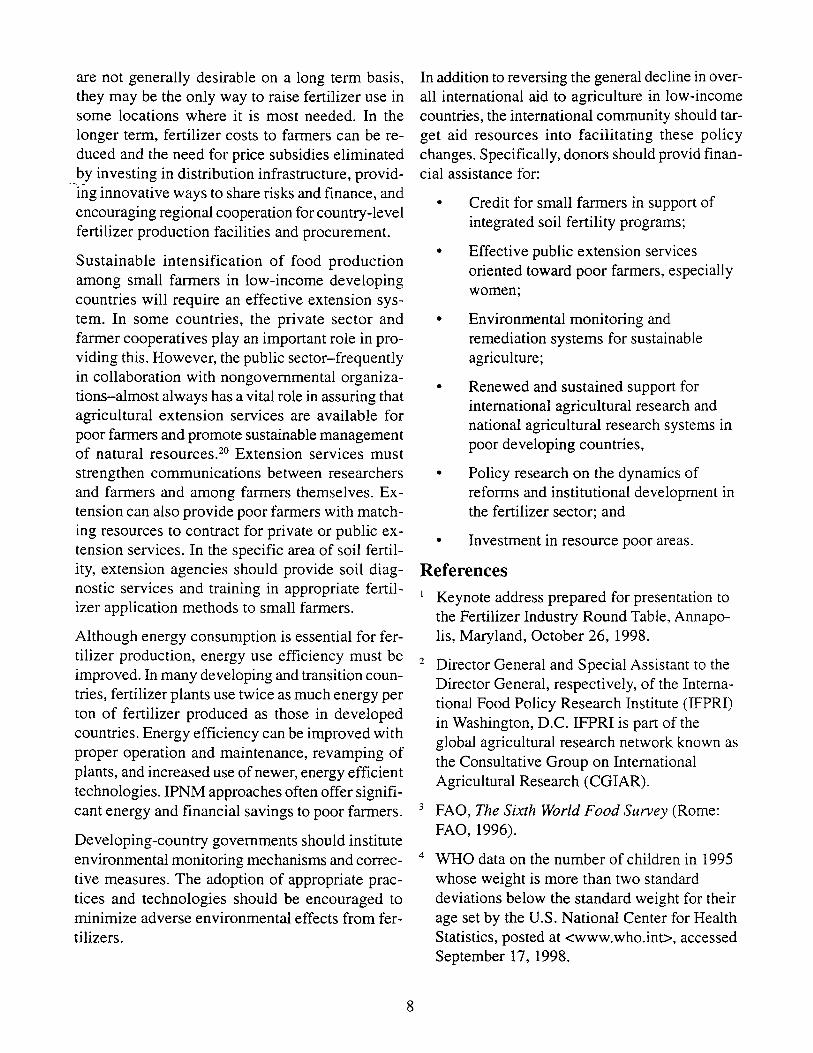
Current State of Global Food Security According to the Food and Agriculture Organization of the United Nations (FAO), about 840 million people in developing countries lack adequate access to food (Figure 1). This represents 20 percent of the population of the developing world. Over 60 percent of this undernourished population lives in the Asia-Pacific region. However, SubSaharan Africa is the only region in which both the number and proportion of undernourished people is on an increasing trend. 3
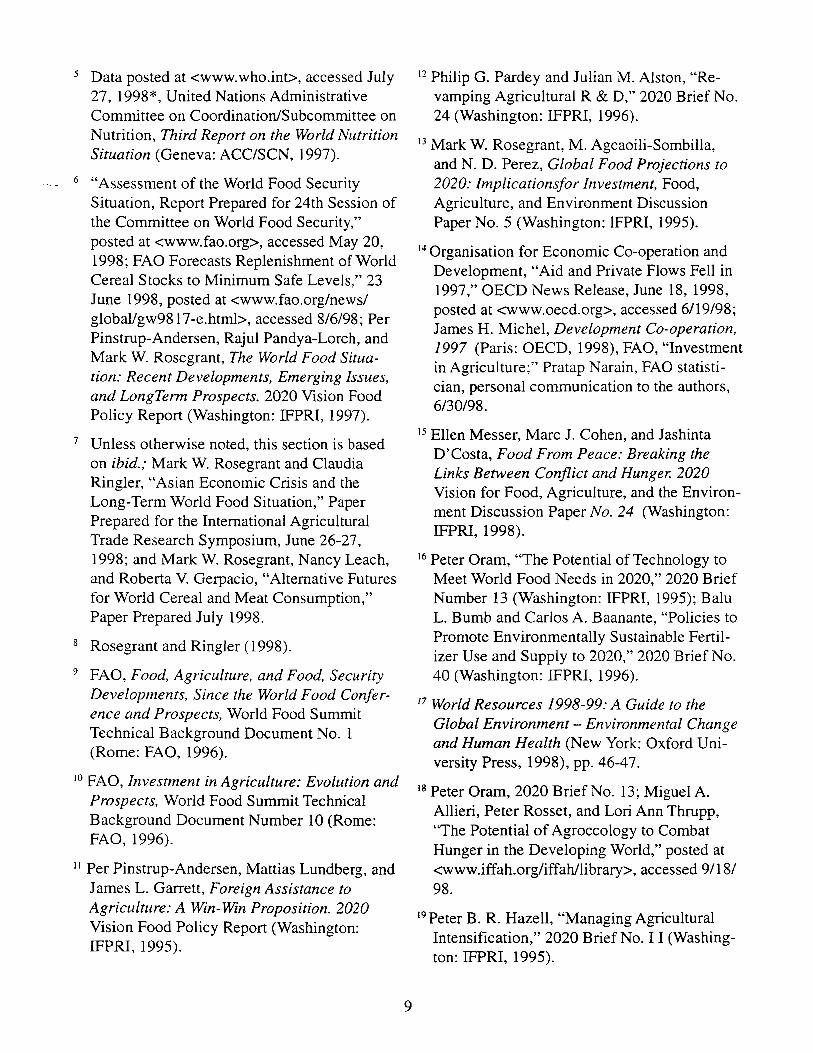
Furthermore, according to the World Health Organization (WHO), 167 million children under the age of 5 in developing countries are malnourished. More than half of these children live in South Asia, where 49 percent of all children under five suffer from malnutrition (Figure 2). Malnutrition can cause irreversible harm to children's mental and physical development, and is a factor in over 5 million child deaths each year.4
These figures on chronic undernutrition and child malnutrition in developing countries tally those
1
who consume less than the minimum number of calories needed for a healthy and active life. At present, nutritionists generally agree that if a person takes in enough calories, he or she will also get the necessary protein. However, even if a person has an adequate calorie intake, this does not guarantee that he or she will also meet vitamin, mineral, and trace element ("micronutrient") requirements. WHO estimates that nearly 2 billion people worldwide suffer from anemia, including 58 percent of pregnant women in developing countries. Anemia often results from inadequate iron intake, and can lead to increased maternal and newborn mortality, impaired health and development of infants and children, limited learning capacity, impaired immune systems, and reduced school and work performance. Nearly 1.6 billion people suffer from iodine deficiency disorders, which include brain damage and severe mental retardation. Ironically, in light of these high numbers of affected people, it is possible to address micronutrient malnutrition with inexpensive public health interventions, such as salt iodization and providing pregnant women with iron sulfate tablets.s In addition, IFPRI is leading a global initiative on breeding nticronutrient-rich staple crops.
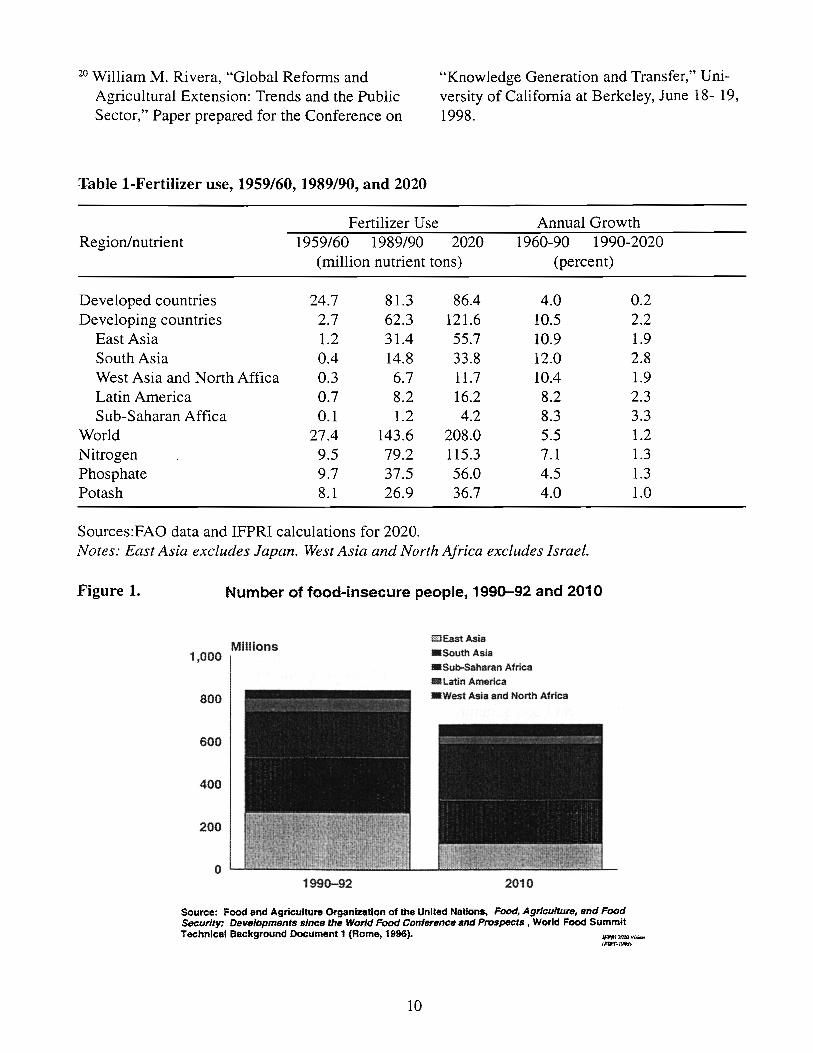
On the supply side, global cereal production rose above the long-term trend for the second consecutive year in 1997, with record wheat and rice harvests. This bounty followed the shortfalls and escalating prices of 1995 and the first half of 1996. The ratio of world cereal stocks to world cereal utilization returned to the 17-18 percent range that FAO considers "safe" in 1998 for the frrst time in four years as a result of favorable harvests and reduced import demand. But cereal production de-
clined in the countries FAO has designated "lowincome food deficit" in 1997, and global food aid fell to a historical low of 4.9 million tons.
Despite this mixed picture, global food production remains more than adequate to provide everyone with the required minimum number of calories if available food were distributed according to needs. Hunger persists not because of inadequate food availability, but because poor people cannot afford to buy all the food they need and do not have access to the resources to produce it for themselves.6
Prospects to 2020 7
IFPRI's International Model for Policy Analysis of Commodities and Trade (IMPACT) projects the future world food situation under several scenarios. In the most likely scenario, the world will continue to produce enough food at least until 2020 to meet the demand of people who can afford to buy it, and real food prices will continue to decline (Figures 3 and 4). However, without significant changes in policy, high levels of malnutrition and food insecurity will persist, and degradation of natural resources will continue, as poor people continue to lack access to the food they need.
IMPACT projections indicate that 143 million preschool children in developing countries will still be malnourished in 2020, or just 14 percent fewer than in 1995 (Figure 2). Child malnutrition is expected to decline in all developing regions except SubSaharan Africa, where the number of malnourished children could climb 24 percent over the 1995 level, to reach 39 million. Also, depending on the severity of the current economic crisis in Asia, another 3 to 15 million children could be malnourished by 2020.8
FAO projects that the total food-insecure population in the developing world will fall to 680 million people by 2010, with the proportion declining to 12 percent. However, food insecurity is likely to increase in Sub-Saharan Africa and the West Asia-North Africa region, even as it declines in other developing regions. By 2010, 70 percent of food insecure people will live in Sub-Saharan Africa and South Asia (Figure 1).9
2
There is likely to be a gap between food production and demand in several parts of the world by 2020. Demand is influenced by population growth and urbanization, as well as income levels and associated changes in dietary preferences. In SubSaharan Africa, the population growth rate has exceeded the rate of growth in food production since the early 1970s and the gap is widening, resulting in declining per capita food production (Figure 5).
According to the United Nations, world population will reach 7.7 billion in 2020, an increase of 35 percent over the 1995 population of 5.7 billion. More than 95 percent of this increase will occur in the developing countries, which will be home to 84 percent of humanity by 2020 (Figure 6). The developing world's urban popUlation, which is growing quite rapidly, will double, to 3.6 billion people (Figure 7). Urbanization brings changes in diets due to new constraints on women's time and new lifestyles. When people move to cities, they generally shift from diets based on roots, tubers, sorghum, millet, and com to rice and wheat, which require less preparation time, and to more meat, milk, fruit, vegetables, and processed foods.
IMPACT projections indicate favorable income growth in all developing regions through 2020, but income inequality is likely to persist within and between countries. Poverty is likely to remain entrenched in South Asia and Latin America, and to increase considerably in Sub-Saharan Affica.
IMPACT projects global demand for cereals to increase by 42 percent between 1993 and 2020, with developing countries accounting for 84 percent of the increase. By 2020, developing countries will account for 65 percent of total global cereal demand and 62 percent of global meat demand (compared to 47 percent in 1993). Linked to growing developing-country demand for meat will be increased cereal feed demand (Figures 8 and 9).
Our projections indicate that expansion of cropped area will not account for much of the growth in cereal production to 2020 (Figure 10). Thus, the burden of meeting increased demand rests on improvements in crop yields. But the annual increase
in yields of the major cereals is projected to slow down during 1993-2020 in both developed and developing countries (Figure 11). Cereal production in developing countries will be insufficient to meet the expected increase in demand.
The "food gap"-the difference between production and demand-is likely to more than double for developing countries by 2020 (Figure 12). Poorer countries are unlikely to be able to make up the difference through commercial imports, and global food aid has declined sharply during the 1990s. Many millions of low-income people may not be able to afford the food they need, even if it is available in the marketplace.
A number of factors that are difficult to predict will influence the global food situation through 2020. These include:
• Increased grain price volatility;
• Policy decisions and changes in lifestyles and incomes in China and India, the world's two most populous countries;
• The impact of short-term weather patterns and long-term climate change;
• Constraints imposed by water scarcity; and
• Continued barriers to developing-country exports in developed country markets.
A Brighter Scenario is Possible Nothing is inevitable about this pessimistic outlook for future food security. If the international community is willing to make food security a higher policy priority and to reverse a number of current trends, a brighter future, with benefits for developed as well as developing countries, is possible. But achieving this will require a turnaround in present declining levels of public investment in agriculture in many developing countries. On average, they are devoting just 7.5 percent of government spending to agriCUlture (and just 7 percent in Sub-Saharan Afiica) , 10 even though in the poorer developing countries most poor people depend on agriculture for their livelihoods, and agriculture is the most viable sector for leading over-
3
all economic growth. In particular, developingcountry governments must create an environment supportive of a competitive and efficient private sector. In addition, they must stress the creation and maintenance of rural infrastructure; effective markets for agricultural inputs and outputs; agricultural research and extension oriented toward small farmers, especially women, who account for the bulk of food production in many developing countries, basic education; primary health care; and other public goods needed to accelerate broadbased growth within and outside agriculture. Development efforts must engage small farmers and other low-income people as active participants, not passive recipients, without a sense of ownership on the part of affected people, development schemes have little likelihood of success.
By establishing such policies and priorities, poor countries, especially in Africa, can sustain the fragile but real growth experienced over the past few years.
For their part, international institutions and the developed countries, particularly the seven richest industrial countries, must reverse the overall decline in official development assistance of recent years. Aid to agriculture and rural development has fallen precipitously, shrinking nearly 50 percent in real terms between 1986 and 1996 (Figure 13). Our research has found that aid to developingcountry agriculture not only is effective in promoting sustainable development and poverty alleviation, but it leads to increased export opportunities for developed countries as well, including, paradoxically, increased agricultural exports. II
Public investment in agricultural research is crucial for achieving future food security. The private sector is unlikely to undertake much of the research needed by small farmers in developing countries because it cannot expect to recuperate sufficient economic gains to cover costs. Benefits to society from such research can be extremely large but will be obtained only if the public sector makes the research investments. Currently, low income developing countries grossly underinvest in agriculture research aimed at solving small farmers' problems. These countries invest less than half of I percent
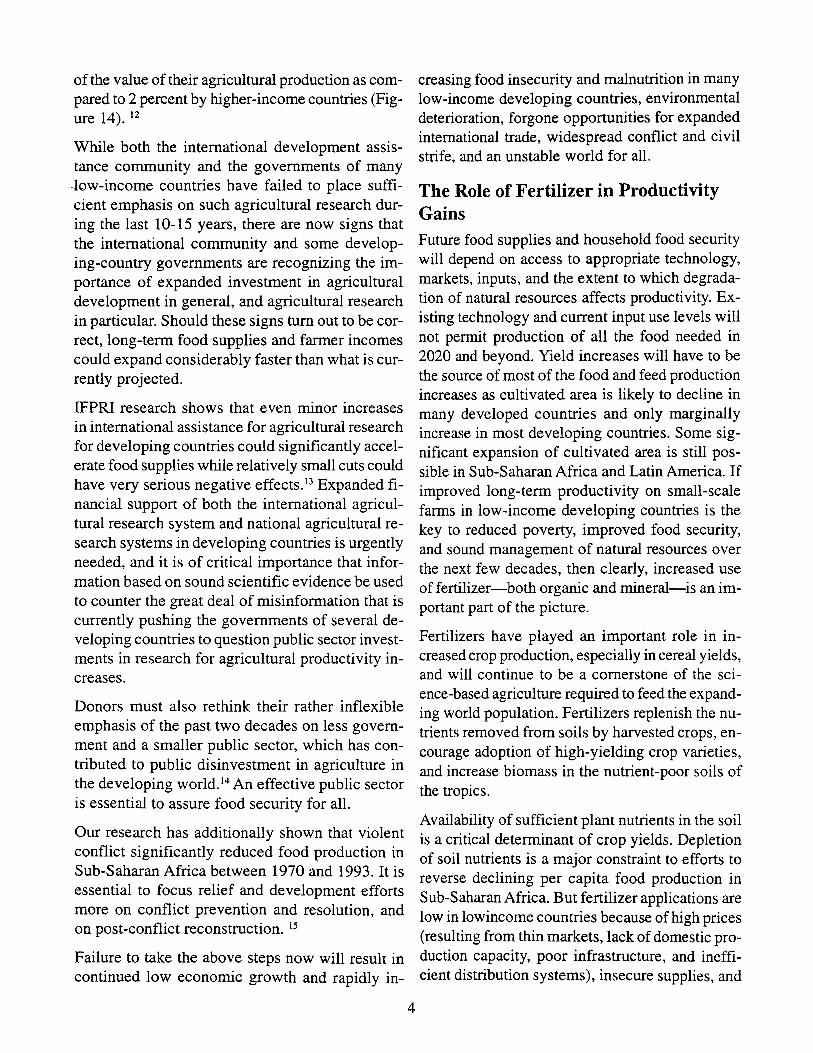
of the value of their agricultural production as compared to 2 percent by higher-income countries (Figure 14). 12
While both the international development assistance community and the governments of many -low-income countries have failed to place sufficient emphasis on such agricultural research during the last 10-15 years, there are now signs that the international community and some developing-country governments are recognizing the importance of expanded investment in agricultural development in general, and agricultural research in particular. Should these signs turn out to be correct, long-term food supplies and farmer incomes could expand considerably faster than what is currently projected.
IFPRI research shows that even minor increases in international assistance for agricultural research for developing countries could significantly accelerate food supplies while relatively small cuts could have very serious negative effects. t3 Expanded financial support of both the international agricultural research system and national agricultural research systems in developing countries is urgently needed, and it is of critical importance that information based on sound scientific evidence be used to counter the great deal of misinformation that is currently pushing the governments of several developing countries to question public sector investments in research for agricultural productivity increases.
Donors must also rethink their rather inflexible emphasis of the past two decades on less government and a smaller public sector, which has contributed to public disinvestment in agriculture in the developing world. t4 An effective public sector is essential to assure food security for all.
Our research has additionally shown that violent conflict significantly reduced food production in Sub-Saharan Africa between 1970 and 1993. It is essential to focus relief and development efforts more on conflict prevention and resolution, and on post-conflict reconstruction. 15
Failure to take the above steps now will result in continued low economic growth and rapidly in-
4
creasing food insecurity and malnutrition in many low-income developing countries, environmental deterioration, forgone opportunities for expanded international trade, widespread conflict and civil strife, and an unstable world for alL
The Role of Fertilizer in Productivity Gains Future food supplies and household food security will depend on access to appropriate technology, markets, inputs, and the extent to which degradation of natural resources affects productivity. Existing technology and current input use levels will not permit production of all the food needed in 2020 and beyond. Yield increases will have to be the source of most of the food and feed production increases as cultivated area is likely to decline in many developed countries and only marginally increase in most developing countries. Some significant expansion of cultivated area is still possible in Sub-Saharan Africa and Latin America. If improved long-term productivity on small-scale farms in low-income developing countries is the key to reduced poverty, improved food security, and sound management of natural resources over the next few decades, then clearly, increased use of fertilizer-both organic and mineral-is an important part of the picture.
Fertilizers have played an important role in increased crop production, especially in cereal yields, and will continue to be a cornerstone of the science-based agriculture required to feed the expanding world popUlation. Fertilizers replenish the nutrients removed from soils by harvested crops, encourage adoption of high-yielding crop varieties, and increase biomass in the nutrient-poor soils of the tropics.
Availability of sufficient plant nutrients in the soil is a critical determinant of crop yields. Depletion of soil nutrients is a major constraint to efforts to reverse declining per capita food production in Sub-Saharan Africa. But fertilizer applications are low in lowincome countries because of high prices (resulting from thin markets, lack of domestic production capacity, poor infrastructure, and inefficient distribution systems), insecure supplies, and
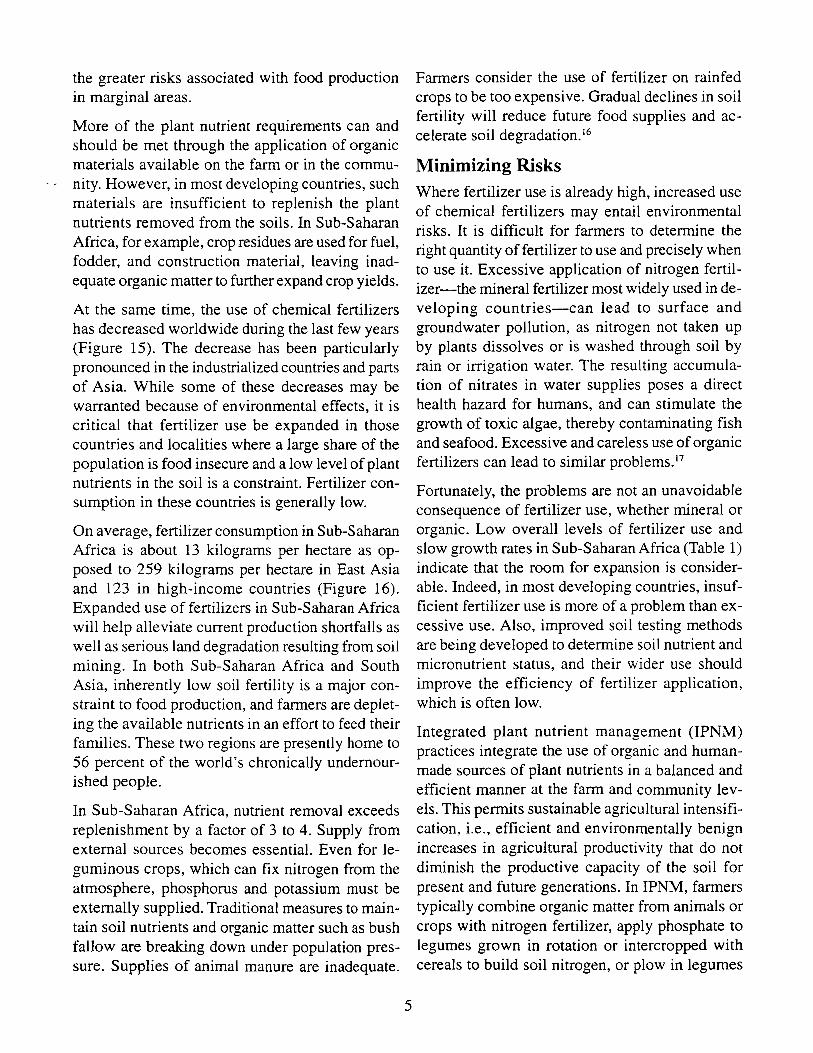
the greater risks associated with food production in marginal areas.
More of the plant nutrient requirements can and should be met through the application of organic materials available on the farm or in the community. However, in most developing countries, such materials are insufficient to replenish the plant nutrients removed from the soils. In Sub-Saharan Africa, for example, crop residues are used for fuel, fodder, and construction material, leaving inadequate organic matter to further expand crop yields.
At the same time, the use of chemical fertilizers has decreased worldwide during the last few years (Figure 15). The decrease has been particularly pronounced in the industrialized countries and parts of Asia. While some of these decreases may be warranted because of environmental effects, it is critical that fertilizer use be expanded in those countries and localities where a large share of the population is food insecure and a low level of plant nutrients in the soil is a constraint. Fertilizer consumption in these countries is generally low.
On average, fertilizer consumption in Sub-Saharan Africa is about 13 kilograms per hectare as opposed to 259 kilograms per hectare in East Asia and 123 in high-income countries (Figure 16). Expanded use of fertilizers in Sub-Saharan Africa will help alleviate current production shortfalls as well as serious land degradation resulting from soil mining. In both Sub-Saharan Africa and South Asia, inherently low soil fertility is a major constraint to food production, and farmers are depleting the available nutrients in an effort to feed their families. These two regions are presently home to 56 percent of the world's chronically undernourished people.
In Sub-Saharan Africa, nutrient removal exceeds replenishment by a factor of 3 to 4. Supply from external sources becomes essentiaL Even for leguminous crops, which can fix nitrogen from the atmosphere, phosphorus and potassium must be externally supplied. Traditional measures to maintain soil nutrients and organic matter such as bush fallow are breaking down under population pressure. Supplies of animal manure are inadequate.
5
Farmers consider the use of fertilizer on rainfed crops to be too expensive. Gradual declines in soil fertility will reduce future food supplies and accelerate soil degradation. 16
Minimizing Risks Where fertilizer use is already high, increased use of chemical fertilizers may entail environmental risks. It is difficult for farmers to determine the right quantity of fertilizer to use and precisely when to use it. Excessive application of nitrogen fertilizer-the mineral fertilizer most widely used in developing countries-can lead to surface and groundwater pollution, as nitrogen not taken up by plants dissolves or is washed through soil by rain or irrigation water. The resulting accumulation of nitrates in water supplies poses a direct health hazard for humans, and can stimulate the growth of toxic algae, thereby contaminating fish and seafood. Excessive and careless use of organic fertilizers can lead to similar problems. 17
Fortunately, the problems are not an unavoidable consequence of fertilizer use, whether mineral or organic. Low overall levels of fertilizer use and slow growth rates in Sub-Saharan Africa (Table 1) indicate that the room for expansion is considerable. Indeed, in most developing countries, insufficient fertilizer use is more of a problem than excessive use. Also, improved soil testing methods are being developed to determine soil nutrient and micronutrient status, and their wider use should improve the efficiency of fertilizer application, which is often low.
Integrated plant nutrient management (IPNM) practices integrate the use of organic and humanmade sources of plant nutrients in a balanced and efficient manner at the farm and community levels. This permits sustainable agricultural intensification, i.e., efficient and environmentally benign increases in agricultural productivity that do not diminish the productive capacity of the soil for present and future generations. In IPNM, farmers typically combine organic matter from animals or crops with nitrogen fertilizer, apply phosphate to legumes grown in rotation or intercropped with cereals to build soil nitrogen, or plow in legumes
for "green manure." They also engage in soil conservation practices, such as constructing drainage and contour ditches, grass barriers, rock walls, and terraces on hillsides. Where local sources of phosphate rock, potash, or limestone exist, their direct use may reduce the need for costly fertilizer imports. IS
On fragile lands, poor infrastructure, drought risk, and lower yield response render high use of modern inputs uneconomic. Poor soils cannot sustain intensive monocultures of annual crops. Intensification strategies must emphasize management of soil fertility and organic matter, moisture conservation, erosion control, and nutrient recycling. These typically require mixed farming systems that integrate annual crops with perennial crops, farm trees, and livestock. 19
Efforts to sustainably intensify small-farm food production in developing countries must include farmer participation in all aspects. Related to this, there must be integration of insights from traditional, local knowledge with those of modern agricultural science.
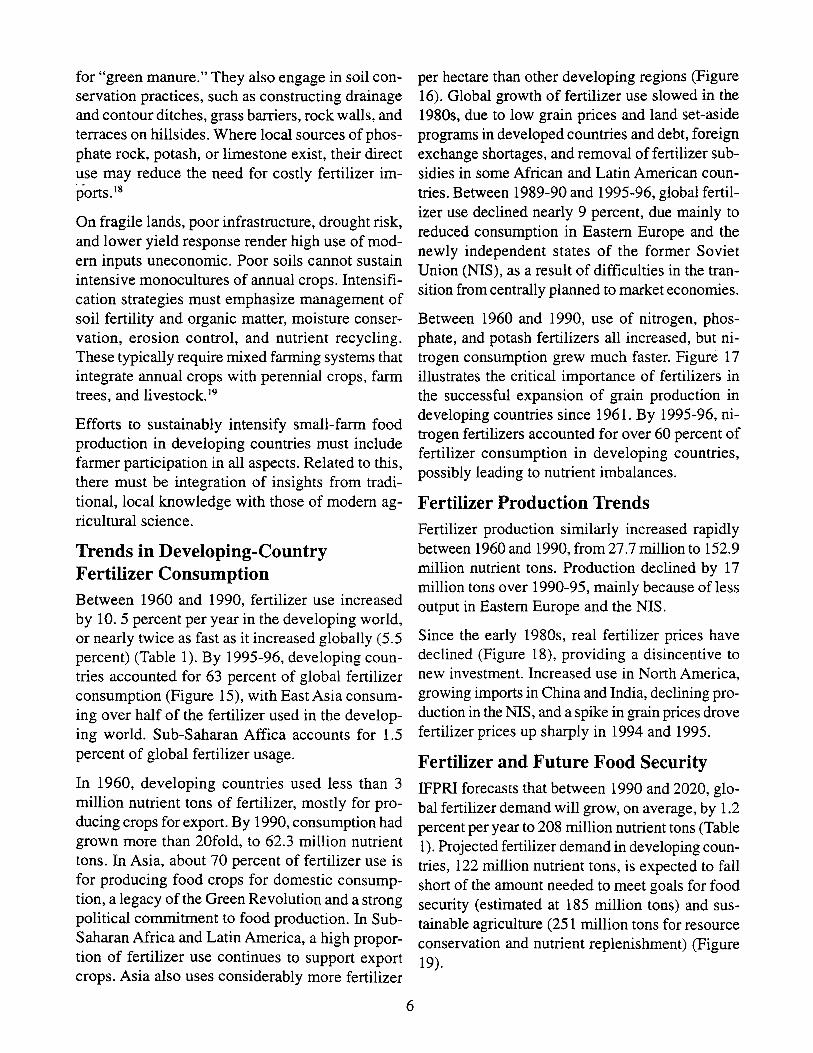
Trends in Developing-Country Fertilizer Consumption Between 1960 and 1990, fertilizer use increased by 10. 5 percent per year in the developing world, or nearly twice as fast as it increased globally (5.5 percent) (Table 1). By 1995-96, developing countries accounted for 63 percent of global fertilizer consumption (Figure 15), with East Asia consuming over half of the fertilizer used in the developing world. Sub-Saharan Affica accounts for 1.5 percent of global fertilizer usage.
In 1960, developing countries used less than 3 million nutrient tons of fertilizer, mostly for producing crops for export. By 1990, consumption had grown more than 20fold, to 62.3 million nutrient tons. In Asia, about 70 percent of fertilizer use is for producing food crops for domestic consumption, a legacy of the Green Revolution and a strong political commitment to food production. In SubSaharan Africa and Latin America, a high proportion of fertilizer use continues to support export crops. Asia also uses considerably more fertilizer
6
per hectare than other developing regions (Figure 16). Global growth of fertilizer use slowed in the 1980s, due to low grain prices and land set-aside programs in developed countries and debt, foreign exchange shortages, and removal of fertilizer subsidies in some African and Latin American countries. Between 1989-90 and 1995-96, global fertilizer use declined nearly 9 percent, due mainly to reduced consumption in Eastern Europe and the newly independent states of the former Soviet Union (NIS), as a result of difficulties in the transition from centrally planned to market economies.
Between 1960 and 1990, use of nitrogen, phosphate, and potash fertilizers all increased, but nitrogen consumption grew much faster. Figure 17 illustrates the critical importance of fertilizers in the successful expansion of grain production in developing countries since 1961. By 1995-96, nitrogen fertilizers accounted for over 60 percent of fertilizer consumption in developing countries, possibly leading to nutrient imbalances.
Fertilizer Production Trends Fertilizer production similarly increased rapidly between 1960 and 1990, from 27.7 million to 152.9 million nutrient tons. Production declined by 17 million tons over 1990-95, mainly because ofless output in Eastern Europe and the NIS.
Since the early 1980s, real fertilizer prices have declined (Figure 18), providing a disincentive to new investment. Increased use in North America, growing imports in China and India, declining production in the NIS, and a spike in grain prices drove fertilizer prices up sharply in 1994 and 1995.
Fertilizer and Future Food Security IFPRI forecasts that between 1990 and 2020, global fertilizer demand will grow, on average, by 1.2 percent per year to 208 million nutrient tons (Table 1). Projected fertilizer demand in developing countries, 122 million nutrient tons, is expected to fall short of the amount needed to meet goals for food security (estimated at 185 million tons) and sustainable agriculture (251 million tons for resource conservation and nutrient replenishment) (Figure 19).
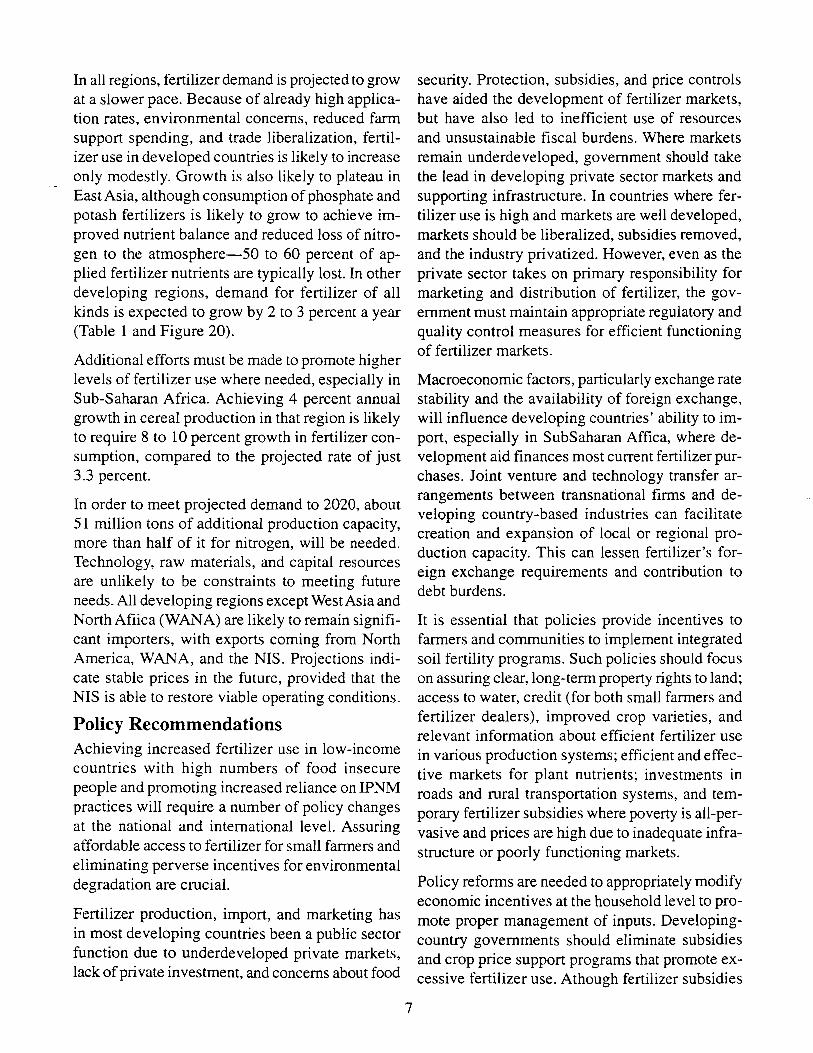
In all regions, fertilizer demand is projected to grow at a slower pace. Because of already high application rates, environmental concerns, reduced farm support spending, and trade liberalization, fertilizer use in developed countries is likely to increase only modestly. Growth is also likely to plateau in East Asia, although consumption of phosphate and potash fertilizers is likely to grow to achieve improved nutrient balance and reduced loss of nitrogen to the atmosphere-50 to 60 percent of applied fertilizer nutrients are typically lost. In other developing regions, demand for fertilizer of all kinds is expected to grow by 2 to 3 percent a year (Table 1 and Figure 20).
Additional efforts must be made to promote higher levels of fertilizer use where needed, especially in Sub-Saharan Africa. Achieving 4 percent annual growth in cereal production in that region is likely to require 8 to 10 percent growth in fertilizer consumption, compared to the projected rate of just 3.3 percent.
In order to meet projected demand to 2020, about 51 million tons of additional production capacity, more than half of it for nitrogen, will be needed. Technology, raw materials, and capital resources are unlikely to be constraints to meeting future needs. All developing regions except West Asia and North Afiica (WANA) are likely to remain significant importers, with exports coming from North America, WANA, and the NIS. Projections indicate stable prices in the future, provided that the NIS is able to restore viable operating conditions.
Policy Recommendations Achieving increased fertilizer use in low-income countries with high numbers of food insecure people and promoting increased reliance on IPNM practices will require a number of policy changes at the national and international level. Assuring affordable access to fertilizer for small farmers and eliminating perverse incentives for environmental degradation are crucial.
Fertilizer production, import, and marketing has in most developing countries been a public sector function due to underdeveloped private markets, lack of private investment, and concerns about food
7
security. Protection, subsidies, and price controls have aided the development of fertilizer markets, but have also led to inefficient use of resources and unsustainable fiscal burdens. Where markets remain underdeveloped, government should take the lead in developing private sector markets and supporting infrastructure. In countries where fertilizer use is high and markets are well developed, markets should be liberalized, subsidies removed, and the industry privatized. However, even as the private sector takes on primary responsibility for marketing and distribution of fertilizer, the government must maintain appropriate regulatory and quality control measures for efficient functioning of fertilizer markets.
Macroeconomic factors, particularly exchange rate stability and the availability of foreign exchange, will influence developing countries' ability to import, especially in SubSaharan Affica, where development aid finances most current fertilizer purchases. Joint venture and technology transfer arrangements between transnational firms and developing country-based industries can facilitate creation and expansion of local or regional production capacity. This can lessen fertilizer's foreign exchange requirements and contribution to debt burdens.
It is essential that policies provide incentives to farmers and communities to implement integrated soil fertility programs. Such policies should focus on assuring clear, long-term property rights to land; access to water, credit (for both small farmers and fertilizer dealers), improved crop varieties, and relevant information about efficient fertilizer use in various production systems; efficient and effective markets for plant nutrients; investments in roads and rural transportation systems, and temporary fertilizer subsidies where poverty is all-pervasive and prices are high due to inadequate infrastructure or poorly functioning markets.
Policy reforms are needed to appropriately modify economic incentives at the household level to promote proper management of inputs. Developingcountry governments should eliminate subsidies and crop price support programs that promote excessive fertilizer use. Athough fertilizer subsidies
are not generally desirable on a long term basis, they may be the only way to raise fertilizer use in some locations where it is most needed. In the longer term, fertilizer costs to farmers can be reduced and the need for price subsidies eliminated by investing in distribution infrastructure, provid-
-lng innovative ways to share risks and finance, and encouraging regional cooperation for country-level fertilizer production facilities and procurement.
Sustainable intensification of food production among small farmers in low-income developing countries will require an effective extension system. In some countries, the private sector and farmer cooperatives play an important role in providing this. However, the public sector-frequently in collaboration with nongovernmental organizations-almost always has a vital role in assuring that agricultural extension services are available for poor farmers and promote sustainable management of natural resources. 20 Extension services must strengthen communications between researchers and farmers and among farmers themselves. Extension can also provide poor farmers with matching resources to contract for private or public extension services. In the specific area of soil fertility, extension agencies should provide soil diagnostic services and training in appropriate fertilizer application methods to small farmers.
In addition to reversing the general decline in overall international aid to agriculture in low-income countries, the international community should target aid resources into facilitating these policy changes. Specifically, donors should provid financial assistance for:
• Credit for small farmers in support of integrated soil fertility programs;
•
•
•
•
•
Effective public extension services oriented toward poor farmers, especially women;
Environmental monitoring and remediation systems for sustainable agricul ture;
Renewed and sustained support for international agricultural research and national agricultural research systems in poor developing countries,
Policy research on the dynamics of reforms and institutional development in the fertilizer sector; and
Investment in resource poor areas.
References I Keynote address prepared for presentation to
the Fertilizer Industry Round Table, Annapolis, Maryland, October 26, 1998. Although energy consumption is essential for fer
tilizer production, energy use efficiency must be 2
improved. In many developing and transition countries, fertilizer plants use twice as much energy per ton of fertilizer produced as those in developed countries. Energy efficiency can be improved with proper operation and maintenance, revamping of plants, and increased use of newer, energy efficient technologies. IPNM approaches often offer significant energy and financial savings to poor farmers.
Director General and Special Assistant to the Director General, respectively, of the International Food Policy Research Institute (IFPRI) in Washington, D.C. IFPRI is part of the global agricultural research network known as the Consultative Group on International Agricultural Research (CGIAR).
3 FAO, The Sixth World Food Survey (Rome:
Developing-country governments should institute environmental monitoring mechanisms and corrective measures. The adoption of appropriate practices and technologies should be encouraged to minimize adverse environmental effects from fertilizers.
8
FAO,1996).
4 WHO data on the number of children in 1995 whose weight is more than two standard deviations below the standard weight for their age set by the U.S. National Center for Health Statistics, posted at <www.who.int>, accessed September 17, 1998.
5 Data posted at <www.who.int>, accessed July 27, 1998*, United Nations Administrative Committee on Coordination/Subcommittee on Nutrition, Third Report on the World Nutrition Situation (Geneva: ACC/SCN, 1997).
6 "Assessment of the World Food Security Situation, Report Prepared for 24th Session of the Committee on World Food Security," posted at <www.fao.org>, accessed May 20, 1998; FAO Forecasts Replenishment of World Cereal Stocks to Minimum Safe Levels," 23 June 1998, posted at <www.fao.org/news/ global/gw9817-e.htm1>, accessed 8/6/98; Per Pinstrup-Andersen, Rajul Pandya-Lorch, and Mark W. Roscgrant, The World Food Situation: Recent Developments, Emerging Issues, and LongTerm Prospects. 2020 Vision Food Policy Report (Washington: IFPRI, 1997).
7 Unless otherwise noted, this section is based on ibid.; Mark W. Rosegrant and Claudia Ringler, "Asian Economic Crisis and the Long-Term World Food Situation," Paper Prepared for the International Agricultural Trade Research Symposium, June 26-27, 1998; and Mark W. Rosegrant, Nancy Leach, and Roberta V. Gerpacio, "Alternative Futures for World Cereal and Meat Consumption," Paper Prepared July 1998.
8 Rosegrant and Ringler (1998).
9 FAO, Food, Agriculture, and Food, Security Developments, Since the World Food Conference and Prospects, World Food Summit Technical Background Document No.1 (Rome: FAO, 1996).
10 FAO, Investment in Agriculture: Evolution and Prospects, World Food Summit Technical Background Document Number 10 (Rome: FAO,1996).
11 Per Pinstrup-Andersen, Mattias Lundberg, and James L. Garrett, Foreign Assistance to Agriculture: A Win-Win Proposition. 2020 Vision Food Policy Report (Washington: IFPRI, 1995).
9
12 Philip G. Pardey and Julian M. Alston, "Revamping Agricultural R&D," 2020 Brief No. 24 (Washington: IFPRI, 1996).
13 Mark W. Rosegrant, M. Agcaoili-Sombilla, and N. D. Perez, Global Food Projections to 2020: Implicationsfor Investment, Food, Agriculture, and Environment Discussion Paper No.5 (Washington: IFPRI, 1995).
14 Organisation for Economic Co-operation and Development, "Aid and Private Flows Fell in 1997," OECD News Release, June 18, 1998, posted at <www.oecd.org>, accessed 6/19/98; James H. Michel, Development Co-operation, 1997 (Paris: OECD, 1998), FAO, "Investment in Agriculture;" Pratap Narain, FAO statistician, personal communication to the authors, 6/30/98.
15 Ellen Messer, Marc J. Cohen, and Jashinta D'Costa, Food From Peace: Breaking the Links Between Conflict and Hunger. 2020 Vision for Food, Agriculture, and the Environment Discussion Paper No. 24 (Washington: IFPRI, 1998).
16 Peter Oram, "The Potential of Technology to Meet World Food Needs in 2020," 2020 Brief Number 13 (Washington: IFPRI, 1995); Balu L. Bumb and Carlos A. Baanante, "Policies to Promote Environmentally Sustainable Fertilizer Use and Supply to 2020," 2020 Brief No. 40 (Washington: IFPRI, 1996).
J7 World Resources 1998-99: A Guide to the Global Environment - Environmental Change and Human Health (New York: Oxford University Press, 1998), pp. 46-47.
18 Peter Oram, 2020 Brief No. 13; Miguel A. Allieri, Peter Rosset, and Lori Ann Thrupp, "The Potential of Agroccology to Combat Hunger in the Developing World," posted at <www.iffah.org/iffah/library>, accessed 9/18/ 98.
19 Peter B. R. Hazell, "Managing Agricultural Intensification," 2020 Brief No. I I (Washington: IFPRI, 1995).
20 William M. Rivera, "Global Reforms and Agricultural Extension: Trends and the Public Sector," Paper prepared for the Conference on
"Knowledge Generation and Transfer," University of California at Berkeley, June 18- 19, 1998.
Table I-Fertilizer use, 1959/60, 1989/90, and 2020
Fertilizer Use Annual Growth Region/nutrient 1959/60 1989/90 2020 1960-90 1990-2020
(million nutrient tons) (percent)
Developed countries 24.7 81.3 86.4 4.0 Developing countries 2.7 62.3 121.6 10.5
East Asia 1.2 31.4 55.7 10.9 South Asia 0.4 14.8 33.8 12.0 West Asia and North Affica 0.3 6.7 11.7 10.4 Latin America 0.7 8.2 16.2 8.2 Sub-Saharan Affica 0.1 1.2 4.2 8.3
World 27.4 143.6 208.0 5.5 Nitrogen 9.5 79.2 115.3 7.1 Phosphate 9.7 37.5 56.0 4.5 Potash 8.1 26.9 36.7 4.0
Sources:FAO data and IFPRI calculations for 2020. Notes: East Asia excludes Japan. West Asia and North Africa excludes Israel.
Figure 1.
1,000
800
600
400
200
Number of food-insecure people, 1990-92 and 2010
Millions
1990-92
tE East Asia aSouth Asia aSub-Saharan Africa • Latin America aWest Asia and North Africa
2010
Source: Food and Agriculture Organization ot the United Nations, Food, Agriculture, lind Food Security: Developments since the World Food Conference tlnd Prospects. World Food Summit
0.2 2.2 1.9 2.8 1.9 2.3 3.3 1.2 1.3 1.3 1.0
Technical Background Document 1 (Rome, 1996). II .. ",' -;m • • , .... iFII«~ "9W)
10
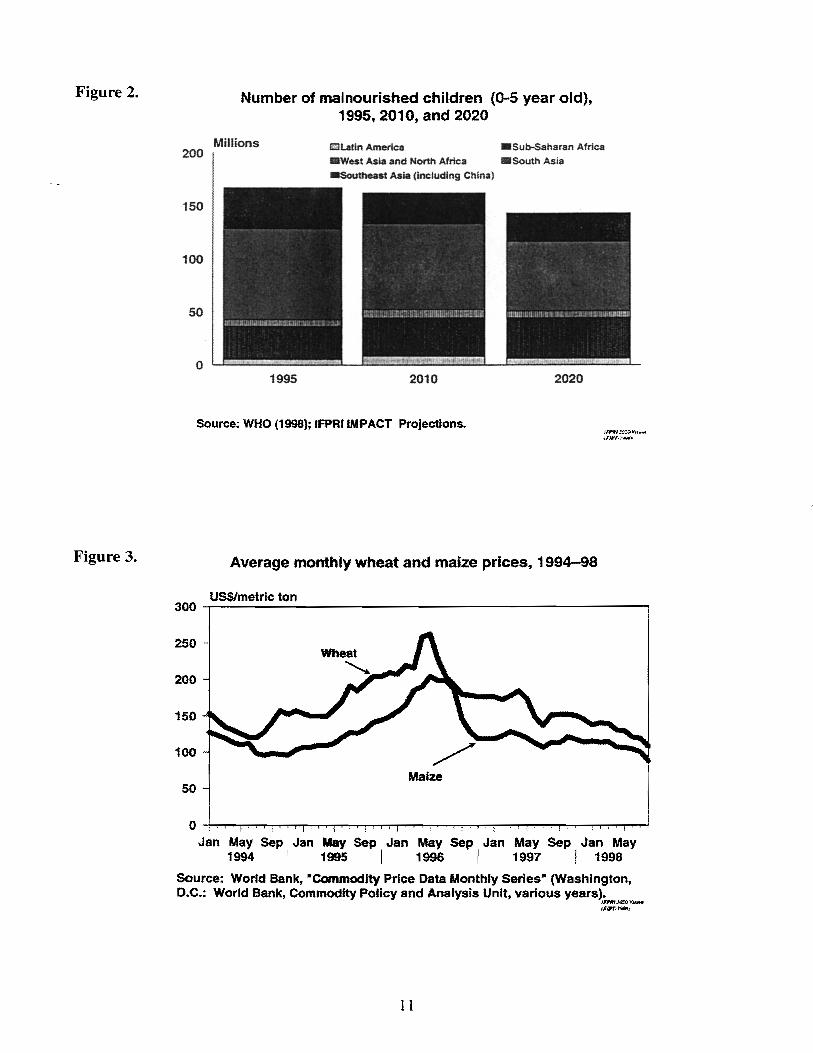
Figure 2.
Figure 3.
200
150
100
50
o
Number of malnourished children (0-5 year old), 1995,2010, and 2020
Millions EllLatin America .Sub-Saharan Africa
.West Asia and North Africa .South Asia
-SOutheast Aaia (including China)
1995 2010 2020
Source: WHO (1998); IFPRIIMPACT Projections. .'rl"ltl16:0 .... "' ... iF/"·'<iIotr.l
Average monthly wheat and maize prices, 1994-98
US$lmetric ton 300 ,------------------------------------------------,
200
150
100
Maize 50
Jan May Sep Jan May Sep Jan May Sep Jan May Sep Jan May 1994 I 1995 I 1996 I 1997 I 1998
Source: World Bank, ·Commodlty Price Data Monthly Series· (Washington, D.C.: World Bank, Commodity Policy and Analysis Unit, various years).
,''*'MOV_ I'~.rwj
11
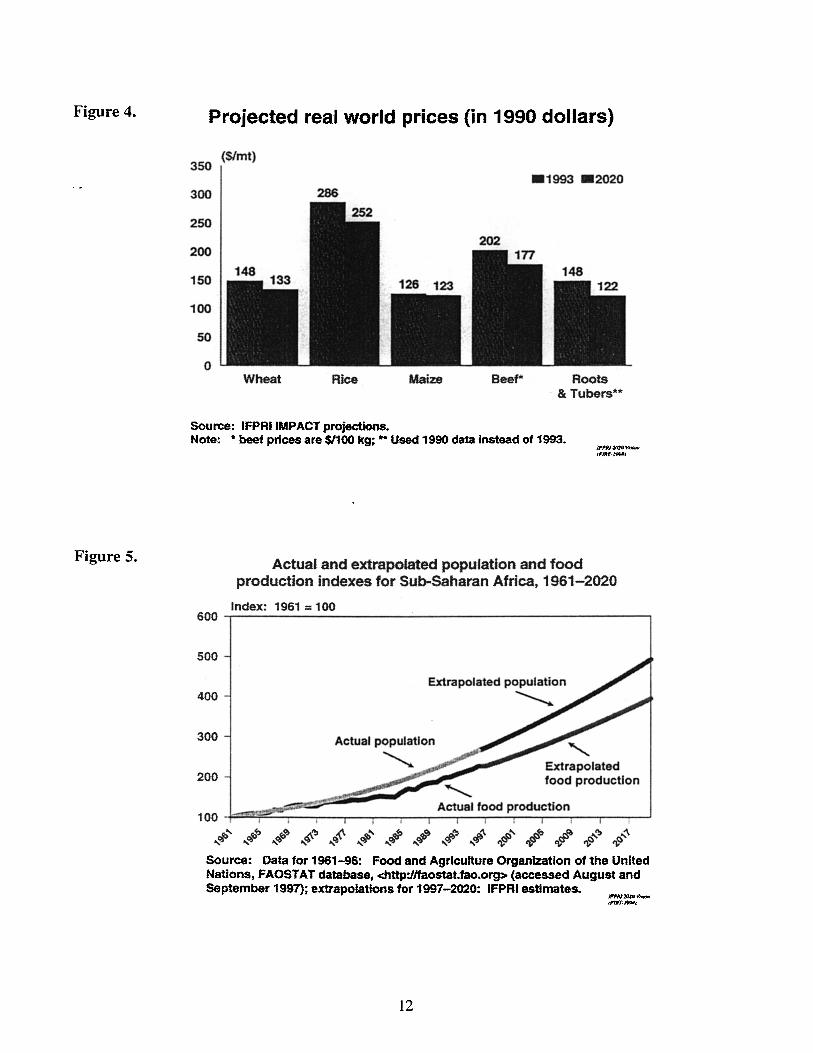
Figure 4.
Figure S.
Projected real world prices (in 1990 dollars)
350 (Slmt)
.1993 .2020 300 2B6
250
200
150
100
50
0 Wheat Rice Maize Beef· Roots
. & Tubers'"
Source: IFPRIIMPACT proJections. Note: • beef prices are $1100 kg; .. Used 1990 data instead of 1993.
UHI .. W .... "Iltr·.""
Actual and extrapolated population and food production indexes for Sub-Saharan Africa, 1961-2020
Index: 1961 = 100 600 ,------------------------------------------------,
500
400
300
200
Extrapolated population
'-.......
Extrapolated food production
1 ~~~~~::::~~::~=-~A~ct~u~a~l~ro~od~p~r~od~u~c:t~io~n~~~~~ 100 -~ ..... ~..... .....OJ~ ..... OJro~ ..... ~"" ..... <b~ ..... o.t'b..... ...o.t~ ..... r1! ..... t:f>"" ... # .#..... #~ #' ~ ..... "" ~ ... '\
Source: Data for 1961-96: Food and Agriculture Organization of the United Nations, FAOSTAT database, <http://faostalfao.org>(accessedAugust and September 1997); extrapolations for 1997-2020: IFPRI estimates.
12
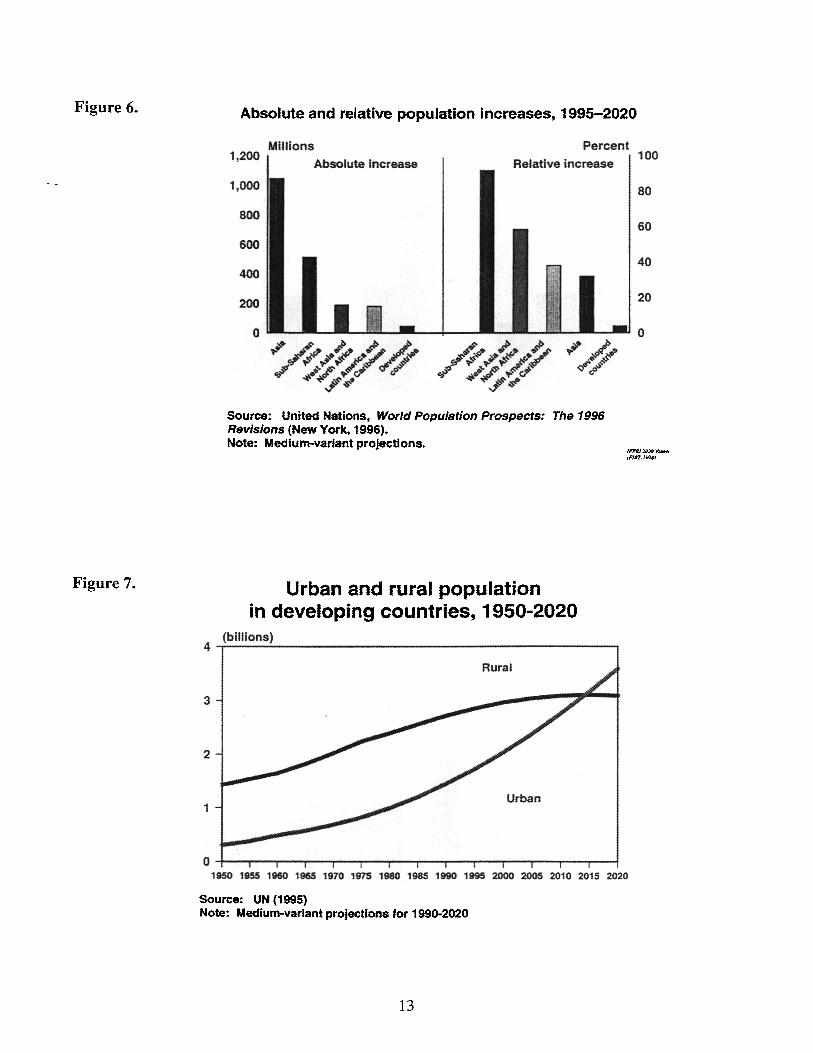
Figure 6.
Figure 7.
Absolute and relative population increases, 1995-2020
1,200
1,000
800
600
400
200
o
Millions
Absolute Increase
Percent
Relative increase
Source: United Nations, World Population Prospects: The 1996 Revisions (New York, 1996).
100
80
60
40
20
o
Note: Medium-variant projections. J"IU JiJltO ........ (F!Jl ·!""' .
Urban and rural population in developing countries, 1950-2020
(billions) 4~----~--------------------------------------,
3
2
1
1950 1955 19&0 1965 1970 1975 1980 1935 1990 1995 2000 2005 2010 2015 2020
Source: UN (1995) Note: Medium-variant projections for 199()"2020
13
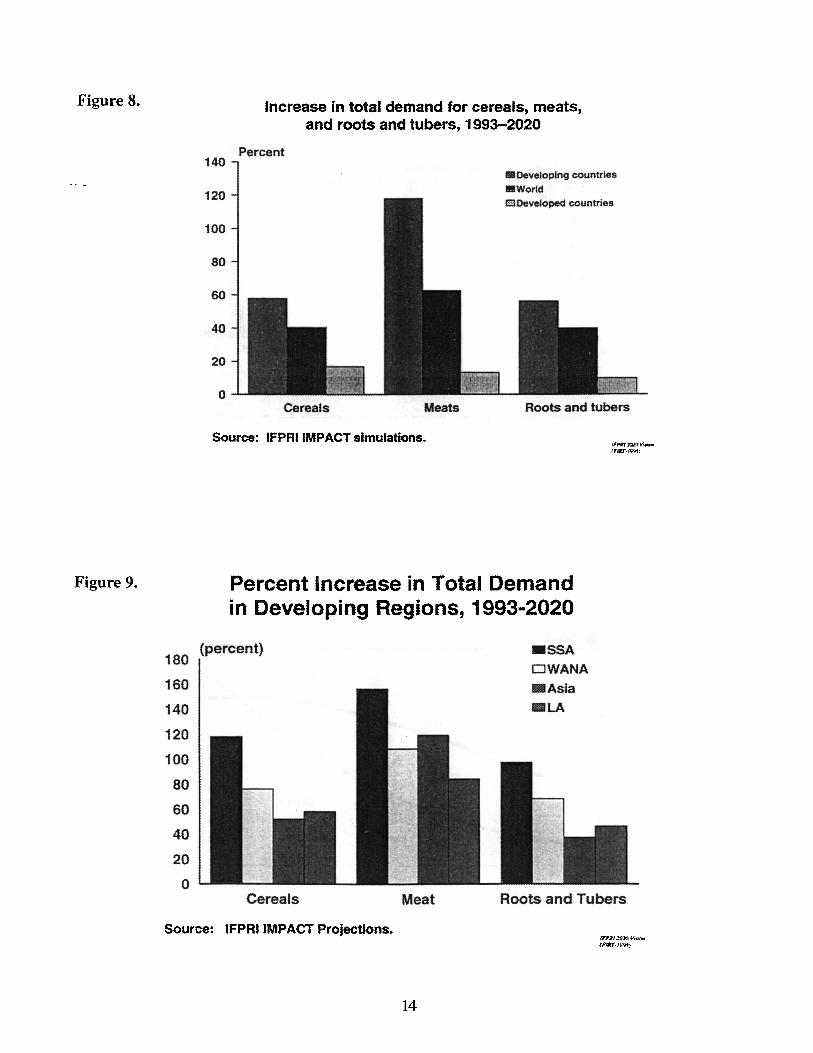
Figure 8.
Figure 9.
180
160
140
120
100
80
60
40
20
0
140
120
100
80
60
40
20
o
Increase in total demand for cereals, meats, and roots and tubers, 1993-2020
Percent
Cereals Meats
_Developing countries
"World mlDeveloped countries
Roots and tubers
Source: IFPRIIMPACTsimulations. IFHf:a.l!I"t .... IFI/tT. /YIC )
Percent Increase in Total Demand in Developing Regions, 1993-2020
(percent)
Cereals Meat
_SSA
DWANA
_Asia _LA
Roots and Tubers
Source: IFPRJ IMPACT Projections.
14
"""J,Z01t'IVjt>.':IoI " IItT.} ;;9.",
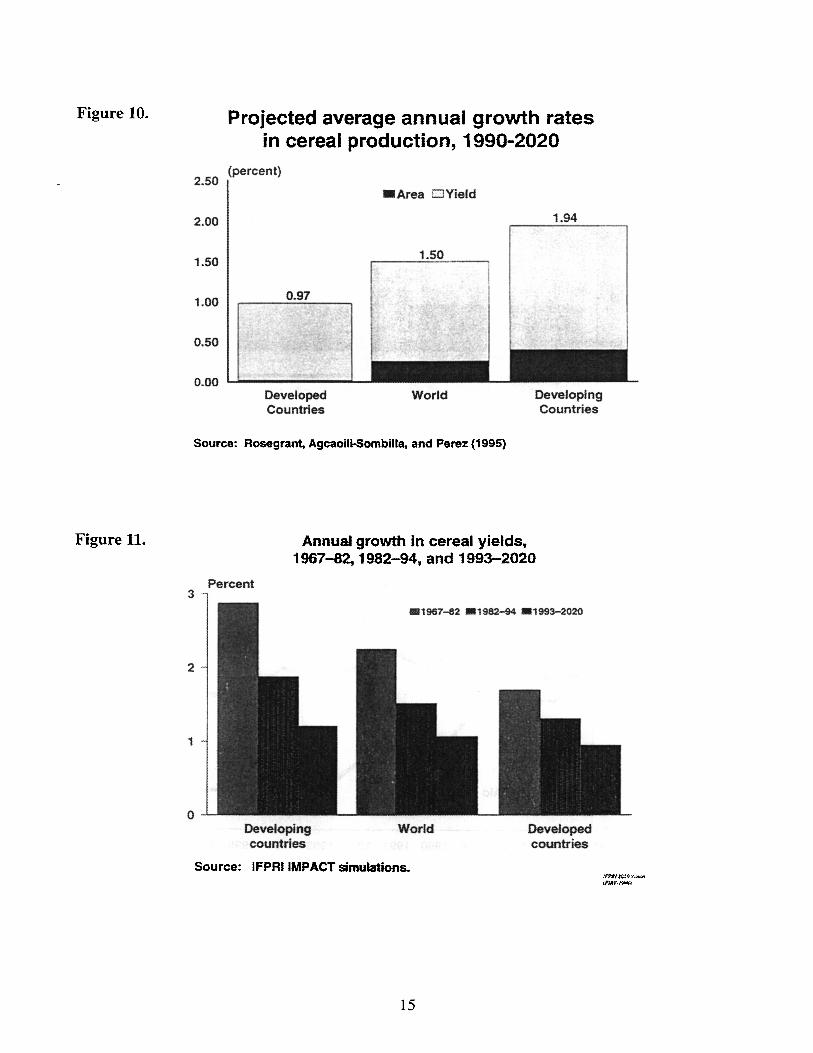
Figure 10.
Figure 11.
Projected average annual growth rates in cereal production, 1990-2020
(percent) 2.50
2.00
1.50
1.00
0.50
0.00 L...Ioo ______ L....-
Developed Countries
-Area O Yield
World
Source: Rosegrant. Agcaoili-Sombilla. and Perez (1995)
1.94
Developing Countries
Annual growth in cereal yields, 1967-82, 1982-94, and 1993-2020
Percent 3 ·
2
1
o Developing countries
World
Source: IFPRIIMPACT simulations.
15
Developed countries
IrPttl,W:O":_ ,PMT·/)ItiIt1fj
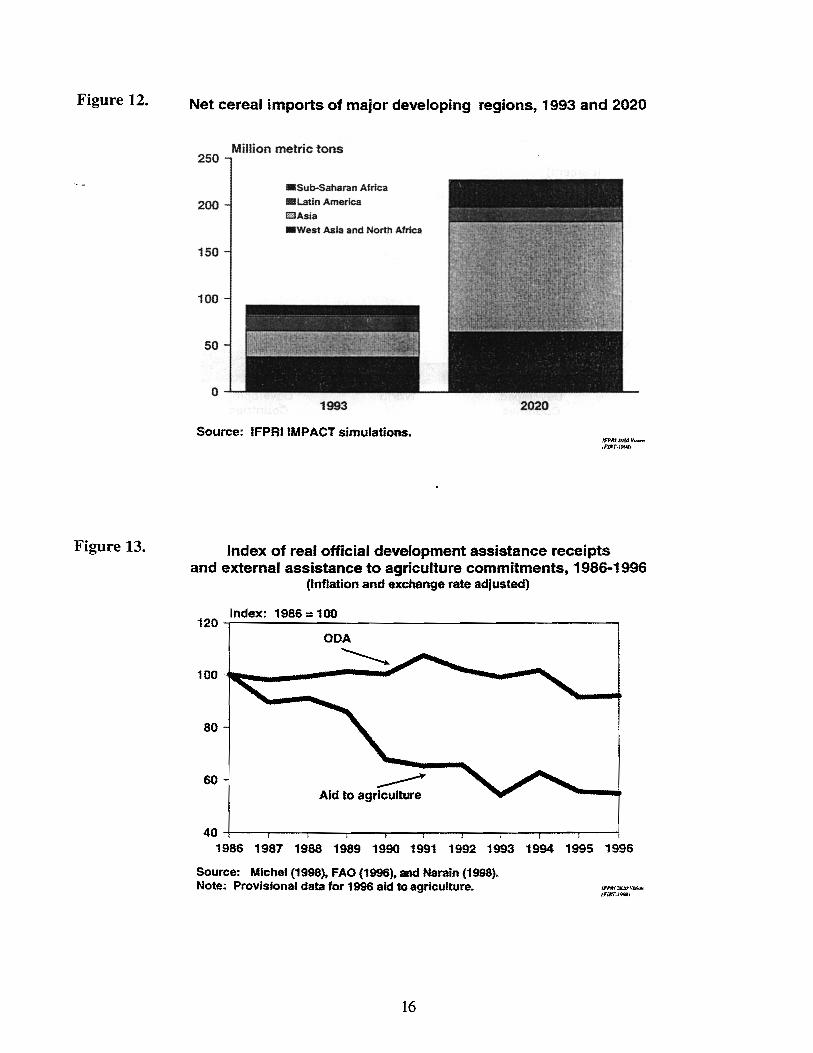
Figure 12.
Figure 13.
Net cereal imports of major developing regions, 1993 and 2020
250
200
150
100
50
o
Million metric tons
_Sub-Saharan Africa
.Latin America EDAsia
_ West Asia and North Africa
1993
Source: IFPRIIMPACT simulations.
2020
IFPiU J:I.JldV_ ,'n.r,/1W)
Index of real official development assistance receipts and external assistance to agriculture commitments, 1986-1996
(Inflation and exchange rate adjusted)
Index: 1986 = 100 120~------------------------------------------~
aDA
-------100 ._ ..... -------.",
80
60 ~ Aid to agriculture
40~.----~---r--~----~---r---,----.----r--~--~
1~1~1~1~1~1~1~1~1~1~1~
Source: Michel (1998), FAO (1996), and Narain (1998). Note: Provisional data for 1996 aid to agriculture.
16
",*IYJJq"~ " iKf.J*,
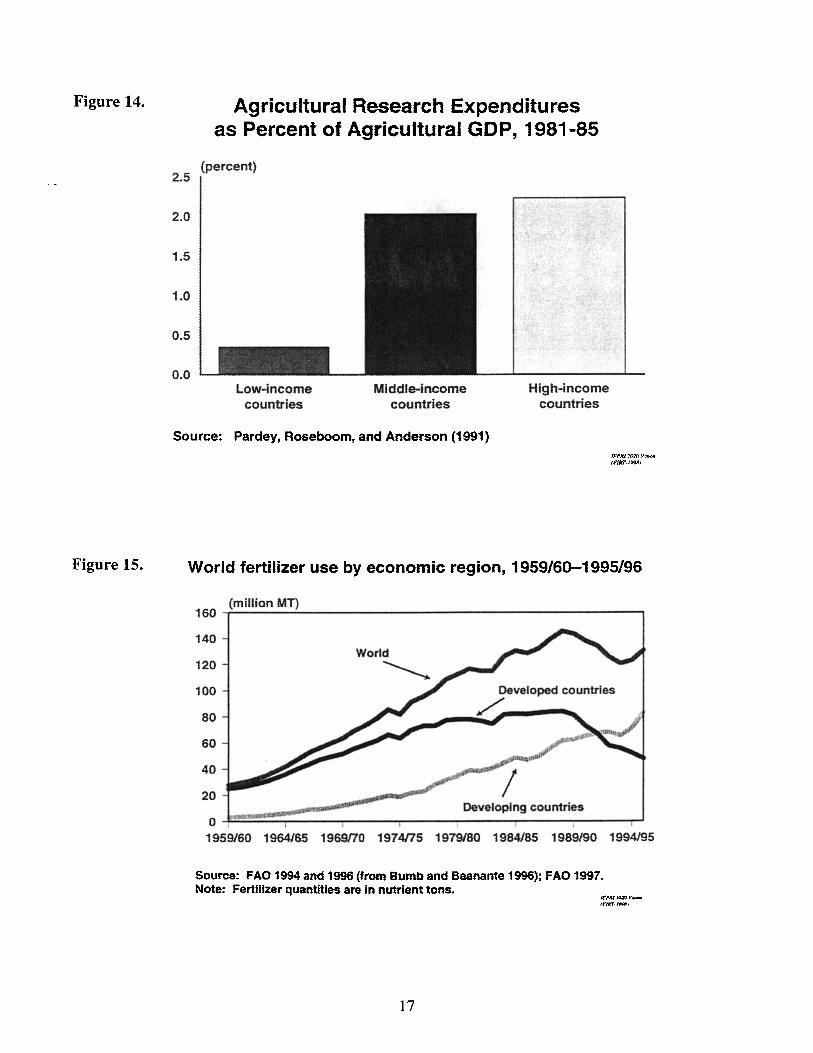
Figure 14.
Figure 15.
2.5
2.0
1.5
1.0
0.5
0.0
Agricultural Research Expenditures as Percent of Agricultural GOP, 1981-85
(percent)
Low-income countries
Middle-income countries
High-income countries
Source: Pardey, Roseboom, and Anderson (1991) fFnu ZC1fl V;"' ... (".r.I'Xl<f1
World fertilizer use by economic region, 1959160-1995/96
(million MT) 160~---------------~------------------------------------------------------------------------------------------~
140
120
100
80
60
40
20
o j~~~~~~::~ _____ ~ __________ ~Oe~v~e~lo~p~ln~g~C~o~untr~ie~S~ _____ ~J 1959160 1964/65 196snO 1974175 1979180 1984/85 1989/90 1994195
Source: FAO 1994 and 1996 (from Bumb and Baanante 1996); FAO 1997. Note: Fertilizer quantities are in nutrient tons.
17
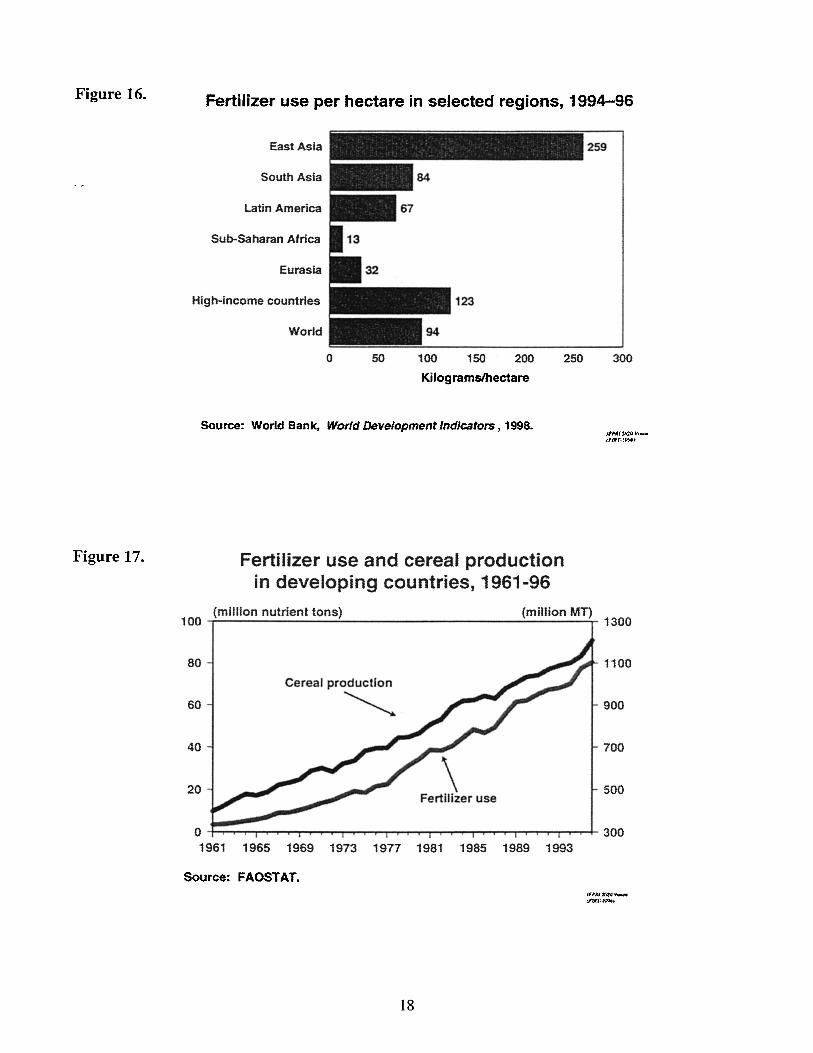
Figure 16.
Figure 17.
Fertilizer use per hectare in selected regions, 1994-96
East Asia
South Asia
Latin America
Sub-Saharan Africa
Eurasia
High-income countries
World
o 50 100 150 200 250
Kilogramslhectare
Source: World Bank. World Development Indicators, 1998.
Fertilizer use and cereal production in developing countries, 1961-96
259
300
JI'/'tfIUl:19h_ tr~r·l~J
(million nutrient tons) (million MT) 100~------------~--------------------~------;- 1300
80 1100
Cereal production
60 ~ 900
40 700
20 \ Fertilizer use
500
a ~~~~~~~~~~,-~~~~,-~~~~,-~~300 1961 1965 1969 1973 1977 1981 1985 1989 1993
Source: FAOSTAT.
18
f/'nI%O...~ ~ __
!l11fr·,..,..~
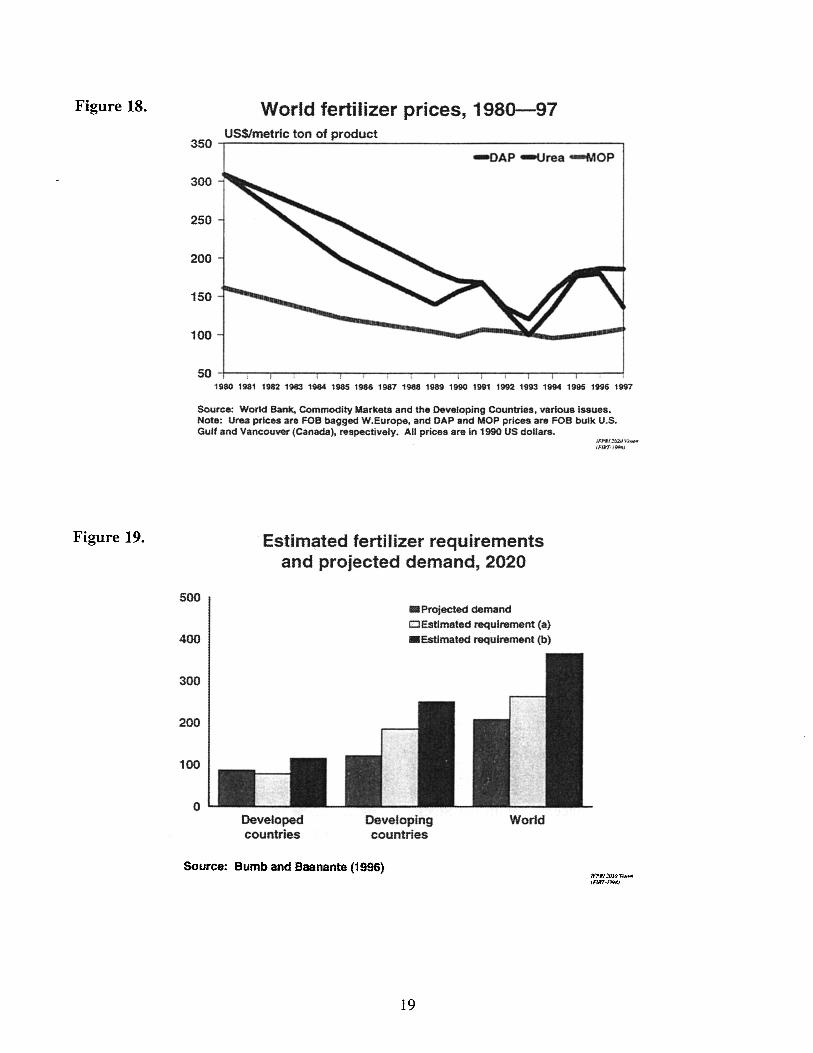
Figure 18.
Figure 19.
World fertilizer prices, 1980-97 US$lmetric ton of product
350 .-----------~----------------------------------.
-nAP -Urea -MOP
300
250
200
150
100
1980 1981 1982 1983 1984 1985 1986 1987 1988 1989 1990 1991 1992 1993 1994 1995 1996 1997
Source: World Bank, Commodity Markets and the Developing Countries . various issues. Note: Urea prices are FOB bagged W.Europe, and OAP and MOP prices are FOB bulk U.S. Gulf and Vancouver (Canada), respectively. All prices are in 1990 US doUars.
500
400
300
200
100
o
Estimated fertilizer requirements and projected demand, 2020
Developed countries
. Projected demand DEstlmsted requirement (a)
.Estimated requirement (b)
Developing countries
World
Source: Bumb and Baanante (1996)
19
l , pttr!Wi'V": __ (FlkT' ~~1
If7tt:;o1<l ,,~ __ Inr.~;WlttJ
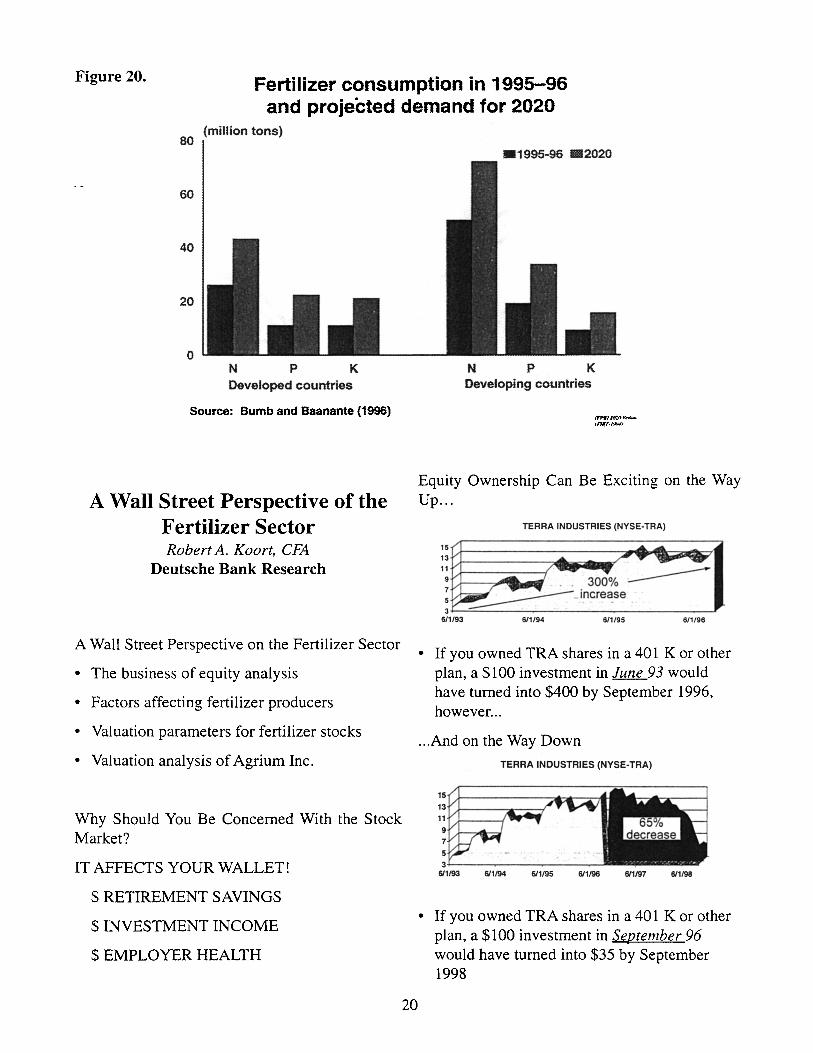
Figure 20.
80
Fertilizer consumption in 1995-96 and projected demand for 2020
(million tons)
60
40
20
o N p K Developed countries
Source: Bumb and Baanante (1996)
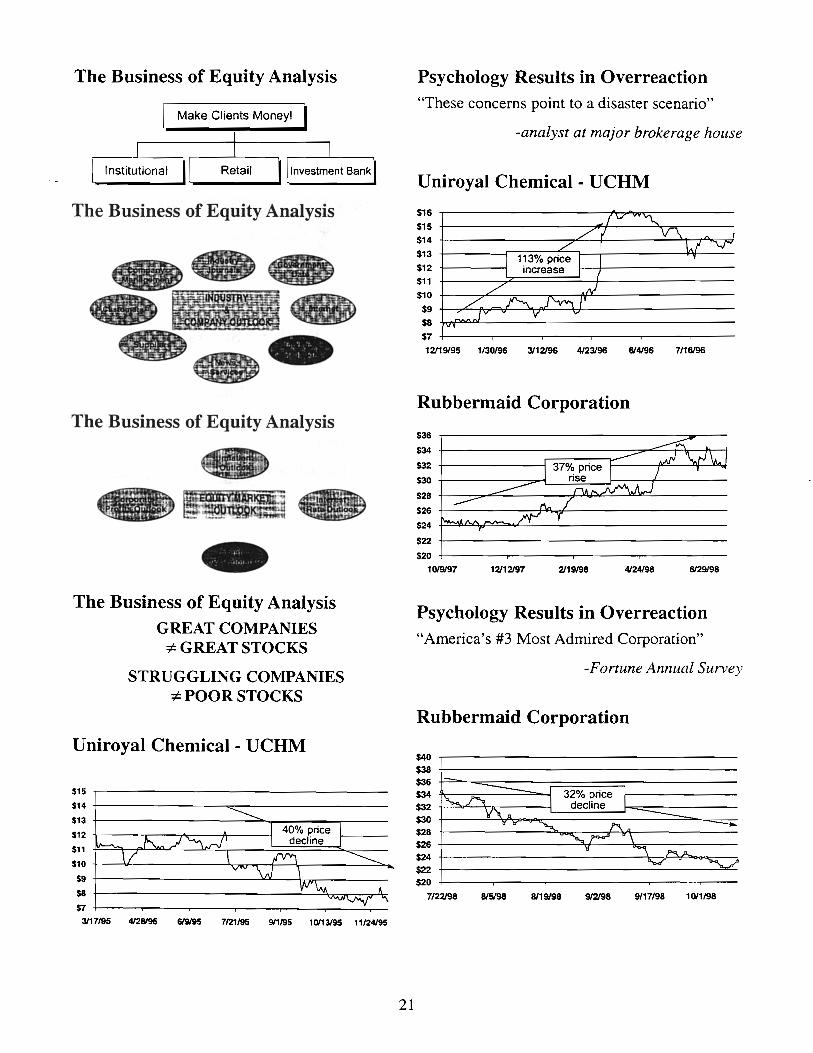
A Wall Street Perspective of the Fertilizer Sector Robert A. Koort, CFA
Deutsche Bank Research
A Wall Street Perspective on the Fertilizer Sector
• The business of equity analysis
• Factors affecting fertilizer producers
• Valuation parameters for fertilizer stocks
• Valuation analysis of Agrium Inc.
Why Should You Be Concerned With the Stock Market?
IT AFFECTS YOUR WALLET!
$ RETIREMENT SAVINGS
$ INVESTMENT INCOME
$ EMPLOYER HEALTH
20
N p K Developing countries
II'HJ lf1ZfI v ...... (rNrl.I9M,'
Equity Ownership Can Be Exciting on the Way Up ...
TERRA INDUSTRIES (NYSE-TRA)
15 ~--------~~----~1~~~~~~. 13 1~1--------/"4 ......... ...-.",-..... __ ---1; ........ ~ 3000/0 ____
7 ~~_ incre~se 3~~----__ --------~------__ -I
6/1/93 611/94 6/1/95 6/1/96
• If you owned TRA shares in a 401 K or other plan, a $100 investment in June 93 would have turned into $400 by September 1996, however ...
... And on the Way Down TERRA INDUSTRIES (NYSE-TRA)
611194 611195 611196 611197 611198
• If you owned TRA shares in a 401 K or other plan, a $100 investment in Seotember 96 would have turned into $35 by September 1998
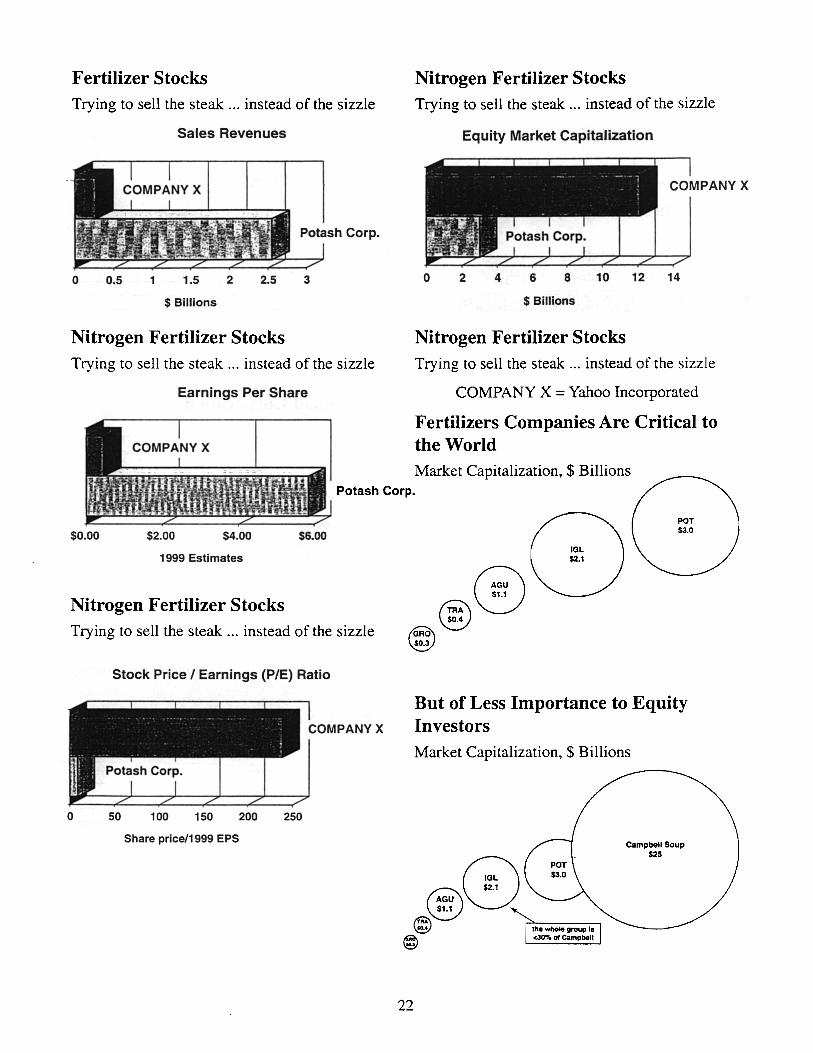
The Business of Equity Analysis
I Make Clients Money! I
The Business of Equity Analysis
The Business of Equity Analysis
The Business of Equity Analysis GREAT COMPANIES * GREAT STOCKS
STRUGGLING COMPANIES * POOR STOCKS
Uniroyal Chemical - U CHM
$15
$14
$13
$12
$11
$10
~
\/ -------_""- ~ ~.rJ l
I 40% price l I decline I
\ rv"\ V"" "\J \
VV'~
---............ $9
$8
$7 'VVf~
A "\
3117/95 4128195 6/9195 7121/95 911/95 10113195 11124195
21
Psychology Results in Overreaction "These concerns point to a disaster scenario"
-analyst at major brokerage house
Uniroyal Chemical- UCHM
$16
$15
$14
$13
$12
$11
$10
$9
$8
$7 'v
[V "\.. /,1
/'
J 1~3% price L Increase
/ .~ /. 6J~J JV v V v
V\ I ... !
12119195 1130/96 3112196 4123196 614196 7/16196
Rubbermaid Corporation
\..I
~6 r-------------------------~._--
$~ ~------------------~~~~.-~ $32 +-----------[""3;;O;':;~~:::::.--~~¥~ ~o t-------~~L-~~~~~r_------$28 +-__ ",.....=-______ -+.Jll,p~---lI!!.JlC!--------
$26 ~--------,.,....fll>,..,.;,~----------------$24 p-!J(l.C::.o..J=.~...,L~ __________________ __
$22 ~---------------------------
$20 +-------,-------r--------,---------,--1019197 12112197 2119/98 4124198 6129198
Psychology Results in Overreaction "America's #3 Most Admired Corporation"
I
-Fortune Annual Survey
Rubbermaid Corporation
$40
~8
$36 $34
$32 $30 $28 $26 $24 $22 $20
-~
"-.~ V"'. ~
• 'or
I 32% price [ decline ___
" f'\ ",- \
u "'\ J"<>..A. 0;;;..;-
-""\.../
7/22198 815198 8119198 9/2198 9117/98 10/1/98
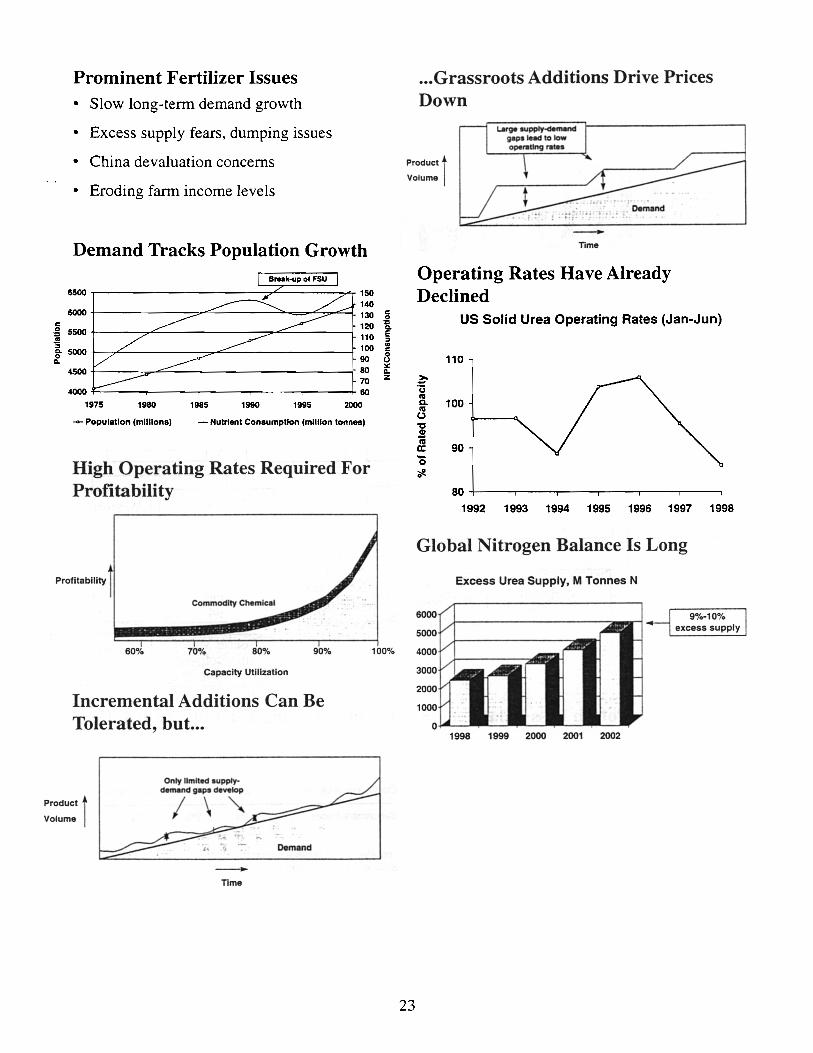
Fertilizer Stocks Trying to sell the steak ... instead of the sizzle
Sales Revenues
o 0.5 1 1.5 2 2.5 3
$ Billions
Nitrogen Fertilizer Stocks Trying to sell the steak ... instead of the sizzle
Earnings Per Share
Nitrogen Fertilizer Stocks Trying to sell the steak ... instead of the sizzle
Equity Market Capitalization
o 2 4 6 8 10 12 14
$ Billions
Nitrogen Fertilizer Stocks Trying to sell the steak ... instead of the sizzle
COMPANY X = Yahoo Incorporated
Fertilizers Companies Are Critical to the World Market Capitalization, $ Billions
Potash Corp.
$0.00 $2.00 $4.00 $6.00
1999 Estimates
Nitrogen Fertilizer Stocks Trying to sell the steak ... instead of the sizzle
Stock Price I Earnings (PIE) Ratio
COMPANY X
o 50 100 150 200 250
Share priceJ1999 EPS
~ ~ rGRO\
~
@GU 51.1
POT $3.0
But of Less Importance to Equity Investors Market Capitalization, $ Billions
0GL
® $2.1
AGU $1.1
© @
22
tho whokt group I. <30% of campbelt
Campbell Soup $25
Prominent Fertilizer Issues • Slow long-term demand growth
• Excess supply fears, dumping issues
• China devaluation concerns
• Eroding farm income levels
Demand Tracks Population Growth
6500 150 140
6000 130 c 120 0 5500 ~ 110
" 100 8" 5000 90 Q.
4500 80 70
4000 60 1975 1980 1985 1990 1995 2000
-- Population (millions, - Nutrient Consumption (million tonnes,
High Operating Rates Required For Profitability
Profitability 1 Commodity Chemical
c ~ a E " .. c 0 (J :.: Q. z
60"10 70"10 80"10 90"10 100%
Capacity Utilization
Incremental Additions Can Be Tolerated, but ...
Product t Volume I
Only limited aupplyd..".nd gaps develop
I \
-TIme
Demend
... Grassroots Additions Drive Prices Down
Product t Volume I
23
-TIme
Operating Rates Have Already Declined
us Solid Urea Operating Rates (Jan-Jun)
110
::-'u ." Q. 100 ." 0 'tI .! ."
90 II: -0 :.!! 0
80+-----~--~----~----r_--~----~
1992 1993 1994 1995 1996 1997 1998
Global Nitrogen Balance Is Long
Excess Urea Supply, M Tonnes N
1998 1999 2000 2001 2002
9%-10% excess supply
'--
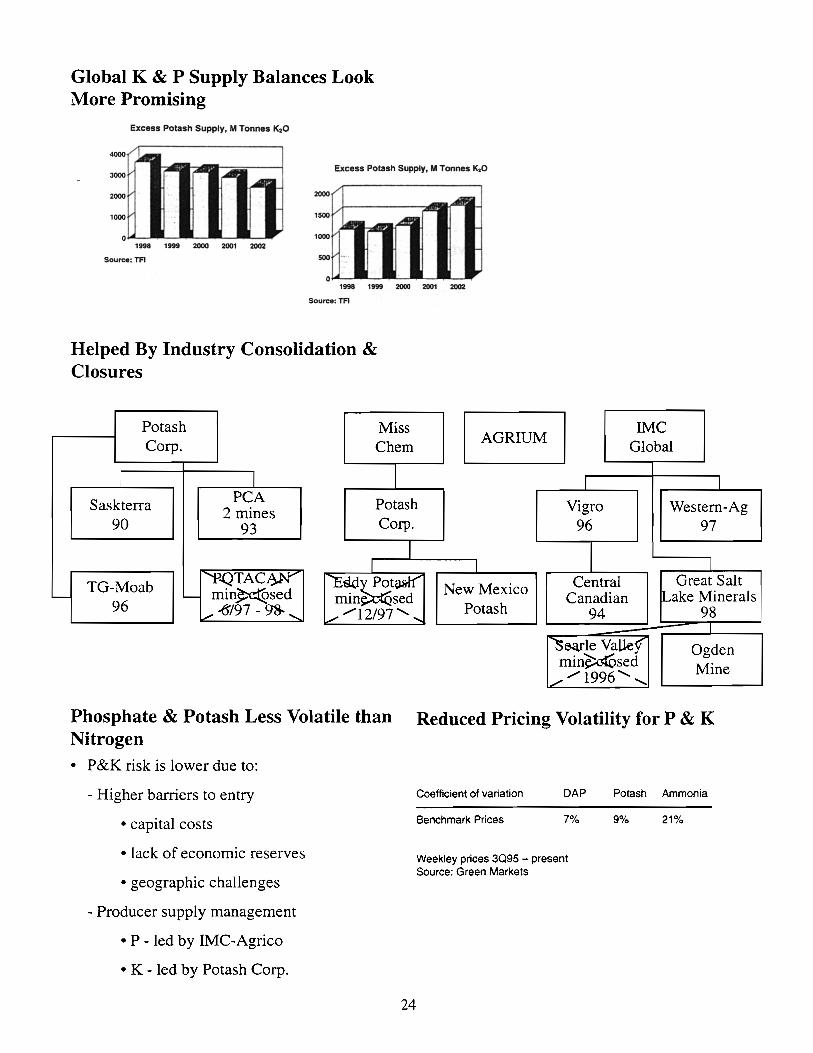
Global K & P Supply Balances Look More Promising
Excess Potash Supply. M Tonnes K20
4000 '/..1. ;.- ~ 4A
Excess Potash Supply. M Tonnes K,O 3000
2000 2000 ,/ ... 1000 V
rd r--.. A
1500
o - 1000 1993 1999 2000 2001 2002
Source: TF1 500 ..
o -1993 1999 2000 2001 2002
Source: TR
Helped By Industry Consolidation & Closures
Potash Corp.
I
Saskterra 90
TG-Moab '--
96
I PCA
2 mines 93
'P.QTAC:~ min~sed
./ ..(5/97 - 98- .......
Miss Chern
Potash Corp.
M IMC
Global
I I
Vigro Western-Ag 96 97
I I Central Great Salt
Canadian lLake Minerals 94 98
I
"58afle Valley Ogden min~sed Mine ././ 1996 ................
Phosphate & Potash Less Volatile than Reduced Pricing Volatility for P & K Nitrogen • P&K risk is lower due to:
- Higher barriers to entry
• capital costs
• lack of economic reserves
• geographic challenges
- Producer supply management
• P - led by IMC-Agrico
• K - led by Potash Corp.
24
Coefficient of variation DAP
Benchmark Prices 7%
Weekley prices 3095 - present Source: Green Markets
Potash Ammonia
9% 21%
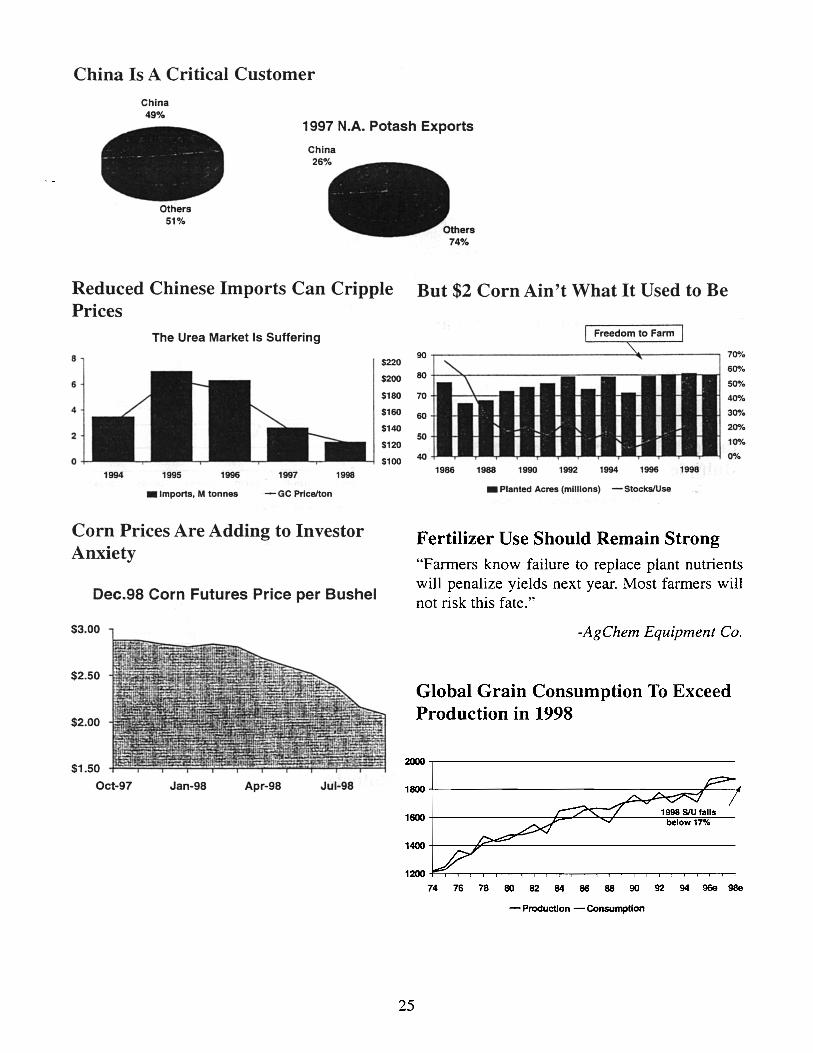
China Is A Critical Customer China 49%
1997 N.A. Potash Exports
Others 51%
China
Reduced Chinese Imports Can Cripple But $2 Corn Ain't What It Used to Be Prices
The Urea Market Is Suffering
8
6
4
2
o 1994 1995 1996 1997 1998
• Imports, M tonnes - GC Price/ton
Corn Prices Are Adding to Investor Anxiety
Dec.98 Corn Futures Price per Bushel
$3.00
$2.50
$2.00
$1.50
Oct-97 Jan-98 Apr-98 Jul-98
$220
$200
$180
$160
$140
$120
$100
90
80
70
60
50
40
~----------------------~--------, 7~k
1986 1988 1990 1992 1994 1996
• Planted Acres (millions) - SlockslUse
1998
6~/.
50%
40%
30%
200/.
100/.
0%
Fertilizer Use Should Remain Strong "Farmers know failure to replace plant nutrients will penalize yields next year. Most farmers will not risk this fate."
-AgChem Equipment Co.
Global Grain Consumption To Exceed Production in 1998
~-------------------------------------
1~+-------------------------~----~--
1~+-----~~---------------------------
- Production - Consumption
25
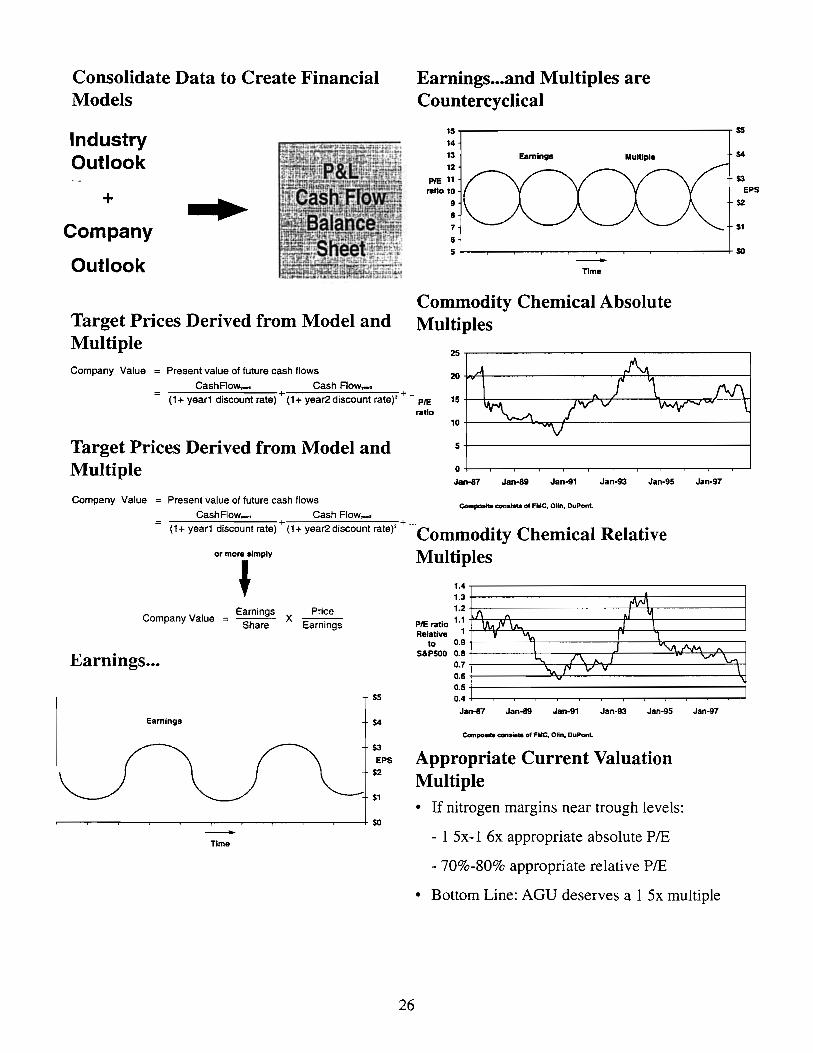
Consolidate Data to Create Financial Models
Industry Outlook
+
Company
Outlook
Target Prices Derived from Model and Multiple Company Value = Present value of future cash flows
Cash Flow_ Cash Flow_
Earnings ... and Multiples are Countercyclical
15r--------------------------------,~
14
13 12
PIE 11 mlo 10
9
8
7 S
Eamings Multiple $4
$3 EPS
52
$1
5~~--~--~~--~--~--~~--~__+~ -Tlma
Commodity Chemical Absolute Multiples
25,-----------------------------------
~~~--------------~F_~------------
(1+ year1 discount rate) + (1+ year2 discount rate), + .. PIE
ratio
Target Prices Derived from Model and Multiple
Company Value = Present value of future cash flows CashFlow_, Cash Flow_
10+---~~4-~~--------------------~
5+---------------------------------~
O+-~--~~--.__.--~~--~~--~_.~
Jan-a7 Jan-89 Jan-91 Jan-93 Jan-9S Jan-97
Compo.n. oon ..... of FMC, OUn, DuPont.
(1+ year1 discount rate) + (1+ year2discount rate)' + "'Commodity Chemical Relative or more simply Multiples
~ = Eamings X Price Company Value -
Share Earnings
Earnings ...
55
Earnings $4
$3
EPS
$2
$1
so --Time
26
1.4 1.3 1.2
PIE ratio 1.1 Relative 1
\0 0.9
J\ 11
IJv.JV\t.. , r'\I'I\ ~ VI .1 \
"In , I J "'v\. AM " S&PSOO 0.8
0.7 0.6 0.5 0.4
-'"'" 1\ J V" \-
".,.r v v v
Jan-a7 Jan-89 Jan-91 Jan-93 Jan-9S Jan-97
Compoeite con.i ... of FMC. Olin, DuPont.
Appropriate Current Valuation Multiple • If nitrogen margins near trough levels:
- 1 5x-1 6x appropriate absolute PIE
- 70%-80% appropriate relative PIE
• Bottom Line: AGU deserves a 1 5x multiple
\
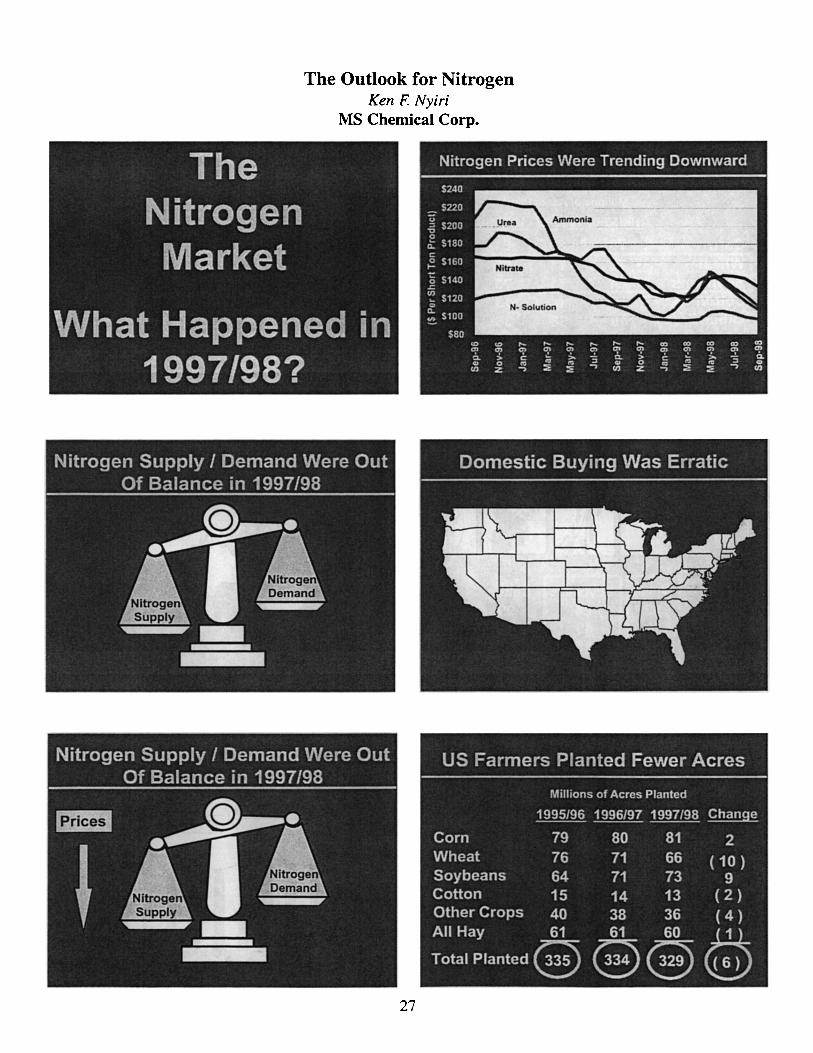
The Nitrogen Market
The Outlook for Nitrogen Ken F. Nyiri
MS Chemical Corp.
What Happened in 1997/98?
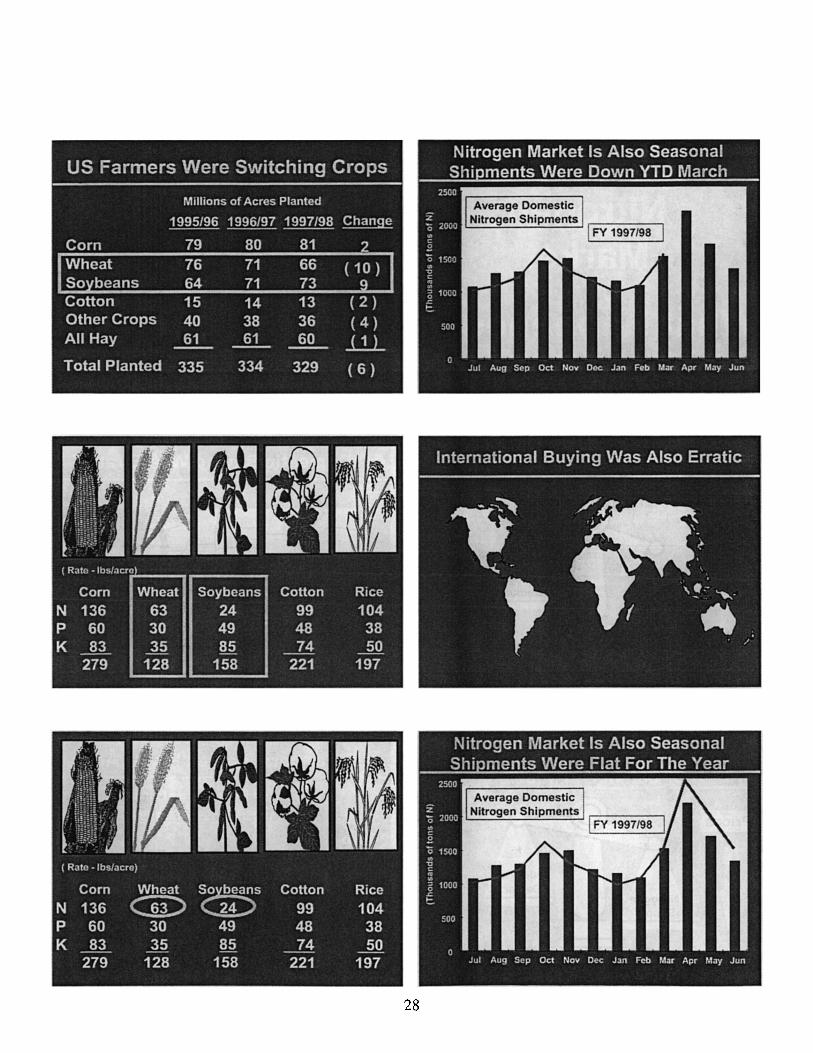
US Farmers Planted Fewer Acres
Millions of Acres Planted
1995/96 1996/97 1997/98 ~
Corn 79 80 81 2 Wheat 76 71 66 ( 10 ) Soybeans 64 71 73 9 Cotton 15 14 13 ( 2 ) Other Crops 40 38 36 ( 4 ) All Hay 61 61 60
(0 Total Planted e ee 27
28
Average Domestic Nitrogen Shipments
I FY 1997/98
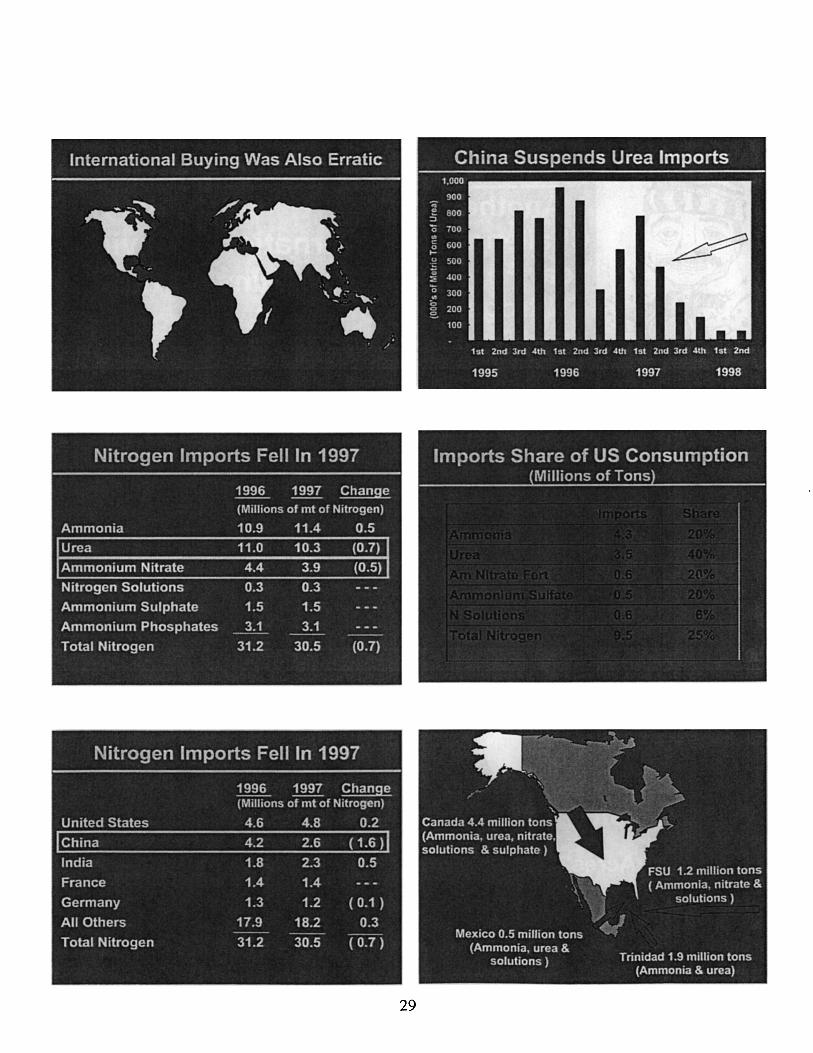
Nitrogen Imports Fellin 1997
1996 1997 ~ (Millions of mt of Nitrogen)
United States 4.6 4.8 0.2 China 4.2 2.6 ( 1.6 ) India 1.8 2.3 0.5 France 1.4 1.4 Germany 1.3 1.2 ( 0.1 ) All Others 17.9 18.2 0.3 Total Nitrogen 31.2 30.5 ( 0.7 )
29
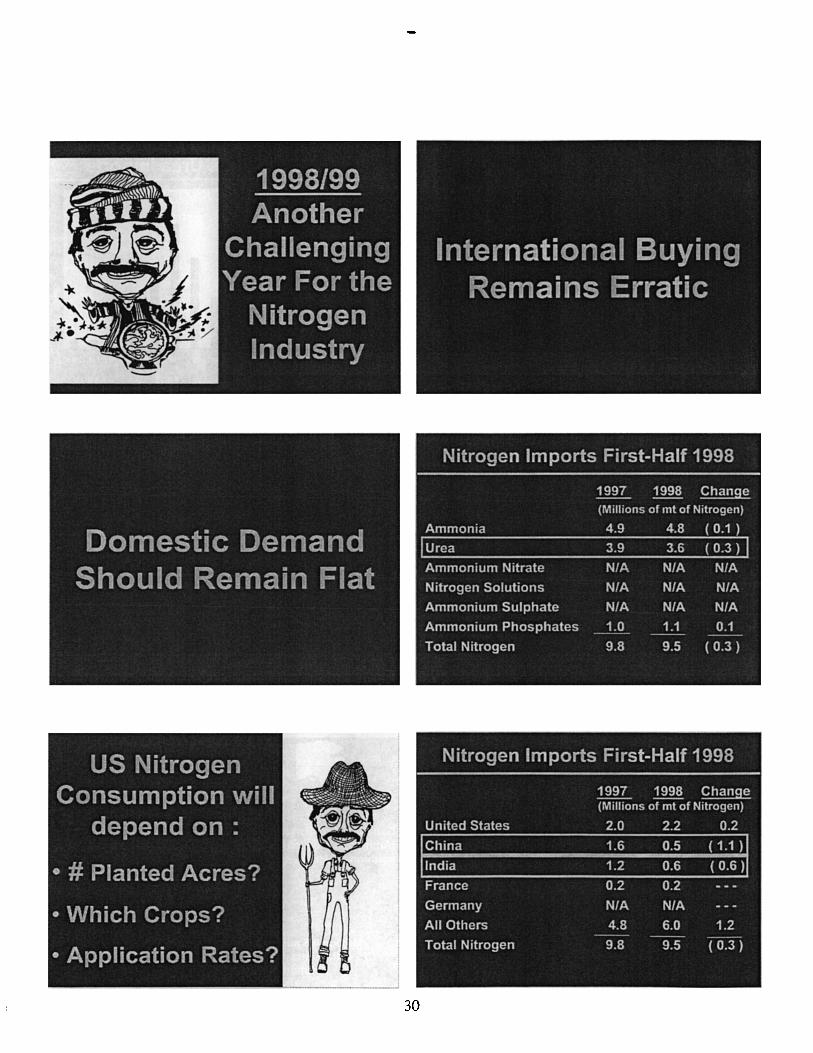
Nitrogen Imports First-Half 1998
1997 1998 ~ (Millions of mt of Nitrogen)
Ammonia 4.9 4.8 ( 0.1 ) Urea 3.9 3.6 ( 0.3 ) Ammonium Nitrate N/A N/A N/A
Nitrogen Solutions N/A N/A N/A
Ammonium Sulphate N/A N/A N/A
Ammonium Phosphates 1.0 1.1 0.1 ... _- ---
Total Nitrogen 9.8 9.5 ( 0.3 )
30
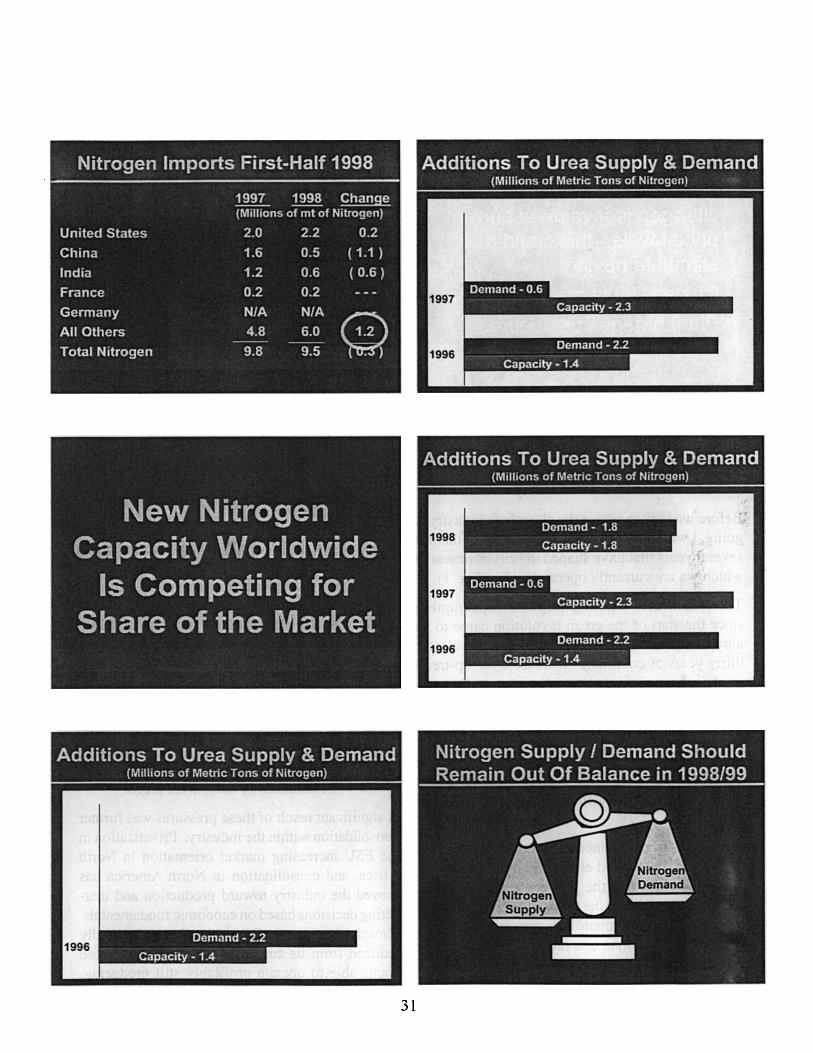
Nitrogen Imports First-Half 1998
1997 1998 ~ (Millions of mt of Nitrogen)
United States 2.0 2.2 0.2 China 1.6 0.5 ( 1.1 ) India 1.2 0.6 ( 0.6 ) France 0.2 0.2 Germany N/A N/A
All Others 4.8 6.0 ~ ---.---Total Nitrogen 9.8 9.5 . )
New Nitrogen Capacity Worldwide
Is Competing for Share of the Market
Additions To Urea Supply & Demand (Millions of Metric Tons of Nitrogen)
996
I
31
Additions To Urea Supply & Demand (Millions of Metric Tons of Nitrogen)
Additions To Urea Supply & Demand (Millions of Metnc Tons of Nitrogen)
Nitrogen Supply 1 Demand Should Remain Out Of Balance in 1998/99
~ . •. I -~ Aa .. ~ ~ ~ .. ...-.-r _ ---
The Outlook for Phosphate Peter 1. Heffernan IMC Global Inc.
Before we look to where the phosphate industry is going, I would like to review the events of the last several years that have shaped the environment in which we are currently operating. (See Fig. 1).
The remarkable rise in phosphate consumption since the start of the green revolution came to an abrupt halt as we enter this decade. After almost thirty years of continuous increases, the up-trend in phosphate consumption fell victim to the economic upheaval in the former Soviet Union and Central Europe. The resulting decline offset some 15 years of consumption gains and left in its wake millions of tons of idled and shuttered phosphate capacity. Essentially all of the decline in global use during this period stemmed from this drop. (See Fig 2).
The effects of the economic disintegration in that region had a profound effect on both the demand and supply sides of the phosphate market. Just consider that during the early 1990's the former Soviet Union's phosphate industry transformed itself from a more than one million metric ton P 20 S importer to an almost two million ton exporter.
32
Disclaimer
Except for the historical statements and discussion contained herein. statements set forth in this presentation constitute ::forwJr.d.:!o.oking s tatcn1cnt',:' These for,vard-Iooking statements rely on a number of a<;5ump:ic~, concerning future events and other u"certainti~<; that arc beyond the speaker's ability fa control. You are cautioned that actual resuits may differ materially from the forward-looking statements.
Important hetors could c<!u5e actual re5ults to differ materially from those indlc<!ted in the for."ard-lookm9 statements, These fJete : " inciud". b"t ,He not IlIn.kd to, a variety of items that can materia lly affect fertJii ler demand and prices such as pl,'nt~d ,lcr_""!::.,,, gave ~n r.l P. n t_ J g r_ici lit Ilf ,I t.P 011C I c.~!...p r _0 if~_c_tcd J:lr_tI i CI_ S !Sl_~ kS l-_c:;. ~ C P._ f:II" ,J' (>;
~e_aJ her .!- (:tl;lnH~~"_ i~ _,l~F ir.~lJJ_ur .l tp r_o.dllction_fT1f'thod~_ol~_d_~Jal U"l'_ o.f c.('t::t.li .n_l f_Hluo;tri;J!.markefo:..._,: ~ d _ttH~_.9c_ne~_a l _t~_conol11~..:~e,v;c n,'1 u .... 19l~ ..9' (c ~tiJ i.lf'.~Ld~ r.'~ n_dc~cc _on!::" t lIr i1 tg;lS 1 _cDy_irG_r:" m c_~taIJ~guJ .11 ic_r.·~:_ p r icc ~~or!1p_l;J~t.DnJro~ _bo th._dGme~JI~c_,ilndfo-,_ci.9.r}_co!!1P_c~t9!~;t~dJJ_o~_~ib:~
d~1 ;].Y.~ _ o_r~ at ~_e r_p_~op h~~ ~_ : r~o bt:l)n} n R P£o_<!uc ~ior:w ~!1Jic~~atc_d e!fi_c~~nci_ .. 'i_ lnd,'~~9~er_pr.C?r1l1.r._t;o_n __ cQ_"J~ fr_o_mL..-or_~_c;_a..!.c5ul~ _of1 !,.pandc_d_f.,cditle~
That swing of some 2.7 million tons P20S in world phosphate trade was equivalent to adding another Morocco to the supply side of the equation almost overnight.
Obviously it resulted in a huge upheaval for the industry, and in particular phosphate trade. As many of you may remember, the effect of that transformation was evidenced in severally disrupted world trade patterns. When combined with reduced demand in China and India, it also resulted in severely depressed phosphate production and prices during the early years of this decade.
Although the initial shock of the transformation was devastating, the resulting economic pressures exerted on the industry, followed by renewed growth in world demand, have ultimately led to stronger operators that are better equipped to respond to the demands of the market place.
A significant result of these pressures was further consolidation within the industry. Privatization in the FSU increasing market orientation in North Africa, and consolidation in North America has moved the industry toward production and marketing decisions based on economic fundamentals. Phosphate output in Russia has been drastically reduced from its earlier levels, with only those plants able to operate profitably still producing.
Reduced government intervention into the operations of North African producers has led to more rational, market based decisions. Producers in that region are focused on optimizing their product mix to meet marketplace demands, which means concentrating on phosphoric acid production and sales to capitalize on their comparative advantage.
Consolidation in the United States has led to the top five U.S. producers now accounting for almost 80 percent of the country's phosphoric acid capacity. Rock exports have been curtailed to extend reserve life of the U.S. industry's chemical plants and production is geared toward meeting customer demand. In addition, PhosChem membership was expanded significantly last year with the additions of Mississippi Phosphate and Mulberry Phosphate. The Association's members now account for almost 60 percent of U.S. concentrated phosphate capacity.
Production and marketing decisions based more on economic fundamentals have been a hallmark of this recovery, but renewed growth in phosphate consumption has been a major contributor as well (See Fig. 3). In fact, last year marked the fourth consecutive annual increase in world use of phosphate fertilizer. Over this period consumption gains have averaged 4 percent per year, approaching the long term historical rate of growth. At the same time, concentrated phosphate trade has registered a remarkable rebound. Despite stabilizing during 1997, world trade of DAP,MAP and TSP has exhibited average annual growth of 4 percent since 1993 as well.
World DAP, MAP and TSP trade growth paused in 1997 after recording consecutive annual increases since 1993 (See Fig. 4). Small declines in DAP and TSP trade were largely offset by increased MAP shipments. DAP imports by China and India were very strong last year, but declines by other Asian countries as well as lower imports by most other regions of the world were offsetting. In the case of MAP, generally strong Latin American imports, including record MAP shipments to Brazil, led the way in increased trade in that product. In fact, the only large reduction in imports of MAP
33
was registered by the United States, which saw imports drop by about 160,000 tonnes in 1997.
World trade in MAP has shown a remarkable growth rate over the last five years of 5.5 percent, lending significant support to overall phosphate trade demand. The areas of strongest growth have been Latin America and in Australia. Brazil remains by far the worlds largest market, importing almost 900,000 metric tons in 1997. However, Argentina, Columbia and Mexico have recorded sustained increases as well. Australia has recorded growth in MAP imports at twice the world average rate since 1992, with both granular and standard product showing strong growth trends. With over 325,000 metric tons of imports in 1997, Australia was the third largest import market for MAP, behind only Brazil and Canada.
The United States remains the world's leading producer of these finished phosphate fertilizer products - products that account for some 70 percent of the world's total phosphate trade (See Fig. 5). As the chart illustrates, U.S. production far exceeds the output of any of its competitors. Moreover, IMC-Agrico and the other member companies of PhosChem account for the bulk of U.S. output. Even if we add net phosphoric acid production for direct sales to these totals, the picture remains largely unchanged. Tunisia and Morocco would show additional output of 700,000 tonnes and 1.7 million tonnes P20 S' respectively, in phosphoric acid production for export. However, the U.S. also produces another 2.6 million tonnes P 20 s of phosphoric acid beyond that required to manufacture its DAP, MAP and TSP. China has ambitious growth plans, but can produce only a small proportion of its total requirements. Mexico and Brazil have steadily expanded output over the last several years, and Jordan continues to grow by adding phosphoric acid and granulation capacity. However, all of these producing countries are still relatively small suppliers of dry phosphate product to the world market. Looking at trade of ammoniated phosphates alone, we see that U.S. producers contribute almost two thirds of the DAP and MAP demanded by the world's importers.
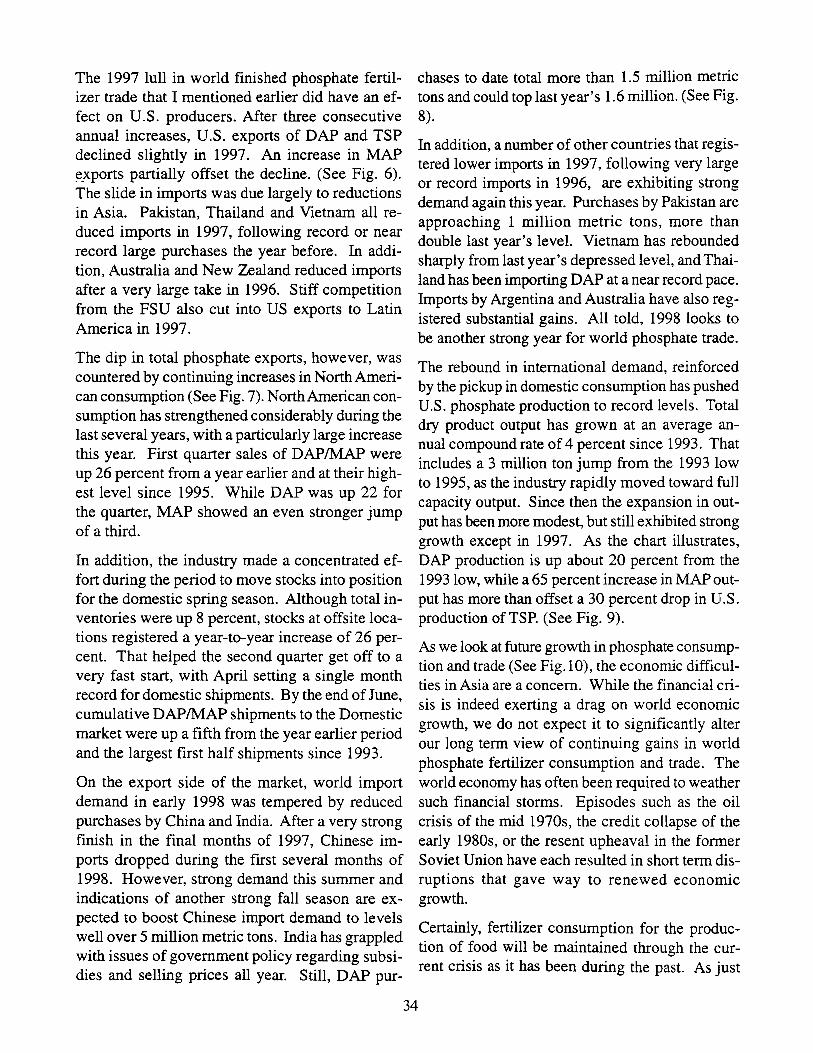
The 1997 lull in world finished phosphate fertilizer trade that I mentioned earlier did have an effect on U.S. producers. After three consecutive annual increases, U.S. exports of DAP and TSP declined slightly in 1997. An increase in MAP ~_xports partially offset the decline. (See Fig. 6). The slide in imports was due largely to reductions in Asia. Pakistan, Thailand and Vietnam all reduced imports in 1997, following record or near record large purchases the year before. In addition, Australia and New Zealand reduced imports after a very large take in 1996. Stiff competition from the FSU also cut into US exports to Latin America in 1997.
The dip in total phosphate exports, however, was countered by continuing increases in North American consumption (See Fig. 7). North American consumption has strengthened considerably during the last several years, with a particularly large increase this year. First quarter sales of DAPIMAP were up 26 percent from a year earlier and at their highest level since 1995. While DAP was up 22 for the quarter, MAP showed an even stronger jump of a third.
In addition, the industry made a concentrated effort during the period to move stocks into position for the domestic spring season. Although total inventories were up 8 percent, stocks at offsite locations registered a year-to-year increase of 26 percent. That helped the second quarter get off to a very fast start, with April setting a single month record for domestic shipments. By the end of June, cumulative DAPIMAP shipments to the Domestic market were up a fifth from the year earlier period and the largest first half shipments since 1993.
On the export side of the market, world import demand in early 1998 was tempered by reduced purchases by China and India. After a very strong finish in the final months of 1997, Chinese imports dropped during the first several months of 1998. However, strong demand this summer and indications of another strong fall season are expected to boost Chinese import demand to levels well over 5 million metric tons. India has grappled with issues of government policy regarding subsidies and selling prices all year. Still, DAP pur-
chases to date total more than 1.5 million metric tons and could top last year's 1.6 million. (See Fig. 8).
In addition, a number of other countries that registered lower imports in 1997, following very large or record imports in 1996, are exhibiting strong demand again this year. Purchases by Pakistan are approaching 1 million metric tons, more than double last year's level. Vietnam has rebounded sharply from last year's depressed level, and Thailand has been importing DAP at a near record pace. Imports by Argentina and Australia have also registered substantial gains. All told, 1998 looks to be another strong year for world phosphate trade.
The rebound in international demand, reinforced by the pickup in domestic consumption has pushed U.S. phosphate production to record levels. Total dry product output has grown at an average annual compound rate of 4 percent since 1993. That includes a 3 million ton jump from the 1993 low to 1995, as the industry rapidly moved toward full capacity output. Since then the expansion in output has been more modest, but still exhibited strong growth except in 1997. As the chart illustrates, DAP production is up about 20 percent from the 1993 low, while a 65 percent increase in MAP output has more than offset a 30 percent drop in U.S. production of TSP. (See Fig. 9).
As we look at future growth in phosphate consumption and trade (See Fig. 1 0), the economic difficulties in Asia are a concern. While the financial crisis is indeed exerting a drag on world economic growth, we do not expect it to significantly alter our long term view of continuing gains in world phosphate fertilizer consumption and trade. The world economy has often been required to weather such financial storms. Episodes such as the oil crisis of the mid 1970s, the credit collapse of the early 1980s, or the resent upheaval in the former Soviet Union have each resulted in short term disruptions that gave way to renewed economic growth.
Certainly, fertilizer consumption for the production of food will be maintained through the current crisis as it has been during the past. As just
34
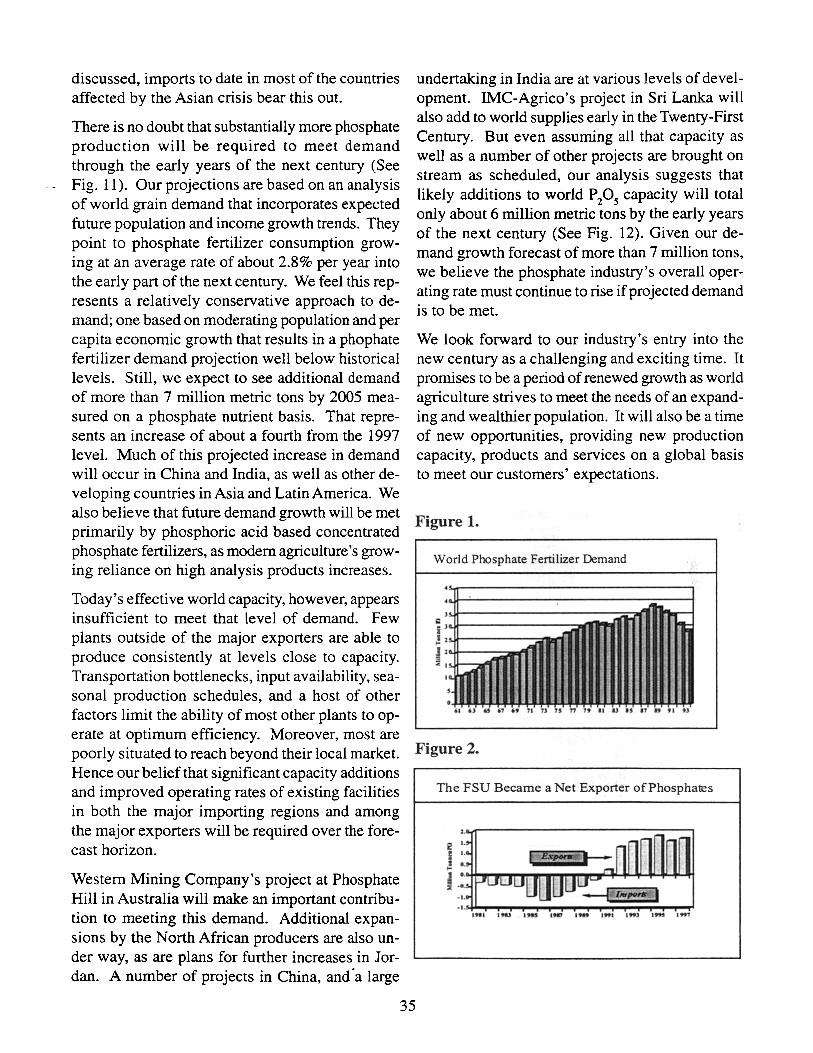
discussed, imports to date in most of the countries affected by the Asian crisis bear this out.
There is no doubt that substantially more phosphate production will be required to meet demand through the early years of the next century (See Fig. 11). Our projections are based on an analysis of world grain demand that incorporates expected future population and income growth trends. They point to phosphate fertilizer consumption growing at an average rate of about 2.8% per year into the early part of the next century. We feel this represents a relatively conservative approach to demand; one based on moderating population and per capita economic growth that results in a phophate fertilizer demand projection well below historical levels. Still, we expect to see additional demand of more than 7 million metric tons by 2005 measured on a phosphate nutrient basis. That represents an increase of about a fourth from the 1997 level. Much of this projected increase in demand will occur in China and India, as well as other developing countries in Asia and Latin America. We also believe that future demand growth will be met primarily by phosphoric acid based concentrated phosphate fertilizers, as modern agriculture's growing reliance on high analysis products increases.
Today's effective world capacity, however, appears insufficient to meet that level of demand. Few plants outside of the major exporters are able to produce consistently at levels close to capacity. Transportation bottlenecks, input availability, seasonal production schedules, and a host of other factors limit the ability of most other plants to operate at optimum efficiency. Moreover, most are poorly situated to reach beyond their local market. Hence our belief that significant capacity additions and improved operating rates of existing facilities in both the major importing regions and among the major exporters will be required over the forecast horizon.
Western Mining Company's project at Phosphate Hill in Australia will make an important contribution to meeting this demand. Additional expansions by the North African producers are also under way, as are plans for further increases in Jordan. A number of projects in China, and·a large
undertaking in India are at various levels of development. IMC-Agrico's project in Sri Lanka will also add to world supplies early in the Twenty-First Century. But even assuming all that capacity as well as a number of other projects are brought on stream as scheduled, our analysis suggests that likely additions to world P
20
S capacity will total
only about 6 million metric tons by the early years of the next century (See Fig. 12). Given our demand growth forecast of more than 7 million tons, we believe the phosphate industry's overall operating rate must continue to rise if projected demand is to be met.
We look forward to our industry's entry into the new century as a challenging and exciting time. It promises to be a period of renewed growth as world agriculture strives to meet the needs of an expanding and wealthier population. It will also be a time of new opportunities, providing new production capacity, products and services on a global basis to meet our customers' expectations.
Figure 1.
World Phosphate Fertilizer Demand
J~------------------~~ -Q Ii JaJI-------------~ ..... ; l~-----____,_ ... J l&#-----~..._.I.
':; ffi , . u " " " 71 n 1S n " II IJ IS 11 " tI t)
Figure 2.
The FSU Became a Net Exporter of Phosphates
IHI .,.., ."s .,., It" 1ft' 1ft) t..s I",
35
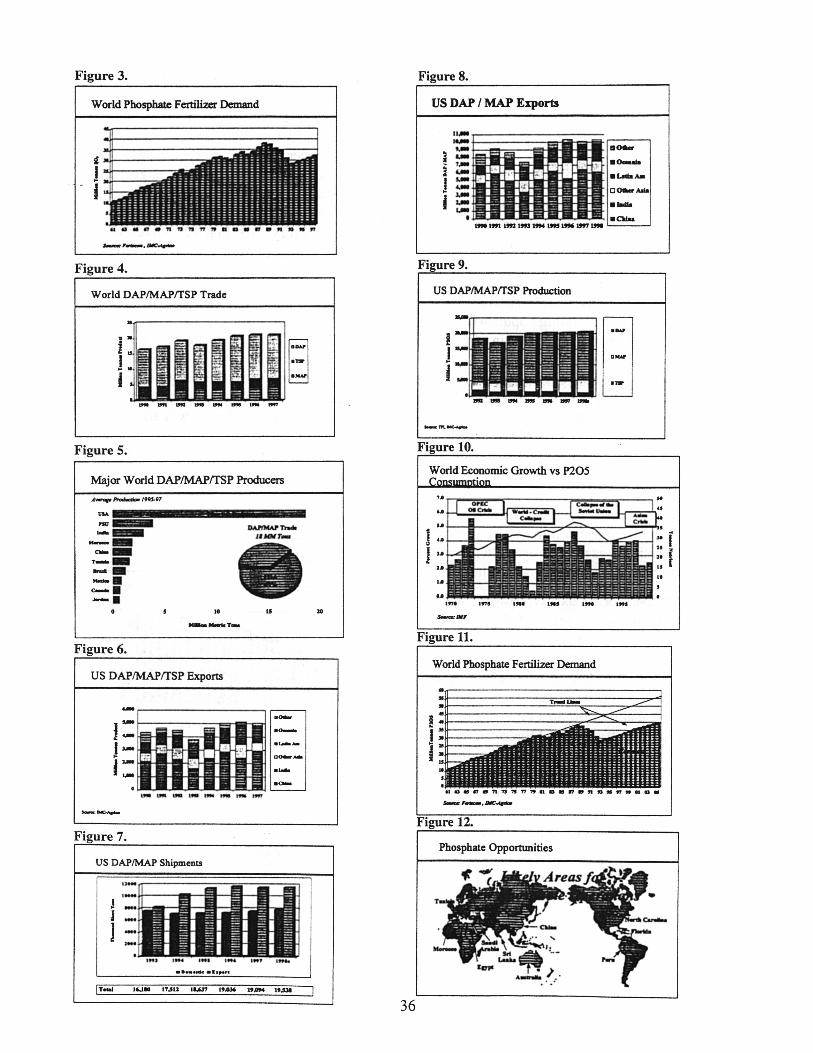
Figure 3.
World Phosphate Fertilizer Demand
~
J . -I
Figure 4.
World DAPIMAPrrSp Trade
I J i
Figure 5.
~ .... ......
Major World DAPIMAPfI'SP Producers
va. !!!!!!!!!~ .... __ _ no_ ----~T __ -. -. .--. -. Figure 6.
10
us DAPlMAPrrSp Exports
u. r-----------------~
Figure 7.
US DAPIMAP Shipments
u
.-....... .w._
.-. .-
:~iIII ! 1
J I"' ..... 1M' .... t"' , .... ......... . ,.,."
IT- I .... 17.5U lun 1.- 1.- 1.-
20
J
36
Figure 8.
US DAP I MAP Exports
IU-... I:: .... .0..-
~ .... • ' ... "!" ' ) .0-.10
i .... ~ . I J
.... .LoIIa ..... .... I I ~ Oo..-.w.
j .... .... .-....
0 .QIaa .". .'" It92 1m ttN lJtS.'" IJf'7 1M
Figure 9.
us DAPlMAPffSP Production
-,.,....------- G'" ~-1- 0 ....
i: .--"'-
Figure 10.
World Economic Growth vs P205
,. .. , ..
I J , .. ... . ..
... ,n, ,n, .- ... , .- .,,' _au
Figure 11.
World Phosphate Fertilizer Demand
~·r----------~~~---
j :t====:;;;;;;;:.
Figure 12.
Phosphate Opportunities
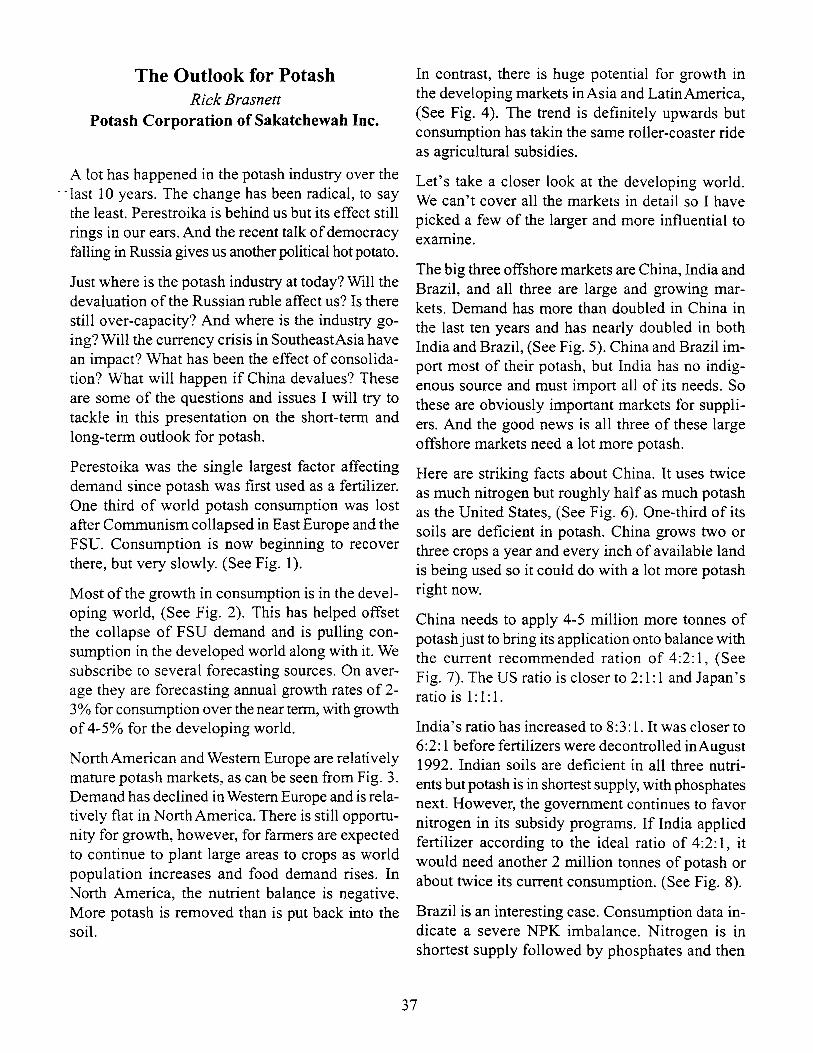
The Outlook for Potash Rick Brasnett
Potash Corporation of Sakatchewah Inc.
A lot has happened in the potash industry over the last 10 years. The change has been radical, to say the least. Perestroika is behind us but its effect still rings in our ears. And the recent talk of democracy falling in Russia gives us another political hot potato.
Just where is the potash industry at today? Will the devaluation of the Russian ruble affect us? Is there still over-capacity? And where is the industry going? Will the currency crisis in Southeast Asia have an impact? What has been the effect of consolidation? What will happen if China devalues? These are some of the questions and issues I will try to tackle in this presentation on the short-term and long-term outlook for potash.
Perestoika was the single largest factor affecting demand since potash was first used as a fertilizer. One third of world potash consumption was lost after Communism collapsed in East Europe and the FSU. Consumption is now beginning to recover there, but very slowly. (See Fig. 1).
Most of the growth in consumption is in the developing world, (See Fig. 2). This has helped offset the collapse of FSU demand and is pulling consumption in the developed world along with it. We subscribe to several forecasting sources. On average they are forecasting annual growth ~ates of 2-3% for consumption over the near term, wIth growth of 4-5% for the developing world.
North American and Western Europe are relatively mature potash markets, as can be seen from Fig. 3. Demand has declined in Western Europe and is relatively flat in North America. There is still opportunity for growth, however, for farmers are expected to continue to plant large areas to crops as world population increases and food demand rises. In North America, the nutrient balance is negative. More potash is removed than is put back into the soil.
In contrast, there is huge potential for growth in the developing markets in Asia and LatinAmerica, (See Fig. 4). The trend is definitely upwards but consumption has takin the same roller-coaster ride as agricultural subsidies.
Let's take a closer look at the developing world. We can't cover all the markets in detail so I have picked a few of the larger and more influential to examme.
The big three offshore markets are China, India and Brazil, and all three are large and growing markets. Demand has more than doubled in China in the last ten years and has nearly doubled in both India and Brazil, (See Fig. 5). China and Brazil import most of their potash, but India has no indigenous source and must import all of its needs. So these are obviously important markets for suppliers. And the good news is all three of these large offshore markets need a lot more potash.
Here are striking facts about China. It uses twice as much nitrogen but roughly half as much potash as the United States, (See Fig. 6). One~third of its soils are deficient in potash. China grows two or three crops a year and every inch of available land is being used so it could do with a lot more potash right now.
China needs to apply 4-5 million more tonnes of potash just to bring its application onto balance with the current recommended ration of 4:2: 1, (See Fig. 7). The US ratio is closer to 2: 1: 1 and Japan's ratio is 1: 1 : 1.
India's ratio has increased to 8:3: 1. It was closer to 6:2: 1 before fertilizers were decontrolled in August 1992. Indian soils are deficient in all three nutrients but potash is in shortest supply, with phosphates next. However, the government continues to favor nitrogen in its subsidy programs. If India applied fertilizer according to the ideal ratio of 4:2: 1, it would need another 2 million tonnes of potash or about twice its current consumption. (See Fig. 8).
Brazil is an interesting case. Consumption data indicate a severe NPK imbalance. Nitrogen is in shortest supply followed by phosphates and then
37
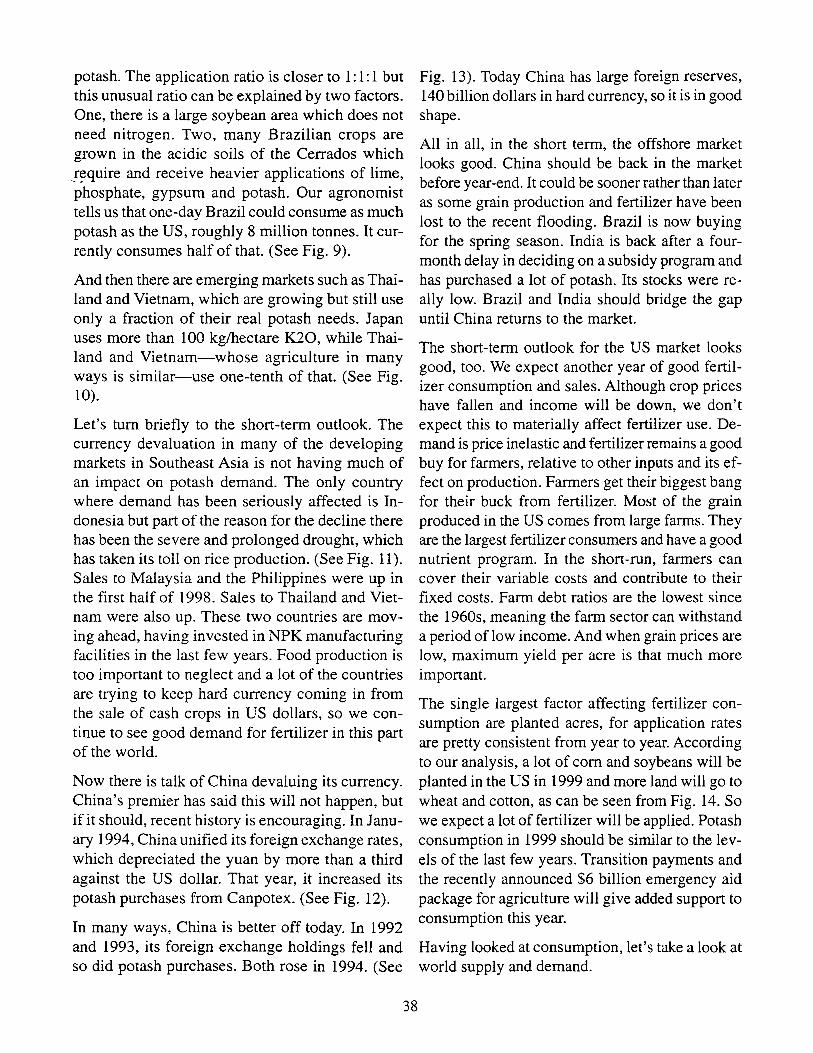
potash. The application ratio is closer to 1: 1 : 1 but this unusual ratio can be explained by two factors. One, there is a large soybean area which does not need nitrogen. Two, many Brazilian crops are grown in the acidic soils of the Cerrados which J~quire and receive heavier applications of lime, phosphate, gypsum and potash. Our agronomist tells us that one-day Brazil could consume as much potash as the US, roughly 8 million tonnes. It currently consumes half of that. (See Fig. 9).
And then there are emerging markets such as Thailand and Vietnam, which are growing but still use only a fraction of their real potash needs. Japan uses more than 100 kg/hectare K20, while Thailand and Vietnam-whose agriculture in many ways is similar-use one-tenth of that. (See Fig. 10).
Let's tum briefly to the short-term outlook. The currency devaluation in many of the developing markets in Southeast Asia is not having much of an impact on potash demand. The only country where demand has been seriously affected is Indonesia but part of the reason for the decline there has been the severe and prolonged drought, which has taken its toll on rice production. (See Fig. 11). Sales to Malaysia and the Philippines were up in the first half of 1998. Sales to Thailand and Vietnam were also up. These two countries are moving ahead, having invested in NPK manufacturing facilities in the last few years. Food production is too important to neglect and a lot of the countries are trying to keep hard currency coming in from the sale of cash crops in US dollars, so we continue to see good demand for fertilizer in this part of the world.
Now there is talk of China devaluing its currency. China's premier has said this will not happen, but if it should, recent history is encouraging. In January 1994, China unified its foreign exchange rates, which depreciated the yuan by more than a third against the US dollar. That year, it increased its potash purchases from Canpotex. (See Fig. 12).
In many ways, China is better off today. In 1992 and 1993, its foreign exchange holdings fell and so did potash purchases. Both rose in 1994. (See
38
Fig. 13). Today China has large foreign reserves, 140 billion dollars in hard currency, so it is in good shape.
All in all, in the short term, the offshore market looks good. China should be back in the market before year-end. It could be sooner rather than later as some grain production and fertilizer have been lost to the recent flooding. Brazil is now buying for the spring season. India is back after a fourmonth delay in deciding on a subsidy program and has purchased a lot of potash. Its stocks were really low. Brazil and India should bridge the gap until China returns to the market.
The short-term outlook for the US market looks good, too. We expect another year of good fertilizer consumption and sales. Although crop prices have fallen and income will be down, we don't expect this to materially affect fertilizer use. Demand is price inelastic and fertilizer remains a good buy for farmers, relative to other inputs and its effect on production. Farmers get their biggest bang for their buck from fertilizer. Most of the grain produced in the US comes from large farms. They are the largest fertilizer consumers and have a good nutrient program. In the short-run, farmers can cover their variable costs and contribute to their fixed costs. Farm debt ratios are the lowest since the 1960s. meaning the farm sector can withstand a period of low income. And when grain prices are low, maximum yield per acre is that much more important.
The single largest factor affecting fertilizer consumption are planted acres, for application rates are pretty consistent from year to year. According to our analysis, a lot of com and soybeans will be planted in the US in 1999 and more land will go to wheat and cotton, as can be seen from Fig. 14. So we expect a lot of fertilizer will be applied. Potash consumption in 1999 should be similar to the levels of the last few years. Transition payments and the recently announced $6 billion emergency aid package for agriculture will give added support to consumption this year.
Having looked at consumption, lefs take a look at world supply and demand.
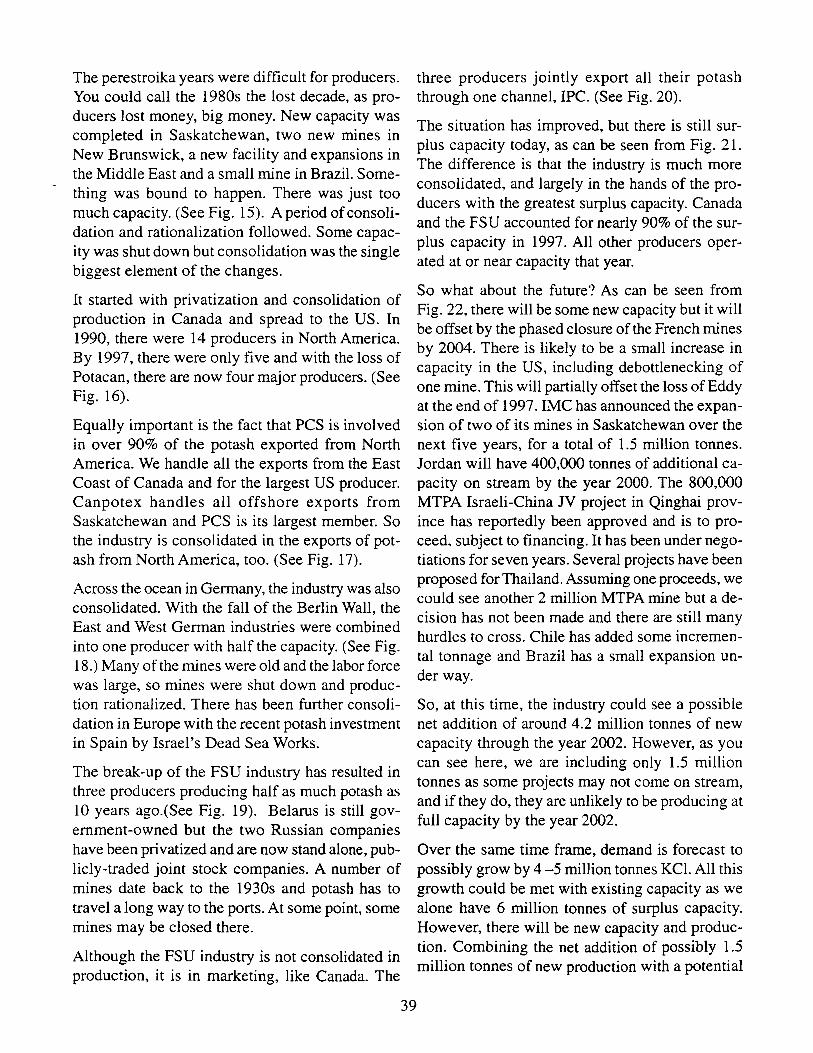
The perestroika years were difficult for producers. You could call the 1980s the lost decade, as producers lost money, big money. New capacity was completed in Saskatchewan, two new mines in New Brunswick, a new facility and expansions in the Middle East and a small mine in Brazil. Something was bound to happen. There was just too much capacity. (See Fig. 15). A period of consolidation and rationalization followed. Some capacity was shut down but consolidation was the single biggest element of the changes.
It started with privatization and consolidation of production in Canada and spread to the US. In 1990, there were 14 producers in North America. By 1997, there were only five and with the loss of Potacan, there are now four major producers. (See Fig. 16).
Equally important is the fact that PCS is involved in over 90% of the potash exported from North America. We handle all the exports from the East Coast of Canada and for the largest US producer. Canpotex handles all offshore exports from Saskatchewan and PCS is its largest member. So the industry is consolidated in the exports of potash from North America, too. (See Fig. 17).
Across the ocean in Germany, the industry was also consolidated. With the fall of the Berlin Wall, the East and West German industries were combined into one producer with half the capacity. (See Fig. 18.) Many of the mines were old and the labor force was large, so mines were shut down and production rationalized. There has been further consolidation in Europe with the recent potash investment in Spain by Israel's Dead Sea Works.
The break-up of the FSU industry has resulted in three producers producing half as much potash as 10 years ago.(See Fig. 19). Belarus is still government-owned but the two Russian companies have been privatized and are now stand alone, publicly-traded joint stock companies. A number of mines date back to the 1930s and potash has to travel a long way to the ports. At some point, some mines may be closed there.
Although the FSU industry is not consolidated in production, it is in marketing, like Canada. The
39
three producers jointly export all their potash through one channel, IPC. (See Fig. 20).
The situation has improved, but there is still surplus capacity today, as can be seen from Fig. 21. The difference is that the industry is much more consolidated, and largely in the hands of the producers with the greatest surplus capacity. Canada and the FSU accounted for nearly 90% of the surplus capacity in 1997. All other producers operated at or near capacity that year.
So what about the future? As can be seen from Fig. 22, there will be some new capacity but it will be offset by the phased closure of the French mines by 2004. There is likely to be a small increase in capacity in the US, including debottlenecking of one mine. This will partially offset the loss of Eddy at the end of 1997. IMC has announced the expansion of two of its mines in Saskatchewan over the next five years, for a total of 1.5 million tonnes. Jordan will have 400,000 tonnes of additional capacity on stream by the year 2000. The 800,000 MTPA Israeli-China JV project in Qinghai province has reportedly been approved and is to proceed, subject to financing. It has been under negotiations for seven years. Several projects have been proposed for Thailand. Assuming one proceeds, we could see another 2 million MTPA mine but a decision has not been made and there are still many hurdles to cross. Chile has added some incremental tonnage and Brazil has a small expansion under way.
So, at this time, the industry could see a possible net addition of around 4.2 million tonnes of new capacity through the year 2002. However, as you can see here, we are including only 1.5 million tonnes as some projects may not come on stream, and if they do, they are unlikely to be producing at full capacity by the year 2002.
Over the same time frame, demand is forecast to possibly grow by 4 -5 million tonnes KCl. All this growth could be met with existing capacity as we alone have 6 million tonnes of surplus capacity. However, there will be new capacity and production. Combining the net addition of possibly 1.5 million tonnes of new production with a potential
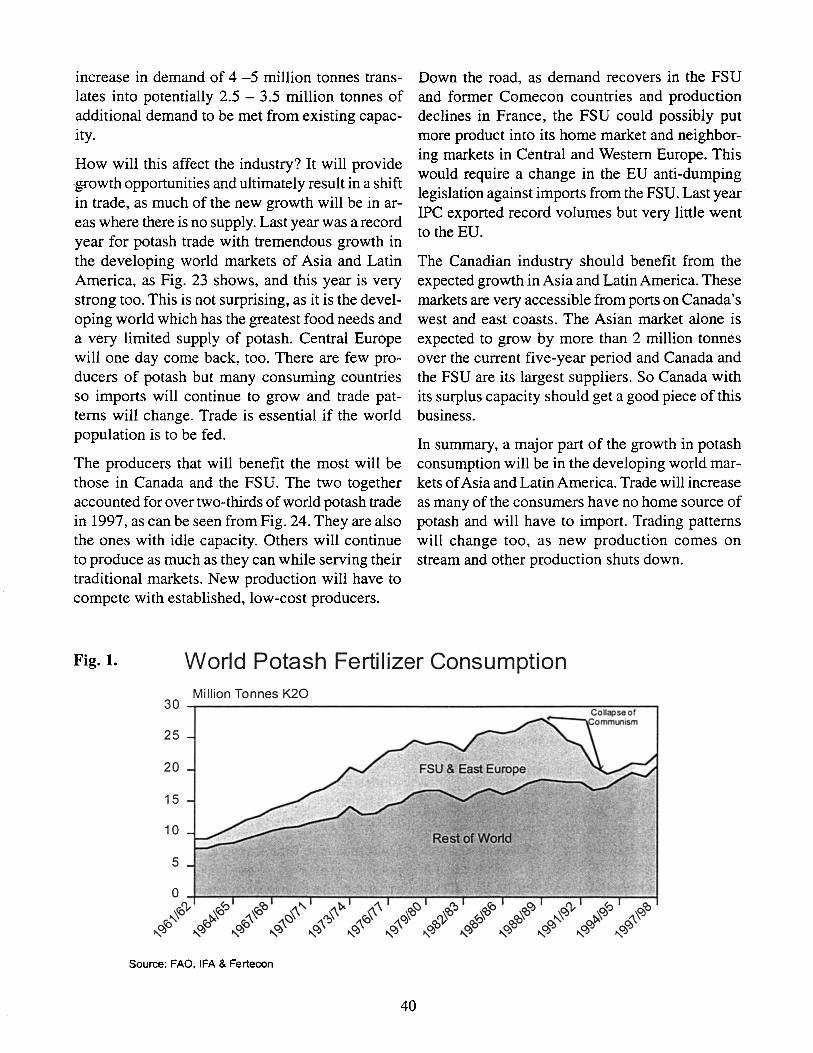
increase in demand of 4 -5 million tonnes translates into potentially 2.5 - 3.5 million tonnes of additional demand to be met from existing capacity.
How will this affect the industry? It will provide -growth opportunities and ultimately result in a shift in trade, as much of the new growth will be in areas where there is no supply. Last year was a record year for potash trade with tremendous growth in the developing world markets of Asia and Latin America, as Fig. 23 shows, and this year is very strong too. This is not surprising, as it is the developing world which has the greatest food needs and a very limited supply of potash. Central Europe will one day come back, too. There are few producers of potash but many consuming countries so imports will continue to grow and trade patterns will change. Trade is essential if the world population is to be fed.
The producers that will benefit the most will be those in Canada and the FSU. The two together accounted for over two-thirds of world potash trade in 1997, as can be seen from Fig. 24. They are also the ones with idle capacity. Others will continue to produce as much as they can while serving their traditional markets. New production will have to compete with established, low-cost producers.
Down the road, as demand recovers in the FSU and former Comecon countries and production declines in France, the FSU could possibly put more product into its home market and neighboring markets in Central and Western Europe. This would require a change in the EU anti-dumping legislation against imports from the FSU. Last year · IPC exported record volumes but very little went to the EU.
The Canadian industry should benefit from the expected growth in Asia and Latin America. These markets are very accessible from ports on Canada's west and east coasts. The Asian market alone is expected to grow by more than 2 million tonnes over the current five-year period and Canada and the FSU are its largest suppliers. So Canada with its surplus capacity should get a good piece of this business.
In summary, a major part of the growth in potash consumption will be in the developing world markets of Asia and Latin America. Trade will increase as many of the consumers have no home source of potash and will have to import. Trading patterns will change too, as new production comes on stream and other production shuts down.
Fig. 1. World Potash Fertilizer Consumption Mi Ilion Tonnes K20
30 ,-------------------------------------------~~--~
25
20
15
10
5
Source: FAO, IFA & Fertecon
40
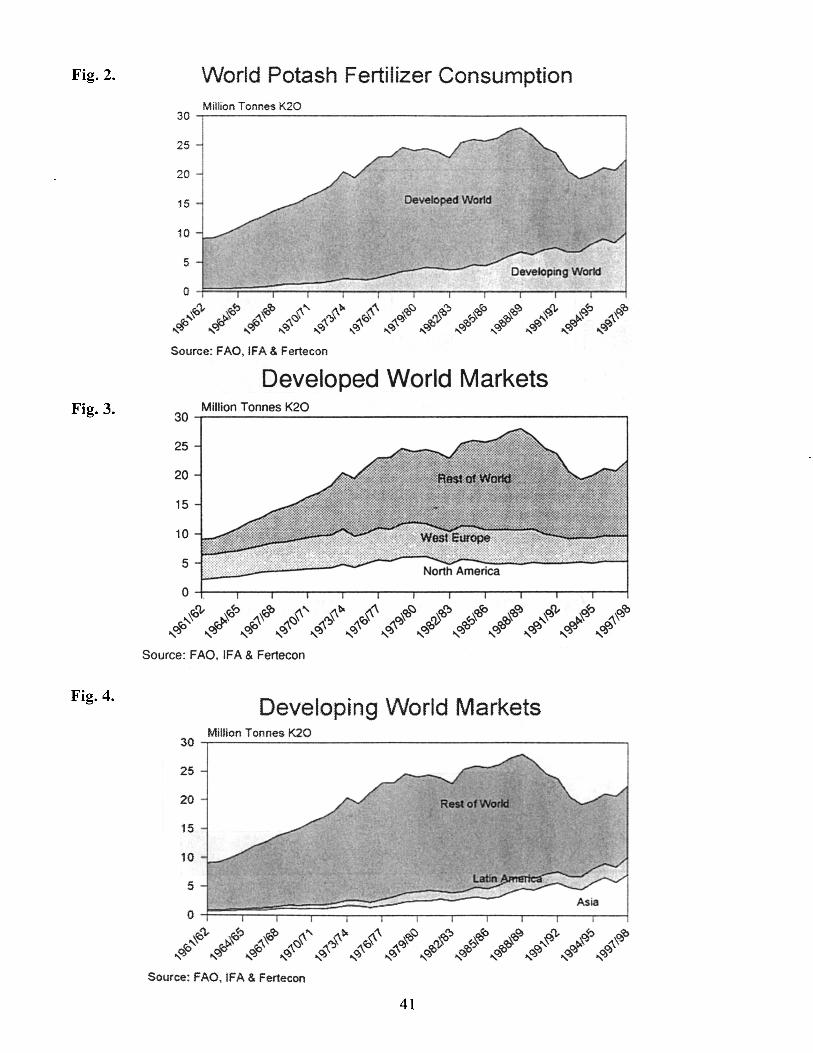
Fig. 2. World Potash Fertilizer Consumption Million Tonnes K20
30 ~----------------------------------------------_.
25
20
15
10
5 Developing Wor1d
o ~=r~==~~~~--~~~~~~~ •. ;~')" ~~'O~ ~.:~'O ~~~ .... ~":>~~ ro~'\ c>s:o~ rV'O":J ~<§> ~'Qo:, ~o/ ~o:,":1 ~~
# ~ # ~ ~ ~ # # ~ , ~ ~ ~ Source: FAO, IFA & Fertecon
Developed World Markets Fig. 3. Million Tonnes K20
30,---------------------------------------------~
25
20
15
10
o 4---~--~--_r--_r--~--~--~--~--_.r_--r_--r_~ .... ~rJ; _~f"o<O l.~<O A.~0"" ~'\t>. V}'\'\ ~<o~ rI~o.;, ~<of"o ~<oo:, ~OJrJ; ~OJ<O ~f.J<O
!O ~ . !O .\ "" ","I. n."I. f6v g) R) p.> ~ p.> ~ ~ ~ ~ ~ ~ ~ ~ ~ ~ ~ ~ ~
Source: FAO. IFA & Fertecon
Fig. 4. Developing World Markets
Million Tonnes K20 30 ,------------------------------------------------,
25
20
15
10
:1=~~~~~===:==~~~~ fo~rof\; ~ro~ £-{o(Q ~~~ .... ~~ .... ~'C~'\ ~~<§> R>~":> R>~r:oro ~:oOJ .... ~f\; ~OJ~ ~\:~<o ~ ~ ~ ~ ~ ~ ~ $ $ ~ ~ ~ ~
Source: FAO, IFA & Fertecon
41
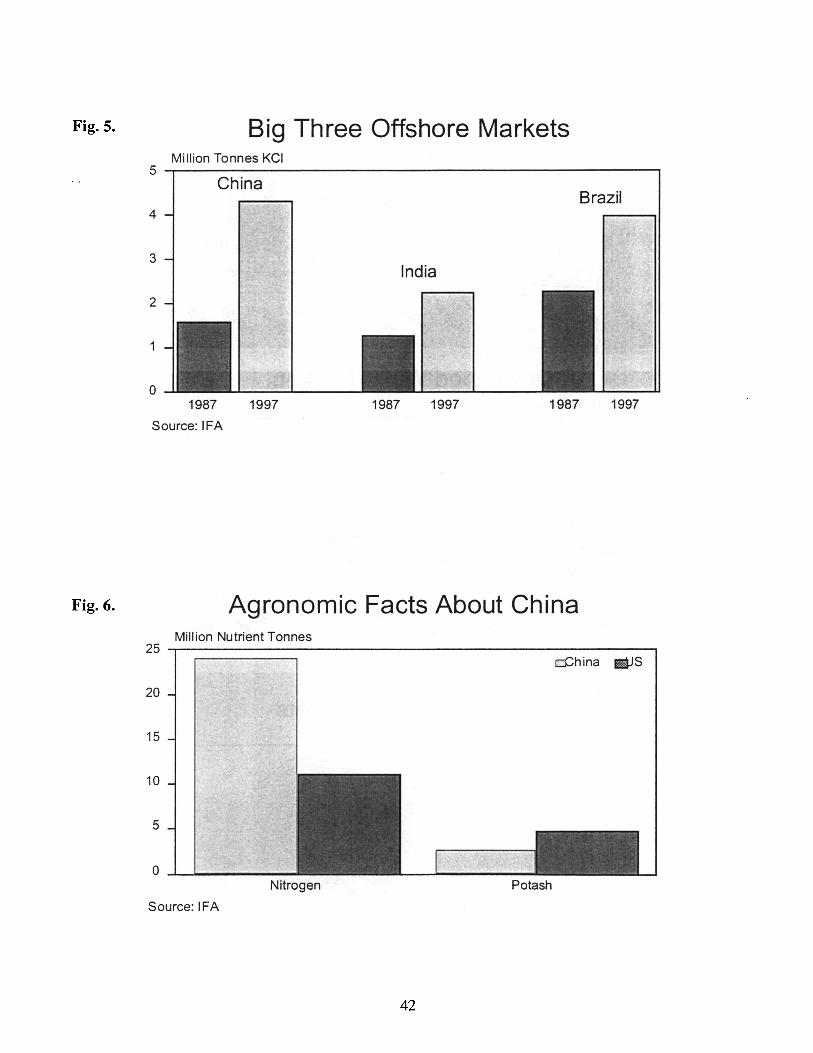
Fig. 6. Agronomic Facts About China Million Nutrient Tonnes
25 ,---------------------------------------------, EChina BiJS
20
15
10
5
0-'--....1...-___ _
Nitrogen Potash
Source: IFA
42
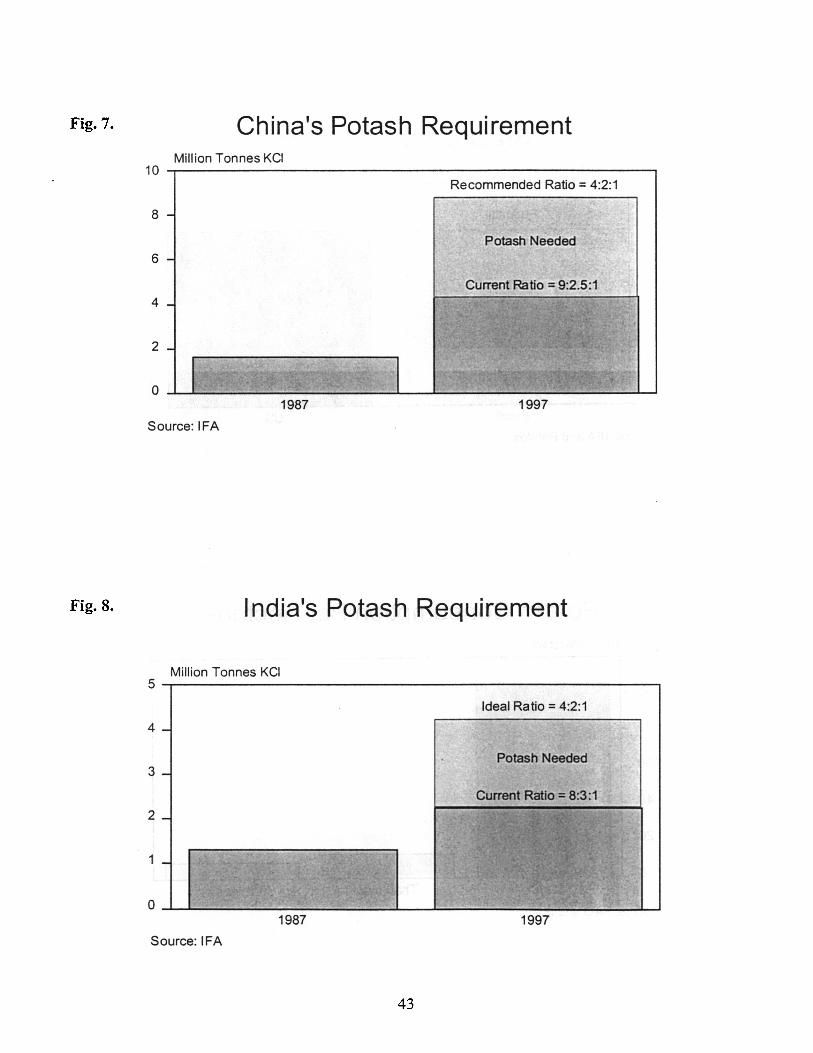
Fig. 7. China's Potash Requirement Million Tonnes KCI
10 ~--------------------------------------------~ Recommended Ratio = 4:2:1
8
Potash Needed 6
4
2
o ~~~~~ ______ ~~~~ __ ~ ______ ~ __________ ~ 1987 1997
Source: IFA
Fig. 8. India's Potash Requirement
Million Tonnes KCI 5.-----------------------------------------------.
Ideal Ratio = 4:2:1
4
Potash Needed
1987 1997
Source: IFA
43
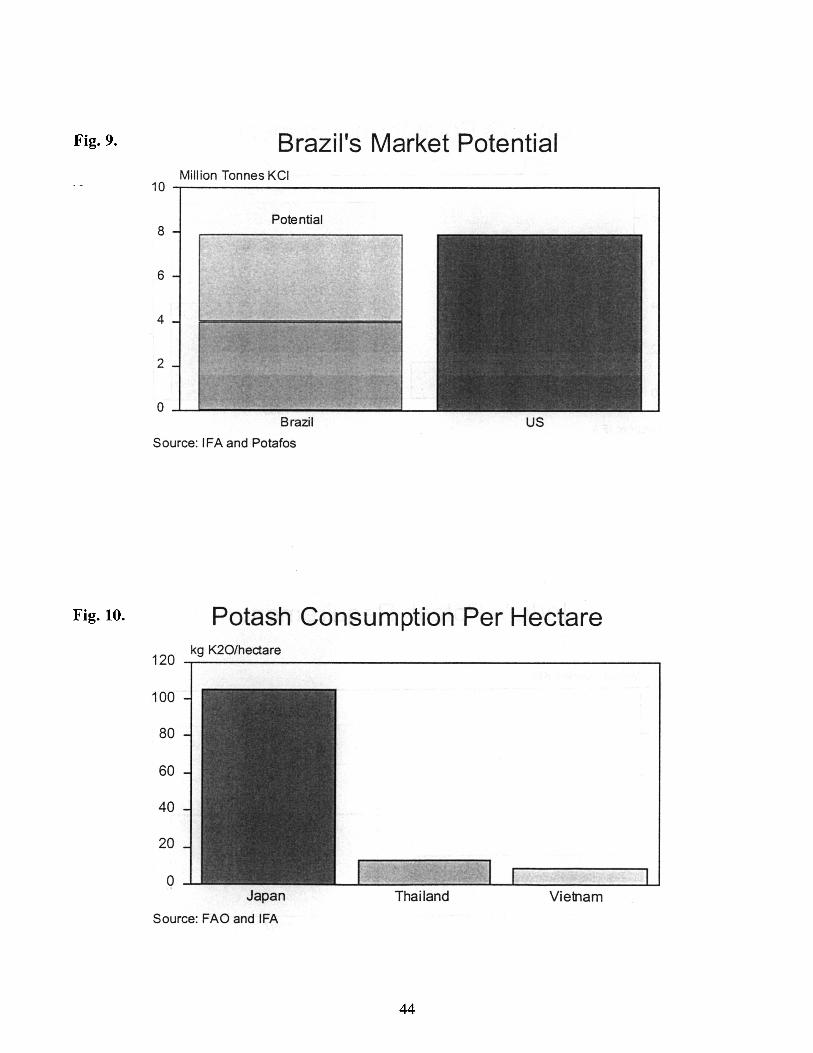
Fig. 9. Brazil's Market Potential Million Tonnes KCI
10 ~------------------------------------------~
Potential
Brazil us Source: IFA and Potafos
Fig. 10. Potash Consumption Per Hectare
120 kg K20/hectare
100
80
60
40
20
Q Japan Thailand Vietnam
Source: FAO and IFA
44
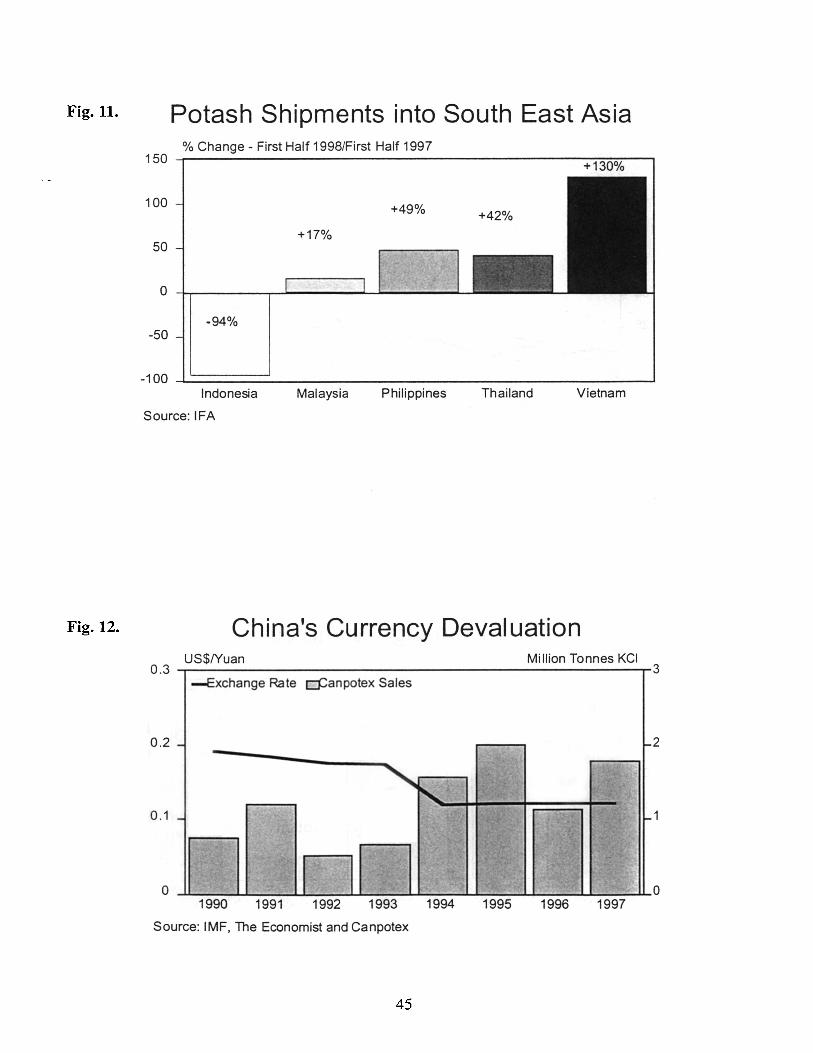
Fig. 11.
Fig. 12.
Potash Shipments into South East Asia % Change - First Half 1998/First Half 1997
150 ;-----------------------------------------~~__,
100
+17% 50
-94% -50
-100 ..L:=======--_________________ ....J Indonesia
Source: IFA
Malaysia Philippines Thailand Vietnam
China's Currency Devaluation US$lYuan Million Tonnes KCI
0 .3 --Exchange Rate Q::anpotex Sales
0 .2 - -, ~
""J --,
-'-, 0 .1 - (
,
,"" r :,.
o 1990 1991 1992 1993 1994 1995 1996 1997
Source: IMF, The Economist and Canpotex
45
3
r- 2
r-
o
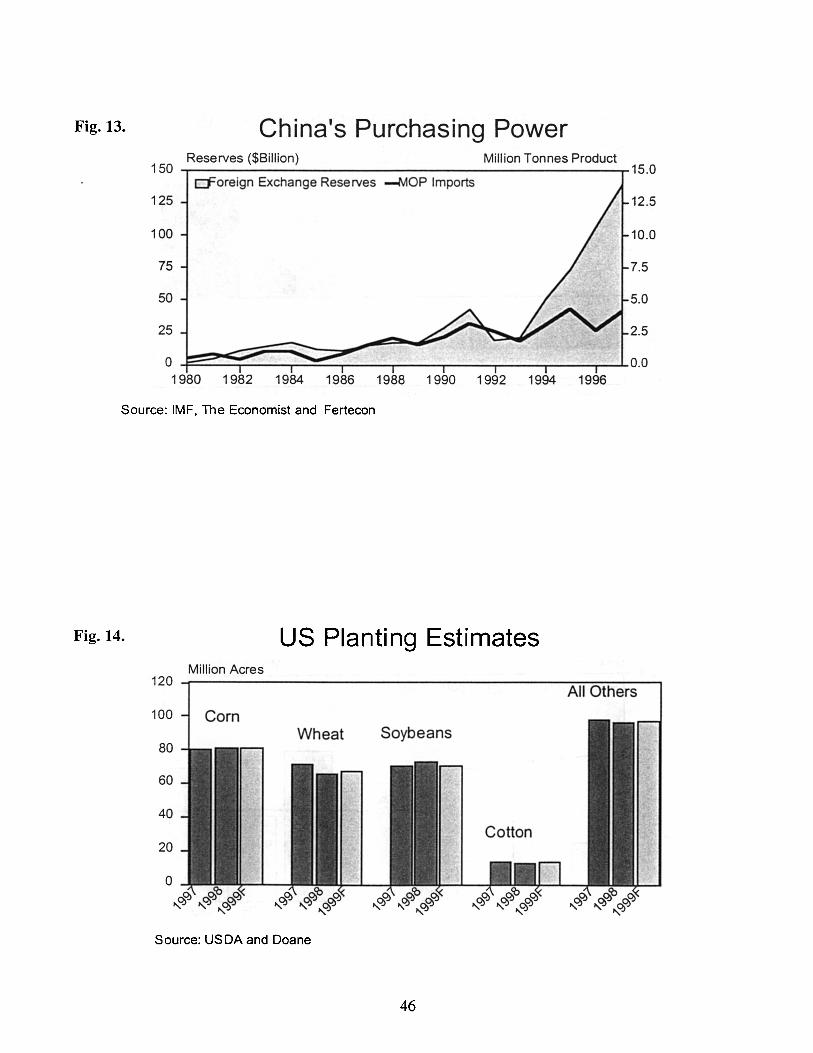
Fig. 13. China's Purchasing Power Reserves ($Billion)
150 -r-------------------------r15.O Million Tonnes Product
O=oreign Exchange Reserves -MOP Imports
125 12.5
100 10.0
75 7.5
50 5.0
25 2.5
1980 1982 1984 1986 1988 1990 1992 1994 1996
Source: IMF. The Economist and Fertecon
Fig. 14. US Planting Estimates Million Acres
120 __ -------------------~~~-~ All Others
100 Corn Wheat Soybeans
80
60
40 Cotton
20
o
Source: USDA and Doane
46
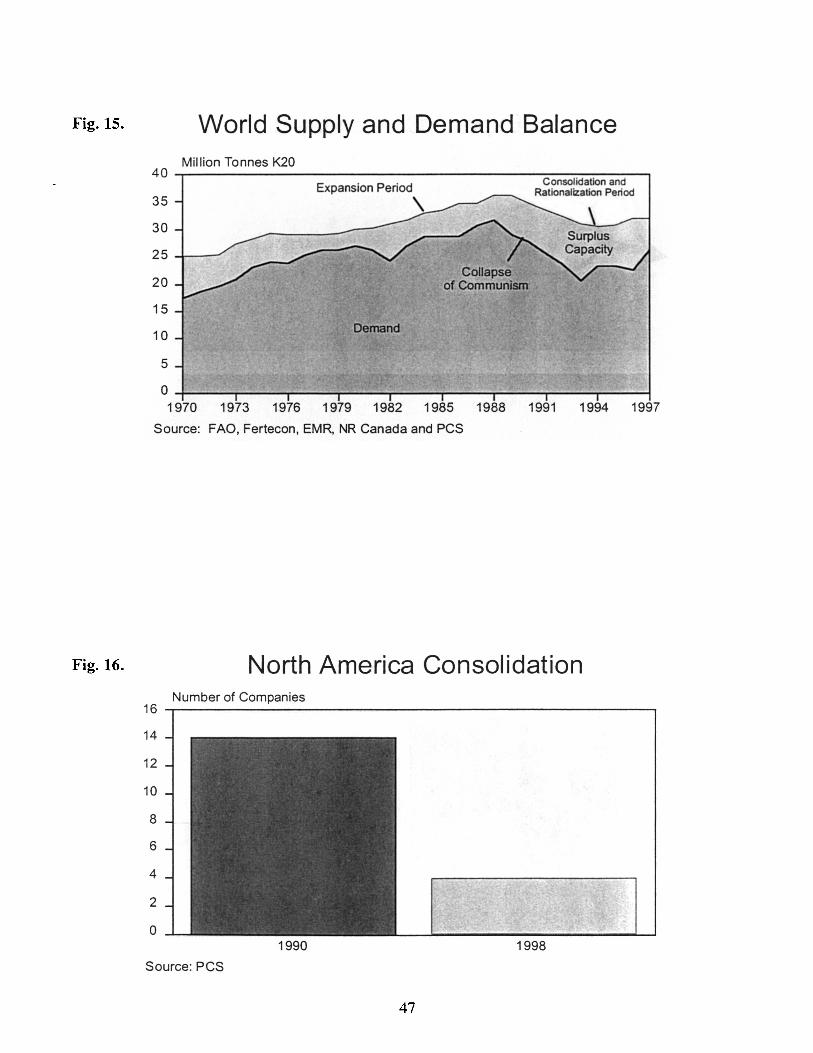
Fig. 15. World Supply and Demand Balance Million Tonnes K20
40 ~------------------------------------~~~--~-, Consolidation and Rationalization Period
35 Expansion Period
\ 30
25
20
15
10
5
0 1970 1973 1976 1979 1982 1985 1988 1991 1994 1997
Source: FAO, Fertecon, EMR, NR Canada and PCS
Fig. 16. North America Consolidation
16 Number of Companies
14
12
10
8
6
4
2
0 1990 1998
Source: PCS
47
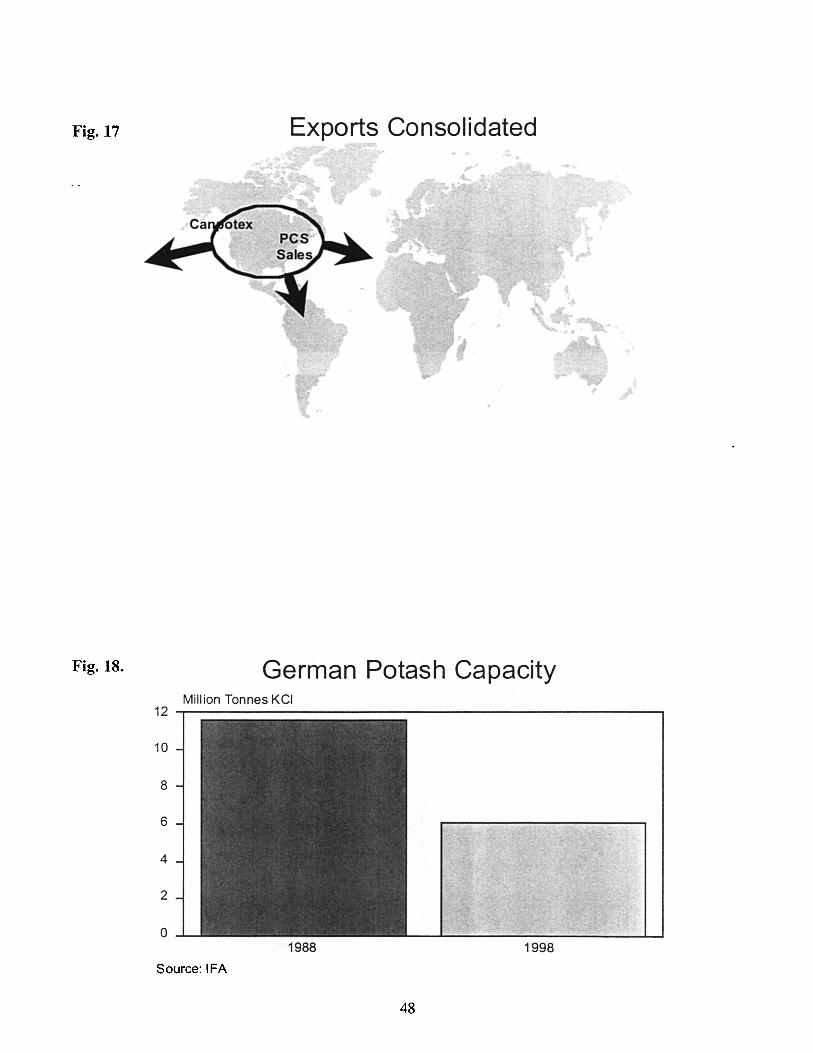
Fig. 17 Exports Consolidated
Fig. 18. German Potash Capacity Million Tonnes KCI
12~--------------------------------------~
10
8
6
4
2
o 1988 1998
Source: IFA
48
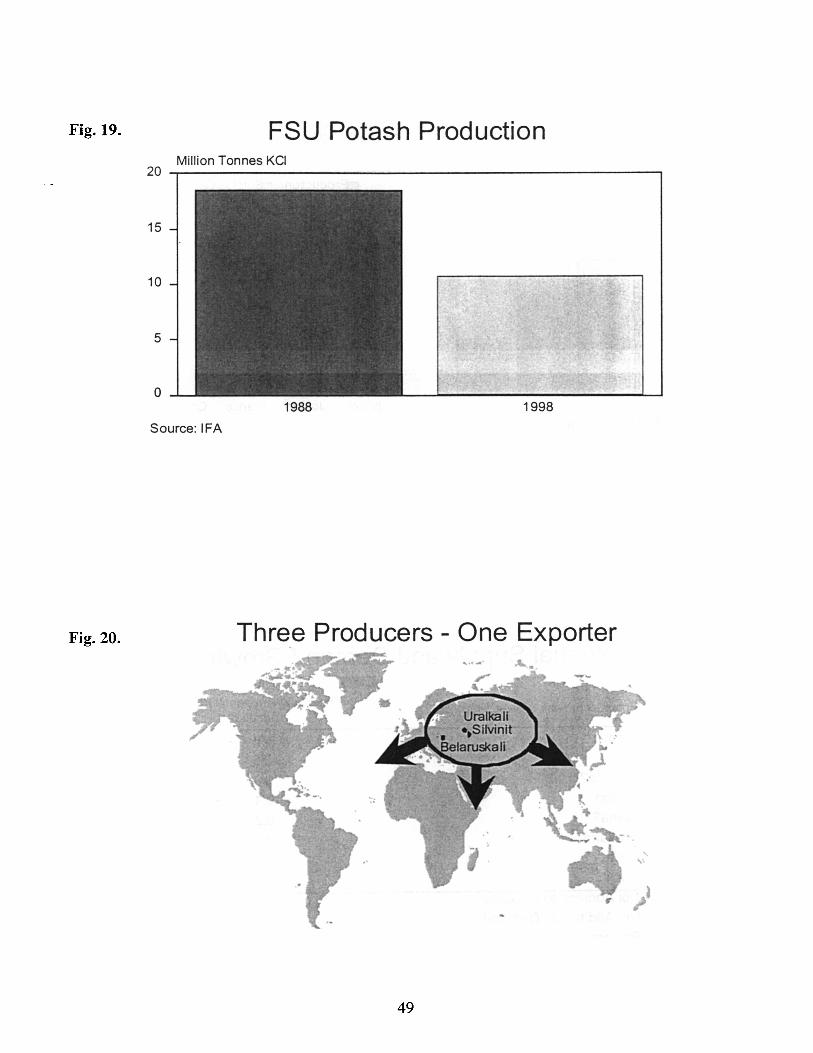
Fig. 19. FSU Potash Production Million Tonnes KCI
20~--------------------------------------~
15
10
5
o 1988 1998
Source: IFA
Fig. 20. Thre,e Producers - One Exporter
49
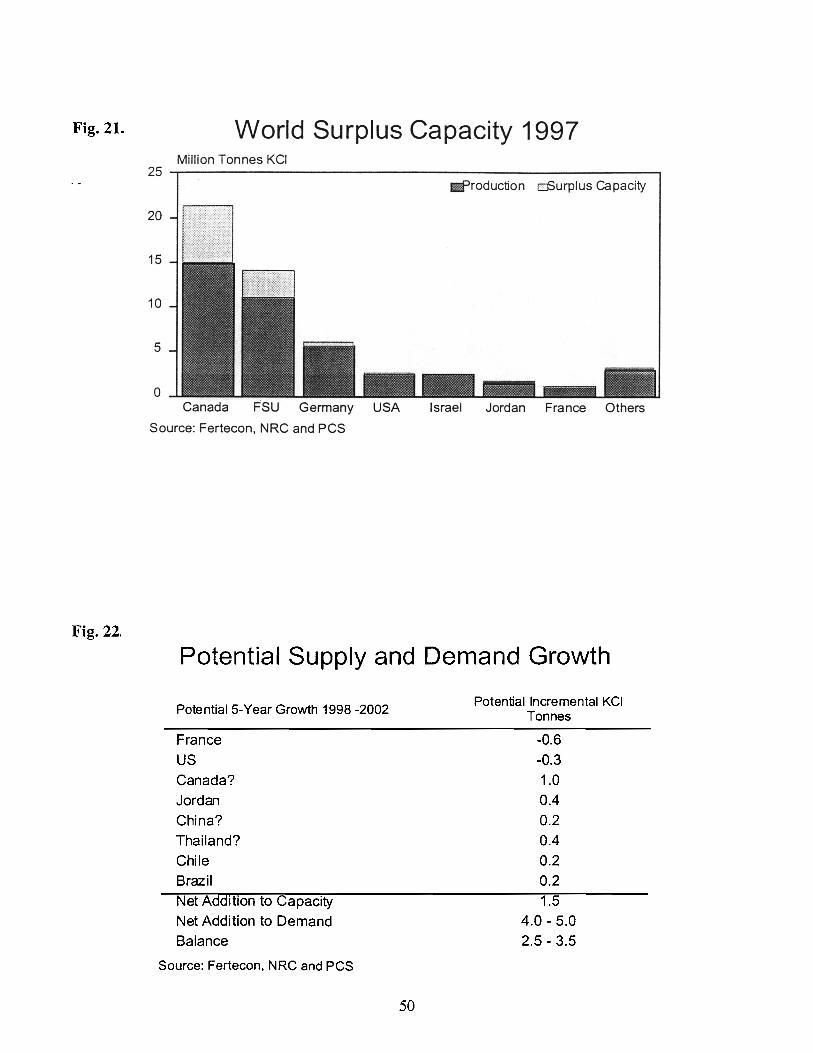
Fig. 21.
Fig. 22.
World Surplus Capacity 1997 Million Tonnes KCI
25 liilt'roduction c:Surplus Capacity
20
15
10
5
0 Canada Germany USA Israel Jordan France Others
Source: Fertecon, NRC and PCS
Potential Supply and Demand Growth
Potential5-Year Growth 1998 -2002
France
US
Canada? Jordan China? Thailand? Chile Brazil Net Addition to Capacity Net Addition to Demand Balance
Source: Fertecon, NRC and PCS
50
Potential Incremental KCI Tonnes
-0.6 -0.3 1.0 0.4 0.2 0.4
0.2 0.2 1.5
4.0 - 5.0 2.5 - 3.5
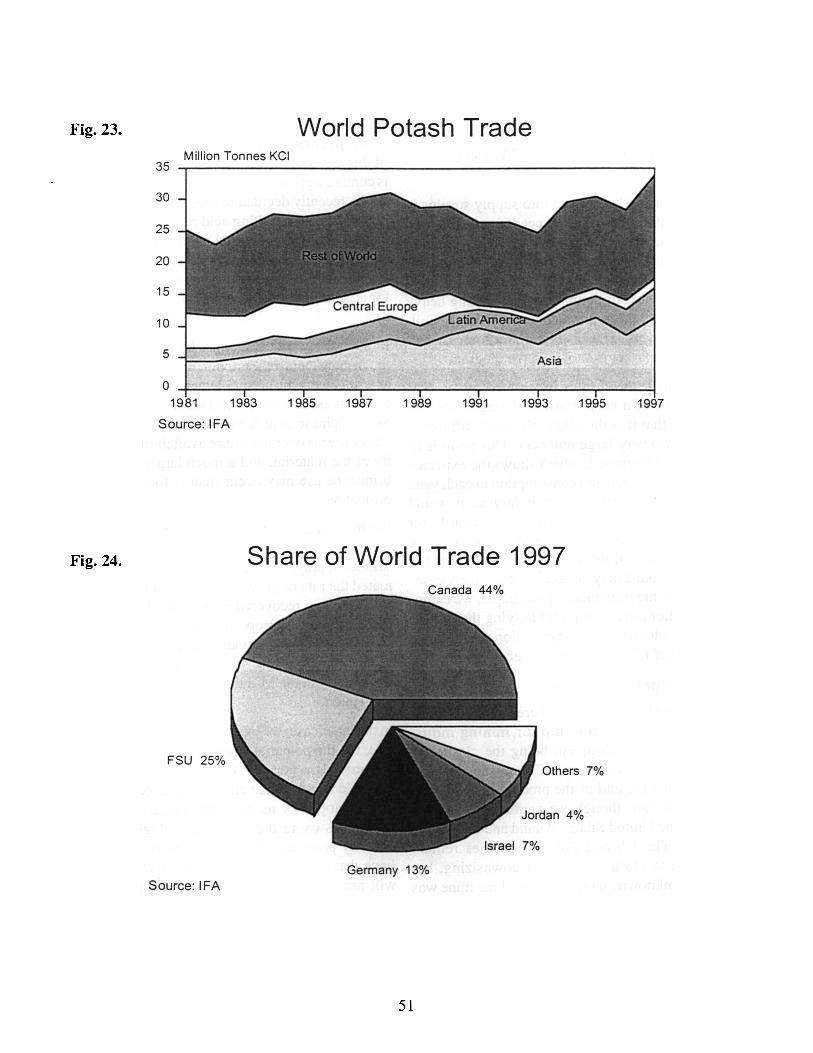
Fig. 23.
Fig. 24.
World Potash Trade Million Tonnes KCI
35 ~------------------------------------------~
30
25
20
15
10
5-i-~~~~~~
o 4-----~----~--~~--~----~----~----~--~
Source: IFA
FSU 25%
Source: IFA
Share of World Trade 1997
Germany 13%
51
Others 7%
Jordan 4%
Israel 7%
The Outlook for Sulphur Mike Kitto
eRU International Ltd
Introduction: The Global Market Outlook The sulphur market moved into supply surplus in 1992 and production has exceeded consumption in each year since. We do not expect this situation to change in the next five years: on the contrary, we foresee large-scale supply surpluses in the early years of the next millennium, necessitating heavy stockpiling by those producers who have the ability to build vats. The historical and forecast balance of the market is shown in the diagram 1.
In Diagram 1, the surplus in the forecast years is shown to be of a very substantial magnitude, but the fact is that it is the relatively small difference between two very large numbers. This point is illustrated in Diagram 2, which shows the expected levels of production and consumption in each year. Even in 2001, when the gap is largest, it would require a swing of only some 4% (upwards for consumption, downwards for production) to restore the market to equilibrium. The picture painted in Diagrams 1 and 2 may be taken as our "likely case" scenario. In the remainder of this paper, we examine the major uncertainties underlying the projections of production and consumption to assess the likelihood of different scenarios emerging.
The Production Outlook Over the last ten years or so, there has been a massive restructuring of the sulphur mining industry, the latest development being the closure of Freeport Sulphur's Culberson County mine in West Texas. Is that the end of the process? The answer is, probably not, though we continue to include output in the United States, Poland and Iraq in our forecasts. The US and Polish industries remain vulnerable to closure or further downsizing, but Iraq is an unknown quantity: the Mishraq mine was last in full production in the late 1980s, before the facts of life caught up with many other producers. Table 1 shows the effect on the balance of the re-
52
moval of projected mined sulphur production in these three countries.(See Table 1).
The other main component of voluntary production is pyrites. In most parts of the world, the use of this material has declined sharply and this trend is continuing: Fertiberia, the Spanish fertilizer producer, recently decided to close down its three remaining roasters, taking acid requirements from a new sulphur-burning plant and from the adjacent copper smelter. In China, though. some 6.4 million tonnes S of pyrites is used as the raw material for around 75% of acid production. (See Diagram 3).
In the last few years, though, China has imported much more elemental sulphur, which has been used as a replacement or supplement for pyrites. Our forecasts assume that pyrites will remain the dominant sulphuric acid feedstock, but there are serious concerns over the future availability and quality of the material, and a much larger increase in brimstone use may occur than is foreseen in our projections.
We may therefore have over-estimated the future contribution of voluntary production to all-forms sulphur supply, but we may also have under-estimated the rate of growth of involuntary production. As far as recovered elemental sulphur is concerned, the largest proportion of output comes from sour natural gas treatment plants, and we expect production from this source to continue to rise, particularly in the Middle East and the former Soviet Union.
In the latter case, we have erred on the side of caution, but the potential from a series of projects in and around the northern Caspian Sea is enormous. It should be noted that all of these projects are being developed by major international oil and gas companies using the latest technology and best industry practices, and there is no reason to believe that their very ambitious production targets will not be achieved, assuming a stable political context.
Recent years have seen a slow-down of the rate of growth of sulphur recovery at oil refineries, at least
in some regions, and this trend is likely to continue in the near term as less sour, heavy crude is processed. In the medium term, though, a combination of factors suggests that there will be a resumption of strong growth:
- • More sour crude will be produced, and a number of refiners, particularly in the US Gulf Coast, have entered into long-term contracts with suppliers in Mexico and Venezuela to process large volumes of heavy, high-sulphur crude.
• The sulphur limit in transportation fuels will be lowered further, and not just in the United States and Europe. Very recently, for example, the government of Thailand announced that the sulphur content of diesel must be cut from 0.25% to 0.05% by 1 January 1999.
• Demand for high sulphur fuel oil is declining as consumption of clean transportation fuels is rising. Mainly, but not exclusively, in Europe, the problem of disposing of heavy residues is resulting in the construction of more integrated gasification/combined-cycle (IGCC) plants, with a consequent large increase in the amount of sulphur recovered per barrel of crude processed.
Outside. the oil refining and gas processing sectors, sulphur recovery is on a relatively small scale, but there are plans for massive expansions of synthetic crude production from oil sands in Western Canada, which will undoubtedly see sulphur production rise sharply from the current level of about 700,000 t/y.
The other main component of involuntary production is the sulphuric acid which is produced at base metals smelters as a means of reducing sulphur dioxide emissions. In 1997, we estimate that smelters worldwide produced just over 34 million tonnes of acid, equivalent to more than 11 million tonnes of contained sulphur. This means that smelter acid now makes a significantly bigger contribution to all-forms sulphur production than either mined elemental sulphur or pyrites.
53
As the diagram below illustrates, the rapid growth of smelter acid production owes much more to the demand for improved sulphur capture than to increased demand for base metals: in Chile, production of blister copper rose by 27% from 1988 to 1997, but acid output recorded fivefold growth. The process is far from finished: even in Chile, where major steps have already been taken to improve the smelters' environmental performance, we expect incremental acid production at existing operations of around 2.5 million tJy over the next five years, and many other countries have much further to go in terms of their clean-up programmes. (See Diagram 4).
In summary, therefore, our forecasts of voluntary production (mined elemental sulphur and pyrites) may prove to be too high, and possibly by a considerable extent, but our projections of involuntary production (recovered elemental sulphur, smelter acid and a few other less important sources) could be significantly too low. On balance, we believe that it is more likely that we have overestimated voluntary output than that we have significantly under-estimated the rate of growth of involuntary production, so that our alternative scenario would show a lower level on the supply side of the equation.
The Consumption Outlook The recent combination of economic, political and even climatic turmoil in an ever-widening range of regions has made the work of the forecaster still more difficult than usual, particularly as some of the events which are currently unfolding may herald fundamental, structural change rather than just temporary upheavaL We can be fairly confident that the economies of South-East Asia will steadily recover, but what of Russia and the other countries of the former Soviet Union?
Russia is of particular importance. In 1986, the USSR imported 1.67 million tonnes of sulphur and exported only 20,000 tonnes. In 1995, Russia imported just 18,000 tonnes, while exports (to nonFSU countries) totalled 1.43 million tonnes. In the space of a decade, there was a swing in the balance of world trade of over 3 million tonnes. The
production potential of the former Soviet Union tion and electrowinning (leachlSX-EW). So far, has already been referred to, but what of the de- this has primarily provided an outlet for by-prodmand outlook? uct acid which would otherwise have had to be
It has to be said that in each of the last several years, we took the view that sulphur demand in the FSU had bottomed out and that a slow but steady recovery· was about to begin. Each time, though, what we took to be the light at the end of the tunnel proved to be the headlamps of the oncoming locomotive! When virtually every dollar which comes into the country is instantly whisked away to some offshore bank account, it is inevitable that the economy will eventually implode, and that is what appears to have happened now. Unattractive as the prospect may be, the only hope for an early revival of sulphur demand would be a return to a command economy, but those who hold the real power will strenuously oppose such a development.
China is a different matter, as the country has achieved much more sustainable economic reforms. As noted earlier, there is the potential for far greater use of elemental sulphur at the expense of pyrites, and the rate of brimstone demand growth may have been underestimated. When imports last rose steeply in the late 1970s and early 1980s, the authorities eventually intervened, both to protect the pyrites miners and because of the cost of subsidising the sulphur price, but circumstances are now very different. (See Diagram 5).
Turning from regional demand to demand by end use, the prospects for phosphate fertilizer consumption have been the subject of an earlier paper, but our own view is that we shall not in the medium term see a return to the rates of growth which were commonplace until the late 1980s. The phosphate fertilizer industry will continue to dominate overall sulphur demand, but it cannot be the suppliers' saviour. Similarly, some other sectors which were hard hit in the late 1980s and early 1990s have now resumed growth, but from a much lowered base and at a relatively modest rate.
The one area in which sulphuric acid use has increased really rapidly is the production of copper by means of leaching followed by solvent extrac-
54
offered on the open market, but there is currently great interest in the use of acid pressure-leaching to produce nickel and cobalt, a process technology which until now has been used only in Cuba.
Three such operations are being brought on stream in Western Australia this year. The two smaller ones - Cawse and Bulong - are using by-product smelter acid, but the large Murrin Murrin operation incorporates a 4,400 tid sulphur-burning sulphuric acid plant. When Cawse and Bulong are expanded, they will also have sulphur-burners, as will the many other large projects currently being developed, primarily because the process consumes huge amounts of energy and the possession of cogeneration facilities greatly improves the overall economics.
The list below shows just some of the nickel-cobalt pressure-leach projects which are now at various stages of development in Asia and Oceania. Acid consumption per tonne of nickel output varies according to the gangue mineralization, but the expected ratio at Murrin Murrin is 30 tonnes H2S04
per tonne of nickel, and this is not abnormally high. The projects in the list, which is not comprehensive, could therefore account for consumption of as much as 4.5 million tly of elemental sulphur. Some allowance for additional demand has been made in our forecasts, but not of this order of magnitude. (See Table 2).
No other individual end-use sector comes close to matching the potential of nickel-cobalt pressureleaching. We acknowledge the rising demand for sulphur-containing fertilizers, but the sulphur values in compound fertilizers are tending to come from by-product sulphuric acid and/or ammonium sulphate rather than from elemental sulphur. In future, changes in caprolactam technology may result in more semi-discretionary production of ammonium sulphate from other sources such as flue gas desulphurization, but we do not foresee really major increases in brimstone demand from this quarter.
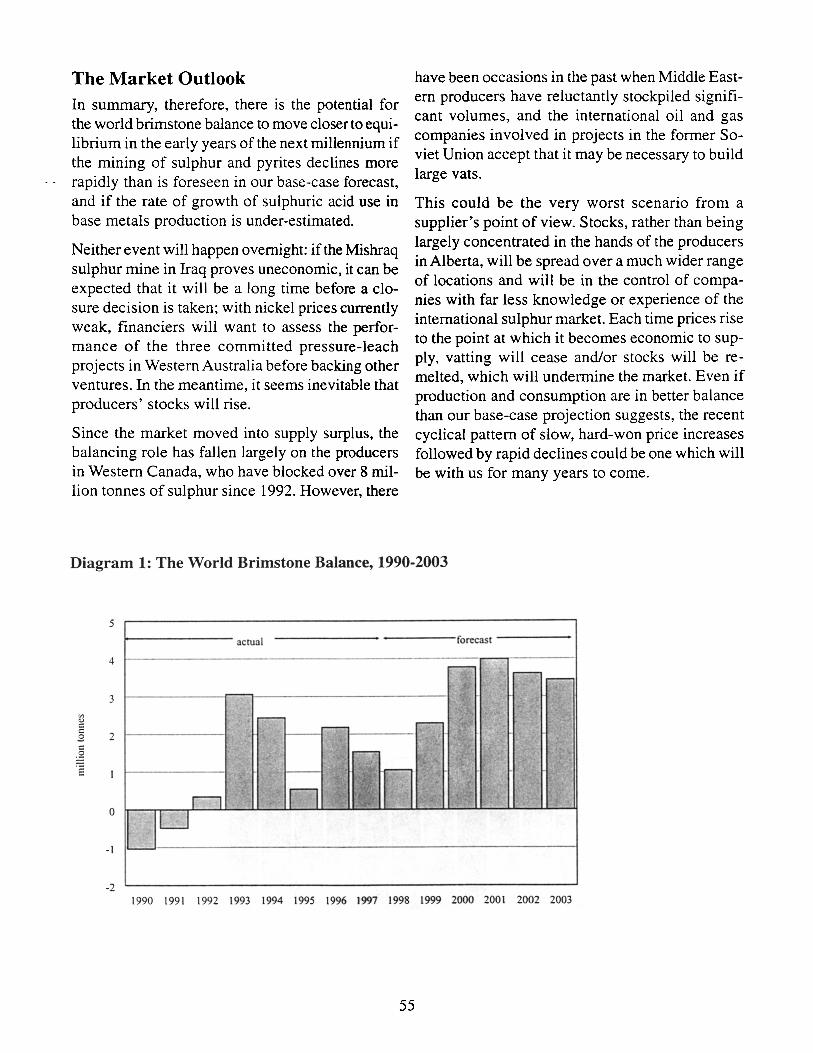
The Market Outlook In summary, therefore, there is the potential for the world brimstone balance to move closer to equilibrium in the early years of the next millennium if the mining of sulphur and pyrites declines more rapidly than is foreseen in our base-case forecast and if the rate of growth of sulphuric acid use i~ base metals production is under-estimated.
Neither event will happen overnight: if the Mishraq sulphur mine in Iraq proves uneconomic, it can be expected that it will be a long time before a closure decision is taken; with nickel prices currently weak, financiers will want to assess the performance of the three committed pressure-leach projects in Western Australia before backino other b
ventures. In the meantime, it seems inevitable that producers' stocks will rise.
Since the market moved into supply surplus, the balancing role has fallen largely on the producers in Western Canada, who have blocked over 8 million tonnes of sulphur since 1992. However, there
have been occasions in the past when Middle Eastern producers have reluctantly stockpiled significant volumes, and the international oil and gas companies involved in projects in the former Soviet Union accept that it may be necessary to build large vats.
This could be the very worst scenario from a supplier's point of view. Stocks, rather than being largely concentrated in the hands of the producers in Alberta, will be spread over a much wider range of locations and will be in the control of companies with far less knowledge or experience of the international sulphur market. Each time prices rise to the point at which it becomes economic to supply, vatting will cease and/or stocks will be remelted, which will undermine the market. Even if production and consumption are in better balance than our base-case projection suggests, the recent cyclical pattern of slow, hard-won price increases followed by rapid declines could be one which will be with us for many years to come.
Diagram 1: The World Brimstone Balance, 1990-2003
5
actual forecast
4 ~
.--- r--
3 -
'" .., §
2 .9 I: .2
r-- .---.----- -" 11
r-- I"
.§
0
I---
II ~ "I.
In " 1£
II ,'.
[LJ -I
-2 1990 1991 1992 1993 1994 1995 1996 1997 1998 1999 2000 2001 2002 2003
55
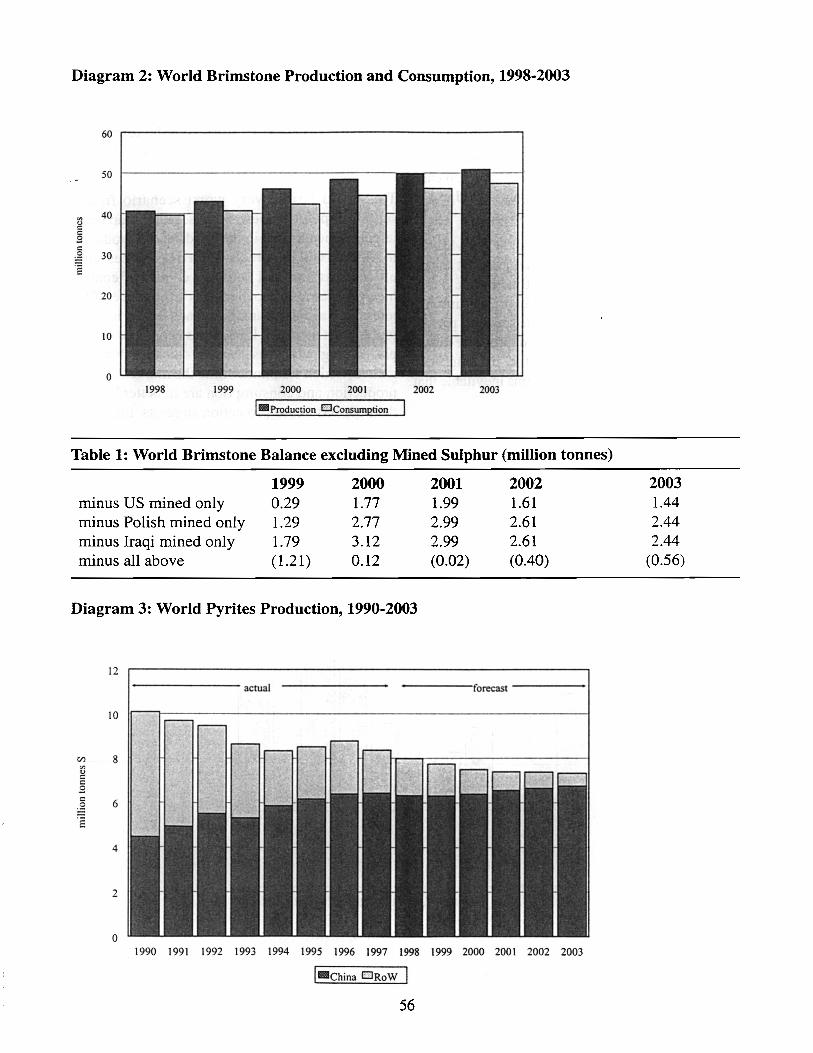
Diagram 2: World Brimstone Production and Consumption, 1998-2003
60
50
'" 40 '-' 2 .9
~ 30 .§
20
10
0 1998 1999 2000 2001 2002 2003
I-Production EJConsumption
Table 1: World Brimstone Balance excluding Mined Sulphur (million tonnes)
1999 2000 2001 2002 minus US mined only 0.29 1.77 1.99 1.61 minus Polish mined only 1.29 2.77 2.99 2.61 minus Iraqi mined only 1.79 3.12 2.99 2.61 minus all above ( 1.21) 0.12 (0.02) (0.40)
Diagram 3: World Pyrites Production, 1990-2003
12
actual forecast
10
CI) 8 on <J
§ .9 I: 6 .S! .§
4
2
o 1990 1991 1992 1993 1994 1995 1996 1997 1998 1999 2000 2001 2002 2003
I-China EJRoW I 56
2003 1.44 2.44 2.44
(0.56)
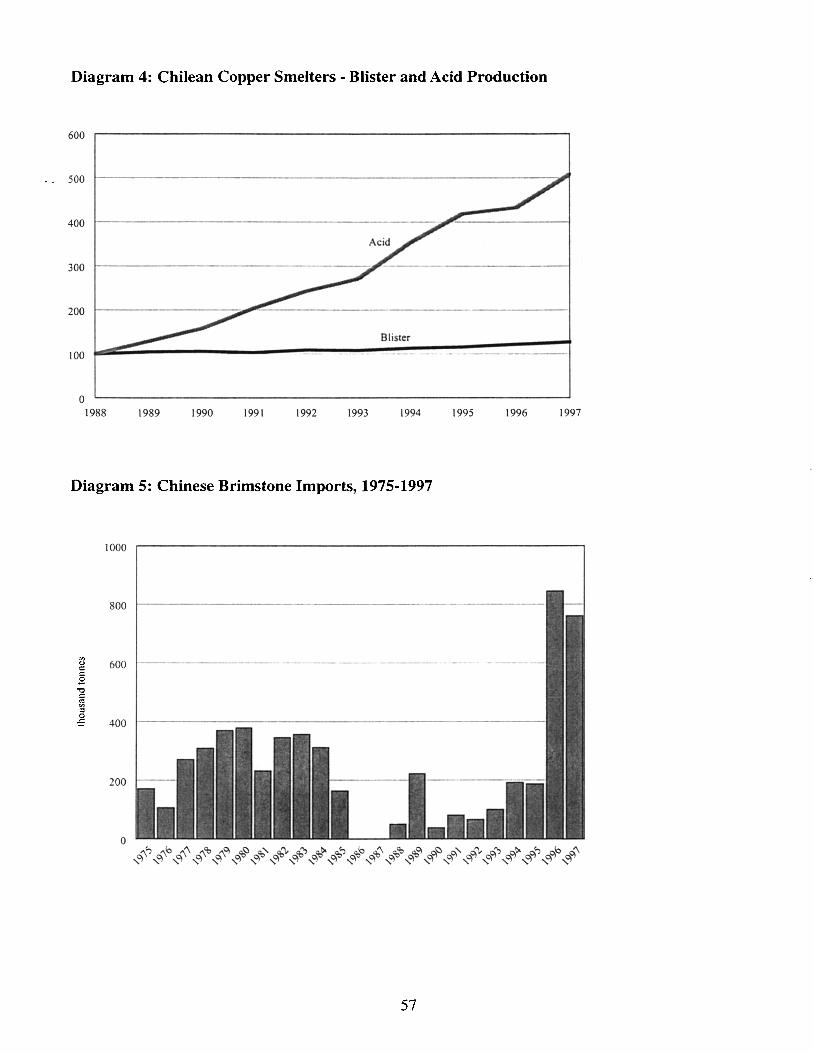
Diagram 4: Chilean Copper Smelters - Blister and Acid Production
600
- _ 500
400
300
200
100
a 1988 1989 1990 1991 1992 1993 1994 1995 1996 1997
Diagram 5: Chinese Brimstone Imports, 1975-1997
1000
800
'" <.> 600 c c E .", c '" '" g -5 400
200
a
57
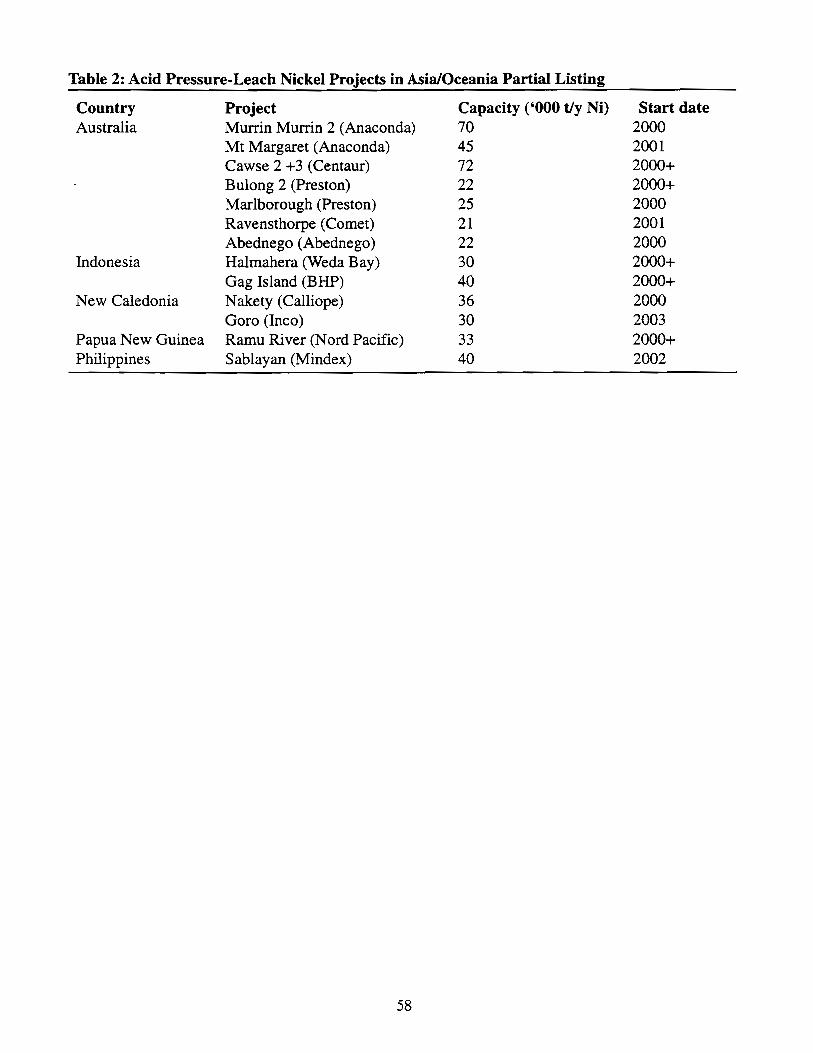
Table 2: Acid Pressure-Leach Nickel Projects in Asia/Oceania Partial Listing
Country Australia
Indonesia
New Caledonia
Papua New Guinea Philippines
Project Murrin Murrin 2 (Anaconda) Mt Margaret (Anaconda) Cawse 2 +3 (Centaur) Bulong 2 (Preston) Marlborough (Preston) Ravensthorpe (Comet) Abednego (Abednego) Halmahera (Weda Bay) Gag Island (BHP) Nakety (Calliope) Goro (Inco) Ramu River (Nord Pacific) Sablayan (Mindex)
58
Capacity ('000 tJy Ni) 70 45 72 22 25 21 22 30 40 36 30 33 40
Start date 2000 2001 2000+ 2000+ 2000 2001 2000 2000+ 2000+ 2000 2003 2000+ 2002
Monday, October 26, 1998
Session II Moderator:
Mike Barry
Environmental Compliance at the Retail Fertilizer Qutles
Michael Kenna IMC AgriBusiness
In the early to mid 1970's the environmental professional was an oddity. As recently as ten years ago full scale environmental compliance was something that, for the most part, was only found in large international corporations such as Dupont, General Motors and IBM. Although many of the environmental regulations that the fertilizer industry is faced with today were in effect ten years ago, it was unusual if not impossible to find even midsize and larger retail fertilizer organizations that had corporate environmental policies. Part of this phenomena is because historically agriculture has been largely exempt from certain Federal regulations, primarily those related to the environment and transportation. Today, environmental compliance is a fact of life for the long term survival and growth of any viable business. Lines between the traditional roles of health and safety, environmental, industrial hygiene and transportation are often blurred. Environmental managers are no longer expected to focus on environmental issues alone. Specific tasks and duties are now more related to overall risk management and incorporated into "Management Systems". Environmental, Health and Safety (EHS) professionals no longer work as separate entities attempting to guide top management of companies through the compliance maze. Instead, progressive corporations involve ail personnel in integrated risk management systems to ensure compliance, while achieving sustainable
growth in today's rapidly changing business culture. For example, the!MC AgriBusiness Environmental, Health and Safety (EHS) staff includes professionals that not only handle EHS issues, but also insurance, workers compensation, liability claims, department of transportation issues, technical services, engineering and construction activities. The (EHS) department at IMC AgriBusiness has grown from five persons in 1988 to a current staff of 31 full time employees.
A quick look at the volume of environmental regulations from Washington D. C. will paint a picture of the job at hand. United States Environmental Protection Agency (EPA) regulations, found in Title 40 of the Code of Federal Regulations (40CFR), consist of fifteen volumes with approximately 17,000 pages of text. There are over thirty separate environmental compliance subjects that directly affect the fertilizer industry. In comparison, the Department of Labor regulations under the Occupational Safety and Health Administration (OSHA) 29CFR, and the Federal Motor Carrier regulations under the Department ofTransportation (DOT) 49CFR are contained in about three volumes with approximately 2800 pages of text.
59
Several things complicate all of these regulations and make compliance even more difficult. Many of the agencies have regulations that address the same issues as other agencies, but the compliance requirements are not comparable. For example, terms relating to hazardous chemicals such as flammable, toxic and even hazardous may be defined and interpreted very differently by the EPA, OSHA and the DOT. There are examples when corporations are caught in the classic regulatory Catch-22
where separate governmental agency regulations concerning the same issue are contradictory. Finally, regulations are not static but constantly in flux with changes appearing in the Federal Register every day. It is no wonder that smaller retail
__ .c_ompanies and the so called "Mom and Pop" stores operate on the fringe of compliance, and more often than not are unaware of the regulations. Certainly it can be argued that this regulatory pressure, among other key factors, is playing a part in the overall consolidation that is occurring in the industry.
For those that have seen the future of the retail fertilizer business, and have the vision to plan for growth in the midst of these regulatory obstacles, Integrated Risk Management systems are as necessary as sales, production, accounting, credit and information systems.
Imagine a large corporation that purchases millions of dollars of equipment each year to be used at retail outlets in mUltiple states. One purchasing agent procures this equipment without knowledge or awareness of potential regulatory implications. Long after the equipment is delivered and in use, it is discovered that the noise level of the exhaust systems exceeds OSHA standards. When noise levels exceed OSHA limits in the work place, the employer must implement a hearing conservation program. One requirement of this program is to develop engineering controls to reduce the noise levels. In this example, the common corrective action is to retrofit the equipment with after-market mufflers costing significantly more than if the equipment had been delivered with factory mufflers. Each exposed employee must have a baseline hearing test and then be tested once per year at an average cost of$20 each. Periodic monitoring must be performed in the high noise areas at an average cost of $3000 per location every two years. In addition to these short term costs, OHSA considers hearing loss an illness. The National Safety Council has estimated that 1.7 million workers in the United States between the ages of 50 and 59 years old have compensable, noise-induced, hearing loss. Assuming that 10 percent of these workers file for compensation, at an average per claim cost of
60
$3000, the potential cost to industry could exceed $500 million. Finally, since any level of noise-induced hearing loss is permanent, the illness is progressive as long as the exposure continues. No cost can be placed on a person losing their sense of hearing. However, in this example, for a relatively inexpensive upgrade in the initial cost the company could have purchased equipment that met OSHA noise levels.
Consider a credit manager who is responsible for drafting lease agreements for company service centers where independents operate on company property. There are no provisions for holding the lessee responsible for environmental damage to the property. After five years of operation the company decides to sell the property and must supply data to the buyer to show the environmental condition of it. Contamination caused by the lessee results in remediation costs for the owner of $150,000. The company decides to close the operation and, as the value of the property declines, an asset becomes a liability.
These are two examples of how typical corporate structures may handle routine and seemingly mundane business decisions. In these examples there were unforeseen costs associated with health, safety and environmental regulations. With an integrated system, EHS professionals would be involved in a wide range of decision making processes such as these and other functions like information systems, capital and expense budgeting and human resources. All too often even separate EHS disciplines operate unilaterally. Health and safety, environmental, insurance and other related risk management functions work more effectively if under one management structure.
How can a company achieve the goal of regulatory compliance and remain competitive? First the commitment must be made from the bottom up. Typically top down mandates are doomed to failure, although senior management must give full support. First of all, the desire for compliance is usually already there. Average workers believe that it is the right thing to do, and most senior management personnel recognize that protecting employee health and the environment makes good business
sense, not only from the prospective of civil and criminal penalties, but from a public relations standpoint.
A company wide survey is a good place to start a strong compliance program. The survey must be
. geared toward establishing two things; where all employees believe the company is with respect to compliance at the present, and where the employees feel the company should be in terms of compliance after a given period of time. This approach involves everyone, and if conducted properly will foster the necessary buy-in at all levels of the corporation. The next step is to develop a corporate policy which incorporates the goals established by the survey. Staffing resources must be evaluated. Standards are written and serve as internal regulations or guidelines in achieving the goals of the policy. The next step is an audit process to identify and document non-compliance issues. Upper management must commit resources to correct the noncompliance issues. Finally, there must be extensive communication, training and follow up to ensure that compliance mistakes are not repeated.
A full discussion of the vast amount of environmental regulations that affect the fertilizer industry is beyond the scope of this paper, however there are a few key regulations that have the potential for significant financial impact on any company, regardless of size.
The Federal Motor Carrier regulations impact retail operations to a great extent. The paperwork burden that must be maintained under the regulations requires an enormous amount of time. IMC typically has 1000 drivers year round and 1500 during the spring and fall seasons. Each one of these employees must go through a specific hiring procedure which includes, training, random drug testing and complete records for drivers files. Four full time !MC employees maintain this compliance program and track this information. But what really makes it work is a strong commitment from the senior management and cooperation from the line management.
The Superfund Amendments and Reauthorization Act (SARA) or so called Community Right to
61
Know Act, includes certain notifications and annual reporting requirements. The retail fertilizer industry is heavily regulated by most of these SARA provisions. For example the notification requirement for releases of certain hazardous substances. Owners must make immediate notifications to federal, state and local authorities if spills exceed reportable quantities (RQ). The RQ for anhydrous ammonia is 100 pounds. Recently IMC was fined $27,000 for the release of approximately 4000 pounds of ammonia from a nurse wagon that was involved in an accident. The unit manager, employees and !MC emergency response personnel acted competently, assisting local authorities with the emergency. The notification was made once the equipment was safely transported back to the unit and inspected to accurately estimate the quantity of remaining ammonia, approximately six hours after the accident occurred. The EPA contended that it should have been apparent much sooner that the leak would exceed the RQ. In a separate incident involving equipment from a competitor, the fine was $13,500 for reporting two days late. Since 1989 the EPA, in region 5 alone, issued 139 complaints for ammonia release reporting violations, of which 123 cases were settled for a total of $3.8 million dollars in fines.
Under the Clean Air Act, locations that store 10,000 pounds or more of anhydrous ammonia will be required to comply with the Risk Management rules by spring of 1999. Locations must prepare risk management plans which detail what would happen in the event of a catastrophic release of ammonia from bulk storage containers. Plans must be made available to the general public. In addition to the plan, tank and plumbing systems must meet ANSI K61.1 standards. IMC has approximately 147 locations with bulk ammonia storage containers, with approximately 250 tanks. Compliance costs are estimated at $3000 per site for a total of $900,000.
The Comprehensive Environmental Response, Compensation and Liability Act, or Superfund, created a pool of money to help clean up hazardous waste sites in this country. It also established a chain of liability to allow the government to as-
sign responsibility for contamination and get money for the cleanup from the responsible party( s). The law also resulted in the so called "due diligence" regulations which makes the buyer of a property responsible for conducting investigations, so called environmental site assessments. These assessments must be performed with reasonable care to determine unknown environmental risks associated with a site prior to purchase. If reasonable care is not exercised, the new owner may be held liable for some or all of the contamination that was caused by a previous owner. In the wake of Superfund many other State regulations were promulgated addressing environmental contamination. Most notable of these were the laws regarding leaking underground storage tanks. These state regulations were specific to soil and groundwater contamination from petroleum products released from underground storage tanks. Many states now also have mechanisms to hold parties responsible for a wide range of media contamination other than petroleum products. In Illinois and Indiana a complete disclosure statement must be filed by the seller of a commercial property specifying any known contamination by hazardous substances. The definition of hazardous substances in these disclosures is sufficiently broad to include fertilizer. Georgia has a Hazardous Site Listing program which requires that land owners inform the state if they have reason to believe that any chemical from a list of over 1900 "hazardous substances" exceeds a reportable concentration in soil or groundwater. For example, discovery of soil ammonia concentrations greater than 500 parts per million (ppm) would trigger notification. The Minnesota Department of Agriculture (MDA) has a sophisticated and aggressive agricultural contamination clean up program for crop protection chemicals as well as fertilizer. This program includes a reimbursement fund for clean up activities, providing the activities are performed in accordance with MDA procedural rules. Many other states have either established similar programs or are in the process of doing so.
Minnesota is one of the few states that has established specific clean up goals for nitrogen and various crop protection chemicals. Although the clean
62
up goal concentrations are not enforceable standards, MDA uses the reimbursement program and their authority under state statutes as a "carrot and stick" program to force retail site owners to clean up their properties.
A review of several case studies will help to illustrate how the hazardous site regulations can impact retail fertilizer businesses. The charts in figures 1 and 2 show data collected from several retail fertilizer properties as part of prepurchase due diligence work. Site one was built and operated by a large southeastern company and sold to a local independent in Georgia. Although a site assessment was performed prior to the transaction, the buyers consultant did not identify significant contamination in soils around a 32 percent VreaAmmonium Nitrate (VAN) bulk storage tank. The soil ammonia concentrations at this site ranged from approximately 5000 ppm at the surface to about 1000 ppm at 20 feet below the ground surface (bgs). This contamination was discovered during a second site assessment conducted when the independent wanted to sell the operation several years later. The purchaser required the owner to disclose the contamination to the state prior to the transaction and place $100,000 in escrow to pay for clean up of the contamination.
The data for site two are summarized in figure 1. This business was located in the Midwest and prepurchase site work indicated significant historical soil contamination at the bulk rail unloading area for V AN. This facility was operated for decades without environmental controls. Shallow, perched groundwater was encountered during the investigation at approximately 11 feet bgs. The nitrate concentration in groundwater samples collected at this location were several orders of magnitude greater than the Federal Drinking Water Standard. Clean up costs for this site have been estimated at $85,000.
Analytical results from sites three and four are given in figure 2. Both facilities were operated by independents and had significant historical contamination at the dry fertilizer, blender loadout points. Site three was a small retail site that handled a significant amount of urea. Although the blender
was on a concrete pad, it was uncovered and stormwater caused spills to concentrate the contamination in soils along the edge of the pad under the loadout. Site four was a site that had been in operation since the turn of the century and had never handled liquid products. The contamination at this site extended to groundwater at approximately 20 feet bgs. Although the highest concentrations of nitrogen were found at the edge of the blender pad, a site characterization revealed that significant contamination existed under the concrete floor in the dry storage bUilding. The building was approximately 33,000 square feet with contamination ranging in depth from four to 16 feet under the slab. Approximately 10,000 tons of soil had elevated nitrate levels. It has been estimated that 30 percent of this soil was significantly contaminated requiring remediation at an estimated cost of $150,000. Site five was a former IMC facility in Wisconsin that underwent an intensive groundwater remediation program using pumpand-treat methods, in conjunction with source removal by minated soils. The system consisted of six recovery wells that pumped shallow groundwater through a granular activated carbon filtration (GAC) system. Effluent from the GAC unit was discharged into a lined holding pond and the water was finally spread on agricultural land at the recommended label rates. The system removed approximately 350,000 gallons of contaminated water from the recovery wells per year over a four year period. Figure 3 shows average decreases in the concentrations of key constituents detected in monitoring well samples, collected downgradient of the recovery wells, in the beginning of the project and at the end. Also shown are the total pounds of each constituent removed over the four year period. To date the costs for this project have exceeded $1.2 million. Approximately $400,000 has been approved by the state for reimbursement.
These few case studies illustrate conditions that are not uncommon at retail fertilizer operations throughout this country, particularly sites that have been in operation for 30 years or more. Data are available from many state agencies that have aggressive agricultural contamination clean up programs like Iowa, Wisconsin and Minnesota. In
63
1989, Minnesota passed the state Groundwater Protection Act which, among other things, instituted requirements for containment structures at bulk agrichemical storage facilities. The Act also provided for the Comprehensive Facility Cleanup Program which included the reimbursement fund, and expanded the Minnesota agrichemical pesticide control laws. In 1996 the MDA conducted a study to investigate historical contamination at 93 sites across the state. 1
In the study the MDA tested soil samples for chemicals that were registered prior to the state agrichemical containment program and several chemicals that were registered after 1989. The graph in figure 4 is a partial summary of this study. Note that of the 93 samples collected, 68 percent contained pesticides registered after the MDA containment regulations went into effect. Of those newly registered chemicals, 39 percent of the soil concentrations exceeded the MDA generic clean up goals.
Figure 5 shows the top five pesticides, with regard to soil concentrations, from the MDA study compared to the MDA generic clean up goals. Also included are the average concentrations of the same pesticides detected during approximately 30 different pre-acquistion site assessments conducted by IMC over the past five years in the Midwest.
It is important to note that of the 93 retail sites investigated by the MDA, there were some that had less contamination than others. The MDAconducted interviews of management
and employees at all test locations. Personnel at the "clean" sites identified basic good house-keeping practices as the reason for the low contamination. High on the list of "good practices" were cleaning up spills, even small ones, immediately. The management noted that making it as easy as possible for the employees to clean up spills and manage sweepings made a significant positive impact on house-keeping. As a point of reference, IMC spent approximately $7.0 million between 1990 and 1995 on bulk storage containment in Ohio. While these capital dollars will protect against contamination from catastrophic releases,
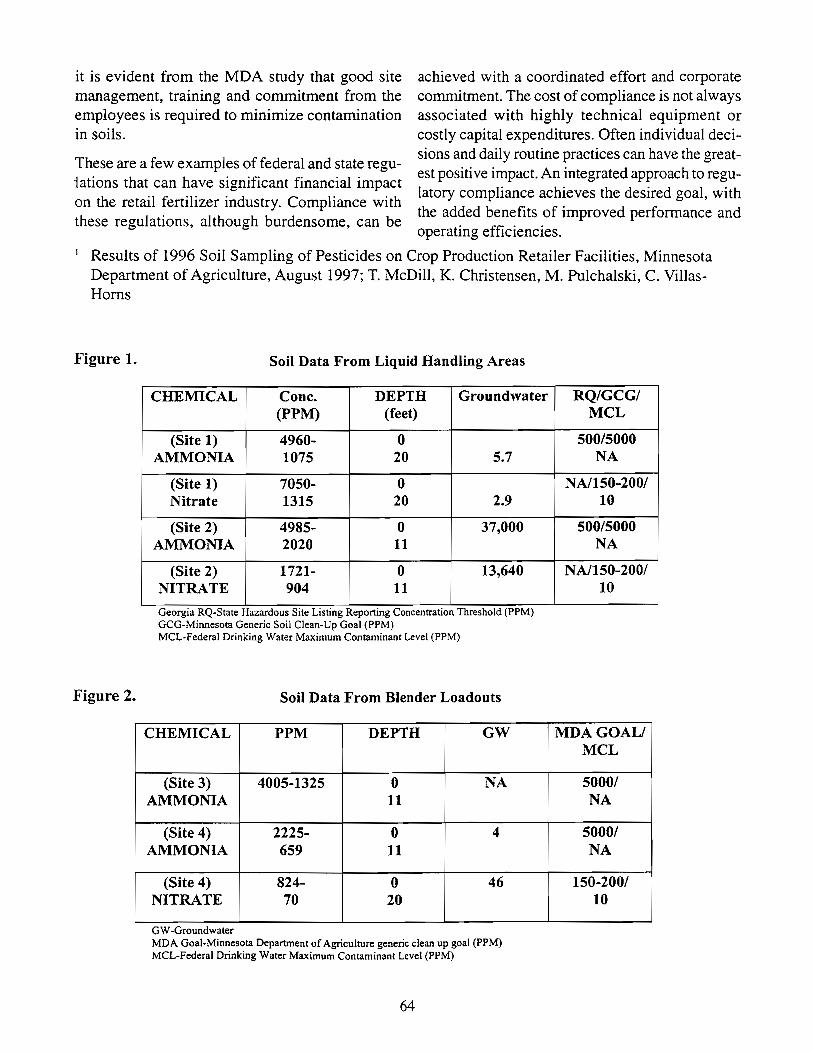
it is evident from the MDA study that good site management, training and commitment from the employees is required to minimize contamination in soils.
achieved with a coordinated effort and corporate commitment. The cost of compliance is not always associated with highly technical equipment or costly capital expenditures. Often individual decisions and daily routine practices can have the greatest positive impact. An integrated approach to regulatory compliance achieves the desired goal, with the added benefits of improved performance and operating efficiencies.
These are a few examples of federal and state reguiations that can have significant financial impact on the retail fertilizer industry. Compliance with these regulations, although burdensome, can be
I Results of 1996 Soil Sampling of Pesticides on Crop Production Retailer Facilities, Minnesota Department of Agriculture, August 1997; T. McDill, K. Christensen, M. Pulchaiski, C. ViUasHorns
Figure 1.
Figure 2.
Soil Data From Liquid Handling Areas
CHEMICAL Cone. DEPTH Groundwater RQ/GCGI (PPM) (feet)
(Site 1) 4960- 0 AMMONIA 1075 20 5.7
(Site 1) 7050- 0 Nitrate 1315 20 2.9
(Site 2) 4985- 0 37,000 AMMONIA 2020 11
(Site 2) 1721- 0 13,640 NITRATE 904 11
Georgla RQ-State Hazardous Slte Listing Reportmg Concentration Threshold (PPM) GCG-Minnesota Generic Soil Clean-Up Goal (PPM) MCL-Federal Drinking Water Maximum Contaminant Level (PPM)
Soil Data From Blender Loadouts
CHEMICAL PPM DEPTH GW
(Site 3) 4005-1325 0 NA AMMONIA 11
(Site 4) 2225- 0 4 AMMONIA 659 11
(Site 4) 824- 0 46 NITRATE 70 20
G W -Groundwater MDA Goal-Minnesota Department of Agriculture generic clean up goal (PPM) MCL·Federal Drinking Water Maximum Contaminant Level (PPM)
64
MCL
500/5000 NA
NAl150-2001 10
500/5000 NA
NAl150-2001 10
. MDAGOALI MCL
50001 NA
50001 NA
150-2001 10
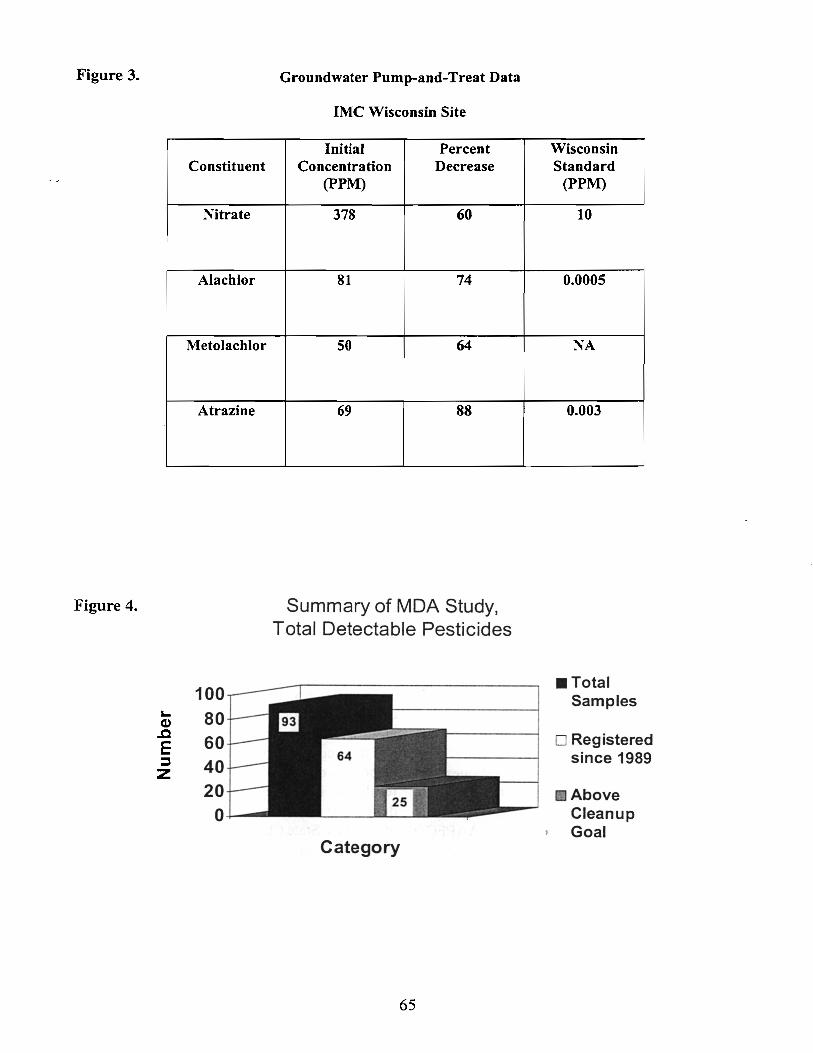
Figure 3.
Figure 4.
Constituent
Nitrate
Alachlor
Metolachlor
Atrazine
100 80 60 40 20
O+--
Groundwater Pump-and-Treat Data
IMe Wisconsin Site
Initial Percent Concentration Decrease
(PPM)
378 60
81 74
50 64
69 88
Summary of MDA Study, Total Detectable Pesticides
Category
65
Wisconsin Standard
(PPM)
10
0.0005
NA
0.003
• Total Samples
o Registered since 1989
Above Cleanup Goal
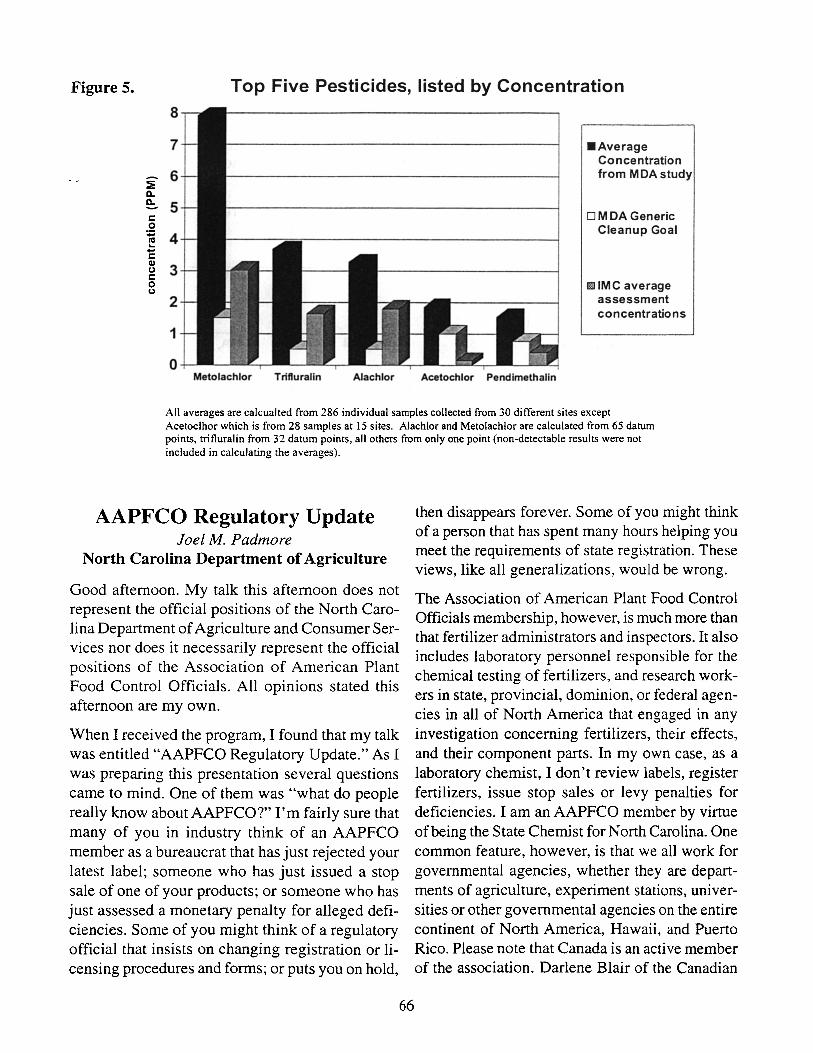
Figure 5. Top Five Pesticides, listed by Concentration 8
7
:!: 6
Il. e:. 5 c: 0 :;:; 4 III ... -c: Q)
3 u c: 0 u
2
1
0 Metolachlor Trifturalln Alachlor Acetochlor Pendimethalin
.Average Concentration from MDA study
OM DA Generic Cleanup Goal
riD IMC average assessment concentratio ns
All averages are calcualted from 286 individual samples collected from 30 different sites except Acetoclhor which is from 28 samples at IS sites. Alachlor and Metolachlor are calculated from 65 datum points, trifluralin from 32 datum points, all others from only one point (non-detectable results were not included in calculating the averages).
AAPFCO Regulatory Update Joel M. Padmore
North Carolina Department of Agriculture
Good afternoon. My talk this afternoon does not represent the official positions of the North Carolina Department of Agriculture and Consumer Services nor does it necessarily represent the official positions of the Association of American Plant Food Control Officials. All opinions stated this afternoon are my own.
When I received the program, I found that my talk was entitled "AAPFCO Regulatory Update." As I was preparing this presentation several questions came to mind. One of them was "what do people really know about AAPFCO?" I'm fairly sure that many of you in industry think of an AAPFCO member as a bureaucrat that has just rejected your latest label; someone who has just issued a stop sale of one of your products; or someone who has just assessed a monetary penalty for alleged deficiencies. Some of you might think of a regulatory official that insists on changing registration or licensing procedures and forms; or puts you on hold,
66
then disappears forever. Some of you might think of a person that has spent many hours helping you meet the requirements of state registration. These views, like all generalizations, would be wrong.
The Association of American Plant Food Control Officials membership, however, is much more than that fertilizer administrators and inspectors. It also includes laboratory personnel responsible for the chemical testing of fertilizers, and research workers in state, provincial, dominion, or federal agencies in all of North America that engaged in any investigation concerning fertilizers, their effects, and their component parts. In my own case, as a laboratory chemist, I don't review labels, register fertilizers, issue stop sales or levy penalties for deficiencies. I am an AAPFCO member by virtue of being the State Chemist for North Carolina. One common feature, however, is that we all work for governmental agencies, whether they are departments of agriculture, experiment stations, universities or other governmental agencies on the entire continent of North America, Hawaii, and Puerto Rico. Please note that Canada is an active member of the association. Darlene Blair of the Canadian
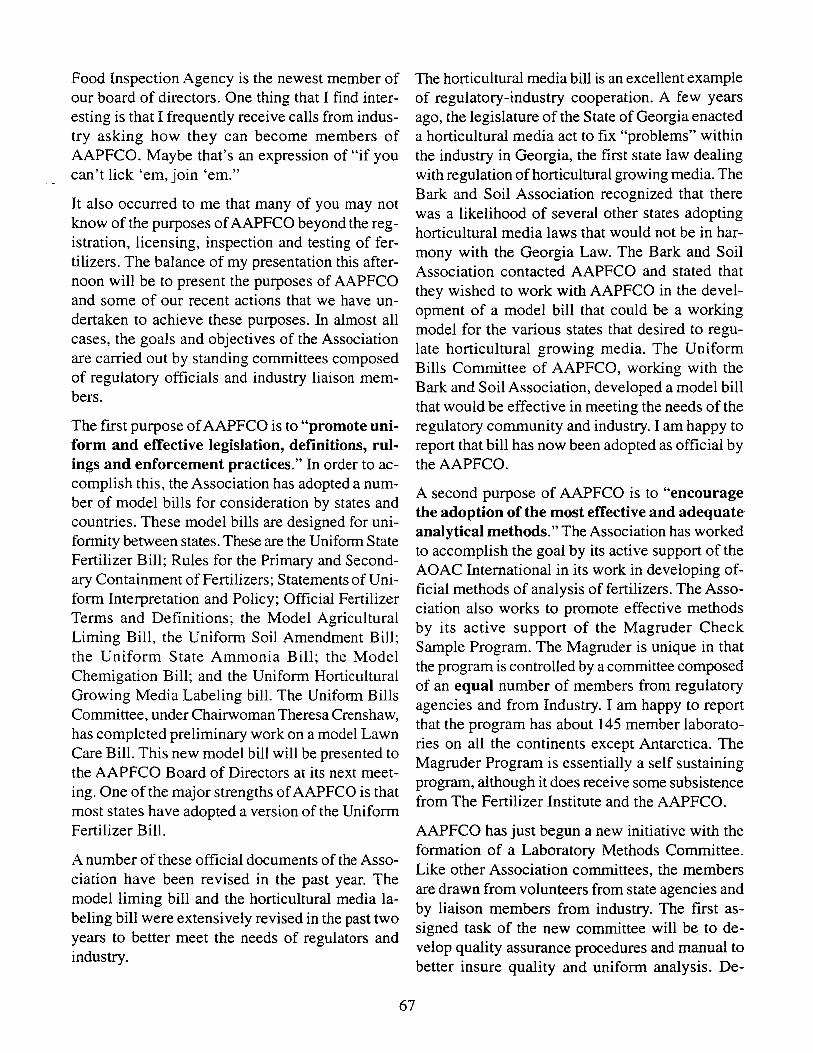
Food Inspection Agency is the newest member of our board of directors. One thing that I find interesting is that I frequently receive calls from industry asking how they can become members of AAPFCO. Maybe that's an expression of "if you can't lick 'em, join 'em."
It also occurred to me that many of you may not know of the purposes of AAPFCO beyond the registration. licensing, inspection and testing of fertilizers. The balance of my presentation this afternoon will be to present the purposes of AAPFCO and some of our recent actions that we have undertaken to achieve these purposes. In almost all cases, the goals and objectives of the Association are carried out by standing committees composed of regulatory officials and industry liaison members.
The first purpose of AAPFCO is to "promote uniform and effective legislation, definitions, rulings and enforcement practices." In order to accomplish this, the Association has adopted a number of model bills for consideration by states and countries. These model bills are designed for uniformity between states. These are the Uniform State Fertilizer Bill; Rules for the Primary and Secondary Containment of Fertilizers; Statements of Un iform Interpretation and Policy; Official Fertilizer Terms and Definitions; the Model Agricultural Liming Bill, the Uniform Soil Amendment Bill; the Uniform State Ammonia Bill; the Model Chemigation Bill; and the Uniform Horticultural Growing Media Labeling bill. The Uniform Bills Committee, under Chairwoman Theresa Crenshaw, has completed preliminary work on a model Lawn Care Bill. This new model bill will be presented to the AAPFCO Board of Directors at its next meeting. One of the major strengths of AAPFCO is that most states have adopted a version of the Uniform Fertilizer Bill.
A number of these official documents of the Association have been revised in the past year. The model liming bill and the horticultural media labeling bill were extensively revised in the past two years to better meet the needs of regulators and industry.
67
The horticultural media bill is an excellent example of regulatory-industry cooperation. A few years ago, the legislature of the State of Georgia enacted a horticultural media act to fix "problems" within the industry in Georgia, the first state law dealing with regulation of horticultural growing media. The Bark and Soil Association recognized that there was a likelihood of several other states adopting horticultural media laws that would not be in harmony with the Georgia Law. The Bark and Soil Association contacted AAPFCO and stated that they wished to work with AAPFCO in the de~elopment of a model bill that could be a workmg model for the various states that desired to regulate horticultural growing media. The Uniform Bills Committee of AAPFCO, working with the Bark and Soil Association, developed a model bill that would be effective in meeting the needs of the regulatory community and industry. I am ha~py to report that bill has now been adopted as offiCIal by theAAPFCO.
A second purpose of AAPFCO is to "encourage the adoption of the most effective and adequate analytical methods." The Association has worked to accomplish the goal by its active support of the AOAC International in its work in developing official methods of analysis of fertilizers. The Association also works to promote effective methods by its active support of the Magruder Check Sample Program. The Magruder is unique in that the program is controlled by a committee composed of an equal number of members from regulatory agencies and from Industry. I am happy to report that the program has about 145 member laboratories on all the continents except Antarctica. The Magruder Program is essentially a self sustaining program, although it does receive some subsistence from The Fertilizer Institute and the AAPFCO.
AAPFCO has just begun a new initiative with the formation of a Laboratory Methods Committee. Like other Association committees, the members are drawn from volunteers from state agencies and by liaison members from industry. The first assigned task of the new committee will be to develop quality assurance procedures and manual to better insure quality and uniform analysis. De-
signed for regularory labs, we hope it will be useful for both regulatory and industry laboratories. This committee will also be asked to determine what additional laboratory methods are needed for regulatory work and to assist in their validation. J~he committee will also be charged with periodically reviewing the performance of the various methods as reported in the Magruder program with reports on the observed bias and precision of related methods
Another purpose of the association is to "develop high standards of fertilizer inspection techniques." Much of this work is done by the Seminars Committee. The committee holds an Administrators Seminar each year to acquaint new, and veteran, control officials in the procedures and methods of fair and effective administration of fertilizer laws and regulations. The committee also conducts regional training seminars for inspectors in which they are instructed in the methods and techniques for inspecting and sampling fertilizers. By bringing together representatives of several different states and agencies, the exchange of new and improved ideas is greatly enhanced. The Inspectors Seminar subcommittee has completed a complete overhaul of the AAPFCO Inspectors manual. This manual will be available to member agencies and the fertilizer industry in the near future. The Sampling Task Force has recently completed their study of sampling procedures for minibulk bags.
One important function of the Association is to "promote adequate labeling and safe use of fertilizers." The Labeling Committee and the Official Terms and Definitions Committees have been merged into a single committee because of the close cooperation needed between the members of these committees and because they have been meeting jointly for several years. The Labeling and Terms committee has committed to the formation of a label review subcommittee to evaluate fertilizer labels for new and established fertilizer manufacturers and distributors. By cooperation with the industry in the development of new products, the committee hopes to head off problem labels before they printed and/or submitted to the various regulatory agencies.
68
Anyone that has ever attended an annual meeting, winter meeting, or a committee meeting knows that the association is meeting its purpose of providing "facilities and opportunities for the free exchange of information and cooperative study of problems confronting the association. Essentially all meetings of the Association are open to everyone, regulatory officials and industry members alike. I can remember only one or two occasions where the Association, its Board of Directors or Committees met in a closed session. I am sure that anyone that has ever attended a meeting of the Labeling and Terms committees will attest to the openness of the meetings in which each of the committee members and guests has ample opportunity to "speak their piece," sometimes several times. Even though such meetings involve widely divergent views of some very vocal proponents, we seem to be able to walk out of the meeting as friends and with respect for the other points of view.
AAPFCO is continually striving to "cooperate with members of industry in order to promote the usefulness and effectiveness of fertilizer products." The winter meeting is held conjointly with the Product Quality Committee of TFI. One highlight of the meeting each year is the joint session held on Wednesday morning where each organization shares their deliberations with the other. One of the most important areas of cooperation is the inclusion of Industry Liaison Members on each of the Associations standing committees. Most of the regulatory community recognizes that effective regulation requires the cooperation of the regulated community. This aspect of fertilizer control work is often misunderstood by the public and the press as "collusion." Once again attendance at a committee meeting debating a controversial proposal would, or should, convince them that such is not the case. A reporter, Duff Wilson of the Seattle times, asked me why we met with industry and had industry liaison members. As I recall, my answer to him was that it was better to settle our differences once in a committee meeting than to conduct the same debate many different times in the various states. I do know that he was somewhat surprised by the spirit of openness with which he was received at association meetings. At the very
least he has not published newspaper articles to the effect that fertilizer regulatory officials are in "cahoots" with the industry.
Lastly, an important purpose of the Association is "the protection of water and soil" Most of the public would look on this as a very worthwhile purpose but there are many critics within the environmental movement that believe that the Association is not doing enough or moving fast enough in this area. Unfortunately, emotion, hype and innuendo are more important than good scientific studies or data. The headlines about "toxic fertilizers," nutrient runoff, or groundwater contaminations grab the public's attention and raise a demand for action. Presentations of scientific data that refutes such headlines are usually printed on the back pages, if they are printed at alL These statements are not made to imply that such problems do not exist; major problems do exist in many of these areas. Only by the cooperation of all pa¢es, including the fertilizer industry and regulatory officials, will such problems be ameliorated and the quality and quantity of the food supply maintained within a healthy, vigorous environment.
I doubt whether many in this room have not heard of the series of newspaper articles by Duff Wilson that was published in the Seattle Times under the title "Fear in the Fields." These articles didn't bring sudden awareness; the Associations Environmental Committee was already considering the problem. The Labeling and Terms committee had a standing topic dealing with heavy metals. It did spur the association to a little faster movement. Faster than we would have liked and certainly faster than industry would have liked.
In my opinion, the questions raised by these articles have several aspects. These include safety of fertilizers, i.e., their toxicity to humans, plants and animals; accumulation of heavy metals in soil and migration to ground and surface water; uptake and accumulation heavy metals by plants; safety of the food supply; and public perception. Perhaps in today's climate the last one, public perception is the most important. Since all too often perception is taken as reality despite all evidence to the contrary, changing public perception of fertilizers
69
is the real problem. IF the public's perception cannot be changed, no amount of scientific evidence will win the day. We must present the facts to the public.
After the publication of the original articles and Duff Wilson's attendance at the AAPFCO Annual Meeting in Providence, Rhode Island in July 1997, heavy metals, possibly better categorized as nonnutritive metals, were suddenly a very important topic of discussion at the midwinter meeting in Long Beach in February 1997. At that meeting the labeling committee recommended to the Board of Directors that the Association move toward replacement of the optional "derived from" statement on fertilizer labels to an ingredient statement and requiring use directions on fertilizer labels. The Board of Directors adopted a policy of working toward including ingredient statements and use directions. The Board also adopted a policy of recommending to the state's consideration of the Canadian Standard for metals in fertilizer. The Board charged the By-products and Recycled Materials Subcommittee of the Associations Environmental: Committee to make a recommendation on stan-dards for heavy metals in fertilizers before the annual meeting in Bismarck, ND in August 1998. As a direct result of the furor, the state of Washington revised their fertilizer law and regulations to incorporate the Canadian Standard into the Washington Fertilizer Law, with modifications of the standard unique to Washington agriculture. In addition, the new Washington law required a labeling statement stating compliance with the Washington standard for heavy metals.
Prior to the annual meeting in Bismarck, questions were raised within the Association about authority to declare fertilizes with high levels of heavy metals as adulterated through the "harmful and deleterious" prohibition in the model fertilizer bill, particularly as there was no "standard" to use as a harmful or deleterious level of heavy metals. Each state would need to adopt an ad-hoc standard which would likely be unique to that state. The By-productslRecycled subcommittee submitted their report to the Board in which they recommended adoption of the Canadian Standard by the Association.
The board also received information that as many as six to eight states might be in the position of adopting heavy metal standards in their fertilizer laws. Such standards were very likely to be unique to the various states. In June and July the fertilizer administrators of several states ruled that the "Washington Statement" could not be used on fertilizer labels within their states.
As a direct consequence, heavy metals were a key topic in the Board of Director's meeting held during the Annual Meeting in Bismarck. David Fagan, representing the EPA, addressed the board and expressed EPA's opinion relative to heavy metals and recycled products in fertilizers. He made several points in his talk. The main points were:
1. EPA is compiling data on concentrations of heavy metals in fertilizers;
2. They are performing a limited risk assessment but not a complete assessment that would be needed to develop risk-based regulatory standards;
3. EPA believes the dimension of heavy metals in fertilizers is relatively small;
4. Based on EPA's preliminary assessment, the Canadian Standard is protective of human health and the environment;
5. EPA's existing regulations governing recycled wastes in fertilizers are somewhat inconsistent and EPA is going to start a regulatory effort under RCRA to establish a more consistent standard for the use of hazardous waste in fertilizers; and
6. EPA has authority to comprehensively regulate fertilizer contaminants under TSCA, but has no plans to do so, especially if the AAPFCO and states undertake to regulate them.
In a recent development, EPA is holding a stakeholder's meeting in Seattle, Washington on November 12 and 13 to obtain comments from the public, the industry and state regulatory officials concerning hazardous wastes and recycled materials in fertilizers.
70
The board, after prolonged and sometimes contentious discussion, voted to recommend to the Association membership the adoption of the Canadian standard by means of a new Statement of Uniform Interpretation and Policy, SUIP 25, which established the Canadian Standard as a temporary AAPFCO guideline for potential adulteration as defined in the Uniform Fertilizer Bill. Subsequent to the board action, the Labeling and Terms Committee developed another new Standard and Uniform Interpretation and Policy, SUIP 26. Product Labels that Meet Metal Guidelines. This statement reads as follows: .. Products that meet the guidelines for metals adopted may include the following statement on the label: 'When applied as directed, this product meets the guidelines for metals adopted by the Association of Plant Food Control Officials." Both actions were designed to head off individual states formulating non-uniform guidelines and labeling policies.
As you probably suspect or know, adoption of SUIP 25 stirred up a great deal of controversy within the fertilizer industry and within the Association. Because of the controversial nature of the recommendation, the board reconvened the evening prior to the annual meeting to further discuss SUIP. Several members of the industry were invited to present their opinions regarding the board's decision. After prolonged discussion, the board voted to present a modified version of SUIP 25 to the membership for a vote. The Association voted to adopt the new SUIP at the membership meeting the next morning. This SUIP reads as follows: SUIP 25. Metals in Fertilizers-As an interim guide for implementation of Section 12(a) of the Uniform State Fertilizer Bill, fertilizers are adulterated when they contain metals in greater amounts than the levels established by the Canadian Standard. Biosolids shall be adulterated when they exceed the levels of metals permitted by the United States Environmental Protection Agency Code of Federal Regulations, Section 503.
A very significant editorial note is attached to this SUIP which reads: "NOTE: these interim guidelines are intended for use until scientific risk-based standards are established by ongoing studies which are expected to be completed within two years."
There are several things about SUIP that deserve comment. It's main intent is to provide a basis for determining a standard of adulteration for section I2(a) of the Uniform Bill. This section states "No person will distribute an adulterated fertilizer product. A fertilizer product will be deemed to be adulterated: a) If it contains any deleterious or harmful substance in sufficient amount to render it injurious to beneficial plant life, animals, humans, aquatic life, soil or water when applied in accordance for use on the label; or, if adequate warning statements or directions for use which may be necessary to protect plant life, animals, humans, aquatic life, soil or water are not shown upon the label." It is important to note also that the Canadian Standard is referenced in an SUIP and not in the uniform bill. Referencing the standard in an SUIP puts the standard in the realm of an administrative regulation, which is much easier to change than a state fertilizer law.
Secondly, the purpose of the Association was not to convince any state to adopt the Canadian Standard within their state fertilizer law. However, if a state did adopt a standard, AAPFCO recommended adoption of the Canadian Standard rather than ad hoc standard of their own. Thirdly, by means of the attached note, the Association put its members on notice that the Canadian Standard was not a risk-based standard, and, in addition, risk-based standards were being developed. In addition, without a standard, SUIP 26 would have been moot.
The forty-eight states with fertilizer laws were surveyed to determine if the AAPFCO statement would be acceptable under their law and regulations. At this time forty-six state fertilizer administrators have responded; all have stated that the statement is allowable on labels in their states. Washington will accept the statement with the proviso that the Washington statement also appears on the label. I also need to point out that when SUIP is changed to reference a risk based standard, the label statement guaranteeing compliance with the AAPFCO guideline, SUIP 26, will not have to be changed.
Later in this meeting, we are to hear about TFI's risk-based assessment of heavy metals in fertiliz-
71
ers. This is a very important project not only for TFI and the fertilizer industry but for AAPFCO. We recognize that the Canadian Standard is an application rate based and that a risk -based standard is needed to effectively regulate heavy metals in fertilizers from the safety and human health aspects. I do have one caveat about this study, however. In a recent conversation with a couple of "radical" environmentalists, I referenced the riskbased studies that were underway, including the TFI sponsored study. Their reply was that no matter how objective and scientific the study,the TFI study was still sponsored by the fertilizer industry; and, therefore, in their viewpoint, was open to skepticism and challenge. With this type of attitude within parts of the environmental movement, we must be prepared to be challenged. Scientific data, in and of itself, will not change the perception of fertilizers in the minds of some sectors of the public. Such risk-based standards also will not answer the questions concerning the build up of heavy metals in soils or accumulation by plants, with subsequent consequences for human and animal health. I believe there is more than adequate data to put these other issues at risk, but we must bring the facts to public view.
Several states are taking action to regulate heavy metals in fertilizers. I will use Utah as an example as they are currently implementing new regulations to control fertilizers containing recycled materials. Utah has just implemented regulations requiring that registrants must identify fertilizers that are "Waste Derived Fertilizers" except for those fertilizers containing biosolids or biosolids products regulated under 40CFR503-the EPA's biosolids regulations. In addition, the registrant of fertilizers containing recycled materials must provide data on the levels of non-nutritive metals, which include, but are not limited to, arsenic, cadmium, mercury, lead and selenium, by means of a laboratory report or other documentation verifying the levels of non-nutritive metals. Distribution of waste-derived fertilizers not so identified by the registrant is subjected to a penalty of $5,000.
Regulation of fertilizers is also becoming an issue in portions of state governments that are not di-
rectly involved with the regulation of fertilizers, i.e., the various state's environmental agencies. Virginia, for example, is considering adopting legislation that would have a profound impact upon fertilizer labels. Such draft requirements have been
. Araf ted by the Division of Soil and Water Conservation of the Virginia Department of Conservation and Recreation. In Virginia's case, the Virginia Department of Agriculture is aware of the proposed draft legislation. In all too many other cases, the fertilizer regulatory agency learns of legislation affecting fertilizer and agriculture only when the bill is published in the legislative journal, the local newspaper, or contacted by an agriculturally related lobbyist. We must all be watchful of such "outside" legislation that would "balkanize" fertilizer regulation and control within the United States.
AAPFCO has another goal that is not explicitly stated in our by laws. That is the goal of promoting uniformity in laws, regulations and rules. Our actions are taken with this goal in mind. We actively promote the adoption of our model documents by the various states and governmental bodies; however, we, as regulators, have no control over the actions of the various legislative bodies. Whenever we knowingly seek a change in our fertilizer laws, we recognize that we might be opening the proverbial "can of worms" or "Pandora's Box." As an Association we greatly appreciate the assistance of the fertilizer industry in supporting our work.
Environmental Standards for Fertilizers: Polutants vs. Nutrients
Jane B. Forste Jane Forste Associates
Introduction
Increasing environmental sensitivity and concerns about food safety that have intensified in recent years have resulted in increased public scrutiny of materials used for food production. Long-standing concerns about pesticide applications have now expanded to the use of by-products such as
72
biosolids and animal manures, and more recently, manufactured fertilizer materials. Greater public awareness of environmental and food quality issues have led to a demand for "safer" or "greener" food in the national and international marketplace . The result is that a number of agricultural inputs that would not in the past have been considered contaminants with respect to having a potential adverse health effect, may now be suspect. Demand for stringent environmental requirements for materials used in producing food that is acceptable in the marketplace has intensified. The results of scientific risk assessment are not the sole criteria by which agricultural production inputs are judged in today's marketplace. This paper will provide examples of public and regulatory scrutiny of several agricultural inputs in recent years, as well as a discussion of some of the factors common to each case.
Agricultural Contaminants In the last decade, potential for soil contamination through agricultural practices has been identified as including contamination by fertilizers, animal manures and soil amendments such as limestone and gypsum. Concerns about these materials go well beyond the more long-standing concerns associated with industrial emissions and pesticides. As agricultural production has intensified, a greater focus on management practices that can potentially exacerbate the negative effects of even naturally occurring soil contaminants has also emerged. At the same time, the economics of managing byproducts (such as biosolids and manures) has spurred increased interest in developing means to allow continuing use of these materials in the context of good environmental stewardship. Unfortunately, these efforts are often hindered by negative publicity and lack of public understanding of what constitutes a real risk to the food supply and to the environment. While the issues can be extremely diverse with respect to the particular agricultural input being considered, a significant environmental regulatory emphasis has been placed on trace elements.
Metals in Fertilizer and Soil Amendments Since all metals are elements that are native to the environment and are present in all rocks, soils and plants, their presence is to be expected in virtually everything that is derived from or contains these components. Specifically, fertilizers derived from mineral deposits, as well as animal manures and biosolids, can all be expected to contain varying levels of metals. These metals can be viewed as benign or contaminants, depending upon the purpose for which the material is intended, the concentration of specific metals and how the materials are to be used. Evaluating the potential of these materials to contaminate soils requires an understanding of how both their nutrient and "pollutant" fractions behave in different agricultural settings. Improved understanding of the sources and nature of contaminants provides a rational basis for identifying real hazards and developing strategies to reduce the potential for problems related to soil contamination.
The following cases illustrate some of the controversy surrounding strategies to obtain maximum benefit from the nutrient supplying capacity of soil amendments while minimizing impacts from the inescapable "pollutant" components.
Pollutants in Fertilizers Phosphatic fertilizers are widely used throughout the world, and particularly in the United States, since P application to crops can result in significant yield increases. Cadmium is one of the main elements of environmental concern in P fertilizers and has been identified as such since the 1960's( 1). The concentration of cadmium in phosphate fertilizers depends upon the concentration in the parent rock and processing technologies used to manufacture the fertilizer product. These variabilities are illustrated in Table 1 "Cadmium and Zinc Concentrations in U.S. Phosphate Fertilizer Production" (adapted from Ref. 1). (See Table 1).
Concern expressed over cadmium accumulation in the food chain has not yet resulted in any national regulation in the United States of the cadmium content of inorganic fertilizer products. There has,
73
however, been increasing discussion and awareness of the presence of cadmium and other metals in such fertilizers and several European countries have already enacted or proposed limits on cadmium content of fertilizers.
More recently, media attention and public concern in the U.S. have focused on the common practice of using industrial by-products as a raw material for fertilizers. A July 1997 series of articles appeared in the Seattle Times entitled "Fear in the Fields: How Hazardous Wastes Become Fertilizer." There was no scientific evidence offered that the steel production by-product powder being used as a source of zinc in fertilizer blends was actually contributing to any crop yield or animal production problems. However, the seri~s highlighted a number of examples in which metal contaminants, low level radioactive waste and other "hazardous" materials were ending up in fertilizer products. One such example highlighted the use of waste from a phosphorus plant as a fertilizer. The newspaper noted that this waste contained cadmium and numerated the various negative human health effects that cadmium can cause. No conclusion was drawn that the material was unsafe to be used as a fertilizer, but the clear implication was that such wastes are potentially extremely dangerous if used as fertilizer. The article stated, "Just as there are no conclusive data to prove a danger, there are none to prove the safety of the practice." From a scientific standpoint, there is no such thing as proof of safety, but in an increasingly strident debate on environmental issues, the burden of proof is in many cases shifting from proof of gUilt to proof of innocence.
Subsequent to the Seattle Times series, a bill was introduced into the Washington State legislature to impose standards for metals in fertilizers sold in the state. A similar bill has also been introduced in the US Congress. The Washington State bill, which has now become law (2), imposes the standards contained in the US/Canadian Trade Agreement Memorandum of August 1996, as shown in Table 2, "Maximum Acceptable Metal Concentrations and Additions to Soil (Canada)".
The metal concentration standards in Table 2 are based on a "long-term" cumulative addition to soil,
which for the purposes of evaluating and labeling a particular product, means 45 years.
In Canada, as well as in the U.S., limits for metals in soils, biosolids, compost or other products that are land applied have been imposed for some time
crt the provincial and state levels. However, the new regulation applies to all fertilizer and soil amendment products. The State of Washington thus became the first state in the nation to impose comprehensive metals standards for fertilizers. As is the case in other states, Washington had not previously regulated the non-nutritive components in fertilizers. The Washington State Department of Ecology has noted that the adopted standards are not specifically linked to human health effects, and that health-based standards for fertilizer components have not been developed nor risk assessments been performed to date. (See Table 2).
The 503 Rule for Biosolids
eralleveL Individual states also impose regulations, which in some cases are either more restrictive and! or more specific and detailed than 503.
The input from the agricultural research community into the development of the 503 technical standards, and the risk assessment model which led to those standards, provide a model for future environmental regulations affecting agriculture. The 503 standards represent an unprecedented compilation of scientific data for a national rule. The cochair of the Scientific Peer Review Committee has noted that with the promulgation of 503 all the major questions posed 20 years earlier have been answered(3). The challenge for those who market biosolids products (and in the future, other agricultural inputs as well) is to convey the depth of understanding that such a risk assessment entails in order to overcome the general public theory that "any amount of a pollutant is bad". Table 3 contains the numeric standards for metals in the 503
As a direct result of the 1972 Clean Water Act, regulations. These metal limits were selected for wastewater treatment facilities throughout the regulation based on a broad preliminary screening United States have dramatically improved the qual- of hundreds of natural elements and man-made ity of the treated water which they discharge to compounds for their occurrence in biosolids and our nation's waterways. This improved treatment, their potential to adversely affect the food chain largely through the construction of biological treat- and human health. (See Table 3.) ment facilities, has resulted in large increases in solids production. Wastewater solids that meet the quality and stabilization or treatment criteria for recycling are referred to as biosolids and are often used as a fertilizer product or soil amendment.
Wastewater solids and biosolids are regulated at the federal level by the U.S. EPA's 40 CFR Part 503 regulations. These regulations were developed following decades of scientific research and using a risk-based pathway analysis for the pollutants of concern, specifically trace metals. It should be noted that during the last several decades of increasing solids generation, improved industrial pretreatment programs have also resulted in much higher quality (i.e., lower trace metal concentrations) in the nation's biosolids. In fact, the 503 regulations were a direct outcome of the environmental community'S concern that a potential loophole in the pretreatment program needed to be closed by regulating biosolids comprehensively at the fed-
74
A fourth column from 503, the APLR (Annual Pollutant Loading Rate) is not shown in Table 3. It became the basis for a legal challenge by the Natural Resources Defense Council (NRDC), which opposed the concept oflabeling as a means of controlling the use of a product. Revisions to 503 are expected to delete the APLR, which used labeling requirements to insure appropriate application rates for biosolids not meeting the PC limits shown in Table 3.
The PC limits contained in column 3 of Table 3 may be of particular interest to the fertilizer industry since these are the risk-based quality numbers which define a biosolids material that can be applied to land in amounts that are unlimited with respect to metals. This concept is based on the scientific data that established biosolids as a sink, as well as a source, for trace metals. The full range of inorganic constituents in biosolids is similar to the relative amounts of inorganic elements in most
topsoils. Thus, biosolids contain significant amounts of aluminum, iron, silica and other nonproblematic elements. Approximately 50 percent of biosolids' dry weight consists of those undecomposable minerals that will remain in the soil as binding sites for potentially polluting metals (e.g., cadmium). In addition, it has been noted that metal availability from biosolids application tends to level off or "plateau" after a relatively small number of applications of biosolids. Improved understanding of the mechanisms governing the availability of metals from biosolids provides some insight into how standards could be developed for other nutrient sources (e.g., fertilizers). The 503 biosolids regulatory development may offer a model for the fertilizer industry in responding to increasing pressure for environmentally based regulations. While the limiting numbers may not be directly applicable, the principles of evaluating data and developing risk models are essential to developing reasonable, scientifically defensible standards.
Nutrients as Pollutants? The 503 biosolids regulations tend to focus on treatment processes and pollutant concentrations in products, rather than the nutrient component of biosolids as a farm input, even for biosolids that are not eligible for marketing as a fertilizer product (Le., have not received treatment to eliminate pathogens). The "agronomic rate" management required by 503 simply states that application rates must be designed to minimize the amount of nitrate leaching to groundwater. Many states have developed more specific methods for calculating available nitrogen for biosolids and use this information to establish agronomic rates. To date however, no state has attempted to comprehensively regulate phosphorus additions to soil. That is about to change with legislation enacted by the 1998 Maryland General Assembly.
Maryland's Eastern Shore is part of the Delmarva Peninsula, which encompasses portions of Delaware, Maryland and Virginia. It is a primarily agricultural area, but increasing development in the region, especially on the mainland, has exacerbated the environmental pressures imposed on intensive
75
agricultural operations. A multi-state cooperative agreement seeks a 40% reduction in nitrogen and phosphorus loadings into the Bay.
In the summer of 1997, an outbreak of fish lesions accompanied by the death of approximately 30,000 menhaden occurred in Maryland's lower Eastern Shore. The fish kill was linked to infection by the Pfiesteria organism, one of whose life cycles can be toxic to fish. In addition, there was concern about possible human health effects, including memory loss, headaches, skin lesions, nausea and diarrhea. Scientific opinion holds that the toxic form of Pfiesteria results from the combination of nutrient enrichment with several other factors. This connection to non-point nutrient enrichment from agricultural operations (particularly manure from animal production) focused attention on Maryland's agricultural community and specifically on the poultry industry which predominates on the Delmarva Peninsula.
As the result of intense public reaction to the fish kill, inflamed by media coverage, and following a report from a Blue Ribbon Citizen's Pfiesteria Action Commission formed by Maryland's governor, agricultural inputs of phosphorus from poultry manure quickly became the focus of public attention and a subject of debate in the 1998 Maryland legislative session.
State legislators, representing both farming and environmental interests, introduced bills to curb nutrient losses in Maryland with the stated goal of preventing such occurrences as the 1997 Pfiesteria outbreak. Pressure from both environmental groups and the pOUltry industry, accompanied by media hype about the "toxic terror", made objective decision-making and response difficult to achieve. The prevailing opinion was that decreases in nutrient loading would improve water quality and most likely lower the risk of future Pfiesteria outbreaks, as well as other negative environment impacts. Despite limited scientific understanding of the various factors that trigger a toxic outbreak, the legislative debate centered on nutrient management plans to be implemented by the Maryland Department of Agriculture (MDA).
One of the many environmental protection measures implemented in Maryland in the last decade is a program of voluntary agricultural nutrient management. Nutrient management planning is seen as key to improving water quality in the
. ,Ghesapeake Bay region, particularly where poultry production operations have become a very important economic component of agriculture (the Eastern Shore). In the last decade, nearly threequarters of the farmers in Maryland, including those on the Delmarva Peninsula, have voluntarily begun nutrient management plans (NMP's) under a program administered by MDA.
Biosolids are already subject to comprehensive and detailed state requirements when used as a nutrient source in Maryland agriculture. The Mary land Department of Environment's (MDE) regulatory program for biosolids is one of the most complex and detailed in the United States. Nitrogen-based NMP's are required for every field that receives biosolids. These plans are prepared by specialists certified under the MDA program and must be updated annually. In contrast to the current voluntary nutrient management program for agriculture, the MDE biosolids program mandates and enforces the identification, implementation and reporting of nutrient management practices for all fields receiving biosolids.
One of the most contentious requirements of the 1998 law became the implementation of phosphorus-based nutrient management planning. Phosphorus reactions in soil systems, particularly from an environmental perspective, have not been defined well enough to enable scientists or regulators to accurately set appropriate environmental limits for phosphorus additions to soils. A number of relatively straightforward calculations are available to determine amounts of plant-available-nitrogen (PA.t~) contained in a given organic nutrient source. Estimating potential phosphorus impacts is more difficult from both an agronomic and environmental perspective. Phosphorus tends to become bound in soils, and is not subject to such losses as volatilization. Unlike nitrogen, the agronomic (crop demand) need for phosphorus is not a reliable or valid method for detennining environmental impacts of greater applications of phosphorus.
76
However, addressing complex phosphorus chemistry in soils is far beyond the usual scope of most legislative initiatives and this case was no exception. The 1998 Water Quality Improvement Act establishes deadlines for implementing both nitrogen and phosphorus-based nutrient management plans throughout the state (see Table 4 "Deadlines for N-and P-Based Nutrient Management Plans as per Maryland's 1988 Water Quality Improvement Act"). The legislation (and the resultant regulations) also include the following:
• nutrient management consultant certification requirements,
• cost share funding for the development of nutrient management plans,
• funding for new animal manure technology development, and
• cost-share funding for transport of animal manure from one area to another to avoid nutrient over-enrichment.
(See Table 4).
The need to establish technical standards for environmental management of phosphorus was a sensitive issue for both biosolids and animals manures, since the University of Maryland's soil test (agronomic) recommendations for phosphorus are currently based more on economic considerations (i.e., whether phosphorus is needed to achieve crop yields) rather than on potential environmental degradation. The composition of organic nutrient sources, such as manures and biosolids, is such that they typically contain excessive levels of phosphorus as compared to nitrogen with respect to crop uptake (agronomic rates). This disparity means that either too little nitrogen or too much phosphorus will be applied if rates are limited strictly by crop uptake.
Historically, even excess phosphorus was viewed as relatively unavailable due to binding mechanisms in soil systems that immobilize phosphorus and preclude transport to water bodies, except through particle movement (erosion). Many soil scientists have now adopted the view that preventing soil erosion alone may not be sufficient to pre-
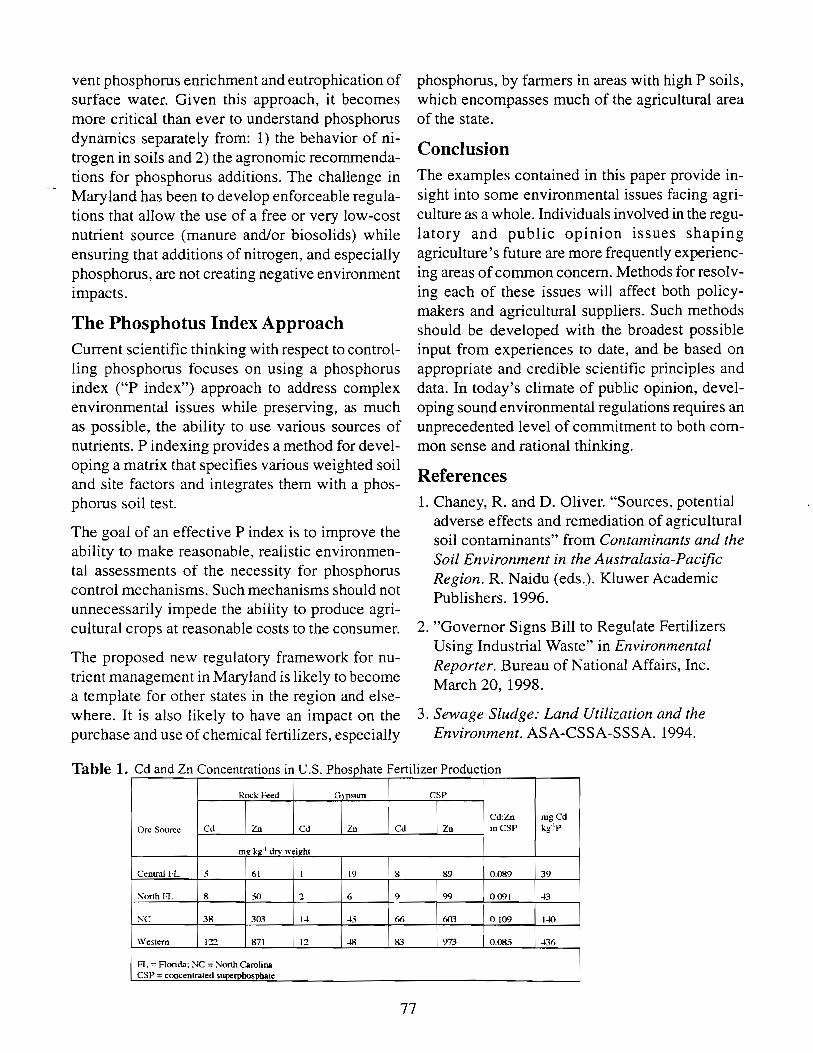
vent phosphorus enrichment and eutrophication of surface water. Given this approach, it becomes more critical than ever to understand phosphorus dynamics separately from: 1) the behavior of nitrogen in soils and 2) the agronomic recommendations for phosphorus additions. The challenge in Maryland has been to develop enforceable regulations that allow the use of a free or very low-cost nutrient source (manure and/or biosolids) while ensuring that additions of nitrogen, and especially phosphorus, are not creating negative environment impacts.
The Phosphotus Index Approach Current scientific thinking with respect to controlling phosphorus focuses on using a phosphorus index ("P index") approach to address complex environmental issues while preserving, as much as possible, the ability to use various sources of nutrients. P indexing provides a method for developing a matrix that specifies various weighted soil and site factors and integrates them with a phosphorus soil test.
The goal of an effective P index is to improve the ability to make reasonable, realistic environmental assessments of the necessity for phosphorus control mechanisms. Such mechanisms should not unnecessarily impede the ability to produce agricultural crops at reasonable costs to the consumer.
The proposed new regulatory framework for nutrient management in Maryland is likely to become a template for other states in the region and elsewhere. It is also likely to have an impact on the purchase and use of chemical fertilizers, especially
phosphorus, by farmers in areas with high P soils, which encompasses much of the agricultural area of the state.
Conclusion The examples contained in this paper provide insight into some environmental issues facing agriculture as a whole. Individuals involved in the regulatory and public opinion issues shaping agriculture'S future are more frequently experiencing areas of common concern. Methods for resolving each of these issues will affect both policymakers and agricultural suppliers. Such methods should be developed with the broadest possible input from experiences to date, and be based on appropriate and credible scientific principles and data. In today's climate of public opinion, developing sound environmental regulations requires an unprecedented level of commitment to both common sense and rational thinking.
References 1. Chaney, R. and D. Oliver. "Sources, potential
adverse effects and remediation of agricultural soil contaminants" from Contaminants and the Soil Environment in the Australasia-Pacific Region. R. Naidu (eds.). KJuwer Academic Publishers. 1996.
2. "Governor Signs Bill to Regulate Fertilizers Using Industrial Waste" in Environmental Reporter. Bureau of National Affairs, Inc. March 20, 1998.
3. Sewage Sludge: Land Utilization and the Environment. ASA-CSSA-SSSA. 1994.
Table 1. Cd and Zn Concentrations in U.S. Phosphate Fertilizer Production i
I Rock Feed (hrlSlun CSP
i Cd:Zn mgCd
I Orc Sourcc Cd Zn Cd Zn Cd Zn inCSP kg'lp
IDi! klr' drv woil/hr I
I Central FL 5 ; 61 1 19 8 89 0.~9 39
i ~()nh R. 8 50 2 6 9 99 OJl91 43 i
:-.:C 311 303 14 -15 66 603 0.109 j..j() I i
Wesrem 122 871 12 -18 !G 973 0.085 436
FL = Ronda; :-.Ie = >lonh Carolina I CS P = concentrared suvc:rohosobale
77
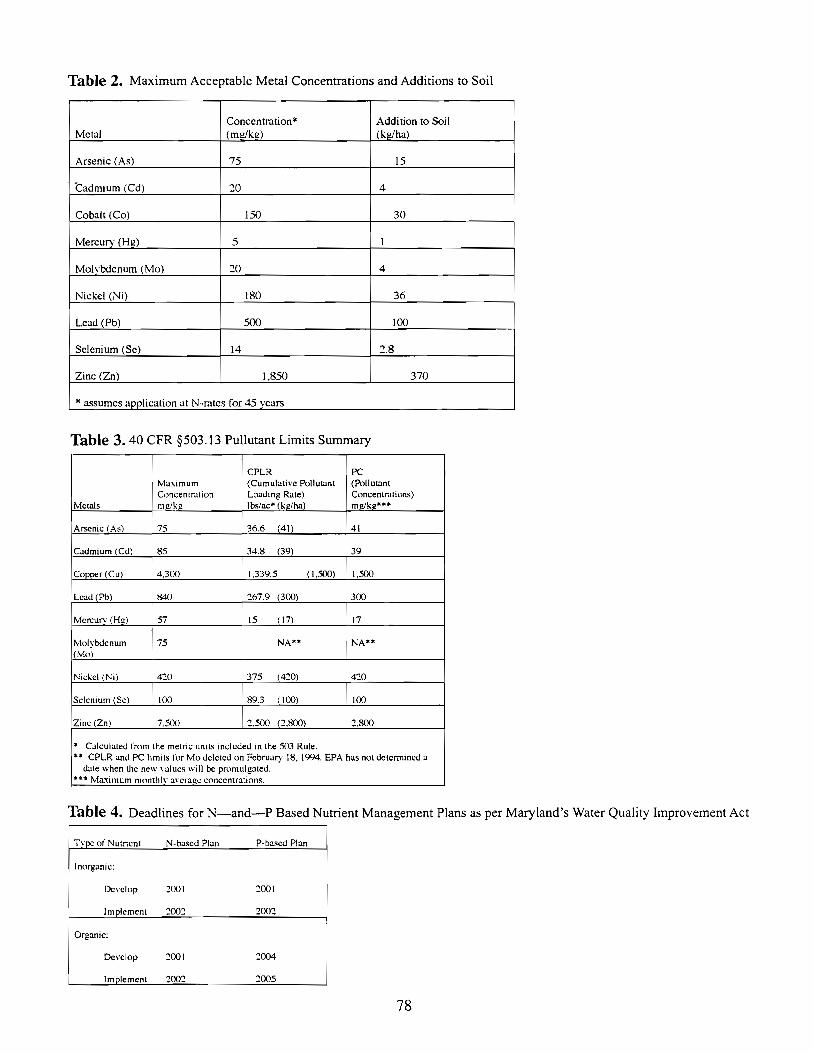
Table 2. Maximum Acceptable Metal Concentrations and Additions to Soil
i !
Concentration* Addition to Soil , Metal (ml!ikg) (kg/hal
Arsenic (As) 75 IS
Cadmium (Cd) :;0 4
i Cobalt (Co) ISO 30 I
i Mercuf\' (Hg) 5 I i
, Molvbdenum (Mo) :;0 4 I
Nickel (Ni) 180 36
Lead (Pb) 500 100
i Selenium (Se) 14 2.8
Zinc (Zn) 1,850 370
" assumes application at N·mtes for 45 vcars
Table 3.40 CFR §503.l3 Pullutant Limits Summary
CPLR PC Maximum (Cumulative Pollutant (Pollutant Concentr.uion Loading Rate) Concentmtions)
Metals ma/k~ Ibslac· (k2iha) m2ikg*'"
,Arsenic (As) 75 36.6 (41) 41
jCaumium(Cu) , 85 34.8 (39) , 39
I C"pper (Cu) 4.300 1.339.5 (1,500) 1.500
,Lcud(Pb) 1840 , '167.9 (300) 1300
Mercurv (Hg) 57 15 (17) 17
Mol"bUenum 75 NA*' i
NAU I(Moi
Nickel (Ni) 4'10 375 (420) 420 I
;Sclcnium (Scl 100 89.3 (100) 100
IZinC(Znl 7.500 2.500 (2.800) ,2.800
," Calculated from the metric un.t, included in the 503 Rule. r* CPLR and PC limits for Modcletcd on February 18. 1994. EPA has not determined a <.late when the new values will be promulgated.
*"* Maximum monthlY average concentrations.
Table 4. Deadlines for N-and-P Based Nutrient Management Plans as per Maryland's Water Quality Improvement Act
Type of Nutrient N-bascd Plan P-based Plan
Inorganic:
Develop ::001 '1CXll
Implcment 2002 :!oo:!
Organic;
Devclop '1001 2004
Implement '100'1 2005
78
Nutrient Runoff and the Chesapeake - Maryland Regulations
Louise Lawrence Maryland Department of Agriculture
Introduction The Maryland General Assembly passed the Water Quality Improvement Act during the closing hours of the 1998 legislative session. Some have described it as the most comprehensive agricultural nutrient control legislation in the country. Others have described it less kindly. Whatever your viewpoint, it introduces a major philosophy change to the voluntary agricultural water quality programs which have been delivered during the first 12 years of Maryland's Chesapeake Bay clean up effort.
I will briefly outline Maryland's traditional approach to agricultural water quality programs. describe the events that were the impetus behind the new nutrient management legislation and then summarize the components of the law, commenting on the current status of regulations to implement it.
Background The Chesapeake Bay Program was initiated in Maryland by a set of initiatives that recognized that "we are all part of the problem and must therefore all be part of the solution." The program's overall goal is to reduce nutrients entering the Bay by 40% by the year 2000. Agriculture, making up the largest land use, was identified as contributing 50-60% of the nutrients. The original agricultural initiatives utilized existing delivery systems to promote and provide technical assistance for implementation of best management practices that would control soil erosion and protect water quality. Program delivery was based on five elements:
1. Outreach and Education
Working with farmers "one on one" or in small groups was viewed as the best way to provide them the information needed to make the right decisions about natural resource management. The concept is to provide adequate information so people have a more complete understanding of pollution concerns and the options for addressing them.
2. Technical Assistance
Management solutions should be tailored to site specific conditions and the individual agricultural operator's management goals. Farmers need technical assistance to design and implement these solutions known as best management practices (BMPs).
3. Financial Assistance
Best management practices that address existing or potential pollution problems often provide either no direct economic return to the farm operation or one that carries such a long-term payback that it becomes difficult to justify in a strictly business context. Cost-share provides the incentive a farmer needs to encourage implementation of these practices.
4. Research
Research assures that new technologies are tested and demonstrated, BMPs are proven to work as expected and questions about how to best solve a problem both from the cost-effectiveness and resource management points of view are answered.
5. Enforcement
If a person has a pollution problem on their farm operation and despite the offer of technical and financial assistance to solve this problem, does not address it, then legal measures should be taken to require correction.
In 1989 Mary land determined additional measures were needed to address the management of nitrogen on farms. It was thought that the soil conservation and water quality best management practices predominantly addressed phosphorus by controlling movement of soil to which the phosphorus adhered. Although the program also emphasized the storage of animal manure, its management as a fertilizer was given less attention. The Nutrient Management Program was developed and resources provided to Cooperative Extension Service to conduct outreach and deliver technical assistance to farmers on the management of nutrient sources in crop production. The focus was to assure proper management of nitrogen in a crop pro-
79
duction system and nutrient management plans used nitrogen as the limiting factor.
In 1992 Maryland's Chesapeake Bay program established a goal of getting nutrient management plans in place on 60% or 1.2 million acres of agri--cultural land by the year 2000. Given public sector staffing and associated costs with its expan-sion to meet this level of program delivery, success seemed unlikely. To address the gap in technical assistance the Maryland Department of Agriculture worked with the private sector, cooperating agencies and environmental groups to develop a certification and licensing program to bring private sector providers of nutrient management services under the program's umbrella.
In 1997 over 400 individuals were certified Nutrient Management Consultants. Approximately 70 private sector consultants were active in the development of nutrient management plans and reported progress in meeting the state's goal. Maryland Cooperative Extension 21 full time consultants continued to provide assistance to farmers. Cumulatively, approximately 1 million acres had been reported to have nutrient management plans by public and private sector between 1989 and 1997.
Setting In the spring and summer of 1997 the micro-organism Pfiesteria caused fish kills in three waterways in Maryland. Outbreaks occurred in Eastern Shore tributaries where the landscape was dominated by agriculture, forestry and wetlands. Poultry and grain production are the main agricultural industries in the area.
In September the Governor appointed the Citizens' Pfiesteria Action Commission to recommend policy actions to prevent further Pfiesteria outbreaks. Throughout the proceedings the consensus presented by scientists was that concentrations of nutrients could be linked to the occurrence of Pfiesteria populations. Additionally, agricultural experts presented preliminary findings that phosphorus, when at high concentrations in the soil, can go into solution and move in its dissolved state potentially threatening water quality. The equation
80
was completed when the intensity of poultry production on the eastern shore and the use of nitrogen-based plans to manage poultry litter as a crop nutrient were factored in. As a result, the need for nutrient management plans using phosphorus as a limiting factor was highlighted in the Commission's recommendations.
The Governor submitted the Water Quality Improvement Act of 1998 to the Senate in January, largely following the recommendations of the Commission. The most controversial element was the requirement that nutrient management plans be on all farms based on nitrogen as the limiting factor by 2000 and based on phosphorus by 2002. A countermeasure, the Nutrient Management Improvement Act of 1998, was introduced in the House by rural legislators. This bill initially kept the program voluntary with a goal of achieving plans for 80% of farms by 2005. Both bills were amended, passed in their respective houses of origin and then went to conference committee where the debate continued until the last day of session when a further amended Water Quality Improvement Act of 1998 was approved.
The Water Quality Improvement Act of 1998 The bill contains a number of regulatory elements, financial incentive programs, research funding and support for technology development. They are summarized briefly below.
REGULATORY ELEMENTS
Mandatory Nutrient Management Plans Any agricultural operation with more than $2500 gross annual income or eight animal units (equivalent of 1000 pounds live weight) must develop and implement a nutrient management plan in accordance with a series of deadlines. Under this law agricultural operations include traditional animal and crop production operations as well as nurseries, green houses, turf grass producers, vegetable growers, organic farms and some horse farms.
Deadlines:
The following deadlines apply for the development of nutrient management plans which must be submitted to the Maryland Department of Agriculture:
1. By December 31, 2001, a person who uses chemical fertilizer in the operation of a farm shall be in possession of a nutrient management plan for nitrogen and phosphorus developed for that farm;
2. By December 31, 2001, a person who uses sludge, animal manure or other organic nutrients in the operation of a farm shall be in possession of a nutrient management plan for nitrogen developed for that farm; and
3. By July I, 2004, a person who uses sludge, animal manure or other organic nutrients in the operation of a farm shall be in possession of a nutrient management plan for nitrogen and phosphorus developed for that farm.
A nutrient management plan shall be implemented according to the following guidelines:
1. By December 31, 2002, a person who uses chemical fertilizer in the operation of a farm shall comply with a nutrient management plan for nitrogen and phosphorus developed for that farm;
2. By December 31, 2002, a person who uses sludge, animal manure or other organic nutrients in the operation of a farm shall comply with a nutrient management plan for nitrogen developed for that farm; and
3. By July 1, 2005, a person who uses sludge, animal manure or other organic nutrients in the operation of a farm shall comply with a nutrient management plan for nitrogen and phosphorus developed for that farm;
Penalties:
If a farmers does not develop a nutrient management plan in accordance with established deadlines a warning is imposed for a first violation and for a second or subsequent violation, an administrative penalty of not more than $250 is imposed. If the
81
Department finds that a person has violated implementation requirements or deadlines, a warning is imposed for a first violation and for a second or subsequent violation, an administrative penalty of not more than $100 for each violation is assessed. The total penalties imposed on a person for each violation may not exceed $2,000 per farmer or operator per year. Failure to comply may also result in restrictions in future access to state financial assistance or requirement that a person pays back financial assistance already received.
Applicator Requirements The law requires a person applying nutrients to more than 10 acres of agricultural land, which that person owns or manages, to attend a three hour training course at least once every three years in order to obtain an applicator's voucher from the Department. Alternatively, if a person applies nutrients to agricultural land for hire, that person must be a certified nutrient management consultant or work under the supervision of someone who is, in order to ensure that the nutrients are applied properly.
When nutrients are applied to property not used for agricultural land by commercial persons for hire or those who are employed by the owner or manager of the land to apply nutrients and the property is three or more acres or state owned, the application must be done according to the recommendations of Maryland Cooperative Extension. Civil penalties of not more than $1,000 for a first violation and not more than $2,000 for each subsequent violation may be imposed for non~ag applicators only_ The total penalties imposed on a person for violations that result from the same set of facts and circumstances may not exceed $10,000.
Contract Feed Requirements By December 31, 2000 all contracted feed that is fed to pOUltry must contain phytase or other enzymes or additives that reduce the phosphorus in poultry waste. Compliance is supervised by Maryland Department of Agriculture and the Secretary may recommend to the legislature that the program be modified or terminated. Maryland has allocated
$350,000 to assist with the conversion of poultry 25% of the cost of updating or modifying a nutri-feed mills to phytase treatment. ent management plan twice.
INCENTIVES
Poultry Litter Transportation Pilot Program The Maryland Department of Agriculture is to work with pOUltry companies to jointly provide up to $20 per ton in financial assistance to transport poultry litter from areas of the state that are phosphorus over enriched. Farmers receiving the litter must utilize it in compliance with a nutrient management plan. The litter may also be transported for uses other than land application such as conversion to energy sources or creation of value added products. The state has allocated $750,000 per year for the first year of this program. It is a four-year pilot with the goal of transporting at least 20% of the poultry litter produced in the four lower eastern shore counties to other areas.
Manure Matching Service
Tax Incentives A state tax subtraction is available for 100% of the purchase price of poultry manure spreading equipment capable of being calibrated to apply manure at 1 ton per acre or other manure spreading equipment, provided they are used to apply manure in accordance with a nutrient management plan and are purchased after December 31,1997.
Individuals or corporations may claim a credit against state income tax for a taxable year in the amount equal to 50% of additional commercial fertilizer costs necessary to convert agricultural production to a nutrient management plan. The claim may be for up to a $4500 tax deduction per year for 3 consecutive years. Credit in excess of tax liability may be carried over for up to 5 succeeding years.
RESEARCH AND DEVELOPl\tIENT
The Maryland Department of Agriculture will ini- Animal Waste Technology Fund tiate a system for helping farmers who produce manure in excess of their needs with farmers who would like to receive manure for use in their operation. MDA will collect information on the amount, nutrient content, location, requested purchase price and availability of manure and match producers with potential recipients whose conditions are compatible. Actual exchange details, such as determination of costs and transport arrangements will be the responsibility of the individuals involved in the transaction.
Cost-share for Nutrient Management Plan Development The Maryland Department of Agriculture will provide 50% of the cost, up to $3 per acre, for the development of nutrient management plans by private sector nutrient management consultants. Plans developed with this financial assistance must be implemented immediately upon their completion. The incentive is provided to encourage farmers to comply with the law earlier than the mandated deadlines. Cost-share may be available for up to
82
Maryland will provide $1 million in financial assistance to individuals and business enterprises that conduct research or develop technologies that are intended to reduce the amount of nutrients in ani-mal waste, alter the composition of animal waste, develop alternative animal waste management strategies or use animal waste in a production process. The goals of the program are to improve publie health and the environment, preserve the viability of the agricultural industry and have a positive impact on state economic develop while addressing issues related to animal waste manage-ment.
Nutrient Reduction Research Grant The state will provide $800,000 per year for three years for the purpose of supporting applied research that reduces nutrient loading in the Bay and its tributaries, with emphasis on assisting farmers in managing nutrients, particularly phosphorus and nitrogen as nutrients and/or pollutants derived from animal waste.
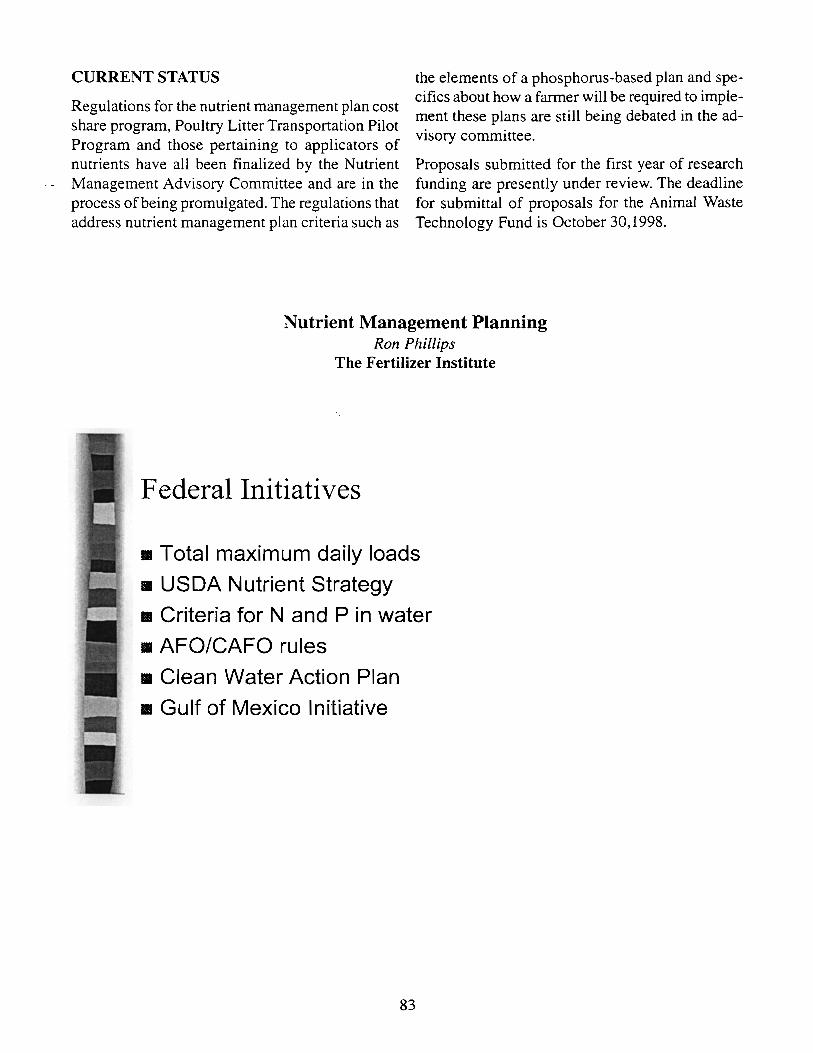
CURRENT STATUS
Regulations for the nutrient management plan cost share program, Poultry Litter Transportation Pilot Program and those pertaining to applicators of nutrients have all been finalized by the Nutrient
. . Management Advisory Committee and are in the process of being promulgated. The regulations that address nutrient management plan criteria such as
the elements of a phosphorus-based plan and specifics about how a farmer will be required to implement these plans are still being debated in the advisory committee.
Proposals submitted for the first year of research funding are presently under review. The deadline for submittal of proposals for the Animal Waste Technology Fund is October 30,1998.
Nutrient Management Planning Ron Phillips
The Fertilizer Institute
Federal Initiatives
• Total maximum daily loads
• USDA Nutrient Strategy
• Criteria for Nand P in water
• AFO/CAFO rules
• Clean Water Action Plan
• Gulf of Mexico Initiative
83
State Initiatives
• Maryland -- new law requires plans
• Delaware, Wisconsin, others with nutrient criteria
• North Carolina, Maryland, Nebraska regulating animal agriculture
• Illinois -- discussion of phosphorous limits
Possible results
• More mandates for farmers to write and follow nutrient management plans
• Restrictions on nutrient applications of all types
• More comnland and control and less flexibility for farmers and their advisors to make agronomic decisions
84
Industry goals
• Maintain the agronomic decisionmaking flexibility between the farmer and his crop advisor .
• Demonstrate increased adoption of nutrient management and increased efficiency of nutrient use
Challenges
• Bring good science into the federal decision-making process
• Engage policymakers at the state level to influence state implementation
• Show progress
85
Science needs
• What are proper limits on phosphorous in the soil?
• What are proper limits for Nand P in various water bodies?
• What are the measurable effects of specific BMPs on water quality?
Influence state decisions
• TMDLs • Nand P standards
• Phosphorous limits
86
Show Progress
• Engaged with CTIC in the nutrient management component of the Core4 program
• Market nutrient management to farmers
• Measure increased adoption of nutrient management
Conclusions
• Farmers will do more nutrient management planning.
• We have an opportunity to voluntarily show willingness and ability to do planning
• Learn to profit and help farmers profit from nutrient management planning
87
The Programs of the Florida Institute of Phosphate Research
Paul Clifford The Florida Institute of Phosphate Research
FIPR-sponsored research will playa critical role in enhancing the competitiveness of the Florida phosphate industry as ore grade declines and environmental restrictions tighten. FIPR's program is developing technology to reduce the cost of movement of solid materials. It is developing new beneficiation flowsheets that will increase yields while reducing energy consumption and chemical and water use. Improved processing efficiency will result from the development of reliable on-line analyzers and modern process control strategies. Economic methods of reducing the magnesium content of dolomitic ore would significantly increase Florida's phosphate reserves. Various applications of phosphogypsum would save the industry millions of dollars in constructing and closing gypsum stacks while providing a substantial economic benefit to the citizens of Florida. FIPR is also looking at better ways of closing gypsum stacks, new uses for previously mined lands, and improved methods for reclaiming lands.
FIPR conducts a public information and education program, of which its library is a key component. The Library contains what is perhaps the world's best collection of phosphate materials. The Library can be contacted through FIPR's home page. FIPR also recently started a K-12 education program in order to help students perform academic performance while providing them with information about the economic and environmental impacts of the industry.
Introduction The Florida Institute of Phosphate Research (FIPR) is an independent, State of Florida research agency.
educate the public concerning phosphate-related technology and issues. FIPR is funded by a severance tax on the industry and is governed by a fivemember Board of Directors appointed by the Governor.
FIPR's research is playing a critical role in enhancing the competitiveness of the Florida phosphate industry. Its technology research program is developing
• A new, low cost method for transporting solid materials
• New and improved methods of beneficiation and fertilizer production, including new process flow sheets, on-line analyzers and process control methods
• New methods for removal of magnesium from dolomitic rock
• Uses for the phosphogypsum byproduct of phosphoric acid production
• Risk assessments for proposed phospho gypsum uses.
FIPR's research program also addresses environmental and health issues associated with the Florida phosphate industry. It is researching more costeffective methods of closing gypstacks and new uses for mined lands, developing better reclamation technology, and conducting research on public and occupational exposure to radioactive materials.
One of FIPR's missions is to provide information to the public and to educate the public about the phosphate industry and its impacts on the state, both economic and environmental. FIPR has an extensive library of phosphate related material and a web page devoted to its programs. It has also started a K-12 education program designed to help students in Florida achieve the Sunshine State Standards while teaching them about phosphate.
It was created in 1978 to conduct research to en- Movement of Solid Materials hance the competitiveness of the Florida phosphate industry and to prevent, minimize, or rectify environmental impacts caused by the industry and to
88
The phosphate industry moves a very large quantity of bulk solid materials each year. Matrix is transported from the mine to the beneficiation
plant, clay is moved to settling areas, tailings are moved to disposal areas, and product is transported to chemical plants, local customers and ports.
Movement of the matrix is one of the most expensive components in the production of phosphate rock because of the cost of electricity, high maintenance costs, and frequent pump replacement. Transportation between the beneficiation plant and chemical plant or customers takes place by truck or rail at a cost of about $0.12 per ton-mile.
A project at IMC-Agrico by Magplane Technology will demonstrate a new method of transport for bulk solids that has the potential to significantly reduce transportation costs. Vehicle propulsion would be provided by a linear synchronous motor system similar to that used to propel high-speed bullet trains. The system would be composed of multiple small-wheeled cars traveling through a tube approximately thirty inches in diameter. A system this size operating twenty four hours a day would be capable of conveying the total phosphate rock output from the mining area to the port. The initial testing will simulate conveying wet phosphate rock from the mine to a chemical plant but the system could be used to transport matrix from the mine to the washer, sand tailings from the washer to a reclamation area, or finished fertilizer products from the chemical plant to the port.
More Effecient Processing Techniques - "Reverse Cargo" The dominant process currently used for processing siliceous phosphates is the Crago "double float" process. In this process, deslimed phosphate ore is first subjected to sizing. The sized feed is then subjected to rougher flotation after conditioning at 70% or higher solids with fatty acid/fuel oil at a pH of about 9 for three minutes. It should be noted that a significant amount of silica (sands) is also floated in this step. The rougher concentrate goes through a dewatering cyclone, an acid scrubber, and a wash box to remove the reagents from phosphate surfaces. After rinsing, the feed is transported into flotation cells where amines (sometimes with diesel) are added, and the silica is floated at neutral pH. Since about 30-40% by weight of the sands
89
in the flotation feed are floated twice, first by fatty acid and then by arnines, the Crago process is inefficient in terms of collector efficiency. Indeed, theoretical fatty acid efficiency in a typical plant is merely 5%. The rest of the reagents are wasted primarily because of silica. The trends of declining grade of phosphate deposits and soaring prices for fatty acid do not favor the standard Crago process.
As a result of a three-year in-house research effort, FIPR developed a Reverse Crago process for siliceous phosphates. In this process, fine silica is first floated with an inexpensive amine as sand collector and an anionic polymer as slime blinder. The prefloat concentrate is further cleaned by fatty acid flotation of phosphate.
The Reverse Crago has evolved based on an understanding of the fundamentals of phosphate flotation. For example, amines are more selective collectors than fatty acids. In addition, amines adsorb instantaneously on sand. Studies showed that amines can float more than 99% of silica from pH 3 to 12, while phosphate flotation by amines is minimal within this pH range. It was also discovered that at near-neutral pHs, there is a large difference in zeta potential between silica and phosphate. Therefore, it is ideal to separate silica from phosphate at neutral pH. It is a well-known fact that fatty acids do not readily adsorb on phosphate surfaces at neutral pH. That leaves only one option: floating silica first. Since amine flotation does not require conditioning, floating silica first may reduce the number of conditioners currently used for flotation. Because amine flotation is conducted at neutral pH, floating silica first would significantly reduce pH modifier consumption. Finally and perhaps most importantly, because amines are more selective than fatty acid, collector efficiency should be improved by floating silica first.
FIPRjust concluded a major pilot-scale testing of the Reverse Crago against the Crago double float process. The testing results showed a clear advantage of the Reverse Crago over the conventional Crago in terms of both the total amount of, and costs for, reagents. Table 1 shows reagent consumption in one of the final parallel tests.
Reagent Consumption (mis/min.). Comparison between the Reverse (See Table 1.)
The pilot testing also resulted in some significant improvements of the Reverse Crago including:
~._ Addition of a re-float step following fatty acid flotation. This makes it much easier to control product grade for the Reverse Crago process.
• High solids flotation. It was found that the amine pre-float should be conducted at 15% or higher flotation solids for better froth characteristics and lower amine consumption.
• More selective polymer. Although extensive lab tests indicated that Perco 90L worked best for the Reverse Crago, pilot testing showed that low molecular weight anionic polymer may be more suitable for large-scale flotation.
FIPR researchers believe that further optimization is possible. For example, more selective polymers and more suitable machines for amine flotation could be used. Better desliming could also be done. Results from the latest round of pilot tests are being evaluated to determine relative recoveries and costs for the two processes.
Process Modeling and Control One of the primary goals in the manufacture of wet process phosphoric acid is to maintain optimum operating conditions in the reactor. This goal can be achieved by proper control of a number of process variables, not the least of which are the natural variations in the composition of the phosphate rock fed to the process. FIPR has sponsored projects that have developed a computer program to control the phosphoric acid reactor operating conditions. This program is finding wide acceptance in the industry and has contributed to higher operating rates and yields for the companies using it for reactor control.
cline and become more difficult to process, improvement in plant efficiency is even more critical to maintaining the competitiveness of the industry.
Process control in phosphate beneficiation plants is still primitive. This may be attributed, in part, to the difficulties with analyzing the processing streams. Searching for an accurate and rapid onstream phosphate assay technique has been on FIPR's agenda since its inception. FIPR has sponsored research on four on-line analytical systems: a magnetic resonance technique, an optical sensor, a neutron activation probe, and an X-ray diffraction system. The magnetic resonance analyzer has been adopted on commercial scale, giving an estimated economic benefit of more than a million dollars per year for one plant.
The most common problem with many on-line analytical techniques is related to the sample feeding and preparation system. FIPR is sponsoring development of an analytical technique that does not require sample preparation. This technique is called Laser Induced Breakdown Spectroscopy (LIBS). The major advantage of the LIBS is the potential for a rapid, in situ, multi-element analysis. LIBS does not require a sample feeding/preparation system because the plasma may be located either on the surface of, or be submerged in, the slurry to be analyzed.
The next logical step after developing on-line analyzers is to develop process models in such a way that the instant on-line analytical information may be utilized by a process control system. Process control systems routinely used in mineral processing were born with the invention of the microprocessor. It is expected that control systems of the future will continue to develop toward user-friendly computer-based systems which use powerful software analysis and control techniques.
On-line analysis and process automation are pow- As a result of a FIPR project, a research team has erful tools for achieving optimal industry effi - developed six computer models to simulate a phosciency. The rewards of an effective on-stream phate flotation system. These models have been analysis technique coupled with modern process tested on plant data obtained from the Florida phoscontrol include improved recovery ofP20 s' reduced phate industry, giving a relatively accurate predicchemical consumption, and improved concentrate tion of phosphate recovery. grade. As the quality of phosphate reserves de-
90
FIPR is funding a new project to develop an optimizing, adaptive process control system for phosphate flotation. The control system will employ the six computer models of phosphate flotation developed under the previous project. Ultimately, it will allow users not intimately familiar with the C++ programming language, genetic algorithms, and fuzzy logic to develop computer models and controllers. An optimizing, adaptive process controller combines the process control capabilities of fuzzy logic with the adaptive capabilities of genetic algorithms. The adaptive control technology has two major advantages over the conventional stabilized control strategy: it has learning capability, and it does not require a lot of sensory information.
Solving the Dolomite Problem - NonDesliming Flotation Among the deleterious impurities in phosphate rock used for producing phosphoric acid, dolomite is the most troublesome. As the carbonate proportion increases, the consumption of sulfuric acid in fertilizer manufacture also increases per ton ofPzOs produced. In addition, the carbonates contain a significant percentage of MgO in the form of dolomite and dolosilt. The MgO increases the viscosity of the slurry, thus reducing the filtering capacity, and ties up an equivalent portion of the P
20
S when acidulated. With the depletion of the higher grade, easy-to-process Bone Valley deposits, the central Florida phosphate industry has been forced to move into the lower-grade, more contaminated ore bodies from the Southern Extension.
The phosphate deposits in the Southern Extension may be divided into an upper zone and a lower zone. The upper zone is easy to process using the current technology, but the lower zone is highly contaminated by dolomite. Geological and mineralogical statistics show that about 50% of the phosphate resource would be wasted if the lower zone is bypassed in mining, and about l3-15% of the resource would be wasted if the dolomitic pebbles in the lower zone are discarded.
In 1994, FIPR conducted a comparative evaluation on five promising flotation processes for sepa-
91
rating dolomite from phosphate, utilizing the same flotation feed. Two of the processes failed to produce a concentrate of less than 1 % MgO and all the processes gave very poor overall phosphate recovery, ranging from 30-60%. No process has proven to be economically compelling for processing the billions of tons of high-dolomite, sedimentary phosphorus resource in Florida.
The major and common problem with most of the available flotation processes is the significant loss of phosphate in desliming the ground high-dolomite pebbles. Whether one deslimes at 150 mesh or 200 mesh, about 20-30% of the phosphate is discarded in the slime.
However, from previous research we know that:
• Flotation is perhaps the most feasible technique in terms of economics, phosphate recovery and environmental friendliness
• Grinding is essential for liberating the dolomite if flotation technology is to be used to separate dolomite from phosphate
• Non-desliming flotation technology may be necessary to maximize phosphate recovery
• A phosphate depressant is essential to accomplish effective separation of dolomite from phosphate, and phosphate based reagents are perhaps most effective.
At their October 1997 meeting, the FIPR Board of Directors approved funding for a joint proposal by IMC-Agrico and the Chinese Lianyungang Design and Research Institute (CLDRI). This project was designed to develop a flotation technology for ground high-dolomite pebble without desliming. Five dolomitic pebble samples have been tested on laboratory scale achieving acceptable grade at overall phosphate recoveries of higher than 80% in most cases. As is shown in the following diagram, the most promising flowsheet consists of floating carbonate using a fatty acid type collector with phosphoric acid as a phosphate depressant. The pre-float concentrate is then cleaned by amine flotation. (See Figure 1.)
Phosphogypsum Most of the phosphate rock mined in the world is used to produce wet process phosphoric acid. The primary use for the phosphoric acid is the manufacture of fertilizers, most commonly ammonium phosphates. Wet process phosphoric acid is the desired end-product of the reaction between phosphate rock and sulfuric acid that also produces a gypsum byproduct, phospho gypsum.
The wet process phosphoric acid process has frequently been thought of as a phosphogypsum manufacturing process since the phosphogypsum crystal characteristics dictate the efficiency of the separation of the phosphoric acid solution and the phosphogypsum crystals and thereby defines both the production rates and yields that are possible. Since there are five tons of phosphogypsum produced per ton of phosphoric acid (as P20 S)' the importance of this separation efficiency is obvious.
With the Florida phosphate industry producing 30 million tons of phosphogypsum each year that is added to an existing on-ground inventory of more than 700 million tons, there has never been any question that an adequate supply of this potentially valuable raw material was available. The problem is to develop uses for phosphogypsum that are technologically feasible, environmentally sound, and economically acceptable.
When FIPR was created, phospho gypsum utilization was one of the research priorities adopted by the FIPR Board of Directors. A research program was developed that addressed three primary potentially high volume uses for phosphogypsum. These uses were:
• As a chemical raw material
• As a construction material
• As a soil amendment in agriculture
Using phosphogypsum as a raw material for sulfur recovery and recycle would be a simple way to reduce the phosphogypsum inventory and supply the 6 million tons of sulfur consumed annually by the industry. FIPR research investigated three pro-
cessing schemes to recover and recycle the sulfur in the phosphogypsum:
• Thermal decomposition to recover sulfur dioxide for sulfuric acid manufacture. At a certain temperature all thermal decomposition processes produce sulfur dioxide as a gas and
92
a solid product. Thermally decomposing pure phosphogypsum generates lime as a second product. By adding other substances to the phosphogypsum feed it is possible to have cement or an aggregate material as the solid product. FIPR developed two processes using a feed mixture of silica (sand), pyrites, and phosphogypsum that produced an aggregatetype solid material. One reason to produce aggregates is that there is a ready Florida market for all the aggregate the industry could produce. A second reason is that aggregates of these compositions are non-leaching and could not create any water quality problems when used for construction purposes.
While both processes were technically feasible and environmentally sound, a sulfur price decrease from $155 to $50 per ton made them uneconomical.
• Thermal decomposition at a lower temperature to produce calcium sulfide. Reacting the calcium sulfide with carbonic acid produces hydrogen sulfide and calcium carbonate. The hydrogen sulfide can be processed to recover sulfur that can be burned to give sulfuric acid. Our efforts in this area were not as successful as with the higher-temperature thermal treatment
• Bacterial decomposition of phosphogypsum to produce hydrogen sulfide.
In the construction area we elected to look at road building as the most appropriate large-volume use for phospho gypsum. Based on laboratory research we developed a plan for demonstration projects for secondary roads and then primary roads. The phosphogypsum was to be used as a road base material. Two secondary roads were constructed, one in Polk County and the second in Hamilton County. Extensive testing of the air, soil, and
ground water at both sites was conducted over a period of five years to determine if there were any adverse environmental effects associated with using phosphogypsum as a road base. A recent tenyear follow-up testing at the Polk County road confirmed the earlier conclusion of no adverse effects.
The Polk County road was subjected to extensive on-going structural analysis. The Hamilton County road confirmed the initial favorable structural results for the Polk County road. Continued testing of the Polk County road over the last ten years has shown a steady improvement in the structural properties.
The economics for using phosphogypsum for road bases is the real driving force behind this use. A detailed cost analysis by the University of Miami Department of Industrial Engineering shows that the cost for the phosphogypsum road base was between 25 and 33% of the cost of traditional road base construction. Cost savings were achieved in labor, equipment utilization, and raw materials.
Phosphogypsum has been shown to be an excellent source of sulfur and calcium in agriculture. It also does a very good job of improving soil conditions. Phospho gypsum fertilization has been shown to increase crop yields.
All efforts to profitably use phosphogypsum have been stymied by an EPA ruling that prohibits all uses due to concerns over the low levels of radium in the phospho gypsum. Our analyses do not agree with EPA conclusions and we are working to persuade EPA to allow uses where the risk to the public is especially low.
Polk County and FIPR filed an exemption request with EPA to build a road with a phosphogypsum base in February 1998 that the EPA accepted in principle in September 1998 with the proviso that Florida DEP develop a monitoring plan for the road site. At this point the only recognized obstacle to building the road is the Florida DEP's inaction. In April 1998 FIPR provided to EPA a comprehensive analysis of the risks associated with phosphogypsum use that was prepared by our consultant. Senes Consultants. We asked EPA to re-
93
view this data so that it could be used as a basis for discussions to determine if the risks used in promulgating the phosphogypsum rule should be modified to more accurately reflect the real world situation. EPA agreed in principle but wanted their consultant to examine the report. To date they have not contracted with their consultant to make the necessary evaluations.
Environment and Public Health Phosphogypsum Stack Closure
FIPR research begun in 1990 developed a methodology and demonstrated that vegetation could be effectively established directly on phosphogypsum without a soil cover. The early results of the study had a strong influence on the development of Florida's Phospho gypsum Management Rule (Florida Administrative Code [FAC] chapter 62-673, March 1993) which allows the use of amended phosphogypsum as final cover, instead of soil, if it can be shown to meet the performance standards. Subsequent FIPR research has indeed shown that amended phosphogypsum can support excellent vegetation cover that will control erosionand produce high-quality runoff water. Use of amended phosphogypsum as the final cover on a closed phosphogypsum stack will be less costly than covering the stack with soil, and it should eliminate the need for a soil borrow area and the accompanying environmental impacts.
The Phosphogypsum Rule also emphasizes control of the potential environmental impacts of leachate from the stack and pond water systems. New stacks are required to have liners beneath them, while both old and new stacks, when closed, must have a barrier layer on top to prevent or greatly reduce infiltration of rain water, and thereby decrease the flow of acidic leachate. The barrier layer (e.g., plastic, or compacted clay or soil) on top of the stack must be covered by soil or amended phospho gypsum able to support a vegetation cover that will control erosion but whose roots will not penetrate the low permeability barrier layer. The Phosphogypsum Rule requires the barrier layer on top of a gypsum stack to have a permeability of less than 10.7 cm S-1 if there is no bottom liner or
10-5 cm S-I for stacks with bottom liners. Highdensity polyethylene (HDPE) has been the preferred material for the top liner on gypsum stacks closed in Florida to date, but the Phosphogypsum Management Rule does allow the use of other _materials, such as compacted soil, if the permeability criteria can be met. Research is in progress to examine the potential for use of other materials that might be less expensive than HDPE but still meet the permeability standards. Compacted phosphogypsum alone might meet the 10-5 cm S-I
standard for gypsum stacks with bottom liners, while phosphogypsum amended with phosphatic clay or bentonite might achieve the 10-7 cm S-I standard for stacks without bottom liners. The technical and economic feasibility, including optimum mixtures, the compaction effort needed, and the possibility of desiccation or tension cracking is also being studied.
In addition to permeability, runoff and evapotranspiration affect infiltration. Thus the entire water balance of a closed phosphogypsum stack is important for controlling leachate. The concern about top barrier layers discussed above was applicable mainly to the relatively flat surface on the top of a stack, but the side slopes also have considerable area where infiltration can take place. Because the sides are sloped, runoff reduces the amount of infiltration relative to a flat surface, but perhaps additional compaction of gypsum in the side slopes could reduce overall stack infiltration further (the surface would have to be tilled to allow vegetation establishment). FIPR research is also examining what might be done to increase evapotranspiration such as increasing the leaf area and rooting depth of the vegetation. This might be accomplished by a combination of selecting superior plants, increasing fertilization, and improving the physical and chemical condition of the growth medium (soil or gypsum) with amendments and tillage.
Water Treatment on Mined Lands with Wetlands and Tailing Sand Filtration
Demand for water in central Florida is increasing while the availability of groundwater is dwindling. Saltwater intrusion is threatening the Floridan Aquifer in coastal areas, while lowered aquifer lev-
94
els are of concern in more inland areas. The Southwest Florida Water Management District (SWFWMD) is proposing to cut back on the permitted quantities of water pumped from the Floridan Aquifer in the Southern Water Use Caution Area (SWUCA), which includes much of the Bone Valley phosphate region. This will have a significant impact on current, and especially future, water users. To meet the growing demands of development, alternative sources of water must be sought. Possible sources are reclaimed wastewater, the capture of storm water, the capture of "excess" surface water, development of the surficial aquifer, and desalinization of seawater.
A FIPR-funded project is examining the feasibility of storing waste water or excess surface water in reservoirs on mined lands, treating the water with wetlands (including wetlands on clay settling areas) and tailing sand filtration, and then injecting the treated water into the Floridan aquifer. The project has examined the leaching of sand tailings in barrels as a first step to be sure that tailing sand filtration would not degrade water quality. Examining the water quality in several sand tailings deposits in the field is further validating the results of the barrel tests. An important issue being addressed in another facet of the project is the ability of sand tailings to filter out microorganisms. The initial results indicate that water filtered through sand tailings can meet drinking water standards and that, with an adequate depth of the unsaturated zone, tailing sands can effectively filter out microorganisms.
A new project being considered, cofunded by FIPR and SWFWMD, would provide a field demonstration of wetland treatment and tailing sand filtration on mined lands at Florida Power Corporation's (FPC) Hines Energy Complex in Polk County. A 1.5 acre tailing sand filtration bed will be constructed, and an existing wetland in aU-shaped ditch 8400 feet long will be upgraded. Water from three sources would be tested in the system: waste water from the city of Bartow; water from the FPC power plant cooling pond; and runoff water from water harvesting areas. Water would be sampled during a two-year period at the inlet and outlet of
the wetland and at the inlet and discharge of the sand tailing filtration bed. The samples would be analyzed for primary and secondary drinking water standards, gross alpha radioactivity, turbidity, pesticides, volatile organic compounds, trihalomethanes, Cryptosporidium, Giardia, and others.
Nuisance Plant Species Management on Forested Wetlands on Phosphate Mined Lands
Primrose willow has been decreed by the Florida Department of Environmental Protection to be a nuisance species that must be controlled on reclaimed wetlands, often at considerable expense. We have found that baldcypress, pop ash, red maple, and water hickory are only mildly affected by competition from primrose willow, and these trees will grow through and overtop the primrose willow in a few years. Evidence from older tree plantings indicates that the trees will eventually shade out the primrose willow. We observed that the chemical and mechanical methods commonly used to control primrose willow had detrimental effects on desirable understory species. Our findings indicate that forested wetlands can be successfully established without the expense of controlling primrose willow, or at least the control efforts can be greatly reduced.
Naturally Occurring Radioactive Material (NORM) People are exposed to ionizing radiation from a number of sources, including medical procedures, fallout from nuclear weapons testing, power production, outer space, and, of most importance, from naturally occurring radioactive materials (NORM) located within the earth's crust. On average, each person in the United States receives yearly a dose of about 200 millirems (mrem) of natural background radiation, about half contributed from radon and its decay products in the lung, and about half from gamma external radiation, internal emitters such as potassium-40 and carbon-14, plus cosmic radiation. The average American also receives about 60 millirems from man-made sources, mostly from medical procedures, but also from weapons fallout, nuclear power, and even certain consumer
95
products. Thus radon is the largest single source of radiation to most Americans, and it is derived from a terrestrial source, natural uranium-238.
Uranium-238 is the most significant of three primordial radioactive species. On average in the United States one square mile of soil one foot thick contains about three tons of uranium, which equates to about three parts per million (ppm). Phosphate ore, on the other hand, contains levels of uranium significantly above this, or about 100 to 150 ppm. Uranium eventually breaks down to radium-226, which in tum decays to radon-222. Radon is a gas and can freely move through and out of the soil, enter structures, and then decay to two isotopes of polonium, both known alpha emitters and known causes of cancer, mainly of the lung. The decay process continues until finally a stable isotope oflead is produced. The U. S. Environmental Protection Agency (EPA) believes that radon is second only to tobacco smoking as a cause of lung cancer.
Radioactive materials of the uranium series are found at elevated levels in virtually all phosphaterelated materials, including ore, products such as phosphoric acid, diammonium phosphate and triple superphosphate, by-products such as phosphogypsum, and waste products such as clays. Some typical radium-226 levels are shown in Table 2.
The concern over NORM materials centers around their ability to emit ionizing radiation, especially gamma and alpha. Gamma rays are highly penetrating and thus create whole-body exposures from external sources. Alpha particles will not penetrate the skin, but are densely ionizing and create significant exposure to target organs if inhaled or ingested. Purely from a scientific standpoint, no differences exist between radiation from NORM and that from a nuclear power plant, but much more attention has been devoted to power sources than to NORM, partly because radiation from nuclear plants is more discrete and amenable to control, whereas NORM is omnipresent throughout the world and often difficult or impossible to controL Thus the guiding rule in protecting the
public from NORM has been to maintain levels that are "as low as reasonably achievable."
Since virtually its inception in 1978, the Florida Institute of Phosphate Research (FIPR) has been concerned about NORM and has funded numer-ous studies on radiation exposure to Florida's citizens, especially those living or working within the phosphate regions. These have included studies of indoor radiation and its mitigation, radionuclides in surface water and groundwater, radionuclides in foods, including that grown on clay settling and reclaimed lands, radionuclides in phospho gypsum and its stack leachate, and radionuclides in forage grown on lands treated with phospho gypsum as a soil amendment. Most effort has gone into public exposure, but in 1996 a significant project was launched to determine occupational exposure to employees of the phosphate industry and its support services. This was prompted by two concerns: (1) Most existing occupational data were two decades old or older; (2) Changes had been made by EPA and the state that would revise occupational exposure limits downward, and the feasibility of meeting lower standards was unknown. The occupationallimit for radiation exposure to workers in non-nuclear industries is now the same as that for the general public.
Completed in August of 1998, the goals were as follows:
• Collect data on worker exposure to radiation and assess doses
• Assist industry to lower exposures if needed
• Evaluate feasibility of meeting a lowered standard
Results of the study show that most phosphate employees receive an annual radiation dose that is much less than 100 millirems per year (mrem/yr), but a small number receive higher doses. Generally the work areas of higher dose are rock receiving, phosphoric acid manufacture, and product shipping.
Public Information and Education FIPR's library plays a vital role in carrying out the
96
Institute's legislative mandate to make available to the public information about Florida's phosphate industry and its impact on the state. The Library has become known, both in the U.S. and abroad, as having perhaps the most extensive collection of phosphate-related materials in the world. This unique collection consists of over 10,000 volumes of books, documents, and journals covering a wide range of subject areas that are related to the technologies and environmental impacts of the phosphate industry. The Library also houses over 3000 U.s. patents and many maps and videos.
The FIPR Library is open to the public and attracts over 1000 visitors a year. Its staff responds to over 100 reference requests per month, many of which require in-depth research of its own collection, literature searches of online databases and the internet, or contacting experts in the field. Books and documents can be checked out to users within Florida. Researchers not able to visit the FIPR Library can still borrow from its collection by utilizing the interlibrary loan service of their local library. The Library's membership in the Online Computer Library Center, which maintains a catalog of over 30 million records representing the holdings of over 15,000 libraries, also allows users to borrow items from these libraries.
The accessibility of FIPR's Library has also been greatly increased as a result of FIPR's website (www.fipr.state.fl.us). created and updated by the Library staff. At the web site researchers around the world can find information about the Institute and its research. The website also keeps users informed of upcoming events, research progress and results, and other Institute programs and priorities. Email links and a discussion forum allow users to submit questions and comments. The site is now averaging 60 user sessions per day at an average of nine minutes per session.
Last year, FIPR began developing an education program for students in kindergarten through high school last. The program is a resource to teachers as they help students achieve applicable Florida Sunshine State Standards in math, science, social studies, and language arts. The Institute uses its expertise about phosphate mining technology, eco-
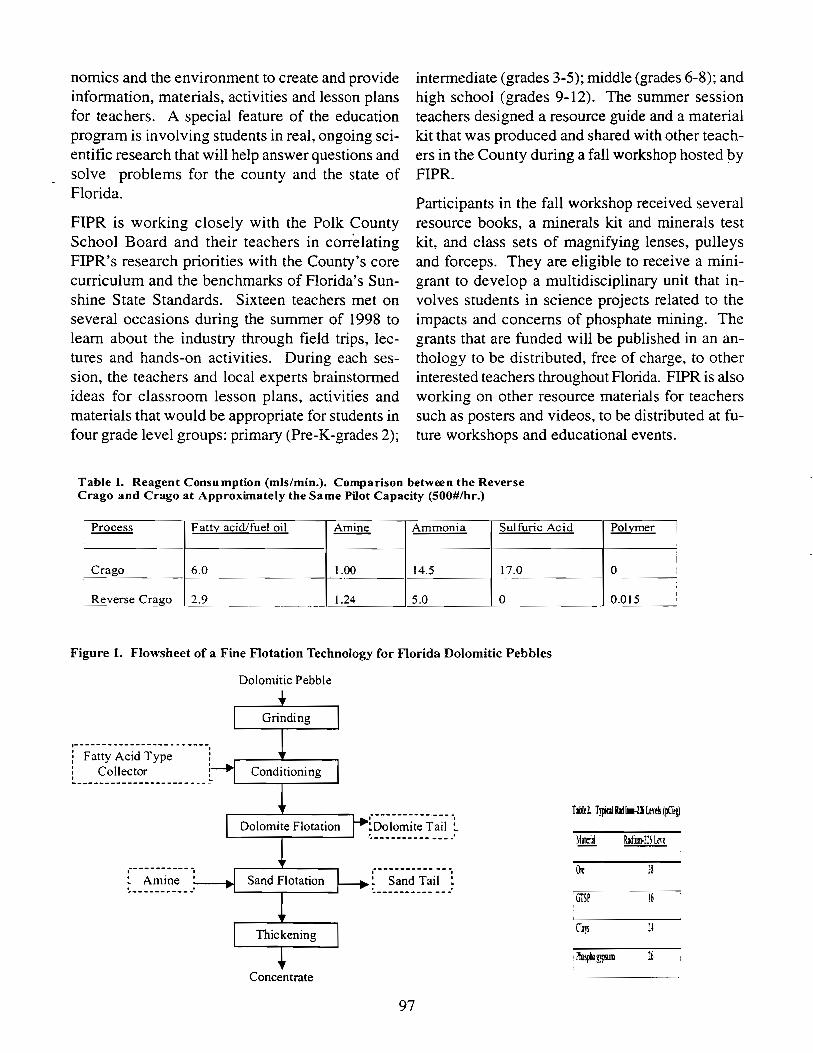
nomics and the environment to create and provide information, materials, activities and lesson plans for teachers. A special feature of the education program is involving students in real, ongoing scientific research that will help answer questions and solve problems for the county and the state of Florida.
FIPR is working closely with the Polk County School Board and their teachers in correlating FIPR's research priorities with the County's core curriculum and the benchmarks of Florida's Sunshine State Standards. Sixteen teachers met on several occasions during the summer of 1998 to learn about the industry through field trips, lectures and hands-on activities. During each session, the teachers and local experts brainstormed ideas for classroom lesson plans, activities and materials that would be appropriate for students in four grade level groups: primary (Pre-K-grades 2);
intermediate (grades 3-5); middle (grades 6-8); and high school (grades 9-12). The summer session teachers designed a resource guide and a material kit that was produced and shared with other teachers in the County during a fall workshop hosted by FIPR.
Participants in the fall workshop received several resource books, a minerals kit and minerals test kit, and class sets of magnifying lenses, pulleys and forceps. They are eligible to receive a minigrant to develop a multidisciplinary unit that involves students in science projects related to the impacts and concerns of phosphate mining. The grants that are funded will be published in an anthology to be distributed, free of charge, to other interested teachers throughout Florida. FIPR is also working on other resource materials for teachers such as posters and videos, to be distributed at future workshops and educational events.
Table 1. Reagent Consumption (mIs/min.). Comparison between the Reverse Crago and Crago at Approximately the Same Pilot Capacity (500#/hr.)
IProcess Fatll: acid/fuel oil ~ Ammonia Sulfuric Acid PolYmer !
Crago 6.0 1.00 14.5 17.0
Reverse Cr5!go 2.9 1.24 5.0 0 -
Figure 1. Flowsheet of a Fine Flotation Technology for Florida Dolomitic Pebbles
Dolomitic Pebble
------------------.---~ Fatty Acid Type
Collector
1 .... _ ... --- .... -_ ... '"'I
~ __ ~~i~_:_ .~: _---+-I
Concentrate
... ------ .......... ,--- -. ~Dolomite Tail :. . . "'-----"""--- --_ ..
...... _--_ ........ _- -_., ~ Sand Tail ~ . . ~--- ........ ---- .......
97
I
0 •
,
0.015 :
Tabid. TyfialRlli ... 21l.mls IpCiIg)
}3
L _____ _
Cla)~ 1~

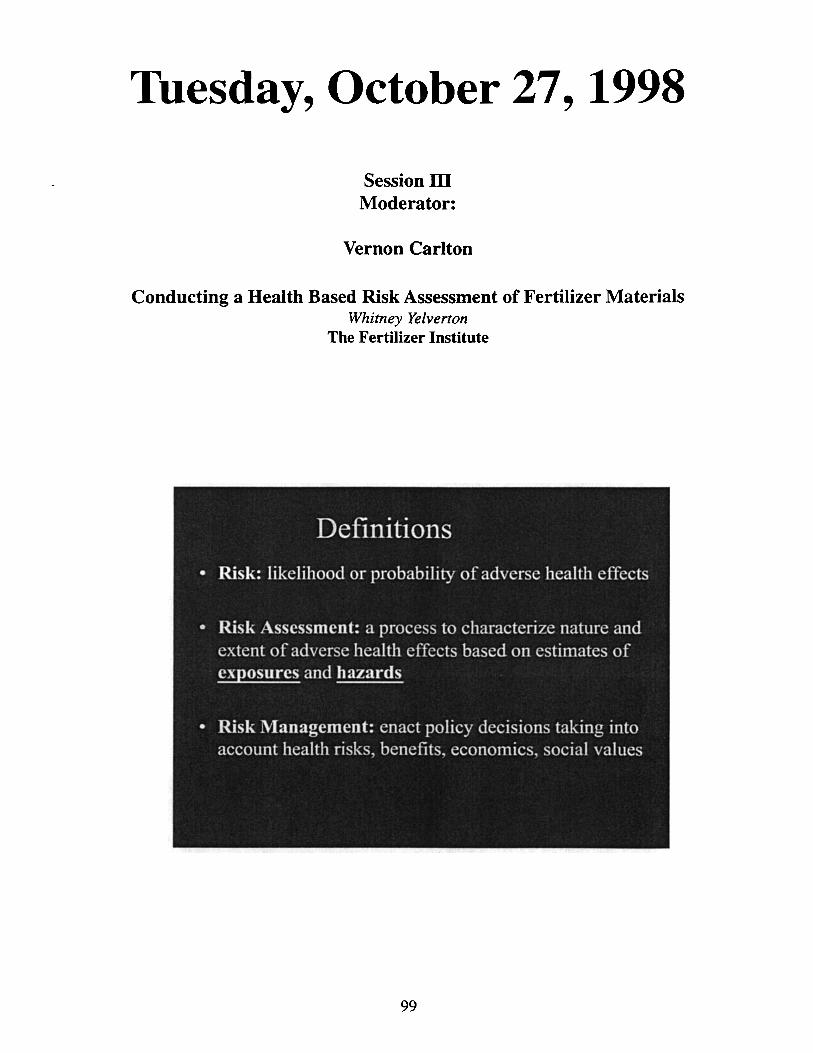
Tuesday, October 27, 1998
Session ITI Moderator:
Vernon Carlton
Conducting a Health Based Risk Assessment of Fertilizer Materials Whitney Yelverton
The Fertilizer Institute
99
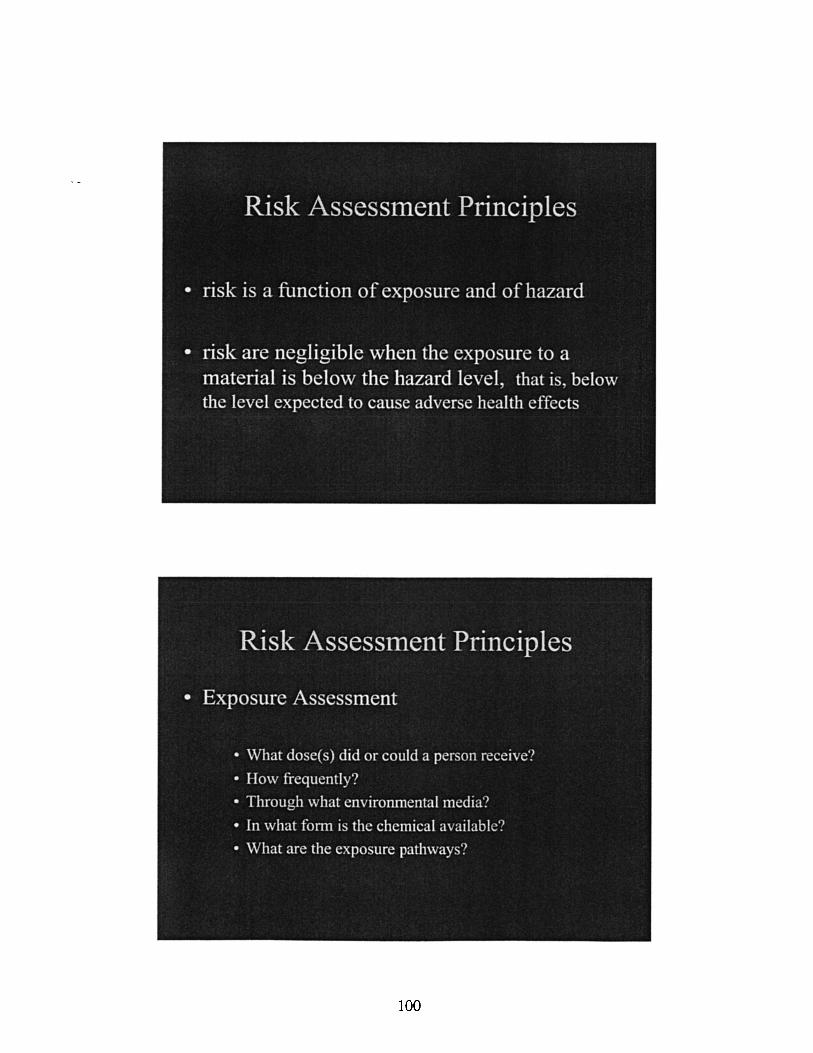
100
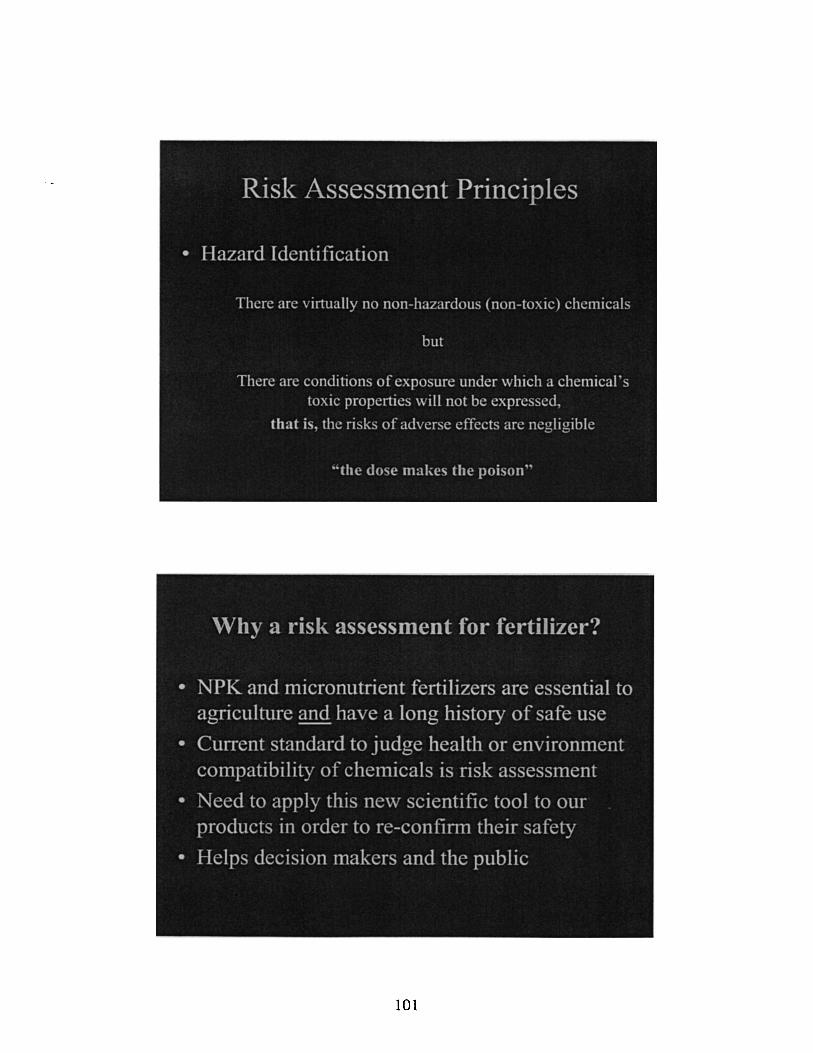
\Vhy a risk assessment 1'0,4 fertilizer'!
• NPK and I11icronutrient fertilizers are essential to agriculture and have a long history of safc usc
• Currcnt standard to judge hcalth or environIl1cnt cOlnpatibility of chclnicals is risk assessment
• Need to apply this ncw scienti fic tool to Ollr products in order to re-confirm their safety
• Helps decision makcrs and the public
101
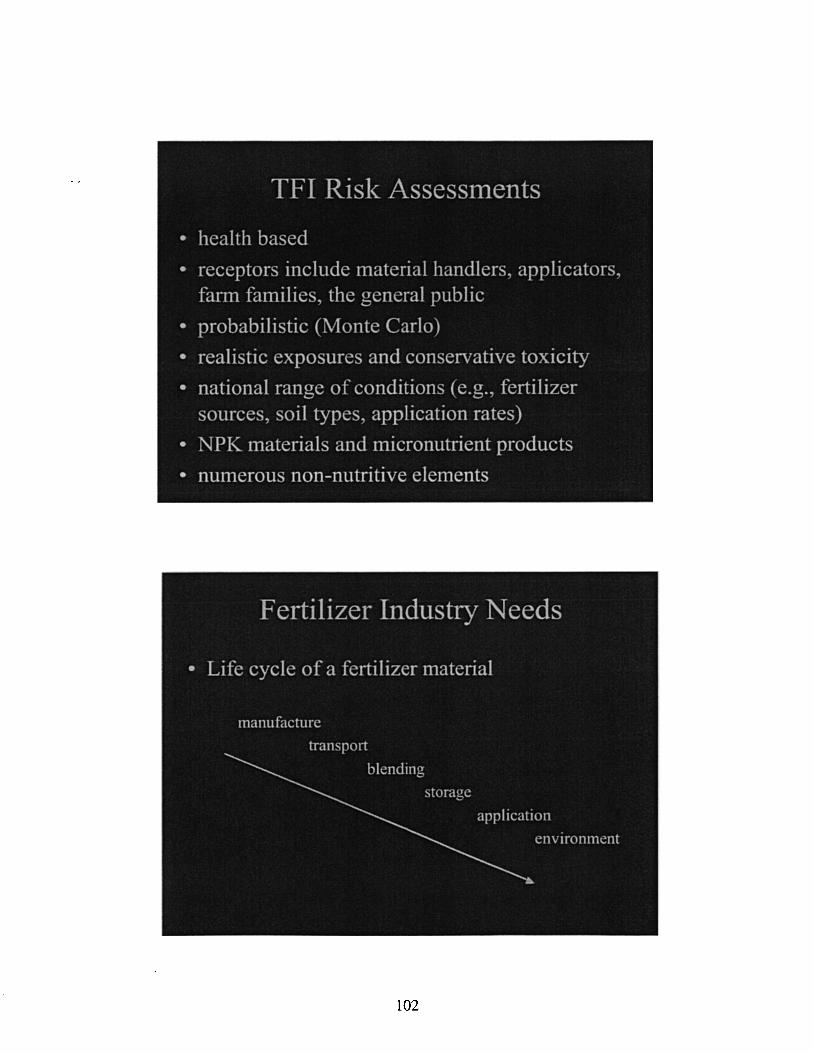
TFI Risk Assessl11ents
• health based
• receptors include Inaterial handlers, applicators, f~lnn tlllnilies, the general public
• probabilistic (Nlonte Carlo)
• realistic exposures and conservative toxicity
• national range of conditions (e.g., ferti I izer sources, soi I types, application rates)
• N PK Inaterials and Inicronutrient products
• nU111erOUS non-nutritive elements
102
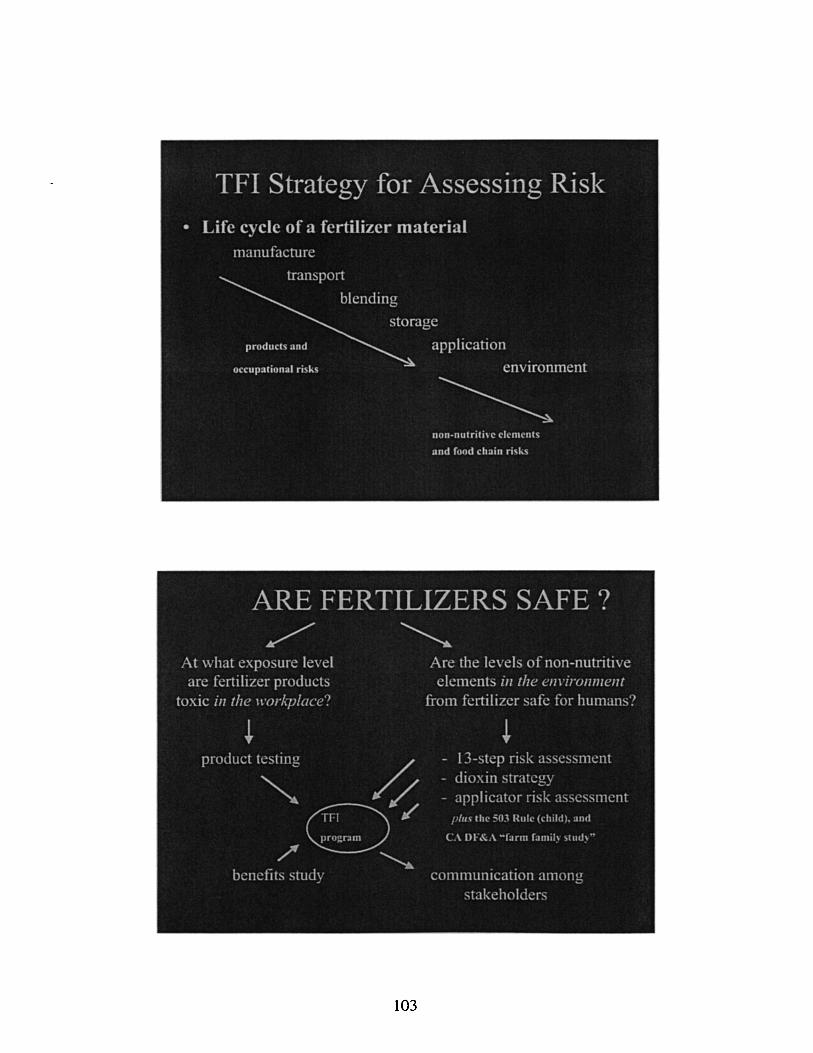
103
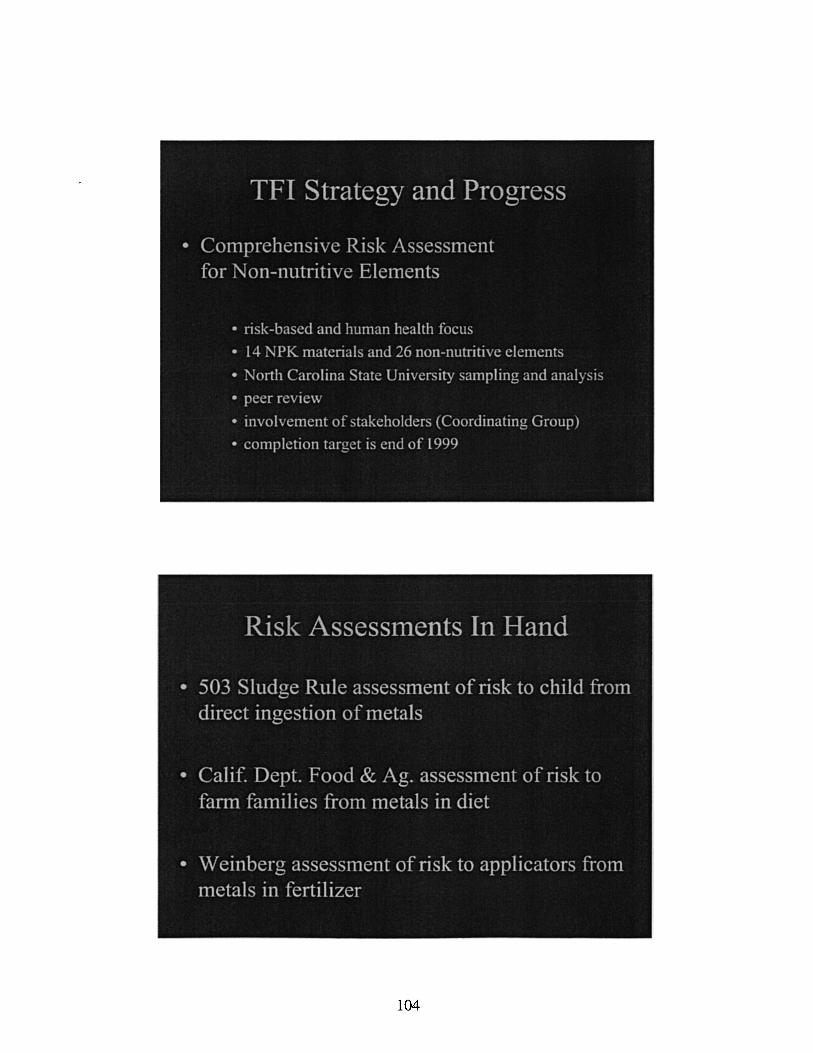
TFI Strategy and Progress
• Comprehensive Risk Assessment for Non-llutritive Elements
• risk-bas~d and human kalth lix:llS
• I .... 0: PK matt:rials anJ 26 I1u!1-nutriti\T t:klll~nts
• \:orth Carolina St:lk UnivC[sity sampling and analysis
• rc~r rcvlt:\\'
• il1\'oln:mcnt 0 r stakdlOldcrs (Coordinating GrouP)
• cOlllJ1ktiol1 target is end of 1999
Risk Assessn1ents In Hand
• 503 Sludge Rule assessn1cnt of risk to child frOIn direct ingestion of lnetals
• Calif Dept. Food & Ag. assessment of risk to fann falnilies froll1 metals in diet
• \Vcinbcrg assessment of risk to applicators from n1etals in ferti I izcr
104
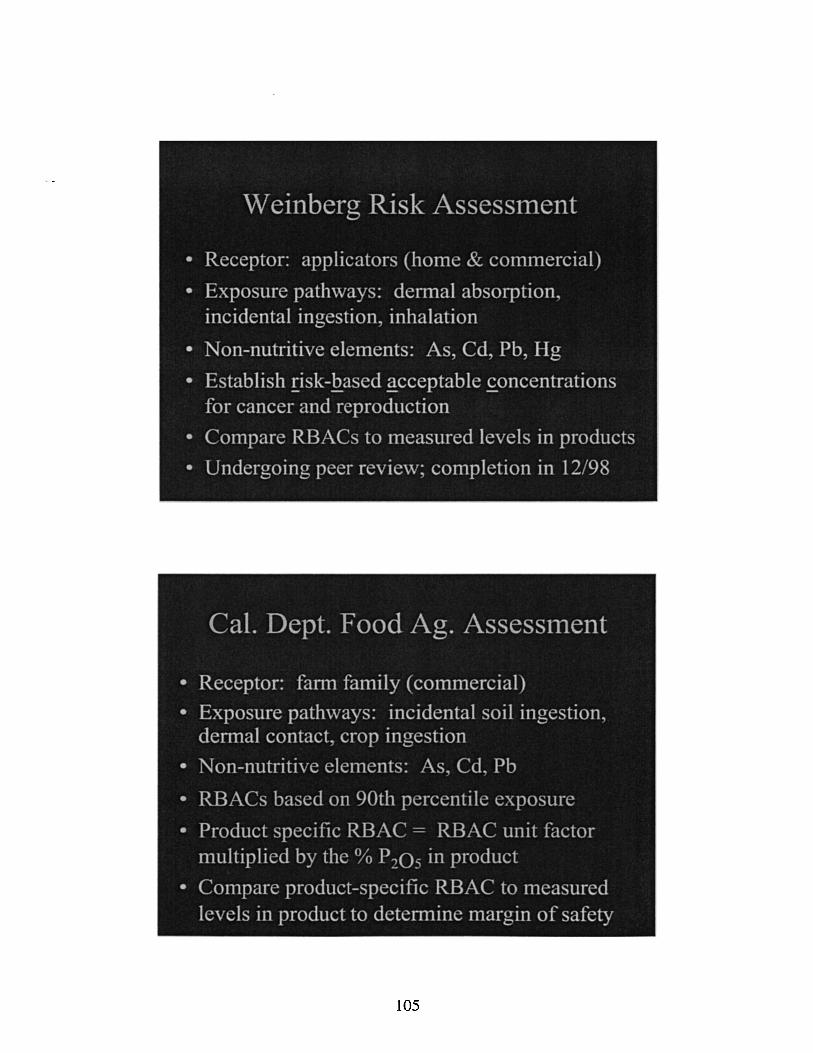
vVeinberg Risk AsseSSlnent '-'
• Receptor: applicators (hOlne L~ cOllllnercial)
• Exposure patlnvays: dennal absorption, incidental ingestion, inhalation
'-
• Non-nutritive elclnents: As, Cd, Pb, Hg
• Establish risk-based acceptable concentrations for cancer and reproduction
• Compare RBACs to Ineasured levels in products
• Undergoing peer revie\v~ conlpletion in 12/98
Cal. Dept. Food Ag. AsseSSlnent
• Receptor: fann fanlily (colnnlercial)
• Exposure pathways: incidental soil ingestion, dennal contact, crop ingestion
• Non-nutritive elelllents: As, Cd. Pb
• RBACs based 011 90th percentile exposure
• Product specific RBAC = RBAC unit Llctor nlliitiplied by thc (~/ ;) P20=, in product
• COlllparc product-specific RBAC to lllcasurcd levels in product to detemline nlargin of safety
105
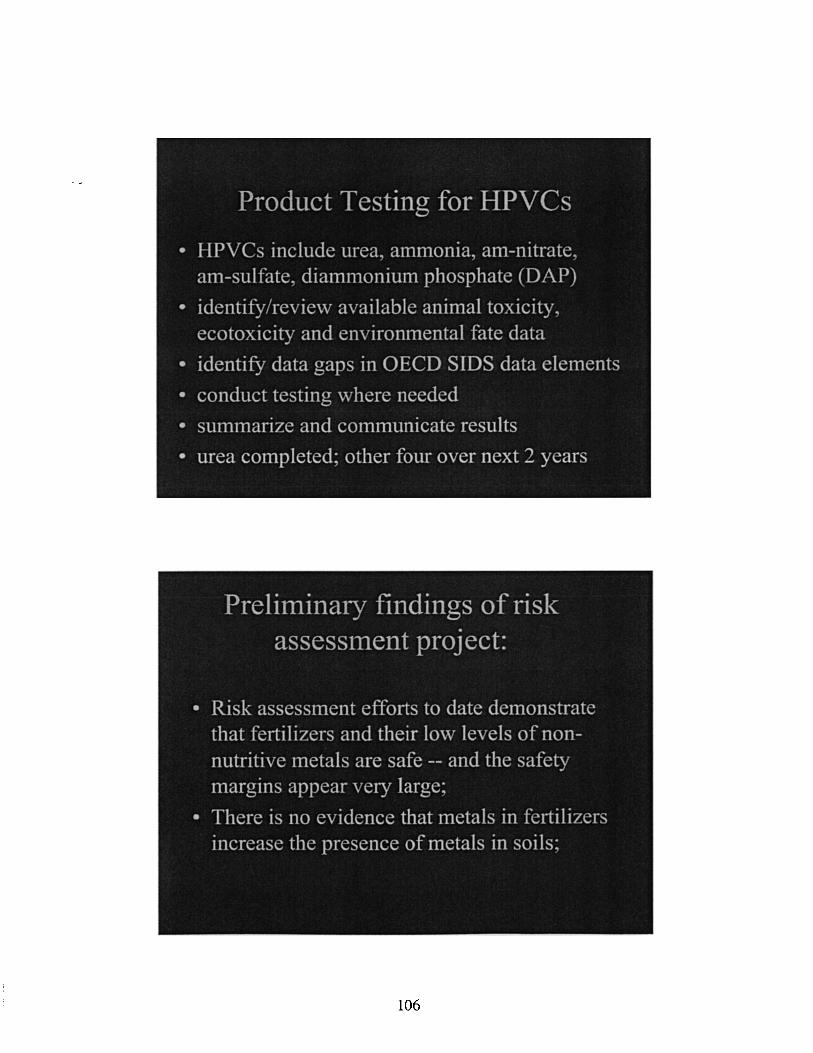
Product Testing for HPVCs '--'
• IIPVCs include urea. amnlonia, anl-nitrate. (lIn-suI fate. diaInmonium phosphate (DAP)
• identifv/revie\v available animal toxicitv. ~ ~
ecotoxicity and enviromnental fate data
• identify data gaps in GECD SIDS data clements
• conduct testing where needed
• sUInInarize and cOIllnlunicate results
• urea cOInpleted~ other four over next 2 years
Prelin1inary findings of risk aSSeSS111ent project:
• Risk asseSSlnent efforts to date deillonstrate that fertilizers and their low levels of nonnutritive Inetais arc safe -- and the safety
~
lnargins appear very large:
• There is no evidence that lnctals in fertilizers increase the presence of metals in soi Is:
106
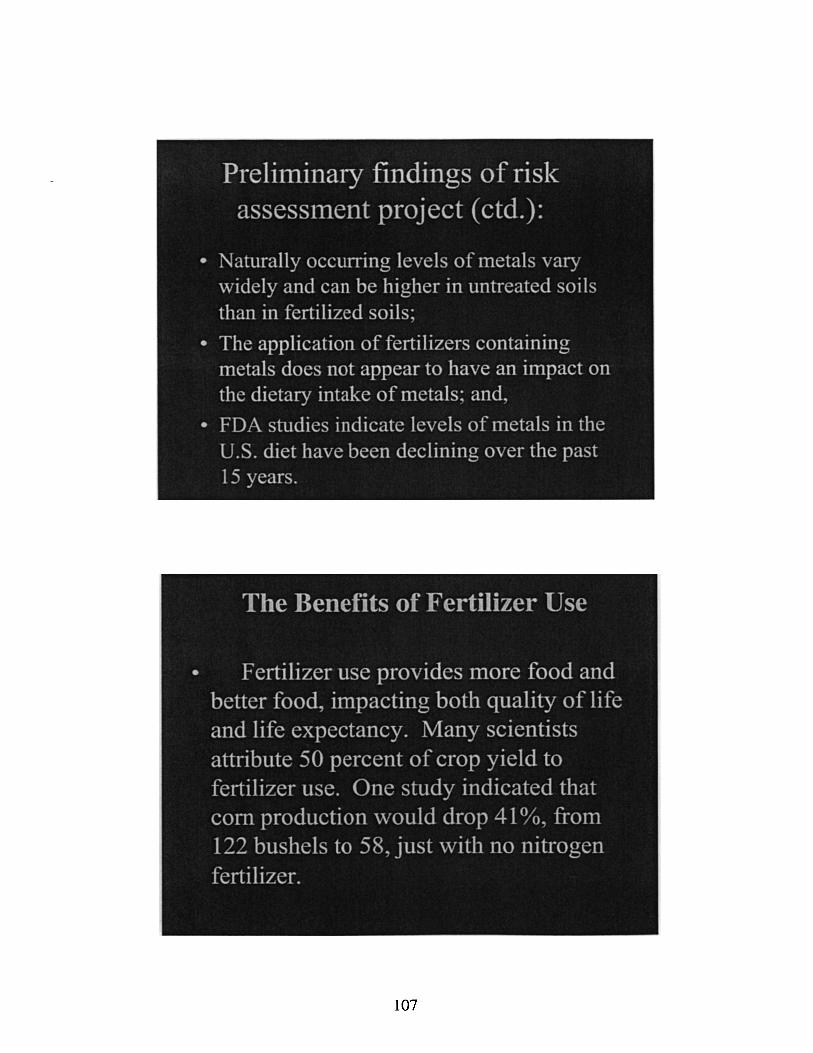
Prelilninary findings of risk asseSSlnent project (ctd.):
• Naturally (Kcun'ing levels of lnetals vary \vidcly and can be higher in untreated soils than in fertilized soils~
• The application of fertilizers containing lnetals docs not appear to have an impact on the dietary intake of nletals~ and.
• FDA studies indicate levels of lnetals in the U.S. diet have been declining over the past 15 vears .
.I
The Benefits of Fertilizer Use
• Fertilizer use provides nlore food and better food~ impacting both quality of life and life expectancy. Many scientists attribute 50 percent of crop yield to fertilizer usc. One study indicated that corn production \vould drop 41 (~ ,~). 1'r0l11 122 bushels to 58. just \vith no nitrogen
fertilizer.
107
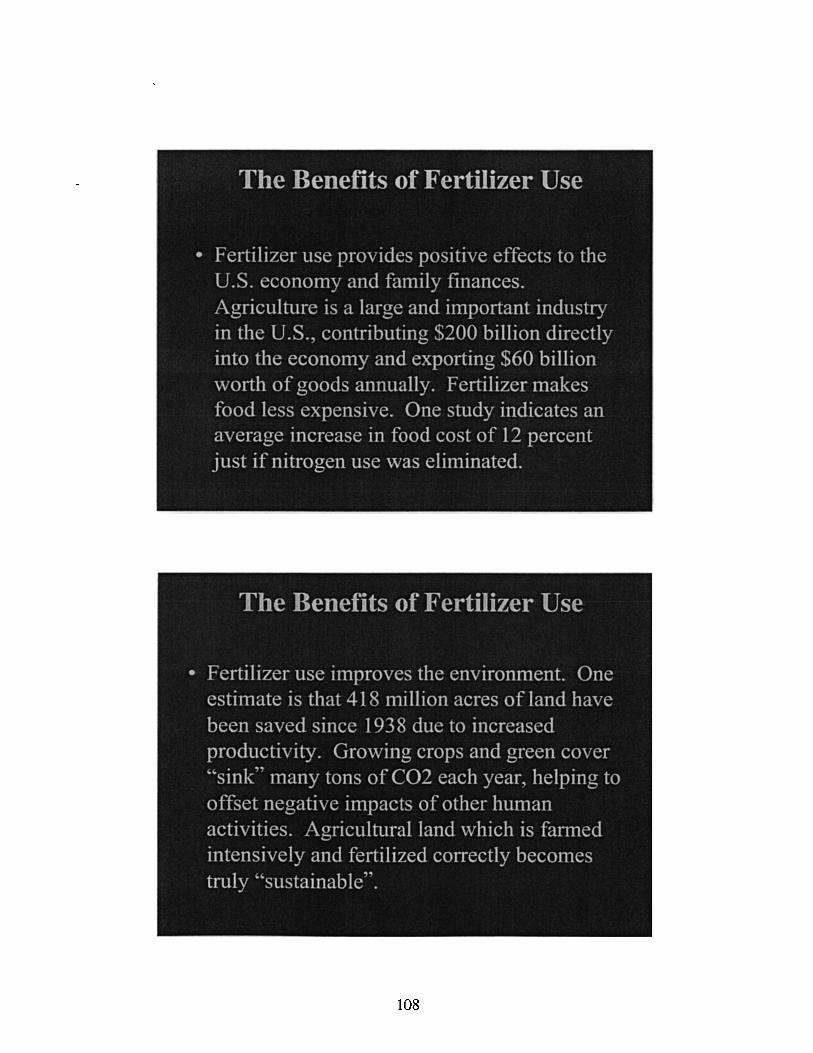
The Benefits of Fertilizer Use
• Fertilizer usc provides positive effects to the U.S. eConOlllV and familv finances .
.; "' Agriculture is a large and iIllportant industry in the U.S., contributing S200 billion directly into the econonlY and exporting S60 billion worth of goods annually. Fertilizer 1l1akes food less expensive. One study indicates an average increase in food cost of 12 percent just if nitrogen use \vas el inlinated.
l'he Benefits of Fertilizer Use
• Fertilizer use iInproves the environnlent. One estiInate is that 41 X nlillion acres of land have
been saved since 1938 due to increased productivity. Growing crops and green cover "sink" Inany tons of C02 each year. helping to
offset negative inlpacts of other hunlan activities. Agricultural land which is f~lnlled intensively and fertilized correctly becolllcs truly "sustainable"".
108
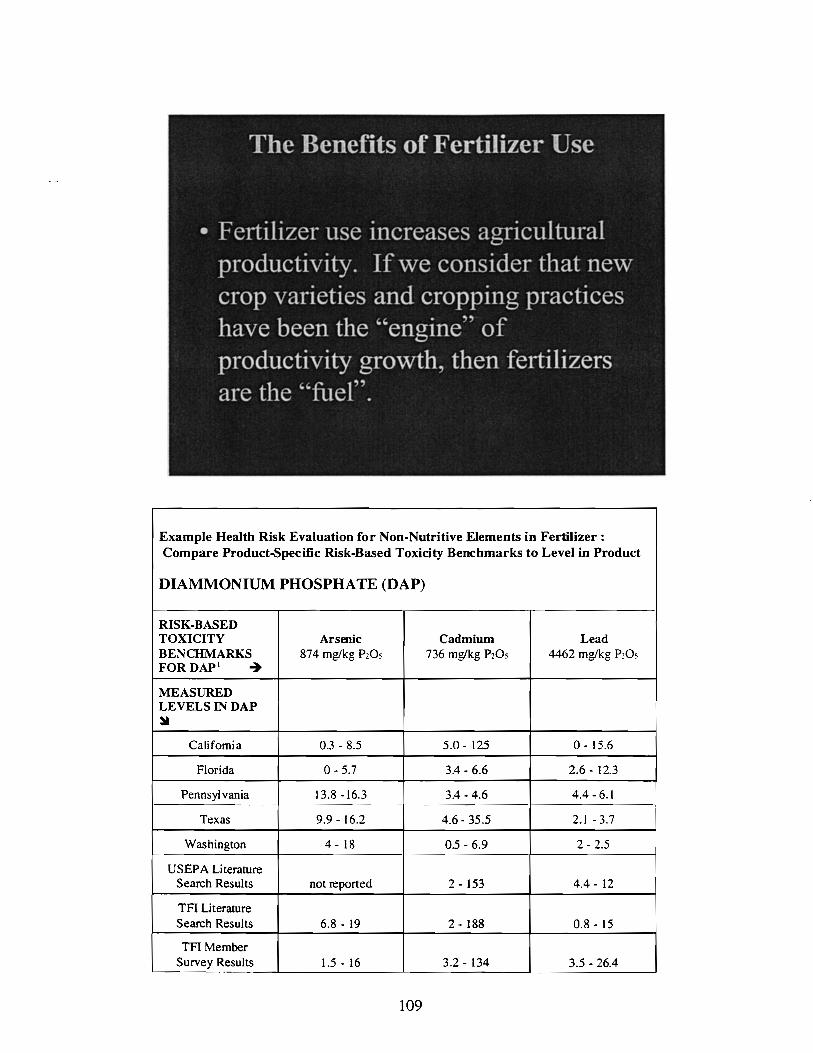
The Benefits of Fertilizer Use
• Fertilizer use increases agricultural productivity. If \ve consider that new crop varieties and cropping practices have been the ""engine" of productivity growth, then fertilizers are the ""fuel".
Example Health Risk Evaluation for Non-Nutritive Elements in Fertilizer: Compare Product-Specific Risk-Based Toxicity Benchmarks to Level in Product
DIAMMONIUM PHOSPHATE (DAP)
RISK-BASED TOXICITY Arsenic Cadmium Lead BENCHMARKS 874 mg/kg PzOs 736 mg/kg PzOs 4462 mg/kg Pl0S FORDAP 1 -+ MEASURED LEVELS IN DAP ~
California OJ - 8.5 5.0 - 125 0-15.6
Florida 0-5.7 3.4 - 6.6 2.6 - 12.3
Pennsyl vania 13.8-16.3 3.4 - 4.6 4.4 - 6.1
Texas 9.9 - 16.2 4.6- 35.5 2.1 - 3.7
Washington 4 - 18 0.5 - 6.9 2 - 2.5
USEP A Literature Search Results not reported 2 - 153 4.4 - 12
TFI Literature Search Results 6.8 - 19 2 - 188 0.8 - 15
TFI Member Survey Results 1.5 - 16 3.2 - 134 3.5 - 26.4
109
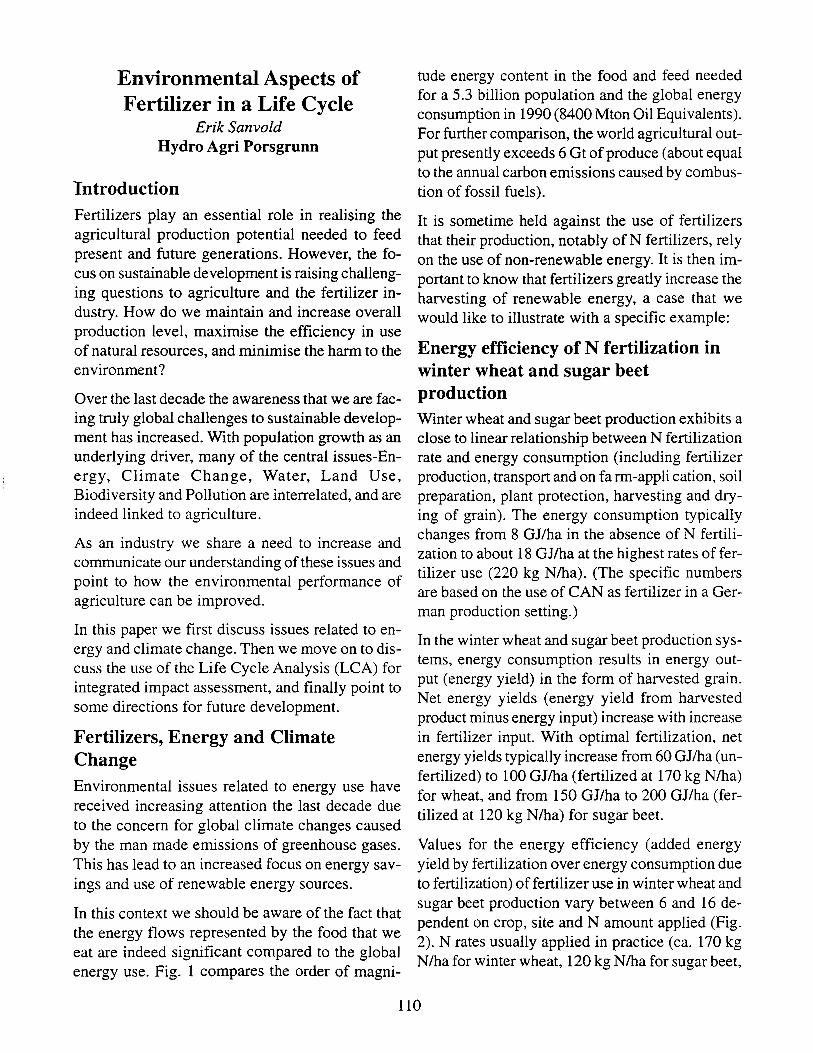
Environmental Aspects of Fertilizer in a Life Cycle
Erik San voId Hydro Agri Porsgrunn
Introduction Fertilizers play an essential role in realising the agricultural production potential needed to feed present and future generations. However, the focus on sustainable development is raising challenging questions to agriculture and the fertilizer industry. How do we maintain and increase overall production level, maximise the efficiency in use of natural resources, and minimise the harm to the environment?
Over the last decade the awareness that we are facing truly global challenges to sustainable development has increased. With population growth as an underlying driver, many of the central issues-Energy, Climate Change, Water, Land Use, Biodiversity and Pollution are interrelated, and are indeed linked to agriculture.
As an industry we share a need to increase and communicate our understanding of these issues and point to how the environmental performance of agriculture can be improved.
In this paper we first discuss issues related to energy and climate change. Then we move on to discuss the use of the Life Cycle Analysis (LCA) for integrated impact assessment, and finally point to some directions for future development.
Fertilizers, Energy and Climate Change Environmental issues related to energy use have received increasing attention the last decade due to the concern for global climate changes caused by the man made emissions of greenhouse gases. This has lead to an increased focus on energy savings and use of renewable energy sources.
In this context we should be aware of the fact that the energy flows represented by the food that we eat are indeed significant compared to the global energy use. Fig. 1 compares the order of magni-
tude energy content in the food and feed needed for a 5.3 billion population and the global energy consumption in 1990 (8400 Mton Oil Equivalents). For further comparison, the world agricultural output presentl y exceeds 6 Gt of produce (about equal to the annual carbon emissions caused by combustion of fossil fuels).
It is sometime held against the use of fertilizers that their production, notably ofN fertilizers, rely on the use of non-renewable energy. It is then important to know that fertilizers greatly increase the harvesting of renewable energy, a case that we would like to illustrate with a specific example:
Energy efficiency of N fertilization in winter wheat and sugar beet production Winter wheat and sugar beet production exhibits a close to linear relationship between N fertilization rate and energy consumption (including fertilizer production, transport and on fa rm-appli cation, soil preparation, plant protection, harvesting and drying of grain). The energy consumption typically changes from 8 GJlha in the absence of N fertilization to about 18 GJlha at the highest rates of fertilizer use (220 kg Nlha). (The specific numbers are based on the use of CAN as fertilizer in a German production setting.)
In the winter wheat and sugar beet production systems, energy consumption results in energy output (energy yield) in the form of harvested grain. Net energy yields (energy yield from harvested product minus energy input) increase with increase in fertilizer input. With optimal fertilization, net energy yields typically increase from 60 GJlha (unfertilized) to 100 GJlha (fertilized at 170 kg Nlha) for wheat, and from 150 GJlha to 200 GJlha (fertilized at 120 kg Nlha) for sugar beet.
Values for the energy efficiency (added energy yield by fertilization over energy consumption due to fertilization) of fertilizer use in winter wheat and sugar beet production vary between 6 and 16 dependent on crop, site and N amount applied (Fig. 2). N rates usually applied in practice (ca. 170 kg Nlha for winter wheat, 120 kg Nlha for sugar beet,
llO
giving optimal farm economy) result in energy efficiency values of 8 and 11, respectively.
That means, the additional energy yield due to these N rates is 8 and 11 times higher than the energy consumed in the use of the N fertilizer (production, transport and application). Fertilization is indeed a very efficient way of increasing our harvesting of renewable energy!
Fertilizers and Climate Change
Although the present concerns about the effect of man made greenhouse gas emissions are primarily linked to the combustion of fossil fuels for energy purposes, agriculture does play an important role. Agriculture is linked to climate issues through C02 emissions from use of fossil fuels-, N20 emissions from denitrification processes and production of nitrate fertilizers; C02 emissions or uptake from land use changes (forest area and soil organic matter changes); and CH4 emissions from animal husbandry.
Here we will discuss greenhouse gas emissions linked to fertilizer use. The product related emissions are dominated by production and use of nitrogen fertilizers-
Nitrogen is by far the most important plant nutrient by volume and therefore gives the largest on farm energy consumption. Production of nitrogen fertilizers requires substantial energy input. Furthermore, N20 is a potent greenhouse gas (its global warming potential is 310 times that of C02 on a weight basis) and is emitted during production and use of nitrogen fertilzers.
Typical emission values for ammonium nitrate and urea are summarised in table 1.
N20 emissions are among the gases included in the Climate Convention (Kyoto protocol), and we should expect pressure to develop production technologies allowing reduction of N20 emissions.
The higher N20 emission for AN is linked to the production of nitric acid. The values for the N20 emissions from agriculture in table 1 are approximate, average numbers based on the estimate used by the International Panel on Climate Change
(IPCC) that 1.25 % of the applied nitrogen is lost as N20.
Table 1 supports a crude estimate of 10 ton C02 equivalents emitted for every ton of nitrogen produced and used in agriculture. The total global emissions related to nitrogen fertilizers can then be estimated to 1 Gton C02 equivalents annually (about 90 million tons of N produced annually).
This is a significant, but not frightening number given the importance of fertilizers for food production. We should, however, be aware that the full magnitude of N20 emissions from the intensified nitrogen cycle may not be known. As illustrated in figure 3, N20 is formed by denitrification, the process by which nitrogen leaves the Ncycle as N2 or N20. The N201N2 ratio might be as high as 10 %, leading to possible long term N20 emissions higher than present estimates. If that is the case, meeting the IPCC reduction targets for greenhouse gas emissions and at the same time feeding the world might be a difficult challenge.
The need for intensive agriculture to produce enough food does gives environmental challenges beyond global warming. To obtain a data based and balanced view (allowing discussion of priorities) of the challenges facing agriculture, an integrated assessment of environmental impacts is needed. In the following chapter, we describe the use of Life Cycle Analysis for this purpose.
Integrated Impact Assessment using Life Cycle Analysis
The Eco-indicator methodology Life Cycle Analysis (LCA) should be done according to accepted SETAC (Society of Environmental Toxicology and Chemistry) guidelines. In this paper, we use the Eco-indicator 95 methodology to obtain an integral environmental impact assessment of different farming practices. However, the depletion of energy resources is an important aspect relevant in agriculture and to the fertilizer industry and is not included in the Eco-indicator. Therefore , following the principles of the Ecoindicator 95, a framework for including the depletion of energy resources was developed.
III
The Eco-indicator methodology is being used to compare and evaluate the environmental impacts of different fertilization strategies in winter wheat production. The Eco-indicator 95 method is a procedure in four steps. Step 1 and 2 are illustrated in _~gure 4.
The first step, the inventory is a listing of all emissions and resources used in a production system. The second step, the aggregation (characterisation) is to group the emissions into impacts categories using equivalence factors, which quantify their contribution to the respective impact (Fig. 4). The higher the equivalence factor, the higher is the contribution of an emission to the respective impact category.
In the third step, the normalisation, the contribution of each impact score to the value of the respective total impact score in Europe (in this case) is examined. This is done by dividing each impact score of the product or system under consideration by the total impact score produced by one average European person during one year (Table 2). The result is a normalised dimensionless score for each impact.
However, the normalised impact scores say little about the potential of the different impact categories to harm the environment. Therefore, in the fourth step called evaluation, the normalised impact scores are multiplied by a weighing or evaluation factor (table 3) to obtain so-called Eco-indicator values for each impact.
In this evaluation the distance-to-target method is used to establish weighing factors for the normalised impact scores. Distance to target means the distance between the current level and a target level of an impact. The target level of an impact category represents an acceptable maximum level of impairment to ecosystems and human health according to scientific knowledge. Table 3 gives the weighing factors used for each impact.
The result of this evaluation procedure is an Ecoindicator score for each impact category. As these scores are dimensionless they can be summed up to represent the total Eco-indicator score for a system. A high impact score in a category is the com-
bination of two effects: The system studied has a large relative contribution to the impact category in question, and the distance to the target level for the impact category is large.
The strength of this method is that it allows an integrated assessment and comparison of environmental impacts. However, while step one, two and three (inventory list, aggregation and normalisation) are fairly objective, step four (evaluation using weighing factors) is quite subjective. Opinions about target level for impact categories will vary with time, as will values for total impact scores in each category (e.g. S02 emissions in Europe have fallen significantly recent years), and so will views on what the important impact categories are. This analysis does, for instance, not include effects on land area use and water use, issues of significant importance in the next century.
Life Cycle Analysis of different fertilizer systems in winter wheat production System definition
Here, we discuss the environmental impact of different fertilizer regimes to produce one ton (functional unit) of winter wheat. As N fertilizers AN, Urea, UAN, NPKlAN and AN/cattle slurry were chosen. The systems are defined to include fertilizer production (raw materials exploration, and fertilizer processing); manufacture of
plant protection substances, seeds and farm machinery; packaging; transportation and agriculture itself (on-farm activities, i.e. soil preparation, fertilizer application, plant protection, harvesting and drying). For cattle slurry, only emissions and energy use during and after application of cattle slurry is considered.
Important figures for the systems are given in Table 4 and Table 5.
LCAresults The result of aggregating the environmental effects of the different wheat production systems (defined by fertilizer type) into impact categories is shown in figure 5. All scores are related to one ton of grain produced.
112
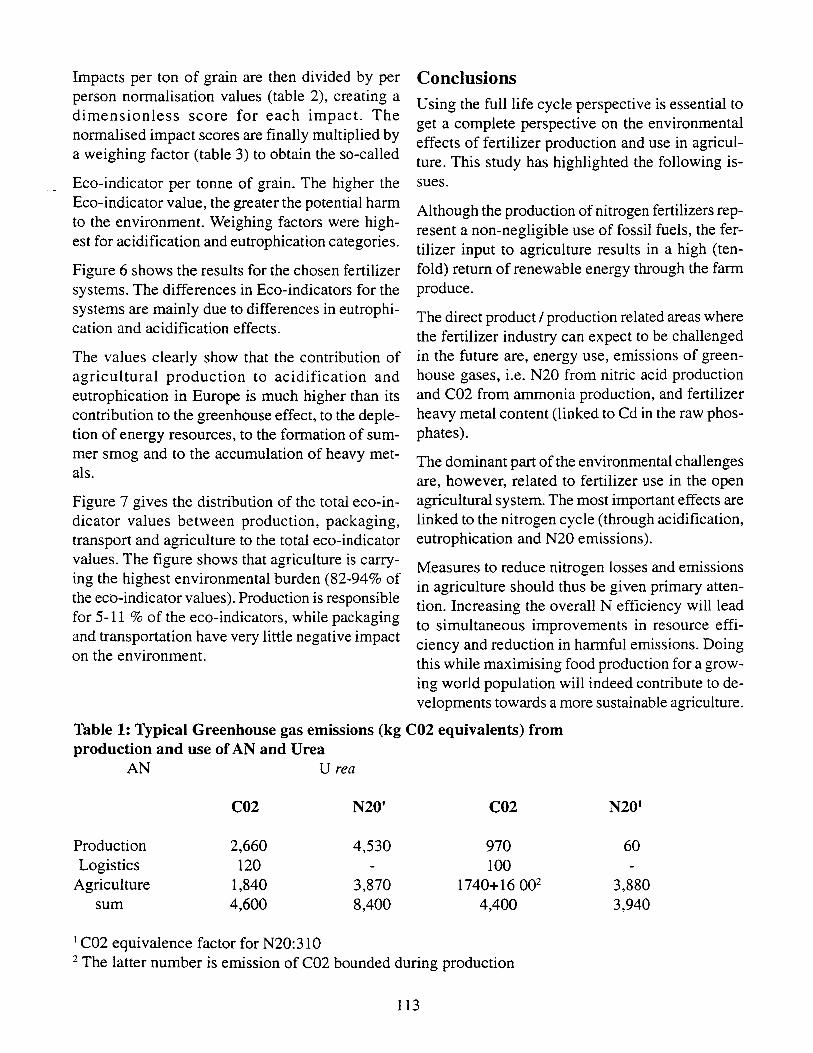
Impacts per ton of grain are then divided by per person normalisation values (table 2), creating a dimensionless score for each impact. The normalised impact scores are finally multiplied by a weighing factor (table 3) to obtain the so-called
Eco-indicator per tonne of grain. The higher the Eco-indicator value, the greater the potential harm to the environment. Weighing factors were highest for acidification and eutrophication categories.
Figure 6 shows the results for the chosen fertilizer systems. The differences in Eco-indicators for the systems are mainly due to differences in eutrophication and acidification effects.
The values clearly show that the contribution of agricultural production to acidification and eutrophication in Europe is much higher than its contribution to the greenhouse effect, to the depletion of energy resources, to the formation of summer smog and to the accumulation of heavy metals.
Figure 7 gives the distribution of the total eco-indicator values between production, packaging, transport and agriculture to the total eco-indicator values. The figure shows that agriculture is carrying the highest environmental burden (82-94% of the eco-indicatorvalues). Production is responsible for 5-11 % of the eco-indicators, while packaging and transportation have very little negative impact on the environment.
Conclusions Using the full life cycle perspective is essential to get a complete perspective on the environmental effects of fertilizer production and use in agriculture. This study has highlighted the following issues.
Although the production of nitrogen fertilizers represent a non-negligible use of fossil fuels, the fertilizer input to agriculture results in a high (tenfold) return of renewable energy through the farm produce.
The direct product I production related areas where the fertilizer industry can expect to be challenged in the future are, energy use, emissions of greenhouse gases, i.e. N20 from nitric acid production and C02 from ammonia production, and fertilizer heavy metal content (linked to Cd in the raw phosphates).
The dominant part of the environmental challenges are, however, related to fertilizer use in the open agricultural system. The most important effects are linked to the nitrogen cycle (through acidification, eutrophication and N20 emissions).
Measures to reduce nitrogen losses and emissions in agriculture should thus be given primary attention. Increasing the overall N efficiency will lead to simultaneous improvements in resource efficiency and reduction in harmful emissions. Doing this while maximising food production for a grow-ing world population will indeed contribute to developments towards a more sustainable agriculture.
Table 1: Typical Greenhouse gas emissions (kg C02 equivalents) from production and use of AN and Urea
AN Urea
CO2 N20' CO2 N201
Production 2,660 4,530 970 60 Logistics 120 100
Agriculture 1,840 3,870 1740+16002 3,880 sum 4,600 8,400 4,400 3,940
I C02 equivalence factor for N20:31 0 2 The latter number is emission of C02 bounded during production
113
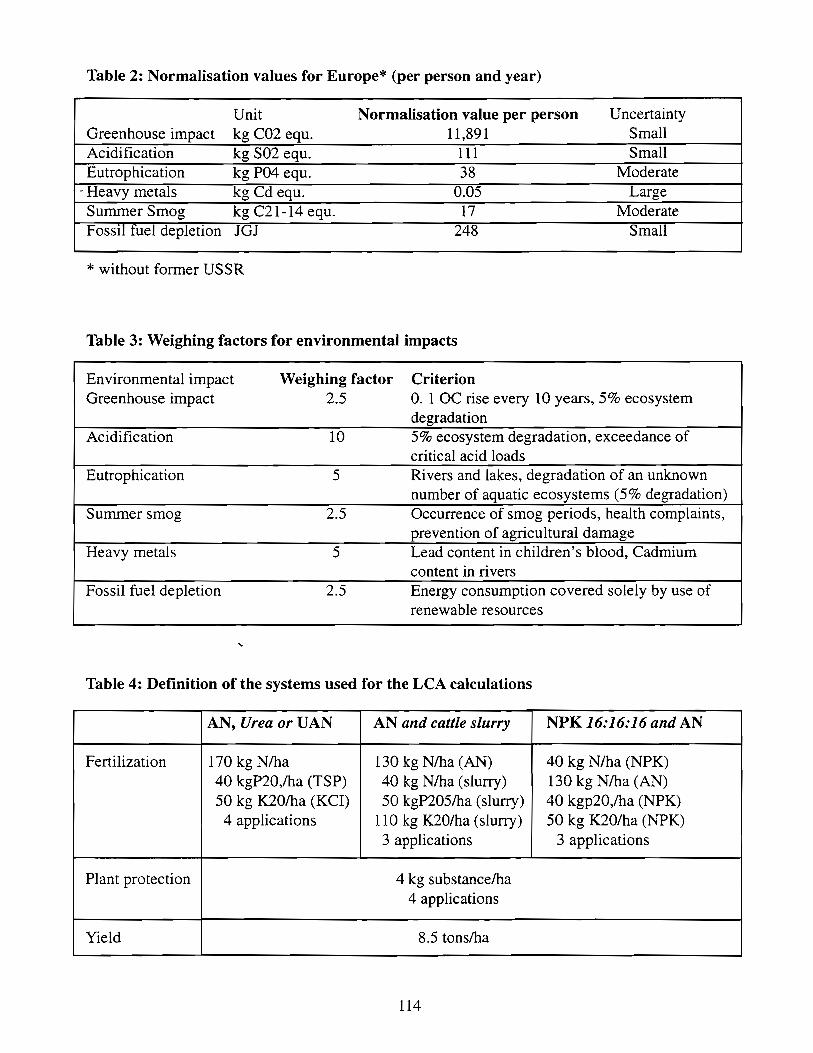
Table 2: Normalisation values for Europe* (per person and year)
Unit Normalisation value per person Uncertainty Greenhouse impact kg C02 equ. 11,891 Small Acidification kg S02 equ. III Small Eutrophication kg P04 equ. 38 Moderate
- Heavy metals kg Cd equ. 0.05 Large Summer Smog kg C21-14 equ. 17 Moderate Fossil thel depletion JGJ 248 Small
* without former USSR
Table 3: Weighing factors for environmental impacts
Environmental impact Weighing factor Criterion Greenhouse impact 2.5 O. 1 OC rise every 10 years, 5% ecosystem
degradation Acidification 10 5% ecosystem degradation, exceedance of
critical acid loads Eutrophication 5 Rivers and lakes, degradation of an unknown
number of aquatic ecosystems (5% degradation) Summer smog 2.5 Occurrence of smog periods, health complaints,
prevention of agricultural damage Heavy metals 5 Lead content in children's blood, Cadmium
content in rivers Fossil fuel depletion 2.5 Energy consumption covered solely by use of
renewable resources
Table 4: Definition of the systems used for the LCA calculations
AN, Urea or VAN AN and cattle slurry NPK 16:16:16 and AN
Fertilization 170 kg Nlha 130 kg Nlha (AN) 40 kg Nlha (NPK) 40 kgP20,lha (TSP) 40 kg Nlha (slurry) 130 kg Nlha (AN) 50 kg K201ha (KCI) 50 kgP205lha (slurry) 40 kgp20,lha (NPK)
4 applications 110 kg K201ha (slurry) 50 kg K201ha (NPK) 3 applications 3 applications
Plant protection 4 kg substancelha 4 applications
Yield 8.5 tonslha
114
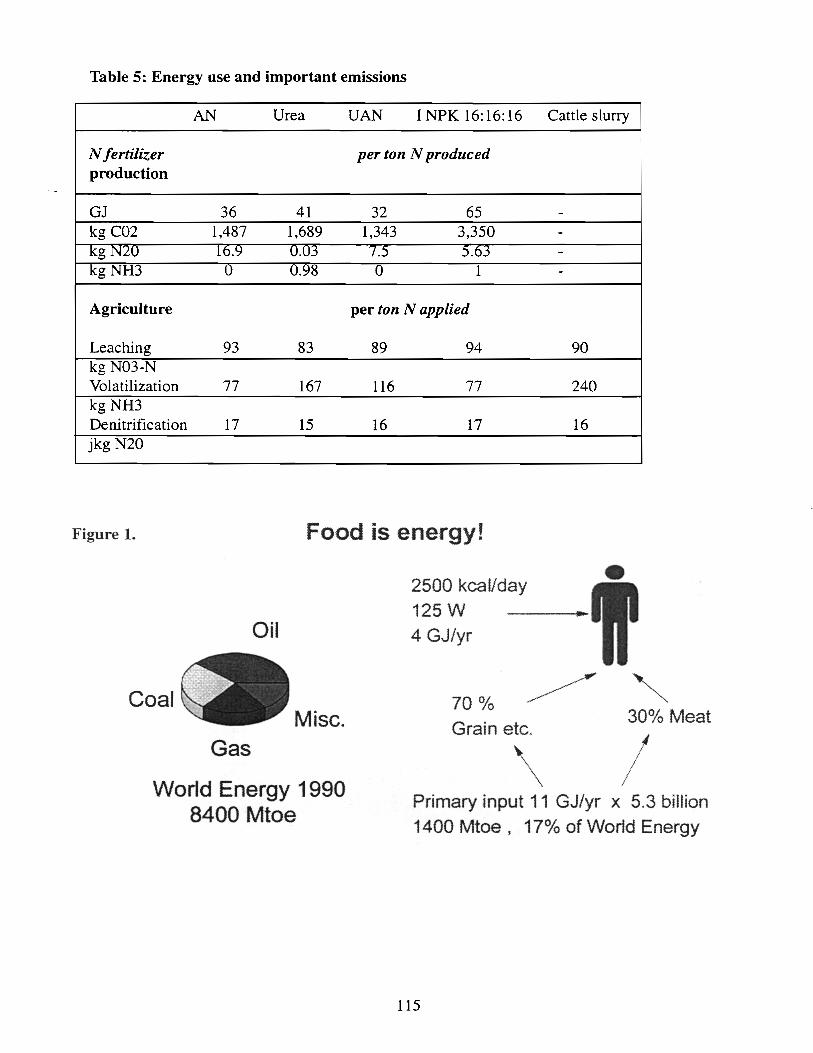
Table 5: Energy use and important emissions
AN Urea UAN I NPK 16: 16: 16 Cattle slurry
N fertilizer per ton N produced production
GJ 36 41 32 65 -kg C02 1,487 1,689 1,343 3,350 -lCgN20 lo.~ U.U3 -1.5 5.03 -kgNH3 0 0.98 0 1 -
Agriculture per ton N applied
Leaching 93 83 89 94 90 kg N03-N Volatilization 77 167 116 77 240 kgNH3 Denitrification 17 15 16 17 16 jkg N20
Figure 1. Food is energy!
Oil
Coal Misc.
Gas
World Energy 1990 8400 Mtoe
2500 kcal/day 125W 4 GJ/yr
• ..
30% Meat Grain etc.
\ ,/1
70 G/o
\\ / Primary input 11 GJ/yr x 5.3 billion 1400 Mtoe, 17% of World Energy
115
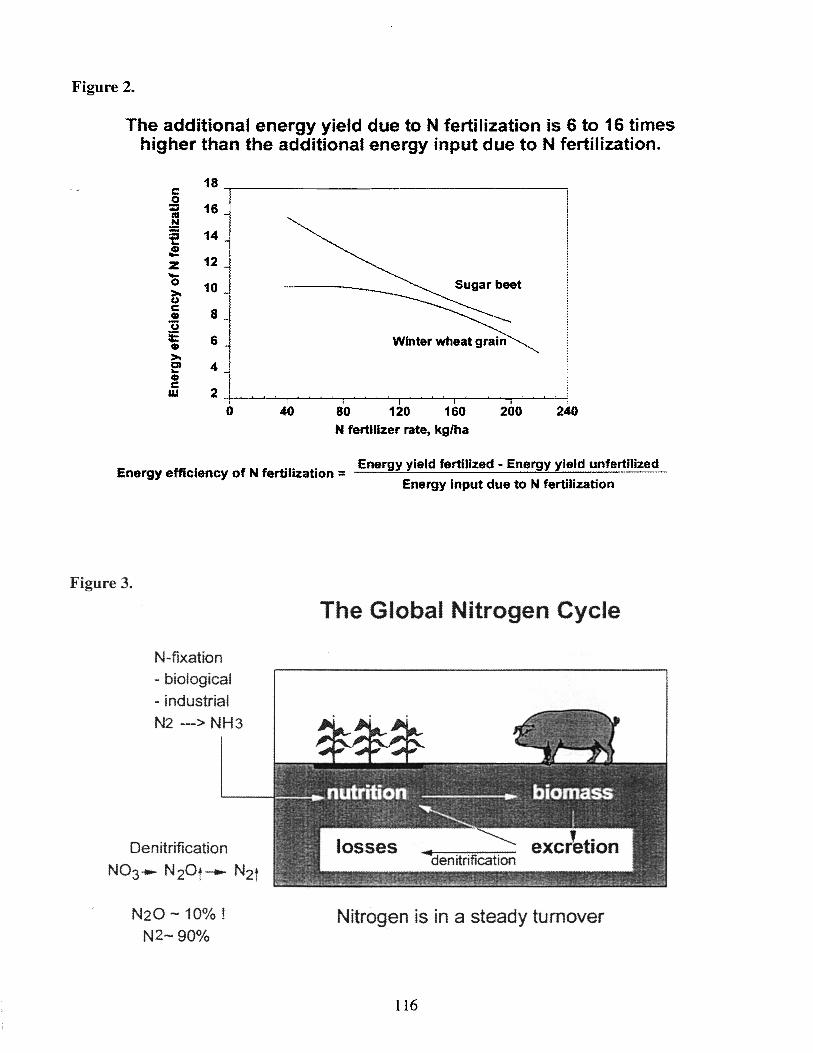
Figure 2.
The additional energy yield due to N fertilization is 6 to 16 times higher than the additional energy input due to N fertilization.
18 c
16 ~ 0 ;::
~ :e 141 .! z 12 ~ - 10 I 0
~ c 8 Q)
U :e 6 Q)
>-2' 4 Q) c w 2 , ,
0 40 80 120 160 200 240
N fertilizer rate, kg/ha
Energy efficiency of N fertilization = ~E:.:...;n.::...er-",g~Y.oLy.::...ie.::...ld.::...fe.::...rt.::...i:.:...;liz_e:.:...;d_._E_n.::...erg~Y.Ly_ie_ld_u_n_fertmz~_<!_ Energy Input due to N fertilization
Figure 3.
N-fixation - biological - industrial N2 ---> NH3
Denitrification
N03'" N20 t---- N2t
N20-10% ! N2-90%
The Global Nitrogen Cycle
Nitrogen is in a steady turnover
116
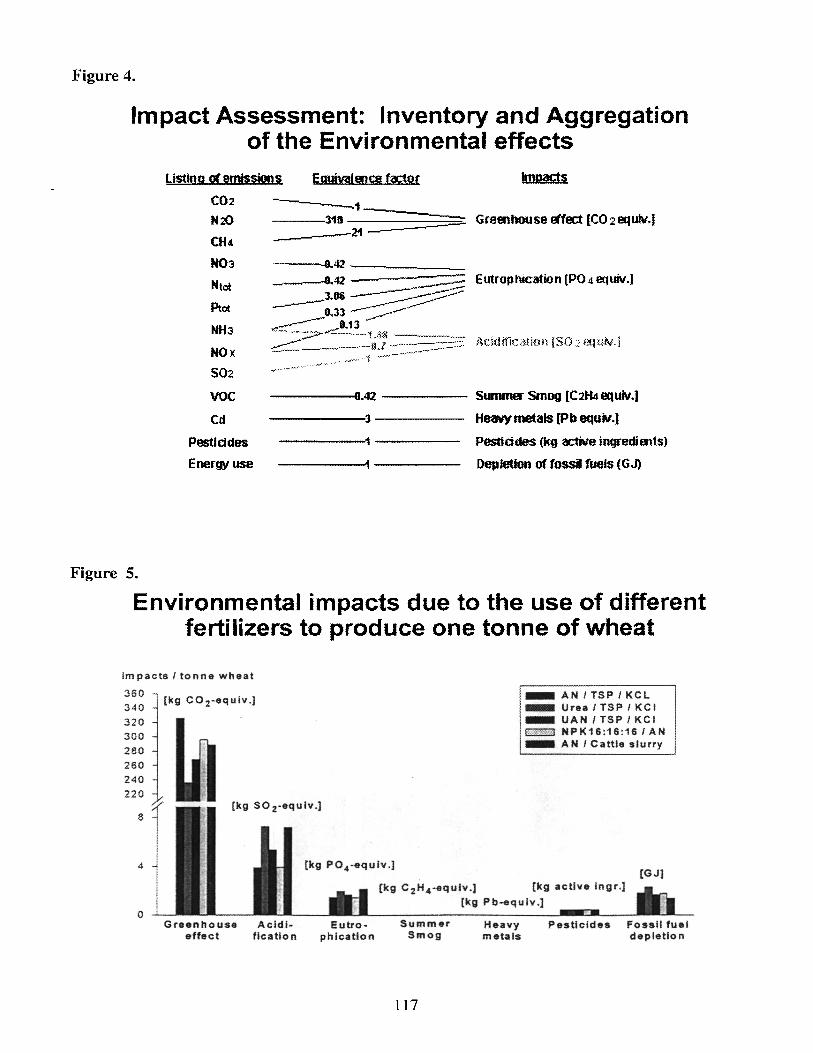
Figure 4.
Impact Assessment: Inventory and Aggregation of the Environmental effects
Figure 5.
listing of emissions Egyiwlence foctor Impacts
C02
N~
CH4 N03
Ntot
Ptot
NH3
NOx
S02
VOC
Cd
Pestiddes
Energy use
Greenhouse effect [CO 2 equlv.)
-----0.42 ----- Summer Smog [C2H4equiv.]
-----:3 Heavy metals [Pb equiv.]
------'1 Pestlddes (kg active ingredimts)
-----'1 Depletion of fossil fuejs (GJ)
Environmental impacts due to the use of different fertilizers to produce one tonne of wheat
Impacts I tonne wheat
360 . 340 [kg COz-equiv.]
320 300 280 260 240 220
(kg SOz-equlv .] 8
4 [kg PO.-equlv .]
!_ AN I TS·P IKCL 1_ Urea/TSP/KCI 1- UAN ITSPIKCI j .,,,,,,",,"1 NPK16 :16:16 I AN 1_ A N I Cattle slurry
(kg C zH4 -equlv .] [kg active ingr.] [GJ]
o Greenhouse Acld!- Eutro- Summer
effect flcation phlcatlon Smog
117
[kg Pb-equ i v .]
Heavy metals
Pesticides Fossil fuel depletion
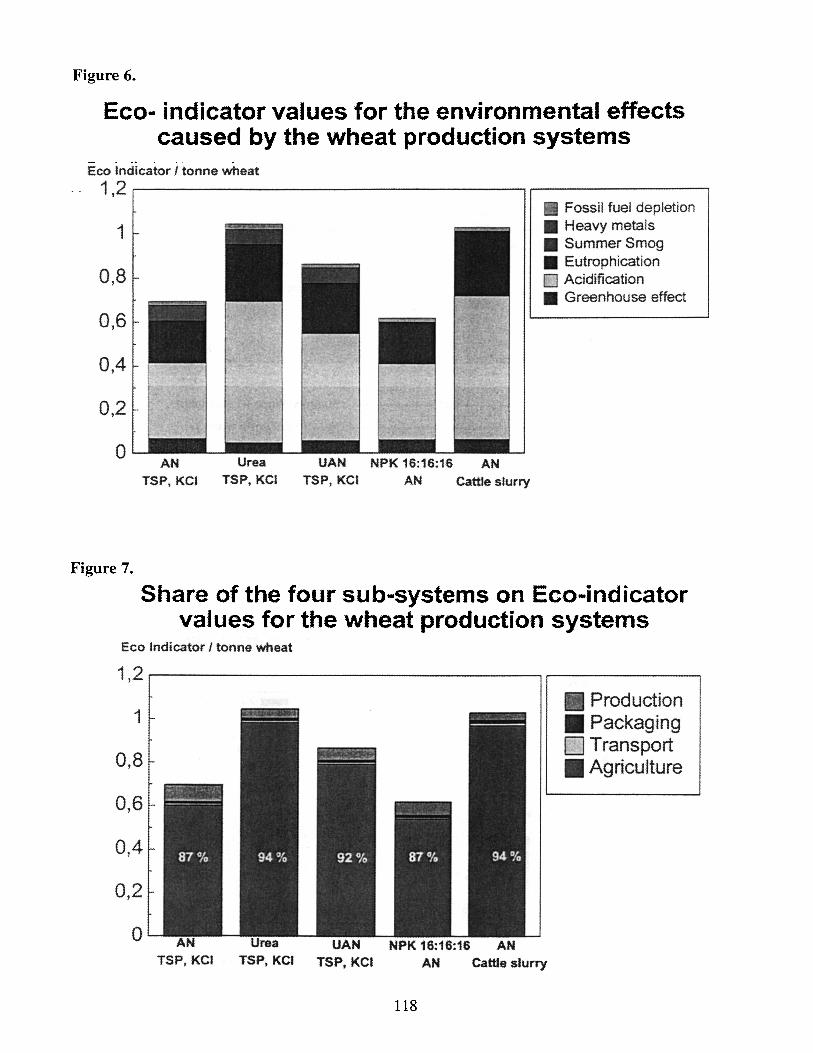
Figure 6.
Eco- indicator values for the environmental effects caused by the wheat production systems
- . _. . -
Eco Indicator I tonne wheat -- 1,2 ,--------------------, ,..----------,
1
0,8
06 ,
0,4
0,2
°
Figure 7.
AN TSP, KCI
Urea TSP, KCJ
UAN NPK 16:16:16 AN TSP, KCI AN Cattle slurry
Fossil fuel depletion • Heavy metals • Summer Smog • Eutrophication o Acidification • Greenhouse effect
Share of the four sub-systems on Eco-indicator values for the wheat production systems
Eco Indicator I tonne wheat
1,2,.--------------------, ...----------,
1
0,8
0,6
0,4
0,2
° TSP, KCl TSP, KCI TSP, KCI Cattle slurry
118
Production • Packaging o Transport • Agriculture
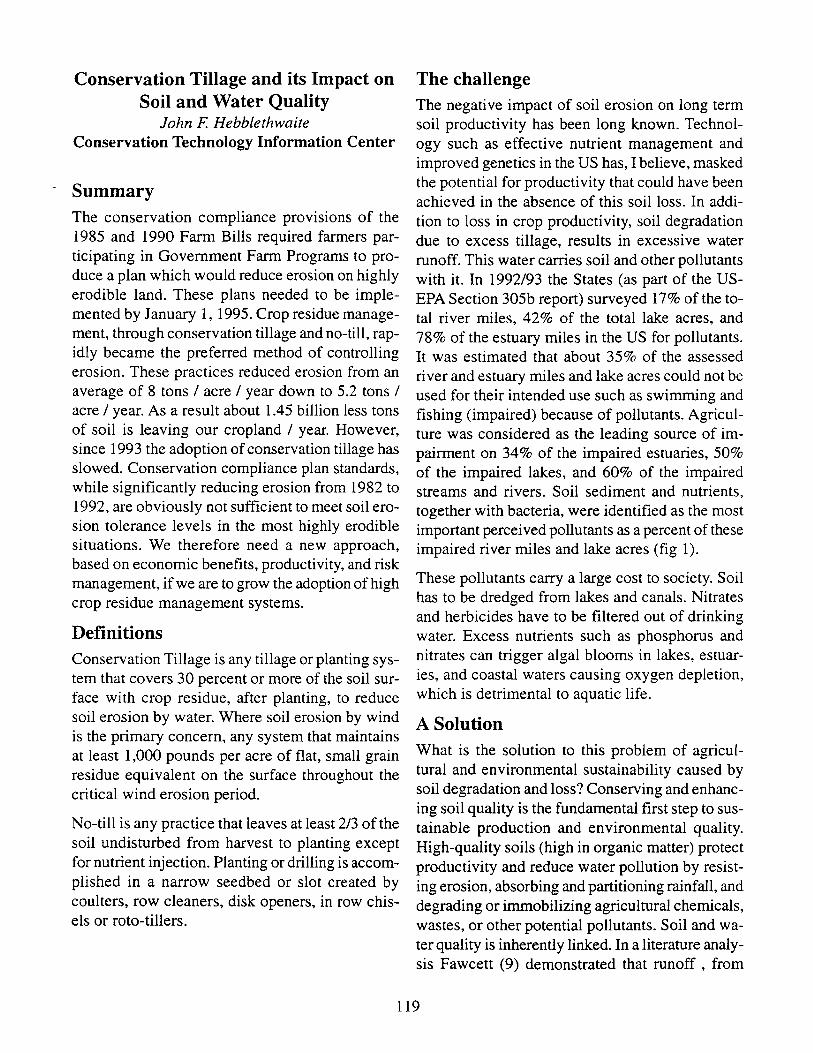
Conservation Tillage and its Impact on Soil and Water Quality
John F. Hebblethwaite Conservation Technology Information Center
. Summary
The conservation compliance provisions of the 1985 and 1990 Farm Bills required farmers participating in Government Farm Programs to produce a plan which would reduce erosion on highly erodible land. These plans needed to be implemented by January 1, 1995. Crop residue management, through conservation tillage and no-till, rapidly became the preferred method of controlling erosion. These practices reduced erosion from an average of 8 tons / acre / year down to 5.2 tons / acre / year. As a result about 1.45 billion less tons of soil is leaving our cropland / year. However, since 1993 the adoption of conservation tillage has slowed. Conservation compliance plan standards, while significantly reducing erosion from 1982 to 1992, are obviously not sufficient to meet soil erosion tolerance levels in the most highly erodible situations. We therefore need a new approach, based on economic benefits, productivity, and risk management, if we are to grow the adoption of high crop residue management systems.
Definitions Conservation Tillage is any tillage or planting system that covers 30 percent or more of the soil surface with crop residue, after planting, to reduce soil erosion by water. Where soil erosion by wind is the primary concern, any system that maintains at least 1,000 pounds per acre of flat, small grain residue equivalent on the surface throughout the critical wind erosion period.
No-till is any practice that leaves at least 2/3 of the soil undisturbed from harvest to planting except for nutrient injection. Planting or drilling is accomplished in a narrow seedbed or slot created by coulters, row cleaners, disk openers, in row chisels or roto-tillers.
The challenge The negative impact of soil erosion on long term soil productivity has been long known. Technology such as effective nutrient management and improved genetics in the US has, I believe, masked the potential for productivity that could have been achieved in the absence of this soil loss. In addition to loss in crop productivity, soil degradation due to excess tillage, results in excessive water runoff. This water carries soil and other pollutants with it. In 1992/93 the States (as part of the USEPA Section 305b report) surveyed 17% of the total river miles, 42% of the total lake acres, and 78% of the estuary miles in the US for pollutants. It was estimated that about 35% of the assessed river and estuary miles and lake acres could not be used for their intended use such as swimming and fishing (impaired) because of pollutants. Agriculture was considered as the leading source of impairment on 34% of the impaired estuaries, 50% of the impaired lakes, and 60% of the impaired streams and rivers. Soil sediment and nutrients, together with bacteria, were identified as the most important perceived pollutants as a percent of these impaired river miles and lake acres (fig 1).
These pollutants carry a large cost to society. Soil has to be dredged from lakes and canals. Nitrates and herbicides have to be filtered out of drinking water. Excess nutrients such as phosphorus and nitrates can trigger algal blooms in lakes, estuaries, and coastal waters causing oxygen depletion, which is detrimental to aquatic life.
A Solution What is the solution to this problem of agricultural and environmental sustainability caused by soil degradation and loss? Conserving and enhancing soil quality is the fundamental first step to sustainable production and environmental quality. High-quality soils (high in organic matter) protect productivity and reduce water pollution by resisting erosion, absorbing and partitioning rainfall, and degrading or immobilizing agricultural chemicals, wastes, or other potential pollutants. Soil and water quality is inherently linked. In a literature analysis Fawcett (9) demonstrated that runoff , from
119
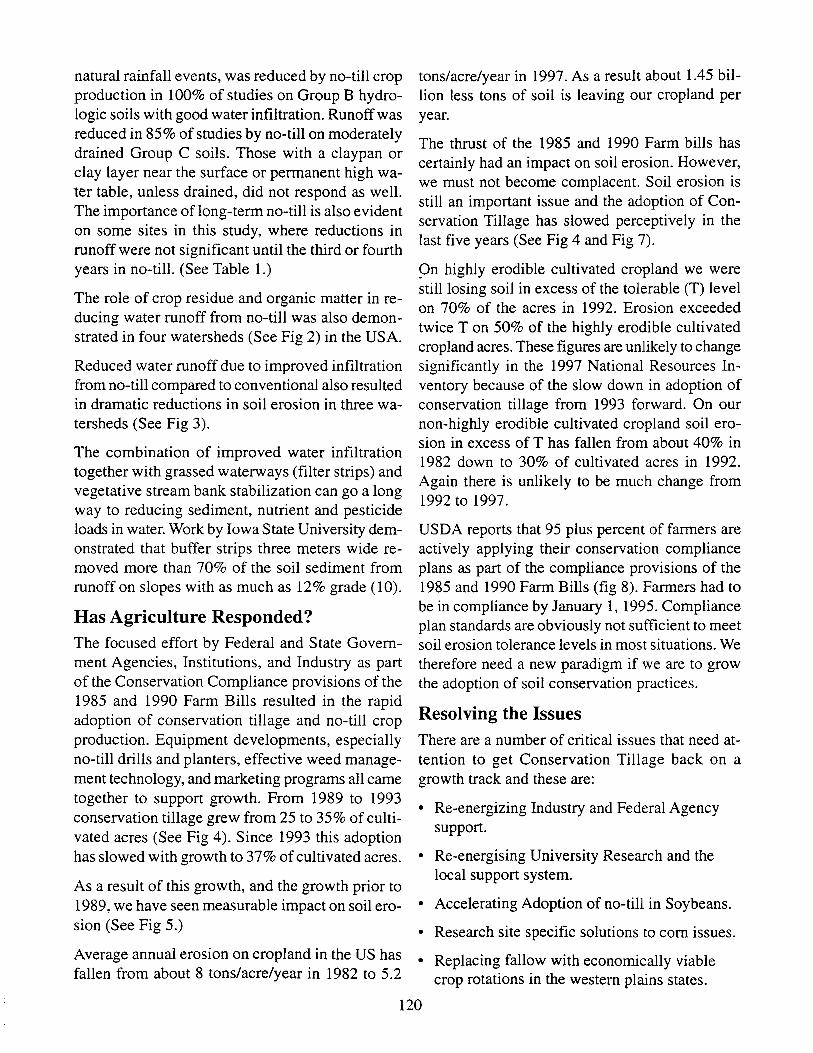
natural rainfall events, was reduced by no-till crop production in 100% of studies on Group B hydrologic soils with good water infiltration. Runoff was reduced in 85% of studies by no-till on moderately drained Group C soils. Those with a claypan or clay layer near the surface or permanent high water table, unless drained, did not respond as well. The importance of long-term no-till is also evident on some sites in this study, where reductions in runoff were not significant until the third or fourth years in no-till. (See Table 1.)
The role of crop residue and organic matter in reducing water runoff from no-till was also demonstrated in four watersheds (See Fig 2) in the USA.
Reduced water runoff due to improved infiltration from no-till compared to conventional also resulted in dramatic reductions in soil erosion in three watersheds (See Fig 3).
The combination of improved water infiltration together with grassed waterways (filter strips) and vegetative stream bank stabilization can go a long way to reducing sediment, nutrient and pesticide loads in water. Work by Iowa State University demonstrated that buffer strips three meters wide removed more than 70% of the soil sediment from runoff on slopes with as much as 12% grade (10).
Has Agriculture Responded? The focused effort by Federal and State Government Agencies, Institutions, and Industry as part of the Conservation Compliance provisions of the 1985 and 1990 Farm Bills resulted in the rapid adoption of conservation tillage and no-till crop production. Equipment developments, especially no-till drills and planters, effective weed management technology, and marketing programs all came together to support growth. From 1989 to 1993 conservation tillage grew from 25 to 35% of cultivated acres (See Fig 4). Since 1993 this adoption has slowed with growth to 37% of cultivated acres.
As a result of this growth, and the growth prior to 1989, we have seen measurable impact on soil erosion (See Fig 5.)
tons/acre/year in 1997. As a result about 1.45 billion less tons of soil is leaving our cropland per year.
The thrust of the 1985 and 1990 Farm bills has certainly had an impact on soil erosion. However, we must not become complacent. Soil erosion is still an important issue and the adoption of Conservation Tillage has slowed perceptively in the last five years (See Fig 4 and Fig 7).
pn highly erodible cultivated cropland we were still losing soil in excess of the tolerable (T) level on 70% of the acres in 1992. Erosion exceeded twice T on 50% of the highly erodible cultivated cropland acres. These figures are unlikely to change significantly in the 1997 National Resources Inventory because of the slow down in adoption of conservation tillage from 1993 forward. On our non-highly erodible cultivated cropland soil erosion in excess of T has fallen from about 40% in 1982 down to 30% of cultivated acres in 1992. Again there is unlikely to be much change from 1992 to 1997.
USDA reports that 95 plus percent of farmers are actively applying their conservation compliance plans as part of the compliance provisions of the 1985 and 1990 Farm Bills (fig 8). Farmers had to be in compliance by January 1, 1995. Compliance plan standards are obviously not sufficient to meet soil erosion tolerance levels in most situations. We therefore need a new paradigm if we are to grow the adoption of soil conservation practices.
Resolving the Issues There are a number of critical issues that need attention to get Conservation Tillage back on a growth track and these are:
• Re-energizing Industry and Federal Agency support.
• Re-energising University Research and the local support system.
• Accelerating Adoption of no-till in Soybeans.
• Research site specific solutions to corn issues.
Average annual erosion on cropland in the US has • Replacing fallow with economically viable fallen from about 8 tons/acre/year in 1982 to 5.2 crop rotations in the western plains states.
120
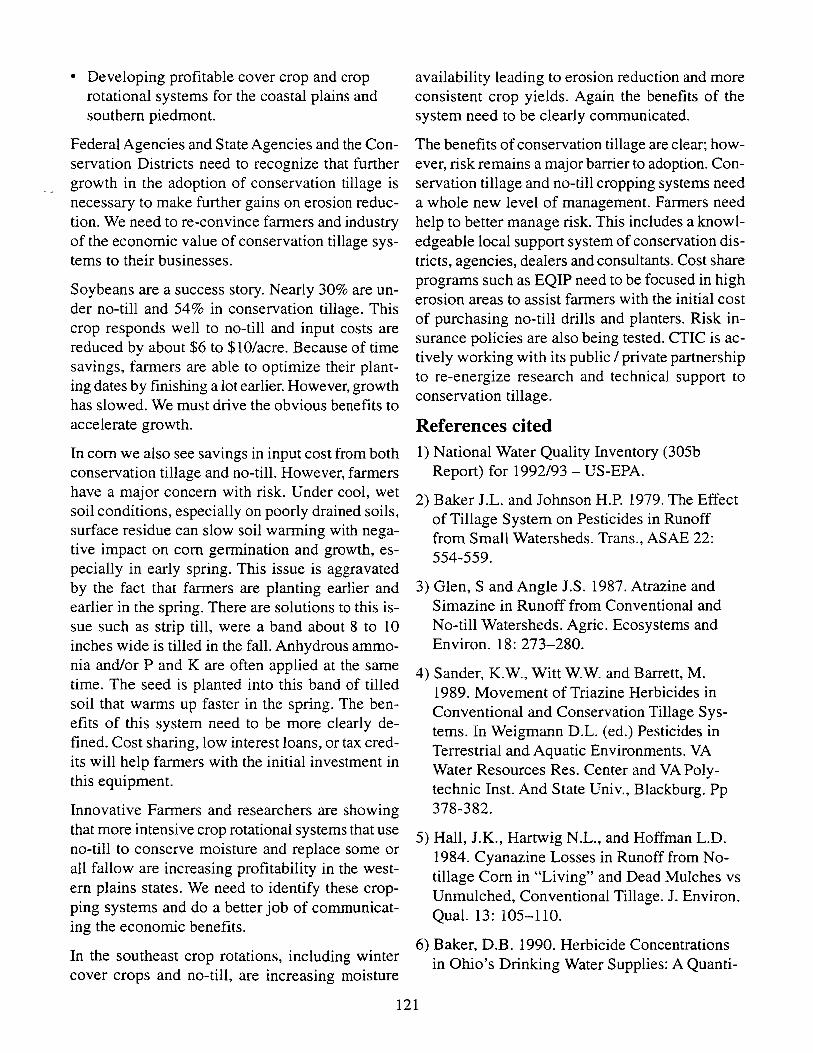
• Developing profitable cover crop and crop rotational systems for the coastal plains and southern piedmont.
Federal Agencies and State Agencies and the Conservation Districts need to recognize that further growth in the adoption of conservation tillage is necessary to make further gains on erosion reduction. We need to re-convince farmers and industry of the economic value of conservation tillage systems to their businesses.
Soybeans are a success story. Nearly 30% are under no-till and 54% in conservation tillage. This crop responds well to no-till and input costs are reduced by about $6 to $1 O/acre. Because of time savings, farmers are able to optimize their planting dates by finishing a lot earlier. However, growth has slowed. We must drive the obvious benefits to accelerate growth.
In com we also see savings in input cost from both conservation tillage and no-till. However, farmers have a major concern with risk. Under cool, wet soil conditions, especially on poorly drained soils, surface residue can slow soil warming with negative impact on com gennination and growth, especially in early spring. This issue is aggravated by the fact that farmers are planting earlier and earlier in the spring. There are solutions to this issue such as strip till, were a band about 8 to 10 inches wide is tilled in the falL Anhydrous ammonia andlor P and K are often applied at the same time. The seed is planted into this band of tilled soil that warms up faster in the spring. The benefits of this system need to be more clearly defined. Cost sharing, low interest loans, or tax credits will help farmers with the initial investment in this equipment.
Innovative Farmers and researchers are showing that more intensive crop rotational systems that use no-till to conserve moisture and replace some or all fallow are increasing profitability in the western plains states. We need to identify these cropping systems and do a better job of communicating the economic benefits.
availability leading to erosion reduction and more consistent crop yields. Again the benefits of the system need to be clearly communicated.
The benefits of conservation tillage are clear; however, risk remains a major barrier to adoption. Conservation tillage and no-till cropping systems need a whole new level of management. Farmers need help to better manage risk. This includes a knowledgeable local support system of conservation districts, agencies, dealers and consultants. Cost share programs such as EQIP need to be focused in high erosion areas to assist farmers with the initial cost of purchasing no-till drills and planters. Risk insurance policies are also being tested. CTIC is actively working with its public 1 private partnership to re-energize research and technical support to conservation tillage.
References cited 1) National Water Quality Inventory (305b
Report) for 1992/93 - US-EPA.
2) Baker J.L. and Johnson H.P. 1979. The Effect of Tillage System on Pesticides in Runoff from Small Watersheds. Trans., ASAE 22: 554-559.
3) Glen, S and Angle J.S. 1987. Atrazine and Simazine in Runoff from Conventional and No-till Watersheds. Agric. Ecosystems and Environ. 18: 273-280.
4) Sander, K.W., Witt W.W. and Barrett, M. 1989. Movement of Triazine Herbicides in Conventional and Conservation Tillage Systems. In Weigmann D.L. (ed.) Pesticides in Terrestrial and Aquatic Environments. VA Water Resources Res. Center and VA Polytechnic Inst. And State Univ., Blackburg. Pp 378-382.
5) Hall, 1.K., Hartwig N.L., and Hoffman L.D. 1984. Cyanazine Losses in Runoff from Notillage Com in "Living" and Dead Mulches vs Unmulched, Conventional Tillage. J. Environ. Qual. 13: 105-110.
6) Baker, D.B. 1990. Herbicide Concentrations In the southeast crop rotations, including winter in Ohio's Drinking Water Supplies: A Quanti-cover crops and no-till, are increasing moisture
121
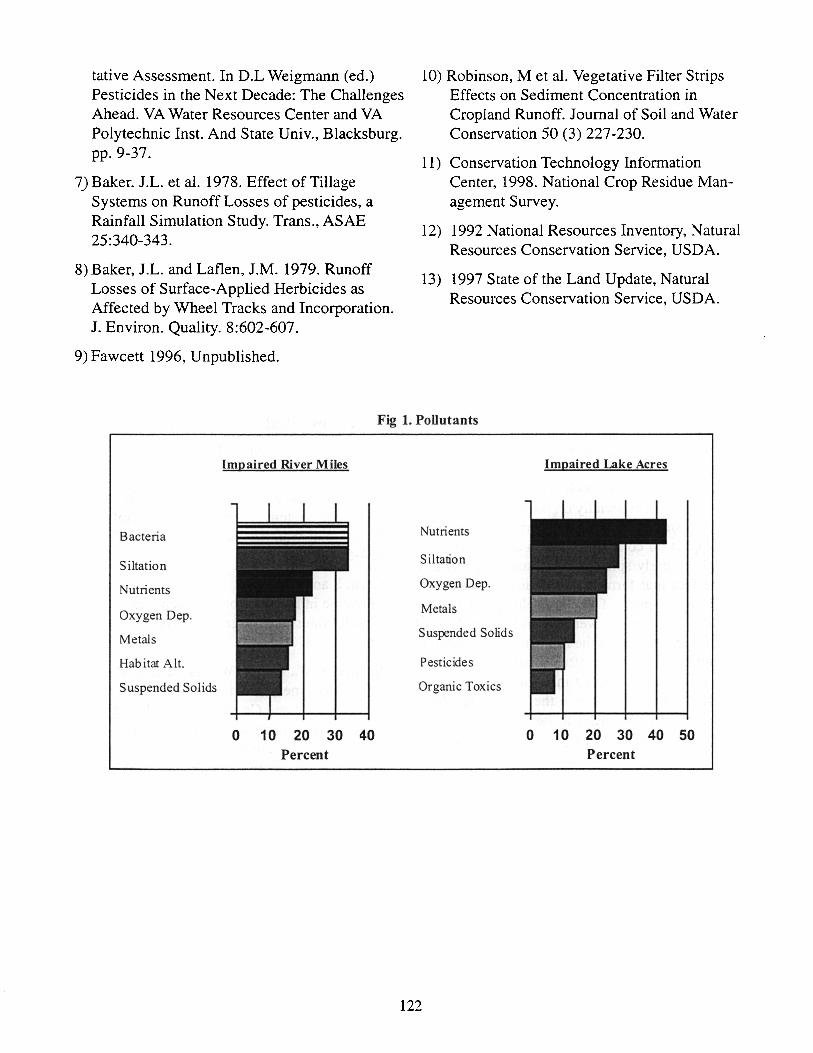
tative Assessment. In D.L Weigmann (ed.) Pesticides in the Next Decade: The Challenges Ahead. VA Water Resources Center and VA Polytechnic Inst. And State Univ., Blacksburg. pp.9-37.
7) Baker. 1.L. et al. 1978. Effect of Tillage Systems on Runoff Losses of pesticides, a Rainfall Simulation Study. Trans., ASAE 25:340-343.
8) Baker, 1.L. and Lafien, 1.M. 1979. Runoff Losses of Surface-Applied Herbicides as Affected by Wheel Tracks and Incorporation. 1. Environ. Quality. 8:602-607.
9) Fawcett 1996, Unpublished.
10) Robinson, M et al. Vegetative Filter Strips Effects on Sediment Concentration in Cropland Runoff. 10urnal of Soil and Water Conservation 50 (3) 227-230.
11) Conservation Technology Information Center, 1998. National Crop Residue Management Survey.
12) 1992 National Resources Inventory, Natural Resources Conservation Service, USDA.
13) 1997 State of the Land Update, Natural Resources Conservation Service, USDA.
Fig 1. Pollutants
Bacteria
Siltation
Nutrients
Oxygen Dep.
Metals
Habitat Alt.
Suspended Solids
Impaired River Miles
o 10 20 30 40 Percent
Nutrients
Siltation
Oxygen Dep.
Metals
Suspended Solids
Pesticides
Organic Toxics
122
Impaired Lake Acres
o 10 20 30 40 50 Percent
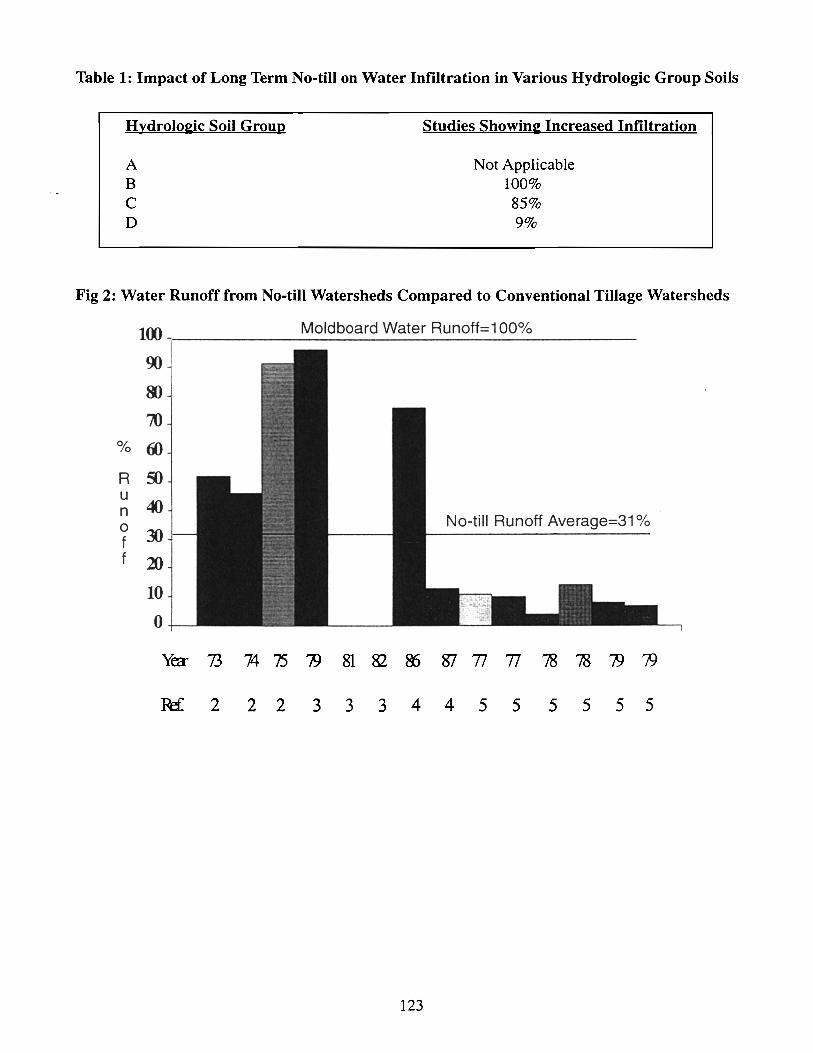
Table 1: Impact of Long Term No-till on Water Infiltration in Various Hydrologic Group Soils
Hydrol02ic Soil Group Studies Showine Increased Infiltration
A B C D
Not Applicable 100% 85% 9%
Fig 2: Water Runoff from No-till Watersheds Compared to Conventional Tillage Watersheds
100 Moldboard Water Runoff=1 00%
~
8)
~ % ro R g) u n 40 0 30 f
No-till Runoff Average=31 %
f 20
10
0
Yea- 73 74 75 7) 81 82 &> fS7 77 77 i8 i8 7) 7)
Fa 2 2 2 3 3 3 4 4 5 5 5 5 5 5
123
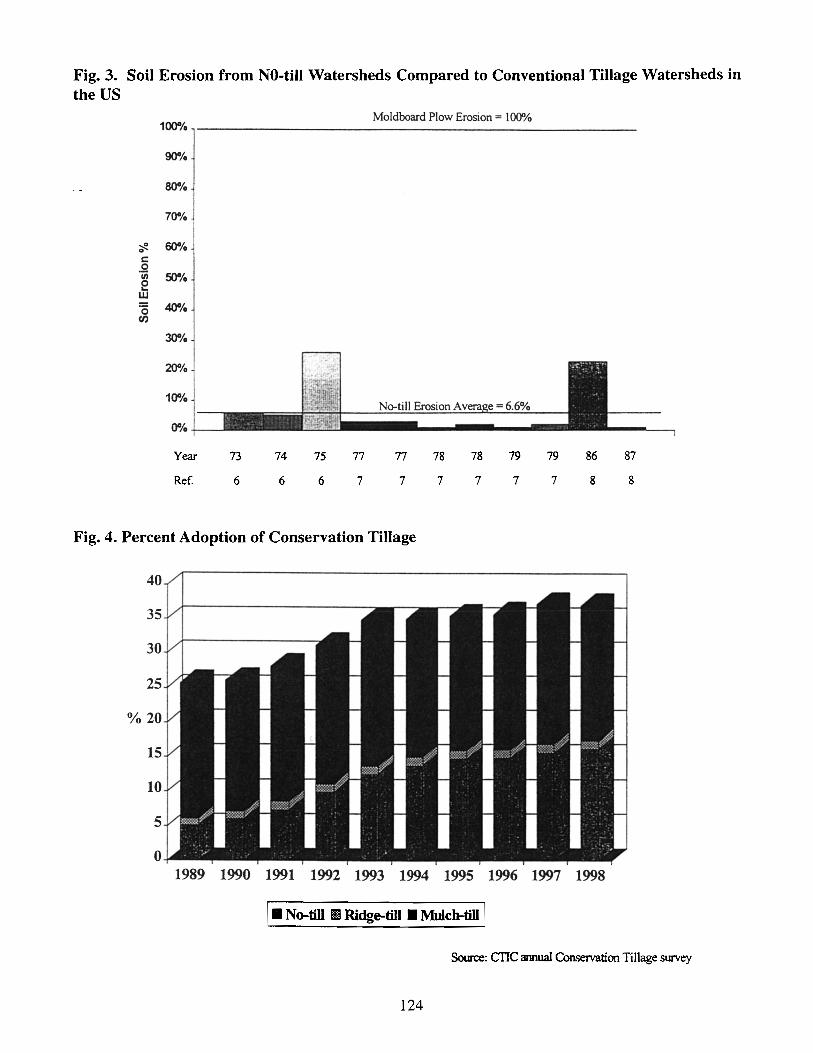
Fig. 3. Soil Erosion from NO-till Watersheds Compared to Conventional Tillage Watersheds in the US
Moldboard Plow Erosion = 100% 100''10
goolo
80"10
70"10
~ 0 60"10 c 0 Ui 50"10 e w ·0 40"/. U)
30"10
20"10
10"10
0"10
Year 73 74 75 77 77 78 78 79 79 86 87
Ref 6 6 6 7 7 7 7 7 7 8 8
Fig. 4. Percent Adoption of Conservation Tillage
40
35
30
25
% 20
15
10
5
o 1989 1990 1991 1992 1993 1994 1995 1996 1997 1998
I- No-till II Ridge-till - MulclHill 1 Source: cnc armuaJ Conservation Tillage survey
124
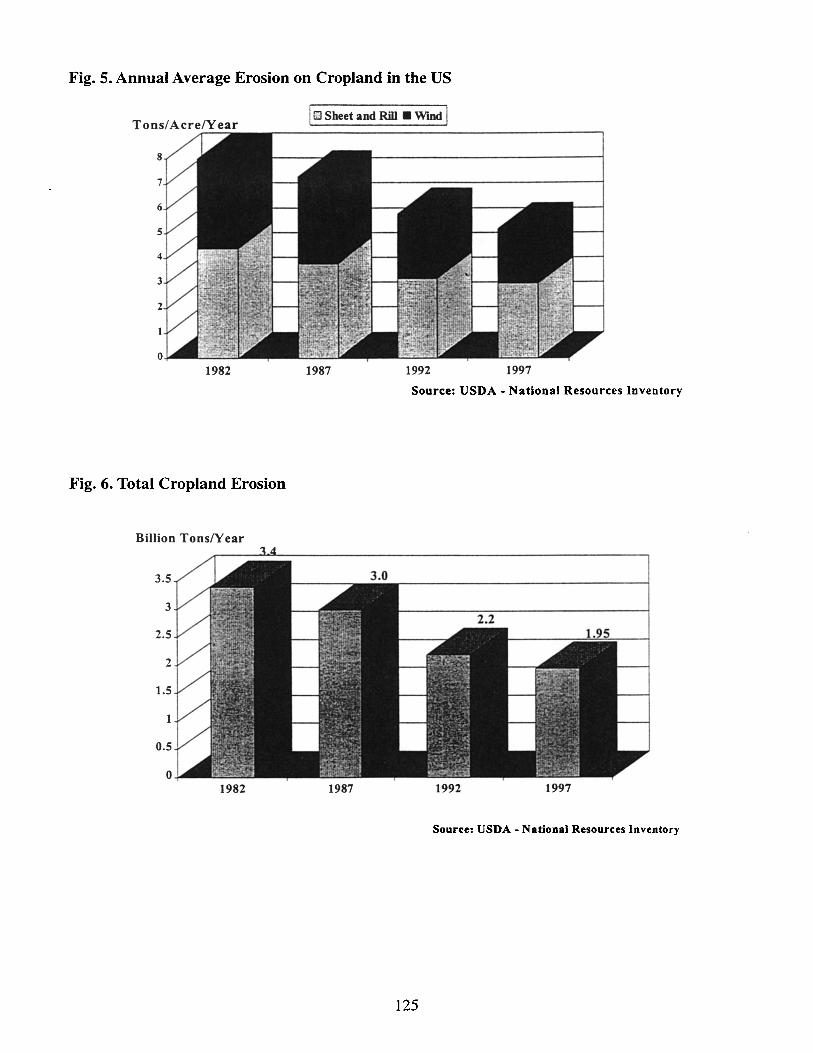
Fig. 5. Annual Average Erosion on Cropland in the US
Tons/Acre/Year
1982
Fig. 6. Total Cropland Erosion
Billion Tons/Year
3.5
3
2.5
2
1.5
1
0.5
o 1982
113 Sheet and Rill • Wmd I
1987 1992 1997
Source: USDA - National Resources Inventory
1987 1992 1997
Source: USDA - National Resources Inventory
125
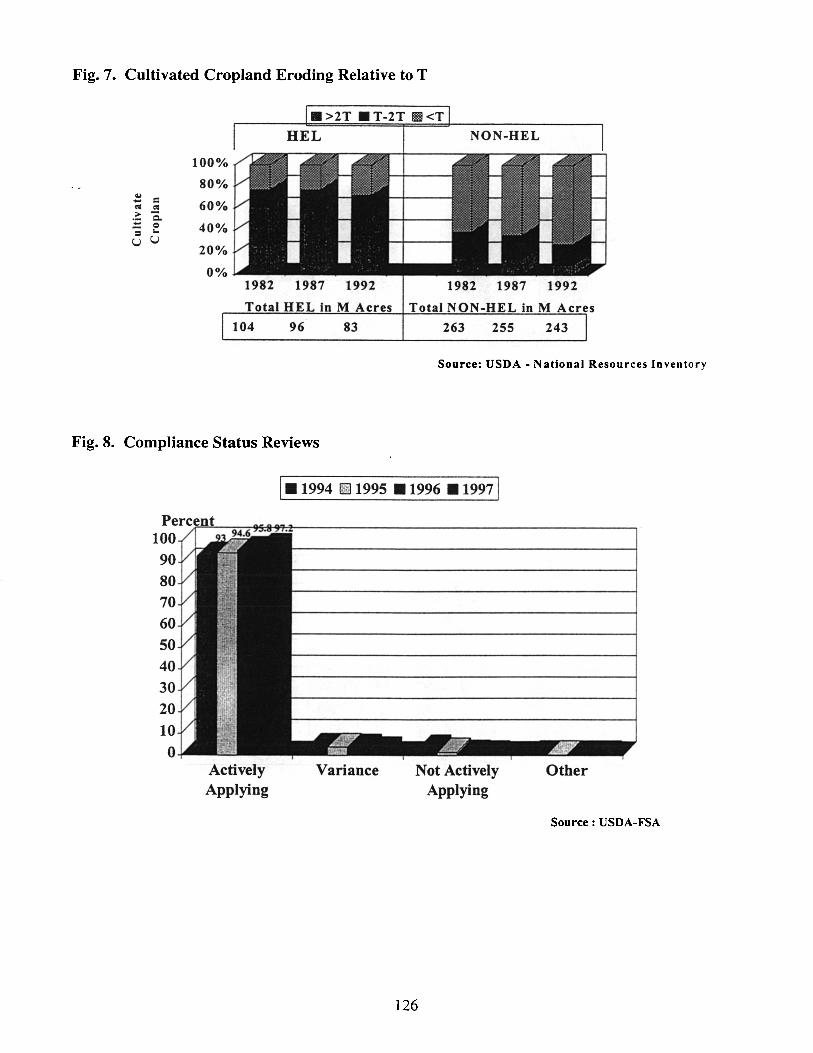
Fig. 7. Cultivated Cropland Eroding Relative to T
NON-HEL
100%
80% ~ - = 60% <'II <'II
.~ Q. - c 40% :;, ... U u
20%
0% 1982 1987 1992 1982 1987 1992
Source: USDA - Na tional Resources Invento ry
Fig. 8. Compliance Status Reviews
1_1994 !lim 1995 _1996 _19971
Actively Applying
Variance Not Actively Applying
126
Other
Source: USDA-FSA
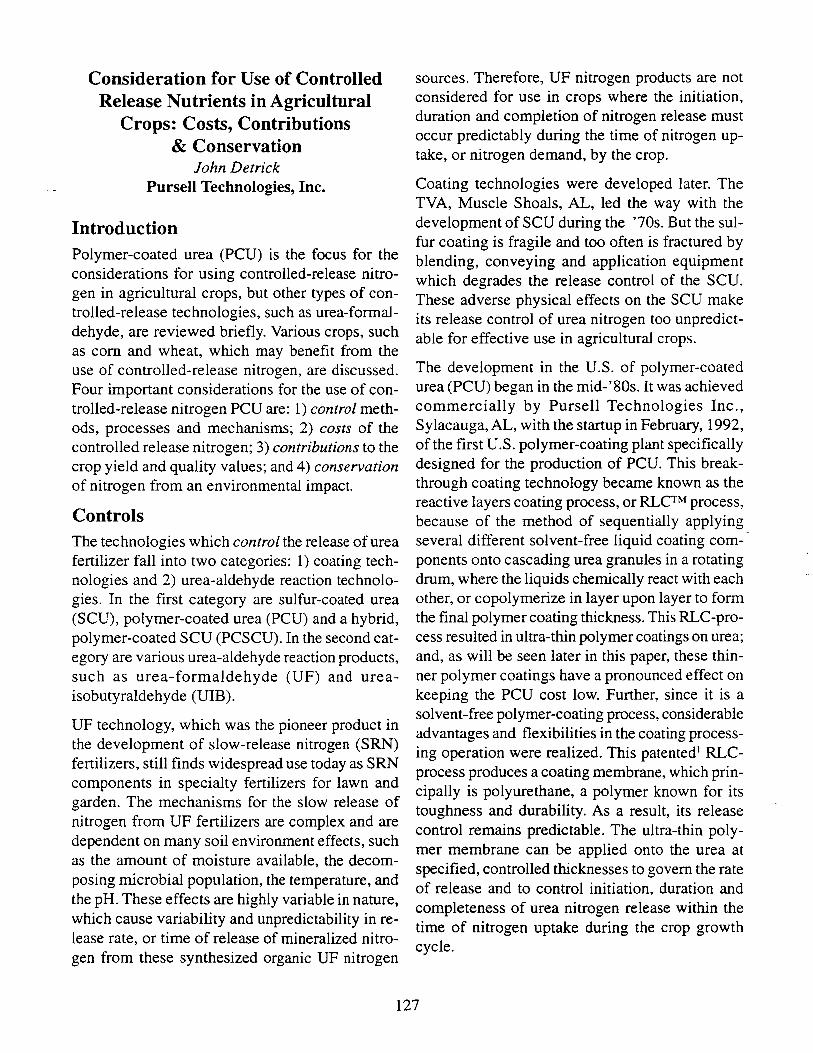
Consideration for Use of Controlled Release Nutrients in Agricultural
Crops: Costs, Contributions & Conservation
John Detrick Pursell Technologies, Inc.
Introduction Polymer-coated urea (PCU) is the focus for the considerations for using controlled-release nitrogen in agricultural crops, but other types of controlled-release technologies, such as urea-formaldehyde, are reviewed briefly. Various crops, such as corn and wheat, which may benefit from the use of controlled-release nitrogen, are discussed. Four important considerations for the use of controlled-release nitrogen PCU are: 1) control methods. processes and mechanisms; 2) costs of the controlled release nitrogen; 3) contributions to the crop yield and quality values; and 4) conservation of nitrogen from an environmental impact.
Controls The technologies which control the release of urea fertilizer fall into two categories: 1) coating technologies and 2) urea-aldehyde reaction technologies. In the first category are sulfur-coated urea (SCU), polymer-coated urea (PCU) and a hybrid, polymer-coated SCU (PCSCU). In the second category are various urea-aldehyde reaction products, such as urea-formaldehyde (UF) and ureaisobutyraldehyde (UIB).
UF technology, which was the pioneer product in the development of slow-release nitrogen (SRN) fertilizers, still finds widespread use today as SRN components in specialty fertilizers for lawn and garden. The mechanisms for the slow release of nitrogen from UF fertilizers are complex and are dependent on many soil environment effects, such as the amount of moisture available, the decomposing microbial population. the temperature, and the pH. These effects are highly variable in nature, which cause variability and unpredictability in release rate. or time of release of mineralized nitrogen from these synthesized organic UF nitrogen
sources. Therefore. UF nitrogen products are not considered for use in crops where the initiation, duration and completion of nitrogen release must occur predictably during the time of nitrogen uptake. or nitrogen demand, by the crop.
Coating technologies were developed later. The TVA, Muscle Shoals, AL, led the way with the development of SCU during the '70s. But the sulfur coating is fragile and too often is fractured by blending, conveying and application equipment which degrades the release control of the SCU. These adverse physical effects on the SCU make its release control of urea nitrogen too unpredictable for effective use in agricultural crops.
The development in the U.S. of polymer-coated urea (PCU) began in the mid-' 80s. It was achieved commercially by Pursell Technologies Inc., Sylacauga, AL, with the startup in February, 1992, of the first U.S. polymer-coating plant specifically designed for the production of PCU. This breakthrough coating technology became known as the reactive layers coating process, or RLCTM process, because of the method of sequentially applying several different solvent-free liquid coating components onto cascading urea granules in a rotating drum, where the liquids chemically react with each other, or copolymerize in layer upon layer to form the final polymer coating thickness. This RLC-process resulted in ultra-thin polymer coatings on urea; and, as will be seen later in this paper, these thinner polymer coatings have a pronounced effect on keeping the PCU cost low. Further, since it is a solvent-free polymer-coating process, considerable advantages and flexibilities in the coating processing operation were realized. This patented I RLCprocess produces a coating membrane, which principally is polyurethane, a polymer known for its toughness and durability. As a result, its release control remains predictable. The ultra-thin polymer membrane can be applied onto the urea at specified, controlled thicknesses to govern the rate of release and to control initiation, duration and completeness of urea nitrogen release within the time of nitrogen uptake during the crop growth cycle.
127
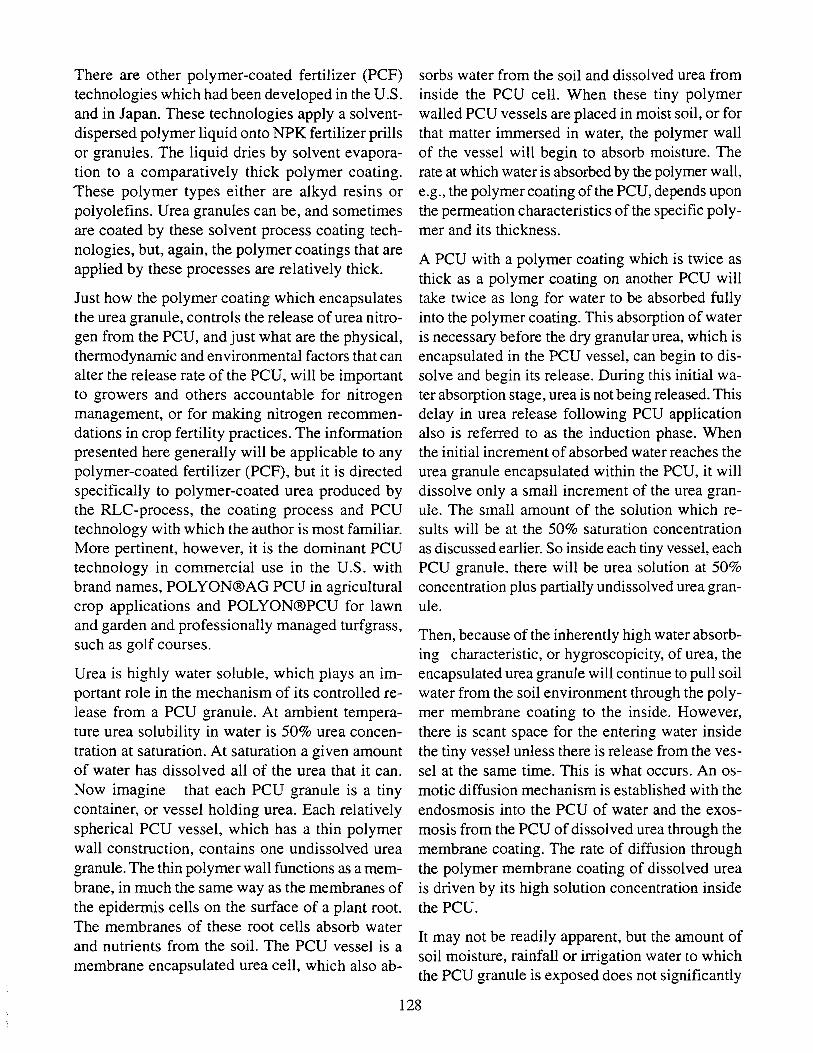
There are other polymer-coated fertilizer (PCF) technologies which had been developed in the U.S. and in Japan. These technologies apply a solventdispersed polymer liquid onto NPK fertilizer prills or granules. The liquid dries by solvent evaporation to a comparatively thick polymer coating. These polymer types either are alkyd resins or polyolefins. Urea granules can be, and sometimes are coated by these solvent process coating technologies, but, again, the polymer coatings that are applied by these processes are relatively thick.
Just how the polymer coating which encapsulates the urea granule, controls the release of urea nitrogen from the PCU, and just what are the physical, thermodynamic and environmental factors that can alter the release rate of the PCU, will be important to growers and others accountable for nitrogen management, or for making nitrogen recommendations in crop fertility practices. The information presented here generally will be applicable to any polymer-coated fertilizer (PCF), but it is directed specifically to polymer-coated urea produced by the RLC-process, the coating process and PCU technology with which the author is most familiar. More pertinent, however, it is the dominant PCU technology in commercial use in the U.S. with brand names, POLYON®AG PCU in agricultural crop applications and POLYON®PCU for lawn and garden and professionally managed turfgrass, such as golf courses.
Urea is highly water soluble, which plays an important role in the mechanism of its controlled release from a PCU granule. At ambient temperature urea solubility in water is 50% urea concentration at saturation. At saturation a given amount of water has dissolved all of the urea that it can. Now imagine that each PCU granule is a tiny container, or vessel holding urea. Each relatively spherical PCU vessel, which has a thin polymer wall construction, contains one undissolved urea granule. The thin polymer wall functions as a membrane, in much the same way as the membranes of the epidermis cells on the surface of a plant root. The membranes of these root cells absorb water and nutrients from the soiL The PCU vessel is a membrane encapsulated urea cell, which also ab-
sorbs water from the soil and dissolved urea from inside the PCU cell. When these tiny polymer walled PCU vessels are placed in moist soil, or for that matter immersed in water, the polymer wall of the vessel will begin to absorb moisture. The rate at which water is absorbed by the polymer Wall, e.g., the polymer coating of the PCU, depends upon the permeation characteristics of the specific polymer and its thickness.
A PCU with a polymer coating which is twice as thick as a polymer coating on another PCU will take twice as long for water to be absorbed fully into the polymer coating. This absorption of water is necessary before the dry granular urea, which is encapsulated in the PCU vessel, can begin to dissolve and begin its release. During this initial water absorption stage, urea is not being released. This delay in urea release following PCU application also is referred to as the induction phase. When the initial increment of absorbed water reaches the urea granule encapsulated within the PCU, it will dissolve only a small increment of the urea granule. The small amount of the solution which results will be at the 50% saturation concentration as discussed earlier. So inside each tiny vessel, each PCU granule, there will be urea solution at 50% concentration plus partially undissolved urea granule.
Then, because of the inherently high water absorbing characteristic, or hygroscopicity, of urea, the encapsulated urea granule will continue to pull soil water from the soil environment through the polymer membrane coating to the inside. However, there is scant space for the entering water inside the tiny vessel unless there is release from the vessel at the same time. This is what occurs. An osmotic diffusion mechanism is established with the endosmosis into the PCU of water and the exosmosis from the PCU of dissolved urea through the membrane coating. The rate of diffusion through the polymer membrane coating of dissolved urea is driven by its high solution concentration inside the PCU.
It may not be readily apparent, but the amount of soil moisture, rainfall or irrigation water to which the PCU granule is exposed does not significantly
128
alter the rate of release.2 Just as long as some soil moisture is present to maintain the osmotic release mechanism, the urea release will continue by this osmotic diffusion process. Whether the PCU granules are completely immersed in water in a paddy rice field in Louisiana, or in moderate moisture soil in a cotton field in Alabama, or in a 2 x 2 band placement in high moisture soil in a no-till corn field in Ohio, or in an essentially dry soil in a nonirrigated wheat field in Kansas, the release rate of that PCU will be unchanged by the amount of water present. The driving force for urea release is from the inside, pushed out by the hydrostatic pressure and the concentration of dissolved urea inside the PCU. Indeed, the derivation of the word osmosis is from the Greek "osmos," meaning a pushing.
A soil environment factor that does have an effect on release rate, is temperature. At higher soil temperature the dissolved urea and water molecules inside the PCU are more thermodynamically activated, which accelerates diffusion and the release rate. As a general rule, for each 10°C (I8·F) temperature increase, the rate of release will double. A doubling of release rate means that the time over which the PCU will release urea nitrogen will be reduced by one-half. For example, if a PCU, with a given polymer coating thickness, has a release duration of four months at 72°F, that PCU would release over just two months under steady temperature conditions of 90°F.
A given PCU in a given soil environment will release urea nitrogen at a fairly steady rate until 50% of the urea from that PCU granule has been released. From that point on the rate of diffusion or release of urea from the PCU will begin to decrease as the internal solution concentration of the polymer encapsulated urea decreases.
Following the brief induction phase, the amount of time it takes a given PCU to release 50% of the applied amount of PCU nitrogen will be about onethird of the total time to release the remaining 50% for a total cumulative release of 100%. This urea release profile from PCU is illustrated in Graph A3, which shows the effect of temperature and coating membrane thickness.
The management of controlled-release nitrogen (CRN) applications requires recognition that a fairly thinly coated PCU placed in a 2 x 2 band on corn at time of planting in the cool soils of northern Iowa will have a longer induction period and a relatively slow release rate until the soils begin to warm up. As the soils warm in late spring and early summer the normal tendency for the PCU release to slow up past its 50% release point may be more than offset by the accelerating release rate effect of the increasing soil temperature. As a result, the release profile, or dissolution rate (DR) profile, of a POLYON AG PCU will look much like a classical nitrogen uptake curve of a com plant during its growth cycle. However, it is important for the PCU to be releasing predictably in advance ofthe nitrogen demand by the crop. Obviously, any PCU nitrogen release which occurs past the demand period of the crop growth cycle will not benefit the crop and may move into the groundwater.
For a fall-planted winter wheat crop the temperature change is the reverse. Following PCU application at time of planting in the fall, the soils become progressively colder. In this case a some-·· what heavier, but still thin polymer coating would be used for the PCU. This somewhat thicker polymer coating would minimize the amount of nitrogen released by the PCU during the time from planting through emergence and early growth until ground freeze. Both the plant growth and the PCU release essentially shut down during the winter. The PCU release would resume during spring greenup and would continue to release to feed nitrogen during the kernel development and headfilling stage. Application of PCU at time of planting winter wheat may provide two functions for the controlled release urea nitrogen. Release of urea in the fall would function to improve plant and root growth and tillering, or stand density. Then resumption of release from the PCU during spring warmup would function to increase kernels per head, kernel size and, perhaps, protein levels in the grain.
Costs The cost of controlled release nitrogen (CRN) in polymer-coated urea (PCU) necessarily will be higher than the cost of nitrogen (N) in uncoated
129
urea. The CRN cost of a PCU is affected significantly by the coating thickness, which is related to the amount or weight percent of the polymer membrane coating applied onto the urea granule to control its release rate. A longer release time requires a slower release rate, which is controlled by increasing the thickness of the RLC polymer membrane.4 A thicker membrane coating results in a higher weight percentage of polymer and, correspondingly, a lower weight percentage of urea in the PCU formulation, which means, also, that the nitrogen analysis, or grade, will be lower. Examples of the effect of coating thickness for a 270 SGN5 urea granule, polymer coated by the RLC-process, are shown in Table 1.
The effect of the various polymer-coating thicknesses on nitrogen costs can be shown by approximating raw material costs for granular urea of $.1 0/ lb ($200/ton) and coating polymer, at an order of magnitude greater, of $l.OO/lb ($2000/ton). The weight percentages of urea and polymer coating from Table 1 above can be applied against these approximated raw material costs to determine the material cost of PCU and to show the effect on the cost of its contained CRN. See Table 2.
These coating polymer and urea materials costs represented in Table 2 are at the manufacturer level, and are shown only to illustrate the effect of the polymer coating weight percentage on nitrogen grade and cost. These are not to be construed as the actual material costs, nor the only costs specific to the manufacture ofPCU. Additional costs include production direct and indirect, distribution, and subsequent blending, plus selling expenses and profit margins, all of which factor into the final price. The final price, in turn, factors into the input cost at the farm-field level. When PCU nitrogen (CRN) is included as part of a fertilizer practice for a given crop. the net fertilizer nitrogen input cost per acre at the farm field level usually will be increased over the cost per acre of the standard fertilizer nitrogen practice. The degree, or incremental amount of this increase principally will depend not only on the CRN cost ($/lb CRN), but also on the pounds ofCRN (lbs CRN/acre) used to replace that amount of the standard fertilizer practice (SFP) nitrogen.
The following will help clarify this incremental cost increase effect on nitrogen input cost of the CRN from a PCU application As an example, assume a total of 120 IbN/acre is applied to a corn crop as SFP; and that the cost of this standard fertilizer N is $.24/lbN. For the CRN application in this example, assume one-fourth of the total standard N, or 30 IbN/ac, is replaced by 30 lbs CRN in a 2 x 2 band at planting. Also, let the CRN cost at the farm field be $.79/lbCRN, or $.55/lbN higher than the SFP-N.
Standard N cost
SFP: 120 IbN/ac x $.24/lbN = $28.80/ac
Incremental increase cost
CRN: 30 IbN/ac x $.55/lbN = $16.50/ac
Such an incremental increase in cost by the PCU will need to be offset by an increase in value from an increase in yield. This increase in yield value must be greater than the increased cost, in order to economically justify the CRN application. The required yield increase to cover the incremental cost increase would be determined by dividing the incremental cost by the corn price.
Incremental Cost = $ 16.50/ac = 6bu
Corn Price $ 2.75/bu ac
Contribution The contribution made by nitrogen management practices through the placement of starter nitrogen fertilizers and nitrogen-phosphate fertilizers, in order to reduce N-Ioss and increase crop production, is documented in agronomic research publications. Placement of small amounts of these starter fertilizers in a narrow band nearby the seed, or even in the seed furrow, at time of planting can be both operationally effective and economically productive, improving yields and crop quality. However, there is potential risk for injury to the germinating seed or to the seedling if there is direct contact between seed and fertilizer in these types of fertilizer placements at time of planting. Even when some soil separates seed and fertilizer, as it does in a side-by band, the risk of seed injury remains if the application rate of the N-fertilizer is
130
too high, or the soil moisture is too low, or the soil is too coarse textured, such as in sandier soils.
The growing importance of reduced tillage and notill practices has been accompanied by an increasing emphasis on the application and placement of
, _ nitrogen fertilizers at time of seed planting. The placements of nitrogen fertilizers can be directly in the seed furrow or in the side-by band, which, commonly, is placed two inches to the side and two inches below the seed, called a 2 x 2 band. With either of these placement practices there can be a risk of seed germination damage, but clearly the risk is higher when the fertilizer and seed are applied directly into the seed furrow.
The type of nitrogen fertilizer to be used also may be a factor. For instance, the Kansas State University Cooperative Extension Service recommendation has been to limit the fertilizer nitrogen (N) plus potash (~O) rate to no more than 20 lbs per acre when the fertilizer application placement is into the wheat seed furrow. Urea as a nitrogen source fertilizer is imposed with even greater restriction, since germination injury from urea, due to free ammonia formation, has been observed at even less than 20 lbs urea-N per acre. Currently, K-State does not recommend the application of dry urea with the seed into the seed furrow for this reason. Similarly, "Tri-State Fertilizer Recommendations," Bulletin E-2567, July, 1995, by Michigan State, the Ohio State and Purdue universities, does not recommend the general practice of applying fertilizer with the seed. In situations where farmers use grain drills or planters, and do place fertilizers in contact with the seed, the sum of the (N) plus (~O) application has a recommended limitation on com of 5 lb/ac on low CEC soils and 8 lb/ac on greater than 8 CEC soils. For soybeans, which are very prone to salt injury, fertilizer placement with the seed is not recommended.
A seed safety assay for seed furrow placed urea-N sources was conducted6 using shallow, rectangular 1 x 2 ft. flats filled with silica sand. One each of com, wheat and soybean seeds were spaced uniformly in each of three, 3/4 in. deep furrows oriented across the flat width. Granular urea 46N, urease inhibitor treated urea46N or POLYON®AG
PCU 43.5N, applied in the seed furrow at 10 IbNI ac or 40 IbN/ac as replicated treatments, were compared to a control group of seeded flats with no urea-N source applications. Daily irrigations were made by hand-held mist sprayer to 1112 inches of water.
All the control group, 0 IbN lac, and nearly all of the PCU treatments emerged in 4 days after treatment (dat). Seed emergence of the urea and urease inhibitor treated urea treatments was delayed to 6 dat to 12 dat on com and wheat; and soybeans did not emerge.
The control group and PCU treatments exhibited good growth after emergence, except for the 40 IbN/ac PCU on soybean treatment at 12 dat, which exhibited some stunting and new leaf tip bum. The other two urea-N sources resulted in a high degree of stunting and foliage tip bum on both com and wheat at the 10 IbN/ac and 40 IbN/ac rates.
Occasionally, granular urea does have its problems under certain use conditions. Ammonia volatilization N losses from unincorporated granules, ammonia toxicity to the germinating seed or seedling", and urea granule wetness under moderate humidity conditions, which adversely affects handling and application, are some of the undesirable characteristics, or problems of urea.
To minimize, or even eliminate these adverse urea characteristics, a thin polymer coating on the urea granules is all that is required. Notwithstanding, can this polymer-coated urea (PCU) be used in controlled release nitrogen (CRN) management applications, in the furrow with the seed, or in a side-by band at significantly higher than customary N-rates without risk of seed injury? If so, will the controlled release delivery of urea-N from this PCU, which is positioned in the developing root zone, be available and completely released during the time of plant demand and crop growth? Will this positioned placement of controlled release PCU-N result in more efficient N-uptake and correspondingly increased crop yield? Will the increase in cost per acre, resulting from the replacement of part of the total-N to be applied with PCUN, yield an acceptable return? Will the doUar-per-
131
acre value of the crop yield increase, which is caused by the peD, exceed the additional incremental cost per acre of the managed eRN fertilizer practice?
To illustrate this added-value above added-cost r~quirement for acceptable return, consider an example where 120 IbN/ac is the total N-rate in a SFP on corn for a given fann field. If, in a managed eRN fertilizer practice, PCD replaces 30 IbN, e.g. 90 IbN + 30 IbCRN = 120 IbN/ac, which causes a 12 bu/ac yield increase, valued at $33/ac ($2.751 bu corn), this value must be greater than the added incremental cost per acre of the CRN practice for a return on the added cost. If the SFP granular urea 46N has a farm field cost of $220/ton, or $.24/lbN, and the PCD 43N is at $680/ton, or $.79IlbCRN, the cost difference is $.55/lbN. The replacement of 30 IbN/ac from urea with 30 IbCRN/ac from PCD 43N, therefore, would have an added input cost of 30 IbN/ac x $.55/lbN = $ 16.50/ac. The value to cost ratio in this example would be $33 to $16.50, or 2 to 1. However, if the CRN used was, instead, the thicker polymer coating of the Japanese technology, peD 40N, which had a higher cost of $ 1150/ton, or $l.44/lbCRN, then the cost difference is $1.20/lbN. The 30 IbCRN substitution at $1.20/1bN then becomes an added $36/ac input cost, which exceeds the $33/ac yield value increase, assuming that in this example the yield increase is 12 bu/ac for this technology as well.
Comparative 1997 research data from two on-farm replicated trials on corn and winter wheat are given below to demonstrate the potential for positive economic yields through the inclusion of eRN from peD as part of the total nitrogen applied to the crop. (See Tables 3 & 4.)
Conservation Fertilizer nitrogen conservation will be advanced when nitrogen management methods or practices result in an increased percentage of the total applied nitrogen being taken up by the crop. This outcome not only means a reduction in the amount of the applied fertilizer nitrogen which potentially could escape from the crop-soil ecosystem, but also can, and often will, boost crop yield, and may improve profitability. What goes up, can't go down.
What is taken up by the crop, can't go down into the groundwater. Greater nitrogen uptake by the crop can mean an "up" in yields, an "up" in profits, as well as the reduction in escaped nitrogen impact on the environment.
Nitrate, the ultimate nitrogen fugitive, escapes into the groundwater environment from a range of sources, which include among others, animal droppings, organic matter decomposition and nitrogen fertilizers. A goal of the fertilizer industry is to focus on those areas for which improvements are needed and where it can have an effect or can exercise control. Management of nitrogen fertilization methods or practices is one such area. Growers and fertilizer dealers need to have the flexibility within the framework of best management practices (BMPs) to select those fertilization practices that have good probability of resulting in both acceptable environmental impact and improved productivity.
Environmental buzz words abound in the fertilizer industry and in the press-nitrate pollution of rivers, hypoxia in the Gulf, nitrates in groundwatercausing much attention and concern by the public. These buzz words are symptomatic of problems needing solutions; and most of the problems reflected in these words arise from unwanted nitrates in the waters of our environment-ground waters , aquifers, waterways, lakes, gulfs and oceans. Problems associated with nitrate pollution will be solved by people implementing processes, methods and practices which are intended for their solution. One fertilizer nitrogen management tool being given consideration in this regard is the "enhanced efficiency" fertilizer which is described in a proposed policy statement in the annual AAPFCO Official Publication of theAssociation of American Plant Food Control Officials. Among the various "enhanced efficiency" fertilizers described are the granular, polymer coated urea (PCD) fertilizers, which generally are considered to be the most efficient of the currently available slow or controlled release nitrogen (CRN) fertilizer technologies.
Release efficiencies of several types of CRN fertilizers were tested peD, SCD (sulfur-coated urea), and aldehyde-urea reaction products including UF
132
(urea-formaldehyde), and UIB (ureaisobutyraldehyde). It was reported that the quantity ofN released was lowest for UF 38N and highest for POLYON PCU 43N, which had a gradual release and essentially complete release during the 16 weeks of the test. 7
Plants or crops cannot respond to unreleased, or extremely slow releasing fractions of CRN fertilizers, such as the high molecular weight fractions of urea-formaldehyde (UF) fertilizers.
Conclusions
Not only is an understanding of these performance factors and the PCU release characteristics required, but, also, the growers, fertilizer dealers, county agents, CCAs and others, who are involved with management of nitrogen fertilization, must be knowledgeable of the soil environmental factors and the nitrogen demand or uptake requirements of the crop. CRN fertilization practices then may be made part of the BMP for the crop. The payback can be increased economic crop yields and reduced environmental impact from nitrogen fertilization. A win-win situation!
References If the desired outcomes of reduced environmental impact of nitrogen fertilizers and increased crop yield profitability are to be realized, the controlled release characteristics and the factors affecting release of each of the several PCU technologies must 2 be understood by those charged with managing their implementation. Within a given coating technology there are numbers of PCU grades or types with different rates of release and with different responses to environmental effects. These environmental factors also must be understood before enhanced efficiency, cost-effective, environmentally protective applications of PCU can be made.
1 U.S. Patents 4,711,659 12/87; 4,804,403 2/89; 5,374,292 12/94; 5,547,486 8/96.
C.B. Christianson, International Fertilizer Development, Muscle Shoals, AL, Factors affecting N release of urea from reactive layers coated urea (Fertilizer Research 16: 279-281, 1988.) Kluwer Academic Publishers, Dordecht, The Netherlands.
3 (See Graph A.)
4 The reactive layers coating (RLC) technology of Pursell Technologies., with the brand name, POLYON®AG PCU, utilizes thichness of the polymer-coating membrane to control rate of release. The Japanese technology, sold in the U.S. as MEISTER®PCU, utilizes a different release rate controlling mechanism, wherein an additive formulated at varying amounts into a fixed thickness polymer coating, alters coating permeabilityrate.
There are a number of performance factors* which must be considered for the successful application development of POLYON AG PCU.
• Safety to the seed germination if PCU applied near the seed at time of planting.
• A positive yield increase must be caused by the PCU application.
• The value of the additional yield must be greater than the added cost of the PCU used to attain it.
• Broadcast application of PCU to the soil surface without subsequent incorporation, such as in late season nitrogen application into soybeans, must not experience significant N-volatilization loss.
• The PCU must withstand physical abuse by conveying, blending, and application equipment without undergoing a significant change in release rate specification.
5 SGN - Size Guide Number, the mean particle size in mmX 100 of the range of particle sizes in a representative lot sample.
6 PAT2H Consulting Service, Inc. Rydal, GA.
7 Dr. J.B. Sartain, University of Florida, in Official Publication No. 48, Association of Southern Feed, Fertilizer and Pesticide Control Officials, 1990.
133
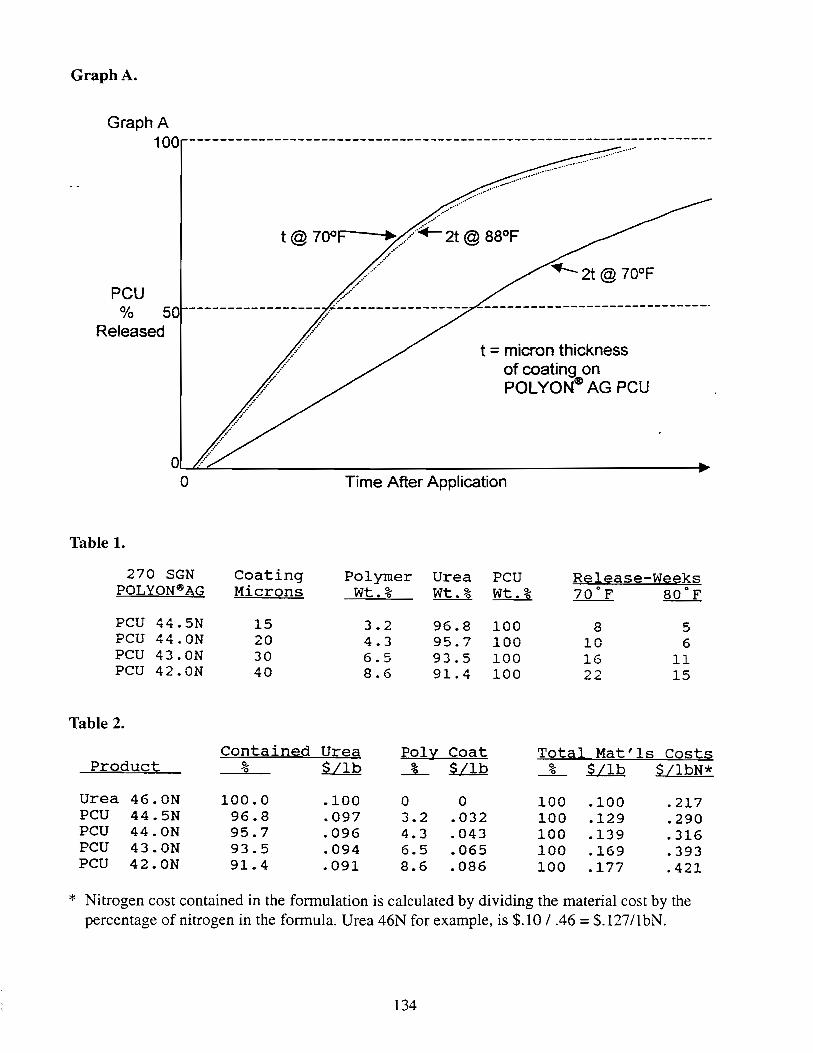
GraphA.
Graph A 100 --------------------------------------------------------------------
PCU % 5
Released
, .. //-,./-,./' ..... , .•.
...-t @ 70o~F-~~ //.:.+- 2t@88°F
.•....•. / .....
-----------------------------~
t = micron thickness of coating on POL YON® AG PCU
o~~ ________________________________________ ~ o Time After Application
Table 1.
270 SGN Coating Polymer Urea PCU Rel~ase-We~ks POLYON®AG Microns Wt.% wt.% wt.% 70"F BO"F
PCU 44.5N 15 3.2 96.8 100 8 5 PCU 44.0N 20 4.3 95.7 100 10 6 PCU 43.0N 30 6.5 93.5 100 16 11 PCU 42.0N 40 B.6 91.4 100 22 15
Table 2.
contained Urea Poly Coat Total Mat'ls Costs Product % £L1Q -L Ul.Q _%- Ul.Q $/lbN*
Urea 46.0N 100.0 .100 a 0 100 .100 .217 PCU 44.5N 96.8 .097 3.2 .032 100 .129 .290 PCU 44.0N 95.7 .096 4.3 .043 100 .139 .316 PCU 43.0N 93.5 .094 6.5 .065 100 .169 .393 PCU 42.0N 91.4 .091 8.6 .086 100 .177 .421
* Nitrogen cost contained in the formulation is calculated by dividing the material cost by the percentage of nitrogen in the formula. Urea 46N for example, is $.10/ .46 = $.12711 bN.
134
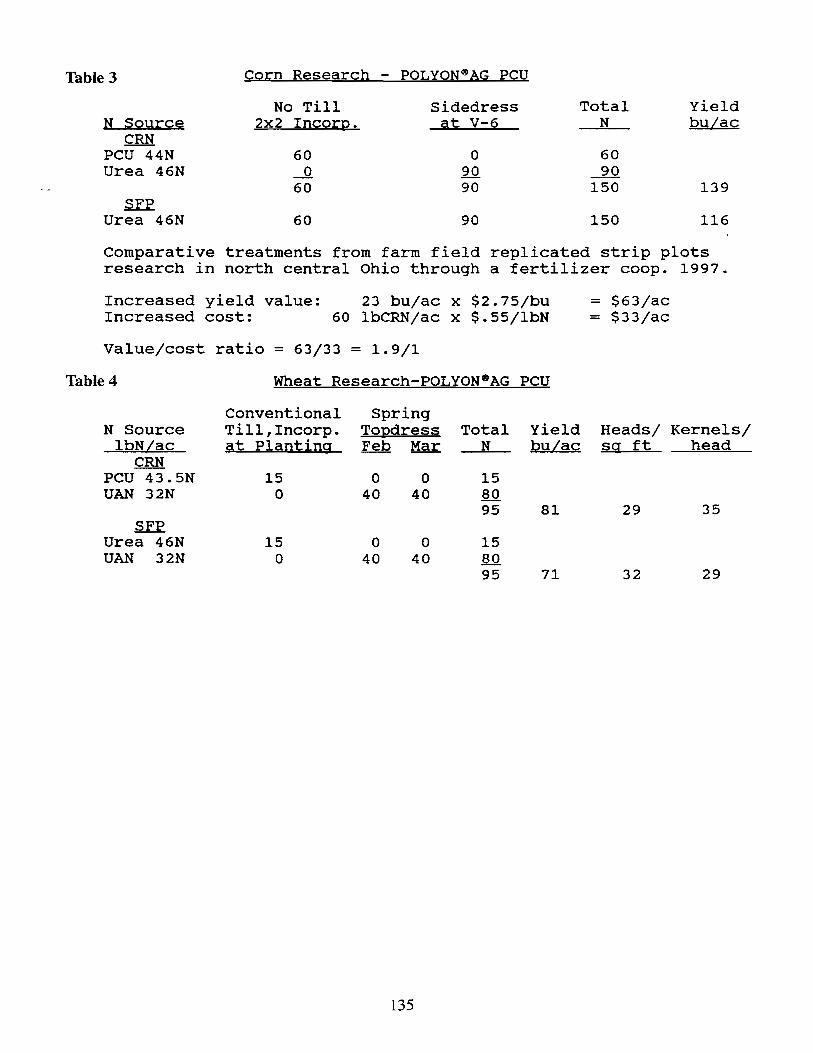
Table 3 Corn Research - POLYON4!lAG PCU
No Till Sidedress Total yield bu/ac N SQy;t:ce 2x2 Inco;t:g. at V-6 N
CRN PCU 44N 60 0 60 Urea 46N ~ 90 90
60 90 150 139 SFP
Urea 46N 60 90 150 116
Comparative treatments from farm field replicated strip plots research in north central Ohio through a fertilizer coop. 1997.
Increased yield value: 23 bu/ac x $2.75/bu Increased cost: 60 lbCRN/ac x $.55/lbN
Value/cost ratio = 63/33 = 1.9/1
Table 4 Wheat Research-POLYON8AG PCU
N Source lbN/ac
CRN PCU 43.5N UAN 32N
SFP Urea 46N UAN 32N
Conventional Till,Incorp. at Planting
15 o
15 o
Spring Topdress Feb Mar
o 0 40 40
o 40
o 40
135
Total N
15 80 95
15 80 95
Yield bu/ac
81
71
= $63/ac = $33/ac
Heads/ Kernels/ sq ft head
29 35
32 29
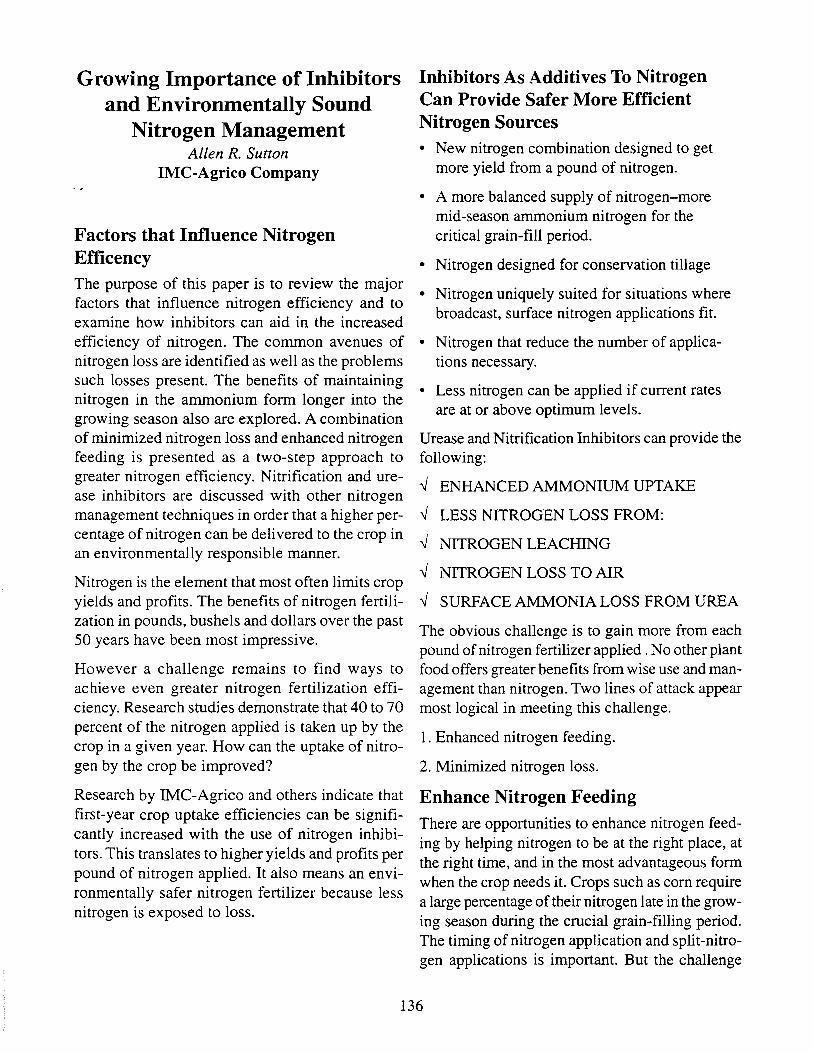
Growing Importance of InhIbitors and Environmentally Sound
Nitrogen Management Allen R. Sutton
IMC-Agrico Company
Factors that Influence Nitrogen Efficency The purpose of this paper is to review the major factors that influence nitrogen efficiency and to examine how inhibitors can aid in the increased efficiency of nitrogen. The common avenues of nitrogen loss are identified as well as the problems such losses present. The benefits of maintaining nitrogen in the ammonium form longer into the growing season also are explored. A combination of minimized nitrogen loss and enhanced nitrogen feeding is presented as a two-step approach to greater nitrogen efficiency. Nitrification and urease inhibitors are discussed with other nitrogen management techniques in order that a higher percentage of nitrogen can be delivered to the crop in an environmentally responsible manner.
Nitrogen is the element that most often limits crop yields and profits. The benefits of nitrogen fertilization in pounds, bushels and dollars over the past 50 years have been most impressive.
However a challenge remains to find ways to achieve even greater nitrogen fertilization efficiency. Research studies demonstrate that 40 to 70 percent of the nitrogen applied is taken up by the crop in a given year. How can the uptake of nitrogen by the crop be improved?
Research by IMC-Agrico and others indicate that first-year crop uptake efficiencies can be significantly increased with the use of nitrogen inhibitors. This translates to higher yields and profits per pound of nitrogen applied. It also means an environmentally safer nitrogen fertilizer because less nitrogen is exposed to loss.
Inhibitors As Additives To Nitrogen Can Provide Safer More Efficient Nitrogen Sources • New nitrogen combination designed to get
more yield from a pound of nitrogen.
• A more balanced supply of nitrogen-more mid-season ammonium nitrogen for the critical grain-fill period.
• Nitrogen designed for conservation tillage
• Nitrogen uniquely suited for situations where broadcast, surface nitrogen applications fit.
• Nitrogen that reduce the number of applications necessary.
• Less nitrogen can be applied if current rates are at or above optimum levels.
Urease and Nitrification Inhibitors can provide the following:
..J ENHANCED AMMONIUM UPTAKE
..J LESS NITROGEN LOSS FROM:
..J NITROGEN LEACHING
..J NITROGEN LOSS TO AIR
..J SURFACE AMMONIA LOSS FROM UREA
The obvious challenge is to gain more from each pound of nitrogen fertilizer applied. No other plant food offers greater benefits from wise use and management than nitrogen. Two lines of attack appear most logical in meeting this challenge.
1. Enhanced nitrogen feeding.
2. Minimized nitrogen loss.
Enhance Nitrogen Feeding There are opportunities to enhance nitrogen feeding by helping nitrogen to be at the right place, at the right time, and in the most advantageous form when the crop needs it. Crops such as corn require a large percentage of their nitrogen late in the growing season during the crucial grain-filling period. The timing of nitrogen application and split-nitrogen applications is important. But the challenge
136
has remained to design a nitrogen material that delivers nitrogen to the crop when and where it is needed and in a form that the crop would use more efficiently. The other side of the challenge to improve nitrogen efficiency is to block common avenues of nitrogen loss. If current nitrogen uptake efficiency is agreed to be in the 40 to 70 percent age, then 30 to 60 percent of the nitrogen is lost or not available to the crop during the year of application. The opportunity exists to modify nitrogen fertilizers with inhibitors to minimize nitrogen loss.
The chief reason for nitrogen loss is the nitrogen cycle itself. It's a very complex biological and chemical process. The primary reason for nitrogen loss in this cycle is because all forms of nitrogen other than N03 nitrogen are transformed to N03 nitrogen too rapidly for maximum crop uptake. Most nitrogen is lost to the crop as N03 nitrogen. Some manure, urea and ammonium nitrogen can be lost by volatilization to the atmosphere.
Minimize Nitrogen Loss Common nitrogen fertilizers consist of four basic nitrogen forms-ammonia, urea nitrogen, ammonium nitrogen and nitrate nitrogen. Some nitrogen fertilizers contain one form; some contain a combination of forms.
Ammonium nitrogen (NH4+) has a positive charge, whereas nitrate nitrogen (N03-) has a minus charge. The clay and humus particles in the soil have a minus charge. Bacteria in the soil convert NH4 nitrogen to N03 nitrogen. When urea nitrogen is applied to the soil, it takes on water(hydrolyzes) and, in the presence of the enzyme urease, undergoes change to NH4 nitrogen.
Because like charges repel and unlike charges attract, N03 nitrogen is pushed away from clay and humus particles, and moves up and down with soil water. Ammonium nitrogen(NH4+) is attracted to clay and humus particles, and is held to these particles until bacteria cause conversion to N03 nitrogen.
When soil conditions (cold, wet, etc. ) do not favor bacteria growth most of the NH4 nitrogen will stay attached to the clay and humus particles and
not change or move. However, when conditions favor crop growth and development, the conversion of urea and NH4 forms of nitrogen to N03 nitrogen is rapid. In many cases this conversion would be 80 percent complete in a matter of three to four weeks.
There is growing evidence that the predominantly nitrate nitrogen environment in the root zone is not ideal for maximizing growth, and yield. Research shows that a mixture ofNH~ and N()3 nitrogen provides a more desirable nitrogen environment for attaining higher yields. Importantly this balance ofNH4 and N03 nitrogen continues to be needed in the latter part of the growing season when the grain is filling. This concept points to the importance of finding ways to deliver at least part of nitrogen as NH4 in the grain filling period.
Dr. Fred Below, a soil scientist with the University of Illinois Agronomy Department, "Nitrogen is the mineral element that corn plants require in the greatest quantityfor growth and yield, yet the soil cannot supply enough for maximum crop productivity. Because N deficiency can severely reduce corn yields, there is a strong incentive to use fertilizers to supply adequate N However in addition to being removed with the crop, N can be lost from the soil in large amounts as the result of leaching, denitrification, volatilization, surface runoff and soil erosion. Nitrogen can also be temporarily removed from the available soil pool due to microbial immobilization. The economic implications of these losses are seff-evident, especially when they are large enough to limit crop productivity. Because N fertilizers have been implicated in contamination of ground and surface waters, corn growers are under increasing pressure to improve their management of N. The increasing use of conservation tillage practices, such as no-till, also raises new questions regarding the best management of fertilizer N. One major difference between conventional and no-till systems is in the potential for N loss via immobilization. Immobilization is typically greater in no-till systems because plant residues, which are low in N, tend to accumulate at the soil surface where soil microorganisms use the fertilizer N to decompose them. Although all N sources are subject to immobilization the problem is greatest for ammoniacal fertilizer applied to the surface of notill fields.
Surface applied N as urea, or urea-containing fertilizer, is also subject to N losses by volatilization.
137
This problem occurs because urea is rapidly cleaved to NH4 and C()1 by the action of urease enzymes present in the soil and plant residue. This conversion gives rise to both high NH41evels and elevated soil pH, two properties that are conducive to volatilization ofN as NH3. N-(n-butyl) thiophosphoric triamide, a urease inhibitor temporarily reduces the activity of urea enzymes, thus maintaining applied N as ureafor several days. Because the uncharged urea molecule is quite mobile in soil, rainfall can move surface-applied urea into the soil profile, where it can hydrolyze with less opportunity for N losses via volatilization or immobilization. Some research has shown that urea inhibitors can decrease N losses from surface-applied urea, leading to more efficient use of fertilizer N (Hendrickson, 1992). Water infiltration can be greater under no-till conditions, which can lead to large N losses from leaching and or denitrification. These losses can be minimized by another fertilizer amendment, known as nitrification inhibitor, dicyandiamide. Nitrification inhibitors block the microbial conversion of NH4 to N()3, thereby maintaining the applied N in NW form. Since only N03 is subject to leaching and denitrification the use of nitrification inhibitors can reduce these losses."
There is evidence, too, that a close relationship exists between ammonium nutrition and hybrid selection in corn. High fertility hybrids benefit from ammonium nitrogen late in the growing season. When nitrogen is not available from the soil during grain fill, the plant will rob stalk protein for nitrogen. This results in lower yield potential plus a weakened stalk.
The plant uses nitrogen to form amino acids, which form proteins, which in turn increase growth and yield. Amino acids are made up of carbon, hydrogen, oxygen, nitrogen and sulfur. These elements, in a multitude of configurations, form proteins.
Both NH4 and N03 nitrogen must be combined with carbon to produce amino acids that form protein. When NH4 nitrogen is taken into the plant it requires no further conversion. It Is immediately converted to amino acids in the root. Nitrate nitrogen, however, must be converted to NH4 nitrogen before it can form amino acids. This process requires energy and the presence of the enzyme reductase. This difference in how and when NH4 and N03 are utilized by the plant helps explain the su-
periority ofNH4 nitrogen in protein formation and in boosting yield.
Creating Barriers to Nitrogen Loss Some of the nitrogen applied in a given year is carried over to succeeding crops, but some is lost. There are five major avenues of nitrogen loss. The chart below depicts some typical percentage ranges of nitrogen uptake and loss. The loss mechanism and form of nitrogen involved are also shown.
Immobilization Loss
Nitrogen is an essential element to soil organisms, just as it is to higher plants and animals. Soil organisms can utilize fertilizer nitrogen as well as crops can. This process of nitrogen "tie-up" by soil organisms is called immobilization.
Soils bacteria require one pound of nitrogen to 11 pounds of carbon in the decomposition process. The greater the carbon containing material, the greater the nitrogen "tie-up" or immobilization. This nitrogen may be lost to the crop during the growing season, but it Is considered only temporarily unavailable. When decomposition is complete and the bacteria expire, the nitrogen contained in these cells will be available to crop plants.
Erosion
Nitrogen obviously can be lost as a result of soil erosion. If clay and humus particles are washed from a field, any NH4 nitrogen attached to these particles or N03 nitrogen contained in the soil water around them can be lost. Close adherence to all good soil conservation practices will minimize this avenue of nitrogen loss.
Nitrogen Loss Via Denitrification
Soil bacteria require oxygen to survive. In well aerated soils, much of the oxygen demand is filled by the gaseous oxygen in the soil's air spaces.
In water logged soils, gaseous oxygen is no longer available. Under these conditions, bacteria can turn to other sources of oxygen. One of these sources is nitrate nitrogen(N03). Certain bacteria remove the oxygen from N03; the end product of this process Is gaseous nitrogen, which can escape to the atmosphere.
138
The amount of nitrogen lost through denitrification depends on temperature and the amount of time it is exposed to waterlogged conditions.
Soil Days Temperature Waterlogged 55-60° F 5
10 75-80°F 3
5 7 9
Loss of Applied N(%)
10 25 60 75 85 95
Denitrification loss of nitrogen occurs when soil nitrogen is present in the N03 nitrogen form and the soil is saturated with water. Improved drainage and midseason side dressings of nitrogen have been two common ways to reduce the occurrence of nitrogen loss by denitrification. Since no single preventive method assures certainty against this type of nitrogen loss, research attention has focused on developing a nitrogen fertilizer that restricted the availability of N03 nitrogen. If a large portion of fertilizer nitrogen can remain in the NH4 nitrogen form until the plant's peak demand is satisfied, the threat of denitrification loss would be reduced.
The Leaching Loss of Nitrogen
Nitrogen can be lost by the downward leaching of N03 nitrogen. Since nitrogen in the NH4 form is held by clay and humus particles, it is not considered leachable. Nitrate nitrogen, however, moves readily with the soil water. In coarse or sandy soils, abundant rain or excessive irrigation can leach N03 nitrogen out of the crop's rooting zone. Two inches of water applied to a sandy soil could move N03 nitrogen as deep as three to four feet.
Nitrate nitrogen that has been leached below the root zone may move upward as water evaporates from the soil surface. This return of N03 nitrogen into the rooting zone may be delayed long enough, however, to lower the crop's yield potential.
The long-term effects ofN03 nitrogen leaching can present a problem of more concern than low yields and profits. There is frequent evidence that groundwater, which can be a source of drinking water, contains nitrate levels too high to be healthy for
human consumption. Also, recent studies link nitrate to the hypoxia issue in the gulf.
Management practices such as limiting the amount of fertilizer nitrogen applied as nitrate, applying nitrogen later to provide a closer fit to crop demand and controlling runoff from bamlots and feedlots have been effective in reducing nitrate leaching.
The N03 nitrogen leaching problem has directed research attention to the development of a nitrification inhibitor that minimizes the availability of NOJ nitrogen. If a nitrogen fertilizer containing urea or NH4 nitrogen can maintain nitrogen in the NH4 nitrogen form longer, the concern about nitrate leaching would be reduced.
Loss of Nitrogen by Ammonia Volatilization Ammonia volatilization is the loss of nitrogen as ammonia (NH3) gas into the atmosphere. This type of nitrogen loss can occur with manure, urea and ammonium sources of nitrogen when appli'ed on the soil surface. Soil incorporation of these mate-rials will essentially eliminate this avenue of nitrogen loss. In situations where incorporation is not practical or desired, the possibility of nitrogen loss in this manner remains in the picture. Obviously, improperly applied anhydrous ammonia is always subject to volatilization nitrogen loss.
Urea nitrogen differs from ammonium nitrogen in its exposure to volatilization loss. After application, urea unites with water (hydrolyzes) and, in the presence of the enzyme urease, converts to various ammonium compounds-frequently ammonium carbonate. When this reaction take place on the soil surface, some free ammonia(NH3) can evolve and be lost into the air. The goal is to find a nitrogen that will resist loss by volatilization.
AboutN-(N-Butyl) Thiophosphoric Triamide When urea fertilizers are applied to soils, they are rapidly converted to ammonium carbonate by enzymes (proteins) that exist in the soil. The urease enzyme is produced by many soil microorganisms
139
and plants, but most of the urease activity in soil is known to reside outside living organisms. The urease enzymes likely originated as components of plant roots and microorganisms, but once released upon decomposition, become stabilized by their close association with humic materials in the soil. When urea is applied to the soil surface, it is very. rapidly hydrolyzed by these enzymes, and the resulting high pH and ammonia concentrations give rise to very extensive losses of nitrogen to the atmosphere. At the same time, these conditions may promote the temporary tie-up of nitrogen by soil microorganisms proliferating in the normally carbon-rich zone at the soil surface.
Research results have shown that these losses of nitrogen can be reduced or eliminated if the urea is instead placed several centimeters below the soil surface or if rainfall is received within hours of surface application. Rainfall is known to move the very mobile urea down into the soil. thus preventing the volatilization of ammonia from the surface and placing the nitrogen below this nutrient-rich surface layer. If rainfall is not received within the first few hours after applying urea to the soil surface, these losses of nitrogen have been shown to cause significant reduction (5 to 20%) in crop yields when compared to incorporated nitrogen or sources of nitrogen such as ammonium nitrate which are not subject to these losses.
Urease inhibitors such as N-(n-butyl) thiophosphoric triamide are aimed at eliminating these losses of surface applied urea. These chemical agents would be applied with the urea or U AN to prevent the normal rapid hydrolysis of urea by the urease enzymes for a period of seven to fourteen days. During that interval, one could normally expect to receive a rainfall event of sufficient magnitude ( 1-2 cm or 0.75 inches) to leach the urea into the soil profile, thereby preventing these losses from occurring.
An effective urease inhibitor such as N-(n-butyl) thiophosphoric triamide would thus enable consistent full value for the applied urea without having to incorporate the nitrogen into the soil or being concerned about weather patterns that may exist after N application. Such consistent fertilizer per-
formance would thus allow growers to apply only that amount of nitrogen necessary for optimum yields. without having to apply additional increments of N as insurance against possible large losses of nitrogen if rainfall does not shortly follow N application.
A urease inhibitor such as N-(n-butyl) thiophosphoric triamide would also enable a grower to apply urea without incorporation as is currently recommended. This not only reduces the energy and labor requirement, but would allow growers to effectively use urea in many cases where such use is not currently recommended.
About Dicyandiamide Dicyandiamide is a unique compound and a slowrelease form of nitrogen, which contains 66 percent actual nitrogen.
Research has demonstrated that dicyandiamide is broken down in the soil to plant usable ammonium nitrogen. It is available for plant uptake after 30 to 90 days, depending on soil temperatures. This feature of dicyandiamide causes nitrogen to be available to plants later in the growing season when the need for nitrogen is greatest. It enhances more abundant ammonium nutrition, which has increased yields and profits. Dicyandiamide also breaks down very slowly from ammonium nitrogen to nitrate nitrogen, and thereby reduces exposure to nitrate nitrogen loss.
Dicyandiamide has been incorporated into a variety of nitrogen and nitrogen-containing fertilizers. Most of the commercial work has been in Europe where dicyandiamide-containing fertilizers for turf, specialty crops and field crops have been successfully marketed. Processes have been developed to incorporate dicyandiamide into urea, ammonium sulfate, urea-ammoniumnitrate solutions, liquid manure and NPK granular fertilizers.
Dicyandiamide has been extensively tested in the United States over the past ten years. Yield increases of up to 25 percent from dicyandiamidecontaining fertilizers have been reported. Dicyandiamide experiments by TVA and leading agricultural universities have been conducted on
140
corn, wheat, grain sorghum, sugar beets, potatoes, tomatoes, rice' and other crops.
IMC-Agrico's Solution and urea fertilizers both contain dicyandiamide and N-(n-butyl) thlophosphoric triamide.
Protection of Our Environment Nitrogen fertilizer has the potential to contaminate groundwater with too much nitrate nitrogen. Over half of this country's popUlation relies exclusively on groundwater for its water supply. The Environmental Protection Agency is focusing considerable attention on groundwater protection.
The Council for Agricultural Science and Technology has suggested the following actions to cut nitrate loss to groundwater:
1 Reduce the amounts of nitrogen fertilizers.
2 Fine tune fertilizer applications with soil and plant testing.
3 Apply nitrogen fertilizer split applications.
4 Vse slow release fertilizers.
5 Vse chemical inhibitors to delay urea hydrolysis and nitrate formation.
6 Avoid fall applications of nitrogen fertilizers.
7 Foliar versus soil applied applications.
8 Adapt systems that supply nitrogen from legumes.
Dicyandiamide has been identified as one compound capable of reducing nitrate levels in groundwater. Data show that nitrate in drainage water can be reduced some 30 percent when the nitrogen applied contains dicyandiamide, when compared to a nitrogen source combination of calcium ammonium nitrate and ammonium sulfate-nitrate.
Economic considerations have guided nitrogen fertilizer use in the past. It is evident that economic considerations will need to be coupled with environmental concerns in the future.
Dicyandiamide is a nitrification inhibitor. Mixtures of dicyandiamide with other nitrogen fertilizer material have' resulted in improved nitrogen effi-
ciency. Such mixtures have held the nitrogen in the ammonium form longer and reduced the amount of nitrate nitrogen found in groundwater. There is evidence that urea or ammonium nitrogen fertilizer sources with dicyandiarnide additions produce a more environmentally safe nitrogen.
1M C-Agrico 's Dicyandiamide-N-(nbutyl) thiophosphoric triamide Concentrate IMC-Agrico's Dicyandiamide-N-(n-butyl) thiophosphoric triamide Concentrate 'is an additive to VAN fertilizer that has been formulated to produce a urea ammonium nitrogen solution with increased nitrogen efficiency. Its nitrogen content remains 28 percent nitrogen, but Its makeup has been enhanced to increase nitrogen uptake and thus, to improve yield.
Dicyandiamide has been tested across the country since 1992. It has proven to be an ideal nitrogen for situations where ammonium feeding is desired and nitrogen loss is a concern. Dicyandiamide is a particularly superior product for top-dress, side dress or surface broadcast applications.
IMC-Agrico's Dicyandiamide-N -en-butyl) thiophosphoric triamide Concentrate is a proprietary concentrated formulation that combines N(n-butyl) thiophosphoric triamide and dicyandiamide with the three forms of nitrogen contained in VAN. The N-(n-butyl) thiophosphoric triamide protects the urea portion of the VAN from surface volatility for up to seven days. Once in the soil. the NBPT continues to slow the urea portion of the nitrogen to ammonium. Simultaneously, the ammonium portion of the V AN is being slowed in its conversion to nitrite and subsequently nitrate by dicyandiamide, a nitrification inhibitor. This process results in more of the stable ammoniacal N remaining for a longer period of time. Ammoniacal N is an excellent source of nutrition for the growing plant and is less likely to be lost due to leaching and denitrification than untreated VAN solution.
IMC-Agrico Dicyandiamide and N-(n-bulyl) thiophosphoric triamide Vrea Fertilizer IMCAgrico's Dicyandiamide and N-(n-butyl)
141
thiophosphoric triamide combination is a new improved urea fertilizer that has been formulated to produce a granulated urea with increased nitrogen efficiency. Its nitrogen content remains 46 percent nitrogen, but its makeup has been enhanced to increase nitrogen uptake and thus, to improve yield.
IMC-Agrico's Dicyandiamide and N-(n-butyl) thiophosphoric triamide combination is a proprietary formulation that combines N-(n-butyl) thiophosphoric triamide and dicyandiamide in the liquid urea melt prior to granulation, giving each granular the unique ability to reduce loss from surface application by inhibiting the urease enzyme for up to seven days. This inhibition stops volatility of urea until rain or mechanical incorporation occur. Another advantage in keeping the urea as urea, is that in high residues, urea will move freely through the residue and into the soil, reducing the possibility of biological immobilization. Once in the soil, the delay in hydrolysis prevents the immediate conversion of the urea molecule to ammonium. Once the urea begins to convert to ammonium the dicyandiamide, a nitrification inhibitor further slows the conversion of ammonium to nitrite and subsequently nitrate. This process results in more of the stable ammoniacal N remaining for a longer period of time. Ammoniacal N is an excellent source of nutrition for the growing plant and is less likely to be lost due to leaching and denitrification than untreated urea compounds. Features To Deliver Benefits
IMC-Agrico Dicyandiamide nitrogen Products result from research and testing to develop nitrogen fertilizers that can deliver these important benefits:
• Nitrogen that can produce sufficient yield increases to provide farmers challenging profit opportunities.
• Nitrogen that can deliver improved first-year profit opportunities.
• Nitrogen that can deliver improved first-year uptake efficiency.
• Nitrogen that can produce prolonged availability of ammonium nitrogen.
• Nitrogen that can be surface applied with reduced chance of nitrogen loss.
• Nitrogen that can be safer from an environ-mental standpoint.
In corn and wheat test plots throughout the country, IMC-Agrico Dicyandiarnide nitrogen products have out yielded conventional urea-ammonium nitrate fertilizer solution and urea fertilizer. Tests have shown that significantly greater nitrogen efficiency can be achieved and this translates to higher yields and profits per pound of nitrogen applied.
142
Wednesday, October 28, 1998
Session V Moderator:
Walter J. Sackett, Jr.
Nitro Phosphate Process Dr. Thomas Meyer
Dr. Johannes Reuvers BASFAG
The BASF Nitrophosphate Process The future of fertilizer industry?
How does the future of fertilizer industry look like? A question we would all like to have an answer to. Or maybe a question of which we think we have an answer to.
Right now we seem to be able to predict in long term what will happen: (See Fig. 1)
• We have a rapidly growing world population, which will need food.
• We will have limited space to grow food, even taking into account the few not used or idled areas.
• There will be in long term an urgent need to intensify agriculture to meet the required supply.
This has become general opinion and so we predict: there will be a golden age for fertilizer industry ! Let's only wait for it.
This is what we call STRUCTURE EXTRAPOLATION. This is what we always do, when we predict or try to plan the future. We extrapolate from our knowledge and experience, i.e. the known structure.
Now there is one strange thing about structure extrapolation, which I would demonstrate with a few slides:
• Fertilizer industry had ups and downs. We have got all kinds of experience with all kinds of business situations. This makes us believe, we know the structure and that we are able to predict, what will happen. (See Fig. 2)
• Based on our experience we develope strategies and visions and proceed in following them. (See Fig.3)
• Then something happens that is different from what we expected. (See Fig. 4)
• Now we perform structure extrapolation. We think we know what to do. And we stick to our strategy. (See Fig. 5)
• Until it is too late. We recognize, that the things are different in a way we did not take into account at the beginning, because it was out of limits of our experience. (See Fig. 6)
Structure extrapolation tends to fail! There are many examples in other industries (car, computer, ... ). Looking at world economy it gets more and more important to be aware of the unaware, to feel ready to face whatwever comes without knowing what comes.
There is another well known saying: The less you plan, the more often you will be hit by fate; the more you plan, the harder you will be hit by fate.
We at BASF feel that we have the technology, that is flexible enough to meet future requirements. (See Fig. 7)
143
The nitrophosphate process
• uses less and lowest cost raw materials,
• needs no large waste deposits,
• is highly flexible in product range and grade,
• switches easy from one grade to another,
• allows flexible design to meet changing environmental demands,
• and gives the user added value on the products.
This flexibility makes us look confidently into the future, if the golden age comes or not. Felxibility made homo sapiens survive, not experience.
The BASF nitrophosphate process The 1965 Fertilizer Industry Round Table was dedicated to the nirophosphate process. Many papers have been published since then about all aspects of the process. A most recent summary is given in the Fertilizer Manual, Kluwer Academic Publishers in cooperation with UNIDO and IFDC, 1998.
The following remarks will therefore not go into too much technical detail. They are just a principle description of how the process works and where the advantages are.
Regional differences in fertilizing practice (different crops, especially high value crops, different soils) require a wide variety of high analysis fertilizers. From single N-to multi-nutrient NPKs this variety can be covered by the BASF nitrophosphate process. It offers the advantage of a simultaneous production of NP or NPK multi-nutrient fertilizers and straight N-fertilizers.
The rock phosphate is digested in nitric acid and insolubles, mostly sand, are separated. Calcium nitrate tetrahydrate (CNTH) is then crystalized by cooling the solution down to approximately O°C with optimized energy efficiency. Calcium nitrate is separated with a filter. This way, the calcium separation does not require sulfuric acid; no gypsum is produced. (See Fig. 8 and 9)
The resulting solution is the nitro-phosphoric acid or NP-solution. This is neutralized with ammonia
and excess water is evaporated to obtain the so called NP -melt. After the addition of potassium the melt is ready for granulation, drying and finishing.
CNTH is further processed with ammonium carbonate, which is synthesized from carbon dioxide and ammonia. The conversion reaction with calcium nitrate leads to calcium carbonate, lime, which precipitates, and to ammonium nitrate. The lime is then separated and the ammonium nitrate solution is concentrated. Both can either be sold as products or can be combined in a further granulation line to calcium ammonium nitrate fertilizer, CAN. The lime does not need to dried for this procedure.
Raw materials needed are rock phosphate, nitric acid, ammonia and carbon dioxide.
Basic advantages Cost savings:
The nutrient sources for the nitrophosphate process are, of course, the same as for other fertilizers: ammonia for N, rock phosphate for P, and MOP/SOP for K. Raw material costs account for the major part of the production costs. The significant cost savings come from: (See Fig. 10.)
When producing phosphoric acid or DAP:
• No sulphur or sulfuric acid is needed for the production.
• No solid waste deposit is needed.
• No costs for the operation and environmental monitoring of a waste deposit.
When producing NPINPK from phosphoric acid orDAP:
• Cheap rock phosphate is used directly instead of high price phosphoric acidlDAP
The other production costs, as for example energy, maintenance and personell, are the same as for any fertilizer production, since the basic unit operations are similar and similar equipment is used.
144
Environment:
No solid wastes are produced. The very small amounts of sand that are seperated from the rock phosphate can be washed, if required. to give it to building industry. In some cases the sand can be recycled to the granulation and is used as filler.
Excess amounts of lime from the conversion. if not used for CAN production. are used in ariculture for soil pH adjustment.
Gaseous effluents are scrubbed in custom designed scrubbers to meet company standards and governmental regulations.
Evaporated water from fertilizer slurries is usually condensed and treated in waste water treatment facilities. If they are not available, the vapors can be treated also in scrubbers, not condensing them, and are released clean to atmosphere. The washing liquids are recycled to the process. A design is possible without any liquid effluents being discharged from the process.
Less market sensitivity:
Another big advantage is the access to a market of higher price products with added value for the user. The high price segment is much less sensitive to price fluctuations than the commodity market. (See Fig. 11.)
The user of NPINPK's does have added value, when using these products (See Fig. l3):
• Especially for high value crops there is a crop specific, balanced nutrition.
• Compared to urea there are practically no volatilization losses of nitrogen.
• There is a proven high nutrient efficiency due to even distribution of the nutrients in each granule. More granules per area are applied which facilitates the root access to the nutrients. This gives higher and better quality yields compared to the application of high concentrated mixtures of DAPlUrea or DAPI AN.
• Compared to DAP or ammonium sulfate application the acidifying effects are negligible.
• There are no phytotoxic effects.
• Applying a basic dressing with NPK and additional dressing with straight-N covers most nutrient requirements and reduces the work for the user.
• Special fertilizers, again for high value crops, like NPK's with trace elements, slow release fertilizers and coated fertilizers are possible.
Of course the whole fertilizer markets suffered Fig. 14 gives an example for the mass ratios for raw materials, intermediates and products for·a
from the rapid price drop of urea, when China stopped imports. But compared to DAP with a price decrease of 18% in West Europe the effect on NPK prices was moderate; the NPK prices fell only 5%. Also the price level of CANI AN, the byproduct of the nitrophosphate process, dropped 19% compared to 43-45% decrease for urea/ammonium sulfate.
Product flexibility and added value
Figure 11 gives some examples of how the NP or NPK grades can look like. At this time BASF is producing for the European market about 35 different grades. The change from one grade to another is easy and takes only a few hours.(See Fig. 12.)
NPK 15-15-15.
Summary BASF has developed the nitrophosphate process to a highly fexible process, meaning the flexibility in NP(K) qualities.
Europe uses mainly NPK's. Northern America uses mainly straight N-, P-, and K-fertilizers. This will most probably not change, although the main grades could be replaced by similar products from the nitrophosphate process. (See Fig. 15)
But when looking at high value crops and special applications nitrophoshate fertilizers have distinct advantages. The nitrophosphate process allows the simultaneous production of NPINPK grades with
145
added value for the user and straight N fertilizers, meeting specific demands. Today the production of only commodities is not enough. The margins are low. Specialization and a share in high price market segment, which is much less sensitive to price fluctuations, is obviously desirable.
--A golden age for fertilizer industry is predicted, based on world population increase and the forecasted need to intensify agriculture.
What if this does not happen?
BASF has the nitrophosphate technology, which as we believe is flexible enough to face the future, whatever it will come up with.
BASF is not only offering the technology as licence process. We also intend to stay in the fertilizer business and are open to establish partnerships with other worldwide producers. We invite everybody, who is interested, to discuss with us.
146
148
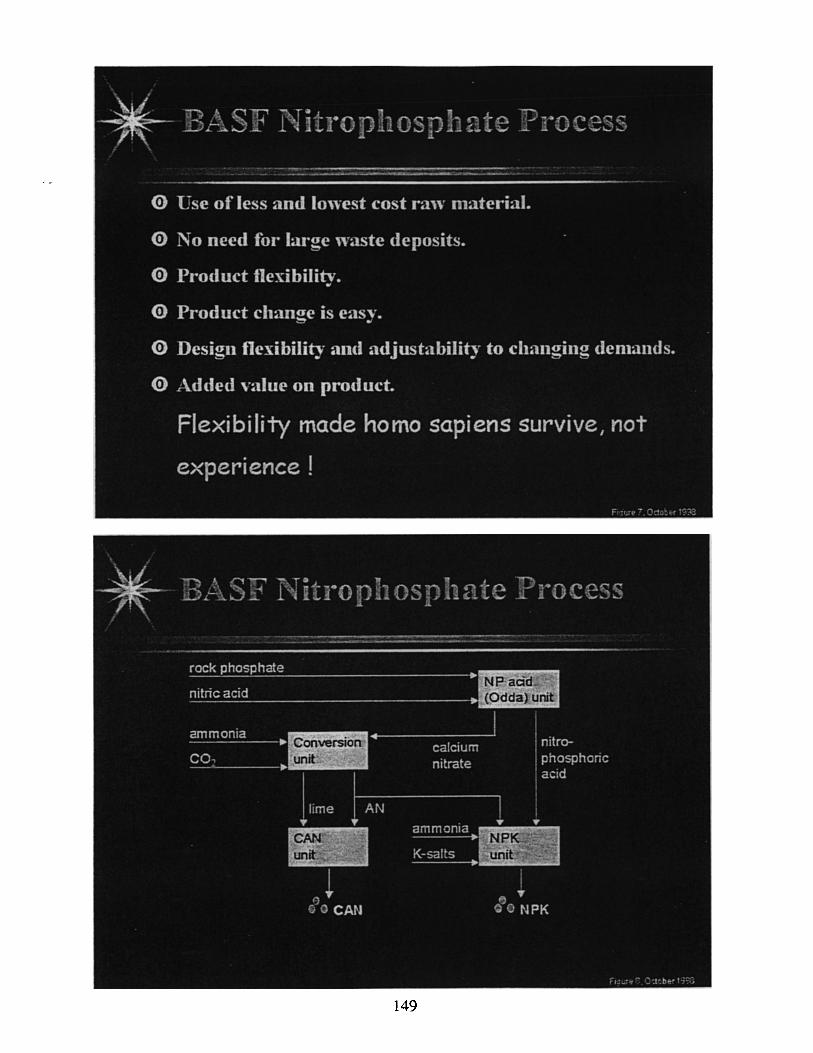
149
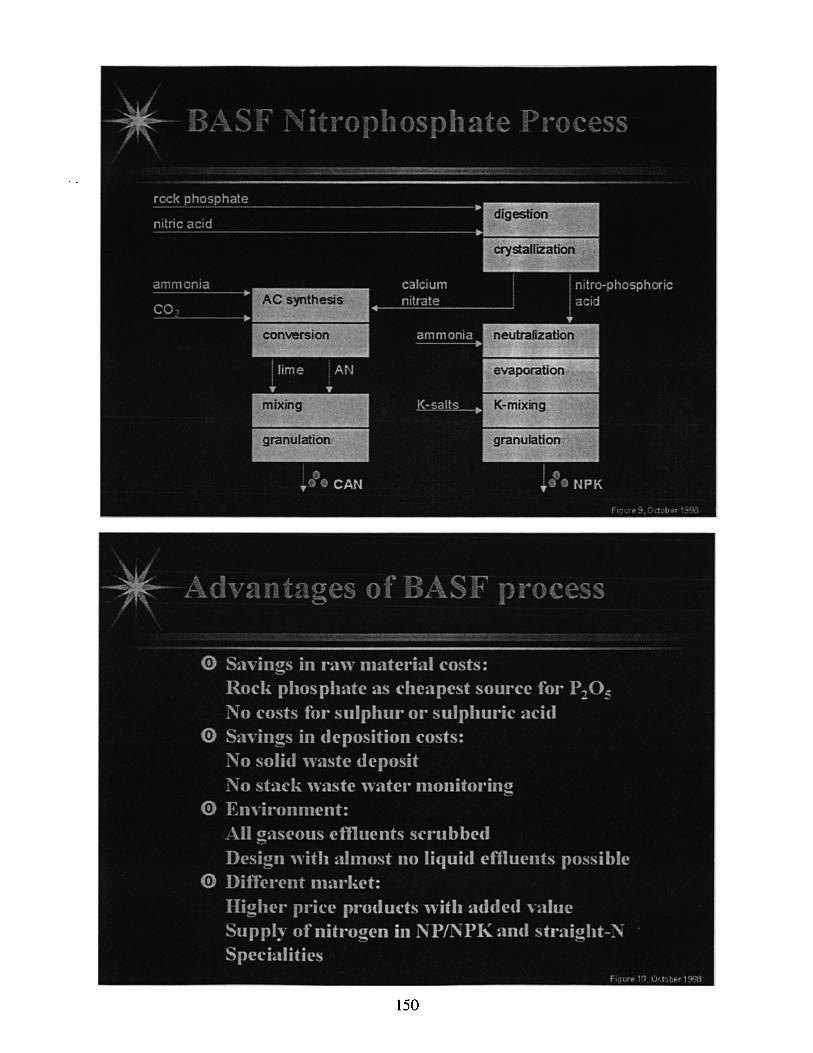
150
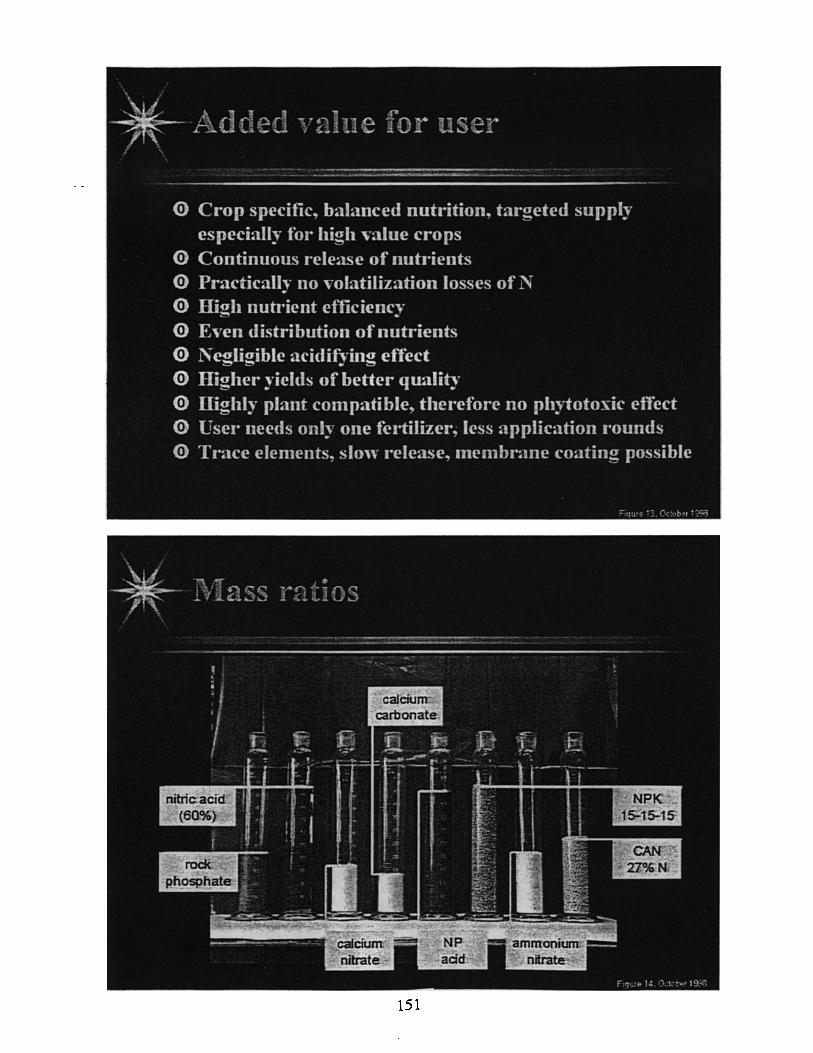
151
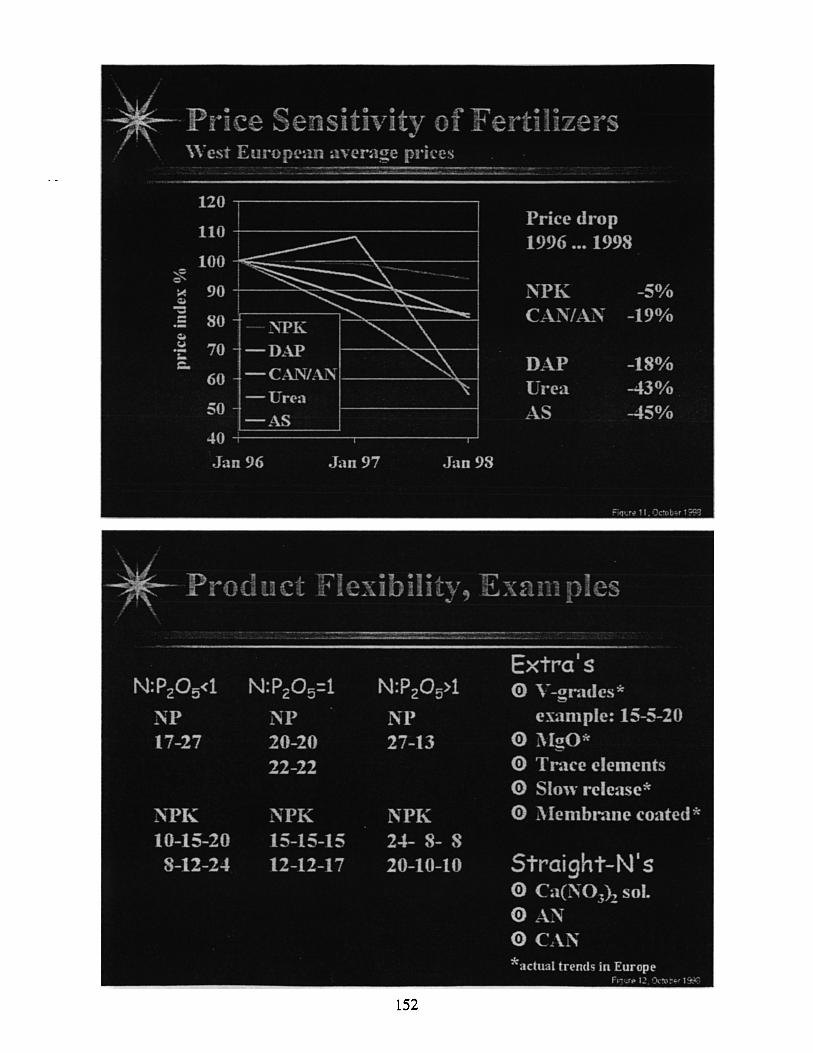
Farmland MissChem's New High Efficiency Ammonia Plant in Trinidad
David D'Andrade Farmland MS Chemival, LTD
Introduction Farmland MissChem Limited is a joint venture company between Farmland Industries of Kansas City, Missouri, and Mississippi Chemical Corporation of Yazoo City, Mississippi. The company is located in the twin islands of Trinidad and Tobago. The plant is situated in Trinidad on the Point Lisas industrial estate, which is on the western coast of the island with access to the sheltered waters of the Gulf of Paria. The plant is now one of eight ammonia plants located in the Point Lisas area. All plants provide ammonia for the international ammonia market.
Two of the motivating factors that have brought these plants to Point Lisas is the availability of high quality natural gas backed by large reserves, and the strategic location of Trinidad which give ready access to the ammonia markets of the United States, Western Europe and North Africa.
The plant is the first in a new generation of ammonia plants built by M.W. Kellogg, using the Kellogg Advance Ammonia Process (KAAP) technology. Its name plate capacity is 1850 MTPD with an overall efficiency between 30 and 32 mmbtulMT HHY.
The main factor that drove the design of the plant is a new ruthenium graphite-base converter catalyst. This catalyst is many times more reactive than traditional iron base catalyst. As a result the synthesis loop can operate at a pressure much lower than that of older plants. Not only is the loop pressure lower but the conversion out of the converter
153
is higher. Physically this allows the synthesis gas compression to be accomplished in a single case rather than a two case compressor. The other spinoff benefit from this is that only one turbine is required to drive both the refrigeration and synthesis compressor trains. All this will translate to capi-
. taJ. savings. The major differences between the new generation of plant and that old are given in the following tabulation.
The plant was mechanically completed and precommissioning 25 months from the start of the contract. First production occurred in April 1998 and the performance test was completed in July 1998.
Great emphasis was placed in the design on construction, and on environmental and safety issues. The plant was built to satisfy all applicable World Bank environmental standards as well as local standards established to protect the overall ecology at Point Lisas.
The construction was completed without a single loss time accident during the 4.25 million manhours that it took to build. This safety achievement did not happen by chance. It was the result of extensive training of all workers.
Plan for Start-Up and Commissioning As a grassroots plant FMCL had to build an organisation from scratch to operate and maintain the facilities. Despite the fact that ammonia plants have been in operation in Trinidad since the later 1950's with great success, the availability of personnel with the necessary experience was in very short supply. The reason for this was that the petrochemical industry in Trinidad was experiencing rapid growth and the demand for persons to man these industries was at a premium. FMCL therefore focussed on attracting a core group of experienced personnel, and to hire and train the remaining of its staff. The training was integrated into the entire plant inspection. commissioning and start-up.
Supervisors were hired early and they wrote the operating manuals for those who would be hired later. A simulator programme was also purchased
and our process engineer, E&I engineer and operations supervisors were able to develop simulation programmes for the major sections of the plant. This simulation was then used to train operators on the DCS system. This was extremely helpful as our E&I engineer became very familiar with the controls, our process engineer became familiar with the plant, and our operators were operating the plant long before it was built. We were also able in this process to debug some of the control problems.
The plant turnover from construction followed a system approach. By this method the plant was divided into ???? operating systems. These were then prioritised in the sequence required for operation. As a system was completed, it was handed over from construction and the commissioning team would pre-commission and put the system in service. We were therefore starting up segments of the plant while construction continued on other areas. This approach required co-ordination between the construction and commissioning teams to ensure safe procedures for both teams. The benefit of the system approach is that we were able to commission and debug the utilities to adequately support the process plant start-up. We were also able to get hands-on training for our new operators as well as our maintenance personnel.
Problems in Commissioning The pie chart shows the lost time we experienced during the commissioning. The three areas that contributed the most to delays were:
• Rotating equipment
• Exchangers
• Instrumentation
Most of the lost time for the rotating equipment was on the synthesis gas compressor train. This train carries dry gas seals and our first downtime on the unit was caused by damaged dry gas seals. Water and grit had got into the seals and damaged those on the synthesis compressor. A second outage was again caused by seal failure either because oil got on the seal or the compressor surged during instrument calibration. The third outage occurred when the turbine was taken out of service and
154
opened up to detennine why the machinery was not developing the designed horsepower. The problem was eventually traced to a damaged nozzle ring which restricting the flow of steam through the machine.
- Exchangers provided the next major source of downtime. Here the fault lay with one exchanger that had a design problem. Vibration on some of the tubes resulted in premature failure. Rods were inserted in the affected tube to act as stiffeners. These tubes were then plugged. There has been no further problem with this exchanger.
Instrument problems lay mostly in software system design. These were easily corrected but nonetheless led to numerous outages. The major flaw lay in the fact that instruments for the safety shutdown system and the digital control system were not properly co-ordinated. Thus the SIS was shutting down the plant while the DCS was showing the operator that he was till within control limits.
Shipping All of the ammonia produced is for export. We can load ships at rates of up to 1200 MTlhour. The system is equipped with a vapour return system to recover vapours if the ship's refrigeration cannot handle it. Special precautions were also taken to avoid over-pressuring the system due to a hydraulic surge when loading at high rates.
Technical Grade MAP & MKP Tim Barnes
Vicksburg Chemical Company
Vicksburg Chemical Company in Vicksburg, MS is a wholly owned subsidiary of Trans Resources, Inc located in New York City. Other subsidiaries of Trans Resources include Haifa Chemicals located in Haifa Israel and NaChurs Plant Food located in Marion, OH. Haifa Chemicals products include potassium nitrate, technical grade MAP and MKP, Phosphoric Acid, Food grade phosphates. magnesium nitrate and MultiCote polymer coated products. Haifa distributes worldwide through a group of marketing subsidiaries and agents.
NaChurs is the leading US manufacturer of clear liquid fertilizers. Alpine is the second largest in the US and a major producer in Canada. NaChurs and Alpine recently signed a letter of intent to fonn a joint venture. Vicksburg Chemical produces several products including K-Power Potassium Nitrate. K-Carb Potassium Carbonate, Nitric Acid, Chlorine, Dinitrogen Tetroxide and now technical grade MonoAmmonium phosphate and MonoPotassium phosphate. Potassium Nitrate (13.75-00-46) is composed of all nitrate nitrogen and is chlorine free. It is fully water soluble. Its primary uses are for a base dressing for chlorine sensitive crops, water soluble manufacturing, fertigation, greenhouses, and in the industrial markets for high quality glass manufacturing and heat salt transfers. Dinitrogen Tetroxide (N204) is used as an oxidizer in liquid rocket fuels. Vicksburg is the exclusive producer of this product for the US Air Force. Potassium Carbonate (00-00-68) is fully water soluble and chlorine free. It is used is specialty agriculture applications and glass manufacturing. The new MAP and MKP plants built in Vicksburg, MS compliment Vicksburg Chemical> Company's desire to provide additional manufacturing products to the water soluble industry. The plant is rated at 35,000 tons per year and utilizes unique technology to produce a clear, fully water soluble product from merchant grade phosphoric acid. MAP is produced from the reaction of Anhydrous Ammonia and phosphoric acid. The product is then filtered and crystallized to produce a clear, fully water soluble crystalline material with the analysis 12-61-00. MKP is produced from the reaction liquid potassium carbonate and/or potassium hydroxide and phosphoric acid. The product is then filtered and crystallized to produce a clear, fully water soluble crystalline material with the analysis 00-52-34. Both MAP and MKP are used in the production of water soluble fertilizers, clear liquid fertilizers, fertigation systems, and as foliars. MA .. I> is also used in the production of fire retardant materials. As a co-product of the MAP and MKP manufacturing process, a filter cake is produced which is utilized as a base ingredient in the manufacturing of dry NPK's.
155
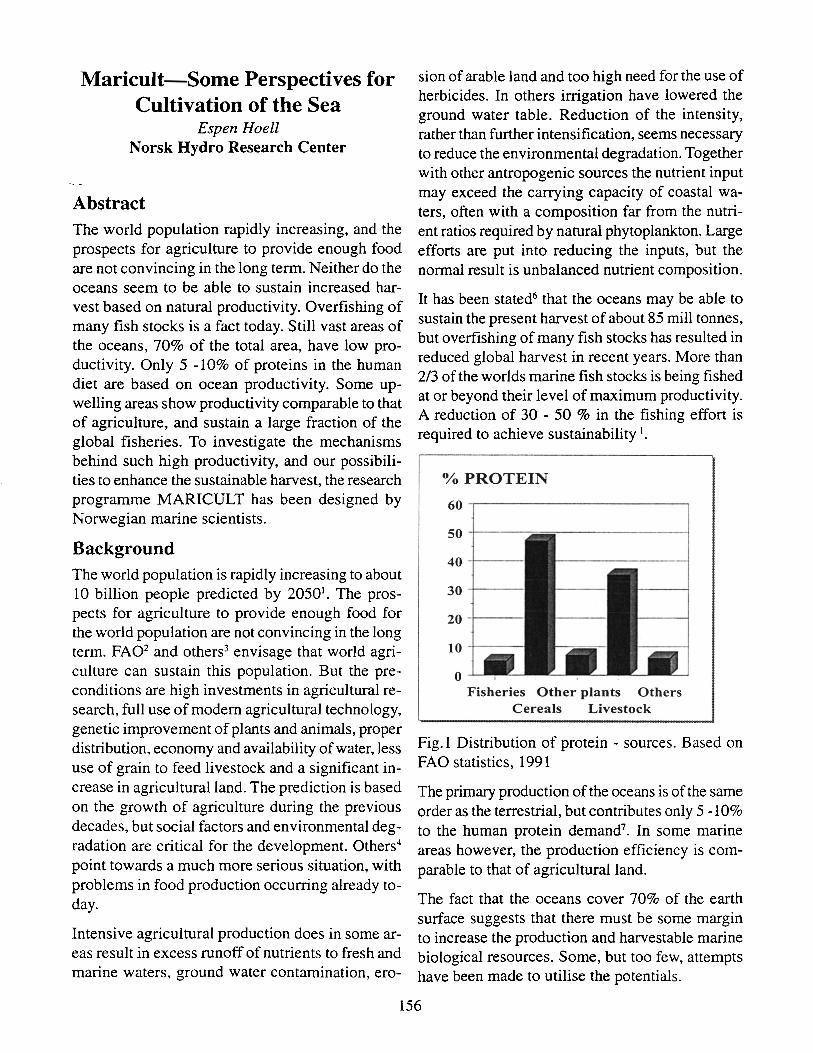
Maricult-Some Perspectives for Cultivation of the Sea
Espen Hoell Norsk Hydro Research Center
Abstract The world population rapidly increasing, and the prospects for agriculture to provide enough food are not convincing in the long term. Neither do the oceans seem to be able to sustain increased harvest based on natural productivity. Overfishing of many fish stocks is a fact today. Still vast areas of the oceans, 70% of the total area, have low productivity. Only 5 -10% of proteins in the human diet are based on ocean productivity. Some upwelling areas show productivity comparable to that of agriculture, and sustain a large fraction of the global fisheries. To investigate the mechanisms behind such high productivity, and our possibilities to enhance the sustainable harvest, the research programme MARl CULT has been designed by Norwegian marine scientists.
Background The world population is rapidly increasing to about 10 billion people predicted by 2050'. The prospects for agriculture to provide enough food for the world population are not convincing in the long term. FA02 and others3 envisage that world agriculture can sustain this population. But the preconditions are high investments in agricultural research, full use of modem agricultural technology, genetic improvement of plants and animals, proper distribution, economy and availability of water, less use of grain to feed livestock and a significant increase in agricultural land. The prediction is based on the growth of agriculture during the previous decades, but social factors and environmental degradation are critical for the development. Others4
point towards a much more serious situation, with problems in food production occurring already today.
Intensive agricultural production does in some areas result in excess runoff of nutrients to fresh and marine waters, ground water contamination, ero-
sion of arable land and too high need for the use of herbicides. In others irrigation have lowered the ground water table. Reduction of the intensity, rather than further intensification, seems necessary to reduce the environmental degradation. Together with other antropogenic sources the nutrient input may exceed the carrying capacity of coastal waters, often with a composition far from the nutrient ratios required by natural phytoplankton. Large efforts are put into reducing the inputs, but the normal result is unbalanced nutrient composition.
It has been stated6 that the oceans may be able to sustain the present harvest of about 85 mill tonnes, but overfishing of many fish stocks has resulted in reduced global harvest in recent years. More than 2/3 of the worlds marine fish stocks is being fished at or beyond their level of maximum productivity. A reduction of 30 - 50 % in the fishing effort is required to achieve sustain ability '.
0/0 PROTEIN
60
50 -f----
40 -l----
30 -l----
20 +---
10 -l----
o Fisheries Other plants Others
Cereals Livestock
Fig. l Distribution of protein - sources. Based on FAO statistics, 1991
The primary production of the oceans is of the same order as the terrestrial, but contributes only 5 -10% to the human protein demand7
• In some marine areas however, the production efficiency is comparable to that of agricultural land.
The fact that the oceans cover 70% of the earth surface suggests that there must be some margin to increase the production and harvestable marine biological resources. Some, but too few, attempts have been made to utilise the potentials.
156
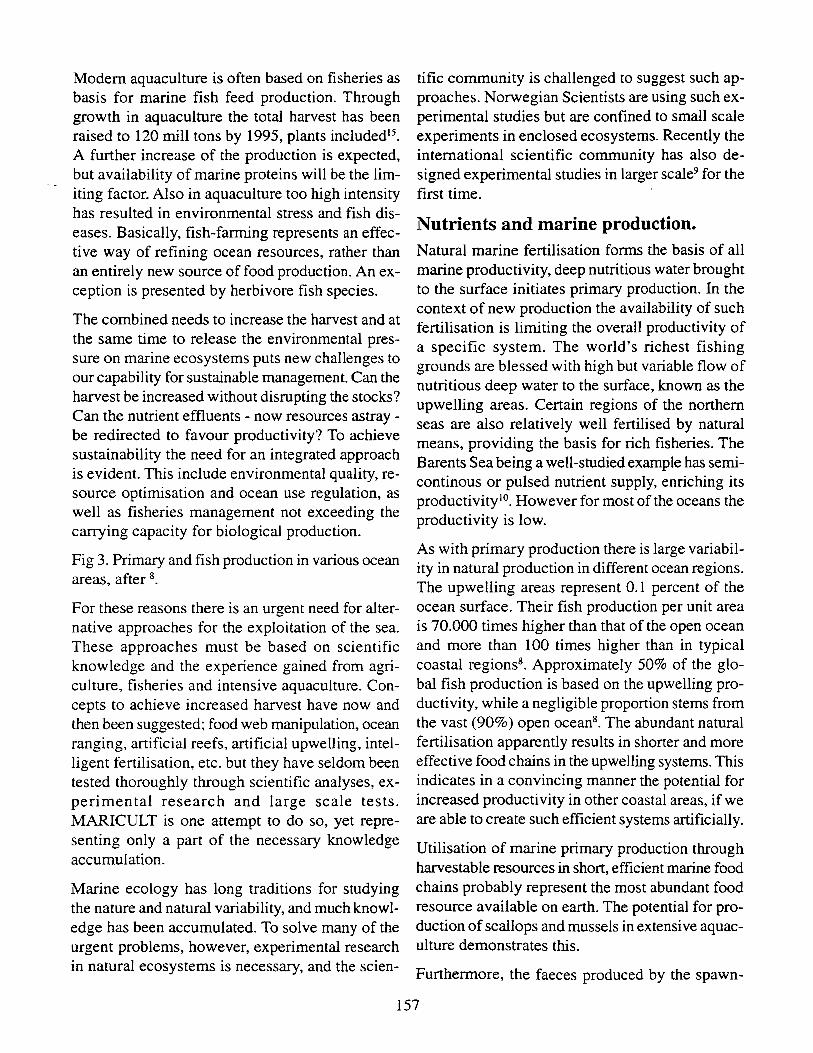
Modern aquaculture is often based on fisheries as basis for marine fish feed production. Through growth in aquaculture the total harvest has been raised to 120 mill tons by 1995, plants included'5. A further increase of the production is expected, but availability of marine proteins will be the limiting factor. Also in aquaculture too high intensity has resulted in environmental stress and fish diseases. Basically, fish-farming represents an effective way of refining ocean resources, rather than an entirely new source of food production. An exception is presented by herbivore fish species.
The combined needs to increase the harvest and at the same time to release the environmental pressure on marine ecosystems puts new challenges to our capability for sustainable management. Can the harvest be increased without disrupting the stocks? Can the nutrient effluents - now resources astray -be redirected to favour productivity? To achieve sustainability the need for an integrated approach is evident. This include environmental quality, resource optimisation and ocean use regulation, as well as fisheries management not exceeding the carrying capacity for biological production.
Fig 3. Primary and fish production in various ocean areas, after 8.
For these reasons there is an urgent need for alternative approaches for the exploitation of the sea. These approaches must be based on scientific knowledge and the experience gained from agriculture, fisheries and intensive aquaculture. Concepts to achieve increased harvest have now and then been suggested; food web manipulation, ocean ranging, artificial reefs, artificial upwelling, intelligent fertilisation, etc. but they have seldom been tested thoroughly through scientific analyses, experimental research and large scale tests. MARICULT is one attempt to do so, yet representing only a part of the necessary knowledge accumulation.
Marine ecology has long traditions for studying the nature and natural variability, and much knowledge has been accumulated. To solve many of the urgent problems, however, experimental research in natural ecosystems is necessary, and the scien-
tific community is challenged to suggest such approaches. Norwegian Scientists are using such experimental studies but are confined to small scale experiments in enclosed ecosystems. Recently the international scientific community has also designed experimental studies in larger scale9 for the first time.
Nutrients and marine production. Natural marine fertilisation forms the basis of all marine productivity, deep nutritious water brought to the surface initiates primary production. In the context of new production the availability of such fertilisation is limiting the overall productivity of a specific system. The world's richest fishing grounds are blessed with high but variable flow of nutritious deep water to the surface, known as the upwelling areas. Certain regions of the northern seas are also relatively well fertilised by natural means, providing the basis for rich fisheries. The Barents Sea being a well-studied example has semicontinous or pulsed nutrient supply, enriching its productivitylO. However for most of the oceans the productivity is low.
As with primary production there is large variability in natural production in different ocean regions. The upwelling areas represent 0.1 percent of the ocean surface. Their fish production per unit area is 70.000 times higher than that of the open ocean and more than 100 times higher than in typical coastal regionss. Approximately 50% of the global fish production is based on the upwelling productivity, while a negligible proportion stems from the vast (90%) open oceans. The abundant natural fertilisation apparently results in shorter and more effective food chains in the upwelling systems. This indicates in a convincing manner the potential for increased producti vi ty in other coastal areas, if we are able to create such efficient systems artificially.
Utilisation of marine primary production through harvestable resources in short, efficient marine food chains probably represent the most abundant food resource available on earth. The potential for production of scallops and mussels in extensive aquaculture demonstrates this.
Furthermore, the faeces produced by the spawn-
157
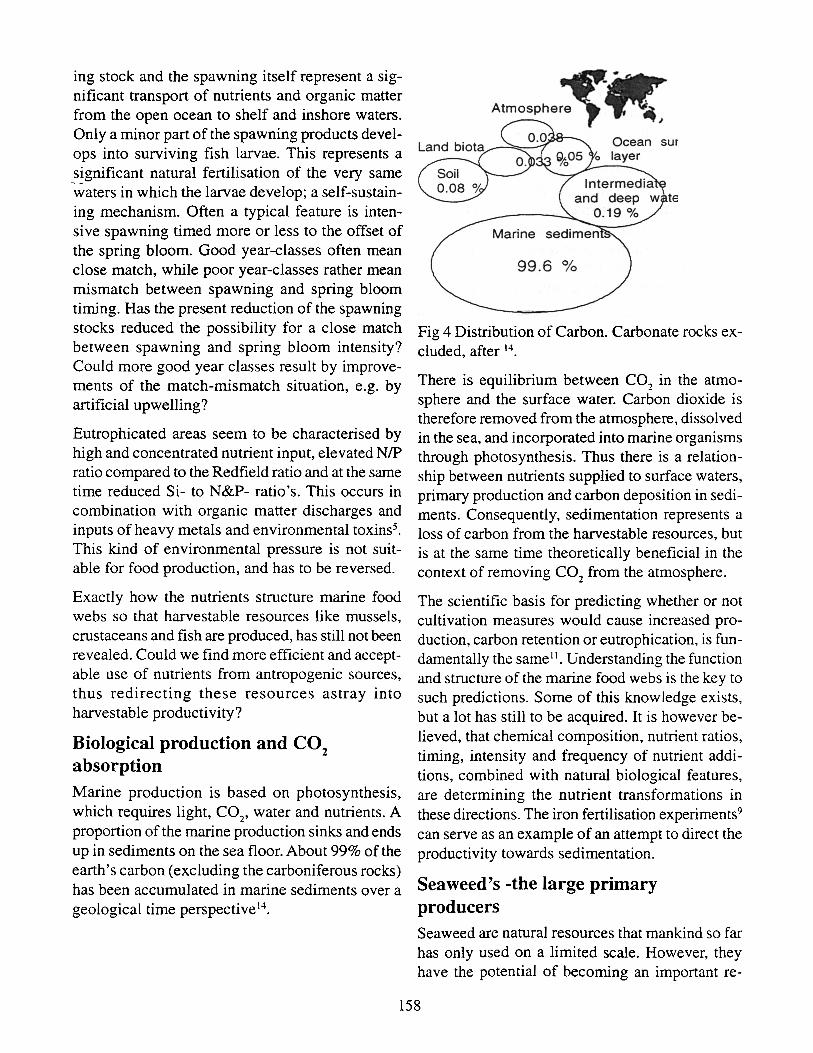
ing stock and the spawning itself represent a significant transport of nutrients and organic matter from the open ocean to shelf and inshore waters. Only a minor part of the spawning products develops into surviving fish larvae. This represents a significant natural fertilisation of the very same waters in which the larvae develop; a self-sustaining mechanism. Often a typical feature is intensi ve spawning timed more or less to the offset of the spring bloom. Good year-classes often mean close match, while poor year-classes rather mean mismatch between spawning and spring bloom timing. Has the present reduction of the spawning stocks reduced the possibility for a close match between spawning and spring bloom intensity? Could more good year classes result by improvements of the match-mismatch situation, e.g. by artificial upwelling?
Eutrophicated areas seem to be characterised by high and concentrated nutrient input, elevated NIP ratio compared to the Redfield ratio and at the same time reduced Si- to N&P- ratio's. This occurs in combination with organic matter discharges and inputs of heavy metals and environmental toxins5.
This kind of environmental pressure is not suitable for food production, and has to be reversed.
Exactly how the nutrients structure marine food webs so that harvestable resources like mussels, crustaceans and fish are produced, has still not been revealed. Could we find more efficient and acceptable use of nutrients from antropogenic sources, thus redirecting these resources astray into harvestable productivity?
Biological production and CO2
absorption Marine production is based on photosynthesis, which requires light, CO
2, water and nutrients. A
proportion of the marine production sinks and ends up in sediments on the sea floor. About 99% of the earth's carbon (excluding the carboniferous rocks) has been accumulated in marine sediments over a geological time perspective l4
•
AtmosPhe~«, 0.0
Marine
99.6 %
Fig 4 Distribution of Carbon. Carbonate rocks excluded, after 14.
There is equilibrium between CO~ in the atmosphere and the surface water. Carbon dioxide is therefore removed from the atmosphere, dissolved in the sea, and incorporated into marine organisms through photosynthesis. Thus there is a relationship between nutrients supplied to surface waters, primary production and carbon deposition in sediments. Consequently, sedimentation represents a loss of carbon from the harvestable resources, but is at the same time theoretically beneficial in the context of removing CO2 from the atmosphere.
The scientific basis for predicting whether or not cultivation measures would cause increased production, carbon retention or eutrophication, is fundamentally the same II. Understanding the function and structure of the marine food webs is the key to such predictions. Some of this knowledge exists, but a lot has still to be acquired. It is however believed, that chemical composition, nutrient ratios, timing, intensity and frequency of nutrient additions, combined with natural biological features, are determining the nutrient transformations in these directions. The iron fertilisation experiments9
can serve as an example of an attempt to direct the productivity towards sedimentation.
Seaweed's -the large primary producers Seaweed are natural resources that mankind so far has only used on a limited scale. However, they have the potential of becoming an important re-
158
source, similar to important types of agricultural vegetation I 2. Future production in offshore sites may provide a raw material with a wide range of applications. Seaweed may be cultivated in quantities large enough to have the potential of becoming a renewable source for bio-energy production 13. Research in this area is among others motivated by the fact that the extensive use of renewable bioenergy can contribute to reducing atmospheric carbon dioxide accumulation. The international interest for this kind of cultivation is rapidly increasing both in the US and elsewhere.
It is also well known that macro algae effectively remove contaminants from seawater. Residual concentrations in the effluents from municipal purification plants may be effectively purified when filtered through a "forest" of seaweed. Macro-algae may also be used to remedy nutrient overloaded effluents, as has been done by the Chinese in large scale cultivation. Recently, both the Japanese and the Chinese also have used slow release fertiliser for seaweed production.
MARl CULT objectives The main objective of the research programme MARICULT (1996 - 2000) is:
• To provide a basis for evaluation of environmental constraints and potentials for increased sustainable provision of food, raw material and energy from the ocean.
Participating scientists focus on the environmental risks of various cultivation approaches. Experiments are limited in size, and the research is of fundamental nature looking into the mechanisms behind high productivity. It is a precondition that future implementation of ideas shall be environmentally acceptable.
Several projects involving the international research community are conducted under the MARICULT umbrella. Projects have been granted funding by the EU 4th. framework programme MAST, the Research Council of Norway and Norsk Hydro. The research is carried out in a wide range of experimental sites around Europe. A number of Norwegian projects are included, reflecting the
large potential for marine cultivation (e.g. extensive aquaculture) along the Norwegian coast.
Programme Description MARICULT carry out research in two main areas:
1 - Marine food webs -
This sub-program treats the controlling mechanisms of production, the biological carbon retention in the ocean (sedimentation), and the mechanisms of harmful eutrophication in coastal marine systems. The main goals are:
• To understand how an enhanced natural or a controlled nutrient supply and appropriate restocking measures of marine systems can affect the marine production and harvesting potential
• To gain insight into the assimilation and cycling of nutrients in pelagic and benthic marine ecosystems and to define the conditions which results in undesired environmental situations.
2 • Marine macro algae -
Seaweed represents poorly exploited, under-developed primary biomass. The long-range goals of oceanic farming of seaweed include:
• To provide crop plants for large-scale marine cultivation.
• To develop efficient methods for their cultivation
• To invent competitive technology for conversion of biomass to fish feed, food ingredients, bulk chemicals, energy carriers and other useful commodities.
The sub-program involves cultivation of marine algae for environmental purposes and the use of macro algae for provision of chemicals, feed and energy carriers.
Preliminary Results So far the research programme - by its mid term has completed a series of laboratory and mesocosm studies. In addition a coastal lagoon along the Nor-
159
wegian coast has been moderately fertilised for one year after two years of baseline studies.
The laboratory experiments have revealed new infonnation on algal nutrient requirements their competition ability under various nutrient regimes. The research has also increased our understanding of the flow of nutrients and energy in the food web.
The mesocosm studies perfonned in Norway, the Baltic and the Mediterranean with nutrient increments along a gradient have shown that the different coastal systems have a similar dose response reaction, but that their carrying capacity for nutrients vary.
The lagoon system that has been moderately fertilised with a well balanced nutrient composition has experienced increase in its primary production without corresponding increase in its algal biomass. In this case that the additional nutrients are entering the food web without causing negative environmental effects.
Another experiment in a Norwegian fjord system with antropogenic nutrient input. indicates potentials to facilitate nutrient recycling by mussel production. The mussels being very efficient harvesters, as they are located at a low level of the food chain.
Whatever conclusions regarding potentials and constraints of marine cultivation are made at the end of the MARICULT programme, the results are expected to contribute to the nutrient management of antropogenic effluents in coastal regions, including recycling of nutrients. MARICULT will without doubt also contribute with knowledge regarding critical nutrient dosages to coastal waters.
tensive coastal cultivation are aspects that must be put on the international agenda. The need is already very apparent, to cope with the present overexploitation of marine resources. Extensive cultivation of marine resources should be carried out under national or international administration, whereby the taxation of fishing fleets could be used to finance the cultivation activities, as well as regulating the harvesting capacity.
Future possibilities It is still far too early to draw finn conclusions as to what future possibilities that may be revealed as a result of MARICULT. Below some foreseeable possibilities are however indicated, given that we understand the complexity of the systems involved;
Production of mussels in nutrient enriched waters is already a world class business today. With typical production of 100-200 kg/m2 it only takes an area of 1000 km2 to double the world annual fisheries harvest of - 100 mill ton and at the same time recycle significant amount of nutrients.
If we where able to create new "upwelling" systems, only 0,2% of the ocean area are required for another doubling of world fisheries. Done properly at a suitable place this would also result in a drawdown of 100 mill ton carbon from the atmosphere by sedimentation.
Ocean farming of seaweed's represents possibilities to produce raw material for bioenergy production. Within a few % of the ocean area it seems possible to produce enough biomass to replace the use of all fossil fuels.
Further it may be possible to;
• Restore fish spawning grounds by improved survival of fish larvae through productivity enhancement at the right time and place.
• Restore eutrophicated areas by redirection of the hannful production through restored nutrient balance and composition, if combined with appropriate harvesting techniques.
Participants in the MARICULT research programme are fully aware of the fact that future uncontrolled large-scale aquatic cultivation may lead to user conflicts, environmental problems and changes in the structure of biological communities. The scientists are stimulated to identify possible detrimental effects, taking into account that moral and ethical reservations about extensive exploitation of the sea are emotionally founded. Certainly there are a lot of opportunities, but it will The ethical. legal and social implications of ex- be fundamental for their feasibility that attempts
160
of utilization is based on fundamental understand- 7 FAa Statistics, 1991 ing and recognition of the complexity of these systems. Thus a major effort by the scientific community should be devoted to these challenging tasks.
MARICULT is only a beginning, established to clarify some possibilities and environmentallirnitations for future development. It will not answer all the questions, but may contribute with results and thinking that may be utilised for a more sustainable development of our coastal systems.
References 1 World Resources 1996-97. Publ. by World
Resources Institute, United Nations Environment Programme, United Nations Development Programme and the World Bank. Oxford Univ. press. ISBN 0-19-521160-X
2 Nicos Alexandratos ed., World Agriculture: Towards 2010. An FAa study. J.Wiley & sons and FAa, Rome 1995.
3 M.W.Rosegrant, M.Agcaoili-Sombila and N.D.Perez, International Food Policy Research Institute (IFPRI) Food, agriculture and Environment, draft discussion paper, Washington D.C., 1995.
4 State of the world 1995. Lester Brown ed. Worldwatch Institute, 1995.
5 North Sea Quality Status Report 1993. North Sea Task Force, Oslo and Paris Commissions London 1993. Olsen & Olsen, Fredensborg Denmark. 132+vi pp.
6 Global fish and shellfish production in 1993. FAa, Rome 1995.
8 Ryther, J.H. 1969. Science 166: 72-75.
9 K.H.Coale et.al 1996. "A massive phytoplankton bloom induced by an ecosystem-scale iron fertilisation experiment in the equatorial Pacific ocean. Nature vol 383, pp. 495-501.
10 E.Sakshaug et. al. eds. Ecosystem Barents Sea. ProM are Research Programme. In Norwegian Lillehammer 1992. ISBN82-90565-17-8
11 Hoell, E., Y.Olsen and E.Sakshaug. 1995. Feasibility Study Marine Production - revised May 95. Hydro report. Doc 95q_PJ9. Hydro Research Centre Porsgrunn.
12 Jensen, A. 1992. Feasibility Study Marine Production. Need for better utilisation. Institute for Biotechnology, Norw. Techn. Univ. Trondheim, 33 pp. (In Norwegian).
13 Electric Power Research Institute, 1991. A Summary Description of the Second Workshop on the role of Macroalgal Farming in Global Change. Palo Alto, California, 58 pp.
14 Longhurst, A.R. Role of the marine biosphere in the global carbon cycle. In: Chisholm, S.W. and F.M.Morel (eds). What controls the phytoplankton production in nutrient-rich areas of the open sea? Lirnnol. Oceanogr. 36(8), pp 1546-1554.
15 Krishen Rana. Recent trends in global aquaculture production: 1984-1995. FAO fisheries departement. www.fao.org 1998.
161
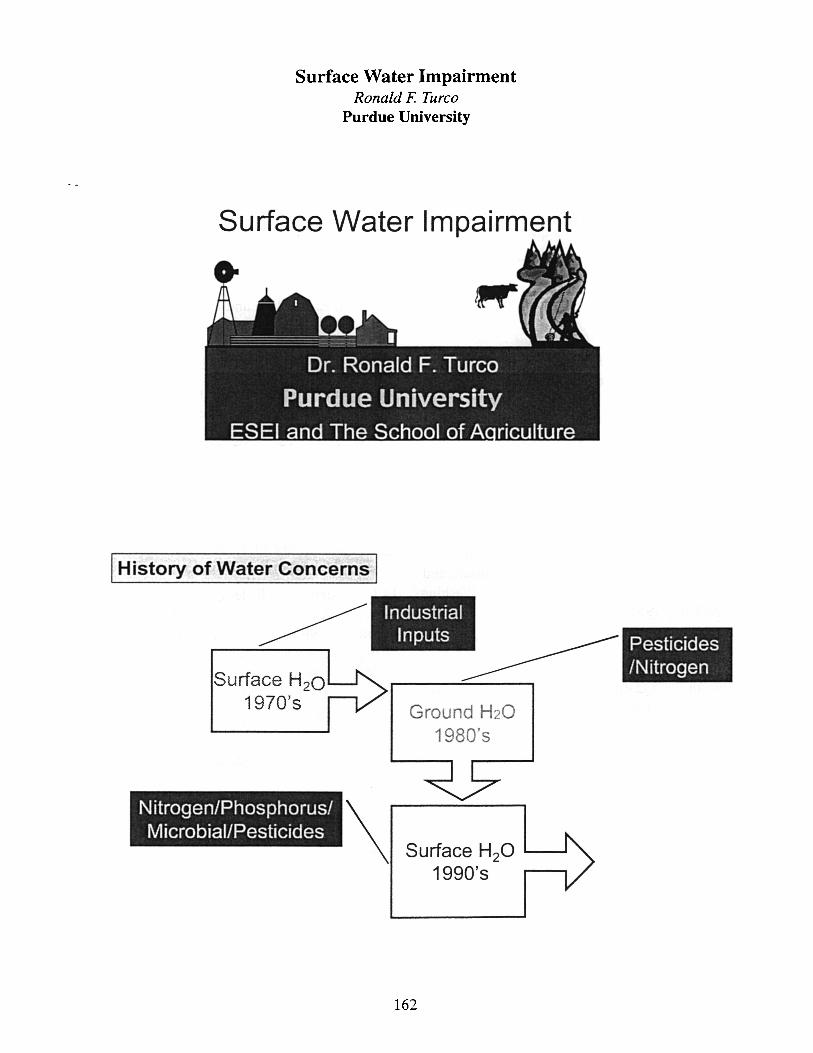
Surface Water Impairment Ronald F. Turco
Purdue University
Surface Water Impairment
I History of Water Concerns I
Surface H20 1970's
Industrial Inputs
Ground H20 1980's
Nitrogen/Phosphorus/ M icrobiallPesticides \ Surface H20 0.....-......
1990's
162
I
Pesticides /Nitrogen
Major Sources of trouble for Surface Water
• Direct input from land surface e.g., runoff
• Indirect input from tile-lines (subsurface drainage)
• Subsurface recharge (limited impact)
• Atmospheric inputs
• Industrial and urban discharges
Status of Water - USGS
• Nitrate concentrations in surface water are highest downstream from agricultural or urban areas.
• Elevated concentrations of N03 in streams of the northeastern States may be related to atmospheric deposition.
• High concentrations in parts of the Midwest may be caused by tile drainage of agricultural fields.
163
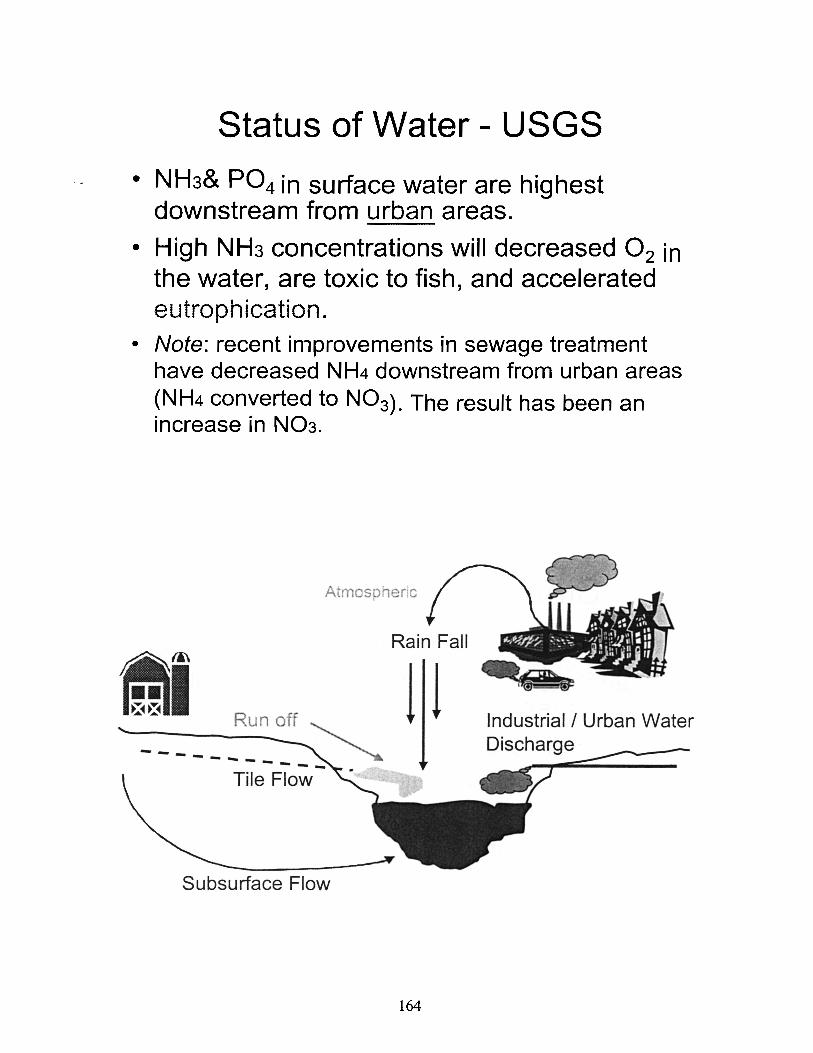
Status of Water - USGS
• NH3& P04 in surface water are highest downstream from urban areas.
• High NH3 concentrations will decreased O2 in the water, are toxic to fish, and accelerated eutrophication.
• Note: recent improvements in sewage treatment have decreased NH4 downstream from urban areas (NH4 converted to N03). The result has been an increase in N03.
AtmospheriC
Industrial/Urban Water
---- - .... _--Tile Flow
Subsurface Flow
164
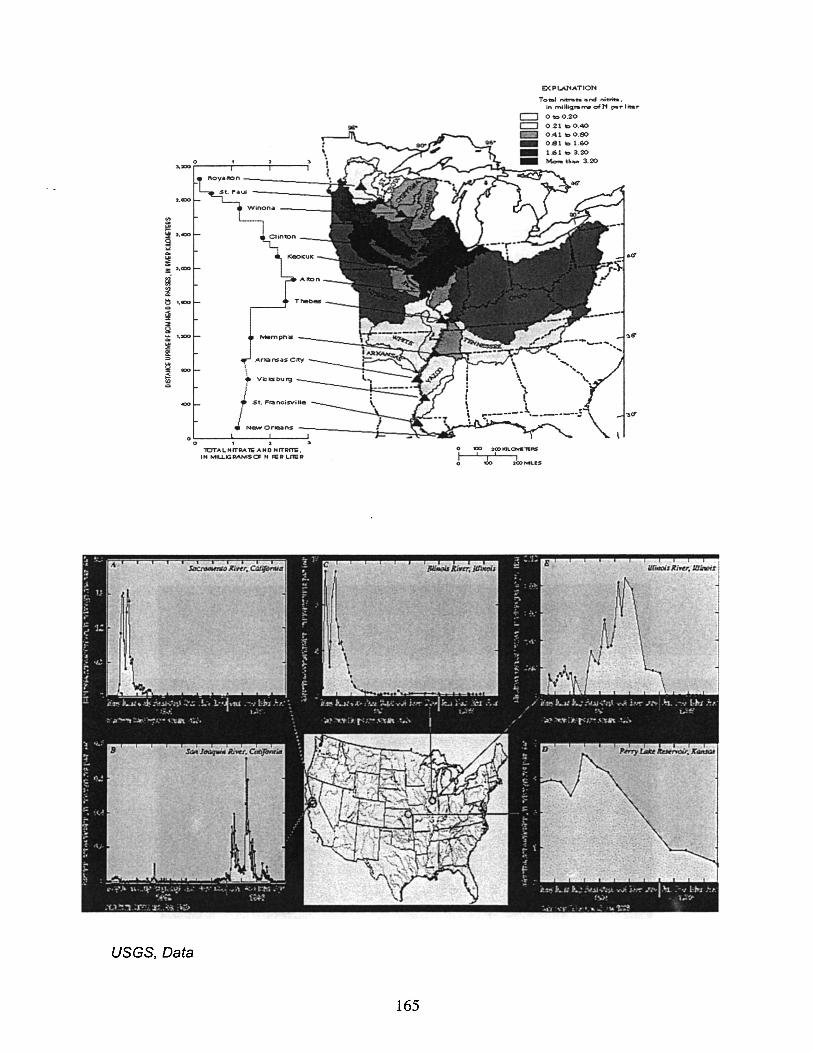
rrv..m pf'l is
Arlla ns .. s City
\ • ViQ)cS bu 19 I
J $t. "",nc;sv;U.
I o • N......, Or-.ans ==~-----~::----::~~o:.~'
o , • 1OTALNfT~A "'I'G AND .. rrpm; ,
I" MILL.IGRAMSO: N FeR'Lm;R
USGS, Data
165
EX P lJU<AT10N
To'" ",~ht.rd rM't"r'iM, in rnillignt,.,.,.ofN perliotar
o ioO.20 0 .21 bO.40 0 .'11 to 0 .60 081 b 1.60
1.61 .. 3.00
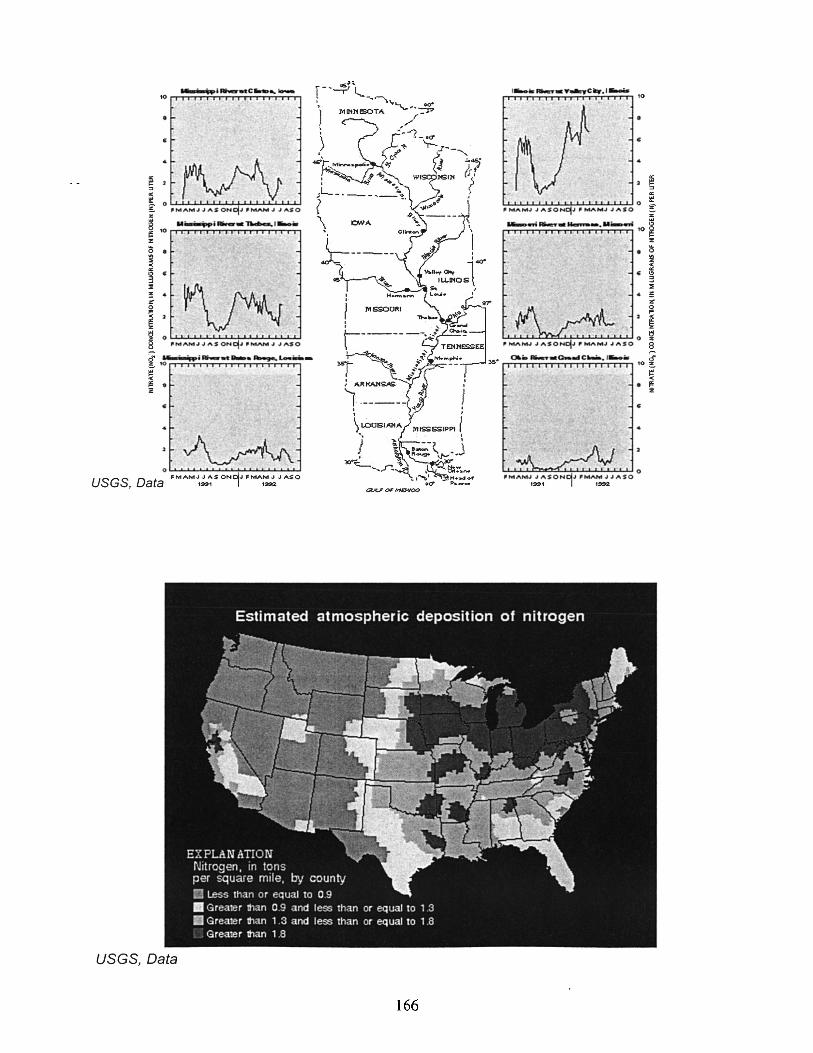
10 ......... I ....... C ...........
• c
!. rv'\t ~ ou...w...w...L..L.L...L.Lf-.L.I....L..L.L..L..LL~ g 'MAM,J.,JA$ON J ,MAM.J JASO
" 8 ............ 1_ ... ,--.,1_ .. I!: 10 %
~ . .. '" '" C) C
"
i~ ~ 4
f 2
!i1 0 LL. ...... .J..J....L.LL..L.L+'-'-LL..L..I...L..I...LJ 8 'Mo"'M.J.,JASONqJ 'M.<"I.M.J .JASO
c
oLL.~~~~~~~~~~~
O t FMAMJJ .... SONa.JfMAM,J.,J..-,SO
USGS, a a , ... , I ,-
USGS, Data
166
• c
2 ~ '" ~~~~~~~~~~~~~O ~
IIMAM,JJASONCI"'fJMA .... J.JASO ~
.......,., ................ a ........ ~ rr~-rrT"-rTT~~TT,-rr~'O ~
%
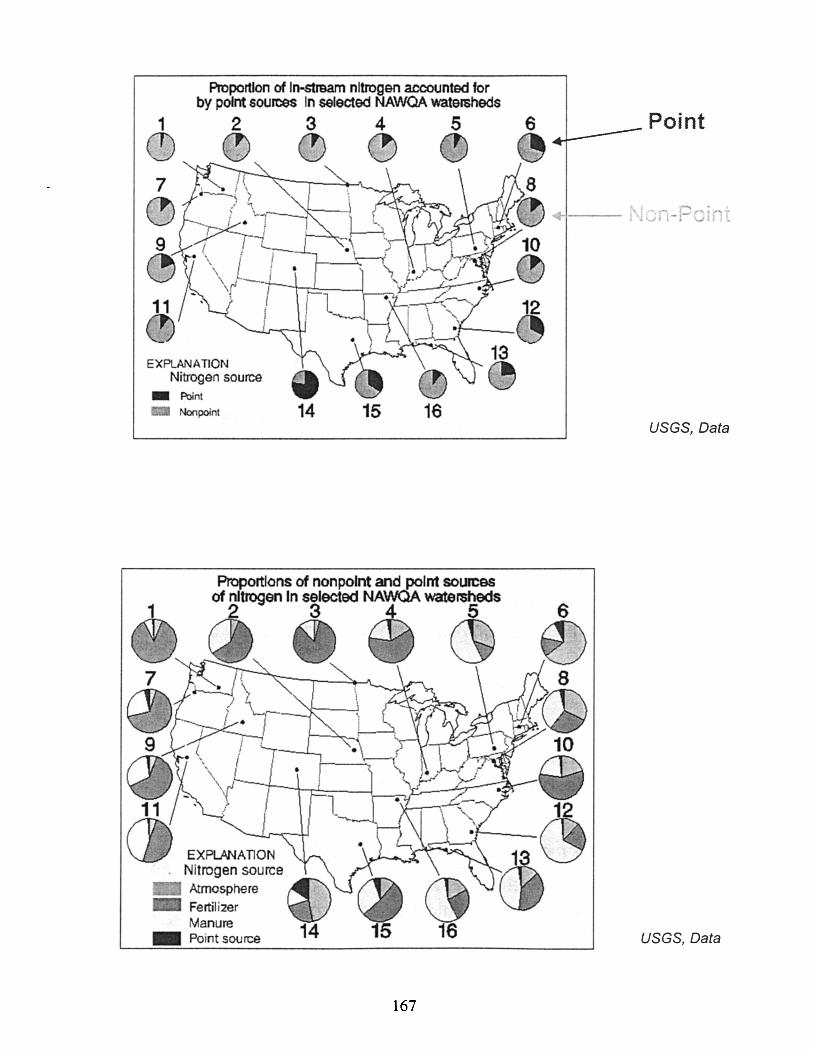
Proportion of In~ream nitrogen accounted for by point sources In selected NAWOA watersheds
2 3 4 5
~ ~ ~ ~
11 C) EXPlANATION
Nitrogen source _ Point
Nonpoint
EXPLmATION Nitrogen source Atmosphere Fertili2er Manure
_ Point source
14 15
and point SOUJC9S sell~elCl NAWQA watersheds
4 5
(j)
167
Point
USGS, Data
USGS, Data
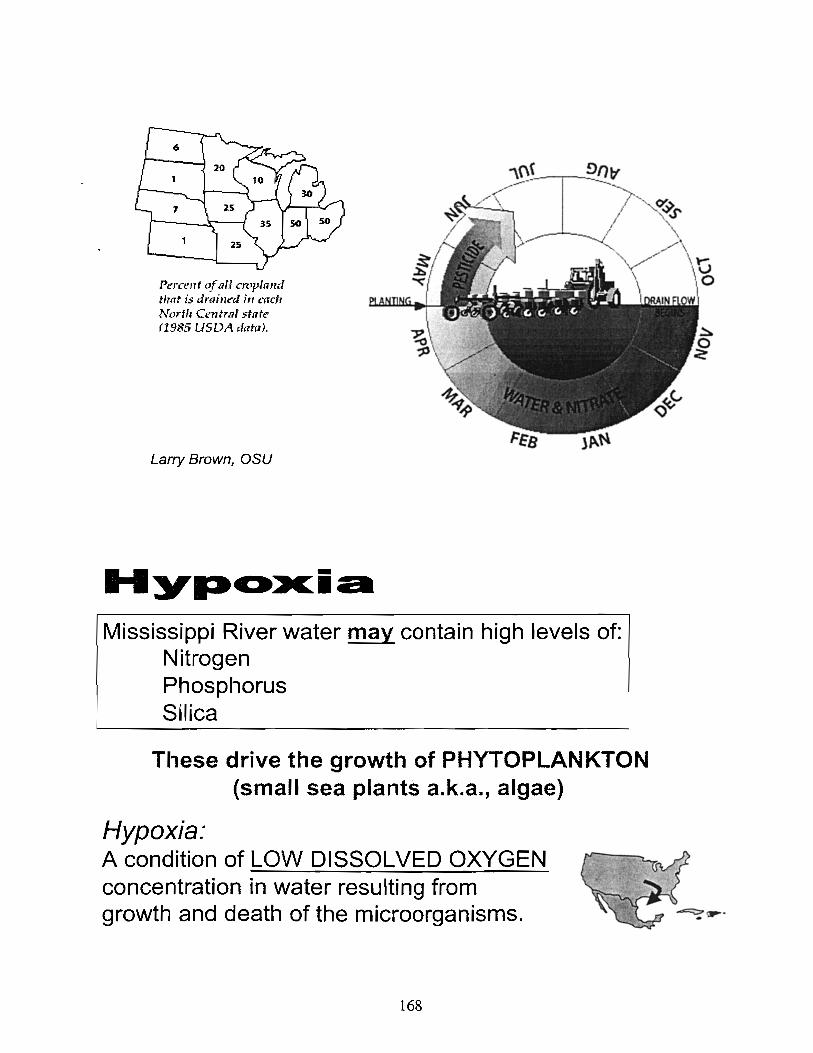
Pacem! (~f an crClpiand tlurt is drained ill melr Norl/i C"'1ItmI5tntt" (1985 USD.·'\ dllta),
Larry Brown, OSU
Mississippi River water may contain high levels of: Nitrogen Phosphorus Silica
These drive the growth of PHYTOPLANKTON (small sea plants a.k.a., algae)
Hypoxia: A condition of LOW DISSOLVED OXYGEN concentration in water resulting from growth and death of the microorganisms.
168
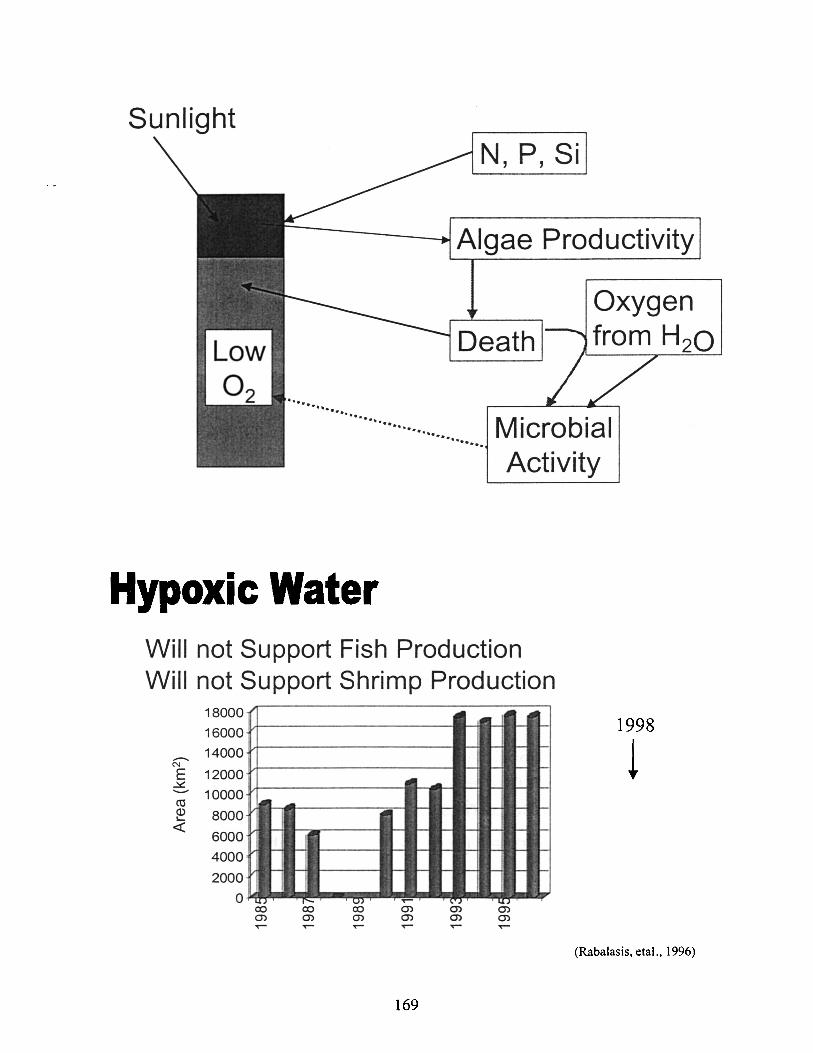
Sunlight
. .. .......... .... ....
N, P, Si
Algae Productivity
Oxygen from H20
.............. Microbial .•. •......
Activity
Hypoxic Water Will not Support Fish Production Will not Support Shrimp Production
18000
16000
..-... 14000 N
E 12000 ~ .......- 10000 ro (l) 8000 ~
<t: 6000
4000
2000
0 0> ..-
169
1998
~
(Rabalasis, eta!., 1996)
What is Pfiesteria piscicida?
• Like other organisms that live in estuaries, Pfiesteria and other Pfiesteria-like dinoflagellates are cause for concern, but they are not cause for alarm or panic.
• Pfiesteria are dinoflagellates--complicated . . . microscopIc organisms
• Pfiesteria and other dinoflagellates can produce toxins that cause lesions in fish.
Pfiesteria piscicida
• 24 different stages in its life cycle;
• The dinoflagellate is only toxic in the presence of fish excreta or secretions;
• Fish kills caused by P. piscicida usually occur in the warmest part of the year, and low dissolved oxygen levels in the estuaries;
• Human influences (e.g., excessive nutrient enrichment) have slowly shifted the environment to allow P. piscicida
170
Recent Surface Water Protection Initiatives
• 25 years after the Clean Water Act, EPA has declared that water restoration and protection program will focus on:
- protection of public health - preventing runoff
- community-based watershed planning
• Programs initiated in recent years include: - Source Water Assessment and Protection (SWAP-EPA)
- Clean Water Action Plan (EPA / NRCS)
Clean Water Action Plan (CWAP)
• Developed to move towards meeting the goals of the Clean Water Act
• Community action-based watershed planning and management
• Requires that states develop Unified Watershed Assessments, prioritize and develop strategies for watershed restoration.
171
CWAP cont.
• EPA will establish numeric criteria for nutrient water quality standards by 2000.
• The CWAP has resulted in creation of a Draft National Strategy for Animal Feeding Operations.
• Tools for minimizing water quality and human heath threats from AFOs.
Source Water Assessment and Protection program (SWAP)
• Part of the Safe Drinking Water Act Amendments of 1996
• Mandates, among other things, that each state inventory all potential sources of contamination to drinking water supplies i.e., Well-head protection.
172
Other Federal programs of interest:
• Total Maximum Daily Load (TMDL) - Starting in 1998, states must submit plans for
implementing TMDL loading allocations for waters impacted by runoff (nitrogen/sediment)
• National Harmful Alga Bloom Research - Includes a call to investigate links between water
quality and harmful algae blooms.
• Nitrate in the Ground Waters of the United States-Assessing the Risk
- By Bernard T. Nolan and Barbara C. Ruddy
- {Electronic version of Fact Sheet FS-092-96]
• National Water-Quality Assessment Program: Nutrients in the Nation's Waters--Too Much of a Good Thing?
- By David K. Mueller and Dennis R. Helsel
- {Electronic version of Circular 1136J
• Nonpoint and Point Sources of Nitrogen In Major Watersheds of the United States
- By Larry J. Puckett
- {Electronic version of Water-Resources Investigations Report 94-4001 J
173
Advances in Fluid Fertilizer Research Dr. Larry S. Murphy
Fluid Fertilizer Foundation
Introduction Continued improvement in use efficiency of fertilizer materials and the direct impact of that progress on food and fiber production depends on continued applied research. Unfortunately, much of the public support for soil fertility research and fertilizer utilization research in particular in both universities and government agencies has declined to near zero in the past couple of decades. This decline has led to a loss of individuals and positions dedicated to such work and represents a loss of resources that is difficult or impossible to replace.
These facts are additionally disturbing in light of projected needs for increased yields by USDA and recognized increases in world food demands. Higher yields and protection of production capacity is predicated on a continuing supply of input management information. The exciting developments in genetic engineering and site specific management are built on adequate plant nutrition and nutrient management. At a time when higher cost seed and precision pest management are opening new horizons, there is a continuing need for information on efficient nutrient management to support those investments.
Continuing erosion in research support in soil fertility and fertilizer management research heightens the importance of industry involvement both through the provision of funds and the identification of research topics. Continued industry consolidation in North America is placing additional stress on this research participation, on continued research progress and on support of those individuals engaged in this important area.
The :F'luid Fertilizer Foundation Since 1982, the Fluid Fertilizer Foundation (FFF), a non-profit research and education arm of the fertilizer industry, has been providing research funding for the development of improved utilization techniques for fluid fertilizers. The Foundation has
annually supported 10 to 20 projects located in the U.S., Canada, England and Mexico.
Support for the Foundation has been and is provided by a wide range of companies including fertilizer dealer and distributors, manufacturers/suppliers of related products and services and producers/suppliers of fertilizer materials. The business of the Foundation is overseen by a Board of Directors. Decisions and recommendations on project support are provided by a Research and Development committee made up of representatives from member companies. Day to day activities are handled by the President and an Administrative Assistant.
The Foundation sponsors an annual Fluid Forum in February in Scottsdale, AZ which includes annual reports on supported projects and presentations on other topics of general interest to the industry.
Some Research Highlights Nitrogen Application Methods. Over the past two decades, substantial progress in efficient utilization of fluid fertilizers has occurred in many areas. Particular notice should be paid to developments in efficient application of urea-ammonium nitrate (U AN) solutions for conservation tillage (high residue) crops and forages. Research sponsored by FFF, the Foundation for Agronomic Research (FAR) and directly by various companies has demonstrated that specific placement in streams or bands below or on the soil surface has increased crop performance to applied nitrogen (N) and resulted in higher N use efficiency. The results of those projects have shaped application concepts in many regions, particularly in the U.S. and Canada, and are now widely adapted.
Nitrification Inhibition. Improved UAN use efficiency has also occurred through the use of nitrification inhibitors such as nitrapyrin, dicyandiamide (DCD) and ammonium thiosulfate (ATS). Slowed conversion of ammonium-N to nitrate-N by the action of these compounds has reduced N losses by leaching and resulted in higher amounts of applied N being available for the crop.
174
Urease Inhibition. Slowing the hydrolysis of urea to control surface losses of ammonia from ureacontaining fertilizers has been demonstrated to be a feasible agronomic practice. Compounds such as NBPT have been demonstrated to be effective both with solid and fluid fertilizers. Now, research is also showing that slowed urea hydrolysis through the use of NBPT can also provide new options in seed-fertilizer applications and may provide additional protection for high seed cost, genetically engineered crops.
High Nitrogen Starter Fertilizers. Fluid research has clearly demonstrated that composition of starter fertilizers can have substantial impact on crop responses to starters. The FFF has provided support for projects that have emphasized the importance of higher N concentrations in starters both in providing adequate early season N as well as influencing the uptake of phosphorus (P). Increasing N :P205 ratios from 1:3 to 1: 1 increases ammonium-N concentrations in fertilizer bands, delaying P fixation reactions and stimulating plant P uptake. The results are improved starter performance on a wide range of soil P tests, enhanced plant P uptake and the ultimate goal, higher yields. These combinations have been particularly effective in high residue cropping systems and have helped emphasize starter use as a management tool in conservation tillage regardless of soil test levels for nutrients such as P, potassium (K) and sulfur (S).
Suspensions. FFF-supported studies of effective methods of NPK suspension applications for row crops have demonstrated that the same concepts governing the efficient utilization of N in VAN also relate to suspensions. Surface and subsurface applications have been demonstrated as advantageous in high residue row crops. Preplant banding of suspensions has also been demonstrated to be particularly effective for soybeans in a com soybeans rotation.
The studies of characteristics and reactions oflime suspensions (fluid lime) were also initiated with FFF support. Lime suspensions have been shown to be a highly reactive and responsive source of high quality lime for a number of crops. Depend-
ing upon the type of liming agent used in the suspensions, research has also shown that nutrients such as Nand K can be included in the formulation. However, that same research emphasized the problems (ammonia volatilization) that can occur when lime sources containing calcium or magnesium oxides are suspended with UAN.
Foliar Fertilization. Jointly sponsored projects between FFF, FAR, companies and state and federal agencies have demonstrated that foliar application of macronutrients can have significant impacts on crop yields and quality. An excellent example is the need of certain, high-yielding cotton varieties for supplemental, late-season K to meet the needs of high boll loads. Subsoil depletion of K in combination with very high boll loads and high, late season K demands created additional needs for K which the crop could not meet. While conventional methods ofK application provided substantial help in meeting these needs, late season (bloom and later) applications of K have been effective in increasing yield and improving lint quality. Such jointly-supported research has led to the development of recommendations for K management of these cotton varieties with the benefit of higher yields, lowered production costs per bale and higher grower profitability.
The FFF was instrumental in funding many of these projects with universities and government agencies. Frequently those grants provided the seed money for acquisition of additional funds from other sources including the industry matching initiatives program of Agriculture Canada. That particular program demonstrates how important industry partnerships with official agriculture can be in bringing resources to bear on specific problems.
Continuing Research Support Areas 1. Phosphate Fertilizer Management for Corn
and Soybean Production in Two Contrasting Tillage Systems. G. Rehm and S. Evans, University of Minnesota
2. Enhancing No Tillage Systems for Corn with Starter Fertilizers, Row Cleaners,and Nitrogen Placement Methods. G.W. Randall and 1. Vetsch, University of Minnesota
175
3. Precision Application of Phosphorus to Winter Wheat. A.J. Schlegel and R.E. Brown, Kansas State University
4. Effects of Complete N-P-K-S Solution and Application Timing Compared to Starter
- Solutions or Individual Plant Nutrients on Yield and Quality of Winter Wheat. F.R. Mulford, F.l. Coale, and 1. Dantinne, University of Maryland.
5. Using Natural Variability in Landscapes to Calibrate Soil Tests. D.G. Westfall and G.A. Peterson, Colorado State University.
6. Evaluation of Fluid Fertilizers as Starters and Supplements in an Intensive Cropping Systems. G.1. Gascho, University of Georgia.
7. Evaluation of Nitrogen and Sulfur Sources in Wheat Grown Under High Yield Environments. S.A. Ebelhar, and E.C. Varsa, University of lllinois, and Southern Illinois University.
8. Effects of Fluid Nitrogen Fertigation Frequency on Microsprinkler Irrigated Citrus. T.A. Thompson and M. Mauer, University of Arizona.
9. Mid-Atlantic Regional Interdisciplinary Cropping System Project. P.E. Fixen, FAR; W. Griffith, Agronomic Management Systems, M. Alley, Virginia Tech University.
10. Cotton Response to Multiple Applications of Nutrient Mixtures. D. Krieg and C. Green, Texas Tech University.
11. Potassium Fertilizers Injected Through Three DriplMicro Irrigated Systems on Almonds. R.D. Meyer, University of California-Davis.
12. Development of a Site-Specific Nitrogen Management Program for Wisconsin Corn Producers. R. Wolkowski, University of Wisconsin.
13. Evaluation of Starter Fertilizers Containing Iron. R. 1. Goos, North Dakota State University.
14. Uptake of Foliar N-P-K Sources in Citrus. L. G. Albrigo and 1. P. Syvertsen, University of Florida.
The FFF research program is continuing its support of fertilizer technology and cropping systems research in a number of areas. Some highlights of some of those research areas are presented in the following section.
Some Highlights of Current Research Potassium Fertigation of Almonds. Research at the University of California-Davis directed by Dr. Roland Meyer is demonstrating that supplying K in a fluid form to almonds via fertigation is highly effective but that type of irrigation system has a strong influence on crop response to the nutrient. Several sources of K are being applied through three types of microirrigation systems ... single line drip, double line drip and microsprinklers. Application of K through the microsprinkler system has proven to be the most effective possibly because of a larger area of K application under the trees' canopies. Banded K as potassium sulfate (SOP) under microsprinkler irrigation also was quite effective. Potassium treatments have been effective in both increasing plant leaf K concentrations and meat yields (See Table 1). This work is demonstrating that nutrient application efficiency interacts with irrigation method and that irrigation practices can be a significant factor in tree nutrition.
Intensive Crop Management Systems. Cropping systems research supported by FFF in the low rainfall area of the Great Plains of eastern Colorado has shown conclusively that the system of wheatfallow widely practiced for the last 100 years to store soil moisture and accumulate nitrate-N can be replaced with more intense dryland cropping rotations that provide more soil protection, more efficient use of water, and increased yields and profits. These cropping systems of wheat-com-fa 1-low or opportunity cropping on fallow require close attention to climate and soil moisture and also require substantial managerial skills to control weeds. Fertilizer requirements are increased because of the higher levels of cropping intensity and nutrient removal. However, long term data show that
176
cash flow is improved and net returns are increased substantially with these more intensive management systems (See Table 2). Fluid fertilizers fit particularly well in these systems with the use of starter fertilizers for wheat and com and combinations of DAN and herbicides for weed control. Recent expansions of this work emphasize spatial variability in soil Nand P availability and the opportunity for management of these nutrients on a spatial basis.
Fluid Fertilizers as Starter, Foliar and Sidedress Applications in an Intensive Crop Rotation. This unique study is evaluating the need for balanced fertilization in conjunction with the use of broiler litter in crop production. The study. directed by Dr. Gary Gascho at the University of Georgia Coastal Plain Experiment Station in Tifton , GA, has recorded significant cotton responses to 10-34-0 and 12-22-5-2S liquid starter fertilizer when broiler litter is applied at rates up to 2 tonsl A (Fig. 1). Cotton has also responded positively to foliar applications of potassium nitrate in combination with litter applications (Fig. 1). Soil testing has shown significant increases in soil P test levels with litter use but soil K levels and availability are declining. This study emphasizes that while broiler litter can supply some nutrients, growers must pay attention to needs for additional nutrients early in the growing season and must replace nutrients not supplied in the litter such as K.
Cotton Responses to Multiple Applications of Nutrient Mixtures. The semi-arid Southern High Plains of Texas represents the largest contiguous cotton production region in the world. Approximately half of this 3.5 to 4.0 million acres of cotton has access to supplemental irrigation water but the water supply is rarely adequate to meet the consumptive use of the cotton crop. When water stress can be reduced satisfactorily, growing season length and nutrient supply become co-limiting to cotton production. Soils of the region are highly calcareous with soil pH values of 7.8 and higher. Phosphorus and micronutrients availabilities are very low due to the soil chemistry. (See Fig. 1.)
This project is studying methods of improving P availability to and uptake by cotton plants by optimizing N:P ratios and time of P application with the goals of increasing yields and improving water use efficiency. Nitrogen source is UAN and P source 10-34-0. Phosphorus application timing variables include (I) P banded 4 inches to the side and 4 inches below the seed; (2) three equal applications preplant, first square and first flower; and (3) all Nand P through the irrigation water (sprinkler) at a ratio of 2.5: 1 N:P205 and at a rate of 10 lb Nand 4 lb P205/inch of water. All N is applied through the water on all treatments at the same N:water ratio. Water rates are also variables ranging from 0.11 to 0.27 inches/day. A second study with the same water application variables is evaluating water applied N :P205 ratios including 2.5:0; 2.5:0.5; 2.5:1.0 and 2.5:1.5.
Water supply of course has a significant effect on boll numbers and lint yield (See Fig. 2). Phosphorus application method also significantly influenced lint yield across all water rates. Within the P treatments, applying P with the water was superior to soil applications (See Fig. 3). Applying Pin the three split applications was slightly superior to all preplant P. This response suggests that P availability is influenced by time or by water supply.
Nitrogen:P205 ratios applied through the irrigation water also had a significant effect on lint yield. Nitrogen rates were varied with the different water regimes ... from 65 Ib N/A with lowest water supply to 95 lb N/ A with the highest water regime. As N :P205 ratio increased, lint yields increased (Fig. 4). The primary effect was on boll numbers rather than boll size. Interestingly, these data agree with the effects of higher ammonium N concentrations in starter fertilizers (higher N :P205 ratios) discussed earlier and may imply that additional study of N forms for cotton could be interesting.
Crop Responses to Chloride. Chloride (CI) has been recognized as an essential element in plant nutrition since 1954. In the late 1970's, wheat responses to CI were documented in the Pacific Northwest and since have been reported from Oregon to Manitoba to Texas. Much of the work over the years has been centered on small grains, par-
177
ticularly wheat and barley. Responses were often associated with depression of root and leaf fungal diseases but responses were also reported were disease pressure was minimal. A wide range of wheat types ... soft white winter, hard red spring, hard red winter and soft red winter. .. have responded positively to CI applications.
Recently work in Montana by Engel has demonstrated that nutritional responses do occur in the field and that certain wheat varieties display distinct CI deficiency symptoms. Those symptoms, earlier described as "physiological leaf spot", have often been confused with leaf diseases such as tan spot but in fact are a distinct symptom of CI deficiency which disappear when the nutrient is applied as a fertilizer.
Continuing research with CI has emphasized strong varietal interactions with the response but also indicates that a large number of hard red winter wheat (HRWW) varieties respond dramatically to CI fertilization. The effect of CIon HRWW varieties is a continuing subject of research in a regional project headed by Dr. Ray Lamond, Kansas State University and including investigations in Kansas, Texas, South Dakota, Idaho and Montana. Kansas and Texas research have indicated that many sources of CI are effective as fertilizers including primarily potassium chloride and magnesium chloride (liquid). Recent HRWW responses to Cl topdressed at rates of 20 to 40 lb CI/A have been both consistent and profitable for growers (See Tables 3 and 4). Soil test CI is a good predictor of need and plant CI concentrations are highly correlated with soil test levels and fertilization.
Recent research has also shown similar Cl responses in corn and grain sorghum in the Great Plains area of the U.S. (See Table 5.)
Where potassium chloride is used regularly, CI supplies are undoubtedly adequate. However, in areas which are high in soil K and do not receive KCI or where soils are very coarse and easily leached, CI may be a profitable component of fertilization practices.
In Summary Research in soil fertility and fertilizer use continues to provide information that helps move us toward supplying the food and fiber needs of a growing world population. However, the support base for that research in the public sector continues to diminish and with that a declining infrastructure for future research. Industry participation in applied research support must grow instead of shrink if progress is to continue at an acceptable leveL The Fluid Fertilizer Foundation, the Foundation for Agronomic Research, the Potash and Phosphate Institute and the Sulphur Institute through their member companies continue to provide support for research in North America and abroad but it is obvious that industry must renew its commitment to research for market development and production progress to continue.
Selected References Bonczkowski, L.c. 1989. Response of hard red
winter wheat to chloride application in eastern Kansas. Ph.D. dissertation, Kansas State University, Manhattan, KS 66506.
Christensen, N.W., R.G. Taylor, T.L. Jackson and B.L. Mitchell. 1981. Chloride effects on water potentials and yield of winter wheat infected with take-all root rot. Agron. J. 73: 1053-1054.
Engel, R.E., P.L. Bruckner, D.E. Mathre and S.K.Z. Brumfield. 1996. Is physiological leaf spot of wheat chloride deficiency? In 1996 Great Plains Soil Fertility Conference Proceedings. 6:284-290. Kansas State Univ.
Gascho, G.1. and T.B. Brenneman. 1998. Fluid fertilizer as starter, foliar and sidedress applications in an intensive crop rotation. p. 114-124. 1998 Fluid Forum Proceedings, Fluid Fertilizer Foundation, Manhattan, KS.
Krieg, D.R. and C. Green. 1998. Cotton response to multiple applications of nutrient mixtures. p. 140-145. 1998 Fluid Forum Proceedings, Fluid Fertilizer Foundation, Manhattan, KS.
Lamond, R.E., D.D. Roberson, K. Rector and B.H. Marsh. 1997. Chloride fertilization on
178
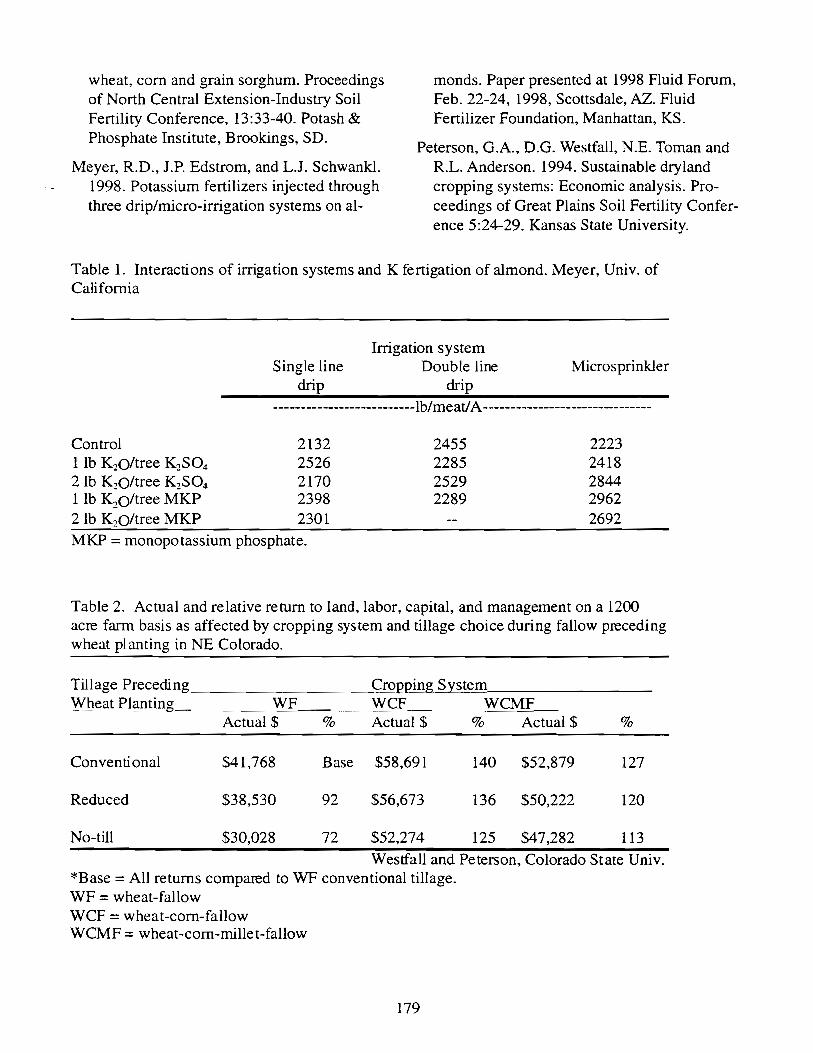
wheat, corn and grain sorghum. Proceedings of North Central Extension-Industry Soil Fertility Conference, 13:33-40. Potash & Phosphate Institute, Brookings, SD.
Meyer, RD., J.P. Edstrom, and L.J. Schwankl. 1998. Potassium fertilizers injected through three drip/micro-irrigation systems on al-
monds. Paper presented at 1998 Fluid Forum, Feb. 22-24, 1998, Scottsdale, AZ. Fluid Fertilizer Foundation, Manhattan, KS.
Peterson, G.A., D.G. Westfall, N.E. Toman and RL. Anderson. 1994. Sustainable dryland cropping systems: Economic analysis. Proceedings of Great Plains Soil Fertility Conference 5:24-29. Kansas State University.
Table 1. Interactions of irrigation systems and K fertigation of almond. Meyer, Univ. of California
Irrigation system Single line Double line Microsprinkler
drip drip --------------------------lb/meat/ A ------------------------------
Control 1 lb K20/tree K2S04
2 lb K20/tree K2S04
1 lb K201tree MKP 2 Ib K20/tree MKP
2132 2526 2170 2398 2301
MKP = monopotassium phosphate.
2455 2285 2529 2289
2223 2418 2844 2962 2692
Table 2. Actual and relative return to land, labor, capital, and management on a 1200 acre farm basis as affected by cropping system and tillage choice during fallow preceding wheat planting in NE Colorado.
Tillage Preceding ~roI>rrin~ystem Whe<il Plafltiflg_ _._WF ___ ... ~Fq_ WCMF
Actual $ % Actual $ % Actual $ %
Conventional $41,768 Base $58,691 140 $52,879 127
Reduced $38,530 92 $56,673 136 $50,222 120
No-till $30,028 72 $52,274 125 $47,282 113 Westfall and Peterson, Colorado State Univ.
*Base = All returns compared to WF conventional tillage. WF = wheat-fallow WCF = wheat-com-fallow WCMF = wheat-com-millet-fallow
179
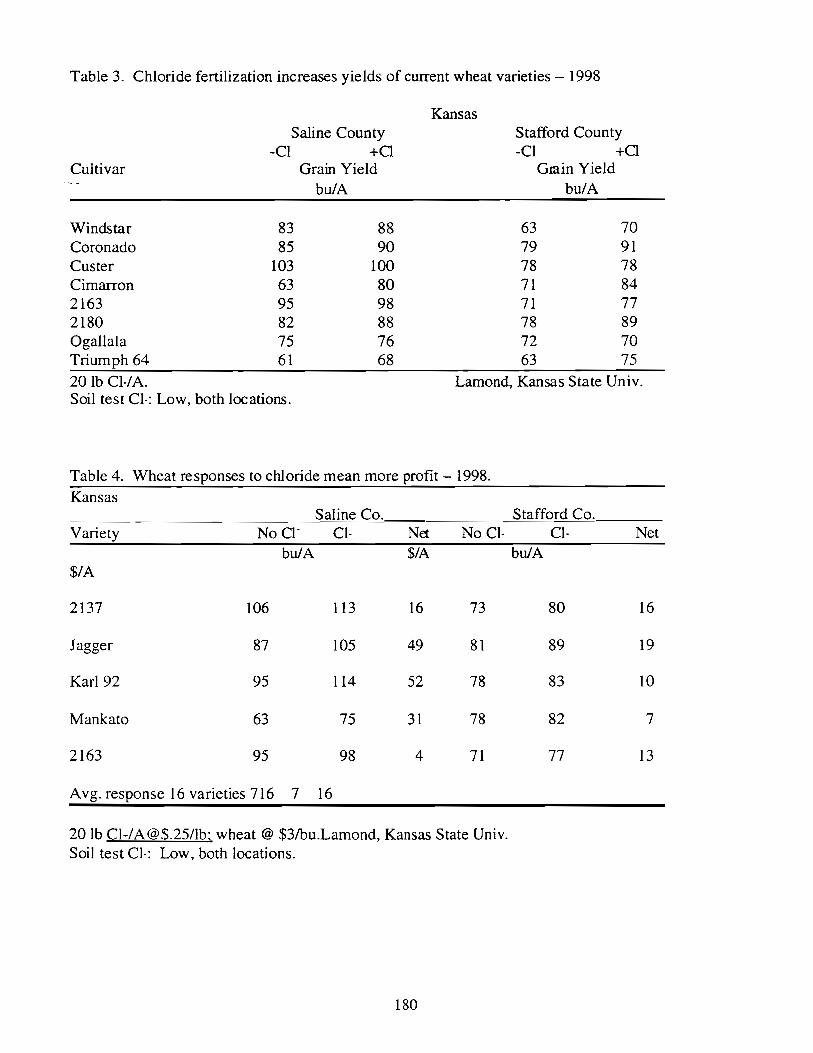
Table 3. Chloride fertilization increases yields of current wheat varieties - 1998
Cultivar
Windstar Coronado Custer Cimarron 2163 2180 Ogallala Triumph 64
Saline County -CI +0
83 85
103 63 95 82 75 61
Grain Yield bu/A
88 90
100 80 98 88 76 68
Kansas Stafford County -Cl +0
63 79 78 71 71 78 72 63
Grain Yield bu/A
70 91 78 84 77 89 70 75
20 lb CI·/A. Lamond, Kansas State Univ. Soil test Cl-: Low, both locations.
Table 4. Wheat responses to chloride mean more profit - 1998.
Kansas Saline Co. Stafford Co.
Variety NoO' Ct· Net No CI· CI- Net bulA $/A bulA
$/A
2137 106 113 16 73 80 16
Jagger 87 105 49 81 89 19
Karl 92 95 114 52 78 83 10
Mankato 63 75 31 78 82 7
2163 95 98 4 71 77 13
A vg. response 16 varieties 716 7 16
20 lb Cl-/A@$.25/tb; wheat @ $3/bu.Lamond, Kansas State Univ. Soil test Cl-: Low, both locations.
180
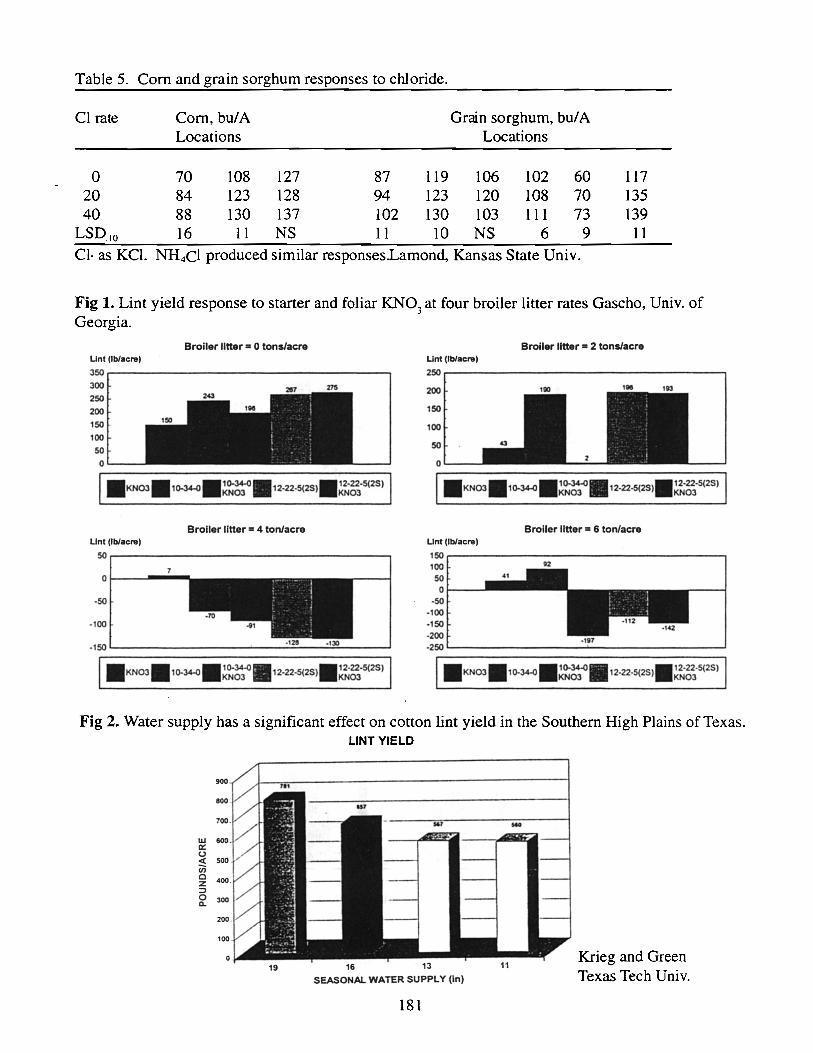
Table 5. Com and grain sorghum responses to chloride.
CI rate Com, bulA Grain sorghum, bul A Locations Locations
0 70 108 127 87 119 106 102 60 117 20 84 123 128 94 123 120 108 70 135 40 88 130 137 102 130 103 111 73 139
LSD 10 16 11 NS 11 10 NS 6 9 11 CI- as KCl. NH 4CI produced similar responsesLamond, Kansas State Univ.
Fig 1. Lint yield response to starter and foliar KN03 at four broiler litter rates Gascho, Univ. of
Georgia.
Broiler litter = 0 tons/acre Lint (Iblacre)
3~ r----------------------------------' 300 2~
200 1~
•KN03.1().34.0 . l G-34-0 . 12' 22'5(2S) . 12-22-S(2S)
KN03 KN03
Broiler litter = 4 ton/acre Lint (Iblacre)
~ r---------------------------------~
o ~------~
-100
-1~ L---____________________ -'= __ --"::.... ____ .....J
•KN03.10-~.10-34~.12_22-5(2S).12.22.5(2S) KN03 KN03
Broiler litter = 2 tons/acre Lint (Iblacre)
~r---------------------------------_,
200
1~
100
~
o
Lint (Iblacre)
' 110 1111:1
Broiler litter = 6 ton/acre
1~ r---------------------------------, 100
5~~ ___ . " _
.~
·100 · 1 ~
·200 -2~ L---______________ ---' ________________ -'
•KN03.10-~.10-~.,2.22.5(2SJ.12.22.5(2S) KN0 3 KN03
Fig 2. Water supply has a significant effect on cotton lint yield in the Southern High Plains of Texas.
w a:: u ~ (J)
o Z ::l o Il.
19
LINT YIELD
16 13
SEASONAL WATER SUPPLY (In)
181
Krieg and Green Texas Tech Univ.
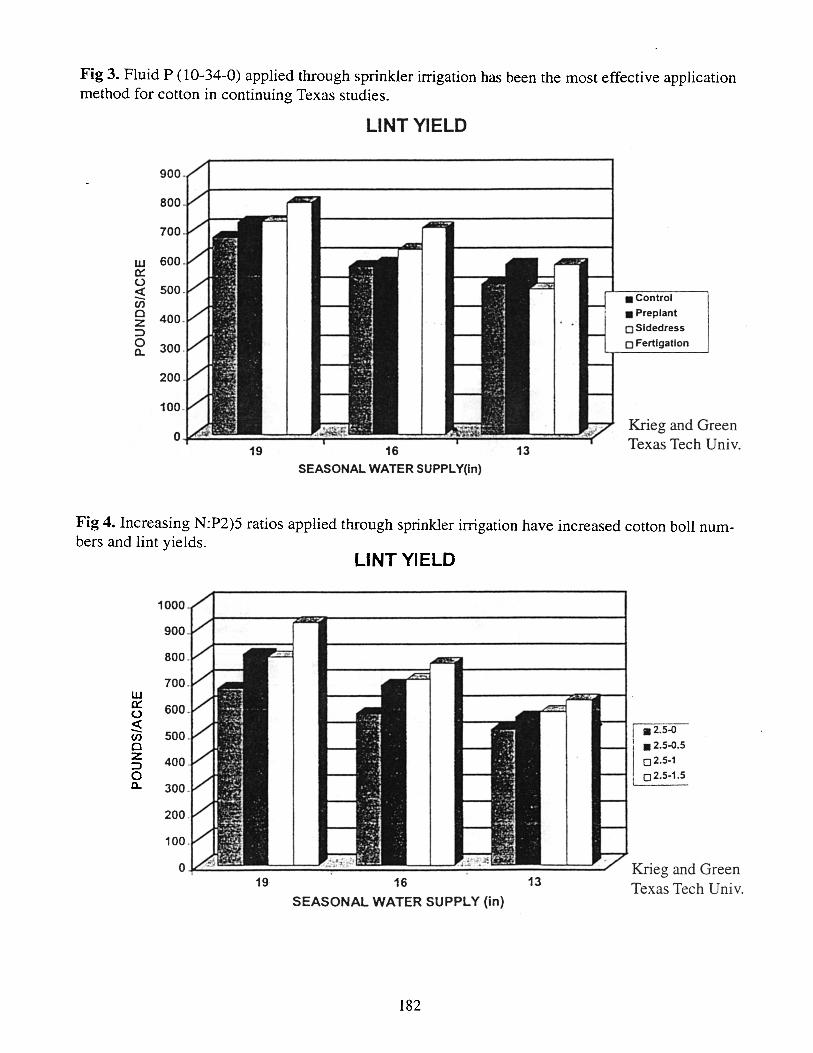
Fig 3. Fluid P (10-34-0) applied through sprinkler irrigation has been the most effective application method for cotton in continuing Texas studies.
900
800
700
w 600 0:: U
500 <! --en Cl 400 z ::> 0 300 Q.
200
100
0 19
LINT YIELD
16 13 SEASONAL WATER SUPPLY(in)
• • Preplant
oSldedress
o Fertlgatlon
Krieg and Green Texas Tech Univ.
Fig 4. Increasing N:P2)5 ratios applied through sprinkler irrigation have increased cotton boll numbers and lint yields.
1000
900
800
700 w 0:: 600 u <! -- 500 en Cl Z 400 ::> 0 Q. 300
200
LINT YIELD
19 16 13
SEASONAL WATER SUPPLY (in)
182
.2.5-0
.2.5-0.5
0 2.5-1
0 2.5-1.5
Krieg and Green Texas Tech U ni v.
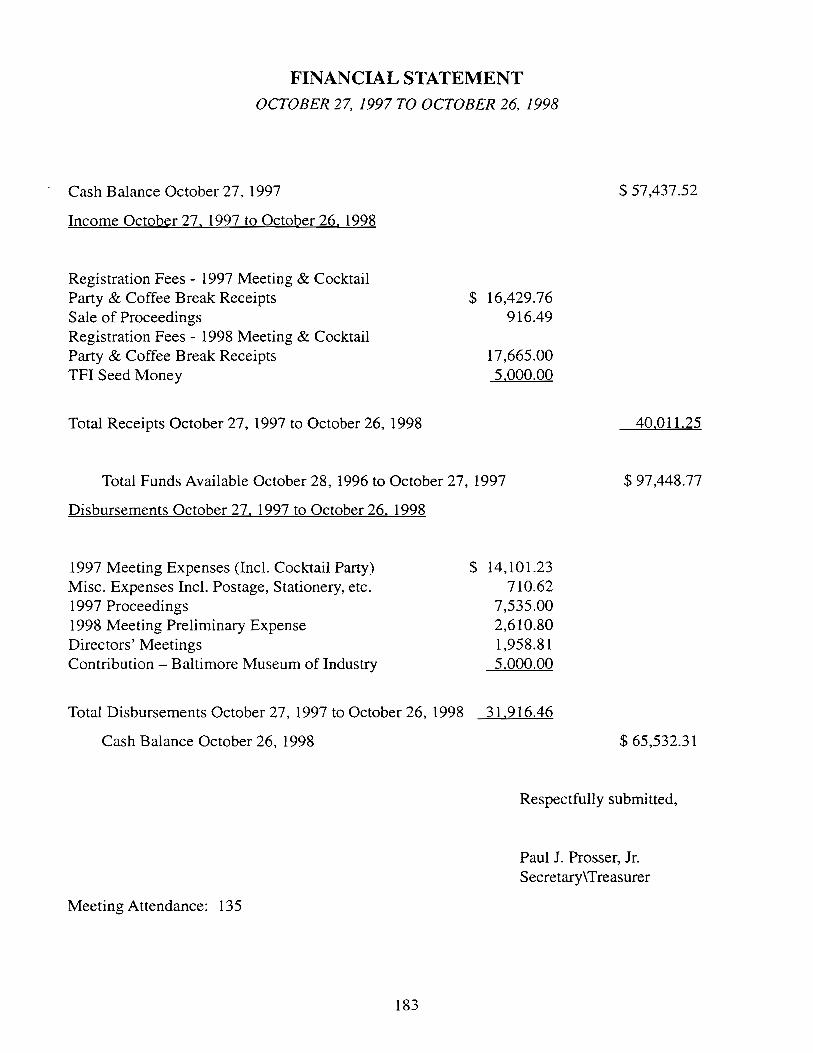
FINANCIAL STATEMENT OCTOBER 27, 1997 TO OCTOBER 26, 1998
- Cash Balance October 27, 1997
Income October 27, 1997 to October 26, 1998
Registration Fees - 1997 Meeting & Cocktail Party & Coffee Break Receipts Sale of Proceedings Registration Fees - 1998 Meeting & Cocktail Party & Coffee Break Receipts TFI Seed Money
Total Receipts October 27, 1997 to October 26, 1998
$ 16,429.76 916.49
17,665.00 5,000.00
Total Funds Available October 28, 1996 to October 27, 1997
Disbursements October 27, 1997 to October 26. 1998
1997 Meeting Expenses (Incl. Cocktail Party) Misc. Expenses Incl. Postage, Stationery, etc. 1997 Proceedings 1998 Meeting Preliminary Expense Directors'Meetings Contribution - Baltimore Museum of Industry
Total Disbursements October 27, 1997 to October 26, 1998
Cash Balance October 26, 1998
$ 14,101.23 710.62
7,535.00 2,610.80 1,958.81 5,000.00
31,916.46
$ 57,437.52
40,011.25
$ 97,448.77
$ 65,532.31
Respectfully submitted,
Meeting Attendance: 135
183
Paul J. Prosser, Jr. Secretary\ Treasurer

N one of the printed matter in these proceedings may be printed or reproduced in any way without written permission of the Fertilizer Industry Round Table.
Copies of Proceedings: (S ubject to availability)
Plus postage where applicable
Current Year Previous Year(s)
$35.00 $25.00
Please make checks payable to: The Fertilizer Industry Round Table
Paul J. Prosser, Jr. Secretaryrrreasurer
5234 Glen Arm Road Glen Arm, Maryland 21057

![[Res.vn]new round up](https://img.dokumen.tips/doc/110x75/635f4651cdabb5e9220a09b6/resvnnew-round-up.jpg)


