Embed Size (px)
Citation preview

APPENDIX C: EMISSIONS RELATED TO CULTIVATION AND FERTILIZER USE
An Appendix to the Report, “A Lifecycle Emissions Model (LEM): Lifecycle
Emissions From Transportation Fuels, Motor Vehicles, Transportation Modes, Electricity Use, Heating and Cooking Fuels, and Materials”
UCD-ITS-RR-03-17C
December 2003
by
Mark A. Delucchi Institute of Transportation Studies
University of California, Davis, CA 95616, USA
with research assistance from
Timothy Lipman University of California, Berkeley
4152 Etcheverry Hall, RAEL Berkeley, CA 94720, USA
Institute of Transportation Studies One Shields Avenue
University of California Davis, California 95616
Tel: 530-752-0247 Fax: 530-752-6572 http://www.its.ucdavis.edu/
email: [email protected]

APPENDIX C: EMISSIONS RELATED TO CULTIVATION AND FERTILIZER USE
An Appendix to the Report “A Lifecycle Emissions Model (LEM): Lifecycle Emissions from Transportation Fuels, Motor Vehicles, Transportation Modes, Electricity Use, Heating and
Cooking Fuels, and Materials”
Mark Delucchi [email protected]
with research assistance from Timothy Lipman [email protected]
UCD-ITS-RR-03-17C
available on the internet at www.its.ucdavis.edu/publications.html (by year) or by contacting [email protected]
Institute of Transportation Studies
One Shields Avenue University of California
Davis, CA 95616
December 2003

i
TABLE OF CONTENTS
INTRODUCTION ..................................................................................................................1 NITROGEN EMISSIONS RELATED TO N FERTILIZATION....................................................1
N2O from the use of N fertilizer, at the site of N application.........................1 N2O from atmospheric deposition of N, at the site of N
deposition ..................................................................................................10 Leaching and erosion losses of fertilizer-N or deposited N
off the site of application or deposition.................................................14 N2O from leached N, off the site of N application or
deposition ..................................................................................................20 NOx and NH3 emissions from nitrogen fertilizer and
deposition inputs ......................................................................................23 CARBON OXIDATION AND SEQUESTRATION IN SOIL (ON SITE),
RELATED TO NITROGEN INPUTS...............................................................................28 Background..........................................................................................................28 Studies of fertilizer use and the carbon content of the soil ...........................28 Studies of fertilizer use and the oxidation of soil carbon..............................30 Our assumptions .................................................................................................31
METHANE EMISSIONS FROM SOIL ...................................................................................32 Background..........................................................................................................32 The effect of the kind of nitrogen and the nitrogen content of
the soil. .......................................................................................................32 Effects of cultivation ...........................................................................................34 Potential for mitigation ......................................................................................35 Our assumptions .................................................................................................35
CHANGES IN CO2 SEQUESTRATION IN SOIL AND BIOMASS ..........................................37 Carbon in soil and biomass ...............................................................................37 Potential for reducing carbon losses due to cultivation ................................41
REFERENCES ......................................................................................................................43
TABLES
TABLE C-1. N2O FLUXES FROM AGRICULTURAL, GRASSLAND, AND FOREST SOILS...........................................................................................................................58
TABLE C-2. SUMMARY OF STUDIES OF LEACHING AND EROSION LOSSES OF FERTILIZER N .............................................................................................................69
TABLE C-3. N2O FLUXES IN DRAINAGE DITCHES AT DIFFERENT POINTS FROM IRRIGATED FIELDS, AND COMPARED WITH SOIL FLUXES .......................................71
TABLE C-4. SUMMARY OF STUDIES OF N-NO AND N-NH3 LOSSES FROM FERTILIZER N .............................................................................................................72

ii
TABLE C-5. METHANE FLUXES FROM AGRICULTURAL, GRASSLAND, AND FOREST SOILS.............................................................................................................74
TABLE C-6. METHANE UPTAKE REDUCTION AS A FUNCTION OF FERTILIZER APPLICATION RATE ..................................................................................................78
TABLE C-7. NET GAINS IN SOIL AND TREE CARBON PREDICTED FOR
AFFORESTATION PROJECTS (TONS C HA-1) ............................................................80

1
INTRODUCTION
Cultivation and fertilizer use can affect climate in many ways. A change to an
agricultural ecosystem can change its primary productivity, and hence change the amount of carbon sequestered in soils and biomass. Agricultural cultivation, along with the use of fertilizer, affects nitrogen and carbon dynamics in soil and groundwater, and thereby changes fluxes of N2O, CH4, CO2, and other gases that affect climate. Nitrogen can leach away from the site of application and fertilize plants, and thereby sequester carbon, in non-agricultural ecosystems.
Our analysis attempts to account for many of the affects of cultivation and fertilizer use on climate, albeit in some instances only crudely. The method is similar to that recommended by the IPCC (1997) in its guidelines for estimating national greenhouse-gas emissions inventories. We pay special attention to the addition and fate of nitrogen (N) fertilizer, because it is involved in so many GHG-producing pathways.
We consider the impact of changing, cultivating, and fertilizing crops, and of nitrogen deposition, on four direct and indirect GHGs: CO2, CH4, N2O, and NOx. The formal method is presented in the main report, to which this Appendix is attached. In this Appendix, we present data pertinent to the following impacts:
• N2O from the use of N fertilizer, at the site of N application • N2O from atmospheric deposition of N, at the site of N deposition • Leaching and erosion losses of fertilizer-N or deposited N off the site of
application or deposition • N2O from leached N, off the site of N application or deposition • NOx and NH3 emissions related to the use of nitrogen fertilizerf • Carbon oxidation and sequestration in soils related to nitrogen inputs • CH4 from soil • CO2 sequestration in soil and biomass
NITROGEN EMISSIONS RELATED TO N FERTILIZATION
N2O from the use of N fertilizer, at the site of N application Generally, a small amount of the nitrogen in the fertilizer ends up being released to the atmosphere as N2O and NOx (the rest ends up in the crop, in the soil, in water, in microorganisms, or in the air as N2). The net amount of N2O and NOx released depends on many factors, including: the type of biomass being grown; the amount, type, depth, and frequency of application of fertilizer; the temperature, water content, and acidity of the soil; agricultural and harvesting practices; and others (Bowden et al., 1991; Brumme and Beese, 1992; Williams et al., 1992; Eichner, 1990; Conrad et al., 1983; Anderson and Levine, 1987; Li et al., 1996, 1994; Groffman et al., 2000)

2
N2O is produced from complex microbial nitrification, denitrification, and decomposition processes in soils. Increases in the amount of N added to the soil typically result in increased N2O emissions (William et al., 1992, p. 368). One study suggests a roughly linear relationship between N lost as N2O and N input, over a range of 0 to 600 kg of fertilizer N per hectare added to several different soil types (Velthof and Oenema, 1995). Several studies have shown that typical values for the percentage of applied N that is emitted as N2O-N range from about 0.2% to 3%, for corn, barley, and wheat fields in the U.S. and Europe, and that these emissions may represent increases of from a few to a few hundred percent above background levels (Mosier et al., 1986; Li et al., 1994; Velthof and Oenema, 1995) (Table C-1). N2O emissions are higher from saturated than from dryer soils, and peat soils and soils high in NO2 and CaCO3 content seem to have particularly high N2O emissions (Velthof and Oenema, 1995; Bandibas et al., 1994).
In general, researchers have a good understanding of many of the individual factors that regulate N2O production from soils, but they cannot yet predict how these factors will interact to produce reliable N2O emissions estimates for specific crop, soil, fertilizer, and management combinations (Mosier, 1994). Thus, the direct (i.e. the actual emission flux of N2O from the field) and even total emissions of N2O (including N2O lost off-site) from soil fertilization can in principle be quantified, but pending further study there will be significant uncertainty in estimates of both direct and indirect emissions. Groffman et al. (2000) come to a similar conclusion, suggesting that “there are indeed coherenet patterns in annual N2O flux at the ecosystem scale in forest, cropland, and rangeland ecosystems but that htese patterns vary by region and emerge only with continuous (or at least daily) flux measurements over multiple years” (p. 1061).
In this section we present data on “direct” N2O emissions, at the site of application of N. In a later section we discuss N2O emissions from N that has leached off the site of application.
N2O produced on site: agricultural crops. Eichner (1990) and Mosier (1994) provided the earliest reviews and summaries of then-available data on N2O emissions from soils, including many studies of N2O emissions specifically from corn fields. (We mention corn specifically because it is the feedstock for bioethanol in the LEM.) Their reviews show that from 0.3-2.1% of the fertilizer N applied to corn fields typically evolves to the atmosphere as N2O-N. (Matthews [1994] uses Eichner’s estimates in her calculation of N2O losses from global fertilizer use.) Averaging the results from the studies reviewed by Eichner and Mosier reveals a 1.3% mean loss rate in both cases.
Mosier et al. (1986) found that 1.5% of the fertilizer N applied to corn was lost as N2O-N (compared to 0.4% for barley), and cited an earlier study which estimated a 1.3% loss rate (0.6% for barley). Anderson and Levine (1987) calculated that 1.2% of the fertilizer applied to a corn plot in April and May was lost as N in N2O in June, July, and August (the corn was harvested in September). Qian et al. (1997) report that studies of

3
N2O evolution from corn fields have found an N-N2O/N-fertilizer loss rate of 1.2 to 2.%. Their own study, shown in Table C-1, found a loss rate of 1.0%. Xu et al. (1998) modeled gross emissions of N-N2O at 3% of N applied to corn, but their figures are not net of background or no-fertilizer emissions. The Dentrification-Decomposition (DNDC) model of Li et al. (1996) predicts that increasing the fertilizer application rate from 50 to 100 kg-N/ha/yr increases N2O emissions by 0.7 kg-N/ha/yr – an N-N2O/N-fertilizer emission rate of 1.4% -- but that increasing the fertilizer application from 100 to 200 kg-N/ha/yr increases N2O emissions by only 0.4 kg-N/ha/yr – an emisson rate of just 0.4%. Table C-1 summarizes the results of these and other studies.
The reviews by Eichner (1990) and Mosier (1994) and some of the other earlier studies indicate that the N2O evolution rate for corn is higher than the rate for grains and grasses, at least for soils predominantly composed of sands and clays (grasslands on peat soil can have relatively high emissions). Grass and grain fields typically emit about 0.2 – 1.5% of fertilizer nitrogen as N2O, compared to 0.3 – 2.1% for corn (Mosier, 1994; Eichner, 1990). Eichner also found that total N2O emissions per acre from corn fields are on average almost four times higher than total emissions from soybean fields (Eichner, 1990).1
However, other recent studies have found lower rates for corn then for othe crops. The N2O model of Mummey et al. (1998), which estimates N2O as a function of the soil’s texture, NH4+ and NO3- content, pH, N turnover, temperature, respiration, and water-filled pore space, predicts that conventionally tilled corn fields have lower total N2O emissions than do conventionally tilled fields of sorghum, soy, cotton, peanuts, tobacco, vegetable row crops, wheat, oats, rice, and barley (only sunflower fields have lower emissions). In their model the total N-N2O loss for corn is 1.9% of the applied fertilizer N, but it is doubtful that all of the total emission is from fertilizer N. (See Parton et al. [1996] for a detailed description of the model.) It is not clear, therefore, whether corn fields really do lose a greater percentage of fertilizer N as N2O than do other fields, and if they do, why. Groffman et al. (2000) review studies of N2O emissions from cropland through 2000, and conclude that differences in such things as soil type and freezing and thawing events may be important determinants of N2O emissions than crop type per se. It is possible that in the studies that found a high evolution rate for corn the high rate might be due to the type of fertilizer used2 or to a higher percentage of excess fertilizer N relative to that needed. Kaiser et al. (1998) measured N2O emissions from fertilized wheat, barley, beet, and rape fields in Germany, and found that 1-8% of fertilizer N was emitted as N-N2O
1These are total emissions during the sample period, not just emissions attributable to fertilizer. Corn and soybean sites were not necessarily treated similarly, and emissions were not adjusted to reflect crop output. 2Conrad et al. (1983) found that the application of nitrate usually resulted in lower N2O emission rates than did the application of ammonium.

4
(Table C-1). The percentage increased when the amount of fertilizer was 50% of the “normal” amount. In a comprehensive review and analysis of the literature, Bouwman (1996) estimates that the total annual direct agricultural field loss of N in N2O: Loss = 1.00 + 0.0125 . N-application (kg N/ha/yr)
where: Loss = the total annual direct field loss of N in N2O (kg-N/ha/yr), for
agricultural systems 1.00 = the background emission level (kg-N/ha/yr)3 0.0125 = kg of N-N2O evolved per kg of N fertilizer applied N-application = the nitrogen fertilizer application rate (kg-N/ha/yr)
This equation is a least squares fit (r2 = 0.8), based on 20 experiments, with measurements over a full year. Bouwman (1996) notes that the global applicability is uncertain. The loss estimate includes N sources from different mineral and organic fertilizers, and also includes N2O from several sources, including native soil N, N from recent atmospheric deposition, past years' fertilization, N from crop residues4, N2O from subsurface aquifers, and current N fertilization5. However, it does not include “indirect” losses from N that leaches off the field of fertilizer application (which we consider separately). The IPCC (1996b, 1997) adopts Bouwman’s (1996) equation, for all field crops. However, the evidence reviewed here report indicates that the emission rate for corn is
3 The background emission of 1 kg N2O-N/ha/yr is based on only 5 experiments for unfertilized plots, with a range of -0.6 to +3.2 kg N2O-N ha/yr. However, the estimate is consistent with 33 measurements of control plots, covering over 100 days, with a measurement of 1.2+/- 1.1 kg N/ha/yr (Bouwman, 1996). 4 Kaiser et al. (1998a) found that over a year the highest N2O emissions were associated not with the application of N fertilizer, but with the mineralization of N in crop residue. 5Bouwman and Taylor (1996) modeled nitrous oxide fluxes for a global transport model and assumed, based on Bouwman et al. (1995), a fertilizer-induced emission for agricultural soils where 1.25% of synthetic N-fertilizer input is lost, with most occurring within the first few weeks of fertilizer application. They assumed that for growing periods shorter than 180 days, application of fertilizer was assumed to take place at the start of the season, and that 60% of N2O was lost in the first month, 20% in the second month, and the remaining 20% equally over the remaining 10 months of the year. For growing seasons of 180 to 300 days, Bouwman and Taylor assumed a split fertilizer application and two growing seasons, with 80% of the emission as a constant flux over the growing season and the remaining 20% in equal portions over the rest of the year. For seasons of 300 to 365 days, emissions were assumed to be equal for the entire year.

5
higher than the emission rate for other crops, and that the emission rate for wood and grass is relatively low.
It might be possible to reduce the rate of N2O emissions using less fertilizer, different fertilizers, or by adding compounds that inhibit nitrification to N2O. (See the sub-section on mitigation measures.) N2O produced on site: woody biomass. Data on N2O emissions from fertilizer applied to woody-biomass systems are summarized in Table C-1. Bowden et al. (1991) note that N2O emissions from forest soils have been related positively to chronic high rates of atmospheric nitrogen deposition (e.g., N2O-N emissions can be 10% of added N), and to short-term additions of nitrogen (see also McKenney et al., 1984). To determine the relationship between nitrogen additions and N2O emissions, Bowden et al. (1991) added low (37 kg-N/ha/yr. in the first year, and 50 in the second) and high (120 kg-N/ha/yr. in the first year, and 150 in the second) amounts of NH4 and NO3 to 30m x 30m plots of pine and mixed-hardwood forests, and compared the N2O emissions with emissions from control plots with no added nitrogen. The difference between N emissions from control plots and fertilized plots indicated that in the hardwood forests only 0.02-0.1% of the added N was emitted as N in N2O, and in the pine forests, 0.03%-0.3%. Moreover, the differences between the control plots and the fertilized plots were not significant at the 5% confidence level. The authors conclude that low rates of net nitrification were responsible for the low N2O emissions.
Hall and Matson (1999) measured N2O and NO emissions from N fertilizer added to N-limited and P-limited tropical soils, and found that in the P-limited soil (which already had N in excess), about 2% of the added N was lost as N2O, and 2% as NO. (In a calculation of emissions to the atmosphere, they assumed that 50% of the NO generated was recaptured by the forest canopy.) Matson et al. (1999) review the consequences of N deposition in tropical environments, and conclude that it is “probable that increasing deposition of anthropogenic N in tropical forest systems will result in increased fluxes of trace gases” (p. 76). They note that this is consistent with limited evidence that chronic N deposition causes increased emissions of NO and N2O from forest ecosystems. Brumme and Beese (1992) applied 140 kg-N/ha/year (as NH4SO4) to a plot in a 145-year-old Beech stand, from 1982 to 1988, and compared N2O emissions with emissions from an unfertilized (“control”) plot, and emissions from a plot that received a one-time treatment of lime 30 tonnes/ha in 1982. All plots receive 35 kg-N/ha/yr. from atmospheric deposition. The differences between the control plots and the fertilized plots indicated that anywhere from 0.2% to 3.3% of the applied nitrogen was emitted as N in N2O, with an average of 1.6%6. The relatively high emission rate may
6 The average increase in N2O was thus 140 . 0.016 . 1.57 = 3.52 kg-N2O/ha, where 1.57 is the ratio of the molecular weight of N2O to N2.

6
be due to the relatively high total rate of N application (175 kg-N/ha) saturating the site with N.
In the Brumme and Beese (1992) experiments the fertilized plot also emitted 2200 kg/ha more CO2 than the control plot -- a rate of 15.7 kg-CO2/kg-N-fertilizer applied. The limed (but not fertilized) plot emitted 6.44 kg/ha less N2O than did the control plot, but 3300-kg/ha more CO2. Assuming a CEF for N2O of 355, we can summarize the results of these experiments as follows: Fertilized
but not limed
Limed but not fertilized
1. Difference in N2O emissions vs. control plot (kg/ha) +3.52 -6.44 2. Difference in CO2 emissions vs. control plot (kg/ha) +2200 +3300 3. CO2-equivalent of difference in N2O emissions (kg/ha) (line 2 vqlue multiplied by CEF of 355)
+1250
-2290
4. Total impact (2+3) +3450 +1010
Matson et al. (1992) found a relatively small conversion to N-N2O of N in synthetic fertilizer applied in Douglas fir forests. Although fertilization strongly affected the overall soil nitrogen dynamics, on an annual-average basis only about 0.35% of the N in added fertilizer was emitted as N in N2O.
In a study of N deposition, methane oxidation, and N2O emissions in a moorland and upland spruce plantation in southern Scotland, MacDonald et al. (1997) found that the addition of 40 kg-N/ha increased N-N2O emissions from about 0.1 g/ha/d to 0.2 to 0.7 g/ha/d. This implies an emission factor of 0.1% to 0.5%, assuming that the increase would last for a year.
Castro et al. (1994) measured fluxes of N2O, CH4, and CO2 from unfertilized soils and soils fertilized with 180 kg-N/ha/yr (urea), in a mature slash pine plantation in Florida. The difference between the N2O emissions of the fertilized soils and the N2O emissions of the unfertilized soils implied a conversion rate of 0.6% to 3.5% g-N-N2O/g-N-fertilizer.
N2O produced on site: grass. Data on N2O emissions from fertilizer applied to grass ecosystems are summarized in Table C-1. Mosier et al. (1998) studied the effect of long-term and short-term N fertilization on Colorado shortgrass steppe. They found that N fertilization signficantly enhanced N2O emissions compared with emissions from an unfertilized plot, even as much as 14 years after fertilization stopped. Their results imply that fertilization stimulates N2O production at the rate of 0.5% g-N (N2O)/g-N-fertilizer (Table C-1). In 1995/96 the difference between the previously fertilized plot and the native pasture had declined by about 25%.
Jorgensen et al. (1997) estimated that the bio-energy crop Miscanthus “Giganteus” evolved at least 1.5% of the applied fertilizer N as N-N2O (Table C-1).

7
Kamman et al. (1998) found that the N-N2O rate ranged from 0.5% to 1.5% of applied N (based on the difference between fertilized and unfertilized plots; Table C-1).
Dobbie and Smith (2003) found that emissions from intensively managed grasslands ranged from 1-3% of applied N (Table C-1).
Smith et al. (1998) studied the effects of temperature, water content, and nitrogen fertilization on N2O emissions, and found that grazed grassland had higher N2O emissions than grassland cut for conservation, which in turn had higher emissions than cereal crops.
Mummey et al. (1998) modeled N2O emissons in the U. S. as a function of a variety of soil and N parameters, and found that unfertilized CRP (Conservation Reserve Program) grassland had roughly half of the total N2O emissons of agricultural lands.
Robertson (1991), faced with the paucity of data pertaining specifically to short-rotation intensive cultivation (SRIC) systems, assumed the same emission rate as with fertilizer applied to agricultural soils. Our assumptions are shown below. Note on N2O from biologically fixed nitrogen. Certain legumes, such as soybeans, get much of their N from fixation of atmospheric N rather than from application of synthetic fertilizer N. (For a general discussion of biological N fixation, see Vitousek et al. [2002].) This gives rise to a question critical to the analysis of lifecycle GHG emissions from fuels derived from N-fixing crops, such as soybeans: does biologically fixed N generate N2O at a rate similar to that for synthetic fertilizer N? If the answer is “yes,” then lifecycle GHG emissions turn out to be quite large, as shown in our main text. A simple analysis of the process of N fixation indicates that N produced from biofixation should be made available to N2O-production pathways in much the same way that synthetic-fertilizer N is. Nitrogen fixation begins with the reduction of atmospheric N2 to NH4+ by specialized bacteria. In the case of soybeans, the fixation is the product of a symbiotic interaction between the plants and Rhizobium bacteria living in nodules on the roots of the soybean plant. The NH4+ produced by reduction of atmospheric N2 is a substrate that can be used in a series of ammonia assimilation pathways involving plant enzymes (Shantharam and Mattoo, 1997, p. 209) and which thereby may be incorporated into plant protein tissue. However, the NH4+ produced by biofixation can be used by the N-fixing bacteria themselves, or may be used by neither plant nor bacteria and instead may accumulate in the soil7. NH4+ produced by biofixation and accumulated in the soil generally is subject to the same fate as synthetic NH4 fertilizer: it can be nitrificated to NO3-, which in turn can be taken up by plants
7 Alves et al. (2003) write that “one of the problems in computing N balances [for soybeans] is that all root N is rarely taken into account since it is impossible to recover all fine roots as well as N exuded into the soil or derived from dying roots” (p. 7; emphasis and bracketed additions ours). They go on to note that non-recoverable root N may account for 30-35% of total plant N. Similarly, Jensen and Hauggaard-Nielsen (2003) state that “it is well known that N2 fixing plants exude greater amounts of amino acids into the rhizosphere than non-legumes” (p. 178).

8
(most plants can use NO3 or NH4 for growth [Boddey et al., 2000, p. 248]), lost in groundwater, or denitrified to gaseous forms such as N2 and N2O. Freney (1997) puts the matter succinctly:
It appears that legumes may contribute to nitrous oxide emission in a number of ways. Atmosperic nitrogen fixed by the legumes can be nitrifiedand denitrified in the same way as fertilizer nitrogen, thus providing a source of nitrous oxide. In addition, symbiotically living Rhizobia in root nodules are able to denitrify and produce nitrous oxide (p. 3).
Similarly, Robertson et al. (2000) suggest that it is “high soil nitrogen availability” in general, rather than synthetic fertilizer N specifically, that causes high N2O emissions. In support of this propostion they note that their own field experiments found that an N-fixing crop system (alfalfa) that received no synthetic fertilizer produced as much N2O as did crop systems fertilized with synthetic N (p.1922).
Because of this, the IPCC’s (1997; see also Mosier et al. [1998a]) recommended emission inventory methods assume that the N-N2O/N-fertilzer rate estimated for synthetic fertilizer N applies to biologically fixed N. We think that this is reasonable.
Mitigation measures for N2O emissions from agriculture. N2O emissions are affected by the type, quantity, and timing of fertilizer application, soil tillage practices, the use of nitrification inhibitors, and other factors (Freney, 1997; Armstrong-Brown et al., 1995; Delgado and Mosier, 1996; Li et al., 1996; Cole et al., 1997; IPCC, 2001a). It is well established that optimal timing and application of N fertilizer can maximize N uptake by plants and minimize N losses (IPCC, 2001a; Freney, 1997; Cole et al., 1997; Armstrong-Brown et al., 1995; Isermann, 1990). For example, Bronson et al. (1992) found that the addition of nitrapyrin to urea fertilizer reduced cumulative N2O losses from irrigated corn fields by about 50%. Webster et al. (2002) note that ammonia-based fertilizers produce more N2O than do other fertilizers. Dobbie and Smith (2003) come to the same conclusions, finding that urea applied to intensive grasslands produces less N2O than does ammonium nitrate, and that nitrification inhibitors further cut emissions (Table C-1).
Mosier and Schimel (1991) report that the application of nitrification inhibitors with urea fertilizer reduced N2O emissions from corn and wheat fields by 72% and 58% respectively, without any loss in productivity and measured over a 10 to 18 month time period. However, the authors note that this reduction occurred at the expense of soil CH4 uptake, which decreased by 50% in the case of the corn field and 78% in the case of the wheat field (Mosier and Schimel, 1991). By contrast, Delgado and Mosier (1996) found that the use of a nitrification inhibitor and a control-release fertilizer reduced N2O and N losses without signficantly affecting CH4 uptake.
Certain conservation-tillage practices may increase N2O emissions, however. Xu et al. (1998) found that in the case of corn the adoption of no-tillage practices, widely advocated as a means of soil conservation, resulted in higher N2O emissions. They also found that irrigated corn had higher emissions than did non-irrigated corn, and that emissions increased with the quantity of fertilizer (Table C-1). Mummey et al. (1998)

9
also found that adopting no-tillage practices generally increased N2O emissions compared with conventional tillage, particularly in relatively dry areas: + 24% for corn, +7% for soy, +8% for cotton, +6% for vegetable row crops, +105% for sunflowers, +11% for oats, =11% for rice, and +10% for barley. Only sorghum (-37%), tobacco (-26%), and wheat (-4%) showed decreases with no-tillage. Mummey et al. (1998) cite other studies that had similar results, and speculate that the higher N2O emissions from no-till agriculture are the result of higher soil moisture content and greater populations of N2O-producing bacteria8. Finally, Baggs et al. (2003) found that emissions of N2O were two to seven times higher from fertilised zero-till treatments than from fertilized conventional-till treatments. They speculated that this was due to anaerobic conditions and localized concentrations of NO3 under the mulch in zero-till treatments.
How might these factors play out? In the first place, we note that there are significant barriers to the widespread adoption of “optimal” fertilizer management practices (IPCC, 2001a; Isermann, 1990). For example, it is not clear how famers can be induced or compelled to use nitrification inhibitors. Furthermore, Mosier et al. (2002) point out that studies have shown that “significant N losses through denitrification and leaching can be expected even at ‘optimal’ N application rates” (p. 493). Finally, it appears that no-till agriculture, which increasingly is being adopted for reasons of soil conservation, and irrigation, which may be used more widely as crops are pushed onto more marginal lands9, increase N2O emissions (Xu et al., 1998; Mummey et al., 1998).
Considering this, we expect that the adoption of optimal fertilizer-management practices will slightly reduce N losses as as N2O, NO, and leached nitrate, but that in the case of N2O any such reduction in emissions will canceled by increases resulting from the use of no-till agriculture
Our assumptions. On the basis of the data discussed above, we assume the following:
8 However, model simulations by Li et al. (1996) indicate that the use of no-till practices actually reduce N2O emissions dramatically, because of reduced rates of N mineralization, reduced potential for episodic wetting, and increased potential for low-oxygen conditions (p. 299). 9 The percentage of total U. S. cropland that is irrigated has increased moderately over the past three decades: 1964 -- 8.5%, 1969 -- 8.5%, 1974 -- 9.4%, 1978 -- 11.1%, 1982 -- 11.0%, 1987 -- 10.5%, 1992 -- 11.4%, 1997 -- 12.8% (National Agricultural Statistics Service, 1999).

10
Corn Grass Wood Soy
N-N2O/N-added, direct or "on-site" emissions, in base year 1990 (applies to synthetic fertilizer N, manure N, biologically fixed N, and crop-residue N)
0.013 0.010 0.008 0.010
annual percentage change in on-site N2O emission rate, from synthetic fertilizer N and manure N
0.000 0.000 0.000 0.000
annual percentage change in on-site N2O emission rate, from biologically fixed N and crop-residue N
0.000 0.000 0.000 0.000
We assume that more efficient use of synthetic fertilizer and manure will reduce N losses, both as N2O on-site and nitrate leached offsite, but that these practices will not affect biologically fixed N or crop residue N. N2O from atmospheric deposition of N, at the site of N deposition
Ambient NOx eventually is deposited at the surface of the earth as nitrate (e.g., nitric acid, HNO3, or ammonium nitrate, NH4NO3) (U. S. Environmental Protection Agency [EPA] 1996; Erisman et al., 1998) . This deposited nitrate, like artificial nitrogen fertilizer, can nitrify or denitrify to produce N2O. According to Bowden et al. (1991), Brumme and Beese (1992), MacDonald et al. (1997), Butterbach-Bahl et al. (1997), and Ineson et al. (1997), there is indeed evidence of a strong relationship between chronic deposition of atmospheric nitrogen onto soils, nitrification, and increased N2O emissions.
N2O from deposition onto soils. The few available empirical studies suggest that approximately 1% of the nitrogen deposited onto soils is re-emitted as N in N2O. In a study of N deposition, methane oxidation, and N2O emissions in a moorland and upland spruce plantation in southern Scotland, MacDonald et al. (1997) found that 1% of the N deposited as nitrate was re-emitted as N in N2O. MacDonald et al. (1997) also cite a study in which 1.7% of the N deposited in an acid conifer forest in Norway was emitted as N in N2O, and another study in which 0.8% of the N deposited in a mixed woodland near a poultry farm in Scotland was emitted as N in N2O.
Skiba et al. (1998) studied N2O and NO emissions from deposited N over a range of soil conditions, from “pristine” (no excess N deposition above natural background rate) to those with long-term heavy nitrogen input. They found that:
-- An initial threshold N deposition rate of at least 40 kg N/ha/yr is required to increase N2O above background values.
-- Over all sites, an average of 0.76% of the excess N deposited was emitted as N in N2O. (Their measure is defined as the difference between measured N2O and N2O

11
given background N deposition divided by the difference between actual N input and background N input.)
-- At sites exposed to excess N input over many years (as little as 10 kg N/ha/yr over background), 3% or more of the input N can be emitted as N in N2O.
Li et al. (1996) used the Denitrification-Decomposition (DNDC) model to simulate the effects of various levels of atmospheric deposition on N2O emissions from a corn field in Iowa, holding constant all other parameters (precipitation, synthetic N input, temperature, soil characteristics, and more). N2O emissions were large, and increased nonlinearly with N deposition: an increase in deposition from 4.0 to 16.1 kg-N/ha/yr was associated with an increase in N2O emissions of 0.9 kg-N/ha/yr – a 7% N-N2O/N-deposition rate -- and an increase in deposition from 161. to 32.1 kg-N/ha/yr was associated with an increase in N2O emissions of 2.3 kg-N/ha/yr – a 14% N-N2O/N-deposition rate. These are very high simulated N2O emission rates, explainable perhaps by relatively high precipitation (about 40 inches) and high total N inputs resulting in N saturation. Li et al. (1996) acknowledge that these rates are high, and call for field studies to determine if nitrate from deposition really is converted to N2O at much higher rates than is fertilizer N (p. 299).
Butterbach-Bahl et al. (1997) measured NO and N2O emissions from forest soils exposted to heavy levels of N deposition, and found that N2O-N emissions ranged from 1.3 to 7% of N deposition (Table C-1). They concluded that the high N2O and NO emisson rates may be due to the high nitrogen inputs via atmospheric deposition (p. 88). Similarly, Groffman et al. (2000) review several studies of N2O emissions from forest soils, and find that generally soils that are “saturated” in N have high N2O emissons: as much as 10% of deposited N can be emitted as N-N2O in forests subject to heavy deposition.
Ineson et al. (1997) measured emissions of N2O from the forest floor of a coniferous plantation downwind from a pig farm, and concluded that substantial amounts of NH4 generated from the pig farm were being deposited on the forest floor, and that “a significant proportion of the deposited N was being re-released as N2O” (p. 3329). The plantation received deposition of about 100 kg-N/ha/yr. (their Table 1), and generated N2O at an hourly rate corresponding to about 3 kg N2O-N/ha/yr. (their Table 2). This indicates that on the order of 3% of the deposited N was re-emitted as N-N2O, a relatively high figure consistent with the very high levels of N deposition.
Matson et al. (1999) report that “limited evience suggests that high levels of chronic N deposition cause increased N gas fluxes from temperate forest ecosystems,” and that “the few studies carried out in the tropics suggest that tropical soils have proportionally higher rates of gaseous losses of fertilizer N than do temperate zone systems” (p. 76). These statements are consistent with the notion that N losses are higher from non-N-limited systems than from N-limited systems, because temperate forests subject to chronic N deposition are no longer N-limited, and tropical forests generally are not N-limited (Matson et al., 1999).
The preceding data imply a figure of 1% g-N-N2O/g-N-deposited. As a global average this seems broadly reasonable, in part because it is comparable to the N-

12
N2O/N-fertilizer rate measured for crop systems. The IPCC’s (1997) revised guidelines for national GHG emissions inventory recommend assuming that 1% of the nitrogen in NOx or NH3 is returned to soils and then re-emitted as N2O (an assumption adopted by the U. S. EPA [1998] and the U. S. Energy Information Administration [1998]; see also Mosier et al. [1998a]). Before them, Robertson (1991) made a similar assumption.
N2O from deposition onto aquatic systems. Oceans also are a significant source of N2O (Dore et al., 1998; Kumar et al., 1995; Law and Owens, 1990). Some of the N in N2O emitted from oceans may come ultimately from N from atmospheric deposition: Karl et al. (2002) show that oceans produce N2O from NO3 and NO2 (see also Kim and Craig [1990] and Takeda et al. [1995])10 and Paerl states that “even remote oceanic waters of the mid-Pacific, Atlantic, and Indian Oceans receive detectable anthropogenic atmospheric N inputs” (p. 244; see also Paerl and Fogel [1994] p. 635), as NOX, which when dissolved in water become NO2 or NO3 – the anions that are the source of oceanic N2O. Falkowski (1997, p. 274) mentions a nonlinear climate model that includes the outgassing of N2O as a consequence of increasing denitrification (NO3 --> N2) in the oceans.
It thus seems reasonable to assume that some N in NOX deposits on oceans, and that that some of this deposited N is re-emitted as N in N2O.
We have found two estimates of N2O emission rates from oceans specifically: Nixon et al. (1996) report an annual mass balance of total N for the Baltic Sea, in which 4 mmol/m/yr. of N-N2O are produced from 217 mmol/m2/yr of N inputs from deposition, N fixation, rivers, and urban and industrial areas (p. 148). This is an emission rate of 2%. Galloway et al. (1995) estimate that pre-industrial oceans globally received 47 Tg N/yr. input and emitted 2 Tg N/yr. N-N2O, an emission rate of 4% (p. 238). However, Galloway et al. (1995) also estimated zero N-N2O emissions from oceans globally from anthropogenic N inputs to oceans.
In a study reviewed below, Kroeze and Seitzinger (1998) estimate N-N2O fluxes from rivers carrying N from fertilizer, deposition, and other sources to be 3.9% to 5.5% of N input (see also Sietzinger and Kroeze [1998]). These rates presumably would apply to N directly deposited from the atmosphere onto lakes and rivers.
Our assumptions: N2O emisson rates from deposited N. In its representation of the impacts of atmospheric deposition of N, the LEM distinguishes N-limited from non-N-limited ecosystems. Empirical studies, simulations, and theory suggest that gaseous and leaching losses of N are lower from N-limited than from non-N-limited ecosystems (Skiba et al, 1998; Matson et al., 1999; Dise et al., 1998; Williams et al., 1996; Li et al., 1996), and lower from dry than from wet ecosystems. Considering this and the data presented above, we make the following assumptions (fraction of N deposited evolved as N-N2O):
N deposited onto ecosystem type:
10 Karl et al. (2002, p. 82) also state that oceanic production of N2O may be linked to dust deposition.

13
freshwater marine arid or urban
other terrestrial
N-N2O/N-deposited (N-limited systems)
0.004 0.004 0.001 0.003
N-N2O/N-deposited (non-N-limited)
0.055 0.035 0.004 0.030
Our assumptions: N-limited versus non-N-limited area of each ecosystem. As indicated above, the LEM distinguishes N-limited from non-N-limited ecosystems. Therefore, for each type of ecosystem I specify the area that is N-limited, as a fraction of total global area of the ecosystem type. Because the areal fraction that is N-limited will change over time, I specify the N-limited fraction for each ecosystem in 1990 and a parameter that determines the rate of change in the N-limited fraction over time (Appendix D). In this section we discuss information in the literature pertinent to the specification of the N-limited fraction of each ecosystem type. Temperate forests. It appears that most aquatic and terrestrial ecosystems in temperate regions of the global are N-limited, but that deposition and fertilization are saturating some areas and making then non-N-limited. According to Vitousek et al. (1997), “it is clear that rates of plant production and of the accumulation of biomass in whole ecosystems are limited by N supply over much of Earth’s surface...particularly in temperate and boreal regions, and equally clear that human activity has increased N deposition substantially over much of this area” (p. 740). However, temperate forests subject to chronic N deposition may no longer be N-limited (Matson et al., 1999; Asner et al., 1997). Davidson and Kingerlee (1997) guess that about 10% of temperate forests are “N-affected,” by which they mean no longer N-limited.
Tropical forests. By contrast, relatively few tropical forests are N-limited. Generally, humid tropical forests have excess N, and are limited in growth by phosphorous (P) rather than N (Asner et al., 2001; Hall and Matson, 1999; Matson et al., 1999). In experiments with N additions to tropical soils in Hawaii, Hall and Matson (1999) found that a P-limited forest soil (characteristic of most topical ecosystems) lost more of the added N as N2O and NO than did an N-limited forest soil. They suggest that tropical forests may not retain as much anthropogenic N as do forests in northern latitudes. Matson et al. (1999) review the consequences of N deposition in tropical environments, and conclude that “unlike the temperate zone, where increasing N deposition may cause at least a transient increase in carbon storage, we suggest that higher inputs to moist tropical systems may lead to lower productivity and reduced carbon storage” (p. 73-74) [emphasis in original]. Agriculture. Agricultural lands generally are not N-limited because of the high N fertilizer input they receive.

14
Aquatic ecosystems. The IPCC (2001) states that “in practice” the availability of nitrate limits the productivity of the oceans (p. 198)11 (see also, Isermann, 1990, p. 256). Paerl and Fogel (1994) write that “accelerating atmospheric N inputs to coastal waters may be linked to enhanced primary production in coastal waters, because production in these waters is frequently N limited and hence sensitive to N enrichment” (p. 635). Galloway et al. (1996) state that “atmospheric N deposition to the open ocean has increased and may increase the productivity of the surface ocean” (p. 3). However, coastal areas receiving substantial N inputs from rivers and deposition may already be N saturated. Over a decade ago Isermann (1990) noted that actual N inputs to the Baltic and North Seas significantly exceeded “maximum long term tolerable loads” (p. 262). Similarly, Howarth et al. (1996) note that estuaries in the North Atlantic may be either N or P-limited. Finally, Hessen et al. (1997) suggest that most freshwater systems are P-limited or both P- and N-limited (p. 319). My assumptions. Given this information, I assume the following N-limited areal fractions in 1990, by type of ecosystem: Tropical Forest
Temp. Forest Grassland Ag. Arid Urban Lakes
Rivers/ Coasts Marine
0.15 0.85 0.50 0.10 0.85 0.50 0.50 0.50 0.95 Leaching and erosion losses of fertilizer-N or deposited N off the site of application or deposition
The preceding subsections pertain to grams of N evolved as N2O per gram N of fertilizer or deposition on site. However, a significant fraction of N from fertilizers or atmospheric deposition can leach or erode off of the site of application or deposition and be transported by surface or groundwater to other terrestrial or aquatic ecosystems (Hessen et al., 1997), where it can undergo nitrification or denitrification to N2O. In general, whatever N is not used by plants on site or released to the atmosphere is converted in the soil to nitrate, which is soluble in water and can easily leach to the water table (Nolan et al., 1997, p. 2229). Smil (1999) notes that the nature of ground cover is the most important determinant of leaching, and thus that leaching rom freshly plowed bare soil is higher than leaching from row crops which is higher than leaching from legume-grass mixtures which have roots that can take up a lot of N (p. 655).
The LEM treats synthetic fertilizer N leached or eroded from agricultural fields (corn, soy, grass, or wood), and N from atmospheric deposition leached or eroded from and to a range of ecosystems. In the case of N leached or eroded from ecosystems subject to atmospheric deposition, the LEM explicitly represents the loss of N as part of 11 In support of this, Takeda et al. (1995) find that iron, nitrogen and other major nutrients “co-limit” phytoplankon production during the monsoon season in the northwest Indian Ocean. Falkowski (1997) proposes that on geologic timescales, nitrogen limits primary productivity in the oceans (p. 272).

15
a closed (balanced) representation of the fate of all added nitrogen in all ecosystems.This subsection discusses data pertinent to the representation of the magnitude and fate of N leaching and erosion loss from synthetic N used in agriculture and from atmospheric N deposited onto ecosystems. The subsequent subsection discusses the rate of N2O evolution from N leached or eroded off the site of application. Most of the studies discussed in this subsection are summarized in Table C-2. Breitenbeck (1990; in Greene and Salt, 1993) estimates that 5-30% of fertilizer N reaches aquifers, resulting in 1.3-2.7 Tg N2O /yr globally. Paustian et al. (1990) made a complete carbon and nitrogen budget for fertilized and unfertilized barley plots, and found that about 10% of the applied fertilizer N was lost by leaching. However, they found essentially no leaching from a fertilized grass ley plot, or from a nitrogen-fixing lucerne ley. Sanderson et al. (1996) report that erosion rates from switchgrass fields are only 1% of the rates from corn fields, and that erosion rates from SRIC plantations are 10% of the rate from corn fields. (For a general discussion of soil erosion and the global C budget, see Lal [2003].)
Perlack et al. (1992) review the literature on emissions of agricultural chemical and estimate the fate of N fertilizer applied to energy-crop systems (%) Energy crop: Groundwater Runoff Air Plant uptake Erosion Sorghum 15 10 15 50 10 Perennials 5 5 10 75 5 Trees 5 5 10 75 5
The IPCC’s (1997) most recent guidelines for estimating national GHG emission inventories suggest that 30% of the applied fertilizer N leaches offsite (see also Mosier et al. [1998a]).
Smil (1999) presents a careful and largely original accounting of global flows of N in crop production. As shown in the subsection on NO and NH3 emissions of this appendix, he estimates that leaching losses of N are 10% of inputs to crop production, and erosion losses 12%. Janzen et al. (2003) perform a complete accounting of the fate of N inputs to Canadian agroecosystems. They assume that N leaching losses are 10% of synthetic-N, manure-N, atmospheric-N, and crop-residue-N inputs (p. 92). Dise et al. (1998) evaluated the relationship between the C:N ratio of soil and nitrate leaching in runoff water from 33 coniferous forests across Europe. They found that at low levels of N deposition (less than 10 kg-N/ha), nitrate leaching was low regardless of the C:N ratio of the soil. However, at deposition levels above 10 kg-N/ha, nitrate leaching increases with increasing deposition and with decreasing C:N ratio. (Gundersen et al. [1998] have a similar finding.) This implies that the more nitrogen a site receives and the more nitrogen-saturated it becomes, the greater the leaching losses of N.

16
Fenn et al. (1998) also show data indicating that as N loading increases, leaching losses increase and the C:N ratio in the soil and biomass uptake by plants decrease. They report N deposition, biomass N increment, N leaching, and soil C:N ratio for three coniferous forests in the U. S. (their Table 3): Washington New York N. Carolina N deposition (kg-N/ha/yr.) 2.0 15.9 27.1 Biomass N increment (kg-N/ha/yr.) 3.6 10.8 1.8 N leaching (kg-N/ha/yr. [% of dep.]) 0.1 [5%] 3.0 [19%] 20.7 [76%] soil C:N 33 20 9 Jaworski e al. (1997) estimated the relationship between total N inputs on the landscape and riverine export of N for 10 watersheds in the Northeast United States. They estimatedthe following average inputs and flows of total N in the 10 watersheds (kg-total-N/km2/yr): • deposition of atmospheric N: 744 • river export of deposited N: 430 • fertilizer N input: 766 • feed and food N input: 975 • biotically fixed N: 843 • river export of “agricultural” N: 209 Their estimates thus are that 57% of deposited N ended up in the rivers, but that only 8 – 27% of “agricultural” inputs ended up in rivers, depending on what is counted as an “agricultural” input (i.e., fertilizer only, or fertilizer, feed and food, and biotically fixed N?). Jaworski et al. (1997) did not determine to what extent each of the thre potential agricultural inputs contributed to the estimated river export of “agricultural” N, but they did imply that biotically fixed N might not be exported to rivers at all (p. 2002). If only fertilizer N leached to rivers, then 27% leached to rivers; if only fertilizer plus feed and food N leached, then 12% leached to rivers, and if fertilizer, feed and food, and biotically fixed N leached, then 8% leached to rivers. Alternatively, if 5% of biotically fixed N and feed and food N leached to rivers, then 15% of fertilizer N leached to rivers. Jaworski et al. (1997) also imply that the Chesapeake Watersheds Model has export coefficients for fertilizer N in the range of 9-15%. Steinheimer et al. (1998, 1998a) measured nitrate losses from a fertilized agricultural field in Iowa. They estimated the fate of applied fertilizer N and atmospheric deposition N as follows: 50% in grain, 19% loss by erosion (2%), drainage (1%) or runoff (16%), and 31% lost in gaseous forms or incorporated into the soil. Isermann (1990) estimates agricultural inputs of N and leaching, drainage, and surface-runoff losses of N from agriculture in four European countries:

17
input loss loss %
Netherlands 465 126 27% erosion losses not included Denmark 220 80 36% Switzerland 218 14 6% drainage losses not included Germany 218 50 23%
Galloway et al. (1996) summarize estimates of the nitrogen fluxes for the watershed, estuary, shelf, and open ocean in the North Atlantic Ocean region. Of the fertilizer, combustion, and legume N-fixation inputs of N to temperate watersheds, 23% was discharged in rivers, 10% was incorporated into food and feed (net exports, apparently), less than 3% was stored in groundwater, less than 23% was stored in forests, and at least 40% was denitrified and stored in wetlands, streams, and rivers.
The summary of Galloway et al. (1996) is based mainly on the work of Howarth et al. (1996) . Howarth et al. (1996) did not count sewage and animal wastes as anthropgoenic N fluxes into regions because they represent a recycling of N within a region (p. 86). Their work indicates that on average 25% of the net anthropogenic N input to the North Atlantic watersheds is expored in rivers. Howarth et al. (1996, p. 105) cite two other studies that indicate a 20% export rate.
Howarth et al. (1996) also estimate leaching losses of fertilizer N specifically, as a function of the type of soil and crop land:
grasslands crop lands sandy soil 10 – 50% 25 – 80% clay soil 3 – 10% 10 – 40%
With these leaching rates, and data on types of soil and land uses, they estimate
that fertilizer-N leaching from agricultural soils is about 35% of net N fertilizer use in Europe and 22% in the U. S.
Howarth et al. (1996) note that export of deposited N from forests depends greatly on the extent to which the forest is becoming N saturated. Similarly, in their model of global N deposition and associated C sequestration, Holland et al. (1997) assume that 20% of added N is lost from non-N-saturated ecosystems, and 20% plus an additional fraction of N deposition in N-saturated ecosystems (p. 15857).
Finally, Kroeze and Seitzinger (K&S) (1998) modeled N inputs to rivers and estuaries and related N2O emissions, worldwide in 1990 and 2050. Their global model results are:

18
Parameter 1990 2050 Comments
fertilizer N input to watersheds (Tg-N/yr)
73.6 181.7
atmospheric NOY deposition input to watersheds (Tg-N/yr)
22.5 38.5 doesn’t include N deposition directly onto continental shelves (K&S, 1998, p. 199, 207)
point source (sewage) dissolved inorganic nitrogen input (DIN) to watersheds (Tg-N/yr)
7.2 14.3
total anthropogenic inputs (Tg-N/yr) 103.3 234.5 sum of above
total DIN export by rivers (Tg-N/yr) 20.8 47.2 K & S estimate
total N export by rivers (Tg-N/yr) 34.7 78.7 our estimate based on K&S assumption that DIN is 60% of total N export
natural DIN export by rivers (Tg-N/yr) 5 5
total anthropogenic N export by rivers (Tg-N/yr)
29.7 73.7 assumes no natural non-DIN N export
anthropogenic N river export as a % of total anthropogenic N input
29% 31%
Thus, the modeling results of Kroeze and Seitzinger (1998) indicate that about
30% of anthropogenic N input from fertilizer and deposition leaches off of fields into aquatic systems. This is consistent with the IPCC’s (1997) recommendation. However, the results of K & S also are consistent with an assumption that 55 – 60% of N deposition input, 80% of sewage N input, and 15 – 20% of fertilizer N input leaches to rivers. These latter assumptions are consistent with the findings of Jaworski et al. (1997).
N losses from crop residues and N-fixing plants. As mentioned above, the IPCC’s (1997) most recent guidelines for estimating national GHG emission inventories suggest that 30% of the applied fertilizer N leaches offsite (see also Mosier et al. [1998a]). The IPCC (1997) applies this off-site loss factor only to synthetic-fertilizer and animal-manure N, apparently on the assumption that no biologically fixed or crop-residue N is lost offiste. Although it seems reasonable to assume that biologically fixed N and crop-residue N is less likely to leach off site than is synthetic-fertilizer N, it does not seem likely that no fixed or crop-residue N is lost at all. Biological fixation converts N2 to NH4+, which in turn can be nitrified to nitrate, which is highly soluble in water. N bound in decomposing organic matter may be susceptible to leaching. As discussed next, several sources indicate that leaching losses of N from residues and N-fixing plants, while perhaps lower than losses from synthetic fertilizer, are not zero.

19
Kroeze and Seitzinger (1998) note that some of the export of dissolved inorganic nitrogen to rivers may come from biologically fixed nitrogen (p. 200). Janzen et al. (2003) assume that 10% of crop-residue-N (but 0% of biologically fixed N) leaches off fields. Jensen and Hauggaard-Nielsen (2003) state that N losses from the use of crop residue and biofixing plants are less than from the synthetic fertilizer, but not zero; they cite estimates of 10-15% N loss from crop residues versus 30-35% N loss from synthetic fertilizers. They also note that “managing nitrate leaching may become inreasingly difficult with N2 fxing crops, due to crop residues of high N concentration” (p. 182). Smil (2002) states that “the losses of the element [N] fixed by symbiotic bacteria and bound in organic matter are lower” (p. 129) than are the losses from fertlizer N (but not zero). Silgram et al. (2001) conclude that the validity of the IPCC assumptions regarding N loss are not valid because “the ability of legumes to fix atmospheric N..will not preclude the leaching of..nitrate derived from the mineralisation of soil organic matter and crop residues” (p. 193). And Bockman (1997) actually suggests that N from residue is more susceptible to leaching than is N from synthetic fertilizer (p. 13).
Our assumptions. The data presented above indicate a global average loss rate for all types of N and all ecosystems in the range of 20-30%, but that some distinctions by ecosystem and type of input can be made:
• losses are lower from N-limited systems than from non-N-limited systems
(e.g., Holland et al., 1997); • losses of synthetic fertilizer N are lower than are losses of deposition-N; • losses of biofixed-N and crop-residue N are lower than are losses of synthetic
fertilizer N (see discussion above); • losses are much lower from grass and wood systems than from row crops
(Paustian et al, 1990; Sanderson et al, 1996; Perlack et al., 1992; Howarth et al., 1996). We also note that better management of N inputs, which is attractive for a
number of reasons, will tend to reduce leaching losses over time, albeit probably modestly (see the discussion in the subsection on N2O emission rates).
On the basis of these conlusions and the data presented above and summarized in Table C-2, we assume the following for N leaching losses:
Corn Grass Wood Soy
N lost offsite through erosoin, drainage or runoff, fraction of fertilizer or manure N applied, in base year 1990
0.250 0.10 0.10 0.200
N lost offsite through erosion, drainage or runoff, fraction of crop-residue N, in base year 1990
0.100 0.050 0.050 0.070
N lost offsite through erosion, drainage or runoff, fraction of biologically fixed N, in base year 1990
0.050 0.050 0.050 0.050

20
annual percentage change in N leaching-loss rate, for synthetic fertilizer N and manure N
-0.500 -0.500 -0.500 -0.500
annual percentage change N leaching-loss rate, for biologically fixed N and crop-residue N
0.000 0.000 0.000 0.000
Losses of atmospherically deposited N by ecosystem are discussed in Appendix D. N2O from leached N, off the site of N application or deposition
The rate of N2O evolution from N leached off site may be different from the rate from N applied or deposited on-site, because leached N generally is in a different form (nitrate) and media (water) then is most on-site N.
Early estimates of the off-site N2O evolution rate were based on very little data. To account for N2O emissions off-site and after the on-site sampling period, Eichner (1990) and the IPCC (1990) double the measured, on-site N2O emissions. Eichner's doubling essentially is a guess; the IPCC's is based on two studies: Ronen et al. (1988) and Conrad et al. (1983). Data in Ronen et al. (1988) indicate that as, an upper limit, emissions of N2O from the drainage of fertilized land could be twice as high the average emission rate measured for corn. The authors do not say what the typical situation would be. Conrad et al. (1983) cite one study of the leaching of nitrogen fertilizer into groundwater, and another showing that groundwater may be supersaturated with N2O, and then guess that the N2O emission from groundwater containing leached nitrogen fertilizer may be equal to the measured field losses. Data in Bowden and Bormann (1986) not reviewed in the 1990 IPCC report roughly support an assumption off-site rate equals the on-site rate: they found that, as a result of clear-cutting a forest, the increase in N2O emissions from the degassing of water was similar to the measured increase in N2O emission from diffusion from soil. They note that the transport of N2O by soil water and subsequent degassing, as a result of fertilization and irrigation, have not been well quantified, and could be a significant source of N2O. A 1990 study by Minami and Ohsawa (1990) also generally supports the IPCC’s early assumption that the off-site N2O evolution rate equals the on-site rate. Measurements of N2O fluxes from drainage ditches in Japan showed that following a heavy fertilizer application of 500 kg N ha-1 yr-1 on an agricultural field, the flux at a point 30 meters from the field was more than double the measured soil flux, on a per surface area basis, and that at a point 450 meters from the field the flux was about 70% of the soil flux (Table C-3). This suggests that drainage systems are a significant source of additional N2O emissions from fertilizer application. However, because the results are expressed in terms of flux per unit area, it is difficult to compare the estimates directly without knowing the ratio of drainage ditch surface area to field surface area for a given drainage ditch length.

21
Isermann (1994) reports that Boller (1980) and Bouwman (1989) conclude that 2-3% of nitrogen introduced into agricultural land is lost as N2O -N, including both direct losses to the atmosphere and losses from drainage zones and aquifers. Nevison et al. (1996) conclude that the percentage of leached N from agricultural fields that becomes N2O can only be narrowed down to two orders of magnitude, from 0.05% to 5%, based on uncertainties in the fate of leached N. The percentage of denitrified N that is released as N2O is on the order of 5-15%, but in stream and river bottom sediments, the N2O yield is only 0.1%-0.4%, rising to 6% in relatively polluted sediments. They suggest that little is known about the percentage yield in the water column, where some denitrification may also occur.
The IPCC (1996b) reviewed much of the literature available through 1996 (including some of the studies cited here), and concluded that the “indirect” emission of N2O from ground water is about 0.75% of the applied N fertilizer. However, the IPCC’s (1997) most recent guidelines for estimating national GHG emission inventories suggest that 2.5% of the offsite N is emitted as N in N2O:1.5% in groundwater and surface runoff, 0.75% in rivers, and 0.25% in coastal areas (see also Mosier et al., 1998a).
Finally, as mentioned in the preceding section, Kroeze and Seitzinger (K&S) (1998) modeled N inputs to rivers and estuaries and related N2O emissions, worldwide in 1990 and 2050. Their global model results for N2O emissions are:
Parameter 1990 2050 Comments
total anthropogenic N export by rivers (Tg-N/yr)
29.7 73.7 assumes no natural non-DIN N export
total N2O emissions from rivers and estuaries (Tg-N/yr)
1.27 4.19
anthropogenic fraction of N2O emissions from rivers and estuaries
90% 96% K&S say “over 95%” for 2050 (p. 207)
anthropogenic N2O from rivers and estuaries (Tg-N/yr)
1.14 4.02
anthropogenic N2O from continental shelves (Tg-N/yr)
0.02 0.06 50% of river DIN export goes to shelves, 0.3% of this goes to N2O (p. 199, 203, 207)
total anthropogenic N2O from all aquatic systems (Tg-N/yr)
1.16 4.08
anthropogenic aquatic N2O as a % of anthropogenic N river export
3.9% 5.5%
Thus, the modeling results of Kroeze and Seitzinger (1998) indicate that 4-5% of
the leached N evolves as N in N2O, the amount increasing as systems become

22
increasing saturated with N. This 4-5% N-N2O evolution rate is much higher than the IPCC’s (1997) recommended value of 2.5%. The likely explanation is that the IPCC value is too low because, as K &S (1998) note, studies done prior to theirs tended to have incomplete representation of N2O from aquatic systems. K&S (1998) also cite work current with theirs that tends to support their conclusions, and in a related paper Sietzinger and Kroeze (1998) they show that their model estimates are reasonably consistent with available observations12. Our assumptions. We think it likely that the K&S (1998) findings are an advance over the recommendations of the IPCC (1997). Their work indicates not only that the N-N2O/N-leached rate is relatively high now, but that it is likely to increase as aquatic systems become subject to increasing nitrate loads. With these considerations, we assume the following for fertilizer N leached from corn, grass, wood, or soy fields:
Corn Grass Wood Soy
N-N2O/N-leached from ecosystem, base year 1990
0.039 0.039 0.039 0.039
annual percentage change in offsite N2O emission rate
0.500 0.500 0.500 0.500
We believe that there is no reason to distinguish the source of the leached N (i.e., fertilizer, manure, crop residue, or biological fixation), because presumably most of the leached N is in the form of nitrate, regardless of the source. In the case of atmospherically deposited N leached from ecosystems, recall again that the LEM distinguishes N-limited from non-N-limited systems. Generally, N2O emissions are lower from N-limited than from non-N-limited systems, and lower for dry systems than for wet systems. However, as regards estimating N2O losses from leached N, the distinction between wet and dry systems may be less important than in the case of N2O from direct deposition of N, because most leached N is transported in groundwater or surface runoff. However, the distinction may not be entirely irrelevant, because some N may be transported in dry form, for example by mechanical erosion, and because the wetness of the receiving ecosystem still may matter. Considering this and the data presented above, we make the following assumptions:
N leached into ecosystem type: freshwater marine arid or
urban other
terrestrial
12 K&S (1998a) say that the S&K (1998) paper shows that their “estimates for aquatic N2O emissions generally are in line with the available observed N2O rates” (K&S, 1998a, p. 157).

23
N-N2O/N-leached into ecosystem (N-limited systems)
0.006 0.005 0.003 0.004
N-N2O/N-leached into ecosystem (non-N-limited systems)
0.055 0.050 0.030 0.045
NOx and NH3 emissions from nitrogen fertilizer and deposition inputs
Some of the nitrogen in fertilizer or deposition inputs is re-emitted to the atmosphere as N2, N2O, NO, NO2, and NH3. In the LEM these emissions are treated as follows:
• N2: not included in the LEM, because N2 is environmentally inert • N2O: direct GHG; emissions estimated in this appendix • NO: indirect GHG NOx; emissions estimated in this subsection • NO2: indirect GHG NOx; emissions estimated in this subsection
• NH3: treated as NOx, because NH3 has effects similar to NOx In this subsection we estimate emissions of NOx and NH3 related to fertilizer and
deposition N. In this case we do not make a distinction between emissions at the site of fertilization or deposition and emissions off-site, but rather estimate one universal emission rate. Table C-4 summarizes the results of the studies reviewed here. The first issue of Nutrient Cycling in Agroecosystem in 1997, volume 48, is devoted to the topic of NO emissions from soils (many of these papers are cited here; see Matson [1997] for an overivew).
Emissions from synthetic fertilizer N. Nitrogen in fertilizer can evolve as NO, via a two step process in which NH4+ first is oxidized to NOx, and NOx then is reduced to NO, N2O, and N2 . The most important controlling factors are the availability of nitrogen, the temperature and moisture of the soil, and microbial activity (Skiba et al., 1997; Aneja et al., 1997). Aneja et al. (1997) report an estimate that in the Southeastern U. S., NO emissions from agricultural and forest soils are more than half of NOx emissions from power plants13.
Studies of the N-NOx/N-fertilizer loss rate have yielded a wide range of results. For example, Anderson and Levine (1987) found that 0.79% of the fertilizer applied to a corn site was lost as N in NO. Hutchinson and Brams (1992) applied 52-kg-N (as (NH4)2SO4) to a Bermuda-Grass pasture and found that 0.39% evolved as N in N2O, and 3.22% as N in NO. Paustian et al. (1990) made a complete carbon and nitrogen budget for a fertilized barley plot, and estimated an N-NOx/N-fertilizer loss rate of less
13Stohl et al. (1996) found that “soil emissions [of NO], which are currently neglected in most other photochemical models,” can have a significant effect on O3 concentrations” (p. 3753). Because, as discussed elsewhere, tropospheric ozone is radiatively active, this finding justifies, at least conceptually, treating NO and NO2 emissions from soil as an indirect greenhouse gas.

24
than 1%, and a N-NH3/N-fertilizer loss rate of less than 4%. For a nitrogen-fixing lucerne ley, total gaseous losses of N were 5% of the N fixed, but the lost N presumably was N2.
Although Anderson and Levine (1987) did not measure NO evolved offsite, they did find that NO was not emitted from soil saturated with water, which implies that little would be emitted from groundwater or drainage water containing fertilizer.
In nine studies tabulated by Stohl et al. (1996) (including Anderson and Levine, and Hutchinson and Brams), the N-NOx/N-fertilizer loss rate ranges from 0.5% to 11.0%. On the basis of this literature review, and their own analysis, they assume an NO loss rate of 4.3%. They also note that the loss rate as NO usually is twice the loss rate as N2O. (See also Sanhuenza [1997], who tabulates many of the same studies, plus an additional one in which fertilization did not increase NO emssions.) Skiba et al. (1997) perform a similar tabulation and find that most N-NO/N-fertilizer emission rates are less than 1.0%, and Veldkamp and Keller (1997) review 23 studies and estimate an average emission rate (which they call a lower bound) of 0.5% N-NO/N-fertilizer for temperate climates.
Note that the studies tabulated above did not measure NO2 or NH3. Most of the studies cited in Stohl et al. (1996) measured only NO, and Stohl et al. imply that most of the NOx emissions is likely to be NO rather than NO2. However, Anderson and Levine (1987) and Stohl et al. (1996) cite one study in which as much NO2 as NO was emitted14.
Jambert et al. (1997) studied N emissions from a heavily fertilized (280 kg-N/ha/yr) corn field in Southwestern France, and found 11.3% of the applied N was emitted as NO, and 0.1% as NH3.
Matthews (1994) estimates emissions of N2O and NH3 from the use of N fertilizer globally. Using two sets of NH3 emission factors for different types of fertilizers, she estimates that 8-10% of the applied fertilizer N was emitted as N-NH3 globally. Davidson and Kingerlee (1997) estimate that total N-NO emissions from agricultural soils globally are 7% of global agricultural application of N, but note that their emissions estimates include “background” NO independent of fertilizer use and so cannot be entirely attributed to fertilizer use.
Holland et al. (1999) review estimates of global nitrogen emissions, and assume that around 1990 agricultural soils emitted about 2 Tg N-NOX/yr, and that synthetic fertilizer use resulted in emissions of 6.4 Tg N-NH3/yr, worldwide. In 1990 synthetic fertilizer use was about 80 Tg-N/yr (Mosier et al, 2002). Thus, the assumptions of Holland et al. (1999) imply that about 10% of added N in synthetic fertilizer is lost as N in NOX or NH3. This is consistent with their statement elsewhere that the “percentage of
14It appears that the application of very volatile fertilizers to some soils can evolve large amounts of dinitrogen. Monaghan and Barraclough (1993) applied cow urine to an undisturbed grass land soil, and found that over the subsequent 30 days, 1-5% of the N in the urine plus the N mineralized from soil organic matter was emitted as N in N2O, and 30 to 65% was emitted as N2.

25
fertilizer returned to the atmosphere as NH3 varies between 2 and 30% depending on the type of fertilizer, soil characteristics, and fertilizer management”(p. 20).
Holland et al. (1997, p. 15854) cite three sources that indicate that indicate that as much as 10-20% of fertilizer N applied to tropical soils can be returned to the atmosphere as N-NOX.
Mosier et al. (1998) found that pasture fertilized with 22 kg-N/ha/yr from 1976 to 1989 emitted 1.7 kg-N (NO)/ha/yr more in 1995/96 – seven years after fertilization was stopped -- than did a comparable unfertilized pasture. This implies that fertilization stimulates NO production at the rate of at least 8% kg-N-NO/kg-N-fertilizer, and that this effect lasts for years beyone the abandonment of cultivation.
Mosier et al. (2002) cite studies of N fertilization/utilization trials of irrigated maize in which “nitrification/denitrification losses (N2 + N2O + NOX) were estimated to be a relatively constant ~22% of N applied.
Hall and Matson (1999) measured N2O and NO emissions from N fertilizer added to N-limited and P-limited tropical soils, and found that in the P-limited soil (which already had N in excess), about 2% of the added N was lost as N2O, and 2% as NO. (In a calculation of emissions to the atmosphere, they assumed that 50% of the NO generated was recaptured by the forest canopy.)
Smil (1999) performs a careful accounting of the fate of N input to the world’s croplands in the 1990s, and estimates the following:
• harvested crops 50.3% • NO emissions 2.4% • N2O emissions 2.4% • N2 emissions 8.3% • NH3 volatilization 6.5% • NO3 leaching 10.1% • soil erosion 11.8% • losses from plant tops 5.9% • balance 2.4%
Galloway et al. (1995) also estimate the fate of anthropogenic N globally. They
show total inputs to soils of 78 Tg N/yr from synthetic fertilizers and 43 Tg N/yr from cultivated legumes, and associated soil emissions of 10 Tg N/yr. NH3 (about 8%) and 2 Tg N/yr. NO (about 2%). They also estimate that emissions of N-NO from pre-industrial soils were about 4% of N inputs to soils from microbial upake.
Janzen et al. (2003) perform a complete accounting of the fate of N inputs to Canadian agroecosystems. They assume that gaseous N losses as N2, N2O, and NO are 10% of synthetic-N, manure-N, atmospheric-N, and crop-residue-N inputs (p. 92). They also assume that some ammonia in manure and urea is volatilized.

26
The IPCC (1997 (see also Mosier et al. [1998a]) recommends an emission factor of 10% N (NOx + NH3)/N-fertilizer.
Emissions from deposited N specifically. Skiba et al. (1998) studied N2O and NO emissions from deposited N over a range of soil conditions, from “pristine” (no excess N deposition above natural background rate) to those with long-term heavy nitrogen input. They found that the loss of N as NO ranged from 1.3% to 20% of the elevated N deposition.
In their analysis of the fate of N added to forest ecosystems, Nadelhoffer et al. (1999) assume that 10% of the added N is lost via leaching or as gaseous NOY, NHX, N2, or N2O.
Butterbach-Bahl et al. (1997) measured NO and N2O emission rates from spruce and beech forests receiving heavy N deposition in Germany, and found that NO-N emissions were 4% (beech) and 20% (spruce) of the estimated N deposition.
Emissions by biome. The LEM requires specifying emissions by type of biome (temperate forest, tropical forest, grassland, etc.). Davidson and Kingerlee (1997) estimate total NO emissions from soils in biomes worldwide. Although they esimate total NO emissions rather than additional emissions due to N deposition or N-fertilizer addition (which is what we want), their estimates do give some indication of relative emissions levels (kg-N/ha/yr. mean flux):
temp. forest
temp. forest
(N-affected)
tropical
forest
temp. grass-land
chap-arral
tropical
savana
temp. ag.
tropical ag.
swamps and
marshes
deserts
tundra
0.1 2.7 0.5 – 1 .1
1.2 5.9 3.1 3.6 4.0 0.04 0.3 0.0
Very wet (temperate forests, swamps and marshes, and tundra) and very dry
biomes (deserts) have low NO emissions. Agricultural soils have relatively large emissions because of high levels of fertilizer N input. On the basis of the Butterbach-Bahl et al. (1997) study and one other, Davidson and Kingerlee (1997) distinguish “N-affected” from non-N-affected forest biomes (their “N-affected” category is conceptually simmilar to our “non-N-limited” category), and estimate relatively high NO emission from N-affected forests, because they are relatively N saturated.
Mitigation of NO emissions. Skiba et al. (1997) summarize mitigation measures for NO emissions. The estimate that increased efficiency of fertilizer use, use of zero-tillage, and replacing slash-and-burn agriculture with more intensified agriculture each can reduce NO emissions by 20%. The most effective measure is the use of nitrification and urease inhibitors, which can reduce NO emissions by as much as 90%.
Our assumptions. The LEM has two sets of emisson factors: one pertaining to the addition of N to corn, soy, wood, or grass crop systems, and one pertaining to deposition of N onto global ecosystems. In the case of N added to crops, the data presented above and summarized in Table C-4 indicate that the IPCC recommended value of 10% N (NOx + NH3)/N-input is reasonable. (This also is the value found or assumed in several comprehensive studies, such as Galloway et al. [1995], Mosier et al.

27
[1998], Holland et al. [1999], and Smil [1999] [see Table C-4].) Given this, and assuming that losses from crop-residue N and biofixed N are slightly less than from synthetic fertilizer N:
Corn Grass Wood Soy
N-(NOY+NHX)/N-input (fertilizer, manure)
0.100 0.100 0.100 0.100
N-(NOY+NHX)/N-input (crop-residue, bio-fixation)
0.060 0.060 0.060 0.060
We could not find any basis to make different assumptions for crop-residue and biologically fixed N inputs than for synthetic fertilizer and manure N inputs. Although our assumptions represent an order of magnitude increase in the input parameter (versus the value in the previous version of the model), fuelcycle GHG emissions change by less than 1%, because of the relatively low CEF for NOx.
In the case of nitrogen deposition, we distinguish between N-limited and non-limited systems, because N-limited systems take up more of the deposited N as a nutrient and have lower gaseous and leaching losses than have non-N-limited systems (e.g., Davidson and Kingerlee, 1997). Our assumptions are:
N leached or deposited into ecossytem type:
tropical forests
temp. forests
grass-lands
ag. land
arid, urban
other land
aquatic systems
N-(NOY+NHX)/N-input (N-limited systems)
0.010 0.010 0.015 0.020 0.005 0.010 0.005
N-(NOY+NHX)/N-input (non-N-limited)
0.070 0.070 0.100 0.120 0.030 0.100 0.050
In both cases (fertilizer input to crop systems, and deposition to ecosystems), the
N-(NOY+NHX)/N-input parameter is meant to include any emissions off the site of N fertilization or deposition.

28
CARBON OXIDATION AND SEQUESTRATION IN SOIL (ON SITE), RELATED TO NITROGEN INPUTS
Background
Nitrogen fertilization, especially with compost or manure, can affect the carbon content of the soil, mainly by affecting the activity of microbes that oxidize carbon in the soil. In some analyses of the effect of nitrogen deposition on the sequestration of carbon (see Appendix D), added nitrogen is presumed to sequester carbon at the prevailing C:N ratio in the soil (typically 10:1 to 30:1; see Appendix D), the idea being that the biological processes that control carbon fixation and oxidation work at fixed C:N ratios, in the way that plants typically fix carbon at constant C:N ratios15. However, studies of the carbon content and carbon oxidation rate of soils, reviewed below, indicate that nitrogen input may decrease or increase the carbon content of the soil, and that when it increases the carbon content, it does so at much less than typical C:N ratios in the soil.
The processes that affect carbon sequestration and oxidation are complicated, and generally not reducible to a simple constant relationship between soil C and soil N. soil nitrogen. Carbon inputs to soils are determined by primary productivity, the lifecycle of vegetation, and exogenous organic matter additions, such as in manure (IPCC, 2000, sec 4.2.2). The decomposition of soil organic matter (SOM) and associated loss of carbon (as CO2) is influenced by the abiotic environment, soil characteristics, root characteristics, and soil disturbance. In some soils, changes in inorganic soil carbon (e.g., as part of CaCO3) can be influenced by land use and land management (IPCC, 2000). In general, fertilization may accelerate decomposition as much as it promotes productivity (see also Emmett, 1999).
In this section we review studies of the carbon content of the soil and studies of the rate of oxidation of carbon in soil. The results of the first group of studies suggest that N fertilization slightly increases the carbon content of the soil, although there is a great deal of variability. The results of the second group show that carbon oxidation depends on a number of factors and can increase or decrease with fertilization (IPCC, 1996c).
Studies of fertilizer use and the carbon content of the soil
Liang and MacKenzie (1992) found that animal manure, crop residue, and mineral N fertilizer all increased the carbon content of the soil. Paustian et al. (1990) measured 7 kg-OC/m2 in unfertilized barley plots, 10 kg-OC/m2 in fertilized Barley plots, and 9 kg-OC/m2 in grass ley (down to 27 cm). Persson and Kirchmann (1994) 15 For example, Johnson et al. (2000) write that “the fact that most N in soils is associated with organic matter has led many forest soil scientists and ecologists to assume that N retention in forest ecosystems is controlled almost exclusively by biological processes” (p. 1503), which presumably immobilize N at prevailing C:N ratios. Janzen et al. (2003) write that “increases in soil C depend on concurrent increases in N [because] the two elements are both constituents of organic matter” (p. 86).

29
measured about 4.4 kg-C/m2 (to 20 cm) in an agricultural soil with cereal crops, prior to amendment with manure and fertilizer, and 5-6 kg-C/m2 after 25 years of amendment with manure. Leinweber and Reuter (1992) found that the application of compost increased the organic-carbon content of the soil more than did the application of manure, which in turn was better than mineral N fertilizer.
Varvel (1994) measured how crop rotation and nitrogen fertilization changed the carbon and nitrogen content of soils growing corn, soybeans, and other crops, over eight years. Three different fertilizer treatments (none, low, and high) were compared. Crop residues were returned to the soil. Generally, the carbon content of the soil increased with the amount of N fertilizer applied; the rate was on the order of 1 g-C/g-N, with a range of about 0 to 2(16). However, there were important variations by cropping system. In the case of continuous corn planting, nitrogen fertilization increased soil C by 1-1.5 g-C/g-N-fertilizer. In the case of continuous soybean planting, or of corn followed by soybeans, a low level of nitrogen fertilization increased soil C, but a high level, compared to the low level, reduced soil C. Salinas-Garcia et al. (1997) found that the carbon content (down to 20 cm) of a Texas soil receiving 90 kg-N/ha/yr for 16 years was about 1800 kg-C/ha higher than the carbon content of a soil receiving only 45 kg-N/ha/yr for 16 years. This implies a sequestration rate of 2.5 g-C/g-N-fertilizer. The crop was 4 years of corn followed by 4 years of cotton, twice. The IPCC (2001, p. 196) cites two studies (one of them -- Fog [1988] – we discuss below) in support of the proposition that nitrogen addition increases the residence time of carbon in the soils. Smith et al. (1999) write that the “impacts of N addition on soil C stores are less clear, however. In agricultural soils, long-term (150 year) addition of NPK fertilizer did not lead to significant changes in soil C compared to unfertilized plots...However, N addition to Minnesota grasslands did lead to net C storage in soils at cetain rates” (p. 188). A model used by Thornley et al. (1991) estimates that the fertilization of a temperate grassland by deposition of atmospheric N increases the carbon sequestered in the soil and litter at a rate of about 0.5 to 1 g-C/g-N-deposited.
Neff et al. (2002) studied the carbon content of alpine soils subject to relatively high, short-term nitrogen fertilization. They find that “nitrogen additions significantly accelerate decomposition of light soil carbon fractions (with decadal turnover times) while further stabilizing soil carbon compounds in heavier, mineral-associated fractions (with multidecadal to century times)” (p. 915). They conclude that the net effects of increased nitrogen on soil carbon are not certain: “the responses of alpine ecosystems to
16Generally, fertilization increased carbon content in the top level (0-7.5 cm) of the soil, and reduced carbon content in the lowest level (15-30 cm). Varvel (1994) reports total changes in carbon per hectare only for the 0-15 cm range, but does report other data that allow one to estimate what the total changes would be down to 30 cm. Ours are rough estimates for the first 30 cm.

30
fertilization include both increased productivity and increased decomposition of the light fraction of SOM, resulting in no statistically detectable change in SOM” (p. 916). They also note that the effects of lower level, longer term nitrogen input (say, from atmospheric deposition) might be different. Neff et al. (2002) are unable to fully elucidate the mechanisms responsible.
Finally, recent research suggests that much added nitrogen may be immobilized by abiotic processes, which do not generally simultaneously sequester carbon (and hence which serve to lower the C:N ratio in the soil). Johnson et al. (2000) performed laboratorly studies on the biotic and abiotic incorporation of nitrogen into soils from a variety of forest sites. They found that biotic N immobilization was greatly reduced in sites with greater N availability (because of N fixing or atmospheric deposition), but that abiotic N immobilization tended to remain constant and was not significantly related to N status (p. 1513). They suggest that abiotic N immobilization may become more important as soils become saturated with N from atmospheric deposition or fertilizers. Studies of fertilizer use and the oxidation of soil carbon Sidorina et al. (1990) found that prolonged fertilization increased the carbon content and rate of oxidation of humic acid in compost. However, Castro et al. (1994) measured fluxes of N2O, CH4, and CO2 from unfertilized soils and soils fertilized with 180 kg-N/ha/yr (urea), in a mature slash pine plantation in Florida, and found that although fertilization increased emissions of N2O and reduced uptake of CH4, it did not affect emissions of CO2. Similarly, Paustian et al. (1990) made a complete nitrogen and carbon budget of a fertilized and an unfertilized barley plot, and found that CO2 emissions from soil (g-C/m2/yr) were similar (or the same17) in both systems.
Bremer et al. (1991) note that “positive and negative effects of added N on the decomposition of plant residues have been observed and may depend on residue quality, especially the chemical composition” (p. 222). In their own experiments, they found that added N reduced CO2 evolution from both lentil and wheat straw, due, they believe, to the relatively high lignin content.
Fog (1988) reviewed the literature through 1988, and concluded that
N added to decomposing organic matter often has no effect or a negative effect on microbial activity, at least in the long term. More than 60 papers are cited in support of this statement. The negative effect of N is mainly found with recalcitrant organic matter with a high C/N ratio (straw, wood, etc.), whereas a positive effect of N is common for easily degradable organic material with low C/N ratio (p. 456).
17In their Table 2, the C emissions are the same in both plots. In their Figure 2, the plot fertilized with 120 kg-N/ha/yr emitted 5 g-C/m2/yr more from the soil than did the unfertilized plot. This difference corresponds to 1.5 g-CO2/g-N.

31
Note that a negative effect means a suppression of microbial activity and hence a reduction in oxidation and in CO2 evolution. Hence, Fog’s (1988) conclusion is consistent with the proposition that N added to N-limited systems (with a relatively high C:N ratio) will sequester carbon (supress microbial activity and reduce oxidation). Finally, Jenkinson et al. (1991) note that an increase in temperature, caused by emissions of CO2 and other greenhouse-gases, could increase the rate of oxidation of soil carbon and lead to substantial emissions of CO2 from soil. Our assumptions
Because the results of studies of the effect of N additions on the carbon content of soil have been so variable, it is difficult to draw general conclusions. The data above suggest that N inputs to crop systems might sequester a minor amount of carbon:
Corn Grass Wood Soy
g-CO2)/g-N-input (fertilizer, manure)
-1.0 -1.0 -1.0 -1.0
g-CO2)/g-N-input (crop-residue, bio-fixation)
-1.0 -1.0 -1.0 -1.0
We could not find any basis to make different assumptions for crop-residue and biologically fixed N inputs than for synthetic fertilizer and manure N inputs. (Note that the units are grams of CO2, not grams of C, per gram of N.) In the case of soil carbon affected by deposition of atmoshperic N, recall that the LEM distinguishes N-limited from non-N-limited ecosystems. In this regards, we note that the findings of Johnson et al. (2000), Varvel (1994), and Fog (1988) suggest that N additions to N-limited systems sequester more carbon than do N additions to to non-N-limited systems, and that no studies seem to contradict this. Therefore, we assume that N-limited but not non-N-limited systems sequester carbon in response to N deposition. The LEM uses molar C:N ratios to calculate C sequestration in response to N deposition, because these ratios are widely available for components of ecosystems, and because this has been the general method of estimating the C sequestration of N deposition (see Appendix D). The molar C:N ratio of soil typically is between 10:1 and 30:1 (Appendix D). A molar C:N ratio of 10:1 corresponds to 31 g-CO2/g-N, which in light of the studies reviewed here seems relatively high. We assume a C:N molar ratio of 3:1, which corresponds to be about 10 g-CO2/g-N, for N-limited ecosystems:
N deposited into soil in ecosystem type:
freshwater marine arid or urban
other terrestri

32
al moles C : mole N (N-limited) 0.0 0.0 - 3.0 - 3.0 moles C : mole N (non-N-limited) 0.0 0.0 0.0 0.0
METHANE EMISSIONS FROM SOIL Background The cultivation of the corn, soybean, wood, or grass feedstocks used to make biofuels (ethanol, methanol, or biodiesel) can reduce the oxidation of methane in aerobic soils, and thereby increase the concentration of methane in the atmosphere (Ojima et al., 1993; Macdonald et al., 1997; IPCC, 1996b; Prieme e al., 1997; Mosier et al., 1998; Powlson et al., 1997; Mosier et al., 1997; Thustos et al., 1998). Some of the reduction in soil uptake (oxidation) of methane is related to the use of nitrogen fertilizer, and some is related to cultivation per se, independent of the use of fertilizer (Powlson et al., 1997; Mosier et al., 1997, 1998; Nesbit and Breitenbeck, 1992) . Ojima et al. (1993) estimate that intensive land cover disturbance and extensive chronic disturbance to terrestrial ecosystems has reduced global CH4 uptake by about 7 Tg per year. The reduction in methane uptake is equivalent to an emission of methane from cultivated soils. In this section we review some of the available data, and estimate these effective methane emissions from soils. Tables C-5 and C-6 summarize some of the available data and estimates. The reduction in CH4 uptake as a result of cultivation and fertilization is sensitive to a number of site-specific factors, such as soil temperature, soil moisture, and the amount and kind of nitrogen fertilizer (Ojima et al., 1993; Macdonald et al., 1997; Thustos et al., 1998, Willison et al, 1995), and as a consequence, measured effective emissions (reductions in uptake) can range over orders of magnitude. As shown in Table C-6, CH4 emissions related to fertilizer use can range from near zero to on the order of 100 g-CH4/kg-N-fertilizer. The effect of the kind of nitrogen and the nitrogen content of the soil.
The Lifecycle Emissions Model (LEM) (for which this appendix is partial documentation) distinguishes six kinds of nitrogen inputs to agricultural systems: synthetic fertilizer, animal manure, biological fixation, crop residues, nitrogen deposition, and nitrogen leaching. The N in these inputs has several different forms. For example, synthetic fertilizer N usually is in the form of NO3 or NH4, biological fixation produces NO3, the atmosphere deposits NOY or NHX, leaching transfers NO3, and manure and crops have N as part of proteins. The form of N appears to influence the rate of CH4 oxidation soils. Most importantly, as discussed next, it appears that NH4 but not NO3 affects CH4 oxidation.
NH4 versus NH3. Willison et al. (1995) performed experiments with soils from unfertilized pasture, soils receiving 96 kg N ha-1 annually as ammonium sulphate

33
(2NH4SO4), and soils receiving 96 kg N ha-1 annually of sodium nitrate (NaNO3). They found that a complete inhibition of methane uptake occurred in the soils receiving ammonium sulphate, while the results for the control and the soils fertilized with sodium nitrate were very similar. Because their samples were taken 8 months after the last fertilizer addition, we can presume that this a long-term effect. Similarly, Thustos et al. (1998) found that the addition of ammonium sulfate to previously unfertilized arable and grassland soils immediately reduced methane oxidation, whereas the addition of potassium nitrate (KNO3) reduced methane oxidation in grassland but not arable soils. They also found that “there was a close relationship between the level of N addition [as NH4] and the decrease in CH4 uptake” (p. 69) (brackets ours). Nesbitt and Breitenbeck (1992) also found significant differences among fertilizers: Amending soils with clover residues decreased CH4 uptake by an avg. of 43%; additions of 7 umol NH4+ g-1 inhibited CH4 uptake substantially; but 7 umol NO3- actually slightly stimulated CH4 uptake. However, Macdonald et al. (1997) (Table C-5 here) found that NaNO3 fertilizer inhibited methane oxidation in soils at least as much as did NH4 fertilizer. They cite other studies with similar findings, although they acknowledge that most studies have found that NH4 has a greater effect than does NO3. They suggest routes by which the NO3 fertilizer might increase NH4 concentrations, but then observe that none of these routes applied in their own work. Manure. Powlson et al. (1997) found that the application of farmyard manure had no inhibitory effect on CH4 uptake (oxidation). This result was surprising because the farmyard manure contained a great deal of NH4 (Powlson et al., 1997, p. 62). On the other hand, Mosier et al. (1997) report the results of a study in which N fertilization with cattle excrement slurry did inhibit CH4 uptake in soil relative to unfertilized soils (Table C-6). N fixation and N in crop residue. We did not find any studies that examined the effect on soil CH4 of N fixation or crop-residue-N specifically. N fixation produces NO3, which as noted above may not inhibit soil oxidation of CH4, but it is not clear if the fixed N is distributed widely enough to affect soil oxidation of CH4. N deposition and leaching. Given that much deposited N and most leached N is nitrate, and that according to most (but not all) of the studies above the addition of synthetic fertilizer N-NO3 does not affect the oxidation of CH4 in soils, one might expect that N deposition or leaching would not affect CH4 in soils. However, Powlson et al. (1997) state that “recent measurements of CH4 uptake by predominantly aerobic soil have shown significant variations that appear to be caused by land management and nitrogen (N) deposition from the atmosphere” (p. 60), and cite a study by Melillo et al. in support of this. Ojima et al. (1993) perform a calculation of the amount the reduction in CH4 uptake by soils due to N deposition, using data in Melillo et al. and Steudler et al. The IPCC (2001, p. 246) says that deposition of atmospheric nitrogen does stimulate CH4 emissions, but it does not cite any studies or theory in support of this assertion. It may be that the particular form and circumstances of N-nitrate deposition are different

34
enough from the form and circumstances of applied N-nitrate fertilizer to have different effects on CH4 oxidation in soils. Alternatively, it may be that deposition of NHY, rather than deposition of NOX, is responsible for the effect. The effect of the N content of the soil. Mosier et al. (1997) suggest that the extent to which added N affects CH4 oxidation depends in part on the extent to which the added N is retained in the soil rather than lost by leaching or gaseous processes or taken up by plants. Unfortunately, the LEM does not classify ecosystems according to the extent to which added N stays in the soil. The LEM does distinguish N-limited from non-N-limited ecosystems, but this distinction does not help, because we cannot identify N-limited ecosystems with “soil N-retaining” or “not soil N-retaining”: N-limited ecosystems will have lower N losses and higher N uptake by plants than will non-N-limited ecosystems, but it is not clear whether they will have greater or lesser soil uptake of N. Effects of cultivation The effect of disturbing the land by cultivation can be distinguished from the effect of nitrogen fertilizer. Mosier et al. (1997) note that conversion of native grasslands and forests to managed pastures and cultivated crops reduces the oxidation of methane in the soil, and that this reduction is attributable partly to N fertilization and partly to disturbance of the soil (p. 73). They cite several studies that show that “cultivated soils generally show much lower CH4 uptake rates than soils under native conditions” (p. 73).
There are several studies of the difference in CH4 uptake between forest soils or grassland soils and cropland. These studies indicate that conversion of forests to cropland reduces CH4 uptake by about 3 kg-CH4/ha/yr, and that conversoin of grassland to cropland reduces uptake by about 1 kg-CH4/ha/yr (Table C-5). Ojima et al. (1993) estimate that the conversion of forest land to crop land has reduced CH4 uptake by on the order of 1-3 kg CH4/ha/yr, and that the conversion of grass land to crop land has reduced CH4 uptake by 0.5 - 2 kg CH4/ha/yr. Similarly, Mosier et al. (1998) assume that converting U. S. Great Plains grasslands to wheat-fallow cropping would reduce CH4 uptake by 1.7 kg/CH4/ha/yr. Powlson et al. (1997) report estimates of the CH4 oxidation rate for various soils, and then in their own calculation of annual CH4 uptake by U. K. soils assume 3.8 kg-CH4/ha/yr. for forest soils, 1.8 for pasture, and 0.7 for arable soils, in 1993. Robertson et al. (2000) found that a late-successional forest oxidized 3.6 kg-CH4/ha/yr more than did crop land or poplar (Table C-5).
Finally, Mosier et al. (1997) estimate the following rates of CH4 uptake, by ecosystem (kg-CH4/ha/yr.)18:
tropical forests 3
18 In their Table 4 Mosier et al. (1997) report uptake in units of mg CH4 /m2/yr, but it appears that the units really are in grams, not milligrams.

35
temperate forest 11 boreal forest 2 shrub and grassland 3 tundra and alpine 1 desert and agriculture 2
Other studies cited in Table C-5 suggest that the impact of cultivation per se,
apart from the impact of fertilization, is of the same order as the impact of fertilization. This implies a rate of 0.5 to 3 kg CH4/ha/yr.19
Measurements of CH4 oxidation in forests at various stages of recovery after abandonment of agriculture suggest that it takes at least 100 years for the oxidation rate to fully recover after cultivation (Prieme et al., 1997). These same experiments indicate that very old forests oxidize about 10 kg CH4/ha/yr more than do croplands (Prieme et al., 1997) (Table C-5). Similarly, Mosier et al. (1998) state that it takes more than 50 years for grasslands to return to their original conditions after cultivation, although it takes less than 50 years for the recovery of the microbial populations that regulate CH4 and N2O in grassland soils.
Potential for mitigation
Estimates of long-term effects of cultivation and N-fertilization on methane emissions from soil should consider the possibility of mitigation measures. Cole et al. (1997) and Armstrong-Brown et al. (1995) discuss measures for mitigating GHG emissions related to soils. Armstrong-Brown et al. (1995) note that reducing the use of ammonium fertilizer and improving the porosity of soil would increase the rate of methane oxidation in soils. The LEM projects long-term declines in fertilizer use, but does not consider long-term changes to soil structure. Hence, we do not project any changes in methane emissions due to mitigation strategies.
Our assumptions
The effect of N fertilization. Based on the data presented in Table C-6 and summarized here, a value of 10 g-CH4/kg-N-fertilizer (reduction in CH4 uptake, which is tantamount to an emission of CH4) seems reasonable for most circumstances. Note, though that even values towards the high end of the range of Table C-6 result in a relatively small contribution to fuelcycle total CO2-equivalent emissions.
19 Willison et al. (1995) remarked that there was no evidence for an effect of cultivation independent of fertilizer use, and cited one laboratory study that showed no change in methane oxidation as a result of disrupting soil (p. 544), but later work by members of their group (Powlson et al., 1997) does indicate that cultivation per se affects methane emissions.

36
Corn Grass Wood Soy Comments
g-CH4/kg-N, fertilizer, manure (reduction in CH4 uptake, which is tantamount to an emission of CH4)
0.10 10.0 10.0 1.00 Based on data presented here. These indicate that fertilization of corn fields has little effect on CH4 uptake, perhaps because these fields are already N saturated. There are no data specific to soybeans; we assume rate in between corn and grass.
g-CH4/kg-N, crop residue, bio-fixation
0.00 0.00 0.00 0.00 Assume N is not readily available or widely distributed in soil.
Deposition onto
ecosystem:
Forests Grasses Others Comments g-CH4/kg-N-deposition-input, N-limited systems
10 10 0 Based on data presented here.
g-CH4/kg-N-deposition-input, non-N-limited systems
10 10 0 Can’t distinguish N-limited from non-N-limited.
g-CH4/kg-N-leaching-input, N-limited systems
10 10 0 Assume leaching has same effect as N deposition.
g-CH4/kg-N-leaching-input, non-N-limited systems
10 10 0
The effect of cultivation. Considering the data presented above (especially but
not exclusively the estimates of Mosier et al. [1997]), we make the following assumptions (g-CH4 uptake/ha/yr [except as noted], independent of N fertilization):
Baseline land uses (displaced by “new” energy crop production)
Tropical forest
Temperate forest
Boreal forest
Tropical grassland
Temperate grassland
Desert
Tundra
Wetland Cropland Low intensity
3,000 10,000 2,500 3,000 3,000 2,000 1,000 3,000 1,500 20% above
high-yield
“New” energy crops (displacing baseline uses)

37
Corn Grass crop
SRIC wood
Soybeans Coal Blank 1 Blank 2 Blank 3 Blank 4 Blank 5
1,500 2,000 2,500 1,500 500 n.a. n.a. n.a. n.a. n.a.
The blanks are placeholders for additional energy crops to be added to the model. Note that these are estimates of the total uptake rate for each type of land use, not estimates of the differences in uptake between different types of land use. In the LEM the effect of cultivation on CH4 uptake (independent of N fertilization) is calculated by taking the difference between the CH4 uptake of the energy-crop system in question and the CH4 uptake of the various land uses displaced by the energy crop. Details are given in the main documentation report.
The land-use category “low-intensity” refers to relatively low-intensity cultivation of land already in energy crop production. We include this as a baseline land use because it is likely that some “new” production of energy crops (particularly corn and soybeans) will occur on land already devoted to production of the energy crop, by increasing yields on such land, and we want to be able to account for the effects of increasing the yield. Because it appears that CH4 uptake is a function of the degree of disturbance, we assume that the less intensively cultivated baseline land has higher CH4 uptake than does the land when yield (and presumably land disturbance) is increased. Thus, we assume that one effect of increasing yields on land already in energy crop production is to reduce the CH4 uptake of the land. CHANGES IN CO2 SEQUESTRATION IN SOIL AND BIOMASS
Carbon in soil and biomass
It is well established that cultivation and disturbance reduces the carbon content of soils (IPCC, 2000). Generally, soils in natural forests contain more carbon per acre than do shrubland and grassland soils, which in turn contain more carbon than crop soils. Cultivation also usually reduces the carbon content of the standing biomass.
The main text documentation presents the methods of analysis used to estimate the CO2-equivalent impact of changes in soil C (and hence in atmospheric CO2) associated with various activities in the lifecycle of fuels and vehicles. The method requires data on the carbon content of soil and biomass in “baseline” or status-quo ecosystems (including agricultural), and on the carbon content of the soil in energy crop systems (corn, soybeans, wood, and grass) and also coal mining. (The carbon content of biomass in energy crop systems is estimated on the basis of the yield and carbon weight fraction of the plant.) In this section we present data on the carbon content of soils and biomass.
Carbon contents of baseline or status-quo ecosystems. The LEM considers nine ecosystems that can replace or be replaced by energy cropy systems: tropical forests, temperate forests, boreal forests, tropical grasslands and savannas, temperate

38
grasslands and shrublands, deserts and semi-deserts, tundra, croplands, and wetlands. Several sources provide data that allow us to estimate carbon contents for these ecosystems. First, the IPCC’s (2001) TAR presents the following estimates of the carbon content of soils and biomass for these ecosystems (kg-C/m2) (see also IPCC [2000]):
plants soil tropical forests 12 – 19 12 temperate forests 6 – 13 (upper end likely too high) 10 – 15 boreal forests 4 – 6 (upper end likely too high) 25 - 34 tropical grasslands and savannas 2.9 9 – 12 temperate grasslands and shrublands 0.7 – 1.3 10 – 24 deserts and semi-deserts 0.2 – 0.4 4 – 6 tundra 0.4 – 0.6 13 – 21 croplands 0.2 – 0.3 8 – 12 wetlands 4 64
My assumptions are based mainly on the IPCC (2001) data. Other data sources are consistent with the IPCC (2001) estimates. In their model
of the global carbon cycle, Hudson et al. (1994) assume the following values for biome carbon pools (kg-C/m2): plants soil temperate forests 12.1 12.7 boreal forests 9.0 21.7 woodland 2.8 7.0 temperate grasslands 0.85 20.3 desert 0.40 6.5 tundra 0.25 19.7 agriculture n.e. 10.1
In their “Terrestrial Carbon Model,” used to define changes in vegetation and soils as a result of converting natural ecosystems to agriculture, Houghton et al. (1983) assume the following values for undisturbed ecosystems (kg-C/m2):

39
plants soil tropical forests 16 – 20 11.7 temperate forests 13.5 – 16 13.4 boreal forests 9 20.6 tropical woodland shrubland 2.7 6.9 temperate woodland shrubland 2.7 6.9 tropical grassland 1.8 4.2 temperate grassland 0.7 18.9 tundra 0.3 20.4 desert scrub 0.3 5.8 crops 0.3 – 0.5 3.4 – 10.3
(minimum) Houghton et al. (1983) also estimate the carbon content of vegetation and soils in forests, shrublands, and grasslands that have recovered after abandonment of agriculture. Generally, they assume that 50 years after abandonment recovered forests have 75% of the vegetation C and 90% of the soil C of undisturbed forests, and that recovered grasslands and shrublands have 100% of the vegetation C and 100% of the soil C of undisturbed ecosystems. A model used by Thornley et al. (1991) predicts 8-12 kg-C/m2 in the soil and litter of temperate grassland, at steady-state, depending on temperature, ambient CO2 concentration, and N deposition. This value is at the low end of the ranges in the studies cited above.
Table C-7 shows studies of the change in carbon content of plants and soil resulting from afforesting former agricultural lands. These data indicate a gain in soil carbon of 4 – 8 kg-C/m2 and a gain in plant carbon of 6 – 14 kg-C/m2 after 55 years. These gains are consistent with the IPCC (2000) data, presented above, on the difference between the carbon content of a forest and the carbon content of a crop system. Similarly, Arrouays et al. (1996) estimated that converting forest land to intensive corn cropping reduced the carbon content of the soil by 6.35 kg-C/m2 over 36 years.
Carbon content of soil in energy crop systems20. The estimates presented above indicate that conventional agricultural soils contain 3-12 kg-C/m2, with a best estimate of around 8-10 kg-C/m2. Other estimates, summarized here, are consistent with this range.
Mann (1986) analyzed 50 different sources that reported the carbon content of cultivated and uncultivated soils, mainly in the U. S. His meta-regression-analysis of the
20 Note that we calculate the carbon content of plants in energy-crop systems on the basis of carbon weight fractions and other data, in the main report.)

40
data in these studies showed that cultivated soils contain about 6 kg-C/m2, and uncultivated soils about 7 kg-C/m2, over all soil types, down to 30 cm. Agriculture and Agri-food Canada (1997) report a study that found about 7.5 kg-C/m2 down to 30 cm for tilled soils, and 8.8 kg-C/m2 for untilled soil, in Canada. Liang and MacKenzie (1992) measured 4.8 kg-OC [organic C]/m2 down to 20 cm, in a corn field augmented with animal manure and corn stover. Lee et al. (1993) estimate that agricultural soils in the U. S. corn belt have a carbon content of about 18 kg-C/m2. Gebhart et al. (1994) measured the carbon content of cropland, CRP (Conservation Reserve Program), and native pasture soils (to 300 cm), and found 5.9 kg-C/m2 for cropland, 6.5 kg-C/m2 for CRP, and 9.1 kg-C/m2 for native pasture. CRP soil gained carbon at an average rate of 0.11 kg-C/m2/yr.
The avaible data suggest that switchgrass and wood energy systems will have a higher soil carbon content than do general agricultural systems. McLaughlin (1998) reports the soil carbon content of swithgrass planted on land used for a variety of purposes, including agriculture. Initial carbon contents to 90 cm were 3.9 and 10 kg-C/m2 in two research trials. Switchgrass increased the C content of the soil at a rate of 0.25 kg-C/m2/yr (trial with 3.9 initial level) and 0.14 kg-C/m2 (trial with 10 kg-C/m2 initial level) for 3 to 5 years. McLaughlin (1998) believes that this rate could be sustained for at least 20-30 years, and that some gains, perhaps at a lesser rate, would continue for 50 to 100 years. This suggests equilibrium soil-C values for switchgrass plantations of on the order of 10 – 20 kg-C/m2.
Andress (2002) reports the results an analysis of carbon content of soil on land converted from crops to switchgrass using a recent model developed specifically for switchgrass. The model estimated that the initial carbon content of the cropland soil was 4.3 kg-C/m2 (to 40 cm), and that switchgrass increased the carbon content to 7.9 kg-C/m2 after about 100 years, an increase of about 0.04 kg-C/m2/yr. Most of the gains occurred in the first 50 years. Note that these results are for the first 40 cm of soil only. Andress suggests that the results be multiplied by 1.25 to obtain results for 100 cm of soil. This results in 5.4 kg-C/m2 for the crop system and 9.9 kg-C/m2 for switchgrass at equilibrium.
Andress (2002) also reports other estimates of the carbon content of soils. One study estimated that the establishment of a poplar plantation over previously tilled prarie increased the carbon content of the soil 0.16 kg-C/m2/yr over 18 years. Another study agricultural lands converted to forest and grasslands gained soil carbon at a rate of 0.03 – 0.04 kg-C/m2/yr.
Finally, Table A-27 of Perlack et al. (1992) and accompanying text provide estimates of the differences in the soil carbon content of various ecosystems (kg-C/m2, expressed as an emission, so that a negative number represent a carbon increase, or uptake):

41
Displaced--> Energy crop system:
Forests CRP, pasture Row crops
Row crops 4.3 0.45 0.0 Perrenial grasses 3.8 0.0 -0.45 Trees 2.5 -1.3 -1.8
On the basis of these analyses, and my own judgment as regards deserts and
land disturbed by mining, I assume the following long-term equilibrium carbon contents: (kg-C/m2): Baseline land uses (displaced by “new” energy crop production) kg-C/m2 Tropical
forest Temperate
forest Boreal forest
Tropical grass
Temp. grass
Desert Tundra Wetland Crop-land
Low intensity
soil 12 13 26 9 18 5.5 20 64 9 20% abovehigh-yield
plants 16 11 6 2.8 0.8 0.35 0.4 4 0.4
“New” energy crops (displacing baseline uses) kg-C/m2
Corn Grass crop
SRIC wood Soybeans Coal Blank 1 Blank 2 Blank 3 Blank 4
soil 8 11 10 9 500 n.a. n.a. n.a. n.a.
Fertilization, especially with compost or manure, can increase the carbon content
of the soil. This effect is covered in the main report, and is discussed briefly in this appendix. Coal mining. The LEM also accounts for changes in the carbon content of soil and biomass as a result of surface coal mining activities. In this regard, Lal and Bruce (1999, p. 181) cite an estimate that reclamation of mineland can sequester C in soils at a rate of 0.15 to 0.20 kg-C/m2/yr., which over 30 years would sequester a total of 4.5 – 6.0 kg-C/m2. Potential for reducing carbon losses due to cultivation As discussed above, cultivation generally reduces the carbon content of soils and biomass compared with that of the natural vegetation displaced by agriculture (IPCC, 2000). However, with the use of appropriate management practices (erosion control, conservation tillage, soil restoration, residue management, and improved farming and cropping systems), the carbon content of agricultural soils can be increased (IPCC, 2001a, 2000; Lal and Bruce, 1999; Salinas-Garcia et al., 1997; Lee et al., 1993). Lal and Bruce (1999) estimate that the carbon content of agricultural soils can be increased at the rate of about 0.01 to 0.2 kg-C/m2/yr, for as long as 30 years, resulting in a net additional sequestration of 0.3 to 6 kg-C/m2. Similarly, the IPCC (2001) reports “key practices”

42
that can sequester carbon on cropland at a rate of about 0.04 kg-C/m/yr. over 20 to 40 years. Lee et al. (1993) project that no-till plus winter cover crop compared with the current mix of tillage practices in the U. S. corn belt can increase the carbon content of the first meter of soil by 0.013 kg-C/m2/yr for at least 100 years, resulting in at least 1.3 kg-C/m2 total additional sequestration.

43
REFERENCES Agriculture and Agri-Food Canada, Corn Production, Utilization and Environmental Assessment, A Review, Ottawa, Ontario, Canada (1997?).
B. J. R. Alves, R. M. Boddey, and S. Urquiaga, “The Success of BNF in Soybean in Brazil,” Plant and Soil 252: 1-9 (2003). P. Ambus and S. Christenson, “Spatial and Seasonal Nitrous Oxide and Methane Fluxes in Danish Forest-, Grassland-, and Agroecosystems,” Journal of Environmental Quality 24(September-October): 993-1001 (1995).
R. C. Anderson and J. S. Levine, “Simultaneous Field Measurements of Biogenic Emissions of Nitric Oxide and Nitrous Oxide,” Journal of Geophysical Research 92(D1): 965-976 (1987).
D. Andress, Soil Carbon Changes for Bioenergy Crops, David Andress and Associates, Inc., prepared for Argonne National Laboratory and Office of Biomass Programs, U. S. Department of Energy, Washington, D. C., September 18 (2002). V. P. Aneja, B. D. Holbrook and W. P. Robarge, “Nitrogen oxide Flux from an Agricultural Soil During Winter Fallow in the Upper Coastal Plain of North Carolina, U. S. A.,” Journal of the Air and Waste Management Association 47: 800-805 (1997).
A. Armstrong-Brown, M. D. A. Rounsevell, and P. Bullock, “Soils and Greenhouse Gases: Management for Mitigation,” Chemistry and Industry 16: 647-650 (1995).
D. Arrouays, J. L. Kicin, J. Daroussin, and P. Berbigier, “Modeling Soil Organic Crbon Fluxes Attributable to Conversion of Forest to Corn Cropping in a Landscape of Southwest France,” Soil Science 161: 188-193 (1996).
G. P. Asner, A. R. Townsend, W. J. Riley, P. A. Matson, J. C. Neff, and C. C. Cleveland, “Physical and Biogeochemical Controls over Terrestrial Ecosystem Responses to Nitrogen Deposition,” Biogeochemistry 54: 1-39 (2001). E. M. Baggs, M. Stevenson, M. Pihlatie, A. Regar, H. Cook, and G. Cadisch, “Nitrous Oxide Emissions Following Application of Residues and Fertilizer under Zero and Conventional Tillage,” Plant and Soil 254: 361-370 (2003). J. Bandibas, A. Vermoesen, J. D. Groot and O. V. Cleemput, “The effect of different moisture regimes and soil characteristics on nitrous oxide emission and consumption by different soils,” Soil Science 158(2): 106-114 (1994).

44
O. C. Bockman, “Fertilizer and Biological Nitrogen Fixation as Sources of Plant Nutrients: Perspectives for Future Agriculture,” Plant and Soil 194: 11-14 (1997).
R. M. Boddey, M. B. Peoples, B. Palmer, and P. J. Dart, “Use of 15N Natural Abundance Technique to Quanity Biological Nitrogen Fixation by Woody Perennials,” Nutrient Cycling in Agroecosystems 57: 235-270 (2000).
A. F. Bouwman, “Direct emission of nitrous oxide from agricultural soils,” Nutrient Cycling in Agroecosystems 46: 53-70 (1996).
A. F. Bouwman and J. A. Taylor, “Testing high-resolution nitrous oxide emission estimates against observations using an atmospheric transport model,” Global Biogeochemical Cycles 10(2): 307-318 (1996).
A. F. Bouwman, K. W. van der Hoek and J. G. J. Olivier, “Uncertainty in the global source distribution of nitrous oxide,” Journal of Geophysical Resources 100(2): 2785-2800 (1995).
R. D. Bowden, J. M. Melillo and P. A. Steudler, “Effects of Nitrogen Additions on Annual Nitrous Oxide Fluxes from Temperate Forest Soils in the Northeastern United States,” Journal of Geophysical Research 96(D5): 9321-9328 (1991).
W. B. Bowden and F. H. Bormann, “Transport and Loss of Nitrous Oxide in Soil Water After Forest Clear-Cutting,” Science 233(August): 867-869 (1986).
E. Bremer, W. van Houtum, and C. van Kessel, "Carbon Dioxide Evolution from Wheat and Lentil Residues as Affected by Grinding, Added Nitrogen, and the Absence of Soil," Biology and Fertility of Soils 11: 221-227 (1991). K. F. Bronson and A. R. Mosier, “Nitrous Oxide Emissions and Methane Consumption in Wheat and Corn-Cropped Systems in Northeastern Colorado,” in Agricultural Ecosystem Effects on Trace Gases and Global Climate Change, ed. by L. A. Harper, A. R. Mosier, J. M. Duxbury and D. E. Rolston, American Society of Agronomy, Madison, pp. 133-144 (1993).
K. F. Bronson, A. R. Mosier and S. R. Bishnoi, “Nitrous Oxide Emissions in Irrigated Corn as Affected by Nitrification Inhibitors,” Journal of the Soil Science Society of America 56: 161-165 (1992).
R. Brumme and F. Beese, “Effects of Liming and Nitrogen Fertilization on Emissions of CO2 and N2O from a Temperate Forest,” Journal of Geophysical Research 97(D12): 12851-12858 (1992).

45
National Agricultural Statistics Service, 1997 Census of Agriculture, Unites States Summary and State Data, Volume 1, Goegraphic Area Series Part 51, AC-97-A-51, U. S. Department of Agriculture, Washington, D. C., March (1999).
K. Butterbach-Bahl, R. Gasche, L. Breuer, and H. Papen, “Fluxes of NO and N2O from Temperate Forest Soils: Impact of Forest Type, N Deposition, and of Liming on the NO N2O Emissions,” Nutrient Cycling in Agroecosystems 48: 79-90 (1997).
M. S. Castro, W. T. Peterjohn, J. M. Melillo, an dP. A. Steudler, "Effects of Nitrogen Fertilization on the Fluxes of N2O, CH4, and CO2 from Soils in a Florida Slash Pine Plantation," Canadian Journal of Forestry Research 24: 9-13 (1994). H. Clayton, J. R. M. Arah and K. A. Smith, “Measurement of nitrous oxide emissions from fertilized grassland using closed chambers,” Journal of Geophysical Research 99(D8): 16,599-516,607 (1994).
C. V. Cole, J. Duxbury, J. Freney, O. Heinemeyer, K. Minami, A. Mosier, K. Paustian, N. Rosenberg, N. Sampson, D. Sauerbeck, and Q. Zhao, “Global Estimates of Potential Mitigation of Greenhouse Gas Emissions by Agriculture,” Nutrient Cycling in Agroecosystems 49: 221-228 (1997).
R. Conrad, W. Seiler and G. Bunse, “Factors Influencing the Loss of Fertilizer Nitrogen into the Atmosphere as N2O,” Journal of Geophysical Research 88(C11): 6709-6718 (1983).
E. A. Davidson and W. Kingerlee, “A Global Inventory of Nitric Oxide Emissions from Soils,” Nutrient Cycling in Agroecosystems 48: 37-50 (1997).
J. A. Delgado and A. R. Mosier, “Mitigation Alternatives to Decrease Nitrous Oxide Emissions and Urea-Nitrogen Loss and Their Effect on Methane flux,” Journal of Environmental Quality 25: 1105-1111 (1996).
N. B. Dise, E. Matzner, and M. Forsius, “Evaluation of Organic C:N Ratios As an Indicator of Nitrate Leaching in Conifer Forests Across Europe,” Environmental Pollution 102 (S1): 453-456 (1998).
K. E. Dobbie and K. A. Smith, “Impact of Different Forms of N Fertilizer on N2O Emssions from Intensive Grassland,” Nutrient Cycling in Agroecosystems 67: 37-46 (2002).
J. E. Dore, B. N. Popp, D. M, Karl, and F. J. Sansone, “A Large Source of Atmospheric Nitrous Oxide from Subtropical North Pacific Surface Waters,” Nature 396: 63-66 (1998).
M. J. Eichner, “Nitrous Oxide Emissions from Fertilized Soils: Summary of Available Data,” Journal of Environmental Quality 19: 272-280 (1990).

46
B. A. Emmett, “The Impact of Nitrogen on Forest Soils and Feedbacks on Tree Growth,” Water, Air and Soil Pollution 116: 65-74 (1999). Energy Information Administration, Emissions of Greenhouse Gases in the United States 1997, DOE/EIA-0573(97), U. S. Department of Energy, Washington, D. C., October (1998). Environmental Protection Agency, Office of Policy, Planning, and Evaluation, Inventory of U. S. Greenhouse Gas Emissions and Sinks: 1990 - 1996, EPA 236-R-98-006, Washington, D. C., March (1998). Environmental Protection Agency, Office of Research and Development, Air Quality Criteria for Ozone and Photochemical Oxidants, EPA/600/P-93/004aF, Washington, D. C., July (1996). J. W. Erisman, T. Brydges, K. Bull, E. Cowling, P. Grennfelt, L. Nordberg, K. Satake, T. Schneider, S. Smeulders, K.W. Vad der Hoelk, J. R. Wisniewske, and J. Wisniewski, “Summary Statement,” Environmental Pollution 102, S1: 3-12 (1998). P. G. Falkowski, “Evolution of the Nitrogen Cycle and Its Influence on the Biological Sequestration of CO2 in the Ocean,” Nature 387: 272-275 (1997).
M. E. Fenn, M. A. Poth, J. D. Aber, J. S. Baron, B. T. Bormann, D. W. Johnson, A. D.Lemly, S. G. McNulty, D. F. Ryan, and R. Stottlemeyer, “Nitrogen Excess in North American Ecosystems: Predisposing Factors, Ecosystem Responses, and Management Strategies,” Ecological Applications 8: 706-733 (1998).
J. R Freney, “Emission of Nitrous Oxide from Soils Used for Agriculture,” Nutrient Cycling in Agroecosystems 49: 1-6 (1997). J. N. Galloway, “The Global Nitrogen Cycle: Changes and Consequences,” Environmental Pollution 102, S1: 15-24 (1998).
J. N. Galloway, R. W. Howarth, A. F.Michaels, S. W. Nixon, J. M. Prospero, and F. J. Dentener, “Nitrogen and Phosphorous Budgets of the North Atlantic Ocean and Its Watersed,” Biogeochemistry 35: 3-25 (1996).
J. N. Galloway, W. H. Schlesinger, H. Levy II, A. Michaels, and J. L. Schnoor, “Nitrogen Fixation: Anthropogenic Enhancement – Environmental Response,” Global Biogeochemical Cycles 9: 235-252 (1995).
D. L. Gebhart, H. B. Johnson, H. S. Mayeux, and H. W. Polley, “The CRP Increases Soil Organic Carbon,” Journal of Soil and Water Conservation 49: 488-492 (1994).

47
O. Greene and J. E. Salt, “Agricultural Emission of Greenhouse Gases: Monitoring and Verification,” in Agricultural Dimensions of Global Climate Change, ed. by H. M. Kaiser and T. W. Drennen, St. Lucie Press, Delray Beach, pp. 259-279 (1993).
W. D. Guenzi, G. L. Hutchinson and W. E. Beard, “Nitric and Nitrous Oxide Emissions and Soil Nitrate Distribution in a Center-Pivot-Irrigated Cornfield,” Journal of Environmental Quality 23(May-June): 483-487 (1994).
P. M. Groffman, R. Brumme, K. Butterbach-Bahl, K. E. Eobbie, A. R.Moser, D. Ojima, H. A. Papen, W. J. Parton, K. A. Smith, and C. Wagner-Riddle, “Evaluating Annual Nitrous Oxide Fluxes at the Ecosystem Scale,” Global Biogeochemical Cycles 14: 1061-1070 (2000).
P. Gunderen, I. Callesen, and W. de Vries, “Nitrate Leaching in Forest Ecosystems Is Related to Forest Floor C/N Ratios,” Environmental Pollution 102, S1: 403-407 (1998).
S. J. Hall and P. A. Matson, “Nitrogen Oxide Emissions Afer Nitrogen Additions in Tropical Forests,” Nature 400: 152-155 (1999).
G. Hardarson and C. Atkins, “Optimising Biological N2 Fixation by Legumes in Farming Systems,” Plant and Soil 252: 41-54 (2003).
D. O. Hessen, A. Hindar, and G. Holtan, “The Significance of Nitrogen Runoff for Eutrophication of Freshwater and Marine Recipients,” Ambio 26: 312-320 (1997).
E. A. Holland, F. J. Dentener, B. H. Braswell, and J. M. Sulzman, “Contemporary and Pre-industrial Global Reactive Nitrogen Budgets,” Biogeochemistry 46: 7-43 (1999).
E. A. Holland, B. H. Braswell, J-F. Lamarque, A. Townsend, J. Sulzman, J-F. Müller, F. Dentener, G. Brasseur, H. Levy II, J. E. Penner, and G.-J. Roelofs, “Variations in the Predicted Spatial Distribution of Atmospheric Nitrogen Deposition and Their Impact on Carbon Uptake by Terrestrial Ecosystems,” Journal of Geophysical Research 102 (D13): 15849-15866 (1997).
R. A. Houghton, J. E. Hobbie, J. M. Melillo, B. Moore, B. J. Peterson, G. R. Shaver, dn G. M. Woodwell, “Changes in the Crbon Content of the Terrestrial Biota and Soils Between 1860 and 1980: A Net Release of CO2 to the Atmosphere,” Ecological Monographs 53: 235-262 (1983).
R. W. Howarth, G. Billen, D. Swaney, A. Townsend, N. Jaworski, K. Lajtha, J. A. Downing, R. Elmgren, N. Caraco, T. Jordan, F. Berendse, J. Freney, V. Kudeyarov, P. Murdoch, and Z. Zhao-Liang, “Regional Nitrogen Budgets and Riverine N & P Fluxes for the drainages to the North Atlantic Ocean: Natural and Human Influences,” Biogeochemistry 35: 75-139 (1996).

48
G. L. Hutchinson and E. A. Brams, “NO Versus N2O Emissions from an NH4+-Amended Bermuda Grass Pasture,” Journal of Geophysical Research 97(D9): 9889-9896 (1992).
P. Ineson, P. A. Coward, D. G. Benham, and S. M. C. Robertson, “Coniferous Forests as “Secondary Agricultural” Sources of Nitrous Oxide,” Atmospheric Environment 32: 3321-330 (1998).
Intergovernmental Panel on Climate Change, Climate Change 2001: The Scientific Basis, ed. By J. T. Houghton, Y. Ding, D. J. Griggs, M. Noguer, P. J. van der Linden, and D. Xiaosu, Cambridge University Press, Cambridge (2001). Available on the internet www.ipcc.ch/pub/tar/wg1/170.htm. Intergovernmental Panel on Climate Change, Climate Change 2001: Mitigation, ed. by B. Metz, O. Davidson, R. Swart, and J. Pan, Cambridge University Press, Cambridge (2001a). Available on the internet at www.grida.no/climate/ippc_tar/wg3.index.htm. Intergovernmental Panel on Climate Change, Land Use, Land-Use Change, and Forestry, A Special Report of the Intergovernmental Panel on Climate Change, ed. by. R. T. Watson, I. R. Noble, B. Bolin, N. H. Ravidranath, D. J. Verardo, and D. J. Dokken, Cambridge University Press, Cambridge (2000). Available on the internet at www.grida.no/climate/ipcc/land_use/. Intergovernmental Panel on Climate Change, Revised 1996 IPCC Guidelines for National Greenhouse Gas Inventories, Volume 3: The Greenhouse Gas Inventory Reference Manual, Intergovernmental Panel on Climate Change, United Nations Environment Programme, Organization for Economic Cooperation and Development, International Energy Agency, Paris, France (1997). Available on the web at www.iea.org/ipcc/invs6.htm.
Intergovernmental Panel on Climate Change (IPCC), Climate Change 1995: Impacts, Adaptions, and Mitigation of Climate Change: Scientific-Technical Analyses, ed. by R. T. Watson, M. C. Zinyowera, R. H. Moss and D. J. Dokken, Cambridge University Press, Cambridge (1996b).
Intergovernmental Panel on Climate Change (IPCC), Climate Change, the IPCC Scientific Assessment, ed. by J. T. Houghton, G. J. Jenkins and J. J. Ephraums, Cambridge University Press, Cambridge (1990).
K. Isermann, “Agriculture’s Share in the Emission of Trace Gases Affecting the Climate and Some Cause-Oriented Proposals for Sufficiently Reducing This Share,” Environmental Pollution 83: 95-111 (1994).

49
K. Isermann, “Share of Agriculture in Nitrogen and Phosphous Emissions into the Surface Waters of Western Europe against the Background of Their Eutrophication,” Fertlizer Research 26: 253-269 (1990).
C. Jambert, D. Serca, R. Delmas, “Quantification of N-Losses as NH3, NO, and N2O and N2 from Fertilized Maize Fields in Southwestern France,” Nutrient Cycling in Agroecosystems 48: 91-104 (1997).
H. H. Janzen, K. A. Beauchemin, Y. Bruinsma, C. A. Campbell, R. L. Desjardins, B. H. Ellert, and E. G. Smith, “The Fate of Nitrogen in Agroecosystems: An Illustration Using Canadian Estimates,” Nutrient Cycling in Agroecosystems 67: 85-102 (2003).
N. A. Jaworski, R. W. Howarth. and L. J. Hetling, “Atmospheric Deposition of Nitrogen Oxides onto the Landscape Contributes to Coastal Eutrophication in the Northeast United States,” Environmental Science and Technology 31: 1195-2004 (1997).
D. S. Jenkinson, D. E. Adams, A. Wild, "Model Estimates of CO2 Emissions from Soil in Response to Global Warming," Nature 351: 304-306 (1991). E. S. Jensen and H. Hauggaard-Nielsen, “How Can Incresaed Use of Biological N2 Fixation in Agriculture Benefit the Environment?,” Plant and Soil 252: 177-186 (2003). D. W. Johnson, W. Cheng, and I. C. Burke, “Biotic and Abiotic Nitrogen Retention in a Variety of Forest Soils,” Soil Science Society of America Journal 64: 1503-1514 (2000). R. N. Jorgensen, B. J. Jorgensen, N. E. Nielsen, M. Maag, and A-M. Lind, “N2O Emission from Energy Crop Fields of Miscanthus “Giganteus” and Winter Rye,” Atmospheric Environment 31: 2899-2904 (1997). E.-A. Kaiser, K. Kohrs, M. Kucke, E. Schnug, J. C. Munch, and O. Heinemeyer, “Nitrous Oxide Release from Arable Soil: Importance of Perennial Forage Crops,” Biology and Fertility of Soils 28: 36-43 (1998a).
E.-A. Kaiser, K. Kohrs, M. Kucke, E. Schnug, O. Heinemeyer, and J. C. Munch, “Nitrous Oxide Release from Arable Soil: Importance of N-Fertilization, Crops, and Temporal Variation,” Soil Biology and Biochemistry 30: 1553-1563 (1998).
C. Kammann, L. Grünhage, C. Müller, S. Jacobi, and H-J. Jäger, “Seasonal Variability and Mitigation Options for N2O Emissions from Differently Managed Grasslands,” Environmental Pollution 102 (S1): 179-186 (1998).
D. Karl, A. Michaels, B. Bergman, D. Capone, E. Carpenter, R. Letelier, F.Lipschultz, H. Paerl, D. Sigman, and L. Stal, “Dinitrogen Fixation in the World’s Oceans,” Biogeochemistry 57/58: 47-98 (2002).

50
K-R Kim and H. Craig, “Two-Isotope Characterization of N2O in the Pacific Ocean and Constraints on Its Origin in Deep Water,” Nature 347: 58-61 (1990).
C. Kroeze and S. P. Seitzinger, “Nitrogen Input to Rivers, Estuaries, and Continental Shelves and Related Nitrous Oxide Emissions in 1990 and 2050: A Global Model,” Nutrient Cycling in Agroecosystems 52: 195-212 (1998).
C. Kroeze and S. P. Seitzinger, “The Impact of Land Use on N2O Emissions from Watersheds Draining the Northeastern Atlantic Ocean and European Seas,” Environmental Pollution 102 (S1): 149-158 (1998a).
M. D. Kumar, S. W. A. Naqvi, D. A. Jayakumar, M. D. George, P. V. Narvekar, and S. N. de Sousa, “Carbon Dioxide and Nitrous Oxide in the North Indian Ocean,” Current Science 69: 672-678 (1995).
K. Fog, "The Effect of Added Nitrogen on the Rate of Decomposition of Organic Matter," Biology Review 63: 433-462 (1988). R.Lal, “Soil Erosion and the Global Carbon Budget,” Environment International 29: 437-450 (2003).
R. Lal and J. P. Bruce, “The Potential of World Cropland Soils to Sequester C and Mitigate the Greenhouse Effect,” Environmental Science and Policy 2: 177-187 (1999).
C. S. Law and N. J. P. Owens, “Significant Flux of Atmospheric Nitrous Oxide from the Northwest Indian Ocean,” Nature 346: 826-828 (1990).
J. J. Lee, D. L. Phillips, and R. Liu, “The Effect of Trends in Tillage Practices on Erosion and Carbon Content of Soils in the US Corn Belt,” Water, Air, and Soil Pollution 70: 389-401 (1993).
P. Leinweber and G. Reuter, "The Influence of Different Fertilization Practices on Concentrations of Organic Carbon and Total Nitrogen in Particle-Size Fractions During 34 Years of a Soil Formation Experiment in Loamy Marl," Biology and Fertility of Soils 13: 119-124 (1992). C. Li, V. Narayanan, and R. C. Harris, “Model Estimates of Nitrous Oxide Emissions from Agricultural Lands in the United States,” Global Biogeochemical Cycles 10: 297-306 (1996). C. Li, S. E. Frolking, A. C. Harriss, and A. E. Terry, "Modeling Nitrous Oxide Emissions from Agriculture: A Florida Case Study," Chemosphere 28(7): 1401-1415 (1994). B. C. Liang and A. F. MacKenzie, "Changes in Soil Organic Carbon and Nitrogen After Six Years of Corn Production," Soil Science 153(4): 307-313 (1992).

51
J. A. Macdonald, U. Skiba, L. J. Sheppard, B. Ball, J. D. Roberts, K. A. Smith, and D. Fowler, "The Effect of Nitrogen Deposition and Seasonal Variability on Methane Oxidation and Nitrous Oxide Emission Rates in Upland Spruce Plantation and Moorland," Atmospheric Environment 31(22): 3693-3706 (1997). L. K. Mann,”Changes in Soil Carbon Storage After Cultivation,” Soil Science 142: 279-288 (1986). P. Matson, “NOX Emission from Soils and Its Consequences for the Atmosphere and Biosphere: Critical Gaps and Research Directions for the Future,” Nutrient Cycling in Agroecosystems 48: 1-6 (1997). P. A. Matson, W. H. McDowell, A. R. Townsend, and P.M. Vitousek, “The Globalization of N Deposition: Ecosystem Consequences in Tropical Environments,” Biogeochemistry 46: 67-83 (1999). E. Matthews, “Nitrogenous Fertilizers: Global Distribution of Consumption and Associated Emissions of Nitrous Oxide,” Global Biogeochemical Cycles 8: 411-439 (1994). P. A. Matson, S. T. Gower, C. Volkmann, C. Billow and C. C. Grier, “Soil Nitrogen Cycling and Nitrous Oxide Flux in a Rocky Mountain Douglas-Fir Forest: Effects of Fertilization, Irrigation, and Carbon Addition,” Biogeochemistry 18: 101-117 (1992).
D. J. McKenney, J. R. Vriesacker and L. Chatarpaul, “Denitrification in Some Northern Ontario Forest Soils,” in Fifth Canadian Bioenergy R & D Seminar, ed. by S. Hasnain, Elsevier Applied Science Publishers, New York, pp. 111-114 (1984).
S. McLaughlin, Bioenergy Feedstock Program, Oak Ridge National Laboratory, personal communication and data transmittal, March 23 , April 1 (1998). K. Minami and A. Ohsawa, “Emission of Nitrous Oxide Dissolved in Drainage Water from Agricultural Land,” in Soils and the Greenhouse Effect, ed. by A. F. Bouwman, John Wiley and Sons, Chichester, England, pp. 503-510 (1990).
R. M. Monaghan and D. Barraclough , "Nitrous Oxide and Dinitrogen Emissions from Urine-Affected Soil Under Controlled Conditions," Plant and Soil 151: 127-138 (1993). A. R. Mosier, “Nitrous oxide emissions from agricultural soils,” Fertilizer Research 37: 191-200 (1994).
A. R. Mosier, M. A. Bleken, P. Chaiwanakupt, E. C. Ellis, J. R. Freney, R. B. Howarth, P. A. Matson, K. Minami, R. Naylor, K. N. Weeks, and Z-L Zhu, “Policy Implications of Human-Accelerated Nitrogen Cycling,” Biogeochemistry 57/58: 477-516 (2002).

52
A. R. Mosier, W. J. Parton, and S. Phongpan, “Long-term Large N and Immediate Small N Addition Effects on Trace Gas Fluxes in the Colorado Shortgrass Steppe,” Biology and Fertility of Soils 28: 44-50 (1998).
A. R. Mosier, C. Kroeze, C. Nevison, O. Oenema, S. Seitzinger, and O. van Cleemput, “Closing the Global N2O Budget: Nitrous Oxide Emissions Through the Agriculture Cycle,” Nutrient Cycling in Agroecosystems 52: 225-248 (1998a).
A. R. Mosier, J. A. Delgado, V. L. Cochran, D. W. Valentine, and W. J. Parton, “Impact of Agriculture on Soil Consumption of Atmospheric CH and a Comparison of CH4 and N2O Flux in Subarctic, Temperate, and Tropical Grasslands,” Nutrient Cycling in Agroecosystems 49: 71-83 (1997).
A. R. Mosier and D. S. Schimel, “Influence of Agricultural Nitrogen on Atmospheric Methane and Nitrous Oxide,” Chemistry and Industry (December 2, 1991): 874-877 (1991).
A. Mosier, D. Schimel, D. Valentine, K. Bronson and W. Parton, “Methane and nitrous oxide fluxes in native, fertilized, and cultivated grasslands,” Nature 250(March 28): 330-332 (1991).
A. R. Mosier, W. D. Guenzi and E. E. Schweizer, “Soil Losses of Dinitrogen and Nitrous Oxide from Irrigated Crops in Northeastern Colorado,” Journal of the Soil Science Society of America 50: 344-348 (1986).
D. L. Mummey, J. L. Smith, and G. Bluhm, “Assessment of Alternative Soil Management Practices on N2O Emissions from U. S. Agriculture,” Agriculture, Ecosystems and Environment 70: 79-87 (1998).
K. J. Nadelhofer, B. A. Emmett, P. Gundersen, O. J. Kjonaas, C. J. Koopmans, P. Schleppi, A. Tietema, and R. F. Wright, “Nitrogen Deposition Makes a Minor Contribution to Carbon Sequestration in Temperate Forests,” Nature 398: 145-148 (1999).
J. C. Neff, W. D. Bowman, E. A. Holland, M. C. Fisk and S. K. Schmidt, “Fluxes of nitrous oxide and methane from nitrogen-amended soils in a Colorado alpine ecosystem,” Biogeochemistry 27: 23-33 (1994).
J. C. Neff, A. R. Townsend, G. Gleixner, S. J. Leman, J. Turnbull, and W. D. Bowman, “Variable Effects of Nitrogen Additions on the Stability and Turnover of Soil Carbon,” Nature 419: 915-917 (2002).
S. P. Nesbitt and G. A. Breitenbeck, “A Laboratory Study of Factors Influencing Methane Uptake by Soils,” Agricultural Ecosystems and Environment 41: 39-54 (1992).
C. D. Nevison, G. Esser and E. A. Holland, “A Global Model of Changing N2O Emission from Natural and Perturbed Soils,” Climatic Change 32: 327-278 (1996).

53
S. W. Nixon, J. W. Ammerman, L. P. Atkinson, V. M. Berounsky, G. Billen, W. C. Boicourt, W. R. Boynton, T. M. Church, D. M. Ditoro, R. Elmgren, J. H. Garber, A. E. Giblin, R. A. Jahnke. N. J. P. Owens, M. E. Q. Pilson, and S. P. Seitzinger, “The Fate of Nitrogen and Phosphorus at the Land-Sea Margin of the North Atlantic Ocean,” Biogeochemistry 35: 141-180 (1996).
B. T. Nolan, B. C. Ruddy, K. J. Hitt, and D. R. Helsel, “Risk of Nitrate in Groundwaters of the United States – A National Perspective,” Environmental Science and Technology 31: 2229-2236 (1997).
D. S. Ojima, D. W. Valentine, A. R. Mosier, W. J. Parton, and D. S. Schimel, "Effect of Land Use Change on Methane Oxidation in Temperate Forest and Grassland Soils," Chemosphere 26(1-4): 675-685 (1993). W. J. Parton, A. R. Mosier, D. S. Ojima, D. W. Valentine, D. S. Schimel, K. Weier, and A. E. Kulmala, “Generalized Model for N2 nd N2O Production from Nitrification and Denitrification,” Global Biogeochemical Cycles 10: 401-412 (1996). K. Paustian, O. Andren, M. Clarholm, A.-C. Hansson, G. Johansson, J. Lagerlof, T. Lindbergh, R. Pettersson, and B. Sohlenius, “Carbon and Nitrogen Budgets of Four Agro-Ecosystems with Annual and Perrenial Crops, With and Without N Fertilization,” Journal of Applied Ecology 27: 60-84 (1990). H. W. Paerl, “Coastal Eutrophication in Relation to Atmospheric Nitrogen Deposition: Current Perspective,” Ophelia 41: 237-259 (1995). H. W. Paerl and M. L. Fogel, “Isotopic characterization of Atmospheric Nitrogen Inputs as Sources of Enhanced Primary Production in Coastal Atlantic Ocean Waters,” Marine Biology 119: 635-645 (1994). R. Perlack, J. Ranney and L. Wright, Energy Crop Production, Storage, and Transportation (Appendix A of Volume II of Fuel Cycle Evaluation of Biomass Ethanol and Reformulated Gasoline), TP-463-4950, National Renewable Energy Laboratory, Golden, Colorado, (1992).
J. Persson and H. Kirchmann, "Carbon and Nitrogen in Arable Soils as Affected by Supply of N Fertilizers and Organic Manures," Agriculture, Ecosystems, and Environment 51: 249-255 (1994). D. S. Powlson, K. W. T. Goulding, T. W. Willison, C. P. Webster, and B. W. Hutsch, “The Effect of Agriculture on Methane Oxidation in Soil,” Nutrient Cycling in Agroecosystems 49: 59-70 (1997).
54
A. Prieme, S. Christensen, K. E. Dobbie, and K. A. Smith, “Slow Increase in Rate of Methane Oxidation in Soils ith Time Following Land Use Change from Arable Agriculture to Woodland,” Soil Biology and Biochemistry 29: 1269-1273 (1997).
J. H. Qian, J. W. Doran, K. L. Weier, A. R. Mosier, T. A. Peterson and J. F. Power, “Soil Denitrification and Nitrous Oxide Losses under Corn Irrigated with High-Nitrate Groundwater,” Journal of Environmental Quality 26: 348-360 (1997).
G. P. Robertson, “Fluxes of Nitrous Oxide and Other Nitrogen Trace Gases from Intensively Managed Landscapes: A Global Perspective,” in Agricultural Ecosystem Effects on Trace Gases and Global Climate Change, ed. by L. A. Harper, A. R. Mosier, J. M. Duxbury and D. E. Rolston, American Society of Agronomy, Madison, pp. 95-108 (1993).
K. Robertson, “Emissions of N2O in Sweden -- Natural and Anthropogenic Sources,” Ambio 20(3/4): 151-154 (1991).
G. P. Robertson, E. A. Paul, and R. R. Harwood, “Greenhouse Gases in Intensive Agriculture: Contributions of Individual Gases to the Radiative Forcing of the Atmosphere,” Science 289: 1922-1925 (2000).
D. Ronen, M. Magaritz and E. Almon, “Contaminated Aquifers Are a Forgotten Component of Global N2O Budget,” Nature 335: 57-59 (1988).
J. R. Salinas-Garcia, F. M. Hons, J. E. Matocha and D. A. Zuberer, "Soil Carbon and Nitrogen Dynamics as Affected by Long-Term Tillage and Nitrogen Fertilization," Biology and Fertility of Soils 25: 182-188 (1997). R. N. Sampson, “The Role of Forest Management in Affecting Soil Carbon: Policy Considerations,” in Soil Management and Greenhouse Effect, ed. by R. Lal, J. Kimble, E. Levine and B. A. Stewart, Lewis Publishers, Boca Raton, pp. 339-350 (1995).
M. A. Sanderson, R. L. Reed, S. B. McLaughlin, S. D. Wullschleger, B. V. Conger, D. J. Parrish, D. D. Wolf, C. Taliaferro, A. A. Hopkins, W. R. Ocumpaugh, M. A. Hussey, J. C. Read, and C. R. Tischler, “Switchgrass as a Sustainable Bioenergy Crop,” Bioresource Technology 56: 83-93 (1996). E. Sanhueza, “Impact of Human Activity on NO Soil Fluxes,” Nutrient Cycling in Agroecosystems 48: 61-68 (1997).
S. P. Seitzinger and C. Kroeze, “Global Distribution of Nitrous Oxide Production and N Inputs Freshwater and Coastal Marine Ecosystems,” Global Biogeochemical Cycles 12: 193-113 (1998).

55
S. Shantharam nd A. K. Mattoo, “Enhancing Biological Ntirogen Fixation: An Appraisal of Current and Alternative Technologies for N Input into Plants,” Plant and Soil 194: 205-216 (1997). S. I. Sidorina, L. K. Shevtsova, and M. P. Bankin, "Effect of Humic Acid on the Evolution of Soil CO2," Soviet Soil Science 22(6): 79-83 (1990). M. Silgram, R. Waring, S. Anthony, and J. Webb, “Intercomparison of National & IPCC Methods for Estimating N Loss from Agricultural Land,” Nutrient Cycling in Agroecosystems 60: 189-195 (2001). U. Skiba, L. Sheppard, C. E. R. Pitcairn, I. Leith, A. Crossley, S. van Dijk, V. H. Kennedy, and D. Fowler, “Soil Nitrous Oxide and Nitric Oxide Emissions as Indicators of Elevated Atmospheric N Deposition Rates in Seminatural Ecosystems,” Environmental Pollution 102, S1: 457-461 (1998). U. Skiba, D. Fowler, and K. A. Smith, “Nitric Oxide Emissions from Agricultural Soils in Temperate and Tropical Climates: Sources, Controls, and Mitigation Options,” Nutrient Cycling in Agroecosystems 48: 139-153 (1997). V. Smil, “Nitrogen and Food Production: Proteins for Human Diets,”Ambio 31: 126-131 (2002). K. A. Smith, P. E. Thomson, H. Clayton, I. P. McTaggart, and F. Conen, “Effects of Temperature, Water Content, and Nitrogen Fertilization on Emissions of Nitrous Oxide by Soils,” Atmospheric Environment 32: 3301-3309 (1998).
V. H. Smith, G. D. Tilman, and J. C. Nekola, “Eutrophication: Impacts of Excess Nutrient Inputs on Freshwater, Marine, and Terrestrial Ecosystems,” Environmental Pollution 100: 179-196 (1999).
T. R. Steinheimer, K. D. Scoggin, and L. A. Kramer, “Agricultural Chemical Movement through a Field-Size Watershed in Iowa: Surface Hydrology and Nitrate Losses in Discharge,” Environmental Science and Technology 32: 1048-1052 (1998).
T. R. Steinheimer, K. D. Scoggin, and L. A. Kramer, “Agricultural Chemical Movement through a Field-Size Watershed in Iowa: Subsurface Hydrology and Distribution of Nitrate in Groundwater,” Environmental Science and Technology 32: 1039-1047 (1998a).
A. Stohl, E. Williams, G. Wotawa and H. Kromp-Kolb, “A European Inventory of Soil Nitric Oxide Emissions and the Effect of These Emissions on the Photochemical Formation of Ozone,” Atmospheric Environment 30(22): 3741-3755 (1996).

56
S. Takeda, A. Kamatani, and K. Kawanobe, “Effects of Nitrogen and Iron Enrichments on Phytoplankton Communities in the Northwestern Indian Ocean,” Marine Chemistry 50: 229-241 (1995).
J. H. M. Thornley, D. Fowler, and M. G. R. Cannel, "Terrestrial Carbon Storage Resulting from CO2 and Nitrogen Fertilization in Temperate Grasslands," Plant, Cell, and Environment 14: 1007-1011 (1991). P. Thustos, T. W. Willison, J. C. Baker, D. V. Murphy, D. Pavlikova, K. W. T. Goulding, and D. S. Powlson, “Short-term Effects of Nitrogen on Methane Oxidation in Soils,” Biology and Fertility of Soils 28: 64-70 (1998).
M. Van Meirvenne, J. Pannier, G. Hofman, and G. Louwagie, “Regional Characterization of the Long-Term Change in Soil Organic Carbon under Intensive Agriculture,” Soil Use and Management 12: 86-94 (1996).
G.E. Varvel, "Rotation and Nitrogen Fertilization Effects on Changes in Soil Carbon and Nitrogen," Agronomy Journal 86: 319-325 (1994). E. Veldkamp and M. Keller, “Fertilizer-Induced Nitric Oxide Emissions from Agricultural Soils,” Nutrient Cycling in Agroecosystems 48: 69-77 (1997).
G. L. Velthof and O. Oenema, “Nitrous oxide fluxes from grassland in the Netherlands: II. Effects of soil type, nitrogen fertilizer application and grazing,” European Journal of Soil Science 46: 541-549 (1995).
P.M. Vitousek, K. Cassman, C. Cleveland, T. Crews, C. B. Field, N. B. Grimm, R. W. Howarth, R. Marino, L. Martinelli, E. B. Rastetter, and J. I. Sprent, “Towards an Ecological Understanding of Biological Nitrogen Fixation,” Biogeochemistry 57/58: 1-45 (2002). P.M. Vitousek, J. D. Aber, R. W. Howarth, G. E. Likens, P. A. Matson, D. W. Schindler, W. H. Schlesinger, and D. G. Tilman, “Technical Report: Human Alteration of the Global Nitrogen Cycle: Sources and Consequences,” Ecological Applications 7: 737-750 (1997). M. D. Webster, M. Babiker, M. Mayer, J. M. Reilly, J. Harnisch, R. Hyman, M. C. Sarofim, and C. Wang, “Uncertainty in Emissions Projections for Climate Models,” Atmospheric Environment 36: 3659-3670 (2002). F. G. Weinhold, M. Welling and G. W. Harris, “Micrometeorological Measurement and Source Region Analysis of Nitrous Oxide Fluxes From An Agricultural Soil,” Atmospheric Environment 29(17): 2219-2227 (1995).

57
E. J. Williams, G. L. Hutchinson, and F. C. Fehseneld, “NOX and N2O Emissions from Soil,” Global Biogeochemical Cycles 6: 351-388 (1992).
M. W. Williams, J. S. Baron, N. Caine, R. Sommerfeld, and R. Saford Jr., “Nitrogen Saturation in Rocky Mountains,” Environmental Science and Technology 30: 640-646 (1996).
T. W. Willison et al., “Methane Oxidation in Temperate Soils: Effects of Land Use and the Chemical Form of Nitrogen Fertilizer,” Chemosphere 30: 539-546 (1995).
C. Xu, M. J. Shaffer,and M. Al-kaisi, “Simulating the Impact of Management Practices on Nitrous Oxide Emissions,” Journal of the Soil Science Society of America 62: 736-742 (1998).

58
TABLE C-1. N2O FLUXES FROM AGRICULTURAL, GRASSLAND, AND FOREST SOILS Site Location
Fertilizer Type
Crop Type
Flux Rate g-N-N2O/ha/d
(unless noted)
Comments
Source
CORN
Near Shelton, Nebraska
Anhydrous injection on April 15, 1991
(112.0 kg N ha-1) and urea-ammonium
nitrate sidedress on 5/9/91
(33.6 kg N ha-1)
Corn hybrid, Pioneer Brand
3379
Avg. (Max) Month:
25 (25) 5/91
10 (125) 6/91
15 (15) 7/91
20 (20) 8/91
2.29 Seasonal loss
Data from 1991, a dry year
Irrigation of 310 mm contributed 88.5 kg N ha-1 to
total N input
1.0% of N applied through fertilizer and irrigation was lost
annually
Qian et al. (1997)
Near Shelton, Nebraska
Ammonium phosphate sidedress on May 1, 1992 (13.4 kg N ha-1) and urea-ammonium nitrate on
6/29, 7/1, and 7/6, 1992 (78.5 kg N ha-1)
Corn hybrid, Pioneer Brand
3379
Avg. (Max.) Month:
2 (2) 4/92
5 (15) 5/92
12 (75) 6/92
5 (10) 7/92
10 (25) 8/92
1.52 Seasonal loss
Data from1992, a wet year
Irrigation of 191 mm contributed60.9 kg N ha-1 to
total N input
1.0% of N applied through fertilizer and irrigation was lost
annually
Qian et al. (1997)

59
TABLE C-1 CONTINUED. Colorado Anhydrous ammonia
(AA), Ammonium sulfate (AS), Urea (U), and Calcium Nitrate
(CN)
Corn AA: 1.3%b
AS: 1.5%b
U: 1.6%b
U: 0.8%b
U: 2.1%b
CN: 0.3%b
Mosier et al. (1986), Bronson et al., (1992), and Duxbury and McConnaughy (1986; in Mosier [1994])
Southwestern France
280 kg-N/ha/yr anhydrous ammonia
maize 3.9% of N fertilizer fertilizer application rate is relatively high
Jambert et al. (1997)
Colorado/
NLEAP model
1). 100 kg-N/ha
2). 100 kg-N/ha no tillage
3). 100 kg-N/ha no irrigation
4). 200 kg-N/ha
corn 1). 3.3% grossb
2). 4.0% grossb
3). 2.8% grossb
4). 2.7% grossb
Results of NLEAP model, modified to include N2O emissions, and calibrated
against field measurements. Values are gross N-N2O as a % of fertilizer, they are not net of
background or no-fertilizer level emissions.
Xu et al. (1998)
Eastern Colorado
Anhydrous ammonia applied at 168 kg N
ha-1 in Fall, 1988
corn Non-irrigated furrows:
25, 3, 10, 4
Irrigated furrows:
17, 2, 0, 3
Data were taken one hour after irrigation on four dates: 7/10,
7/24, 8/9, and 9/6
Guenzi et al. (1994)
Iowa (DNDC model)
1). Increase fertilizer from 50 to 100 kg-
N/ha/yr
2). Increase from 100 to 200 kg-N/ha/yr
corn 1). 1.4% N-N2O/N-fertilizer increment
2). 0.4% N-N2O/N-fertilizer increment
Model simulation holding constant all other parameters
(precipitation, deposition, temperature, etc.)
Li et al. (1996)

60
TABLE C-1 CONTINUED.
VARIOUS CROPS
Northeastern Colorado
Urea and urea plus nitrification inhibitors
ECC (20 kg ha-1), DCD (10% N), and
nitrapyrin (0.5 L ha-1)
Dryland wheat, irrigated wheat,
and irrigated corn
Dryland wheat:c
101 Wheat
112 Fallow
Irrigated wheat:c
929 Urea alone
509 Urea + ECC
437 Urea + DCD
360 ECC alone
440 Control
Irrigated corn:c
1,651 Urea alone
980 Urea + NP
483 Urea + ECC
108 Control
Nitrification inhibitors reduced N2O emissions
Bronson and Mosier (1993)
Denmark
Drained Fjord
None Wheat 46-139 diurnal flux
93 (avg. diurnal flux)
Weinhold et al. (1995)
Germany (Lower Saxony)
1.) 0,105, 210 kg/ha
2.) 0, 45, 90 kg/ha
3.) 0, 70, 150 kg/ha
4.) 0, 45, 100 kg/ha
1). winter wheat
2). winter barley
3). sugar beet
4.) winter rape
1). ~ 4 (0.7 - 4.2% of N)
2). ~4 (1.6 – 4.2% of N)
3). ~4 (1.5 – 8.5% of N)
4). ~4 (1.4 – 3.5% of N)
Percentage of fert. N lost as N-N2O was higher at 50%
fertilization rate, for all crops
Kaiser et al. (1998)

61
TABLE C-1 CONTINUED.
Northeastern Colorado
Not specified Pasture, grassland, wheat,
and corn
Pasture:
6.1 Fertilized
2.5 Unfert.
Unfert. wheat: 3.5
Grassland: 3.5
Irrig. corn field:
Urea fert. 16.5
Urea-inhibit. 4.6
Control 1.1
Irrig. wheat field:
Urea fert. 6.0
Urea-inhibit. 2.5
Control 2.0
Mosier and Schimel (1991)
New York Ammonium nitrate (AN), Ammonium sulfate (AS), and
Sewage sludge (SS)
Spring Barley AN: 0.6%b
AS: 0.4%b
SS: 1.4%b
Mosier et al. (1986; in Mosier [1994])
England Ammonium nitrate Winter wheat 3.5% direct seeded, clay soilb
1.5% plowed, clay soilb
0.9% direct seeded, clay loamb
0.4 % plowed, clay loamb
Burford et al. (1981; in Mosier [1994])
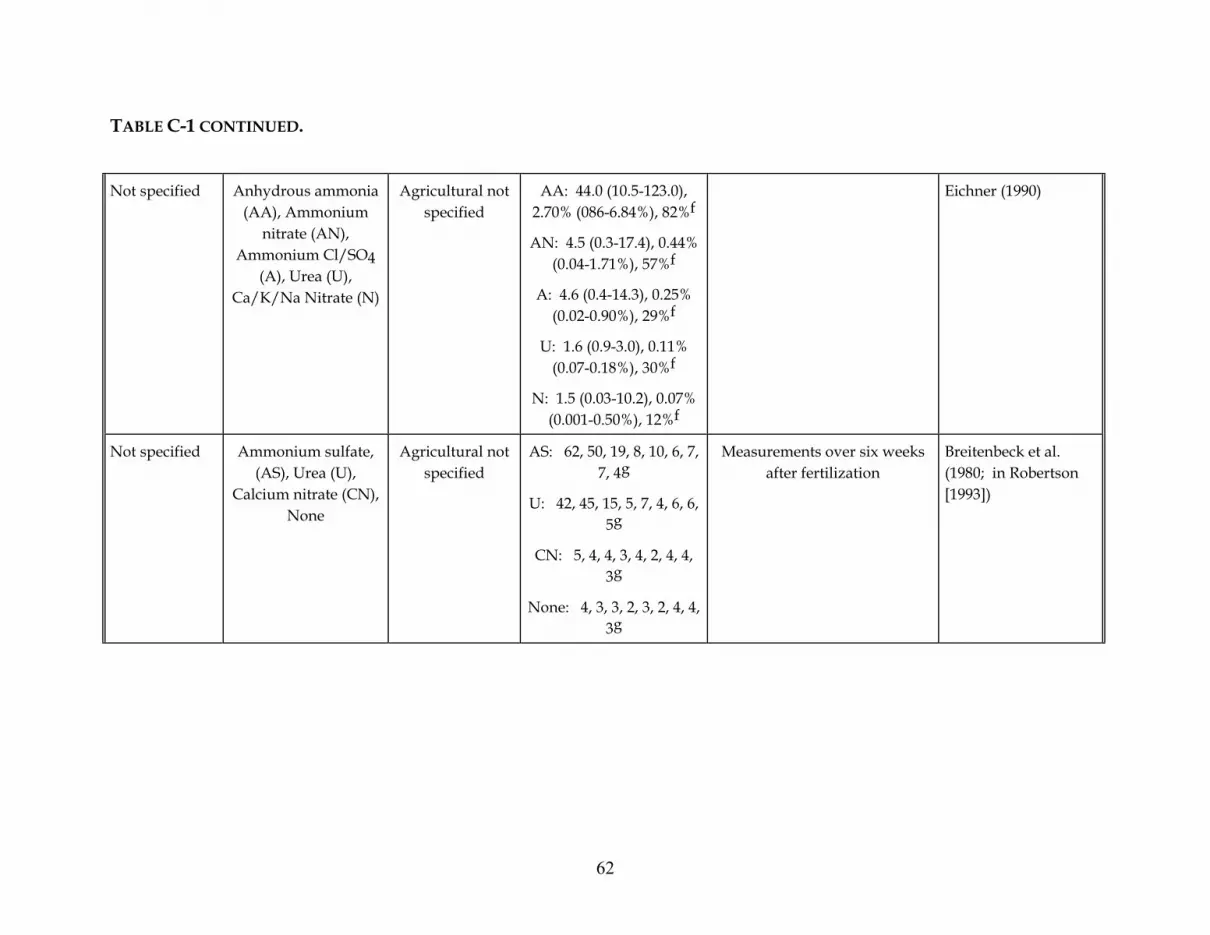
62
TABLE C-1 CONTINUED.
Not specified Anhydrous ammonia (AA), Ammonium
nitrate (AN), Ammonium Cl/SO4
(A), Urea (U), Ca/K/Na Nitrate (N)
Agricultural not specified
AA: 44.0 (10.5-123.0), 2.70% (086-6.84%), 82%f
AN: 4.5 (0.3-17.4), 0.44% (0.04-1.71%), 57%f
A: 4.6 (0.4-14.3), 0.25% (0.02-0.90%), 29%f
U: 1.6 (0.9-3.0), 0.11% (0.07-0.18%), 30%f
N: 1.5 (0.03-10.2), 0.07% (0.001-0.50%), 12%f
Eichner (1990)
Not specified Ammonium sulfate, (AS), Urea (U),
Calcium nitrate (CN), None
Agricultural not specified
AS: 62, 50, 19, 8, 10, 6, 7, 7, 4g
U: 42, 45, 15, 5, 7, 4, 6, 6, 5g
CN: 5, 4, 4, 3, 4, 2, 4, 4, 3g
None: 4, 3, 3, 2, 3, 2, 4, 4, 3g
Measurements over six weeks after fertilization
Breitenbeck et al. (1980; in Robertson [1993])

63
TABLE C-1 CONTINUED. Not specified Anhydrous ammonia
and aqua ammonia (AA), Ammonium
nitrate (AN), Ammonium sulfate or phosphate (AS), Urea (U), Other nitrogen or complex fertilizer (N)
Agricultural not specified
AA: 1.63% (0.86-6.84%)b
AN: 0.26% (0.04-1.71%)b
AS: 0.12% (0.02-1.5%)b
U: 0.11% (0.07-1.5%)b
N: 0.11% (0.001-6.84%)b
OECD (1991; in Greene and Salt [1993])
Generalized Form
A variety of mineral and organic fertilizers
Generalized Form
1 + (0.0125 * N applied)h
Includes N sources from different mineral and organic fertilizers, and also includes
N2O from all sources, including native soil N, N from recent atmospheric deposition, past
years' fertilization, N from crop residues, N2O from subsurface
aquifers, and current N fertilization
Bouwman (1996) (see also Mosier et al. [1998a])

64
TABLE C-1 CONTINUED. GRASSLAND
Near Nunn, Colorado
Ammonium nitrate administered at 2.2 g N m-2 per year from
1976 to 1989
Swale,
Midslope,
Wheat,
Fallow, and Grass
Swale:
6.2 Fertilized
3.0 Unfert.
Midslope:
3.1 Fertilized
1.8 Unfert.
Pasture:
6.1 Fertilized
2.5 Unfert.
Wheat: 2.6
Fallow: 4.5
Grassland: 3.5
Mosier et al. (1991)
Denmark 1). 75 kg-N/ha/yr NH4NO3
2). 120 kg-N/ha/yr NH4NO3
1). M. “Giganteus” (perennial
energy crop)
2). Winter rye
1). 1.5% over 8 monthsb
2). 0.5% over 8 monthsb
Authors suspect that emissions over remaining 4 months were
low. However, precipitation was low, and N2O increases with rainfall. So these % are
lower bounds.
Jorgensen et al. (1997)
Multiple sites None Field and grassland
14 (average)
1-78 (range )
Based on data from 57 sites Ottow et al. (1990; in Isermann [1994])

65
TABLE C-1 CONTINUED. Near Stirling, Central Scotland
Ammonium nitrate, 185 kg NH4-NO3-N
ha-1 on 4/3/92
Grassland Mean fluxes (see comments):
153 ± 9 Ungrazed
557 ± 107 Grazed
Measured over a three-week period following fertilization,
not annual means
Total N2O-N losses were 1.7% and 5.1% of applied N for
ungrazed and grazed areas, respectively
Clayton et al. (1994)
Near Heino, Netherlands
Calcium ammonium nitrate (kg N ha-1):
Sand 313
Clay 277
Peat 1 266
Peat 2 161
Grassland Sand: 1.7 0.5%a
Clay: 3.9 1.4%a
Peat 1: 6.2 2.3%a
Peat 2: 6.2 3.9%a
Peat soils showed high N2O emissions relative to sand and
clay soils
Velthof and Oenema (1995)
Colorado 22 kg-N/ha/yr NH4NO3
fertilized pasture and native
unfertilized pasture
(shortgrass steppe)
- 0.4 (native unfertilized)
- 0.7 (fertilized)
Implies about 0.5% of fertlizer N evolving as N in N2O. Note that measurements were taken
in 1990-1994 and that fertilization occurred from 1976-1989, so results show
residual post-cultivation effects.
Mosier et al. (1998)

66
TABLE C-1 CONTINUED. England 1). 300 kg-N/ha/yr
NH4NO3
2) 300 kg-N/ha/yr
urea
3). #2 + nitrification inhibitor
intensively managed grassland
1). 37 (4.5% of applied N)
2). 14 (1.8% of applied N)
3). 8 (0.9% of applied N)
Percentages of applied N are net of unfertilized control.
Dobbie and Smith (2003)
Germany 1). Unfertilized
2). 329 g-N/ha/day Calcium ammonium
nitrate
grasslands 1). 0.55
2). 3.6 (0.9% of applied N)
The difference between the fertilized and unfertilized
emission emission rates ranged from 0.5% to 1.5% of applied N
Kammann et al. (1998)
Niwot Ridge, Colorado.
2500 meters in elevation.
Alpine meadows dominated by C. scopulorum and K. myosuroides
Slow release 40-0-0 Urea nitrogen applied in two years prior to
tests. Average N input of 25 g N m-2 yr-1
Dry meadow fertilized
Dry meadow unfertilized
Wet meadow fertilized
Wet meadow unfertilized
6.48, 5.52, 5.40, 1.68, 1.44, 0.60, 3.00d
0.24, 0.12, 0.48, 0.00, 0.00, 0.00, 0.12d
n.m., 4.32, 6.24, 5.76, 10.32, 9.00, 7.44d
0.00, 0.00, 0.36, 0.36, 0.24, 0.24, 0.24d
Overall boost in N2O production from fertilizer was
45-fold for wet meadow and 22-fold for dry meadow
Neff et al. (1994)

67
TABLE C-1 CONTINUED.
FOREST
Near Copenhagen, Denmark
None Spruce forest
Beech forest
Riparian
Coast grassland
Fallow farmland
Upland arable
Drained arable
2.1 (-0.2-9.0 range)e
2.2 (-0.3-9.0 range)e
1.8 (-0.4-9.0 range)e
3.4 (-0.4-23 range)e
0.7 (-0.3-2.0 range)e
9.9 (0.4-66 range)e
12.8 (1-36 range)e
Arable soils emitted N2O at higher rates
Ambus and Christenson (1995)
Southern Scotland
40 kg/ha N as NH4 NO3, NaNO3, or
NH4Cl (also studied deposition of
atmospheric N)
Spruce forest, moors, control
Spruce forest, moors, fertilized
about 0.1 in the “control” soils (over 14
days);
0.2 to 0.7 fertilized soils (over 14 days)
If the difference of 0.1 to 0.6 g-N-N2O/ha/d was maintained over a year, then 0.1% - 0.5% of the N in fertilizer evolved as N-
N2O
MacDonald et al. (1997)
Germany 1). Est. N deposition 35+ kg-N/ha/yr.
2). Est. N deposition 20 kg-N/ha/yr.
1). spruce plot
2). beech plot
1). 1.2 (about 1.3% of N deposition)
2). 4.0 (about 7% of N deposition)
Butterbach-Bahl et al. (1997)
Florida 180 kg-N/ha/yr (urea) from Feb. 1987 to Dec.
1991
Slash pine control
Slash pine fertilized
0 to 0.9 in the “control” soils (3 samples in a yr.)
3.0 to 17.7 in fertilized soils (3 samples in a yr.)
The difference of 3.0 to 17.3 g-N-N2O/ha/d implies that 0.6 -
3.5% of the N in fertilizer evolved as N- N2O
Castro et al. (1994)

68
Notes: n.m. = number missing in series; DCD = dicyandiamide; ECC = encapsulated calcium carbide; NP = nitrapyrin. See Eichner (1990) for a similar table with data on experiments in the 1980s. a The first number shown is the annual fertilizer derived N2O loss in units of kg N2O-N per year. The second number is the % of N
applied that is lost as N2O-N. b Units are % of N applied that is emitted as N2O-N. c Units are cumulative fluxes in g N2O-N ha-1. Fluxes were measured from time of planting to just before harvest (329 days) for
dryland wheat, from time of planting and fertilization to just before harvest (292 days) for irrigated wheat, and from time of fertilization (9 weeks after planting) to just before harvest (97 days) for irrigated corn.
d Emissions figures were converted from mg N2O-N m-2 yr-1 to g N2O-N ha-1 d-1. e Converted from ng N2O-N cm-2 hr-1 to g N2O-N ha-1 d-1 using 2.4 ng N2O-N cm-2 hr-1 per g N2O-N ha-1 d-1. The values were
read from a graph and are therefore approximate. The series of numbers corresponds to measurements over a summer season, with data taken in 1992 on June 11, June 22, June 29, July 6, July 13, August 3, and August 17.
f The first number is the average daily emission of N2O, followed by the range in daily emissions, during the sampling period
(which was variable). The next number is the average percentage of fertilizer N that is evolved as N2O for each fertilizer type, followed by the range in percentages. The final number is the average percentage of total N that is emitted as fertilizer N2O-N.
g Numbers correspond to readings 3, 9, 14, 18, 21, 25, 28, 38, and 42 days after fertilizer application. The values were read from a
graph and are therefore approximate. h Units for equation are: kg N2O-N ha-1 yr-1.

69
TABLE C-2. SUMMARY OF STUDIES OF LEACHING AND EROSION LOSSES OF FERTILIZER N
Type of study N losses Source Fertilizer N reaching aquifiers 5 – 30% Breitenbeck (in Greene and
Salt, 1993)
Carbon and N budgets of fertilized and unfertilized plots; estimates of leaching losses
10% from barley 0% from grass ley or N-fixing lucerne
Paustian et al. (1990)
Fate of N fertilizer applied to energy crop systems; estimates of N in runoff, groundwater, erosion
35% from sorghum 15% from perrenials, trees
Perlack et al. (1992)
IPCC guideline estimates of leaching loss of applied fertilizer N
30% of fertilizer and manure N 0% of crop residue, fixed N
IPCC (1997)
Accounting of N inputs to Canadian agriculture, estimate of N leaching loss from fertilizer, manure, deposited, and crop-residue N
10% of inputs Jantzen et al. (2003)
Relationship between N inputs to landscape and riverine export of N in Northeast U. S.
57% of deposited N 8 – 27% of agricultural N
Jaworski et al. (1997)
Chesepeake Watersheds Model, export coefficients for fertilizer N
9 – 15% of N in Jaworski et al. (1997)
Measurement of nitrate losses from ag. field, estimate of fertilizer N lost to erosion, drainage, runoff
19% of N lost Steinheimer et al. (1998, 1998a)
Estimate of leaching, drainage, erosion, and run-off losses in four countries in Europe
6%, 23%, 27%, 36% for four countries
Isermann (1990)
Nitrogen fluxes in the North Atlantic region, estimate of fertilizer, combustion, and N-fixation inputs that end up in rivers
23% of inputs discharged in rivers
Galloway et al. (1996)

70
TABLE C-2 CONTINUED. Estimate of fertilizer N leaching from agricultural soils
35% in Europe 22% in the U. S.
Howarth et al. (1996)
Reference to studies of N inputs lost to rivers
20% of inputs lost to rivers
in Howarth et al. (1996)
Model of N deposition and C sequestration
20% N loss (non-N-saturated) 20% + N loss (N-saturated)
Holland et al. (1997)
Account of global flows of N in crop production
22% leaching, erosion loss
Smil (1999)
Estimate of N input from fertilizer and deposition that leaches into aquatic systems, worldwide
30% of N inputs to leaches to rivers
Kroeze and Seitzinger (1998)
See the text for full details of the studies.

71
TABLE C-3. N2O FLUXES IN DRAINAGE DITCHES AT DIFFERENT POINTS FROM IRRIGATED FIELDS, AND COMPARED WITH SOIL FLUXES Month Flux at Point 2
(30 meters) (ng N2O/0.1 ha/d)
Flux at Point 6 (450 meters)
(ng N2O/0.1 ha/d)
Soil
(ng N2O/0.1 ha/d)
May 13.0 8.5 --
June 5.5 2.0 --
July 11.0 1.0 --
August -- 10.5 16.0
October 27.5 5.0 5.0
November 15.0 3.0 5.5
December 7.5 0.5 0.5
February 1.0 0.5 0.5
Average for months tested
11.5 3.9 5.5
Average for months tested (g N2O ha-1 yr-1
4.2 x 10⁻⁵
1.4 x 10⁻⁵
2.0 x 10⁻⁵
Source: Minami and Ohsawa (1990). Notes: Fertilizer application was 500 kg N ha-1 yr-1.

72
TABLE C-4. SUMMARY OF STUDIES OF N-NO AND N-NH3 LOSSES FROM FERTILIZER N
Study Losses (% of input) Source Fertilizer applied to corn 0.79% N-NO Anderson & Levine (1987)
Ammonium sulfate applied to Bermuda-grass pasture
3.22% N-NO Hutchinson and Brams (1992)
Tabulation of studies of N-NO/N-fertilizer rates
0.5% to 11.0% N-NO (authors assume 4.3%)
in Stohl et al. (1996) (see also Skiba et al. [1997] and Sanhuenza [1997])
Tabulation of studies of N-NO/N-fertilizer rates
lower bound of 0.5% N-NO
in Veldkamp and Keller (1997)
Heavily fertilized corn field in France
11.3% N-NO 0.1% N-NH3
Jambert et al. (1997)
Estimate of global NH3 emissions from fertilizer
8-10% N-NH3 Matthews (1994)
Estimate of global NO losses from agricultural soils
not more than 7% of N fertilizer input
Davidson and Kingerlee (1997)
Estimate of global N emissions 10% N-(NOX+NH3) Holland et al. (1999)
Fertilized pasture at least 8% N-NO, long term
Mosier et al. (1998)
Citation of studies of N fertilization trials with irrigated maize
~ 22% N-(N2+N2O+NOX)
in Mosier et al. (2002)
NO and N2O from fertilized tropical soils
2% N-NO in P-limited soil
Hall and Matson (1999)
Reference to other studies up to 10-20% N-NOx, tropical soils
in Holland et al. (1997)
Fate of N in global agroecosystems 2% N-NO 8% N-NHX 4% N-NO from N fixed by plants (pre-industrial)
Galloway et al. (1995)
Account of global flows of N in crop production in 1990s
2.4% N-NO 6.5% N-NH3
Smil (1999)

73
TABLE C-4 CONTINUED. Fate of N inputs to Canadian agroecosystems
10% N-(N2+N2O+NO)
Janzen et al. (2003)
Recommended emission factor 10% N-(NOX+NH3) IPCC (1997)
Studies of deposition specifically:
N deposition on soils 1.3 to 20% N-NO Skiba et al. (1998)
Analysis of N added to forests assume 10% N loss (gaseous+leachate)
Nadelhoffer et al. (1999).
Emissions from forests receiving heavy N deposition in Germany
4% (beech), 20% (spruce) N-NO
Butterbach-Bahl et al. (1997)
See the text for full details of the studies.

74
TABLE C-5. METHANE FLUXES FROM AGRICULTURAL, GRASSLAND, AND FOREST SOILS Site Location
Fertilizer Type Ecosystem Type
Flux Rate (g-C-CH4/ha/d unless noted)
Comments Source
Niwot Ridge, CO
2500 meters in elevation
Alpine vegetation
Slow release 40-0-0 Urea nitrogen
Dry meadow fertilized
Dry meadow unfertilized
Wet meadow fertilized
Wet meadow unfertilized
1.0, 1.4, 1.3, 2.2, 0.9, 0.7, 4.60a
2.0, 3.7, 2.9, 4.3, 2.9, 2.65, 2.6a
0, 0, 0.1, -0.3, 0, 8.1, 0.30a
0, -0.1, 0, 1.2, -0.3, 2.0, -1.0a
CH4 uptake in dry meadow was reduced 52% by
fertilization. Net CH4 production was observed in both wet meadow plots (the
difference was not significant)
Neff et al. (1994)
Northeastern Colorado
Not specified Pasture, grassland, wheat,
and corn
Pasture:
Fertilized: - 4.1
Unfertilized: - 6.3
Unfert. wheat: -1.5
Grassland: -2.6
Irrig. corn field:
Urea fert. -0.6
Urea-inhibit. -0.3
Control -0.6
Irrig. wheat field:
Urea fert. -0.9
Urea-inhibit. -0.2
Control -0.8
Fertilization and cultivation of grasslands both reduced
methane uptake by 30-50%
Mosier and Schimel (1991)

75
TABLE C-5 CONTINUED. Near Nunn, Colorado
Ammonium nitrate administered at 2.2 g N m-2 per year from
1976 to 1989
Swale,
Midslope,
Wheat,
Fallow, and Grass
Swale: -3.6 Fertilized
-3.6 Unfertilized Midslope:
-4.1 Fertilized -6.3 Unfertilized
Pasture: -3.8 Fertilized
-5.8 Unfertilized Wheat: -1.3 Fallow: -1.8
Grassland: -2.6
Methane uptake was reduced by 41% from fertilization in annually fertilized plots, but
no decrease due to fertilization in fertile swale plots . Results suggest the clearing of the grassland
resulted in a 31% reduction in methane uptake, and
fertilization in an additional 27%
Mosier et al. (1991)
Northeastern Colorado
Urea and urea plus nitrification inhibitors
ECC (20 kg ha-1), DCD (10% N), and
nitrapyrin (0.5 L ha-1)
Dryland wheat, irrigated wheat,
and irrigated corn
Dryland wheat:b -393 Wheat -257 Fallow
Irrigated wheat:b -188 Urea alone -66 Urea + ECC
-156 Urea + DCD -75 ECC alone -185 Control
Irrigated corn:b -43 Urea alone
-36 Urea + nitrapyrin -25 Urea + ECC
-45 Control
Urea fertilization had little effect on CH4 uptake for
irrigated wheat and corn but nitrification inhibitors,
especially ECC, reduced CH4 uptake by up to 65%
Bronson and Mosier (1993)

76
TABLE C-5 CONTINUED. Near Copenhagen, Denmark
None Spruce forest
Beech forest
Riparian
Coast grassland
Abandoned farm
Upland arable
Drained arable
-2.5c
-1.0c
19.7c
0.6c
-2.2c
-0.6c
-0.3c
Methane uptake not correlated with inorganic N in soils, but uptake tended to be
higher at uncropped sites
Ambus and Christenson (1995)
Southern Scotland
40 kg/ha N as NH4 NO3, NaNO3, or
NH4Cl (also studied deposition of
atmospheric N)
Spruce forest, moors, control
Spruce forest, moors, fertilized
13 in the “control” soils (over 14 days)
1.6 to 4 in the fertilized soils (over 14 days)
Fertilization reduced CH4 uptake by about 70-90%, or
about 10 g-C-CH4/ha/d, and increased N2O emissions
severalfold, over the 14-day measurement period
MacDonald et al. (1997)
Colorado 22 kg-N/ha/yr NH4NO3
fertilized pasture and native
unfertilized pasture
(shortgrass steppe)
- 8.4 (native unfertilized)
- 5.5 (fertilized)
Implies about 50 g- CH4/kg-N-fertilizer. Note that
measurements were taken in 1990-1994, and fertilization occurred from 1976-1989, so results show residual post-
cultivation effects.
Mosier et al. (1998)
Denmark and Scotland
None forests at various stages of
succeeding cropland
~2 (CH4 oxidation rate) in crop land
1 – 3 (CH4 oxidation rate) in new forestsd
18 – 27 (CH4 oxidation rate) in old forestsd
CH4 oxidation decreased in the first five years after
abandonment, then increased from 1 - 3 after five years to 18 - 27 in the oldest (200-yr)
forests
Prieme et al. (1997)

77
TABLE C-5 CONTINUED. 1). Panama
2). Costa Rica
none tropical forests converted to
pasture
1). 1 – 5 (∆ CH4)
2). 14 (∆ CH4)
Figures shown are the reduction in CH4 oxidation as
a result of the conversion.
Keller et al. cited in Mosier et al. (1997)
Midwestern U. S.
1). various
2). No N
3). No N
1). annual crops
2). poplar crop
3). recovered forest
1). about – 1.8
2). – 1.8
3). – 9.2
recovered forest oxidized 3.6 kg CH4/ha/yr more than did
poplar or annual crops.
Robertson et al. (2000).
Florida 180 kg-N/ha/yr (urea) from Feb. 1987
to Dec. 1991
Slash pine control
Slash pine fertilized
-3.6 to -8.4 in “control” soils (3 samples in a yr.)
-0.2 to -1.7 in fertilized soils (3 samples in a yr.)
The difference of 3.4 to 6.7 g-C-CH4/ha/d implies an emission factor of 9-18 g-
CH4/kg-N-fertilizer
Castro et al. (1994)
a The values were read from a graph and are therefore approximate. The series of numbers corresponds to measurements over a
summer season, with data taken in 1992 on June 11, June 22, June 29, July 6, July 13, August 3, and August 17. The original units were µmoles CH4 m-2 hr-1; we converted to g CH4-C ha-1 d-1 assuming 24 hours per day.
b Units are cumulative fluxes in g CH4-C ha-1. Fluxes were measured from time of planting to just before harvest (329 days) for
dryland wheat, from time of planting and fertilization to just before harvest (292 days) for irrigated wheat, and from time of fertilization (9 weeks after planting) to just before harvest (97 days) for irrigated corn.
c Units were converted from mg CH4-C m-2 yr-1 to g CH4-C ha-1 d-1. c Units were converted from µg CH4 m-2 hr-1 to g-CH4-C ha-1 d-1 assuming 24 hours/day.Note that units refer to total oxidation
rate measured in the soil.

78
TABLE C-6. METHANE UPTAKE REDUCTION AS A FUNCTION OF FERTILIZER APPLICATION RATE Crop Type
Conditions
CH4 uptake reduction
(g-CH4 /kg -N )
Source
Grassland/Wheat Swale Midslope Pasture Wheat
0.0a 48.9a 44.5a 11.1a
Mosier et al. (1991)
Alpine meadow Dry Wet
3.77b N.A.
Neff et al. (1994)
Wheat/Corn Irrigated fields Irrigated wheat: -.04 Urea alonec
1.59 Urea + ECCc 0.39 Urea + DCDc
Irrigated corn: 0.01 Urea alonec
0.06 Urea + nitrapyrinc
0.12 Urea + ECC
Bronson and Mosier (1993)
Spruce forest, and moorland
fertilized vs. unfertilized fields
10 - 121d MacDonald et al. (1997)
Pasture fertilized vs. unfertilized
~ 50 (see Table C-5) Mosier et al. (1998)
Slash pine plantation
fertilized vs. unfertilized fields
9 - 18e Castro et al. (1994)
Cropped soils in Norway
fertilized vs. unfertilized fields
~ 3 - 5 manuree ~10 NH4NO3
Hansen et al. in Mosier et al. (1997)
a For the midslope area, the average daily methane flux dropped from 6.3 to 4.1 g CH4-C ha-1
d-1, resulting in a decline in uptake of 803 g CH4-C ha-1 yr-1. For the pasture, the decline in methane flux was from 5.8to 3.8 g CH4-C ha-1 d-1, resulting in a decline in uptake of 730 g CH4-C ha-1 yr-1. For the wheat field, the difference between fertilized and fallow plots was 0.5 g CH4-C ha-1 d-1, resulting in a decline in uptake of 183 g CH4-C ha-1 yr-1. The fertilized plots received 2.2 g N m-2 of ammonium nitrate annually. Units were converted

79
from g CH4-C ha-1 yr-1 to g CH4 ha-1 yr-1 using 1.34 g CH4 per g CH4-C (16.04 g per mol. for CH4 / 12.01 g per mol. for CH4-C).
b The fertilized plots received 25 g N m-2 of 40-0-0 Urea nitrogen in 1990 and 1991, and none
in 1992 when measurements were taken. The mean reduction in methane uptake in the dry meadow was reduced from -1.29 µmols CH4 m-2 hr-1 to -0.62 µmols CH4 m-2 hr-1 by fertilization. Values were converted from µmols CH4 m-2 hr-1 to g CH4 ha-1 yr-1 using 1405.1 µmols CH4 m-2 hr-1 / g CH4 ha-1 yr-1.
c The wheat field received urea fertilization averaging 100 kg N ha-1, plus treatments of urea
plus encapsulated Ca carbide (ECC) at 20 kg CaC2 ha-1 and urea plus dicyandiamide (DCC) at 10% of N application rate. The corn field received 218 kg urea-N ha-1, plus application with nitrapyrin at 0.5 L ha-1 and with ECC at 20 kg CaC2 ha-1. Units were converted from g CH4-C ha-1 yr-1 to g CH4 ha-1 yr-1 using 1.34 g CH4 per g CH4-C (16.04 g per mol. for CH4 / 12.01 g per mol. for CH4-C).
d The addition of 40 kg-N/ha reduced CH4 uptake by about 13 g/ha/d, over a 14-day period.
If the reduction in uptake would have lasted for only 30 days, the emission factor would have been 10 g-CH4/kg-N-fertilizer. If it would have lasted a whole year, the emission factor would have been 120 g-CH4/kg-N-fertilizer.
Alternatively, MacDonald et al. (1997) remark that the deposition of some 46 kg-N/ha/yr at a high forest site might have reduced the methane uptake by 50%. They estimate that the uptake at the site was 0.7 kg-CH4/ha/yr, which implies that the deposition reduced uptake by 0.7 kg-CH4/ha/yr, or 15 g-CH4/kg-N.
e See Table C-5. f Mosier et al. (1997) report findings from Hansen et al.: in µg C-CH m-2 h-1 oxidation rate: 9.7
for unfertilized soils, 5.9 for soil fertilized with 81 kg N ha-1 cattle excrement slurry (manure), 5.1 for soil fertilized with 189 kg N ha-1 cattle excrement slurry (manure), and 5.7 for soil fertilized with 140 kg ha-1 NH4NO3. We assume that the N applications are annual amounts, and that the CH4 oxidation rate is sustained over the year.

80
TABLE C-7. NET GAINS IN SOIL AND TREE CARBON PREDICTED FOR AFFORESTATION
PROJECTS (TONS C HA-1 [KG-C/M2 SHOWN IN PARENTHESES]) Location/Species/Site Initial C
content C content at
age 55 Net C
increase
Southern pine plantation on cropland
Trees
Soil
Total
0 (0)
25 (2.3)
25 (2.3)
157 (14.2)
74 (6.7)
231 (21.0)
157 (14.2)
49 (4.4)
206 (18.7)
Lake States pine plantation on cropland
Trees
Soil
Total
0 (0)
54 (4.9)
54 (4.9)
208 (18.9)
119 (10.8)
327 (29.7)
208 (18.9)
65 (5.9)
273 (24.8)
Northeast spruce/fir plantation on cropland
Trees
Soil
Total
0 (0)
61 (5.5)
61 (5.5)
70 (6.3)
146 (13.2)
216 (19.6)
70 (6.3)
85 (7.7)
155 (14.1)
Northeast spruce/fir planting on cutover forest
Trees
Soil
Total
9 (0.8)
161 (14.6)
170 (15.4)
72 (6.5)
161 (14.6)
233 (21.1)
63 (5.7)
0 (0)
63 (5.7) Source: Sampson (1995). Converted to kg-C/m2 by multiplying by 0.091.


