Embed Size (px)
Citation preview
Condition Monitoring of power Condition Monitoring ofpower Transformers
Er.R.Panneer SelvamSuperintending
Engineer(Retd.)(Protection and Communication)
Synopsis
Power transformer is the costliest Equipment inany substation and therefore is always desired to fixthe headlines of power Transformer. The un-expectedfailure of such vital equipment not only causefinancial burden, but also pose threat to the supply ofquality power to customer. There are several diagnosistests available to monitor the condition of Insulation.Some of them are dielectric loss angle (tan δ),dissolved Gas analysis (DGA), Furan analysis, andmeasurement of insulation resistance and monitoring thecondition by checking absorption Rates, polarizationIndex Etc.
Recently a number of physical, Chemical andelectrical Techniques have been devised to foridentifying quality of insulation. Some of them arefrequency response, response analyzer, Recovery voltagemeasurement practical discharge measurement etc. therecovery voltage measurement can effectively monitorthe moisture dynamics in paper / press boardinsulation. This paper reviews the effectiveness ofthe vatious techniques.
1 Introduction
Among the factors affecting the service life ofequipment for transmitting and distributing electricalpower are wear and tear and the aging process. Arealistic assessment of the condition of equipmentinvolves the measurement of parameters that are relevantto aging, and the interpretation of the acquired datausing reference values and databases and with the benefitof expert knowledge of the equipment. The objective is toobtain reliable information in order to make the correctchoice between the alternatives of maintenance, retrofit,or purchasing a new installation. The advantages for theequipment are the well targeted use of funds for thepurchase of new equipment and the identification of
existing operating risks, Benefits to operators oftransmission and distribution networks.
a) Optimized availability of resourcesb) Enhanced service to consumersc) Reduced overall operating costs.
2. Necessity
A diagnosis is advisable in the followingsituations, for example:
When technical condition of important or criticalequipment is unclear
When information is requires on which to base adecision on the postponement of an investment
When a particular item or equipment has beenincreasingly subject to failures, and the conditionother items of equipments of the same type thereforeneeds to be investigated
In order to obtain initial reference values as basisfor subsequent maintenance work or to identifytrends in the aging process.
To access the remaining service life of agedsubstation equipments.
To put together cost optimized spare parts packagesfor older equipments.
3. Diagnostic Tests on various Switch yard Equipment
Tests on power and Instrument TransformersA transformer Consist of :-
1. Paper Insulation2. Dielectic insulation3. Other auxiliaries
There are various diagnostic tests available fortransformer performing these is a time taking process inorder to assess the condition of there transformer it isessential to know the condition of the above parts. Hereeach part is taken separately and the various testsavailable on those are given. A brief Summary of thetests is given in the table.
Tests on Paper Tests on Oil Other tests
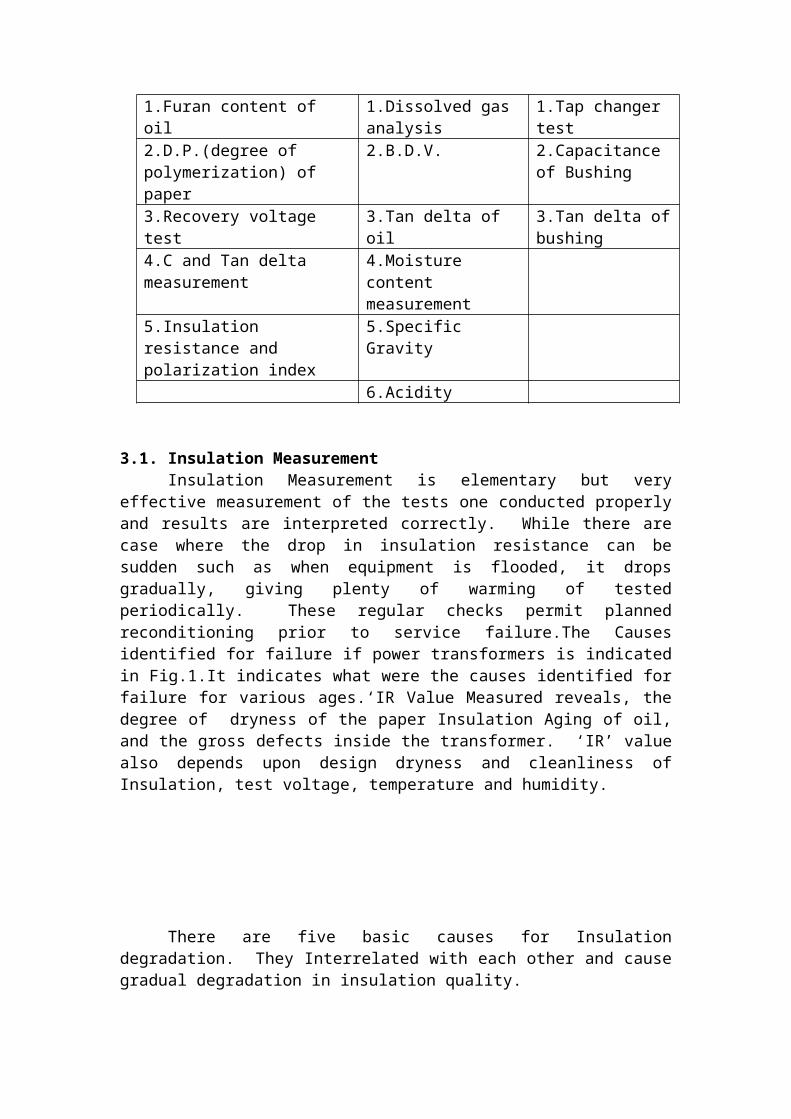
1.Furan content of oil
1.Dissolved gas analysis
1.Tap changer test
2.D.P.(degree of polymerization) of paper
2.B.D.V. 2.Capacitance of Bushing
3.Recovery voltage test
3.Tan delta of oil
3.Tan delta ofbushing
4.C and Tan delta measurement
4.Moisture content measurement
5.Insulation resistance and polarization index
5.Specific Gravity
6.Acidity
3.1. Insulation MeasurementInsulation Measurement is elementary but very
effective measurement of the tests one conducted properlyand results are interpreted correctly. While there arecase where the drop in insulation resistance can besudden such as when equipment is flooded, it dropsgradually, giving plenty of warming of testedperiodically. These regular checks permit plannedreconditioning prior to service failure.The Causesidentified for failure if power transformers is indicatedin Fig.1.It indicates what were the causes identified forfailure for various ages.‘IR Value Measured reveals, thedegree of dryness of the paper Insulation Aging of oil,and the gross defects inside the transformer. ‘IR’ valuealso depends upon design dryness and cleanliness ofInsulation, test voltage, temperature and humidity.
There are five basic causes for Insulationdegradation. They Interrelated with each other and causegradual degradation in insulation quality.
1. Electrical Stress :- When Insulator is designed for a particular voltage,
over voltage and under voltage may cause, abnormal stresswithin insulation, which can lead to crack ordelaminating of the insulation.2. Mechanical Stress
Mechanical damage such as butting a cable whiledigging a branch on due to mechanical forces developed atan windings when stop funted surge or traveling waveenters a transformer.3. Chemical attack
Insulation is affected by corrosive vapour and oilcan also operate to reduce the effectiveness ofInsulation.4. Thermal Stress.
Running equipment in excessively hot or coldconditions will cause over expansion and contraction ofInsulation which might result in cracks and failures.5. Environmental Contamination
Environment contamination ranges from moisture fromprocesses, to humidity on a muggy day, and even by attackby rodents that grows their way into insulation.
The Insulation tester, a hand operator ‘MEGGER’ dateback to early 20th Century when Sidney Evershed andEarnest vignoles developed their first insulation tester(Developed in 1903). The Modern Testing equipments withcombination of stable voltage and enhanced sensitivityare capable of measuring very small leakage currents andenhance then measuring range to terraohm ( TΩ).
4. Insulation Resistance Measurement4.1.1. Test Instrument
Megger provides resistance value in megaohms gigohmor teraohms. The instrument have dc Generator, whichgenerate the voltage to be applied on the test equipmentby either hand grank, battery operated or main’soperated. The total current circulated gives data formeasurement of insulation resistance
4.1..2. Component of Test CurrentThe resistance value is measured by computing the
value from applied voltage and leakage current through to
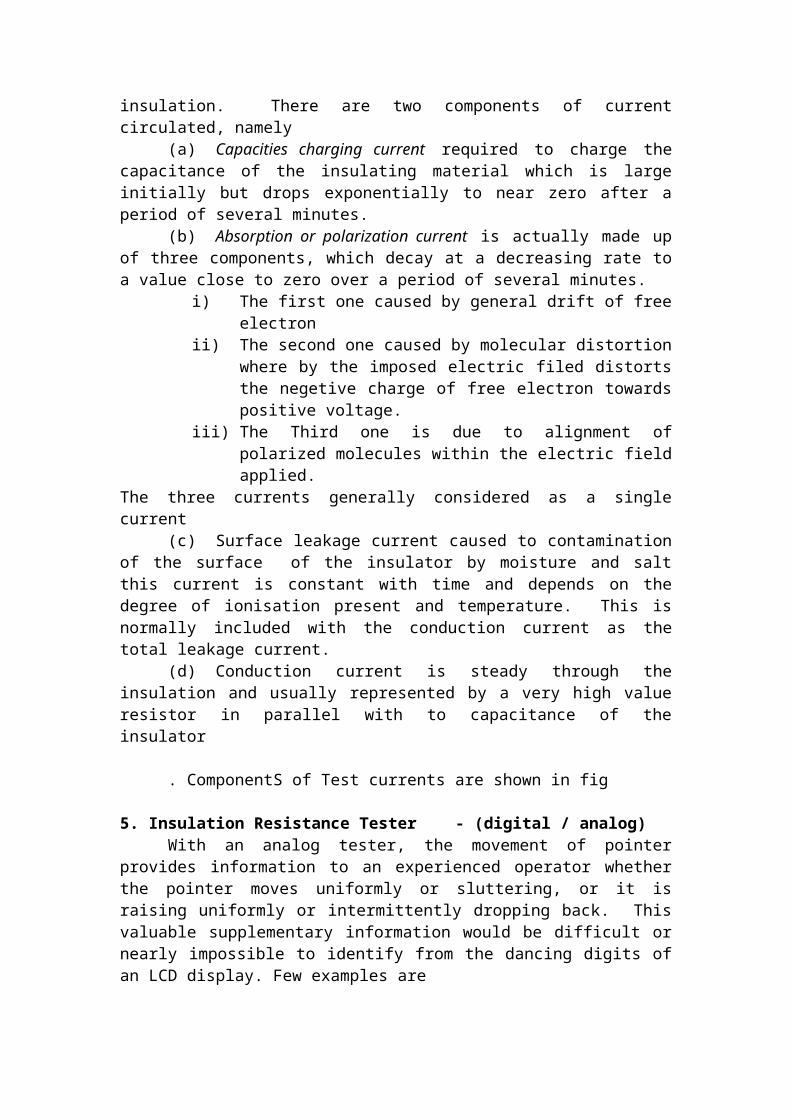
insulation. There are two components of currentcirculated, namely
(a) Capacities charging current required to charge thecapacitance of the insulating material which is largeinitially but drops exponentially to near zero after aperiod of several minutes.
(b) Absorption or polarization current is actually made upof three components, which decay at a decreasing rate toa value close to zero over a period of several minutes.
i) The first one caused by general drift of freeelectron
ii) The second one caused by molecular distortionwhere by the imposed electric filed distortsthe negetive charge of free electron towardspositive voltage.
iii) The Third one is due to alignment ofpolarized molecules within the electric fieldapplied.
The three currents generally considered as a singlecurrent
(c) Surface leakage current caused to contaminationof the surface of the insulator by moisture and saltthis current is constant with time and depends on thedegree of ionisation present and temperature. This isnormally included with the conduction current as thetotal leakage current.
(d) Conduction current is steady through theinsulation and usually represented by a very high valueresistor in parallel with to capacitance of theinsulator
. ComponentS of Test currents are shown in fig
5. Insulation Resistance Tester - (digital / analog)With an analog tester, the movement of pointer
provides information to an experienced operator whetherthe pointer moves uniformly or sluttering, or it israising uniformly or intermittently dropping back. Thisvaluable supplementary information would be difficult ornearly impossible to identify from the dancing digits ofan LCD display. Few examples are
a) As the test voltage increases and item under testapproaches breakdown or corona discharge cause thepointer to “jilter” indicating that the maximumwithstandable voltage is reached.
b) The speed in which the pointer moves givesinformation on the capacitance of the equipmentunder test.
3) If the pointer alternatively rises and falls back,it is an indication that there is internal arcing inthe specimen under test.
6. Evaluation and Interpretation of Resuelsa)Interpretation of value of ‘∞’ (infiinilty)readingThe range of measurement by insulation tester playsvial role. Normally a tester with maximum readingof 1000 will reed infinetly for a good insulator.However the operator knows only that insulation is‘good’, but with testers with extended range, uptoterraolms (1,00,000 mΩ) actual measurement can berecorded from the date of installation.Thereby enabling a long time line that gives themeasurement to the maintenance personnel plenty ofbreathing time. This has been illustrated in Fig.3.(b).Diagnostic High Voltage Insulation TestDiagnostic insulation tests covers a vide range ofTechniques, some of which involves portableequipment are
Trending Spot Test Time Constant Polarization Index (PI) Step Voltage (SV) Dielectric discharge (DD)
6.1. Trending Spot Test
White analyzing the test results it is to be notedthat the trend of the insulation value is more importantthan the absolute valve. For example the cases shown inFig, …..the apparatus “A” shows higher resistance valuecompared to apparatus ‘B’ ,but on observing the trend ofthe curve, the current of is almost flat and shows causeper concern. 6n the contrary, the curve of ‘A’ is diving
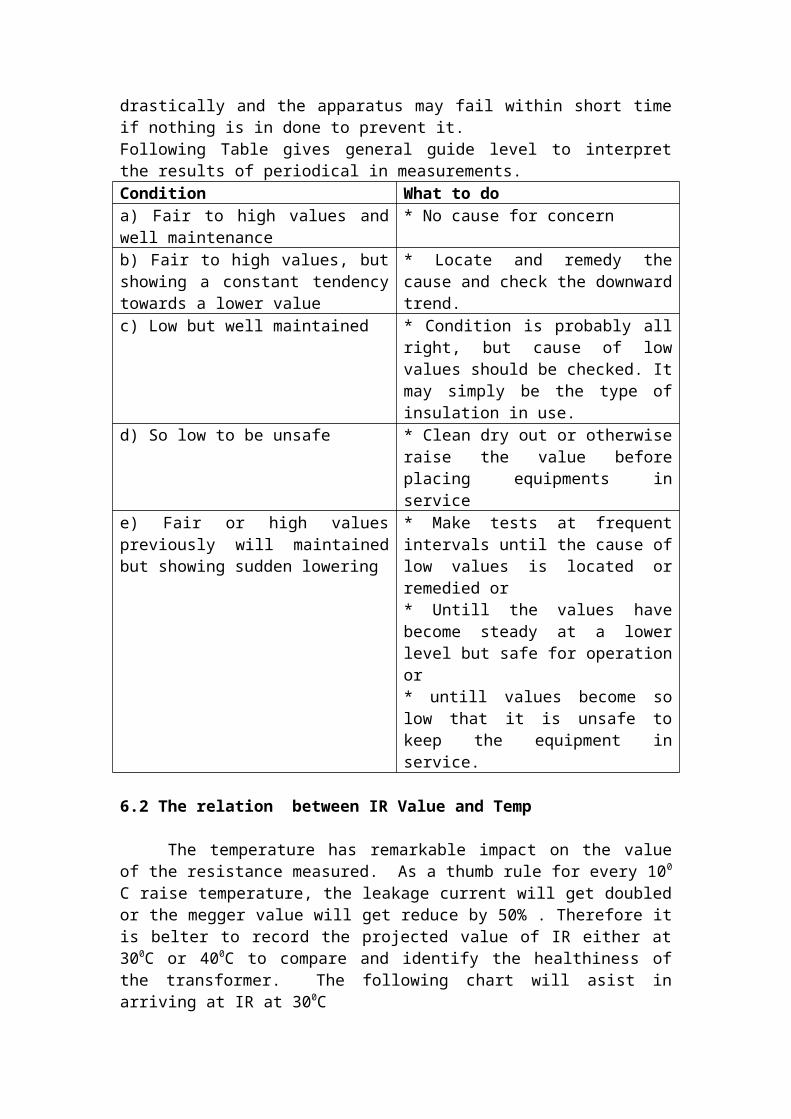
drastically and the apparatus may fail within short timeif nothing is in done to prevent it.Following Table gives general guide level to interpretthe results of periodical in measurements.Condition What to doa) Fair to high values andwell maintenance
* No cause for concern
b) Fair to high values, butshowing a constant tendencytowards a lower value
* Locate and remedy thecause and check the downwardtrend.
c) Low but well maintained * Condition is probably allright, but cause of lowvalues should be checked. Itmay simply be the type ofinsulation in use.
d) So low to be unsafe * Clean dry out or otherwiseraise the value beforeplacing equipments inservice
e) Fair or high valuespreviously will maintainedbut showing sudden lowering
* Make tests at frequentintervals until the cause oflow values is located orremedied or* Untill the values havebecome steady at a lowerlevel but safe for operationor* untill values become solow that it is unsafe tokeep the equipment inservice.
6.2 The relation between IR Value and Temp
The temperature has remarkable impact on the valueof the resistance measured. As a thumb rule for every 100
C raise temperature, the leakage current will get doubledor the megger value will get reduce by 50% . Therefore itis belter to record the projected value of IR either at300C or 400C to compare and identify the healthiness ofthe transformer. The following chart will asist inarriving at IR at 300C
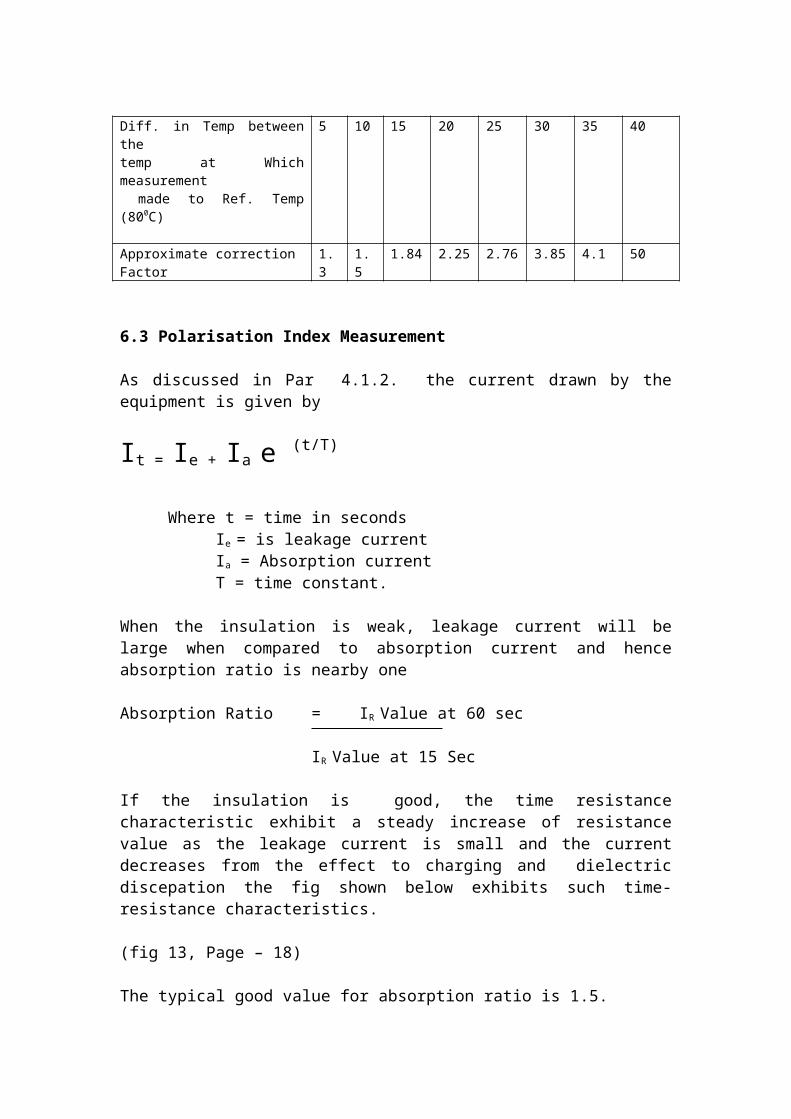
Diff. in Temp betweenthe temp at Whichmeasurement made to Ref. Temp(800C)
5 10 15 20 25 30 35 40
Approximate correction Factor
1.3
1.5
1.84 2.25 2.76 3.85 4.1 50
6.3 Polarisation Index Measurement
As discussed in Par 4.1.2. the current drawn by theequipment is given by
It = Ie + Ia e (t/T)
Where t = time in secondsIe = is leakage currentIa = Absorption currentT = time constant.
When the insulation is weak, leakage current will belarge when compared to absorption current and henceabsorption ratio is nearby one
Absorption Ratio = IR Value at 60 sec
IR Value at 15 Sec
If the insulation is good, the time resistancecharacteristic exhibit a steady increase of resistancevalue as the leakage current is small and the currentdecreases from the effect to charging and dielectricdiscepation the fig shown below exhibits such time-resistance characteristics.
(fig 13, Page – 18)
The typical good value for absorption ratio is 1.5.
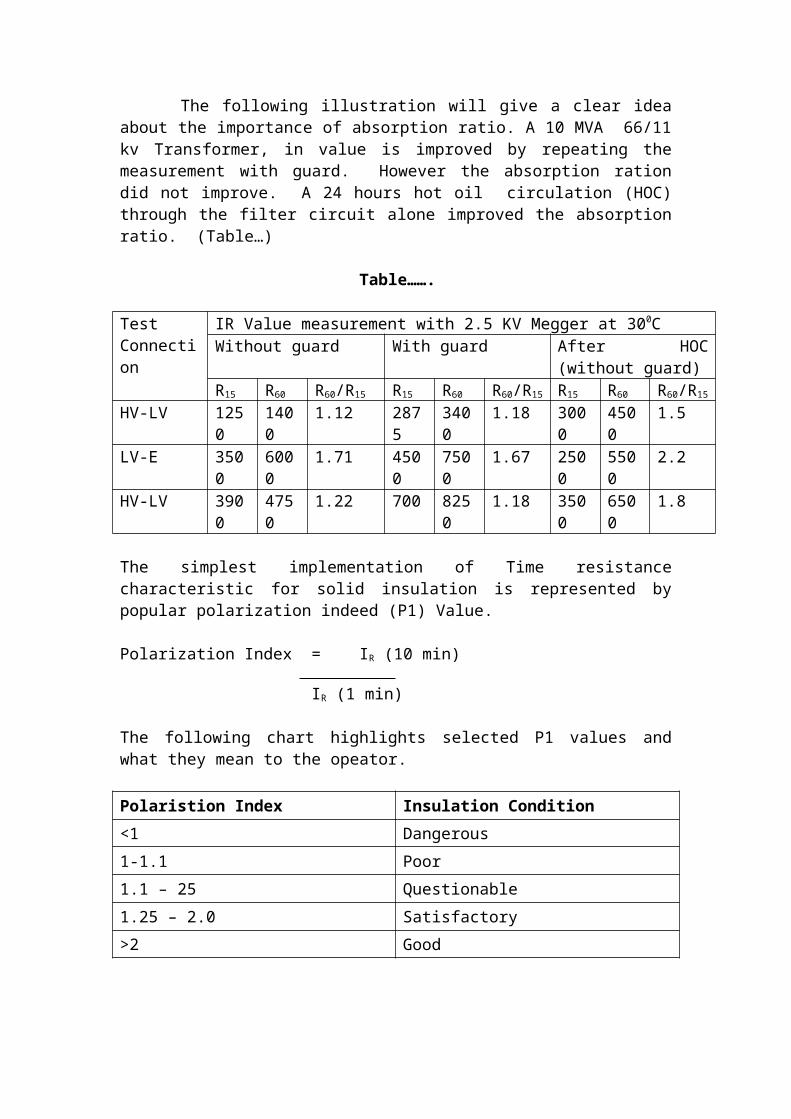
The following illustration will give a clear ideaabout the importance of absorption ratio. A 10 MVA 66/11kv Transformer, in value is improved by repeating themeasurement with guard. However the absorption rationdid not improve. A 24 hours hot oil circulation (HOC)through the filter circuit alone improved the absorptionratio. (Table…)
Table…….
TestConnection
IR Value measurement with 2.5 KV Megger at 300CWithout guard With guard After HOC
(without guard)R15 R60 R60/R15 R15 R60 R60/R15 R15 R60 R60/R15
HV-LV 1250
1400
1.12 2875
3400
1.18 3000
4500
1.5
LV-E 3500
6000
1.71 4500
7500
1.67 2500
5500
2.2
HV-LV 3900
4750
1.22 700 8250
1.18 3500
6500
1.8
The simplest implementation of Time resistancecharacteristic for solid insulation is represented bypopular polarization indeed (P1) Value.
Polarization Index = IR (10 min)
IR (1 min)
The following chart highlights selected P1 values andwhat they mean to the opeator.
Polaristion Index Insulation Condition<1 Dangerous1-1.1 Poor1.1 – 25 Questionable1.25 – 2.0 Satisfactory>2 Good
The benefit of the P1 Test is that it can provide anindication of the insulation quality in ten minutes onvery large pieces of equipment that might take an hour ormore to fully charge.
It is interesting to note that PI value of knowngood oil filled transformer is close to 1.0 which couldnot be easily understood or accepted. The reason is thepolarization index is more appropriate to solid insulation, whereabsorption of energy is required to reconfigure theelectronic structure of comparatively fixed moleculesagainst applied field. As P1 test is defined by thephenomenon, it cannot be successfully applied to a tofluid materials since the passage of test current throughan oil filled sample creates convection currents thatcontinuously swirls the oil resulting in a chaotic lackof structure that opposes the basic premise upon whichthe Pl Test rests.
6.4 step voltage Test.
In this two or more test voltages are applied insteps and 1 minute 1R values are measured therecommended ration for less voltage step is 1 to 5. Agood insulation will provide roughly same resistancevalues at higher voltage levels. A decrease in IR valuesof 25% or greater is an indication of excessive moisture.The Fig…… illustrates typical characteristics.
6.5 Recovery Voltage Measurement
This test is used to measure the aging of oil –paperinsulation of the transformer. This will enable assessingthe residual life of the power transformer.
This measurement is based on interfacialpolarization mechanism of insulation. It gives plot ofrecovery voltage vs time which helps us to detectabnormal aging of insulation .
6.6 C and Dissipation Factor(Tan- delta)(to detect the losses due to conduction and partialdischarges.)
Degradation of cellulose and increase in moisturecontent can cause in losses of insulation due toincrease in leakage current and partial discharges.This leads to increase in temperature of insulation andsubsequently reduction in life.This measurement will identify if there are increase inconduction losses or partial discharges.
6.7 Dissolved gas analysis of oil To interpret the concentration of free and dissolvedgases in transformer oil and diagnose the internalcondition of the transformer.
A transformer in service is subjected to twotypes of stresses they being Electrical and Thermalstress. The insulating material with in the transformercan break down as a result of these stresses to yieldgasses. The relative quantities of the above gassesvary according to the energy available fordecomposition of oil. The gasses mainly consist ofHydrogen, light hydrocarbons, and carbon oxides. Theconcentrations of these gases indicate the presence ofa fault and type of fault.The gases dissolved in transformer oil can be separatedby gas chromatography. The analysis of theconcentration of the various gasses and also the rateof the concentration of these gases can providevaluable information on the present condition of theoil filled equipment.
The most commonly used methods fordiagnosis are as per IEC…………and IS------------- are
a) Ratio methodb) Key gas methodc) Acceptance limits (shown in table)
The ratio is detailed in table… Key gas method isexplained in
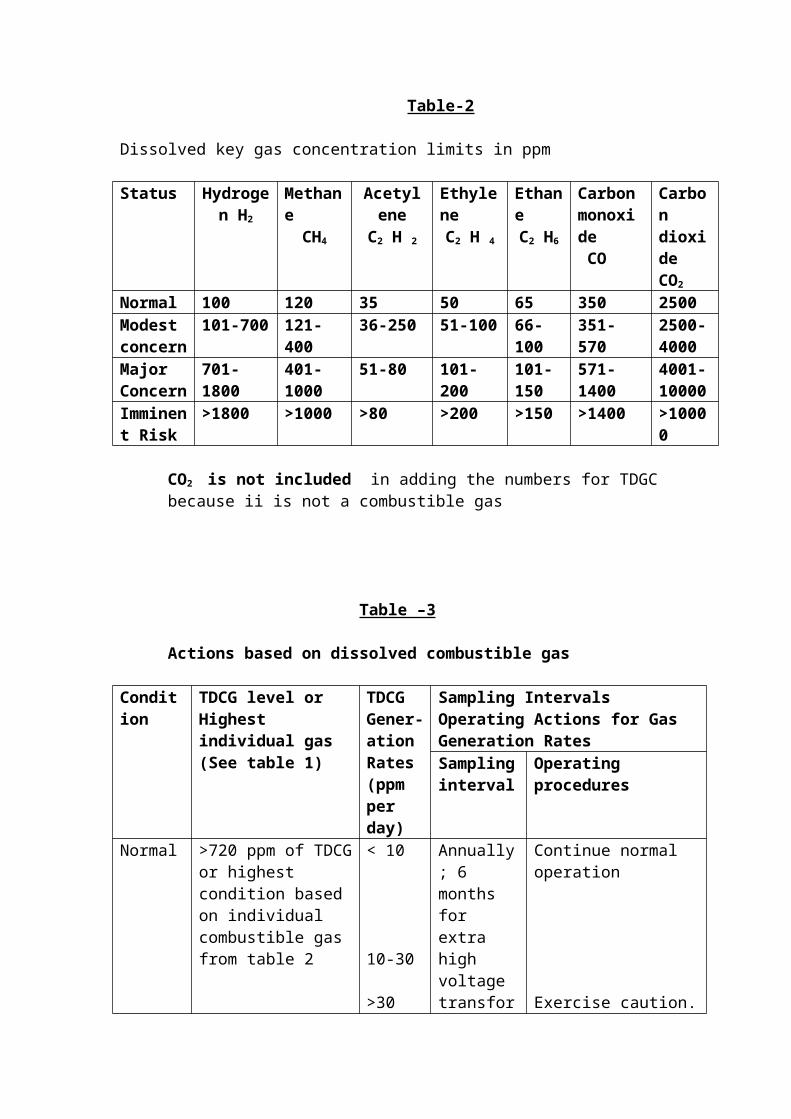
Table-2
Dissolved key gas concentration limits in ppm
Status Hydrogen H2
MethaneCH4
Acetylene
C2 H 2
EthyleneC2 H 4
EthaneC2 H6
Carbonmonoxide CO
Carbon dioxideCO2
Normal 100 120 35 50 65 350 2500Modest concern
101-700 121-400
36-250 51-100 66-100
351-570
2500-4000
Major Concern
701-1800
401-1000
51-80 101-200
101-150
571-1400
4001-10000
Imminent Risk
>1800 >1000 >80 >200 >150 >1400 >10000
CO2 is not included in adding the numbers for TDGC because ii is not a combustible gas
Table –3
Actions based on dissolved combustible gas
Condition
TDCG level orHighest individual gas(See table 1)
TDCGGener-ation Rates(ppm per day)
Sampling Intervals Operating Actions for Gas Generation Rates Samplinginterval
Operating procedures
Normal >720 ppm of TDCGor highest condition based on individual combustible gas from table 2
< 10
10-30
>30
Annually; 6 months for extra high voltage transfor
Continue normal operation
Exercise caution.
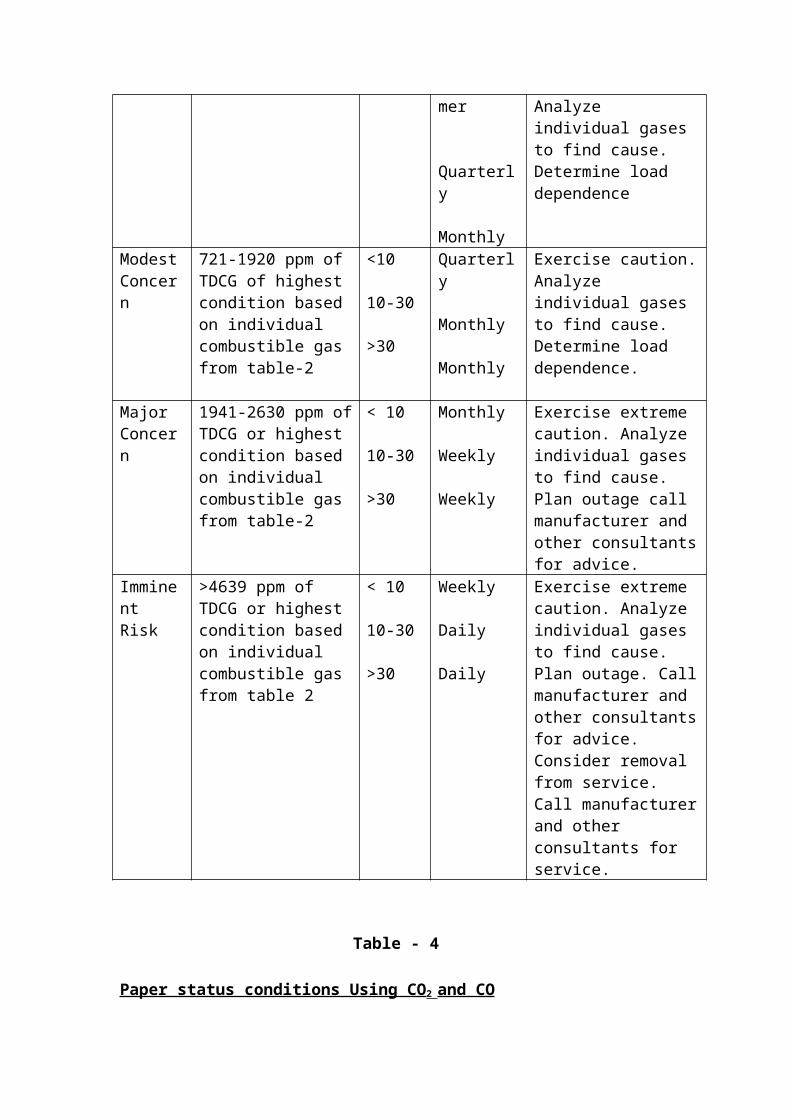
mer
Quarterly
Monthly
Analyze individual gases to find cause. Determine load dependence
ModestConcern
721-1920 ppm of TDCG of highest condition based on individual combustible gas from table-2
<10
10-30
>30
Quarterly
Monthly
Monthly
Exercise caution.Analyze individual gases to find cause. Determine load dependence.
Major Concern
1941-2630 ppm ofTDCG or highest condition based on individual combustible gas from table-2
< 10
10-30
>30
Monthly
Weekly
Weekly
Exercise extreme caution. Analyze individual gases to find cause. Plan outage call manufacturer and other consultantsfor advice.
Imminent Risk
>4639 ppm of TDCG or highest condition based on individual combustible gas from table 2
< 10
10-30
>30
Weekly
Daily
Daily
Exercise extreme caution. Analyze individual gases to find cause. Plan outage. Callmanufacturer and other consultantsfor advice. Consider removal from service. Call manufacturerand other consultants for service.
Table - 4
Paper status conditions Using CO2 and CO
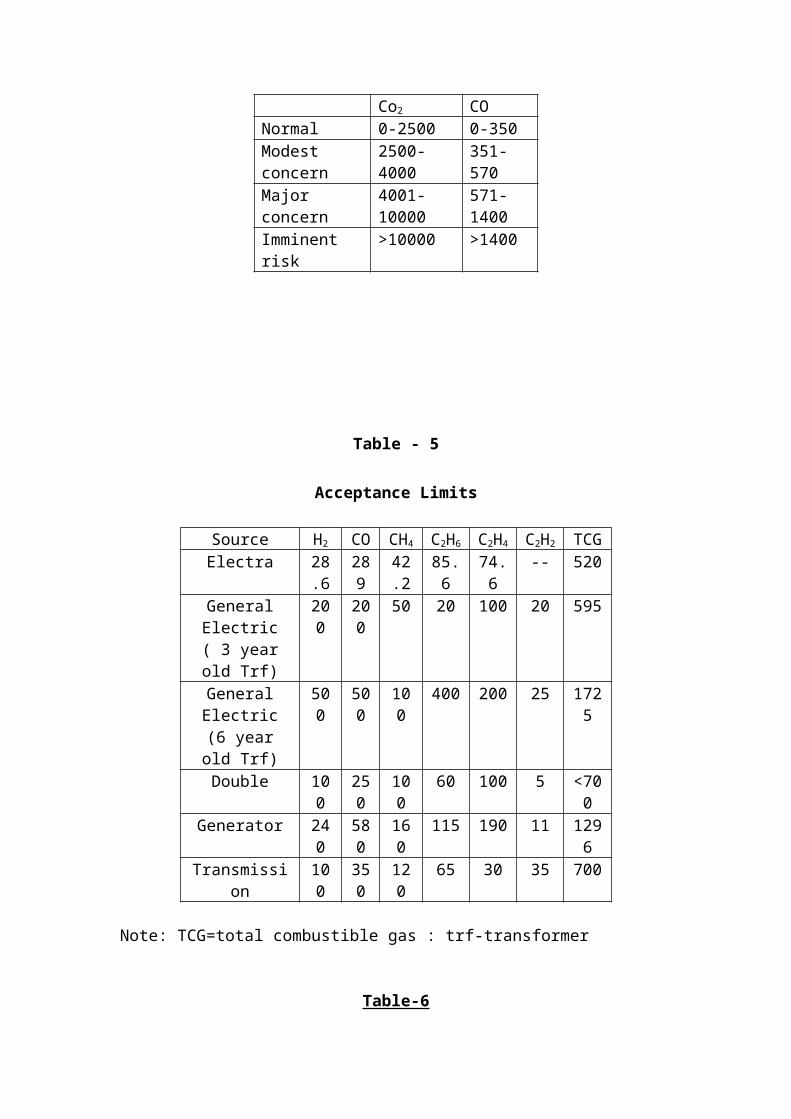
Co2 CONormal 0-2500 0-350Modest concern
2500-4000
351-570
Major concern
4001-10000
571-1400
Imminent risk
>10000 >1400
Table - 5
Acceptance Limits
Source H2 CO CH4 C2H6 C2H4 C2H2 TCGElectra 28
.6289
42.2
85.6
74.6
-- 520
GeneralElectric( 3 yearold Trf)
200
200
50 20 100 20 595
GeneralElectric(6 yearold Trf)
500
500
100
400 200 25 1725
Double 100
250
100
60 100 5 <700
Generator 240
580
160
115 190 11 1296
Transmission
100
350
120
65 30 35 700
Note: TCG=total combustible gas : trf-transformer
Table-6
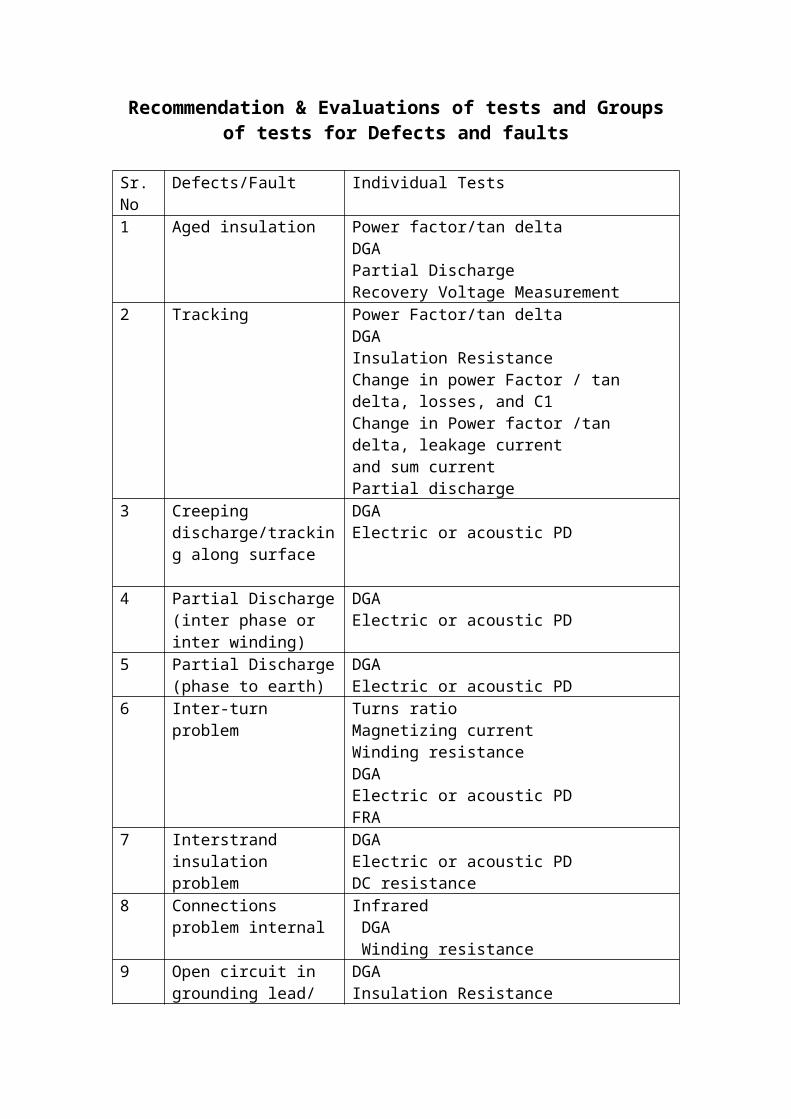
Recommendation & Evaluations of tests and Groupsof tests for Defects and faults
Sr.No
Defects/Fault Individual Tests
1 Aged insulation Power factor/tan deltaDGAPartial DischargeRecovery Voltage Measurement
2 Tracking Power Factor/tan deltaDGAInsulation ResistanceChange in power Factor / tan delta, losses, and C1Change in Power factor /tan delta, leakage currentand sum currentPartial discharge
3 Creeping discharge/tracking along surface
DGAElectric or acoustic PD
4 Partial Discharge(inter phase or inter winding)
DGAElectric or acoustic PD
5 Partial Discharge(phase to earth)
DGAElectric or acoustic PD
6 Inter-turn problem
Turns ratioMagnetizing currentWinding resistanceDGAElectric or acoustic PDFRA
7 Interstrand insulation problem
DGAElectric or acoustic PDDC resistance
8 Connections problem internal
Infrared DGA Winding resistance
9 Open circuit in grounding lead/
DGAInsulation Resistance
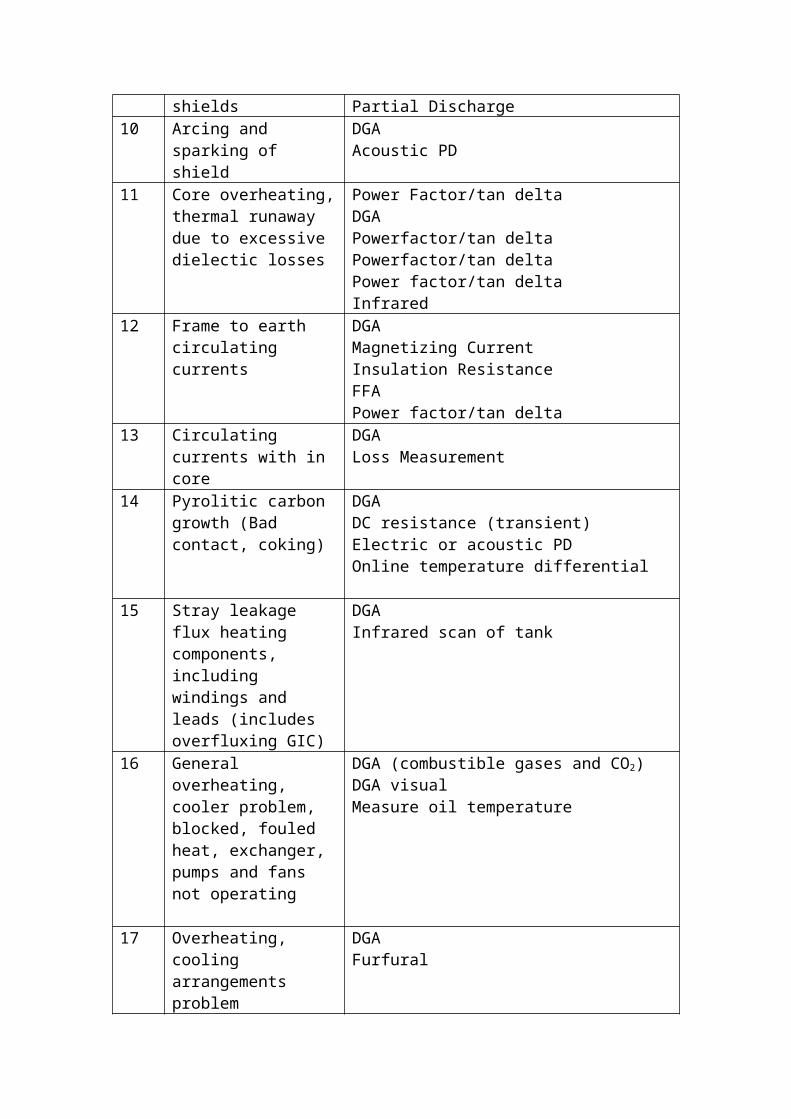
shields Partial Discharge10 Arcing and
sparking of shield
DGAAcoustic PD
11 Core overheating,thermal runaway due to excessive dielectic losses
Power Factor/tan deltaDGAPowerfactor/tan deltaPowerfactor/tan deltaPower factor/tan deltaInfrared
12 Frame to earth circulating currents
DGAMagnetizing CurrentInsulation ResistanceFFAPower factor/tan delta
13 Circulating currents with in core
DGALoss Measurement
14 Pyrolitic carbon growth (Bad contact, coking)
DGADC resistance (transient)Electric or acoustic PDOnline temperature differential
15 Stray leakage flux heating components, including windings and leads (includes overfluxing GIC)
DGAInfrared scan of tank
16 General overheating, cooler problem, blocked, fouled heat, exchanger, pumps and fans not operating
DGA (combustible gases and CO2)DGA visualMeasure oil temperature
17 Overheating, cooling arrangements problem
DGAFurfural
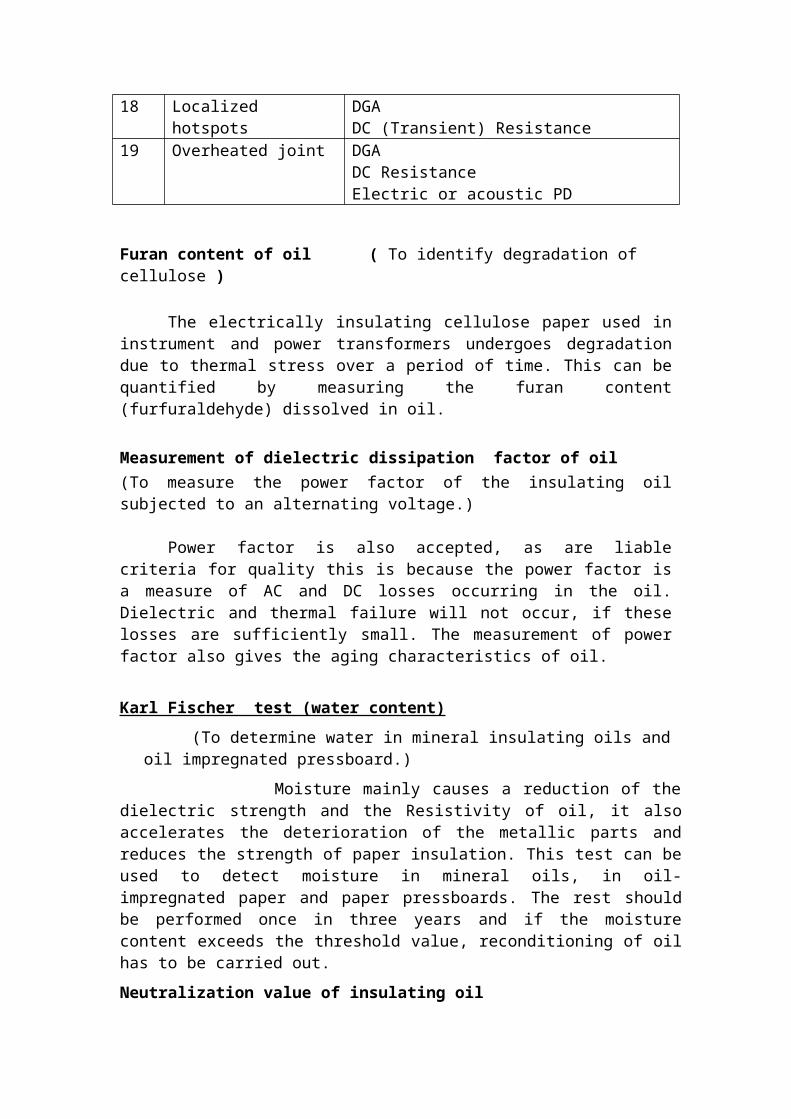
18 Localized hotspots
DGADC (Transient) Resistance
19 Overheated joint DGA DC ResistanceElectric or acoustic PD
Furan content of oil ( To identify degradation of cellulose )
The electrically insulating cellulose paper used ininstrument and power transformers undergoes degradationdue to thermal stress over a period of time. This can bequantified by measuring the furan content(furfuraldehyde) dissolved in oil.
Measurement of dielectric dissipation factor of oil(To measure the power factor of the insulating oilsubjected to an alternating voltage.)
Power factor is also accepted, as are liablecriteria for quality this is because the power factor isa measure of AC and DC losses occurring in the oil.Dielectric and thermal failure will not occur, if theselosses are sufficiently small. The measurement of powerfactor also gives the aging characteristics of oil.
Karl Fischer test (water content) (To determine water in mineral insulating oils andoil impregnated pressboard.)
Moisture mainly causes a reduction of thedielectric strength and the Resistivity of oil, it alsoaccelerates the deterioration of the metallic parts andreduces the strength of paper insulation. This test can beused to detect moisture in mineral oils, in oil-impregnated paper and paper pressboards. The rest shouldbe performed once in three years and if the moisturecontent exceeds the threshold value, reconditioning of oilhas to be carried out. Neutralization value of insulating oil
To determine the total acidity of used and unusedmineral insulating oils.
Acids in the oil attack the insulation and core ofthe transformer and also cause the formation of sludge.Measurement of neutralization value at regular intervalsgives data about acid level in the oil and timely action(filtration or reclamation) helps in minimizing the extentthe damage caused by the acids in oil.
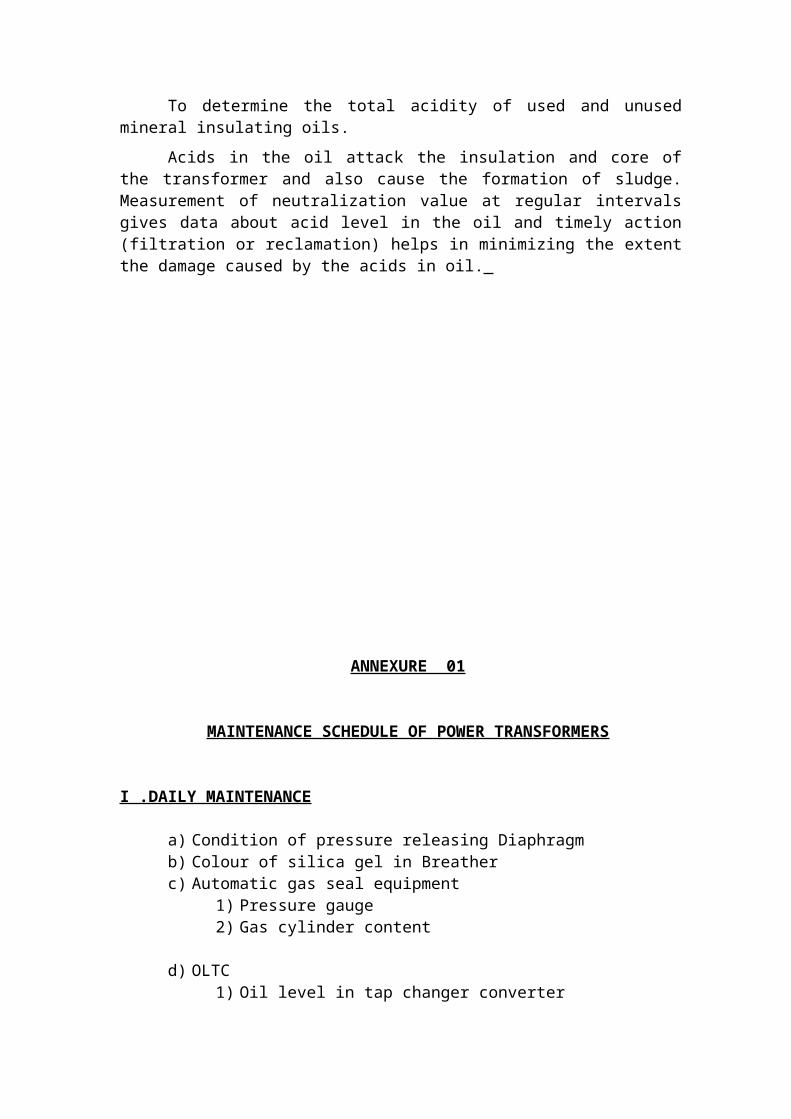
ANNEXURE 01
MAINTENANCE SCHEDULE OF POWER TRANSFORMERS
I .DAILY MAINTENANCE
a) Condition of pressure releasing Diaphragmb) Colour of silica gel in Breatherc) Automatic gas seal equipment
1) Pressure gauge2) Gas cylinder content
d) OLTC1) Oil level in tap changer converter
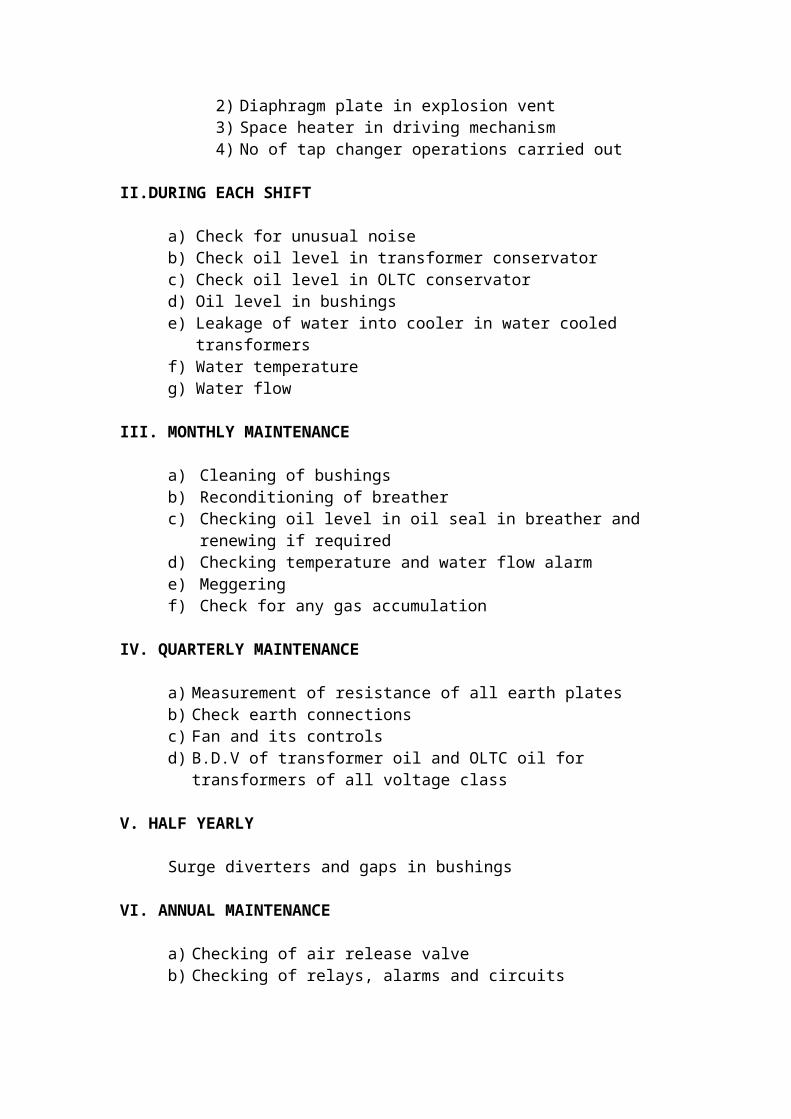
2) Diaphragm plate in explosion vent3) Space heater in driving mechanism4) No of tap changer operations carried out
II.DURING EACH SHIFT
a) Check for unusual noiseb) Check oil level in transformer conservatorc) Check oil level in OLTC conservatord) Oil level in bushingse) Leakage of water into cooler in water cooled
transformersf) Water temperatureg) Water flow
III. MONTHLY MAINTENANCE
a) Cleaning of bushingsb) Reconditioning of breatherc) Checking oil level in oil seal in breather and
renewing if required d) Checking temperature and water flow alarme) Meggeringf) Check for any gas accumulation
IV. QUARTERLY MAINTENANCE
a) Measurement of resistance of all earth platesb) Check earth connectionsc) Fan and its controlsd) B.D.V of transformer oil and OLTC oil for
transformers of all voltage class
V. HALF YEARLY
Surge diverters and gaps in bushings
VI. ANNUAL MAINTENANCE
a) Checking of air release valve b) Checking of relays, alarms and circuits
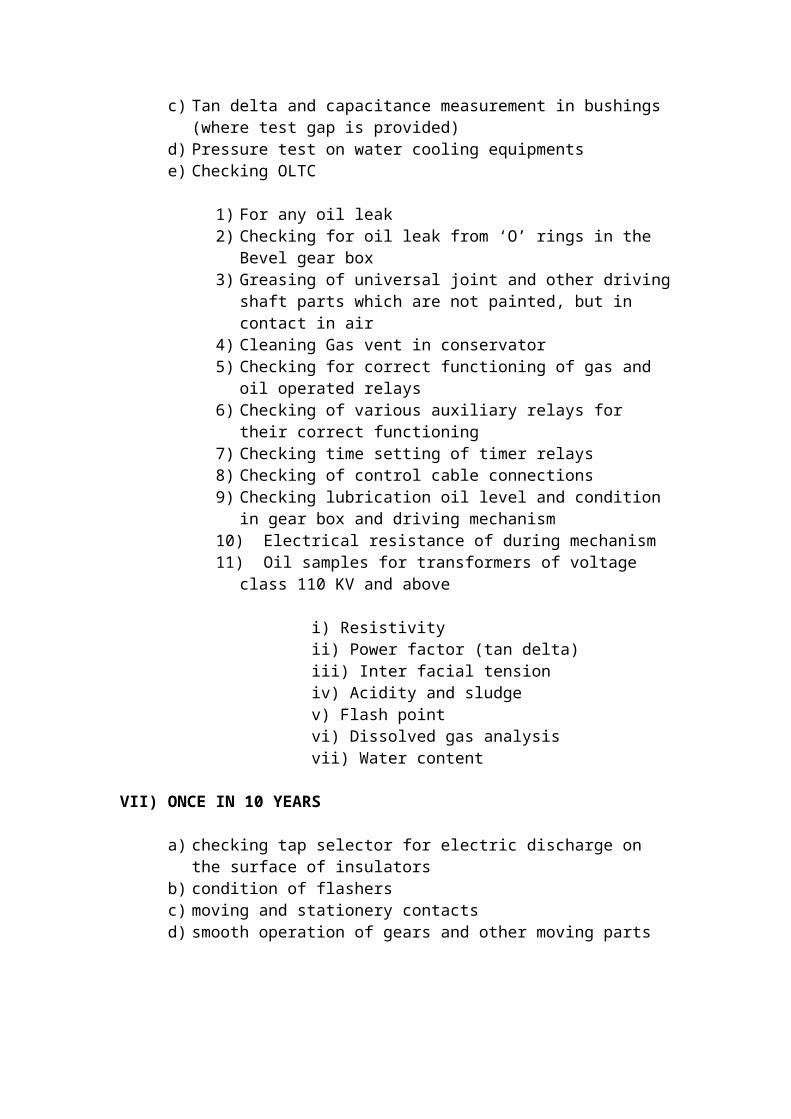
c) Tan delta and capacitance measurement in bushings (where test gap is provided)
d) Pressure test on water cooling equipments e) Checking OLTC
1) For any oil leak2) Checking for oil leak from ‘O’ rings in the
Bevel gear box3) Greasing of universal joint and other driving
shaft parts which are not painted, but in contact in air
4) Cleaning Gas vent in conservator5) Checking for correct functioning of gas and
oil operated relays6) Checking of various auxiliary relays for
their correct functioning 7) Checking time setting of timer relays8) Checking of control cable connections9) Checking lubrication oil level and condition
in gear box and driving mechanism10) Electrical resistance of during mechanism11) Oil samples for transformers of voltage
class 110 KV and above
i) Resistivity ii) Power factor (tan delta)iii) Inter facial tensioniv) Acidity and sludge v) Flash pointvi) Dissolved gas analysisvii) Water content
VII) ONCE IN 10 YEARS
a) checking tap selector for electric discharge on the surface of insulators
b) condition of flashersc) moving and stationery contactsd) smooth operation of gears and other moving parts


