Embed Size (px)
Citation preview
International Journal of RF Technologies 11 (2020) 81ndash107DOI 103233RFT-190210IOS Press
81
An IoT based rail track condition monitoring and derailmentprevention system
C Chellaswamyalowast TS Geethab A Vanathic and K Venkatachalamd
aDepartment of ECE Kings Engineering College Chennai IndiabDepartment of ECE Sriram Engineering College Chennai IndiacDepartment of ECE Rajalakshmi Institute of Technology Chennai IndiadDepartment of ECE Audisankara College of Engineering and Technology (Autonomous) GudurAndrapradesh India
Abstract This paper proposes a new method for monitoring the irregularities in railway tracks by updatingthe status of the tracks in the cloud The IoT based Railway Track Monitoring System (IoT-RMS) is proposedfor monitoring the health of the railway track The system identifies any abnormality in the tracks at an earlystage These abnormalities are rectified before they develop for smoother transportation The micro electromechanical system (MEMS) accelerometers are placed in the axle box for measuring the signal It becomeshard to identify the exact location of abnormalities when the global positioning system (GPS) falters dueto signalling issues In this paper a new hybrid method is proposed for locating irregularities on a trackeven in the absence of a GPS signal Pre-processing of the GPS signal is carried out effectively because thesensors used in IoT-RMS are capable of functioning in a high noise environment The IoT-RMS updatesthe location of the abnormality in the cloud and shares it with other trains that will be passing through thatlocation As a result the drivers of trains respond accordingly and avoid derailment An experimental setuphas been developed for a study of the performances for four different abnormal cases and the result showsthe effectiveness of the proposed system
Keywords Location of irregularity MEMS accelerometer track condition monitoring internet of thingsderailment
1 Introduction
Rail transport plays a vital role in our day-to-day life In the last ten years therehas been a remarkable growth in the infrastructure of the railway system especiallyin developing countries One challenge that arises is the ability to sufficiently powermonitoring equipment in remote location (Hodge et al 2015) A solution to the issuecould be to use batteries or a renewable source of energy However these sources ofenergy require constant maintenance which can be hindered in remote locations (Leeet al 2014) Tsunashima et al (2014) describe an in-service vehicle with sensors and
lowastCorresponding author C Chellaswamy Professor Department of ECE Kings Engineering CollegeChennai India E-mail chella infoyahoocoin httpsorcidorg0000-0002-2473-6042
1754-573020$3500 copy 2020 ndash IOS Press and the authors All rights reserved
82 C Chellaswamy et al An IoT based rail track condition monitoring
in the irregularities in the tracks are detected and relayed using a global positioningsystem
Trains generate significant amounts of force which causes the tracks to degradeover time (Bogacz et al 2007) In order to meet the safety standards created by theFederal Railroad Administration (FRA) continuous monitoring is necessary Wavelettransform-based track monitoring system has proposed by Lei et al (2018) It identifiesthe abnormalities of the track and inform to the control room Molodova et al (2014)have suggested a method to locate any surface problem on the tracks The track irregu-larities are detected using these signals An optimal track monitoring system based onaccelerometer signals has been discussed by Chellaswamy et al (2017a)
The signal is analyzed using the principal component analysis (PCA) which attractsour attention to the railway track signal analysis and fault detection The PCA methodis a standard multivariate technique capable of diminishing data dimensionality Dueto its simple structure it can quickly analyze and retain essential information (Giginet al 2018) PCA with gray relational analysis based multi-objective optimization wasintroduced by Gaurav et al (2020) for analyzing the vibrations from drilling Faultdetection based on the PCA method was proposed by Guannan and Yunpeng (2019)The ensemble empirical mode decomposition is essential for extracting informationfrom the noise The PCA method is required to detect faults by establishing the Q-statistic with a threshold Xianping and Feng (2019) suggested a new PCA method formanaging the unstructured data with a reduced number of variables This method issignificantly more efficient than the conventional methods of big data analysis
Zhai et al (2015) developed a test unit to locate abnormalities on tracks with high-speed trains A fiber optic monitoring system was recommended for its high sensitivityand dynamic range by Naderi and Mirabadi (2006) Konop and Konowrocki (2013)used the wheel-rail dynamics of the tracks for determining their health Lee et al(2012) used a three-filter band pass a compensation filter and a Kalman filter forthe estimation of track irregularities on high-speed railway tracks Chellaswamy etal (2013) Chellaswamy et al (2020) estimated the track abnormalities using a fuzzylogic-based monitoring system for improving the ride quality of rail transportation
Chellaswamy et al (2017b) have proposed the IoT based rail track monitoring sys-tem When the vibrations exceed a set threshold value the controller identifies thecoordinates and updates the cloud A video surveillance system may be necessary formonitoring locations with heavy fog (Chen et al 2016) The disadvantages of thismethod have been discussed by Jian et al (2015) and Huang et al (2019) Continuousvideo streaming requires broadband connectivity if not present then it will be hardto achieve accuracy and quality in the recognition of abnormalities Several pieces oftechnology require cloud-based technology such as industrial medical agriculturaland even home appliances (Feng et al 2016 Mainetti et al 2016 Kidd 2012 amp Amyet al 2017) Humanoid robots use IoT-based real-time networking Han-pang et al(2017) have compared this technology with the existing network parameters such asefficiency flow control and priority
Big data can process datasets of larger sizes efficiently unlike older software (Bevilac-qua et al 2017) New sets of techniques and technologies are used by big data to revealinsights from massive diverse and complex data sets With a large volume of sensor
C Chellaswamy et al An IoT based rail track condition monitoring 83
user and operation data accumulation in the railway industry the big data has becomethe main drive (Uckelmann amp Harrison 2010) The computer-based algorithm controlsthe physical entities of the modern railway system while trains are interconnected andact as communication hubs They collect information from the onboard devices andexchange the information with other trains and railway control centers The real-timestatus is shared and instructions are received from the control centers To improvesafety and performance a modern railway system should implement IoT and big data
In this paper the IoT-based railway track condition monitoring system is introducedfor establishing continuous monitoring of the railway tracks The PCA method waschosen for its simple software redundancy technique and false alarm reducing methodsIf any abnormality is detected in the track the corresponding coordinates are capturedfrom the GPS by the controller The location of the abnormality (LOA) is capturedwhen the acceleration signal exceeds the set threshold value When the train passesthrough any remote or hilly areas the signal either becomes weak or it will transpireHenceforth it becomes very difficult to find the faulty location So hybrid sensingmethod using proximity sensors are combined with the GPS for the estimation of theexact LoA The LoA is updated in the cloud server and the information is provided toother trains which pass through the fault location It also provides information to othertrains to enable the drivers to reduce their speed to avoid derailment The messageis also sent to the maintenance department so they can take necessary action Thenovelties of the proposed IoT-RMS are as follows
bull Principal component analysis-based preprocessing and fault detection method areused
bull A hybrid sensing method is introduced for estimating the exact location of abnor-mality even when the GPS signal is absent
bull The information is updated in a cloud server and shared with other trains that maypass through the same location
2 Proposed IoT-RMS
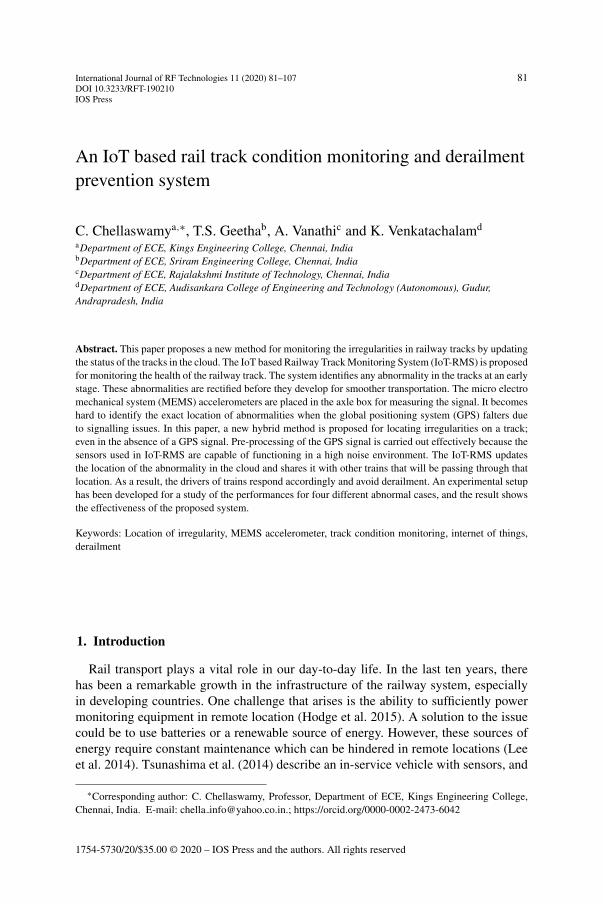
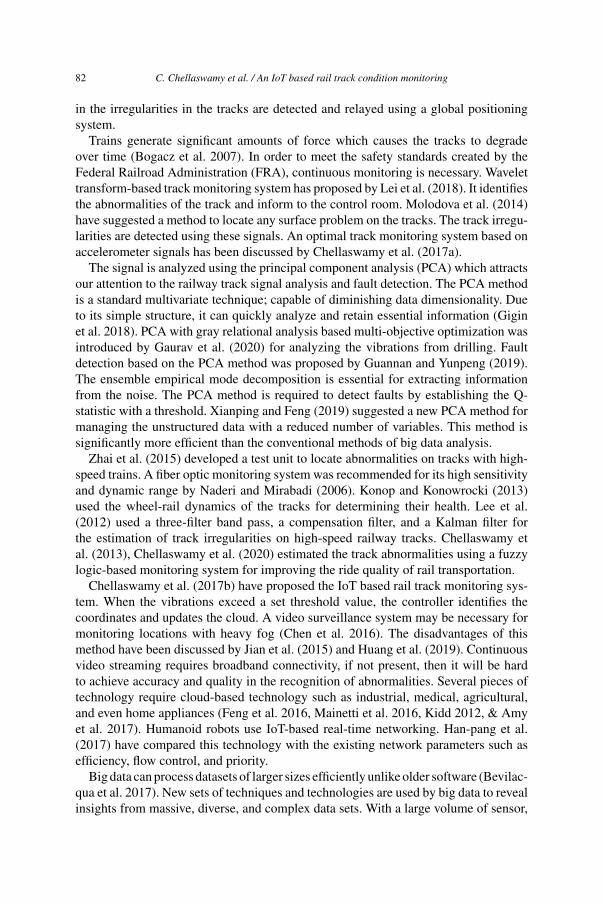
This section discusses the IoT-RMS that helps to avoid train derailment Differenttypes of sensors such as speed and acceleration sensors are used locate anomalies Thesensors are mounted in the passenger or goods railcars and integrated with the IoTcloud for storage and processing Accelerometers have been installed in the verticaland lateral direction of the axle-box When any abnormality is detected the controllersends details of the abnormality with location information to OpenGTS (open sourceGPS tracking system) server MongoDB a distributed database is used to store andtrack information about abnormalities collected from trains (Divya amp Ziliang 2017Anand amp Mallikarjuna 2017) Alert message can be shared to the driver of the trainthat is going to pass through the abnormalityrsquos location This allows the driver to prepareand react accordingly before passing through the location to avoid derailment Fourdifferent abnormalities namely cracks rusted deformations on rail tops loose boltsand missing bolt are considered and are shown in Fig 1 GPS-DSM132 a trackerdevice was used for tracking the location of irregularities It measures and records
84 C Chellaswamy et al An IoT based rail track condition monitoring
(a) (c)
(b) (d)
Fig 1 Examples of track abnormalities (a) deformation with crack (b) rusty deformation on rail top (c)loose bolts and (d) missing bolt
geo-location coordinates such as latitude longitude as well as velocity This deviceensures accuracy while also being compact in size and is easy to handle Hence it iswidely used in applications like mobile objects and vehicle tracking
A 4G network is used for the transfer of abnormality location coordinates from arail vehicle to an OpenGTS server ATM buses in Messina use this system for locationtracking (The OpenGTS project httpopengtssourceforgenet) Open source GPStracking systems (OpenGTS) are used for web-based tracking The restful approachperforms communication between OpenGTS and trackers and is used in passen-ger trains goods wagons high-speed trains etc Tracking information provides twofunctions 1) An open street map like the one used by OpenGTS for visualizing geo-located information on a map (The OpenDMTP Project httpwwwopendmtporg andhttpopengtssourceforgenetdocumentationhtml) 2) The geographic data structureis encoded by human and machine-readable system GeoJSON The geo-informationSQL-GeoJSON translator is used for visualizing
Abnormalities on the track are detected using accelerometer signals The receivedsignals are preprocessed by Principal Component Analysis Method (PCAM) In this
C Chellaswamy et al An IoT based rail track condition monitoring 85
Table 1Technical specifications of ADXL345 accelerometer
Parameters Values
Type ADXL345
Image
Manufacturer Analog DevicesAxis 3Voltage (V) 18 ndash 36Current (A) 350Interface SPI I2CPrecision 3 gTemperature ( C) 85Price ($) 3
study the statistics-based correlation method is used for fault identification due to itssimple structure speed and faster estimation time The correlation analysis has beenperformed between the measured signal and the track geometry measurement signal(Lee et al 2012) (for more details refer to section 23) Table 1 shows the variousparameters of the accelerometer Accelerometers are suitable for track monitoring sys-tems because they have decent scalability stability are relatively light and significantlycheaper Hence this paper proposes an accelerometer based measurement and trackingsystem for increasing the safety of the passengers
The workflow of IoT-RMS is shown in Fig 2 This algorithm checks the statusof the track continuously and updates it in the cloud GPS finds the location of theabnormality and the controller transfers this information to the driver before the traincrosses this location Track measurements are sent to a cloud server and decision aremade involving this workflow The accelerometer signals (Ax) the GPS data (DGPS)the IoT-ESP8266 (DIoT) and the GSM (DGSM) data are present in the track measure-ment section The controller turns on the proximity sensor when the GPS signal is lessthan the set threshold value (ATHD) or is completely absent When proximity sensorsstart to measure the abnormalities during the absence of the GPS signal (DPRO) (refersection 4 for more information) and the total abnormal distance is obtained as DPRO+DGPS The controller updates the abnormality location information to the cloud Theinformation will be updated by the first two trains who detect the irregularity If thefirst two trains update the cloud server with same location information then the serverultimately decides there is an abnormality present It will then share the current abnor-mality information (Dcur) to all the trains that will pass through the location If anytrain detects an abnormality (Drec) it will check both the Dcur and Drec If both areequal it will discard the process of updating the abnormality in the database
86 C Chellaswamy et al An IoT based rail track condition monitoring
Fig 2 Workflow of the proposed IoT based track monitoring system
C Chellaswamy et al An IoT based rail track condition monitoring 87
21 PCAM
The PCAM retains most information of the original data while transforming a set ofcorrelated variables onto a set of uncorrelated variables The abnormalities are detectedand isolated from the uncorrelated variables method (Li et al 2012) The data matrix(A) consists of m variables and n samples decomposed as a sum of the residual matrix(G) along with an estimation matrix (A)
A = G +(A
) = t1PT1 + t2PT
2 + middot middot middot + tkPTk (1)
In the equation above t and P respectively denote the scores and loading matricesof A Both the vectors ti and Pi are orthonormal Now ti can be expressed as
ti = AnPi (2)
The new observation An is equal to the 1 times M vector and the corresponding score ti isequal to a 1 times A vector PCAM has the capability to handle a data set with larger dimen-sion For instance it is currently used to analyze genomic data which has significantlymore variables (Milting et al 2013)
Statistics such as Q and T2 are used to detect the faults of PCAM The Q andT2 measure the corresponding variation in G and A (Jiang 2011) In particular theQ statistics measure the lack of fit between the model and the testing vectors Onthe other hand the T2 statistics quantifies variations within the model When abnor-malities are detected the limits are consistently exceeded A confidence level can beestablished from these statistics The confidence level can then be used for monitoringthe railway tracks Both the Q statistics and T2 statistics can be expressed based on Li(2011) as
Qk =sumN
k=1
(tk minus βk
σk
)2
(3)
T 2n =
sumM
n=1(en)2 (4)
Here tk σk and βk denote the score of the observation in the k-th component themean and the standard deviation of the scores of that component in the calibrationdata respectively en represents the residual value corresponding to the n-th variableThe analysis is done in two steps 1) Initially the received data is inspected for specialcauses of vibration which are iteratively solved Once the collected data is free ofspecial causes of variation it is used to model the normal operation condition of thecalibration of the IoT-RMS Next the IoT-RMS monitors new data 2) In the secondstep the monitored data and calibration data are distinguished The scores are linearcombinations of the original variables and normally distributed As a result the T2-statistic is multiplied by a constant while also following a beta distribution (Tracy et al1992) This is given by
T 2sim (P minus 1)2
PBA
2 (PminusAminus1)2 (5)
88 C Chellaswamy et al An IoT based rail track condition monitoring
where P and B denotes respectively the number of observations and beta distributionsHence the upper limit (UL) for the T2-statistic at significance level is given by
UL(T 2
)γ
= (P minus 1)2
PBA
2 (PminusAminus1)2 (6)
whereBA2 (PminusAminus1)2 is the 100(1-) percentile of the corresponding beta distribution
that can be computed from the 100(1-) percentile of the corresponding F distribution(for more details readers can refer Tracy et al 1992) When done in by the same methodUL for the T2 statistics for new incoming data is given by
T 2simAP
(P2 minus 1
)(P minus A)
FA(PminusA) (7)
UL for theT2 statistic at significance level is given by
UL(T 2
)γ
= A
P
(P2 minus 1
)(P minus A)
F(A(PminusA))γ (8)
Several procedures can be used for setting the UL for Q-statistics Here assume thatthe residuals follow a multi-normal distribution and the significance level is given by
UL(Q)γ = α1
⎡⎣zθ
radic2α2j
20
α1+ 1 + α2j0 (j0 minus 1)
α21
⎤⎦
1j0
(9)
where αn = sumrank(X)a=A+1 (λa)n with rank(X) is the rank of the data matrix X and λa is the
eigenvalues of matrix 1Pminus1 middot EA middot ETAEA is the matrix of residuals j0 = 1 minus 2α1α3
3α22
and Zθ is the 100(1-) normal percentile
22 Preprocessing of signal
The sensors used in IoT-RMS works under high noise and humid environments Sonoise-like fluctuations are predictable during real-time signal measurement (Yabin etal 2017) The abnormal fluctuations in the received IoT-RMS consist of singular pointsand random fluctuations The monitoring result of the measured signal of the railwaytrack is shown in Fig 3 The results of both the T2and Q statistics are not enoughto consistently alarms As a result the preprocessing of data is needed for IoT-RMSsignal measurements In this study the statistics-based correlation method is used dueto its simple structure and efficiency (Chunli et al 2012) The random error from thesensors have three standard deviations (Walpole 2012) The singular point eliminationcan be expressed as∣∣ki minus k
∣∣ gt 3σ (i = 1 2 n) (10)
Where ki σ and k denotes respectively the singular point the standard deviation andthe arithmetic average If ki satisfies Eqn 10 it is removed from the measured signalThe acceleration signals are measured from two different locations and the singular
C Chellaswamy et al An IoT based rail track condition monitoring 89
Fig 3 Measured signal of the railway track (a) T2 statistics (b) Q statistics
Fig 4 Singular points elimination (a) deformation with crack (b) missing bolt
point removal is shown in Fig 4 The effectiveness of the singular points eliminationmethod is evident in Fig 4 The random fluctuations of the measured signal from IoT-RMS have to be reduced and thus arithmetic average filtering discrete wavelet analysisweighted recursive filtering and median filtering are widely used to remove the random
90 C Chellaswamy et al An IoT based rail track condition monitoring
fluctuations The discrete wavelet transform (DWT) has its advantages when localizingwhich reduces the noise present (Messai et al 2015) DWT is used in this study forthe denoising process The discretized wavelet function can be represented as
ψmn (k) = 1radicαmψ
(k minus nβαm
αm
)(11)
where m ψ(k) and nm denotes respectively the scale parameter the motherwavelet and the shift parameters Commonly dyadic grid values such as and havechosen 2 and 1 The dyadic grid wavelet function can be written as
ψmn (k) = 2minusm2ψ(2minusmk minus n
)(12)
The information represented by these discrete dyadic wavelets do not repeat andtherefore allow complete reconstruction The DWT for any signal y(k) can be written as
Dmn =sum
ky (k)ψmn (k) (13)
where Dmn is known as the detail coefficient The detail coefficient acts as a generalthresholder at each level of decomposition is generally using a universal value in orderto remove the noise (Kopsinis amp McLaughlin 2009)
The hard and soft threshold values for D can be calculated as
fn (D) =D if D Th
0 otherwise(14)
and
fs (D) =⎧⎨⎩Dminus Th if D Th
D+ Th if D Th
0 if D lt Th
(15)
where the threshold value is represented by Th = σradic
2log (N) σ is the standard devi-ation of the noise and can be calculated from the median of the detail coefficientsDmn σ = MAD
(∣∣Dmn∣∣)06745 MAD is the median absolute deviation of the detailcoefficient as given by
MAD = Median∣∣Dmn minusMedian
(Dmn
)∣∣ (16)
To study the effectiveness of the random fluctuations Fig 2 is used again Theresults of random fluctuation reduction from the measured signal is shown in Fig 5It is evident from Fig 5 that the random fluctuation is greatly reduced This greatlyreduces Q and T2 false alarms It can be concluded that the preprocessing is necessaryfor the IoT-RMS signal measurement
23 Parameter selection and fault detection
After preprocessing the data of IoT-RMS the next step is to develop a model withpreprocessed data In this study the correlation analysis has been performed betweenthe measured signal (m) and the track geometry measurement signal (n) Correlation
C Chellaswamy et al An IoT based rail track condition monitoring 91
Fig 5 Reduction of random fluctuation (a) T2 statistics (b) Q statistics
refers to the relation between the coefficient of two signals (m n) and it can be exp-ressed as
Rmn =sumki=1 (m (i) minus m) (n (i) minus n)radicsumk
i=1 (m (i) minus m)2radicsumk
i=1 (n (i) minus n)2
(17)
where m and n represent the mean value of the signal m and n respectively A highercorrelation between m and n typically indicates a higher R value
After preprocessing and selecting the parameter of the received signal of IoT-RMSthe accuracy and stability of the detection stage is improved by introducing anotherconfidence limit This method reduces the false alarm of T2 and Q statistics The secondconfidence limit can be expressed as
f (xβ y) =sumx
i=0P (xβ y) =
sumx
i=0Cinβ
i(1 minus β)nminusi lt α (18)
where y is the basic observation window length x is the maximum allowable value is the false alarm probability and is the experience value determined from the modelIf the false alarm signaled by the T2 and Q statistics exceed the maximum value x thenx will become the faulty true state The track abnormality can be detected when the T2
and Q statistics exceeds the second confidence
24 Performance indicators
There are four different test indexes the Mean Square Error (MSE) the Relative Error(RE) Signal to Noise Ratio (SNR) and Correlation Coefficient (CC)These are used
92 C Chellaswamy et al An IoT based rail track condition monitoring
in this evaluation between original and denoised measurements A statistical analysiswas carried out for evaluating the results of the proposed IoT-RMS The performanceof the proposed PCAM-DWT was compared with two other related methods namelythe conventional measurement (CM) and the sliding window average (SWA) methodThe test was performed with the measured data and the data was recorded identify ifthe tracks were in a healthy condition The MSE can be expressed as
MSE =radicsumN
i=1
(Pmesi minus Pd
)2
N(19)
where Pmes and Pd represent the original and denoised data Obviously a smaller MSEmeans a smaller error RE can be expressed as
RE =sumNi=1
(Pmesi minus Pd
)Pd
(20)
A traditional method to measure the noise level in the measurements is defined as
SNR = 10 times log
⎛⎝
sumNiminus1
(Pmesi
)2N
(RMSE)2
⎞⎠ (21)
The CC between original and denoised measurement can be expressed as
CC =sumNi=1
(Pmesi minus Pmesi
) (Pdi minus Pd
)radicsumN
i=1
(Pmesi minus Pmesi
)2radicsumN
i=1
(Pdi minus Pd
)2(22)
From the definition it can be seen that a higher CC implies a stronger relationshipbetween original and denoised measurements
The performance indicators for PCAM-DWT for the proposed IoT-RMS is comparedwith the SWA and CM methods In the SWA method the window length is 12 Thiswas selected based on several experiments conducted by Pei and Guo (2001) The testvalues of the performance indicators for the four different cases of IoT-RMS are shownin Table 2 Table 2 shows the variations of MSE from 0304 to 0701 the lowest valuefor PCAM-DWT for all the four cases and the largest value for CM The relative errorof the proposed method was the lowest followed by SWA and CM This indicates thatthe proposed PCAM-DWT provides higher SNR and CC compared to other methodsBased on the definition of the performance indicators the proposed PCAM-DWTprovides a better denoising effect and it is suitable for IoT-RMS
3 Cloud architecture
IoT based railway track monitoring systems present in the trains are connected to thecloud server The controller of the track monitoring system performs various operationsnamely abnormal location identification updating of the cloud server and duplicationmonitoring The event hub is placed to receive the data from different tracks It can
C Chellaswamy et al An IoT based rail track condition monitoring 93
Table 2Test results of different performance indicators for the four test cases
Abnormalities Methods
CM SWA PCA-DWT CM SWA PCA-DWT
MSE RE
Deformation with crack 0638 0431 0372 3025 2849 2683Rusty deformation on rail top 0701 0528 034 2973 2628 2392Loose bolts 0679 0420 0351 2893 2710 2471Missing bolt 0592 0398 0304 3172 2921 2729
SNR (dB) CC
Deformation with crack 627 652 745 0893 0953 0982Rusty deformation on rail top 674 689 802 0875 0937 0975Loose bolts 658 718 764 0892 0952 0986Missing bolt 671 674 848 0873 0963 0974
Fig 6 Proposed architecture for smart track monitoring system
capture thousands of events and handle multiple applications (Xiaowei et al 2017) ASQL warehouse stores the data as big data analyzes it for load forecasting visual dataand control etc If further action in required results are shared with the central controloffice The generic architecture of the IoT-RMS is shown in Fig 6 The architecturehas four layers a perceptionaction layer a transfer layer a data engine layer and anapplication layer These are discussed in the following sections
94 C Chellaswamy et al An IoT based rail track condition monitoring
31 Perception and action layer
Apart from on-board railway track monitoring via sensors the network also receivesinformation from different sensors such as sensors mounted in infrastructure environ-mental sensors and the detectors that gather information from the rail passengersOther key parameters namely bogie conditions bearing temperature power supplyvoltage and the amount of air braking are obtained from the different sensors mountedin a modern train These parameters help identify the exact condition of the train Inthis study the condition of the railway tracks is measured through an accelerometer andanalyzed by the controller present in each train The controller sends the abnormalityinformation with the location coordinates to the transport layer for further operationVarious trains are linked wirelessly to a local node The node can identify the trainsthrough its ID number
32 Transfer layer
On receipt of the data from the perception layer it is first pre-processed for meetingthe requirements of the upper layers For example information relating to the status ofthe train is transferred to the data server Train-ground wireless networks such as GSM-R network long-term evolution for railways (LTE-R) networks or 4G5G networksare used for sending information relating to the track condition air brake pressure andbearing temperature to the core network (Huansheng et al 2020) Then the representa-tive node transmits the compressed data to the core networks This reduces the amountof data exchanged between the sensors and the networks Thus it is a heterogeneousarchitecture considering the existence of various data sensing and transfer networksThe key status would need to be updated to the control center so the necessary stepscan be taken within a short span of time This means that data transfer must be highlyefficient It is essential that the data transmission link is robust The link must withstandextreme network situations like fast fading shadowing and high Doppler frequencyshifts Additionally the network must be elastic in order to enable the accommodationof a larger number of sensors and monitors In general the network should be robustelastic and stable in order to adapt to various situations
33 Data engine layer
Data from the different sources should be processed before it is used by the applica-tions Smart railway data has the following characteristics 1) Data may be a numbertext audio video and image It can be structured semi-structured or unstructureddata 2) Huge data in the range of a few dozen terabytes to petabytes are availableFor example 10 million status records are produced by Beijing-Shanghai high-speedtrains every day 3) Data may be from different places which include headquarterslocal offices and divisions
Intelligent data processing such as distributed storage noise filtering data fusioninformation indexing data mining visualization etc is performed by the data enginelayer (Sunitha et al 2019) The collected data should be stored in the network for easy
C Chellaswamy et al An IoT based rail track condition monitoring 95
access In the smart railways sources of the data are distributed and have decentralizedcontrol The data source can generate and collect information in the absence of anycentralized control Google has proposed MapReduce to provide a parallel processingmodel This will allow a large amount of data to be processed by its associated imple-mentation Multiple layer architecture is used for overcoming the issues relating to bigdata Multiple servers store the data so that the parallel execution increases the pro-cessing speed using the Map Reduce and Hadoop frameworks These types of multiplelayer architectures are necessary for any smart railway
34 Application layer
Customer service and inspection of infrastructure smart railways use advanced tech-nologies such as sensors communications intelligent controls and computing for theperformance of various functions like train control and dispatch Applications of smartrailways are train-related infrastructure-related and passenger and freight-related
4 Signal coverage problems
When a train goes through tunnels mountains and thick forest areas the signalgrows weak and the controller cannot easily identify them Consequently it becomeschallenging to determine the correct location of vibrations Therefore there is a needto consider this problem while calculating the location of vibrations
41 GPS coverage problem
GPS module DSM132 has more accuracy and less tolerance (up to 10 cm) Thisallows it to be used in this study When a train passes through forests and hilly regionsthe GPS signal is reduced This makes it difficult to find the exact location of irregularity(Schlain et al 2015 amp Mohsen et al 2016) Thus a new method for determining thelocation is introduced in this study Even when the GPS signal is low proximity sensorsare interfaced with the controller to determine the location of abnormalities (LOA)The proposed system immediately activates the proximity when the GPS signal is low
A GPS signal is essential for the calculation of the LOA GPS signal coverage areaand estimation of LOA are shown in Fig 7 The proximity sensor which is mountedin a wheel disc produces one pulse per rotation The controller counts these pulsesand determines the distance of the uncovered region by the GPS Distance (X1) isestimated as
X1 = n times k (23)
where n is the number of pulses produced by the proximity sensor and k is the circum-ference of the disc LOA is estimated as
LOA = Coordinateold + X1 (24)
where Coordinateold denotes the location where the GPS signal goes absent and X1 isthe distance from Coordinateold to the abnormality location For example if D = 6 km
96 C Chellaswamy et al An IoT based rail track condition monitoring
Fig 7 GPS coverage problem and estimation of LOA
Table 3Status of GPS GSM proximity sensor and the controller operation
DGPS Signal CommunicationSignal
Controller Operation Condition of Proximity
Not Present Present Estimate the location of vibrationbased on (2) and send to the cloud
ON
Present Present Send GPS coordinates if vibrationpresent
OFF
Present Not Present Store GPS coordinates if vibrationpresent
OFF
Not Present Not Present Store the location of vibration andswitch on the proximity and storethe location if abnormality isdetected
ON
then the abnormality location is determined by adding 6 km to the previously storedcoordinates Table 3 shows the different signal status and the corresponding opera-tions done by the controller In the first case when the GPS signal is absent IoT-RMSimmediately turns on the proximity sensor to determine the location of abnormalitybased on (15) In the second case the controller sends the abnormality location with-out any problem when the GPS and communication signals are present In the thirdcase the controller stores the LOA when the GPS is present and the communica-tion signal is absent Data is then sent to the cloud when the signal is available Inthe final case both GPS and communication signal are absent and it automaticallyswitches the proximity on stores the location of the abnormality and sends it to thecloud when the communication signal is available The route of the train is definedat the starting time so that no confusion will come in the direction of LOA fromCoordinateold
C Chellaswamy et al An IoT based rail track condition monitoring 97
Fig 8 T2 and Q statistics with 015 drift (a) deformation with crack (b) missing bolt
5 Simulation and experimental results
51 Experimental setup
In this section the prototype of the proposed system is analyzed and presented withdifferent experiments that are performed by sending the alert notice to other trains thatpass through the location This helps the driver plan ahead and avoid derailment Fourdifferent experiments were conducted to look at the effects of visible damage (missingbolt) invisible damage (loose bolts and battered rail surface) rusty deformation on railtop and deformations with The proposed method was also performed at three differentspeeds 20 km 45 km and 80 km A huge amount of data approximately 78 GB wasstored on 27 January 2018 Four different places around Chennai were selected fortwo-way travel in the same route and the location of the abnormalities were notedThe field tests for manipulated variables were performed near the industrial city ofTamilnadu To start the tests were performed under normal conditions as a controlFour routes Chennai Beach to Chennai Central (A) Chennai Central to Egmore (B)Pallavaram to Trisulam (C) and Tambaram to Chengalpat (D) were chosen for thestudy At these locations the abnormality detection system was tested for its efficiencyand accuracy
52 Performance of Proposed PCAM-DWT
To verify the detection capability of PCAM-DWT used in the proposed IoT-RMSwith two scenarios (deformation with crack and missing bolt) are considered Heresignals with a duration of 2000 milliseconds were taken near the abnormalities for easeof understanding In the first scenario artificial drifts were imposed on the accelerom-eter signal received from the deformation with a crack at the 7500th sample point andmissing bolt for the 2700th sample point In the simulation the drift grows to 015for the deformation with crack and 0156 for missing bolt measurements For boththe cases the small drift alters the measurement that is unnoticeable in the time profileas shown in Fig 8 Figure 8 indicates that the T2 statistic has not exceeded the limitduring the test On the other hand the Q statistics have negligible variation
98 C Chellaswamy et al An IoT based rail track condition monitoring
Fig 9 T2 and Q statistics with 125 drift (a) deformation with crack (b) missing bolt
In the second scenario drift grows to 125 for the deformation with a crack at the7500th sample point and missing bolt for the 2700th sample point The measurementcan be seen in the time profile and is shown in Fig 9 Figure 9 indicates that boththe T2 and Q statistics have exceeded the limit during the test at the correspondingsample point The T2 statistics exceed 224 in the deformation with crack and 373for missing bolt cases The Q statistics exceed 436 in the deformation with crackand 449 for missing bolt cases It is evident that T2 and Q statistics for both thedeformation with crack and missing bolt cases exceeds only in the abnormal pointsand not exceeded due to large variation in the amplitude
53 Performance of IoT-RMS
Acceleration of the train is measured by the MEMS accelerometers The measuredacceleration is applied to PCAM-DWT and correlation analysis was performed Thecorrelation analysis has been performed between the measured signal and the trackgeometry measurement signal (for more details refer to section 23) The track abnor-mality can be detected when the T2 and Q statistics exceeds the second confidenceFigure 10 shows the abnormality measured by the axle box accelerometer during thedeparture of the train for four different locations (locations A B C and D) undervarious speeds Figure 10 (a) and (b) show the accelerometer signal for visible andinvisible damage for three different speeds The figure shows the signal level of invis-ible damage as less than the visible damage and the abnormalities present at 7 km and62 km respectively from the start of the track for all the speed Figure 10 (c) shows theabnormality for deformation with a crack for three different speeds It shows abnor-mality at 38 km from the start of the track for all the speeds Figure 10 (d) shows theabnormality for rusty deformation on the track top and the irregularity seen in 53 kmfor all the speed scenarios
Figure 11 shows the abnormality measured by the axle box accelerometer during thearrival of the train for four different locations (locations A B C and D) under threedifferent speed scenarios Comparing Fig 10 and 11 the accelerometer signal receivedfrom both the departure and arrival of the same route indicates that the presence ofabnormality Figure 10 and 11 show the accuracy of the proposed method
C Chellaswamy et al An IoT based rail track condition monitoring 99
Fig 10 Abnormality in axle box mounted accelerometer during departure (a) invisible damage (loose boltsand battered rail surface) (b) visible damage (missing bolt) (c) deformation with crack (d) rusty deformationon rail top
Fig 11 Abnormality in axle box mounted accelerometer during arrival (a) invisible damage (loose boltsand battered rail surface) (b) visible damage (missing bolt) (c) deformation with crack (d) rusty deformationon rail top
54 Experimental results
The prototype of the proposed system developed uses the ARM processor (LPC2148)and has been deployed on the super-fast train (26142) The acceleration signal wasrecorded for different test cases under running conditions Figure 12 shows the exper-
100 C Chellaswamy et al An IoT based rail track condition monitoring
Fig 12 Experimental Setup of the proposed IoT-RMS
Fig 13 Experimental results for different location of abnormalities with coordinates (a) visible damage(missing bolt) (b) Invisible damage (loose bolts and battered rail surface) (c) deformation with crack (d)rusty deformation on rail top
imental setup and the coordinates for the location of the abnormality Figure 13 showsthe different locations of abnormalities such as the missing bolt at location A loose boltsat location B deformation with a crack at location C and severe plastic deformationon rail top at location D
Accelerometer data were recorded and analyzed for the four abnormality casesThe test was done on 27 January 2018 and the values for a particular test track werecollected The controller finds the abnormal condition when the signal exceeds thesecond confidence level and records the location using GPS Figure 13 shows the
C Chellaswamy et al An IoT based rail track condition monitoring 101
Fig 14 Visualization of OpenStreetMap for real-time track abnormality monitoring
experimental results in a zoomed view for various track irregularities Figure 13 (a)shows the presence of the irregularity in the coordinate 130815 N amp 802768 EWhen these coordinates were compared with the predefined values they found to bealmost the same with only 1 m variation from the fault location Recorded invisibledamage coordinates are shown in Fig 13 (b) This shows abnormality present in thecoordinate 130739 N amp 802618 E The coordinates of deformation with crack andrusty deformation on rail top are shown in Fig 13 (c) and (d) It shows the presence ofthe abnormality in 129679 N amp 801484 E 129336 N amp 801020 E These valuesexactly match with the predefined values
Web-based tracking for vehicles is provided by the open-source OpenGTS underApache Software License This technology can be used in general-purpose vehiclesprivate transport vehicles and different kinds of the satellite tracking system Open-StreetMap helps visualization of the location of track abnormality Figure 14 shows thereal-time track abnormality MongoDB database is used for the storage of the data andmonitors the abnormal location Data analysis and manipulations can be performed onthese unstructured data
55 Performance comparison
The performance of the network was studied by considering the constant latencyof the network at which the data is sent from the vehicle to infrastructure and alertmessage from the infrastructure to the vehicle The focus of the analysis is on inquiryand data processing and data insertion and parsing Two types of server are used inthe proposed system one for the storage of the data and the other for data collectionand manipulation OpenGTS software was installed in the i7-6700 CPU with 64 GBRAM and used for collecting and manipulating the data from the track The datastorage server was installed with MongoDB and it configured under single servermode
102 C Chellaswamy et al An IoT based rail track condition monitoring
Fig 15 Performance comparison (a) Parsing row data in MongoDB (b) Processing time
Fig 16 Comparison of accuracy in fault detection during departure of train
Scalability analysis was performed 40 times for both the scenarios for ensuringreliability in the results Figure 15(a) shows the performance of parsing row data toGeoJSON and included in MongoDB The chart was plotted using the number of thedata size and the corresponding response time There was a linear increase in responsetime with an increase in the data size The chart shows that the size of the data isproportional to the response time
The response time of the MongoDB was assessed considering 10000 documents Fig-ure 15(b) shows the response time in which the distance varied from 1 km to 8 km Slightvariations in response time around 25 meters were seen with an increase in the distance
The accuracy of the proposed IoT-RMS had been studied by conducting differentexperiments for both the departure and arrival of the train The experiment results forthe departure of the train are shown in Fig 16 Comparing the proposed IoT-RMSwith other methods 1959 higher than the conventional method 1134 and 825higher than the methods used by Mingyun (2017) respectively for the abnormalitydetected at location A In the same way the comparison is made with the abnormality
C Chellaswamy et al An IoT based rail track condition monitoring 103
Fig 17 Comparison of accuracy in fault detection during arrival of train
location at B the proposed IoT-RMS is 1848 than the conventional method 326and 544 compared to Lee et al (2012) and Mingyun et al (2017) respectivelySimilarly the proposed method is compared with the abnormality locations at C andD the proposed method is higher than all the other methods The results show thatthe proposed method identifies the abnormalities in the exact location whereas theconventional method provides the least accuracy compared to the proposed IoT-RMSfollowed by Lee et al (2012) and Mingyun et al (2017) Figure 17 shows the results ofthe arrival of the train The results show that the accuracy of detecting the abnormalityis exact and better than other methods namely the conventional method by Lee et al(2012) and Mingyunet et al (2017)
Meanwhile to study the accuracy of the proposed IoT-RMS the abnormalities arecreated purposely in four different locations (130815 N amp 802768 E 130739N amp 802618 E 129679 N amp 801484 E 129336 N amp 801020 E) and theperformances were analyzed The accuracy of the proposed IoT-RMS detecting theabnormality for different speed scenarios are listed in Table 4 The controller estimatesthe coordinates for different abnormalities exactly at 25 km speed The GPS is switchedoff purposely in the rusty deformation on the top case and the accuracy of the systemis verified In this case the controller switches on the proximity and exactly calculatesthe distance (Coordinateold+475 km) of abnormality The location of abnormality canbe identified by taking 475 km from the Coordinateold The abnormality location isalso exactly calculated in the 50 km speed There is a little variation in the abnormalitylocation for visible and deformation with crack fault case a deviation of 094 m ispresent from the fault set coordinates
The performance of the proposed IoT-RMS is compared with three different existingmethods namely Lei et al (2018) Chellaswamy et al (2017b) Mingyuan et al (2017)and the proposed method is shown in Table 5 The proposed method has an automaticsystem that monitors and manages when a GPS signal is not available or less than theset threshold Additionally Table 5 indicates that the proposed system provides priorinformation to the driver with more accuracy than other systems
104 C Chellaswamy et al An IoT based rail track condition monitoring
Table 4Fault detection and the corresponding GPS coordinates different speeds
Type of abnormality Fault set coordinates Fault identified Distanceestimated byproximity (km)
Accuracy ()coordinates
Latitude Longitude Latitude Longitude
Speed 25 kmVisible damage 130815 N 802768 E 130815 N 802768 E No 100Invisible damage 130739 N 802618 E 130739 N 802618 E No 100Deformation with
crack129679 N 801484 E 129679 N 801484 E No 100
Rusty deformationon the top
129336 N 801020 E 129336 N 801020 E 475 100
Speed 50 kmVisible Fault 130815 N 802768 E 130815 N 802768 E No 100Invisible Fault 130739 N 802618 E 130739 N 802618 E No 100Deformation with
crack129679 N 801484 E 129679 N 801483 E 352 9952
Rusty deformationon the top
129336 N 801020 E 129336 N 801020 E No 100
Speed 80 kmVisible Fault 130815 N 802768 E 130813 N 802767 E 427 9914Invisible Fault 130739 N 802618 E 130739 N 802618 E No 100Deformation with
crack129679 N 801484 E 129677 N 801483 E No 9925
Rusty deformationon the top
129336 N 801020 E 129336 N 801020 E No 100
Table 5Performance comparison of the proposed IoT-RMS with existing methods
Methods Fault detection method Method for Global Accuracy CostGPS signaling Information () (Euro)
problem sharing
Lei et al (2018) Time-frequency model Not available Not available 92 18000Chellaswamy et al
(2017b)Accelerometer with IoT Not available Available 94 27000
Mingyuan et al (2017) ZigBee with wirelesssensor network
Not available Not available 97 55000
Proposed IoT-RMS Accelerometer with IoT Available Available 99 42000
6 Conclusion
Rail track monitoring is essential for detecting vibrations in the track identifyingthe location information and ultimately avoiding derailment This paper has proposedan IoT based condition monitoring system for detecting any abnormalities in the railtrack and updating it in the cloud Accordingly this information has sent to alert thedrivers of the trains that pass through the abnormal location so that they can reducethe speed in the specified location thereby avoid derailment Signals from the MEMSaccelerometers mounted in the axle box of the train have pre-processed because thesensors used in IoT-RMS works in a high noise environment They have tested forthree different speeds for four abnormality cases It is clear from the results that the
C Chellaswamy et al An IoT based rail track condition monitoring 105
IoT-RMS provides the exact location of irregularity and it could also be passed toother vehicles through the cloud Performances of the network like query time andprocessing speed are studied A prototype has been developed and the accuracy ofthe system has been shown through different tests conducted This system tracks theabnormality at the beginning itself and thus avoids the chances of derailment Theproposed IoT-RMS exactly identifies the abnormality and captures the correspondinglocation The accuracy of the proposed system is higher when compared to earlierversions Due to these factors the proposed system can easily be integrated to therailway network
The limitation of our study is that four cases of abnormalities have been consideredIn the near future it will be enhanced by introducing more scenarios Moreover opti-mization algorithms can be included in the signal analysis This system can be extendedfor avoiding frontal collision by updating and sharing the branching information ofrunning trains
References
Amy J C T Charles V T Chin-Yuan F Abby P T H Xuan-Kai L amp Ian J Y L (2017) IOT Patentroadmap for smart logistic service provision in the context of industry 40 Journal of the Chinese Instituteof Engineers 40(7) 593ndash602 httpsdoiorg1010800253383920171362325
Anand V amp Mallikarjuna R C (2016) MongoDB and Oracle NoSQL A technical critique for designdecisions International Conference on Emerging Trends in Engineering Technology and Science 1ndash4httpsdoiorg101109ICETETS20167602984
Bevilacqua M Ciarapica F E Diamantini C amp Potena D (2017) Big Data Analytics Methodolo-gies Applied at Energy Management in Industrial Sector A Case Study International Journal of RFTechnologies 8(3) 105ndash122 httpsdoiorg103233RFT-171671
Bogacz R Czyczula W amp Konowrocki R (2007) Influence of sleepers shape and configuration ontrackndashtrain dynamics Shock and Vibration 1ndash7 httpdxdoiorg1011552014393867
Chellaswamy C Vanathi A Duraichami S amp Glaretsubin P (2017a) Optimized Vehicle accelerationmeasurement for Rail Track Condition Monitoring IEEE International Conference on Computing andCommunication Technologies 155ndash160 httpsdoiorg101109ICCCT220177972265
Chellaswamy C Balaji L Vanathi A amp Saravanan L (2017b) IoT based rail track health monitoring andinformation system IEEE International Conference on Microelectronic Devices Circuits and Systems1ndash6 httpsdoiorg101109ICMDCS20178211548
Chellaswamy C Akila V Dinesh Babu A amp Arasan N K (2013) Fuzzy logic based railway trackcondition monitoring system IEEE International Conference on Communication and Nanotechnology(ICE-CCN) 250ndash255 httpsdoiorg101109ICE-CCN20136528503
Chellaswamy C Krishnasamy M Balaji L Dhanalakshmi A amp Ramesh R (2020) Optimized railtrack health monitoring system based on dynamic differential evolution algorithm Measurement vol152 Article ID107332 httpsdoiorg101016jmeasurement2019107332
Chen X (2013) Research on data preprocess method for thermal parameters [Master thesis] North ChinaElectric Power University
Chen N Chen Y You Y Ling H Liang P amp Zimmermann R (2016) Dynamic urban surveillancevideo stream processing using fog computing In Proc IEEE Int Conf Multimedia Big Data 105ndash112httpsdoiorg101109BigMM201653
Chunli W Chunlei Z amp pengtu Z (2012) Denoising algorithm based on wavelet adaptive thresholdPhysics Procedia 24 678ndash685
Divya M amp Ziliang Z (2017) Energy efficiency analysis of query optimizations on MongoDB and Cassan-dra Eighth International Green and Sustainable Computing Conference 1ndash6 httpsdoiorg101109IGCC20178323581
106 C Chellaswamy et al An IoT based rail track condition monitoring
Feng Z Min L Zhuo Z amp Weiming S (2016) An IoT Based Online Monitoring System for Con-tinuous Steel Casting IEEE Internet of Things Journal 3 1355ndash1363 httpsdoiorg101109JIOT20162600630
Gaurav K P amp Sanjeev K S Y (2020) Multi-objective optimization of vibration assisted electrical dis-charge drilling process using PCA based GRA method Materials Today Proceedings httpsdoiorg101016jmatpr202002561
Gigin G In-Mook C amp Sung-Mok K (2018) PCA exchange method for compensation of error sourcesin pressure balance calibration Measurement 124 179ndash183 httpsdoiorg101016jmeasurement201804021
Guannan L amp Yunpeng H (2019) An enhanced PCA-based chiller sensor fault detection method usingensemble empirical mode decomposition based denoising Energy and Buildings 18315 311ndash324httpsdoiorg101016jenbuild201810013
Han-Pang H Jiu-Lou Y Tzu-How H amp Ming-Bao H (2017) IoT-Based networking for humanoidrobot Journal of the Chinese Institute of Engineers 40(7) 603ndash613 httpsdoiorg1010800253383920171372224
Hodge VJ OrsquoKeefe S Weeks M amp Moulds A (2015) Wireless sensor networks for condition mon-itoring in the railway industry A survey IEEE Trans Intell Transp Syst 6 1088ndash1106 httpsdoiorg101109TITS20142366512
Huang Y Huang S Zhang Y Sheng S Yang X amp Liu R (2019) A Process Innovation Mode ofSemiconductor Integrated Circuit Products Based on the Integration of Internet of Things and Sens-ing Big Data International Journal of RF Technologies 10 89ndash104 httpsdoiorg103233RFT-180105
Ning H Li Yunfei Shi F amp Laurence T Y (2020) Heterogeneous edge computing open platformsand tools for internet of things Future Generation Computer Systems 106 67ndash76 httpsdoiorg101016jfuture201912036
Jian Y Xin W Xue Z amp You DZ (2015) Cloud computing and visual attention based object detectionfor power substation surveillance robots In Proc IEEE Can Conf Elect Comput Eng (CCECE) 337ndash342httpsdoiorg101109CCECE20157129299
Jiang L (2011) Sensor fault detection and isolation using system dynamic identification techniques TheUniversity of Michigan [PhDthesis] 2011
Kidd P T (2012) The Role of the Internet of Things in Enabling Sustainable Agriculture in EuropeInternational Journal of RF Technologies 3(1) 67ndash83 httpsdoiorg103233RFT-2011-017
Konop J amp Konowrocki R (2013) On evaluation of the wheelsets-track interaction quality in railwayengineering Machine Dynamics Research 37 61ndash70
Kopsinis Y amp McLaughlin S (2009) Development of EMD-based denoising methods inspired by waveletthresholding IEEE Trans Signal Process 57 1351ndash62
Lee J S Choi S Kim S S Park S amp Kim Y G (2012) A mixed filtering approach for track conditionmonitoring using accelerometers on the axle box and bogie IEEE Transactions on Instrumentation andMeasurement 61 749ndash758 httpsdoiorg101109TIM20112170377
Lee K W Correia A J Lee K H Neilan B D J amp Gregor S (2014) Solar energy harvesting fromroadways In Proc 93rd Annu Meeting Transp Res Board Washington DC USA 4380-1-4380-18httpstridtrborgview1289344
Lei X Wanming Z amp Zhaowei C (2018) On use of characteristic wavelengths of track irregularities topredict track portions with deteriorated wheelrail forces Mechanical Systems and Signal Processing1041 264ndash278 httpsdoiorg101016jymssp201710038
Li F (2011) Dynamic modeling sensor placement design and fault diagnosis of nuclear desalinationsystems The University of Tennessee [PhD thesis]
Li F Upadhyaya B R amp Perillo S R P (2012) Fault diagnosis of helical coil steam generator systemsof an integral pressurized water reactor using optimal sensor selection IEEE Transactions on NuclearScience 59(2) 403ndash410
Mainetti L Marasovic I Patrono L Solic P Stefanizzi M L amp Vergallo R (2016) A Novel IoT-awareSmart Parking System Based on the Integration of RFID and WSN Technologies International Journalof RF Technologies 7(4) 175ndash199 httpsdoiorg103233RFT-161523
C Chellaswamy et al An IoT based rail track condition monitoring 107
Messai A Mellit A Abdellani I amp Massi P A (2015) On-line fault detection of a fuel rod temperaturemeasurement sensor in a nuclear reactor core using ANNs Prog Nucl Energy 79 8ndash21
Milting H Kassner A Oezpeker C Morhuis M Bohms B Boergermann J et al (2013) Genomics ofmyocardial recovery in patients with mechanical circulatory support J Heart Lung Transplant 32(4Suppl) 229 httpsdoi101016jhealun201301582
Mingyuan G Ping W Yifeng W amp Lingkan Y (2017) Self-Powered ZigBee Wireless Sensor Nodesfor Railway Condition Monitoring IEEE Transactions on Intelligent Transportation Systems 99 1ndash10httpsdoiorg101109TITS20172709346
Mohsen R Denis G amp Dominique G (2016) A Novel Approach for Improved Vehicular PositioningUsing Cooperative Map Matching and Dynamic Base Station DGPS Concept IEEE Transactions onIntelligent Transportation Systems 17 230ndash239 httpsdoiorg101109TITS20152465141
Molodova M Li Z Nunez A amp Dollevoet R (2014) Automatic detection of squats in railway infras-tructure IEEE Transactions on Intelligent Transportation Systems 15 1980ndash1990 httpsdoiorg101109TITS20142307955
Naderi H amp Mirabadi A (2006) Railway track condition monitoring using FBG and FPI fiber opticsensors International Conference on Railway Condition Monitoring 198ndash203
Pei Y X amp Guo M (2001) The fundamental principle and application of sliding average method GunLaunch amp Control Journal 1 21ndash24
Schlain L Gonzalez G Gregorio F amp Cousseau J (2015) Adaptive cyclostationary filtering forDGPS interference cancellation Workshop on Information Processing and Control 1ndash6 httpsdoiorg101109RPIC20157497088
Sunitha S Naveen Naik S amp Danda B Rawat (2019) Recent advances in mobile edge computingand content caching Digital Communications and Networks In press corrected proof httpsdoiorg101016jdcan201908004
Tracy N D Young J C amp Mason R L (1992) Multivariate control charts for individual observationsJ Qual Technol 24(2) 88ndash95
Tsunashima H Mori H Yanagisawa K Ogino M amp Asano A (2014) Condition Monitoring of RailwayTracks Using Compact Size On-board Monitoring Device 6th IET Conference on Railway ConditionMonitoring 1ndash5 httpsdoiorg101049cp20140996
Uckelmann D amp Harrison M (2010) Integrated Billing Mechanisms in the Internet of Things to SupportInformation Sharing and Enable New Business Opportunities International Journal of RF Technologies2(2) 73ndash90 httpsdoiorg103233RFT-2010-006
Walpole E R (2012) Probability and Statistics for Engineers and Scientists Prentice Hall 9th editionXiaowei Y Xiaoxiao W Yuan W Liping Q Weidang L amp Haibo Z (2017) Small-cell assisted secure
traffic offloading for narrow-band internet of thing (NB-IoT) systems IEEE Internet of Things Journalhttpsdoiorg101109JIOT20172779820
Xianping D amp Feng Z (2019) A novel principal components analysis PCA method for energy absorbingstructural design enhanced by data mining Advances in Engineering Software 127 17ndash27 httpsdoiorg101016jadvengsoft201810005
Yabin G Guannan L Huanxin C Yunpeng H Haorong Li Lu X amp Wenju H (2017) An enhancedPCA method with Savitzky-Golay method for VRF system sensor fault detection and diagnosis Energyand Buildings 1421 167ndash178 httpsdoiorg101016jenbuild201703026
Zhai W Liu P Lin J amp Wang K (2015) Experimental investigation on vibration behaviour of aCRH train at speed of 350 kmh International Journal of Rail Transportation 3 1ndash16 httpsdoiorg101080232483782014992819
82 C Chellaswamy et al An IoT based rail track condition monitoring
in the irregularities in the tracks are detected and relayed using a global positioningsystem
Trains generate significant amounts of force which causes the tracks to degradeover time (Bogacz et al 2007) In order to meet the safety standards created by theFederal Railroad Administration (FRA) continuous monitoring is necessary Wavelettransform-based track monitoring system has proposed by Lei et al (2018) It identifiesthe abnormalities of the track and inform to the control room Molodova et al (2014)have suggested a method to locate any surface problem on the tracks The track irregu-larities are detected using these signals An optimal track monitoring system based onaccelerometer signals has been discussed by Chellaswamy et al (2017a)
The signal is analyzed using the principal component analysis (PCA) which attractsour attention to the railway track signal analysis and fault detection The PCA methodis a standard multivariate technique capable of diminishing data dimensionality Dueto its simple structure it can quickly analyze and retain essential information (Giginet al 2018) PCA with gray relational analysis based multi-objective optimization wasintroduced by Gaurav et al (2020) for analyzing the vibrations from drilling Faultdetection based on the PCA method was proposed by Guannan and Yunpeng (2019)The ensemble empirical mode decomposition is essential for extracting informationfrom the noise The PCA method is required to detect faults by establishing the Q-statistic with a threshold Xianping and Feng (2019) suggested a new PCA method formanaging the unstructured data with a reduced number of variables This method issignificantly more efficient than the conventional methods of big data analysis
Zhai et al (2015) developed a test unit to locate abnormalities on tracks with high-speed trains A fiber optic monitoring system was recommended for its high sensitivityand dynamic range by Naderi and Mirabadi (2006) Konop and Konowrocki (2013)used the wheel-rail dynamics of the tracks for determining their health Lee et al(2012) used a three-filter band pass a compensation filter and a Kalman filter forthe estimation of track irregularities on high-speed railway tracks Chellaswamy etal (2013) Chellaswamy et al (2020) estimated the track abnormalities using a fuzzylogic-based monitoring system for improving the ride quality of rail transportation
Chellaswamy et al (2017b) have proposed the IoT based rail track monitoring sys-tem When the vibrations exceed a set threshold value the controller identifies thecoordinates and updates the cloud A video surveillance system may be necessary formonitoring locations with heavy fog (Chen et al 2016) The disadvantages of thismethod have been discussed by Jian et al (2015) and Huang et al (2019) Continuousvideo streaming requires broadband connectivity if not present then it will be hardto achieve accuracy and quality in the recognition of abnormalities Several pieces oftechnology require cloud-based technology such as industrial medical agriculturaland even home appliances (Feng et al 2016 Mainetti et al 2016 Kidd 2012 amp Amyet al 2017) Humanoid robots use IoT-based real-time networking Han-pang et al(2017) have compared this technology with the existing network parameters such asefficiency flow control and priority
Big data can process datasets of larger sizes efficiently unlike older software (Bevilac-qua et al 2017) New sets of techniques and technologies are used by big data to revealinsights from massive diverse and complex data sets With a large volume of sensor
C Chellaswamy et al An IoT based rail track condition monitoring 83
user and operation data accumulation in the railway industry the big data has becomethe main drive (Uckelmann amp Harrison 2010) The computer-based algorithm controlsthe physical entities of the modern railway system while trains are interconnected andact as communication hubs They collect information from the onboard devices andexchange the information with other trains and railway control centers The real-timestatus is shared and instructions are received from the control centers To improvesafety and performance a modern railway system should implement IoT and big data
In this paper the IoT-based railway track condition monitoring system is introducedfor establishing continuous monitoring of the railway tracks The PCA method waschosen for its simple software redundancy technique and false alarm reducing methodsIf any abnormality is detected in the track the corresponding coordinates are capturedfrom the GPS by the controller The location of the abnormality (LOA) is capturedwhen the acceleration signal exceeds the set threshold value When the train passesthrough any remote or hilly areas the signal either becomes weak or it will transpireHenceforth it becomes very difficult to find the faulty location So hybrid sensingmethod using proximity sensors are combined with the GPS for the estimation of theexact LoA The LoA is updated in the cloud server and the information is provided toother trains which pass through the fault location It also provides information to othertrains to enable the drivers to reduce their speed to avoid derailment The messageis also sent to the maintenance department so they can take necessary action Thenovelties of the proposed IoT-RMS are as follows
bull Principal component analysis-based preprocessing and fault detection method areused
bull A hybrid sensing method is introduced for estimating the exact location of abnor-mality even when the GPS signal is absent
bull The information is updated in a cloud server and shared with other trains that maypass through the same location
2 Proposed IoT-RMS
This section discusses the IoT-RMS that helps to avoid train derailment Differenttypes of sensors such as speed and acceleration sensors are used locate anomalies Thesensors are mounted in the passenger or goods railcars and integrated with the IoTcloud for storage and processing Accelerometers have been installed in the verticaland lateral direction of the axle-box When any abnormality is detected the controllersends details of the abnormality with location information to OpenGTS (open sourceGPS tracking system) server MongoDB a distributed database is used to store andtrack information about abnormalities collected from trains (Divya amp Ziliang 2017Anand amp Mallikarjuna 2017) Alert message can be shared to the driver of the trainthat is going to pass through the abnormalityrsquos location This allows the driver to prepareand react accordingly before passing through the location to avoid derailment Fourdifferent abnormalities namely cracks rusted deformations on rail tops loose boltsand missing bolt are considered and are shown in Fig 1 GPS-DSM132 a trackerdevice was used for tracking the location of irregularities It measures and records
84 C Chellaswamy et al An IoT based rail track condition monitoring
(a) (c)
(b) (d)
Fig 1 Examples of track abnormalities (a) deformation with crack (b) rusty deformation on rail top (c)loose bolts and (d) missing bolt
geo-location coordinates such as latitude longitude as well as velocity This deviceensures accuracy while also being compact in size and is easy to handle Hence it iswidely used in applications like mobile objects and vehicle tracking
A 4G network is used for the transfer of abnormality location coordinates from arail vehicle to an OpenGTS server ATM buses in Messina use this system for locationtracking (The OpenGTS project httpopengtssourceforgenet) Open source GPStracking systems (OpenGTS) are used for web-based tracking The restful approachperforms communication between OpenGTS and trackers and is used in passen-ger trains goods wagons high-speed trains etc Tracking information provides twofunctions 1) An open street map like the one used by OpenGTS for visualizing geo-located information on a map (The OpenDMTP Project httpwwwopendmtporg andhttpopengtssourceforgenetdocumentationhtml) 2) The geographic data structureis encoded by human and machine-readable system GeoJSON The geo-informationSQL-GeoJSON translator is used for visualizing
Abnormalities on the track are detected using accelerometer signals The receivedsignals are preprocessed by Principal Component Analysis Method (PCAM) In this
C Chellaswamy et al An IoT based rail track condition monitoring 85
Table 1Technical specifications of ADXL345 accelerometer
Parameters Values
Type ADXL345
Image
Manufacturer Analog DevicesAxis 3Voltage (V) 18 ndash 36Current (A) 350Interface SPI I2CPrecision 3 gTemperature ( C) 85Price ($) 3
study the statistics-based correlation method is used for fault identification due to itssimple structure speed and faster estimation time The correlation analysis has beenperformed between the measured signal and the track geometry measurement signal(Lee et al 2012) (for more details refer to section 23) Table 1 shows the variousparameters of the accelerometer Accelerometers are suitable for track monitoring sys-tems because they have decent scalability stability are relatively light and significantlycheaper Hence this paper proposes an accelerometer based measurement and trackingsystem for increasing the safety of the passengers
The workflow of IoT-RMS is shown in Fig 2 This algorithm checks the statusof the track continuously and updates it in the cloud GPS finds the location of theabnormality and the controller transfers this information to the driver before the traincrosses this location Track measurements are sent to a cloud server and decision aremade involving this workflow The accelerometer signals (Ax) the GPS data (DGPS)the IoT-ESP8266 (DIoT) and the GSM (DGSM) data are present in the track measure-ment section The controller turns on the proximity sensor when the GPS signal is lessthan the set threshold value (ATHD) or is completely absent When proximity sensorsstart to measure the abnormalities during the absence of the GPS signal (DPRO) (refersection 4 for more information) and the total abnormal distance is obtained as DPRO+DGPS The controller updates the abnormality location information to the cloud Theinformation will be updated by the first two trains who detect the irregularity If thefirst two trains update the cloud server with same location information then the serverultimately decides there is an abnormality present It will then share the current abnor-mality information (Dcur) to all the trains that will pass through the location If anytrain detects an abnormality (Drec) it will check both the Dcur and Drec If both areequal it will discard the process of updating the abnormality in the database
86 C Chellaswamy et al An IoT based rail track condition monitoring
Fig 2 Workflow of the proposed IoT based track monitoring system
C Chellaswamy et al An IoT based rail track condition monitoring 87
21 PCAM
The PCAM retains most information of the original data while transforming a set ofcorrelated variables onto a set of uncorrelated variables The abnormalities are detectedand isolated from the uncorrelated variables method (Li et al 2012) The data matrix(A) consists of m variables and n samples decomposed as a sum of the residual matrix(G) along with an estimation matrix (A)
A = G +(A
) = t1PT1 + t2PT
2 + middot middot middot + tkPTk (1)
In the equation above t and P respectively denote the scores and loading matricesof A Both the vectors ti and Pi are orthonormal Now ti can be expressed as
ti = AnPi (2)
The new observation An is equal to the 1 times M vector and the corresponding score ti isequal to a 1 times A vector PCAM has the capability to handle a data set with larger dimen-sion For instance it is currently used to analyze genomic data which has significantlymore variables (Milting et al 2013)
Statistics such as Q and T2 are used to detect the faults of PCAM The Q andT2 measure the corresponding variation in G and A (Jiang 2011) In particular theQ statistics measure the lack of fit between the model and the testing vectors Onthe other hand the T2 statistics quantifies variations within the model When abnor-malities are detected the limits are consistently exceeded A confidence level can beestablished from these statistics The confidence level can then be used for monitoringthe railway tracks Both the Q statistics and T2 statistics can be expressed based on Li(2011) as
Qk =sumN
k=1
(tk minus βk
σk
)2
(3)
T 2n =
sumM
n=1(en)2 (4)
Here tk σk and βk denote the score of the observation in the k-th component themean and the standard deviation of the scores of that component in the calibrationdata respectively en represents the residual value corresponding to the n-th variableThe analysis is done in two steps 1) Initially the received data is inspected for specialcauses of vibration which are iteratively solved Once the collected data is free ofspecial causes of variation it is used to model the normal operation condition of thecalibration of the IoT-RMS Next the IoT-RMS monitors new data 2) In the secondstep the monitored data and calibration data are distinguished The scores are linearcombinations of the original variables and normally distributed As a result the T2-statistic is multiplied by a constant while also following a beta distribution (Tracy et al1992) This is given by
T 2sim (P minus 1)2
PBA
2 (PminusAminus1)2 (5)
88 C Chellaswamy et al An IoT based rail track condition monitoring
where P and B denotes respectively the number of observations and beta distributionsHence the upper limit (UL) for the T2-statistic at significance level is given by
UL(T 2
)γ
= (P minus 1)2
PBA
2 (PminusAminus1)2 (6)
whereBA2 (PminusAminus1)2 is the 100(1-) percentile of the corresponding beta distribution
that can be computed from the 100(1-) percentile of the corresponding F distribution(for more details readers can refer Tracy et al 1992) When done in by the same methodUL for the T2 statistics for new incoming data is given by
T 2simAP
(P2 minus 1
)(P minus A)
FA(PminusA) (7)
UL for theT2 statistic at significance level is given by
UL(T 2
)γ
= A
P
(P2 minus 1
)(P minus A)
F(A(PminusA))γ (8)
Several procedures can be used for setting the UL for Q-statistics Here assume thatthe residuals follow a multi-normal distribution and the significance level is given by
UL(Q)γ = α1
⎡⎣zθ
radic2α2j
20
α1+ 1 + α2j0 (j0 minus 1)
α21
⎤⎦
1j0
(9)
where αn = sumrank(X)a=A+1 (λa)n with rank(X) is the rank of the data matrix X and λa is the
eigenvalues of matrix 1Pminus1 middot EA middot ETAEA is the matrix of residuals j0 = 1 minus 2α1α3
3α22
and Zθ is the 100(1-) normal percentile
22 Preprocessing of signal
The sensors used in IoT-RMS works under high noise and humid environments Sonoise-like fluctuations are predictable during real-time signal measurement (Yabin etal 2017) The abnormal fluctuations in the received IoT-RMS consist of singular pointsand random fluctuations The monitoring result of the measured signal of the railwaytrack is shown in Fig 3 The results of both the T2and Q statistics are not enoughto consistently alarms As a result the preprocessing of data is needed for IoT-RMSsignal measurements In this study the statistics-based correlation method is used dueto its simple structure and efficiency (Chunli et al 2012) The random error from thesensors have three standard deviations (Walpole 2012) The singular point eliminationcan be expressed as∣∣ki minus k
∣∣ gt 3σ (i = 1 2 n) (10)
Where ki σ and k denotes respectively the singular point the standard deviation andthe arithmetic average If ki satisfies Eqn 10 it is removed from the measured signalThe acceleration signals are measured from two different locations and the singular
C Chellaswamy et al An IoT based rail track condition monitoring 89
Fig 3 Measured signal of the railway track (a) T2 statistics (b) Q statistics
Fig 4 Singular points elimination (a) deformation with crack (b) missing bolt
point removal is shown in Fig 4 The effectiveness of the singular points eliminationmethod is evident in Fig 4 The random fluctuations of the measured signal from IoT-RMS have to be reduced and thus arithmetic average filtering discrete wavelet analysisweighted recursive filtering and median filtering are widely used to remove the random
90 C Chellaswamy et al An IoT based rail track condition monitoring
fluctuations The discrete wavelet transform (DWT) has its advantages when localizingwhich reduces the noise present (Messai et al 2015) DWT is used in this study forthe denoising process The discretized wavelet function can be represented as
ψmn (k) = 1radicαmψ
(k minus nβαm
αm
)(11)
where m ψ(k) and nm denotes respectively the scale parameter the motherwavelet and the shift parameters Commonly dyadic grid values such as and havechosen 2 and 1 The dyadic grid wavelet function can be written as
ψmn (k) = 2minusm2ψ(2minusmk minus n
)(12)
The information represented by these discrete dyadic wavelets do not repeat andtherefore allow complete reconstruction The DWT for any signal y(k) can be written as
Dmn =sum
ky (k)ψmn (k) (13)
where Dmn is known as the detail coefficient The detail coefficient acts as a generalthresholder at each level of decomposition is generally using a universal value in orderto remove the noise (Kopsinis amp McLaughlin 2009)
The hard and soft threshold values for D can be calculated as
fn (D) =D if D Th
0 otherwise(14)
and
fs (D) =⎧⎨⎩Dminus Th if D Th
D+ Th if D Th
0 if D lt Th
(15)
where the threshold value is represented by Th = σradic
2log (N) σ is the standard devi-ation of the noise and can be calculated from the median of the detail coefficientsDmn σ = MAD
(∣∣Dmn∣∣)06745 MAD is the median absolute deviation of the detailcoefficient as given by
MAD = Median∣∣Dmn minusMedian
(Dmn
)∣∣ (16)
To study the effectiveness of the random fluctuations Fig 2 is used again Theresults of random fluctuation reduction from the measured signal is shown in Fig 5It is evident from Fig 5 that the random fluctuation is greatly reduced This greatlyreduces Q and T2 false alarms It can be concluded that the preprocessing is necessaryfor the IoT-RMS signal measurement
23 Parameter selection and fault detection
After preprocessing the data of IoT-RMS the next step is to develop a model withpreprocessed data In this study the correlation analysis has been performed betweenthe measured signal (m) and the track geometry measurement signal (n) Correlation
C Chellaswamy et al An IoT based rail track condition monitoring 91
Fig 5 Reduction of random fluctuation (a) T2 statistics (b) Q statistics
refers to the relation between the coefficient of two signals (m n) and it can be exp-ressed as
Rmn =sumki=1 (m (i) minus m) (n (i) minus n)radicsumk
i=1 (m (i) minus m)2radicsumk
i=1 (n (i) minus n)2
(17)
where m and n represent the mean value of the signal m and n respectively A highercorrelation between m and n typically indicates a higher R value
After preprocessing and selecting the parameter of the received signal of IoT-RMSthe accuracy and stability of the detection stage is improved by introducing anotherconfidence limit This method reduces the false alarm of T2 and Q statistics The secondconfidence limit can be expressed as
f (xβ y) =sumx
i=0P (xβ y) =
sumx
i=0Cinβ
i(1 minus β)nminusi lt α (18)
where y is the basic observation window length x is the maximum allowable value is the false alarm probability and is the experience value determined from the modelIf the false alarm signaled by the T2 and Q statistics exceed the maximum value x thenx will become the faulty true state The track abnormality can be detected when the T2
and Q statistics exceeds the second confidence
24 Performance indicators
There are four different test indexes the Mean Square Error (MSE) the Relative Error(RE) Signal to Noise Ratio (SNR) and Correlation Coefficient (CC)These are used
92 C Chellaswamy et al An IoT based rail track condition monitoring
in this evaluation between original and denoised measurements A statistical analysiswas carried out for evaluating the results of the proposed IoT-RMS The performanceof the proposed PCAM-DWT was compared with two other related methods namelythe conventional measurement (CM) and the sliding window average (SWA) methodThe test was performed with the measured data and the data was recorded identify ifthe tracks were in a healthy condition The MSE can be expressed as
MSE =radicsumN
i=1
(Pmesi minus Pd
)2
N(19)
where Pmes and Pd represent the original and denoised data Obviously a smaller MSEmeans a smaller error RE can be expressed as
RE =sumNi=1
(Pmesi minus Pd
)Pd
(20)
A traditional method to measure the noise level in the measurements is defined as
SNR = 10 times log
⎛⎝
sumNiminus1
(Pmesi
)2N
(RMSE)2
⎞⎠ (21)
The CC between original and denoised measurement can be expressed as
CC =sumNi=1
(Pmesi minus Pmesi
) (Pdi minus Pd
)radicsumN
i=1
(Pmesi minus Pmesi
)2radicsumN
i=1
(Pdi minus Pd
)2(22)
From the definition it can be seen that a higher CC implies a stronger relationshipbetween original and denoised measurements
The performance indicators for PCAM-DWT for the proposed IoT-RMS is comparedwith the SWA and CM methods In the SWA method the window length is 12 Thiswas selected based on several experiments conducted by Pei and Guo (2001) The testvalues of the performance indicators for the four different cases of IoT-RMS are shownin Table 2 Table 2 shows the variations of MSE from 0304 to 0701 the lowest valuefor PCAM-DWT for all the four cases and the largest value for CM The relative errorof the proposed method was the lowest followed by SWA and CM This indicates thatthe proposed PCAM-DWT provides higher SNR and CC compared to other methodsBased on the definition of the performance indicators the proposed PCAM-DWTprovides a better denoising effect and it is suitable for IoT-RMS
3 Cloud architecture
IoT based railway track monitoring systems present in the trains are connected to thecloud server The controller of the track monitoring system performs various operationsnamely abnormal location identification updating of the cloud server and duplicationmonitoring The event hub is placed to receive the data from different tracks It can
C Chellaswamy et al An IoT based rail track condition monitoring 93
Table 2Test results of different performance indicators for the four test cases
Abnormalities Methods
CM SWA PCA-DWT CM SWA PCA-DWT
MSE RE
Deformation with crack 0638 0431 0372 3025 2849 2683Rusty deformation on rail top 0701 0528 034 2973 2628 2392Loose bolts 0679 0420 0351 2893 2710 2471Missing bolt 0592 0398 0304 3172 2921 2729
SNR (dB) CC
Deformation with crack 627 652 745 0893 0953 0982Rusty deformation on rail top 674 689 802 0875 0937 0975Loose bolts 658 718 764 0892 0952 0986Missing bolt 671 674 848 0873 0963 0974
Fig 6 Proposed architecture for smart track monitoring system
capture thousands of events and handle multiple applications (Xiaowei et al 2017) ASQL warehouse stores the data as big data analyzes it for load forecasting visual dataand control etc If further action in required results are shared with the central controloffice The generic architecture of the IoT-RMS is shown in Fig 6 The architecturehas four layers a perceptionaction layer a transfer layer a data engine layer and anapplication layer These are discussed in the following sections
94 C Chellaswamy et al An IoT based rail track condition monitoring
31 Perception and action layer
Apart from on-board railway track monitoring via sensors the network also receivesinformation from different sensors such as sensors mounted in infrastructure environ-mental sensors and the detectors that gather information from the rail passengersOther key parameters namely bogie conditions bearing temperature power supplyvoltage and the amount of air braking are obtained from the different sensors mountedin a modern train These parameters help identify the exact condition of the train Inthis study the condition of the railway tracks is measured through an accelerometer andanalyzed by the controller present in each train The controller sends the abnormalityinformation with the location coordinates to the transport layer for further operationVarious trains are linked wirelessly to a local node The node can identify the trainsthrough its ID number
32 Transfer layer
On receipt of the data from the perception layer it is first pre-processed for meetingthe requirements of the upper layers For example information relating to the status ofthe train is transferred to the data server Train-ground wireless networks such as GSM-R network long-term evolution for railways (LTE-R) networks or 4G5G networksare used for sending information relating to the track condition air brake pressure andbearing temperature to the core network (Huansheng et al 2020) Then the representa-tive node transmits the compressed data to the core networks This reduces the amountof data exchanged between the sensors and the networks Thus it is a heterogeneousarchitecture considering the existence of various data sensing and transfer networksThe key status would need to be updated to the control center so the necessary stepscan be taken within a short span of time This means that data transfer must be highlyefficient It is essential that the data transmission link is robust The link must withstandextreme network situations like fast fading shadowing and high Doppler frequencyshifts Additionally the network must be elastic in order to enable the accommodationof a larger number of sensors and monitors In general the network should be robustelastic and stable in order to adapt to various situations
33 Data engine layer
Data from the different sources should be processed before it is used by the applica-tions Smart railway data has the following characteristics 1) Data may be a numbertext audio video and image It can be structured semi-structured or unstructureddata 2) Huge data in the range of a few dozen terabytes to petabytes are availableFor example 10 million status records are produced by Beijing-Shanghai high-speedtrains every day 3) Data may be from different places which include headquarterslocal offices and divisions
Intelligent data processing such as distributed storage noise filtering data fusioninformation indexing data mining visualization etc is performed by the data enginelayer (Sunitha et al 2019) The collected data should be stored in the network for easy
C Chellaswamy et al An IoT based rail track condition monitoring 95
access In the smart railways sources of the data are distributed and have decentralizedcontrol The data source can generate and collect information in the absence of anycentralized control Google has proposed MapReduce to provide a parallel processingmodel This will allow a large amount of data to be processed by its associated imple-mentation Multiple layer architecture is used for overcoming the issues relating to bigdata Multiple servers store the data so that the parallel execution increases the pro-cessing speed using the Map Reduce and Hadoop frameworks These types of multiplelayer architectures are necessary for any smart railway
34 Application layer
Customer service and inspection of infrastructure smart railways use advanced tech-nologies such as sensors communications intelligent controls and computing for theperformance of various functions like train control and dispatch Applications of smartrailways are train-related infrastructure-related and passenger and freight-related
4 Signal coverage problems
When a train goes through tunnels mountains and thick forest areas the signalgrows weak and the controller cannot easily identify them Consequently it becomeschallenging to determine the correct location of vibrations Therefore there is a needto consider this problem while calculating the location of vibrations
41 GPS coverage problem
GPS module DSM132 has more accuracy and less tolerance (up to 10 cm) Thisallows it to be used in this study When a train passes through forests and hilly regionsthe GPS signal is reduced This makes it difficult to find the exact location of irregularity(Schlain et al 2015 amp Mohsen et al 2016) Thus a new method for determining thelocation is introduced in this study Even when the GPS signal is low proximity sensorsare interfaced with the controller to determine the location of abnormalities (LOA)The proposed system immediately activates the proximity when the GPS signal is low
A GPS signal is essential for the calculation of the LOA GPS signal coverage areaand estimation of LOA are shown in Fig 7 The proximity sensor which is mountedin a wheel disc produces one pulse per rotation The controller counts these pulsesand determines the distance of the uncovered region by the GPS Distance (X1) isestimated as
X1 = n times k (23)
where n is the number of pulses produced by the proximity sensor and k is the circum-ference of the disc LOA is estimated as
LOA = Coordinateold + X1 (24)
where Coordinateold denotes the location where the GPS signal goes absent and X1 isthe distance from Coordinateold to the abnormality location For example if D = 6 km
96 C Chellaswamy et al An IoT based rail track condition monitoring
Fig 7 GPS coverage problem and estimation of LOA
Table 3Status of GPS GSM proximity sensor and the controller operation
DGPS Signal CommunicationSignal
Controller Operation Condition of Proximity
Not Present Present Estimate the location of vibrationbased on (2) and send to the cloud
ON
Present Present Send GPS coordinates if vibrationpresent
OFF
Present Not Present Store GPS coordinates if vibrationpresent
OFF
Not Present Not Present Store the location of vibration andswitch on the proximity and storethe location if abnormality isdetected
ON
then the abnormality location is determined by adding 6 km to the previously storedcoordinates Table 3 shows the different signal status and the corresponding opera-tions done by the controller In the first case when the GPS signal is absent IoT-RMSimmediately turns on the proximity sensor to determine the location of abnormalitybased on (15) In the second case the controller sends the abnormality location with-out any problem when the GPS and communication signals are present In the thirdcase the controller stores the LOA when the GPS is present and the communica-tion signal is absent Data is then sent to the cloud when the signal is available Inthe final case both GPS and communication signal are absent and it automaticallyswitches the proximity on stores the location of the abnormality and sends it to thecloud when the communication signal is available The route of the train is definedat the starting time so that no confusion will come in the direction of LOA fromCoordinateold
C Chellaswamy et al An IoT based rail track condition monitoring 97
Fig 8 T2 and Q statistics with 015 drift (a) deformation with crack (b) missing bolt
5 Simulation and experimental results
51 Experimental setup
In this section the prototype of the proposed system is analyzed and presented withdifferent experiments that are performed by sending the alert notice to other trains thatpass through the location This helps the driver plan ahead and avoid derailment Fourdifferent experiments were conducted to look at the effects of visible damage (missingbolt) invisible damage (loose bolts and battered rail surface) rusty deformation on railtop and deformations with The proposed method was also performed at three differentspeeds 20 km 45 km and 80 km A huge amount of data approximately 78 GB wasstored on 27 January 2018 Four different places around Chennai were selected fortwo-way travel in the same route and the location of the abnormalities were notedThe field tests for manipulated variables were performed near the industrial city ofTamilnadu To start the tests were performed under normal conditions as a controlFour routes Chennai Beach to Chennai Central (A) Chennai Central to Egmore (B)Pallavaram to Trisulam (C) and Tambaram to Chengalpat (D) were chosen for thestudy At these locations the abnormality detection system was tested for its efficiencyand accuracy
52 Performance of Proposed PCAM-DWT
To verify the detection capability of PCAM-DWT used in the proposed IoT-RMSwith two scenarios (deformation with crack and missing bolt) are considered Heresignals with a duration of 2000 milliseconds were taken near the abnormalities for easeof understanding In the first scenario artificial drifts were imposed on the accelerom-eter signal received from the deformation with a crack at the 7500th sample point andmissing bolt for the 2700th sample point In the simulation the drift grows to 015for the deformation with crack and 0156 for missing bolt measurements For boththe cases the small drift alters the measurement that is unnoticeable in the time profileas shown in Fig 8 Figure 8 indicates that the T2 statistic has not exceeded the limitduring the test On the other hand the Q statistics have negligible variation
98 C Chellaswamy et al An IoT based rail track condition monitoring
Fig 9 T2 and Q statistics with 125 drift (a) deformation with crack (b) missing bolt
In the second scenario drift grows to 125 for the deformation with a crack at the7500th sample point and missing bolt for the 2700th sample point The measurementcan be seen in the time profile and is shown in Fig 9 Figure 9 indicates that boththe T2 and Q statistics have exceeded the limit during the test at the correspondingsample point The T2 statistics exceed 224 in the deformation with crack and 373for missing bolt cases The Q statistics exceed 436 in the deformation with crackand 449 for missing bolt cases It is evident that T2 and Q statistics for both thedeformation with crack and missing bolt cases exceeds only in the abnormal pointsand not exceeded due to large variation in the amplitude
53 Performance of IoT-RMS
Acceleration of the train is measured by the MEMS accelerometers The measuredacceleration is applied to PCAM-DWT and correlation analysis was performed Thecorrelation analysis has been performed between the measured signal and the trackgeometry measurement signal (for more details refer to section 23) The track abnor-mality can be detected when the T2 and Q statistics exceeds the second confidenceFigure 10 shows the abnormality measured by the axle box accelerometer during thedeparture of the train for four different locations (locations A B C and D) undervarious speeds Figure 10 (a) and (b) show the accelerometer signal for visible andinvisible damage for three different speeds The figure shows the signal level of invis-ible damage as less than the visible damage and the abnormalities present at 7 km and62 km respectively from the start of the track for all the speed Figure 10 (c) shows theabnormality for deformation with a crack for three different speeds It shows abnor-mality at 38 km from the start of the track for all the speeds Figure 10 (d) shows theabnormality for rusty deformation on the track top and the irregularity seen in 53 kmfor all the speed scenarios
Figure 11 shows the abnormality measured by the axle box accelerometer during thearrival of the train for four different locations (locations A B C and D) under threedifferent speed scenarios Comparing Fig 10 and 11 the accelerometer signal receivedfrom both the departure and arrival of the same route indicates that the presence ofabnormality Figure 10 and 11 show the accuracy of the proposed method
C Chellaswamy et al An IoT based rail track condition monitoring 99
Fig 10 Abnormality in axle box mounted accelerometer during departure (a) invisible damage (loose boltsand battered rail surface) (b) visible damage (missing bolt) (c) deformation with crack (d) rusty deformationon rail top
Fig 11 Abnormality in axle box mounted accelerometer during arrival (a) invisible damage (loose boltsand battered rail surface) (b) visible damage (missing bolt) (c) deformation with crack (d) rusty deformationon rail top
54 Experimental results
The prototype of the proposed system developed uses the ARM processor (LPC2148)and has been deployed on the super-fast train (26142) The acceleration signal wasrecorded for different test cases under running conditions Figure 12 shows the exper-
100 C Chellaswamy et al An IoT based rail track condition monitoring
Fig 12 Experimental Setup of the proposed IoT-RMS
Fig 13 Experimental results for different location of abnormalities with coordinates (a) visible damage(missing bolt) (b) Invisible damage (loose bolts and battered rail surface) (c) deformation with crack (d)rusty deformation on rail top
imental setup and the coordinates for the location of the abnormality Figure 13 showsthe different locations of abnormalities such as the missing bolt at location A loose boltsat location B deformation with a crack at location C and severe plastic deformationon rail top at location D
Accelerometer data were recorded and analyzed for the four abnormality casesThe test was done on 27 January 2018 and the values for a particular test track werecollected The controller finds the abnormal condition when the signal exceeds thesecond confidence level and records the location using GPS Figure 13 shows the
C Chellaswamy et al An IoT based rail track condition monitoring 101
Fig 14 Visualization of OpenStreetMap for real-time track abnormality monitoring
experimental results in a zoomed view for various track irregularities Figure 13 (a)shows the presence of the irregularity in the coordinate 130815 N amp 802768 EWhen these coordinates were compared with the predefined values they found to bealmost the same with only 1 m variation from the fault location Recorded invisibledamage coordinates are shown in Fig 13 (b) This shows abnormality present in thecoordinate 130739 N amp 802618 E The coordinates of deformation with crack andrusty deformation on rail top are shown in Fig 13 (c) and (d) It shows the presence ofthe abnormality in 129679 N amp 801484 E 129336 N amp 801020 E These valuesexactly match with the predefined values
Web-based tracking for vehicles is provided by the open-source OpenGTS underApache Software License This technology can be used in general-purpose vehiclesprivate transport vehicles and different kinds of the satellite tracking system Open-StreetMap helps visualization of the location of track abnormality Figure 14 shows thereal-time track abnormality MongoDB database is used for the storage of the data andmonitors the abnormal location Data analysis and manipulations can be performed onthese unstructured data
55 Performance comparison
The performance of the network was studied by considering the constant latencyof the network at which the data is sent from the vehicle to infrastructure and alertmessage from the infrastructure to the vehicle The focus of the analysis is on inquiryand data processing and data insertion and parsing Two types of server are used inthe proposed system one for the storage of the data and the other for data collectionand manipulation OpenGTS software was installed in the i7-6700 CPU with 64 GBRAM and used for collecting and manipulating the data from the track The datastorage server was installed with MongoDB and it configured under single servermode
102 C Chellaswamy et al An IoT based rail track condition monitoring
Fig 15 Performance comparison (a) Parsing row data in MongoDB (b) Processing time
Fig 16 Comparison of accuracy in fault detection during departure of train
Scalability analysis was performed 40 times for both the scenarios for ensuringreliability in the results Figure 15(a) shows the performance of parsing row data toGeoJSON and included in MongoDB The chart was plotted using the number of thedata size and the corresponding response time There was a linear increase in responsetime with an increase in the data size The chart shows that the size of the data isproportional to the response time
The response time of the MongoDB was assessed considering 10000 documents Fig-ure 15(b) shows the response time in which the distance varied from 1 km to 8 km Slightvariations in response time around 25 meters were seen with an increase in the distance
The accuracy of the proposed IoT-RMS had been studied by conducting differentexperiments for both the departure and arrival of the train The experiment results forthe departure of the train are shown in Fig 16 Comparing the proposed IoT-RMSwith other methods 1959 higher than the conventional method 1134 and 825higher than the methods used by Mingyun (2017) respectively for the abnormalitydetected at location A In the same way the comparison is made with the abnormality
C Chellaswamy et al An IoT based rail track condition monitoring 103
Fig 17 Comparison of accuracy in fault detection during arrival of train
location at B the proposed IoT-RMS is 1848 than the conventional method 326and 544 compared to Lee et al (2012) and Mingyun et al (2017) respectivelySimilarly the proposed method is compared with the abnormality locations at C andD the proposed method is higher than all the other methods The results show thatthe proposed method identifies the abnormalities in the exact location whereas theconventional method provides the least accuracy compared to the proposed IoT-RMSfollowed by Lee et al (2012) and Mingyun et al (2017) Figure 17 shows the results ofthe arrival of the train The results show that the accuracy of detecting the abnormalityis exact and better than other methods namely the conventional method by Lee et al(2012) and Mingyunet et al (2017)
Meanwhile to study the accuracy of the proposed IoT-RMS the abnormalities arecreated purposely in four different locations (130815 N amp 802768 E 130739N amp 802618 E 129679 N amp 801484 E 129336 N amp 801020 E) and theperformances were analyzed The accuracy of the proposed IoT-RMS detecting theabnormality for different speed scenarios are listed in Table 4 The controller estimatesthe coordinates for different abnormalities exactly at 25 km speed The GPS is switchedoff purposely in the rusty deformation on the top case and the accuracy of the systemis verified In this case the controller switches on the proximity and exactly calculatesthe distance (Coordinateold+475 km) of abnormality The location of abnormality canbe identified by taking 475 km from the Coordinateold The abnormality location isalso exactly calculated in the 50 km speed There is a little variation in the abnormalitylocation for visible and deformation with crack fault case a deviation of 094 m ispresent from the fault set coordinates
The performance of the proposed IoT-RMS is compared with three different existingmethods namely Lei et al (2018) Chellaswamy et al (2017b) Mingyuan et al (2017)and the proposed method is shown in Table 5 The proposed method has an automaticsystem that monitors and manages when a GPS signal is not available or less than theset threshold Additionally Table 5 indicates that the proposed system provides priorinformation to the driver with more accuracy than other systems
104 C Chellaswamy et al An IoT based rail track condition monitoring
Table 4Fault detection and the corresponding GPS coordinates different speeds
Type of abnormality Fault set coordinates Fault identified Distanceestimated byproximity (km)
Accuracy ()coordinates
Latitude Longitude Latitude Longitude
Speed 25 kmVisible damage 130815 N 802768 E 130815 N 802768 E No 100Invisible damage 130739 N 802618 E 130739 N 802618 E No 100Deformation with
crack129679 N 801484 E 129679 N 801484 E No 100
Rusty deformationon the top
129336 N 801020 E 129336 N 801020 E 475 100
Speed 50 kmVisible Fault 130815 N 802768 E 130815 N 802768 E No 100Invisible Fault 130739 N 802618 E 130739 N 802618 E No 100Deformation with
crack129679 N 801484 E 129679 N 801483 E 352 9952
Rusty deformationon the top
129336 N 801020 E 129336 N 801020 E No 100
Speed 80 kmVisible Fault 130815 N 802768 E 130813 N 802767 E 427 9914Invisible Fault 130739 N 802618 E 130739 N 802618 E No 100Deformation with
crack129679 N 801484 E 129677 N 801483 E No 9925
Rusty deformationon the top
129336 N 801020 E 129336 N 801020 E No 100
Table 5Performance comparison of the proposed IoT-RMS with existing methods
Methods Fault detection method Method for Global Accuracy CostGPS signaling Information () (Euro)
problem sharing
Lei et al (2018) Time-frequency model Not available Not available 92 18000Chellaswamy et al
(2017b)Accelerometer with IoT Not available Available 94 27000
Mingyuan et al (2017) ZigBee with wirelesssensor network
Not available Not available 97 55000
Proposed IoT-RMS Accelerometer with IoT Available Available 99 42000
6 Conclusion
Rail track monitoring is essential for detecting vibrations in the track identifyingthe location information and ultimately avoiding derailment This paper has proposedan IoT based condition monitoring system for detecting any abnormalities in the railtrack and updating it in the cloud Accordingly this information has sent to alert thedrivers of the trains that pass through the abnormal location so that they can reducethe speed in the specified location thereby avoid derailment Signals from the MEMSaccelerometers mounted in the axle box of the train have pre-processed because thesensors used in IoT-RMS works in a high noise environment They have tested forthree different speeds for four abnormality cases It is clear from the results that the
C Chellaswamy et al An IoT based rail track condition monitoring 105
IoT-RMS provides the exact location of irregularity and it could also be passed toother vehicles through the cloud Performances of the network like query time andprocessing speed are studied A prototype has been developed and the accuracy ofthe system has been shown through different tests conducted This system tracks theabnormality at the beginning itself and thus avoids the chances of derailment Theproposed IoT-RMS exactly identifies the abnormality and captures the correspondinglocation The accuracy of the proposed system is higher when compared to earlierversions Due to these factors the proposed system can easily be integrated to therailway network
The limitation of our study is that four cases of abnormalities have been consideredIn the near future it will be enhanced by introducing more scenarios Moreover opti-mization algorithms can be included in the signal analysis This system can be extendedfor avoiding frontal collision by updating and sharing the branching information ofrunning trains
References
Amy J C T Charles V T Chin-Yuan F Abby P T H Xuan-Kai L amp Ian J Y L (2017) IOT Patentroadmap for smart logistic service provision in the context of industry 40 Journal of the Chinese Instituteof Engineers 40(7) 593ndash602 httpsdoiorg1010800253383920171362325
Anand V amp Mallikarjuna R C (2016) MongoDB and Oracle NoSQL A technical critique for designdecisions International Conference on Emerging Trends in Engineering Technology and Science 1ndash4httpsdoiorg101109ICETETS20167602984
Bevilacqua M Ciarapica F E Diamantini C amp Potena D (2017) Big Data Analytics Methodolo-gies Applied at Energy Management in Industrial Sector A Case Study International Journal of RFTechnologies 8(3) 105ndash122 httpsdoiorg103233RFT-171671
Bogacz R Czyczula W amp Konowrocki R (2007) Influence of sleepers shape and configuration ontrackndashtrain dynamics Shock and Vibration 1ndash7 httpdxdoiorg1011552014393867
Chellaswamy C Vanathi A Duraichami S amp Glaretsubin P (2017a) Optimized Vehicle accelerationmeasurement for Rail Track Condition Monitoring IEEE International Conference on Computing andCommunication Technologies 155ndash160 httpsdoiorg101109ICCCT220177972265
Chellaswamy C Balaji L Vanathi A amp Saravanan L (2017b) IoT based rail track health monitoring andinformation system IEEE International Conference on Microelectronic Devices Circuits and Systems1ndash6 httpsdoiorg101109ICMDCS20178211548
Chellaswamy C Akila V Dinesh Babu A amp Arasan N K (2013) Fuzzy logic based railway trackcondition monitoring system IEEE International Conference on Communication and Nanotechnology(ICE-CCN) 250ndash255 httpsdoiorg101109ICE-CCN20136528503
Chellaswamy C Krishnasamy M Balaji L Dhanalakshmi A amp Ramesh R (2020) Optimized railtrack health monitoring system based on dynamic differential evolution algorithm Measurement vol152 Article ID107332 httpsdoiorg101016jmeasurement2019107332
Chen X (2013) Research on data preprocess method for thermal parameters [Master thesis] North ChinaElectric Power University
Chen N Chen Y You Y Ling H Liang P amp Zimmermann R (2016) Dynamic urban surveillancevideo stream processing using fog computing In Proc IEEE Int Conf Multimedia Big Data 105ndash112httpsdoiorg101109BigMM201653
Chunli W Chunlei Z amp pengtu Z (2012) Denoising algorithm based on wavelet adaptive thresholdPhysics Procedia 24 678ndash685
Divya M amp Ziliang Z (2017) Energy efficiency analysis of query optimizations on MongoDB and Cassan-dra Eighth International Green and Sustainable Computing Conference 1ndash6 httpsdoiorg101109IGCC20178323581
106 C Chellaswamy et al An IoT based rail track condition monitoring
Feng Z Min L Zhuo Z amp Weiming S (2016) An IoT Based Online Monitoring System for Con-tinuous Steel Casting IEEE Internet of Things Journal 3 1355ndash1363 httpsdoiorg101109JIOT20162600630
Gaurav K P amp Sanjeev K S Y (2020) Multi-objective optimization of vibration assisted electrical dis-charge drilling process using PCA based GRA method Materials Today Proceedings httpsdoiorg101016jmatpr202002561
Gigin G In-Mook C amp Sung-Mok K (2018) PCA exchange method for compensation of error sourcesin pressure balance calibration Measurement 124 179ndash183 httpsdoiorg101016jmeasurement201804021
Guannan L amp Yunpeng H (2019) An enhanced PCA-based chiller sensor fault detection method usingensemble empirical mode decomposition based denoising Energy and Buildings 18315 311ndash324httpsdoiorg101016jenbuild201810013
Han-Pang H Jiu-Lou Y Tzu-How H amp Ming-Bao H (2017) IoT-Based networking for humanoidrobot Journal of the Chinese Institute of Engineers 40(7) 603ndash613 httpsdoiorg1010800253383920171372224
Hodge VJ OrsquoKeefe S Weeks M amp Moulds A (2015) Wireless sensor networks for condition mon-itoring in the railway industry A survey IEEE Trans Intell Transp Syst 6 1088ndash1106 httpsdoiorg101109TITS20142366512
Huang Y Huang S Zhang Y Sheng S Yang X amp Liu R (2019) A Process Innovation Mode ofSemiconductor Integrated Circuit Products Based on the Integration of Internet of Things and Sens-ing Big Data International Journal of RF Technologies 10 89ndash104 httpsdoiorg103233RFT-180105
Ning H Li Yunfei Shi F amp Laurence T Y (2020) Heterogeneous edge computing open platformsand tools for internet of things Future Generation Computer Systems 106 67ndash76 httpsdoiorg101016jfuture201912036
Jian Y Xin W Xue Z amp You DZ (2015) Cloud computing and visual attention based object detectionfor power substation surveillance robots In Proc IEEE Can Conf Elect Comput Eng (CCECE) 337ndash342httpsdoiorg101109CCECE20157129299
Jiang L (2011) Sensor fault detection and isolation using system dynamic identification techniques TheUniversity of Michigan [PhDthesis] 2011
Kidd P T (2012) The Role of the Internet of Things in Enabling Sustainable Agriculture in EuropeInternational Journal of RF Technologies 3(1) 67ndash83 httpsdoiorg103233RFT-2011-017
Konop J amp Konowrocki R (2013) On evaluation of the wheelsets-track interaction quality in railwayengineering Machine Dynamics Research 37 61ndash70
Kopsinis Y amp McLaughlin S (2009) Development of EMD-based denoising methods inspired by waveletthresholding IEEE Trans Signal Process 57 1351ndash62
Lee J S Choi S Kim S S Park S amp Kim Y G (2012) A mixed filtering approach for track conditionmonitoring using accelerometers on the axle box and bogie IEEE Transactions on Instrumentation andMeasurement 61 749ndash758 httpsdoiorg101109TIM20112170377
Lee K W Correia A J Lee K H Neilan B D J amp Gregor S (2014) Solar energy harvesting fromroadways In Proc 93rd Annu Meeting Transp Res Board Washington DC USA 4380-1-4380-18httpstridtrborgview1289344
Lei X Wanming Z amp Zhaowei C (2018) On use of characteristic wavelengths of track irregularities topredict track portions with deteriorated wheelrail forces Mechanical Systems and Signal Processing1041 264ndash278 httpsdoiorg101016jymssp201710038
Li F (2011) Dynamic modeling sensor placement design and fault diagnosis of nuclear desalinationsystems The University of Tennessee [PhD thesis]
Li F Upadhyaya B R amp Perillo S R P (2012) Fault diagnosis of helical coil steam generator systemsof an integral pressurized water reactor using optimal sensor selection IEEE Transactions on NuclearScience 59(2) 403ndash410
Mainetti L Marasovic I Patrono L Solic P Stefanizzi M L amp Vergallo R (2016) A Novel IoT-awareSmart Parking System Based on the Integration of RFID and WSN Technologies International Journalof RF Technologies 7(4) 175ndash199 httpsdoiorg103233RFT-161523
C Chellaswamy et al An IoT based rail track condition monitoring 107
Messai A Mellit A Abdellani I amp Massi P A (2015) On-line fault detection of a fuel rod temperaturemeasurement sensor in a nuclear reactor core using ANNs Prog Nucl Energy 79 8ndash21
Milting H Kassner A Oezpeker C Morhuis M Bohms B Boergermann J et al (2013) Genomics ofmyocardial recovery in patients with mechanical circulatory support J Heart Lung Transplant 32(4Suppl) 229 httpsdoi101016jhealun201301582
Mingyuan G Ping W Yifeng W amp Lingkan Y (2017) Self-Powered ZigBee Wireless Sensor Nodesfor Railway Condition Monitoring IEEE Transactions on Intelligent Transportation Systems 99 1ndash10httpsdoiorg101109TITS20172709346
Mohsen R Denis G amp Dominique G (2016) A Novel Approach for Improved Vehicular PositioningUsing Cooperative Map Matching and Dynamic Base Station DGPS Concept IEEE Transactions onIntelligent Transportation Systems 17 230ndash239 httpsdoiorg101109TITS20152465141
Molodova M Li Z Nunez A amp Dollevoet R (2014) Automatic detection of squats in railway infras-tructure IEEE Transactions on Intelligent Transportation Systems 15 1980ndash1990 httpsdoiorg101109TITS20142307955
Naderi H amp Mirabadi A (2006) Railway track condition monitoring using FBG and FPI fiber opticsensors International Conference on Railway Condition Monitoring 198ndash203
Pei Y X amp Guo M (2001) The fundamental principle and application of sliding average method GunLaunch amp Control Journal 1 21ndash24
Schlain L Gonzalez G Gregorio F amp Cousseau J (2015) Adaptive cyclostationary filtering forDGPS interference cancellation Workshop on Information Processing and Control 1ndash6 httpsdoiorg101109RPIC20157497088
Sunitha S Naveen Naik S amp Danda B Rawat (2019) Recent advances in mobile edge computingand content caching Digital Communications and Networks In press corrected proof httpsdoiorg101016jdcan201908004
Tracy N D Young J C amp Mason R L (1992) Multivariate control charts for individual observationsJ Qual Technol 24(2) 88ndash95
Tsunashima H Mori H Yanagisawa K Ogino M amp Asano A (2014) Condition Monitoring of RailwayTracks Using Compact Size On-board Monitoring Device 6th IET Conference on Railway ConditionMonitoring 1ndash5 httpsdoiorg101049cp20140996
Uckelmann D amp Harrison M (2010) Integrated Billing Mechanisms in the Internet of Things to SupportInformation Sharing and Enable New Business Opportunities International Journal of RF Technologies2(2) 73ndash90 httpsdoiorg103233RFT-2010-006
Walpole E R (2012) Probability and Statistics for Engineers and Scientists Prentice Hall 9th editionXiaowei Y Xiaoxiao W Yuan W Liping Q Weidang L amp Haibo Z (2017) Small-cell assisted secure
traffic offloading for narrow-band internet of thing (NB-IoT) systems IEEE Internet of Things Journalhttpsdoiorg101109JIOT20172779820
Xianping D amp Feng Z (2019) A novel principal components analysis PCA method for energy absorbingstructural design enhanced by data mining Advances in Engineering Software 127 17ndash27 httpsdoiorg101016jadvengsoft201810005
Yabin G Guannan L Huanxin C Yunpeng H Haorong Li Lu X amp Wenju H (2017) An enhancedPCA method with Savitzky-Golay method for VRF system sensor fault detection and diagnosis Energyand Buildings 1421 167ndash178 httpsdoiorg101016jenbuild201703026
Zhai W Liu P Lin J amp Wang K (2015) Experimental investigation on vibration behaviour of aCRH train at speed of 350 kmh International Journal of Rail Transportation 3 1ndash16 httpsdoiorg101080232483782014992819
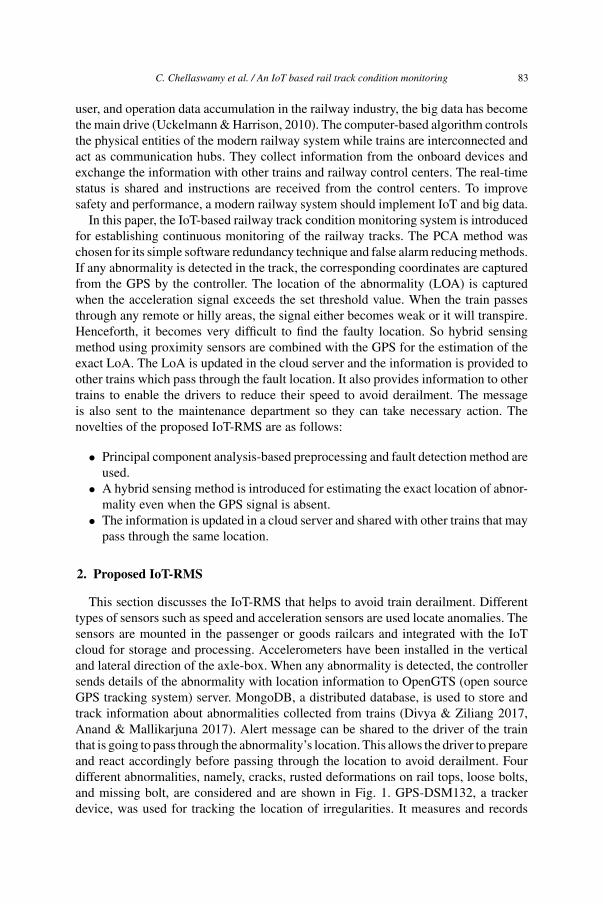
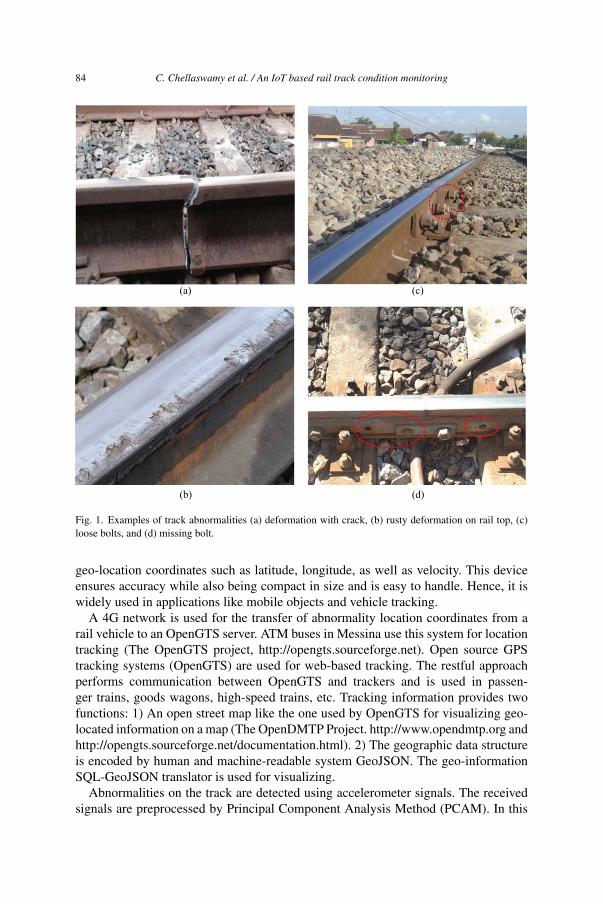
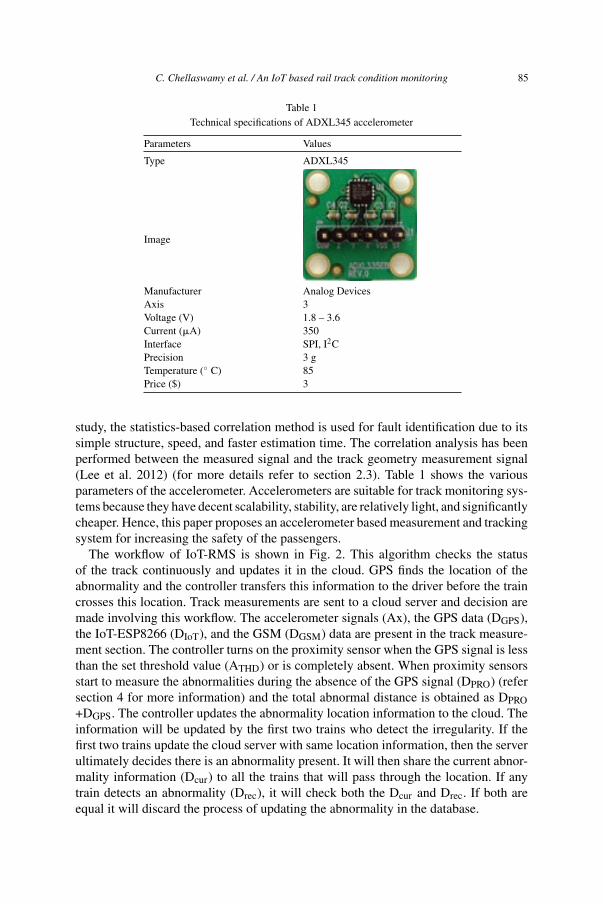
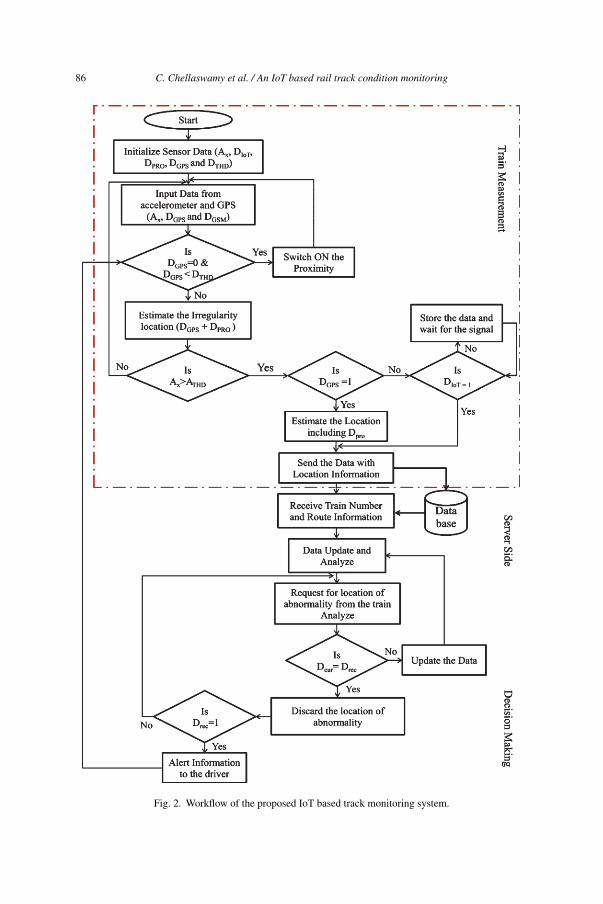
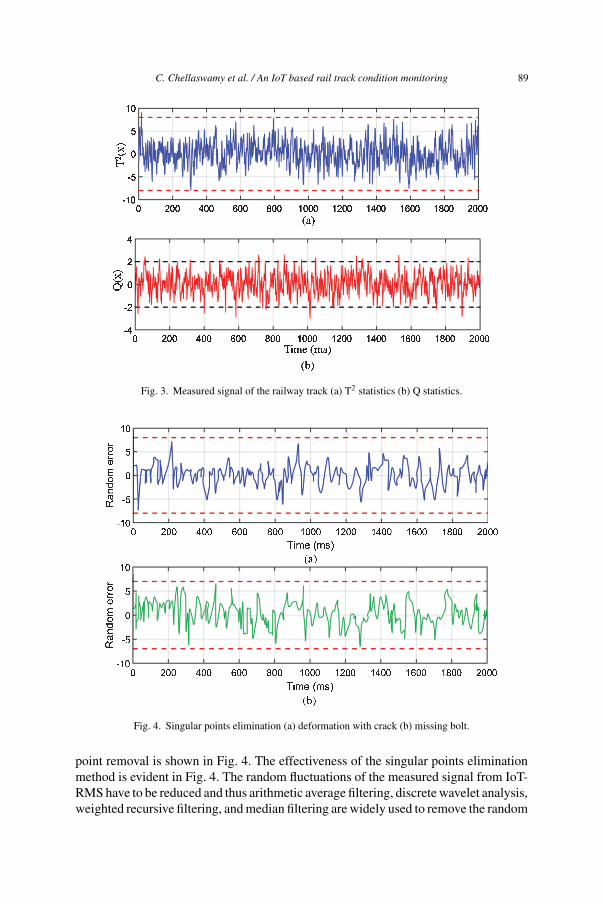
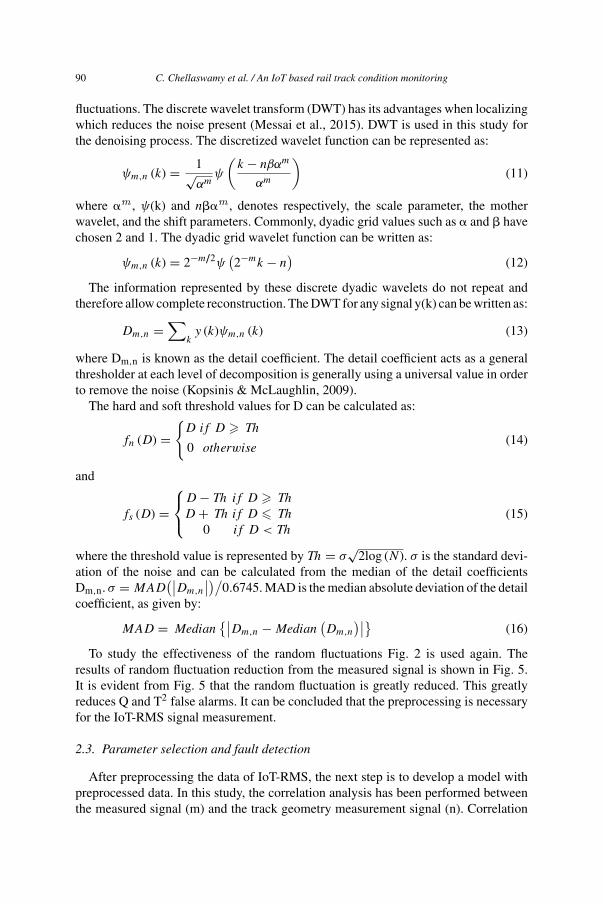
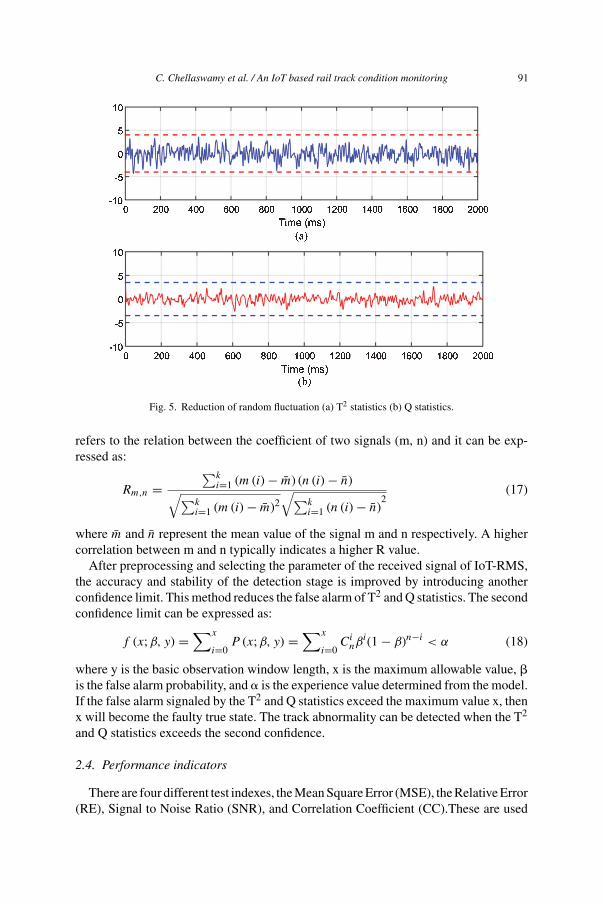
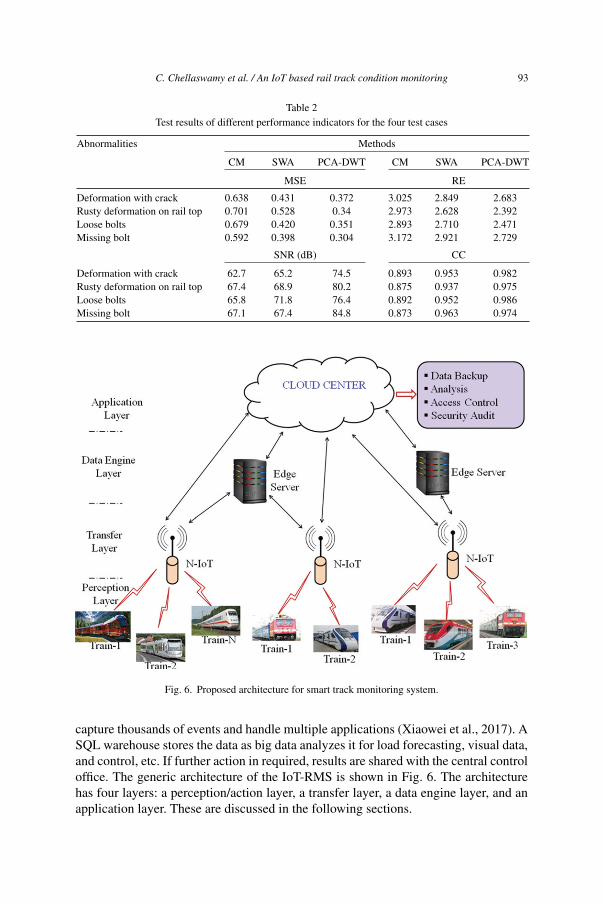
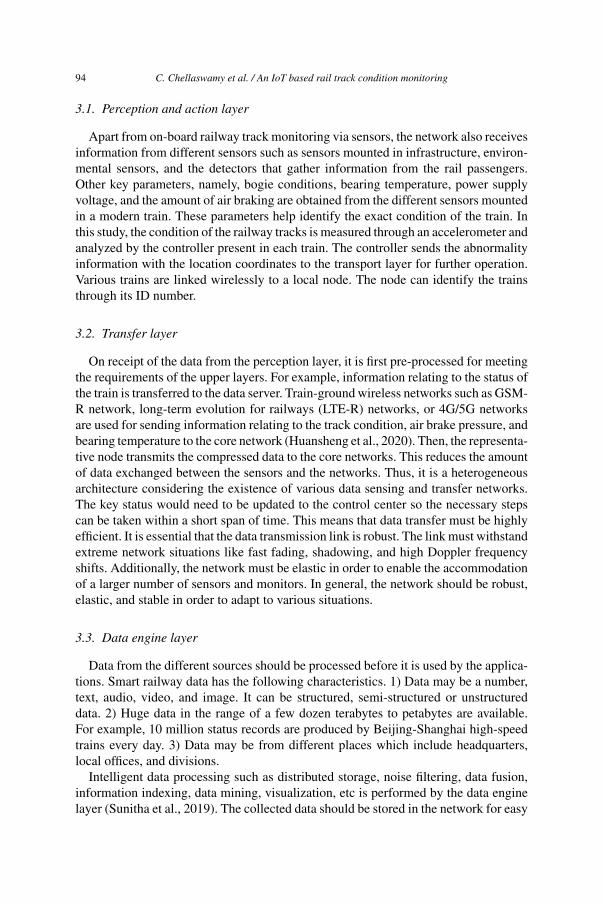
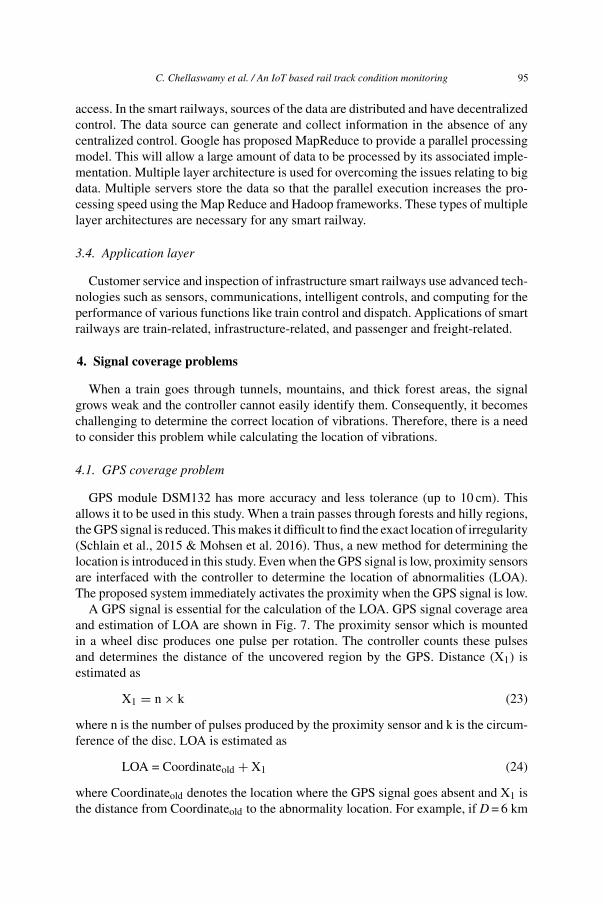
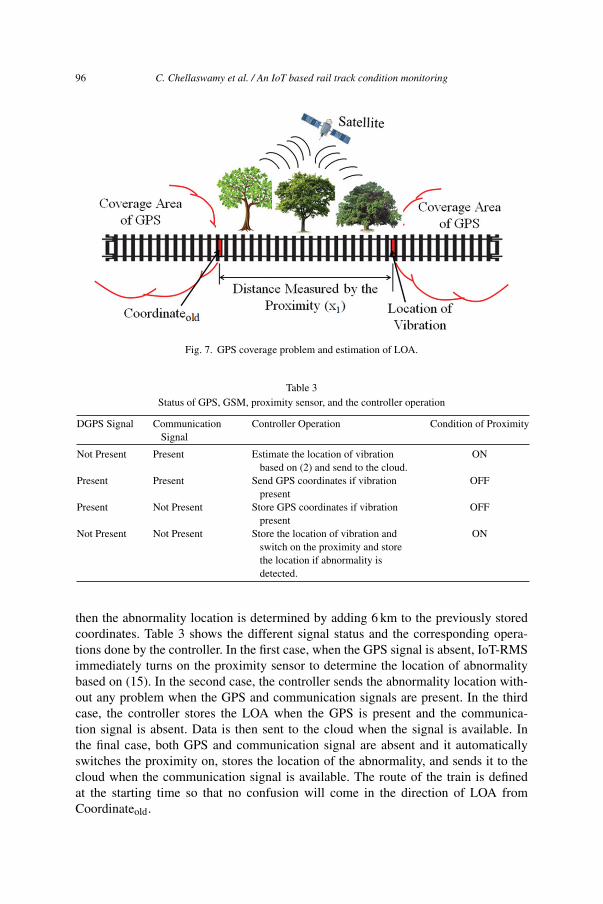
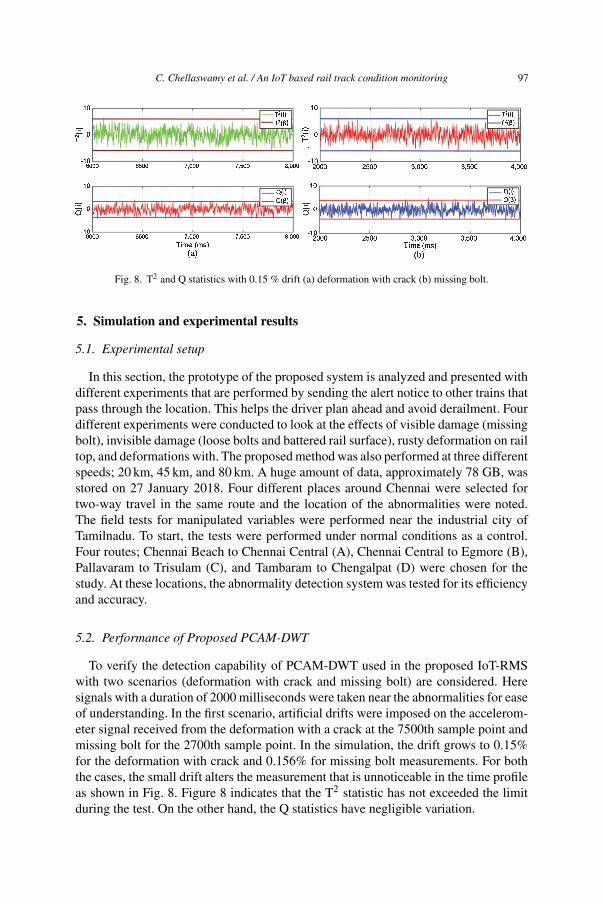
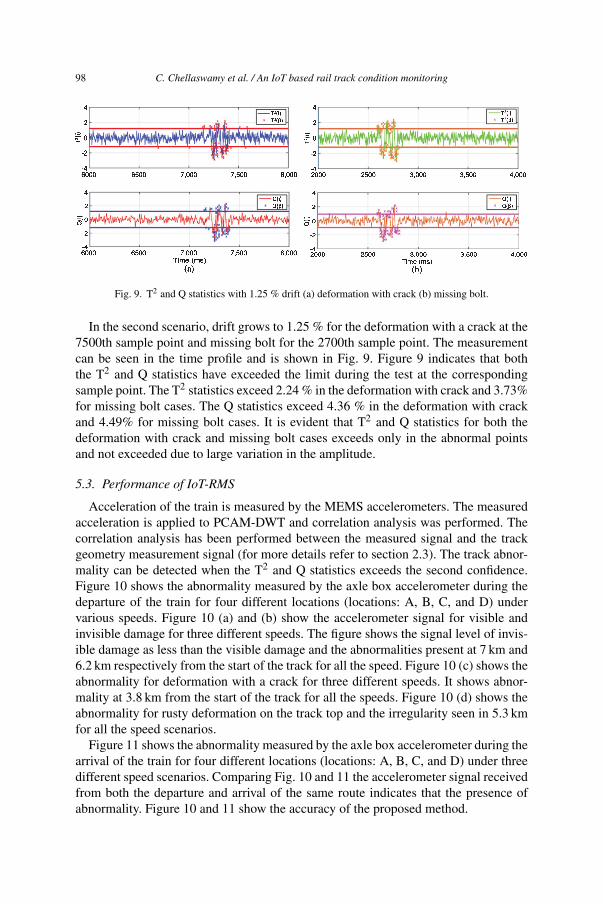
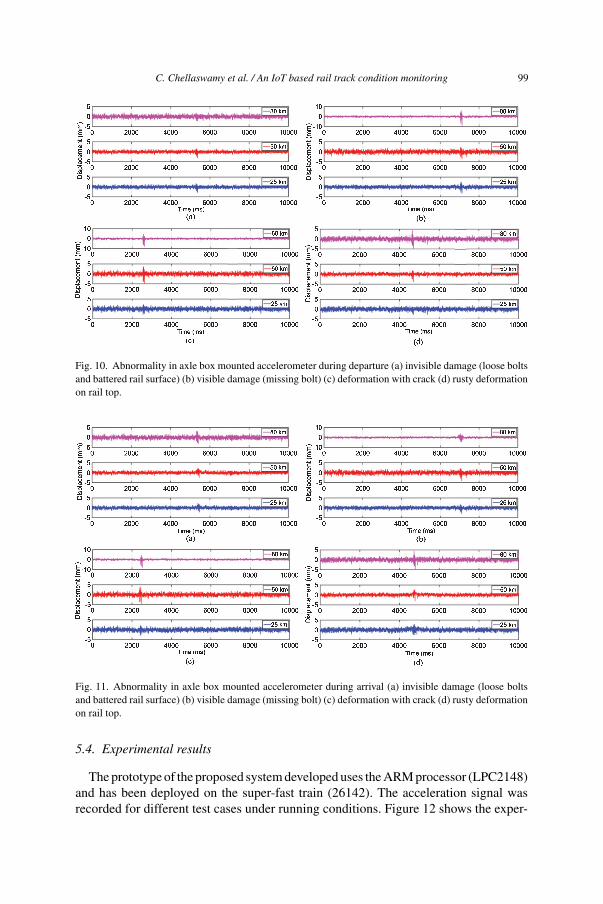
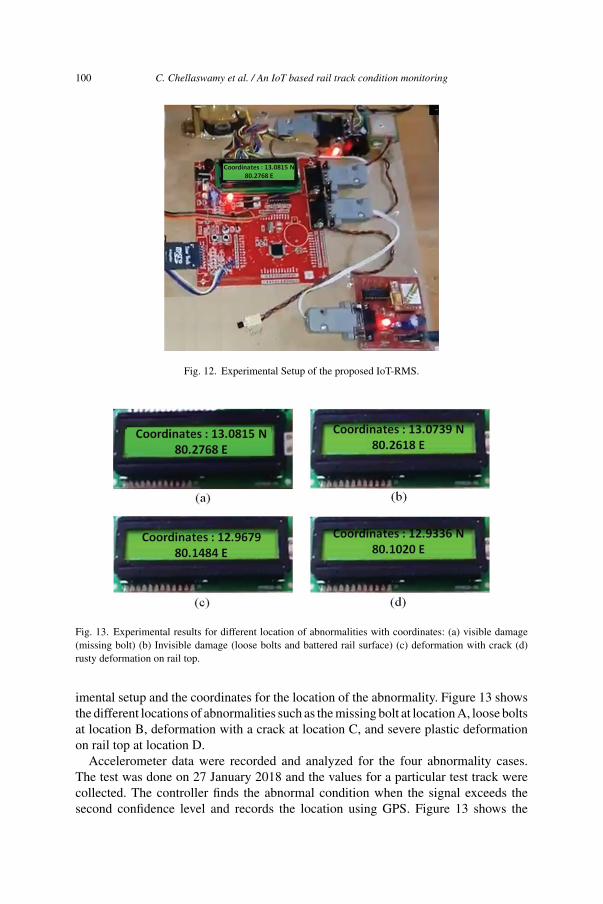
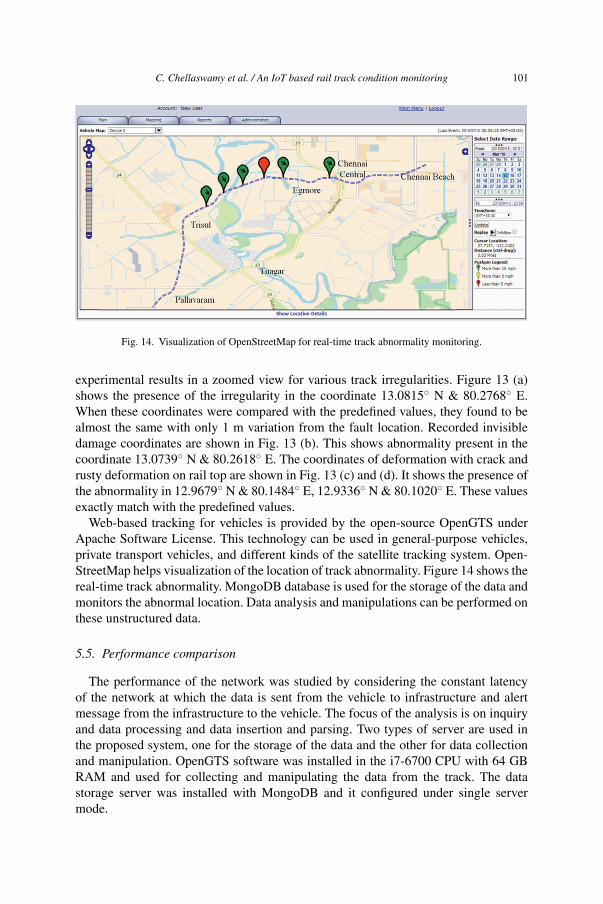
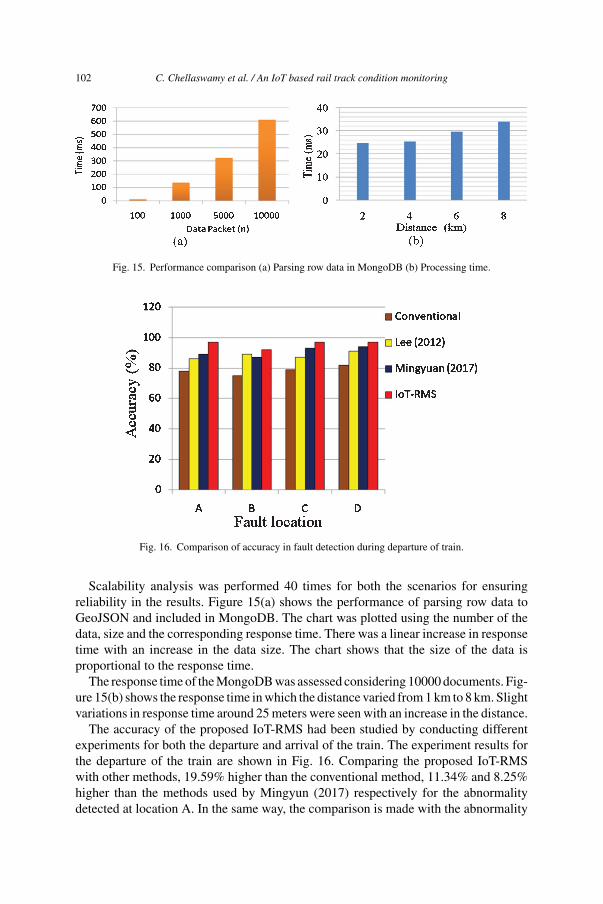
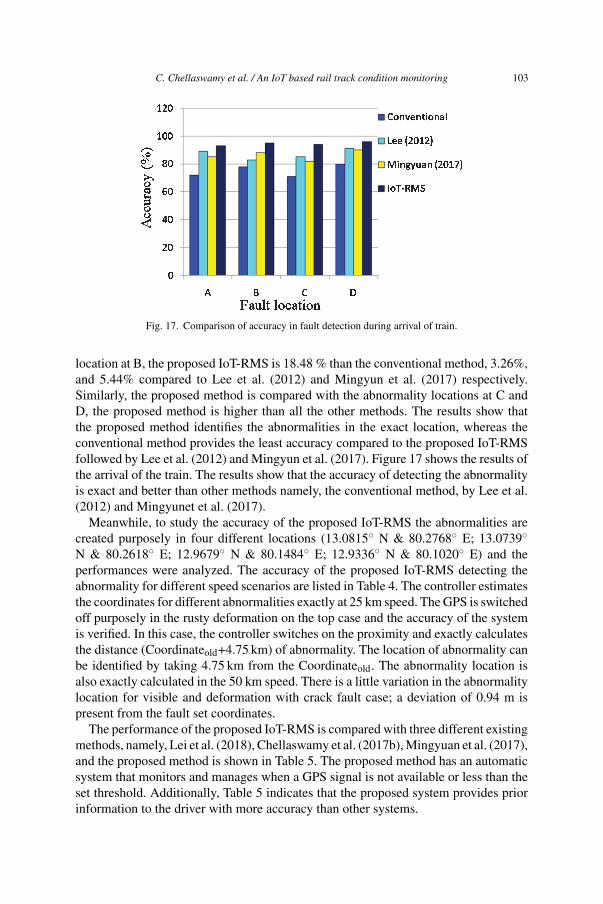
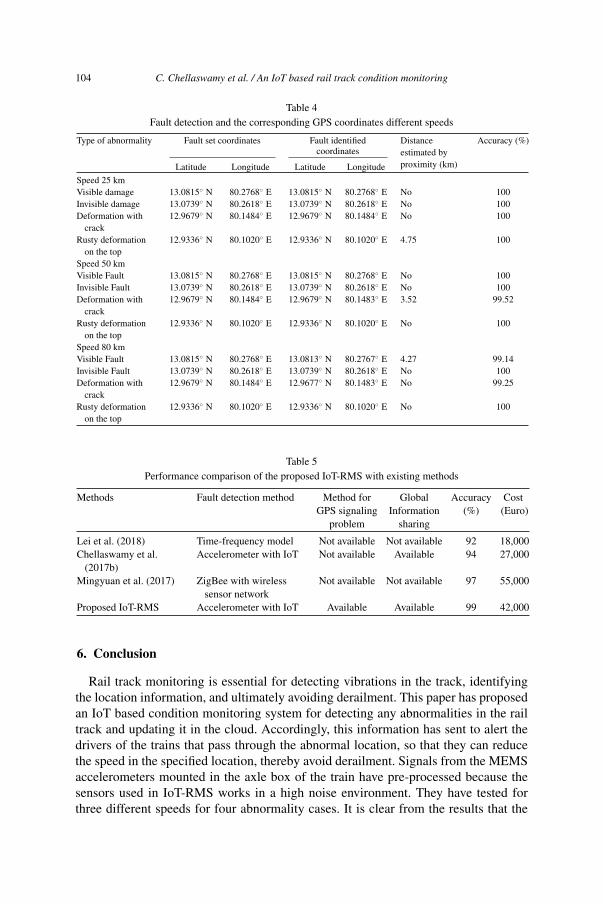
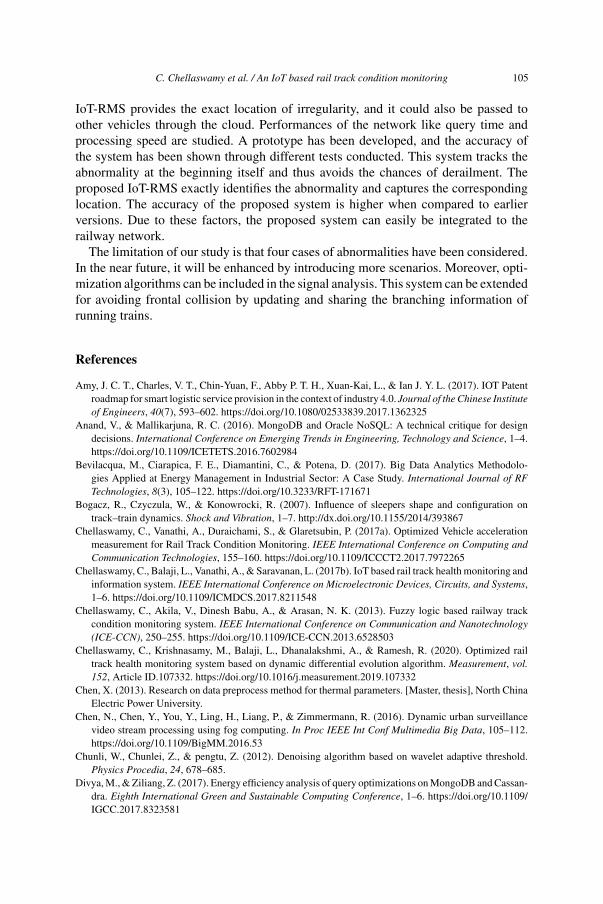


