Embed Size (px)
Citation preview
�����������������
Citation: Kogoj, R.; Korva, M.; Knap,
N.; Resman Rus, K.; Pozvek, P.;
Avšic-Županc, T.; Poljak, M.
Comparative Evaluation of Six
SARS-CoV-2 Real-Time RT-PCR
Diagnostic Approaches Shows
Substantial Genomic
Variant–Dependent Intra- and
Inter-Test Variability, Poor
Interchangeability of Cycle Threshold
and Complementary Turn-Around
Times. Pathogens 2022, 11, 462.
https://doi.org/10.3390/
pathogens11040462
Academic Editors: Dan Otelea,
Snjezana Zidovec Lepej and
Anna Honko
Received: 4 March 2022
Accepted: 10 April 2022
Published: 12 April 2022
Publisher’s Note: MDPI stays neutral
with regard to jurisdictional claims in
published maps and institutional affil-
iations.
Copyright: © 2022 by the authors.
Licensee MDPI, Basel, Switzerland.
This article is an open access article
distributed under the terms and
conditions of the Creative Commons
Attribution (CC BY) license (https://
creativecommons.org/licenses/by/
4.0/).
pathogens
Article
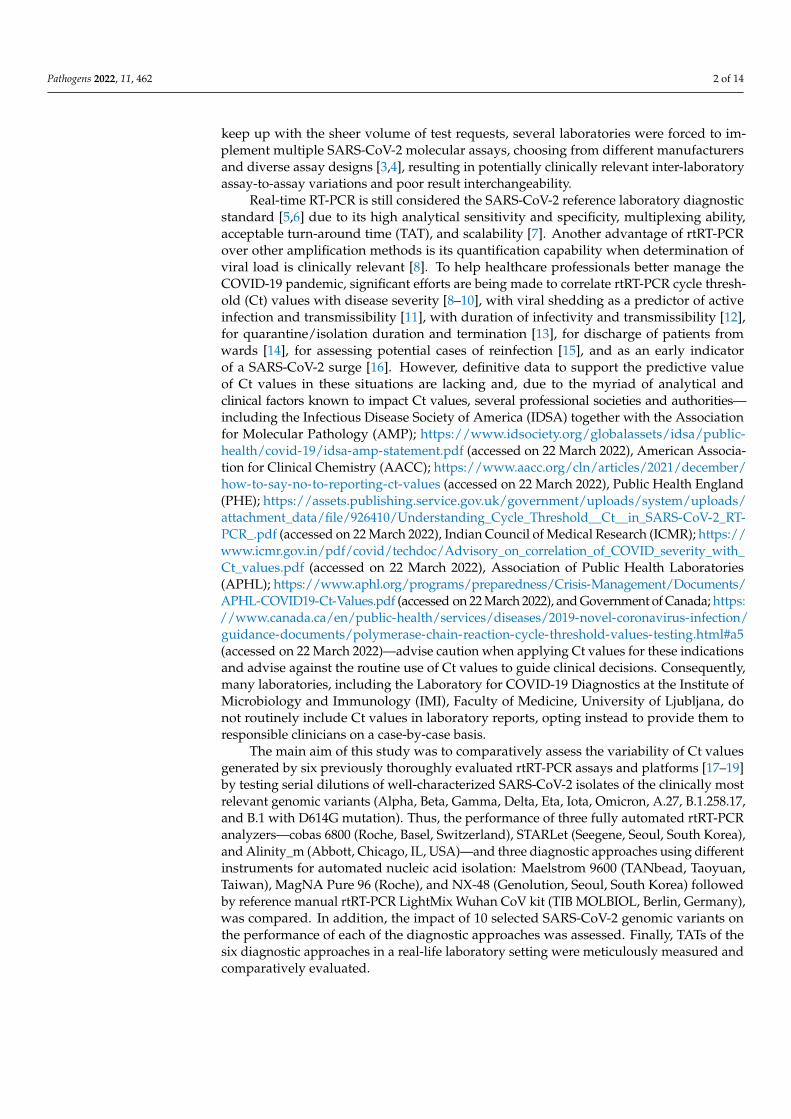
Comparative Evaluation of Six SARS-CoV-2 Real-Time RT-PCRDiagnostic Approaches Shows Substantial GenomicVariant–Dependent Intra- and Inter-Test Variability, PoorInterchangeability of Cycle Threshold and ComplementaryTurn-Around TimesRok Kogoj , Misa Korva , Nataša Knap, Katarina Resman Rus, Patricija Pozvek, Tatjana Avšic-Županc *and Mario Poljak *
Institute of Microbiology and Immunology, Faculty of Medicine, University of Ljubljana, Zaloška Cesta 4,1000 Ljubljana, Slovenia; [email protected] (R.K.); [email protected] (M.K.);[email protected] (N.K.); [email protected] (K.R.R.); [email protected] (P.P.)* Correspondence: [email protected] (T.A.-Ž.); [email protected] (M.P.)
Abstract: Several professional societies advise against using real-time Reverse-Transcription PCR(rtRT-PCR) cycle threshold (Ct) values to guide clinical decisions. We comparatively assessed thevariability of Ct values generated by six diagnostic approaches by testing serial dilutions of well-characterized isolates of 10 clinically most relevant SARS-CoV-2 genomic variants: Alpha, Beta,Gamma, Delta, Eta, Iota, Omicron, A.27, B.1.258.17, and B.1 with D614G mutation. Comparison ofthree fully automated rtRT-PCR analyzers and a reference manual rtRT-PCR assay using RNA isolatedwith three different nucleic acid isolation instruments showed substantial inter-variant intra-testand intra-variant inter-test variability. Ct value differences were dependent on both the rtRT-PCRplatform and SARS-CoV-2 genomic variant. Differences ranging from 2.0 to 8.4 Ct values wereobserved when testing equal concentrations of different SARS-CoV-2 variants. Results confirm thatCt values are an unreliable surrogate for viral load and should not be used as a proxy of infectivityand transmissibility, especially when different rtRT-PCR assays are used in parallel and multipleSARS-CoV-2 variants are circulating. A detailed turn-around time (TAT) comparative assessmentshowed substantially different TATs, but parallel use of different diagnostic approaches was beneficialand complementary, allowing release of results for more than 81% of non-priority samples within 8 hafter admission.
Keywords: severe acute respiratory syndrome coronavirus 2 (SARS-CoV-2); coronavirus disease 19(COVID-19); genomic variant; real-time RT-PCR; Ct value; turn-around time
1. Introduction
Following the initial emergence of Severe Acute Respiratory Syndrome Coronavirus2 (SARS-CoV-2) and its subsequent global pandemic spread, a range of molecular SARS-CoV-2 RNA assays, both in-house and commercial, were rapidly developed following thereal-time Reverse-Transcription PCR (rtRT-PCR) protocols summary by the WHO (https://www.who.int/docs/default-source/coronaviruse/whoinhouseassays.pdf, accessed on22 March 2022). Consequently, a substantial number of SARS-CoV-2 RNA assays receivedIn Vitro Diagnostics Emergency Use Authorization (EUA) approval from the US Food andDrug Administration (FDA) (https://www.fda.gov/medical-devices/coronavirus-disease-2019-covid-19-emergency-use-authorizations-medical-devices/in-vitro-diagnostics-euas-molecular-diagnostic-tests-sars-cov-2, accessed on 22 March 2022). Due to the unprece-dented need for SARS-CoV-2 testing, significant supply problems and a shortage of sampledevices, instruments, reagents, and consumables soon arose and are ongoing [1,2]. To
Pathogens 2022, 11, 462. https://doi.org/10.3390/pathogens11040462 https://www.mdpi.com/journal/pathogens
Pathogens 2022, 11, 462 2 of 14
keep up with the sheer volume of test requests, several laboratories were forced to im-plement multiple SARS-CoV-2 molecular assays, choosing from different manufacturersand diverse assay designs [3,4], resulting in potentially clinically relevant inter-laboratoryassay-to-assay variations and poor result interchangeability.
Real-time RT-PCR is still considered the SARS-CoV-2 reference laboratory diagnosticstandard [5,6] due to its high analytical sensitivity and specificity, multiplexing ability,acceptable turn-around time (TAT), and scalability [7]. Another advantage of rtRT-PCRover other amplification methods is its quantification capability when determination ofviral load is clinically relevant [8]. To help healthcare professionals better manage theCOVID-19 pandemic, significant efforts are being made to correlate rtRT-PCR cycle thresh-old (Ct) values with disease severity [8–10], with viral shedding as a predictor of activeinfection and transmissibility [11], with duration of infectivity and transmissibility [12],for quarantine/isolation duration and termination [13], for discharge of patients fromwards [14], for assessing potential cases of reinfection [15], and as an early indicatorof a SARS-CoV-2 surge [16]. However, definitive data to support the predictive valueof Ct values in these situations are lacking and, due to the myriad of analytical andclinical factors known to impact Ct values, several professional societies and authorities—including the Infectious Disease Society of America (IDSA) together with the Associationfor Molecular Pathology (AMP); https://www.idsociety.org/globalassets/idsa/public-health/covid-19/idsa-amp-statement.pdf (accessed on 22 March 2022), American Associa-tion for Clinical Chemistry (AACC); https://www.aacc.org/cln/articles/2021/december/how-to-say-no-to-reporting-ct-values (accessed on 22 March 2022), Public Health England(PHE); https://assets.publishing.service.gov.uk/government/uploads/system/uploads/attachment_data/file/926410/Understanding_Cycle_Threshold__Ct__in_SARS-CoV-2_RT-PCR_.pdf (accessed on 22 March 2022), Indian Council of Medical Research (ICMR); https://www.icmr.gov.in/pdf/covid/techdoc/Advisory_on_correlation_of_COVID_severity_with_Ct_values.pdf (accessed on 22 March 2022), Association of Public Health Laboratories(APHL); https://www.aphl.org/programs/preparedness/Crisis-Management/Documents/APHL-COVID19-Ct-Values.pdf (accessed on 22 March 2022), and Government of Canada; https://www.canada.ca/en/public-health/services/diseases/2019-novel-coronavirus-infection/guidance-documents/polymerase-chain-reaction-cycle-threshold-values-testing.html#a5(accessed on 22 March 2022)—advise caution when applying Ct values for these indicationsand advise against the routine use of Ct values to guide clinical decisions. Consequently,many laboratories, including the Laboratory for COVID-19 Diagnostics at the Institute ofMicrobiology and Immunology (IMI), Faculty of Medicine, University of Ljubljana, donot routinely include Ct values in laboratory reports, opting instead to provide them toresponsible clinicians on a case-by-case basis.
The main aim of this study was to comparatively assess the variability of Ct valuesgenerated by six previously thoroughly evaluated rtRT-PCR assays and platforms [17–19]by testing serial dilutions of well-characterized SARS-CoV-2 isolates of the clinically mostrelevant genomic variants (Alpha, Beta, Gamma, Delta, Eta, Iota, Omicron, A.27, B.1.258.17,and B.1 with D614G mutation). Thus, the performance of three fully automated rtRT-PCRanalyzers—cobas 6800 (Roche, Basel, Switzerland), STARLet (Seegene, Seoul, South Korea),and Alinity_m (Abbott, Chicago, IL, USA)—and three diagnostic approaches using differentinstruments for automated nucleic acid isolation: Maelstrom 9600 (TANbead, Taoyuan,Taiwan), MagNA Pure 96 (Roche), and NX-48 (Genolution, Seoul, South Korea) followedby reference manual rtRT-PCR LightMix Wuhan CoV kit (TIB MOLBIOL, Berlin, Germany),was compared. In addition, the impact of 10 selected SARS-CoV-2 genomic variants onthe performance of each of the diagnostic approaches was assessed. Finally, TATs of thesix diagnostic approaches in a real-life laboratory setting were meticulously measured andcomparatively evaluated.
Pathogens 2022, 11, 462 3 of 14
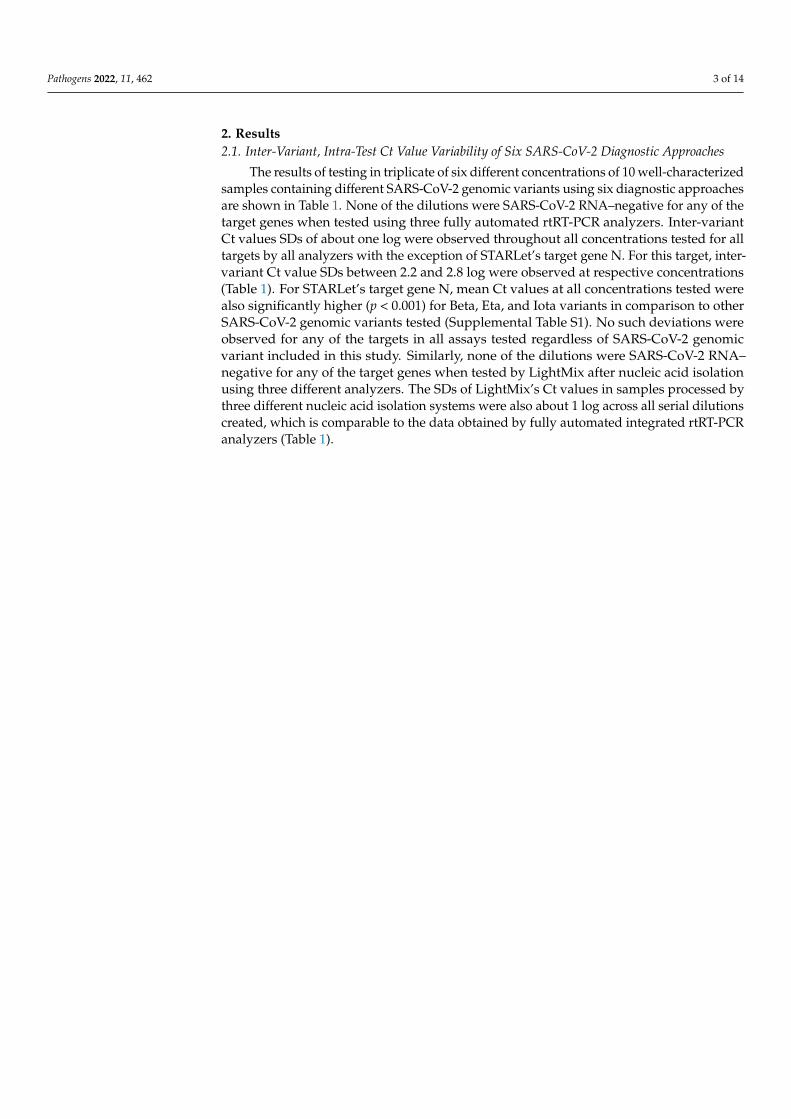
2. Results2.1. Inter-Variant, Intra-Test Ct Value Variability of Six SARS-CoV-2 Diagnostic Approaches
The results of testing in triplicate of six different concentrations of 10 well-characterizedsamples containing different SARS-CoV-2 genomic variants using six diagnostic approachesare shown in Table 1. None of the dilutions were SARS-CoV-2 RNA–negative for any of thetarget genes when tested using three fully automated rtRT-PCR analyzers. Inter-variantCt values SDs of about one log were observed throughout all concentrations tested for alltargets by all analyzers with the exception of STARLet’s target gene N. For this target, inter-variant Ct value SDs between 2.2 and 2.8 log were observed at respective concentrations(Table 1). For STARLet’s target gene N, mean Ct values at all concentrations tested werealso significantly higher (p < 0.001) for Beta, Eta, and Iota variants in comparison to otherSARS-CoV-2 genomic variants tested (Supplemental Table S1). No such deviations wereobserved for any of the targets in all assays tested regardless of SARS-CoV-2 genomicvariant included in this study. Similarly, none of the dilutions were SARS-CoV-2 RNA–negative for any of the target genes when tested by LightMix after nucleic acid isolationusing three different analyzers. The SDs of LightMix’s Ct values in samples processed bythree different nucleic acid isolation systems were also about 1 log across all serial dilutionscreated, which is comparable to the data obtained by fully automated integrated rtRT-PCRanalyzers (Table 1).
Pathogens 2022, 11, 462 4 of 14
Table 1. Inter-variant mean Ct values with standard deviations (SD), coefficient of variation (CV), and individual variant lowest mean/highest mean Ct at respectiveconcentration points generated by specific PCR targets in all rtRT-PCR diagnostic approaches assessed (Alinity, cobas, STARLet, and LightMix) when testing intriplicate six different concentrations of 10 well-characterized isolates containing different SARS-CoV-2 genomic variants.
Concentration 1 × 10⁴
[PFU/mL]1 × 103
[PFU/mL]1 × 102
[PFU/mL]1 × 101
[PFU/mL]1 × 100
[PFU/mL]1 × 10−1
[PFU/mL]
Alinity N/R † N/R † N/R † N/R † N/R † N/R †inter-variant mean Ct
± SD11.0± 0.6
14.3± 0.8
18.0± 0.8
21.7± 0.8
25.0± 1.2
28.3± 1.3
var. + lowest mean Ctvar. + highest mean Ct
10.212.2
13.015.3
17.119.9
20.623.4
23.827.8
26.731.1
inter-variant CV [%] 5.5 5.6 4.4 3.7 4.8 4.6cobas ORF ‡ E ORF ‡ E ORF ‡ E ORF ‡ E ORF ‡ E ORF ‡ E
inter-variant mean Ct± SD
14.1± 0.8
14.4± 0.9
17.2± 0.9
17.6± 1.0
20.7± 1.0
21.2± 1.0
24.1± 0.9
24.6± 0.9
27.3± 0.9
27.8± 1.0
30.4± 1.0
31.0± 1.2
var. + lowest mean Ctvar. + highest mean Ct
13.015.7
13.016.0
16.019.0
15.719.4
19.322.6
19.423.0
22.925.9
23.126.3
26.229.3
26.229.8
28.932.2
28.933.1
inter-variant CV [%] 5.7 6.3 5.2 5.7 4.8 4.7 3.7 3.7 3.3 3.6 3.3 3.9STARLet E R †/S N E R †/S N E R †/S N E R †/S N E R †/S N E R †/S N
inter-variant mean Ct± SD
15.3± 0.8
14.5± 1.0
15.6± 2.8
18.5± 1.2
18.1± 1.1
19.4± 2.5
22.3± 1.3
22.2± 1.1
23.2± 2.4
25.8± 1.2
25.8± 1.0
26.2± 2.2
28.9± 1.1
29.2± 1.1
29.8± 2.4
32.4± 1.5
32.8± 1.2
33.7± 2.7
var. + lowest mean Ctvar. + highest mean Ct
13.416.4
12.915.9
11.319.7
15.919.7
16.119.4
16.023.4
19.523.7
20.623.7
19.726.9
23.526.8
24.327.0
23.230.0
26.530.2
27.530.8
26.633.1
29.434.0
30.934.3
29.937.9
inter-variant CV [%] 5.2 6.9 17.9 6.5 6.1 12.9 5.8 5.0 10.3 4.7 3.9 8.4 3.8 3.8 8.1 4.6 3.7 8.0Maelstrom + LM * E R † E R † E R † E R † E R † E R †
interv-ariant mean Ct± SD
11.5± 1.0
13.0± 0.7
15.3± 1.1
16.9± 1.1
19.2± 1.1
20.4± 1.0
22.5± 1.2
23.9± 1.0
26.0± 1.0
27.3± 0.7
29.5± 1.2
30.7± 1.0
var. + lowest mean Ctvar. + highest mean Ct
9.913.6
11.914.2
13.217.0
15.118.5
17.220.8
18.821.8
20.324.1
22.325.4
24.227.5
26.228.2
27.231.1
28.732.2
inter-variant CV [%] 8.7 5.4 7.2 6.5 5.7 4.9 5.3 4.2 3.8 2.6 4.1 3.3MagNA + LM * E R † E R † E R † E R † E R † E R †
inter-variant mean Ct± SD
12.4± 1.2
13.6± 1.0
16.0± 0.8
17.3± 0.8
19.6± 1.2
21.1± 1.1
23.2± 1.1
24.5± 1.2
26.7± 1.1
28.1± 1.3
30.1± 1.2
31.3± 0.9
var. + lowest mean Ctvar. + highest mean Ct
10.214.9
11.915.2
14.617.5
16.218.7
18.122.3
20.123.6
22.326.1
23.627.4
25.829.3
26.631.0
28.432.1
30.033.1
inter-variant CV [%] 9.7 7.4 5.0 4.6 6.1 5.2 4.7 4.9 4.1 4.6 4.0 2.9NX-48 + LM * E R † E R † E R † E R † E R † E R †
inter-variant mean Ct± SD
13.4± 1.3
14.6± 0.9
16.4± 0.8
17.5± 0.7
20.0± 1.0
21.3± 0.9
23.8± 1.1
25.0± 1.0
27.3± 1.3
28.7± 1.2
30.5± 1.5
31.9± 1.4
var. + lowest mean Ctvar. + highest mean Ct
10.915.1
12.815.6
14.517.6
16.118.4
17.921.3
19.522.5
21.725.2
23.526.5
25.229.2
27.130.5
28.132.9
29.934.1
inter-variant CV [%] 9.7 6.2 4.9 4.0 5.0 4.2 4.6 4.0 4.8 4.2 4.9 4.4
†—RdRP, ‡—ORF1ab, +—individual variant, *—LightMix.
Pathogens 2022, 11, 462 5 of 14
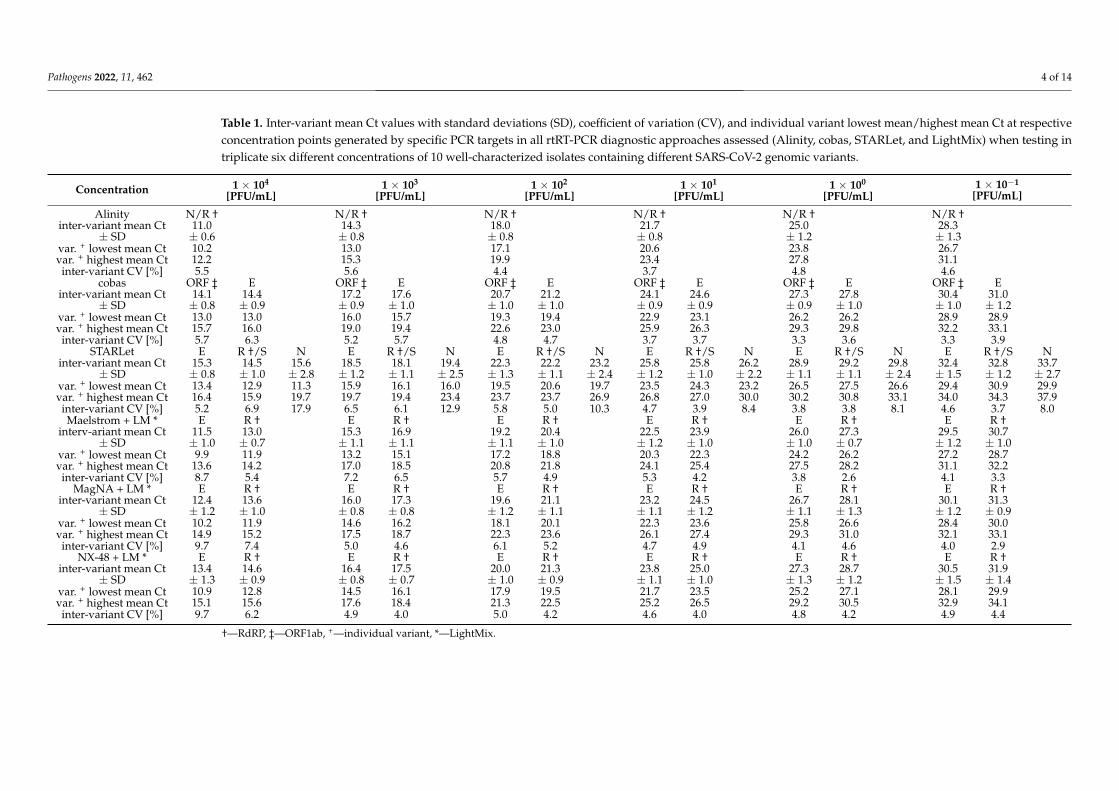
2.2. Intra-Variant, Inter-Test rtRT-PCR Efficiency Variability of Six SARS-CoV-2Diagnostic Approaches
Different numbers of rtRT-PCR targets, target gene regions, or even a combination oftargets are used in the diagnostic approaches evaluated. Therefore, rtRT-PCR efficiencywas chosen rather than Ct values for comparison of results obtained by six diagnosticapproaches related to respective SARS-CoV-2 genomic variants. As presented in Table 2,the comparative assessment showed that, regardless of the SARS-CoV-2 variant, all sixdiagnostic approaches performed with rtRT-PCR efficiencies between 80.1% and 106.8%.However, rtRT-PCR efficiencies for the same genomic variant were not consistent betweenassays. Regardless of the SARS-CoV-2 variant tested, cobas showed the most consistentrtRT-PCR efficiency, ranging from 98.8% to 105.0% and from 95.8% to 106.8% for Target 1(ORF1ab) and Target 2 (E gene), respectively (Table 2).
Table 2. Comparison of PCR efficiencies [%] of all assessed diagnostic approaches for 10 clinicallyrelevant SARS-CoV-2 genomic variants. Efficiency (%) = ((10e (−1/slope)) − 1) × 100).
B.1[%]
B.1.258.17[%]
A.27[%]
Alpha[%]
Beta[%]
Gamma[%]
Delta[%]
Eta[%]
Iota[%]
Omicron[%]
Alinity N/RdRP 95.3 97.1 95.6 95.5 92.0 89.1 96.0 92.5 81.6 104.8
cobas ORF1ab 98.8 99.5 103.2 101.9 105.0 100.1 104.3 103.0 99.7 104.0E 95.9 95.8 100.4 100.2 102.4 96.8 102.6 101.7 95.8 106.8
STARLetE 99.9 94.7 91.1 93.8 92.2 88.9 101.0 94.7 96.6 105.6
S/RdRP 87.1 88.2 84.5 84.3 86.0 81.1 88.0 81.5 89.1 96.5N 85.1 94.0 92.0 94.6 87.1 80.6 87.3 88.3 91.8 104.6
Maelstrom+ LM *
E 97.6 83.3 87.6 90.6 90.7 83.6 92.7 87.8 93.5 97.4RdRP 94.4 88.7 91.6 90.3 100.3 88.1 95.0 89.0 91.4 101.4
MagNA+ LM *
E 90.4 92.6 96.6 93.6 98.6 87.6 82.6 87.3 90.3 100.3RdRP 89.1 91.9 98.2 93.8 96.5 89.1 80.1 87.8 85.4 102.4
NX-48+ LM *
E 93.3 83.6 99.1 97.3 95.1 88.3 93.9 91.4 95.8 104.2RdRP 89.7 82.7 100.1 97.0 93.9 88.1 91.4 90.5 86.5 106.4
mean 93.1 91.0 94.5 94.4 95.0 88.5 92.9 91.3 91.5 102.9SD 4.7 5.7 5.7 4.7 5.9 5.6 7.6 6.1 5.2 3.4
minimal 85.1 82.7 84.5 84.3 86.0 80.6 80.1 81.5 81.6 96.5maximal 99.9 99.5 103.2 101.9 105.0 100.1 104.3 103.0 99.7 106.8
* LightMix.
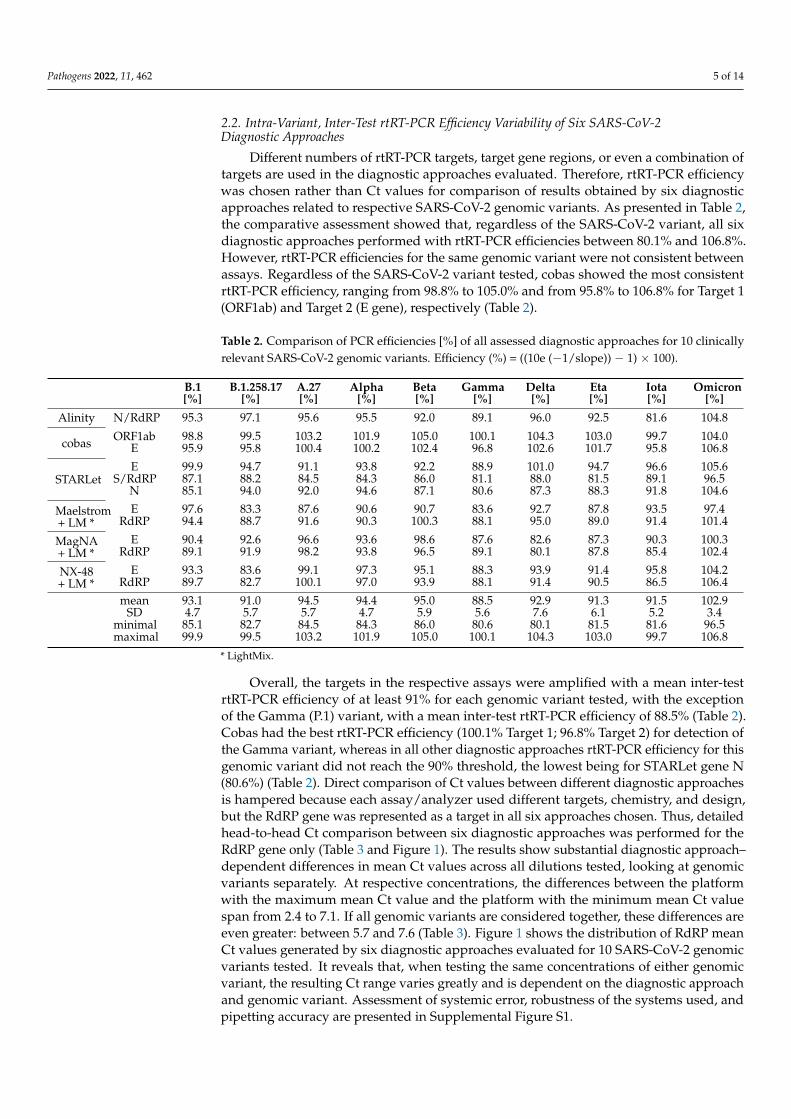
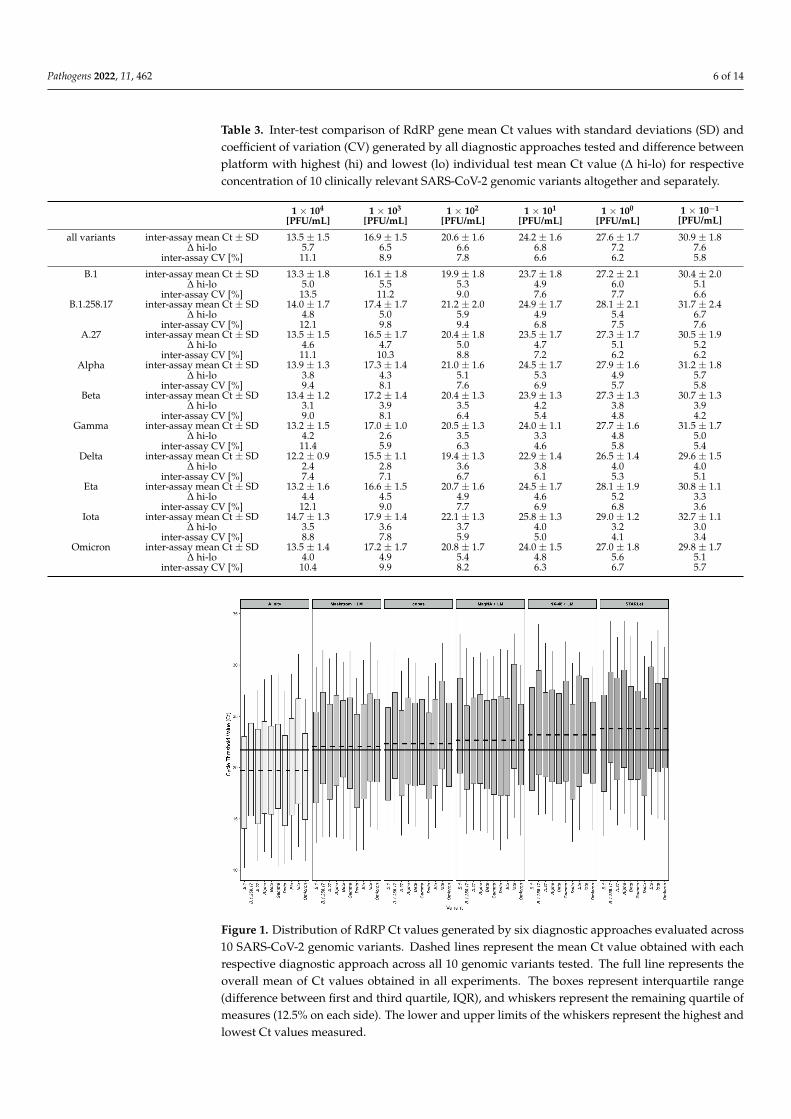
Overall, the targets in the respective assays were amplified with a mean inter-testrtRT-PCR efficiency of at least 91% for each genomic variant tested, with the exceptionof the Gamma (P.1) variant, with a mean inter-test rtRT-PCR efficiency of 88.5% (Table 2).Cobas had the best rtRT-PCR efficiency (100.1% Target 1; 96.8% Target 2) for detection ofthe Gamma variant, whereas in all other diagnostic approaches rtRT-PCR efficiency for thisgenomic variant did not reach the 90% threshold, the lowest being for STARLet gene N(80.6%) (Table 2). Direct comparison of Ct values between different diagnostic approachesis hampered because each assay/analyzer used different targets, chemistry, and design,but the RdRP gene was represented as a target in all six approaches chosen. Thus, detailedhead-to-head Ct comparison between six diagnostic approaches was performed for theRdRP gene only (Table 3 and Figure 1). The results show substantial diagnostic approach–dependent differences in mean Ct values across all dilutions tested, looking at genomicvariants separately. At respective concentrations, the differences between the platformwith the maximum mean Ct value and the platform with the minimum mean Ct valuespan from 2.4 to 7.1. If all genomic variants are considered together, these differences areeven greater: between 5.7 and 7.6 (Table 3). Figure 1 shows the distribution of RdRP meanCt values generated by six diagnostic approaches evaluated for 10 SARS-CoV-2 genomicvariants tested. It reveals that, when testing the same concentrations of either genomicvariant, the resulting Ct range varies greatly and is dependent on the diagnostic approachand genomic variant. Assessment of systemic error, robustness of the systems used, andpipetting accuracy are presented in Supplemental Figure S1.
Pathogens 2022, 11, 462 6 of 14
Table 3. Inter-test comparison of RdRP gene mean Ct values with standard deviations (SD) andcoefficient of variation (CV) generated by all diagnostic approaches tested and difference betweenplatform with highest (hi) and lowest (lo) individual test mean Ct value (∆ hi-lo) for respectiveconcentration of 10 clinically relevant SARS-CoV-2 genomic variants altogether and separately.
1 × 10⁴
[PFU/mL]1 × 103
[PFU/mL]1 × 102
[PFU/mL]1 × 101
[PFU/mL]1 × 100
[PFU/mL]1 × 10−1
[PFU/mL]
all variants inter-assay mean Ct ± SD 13.5 ± 1.5 16.9 ± 1.5 20.6 ± 1.6 24.2 ± 1.6 27.6 ± 1.7 30.9 ± 1.8∆ hi-lo 5.7 6.5 6.6 6.8 7.2 7.6
inter-assay CV [%] 11.1 8.9 7.8 6.6 6.2 5.8
B.1 inter-assay mean Ct ± SD 13.3 ± 1.8 16.1 ± 1.8 19.9 ± 1.8 23.7 ± 1.8 27.2 ± 2.1 30.4 ± 2.0∆ hi-lo 5.0 5.5 5.3 4.9 6.0 5.1
inter-assay CV [%] 13.5 11.2 9.0 7.6 7.7 6.6B.1.258.17 inter-assay mean Ct ± SD 14.0 ± 1.7 17.4 ± 1.7 21.2 ± 2.0 24.9 ± 1.7 28.1 ± 2.1 31.7 ± 2.4
∆ hi-lo 4.8 5.0 5.9 4.9 5.4 6.7inter-assay CV [%] 12.1 9.8 9.4 6.8 7.5 7.6
A.27 inter-assay mean Ct ± SD 13.5 ± 1.5 16.5 ± 1.7 20.4 ± 1.8 23.5 ± 1.7 27.3 ± 1.7 30.5 ± 1.9∆ hi-lo 4.6 4.7 5.0 4.7 5.1 5.2
inter-assay CV [%] 11.1 10.3 8.8 7.2 6.2 6.2Alpha inter-assay mean Ct ± SD 13.9 ± 1.3 17.3 ± 1.4 21.0 ± 1.6 24.5 ± 1.7 27.9 ± 1.6 31.2 ± 1.8
∆ hi-lo 3.8 4.3 5.1 5.3 4.9 5.7inter-assay CV [%] 9.4 8.1 7.6 6.9 5.7 5.8
Beta inter-assay mean Ct ± SD 13.4 ± 1.2 17.2 ± 1.4 20.4 ± 1.3 23.9 ± 1.3 27.3 ± 1.3 30.7 ± 1.3∆ hi-lo 3.1 3.9 3.5 4.2 3.8 3.9
inter-assay CV [%] 9.0 8.1 6.4 5.4 4.8 4.2Gamma inter-assay mean Ct ± SD 13.2 ± 1.5 17.0 ± 1.0 20.5 ± 1.3 24.0 ± 1.1 27.7 ± 1.6 31.5 ± 1.7
∆ hi-lo 4.2 2.6 3.5 3.3 4.8 5.0inter-assay CV [%] 11.4 5.9 6.3 4.6 5.8 5.4
Delta inter-assay mean Ct ± SD 12.2 ± 0.9 15.5 ± 1.1 19.4 ± 1.3 22.9 ± 1.4 26.5 ± 1.4 29.6 ± 1.5∆ hi-lo 2.4 2.8 3.6 3.8 4.0 4.0
inter-assay CV [%] 7.4 7.1 6.7 6.1 5.3 5.1Eta inter-assay mean Ct ± SD 13.2 ± 1.6 16.6 ± 1.5 20.7 ± 1.6 24.5 ± 1.7 28.1 ± 1.9 30.8 ± 1.1
∆ hi-lo 4.4 4.5 4.9 4.6 5.2 3.3inter-assay CV [%] 12.1 9.0 7.7 6.9 6.8 3.6
Iota inter-assay mean Ct ± SD 14.7 ± 1.3 17.9 ± 1.4 22.1 ± 1.3 25.8 ± 1.3 29.0 ± 1.2 32.7 ± 1.1∆ hi-lo 3.5 3.6 3.7 4.0 3.2 3.0
inter-assay CV [%] 8.8 7.8 5.9 5.0 4.1 3.4Omicron inter-assay mean Ct ± SD 13.5 ± 1.4 17.2 ± 1.7 20.8 ± 1.7 24.0 ± 1.5 27.0 ± 1.8 29.8 ± 1.7
∆ hi-lo 4.0 4.9 5.4 4.8 5.6 5.1inter-assay CV [%] 10.4 9.9 8.2 6.3 6.7 5.7
Pathogens 2022, 11, x FOR PEER REVIEW 6 of 14
inter-assay CV [%] 12.1 9.0 7.7 6.9 6.8 3.6
Iota inter-assay mean Ct ± SD 14.7 ± 1.3 17.9 ± 1.4 22.1 ± 1.3 25.8 ± 1.3 29.0 ± 1.2 32.7 ± 1.1
hi-lo 3.5 3.6 3.7 4.0 3.2 3.0
inter-assay CV [%] 8.8 7.8 5.9 5.0 4.1 3.4
Omicron inter-assay mean Ct ± SD 13.5 ± 1.4 17.2 ± 1.7 20.8 ± 1.7 24.0 ± 1.5 27.0 ± 1.8 29.8 ± 1.7
hi-lo 4.0 4.9 5.4 4.8 5.6 5.1
inter-assay CV [%] 10.4 9.9 8.2 6.3 6.7 5.7
Figure 1. Distribution of RdRP Ct values generated by six diagnostic approaches evaluated across
10 SARS-CoV-2 genomic variants. Dashed lines represent the mean Ct value obtained with each
respective diagnostic approach across all 10 genomic variants tested. The full line represents the
overall mean of Ct values obtained in all experiments. The boxes represent interquartile range (dif-
ference between first and third quartile, IQR), and whiskers represent the remaining quartile of
measures (12.5% on each side). The lower and upper limits of the whiskers represent the highest
and lowest Ct values measured.
2.3. Turn-Around Times of Six SARS-CoV-2 Diagnostic Approaches
TATs were comparatively assessed during the period when all six diagnostic ap-
proaches were used in parallel. From March 2020 to the end of May 2021, a total of 504,173
samples for SARS-CoV-2 RNA testing were received at IMI. Of these, 96.1%
(484,336/504,173) were processed as regular samples. The remaining 3.9% (19,837/504,173)
were ordered as high-priority samples (STAT) and were processed either by XpertXpress
SARS-CoV-2 (Cepheid, Sunnyvale, CA, USA) or cobas LIAT (Roche). However, due to the
frequent supply shortage of cartridges/assay tubes needed for two ultra-fast rtRT-PCRs,
Figure 1. Distribution of RdRP Ct values generated by six diagnostic approaches evaluated across10 SARS-CoV-2 genomic variants. Dashed lines represent the mean Ct value obtained with eachrespective diagnostic approach across all 10 genomic variants tested. The full line represents theoverall mean of Ct values obtained in all experiments. The boxes represent interquartile range(difference between first and third quartile, IQR), and whiskers represent the remaining quartile ofmeasures (12.5% on each side). The lower and upper limits of the whiskers represent the highest andlowest Ct values measured.
Pathogens 2022, 11, 462 7 of 14
2.3. Turn-Around Times of Six SARS-CoV-2 Diagnostic Approaches
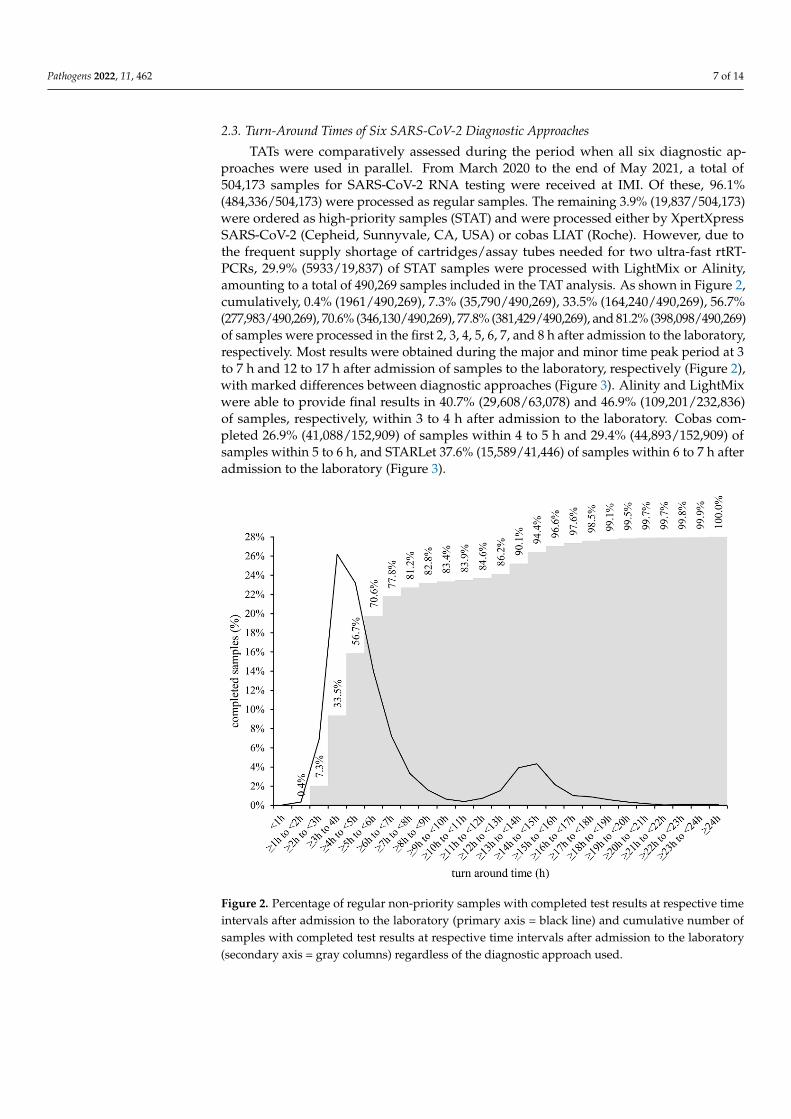
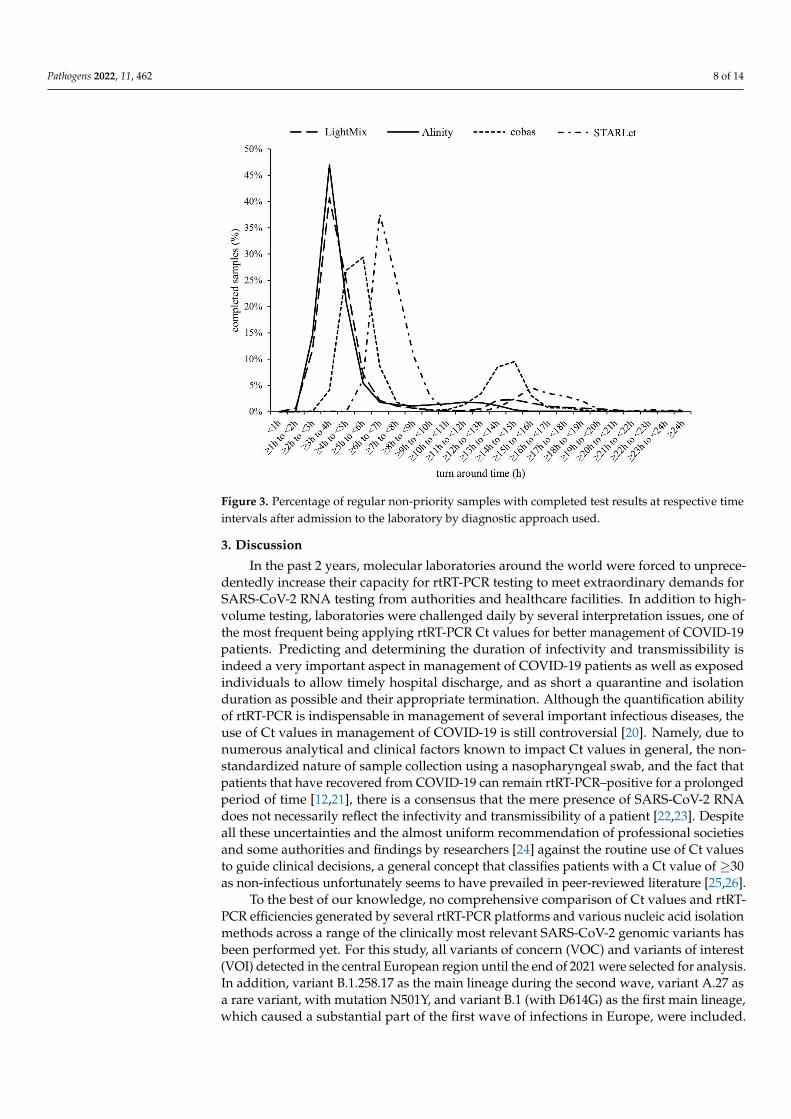
TATs were comparatively assessed during the period when all six diagnostic ap-proaches were used in parallel. From March 2020 to the end of May 2021, a total of504,173 samples for SARS-CoV-2 RNA testing were received at IMI. Of these, 96.1%(484,336/504,173) were processed as regular samples. The remaining 3.9% (19,837/504,173)were ordered as high-priority samples (STAT) and were processed either by XpertXpressSARS-CoV-2 (Cepheid, Sunnyvale, CA, USA) or cobas LIAT (Roche). However, due tothe frequent supply shortage of cartridges/assay tubes needed for two ultra-fast rtRT-PCRs, 29.9% (5933/19,837) of STAT samples were processed with LightMix or Alinity,amounting to a total of 490,269 samples included in the TAT analysis. As shown in Figure 2,cumulatively, 0.4% (1961/490,269), 7.3% (35,790/490,269), 33.5% (164,240/490,269), 56.7%(277,983/490,269), 70.6% (346,130/490,269), 77.8% (381,429/490,269), and 81.2% (398,098/490,269)of samples were processed in the first 2, 3, 4, 5, 6, 7, and 8 h after admission to the laboratory,respectively. Most results were obtained during the major and minor time peak period at 3to 7 h and 12 to 17 h after admission of samples to the laboratory, respectively (Figure 2),with marked differences between diagnostic approaches (Figure 3). Alinity and LightMixwere able to provide final results in 40.7% (29,608/63,078) and 46.9% (109,201/232,836)of samples, respectively, within 3 to 4 h after admission to the laboratory. Cobas com-pleted 26.9% (41,088/152,909) of samples within 4 to 5 h and 29.4% (44,893/152,909) ofsamples within 5 to 6 h, and STARLet 37.6% (15,589/41,446) of samples within 6 to 7 h afteradmission to the laboratory (Figure 3).
Pathogens 2022, 11, x FOR PEER REVIEW 7 of 14
29.9% (5933/19,837) of STAT samples were processed with LightMix or Alinity, amount-
ing to a total of 490,269 samples included in the TAT analysis. As shown in Figure 2, cu-
mulatively, 0.4% (1961/490,269), 7.3% (35,790/490,269), 33.5% (164,240/490,269), 56.7%
(277,983/490,269), 70.6% (346,130/490,269), 77.8% (381,429/490,269), and 81.2%
(398,098/490,269) of samples were processed in the first 2, 3, 4, 5, 6, 7, and 8 h after admis-
sion to the laboratory, respectively. Most results were obtained during the major and mi-
nor time peak period at 3 to 7 h and 12 to 17 h after admission of samples to the laboratory,
respectively (Figure 2), with marked differences between diagnostic approaches (Figure
3). Alinity and LightMix were able to provide final results in 40.7% (29,608/63,078) and
46.9% (109,201/232,836) of samples, respectively, within 3 to 4 h after admission to the
laboratory. Cobas completed 26.9% (41,088/152,909) of samples within 4 to 5 h and 29.4%
(44,893/152,909) of samples within 5 to 6 h, and STARLet 37.6% (15,589/41,446) of samples
within 6 to 7 h after admission to the laboratory (Figure 3).
Figure 2. Percentage of regular non-priority samples with completed test results at respective time
intervals after admission to the laboratory (primary axis = black line) and cumulative number of
samples with completed test results at respective time intervals after admission to the laboratory
(secondary axis = gray columns) regardless of the diagnostic approach used.
Figure 2. Percentage of regular non-priority samples with completed test results at respective timeintervals after admission to the laboratory (primary axis = black line) and cumulative number ofsamples with completed test results at respective time intervals after admission to the laboratory(secondary axis = gray columns) regardless of the diagnostic approach used.
Pathogens 2022, 11, 462 8 of 14Pathogens 2022, 11, x FOR PEER REVIEW 8 of 14
Figure 3. Percentage of regular non-priority samples with completed test results at respective time
intervals after admission to the laboratory by diagnostic approach used.
3. Discussion
In the past 2 years, molecular laboratories around the world were forced to unprece-
dentedly increase their capacity for rtRT-PCR testing to meet extraordinary demands for
SARS-CoV-2 RNA testing from authorities and healthcare facilities. In addition to high-
volume testing, laboratories were challenged daily by several interpretation issues, one of
the most frequent being applying rtRT-PCR Ct values for better management of COVID-
19 patients. Predicting and determining the duration of infectivity and transmissibility is
indeed a very important aspect in management of COVID-19 patients as well as exposed
individuals to allow timely hospital discharge, and as short a quarantine and isolation
duration as possible and their appropriate termination. Although the quantification abil-
ity of rtRT-PCR is indispensable in management of several important infectious diseases,
the use of Ct values in management of COVID-19 is still controversial [20]. Namely, due
to numerous analytical and clinical factors known to impact Ct values in general, the non-
standardized nature of sample collection using a nasopharyngeal swab, and the fact that
patients that have recovered from COVID-19 can remain rtRT-PCR–positive for a pro-
longed period of time [12,21], there is a consensus that the mere presence of SARS-CoV-2
RNA does not necessarily reflect the infectivity and transmissibility of a patient [22,23].
Despite all these uncertainties and the almost uniform recommendation of professional
societies and some authorities and findings by researchers [24] against the routine use of
Ct values to guide clinical decisions, a general concept that classifies patients with a Ct
value of ≥30 as non-infectious unfortunately seems to have prevailed in peer-reviewed
literature [25,26].
To the best of our knowledge, no comprehensive comparison of Ct values and rtRT-
PCR efficiencies generated by several rtRT-PCR platforms and various nucleic acid isola-
tion methods across a range of the clinically most relevant SARS-CoV-2 genomic variants
has been performed yet. For this study, all variants of concern (VOC) and variants of in-
terest (VOI) detected in the central European region until the end of 2021 were selected
for analysis. In addition, variant B.1.258.17 as the main lineage during the second wave,
Figure 3. Percentage of regular non-priority samples with completed test results at respective timeintervals after admission to the laboratory by diagnostic approach used.
3. Discussion
In the past 2 years, molecular laboratories around the world were forced to unprece-dentedly increase their capacity for rtRT-PCR testing to meet extraordinary demands forSARS-CoV-2 RNA testing from authorities and healthcare facilities. In addition to high-volume testing, laboratories were challenged daily by several interpretation issues, one ofthe most frequent being applying rtRT-PCR Ct values for better management of COVID-19patients. Predicting and determining the duration of infectivity and transmissibility isindeed a very important aspect in management of COVID-19 patients as well as exposedindividuals to allow timely hospital discharge, and as short a quarantine and isolationduration as possible and their appropriate termination. Although the quantification abilityof rtRT-PCR is indispensable in management of several important infectious diseases, theuse of Ct values in management of COVID-19 is still controversial [20]. Namely, due tonumerous analytical and clinical factors known to impact Ct values in general, the non-standardized nature of sample collection using a nasopharyngeal swab, and the fact thatpatients that have recovered from COVID-19 can remain rtRT-PCR–positive for a prolongedperiod of time [12,21], there is a consensus that the mere presence of SARS-CoV-2 RNAdoes not necessarily reflect the infectivity and transmissibility of a patient [22,23]. Despiteall these uncertainties and the almost uniform recommendation of professional societiesand some authorities and findings by researchers [24] against the routine use of Ct valuesto guide clinical decisions, a general concept that classifies patients with a Ct value of ≥30as non-infectious unfortunately seems to have prevailed in peer-reviewed literature [25,26].
To the best of our knowledge, no comprehensive comparison of Ct values and rtRT-PCR efficiencies generated by several rtRT-PCR platforms and various nucleic acid isolationmethods across a range of the clinically most relevant SARS-CoV-2 genomic variants hasbeen performed yet. For this study, all variants of concern (VOC) and variants of interest(VOI) detected in the central European region until the end of 2021 were selected for analysis.In addition, variant B.1.258.17 as the main lineage during the second wave, variant A.27 asa rare variant, with mutation N501Y, and variant B.1 (with D614G) as the first main lineage,which caused a substantial part of the first wave of infections in Europe, were included.
Pathogens 2022, 11, 462 9 of 14
All 10 genomic variants were tested in triplicate using six selected diagnostic approachesat concentrations ranging from 1 × 10⁴ PFU/mL to 1 × 10⁻¹ PFU/mL. This study clearlyshowed substantial differences in Ct values generated by six selected diagnostic approacheswith respect to the SARS-CoV-2 genomic variant, even without taking into account samplequality variability. Differences ranging from 2.0 to 8.4 Ct values were observed for thesame concentration of different SARS-CoV-2 genomic variants, clearly showing a relevantinfluence of genomic variant on the detection capability of rtRT-PCRs. Although larger Ctvariability was initially expected for manual diagnostic approaches over fully automatedanalyzers, it turned out that SD values for respective concentrations were quite similarbetween manual and automated approaches, except when targeting STARLet’s N gene.In addition, for STARLet’s N gene, significantly higher Ct values (p < 0.001) for the Beta(B.1.351), Eta (B.1.525), and Iota (B.1.526) genomic variants were found at all concentrationstested compared to other genomic variants included in the study. Similar deviations forthe SARS-CoV-2 Alpha genomic variant were previously observed with the SARS-CoV-2/FluA/FluB/RSV assay [27–29]. There is reason to believe that these genomic variantsmost likely have mutation(s) in the N gene at primers and/or probe binding site(s) thataffect the amplification efficacy and/or intensity of the probe signal, resulting in higherCt values. In this study, such N-gene Ct value deviations were not observed for theAlpha genomic variant using the SARS-CoV-2 specific Allplex assay. With other diagnosticapproaches included in this study such deviations were not observed for any of the rtRT-PCR targets regardless of SARS-CoV-2 genomic variant tested. These results clearly indicatethat Ct values as a surrogate for viral load are unreliable and should not be used as anindicator of infectivity and transmissibility, especially when different rtRT-PCR assays areused in the laboratory in parallel and multiple SARS-CoV-2 genomic variants are circulatingin a population. This observation is supported by the findings of Arons et al. [30] andScola et al. [14], who have shown that 25% and even 50% of clinical samples with Ct valuesabove 30 can be cultured and could be potentially infectious. In addition, the results ofrecent external quality assessment showed that Ct values reported by laboratories can varyby more than ±4 (up to 18) depending on the nucleic acid extraction protocol and rtRT-PCRplatform used [31]. Furthermore, the results of this study showed that some SARS-CoV-2genomic variants are not amplified with equal rtRT-PCR efficiency using different rtRT-PCRassays. Although all targets in the diagnostic approaches assessed were amplified withrtRT-PCR efficiencies between 80 and 120%, which is generally considered acceptable, rtRT-PCR efficiencies for some SARS-CoV-2 genomic variants showed a 14.8 to 24.1% differencebetween diagnostic approaches with potential patient management consequences. Suchdifferences are best recognizable when mean Ct values for the RdRP gene, which is acommon target for all six diagnostic approaches, are compared head-to-head. The RdRPgene mean Ct values varied from 2.4 to 7.1 across diagnostic approaches tested whenthe genomic variants are considered individually, and when the results are calculatedindependent of genomic variant, the differences for given concentrations ranged from 5.7to 7.6 at respective concentrations across the diagnostic approaches tested. This clearlyindicates that the use of the Ct value 30 as a simple cutoff for infectivity and transmissibilityis inappropriate and that the Ct values measured are dependent on the diagnostic platformand genomic variant. However, quantification precision can be significantly improved byusing standardized quantitative rtRT-PCR or droplet digital PCR [32].
Several strategies have been employed by laboratories worldwide to meet the highCOVID-19 testing demand, including pooling of samples [33–35], multiplexing [36–38],and omission or simplification of nucleic acid isolation [39,40], all with expected tradeoffsin overall analytical sensitivity. In many laboratories, including our laboratory, requesteddiagnostic scaling up could only be achieved by using several molecular platforms inparallel, ranging from fully automated integrated sample-to-result analyzers such as cobasor Alinity to different semi-automated or manual approaches. Although such a strategywas proven to be beneficial timewise, the use of diverse diagnostic approaches in parallel
Pathogens 2022, 11, 462 10 of 14
undeniably led to potentially clinically relevant intra-laboratory assay-to-assay variationsand poor result interchangeability, as shown in this study.
However, on the positive side, having diverse diagnostic approaches running inparallel allowed us to meticulously measure and comparatively evaluate TATs of differentdiagnostic approaches in a real-life laboratory setting. Overall, during three SARS-CoV-2waves, a combination of six automated and manual diagnostic approaches made possiblethe release of final results for more than 81% of routine non-priority samples within 8 hafter admission to the laboratory. A detailed TAT analysis showed that most results werereleased in two peak time periods, the major one being within the first 8 h after admission(Figure 2). This first peak time period was composed of several sub-peaks (Figure 3),the first containing samples processed by LightMix and Alinity, followed by cobas andfinally STARLet. Both Alinity and LightMix were found to be comparable in terms ofTAT and the fastest of the diagnostic approaches comparatively assessed, with TAT in3 to 4 h. This observation is not surprising because Alinity takes 140 min to process a batchof the first 12 samples, adding another 12 samples every 16 min. Similarly, LightMix, inconjunction with the slowest of the automated nucleic acid isolation approaches assessed(MagNA), requires up to 160 min for 96 samples. Cobas follows with mean TAT of 4 to6 h, processing samples in batches of up to 94 in 180 min. The slowest of the diagnosticapproaches evaluated was STARLet, which took 6 to 7 h to process most of the samplesbecause it had the longest processing time for batches of 94 samples (250 min). Althoughhaving substantially different individual TATs, a parallel use of six diagnostic approacheswas found to be quite complementary in a real-life laboratory setting, allowing day-to-day flexibility, testing of up to 8000 samples in 24 h without significant prolongationof TAT, and providing a valuable back-up solution in cases of technical issues, failures,and temporary reagent shortages. Other possibilities to shorten TAT are available suchas ultrafast PCR [41,42] and isothermal assays [43,44] however, implementation of suchmethods in parallel to rtRT-PCR may bring even further complexity and complicationswhen a request for Ct value is made.
There are some important limitations of this study. The input volume of samplesdiffered slightly across the diagnostic approaches evaluated, both automated and manual,but it was dictated by manufacturers’ instructions. Unfortunately, the elution volumesduring RNA extraction and the volumes used for subsequent rtRT-PCR in the automatedanalyzers are not disclosed by the manufacturers. The sample input volumes as wellas elution volumes for the three automated nucleic acid isolation platforms were alsoslightly different. In addition, virus quantification by PFU is associated with some degreeof inaccuracy due to the method design, which cannot be fully avoided [45]. Finally, onlythe clinically most relevant VOCs, VOIs, and major lineages circulating in central Europeuntil the end of 2021 were tested. Although the factors listed may introduce some biasesand variability in the Ct values generated, we remain confident that the differences in Ctvalues and rtRT-PCR efficiencies identified in this comparative study are mainly driven bydifferences in the assays’ design and are genomic variant–dependent.
4. Conclusions
In summary, testing serial dilutions of well-characterized SARS-CoV-2 isolates of arange of the clinically most relevant SARS-CoV-2 genomic variants using six previouslythoroughly evaluated diagnostic approaches showed substantial inter-variant intra-testas well as intra-variant inter-test variability. The differences obtained in Ct values weredependent on both the rtRT-PCR platform and SARS-CoV-2 genomic variant. This studyfurther supports recommendations against the routine use of Ct values to guide clinicaldecisions and reconfirms the need for close monitoring of new emerging SARS-CoV-2genomic variants and their potential impact on the performance of rtRT-PCR assays. Adetailed TAT analysis showed that, despite substantially different individual TATs in areal-life laboratory setting, the parallel use of several diagnostic approaches was beneficialand complementary and made possible the release of final results for more than 81% of
Pathogens 2022, 11, 462 11 of 14
routine non-priority samples within 8 h after admission to the laboratory during threeSARS-CoV-2 waves.
5. Materials and Methods5.1. SARS-CoV-2 Genomic Variant Selection
Since March 2020, complete SARS-CoV-2 genomes have been routinely sequenced atIMI with next-generation sequencing (NGS) using residual nasopharyngeal swab samplesof COVID-19–positive patients to actively monitor the epidemiology, circulation, and emer-gence of SARS-CoV-2 variants in the country. All fully characterized samples have beenstored at −70 ◦C and whole genome sequences uploaded to the GISAID database (https://www.gisaid.org, (accessed on 22 March 2022)). Selected samples with Ct values below25 have been additionally cultured on Vero E6 cells and quantified by TCID50 as describedpreviously [46]. The following 10 SARS-CoV-2 variants were selected for this study: Alpha(B.1.1.7), Beta (B.1.351), Gamma (P.1), Delta (B.1.617.2), Eta (B.1.525), Iota (B.1.526), Omi-cron (B.1.1.529) A.27, B.1.258.17, and B.1 with D614G mutation, all of which are depositedin the EVA-GLOBAL Virus Archive under the following reference numbers (Ref-SKU):005V-04053, 005V-04107, 005V-04248, 005V-04249, 005V-04109, 005V-04401, 005V-04479,005V-04144, 005V-04394, and 005V-03961. The genomes can be downloaded from GI-SAID under the following references: EPI_ISL_877453, EPI_ISL_1118868, EPI_ISL_1240606,EPI_ISL_1935543, EPI_ISL_1181833, EPI_ISL_5305342, EPI_ISL_9007956, EPI_ISL_1668566,EPI_ISL_1668577, and EPI_ISL_635205.
5.2. SARS-CoV-2 rtRT-PCRs
Six different diagnostic approaches were comparatively evaluated: three fully au-tomated and integrated rtRT-PCR analyzers and a reference manual rtRT-PCR assay us-ing RNA isolated with three different instruments for automated nucleic acid isolation.All testing was performed strictly following the respective manufacturers’ instructions.Briefly, logarithmic dilutions of nine samples containing the SARS-CoV-2 genomic variantslisted above were prepared in fresh RPMI medium (Sigma Aldrich, St. Louis, MO) toobtain 1 × 10⁴/1 × 103/1 × 102/1 × 101/1 × 100/1 × 10−1 PFU/mL. The dilutions weredistributed in aliquots of appropriate volume and tested in triplicate with cobas SARS-CoV-2 Test (Roche) on a cobas 6800 analyzer (cobas), Allplex SARS-CoV-2 Assay (Seegene) ona STARLet analyzer (STARLet), and SARS-CoV-2 Kit (Abbott) on an Alinity_m analyzer(Alinity). Similarly, for manual LightMix Wuhan CoV kits (LightMix), nucleic acids wereisolated from triplicates of appropriate sample volume for each automated nucleic acidisolation instrument: 190 µL for NX-48, 200 µL for MagNA Pure 96, and 300 µL for Mael-strom 9600. Nucleic acids were eluted in volumes as recommended by the manufacturers.Isolated RNA and reagents for rtRT-PCRs were automatically pipetted into 384-well PCRplates (Applied Biosystems, Foster City, CA, USA) using a Janus G3 pipetting robot (PerkinElmer, Waltham, MA, USA) dispensing 5 µL of RNA eluate and 7.5 µL of rtRT-PCR mastermix per well. Two separate master mixes were prepared from 1 × TaqMan FastVirus1-Step Master Mix (Applied Biosystems) and each Wuhan SARS-CoV-2 E gene and WuhanSARS-CoV-2 RdRP gene kits. Real-time RT-PCR amplification and detection were per-formed using a QuantStudio7Pro instrument (Applied Biosystems). Ct values generatedby six diagnostic approaches were collected and, after computing mean Ct values for eachconcentration tested, used for calculation of respective rtRT-PCR efficiencies obtained fromthe slopes of linear regression lines across dilutions tested using the following equation:Efficiency (%) = ((10e (−1/slope)) − 1) × 100). PCR efficiency of 100% means that in eachPCR cycle the amount of target is doubled. Statistical calculations and graph plottingwere performed using Excel 2016 version 16.0.5188.1000 (Microsoft, Redmond, MA, USA),Prism7 version 7.04 (GraphPad, San Diego, CA, USA), and R software version 4.1.2 (The RFoundation for Statistical computing, Vienna, Austria).
Pathogens 2022, 11, 462 12 of 14
5.3. Turn-Around Time of Six Diagnostic Approaches
Data for laboratory admission time and time-to-result reporting were analyzed fromMarch 2020 until the end of May 2021 and used to calculate the total TAT for each of thesix diagnostic approaches. Only routinely processed samples tested with cobas, STARLet,Alinity, and LightMix were included in the TAT analysis, and fast-track prioritized sampleswere not considered.
Supplementary Materials: The following supporting information can be downloaded at: https://www.mdpi.com/article/10.3390/pathogens11040462/s1. Table S1: STARLet’s mean Ct valuesobtained by testing serial dilutions of 10 SARS-CoV-2 genomic variants; Figure S1: Assessment ofsystemic error, robustness of the systems used, and pipetting accuracy.
Author Contributions: Conceptualization, M.K., M.P. and T.A.-Ž.; methodology, R.K., M.K., K.R.R.and P.P.; validation, R.K., M.K., N.K. and K.R.R.; data curation, R.K., M.K., K.R.R. and N.K.; writing—original draft preparation, R.K., M.K., N.K.,and K.R.R.; writing—review and editing, M.P. and T.A.-Ž.;visualization, R.K.; supervision, M.K., M.P. and T.A.-Ž.; project administration, M.P. and T.A.-Ž.;funding acquisition, M.P. and T.A.-Ž. All authors have read and agreed to the published version ofthe manuscript.
Funding: This research was funded by the Institute of Microbiology and Immunology, Facultyof Medicine, University of Ljubljana; by the Slovenian Research Agency (grants P3-0083 and V3-2034); and by the European Virus Archive—GLOBAL project, which has received funding from theEuropean Union’s Horizon 2020 research and innovation program under grant agreement no. 871029;Network of infrastructure Centres of University of Ljubljana (MRIC-UL-IC-BSL3+, IP-022), financedby the Slovenian Research Agency.
Institutional Review Board Statement: The study protocol conformed to the Declaration of Helsinki,Oviedo Convention on Human Rights and Biomedicine, and Slovenian Code on Medical Deontology,and it was approved by the Medical Ethics Committee of the Republic of Slovenia (consent number0120-211/2020/7). All data used were linked to randomized numerical codes only.
Informed Consent Statement: Not applicable.
Data Availability Statement: Additional data presented in this study are available on request fromthe corresponding author.
Acknowledgments: We express our gratitude to all members of the COVID-19 diagnostic team, whohave been working diligently for the past 20 months to ensure timely SARS-CoV-2 results, and toAlen Suljic for help with graphic artwork. We also thank the Office of Defense Cooperation, U.S.Embassy in Slovenia, for the donation of a Janus G3 pipetting robot.
Conflicts of Interest: The Institute of Microbiology and Immunology, Faculty of Medicine, Universityof Ljubljana, Slovenia, received research grants from Roche, Seegene, and Abbott Molecular in thepast 5 years, but not for this work. All authors declare no competing interest. The manufacturers ofthe evaluated fully automated integrated rtRT-PCR analyzers and processors for automated nucleicacid isolation had no role in the study design, data collection, analysis and interpretation of results,writing of the manuscript, or decision to submit the work for publication.
References1. Fomsgaard, A.S.; Rosenstierne, M.W. An alternative workflow for molecular detection of SARS-CoV-2-escape from the NA
extraction kit-shortage, Copenhagen, Denmark, March 2020. Eurosurveillance 2020, 25, 2000398. [CrossRef]2. Al-Saud, H.; Al-Romaih, K.; Bakheet, R.; Mahmoud, L.; Al-Harbi, N.; Alshareef, I.; Judia, S.B.; Aharbi, L.; Alzayed, A.;
Jabaan, A.; et al. Automated SARS-CoV-2 RNA extraction from patient nasopharyngeal samples using a modified DNA extractionkit for high throughput testing. Ann. Saudi Med. 2020, 40, 373–381.
3. Rotondo, J.C.; Martini, F.; Maritati, M.; Mazziotta, C.; Di Mauro, G.; Lanzillotti, C.; Barp, N.; Gallerani, A.; Tognon, M.; Contini, C.SARS-CoV-2 Infection: New Molecular, Phylogenetic, and Pathogenetic Insights. Efficacy of Current Vaccines and the PotentialRisk of Variants. Viruses 2021, 13, 1687. [CrossRef]
4. Rong, G.; Zheng, Y.; Chen, Y.; Zhang, Y.; Zhu, P.; Sawan, M. COVID-19 Diagnostic Methods and Detection Techniques: A Review.Ref. Modul. Biomed. Sci. 2021. [CrossRef]
5. Ravi, N.; Cortade, D.L.; Ng, E.; Wang, S.X. Diagnostics for SARS-CoV-2 detection: A comprehensive review of the FDA-EUACOVID-19 testing landscape. Biosens. Bioelectron. 2020, 165, 112454. [CrossRef]
Pathogens 2022, 11, 462 13 of 14
6. Loeffelholz, M.J.; Tang, Y.W. Laboratory diagnosis of emerging human coronavirus infections-the state of the art. Emerg. MicrobesInfect. 2020, 9, 747–756. [CrossRef]
7. Arena, F.; Pollini, S.; Rossolini, G.M.; Margaglione, M. Summary of the Available Molecular Methods for Detection of SARS-CoV-2during the Ongoing Pandemic. Int. J. Mol. Sci. 2021, 22, 1298. [CrossRef]
8. Zuin, M.; Gentili, V.; Cervellati, C.; Rizzo, R.; Zuliani, G. Viral Load Difference between Symptomatic and AsymptomaticCOVID-19 Patients: Systematic Review and Meta-Analysis. Infect. Dis. Rep. 2021, 13, 645–653. [CrossRef]
9. Shenoy, S. SARS-CoV-2 (COVID-19), viral load and clinical outcomes; lessons learned one year into the pandemic: A systematicreview. World J. Crit. Care Med. 2021, 10, 132–150.
10. Rabaan, A.A.; Tirupathi, R.; Sule, A.A.; Aldali, J.; Mutair, A.A.; Alhumaid, S.; Muzaheed; Gupta, N.; Koritala, T.; Adhikari, R.; et al.Viral Dynamics and Real-Time RT-PCR Ct Values Correlation with Disease Severity in COVID-19. Diagnostics 2021, 11, 1091.[CrossRef]
11. Cevik, M.; Tate, M.; Lloyd, O.; Maraolo, A.E.; Schafers, J.; Ho, A. SARS-CoV-2, SARS-CoV, and MERS-CoV viral load dynamics,duration of viral shedding, and infectiousness: A systematic review and meta-analysis. Lancet Microbe 2021, 2, e13–e22. [CrossRef]
12. Singanayagam, A.; Patel, M.; Charlett, A.; Bernal, L.J.; Saliba, V.; Ellis, J.; Ladhani, S.; Zambon, M.; Gopal, R. Duration ofinfectiousness and correlation with RT-PCR cycle threshold values in cases of COVID-19, England, January to May 2020.Eurosurveillance 2020, 25, 2001483. [CrossRef]
13. Piralla, A.; Ricchi, M.; Cusi, M.G.; Prati, P.; Vicari, N.; Scarsi, G.; Gandolfo, C.; Anichini, G.; Terrosi, C.; Percivalle, E.; et al.Residual SARS-CoV-2 RNA in nasal swabs of convalescent COVID-19 patients: Is prolonged quarantine always justified? Int. J.Infect. Dis. 2021, 102, 299–302. [CrossRef]
14. Scola, B.L.; Bideau, M.L.; Andreani, J.; Hoang, V.T.; Grimaldier, C.; Colson, P.; Gautret, P.; Raoult, D. Viral RNA load as determinedby cell culture as a management tool for discharge of SARS-CoV-2 patients from infectious disease wards. Eur. J. Clin. Microbiol.Infect. Dis. 2020, 39, 1059–1061. [CrossRef]
15. Julian, K.; Shah, N.; Banjade, R.; Bhatt, D. Utility of Ct values in differentiating COVID-19 reinfection versus prolonged viralshedding in an immunocompromised patient. BMJ Case Rep. 2021, 14, e243692. [CrossRef]
16. Mishra, B.; Ranjan, J.; Purushotham, P.; Saha, S.; Payal, P.; Kar, P.; Das, S.; Deshmukh, V. High proportion of low cycle thresholdvalue as an early indicator of COVID-19 surge. J. Med. Virol. 2022, 94, 240–245. [CrossRef]
17. Kogoj, R.; Kmetic, P.; Valencak, A.O.; Komlos, K.F.; Seme, K.; Sagadin, M.; Korva, M.; Poljak, M. Real-Life Head-to-Head Compar-ison of Performance of Two High-Throughput Automated Assays for the Detection of SARS-CoV-2 RNA in NasopharyngealSwabs: The Alinity m and cobas 6800 SARS-CoV-2 Assays. J. Mol. Diagn. 2021, 23, 920–928. [CrossRef]
18. Poljak, M.; Korva, M.; Gasper, N.K.; Komlos, K.F.; Sagadin, M.; Ursic, T.; Zupanc, T.A.; Petrovec, M. Clinical Evaluation of thecobas SARS-CoV-2 Test and a Diagnostic Platform Switch during 48 Hours in the Midst of the COVID-19 Pandemic. J. Clin.Microbiol. 2020, 58, e00599-20. [CrossRef]
19. Freire-Paspuel, B.; Garcia-Bereguiain, M.A. Analytical and Clinical Evaluation of “AccuPower SARS-CoV-2 Multiplex RT-PCR kit(Bioneer, South Korea)” and “Allplex 2019-nCoV Assay (Seegene, South Korea)” for SARS-CoV-2 RT-PCR Diagnosis: KoreanCDC EUA as a Quality Control Proxy for Developing Countries. Front. Cell. Infect. Microbiol. 2021, 11, 630552. [CrossRef]
20. Schnuriger, A.; Perrier, M.; Marinho, V.; Michel, Y.; Saloum, K.; Boukli, N.; Lambert-Niclot, S.; Amiel, C.; Fofana, D.B.;Gozlan, J.; et al. Caution in interpretation of SARS-CoV-2 quantification based on RT-PCR cycle threshold value. Diagn. Microbiol.Infect. Dis. 2021, 100, 115366. [CrossRef]
21. Molina, L.P.; Chow, S.K.; Nickel, A.; Love, J.E. Prolonged Detection of Severe Acute Respiratory Syndrome Coronavirus 2(SARS-CoV-2) RNA in an Obstetric Patient with Antibody Seroconversion. Obstet. Gynecol. 2020, 136, 838–841. [CrossRef]
22. Huang, C.G.; Lee, K.M.; Hsiao, M.J.; Yang, S.L.; Huang, P.N.; Gong, Y.N.; Hsieh, T.H.; Huang, P.W.; Lin, Y.J.; Liu, Y.C.; et al.Culture-Based Virus Isolation To Evaluate Potential Infectivity of Clinical Specimens Tested for COVID-19. J. Clin. Microbiol. 2020,58, e01068-20. [CrossRef]
23. Atkinson, B.; Petersen, E. SARS-CoV-2 shedding and infectivity. Lancet 2020, 395, 1339–1340. [CrossRef]24. Platten, M.; Hoffmann, D.; Grosser, R.; Wisplinghoff, F.; Wisplinghoff, H.; Wiesmüller, G.; Schildgen, O.; Schildgen, V. SARS-CoV-2,
CT-Values, and Infectivity-Conclusions to Be Drawn from Side Observations. Viruses 2021, 13, 1459. [CrossRef]25. Bayat, S.A.; Mundodan, J.; Hasnain, S.; Sallam, M.; Khogali, H.; Ali, D.; Alateeg, S.; Osama, M.; Elberdiny, A.; Al-Romaihi, H.; et al.
Can the cycle threshold (Ct) value of RT-PCR test for SARS CoV2 predict infectivity among close contacts? J. Infect. Public Health2021, 14, 1201–1205. [CrossRef]
26. Aranha, C.; Patel, V.; Bhor, V.; Gogoi, D. Cycle threshold values in RT-PCR to determine dynamics of SARS-CoV-2 viral load: Anapproach to reduce the isolation period for COVID-19 patients. J. Med. Virol. 2021, 93, 6794–6797. [CrossRef]
27. Giovacchini, N.; Coppi, M.; Aiezza, N.; Baccani, I.; Malentacchi, F.; Pollini, S.; Antonelli, A.; Rossolini, G.M. Rapid screening forSARS-CoV-2 VOC-Alpha (202012/01, B.1.1.7) using the Allplex™ SARS-CoV-2/FluA/FluB/RSV Assay. Int. J. Infect. Dis. 2021,113, 207–209. [CrossRef]
28. Wollschläger, P.; Todt, D.; Gerlitz, N.; Pfaender, S.; Bollinger, T.; Sing, A.; Dangel, A.; Ackermann, N.; Korn, K.; Ensser, A.; et al.SARS-CoV-2 N gene dropout and N gene Ct value shift as indicator for the presence of B.1.1.7 lineage in a commercial multiplexPCR assay. Clin. Microbiol. Infect. 2021, 27, 1353.e1. [CrossRef]
Pathogens 2022, 11, 462 14 of 14
29. Sánchez-Calvo, J.M.; Arboledas, J.C.A.; Vidal, L.R.; de Francisco, J.L.; Prieto, M.D.L. Diagnostic pre-screening method basedon N-gene dropout or delay to increase feasibility of SARS-CoV-2 VOC B.1.1.7 detection. Diagn. Microbiol. Infect. Dis. 2021,101, 115491. [CrossRef]
30. Arons, M.M.; Hatfield, K.M.; Reddy, S.C.; Kimball, A.; James, A.; Jacobs, J.R.; Taylor, J.; Kevin Spicer, M.D.; Ana, C.;Bardossy, M.D.; et al. Presymptomatic SARS-CoV-2 Infections and Transmission in a Skilled Nursing Facility. N. Engl. J. Med.2020, 382, 2081–2090. [CrossRef]
31. Buchta, C.; Gorzer, I.; Chiba, P.; Camp, J.V.; Holzmann, H.; Puchhammer-Stockl, E.; Mayerhofer, M.; Muller, M.M.; Aberle, S.W.Variability of cycle threshold values in an external quality assessment scheme for detection of the SARS-CoV-2 virus genome byRT-PCR. Clin. Chem. Lab. Med. 2021, 59, 987–994. [CrossRef]
32. Vasudevan, H.N.; Xu, P.; Servellita, V.; Miller, S.; Liu, L.; Gopez, A.; Chiu, C.Y.; Abate, A.R. Digital droplet PCR accuratelyquantifies SARS-CoV-2 viral load from crude lysate without nucleic acid purification. Sci. Rep. 2021, 11, 780. [CrossRef]
33. Griesemer, S.B.; Van Slyke, G.; St George, K. Assessment of Sample Pooling for Clinical SARS-CoV-2 Testing. J. Clin. Microbiol.2021, 59, e01261-20. [CrossRef]
34. Aubry, M.; Teiti, I.; Teissier, A.; Richard, V.; Mariteragi-Helle, T.; Chung, K.; Deen, F.; Paoaafaite, T.; Cao-Lormeau, V.M. Self-collection and pooling of samples as resources-saving strategies for RT-PCR-based SARS-CoV-2 surveillance, the example oftravelers in French Polynesia. PLoS ONE 2021, 16, e0256877. [CrossRef]
35. Joachim, A.; Dewald, F.; Suarez, I.; Zemlin, M.; Lang, I.; Stutz, R.; Marthaler, A.; Bosse, H.M.; Lubke, N.; Munch, J.; et al. PooledRT-qPCR testing for SARS-CoV-2 surveillance in schools-a cluster randomised trial. EClinicalMedicine 2021, 39, 101082. [CrossRef]
36. Kudo, E.; Israelow, B.; Vogels, C.B.F.; Lu, P.; Wyllie, A.L.; Tokuyama, M.; Venkataraman, A.; Brackney, D.E.; Ott, I.M.;Petrone, M.E.; et al. Detection of SARS-CoV-2 RNA by multiplex RT-qPCR. PLoS Biol. 2020, 18, e3000867. [CrossRef]
37. Waggoner, J.J.; Stittleburg, V.; Pond, R.; Saklawi, Y.; Sahoo, M.K.; Babiker, A.; Hussaini, L.; Kraft, C.S.; Pinsky, B.A.;Anderson, E.J.; et al. Triplex Real-Time RT-PCR for Severe Acute Respiratory Syndrome Coronavirus 2. Emerg. Infect. Dis. 2020,26, 1633–1635. [CrossRef]
38. Lu, X.; Sakthivel, S.K.; Wang, L.; Lynch, B.; Dollard, S.M. Enhanced throughput of the severe acute respiratory syndromecoronavirus 2 (SARS-CoV-2) real-time RT-PCR panel by assay multiplexing and specimen pooling. J. Virol. Methods 2021,293, 114149. [CrossRef]
39. Kim, Y.K.; Chang, S.H. Clinical usefulness of extraction-free PCR assay to detect SARS-CoV-2. J. Virol. Methods 2021, 296, 114217.[CrossRef]
40. Visseaux, B.; Collin, G.; Houhou-Fidouh, N.; Le Hingrat, Q.; Ferre, V.M.; Damond, F.; Ichou, H.; Descamps, D.; Charpentier, C.Evaluation of three extraction-free SARS-CoV-2 RT-PCR assays: A feasible alternative approach with low technical requirements.J. Virol. Methods 2021, 291, 114086. [CrossRef]
41. Cheong, J.; Yu, H.; Lee, C.Y.; Lee, J.; Choi, H.-J.; Lee, J.-H.; Lee, H.; Cheon, J. Fast detection of SARS-CoV-2 RNA via the integrationof plasmonic thermocycling and fluorescence detection in a portable device. Nat. Biomed. Eng. 2020, 4, 1159–1167.
42. You, M.; Li, Z.; Feng, S.; Gao, B.; Yao, C.; Hu, J.; Xu, F. Ultrafast Photonic PCR Based on Photothermal Nanomaterials. TrendsBiotechnol. 2020, 38, 637–649.
43. James, A.S.; Alawneh, J.I. COVID-19 Infection Diagnosis: Potential Impact of Isothermal Amplification Technology to ReduceCommunity Transmission of SARS-CoV-2. Diagnostics 2020, 10, 399. [CrossRef]
44. Yu, L.; Wu, S.; Hao, X.; Dong, X.; Mao, L.; Pelechano, V.; Chen, W.H.; Yin, X. Rapid Detection of COVID-19 Coronavirus Using aReverse Transcriptional Loop-Mediated Isothermal Amplification (RT-LAMP) Diagnostic Platform. Clin. Chem. 2020, 66, 975–977.[CrossRef]
45. Smither, S.J.; Lear-Rooney, C.; Biggins, J.; Pettitt, J.; Lever, M.S.; Olinger, G.G., Jr. Comparison of the plaque assay and 50% tissueculture infectious dose assay as methods for measuring filovirus infectivity. J. Virol. Methods 2013, 193, 565–571. [CrossRef]
46. Rus, K.R.; Korva, M.; Knap, N.; Zupanc, T.A.; Poljak, M. Performance of the rapid high-throughput automated electrochemilumi-nescence immunoassay targeting total antibodies to the SARS-CoV-2 spike protein receptor binding domain in comparison to theneutralization assay. J. Clin. Virol. 2021, 139, 104820. [CrossRef]