Embed Size (px)
Citation preview
SARS-CoV-2 Lineage Tracking, and Evolving Trends Seen duringThree Consecutive Peaks of Infection in Delhi, India: a Clinico-Genomic Study
Pramod Gautam,a Diptanu Paul,b Varun Suroliya,a Rahul Garg,b Reshu Agarwal,b Santanu Das,c Urvinder S. Kaur,c Amit Pandey,b
Arjun Bhugra,b Bansidhar Tarai,d Chhagan Bihari,c S. K. Sarin,e Ekta Guptab
aGenome Sequencing Laboratory, Institute of Liver and Biliary Sciences, New Delhi, IndiabDepartment of Clinical Virology, Institute of Liver and Biliary Sciences, New Delhi, IndiacDepartment of Pathology, Institute of Liver and Biliary Sciences, New Delhi, IndiadMax Super Speciality Hospital, Max Healthcare, New Delhi, IndiaeDepartment of Hepatology, Institute of Liver and Biliary Sciences, New Delhi, India
Pramod Gautam, Diptanu Paul, and Varun Suroliya contributed equally to the article. Author order was decided by alphabetic sequence of the surnames.
ABSTRACT Since its advent, the pandemic has caused havoc in multiple waves duepartly to amplified transmissibility and immune escape to vaccines. Delhi, India also wit-nessed brutal multiple peaks causing exponential rise in cases. Here we had retrospec-tively investigated clade variation, emergence of new lineages and varied clinical charac-teristics during those three peaks in order to understand the trajectory of the ongoingpandemic. In this study, a total of 123,378 samples were collected for a time span of 14months (1 June 2020 to 3 August 2021) encompassing three different peaks in Delhi. Asubset of 747 samples was processed for sequencing. Complete clinical and demo-graphic details of all the enrolled cases were also collected. We detected 26 lineagesacross three peaks nonuniformly from 612 quality passed samples. The first peak wasdriven by diverse early variants, while the second one by B.1.36 and B.1.617.2, unlikethird peak caused entirely by B.1.617.2. A total of 18,316 mutations with median of 34were reported. Majority of mutations were present in less than 1% of samples.Differences in clinical characteristics across three peaks was also reported. To be aheadof the frequently changing course of the ongoing pandemic, it is of utmost importancethat novel lineages be tracked continuously. Prioritized sequencing of sudden local out-burst and community hot spots must be done to swiftly detect a novel mutation/lineageof potential clinical importance.
IMPORTANCE Genome surveillance of the Delhi data provides a more detailed pictureof diverse circulating lineages. The added value that the current study provides byclinical details of the patients is of importance. We looked at the shifting patterns oflineages, clinical characteristics and mutation types and mutation load during eachsuccessive infection surge in Delhi. The importance of widespread genomic surveil-lance cannot be stressed enough to timely detect new variants so that appropriatepolicies can be immediately implemented upon to help control the infection spread.The entire idea of genomic surveillance is to arm us with the clues as to how thenovel mutations and/or variants can prove to be more transmissible and/or fatal. InIndia, the densely populated cities have an added concern of the huge burden thateven the milder variants of the virus combined with co-morbidity can have on thecommunity/primary health care centers.
KEYWORDS SARS-CoV-2 variants, COVID-19, pandemic, lineage tracking, Delhi, India,COVID-19 in Delhi, COVID-19 tracking, genome surveillance, SARS-CoV-2 lineages
Editor Heba H. Mostafa, Johns HopkinsHospital
Copyright © 2022 Gautam et al. This is anopen-access article distributed under the termsof the Creative Commons Attribution 4.0International license.
Address correspondence to Ekta Gupta,[email protected].
The authors declare no conflict of interest.
Received 22 December 2021Accepted 17 February 2022Published 21 March 2022
March/April 2022 Volume 10 Issue 2 10.1128/spectrum.02729-21 1
RESEARCH ARTICLE
Severe acute respiratory syndrome coronavirus-2 (SARS-CoV-2), a novel human beta-coronavirus, was declared as a causative agent for global pandemic of the disease
Coronavirus disease 2019 (COVID-19) on11th March 2020, by World HealthOrganization (WHO) (1, 2). In India, the first case of SARS-CoV-2 was reported on 27th
January 2020 (3). Following this, the country witnessed two major waves of infection inAugust and September 2020 and April and May 2021 unlike National Capital Region,Delhi with three peaks of infection reported in May–July 2020, November-December2020, and later on a massive and deadly one in April–June 2021 (4, 5). A sudden surgein cases of SARS-CoV-2 in a population rests upon several factors among which emer-gence of novel mutations in the viral genome leading to the appearance of possiblymore virulent and fatal variants is a huge cause for concern in this ongoing pandemic(6). In India, as has been observed by many studies, the spread of COVID-19 infection isattributable to rising novel variants and their spread (7, 8). Studying SARS-CoV-2genomic variants and their tracking with time might help us in understanding viralevolution, behavior, and infection trajectory. To put a break on the possible eventualwaves of infection, continuous tracking on emerging mutations leading to novel virallineages and their clinical impact is of paramount importance.
Hence, a comparison between three peaks of infection in Delhi capital region is the focusof the present study. Here we have described clade variation, emergence of new lineagesand varied clinical characteristics to understand the trajectory of the ongoing pandemic.
RESULTS
Among 612 samples, 560 fell into the defined time period of peak definition. A totalof 98 (16%) samples were collected during first peak, 83 (13.5%) during second peakand 379 (61.9%) during the third peak (Table 1). The remaining 52 samples were col-lected either just before (pre-third peak) or after Peak 3 (post-third peak).
Whenever peak-wise comparison was made, these 560 samples only were taken intoconsideration. For rest of the analyses, total 612 sequences samples were considered.
Demographic and clinical data. Complete demographic and clinical details alongwith comparison across different peaks are as follows:
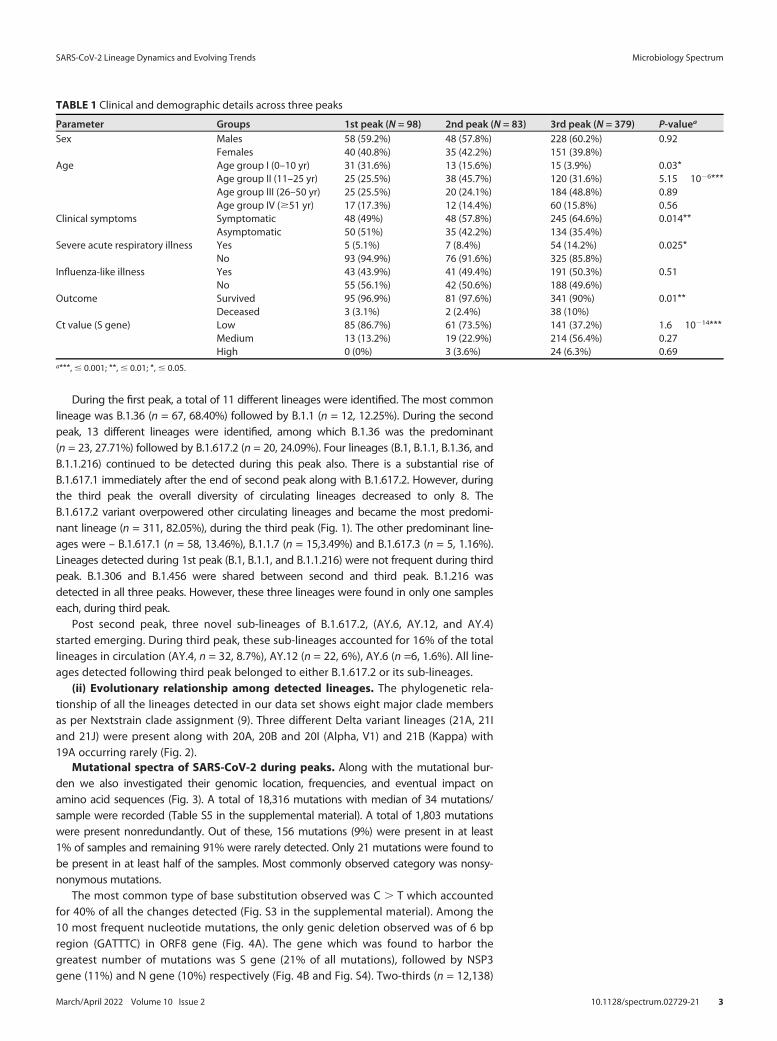
(i) Overall clinical and demographic details. Among 612 cases, 60.4% (n = 370)were males and 39.54% (n = 242) were females. The age-wise distribution was as follows:67 cases (0–10 yr), 210 cases (11–25 yr), 237 cases (26–50 years) and 98 cases (.50 yr).Majority of the enrolled cases (60.4%, n = 370) were symptomatic. Among these, severeacute respiratory illness (SARI) was recorded only in 19% (n = 70) and remaining cases pre-sented with influenza-like illness (ILI). Fatal outcome was reported in 7.5% (n = 46) cases.
(ii) Peak-wise comparison of clinical and demographic details. Males were moreaffected than females, but no significant difference was found across peaks. For age groupI (0–10 yr), a significant difference was observed between three peaks (P = 0.03). Similarly,more cases belonging to age group II (11–25 years) were reported in third peak comparedwith first peak (P , 0.001) and second peak (P = 0.001) (Fig. S1 in the supplemental mate-rial). Fraction of symptomatic cases gradually rose from 49% in first peak to 65% in thirdpeak with statistically significant difference (P = 0.01). Maximum SARI cases were recordedduring the third peak (P = 0.02). No significant difference in proportion of ILI cases wasseen across the peaks (Table 1). The mortality rate was considerably higher (10%) duringthe third peak than the first (3.1%), and the second peak (2.4%). The specimen with low Ctvalues was found to be significantly higher in third peak possibly indicating higher viralload during infection. The median Ct value during the first two peaks were 15.3 and 17.7,respectively, but during third peak, it was 21.6. (Fig. S2).
Diversity and distribution of SARS-CoV-2 lineages. A total of 26 different lineageswere identified from 612 sequences following PANGO (Phylogenetic Assignment ofNamed Global Outbreak) nomenclature (Table S4 in the supplemental material).
(i) Trends of various circulating lineages across peaks. The most frequently detectedlineages in our data set were B.1.617.2 including its sub-lineages (n = 369, 60.3%) andB.1.36 (n = 90, 14.7%). However, some of the lineages were observed to emerge and wanewith each emerging peak.
SARS-CoV-2 Lineage Dynamics and Evolving Trends Microbiology Spectrum
March/April 2022 Volume 10 Issue 2 10.1128/spectrum.02729-21 2
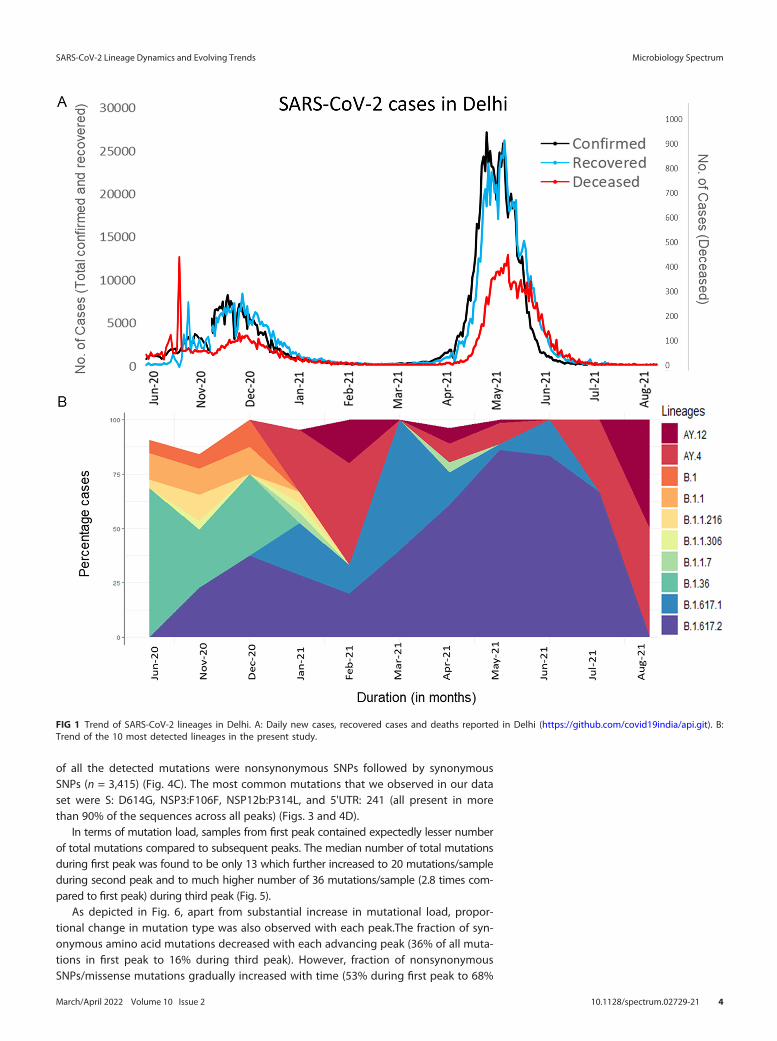
During the first peak, a total of 11 different lineages were identified. The most commonlineage was B.1.36 (n = 67, 68.40%) followed by B.1.1 (n = 12, 12.25%). During the secondpeak, 13 different lineages were identified, among which B.1.36 was the predominant(n = 23, 27.71%) followed by B.1.617.2 (n = 20, 24.09%). Four lineages (B.1, B.1.1, B.1.36, andB.1.1.216) continued to be detected during this peak also. There is a substantial rise ofB.1.617.1 immediately after the end of second peak along with B.1.617.2. However, duringthe third peak the overall diversity of circulating lineages decreased to only 8. TheB.1.617.2 variant overpowered other circulating lineages and became the most predomi-nant lineage (n = 311, 82.05%), during the third peak (Fig. 1). The other predominant line-ages were – B.1.617.1 (n = 58, 13.46%), B.1.1.7 (n = 15,3.49%) and B.1.617.3 (n = 5, 1.16%).Lineages detected during 1st peak (B.1, B.1.1, and B.1.1.216) were not frequent during thirdpeak. B.1.306 and B.1.456 were shared between second and third peak. B.1.216 wasdetected in all three peaks. However, these three lineages were found in only one sampleseach, during third peak.
Post second peak, three novel sub-lineages of B.1.617.2, (AY.6, AY.12, and AY.4)started emerging. During third peak, these sub-lineages accounted for 16% of the totallineages in circulation (AY.4, n = 32, 8.7%), AY.12 (n = 22, 6%), AY.6 (n =6, 1.6%). All line-ages detected following third peak belonged to either B.1.617.2 or its sub-lineages.
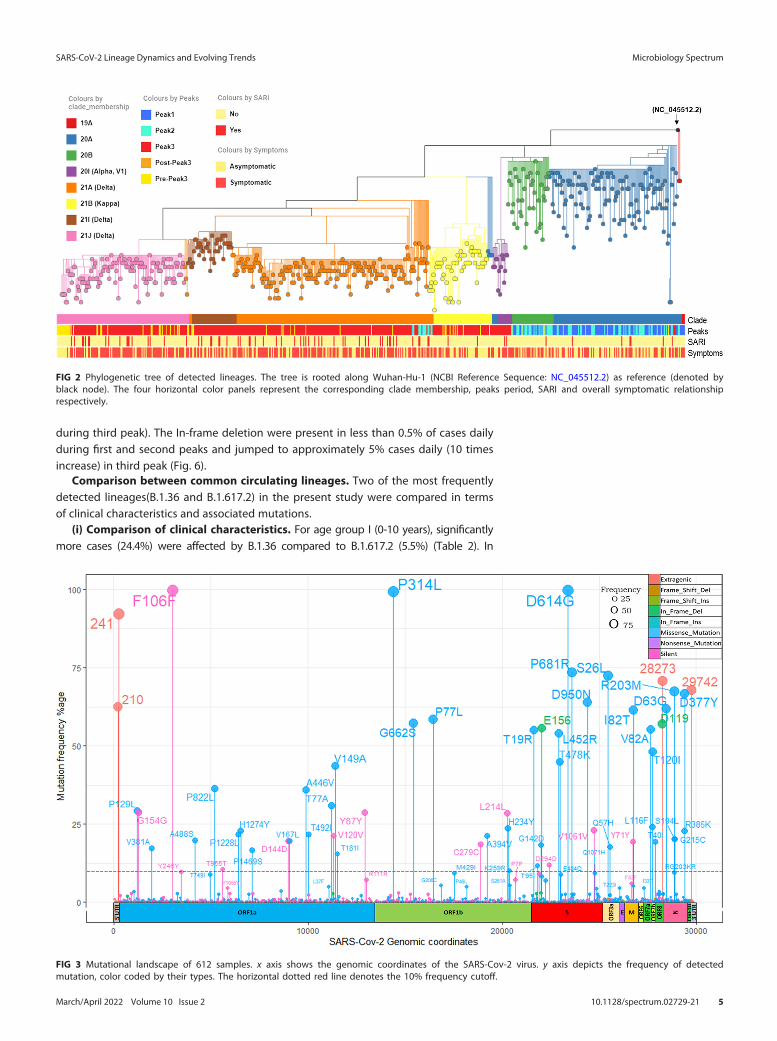
(ii) Evolutionary relationship among detected lineages. The phylogenetic rela-tionship of all the lineages detected in our data set shows eight major clade membersas per Nextstrain clade assignment (9). Three different Delta variant lineages (21A, 21Iand 21J) were present along with 20A, 20B and 20I (Alpha, V1) and 21B (Kappa) with19A occurring rarely (Fig. 2).
Mutational spectra of SARS-CoV-2 during peaks. Along with the mutational bur-den we also investigated their genomic location, frequencies, and eventual impact onamino acid sequences (Fig. 3). A total of 18,316 mutations with median of 34 mutations/sample were recorded (Table S5 in the supplemental material). A total of 1,803 mutationswere present nonredundantly. Out of these, 156 mutations (9%) were present in at least1% of samples and remaining 91% were rarely detected. Only 21 mutations were found tobe present in at least half of the samples. Most commonly observed category was nonsy-nonymous mutations.
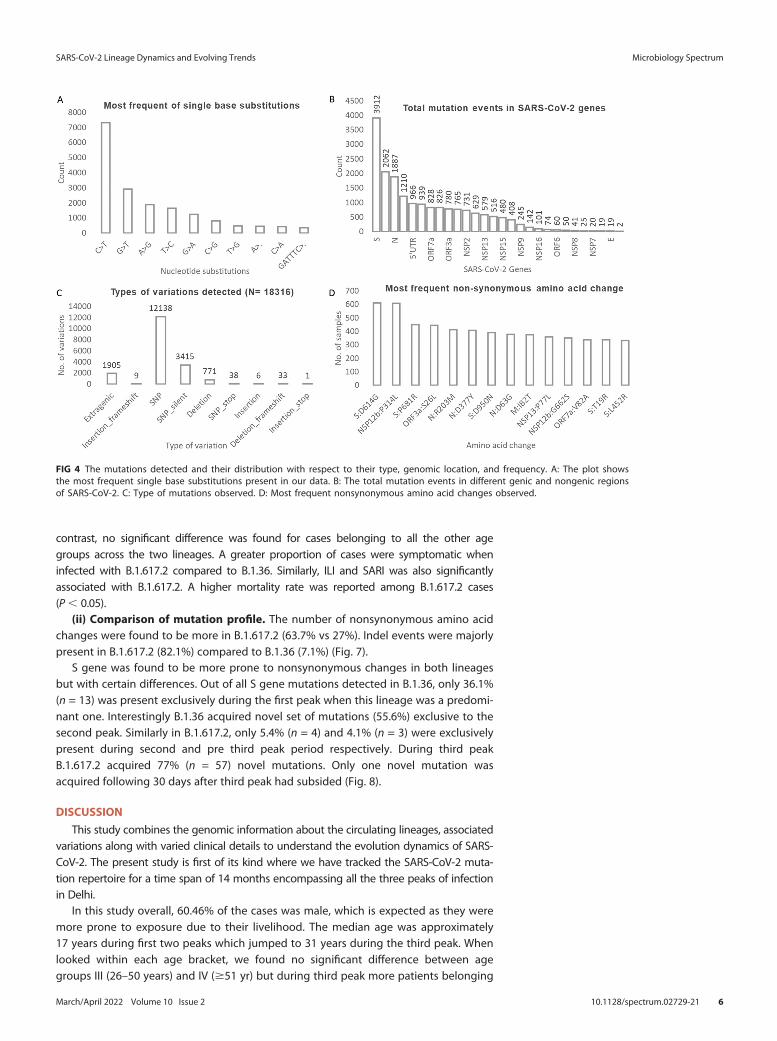
The most common type of base substitution observed was C . T which accountedfor 40% of all the changes detected (Fig. S3 in the supplemental material). Among the10 most frequent nucleotide mutations, the only genic deletion observed was of 6 bpregion (GATTTC) in ORF8 gene (Fig. 4A). The gene which was found to harbor thegreatest number of mutations was S gene (21% of all mutations), followed by NSP3gene (11%) and N gene (10%) respectively (Fig. 4B and Fig. S4). Two-thirds (n = 12,138)
TABLE 1 Clinical and demographic details across three peaks
Parameter Groups 1st peak (N = 98) 2nd peak (N = 83) 3rd peak (N = 379) P-valuea
Sex Males 58 (59.2%) 48 (57.8%) 228 (60.2%) 0.92Females 40 (40.8%) 35 (42.2%) 151 (39.8%)
Age Age group I (0–10 yr) 31 (31.6%) 13 (15.6%) 15 (3.9%) 0.03*Age group II (11–25 yr) 25 (25.5%) 38 (45.7%) 120 (31.6%) 5.15� 1026***Age group III (26–50 yr) 25 (25.5%) 20 (24.1%) 184 (48.8%) 0.89Age group IV ($51 yr) 17 (17.3%) 12 (14.4%) 60 (15.8%) 0.56
Clinical symptoms Symptomatic 48 (49%) 48 (57.8%) 245 (64.6%) 0.014**Asymptomatic 50 (51%) 35 (42.2%) 134 (35.4%)
Severe acute respiratory illness Yes 5 (5.1%) 7 (8.4%) 54 (14.2%) 0.025*No 93 (94.9%) 76 (91.6%) 325 (85.8%)
Influenza-like illness Yes 43 (43.9%) 41 (49.4%) 191 (50.3%) 0.51No 55 (56.1%) 42 (50.6%) 188 (49.6%)
Outcome Survived 95 (96.9%) 81 (97.6%) 341 (90%) 0.01**Deceased 3 (3.1%) 2 (2.4%) 38 (10%)
Ct value (S gene) Low 85 (86.7%) 61 (73.5%) 141 (37.2%) 1.6� 10214***Medium 13 (13.2%) 19 (22.9%) 214 (56.4%) 0.27High 0 (0%) 3 (3.6%) 24 (6.3%) 0.69
a***,# 0.001; **,# 0.01; *,# 0.05.
SARS-CoV-2 Lineage Dynamics and Evolving Trends Microbiology Spectrum
March/April 2022 Volume 10 Issue 2 10.1128/spectrum.02729-21 3
of all the detected mutations were nonsynonymous SNPs followed by synonymousSNPs (n = 3,415) (Fig. 4C). The most common mutations that we observed in our dataset were S: D614G, NSP3:F106F, NSP12b:P314L, and 5'UTR: 241 (all present in morethan 90% of the sequences across all peaks) (Figs. 3 and 4D).
In terms of mutation load, samples from first peak contained expectedly lesser numberof total mutations compared to subsequent peaks. The median number of total mutationsduring first peak was found to be only 13 which further increased to 20 mutations/sampleduring second peak and to much higher number of 36 mutations/sample (2.8 times com-pared to first peak) during third peak (Fig. 5).
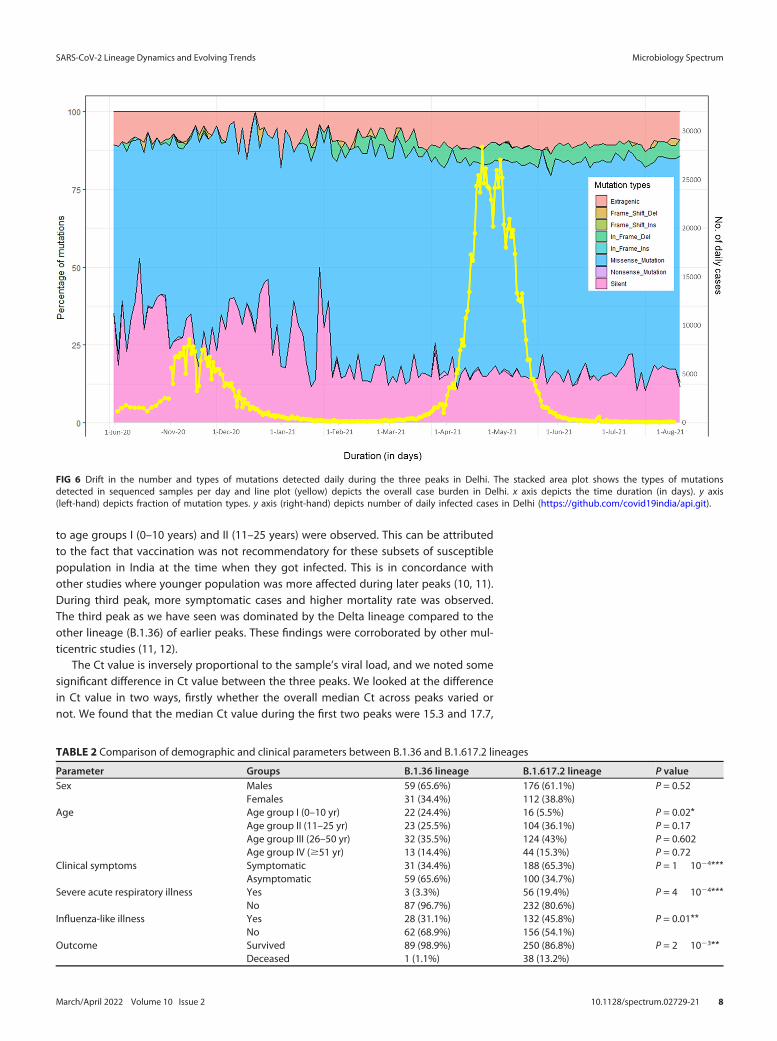
As depicted in Fig. 6, apart from substantial increase in mutational load, propor-tional change in mutation type was also observed with each peak.The fraction of syn-onymous amino acid mutations decreased with each advancing peak (36% of all muta-tions in first peak to 16% during third peak). However, fraction of nonsynonymousSNPs/missense mutations gradually increased with time (53% during first peak to 68%
FIG 1 Trend of SARS-CoV-2 lineages in Delhi. A: Daily new cases, recovered cases and deaths reported in Delhi (https://github.com/covid19india/api.git). B:Trend of the 10 most detected lineages in the present study.
SARS-CoV-2 Lineage Dynamics and Evolving Trends Microbiology Spectrum
March/April 2022 Volume 10 Issue 2 10.1128/spectrum.02729-21 4
during third peak). The In-frame deletion were present in less than 0.5% of cases dailyduring first and second peaks and jumped to approximately 5% cases daily (10 timesincrease) in third peak (Fig. 6).
Comparison between common circulating lineages. Two of the most frequentlydetected lineages(B.1.36 and B.1.617.2) in the present study were compared in termsof clinical characteristics and associated mutations.
(i) Comparison of clinical characteristics. For age group I (0-10 years), significantlymore cases (24.4%) were affected by B.1.36 compared to B.1.617.2 (5.5%) (Table 2). In
FIG 2 Phylogenetic tree of detected lineages. The tree is rooted along Wuhan-Hu-1 (NCBI Reference Sequence: NC_045512.2) as reference (denoted byblack node). The four horizontal color panels represent the corresponding clade membership, peaks period, SARI and overall symptomatic relationshiprespectively.
FIG 3 Mutational landscape of 612 samples. x axis shows the genomic coordinates of the SARS-Cov-2 virus. y axis depicts the frequency of detectedmutation, color coded by their types. The horizontal dotted red line denotes the 10% frequency cutoff.
SARS-CoV-2 Lineage Dynamics and Evolving Trends Microbiology Spectrum
March/April 2022 Volume 10 Issue 2 10.1128/spectrum.02729-21 5
contrast, no significant difference was found for cases belonging to all the other agegroups across the two lineages. A greater proportion of cases were symptomatic wheninfected with B.1.617.2 compared to B.1.36. Similarly, ILI and SARI was also significantlyassociated with B.1.617.2. A higher mortality rate was reported among B.1.617.2 cases(P, 0.05).
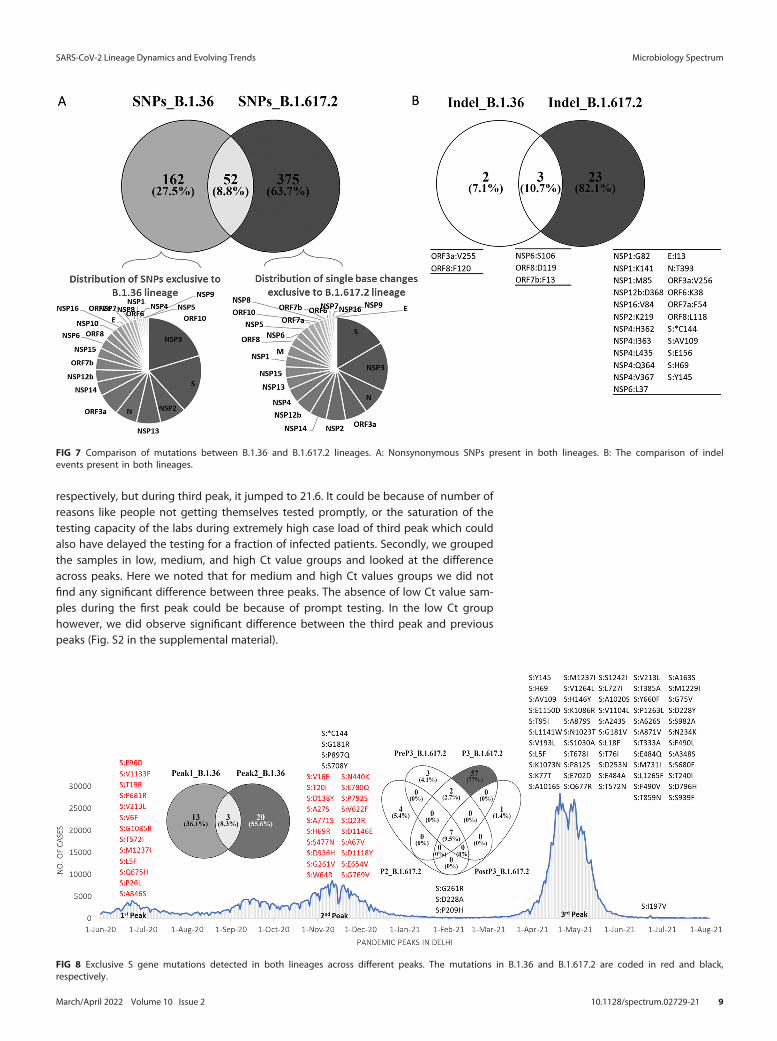
(ii) Comparison of mutation profile. The number of nonsynonymous amino acidchanges were found to be more in B.1.617.2 (63.7% vs 27%). Indel events were majorlypresent in B.1.617.2 (82.1%) compared to B.1.36 (7.1%) (Fig. 7).
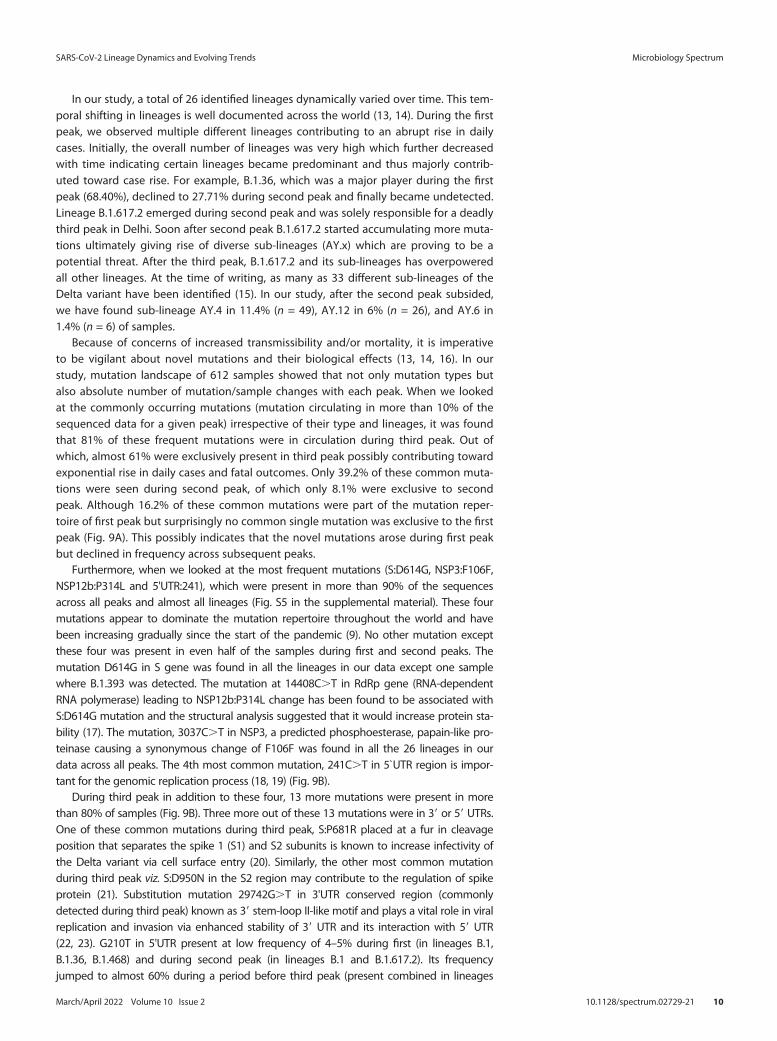
S gene was found to be more prone to nonsynonymous changes in both lineagesbut with certain differences. Out of all S gene mutations detected in B.1.36, only 36.1%(n = 13) was present exclusively during the first peak when this lineage was a predomi-nant one. Interestingly B.1.36 acquired novel set of mutations (55.6%) exclusive to thesecond peak. Similarly in B.1.617.2, only 5.4% (n = 4) and 4.1% (n = 3) were exclusivelypresent during second and pre third peak period respectively. During third peakB.1.617.2 acquired 77% (n = 57) novel mutations. Only one novel mutation wasacquired following 30 days after third peak had subsided (Fig. 8).
DISCUSSION
This study combines the genomic information about the circulating lineages, associatedvariations along with varied clinical details to understand the evolution dynamics of SARS-CoV-2. The present study is first of its kind where we have tracked the SARS-CoV-2 muta-tion repertoire for a time span of 14 months encompassing all the three peaks of infectionin Delhi.
In this study overall, 60.46% of the cases was male, which is expected as they weremore prone to exposure due to their livelihood. The median age was approximately17 years during first two peaks which jumped to 31 years during the third peak. Whenlooked within each age bracket, we found no significant difference between agegroups III (26–50 years) and IV ($51 yr) but during third peak more patients belonging
FIG 4 The mutations detected and their distribution with respect to their type, genomic location, and frequency. A: The plot showsthe most frequent single base substitutions present in our data. B: The total mutation events in different genic and nongenic regionsof SARS-CoV-2. C: Type of mutations observed. D: Most frequent nonsynonymous amino acid changes observed.
SARS-CoV-2 Lineage Dynamics and Evolving Trends Microbiology Spectrum
March/April 2022 Volume 10 Issue 2 10.1128/spectrum.02729-21 6
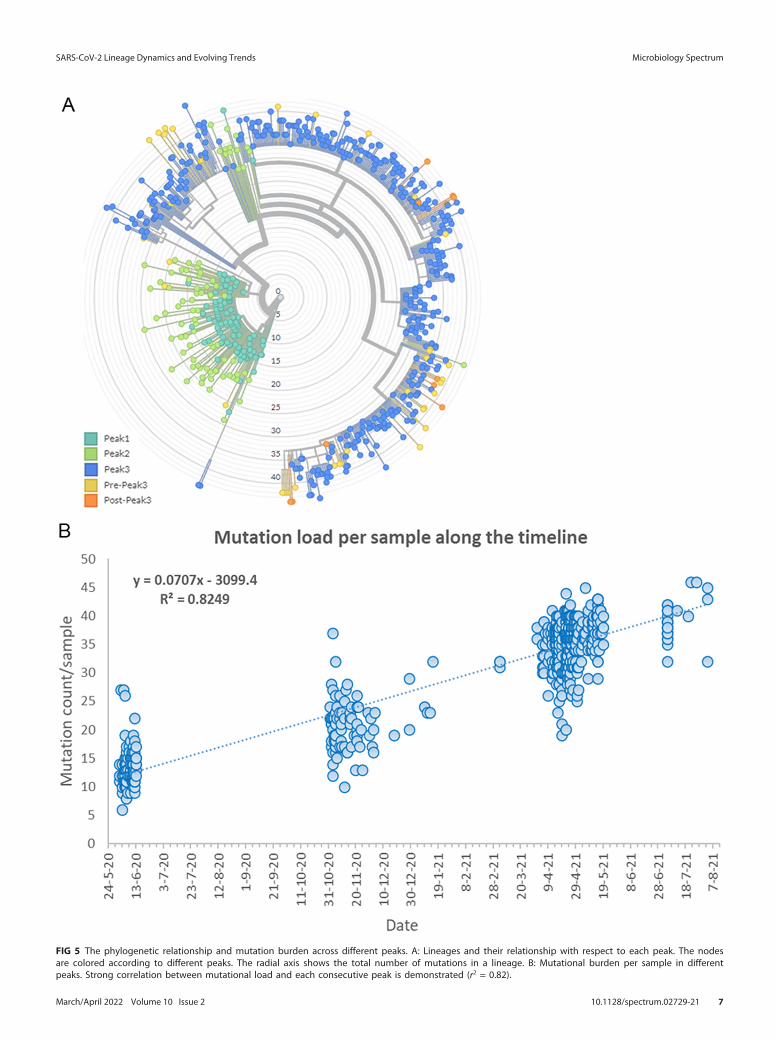
FIG 5 The phylogenetic relationship and mutation burden across different peaks. A: Lineages and their relationship with respect to each peak. The nodesare colored according to different peaks. The radial axis shows the total number of mutations in a lineage. B: Mutational burden per sample in differentpeaks. Strong correlation between mutational load and each consecutive peak is demonstrated (r2 = 0.82).
SARS-CoV-2 Lineage Dynamics and Evolving Trends Microbiology Spectrum
March/April 2022 Volume 10 Issue 2 10.1128/spectrum.02729-21 7
to age groups I (0–10 years) and II (11–25 years) were observed. This can be attributedto the fact that vaccination was not recommendatory for these subsets of susceptiblepopulation in India at the time when they got infected. This is in concordance withother studies where younger population was more affected during later peaks (10, 11).During third peak, more symptomatic cases and higher mortality rate was observed.The third peak as we have seen was dominated by the Delta lineage compared to theother lineage (B.1.36) of earlier peaks. These findings were corroborated by other mul-ticentric studies (11, 12).
The Ct value is inversely proportional to the sample’s viral load, and we noted somesignificant difference in Ct value between the three peaks. We looked at the differencein Ct value in two ways, firstly whether the overall median Ct across peaks varied ornot. We found that the median Ct value during the first two peaks were 15.3 and 17.7,
FIG 6 Drift in the number and types of mutations detected daily during the three peaks in Delhi. The stacked area plot shows the types of mutationsdetected in sequenced samples per day and line plot (yellow) depicts the overall case burden in Delhi. x axis depicts the time duration (in days). y axis(left-hand) depicts fraction of mutation types. y axis (right-hand) depicts number of daily infected cases in Delhi (https://github.com/covid19india/api.git).
TABLE 2 Comparison of demographic and clinical parameters between B.1.36 and B.1.617.2 lineages
Parameter Groups B.1.36 lineage B.1.617.2 lineage P valueSex Males 59 (65.6%) 176 (61.1%) P = 0.52
Females 31 (34.4%) 112 (38.8%)Age Age group I (0–10 yr) 22 (24.4%) 16 (5.5%) P = 0.02*
Age group II (11–25 yr) 23 (25.5%) 104 (36.1%) P = 0.17Age group III (26–50 yr) 32 (35.5%) 124 (43%) P = 0.602Age group IV ($51 yr) 13 (14.4%) 44 (15.3%) P = 0.72
Clinical symptoms Symptomatic 31 (34.4%) 188 (65.3%) P = 1� 1024***Asymptomatic 59 (65.6%) 100 (34.7%)
Severe acute respiratory illness Yes 3 (3.3%) 56 (19.4%) P = 4� 1024***No 87 (96.7%) 232 (80.6%)
Influenza-like illness Yes 28 (31.1%) 132 (45.8%) P = 0.01**No 62 (68.9%) 156 (54.1%)
Outcome Survived 89 (98.9%) 250 (86.8%) P = 2� 1023**Deceased 1 (1.1%) 38 (13.2%)
SARS-CoV-2 Lineage Dynamics and Evolving Trends Microbiology Spectrum
March/April 2022 Volume 10 Issue 2 10.1128/spectrum.02729-21 8
respectively, but during third peak, it jumped to 21.6. It could be because of number ofreasons like people not getting themselves tested promptly, or the saturation of thetesting capacity of the labs during extremely high case load of third peak which couldalso have delayed the testing for a fraction of infected patients. Secondly, we groupedthe samples in low, medium, and high Ct value groups and looked at the differenceacross peaks. Here we noted that for medium and high Ct values groups we did notfind any significant difference between three peaks. The absence of low Ct value sam-ples during the first peak could be because of prompt testing. In the low Ct grouphowever, we did observe significant difference between the third peak and previouspeaks (Fig. S2 in the supplemental material).
FIG 8 Exclusive S gene mutations detected in both lineages across different peaks. The mutations in B.1.36 and B.1.617.2 are coded in red and black,respectively.
FIG 7 Comparison of mutations between B.1.36 and B.1.617.2 lineages. A: Nonsynonymous SNPs present in both lineages. B: The comparison of indelevents present in both lineages.
SARS-CoV-2 Lineage Dynamics and Evolving Trends Microbiology Spectrum
March/April 2022 Volume 10 Issue 2 10.1128/spectrum.02729-21 9
In our study, a total of 26 identified lineages dynamically varied over time. This tem-poral shifting in lineages is well documented across the world (13, 14). During the firstpeak, we observed multiple different lineages contributing to an abrupt rise in dailycases. Initially, the overall number of lineages was very high which further decreasedwith time indicating certain lineages became predominant and thus majorly contrib-uted toward case rise. For example, B.1.36, which was a major player during the firstpeak (68.40%), declined to 27.71% during second peak and finally became undetected.Lineage B.1.617.2 emerged during second peak and was solely responsible for a deadlythird peak in Delhi. Soon after second peak B.1.617.2 started accumulating more muta-tions ultimately giving rise of diverse sub-lineages (AY.x) which are proving to be apotential threat. After the third peak, B.1.617.2 and its sub-lineages has overpoweredall other lineages. At the time of writing, as many as 33 different sub-lineages of theDelta variant have been identified (15). In our study, after the second peak subsided,we have found sub-lineage AY.4 in 11.4% (n = 49), AY.12 in 6% (n = 26), and AY.6 in1.4% (n = 6) of samples.
Because of concerns of increased transmissibility and/or mortality, it is imperativeto be vigilant about novel mutations and their biological effects (13, 14, 16). In ourstudy, mutation landscape of 612 samples showed that not only mutation types butalso absolute number of mutation/sample changes with each peak. When we lookedat the commonly occurring mutations (mutation circulating in more than 10% of thesequenced data for a given peak) irrespective of their type and lineages, it was foundthat 81% of these frequent mutations were in circulation during third peak. Out ofwhich, almost 61% were exclusively present in third peak possibly contributing towardexponential rise in daily cases and fatal outcomes. Only 39.2% of these common muta-tions were seen during second peak, of which only 8.1% were exclusive to secondpeak. Although 16.2% of these common mutations were part of the mutation reper-toire of first peak but surprisingly no common single mutation was exclusive to the firstpeak (Fig. 9A). This possibly indicates that the novel mutations arose during first peakbut declined in frequency across subsequent peaks.
Furthermore, when we looked at the most frequent mutations (S:D614G, NSP3:F106F,NSP12b:P314L and 5'UTR:241), which were present in more than 90% of the sequencesacross all peaks and almost all lineages (Fig. S5 in the supplemental material). These fourmutations appear to dominate the mutation repertoire throughout the world and havebeen increasing gradually since the start of the pandemic (9). No other mutation exceptthese four was present in even half of the samples during first and second peaks. Themutation D614G in S gene was found in all the lineages in our data except one samplewhere B.1.393 was detected. The mutation at 14408C.T in RdRp gene (RNA-dependentRNA polymerase) leading to NSP12b:P314L change has been found to be associated withS:D614G mutation and the structural analysis suggested that it would increase protein sta-bility (17). The mutation, 3037C.T in NSP3, a predicted phosphoesterase, papain-like pro-teinase causing a synonymous change of F106F was found in all the 26 lineages in ourdata across all peaks. The 4th most common mutation, 241C.T in 5`UTR region is impor-tant for the genomic replication process (18, 19) (Fig. 9B).
During third peak in addition to these four, 13 more mutations were present in morethan 80% of samples (Fig. 9B). Three more out of these 13 mutations were in 39 or 59 UTRs.One of these common mutations during third peak, S:P681R placed at a fur in cleavageposition that separates the spike 1 (S1) and S2 subunits is known to increase infectivity ofthe Delta variant via cell surface entry (20). Similarly, the other most common mutationduring third peak viz. S:D950N in the S2 region may contribute to the regulation of spikeprotein (21). Substitution mutation 29742G.T in 3'UTR conserved region (commonlydetected during third peak) known as 39 stem-loop II-like motif and plays a vital role in viralreplication and invasion via enhanced stability of 39 UTR and its interaction with 59 UTR(22, 23). G210T in 5'UTR present at low frequency of 4–5% during first (in lineages B.1,B.1.36, B.1.468) and during second peak (in lineages B.1 and B.1.617.2). Its frequencyjumped to almost 60% during a period before third peak (present combined in lineages
SARS-CoV-2 Lineage Dynamics and Evolving Trends Microbiology Spectrum
March/April 2022 Volume 10 Issue 2 10.1128/spectrum.02729-21 10
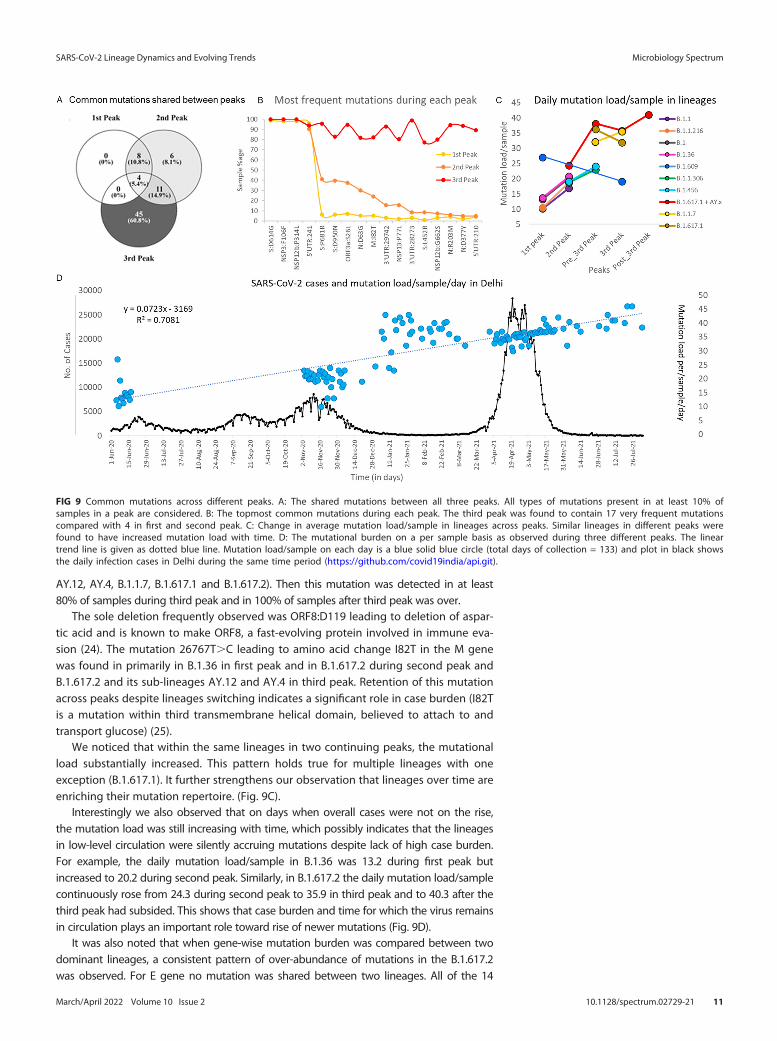
AY.12, AY.4, B.1.1.7, B.1.617.1 and B.1.617.2). Then this mutation was detected in at least80% of samples during third peak and in 100% of samples after third peak was over.
The sole deletion frequently observed was ORF8:D119 leading to deletion of aspar-tic acid and is known to make ORF8, a fast-evolving protein involved in immune eva-sion (24). The mutation 26767T.C leading to amino acid change I82T in the M genewas found in primarily in B.1.36 in first peak and in B.1.617.2 during second peak andB.1.617.2 and its sub-lineages AY.12 and AY.4 in third peak. Retention of this mutationacross peaks despite lineages switching indicates a significant role in case burden (I82Tis a mutation within third transmembrane helical domain, believed to attach to andtransport glucose) (25).
We noticed that within the same lineages in two continuing peaks, the mutationalload substantially increased. This pattern holds true for multiple lineages with oneexception (B.1.617.1). It further strengthens our observation that lineages over time areenriching their mutation repertoire. (Fig. 9C).
Interestingly we also observed that on days when overall cases were not on the rise,the mutation load was still increasing with time, which possibly indicates that the lineagesin low-level circulation were silently accruing mutations despite lack of high case burden.For example, the daily mutation load/sample in B.1.36 was 13.2 during first peak butincreased to 20.2 during second peak. Similarly, in B.1.617.2 the daily mutation load/samplecontinuously rose from 24.3 during second peak to 35.9 in third peak and to 40.3 after thethird peak had subsided. This shows that case burden and time for which the virus remainsin circulation plays an important role toward rise of newer mutations (Fig. 9D).
It was also noted that when gene-wise mutation burden was compared between twodominant lineages, a consistent pattern of over-abundance of mutations in the B.1.617.2was observed. For E gene no mutation was shared between two lineages. All of the 14
FIG 9 Common mutations across different peaks. A: The shared mutations between all three peaks. All types of mutations present in at least 10% ofsamples in a peak are considered. B: The topmost common mutations during each peak. The third peak was found to contain 17 very frequent mutationscompared with 4 in first and second peak. C: Change in average mutation load/sample in lineages across peaks. Similar lineages in different peaks werefound to have increased mutation load with time. D: The mutational burden on a per sample basis as observed during three different peaks. The lineartrend line is given as dotted blue line. Mutation load/sample on each day is a blue solid blue circle (total days of collection = 133) and plot in black showsthe daily infection cases in Delhi during the same time period (https://github.com/covid19india/api.git).
SARS-CoV-2 Lineage Dynamics and Evolving Trends Microbiology Spectrum
March/April 2022 Volume 10 Issue 2 10.1128/spectrum.02729-21 11
mutations present in M gene was present in B.1.617.2 with only one mutation M:I82T (pres-ent across all samples between two lineages and peaks) shared with B.1.36 (Fig. S6 in thesupplemental material). As mentioned previously this is the worth highlighting again thatthis shared mutation is present in high frequency in both the lineages. We also noted thata substantial proportion of S gene mutations (94.6%) in B.1.617.2 were acquired after sec-ond peak. As far as clinical characteristics are concerned, greater accumulation of muta-tions in B.1.167.2 compared with B.1.36 could have contributed toward more severe symp-toms and increased fatality as seen during third peak in Delhi.
Hence, we conclude that molecular epidemiology of SARS-CoV-2 needs to be stud-ied continuously to track change in the amino acids. In addition, effect of such muta-tions in the disease transmission dynamics and pathophysiology must be promptlyassessed. Recent news of emergence of a new variant “B.1.1.529- Omicron” which con-tains heavily mutated S gene (;30 mutations) is making waves and has spread toapproximately 30 countries around the world and counting including India (25). Thepandemic is constantly changing, and we believe many novel mutations and lineagespotentially more infectious and/or fatal are bound to occur in near future.
Limitation of the study. This is a single center study and clinical details fetchedfrom the specimen referral form were limited. Hence genomic studies with larger sam-ple size integrating data detailing patient’s clinical course are warranted.
Conclusion. To the best of our knowledge, this is the first study in which the datafrom three consecutive peaks of COVID-19 pandemic in Delhi, has been analyzed. Thefindings from our study suggest that lineage tracking and emergence of novel muta-tion is of paramount importance. Thus, it is strongly believed that we need fastersequencing in a greater number of samples in order to be ahead of the curve in thefight with SARS-CoV-2.
MATERIALS ANDMETHODSThe Department of Clinical Virology, at the Institute of Liver and Biliary Sciences, New Delhi (ILBS) is
an ICMR (Indian Council of Medical Research) designated COVID-19 diagnostic facility and a satellite sitefor INSACOG (Indian SARS-CoV-2 Genomics Consortium). Respiratory specimens (combined nasopharyn-geal and oropharyngeal swabs in Viral Transport Medium) tested for COVID-19 in the laboratory from 1June 2020 to 3 August 2021 were included in the present study. Combined nasopharyngeal and oralswabs were collected from suspected cases of SARS-CoV-2 infection in viral transport media tubes(2 mL) and was subjected to COVID-19 RT-PCR assay for diagnosis. For NGS, RNA elutes after extractionfrom the viral transport media were used. For the purpose of the study, the time period of differentpeaks in Delhi was defined as follows: first peak: June to July 2020; second peak: November toDecember 2020; and third peak: April to July 2021.
A total of 1,23,378 samples were tested from 1 June 2020 to 3 August 2021 among which 15,652 (12.6%)were found positive for COVID-19. Among these positives, a subset of 747 (4.7%) samples representing allthree peaks of infection having a cycle threshold (Ct) of # 30 on reverse transcriptase real-time PCR (RT-PCR)were randomly selected from our in-house database and subjected to whole-genome sequencing.
Clinical analysis. Complete demographic and clinical details of patients infected with SARS-CoV-2were recorded from the specimen referral form issued by ICMR. Cases were divided into different agegroups: #10, 11–25, 26–50, and .50 years.
Outcomes of all the enrolled cases were recorded via telephonic interviews. The cases were classifiedinto various groups as per WHO clinical definition (26).
SARS-CoV-2 RT-PCR testing. Total viral RNA was extracted using 300 mL of specimen using ChemagicViral DNA/RNA kit (PerkinElmer, Waltham, MA, USA) in a Chemagic 360 instrument (PerkinElmer, Waltham,MA, USA) following manufacturer’s instructions. A 10 mL of the extracted viral RNA elute was further sub-jected to RT-PCR for the detection of SARS-CoV-2 using RealStar SARS-CoV-2 RT-PCR (Altona Diagnostics,Germany) targeting E gene and S gene. All the positive specimens were grouped into three categories basedon Ct values obtained: low (Ct#20), medium (Ct 21–25) and high (Ct 26–30).
SARS-CoV-2 whole-genome sequencing. Sequencing of the viral isolates was done by Illumina COVIDSeqprotocol on NextSeq 550 platform as per the manufacturer’s instructions. The quality check of the prepared librarieswas performed using DNA high sensitivity assay kit on Bioanalyzer 2100 (Agilent Technologies, United States). Theconcentration of the libraries was assessed on Qubit (Thermo Fisher Scientific Inc., USA). For amplification andcDNA conversion steps during library preparation, Veriti 96-Well Thermal Cycler (Applied Biosystems).
Quality control, mapping of sequences, and lineage assignment. The raw data in the form of bi-nary base call format (.bcl files) was generated from the NextSeq 550 instrument. These raw files were con-verted, demultiplexed to fastq file using bcl2fastq (Illumina, v2.20) and were aligned against the SARS-CoV-2reference genome (NC_045512.2). The alignment of unmapped reads to a reference genome and generationof a consensus genome sequence was done within the custom Illumina BaseSpace Sequence Hub. The line-ages nomenclature for each sequence was retrieved using Illumina DRAGEN COVID Lineage App (v3.5.3)
SARS-CoV-2 Lineage Dynamics and Evolving Trends Microbiology Spectrum
March/April 2022 Volume 10 Issue 2 10.1128/spectrum.02729-21 12
following the default parameters. The minimum accepted alignment score was set to 12 and results withscores ,12 were discarded. The coverage threshold and virus detection threshold were set to 20 and 5respectively. The variant calling target coverage which specifies the maximum number of reads with a startposition overlapping any given position was set at 50.
Among 747 sequenced, 612 (81.9%) samples with genomic coverage . 80% were finally selected fordownstream analysis. The median genomic coverage of quality passed samples was 98.8 while the me-dian sequencing depth was 1805 (Supplementary Figs. S7 to S10 in the supplemental material).
Phylogenetic analysis and mutation profiling. QC-threshold passed FASTA files containing sequencesfrom 612 SARS-CoV-2 samples and a reference genome of SARS-CoV-2 isolate named Wuhan-Hu-1 (NCBIReference Sequence: NC_045512.2) was used for generating phylogenetic tree (Table S1 in the supplemen-tal material). To do this, first multiple sequence alignment was done using MAFFT (MAFFT v7.487) with thedefault options. After performing the alignment, the FASTA file was further refined to perform biologicallyrelevant trimming. Finally, FastME was used for distance-based inference to create an output tree file whichwas used for visualization of phylogenetic tree. The annotation of nucleotide sequences was done basedon NUCMER (Nucleotide Mummer) alignment tool, version 3.1 (a part of the MUMmer package). The muta-tions are classified according to frequency, the genomic coordinates affected and their subsequent effecton amino acid sequences (Table S2). The retrieved sequences were deposited in the public repository,GISAID (Global Initiative on Sharing All Influenza Data; https://www.gisaid.org) details of which are providedas supplementary data (Table S3). Refer to the supplementary data for extended methodology.
Data availability. The raw sequencing data of all the samples have been submitted to the GISAIDdatabase and the submission details are given in the Table S3 in the supplemental material. Moreover,the sequences in the FASTA format are also supplied as Table S1.
SUPPLEMENTAL MATERIAL
Supplemental material is available online only.SUPPLEMENTAL FILE 1, PDF file, 1.4 MB.SUPPLEMENTAL FILE 2, XLSX file, 3.2 MB.SUPPLEMENTAL FILE 3, XLSX file, 0.01 MB.SUPPLEMENTAL FILE 4, XLSX file, 0.05 MB.SUPPLEMENTAL FILE 5, XLSX file, 0.01 MB.SUPPLEMENTAL FILE 6, XLSX file, 0.01 MB.
ACKNOWLEDGMENTSWe acknowledge the Government of NCT, Delhi for facilitating the Whole Genome
Sequencing Laboratory for COVID-19 at our institute. We also extend our gratitude toNational Liver Disease Biobank, ILBS for providing Next Generation Sequencing platforms.
Conceptualization: S.K.S., E.G.; data curation: P.G., D.P., V.S., A.B.; formal analysis: P.G.;funding acquisition: S.K.S., E.G., C.B.; investigation: V.S., U.S.K., S.D., A.P., D.P.; projectadministration: S.K.S., E.G., C.B.; resources: S.K.S., E.G., C.B., B.T.; supervision: S.K.S., E.G.,C.B.; visualization: P.G.; writing – original draft: P.G., R.A., D.P., R.G., V.S.; writing – review& editing: P.G., R.A., E.G., S.K.S.
All authors have read and agreed to the published version of the manuscript.The present study was approved by Institutional Ethics Committee (IEC) at Institute of Liver
and Biliary Sciences, New Delhi (Ethical no. IEC/2020/77/MA07). In this study de-identified andanonymized archived samples were subjected to whole-genome sequencing. No personaldetails except clinically relevant information (age, sex, symptoms, and outcome) were used forthe purpose of the study. Hence individual consent formwas waived off by the IEC.
We declare no conflict of interest.
REFERENCES1. Zhu N, Zhang D, Wang W, Li X, Yang B, Song J, Zhao X, Huang B, Shi W, Lu
R, Niu P, Zhan F, Ma X, Wang D, Xu W, Wu G, Gao GF, Tan W, China NovelCoronavirus Investigating and Research Team. 2020. A novel coronavirusfrom patients with pneumonia in China, 2019. N Engl J Med 382:727–733.https://doi.org/10.1056/NEJMoa2001017.
2. Cucinotta D, Vanelli M. 2020. WHO Declares COVID-19 a Pandemic. ActaBiomed 91:157–160.
3. AndrewsMA, Areekal B, Rajesh KR, Krishnan J, Suryakala R, Krishnan B, Muraly CP,Santhosh PV. 2020. First confirmed case of COVID-19 infection in India: A casereport. Indian JMed Res 151:490–492. https://doi.org/10.4103/ijmr.IJMR_2131_20.
4. WHO. 2021. India: WHO Coronavirus Disease (COVID-19) Dashboard WithVaccination Data [Internet]. https://covid19.who.int.
5. Dhar MS, Marwal R, Vs R, Ponnusamy K, Jolly B, Bhoyar RC, Sardana V,Naushin S, Rophina M, Mellan TA, Mishra S, Whittaker C, Fatihi S, Datta M,Singh P, Sharma U, Ujjainiya R, Bhatheja N, Divakar MK, Singh MK, CherianSS. 2021. Genomic characterization and epidemiology of an emergingSARS-CoV-2 variant in Delhi, India. Science 374:995–999. https://doi.org/10.1126/science.abj9932.
6. Li X, Zai J, Zhao Q, Nie Q, Li Y, Foley BT, Chaillon A. 2020. Evolutionary his-tory, potential intermediate animal host, and cross-species analyses ofSARS-CoV-2. J Med Virol 92:602–611. https://doi.org/10.1002/jmv.25731.
7. Yadav PD, Nyayanit DA, Majumdar T, Patil S, Kaur H, Gupta N, Shete AM,Pandit P, Kumar A, Aggarwal N, Narayan J, Vijay N, Kalawat U, SugunanAP, Munivenkatappa A, Sharma T, Devi S, Majumdar T, Jaryal S, Bakshi R,
SARS-CoV-2 Lineage Dynamics and Evolving Trends Microbiology Spectrum
March/April 2022 Volume 10 Issue 2 10.1128/spectrum.02729-21 13
Joshi Y, Sahay R, Shastri J, Singh M, Kumar M, Rawat V, Dutta S, Yadav S,Krishnasamy K, Raut S, Biswas D, Borkakoty B, Verma S, Rani S, Deval H,Patel D, Turuk J, Malhotra B, Fomda B, Nag V, Jain A, Bhargava A, Potdar V,Cherian S, Abraham P, Gopal A, Panda S, Bhargava B. 2021. An epidemio-logical analysis of SARS-CoV-2 genomic sequences from different regionsof India. Viruses 13:925. https://doi.org/10.3390/v13050925.
8. Pattabiraman C, Prasad P, George AK, Sreenivas D, Rasheed R. 2022.Importation, circulation, and emergence of variants of SARS-CoV-2 in theSouth Indian State of Karnataka. Wellcome Open Res 6:110. https://doi.org/10.12688/wellcomeopenres.16768.2.
9. Urhan A, Abeel T. 2021. Emergence of novel SARS-CoV-2 variants in the Neth-erlands. Sci Rep 11:6625. https://doi.org/10.1038/s41598-021-85363-7.
10. Jain VK, Iyengar KP, Vaishya R. 2021. Differences between first wave andsecond wave of COVID-19 in India. Diabetes & Metabolic Syndrome.
11. Budhiraja S, Indrayan A, Aggarwal M, Jha V, Jain D, Tarai B, Das P,Aggarwal B, Mishra RS, Bali S, Mahajan M. 2021. Differentials in the char-acteristics of COVID-19 cases in Wave-1 and Wave-2 admitted to a net-work of hospitals in North India. medRxiv.
12. Sarkar A, Chakrabarti AK, Dutta S. 2021. Covid-19 infection in India: Acomparative analysis of the second wave with the first wave. Pathogens10:1222. https://doi.org/10.3390/pathogens10091222.
13. Callaway E. 2020. The coronavirus is mutating—does it matter? NatureNLM 585:174–177. https://doi.org/10.1038/d41586-020-02544-6.
14. Vilar S, Isom DG. 2021. One year of SARS-CoV-2: How much has the viruschanged? Biology (Basel) 10:91. https://doi.org/10.3390/biology10020091.
15. Baj A, Novazzi F, Ferrante FD, Genoni A, Tettamanzi E, Catanoso G,Gasperina DD, Dentali F, Focosi D, Maggi F. 2021. Spike protein evolutionin the SARS-CoV-2 Delta variant of concern: a case series from NorthernLombardy. Emerg Microbes Infect 10:2010–2015. https://doi.org/10.1080/22221751.2021.1994356.
16. Volz E, Mishra S, Chand M, Barrett JC, Johnson R, Geidelberg L, HinsleyRW, Laydon JD, Dabrera G, Tool OÁ, Amato R, Ragonnet-Cronin M,Harrison I, Jackson B, Ariani VC, Boyd O, Loman NG, McCrone JT,Gonçalves S, Jorgensen D, Myers J, Hill V, Jackson D, Gaythorpe K, GrovesN, Sillitoe J, Kwiatkowski PD, Flaxman S, Ratmann O, Bhatt S, Hopkins S,Gandy A, Rambaut A, Ferguson MN. 2021. Transmission of SARS-CoV-2lineage B.1.1.7 in England: insights from linking epidemiological andgenetic data [Internet]. https://www.medrxiv.org/content/10.1101/2020.12.30.20249034v2.
17. Haddad D, John SE, Mohammad A, Hammad MM, Hebbar P, ChannanathA, Nizam R, Al-Qabandi S, Al Madhoun A, Alshukry A, Ali H, Thanaraj TA,Al-Mulla F. 2021. SARS-CoV-2: Possible recombination and emergence ofpotentially more virulent strains. PLoS One 16:e0251368. https://doi.org/10.1371/journal.pone.0251368.
18. Li T, Zhang Y, Fu L, Yu C, Li X, Li Y, Zhang X, Rong Z, Wang Y, Ning H, Liang R,Chen W, Babiuk LA, Chang Z. 2005. siRNA targeting the leader sequence ofSARS-CoV inhibits virus replication. Gene Ther 12:751–761. https://doi.org/10.1038/sj.gt.3302479.
19. Rangan R, Zheludev IN, Hagey RJ, Pham EA, Wayment-Steele HK, GlennJS, Das R. 2020. RNA genome conservation and secondary structure inSARS-CoV-2 and SARS-related viruses: a first look. RNA 26:937–959.https://doi.org/10.1261/rna.076141.120.
20. Liu Y, Liu J, Johnson BA, Xia H, Ku Z, Schindewolf C, Widen SG, An Z,Weaver SC, Menachery VD, Xie X, Shi P-Y. 2021. Delta spike P681R muta-tion enhances SARS-CoV-2 fitness over alpha variant. bioRxiv.
21. Planas D, Veyer D, Baidaliuk A, Staropoli I, Guivel-Benhassine F, Rajah MM,Planchais C, Porrot F, Robillard N, Puech J, Prot M, Gallais F, Gantner P, VelayA, Le Guen J, Kassis-Chikhani N, Edriss D, Belec L, Seve A, Courtellemont L,Péré H, Hocqueloux L, Fafi-Kremer S, Prazuck T, Mouquet H, Bruel T, Simon-Lorière E, Rey FA, Schwartz O. 2021. Reduced sensitivity of SARS-CoV-2 vari-ant Delta to antibody neutralization. Nature 596:276–280. https://doi.org/10.1038/s41586-021-03777-9.
22. Li L, Kang H, Liu P, Makkinje N, Williamson ST, Leibowitz JL, Giedroc DP. 2008.Structural lability in stem–loop 1 drives a 59 UTR–39 UTR interaction in coro-navirus replication. J Mol Biol 377:790–803. https://doi.org/10.1016/j.jmb.2008.01.068.
23. Yang D, Leibowitz JL. 2015. The structure and functions of coronavirusgenomic 39 and 59 ends. Virus Res 206:120–133. https://doi.org/10.1016/j.virusres.2015.02.025.
24. Flower TG, Buffalo CZ, Hooy RM, Allaire M, Ren X, Hurley JH. 2021. Struc-ture of SARS-CoV-2 ORF8, a rapidly evolving immune evasion protein.Proc Natl Acad Sci U S A 118:e2021785118. https://doi.org/10.1073/pnas.2021785118.
25. Rao S, Singh M. 2021. The newly detected B. 1.1. 529 (Omicron) variant ofSARS-CoV-2 with multiple mutations: Implications for transmission, diag-nostics, therapeutics, and immune evasion. Dhrp 1:7–10. https://doi.org/10.47488/dhrp.v1iS5.35.
26. WHO. 2021. WHO COVID-19 Case definition [Internet]. https://www.who.int/publications/i/item/WHO-2019-nCoV-Surveillance_Case_Definition-2020.2.
SARS-CoV-2 Lineage Dynamics and Evolving Trends Microbiology Spectrum
March/April 2022 Volume 10 Issue 2 10.1128/spectrum.02729-21 14