Embed Size (px)
Citation preview
SOCIAL PROTECTION & JOBS
No. 2101 | JANUARY 2021
DISCUSSION PAPER
Cash in the City: Emerging Lessons from Implementing
Cash Transfers in Urban Africa
Ugo Gentilini, Saksham Khosla, and Mohamed Almenfi
with Tinahy Aristide, Paul Bance, Joachim Boko, Ioana Botea, Samantha de Silva, Jordi Gallego-Ayala, Tina George, Sarika Gupta, Ayuba Hussein, Abu Kargbo, Matthieu Lefebvre, Erkin Mamadaliev,
Muderis Mohammed, Mack Capehart Mulbah, Junko Onishi, Julia Rachel Ravelosoa, Solene Rougeaux, Victoria Strokova, Siv Tokle,
Andrea Vermehren, Margaux Vinez and Emma Wadie Hobson
Pub
lic D
iscl
osur
e A
utho
rized
Pub
lic D
iscl
osur
e A
utho
rized
Pub
lic D
iscl
osur
e A
utho
rized
Pub
lic D
iscl
osur
e A
utho
rized
© 2021 International Bank for Reconstruction and Development / The World Bank
1818 H Street NW Washington DC 20433 Telephone: +1 (202) 473 1000 Internet: www.worldbank.org
This work is a product of the staff of The World Bank with external contributions. The findings, interpretations, and conclusions expressed in this work do not necessarily reflect the views of The World Bank, its Board of Executive Directors, or the governments they represent.
The World Bank does not guarantee the accuracy of the data included in this work. The boundaries, colors, denominations, and other information shown on any map in this work do not imply any judgment on the part of The World Bank concerning the legal status of any territory or the endorsement or acceptance of such boundaries.
RIGHTS AND PERMISSIONS The material in this work is subject to copyright. Because The World Bank encourages dissemination of its knowledge, this work may be reproduced, in whole or in part, for noncommercial purposes as long as full attribution to this work is given.
Any queries on rights and licenses, including subsidiary rights, should be addressed to World Bank Publications, The World Bank Group, 1818 H Street NW, Washington, DC 20433, USA; fax: +1 (202) 522 2625; e-mail: [email protected].
Abstract retro geometric background: © iStock.com/marigold_88 Project 41595
Cash in the City Emerging Lessons from Implementing Cash Transfers in Urban Africa
Ugo Gentilini, Saksham Khosla and Mohamed Almenfi
with Tinahy Aristide, Paul Bance, Joachim Boko, Ioana Botea, Samantha de Silva, Jordi Gallego-Ayala, Tina George, Sarika Gupta, Ayuba Hussein, Abu Kargbo, Matthieu Lefebvre, Erkin Mamadaliev, Muderis Mohammed, Mack Capehart Mulbah, Junko Onishi, Julia Rachel Ravelosoa, Solene Rougeaux, Victoria Strokova, Siv Tokle, Andrea Vermehren, Margaux Vinez and Emma Wadie Hobson
JEL codes. H53; H84; R10.
Keywords. Africa; social assistance; safety nets; social protection; cash transfers; urbanization; delivery; informality.
Abstract. Poverty and crises are rapidly “urbanizing”. Yet experience with operationalizing cash transfers in urban areas is limited. This paper captures early lessons from a new generation of urban cash transfer responses to Covid-19 in eleven African countries. The analysis contextualizes such initiatives within a longer-term trajectory of urban social protection programs from the early 2000s. A range of lessons emerge around design and implementation, partnerships, institutions and political economy, strategic issues, and evidence and learning.

Outline
Acknowledgements .......................................................................................................... 3
1. Introduction ................................................................................................................. 4
2. Rationale for engaging in urban areas ........................................................................... 5
An exponentially growing urban population ......................................................................... 5 Structural transformation and congestion economies .......................................................... 6 Sprawling informal settlements and slums ........................................................................... 7 Informality .............................................................................................................................. 7 Youth unemployment and urban discontent ........................................................................ 8 The urbanization of poverty .................................................................................................. 9 Urbanization of crises .......................................................................................................... 10
3. State of current social protection coverage in urban areas: insights from survey andadministrative data .................................................................................................... 12
Coverage .............................................................................................................................. 12 Social registries .................................................................................................................... 13
4. The first generation of urban safety nets ..................................................................... 14
Contextualizing the first generation .................................................................................... 14 Ethiopia’s Urban Productive Safety Net Project .................................................................. 18 Mozambique, the Productive Social Action Program .......................................................... 22 Uganda’s Girls-empowering-Girls program ......................................................................... 27
5. The second generation of urban safety nets: emerging insights from Covid-19 responsesin Africa ..................................................................................................................... 28
Beneficiary outreach, selection and enrollment ................................................................. 30 Management information systems ..................................................................................... 38 Payments.............................................................................................................................. 40
6. Emerging lessons ........................................................................................................ 41
Design and implementation ................................................................................................. 41 Partnerships, institutions and political economy ................................................................ 43 Strategic issues ..................................................................................................................... 43 Evidence and learning .......................................................................................................... 44
References ..................................................................................................................... 46
3
Acknowledgements The paper is preliminary and updated versions will be issued as urban social protection programs in the region advance in implementation. As such, it should be considered a “living paper” subject to revisions. The draft was produced under the strategic guidance of Iffath Sharif, Rob Chase, Jehan Arulpragasam, Paolo Belli, and Michal Rutkowski. Special thanks go to Albert Zeufack, Margaret Grosh, Loli Arribas-Banos, Christian Bodewig, Wendy Cunningham, Melis Guven, Dhushyanth Raju, Ananda Paez Rodas, and Aparajita Goyal for their comments and support. We are grateful to Michael Weber for sharing data on JOIN/I2D2 database on labor markets, to the ASPIRE team for administrative and survey data on social protection, and to participants of an e-workshop on urban safety nets organized by the Harare office of the World Bank and the Government of Zimbabwe (November 19, 2020). Comments are welcome ([email protected]).
4
1. IntroductionThe urban population in Africa is growing by one person every second – or by about 90,000 per day,2.6 million per month, and over 31 million a year. By 2050, Africa’s cities will host an additional 950million people. Such astounding rate of growth underscores that urbanization is not, as oftenportrayed in the past, a “frontier” issue for the region – it’s a salient, compelling present-daychallenge. The current Covid-19 pandemic has amplified the relevance of the “urban agenda” for socialprotection. The basic aim of this paper is to shed light on how social assistance can help meet urbanchallenges in Africa based on practical, ongoing implementation lessons. In follow up papers, we willexamine this question from a wider social protection perspective, including urban social insurance andlabor market programs.
Evidence and practices on cash transfers abound. The robust empirical base underpinning them, combined with investments in delivery systems, have propelled cash transfers as the most widely adopted response to Covid-19 worldwide1. Yet the crisis puts the spotlight on a lingering gap – that is, how to extend coverage of social assistance in urban areas in low and middle-income countries. With a marked rural footprint, cash transfers in Africa have only recently started being implemented in cities, often at modest scale. Where attempts were made in other regions, chiefly Latin America and Asia, results are mixed and point to a basic lesson: simply replicating rural models doesn’t work and urban areas call for adapting or even reimagining safety net approaches.
The Covid pandemic has renewed the attention to urban vulnerabilities. For instance, Roever and Rogan (2020) show that while about 40% of informal sector workers are covered by some form of emergency cash and food transfers, such rate was 1% in Dakar and Dar es Salam, and zero in Accra. At the same time, the crisis provided an opportunity to innovate amidst extensive informality2. This is precisely what most African governments are doing by pushing the boundaries of knowledge and practices in urban social protection.
This paper captures early lessons from a dozen countries as they scale-up cash transfers in cities, and contextualizes such initiatives within the longer-term trajectory of urban social protection engagement. In doing so, the paper translates calls for “supporting urban informal workers” into practice and showcases how such support is rendered through real-time case studies. Because of the nascent nature of emerging experiences, findings are preliminary and will be updated in the coming months (hence this paper’s “living” nature). At the same time, lessons might help to start informing both future strategic directions for urban social protection and, hopefully, offer a platform to facilitate ongoing, cross-country learning and innovations in a context where poverty and crises are rapidly “urbanizing”.
This reminder of the paper is organized as follows: the next section sets out the rationale for strengthening the provision of cash transfers in urban settings. Drawing from administrative data, stylized facts on social protection in urban areas, including coverage and social registries, are discussed in section 3. There is a lineage of urban safety net programs, with its first generation (2000-2020) laid out in section 4, while a bulging second-generation of programs in response to Covid-19 are documented in section 5. A set of concluding reflections are offered in section 6, including with lessons around design and implementation, partnerships, institutions and political economy, strategic issues, and evidence and learning.
1 A total of 340 cash transfer programs are implemented as part of Covid-19 responses, which represent nearly one-third of total social protection responses (Gentilini et al 2020). 2 This is defined as having no social security, health insurance, or employment contract.
5
2. Rationale for engaging in urban areas
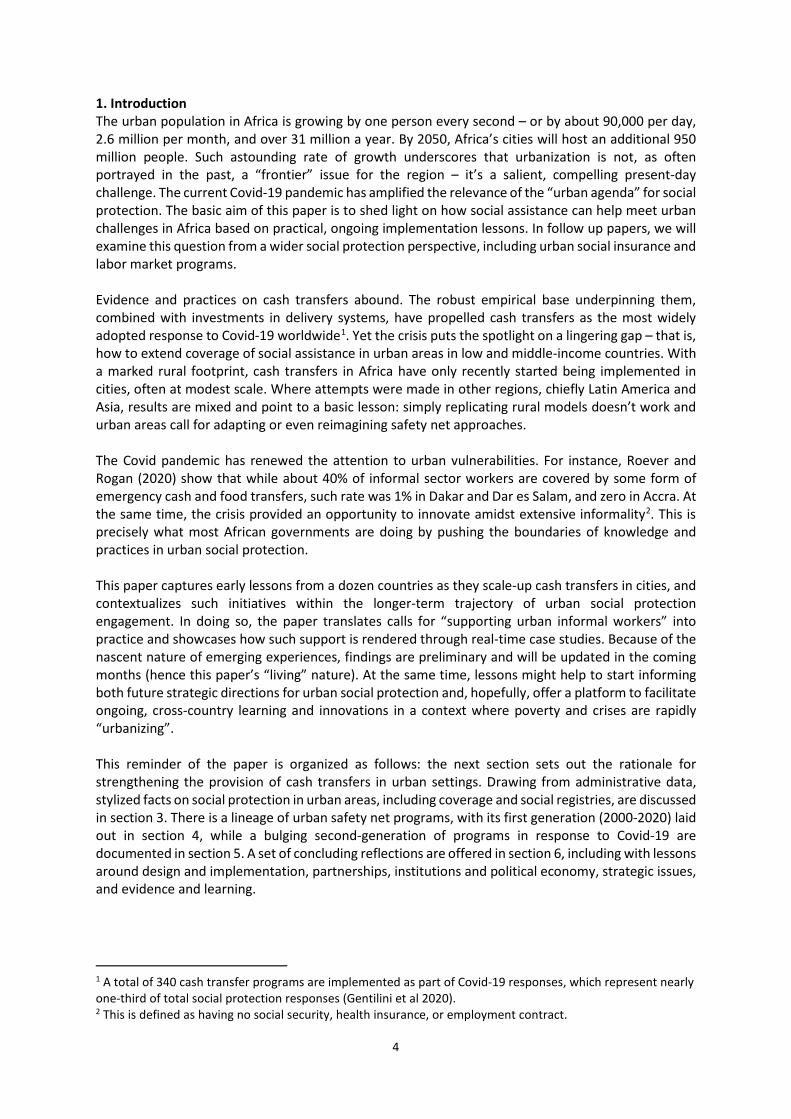
An exponentially growing urban population Over half the world’s population – around 4.4 billion people – live in urban areas today, and 80% of global GDP is generated in cities. The global urban population is projected to grow by 2.5 billion urban dwellers between 2018 and 2050, with nearly 90% of the increase concentrated in Asia and Africa. This is roughly 183,000 people each day. African cities have led the way: in 1950, Africa’s urban population was 27 million people, a minute fraction of today’s urban population of roughly 567 million people. Out of the top 20 countries with fastest urbanization growth, 16 are in Africa (figure 1). The region’s population will double between now and 2050, and two-thirds of this population increase will be absorbed by urban areas3.
Figure 1. Africa’s urbanization trends since 1950
Source: adapted from OECD (2020) While the overall urbanization rate of the region is around 50%, country-level data shows a highly heterogeneous picture. Some countries have recorded low levels of an extraordinary level of urbanization over the past 25 years. For instance, Kenya and Rwanda had an increase of about 40 percentage points; Angola, Gabon and Equatorial Guinea had over 30 percentage points increase; also, countries whose population is still prevalently rural, like Uganda and Tanzania, witnessed a remarkable surge of 25 percentage points. Differently from the early 2000s when most (40%) growth occurred in small towns, 40% of current urban growth tends to happen in large cities of 1 million people or more (medium-size cities remained constant at 28-30%). Megacities, or cities with a population of at least 10 million, are mushrooming across the region: Cairo, Kinshasa and Lagos are already megacities, while Luanda, Dar es Salaam and Johannesburg will attain the status by 2030; Abidjan and Nairobi will do so by 20404.
3 It’s important to note that the definition of an “urban area” varies by country – sometimes dramatically. For example, in Ethiopia and Kenya an urban area includes localities of 2000 or more inhabitants (plus other economic and infrastructure criteria); Botswana, Sudan and Zambia adopt more than double that threshold (5,000 or more people), while Senegal five times the Ethiopia level (10,000 or more). In Equatorial Guinea, the threshold is 1,500 or more inhabitants. 4 By 2050, Ouagadougou, Addis Ababa, Bamako, Dakar, and Ibadan and Kano in Nigeria will join the ranks, bringing the total number of megacities in Africa to 14 in about 30 years.
6
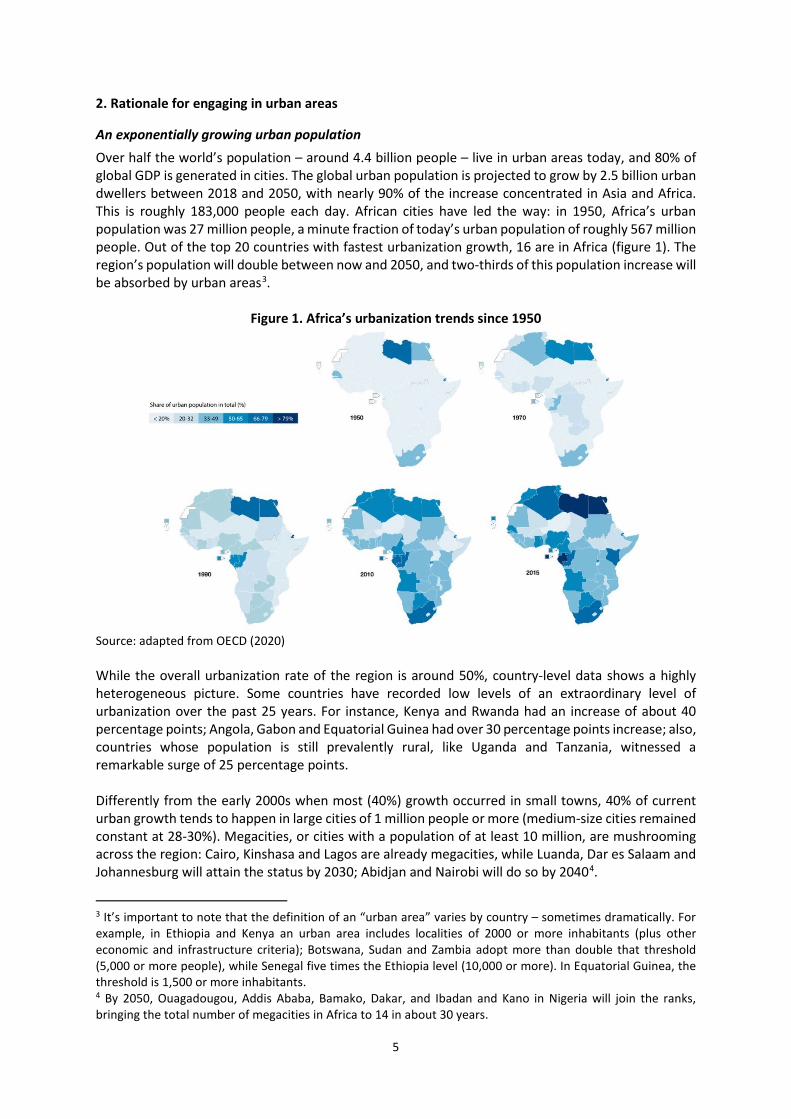
Structural transformation and congestion economies Another characteristic of Africa’s urbanization is it’s informal and often haphazard nature. In general, urbanization is a positive force for development as economies undergo their structural transformation process from low to higher-productivity activities. At the same time, urbanization can also represent “… an unwelcome forbearer of new poverty problems, with slums mushrooming in congested cities” (Ravallion 2016). In other words, the agglomeration economies sparked by spatial concentration are not automatic: when the demand for services, jobs and housing outstrips government and city-level capacities to meet them, the urbanization process can evolve into congestion economies. The generation of congestion instead of agglomeration economies has led to a body of research investigating such puzzle. Typically, productivity growth in agriculture releases workers from farming, pushing them towards urban areas where higher productivity sectors locate as they benefit from higher economies of agglomeration and knowledge spillovers. Interestingly, this traditional model of structural change does not seem to apply to most African countries, where “urbanization has occurred without industrialization”5 (figure 2). And yet the pace of urbanization is remarkable: in Europe, it took 110 years to shift from an urbanization rate of 15% in 1800 to 40% in 1910; conversely, Africa undertook the same process in just 50 years, with urbanization rates rising from 15% in 1950 to 40% in 2010.
Figure 2. Structural transformation in East Asia vs Africa, select countries
Furthermore, most of such urban growth is natural (as opposed to migration-induced or fueled by urban expansion) and has not been accompanied by a demographic transition, that is, in most countries in region both urban and rural populations are fast-increasing in absolute terms. This represents a different model from the rural exodus experienced by other countries (figure 3).
Figure 3. Decomposing urban growth
5 For example, see Gollin et al (2016).
7
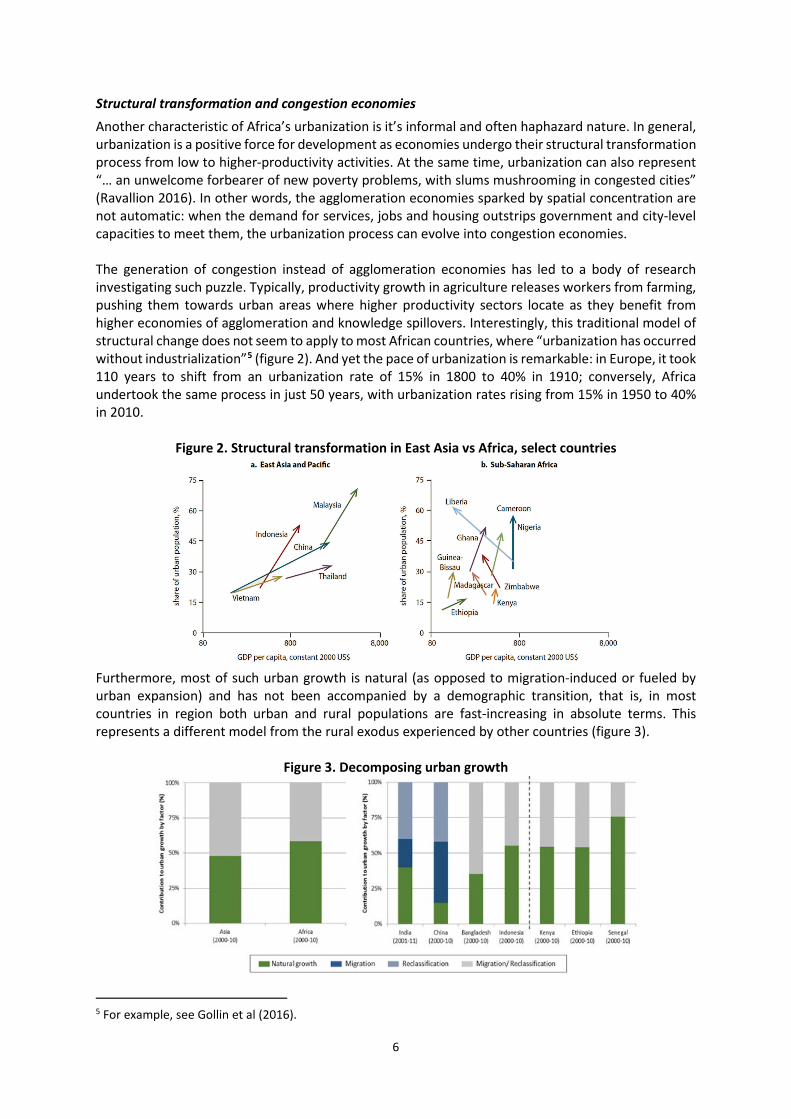
Sprawling informal settlements and slums Slum formation is a symptom of low-quality urbanization process. About 53-56% of African’s urban dwellers live in informal settlements or slums. The number of Africans living in urban slums doubled from 100 million in 1990 to 200 million in 2014, although the share of urban population living in these settlements declined from 70 to 56% over this time period. The share living in slums, however, has not declined as rapidly as it has in South and East Asia, and is about 20 percentage points higher than the second-worst region, South Asia. In countries like Central African Republic and South Sudan, the share of slum dwellers out of the total urban populations exceeds 90%, while it’s above 70% in Mozambique DRC, Sudan, Chad, Sao Tome, Liberia and Somalia6 (figure 4).
Figure 4. Share and number of people living in slums in Africa
Source: Madden (2020)
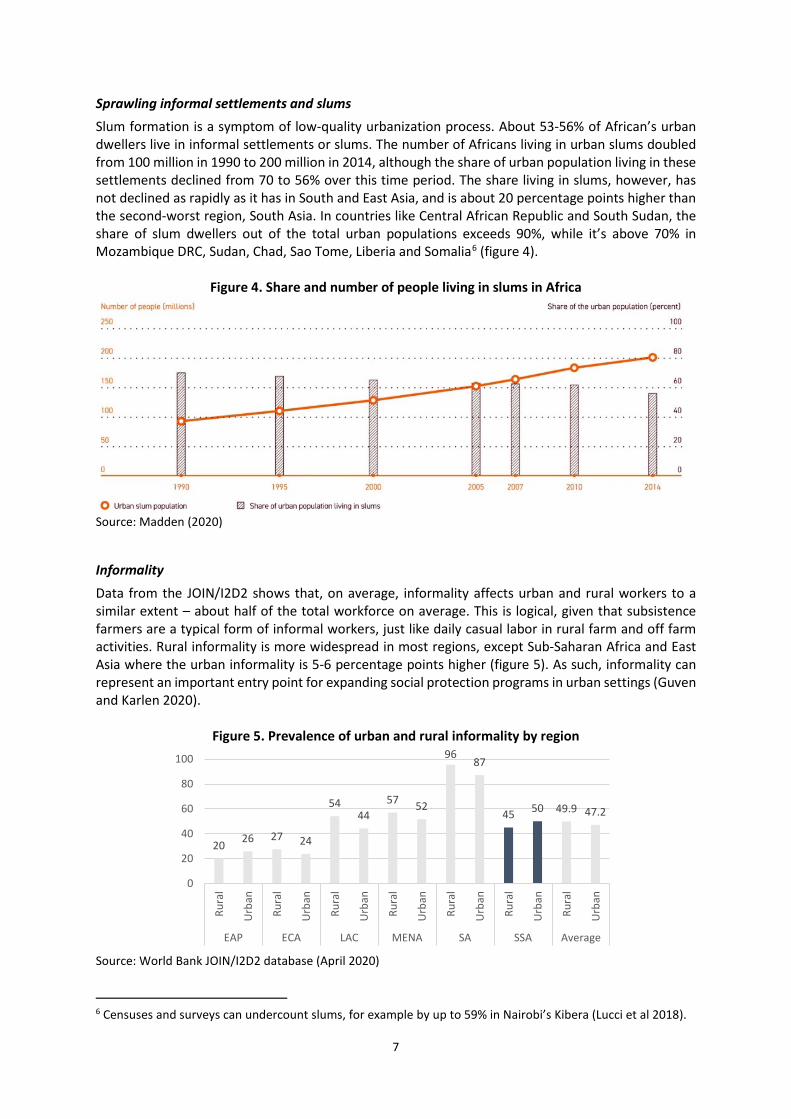
Informality Data from the JOIN/I2D2 shows that, on average, informality affects urban and rural workers to a similar extent – about half of the total workforce on average. This is logical, given that subsistence farmers are a typical form of informal workers, just like daily casual labor in rural farm and off farm activities. Rural informality is more widespread in most regions, except Sub-Saharan Africa and East Asia where the urban informality is 5-6 percentage points higher (figure 5). As such, informality can represent an important entry point for expanding social protection programs in urban settings (Guven and Karlen 2020).
Figure 5. Prevalence of urban and rural informality by region
Source: World Bank JOIN/I2D2 database (April 2020)
6 Censuses and surveys can undercount slums, for example by up to 59% in Nairobi’s Kibera (Lucci et al 2018).
20 26 27 24
5444
57 52
9687
45 50 49.9 47.2
0
20
40
60
80
100
Rura
l
Urb
an
Rura
l
Urb
an
Rura
l
Urb
an
Rura
l
Urb
an
Rura
l
Urb
an
Rura
l
Urb
an
Rura
l
Urb
an
EAP ECA LAC MENA SA SSA Average
8
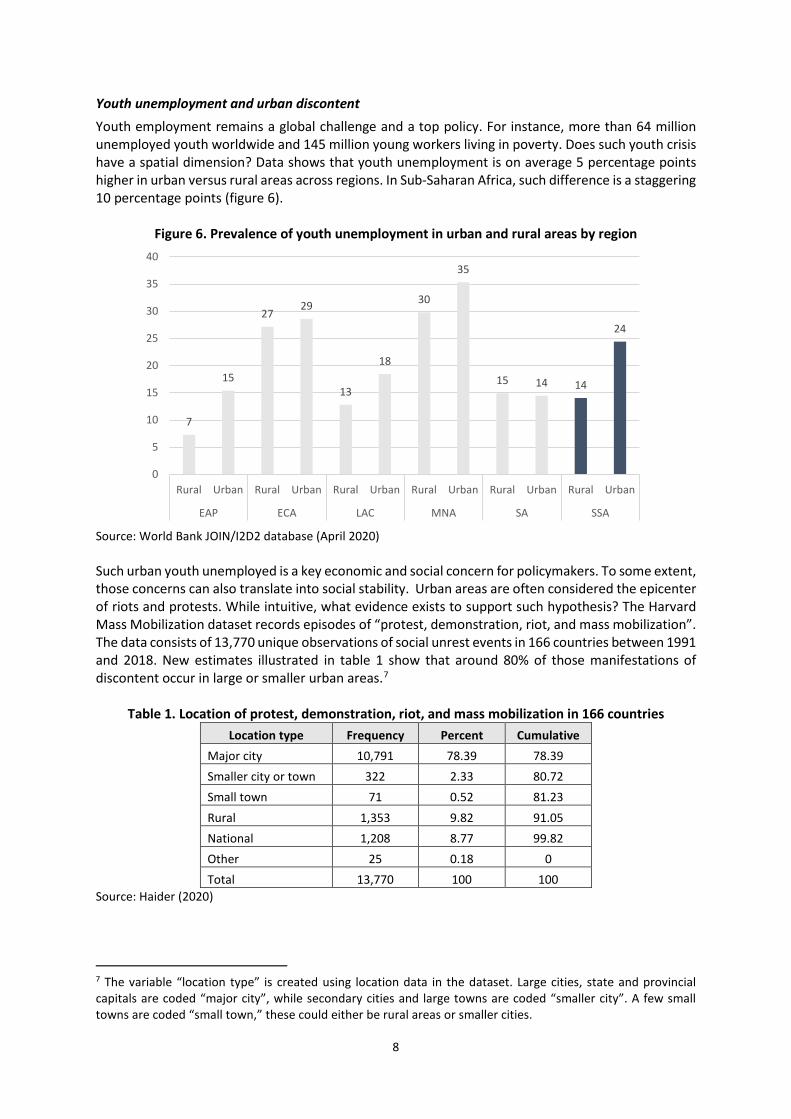
Youth unemployment and urban discontent Youth employment remains a global challenge and a top policy. For instance, more than 64 million unemployed youth worldwide and 145 million young workers living in poverty. Does such youth crisis have a spatial dimension? Data shows that youth unemployment is on average 5 percentage points higher in urban versus rural areas across regions. In Sub-Saharan Africa, such difference is a staggering 10 percentage points (figure 6).
Figure 6. Prevalence of youth unemployment in urban and rural areas by region
Source: World Bank JOIN/I2D2 database (April 2020) Such urban youth unemployed is a key economic and social concern for policymakers. To some extent, those concerns can also translate into social stability. Urban areas are often considered the epicenter of riots and protests. While intuitive, what evidence exists to support such hypothesis? The Harvard Mass Mobilization dataset records episodes of “protest, demonstration, riot, and mass mobilization”. The data consists of 13,770 unique observations of social unrest events in 166 countries between 1991 and 2018. New estimates illustrated in table 1 show that around 80% of those manifestations of discontent occur in large or smaller urban areas.7
Table 1. Location of protest, demonstration, riot, and mass mobilization in 166 countries Location type Frequency Percent Cumulative
Major city 10,791 78.39 78.39 Smaller city or town 322 2.33 80.72 Small town 71 0.52 81.23 Rural 1,353 9.82 91.05 National 1,208 8.77 99.82 Other 25 0.18 0 Total 13,770 100 100
Source: Haider (2020)
7 The variable “location type” is created using location data in the dataset. Large cities, state and provincial capitals are coded “major city”, while secondary cities and large towns are coded “smaller city”. A few small towns are coded “small town,” these could either be rural areas or smaller cities.
7
15
2729
13
18
30
35
15 14 14
24
0
5
10
15
20
25
30
35
40
Rural Urban Rural Urban Rural Urban Rural Urban Rural Urban Rural Urban
EAP ECA LAC MNA SA SSA
9
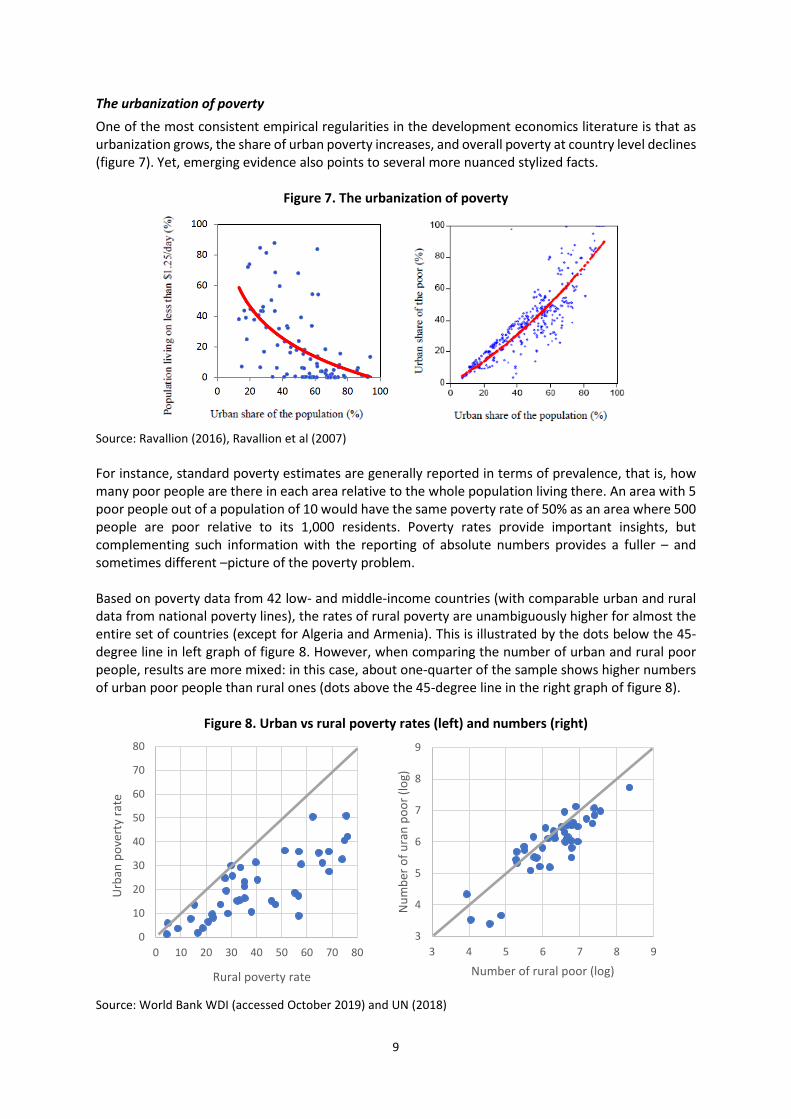
The urbanization of poverty One of the most consistent empirical regularities in the development economics literature is that as urbanization grows, the share of urban poverty increases, and overall poverty at country level declines (figure 7). Yet, emerging evidence also points to several more nuanced stylized facts.
Figure 7. The urbanization of poverty
Source: Ravallion (2016), Ravallion et al (2007) For instance, standard poverty estimates are generally reported in terms of prevalence, that is, how many poor people are there in each area relative to the whole population living there. An area with 5 poor people out of a population of 10 would have the same poverty rate of 50% as an area where 500 people are poor relative to its 1,000 residents. Poverty rates provide important insights, but complementing such information with the reporting of absolute numbers provides a fuller – and sometimes different –picture of the poverty problem. Based on poverty data from 42 low- and middle-income countries (with comparable urban and rural data from national poverty lines), the rates of rural poverty are unambiguously higher for almost the entire set of countries (except for Algeria and Armenia). This is illustrated by the dots below the 45-degree line in left graph of figure 8. However, when comparing the number of urban and rural poor people, results are more mixed: in this case, about one-quarter of the sample shows higher numbers of urban poor people than rural ones (dots above the 45-degree line in the right graph of figure 8).
Figure 8. Urban vs rural poverty rates (left) and numbers (right)
Source: World Bank WDI (accessed October 2019) and UN (2018)
0
10
20
30
40
50
60
70
80
0 10 20 30 40 50 60 70 80
Urb
an p
over
ty ra
te
Rural poverty rate
3
4
5
6
7
8
9
3 4 5 6 7 8 9
Num
ber o
f ura
n po
or (l
og)
Number of rural poor (log)
10
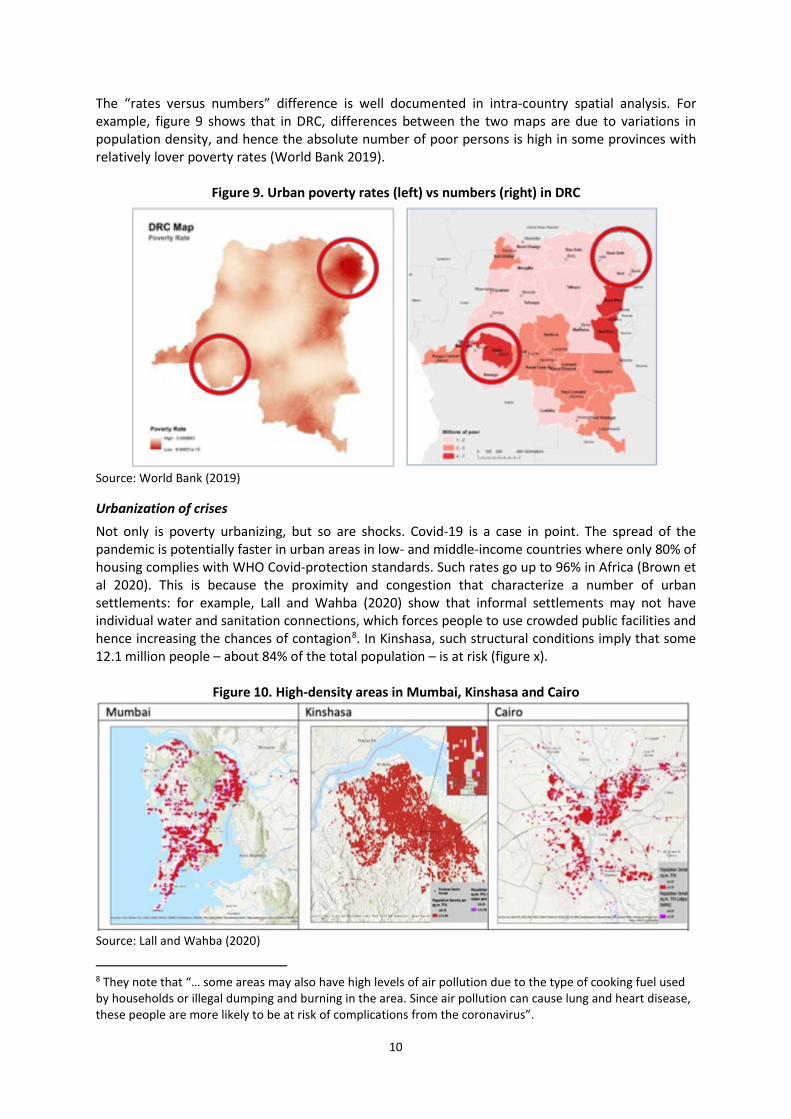
The “rates versus numbers” difference is well documented in intra-country spatial analysis. For example, figure 9 shows that in DRC, differences between the two maps are due to variations in population density, and hence the absolute number of poor persons is high in some provinces with relatively lover poverty rates (World Bank 2019).
Figure 9. Urban poverty rates (left) vs numbers (right) in DRC
Source: World Bank (2019)
Urbanization of crises Not only is poverty urbanizing, but so are shocks. Covid-19 is a case in point. The spread of the pandemic is potentially faster in urban areas in low- and middle-income countries where only 80% of housing complies with WHO Covid-protection standards. Such rates go up to 96% in Africa (Brown et al 2020). This is because the proximity and congestion that characterize a number of urban settlements: for example, Lall and Wahba (2020) show that informal settlements may not have individual water and sanitation connections, which forces people to use crowded public facilities and hence increasing the chances of contagion8. In Kinshasa, such structural conditions imply that some 12.1 million people – about 84% of the total population – is at risk (figure x).
Figure 10. High-density areas in Mumbai, Kinshasa and Cairo
Source: Lall and Wahba (2020)
8 They note that “… some areas may also have high levels of air pollution due to the type of cooking fuel used by households or illegal dumping and burning in the area. Since air pollution can cause lung and heart disease, these people are more likely to be at risk of complications from the coronavirus”.
11
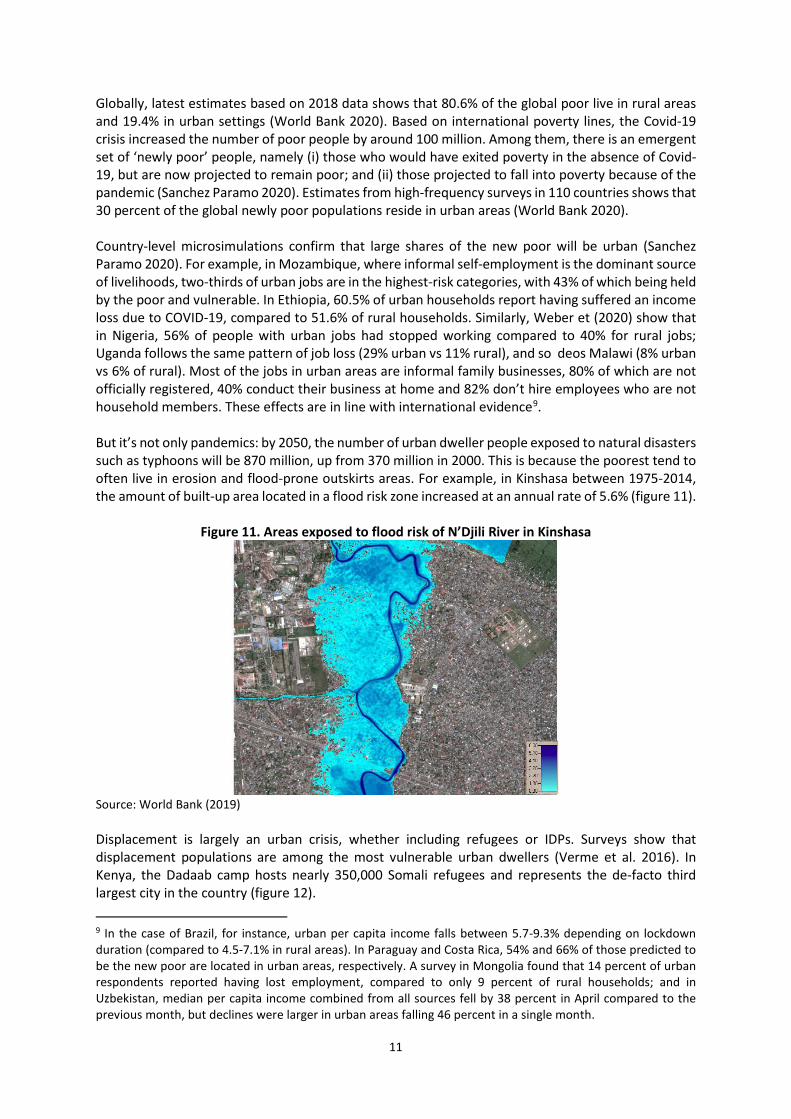
Globally, latest estimates based on 2018 data shows that 80.6% of the global poor live in rural areas and 19.4% in urban settings (World Bank 2020). Based on international poverty lines, the Covid-19 crisis increased the number of poor people by around 100 million. Among them, there is an emergent set of ‘newly poor’ people, namely (i) those who would have exited poverty in the absence of Covid-19, but are now projected to remain poor; and (ii) those projected to fall into poverty because of the pandemic (Sanchez Paramo 2020). Estimates from high-frequency surveys in 110 countries shows that 30 percent of the global newly poor populations reside in urban areas (World Bank 2020). Country-level microsimulations confirm that large shares of the new poor will be urban (Sanchez Paramo 2020). For example, in Mozambique, where informal self-employment is the dominant source of livelihoods, two-thirds of urban jobs are in the highest-risk categories, with 43% of which being held by the poor and vulnerable. In Ethiopia, 60.5% of urban households report having suffered an income loss due to COVID-19, compared to 51.6% of rural households. Similarly, Weber et (2020) show that in Nigeria, 56% of people with urban jobs had stopped working compared to 40% for rural jobs; Uganda follows the same pattern of job loss (29% urban vs 11% rural), and so deos Malawi (8% urban vs 6% of rural). Most of the jobs in urban areas are informal family businesses, 80% of which are not officially registered, 40% conduct their business at home and 82% don’t hire employees who are not household members. These effects are in line with international evidence9. But it’s not only pandemics: by 2050, the number of urban dweller people exposed to natural disasters such as typhoons will be 870 million, up from 370 million in 2000. This is because the poorest tend to often live in erosion and flood-prone outskirts areas. For example, in Kinshasa between 1975-2014, the amount of built-up area located in a flood risk zone increased at an annual rate of 5.6% (figure 11).
Figure 11. Areas exposed to flood risk of N’Djili River in Kinshasa
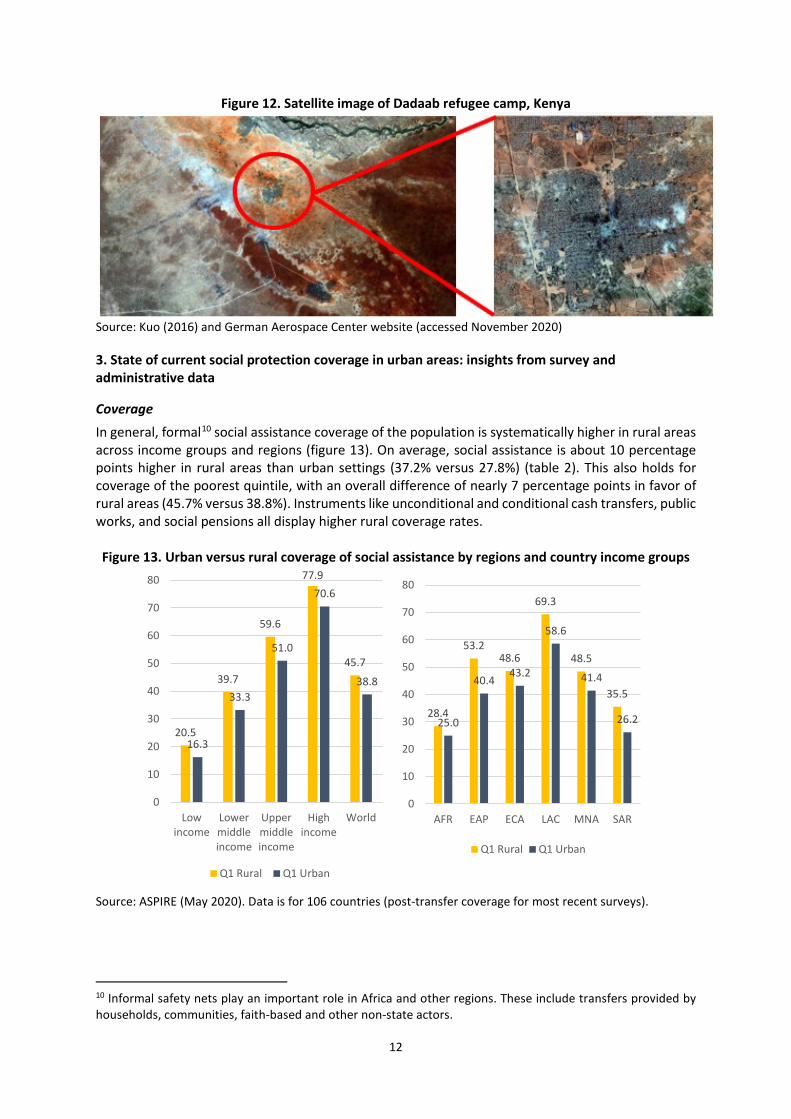
Source: World Bank (2019) Displacement is largely an urban crisis, whether including refugees or IDPs. Surveys show that displacement populations are among the most vulnerable urban dwellers (Verme et al. 2016). In Kenya, the Dadaab camp hosts nearly 350,000 Somali refugees and represents the de-facto third largest city in the country (figure 12).
9 In the case of Brazil, for instance, urban per capita income falls between 5.7-9.3% depending on lockdown duration (compared to 4.5-7.1% in rural areas). In Paraguay and Costa Rica, 54% and 66% of those predicted to be the new poor are located in urban areas, respectively. A survey in Mongolia found that 14 percent of urban respondents reported having lost employment, compared to only 9 percent of rural households; and in Uzbekistan, median per capita income combined from all sources fell by 38 percent in April compared to the previous month, but declines were larger in urban areas falling 46 percent in a single month.
12
Figure 12. Satellite image of Dadaab refugee camp, Kenya
Source: Kuo (2016) and German Aerospace Center website (accessed November 2020)
3. State of current social protection coverage in urban areas: insights from survey and administrative data
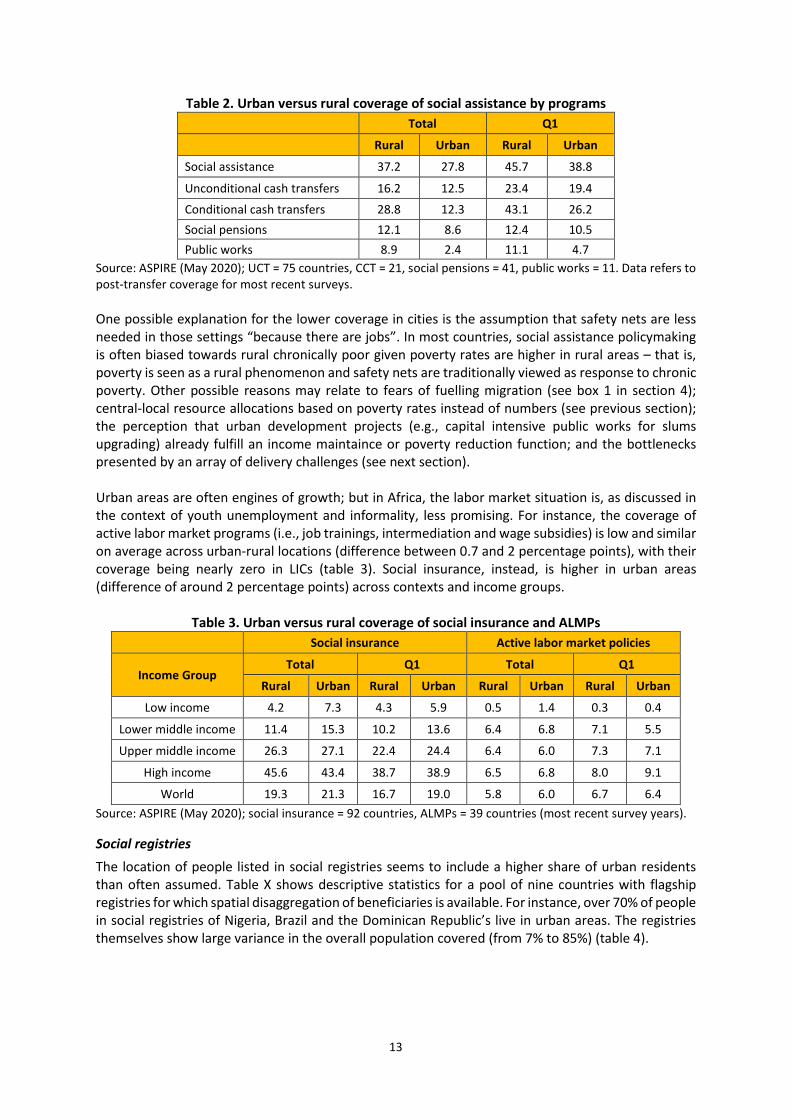
Coverage In general, formal10 social assistance coverage of the population is systematically higher in rural areas across income groups and regions (figure 13). On average, social assistance is about 10 percentage points higher in rural areas than urban settings (37.2% versus 27.8%) (table 2). This also holds for coverage of the poorest quintile, with an overall difference of nearly 7 percentage points in favor of rural areas (45.7% versus 38.8%). Instruments like unconditional and conditional cash transfers, public works, and social pensions all display higher rural coverage rates. Figure 13. Urban versus rural coverage of social assistance by regions and country income groups
Source: ASPIRE (May 2020). Data is for 106 countries (post-transfer coverage for most recent surveys).
10 Informal safety nets play an important role in Africa and other regions. These include transfers provided by households, communities, faith-based and other non-state actors.
20.5
39.7
59.6
77.9
45.7
16.3
33.3
51.0
70.6
38.8
0
10
20
30
40
50
60
70
80
Lowincome
Lowermiddleincome
Uppermiddleincome
Highincome
World
Q1 Rural Q1 Urban
28.4
53.248.6
69.3
48.5
35.5
25.0
40.443.2
58.6
41.4
26.2
0
10
20
30
40
50
60
70
80
AFR EAP ECA LAC MNA SAR
Q1 Rural Q1 Urban
13
Table 2. Urban versus rural coverage of social assistance by programs Total Q1
Rural Urban Rural Urban
Social assistance 37.2 27.8 45.7 38.8
Unconditional cash transfers 16.2 12.5 23.4 19.4
Conditional cash transfers 28.8 12.3 43.1 26.2 Social pensions 12.1 8.6 12.4 10.5 Public works 8.9 2.4 11.1 4.7
Source: ASPIRE (May 2020); UCT = 75 countries, CCT = 21, social pensions = 41, public works = 11. Data refers to post-transfer coverage for most recent surveys. One possible explanation for the lower coverage in cities is the assumption that safety nets are less needed in those settings “because there are jobs”. In most countries, social assistance policymaking is often biased towards rural chronically poor given poverty rates are higher in rural areas – that is, poverty is seen as a rural phenomenon and safety nets are traditionally viewed as response to chronic poverty. Other possible reasons may relate to fears of fuelling migration (see box 1 in section 4); central-local resource allocations based on poverty rates instead of numbers (see previous section); the perception that urban development projects (e.g., capital intensive public works for slums upgrading) already fulfill an income maintaince or poverty reduction function; and the bottlenecks presented by an array of delivery challenges (see next section). Urban areas are often engines of growth; but in Africa, the labor market situation is, as discussed in the context of youth unemployment and informality, less promising. For instance, the coverage of active labor market programs (i.e., job trainings, intermediation and wage subsidies) is low and similar on average across urban-rural locations (difference between 0.7 and 2 percentage points), with their coverage being nearly zero in LICs (table 3). Social insurance, instead, is higher in urban areas (difference of around 2 percentage points) across contexts and income groups.
Table 3. Urban versus rural coverage of social insurance and ALMPs
Social insurance Active labor market policies
Income Group Total Q1 Total Q1
Rural Urban Rural Urban Rural Urban Rural Urban
Low income 4.2 7.3 4.3 5.9 0.5 1.4 0.3 0.4
Lower middle income 11.4 15.3 10.2 13.6 6.4 6.8 7.1 5.5
Upper middle income 26.3 27.1 22.4 24.4 6.4 6.0 7.3 7.1
High income 45.6 43.4 38.7 38.9 6.5 6.8 8.0 9.1
World 19.3 21.3 16.7 19.0 5.8 6.0 6.7 6.4 Source: ASPIRE (May 2020); social insurance = 92 countries, ALMPs = 39 countries (most recent survey years).
Social registries The location of people listed in social registries seems to include a higher share of urban residents than often assumed. Table X shows descriptive statistics for a pool of nine countries with flagship registries for which spatial disaggregation of beneficiaries is available. For instance, over 70% of people in social registries of Nigeria, Brazil and the Dominican Republic’s live in urban areas. The registries themselves show large variance in the overall population covered (from 7% to 85%) (table 4).
14
Table 4. Urban-rural location of beneficiaries in select social registries Country Urbanization
rate Registry Registry coverage
as % of pop % of people in registry
in urban areas % of people in
registry in rural areas Brazil 87 Cadastro 45 76 24 Dominican Rep. 81 SIUBEN 85 70 30 Haiti 55 SIMAST 18 20 80 Indonesia 55 DTKS 40 11 89 Mauritania 54 Registre Social 23 20 80 Nigeria 50 NSR 7 87 13 Pakistan* 37 NSER 87 43 57 Peru 78 SISFOH 85 60 40 Philippines** 47 Listahanan 75 24 76
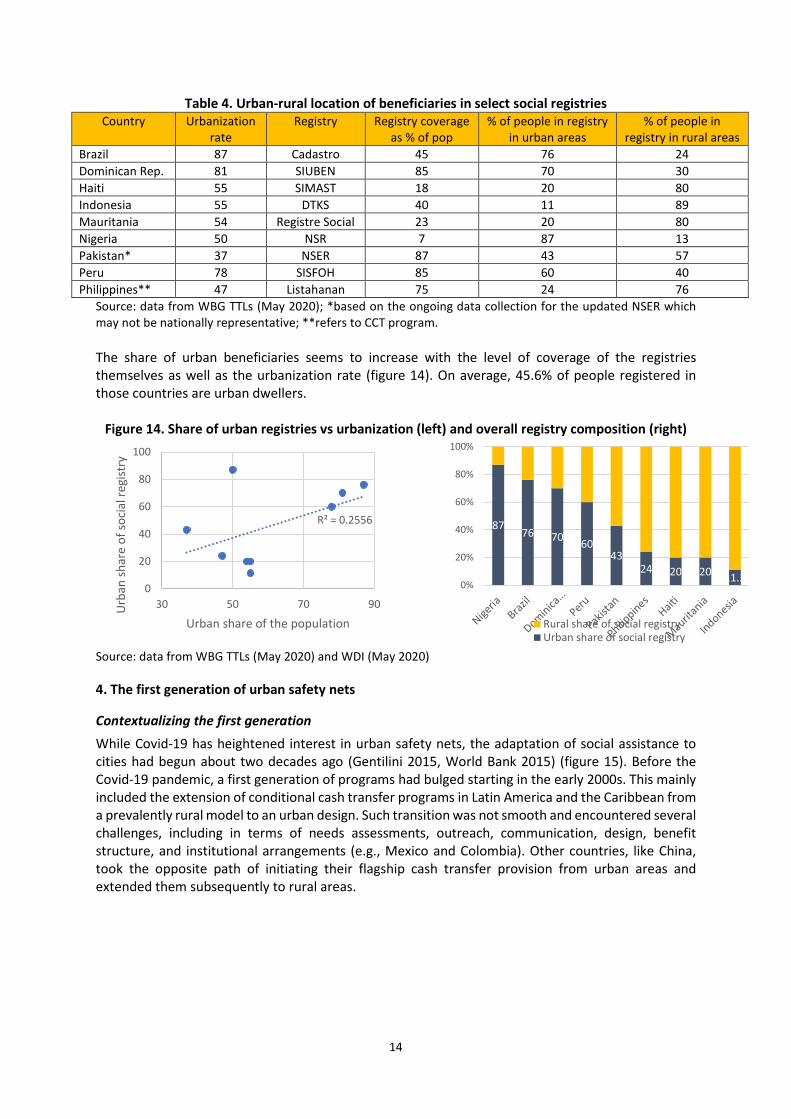
Source: data from WBG TTLs (May 2020); *based on the ongoing data collection for the updated NSER which may not be nationally representative; **refers to CCT program. The share of urban beneficiaries seems to increase with the level of coverage of the registries themselves as well as the urbanization rate (figure 14). On average, 45.6% of people registered in those countries are urban dwellers.
Figure 14. Share of urban registries vs urbanization (left) and overall registry composition (right)
Source: data from WBG TTLs (May 2020) and WDI (May 2020)
4. The first generation of urban safety nets
Contextualizing the first generation While Covid-19 has heightened interest in urban safety nets, the adaptation of social assistance to cities had begun about two decades ago (Gentilini 2015, World Bank 2015) (figure 15). Before the Covid-19 pandemic, a first generation of programs had bulged starting in the early 2000s. This mainly included the extension of conditional cash transfer programs in Latin America and the Caribbean from a prevalently rural model to an urban design. Such transition was not smooth and encountered several challenges, including in terms of needs assessments, outreach, communication, design, benefit structure, and institutional arrangements (e.g., Mexico and Colombia). Other countries, like China, took the opposite path of initiating their flagship cash transfer provision from urban areas and extended them subsequently to rural areas.
R² = 0.2556
0
20
40
60
80
100
30 50 70 90Urb
an sh
are
of so
cial
regi
stry
Urban share of the population
8776 70 60
4324 20 20 11.3
0%
20%
40%
60%
80%
100%
Rural share of social registryUrban share of social registry
15
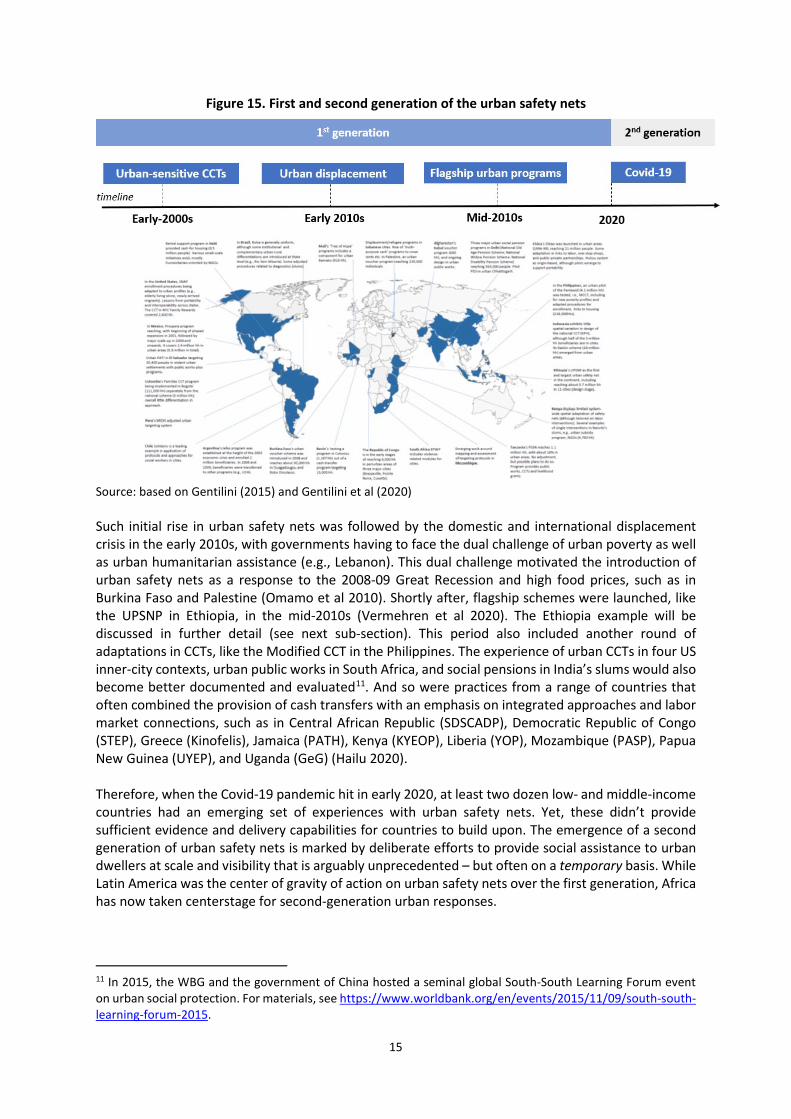
Figure 15. First and second generation of the urban safety nets
Source: based on Gentilini (2015) and Gentilini et al (2020) Such initial rise in urban safety nets was followed by the domestic and international displacement crisis in the early 2010s, with governments having to face the dual challenge of urban poverty as well as urban humanitarian assistance (e.g., Lebanon). This dual challenge motivated the introduction of urban safety nets as a response to the 2008-09 Great Recession and high food prices, such as in Burkina Faso and Palestine (Omamo et al 2010). Shortly after, flagship schemes were launched, like the UPSNP in Ethiopia, in the mid-2010s (Vermehren et al 2020). The Ethiopia example will be discussed in further detail (see next sub-section). This period also included another round of adaptations in CCTs, like the Modified CCT in the Philippines. The experience of urban CCTs in four US inner-city contexts, urban public works in South Africa, and social pensions in India’s slums would also become better documented and evaluated11. And so were practices from a range of countries that often combined the provision of cash transfers with an emphasis on integrated approaches and labor market connections, such as in Central African Republic (SDSCADP), Democratic Republic of Congo (STEP), Greece (Kinofelis), Jamaica (PATH), Kenya (KYEOP), Liberia (YOP), Mozambique (PASP), Papua New Guinea (UYEP), and Uganda (GeG) (Hailu 2020). Therefore, when the Covid-19 pandemic hit in early 2020, at least two dozen low- and middle-income countries had an emerging set of experiences with urban safety nets. Yet, these didn’t provide sufficient evidence and delivery capabilities for countries to build upon. The emergence of a second generation of urban safety nets is marked by deliberate efforts to provide social assistance to urban dwellers at scale and visibility that is arguably unprecedented – but often on a temporary basis. While Latin America was the center of gravity of action on urban safety nets over the first generation, Africa has now taken centerstage for second-generation urban responses.
11 In 2015, the WBG and the government of China hosted a seminal global South-South Learning Forum event on urban social protection. For materials, see https://www.worldbank.org/en/events/2015/11/09/south-south-learning-forum-2015.
16
What lessons emerged from such first generation of programs? We here outline ten main insights as discussed and elaborated in the literature (Gentilini 2020, 2017, 2015; Devereux et al 2018; Moreira and Gentilini 2016; Burgin and Gentilini 2016): Defining an urban “household” and a “community” can be challenging. While standard
approaches to define rural households sometimes include “people living under the same roof”, urban arrangements can make such distinction blurred given multiple families sharing the same room, the same housing unit, or live in multi-story buildings. Similarly, community arrangements are present, but present different levels of strengths and functions.
Informal and mushrooming settlements. It is not unusual for informal settlements to expand and contract over time, and sometimes do so rapidly. Such fluid dynamic can change the outlook of geographical targeting (e.g., Philippines). Also, there are degrees of legal provision in slum settlements (e.g., India), which make the provision of services challenging.
Outreach, communication, mobilization of communities requires careful adaptation. This is because of the variety of channels of communications available, which require coordination (e.g., Brazzaville), the lack of housing addresses (e.g., Benin), and the constrained physical space available for meetings involving large communities and crowds (e.g., Tanzania).
For targeting, data collection, its granularity, the choice and adaptation of methods, and the role of communities have all required adaptation. This includes investments and “extra efforts”, e.g., in Mali the identification of households took 2-3 days in villages, 2-3 weeks in towns, and over one month in Bamako (in census-type in select areas). This triggered multiple visits and rose costs for communication, travel, and meetings.
High opportunity costs of beneficiaries have affected take-up rates12 (e.g., Mexico, Colombia), while programs like urban public works have seldom been attractive to the youth (e.g., Ethiopia and Mozambique).
Benefit size and structure has been altered to reflect, for example, the different nature of the education problem, i.e., often less of basic enrollment at early grades and more of completion of higher grades (e.g., Colombia). The supply-side of service provision in health, education, and nutrition is often saturated, calling for softer use in conditionalities, if any.
Similarly, adaptation to the different types of labor market interventions are required, although evidence is more limited on their performance.
Referrals, interventions and a range of psychological support services are often required because of problems in substance abuse (New York and Memphis in the United States), violence (e.g., South Africa), and homelessness (e.g., Philippines).
There is a need for stronger institutional linkages to spatial issues of housing, slums upgrading (e.g., Rio, Medellin, India, Kenya), and violence and social cohesion (e.g., El Salvador). This also includes better integration with city and municipal plans (e.g., Argentina, China and Brazil) and be able to mediate between city and federal interests (e.g., Lebanon, Ethiopia, Colombia).
One of the key concerns of policymakers on introducing urban safety nets is its “magnet effect” on migration. However, evidence shows that the effect depends on design (box 1).
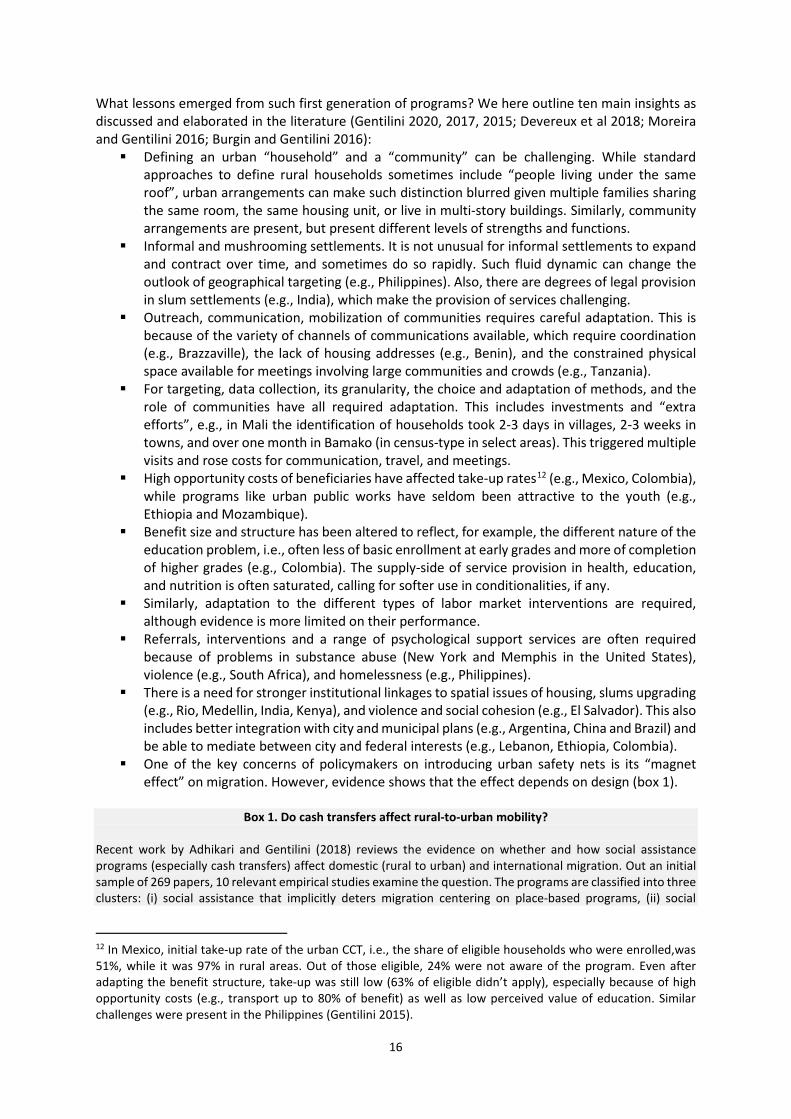
Box 1. Do cash transfers affect rural-to-urban mobility?
Recent work by Adhikari and Gentilini (2018) reviews the evidence on whether and how social assistance programs (especially cash transfers) affect domestic (rural to urban) and international migration. Out an initial sample of 269 papers, 10 relevant empirical studies examine the question. The programs are classified into three clusters: (i) social assistance that implicitly deters migration centering on place-based programs, (ii) social
12 In Mexico, initial take-up rate of the urban CCT, i.e., the share of eligible households who were enrolled,was 51%, while it was 97% in rural areas. Out of those eligible, 24% were not aware of the program. Even after adapting the benefit structure, take-up was still low (63% of eligible didn’t apply), especially because of high opportunity costs (e.g., transport up to 80% of benefit) as well as low perceived value of education. Similar challenges were present in the Philippines (Gentilini 2015).
17
assistance that implicitly facilitates migration by relaxing liquidity constraints and reducing transaction costs, and (iii) social assistance that is explicitly conditioned on spatial mobility. The paper finds that impacts on migration generally align with the implicit or explicit goals of interventions (see figure below). Under cluster (i), the likelihood of moving declined between 0.22 and 11 percentage points; among schemes in clusters (ii) and (iii), the probability to move soared between 0.32–25 and 20–55 percentage points, respectively. The analysis also finds spillover effects within households and communities. While social assistance seems not to determine migration decisions per se, it nonetheless enters the broader calculous of mobility decision making.
Some specific case studies from the Africa region are hereafter discussed, including from Ethiopia, Mozambique and Uganda. These were selected for their stage in maturity (Ethiopia and Mozambique) or because of the particular nature of objectives pursued (e.g., Uganda). As figure 15 shows, other programs are present and offer precious lessons on an array of specific issues. For example, box 2 offers some brief insights into implementation of public works in fragile urban settings in DRC and Cote d’Ivoire.
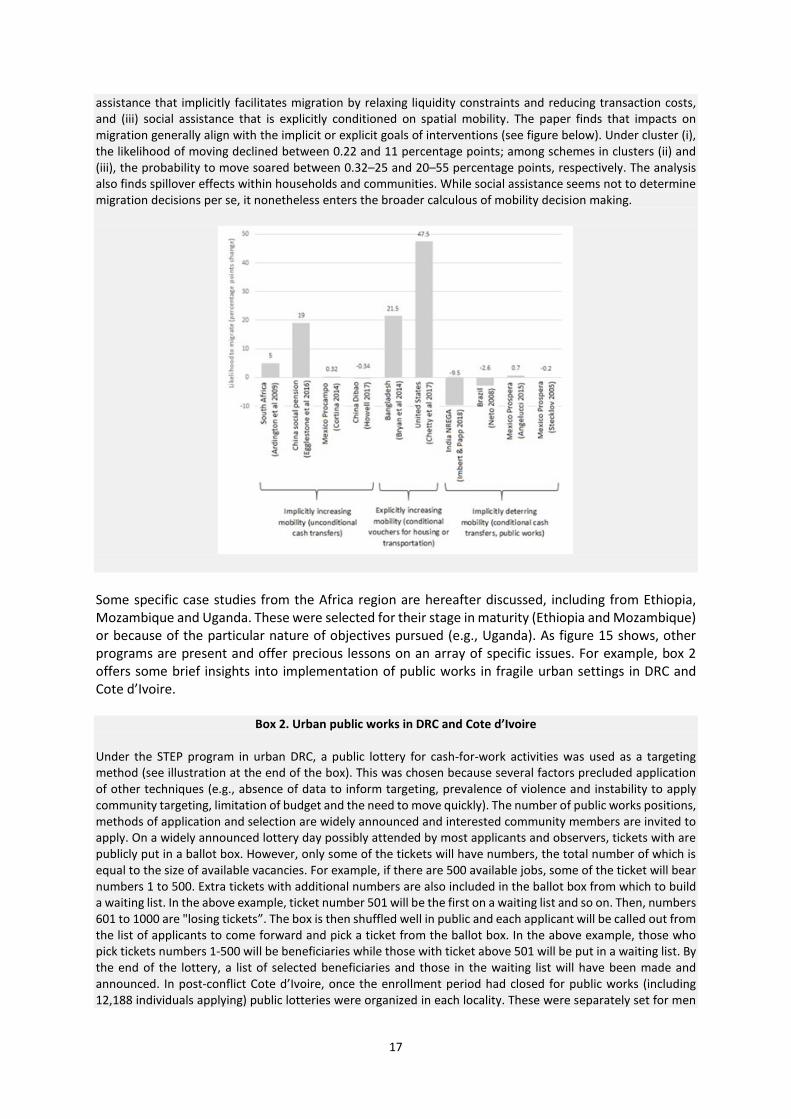
Box 2. Urban public works in DRC and Cote d’Ivoire Under the STEP program in urban DRC, a public lottery for cash-for-work activities was used as a targeting method (see illustration at the end of the box). This was chosen because several factors precluded application of other techniques (e.g., absence of data to inform targeting, prevalence of violence and instability to apply community targeting, limitation of budget and the need to move quickly). The number of public works positions, methods of application and selection are widely announced and interested community members are invited to apply. On a widely announced lottery day possibly attended by most applicants and observers, tickets with are publicly put in a ballot box. However, only some of the tickets will have numbers, the total number of which is equal to the size of available vacancies. For example, if there are 500 available jobs, some of the ticket will bear numbers 1 to 500. Extra tickets with additional numbers are also included in the ballot box from which to build a waiting list. In the above example, ticket number 501 will be the first on a waiting list and so on. Then, numbers 601 to 1000 are "losing tickets”. The box is then shuffled well in public and each applicant will be called out from the list of applicants to come forward and pick a ticket from the ballot box. In the above example, those who pick tickets numbers 1-500 will be beneficiaries while those with ticket above 501 will be put in a waiting list. By the end of the lottery, a list of selected beneficiaries and those in the waiting list will have been made and announced. In post-conflict Cote d’Ivoire, once the enrollment period had closed for public works (including 12,188 individuals applying) public lotteries were organized in each locality. These were separately set for men
18
and women to randomly select beneficiaries. A total of 10,966 people participated in public lotteries where 3,125 beneficiaries were selected. Lotteries were put in place at the time of the post-conflict assistance project. Since then, they have been used continuously as a transparent assignment mechanism to allocate limited public works jobs in a way that would be socially acceptable and limit potential tensions
Source: Hailu (2020); Bisca and Bance (2019); Bertrand et al (2017)
Ethiopia’s Urban Productive Safety Net Project13 In the first phase of five years (2016-2020), the Urban Productive Safety Net Project (UPSNP) focused on 11 cities (one each from 9 regional states and the two chartered city administrations of Addis Ababa14 and Dire Dawa) and it is serving a total of 604,000 beneficiaries, representing an estimated 55% of the population living below poverty line in those cities. The UPSNP applied a combination of geographic, community based, categorical, proxy means test methods to select beneficiaries eligible for its various services.
Geographic targeting was applied to select cities and parts of a city for the first year of implementation. The selection of the cities was guided by equity and operational feasibility considerations. Equity because the government ensured that in each region one city was selected by regional governments15. Given the large size of Addis Ababa and the relatively high poverty rates it records, about three-quarters of the beneficiaries were from the capital. Within larger cities, the UPSNP was rolled out gradually. In the first year of the program’s implementation, sub-areas of a selected city were selected using poverty maps and then expanded to other parts in the second and
13 Section based on Hailu (2020) and Vermehren and Manfredicini Bohm (2020). 14 Given the large size of Addis Ababa and the relatively high poverty rates it records, about three-quarters of the beneficiaries are from Addis Ababa. 15 Only those cities which had already benefited from a parallel Urban Infrastructure Development Project were selected to ensure that the cities had basic capacity in fiduciary and safeguard matters.
19
third year. City poverty maps produced three level of poverty – low, moderate and high. In the first year of implementation, the program started in a selection of the poorest woredas (those with high and moderate poverty rates) with the remaining high and moderate poverty woredas being included in the second year. In the final year, low poverty woredas would also be included (the program is still active).
Community based targeting (CBT) was chosen to select eligible households in selected parts of a city due to its social acceptability in the Ethiopian context, where community social solidarity mechanisms have a long-standing tradition. To this end, a ketena (block) Targeting Committee was established at the neighborhood level, with representation from local government and non-government entities. The committees rank residents in their neighborhood guided by a set of eligibility criteria provided by the program and selects those deemed to belong to the poorest group.
A Proxy Means Test (PMT) is applied to validate the selection of the CBT. To this end, a PMT model was developed for the program which includes socio-economic and household composition data. An independent agency was contracted to gather data on each of a representative sample of households selected through CBT in each community. Based on the collected data, a PMT score was calculated. If the PMT score for a woreda (local government level) was above a threshold, the woreda had to be retargeted to improve the poverty-focus of the selection.
Categorical targeting is used to assign eligible household for conditional or unconditional transfers. Those who are eligible for the conditional transfers participate in public works and receive their transfer based on the number of days worked. They may also choose to opt out of the program. Those eligible for permanent income transfers receive these transfers up on submission of verification of age (above 65 years only) or of their disability or chronic illness that prevents them from being able to meet conditions for the transfer. Public work participants may temporarily be relieved from participation in public work if they produce proof of their conditions that do not allow them to participate in public work such as pregnancy or other temporary illnesses. To be eligible for income support (cash transfer and participation in livelihood program), households that have able-bodied members must participate in public works. Public work is generally labor-intensive creation of public goods and services such as improving the neighborhood’s social infrastructures, safety, hygiene levels and greenery, urban watershed management structures, public toilets, tree-planting, green urban beautification and urban agriculture. Public works beneficiaries participate three years in the program. In the first year, a household with four members or more can work up to a maximum of 240 days, falling to 160 and 80 days per household, respectively in the second and third year. Benefit levels aim at balancing the need to reduce poverty and avoiding labor disincentives. The original wage rate for the public works component was determined based on a wage rate analysis of the 2014 Urban Employment and Unemployment Survey. Wage rates for un- or low-skilled labor (the target group for UPSNP) converged around ETB50 per day (in 2014). To account for inflation between the year of the survey (2014) and the year of project approval (2016), the starting wage rate was set at ETB60 per day (US$2.9) at the time of approval and is reviewed annually in light of urban food price inflation. The monthly transfer value for the direct support component is lower than the daily wage of public works, and its calculation was based on a model of the urban labor market (this showed that the transfer value would lift half of direct support beneficiaries above the national poverty line). Data analysis shows that wage rates are still below prevailing market wages for the relevant education categories, but nevertheless make a large contribution to household income of beneficiaries. Market wages for daily labor and inflation rates are monitored systematically to make sure the wage rate remains lower that the market wage but still meaningful for the beneficiaries. Benefits were calibrated also based on ex-ante simulations of the poverty-headcount-reducing effect of different transfer
20
amounts. A wage-rate study was carried out prior to implementation, to determine the market wages paid in various urban centers, and ensure that daily wages under the public-works scheme did not introduce labor disincentives. The frequency of payments was determined to be monthly, considering the need to pay beneficiaries as often as possible due to their lack of cash and operational capacity considerations. The Commercial Bank of Ethiopia (CBE) is making monthly payments in all cities. Payment is made through banks (over the counter service- OTC) and clients have an option to take debit cards. Bank branches are the most widely available financial access points in the targeted cities. Moreover, given the profile of the target beneficiaries (urban poor – with little financial literacy) who are largely financially excluded and the need to ensure payment security and transparency, direct bank payment was selected as a main payment method- with clients having the option to use ATMs if needed. Direct transfers through the CBE does not involve additional cost to the client or the program (there is no cash withdrawal and deposit fee for over the counter service at the CBE). Over the counter service at bank branches and ATMs are used by beneficiaries to collect payments. These payment devices were chosen because bank branches and ATMs are the most widely available financial access points in the target cities. Availability of access points, appropriateness of payment method to target groups, payment security and transparency, and cost of transfers were the main decision variable while choosing the specific instruments and devices. Public-work participants are asked to save 20% of their public works income – though they are not forced to do so. These savings are meant to constitute additional capital for the investment in their business development plan, in addition to the livelihood grant they receive at the end of the second year of their participation. All public works beneficiaries are eligible to receive a livelihood grant. Participation in public works is a condition of accessing the livelihood program. One individual per household is selected by the household and participates in the respective trainings and preparatory activities. Eligible beneficiaries can choose whether they would like to receive support to increase their income from self-employment (either by starting a business or increasing the profitability of an existing business) or wage employment (either by gaining access to wage employment or moving from low to higher wage employment). All beneficiaries participate in life and financial skills training. Specifically: Self-Employment/ livelihood services: the Urban Job Creation and Food Security Agency is in
charge of woreda-level One Stop Shop Center (OSSCs) that provide a package of livelihood advisory services to enable UPSNP beneficiaries to set up gainful self-employment, suited to their skills, training, aptitude and local conditions. At least 50% of the beneficiaries are women and no minimum educational qualification is required to participate in the livelihood activities. The OSSCs first provide counseling to each beneficiary regarding the type of livelihood activity they would like to engage. This involves undertaking market/ value chain analysis on the potential areas for livelihood engagement. Once a livelihood activity is identified, the center helps the beneficiaries to develop a business plan and provides a short entrepreneurship training to support the beneficiary with advice on technical and business skills needed to implement the business plan.
Wage employment: those who opt for wage employment, can undertake a TVET training. Following the completion of the training, TVET agents submit to the implementing agency and employers the list of graduates who have successfully completed training, with personal references and linkages wherever possible. Livelihood grants can cover a stipend to attend training to build skills for a wage job; an allowance to travel to facilitate job search; and/or an allowance to travel to work or cover the ancillary costs of employment such as child-care expenses. The rationale for providing the allowance during early workdays is that individuals
21
gain useful experience in the early days of a new job even though the net take-home pay may be late or low so that persistence can be encouraged.
Livelihood Grant: the OSSC approves a livelihood grant of USD 500 to enable the beneficiary to implement and, hence, conditional upon submission of a business plan. Beneficiaries are encouraged to complement this grant with own saving and loan from micro finance institutions. In addition, the center compiles and disseminate information on facilities deemed potentially useful to enable clients better utilize the support received e.g. on marketing, access to loans and other support services.
The UPSNP also includes support the social, economic and educational re-integration of homeless. These highly vulnerable groups are not included in the regular cash transfer programs. Instead, under the leadership of the Ministry of Labor and Social Affairs (MoLSA), the UPSNP finances the contracting of specialized services for homeless. To this end, the project has launched call for proposals for NGOs to provide services for the following four groups of homeless: Children in street situations (ages 6-18), homeless women with children, homeless elderly (65+) and homeless adults. The program supports NGOs for two years to provide services to up to 22,000 homeless in the 11 cities of the UPSNP. A rigorous impact evaluation has estimated the short-run effects of the public works and direct support cash transfers. Longer-run effects will be assessed through several rounds of follow-up surveys yet to be conducted. A separate baseline survey for the livelihood’s component has been completed and a first follow-up survey is planned after one year of implementation to estimate the effect of the livelihood grants. Key emerging findings include the following: Participation in public works increased household income by 28%. UPSNP significantly increased households bank and informal (Idir and Iquib) saving. UPSNP
increased informal saving by 24% and 29% for male and female headed households respectively. On the other hand, even though participation in UPSNP increased saving in bank accounts of male headed household by Birr 1736, it did not have a statistically significant effect for female headed households.
The qualitative evaluation found no impacts on consumption. However, all participants in the qualitative study reported seeing improvement in their expenditure on food and non-food items and use of social services.
Positive impacts were also found on the mental health status of beneficiaries (lower incidence of depression and anxiety) and on school enrolment of beneficiary households’ children.
Public works created job opportunity for more women than men, 85% and 25% respectively. Mean age of participants is 40.47. This means participants in public works tend to mostly be mid-aged women. The decomposition of the employment effect of UPSNP for the youth (under 26 years old) and non-youth (above 25 years old) unveiled that UPSNP did not have a statistically significant effect on youth employment.
Public works participation led to decreased labor supply for other activities, meaning that beneficiaries displaced inferior work with possibly better paid UPSNP activities.
The program led to greater financial inclusion of beneficiaries, particularly for women. It increased the number of households who own bank accounts by 34%. UPSNP increased the probability of households to own a bank account by 33% for male headed households and by 30% for female headed households, compared to male headed and female headed households respectively who did not participate in the program.
UPSNP increased the credit worthiness of the beneficiaries at the community level because it was observed as a source of a sustainable income for beneficiaries thereby increasing lenders’ confidence. Hence, beneficiaries could access informal loans and credits from neighboring shops and kiosks. However, the evaluation did not find a statistically significant effect of UPSNP on household borrowing.
22
The direct and the indirect spillover effect of the public work component on the following indicators of community cohesion was statistically significant: community cohesion index, neighborhood good will index, willingness to fix public amenity, willingness to pick up trash, perceived willingness of community, inverse of community frequency of conflict and dummy for caring neighbors.
While the evaluation results pointed to large positive impacts of Public Works participation, it found no statistically significant effect on total household income, total non-public work earning, total non-labor income, mental wellbeing and children human capital development. This however may be due to the small sample size of the direct support component beneficiary.
The Public Works generated positive spillovers for non-beneficiaries living in project locations in the form of cleaner and safer neighborhoods but did not increase the quantity of community assets. For example, the program has improved the quality of existing public toilet but had not increased their quantity, may be due to resources other than labor provided by the UPSNP program.
There is a range of lessons for policy, operations, institutional arrangements, and future research. Among these are the following: Administrative, technology and communication capacity of city governments is often strong
and enables the safety net program to use modern ways of communication and monitoring. Particularly young staff at the local levels are well educated and know how to manage computers and communication. This should be explored increasingly over time.
Most beneficiaries chose self-employment over wage employment. This may have multiple causes but urban safety net programs should also promote wage employment, particularly in the service sector where jobs growth in Africa’s cities is happening.
There is some anecdotal evidence that neighbors withdraw their support to elderly/disabled safety net beneficiaries. While this could be similar in rural areas, communication could help in fostering neighbor help and support.
Cities have strong and political governments, and hence the national urban safety net program needs to strike a balance between federal and city interests. Designing incentives for proper engagement, monitoring and implementation is important as cities also have their own budgets and can be occupied by implementing the programs financed by themselves.
Urban areas provide important opportunities to link safety nets with labor market services. Close ties between safety net programs and job centers, active labor market programs and other labor market interventions are crucial elements of an integrated social protection and jobs system, which is feasible and needed in urban areas.
Mozambique, the Productive Social Action Program16 The Productive Social Action Program (PSAP) was launched in 2011 and included three forms of public works, namely labor-intensive public works (LIPW), inclusive public work (IPW) and post-emergency public works (PEPW). Each offered slight variations in the target population, targeting methods and type of public works engaged (table 5).
Table 5. Targeting in Mozambique’s three public works variants
Sub-component Target population Targeting method LIPW Poor able-bodied persons Geographic, community based and PMT
IPW Physically constrained poor and
vulnerable households (including pregnant women and people with
Geographic, community based and PMT and categorical
16 Section based on Hailu and Gallego-Ayala (2020).
23
physical handicaps, all with labor capacity)
PEPW Poor and vulnerable people in areas affected by natural disasters Geographic, community-based
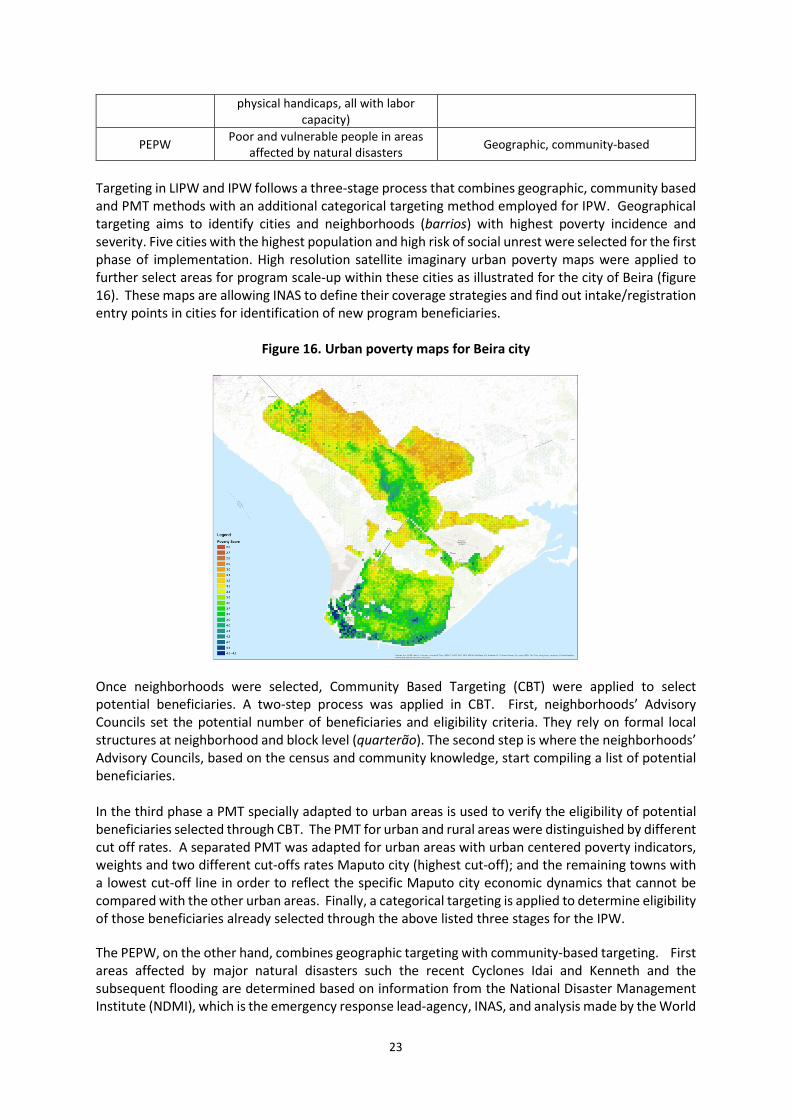
Targeting in LIPW and IPW follows a three-stage process that combines geographic, community based and PMT methods with an additional categorical targeting method employed for IPW. Geographical targeting aims to identify cities and neighborhoods (barrios) with highest poverty incidence and severity. Five cities with the highest population and high risk of social unrest were selected for the first phase of implementation. High resolution satellite imaginary urban poverty maps were applied to further select areas for program scale-up within these cities as illustrated for the city of Beira (figure 16). These maps are allowing INAS to define their coverage strategies and find out intake/registration entry points in cities for identification of new program beneficiaries.
Figure 16. Urban poverty maps for Beira city
Once neighborhoods were selected, Community Based Targeting (CBT) were applied to select potential beneficiaries. A two-step process was applied in CBT. First, neighborhoods’ Advisory Councils set the potential number of beneficiaries and eligibility criteria. They rely on formal local structures at neighborhood and block level (quarterão). The second step is where the neighborhoods’ Advisory Councils, based on the census and community knowledge, start compiling a list of potential beneficiaries. In the third phase a PMT specially adapted to urban areas is used to verify the eligibility of potential beneficiaries selected through CBT. The PMT for urban and rural areas were distinguished by different cut off rates. A separated PMT was adapted for urban areas with urban centered poverty indicators, weights and two different cut-offs rates Maputo city (highest cut-off); and the remaining towns with a lowest cut-off line in order to reflect the specific Maputo city economic dynamics that cannot be compared with the other urban areas. Finally, a categorical targeting is applied to determine eligibility of those beneficiaries already selected through the above listed three stages for the IPW. The PEPW, on the other hand, combines geographic targeting with community-based targeting. First areas affected by major natural disasters such the recent Cyclones Idai and Kenneth and the subsequent flooding are determined based on information from the National Disaster Management Institute (NDMI), which is the emergency response lead-agency, INAS, and analysis made by the World
24
Bank. Next, beneficiaries are shortlisted based on the existing PWP beneficiary roster of INAS and additional participants that may be drawn from the lists of affected population by NDMI. PASP provided a cash transfer value of MZN 650 per month (equivalent to USD 21 in 2012 exchange rate) for 16 days of work per month during each annual cycle, which in urban areas consists of six months. This benefit amount has been re-adjusted to MZM 1,050 (which was only USD 18 in 2017/18 exchange rate) on and since 2017. This new cash transfer value represents 28 percent of the average consumption of a poor household in 2017. Beneficiaries on the regular subcomponents (LIPWs and IPWs) are enrolled for three-cycles, participation under PEPW lasts only for one cycle of three months by which time a beneficiary is reassessed by INAS and may be referred to either of the regular programs i.e. LIPW or SPW, if eligible. At the start of the program, payments were made in cash by INAS and beneficiaries present their identity cards and receive the payment. At that time, payments were often late, and they rarely came monthly, but only every two or three months because of the limitations inherent in manual payment as well as the complex process to compile and validate the information to prepare the beneficiaries payment sheets that needs a close coordination between local authorities and INAS. This situation has significantly improved over the years, since municipalities and INAS staff became familiar with the administrative procedures for the beneficiary payment. In parallel as INAS is moving rapidly towards digital payments in particularly urban areas involving banks and mobile companies as well as delivering the payments through third party agencies. The types of public works in urban areas has evolved significantly over the years from simple cleaning of streets to a variety of activities such as rehabilitation of roads, cleaning of sewage canals, beachfront and gardens, maintenance of schools, clinics and natural resource conservation and management. Types of LIPW are like PEPW except that the later are implemented in post emergency contexts to rehabilitate community assets destroyed by disasters as well as removal of debris. IPW began as an innovative public works scheme to provide greater opportunity for women, partially disabled and other partially capacitated but vulnerable citizens to participate in the program. The public work activities consist of less physically demanding social and community services that are greatly needed by particularly vulnerable populations (children, HIV patients, chronically ill individuals, the elderly). Currently implemented activities include the delivery of public awareness campaigns on topics such as nutrition, sexual and reproductive health, environmental sanitation, other activities are related to childcare and urban gardening, As part of the regular public works schemes of the program, LIPW and IPW follow main implementation steps of the annual public works cycle in both urban and rural areas, with the following difference in urban vs rural areas: Annual schedule of PW activities depends on the nature of the activities (for example, avoiding
certain periods of rain) but is not linked to seasonal income fluctuations as in rural areas. Annual cycle in urban areas consists of 6 lean months while in rural areas it is 4 months, which
results in differences in annual income from PW between urban and rural areas. Municipalities are responsible for leading on the development of the annual PW plans within
targeted communities. The plan must identify enough PW projects that can absorb the requisite number of person-days allocated per neighborhood. They are responsible for ensuring that this planning process involves members of targeted communities. The plan is first developed by municipal technical staff in consultation with targeted communities and must then be approved the municipal councils.
25
The National Institute of Social Action (INAS) is the primary implementor in collaboration with municipalities. In relation to the public work component, INAS is responsible for the funding, beneficiary selection, and guarantee the cash transfer while municipalities are responsible for the management the design of the activities and provide support implementation through the monitoring of the activities implemented. The following are some of the most salient results documented by evaluations conducted so far: The program has good targeting performance compared to targeting performance in urban
areas in other countries. However, CBT may not be working well. Despite the good results (80% of retained participants belong to the poorest two quintiles), the CBT applied to initially select candidates was not very effective. For example, when potential beneficiaries selected through CBT in Maputo and Tete were tested through CBT, only 23% of them were found to be eligible (living below the poverty line), meaning that the remaining 77% were not eligible. Also contributing to the good targeting performance is the low cash transfer value and the type of public works designed, which lead to self-selection into the program by poor people and people with few options for work. This effectiveness has, however, come at a significant expense of poor urban youth who are not attracted by the program due to the opportunity cost they would, otherwise, incur if they accepted the benefit and types of public works. Hence, the majority of PASP beneficiaries in urban areas are women (more than 70% of beneficiaries) and were reported to be between 45-54 years of age.
The generosity of the program is low compared to international standards. Initially, PSAP beneficiaries received MZM 650 per month (in 2012 the value was USD 21 per month), which was enough to cover 30% of the food basket. However, that real value of that amount became eroded with increasing inflection and rise in the price of food. Although the cash transfer level was readjusted in 2017 (MZM 1,050 which in 2018 equals to USD 18), it could represent only 28 percent of the average consumption of a poor household. Currently that percentage has further deteriorated to about 23% due to further increase in inflation and price of food. Beneficiaries complain that PASP benefit amounts are low, only cover for some basic expenses, do not allow for savings and have no potential for productive investments. Their complaint is corroborated by estimate of about MZM 2,570 that is needed to purchase a 2,000-calorie diet in Maputo, and around MZM 12,850 for an average 5-members family.
At the early stages of program implementation, beneficiaries complained that the type of work offered was not interesting for many poor individuals. Initially, types of work were limited to cleaning the streets and roads of the neighboring area. Other jobs included cleaning the sewage canals, cleaning the beachfront and cleaning the cemetery. As municipalities observe the added value of PASP, the type of activities has further diversified to include rehabilitation of social infrastructure, natural resources management (mangrove forest restoration); and social activities. However, these activities were only labor intensive and did not add much to the skill set that beneficiaries could use in subsequent wage employment they could seek. As noted earlier, this combined with the low cash transfer value was not sufficiently attractive for some eligible households and many youths to participate in the program.
Public works in urban areas need not be implemented seasonally. PASP is implemented for 6 months in urban areas and beneficiaries participate in the program for a three years’ period. The logic for this seasonality comes from the experience in rural areas, where households are engaged in agriculture for longer periods of the year and labor-intensive public works are only implemented during the lean season.
PASP has low coverage mainly due to the implementation complexity of the program (linked as well to a high administrative implementation costs) and the lack of appeal to attract more beneficiaries in urban areas due to the low cash transfer value and type of PW activities. For example, in 2019, the program covered 121,000 beneficiaries in both urban and rural areas.
26
Of these 12,000 are in 5 urban areas, including the capital Maputo (11,000 beneficiaries in the LIPWs sub-component and 1000 beneficiaries enrolled in the IPW).
The IPW sub-component of the program has demonstrated at least two positive outcomes. First, it offered women opportunity to participate in the program, making women 95 % of all regular PW participants. This has contributed to the empowerment of women and their improved self-esteem. Furthermore, the IPW has improved coordination among social protection, health and education because as the three sectors had to work together to deliver training and supervise activities.
The ensuing lessons towards further improvement of PASP are distilled from available evaluations: PASP could offer higher benefit levels to make it more attractive for beneficiaries in urban
areas. It may also ensure regular, timely and predictable transfers to allow beneficiary households better plan their productive investments. To this end, the current initiative to move to digital payments should be accelerated in particularly urban areas where there is a good penetration of banks and mobile companies.
Regularity of payments corresponded with administrative capacity of INAS. Initially, irregular payments were common. This was due to one or a combination of the following factors: (i) INAS did not have enough human resources to compile beneficiaries attendance to public works in a timely manner in the district to prepare the payment sheet; and (ii) INAS did not have an effective coordination link between the municipalities and INAS delegations which resulted in continuous delays in the information flow. However, as administrative capacity improved particularly in urban areas, these bottlenecks were addressed to effective payments more regularly.
The design of public works in urban areas can be further improved to attract particularly the youth. To begin with, public works may be further tailored to the needs of urban areas rather than simply adopting activities and operational designs for rural areas. It may also aim at exploiting the potential of public works for on-the- job training and skills transfer in conjunction with operationalizing the productive inclusion component of the program.
The program may further improv its coordination with municipalities so they could appreciate its value in meeting their needs and be motivated to champion its rapid expansion. Experience thus far shows that when municipalities were fully on board and felt part of the program, implementation moved faster and more effectively. It has also increased the demands of municipalities for more public work labor and adapted public work activities to their needs. For example, public works were discontinued after one year of implementation in Nampula due to lack of coordination between the municipality and INAS. In contrast, it was effectively sustained in Beira because there was a high degree of coordination between INAS and the municipality and ownership by the later.
The inclusion of the post-emergency public works program enabled the program to be flexible in responding to transient shocks due to draughts, cyclones and epidemics/ pandemics. It was critical for a timely and agile response of this program, that INAS delegations were already familiar with the regular program implementation mechanism.
The inclusion of persons with disabilities allowed the beneficiaries to increase their self-esteem. Most such participants felt themselves excluded from the socioeconomic dynamics but started to gain respect after being involved in public works.
The activities allowed to fill the gap in availability of social workers. Moreover, the awareness campaigns delivered by the beneficiaries in a systematic way allowed behavioral change in nutrition and environmental sanitation at the household level.
The coordination of the social protection sector with the health sector works better at the grassroot level than at the central level. In fact, the close coordination of these two sectors in the ground allowed effective delivery of services given the limited institutional capabilities in the local level. For instance, social protection beneficiaries where trained by health sector
27
workers to guaranty that the correct messages were deliver and support the social protection sector to monitor beneficiaries’ activities.
Materials used by the beneficiaries needs to be simplified and be adapted to the local context; since the materials used during these activities where provided by the health sector which in some cases were difficult to understand by the beneficiaries even if the messages to be deliver were simple.
Uganda’s Girls-empowering-Girls program The Girls-empowering-Girls (GeG) scheme is a “mentoring plus cash” program to ensure that girls transition safely into adulthood, receive education and training, and are empowered to achieve their aspirations. It does so by providing in- and out-of-school adolescent girls living in Kampala with a package of services that combines cash transfers with peer mentoring, education, training, and referrals to support services. The program uses a geographical-categorial targeting mechanism, identifying vulnerable adolescent girls living in a catchment area of a public primary school or in parishes with high levels of multidimensional child poverty. Specifically, the program targets two categories of vulnerable adolescent girls: girls in upper primary, attending selected Universal Primary Education schools with high drop-out rates, who are at risk of not transitioning to secondary school; adolescent girls between 12-14 years old, who have dropped out of school, who are vulnerable, and living in selected municipalities, and which correspond with the school catchment areas. Once the schools were selected17, all girls set to be enrolled in “primary 6” in January 2020 were eligible to enroll in the program. The program is structured around three pillars designed to complement each other: “Empower”: the first pillar is structured around mentoring services provided through a
network of 300 peer mentors, overseen by 30 lead mentors, and which together support 1,500 adolescent girls. The girls interact with their peer mentor during one-on-one mentor sessions, digital contact moments, and group mentor sessions. They establish and maintain a mentoring relationship over time to increase knowledge and skills, and facilitate referrals. If the mentors identify certain needs they cannot address, they can seek support and guidance from their fellow peer mentors or from the lead mentors. If the girls have specific needs, such as health, education, or protection-related needs, they mentors can refer the girls to existing services under the second pillar.
“Engage”: the second pillar is the referral to services, which aims to link the girls to support from external sources, and to inform them of services at health facilities, universal primary education schools, civil society organizations (CSOs), and similar. Through this pillar, the girls will also be encouraged to take up other services, such as vocational training.
“Enable”: the third pillar is the cash transfer. This pillar consists of the provision of a small cash transfer to support programme participation, the uptake of services (including education), and otherwise enable positive outcomes for the long-term future of the girl. The cash is transferred via mobile money to the selected primary caregiver of the girls in three disbursements per year, which are aligned with the school year and its trimesters. The transfer is unconditional, though it is accompanied with soft nudges.
17 School selection criteria included (i) schools with highest dropout rates, (ii) catchment areas with highest multidimensional child poverty rates, and (iii) equitable distribution by divisions; parish Selection Criteria included (i) alignment with school catchment areas; (ii) parishes with highest multidimensional child poverty rates, cross- referenced for slums; (iii) percentage of child population (10-15yrs); and (iv) equitable distribution by division.
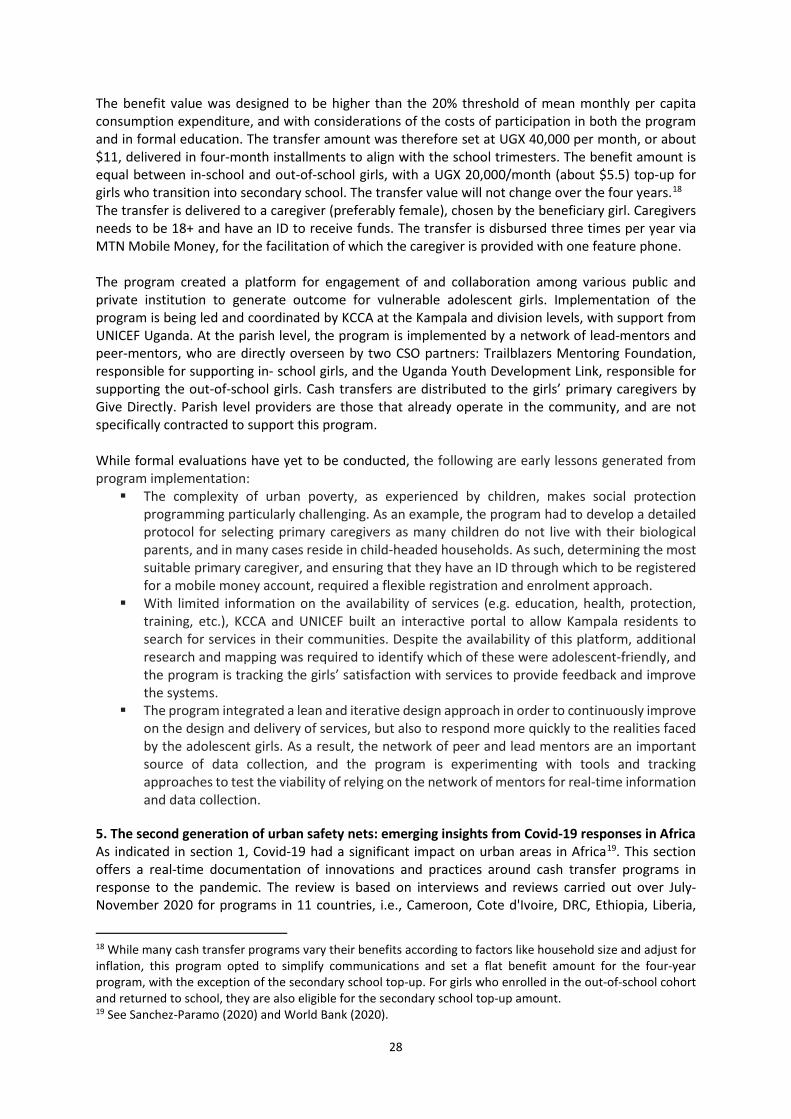
28
The benefit value was designed to be higher than the 20% threshold of mean monthly per capita consumption expenditure, and with considerations of the costs of participation in both the program and in formal education. The transfer amount was therefore set at UGX 40,000 per month, or about $11, delivered in four-month installments to align with the school trimesters. The benefit amount is equal between in-school and out-of-school girls, with a UGX 20,000/month (about $5.5) top-up for girls who transition into secondary school. The transfer value will not change over the four years.18 The transfer is delivered to a caregiver (preferably female), chosen by the beneficiary girl. Caregivers needs to be 18+ and have an ID to receive funds. The transfer is disbursed three times per year via MTN Mobile Money, for the facilitation of which the caregiver is provided with one feature phone. The program created a platform for engagement of and collaboration among various public and private institution to generate outcome for vulnerable adolescent girls. Implementation of the program is being led and coordinated by KCCA at the Kampala and division levels, with support from UNICEF Uganda. At the parish level, the program is implemented by a network of lead-mentors and peer-mentors, who are directly overseen by two CSO partners: Trailblazers Mentoring Foundation, responsible for supporting in- school girls, and the Uganda Youth Development Link, responsible for supporting the out-of-school girls. Cash transfers are distributed to the girls’ primary caregivers by Give Directly. Parish level providers are those that already operate in the community, and are not specifically contracted to support this program. While formal evaluations have yet to be conducted, the following are early lessons generated from program implementation: The complexity of urban poverty, as experienced by children, makes social protection
programming particularly challenging. As an example, the program had to develop a detailed protocol for selecting primary caregivers as many children do not live with their biological parents, and in many cases reside in child-headed households. As such, determining the most suitable primary caregiver, and ensuring that they have an ID through which to be registered for a mobile money account, required a flexible registration and enrolment approach.
With limited information on the availability of services (e.g. education, health, protection, training, etc.), KCCA and UNICEF built an interactive portal to allow Kampala residents to search for services in their communities. Despite the availability of this platform, additional research and mapping was required to identify which of these were adolescent-friendly, and the program is tracking the girls’ satisfaction with services to provide feedback and improve the systems.
The program integrated a lean and iterative design approach in order to continuously improve on the design and delivery of services, but also to respond more quickly to the realities faced by the adolescent girls. As a result, the network of peer and lead mentors are an important source of data collection, and the program is experimenting with tools and tracking approaches to test the viability of relying on the network of mentors for real-time information and data collection.
5. The second generation of urban safety nets: emerging insights from Covid-19 responses in Africa As indicated in section 1, Covid-19 had a significant impact on urban areas in Africa19. This section offers a real-time documentation of innovations and practices around cash transfer programs in response to the pandemic. The review is based on interviews and reviews carried out over July-November 2020 for programs in 11 countries, i.e., Cameroon, Cote d'Ivoire, DRC, Ethiopia, Liberia,
18 While many cash transfer programs vary their benefits according to factors like household size and adjust for inflation, this program opted to simplify communications and set a flat benefit amount for the four-year program, with the exception of the secondary school top-up. For girls who enrolled in the out-of-school cohort and returned to school, they are also eligible for the secondary school top-up amount. 19 See Sanchez-Paramo (2020) and World Bank (2020).
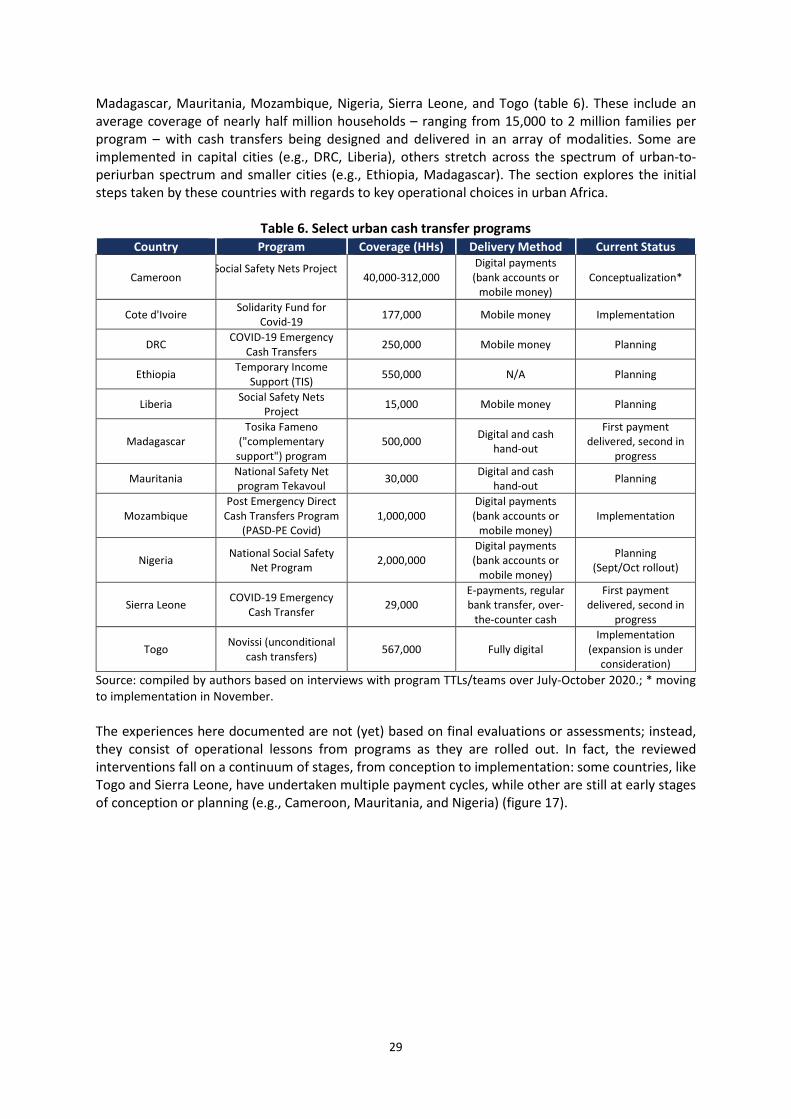
29
Madagascar, Mauritania, Mozambique, Nigeria, Sierra Leone, and Togo (table 6). These include an average coverage of nearly half million households – ranging from 15,000 to 2 million families per program – with cash transfers being designed and delivered in an array of modalities. Some are implemented in capital cities (e.g., DRC, Liberia), others stretch across the spectrum of urban-to-periurban spectrum and smaller cities (e.g., Ethiopia, Madagascar). The section explores the initial steps taken by these countries with regards to key operational choices in urban Africa.
Table 6. Select urban cash transfer programs Country Program Coverage (HHs) Delivery Method Current Status
Cameroon Social Safety Nets Project 40,000-312,000
Digital payments (bank accounts or
mobile money) Conceptualization*
Cote d'Ivoire Solidarity Fund for Covid-19 177,000 Mobile money Implementation
DRC COVID-19 Emergency Cash Transfers 250,000 Mobile money Planning
Ethiopia Temporary Income Support (TIS) 550,000 N/A Planning
Liberia Social Safety Nets Project 15,000 Mobile money Planning
Madagascar Tosika Fameno
("complementary support") program
500,000 Digital and cash hand-out
First payment delivered, second in
progress Mauritania National Safety Net
program Tekavoul 30,000 Digital and cash hand-out Planning
Mozambique Post Emergency Direct
Cash Transfers Program (PASD-PE Covid)
1,000,000 Digital payments (bank accounts or
mobile money) Implementation
Nigeria National Social Safety Net Program 2,000,000
Digital payments (bank accounts or
mobile money) Planning
(Sept/Oct rollout)
Sierra Leone COVID-19 Emergency Cash Transfer 29,000
E-payments, regular bank transfer, over-
the-counter cash
First payment delivered, second in
progress
Togo Novissi (unconditional cash transfers) 567,000 Fully digital
Implementation (expansion is under
consideration) Source: compiled by authors based on interviews with program TTLs/teams over July-October 2020.; * moving to implementation in November. The experiences here documented are not (yet) based on final evaluations or assessments; instead, they consist of operational lessons from programs as they are rolled out. In fact, the reviewed interventions fall on a continuum of stages, from conception to implementation: some countries, like Togo and Sierra Leone, have undertaken multiple payment cycles, while other are still at early stages of conception or planning (e.g., Cameroon, Mauritania, and Nigeria) (figure 17).
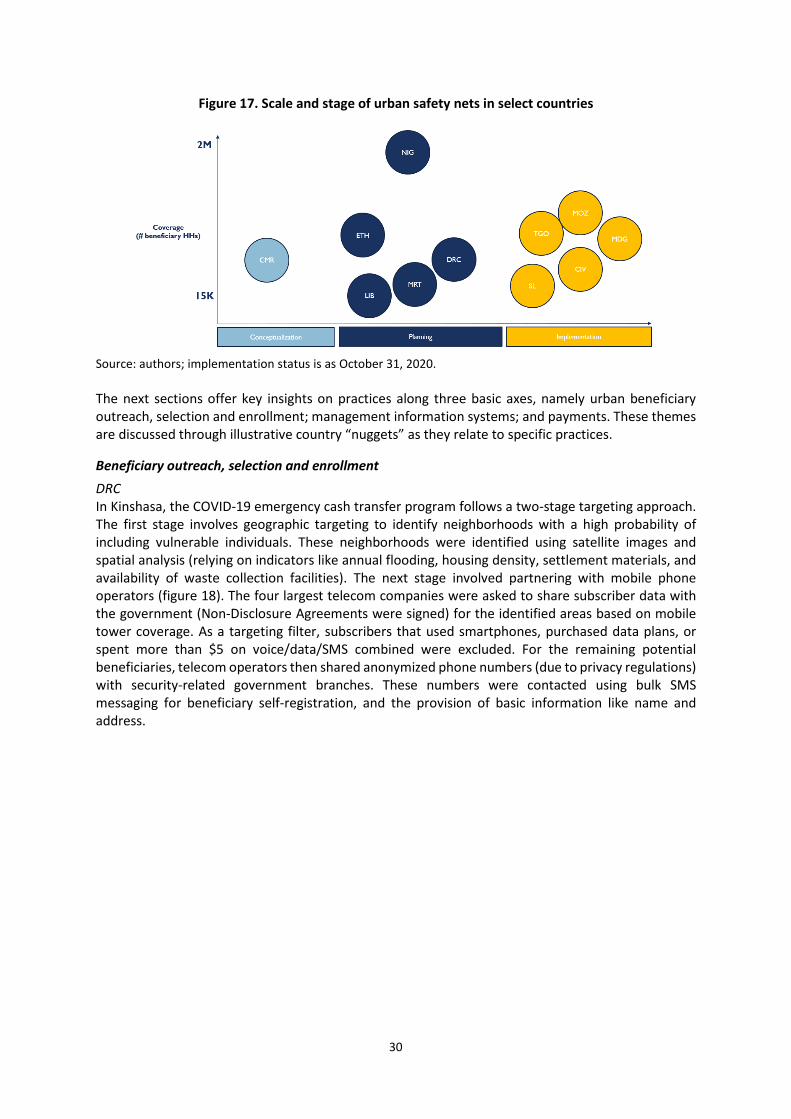
30
Figure 17. Scale and stage of urban safety nets in select countries
Source: authors; implementation status is as October 31, 2020. The next sections offer key insights on practices along three basic axes, namely urban beneficiary outreach, selection and enrollment; management information systems; and payments. These themes are discussed through illustrative country “nuggets” as they relate to specific practices.
Beneficiary outreach, selection and enrollment DRC In Kinshasa, the COVID-19 emergency cash transfer program follows a two-stage targeting approach. The first stage involves geographic targeting to identify neighborhoods with a high probability of including vulnerable individuals. These neighborhoods were identified using satellite images and spatial analysis (relying on indicators like annual flooding, housing density, settlement materials, and availability of waste collection facilities). The next stage involved partnering with mobile phone operators (figure 18). The four largest telecom companies were asked to share subscriber data with the government (Non-Disclosure Agreements were signed) for the identified areas based on mobile tower coverage. As a targeting filter, subscribers that used smartphones, purchased data plans, or spent more than $5 on voice/data/SMS combined were excluded. For the remaining potential beneficiaries, telecom operators then shared anonymized phone numbers (due to privacy regulations) with security-related government branches. These numbers were contacted using bulk SMS messaging for beneficiary self-registration, and the provision of basic information like name and address.
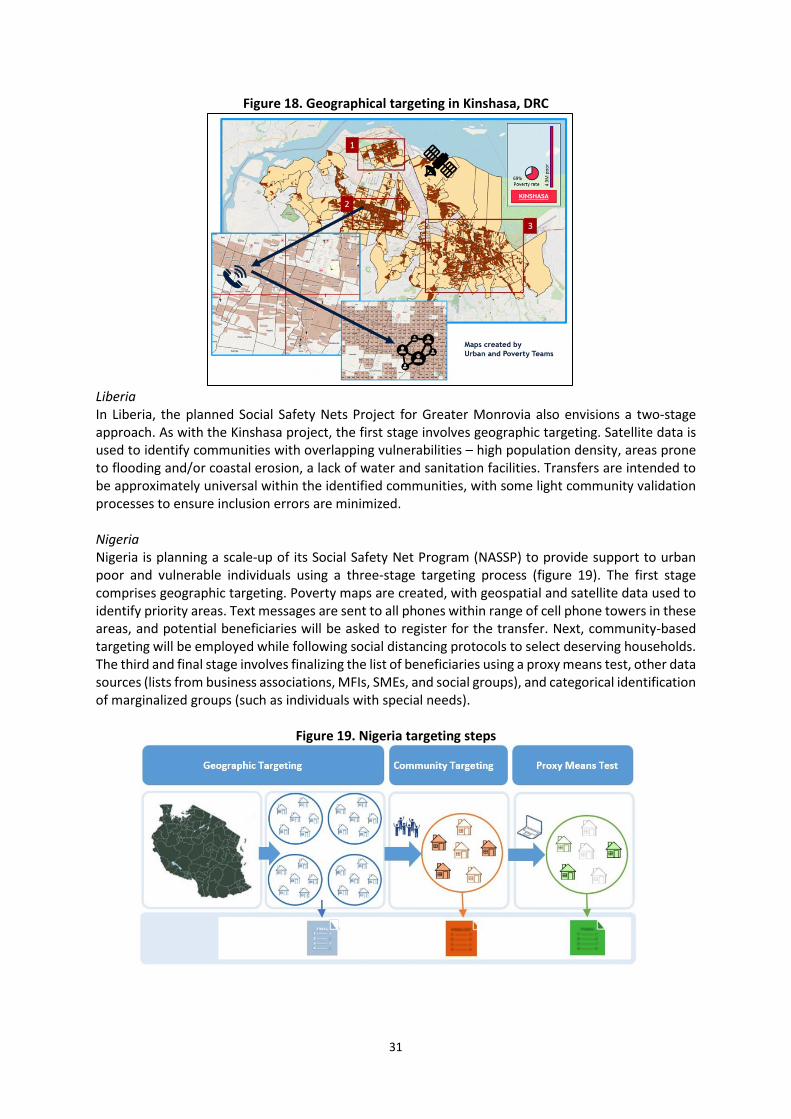
31
Figure 18. Geographical targeting in Kinshasa, DRC
Liberia In Liberia, the planned Social Safety Nets Project for Greater Monrovia also envisions a two-stage approach. As with the Kinshasa project, the first stage involves geographic targeting. Satellite data is used to identify communities with overlapping vulnerabilities – high population density, areas prone to flooding and/or coastal erosion, a lack of water and sanitation facilities. Transfers are intended to be approximately universal within the identified communities, with some light community validation processes to ensure inclusion errors are minimized. Nigeria Nigeria is planning a scale-up of its Social Safety Net Program (NASSP) to provide support to urban poor and vulnerable individuals using a three-stage targeting process (figure 19). The first stage comprises geographic targeting. Poverty maps are created, with geospatial and satellite data used to identify priority areas. Text messages are sent to all phones within range of cell phone towers in these areas, and potential beneficiaries will be asked to register for the transfer. Next, community-based targeting will be employed while following social distancing protocols to select deserving households. The third and final stage involves finalizing the list of beneficiaries using a proxy means test, other data sources (lists from business associations, MFIs, SMEs, and social groups), and categorical identification of marginalized groups (such as individuals with special needs).
Figure 19. Nigeria targeting steps
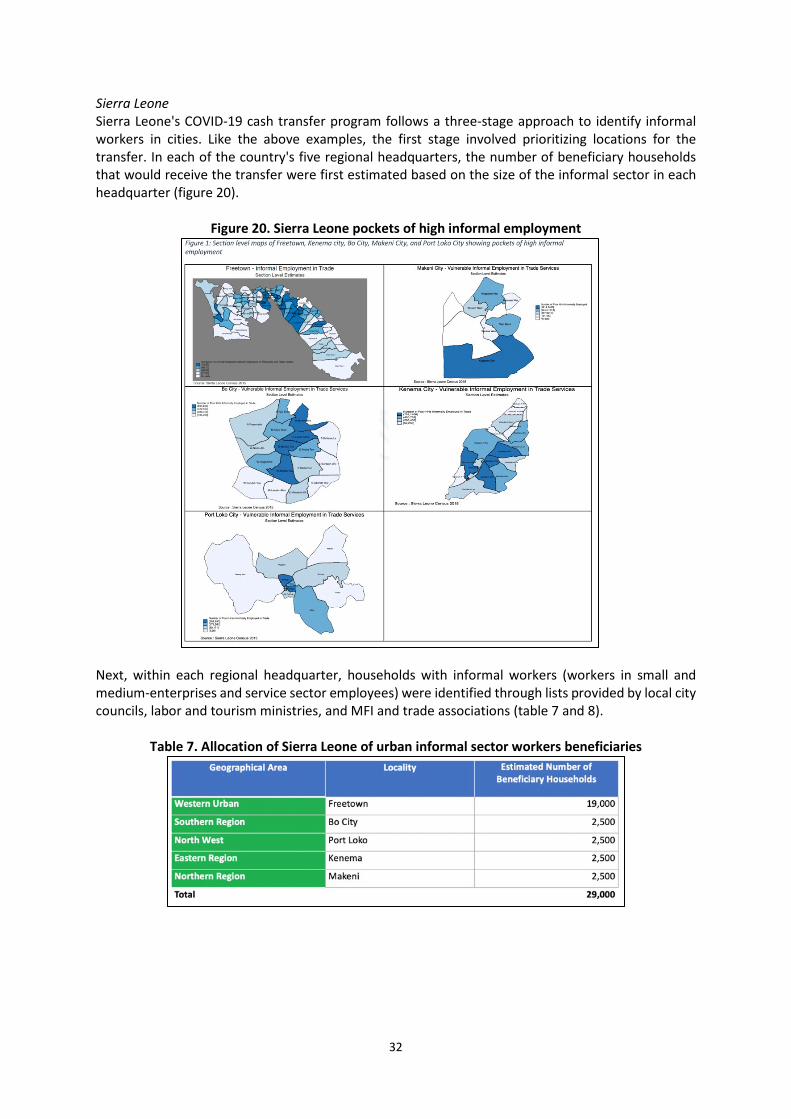
32
Sierra Leone Sierra Leone's COVID-19 cash transfer program follows a three-stage approach to identify informal workers in cities. Like the above examples, the first stage involved prioritizing locations for the transfer. In each of the country's five regional headquarters, the number of beneficiary households that would receive the transfer were first estimated based on the size of the informal sector in each headquarter (figure 20).
Figure 20. Sierra Leone pockets of high informal employment
Next, within each regional headquarter, households with informal workers (workers in small and medium-enterprises and service sector employees) were identified through lists provided by local city councils, labor and tourism ministries, and MFI and trade associations (table 7 and 8).
Table 7. Allocation of Sierra Leone of urban informal sector workers beneficiaries
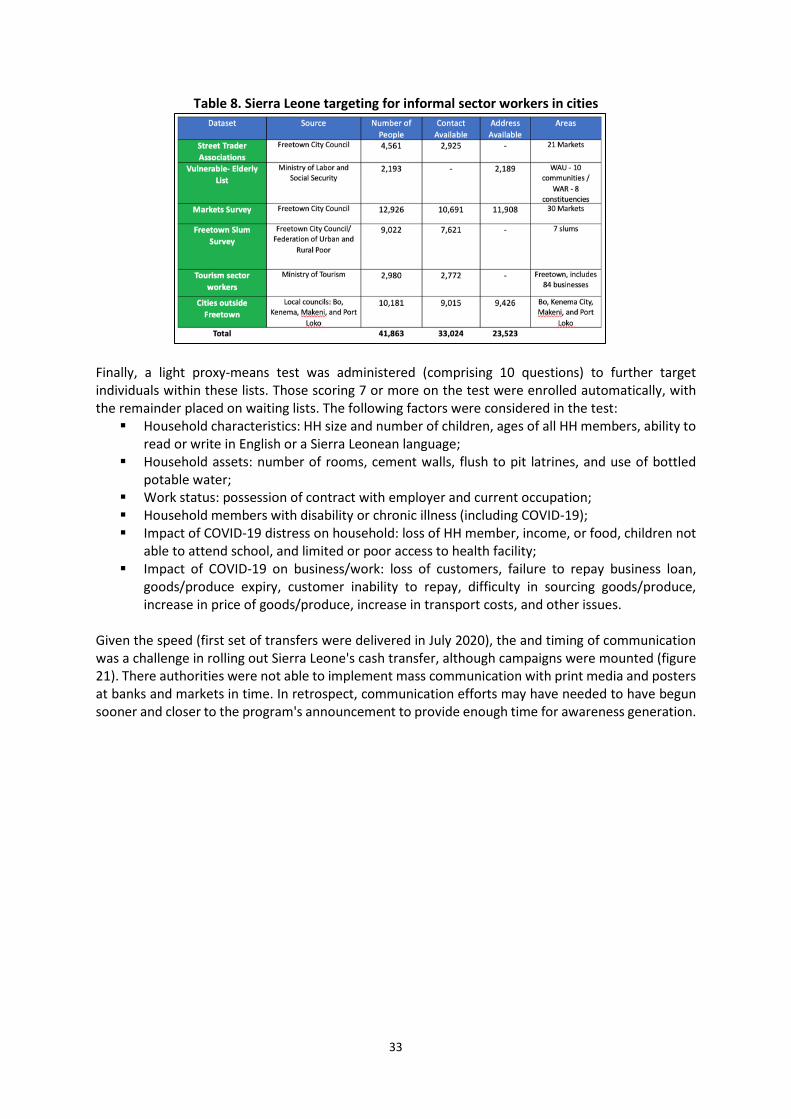
33
Table 8. Sierra Leone targeting for informal sector workers in cities
Finally, a light proxy-means test was administered (comprising 10 questions) to further target individuals within these lists. Those scoring 7 or more on the test were enrolled automatically, with the remainder placed on waiting lists. The following factors were considered in the test: Household characteristics: HH size and number of children, ages of all HH members, ability to
read or write in English or a Sierra Leonean language; Household assets: number of rooms, cement walls, flush to pit latrines, and use of bottled
potable water; Work status: possession of contract with employer and current occupation; Household members with disability or chronic illness (including COVID-19); Impact of COVID-19 distress on household: loss of HH member, income, or food, children not
able to attend school, and limited or poor access to health facility; Impact of COVID-19 on business/work: loss of customers, failure to repay business loan,
goods/produce expiry, customer inability to repay, difficulty in sourcing goods/produce, increase in price of goods/produce, increase in transport costs, and other issues.
Given the speed (first set of transfers were delivered in July 2020), the and timing of communication was a challenge in rolling out Sierra Leone's cash transfer, although campaigns were mounted (figure 21). There authorities were not able to implement mass communication with print media and posters at banks and markets in time. In retrospect, communication efforts may have needed to have begun sooner and closer to the program's announcement to provide enough time for awareness generation.
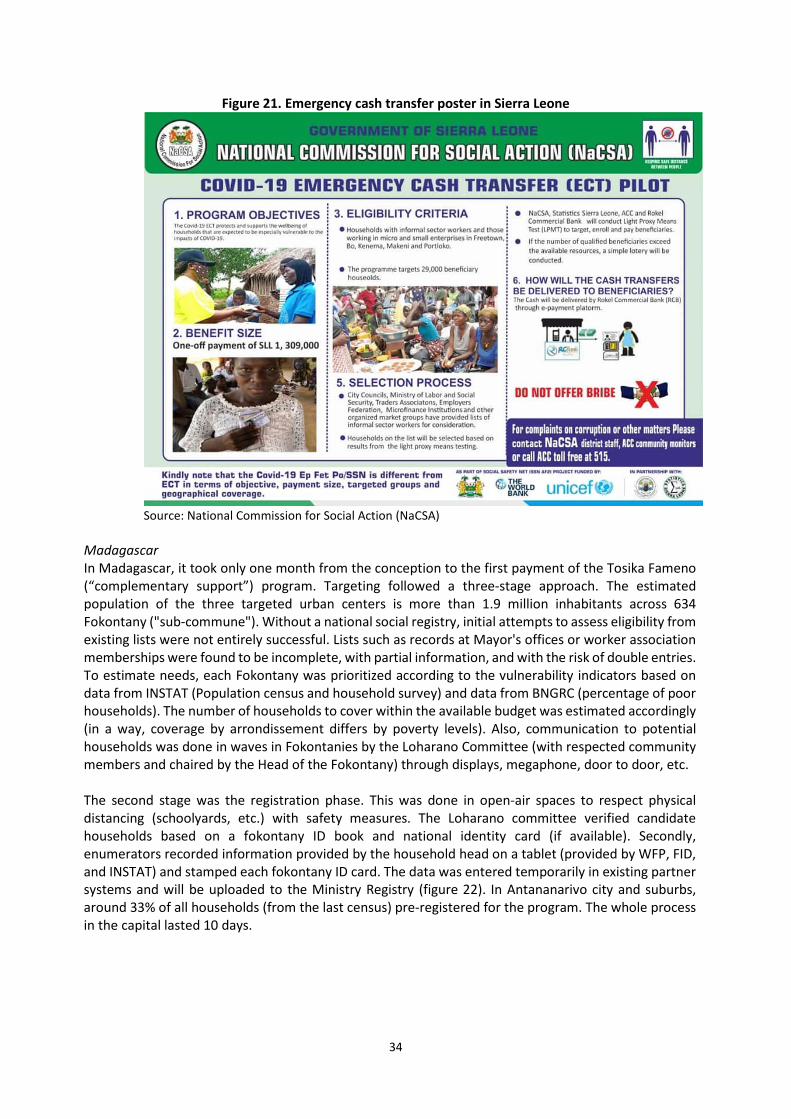
34
Figure 21. Emergency cash transfer poster in Sierra Leone
Source: National Commission for Social Action (NaCSA)
Madagascar In Madagascar, it took only one month from the conception to the first payment of the Tosika Fameno (“complementary support”) program. Targeting followed a three-stage approach. The estimated population of the three targeted urban centers is more than 1.9 million inhabitants across 634 Fokontany ("sub-commune"). Without a national social registry, initial attempts to assess eligibility from existing lists were not entirely successful. Lists such as records at Mayor's offices or worker association memberships were found to be incomplete, with partial information, and with the risk of double entries. To estimate needs, each Fokontany was prioritized according to the vulnerability indicators based on data from INSTAT (Population census and household survey) and data from BNGRC (percentage of poor households). The number of households to cover within the available budget was estimated accordingly (in a way, coverage by arrondissement differs by poverty levels). Also, communication to potential households was done in waves in Fokontanies by the Loharano Committee (with respected community members and chaired by the Head of the Fokontany) through displays, megaphone, door to door, etc. The second stage was the registration phase. This was done in open-air spaces to respect physical distancing (schoolyards, etc.) with safety measures. The Loharano committee verified candidate households based on a fokontany ID book and national identity card (if available). Secondly, enumerators recorded information provided by the household head on a tablet (provided by WFP, FID, and INSTAT) and stamped each fokontany ID card. The data was entered temporarily in existing partner systems and will be uploaded to the Ministry Registry (figure 22). In Antananarivo city and suburbs, around 33% of all households (from the last census) pre-registered for the program. The whole process in the capital lasted 10 days.
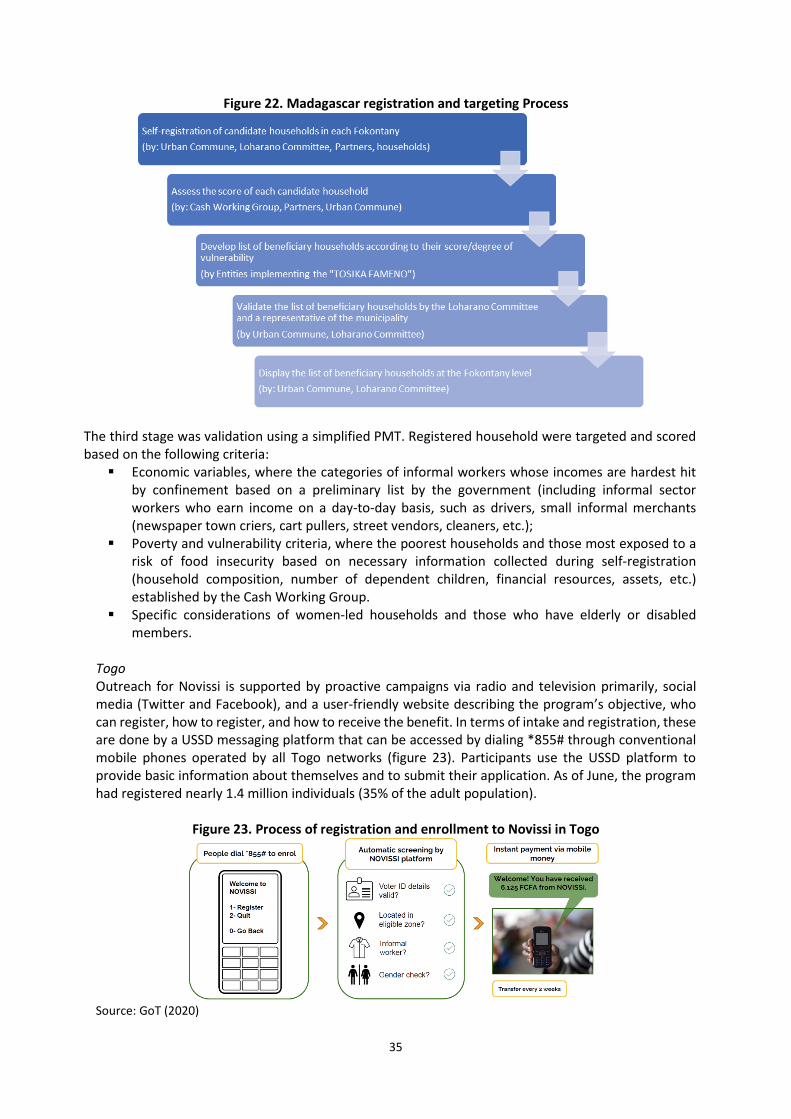
35
Figure 22. Madagascar registration and targeting Process
The third stage was validation using a simplified PMT. Registered household were targeted and scored based on the following criteria: Economic variables, where the categories of informal workers whose incomes are hardest hit
by confinement based on a preliminary list by the government (including informal sector workers who earn income on a day-to-day basis, such as drivers, small informal merchants (newspaper town criers, cart pullers, street vendors, cleaners, etc.);
Poverty and vulnerability criteria, where the poorest households and those most exposed to a risk of food insecurity based on necessary information collected during self-registration (household composition, number of dependent children, financial resources, assets, etc.) established by the Cash Working Group.
Specific considerations of women-led households and those who have elderly or disabled members.
Togo Outreach for Novissi is supported by proactive campaigns via radio and television primarily, social media (Twitter and Facebook), and a user-friendly website describing the program’s objective, who can register, how to register, and how to receive the benefit. In terms of intake and registration, these are done by a USSD messaging platform that can be accessed by dialing *855# through conventional mobile phones operated by all Togo networks (figure 23). Participants use the USSD platform to provide basic information about themselves and to submit their application. As of June, the program had registered nearly 1.4 million individuals (35% of the adult population).
Figure 23. Process of registration and enrollment to Novissi in Togo
Source: GoT (2020)
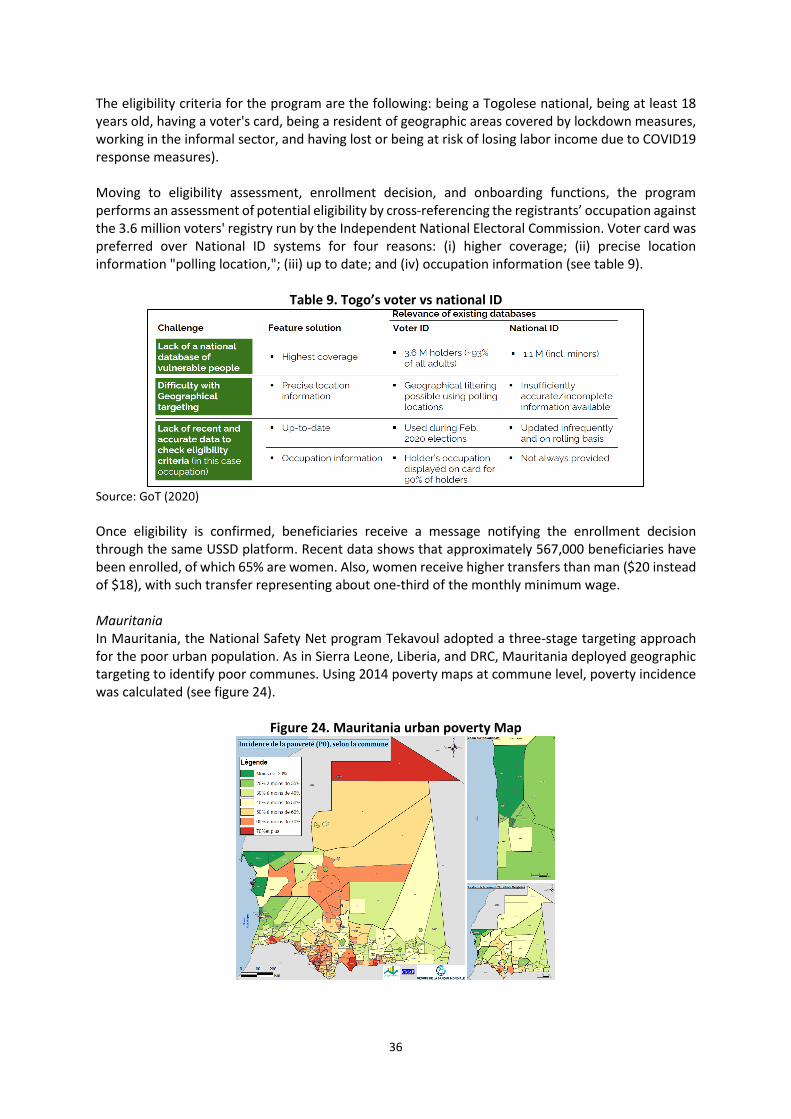
36
The eligibility criteria for the program are the following: being a Togolese national, being at least 18 years old, having a voter's card, being a resident of geographic areas covered by lockdown measures, working in the informal sector, and having lost or being at risk of losing labor income due to COVID19 response measures). Moving to eligibility assessment, enrollment decision, and onboarding functions, the program performs an assessment of potential eligibility by cross-referencing the registrants’ occupation against the 3.6 million voters' registry run by the Independent National Electoral Commission. Voter card was preferred over National ID systems for four reasons: (i) higher coverage; (ii) precise location information "polling location,"; (iii) up to date; and (iv) occupation information (see table 9).
Table 9. Togo’s voter vs national ID
Source: GoT (2020) Once eligibility is confirmed, beneficiaries receive a message notifying the enrollment decision through the same USSD platform. Recent data shows that approximately 567,000 beneficiaries have been enrolled, of which 65% are women. Also, women receive higher transfers than man ($20 instead of $18), with such transfer representing about one-third of the monthly minimum wage. Mauritania In Mauritania, the National Safety Net program Tekavoul adopted a three-stage targeting approach for the poor urban population. As in Sierra Leone, Liberia, and DRC, Mauritania deployed geographic targeting to identify poor communes. Using 2014 poverty maps at commune level, poverty incidence was calculated (see figure 24).
Figure 24. Mauritania urban poverty Map
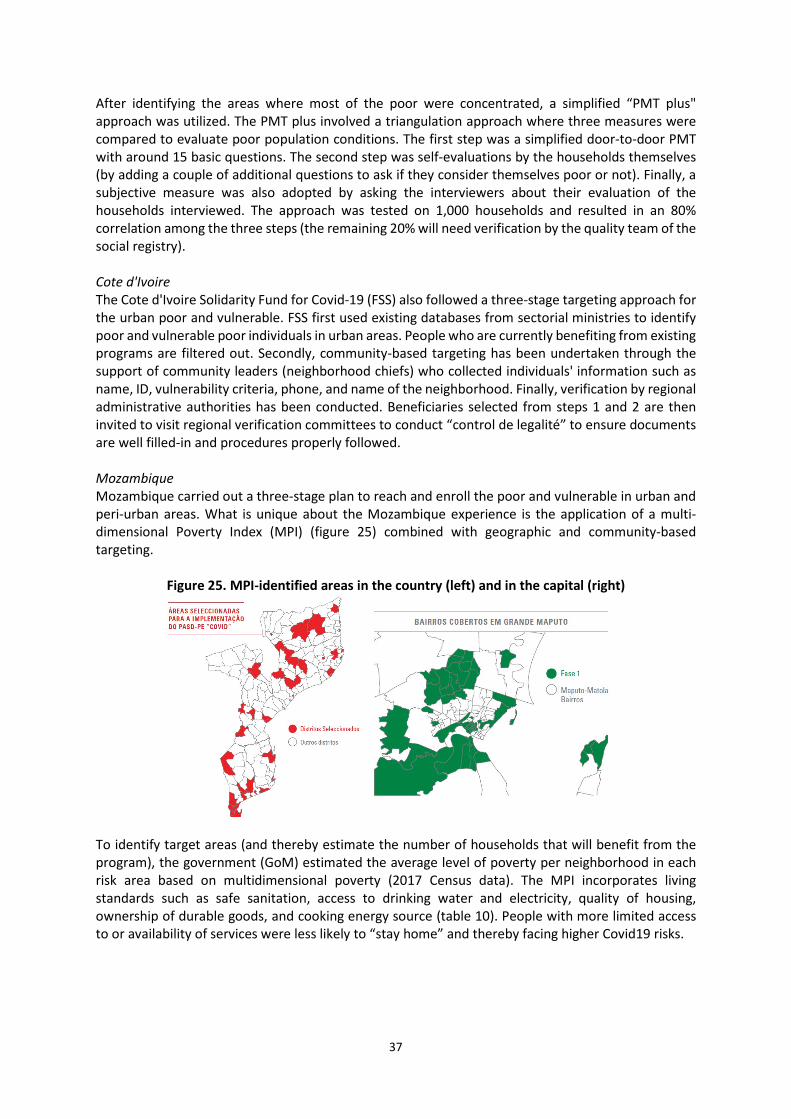
37
After identifying the areas where most of the poor were concentrated, a simplified “PMT plus" approach was utilized. The PMT plus involved a triangulation approach where three measures were compared to evaluate poor population conditions. The first step was a simplified door-to-door PMT with around 15 basic questions. The second step was self-evaluations by the households themselves (by adding a couple of additional questions to ask if they consider themselves poor or not). Finally, a subjective measure was also adopted by asking the interviewers about their evaluation of the households interviewed. The approach was tested on 1,000 households and resulted in an 80% correlation among the three steps (the remaining 20% will need verification by the quality team of the social registry). Cote d'Ivoire The Cote d'Ivoire Solidarity Fund for Covid-19 (FSS) also followed a three-stage targeting approach for the urban poor and vulnerable. FSS first used existing databases from sectorial ministries to identify poor and vulnerable poor individuals in urban areas. People who are currently benefiting from existing programs are filtered out. Secondly, community-based targeting has been undertaken through the support of community leaders (neighborhood chiefs) who collected individuals' information such as name, ID, vulnerability criteria, phone, and name of the neighborhood. Finally, verification by regional administrative authorities has been conducted. Beneficiaries selected from steps 1 and 2 are then invited to visit regional verification committees to conduct “control de legalité” to ensure documents are well filled-in and procedures properly followed. Mozambique Mozambique carried out a three-stage plan to reach and enroll the poor and vulnerable in urban and peri-urban areas. What is unique about the Mozambique experience is the application of a multi-dimensional Poverty Index (MPI) (figure 25) combined with geographic and community-based targeting.
Figure 25. MPI-identified areas in the country (left) and in the capital (right)
To identify target areas (and thereby estimate the number of households that will benefit from the program), the government (GoM) estimated the average level of poverty per neighborhood in each risk area based on multidimensional poverty (2017 Census data). The MPI incorporates living standards such as safe sanitation, access to drinking water and electricity, quality of housing, ownership of durable goods, and cooking energy source (table 10). People with more limited access to or availability of services were less likely to “stay home” and thereby facing higher Covid19 risks.
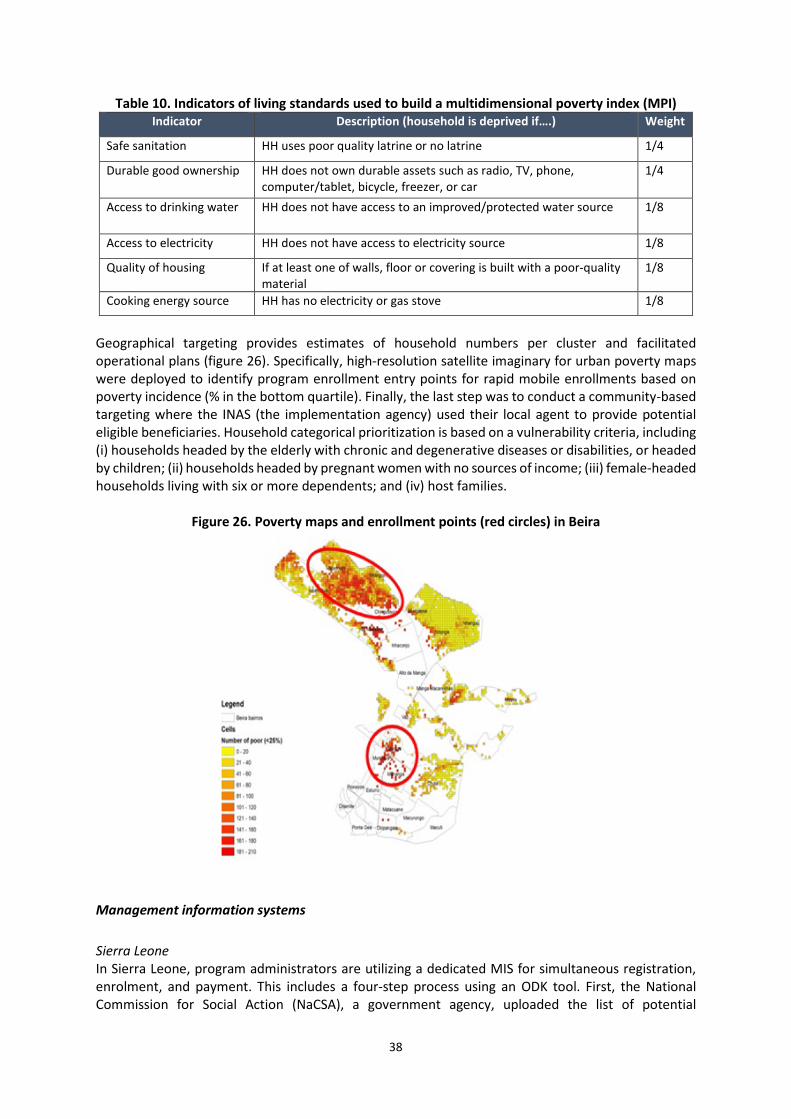
38
Table 10. Indicators of living standards used to build a multidimensional poverty index (MPI) Indicator Description (household is deprived if….) Weight
Safe sanitation HH uses poor quality latrine or no latrine 1/4
Durable good ownership HH does not own durable assets such as radio, TV, phone, computer/tablet, bicycle, freezer, or car
1/4
Access to drinking water HH does not have access to an improved/protected water source 1/8
Access to electricity HH does not have access to electricity source 1/8
Quality of housing If at least one of walls, floor or covering is built with a poor-quality material
1/8
Cooking energy source HH has no electricity or gas stove 1/8
Geographical targeting provides estimates of household numbers per cluster and facilitated operational plans (figure 26). Specifically, high-resolution satellite imaginary for urban poverty maps were deployed to identify program enrollment entry points for rapid mobile enrollments based on poverty incidence (% in the bottom quartile). Finally, the last step was to conduct a community-based targeting where the INAS (the implementation agency) used their local agent to provide potential eligible beneficiaries. Household categorical prioritization is based on a vulnerability criteria, including (i) households headed by the elderly with chronic and degenerative diseases or disabilities, or headed by children; (ii) households headed by pregnant women with no sources of income; (iii) female-headed households living with six or more dependents; and (iv) host families.
Figure 26. Poverty maps and enrollment points (red circles) in Beira
Management information systems Sierra Leone In Sierra Leone, program administrators are utilizing a dedicated MIS for simultaneous registration, enrolment, and payment. This includes a four-step process using an ODK tool. First, the National Commission for Social Action (NaCSA), a government agency, uploaded the list of potential
39
beneficiaries into a dedicated MIS where data templates pre-specified the types of variables and mandatory data fields (such as name and location). Next, beneficiary data was cleaned and validated by NaCSA by checking for incomplete or duplicate information. For faulty records, the upload was rejected, and associated file amended and re-imported. The third step included pre-enrolment, or loading validated files onto a table of “potential beneficiaries” with three variable types: mandatory fields (with data needed to locate and identify beneficiaries), payment details (payment method, unique account number, bank/MFI/MNO name, and optional variables (e.g., categorical targeting). Beneficiary enrolment took place in the fourth and final step. After the beneficiary's account details were confirmed, their profile was “activated: in the MIS and the beneficiary was included in the payment delivery list. There were two approaches used for enrolment. The first was remote enrolment: under this model, once valid payment account details were already provided the beneficiary was directly activated and included in future payrolls. Then other method included field enrolment: if payment account details were not available, lists of these beneficiaries were prepared in print form and for electronic devices used for enrolment. QR codes for each beneficiary were generated to serve as temporary ID cards. Each potential beneficiary on the list was then called or visited at home to verify their identity. Verification required a valid national ID, or a signed declaration form accompanied by a witness. Following confirmation, the beneficiary's information was pre-populated using their code, and additional mandatory information such as beneficiary photo and account details was collected. Once this process was completed for all individuals on the list, the data collected in the devices was validated against the paper lists (with the mobile information prevailing in case of inconsistency). The electronic records were then uploaded into the MIS, and applicants with successful uploads were activated. With almost instantaneous enrolment and payment, this process minimized in-field staff time, improved payment delivery time, and reduced the need for social interaction. Nigeria The planned project in Nigeria is considering a similar infrastructure capable of conducting immediate enrolment and payment – that is, government agencies will seek payment account details from beneficiaries at the point of registration. Immediately following validation, the payment would be released to the beneficiary. While the current MIS is being used to ensure the system can handle the additional caseload, a temporary beneficiary is being developed for new beneficiaries. Those beneficiaries still needing support once the crisis ends will be moved to the existing national social registry while others will be removed. Mozambique In Mozambique, there are plans to incorporate the new urban beneficiaries into the social assistance MIS. Mozambique's MIS, or e-INAS information system, is considered a limited social registry because the only information in the MIS is for registrants’ households that applied to social assistance programs before and it does not cover the whole nation. Due to the Covid response, the government is planning to add the new beneficiaries' socioeconomic information in the urban and peri-urban areas, which are around a million new households, into the social assistance e-INAS information system.
Cote d’Ivoire The Cote d'Ivoire solidarity Fund for the Covid-19 program faced some timeliness challenges due to limited IT solutions. The multi-level FSS verification process was lengthy. Beneficiaries lists were sent to a different level administration committee for verification, and when these were sent back to the team with results. Since beneficiaries are added on a rolling basis, the process became more cumbersome and time intensive.
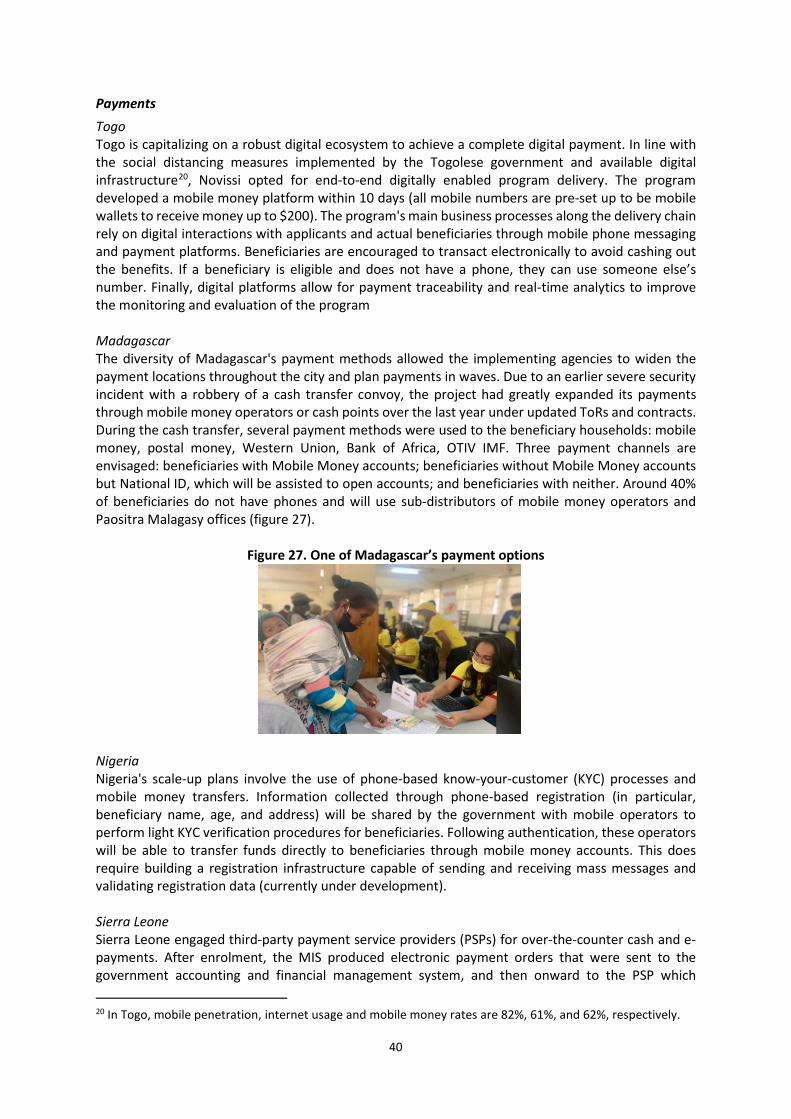
40
Payments Togo Togo is capitalizing on a robust digital ecosystem to achieve a complete digital payment. In line with the social distancing measures implemented by the Togolese government and available digital infrastructure20, Novissi opted for end-to-end digitally enabled program delivery. The program developed a mobile money platform within 10 days (all mobile numbers are pre-set up to be mobile wallets to receive money up to $200). The program's main business processes along the delivery chain rely on digital interactions with applicants and actual beneficiaries through mobile phone messaging and payment platforms. Beneficiaries are encouraged to transact electronically to avoid cashing out the benefits. If a beneficiary is eligible and does not have a phone, they can use someone else’s number. Finally, digital platforms allow for payment traceability and real-time analytics to improve the monitoring and evaluation of the program
Madagascar The diversity of Madagascar's payment methods allowed the implementing agencies to widen the payment locations throughout the city and plan payments in waves. Due to an earlier severe security incident with a robbery of a cash transfer convoy, the project had greatly expanded its payments through mobile money operators or cash points over the last year under updated ToRs and contracts. During the cash transfer, several payment methods were used to the beneficiary households: mobile money, postal money, Western Union, Bank of Africa, OTIV IMF. Three payment channels are envisaged: beneficiaries with Mobile Money accounts; beneficiaries without Mobile Money accounts but National ID, which will be assisted to open accounts; and beneficiaries with neither. Around 40% of beneficiaries do not have phones and will use sub-distributors of mobile money operators and Paositra Malagasy offices (figure 27).
Figure 27. One of Madagascar’s payment options
Nigeria Nigeria's scale-up plans involve the use of phone-based know-your-customer (KYC) processes and mobile money transfers. Information collected through phone-based registration (in particular, beneficiary name, age, and address) will be shared by the government with mobile operators to perform light KYC verification procedures for beneficiaries. Following authentication, these operators will be able to transfer funds directly to beneficiaries through mobile money accounts. This does require building a registration infrastructure capable of sending and receiving mass messages and validating registration data (currently under development).
Sierra Leone Sierra Leone engaged third-party payment service providers (PSPs) for over-the-counter cash and e-payments. After enrolment, the MIS produced electronic payment orders that were sent to the government accounting and financial management system, and then onward to the PSP which
20 In Togo, mobile penetration, internet usage and mobile money rates are 82%, 61%, and 62%, respectively.
41
executed over-the-counter physical payments in the presence of Anti-Corruption Commission officers. Furthermore, by partnering with a commercial bank's e-payment platform (with agents in urban centers), the government was also able to provide beneficiaries with the option of receiving payments into a digital wallet that could be cashed out at their convenience. To ensure transfers are reaching their intended recipients, payments are being validated through the MIS with photo proof. A similar system is being created to allow PSPs to submit proof of payment directly to the government. Cote d'Ivoire In Cote d'Ivoire, pre-Covid partnerships with mobile money operators helped facilitate Covid response. The GoC decided to go with the same operator (Wizaal) in the regular urban safety net program, which is already active in urban areas for more than a year. The government's main goal was to move quickly, but this came at the expense of no competitive selection process. Individuals with smartphones will receive transfers through an electronic wallet. Individuals who do not have a smartphone but only a normal phone could receive an electronic transfer that they could cash out to the Payment providers cash-out points.
Mozambique In Mozambique, the government invested in digitalizing the payment delivery by procuring cell phones for the beneficiaries to allow them to receive payments into a digital wallet that can be cashed out at their convenience or transacted electronically. However, due to limitations in cell phone supply, not all beneficiaries received phones. Furthermore, beneficiaries received electronic bank accounts in areas with a high number of commercial banks. To overcome the ID barrier, the central bank allowed commercial banks and mobile operators to accept the project beneficiary ID card to be used as a legal ID to open an account. Similar arrangements were put in place in DRC (box 2)
Box 2. Special accounts for social protection payments in DRC In July 2020, the Central Bank of Congo issued Instruction #45, with which it implemented special accounts for beneficiaries of social protection payments. Social protection agencies are now able to set-up transaction accounts for beneficiaries of emergency programs. There are two type of special accounts, one for bank deposits (Type A) and other for electronic money (Type B). Special accounts can be used when the accountholder has been previously identified by a recognized social protection agency, including international organizations, and the holder can only have one special account. Information to identify accountholders must be provided by recognized social protection agencies and include the name, address, birth date and occupation. Also, documents to identify accountholders have been expanded and can now include letters issued by the Neighborhood Chiefs and presence in beneficiaries’ lists from recognized social protection agencies. The process for account opening can be carried-out remotely and will enable recognized social protection agencies to open accounts on behalf of beneficiaries. In order to limit financial integrity risks, special accounts have amount limits for deposits, withdrawals, balance and transfers. Important to note that transaction limits are higher when the process to open the account is done physically than when the process is carried-out remotely. Source: Gentilini et al (2020)
6. Emerging lessons
Design and implementation Lean design and simplicity have been signature principles to ensure rapid scale-up in the first phases of the pandemic. Countries that appear to have been particularly successful in rolling out urban safety nets in response to Covid-19 have programs that are relatively simple in design. In a way, the nature of the pandemic has made simplicity a necessity, with programs that tend to be unconditional and, in some cases, establishing broad-based eligibility criteria (e.g., Togo). Maintaining such simplicity has likely helped accelerate program response. For example, in Antananarivo and surrounding areas
42
nearly 33% of the population pre-registered for the cash transfer program through a process lasting only 10 days – and with the overall program went from conception to payments in just 1 month.
Balancing speed with proper communication is important. Because of proximity and connectivity, urban areas tend to present opportunities for high-speed implementation. However, it is important to balance speed and communication. Sierra Leone’s program was rapid in scale-up, but part of the implementation occurred before mass communication could be rolled out in full, hence limiting awareness-building among the population. Big data and other new sources of information are being deployed for fast emergency response as opposed to more intensive data-collection sources. Satellite images available at granular street-level are becoming routinely integrated in program design. These were combined with other information in several ways. In urban DRC and Nigeria, data from mobile phone service providers was obtained from areas identified via geotargeting. In Mozambique, high-resolution satellite imaginary generated not only urban poverty maps, but was also used to identify “catchment areas” for program enrollment.
Despite a variety of ongoing innovations in beneficiary identification, a few challenges emerge across case studies in geographic targeting, heterogenous communities, or “floating” populations. Ongoing experiences often point to the lack of clean demarcations between communities, like in Liberia; a national ID system with comprehensive coverage21; and the absence of migrant and refugee populations from existing databases. For instance, the planned scale-up of Cameroon's program faced the challenge of reaching internally displaced populations not included in government registries.
Programs are adapting several steps to make design and delivery more agile. Programs have attempted to make select processes more streamlined and time efficient. For example, an abbreviated proxy means tests in Liberia comprised 10 questions, while Mauritania’s “PMT plus" included 15 questions and was complemented by subjective perspectives from beneficiaries and enumerators. Adaptations also included undertaking select delivery functions simultaneously to improve timeliness. In Sierra Leone, the cash transfer program minimized the time between beneficiary registration and payment (indeed, even doing so simultaneously), which significantly improved transfers’ timeliness. Plans to do so are also underway in Nigeria.
Leveraging technology for payments is easier. Where infrastructure is adequate, such as Togo, payments are made almost completely digital. In Fact, the Novissi program developed a mobile money platform within 10 days. In other contexts, infrastructure and connectivity is less reliable and calling for flexible arrangements. Madagascar provided a suite of payment methods (about 40% of urban beneficiaries did not have phones), while Sierra Leone opted for over-the-counter cash and e-payments, including transferring cash to digital wallets that could be cashed out at people’s convenience. Where payments were made manually, authorities in the country found it challenging to enforce social distancing protocols and necessitated police presence. Queue management during payment in Madagascar was equally difficult. While measures were often well implemented inside payment locations, unexpected people gathered outside those premises with limited crowd control. Temporary urban registries and alternative information systems can facilitate rapid response. In Nigeria, a new Covid-19 special registry was introduced for urban dwellers not included in the National Social Registry. In Madagascar, data from registration was entered temporarily in a partner system and later uploaded onto the Ministry’s registry. In cases where “light” eligibility criteria were established, social registries weren’t necessary for implementation. In Togo, for example, relatively
21 In Liberia, acquiring an ID costs around $5.
43
simple criteria like citizenship, residency, and employment informality made the use of voter ID cards (and related database) the cornerstone of the program’s information system. Urban communities can also be mobilized for community targeting. The notion that communities in urban settings don’t exist or cannot be used effectively is somewhat disproved by case studies. Granted, urban communities differ from rural arrangements and need careful examination for operational purposes. In Madagascar, the Loharano Committee (inclusive of “respected” community members and chaired by the head of the Fokontany) played a major role in program pre-registration. Similarly, in Cote d’Ivoire community leaders or neighborhood chiefs collected information on people’s IDs, vulnerability information, phone number, etc. In Mauritania, a community-based approach in urban areas was challenging as local knowledge of “who knew who” was not as strong as in rural areas.
Partnerships, institutions and political economy Working with national as well as city (mayors) and municipal institutions important to overcome political economy challenges. Urban areas include multiple institutional actors. Especially in the capital, political attention can be heightened at the highest levels. Such attention was particularly acute in Madagascar and Sierra Leone. In particular, working directly with mayors – who tend to have a deeper and more technical knowledge of the cities’ institutions and conditions than national counterparts – is not a traditional arrangement for national cash transfers schemes, and it’s a feature that would likely recur in future urban safety net programs. Partnering with new and semi-formal actors help overcome capacity constraints, but come at a cost. In Sierra Leone, the second step in the targeting process utilizes lists provided by government as well as trade associations to identify households with informal workers. In Nigeria, the final stage of targeting uses a PMT, but also uses data from business associations, SMEs, and social groups. In Madagascar, the Cash Working Group including UN and NGOs played an important role in the targeting process, especially in the third leg of the methodology involving a simplified PMT formula. While these partnerships are helpful, they come at cost financially as well as from government capacity building point of view. Urban areas can amplify political visibility of programs. In Madagascar, program implementers navigated the challenge of high political visibility and local-national government relationships. The direct involvement and interest from the highest national officials, and their strong bonding with mayor-level offices, helped marshal the response; but at times, broad and sudden political announcements (e.g., not detailing eligibility criteria) required efforts to address beneficiaries’ requests for clarification. This was handled by leveraging existing grievance and redress mechanisms (96% of complaints were resolved favorably in less than a week). In Sierra Leone, urban political economy factors were significant. For instance, the targeting process had to be repeated following concerns over political favoritism and preferential access to the program. Re-listing beneficiaries and manually verifying their status significantly extended the payment timeline.
Strategic issues The Covid-19 crisis has brought to the fore the tremendous need for social protection to support Africa’s cities economic, social and spatial development. Cities are magnets of opportunity, and rising urban poverty is often part of the development process largely driven by urban economic growth. Yet the pattern of Africa’s “urbanization of poverty” process raises concerns. In general, the region’s fast urbanization process is not generating high-productivity jobs, with pervasive informality likely playing a dominant role in most urban labor markets. Millions or urban dwellers live just above the poverty line and are thus vulnerable to falling into poverty. At the same time, the haphazard nature of urbanization is accompanied by the proliferation of informal settlements or slums, which act as a
44
vector for the spread of pandemics such as Covid-19. High urban youth unemployment, social tensions, and growing exposure to natural disasters further compound the need for effective social protection systems as part of an integrated package of economic, social and spatial policies for urban upward mobility as well as mitigate any impacts of shocks. Framing social protection within an urban development narrative may facilitate policy uptake during post-crisis and recovery phases. Policymakers are sometimes skeptical about cash transfers or any form of social protection in urban areas. In fact, there can be deep seated concerns around generating “dependency”, work disincentives, and inducing urban congestion by encouraging migration from other areas. The persistence of such bias poses a key framing challenge for urban social protection. Granted, there is evidence that largely burst such “myths” on cash transfers. But such evidence may need to be conveyed a framework that reflects city priority functions. For example, urban public works for garbage collection can address “urban poverty”; but framing them in such way may not resonate fully with city administrators. Instead, developing a narrative that situates such public works within cities’ “sustainable waste management systems” could brighten the prospects for policy backing. Similar considerations apply to urban primary healthcare, transportation, and housing. This may require not retrofitting urban issues within a “social protection framework”, but rather locate social protection within the realm, terminology and perspectives of urban jobs, services and infrastructure. It’s not a zero-sum-game of urban “versus” rural social protection – but a systemic approach to both. While deserving renewed attention, urban areas should be seen as part of a continuum of a national social protection system – that is, they are part of the broader and interconnected interactions between rural, periurban and urban areas of various size. Value chains, domestic migration, infrastructure and other factors make urban and rural areas inextricably linked. The Covid crisis has exposed the perils from not having a social protection system that protects against vulnerabilities across space. To this effect, there is a need to combine social assistance, insurance and labor markets interventions in a coherent and connected way across the urban-rural space.
Evidence and learning Need for crisis preparedness, early warnings and objective scalability mechanisms. Countries in Africa will likely face a range of challenges, like a contracting economy, high levels of debt and increased pressures to cut public expenditures. Countercyclical expenditures allocated to sectors like social protection that show both promise of lowering deprivation as well as promoting economic activity among the vast informal sector in urban areas can be an effective and efficient policy response. Building a countercyclical social protection framework would require a strong emphasis on prevention and early warning systems. Currently, most of those systems are based on climatic risks, and there is a rich agenda for integrating them with health risks. Early warning systems, however, need to be connected with objective criteria for scale-up. Much of the current coverage expansions globally are based on “policy processes”: devising triggers for automatic scale up would be another promising area of action moving forward. At project level, promising practices like Sierra Leone’s inclusion of a contingency budget at project design phase helped enormously in the rapid scale-up of cash transfers. And Togo’s Novissi program is now expanding to rural areas as it becomes more firmly anchored to pandemic lockdown decisions. Calibrating the right level of “complexity” during recovery. As mentioned, design simplicity was at the core of emergency responses to Covid-19. The question then remains on “how complex” should programs be in the recovery phase. Insights from first-generation programs can help: for instance, beneficiaries’ opportunity costs for participation are high and bandwidth is largely absorbed by many competing priorities, such as time spent on commuting, suitable childcare, the need to cover expenses not always present in rural areas such as rents – or even lack of housing (e.g., Philippines). Hence, cash
45
transfers molded on rural models had to be made more flexible in urban areas (e.g., Mexico and Colombia). In fact, comprehensive, multi-component programs with several interrelated interventions seem to have had mixed success in the first phases of implementation (e.g., Ethiopia). Additional measures are added to complement regular cash transfers vary extensively by expected benefit, costs, scalability and implementation complexity. Quantifying such program benefits and costs in cities are a key area for further research. Combining nimble lessons-sharing and real-time learning with solid evaluations. A range of first-generation urban safety net programs were supported by robust evaluations, such as the UPSNP in Ethiopia. The second-generation is now only bulging, with emerging lessons – including those documented in this paper – largely based on interviews with key informants, implementation reports, and operational materials. These insights provide precious information for a range of stakeholders interested and involved in the urban social protection space. Moving forward, it would be important to combine the nimble identification and documentation of lessons with more structured evaluation and lessons-sharing initiatives.
46
References
Adhikari, S. and Gentilini, U. (2018) “Should I Stay or Should I Go: Do Cash Transfers Affect Migration?” World Bank, Policy Research Working Paper 8525. Washington, DC.
Boko, J., Alberro, L., Gueye, M., Ariss, A. and George, T. (2020) “Technical Note on Togo’s Novissi Program: Technology and Innovations for Africa’s Human Capital in the Face of the Covid-19 Crisis”. World Bank. Washington DC.
Burgin, A. and Gentilini, U. (2016) “Cross-country urban institutional arrangements for safety nets”. World Bank. Mimeo.
Devereux, S., Abdulai, A., Cuesta J., Gupte, J., Ragno, L., Roelen, K., Sabates–Wheeler, R. and Spadafora, T. (2018) “Can Social Assistance (with a Child Lens) Help in Reducing Urban Poverty in Ghana? Evidence, Challenges and the Way Forward”. UNICEF, Office of Research Innocenti Working Paper 2018-16. Firenze.
Gallego-Ayala, J. and Hailu, D. (2020) “Mozambique: the Productive Social Action Program (PASP) in urban areas”. Maputo.
Gentilini, U., Almenfi, M., Dale, P., Palacios, R., Natarajan, H., Galicia Rabadan, A., Okamura, Y., Blomquist, J., Abels, M., Demarco, G. and Santos, I. (2020) “Social Protection and Jobs Responses to Covid-19: A Real-Time Review of Country Measures”. World Bank, “Living Paper” v.14 (December 11). Washington DC.
Gentilini, U. (2020) “Social protection in urban areas: Emerging lessons and practices from cross country experiences”. Presentation at e-workshop on urban social protection. Harare and Washington DC.
Gentilini, U. (2017) “Social assistance in urban areas: Emerging issues, evidence and lessons from global practices”. Presentation at World Bank Social Safety Nets Core Course. Washington, DC.
Gentilini, U. (2015) “Entering the City: Emerging Evidence and Practices with Safety Nets in Urban Areas”. World Bank, Social Protection and Labor Discussion Paper 1504. Washington DC.
Gollin, D., Jedwab, R. and Vollrath, D. (2016) “Urbanization With and Without Industrialization”. Journal of Economic Growth 21(1): 35-70.
GoT (Government of Togo) (2020) “Novissi: Digital Cash Transfer Programme in Response to COVID 19”. Presentation at Government of Zimbabwe-World Bank e-workshop on urban safety nets (November 19).
Guven, M. and Karlen, R. (2020) “Supporting Africa’s urban informal sector: Coordinated policies with social protection at the core”. World Bank, Africa Can End Poverty blog (December 3).
Haider, E. (2020) “Energy and Social Unrest in Urban Areas”. Note prepared for the World Bank. Washington DC.
Hailu, D. (2020) “Case Studies of 15 Urban Safety Net and Labor Activation Programs from Around the World”. Paper prepared for the World Bank. Harare. Mimeo.
Kuo, L. (2016) “Four ways closing the world’s largest refugee camp will hurt Kenya.” Quarz Africa online note (June 17).
Lall, S. and Wahba, M. (2020) “Cities, crowding, and the coronavirus: Predicting contagion risk hotspots”. World Bank, Sustainable cities blog (April 23).
Madden, P. (2020) “Figures of the Week: Service Delivery in Africa’s Urban Areas”. Brookings. Washington, DC.
47
Moreira, V. and Gentilini, U. (2016) “Urban Safety Nets – Experiences from Three Countries: Benin, Republic of Congo, and Mali”. World Bank, Social Protection and Labor Discussion Paper 1614. Washington, DC.
OECD (2020) Africa's Urbanisation Dynamics 2020: Africapolis, Mapping a New Urban Geography. Paris.
Rahman, H., Hashemi, S. and Waz, M. (2020) “Structured Stocktaking and a Policy Roadmap towards Urban Social Protection in Bangladesh”. Power and Participation Research Centre, report preparaed for the World Bank. Dhaka.
Ravallion, M. (2016) The Economics of Poverty: History, Measurement and Policy. Oxford University Press.
Ravallion, M., Chen, S. and Sangraula, P. (2007) “New Evidence on the Urbanization of Global Poverty”. World Bank, Policy Research Working Paper 4199. Washington, DC.
Roever, S. and Rogan, M. (2020) “Informal Workers See a Long Road to Recovery Ahead – Unless Governments Act”. WIEGO Blog (November 22).
Sanchez Paramo, C. (2020) “The new poor are different: Who they are and why it matters”. World Bank LTD Blog (August 13).
Tigabu, D. and Abebe, G. (2019) “The Short-Term Effect of the Public Work and Direct Support Component of the UPSNP”. Addis Ababa.
Vermehren, A. and Manfredini Bohm, A. (2020) “The Ethiopia’s Urban Productive Safety Net Program”. World Bank. Addis Ababa.
Weber, M., Palacios-Lopez, A., and Contreras-González, I. (2020) “What We Have Learned About the Labor Market Impacts of COVID-19 in four African countries”. World Bank, Jobs and Development Blog 18.
World Bank (2020) Poverty and Shared Prosperity 2020: Reversals of Fortune. Washington, DC.
World Bank (2019) “Profiling Living Conditions of DRC Urban Population: Access to Housing and Services in Kinshasa Province”. Washington, DC.
Zapatero, E., Majoka, Z., Gallego-Ayala, J., Zini, M., Beck, P., and Ajwad, M. (2017) “Urban Safety Nets and Activation in Mozambique”. Maputo.
Social Protection & Jobs Discussion Paper Series Titles 2019-2021
No. Title 2101 Cash in the City: Emerging Lessons from Implementing Cash Transfers in Urban Africa By Ugo Gentilini, Saksham Khosla, and Mohamed Almenfi January 2021 2010 Safety nets, health crises and natural disasters: Lessons from Sierra Leone By Judith Sandford, Sumati Rajput, Sarah Coll-Black, and Abu Kargbo December 2020 2009 A Reforma do Bolsa Família: Avaliação das propostas de reforma debatidas em 2019 by Matteo Morgandi, Liliana D. Sousa, Alison Farias, e Fabio Cereda November 2020 2008 The Role of Social Protection in Building, Protecting, and Deploying Human Capital in the East Asia and
Pacific Region by Harry Edmund Moroz October 2020 2007 Boosting the Benefits of Cash Transfer Programs During the Early Years: A Case Study Review of
Accompanying Measures by Laura Rawlings, Julieta Trias, and Emma Willenborg October 2020 2006 Expansion of Djibouti’s National Family Solidarity Program: Understanding Targeting Performance of
the Updated Proxy Means Test Formula by Vibhuti Mendiratta, Amr Moubarak, Gabriel Lara Ibarra, John van Dyck, and Marco Santacroce August 2020 2005 Assessing the Targeting System in Georgia: Proposed Reform Options by Maddalena Honorati, Roberto Claudio Sormani, and Ludovico Carraro July 2020 2004 Jobs at risk in Turkey: Identifying the impact of COVID-19 by Sirma Demir Şeker, Efşan Nas Özen, and Ayşenur Acar Erdoğan July 2020 2003 Assessing the Vulnerability of Armenian Temporary Labor Migrants during the COVID-19 pandemic by Maddalena Honorati, Soonhwa Yi, and Thelma Choi July 2020 2002 Getting it Right: Strengthening Gender Outcomes in South Sudan by Samantha de Silva, Abir Hasan, Aissatou Ouedraogo, and Eliana Rubiano-Matulevich July 2020 2001 The Science of Adult Literacy by Michael S. C. Thomas, Victoria C. P. Knowland, Cathy Rogers January 2020
1936 Moving forward with ALMPs: Active labor policy and the changing nature of labor markets by Jose Manuel Romero and Arvo Kuddo November 2019 1935 Unbundled: A framework for connecting safety nets and humanitarian assistance in refugee settings by Karin Seyfert, Valentina Barca, Ugo Gentilini, Manjula Luthria, and Shereen Abbady September 2019 1934 Decentralization’s effects on education and health: Evidence from Ethiopia by Jean-Paul Faguet, Qaiser Khan, and Devarakonda Priyanka Kanth September 2019 1933 Extending Pension Coverage to the Informal Sector in Africa by Melis Guven July 2019 1932 What Employers Actually Want - Skills in demand in online job vacancies in Ukraine by Noël Muller and Abla Safir May 2019 1931 Can Local Participatory Programs Enhance Public Confidence: Insights from the Local Initiatives Support
Program in Russia by Ivan Shulga, Lev Shilov, Anna Sukhova, and Peter Pojarski May 2019 1930 Social Protection in an Era of Increasing Uncertainty and Disruption: Social Risk Management 2.0 by Steen Lau Jorgensen and Paul B. Siegel May 2019 1929 Developing Coherent Pension Systems: Design Issues for Private Pension Supplements to NDC Schemes by William Price April 2019 1928 Pensions in a Globalizing World: How Do (N)DC and (N)DB Schemes Fare and Compare on Portability
and Taxation? by Bernd Genser and Robert Holzmann April 2019 1927 The Politics of NDC Pension Scheme Diffusion: Constraints and Drivers by Igor Guardiancich, R. Kent Weaver, Gustavo Demarco, and Mark C. Dorfman April 2019 1926 Setting Up a Communication Package for the Italian NDC by Tito Boeri, Maria Cozzolino, and Edoardo Di Porto April 2019 1925 Sweden’s Fifteen Years of Communication Efforts by María del Carmen Boado-Penas, Ole Settergren, Erland Ekheden, and Poontavika Naka April 2019
1924 Information and Financial Literacy for Socially Sustainable NDC Pension Schemes by Elsa Fornero, Noemi Oggero, and Riccardo Puglisi April 2019 1923 Communicating NEST Pensions for “New” DC Savers in the United Kingdom by Will Sandbrook and Ranila Ravi-Burslem April 2019 1922 Harnessing a Young Nation's Demographic Dividends through a Universal NDC Pension Scheme: A Case
Study of Tanzania by Bo Larsson, Vincent Leyaro, and Edward Palmer April 2019 1921 The Notional and the Real in China’s Pension Reforms by Bei Lu, John Piggott, and Bingwen Zheng April 2019 1920 Administrative Requirements and Prospects for Universal NDCs in Emerging Economies by Robert Palacios April 2019 1919 Bridging Partner Lifecycle Earnings and Pension Gaps by Sharing NDC Accounts by Anna Klerby, Bo Larsson, and Edward Palmer April 2019 1918 The Impact of Lifetime Events on Pensions: NDC Schemes in Poland, Italy, and Sweden and the Point
Scheme in Germany by Agnieszka Chłoń-Domińczak, Marek Góra, Irena E. Kotowska, Iga Magda, Anna Ruzik-Sierdzińska, and
Paweł Strzelecki April 2019 1917 Drivers of the Gender Gap in Pensions: Evidence from EU-SILC and the OECD Pension Model by Maciej Lis and Boele Bonthuis April 2019 1916 Gender and Family: Conceptual Overview by Nicholas Barr April 2019 1915 Labor Market Participation and Postponed Retirement in Central and Eastern Europe by Robert I. Gal and Márta Radó April 2019 1914 NDC Schemes and the Labor Market: Issues and Options by Robert Holzmann, David Robalino, and Hernan Winkler April 2019 1913 NDC Schemes and Heterogeneity in Longevity: Proposals for Redesign by Robert Holzmann, Jennifer Alonso-García, Heloise Labit-Hardy, and Andrés M. Villegas April 2019
1912 Annuities in (N)DC Pension Schemes: Design, Heterogeneity, and Estimation Issues by Edward Palmer and Yuwei Zhao de Gosson de Varennes April 2019
1911 Overview on Heterogeneity in Longevity and Pension Schemes by Ron Lee and Miguel Sanchez-Romero April 2019
1910 Chile's Solidarity Pillar: A Benchmark for Adjoining Zero Pillar with DC Schemes by Eduardo Fajnzylber April 2019
1909 Sweden: Adjoining the Guarantee Pension with NDC by Kenneth Nelson, Rense Nieuwenhuis, and Susanne Alm April 2019
1908 The ABCs of NDCs by Robert Holzmann April 2019
1907 NDC: The Generic Old-Age Pension Scheme by Marek Góra and Edward Palmer April 2019
1906 The Greek Pension Reforms: Crises and NDC Attempts Awaiting Completion by Milton Nektarios and Platon Tinios April 2019
1905 The Norwegian NDC Scheme: Balancing Risk Sharing and Redistribution by Nils Martin Stølen, Dennis Fredriksen, Erik Hernæs, and Erling Holmøy April 2019
1904 The Polish NDC Scheme: Success in the Face of Adversity by Sonia Buchholtz, Agnieszka Chłoń-Domińczak, and Marek Góra April 2019
1903 The Italian NDC Scheme: Evolution and Remaining Potholes by Sandro Gronchi, Sergio Nisticò, and Mirko Bevilacqua April 2019
1902 The Latvian NDC Scheme: Success Under a Decreasing Labor Force by Edward Palmer and Sandra Stabina April 2019
1901 The Swedish NDC Scheme: Success on Track with Room for Reflection by Edward Palmer and Bo Könberg April 2019
To view Social Protection & Jobs Discussion Papers published prior to 2019, please visit www.worldbank.org/sp.
ABSTRACTPoverty and crises are rapidly “urbanizing”. Yet experience with operationalizing cash transfers in urban areas is limited. This paper captures early lessons from a new generation of urban cash transfer responses to Covid-19 in eleven African countries. The analysis contextualizes such initiatives within a longer-term trajectory of urban social protection programs from the early 2000s. A range of lessons emerge around design and implementation, partnerships, institutions and political economy, strategic issues, and evidence and learning.
ABOUT THIS SERIES Social Protection & Jobs Discussion Papers are published to communicate the results of The World Bank’s work to the development community with the least possible delay. This paper therefore has not been prepared in accordance with the procedures appropriate for formally edited texts.
For more information, please contact the Social Protection Advisory Service via e-mail: [email protected] or visit us on-line at www.worldbank.org/sp