Embed Size (px)
Citation preview

A
tntdlsu©
J
K
R
mAsM
P
h1
Available online at www.sciencedirect.com
ScienceDirectHOSTED BY
EconomiA 15 (2014) 243–260
Evidence of eligibility manipulation for conditionalcash transfer programs
Sergio Firpo a,b, Renan Pieri a, Euclides Pedroso Jr. c, André Portela Souza a,∗a C-Micro – FGV, Escola de Economia de São Paulo (EESP) – FGV, Brazil
b IZA, Germanyc Escola de Economia de São Paulo (EESP) – FGV, Brazil
Received 29 January 2014; received in revised form 1 August 2014; accepted 2 September 2014Available online 17 October 2014
bstract
This paper assesses whether eligibility for conditional cash transfer programs has been manipulated, as well as the impact ofhis phenomenon on time allocation within households. To perform this analysis, we use data from the 2006 PNAD (Brazilianational household survey) and investigate the eligibility manipulation for the Bolsa Família (Family Stipend) program during thisime period. The program assists families with a monthly per capita income of around R$120.00 (US$60.00). By applying the testseveloped by McCrary (2008), we find suggestive evidence that individuals manipulate their income by voluntarily reducing theirabor supply in order to become eligible to the program. Moreover, the reduction in labor supply is greater among women, especiallyingle or divorced mothers. This evidence raises some concern about the unintended consequences related to the eligibility criteriatilized by Bolsa Família, as well as the program’s impact on individuals living in extreme poverty.
2014 Production and hosting by Elsevier B.V. on behalf of National Association of Postgraduate Centers in Economics, ANPEC.
EL classification: I38; O15
eywords: Conditional cash transfers; Brazilian Bolsa Família; Regression discontinuity; Eligibility manipulation
esumo
O artigo investiga a manipulacão para a elegibilidade de programa de transferência condicional de renda bem como se essaanipulacão se dá através de mudancas da alocacão do tempo dos membros da família. Para tanto, ele utiliza os dados da Pesquisa Pormostragem Domiciliar 2006 (PNAD/IBGE) no Brasil e investiga a a manipulacão para elegibilidade no Bolsa Família. O programa
e dirige a famílias com renda per capita familiar inferior a R$120 (US$ 60.00) mensais. utilizando-se os testes desenvolvidos porcCrary (2008), se encontram evidências sugestivas que indivíduos manipulam suas rendas reduzindo voluntariamente sua oferta
∗ Corresponding author at: Sao Paulo School of Economics, Getulio Vargas Foundation, Rua Itapeva 474, 12 andar, sala 1205, 01332-000 Saoaulo, SP, Brazil. Tel.: +55 1137993358.
E-mail address: [email protected] (A.P. Souza).Peer review under responsibility of National Association of Postgraduate Centers in Economics, ANPEC.
ttp://dx.doi.org/10.1016/j.econ.2014.09.001517-7580 © 2014 Production and hosting by Elsevier B.V. on behalf of National Association of Postgraduate Centers in Economics, ANPEC.

244 S. Firpo et al. / EconomiA 15 (2014) 243–260
de trabalho. esta reducão é maior entre as mulheres solteiras e chefes de família. Estas evidências levantam algumas preocupacõessobre as consequências não intencionais dos critérios de elegibilidade do Bolsa Família e dos seus impactos sobre a pobreza e bemestar das famílias.© 2014 Production and hosting by Elsevier B.V. on behalf of National Association of Postgraduate Centers in Economics, ANPEC.
Palavras chaves: Transferências Condicionais de Renda; BolsaFamília; Regressão com Descontinuidade; Manipulacão de Elegibilidade
1. Introduction
Brazil is a country known to have a high level of income inequality with a Gini coefficient of per capita householdincome of approximately 0.54 (IPEADATA, 2013). Aside from this factor, Brazil also has significant levels of bothpoverty and extreme poverty. In 2009, about 21.4% and 7.3% of the population was poor and extremely poor, respectively(IPEADATA, 2013).
In order to help combat this poverty, a conditional cash transfer program – the Bolsa Família Program (PBF)1
– was created in 2004. The goal of the program was to increase the income level of economically underprivilegedsubpopulations, as well as generate direct incentives for children to improve their education and health outcomes.By 2013, there were around 14 million families participating in the program, encompassing more than 50 millionindividuals. The total value of the cash transfers reached more than 0.5% of the Brazilian Gross Domestic Product(GDP).
According to Foguel and Ulyssea (2007), public transfers have accounted for the major source of non-work relatedincome in the past few years. Some studies, such as those by de Barros et al. (2007a,b,c), Hoffmann (2006), Soareset al. (2006), and Cury et al. (2009), find that the PBF has had a positive impact PBF on the reduction of incomeinequality and poverty in Brazil. Ferro and Kassouf (2003), Cardoso and Souza (2004), Bourguignon et al. (2004),and Glewwe and Kassouf (2012) note the positive effect that conditional cash transfer programs have on increasingthe school attendance of children whose families are beneficiaries. However, there is no evidence of positive impacton vaccination (CEDEPLAR, 2007).
However, since per capita household income is one of the eligibility criteria for the PBF, the program may haveadverse effects on agents’ labor supply. For example, individuals with incomes slightly higher than the maximumlevel for participation in the program would be encouraged to reduce their labor supply in order to meet the eligibilitycriteria.
Manipulation of income may shift the focus away from the subpopulation of interest, for which the benefit is badlyneeded. Data for 2012 show that there were 16.2 million people in Brazil with a monthly income per capita less thanR$70.00, which is the extreme poverty line (World Bank, 2013). Hence, if non-eligible individuals benefit from theprogram, those most in need are likely to be excluded from the PBF as the budget becomes larger than expected.
The aim of this paper is to ascertain possible manipulation in the eligibility status for the PBF and verify if themanipulation is performed by behavioral changes on the time allocation of the individuals within the households. Thismanipulation is assessed by the test developed by McCrary (2008), which determines the presence of discontinuity inthe density estimated by local linear regressions around the cutoff that defines the eligibility for the program, whichwas R$120.00 (US$60.00) in terms of monthly per capita household income in 2006. Next, we use a fuzzy regressiondiscontinuity design in order to obtain evidences of the eligibility manipulation by changes on time allocation.
The paper contributes to the public debate of social policy design. Particularly, there is a debate whether thetargeting of social programs should be means tested or proxy-means tested. A means tested targeting strategy impliesthat household with income below certain thresholds qualify to the program. This is the case of Bolsa Familia program.On the other hand, a proxy-means tested strategy makes program eligibility to depend on a composite score of ahousehold’s characteristic such as asset holdings, demographic composition, and dwelling characteristics that are
proxies for household income. This is the case of the Oportunidades program in Mexico.The advantage of the means-tested targeting strategy is its simplicity and low cost (less information collectionrequired, easiness to compute, etc.). Its drawback is that it may increase the probability of including non-eligible
1 Throughout the paper we use the Portuguese version of the acronym (Programa Bolsa Família).

fcHi
Th
tnc
2
IAI2a
fRwecatt
••
•
oia
ats
i
H
S. Firpo et al. / EconomiA 15 (2014) 243–260 245
amilies because household may lie about their true income. On the other hand, the proxy-means testing decreases thehances of inclusion error because household’s asset holdings and other characteristics are more difficult to manipulate.owever, the disadvantage is that it may increase the chance of exclusion error. The program may not react properly
n case of families that suffer a negative income shock and become eligible to the program.Although this is an important debate, there is scant evidence on the advantages or disadvantages of each strategy.
his paper sheds new light to this debate by showing that means-tested targeting leads to inclusion error, becauseouseholds change their behavior in order to become eligible to the program.2
Including this introduction, the paper is organized into six sections. Section 2 describes the main characteristics ofhe PBF and the incentives associated with participation. The construction of the database and the sample selected areoted in Section 3. Section 4 describes the methodology. Results are presented in Section 5, while Section 6 offers ouronclusions.
. The Bolsa Família Program
The PBF is a conditional cash transfer program officially launched by the Brazilian federal government in 2004.t consisted of a merger of several existing social programs, such as the cooking gas subsidy, the National Schoolllowance Program, the Food Card Program, the Food Allowance Program, and the Child Labor Eradication Program.3
n this section, the description of the PBF relates to 2006 because the data used in this study were obtained from the006 PNAD (Brazilian national household survey). In that year, the supplement of the survey collected informationbout the conditional cash transfer programs.4
In 2006, a household needed to have a monthly per capita household income equal or below to R$120.00 to qualifyor the PBF. “Poor” families, defined as those with a monthly per capita household income between R$60.00 and$120.00, were eligible if they had children younger than 15 years of age, or if family members included pregnantomen or breastfeeding mothers. If these factors existed, the family would receive a variable transfer of R$15.00 for
ach child (or pregnant woman or breastfeeding mother), restricted to a maximum of three transfers per household. Forases in which the monthly household income was lower than R$60.00, the families were classified as “extremely poor”nd received a basic transfer of R$50.00, even if there were no children, pregnant women or breastfeeding mothers inhe household. In addition, these families could receive a variable transfer of R$15.00 per beneficiary (not to exceedhree beneficiaries).
In order to qualify for the R$15.00 variable cash transfer, households needed to meet the following requirements:
Children aged 6–15 years old had to be enrolled in school and have a school attendance rate of at least 85%. Pregnant women and breastfeeding mothers were required to attend prenatal and postnatal visits, according to the
timetable established by the Brazilian Ministry of Health. Children up to seven years of age had to be up-to-date with the recommended vaccine schedule.
Families failing to meet these requirements were subject to gradual penalties, including notification, cancellationf the cash transfer, and exclusion from the program. Nevertheless, no severe penalties exist for manipulating incomenformation. Income verification for participation in the program depends on the institutional framework of each region,nd this data is seriously compromised by the fact that a large number of beneficiaries hold informal job contracts.
With these imposed requirements, it is reasonable to assume that violations linked to mandatory school attendancere the most likely to incur severe penalties. In addition, the Ministry of Social Development (MDS), which manageshe PBF, relies on the state and municipal public education systems to check whether the requirements are properly
atisfied.The effects on labor supply of programs similar to the PBF have been addressed by comprehensive studies, chieflyn the United States and in the United Kingdom (e.g., Moffitt, 1992; Blundell and Macurdy, 1999; Eissa et al., 2006).
2 The authors would like to thank an anonymous referee for highlighting this point.3 The program is pursuant to law 10.836, as of January 9, 2004, and is currently managed by the Brazilian Ministry of Social Development andunger Eradication.4 Additional information about the program is available at www.mds.gov.br.
246 S. Firpo et al. / EconomiA 15 (2014) 243–260
There are a sizeable number of empirical studies focusing on disincentives to labor force participation due toconditional cash transfer programs adopted by developing countries. However, the findings are not conclusive. Forinstance, Parker and Skoufias (2000) and Skoufias and di Maro (2006) investigated the Mexican program Oportunidadesand did not find disincentives to contributing to the labor supply among adult workers. Likewise, Edmonds and Schady(2008) also suggest that Ecuador’s Bono de Desarrollo Humano (BDH) program did not produce effects on the rate ofparticipation of adult individuals in the labor market. On the other side of the spectrum, Maluccio and Flores (2005)showed that Nicaragua’s Red de Protección Social (RPS) program significantly reduced hours worked among adultmale workers, but not among adult female workers.
Recently, several studies have sought to determine the effects of the PBF and other conditional cash transfer programson adult labor supply in Brazil (e.g., Soares et al., 2007; Ferro and Nicollela, 2007; Tavares, 2008; Teixeira, 2008; Covreet al., 2008; Foguel and de Barros, 2008). In general, these analyses on the adverse incentives related to conditionalcash transfer programs have also led to distinct conclusions. These studies use different empirical strategies to compareall beneficiaries against observationally similar non-beneficiaries. The program has a set of incentives that can affectthe adult labor supply in opposing directions. On one hand, the income transfer may lead to a decrease in labor supply ifleisure is a normal good. On the other hand, the conditionalities related to the time allocation of children and adolescentsmay change adult time allocation, which may increase this group’s labor supply. Thus far, the empirical studies estimatethe net effect of these different channels.
Our present study contributes to the literature in two ways. Firstly, we find evidence that indicates income eligibilitymanipulation for a conditional cash transfer program. Secondly, our study shows that this manipulation occurs (in part)through a decrease in the labor supply of adult members for those families on the margin of qualifying for the PBF.
3. Dataset and sample selection
The data used in the present study were obtained from the Brazilian national household survey (PNAD) conductedin 2006. The Brazilian Institute of Geography and Statistics (IBGE) conducts the PNAD on an annual basis. Thesurvey covers all regions of Brazil (except for some rural areas). Around 75,000 households (300,000 individuals)are interviewed. The PNAD general questionnaire collects information about social, demographic, and economiccharacteristics of the individuals and households.
For each year, there is a specific questionnaire, aside from the general one, that gathers information about a specifictopic or issue. The 2006 PNAD is especially useful in identifying which households had at least one PBF beneficiary.However, the PNAD does not have a specific variable to assess the cash transfers an individual receives from socialprograms. Cash transfers from these programs are included in the V1273 variable, along with the interest generatedfrom savings accounts and other financial applications, dividends, and other revenues.
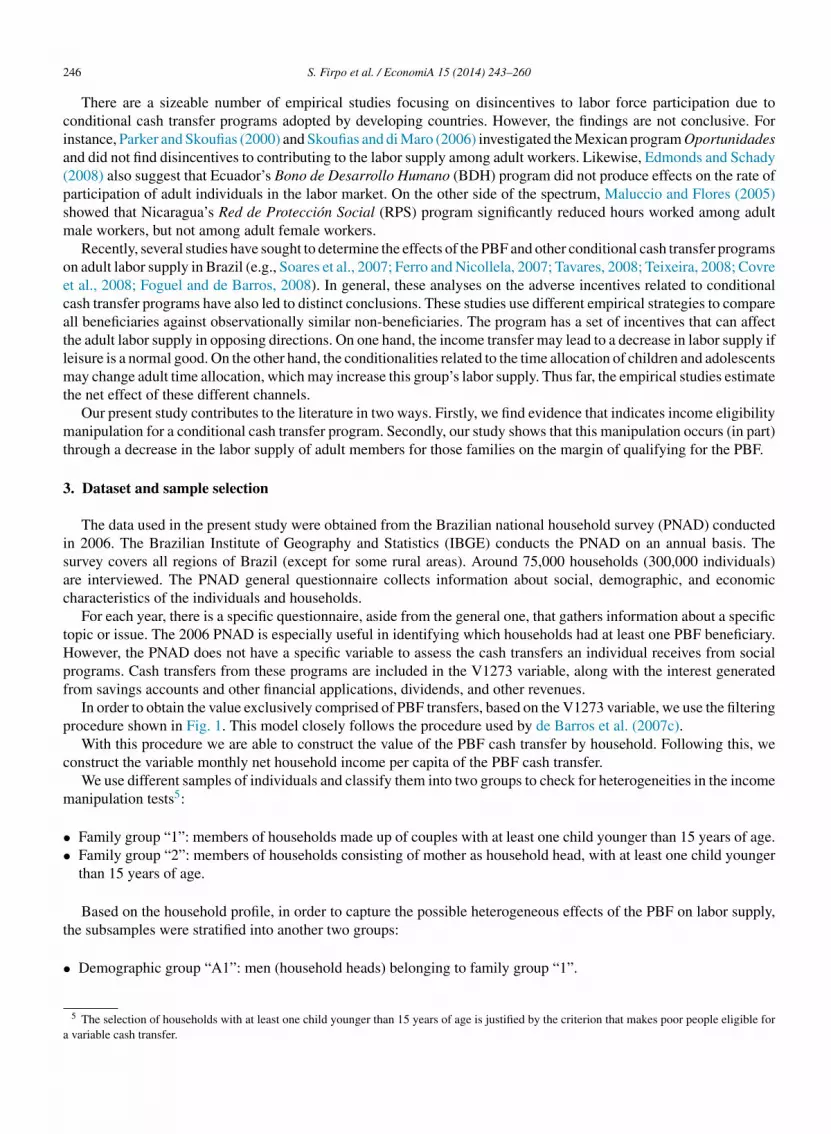
In order to obtain the value exclusively comprised of PBF transfers, based on the V1273 variable, we use the filteringprocedure shown in Fig. 1. This model closely follows the procedure used by de Barros et al. (2007c).
With this procedure we are able to construct the value of the PBF cash transfer by household. Following this, weconstruct the variable monthly net household income per capita of the PBF cash transfer.
We use different samples of individuals and classify them into two groups to check for heterogeneities in the incomemanipulation tests5:
• Family group “1”: members of households made up of couples with at least one child younger than 15 years of age.• Family group “2”: members of households consisting of mother as household head, with at least one child younger
than 15 years of age.
Based on the household profile, in order to capture the possible heterogeneous effects of the PBF on labor supply,
the subsamples were stratified into another two groups:• Demographic group “A1”: men (household heads) belonging to family group “1”.
5 The selection of households with at least one child younger than 15 years of age is justified by the criterion that makes poor people eligible fora variable cash transfer.
S. Firpo et al. / EconomiA 15 (2014) 243–260 247
Fig. 1. Filtering procedure for calculation of the PBF value. Notes: MW ⇒ minimum wage in September 2006 used as reference (R$260.00). Valuesequal to, or a multiple of, constant MW in the V1273 variable are attributed to cash transfer from the Continuous Cash Benefit (BPC) program, asis explained in de Barros et al. (2007c); Typical Values = Typical values of PBF and correlates, as well as their combinations, as illustrated in Table6p
••
a
Wccip
dc
n(nm
finabb
in de Barros et al. (2007c). Values close to “Typical Values” (±R$5.00) were considered in order to make up for possible incorrect informationrovided by the respondent.
Demographic group “B1”: women (mothers) belonging to family group “1”. Demographic group “B2”: women (mothers) belonging to family group “2”.
We perform our empirical analysis separately for each demographic group. The descriptive statistics of the samplesre presented in Table 1.
In Table 1, the descriptive statistics for family groups “1” and “2” are presented together, as well as separately.ithin a group, the statistics are presented separately for beneficiaries and non-beneficiaries. The average monthly per
apita household income of PBF beneficiaries, discounted from the cash transfer values for the whole sample, is quitelose to the eligibility criterion (R$120.00). For family group “1,” the average monthly per capita household incomes slightly greater (1.2%) than the cutoff point, whereas for family group “2,” that figure is 7.6% lower than the cutoffoint.
It is important to note that the average number of children is larger for PBF beneficiaries and that the geographicalistribution between the two groups is different, since approximately 50% of beneficiaries live in the northeast, inontrast to non-beneficiaries. Non-white individuals are the overwhelming majority among beneficiaries.
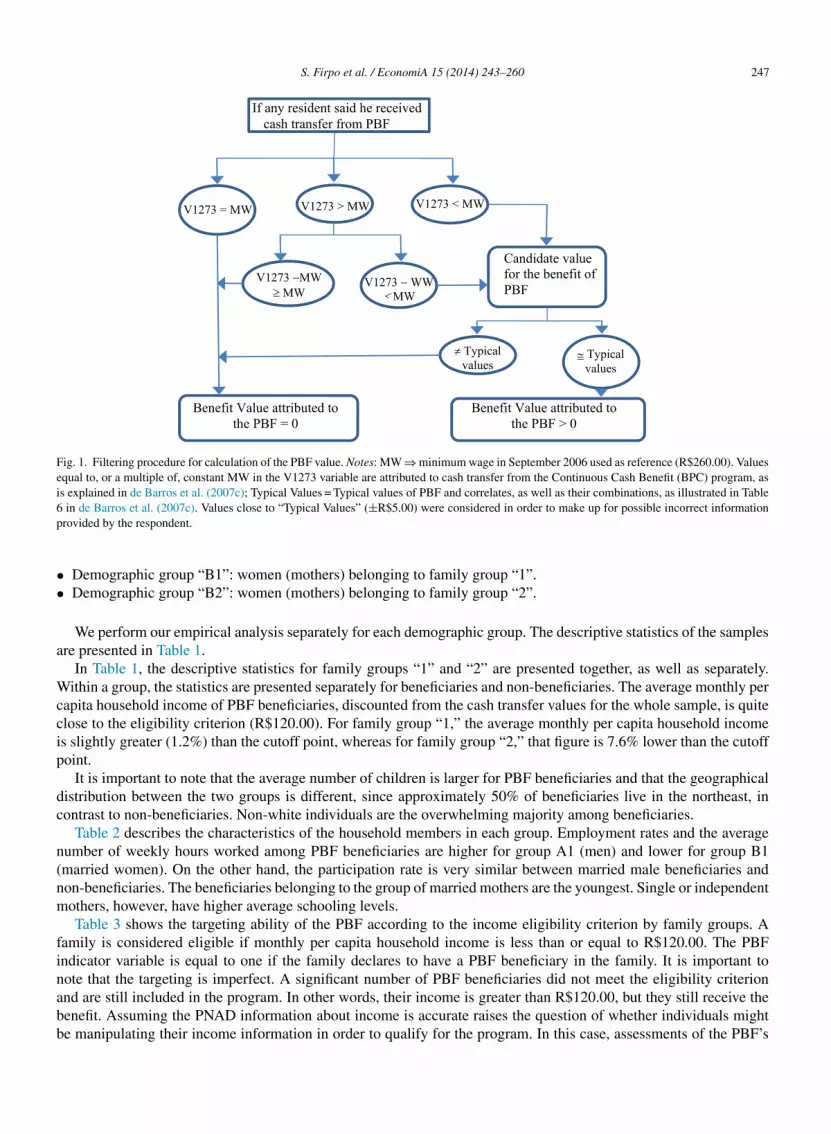
Table 2 describes the characteristics of the household members in each group. Employment rates and the averageumber of weekly hours worked among PBF beneficiaries are higher for group A1 (men) and lower for group B1married women). On the other hand, the participation rate is very similar between married male beneficiaries andon-beneficiaries. The beneficiaries belonging to the group of married mothers are the youngest. Single or independentothers, however, have higher average schooling levels.Table 3 shows the targeting ability of the PBF according to the income eligibility criterion by family groups. A
amily is considered eligible if monthly per capita household income is less than or equal to R$120.00. The PBFndicator variable is equal to one if the family declares to have a PBF beneficiary in the family. It is important toote that the targeting is imperfect. A significant number of PBF beneficiaries did not meet the eligibility criterion
nd are still included in the program. In other words, their income is greater than R$120.00, but they still receive theenefit. Assuming the PNAD information about income is accurate raises the question of whether individuals mighte manipulating their income information in order to qualify for the program. In this case, assessments of the PBF’s
248 S. Firpo et al. / EconomiA 15 (2014) 243–260
Table 1Descriptive statistics of family groups.
Variables Family groups “1” + “2” Family group “1” Family group “2”
PBF = 1 PBF = 0 PBF = 1 PBF = 0 PBF = 1 PBF = 0
Observations 10,796 34,767 9184 30,299 1612 4468
(A) Household characteristicsMonthly household income per capita (Avg., in R$)
With Transfera 134.68 453.20 135.59 464.71 129.48 375.12Without Transfer 119.90 453.20 121.48 464.71 110.87 375.12
Number of children (Avg.)Total 2.7 2.0 2.7 2.0 2.6 2.0<15 years 2.3 1.7 2.3 1.7 2.1 1.5
RegionNorth 1427 4566 1243 4012 184 554
(13.2%) (13.1%) (13.5%) (13.2%) (11.4%) (12.4%)Northeast 5626 8389 4879 7251 747 1138
(52.1%) (24.1%) (53.1%) (23.9%) (46.3%) (25.5%)Southeast 2064 10,935 1691 9545 373 1390
(19.1%) (31.5%) (18.4%) (31.5%) (23.1%) (31.1%)South 994 6331 800 5535 194 796
(9.2%) (18.2%) (8.7%) (18.3%) (12.0%) (17.8%)Central West 685 4546 571 3956 114 590
(6.3%) (13.1%) (6.2%) (13.1%) (7.1%) (13.2%)
(B) Characteristics of household headsSex
Male 8526 27,883 8526 27,883 0 0(79.0%) (80.2%) (92.8%) (92.0%) (0.0%) (0.0%)
Female 2270 6884 658 2416 1612 4468(21.0%) (19.8%) (7.2%) (8.0%) (100.0%) (100.0%)
RaceWhite 3274 17,223 2789 15,115 485 2108
(30.3%) (49.5%) (30.4%) (49.9%) (30.1%) (47.2%)Other 7522 17,544 6395 15,184 1127 2360
(69.7%) (50.5%) (69.6%) (50.1%) (69.9%) (52.8%)
Years of schooling (Avg.) 4.3 7.8 4.1 7.7 5.1 8.0Age (Avg.) 38.2 37.8 38.3 37.7 37.3 38.0
Source: PNAD/IBGE (2006).Family group “1”: families made up of couples with at least one child younger than 15 years of age.Family group “2”: families made up of mother (household head) with at least one child younger than 15 years of age.
a “With Transfer” designates families that received the extra payment because of the number of children eligible for the program.
impact PBF on outcomes relied on the variation of participation in the program, based on the discontinuity of a runningvariable that determines the eligibility criterion will likely be biased.
Fig. 2 shows the kernel density functions for the monthly net household income per capita of the PBF transfers in2006. First, the average income of recipients is below the income cutoff for eligibility (R$120.00). Another importantcharacteristic of recipient households is the existence of a larger concentration of observations below the cutoff value,compared to the distribution of non-recipients. Despite the greater proportion of beneficiaries among poor families,there are a non-negligible number of PBF participants whose monthly per capita household income is higher than thecutoff value. These characteristics raise two possibilities:
a) The focus of the program was appropriate as the mean of the average per capita household income, discounted fromthe cash transfers, is much lower than the eligibility cutoff.
S. Firpo et al. / EconomiA 15 (2014) 243–260 249
Table 2Descriptive statistics of family group members.
Variables Demographic group A1 Demographic group B1 Demographic group B2
PBF = 1 PBF = 0 PBF = 1 PBF = 0 PBF = 1 PBF = 0
Observations 9184 30,299 9184 30,299 1612 4468
(A) Characteristics of individualsLabor force participation rate 95.4% 95.8% 61.6% 64.6% 78.2% 82.9%Employment rate 91.5% 93.1% 55.6% 58.6% 68.9% 75.9%Hours worked if employed (Avg.) 45.7 46.9 28.5 36.2 35.6 39.9Years of schooling (Avg.) 4.1 7.7 4.8 8.2 5.1 8.0Age (Avg.) 38.6 37.9 34.1 33.9 37.3 38.0Race
White 2777 15,088 2816 15,493 485 2108(15.5%) (84.5%) (15.4%) (84.6%) (18.7%) (81.3%)
Other 6407 15,211 6368 14,806 1127 2360(29.6%) (70.4%) (30.1%) (69.9%) (32.3%) (67.7%)
(B) Household characteristicsMonthly household income per capita (Avg., in R$)
With Transfer 135.59 464.71 135.59 464.71 129.48 375.12Without Transfer 121.48 464.71 121.48 464.71 110.87 375.12
Number of children (Avg.)Total 2.7 2.0 2.7 2.0 2.7 2.0<15 years 2.3 1.7 2.3 1.7 2.3 1.7
RegionNorth 1243 4012 1243 4012 184 554
(23.7%) (76.3%) (23.7%) (76.3%) (24.9%) (75.1%)Northeast 4879 7251 4879 7251 747 1138
(40.2%) (59.8%) (40.2%) (59.8%) (39.6%) (60.4%)Southeast 1691 9545 1691 9545 373 1390
(15.0%) (85.0%) (15.0%) (85.0%) (21.2%) (78.8%)South 800 5535 800 5535 194 796
(12.6%) (87.4%) (12.6%) (87.4%) (19.6%) (80.4%)Central West 571 3956 571 3956 114 590
(12.6%) (87.4%) (12.6%) (87.4%) (16.2%) (83.8%)
Source: PNAD/IBGE (2006).Demographic group “A1”: men (household heads) belonging to family group “1”.Demographic group “B1”: women (married mothers) belonging to family group “1”.Demographic group “B2”: women (single mothers) belonging to family group “2”.
Table 3Frequency of PBF beneficiaries and non-beneficiaries according to the eligibility criterion (cutoff = R$120.00).
Beneficiaries Eligibility
Family groups “1” + “2” Family group “1” Family group “2”
Di = 1 Di = 0 Di = 1 Di = 0 Di = 1 Di = 0
PBF = 1 6701 4095 5671 3513 1030 582PBF = 0 6810 27,957 5,741 24,558 1069 3399
Total 13, 511 32,052 11,412 28,071 2099 3981
Source: PNAD/IBGE (2006).Eligible if monthly household income per capita is less than or equal to R$120.00. Ineligible, otherwise.Family group “1”: families made up of couples with at least one child younger than 15 years of age.Family group “2”: families made up of mother (household head) with at least one child younger than 15 years of age.

250 S. Firpo et al. / EconomiA 15 (2014) 243–260
0.0
02.0
04.0
06
Den
sity
0 60 12 0 18 0 24 0 30 0 36 0 42 0
Monthly Income Per Capita (i n Reais)
Non-benefited familiesBenefited families
Fig. 2. Kernel density of monthly household income per capita, 2006.
b) The household income criterion encourages people to behave opportunistically and creates a classical moral hazardsituation. Some people on the margin of the threshold voluntarily reduce their labor market participation or theirworking hours in order to become eligible for the program.
4. Methodology
4.1. McCrary’s test
McCrary (2008) suggests that if there is a discontinuity in the density of the running variable at the program’seligibility threshold, this may imply that some agents were able to perfectly manipulate their treatment status. In ourcase, this phenomenon means that the allocation of the household from one side of the cutoff point to the other ismanipulated. This is done by participants either altering their household income or by omitting information about it tothe policy maker.
We use the density test proposed by McCrary (2008) to check whether there is evidence of discontinuity in thedensity of the monthly per capita household income at the cutoff value for the eligibility criterion. This procedure is alocal linear density estimator performed in two stages: the first step estimates a per capita household income histogram,while the second phase smoothens the histogram on each side of the cutoff point using a local linear regression. Sinceit is a test of the existence of discontinuity in the density, the estimation uses the entire distribution of the monthlyper capita household income. After this computation, a Wald estimator is used to test the null hypothesis of whetherdiscontinuity is equal to zero around the cutoff.
4.2. Regression discontinuity design
In order to further investigate whether individuals manipulate their eligibility status by changing their income throughlabor supply decisions, we evaluate the effect of being qualified for the PBF on a series of individual outcomes. Weestimate the following type of regression:
yi = α + βDi + g(Ri) + θXi + ui, i = 1, . . ., n (1)
where g(Ri) = ψ00 + ∑Jj=1ψ1j(Ri − R)j + ∑J
j=1γj(Ri − R)jDi.

S. Firpo et al. / EconomiA 15 (2014) 243–260 251
Eq. (1) specifies the relationship of an outcome variable yi and the indicator variable Di = 1[Ri ≤ R] of programeligibility, g(Ri) and additional controls Xi. The outcomes of interest are: an indicator variable, of PBF participation; anindicator variable of labor market participation; an indicator variable, if the individual is working in the labor market;and the number of weekly hours worked in the labor market. The indicator variable Di assumes a value equals one ifthe individual ex ante income Ri is equal or below the threshold value R of the eligibility criterion for participation inthe PBF. The function g(Ri) is a polynomial based on the individual ex ante income centered at the cutoff given by theeligibility criterion. Xi is a vector of additional controls and includes region dummies, sector of activity, race, age, agesquared, years of schooling, and a dummy variable indicating whether an individual holds a formal job.
The coefficient of interest is β. This term measures the difference in the outcome between an individual located rightbelow the cutoff point R and an individual immediately above this threshold. Two points are worth emphasizing here.First, we test parametrically if there are discontinuities around the eligibility cut-off criterion for program participationand labor supply outcomes separately. Since being below or above the cut-off does not perfectly predict participation,we refer to these estimations as “fuzzy” regression discontinuity estimators.
Second, for this exercise we do not perform a Wald estimator using a classical fuzzy regression discontinuity designwhere the indicator variable of program eligibility serves as excluded instrument in a first stage regression of programparticipation. The reasons are that the instrument may not be exogenous and we rather want to know if there aresuggestive evidences that the program participation is manipulated by labor supply responses.
5. Results
5.1. Manipulation tests
Figs. 3–5 show the density of monthly household per capita income net of the transfer values received by beneficiaries.Fig. 3 represents the density for family groups “1” and “2” jointly, and Figs. 4 and 5 illustrate the individual densities forfamily groups “1” and “2” respectively. All of the figures have significant discontinuity around the eligibility criterionof R$120.00. It is important to note that the density of the sample is increasing from having zero income to R$120.00.The density is also decreasing to the right from the cutoff of R$120.00.
Additionally, we perform the McCrary density tests for different cutoff values. The results are presented inFigs. 6 and 7. We estimated household income density functions with cutoff points of R$150.00 and R$140.00 for
0.0
05.0
1.0
15
Den
sity
0 12 0 24 0 36 0 48 0 60 0 72 0 84 0 96 0
Monthly Income Per Capita (in Reais)
Fig. 3. Normalized density of the PBF eligibility variable – cutoff = R$120.00 (family groups “1” and “2”).

252 S. Firpo et al. / EconomiA 15 (2014) 243–260
0.0
05.0
1.0
15
Den
sity
0 12 0 24 0 36 0 48 0 60 0 72 0 84 0 96 0
Monthly Inco me Per Ca pita (in Re ais)
Fig. 4. Normalized density of the PBF eligibility variable – cutoff = R$120.00 (family group “1”).
0.0
02.0
04.0
06.0
08.0
1
Den
sity
0 12 0 24 0 36 0 48 0 60 0 72 0 84 0 96 0
Monthly Inco me Per Ca pita (in Re ais)
Fig. 5. Normalized density of the PBF eligibility variable – cutoff = R$120.00 (family group “2”).
family groups “1” and “2” respectively. These two figures indicate that the densities on the right and left sides of thecutoff points are similar.
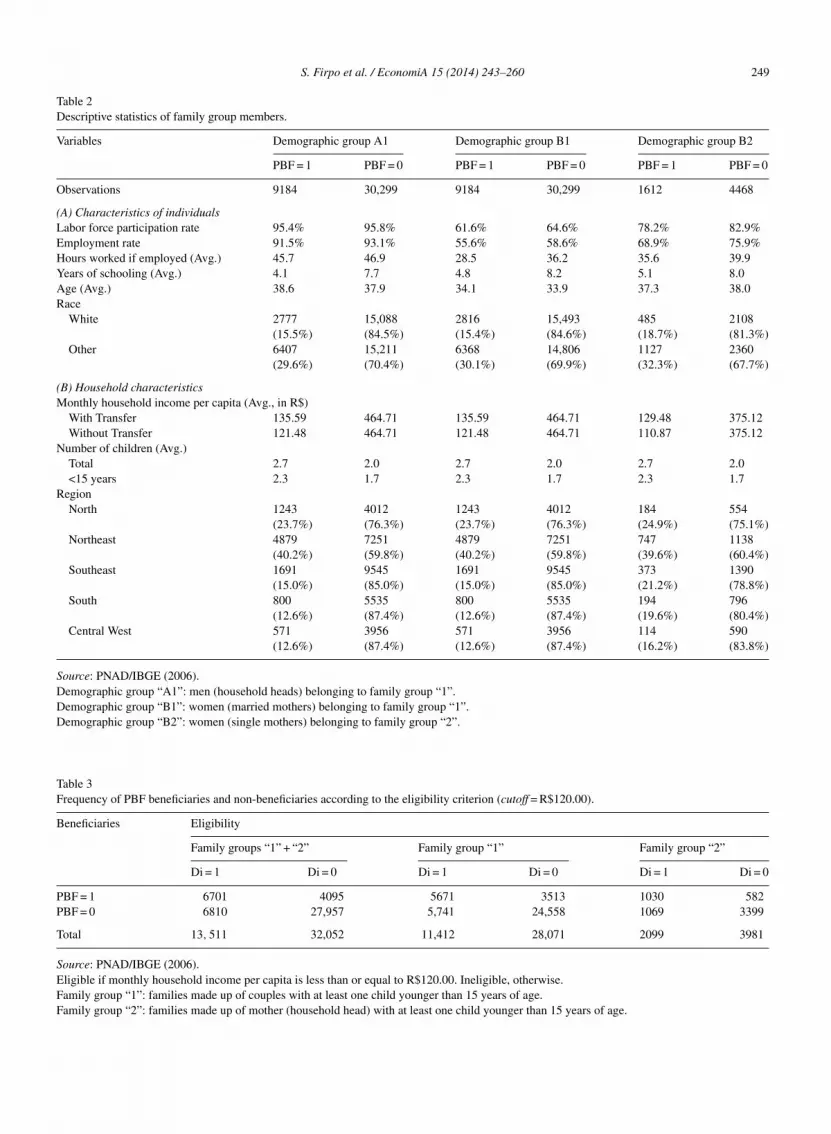
We also perform the McCrary test for the distribution of the logarithm of income. In this case, we drop all observationswith zero income. Table 4 shows the discontinuity estimates in logarithm of household income per capita, accordingto the local linear density estimator proposed by McCrary (2008). There are discontinuities for all family groups
around the cutoff of R$120.00. The density is lower immediately after the threshold and the difference is statisticallysignificant.
S. Firpo et al. / EconomiA 15 (2014) 243–260 253
0.0
05.0
1.0
15
Den
sity
0 15 0 30 0 45 0 60 0 75 0 90 0 10 50
Monthly Inco me Per Ca pita (in Re ais)
Fig. 6. Normalized density of the PBF eligibility variable – cutoff = R$150.00 (family group “1”).
0 .0
02
.004
.0
06
.008
.0
1
Den
sity
0 14 0 28 0 42 0 56 0 70 0 84 0 98 0 Monthly Inco me Per Ca pita (in Re ais)
Rddcm
i
Fig. 7. Normalized density of the PBF eligibility variable – cutoff = R$140.00 (family group “2”).
We also perform the McCrary test for different cutoff points. The value of these cutoff points include R$130.00,$140.00, and R$150.00. We find some discontinuities for these threshold values as well. They are significantlyifferent from zero for the R$130.00 and R$140.00 cutoffs for family group “1” and the whole sample. However, theiscontinuity is no longer significantly different from zero at the cutoff value of R$150.00. Discontinuities at otherutoff values may be due to the fact that our measure of income is imperfect. The actual threshold used by the policy
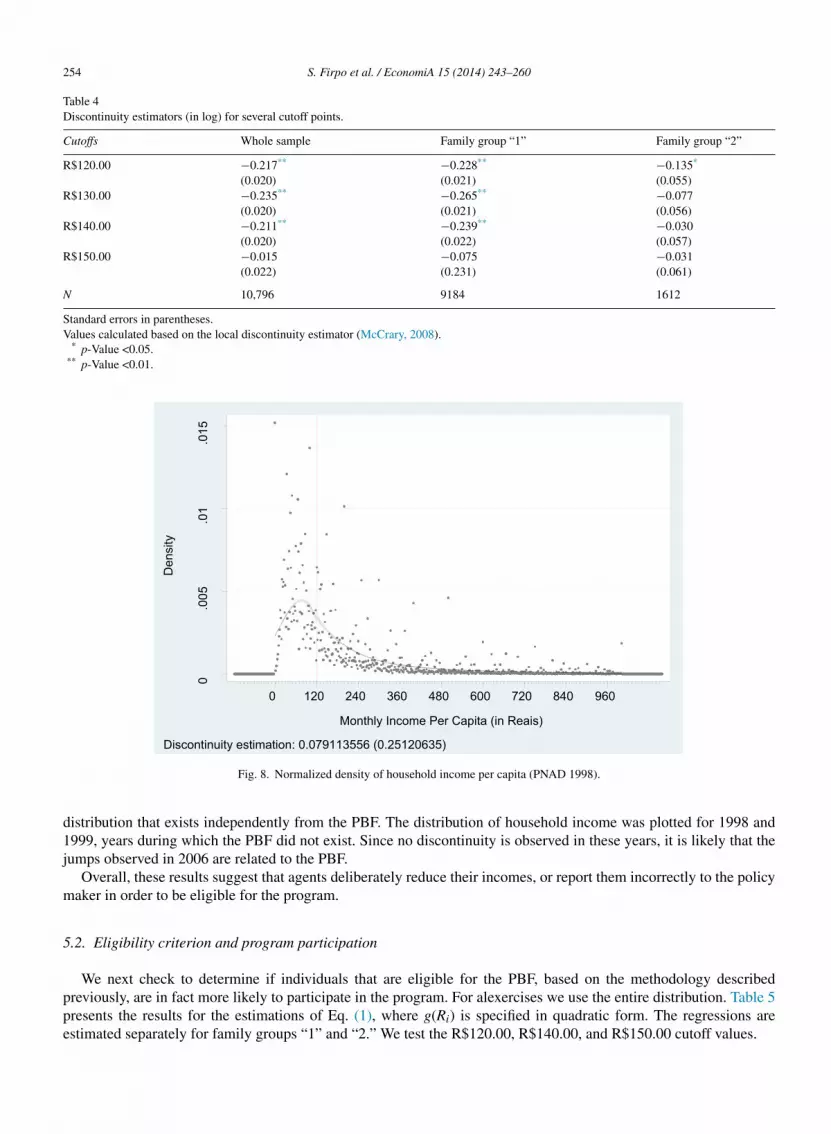
aker is more likely to be around our R$120.00 value.Finally, Figs. 8 and 9 show robustness checks that were carried out. These tests determine whether this discontinuitys due to the incentives provided by the program, or whether it is a systematic characteristic of the Brazilian income
254 S. Firpo et al. / EconomiA 15 (2014) 243–260
Table 4Discontinuity estimators (in log) for several cutoff points.
Cutoffs Whole sample Family group “1” Family group “2”
R$120.00 −0.217** −0.228** −0.135*
(0.020) (0.021) (0.055)R$130.00 −0.235** −0.265** −0.077
(0.020) (0.021) (0.056)R$140.00 −0.211** −0.239** −0.030
(0.020) (0.022) (0.057)R$150.00 −0.015 −0.075 −0.031
(0.022) (0.231) (0.061)
N 10,796 9184 1612
Standard errors in parentheses.Values calculated based on the local discontinuity estimator (McCrary, 2008).
* p-Value <0.05.** p-Value <0.01.
0.0
05.0
1.0
15
Den
sity
0 12 0 24 0 36 0 48 0 60 0 72 0 84 0 96 0
Monthly Inco me Per Ca pita (in Re ais)
Discontinuity estimation: 0.0 791 13556 (0.2 512 0635)
Fig. 8. Normalized density of household income per capita (PNAD 1998).
distribution that exists independently from the PBF. The distribution of household income was plotted for 1998 and1999, years during which the PBF did not exist. Since no discontinuity is observed in these years, it is likely that thejumps observed in 2006 are related to the PBF.
Overall, these results suggest that agents deliberately reduce their incomes, or report them incorrectly to the policymaker in order to be eligible for the program.
5.2. Eligibility criterion and program participation
We next check to determine if individuals that are eligible for the PBF, based on the methodology describedpreviously, are in fact more likely to participate in the program. For alexercises we use the entire distribution. Table 5
presents the results for the estimations of Eq. (1), where g(Ri) is specified in quadratic form. The regressions areestimated separately for family groups “1” and “2.” We test the R$120.00, R$140.00, and R$150.00 cutoff values.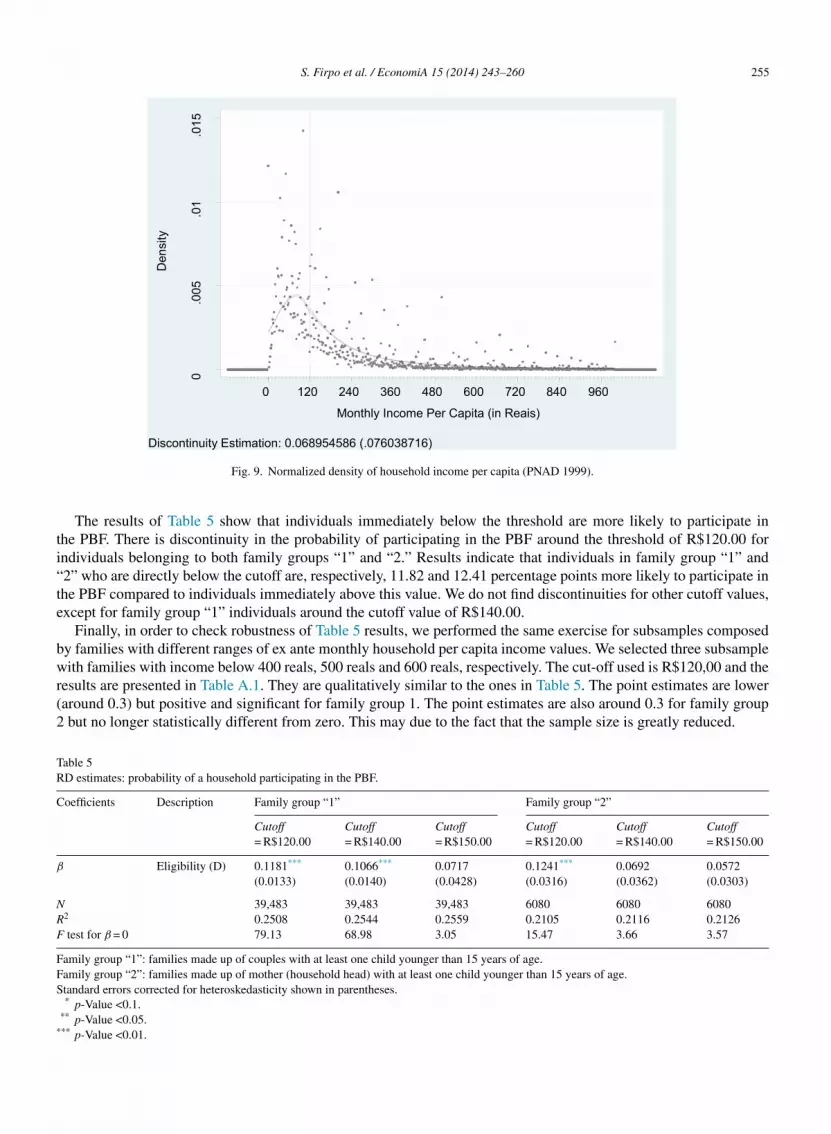
S. Firpo et al. / EconomiA 15 (2014) 243–260 255
0.0
05.0
1.0
15
Den
sity
0 12 0 24 0 36 0 48 0 60 0 72 0 84 0 96 0
Monthly Inco me Per Ca pita (in Re ais)
Discontinuity Estimation: 0.0 689 54586 (.07 603 8716)
ti“te
bwr(2
TR
C
β
NRF
FFS
*
Fig. 9. Normalized density of household income per capita (PNAD 1999).
The results of Table 5 show that individuals immediately below the threshold are more likely to participate inhe PBF. There is discontinuity in the probability of participating in the PBF around the threshold of R$120.00 forndividuals belonging to both family groups “1” and “2.” Results indicate that individuals in family group “1” and2” who are directly below the cutoff are, respectively, 11.82 and 12.41 percentage points more likely to participate inhe PBF compared to individuals immediately above this value. We do not find discontinuities for other cutoff values,xcept for family group “1” individuals around the cutoff value of R$140.00.
Finally, in order to check robustness of Table 5 results, we performed the same exercise for subsamples composedy families with different ranges of ex ante monthly household per capita income values. We selected three subsampleith families with income below 400 reals, 500 reals and 600 reals, respectively. The cut-off used is R$120,00 and the
esults are presented in Table A.1. They are qualitatively similar to the ones in Table 5. The point estimates are lower
around 0.3) but positive and significant for family group 1. The point estimates are also around 0.3 for family groupbut no longer statistically different from zero. This may due to the fact that the sample size is greatly reduced.
able 5D estimates: probability of a household participating in the PBF.
oefficients Description Family group “1” Family group “2”
Cutoff= R$120.00
Cutoff= R$140.00
Cutoff= R$150.00
Cutoff= R$120.00
Cutoff= R$140.00
Cutoff= R$150.00
Eligibility (D) 0.1181*** 0.1066*** 0.0717 0.1241*** 0.0692 0.0572(0.0133) (0.0140) (0.0428) (0.0316) (0.0362) (0.0303)
39,483 39,483 39,483 6080 6080 60802 0.2508 0.2544 0.2559 0.2105 0.2116 0.2126 test for β = 0 79.13 68.98 3.05 15.47 3.66 3.57
amily group “1”: families made up of couples with at least one child younger than 15 years of age.amily group “2”: families made up of mother (household head) with at least one child younger than 15 years of age.tandard errors corrected for heteroskedasticity shown in parentheses.* p-Value <0.1.
** p-Value <0.05.** p-Value <0.01.

256 S. Firpo et al. / EconomiA 15 (2014) 243–260
Table 6RD estimates: effects on labor supply.
Demographic groups Cutoff = R$120.00
Linear Quadratic Cubic
(A) Labor force participationGDA1 −0.0299*** −0.0286*** −0.0269***
(0.0025) (0.0025) (0.0026)GDB1 −0.1346*** −0.1311*** −0.1261***
(0.0053) (0.0054) (0.0055)GDB2 −0.1233*** −0.1228*** −0.1176***
(0.0108) (0.0110) (0.0115)
(B) EmployedGDA1 −0.1207*** −0.1175*** −0.1117***
(0.0032) (0.0032) (0.0033)GDB1 −0.2024*** −0.1955*** −0.1841***
(0.0061) (0.0062) (0.0063)GDB2 −0.2580*** −0.2539*** −0.2398***
(0.0127) (0.0129) (0.0135)
(C) Weekly hours workedGDA1 −2.4554*** −2.3309*** −2.2518***
(0.1723) (0.1740) (0.1782)GDB1 −4.6125*** −4.4899*** −4.3133***
(0.2882) (0.2901) (0.2948)GDB2 −4.9221*** −4.6078*** −4.2982***
(0.5605) (0.5660) (0.5826)
(1) GDA1: men (married fathers) belonging to family group “1”; GDB1: women (married mothers) belonging to family group “1”; GDB2: women(single or divorced mothers) belonging to family group “2”.(2) Standard errors in parentheses.(3) Besides the variables specified in Eq. (1), the following covariates were used: region, sector of activity, race, age, age squared, schooling, anddummy variable indicating if individuals hold a formal job.
* p-Value <0.1.** p-Value <0.05.
*** p-Value <0.01.
5.3. Eligibility criterion and labor supply
Thus far, we have found that (i) there is greater density of individuals immediately below the threshold level ofthe eligibility criterion for the PBF along the ex ante family income per capita distribution; and (ii) the individualsimmediately below the threshold level of the PBF eligibility criterion are more likely to participate in the program. Inthis section, we further investigate whether there are suggestive evidences indicating that individuals manipulate theirparticipation eligibility by changing their labor supply decisions.
In order to do this, we perform two exercises. First, we obtain separate regression discontinuity (RD) estimates ofEq. (1) for the labor supply outcomes of three different demographic groups. They are: GDA1: men (married fathers)belonging to family group “1”; GDB1: women (married mothers) belonging to family group “1”; GDB2: women (singleor divorced mothers) belonging to family group “2.” The outcomes utilized are labor force participation, employed,and weekly hours worked. We used three different specifications for the g(Ri) function: linear, quadratic, and cubic.The results for the β coefficients for each regression are presented in Table 6.
Table 6 shows that, for all demographic groups, individuals immediately below the cutoff value of R$120.00 supplyless labor than those immediately above this threshold. They are less likely to participate in the labor market, less likely
to be employed during the survey week of reference, and work fewer hours per week. Moreover, women (married orsingle) reduce their labor supply more than married men. In fact, the point estimates for GDA1 are always below thepoint estimates for GDB1 and GDB2.66 We also performed the same exercise of Table 6 using different subsamples of families with income below 400, 500, and 600 reals. Most of theresults are qualitatively similar. All the parameters estimated are negative and statistically different from zero for all groups when we use the linear

S. Firpo et al. / EconomiA 15 (2014) 243–260 257
Table 7McCrary discontinuity estimators (in log) by to occupational status.
Cutoffs Family group “1” Family group “2”
ocupi06 = 1 ocupi06 = 0 ocupi06 = 1 ocupi06 = 0
R$120.00 −0.347** −0.022 −0.287* −0.208(0.083) (0.046) (0.120) (0.121)
R$130.00 −0.157 −0.064 −0.191 −0.061(0.089) (0.045) (0.127) (0.103)
R$140.00 −0.314** −0.071 −0.073 −0.099(0.088) (0.045) (0.133) (0.099)
R$150.00 −0.143 −0.063 −0.048 −0.063(0.103) (0.048) (0.159) (0.113)
N 4262 35,221 1790 4290
Standard errors in parentheses.Values calculated based on the local discontinuity estimator (McCrary, 2008).Family group “1”: families made up of couples with at least one child younger than 15 years of age.F
auwlil
c
ct
aeiiaa
isb(m
6
O
sa
amily group “2”: families made up of mother (household head) with at least one child younger than 15 years of age.* p-Value <0.05.
** p-Value <0.01.
The second exercise classifies the individuals into two occupational groups according to their degree of labor marketttachment. Group ocupi06 = 1 designates individuals employed for less than five months in 2006, or those who werenemployed in the survey week of reference, but employed in that year; group ocupi06 = 0 designates individuals whoere continuously employed throughout the year. The idea being examined is that individuals in group ocupi06 = 1 are
ess attached to the labor market, and; therefore, more prone to manipulating their income by changing their labor supplyn order to qualify for the PBF. We perform the McCrary test on the distribution of the logarithm of income using theocal linear estimator separately for each group. We use different cutoff values and the results are presented in Table 7.
Table 7 shows that discontinuities only remain for the group less attached to the labor market, especially around theutoff of R$120.00. The density is lower directly after this threshold and the difference is statistically significant.
The results of Table 7 are additional suggestive evidence that individuals manipulate their eligibility status byhanging their labor supply decisions since the discontinuity is observed only among those that are weaker attachedo the labor market.
Finally, two caveats should be made. First, we interpret the results of greater incidence of program participationnd lower labor supply of households slightly below the cutoff value of the PBF eligibility criterion as evidences ofligibility manipulation. However, it might be acknowledged that some decrease of the labor supply may be due to thencome effect of the cash transfer itself. Nonetheless, we do not think that the lower labor supply is entirely due to thencome effect because of the additional finding of the greater density immediate below the threshold value of the exnte per capita household income. Some part of this reduction might be due to the manipulation although the precisemount of it is unclear.
Second, the results are also consistent with an alternative explanation. It may be that households underreportncome to be eligible to the PBF and those that underreport their income are more likely to also underreport their laborupply. In this case the manipulation would be of a different mechanism. There are no real labor supply responsesut manipulation in the reporting itself. Although the PNAD information are reported to the interviewer of the IBGEBrazilian census bureau) for other purposes and not to the officials from the PBF, we cannot rule out the underreportanipulation hypothesis.
. Conclusions
In this paper, we assessed the existence of eligibility status manipulation by individuals for participation in the PBF.ur goal was to investigate a possible channel for this type of manipulation through changes in the time allocation
pecification. When using the quadratic specification, most of the results for GDB1 are negative and significantly different from zero but for GDA1nd GDB2 become positive.

258 S. Firpo et al. / EconomiA 15 (2014) 243–260
decisions of individuals. The PBF eligibility criterion establishes that families with a monthly family income per capitaequal to or below R$120.00 are eligible for the program. Evidence of manipulation was obtained through the formaltest proposed by McCrary (2008). We found that (i) there is a greater density of individuals immediately below thethreshold level of the eligibility criterion for the PBF along the ex ante family income per capita distribution; (ii)individuals immediately below the threshold level of the eligibility criterion PBF are more likely to participate in theprogram; and (iii) individuals immediately below the threshold level of the eligibility criterion PBF are less likelyto participate in the labor market, less likely to be employed, and work fewer hours in the labor market. Moreover,individuals who are less attached to the labor market are the ones associated with the manipulation of their eligibilitystatus. Finally, most of the results are robust for different periods or at different cutoff points.
Our findings contribute to two debates in the microeconomic development literature. First, there is a discussion ofthe best way to targeting social programs. The targeting mechanism can use objective information (e.g., householdsurveys) to construct means tests or proxy means tests, or subjective information directly from the individuals orcommunities, or even a combination of both source of information. There are trade-offs involved in this choice. Theuse of subjective information is more sensitive to shocks that change the eligibility status. On the other hand, it ismore prone to misinformation or conflicting information. The use of objective information can be more verifiable butless sensitive to changes in the eligibility status. Moreover, there is a tarde-off between means tested and proxy meanstested programs. The means tested targeting is more likely to incur in inclusion error whereas the proxies means testedtargeting is more likely to incur in exclusion error. There are scant evidences on these trade-offs. Among the few ones,Alatas et al. (2012) show evidence of the trade-off between the uses of objective or subjective information. They run anexperiment on Indonesia on three approaches to targeting the poor families: proxy means tests, community targetingwhere individuals rank everyone from richest to poorest, and a hybrid of both. They find that proxy means tests performa little better in targeting the poor but community targeting results in better satisfaction perhaps because the applya different concept of to being poor. Camacho and Conover (2011), on the other hand, show evidence of inclusionerror from a program in Colombia where local politicians manipulate for their own interests the information collectionfrom “poor” households in order to classify them to the central government welfare program. Different from these twostudies, our results add to this debate by presenting new evidence of the cost of the use of proxy means tests throughinclusion error driven directly by the manipulation of the households themselves.
Second, there are several studies that aimed to estimate the causal impact of the conditional cash transfer programson adult labor supply in Brazil (e.g., Soares et al., 2007; Ferro and Nicollela, 2007; Tavares, 2008; Teixeira, 2008; Covreet al., 2008; Foguel and de Barros, 2008). These studies use different empirical strategies to compare all beneficiariesagainst observationally similar non-beneficiaries. Their results are not conclusive. Some find no effects and others findnegative effects particularly among women. Our results suggest that their estimations may be biased since we findsuggestive evidence of reverse causality from labor supply to program participation.
By considering all of our results together, we believe they suggest evidence that some individuals deliberatelyreduce their income in order to take part in the PBF. This is strongly observed among women. The evidence indicatingeligibility status manipulation addressed in this study demands the attention of policy makers, in order for them todevelop properly designed social programs. Mechanisms to minimize adverse effects need to be constructed. This willhelp prevent the diversion of financial resources from the primary goals of these programs, which seek to fight povertyand extreme poverty in the short term and long term.
Appendix A.
See Tables A.1 and A.2.

S. Firpo et al. / EconomiA 15 (2014) 243–260 259
Table A.1RD estimates: probability of a household participating in the PBF – quadratic polynomial.
Coefficients Description Family group “1” Family group “2”
Per capita income below Per capita income below
400 reals 500 reals 600 reals 400 reals 500 reals 600 reals
β Eligibility (D) 0.0335*** 0.0359*** 0.0389*** 0.0368 0.0306 0.0321(0.0108) (0.0103) (0.0100) (0.0266) (0.0255) (0.0246)
N 29,193 31,605 33,301 4934 5218 5408R2 0.1983 0.2144 0.2259 0.1657 0.1787 0.1875
Standard errors corrected for heteroskedasticity shown in parentheses.Cutoff = R$120.
* p-Value <0.1.** p-Value <0.05.
*** p-Value <0.01.
Table A.2Effects on labor supply (cutoff = R$120).
Demographic groups Income below 400 reals Income below 500 reals Income below 600 reals
Linear Quadratic Linear Quadratic Linear Quadratic
Labor force participationGDA1 −0.0125*** 0.0173*** −0.0175*** 0.0127*** −0.0211*** 0.0108**
(0.0039) (0.0048) (0.0035) (0.0045) (0.0033) (0.0044)GDB1 −0.0501*** −0.0686*** −0.0610*** −0.0715*** −0.0816*** −0.0716***
(0.0082) (0.0101) (0.0074) (0.0096) (0.0069) (0.0093)GDB2 −0.0328* 0.0676*** −0.0574*** 0.0538*** −0.0840*** 0.0520***
(0.0172) (0.0206) (0.0156) (0.0197) (0.0146) (0.0190)
EmployedGDA1 −0.0482*** 0.0392*** −0.0679*** 0.0314*** −0.0814*** 0.0277***
(0.0050) (0.0061) (0.0045) (0.0058) (0.0042) (0.0055)GDB1 −0.0487*** −0.0714*** −0.0688*** −0.0737*** −0.0995*** −0.0756***
(0.0091) (0.0112) (0.0083) (0.0107) (0.0078) (0.0104)GDB2 −0.0771*** 0.0723*** −0.1207*** 0.0534** −0.1631*** 0.0483**
(0.0198) (0.0236) (0.0180) (0.0226) (0.0170) (0.0219)
Weekly hours workedGDA1 −1.0748*** 0.1236 −1.3114*** 0.1459 −1.4919*** 0.2384
(0.2417) (0.3012) (0.2209) (0.2890) (0.2090) (0.2807)GDB1 −1.6399*** −0.5514 −2.1652*** −0.7638 −2.4249*** −0.8954*
(0.4180) (0.5381) (0.3767) (0.5140) (0.3540) (0.4973)GDB2 −2.7858*** −0.8925 −3.3337*** −0.8052 −3.5339*** −0.9189
(0.7934) (1.0083) (0.7245) (0.9567) (0.6910) (0.9272)
Standard errors corrected for heteroskedasticity shown in parentheses.*
*
R
A
B
B
C
p-Value <0.1.** p-Value <0.05.** p-Value <0.01.
eferences
latas, V., Banerjee, A., Hanna, R., Olke, B., Tobias, J., 2012. Targeting the poor: evidence from a field experiment in Indonesia. Am. Econ. Rev.102 (4), 1206–1240.
lundell, R., Macurdy, T., 1999. Labor supply: a review of alternative approaches. In: Ashenfelter, O., Card, D. (Eds.), Handbook of Labor Economics,vol. 3A. North Holland, Cap, Amsterdam, p. 27.
ourguignon, F., Ferreira, F.G.H., Leite, P.G., 2004. Ex ante evaluation of conditional cash transfer programs: the case of Bolsa Escola. In: Inequalityand Economic Development in Brazil. World Bank, Washington, D.C.
amacho, A., Conover, E., 2011. Manipulation of social program eligibility. Am. Econ. J.: Econ. Policy 3 (May), 41–65.
260 S. Firpo et al. / EconomiA 15 (2014) 243–260
Cardoso, E., Souza, A.P., 2004. The Impact of Cash Transfers on Child Labor and School Attendance in Brazil. Working Paper, No. 04-W0.Department of Economics, Vanderbilt University, Nashville, TN.
CEDEPLAR – Centro de Desenvolvimento e Planejamento Regional de Minas Gerais, 2007. Primeiros resultados da análise de linha de base dapesquisa de impacto do Programa Bolsa Família. SAGI/MDS, Brasília.
Covre, S., Marques, F., Mattos, E., 2008. Oferta de trabalho e transferências: Evidências dos efeitos das condicões impostas pelo programaBolsa-Família. ANPEC, Available at http://www.anpec.org.br/encontro2008/artigos/200807141223420-.pdf
Cury, S., Pedrozo, E., Coelho, A.M., Callegari, I., 2009. The Impacts of Income Transfer Programs on Income Distribution and Poverty in Brazil: AnIntegrated Microsimulation and Computable General Equilibrium Analysis. Final Research Report – MPIA, No. 11086. MPIA/PEP, Quebec.
de Barros, R.P., Carvalho, M., Franco, S., Mendonca, R., 2007a. A Queda Recente da Desigualdade de Renda no Brasil. In: de Barros, R.P., Foguel,M.N., Ulyssea, G. (Eds.), Desigualdade de Renda no Brasil: Uma Análise da Queda Recente, vol. 1. IPEA, Brasília.
de Barros, R.P., Carvalho, M., Franco, S., Mendonca, R., 2007b. A Importância da Queda Recente da Desigualdade Para a Pobreza. In: de Barros,R.P., Foguel, M.N., Ulyssea, G. (Eds.), Desigualdade de Renda no Brasil: Uma Análise da Queda Recente, vol. 1. IPEA, Brasília.
de Barros, R.P., Carvalho, M., Franco, S., 2007c. O Papel das Transferências Públicas na Queda Recente da Desigualdade de Renda Brasileira. In:de Barros, R.P., Foguel, M.N., Ulyssea, G. (Eds.), Desigualdade de Renda no Brasil: Uma Análise da Queda Recente, vol. 2. IPEA, Brasília.
Edmonds, E.V., Schady, N., 2008. Poverty alleviation and child labor. In: Policy Research Working Paper n◦. 4702. World Bank, Washington, DC.Eissa, N., Kleven, H.J., Kreiner, C.T., 2006. Welfare effects of tax reform and labor supply at the intensive and extensive margins. In: Agell, J.,
Sorensen, P.B. (Eds.), Tax Policy and Labor Market Performance. The MIT Press, Cambridge.Ferro, A.R., Kassouf, A.N., 2003. Avaliacão do Impacto dos Programas de Bolsa Escola na Incidência de Trabalho Infantil no Brasil. ANPEC,
Available at http://www.anpec.org.br/encontro2003/artigos/F32.pdfFerro, A.R., Nicollela, A.C., 2007. The impact of conditional cash transfer programs on household work decisions in Brazil. In: Population
Association of America 2007 Annual Meeting, Available at http://paa2007.princeton.edu/download.aspx?submissionId=71442Foguel, M.N., de Barros, R.P., 2008. The Effects of Conditional Cash Transfer Programmes on Adult Labour Supply: An Empirical
Analysis Using a Time-Series-Cross-Section Sample of Brazilian Municipalities. ANPEC, Available at http://www.anpec.org.br/encontro2008/artigos/200807211655420-.pdf
Foguel, M.N., Ulyssea, G., 2007. Desigualdade de Renda no Brasil: Uma Análise da Queda Recente, vol. 1. IPEA, Brasília.Glewwe, P., Kassouf, A.L., 2012. The impact of the Bolsa Escola/Família conditional cash transfer program on enrollment, drop out rates and grade
promotion in Brazil. J. Dev. Econ. 97, 505–517.Hoffmann, R., 2006. Brasil, 2004: Menos pobres e menos ricos. In: Parcerias Estratégicas – Edicão especial: Análise sobre a Pesquisa Nacional por
Amostra de Domicílios (PNAD 2004). Centro de Gestão e Estudos Estratégicos, n◦. 22, Brasília, pp. 77–88.IPEADATA, 2013. Available at: http://www.ipeadata.gov.br/ (accessed on February 2013).Maluccio, J.A., Flores, R., 2005. Impact Evaluation of a Conditional Cash Transfer Program: The Nicaraguan Red de Protección Social. Research
Report, No. 141. International Food Policy Research Institute, Washington, DC.McCrary, J., 2008. Manipulation of the running variable in the regression discontinuity design: a density test. J. Econometrics 142 (2), 698–714.Moffitt, R.A., 1992. Incentive effects of the U.S. welfare system: a review. J. Econ. Lit. 30 (1), 1–61.Parker, S.W., Skoufias, E., 2000. The Impact of PROGRESA on Work, Leisure, and Allocation. Final Report. International Food Policy Research
Institute, Washington, DC.Skoufias, E., di Maro, V., 2006. Conditional Cash Transfers, Work Incentives, and Poverty. Policy Research Working Paper, No. 3973. World Bank,
Washington, DC.Soares, S., Osório, R.G., Soares, F.V., Medeiros, M., Zepeda, E., 2006. Conditional cash transfers in Brazil, Chile and Mexico: impacts upon
inequality. In: Working Paper, n◦. 35. International Poverty Centre, Brasília.Soares, F.V., Ribas, R.P., Osório, R.G., 2007. Avaliando o Impacto do Programa Bolsa Família: uma Comparacão com Programas de Transferência
Condicionada de Renda de Outros Países. IPC Evaluation Note, No. 1. IPC, Brasília.Tavares, P.A., 2008. Efeito do Programa Bolsa Família sobre a Oferta de Trabalho das Mães. ANPEC, Available at http://www.anpec.org.br/
encontro2008/artigos/200807211028050-.pdfTeixeira, C.G., 2008. Análise do Impacto do Programa Bolsa Família na Oferta de Trabalho dos Homens e Mulheres. UNDP/IPC, Available at
http://www.ipc-undp.org/publications/mds/27P.pdfWorld Bank, 2013. Report No. 63731, Available at http://siteresources.worldbank.org (accessed on February 2013).