Embed Size (px)
Citation preview
2nd Reading
August 21, 2013 17:4 WSPC-277-IJCMSE S2047-6841 1350007
International Journal of Computational MaterialsScience and EngineeringVol. 2, No. 2 (2013) 1350007 (15 pages)c© Imperial College PressDOI: 10.1142/S2047684113500073
BAND STRUCTURE, HARDNESS, THERMODYNAMICAND OPTICAL PROPERTIES OF SUPERCONDUCTING
Nb2AsC, Nb2InC AND Mo2GaC
M. A. HADI, M. S. ALI and S. H. NAQIB
Department of Physics, Rajshahi UniversityRajshahi 6205, Bangladesh
A. K. M. A. ISLAM∗
International Islamic University Chittagong154/A College Road, Chittagong, Bangladesh
Received 10 February 2013Revised 17 July 2013Accepted 25 July 2013
Published 23 August 2013
First-principles investigation of the geometry, electronic band structure, Vickers hard-ness, thermodynamic and optical properties of three superconducting MAX compoundsNb2AsC, Nb2InC and Mo2GaC have been carried out by the plane-wave pseudopotentialmethod based on density functional theory (DFT) implemented in the CASTEP code.The theoretical Vickers hardness has been studied by means of Mulliken bond popu-lation analysis and electronic densities of states. The thermodynamic properties suchas the temperature and pressure dependent bulk modulus, Debye temperature, specificheats and thermal expansion coefficient of the three 211 MAX phases are derived fromthe quasi-harmonic Debye model with phononic effect for the first time. Furthermore,all the optical properties are determined and analyzed for the first time for two differentpolarization directions. The theoretical findings are compared with relevant experiments(where available) and the various implications are discussed in details.
Keywords: MAX superconductors; DFT; Vickers hardness; Debye model; thermodynamicproperties; optical properties.
1. Introduction
Nowotny [1970] synthesized a family of ternary layered compounds known as MAXphases with the general formula: Mn+1AXn, where n is 1, 2 or 3, M is an early transi-tion metal, A is an A-group element, and X is either C or N. These compounds havedrawn much attention of the scientific community due to their simultaneous metallicand ceramic characteristics with thermo-dynamical stability [Barsoum, 2000]. Thisclass of solids characterized to date naturally falls into three groups, based on the
∗Corresponding author.
1350007-1
Int.
J. C
omp.
Mat
. Sci
. Eng
. Dow
nloa
ded
from
ww
w.w
orld
scie
ntif
ic.c
omby
WSP
C o
n 10
/16/
13. F
or p
erso
nal u
se o
nly.
2nd Reading
August 21, 2013 17:4 WSPC-277-IJCMSE S2047-6841 1350007
M. A. Hadi et al.
atoms of the M, A, and X elements in each molecules; these groups are known as211, 312 and 413 MAX phases. At present we have over 70 MAX phases [Wang andZhou, 2009], amongst which there are eight low-temperature superconductors, e.g.Mo2GaC [Toth, 1967], Nb2SC [Sakamaki et al., 1999], Nb2SnC [Bortolozo et al.,2006], Nb2AsC [Lofland et al., 2006], Ti2InC [Bortolozo et al., 2007], Nb2InC [Bor-tolozo et al., 2009], Ti2InN [Bortolozo et al., 2010], and Ti2GeC [Bortolozo et al.,2012].
The phase Mo2GaC became the first MAX compound, for which superconduc-tivity with TC ∼ 4K was discovered [Toth, 1967]. Beckmann et al. [1968] synthe-sized Nb2AsC first in powder form. Lofland et al. [2006] reported the discovery ofits superconducting behavior with a transition temperature of 2K. Bortolozo et al.[2009] showed that Nb2InC compound superconducts at 7.5K. Jeitschko et al. [1964]first synthesized the Nb2InC phase.
Barsoum [2000] published experimental results on the structural properties ofNb2AsC, Nb2InC and Mo2GaC. Jeitschko et al. [1964] and Beckmann et al. [1968]measured experimentally the structural properties of Nb2InC and Nb2AsC, respec-tively. Shein and Ivanovskii [2011] reported the structural and elastic propertiesof six superconducting MAX phases: Mo2GaC, Nb2SC, Nb2SnC, Nb2AsC, Nb2InCand Ti2InC using the VASP code in projector augmented waves formalism. Liaoet al. [2006], on the other hand, studied the elastic as well as electronic propertiesof Nb2AsC applying the CASTEP code with plane wave pseudopotential. Shein andIvanovskii [2010a, 2010b] completed a theoretical investigation of elastic and elec-tronic properties of Nb2InC and Mo2GaC, separately. Bouhemadou [2008] carriedout a theoretical study on structural and elastic properties of Nb2InC along withother M2InC phase. Up to this point, most theoretical and experimental studies havebeen concentrated on the structural, elastic and electronic properties of Nb2AsC,Nb2InC and Mo2GaC. Little work exists on thermal properties (linear thermalexpansion coefficient) for Nb2AsC phase [Scabarozi et al., 2009] only. To the bestof our knowledge, no work on thermal properties has been done for Nb2InC andMo2GaC. We also have to point out that the optical properties of Nb2AsC, Nb2InCand Mo2GaC phases have not received any attention from neither the experimen-talists nor the theorists so far. Measurements and calculations of optical propertieshave long been a powerful tool in studying the electronic structure of solids. Today,knowledge of the refractive indices and absorption coefficients of solids is especiallyimportant in the design and analysis of new optoelectronic devices [Reshak et al.,2008]. High dielectric materials can be used in the next generation of microelec-tronic devices in which the reduced dimension requires gate insulators with highdielectric constants [Xu et al., 2006]. Further, the MAX phases have the poten-tial to be used as a coating on spacecrafts to avoid solar heating [Li et al., 2008].Again, the thermodynamic properties are the basis of solid-state science and indus-trial applications since they can extend our knowledge on the specific behavior ofmaterials under high pressure and high temperature environments [Du et al., 2009].
1350007-2
Int.
J. C
omp.
Mat
. Sci
. Eng
. Dow
nloa
ded
from
ww
w.w
orld
scie
ntif
ic.c
omby
WSP
C o
n 10
/16/
13. F
or p
erso
nal u
se o
nly.
2nd Reading
August 21, 2013 17:4 WSPC-277-IJCMSE S2047-6841 1350007
Band Structure, Hardness, Thermodynamic and Optical Properties
Therefore, we are encouraged to investigate the detailed thermal and optical prop-erties of Nb2AsC, Nb2InC and Mo2GaC for the first time, including an investigationof the Vickers hardness. Further, in order to make the study a complete one a revisiton some aspects of the structural and electronic properties are also carried out.
2. Computational Methods
The first-principles calculations were carried out using the plane-wave pseudopoten-tial method based on the density-functional theory [Kohn and Sham, 1965] imple-mented in the CASTEP code [Clark et al., 2005]. The exchange-correlation energywas treated within the generalized gradient approximation (GGA) using Perdew–Burke–Ernzerhof (PBE) scheme [Perdew et al., 1996]. The ultrasoft pseudopoten-tials were used in the calculations, and the plane-wave cutoff energy was used 500 eV.For the sampling of the Brillouin zone a Monkhorst–Pack grid [Monkhorst and Pack,1976] of 10× 10× 2 k-points for Nb2InC and 16× 16× 4 k-points for Nb2AsC andMo2GaC were used. All structures were relaxed by the Broyden–Fletcher–Goldfarb–Shanno (BFGS) method [Fischer and Almlof, 1992]. Geometry optimization wasperformed with the total energy of 10−5 eV/atom, maximum force of 0.002 eV/A,maximum stress of 0.05GPa, and the maximum atomic displacement of 10−3 A.Mulliken bond population, electronic density of states (EDOS), band structures,and optical properties were all directly calculated by using the code.
To calculate the thermodynamic properties of Nb2AsC, Nb2InC and Mo2GaC atambient and elevated temperature and pressure, the quasi-harmonic Debye model[Blanco et al., 2004] has been employed. For this purpose we have used E–V datacalculated from the third-order Birch–Murnaghan equation of state (EOS) [Birch,1978] using the zero temperature and zero pressure equilibrium values of E0, V0 andB0, obtained through the DFT method.
3. Results and Discussion
3.1. Structural properties
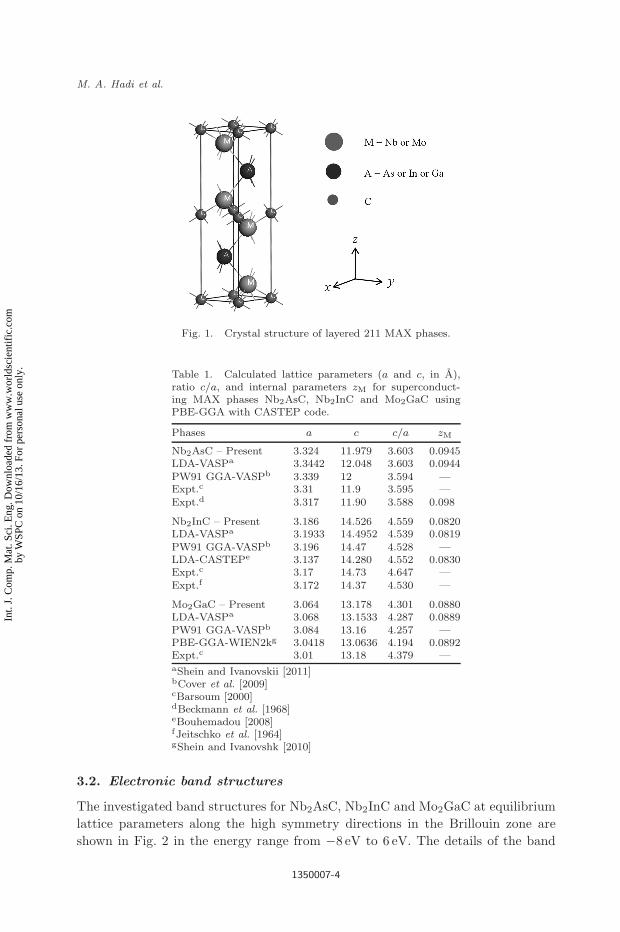
Like all MAX phases the under studied superconducting 211 phases Nb2AsC,Nb2InC and Mo2GaC belong to the hexagonal structure with space group P63/mmc(no. 194), where blocks of transition-metal carbides [MC] (formed by edge-sharedM6C octahedra) are sandwiched with A-group atomic sheets (Fig. 1). Here M standsfor Nb in Nb2AsC and Nb2InC and for Mo in Mo2GaC. On the other hand, A rep-resents As, In and Ga in Nb2AsC, Nb2InC and Mo2GaC, respectively.
The calculated equilibrium lattice constants (a and c) and internal parameterszM for all the considered superconducting M2AC phases are compared with availabletheoretical and experimental data in Table 1. The comparison shows that our resultsare in reasonable agreement with both theoretical and experimental values. Thisensures the reliability of the present first-principles investigations.
1350007-3
Int.
J. C
omp.
Mat
. Sci
. Eng
. Dow
nloa
ded
from
ww
w.w
orld
scie
ntif
ic.c
omby
WSP
C o
n 10
/16/
13. F
or p
erso
nal u
se o
nly.
2nd Reading
August 21, 2013 17:4 WSPC-277-IJCMSE S2047-6841 1350007
M. A. Hadi et al.
Fig. 1. Crystal structure of layered 211 MAX phases.
Table 1. Calculated lattice parameters (a and c, in A),ratio c/a, and internal parameters zM for superconduct-ing MAX phases Nb2AsC, Nb2InC and Mo2GaC usingPBE-GGA with CASTEP code.
Phases a c c/a zM
Nb2AsC – Present 3.324 11.979 3.603 0.0945LDA-VASPa 3.3442 12.048 3.603 0.0944PW91 GGA-VASPb 3.339 12 3.594 —Expt.c 3.31 11.9 3.595 —Expt.d 3.317 11.90 3.588 0.098
Nb2InC – Present 3.186 14.526 4.559 0.0820LDA-VASPa 3.1933 14.4952 4.539 0.0819PW91 GGA-VASPb 3.196 14.47 4.528 —LDA-CASTEPe 3.137 14.280 4.552 0.0830Expt.c 3.17 14.73 4.647 —Expt.f 3.172 14.37 4.530 —
Mo2GaC – Present 3.064 13.178 4.301 0.0880LDA-VASPa 3.068 13.1533 4.287 0.0889PW91 GGA-VASPb 3.084 13.16 4.257 —PBE-GGA-WIEN2kg 3.0418 13.0636 4.194 0.0892Expt.c 3.01 13.18 4.379 —aShein and Ivanovskii [2011]bCover et al. [2009]cBarsoum [2000]dBeckmann et al. [1968]eBouhemadou [2008]fJeitschko et al. [1964]gShein and Ivanovshk [2010]
3.2. Electronic band structures
The investigated band structures for Nb2AsC, Nb2InC and Mo2GaC at equilibriumlattice parameters along the high symmetry directions in the Brillouin zone areshown in Fig. 2 in the energy range from −8 eV to 6 eV. The details of the band
1350007-4
Int.
J. C
omp.
Mat
. Sci
. Eng
. Dow
nloa
ded
from
ww
w.w
orld
scie
ntif
ic.c
omby
WSP
C o
n 10
/16/
13. F
or p
erso
nal u
se o
nly.
2nd Reading
August 21, 2013 17:4 WSPC-277-IJCMSE S2047-6841 1350007
Band Structure, Hardness, Thermodynamic and Optical Properties
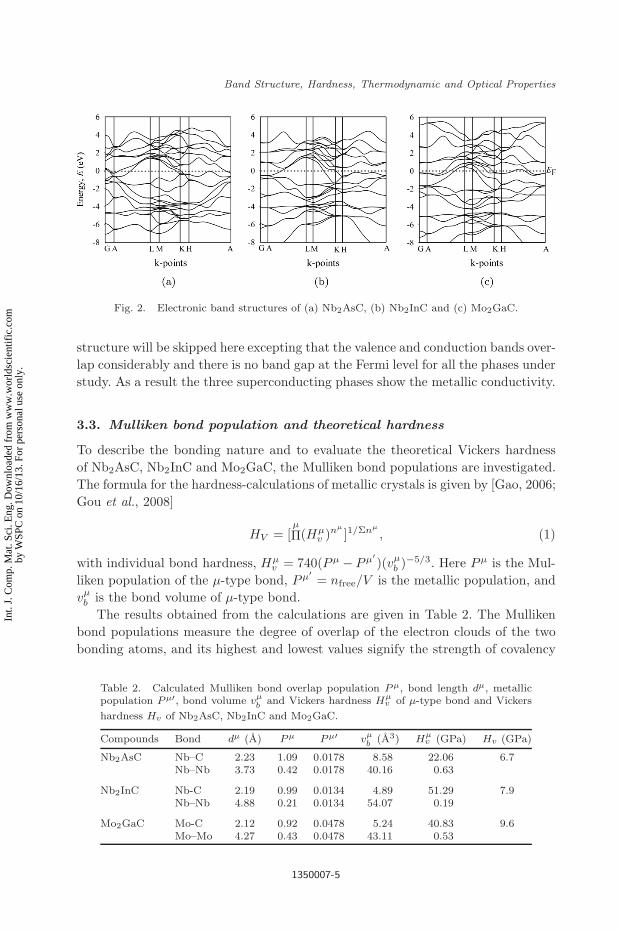
Fig. 2. Electronic band structures of (a) Nb2AsC, (b) Nb2InC and (c) Mo2GaC.
structure will be skipped here excepting that the valence and conduction bands over-lap considerably and there is no band gap at the Fermi level for all the phases understudy. As a result the three superconducting phases show the metallic conductivity.
3.3. Mulliken bond population and theoretical hardness
To describe the bonding nature and to evaluate the theoretical Vickers hardnessof Nb2AsC, Nb2InC and Mo2GaC, the Mulliken bond populations are investigated.The formula for the hardness-calculations of metallic crystals is given by [Gao, 2006;Gou et al., 2008]
HV = [µ
Π(Hµv )nµ
]1/Σnµ
, (1)
with individual bond hardness, Hµv = 740(Pµ − Pµ′
)(vµb )−5/3. Here Pµ is the Mul-
liken population of the µ-type bond, Pµ′= nfree/V is the metallic population, and
vµb is the bond volume of µ-type bond.
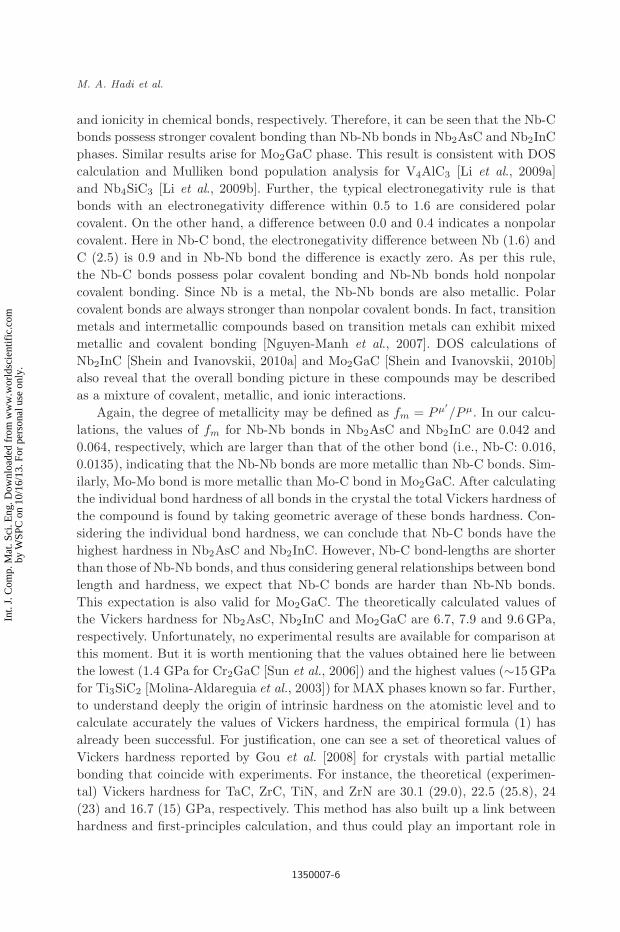
The results obtained from the calculations are given in Table 2. The Mullikenbond populations measure the degree of overlap of the electron clouds of the twobonding atoms, and its highest and lowest values signify the strength of covalency
Table 2. Calculated Mulliken bond overlap population P µ, bond length dµ, metallicpopulation P µ′, bond volume vµ
b and Vickers hardness Hµv of µ-type bond and Vickers
hardness Hv of Nb2AsC, Nb2InC and Mo2GaC.
Compounds Bond dµ (A) P µ P µ′ vµb (A3) Hµ
v (GPa) Hv (GPa)
Nb2AsC Nb–C 2.23 1.09 0.0178 8.58 22.06 6.7Nb–Nb 3.73 0.42 0.0178 40.16 0.63
Nb2InC Nb-C 2.19 0.99 0.0134 4.89 51.29 7.9Nb–Nb 4.88 0.21 0.0134 54.07 0.19
Mo2GaC Mo-C 2.12 0.92 0.0478 5.24 40.83 9.6Mo–Mo 4.27 0.43 0.0478 43.11 0.53
1350007-5
Int.
J. C
omp.
Mat
. Sci
. Eng
. Dow
nloa
ded
from
ww
w.w
orld
scie
ntif
ic.c
omby
WSP
C o
n 10
/16/
13. F
or p
erso
nal u
se o
nly.
2nd Reading
August 21, 2013 17:4 WSPC-277-IJCMSE S2047-6841 1350007
M. A. Hadi et al.
and ionicity in chemical bonds, respectively. Therefore, it can be seen that the Nb-Cbonds possess stronger covalent bonding than Nb-Nb bonds in Nb2AsC and Nb2InCphases. Similar results arise for Mo2GaC phase. This result is consistent with DOScalculation and Mulliken bond population analysis for V4AlC3 [Li et al., 2009a]and Nb4SiC3 [Li et al., 2009b]. Further, the typical electronegativity rule is thatbonds with an electronegativity difference within 0.5 to 1.6 are considered polarcovalent. On the other hand, a difference between 0.0 and 0.4 indicates a nonpolarcovalent. Here in Nb-C bond, the electronegativity difference between Nb (1.6) andC (2.5) is 0.9 and in Nb-Nb bond the difference is exactly zero. As per this rule,the Nb-C bonds possess polar covalent bonding and Nb-Nb bonds hold nonpolarcovalent bonding. Since Nb is a metal, the Nb-Nb bonds are also metallic. Polarcovalent bonds are always stronger than nonpolar covalent bonds. In fact, transitionmetals and intermetallic compounds based on transition metals can exhibit mixedmetallic and covalent bonding [Nguyen-Manh et al., 2007]. DOS calculations ofNb2InC [Shein and Ivanovskii, 2010a] and Mo2GaC [Shein and Ivanovskii, 2010b]also reveal that the overall bonding picture in these compounds may be describedas a mixture of covalent, metallic, and ionic interactions.
Again, the degree of metallicity may be defined as fm = Pµ′/Pµ. In our calcu-
lations, the values of fm for Nb-Nb bonds in Nb2AsC and Nb2InC are 0.042 and0.064, respectively, which are larger than that of the other bond (i.e., Nb-C: 0.016,0.0135), indicating that the Nb-Nb bonds are more metallic than Nb-C bonds. Sim-ilarly, Mo-Mo bond is more metallic than Mo-C bond in Mo2GaC. After calculatingthe individual bond hardness of all bonds in the crystal the total Vickers hardness ofthe compound is found by taking geometric average of these bonds hardness. Con-sidering the individual bond hardness, we can conclude that Nb-C bonds have thehighest hardness in Nb2AsC and Nb2InC. However, Nb-C bond-lengths are shorterthan those of Nb-Nb bonds, and thus considering general relationships between bondlength and hardness, we expect that Nb-C bonds are harder than Nb-Nb bonds.This expectation is also valid for Mo2GaC. The theoretically calculated values ofthe Vickers hardness for Nb2AsC, Nb2InC and Mo2GaC are 6.7, 7.9 and 9.6GPa,respectively. Unfortunately, no experimental results are available for comparison atthis moment. But it is worth mentioning that the values obtained here lie betweenthe lowest (1.4 GPa for Cr2GaC [Sun et al., 2006]) and the highest values (∼15GPafor Ti3SiC2 [Molina-Aldareguia et al., 2003]) for MAX phases known so far. Further,to understand deeply the origin of intrinsic hardness on the atomistic level and tocalculate accurately the values of Vickers hardness, the empirical formula (1) hasalready been successful. For justification, one can see a set of theoretical values ofVickers hardness reported by Gou et al. [2008] for crystals with partial metallicbonding that coincide with experiments. For instance, the theoretical (experimen-tal) Vickers hardness for TaC, ZrC, TiN, and ZrN are 30.1 (29.0), 22.5 (25.8), 24(23) and 16.7 (15) GPa, respectively. This method has also built up a link betweenhardness and first-principles calculation, and thus could play an important role in
1350007-6
Int.
J. C
omp.
Mat
. Sci
. Eng
. Dow
nloa
ded
from
ww
w.w
orld
scie
ntif
ic.c
omby
WSP
C o
n 10
/16/
13. F
or p
erso
nal u
se o
nly.
2nd Reading
August 21, 2013 17:4 WSPC-277-IJCMSE S2047-6841 1350007
Band Structure, Hardness, Thermodynamic and Optical Properties
the design of new superhard materials. According to the value of vµb , we observe
that the lowest bond volume results in a highest hardness of the bond and accord-ing to the value of HV , we may conclude that Nb2AsC is relatively soft and easilymachinable compared to other two phases.
3.4. Thermodynamic properties
We apply the quasi-harmonic Debye model to investigate the thermodynamic prop-erties of Nb2AsC, Nb2InC and Mo2GaC, in which the nonequilibrium Gibbs functionG∗(V ;P, T ) can be written as [Blanco et al., 2004]:
G∗(V ;P, T ) = E(V ) + PV +Avib(ΘD(V );T ), (2)
where E(V ) is the total energy per unit cell, PV corresponds to the constanthydrostatic pressure condition and Avib(ΘD(V ); T ) is the vibrational Helmholtzfree energy which given by
Avib(ΘD(V );T ) = nkT
[9ΘD
8T+ 3 ln(1 − e−ΘD/T ) −D
(ΘD
T
)], (3)
where n is the number of atoms in per formula unit, k is the Boltzmann constant,D(ΘD/T ) is the Debye integral and ΘD represents the Debye temperature.
The thermal equation of state V (P, T ) and the chemical potentialG(P, T ) can beobtained by minimizing the nonequilibrium Gibbs function with respect to volumeV . Other macroscopic properties as a function of pressure P and temperature Tcan also be derived from standard thermodynamic relations [Blanco et al., 2004].The thermodynamic properties are evaluated in the temperature range from 0 to1200K, where the quasi-harmonic Debye model is expected to be valid.
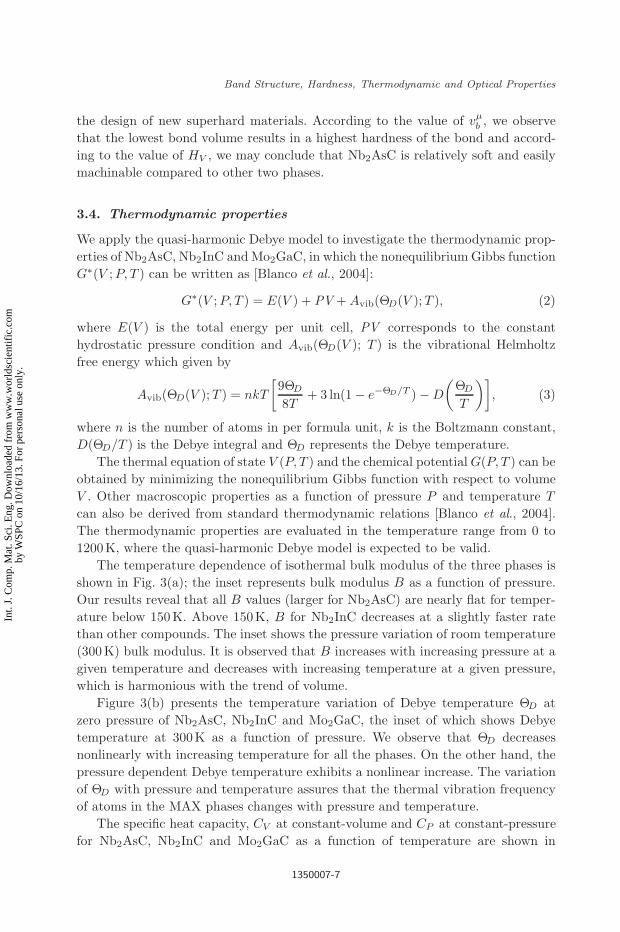
The temperature dependence of isothermal bulk modulus of the three phases isshown in Fig. 3(a); the inset represents bulk modulus B as a function of pressure.Our results reveal that all B values (larger for Nb2AsC) are nearly flat for temper-ature below 150K. Above 150K, B for Nb2InC decreases at a slightly faster ratethan other compounds. The inset shows the pressure variation of room temperature(300K) bulk modulus. It is observed that B increases with increasing pressure at agiven temperature and decreases with increasing temperature at a given pressure,which is harmonious with the trend of volume.
Figure 3(b) presents the temperature variation of Debye temperature ΘD atzero pressure of Nb2AsC, Nb2InC and Mo2GaC, the inset of which shows Debyetemperature at 300K as a function of pressure. We observe that ΘD decreasesnonlinearly with increasing temperature for all the phases. On the other hand, thepressure dependent Debye temperature exhibits a nonlinear increase. The variationof ΘD with pressure and temperature assures that the thermal vibration frequencyof atoms in the MAX phases changes with pressure and temperature.
The specific heat capacity, CV at constant-volume and CP at constant-pressurefor Nb2AsC, Nb2InC and Mo2GaC as a function of temperature are shown in
1350007-7
Int.
J. C
omp.
Mat
. Sci
. Eng
. Dow
nloa
ded
from
ww
w.w
orld
scie
ntif
ic.c
omby
WSP
C o
n 10
/16/
13. F
or p
erso
nal u
se o
nly.
2nd Reading
August 21, 2013 17:4 WSPC-277-IJCMSE S2047-6841 1350007
M. A. Hadi et al.
(a) (b)
Fig. 3. Temperature dependence of (a) Bulk modulus B and (b) Debye temperature ΘD ofNb2AsC, Nb2InC and Mo2GaC. Inset shows pressure variation.
(a) (b)
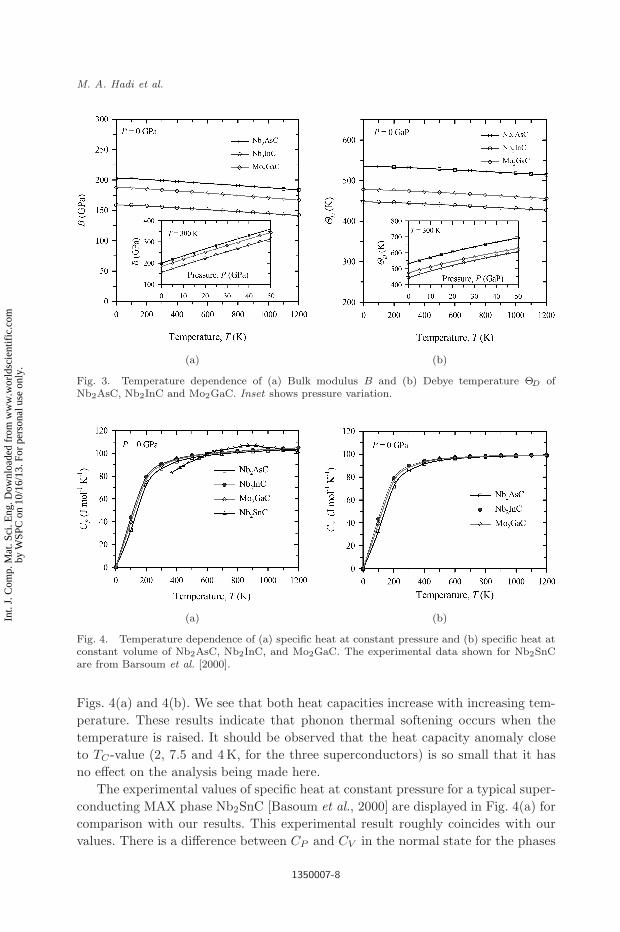
Fig. 4. Temperature dependence of (a) specific heat at constant pressure and (b) specific heat atconstant volume of Nb2AsC, Nb2InC, and Mo2GaC. The experimental data shown for Nb2SnCare from Barsoum et al. [2000].
Figs. 4(a) and 4(b). We see that both heat capacities increase with increasing tem-perature. These results indicate that phonon thermal softening occurs when thetemperature is raised. It should be observed that the heat capacity anomaly closeto TC -value (2, 7.5 and 4 K, for the three superconductors) is so small that it hasno effect on the analysis being made here.
The experimental values of specific heat at constant pressure for a typical super-conducting MAX phase Nb2SnC [Basoum et al., 2000] are displayed in Fig. 4(a) forcomparison with our results. This experimental result roughly coincides with ourvalues. There is a difference between CP and CV in the normal state for the phases
1350007-8
Int.
J. C
omp.
Mat
. Sci
. Eng
. Dow
nloa
ded
from
ww
w.w
orld
scie
ntif
ic.c
omby
WSP
C o
n 10
/16/
13. F
or p
erso
nal u
se o
nly.
2nd Reading
August 21, 2013 17:4 WSPC-277-IJCMSE S2047-6841 1350007
Band Structure, Hardness, Thermodynamic and Optical Properties
due to the thermal expansion caused by anharmonicity effects. This difference isgiven by CP −CV = α2
V (T )BTV , where αV is volume thermal expansion coefficient.The specific heat obeys the Debye T 3 power-law in the low temperature limit. Theanharmonic effect on heat capacity is restrained at the temperature above 300K,and CV approaches the classical asymptotic limit of CV = 3nNkB = 99.8J/mol K.These results imply that the interactions between ions in the nanolaminates havegreat effect on heat capacities particularly at low temperatures. To evaluate theelectronic contribution to specific heat through the Sommerfeld constant γ withinthe free electron model: γ = (1/3)π2k2
BN(EF ), we can use N(EF ) from the inves-tigated DOS for the three nanolaminates. This scheme gives the values 2.9, 4.3 and5.4mJ mol−1 K−2 for Nb2AsC, Nb2InC and Mo2GaC, respectively.
We can also determine the electron–phonon coupling constant (λ) using McMil-lan’s relation [McMillan, 1968]. Taking the known values of TC , calculated ΘD withthe repulsive Coulombic pseudopotential (µ∗ = 0.10), the estimated λ values are0.40, 0.57 and 0.48 for Nb2AsC, Nb2InC and Mo2GaC, respectively. These valuesindicate that all the phases are moderately coupled superconductors. The theoret-ical λ-values for the three compounds are similar in several studied MAX phases[Lofland et al., 2006; Hettinger et al., 2005].
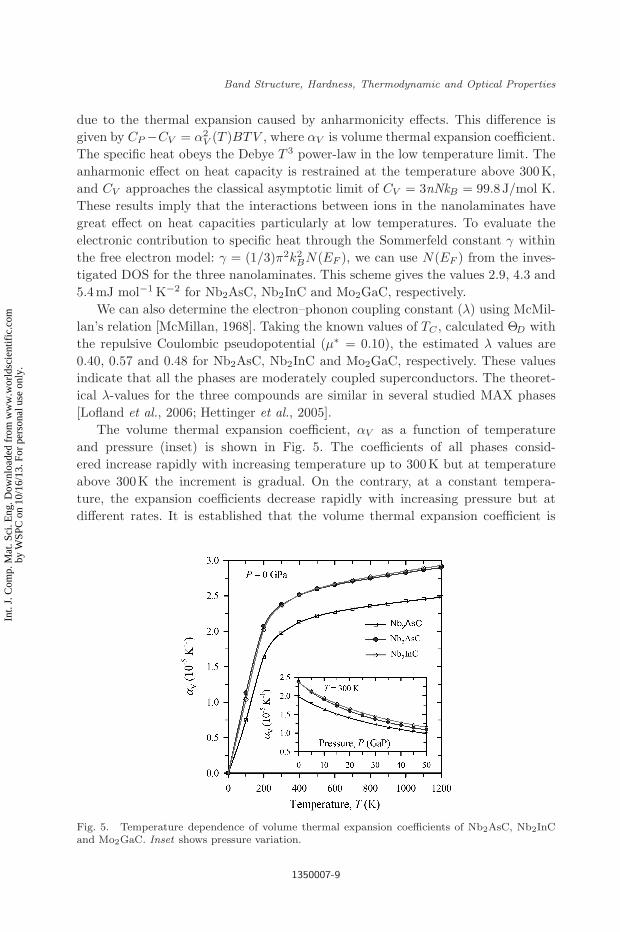
The volume thermal expansion coefficient, αV as a function of temperatureand pressure (inset) is shown in Fig. 5. The coefficients of all phases consid-ered increase rapidly with increasing temperature up to 300K but at temperatureabove 300K the increment is gradual. On the contrary, at a constant tempera-ture, the expansion coefficients decrease rapidly with increasing pressure but atdifferent rates. It is established that the volume thermal expansion coefficient is
Fig. 5. Temperature dependence of volume thermal expansion coefficients of Nb2AsC, Nb2InCand Mo2GaC. Inset shows pressure variation.
1350007-9
Int.
J. C
omp.
Mat
. Sci
. Eng
. Dow
nloa
ded
from
ww
w.w
orld
scie
ntif
ic.c
omby
WSP
C o
n 10
/16/
13. F
or p
erso
nal u
se o
nly.
2nd Reading
August 21, 2013 17:4 WSPC-277-IJCMSE S2047-6841 1350007
M. A. Hadi et al.
inversely related to the bulk modulus of a material. The calculated values of αV
at 300K for Nb2AsC, Nb2InC and Mo2GaC are 2.04 × 10⁻⁵, 2.42 × 10⁻⁵, and2.40 × 10−5 K−1, respectively. For Nb2AsC, the estimated linear expansion coeffi-cient (α = αV /3) is 6.8× 10⁻⁶ K−1, which agrees rather well with the experimentalvalue of α = 7.3 × 10⁻⁶ K−1 [Scabarozi et al., 2009].
3.5. Optical properties
The optical properties of Nb2AsC, Nb2InC and Mo2GaC with different photonenergies are investigated by the frequency-dependent dielectric function ε(ω) =ε1(ω) + iε2(ω) which is closely related to the electronic band structure. The imagi-nary part ε2(ω) of the dielectric function can be expressed as the momentum matrixelements between the occupied and the unoccupied electronic states and can be cal-culated directly using:
ε2(ω) =2e2πΩε0
∑k,v,c
|〈ψck|u · r |ψv
k〉|2δ(Eck − Ev
k − E), (4)
where ω is the frequency of light, e is the electronic charge, u is the vector defin-ing the polarization of the incident electric field, and ψc
k and ψvk are the conduc-
tion and valence band wave functions at k, respectively. From the imaginary partε2(ω), the real part ε1(ω) of the dielectric function is derived through the Kramers–Kronig relations. The remaining optical properties, such as refractive index, absorp-tion spectrum, loss-function, reflectivity and conductivity (real part) are derivedfrom ε1(ω) and ε2(ω) [Saha et al., 1976]. The calculational approaches are wellestablished and widely available in literature [see for example, Li et al., 2009a;Li et al., 2009b] and hence will not be repeated here. For the metallic compoundsboth inter-band and intra-band transitions contribute to dielectric function. Asthe investigated materials are metallic, which is evident from our calculated bandstructures, a Drude term [Li et al., 2008; Saniz et al., 2006] with unscreened plasmafrequency 5 eV and damping 0.05 eV has been used. Its effect is to enhance thelow energy part of the spectrum. We have used a 0.5 eV Gaussian smearing for allcalculations.
The calculated optical properties of Nb2AsC, Nb2InC and Mo2GaC for photonenergies up to 20 eV for polarization vectors [100] and [001] are shown in Fig. 6. Thereal and imaginary parts of dielectric functions of the three nanolaminates for a lim-ited energy range are shown in Figs. 6(a) and 6(b) along with the measured valuesfor NbC0.87 [Allison et al., 1987]. All phases exhibit metallic characteristics in theenergy range for which ε1(ω) < 0. In the real part we observe that the highest peakcentered at 3.7 eV for NbC0.87 is shifted to the left with a sharp peak at around2.66 eV for Nb2AsC, and 2.20 eV for Nb2InC for the polarization direction [100].We also see that the same peak for Mo2GaC at around 2.77 eV. In Fig. 6(b), theimaginary part of the dielectric function of the three nanolaminates for both polar-ization directions approaches zero from above at about 10.5–11.75eV. The peak of
1350007-10
Int.
J. C
omp.
Mat
. Sci
. Eng
. Dow
nloa
ded
from
ww
w.w
orld
scie
ntif
ic.c
omby
WSP
C o
n 10
/16/
13. F
or p
erso
nal u
se o
nly.
2nd Reading
August 21, 2013 17:4 WSPC-277-IJCMSE S2047-6841 1350007
Band Structure, Hardness, Thermodynamic and Optical Properties
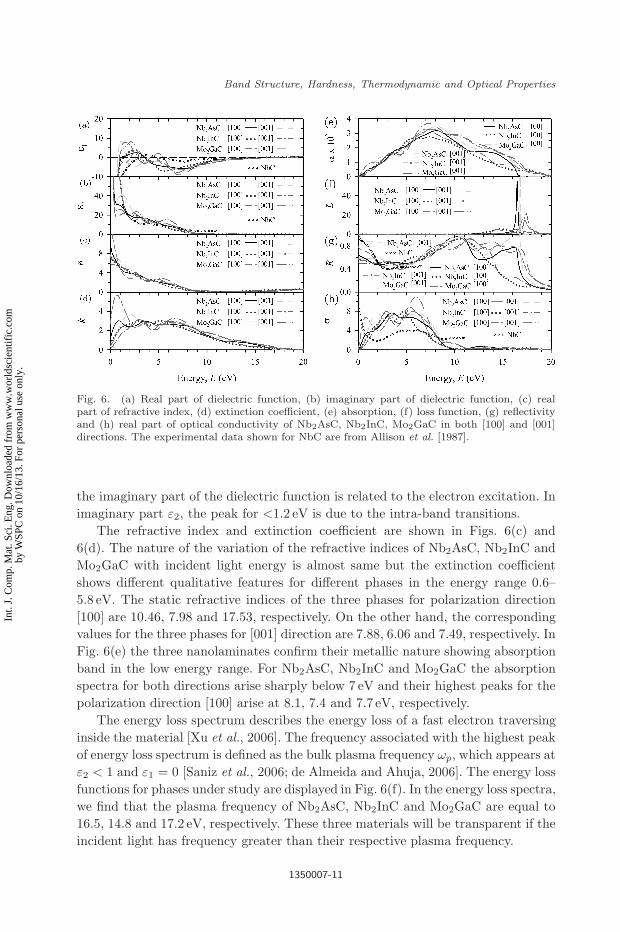
Fig. 6. (a) Real part of dielectric function, (b) imaginary part of dielectric function, (c) realpart of refractive index, (d) extinction coefficient, (e) absorption, (f) loss function, (g) reflectivityand (h) real part of optical conductivity of Nb2AsC, Nb2InC, Mo2GaC in both [100] and [001]directions. The experimental data shown for NbC are from Allison et al. [1987].
the imaginary part of the dielectric function is related to the electron excitation. Inimaginary part ε2, the peak for <1.2 eV is due to the intra-band transitions.
The refractive index and extinction coefficient are shown in Figs. 6(c) and6(d). The nature of the variation of the refractive indices of Nb2AsC, Nb2InC andMo2GaC with incident light energy is almost same but the extinction coefficientshows different qualitative features for different phases in the energy range 0.6–5.8 eV. The static refractive indices of the three phases for polarization direction[100] are 10.46, 7.98 and 17.53, respectively. On the other hand, the correspondingvalues for the three phases for [001] direction are 7.88, 6.06 and 7.49, respectively. InFig. 6(e) the three nanolaminates confirm their metallic nature showing absorptionband in the low energy range. For Nb2AsC, Nb2InC and Mo2GaC the absorptionspectra for both directions arise sharply below 7 eV and their highest peaks for thepolarization direction [100] arise at 8.1, 7.4 and 7.7 eV, respectively.
The energy loss spectrum describes the energy loss of a fast electron traversinginside the material [Xu et al., 2006]. The frequency associated with the highest peakof energy loss spectrum is defined as the bulk plasma frequency ωp, which appears atε2 < 1 and ε1 = 0 [Saniz et al., 2006; de Almeida and Ahuja, 2006]. The energy lossfunctions for phases under study are displayed in Fig. 6(f). In the energy loss spectra,we find that the plasma frequency of Nb2AsC, Nb2InC and Mo2GaC are equal to16.5, 14.8 and 17.2 eV, respectively. These three materials will be transparent if theincident light has frequency greater than their respective plasma frequency.
1350007-11
Int.
J. C
omp.
Mat
. Sci
. Eng
. Dow
nloa
ded
from
ww
w.w
orld
scie
ntif
ic.c
omby
WSP
C o
n 10
/16/
13. F
or p
erso
nal u
se o
nly.
2nd Reading
August 21, 2013 17:4 WSPC-277-IJCMSE S2047-6841 1350007
M. A. Hadi et al.
Figure 6(g) represents the reflectivity spectra as a function of incident lightenergy. For comparison the measured spectra of NbC0.98 [Allison et al., 1987] are dis-played in the plot. It is seen that the reflectivity spectra for the three phases exhibitno significant changes in the energy range 1.8–6.0 eV and the values are always above44%. This almost constant reflectance in the visible region (up to 3.1 eV) shouldmake the three phases appear metallic gray. Further, the spectra of the differentphases rise to reach maximum value of ∼0.93–0.97 in the UV region (between 10.48and 11.65 eV). According to Li et al. [2008] the MAX compound Ti3SiC2 having theaverage reflectivity ∼44% in the visible light region, show the nonselective charac-teristic that is responsible for reducing solar heating. Therefore, we can say that thethree MAX compounds Nb2AsC, Nb2InC and Mo2GaC are also candidate materialsfor coating. The real part of photoconductivity for the three compounds is shown inFig. 6(h). For all the phases the conductivity occurs at zero photon energy. Hence,the phases have no band gap. These three nanolaminates have their highest peaks inphotoconductivity at 3.48, 4.70 and 5.71 eV, respectively. The measured photocon-ductivity of NbC0.98 [Allison et al., 1987] is also shown in the figure for comparison.
4. Conclusion
We have carried out the first-principles calculations of the geometry, electronicbands, Vickers hardness, thermodynamic and optical properties of the three 211MAX superconducting phases Nb2AsC, Nb2InC and Mo2GaC. The theoretical val-ues of the Vickers hardness for the three phases are 6.7, 7.9 and 9.6GPa, respectively.The phase Nb2AsC is relatively soft and is easily machinable compared to other twophases. The temperature and pressure dependence of bulk modulus, specific heats,thermal expansion coefficient and Debye temperature are investigated by the quasi-harmonic Debye model, and the results are discussed. The increase of the specificheats with temperature indicates that phonon thermal softening occurs when thetemperature increases. The estimated electron–phonon coupling constant of 0.40,0.57 and 0.48 for Nb2AsC, Nb2InC and Mo2GaC, respectively, signify that all thephases are moderately coupled conventional superconductors. Finally, the dielectricfunction, refractive index, absorption spectra, energy loss function, reflectivity andconductivity are determined and analyzed in detail. The reflectivity spectra of allthree nanolaminates imply that they are potential candidate materials for coatingto avoid solar heating. The optical properties such as refractive index, reflectivityand conductivity are found to be polarization dependent. The results provide clearindications of the anisotropy in the optical properties of the three MAX phasesunder consideration.
References
Allison, C. Y., Modine, F. A. and French, R. H. [1987] “Optical and electrical propertiesof niobium carbide,” Phys. Rev. B 35, 2573–2582.
1350007-12
Int.
J. C
omp.
Mat
. Sci
. Eng
. Dow
nloa
ded
from
ww
w.w
orld
scie
ntif
ic.c
omby
WSP
C o
n 10
/16/
13. F
or p
erso
nal u
se o
nly.
2nd Reading
August 21, 2013 17:4 WSPC-277-IJCMSE S2047-6841 1350007
Band Structure, Hardness, Thermodynamic and Optical Properties
Barsoum, M. W., El-Raghy, T., Porter, W. D., Wang, H., Ho, J. C. and Chakraborty, S.[2000] “Thermal properties of Nb2SnC,” J. Appl. Phys. 88, 6313–6316.
Barsoum, M. W. [2000] “The MN+1AXN phases: A new class of solids; thermodynamicallystable nanolaminates,” Progr. Solid State Chem. 28, 201–281.
Beckmann, O., Boller, H. and Nowotny, H. [1968] “Neue H-Phasen,” Monatshefte furChemie 99, 1580–1583.
Birch, F. [1978] “Finite strain isotherm and velocities for single-crystal and polycrystallineNaCl at high pressures and 300K,” J. Geophys. Res.: Solid Earth 83, 1257–1268.
Blanco, M. A., Francisco, E. and Luana, V. [2004] “GIBBS: Isothermal-isobaric thermo-dynamics of solids from energy curves using a quasi-harmonic Debye model,” Comput.Phys. Commun. 158, 57–72.
Bortolozo, A. D., Sant’Anna, O. H., da Luz, M. S., dos Santos, C. A. M., Pereira, A.S., Trentin, K. S. and Machado, A. J. S. [2006] “Superconductivity in the Nb2SnCcompound,” Solid State Commun. 139, 57–59.
Bortolozo, A. D., Sant’Anna, O. H., dos Santos, C. A. M. and Machado, A. J. S. [2007]“Superconductivity in the hexagonal-layered nanolaminates Ti2InC compound,” SolidState Commun. 144, 419–421.
Bortolozo, A. D., Fisk, Z., Sant’Anna, O. H., dos Santos, C. A. M. and Machado, A. J. S.[2009] “Superconductivity in Nb2InC,” Physica C 469, 256–258.
Bortolozo, A. D., Serrano, G., Serquis, A., Rodrigues, Jr. D., dos Santos, C. A. M., Fisk,Z. and Machado, A. J. S. [2010] “Superconductivity at 7.3 K in Ti2InN,” Solid StateCommun. 150, 1364–1366.
Bortolozo, A. D., Sant’anna, O. H., dos Santos, C. A. M. and Machado, A. J. S.[2012] “Superconductivity at 9.5 K in the Ti2GeC compound,” Mater. Sci.-Poland 30,92–97.
Bouhemadou, A. [2008] “Calculated structural and elastic properties of M2InC (M = Sc,Ti, V, Zr, Nb, Hf, Ta),” Mod. Phys. Lett. B 22, 2063–2076.
Clark, S. J., Segall, M. D., Pickard, C. J., Hasnip, P. J., Probert, M. I. J., Refson, K.and Payne, M. C. [2005] “First principles methods using CASTEP,” Zeitschrift furKristallographie 220, 567–570.
Cover, M. F., Warschkow, O., Bilek, M. M. M. and McKenzie, D. R. [2009] “A comprehen-sive survey of M2AX phase elastic properties,” J. Phys.: Condens. Matter 21, 305403.
de Almeida, J. S. and Ahuja, R. [2006] “Electronic and optical properties of RuO2 andIrO2,” Phys. Rev. B 73, 165102.
Du, Y. L., Sun, Z. M., Hashimoto, H. and Tian, W. B. [2009] “First-principles study onthermodynamic properties of Ti2AlC and Ti2SC,” Mater. Trans. 50, 2173–2176.
Fischer, T. H. and Almlof, J. [1992] “General methods for geometry and wave functionoptimization,” J. Phys. Chem. 96, 9768–9774.
Gao, F. M. [2006] “Theoretical model of intrinsic hardness,” Phy. Rev. B 73, 132104.Gou, H. Y., Hou, L., Zhang, J. W. and Gao, F. M. [2008] “Pressure-induced incompressibil-
ity of ReC and effect of metallic bonding on its hardness,” Appl. Phys. Lett. 92, 241901.Hettinger, J. D., Lofland, S. E., Finkel, P., Meehan, T., Palma, J., Harrell, K., Gupta, S.,
Ganguly, A., El-Raghy, T. and Barsoum, M. W. [2005] “Electrical transport, thermaltransport, and elastic properties of M2AlC (M = Ti, Cr, Nb and V),” Phys. Rev. B72, 115120.
Jeitschko, W., Nowotny, H. and Benesovsky, F. [1964] “Die H-Phasen Ti2TlC, Ti2PbC,Nb2InC, Nb2SnC and Ta2GaC,” Monatshefte fur Chemie 95, 431–435.
Kohn, W. and Sham, L. J. [1965] “Self-consistent equations including exchange and cor-relation Effects,” Phys. Rev. 140, A1133–A1138.
Li, C., Wang, B., Li, Y. and Wang, R. [2009a] “First-principles study of electronic structure,mechanical and optical properties of V4AlC3,” J. Phys. D: Appl. Phys. 42, 065407.
1350007-13
Int.
J. C
omp.
Mat
. Sci
. Eng
. Dow
nloa
ded
from
ww
w.w
orld
scie
ntif
ic.c
omby
WSP
C o
n 10
/16/
13. F
or p
erso
nal u
se o
nly.
2nd Reading
August 21, 2013 17:4 WSPC-277-IJCMSE S2047-6841 1350007
M. A. Hadi et al.
Li, C., Kuo, J., Wang, B., Li, Y. and Wang, R. [2009b] “A new layer compound Nb4SiC3
predicted from first-principles theory,” J. Phys. D: Appl. Phys. 42, 075404.Li, S., Ahuja, R., Barsoum, M. W., Jena, P. and Johansson, B. [2008] “Optical properties
of Ti3SiC2 and Ti4AlN3,” Appl. Phys. Lett. 92, 221907.Liao, T., Wang, J. and Zhou, Y. [2006] “Superior mechanical properties of Nb2AsC to
those of other layered ternary carbides: A first-principles study,” J. Phys.: Condens.Matter 18, L527–L533.
Lofland, S. E., Hettinger, J. D., Meehan, T., Bryan, A., Finkel, P., Gupta, S., Barsoum,M. W. and Hug, G. [2006] “Electron-phonon coupling in Mn+1AX n-phase carbides,”Phys. Rev. B 74, 174501.
McMillan, W. L. [1968] “Transition temperature of strong-coupled superconductors,” Phys.Rev. 167, 331–344.
Molina-Aldareguia, J. M., Emmerlich, J., Palmquist, J.-P., Jansson, U. and Hultman, L.[2003] “Kink formation around indents in laminated Ti3SiC2 thin films studied in thenanoscale,” Scripta Materialia 49, 155–160.
Monkhorst, H. J. and Pack, J. D. [1976] “Special points for Brillouin-zone integrations,”Phys. Rev. B 13, 5188–5192.
Nguyen, D., Vitek, V. and Horsfield, A. P. [2007] “Environmental dependence of bonding:A challenge for modeling of intermetallics and fusion materials,” Progr. Mater. Sci.52, 255–298.
Nowotny, H. [1970] Progress in Solid State Chemistry, Vol. 2 (Pergamon Press, New York,NY, USA).
Perdew, J. P., Burke, K. and Ernzerhof, M. [1996] “Generalized gradient approximationmade simple,” Phys. Rev. Lett. 77, 3865–3868.
Reshak, A. H., Charifi, Z. and Baaziz, H. [2008] “The effect of the phase transition on theoptical properties of the lanthanum monopnictide compounds,” J. Phys.: Condens.Matter 20, 325207.
Saha, S., Sinha, T. P. and Mookerjee, A. [2000] “Electronic structure, chemical bonding,and optical properties of paraelectric BaTiO3,” Phys. Rev. B 62, 8828–8834.
Sakamaki, K., Wada, H., Nozaki, H., Onuki, Y. and Kawai, M. [1999] “Carbosulfide super-conductor,” Solid State Commun. 112, 323–327.
Saniz, R., Ye, L. H., Shishidou, T. and Freeman, A. J. [2006] “Structural, electronic, andoptical properties of NiAl3: First-principles calculations,” Phys. Rev. B 74, 014209.
Scabarozi, T. H., Amini, S., Leaffer, O., Ganguly, A., Gupta, S., Tambussi, W., Clipper, S.,Spanier, J. E., Barsoum, M. W., Hettinger, J. D. and Lofland, S. E. [2009] “Thermalexpansion of select Mn+1AXn (M = early transition metal, A = A group element, X= C or N) phases measured by high temperature x-ray diffraction and dilatometry,”J. Appl. Phys. 105, 013543.
Shein, I. R. and Ivanovskii, A. L. [2010a] “Ab initio calculation of the electronic structure,fermi surface, and elastic properties of the new 7.5-K superconductor Nb2InC,” J. Exp.Theor. Phys. Lett. 91, 410–414.
Shein, I. R. and Ivanovskii, A. L. [2010b] “Structural, elastic, electronic properties andfermi surface for superconducting Mo2GaC in comparison with V2GaC and Nb2GaCfrom first principles,” Physica C 470, 533–537.
Shein, I. R. and Ivanovskii, A. L. [2011] “Elastic properties of superconducting MAXphases from first-principles calculations,” Physica. Status Solidi B 248, 228–232.
Sun, Z. M., Hashimoto, H., Zou, Y. and Tada, S. [2006] “Synthesis of ternary compoundsCr2GaC and Ti2GaC,” Proc. 2006 Autumn Meeting of Japan Institute of Metals, Niyi-gata, Japan.
1350007-14
Int.
J. C
omp.
Mat
. Sci
. Eng
. Dow
nloa
ded
from
ww
w.w
orld
scie
ntif
ic.c
omby
WSP
C o
n 10
/16/
13. F
or p
erso
nal u
se o
nly.
2nd Reading
August 21, 2013 17:4 WSPC-277-IJCMSE S2047-6841 1350007
Band Structure, Hardness, Thermodynamic and Optical Properties
Toth, L. E. [1967] “High superconducting transition temperatures in the molybdenumcarbide family of compounds,” J. Less Common Metals 13, 129–131.
Wang, J. and Zhou, Y. [2009] “Recent progress in theoretical prediction, preparation, andcharacterization of layered ternary transition-metal carbides,” Annu. Rev. Mater. Res.39, 415–443.
Xu, M., Wang, S., Yin, G., Li, J., Zheng, Y., Chen, L. and Jia, Y. [2006] “Optical propertiesof cubic Ti3N4, Zr3N4, and Hf3N4,”Appl. Phys. Lett. 89, 151908.
1350007-15
Int.
J. C
omp.
Mat
. Sci
. Eng
. Dow
nloa
ded
from
ww
w.w
orld
scie
ntif
ic.c
omby
WSP
C o
n 10
/16/
13. F
or p
erso
nal u
se o
nly.


