Embed Size (px)
Citation preview
ORIGINAL PAPER
Removal of organic compounds by a biofilm supportedon GAC: modelling of batch and column data
Cristina Quintelas • Bruna Silva •
Hugo Figueiredo • Teresa Tavares
Received: 20 February 2009 / Accepted: 22 October 2009 / Published online: 1 November 2009
� Springer Science+Business Media B.V. 2009
Abstract The performance of a biofilm of Arthro-
bacter viscosus supported on granular activated
carbon on the retention of organic compounds was
evaluated. The presence of functional groups on the
cell wall surface of the biomass that may interact with
the organic compounds was confirmed by Fourier
transform infrared spectroscopy, to assess the applica-
bility of this system to the removal of those com-
pounds. The batch assays showed that the removal
percentage decreases with the increasing initial con-
centration. The removal of phenol ranged from 99.5 to
93.4%, the chlorophenol removal ranged from 99.3
to 61.6% and the o-cresol removal ranged from 98.7 to
73.5%, for initial concentrations between 100 and
1,700 mg/L. The batch data were described by Fre-
undlich, Langmuir, Redlich–Peterson, Dubinin-Rad-
ushkevich, Sips and Toth model isotherms and the best
fit for the retention of phenol and for the retention of
o-cresol was obtained with the Sips model, while for
chlorophenol, the best fit was obtained with the
Freundlich model. The column tests showed that
the retention performance followed the order: phe-
nol [ chlorophenol[ o-cresol, and increased with
the increasing initial organic compound concentra-
tion. Data from column runs were described by
Adams–Bohart, Wolborska and Yoon and Nelson
models with good fitting for all the models.
Keywords Arthrobacter viscosus �Biodegradation � Biosorption � Hazardous compounds
List of symbols
Qe (mg/g) Ratio between mass of
compound sorbed by the
biofilm and the mass of GAC,
at the equilibrium
Qmax (mg/g) Maximum mass of compound
sorbed per mass of GAC
Ce (mg/L) Concentration of compound
in solution at equilibrium
b (L/mg) Langmuir adsorption
equilibrium constant
Kf Capacity of adsorption
n Intensity of adsorption
KR (L/g), aR (L/mg)
and bRedlich–Peterson constants.
b varies between 0 and 1
KS (Lbsmg1-bs/g),
aS (L/mg)bs and bS
Sips isotherm parameters
Kt (mg/g), at and t Toth isotherm constants
BD Related to the mean free
energy of sorption per gram
of the sorbate as it is
transferred to the surface of
the solid from infinite
distance in the solution
C. Quintelas (&) � B. Silva � H. Figueiredo � T. Tavares
IBB-Institute for Biotechnology and Bioengineering,
Centre of Biological Engineering, University of Minho,
Campus de Gualtar, 4710-057 Braga, Portugal
e-mail: [email protected]
123
Biodegradation (2010) 21:379–392
DOI 10.1007/s10532-009-9308-5

T Temperature (K)
R Universal gas constant
kAB Kinetic constant (L/(mg�min)
for the Adams–Bohart model
N0 Saturation concentration
(mg/L) for the Adams–Bohart
model
C0 Inlet compound concentration
(mg/L)
C Effluent compound
concentrations (mg/L)
Cs Compound concentration at
the solid/liquid interface
(mg/L)
D Axial diffusion coefficient
(cm2/min)
m Is the migration rate (cm/min)
ba Kinetic coefficient of the
external mass transfer
(min-1)
b0 External mass transfer
coefficient with a negligible
axial dispersion coefficient D
kYN Rate constant (min-1)
s Time required for 50%
adsorbate breakthrough (min)
T Breakthrough time (min)
Introduction
The chemical pollution caused by the presence of
heavy metals and organic compounds in the environ-
ment is, at present, one of the most serious problems
faced by nature. This pollution can cause changes in
physical (turbidity, colour, temperature, viscosity,
surface tension), chemical (chemical oxygen demand,
pH, acidity, alkalinity, dissolved oxygen, toxicity
level, nutrients) and biological characteristics of an
aquatic medium compromising the water quality for
human consumption. A variety of industries includ-
ing olive mills, oil refineries, plastics, leather, paint,
pharmaceutical and steel industries are responsible
for the presence of phenolic compounds in wastewa-
ters. Cresol is used in disinfectants and fumigants, in
the manufacture of synthetic resins, in photographic
developers and in explosives. This compound is
highly toxic, corrosive and causes nervous system
depression (Tallur et al. 2006). Chlorophenols are
used in petrochemical refinery, plastic, pesticide,
herbicide, fiberglass manufacturing and coal conver-
sion industries, hence, they are present in the
respective effluents. General weakness, fatigue,
ataxia, headache, anorexia, sweating, hyperpyrexia,
nausea, vomiting, tachycardia, abdominal pain, ter-
minal spasms and death characterize acute poisoning
by dichlorophenol (Sathishkumar et al. 2007).
The conventional treatments, physical or chemical,
applied to the removal of hazardous compounds are
effective but present several limitations that include
excessive usage of chemicals, expensive plant
requirements, high operational costs and sensitivity
to variations in the wastewater input (Prigione et al.
2008). The development of a robust, highly compet-
itive process, with high performance and efficiency,
based on the ability of certain biological materials to
accumulate and eventually to transform molecules
from effluents by physico-chemical or metabolic
reactions, is strongly recommended. This process
would include a biosorption step followed by a
biodegradation step, depending on the microorganism
ability to degrade the pollutants. The main advanta-
ges of such system are the reusability of biomaterial,
low operating cost, improved selectivity for specific
pollutants, short operation time and no production of
secondary compounds which might be toxic (Mun-
gasavalli et al. 2007).
Several authors have been studying biosorption
applied to the removal of organic compounds from
wastewaters. Wu and Yu (2006, 2007) used a fungus,
Phanerochaete chrysosporium, for the removal of
phenol and chlorophenols. A wider approach was
used by Tallur et al. (2006) who studied the
biodegradation of p-cresol using Bacillus sp. More-
over, the fungus Trametes versicolor was used for the
treatment of phenol and o-cresol contaminated
wastewaters (Ryan et al. 2007). Bacteria tend to
retain strongly many organic compounds including
dyes, phenolics and pesticides. According to Xiao
et al. (2007), as the interior plasma membrane is
impermeable to organic pollutants, the bacterial cell
wall is expected to be the primary element respon-
sible for organic biosorption.
Bacteria spend most of their natural existence
growing as a biofilm. It is possible that the presence
of a suitable substrate for attachment is all that is
required to trigger biofilm formation (Jefferson
2004). Biofilms have also been used for the treatment
380 Biodegradation (2010) 21:379–392
123
of wastewaters contaminated with organic contami-
nants (Quintelas et al. 2006; Wicke et al. 2007). The
use of activated carbon for the removal of organic
compounds was extensively studied by several
authors (Canizares et al. 2006; Mourao et al. 2006;
Li et al. 2002). Aktas and Cecen (2007) studied the
adsorption and desorption of chlorophenol on acti-
vated carbon and activated sludge. The use of
bacteria supported on activated carbon allows com-
bining the good capabilities of both to retain and/or
degrade organic compounds and, eventually, a syn-
ergetic effect is expected between support and
biofilm.
The design and analysis of the adsorption process
require equilibrium characterization. Sorption equi-
libria provide fundamental physicochemical data to
evaluate the applicability of the sorption process as a
unit operation and to describe the fixation capacity of
the biosorbents. The prediction of the concentration–
time profile or breakthrough curve for the effluent to
be treated is one of the requirements for a successful
design of a column adsorption process.
The main focus of this study was the evaluation of
the retention ability of a biofilm of Arthrobacter
viscosus supported on granular activated carbon
(GAC), for the removal of organic compounds from
liquid solutions.
The presence of functional groups in the suspended
biomass that may have a role in the retention process
was confirmed by Fourier transform infrared spec-
troscopy aiming to evaluate the applicability of this
microorganism to the removal of organic compounds.
The removal ability was investigated using batch and
column studies. All the equilibrium isotherms for the
biosorption of phenol, chlorophenol and o-cresol by
the biofilms were described by Freundlich, Langmuir,
Redlich–Peterson, Dubinin–Radushkevich, Sips and
Toth isotherms. The dynamic behaviour of the
columns with respect to the inlet organic compound
concentration was analysed by the Adams–Bohart,
Wolborska and Yoon and Nelson models.
Materials and methods
Materials
The bacterium A. viscosus (CECT 908) was obtained
from the Spanish Type Culture Collection of the
University of Valencia. The organic compounds
solutions were prepared by diluting extra pure
o-cresol (Riedel–de Haen), phenol and chlorophenol
(Merck) in distilled water. Glassware used for
experimental purposes were washed in 60% nitric
acid and subsequently rinsed with deionised water to
remove any possible interference by other com-
pounds. The support was GAC from MERCK,
characterised by N2 adsorption (77 K) with an ASAP
Micromeritics 2001. This support has an average
particle size of 2.5 mm, a Langmuir area of
1,270 m2/g and an average pore diameter of 2 nm.
Methods
Fourier transform infrared spectroscopy
Infrared spectra of suspended biomass, with and
without previous contact with the organic compound,
were obtained using a Fourier transform infrared
spectrometer (FTIR BOMEM MB 104). For the FTIR
study, biomass were centrifuged and dried (24 h at
60�C), followed by weighting. Then, 10 mg of finely
ground biomass was encapsulated in 100 mg of KBr
(Riedel) in order to prepare translucent sample disks.
Background correction for atmospheric air was used
for each spectrum. The resolution was 4 cm-1 and a
minimum of five scans were conducted for each
spectrum with the range between 500 and 4,000
wavenumbers.
Batch biosorption
The biofilm formation was prepared according to
previous studies (Quintelas and Tavares 2001, 2002).
A medium with 10 g/L of glucose, 5 g/L of peptone,
3 g/L of malt extract and 3 g/L of yeast extract was
used for growth and maintenance of the microorgan-
ism. Bacteria are always harvested during the expo-
nential phase of the growth curve, as described in
previous publications. The biosorption isotherms for
the organic compounds by the biofilm supported on
GAC were obtained from batch experiments at 28�C.
The experiments were performed with 250 mL Erlen-
meyer flasks containing 150 mL of the organic com-
pound solution and 1.5 g of GAC covered with biofilm.
The concentrations tested ranged between 100 and
1,000 mg/L, for phenol, between 100 and 1,500 mg/L,
for chlorophenol and between 150 and 1,700 mg/L, for
Biodegradation (2010) 21:379–392 381
123
o-cresol. The flasks were rotated at a constant rate of
150 rpm until equilibrium was reached. Previous
assays were made to determine the time needed for
equilibrium to be reached (5 days). Samples of 5 mL
were taken after reaching equilibrium, centrifuged at
2,500g during 5 min and the supernatant liquid was
analysed for the organic compounds using spectrom-
etry with the 4-aminoantipyrine method (Clesceri et al.
1989). This method is based on the fact that phenolic
compounds react with 4-aminoantipyrine in alkaline
solution, in the presence of ferricyanide to produce a
red reaction product.
Column biosorption
All experiments were conducted in triplicate. GAC
was placed in Erlenmeyer flasks of 250 ml with
150 ml of distilled water. It was sterilised at 120�C
for 20 min to release the air inside the pores. Then, it
was placed in mini-columns (internal diame-
ter = 2 cm, height = 30 cm) for open system stud-
ies. The microorganism culture and the nutrient
broth, composed by glucose, peptone, yeast extract
and malt extract, were pumped through at a flow rate
of 25 mL/min, according with previous works of this
group (Quintelas and Tavares 2001, 2002). The high
flow rate used (25 mL/min) allows the formation of a
compact biofilm, resistant to the erosion stress
promoted by hydrodynamic forces. After biofilm
formation, beds were washed out and 5 L of the
organic compound solutions with concentrations
between 10 and 100 mg/L, were passed through the
columns with a flow rate of 5 mL/min for 17 h. At
the end of each run, columns were washed out and
samples of the effluent were seeded in Petri plates
with nutrient agar to assess the metabolic activity of
the microorganism. Organic compound concentration
at the inlet and at the outlet of the columns was
systematically measured by spectrometry with the
4-aminoantipyrine method (Clesceri et al. 1989).
Modelling
Adsorption isotherm models
Equilibrium isotherm equations are used to describe
experimental sorption data. The equation parameters
and the underlying thermodynamic assumptions of
these equilibrium models often provide some insight
into the sorption mechanism, the surface properties
and the affinity of the sorbent (Gerente et al. 2007).
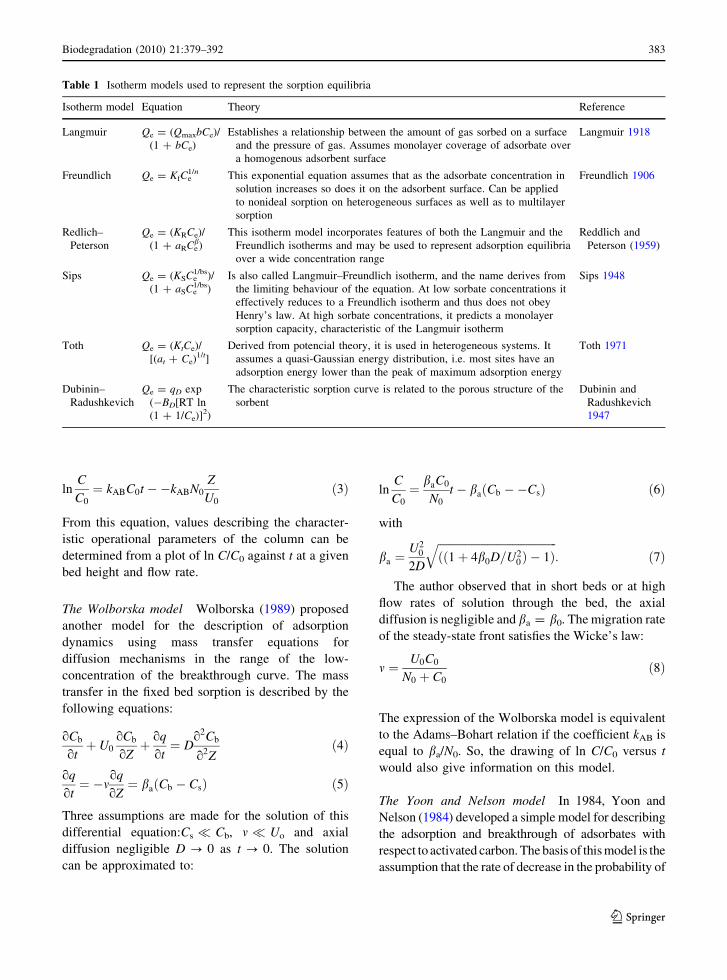
Six isotherm equations have been tested in the
present study and are presented in Table 1. The
simplest method to determine isotherms constants for
two parameter isotherms (Langmuir, Freundlich and
Dubinin-Radushkevich) is to convert the equation to
a linear form and then to apply linear regression. For
the other equations, the model parameters were
estimated by non-linear regression using MATLAB
and EXCEL software.
Modelling column biosorption data
The Adams–Bohart, Wolborska and Yoon and Nelson
models
The prediction of the concentration–time profile or
breakthrough curve for the effluent to be treated is
one of the requirements for a successful design of a
column adsorption process. The Adams–Bohart,
Wolborska and Yoon and Nelson models can be
used to predict the behavior of breakthrough curves.
All parameters are referred to in the Nomenclature
section, in order of appearance.
The Adams–Bohart model In 1920, Bohart and
Adams (1920) established the fundamental equations
that described the relationship between C/C0 and t in a
flowing system for the adsorption of chlorine on
charcoal. The proposed model assumes that the
adsorption rate is proportional to the residual
capacity of the activated carbon and to the
concentration of the sorbing species. The mass
transfer rates obey the following equations:
oq
ot¼ �kABqCb ð1Þ
oCb
oZ¼ � kAB
U0
� �qCb ð2Þ
Two assumptions are made for the solution of these
differential equations system: t ? ? and q ? N0.
When the differential equations system is solved, the
following equation is obtained with parameters kAB
and N0:
382 Biodegradation (2010) 21:379–392
123
lnC
C0
¼ kABC0t ��kABN0
Z
U0
ð3Þ
From this equation, values describing the character-
istic operational parameters of the column can be
determined from a plot of ln C/C0 against t at a given
bed height and flow rate.
The Wolborska model Wolborska (1989) proposed
another model for the description of adsorption
dynamics using mass transfer equations for
diffusion mechanisms in the range of the low-
concentration of the breakthrough curve. The mass
transfer in the fixed bed sorption is described by the
following equations:
oCb
otþ U0
oCb
oZþ oq
ot¼ D
o2Cb
o2Zð4Þ
oq
ot¼ �m
oq
oZ¼ ba Cb � Csð Þ ð5Þ
Three assumptions are made for the solution of this
differential equation:Cs � Cb, m � Uo and axial
diffusion negligible D ? 0 as t ? 0. The solution
can be approximated to:
lnC
C0
¼ baC0
N0
t � ba Cb ��Csð Þ ð6Þ
with
ba ¼U2
0
2D
ffiffiffiffiffiffiffiffiffiffiffiffiffiffiffiffiffiffiffiffiffiffiffiffiffiffiffiffiffiffiffiffiffiffiffiffiffiffiffiffiffiffiffiðð1þ 4b0D=U2
0Þ � 1Þq
: ð7Þ
The author observed that in short beds or at high
flow rates of solution through the bed, the axial
diffusion is negligible and ba = b0. The migration rate
of the steady-state front satisfies the Wicke’s law:
m ¼ U0C0
N0 þ C0
ð8Þ
The expression of the Wolborska model is equivalent
to the Adams–Bohart relation if the coefficient kAB is
equal to ba/N0. So, the drawing of ln C/C0 versus t
would also give information on this model.
The Yoon and Nelson model In 1984, Yoon and
Nelson (1984) developed a simple model for describing
the adsorption and breakthrough of adsorbates with
respect to activated carbon. The basis of this model is the
assumption that the rate of decrease in the probability of
Table 1 Isotherm models used to represent the sorption equilibria
Isotherm model Equation Theory Reference
Langmuir Qe = (QmaxbCe)/
(1 ? bCe)
Establishes a relationship between the amount of gas sorbed on a surface
and the pressure of gas. Assumes monolayer coverage of adsorbate over
a homogenous adsorbent surface
Langmuir 1918
Freundlich Qe = KfCe1/n This exponential equation assumes that as the adsorbate concentration in
solution increases so does it on the adsorbent surface. Can be applied
to nonideal sorption on heterogeneous surfaces as well as to multilayer
sorption
Freundlich 1906
Redlich–
Peterson
Qe = (KRCe)/
(1 ? aRCeb)
This isotherm model incorporates features of both the Langmuir and the
Freundlich isotherms and may be used to represent adsorption equilibria
over a wide concentration range
Reddlich and
Peterson (1959)
Sips Qe = (KSCe1/bs)/
(1 ? aSCe1/bs)
Is also called Langmuir–Freundlich isotherm, and the name derives from
the limiting behaviour of the equation. At low sorbate concentrations it
effectively reduces to a Freundlich isotherm and thus does not obey
Henry’s law. At high sorbate concentrations, it predicts a monolayer
sorption capacity, characteristic of the Langmuir isotherm
Sips 1948
Toth Qe = (KtCe)/
[(at ? Ce)1/t]
Derived from potencial theory, it is used in heterogeneous systems. It
assumes a quasi-Gaussian energy distribution, i.e. most sites have an
adsorption energy lower than the peak of maximum adsorption energy
Toth 1971
Dubinin–
Radushkevich
Qe = qD exp
(-BD[RT ln
(1 ? 1/Ce)]2)
The characteristic sorption curve is related to the porous structure of the
sorbent
Dubinin and
Radushkevich
1947
Biodegradation (2010) 21:379–392 383
123
adsorption for each adsorbate molecule is proportional
to the probability of adsorbate adsorption and to the
probability of adsorbate breakthrough on the adsorbent.
The Yoon and Nelson model can be expressed by the
following equation:
lnC
C0 � C¼ kYNt � skYN ð9Þ
The values values of kYN and s can be calculated
from the plot of ln (C/(C0-C)) versus t.
Results and discussion
FTIR spectral analysis
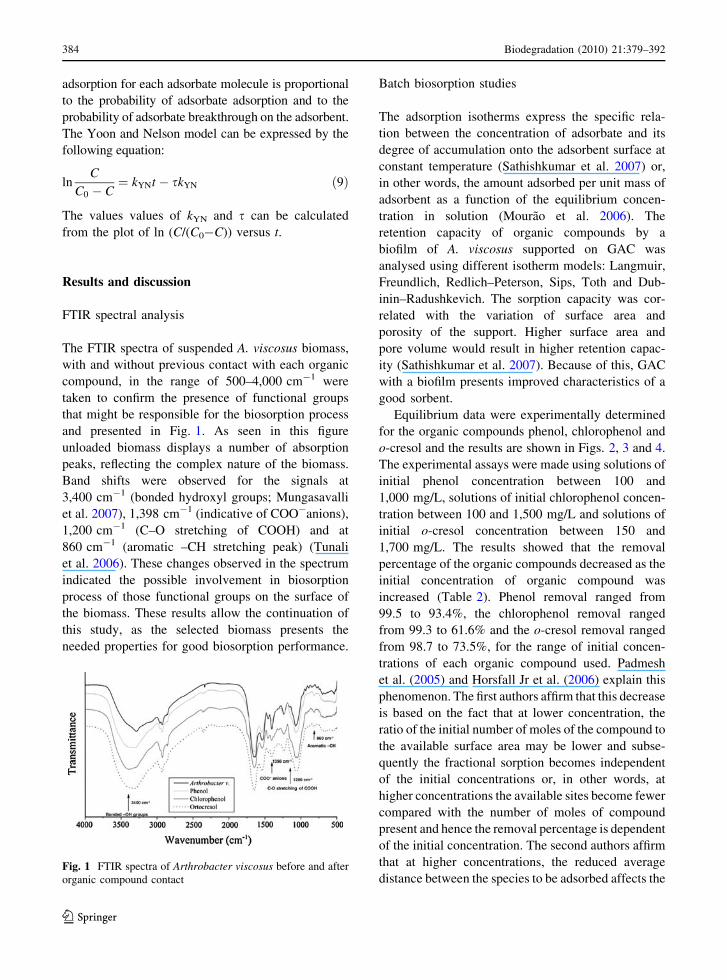
The FTIR spectra of suspended A. viscosus biomass,
with and without previous contact with each organic
compound, in the range of 500–4,000 cm-1 were
taken to confirm the presence of functional groups
that might be responsible for the biosorption process
and presented in Fig. 1. As seen in this figure
unloaded biomass displays a number of absorption
peaks, reflecting the complex nature of the biomass.
Band shifts were observed for the signals at
3,400 cm-1 (bonded hydroxyl groups; Mungasavalli
et al. 2007), 1,398 cm-1 (indicative of COO-anions),
1,200 cm-1 (C–O stretching of COOH) and at
860 cm-1 (aromatic –CH stretching peak) (Tunali
et al. 2006). These changes observed in the spectrum
indicated the possible involvement in biosorption
process of those functional groups on the surface of
the biomass. These results allow the continuation of
this study, as the selected biomass presents the
needed properties for good biosorption performance.
Batch biosorption studies
The adsorption isotherms express the specific rela-
tion between the concentration of adsorbate and its
degree of accumulation onto the adsorbent surface at
constant temperature (Sathishkumar et al. 2007) or,
in other words, the amount adsorbed per unit mass of
adsorbent as a function of the equilibrium concen-
tration in solution (Mourao et al. 2006). The
retention capacity of organic compounds by a
biofilm of A. viscosus supported on GAC was
analysed using different isotherm models: Langmuir,
Freundlich, Redlich–Peterson, Sips, Toth and Dub-
inin–Radushkevich. The sorption capacity was cor-
related with the variation of surface area and
porosity of the support. Higher surface area and
pore volume would result in higher retention capac-
ity (Sathishkumar et al. 2007). Because of this, GAC
with a biofilm presents improved characteristics of a
good sorbent.
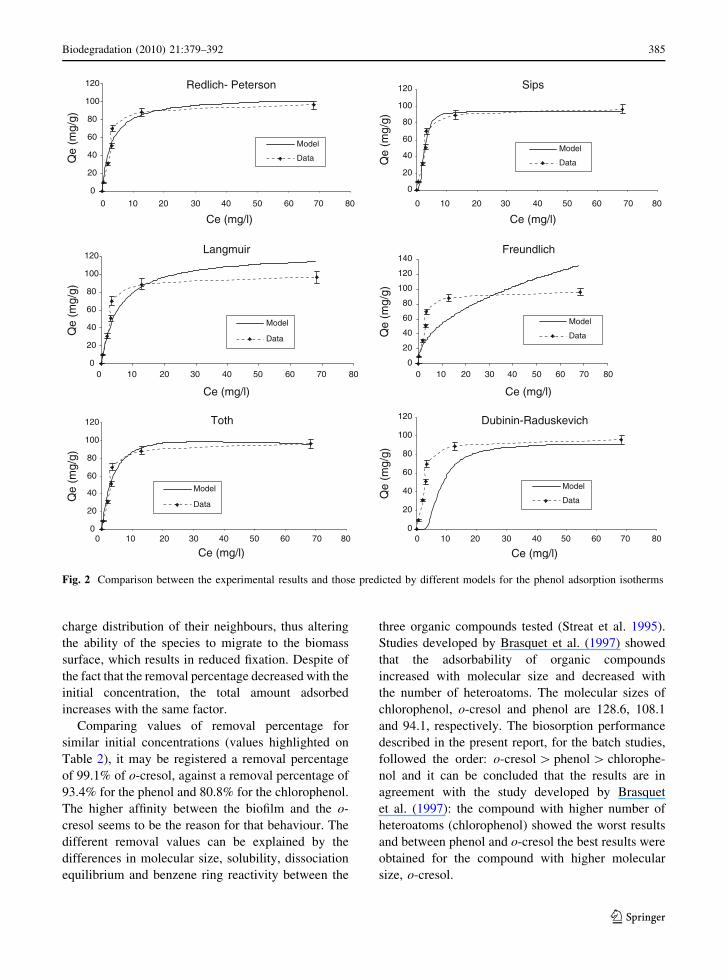
Equilibrium data were experimentally determined
for the organic compounds phenol, chlorophenol and
o-cresol and the results are shown in Figs. 2, 3 and 4.
The experimental assays were made using solutions of
initial phenol concentration between 100 and
1,000 mg/L, solutions of initial chlorophenol concen-
tration between 100 and 1,500 mg/L and solutions of
initial o-cresol concentration between 150 and
1,700 mg/L. The results showed that the removal
percentage of the organic compounds decreased as the
initial concentration of organic compound was
increased (Table 2). Phenol removal ranged from
99.5 to 93.4%, the chlorophenol removal ranged
from 99.3 to 61.6% and the o-cresol removal ranged
from 98.7 to 73.5%, for the range of initial concen-
trations of each organic compound used. Padmesh
et al. (2005) and Horsfall Jr et al. (2006) explain this
phenomenon. The first authors affirm that this decrease
is based on the fact that at lower concentration, the
ratio of the initial number of moles of the compound to
the available surface area may be lower and subse-
quently the fractional sorption becomes independent
of the initial concentrations or, in other words, at
higher concentrations the available sites become fewer
compared with the number of moles of compound
present and hence the removal percentage is dependent
of the initial concentration. The second authors affirm
that at higher concentrations, the reduced average
distance between the species to be adsorbed affects theFig. 1 FTIR spectra of Arthrobacter viscosus before and after
organic compound contact
384 Biodegradation (2010) 21:379–392
123
charge distribution of their neighbours, thus altering
the ability of the species to migrate to the biomass
surface, which results in reduced fixation. Despite of
the fact that the removal percentage decreased with the
initial concentration, the total amount adsorbed
increases with the same factor.
Comparing values of removal percentage for
similar initial concentrations (values highlighted on
Table 2), it may be registered a removal percentage
of 99.1% of o-cresol, against a removal percentage of
93.4% for the phenol and 80.8% for the chlorophenol.
The higher affinity between the biofilm and the o-
cresol seems to be the reason for that behaviour. The
different removal values can be explained by the
differences in molecular size, solubility, dissociation
equilibrium and benzene ring reactivity between the
three organic compounds tested (Streat et al. 1995).
Studies developed by Brasquet et al. (1997) showed
that the adsorbability of organic compounds
increased with molecular size and decreased with
the number of heteroatoms. The molecular sizes of
chlorophenol, o-cresol and phenol are 128.6, 108.1
and 94.1, respectively. The biosorption performance
described in the present report, for the batch studies,
followed the order: o-cresol [ phenol [ chlorophe-
nol and it can be concluded that the results are in
agreement with the study developed by Brasquet
et al. (1997): the compound with higher number of
heteroatoms (chlorophenol) showed the worst results
and between phenol and o-cresol the best results were
obtained for the compound with higher molecular
size, o-cresol.
Redlich- Peterson
0
20
40
60
80
100
120
0 10 20 30 40 50 60 70 80
Ce (mg/l)
Qe
(mg/
g)
Model
Data
Sips
0
20
40
60
80
100
120
Ce (mg/l)
Qe
(mg/
g)
Model
Data
Langmuir
0
20
40
60
80
100
120
Ce (mg/l)
Qe
(mg/
g)
Model
Data
Freundlich
0
20
40
60
80
100
120
140
Ce (mg/l)Q
e (m
g/g)
Model
Data
Toth
0
20
40
60
80
100
120
Ce (mg/l)
Qe
(mg/
g)
Model
Data
Dubinin-Raduskevich
0
20
40
60
80
100
120
Ce (mg/l)
Qe
(mg/
g)
Model
Data
0 10 20 30 40 50 60 70 80
0 10 20 30 40 50 60 70 80 0 10 20 30 40 50 60 70 80
0 10 20 30 40 50 60 70 80
0 10 20 30 40 50 60 70 80
Fig. 2 Comparison between the experimental results and those predicted by different models for the phenol adsorption isotherms
Biodegradation (2010) 21:379–392 385
123
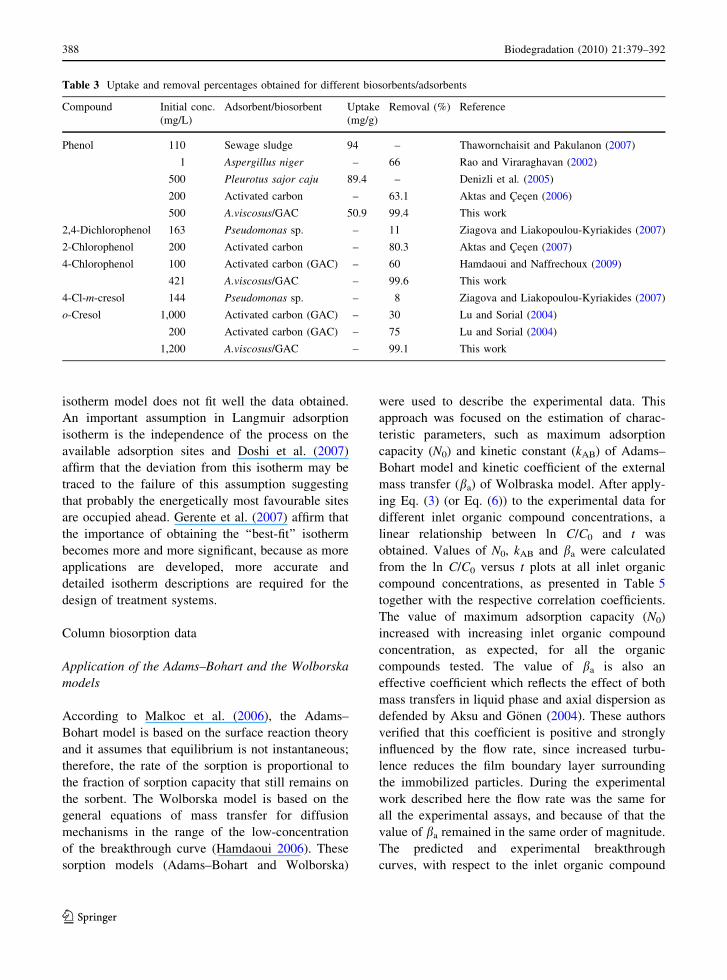
A comparison between the performance of a biofim
supported on GAC and the performance of other
adsorbents/biosorbents was made and is presented on
Table 3. The activated carbon has been used for the
treatment of organic compounds solution (Aktas and
Cecen 2006, 2007; Lu and Sorial 2004; Hamdaoui and
Naffrechoux 2009). The A. viscosus biofilm supported
on GAC presents better results in terms of removal
percentage than the activated carbon by itself, for the
three compounds under study. Several reports showed
that the microorganisms are able to degrade organic
compounds (Thawornchaisit and Pakulanon 2007;
Rao and Viraraghavan 2002; Denizli et al. 2005;
Ziagova and Liakopoulou-Kyriakides 2007). The
biofilm supported on GAC probably combines the
adsorption by GAC with the biosorption and possible
degradation by the microorganisms, resulting in a
more effective and resilient treatment system for
aqueous solutions with relevant concentrations of
some specific organic compounds. The A. viscosus
ability to degrade the organic compounds under study
was assess by parallel assays in which all the
experimental parameters were the same as before,
but in which the biofilm was used in its suspended
form, without GAC to act as support and or as
adsorbent. Degradation occurred for phenol and for
o-cresol but not for chlorophenol. Moreover, the
degradation was detected just after a much longer
period (13 days) than the one needed for biosorption/
adsorption to reach equilibrium (5 days).
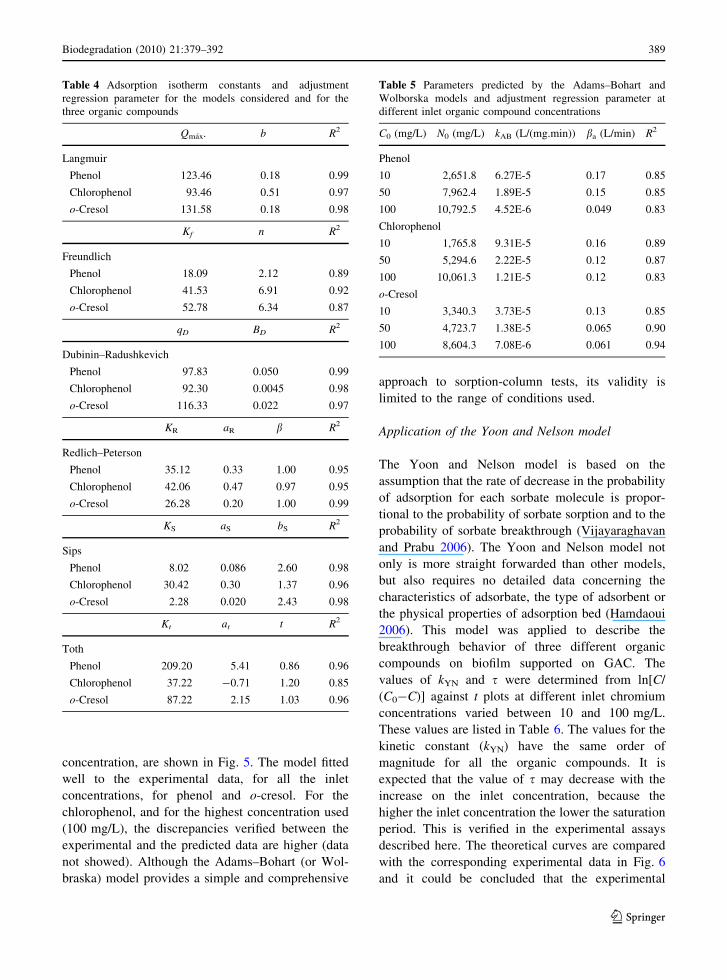
The best fit for the biosorption equilibrium of
phenol was obtained with the Sips model, followed
Redlich-Peterson
020
40
60
80
100
120
140
0 200 400 600 800 1000 1200
Ce (mg/l)
Qe
(mg/
g)
Model
Data
Sips
0
20
40
60
80
100
120
140
0 200 400 600 800 1000 1200
Ce (mg/l)
Qe
(mg/
g)
Model
Data
Langmuir
0
20
40
60
80
100
120
140
Ce (mg/l)
Qe
(mg/
g)
Model
Data
Freundlich
020406080100120140
0 200 400 600 800 1000 1200
Ce (mg/l)Q
e (m
g/g)
Model
Data
Toth
0
20
40
60
80
100
120
140
0 200 400 600 800 1000 1200
Ce (mg/l)
Qe
(mg/
g)
Model
Data
Dubinin-Radushkevich
0
20
40
60
80
100
120
140
0 200 400 600 800 1000 1200
Ce (mg/l)
Qe
(mg/
g)
Model
Data
0 200 400 600 800 1000 1200
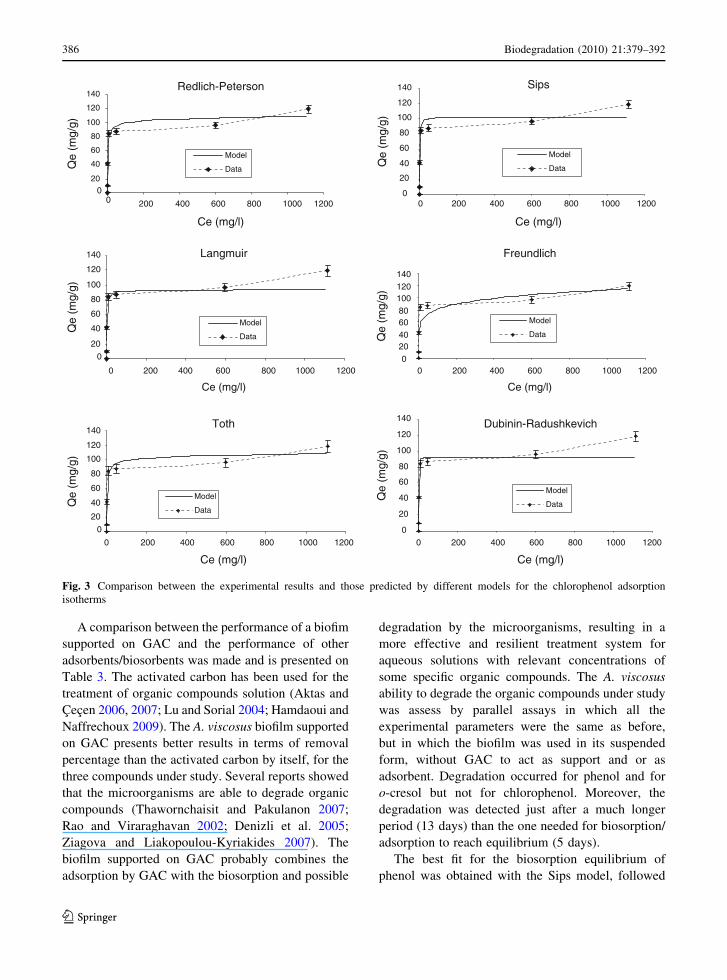
Fig. 3 Comparison between the experimental results and those predicted by different models for the chlorophenol adsorption
isotherms
386 Biodegradation (2010) 21:379–392
123
by the Redlich- Peterson and Toth models (Fig. 2).
For the chlorophenol, the best fit was obtained with
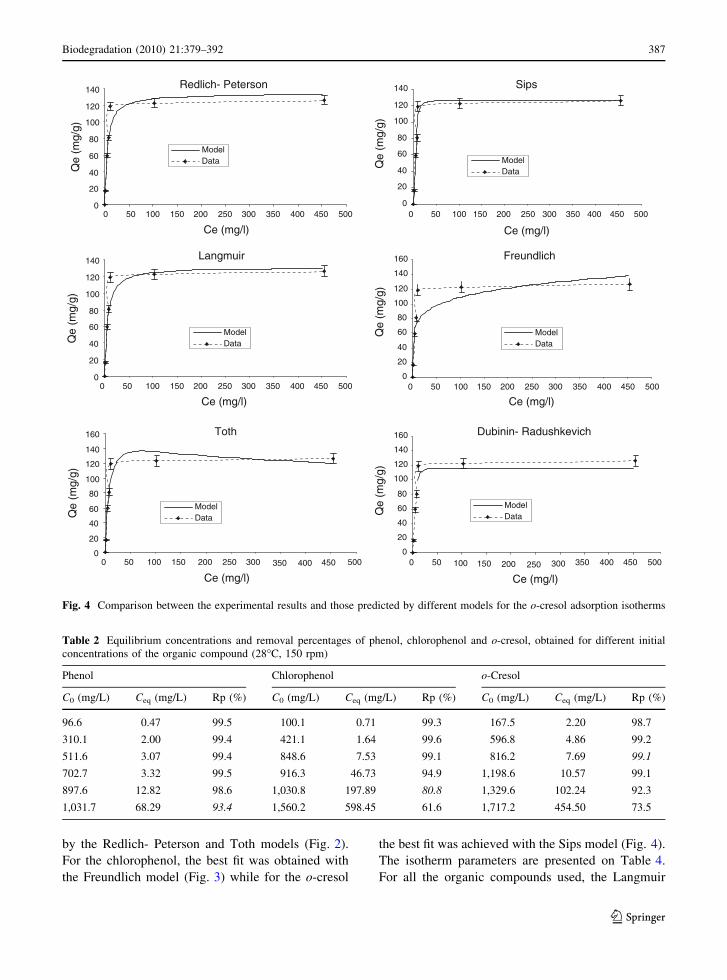
the Freundlich model (Fig. 3) while for the o-cresol
the best fit was achieved with the Sips model (Fig. 4).
The isotherm parameters are presented on Table 4.
For all the organic compounds used, the Langmuir
Redlich- Peterson
0
20
40
60
80
100
120
140
0 50 100 150 200 250 300 350 400 450 500
Ce (mg/l)
Qe
(mg/
g)
ModelData
Sips
0
20
40
60
80
100
120
140
Ce (mg/l)
Qe
(mg/
g)
Langmuir
0
20
40
60
80
100
120
140
Ce (mg/l)
Qe
(mg/
g)
Freundlich
0
20
40
60
80
100
120
140
160
Ce (mg/l)
Qe
(mg/
g)
Toth
0
20
40
60
80
100
120
140
160
Ce (mg/l)
Qe
(mg/
g)
Dubinin- Radushkevich
0
20
40
60
80
100
120
140
160
Ce (mg/l)
Qe
(mg/
g)0 50 100 150 200 250 300 350 400 450 500
0 50 100 150 200 250 300 350 400 450 500 0 50 100 150 200 250 300 350 400 450 500
0 50 100 150 200 250 300 350 400 450 500
0 50 100 150 200 250 300 350 400 450 500
ModelData
ModelData
ModelData
ModelData
ModelData
Fig. 4 Comparison between the experimental results and those predicted by different models for the o-cresol adsorption isotherms
Table 2 Equilibrium concentrations and removal percentages of phenol, chlorophenol and o-cresol, obtained for different initial
concentrations of the organic compound (28�C, 150 rpm)
Phenol Chlorophenol o-Cresol
C0 (mg/L) Ceq (mg/L) Rp (%) C0 (mg/L) Ceq (mg/L) Rp (%) C0 (mg/L) Ceq (mg/L) Rp (%)
96.6 0.47 99.5 100.1 0.71 99.3 167.5 2.20 98.7
310.1 2.00 99.4 421.1 1.64 99.6 596.8 4.86 99.2
511.6 3.07 99.4 848.6 7.53 99.1 816.2 7.69 99.1
702.7 3.32 99.5 916.3 46.73 94.9 1,198.6 10.57 99.1
897.6 12.82 98.6 1,030.8 197.89 80.8 1,329.6 102.24 92.3
1,031.7 68.29 93.4 1,560.2 598.45 61.6 1,717.2 454.50 73.5
Biodegradation (2010) 21:379–392 387
123
isotherm model does not fit well the data obtained.
An important assumption in Langmuir adsorption
isotherm is the independence of the process on the
available adsorption sites and Doshi et al. (2007)
affirm that the deviation from this isotherm may be
traced to the failure of this assumption suggesting
that probably the energetically most favourable sites
are occupied ahead. Gerente et al. (2007) affirm that
the importance of obtaining the ‘‘best-fit’’ isotherm
becomes more and more significant, because as more
applications are developed, more accurate and
detailed isotherm descriptions are required for the
design of treatment systems.
Column biosorption data
Application of the Adams–Bohart and the Wolborska
models
According to Malkoc et al. (2006), the Adams–
Bohart model is based on the surface reaction theory
and it assumes that equilibrium is not instantaneous;
therefore, the rate of the sorption is proportional to
the fraction of sorption capacity that still remains on
the sorbent. The Wolborska model is based on the
general equations of mass transfer for diffusion
mechanisms in the range of the low-concentration
of the breakthrough curve (Hamdaoui 2006). These
sorption models (Adams–Bohart and Wolborska)
were used to describe the experimental data. This
approach was focused on the estimation of charac-
teristic parameters, such as maximum adsorption
capacity (N0) and kinetic constant (kAB) of Adams–
Bohart model and kinetic coefficient of the external
mass transfer (ba) of Wolbraska model. After apply-
ing Eq. (3) (or Eq. (6)) to the experimental data for
different inlet organic compound concentrations, a
linear relationship between ln C/C0 and t was
obtained. Values of N0, kAB and ba were calculated
from the ln C/C0 versus t plots at all inlet organic
compound concentrations, as presented in Table 5
together with the respective correlation coefficients.
The value of maximum adsorption capacity (N0)
increased with increasing inlet organic compound
concentration, as expected, for all the organic
compounds tested. The value of ba is also an
effective coefficient which reflects the effect of both
mass transfers in liquid phase and axial dispersion as
defended by Aksu and Gonen (2004). These authors
verified that this coefficient is positive and strongly
influenced by the flow rate, since increased turbu-
lence reduces the film boundary layer surrounding
the immobilized particles. During the experimental
work described here the flow rate was the same for
all the experimental assays, and because of that the
value of ba remained in the same order of magnitude.
The predicted and experimental breakthrough
curves, with respect to the inlet organic compound
Table 3 Uptake and removal percentages obtained for different biosorbents/adsorbents
Compound Initial conc.
(mg/L)
Adsorbent/biosorbent Uptake
(mg/g)
Removal (%) Reference
Phenol 110 Sewage sludge 94 – Thawornchaisit and Pakulanon (2007)
1 Aspergillus niger – 66 Rao and Viraraghavan (2002)
500 Pleurotus sajor caju 89.4 – Denizli et al. (2005)
200 Activated carbon – 63.1 Aktas and Cecen (2006)
500 A.viscosus/GAC 50.9 99.4 This work
2,4-Dichlorophenol 163 Pseudomonas sp. – 11 Ziagova and Liakopoulou-Kyriakides (2007)
2-Chlorophenol 200 Activated carbon – 80.3 Aktas and Cecen (2007)
4-Chlorophenol 100 Activated carbon (GAC) – 60 Hamdaoui and Naffrechoux (2009)
421 A.viscosus/GAC – 99.6 This work
4-Cl-m-cresol 144 Pseudomonas sp. – 8 Ziagova and Liakopoulou-Kyriakides (2007)
o-Cresol 1,000 Activated carbon (GAC) – 30 Lu and Sorial (2004)
200 Activated carbon (GAC) – 75 Lu and Sorial (2004)
1,200 A.viscosus/GAC – 99.1 This work
388 Biodegradation (2010) 21:379–392
123
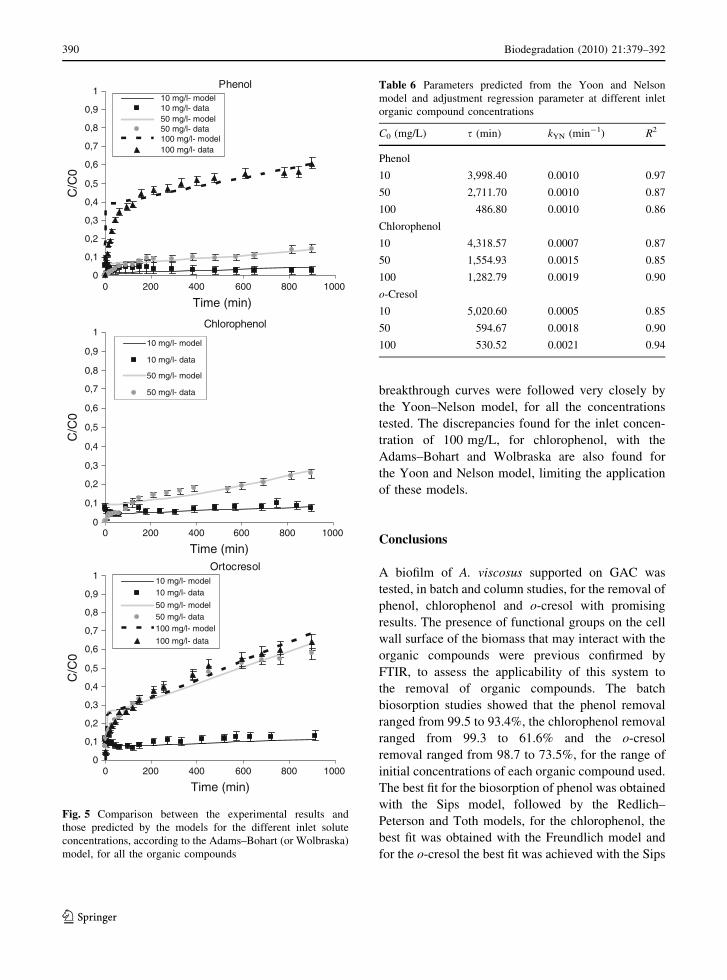
concentration, are shown in Fig. 5. The model fitted
well to the experimental data, for all the inlet
concentrations, for phenol and o-cresol. For the
chlorophenol, and for the highest concentration used
(100 mg/L), the discrepancies verified between the
experimental and the predicted data are higher (data
not showed). Although the Adams–Bohart (or Wol-
braska) model provides a simple and comprehensive
approach to sorption-column tests, its validity is
limited to the range of conditions used.
Application of the Yoon and Nelson model
The Yoon and Nelson model is based on the
assumption that the rate of decrease in the probability
of adsorption for each sorbate molecule is propor-
tional to the probability of sorbate sorption and to the
probability of sorbate breakthrough (Vijayaraghavan
and Prabu 2006). The Yoon and Nelson model not
only is more straight forwarded than other models,
but also requires no detailed data concerning the
characteristics of adsorbate, the type of adsorbent or
the physical properties of adsorption bed (Hamdaoui
2006). This model was applied to describe the
breakthrough behavior of three different organic
compounds on biofilm supported on GAC. The
values of kYN and s were determined from ln[C/
(C0-C)] against t plots at different inlet chromium
concentrations varied between 10 and 100 mg/L.
These values are listed in Table 6. The values for the
kinetic constant (kYN) have the same order of
magnitude for all the organic compounds. It is
expected that the value of s may decrease with the
increase on the inlet concentration, because the
higher the inlet concentration the lower the saturation
period. This is verified in the experimental assays
described here. The theoretical curves are compared
with the corresponding experimental data in Fig. 6
and it could be concluded that the experimental
Table 5 Parameters predicted by the Adams–Bohart and
Wolborska models and adjustment regression parameter at
different inlet organic compound concentrations
C0 (mg/L) N0 (mg/L) kAB (L/(mg.min)) ba (L/min) R2
Phenol
10 2,651.8 6.27E-5 0.17 0.85
50 7,962.4 1.89E-5 0.15 0.85
100 10,792.5 4.52E-6 0.049 0.83
Chlorophenol
10 1,765.8 9.31E-5 0.16 0.89
50 5,294.6 2.22E-5 0.12 0.87
100 10,061.3 1.21E-5 0.12 0.83
o-Cresol
10 3,340.3 3.73E-5 0.13 0.85
50 4,723.7 1.38E-5 0.065 0.90
100 8,604.3 7.08E-6 0.061 0.94
Table 4 Adsorption isotherm constants and adjustment
regression parameter for the models considered and for the
three organic compounds
Qmax. b R2
Langmuir
Phenol 123.46 0.18 0.99
Chlorophenol 93.46 0.51 0.97
o-Cresol 131.58 0.18 0.98
Kf n R2
Freundlich
Phenol 18.09 2.12 0.89
Chlorophenol 41.53 6.91 0.92
o-Cresol 52.78 6.34 0.87
qD BD R2
Dubinin–Radushkevich
Phenol 97.83 0.050 0.99
Chlorophenol 92.30 0.0045 0.98
o-Cresol 116.33 0.022 0.97
KR aR b R2
Redlich–Peterson
Phenol 35.12 0.33 1.00 0.95
Chlorophenol 42.06 0.47 0.97 0.95
o-Cresol 26.28 0.20 1.00 0.99
KS aS bS R2
Sips
Phenol 8.02 0.086 2.60 0.98
Chlorophenol 30.42 0.30 1.37 0.96
o-Cresol 2.28 0.020 2.43 0.98
Kt at t R2
Toth
Phenol 209.20 5.41 0.86 0.96
Chlorophenol 37.22 -0.71 1.20 0.85
o-Cresol 87.22 2.15 1.03 0.96
Biodegradation (2010) 21:379–392 389
123
breakthrough curves were followed very closely by
the Yoon–Nelson model, for all the concentrations
tested. The discrepancies found for the inlet concen-
tration of 100 mg/L, for chlorophenol, with the
Adams–Bohart and Wolbraska are also found for
the Yoon and Nelson model, limiting the application
of these models.
Conclusions
A biofilm of A. viscosus supported on GAC was
tested, in batch and column studies, for the removal of
phenol, chlorophenol and o-cresol with promising
results. The presence of functional groups on the cell
wall surface of the biomass that may interact with the
organic compounds were previous confirmed by
FTIR, to assess the applicability of this system to
the removal of organic compounds. The batch
biosorption studies showed that the phenol removal
ranged from 99.5 to 93.4%, the chlorophenol removal
ranged from 99.3 to 61.6% and the o-cresol
removal ranged from 98.7 to 73.5%, for the range of
initial concentrations of each organic compound used.
The best fit for the biosorption of phenol was obtained
with the Sips model, followed by the Redlich–
Peterson and Toth models, for the chlorophenol, the
best fit was obtained with the Freundlich model and
for the o-cresol the best fit was achieved with the Sips
Table 6 Parameters predicted from the Yoon and Nelson
model and adjustment regression parameter at different inlet
organic compound concentrations
C0 (mg/L) s (min) kYN (min-1) R2
Phenol
10 3,998.40 0.0010 0.97
50 2,711.70 0.0010 0.87
100 486.80 0.0010 0.86
Chlorophenol
10 4,318.57 0.0007 0.87
50 1,554.93 0.0015 0.85
100 1,282.79 0.0019 0.90
o-Cresol
10 5,020.60 0.0005 0.85
50 594.67 0.0018 0.90
100 530.52 0.0021 0.94
Chlorophenol
0
0,1
0,2
0,3
0,4
0,5
0,6
0,7
0,8
0,9
1
Time (min)
C/C
0
10 mg/l- model
10 mg/l- data
50 mg/l- model
50 mg/l- data
Phenol
0
0,1
0,2
0,3
0,4
0,5
0,6
0,7
0,8
0,9
1
0 200 400 600 800 1000
Time (min)
C/C
0
10 mg/l- model10 mg/l- data50 mg/l- model50 mg/l- data100 mg/l- model100 mg/l- data
Ortocresol
0
0,1
0,2
0,3
0,4
0,5
0,6
0,7
0,8
0,9
1
0 200 400 600 800 1000
0 200 400 600 800 1000
Time (min)
C/C
0
10 mg/l- model10 mg/l- data
50 mg/l- model50 mg/l- data100 mg/l- model
100 mg/l- data
Fig. 5 Comparison between the experimental results and
those predicted by the models for the different inlet solute
concentrations, according to the Adams–Bohart (or Wolbraska)
model, for all the organic compounds
390 Biodegradation (2010) 21:379–392
123

model. The modelling of the biosorption process
allows the successful design of a column adsorption
process aiming a future industrial usage. Data from
column runs were described by Adams–Bohart,
Wolborska and Yoon and Nelson models, with good
agreement for both models.
Acknowledgments This work was supported by Fundacao
para a Ciencia e Tecnologia (FCT-Portugal), under programme
POCTI/FEDER (POCTI/CTA/44449/2002). Cristina Quintelas
gratefully acknowledges the Fundacao para a Ciencia e
Tecnologia (FCT-Portugal) for a Post-Doc grant.
References
Aksu Z, Gonen F (2004) Biosorption of phenol by immobilized
activated sludge in a continuous packed bed: prediction of
breakthrough curves. Process Biochem 39:599–613
Aktas O, Cecen F (2006) Effect of type of carbon activation on
adsorption and its reversibility. J Chem Technol Bio-
technol 81:94–101
Aktas O, Cecen F (2007) Adsorption, desorption and biore-
generation in treatment of 2-chlorophenol with activated
carbon. J Hazard Mater 141:769–777
Bohart G, Adams EQ (1920) Some aspects of the behaviour of
charcoal with respect to chlorine. J Am Chem Soc
42:523–544
Brasquet C, Subrenat E, Le Cloirec P (1997) Selective
adsorption on fibrous activated carbon of organics from
aqueous solutions: correlation between adsorption and
molecular structure. Water Sci Technol 35:251–259
Canizares P, Carmona M, Baraza O, Delgado A, Rodrigo MA
(2006) Adsorption equilibrium of phenol onto chemically
modified activated carbon F400. J Hazard Mater B131:
243–248
Clesceri LS, Greenberg AE, Trussell RR (1989) Standard
methods for the examination of water and wastewater, 17th
edn. American Public Health Association, Washington
Denizli A, Cihangir N, Tuzmen N, Alsancak G (2005)
Removal of chlorophenols from aquatic systems using the
dried and dead fungus Pleurotus sajor caju. Bioresour
Technol 96:59–62
Doshi H, Ray A, Kothari IL (2007) Bioremediation potential of
live and dead Spirulina: spectroscopic, kinetics and SEM
studies. Biotechnol Bioeng 96:1051–1063
Dubinin MM, Radushkevich LV (1947) The equation of the
characteristic curve of activated charcoal. Dokl Akad
Nauk SSSR 55:327–329
Freundlich H (1906) Adsorption in solutions. Phys Chemie
57:384–410
Gerente C, Lee VKC, Le Cloirec P, McKay G (2007) Appli-
cation of chitosan for the removal of metals from waste-
waters by adsorption—mechanisms and models review.
Rev Environ Sci Bio/Technol 37:41–127
Hamdaoui O (2006) Dynamic sorption of methylene blue by
cedar sawdust and crushed brick in fixed bed columns.
J Hazard Mater B138:293–303
Chlorophenol
0
0,1
0,2
0,3
0,4
0,5
0,6
0,7
0,8
0,9
1
Time (min)
C/C
0
10 mg/l- model
10 mg/l- data
50 mg/l- model
50 mg/l- data
0
0,1
0,2
0,3
0,4
0,5
0,6
0,7
0,8
0,9
1
Time (min)
C/C
0
10 mg/l- model10 mg/l- data50 mg/l- model50 mg/l- data100 mg/l- model100 mg/l- data
0
0,1
0,2
0,3
0,4
0,5
0,6
0,7
0,8
0,9
1
0 200 400 600 800 1000
0 200 400 600 800 1000
0 200 400 600 800 1000
Time (min)
C/C
0
10 mg/l- model10 mg/l- data
50 mg/l- model50 mg/l- data100 mg/l- model
100 mg/l- data
Phenol
Ortocresol
Fig. 6 Comparison between the experimental data and those
predicted by the models for the different inlet solute
concentrations, according to the Yoon and Nelson model, for
all the organic compounds
Biodegradation (2010) 21:379–392 391
123

Hamdaoui O, Naffrechoux E (2009) Adsorption kinetics of 4-
chlorophenol onto granular activated carbon in the pres-
ence of high frequency ultrasound. Ultrason Sonochem
16:15–22
Horsfall M Jr, Ogban F, Akporhonor EE (2006) Sorption of
chromium (VI) from aqueous solution by cassava (Man-
ihot sculenta CRANZ) waste biomass. Chem & Bio
3:161–173
Jefferson K (2004) What drives bacteria to produce a biofilm?
FEMS Microbiol Lett 236:163–173
Langmuir I (1918) Adsorption of gases on plane surfaces of
glass, mica and platinum. J Am Chem Soc 40:1361–
1403
Li L, Quinlivan PA, Knappe DRU (2002) Effects of activated
carbon surface chemistry and pore structure on the
adsorption of organic contaminants from aqueous solu-
tion. Carbon 40:2085–2100
Lu Q, Sorial GA (2004) Adsorption of phenolics on activated
carbon—impact of pore size and molecular oxygen.
Chemosphere 55:671–679
Malkoc E, Nuhoglu Y, Dundar M (2006) Adsorption of chro-
mium (VI) on pomace—An olive oil industry waste: batch
and column studies. J Hazard Mater B138:142–151
Mourao PAM, Carrott PJM, Ribeiro Carrott MML (2006)
Application of different equations to adsorption isotherms
of phenolic compounds on activated carbons prepared
from cork. Carbon 44:2422–2429
Mungasavalli DP, Viraraghavan T, Jin Y-C (2007) Biosorption
of chromium from aqueous solutions by pretreated
Aspergillus niger: batch and column studies. Colloids Surf
A 301:214–223
Padmesh TVN, Vijayaraghavan K, Sekaran G, Velan M (2005)
Batch and column studies on biosorption of acid dyes on
fresh water macro alga Azolla filiculoides. J Hazard Mater
B125:121–129
Prigione V, Varese GC, Casieri L, Marchisio VF (2008) Bio-
sorption of simulated dyed effluents by inactivated fungal
biomasses. Bioresour Technol 99:3559–3567
Quintelas C, Tavares T (2001) Removal of chromium (VI) and
cadmium (II) from aqueous solution by a bacterial biofilm
supported on granular activated carbon. Biotechnol Lett
23:1349–1353
Quintelas C, Tavares T (2002) Lead (II) and iron (II) removal
from aqueous solution: biosorption by a bacterial biofilm
supported on granular activated carbon. J Res Environ
Biotechnol 3:196–202
Quintelas C, Sousa E, Silva F, Neto S, Tavares T (2006)
Competitive biosorption of ortho-cresol, phenol, chloro-
phenol and chromium (VI) from aqueous solution by a
bacterial biofilm supported on granular activated carbon.
Process Biochem 41:2087–2091
Rao JR, Viraraghavan T (2002) Biosorption of phenol from an
aqueous solution by Aspergillus niger biomass. Bioresour
Technol 85:165–171
Reddlich O, Peterson DL (1959) A useful adsorption isotherm.
J Phys Chem 63:1024
Ryan D, Leukes W, Burton S (2007) Improving the bioreme-
diation of phenolic wastewaters by Trametes versicolor.
Bioresour Technol 98:579–587
Sathishkumar M, Binupriya AR, Kavitha D, Yun SE (2007)
Kinetic and isothermal studies on liquid- phase adsorption
of 2, 4-dichlorophenol by palm pith carbon. Bioresour
Technol 98:866–873
Sips R (1948) Combined form of Langmuir and Freundlich
equations. J Chem Phys 16:490–495
Streat M, Patrick JW, Camporro Perez MJ (1995) Sorption of
phenol and pchlorophenol from water using conventional
and novel activated carbon. Water Res 29:467–472
Tallur PN, Megadi VB, Kamanavalli CM, Ninnekar HZ (2006)
Biodegradation of p-cresol by Bacillus sp. strain PHN 1.
Curr Microbiol 53:529–533
Thawornchaisit U, Pakulanon K (2007) Application of dried
sewage sludge as phenol biosorbent. Bioresour Technol
98:140–144
Toth J (1971) State equations of the solid–gas interface layer.
Acta Chim Acad Sci Hung 69:311–328
Tunali S, Cabuk A, Akar T (2006) Removal of lead and copper
ions from aqueous solutions by bacterial strain isolated
from soil. Chem Eng J 115:203–211
Vijayaraghavan K, Prabu D (2006) Potential of Sargassumwightii biomass for copper(II) removal from aqueous
solutions: application of different mathematical models to
batch and continuous biosorption data. J Hazard Mater
B137:558–564
Wicke D, Bockelmann U, Reemtsma T (2007) Experimental
and modelling approach to study sorption of dissolved
hydrophobic organic contaminants to microbial biofilms.
Water Res 41:2202–2210
Wolborska A (1989) Adsorption on activated carbon of
p-nitrophenol from aqueous solution. Water Res 23:85–91
Wu J, Yu H-Q (2006) Biosorption of phenol and chlorophenols
from aqueous solutions by fungal mycelia. Process Bio-
chem 41:44–49
Wu J, Yu H-Q (2007) Biosorption of 2, 4-dichlorophenol by
immobilized white-rot fungus Phanerochaete chrysospori-um from aqueous solutions. Bioresour Technol 98:253–259
Xiao L, Qu X, Zhu D (2007) Biosorption of nonpolar hydro-
phobic organic compounds to Escherichia coli facilitated
by metal and proton surface binding. Environ Sci Technol
41:2750–2755
Yoon YH, Nelson JH (1984) Application of gas adsorption
kinetics-II. A theoretical model for respirator cartridge
service life and its practical applications. Am Ind Hyg
Assoc J 45:509–516
Ziagova M, Liakopoulou-Kyriakides M (2007) Kinetics of 2,
4-dichlorophenol and 4-Cl-m-cresol degradation by
Pseudomonas sp. cultures in the presence of glucose.
Chemosphere 68:921–927
392 Biodegradation (2010) 21:379–392
123


