Embed Size (px)
Citation preview
[The Journal of Geology, 2000, volume 108, p. 253–274] q 2000 by The University of Chicago. All rights reserved. 0022-1376/2000/10803-0001$01.00
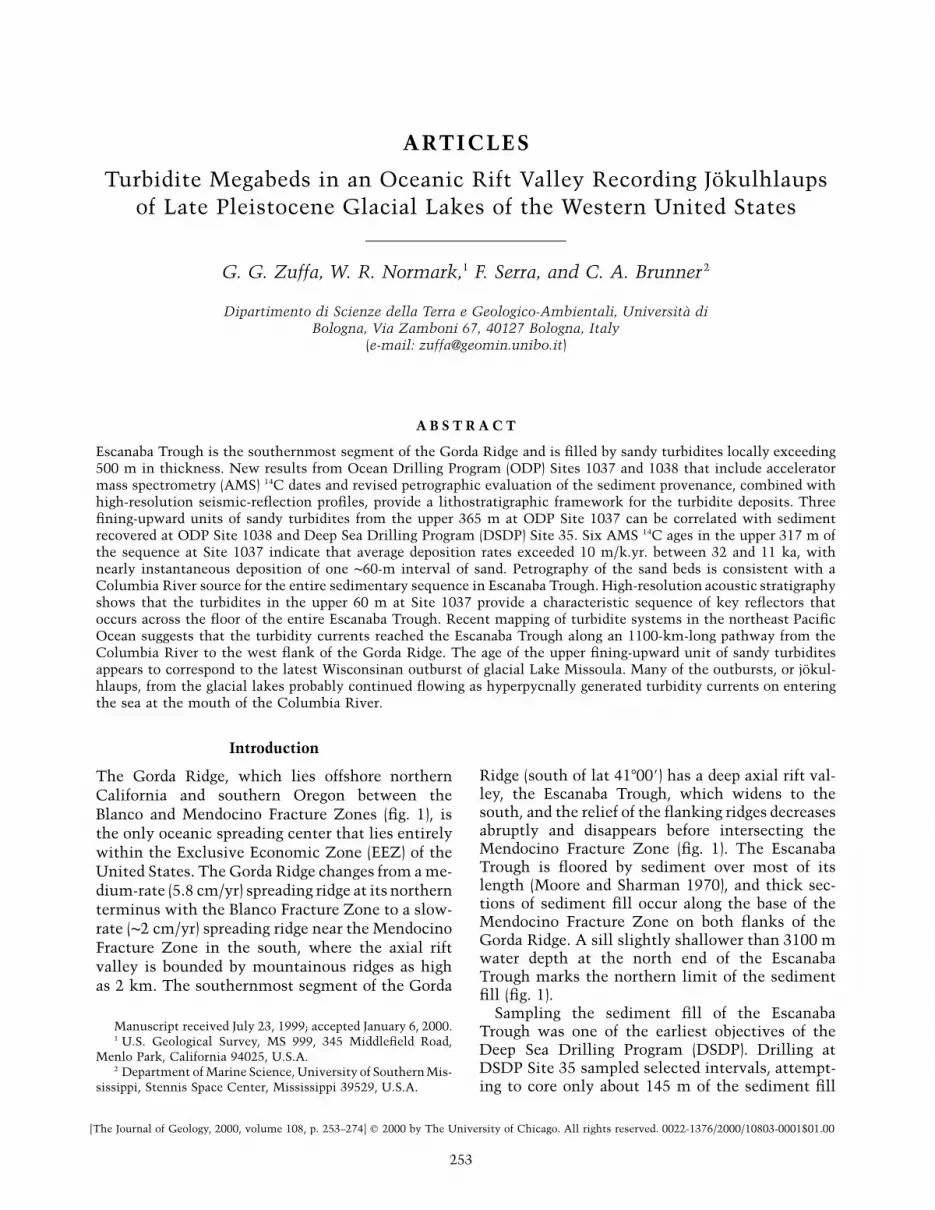
253
ARTICLES
Turbidite Megabeds in an Oceanic Rift Valley Recording Jokulhlaupsof Late Pleistocene Glacial Lakes of the Western United States
G. G. Zuffa, W. R. Normark,1 F. Serra, and C. A. Brunner2
Dipartimento di Scienze della Terra e Geologico-Ambientali, Universita diBologna, Via Zamboni 67, 40127 Bologna, Italy
(e-mail: [email protected])
A B S T R A C T
Escanaba Trough is the southernmost segment of the Gorda Ridge and is filled by sandy turbidites locally exceeding500 m in thickness. New results from Ocean Drilling Program (ODP) Sites 1037 and 1038 that include acceleratormass spectrometry (AMS) 14C dates and revised petrographic evaluation of the sediment provenance, combined withhigh-resolution seismic-reflection profiles, provide a lithostratigraphic framework for the turbidite deposits. Threefining-upward units of sandy turbidites from the upper 365 m at ODP Site 1037 can be correlated with sedimentrecovered at ODP Site 1038 and Deep Sea Drilling Program (DSDP) Site 35. Six AMS 14C ages in the upper 317 m ofthe sequence at Site 1037 indicate that average deposition rates exceeded 10 m/k.yr. between 32 and 11 ka, withnearly instantaneous deposition of one ∼60-m interval of sand. Petrography of the sand beds is consistent with aColumbia River source for the entire sedimentary sequence in Escanaba Trough. High-resolution acoustic stratigraphyshows that the turbidites in the upper 60 m at Site 1037 provide a characteristic sequence of key reflectors thatoccurs across the floor of the entire Escanaba Trough. Recent mapping of turbidite systems in the northeast PacificOcean suggests that the turbidity currents reached the Escanaba Trough along an 1100-km-long pathway from theColumbia River to the west flank of the Gorda Ridge. The age of the upper fining-upward unit of sandy turbiditesappears to correspond to the latest Wisconsinan outburst of glacial Lake Missoula. Many of the outbursts, or jokul-hlaups, from the glacial lakes probably continued flowing as hyperpycnally generated turbidity currents on enteringthe sea at the mouth of the Columbia River.
Introduction
The Gorda Ridge, which lies offshore northernCalifornia and southern Oregon between theBlanco and Mendocino Fracture Zones (fig. 1), isthe only oceanic spreading center that lies entirelywithin the Exclusive Economic Zone (EEZ) of theUnited States. The Gorda Ridge changes from a me-dium-rate (5.8 cm/yr) spreading ridge at its northernterminus with the Blanco Fracture Zone to a slow-rate (∼2 cm/yr) spreading ridge near the MendocinoFracture Zone in the south, where the axial riftvalley is bounded by mountainous ridges as highas 2 km. The southernmost segment of the Gorda
Manuscript received July 23, 1999; accepted January 6, 2000.1 U.S. Geological Survey, MS 999, 345 Middlefield Road,
Menlo Park, California 94025, U.S.A.2 Department of Marine Science, University of Southern Mis-
sissippi, Stennis Space Center, Mississippi 39529, U.S.A.
Ridge (south of lat 417009) has a deep axial rift val-ley, the Escanaba Trough, which widens to thesouth, and the relief of the flanking ridges decreasesabruptly and disappears before intersecting theMendocino Fracture Zone (fig. 1). The EscanabaTrough is floored by sediment over most of itslength (Moore and Sharman 1970), and thick sec-tions of sediment fill occur along the base of theMendocino Fracture Zone on both flanks of theGorda Ridge. A sill slightly shallower than 3100 mwater depth at the north end of the EscanabaTrough marks the northern limit of the sedimentfill (fig. 1).
Sampling the sediment fill of the EscanabaTrough was one of the earliest objectives of theDeep Sea Drilling Program (DSDP). Drilling atDSDP Site 35 sampled selected intervals, attempt-ing to core only about 145 m of the sediment fill

Figure 1. Bathymetric map of Escanaba Trough, adapted from Smith and Sandwell (1997), showing igneous centers,DSDP Site 35, ODP Sites 1037 and 1038 (modified from Shipboard Scientific Party 1998c), and location of seismic-reflection profiles in figures 4A, 4B, and 5A–5D. Inset shows location and setting of Escanaba Trough (rectangularbox at southern end of Gorda Ridge) and location of line L3 80 shown in figure 4C.
Journal of Geology T U R B I D I T E M E G A B E D S I N A N O C E A N I C R I F T V A L L E Y 255
to a hole depth of 390 m (fig. 2; Moore and Sharman1970; Shipboard Scientific Party 1970). Much of therecovered sequence is turbidite deposits, and thepetrography of the sandy beds suggested that tur-bidites in the upper part of the sediment fill comefrom the distant Columbia River, whereas thosenear the bottom of the hole might be from themuch nearer Klamath River (Vallier et al. 1973;Zuffa et al. 1997). This early DSDP sampling pro-vided no information on the age of the turbiditefill, which was unlikely to be older than latestPleistocene (!100 ka) because of the active riftingand creation of new oceanic crust along the ridgeaxis (see discussion in Normark et al. 1994).
As a result of an effort by the U.S. Minerals Man-agement Service to lease the entire Gorda Ridgearea for mineral exploitation following the decla-ration of the U.S. EEZ, the Escanaba Trough be-came the focus for detailed geological and geo-physical survey efforts (see extensive reviews inMcMurray 1987; Morton et al. 1994b). Volcano-genic massive sulfide deposits and associated hy-drothermal vents were found at several localitieson and within the sediment fill near the axis of theEscanaba Trough (Koski et al. 1994; Morton et al.1994a; Zierenberg et al. 1994). To understand theinteraction of the hydrothermal fluids with thehost sedimentary sequence, the lateral extent, sed-imentologic processes, and thermal structure of theaxial valley fill were investigated (e.g., Davis andBecker 1994; Morton and Fox 1994; Normark et al.1994). The areas of volcanogenic massive sulfidesare generally associated with hills formed by localuplifts of the turbidite fill. The lateral connectivityof the turbidite sand units provides pathways forthe hydrothermal fluids to migrate horizontallywithin the sediment. Migration of hydrothermalfluids could explain the diagenetic effects on thesediment suggested by the petrography of samplesrecovered at DSDP Site 35 (Vallier et al. 1973; Zuffaet al. 1997). The most northerly site of hydrother-mal mineralization in the Escanaba Trough wassubsequently chosen for Ocean Drilling Program(ODP) drilling (Fouquet et al. 1998).
Most of the sand-sized material recovered fromthe turbidite fill of the Escanaba Trough at DSDPSite 35 is clearly from the North American conti-nent (Vallier et al. 1973; Zuffa et al. 1997); the path-way followed, especially considering the inferredsource from the Columbia River drainage basin, isless certain. The continental margin of the westernUnited States north of the Mendocino FractureZone is an accretionary prism that incorporates tur-bidites and pelagic sediment deposited on a seriesof submarine fan systems that extend from the Ni-
tinat fan north of the Columbia River to the Eelfan at the base of the Mendocino Fracture Zone (fig.1; Carlson and Nelson 1987; Clarke 1987; Snavely1987). North of the Blanco Fracture Zone, the mod-ern turbidite fans have buried much of the sub-ducting plate and the easternmost part of the frac-ture zone as well. The turbidite fan systems offnorthern California are much less extensive andonly locally bury the ridge topography of the east-ern flank of the Gorda Ridge. A large mass failuredeposit, the Heceta submarine slide (fig. 1, inset),at 447N latitude on the Oregon continental margin,has blocked turbidity currents initiated off the Co-lumbia River from reaching the area south of theBlanco Fracture Zone along the base of the conti-nental slope since the time of the failure about 110ka (Goldfinger et al. 2000). Before 110 ka, a turbiditechannel from Astoria Canyon extended across thefracture zone to the eastern flank of EscanabaTrough.
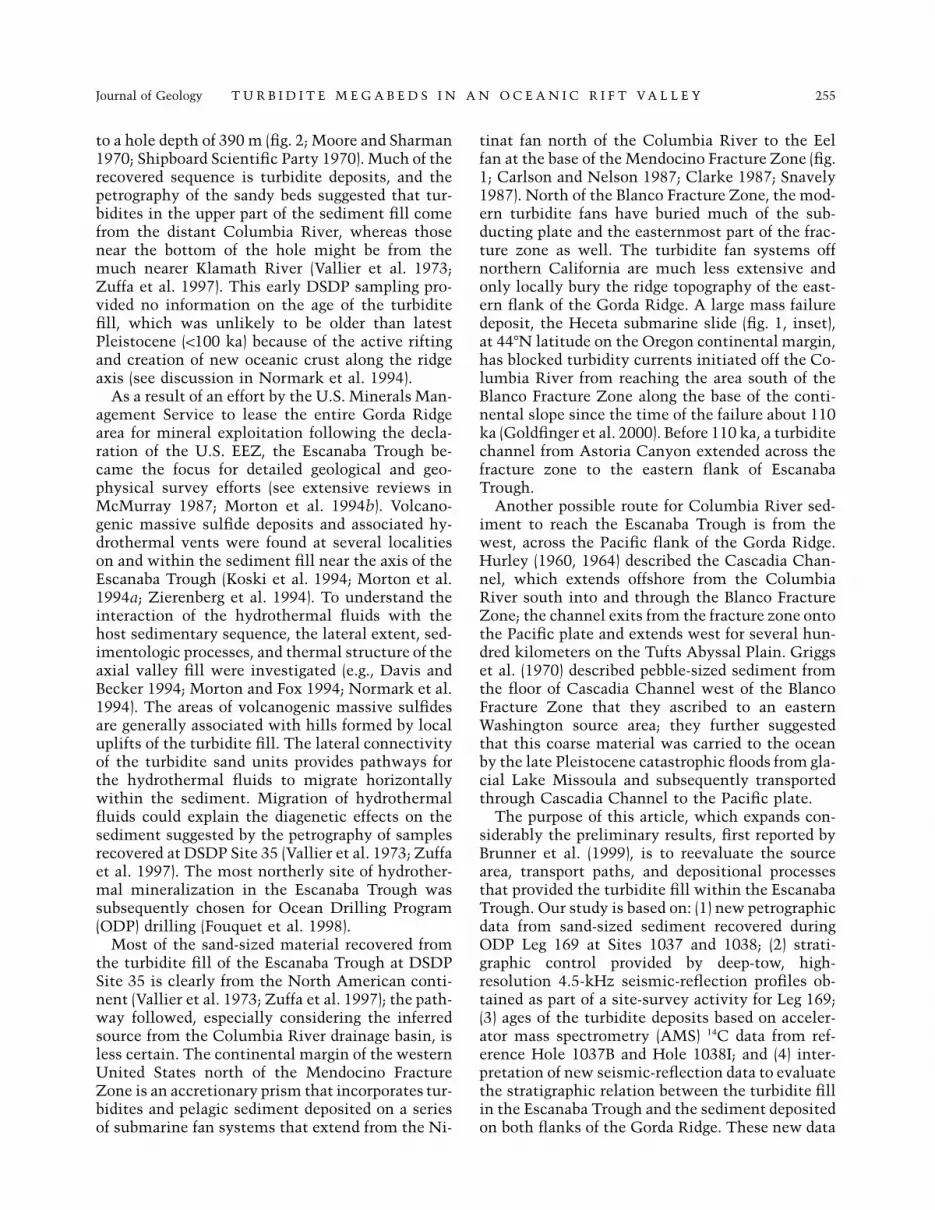
Another possible route for Columbia River sed-iment to reach the Escanaba Trough is from thewest, across the Pacific flank of the Gorda Ridge.Hurley (1960, 1964) described the Cascadia Chan-nel, which extends offshore from the ColumbiaRiver south into and through the Blanco FractureZone; the channel exits from the fracture zone ontothe Pacific plate and extends west for several hun-dred kilometers on the Tufts Abyssal Plain. Griggset al. (1970) described pebble-sized sediment fromthe floor of Cascadia Channel west of the BlancoFracture Zone that they ascribed to an easternWashington source area; they further suggestedthat this coarse material was carried to the oceanby the late Pleistocene catastrophic floods from gla-cial Lake Missoula and subsequently transportedthrough Cascadia Channel to the Pacific plate.
The purpose of this article, which expands con-siderably the preliminary results, first reported byBrunner et al. (1999), is to reevaluate the sourcearea, transport paths, and depositional processesthat provided the turbidite fill within the EscanabaTrough. Our study is based on: (1) new petrographicdata from sand-sized sediment recovered duringODP Leg 169 at Sites 1037 and 1038; (2) strati-graphic control provided by deep-tow, high-resolution 4.5-kHz seismic-reflection profiles ob-tained as part of a site-survey activity for Leg 169;(3) ages of the turbidite deposits based on acceler-ator mass spectrometry (AMS) 14C data from ref-erence Hole 1037B and Hole 1038I; and (4) inter-pretation of new seismic-reflection data to evaluatethe stratigraphic relation between the turbidite fillin the Escanaba Trough and the sediment depositedon both flanks of the Gorda Ridge. These new data

Figure 2. Graphic sedimentation columns for Holes 1038I and 1037B and DSDP Site 35 (see also Shipboard ScientificParty 1970, 1998a, 1998b). Uppercase letters denote lithostratigraphic units defined in this article for Hole 1037B;dashed lines show probable correlation of these units with Site 35 and Hole 1038I.

Journal of Geology T U R B I D I T E M E G A B E D S I N A N O C E A N I C R I F T V A L L E Y 257
allow a direct correlation with the previous sam-ples recovered at the more southerly DSDP Site 35and show that the results based on the Leg 169drilling can be applied to the turbidite fill along theentire 75-km length of the Escanaba Trough. Thevolume and age of the upper part of the turbiditedeposits indicate that they accumulated in a veryshort time interval (≤5 k.yr.) and suggest that thedeposits might have been generated as a resultof outbursts from glacial lakes of the Pacificnorthwest.
Lithostratigraphy
Site 1037. The core stratigraphy at referenceHole 1037B (fig. 2) was constructed on the basis ofvisual core descriptions made onboard Leg 169.Eight lithostratigraphic units were distinguished onthe ship, chiefly on the basis of sand/silt-dominantversus mud-dominant turbidites and sedimentarystructures, but also using magnetic susceptibilitydata that, with few exceptions, distinguished thegraded turbidite layers (Shipboard Scientific Party1998b). A nearly complete sedimentary sequence(495.60 m) was recovered. A rubble comprisingmetamorphosed claystone and siltstone was recov-ered beneath the turbidite sequence between495.60 and 507.80 mbsf (meters below sea floor).The base of the cored interval consists of basalt thatwas recovered from 507.80 to 546 mbsf.
The lithostratigraphic units of the Shipboard Sci-entific Party (1998b) are reinterpreted in this reportand are based on stratigraphic trends, depositional-process similarities, and sediment age in additionto the lithology, which was the primary basis fordistinguishing units during Leg 169. The descrip-tion of the revised lithostratigraphic units follows.
Unit A (Holocene). This unit consists mostly ofhemipelagic, fossiliferous, unconsolidated green-ish-gray clay and extends downcore to 1.68 mbsf,which corresponds to the top of the first turbiditebed of the underlying unit B. The AMS 14C datingof planktonic foraminifers at 1.56 mbsf gave an ageof yr (table 1; fig. 2). The implied Ho-8762 5 95locene sedimentation rate is in agreement with pre-vious determinations from Escanaba Trough (Kar-lin and Lyle 1986).
Unit B (Late Pleistocene). Unit B consists of a fin-ing- and thinning-upward sequence of megaturbi-dite beds that extends to 120.60 mbsf. It containsa basal package (from 120.60 to 63.52 mbsf) of mas-sive, dark gray, fine- to medium-grained sand grad-ing upward to pelite in the upper 6 m. Small piecesof woody material are present throughout this strat-igraphic interval. The basal sand megabed is over-
lain by a sequence of 10 thinning-upward, well-defined megaturbidite beds (from 63.52 to 1.68mbsf). This sequence shows a distinct fining up-ward from fine- to very fine-grained sand to silt andclay. A thin hemipelagite layer near the top ofthe unit at 21.57 mbsf is yr old, and a10,882 5 85pinecone scale near the base of the unit at 56.81mbsf is yr old, based on AMS 14C15,750 5 70dating.
Unit C (Late Pleistocene). This unit is lithologi-cally similar to unit B. It consists of a fining- andthinning-upward sequence that extends from177.60 to 120.60 mbsf. The basal 35 m of this unitconsist of massive, dark gray, very fine- to medium-grained, very poorly sorted sand that is interpretedto consist of three megaturbidite beds (fig. 2). Theunit fines upward and in the upper part includessix mud turbidite beds with thin basal intervals offinely laminated, dark gray, fine sand and silt thatfines upward to silty clay and clay. A hemipelagiclayer at the top of the unit is yr old15,482 5 100based on AMS 14C dating.
Unit D (Late Pleistocene). This unit extendsdownhole to 366.58 mbsf and consists of thick tur-bidite beds fining upward from thin intervals of siltor very fine-grained sand to clay. The AMS 14C dat-ing of planktonic foraminifers at 262.25 and 316.90mbsf gave ages of yr and24,982 5 160 32,182 5
yr, respectively.200Unit E (Late Pleistocene). This unit extends to
495.60 mbsf and consists dominantly of dark graysiltstone and minor fine-grained moderately indu-rated sandstone turbidite beds of variable thick-ness. A greater number of beds occurs in this unitthan in overlying units, and parallel-, wavy-, andcross-lamination are more common structures herethan in the overlying unit D.
Site 1038. On the basis of core lithology (fig. 2),the upper 78 m of Hole 1038I can be correlatedreasonably well with reference Hole 1037B. Poorrecovery between 100 and 258 mbsf prevents reli-able correlation in the middle part of the sectionat Hole 1038I. The lower part of the section at Hole1038I (from 258 to 403 mbsf) cannot be correlatedbed by bed with reference Hole 1037B, but the li-thology, the structures, and the style of the turbi-dite beds appear similar to unit E.
Site 35. On DSDP Leg 5, drilling at Site 35 ex-tended to nearly 400 mbsf in the southern part ofEscanaba Trough, but the section was not contin-uously cored. Poor recovery and discontinuous cor-ing resulted in sampling of only about 25% of thetotal hole depth. Although recovery was notablypoor in the interval from 106 to 280 mbsf, a 25-m-thick sand interval between 80 and 105 mbsf was

Table 1. Accelerator Mass Spectrometry 14C Dates Used to Estimate Sedimentation Rates
Site, core, and sectionsampled (cm)
Depth(mbsf) Age (yr)
Error(1/2yr)
Oceanreservoircorrection
(yr)Corrected
age (yr)AMS laboratorysample number
Lithologicunit
Host lithology and depth tocalculate sedimentation rate
Materialdated
1037B-1H-2 (6-8) 1.56 9480 95 2718 8762 NOSAMSOS-12352
A H, base at 1.68 mbsf, ∼9436 ka Pf
1037B-3H-4 (97-100) 21.57 11,600 85 2718 10,882 NOSAMSOS-12620
B H at top of a turbidite Pf
1037B-7H-2 (121-124) 56.81 15,750 70 ) 15,750 NOSAMSOS-11810
B T, base at 63.6 mbsf Pcs
1037B-7H-3 (124-128) 58.10 35,800 370 ) 35,800 NOSAMSOS-11811
B T, base at 63.6 mbsf Wa
1037B-8H-CC (26-28);1037B-9H-1 (0-4)
73.10 20,230 160 ) 20,230 ETH-17054/6 B T, base at 82.47 mbsf C
1037B-8H-CC (26-28) 73.07 43,510 1190 ) 43,510 ETH-17055 B T, base at 82.47 mbsf Wb1037B-9H-1 (0-4) 73.12 33,590 470 ) 33,590 ETH-17057 B T, base at 82.47 mbsf Wb1037B-14H-1 (89-92) 121.50 16,200 100 2718 15,482 NOSAMS
OS-13927C H at top of a turbidite Pf
1037B-29X-2 (135-137) 262.25 25,700 160 2718 24,982 NOSAMSOS-14127
D H at top of a turbidite Pf
1037B-34X-CC (29-31) 316.90 32,900 200 2718 32,182 NOSAMSOS-13928
D H Pf
1038I-9X-3 (37-39) 77.77 31,400 300 ) ) NOSAMSOS-11812
B T, base 84-100 mbsf Wb
Note. Pf, planktonic foraminifers; Pcs, pinecone scale ( cm); Wa, wood ( cm); Wb, wood (!mm-sized pieces); C, charcoal; H,1.5 # 2.0 # 0.4 5.0 # 0.8 # 0.5Hemipelagite; T, Turbidite. For lithologic units see figure 2.

Journal of Geology T U R B I D I T E M E G A B E D S I N A N O C E A N I C R I F T V A L L E Y 259
correlated with the massive sand interval of unit B(fig. 2). Sand intervals recovered from ∼160 mbsfmight correspond to the thick basal sand intervalof unit C. Discontinuous and incompletely recov-ered sandy turbidite beds are also present in thebasal portion of the section between 280 and 382mbsf and might correlate with unit E in the ref-erence hole.
Geochronology
Methods. More than 200 samples from Hole1037B were examined for carbon-rich materialssuitable for 14C dating by AMS. Five samples con-taining wood and charcoal were extracted fromwood-bearing intervals observed during physicaldescription of the cores (table 1). The remainingsamples were taken from the topmost clay-and-siltunits of turbidites in hopes of sampling planktonicforaminifers from hemipelagites, which best indi-cate the emplacement age of the underlying tur-bidite. Most of the samples, however, were barrenof foraminifers or contained less than the mini-mum 10 mg of carbonate material that is requiredfor AMS 14C dating.
Samples that contained enough planktonic for-aminifers for AMS 14C dating were evaluated fur-ther to determine whether the samples were hem-ipelagic or turbiditic. A census of the benthicforaminifers was used to reject those samples withmore than ∼20% neritic and upper bathyal taxa inthe 1150-mm fraction. The neritic and upper bathyalconstituents indicate that the samples might beturbiditic or might contain admixtures of resedi-mented material. Five samples of planktonic fora-minifers were accepted for AMS 14C dating.
Foraminifer tests were cleansed of detrital matterby sonification in a hot 1% solution of Calgon. Thetests were subsequently rinsed in distilled water,dried, and bottled in clean glass vials. Wood wasrinsed in a dilute (10%) HCl solution to removeadhering carbonate, then rinsed in distilled waterand bottled in clean glass bottles for shipment.
The AMS 14C analyses were done by the NationalOcean Sciences Accelerator Mass Spectrometry Fa-cility (NOSAMS). Ages were reported using a ra-diocarbon half-life of 5568 yr. Ages of planktonicforaminifer samples were corrected for a regionalocean reservoir effect of 2718 yr (Southon et al.1990). Ages were not corrected to calendar years,so they are more comparable to ages reported fromthe Washington Scabland (Waitt 1985; Atwater,1986).
Sedimentation rates in the turbidite sequence atHole 1037B were calculated using two sets of cri-
teria, one for turbidites and one for hemipelagites.Turbidites are deposited over a geologically shorttime interval, perhaps days or weeks, and can beviewed as essentially instantaneous events. Tur-bidites comingle older reworked sediment withcontemporaneous material. Therefore, interpreta-tion of dates on samples from turbidites must takeinto account both effects in order to estimate sed-imentation rates. In cases where more than onesample was dated from a single turbidite, theyoungest age was considered the best estimate ofthe age of turbidite emplacement. The appropriatedepth to assign a date from a turbidite is the baseof the bed because emplacement of the turbidite isessentially instantaneous. In the case of hemipe-lagites, however, no adjustment for the depth of thedated hemipelagic sample is needed in order to cal-culate the sedimentation rate.
Age and Sedimentation Rates. Six dates were se-lected for use: five dates on planktonic foraminifersfrom hemipelagic layers and one date on a largepinecone scale from a turbidite (table 1; fig. 3A).The age of the latter is viewed with some cautionas a maximum possible age because the scale isreworked and could be older than the age of em-placement of the turbidite. All other dates wererejected on the basis of the selection criteria dis-cussed above. Specifically, the dates were made onpieces of reworked charcoal and wood from turbi-dites, and the ages were substantially older thanother materials dated from within the turbidites orfrom hemipelagic units below turbidites. Datesrange from the early Holocene at yr to8762 5 95oxygen isotope stage 3 at yr.32,182 5 200
A sedimentation rate curve was plotted using thesix selected dates. Average sedimentation rates ex-ceeded 10 m/k.yr. below unit A, which is the hem-ipelagite that caps the sequence (fig. 3A). The upperpart of unit B was deposited at rates averaging 13.8and 8.6 m/k.yr., and the lower part of unit B, whichis a 150-m-thick sand bed, was deposited essen-tially instantaneously. Unit C and the upper partof unit D were deposited at 14.8 m/k.yr., and thelower part of unit D was deposited at 7.6 m/k.yr.Measured sedimentation rates are comparable topreviously estimated rates (Normark et al. 1994;Davis and Becker 1994) and confirm extraordinarilyfast deposition at Escanaba Trough.
Acoustic Stratigraphy
Air-Gun Seismic-Reflection Profiles. The sedimentfill within the axis of the Escanaba Trough extendsmore or less continuously at least 75 km northwardfrom the north flank of the Mendocino Fracture

260 G . G . Z U F F A E T A L .
Figure 3. A, Sedimentation rate curve for Hole 1037Bbased on accelerator mass spectrometry 14C ages of tur-biditic and hemipelagic intervals (table 1). B, Estimatedvolumes of the Missoula-flood-source turbidites in Es-canaba Trough.
Zone (fig. 4A). The sediment fill locally exceeds 500m in thickness, and the sea floor is offset alongfaults that maintain the axial graben of the GordaRidge. Offset of the sea floor mimics that of thesubbottom reflectors, suggesting that either dis-placement occurred after the sediment fill was em-placed or sedimentation was relatively uniformacross the axial graben despite the sea floor offsets.In general, the upper 200 m of sediment along theaxis appears uniform in reflection character com-pared with the deeper intervals (fig. 4A) exceptwhere there is possible volcanic intrusion, for ex-ample, 7 km north of DSDP Site 35.
The high relief of the ridges that bound the Es-canaba Trough decreases abruptly to the south, andthe southern ends of the ridge flanks, north of theMendocino Fracture Zone, are buried by sediment
(fig. 1). An east-west profile across the mouth ofthe Escanaba Trough (fig. 4B) clearly shows thedown-dropped axis of the Trough with 1600 m ofsediment fill. The thick sediment fill wedges out!20 km east of the axis. In contrast, thick sedimentfill characterizes the interridge valleys on the westflank of Gorda Ridge. The extensive sediment sec-tion along the north flank of the Mendocino Frac-ture Zone extends 150 km west (near 1297259W;fig. 1).
Deep-Tow 4.5-kHz High-Resolution Profiles. A de-tailed site survey to obtain deep-tow side-lookingsonar images and 4.5-kHz seismic-reflection pro-files of the northern Escanaba Trough was con-ducted several months before Leg 169 (Ross et al.1996). The grid of high-resolution 4.5-kHz profiles,with a line spacing of 1–2 km in the area of Sites1037 and 1038, defines a distinct stratigraphic se-quence of key reflectors in the upper 70 m of sed-iment that could be observed throughout the area.The “type locality” of the key reflectors is fromline ET 09 at the location of Site 1037 (figs. 5A, 6).Eight key reflectors, denoted from the top down asB–I, are found on the valley floor and lower bound-ing terraces within the Escanaba Trough over adepth range of 1150 m of relief on the trough floor(fig. 5). Figure 6 shows that the key reflectors cor-respond to the bases of the thinner, shallower tur-bidites and to the tops of the turbidites with thickersand intervals. The physical properties recorded inthe shipboard core logs mimic the graded beddingof the turbidites. Three additional, weak, and dis-continuous reflectors observed at the type locality(Site 1037) include the shallowest (reflector A), areflector that is generally found above D (about athird of the spacing between C and D), and a re-flector just above F. These three reflectors were notrecognized over the entire survey area and were notincluded as part of the key reflector sequence. Thegreatest variability in reflector character is in theinterval between the sea floor and reflector B,where from none to as many as three reflectingsurfaces were observed locally. Previous studieshave shown that the upper 2 m of sediment in Es-canaba Trough include thin, locally initiated tur-bidites that are not laterally extensive (Karlin andLyle 1986; Normark et al. 1994). The variable num-ber of reflectors above reflector B is probably a rec-ord of these locally restricted turbidites. The pri-mary characteristics of the B–I sequence of keyreflectors include: (1) thin, distinct parallel reflec-tions separated by acoustically transparent inter-vals; (2) prominent reflector pairs (B with C and Dwith E) underlain by relatively uniform spacing be-tween E and F, F and G, and G and H; and (3) com-
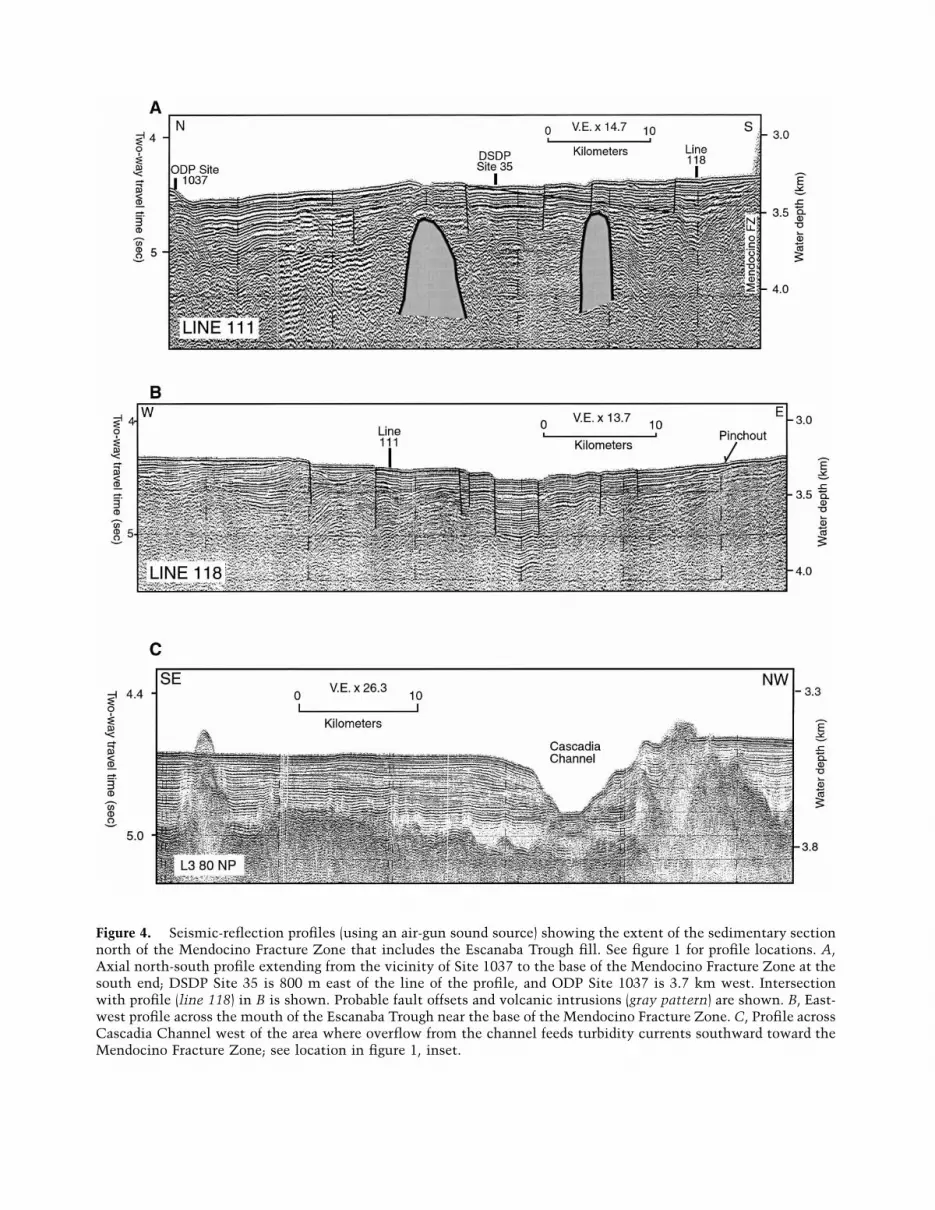
Figure 4. Seismic-reflection profiles (using an air-gun sound source) showing the extent of the sedimentary sectionnorth of the Mendocino Fracture Zone that includes the Escanaba Trough fill. See figure 1 for profile locations. A,Axial north-south profile extending from the vicinity of Site 1037 to the base of the Mendocino Fracture Zone at thesouth end; DSDP Site 35 is 800 m east of the line of the profile, and ODP Site 1037 is 3.7 km west. Intersectionwith profile (line 118) in B is shown. Probable fault offsets and volcanic intrusions (gray pattern) are shown. B, East-west profile across the mouth of the Escanaba Trough near the base of the Mendocino Fracture Zone. C, Profile acrossCascadia Channel west of the area where overflow from the channel feeds turbidity currents southward toward theMendocino Fracture Zone; see location in figure 1, inset.
Figure 5. Deep-tow 4.5-kHz seismic-reflection profiles from the area of DSDP Site 35, ODP Sites 1037 and 1038,and surface-ship 3.5-kHz profile (D) from the southern limit of Escanaba Trough; see figure 1 for profile locations.A, Line ET 09 trends northeast-southwest through Site 1037 and shows a distinctive vertical spacing of reflectorsthat can be recognized throughout the profile length; the strongest and more laterally extensive reflectors are indicatedby letters B–I; these key reflectors are correlated with the core data from Hole 1037B in figure 6. B, Line ET 04 is anorth-south profile that passes 600 m west of DSDP Site 35; key reflectors B–H are present in the vicinity of thedrill site. C, Line ET 12, which trends north-south, crosses line ET 09 and shows an undisturbed key reflector patternat the south end; Hole 1038I, near the top of Central Hill, is at the north end of the profile. D, 3.5-kHz profile showsthe same vertical pattern of reflections observed on the deep-tow images from the drill sites despite the more diffusecharacter of the reflectors caused by the much greater acoustic travel path for the surface-ship profile.

Journal of Geology T U R B I D I T E M E G A B E D S I N A N O C E A N I C R I F T V A L L E Y 263
Figure 6. Correlation of the lithology, physical properties, and high-resolution 4.5-kHz profile from reference Hole1037B. The lithologic log is from graphic sedimentation column (fig. 2) and the 4.5-kHz image is extracted fromfigure 5A. The logs for magnetic susceptibility, P-wave velocity, and gamma density are taken from the shipboardmeasurements using the Multi-Sensor Track (MST; fig. 17 in Shipboard Scientific Party 1998c). The basis of thecorrelation among the sediment log, MST logs, and 4.5-kHz profile is discussed in the text. The low-resolution seismic-reflection profile segment on the right side of the figure is extracted from line 3 of figure 3.3 in Davis and Becker(1994); the profile is in the vicinity of Hole 1037B.
mon occurrence on flat areas, slopes, and blocksseparated by apparent faults (fig. 5A, 5B).
The observed range in water depth of the keyreflector sequence suggests that the turbidity cur-rents were at least 170 m thick after entering Es-canaba Trough (Normark et al. 1997). The 4.5-kHzand deeper-penetration seismic-reflection profilesshow that the turbidites of unit B can be mappedthroughout the southernmost 75 km of EscanabaTrough (fig. 1). The volume of sediment depositedin the trough is shown in figure 3B. The totalamount of sediment brought to the Pacific platethrough Cascadia Channel is likely to be more thanan order of magnitude greater than the volumes inEscanaba Trough because only the tops of the larg-est flows in Cascadia Channel could overflow toprovide sediment in the trough.
Several of the deep-tow survey lines extend southto the area of DSDP Site 35; line ET 04 passes abouthalf a kilometer west of DSDP Site 35 and shows
the same distinct key reflector sequence (fig. 5B).The B-C and D-E pairs are especially distinct in thissouthern area, and the deepest reflector observedis H, about 43 mbsf. The sequence of key reflectorsthus establishes a reasonably strong correlation be-tween DSDP Site 35 and the reference Hole 1037B.
Part of the key reflector sequence (e.g., the twopairs of reflectors) is seen on the southern upperflank of Central Hill, where they are disrupted byminor faults. These observations can be used toprovide a stratigraphic tie between the referenceHole 1037B and Hole 1038I.
Stratigraphic Correlations
Hole 1037B: Lithology, Reflection Profiles, and MSTLog Profiles. The graded silt and sand megabeds inthe interval between 1.68 and 63.60 mbsf (most ofunit 2 in Shipboard Scientific Party 1998b) are welldefined in several of the logged parameters from
264 G . G . Z U F F A E T A L .
the Multi-Sensor Track (MST) (see fig. 6). Thegamma density and P-wave velocity clearly recordboth the sharp basal boundary and the gradingwithin individual turbidite beds. The magnetic sus-ceptibility profile generally shows sharp bases forthe beds but does not mimic the graded characteras faithfully as the other two MST parameters. Verythin, graded silty mud beds, however, are well de-fined by the magnetic susceptibility but are diffi-cult to detect in the velocity and density profiles(e.g., the two shallowest beds in unit B; figs. 2, 6).
The key reflectors B–I in the 4.5-kHz seismic-reflection profile that passes through Site 1037clearly correlate with the turbidite beds (fig. 6). Re-flectors B, C, and E correspond to the sharp basesof the turbidite beds, whereas D and the deeperreflectors, G, H, and I, correspond to the tops ofgraded sand intervals. It is not clear whether re-flector F is from the base of the graded bed at 32mbsf or from a thin underlying ungraded sand. Lo-cally, the discontinuous reflector above F is prob-ably from the upper part of the shallower, slightlycoarser, and graded bed (fig. 6).
Below the turbidite bed identified as reflector I,there is a thick section of massive, poorly sortedsand in which no sedimentary structures survivedthe coring process (Shipboard Scientific Party1998b). This sandy interval extends from 63.60 to120.60 mbsf and makes up the bottom of unit 2and all of unit 3 in the original shipboard descrip-tion (lower part of unit B in this report). The MSTlog data, especially the velocity and density pro-files, suggest that this interval might be one ex-ceptionally thick-graded megabed (fig. 6).
The high-resolution 4.5-kHz profiles did not re-solve any reflectors deeper than key bed I excepton rift-valley terraces on the walls of the EscanabaTrough that stand 1100 m above the axial valleyfloor. At the higher elevations, the total thicknessof the key bed sequence (B–I) is thinner, but bedrocksurfaces were observed beneath the sequence with-out any deeper turbidites (i.e., below reflector I).Seismic-reflection profiles across the northern Es-canaba Trough, however, obtained by Davis andBecker (1994), show a distinct interval of no inter-nal reflectors that appears to correspond to thelower part of unit B (fig. 6, right side). Above thisacoustically transparent interval, there are numer-ous internal reflectors giving a signature that is typ-ical for turbidite sediment. The observed reflectioncharacter for unit B in the Davis and Becker (1994)profiles is consistent with the interpretation thatthe lower 57 m of unit B represents a single dep-ositional unit.
Correlation between Drill Sites. The key reflec-
tors observed in the 4.5-kHz seismic-reflection pro-files provide a compelling stratigraphic tie betweenreference Hole 1037B and DSDP Site 35, which wasincompletely cored with the older drilling tech-niques and had poor recovery in many sections. The4.5-kHz profiles also provide a tie between Holes1037B and 1038I. The disruption of the key reflec-tor pattern across the crest of Central Hill shownin figure 5C indicates a possible reason for the ob-servation made by the Shipboard Scientific Party(1998a) that below about 100 mbsf the correlationsamong the nine holes at Site 1038 become moretenuous. The poor recovery between 78 and 257mbsf in 1038I limits the correlation of the domi-nantly sandy section to the upper part of our unitB, which is the only interval effectively imaged bythe 4.5-kHz profiles, and to the lower part of thesection.
Petrography
Methods. Table 2 gives sample depths and typesof analyses for cores that are included in this study(see fig. 2 for locations). The samples, which werecollected from the more distinctly coarse-grainedcore intervals, were processed by wet sieving toremove the fraction finer than 62 mm in order toprepare thin sections of impregnated sand and theheavy-mineral grain mounts. Sand samples are gen-erally very fine grained, in the range of 3–4 Ø, andonly a few samples in the lower part of unit B aremedium sand size. Point-counting procedures usedthe criteria proposed by Gazzi (1966) and Zuffa(1980, 1985, 1987) that minimize errors resultingfrom the dependence between grain size and rockcomposition. This approach to compositional anal-ysis uses between 50 and 100 petrographic point-counting classes (table 3, available from The Jour-nal of Geology office free of charge on request).From 300 to 400 grains were counted on thin sec-tions stained for K-feldspar and used for the quartz-feldspar-lithics (QFL) classification. Grain counts ofspecial heavy-mineral grain preparations (Gazzi etal. 1973, p. 26) were conducted by the ribbonmethod to tabulate different grain types (i.e., trans-luscents, opaques, turbids) in order to identifyabout 200 transluscent grains from each sample (ta-ble 4, available from The Journal of Geology officefree of charge on request). The fraction examinedhas a grain density 12.96 g/cc (tetrabromoethane)and a size range of 0.25–0.0625 mm.
Gross Composition. The sand samples are feld-spatholithic to lithic and fall in the dissected andtransitional subfields of the “magmatic arc” fieldof Dickinson (1985; fig. 7A). The recalculated light

Journal of Geology T U R B I D I T E M E G A B E D S I N A N O C E A N I C R I F T V A L L E Y 265
Table 2. Summary of Samples Analyzed for Gross Composition and Heavy Minerals from Ocean Drilling ProgramLeg 169, Holes 1037B and 1038I
Samplenumber
Core andSection
Sampledinterval (cm)
Grosscomposition
Heavyminerals
Depth belowsea floor (m)
9 3H-03 57-61 2 # 19.6911 3H-04 82-85 # 2 21.4414 4H-CC 6-8 # # 35.4216 6H-05 7-9 # 2 50.6818 7H-CC 8-10 # # 63.9721 9H-07 66-70 # 2 82.7822 10H-02 115-120 # 2 85.2724 12H-04 18-23 # # 106.3125 13H-03 118-122 # 2 115.3026 15H-01 0-2 2 # 130.1129/29a 17H-07 50-62 2 # 158.6630 18H-07 36-41 2 # 167.9931 19H-06 7-10 # 2 175.4333/33a 21X-CC 26-35 2 # 182.8134 22X-02 100-102 # # 194.7139 27X-01 15-20 # 2 240.3840/40a 29X-02 29X-02 118-123 130-136 2 # 262.1740b 32X-05 120-126 2 # 294.1951a 42X-02 10-16 # # 385.9352 42X-04 73-75 2 # 389.5453 43X-CC 13-18 # # 403.4954 44X-02 126-132 2 # 406.3954a 45X-CC 23-29 # # 418.5657/57a 49X-06 49X-07 146-148 6-8 # # 460.6161/61a 53X-01 53X-CC 49-51 24-30 # # 491.2496 1X-01 29-31 # 2 0.3097 1X-01 125-127 # 2 1.26104 5H-CC 12-14 # # 45.69107 8X-02 27-31 # 2 66.60108 9X-02 124-126 # # 77.15109 12X-01 6-8 # 2 103.27110 16X-CC 8-10 # # 141.79110a 21X-01 14-20 # # 189.87111/111a 28X-04 135-142 2 # 262.99113/113a 30X-03 8-13 # # 279.00114 31X-01 83-87 2 # 286.95119/119a 36X-01 35-44 # # 334.49
Note. Samples from 9 to 61/61a are from Hole 1037B; samples from 96 to 119/119a are from Hole 1038I. A cross indicates analyzed;a minus, not analyzed.
and heavy mineral average composition of modernsand from deposits of the Columbia River analyzedby Whetten et al. (1969, p. 1160; i.e., Q 42%, F 27%,L 31%; orthopyroxene 11%, clinopyroxene 31%,amphibole 42%) closely matches that of the Es-canaba Trough sand turbidites. A few samples plotoutside of the main cluster in the “continentalblock” and “undissected arc” subfields. One sam-ple is uncommonly mica rich (sample 53), and threearkosic samples (14, 17a, and 17b: see Zuffa et al.1997, table 2) are strongly affected by diagenesis.The sand samples generally contain an abundantvolcanic component with high plagioclase/K-feld-spar (P/K) ratios (fig. 7B) and lithic-volcanic/lithic-sedimentary ratios (fig. 7C). The feldspar compo-nent consists mostly of pristine plagioclase(andesine-labradorite) and minor sericitized K-feld-
spar, including rare microcline and fresh sanidine.The unaltered plagioclase grains that have the samemineralogical and textural features as the plagio-clase observed in the phenocrysts of the volcanicrock fragments have been distinguished as “pristineplagioclase” during point counting. The mafic vol-canic component consists mainly of perlitic brownglass (commonly chloritized), porphyritic grainswith aphanitic or brown vitric groundmass, plagio-clase, clinopyroxene, orthopyroxene, hornblendephenocrysts, and Fe-Ti oxides. Volcanic grains ofintermediate composition show a plagioclase mi-crolithic texture with rare pyroxene and opaqueminerals. Acidic volcanic grains include pristineglass, glass shards, and pumices, colorless or brown-ish grains with vitric and felsitic texture, some con-taining microphenocrysts of plagioclase, quartz,

266 G . G . Z U F F A E T A L .
Figure 7. Classification of the light-mineral sand fraction integrated for DSDP Site 35 and Holes 1037B and 1038I.A, arc, arc, arc (Dickinson 1985). C, Lv = lithic volcanics,U = undissected T = transitional D = dissected Lm = lithicmetamorphic, sedimentary (including calcite monocrystals). Samples indicated as DSDP 35 and box coreLs = lithicare from Zuffa et al. (1997).
and rare K-feldspar. K-feldspar is also locally pre-sent as a constituent of the groundmass of felsiticgrains. The nonvolcanic fine-grained rock-fragmentcomponent is made up of low-grade phyllite andslate grains in trace quantities. The coarse-grainedrock fragments are represented by rare granitoidand gneiss.
Unworn tests and/or fragments of foraminifersare generally present in low amounts. A few sam-ples contain significant quantities of spheroidal tooblate clayey grains that show internal brownish-dull halos, which are carbon and phosphorous richand that mimic the grain contour. These grains aretentatively interpreted as fecal pellets representingintrabasinal grains ripped up by the turbidity cur-rents and subsequently deposited in the coarse-grained intervals at the base of the turbidite beds.
Volcanic rock fragments make up more than one-third of the sand component of the EscanabaTrough sediment and are by far the most abundantconstituents of the fine-grained lithic fraction (fig.7C). If pristine plagioclase and sanidine are addedto the volcanic rock fragment component, the re-
sult is that more than half of the sand grains of theEscanaba Trough sediment fill are derived from vol-canic sources. The QFL plot (fig. 7A) shows littlevariation in the Q/F ratio. In contrast, variationsin the fine-grained rock-fragment contents showscatter of the samples from the QF side to the Lvertex of the triangle. The down-hole distributionof the ratio integrated for ODP HolesV/(Q 1 F 1 V)1037B and 1038I and DSDP Site 35 (fig. 8) showsthat the volcanic component in the upper 180 mof the section is generally higher than in the lowerportion of the section.
Heavy Minerals. The heavy-mineral assemblageis mainly characterized by amphiboles (brown andgreen, blue-green hornblende, basaltic hornblende,and actinolite), clinopyroxene (augite and titanaug-ite), orthopyroxene (bronzite and hypersthene), andepidotes (clinozoisite/epidote). Garnet and titaniteare present in almost all samples but in variableamounts. Other characteristic minerals such as al-lanite, zoisite, olivine, chloritoid, staurolite, glau-cophane, sillimanite, kyanite, andalusite, mona-zite, spinel, and apatite occur irregularly in small

Journal of Geology T U R B I D I T E M E G A B E D S I N A N O C E A N I C R I F T V A L L E Y 267
Figure 8. Down-hole distribution of the volcanic com-ponent integrated for Holes 1037B and 1038I (this study)and DSDP Site 35 (Zuffa et al. 1997). grains,V = volcanic
; . Dashed lines indicate the stan-Q = quartz F = feldsparsdard deviation (1j).
Figure 9. Down-hole distribution of garnet, epidote,amphibole, and clino- and orthopyroxene for Hole 1037B(upper), DSDP Site 35 (middle; taken from Vallier et al.1973; Zuffa et al. 1997) and 1038I (lower).
or in trace amounts. Barite and mesitite occur lo-cally, mostly as authigenic minerals. Some pyrox-ene and amphibole grains show distinct corrosionfeatures, resulting from postdepositional dissolu-tion phenomena (see also Zuffa et al. 1997, fig. 6E).
The down-hole heavy-mineral distributionin ODP Hole 1037B shows a transition froman amphibole/clino-orthopyroxene assemblage toan pyroxene assemblageamphibole-rich 5 minorto an amphibole-rich assemblage (fig. 9). The deep-est 30 m of sediment that overlies the basalt at507.8 mbsf exhibits a garnet-epidote association.The sand samples from Site 35 and Hole 1038I showthe same trends; however, there are samples char-acterized only by the garnet-epidote assemblage
that occur at shallower depths (i.e., samples at141.8, 189.9, and 236.0 mbsf), which at Hole 1038Iis consistent with a greater degree of hydrothermalalteration as expected because of the known near-surface sulfide mineralization.
Discussion
To understand the conditions that produce theyoung, thick sediment fill within Escanaba Trough,

268 G . G . Z U F F A E T A L .
we will (1) discuss the provenance of the turbiditesand, (2) evaluate the probable pathway(s) for theturbidity currents to reach the axial valley, and (3)speculate on the flow processes. The processes thatapply to the upper part of the sequence in the ref-erence Hole 1037B (from the sea floor to 120 mbsf),for which there is good seismic-stratigraphic cor-relation with Site 35 and 1038, can be used to eval-uate the depositional history for the lower part ofthe sediment sequence in the axial valley, for whichthere is a weaker correlation.
Provenance. Most of the sand-sized material re-covered from the turbidite fill of the EscanabaTrough at DSDP Site 35 is clearly from the NorthAmerican continent (Vallier et al. 1973; Zuffa et al.1997). In spite of the high relief of the MendocinoFracture Zone just south of the Escanaba Trough,this source area can be easily ruled out because ofits oceanic-crust lithology, which does not matchwith the gross sand composition characterized bysignificant amounts of quartz, K-feldspar, andesiticto rhyolithic rock fragments, and granitic rocks.
Vallier et al. (1973) and Zuffa et al. (1997) studiedthe composition of the Escanaba Trough sands fromDSDP Site 35 although it was cored discontinu-ously (fig. 2). Studies of the sand fraction fromDSDP Site 35 distinguished two different petrofa-cies for the source rocks: (1) a facies of lithic arkosesto litharenites with amphibole and pyroxene in theupper part of the sediment fill, and (2) a facies ofarkose with only amphibole in the lower part ofthe fill. On this basis, the authors related the upperpetrofacies to the Columbia River drainage basin,while the lower assemblages were related to theKlamath River source of northern California.
The new data from the samples collected inHoles 1037B and 1038I are entirely consistent withthe results of Vallier et al. (1973) and Zuffa et al.(1997) for the upper part of the section. The resultsfrom this study, however, suggest a reinterpretationof the lower part of the section because the com-position of the light fraction is not only arkosic butsome samples are litharenitic. In addition, the dis-tribution of heavy minerals in Hole 1037B (fig. 9)shows a down-hole transition from amphibole/clino-orthopyroxene assemblage to amphibole/clinopyroxene assemblage to an amphibole-richassemblage, and finally to an epidote-garnet assem-blage at the bottom of the section. The epidote-garnet assemblage also occurs in several samplesfrom the intermediate part of Hole 1038I (fig. 9)that is affected by severe hydrothermal alteration(Shipboard Scientific Party 1998a). This observa-tion suggests diagenetic changes within the heavy-mineral component in the section and further
indicates an increasing effect of intrastratal disso-lution with subbottom depth (e.g., Scheidegger etal. 1973). The data indicate that the effects of thehydrothermal fluids reach a maximum in the per-meable intervals of the section (samples at 141.8and 189.9 mbsf, table 2).
The trends noted above (i.e., the down-holechange of the amphibole/clino-orthopyroxene as-sociation to an amphibole-rich association) aremost likely related to diagenesis and not to differ-ences in the sediment-source areas. The down-holedistribution of the ratio for ODPV/(Q 1 F 1 V)Holes 1037B and 1038I and DSDP Site 35 (fig. 8)shows that the volcanic component in the upperpart of the section is generally higher than in thelower part of the section. Sediment from the upper177.60 m of the section (fig. 2) is related to thestages of Wisconsinan deglaciation. It can be ob-served that a significant amount of sand derived bypyroclastic fall, surge, and flow volcanic activitywas likely deposited and stored within the glaciersduring the Wisconsinan ice accumulation phaseswhen onland erosion was necessarily limited andvolcaniclastic grains were the only clastic sedimentavailable. During deglaciation this sand was thenreleased, thus increasing the content of the vol-canic component of the discharged sediment. Weconclude that a distinct terrigenous supply fromthe northern California rivers is not demonstrated,and the bulk of the Escanaba Trough sediment ismostly derived from the Columbia River drainagebasin.
Pathway. The simplest pathway to envision forthe transportation of sediment from the mouth ofthe Columbia River to the Escanaba Trough is toassume southward flow along the base of the con-tinental slope. A generally southerly trending chan-nel (the Astoria Channel) on the Astoria fan ex-tends from near the fan apex, which is close to theColumbia River mouth, south to about the BlancoFracture Zone (fig. 1, inset). The average rate ofdeposition for Pleistocene turbidites at DSDP Site174, which lies on a broad levee about 35 km westof the axis of Astoria Channel, is about 0.25 m/k.yr. (Shipboard Scientific Party 1973). This averagerate is more than an order of magnitude less thanthose for units B through D (as defined in this re-port) in Escanaba Trough (fig. 3A). Recent work hasshown that the Astoria channel formerly continuedsouth across the Blanco Fracture Zone. Wolf et al.(1999) compiled available seismic-reflection datafrom the Gorda plate and found that the Astoriachannel extended almost to the Mendocino Frac-ture Zone, but it is now sediment filled for mostof its length south of 447N. New multibeam bath-

Journal of Geology T U R B I D I T E M E G A B E D S I N A N O C E A N I C R I F T V A L L E Y 269
ymetric data indicate that the Astoria channel hasbeen blocked by the Heceta megaslump that oc-curred about 110 ka (Goldfinger et al. 2000). Theage of the Heceta failure, therefore, substantiallypredates deposition of the section recovered at ref-erence Hole 1037B.
The compilation of 3.5-kHz seismic-reflectionprofiles as part of the study by Wolf et al. (1999)did not record deposits showing an acoustic char-acter similar to that of the upper 60 m of sedimentat Hole 1037B (S. Wolf, pers. comm., 1998). Becausethe thickness of the turbidity-current flow in theEscanaba Trough was at least 170 m (Normark etal. 1997), it is likely that some record of the passageof the flows should have been left on the Gordaplate south of the Blanco Fracture Zone if the As-toria channel had been the main pathway to theEscanaba Trough and if turbidity currents from theAstoria Channel were not blocked by the Hecetaslump.
ODP Site 1020 is on a small hill about 100 mhigh that lies along the west side of the Astoriachannel trace on the Gorda plate (fig. 1, inset). Afew graded, sandy silt beds were recovered in theupper 15 m during coring at this site, but there wereno thick turbidite sand beds (Shipboard ScientificParty 1997). The average sedimentation rate at thissite is 0.1 m/k.yr., which is about two orders ofmagnitude less than the deposition rate in EscanabaTrough. Turbidity currents as thick as those thatentered the Escanaba Trough would be expected tohave left more sediment on the hilltop that standsonly about 100 m above the channel. In addition,Site 1020 is on the right-hand side (looking down-channel) of the trace of Astoria channel, and theeffects of the Coriolis force would have resulted inthicker flow on the right side. Finally, the petrog-raphy of the sand grains in two beds at Site 1020from 0.80 mbsf and 2.47 mbsf are more consistentwith a source from a northern California river(G. G. Zuffa and F. Serra, unpub. data).
The evidence presented above is mostly circum-stantial and does not preclude the possibility thatturbidity currents generated offshore of the Colum-bia River might have flowed south along the mar-gin; there is, nevertheless, little observational sup-port for this eastern pathway.
The seismic-reflection data (e.g., fig. 4B) showthat the sediment fill of the Escanaba Trough at itsintersection with the Mendocino Fracture Zonewedges out to the east. Available high-resolution3.5-kHz reflection profiles show that the sequenceof key reflectors seen in the deep-tow records fromthe northern part of the Escanaba Trough can berecognized along the same tracklines depicted in
figure 4A and 4B (fig. 5B and 5D, respectively). Sim-ilar to the reflector geometry seen in the deeperpenetration air-gun profile of figure 4B, the 3.5-kHzdata at the southern end of the Escanaba Troughshows that the key reflector sequence in the upperpart of the section thins eastward and becomes un-recognizable. Locally, the lateral equivalent to thekey reflector sequence appears to onlap sedimentof the Gorda plate to the east.
West of the Escanaba Trough, the sediment ac-cumulation locally exceeds that along the axis ofthe rift valley. The key reflector sequence, however,is not unequivocally recognized west of longitude1287W. Normark and Reid (1998) show that thethick sediment accumulations along the northernflank of the Mendocino Fracture Zone are contig-uous with the Tufts fan and abyssal plain to thenorth (fig. 1). The apex of the Tufts fan is near thecurrent exit of the Cascadia Channel from theBlanco Fracture Zone. Long-range side-looking so-nar images show patterns similar to channel andlobe features that have been described from largemodern turbidite systems (Normark and Reid1998). The backscatter pattern on the side-lookingsonar images indicates southerly dispersal of sed-iment.
The seismic-reflection and side-looking sonardata available from the western flank of GordaRidge provide reasonable evidence for concludingthat the main pathway for turbidity currents flow-ing to the Escanaba Trough was on the Pacific plate(fig. 10). The pebble-grade sediment with an easternWashington provenance that was recovered fromCascadia Channel west of the Blanco Fracture Zone(Griggs et al. 1970) suggests that overflow from theCascadia Channel near its exit from the BlancoFracture Zone deposited turbidite sediment on theTufts fan and that part of the flows continuedsouth, where they were deflected eastward by theMendocino Fracture Zone before being interceptedby the axial rift in the Escanaba Trough. The Cas-cadia channel at the point of overflow to the Tuftsfan is 1200 m deep; immediately to the west ofTufts fan, the channel is observed to be deeplyeroded into the turbidite sequence of the TuftsAbyssal Plain (fig. 4C). The relief of the CascadiaChannel suggests that only the largest turbiditycurrents could overflow onto Tufts fan and providea source for Escanaba Trough fill. Thus, even if allthe Lake Missoula flood events resulted in hyper-pycnally generated turbidity currents, only the larg-est of these would be recorded in Escanaba Trough.
Missoula Floods. The age of the graded sand bedsfrom the upper 120 m (unit B) of the reference Hole1037B and the sediment source in eastern Wash-

Journal of Geology T U R B I D I T E M E G A B E D S I N A N O C E A N I C R I F T V A L L E Y 271
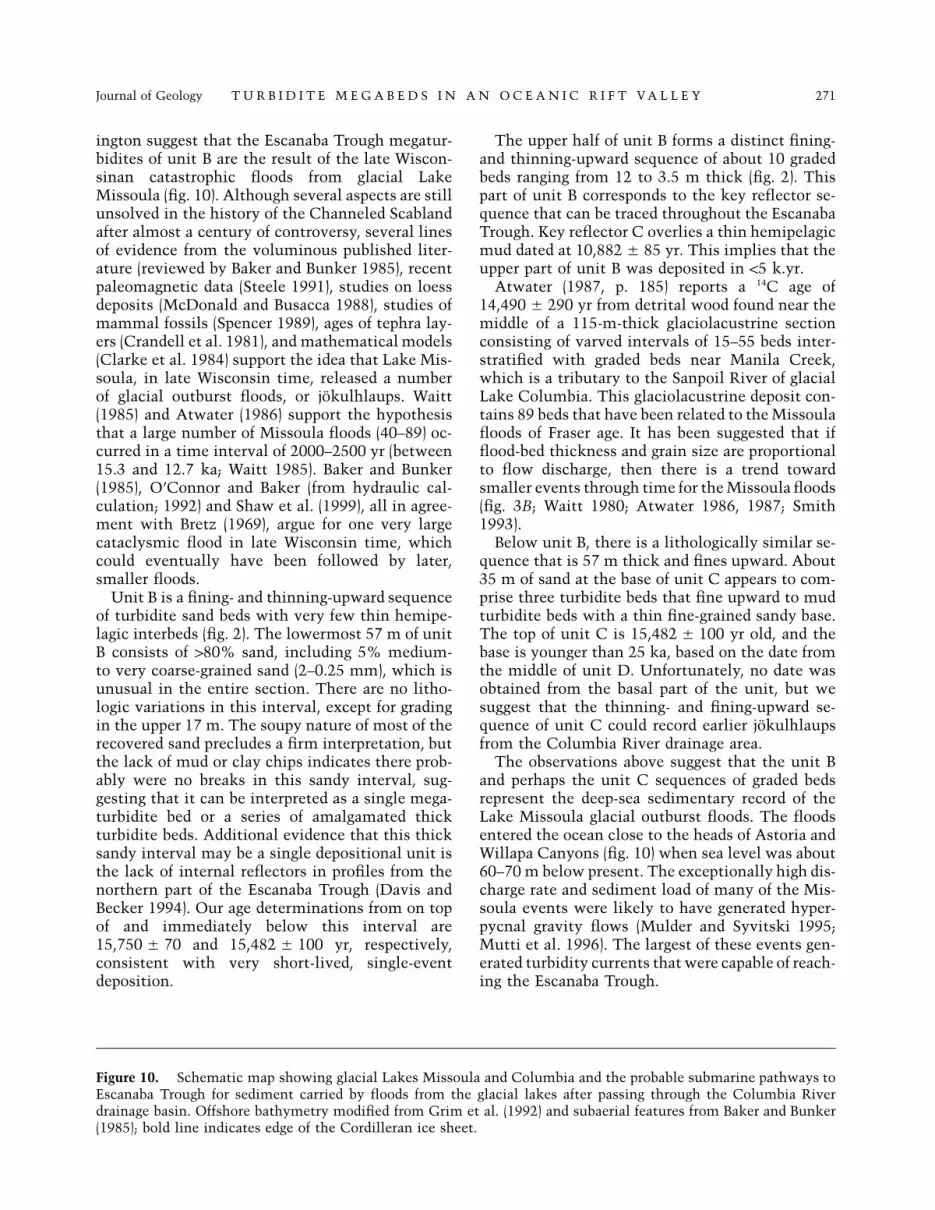
Figure 10. Schematic map showing glacial Lakes Missoula and Columbia and the probable submarine pathways toEscanaba Trough for sediment carried by floods from the glacial lakes after passing through the Columbia Riverdrainage basin. Offshore bathymetry modified from Grim et al. (1992) and subaerial features from Baker and Bunker(1985); bold line indicates edge of the Cordilleran ice sheet.
ington suggest that the Escanaba Trough megatur-bidites of unit B are the result of the late Wiscon-sinan catastrophic floods from glacial LakeMissoula (fig. 10). Although several aspects are stillunsolved in the history of the Channeled Scablandafter almost a century of controversy, several linesof evidence from the voluminous published liter-ature (reviewed by Baker and Bunker 1985), recentpaleomagnetic data (Steele 1991), studies on loessdeposits (McDonald and Busacca 1988), studies ofmammal fossils (Spencer 1989), ages of tephra lay-ers (Crandell et al. 1981), and mathematical models(Clarke et al. 1984) support the idea that Lake Mis-soula, in late Wisconsin time, released a numberof glacial outburst floods, or jokulhlaups. Waitt(1985) and Atwater (1986) support the hypothesisthat a large number of Missoula floods (40–89) oc-curred in a time interval of 2000–2500 yr (between15.3 and 12.7 ka; Waitt 1985). Baker and Bunker(1985), O’Connor and Baker (from hydraulic cal-culation; 1992) and Shaw et al. (1999), all in agree-ment with Bretz (1969), argue for one very largecataclysmic flood in late Wisconsin time, whichcould eventually have been followed by later,smaller floods.
Unit B is a fining- and thinning-upward sequenceof turbidite sand beds with very few thin hemipe-lagic interbeds (fig. 2). The lowermost 57 m of unitB consists of 180% sand, including 5% medium-to very coarse-grained sand (2–0.25 mm), which isunusual in the entire section. There are no litho-logic variations in this interval, except for gradingin the upper 17 m. The soupy nature of most of therecovered sand precludes a firm interpretation, butthe lack of mud or clay chips indicates there prob-ably were no breaks in this sandy interval, sug-gesting that it can be interpreted as a single mega-turbidite bed or a series of amalgamated thickturbidite beds. Additional evidence that this thicksandy interval may be a single depositional unit isthe lack of internal reflectors in profiles from thenorthern part of the Escanaba Trough (Davis andBecker 1994). Our age determinations from on topof and immediately below this interval are
and yr, respectively,15,750 5 70 15,482 5 100consistent with very short-lived, single-eventdeposition.
The upper half of unit B forms a distinct fining-and thinning-upward sequence of about 10 gradedbeds ranging from 12 to 3.5 m thick (fig. 2). Thispart of unit B corresponds to the key reflector se-quence that can be traced throughout the EscanabaTrough. Key reflector C overlies a thin hemipelagicmud dated at yr. This implies that the10,882 5 85upper part of unit B was deposited in !5 k.yr.
Atwater (1987, p. 185) reports a 14C age ofyr from detrital wood found near the14,490 5 290
middle of a 115-m-thick glaciolacustrine sectionconsisting of varved intervals of 15–55 beds inter-stratified with graded beds near Manila Creek,which is a tributary to the Sanpoil River of glacialLake Columbia. This glaciolacustrine deposit con-tains 89 beds that have been related to the Missoulafloods of Fraser age. It has been suggested that ifflood-bed thickness and grain size are proportionalto flow discharge, then there is a trend towardsmaller events through time for the Missoula floods(fig. 3B; Waitt 1980; Atwater 1986, 1987; Smith1993).
Below unit B, there is a lithologically similar se-quence that is 57 m thick and fines upward. About35 m of sand at the base of unit C appears to com-prise three turbidite beds that fine upward to mudturbidite beds with a thin fine-grained sandy base.The top of unit C is yr old, and the15,482 5 100base is younger than 25 ka, based on the date fromthe middle of unit D. Unfortunately, no date wasobtained from the basal part of the unit, but wesuggest that the thinning- and fining-upward se-quence of unit C could record earlier jokulhlaupsfrom the Columbia River drainage area.
The observations above suggest that the unit Band perhaps the unit C sequences of graded bedsrepresent the deep-sea sedimentary record of theLake Missoula glacial outburst floods. The floodsentered the ocean close to the heads of Astoria andWillapa Canyons (fig. 10) when sea level was about60–70 m below present. The exceptionally high dis-charge rate and sediment load of many of the Mis-soula events were likely to have generated hyper-pycnal gravity flows (Mulder and Syvitski 1995;Mutti et al. 1996). The largest of these events gen-erated turbidity currents that were capable of reach-ing the Escanaba Trough.

272 G . G . Z U F F A E T A L .
Unit D consists of thick-bedded muddy turbi-dites locally with fine sand bases. A sedimentationrate of 7.6 m/k.yr. was calculated from two ages inthe unit, 24,982 and 32,182 yr at 262.25 and at316.90 mbsf (table 1), respectively, which is slowerthan that of the overlying sandier units B and C. Ifa similar rate of sedimentation characterizes thelower part of unit D, then the bottom of the unitat 366 mbsf would be about 40 ka. Unit D and unitE, which is slightly sandier than unit D, probablywere deposited during oxygen isotope stage 3 (Mar-tinson et al. 1987), when sea level was lower thanat present and more variable.
Conclusions
Depositional geometry, high-resolution stratigra-phy, and sand composition indicate that the oce-anic rift-valley sedimentary fill of the EscanabaTrough was derived dominantly from the ColumbiaRiver. This sediment reached the Escanaba Troughthrough the Cascadia Channel and the Tufts abys-sal plain, flowing along the north flank of the Men-docino Fracture Zone ridge and entering the oce-anic rift valley flowing toward the north (fig. 10).Two fining- and thinning-upward turbidite se-quences (units B and C), which together are 175 mthick, were cored below the thin surficial Holocenehemipelagic interval of mud. The two sequenceshave AMS 14C ages from 16 to 11 ka and a depo-sition rate from 9 m/k.yr. to essentially instanta-neous (fig. 3A). The type of sequence and the com-position of sand, age, and deposition rate suggest
that these turbidite beds were derived from theLake Missoula outbursts during Wisconsinan de-glaciation. Many of the jokulhlaups from the glaciallakes continued flowing as hyperpycnally gener-ated turbidity currents on entering the sea at themouth of the Columbia River and were able toreach the oceanic ridge valley of the EscanabaTrough, resulting in a submarine transport path of11100 km.
A C K N O W L E D G M E N T S
The financial support for G. Zuffa was provided bythe National Council of Research (CNR 96.00286CT 05, 97.00268 CT 05). Radiometric analyses wereperformed by the National Ocean Sciences Accel-erator Mass Spectrometry Facility at Woods Hole(National Science Foundation Cooperative Agree-ment OCE-9301015) and the EidgenossischeTechnische Hochschule at Zurich. The JointOceanographic Institutions/U.S. Science SupportProgram funded work by C. Brunner. We thankJ. A. Reid for assisting with preparation of figure 1.The manuscript has benefited from reviews byF. L. Wong and H. E. Clifton. We would like tothank V. R. Baker, B. F. Atwater, and an anonymousreviewer, whose comments greatly strengthenedthis article. This article is University of SouthernMississippi Department of Marine Science Contri-bution 195. This article is one of the primary con-tributions by C. Brunner and G. Zuffa for the ODPLeg 169.
R E F E R E N C E S C I T E D
Atwater, B. F. 1986. Pleistocene glacial-lake deposits ofthe Sanpoil River Valley, northeastern Washington.U.S. Geol. Surv. Bull. 1661.
———. 1987. Status of glacial Lake Columbia during thelast floods from glacial Lake Missoula. Quat. Res. 27:182–201.
Baker, V. R., and Bunker, R. C. 1985. Cataclysmic latePleistocene flooding from glacial Lake Missoula: a re-view. Quat. Sci. Rev. 4:1–41.
Bretz, J. H. 1969. The Lake Missoula floods and the Chan-neled Scabland. J. Geol. 77:505–543.
Brunner, C. A.; Normark, W. R.; Zuffa, G. G.; and Serra,F. 1999. Deep-sea sedimentary record of the late Wis-consin cataclysmic floods from the Columbia River.Geology 27:463–466.
Carlson, P. R., and Nelson, C. H. 1987. Marine geologyand resource potential of Cascadia Basin. In Scholl,D. W.; Grantz, A.; and Vedder, J. G., eds. Geology andresource potential of the continental margin of west-
ern North America and adjacent ocean basins—Beaufort Sea to Baja California. Circum-Pacific Coun-cil for Energy and Mineral Resources, Earth ScienceSeries 6:523–535.
Clarke, G. K. C.; Mathews, W. H.; and Pack, R. T. 1984.Outburst floods from glacial Lake Missoula. Quat.Res. 22:289–299.
Clarke, S. H., Jr. 1987. Geology of the California conti-nental margin north of Cape Mendocino. In Scholl,D. W.; Grantz, A.; and Vedder, J. G., eds. Geology andresource potential of the continental margin of west-ern North America and adjacent ocean basins—Beaufort Sea to Baja California. Circum-Pacific Coun-cil for Energy and Mineral Resources, Earth ScienceSeries 6:337–351.
Crandell, D. R.; Mullineaux, D. R.; Rubin, M.; Spiker, E.;and Kelly, M. L. 1981. Radiocarbon dates from vol-canic deposits at Mount St. Helens, Washington. U.S.Geol. Surv. Open-File Rep. 81-844.

Journal of Geology T U R B I D I T E M E G A B E D S I N A N O C E A N I C R I F T V A L L E Y 273
Davis, E. E., and Becker, K. 1994. Thermal and tectonicstructure of Escanaba Trough: new heat-flow mea-surements and seismic-reflection profiles. In Morton,J. L.; Zierenberg, R. A.; and Reiss, C. A., eds. Geologic,hydrothermal, and biologic studies at EscanabaTrough, Gorda Ridge, offshore northern California.U.S. Geol. Surv. Bull. 2022, p. 45–64.
Dickinson, W. R. 1985. Interpreting provenance relationsfrom detrital modes of sandstones. In Zuffa G. G., ed.Provenance of arenites, NATO-ASI. Dordrecht, Rei-del, p. 333–361.
Fouquet, Y.; Zierenberg, R. A.; Miller, D. J., et al. 1998.Proc. Ocean Drilling Program, Init. Rep. 169. CollegeStation, Tex., 592 p.
Gazzi, P. 1966. Le arenarie del flysch sopracretaceodell’Appennino modenese: correlazioni con il flyschdi Monghidoro. Mineral. Petrogr. Acta 12:69–97.
Gazzi, P.; Zuffa, G. G.; Gandolfi, G.; and Paganelli, L.1973. Provenienza e dispersione litoranea della sabbiedelle spiagge adriatiche fra le foci dell’Isonzo e delFoglia: inquadramento regionale. Soc. Geol. Ital.Mem. 12:1–37.
Goldfinger, C.; Kulm, L. D.; and McNeill, L. C. 2000.Super-scale failure of the southern Oregon Cascadiamargin. Pure Appl. Geophys., in press.
Griggs, G. B.; Kulm, L. D.; Waters, A. C.; and Fowler, G.A. 1970. Deep-sea gravel from Cascadia Channel. J.Geol. 78:611–619.
Grim, M. S.; Chase, T. E.; Evenden, G. I.; Holmes, M. C.;Normark, W. R.; Wilde, P.; Fox, C. G.; Lief, C. J.; andSeekins, B. A. 1992. Map showing bottom topographyof the Pacific continental margin, Strait of Juan deFuca to Cape Mendocino. U.S. Geol. Surv. Misc. In-vestig. Ser. Map I-2091-C.
Hurley, R. J. 1960. The geomorphology of abyssal plainsin the northeast Pacific Ocean. Marine Physical Lab-oratory, Scripps Institution Oceanography Reference60–7, 105 p.
———. 1964. Analysis of flow in Cascadia deep-sea chan-nel. In Miller, R. L., ed. Papers in marine geology. NewYork, Macmillan, p. 117–132.
Karlin, R., and Lyle, M. 1986. Sediment studies on theGorda Ridge. Oreg. Dep. Geol. Miner. Ind. Open-FileRep., 0-86-19, 76 p.
Koski, R. A.; Benninger, L. M.; Zierenberg, R. A.; andJonasson, I. R. 1994. Composition and growth historyof hydrothermal deposits in Escanaba Trough, south-ern Gorda Ridge. In Morton, J. L.; Zierenberg, R. A.;and Reiss, C. A., eds. Geologic, hydrothermal, and bi-ologic studies at Escanaba Trough, Gorda Ridge, off-shore northern California. U.S. Geol. Surv. Bull. 2022,p. 293–324.
Martinson, D. G.; Pisias, N. G.; Hays, J. D.; Imbrie, J.;Moore, T. C., Jr.; and Shackleton, N. J. 1987. Age dat-ing and the orbital theory of the ice ages: developmentof a high-resolution 0 to 300,000-year chronostratig-raphy. Quat. Res. 27:1–29.
McDonald, E. V., and Busacca, A. J. 1988. Record of pre-late Wisconsin giant floods in the Channeled Scablandinterpreted from loess deposits. Geology 16:728–731.
McMurray, G. R., ed. 1987. Gorda Ridge: a seafloorspreading center in the United States’ Exclusive Ec-onomic Zone. New York, Springer, 311 p.
Moore, G. W., and Sharman, G. F. 1970. Summary ofSCAN site 4. In McManus, D. A.; Burns, R. E.; et al.,eds. Initial reports of the Deep Sea Drilling Project, 5.Washington, D.C., Government Printing Office, p.761–773.
Morton, J. L., and Fox, C. G. 1994. Structural setting andinteraction of volcanism and sedimentation at Esca-naba Trough: geophysical results. In Morton, J. L.;Zierenberg, R. A.; and Reiss, C. A., eds. Geologic, hy-drothermal, and biologic studies at Escanaba Trough,Gorda Ridge, offshore northern California. U.S. Geol.Surv. Bull. 2022, p. 21–43.
Morton, J. L.; Zierenberg, R. A.; and Reiss, C. A. 1994a.Geologic, hydrothermal, and biologic studies at Es-canaba Trough: an introduction. In Morton, J. L.; Zier-enberg, R. A.; and Reiss, C. A., eds. Geologic, hydro-thermal, and biologic studies at Escanaba Trough,Gorda Ridge, offshore northern California. U.S. Geol.Surv. Bull. 2022, p. 1–18.
———. 1994b. Geologic, hydrothermal, and biologicstudies at Escanaba Trough, Gorda Ridge, offshorenorthern California. U.S. Geol. Surv. Bull. 2022, 359p.
Mulder, T., and Syvitski, J. P. M. 1995. Turbidity currentsgenerated at mouths of rivers during exceptional dis-charges to the world oceans. J. Geol. 103:285–299.
Mutti, E.; Davoli, G.; Tinterri, R.; and Zavala, C. 1996.The importance of ancient fluvio-deltaic systemsdominated by catastrophic flooding in tectonically ac-tive basins. Mem. Sci. Geol. 48:233–291.
Normark, W. R.; Gutmacher, C. E.; Zierenberg, R. A.;Wong, F. L.; and Rosenbauer, R. J. 1994. Sediment fillof Escanaba Trough. In Morton, J. L.; Zierenberg, R.A.; and Reiss, C. A., eds. Geologic, hydrothermal, andbiologic studies at Escanaba Trough, Gorda Ridge, off-shore northern California. U.S. Geol. Surv. Bull. 2022,p. 91–129.
Normark, W. R., and Reid, J. A. 1998. Tufts deep-sea fan:a gateway for catastrophic turbidity currents thatfilled Escanaba Trough, southern Gorda Ridge. EOSTrans. Am. Geophys. Union 79:F511.
Normark, W. R.; Reid, J. R.; Ross, S. L.; and Zierenberg,R. A. 1997. Tectonism and turbidites in EscanabaTrough, southern Gorda Ridge. EOS Trans. Am. Geo-phys. Union 78:F630.
O’Connor, J. E., and Baker, V. R. 1992. Magnitudes andimplications of peak discharges from glacial Lake Mis-soula. Geol. Soc. Am. Bull. 104:267–279.
Ross, S. L.; Klitgord, K. D.; Reid, J. A.; and Zierenberg,R. A. 1996. New sidescan imagery of NESCA site atEscanaba Trough, southern Gorda Ridge. EOS Trans.Am. Geophys. Union 77:F316.
Scheidegger, K. F.; Kulm, L. D.; and Piper, D. J. W. 1973.Heavy mineralogy of unconsolidated sands in north-eastern Pacific sediments: leg 18, Deep Sea DrillingProject. In Kulm, L. D.; von Huene, R.; et al., eds.Initial Reports of the Deep Sea Drilling Project, 18.
274 G . G . Z U F F A E T A L .
Washington, D.C., Government Printing Office, p.877–887.
Shaw, J.; Munro-Stasiuk, M.; Sawyer, B.; Beaney, C.;Lesemann, J.; Musacchio, A.; Rains, B.; and Young,R. R. 1999. The Channeled Scabland: back to Bretz?Geology 27:605–608.
Shipboard Scientific Party. 1970. Site 35. In McManus,D. A.; Burns, R E.; et al., eds. Initial Reports of theDeep Sea Drilling Project, 5. Washington, D.C., Gov-ernment Printing Office, p. 165–202.
———. 1973. Site 174. In Kulm, L. D.; von Huene, R.;et al., eds. Initial Reports of the Deep Sea DrillingProject, 18. Washington, D.C., Government PrintingOffice, p. 97–167.
———. 1997. Site 1020. In Lyle, M.; Koizumi, I.; et al.,eds. Proc. Ocean Drilling Program Init. Rep. 167. Col-lege Station, Tex., p. 389–429.
———. 1998a. Escanaba Trough: Central Hill (Site 1038).In Fouquet, Y.; Zierenberg, R. A.; et al., eds. Proc.Ocean Drilling Program, Init. Rep. 169. College Sta-tion, Tex., p. 253–298.
———. 1998b. Escanaba Trough: Reference Site (Site1037). In Fouquet, Y.; Zierenberg, R. A.; et al., eds.Proc. Ocean Drilling Program, Init. Rep. 169. CollegeStation, Tex., p. 205–251.
———. 1998c. Introduction: investigation of hydrother-mal circulation and genesis of massive sulfide depositsat sediment-covered spreading centers at MiddleValley and Escanaba Trough. In Fouquet, Y.; Zieren-berg, R. A.; et al., eds. Proc. Ocean Drilling Program,Init. Rep. 169. College Station, Tex., p. 7–15.
Smith, G. A. 1993. Missoula flood dynamics and mag-nitudes inferred from sedimentology of slack-waterdeposits on the Columbia Plateau, Washington. Geol.Soc. Am. Bull. 105:77–100.
Smith, W. H. F., and Sandwell, D. T. 1997. Global seafloor topography from satellite altimetry and shipdepth soundings. Science 277:1956–1962.
Snavely, P. D., Jr. 1987. Tertiary geologic framework, neo-tectonics, and petroleum potential of the Oregon-Washington continental margin. In Scholl, D. W.;Grantz, A.; and Vedder, J. G., eds. Geology and re-source potential of the continental margin of westernNorth America and adjacent ocean basins—BeaufortSea to Baja California. Circum-Pacific Council for En-ergy and Mineral Resources, Earth Science Series 6:305–335.
Southon, J. R.; Nelson, D. E.; and Vogel, J. S. 1990. Arecord of past ocean-atmosphere radiocarbon differ-
ence from the northeast Pacific. Paleoceanography 5:197–206.
Spencer, P. K. 1989. A small mammal fauna from thetouchet beds of Walla Walla County, Washington: sup-port for the multiple-flood hypothesis. Northwest Sci.63:167–174.
Steele, W. K. 1991. Paleomagnetic evidence from re-peated glacial Lake Missoula floods from sedimentsof the Sanpoil River Valley, northeastern Washington.Quat. Res. 35:197–207.
Vallier, T. L.; Harold, P. J.; and Gerdley, W. A. 1973. Prov-enances and dispersal patterns of turbidite sand in Es-canaba Trough, northeastern Pacific Ocean. Mar.Geol. 15:67–87.
Waitt, R. B., Jr. 1980. About forty last-glacial Lake Mis-soula jokulhlaups through southern Washington. J.Geol. 88:653–679.
———. 1985. Case for periodic, colossal jokulhlaups fromPleistocene glacial Lake Missoula. Geol. Soc. Am.Bull. 96:1271–1286.
Whetten, J. T.; Kelly, J. C.; and Hanson, L. G. 1969. Char-acteristic of Columbia River sediment and sedimenttransport. J. Sediment. Petrol. 39:1149–1166.
Wolf, S.; Nelson, C. H.; and Hamer, M. 1999. Turbiditepathways on Cascadia Basin and Tufts Abyssal Plain:part A, Astoria channel to Mendocino channel. U.S.Geol. Surv. Open-File Rep. 99-157, 7 p.
Zierenberg, R. A.; Morton, J. L.; Koski, R. A.; and Ross,S. L. 1994. Geologic setting of massive sulfide min-eralization in Escanaba Trough. In Morton, J. L.; Zier-enberg, R. A.; and Reiss, C. A., eds. Geologic, hydro-thermal, and biologic studies at Escanaba Trough,Gorda Ridge, offshore northern California. U.S. Geol.Surv. Bull. 2022, p. 171–197.
Zuffa, G. G. 1980. Hybrid arenites: their composition andclassification. J. Sediment. Petrol. 50:21–29.
———. 1985. Optical analyses of arenites: influence ofmethodology on compositional results. In Zuffa,G. G., ed. Provenance of Arenites: NATO-ASI. Dor-drecht, Reidel, p. 165–189.
———. 1987. Unravelling hinterland and offshore pa-laeogeography from deep-water arenites. In Leggett,J. K., and Zuffa, G. G., eds. Marine clastic sedimen-tology, models and case studies. London, Graham &Trotman, p. 39–61.
Zuffa, G. G.; De Rosa, R.; and Normark, W. R. 1997.Shifting sources and transport paths for the late Qua-ternary Escanaba Trough sediment fill (northeast Pa-cific). G. Geol. 59:35–53.


