Embed Size (px)
Citation preview

ABSTRACT
We investigated the sequence architecture of two expanded Cenomanian successions along a depth transect in the Tarfaya Basin (SW Morocco) and correlated these succes-sions to published records from northwest Europe and India. Changes in terrigenous material, carbonate and organic carbon content, carbonate microfacies and forami-niferal biofacies, as well as nondepositional and erosional surfaces were used to defi ne depositional sequences and systems tracts. We identifi ed two main transgressive cycles in the lower and middle-upper Cenoma-nian separated by a major regression at the early-middle Cenomanian transition (sequence boundary Ce 3). This regressive interval is characterized by lagoonal low-stand deposits indicating an overall sea-level fall of more than 30 m. Superimposed on the two main transgressive cycles, there are 11 third-order depositional sequences that correlate to globally recognized sea-level fl uctuations and appear to be paced by long eccentricity variations (400 Ka period). Positive carbon isotope excursions in the middle Cenomanian (96.0 Ma) and latest Cenomanian (94.0 Ma) following sea-level lowstands together with planktonic foraminiferal and ammonite datums pro-vide a robust framework for stratigraphic correlation. We suggest that the onset of these excursions was triggered by eccentric-ity minima during periods of low variability in obliquity (nodes), which probably coin-cided with glacioeustatic lowstands.
INTRODUCTION
Enigma of Middle Cretaceous High-Frequency, Low-Amplitude Sea-Level Fluctuations
The origins and driving mechanisms of Middle Cretaceous rapid, low-amplitude sea-level fl uctuations have remained enigmatic. In contrast, low-frequency, high-amplitude sea-level changes (second-order sequences in the sense of Vail et al. [1991]) are somewhat better understood and have been attributed to tectono-volcanic events such as changes in spreading rates or activity of large igneous provinces. The main body of evidence for Middle Creta-ceous rapid sea-level fl uctuations comes from the identifi cation of regional unconformities (sequence boundaries), resulting from rapid basinward shifts in sediment accumulation due to relative sea-level falls. These sea level–related unconformities, which are correlatable over long distances across basins (Robaszynski et al., 1998; Wilmsen, 2003; Miller et al., 2003, 2004), have been suggested to primarily refl ect Middle Cretaceous eustatic sea-level fl uctua-tions (Gale et al., 2002).
The rapid sea-level fall at the base of the middle Cenomanian (Cunningtoniceras inerme ammonite zone, base of the Rotalipora reicheli planktonic foraminiferal zone), which cor-responds to sequence boundary Ce 3 in the sea-level curve of Hardenbol et al. (1998), has been interpreted as glacioeustatic (Miller et al., 2003, 2004), although evidence from marine δ18O records is still ambiguous and vigorously debated (Frakes, 1999; Stoll and Schrag, 2000; Miller et al., 2003, 2004; Moriya et al., 2007). Recent evidence for large and rapid sea-level changes in the Late Cretaceous was provided by benthic δ18O and backstripped eustatic esti-mates from the New Jersey margin and the
Russian Platform, which shed new light on Cretaceous glacioeustasy (Miller et al., 2005a, 2005b). These authors suggested that glacio-eustatic sea-level fl uctuations of up to 25 m occurred in the Cretaceous greenhouse world, when Antarctic ice sheets of 8–12 × 106 km3 volume (or 20–30 m glacioeustatic sea-level change) developed without reaching the coast or signifi cantly cooling circum-Antarctic–derived deep water during short intervals of minimum Antarctic summer insolation.
Alternative hypotheses to explain low-amplitude (<10 m) fl uctuations in sea level include thermal expansion of ocean water masses (Schulz and Schäfer-Neth, 1997; Gale et al., 2002) and periodic changes in continen-tal lake and groundwater storage associated with monsoonal climate variability. Jacobs and Sahagian (1993) calculated potential sea-level fl uctuations of 4–8 m associated with late Qua-ternary precessionally forced changes in the Intertropical Convergence Zone position and monsoonal strength. Given that a higher pro-portion of the landmass was close to the equa-torial monsoonal belt during the Cretaceous, the effect of lake and groundwater storage in larger volumes of porous sediments could have easily produced sea-level fl uctuations of 10–20 m (Hay and Leslie, 1990). This is in the amplitude range of the majority of Cretaceous high-frequency eustatic sea-level fl uctuations, although it is lower than during main regres-sive phases such as the middle Cenomanian event. In conclusion, there is ample evidence for the existence and synchroneity of Middle Cretaceous high-frequency sea-level fluc-tuations, mainly from well-studied European basins. However, additional records from dif-ferent tectonic plates are needed to unequivo-cally ascribe Cretaceous sea-level fl uctuations to eustatic change and to decipher links to potential glaciation events.
For permission to copy, contact [email protected]© 2009 Geological Society of America
1695
GSA Bulletin; November/December 2009; v. 121; no. 11/12; p. 1695–1710; doi: 10.1130/B26418.1; 9 fi gures; 2 tables; Data Repository item 2009051.
†E-mail: [email protected]
Cenomanian sequence stratigraphy and sea-level fl uctuations in the Tarfaya Basin (SW Morocco)
Wolfgang Kuhnt,1,† Ann Holbourn,1 Andy Gale,2 El Hassane Chellai,3 and William J. Kennedy4
1Institute for Geosciences, Christian-Albrechts University, 24118 Kiel, Germany2Department of Earth and Environmental Sciences, University of Portsmouth, Portsmouth PO1 3QL, UK3Department of Geology, Faculty of Sciences Semlalia, Cadi Ayyad University–Marrakech, P.O. Box 2390, Marrakech, Morocco4University Museum of Natural History, Oxford OX1 3PW, UK

Kuhnt et al.
1696 Geological Society of America Bulletin, November/December 2009
Orbital Forcing of Cretaceous Climate and Sea Level
Orbital variability recorded in Cretaceous marine sediments can serve as a powerful tool to reconstruct the timing and duration of envi-ronmental change in a greenhouse world. In contrast to precession and obliquity, long-term variations in Earth’s eccentricity (i.e., 400 k.y. and 2400 k.y. periods) have remained largely consis-tent over the last 100 m.y. (Laskar, 1999; Laskar et al., 2004), thus providing a robust chronologi-cal framework (Berger et al., 1984; Herbert and Fischer, 1986; Fischer et al., 1990; Einsele et al., 1991; Schwarzacher , 1993; Herbert et al., 1995; Shackleton et al., 1999). However, the correlation between Cretaceous eustatic sea-level fl uctuations and orbital cyclicity is still in a preliminary stage, mainly because complete deep-water successions exhibiting a clear orbital signal are diffi cult to correlate to shallow-marine successions showing clear evidence of sea-level changes. The quanti-fi cation of eustatic sea-level fl uctuations remains an additional challenge (Burton et al., 1987; Ken-dall et al., 1992; Kominz and Pekar, 2001; Cathro et al., 2003). Benthic oxygen isotopes, which are commonly used to correlate and quantify glacio-eustatic sea-level and deep-water records in the Neogene, are problematic in the Middle Creta-ceous mainly due to diagenesis, shallower calcite compensation depth (CCD), small signal ampli-tude, or incompleteness of records.
Recent attempts to correlate Cretaceous and Paleogene greenhouse climate fl uctuations to orbital variations have concentrated either on sediment parameters refl ecting precipitation and continental runoff (Beckmann et al., 2005), marine productivity, carbonate and organic car-bon burial (Meyers et al., 2001; Sageman et al., 2006), or δ13C as a proxy indicator of global carbon cycle fl uctuations. Lourens et al. (2005) suggested that the Paleocene-Eocene thermal maximum (55 Ma) and a successive global warming event and δ13C depletion corresponded to maxima in the 405 Ka and 100 Ka eccen-tricity periods, postdating prolonged minima in the 2.25 m.y. modulation of the eccentricity period. For the last major phase of global warmth in the middle Miocene, it has also been proposed that changes in the carbon cycle and climate were paced by eccentricity, where warm periods corre-late with low δ13C and high eccentricity and cool periods correlate with increasing δ13C and low eccentricity (Holbourn et al., 2005, 2007).
The Cenomanian Stage as a Test Case
The Cenomanian is arguably one of the most suitable stages to disentangle the relationship among sea-level fl uctuations, orbital varia-
tions, and δ13C in the Cretaceous because thick bodies of shelf sediments were widely depos-ited during a fi rst-order (tectonically forced) sea-level rise lasting throughout the entire Cenomanian (Haq et al., 1987). Orbitally bed-ded hemi pelagic sediments have allowed the development of biostratigraphically calibrated cyclostratigraphic time scales and global corre-lation of eustatic sequences for the Cenomanian stage (Gale, 1995; Owen, 1996; Robaszynski et al., 1993, 1994, 1998; Sageman et al., 1997, 2006; Meyers et al., 2001; Prokoph et al., 2001; Gale et al., 1999, 2002; Wilmsen, 2003; Kennedy and Gale, 2006). Furthermore, the lat-est orbital solution proposed by Laskar et al. (2004), which covers the entire Cenomanian stage, allows for more precise correlation of sedimentary successions and δ13C variations to calculated orbital confi gurations.
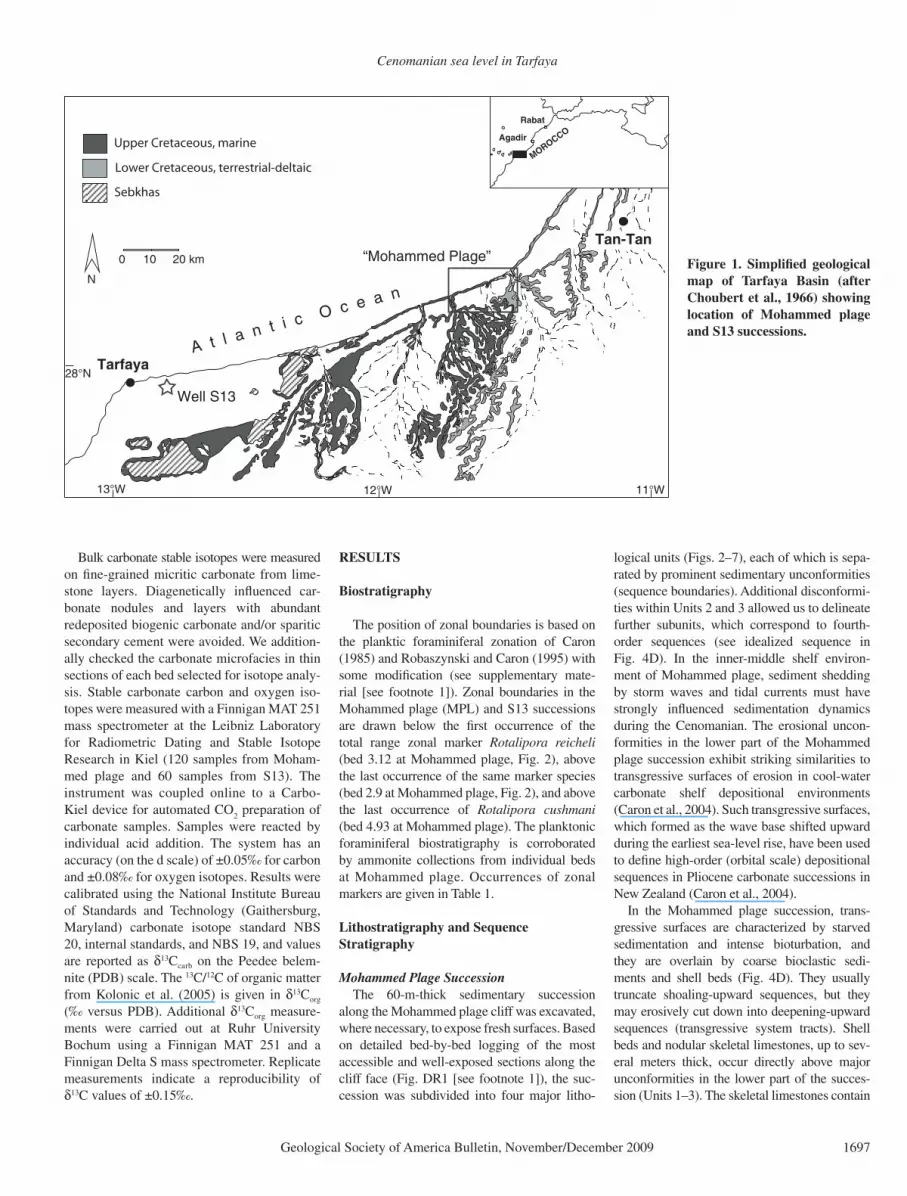
We investigated the sequence architecture of two expanded Cenomanian successions along a depth transect in the Tarfaya-Laayoune coastal basin in SW Morocco (Fig. 1; Fig. DR11). The proximal Mohammed plage (MPL) succession was deposited at the northwestern margin of the stable Sahara Platform close to the origi-nal coastline. The more distal succession from a cored Shell-ONAREP exploration well (S13) represents an open-marine shelf setting, located closer to the depocenter of the basin. Thus, this minitransect allows us to closely track relative sea-level fl uctuations in the proximal basin and to correlate these to the more complete record in the distal part of the basin. Our principal objec-tives were (1) to discriminate whether Cenoma-nian sea-level change was slow and continuous or rapid and punctuated on a Milankovitch time scale, (2) to test whether high-frequency sea-level fl uctuations followed orbital cyclicity, in particular the 400-k.y.-long eccentricity period, and (3) to assess potential links between sea-level falls and glaciation events.
MATERIAL AND METHODS
During four fi eld campaigns in 1997, 1998, 2000, and 2003, we undertook detailed sedi-mentary logging, sequence stratigraphic analy-sis, and photographic documentation, as well as high-resolution (~10 cm corresponding to ~8 k.y.) micropaleontological and geochemi-cal sampling of organic-rich clay intervals in the Mohammed plage succession. Limestone intervals were additionally sampled for thin section and bulk isotope analyses. From the
oil-shale exploration well S13, only lower-resolution samples (~1–5 m corresponding to 10–50 k.y.) were available, which were pro-vided by the Moroccan National Oil Company ONAREP in Rabat.
In total, 150 micropaleontological samples from organic-rich clay intervals were dried, weighed, and processed using an alcoholic solution of anionic tensides (REWOQUAT by REWO-Chemie, Steinau, Germany), which helps to break down indurated, organic-rich chalk samples. Foraminifers were quantitatively picked from splits of the 63–125, 125–250, and 250–630 µm fractions. Approximately 100 highly indurated samples were dissolved in hydrochloric acid, then the acid residue >63 µm was weighed and examined for microfossil con-tent and presence of quartz, mica, and other ter-rigenous grains.
Approximately 100 thin sections from lime-stone intervals in the Mohammed plage succes-sion were examined to estimate the abundance of planktonic foraminifers, presence of char-acteristic shallow-water benthic foraminifers, such as large textulariids and spiroplectam-minids, and proportion of terrigenous material (mainly quartz grains) and macrofossil shell fragments, mainly transported from shallower (littoral) settings. Thin sections were scanned using a Mikrothek slide-scanner in 24 × 36 mm frames with 1200 dpi resolution and 6× mag-nifi cation, and the percentage of quartz grains was estimated using ImageJ image-analyzing software. We set the particle analyzer tool in ImageJ to count particles of 15–150 µm diameter with threshold of 129–255 grayscale units (corresponding to the size and lightness of quartz grains) and circularity of 0.2–0.8 in order to exclude elongate and spherical par-ticles (biogenic calcite) of similar lightness. Results provide average grain size of measured quartz particles (typically around 60 µm) and area fraction of quartz grains in percent (typi-cally around 2%–3% in thin sections from sequences with enhanced terrigenous input).
Carbonate and organic carbon analyses were performed at the Institute Français du Pétrole (IFP), Rueil-Malmaison (S13), and the Uni-versity of Bremen (Mohammed plage succes-sion), using a Rock Eval II pyrolysis system and a LECO-CS-300 carbon analyzer. Since Rock-Eval measurements of total organic car-bon (TOC) were only possible in spot samples from S13 (Kuhnt et al., 1990), we additionally used the initial Fisher Assay pyrolysis data of Shell-ONAREP. These measurements, which were carried out on homogenized intervals of the core (1–3 m thick), represent robust, con-tinuous estimates of organic matter percentages and oil yield.
1GSA Data Repository item 2009051, sedimento-logical, stable isotope and geochemical data, is avail-able at http://www.geosociety.org/pubs/ft2009.htm or by request to [email protected].
Cenomanian sea level in Tarfaya
Geological Society of America Bulletin, November/December 2009 1697
Bulk carbonate stable isotopes were measured on fi ne-grained micritic carbonate from lime-stone layers. Diagenetically infl uenced car-bonate nodules and layers with abundant redeposited biogenic carbonate and/or sparitic secondary cement were avoided. We addition-ally checked the carbonate microfacies in thin sections of each bed selected for isotope analy-sis. Stable carbonate carbon and oxygen iso-topes were measured with a Finnigan MAT 251 mass spectrometer at the Leibniz Laboratory for Radiometric Dating and Stable Isotope Research in Kiel (120 samples from Moham-med plage and 60 samples from S13). The instrument was coupled online to a Carbo-Kiel device for automated CO
2 preparation of
carbonate samples. Samples were reacted by individual acid addition. The system has an accuracy (on the d scale) of ±0.05‰ for carbon and ±0.08‰ for oxygen isotopes. Results were calibrated using the National Institute Bureau of Standards and Technology (Gaithersburg, Maryland) carbonate isotope standard NBS 20, internal standards, and NBS 19, and values are reported as δ13Ccarb on the Peedee belem-nite (PDB) scale. The 13C/12C of organic matter from Kolonic et al. (2005) is given in δ13Corg (‰ versus PDB). Additional δ13Corg measure-ments were carried out at Ruhr University Bochum using a Finnigan MAT 251 and a Finnigan Delta S mass spectrometer. Replicate measurements indicate a reproducibility of δ13C values of ±0.15‰.
RESULTS
Biostratigraphy
The position of zonal boundaries is based on the planktic foraminiferal zonation of Caron (1985) and Robaszynski and Caron (1995) with some modifi cation (see supplementary mate-rial [see footnote 1]). Zonal boundaries in the Mohammed plage (MPL) and S13 successions are drawn below the fi rst occurrence of the total range zonal marker Rotalipora reicheli (bed 3.12 at Mohammed plage, Fig. 2), above the last occurrence of the same marker species (bed 2.9 at Mohammed plage, Fig. 2), and above the last occurrence of Rotalipora cushmani (bed 4.93 at Mohammed plage). The planktonic forami niferal biostratigraphy is corroborated by ammonite collections from individual beds at Mohammed plage. Occurrences of zonal markers are given in Table 1.
Lithostratigraphy and Sequence Stratigraphy
Mohammed Plage SuccessionThe 60-m-thick sedimentary succession
along the Mohammed plage cliff was excavated, where necessary, to expose fresh surfaces. Based on detailed bed-by-bed logging of the most accessible and well-exposed sections along the cliff face (Fig. DR1 [see footnote 1]), the suc-cession was subdivided into four major litho-
logical units (Figs. 2–7), each of which is sepa-rated by prominent sedimentary uncon formi ties (sequence boundaries). Additional disconformi-ties within Units 2 and 3 allowed us to delineate further subunits, which correspond to fourth-order sequences (see idealized sequence in Fig. 4D). In the inner-middle shelf environ-ment of Mohammed plage, sediment shedding by storm waves and tidal currents must have strongly infl uenced sedimentation dynamics during the Cenomanian. The erosional uncon-formities in the lower part of the Mohammed plage succession exhibit striking similarities to transgressive surfaces of erosion in cool-water carbonate shelf depositional environments (Caron et al., 2004). Such transgressive surfaces, which formed as the wave base shifted upward during the earliest sea-level rise, have been used to defi ne high-order (orbital scale) depositional sequences in Pliocene carbonate successions in New Zealand (Caron et al., 2004).
In the Mohammed plage succession, trans-gressive surfaces are characterized by starved sedimentation and intense bioturbation, and they are overlain by coarse bioclastic sedi-ments and shell beds (Fig. 4D). They usually truncate shoaling-upward sequences, but they may erosively cut down into deepening-upward sequences (transgressive system tracts). Shell beds and nodular skeletal limestones, up to sev-eral meters thick, occur directly above major unconformities in the lower part of the succes-sion (Units 1–3). The skeletal limestones contain
11°W
11°´
12°W13°W
28°N
Upper Cretaceous, marine
Lower Cretaceous, terrestrial-deltaic
Sebkhas
20 km100
N
Tarfaya
Tan-Tan
A t l a n t i c
O c e a n
“Mohammed Plage”
Rabat
Agadir
MOROCCO
Well S13
Figure 1. Simplifi ed geological map of Tarfaya Basin (after Choubert et al., 1966) showing location of Mohammed plage and S13 successions.

Kuhnt et al.
1698 Geological Society of America Bulletin, November/December 2009
redeposited shell debris and shallow-water faunal elements mixed with pelagic micro- and macro-fossils, which become more abundant toward the top of the limestones. We interpreted these units as sediments deposited during the phase of rapid sea-level rise following a sea-level lowstand, which may partly correspond to an underlying unconformity. These units exhibit lithological similarity to Middle Cretaceous lowstand tem-pestites in the Western Interior Basin (Sageman, 1996), which include common Thalassinoides burrows, although they are not incised into lami-nated deep-water shales but are deposited uncon-formably above silty-sandy lowstand deposits. Lowstand deposits in the upper part of the suc-cession (Unit 4) are represented by thin (50 cm to a few centimeters), more evenly bedded skel-etal limestones and shell debris layers. Hum-mocky cross-stratifi cation and intermediate- to large-scale erosive contacts are typical for these lowstand tempestites.
The preservation of organic matter at the sea-fl oor, and hence the organic carbon content in the Mohammed plage succession, is strongly related to relative sea level. Intense impinging of the oxygen minimum zone into shallower shelf areas and consequent preservation of organic matter at the seafl oor only occurred at relatively high sea level. Thus, we used TOC maxima as an indication of sea-level highstands and maximum fl ooding (condensed sections in the sense of Loutit et al., 1988), while TOC minima generally correspond to sequence boundaries/lowstands. Terrigenous input, estimated from the abundance of quartz and mica in thin sec-tions and the >63 μm residue of decarbonated sediment samples, also fl uctuates markedly with distance from the paleocoastline. During sea-level highstands, virtually no terrigenous component is present in the sand fraction, whereas the terrigenous proportion reaches sev-eral weight percent of the total sediment during lowstands and early transgressive phases. The proportion of sand-size terrigenous components in the sediment could thus be additionally used to identify major sequence boundaries and rela-tive sea-level lowstands (Fig. 2).
Sedimentation rates in the Mohammed plage section range between 1 and 3 cm/k.y. Unit 1 exhibits an average sedimentation rate of 2.3 cm/k.y.; however, individual sandstone and lumachelle beds indicate intervals of rapid sediment accumulation interrupted by erosive unconformities. Minimal sedimentation rates of 1.0–1.3 cm/k.y. characterize Unit 2 and the lower part of Unit 3 (up to the unconformity at the base of bed 1.26), as this area was a sediment-bypass zone on the shelf during depo-sition of these units. Higher sedimentation rates in the upper part of Units 3 and 4 (~2.0 cm/k.y.)
refl ect increased accommodation space during a third-order transgressive cycle, following the middle Cenomanian lowstand.
Unit 1. Uppermost Albian to Basal Ceno-manian Shallow-Water Sandstone-Siltstones with Lumachelles (Fig. 3). The lowermost part of the Mohammed plage succession (Unit 1) is composed of three main lithological subunits (Fig. 2). A cross-laminated sandstone-siltstone subunit forms the base of Unit 1 (beds 9.1–9.3, Fig. 3D). The sandstones, which exhibit exten-sive cross-bedding, were probably deposited in a tidal environment. They are erosively truncated by a transgressive shell layer (bed 9.4, subunit 2) of ~80 cm thickness (Figs. 3B and 3C). This lumachelle, which represents the fi rst fully marine ingression at Mohammed plage, corre-sponds to the base of the Cenomanian marine succession above a major sequence boundary (Ce 0). The top of this lumachelle is formed by a hardground, which is overlain by a thick (~13.5 m) sequence of intertidal claystones and siltstones (beds 9.5–9.16, subunit 3, Fig. 3A). A single fully marine ingression within this sequence is documented in bed 9.12, which con-sists of an ~20-cm-thick shell layer that contains various reworked shell fragments and lithoclasts
and that laterally grades into a conglomeratic bed. Unit 1 is virtually TOC free: traces of organic matter in this interval (TOC values sig-nifi cantly below 1%) derive from minor input of terrigenous organic material.
Unit 2. Lower Cenomanian Oyster Luma-chelle and Nodular Limestone–Green Marl stone/Siltstone Successions (Figs. 4 and 5). The tidal sequence forming the top of Unit 1 is truncated by a major lumachelle deposit, which consists of several amalgamated beds with sig-nifi cant lateral variability in thickness and com-position. Main components are oysters (mainly Lopha syphax [Coquand, 1862]), large bivalves (i.e., Idonarca chouberti [Freneix, 1972]), and various reworked rock fragments. The base of this prominent shell bed is sharp, probably an erosional contact to the underlying green silty clay with frequent, large Thalassinoides bur-rows. We interpret the base of Unit 2 (bed 9.17), where the oyster lumachelle deposit erosively cuts into paralic clays and is devoid of open-marine microfossils, as a major transgressive event, which marks a relative sea-level rise of ~10–20 m, and which may include a signifi cant hiatus. A sandy layer with whole oysters and fragments is intercalated in the middle part of the
main occurrence of ammonites
shale
limestone packages
Legend
nodular limestone beds
bioturbationoyster lumachellecross-bedding
erosional base
sandstone
gypsum
TST transgressive systems tract (above transgressive surface of erosion)
LS lowstand sediments (with quartz grains and shallow-water microfossils)
Cycle 1Cycle 2
OAE2 cycles in organic carbon content (corresponding to 100 k.y. eccentricity, Kolonic et al., 2004)
Figure 2 (on this and following page). Composite Mohammed plage succession with litho-logical units, sequence stratigraphy, percentage total organic carbon (TOC), carbonate δ13C and δ18O, organic carbon δ13C, percentage of terrigenous grains in >63 µm fraction, and biostratigraphy. Estimated sea-level change is based on paleo–water depths derived from statistical analysis of benthic foraminiferal assemblages (Gebhardt et al., 2004) and sedi-mentological interpretation. Gray arrows correspond to third-order sequences of Haq et al. (1987). OAE—oceanic anoxic event.

Cenomanian sea level in Tarfaya
Geological Society of America Bulletin, November/December 2009 1699
9.19.2
9.3
9.4 base9.4 top
9.5
9.69.79.89.99.10
9.11
9.12 = 8.09.13
9.14 = 8.1
8.2 = 9.15
8.3 = 9.16
9.17 top
9.17 = 8.4 = 7.1
9.17 middle
7.47.8
7.14
7.24
7.257.267.287.30 = 6.1
6.2
6.3
6.17 = 5.0
1.26
4.100
4.98
4.954.94 top4.94 base
4.884.85
4.78 top
4.694.63
4.33 top
4.52
4.49
4.83
4.81
4.734.72
4.71
4.56
4.45
4.41
4.36
4.32
1.111.141.181.23
4.30
1.28
1.61.41.1 = 2.18
2.102.72.52.3
2.1 = 3.213.193.173.13
5.3
5.135.14 = 3.1
3.7
S e
c t
i o
n 4
Se
cti
on
1S
ec
tio
n 2
Se
cti
on
5S
ec
tio
n 6
Se
cti
on
7S
ec
tio
n 8
S e
c t
i o
n 9
0
1
2
3
4
56
7
8
9
10
11
12
13
14
15
16
17
18
19
20
21
22
23
24
25
26
27
28
29
30
31
32
33
34
35
36
37
38
39
40
41
42
43
44
45
46
47
48
49
50
51
52
53
54
55
56
57
58
59
60
(m)TOC (%)
Cycle 2
Cycle 1
3.10
Se
cti
on
3
greenshales
Ce 0Exposed (tidal sands)
3.12
2.13
1.7
TST
TST
TST
TST
TST
TST
TST
TST
LS
LS
LS
LS
TST
2.16
CTBE/OAE2
0
δ13C carb δ18O
MiddleCenomanianexcursion
UP
PE
R
C E
N O
M A
N I
A N
MID
DL
EC
EN
OM
AN
IAN
LO
WE
RC
E N
O M
A N
I A
N
Ro
tali
po
ra c
ush
ma
ni
Ro
tali
po
ra b
rotz
en
iR
. re
ich
eli
Ma
nte
llic
era
s m
an
tell
i
N. c
arc
ita
ne
nse
M.s
ax
bii
M. d
ixo
ni
Cunningtonicerascunningtoni
Ac
an
toc
era
s rh
oto
ma
ge
nse
T. acutus
T.costatus
ec
ne
dis
bu
s
Ce 2.1
Ce 2
Ce 3
Ce 3.1
Ce 5
Ce 4
Ce 4.1
Ce 1
3.9
5.11
UN
IT 1
UN
IT 3
UN
IT 4
eustasy
–4–3–2–1–3 –2 –1
UN
IT 2
50 10 15
% terrigenous components >63 µm
2 4 6 80 10
W. a
rch
ae
oc
reta
ce
a
0 50 100 150 m
Estimated sea-level change
δ13C org
–26 –25 –24–29 –28 –27
Am
mo
nit
es
Fora
min
ifers
LS
S. s
ch
lue
teri
b-peaks
Jukes Browne Event
Figure 2 (continued).

Kuhnt et al.
1700 Geological Society of America Bulletin, November/December 2009
lumachelle, and it reaches 30 cm in thickness in the SW part of the exposed succession (Fig. 4C). This sandy, laterally inconsistent interval mainly provides the infi ll of small depressions, and it may represent a short period of relative sea-level fall, but it does not appear to represent a major eustatic sea-level–related disconformity.
The basal lumachelle beds of the transgres-sive sequence in the lower part of Unit 2 (up to bed 7.25) grade into thinner, nodular shell beds with generally smaller components and the fi rst irregular, organic-rich marly intercala-tions (Fig. 4A). Small echinoids of the genus Goniopygus with large phyllodes and mouth, suggesting a shallow-water mode of life, attached to hard substrates (Taylor and Wilson, 2003) are common. These were probably trans-ported into deeper water and size sorted post-mortem. Bedding is very irregular and nodular in the basal part of the bituminous limestone sequence, and individual beds often cannot be discriminated (Fig. 4A). TOC reaches more than 3% in the lowermost bituminous marls (3.2% TOC in bed 7.3).
The sharp basal contact of the transgressive nodular limestone bundle (bed 6.2) in the lower part of Unit 2 forms a prominent sequence boundary. The limestone bundle overlies fi ne-sandy marls, which contain shallow-water (inner-shelf) microfauna. A second transgres-sive surface of erosion is observed at the base of limestone bundle 5.3 in the upper part of the Rotalipora brotzeni zone (upper third of Unit 2). Lowstand deposits directly below the sequence boundary exhibit a sharp δ13C minimum. A third transgressive surface of erosion is situated at the base of the prominent marker bed (nodular limestone bundle 3.12) above dark greenish-gray claystones with unusually low TOC and
conspicuous benthic foraminiferal assemblages dominated by shallow-water forms.
There are overall three transgressive cycles within Unit 2 (Fig. 2). Each cycle starts above a prominent unconformity (sequence boundary) with a thick (~1–2 m) package of nodular lime-stones. Thin, discontinuous, organic-rich marls are intercalated within the upper bundles (beds 6.2 and 5.3). The limestones, which contain signifi cant amounts of shell debris and dissemi-nated kerogen (TOC generally above 1%–2%), are originally dark brown but weather light gray. Thalassinoides occurs at the base of bed 6.2, and the distinct nodular bedding probably originates from diagenetic alteration of larger burrows. Ammonites (i.e., Mantelliceras spp.) are common in these packages, especially in the uppermost surfaces of limestones, indicating condensation at maximum fl ooding surfaces.
Marly sequences with high organic matter content (3%–5% TOC) and thin (~10–20 cm), more evenly bedded limestone layers occur above the limestone packages. Pelagic micro-fossils are common in these marly packages, which become more clay-rich or even silty or fi nely sandy toward the top, where TOC decreases. Intercalated limestones in the upper-most part of each sequence are greenish-gray, micritic, and contain very low organic matter. Terrigenous content strongly increases in the marly layers, consisting predominantly of fi ne-grained quartz with mica as the main accessory component. This regressive part of the sequence is truncated by a sharp unconformity at the base of the next nodular limestone package.
The uppermost part of Unit 2 (bed 3.9) con-sists of a distinctive intercalation of dark green-ish-gray claystones and lenticular, thin-bedded micritic limestones (Figs. 5B and 5C). This
interval contains characteristic benthic forami-niferal assemblages indicating a paralic deposi-tional environment during a sea-level lowstand (see supplementary material [see footnote 1]). The marls are discontinuously overlain by nod-ular limestones (bed 3.12), which resemble the transgressive nodular limestones in the lower part of Unit 2. Bed 3.12 is followed by a marly TOC-rich interval with regular bedded lime-stone (Figs. 5A and 5D).
Unit 3. Middle to Upper Cenomanian Bituminous Marls and Limestone Beds with Channels (Fig. 6). Nodular limestones with shell fragments, typical for the transgressive lower Cenomanian interval, disappear at the base of the Rotalipora reicheli zone. Bed 3.12, which represents the last of these nodular lime-stones, also contains the highest numbers of the shallow-water, hard substrate echinoid Goniopy-gus. Unconformities above this level are clearly erosive and generally exhibit broad, shallow, channel-like structures. Most typical is the bound-ary between beds 2.12 and 2.13, which forms a prominent unconformity over the entire outcrop with spectacular erosive structures (Fig. 6D). Limestone beds below and above the uncon-formity consist of microsparitic wackestones to packstones with abundant angular quartz grains (up to 40%) and rare planktonic foraminifers, calcispheres, bivalves, and fecal pellets.
The overlying sequence (bed 1.1 to the base of bed 1.26) is typical of a sea-level lowstand. Sedimentological lowstand indicators include channelized deposits and storm beds (bed 1.7 and the major scoured tempestite bed 1.10; Figs. 6A and 6C). The sequence boundary at the erosive base of bed 1.26 represents a trans-gressive horizon, consisting of several amalga-mated layers with coarse-grained redeposited
TABLE 1. DISTRIBUTION OF AMMONITES COLLECTED IN MOHAMMED PLAGE SUCCESSION
Zone Ammonites in MPL section Occurrence in MPLMantelliceras mantelli zone(lower part, carcitanense subzone)
Phylloceras (Hypophylloceras) sp., Bhimaites (?) sp., Utaturiceras bethlehemense Avnimelech and Shoresh, 1962, Mantelliceras mantelli (J. Sowerby, 1814), Mantelliceras lymense (Spath, 1926), Mariella sp., Neostlingoceras sp.
bed 9.17 top
Mantelliceras mantelli zone Parapuzosia (Austiniceras) sp. bed 7.9Mantelliceras mantelli zone Puzosia cf. mayoriana (d’Orbigny, 1841), Hypoturrilites sp. (gravesianus or tuberculatus),
Mantelliceras spp.bed 7.25
Mantelliceras mantelli zone(upper part)
Mantelliceras saxbii (Sharpe, 1857) middle to upper part of section 7
Mantelliceras mantelli zone(upper part, schluteri subzone)
Sharpeiceras sp. bed 7.26
Mantelliceras mantelli zone(upper part)
Phylloceras (Hypophylloceras) sp., Puzosia mayoriana (d’Orbigny, 1841), Mantelliceras mantelli (J. Sowerby, 1814), Sciponoceras roto (Cieslinski, 1859)
bed 6.2
Mantelliceras mantelli zone(upper part)
Mantelliceras cantianum (Spath, 1926) beds 6.2–6.4
Cunningtoniceras cunningtoni zone (basal part)
Acompsoceras renevieri (Sharpe, 1857), Cunningtoniceras sp. (Wright and Kennedy, 1987), Pachydesmoceras sp.
bed 3.2
Cunningtoniceras cunningtoni zone Cunningtoniceras cunningtoni (Sharpe, 1855), Turrilites sp. bed 3.12Cunningtoniceras cunningtoni zone Cunningtoniceras cunningtoni (Sharpe, 1855) bed 3.12 (top)Acanthoceras rhotomagense zone (upper part, acutus subzone)
Calycoceras (Newboldiceras) cf. vergonsense (Collignon, 1937) bed 2.06
Acanthoceras rhotomagense zone Acanthoceras or Cunningtoniceras bed 2.13Acanthoceras rhotomagense zone Acanthoceras rhotomagense beds 2.13–18Acanthoceras jukesbrownei zone Pseudocalycoceras sp., Cunningtoniceras sp. base of bed 1.26

Cenomanian sea level in Tarfaya
Geological Society of America Bulletin, November/December 2009 1701
carbonate material (Fig. 6B). Tempestite layers with reworked shallow-water shell debris and graded erosional scour-fi lls at the bottom of the bed occur throughout Unit 3 (i.e., beds 3.12, 2.13, 1.10, 1.26, 4.34, 4.38, 4.57, 4.73, 4.80, and base of 4.94; Figs. 6A, 6C, and 6D). These beds, which were probably deposited above the storm wave base, indicate a paleobathymetric setting shallower than 100–120 m. TOC values within marls remain generally below or just above 5%. Several erosional unconformities occur within the uppermost part of Unit 3 in the Mohammed plage succession (~49–53 m), including the base of wavy laminated bed 4.56, the shell layer with sharp basal contact (tempestite) at the base of bed 4.57, and the erosional surface at the top of bed 4.79.
Unit 4. Uppermost Cenomanian Cyclic Lami-nated Organic Carbon–Rich Marls (Fig. 7). The massive transgression at the base of bed 4.94, which led to the deposition of extremely dark shales (Fig. 2), probably due to the imping-ing intensifi ed oxygen minimum zone on the shelf, marks the complete disappearance of storm-generated beds (i.e., depositional setting below 120–150 m water depth). The base of bed 4.94 consists of a prominent shell debris layer, and it rests unconformably upon lighter brown-ish marly limestones (bed 4.93). The major disconformity between beds 4.93 and 4.94, which is formed by an erosional surface repre-senting a signifi cant hiatus, is interpreted as a major sequence boundary. The laminated black shales above this sequence boundary exhibit prominent cyclicity in carbonate and TOC content, and they are correlatable to orbitally forced upwelling/productivity cycles at more distal locations (including S13) in the center of the Tarfaya Basin (Kuhnt et al., 1997, 2004; Kolonic et al., 2005). Highest TOC is reached in Unit 4, where values >10% are common in thick, dark, laminated marlstone packages (beds 4.94 and 4.98–4.100). Higher-frequency fl uc-tuations closely refl ect transgressive-regressive cycles, where lowest TOC values are close to unconformities and highest TOC values occur in the upper third of each sedimentary cycle.
Shell-ONAREP Well S13The lithostratigraphy and sequence stratig-
raphy in S13 are mainly based on the initial core log of Shell-ONAREP (Szuts et al., ONAREP, 1975, personal commun.) and representative samples of characteristic lithologies. Three main types of lithology are discriminated (Fig. DR3 [see footnote 1]): (1) organic car-bon–poor, homogeneous micritic limestones (<1% TOC), (2) homogeneous to strongly bio-turbated marls with variable organic carbon content (1%–3% TOC), dominant below 208 m,
Moghrabien(Plio-Pleistocene)
Section 7
beds 8.4 - 8.6
Section 99.11
9.12
9.15
Ce 1
9.6-79.5
9.9
A
B C
D
Ce 0
9.3
9.2
9.1
9.4
Figure 3. (A) Overview of lower part of Mohammed plage succession from NE. Sequence boundary Ce 1 (erosive base of thick oyster lumachelle beds 8.4–8.6) is well exposed along cliff. (B–C) Lowermost lumachelle (bed 9.4), corresponding to sequence boundary Ce 0, cuts erosively into underlying tidal sandstone (scale = 1 m). Top of lumachelle forms hard ground (maximum fl ooding surface). (D) Cross-bedded shoreface sandstones underlying Ce 0.

Kuhnt et al.
1702 Geological Society of America Bulletin, November/December 2009
and (3) organic-rich laminated marls (above 3% TOC), dominant above 188 m. Main sequence boundaries are placed at the base of limestone beds (1) in the lowermost part of the Rotalipora reicheli zone (268–270 m), corresponding to the boundary between Units 2 and 3 at Mohammed plage, (2) in the middle of Rotalipora cushmani zone (201–208 m), and (3) close to the top of the R. cushmani zone (188–190 m), corresponding to the boundary between Units 3 and 4 at Moham-med plage. Continuous Fisher assay pyrolysis data reveal a general trend of increasing organic matter content and oil yield with a nested higher-frequency cyclicity (Fig. 8). As in the Moham-med plage succession, sequence boundaries generally coincide with rapid declines in TOC.
Sedimentation rates in this distal setting, where sediment supply rather than accommoda-tion space is the main limiting factor, are con-siderably higher than in the Mohammed plage section (10–12 cm/k.y. in the lower Cenoma-nian, 2.5–5 cm/k.y. in the middle Cenomanian and lower upper Cenomanian, and ~10 cm/k.y. in the upper Cenomanian). Lowest sedimenta-tion rates (2.5 cm/k.y.) occur between 190 and 220 m during the onset of the late Cenomanian third-order sea-level rise, probably caused by minimal terrigenous sediment supply (sediment dominated by pelagic carbonate).
Isotope Stratigraphy
Mohammed Plage SuccessionBulk isotope analysis of 120 samples in the
Mohammed plage succession reveals a decrease in δ13C from ~0–0.5‰ to values below –2‰ from the top of Unit 1 to the middle of Unit 2 (Fig. 2). Minimum values, measured in samples from bed 5.2 at ~24.8 m, correspond to a TOC maximum directly below an unconformity, which is interpreted as a sequence boundary at the base of bed 5.3. The δ13C values increase above this unconformity, reaching a maximum of –0.1‰ at 29 m in the upper part of Unit 2 (bed 3.9). The δ13C maximum (–1‰) between 28 and 35 m (shaded in Fig. 2) corresponds to the global middle Cenomanian δ13C excursion, which covers the Cunningtoniceras inerme and lower part of the Acanthoceras rhotomagense ammonite zones (Jarvis et al., 2006). In both the Tarfaya sections, the middle Cenomanian δ13C maximum is broad and covers the entire interval between Ce 3 and Ce 3.1.
The δ13C values decrease once more to a minimum (–2.3‰) at 36 m in bed 1.3. Rapid fl uctuations of up to 3‰ occur in organic-rich and organic-poor layers between 37 and 41 m (beds 1.7–1.26). However, the fi ve samples with low δ13C values (open circles in Fig. 2) mainly consist of reworked carbonate (mollusc shell
bed 6.2
Ce 27.30
7.25
7.23
7.21 I7.17
7.1
7.28
7.26
A
CB
SB
SB
(transgressive surface of erosion)
RST
LS(?)
TST
mfs (condensed horizon at TST/HST turnaround)
HST
(transgressive surface of erosion)
maximum impinging of OMZ
TST
Thalassinoides
mfs
LS(?)
fine q
uartz
sand
TOC a
nd A
noxia
Thalassinoides
D
Figure 4. (A) Nodular silty bituminous limestone bundles in the lower part of Unit 2 at Mohammed plage cliff. Beds 7.26–7.30 (regressive-lowstand deposits) contain shallow-water ostracodes and abundant quartz sand. Beds 7.25 and 7.17–7.21 represent transgressive sub-sequences, which may correlate to 100 k.y. eccentricity cycles. (B) Bivalve lumachelle (Idonearca chouberti [Freneix, 1972]) with rare oyster shells on top of bed 9.17. (C) Detail of sandy inter-calation within bed 9.17. (D) Idealized sequence in the lower part of Mohammed plage succes-sion (Unit 2 and basal part of Unit 3). LS—lowstand sediments, TST—transgressive systems tract, HST—highstand systems tract, RST —regressive systems tract, mfs—maximum fl ood-ing surface, SB—sequence boundary (transgressive surface of erosion), OMZ—oxygen mini-mum zone, TOC—total organic carbon. Main occurrences of ammonites and trace fossils (Thalassinoides ) are indicated by symbols. Lithological expression of regressive and lowstand systems tracts is less pronounced in Units 3 and 4 due to increasing water depth, although sequence boundaries are still marked by erosional unconformities.

Cenomanian sea level in Tarfaya
Geological Society of America Bulletin, November/December 2009 1703
fragments) and are considered unreliable. The high δ13C values (–0.5‰) around 44 m may represent the Jukes-Browne event (Jarvis et al., 2006) in the lower part of the upper Cenoma-nian. A spiky δ13C maximum in the upper part of Unit 3 (51–53 m) may correlate to the “b-peaks” of Jarvis et al. (2006).
The extremely abrupt increase in δ13Corg (~3‰) in bed 4.94 at the base of Unit 4 (Kolonic et al., 2005) indicates the presence of a hiatus, probably truncating at least two sedimen-tary cycles (cycles –1 and 0 in S13 following the cyclostratigraphic scheme of Kuhnt et al., 1997). If the interpretation of these cycles as short eccentricity cycles is correct, then the ini-tial 200 k.y. of the positive shift in δ13Corg are not represented in the Mohammed plage succes-sion. The hiatus includes the sequence bound-ary ZC2.5A/ZC2.5B of Juignet and Breton (1992) at the base of the Neocardioceras juddii zone, respectively, sequence boundary Ce 5 of Gale et al. (2002) below the last occurrence (LO) of Rotalipora cushmani and Rotalipora greenhornensis.
Shell-ONAREP Well S13Bulk carbonate δ13C in the middle and upper
Cenomanian of S13 exhibits four positive excur-sions above the lower Cenomanian background level, which hardly exceeds 0‰ (Fig. 8). The fi rst positive excursion starts at ~270 m in the R. reicheli zone, which is quite expanded in S13, and it reaches into the basal part of the R. cush-mani zone (~225 m). This excursion (shaded in Fig. 8) probably represents the global middle Cenomanian event (Jarvis et al., 2006), extend-ing over 40 m sediment thickness in S13. Two shorter positive excursions in the middle part of the R. cushmani zone occur between sequence boundaries Ce 3.1 and Ce 4 and between Ce 4 and Ce 5, including the Jukes-Browne event of Jarvis et al. (2006). The onset of the last major δ13C excursion is coincident with sequence boundary Ce 5. This excursion, which reaches a fi rst maximum (>3‰) just below the extinction of R. cushmani, corresponds to the fi rst peak of the Cenomanian-Turonian boundary event (Jarvis et al., 2006).
DISCUSSION
Correlation of Tarfaya Sequences to Records from the Anglo-Paris Basin and India
The main depositional sequences in the Tar-faya Basin (Figs. 2 and 8) are correlatable over long distances across different tectonic plates through a combination of planktonic foraminif-eral and ammonite datums in addition to carbon
4-26
4-18
3.12
Ce 3
3.11a
Ce 2.15.3
3.11a
3.12
3.11b
3.9
3.12
2.13
Ce 3.1
Ce 3
A
B
C
D
Figure 5. (A) Transition from Unit 2 (nodular limestone bundles with clay and silt intercala-tions) to Unit 3 (regular bedded limestones and laminated black shales at Mohammed plage cliff). Bed 3.12 represents the last transgressive nodular limestone unit. Bed 3.12 is followed by marly total organic carbon (TOC)–rich interval with regular bedded limestone becoming siltier and greenish TOC-free limestone intercalations toward top. Sequence is truncated by disconformity at base of bed 2.13 (sequence boundary Ce 3.1). (B–C) Details of dis con-formity at base of bed 3.12. (D) Logged Sections 5 and 3 partially cleared from debris. Note disconformity at base of bed 5.3 (sequence boundary Ce 2.1).

Kuhnt et al.
1704 Geological Society of America Bulletin, November/December 2009
isotope stratigraphy. The middle to late Ceno-manian sequence boundaries (Ce 3 to Ce 5) in the Mohammed plage and S13 successions exhibit remarkable biostratigraphic and iso-topic synchroneity with records from the Anglo-Paris Basin and India (Robaszynski et al., 1998; Gale et al., 2002; Kennedy and Gale, 2006). However, the early Cenomanian sequence boundaries (Ce 0 to Ce 2) are not identifi ed in S13, where the base of the Cenomanian is not reached. Main sequence boundaries in the Tar-faya Basin and their correlation to the Anglo-Paris Basin and India are summarized in Table 2.
Cenomanian Eustatic Sea-Level Fluctuations
Our paleobathymetric estimates, based on foraminiferal biofacies and sedimentological indicators (i.e., storm wave base), indicate an overall relative sea-level rise of ~150 m within the Mohammed plage succession (Fig. 2). A long-term (second-order) eustatic sea-level rise of ~70 m was previously suggested for the Ceno-manian based on records from the stable Russian Platform (Sahagian and Jones, 1993; Sahagian et al., 1996) and from western European sedi-mentary basins (Gräfe, 2002). We therefore assume that a tectonically induced local rela-tive sea-level rise of ~80 m occurred between the base of the Cenomanian and the sea-level highstand in the latest Cenomanian (Whiteinella archaeocretacea zone). There is no evidence for subaerial exposure during any of the regressive phases corresponding to sequence boundaries in the Mohammed plage succession. Even during the largest sea-level fall associated with sequence boundary Ce 3, the lagoonal sediments deposited in this part of the basin contain benthic forami-niferal assemblages indicating water depths of a few tens of meters. Thus, the maximum sea-level fall within the Mohammed plage succession did not exceed ~50–70 m. Furthermore, several sequence boundaries (i.e., Ce 2.1, Ce 3.1, and Ce 4) are not characterized by any marked change in benthic foraminiferal biofacies. As the sensitiv-ity of benthic foraminiferal assemblages to sea-level change may be estimated at ~10–20 m in such an inner shelf environment, these sequence boundaries represent sea-level falls of relatively low amplitude (less than 20 m). This agrees with the order of magnitude recorded in the New Jersey transect for the Late Cretaceous (~25 m sea-level change in less than 1 m.y.; Miller et al., 2003, 2004, 2005a, 2005b).
The synchroneity of sea-level change in the Tarfaya Basin, United Kingdom, India (Gale et al., 2002), and Western Interior of the United States (Gale et al., 2009) provides evidence for a global eustatic control on Cenomanian
6-18
9-25
1.10
1.7
1.5
1.3
1.1 = 2.18
2.16
1.10
1.7
1.5
1.26
Ce 4Ce 4
1.30
Ce 3.1
2.11
1.10
1.7
1.5
1.14
1.26
1.30
50 cm50 cm
A
B
C
D
Figure 6. (A) Lower part of Unit 3 at Mohammed plage cliff: channelized bed 1.7 and scoured tempestite bed 1.10 are indicated. Base of overhanging bed 1.26 corresponds to sequence boundary Ce 4. (B) Bed 1.26 with clear erosive base represents transgressive hori-zon, consisting of several amalgamated layers and coarse-grained redeposited carbonate material. (C) Same sequence as in part A, some tens of meters further along cliff. Note inter-calation of nodular limestone layers between beds 1.14 and 1.26, missing in A. (D) Channel structure in beds 2.13–2.14 (sequence boundary Ce 3.1).

Cenomanian sea level in Tarfaya
Geological Society of America Bulletin, November/December 2009 1705
sea-level fl uctuations. Ice-volume change is the only known mechanism that could produce sea-level changes of several tens of meters within a relatively short time interval (~100 k.y.). While glacioeustatic sea-level changes in the range of 5–20 m may be hardly detectable in the marine isotope record, the middle Cenomanian sea-level fall of ~50 ± 20 m corresponding to Ce 3 should be recognizable. However, this has proven to be a controversial issue. The abrupt middle Cenoma-nian increase in benthic δ18O of ~0.9‰ at Ocean Drilling Program (ODP) Site 1050 at Blake Nose (Huber et al., 1999, 2002) was interpreted as a glacioeustatic sea-level fall of ~25 m by Miller et al. (2003, 2004, 2005a, 2005b). In contrast, the planktonic δ18O record from ODP Site 1258 (Demarara Rise) remains remarkably invariant despite signifi cant variability in the benthic δ18O record, leading Moriya et al. (2007) to suggest that no change in ice volume was associated with the middle Cenomanian regression. How-ever, lower Turonian seawater oxygen isotope estimates based on planktonic δ18O and TEX
86
(paleotemperature proxy based on the composi-tion of membrane lipids of marine picoplank-ton Crenarchaeota) derived temperatures in the same site support short-term glaciation events in Antarctica during the Middle Cretaceous super-greenhouse (Bornemann et al., 2008).
The lack of unequivocal evidence for major ice-volume changes in Cenomanian marine δ18O records may be explained by several factors: (1) the buildup and melting of an 8–12 × 106 km3 Antarctic ice sheet (20–30 m sea-level equivalent) would have a relatively small isotopic effect on the marine reservoir, probably <0.2‰; (2) Cenomanian deep-water isotope records (below ~3000 m water depth) carrying a strong imprint of ice-volume change are not available due to the high carbonate com-pensation depth (CCD) during the Cenomanian; and (3) ice-volume effects in intermediate- and shallow-water records may be compensated by tropical warming and monsoon intensifi -cation during periods of enhanced latitudinal temperature contrast. A further consideration is that ephemeral ice sheets may have existed for only relatively short intervals (i.e., less than 100 k.y.), and were probably confi ned to the interior of Antarctica, which would have had no major imprint on the global deep-water circula-tion (Miller et al., 2005a).
Potential Link among δ13C, Organic Carbon Burial, Eustatic Sea-Level Change, and Orbital Forcing
The duration for the deposition of individual sequences in continuous chalk successions from the United Kingdom was suggested to
Ce 5
4.94
4.92
4.90
4.83
4.81
4.79
4.73
4.71
4.56
4.51
4.47
4.39
4.32
4.34
4.73
4.63
Ce 4.1
4.79
4.73
4.94
4.92
Ce 5
Ce 4.1
A
B
C
D
Figure 7. (A–B) Top of Cenomanian succession at Mohammed plage cliff. Main uncon-formity (sequence boundary Ce 5) at base of bed 4.94 is clearly visible on truncated top of prominent limestone bundle. Bed 4.79 is truncated by erosional surface corresponding to sequence boundary Ce 4.1. (C) Detail of nodular bedding below bed 4.73. (D) Transgressive (beds 4.32–4.51) and lowstand (beds 4.52–4.73) systems tracts with characteristic nodular limestone layers and laminated black shales.

Kuhnt et al.
1706 Geological Society of America Bulletin, November/December 2009
approximate the 400 k.y. eccentricity period (Grant et al., 1999; Gale et al., 1999). Strati-graphic data also support this notion in the Tarfaya Basin, providing further evidence for a climatic control of Cenomanian eustatic sea level through orbital forcing (Fig. 6). Despite recent advances in Cenomanian cyclo stratig-raphy and radiometric dating (Gale et al., 2002; Kennedy and Gale, 2006; Sageman et al., 2006) and the availability of an orbital solution reaching back to 100 Ma that provides accept-able calculations for at least long eccentricity (Laskar et al., 2004), orbital tuning of Cenoma-nian records remains tricky due to the scarcity of continuous high-resolution climate proxy records and remaining uncertainties in the lat-est orbital solution. Nevertheless, a comparison of the Cenomanian eustatic sea-level record from India and the United Kingdom (Gale et al., 2002), the sea-level reconstruction and δ13C record in the Tarfaya Basin, the latest global δ13C compilation (Jarvis et al., 2006), and the most recent orbital solution (Laskar et al., 2004) already reveals some striking patterns (Fig. 9).
(1) Extreme sea-level lowstands in the latest Albian, middle Cenomanian, and basal Turonian, which may be linked to the buildup of ephemeral ice sheets on Antarctica, correlate with extended periods of low eccentricity (low amplitude of the 100 k.y. eccentricity cycle), coinciding with nodes in obliquity (prolonged periods of low seasonality and absence of hot summers in Ant-
arctica). Such periods recur approximately every 2.25 m.y. and last up to 800 k.y.
(2) The three main positive carbon isotope excursions in the latest Albian, middle Ceno-manian, and basal Turonian immediately follow periods of low eccentricity and could therefore have been triggered by the onset of high-latitude cooling, ice-sheet expansion, and sea-level fall. These δ13C oscillations probably repre-sent global carbon reservoir changes forced by increased burial of marine organic carbon. Enhanced marine productivity may have led to intense sequestration of organic carbon from the marine reservoir, resulting in oxygen deple-tion and acidifi cation of the deep ocean, which in turn released further nutrients to the water column (Arthur et al., 1988; Föllmi et al., 1994; Wallmann, 2004).
Close linkages among eccentricity forcing, δ13C, and the marine carbon cycle have been pro-posed for extended intervals of the Paleogene and Neogene (Zachos et al., 2001; Wade and Pälike, 2004; Holbourn et al., 2005, 2007; Pälike et al., 2006), implying that the 400 k.y. eccentricity period plays an essential role in modulating long-term carbon budgets. Cramer et al. (2003) suggested that the modulation of precessional insolation at low to mid-latitudes was transferred to the eccentricity band due to the relatively long residence time of carbon in the ocean, resulting in a strong smoothing effect for the oceanic δ13C res-ervoir. Such long-term fl uctuations in δ13C likely
relate to the fraction of carbon deposited as car-bonate and organic carbon: enhanced carbonate deposition at eccentricity maxima results in δ13C depletion, whereas higher organic carbon burial at eccentricity minima leads to δ13C enrichment. Furthermore, paleogeographic shifts in global productivity between high and low latitudes may act in conjunction with eustatic sea-level fl uctua-tions. For instance, strengthened monsoons dur-ing sea-level highstands at eccentricity maxima would enhance carbonate production on fl ooded tropical/subtropical shelves, decreasing carbon storage in the deep sea. However, our understand-ing of such processes is still extremely limited, and detailed isotopic investigations in several ocean basins are urgently needed to test these hypotheses.
CONCLUSION
We present lithological, paleontological, and geochemical data in two expanded Ceno manian successions that allow us to closely track sea-level fl uctuations within the Tarfaya Basin. We identify two main transgressive cycles in the lower and middle/upper Cenomanian sepa-rated by a major regression at the early-middle Cenomanian transition (sequence boundary Ce 3). This regressive interval is characterized by lagoonal lowstand deposits, indicating an overall sea-level fall of more than 30 m. The correlation between the proximal Mohammed plage and
TABLE 2. SEQUENCE BOUNDARIES IN THE CENOMANIAN OF THE TARFAYA BASIN AND THEIR CORRELATION TO THE ANGLO-PARIS BASIN AND INDIASequence boundary
nisaBsiraP-olgnAotnoitalerrocfosisaBnisaBayafraTninoitisoP
Ce 0 Base of Unit 1, where first transgressive lumachelle (bed 9.4) disconformably overlies shoreface sandstones (bed 9.3).
First Cenomanian transgression below Neostlingoceras carcitanensesubzone (Robaszynski et al., 1998).
Ce 1 Second major transgressive event at base of Unit 2 (bed 9.17), where a thick (several meters), massive oyster lumachelle erosively cuts into paralic clays, devoid of open-marine microfossils.
Ce 1 boundary of Gale et al. (2002), based on occurrence of Neostlingoceras carcitanense directly above sequence boundary.
Ce 2 Sharp basal contact of transgressive nodular limestone bundle (bed 6.2) in lower part of Unit 2.
Position of Ce 2 within upper part of Mantelliceras mantelli zone constrained by ammonite occurrences (Sharpeiceras schluteri subzone) above and below boundary.
Ce 2.1 Trangressive surface of erosion at base of limestone bundle 5.3 in upper part of Rotalipora brotzeni zone (upper third of Unit 2). Lowstand deposits directly below sequence boundary exhibit sharp δ13C minimum.
Correlation with Ce 2.1 supported by ammonites (position between Sharpeiceras schluteri subzone and Cunningtoniceras cunningtoni zone).
Ce 3 Above lowstand deposits at base of prominent marker bed (nodular limestone bundle 3.12) marking base of Unit 3. In S13, Ce 3 is placed at base of distinct limestone bed at 276–278 m.
Correlation based on δ13C records (within brief δ13C minimum in lower part of broad middle Cenomanian excursion) and on planktonic foraminiferal biostratigraphy (close to or just above first occurrence of R. reicheli).
Ce 3.1 Disconformity at end of middle Cenomanian δ13C excursion in lowermost part of R. cushmani zone in lower part of Unit 3 (bed 2.13). Although no lithological unconformity is detected in S13, end of middle Cenomanian δ13C excursion allows placement of Ce 3.1 at ~223 m.
Sequence boundary Ce 3.1 (Gale et al., 2002) located just above R.reicheli zone.
Ce 4 In lower–middle part of R. cushmani zone within positive δ13C excursion that follows negative δ13C excursion associated with Ce 3.1. In S13, Ce 4 is placed just below a prominent limestone unit (between 200 and 208 m).
Ammonites corresponding to jukesbrownei zone at base of bed 1.26 indicate late middle Cenomanian age for unconformity, in agreement with placement of Ce 4 in Anglo-Paris Basin and India by Gale et al. (2002).
Ce 4.1 Ce 4.1 placed provisionally at unconformity (bed 4.73) between Jukes-Browne δ13C excursion and Cenomanian-Turonian boundary event (CTBE). Ce 4.1 is not clearly expressed in S13, where gamma-ray and density logs indicate three unconformities at 194 m, 196 m, and 198 m, any of which may correspond to Ce 4.1.
Sequence boundary falls in lower part of Calycoceras guerangeri zone (Gale et al., 2002), above Jukes-Browne δ13C event of Jarvis et al. (2006).
Ce 5 At truncated surface of prominent limestone unit (beds 4.90 to 4.93), which coincides with abrupt increase in δ13Corg at top of Unit 3. In S13, at base of limestone bed at 186–188 m (Fig. 8), corresponding to base of cycle –1 following cyclostratigraphy of Kuhnt et al. (1997).
Base of late Cenomanian δ13C excursion (CTBE). Although no major transgressive event is associated with Ce 5 in eustatic sea-level reconstruction by Gale et al. (2002), Juignet and Breton (1992) indicated a major transgressive pulse (transgression 2.5) at this level, in agreement with Mohammed plage (MPL) record.

Cenomanian sea level in Tarfaya
Geological Society of America Bulletin, November/December 2009 1707
more distal mid- to outer-shelf S13 successions reveals markedly different sedimentation regimes during sea-level lowstands and highstands.
In the early Cenomanian, S13 is characterized by high sedimentation rates at low sea level, with an average rate exceeding 8 cm/k.y. In contrast, Mohammed plage sedimentation rates did not exceed 1.5 cm/k.y., except during deposition of sandstones, clays, and oyster beds between Ce 0 and Ce 1, when sea level rose rapidly. In the late Cenomanian, accommodation space increased at Mohammed plage, as shown by increasing sedimentation rates of hemi pelagic deposits within Unit 3. In contrast, sedimentation rates in S13 decreased to ~4 cm/k.y., only recovering
to values >10 cm/k.y. within the W. archaeo-cretacea zone, when high productivity pelagic carbonate and organic carbon accumulation rose signifi cantly. Decreasing accommodation space on the shelf and increased basinward redistribution of sediments by storm waves and tidal currents probably led to a shift of the depo-center toward deeper parts of the basin during regressive-lowstand phases.
Cenomanian high-frequency sea-level fl uc-tuations correlate well across different tectonic plates, supporting a probable eustatic origin. The prominent transgressive events following low-stands in the latest Albian, middle Cenomanian, and basal Turonian appear to be linked to funda-
mental changes in orbital eccentricity (from low to high eccentricity). Such changes may have favored the melting of ephemeral ice sheets in Antarctica and over NE Asia, which had formed during prolonged intervals (>100 k.y.) of a more circular orbit. Interestingly, δ13C excursions fol-low similar trends: δ13C depletion (enhanced carbonate deposition) occurred during eccen-tricity maxima, whereas δ13C enrichment (higher organic carbon burial) corresponded to eccen-tricity minima. Paleogeographic shifts in global productivity from the open ocean during eccen-tricity minima to fl ooded tropical/subtropical shelves during eccentricity maxima may have been responsible for such oscillations. There
0
1
–1
–2
OM (%) Oil yield (l/t)
0
1
–1
–2
δ13Corg
(‰ vs. PDB) δ13Ccarb
(‰ vs. PDB)
W. a
rch
R. c
ushm
ani
R. re
iche
liR.
bro
tzen
i
Ce 3
Ce 4
Ce 5
LOW
ERM
IDD
LEU
PPER
C E
N O
M A
N I
A N
280
200
240
320
360
Depth(m)
CTBE/OAE2
Middle Cenomanian excursion
0
10
20
30
40
50
60
Depth (m)
280
200
240
320
360
Depth (m)
Ce 5
Ce 4
Ce 3.1
Ce 3
Ce 2.1
Ce 2
Ce 2.1
Ce 3.1
Jukes-BrowneEvent
2 4 6 8 10 12 14 16 20 40 60 80 100 –28 –27 –26 –25 –24 –3 –2 –1 0 1 2 3 4
Figure 8. Lithological log of Cenomanian succession in S13 with organic matter percentage and oil yield data from Fisher Assay analysis, organic carbon δ13C, and carbonate δ13C. CTBE—Cenomanian-Turonian boundary event, OAE2—Oceanic anoxic event 2, OM—organic matter. Arrows on oil yield plot indicate cyclicity in organic matter accumulation with a periodicity in the range of orbital eccentricity (100 and 400 k.y.). Numbers in the Upper Cenomanian part of the plot correspond to the numbering scheme of organic matter accumulation cycles of Kuhnt et al. (1997). Lithologic log represents the two main lithologies in the Cenomanian of S13: organic-rich marls (laminated in upper part of the succession) and organic-poor micritic limestones. Detailed examples of these lithologies are given in Figure DR2 (see text footnote 1). Insert shows correlation between Mohammed plage section and Well S13.

Kuhnt et al.
1708 Geological Society of America Bulletin, November/December 2009
remain, however, a number of unresolved issues, in particular, concerning the linkages among eustatic sea-level fl uctuations, regional/global anoxia and δ13C excursions, and the potential role of orbital forcing in triggering oceanic anoxia and δ13C excursions.
ACKNOWLEDGMENTS
We thank Brendan Murphy, Martin Kennedy, Angela Coe, and an anonymous reviewer for construc-tive comments and in-depth reviews. Harald Strauss (Bochum), Jean-Paul Herbin (Rueil-Malmaison), Sadat Kolonic (Bremen), and Helmut Erlenkeuser (Kiel) pro-
vided total organic carbon and stable isotope analyses, Hiroshi Kawamura contributed regional fi eld mapping results. We gratefully acknowledge the Deutsche For-schungs gemein schaft (DFG) for funding this research (grants Ku 649/9 and 445MAR-113/9/3-2).
REFERENCES CITED
Arthur, M.A., Dean, W.E., and Pratt, L.M., 1988, Geochem-ical and climatic effects of increased marine organic carbon burial at the Cenomanian/Turonian boundary: Nature, v. 335, p. 714–717, doi: 10.1038/335714a0.
Beckmann, B., Flögel, S., Hofmann, P., Schulz, M., and Wagner, T., 2005, Orbital forcing of Cretaceous river discharge in tropical Africa and ocean response: Nature, v. 437, p. 241–244, doi: 10.1038/nature03976.
Berger, A., Imbrie, J., Hays, J., Kukla, G., and Saltzman, B., eds., 1984, Milankovitch and Climate: Dordrecht, Reidel, vol. 1, 510 p., and vol. 2, 795 p.
Bornemann, A., Norris, R.D., Friedrich, O., Beckmann, B., Schouten, S., Damste, J.S.S., Vogel, J., Hofmann, P., and Wagner, T., 2008, Isotopic evidence for glacia-tion during the Cretaceous supergreenhouse: Science, v. 319, p. 189–192, doi: 10.1126/science.1148777.
Burton, R., Kendall, C.G.St.C., and Lerche, I., 1987, Out of our depth: On the impossibility of fathoming eustasy from the stratigraphic record: Earth-Science Reviews, v. 24, p. 237–277, doi: 10.1016/0012-8252(87)90062-6.
Caron, M., 1985, Cretaceous planktic foraminifera, in Bolli, H.M., Saunders, E., and Perch-Nielsen, K., eds., Plank-ton Stratigraphy: Cambridge, Cambridge University Press, p. 17–86.
0 0.02 0.04 0.06
0.38 0.39 0.4 0.41 0.42
Eccentricity
Obliquity
93
94
95
96
97
98
0 5–10 –5
1
2
3
4
5
6
7
8
9
10
12
11
Tu 1Tu 1
Ce 5.1Ce 5.1
Ce 4.1Ce 4.1
Ce 5Ce 5
Ce 4Ce 4
Ce 3.1Ce 3.1
Ce 3Ce 3
Ce 2.1Ce 2.1
Ce 2Ce 2
Ce 1Ce 1
Ce 0Ce 0
A 11A 11
TURO
NIA
NC
E N
O M
A N
I A
NA
LBIA
NEA
RLY
MID
DLE
LATE
appe
nnin
ica
brot
zeni
reic
heli
cush
man
iar
chae
ocre
tace
ahe
lvet
ica
Eustatic sea level (Gale et al., 2002)
Ce 5Ce 5
Ce 4Ce 4
Ce 3Ce 3
Ce 2Ce 2
Ce 1Ce 1
0 100 (m)
Relative sea levelMohammed Plage
Age (Ma)
0 5 10 0 100 (m)
δ13C (‰)Mohammed Plage
–2 0 2
δ13C (‰ vs. PDB)–10 –5 –2 0 2
2 3δ13C (‰ vs. PDB)
δ13C (‰) Speeton
(Jarvis et al., 2006)
(m)
terr
igen
ous
Jukes-Browne Event
b-peaks
CTBE
MCE
ACBE
10 (m)
Figure 9. Comparison of Cenomanian eustatic sea-level history (modifi ed after Gale et al., 2002) and European δ13C record (modifi ed after Jarvis et al., 2006) with Mohammed plage sea-level and δ13C records and Earth’s obliquity and eccentricity from Laskar et al. (2004). CTBE—Cenomanian-Turonian boundary event, MCE—Middle Cenomanian event, ACBE—Albian-Cenomanian boundary event.

Cenomanian sea level in Tarfaya
Geological Society of America Bulletin, November/December 2009 1709
Caron, V., Nelson, C.S., and Kamp, P.J.J., 2004, Transgres-sive surfaces of erosion as sequence boundary markers in cool-water shelf carbonates: Sedimentary Geology, v. 164, p. 179–189, doi: 10.1016/j.sedgeo.2003.10.001.
Cathro, D.L., Austin, J.A., Jr., and Moss, G.D., 2003, Progradation along a deeply submerged Oligocene–Miocene heterozoan carbonate shelf: How sensitive are clinoforms to sea level variations?: American Associa-tion of Petroleum Geologists (AAPG) Bulletin, v. 87, p. 1547–1574, doi: 10.1306/05210300177.
Choubert, G., Faure Muret, A., and Hottinger, L., 1966, Aperçu géologique du Bassin côtier de Tarfaya (Stratigraphie ), in Choubert, G., Faure Muret, A., Hottinger, L., Viotti, C., and Lecointre, G., eds., Le Bassin Côtier de Tar-faya (Maroc Méridional): Notes et Mèmoires Service Géologique du Maroc, v. 175/1, p. 7–106.
Cramer, B.S., Wright, J., Kent, D.V., and Aubry, M.-P., 2003, Orbital climate forcing of δ13C excursions in the late Paleocene–early Eocene (chrons C24n-C25n): Paleoceanography, v. 18, p. 1097, doi: 10.1029/2003PA000909.
Einsele, G., Ricken, W., and Seilacher, A., eds., 1991, Cycles and Events in Stratigraphy: Berlin, Springer-Verlag, 955 p.
Fischer, A.G., De Boer, P.L., and Premoli Silva, I., 1990, Cyclostratigraphy, in Ginsburg, R.N., and Beaudoin, B, eds., Cretaceous Resources, Events and Rhythms: NATO Advanced Science Institutes Series C: Dor-drecht, Netherlands, Kluwer Academic Publishers, v. 304, p. 139–172.
Föllmi, K.B., Weissert, H., Bisping, M., and Funk, H., 1994, Phosphogenesis, carbon isotope stratigraphy, and carbonate-platform evolution along the Lower Cretaceous northern Tethyan margin: Geological Society of America Bulletin, v. 106, p. 729–746, doi: 10.1130/0016-7606(1994)106<0729:PCISAC>2.3.CO;2.
Frakes, L.A., 1999, Estimating the global thermal state from Cretaceous sea surface and continental temperature data, in Barrera, E., and Johnson, C.C., eds., Evolution of the Cretaceous Ocean-Climate System: Geological Society of America Special Paper 332, p. 49–57.
Gale, A.S., 1995, Cyclostratigraphy and correlation of the Cenomanian of Europe, in House, M.R., and Gale, A.S., eds., Orbital Forcing, Timescales, and Cyclo-stratigraphy: Geological Society of London Special Publication 85, p. 177–197.
Gale, A.S., Young, J.R., Shackleton, N.J., Crowhurst, S.J., and Wray, D.S., 1999, Orbital tuning of Cenomanian marly chalk successions; towards a Milankovitch timescale for the Late Cretaceous: Royal Society of London Philosophical Transactions, Ser. A, v. 357, p. 1815–1829.
Gale, A.S., Hardenbol, J., Hathway, B., Kennedy, W.J., Young, J.R., and Phansalkar, V., 2002, Global correlation of Cenomanian (Upper Cretaceous) sequences: Evidence for Milankovitch control on sea level: Geology, v. 30, p. 291–294, doi: 10.1130/0091-7613(2002)030<0291:GCOCUC>2.0.CO;2.
Gale, A.S., Voigt, S., Sageman, B.B., and Kennedy, W.J., 2008, Eustatic sea-level record for the Cenomanian (Late Cretaceous)—Extension to the Western Interior Basin, USA: Geology, v. 36, p. 859–862.
Gebhardt, H., Kuhnt, W., and Holbourn, A., 2004, Forami-niferal response to sea level change. Organic car-bon fl ux and oxygen defi ciency in the Cenomanian of the Tarfaya Basin, southern Morocco: Marine Micro paleontology, v. 53, p. 133–157, doi: 10.1016/j.marmicro.2004.05.007.
Gräfe, K.-U., 2002, Stratigraphische Korrelation und Steuerungs faktoren sedimentärer Zyklen in aus-gewählten borealen und tethyalen Becken des Cenoman/Turon (Oberkreide) Europas und Nordwest-afrikas: Berichte aus dem Fachbereich Geowissen-schaften der Universität Bremen, v. 198, p. 1–197.
Grant, S.F., Coe, A.L., and Armstrong, H.A., 1999, Sequence stratigraphy of the Coniacian succession of the Anglo-Paris Basin: Geological Magazine, v. 136, p. 17–38, doi: 10.1017/S0016756899002216.
Haq, B.U., Hardenbol, J., and Vail, P.R., 1987, Chronol-ogy of fl uctuating sea levels since the Triassic: Sci-
ence, v. 235, p. 1156–1167, doi: 10.1126/science.235.4793.1156.
Hardenbol, J., Thierry, J., Farley, M.B., Jacquin, T., De Graciansky , P.C., and Vail, P.R., 1998, Mesozoic and Cenozoic sequence chronostratigraphic framework of European basins, in Graciansky, P.C. de, Hardenbol , J., Jacquin, T., and Vail, P.R., eds., Mesozoic and Cenozoic Sequence Stratigraphy of European Basins: Society for Sedimentary Geology (SEPM) Special Publication 60, p. 3–13.
Hay, W.W., and Leslie, M.A., 1990, Could possible changes in global groundwater reservoir cause eustatic sea-level fl uctuations?, in Geophysics Study Committee, Commission on Physical Sciences, Mathematics, and Resources, National Research Council, ed., Sea-Level Change: Studies in Geophysics: Washington D.C., The National Academy of Sciences, National Academy Press, p. 161–170.
Herbert, T.D., and Fischer, A.G., 1986, Milankovitch cli-matic origin of mid-Cretaceous black shale rhythms in central Italy: Nature, v. 321, p. 739–743, doi: 10.1038/321739a0.
Herbert, T.D., Premoli Silva, I., Erba, E., and Fischer, A.G., 1995, Orbital chronology of Cretaceous-Paleocene marine sediments, in Berggren, W.A., Kent, D.V., Aubry, M.-P., and Hardenbol, J., eds., Geochronol-ogy, Time Scales and Global Stratigraphic Correlation: Society for Sedimentary Geology (SEPM) Special Publication 54, p. 81–93.
Holbourn, A.E., Kuhnt, W., Schulz, M., and Erlenkeuser, H., 2005, Impacts of orbital forcing and atmospheric CO2 on Miocene ice-sheet expansion: Nature, v. 438, p. 483–487, doi: 10.1038/nature04123.
Holbourn, A., Kuhnt, W., Schulz, M., Flores, J.-A., and Andersen, N., 2007, Orbitally-paced climate evolution during the middle Miocene “Monterey” carbon-isotope excursion: Earth and Planetary Science Letters, v. 261, p. 534–550, doi: 10.1016/j.epsl.2007.07.026.
Huber, B.T., Leckie, R.M., Norris, R.D., Bralower, T.J., and CoBabe, E., 1999, Foraminiferal assemblage and stable isotopic change across the Cenomanian-Turonian boundary in the subtropical North Atlantic: Journal of Foraminiferal Research, v. 29, p. 392–417.
Huber, B.T., Norris, R.D., and MacLeod, K.G., 2002, Deep-sea paleotemperature record of extreme warmth dur-ing the Cretaceous: Geology, v. 30, p. 123–126, doi: 10.1130/0091-7613(2002)030<0123:DSPROE>2.0.CO;2.
Jacobs, D.K., and Sahagian, D.L., 1993, Climate-induced fl uctuations in sea level during non-glacial times: Nature, v. 361, p. 710–712, doi: 10.1038/361710a0.
Jarvis, I., Gale, A.S., Jenkyns, H.C., and Pearce, M.A., 2006, Secular variation in Late Cretaceous carbon isotopes: A new δ13C carbonate reference curve for the Cenomanian–Campanian (99.6–70.6 Ma): Geo-logical Magazine, v. 143, p. 561–608, doi: 10.1017/S0016756806002421.
Juignet, P., and Breton, G., 1992, Mid-Cretaceous sequence stratigraphy and sedimentary cyclicity in the west-ern Paris Basin: Palaeogeography, Palaeoclimatol-ogy, Palaeo ecology, v. 91, p. 197–218, doi: 10.1016/0031-0182(92)90067-F.
Kendall, C.G.St.C., Moore, P., Whittle, G., and Cannon, R., 1992, A challenge: Is it possible to determine eustasy and does it matter?, in Dott, R.H., Jr., ed., Eustasy: The Historical Ups and Downs of a Major Geological Concept: Geological Society of America Memoir 180, p. 93–107.
Kennedy, W.J., and Gale, A.S., 2006, The Cenomanian Stage: Proceedings of the Geologists’ Association, v. 117, p. 187–205.
Kolonic, S., Wagner, T., Forster, A., Sinninghe-Damsté, J.S., Walsworth-Bell, B., Erba, E., Turgeon, S., Brumsack , H.-J., Chellai, E.H., Tsikos, H., Kuhnt, W., and Kuypers, M.M.M., 2005, Mechanisms of black shale deposition at the NW-African shelf dur-ing the Cenomanian/Turonian oceanic anoxic event 2: Implications for climate coupling and global organic carbon burial: Paleoceanography, v. 20, PA 1006, doi: 10.1029/2003PA000950.
Kominz, M.A., and Pekar, S.F., 2001, Oligocene eustasy from two-dimensional sequence stratigraphic backstripping:
Geological Society of America Bulletin, v. 113, p. 291–304, doi: 10.1130/0016-7606(2001)113<0291:OEFTDS>2.0.CO;2.
Kuhnt, W., Herbin, J.P., Thurow, J., and Wiedmann, J., 1990, Distribution of Cenomanian-Turonian organic facies in the western Mediterranean and along the adjacent Atlantic Margin, in Huc, A.Y., ed., Deposi-tion of Organic Facies: American Association of Petro-leum Geologists (AAPG) Studies in Geology, v. 40, p. 133–160.
Kuhnt, W., Nederbragt, A., and Leine, L., 1997, Cyclicity of Cenomanian-Turonian organic-carbon–rich sedi-ments in the Tarfaya Atlantic coastal basin (Morocco): Cretaceous Research, v. 18, p. 587–601, doi: 10.1006/cres.1997.0076.
Kuhnt, W., Luderer, F., Nederbragt, S., Thurow, J., and Wagner, T., 2004, Orbital-scale record of the late Cenomanian-Turonian oceanic anoxic event (OAE-2) in the Tarfaya Basin (Morocco): International Journal of Earth Sciences, v. 94, p. 147–159, doi: 10.1007/s00531-004-0440-5.
Laskar, J., 1999, The limits of Earth orbital calculations for geological timescale use: Royal Society of London Philosophical Transactions, Ser. A, v. 357, p. 1735–1759.
Laskar, J., Robutel, P., Joutel, F., Gastineau, M., Correia, A.C.M., and Levrard, B., 2004, A long term numeri-cal solution for the insolation quantities of the Earth: Astronomy & Astrophysics, v. 428, p. 261–285, doi: 10.1051/0004-6361:20041335.
Lourens, L., Slujs, A., Kroon, D., Zachos, J.C., Thomas, E., Röhl, U., Bowles, J., and Raffi , I., 2005, Astronomical pacing of late Palaeocene to early Eocene global warm-ing events: Nature, v. 435, p. 1083–1087, doi: 10.1038/nature03814.
Loutit, T.S., Hardenbol, J., and Vail, P.R., 1988, Condensed sections: The key to age determination and correla-tion of continental margin sequences, in Wilgus, C.K., et al., eds., Sea-Level Changes: An Integrated Approach: Society for Sedimentary Geology (SEPM) Special Publication 42, p. 183–213.
Meyers, S.R., Sagemen, B.B., and Hinnov, L.A., 2001, Inte-grated quantitative stratigraphy of the Cenomanian-Turonian Bridge Creek Limestone Member using evolutive harmonic analysis and stratigraphic model-ling: Journal of Sedimentary Research, v. 71, p. 628–644, doi: 10.1306/012401710628.
Miller, K.G., Sugarman, P.J., Browning, J.V., Kominz, M.A., Hernández, J.C., Olsson, R.K., Wright, J.D., Feigenson, M.D., and Van Sickel, W., 2003, Late Cretaceous chronol-ogy of large, rapid sea level changes: Glacioeustasy dur-ing the greenhouse world: Geology, v. 31, p. 585–588, doi: 10.1130/0091-7613(2003)031<0585:LCCOLR>2.0.CO;2.
Miller, K.G., Sugarman, P.J., Browning, J.V., Kominz, M.A., Olsson, R.K., Feigenson, M.D., and Hernández, J.C., 2004, Upper Cretaceous sequences and sea level his-tory, New Jersey Coastal Plain: Geological Society of America Bulletin, v. 116, p. 368–393, doi: 10.1130/B25279.1.
Miller, K.G., Wright, J.D., and Browning, J.V., 2005a, Visions of ice sheets in a greenhouse world: Marine Geol-ogy, v. 217, p. 215–231, doi: 10.1016/j.margeo.2005.02.007.
Miller, K.G., Kominz, M.A., Browning, J.V., Wright, J.D., Mountain, G.S., Katz, M.E., Sugarman, P.J., Cramer, B.S., Christie-Blick, N., and Pekar, S.F., 2005b, The Phanerozoic record of global sea-level change: Sci-ence, v. 310, p. 1293–1298.
Moriya, K., Wilson, P., Friedrich, O., Erbacher, J., and Kawahata, H., 2007, Testing for ice sheets during the mid-Cretaceous greenhouse using glassy foraminiferal calcite from the mid-Cenomanian tropics on Demerara Rise: Geology, v. 35, p. 615–618, doi: 10.1130/G23589A.1.
Owen, D., 1996, Interbasinal correlation of the Ceno manian Stage: Testing the lateral continuity of sequence boundaries, in Howell, J.A., and Aiken, J.F., eds., High-Resolution Sequence Stratigraphy; Innovation and Applications: Geological Society of London Spe-cial Publication 104, p. 269–295.
Pälike, H., Norris, R.D., Herrle, J.O., Wilson, P.A., Coxall , H.K., Lear, C.H., Shackleton, N.J., Tripati, A.K., and

Kuhnt et al.
1710 Geological Society of America Bulletin, November/December 2009
Wade, B.S., 2006, The heartbeat of the Oligocene climate system: Science, v. 314, p. 1894–1998, doi: 10.1126/science.1133822.
Prokoph, A., Villeneuve, M., Agterberg, F.P., and Rachold, V., 2001, Geochronology and calibration of global Milankovitch cyclicity at the Cenomanian-Turonian boundary: Geology, v. 29, p. 523–526, doi: 10.1130/0091-7613(2001)029<0523:GACOGM>2.0.CO;2.
Robaszynski, F., and Caron, M., 1995, Foraminifères planctoniques du Crétacé: Commentaire de la zona-tion Europe-Méditerranée: Bulletin de la Société Géologique de France, v. 166, p. 681–692.
Robaszynski, F., Hardenbol, J., Caron, M., Amédro, F., Dupuis, C., González Donoso, J.-M., Linares, D., and Gartner, S., 1993, Sequence stratigraphy in a distal environment: The Cenomanian of the Kelaat Senan region of central Tunisia: Bulletin des Centres de Recherches Exploration-Production Elf-Aquitaine, v. 17, p. 395–433.
Robaszynski, F., Caron, M., Amédro, F., Dupuis, C., Hardenbol , J., González Donoso, J.-M., Linares, D., and Gartner, S., 1994, Le Cénomanien de la region de Kelaat Senan (Tunisie centrale): Litho-biostratigraphie et interpretation séquentielle: Revue de Paléobologie, Genève, v. 12, p. 351–505.
Robaszynski, F., Gale, A.S., Juignet, P., Amedro, F., and Hardenbol, J., 1998, Sequence stratigraphy in the Upper Cretaceous of the Anglo-Paris Basin, exemplifi ed by the Cenomanian Stage, in de Graciansky, P.C., et al., eds., Mesozoic and Cenozoic Sequence Stratigraphy of Euro-pean Mesozoic Basins: Society for Sedimentary Geol-ogy (SEPM) Special Publication 60, p. 363–386.
Sageman, B.B., 1996, Lowstand tempestites: Depositional model for Cretaceous skeletal limestones, West-
ern Interior Basin: Geology, v. 24, p. 888–892, doi: 10.1130/0091-7613(1996)024<0888:LTDMFC>2.3.CO;2.
Sageman, B.B., Rich, J., Arthur, M.A., Birchfi eld, G.E., and Dean, W.E., 1997, Evidence for Milankovitch periodicities in Cenomanian-Turonian lithologic and geochemical cycles, Western Interior USA: Journal of Sedimentary Research, v. 67, p. 286–302.
Sageman, B.B., Meyers, S.R., and Arthur, M.A., 2006, Orbital time scale and new C-isotope record from Cenomanian-Turonian boundary stratotype: Geology, v. 34, p. 125–128, doi: 10.1130/G22074.1.
Sahagian, D., and Jones, M., 1993, Quantifi ed Middle Juras-sic to Paleocene eustatic variations based on Russian Platform stratigraphy: Stage level resolution: Geologi-cal Society of America Bulletin, v. 105, p. 1109–1118, doi: 10.1130/0016-7606(1993)105<1109:QMJTPE>2.3.CO;2.
Sahagian, D., Pinous, O., Olferiev, A., Zakaharov, V., and Beisel, A., 1996, Eustatic curve for the Middle Jurassic–Cretaceous based on Russian Platform and Siberian stratigraphy: Zonal resolution: American Association of Petroleum Geologists Bulletin, v. 80, p. 1433–1458.
Schulz, M., and Schäfer-Neth, C., 1997, Translating Milanko vitch climate forcing into eustatic fl uctuations via thermal deep water expansion: A conceptual link: Terra Nova, v. 9, p. 228–231, doi: 10.1111/j.1365-3121.1997.tb00018.x.
Schwarzacher, W., 1993, Cyclostratigraphy and the Milanko-vitch Theory: Amsterdam, Elsevier, 225 p.
Shackleton, N.J., Crowhurst, S.J., Weedon, G.P., and Laskar , J., 1999, Astronomical calibration of Oligocene–Miocene time: Royal Society of London Philosophical Transactions, Ser. A, v. 357, p. 1907–1929.
Stoll, H.M., and Schrag, D.P., 2000, High-resolution stable isotope records from the Upper Cretaceous rocks of Italy and Spain: Glacial episodes in a greenhouse planet?: Geological Society of America Bulletin, v. 112, p. 308–319, doi: 10.1130/0016-7606(2000)112<0308:HRSIRF>2.3.CO;2.
Taylor, P.D., and Wilson, M.A., 2003, Palaeoecology and evolution of marine hard substrate communities: Earth-Science Reviews, v. 62, p. 1–103, doi: 10.1016/S0012-8252(02)00131-9.
Vail, P.R., Audemard, F., Bowman, S.A., Eisner, P.N., and Perez-Cruz, G., 1991, The stratigraphic signatures of tectonics, eustasy and sedimentology—An overview, in Einsele, G., Ricken, W., and Seilacher, A., eds., Cycles and Events in Stratigraphy: Berlin, Springer, p. 617–659.
Wade, B., and Pälike, H., 2004, Oligocene climate dynamics: Paleoceanography, v. 19, doi: 10.1029/2004PA001042.
Wallmann, K., 2004, Impact of atmospheric CO2 and galac-tic cosmic radiation on Phanerozoic climate change and the marine δ18O record: Geochemistry, Geophys-ics, Geosystems, v. 5, doi: 10.1029/2003GC000683.
Wilmsen, M., 2003, Sequence stratigraphy and palaeoceanog-raphy of the Cenomanian Stage in northern Germany: Cretaceous Research, v. 24, p. 525–568, doi: 10.1016/S0195-6671(03)00069-7.
Zachos, J., Pagani, M., Sloan, L., Thomas, E., and Billups, K., 2001, Trends, rhythms, and aberrations in global climate 65 Ma to present: Science, v. 292, p. 686–693, doi: 10.1126/science.1059412.
MANUSCRIPT RECEIVED 18 FEBRUARY 2008REVISED MANUSCRIPT RECEIVED 21 SEPTEMBER 2008MANUSCRIPT ACCEPTED 13 NOVEMBER 2008
Printed in the USA


