Embed Size (px)
Citation preview

Energies 2014, 7, 1171-1192; doi:10.3390/en7031171
energies ISSN 1996-1073
www.mdpi.com/journal/energies
Article
Appraising Bioenergy Alternatives in Uganda Using Strengths, Weaknesses, Opportunities and Threats (SWOT)-Analytical Hierarchy Process (AHP) and a Desirability Functions Approach
Collins Okello 1,2, Stefania Pindozzi 2, Salvatore Faugno 2 and Lorenzo Boccia 2,*
1 Department of Biosystems Engineering, Gulu University, P.O. Box 166, Gulu, Uganda;
E-Mail: [email protected] 2 Department of Agriculture, University of Naples Federico II, Via Università 100, Portici 80055,
Napoli, Italy; E-Mails: [email protected] (S.P.); [email protected] (S.F.)
* Author to whom correspondence should be addressed; E-Mail: [email protected];
Tel.: +39-081-253-9151; Fax: +39-081-253-9157.
Received: 27 November 2013; in revised form: 16 January 2014 / Accepted: 7 February 2014 /
Published: 26 February 2014
Abstract: Poor access to clean and reliable energy technologies is a major challenge to
most developing countries. The decision to introduce new technologies is often faced by
low adoption rates or even public opposition. In addition, the data required for effective
decision making is often inadequate or even lacking, thus constraining the planning process.
In this study, a methodology for participatory appraisal of technologies, integrating desirability
functions to the strengths, weaknesses, opportunities and threats (SWOT)-analytical hierarchy
process (AHP) methodology was developed. Application of the methodology was illustrated
with an example for participatory appraisal of four bioenergy technologies in Uganda.
Results showed that the methodology is effective in evaluating stakeholder preferences for
bioenergy technologies. It showed a high potential to be used to identify and rate factors
that stakeholders take into consideration when selecting bioenergy systems. The method
could be used as a tool for technology screening, or reaching consensus in a participatory
setup in a transparent manner.
Keywords: analytic hierarchy process; bioenergy technologies; multi-criteria analysis;
decision making; participatory appraisal; developing countries
OPEN ACCESS

Energies 2014, 7 1172
1. Introduction
Ensuring a sustainable supply of energy is one of the major challenges of the 21st century. The need
for renewable energy supplies is becoming increasingly more urgent as conventional sources are
blamed for the increasing levels of atmospheric greenhouse gases, global warming, and climate change.
Moreover, reserves of fossil fuels are finite, and threatened by depletion [1]. Also, fossil fuels reserves
are not uniformly distributed over the World, therefore compromising the energy security of countries
without the resources. However, developing countries have more diverse concerns including lack of
access to adequate clean energy, extensive deforestation due to fuelwood harvesting and expansion of
agricultural land. The end results are negative impacts such as soil erosion, loss of biodiversity and
reduced availability and access to fuelwood resources by the population. With reduced accessibility
to fuelwood, households fall down the energy ladder; thus, resorting to low quality energy sources
such as agricultural residues and dried cattle manure, which have adverse impacts on the health of
users due to increased indoor air pollution from cooking devices [2], which is known to be a serious
health burden in developing countries. It is estimated that close to two million [3] people die
prematurely every year due to ailments caused by indoor pollution, of which 400,000 [4] cases are
in sub-Saharan Africa (SSA).
Nevertheless, biomass combustion in inefficient devices remains the dominant household energy in
most SSA countries. In Uganda, for example, over 90% of energy needs is provided by biomass,
mainly in form of firewood, charcoal and agricultural residues [5]. Despite the high potential of
renewable energy resources in the country, it is estimated that only 5% of the population has access to
electricity [6]. Currently, the country is experiencing high rates of increase in demand for biomass energy,
estimated at 3% and 6% for firewood and charcoal per annum, respectively [7]. The increasing demand,
coupled with agricultural land expansion, is leading to accelerated deforestation and consequently
fuelwood deficit in many parts of the country [8]. To ensure sustainability of energy supply, the country
developed the Renewable Energy Policy [9] with the aim of increasing use of modern energy
technologies that are cleaner and more sustainable than existing practices. Under the policy, the use of
improved stoves with higher efficiency is being promoted. The policy also aims at increasing the use
of domestic biogas systems for household cooking and lighting. Consequently, several agencies are
now promoting improved bioenergy technologies in the country. Examples of technologies promoted
include improved biomass stoves, domestic biogas systems, biomass briquettes, and plant oil based
systems. However the level of adoption of improved bioenergy technologies in Uganda remains low,
with over 70% of the population still using inefficient combustion devices [5].
Generally, efforts to introduce improved renewable energy technologies in many communities are
faced by multiple challenges, including low adoption rates [10]. In some cases, there is even direct
public opposition, a phenomenon commonly referred to as the not-in-my-backyard (NIMBY) effect [11].
This is probably due to public concerns such as competition with food production, changes in land use
and aesthetics. In some cases, renewable energy technologies are less economically competitive than
fossil fuels or even against the cultural norms and beliefs of the target population. In the case of Uganda,
specific reasons for the slow rates of adoption of improved bioenergy technologies are not clearly known.
Involving stakeholders is critical in understanding barriers to dissemination of bioenergy technologies
and is recognised as the key to the successful implementation of projects. Suitable tools are required to

Energies 2014, 7 1173
ensure successful consultation of stakeholders in the bioenergy decision making process. So far, several
tools are available for the purpose, but one of the most popular is the analysis of strengths, weaknesses,
opportunities and threats (SWOT). The method has been widely used for participatory decision
making. For example, Liu et al. [12] used it to evaluate the social, economic and environmental
impacts of bioenergy production on marginal land. Lee et al. [13] also employed SWOT analysis to
analyse and develop strategies for the development of the Korean energy sector. A similar study
using SWOT analysis was conducted in China for planning the strategic development of the shale gas
industry [14]. The main weakness of the SWOT analysis, however, is that the results are not quantified
and therefore it is difficult to attach levels of importance to the individual identified SWOT factors.
Consequently, Kurtilla et al. [15] developed a method that incorporates the results of SWOT
analysis in the analytical hierarchy process (AHP). The method, commonly abbreviated as SWOT-AHP
or A’WOT has been widely used in forest policy decision analyses [16–18]. Other examples of the
application of the method include studies in the field of safety and environment [19], agriculture [20],
and water resource management [21]. Ramirez et al. [22] conducted one of the first studies applying
the SWOT-AHP method to bioenergy technologies in developing countries to assess stakeholders’
perception about non-traditional cooking stoves in Honduras. However, all these studies are limited to
the quantification of SWOT factors for a single scheme of intervention. The use of the SWOT-AHP
method as a tool for comparative analysis of strategic alternatives is generally limited in the literature;
an example was proposed by Pesonen et al. [23].
Against this background, the objectives of this study were to: (1) improve the capability of the
SWOT-AHP methodology as a tool for participatory appraisal of alternative bioenergy technologies;
and (2) illustrate the use of the proposed methodology with an application example. The present study
gives a detailed description of the SWOT-AHP methodology and its proposed extension with desirability
functions [24]. An application example for participatory appraisal of four different bioenergy technologies
in Uganda is also given.
2. Methodology
The proposed methodology incorporates desirability function [25] into the SWOT-AHP
method [15–17], followed by synthesis of results using a weighted summation method [26]. In the
SWOT analysis phase, SWOT of the technology is analysed [27]. The AHP methodology,
developed by Saaty [28] in the 1970s, can then be used to convert SWOT factors into quantifiable
indicators [15]. Desirability functions [25] are then used to transform the weights of the SWOT group
factors into measures of suitability of each technology. In the last step, ranks of technologies can then
be subjected to sensitivity analysis [29] so as to evaluate their robustness to changes in weights of criteria.
The flow chart of proposed method is illustrated in Figure 1, and detailed explanations are given in the
following sections.
Energies 2014, 7 1174
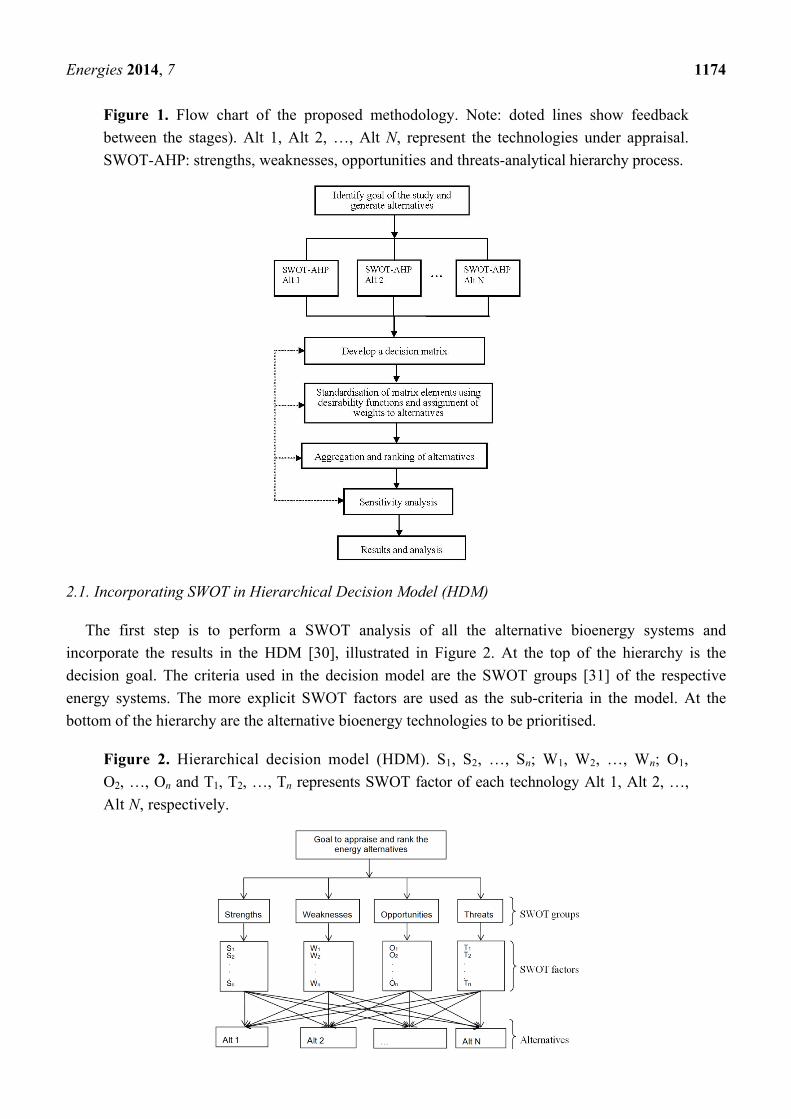
Figure 1. Flow chart of the proposed methodology. Note: doted lines show feedback
between the stages). Alt 1, Alt 2, …, Alt N, represent the technologies under appraisal.
SWOT-AHP: strengths, weaknesses, opportunities and threats-analytical hierarchy process.
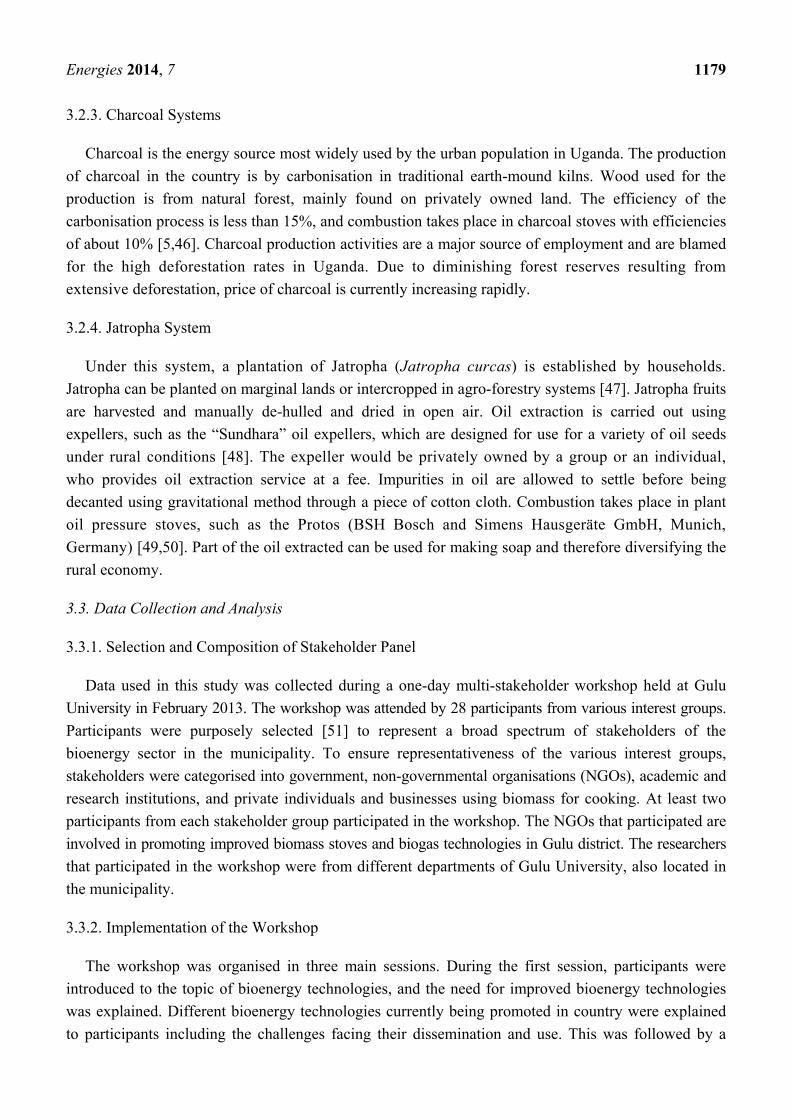
2.1. Incorporating SWOT in Hierarchical Decision Model (HDM)
The first step is to perform a SWOT analysis of all the alternative bioenergy systems and
incorporate the results in the HDM [30], illustrated in Figure 2. At the top of the hierarchy is the
decision goal. The criteria used in the decision model are the SWOT groups [31] of the respective
energy systems. The more explicit SWOT factors are used as the sub-criteria in the model. At the
bottom of the hierarchy are the alternative bioenergy technologies to be prioritised.
Figure 2. Hierarchical decision model (HDM). S1, S2, …, Sn; W1, W2, …, Wn; O1,
O2, …, On and T1, T2, …, Tn represents SWOT factor of each technology Alt 1, Alt 2, …,
Alt N, respectively.

Energies 2014, 7 1175
2.2. Quantifying SWOT Factors Using AHP
In the second step, the SWOT factors (or sub-criteria) and SWOT groups (or criteria) are prioritised
using a pairwise comparison method [31]. First, pairwise comparison of SWOT factors is done,
followed by that of SWOT groups using a suitable scale, usually ranging from one to nine [32].
Results of the pairwise comparison exercises are transformed into positive pairwise comparison
matrices A, illustrated by Equation (1):
=
1
1
1
21
212
121
cccc
cccc
cccc
A
nn
n
n
(1)
where ci are the relative importance of SWOT factors or SWOT groups obtained from pairwise
comparison. Values of ci equal to one denote equal importance between a given pair of factors or groups
while nine indicates that one factor is absolutely more important than the other [33]. Then, matrix A is
normalised by dividing each element of a columns by the sum of the column elements, to generate
Equation (2):
=
nnnn
n
n
xxx
xxx
xxx
B
21
22221
11211
(2)
where B is the normalised pairwise comparison matrix. The weighted matrix, W, is then generated
from the mean of each row of matrix B, as illustrated by Equation (3):
==
=
n
n
jij
w
w
w
n
x
W
1
12
11
1
(3)
where wij are the overall weights or scores of SWOT groups or factors of a given alternative. The result
is then checked through consistency test by evaluating the value of consistency ratio, calculated using
Equation (4):
RICICR = (4)
where CR is consistency ratio; CI is consistency index given by Equation (5); and RI is random index
given in Table 1 [32]:
maxλ
1
nCI
n
−=−
(5)
where CI is the consistency index; λmax is the largest eigenvalue of matrix A; and n is the number of
SWOT groups or factors. It is a general rule that if the consistency ratio is greater than 0.1, then the
results of the pairwise comparison is inconsistent, and therefore cannot be accepted [34]. Actions described
in Sections 2.3 and 2.4 are repeated for each of the alternatives under consideration.

Energies 2014, 7 1176
Table 1. Values of random index (RI) [30].
Values Number of elements in pairwise comparison
n 2 3 4 5 6 7 8 9 RI(n) 0 0.58 0.90 1.12 1.24 1.32 1.41 1.45
2.3. Ranking of Technologies
Ranking of the technologies is achieved by minimising the weaknesses and threats, and maximising
strengths and opportunities. To achieve this, a decision matrix [25] is developed from the weights of
SWOT groups, as illustrated in Table 2. Elements of the decision matrix are then transformed into a
measure of suitability ranging from zero to one using desirability functions [25]. A desirability value
of one that implies that the SWOT group factor is optimal, while a value of zero means the attribute is
totally undesirable. Transformation of beneficial criteria, in this case strengths and opportunities,
is done using Equation (6), while for non-beneficial criteria, i.e., weaknesses and threats, is accomplished
using Equation (7):
min
δ
minmin max
max min
max
0 if
if
1 if
ij j
ij ji j ij j
j j
ij j
w w
w wd w w w
w w
w w
≤ −= ≤ ≤ − ≥
(6)
min
δ
maxmin max
min max
max
1 if
if
0 if
ij j
ij ji j ij j
j j
ij j
w w
w wd w w w
w w
w w
≤ −= ≤ ≤ − ≥
(7)
In Equations (6) and (7), di are the individual desirability of SWOT group weights of a given
alternative i; wminj and wmaxj are the maximum and minimum values of a given set of SWOT groups
weights, respectively; derived using from Equation (3) and summarised in Table 2, and wij are SWOT
group weights between wminj and wmaxj. The parameter δ is a constant that determines the shape of the
desirability function. When the value of δ is equal to 1, the function varies linearly between 0 and 1,
in the case where δ is greater than 1, the shape is concave, while values of δ less than 1 results in a
convex function.
Table 2. Multi-criteria analysis (MCA) decision matrix diagram.
Criteria Alternative technologies
A1 A2 … An C1 w11 w12 w1n C2 w21 … … w2n … … … … … Cn wn1 wn2 … wnn
Ci are criteria, in this case SWOT groups; Ai are technologies to be ranked; wij are weights assigned to each
SWOT group (see Section 2.2).

Energies 2014, 7 1177
The overall desirability of a given alternative can then be calculated using the weighted summation
method [26] according to Equation (8):
1
ωn
i i ii
D d=
= (8)
where Di is desirability of a given bioenergy technology; and ɷi are the weights assigned to SWOT
groups i. The technologies can then be ranked basing on their overall desirability, and those with
higher desirability values are the preferred options.
2.4. Sensitivity Analysis
The last step is to carry out sensitivity analysis to determine the stability of the ranks of alternative
bioenergy systems subject to changes in weights of SWOT group factors. During this process,
point data is modified to observe their effects on the ranks of technologies, therefore enabling
generation of scenarios [35].
3. Application of the Methodology
3.1. Description of the Study Area
The study was carried out in Gulu municipality, located about 330 km by road to the north of the
Ugandan capital, Kampala (Figure 3).
Figure 3. Map of Uganda showing the location of study area, in circle (based on United
Nations (UN) map, Source: UN Cartographic section [36]). Reprinted/Reproduced with
permission from UN Online Project, 2014.

Energies 2014, 7 1178
The municipality is the second largest urban settlement in Uganda, with an estimated population of
150,000 inhabitants [37]. The majority of households rely on charcoal and firewood as the main
sources of domestic energy, but the biomass resources in the area are being extracted faster than the
rate of replenishment [38]. A study by Drigo [8] indicated that the municipality currently experiences a
net deficit of fuel wood resources. Recent efforts by the government and development partners have
led to an increased use of energy-saving stoves. Bioenergy technologies such as biomass briquetting,
biogas and gasification are still new to the area and not widely adopted [39].
3.2. Technologies Considered in the Study
A literature survey and field visits were carried out to identify possible bioenergy technologies that
could be developed for use in the study area. Emphasis was placed on identifying technologies which
have been successfully employed in the country, but are not widely adopted. Where possible,
samples of the technologies were acquired for demonstration during stakeholder workshop, otherwise,
photographs were taken. The following is a brief description of technologies that were identified and
considered for this study. More detailed explanation of these technologies is available in Okello et al. [5].
3.2.1. Biogas System
Biogas technology was introduced in Uganda in the 1950s, and is one of the priority bioenergy
technologies being promoted in the country [40]. As per the renewable energy policy, Uganda has set a
target of installing 100,000 domestic biogas digesters by the year 2017 [9]. The systems range in
volume from 6 m3 to 16 m3 and are specifically designed to fulfil household energy needs [5,41].
Cattle manure is the most common substrate for feeding biogas plants in the country. In the
proposed system, grass is cultivated to ensure reliable supply of cattle feeds, which are kept under a
zero-grazing system. An acre of pasture is provided for each animal, and normally a household
requires two heads of cattle to generate sufficient biogas. The bio-digester is constructed underground
and the substrate is mixed with water and fed to the digester on daily basis. Simple burners are
provided for combustion of the biogas, which is conveyed from the digester to the house through pipes.
3.2.2. Briquetting System
Biomass briquetting is the conversion of loose biomass material into a high density product by
subjecting the material to pressure, with or without a binder [42]. The briquetting process involves
material collection, drying, commutation and densification, using various types of presses [43].
The resulting product is called briquettes and is easier to handle and has better combustion properties
than the original biomass material. In Uganda, the available agricultural and forest residues could be
used as raw material for briquetting [44,45]. In the proposed system, the briquettes are used for
cooking in gasifier stoves that are more efficient than traditional stoves [45]. Since briquetting
machines are expensive, briquetting services can be provided by a private proprietor at a fee.
Energies 2014, 7 1179
3.2.3. Charcoal Systems
Charcoal is the energy source most widely used by the urban population in Uganda. The production
of charcoal in the country is by carbonisation in traditional earth-mound kilns. Wood used for the
production is from natural forest, mainly found on privately owned land. The efficiency of the
carbonisation process is less than 15%, and combustion takes place in charcoal stoves with efficiencies
of about 10% [5,46]. Charcoal production activities are a major source of employment and are blamed
for the high deforestation rates in Uganda. Due to diminishing forest reserves resulting from
extensive deforestation, price of charcoal is currently increasing rapidly.
3.2.4. Jatropha System
Under this system, a plantation of Jatropha (Jatropha curcas) is established by households.
Jatropha can be planted on marginal lands or intercropped in agro-forestry systems [47]. Jatropha fruits
are harvested and manually de-hulled and dried in open air. Oil extraction is carried out using
expellers, such as the “Sundhara” oil expellers, which are designed for use for a variety of oil seeds
under rural conditions [48]. The expeller would be privately owned by a group or an individual,
who provides oil extraction service at a fee. Impurities in oil are allowed to settle before being
decanted using gravitational method through a piece of cotton cloth. Combustion takes place in plant
oil pressure stoves, such as the Protos (BSH Bosch and Simens Hausgeräte GmbH, Munich,
Germany) [49,50]. Part of the oil extracted can be used for making soap and therefore diversifying the
rural economy.
3.3. Data Collection and Analysis
3.3.1. Selection and Composition of Stakeholder Panel
Data used in this study was collected during a one-day multi-stakeholder workshop held at Gulu
University in February 2013. The workshop was attended by 28 participants from various interest groups.
Participants were purposely selected [51] to represent a broad spectrum of stakeholders of the
bioenergy sector in the municipality. To ensure representativeness of the various interest groups,
stakeholders were categorised into government, non-governmental organisations (NGOs), academic and
research institutions, and private individuals and businesses using biomass for cooking. At least two
participants from each stakeholder group participated in the workshop. The NGOs that participated are
involved in promoting improved biomass stoves and biogas technologies in Gulu district. The researchers
that participated in the workshop were from different departments of Gulu University, also located in
the municipality.
3.3.2. Implementation of the Workshop
The workshop was organised in three main sessions. During the first session, participants were
introduced to the topic of bioenergy technologies, and the need for improved bioenergy technologies
was explained. Different bioenergy technologies currently being promoted in country were explained
to participants including the challenges facing their dissemination and use. This was followed by a

Energies 2014, 7 1180
detailed explanation of the four bioenergy technologies to be ranked in this study. The process was
made as participatory as possible so that participants could freely share their knowledge and experiences
with the technologies. During the third session, participants were divided into four groups, and each
tasked with development of SWOT factors for one of the technologies. Results of SWOT analysis
developed by individual groups were presented to the general stakeholder’s forum and discussed and a
final list of SWOT factors agreed upon. Finally, the SWOT factors were typed in a specially designed
spreadsheet format for pairwise comparison. These were printed and given to each participant to carry
out a pairwise comparison.
3.3.3. Analysis of Results
Results of SWOT analysis were processed following the AHP procedure as described in Section 2.
A spreadsheet programme was developed in Microsoft Excel® and used for pairwise comparison of
the factors. The spreadsheet was also used to test for consistency of the pairwise comparison.
Results were aggregated using geometric mean as recommended by Forman and Peniwati [52].
Ranking of technologies and sensitivity analysis were carried out using the multi-criteria analysis (MCA)
software DEFINITE [53]. It was assumed that the SWOT factors had equal weights of 0.25. The sensitivity
analysis phase was used to evaluate the effect of varying the weights on the ranks of the technologies.
A numerical example of calculation steps used for ranking the technologies is given in the Appendix.
4. Results and Discussions
4.1. Results of SWOT-AHP Phase
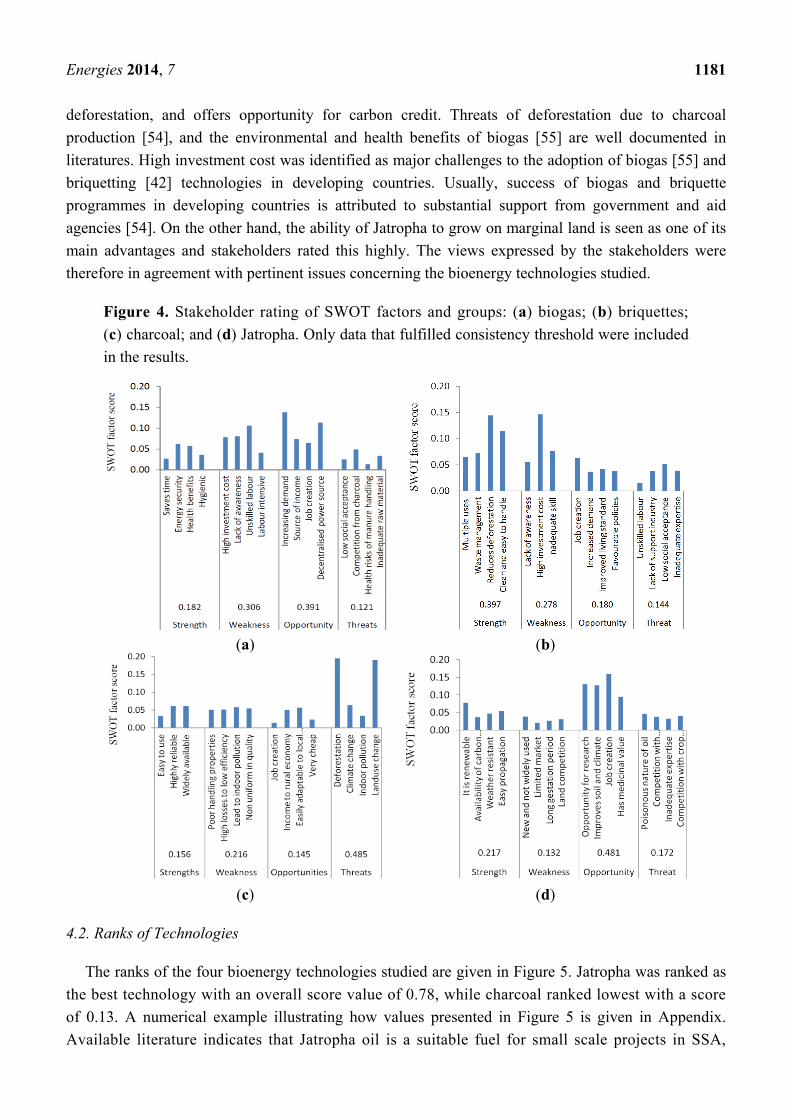
Results of the SWOT-AHP phase is illustrated in Figure 4, and details of individual scores of the
SWOT groups and factors are given in Table A1 of the Appendix. The graphs show that biogas
systems had opportunities ranked highest at 0.390, mainly due to increasing demand for the systems
and its ability to provide decentralised energy services to individual households (Figure 4a).
Inadequacy of skilled personnel, lack of awareness about the technology and high investment costs
were identified as the most detrimental factors to the adoption of biogas technology. Results of the
briquette systems are given in Figure 4b, with its strengths scoring highest at 0.397. The most
important strengths of briquettes identified were reduction in deforestation, cleanness and ease of handling.
However, high investment costs and lack of skilled personnel were identified as most unfavourable
factors to the technology. For charcoal systems, threats scored highest at 0.485 as shown in Figure 4c.
This is mainly attributed to deforestation and land use change caused by charcoal production from
natural forests. Meanwhile, opportunities of Jatropha system was greater than that of other SWOT
group factors with a score of 0.481 (Figure 4d), mainly due to job creation, opportunities for research
and development of products, diversity rural economy and the favourable climate and soils. The poisonous
nature of Jatropha and competition with other fuels were the most detrimental factors identified.
Results of the SWOT-AHP phase presented here demonstrates the ability of the methodology to
identify issues that stakeholders consider as critical for selecting bioenergy technologies. Some of the
issues identified by the stakeholders are in agreement with available literature, for example,
Mwampamba et al. [42] observed that briquetting has environmental benefits such as reduced
Energies 2014, 7 1181
deforestation, and offers opportunity for carbon credit. Threats of deforestation due to charcoal
production [54], and the environmental and health benefits of biogas [55] are well documented in
literatures. High investment cost was identified as major challenges to the adoption of biogas [55] and
briquetting [42] technologies in developing countries. Usually, success of biogas and briquette
programmes in developing countries is attributed to substantial support from government and aid
agencies [54]. On the other hand, the ability of Jatropha to grow on marginal land is seen as one of its
main advantages and stakeholders rated this highly. The views expressed by the stakeholders were
therefore in agreement with pertinent issues concerning the bioenergy technologies studied.
Figure 4. Stakeholder rating of SWOT factors and groups: (a) biogas; (b) briquettes;
(c) charcoal; and (d) Jatropha. Only data that fulfilled consistency threshold were included
in the results.
(a) (b)
(c) (d)
4.2. Ranks of Technologies
The ranks of the four bioenergy technologies studied are given in Figure 5. Jatropha was ranked as
the best technology with an overall score value of 0.78, while charcoal ranked lowest with a score
of 0.13. A numerical example illustrating how values presented in Figure 5 is given in Appendix.
Available literature indicates that Jatropha oil is a suitable fuel for small scale projects in SSA,

Energies 2014, 7 1182
when used in multifunctional platforms [56]. It can be processed into biodiesel or used for making soap,
therefore supporting diversification of rural economy [57]. However, there are debates about
Jatropha production; for example, it is reported to have a negative impact on carbon stock [58].
Other challenges include low yield, limited know-how for feedstock conversion, high investment costs
and inadequate private capacity to support the development of the sector [59].
Figure 5. Scores of bioenergy technologies studied—higher scores are preferable.
4.3. Sensitivity Analysis
The effect of varying factor weights on the ranking of the technologies was analysed through
sensitivity analysis, and the results are shown in Figure 6.
Figure 6. Sensitivity analysis plots: (a) Jatropha; (b) briquettes; (c) biogas; and (d) charcoal.

Energies 2014, 7 1183
Biogas and briquettes were found to be highly sensitive to variation in the values of the weakness
factors, with their scores dropping near to zero with high values of weaknesses. However, charcoal is
more robust to variation of weakness values. Sensitivity analysis also indicates that rank reversal
occurs between Jatropha and biogas systems, with biogas ranking highest when values of strengths
were increased beyond 0.6. Therefore, both biogas and briquettes technologies would be acceptable by
the community depending on management policies and incentives.
4.4. Discussions on the Methodology
In this study, we developed a method that incorporates desirability functions into the SWOT-AHP
methodology for participatory appraisal of alternative bioenergy systems. The AHP methodology used
is a very powerful MCA tool with capabilities of allowing commensurability of both quantitative and
qualitative variables. Use of pairwise comparison in AHP enhances the aptitude of the decision maker
in the analysis of the alternatives therefore resulting in more rational decisions. The method offers
more flexibility over traditional approaches such as contingent evaluation, which requires that all
variables are measured in financial terms. The multi-criteria technique employed has capability of
ranking multidimensional, conflicting and uncertain systems. Furthermore, participation of stakeholders
in AHP studies is based on opinion leadership and representative democracy, therefore allowing for
smaller number of samples than in statistical approaches [17]. The method is useful in environments
where data for decision making is not readily available. It could help in identification of hidden interests,
cultural constraints and other social values of the target community.
However, the methodology is based on some assumptions and has limitations that should be taken
into consideration. First, during the SWOT analysis, there is a possibility that some factors
proposed by participants may not be technically suitable for consideration. Therefore, the researcher
has to ensure the appropriateness of the factors by ensuring legibility and avoiding redundancy [60].
Secondly, the assumption of AHP methodology that the hierarchical factors are independent of each
other may not necessarily be true, especially when complex systems are taken into consideration. This
weakness could probably be reduced by integrating desirability functions in the SWOT-ANP
(analytical hierarchy process) as suggested by Catron et al. [61]. Also, the SWOT methodology does
not take uncertainties related to future development into consideration. As proposed by Kurttila et al. [15]
scenario modelling using dynamic SWOT analysis could be a possible solution to this limitation.
As a rule, the number of SWOT factors for pairwise comparisons should be limited to 10;
otherwise human cognition may not be capable of objectively carrying out pairwise comparison. In cases
where this rule cannot be obeyed, grouping the factors under different categories is proposed as a remedy.
Much as the SWOT-AHP method is a very useful tool, it heavily relies on qualitative judgement of
the SWOT factors. It does not incorporate measurable economic, social and environmental variables of
sustainability. It is therefore recommended that it should be used to supplement other more rigorous
methods such as financial cash flow or cost-benefit analysis (CBA) [62], life-cycle analysis (LCA) [63]
and life cycle costing (LCC) [64]. Usually, these methods require considerable amount of data and
time to implement. Therefore, the proposed method may help in pre-screening of technologies that will
most likely be accepted by the target community prior to more rigorous methods such as LCA,
CBA and LCC. This is particularly important in developing countries where required data and logistics
Energies 2014, 7 1184
for their collection are often lacking. Pre-screening of technologies is advantageous since it helps to
eliminate trivial options therefore enabling directing resources to a few promising alternatives. The method
could also be used to identify stakeholders concerns about bioenergy technologies; thus, developing
appropriate strategies for addressing them. Alternatively, the method could be used as a tool for
reaching consensus in cases where there are conflicting interests among stakeholders. Generally, it could
be used as a tool for soliciting stakeholder opinion during multi-criteria decision analysis of technologies,
which considers social, economic and environmental aspects simultaneously [65].
The application example presented is the first of its kind and could benefit from further trials.
More rigorous data collection methods could be taken into consideration to evaluate the repeatability
of the results. One could also study if there would be differences in the ranking of the technologies
amongst different stakeholder groups. Furthermore, the possibility of incorporating other participatory
techniques such as Delphi techniques could be taken into consideration to improve the overall rigour of
the participatory process.
5. Conclusions
In this study, we proposed a methodology for participatory appraisal of technologies, and applied it
in a case study to rank four bioenergy systems in Uganda. The methodology is intended to identify
bioenergy technologies with a higher chance of public acceptance at the early stages of project
development. The case study implemented showed that the tool is effective for identifying stakeholder
preference of bioenergy technologies including the underlying reasons for their choices. The results of
the study suggest that Jatropha could be accepted as a fuel for household energy in Uganda.
Further, stakeholders regard charcoal as not sustainable mainly because of the threats it poses to the
environment. Results suggest that suitable policies aimed at increasing affordability of bioenergy
technologies could help increase their adoption rates in Uganda. Also, improving the critical mass of
skilled personnel could play an important role in ensuring increased dissemination of improved
bioenergy technologies.
Acknowledgments
We acknowledge GuluNap, a collaborative project between Gulu University and University of
Naples Federico II, for financial support to this study. We appreciate facilitators of the stakeholder
workshop: Eng. Benedict Ebangu Orari, Walter Odongo, and Martine Nyeko and to all the participants.
Gratitude to Ahmed Harb Rabia for proof reading the manuscript. Special acknowledgement to the
three anonymous reviewers for comments that greatly helped to improve the quality of this paper.
Energies 2014, 7 1185
Appendix: SWOT Factors and Their Rankings and a Numerical Example for Generating Figure 5
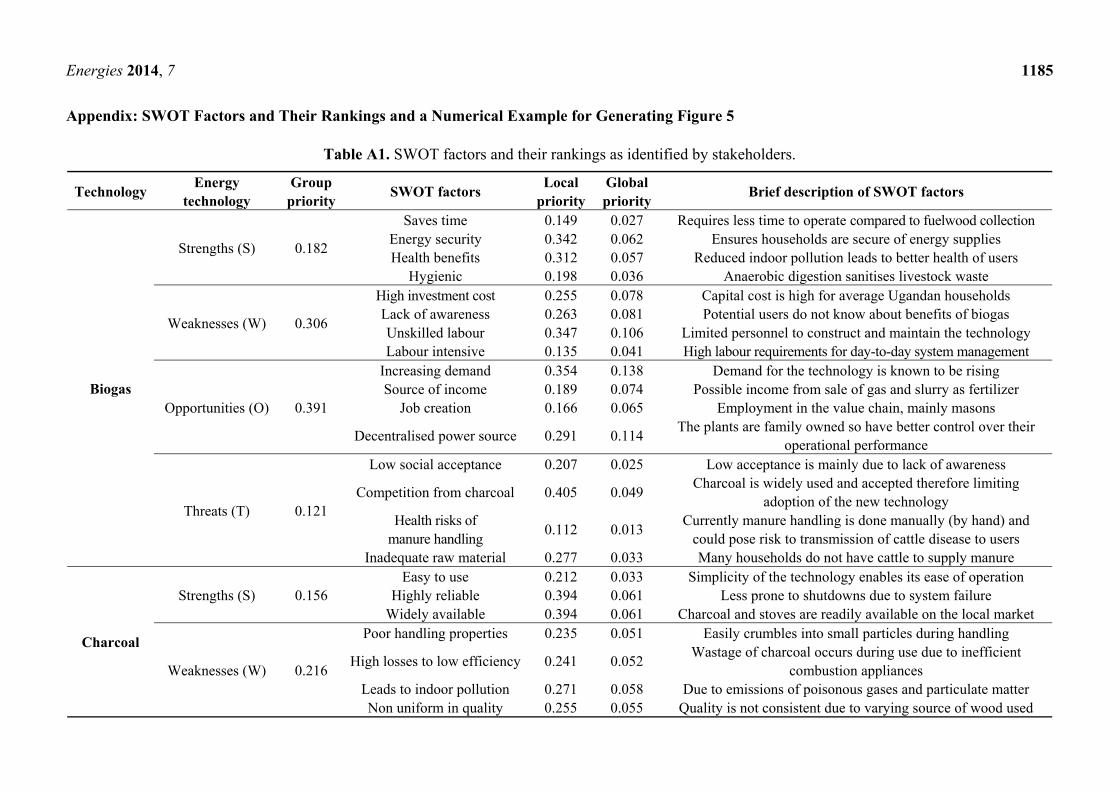
Table A1. SWOT factors and their rankings as identified by stakeholders.
Technology Energy
technology Group
prioritySWOT factors
Local priority
Global priority
Brief description of SWOT factors
Biogas
Strengths (S) 0.182
Saves time 0.149 0.027 Requires less time to operate compared to fuelwood collection Energy security 0.342 0.062 Ensures households are secure of energy supplies Health benefits 0.312 0.057 Reduced indoor pollution leads to better health of users
Hygienic 0.198 0.036 Anaerobic digestion sanitises livestock waste
Weaknesses (W) 0.306
High investment cost 0.255 0.078 Capital cost is high for average Ugandan households Lack of awareness 0.263 0.081 Potential users do not know about benefits of biogas Unskilled labour 0.347 0.106 Limited personnel to construct and maintain the technology Labour intensive 0.135 0.041 High labour requirements for day-to-day system management
Opportunities (O) 0.391
Increasing demand 0.354 0.138 Demand for the technology is known to be rising Source of income 0.189 0.074 Possible income from sale of gas and slurry as fertilizer
Job creation 0.166 0.065 Employment in the value chain, mainly masons
Decentralised power source 0.291 0.114 The plants are family owned so have better control over their
operational performance
Threats (T) 0.121
Low social acceptance 0.207 0.025 Low acceptance is mainly due to lack of awareness
Competition from charcoal 0.405 0.049 Charcoal is widely used and accepted therefore limiting
adoption of the new technology Health risks of
manure handling 0.112 0.013
Currently manure handling is done manually (by hand) and could pose risk to transmission of cattle disease to users
Inadequate raw material 0.277 0.033 Many households do not have cattle to supply manure
Charcoal
Strengths (S) 0.156 Easy to use 0.212 0.033 Simplicity of the technology enables its ease of operation
Highly reliable 0.394 0.061 Less prone to shutdowns due to system failure Widely available 0.394 0.061 Charcoal and stoves are readily available on the local market
Weaknesses (W) 0.216
Poor handling properties 0.235 0.051 Easily crumbles into small particles during handling
High losses to low efficiency 0.241 0.052 Wastage of charcoal occurs during use due to inefficient
combustion appliances Leads to indoor pollution 0.271 0.058 Due to emissions of poisonous gases and particulate matter Non uniform in quality 0.255 0.055 Quality is not consistent due to varying source of wood used

Energies 2014, 7 1186
Table A1. Cont.
Technology Energy
technology Group
prioritySWOT factors
Local priority
Global priority
Brief description of SWOT factors
Charcoal
Opportunities (O) 0.145
Job creation 0.101 0.015 Employment in the production and sale of charcoal and stoves Income to rural economy 0.344 0.050 Charcoal is a major source of income to rural households
Easily adaptable to local conditions
0.392 0.057 Technology is simple and can easily offer opportunity to be
easily adopted/improved to local conditions
Very cheap 0.164 0.024 Potential savings by households due to low capital an
operating costs
Threats (T) 0.485
Deforestation 0.403 0.195 Currently there is rapid loss of forest vegetation in Uganda Climate change 0.132 0.064 Emissions from charcoal could contribute to climate change Indoor pollution 0.072 0.035 Indoor pollutants have negative health impacts on users
Land use change 0.394 0.191 Undesirable change in land use due to wood harvesting leading to
loss of biodiversity
Jatropha
Strengths (S) 0.217
It is renewable 0.360 0.078 It is a renewable energy source
Availability of carbon credit 0.171 0.037 This is an incentive for using renewable energy under cleaner
development mechanism (CDM) Weather resistant 0.218 0.047 Jatropha plant grows in adverse weather conditions Easy propagation 0.251 0.054 Availability and ease of propagation from seeds and cuttings
Weaknesses (W) 0.132
New and not widely used 0.329 0.043 Being new technology, it is not known by potential users,
thus limiting its adoption Limited market 0.177 0.023 Under developed market system for Jatropha technology
Long gestation period 0.229 0.030 Time lag from planting to sustainable yield of 3–5 years Land competition 0.265 0.035 Competition for land for other productive activities
Opportunities (O) 0.481
Opportunity for research 0.255 0.123 Opportunity to develop biodiesel, soap and medicines
Improves soil and climate 0.249 0.119 Jatropha reduces soil erosion and improves microclimate in areas
where it is grown Job creation 0.311 0.149 Employment in the value chain of Jatropha energy system
Has medicinal value 0.186 0.089 Jatropha products could be used for treatment of ailments
Energies 2014, 7 1187
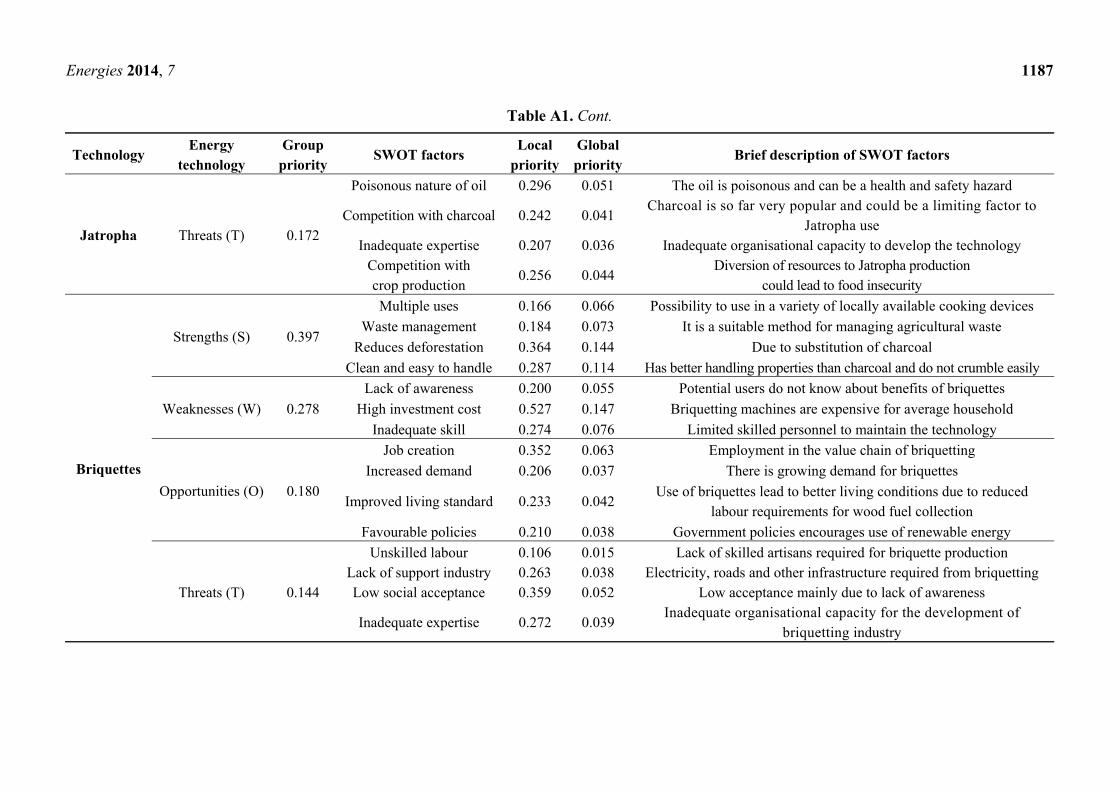
Table A1. Cont.
Technology Energy
technology Group
prioritySWOT factors
Local priority
Global priority
Brief description of SWOT factors
Jatropha Threats (T) 0.172
Poisonous nature of oil 0.296 0.051 The oil is poisonous and can be a health and safety hazard
Competition with charcoal 0.242 0.041 Charcoal is so far very popular and could be a limiting factor to
Jatropha use Inadequate expertise 0.207 0.036 Inadequate organisational capacity to develop the technology
Competition with crop production
0.256 0.044 Diversion of resources to Jatropha production
could lead to food insecurity
Briquettes
Strengths (S) 0.397
Multiple uses 0.166 0.066 Possibility to use in a variety of locally available cooking devices
Waste management 0.184 0.073 It is a suitable method for managing agricultural waste
Reduces deforestation 0.364 0.144 Due to substitution of charcoal
Clean and easy to handle 0.287 0.114 Has better handling properties than charcoal and do not crumble easily
Weaknesses (W) 0.278
Lack of awareness 0.200 0.055 Potential users do not know about benefits of briquettes
High investment cost 0.527 0.147 Briquetting machines are expensive for average household
Inadequate skill 0.274 0.076 Limited skilled personnel to maintain the technology
Opportunities (O) 0.180
Job creation 0.352 0.063 Employment in the value chain of briquetting
Increased demand 0.206 0.037 There is growing demand for briquettes
Improved living standard 0.233 0.042 Use of briquettes lead to better living conditions due to reduced
labour requirements for wood fuel collection
Favourable policies 0.210 0.038 Government policies encourages use of renewable energy
Threats (T) 0.144
Unskilled labour 0.106 0.015 Lack of skilled artisans required for briquette production Lack of support industry 0.263 0.038 Electricity, roads and other infrastructure required from briquetting Low social acceptance 0.359 0.052 Low acceptance mainly due to lack of awareness
Inadequate expertise 0.272 0.039 Inadequate organisational capacity for the development of
briquetting industry
Energies 2014, 7 1188
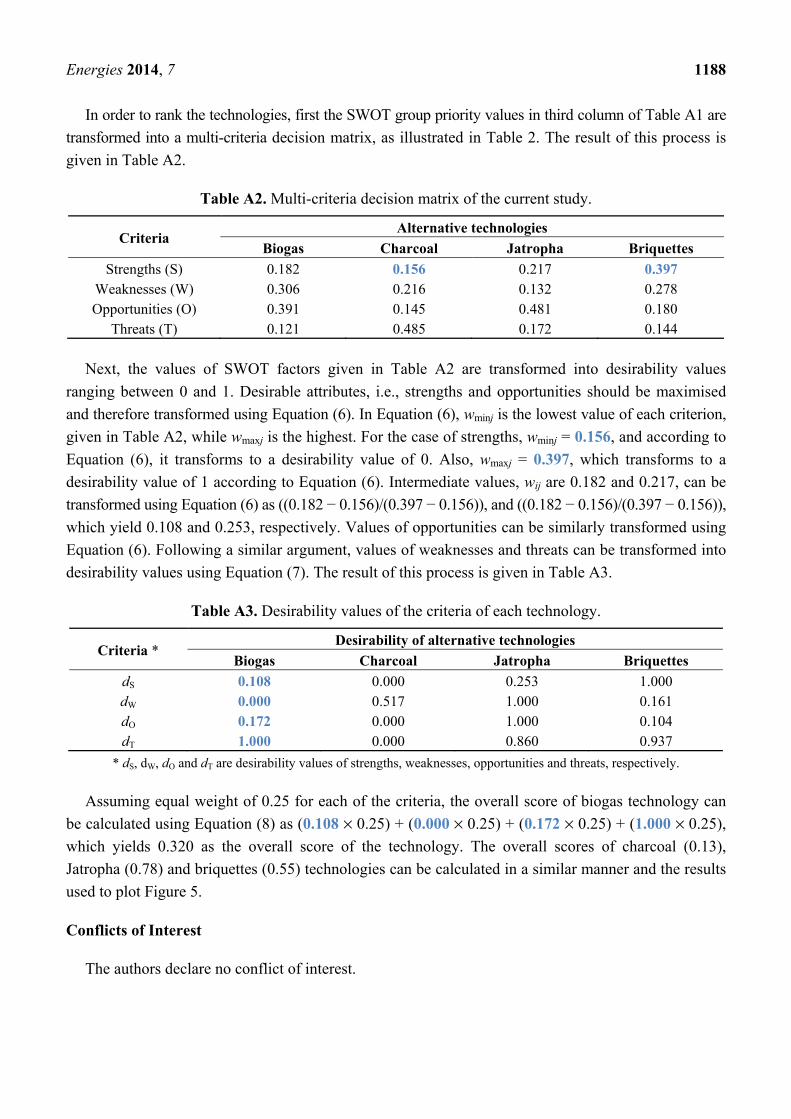
In order to rank the technologies, first the SWOT group priority values in third column of Table A1 are
transformed into a multi-criteria decision matrix, as illustrated in Table 2. The result of this process is
given in Table A2.
Table A2. Multi-criteria decision matrix of the current study.
Criteria Alternative technologies
Biogas Charcoal Jatropha Briquettes
Strengths (S) 0.182 0.156 0.217 0.397 Weaknesses (W) 0.306 0.216 0.132 0.278 Opportunities (O) 0.391 0.145 0.481 0.180
Threats (T) 0.121 0.485 0.172 0.144
Next, the values of SWOT factors given in Table A2 are transformed into desirability values
ranging between 0 and 1. Desirable attributes, i.e., strengths and opportunities should be maximised
and therefore transformed using Equation (6). In Equation (6), wminj is the lowest value of each criterion,
given in Table A2, while wmaxj is the highest. For the case of strengths, wminj = 0.156, and according to
Equation (6), it transforms to a desirability value of 0. Also, wmaxj = 0.397, which transforms to a
desirability value of 1 according to Equation (6). Intermediate values, wij are 0.182 and 0.217, can be
transformed using Equation (6) as ((0.182 − 0.156)/(0.397 − 0.156)), and ((0.182 − 0.156)/(0.397 − 0.156)),
which yield 0.108 and 0.253, respectively. Values of opportunities can be similarly transformed using
Equation (6). Following a similar argument, values of weaknesses and threats can be transformed into
desirability values using Equation (7). The result of this process is given in Table A3.
Table A3. Desirability values of the criteria of each technology.
Criteria * Desirability of alternative technologies
Biogas Charcoal Jatropha Briquettes
dS 0.108 0.000 0.253 1.000 dW 0.000 0.517 1.000 0.161 dO 0.172 0.000 1.000 0.104 dT 1.000 0.000 0.860 0.937
* dS, dW, dO and dT are desirability values of strengths, weaknesses, opportunities and threats, respectively.
Assuming equal weight of 0.25 for each of the criteria, the overall score of biogas technology can
be calculated using Equation (8) as (0.108 × 0.25) + (0.000 × 0.25) + (0.172 × 0.25) + (1.000 × 0.25),
which yields 0.320 as the overall score of the technology. The overall scores of charcoal (0.13),
Jatropha (0.78) and briquettes (0.55) technologies can be calculated in a similar manner and the results
used to plot Figure 5.
Conflicts of Interest
The authors declare no conflict of interest.
Energies 2014, 7 1189
References
1. Shafiee, S.; Topal, E. When will fossil fuel reserves be diminished? Energy Policy 2009, 37,
181–189.
2. Holdren, J.P.; Smith, K.R.; Kjellstrom, T.; Streets, D.; Wang, X.; Fischer, S. Energy, the
Environment and Health; United Nations Development Programme: New York, NY, USA, 2000.
3. Bruce, N.; Perez-Padilla, R.; Albalak, R. Indoor air pollution in developing countries: A major
environmental and public health challenge. Bull. World Health Organ. 2000, 78, 1078–1092.
4. Kebede, E.; Kagochi, J.; Jolly, C.M. Energy consumption and economic development in Sub-Sahara
Africa. Energy Econ. 2010, 32, 532–537.
5. Okello, C.; Pindozzi, S.; Faugno, S.; Boccia, L. Development of bioenergy technologies in Uganda:
A review of progress. Renew. Sustain. Energy Rev. 2013, 18, 55–63.
6. Kaijuka, E. GIS and rural electricity planning in Uganda. J. Clean. Prod. 2007, 15, 203–217.
7. Kanabahita, C. Forestry Outlook Studies in Africa (FOSA) Uganda; Forestry Department,
Ministry of Water, Lands & Environment: Kampala, Uganda, 2001.
8. Drigo, R. WISDOM, East Africa. Woodfuel Integrated Supply/Demand Overview Mapping
(WISDOM) Methodology. Spatial Woodfuel Production and Consumption Analysis of Selected
African Countries; Food and Agriculture Organisation of the United Nations (FAO)-Forestry
Department-Wood Energy: Rome, Italy, 2005.
9. Renewable Energy Policy for Uganda; Ministry of Energy and Mineral Development (MEMD):
Kampala, Uganda, 2007.
10. Mobarak, A.M.; Dwivedi, P.; Bailis, R.; Hildemann, L.; Miller, G. Low demand for nontraditional
cookstove technologies. Proc. Natl. Acad. Sci. USA 2012, 109, 10815–10820.
11. Ribeiro, F.; Ferreira, P.; Araújo, M. The inclusion of social aspects in power planning. Renew. Sustain.
Energy Rev. 2011, 15, 4361–4369.
12. Liu, T.T.; McConkey, B.G.; Ma, Z.Y.; Liu, Z.G.; Li, X.; Cheng, L.L. Strengths, weaknessness,
opportunities and threats analysis of bioenergy production on marginal land. Energy Proc. 2011,
5, 2378–2386.
13. Lee, S.K.; Mogi, G.; Kim, J.W. Energy technology roadmap for the next 10 years: The case of Korea.
Energy Policy 2009, 37, 588–596.
14. Xingang, Z.; Jiaoli, K.; Bei, L. Focus on the development of shale gas in China—Based on
SWOT analysis. Renew. Sustain. Energy Rev. 2013, 21, 603–613.
15. Kurttila, M.; Pesonen, M.; Kangas, J.; Kajanus, M. Utilizing the analytic hierarchy process
(AHP) in SWOT analysis—A hybrid method and its application to a forest-certification case.
For. Policy Econ. 2000, 1, 41–52.
16. Stainback, G.A.; Masozera, M.; Mukuralinda, A.; Dwivedi, P. Smallholder agroforestry in Rwanda:
A SWOT-AHP analysis. Small-Scale For. 2012, 11, 285–300.
17. Masozera, M.K.; Alavalapati, J.R.; Jacobson, S.K.; Shrestha, R.K. Assessing the suitability of
community-based management for the Nyungwe Forest Reserve, Rwanda. For. Policy Econ. 2006,
8, 206–216.
18. Dwivedi, P.; Alavalapati, J.R. Stakeholders’ perceptions on forest biomass-based bioenergy
development in the southern US. Energy Policy 2009, 37, 1999–2007.
Energies 2014, 7 1190
19. Eslamipoor, R.; Sepehriar, A. Firm relocation as a potential solution for environment
improvement using a SWOT-AHP hybrid method. Process Saf. Environ. Prot. 2013, doi:10.1016/
j.psep.2013.02.003.
20. Shrestha, R.K.; Alavalapati, J.R.; Kalmbacher, R.S. Exploring the potential for silvopasture
adoption in south-central Florida: An application of SWOT–AHP method. Agric. Syst. 2004, 81,
185–199.
21. Gallego-Ayala, J.; Juízo, D. Strategic implementation of integrated water resources management
in Mozambique: An A’WOT analysis. Phys. Chem. Earth Parts A/B/C 2011, 36, 1103–1111.
22. Ramirez, S.; Dwivedi, P.; Bailis, R.; Ghilardi, A. Perceptions of stakeholders about nontraditional
cookstoves in Honduras. Environ. Res. Lett. 2012, 7, doi:10.1088/1748-9326/7/4/044036.
23. Pesonen, M.; Kurttila, M.; Kangas, J.; Kajanus, M.; Heinonen, P. Assessing the priorities using
AWOT among resource management strategies at the Finnish Forest and Park Service. For. Sci.
2001, 47, 534–541.
24. Derringer, G.; Suich, R. Simultaneous optimisation of several response variables. J. Qual. Technol.
1980, 12, 214–2199.
25. Karande, P.; Gauri, S.K.; Chakraborty, S. Applications of utility concept and desirability function
for materials selection. Mater. Des. 2013, 45, 349–358.
26. Sudhakaran, S.; Lattemann, S.; Amy, G.L. Appropriate drinking water treatment processes for
organic micropollutants removal based on experimental and model studies—A multi-criteria
analysis study. Sci. Total Environ. 2013, 442, 478–488.
27. Koo, L.; Koo, H. Holistic approach for diagnosing, prioritising, implementing and monitoring
effective strategies through synergetic fusion of SWOT, Balanced Scorecard and QFD. World Rev.
Entrepr. Manag. Sustain. Dev. 2007, 3, 62–78.
28. Saaty, T.L. The Analytic Hierarchy Process: Planning, Priority Setting, and Resource Allocation;
McGraw-Hill: New York, NY, USA, 1980.
29. Geneletti, D. Multicriteria analysis to compare the impact of alternative road corridors: A case
study in northern Italy. Impact Assess. Proj. Apprais. 2005, 23, 135–146.
30. Van Blommestein, K.C.; Daim, T.U. Residential energy efficient device adoption in South Africa.
Sustain. Energy Technol. Assess. 2013, 1, 13–27.
31. Wang, J.-J.; Jing, Y.-Y.; Zhang, C.-F.; Zhao, J.-H. Review on multi-criteria decision analysis aid
in sustainable energy decision-making. Renew. Sustain. Energy Rev. 2009, 13, 2263–2278.
32. Scott, J.A.; Ho, W.; Dey, P.K. A review of multi-criteria decision-making methods for
bioenergy systems. Energy 2012, 42, 146–156.
33. Chang, H.-H.; Huang, W.-C. Application of a quantification SWOT analytical method. Math.
Comput. Model. 2006, 43, 158–169.
34. Benítez, J.; Delgado-Galván, X.; Gutiérrez, J.; Izquierdo, J. Balancing consistency and expert
judgment in AHP. Math. Comput. Model. 2011, 54, 1785–1790.
35. Geneletti, D. Combining stakeholder analysis and spatial multicriteria evaluation to select and
rank inert landfill sites. Waste Manag. 2010, 30, 328–337.
36. Political Map of Uganda. Available online: http://www.nationsonline.org/oneworld/map/uganda-
map.htm (accessed on 14 January 2014).

Energies 2014, 7 1191
37. Mukwaya, P.; Bamutaze, Y.; Mugarura, S.; Benson, T. Rural-Urban Transformation in Uganda.
In Proceedings of the IFPRI-University of Ghana Conference on Understanding Economic
Transformation in Sub-Saharan Africa, Accra, Ghana, 10–11 May 2011.
38. Zanchi, G.; Frieden, D.; Pucker, J.; Bird, D.N.; Buchholz, T.; Windhorst, K. Climate benefits
from alternative energy uses of biomass plantations in Uganda. Biomass Bioenergy 2013, 59,
128–136.
39. Centre for Research in Energy and Energy Conservation (CREEC), Makerere University.
Northern Uganda Energy Study. Available online: https://energypedia.info/images/6/60/Northern_
Uganda_Energy_study_report_2011-04-05.pdf (accessed on 19 February 2014).
40. Sengendo, M.; Turyahabwe, E.; Christopher, K.; Muganzi, M.; Kamara, E.; Rugumayo, A.;
Nyanzi, S.; Mubiru, D.; Mussazi, M. Programme Implementation Document (PID) for Uganda
Domestic Biogas Programme; Uganda Domestic Biogas Programme: Kampala, Uganda, 2010.
41. Walekhwa, P.N.; Mugisha, J.; Drake, L. Biogas energy from family-sized digesters in Uganda:
Critical factors and policy implications. Energy Policy 2009, 37, 2754–2762.
42. Mwampamba, T.H.; Owen, M.; Pigaht, M. Opportunities, challenges and way forward for the
charcoal briquette industry in Sub-Saharan Africa. Energy Sustain. Dev. 2013, 17, 158–170.
43. Samson, R.; Mani, S.; Boddey, R.; Sokhansanj, S.; Quesada, D.; Urquiaga, S.; Reis, V.; Ho Lem, C.
The potential of C4 perennial grasses for developing a global BIOHEAT industry. Crit. Rev. Plant Sci.
2005, 24, 461–495.
44. Okello, C.; Pindozzi, S.; Faugno, S.; Boccia, L. Bioenergy potential of agricultural and forest
residues in Uganda. Biomass Bioenergy 2013, 56, 515–525.
45. Raman, P.; Murali, J.; Sakthivadivel, D.; Vigneswaran, V.S. Performance evaluation of three
types of forced draft cook stoves using fuel wood and coconut shell. Biomass Bioenergy 2013, 49,
333–340.
46. Knöpfle, M. A Study on Charcoal Supply in Kampala; Ministry of Energy and Mineral Development:
Kampala, Uganda, 2004.
47. Contran, N.; Chessa, L.; Lubino, M.; Bellavite, D.; Roggero, P.P.; Enne, G. State-of-the-art of the
Jatropha curcas productive chain: From sowing to biodiesel and by-products. Ind. Crops Prod.
2013, 42, 202–215.
48. Grimsby, L.K.; Aune, J.B.; Johnsen, F.H. Human energy requirements in Jatropha oil production
for rural electrification in Tanzania. Energy Sustain. Dev. 2012, 16, 297–302.
49. Kratzeisen, M.; Müller, J. Effect of fatty acid composition of soybean oil on deposit and
performance of plant oil pressure stoves. Renew. Energy 2009, 34, 2461–2466.
50. Gaul, M. A comparative study of small-scale rural energy service pathways for lighting,
cooking and mechanical power. Appl. Energy 2013, 101, 376–392.
51. Stidham, M.; Simon-Brown, V. Stakeholder perspectives on converting forest biomass to energy
in Oregon, USA. Biomass Bioenergy 2011, 35, 203–213.
52. Forman, E.; Peniwati, K. Aggregating individual judgments and priorities with the analytic
hierarchy process. Eur. J. Oper. Res. 1998, 108, 165–169.
53. VU University, Institute for Environmental Studies. DEFINITE—A DSS for a Finite Set of
Alternatives. Available online: http://www.ivm.vu.nl/en/projects/Projects/spatial-analysis/DEFINITE/
index.asp (accessed on 15 May 2013).
Energies 2014, 7 1192
54. Chidumayo, E.N.; Gumbo, D.J. The environmental impacts of charcoal production in tropical
ecosystems of the world: A synthesis. Energy Sustain. Dev. 2013, 17, 86–94.
55. Bond, T.; Templeton, M.R. History and future of domestic biogas plants in the developing world.
Energy Sustain. Dev. 2011, 15, 347–354.
56. Eckart, K.; Henshaw, P. Jatropha curcas L. and multifunctional platforms for the development of
rural sub-Saharan Africa. Energy Sustain. Dev. 2012, 16, 303–311.
57. Dyer, J.C.; Stringer, L.C.; Dougill, A.J. Jatropha curcas: Sowing local seeds of success in Malawi?:
In response to Achten et al. (2010). J. Arid Environ. 2012, 79, 107–110.
58. Vang Rasmussen, L.; Rasmussen, K.; Bech Bruun, T. Impacts of Jatropha-based biodiesel production
on above and below-ground carbon stocks: A case study from Mozambique. Energy Policy 2012,
51, 728–736.
59. Ewing, M.; Msangi, S. Biofuels production in developing countries: Assessing tradeoffs in
welfare and food security. Environ. Sci. Policy 2009, 12, 520–528.
60. Munda, G. Social multi-criteria evaluation: Methodological foundations and operational
consequences. Eur. J. Oper. Res. 2004, 158, 662–677.
61. Catron, J.; Stainback, G.A.; Dwivedi, P.; Lhotka, J.M. Bioenergy development in Kentucky:
A SWOT-ANP analysis. For. Policy Econ. 2013, 28, 38–43.
62. O’Mahoney, A.; Thorne, F.; Denny, E. A cost-benefit analysis of generating electricity from biomass.
Energy Policy 2013, 57, 347–354.
63. Fazio, S.; Monti, A. Life cycle assessment of different bioenergy production systems including
perennial and annual crops. Biomass Bioenergy 2011, 35, 4868–4878.
64. Silalertruksa, T.; Bonnet, S.; Gheewala, S.H. Life cycle costing and externalities of palm oil
biodiesel in Thailand. J. Clean. Prod. 2012, 28, 225–232.
65. Nzila, C.; Dewulf, J.; Spanjers, H.; Tuigong, D.; Kiriamiti, H.; van Langenhove, H. Multi criteria
sustainability assessment of biogas production in Kenya. Appl. Energy 2012, 93, 496–506.
© 2014 by the authors; licensee MDPI, Basel, Switzerland. This article is an open access article
distributed under the terms and conditions of the Creative Commons Attribution license
(http://creativecommons.org/licenses/by/3.0/).