Embed Size (px)
Citation preview

BIOENERGY • and the •: : ENVIRONMENT
edited by Janos Pasztor and
Lars A. Kristoferson Westview Special Studies in
Natural Resources and Energy Management
I:
• 1
I' •• I •
• • I. •,•b•• ' •
• .• • .• •1 t a • • • 4.
• .• a- • ,
• : :.. I. •; • ••• •
: •• I - I •.. •
•:
•; 1t1
:
• • I.
.1 •
H'
Contents
Foreword vii
Introduction: Biomass fuels and developing countries xi
PART I: THE FUELS I. Bioenergy and the environment—the challenge 1
J. Pasztor and L. Kristoferson Traditional fuels 29
B. K. Kaale Modern wood fuels 49
I. Stjernquist Use of agricultural residues as fuel 85
G. W Barnard Liquid fuels 113
F. Rosillo Calle 6. Biogas 163
A. Ellegdrd 7. Producer gas 183
B. Kjellström 8. The modern combustion of dry biomass 201
A. Strehier
PART II: EFFECTS ON THE ENVIRONMENT 9. Land-use impacts 213
D. R. Newman andD. 0. Hall

vi Contents
Air pollution 267 M. J. Chadwick
Water 287 A. K. Biswas
Health effects in developing countries 301 K. R. Smith
Health effects in developed countries 323 S. C. Morris with C. A. Grimshaw
Socioeconomic aspects 361 R. K. Bhatia and A. F. Pereira
Appendix: energy and power units 395
Contributors 397
Index 399
Bioenergy and the Environment
EDITED BY
Janos Pasztor and Lars A. Kristoferson
A Study by the Stockholm Environment Institute for the United Nations Environment Programme
Gi l UNEP
et
i; y
Westview Press BOULDER • SAN FRANCISCO • OXFORD

Wealview Special Studies in Natural Resources and Energy Management
This Westview softcover edition is printed on acid-free paper and bound in library-quality, coated covers that carry the highest rating of the National Association of State Textbook Administrators, in consultation with the Association of American Publishers and the Book Manufacturers Institute.
Figures 5.1 and 5.2 are reprinted by permission of John Wiley & Sons, Ltd., from IJ. 0. Hall and R. P. Overend, eds., Biomass: Regenerable Energy (Chichester: John Wiley & Sons, 1987; copyright © 1987 by John Wiley & Sons, Ltd.), pp. 311 and 312; Table 14.2 is reprinted by permission of the International Labour Organisation (ILO) from R. Bhatia and A. Pereira, eds., Socioeconomic Aspects of Renewable Energy Technologies (New York: Praeger, 1988; copyright © 1988 by the ILO, Geneva; published on behalf of the ILO by Praeger Publishers, New York), p. 168; Table 14.3 is reprinted by permission of the ILO from Armand F. Pereira, Ethanol, Employment, and Development: Lessons from Brazil (Geneva: ILO, 1986; copyright © 1986 by the ILO, Geneva), p. 69.
All rights reserved. No part of this publication may be reproduced or transmitted in any form or by any means, electronic or mechanical, including photocopy, recording, or any information storage and retrieval system, without permission in writing from the publisher.
Copyright © 1990 by Westview Press, Inc.
Published in 1990 in the United States of America by Westview Press, Inc., 5500 Central Avenue, Boulder, Colorado 80301, and in the United Kingdom by Westview Press, 36 Lonsdale Road, Summertown, Oxford 0X2 7EW
Library of Congress Cataloging-in-Publication Data Bioenergy and the Environment / [edited] by Janos Pasztor and Lars A.
Kristoferson. p. cm.—(WVSS in natural resources and energy management)
Includes bibliographical references and index. ISBN 0-8133-8062-6 1. Biomass energy—Environmental aspects. I. Pasztor, Janos,
1955- . II. Kristoferson, Lars A. Ill. Series. TD195.B56B54 1990 333.95'39—dc2O 90-12841
CIP
Printed and bound in the United States of America
The paper used in this publication meets the requirements of the American National Standard for Permanence of Paper for Printed Ubrary Materials Z39.48-1984.
10 9 8 7 6 5 4 3

Bloenergy and the Environment

Foreword
Globally, biomass fuels represent the second largest source of energy used, after fossil fuels. In developing countries, about two thousand mil-lion people rely almost entirely on biomass fuels for their energy needs, representing about 55 EJ (1257 MtOe) or 35 per cent of the energy used in developing countries. These fuels include fuelwood, charcoal, various agricultural residues such as animal dung and crop wastes, as well as more modem biomass fuels, such as alcohols.
Even the above does not fully reflect the high level of dependence on bioenergy by developing countries. In areas where wood is in abundant supply, fuelwood or charcoal are usually the preferred fuels. The average person in rural areas uses about one tonne wood equivalent of biofuels per year, while in the urban areas this figure seems to be about half a tonne. Although the figures are very imprecise, about half of all the trees cut in the world, for whatever reasons, end up being used as fuel for cooking and beating. In areas of wood scarcity, however, people turn to various biomass residues. For example, in the highly populated plains of Northern India, Bangladesh and China, up to 90 per cent of domestic energy in rural areas comes from biomass residues. In spite of their bulk-iness, biomass residues are also heavily used in some urban areas.
In industrialized countries both the absolute level and the percentage of total energy consumption that biomass fuels represent are much lower, but not negligible (approximately 3 per cent). As a comparison, assuming that the contribution of nuclear energy is calculated as a gross output of electricity, the contribution of biomass in developed countries is close to that of nuclear. In industrialized countries, however, most biomass energy is consumed by industry.

viii Foreword
In total, biomass fuels represent some 13 per cent of the world's energy use, and much of present biomass use could be made consider-ably more efficient using improved methods of biomass management and conversion systems, particularly in developing countries. By intro-ducing such methods, in the medium term, considerably more energy end-uses could be satisfied with the same level of biomass.
At the same time, the theoretical potential for biomass energy is sub-stantial. Presently there is about ten times as much energy stored in biomass as annual biomass energy being consumed. Unfortunately, pho-tosynthetic efficiency is rarely more than 1 per cent even over short peri-ods and on a yearly basis, the efficiencies are only 0.1-0.5 per cent. The environmental consequences of very large increases in biomass utiliza-tion could, however, be serious, if they were carried Out without proper management, as this book will show in detail.
One of the keys to the future of biom ass will be the synergistic devel-opmerit of two separate, but strongly interrelated areas, namely the pro-duction of biomass for food and feedstocks (i.e. conventional agriculture and industrial use) and the production of biomass for energy. Both require land, and generally biomass production for energy entails the same agricultural inputs as for food production, such as fertilizers, pesti-cides, labour and capital. If there is a limiting factor to the amount of biom ass which can be produced in a given area, the limit will equally affect food, feedstock and energy production. Furthermore, aside from purely political and national security considerations, it will be the marginal profitability of each type of biomass which will decide whether emphasis is placed on the production of biomass for food, industry, energy or a mixture of these.
In the future, we can expect demand for biomass to rise considerably. One reason is that as populations grow, even with a constant per capita consumption level, overall demand will grow. As regards biomass for energy, since the greatest population growth is likely to take place in urban areas of developing countries, where—in part due to the high lev-els of charcoal consumption—total wood demand is high, one can expect the largest increase in biomass demand to be for wood. While much of the fuel needs of increased populations will certainly be met by fuels other than biomass, considerable overall increase in demand for biom ass fuels can be expected in developing countries.
One can also expect increases in demand for biom ass fuels in devel-oped countries. This will arise from the search for alternative energy sys-

Foreword ix
tems, in part fuelled by environmental considerations, though the future price of oil will have a very important effect on these developments. Increases in demand for biomass fuels are also likely to arise from tech-nologies presently being developed which allow either the production of new or improved biomass fuels, or the improved conversion of biofuels into more efficient energy carriers. In most developed countries the potential use of biomass is greater than the average present use and in some, such as the Nordic countries, the potential use of biomass is con-siderable.
Thus, we conclude that bioenergy is here to stay and is probably going to increase in importance. It is essential, therefore, for energy planners to have a good knowledge of both the adverse and the beneficial effects that bioenergy systems have on the environment. We hope that this book will prove useful in this regard.
Dr Mostafa Tolba Dr Gordon T. Goodman Executive Director Executive Director United Nations Stockholm Environment Institute Environment Programme Stockholm Nairobi Sweden Kenya

Introduction
Biomass fuels and developing countries
The book which follows was written mainly for professionals working in the area of energy development and planning, as well as for those work-ing in the environmental field. The work, therefore, is technical although in a number of cases, due to the lack of quantitative data the presentation is qualitative. The book has been kept concise, and more data can be found in the various references cited.
This book concentrates on the environmental impacts of the more important bloenergy systems. In order to explain those, some discussion of the various bioenergy processes was necessary. However, the book is not meant to be a comprehensive treatise of bioenergy. Several options, either presently marginal or more futuristic, have been left out. Inter-ested readers, wanting to know more about the details of bioenergy sys-tems, should read, for example, the book edited by Hall and Overend (1987) included in the bibliography on page 28.
Chapter 1: Bioenergy and the environment—the challenge summarizes the essential elements and outlines a few policy conclusions drawn by the editors from the technical chapters. While this summary is meant to be a policy analysis guide for the technical readers of the book, it was also written in a way so that it could be read by those who have no detailed knowledge of bioenergy systems and of environmental impacts. This summary, therefore, should be useful for the decision makers involved in bioenergy and environment issues. To broaden its scope, this summary will also be available separately in English, French and Spanish as part of the UNEP Energy Report Series. A well-illustrated, popular book, aimed at a wide, general readership, has also been pub-lished by UNEP on the same subject.

xii Introduction
The object of this technical work is to collect relevant material on the environmental impacts of bioenergy systems; and for this material to be presented as quantitatively as possible. The editors hope that by collect-ing this information in one volume, Bioenergy and the Environment will be a useful starter for those who want to know more about this subject.
The book is mainly, but deliberately not entirely, about and for devel-oping countries. As has already been said, while bioenergy is important everywhere, in developing countries it is among the most important pre-sent and future sources of energy. Nevertheless bioenergy is used and will be used more intensively in future in industrialized countries, and some of the experience and concepts there will have relevance in devel-oping countries.
The book is in three main parts. This introduction and Chapter 1 were prepared by the editors. Part I comprises seven technical chapters, deal-ing with the environmental impacts of specific bioenergy systems, including production, conversion and end-use.
Eminent professionals in the various aspects of bioenergy, from differ-ent parts of the world, prepared the individual technical chapters for Part I.
Chapter 2, Traditional fuels, was prepared by B. K. Kaale of Tanza-nia, with additional inputs from G. Foley of the UK. This paper deals with the issues relating to the traditional patterns of biomass gathering and use, concentrating mainly on wood fuels. Chapter 3, Modern wood fuels, was written by I. Stjemquist of Sweden, and discusses the environ-mental impacts of modem biomass production systems, particularly of forestry. Chapter 4, Use of agricultural residues as fuel, is the work of G. W. Barnard of the UK, and analyses the critical issues which have to be considered when removing residues, or not replacing them in the soil. Chapter 5, Liquid fuels, was written by F. Rosillo-Calle of Spain, look-ing primarily at the ethanol fuel cycle and its environmental impacts. Chapter 6, Biogas, is the work of A. Ellegãrd of Sweden, analyzing the many beneficial and few adverse impacts of this energy system. Chapter 7 on Producer gas was written by B. KjellstrOm of Sweden showing that, with careful management, the adverse impacts of this form of bioenergy can be minimized. A. Strehler of the lederal Republic of Germany wrote Chapter 8, on Modern co,nbustion of dry biomass.
In Part II, the book addresses the same issues but according to the major potential environmental impacts, both adverse and beneficial, that result from the use of biofuels. Chapter 9, Land-use impacts, was writ-

Biomass fuels and developing countries xiii
ten jointly by D. 0. Hall and D. Newman, both of the UK. This chapter analyses the different angles from which land-use issues are looked at. National and regional governments have stakes in the land as well as vil-lage councils and individuals; often divergent ones. As a consequence, the environmental considerations are also analysed in this context. Chapter 10, Air pollution, is the work of M. J. Chadwick of the UK. This compares the impact on air pollution of biofuels with that of con-venlional fossil fuels. Chapter 11, Water, was prepared by A. Biswas of Canada. Chapter 12, Health effects in developing countries, was pre-pared by K. Smith, USA, and discusses the very serious public health problem presented by the indoor combustion of biofuels in developing countries. Chapter 13, Health effects in developed countries, is the work of S. Morris and C. A. Grimshaw of the USA which analyses the health impacts of biomass energy systems mainly from an industrialized coun-try perspective. Chapter 14, Socioeconomic aspects, was jointly written by R. Bhatia of India and A. Pereira of Brazil, with inputs also by V. Shiva of India.
After the authors completed their respective chapters, the material was edited and brought into a common format. Nevertheless the ideas and conclusions of the individual chapters are those of their respective authors. The technical chapters for Parts I and II were all subjected to peer review before they were finalized. A small group of experts met in Glion, Switzerland in May 1988 to do the review. Members of the Review Group were:
Dr Gustavo Best, Senior Officer, Energy, FAO, Rome Professor David 0. Hall, King's College, London, UK Professor Mark Mwandosya, Commissioner for Energy and Petroleum Affairs, Ministry of Energy and Minerals, Dar-Es-Salaam, Tanzania Professor David Pimentel, Cornell University, Ithaca, NY, USA Mr Dana Silk, Centre intemationale de recherche sur l'environnement et le dveloppement, Paris, France.
While the reviewers did an excellent job in identifying problem areas and gaps in the technical material, it was up to the authors of the individ-ual chapters to amend their work accordingly. The editors would like to thank the members of the Review Group, whose assistance was invalu-able in making this book. We would also like to thank Words and Publi-

xiv Introduction
cations for finally putting together the text and producing it in such an easily readable format. We also thank both the United Nations Environ-ment Programme and the Stockholm Environment Institute (formerly the Beijer Institute) for making this book possible.
The Editors Nairobi and Stockholm
PART 1:1 Bioenergy and the environment- the challenge
J. Pasztor and L. Kristoferson
The work presented in this book aims to show that, if biomass energy systems are well managed, they can form part of a matrix of energy sup-ply which is environmentally sound and can, therefore, contribute to sus-tainable development. The overall impacts of bioenergy systems may be less damaging to the environment than those of conventional fossil ftiels, since they produce many, but local and relatively small, impacts on their surrounding environment, compared with fewer but much larger impacts, distributed over greater areas for fossil fuels. It is these quali-ties which can make the environmental impacts of bioenergy systems more controllable and more reversible, and consequently more benign. Furthermore, reliance on bioenergy may often result in additional benefi-cial side effects, both locally and globally.
Towards sustainable energy development
All bioenergy systems, like any other energy systems, result in some environmental impacts. While certainly some are more favourable from an environmental point of view than others, it is not possible to say that there are energy systems without any impacts at all. In the case of bioenergy, the actual impact often depends more on the way the whole system is managed than merely on the fuel or the conversion technology. It is important to realize that the impacts vary both in quality and in quantity. The objective of an environmentally conscious energy policy would be to arrive at patterns of energy consumption and supply where

2 J. Pasztor and L. Kristoferson
the total environmental impact could be minimized, in accordance with local economic and social realities.
The sense in which the term 'environmental impact' is used here implies either an adverse or a beneficial impact resulting from the pro-cess of producing or converting and using energy, acting on a subject outside the formal framework for analysis. For example, cost is not an impact, since costs are calculated as part of the classical analysis of an energy system. However, the effect of harmful pollutants dispersed into the atmosphere is 'external' and is not generally calculated in the analy-sis. Similarly, an energy forest may provide benefits in addition to energy production, such as diminished soil erosion, green space, and aesthetic beauty; issues which, again, are external to the conventional economic analysis. Further, the impact may be positive when compared with the effects of another technology. This is sometimes particularly relevant to bioenergy systems compared with conventional fossil-based systems.
When we use the words 'environmental impacts' we may mean harm to human health, to natural or human-made ecosystems, to human-made structures or to the socioeconomic fabric. Each of these impacts can be further classified according to a number of characteristics which are tun-damental in the evaluation of environmental impacts. One important factor is size. A small impact may not be worth evaluating, while a big one may cause a lot of harm. Furthermore, there is a considerable judge-mental component in the assessment of some of these impacts; what is judged as negative by some may be regarded as positive by others.
Some impacts cause reversible damage to the object they act on. For example, someone falling off a roof during the cleaning of a solar panel may break a leg, but after a few weeks the damage can be completely reversed following appropriate health care. On the other hand, defor-estation on some soils may be irreversible, since the exposed soil is unable to support new vegetation, and rapidly the topsoil erodes.
In the case of a person cooking on an open fire in an unvented hut, the impact (the indoor air pollution) is acting on the same persons who are enjoying the benefits, both in space and in time. In many cases, how-ever, this is not true. For example in the case of the combustion of most fossil fuels, the air pollution often harms people or ecosystems at consid-erable distances away. In the case of biom ass use without replanting, the carbon dioxide produced during its combustion is not absorbed by the
Bioenergy and the environment—the challenge 3
growing biomass. The resulting climate change will affect people throughout the globe, and not just present, but also future generations.
The different categories of environmental impact listed above as examples are not independent of each other. A small emission may result in a reversible effect. However, if the level of emission rises above a certain value (a threshold), the effect may become irreversible. Similarly, a small amount of toxic emission from a particular source may only produce an occupational hazard, but after a certain level the emis-sion may also cause a public health problem. The different characteris-tics are interrelated, and they have to be considered accordingly.
The purpose of environmentally conscious energy development, therefore, is to try to make considered choices between different energy systems, in order to minimize their environmental impacts, while being conscious of social and economic realities. The problem is, however, as we have seen above, that the environmental aspects have different aspects, which are measured by different, often incomparable measures. Rarely can one express all concerns in just one value, such as monetary costs.
How can one decide between one irreversible impact and many reversible ones? How can one decide between a potential health impact (and thus a cost) today and one for people of future generations, espe-cially when conventional economic analysis is heavily weighted against present costs and future returns? Is it better to have an energy system with an occupational or a public health impact? For example, by opting for a well-managed bioenergy system for home heating, one is implicitly promoting a health risk to individuals in the home (although with addi-tional cost this risk can be reduced to negligible levels), and promoting health risks outdoors for the population at large with air pollutants pro-duced from biomass combustion. Biomass energy, however, still often compares favourably with the widespread environmental impacts of fos-sil fuel-based air pollution and climate change. The latter impacts may sometimes he more difficult to remove at any 'reasonable' level of cost.
These are questions which, of course, cannot be answered using any one, simple formula. More often than not, they involve the considera-tion of important political and moral choices. The best the professionals working in the energy field can do is to provide as much, and as high a quality of, scientific information as possible, on all the different environ-mental impacts produced by each energy system, and thus provide deci-sion makers and the public with relevant information on which to base
4 J. Pasztor and L. Kristoferson
their choices. In many situations, particularly with regard to bioenergy systems, such information is simply not available, and in many cases will not be available without considerable effort. Some bioenergy sys-tems are complicated, and information on the consequences and proper -ties of all involved parameters may not yet be available.
One issue which is particularly relevant for bioenergy systems is the potential benefits. These could include benefits in the sense of avoiding an adverse impact of a strongly polluting energy system, by substitution. For example, replacing a well-managed (i.e., using the best abatement technologies, and best environmental practice throughout the fuel cycle) coal-fired boiler with a well-managed wood-fired one will result in cer -tain improvements in air quality. In some cases, however, in addition to the avoidance of adverse effects, some positive effects can also be pro-duced. For example, a well-managed energy forest, in addition to pro-viding wood for the above boiler, would also provide green space, absorb carbon dioxide, may improve soils, would increase wild life and would provide fruits and building materials. The challenge, therefore, is to incorporate all the adverse and positive impacts of energy systems into the overall cost benefit analysis, as well as into the planning pro-cess.
One difficulty in environmental management has been the problem of externality. Technologies to manage environmental impacts often cost money. If the environmental impact happens to subjects outside the (usually) narrow framework for analysis, the impact is ignomd, and the management of the environmental impact is considered to be too expen-sive. Internalization of environmental impacts of energy systems, there-fore, must be an explicit goal both of energy policy and of research and development, if our aim is to move toward more sustainable energy futures.
The recently published report of the World Commission on Environ-ment and Development stated that "Sustainable development is develop-ment that meets the needs of the present without compromising the ability of future generations to meet their own needs". It follows from this that as far as environmental impacts are concerned, in addition (of course) to trying to reduce the size of the adverse impacts to levels con-sidered acceptable, and trying to maximize the positive impacts, one should aim at those energy systems which result in impacts which are more reversible than irreversible, and which consequently are more able to internalize the environmental impacts, both in space and time. When
Bioenergy and the environment—the challenge 5
this is not possible, one should aim at those energy systems in which the externalities can be clearly identified and consequently reduced.
All this will have to take place in a context in which the development needs in the developing countries will require considerable increases in energy inputs, even in cases where more energy efficient scenarios are adopted for the future.
Like all energy options, bioenergy systems also come with a certain number of environmental impacts, as will be shown in more detail in later chapters of this study. After reading those detailed discussions, however, it will be clear that well-managed bioenergy systems generally may have limited negative effects on the environment, and often they can be very beneficial indeed. In fact, it is one of the main conclusions of this study that, in many cases, well-managed bioenergy systems are environmentally sound substitutes to other more polluting energy sys-tems, particularly fossil fuels. Very often, therefore, the most important positive aspect of bioenergy use would be the avoidance of the adverse environmental impact of another energy system.
Given present levels of energy consumption, it is of course not con-ceivable that bioenergy systems could substitute for all the fuels presently used in the global energy supply mix. Much of bioenergy use today has very serious environmental consequences. Over-exploitation of biofuels can be very harmful, as the following chapters will indicate. Bioenergy systems have their niche in the energy supply matrices in most countries, and this niche is potentially considerably larger than is exploited today. In order for the bioenergy share to increase, however, bioenergy has to be managed well. For the moment, however, this is far from being the case, in general, and some of the most serious environ-mental problems today have their origin in the current patterns of bioen-ergy use, not least in developing countries. The transition to sustainable energy pmduction and use is therefore just as important in relation to biofuels as it is to other energy forms. In this respect, bioenergy and other forms of energy share the same problems.
Bioenergy systems and the environment
In order to be in a position to assess and consequently manage the envi-ronmental impacts of different energy policies, one has first to have information about the environmental impacts of individual energy con-version processes and end-use devices. This section summarizes, in a

6 J. Pasztor and L. Kristoferson
qualitative way, the more detailed analysis found in Chapters 2-8 of this book.
Traditional biomass resources Most people in the developing countries, and especially rural households and the urban poor, rely on traditional biom ass resources for their energy needs: fuelwood, charcoal and various forms of agricultural and animal wastes. In rural areas, most traditional biomass resources are collected by the users, or come from informal, non-commercial markets, in stark contrast to urban and industrial traditional biomass resources, which are almost entirely bought and sold in commercial markets.
It is simply impossible to make a universally valid statement of how the traditional biomass resources are produced, collected and acquired. One of the most important characteristics of traditional biomass systems is their very high levels of site specificity. Nevertheless, a few points seem to emerge which seem to be generally valid.
According to the conventional wisdom of the past two decades, wood fuel has been blamed as the primary cause of deforestation and conse-quent desertification in developing countries. The information emerging from more detailed, site specific studies, however, indicates otherwise. Although a large proportion of the trees felled do end up as fuel, the most important driving force for the cutting of the trees, and conse-quently for the disappearance of forests, seems to be the need to open up land for agriculture and grazing, followed by other commercial uses of trees, including commercial wood fuel requirements by urban and indus-trial users. Rural wood fuel requirements rarely cause deforestation. Therefore the 'second energy crisis' due to wood fuel shortages needs to be looked at, not merely as an energy crisis, but rather as a subset of crises in land-use and development patterns.
Rural collection of traditional wood fuels rarely causes significant environmental damage. Many traditional practices of tree management (such as pruning) and of combining tree growing with food producing units (agroforestry) are environmentally sound, and may often result in increased wood and crop yields.
Exploitation of forests and woodlands by commercial loggers, as well as by expanding agricultural and grazing interests, however, often do have adverse impacts. Often forest soils are unable to sustain agriculture once the trees are removed, and become completely exhausted and bar-

Bioenergy and the environment—the challenge 7
ren after a few years. This, however, is not an energy issue but rather an agriculture one.
The charcoal and fuelwood requirements of urban and industrial users usually result in major adverse environmental impacts. Forests and woodlands are indiscriminately cleared, without replanting, often in con-centrated areas near major urban agglomerations; also frequently in more distant areas.
Much current action, including tree planting and improved Stove pro-grammes, has been based on wrong assumptions about the nature of the wood fuel problem, as described in the paragraphs above. Consequently, many of these programmes have failed completely, or succeeded only partly in reaching their objectives. They may, however, have improved the environmental and social benefits which were initially considered secondary.
In order to analyse the policy issues, one requires a good factual knowledge of the particular situation. General approaches, while useful to develop concepts and strategies, are not useful for policy interven-tions, as problems related to the use of traditional biomass fuels are inherently local. Before any successful policy intervention can take place, therefore, the nature, size and quality of biom ass flows need to be known. The availability and price of fuels, time series data, end-user profiles and cross-elasticities are lacking in most places.
Only if based on detailed, local knowledge of the above can the prob-lems and their root causes be identified, and formulated in ways which lend themselves to policy intervention. The importance of doing this with the local populations involved cannot be over-stressed. This is par-ticularly true of the women, who are usually the most important providers and users of biomass, but who are more often than not outside the decision-making processes. In rural situations, it is not possible to separate the energy issues from the other development issues. Energy has to be looked at as one element of an integrated whole, and policy interventions have to be developed accordingly. While these issues apply to all energy systems, in the traditional sector they are particularly relevant, given their site and culture specificity.
One specific technical issue seems to be valid in most places. The urban, industrial, institutional and commercial demand for biomass (both fuel and food) is a major cause for deforestation in the rural areas. Poli-cies which are available to improve the biomass supply/demand situation for these needs should be pursued by all countries, including conserva-
8 J. Pasztor and L. Kristoterson
tion and substitution measures. Generally, tree planting in rural and pen-urban areas to increase wood fuel supplies to urban areas tends to be very expensive. Such solutions, however, have worked well to supply specific industries, agro-processing plants or modem energy conversion systems with fuel.
Traditional charcoal conversion Charcoal is more popular than fuelwood in many areas in developing countries, particularly since it bums more cleanly than fuelwood, and it has a higher energy content per unit weight. It is also often more easily available than fuelwood. Most charcoal conversion is done in ineffi-cient, traditional earthen kilris, although some recent studies indicate that actual efficiencies tend to be considerably higher than previously indi-cated. This shows the importance of detailed, site-specific surveys before any analysis and policy intervention are considered. Whole trees, branches, and some agricultural residues, such as coffee husks, can be used as feedstocks.
In spite of the higher conversion efficiency of charcoal at the point of end-use, typically one needs more than twice as much wood to deliver the same final energy as with fuelwood. This, by itself, has tremendous resource implications. Furthermore, charcoal use is almost entirely com-mercial, usually in urban and industrial areas. While a lot of the wood which is being converted to charcoal comes from forests cleared for agriculture, most often the producers Cut trees specifically, in order to produce charcoal. This can directly contribute to deforestation.
The health impacts of charcoal use are considerably reduced com-pared to fuelwood or residues at the point of combustion, although invis-ible carbon monoxide production during incomplete combustion can be a problem. Given its clean burning and convenience, charcoal is a desir-able fuel. Conversion efficiencies can be substantially increased using more sophisticated technologies. This is, for example, relatively easy in an energy forest (planted or natural) on a commercial scale. It is, how-ever, difficult to do on a small scale, since the livelihoods of many small-scale charcoal makers may be threatened. Introduction of a fixed kiln would also introduce a considerable transport problem.
It is worth increasing the end-use efficiency of charcoal combustion through the development of more efficient charcoal cookers as the widespread commercial consumption ensures a market for more efficient Stoves even if these are more costly.
Bioenergy and the environment—the challenge 9
AQricu!tural residues The term 'agricultural residues' includes various woody crop residues, cereal remains, and green crop residues as well as crop processing residues. Those that are dry tend to be best suited for use as fuel, whereas green residues tend to be better as animal fodder or manure. The latter can also be used as feedstock in biogas plants.
The largest energy use for residues is as domestic fuel in developing countries. In some areas, such as in certain areas of China and Bangladesh, residues can provide as much as two-thirds of household energy. In Africa and Latin America, the energy use of residues is smaller but increasing in significance.
There has also been increased interest in the use of residues for energy purposes outside the traditional sector, and also in industrialized coun-tries. Considerable potential exists for increased residue use in a number of areas. One key constraint, apart from the serious environmental ones, is the competing uses for residues such as fertilizer and basket making.
The wide variety of agricultural residues implies a wide variety of potential environmental effects. There are, essentially, two areas where environmental impacts may occur. Firstly, the removal of residues may have an impact by intensifying soil erosion and rapid water run-off. Secondly, the combustion of the residues themselves may result in spe-cific hazards.
There is, in general, a strong correlation between increased removal of residues from the soil and decreasing soil fertility and intensified ero-sion. The extent of this correlation, however, depends on many factors such as the specific plant and residue in question, the type and condition of the soil, the climate, and the intensity of residue removal. Conse-quently, only a detailed, site-specific analysis can tell what the impacts of the removal of a certain residue will be.
In a few cases, plant residues can be removed from the land without serious environmental consequences. In many cases, however, the removal of crop residues will severely intensify soil erosion. This will result in the loss of soil nutrients, water-holding capacity, soil organic matter and soil biota. In addition, residue removal increases the rate of water run-off between 10 and 100 fold.
Recycling of residues acts as a crucial soil conditioner in many places and its lack is more serious in some areas than in others. Tropical sites, and mountainous areas are more vulnerable than flat, low-land areas in temperate regions.

10 J. Pasztor and L. Kristoferson
Combustion of residues has generally the same kind of health impacts as combustion of wood fuels. However, since the energy content of residues is lower and the moisture content sometimes higher than those for wood fuels, the size of the impacts is much higher. The considerable health impacts of cooking in an unvented space are further aggravated by the fact that residues tend to be bulky, and consequently need con-stant attention from the cook, thus increasing exposure.
Combustion of agricultural residues in modem devices is highly dependent on the specific technology used. Using techniques such as emission standards and mandatory emission control devices, the emis-sion levels can be minimized.
The health impacts of indoor residue combustion can be considerable, and this problem is difficult to control. From this standpoint, therefore, residue utilization is not advocated. In reality, however, many people in developing countries are obliged to depend on residues. For these peo-ple, venting out of smoke from the cooking space is the key technical problem to be solved.
Health impacts of traditional biomass combustion The indoor combustion of hiomass fuels in traditional settings (usually unvented cooking space) causes considerable health problems directly to the principal users, who are mainly woman and children. Hundreds of millions of people in developing countries are exposed to this pollution, which is a risk factor for several of the most important causes of ill-health and death in developing countries.
The combustion of all biomass fuels releases considerable amounts of toxic gases into the cooking space. Dry wood and charcoal bum rela-tively cleanly. However, as the moisture content of wood increases, and as other biomass fuels of lower energy content (such as residues) are used, the emissions rise. A wide range of pollutants are emitted, cover-ing carbon monoxide, nitrous oxide, hydrocarbons, organics, aldehydes and aromatics. In the case of incomplete combustion of charcoal, con-siderable amounts of carbon monoxide can be emitted. This may go unnoticed due to the relatively small smoke emission of charcoal fires, but it can create an important hazard.
Actual emissions and exposure levels have been subject to only a lim-ited number of studies to date and standard methods allowing scientific comparisons have not yet been developed. Concentrations resulting from open fires in badly ventilated rooms, however, will generally be
Bioenergy and the environment—the challenge 11
higher than in the dirtiest outdoor urban environments. With long cook-ing periods, the levels of exposure can be high. A number of factors influence the level of impact, including the type of fuel used, style of cooking, type of food, type of stove, and house construction.
The main observed health effects include acute respiratory infections, chronic obstructive lung disease, low birth weights, cancer and eye infections. While there are few comprehensive scientific studies avail-able giving statistics of the above, some smaller surveys and other expe-rience suggest serious impacts at least as far as the first three of the above are concerned. As well as the chronic health effects there is, of course, the risk of bums and of children falling into the open fires.
The relative scarcity of biomass fuels in a number of settings has resulted in additional, indirect, health-related effects as a result of, for instance, cutting down on cooking times or failing to boil water for drinking.
Although more health research is needed, enough evidence is avail-able to suggest that unventilated combustion of biom ass in some areas of developing countries is a serious public health problem. The problem of the health impacts of traditional biomass combustion is not just an energy problem but a much broader problem of rural development. When designing strategies to reduce these problems, the positive side effects of open indoor combustion must not be overlooked. These include the lighting of houses, repelling insects such as mosquitoes and the preservation of thatched roofs.
Nor should it be forgotten that approaches concentrating on single specific elements of the problem, such as stove efficiency or smoke emissions, have not in the past proved very useful. An integrated approach is required, evaluating the whole system of cooking or kitchen management. For example, the provision of alternatives for indoor light-ing may be the key to the acceptance of enclosed and vented stoves in many areas. Stove programmes, while including many positive ele-ments, must be liberated from being only energy programmes, and be converted into programmes with much broader objectives, including health, hygiene, comfortable kitchens and labour productivity as well as fuel efficiency and cost. As the main users are women, it cannot be overemphasized that their full participation in the development and implementation of any strategy is essential.

12 J. Pasztor and L. Kristoferson
Biogas Most wet biom ass can be converted into a combustible gas through the anaerobic digestion in a biogas digester. Typically, animal or human wastes or wet plant material are collected, mixed with water and fed into an airtight container. The gas which is produced can be collected, while the resulting sludge needs to be disposed of; for example, used as fertil-izer. Biogas digesters come in various sizes from small, single family units up to large, industrial scale facilities. Because of the need for water, as well as due to problems of cultural acceptability, biogas has been successful only in some areas. For cooking purposes biogas can be burned directly. It can also be used to drive internal combustion engines, but traces of hydrogen sulphide need to be cleaned out of the gas to avoid corrosion.
The most important impact is positive, namely that the digestion pro-cess destroys some harmful bacteria and pathogens found in animal and human wastes. The technology of biogas, therefore, is generally an environmentally sound way of managing animal and human wastes, which otherwise would either present important health hazards or whose disposal would entail considerable costs.
The resulting waste sludge is an excellent fertilizer, sometimes better than the original wastes (for example, some seeds in the wastes are destroyed by the digestion process), especially if they are quickly returned to the soil. If waste water is used in the digester, the value of the resulting sludge as a fertilizer will partly depend on the level and the type of contamination found in the original waste water. If feedstock is contaminated with pollutants such as heavy metals, then the waste sludge will also contain the heavy metals and this could represent a dis-. posal problem, although the volumes may be lower.
Collection of animal wastes to be used in biogas digesters, especially in the decentralized rural settings, may result in a transfer of wealth from the land, where the collection takes place, to the owner of the digester. Leaks from the digester, especially large ones, could potentially contam-inate drinking water supplies. Emissions from the combustion of biogas are essentially harmless, though the small amounts of hydrogen sulphide present may cause eye irritation. There is also a very small chance of explosion of the biogas in critical mixtures with air.
Biogas technology is an environmentally sound method for managing human and animal wastes. In addition, a useful fertilizer and a com-bustible gas are produced. Overall, the main impacts are positive. How-
Bloenergy and the environment—the challenge 13
ever, given the water requirements of the process, biogas technology is not recommended in water-scarce areas unless waste water is readily available.
The relatively minor negative impacts listed above can be controlled with proper management. The social impacts of animal waste collection in rural areas need to be considered on a case-by-case basis, particularly in view of the considerable labour requirements involved.
Producer gas Producer gas is generated by pyrolysis or the partial combustion of biomass, such as wood or various crop residues. The main types of gasi-hers include up-draught, down-draught, cross-draught and fluidized-bed gasifiers. In terms of environmental impact they are similar.
The gas can be utilized either for direct combustion in a boiler or for operation in an internal combustion engine. Both of these, in large and small sizes, have been shown to operate using producer gas. The biomass feedstocks can be obtained directly from an energy plantation, or commercial or non-commercial biomass markets.
The supply of biomass feedstocks to the gasifier process will have dif-ferent environmental impacts, depending on the actual source of the biomass. Following gasification, the gas consists mainly of carbon monoxide, hydrogen, carbon dioxide, water vapour, methane and nitro-gen. There are also small amounts of condensable organic vapours. The gas, if mixed with air, can cause explosions. The high content of carbon monoxide malces the gas highly toxic, and chronic exposures may lead to chronic health problems and to death. This is mainly an occupational risk. Both problems can be reduced with adequate design and use of safety devices, as has been shown by the experience of some industrial-ized countries during World War H.
The potentially harmful organic vapours will be destroyed during direct combustion. However, if the gas is to be used in an engine, the organic vapours will condense during cooling of the gas. The conden-sate will then represent a certain hazard for the operator's health and the surrounding environment if not handled properly. This might become a problem during larger-scale operations. Disposal of the solid residue from the gasifier may lead to locally increased concentrations of heavy metals following possible leakage from residue dumps, creating a prob-lem where there are many small installations or a few larger installa-tions.
14 J. Pasztor and L. Kristoferson
Combustion of producer gas will result mainly in carbon dioxide and water vapour. There are also some nitrous oxides, which will cause acidification and health effects similar to those of fossil fuels. Neverthe-less, compared to fossil fuels, where usually considerable amounts of sulphur oxides are emitted, the effects are much smaller. Also, the emis-sion of nitrous oxides during the combustion of producer gas is less compared to direct combustion of the original biomass feedstock.
The producer gas cycle may have a number of adverse impacts on land-use, occupational and public health, as well as on the natural envi-ronment. Nevertheless, all these impacts can be minimized with proper design, systems management and following of safety procedures. If these problems are taken care of, producer gas can sometimes be a viable and environmentally sound alternative to fossil fuels. Neverthe-less, the maturity of this technology as well as the economics of pro-ducer gas generation remain problems, which will be constraints on widespread development.
Alcohol fuels (ethanol) A number of processes are available to produce ethanol from different sugary and starchy plants. The main processes are based on sugar cane (as in Brazil and Zimbabwe, for example) or on corn (as in the US). The basic processes involve fermentation and distillation, which require con-siderable energy input. This can come either from conventional energy sources such as fossil fuels, or from the by-products of the sugar indus-try, such as bagasse. The alcohol produced can be used either neat or in various blends with gasoline (gasohol). The use of alcohols as a motor fuel has been increasing world-wide, although with the continuing low oil prices such a trend will be difficult to sustain.
On the resource side, growing of the feedstock for alcohol production can have considerable environmental impacts, similar in quality and quantity to the environmental impacts of commercial agriculture or pro-duction of other energy crops. Depending on the particular crop, soil, climatic conditions and chemical fertilizer use, sustained monoculture can result in reduction in soil fertility if not well managed—as is gener -ally the case with sugar cane plantations. Depending on the previous use of the land, the considerable land requirements of feedstock production can create serious problems. For example, subsistence farmers or multi-species tropical forests may be replaced.
During the production of alcohol fuels, two main environmental
Bioenergy and the environment—the challenge 15
impacts occur. In the distillation process, considerable energy—either from fossil fuels or from locally available biomass (such as the bagasse from sugar cane)—is required. In either case a number of air pollution-related problems will arise and will need to be controlled.
One of the by-products is the stillage waste, which has very high bio-logical and chemical oxygen demand. Dumping this into local water bodies can, and indeed has, caused serious environmental problems. It is practical to recycle this stillage, using it as fertilizer back on the sugar cane fields. Alternative uses of the stillage itself and of the waste prod-uct after anaerobic digestion are also possible.
During combustion of pure ethanol, the products are water vapour, carbon dioxide and small amounts of aldehydes and unburned alcohol vapour. The aldehydes can be controlled with catalytic converters. The emissions from the combustion of alcohol-gasoline blends depend on the actual concentrations. Generally there are no major differences between emissions of gasoline or of gasohol. Nevertheless, one expects increas-ing aldehyde levels, and decreasing carbon monoxide and hydrocarbon levels. More studies need to be made on this, since precise effects are site-specific, depending on usage and climate. Certain mixtures of air and alcohol in fuel tanks may pose potential risks of explosion. Qualita-tively, however, the problem is no different than that of gasoline.
The use of alcohol fuels has been increasing world-wide. Under proper management, growing of feedstocks for alcohol production should not present serious environmental problems. The same care has to be taken as during other commercial agricultural activities. The total land area required, however, may be considerable. In addition, it is important to ensure that alcohol feedstock production does not replace essential food production. This is particularly important in the case of subsistence food production, since displaced growers will usually be unable to purchase their food requirements unless they are well employed for sugar cane production.
Modem wood fuel resources The large-scale harvesting of trees specifically for energy purposes is being practised in a number of areas, and it is increasing world-wide. Some of the Brazilian steel and cement industry is fuelled by charcoal from energy forests specifically planted for that purpose. Many natural forests are also being managed with the objective of supplying sustain-

16 J. Pasztor and L. Kristoferson
able yields of wood for energy purposes. Other sources of biomass can also be grown specifically for energy purposes.
The two major options include management of natural forest, in order to supply wood for energy purposes at sustainable rates and the planting of new forests. For the latter, quick-growing or slower-growing trees may be planted, to be harvested on short or long rotations. The planted forests are usually monocultures. In addition, the residues either from conventional forestry, or from the different wood-based industries, can also be used.
With regard to forest energy, the environmental impacts will differ considerably between the different climatic zones, the type of soils and the management regime. In general, the utilization of residues and thin-flings will affect soil conditions, including the possibility of erosion, nutrient loss and acidification. If heavy equipment is used soil com-paction may occur, leading to increased run-off and to erosion.
As a whole, the environmental impacts of forestry for energy are simi-lar to what one may encounter in industrialized forest management. The complete removal and utilization of residues and thinnings, however, may significantly add to the adverse impacts, unless carefully managed.
The effects of short rotation forestry to a large extent depend on previ-ous land use. If plantations are made on poor soils or abandoned arable land, depending on appropriate selection of species, the forest may grad-ually lead to soil improvement, and may also be positive in terms of wildlife. When existing natural forests are cleared to provide space for fast growing new species, the effect may be negative in the sense that diversity of the flora will be reduced and rare species may even be threatened. This is also true for many other types of land being trans-ferred into intensive use such as wetlands, meadows and pasture land.
Energy forests, depending on the particular species chosen, the eco-climatic region and the specific soil conditions, will usually require the application of fertilizers, herbicides and insecticides in order to achieve sufficient growth rates. This will have to follow sound agricultural and forestry management practices to avoid unnecessary adverse impacts. Ecologically sound spacing of plantations is important.
Energy forests also come with a particular occupational hazard of their own. Tree harvesting, in some countries, is one of the most haz-ardous jobs in all industries and the reduction of accident and injury rates in the forest industry is important; appropriate protective clothing

Bioenergy and the environment—the challenge 17
needs to be worn, safety procedures adhered to consistently and continu-ous training of workers implemented.
In areas other than those where considerable unused or waste lands are available, the land requirements of energy plantations are the most critical issues to be considered. In developing countries, commercial plantations meant to produce fuelwood for rural consumption have not been found to be economical.
The actual impacts on the soil and mn-off into the watershed are all issues which, with careful management, similar to other industrial forest management practices, can be controlled for benefit. Use of mixed species and planting blocks are examples of such practices.
Modern biomass combustion Biomass can serve as a feedstock for direct combustion in modern devices. These range from very small, domestic boilers, stoves and ovens up to larger scale boilers and even multi-megawatt size power plants. The original biomass resource often has to be processed before utilization in the combustion device. Since the energy content of biomass is usually lower than of coal, for example, considerable vol-umes may need to be transported to the point of use.
The cutting of wood logs, briquetting and other techniques all have certain injury rates associated with them. Following safety procedures and careful use of equipment can reduce these considerably.
The combustion of biomass in domestic stoves and other appliances is highly variable. Emissions can be quite high, due to badly managed fires. Particulates and carbon monoxide (in the dwelling) are often the main problems. Generally, the sulphur content of biomass is very small, and SOX emissions are not significant. Combustion of biomass on a large scale has similar problems to domestic combustion, except that fire management can be controlled much more effectively and pollution con-trol equipment more easily installed and operated.
The combustion of biomass in modem stoves and boilers, where eco-nomic, is an environmentally sound substitute for conventional fossil fuels, particularly coal and oil. The carbon cycle is not affected if trees regrow or are replanted at the same rate as they are being burned, and soil degradation does not occur. Sulphur emissions are much lower than for fossil fuels. The particulates can be controlled well at the source, particularly in larger installations, as is the case with fossil fuels.

18 J. Pasztor and L. Kristoterson
Environment and bioenergy
It is not enough to analyse the energy systems, one by one, in terms of the kinds of environmental impacts they cause. It is also useful to look at a few categories of energy-environment problems as a whole, and see what role is played by the biomass energy systems, both in an absolute sense and compared to other conventional energy systems. This section summarizes, in a qualitative way, the more detailed analysis found in chapters 9 to 14 of this book.
Land use There are very few areas in the world where people live and land is freely available. Biomass requires land for it to grown. Furthermore, biomass has relatively low energy densities, which means that relatively large areas of land are required to support bioenergy programmes.
Land use, as a policy issue, is therefore crucial in the context of bioen-ergy programmes. Do we have sufficient land, and of the right type, to grow a certain quantity of biomass? Will it conflict with existing food and fodder production? Will it conflict with the interests of the farmers, or of the industries?
In one country there may often be different objectives concerning the use of land. On the one hand, a farmer may wish to attain food-fuel-income security. On the other, the state may wish to attain national self-sufficiency in food and export/import balance or increase foreign exchange reserves. Sometimes these objectives reinforce each other, while often they are in conflict. Where there is clear understanding by each side about their objectives, and where there is possibility of dia-logue, it is relatively easy to resolve such conflicts. Unfortunately, in many areas this is not possible, and conflicts remain unresolved.
At the two ends of the spectrum, we have low and high intensity farm-ing systems. The former includes systems such as shifting cultivation, which are sustainable as long as sufficient fallow periods are possible. Increased populations, shifts in climatic conditions and outside interfer-ence can lead to shorter rotation periods, gradual deforestation, devege-tation and soil degradation.
In the high intensity systems, the farmers increase outputs by relying on external inputs to the system, including—directly—energy for the machines and—indirectly--chemical fertilizers and pesticides. Depend-

Bloenergy and the environment—the challenge 19
ing on the exact nature of these inputs, the envimnmental impacts can be negligible or severe.
One of the most important conflict areas is the 'food versus fuel' con-flict. While in smaller, on-farm systems, it is generally easy to use agro-forestry techniques to combine food and fuel production, in larger-scale, industrial systems this is generally quite difficult and not much prac-tised. Large programmes, such as national programmes to produce feed-stocks for alcohol production, can displace land on which, for example, subsistence food production is taking place.
Another important type of conflict for land resources may occur between industries and communities living on the same land. For exam-ple, many communities living near or inside forests depend on the multi-ple products provided by forests such as food, fodder, medicines, and firewood. For certain industrial needs, a monoculture of a generally fast-growing tree such as Eucalyptus is more useful. An industrial con-cern clearing the forest and replanting with a single species will almost certainly create serious conflict.
Sometimes the conflict can arise for more ecological reasons. The planting of a certain species of forest, on a certain soil type in a certain climatic zone may not be sustainable.
As a general rule, it is essential to identify and clarify the interests and resources of each relevant target group. Before any activity can be implemented it is necessary not only to take into account these (often conflicting) interests, but also to seek and attain the full participation of the different target groups. Only in this way can the different conflicts be resolved.
When resources such as land are scarce, the first step is always to try to go further with the existing resources. In our context,this implies con-certed efforts to produce and use more rationally and efficiently biomass resources, including food and fuel.
In the area of bioenergy use, a number of options are available for increasing the efficiency of conversion. The areas where the greatest efficiency improvements can be made include charcoal kilns and domes-tic stoves, using charcoal or fuelwood, and a number of formal and informal industrial activities. In those areas where increasing efficien-cies is difficult, substitution of conventional fuels such as kerosene and electricity needs to be considered. Fuel switching is particularly relevant for urban areas in developing countries but is difficult to implement cost-effectively unless soda-economic conditions are favourable.
20 J. Pasztor and L. Kristoferson
Improved management of biomass resources (whether food or fuel) is also crucial. Much of the food requirement in developing countries is met from very low-output, subsistence farming systems, using consider -able amounts of land. If productivity could be increased, the same land could feed many more mouths or, possibly, less land would be required, thus reducing some of the pressures for deforestation and potentially increasing sustainable fuelwood yields from the forests.
One way of getting increased outputs from biom ass systems is to aim increasingly to use multi-purpose plants, in order to produce not just one, but many products, including food, fuelwood, fodder, construction materials and medicines. If this is carried out in agroforestry systems, that is to say in systems where trees are grown together with plants for food, as well as with grazing animals, in some temporal or spatial alloca-tion on the same land, even higher overall outputs can be achieved. The key word here is integration.
Overall, environmentally sound land-use planning should attempt to integrate all the relevant sectoral concerns. The importance of the full participation of all the relevant target groups cannot be overemphasized.
Health impacts There are three major categories of biomass fuels, where health effects need to be particularly stressed: centralized technologies, combustion of alcohol fuels and domestic fuelwood combustion. The occupational risks of forestry activities are well documented and can be quite high. Although only limited information is available, the emission of most pollutants during combustion is considerably lower for biof'uels than for coal, except perhaps for polycyclic organics.
Domestic fuciwood combustion in stoves and boilers is a relatively adverse activity from an environmental point of view. Wood-cutting and gathering, especially by non-professionals, is a very high-injury risk task. Residential combustion has limited pollution impacts indoors if the stoves are properly installed and used. There are increased risks of burns and other injuries, especially for children.
The outdoor air pollution from residential fuelwood combustion is rel-atively high compared to domestic oil furnaces or to large-scale wood combustion. The main pollutants of concern are organic particulate mat-ter of inhalable size. Other pollutants include carbon monoxide and benzo(a)pyrene. The actual health impacts will depend greatly on the geographical distribution of emissions and of the exposed populations.

Bioenergy and the environment—the challenge 21
The health impact of the use of alcohol-gasoline blends is generally positive, compared to those resulting from gasoline combustion. There are usually increased levels of aldehyde, but this can be controlled with catalytic converters.
Most bioenergy systems have a less adverse impact on human health, in comparison to those of fossil-based systems. Where important impacts occur, they can be kept down to acceptable levels, with proper management and appropriate use of technology.
The particular case of domestic fuelwood combustion in industrialized countries has to be considered differently. In certain geographical and climatological locations, the local air pollution produced can be consid-erable, and cause for alarm. In other areas, with properly installed stoves and furnaces, in spite of the often high injury risk of wood collec-[ion, it can be—especially from an individual's point of view—a very desirable activity.
Air pollution Biomass fuels cause various forms of air pollution upon their combus-tion similar to, but less than, that caused by fossil fuels. The actual quantities of the pollutants emitted, however, differ depending on the type of fuel used and the type of energy conversion system considered.
Indoor air pollution caused by unvented fires is the most critical local effect of air pollution. The scanty evidence available seems to show that the burning of wood is less hazardous for health than dirty, low quality coal, but more hazardous than clean, high quality coal. In addition, another important local effect of air pollution is the damage to human-made structures through various constituents of photochemical smog. One of the causes of this is sulphur contained in the fuel. Wood rarely contains more than 0.1 per cent sulphur compared, typically, to 1-5 per cent for coal. However other biomass, such as dung and other residues, may contain more sulphur.
The sulphur contained in the fuel is also an important cause of a regional air pollution issue: that resulting from acidification. Again, due to the smaller sulphur content of biofuels, substitution of fossil fuels by biofuels would reduce this problem considerably.
Climate change, induced by various greenhouse gases, the most important being carbon dioxide, is the most important global effect of air pollution. Carbon dioxide is produced upon the combustion of both fossil and biomass fuels. For a given production of energy, coal pro-
22 J. Pasztor and L. Kristoferson
duces somewhat more, while oil produces somewhat less carbon dioxide than wood. However, if biomass combustion is accompanied by an equal amount of regrowth or replanting, the overall effect of the wood cycle on the carbon dioxide balance of the atmosphere is negligible. Furthermore, large biomass plantations could serve as additional sinks to carbon dioxide which had been produced by the combustion of fossil fuels. Such plantations would also have auxiliary environmental bene-fits on local soil properties and water balances.
The removal of biomass and vegetative cover that causes soil erosion will result in increasing the release of greenhouse gases because of the poor plant growth and rapid oxidation of exposed organic matter. A healthy productive soil is essential for a favourable carbon dioxide bal-ance.
As far as the local impacts are concerned, the use of biomass does not represent major improvements or decline over the impacts produced by fossil fuels. The specific emissions depend on the type of fuel and nature of conversion systems being used. Local use of biomass for domestic purposes, however, may increase air pollution over the levels produced by some centralized systems.
Increased use of biomass fuels, however, would certainly improve the situation as far as regional air pollution is concerned, primarily due to the relatively low level of sulphur of most biomass, particularly of wood.
Increased use of biomass would result in approximately the same level of carbon dioxide emissions as the equivalent of fossil fuels, if no regrowth or replanting is carried out. If the latter does take place, how-ever, there is no impact on the global carbon dioxide budget. Conse-quently, the use of biomass as a fuel has, overall, a net positive impact on air pollution.
Water Water is a crucial aspect in bioenergy development. Like land, it is one of the critical natural inputs to biomass growth, which is usually limited by geo-climatic, as well as human-made constraints. The availability of the required amount of water can be a limiting factor for biomass growth. Too little water can reduce and stop biomass growth, while too much can cause waterlogging, salinity, reduce growth and can eventually stop biomass growth. A crop, like corn, transpires more than 4.2 million litres of water per hectare in three months. The prime cause of water
Bioenergy and the environment—the challenge 23
loss and erosion in agriculture is a shortage of vegetative cover of biomass.
The proper management of water supply, therefore, is vital in all areas. In and and semi-arid areas, where most water is already being used for some agricultural, industrial or domestic purposes, or where expanded biomass production is envisaged, the parallel implementation of water conservation programmes will also be central.
In the case of properly irrigated agriculture, the amount of biomass produced will be more than in the case of unirrigated production. In addition to the increased yield of the economically valuable part of the crop, this can result in considerably increased production of residues, many of which can be used as fuels as has happened in many parts of the world, particularly with rice straw on the Asian sub-continent.
The existence of a large energy plantation may itself have an impact on the local climate, through evapotranspiration, and consequently have impacts on the total amount of rainfall in the area. When planning such a plantation, therefore, all the possible positive and negative feedback effects have to be considered.
At the same time, both the production and the conversion and use of biomass energy can have significant impacts, both physical and chemi-cal, on local and even regional water bodies and ecosystems. A defor-ested mountain slope, if not replanted, quickly erodes and the lost topsoil ends up in the rivers, lakes and hydroelectric reservoirs downstream. With no vegetation cover, the run-off on the slopes is much faster and causes flash floods in the valleys. Apart from loss of hydro-power and reduced irrigation potential, the silting up of water bodies is another cause of flooding. Dredging of waterways is expensive; usually more expensive than it would be to reforest the surrounding mountain slopes a few years before the problem occurs.
Biomass energy systems may also affect water bodies by releasing potentially harmful chemical compounds from various stages of the fuel cycle. Energy plantations, be they forests or other energy crops, may release pesticides, fertilizers and other chemicals which are being used to control the growth processes. The chemicals and quantities concerned will depend on the production system being used, as well as the soil and climatic conditions. In addition, different methods of harvesting and residue collection and utilization will affect potential run-off to water bodies.
Rapid water run-off and water loss is a major problem in world agri-

24 J. Pasztor and L. Kristoferson
culture and this is caused by a shortage of vegetative cover and biomass. Also, a lack of soil organic matter reduces the water-holding capacity of the soil. Thus crop residues should be partially removed only in specific situations.
Many biomass processing activities release various pollutants into water bodies. Accidental spillage of manure or sludge from a large bio-gas plant can cause considerable pollution to local water bodies. The effluents from an alcohol distillery will also contain high levels of nitro-gen, phosphorus and potassium, and have high chemical and biological oxygen demand. If these are dumped directly into freshwater bodies they will cause considerable pollution. With proper management, how-ever, these problems can be minimized or eliminated. Properly con-structed plants and careful adherence to safety procedures can reduce the risk of accidental spills to negligible levels. The effluents from alcohol distilleries can be used for irrigation, to act as fertilizer to enhance biomass growth, or can be broken down through anaerobic digestion to produce biogas.
The careless disposal of solid residues from the gasification process may also lead to the contamination of local water bodies. As with the disposal of other chcmicals, if procedures are followed, these can be kept below levels which are considered harmful.
Increased biomass production for energy, if not accompanied by envi-ronmentally-sound water management efforts, can have negative impacts on water bodies, either by using too much of it when scarce or by releas-ing physical and chemical pollutants to local and regional water bodies. In areas of absolute water shortages, only well planned water conserva-tion efforts will help in making sufficient water available for expanded biomass production. Otherwise, all other potential environmental impacts to water bodies can be controlled with proper management tech-niques. The concept of integrated watershed management is increas-ingly being applied in many places. It is crucial that all the above impacts of bioenergy systems also be considered in the practical imple-mentation of such management systems.
Socioeconomic impacts One of the most important messages of this book is the need for further integration of environmental considerations in the decision making pro-cess about energy. Yet, obviously, environmental considerations cannot be the only criteria in making policy. Socioeconomic issues, for exam-
Bioenergy and the environment—the challenge 25
pie, are critical in decisions about the feasibility of a particular project, a programme, or a whole set of energy policies.
In the past, the environmental, employment and income distribution aspects of bioenergy systems have been neglected. These should be integrated into a framework of comparative evaluation. The objective of economic evaluations, however, should not be to recommend or reject a particular system, but rather to be a tool in the overall selection process. When some costs and benefits are difficult to quantify, the evaluations should include different scenarios, followed by sensitivity analysis to throw light onto various assumptions and uncertainties.
Different methodologies used for the socioeconomic evaluations may lead to different conclusions about the comparative costs and benefits of different energy systems. Sometimes even minor differences in methods can significantly alter the results. Even when everything else is equal, the results of economic evaluations including bioenergy systems tend to be highly site specific, reflecting site-specific conditions and assump-tions. The methodological details and the assumptions used, therefore, need to be made explicit
The findings of the socioeconomic evaluation will help in the formu-lation of tax/subsidy and pricing policy recommendations which may be required to promote investment in energy systems that are profitable from the viewpoint of society as a whole. Care needs to be taken, how-ever, that such schemes do not lead to net transfers of resources from the society at large to higher income households.
The brief analysis in Chapter 14 thdicates that many of the bioenergy systems can be economically attractive for certain end-uses, regardless of some of the erratic fluctuations in world oil prices. The incorporation of environmental costs and benefits in the evaluations will help improve the comparative ranking of small-scale, rural-oriented bioenergy sys-tems, as well as improved stoves in urban and semi-urban areas.
When bioenergy systems are compared to conventional centralized electricity supply systems, the analysis should try to include all adverse and beneficial impacts possible for both sides. When quantification is possible, it should be done. However, when only qualitative information is available about a particular impact, it should still form part of the eval-uation. These could be incorporated in various multi-criteria compar-isons using, perhaps, a weighting system for relative importance, through sensitivity analysis.
In conclusion, in addition to the often favourable environmental per-
26 J. Pasztor and L. Kristoterson
form ance of bioenergy systems when compared to conventional systems, their relatively decentralized nature can be a significant socioeconomic advantage, especially when considering their potential for promoting a more balanced and more evenly distributed pattern of investment and resource use. However from an overall socioeconomic perspective, the environmental advantages of biocnergy systems are not a sufficient con-dition for their selection. What is crucial is that when environmental advantages exist, whether quantifiable or not, they should be properly valued in some integrated framework.
Towards sustainable bioenergy utilization Present patterns of food and energy biomass resource exploitation in the developing countries cannot continue. The low productivity of the agri-cultural sector coupled with rising populations mean that increasingly large areas of open and closed forests need to be cleared for agricultural production and animal grazing. At the same time, the urban and indus-trial users are causing an increasingly large demand for wood fuels, both in the form of fuelwood and charcoal. The result is unabated deforesta-tion. The first result is the easy availability of wood fuels; this disguises the serious shortages of wood fuels which follow. While there are con-siderable local variations on this theme, the problem is universal.
The environmental consequences of this are well known: soil erosion, desertification, the silting up of hydro reservoirs, flooding, increased atmospheric carbon dioxide concentrations and many more. The very basis of the livelihoods of most people living in rural areas is being destroyed, without which sustainable development will be impossible.
To look at this narrowly as an energy problem is not only simplistic but plainly wrong. However, energy has its share in it. We believe that properly managed bioenergy strategies, while not resolving these prob-lems, will be able to contribute positively.
At the same time, the environmental impacts of continued utilization of fossil fuels, especially through climatic change and the acidification of water bodies, soils and forests must signal a limit to the exploitation of fossil fuels, at least with today's technologies. Globally, it is quite possible that we may need to reduce fossil fuel consumption drastically or at least change over to new technologies for conversion and use in the next few decades. A certain mixture of all possible alternatives will be required, including energy conservation, the use of renewable energy
Bioenergy and the environment—the challenge 27
sources and possibly even nuclear energy if current pmblems of accept-ability can be overcome. Biomass could provide a considerable percent-age of this mix in an environmentally sound way.
The most crucial element for successful and environmentally-sound bioenergy programmes is good management. There are generally no inherent environmental constraints to using biofuels. As discussed in this study, most impacts can be eliminated or reduced to sufficiently low levels by following certain procedures such as proper agricultural and forestry practices, applying fertilizers or removing residues judiciously, keeping yields at or below sustainable levels and following safety proce-dures. In most cases, if properly managed, the environmental impacts can be relatively easily internalized. However, badly-managed bioen-ergy systems can have very serious impacts on the environment, poten-tially much worse than equivalent fossil-based systems.
Another key issue in achieving sustainable bioenergy programmes is the integration of different components through systems analysis and management. It is not realistic to look at bioenergy systems as technical systems isolated from their surroundings. Bioenergy programmes work best when the people for whom the programme will be useful are fully integrated into its formulation and implementation. Local participation, therefore, is a crucial element for sustainable bioenergy programmes.
But local participation alone is not enough. The bioenergy pro-granime must be able to respond to the multiple needs of the users and of the surrounding environment. Integration at a technical level, through the use of agroforestry techniques, as well as through multi-purpose plants, is the key to many of the bioenergy programmes which will be outlined in the technical chapters. A biogas plant is viable in many situ-ations, not simply because it produces a combustible gas, but because it also produces a good fertilizer, and hygienically manages human and animal wastes. Similarly, an alcohol distillery can be made much more effective and, of course, economic, if the waste product is used to fuel the distillation—instead of bought-in fossil fuels—and the stillage is used as a fertilizer.
This, of course, has tremendous implications for the economic analy-ses of the bioenergy systems discussed above. While there are various ways of analysing the total costs, benefits and profitability of biocncrgy systems, most rely on calculating the perceived financial costs and bene-fits. But most bioenergy systems provide benefits which are difficult or impossible to calculate financially. For example, a newly planted energy
28 J. Pasztor and L. Kristoferson
forest on a previously unused wasteland will often have very positive impacts on the environment, including wildlife and fauna, local climate, soil erosion and visual impacts. Whilst these benefits are impossible to formulate in financial terms, they must somehow be part of the equation.
In conclusion, if biomass energy systems are well managed, they can form part of a matrix of energy supply which is environmentally sound and therefore contributes to sustainable development. When compared, for example, to conventional fossil fuels, overall the impacts of bio-energy systems may be less damaging to the environment, since they produce many, but local and relatively small impacts on the surrounding environment, compared with fewer, but larger and more distributed impacts for fossil fuels. It is these qualities which may make the envi-ronmental impacts of bioenergy systems more controllable, more reversible and, consequently, more benign.
References
Hall, D. 0. and Overend, R. P. (1987) Editors: Biomass, Regenerable Energy, Wiley.
Hall, D. 0. and Overend, R. P. (1987) Biomass for Ever, in D. 0. Hall and R. P. Overend (eds) Biomass: Regenerable Energy, Wiley.
Pimentel, D., Wameke, A., Ted, W., Schwab, K., Simcox, N., Ebert, D., Baenisch, K. and Aaron, M. (1988) Food versus Biomass fuel: Socioeconomic and Environmental Impacts in the United States, Brazil, India and Kenya, Advances in Food Research 32, 185-238.
Scarlock, J. M. 0. and Hall, D. 0. (1989) The Contribution of Biomass to Global Energy Use, Biomass (in press).

2 Traditional fuels
B. K. Kaaie
Traditional fuels play a vital role in the developing world. More than 2 billion people rely on them to meet the majority of their energy needs, obtaining these fuels from the same natural environment on which peo-ple also depend for food crops and grazing for their animals.
Changes that could undermine the present position are, however, tak-ing place throughout the developing world. Rising populations place increasing stress on the farming and natural ecological systems of many Third World countries. Lands that were previously able to support sub-sistence farming and pastoralist societies on a sustainable basis are being degraded through over-cultivation or bad management. It is also clear that the supply of traditional wood fuel is declining in many areas.
Although there are still major gaps in current knowledge about both existing levels and the dynamics of biomass fuel utilization, it is obvious that the issues of energy supply and preservation of the natural envimn-ment are of supreme importance to the developing world. In this chapter some of the key questions concerning traditional fuel consumption and its relation to the environment are outlined.
The use of traditional fuels in the developing world
The term 'traditional fuels' is used here to refer to biomass fuels used mainly for domestic energy, including wood, charcoal, agricultural residues and animal waste. 'Fuelwood' refers to wood which is used directly for fuel; the term 'wood fuels' covers fuelwood and charcoal.
30 B. K. Kaale
Traditional fuels are the dominant source of energy in the Third World. It is estimated that they account for about 50 per cent of the total energy consumption in the developing countries. In many countries—Burkina Faso, Ethiopia, Malawi, Tanzania and Uganda, to mention but a few—the proportion can be as high as 90 per cent (Beijer Institute 1982; Leach 1987).
Traditional fuel use can be divided into three broad consumption sec-tors: rural domestic, rural industry, and urban. Of these, the rural domes-tic sector is by far the largest, probably accounting for between 70 and 90 per cent of the total traditional fuel use in most countries.
Rural domestic fuel use
The most characteristic aspect of rural domestic fuel use is its informal and largely non-commercial character. In the vast majority of cases, individual families gather their own fuel supplies from farming areas, common lands or other local sources to which they have access. The collection is usually done by women and children.
Given this diffused family-based nature of rural fuel collection it is not surprising that there are many uncertainties about the actual quanti-ties involved. It is, however, evident that there are major variations in consumption, not only between countries and climatic zones but also at a detailed village level. In some cases, neighbouring families in appar -ently similar circumstances show widely different fuel consumption pat-[ems. A survey of 15 villages in the semi-arid zone of Tanzania, for example, showed a variation from 0.5 m 3 solid wood per head in the Ntuka village in Dodoma through to 1.8 m 3 in the village of Bonga in the Arusha region (FAO 1984). Another review provides similar exam-ples of such variations from other parts of the developing world; it quotes examples of surveys from Burkina Faso and Nicaragua which have also shown two- and three-fold variations in consumption. The most spectacular example quoted comes from Nepal where an analysis of the wood fuel estimates made there found a variation of 67 times between the highest and the lowest (Foley 1988).
The errors which can be introduced by use of figures for the average consumption per head also need to be borne in mind. The actual fuel consuming unit in the rural areas is not the individual but the family. As the family size expands, fuel consumption does not necessarily grow in proportion. A family of twelve may, in fact, consume little more cook-

Traditional fuels 31
ing fuel than a family of six; but if the figures are expressed in terms of consumption per head there is a two-fold difference.
A number of sources have suggested an average consumption of 1 m 3 of wood per head for the sub-Saharan African countries (Beijer Institute 1982; Leach 1987). Any such estimates must, however, be treated with extreme caution: even if they do provide a broadly representative figure for average consumption, they conceal the large variations which occur at a local and family level. Great care must therefore be taken in gener-alizing from the results of local surveys or those based on small samples as failure to correct for local distorting effects can lead to major errors.
Agricultural residues such as straw and stalks, dung, twigs, and other locally available biomass materials are also widely used as domestic fuel throughout the developing world. Even where fuelwood is the principal fuel, families often supplement it with maize cobs, millet stalks and other material when these are readily available. The use of these fuels is not, in itself, evidence that wood fuel is scarce, but in areas where it is traditionally difficult to obtain, agricultural residues and other biomass fuels may be the principal or, indeed, the only source of domestic fuel. This is particularly tnie in Asia—for example, in parts of Bangladesh, India and China. Exclusive dependence on these fuels is relatively uncommon in Africa though they do play an important role in Egypt, Ethiopia, some of the Sahelian countries, and Lesotho and other southern African countries (Barnard and Kristoferson 1985).
The use of these fuels is even more difficult to monitor than that of wood. Most are simply collected in the immediate vicinity of the home. When surveys are done there are also considerable problems in arriving at standard methods of measurement. A pile of green crop stalks which is freshly cut may weigh four times as much as the same pile left to dry in the sun for a few days. Nevertheless, it is clear that these biomass fuels are a significant component in the energy supply in many areas in the developing world (Barnard and Kristoferson 1985).
Urban biomass fuel use The data position on the urban use of traditional fuels is also unsatisfac-tory in most areas. There are virtually no reliable data on the actual wood fuel quantities consumed at an individual household level, nor on how these quantities are affected by price and the availability of other

32 B. K. Kaare
fuels such as gas or kerosene. Neither are there data on the aggregate total consumption of most urban areas.
Even when reliable sample surveys of household consumption are available, it is difficult to extrapolate them in a meaningful way because of the very large differences that exist between different social and income groups. Most Third World cities, for example, have large num-bers of newly arrived migrant workers from the rural areas. A high pro.-portion of these are single males; the proportion of men to women in Kampala during its period of rapid growth during the 1960s was 1.24:1.0. Few single men actually use cooking fuel; they obtain their food from kiosks and street vendors (Foley 1988).
The same is true of the consumption of refugee families driven to the urban areas by crop failures or poverty. They live on the margin of urban existence and lacking an adequate income, are forced to rely on scavenged urban rubbish for a considerable proportion of their fuel sup-piy. Using the fuel consumption figures of established households as a basis for calculating the total wood fuel consumption in an urban area is therefore likely to introduce major inaccuracies.
Although accurate data are lacking, there is nevertheless clear evi-dence that wood fuels, either fuelwood or charcoal, are used in very large quantities in many Third World cities. Large trucks carrying mas-sive loads of wood fuel are a feature of the major access roads to cities such as Dar es Salaam, Bamako, Dakar and Nairobi. Vehicle checks at the official charcoal control points on the roads leading into Dakar in Senegal indicate a total consumption of 100 000 tonnes per year.
In contrast with the rural areas, virtually all urban wood fuel transac-tions take place on a commercial basis. Within the cities there is usually a well developed wood fuel distribution system. Wholesalers obtain their supplies from a small number of central markets and distribute them to a network of retailers who sell through local markets or door to door deliveries.
But, despite the commercial nature of the wood fuel trade, in most areas there is surprisingly little useful information on prices and, in par-ticular, how they change with time. Partly this arises from the sheer dif-ficulty of collecting reliable statistical data. It is also because one of the most common failings in the literature is to quote price changes without any reference to the prevailing rate of inflation. The fact that prices may have quadrupled over a given period means nothing in itself; without

Traditional fuels 33
reference to the rate of inflation it is impossible to know whether they have risen, fallen, or remained stable in real terms.
There is, nevertheless, a widespread belief that urban wood fuel prices are rapidly rising throughout the developing world. A 1988 report com-ments:
This picture of universal and inexorably rising prices is simply not true. It can only have been drawn by a careless reading of price trends in nominal terms, without correcting for inflation. In fact, in real or constant currency terms, urban woodfuel prices in some Cities have been remarkably steady or have fallen over long peri-ods; in others they have risen sharply for a time and then flattened off or fallen; in others they have been extremely erratic. (Leach and Meams 1988)
Small-scale industrial uses Fuelwood and charcoal are also used for non-domestic purposes. These include activities such as tobacco curing, tea drying, beer brewing, fish smoking, brick burning, pottery and ceramics to cite but a few. The amounts used depend on the scale of activities being undertaken. For example, in Malawi about 23 per cent of the total fuelwood consumed in the country is used for curing tobacco, the major agricultural export crop for the country (Malawi energy Studies Unit 1986). It is estimated that about 100 kg of wood are required to produce about 6 kg of cured tobacco. Rural beer brewing can also be a heavy consumer of wood; in Burkina Faso, for example, each litre of the local beer requires about I kg of fuelwood. In Kenya, the wood fuel use in rural industry has been estimated to be about 8 per cent of the national total (Beijer Institute 1984).
Whether industrial consumers pay for the wood they use depends on local circumstances. Smaller home-based commercial activities such as beer brewing generally rely on fuel which has been gathered without payments. The marginal nature of such businesses means that many would not be able to survive in the face of commercial competition if they had to pay for the wood they use. When wood can be obtained without payment from common lands or unprotected forest areas, it will naturally be the first choice for such industrial uses as tea drying, coffee
34 B. K. Kaale
curing and brick making. In Tanzania, it has been estimated that for every hectare of tobacco grown, a hectare of the natural 4 miombo' woodland has to be Cut to cure it (European Commission 1988). In some countries, however, rural industries generally have to pay for the wood they use. When this is the case, industries may find it worthwhile to maintain their own plantations of fast-growing trees—often eucalyptus species—in order to meet their wood fuel needs on a continuing basis.
There are few reliable data concerning the extent of wood fuel use by rural industries. Such data are clearly vital for any assessment of the impact of rural industry on the supply of wood fuel and on the larger nat-ural environment, and further information needs to be gathered (Leach and Meams 1988).
Biomass fuel resource levels
The local level of wood fuel and other biofuel resources varies in accor-dance with several factors, including ecological and climatic conditions, land-use patterns and population density. The main sources of wood fuel include the natural bush and fallow around villages; woodlands and savannah woodlands; farmland trees; village woodlots; and forest planta-tions. The proportion coming from the various sources depends on local conditions.
A great deal of uncertainty still surrounds the question of how much wood fuel can be obtained from such sources. The majority of research into the amounts of wood produced by forests and woodlands in the past has concentrated on establishing the amounts of usable timber produced by commercial tree species. In other words, the main focus was on the annual increment of trunk wood; but in contrast with commercial forestry, the tree trunk is not the part of the tree of primary interest to most rural families. The greater part of rural fuel collection is carried out by women and children equipped, at best, with a machete. It is rare that they fell whole trees; instead they rely on fallen dead wood. Where this is not available, small and medium size branches may be hacked from the tree instead. Often this green wood is left to dry and collected later when it is lighter and easier to carry.
The cutting of tree branches is frequently seen as ignorant destruction of woodlands by local people and an indication of acute local wood fuel

Traditional fuels 35
scarcity. It is more likely to be evidence of local knowledge about the intelligent harvesting of trees. While heavy pruning can kill some tree species, the proper pruning of trees stimulates them to further rapid growth in most cases. Unfortunately, there are virtually no data on the yields of wood from trees which are vigorously pollarded or pruned in this way. It is nevertheless abundantly clear that such yields can be con-siderably greater than those of trunk wood. Moreover, they provide wood in a form which is readily usable by the rural family.
There has also been a tendency to ignore the yield of wood obtained from traditional fallow agricultural systems. It is frequently assumed that once an area of forest has been cleared for agriculture, its potential for wood fuel production drops to zero. This is not necessarily the case, as the following description of how a Sahelian farming family meets its wood fuel needs makes clear:
The farmer's wife gathers firewood in the plots cleared by her hus-band and from time to time collects a little dead wood in the sur-rounding natural woodland. She has no difficulty in meeting her household's wood requirements. If need be she can gather wood from the fallow land which once it has been left for 4-5 years begins to produce wood again. Thus, this rural family can survive without cutting any fuelwood from the natural woodland. (European Commission 1988)
An example of how the conventional assessment of wood fuel yields can underestimate the actual availability of wood fuel comes from the Gutu area of Zimbabwe. A 1983 report stated that the remaining wood fuel resources, even if they were completely felled, would provide only enough fuel to meet local needs for three months. Four years later, the inhabitants of the area were still cooking with wood, brewing beer and burning bricks (Hancock et al. 1988).
There is obviously an acute need for studies that will establish the actual wood fuel yields that can be obtained from active trimming and pruning of individual trees and areas of woodland. Without such infor -mation it is impossible to ascertain whether the conventional estimates of wood fuel availability are, in fact, seriously in error. Neither is it pos-sible to make a realistic assessment of how many trees are required to meet the woodfuel needs of rural families.

36 B. K. Kaale
Biomass fuels other than wood
Apart from the fuel provided by trees, there is, of course, a great deal of other naturally available burnable biomass in rural areas. This is in the form of bushes, shrubs and other plants with hard or woody stalks; many of these grow extremely rapidly. There do not appear to be any compre-hensive studies of the annual yields of such materials under different conditions. It is nevertheless, evident that air dry yields of at least 2 to 3 tonnes per hectare are commonly available. Although such materials have a lower density than wood, and hence are more difficult to collect and use, they have roughly the same air-dry calorific value of about 15 MJ/kg.
There are also substantial quantities of agricultural residues in farming areas. These include maize cobs, millet and sorghum stalks, rice husks, Coconut shells and fronds and banana stalks, depending on the location and type of agriculture. There are also the trimmings, stalks and other burnable residues from cash crops such as tea, coffee and cotton.
The yield of stalks from grain crops is typically from 2 to 4 times that of grain. Thus, even in relatively low productivity areas where the grain yield is around 500 kg/ha, the amounts of straw produced will be in the range 1.0 to 2.0 tonnes/ha. The calorific value of agricultural residues varies between different materials but is, in general, rather lower than that of wood. An average air-dry figure of 12 MJIkg is often assumed.
The yield of dung varies considerably according to the size and coridi-tion of the animal and the amount of food it has to eat. The amount pro-duced by a cow is in the range 0.5 to 1.7 tonnes dry weight per year (Barnard and Kristoferson 1985). Under reasonable conditions a farmer with a herd of 20 cattle might therefore expect a total annual yield of around 20 tonnes of dry dung. The calorific value of dung is around 12 MJ/kg compared with about 15 MJ/kg for air-dry wood.
There is no doubt that good quality wood is the preferred fuel in rural areas. But this does not mean that it is the only fuel that can be obtained. There are normally considerable amounts of other forms of burnable biomass. However, there has been little study of the actual quantities available, though evidence from Indonesia suggests that the total biomass available for fuel may be four times greater than wood fuel alone (Foley 1988).

Traditional fuels 37
Reactions to the increasing scarcity of wood fuels
Wood fuels are becoming more difficult to obtain in many areas of the developing world. Evidence from Botswana, Uganda and Tanzania, for example, demonstrates that women and children are having to spend more time collecting wood fuel that was formerly readily available (SADCC 1987; Dutki 1983; Mnzava 1983).
In some areas this has led to a change in family arrangements for fuel collection. Thus in the Shinyanga region in Tanzania, the responsibility is being increasingly shared between men and women: women collect agricultural residues and shrubs from farm lands; the men, periodically assisted by their wives or children, collect fuelwood from government forest reserves some 20 to 30 km from their villages. A round trip takes between 2 and 3 days. Ox carts are normally used for carrying the wood, though farm tractors are employed in some cases (Kaale and Gilliusson 1985).
In the past, it was believed that wood fuel cutting was itse1fa major cause of wood fuel scarcities and the disappearance of forest resources: this is now widely agreed to be the exception. It is now accepted that the principal reason for deforestation and wood fuel scarcities is the clearing of natural forest lands for agriculture. This is happening in almost all African countries as well as in such other areas of the developing world as Brazil, Nepal and parts of China (Energy Research Group 1986; FAO 1985; SADCC 1987).
Commercial logging for timber extraction is also a potent cause of forest destruction in some areas, but this usually has little, if any, direct impact on domestic fuelwood use. Cutting for charcoal and fuelwood to meet urban demands is, however, seriously depleting forest and wood-land resources in some areas (Leach and Meams 1988).
Weakness of the wood fuel 'gap' concept The emergence of wood fuel scarcity in an area is commonly described in terms of a wood fuel 'gap' between supply and demand which emerges as a result of rising consumption and falling levels of supply. This concept has heavily influenced thinking about wood fuel policies in the past 10 to 15 years, but has been coming under increasing criticism.
The weakness in the 'gap' concept is that it does not take account of the fact that people's fuel consumption and behaviour patterns are not

38 B. K. Kaale
fixed. In practice, consumption of a resource does not continue on an uninterrupted rising trend as the resource becomes scarcer. Instead, when wood resources become harder to obtain, people adapt in ways that vary according to circumstances.
The first reaction is usually to economize on fuel. There are numer-ous ways in which this can be done and then are widely used throughout the developing world: fires can be built in more sheltered places and shielded from draughts; they can be made smaller and kept lit for a shorter time; greater care can be taken with the management of the fire, and fuel can be quenched at the end of cooking and reused instead of being allowed to smoulder away. Raising the overall cooking efficiency of an open fire by such simple measures from 5 per cent to 10 per cent, for example, would halve the amount of fuel used.
Changes can be made in cooking practices: pre-soaking some foods shortens the cooking time. In Nepal, greater use of uncooked food has been noted as a response to fuel scarcities, while in Guatemala, Mexico, Somalia and Tanzania them has been a reduction in the consumption of those staple foods, such as beans, which require long cooking times (Leach and Gowen 1987). Similar observations have been made about the villagers of Nyamwigura in the Mara region of Tanzania where beans that require 3 hours to cook have largely been substituted by rice and cabbage which require only 30 minutes (Tobisson 1980).
People also turn to the use of alternative fuels. This will generally take place gradually rather than suddenly. Thus there is a shift from good quality fuelwood to smaller twigs and branches; agricultural residues come into greater use. The cultural resistance to the use of dung is overcome and people begin to rely upon it increasingly as a fuel.
There is no doubt that the transition from the exclusive use of wood for cooking can cause considerable problems of adjustment for the fami-lies concerned. The alternative fuels are not as easy to use as wood and may require the development of new techniques of cooking and fire management. In some areas, for example, women dampen millet straw before using it in order to slow down the rate of combustion. But expe-rience shows that although there may be strong initial resistance, the use of these fuels can become accepted on a widespread basis. This is what has happened in some parts of the Indian subcontinent and China, where wood has long lost its position as the basic fuel of the rural areas. In Africa the number of areas where the transition has occurred is still lim-ited, but there are likely to be more as time passes. Because these fuels
Traditional fuels 39
are usually more abundant than wood fuel, once they are in use the prob-lem of the physical availability of energy resources is, in fact, eased.
The evolution of wood fuel consumption in an area therefore cannot realistically be characterized as the opening of a wood fuel 'gap'. The process is considerably more complicated and is better considered as a process of adjustment in which the pattern of domestic fuel consumption gradually changes.
No longer able to rely on an abundance of good quality firewood and the consequent absence of any need for economies, people are gradually forced to exercise care and frugality in the use a variety of substitute fuels. As a result a new equilibrium in fuel use is eventually reached. However, people may be able to meet their household energy needs, there is no question that for many it represents a lowering in the quality of their daily lives.
The environmental effects of the use of traditional fuels
Deforestation, without any doubt, poses a major threat to the environ-ment not just in the developing world but of the whole planet. It has exacerbated the problems of soil erosion and increased the risk of flood-ing in a variety of countries (FAO 1986), id it is implicated in the pro-cess of desertification in areas such as the Sahel (Timberlake 1985). The continued deforestation of major areas such as the Amazon Basin may also contribute to the process of global warming which could wreak incalculable damage to the world's farming systems in the next century. FAO has estimated that about 11.3 million ha of tropical forest are cur-rently being lost every year (FAO 1987). The tropical forests which were estimated to cover about 2450 million ha a century ago, have now shrunk to an estimated 1000 million ha (Malingreau and Tucker 1988).
The clearing of forests and woodlands for agriculture and livestock is without doubt the main cause of the loss of virgin forests and wood-lands. One estimate of the breakdown between the two causes over the last century attributes 1100 million ha to agriculture clearing and a fur -ther 350 million hectares to grazing (Malingreau and Tucker 1988). This completely excludes wood fuel as a cause of deforestation. Indeed, it has been said that 'if all fuelwood and charcoal use stopped tomorrow, deforestation rates would hardly be altered' (Leach and Mearns 1988).
40 B. K. Kaale
All of this highlights the fact that solutions to the problem of large-scale deforestation and its environmental effects will have to be based on a much wider set of considerations than simply the issue of energy sup-plies. But it does not mean that, at a local level, there are no environ-mental effects from the use of traditional fuels.
The transition from the use of freely available and abundant wood supplies to dependence on agricultural residues raises important ques-tions; so also do charcoal making and the provision of fuelwood for the urban areas. Nor should it be forgotten that the use of traditional biomass fuels can also have considerable effects on the micro environ-ment in which they are used: the cooking area.
The environmental implications of the transition from fuelwood for domestic energy supplies In areas where the pressure on land resources is low, obtaining house-hold energy supplies rarely causes any environmental problem. Wood supplies are generally abundant and can easily be supplemented by other materials. Where environmental damage occurs it is likely to be as a result of poor farming practices. Uncontrolled grazing can also cause major problems: in areas where there are large herds of animals, the nat-ural regeneration of species in the grazing areas can also be completely prevented because the seedlings are trampled or eaten.
Energy problems also tend to be minimal when an area is being newly cleared of trees for agriculture. There is often a massive surplus of wood which farmers may bum simply to get rid of it. The environmental dan-ger comes not from fuelwood collection, but from the fact that forest soils may not be suitable for sustained agriculture. Many areas of cleared forest turn into barren wastelands after a few years cropping. This is not an energy issue; the land should never have been cleared for agriculture. But when an area has been converted completely to agricul-ture, and all the surplus wood has been used, the local people still have to meet their energy needs from the remaining trees and other biomass resources. This can result in serious over-exploitation of the few remaining trees.
It is, however, necessary to be cautious about attributing the disap-pearance of trees from the fanning landscape exclusively to cutting for fuelwood, even in areas where fuelwood is obviously scarce. A detailed investigation of attitudes to trees at a local level is always required

Traditional fuels 41
before such a conclusion can be reached. Farmers may have a variety of reasons for getting rid of trees from their land: trees take up space which can be important when land is becoming scarce; they can compete with crops for light, water and soil nutrients; or they can interfere with ploughing. They can also be seen as a haven for insect and bird pests and hence a threat to crops; in some African countries, it is still officially regarded as good agricultural practice to clear all the trees from farmland to help in the the eradication of tsctse fly. Some of these reasons may be invalid, others may be justified in some circumstances. The important factor as far as the removal of trees is concerned is whether farmers believe them to be true.
The shift towards the non-wood biomass fuels also raises a variety of questions, since it can mean that a biomass source is diverted from its previous use. An FAO survey conducted in Jordan in 1982, for example, found that nearly 200 miffion shrubs were being uprooted annually to provide domestic fuel. This use was in direct competition with the ani-mals who relied upon the shrubs for fodder (FAO 1986).
It is also widely believed that any use of agricultural residues for fuel will inevitably be to the detriment of the agricultural system because it reduces the fertility of the soil. But, again, a careful local analysis is required before any such conclusions can be drawn. Some of the agri-cultural residues most likely to be used as fuel, such as corn cobs, millet stalks, jute sticks, coffee prunings and coconut shells and husks, are extremely difficult to recycle because they are hard and woody and decompose slowly. Some, such as Cotton and tobacco stalks, are a haz-ard because they harbour pests and diseases and cannot be left to rot in the fields. Since the majority of these woody residues are not recycled in any case, using them as fuel will have no effect on the soil. The same can be true of dung. When cattle graze over a relatively wide area, most of the dung produced is not recycled because of the labour that would be involved in collecting it. Moreover, dung which has lain in the sun for a few days loses a great deal of its value as a fertilizer, using it as a fuel does not therefore imply any great loss to the agricultural system.
The farming system will, on the other hand, be put at risk when fuel shortages force farmers to use as fuel those organic materials which do play an important role in maintaining the fertility of the soil. It is impor -tant that such cases are identified.
The question of using agricultural residues for fuel is thus somewhat contentious. As one commentator remarks,
42 B. K. Kaale
It is clear that using agricultural residues as a fuel is not the univer-sal crime that it is sometimes made out to be. In any individual case, however, it is crucial that local factors be carefully analysed before any conclusion is reached regarding the potential for increased use of agricultural residues. In many cases, practically nothing is known about current patterns of production and use or about what the tradeoffs will be if more residues start to be diverted for fuel use. Further research in these areas is clearly the first prior -ity if the debate on the use of agricultural residues is to progress any further. (Barnard 1985)
Environ mental implications of charcoal making and urban fuelwood supplies The environmental impacts of charcoal making and fuelwood cutting to meet urban demands can be extremely severe. The problems are more or less universal throughout the developing world. In Zambia, for exam-ple, uncontrolled fuelwood cutting for charcoal production outside forest reserves, and encroachment on the forest reserves themselves, have deforested most of the hinterlands surrounding the urban centres. In the case of Lusaka, the effects of deforestation have extended over 200 km from the city centre (Chidumayo 1988). The government of Kenya banned the export of charcoal in 1975 because charcoal makers were causing severe deforestation, especially along the coastal mangrove forests (Kinyanjui 1987).
Charcoal making and the provision of urban fuelwood are commercial operations, unlike the supply of rural domestic energy. They are often carried out on a large scale, and charcoal makers are paid on the basis of what they produce. There is consequently a lack of care and selectivity in the obtaining of wood supplies. The need for large volumes of wood and the availability of saws and axes means that whole trees are cut. In many cases, there is little social or cultural attachment to the area being felled. Charcoal workers are often itinerants who move on to find fresh wood resources when all the trees have been cut in an area. Charcoal making for the urban market can take place at a considerable distance from the city. Large trucks can be used to transport the charcoal several hundred kilometres in some cases. The environmental effects of char-coal making can therefore be felt over large areas.
Traditional fuels 43
Fuelwood tends to come from closer to the urban area. The resources in the immediate surroundings of the city are usually the first to be cut. As these supplies are depleted, collection usually extends outwards along the main routes to the city. As time passes, the distance the wood is transported gradually increases: for example, supplies to I3amako in Mali are bought from sites as far away as 175 km (Foley 1987).
Charcoal making and cutting for urban fuelwood supplies are obvi-ously a major cause of deforestation in many areas. But they are not the only factors which are causing the loss of forests in the vicinity of the major cities of the developing world. Economic pressures must also be taken into account. Cities provide markets for cash crops and animal products. The closer to the market these can be produced, the lower the transport costs. The economic return from natural forests can rarely compete with that from food production. There is therefore a continuing economic pressure to clear the woodlands in the areas around cities and devote them instead to crop production and grazing. Even when cities have switched completely to the use of conventional fi.iels, the destruc-tion of the woodland resources in the areas surrounding them continues to take place.
Micro-environmental effects The use of biomass energy sources can a1s' have micro-environmental effects. The pollution levels in the kitchens and cooking areas of many Third World dwellings pose a serious threat to the health of the women using them. Wood fires can produce considerable quantities of smoke, particularly when they are being lit or if the wood is damp. Charcoal generally bums cleanly but can cause smoke when it is being lit; char-coal stoves can also release carbon monoxide. Some of the substances contained in wood smoke are capable of causing a variety of respiratory ailments as well as cancer.
These problems are generally aggravated when other biom ass fuels are used. The World Health Organization has pointed out that the smoke from low quality biofuels such as farm residues and animal wastes can cause acute bronchitis and pneumonia among infants; other effects include nasopharyngeal cancer as well as chronic carbon monoxide poi-soning (WHO 1984).

44 B. K. Kaale
The effective targeting of remedial actions
The history of interventions in the energy area over the past decade and a half does not make happy reading. A large number of programmes have failed completely or only partly achieved their aims. II is important that future programmes of remedial action are more effectively targeted than in the past.
In areas where deforestation is taking place on a large scale any attempt to remedy the situation must first identify the basic cause. Only then can an appropriate response be developed. Programmes which, for example, focus on the provision of fuelwood as a means of slowing down the rate of deforestation are unlikely to succeed in their objective if the main cause of the deforestation in a particular area is agricultural expansion because of population pressure.
Where the implementation of programmes depends upon the collabo-ration of local people, the problems addressed must be those which the people themselves regard as serious. Programmes must also provide benefits which the people regard as an adequate compensation for the efforts they have to expend. And the course of action they are expected to follow must appear realistic and feasible. Tree growing, for example, is difficult in many areas. Seedlings have to be planted, watered and weeded at times when other urgent tasks connected with growing and harvesting the family's food supplies have to be carried out. Seedlings also have to be fenced or guarded against marauding animals until they are large enough to survive on their own. Given all these difficulties, plus the long time delay until wood is harvestable people may feel it is simpler to shift to the use of agricultural residues rather than try to grow trees for fuel.
Questions of land tenure and rights to trees must also be resolved in the case of tree growing programmes (FAO 1987). In many areas, farm-ers hold their lands under traditional systems of communal land owner-ship. As a result, they may not have exclusive rights to trees which they grow; or they may not be entitled to fence off areas to protect seedlings from animals. In such cases, tree growing is unlikely to be regarded as a realistic option.
Attention also needs to be paid to the institutional context within which programmes are expected to work. There is little point in embarking on a particular course of action if the support measures nec-essary to make it effective cannot be provided. Pen-urban plantations,
Traditional fuels 45
for example, have been suggested as a means of supplying urban fuel-wood needs and consequently easing the pressure of exploitation on nat-ural woodland resources. The problem such projects face is that the wood from pen-urban plantations is inevitably going to be considerably more expensive than that obtained from natural woodlands where there are no establishment costs. Wood fuel dealers and charcoal makers will therefore continue to use the natural woodlands unless they are effec-tively prevented from doing so.
Legislation prohibiting the use of these naturally occurring resources will not, on its own, solve the problem. The crucial institutional element in such a programme is whether the forest service, or other agencies, have the ability to police the natural forest areas to prevent illegal extrac-tion. Given the huge areas involved and the meagre resources at the dis-posal of most forest services this is not a practical proposition in many countries. Under these conditions, pen-urban plantations cannot fulfil the objective of relieving the pressure on the natural woodland resources.
Conclusions
In this Chapter I have attempted to examine some of the main environ-mental aspects of the utilization of biomass fuels. In doing so I have shown that there is still a great deal of uncertainty surmunding the issue: reliable information is lacking on such key factors as the levels of con-sumption, the available resources, and the way in which people respond to scarcity and changing economic circumstances. I have also attempted to show how the conventional wisdom about the traditional energy sys-tems of the developing world is increasingly coming into question. A new and more comprehensive model of the traditional energy problema-tique is in the process of being developed. This new model seeks to incorporate the knowledge of people's actual behaviour which has been gained from the experience of the past 15 years. 1 have attempted to indicate some of the main lines of this new thinking.
The issues of energy scarcity and the degradation of the natural envi-ronment are of critical importance to the Third World. The hope is that by approaching the analysis of their underlying causes and interrelation-ships in an open and constructive manner a new and more secure basis will be provided for future programmes of intervention.

46 B. K. Kaale
Acknowledgement The comments and suggestions made by Gerald Foley on a previous draft of this paper are gratefully acknowledged.
References Barnard, G. W. and Kristoferson, L. (1985) 'Agricultural residues as fuel
in the Third World', Technical Report No. 4, Energy Information Programme, Earthscan, London.
Barnard, C. W. (1985) 'The use of agricultural residue as fuel', Ambio, 14, 4-5, Royal Swedish Academy of Sciences, Stockholm.
Beijer Institute (1982) 'SADCC Energy Seminar: Country background reports', Beijer Institute, Stockholm.
Beijer Institute (1984) 'Energy and development in Kenya: Opportunities and constraints', Beijer Institute, Stockholm.
Chidumayo, E. N. (1988) 'Woodfuel forestry issues: The Zambian experience', University of Zambia, Lusaka.
Dutki, G. Z. (1983) 'Afforestation for fuelwood in Uganda', in Wood Energy in East Africa', IDR C-MR 73e, IDRC, Ottawa, Canada.
Energy Research Group (1986) 'Energy research directions and issues for developing countries', IDRC-250e, IDRC, Ottawa, Canada.
European Commission (1988) A dossier on woodfuel in the developing world', Directorate General for Development, Commission of the European Communities, Brussels, Belgium.
FAO (1984) 'Tanzania Fuelwood Supply and Consumption in Arid Areas', Forestry for Local Community Development Programme, FAQ, Rome.
FAO (1985) 'Tropical forestry action plan', FAO, Rome. FAQ (1986) 'FAO and the environment', FAO, Rome. FAQ (1987) 'Bellagio strategy meeting on tropical forests calls for
policy reforms', Unasylva 157/158, Vol.39, FAO, Rome. Foley, G. (1987) 'Exaggerating the Sahelian woodfuel problem', Ambio,
16, 6, Royal Swedish Academy of Sciences, Stockholm, Sweden. Foley, G. (1988) 'Discussion paper on demand management', presented
to the World Bank Eastern and Southern Africa Seminar on Household Energy Planning, Harare, Zimbabwe.
Hancock, D. Et al (1988) 'Rural electrification in Zimbabwe', Panos Institute, London.
Kaale, B. K. and Gilliusson, R. (1985) 'Plan for planting and conservation of trees in Shinyanga region 1986-2010', Ministry of

Traditional fuels 47
Natural Resources and Tourism, Dares Salaam, Tanzania. Kinyanjui, M. (1987) 'Fuelling Nairobi: the importance of small sCale
charcoaling enterprises', Unasyiva, 157/158, Vol.39, FAO, Rome. Leach, G. (1987) 'Household energy in South Asia', Elsevier Applied
Science, London and New York. Leach, G. and Gowan, M. (1987) 'Household energy handbook',
Technical Paper 67, World Bank, Washington DC. Leach, G. and Meams, R. (1988) 'Bioenergy issues and options for
Africa', lIED, London. Malawi Energy Studies Unit (1986) 'Malawi flue-cured tobacco energy
use study', Report No. 6, Ministry of Forestry and Natural Resources, Lilongwe, Malawi.
Malingreau, J. P. and Tucker, C. J. (1988) 'Large scale deforestation in the southeastern Amazon Basin of Brazil', Ambio, 17, 1, Royal Swedish Academy of Sciences, Stockholm.
Mnzava, E. M. (1983) 'Tree planting in Tanzania—a voice from villagers', Forest Division, Dares Salaam, Tanzania.
SADCC (1987) 'Energy development fuelwood study', ETC Foundation, Netherlands,
Timberlake. L. (1985) 'Africa in crisis: The causes and the cures of environmental bankruptcy', Earthscan, London.
Tobisson, E. (1980) 'Women, work, food and nutrition in Nywamigura Village, Mara Region, Tanzania', Stockholm University, Sweden.
WHO (1984) 'Biomass fuel combustion and health', EFP/84.64 WHO, World Health Organization, Geneva.
3 Modern wood fuels
I. Stjernquist
Introduction
The nature of modern wood fuels
Wood has been used as an energy resource in homes and industry since ancient times. During much of the past, when the total energy demand was much lower than it is today, users generally had to cut, chop and transport their wood themselves. This traditional way of procuring wood fuels is still dominant in many of the developing countries.
During the last two centuries the energy needs of the industrialized countries have increased. At the same time major corporations and large utilities have taken over the primary role in producing energy and dis-tributing it to the consumer. As a consequence, energy production and distribution now occur on a large scale, which requires that great amounts of fuels be supplied on a continuous basis. There are several arguments in favour of increasing the utilization of woods fuels, as described later in the text. If the future energy systems of industrialized countries are to contain a high percentage of wood fuels, the biomass production per unit will have to be high, and handling and transport effective. The perspective employed in this chapter defines modem wood fuels to consist of the following resources: Forest energy Residues from clear-felled areas.
Small trees and residues from thinning. Small trees that cannot be utilized by industry. Residues from wood industries.

50 1. Stjernquist
Short rotation forests Fast growing monoculture of deciduous or coniferous trees; most species are coppiced.
Energy crops Residues from agriculture and horticulture. Agricultural crops grown exclusively for energy. Natural vegetation such as reeds.
The production of modem wood fuels generally requires advanced sil-vicultural and agricultural technology as well as large areas of suitable land. The background information in this chapter about environmental effects comes from countries that presently rely on this kind of technol-ogy—that is Australia, New Zealand, the industrialized countries of Eurasia and North America, and those regions, such as Brazil and south-east Asia, with large short-rotation plantations.
This chapter concentrates on the environmental impacts of growing, harvesting and handling modem wood fuels. Emissions from combus-tion are discussed briefly in the last section, since this conversion method has, up until now, been the dominant one and is likely to remain so in the immediate future.
Climatic and soil conditions in areas used to produce modern wood fuels In many papers discussing biofuels from a general point of view, all potential impacts ever identified are listed. This may result in an overemphasis on adverse impacts. To better predict potential impacts, especially those associated with exploitation, special attention must be given to the specific climatic, edaphic and hydrological characteristics of an area, as well as to the energy technology used.
Climate and soil type are the two most important factors determining the composition and productivity of a natural community, and they also affect the cultural characteristics of a particular area; thus they play a large role in determining the species available for silvicultural and agri-cultural exploitation and the potential level of biomass productivity. The total amount of rainfall and its distribution over the year are important factors influencing the erosion caused by wind and water. The nutrient content of the soil determines its sensitivity to acidification and the need for fertilization. Since few attempts have been made to determine the impacts of exploitation associated with modem wood fuel production, the climate and soil conditions may give a good indication of potential
Modern wood fuels 51
impacts. Figure 3.1 shows the climatic zones of the world. The environ-mental hazards connected with the production of wood fuels in different climatic zones are summarized in table 3.1. Figure 3.2 shows areas where the risk of desertification is high. Outside the areas shown in Figure 3.2, erosion may also occur on steep slopes and in regions with heavy rainfall. Harsh local climatic conditions together with the improper use of machines and poor management can lead to erosion in forest and farm areas around the globe.
Certain soils have characteristics rendering them very susceptible to damage resulting from practices associated with bioenergy production. The acid, nutrient-poor soils of the boreal zone, the podzols, are sensi-tive to acidification and nutrient loss caused by leaching and harvest. The soils of the tropical rainforest regions are severely leached and con-tain little or no mineral reserves. All of the nutrient reserves are con-tained in the above-ground biomass. In these cases, therefore, clear-felling causes a rapid decline in soil fertility. The tropical region also includes podzols—for example, in Malaysia, Guyana, Zaire and Brazil; these areas are naturally very poor in nutrients. The tropical soils of the dry woodland and savannah grasslands developed on acid crys-talline basement rocks (northern Nigeria and Ghana) have become nutri-ent poor through weathering. Changes in land use resulting in losses of protective plant cover have led to soil erosion. Fertile tropical soils are located in the USSR, Java, Uganda and Australia. (For further infom-ia-tion see Bridges 1982.)
Environmental impacts
Any study which describes and compares the various environmental impacts of different energy sources is fraught with methodological com-plications, generalizations and a lack of data. Nevertheless, comparisons have to be attempted if the aim is to create an energy system with the minimum environmental impact. A complete analysis must address all impacts of the exploitation, conversion and waste-handling stages, suit-ably quantified on a production-unit basis (in terms of heat or electric power). For modem wood fuels as well as for other biomass resources, there is a fundamental problem invo'ved in the subjective assessment of environmental effects (see figure 3.3).
The exploitation of biomass and its conversion into energy result in
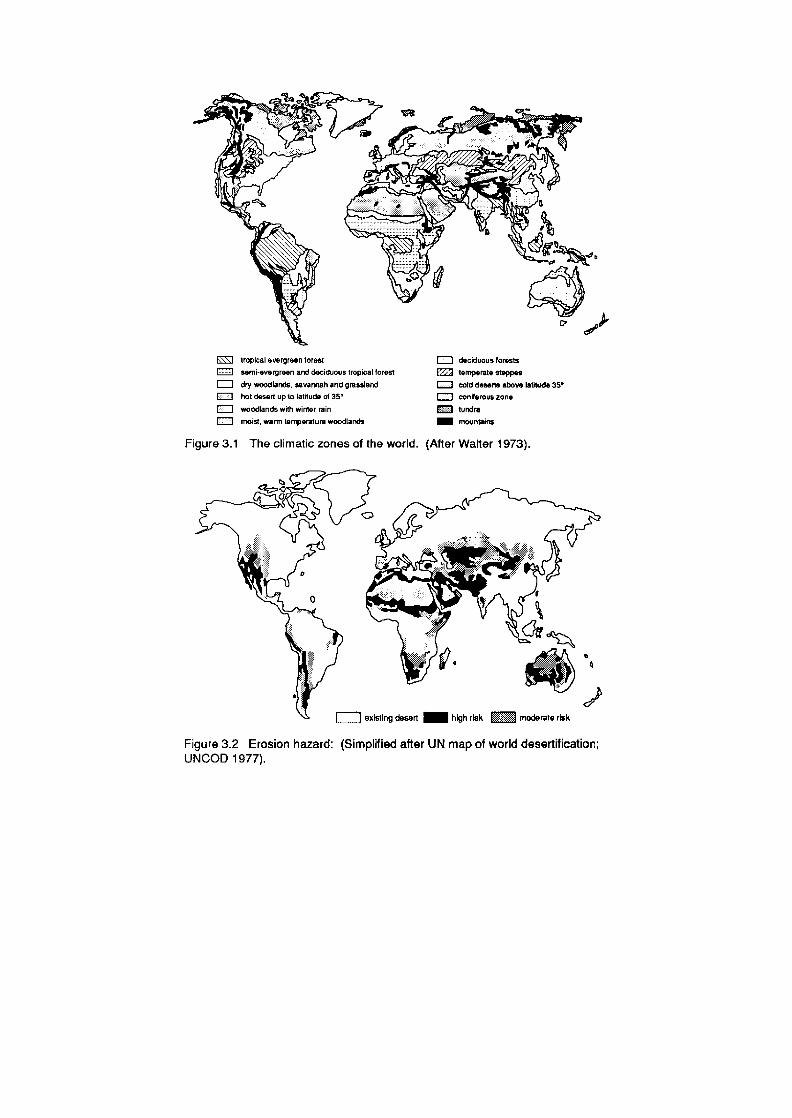
.
IF, yv~'%
stlng desert high risk MOM moderate risk
tropical evergreen lorast
semi-evergreen and deciduous tropical forest
dry woodlands, savannah and grassland
hot dose t up to latitude of
woodlands with winter rain
moist, warm temperature woodlands
deciduous forests
EZ2 temperate steppes
---- cold deserts above latitude 35
coniferous zone
tundra
mountairra
Figure 3.1 The climatic zones of the world. (After Walter 1973).
Figure 3.2 Erosion hazard: (Simplified after UN map of world desertitication; UNCOD 1977).

53
Table 3.1 General characteristics and environmental hazards connected with wood fuel production in different climatic zones of the world.
Climatic zone Characteristics Environmental hazard
1 Tropical The wettest of all zones. Risk of erosion by water. Some areas have a short dry Leaching of nutritional season. Growing site for reserves in roots and rai nforests. litter.
2 Tropical Tropical zone with summer rains and a winter dry season. Deciduous forests and savannahs.
4 Mediterranean Cyclonic rains in winter, Risk of erosion by water hot summers and a main extremely high. growing season in spring.
5 Warm temperate Climate warm and wet
6 Temperate A warm vegetation period of
Risk of nutrient leaching 410 6 months and a mild
when crops or forests are winter. The rainfall
harvested. maximum occurs during summer.
7 Arid temperate Summers are more and and When cultivated there is a the winter colder than 2. great risk of wind erosion. This is the region of
Irrigation may result in a steppes and prairies. The shortage of water supply dry summer climate and the salinization of soils. decreases biomass production, and irrigation has been used to increase yield.
8 Cold temperate Cool, short summers, and cold winters of longer than 6 months. The 'natural' coniferous forests in Canada, Alaska and eastern Asia contain a large number of different plant species, unlike the forests of the Euro-Siberian region.
Risk of nutrient leaching from bare soils during autumn and at snow-rn elI.

54 I. Stjernquist
emissions and mechanical disturbances to the ecosystem; these change soil and water processes and indirectly also the conditions for plants and animals. The biological/chemical effects can often be measured. However, evaluation of the severity of these effects is subjective and may differ between political groups, organizations and individuals. For example, it may be easier to accept the disappearance of plant or animal species from an area if one is not interested in nature and also benefits by the change. Changes in land use—and thus in landscape—are hard to measure in an objective fashion since the elements used in the analysis are often subjectively chosen, and because landscape aesthetics are highiy dependent on culture, personal attitudes, education and other fac-tors.
The environmental effects resulting from the cultivation and harvest-ing of wood fuels are similar to those resulting from conventional silvi-cultural and agricultural practices. To determine the actual environmental effects of an energy system, consideration must also be given to the impact of other human activities and to potential synergistic effects.
Modem silviculture has already affected many forests of the world. Natural mixed-species forests have been replaced by monocultures with a high productivity per unit area. As a result, these forests often contain a trivialized flora and fauna, and their utilization for wood fuel produc-tion generally has little effect on the existing ecosystem.
in the pre-industrial era, farmlands of the northern hemisphere used to contain a large number of plant and animal species owing to the diver-sity of the landscape and the cultivation methods. With the rise of mod-em agriculture, however, there has been a large-scale conversion to expansive, homogeneous fields. Hedges, meadows and coppiced woods as well as weeds have disappeared or are disappearing. The changes have negatively affected wildlife. Moreover, in and and tropical regions cultivation has led to soil erosion and degradation of the soil. The effects of wood fuel production on the environment will vary with the type of land used for cultivation—whether it is fertilized arable land, derelict farmland or degraded land, for example.
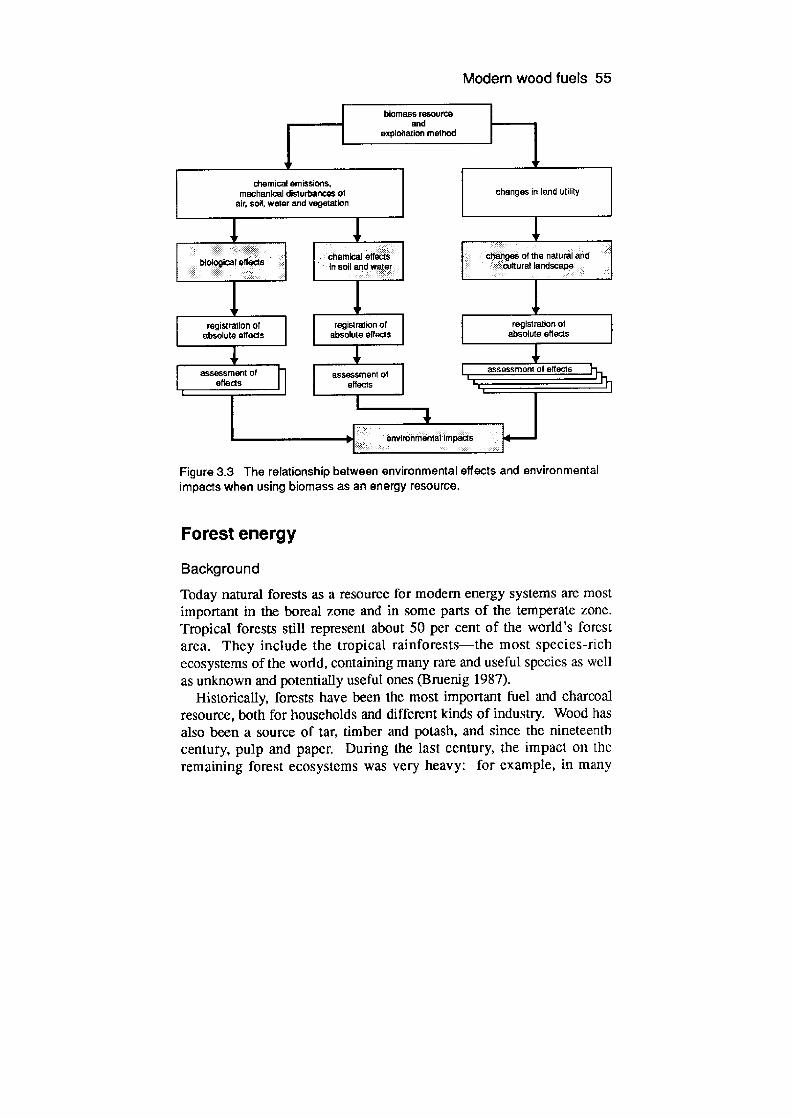
Modern wood fuels 55
biomass resource and
exploitation method
chemical omissions, I mechanical dlstwt,ancas of I changes in land Utility
aIr, soil, water and vegetation ]
In soil and waler
rogistratlon of I I
registration of I I registration of absolutS effects absolute Gtfeds absolute effects
4,1 1____
assessment of effects
[assessment Of I I assessment of elfectr
effects
Onvirdhmenlsl imp.3C15
Figure 3.3 The relationship between environmental effects and environmental impacts when using biomass as an energy resource.
Forest energy
Background
Today natural forests as a resource for modem energy systems are most important in the boreal zone and in some parts of the temperate zone. Tropical forests still represent about 50 per cent of the world's forest area. They include the tropical rainforests—the most species-rich ecosystems of the world, containing many rare and useful species as well as unknown and potentially useful ones (Bruenig 1987).
Historically, forests have been the most important fuel and charcoal resource, both for households and different kinds of industry. Wood has also been a source of tar, timber and potash, and since the nineteenth century, pulp and paper. During the last century, the impact on the remaining forest ecosystems was very heavy: for example, in many
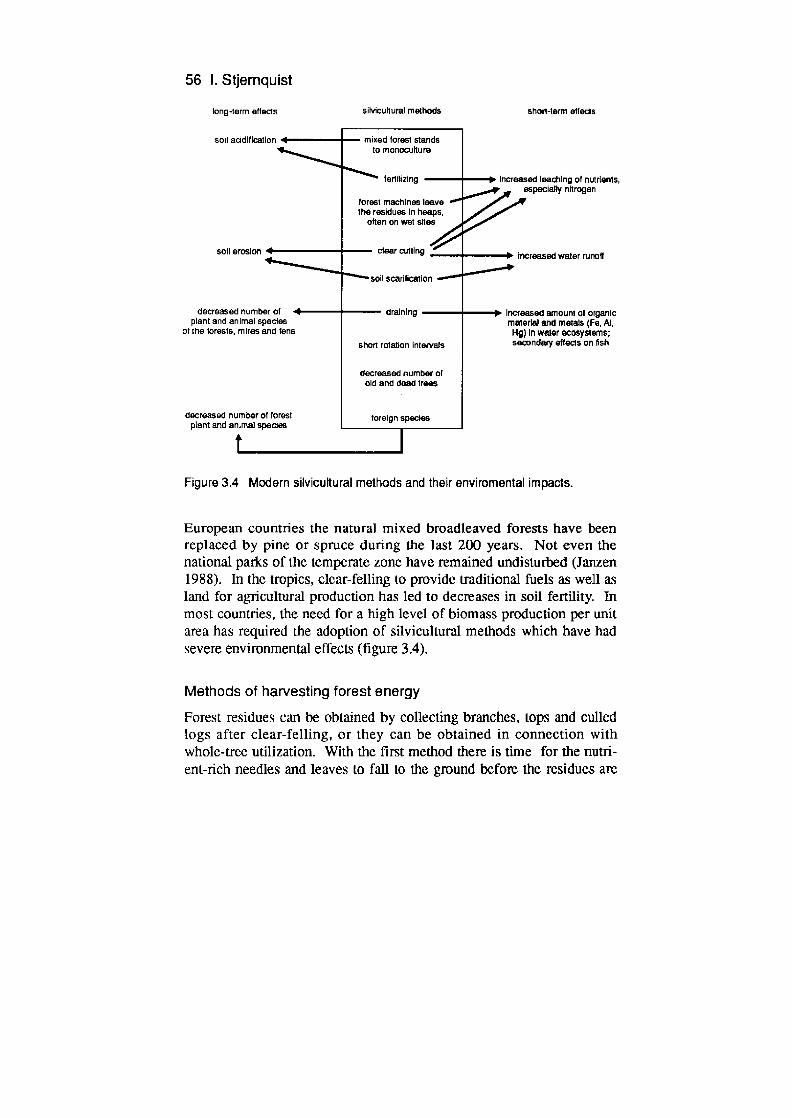
56 I. Stjernquist
long-term effects siMcultural methods shod-term effects
soil acidification I mixed forest stands to monoculture
tertdiing P. IncreaSed leaching of nutrients, especially nftrogen
forest macfines leave the residues In heaps,
often on wet sites
soil erosion 0 1 clear cuttIng
'J•'' Increased water runoff
Soil scanuicatIon
decreased number of I draining 0 Increased emount of organic plant and animal species material and metals (Fe, Al,
of the forests, mires and tens Hg) in waler ecosystems: short rotation Intervals secondaly effects on fish
decreased number of old and dead trees
decreased number of forest I foreign species pan1 and animal species
Figure 3.4 Modern silvicultural methods and their enviromental impacts.
European countries the natural mixed broadleaved forests have been replaced by pine or spruce during the last 200 years. Not even the national parks of the temperate zone have remained undisturbed (Janzen 1988). In the tropics, clear-felling to provide traditional fuels as well as land for agricultural production has led to decreases in soil fertility, in most countries, the need for a high level of biomass production per unit area has required the adoption of silvicultural methods which have had severe environmental effects (figure 3.4).
Methods of harvesting forest energy
Forest residues can be obtained by collecting branches, tops and culled logs after clear-felling, or they can be obtained in connection with whole-tree utilization. With the first method there is time for the nutn-ent-rich needles and leaves to fall to the ground before the residues are

Modern wood fuels 57
collected with a forwarder. In the latter case a harvester is used to cut and transport the entire tree Out of the area. Once at the road the trees can either be processed at once or transported to a processing plant. In regions with cold or dry seasons the harvest usually takes place once the deciduous trees have lost all or some of their leaves.
After clear-felling the area is replanted. The productivity of individ-ual trees is maximized by thinning the stand from 2 to 5 times during the rotation. Thinned trees are usually transported out of the stand. Normally the branches and foliage are placed on the tracks between the stands to prevent root damage, if they are not to be used as fuel.
Environmental effects Such solid wood residues as sawdust, bark and black liquor constitute a large potential energy resource in Europe and the USA (Koning 1987). The utilization of these kinds of wood fuel has no adverse effects associ-ated with production or harvesting. On the contrary, energy production offers a way for disposing of waste biomass which would otherwise have been processed or dumped. The following discussion of environ-mental effects is based on the assumptions that only modem machines, causing little soil compaction, are used, and that effective erosion control is practised in areas where the erosion risk is high.
Residues The boreal zone In the boreal zone, where the erosion risk is low, the most important effects of residue utilization are listed below. Of the effects discussed the first one is indirect and the remainder are direct. Plants and wildlife are insignificantly affected. Mechanical clear-felling leaves heaps of residues on about 15 per cent of the clear-cut area. Under the heaps, nitrogen leaching from the soil increases, creating the risk of greater nitrogen input to streams and to the atmosphere (Rosen and Lundmark-Thelin 1986). Residue collection prevents this leaching.
Negative effects are as follows: Decreased growth of the next forest generation. This is an indirect
measurable effect of decreased nutrient supply to the soil, especially nitrogen. The changes in microclimate, soil temperature and soil mois-ture lead to a decrease in decomposition rate which in turn decreases the

58 1. Stjernquist
soil nutrient supply. Studies on Norway spruce have revealed that residue utilization can decrease growth rate by up to 40 per cent during the first 20 years of growth, depending on soil type. The effect is also species-specific; for example, growth in Scots pine is not markedly affected (Lundkvist 1987).
Increased nitrogen loss. At whole-tree utilization the additional nitro-gen loss through biomass output represents about 10 per cent of the total nitrogen supply in the forest ecosystem (Lejon 1985).
Decreased litter input. The organic layer of very poor soils has been reported decreasing by 20 per cent (Berg and Staaf 1983). The effect may also lead to a decrease in the nutrient supply to trees.
Soil organisms and fungi. Generally both abundance and number of species decrease for some years after residue removal (Rosen and Lundmark-Thelin 1986). The fungal biomass also decreases.
Soil acidification. The soil under a conifer stand is acidic. Removal of residues may increase the level of acidification, because the neutral-ization capacity associated with the decomposition of biomass is decreased as the nutrient-rich foliage and small branches are exported from the clear-felling area. Investigations from Sweden show a decrease of 0.1 pH units up to 20 years after slash removal (Nykvist and Rosen 1985). At the time of clear-felling, soil acidification is probably higher. Soil acidification resulting from biomass export is probably of greatest importance in regions with a high atmospheric pollutant load and where soils have a low buffering capacity. Large regions of Europe and North America are adversely affected by air pollution. As the pH of the soil decreases below 5, the leaching of nutrients, especially,calcium. potas-sium and manganese, begins. Aluminium solubility increases dramati-cally below pH 4.5 and the released A13+ ions are toxic to the root system (Ulrich 1983). An additive acidification effect may be avoided by not utilizing residues from forest stands growing in highly polluted areas.
There is a single positive effect to set against the above. The produc-tion of berries is important for the local economy. Berry production increases in response to slash removal (Westerlund and Ingelog 1981).
The temperate and Mediterranean zones The negative effects on plants and animals of forest residue removal depend on the earlier treatment of the forest. Modem silviculture and residue removal affect those animal species which utilize rotting logs for

Modern wood fuels 59
food and shelter (Van Hook et al. 1982). In replanted areas with little dead wood, the effects of residue collection on these species are insignif-icant. Within these zones, the use of forest residues as an energy resource has received the most attention in North America.
Negative effects are as follows: Decreased growth of the next forest generation. Studies in forests
growing on the southern coastal plain of the USA show that the phos-phorus supply in the soil may be depleted by residue collection, resulting in a long-term decline of the next forest generation. For aspen stands in Wisconsin the level of calcium reserves appears to be the limiting growth factor affected by residue removal.
Nutrient loss. In relation to the total nutrient supply rate to the soil, the loss by slash removal is about 10 per cent—approximately the same as that found in the boreal zone. Losses vary, however, depending on the tree species. The biomassfnutricnt content ratio is highest in temper -ate conifers, followed in decreasing order by temperate broadleaved trees, boreal conifers and tropical trees (Van Hook et al. 1982). Nutrient loss is least when temperate conifer species are used. The nutrient loss is also a function of the time of the year during which slash is removed: since foliage has a higher nutrient content than the branches and bole, harvesting after leaf-fall decreases nutrient loss. Even in south-eastern USA, where the forests contain evergreen species, the level of nutrient withdrawal is lower in winter when the trees have less foliage. For nitrogen the figure varies between 20 and 40 per cent (McMinn and Nutter 1982).
Soil erosion. In north-western USA the erosion hazard is great (see figure 32). Slash removal may increase the erosion rate, which in turn increases the rate of nutrient loss. However, the problem can be mini-mized by restricting clear-felling and leaving buffer strips along streams (Davis 1979).
Soil compaction. In regions with no winter frost, soil compaction caused by the heavy equipment can pose a serious problem, since such compaction can increase water runoff and soil erosion. The effect should only be attributed to the energy system if the residues are col-lected separately.
Soil acidflcation. For comments see the discussion of soil acidifica-tion in the boreal zone above.
Again there is a positive effect. There is a decreased fire hazard, especially in the Pacific north-west of North America, where a thick
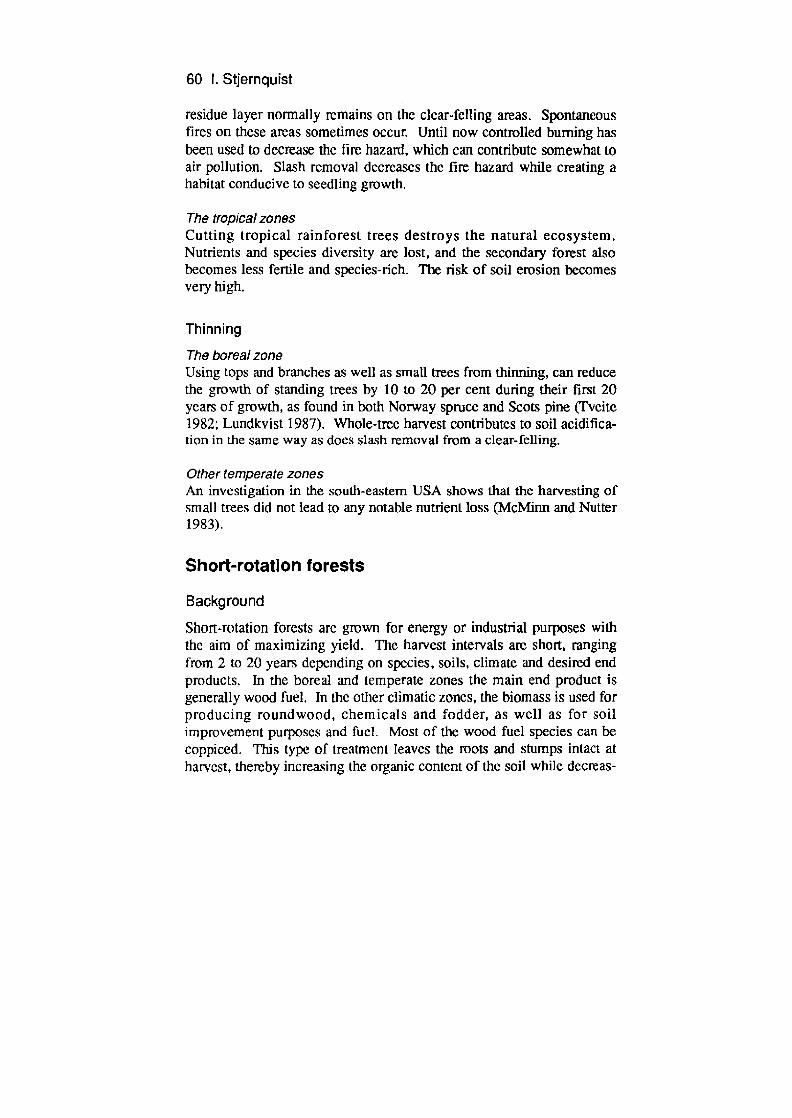
60 I. Stjernquist
residue layer normally remains on the clear-felling areas. Spontaneous fires on these areas sometimes occur. Until now controlled burning has been used to decrease the fire hazard, which can contribute somewhat to air pollution. Slash removal decreases the fire hazard while creating a habitat conducive to seedling growth.
The tropical zones Cutting tropical rainforest trees destroys the natural ecosystem. Nutrients and species diversity are lost, and the secondary forest also becomes less fertile and species-rich. The risk of soil erosion becomes very high.
Thinning
The boreal zone Using tops and branches as well as small trees from thinning, can reduce the growth of standing trees by 10 to 20 per cent during their first 20 years of growth, as found in both Norway spruce and Scots pine (Tveite 1982; Lundkvist 1987). Whole-tree harvest contributes to soil acidifica-tion in the same way as does slash removal from a clear-felling.
Other temperate zones An investigation in the south-eastern USA shows that the harvesting of small trees did not lead to any notable nutrient loss (McMinn and Nutter 1983).
Short-rotation forests
Background
Short-rotation forests are grown for energy or industrial purposes with the aim of maximizing yield. The harvest intervals are short, ranging from 2 to 20 years depending on species, soils, climate and desired end products. In the boreal and temperate zones the main end product is generally wood fuel. In the other climatic zones, the biomass is used for producing roundwood, chemicals and fodder, as well as for soil improvement purposes and fuel. Most of the wood fuel species can be coppiced. This type of treatment leaves the roots and stumps intact at harvest, thereby increasing the organic Content of the soil while decreas-

Modern wood fuels 61
ing the tendency for leaching and erosion. Nitrogen-fixing plants are of particular interest as plantation species since this trait reduces the need for nitrogenous fertilizers.
The demand for wood fuels is high in many of the tropical countries because of rapidly increasing populations. Wood is still the major source of energy, and 90 per cent of the trees harvested are converted to energy. Deforestation and cultivation have created infertile wastelands through wind and water erosion. Today, 10 to 40 per cent of the total area within tropical countries is desertified or designated as wastelands (Perera 1979). Short-rotation forest plantations have been used to meet the growing need for biomass for energy and industry. Gilliusson (1985) compared the amount of plantation area in Asia and Latin America as of 1980 with the amount of land potentially suitable for forest plantations (table 3.2).
Cultivating and harvesting tree crops
The borea! zone In the boreal zone the main species used for short-rotation forests are willow, birch and alder, all of which have wide ecological ranges (Robertson 1984). The clones used are evaluated in terms of productiv-ity, resistance against insects and pathogens, cold hardiness, tolerance to water stress and nutrient stress, degree of competitiveness with weeds and attractiveness to grazing animals (Siren 1984). These characteristics determine the needed input levels of herbicides, pesticides and fertilizer. In alder plantations the nitrogen requirement is generally lower than for other species because of the nitrogen fixation capacity of the roots.
Short-rotation forests may be cultivated on sandy to clayey soils with a soil depth of at least 70 cm. Suitable sites range from forest land and
Table 3.2 The existing area covered by forest plantations and deforested areas suitable for new plantations in Asia and Latin America (After Gilliusson 1984).
Region Total plantations Ratio of existing (ha) plantations/deforestod
area
Asia excluding China) 7 700 x 103 1/4.5 Latin America 7 000 x io 1/9.4
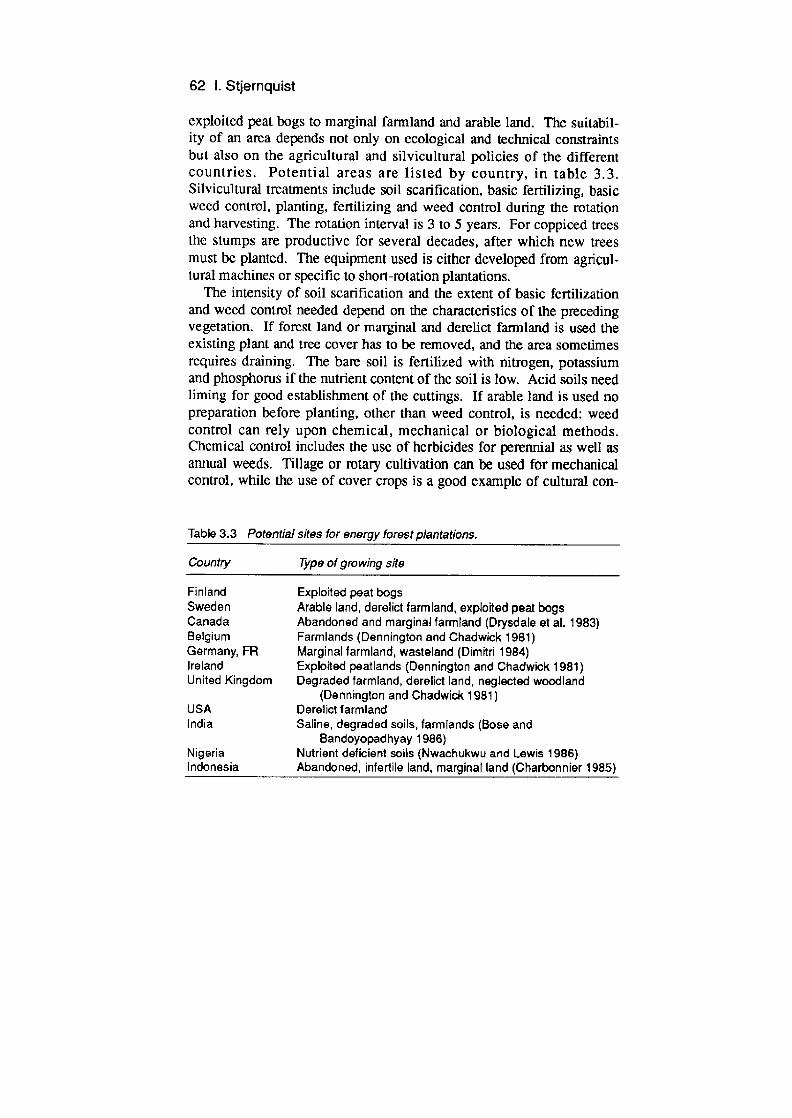
62 1. Stjernquist
exploited peat bogs to marginal farmland and arable land. The suitabil-ity of an area depends not only on ecological and technical constraints but also on the agricultural and silvicultural policies of the different countries. Potential areas are listed by country, in table 3.3. Silvicultural treatments include soil scarification, basic fertilizing, basic weed control, planting, fertilizing and weed control during the rotation and harvesting. The rotation interval is 3 to 5 years. For coppiced trees the stumps are productive for several decades, after which new trees must be planted. The equipment used is either developed from agricul-tural machines or specific to short-rotation plantations.
The intensity of soil scarification and the extent of basic fertilization and weed control needed depend on the characteristics of the preceding vegetation. If forest land or marginal and derelict farmland is used the existing plant and tree cover has to be removed, and the area sometimes requires draining. The bare soil is fertilized with nitrogen, potassium and phosphorus if the nutrient content of the soil is low. Acid soils need liming for good establishment of the cuttings. If arable land is used no preparation before planting, other than weed control, is needed: weed control can rely upon chemical, mechanical or biological methods. Chemical control includes the use of herbicides for perennial as well as annual weeds. Tillage or rotary cultivation can be used for mechanical control, while the use of cover crops is a good example of cultural con-
Table 3.3 Potential sites for energy forest plantations.
Country Type of growing site
Finland Exploited peat bogs Sweden Arable land, derelict farmland, exploited peat bogs Canada Abandoned and marginal farmland (Drysdale et al. 1983) Belgium Farmlands (Dennington and Chadwick 1981) Germany, FR Marginal farmland, wasteland (Dim itri 1984) Ireland Exploited peatlands (Dennington and Chadwick 1981) United Kingdom Degraded farmland, derelict land, neglected woodland
(Dennington and Chadwick 1981) USA Derelict farmland India Saline, degraded soils, farmlands (Bose and
Bandoyopadhyay 1986) Nigeria Nutrient deficient soils (Nwachukwu and Lewis 1986) Indonesia Abandoned, infertile land, marginal land (Charbonnier 1985)

Modern wood fuels 63
trol (Danfors 1984). Weed control is only necessary during the estab-lishment phase of the plantation.
The amounts of fertilizer used are normally within the same range as those used in agriculture. Nitrogen input is about 120 kg/ha per year. With liquid fertilization, about 80 per cent of the supplied nitrogen is uti-lized for above-ground uptake. Roots and weeds utilize the remaining part (Nilsson 1985). The need for fertilizer decreases as the nutrient supply in the soil increases. The uptake of nitrogen per ton of biomass decreases with increasing stand age in willow and alder as well as poplar species. To minimize nutrient leaching the plantations are fertilized sev-eral times during the vegetation period. Where it is dry, irrigation is needed (Perttu and Lindroth 1986).
Harvest takes place after the leaves have been shed. The stems are collected in bundles or chipped for transport to the conversion plant. However, stored wood chips may suffer from microbial breakdown through moulding, which can result in a loss of biomass and may pose a health hazard.
The tenerate and Mediterranean zones A great variety of tree species have been evaluated for use in short-rota-tion plantations, including species from the boreal zone. They include acacias, red oak, hombeam, tulip tree, chestnut, ash, eucalypts, red alder, sycamore and lodgepole pine. Of these, acacia and red aIder are nitro-gen-fixing species. In the warmer climate of the south-eastern USA, sweetgum and black locust are suitable species. In the drier Mediterranean climate, Euphorbia and carob are alternatives. For pro-duction figures see table 3.4.
The areas potentially suitable for short-rotation plantations are given in table 3.3. All have one attribute in common: they are affected by man, and the vegetation prior to establishment of the plantation is likely to be trivial, though one exception may be the neglected woodlands of the United Kingdom. Some of the species have rather long rotation intervals of about 10 years. The planned end products therefore include both biomass for pulp and energy as well as fodder and chemical prod-ucts. Carob can be used for food, fodder and fuel as a result of its high sugar content.
Cultivation methods are the same as those discussed above. The need for fertilizer depends on the soil and the nitrogen-fixation capacity. The soils are normally rich in nutrients, and in some areas there is no need
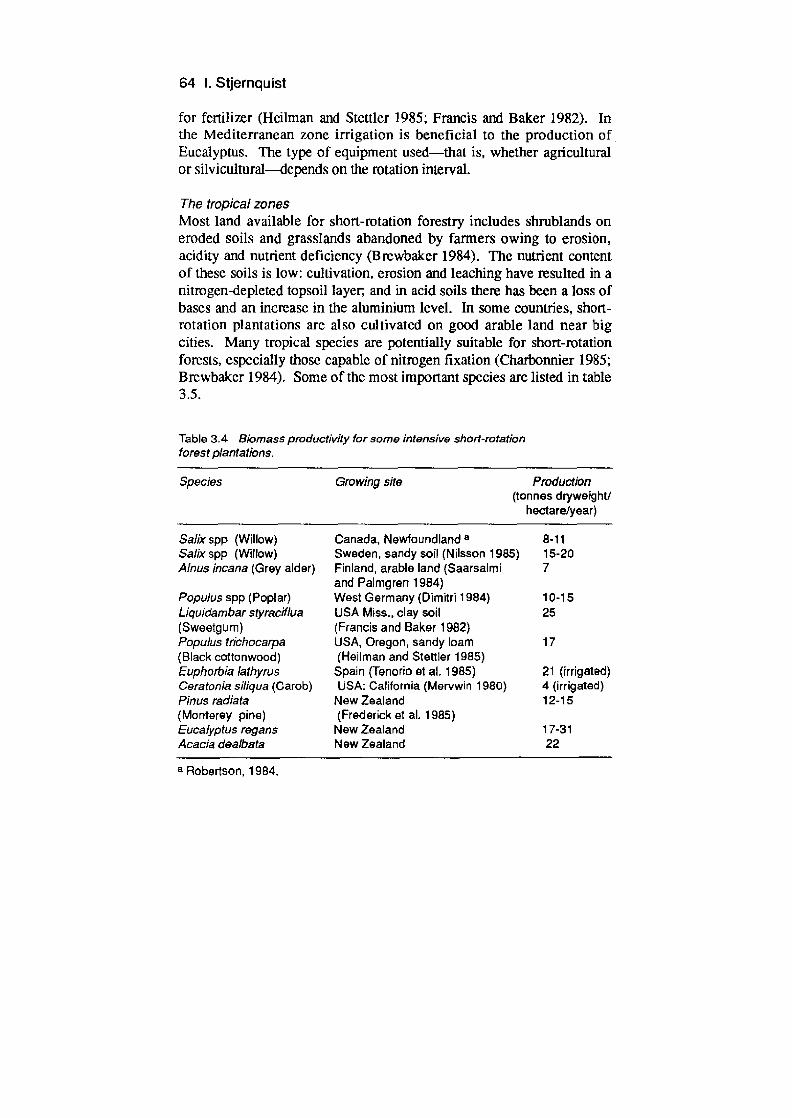
64 I. Stjernquist
for fertilizer (Heilman and Stettler 1985; Francis and Baker 1982). In the Mediterranean zone irrigation is beneficial to the production of Eucalyptus. The type of equipment used—that is, whether agricultural or silvicultural—depends on the rotation interval.
The tropical zones Most land available for short-rotation forestry includes shrublands on eroded soils and grasslands abandoned by farmers owing to erosion, acidity and nutrient deficiency (l3rewbaker 1984). The nutrient content of these soils is low: cultivation, erosion and leaching have resulted in a nitrogen-depleted topsoil layer, and in acid soils there has been a loss of bases and an increase in the aluminium level. In some countries, short-rotation plantations are also cultivated on good arable land near big cities. Many tropical species are potentially suitable for short-rotation forests, especially those capable of nitrogen fixation (Charbonnier 1985; Brewbaker 1984). Some of the most important species are listed in table 3.5.
Table 3.4 Biomass productivity for some intensive short-rotation forest plantations.
Species Growing site Production (tonnes dryweight/
hectarelyear)
Salix spp (Willow) Canada, Newfoundland a 8-11 Sallxspp (Willow) Sweden, sandy soil (Nilsson 1985) 15-20 Alnus incana (Grey alder) Finland, arabia land (Saarsalmi 7
and Palmgren 1984) Populus spp (Poplar) West Germany (Dimitri 1984) 10-15 Liquidambarstyraciflua USA Miss., clay soil 25 (Sweetgum) (Francis and Baker 1982) Populus trichocarpa USA, Oregon, sandy loam 17 (Black cottonwood) (Heilman and Stettler 1985) Euphorbia lathyrus Spain (Tenorio at al. 1985) 21 (irrigated) Ceratonia siliqua (Carob) USA: California (Mervwin 1980) 4 (irrigated) Pinus radiata New Zealand 12-15 (Monterey pine) (Frederick at al. 1985) Eucalyptus regans New Zealand 17-31 Acacia dealbata New Zealand 22
aRobe - sofl, 1984

Modern wood fuels 65
The high growth rate of tropical tree species means that rotation times are relatively short. Rotations can vary in length from 4 to 10 years, depending on species and end use. Normally the trees are harvested after 6 years (Brewbaker 1984). In the tropical zones cultivation meth-ods are more diverse than in other climatic zones. Short-rotation energy forests are established with cuttings or seeds. Herbicides are important especially at the start to eliminate the heavy weed and grass growth typi-cal of degraded soils. The need for fertilizer depends on soil characteris-tics. Nitrogen, phosphorus, sulphur, zinc and various micronutrients may be growth limiting. By carefully selecting species adapted to the particular site conditions the level of nutrient supplementation can be minimized—for example, by planting acid tolerant Acacia on acid soils. Of the species presented in table 3.5, Acacia, Calliandra, Leucaena and Casuarina are nitrogen fixers.
The tropical nitrogen fixation species have evolved in areas rich in pests and insects. Consequently, many have developed a certain resis-tance to biomass loss (Brewbaker 1984). Such resistance may decrease the need for chemical pest control during cultivation.
Table 3.5 Productivity and and use of some species used in short-rotation energy forestry in tropical areas.
Species Productivity (m3lha year)
Rotation inteival (years)
End use
Acacia auriculiformis 17-20 10 Fuel, pulp, tannins Calliandra calothyrsus 35-60 1 Fuel, fodder, tirbreaks,
erosion control, soil improvement
Gmellna arborea 20-35 5-8 Fuel, pulp Leucaena leucocephala 20-35 4 Fuel, charcoal, eorsion
control Eucalyptus spp 10-100 2-10 Fuel, charcoal, timber,
pulp Casuarina equisetifolia 10-20 7-10 Fuel, timber, dye, tannins,
pulp, windbreaks, erosion control
Azadirachtaindica 13-17 8 Fuel, oil
Source: Charbonnier 1985; Brewbaker 1984.
66 I. Stjernquist
Environmental effects
Environmental effects may be divided into three groups: positive effects, effects depending on previous land use, and effects depending on culti-vation methods.
The boreal to the Mediterranean zones Positive effects in these zones are as follows:
Soil improvement. Short-rotation forestry on naturally poor soils increases the organic content of the soil through leaf-fall and root turnover, thereby improving the soil structure and water infiltration (Andersson et aL 1983). For willow, the litter input to soil is about 10 tlha per year. The positive effect is especially evident if energy forests are planted on abandoned arabic lands with low organic content resulting from repeated harvesting and straw burning. Mechanical weed control can also improve the soil structure.
Wildlfe. In agricultural areas a short-rotation forest plantation may increase wildlife populations by providing food and shelter.
Several effects depend on previous land-use history: Flora. Old coppiced woods often have a very diverse flora and fauna.
In Europe some are even converted to nature reserves. Intensive short-rotation forest, however, favours weed species. The effect on the floral composition therefore depends on the previous vegetation cover as well as the cultivation method. High amounts of fertilizer and herbicides and long rotation periods favour a few weed species and investigations from Sweden show that weeds make up 50 to 80 per cent of the vegetation cover (Gustavsson 1986). Among the types of available growing sites listed in table 3.3 two main groups, based on their different vegetation histories, can be identified.
The first group includes areas with no vegetation or a very trivialized flora including many weed species. Exploited peat bogs, arable land and farmland affected by fertilizer and herbicides, waste land, derelict land and degraded farmlands exemplify this type of land. Short-rotation forestry on such sites has no adverse effects, and sometimes can have a positive influence: for example, it may lead to higher floristic diversity as a result of the establishment of new boundary zones in an otherwise open landscape. Weed control should rely on mechanical methods, since an initial treatment with herbicides can have long-term effects on species

Modern wood fuels 67
composition (Gustavsson 1986). In these areas mechanical weed control does not cause soil erosion.
The second group includes natural forests and meadows or pastures given no chemical fertilizer. Such areas usually have a diverse flora and sometimes contain rare or endangered species. These sites are nega-tively affected upon transformation into short-rotation forests: plant diversity decreases drastically and rare species restricted to forests or meadows may disappear. Indirectly this will lead to a decrease in abun-dance and diversity of insects and other animals.
Nutrient loss. Soils with a downward soil water movement suffer the risk of nutrient leaching to the groundwater. Investigations have shown, however, that nitrogen leaching during cultivation of short-rotation for-est is low—the result of effective nitrogen utilization by the trees, the presence of perennial stumps after harvest, with their associated living roots, and the lack of tillage (Nilsson 1985). By spreading out the fertil-izer applications over time, nutrient losses can be minimized.
At planting time, the nitrogen loss from the bare soil may be equiva-lent to the loss from arable land: a mean figure is 12 kg/ha per year. During the renewal of stumps in a short-rotation forest nutrient losses are probably high; howevcr, no figures are available.
The leaching of nutrients can negatively affect aquatic ecosystems. In lakes, streams and shallow coastal waters, increased levels of nitrogen may lead to a change in the species composition of flora and fauna as well as an increased plankton biomass. At decomposition the oxygen demand may result in the suffocation or decreased vitality of fish and bottom animals.
Intensively cultivated arable land areas are generally given a higher input of nutrients per unit area than short-rotation forests, and the nutri-ent loss through leaching and runoff would also be higher, as most agri-cultural crops are annual and require tillage. Areas of short-rotation forests which have never been fertilized during their previous use receive an increased nutrient input. The environmental effects of nutri-ent loss, accounted to the energy system, therefore depend on earlier land use.
To summarize: the conversion of unfertilized farm lands, forest land and wetlands into short-rotation forest increases the nutrient input to aquatic ecosystems, thereby leading to the negative effects described above. However, by using appropriate fertilizing techniques such effects can be minimized. The conversion from agricu1ture to short-rotation
68 I. Stjernquist
forestry on arabic land leads to a reduction in the level of nutrient inputs to surrounding waters, resulting in a positive effect.
Finally, there are those effects that depend on cultivation methods: The effects of weed control. The use of herbicides for weed control
poses a potential hazard to organisms affected by water run-off. In areas with insignificant water erosion, mechanical weed control methods can be used, thereby avoiding the negative effects of herbicides.
Landscape effects. The visual and aesthetic impacts of short-rotation forests on the landscape in the boreal and temperate zones have been the subject of much discussion. Plantations tend to close the existing open cultural landscape. However, it is important to notice that coppiced woods have been common in Europe and Asia since prehistoric times, and that the wide open arable landscape found today is a result of the agricultural methods belonging to the last two centuries (Rackham 1980). Coppice management has generally been practised up to the southern boundary of the boreal zone and further north, wherever wood was a scarce resource.
It is hard to describe the effects of visual impacts objectively. This is not to say that visual impact is unimportant but the assumed effect on landscape depends largely on the attitudes of individuals and organiza-tions about what constitutes an aesthetic or an ideal landscape, and these attitudes depend in turn on history and profession. In the western coun-tries, the farmland of the late nineteenth and early twentieth century is probably still an ideal landscape model. Closing up this landscape is regarded as undesirable. On the other hand, a diverse landscape often appears more pleasing than large areas with monocultures; thus, by planting short-rotation forests in rather small units of varied appearance and clone composition, the negative effects on landscape can be mini-mized.
The tropical zones The environmental effects of short-rotation forestry strongly depend on previous land-use history. If degraded soils are used for energy planta-tions, positive social impacts can result from the increased biomass resource, and the supplemental products can be utilized by both industry and agriculture. However, the impacts on the tropical landscape are still unknown.
Some positive effects can be identified: Soil improvement. The soil improvement effect is very pronounced on
Modern wood fuels 69
infertile and eroded soils. Both the nutrient content and the organic component increase. Nitrogen-fixing species are especially important since they restore 50 to 100 kg/ha per year of nitrogen to the soil (Perera 1979; Brewbaker 1984).
Soil erosion. Water emsion is low in abandoned farmlands supporting short-rotation plantations, because of the presence of living roots. This beneficial effect may even be extended outside the plantation areas; for example, on steep agricultural slopes short-rotation trees used as contour hedges around the cultivated areas stop the downward erosion process (Brewbaker 1984).
Flora and fauna. Energy forests can positively affect the flora and fauna of the remaining tropical rainforest in an indirect way. On islands, such as Sri Lanka and Hawaii, a high percentage of the rainforest species is endemic. Also, many of the species in tropical rainforests have yet to be described. Another aspect is that some of the primary forest species may turn out to be a valuable gene-pool for potential chemical or phar-maceutical compounds. The establishment of short-rotation plantations for fuel production decreases the need to exploit natural tropical forests, thereby indirectly protecting them to some degree.
Cultivation methods also have an effect: Nutrient loss. Nutrient loss may occur during the initial phases of
plantation development because of soil erosion. At harvest, similar effects result from biomass mmoval and leaching. In a plantation rather similar in structure to a monocultural forest the losses of available nutri-ents through soil erosion and leaching represented about 2 to 50 per cent of the loss through bole harvest (Bruijnzeel and Wiersum 1985). For coppiced species, the sole utilization of stems minimized the nutrient losses.
Cultivated energy crops
Background
Energy crops can be cultivated in all regions of the world supporting intensive agriculture. Since the energy production per unit area is low when compared with wood fuels, the total harvesting area has to be large if energy crops are to play a major part in the energy system. Cultivated energy crops may be subdivided into three groups on the basis of their
70 I. Stjernquist
cultivating system: crop residues, catch crops and energy crops. The first two are associated exclusively with areas where modem and mecha-nized agriculture are practised.
Crop residues are either dry residues, suitable for direct combustion, or wet, green residues, suitable for methane production. Residues can be obtained from field, orchard and vegetable crops. Catch crops, mostly grown in temperate climates, are cultivated on arable land to prevent the leaching of nutrients during periods between harvest and sowing of main crops. Energy crops are grown exclusively for energy purposes. In countries with a surplus of agricultural products, energy crops are well suited for cultivation within the normal crop rotation. In other countries there may be a conflict between food and energy production. In temper-ate climates, the energy crops may either be traditional ones, such as cereals, pasture plants, sugar beet, potatoes, oilseed crops, or new fast-growing species such as Jerusalem artichoke and Japanese knotweed. The main conversion processes are combustion and methane production. In tropical areas carbohydrate producing crops, such as sugar cane and cassava, and oil producing species, including African oil palm, soybean and peanut, are important energy plants. In and or semi-arid areas hydrocarbon-producing species, like Euphorbia larhyrus, have been tested. Species rich in starch and sugars are suitable for ethanol produc-tion, and species with a high oil content are processed into vegetable oils.
The environmental effects and associated risks are largely crop and technology dependent, but may be aggravated or mitigated by local cli-matic and topographical conditions. The following discussion is gener-ally valid for all climatic zones.
Cultivation and harvest Crop residues Dry residues include straw from cereals; stalks from cotton, sunflower, sorghum and corn; corn cobs and tree prunings. In cool, humid climates where the decomposition rate is slow, straw left on the field has gener-ally been regarded as a problem, since it causes nitrogen immobilization. It has therefore been burnt. Straw has only been used to a limited extent as a source of forage, litter and industrial products (Have 1982). In cli-matic zones where the erosion hazard is evident, residues are important for soil fertility. This is especially true for tropical areas. Consequently,

Modern wood fuels 71
the amount of dry residue available to the energy system is dependent on the agricultural system and may also vary over the years. Dry residues may either be collected with conventional harvesting equipment, mostly by baling, after harvest of the primary crop, or in connection with a total harvest system. Existing forage harvesting equipment can be utilized for cereal straw, but in most cases specialized collection systems are needed (Jenkins and Sumner 1986).
Although biomass production depends on soil, climate and species, with the advent of artificial fertilization variations have become minor at the regional level. World-wide production is from 25 to 9 tlha per year for field crops and 0.7 to 3.8 l]ha per year for orchard crops. For some of the species such as rice, the initial moisture content of the residue is as high as 50 to 80 per cent while in cereal straw the moisture content can be as low as 10 per cent. Drying in the field reduces the fire hazard in connection with storage.
Crops such as sugar beet, potatoes, legumes, mustards and horticul-tural crops produce wet, green residues. The available energy content per unit area is less than that of dry residues as a result of the higher moisture content and the additional energy lost during the methane pro-cess. However, when producing sugar from sugar cane 30 to 35 per cent of bagasse concentrate, which is suitable for combustion, is left at the refineries (Hosier and Svenningson 1987).
Energy crops and catch crops With the exception of tree and shrub species, most energy crops are grown using conventional agricultural methods, including applications of artificial fertilizers, herbicides and fungicides. The input of these sub-stances per unit area depends on the species cultivated. The productivity of crops grown exclusively for energy is often higher than that of tradi-tional agricultural crops. For example, in Scandinavian studies, energy grass and Jerusalem artichoke produced 7 and 16 tonnes dry weight per year respectively, while Japanese knotweed in the UK produced 20 t dw/ha per year (SUAS 1984; Carruthers and Jones 1982). In Brazil an annual yield of 45 and 13 t dw/ha for sugar cane and cassava respec-tively resulted in an ethanol yield of 67 and 180 l/t. The African oil palm produces 4 to 5 t/ha of oil per year under adequate management (Alvim 1983). In more and areas, for example California and Australia, Euphorbia lathyris has been reported as producing 25 t dw/ha per year (Kumar and Kumar 1984).
72 I. Stjernquist
Catch crops are restricted to temperate regions with winter periods without heavy frost. Carruthers and Jones (1982) reported a production level of catch crops in the UK between 2.5 and 13.9 t dw/ha per year. Suitable catch crop species include fodder beets, kale, fodder radish and cereals.
Environmental effects The use of cultivated crops as a resource in modem energy systems attracts the greatest interest in countries where access to wood resources is limited and where the cultivated area is large enough to support advanced harvest and cultivation systems. Today these areas are faced with two major climate-dependent problems: erosion of the topsoil by wind and water, and leaching of nutrients. The water erosion and leach-ing hazards are most pronounced in areas with heavy rain and no frost during the autumn and winter, or in areas with intense snow melting. Wind erosion is a hazard in areas affected by drought before or during initial crop establishment. In the northern parts of the American conti-nent and Eurasia the erosion hazards are limited (see figure 3.2). Fields with bare soils or a thin vegetation cover are most prone to erosion.
In many areas, agricultural practices have led to erosion, resulting from the use of tilling, annual species, rotations including only a few species, or single crops under continuous cultivation. These problems are most pronounced in tropical areas where soil degradation is often the result. In the USA soil erosion in agriculture decreases crop yield because of nutrient losses, decreases in the water infiltration capacity of the soil and decreases in organic content (Pimentel and Krummel 1987). Any analysis of the environmental impacts of residue and energy crop utilization must treat each region separately, taking into account both the effects of present technology and those of non-conventional, more envi-ronmentally sound methods that should be available in the future; in the brief discussion below not all of these aspects can be illustrated in detail.
The conversion efficiency is between 85 and 90 per cent for combus-tion and around 50 per cent for methane production. Per unit of heat or power delivered, the exploitation effects of methane production are greater than those for combustion, because of the higher energy losses in the former.

Modern wood fuels 73
Residues For residues, only the environmental effects related to collection, storage and transport are to be considered as being due to the energy system. The harvesting of orchani residues does not appear to cause adverse environmental effects. Crop residues left in the field protect the soil from erosion and also contribute substantially to the soil organic matter. Investigations from the moderately humid corn belt in the USA have shown erosion rate increases by 1 to 2.5 t/ha for each tonne of residue removed (Lockeretz 1981). The rate of erosion was not affected by tillage practices. The potential adverse effects caused by reduced organic content in the soil are minimized if some of the biomass is left in
Table 3.6 The negative environmental effects of residue collection, and possible countermeasures.
Process Environmental effect Countermeasure
Increased erosion Reduced yield of the next Erosion rate can be agricultural crop reduced by using non-
tillage cultivation or Silt deposited in dams and agricultural methods reservoirs, thereby including cover crops decreasing their lifetime (Pimental et al. 1981)
Increased leaching of nutrients and pesticides which decrease the survival capacity and reproduction of limnic plants and animals
Reduced organic content Reduced nutrient content of the soil and water capacity of soil
Biomass outtake Nutrient loss
Dust produced during Health hazard through straw and stalk collecting dust
Apply fertilizer or leave part of the biomass on the field
Artificial fertilization
improve machine technology
Storage of dry residues Health hazard through mould. Store bales in the Breeding areas for field pests field (Jenkins and Sumner 1986)
74 I. Stjernquist
the field (Jenkins and Sumner 1986). In Scandinavia a figure of 20 per cent has been reported (SUAS 1984). In areas with no erosion hazard and a slow decomposition rate, residue collection can lead to a reduction in air pollution, especially of hydrocarbon emissions associated with burning. A positive effect has also been reported from California, where Straw collection on rice fields helps to control a fungal disease (Jenkins and Sumner 1986). The negative environmental effects are summarized in table 3.6.
Energy crops and catch crops In many areas where modem agriculture causes environmental prob-lems, the changeover from conventional crops to perennial energy species, or the introduction of energy species into the rotation, may decrease the extent of such problems.
Erosion. With annual crops the soil is exposed to rain and wind dur-ing part of the year. In areas where the risk of erosion is high, annual energy crops generally have the same erosion effect as conventional annual crops. In contrast, perennial energy species, which provide veg-etation cover throughout the year, reduce the erosion rate. A decrease from 18 to 0.2 t/ha has been reported from the USA (Pimentel and Krummel 1987).
Effects of fertilizer and pesticides. If annual species demanding a high input of fertilizer and pesticides, such as oilseed crops and sugar beet, are grown as energy crops, the total input of these compounds to the arabic land increases compared with conventional cultivation. For example, the nitrogen input must be increased by 40 to 60 per cent over that used in cereals (SUAS 1984). In regions with a leaching or erosion risk, large areas of such crops may increase the amounts of nutrients and pesticides entering surrounding aquatic ecosystems. Many perennial species, like energy grass and Jerusalem artichoke, need less fertilizer and pesticides than cereals. If cereals are replaced with energy grass the nitrogen loss per hectare from leaching and runoff decreases 2 to 3 times.
Increased production. Modem agricultural practices based on simpli-fled crop rotations have led to reduced soil productivity. The introduc-tion of non-traditional species into the rotation seems to increase the yield of the following crop by 5 to 10 per cent.
If energy crops are planted on non-agricultural land, the amounts of
Modern wood fuels 75
fertilizer, herbicides and pesticides entering the environment increases. In regions with high erosion hazards, the areas affected by soil destruc-tion increase. However, in tropical regions, some non-traditional peren-nial species, often grasses, can be grown on wastelands with a minimum of fertilizer (Vasudevan and Gujral 1984). The environmental effects are about the same as those associated with short-rotation plantations.
The cultivation of catch crops has positive environmental effects. The roots of the crop decrease nutrient leaching and water-caused erosion during a period when the land normally has no vegetation.
Non-cultivated energy crops
Non-cultivated energy crops are defined as wild terrestrial or aquatic species with a naturally high rate of biomass production. They often dominate the habitat where they occur and include marsh plants such as reed, papyrus and salt marsh grass, as well as weedy species such as net-tie and bracken. For marshland species, production is often in the same range as short-rotation forests. For example, papyrus may reach 74 t/ha per year (Callaghan et al. 1984), and in Scandinavia reed has an average productivity of 10 1 dw/ha per year. Production by weedy species is lower but is still in the range of agricultural crops; for example, nettle produces 8 t dw/ha per year and bracken 7 to 9 t dw/ha per year.
The environmental effects of utilizing non-cultivated energy crops are relatively unknown, and a closer analysis for each country is necessary. In temperate climates, the overall effect of weed exploitation seems to be a positive one; for example in the UK, where bracken is a major weed on agricultural land, this species has turned out to be a valuable energy resource (Callaghan et al. 1984). In areas with reclamation and revege-tation problems the potential environmental effects are very high.
Environmental effects of conversion
The most important method for converting wood fuels to heat or power is combustion. The rate and type of emissions to air, soil and water vary depending on the methods used for combustion and flue gas cleaning. An increase in combustion efficiency may reduce emissions of hydrocar-bons while at the same time increasing emissions of nitrogen oxides. An
76 L Stjernquist
effective flue gas cleaning and desuiphurizing system reduces the output of sulphur and metals but can increase the amount of ash and waste products.
Among the emissions that are the most interesting from an environ-mental point of view are the substances having long-term effects. Such substances include (1) carbon dioxide, nitrogen oxides and dust, which affect the climate and the radiation balance of the earth; (2) sulphur dioxide and nitrogen dioxide, which cause acidification, forest damage and metal corrosion, and (3) a mixed group comprising heavy metals and polyaromatic hydrocarbons, which negatively affect ecosystems and human health.
Emissions to the atmosphere can now be considerably reduced with the aid of modem technology. In the desulphurizing processes, calcare-ous compounds are used to immobilize the sulphur—one mole of Ca immobilizing one mole of S with a 90 to 95 per cent efficiency (APS 1985). The nitrogen oxide (NO 1) emissions depend both on the kind of fuel used and the combustion technology. Combustion of wood fuels in a fluidized bed can reduce the atmospheric emissions to levels as low as 0.07gIMJ of NO1. The figure from coal combustion is twice as high. The utilization of advanced flue gas cleaning technology (selective cat-alytic reduction) increases the efficiency, so that 90 per cent of the NO 1 in the flue gas is reduced. The end products are water and nitrogen, but the process utilizes ammonia, which may consequently be emitted (Becker 1986). The particles and metals in flue gas are also removed by flue gas cleaning. A fabric filter has a reduction efficiency of above 99 per cent (Russell and (]reenwold 1986). Since techniques for air pollu-tant control are continuously being improved, it should be possible to reduce the atmospheric emissions to low levels. However, with increas-ing efficiency the amount of waste products will necessarily increase.
The original content of a fuel in terms of ash, sulphur, and the like determines the extent to which emissions will need to be reduced. Compared with coal and heavy oil, wood fuels have a low sulphur con-tent (table 3.7). Moreover, the ash and mercury Contents are drastically low compared with coal but higher compared with heavy oil. Gas is a clean fuel with a low content of such products as metals and sulphur. Wood fuels, however, have a great advantage over the fossil fuels in that the combustion process does not increase the net carbon dioxide concen-tration of the atmosphere. The net CO2-C released into the atmosphere is 23.8 g/MJ delivered fuel for coal combustion. The figures for oil, gas
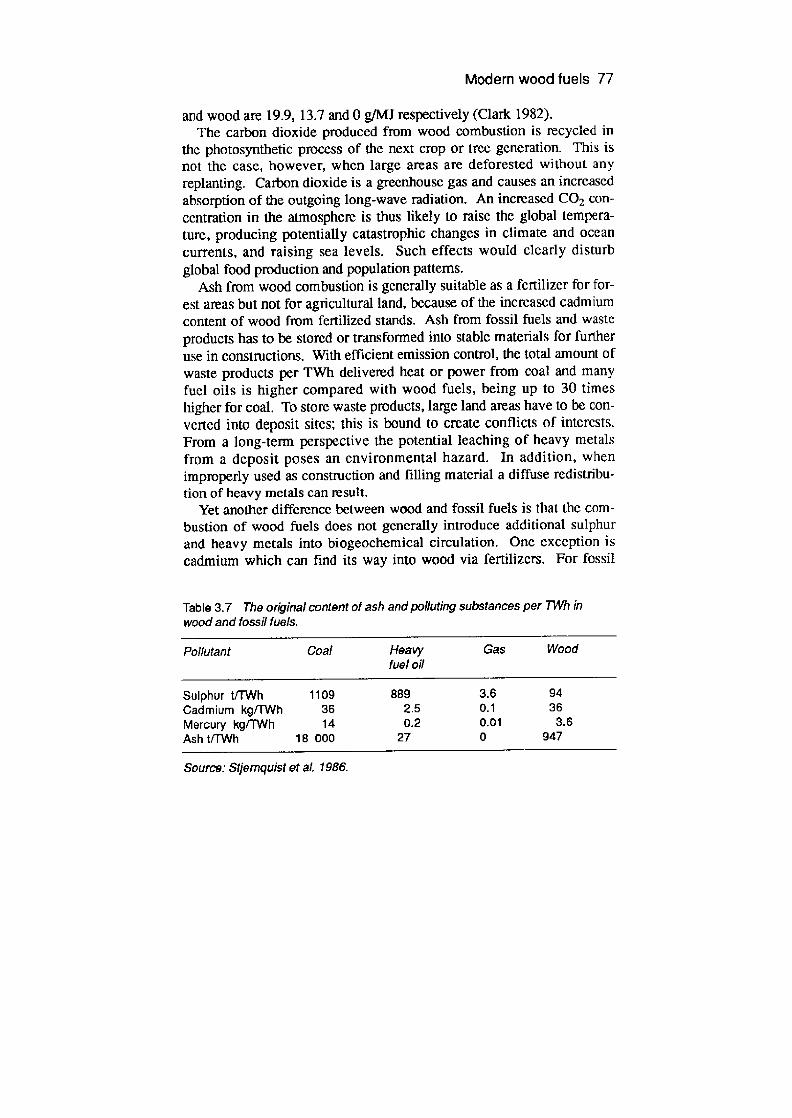
Modern wood fuels 77
and wood are 19.9, 13.7 and 0 gfMJ respectively (Clark 1982). The carbon dioxide produced from wood combustion is recycled in
the photosynthetic process of the next crop or tree generation. This is not the case, however, when large areas are deforested without any replanting. Carbon dioxide is a greenhouse gas and causes an increased absorption of the outgoing long-wave radiation. An increased CO2 con-centration in the atmosphere is thus likely to raise the global tempera-ture, producing potentially catastrophic changes in climate and ocean currents, and raising sea levels. Such effects would clearly disturb global food production and population patterns.
Ash from wood combustion is generally suitable as a fertilizer for for -est areas but not for agricultural land, because of the increased cadmium content of wood from fertilized stands. Ash from fossil fuels and waste products has to be stored or transformed into stable materials for further use in constructions. With efficient emission control, the total amount of waste products per TWIt delivered heat or power from coal and many fuel oils is higher compared with wood fuels, being up to 30 times higher for coal. To store waste products, large land areas have to be con-verted into deposit sites; this is bound to create conflicts of interests. From a long-term perspective the potential leaching of heavy metals from a deposit poses an environmental hazard. In addition, when improperly used as construction and filling material a diffuse redistribu-tion of heavy metals can nsult.
Yet another difference between wood and fossil fuels is that the com-bustion of wood fuels does not generally introduce additional sulphur and heavy metals into biogeochemical circulation. One exception is cadmium which can find its way into wood via fertilizers. For fossil
Table 3.7 The original cont9nt of ash and polluting substances per TWh in wood and fossil fuels.
Pollutant Coal Heavy Gas Wood fuel oil
Sulphur t/TWh 1109 889 3.6 94 Cadmium kg/lWh 36 2.5 0.1 36 Mercury kg/lWh 14 0.2 0.01 3.6 Ash t/TWh 18 000 27 0 947
Source: Stjernquist etal. 1986.
78 I. Stjernquist
fuels, these substances are remobilized from the geosphere and are dis-persed at combustion into the biosphere.
Conclusions and discussion
The present review of the environmental effects associated with the pro-duction and use of modem wood fuels shows that it is possible to reduce many of the negative effects through a careful choice of species, technol-ogy and production area.
Species. The utilization of nitrogen-fixing or perennial species reduces the risk for nitrogen leaching to aquatic ecosystems. The use of perennial species also reduces the leaching rates of other nutrients and decreases the erosion rate. Some energy crops have less need for nutrients and pesticides comoared with conventional agricultural crops; thus a changeover to energy crops may decrease the overall impact on the environment. Technology. In regions where erosion is not a potential problem, production of bioenergy with or without a small input of fertilizer reduces the environmental impacts in spite of the larger area needed to produce one TWh of energy. In regions with an evident erosion risk, intensive forest management can minimize the total impact, in spite of nutrient leaching. By spreading out fertilizer applications over the rotation, using smaller amounts corresponding to the actual need of the growing trees, the risk of nutrient loss through leaching can be reduced. Mechanical weed control in short-rotation forest provides a way to escape environmental impacts associated with her-bicide use, but in areas with a high risk of erosion this method can lead to severe soil erosion. The cumulative impacts of several small short-rotation plantations on the landscape is less than that of one large plantation. By using agricultural methods not requiring tillage, or by cultivating cover crops, the erosion rate in regions with erosion hazards can be reduced. Strip cultivation (for example strip farming) of energy crops may also reduce erosion hazards. Production area. In areas with thin soil, steep topography or extreme climatic conditions, biomass exploitation may have lasting adverse effects and should be avoided. The same is true for areas with soil acidification resulting from air pollution. For example, the Swedish Forestry Board has restricted the utilization of forest

Modern wood fuels 79
residues in areas with a high deposition of air pollution. Short- rota-tion plantations in tropical areas on degraded soils increase soil fer-tility. Ecosystems with high biological diversity should not be replaced by energy plantations.
One way to compare the impacts of the production, conversion and waste handling of modem wood fuels with those of other fuels is to eval-uate the effects using some basic ethical criteria (IUCN 1980). Such cr1-teria might include:
Does the practice cause any irreversible damage to the environment? Most importantly, the long-range productivity of the soils must not be reduced. A negative effect that disappears once the stress has ended is of minor importance compared with genuinely irreversible effects. Irreversible effects of wood fuel utilization include: flora and fauna extinction; changes in soil fertility; siltation, eutrophica-tion and herbicide contamination of aquatic ecosystems; soil erosion and acidification. Is genetic variation conserved? Extinction of a plant or animal species is unacceptable. A severe decrease in population size may also be a hazard because of the reduction in genetic variation as well as the increased risk for extinction due to climatic, biological or chance factors to which small or marginal populations are exposed. How great is the heavy metal mobilization in the environment? How severe is the potential maximum catastrophe? For wood fuels there are only two major catastrophic risks: soil erosion, and the chance of non-indigenous plant species escaping and becoming pests—both avoidable through choice of cultivation practice.
A general assessment of the environmental impacts at the exploitation stage for modem wood fuels using the above criteria is impossible because of the differences in climate and soil conditions existing between different regions. Instead, such an analysis must be made on a national or, preferably, regional basis. Evaluated against the criteria, the impacts of combustion and waste handling are relatively low for wood fuels since (1) combustion does not lead to an overall increase in atmo-spheric CO2 level, and (2) the low heavy metal content in the fuels mini-mizes the metal mobilization to the environment.
According to some predictions, energy biomass production will occur at the expense of silviculture and agriculture, leading to conflicts of interests in a future world characterized by increased demands for food, fodder and wood products (Pimentel et al. 1984). However, with the
80 1. Stjernquist
right cultivation technology, short-rotation forests should be able to meet the demands of the wood industry as well as the energy system. Such multiple-use management programmes already exist in many tropical countries.
Wood fuels, together with an increased efficiency in energy conver-sion and end use, not only provide a sustainable energy resource, but their use appears to be the most important step towards reducing the imminent threat of a major man-made climatic change (Goldemberg et al. 1988).
References Alvim, R. (1983) 'Energy farming in Brazil: The role of agroforestry in
the production of food and energy from biomass in southeast Bahia', Resource Management and Optimization, 3(1), 47-71.
Andersson, H. W., Papadopol, C. S. and Zsuffa, L. (1983) 'Wood energy plantations in temperate climates', Forest Ecology and Management, 6, 28 1-306.
APS (1985) 'Air pollution across boundaries', Air pollution studies no. 2; Report prepared within the framework of the Convention on Long-range Transboundary Air Pollution; ECE/EB.AIR/5, 1985.
Becker, J. (1986) 'West Germany's initial SCR experience', Modern Power Systems, 7(6), 19-25.
Berg, B. and Staaf, H. (1983) 'The influence of slash removal on soil organic matter and plant nutrients in a sandy Scots pine forest soil', Swedish University of Agricultural Science, Technical Report no.33, Uppsala.
Bose, R. K. and Bandyopadhyay, S. K. (1986) 'Economics of energy plantations in alkali soils of Indian semi-and regions', Biomass, 11, 51-60,
Brewbaker, J. L. (1984) 'Short-rotation forestry in tropical areas', in Egndus, H. and Ellegârd, A. (eds), Bioenergy, 84(1), 58-78.
Bridges, E. M. (1982) World Soils, Cambridge University Press, Cambridge.
Bruenig, E. F (1987) 'The forest ecosystem: tropical and boreal', Ambio, 16 (2-3), 68-79.
Bmijnzeel, L. A. and Wiersum (1985) 'A nutrient balance sheet for Agathis Damnara Werb. plantation forest under various management conditions in Central Java, Indonesia', Forest Ecology and Management, 10, 195-208.

Modern wood fuels 81
Callaghan, T. V., Lawson, G. J. and Scott, R. (1984) 'Natural vegetation as an energy resource', in Egndus, H. and Ellegárd, A. (eds), Bioenergy, 84(11), 150-8.
Carruthers, S. P. and Jones, M. (1982) 'The role of agriculture in British biofuel production', in Vogt, F. (ed), Energy Conservation and Use of Renewable Energies in the Rio-industries 2, Pergamon Press, Oxford.
Charbonnier, S. (1985) 'Fuelwood plantations in S.E. Asia', in Sirdn, G. and Mitchell, C. P. (eds), Forest Energy and the Fuelwood Crisis, Proceedings of IUFRO Project Group P1.09.00 Meeting in Uppsala, Sweden June 8-9 1984, Swedish University of Agricultural Sciences, Dept. of Ecology and Environmental Research, Uppsala. Report no. 4 1:22-28.
Clark, W. C. (ed) (1982) Carbon Dioxide Review: 1982, Oxford University Press, New York.
Danfors, R. (1984) 'Weed control in stands of growing energy forests', in Egndus, H. and Ellegrd, A. (eds), Bioenergy, 84(11), 139-44.
Davis, R. F. (1979) 'The effect of whole-tree utilization on the forest environment', Tappi, 59(7), 76-8.
Dennington, V. N. and Chadwick, M. 1 (1981) 'Forest energy crops from derelict and waste land', in Palz, Chartier and Hall (eds) Energy from Riomass, Barking APS, UK.
Dimitri, L. (1984) 'Production of forest-biomass through growth of fast-growing tree species in short rotation', in Egntus, H. and Ellegrd, A. (eds), Bioenergy, 84(11), 70-6.
Drysdale, D. P., Morgan, D. and Zsuffa, L. (1983) 'Energy plantations: the present situation and plans for 1983-1988', in Nilsson, P. o. and Zsuffa, L., Short Rotation Forest Biomass: Production, Technology and Mechanization, Swedish University of Agricultural Sciences, Dept. of Operational Efficiency, Internal report no. 229.
Francis, J. K. and Baker, J. K. (1982) 'Potential for nutrient depletion by short-rotation harvest of sweet-gum', Soil. Sci. Am. J., 46, 116-18.
Frederick, D. J., Madgwick, H. A. I., Jurgensen, M. E and Oliver, G. R. (1985) 'Dry matter, energy and nutrient contents of 8-year old stands of Eucalyptus regnans, Acacia dealbata and Pinus radiata in New Zealand, New Zealand Journal of Forest Science, 15((2), 142-57.
Gilliusson, R. (1985) 'Wood energy needs', in Sirn, G. and Mitchell, C.

82 1. Stjernquist
P. (eds), Forest Energy and the Fue/wood Crisis, Proceedings of IUFRO Project Group P1.09.00 Meeting in Uppsala, Sweden, June 8-9, 1984. Swedish University of Agricultural Sciences, Dept. of Ecology and Environmental Research, Report no. 41:1-15.
Goldemberg, J., Johansson, T. B., Reddy, K. N. A. and Williams, R. H. (1988) Energy for a Sustainable World, Wiley Eastern Limited, New Delhi.
Gustavsson, L. (1986) 'Vegetation and flora of short-rotation willow stands from a conservation viewpoint', Swedish University of Agricultural Sciences. Dept. of Ecology and Environmental Research, Uppsala, Report no. 23.
Have, H. (1982) 'Combustion of straw in Denmark', in Willielmsen, G. (ed), Bioenergy Research Activities in Denmark, Finland, Norway and Sweden, Bioenergy Conference, October 13, Vettre, Norway.
Heilman, P. and Stettler, R. F. (1985) 'Mixed, short-rotation culture of red alder and black cottonwood: Growth, coppicing, nitrogen fixation and allelopathy', Forest Science, 31, 607-16.
Hosier, R. and Svenningson, P. J. (1987) 'Biomass briquettes in the Dominican Republic. Part I: Social and economic feasibility', Biomass 13(3), 199-217.
IUCN et al. (1980) The World Conservation Strategy, IUCN, Gland, Switzerland.
Janzen, D. (1988) 'There are differrences between tropical and extra-tropical national parks', Oikos, 51, 12 1-3.
Jenkins, B. M. and Sumner, H. R. (1986) 'HarvestIng and handling agricultural residues for energy', Transactions of the ASAE, 29(3), 824-36.
Koning, J. W. (1987) 'Use of wood energy in the United States—an opportunity', Biomass, 12, 27-36.
Kumar, A. and Kumar, P. (1984) 'Agronomic studies on growth of Euphorbia lathyris', in Egnéus, H. and Ellegârd, A. (eds), Bioenergy, 84(11), 170-5,
Lejon, B. (1985) Skogens tillvaxt efter heltradsutnyttjande (Foist growth after whole-tree utilization), Swedish University of Agricultural Science, Skogsfakta, Konf. nr 7, Uppsala.
Lockeretz, W. (1981) 'Crop residues for energy. Comparative costs and benefits for the famier, the energy facility and the public', Energy in Agriculture, 1, 7 1-89.
Modern wood fuels 83
Lundkvist, H. (1987) Heltra4rutnyttjande-effekter pa skogsproduktion och mark (Whole-tree utilization—effects on tree production and soil), Swedish University of Agricultural Science, Skogsfakta, Koni. nr 10, Uppsala.
McMinn, J. W. and Nutter, W. L. (1983) 'Nutrient removal under whole-tree utilization for fuel chips', Georgia Forest Research Paper, 47, 3-7.
Mervwin, M. L. (1980) 'The culture of carob (Ceratonia siliqua L.) for food, fodder and fuel in semi-arid environment', Tree crops for energy co-production on farms, November 12-14, YMCA of the Rockies, Estes Park, Colorado.
Nilsson, L. 0. (1985) 'Growth and yields of willow stands in relation to climate and nutrition', Swedish University of Agricultural Science, Dept. of Ecology and Environmental Research, Uppsala, Report no. 21.
Nwachukwu, C. C. and Lewis, C. (1986) 'A net energy analysis of fuels from biomass: The case of Nigeria', Biomass, 11, 271-98.
Nykvist, N. and Rosen, K. (1985) 'Effects of clear-felling and slash removal on the acidity of northern coniferous soils', Forest Ecology and Management, 11, 157-69.
Perera, W. R. H. (1979) Biofuel Systems and Plantations. Energy Farms: Their Environmental implications, Environment and Policy Institute, East-west Center, Honolulu, Hawaii.
Perttu, K and Lindroth, A. (1986) 'Climatic influences on energy forest growth in Sweden', Proceedings from the 18th IUFRO World Congress, 7-21 Sept. 1986, Ljubljana, Yugoslavia, 1, 84-96.
Pimentel, D. and Krummel, J. (1987) 'Biomass energy and soil erosion: Assessment of resource costs', Biomass, 14, 15-38,
Pimentel, D. et al. (1981) 'Biomass energy from crop and forest residues', Science, 212, 1110-15.
Pimentel, D. et al. (1984) 'Environmental and social costs of biomass energy', Bioscience, 34, 89-94.
Rackham, 0. (1980) Ancient Woodland: its History, Vegetation and Uses in England, Edward Arnold, London.
Robertson, A. (1984) 'Willow plantations in agroforestry', Span, 27(1), 32-4,
Rosen, K. and Lundmark-Thelin, A. (1986) Hyggesbruker och markvdrden (Clear-felling and soil management), Swedish

84 I. Stjernquist
University of Agricultural Science, Skogsfakta, Konf. nr 9, Uppsala.
Russell, M. and (ireenwald, J. (1986) 'Environmental policies affecting the development of newer coal technologies', Energy. 11(11/12), 1301-14.
Saarsalmi, A. and Palmgren, K. (1984) 'Biomass production and nutrient requirements of a young grey alder plantation', in Egnëus, H. and Eflegârd, A. (ecis), Bioenergy, 84(11), 110-18.
Siren, G. (1984) 'The many aspects of intensive energy forestry', in Egnéus, H. and Ellegârd, A. (eds), Bioenergy, 84(11), 52-62.
Stjemquist, et al. (1986) Environment and Energy, SNV rapport 3238 (Swedish Nature Conservancy).
SUAS (1984) Bra nsl enfnin jordbruket (Fuels from agriculture). Swedish University of Agricultural Sciences, Project Agrobioenergy, Uppsala.
Tenorio, J. L., Ventas, P., Funes, E. and Ayerbe, L. (1985) 'La Euphorbia lathyris fuente dc biomasa para uso energetico', An. IN1A, ser Agric. 28(3), 11-23.
Tveite, B. (1983) 'Heiltretynning—fare for tilvexttap', (Whole-tree thinning—a hazard for reduced growth), Aktueltfra Statens Fagtjenste for Landbruket, 3, 98-105, Oslo.
Ulrich, B. (1983) 'Soil, acidity and its relations to acid deposition', in Ulrich, B. and Pankrath, J. (eds), Effects ofAccuinulation of Air Pollutants in Forest Ecosystems, 127-46. D. Reidel, Dordrecht.
UNEP (1977) United Nations Conference on Desertification, 1977. UNEP. Nairobi.
Van Hook, R. I., Johnson, D. W., West, D. C. and Mann, L. K. (1982) 'Environmental effects of harvesting forests for energy', Forest Ecology and Management, 4, 79-94.
Vasudevan, P. and Gujral, 0. S. (1984) 'Potential of unexploited weeds as bioenergy resource', in Egndus, H. and EllegArd, A. (eds), Bioenergy, 84(11), 162-65.
Walter, H. (1973) Vegetation of the Earth: In Relation to Climate and the Eco-physiological Conditions, Springer-Verlag. New York.
Westerlund, L. and Tngelog, T. (1981) 'Fruit body production of larger fungi in some young Swedish forests with special reference to logging waste', Forest Ecology and Management, 3, 269-94.
ri Use of agricultural residues as fuel
G. W. Barnard
Agricultural residues are becoming an increasingly important energy source. On the one hand, they are seen as a major untapped biom ass resource, with a range of possible new and enhanced energy applications (Strehier and StUtzle 1987). On the other, in many parts of the Third World, more and more families are being forced to turn to agricultural residues to supplement or replace their dwindling firewood supplies (Barnard and Kristoferson 1985).
In each case, the environmental implications need careful considera-tion. This chapter summarizes the main applications of agricultural residues as fuel and investigates the environmental risks involved. Two broad areas of concern are distinguished; those related to the combustion and end use of the fuel, and those linked to the diversion of agricultural residues from other uses, in particular as an organic fertilizer.
The conclusion reached is that local considerations are critical in determining the environmental impact of agricultural residue use. Whereas there is a clear potential for increasing the energy contribution from agricultural residues in some cases, in others there are very serious hazards involved. Although controversies exist as to what proportion of agricultural residues can be safely diverted for fuel uses, there is little doubt that in many parts of the world excessive removal and burning of agricultural residues is jeopardizing the long-term viability of farming systems.
The policy implications of this vary, however. In the developed world, the benefits and risks can be quantified and measures taken to minimize the negative effects. But in a Third World context, the realities of poverty and fuelwood scarcity restrict the choices that are open to many
86 G. W. Barnard
farmers. Once fuelwood resources are depleted, many families are forced to turn to agricultural residues as a substitute fuel. Although well aware of the risks involved, they often have no alternative. Policies and outside interventions, if they are to have any relevance, have to address this fundamental dilemma.
Types of agricultural residues
The term 'agricultural residues' covers a broad spectrum of biomass materials produced as a by-product of agriculture and agricultural pro-cessing. In some cases they are genuinely waste products, and are regarded more as a nuisance than a resource. But in many other situa-tions, especially for Third World farmers, their role is much more impor -tant. Far from being a waste product, they are a vital part of the biomass production on the farm. Indeed, some crops are grown more for their residues than for the food they yield.
A number of broad categories of agricultural residues can be distin-guished:
1 woody crop residues—coconut shells, jute sticks, etc. 2 cereal residues—rice and wheat straw, maize stalks, etc. 3 green crop residues—groundnut straw, soybean tops, etc. 4 crop processing residues—bagasse, rice husks, etc. 5 animal dung. The characteristics of agricultural residues vary widely (FAO 1982).
The properties and uses of a selection of the most common crop residues are compared in table 4.1. As a general rule, those that are dry and woody tend to be most suited for use as fuel and building materials, whereas green residues are better as animal fodder and green manure. Cow dung is included in the table as it, too, is an extremely versatile material. As well as being employed as fuel and fertilizer, it is used in parts of the Third World as a traditional building material, an insect repellent and in a variety of other applications (Agarwal 1981; Davey 1980).
In most fanning systems, the amount of agricultural residues pro-duced each year is surprisingly large. Healthy animals produce four to five times their own weight in dry dung each yeat Cereal crops give between 0.7 and 2.5 tonnes of straw for every tonne of grain; some Ira-ditional varieties, such as deep water rice, yield even more. Though
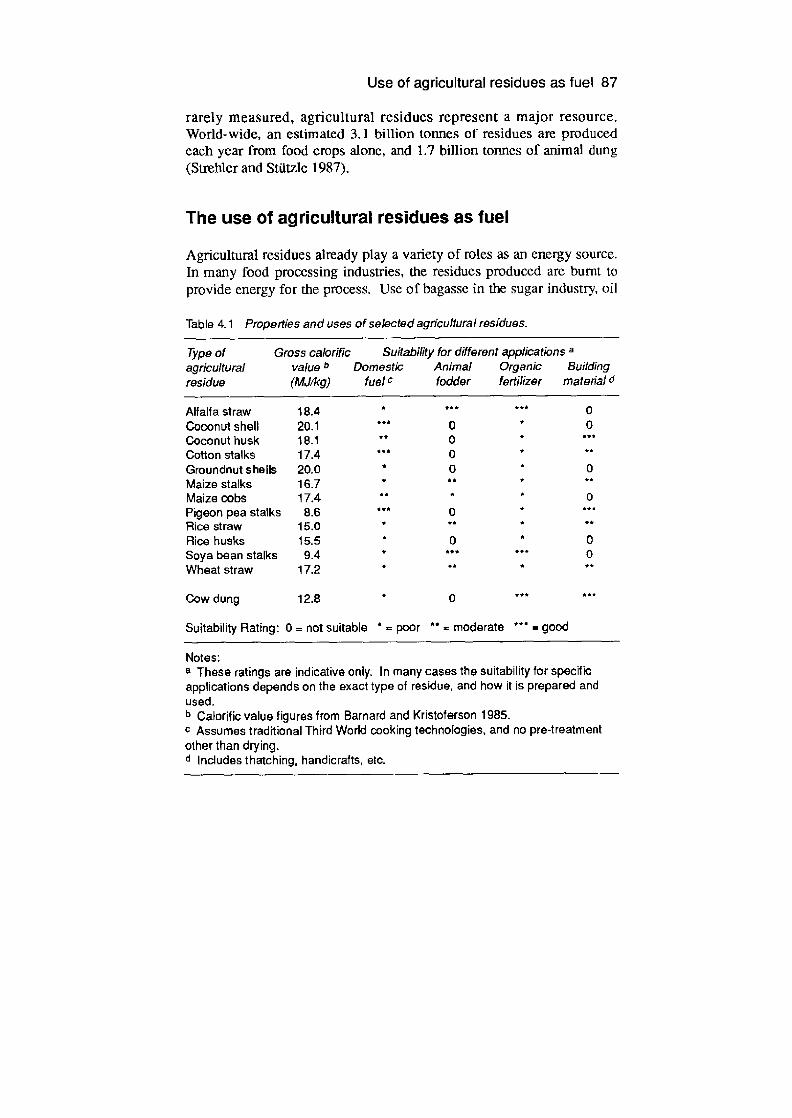
Use of agricultural residues as fuel 87
rarely measured, agricultural residues represent a major resource. World-wide, an estimated 3.1 billion tonnes of residues are produced each year from food crops alone, and 1.7 billion tonnes of animal dung (Strebler and StUtzle 1987).
The use of agricultural residues as fuel
Agricultural residues already play a variety of roles as an energy source. In many food processing industries, the residues produced are burnt to provide energy for the process. Use of bagasse in the sugar industry, oil
Table 4.1 Properties and uses of selected agricultural residues.
Type of Cross calorific Suitability for different appilcations a
agricultural value b Domestic Animal Organic Building residue (MJ/kg) fuel C fodder fertilizer material d
Alfalfa straw 18.4 * **. 0 Coconut shell 201 0 * 0 Coconut husk 18.1 ** 0 *
Cotton stalks 17.4 0 **
Groundnut shells 20.0 * 0 * 0 Maize stalks 16.7 IA *
Maize cobs 17.4 * * 0 Pigeon pea stalks 8.6 0 Rice straw 15.0 * *1 *
Rice husks 15.5 0 0 Soya bean stalks 9.4 III *** 0 Wheat straw 17.2 * *
Cow dung 12.8 * 0
Suitability Rating: 0 = not suitable I = poor = moderate = good
Notes: a These ratings are indicative only. In many cases the suitability for specific applications depends on the exact type of residue, and how it is prepared and used. b Calorif Ic value figures from Barnard and Kristoferson 1985. C Assumes traditional Third World cooking technologies, and no pre.treatment other than drying. d Includes thatching, handicrafts, etc.
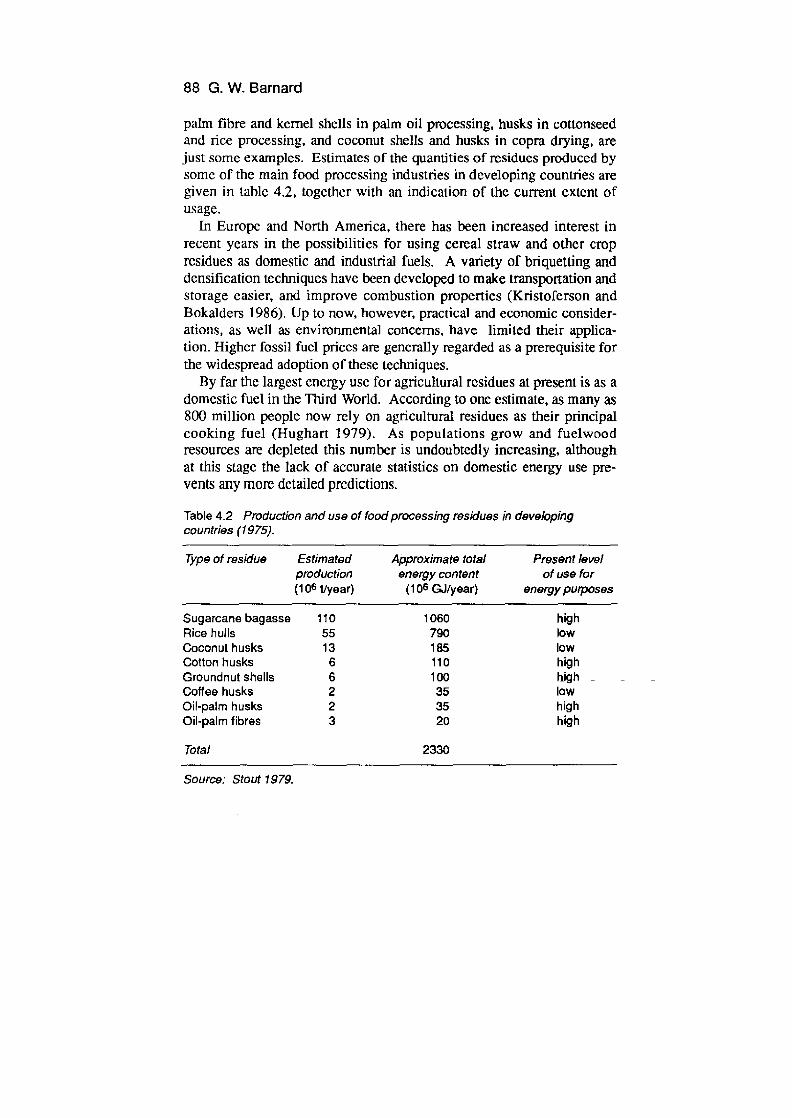
88 G. W. Barnard
palm fibre and kernel shells in palm oil processing, husks in cottonseed and rice processing, and coconut shells and husks in copra drying, are just some examples. Estimates of the quantities of residues produced by some of the main food processing industries in developing countries are given in table 4.2, together with an indication of the current extent of usage.
In Europe and North America, there has been increased interest in recent years in the possibilities for using cereal straw and other crop residues as domestic and industrial fuels. A variety of bnquetting and densification techniques have been developed to make transportation and storage easier, and improve combustion properties (Kristoferson and Bokalders 1986). Up to now, however, practical and economic consider -ations, as well as environmental concerns, have limited their applica-tion. Higher fossil fuel prices are generally regarded as a prerequisite for the widespread adoption of these techniques.
By far the largest energy use for agricultural residues at present is as a domestic fuel in the Third World. According to one estimate, as many as 800 million people now rely on agricultural residues as their principal cooking fuel (Hughart 1979). As populations grow and fuelwood resources are depleted this number is undoubtedly increasing, although at this stage the lack of accurate statistics on domestic energy use pre-vents any more detailed predictions.
Table 4.2 Production and use of food processing residues in developing countries (1975).
Type of residue Estimated production (106 I/year)
Approximate total energy content
(106 GJ/year)
Present level of use for
energy purposes
Sugarcariebagasse 110 1060 high Rice hulls 55 790 low Coconut husks 13 185 low Cotton husks 6 110 high Groundnut shells 6 100 high -
Coffee husks 2 35 low Oil-palm husks 2 35 high Oil-palm fibres 3 20 high
Total 2330
Source: Stout 1979.
Use of agricultural residues as fuel 89
The greatest concentration of use is in the densely populated plains of Northern India, Bangladesh and China (NCAER 1979; Islam 1983; Wu and Chen 1983). Here, dung and crop residues are the major domestic fuels, providing as much as 50-70 per cent of household energy in many villages, and a considerable proportion in urban areas too, especially among the poorer communities.
Residues are also burnt in many parts of Africa, south-east Asia and Latin America. In most cases their role is relatively minor, woody crop stalks are used, for example, as a supplementary fuel at harvest time. But in Ethiopia, parts of the Sabel, highland Peru, and other areas where wood has become very scarce, surveys are showing that agricultural residues are playing far more than a peripheral role; frequently they pro-vide more than half of the energy needs of households in these areas.
With growing pressure on biomass resources, patterns of land owner-ship and animal ownership become an increasingly important factor in determining the availability of agricultural residues to individual fami-lies. Residues that were previously regarded as common property fre-quently become privatized, leaving the landless and the poor with greatly restricted access (Briscoe 1979). Dung and crop residues also start to be traded, either for cash or in return for labour (Ceceiski 1984; Newcombe 1984). What was once shared, can become a valuable and jealously guarded commodity.
Environmental impacts: end-use considerations
The environmental impacts of using agricultural residues as fuel can be divided into two main groups. The first relates to their combustion and end use as fuel; the second, to be considered in the next section, relates to environmental 'opportunity cost'.
In agro-processing industries, use of residues as fuel can have the important advantage of disposing of what would otherwise be a waste product and a pollution hazard. Burning low-value wastes such as rice husks in a furnace, for example, is a far cleaner method of disposal than burning them in a smouldering heap outside the factory. Similarly, with certain high organic content liquid wastes, energy production using anaerobic digestion can provide a much more environmentally sound alternative to disposal in rivers.
Using residues as fuel can thus contribute to reducing the environ-

90 G. W. Barnard
mental side-effects of industries. The extent to which this happens, how-ever, depends on the technology being used. Low-density residues, espe-cially when they are damp, need specially designed combustion equipment if they are to be burnt cleanly (Beagle 1978). The traditional methods used in many small-scale crop processing industries in the Third World are notoriously bad in this respect. Thick plumes of acrid smoke curling up from traditional copra drying or sugar making opera-tions is a common sight in many countries. Such cases may not pose any significant environmental threat at a national level, but for the operators working there, prolonged exposure to such pollutants may represent a serious, though unmeasured, health hazard.
Similar problems are common in a domestic end-use context, espe-cially when residues are being used in the poorly ventilated conditions typical of many Third World kitchens. The amount of smoke produced depends on the type of residue being burnt. Some of the more woody crop residues, such as coconut shells and jute sticks, bum well and pro-vided they are dry have combustion characteristics similar to wood (Barnard and Kristoferson 1985). Others are much more problematic. Rice husks, in particular, bum slowly and produce a large amount of smoke. Special stoves are generally needed if they are to be used effec-tively.
Smoke is a particular problem with dung as a fuel, especially when the fire is first lit. Though detailed evidence is lacking, the widespread burning of cow dung has been linked to the very high levels of 'cor pul-monale' (heart failure caused by chronic lung disease) in northern and central India. In these areas, chronic cor pulmonale accounts for 10 to 30 per cent of hospital admissions, the highest rates of any non-industrial country in the world (Padmavati 1974).
Relatively few direct measurements of indoor pollution levels have been made. The results of one study in India are shown in table 4.3, and indicate the higher levels both of suspended particulates and benzo (alpha) pyrene when burning dung as opposed to wood. Much depends on the type of stove used and the degree of ventilation in the room.
The reality, however, is that over time people have to adapt to the characteristics of the fuels available to them. In some cases, women get round the smoke problem by cooking in the open whenever possible, though this may be difficult during the rainy season. In Lesotho, where they use a portable stove called a 'paolo', women light dung fires out-
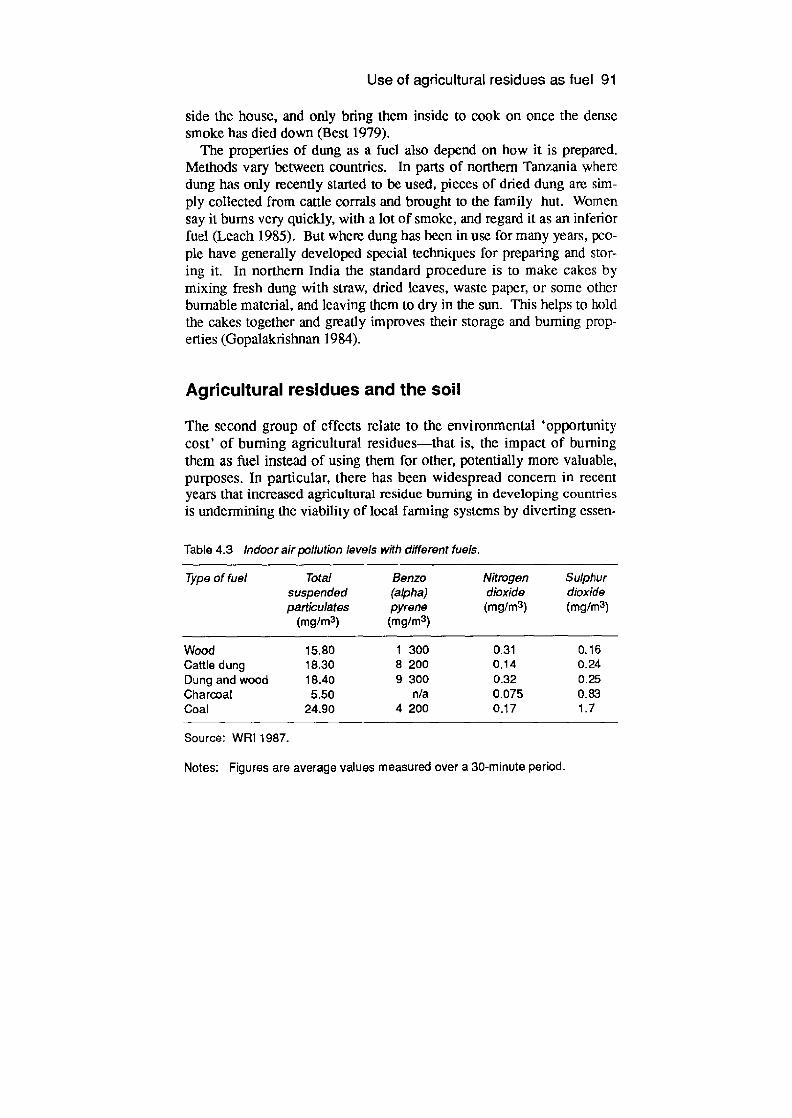
Use of agricultural residues as fuel 91
side the house, and only bring them inside to cook on once the dense smoke has died down (Best 1979).
The properties of dung as a fuel also depend on how it is prepared. Methods vary between countries. In parts of northern Tanzania where dung has only recently started to be used, pieces of dried dung are sim-ply collected from cattle corrals and brought to the family hut. Women say it bums very quickly, with a lot of smoke, and regard it as an inferior fuel (Leach 1985). But where dung has been in use for many years, peo-ple have generally developed special techniques for preparing and stor-ing it. In northern India the standard procedure is to make cakes by mixing fresh clung with straw, dried leaves, waste paper, or some other burnable material, and leaving them to dry in the sun. This helps to hold the cakes together and greatly improves their storage and burning prop-erties (Gopalakrishnan 1984).
Agricultural residues and the soil
The second group of effects relate to the environmental 'opportunity Cost' of burning agricultural residues—that is, the impact of burning them as fuel instead of using them for other, potentially more valuable, purposes. In particular, there has been widespread concern in recent years that increased agricultural residue burning in developing countries is undermining the viability of local farming systems by diverting essen-
Table 4.3 indoor air pollution levels with different fuels.
Type of fuel Total Benzo Nitrogen Sulphur suspended (alpha) dioxide dioxide particulates pyrene (mg/rn3 ) (mg/rn3)
(mg/rn3) (mg/rn3 )
Wood 15.80 1 300 0.31 0.16 Cattle dung 18.30 8 200 0.14 0.24 Dung and wood 18.40 9 300 0.32 0.25 Charcoal 5.50 n/a 0.075 0.83 Coal 24.90 4 200 0.17 1.7
Source: WR1 1987.
Notes: Figures are average values measured over a 30-minute penod.
92 G. W. Barnard
tial nutrients and organic matter that would otherwise be returned to the soil (Pimentel et al. 1984).
It is often assumed that increased agricultural residue burning auto-matically leads to reduced organic recycling, and that as a result there will always be a direct negative impact on the soil. In fact, this is not necessarily the case, and figures which attempt to draw a simple correla-tion between residue burning and reduced crop yields have to be regarded with suspicion. There are many situations where residue recy-cling is either impractical or uneconomic. There are also cases where, because they have other more important priorities, farmers choose to use residues for fodder or other purposes instead of returning them to the soil. If some of these residues are burnt, people may have to make trade-offs in other areas; but there will be no immediate impact on the soil.
Limitations on residue recycling
Although agricultural residues have valuable functions as organic fertil-izers, they cannot all be used for this purpose. Farmers have to be prag-matists. While most are aware of the benefits of organic recycling, often there are limitations that prevent them from practising what in strict soil science terms would be best.
Of the total amount of animal dung produced each year, the fraction which is recycled varies widely depending on local circumstances. In China, Nepal, and Java, farmers go to great lengths to make the best use of the available dung. Many animals are stall fed, and their dung, after composting with a variety of plant wastes, is carefully reapplied to fields and vegetable plots. Examples of similar practices can be found in parts of Africa; the island of Ukara in Lake Victoria is a classic example of high population densities leading local farmers to make maximum use of the available resources (Ruthenberg 1983).
Throughout much of the world, however, the proportion of dung that is recycled is far less, and of that which is recycled not all is used in the most effective manner. Grazing practices are one of the main explana-tions for this. Dung which is deposited on roadsides, common land, and grazing areas is much more difficult to collect and use than that which is produced in stalls and pens. Where animals am free grazed for a large part of the year, much of their dung ends up being wasted—or, at best, being recycled very inefficiently, since dung which is allowed to dry out
Use of agricultural residues as fuel 93
in the sun loses a considerable proportion—in some cases up to 80 per cent—of its nitrogen content through ammonia volatilization (Gillard 1967). There are also problems when animal pens are situated a long way from crop fields. For families without carts or trucks, and in areas where there are no roads, labour shortages and transportation difficulties combine to restrict the amount of dung that can be recycled.
Sometimes dung is not recycled because animal owners have no incentive to do so. Share-croppers, for example, have little motivation to put in the time and effort needed to recycle manure if they will receive only a small proportion of the benefits derived (Islam 1983).
In such cases as these, where recycling is either not occurring, or hap-pening in a haphazard and inefficient manner, burning part of this dung for fuel may not be as serious as it appears at first sight.
Similar limitations apply to the use of crop residues. In many farming systems, the proportion that is ploughed back into the soil, or recycled as mulch or compost, is relatively small. Often this is because of the physi-cal difficulties involved. Ploughing crop residues back into the soil may be possible with mechanized agriculture, but for farmers with only hand implements, incorporating large amounts of tough, dry residues is often entirely impractical. With cotton and tobacco there are also problems with pests and plant diseases if residues are left in the fields without being properly incorporated (Svenningsson 1985).
Burning in the field is often the method used to dispose of crop residues in instances such as these. Though it may not be the optimum way of conserving nutrients and organic matter, for the farmer it has the advantage of being quick and easy. This is particularly important in wet-land farming systems where another crop has to be planted immediately after the first is harvested. Although burning crop residues in the fields is being increasingly discouraged in Europe and North America, partly for air pollution reasons, in Burma, Indonesia, Malaysia and Thailand it is still the most widely used method of disposing of rice straw, for exam-ple (Ponnamperuma 1984). If residues that would otherwise be burnt in the fields are collected for use as fuel, the effect on the soil is likely to be small, especially if the ashes are spread back on the land. Certainly, the implications for the nitrogen balance will be minimal, since all the nitrogen would be lost anyway.
In other cases, crop residues are not recycled because they have a range of other more important applications. Principal among these is as a source of animal fodder. Where fuel is scarce, there may be direct
94 G. W. Barnard
competition between fuel and fodder uses. Burning residues as fuel may thus create problems in finding alternative livestock feeds. The trade-off, however, is not a direct one between fuel and fertilizer uses; it is between fuel and fodder. In extreme situations in which large amounts of fodder have to be diverted for fuel uses, fodder shortages may compel farmers to Cut down on the number of animals they keep, and the ones that remain may be less well fed. This will lead to a drop in dung pro-duction and a reduction in the amount available for recycling. There may therefore be an indirect effect on the soil, although without knowing the detailed nature of the particular farming system this link cannot auto-matically be assumed.
Other crop residues have important functions as building materials and for use in thatching, making woven baskets, and other handicrafts. Some, also, are sold to towns for manufacturing paper, composite materials and other products. If these residues are burnt instead there may be a variety of negative effects on the family. Inferior materials may have to be used to fulfil these functions. There may also be a loss of income if the sale of crop residues has to be curtailed. The effect on the soil, however, will be slight.
The impact of reduced agricultural residue recycling
The position is clearly very different in cases where agricultural residues are being diverted from fertilizer uses. Here there will be a direct impact on the soil.
Agricultural residues are the main source of organic matter in the soil in most farming systems. Though present in only small amounts, organic matter is one of the most critical components in the soiL As the box below shows, its effects can be divided into two main groups; physi-cal and nutrient-related (Sanchez 1976).
Ascertaining the effects of reduced residue recycling is not easy, as there are virtually no tong-term experimental data to go on. However, a certain amount can be said from first principles and there is a variety of indirect evidence that can be used—provided its limitations are recog-nized.
Most of the damage caused by reduced residue recycling can be linked to changes in the organic matter content of the soil. Under stable

Use of agricultural residues as fuel 95
The Role of Organic Matter In Soil
Nutrient-related effects The breakdown of organic matter in soil provides an important source of plant nutrients. In traditional agricultural systems where no chemical fertilizers are being applied this role is vital—organic matter supplies the majority of the nitrogen and sulphur needed by plants and as much as half of the phosphorus.
Organic matter adds considerably to the cation exchange capacity of the soil—its ability to bind positively charged ions such as magnesium, calcium, potassium and ammonium. In mineral soils it accounts for 30 to 90 per cent of the total cation exchange capacity. Without this bind-ing effect, nutrients would be rapidly leached away when it rained. This is particularly important in acid soils, and those with a low clay content, since these have very low inherent binding ability.
Organic matter forms complexes with micronutrients such as iron, zinc, manganese, copper and boron. Though only needed in tiny amounts, these nutrients are essential for plant growth. By binding with them, organic matter helps prevent them being lost from the system through leaching.
Organic matter helps increase phosphorus availability by forming complexes with amorphous oxides in the soil, and preventing them from binding and immobilizing phosphate ions.
Organic matter helps buffer the pH of soil, keeping it towards the neutraL range. This increases the availability of phosphorus, molybdate, borate, and a number of other nutrients. In acid soils it also improves the cation exchange capacity of the soil.
Physical effects Organic matter helps to bind soil particles together into aggregates. This improves the physical properties of the soil, making it easier for roots to penetrate and more easy to till, and improving the drainage characteristics.
By binding the soil together, organic matter reduces its susceptibility to erosion, both by wind and water.
Organic matter increases the water retention, particuLarly in sandy soils, acting as a sponge and releasing water slowly when needed by plants.

96 G.W.Barnard
agricultural conditions, the rate of addition and breakdown of organic matter reaches an approximate equilibrium. Altering residue manage-ment practices will upset this balance. If less dung or crop residues are returned to the soil, the organic matter content of the soil will tend to decline until a new equilibrium is reached. The rate of this decline, and how far it will go, is what is at issue. On the specific question of what happens when agricultural residue recycling is reduced there has been very little work, particularly under tropical conditions. But inferences can be drawn from a number of other studies under comparable circum-stances.
Converting natural forest to agriculture, for example, involves a simi lar reduction in organic matter recycling to the soil. Experiments in Sierra Leone, measured a fall of 45 to 50 per cent in the organic matter in the topsoil over a period of 5 years, when tropical moist forest was converted to farmland (Sanchez 1976). A study in India showed the same pattern. Measurements were taken of 500 soils throughout the country and it was found that, where land had been converted to agricul-ture, organic matter had declined to between 30 to 60 per cent of the level in nearby forest soils (Jenny and Raychaudhuri 1960). In North America, the conversion of virgin prairie to farming land has also led to a drop in the organic matter content of the soil. One set of tests in Canada measured a reduction of 20 to 30 per cent in organic carbon lev-els in surface layers over a 22 year period (Campbell 1978).
These examples are not strictly analogous because decomposition rates are also thought to change when forest or grassland is put under the plough, as a result of factors such as increased soil temperature (Ayanaba et al. 1976). Nevertheless, the trend is likely to be similar.
Modelling organic matter levels Another approach to predicting changes in organic matter levels in the soil is to use computer models. One of the most sophisticated of these has been developed at Rothamsted in England, based on experiments carried Out under controlled conditions, together with data from bag-term field trials that have been under way at Rothamsted for more than 100 years (Jerikinson 1982; Hart 1984). The Rothamsted model takes into account soil temperature, rainfall patterns, soil properties, the effects of crop cover, and the quantities and type of organic matter being re-cycled to the soil. Its basic approach is to divide the carbon contained in
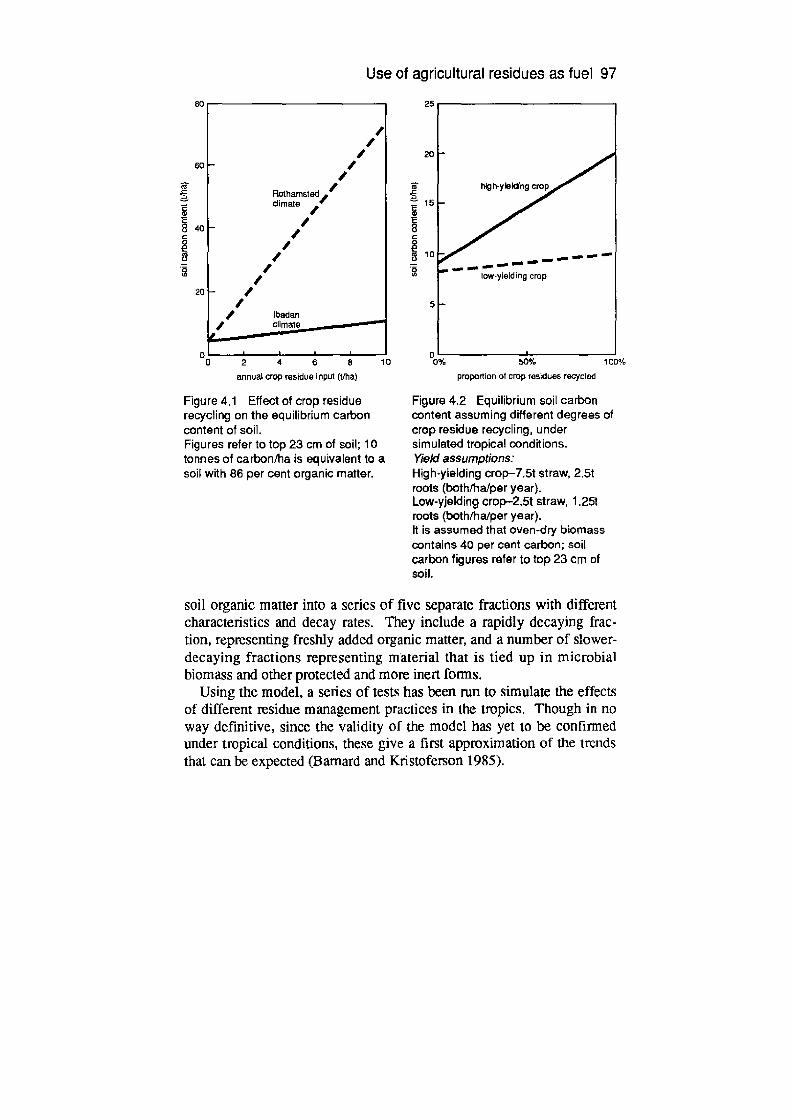
Use of agricultural residues as fuel 97
80
60
C
C
8 40 C
2 C,
a 20
0 0
/ /
/ Rothamsted / dfrliate
/ /
/ /
/ /
/ /
Ibadan /
annua' crop residue inpul (tlha)
25
p
20
a 0
15 C a C
8 C
2 10
a
5
10 0%
hh-yieding crop
F
— — — — — — I — — — —
low-yieldi—
ng crop
50% 100%
proportion of crop residues recycled
rA
Figure 4.1 Effect of crop residue recycling on the equilibrium carbon content of soil. Figures refer to top 23 cm of soil; 10 tonnes of carbon/ha is equivalent to a soil with 86 per cent organic matter.
Figure 4.2 Equilibrium soil carbon content assuming different degrees of crop residue recycling, under simulated tropical conditions. Weld assumptions: High-yielding crop-7.5t straw, 2.5t roots (both/ha/per year). Low-yielding crop-2.5t straw, 1 .25t roots (both/ha/per year). It is assumed that oven-dry biomass contains 40 per cent carbon; soil carbon figures refer to top 23 cm of soil.
soil organic matter into a series of five separate fractions with different characteristics and decay rates. They include a rapidly decaying frac-tion, representing freshly added organic matter, and a number of slower-decaying fractions representing material that is tied up in microbial biomass and other protected and more inert forms.
Using the model, a series of tests has been run to simulate the effects of different residue management practices in the tropics. Though in no way definitive, since the validity of the model has yet to be confirmed under tropical conditions, these give a first appmximation of the trends that can be expected (Barnard and Kristoferson 1985).
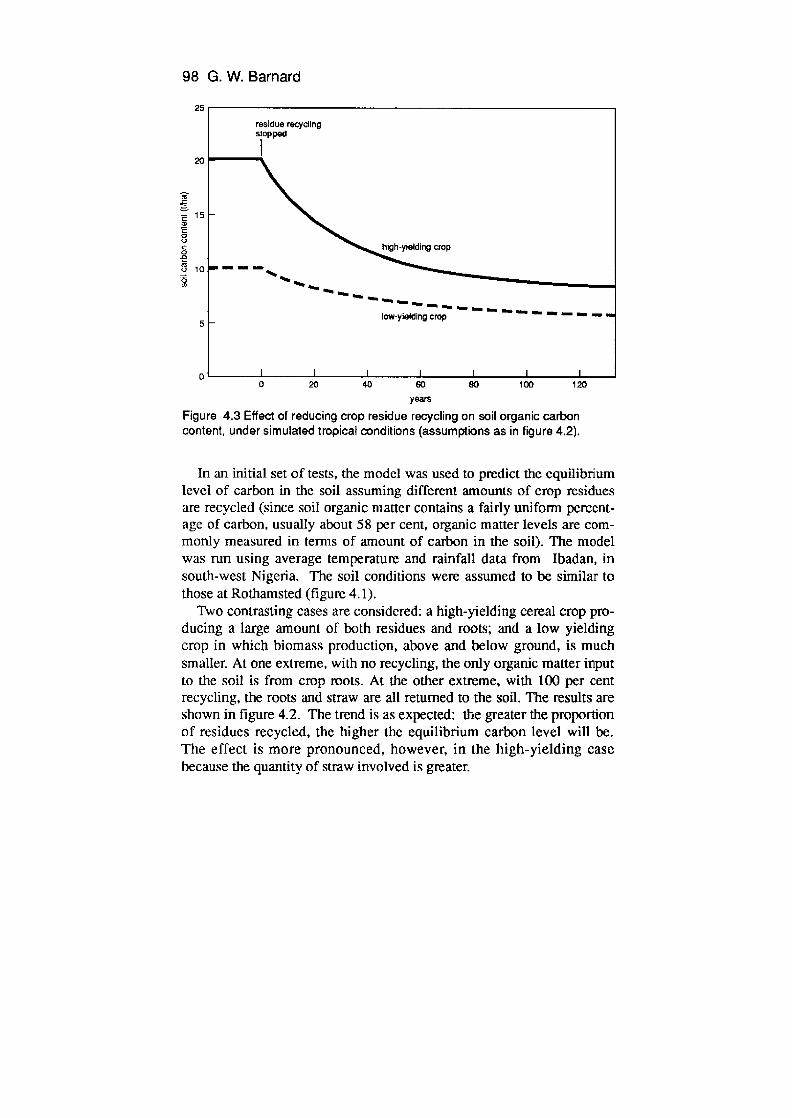
a E
= a = 0 U C 0 .0 a U
ip
10 0
98 G. W. Barnard
25
residue recycling slopped
20
high-yielding crop
— — —
— low-yielding crop — —
20 40 60 80 100 120
years
Figure 4.3 Effect of reducing crop residue recycling on soil organic carbon content, under simulaled tropical conditions (assumptions as in figure 4.2).
In an initial set of tests, the model was used to predict the equilibrium level of carbon in the soil assuming different amounts of crop residues are recycled (since soil organic matter contains a fairly uniform percent-age of carbon, usually about 58 per cent, organic matter levels are com-monly measured in terms of amount of carbon in the soil). The model was run using average temperature and rainfall data from Ibadan, in south-west Nigeria. The soil conditions were assumed to be similar to those at Rothamsted (figure 4.1).
Two contrasting cases are considered: a high-yielding cereal crop pro-ducing a large amount of both residues and roots; and a low yielding crop in which biomass production, above and below ground, is much smaller. At one extreme, with no recycling, the only organic matter input to the soil is from crop mots. At the other extreme, with 100 per cent recycling, the roots and straw are all returned to the soil. The results are shown in figure 4.2. The trend is as expected: the greater the proportion of residues recycled, the higher the equilibrium carbon level will be. The effect is more pronounced, however, in the high-yielding case because the quantity of straw involved is greater.

Use of agricultural residues as fuel 99
Predictions of organic carbon levels at equilibrium provide an idea of what happens to soil organic matter if agricultural techniques stay the same over a long period. They say nothing, however, about how rapidly changes will occur if residue management practices are altered. A sec-ond set of tests were therefore run to simulate the effect of reducing crop residue recycling. The results are presented in figure 4.3.
Two curves are shown, corresponding to the same high- and low-yielding cereal crop examples described above. The assumption is made that under the initial starting conditions the system is at equilibrium, with all residues being recycled. At that point (year zero), residue recy-cling stops completely. From then on it is assumed that the only carbon addition to the soil is from crop roots. The graph shows how organic carbon levels decline, year by year, until they eventually reach a new equilibrium.
The fall is most dramatic in the high-yielding case. This is because the reduction in the organic matter input, in quantitative terms, is larger. In both cases, however, the pattern is similar, carbon levels drop fastest at first, then gradually level off. It is important to note that organic car-bon levels do not plummet overnight. It takes five years with the high-yielding crop before the organic carbon content drops by 10 per cent, and 16 years before it falls by a quarter. It is only after several hundred years that the position stabilizes, at around 40 per cent of the original level.
Though these detailed predictions should not be taken literally, what they do suggest is that organic matter levels in the soil are in fact quite stable. It takes a long time for major changes to occur, even when the input of crop residues is drastically reduced. But in the long term, the effect of reduced organic recycling catches up. Organic matter levels do fall considerably, and the consequences will then have to be borne.
What this means in practice, in terms of damage to the soil and impairment of fertility, is not easy to predict. The main areas of concern can, however, be divided into two categories: the effect on nutrient bal-ances, and the impact on the physical structure of the soil.
Upsetting the nutrient balance When agricultural residues are added to the soil, the nutrients they con- tain are not released immediately (see tables 4.4 and 4.5 for typical fig-
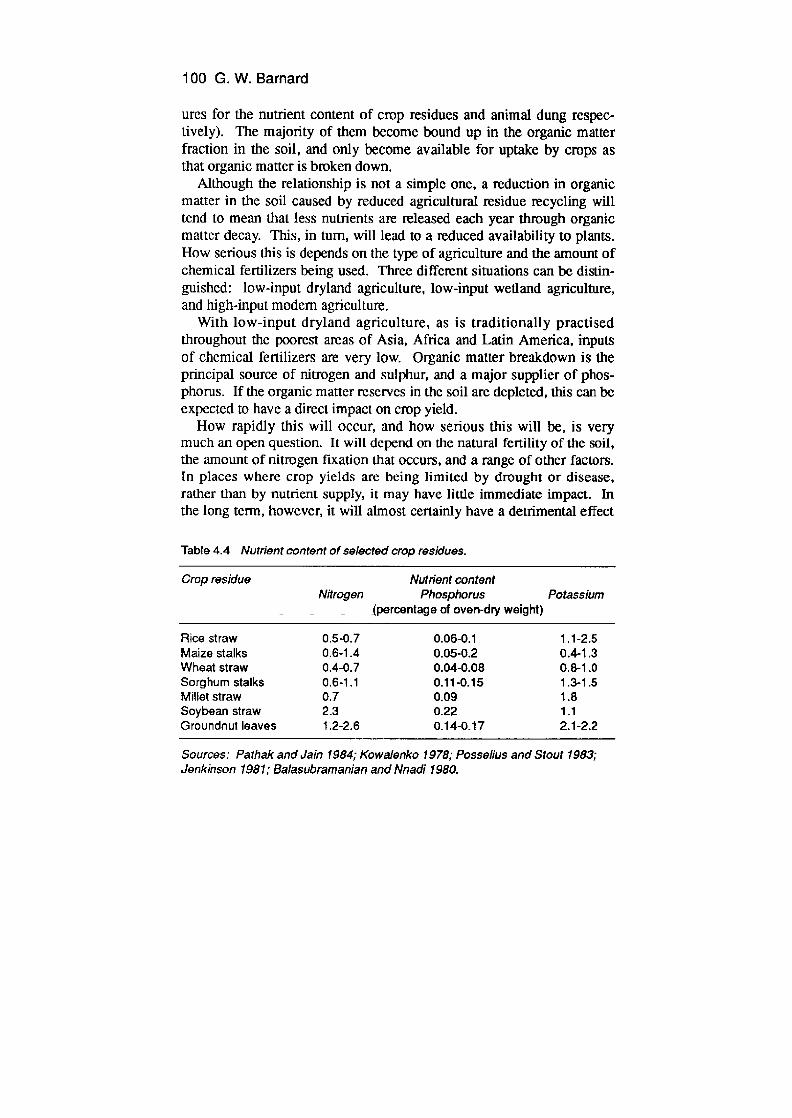
100 G. W. Barnard
ures for the nutrient content of crop residues and animal dung respec-tively). The majority of them become bound up in the organic matter fraction in the soil, and only become available for uptake by crops as that organic matter is bmken down.
Although the relationship is not a simple one, a reduction in organic matter in the soil caused by reduced agricultural residue recycling will tend to mean that less nutrients are released each year through organic matter decay. This, in turn, will lead to a reduced availability to plants. How serious this is depends on the type of agriculture and the amount of chemical fertilizers being used. Three different situations can be distin-guished: low-input dryland agriculture, low-input wetland agriculture, and high-input modem agriculture.
With low-input dryland agriculture, as is traditionally practised throughout the poorest areas of Asia, Africa and Latin America, inputs of chemical fertilizers are very low. Organic matter breakdown is the principal source of nitrogen and sulphur, and a major supplier of phos-phorus. If the organic matter reserves in the soil are depleted, this can be expected to have a direct impact on crop yield.
How rapidly this will occur, and how serious this will be, is very much an open question. It will depend on the natural fertility of the soil, the amount of nitngen fixation that occurs, and a range of other factors. In places where crop yields are being limited by drought or disease, rather than by nutrient supply, it may have little immediate impact. In the long term, however, it will almost certainly have a detrimental effect
Table 4.4 Nutrient content of selected crop residues.
Crap residue
-
Nitrogen - -
Nutrient content Phosphorus
(percentage of oven-dry weight) Potassium
Rice straw 0.5-0.7 0.06-0.1 1.1-2.5 Maize stalks 0.6-1 .4 0.05-0.2 0.4-1.3 Wheat straw 0.4-0.7 0.04-0.08 0.8-1 .0 Sorghum stalks 0.6-1.1 0.11-0.15 1.3-1.5 Millet straw 0.7 0.09 1.8 Soybean straw 2.3 0.22 1.1 Groundnut leaves 1.2-2.6 0.14-0.17 2.1-2.2
Sources: Pathak and Jain 1984; Kowalenko 1978; Possellus and Stout 1983; Jenkinon 1981; Balasubramanian and Nnadi 1980.
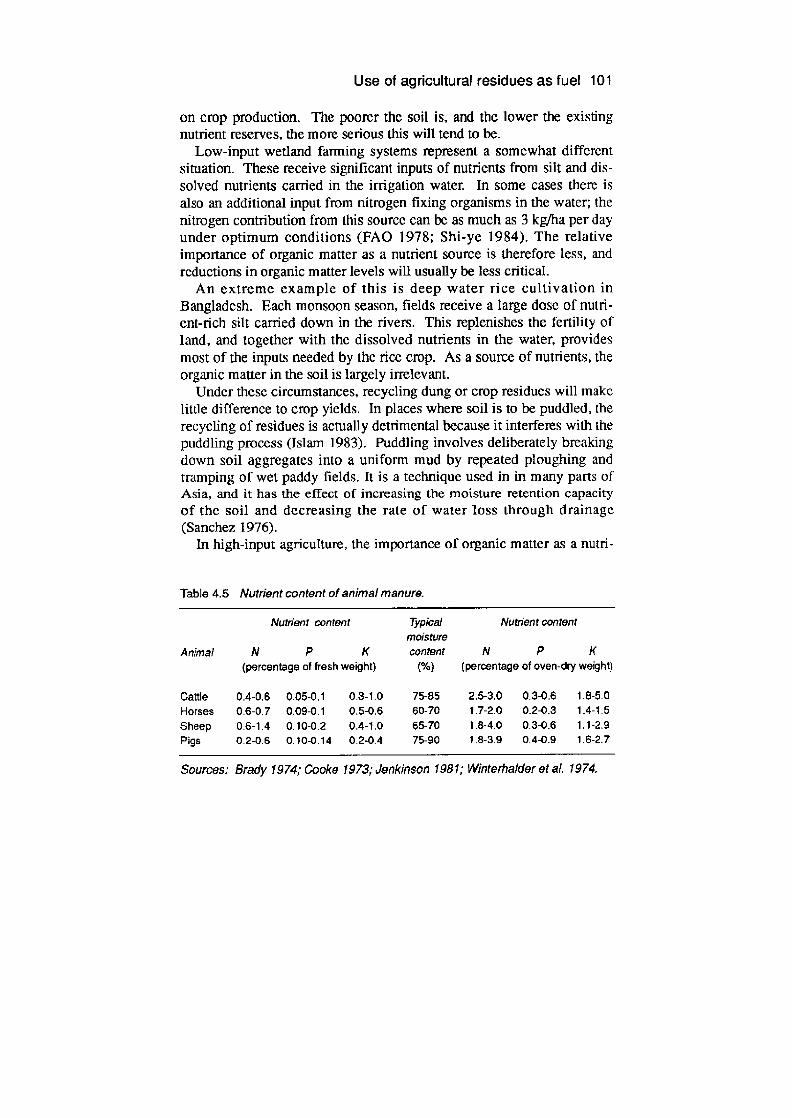
Use of agricultural residues as fuel 101
on crop production. The poorer the soil is, and the lower the existing nutrient reserves, the more serious this will tend to be.
Low-input wetland farming systems represent a somewhat different situation. These receive significant inputs of nutrients from silt and dis-solved nutrients carried in the irrigation water. In some cases there is also an additional input from nitrogen fixing organisms in the water; the nitrogen contribution from this source can be as much as 3 kg/ha per day under optimum conditions (fAO 1978; Shi-ye 1984). The relative importance of organic matter as a nutrient source is therefore less, and reductions in organic matter levels will usually be less critical.
An extreme example of this is deep water rice cultivation in Bangladesh. Each monsoon season, fields receive a large dose of nutri-ent-rich silt carried down in the rivers. This replenishes the fertility of land, and together with the dissolved nutrients in the water, provides most of the inputs needed by the rice crop. As a source of nutrients, the organic matter in the soil is largely irrelevant.
Under these circumstances, recycling dung or crop residues will make little difference to crop yields. In places where soil is to be puddled, the recycling of residues is actually detrimental because it interferes with the puddling process (Islam 1983). Puddling involves deliberately breaking down soil aggregates into a uniform mud by repeated ploughing and tramping of wet paddy fields. It is a technique used in in many parts of Asia, and it has the effect of increasing the moisture retention capacity of the soil and decreasing the rate of water loss through drainage (Sanchez 1976).
In high-input agriculture, the importance of organic matter as a nutri-
Table 4.5 Nutri9nt content of animal manure.
Nutrient content Typical Nutrient content moisture
Animal N P K content N P K (percentage of tresh weight) (%) (percentage of oven-dry weight)
Cattle 0.4-0.6 0.05-0.1 0.3-1.0 75-85 2.5-3.0 0.3-0.6 1.8-5.0 Horses 0.6-0.7 0.09-0.1 0.5-0.6 60-70 1.7-2.0 0.2-0.3 1.4-1.5 Sheep 0.6-1.4 0.10-0.2 0.4-1.0 65-70 1.8-4.0 0.3-0.6 1.1-2.9 Pigs 0.2-0.6 0.10-0.14 0.2-0.4 75-90 1.8-3.9 0.4-0.9 1.6-2.7
Sources: Brady 1974; Cooke 1973; Jenkinson 1981; Winterha/der etal. 1974.

102 G.W.Barnard
ent source is also less than in traditional low-input systems. Chemical fertilizers provide the majority of nutrients needed. Though organic matter recycling will help economize on the amount of fertilizer required, and may provide a variety of other benefits, from a nutrient point of view it is not strictly essential for good plant yields.
As one study in India has pointed out, in areas where fuel prices are high dung may have a greater value as fuel than fertilizer. From a farmer's perspective, buying wood or kerosene to replace dung as a fuel can be more expensive than paying for a little more chemical fertilizer to substitute for the nutrient value of the dung (Aggarwal and Singh 1984).
Probably the biggest problem with high-input systems in this conLext is micronutrients. Large applications of nitrogen, phosphorus and potas-sium can sustain high crop yields over a long period. But sooner or later, problems will tend to arise due to the depletion of minor nutrients such as sulphur, zinc, boron and manganese. Zinc and sulphur short-ages, for example, have been reported in some green revolution areas of India and Bangladesh (Islam 1983)
Recycling organic matter provides a partial insurance policy against micronutrient depletion. Even so, if farmers are aware of the potential problems that can arise, they may be able to avert them by carrying out regular soil tests and correcting any imbalances with extra additions of chemical fertilizers. But while this may be feasible for some farmers, it is obviously not an option that is open to all. For poor farmers who can-not afford the necessary fertilizers, or lack the knowledge and technical backup to use them effectively, nutrient depletion poses a major threat.
Physical damage to soils: the erosion threat
Independent of the effect on nutrient supplies, the impact of organic mat-ter depletion on the physical properties of the soil is also a serious con-cern. If soil organic matter levels drop, a number of consequences can be expected: the water retention capabilities of the soil will be reduced, it will become harder to till, and there will be a greater risk of erosion.
In practice, the rate at which these problems will emerge, and their severity, is hard to predict. Soil erosion, in particular, is an extremely complex phenomenon. Separating out the effect of organic matter levels from those of site and weather conditions, farming practices, and other related factors is often difficult. Quantifying the impact on agriculture is also problematic; as well as the on-site effects caused by the loss of
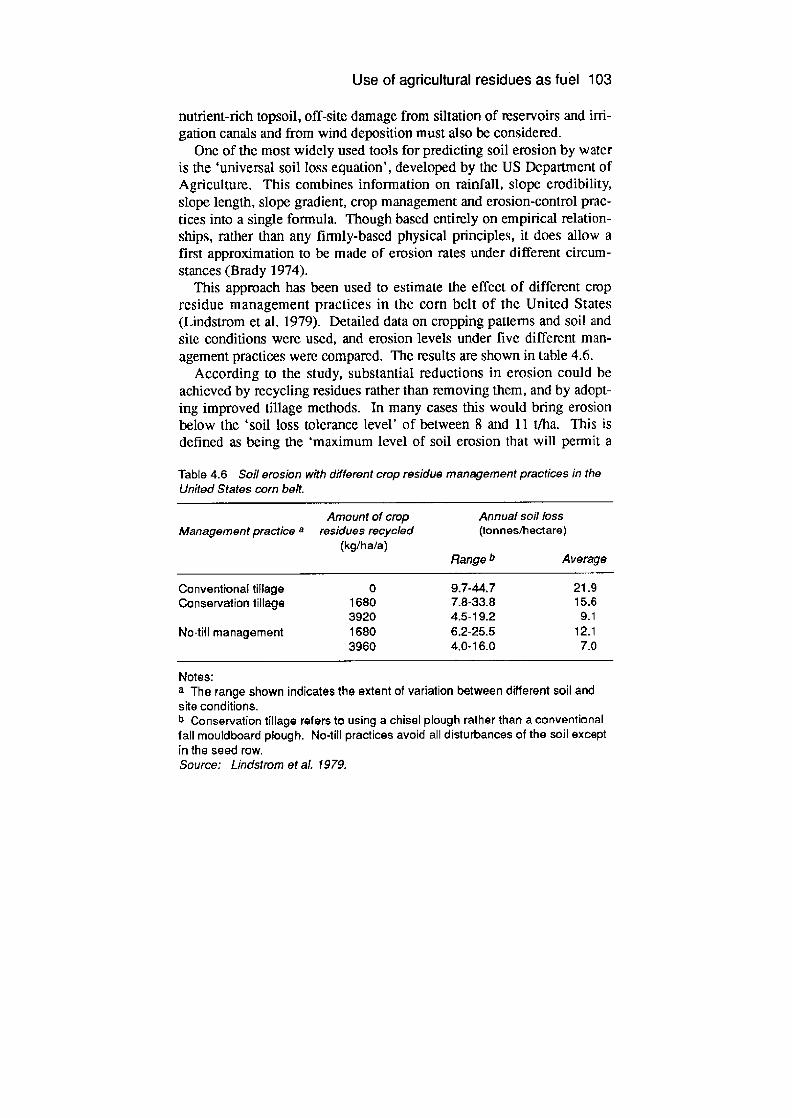
Use of agricultural residues as fuel 103
nutrient-rich topsoil, off-site damage from siltation of reservoirs and irri-gation canals and from wind deposition must also be considered.
One of the most widely used tools for predicting soil erosion by water is the 'universal soil loss equation', developed by the US Department of Agriculture. This combines information on rainfall, slope erodibility, slope length, slope gradient, crop management and erosion-control prac-tices into a single formula. Though based entirely on empirical relation-ships, rather than any firmly-based physical principles, it does allow a first approximation to be made of erosion rates under different circum-stances (Brady 1974).
This approach has been used to estimate the effect of different crop residue management practices in the corn belt of the United States (Lindstrom et al. 1979). Detailed data on cropping patterns and soil and site conditions were used, and erosion levels under five different man-agement practices were compared. The results are shown in table 4.6.
According to the study, substantial reductions in erosion could be achieved by recycling residues rather than removing them, and by adopt-ing improved tillage methods. In many cases this would bring erosion below the 'soil loss tolerance level' of between 8 and 11 t/ha. This is defined as being the 'maximum level of Soil erosion that will permit a
Table 4.6 Soil erosion with different crop residue management practices in the United States corn belt.
Amount of crop Annual soil loss Management practice a residues recycled (tonnes/hectare)
(kg/ha/a) Range b Average
Conventional tillage 0 9.7-44.7 21.9 Conservation lillage 1680 7.8-33.8 15.6
3920 4.5-19.2 9.1 No-till management 1680 6.2-25.5 12.1
3960 4.0-16.0 7.0
Notes: a The range shown indicates the extent of variation between different soil and site conditions. b Conservation tillage refers to using a chisel plough rather than a conventional fall mouldboard plough. No-till practices avoid all disturbances of the soil except in the seed row. Source: Lindstrom et aL 1979.

104 G.W.Barnard
high level of crop productivity to be sustained economically and indefi-nitely'. The converse of this is that if crop residues were removed, rather than being recycled, there would be a significant increase in ero-sion losses. In both conservation tillage and no-till systems, erosion would be increased by 70 per cent if residue recycling were cut from 3960 kg/ha to 1680 kg/ha.
Considerable variation was noted, however, between different soil and site conditions. Erosion losses in areas with a flat topography were much lower than those on hilly land. These variations were at least as great as those between different management practices, emphasizing the importance of local conditions in dictating erosion rates. Over the whole study area, it was concluded that only 35 per cent of the residues pro-duced could be safely removed under conventional tillage practices. Using no-till techniques, this figure could be increased. It would still be necessary to leave around 42 per cent of the residues on the land, how-ever, to keep erosion within the tolerance level (Lindstmm et al. 1979).
More recently, a computer model has been developed to estimate the maximum quantity of residues that can be removed in individual fields. This is designed for use by farmers, and accounts for both wind and water erosion. Trial runs under two specific site conditions found that the proportion of residues that could be safely removed varied from 0 per cent to 73 per cent in one field, and 30 per cent to 72 per cent in the other, depending on the crop being grown and the slope (Posselius and Stout 1983).
Though soil erosion is widely recognized as being a critical problem in the developing countries, far less work has been done either to mea-sure or model erosion under the conditions prevailing in the tropics (Brown and Wolf 1984; Blaikie 1984). As a result, there is no equiva-lent data base on which to predict the impact of reduced residue recy-cling.
How relevant these US results are to developing countries is, there-fore, a matter of considerable doubt. Soil types are very different in the tropics, and weather patterns often more extreme. For similar soils and topography, soil erosion tends to be more pronounced than in temperate regions. This is because the topsoil is generally thinner, the rains more intense, and the soils inherently less stable (Lal 1984).
Agricultural practices are also very different. In some cases certain practices increase the threat of erosion; hand cultivation of steep hill-sides, for example, can lead to very severe erosion losses if no soil con-

Use of agricultural residues as fuel 105
servation measures are taken. In others, they decrease it; on flat land hoe cultivation is often less destructive than mechanized fanning meth-ods because it disturbs the soil less (Lal 1984). With some traditional agroforestry systems, in which trees and crops are grown together, the canopy of the trees provides shelter for the soil below and greatly reduces the erosion hazard. The sophisticated terracing methods used in parts of south-east Asia are also highly effective in preventing erosion.
What is certain is that the implications will vary enormously from place to place. Factors such as the slope of the land, the pattern of wind and rainfall, the type of crops being grown, the ground cover, and the soil type, all have a major influence on how bad the erosion problem is. In flat lowland areas, protected by trees and blessed with a gentle cli-mate, erosion may not even be an issue. But on steeply sloping hillsides, where violent tropical rainstorms are an annual occurrence, even a minor impairment of the soil's structural stability through organic matter deple-tion could have serious consequences.
Identifying the high risk areas Given the many factors involved, there is clearly no single answer to the question: what happens when you stop recycling agricultural residues? Without reliable field data, all that can be done is to provide pointers toward the areas which are likely to be at greatest risk from deptetion of soil organic matter. Certain soil types, for example, are at greater risk than others: 1 soils with a low clay content (especially acid soils)—these need
organic matter to help bind nutrients and stop them being leached away
2 sandy soils which dry out rapidly—these need organic matter to increase water retention
3 soils with a poor physical structure—these need organic matter to bind the soil into aggregates and improve the tillage properties
Likewise, areas where erosion is a special threat will be particularly susceptible to damage through organic matter depletion. These include: 1 steeply sloping hillsides with inadequate terracing 2 areas with sparse tree cover and bare soils 3 regions with violent rainstorms or high winds
At the level of the individual farm, factors such as the access to fertil-
106 G. W. Barnard
izer will also have a major influence on the risks a farmer runs in divert-ing agricultural residues away from the soil.
Farmers who use chemical fertilizers will tend to be in the best posi-tion. If applied scientifically, fertilizers can to a considerable extent replace the role of organic matter as a nutrient supply. And because of the higher overall crop yield, root production also tends to be greater, with the effect that soil organic matter levels are less likely to fall drasti-cally even if all the above-ground crop residues are removed. For sub-sistence farmers who are unable to afford fertilizers, the threat is much more real. They rely far more on organic matter as a source of nutrients. In some cases, reducing the recycling of residues could push them on to a 'slippery slope' of lower biomass yields leading to reduced residue production, less recycling and further losses in crop productivity.
Conclusions and policy implications
The environmental implications of using agricultural residues as fuel are clearly very site specific. It is certainly not the universal crime that it is sometimes portrayed. But neither are agricultural residues a freely avail-able waste product—as they are sometimes treated in surveys of biomass energy potential—that can be used indiscriminately without heed of the possible consequences to the soil and to the environment.
The impact of using agricultural residues as a fuel for industry depends to a large extent on the technology involved. An efficient residue-buming furnace, for example, can provide a clean and environ-mentally sound method for disposing of crop processing residues, whilst supplying all or part of the energy needed to run the process. Yet a badly designed or badly operated system may solve one problem—that of dis-posing of processing wastes—but create an air pollution problem in its place.
Environmental legislation that sets limits on pollution levels can play a useful role in such cases, provided the regulations can be properly enforced. But policies need to be realistic. Particularly in the Third World, shortage of capital is a well-recognized bamer to the moderniza-tion of equipment, especially for small-scale industries. Efforts to clean up agricultural processing industries may therefore have to be accompa-nied by technical and financial support packages if they are to be effec-tive.

Use of agricultural residues as fuel 107
Policies on air pollution from burning residues in the home are more difficult to implement. Banning certain fuels on the grounds that burn-ing them is hazardous to health is not a credible option. Improved stove programmes, however, where the design emphasis is placed on minimiz-ing smoke, may assist to some degree, and this may be an important fac-tor in the slow and complex task of gaining acceptance for new stove designs.
On the supply side, the effects on the soil of using agricultural residues as fuel is an area where a great deal more research is needed before firm conclusions can be drawn. The assumption that residue burning automatically harms the soil is clearly wrong. There are many cases where dung and crop residues cannot be recycled easily, or are already being used for other purposes instead. In such instances, burn-ing residues will have little direct effect on the soil—although it may create problems in other parts of the farming system, such as in fodder supply.
Where burning residues does lead to reduced organic recycling then there is likely to be a direct impact on the soil. How severe this will be, however, depends on the type of agriculture being practised and the resources available to the farmer.
At worst, the implications can be very serious. For a poor farmer on infertile land and without access to fertilizers, having to divert residues from the soil may mean that crop yields will be significantly impaired. In high-risk areas with unstable soils, it may also increase the risk of catastrophic erosion jeopardizing his entire livelihood. Under these cir-cumstances, a switch to agricultural residue burning would almost cer -tainly represent an important negative step. The hills of Nepal, northern India and Ethiopia are examples of where this danger seems imminent. Organic recycling has traditionally played a key role in maintaining agri-cultural output in these areas. If this role is threatened, the stability of the whole agricultural system could be undermined.
At the other extreme, for better-off farmers on good land, the effects of burning agricultural residues are likely to be less serious. Reduced organic recycling will mean that farmers will have to use more fertilizers to obtain the same crop yields. In erosion prone areas it may require them to pay more attention to contour ploughing, use of cover crops, and other soil management measures, so as to reduce the risk of erosion. But provided the farmer knows the dangers involved, and has the money and
108 G.W.Barnard
resources to take corrective action, increased agricultural residue burn-ing may not create any major problems.
In between these two extremes lies a spectrum where local circum-stances will play a major part in determining both the potential for increased use of agricultural residues for energy, and the risks involved. Recognizing this diversity is essential, since no generalizations can accu-rately encompass the enormous differences in how farming systems function in different parts of the world.
From a policy perspective there are two key points that must be borne in mind when framing policies on agricultural residue use. The first of these is information, since local data on the current use of agricultural residues are essential if an accurate assessment is to be made of the trade-offs involved when more residues are burnt. The second is a ques-tion of alternatives, as there is little point in proposing policies that farm-ers and agricultural residue users are unable to carry out.
In the developed world devising a realistic set of policies on agricul-tural residue use is comparatively straightforward. Farming practices are well established and in most countries there is a sufficient foundation of soil science information to allow detailed advice to be given to farmers on how best to manage agricultural residues. Furthermore, most farmers are in the position to accept the advice given, and take the necessary action to minimize environmental risks. In much of the Third World the position is much less clear cut. Not only is there a severe dearth of infor-mation, both on current residue-use practices and on long-term soil behaviour, but the freedom of action for individual farmers is much more restricted. Where farmers are damaging their soil and their local farming system by burning residues, usually they are fully aware of it, and rarely are they doing it Out of choice. In almost all cases it is because they have no alternative.
Policies designed to rationalize the use of agricultural residues must therefore be based on a detailed understanding of local farming systems, and on the constraints that farmers face. The competing needs for fuel, fodder, building materials and organic fertilizers must all be considered, as no one problem is likely to be solved in isolation. Certainly, there is no future in promoting new approaches to agricultural residue manage-ment that address one problem, but create others in the process. It is only by collaborating with farmers themselves is identifying priorities, and in working out approaches that are realistic in their terms, that effec-tive and sustainable solutions can be found.
Use of agricultural residues as fuel 109
References Agarwal, A. (1981) 'Mud, mud: The potential of earth-based materials
for Third World housing." Earthscan, London. Aggarwal, G. C. and Singh, N. T. (1984) 'Energy and economic returns
from cattle dung as manure and fuel', Energy, 9, no. 1, 87. Ayanaba, A. et al. (1976) 'The effects of clearing and cropping on the
organic matter reserves in tropical forest soils', Soil Biology and Biochemistry, 8, p.5 19.
Balasubramanian, V. and Nnadi, L. A. (1980) 'Crop residue management and soil productivity in savanna areas of Nigeria', in Organic Recycling in Africa, Soils Bulletin, no 43, FAO, Rome, 1980.
Barnard, G. W. and Kristoferson, L. A. (1985) 'Agricultural residues as fuel in the Third World', Technical Report no. 5, Earthscan, London.
Beagle, E. C. (1978) 'Rice husk conversion to energy', FAO Agricultural Services Bulletin no. 31, FAO, Rome.
Best, M. (1979) 'The scarcity of domestic energy: A study of three villages', Working Paper no. 27, South Africa Labour and Development Research Unit, Cape Town.
Blaikie. P. (1984) The Political Economy of Soil Erosion in Developing Countries, Longman, London.
Brady, N. C. (1974) The Nature and Properties of Soils, Macmillan, New York.
Briscoe, J. (1979) 'Energy use and social structure in a Bangladesh village', Population and Development Review, 5, no. 4, 615.
Brown, L. R. and Wolf, E. C. (1984) 'Soil erosion: Quiet crisis in the world economy', Woridwatch Paper no. 60, Woridwatch Institute, Washington DC.
Campbell, C. A. (1978) 'Soil organic carbon, nitrogen and fertility', in S. U. Schnitzer and S. U. Kahn (eds), Soil Organic Matter, Elsevier.
Cecelski, E. (1984) 'The rural energy crisis: Women's work and family welfare: Perspectives and approaches to action', Rural Employment Policy Research Programme, 110, Geneva.
Cooke, G. W. (1973) Fertilizing for Maximum Yield, Crosby, Lockwood and Staples, London.
Davey, C. J. (1980) 'Excreta: The social implications of using a primary resource', M.Sc. dissertation, Agricultural Extension and Rural Development Centre, Reading University, UK.
110 G.W.Barnard
FAO (1978) 'China: Azolla propagation and small-scale biogas technology', FAO Soils Bulletin no. 41, FAO, Rome.
FAO (1982) 'Agricultural residues: Bibliography 1975-8 1 and quantitative survey', FAO Agricultural Services Bulletin no. 47, rev. 1, FAO, Rome.
Gillard, P. (1967) 'Coprophagous beetles in pasture ecosystems', Journal of the Australian Institute ofAgricultural Science, 33, no. 1, 30.
Gopalakrishnan, K. (1984) 'The use of dung in India', Special report prepared for Earthscan, London.
Hart, P. B. S. (1985) 'Effect of soil type and past cropping on the nitrogen supplying ability of amble soils', Ph.D. thesis, University of Reading, UK.
Hughart, D. (1979) 'Prospects for traditional and non-conventional energy sources in developing countries', World Bank Staff Working Paper no. 346, World Bank, Washington DC.
Islam, M. N. (1983) 'Evaluating the impact of using agricultural residues for fuel as a substitute to insufficient fuelwood supplies', Report to FAO, Institute of Appropriate Technology, Bangladesh University of Engineering and Technology, Dhaka.
Jenkinson, D. S. (1981) 'The fate of plant and animal residues in soil', in D. J. Greenland and M. H. B. Hayes (eds) The Chemistry of Soil Processes John Wiley, London.
Jenkinson, D. S. (1982) 'The nitrogen cycle in long-term field experiments', Phil. Trans. R. Soc. Lond., B 296, p.563 .
Jenny, H. and Raychaudhuri, S. P. (1960) 'Effect of climate and cultivation on nitrogen and organic matter reserves in Indian soils', Indian Council of Agricultural Research, New Delhi.
Kowalenko, C. G. (1978) 'Organic nitrogen, phosphorus and sulfur in soils', in S. U. Schnitzer and S. U. Kahn (eds), Soil Organic Matter, Elsevier.
Knstoferson, L. A. and Bokalders, V. (1986) Renewable Energy Technologies: Their Application in Developing Countries, Pergamon, Oxford, UK.
Lal, R. (1984) 'Soil erosion from tropical arable land and its control', Advances in Agronomy, 37, 183,
Leach, M. (1985) 'Responding to fuelwood scarcity: Outside intervention and the household view in two Maasai villages in

Use of agricultural residues as fuel 111
Tanzania', Undergraduate dissertation, Newnham College, University of Cambridge, UK.
Lindstrom, M. J. et al. (1979) 'Tillage and crop residue effects on soil erosion in the corn belt', Chapter in Soil Conservation Society of America, 1979.
NCAER (1979) 'Domestic fuel survey with special reference to kerosene', National Centre of Applied Economic Research, New Delhi.
Newcombe, L. (1984) 'An economic justification for rural afforestation: The case of Ethiopia', Draft Energy Department Paper, World Bank, Washington DC.
Padmavati, S. (1974) 'CorPulmonale in India', in Cardiovascular Diseases in the Tropics, British Medical Association, London.
Pathak, B. S. and Jam, A. K. (1984) 'Characteristics of crop residues: Report on the physical, chemical and thermochemical properties of ten selected crop residues', Punjab Agricultural University, Ludhiana, India.
Pimentel, D. et al. (1984) 'Environmental and social costs of biomass energy', Bioscience, 34, no. 2, 89.
Ponnamperuma, F. N. (1984) 'Straw as a source of nutrients in wetland rice', in Organic Matter and Rice, International Rice Research Institute, Los Banos, Philippines.
Posselius , J. H. and Stout, B. A. (1983) 'Crop residue availability for fuel', in D. L. Wise (ed), Liquid Fuel Systems, CRC Press, Boca Raton, Florida.
Ruthenburg, H. (1983) Farming Systems in the Tropics, Clamndon Press, Oxford.
Sanchez, P. A. (1976) Properties and Management of Soils in the Tropics, John Wiley, New York.
Shi-Ye, L. (1984) 'Azolla in the paddy fields of eastern China', in Organic Matter and Rice, International Rice Research Institute, Los Banos, Philippines.
Stout, B. A. (1979) Energy for World Agriculture, FAO, Rome. Strehier, A. and SWtzle, W. (1987) Article in D. 0. Hall and R. Overend
(eds), Biomass: Regenerable Energy, John Wiley. Svenningsson, P. J. (1985) 'Cotton stalks as an energy source for
Nicaragua', Ambio4, no. 5. Winterhalder, B., Larsen, R. and Brooke, Thomas R. (1974) 'Dung as an

112 G.W.Barnard
essential resource in a highland Peruvian community', Human Ecology, 2, no. 2, 89.
Wu, W. and Chen, E. J. (1983) 'Our views on the resolution of China's rural energy requirements', Biomass, 3, 287.
5 Liquid fuels
F. RosUlo Calle
The large-scale production and use of alcohol fuels will have a signifi-cant number of environmental benefits, but will also create problems. Alcohols are widely recognized as the best candidates for the rapid intro-duction of a new liquid fuel source; but only one country so far—Brazil—has introduced ethanol fuels into the transport sector, on a scale unknown and unmatched elsewhere, and in a remarkably short time. From 1975 to 1988 Brazil has produced about 75 billion litres of ethanol from sugar cane, most of this for fuels, but some for the chemi-cal industry. Brazil's pioneering fuel policy has provided important insights into the transition to non-petroleum transport fuels. Alcohols have the potential to revolutionize the supply and use of energy fuel throughout the world, particularly in transportation, because (a) there is a variety of widely available raw materials from which alcohol can be made; (b) there exists an improved and demonstrated technology for the production and use of alcohol; and (c) alcohols have favourable combus-tion characteristics, namely clean burning and high octane performance.
In the past decade, research and development into the appropriate engine technology has grown dramatically, as in many countries has the use of alcohol fuels. The value of alcohol fuels has now been recog -nized, and policies to support development and implementation are being introduced. World-wide government expenditure on alcohol fuel schemes in the form of grants, subsidies, loans, etc. amounts over US$2 billion annually. Fermentation ethanol capacity has increased eight fold since the middle of the 1970s to about 19 billion litres in 1987.
Policies are not based on the concept of a single world-wide fuel, but on regional solutions; those developed reflect the prevailing conditions

114 F. Rosillo Calle
in different countries, including: (a) oil supply vulnerability; (b) eco-nomic benefits arising from alternatives to oil imports, combined with the use of indigenous energy resources; (c) environmental benefits.
The main barriers to the widespread use of alcohol fuels are their cur -rent high cost when compared with current oil prices, lack of an estab-lished distribution system, excluding Brazil and a few other countries such as the USA and Zimbabwe, engine considerations, and concern about health hazards.
Alcohols: general considerations
The best known alcohols are grain ethanol C 2H50H, manufactured since antiquity by fermentation, and methanol or wood alcohol, CH 3 0H, so named because it was originally produced as a by-product of the destruc-tive distillation of wood to produce charcoal. A third alcohol is iso-propanol, C 3H7 01-1, and a fourth tertiary butanol C4H9OH, produced during the manufacture of plastics. These alcohols, particularly ethanol and methanol, present favourable opportunities as components of trans-portation fuels. In addition methyl tertiary butyl ether (MTEB), though not an alcohol and made from methanol and isobutane, is also widely used in gasoline blends. Both ethanol and methanol improve the octane rating of gasoline if added in small quantities of 5 to 15 per cent, and are preferable to lead additives or alternative refining processes for this pur -pose.
There are three major technologies available for converting biomass into fuels: (a) thermal, (b) biological, and (c) extraction. Thermal pro-cesses include direct combustion, gasification, and liquefaction. The major biological conversion processes are fermentation to yield liquid fuels, and anaerobic digestion to yield gaseous fuels. Extraction pro-cesses are well developed commercially and supply oils for food and industrial uses.
Two additional processes that show promise for the conversion of biomass into forms that can be converted to liquid fuels are acid hydrol-ysis and enzymatic hydrolysis. Acid hydrolysis is a mature technol-ogy—simple but energy- and capital-intensive--but is inefficient, with about 50 per cent feedstock losses. Despite its limitations, the technol-ogy is being improved and this will reduce ethanol production costs sig-nificantly. Enzymatic hydrolysis is a much newer technology and seems
Liquid Fuels 115
to offer more promise because it allows fermentable sugar solutions to be obtained directly. It offers the possibility of producing ethanol from the xylose and lignin portions of biomass.
Ethanol
Currently, ethanol is produced by both fermentation and synthetic meth-ods. The commercial use of fermentation techniques developed signifi-cantly during the first 30 years of this century, but by the mid- 1940s many chemical production processes that were based on fermentation were replaced by synthetic processes based on crude oil. A wide variety of crops have been used for the production of ethanol by fermentation. For sugar-containing crops, the juice is extracted and fermented directly. Starch-containing raw materials must be pre-treated with acid or enzymes to convert their starch to glucose. Cellulose-containing raw materials are not easy to degrade to glucose, principally because of cel-lulose crystallinity and the naturally occurring binding materials—lignins—which give wood its structural strength.
Ethanol production from any biomass-based feedstock involves four main steps: (a) pre-treatment—the physical or chemical conversion of the raw material to a hydrolysable substrate; (b) hydrolysis—the enzy-matic reaction that converts the starch or cellulose to sugar; (C) yeast fer-mentation—the conversion of sugars to ethanol and carbon dioxide; and (d) purfication—the separation of ethanol from the by-products and water (see figure 5.1). In the past decade fermentation technology has improved rapidly and is undergoing a series of technical innovations aimed at using new alternative materials, improving operating condi-tions, increasing overall energy and efficiency, and reducing costs. Current fermentation technology is used effectively on certain feed-stocks only—sugarcane and maize. Technological advances will have less of an impact on market growth than will the increased availability and Cost of feedstocks, and favourable financial conditions. For ethanol fuel, the cost-competing energy options—fossil fuels—will affect the demand for alcohol for fuel more profoundly (Anon 1987a).
Ethanol production by fermentation is based largely on yeasts, and for large-scale fuel production these are generally of the genus Cerevisiae, although bacteria and fungi will also produce ethanol. Considerable research interest has been shown in the use of bacterial systems based on Zymomonas or thermophilic Clostrida. A variety of systems based on
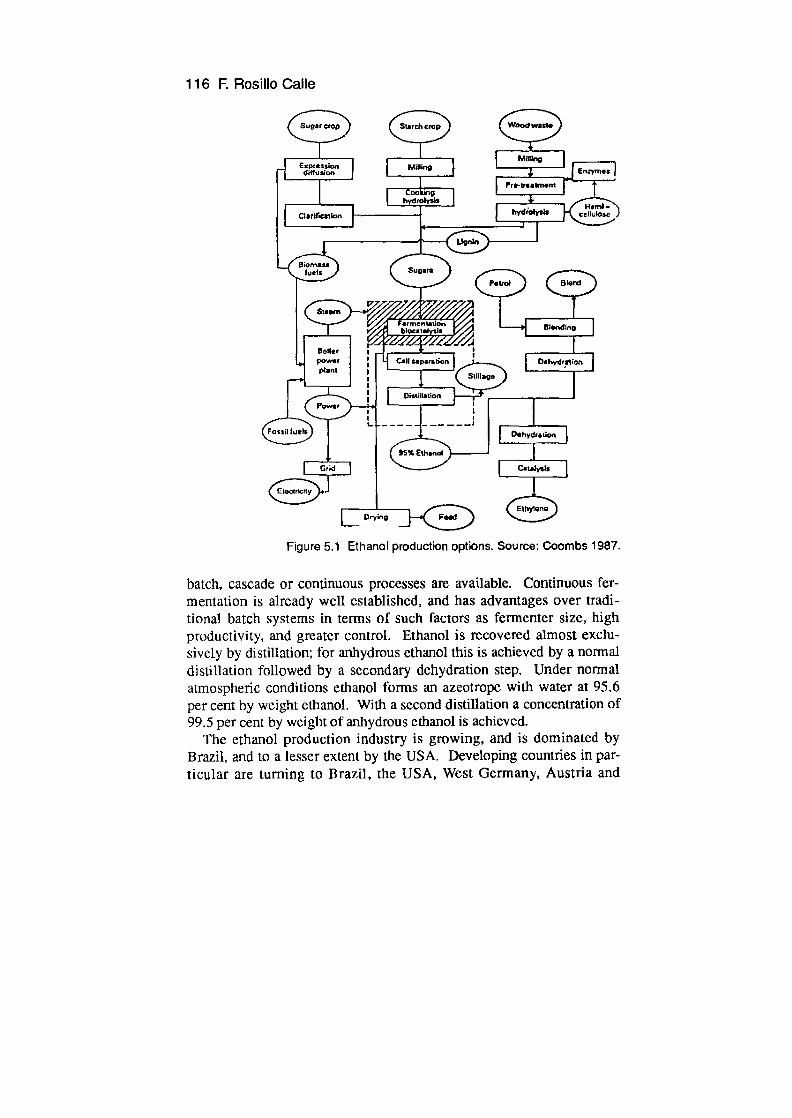
116 F. Rosillo Galle
S
S"ogfctoi)
""11110 I Il diffuJc.
P aar trwAiin I
Woodwas
MPhiQ -
Ww
En—Erymes
I —4 ceRviOc
Lignin
L<~~ Diornala fuels SugirL
ormentation er.ndu bIoca1iiyiiI y
Boilir I •
pol-Or I Ciii Upiribori I Dehyrion plant
I. SU11896
I Distillation L Power ___________________________________
Fottil fuels
Ij - —
I Dehydra tion
Ea Gr;d I EkKgrictly (J I
Figure 5.1 Ethanol production options. Source: Coombs 1987,
batch, cascade or continuous processes are available. Continuous fer-mentation is already well established, and has advantages over tradi-tional batch systems in terms of such factors as fermenter size, high productivity, and greater control. Ethanol is recovered almost exclu-sively by distillation; for arthydrous ethanol this is achieved by a normal distillation followed by a secondary dehydration step. Under normal atmospheric conditions ethanol forms an azeotrope with water at 95.6 per cent by weight ethanol. With a second distillation a concentration of 99.5 per cent by weight of anbydrous ethanol is achieved.
The ethanol production industry is growing, and is dominated by Brazil, and to a lesser extent by the USA. Developing countries in par-ticular are turning to Brazil, the USA, West Germany, Austria and
Liquid Fuels 117
Sweden for ethanol production technology. Exports are expected to be dominated by Brazilian firms for the next several years, as they have already developed appropriately scaled equipment packages. Ironically, Brazil does not enjoy a technological advantage, particularly with regard to process technology; rather, its leading position stems from a natural advantage coupled with its accumulated experience, and its ability to provide a whole range of services such as consultancy, alcohol blending and alcohol fuel technology. However, a major difficulty facing Brazilian firms has been the lack of long-term financial credit for exports.
Methano'
Methanol, an organic chemical manufactured in large quantities, is now produced solely by synthetic methods. The previous technique of dry distillation (pyrolysis) of wood has now been abandoned because of its high cost and poor yields of about 30 kg per tonne of hardwood. Current processes use 'synthesis gas' (syngas), a mixture of carbon monoxide (CO) and tiydrogen (H2 ) initially derived from natural gas. Although natural gas is the predominant source of CO and H 2 for this reaction, it is possible to generate synthesis gas from coal, wood, peat or urban solid wastes. To our knowledge, all commercial plants of any significance used fossil -fuel -based sources despite the fact that several countries (New Zealand, Brazil, Canada, USA) have carried out extensive engi-neering and economic studies processes using wood as a feedstock.
A drawback to any biomass-to-methanol scheme is the size of the plant required and the amount of raw material needed to keep it operat-ing. The minimum practical plant size (producing about 200 tonnes per day of methanol), requires about 500 torines per day of oven-dry wood or equivalent biomass. Such volumes of biomass are not usually avail-able at a given site without extensive gathering and transport costs. Whether biomass, natural gas, coal or peat are used as a source of CO and H2, the final reaction is the same: the gases are mixed and com-pressed to between 50 and 100 atmospheres and are reacted over a cata-lyst at about 250 C (Anon 1983).
A cheap one-step process that converts natural gas to fuel-grade methanol, claimed to be 20 per cent cheaper than the two-step syrigas process, has recently been reported (Milgrom 1987). This process,
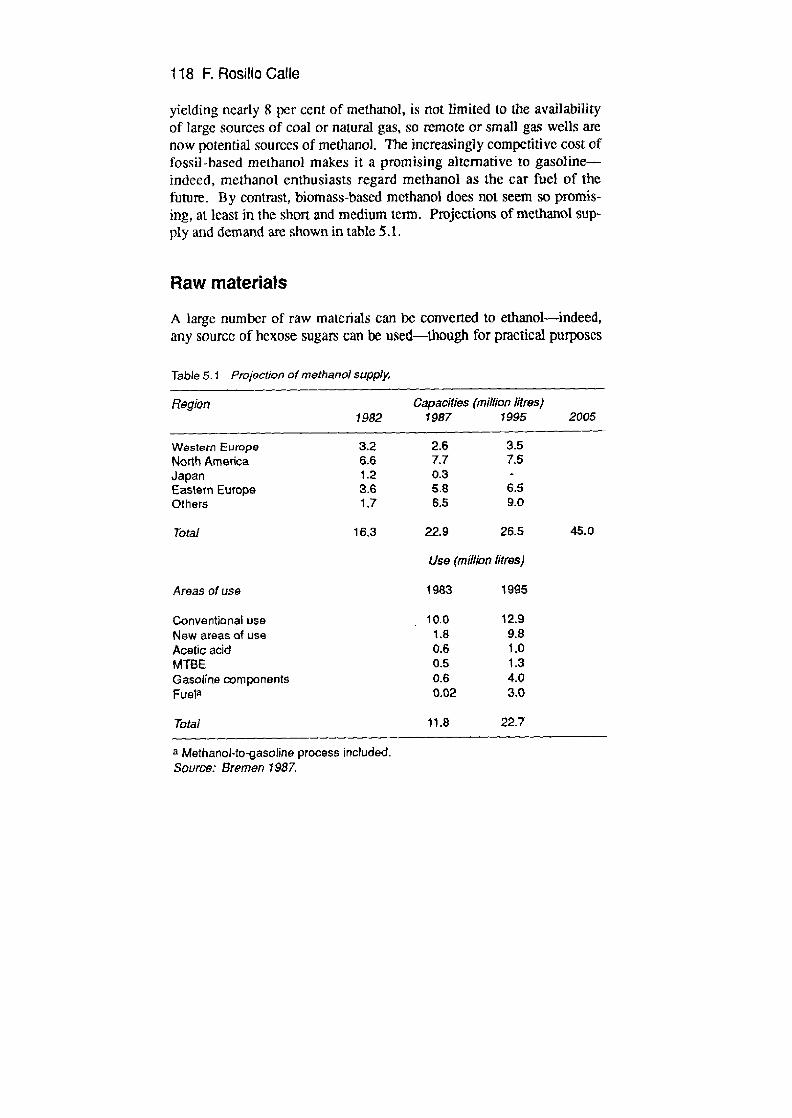
118 F. Rosfflo Cafle
yielding nearly 8 per cent of methanol, is not limited to the availability of large sources of coal or natural gas, so remote or small gas wells are now potential sources of methanol. The increasingly competitive cost of fossil-based methanol makes it a promising alternative to gasoline-indeed, methanol enthusiasts regard methanol as the car fuel of the future. By contrast, biomass-based methanol does not seem so promis-ing, at least in the short and medium term. Projections of methanol sup-ply and demand are shown in table 5.1.
Raw materials
A large number of raw materials can be convened to ethanol-indeed, any source of hexose sugars can be used-though for practical purposes
Table 5.1 Projection of methanol supply.
Region 1982
Capacities (mi/lion litres) 1987 1995 2005
Western Europe 3.2 2.6 3.5 t4orth America 6.6 7.7 7.5 Japan 1.2 0.3 -
Eastern Europe 3.6 5.8 6.5 Others 1.7 6.5 9.0
Total 16.3 22.9
26.5 45.0
Use ( nil/ion litres)
Areas of use 1983
1995
Conventional use 10.0
12.9 Now areas of use LB
9.8
Acetic acid 0.6
1.0 MTBE 0.5
1.3
(asoline components 0.6
4.0 Fuela 0,02
3.0
Total 11.8 22.7
a Methanol-to-gasoline process included. Source: Bremen 1987
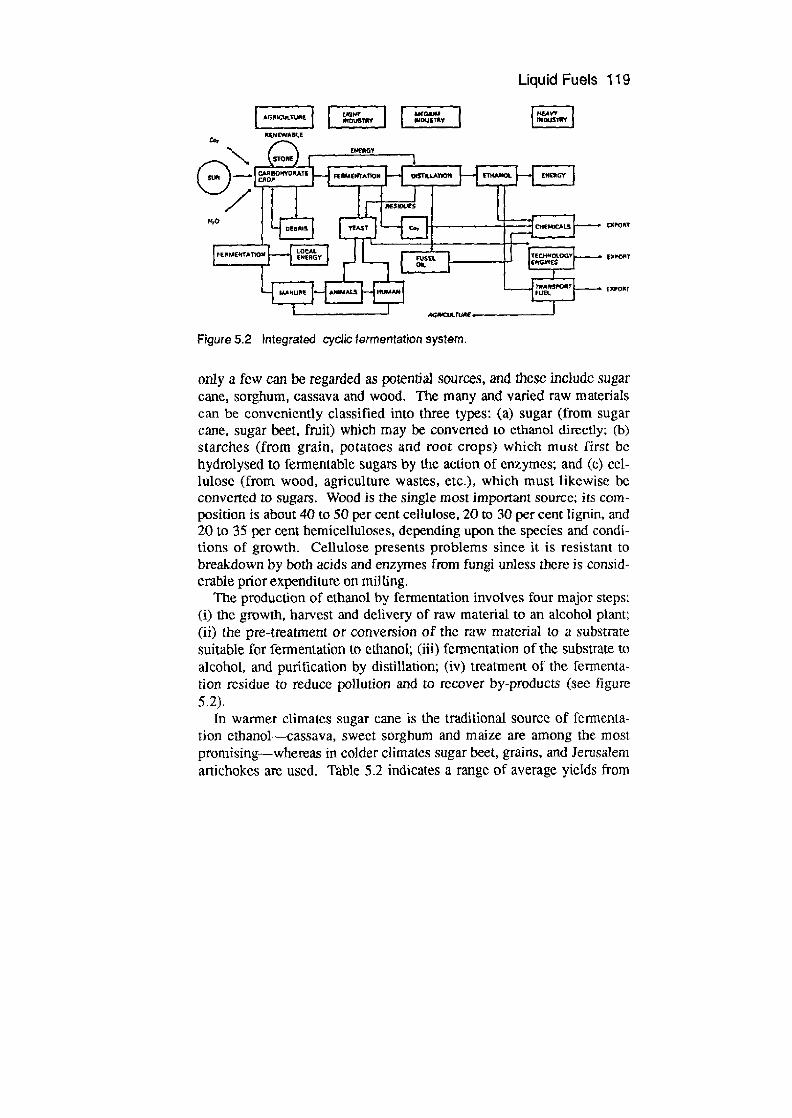
I RLN(WASU
- kOlYOPATC QP
IMENT*T%OM .___• I.00AL 1NERG
I I I I I .!_OIJTAV
I_FE*IA11QN}[ 51)UAThOM }_4T4øOL
PASMUES
VMT
I II ____ I o
Liquid Fuels 119
INQUZ1W
-LE1 EXPORT
fxror M*NtJI I'l ANAL3 I—.I II$4AN
Figure 5.2 Integrated cyclic fermentation system.
only a few can be regarded as potential sources, and these include sugar cane, sorghum, cassava and wood. The many and varied raw materials can be conveniently classified into three types: (a) sugar (from sugar cane, sugar beet, fruit) wthth may be converted to ethanol dircctiy; (b) starches (from grain, potatoes and root crops) which must first be hydrolysed to femientable sugars by the action of enzymes; and (c) cel-lulose (from wood, agriculture wastes, etc.), which must likewise be converted to sugars. Wood is the single most important source; its com-position is about 40 to 50 per cent cellulose, 20 to 30 per cent ligniri, and 20 to 35 per cent hemicelluloses, depending upon the species and condi-tions of growth. Cellulose presents problems since it is resistant to breakdown by both acids and enzymes from fungi unless there is consid-erable prior expenditure on milling.
The production of ethanol by fermentation involves four major steps: (1) the growth, harvest and delivery of raw material to an alcohol plant; (ii) the pre-treatment or conversion of the raw material to a substrate suitable for fermentation to ethanol; (iii) fermentation of the substrate to alcohol, and purification by distillation; (iv) treatment of the fermenta-tion residue to iduce pollution and to recover by-products (see figure 5.2).
In warmer climates sugar cane is the traditional source of fermenta-tion ethanol—cassava, sweet sorghum and maize are among the most promising—whereas in colder climates sugar beet, grains, and Jerusalem artichokes are used. Table 5.2 indicates a range of average yields from
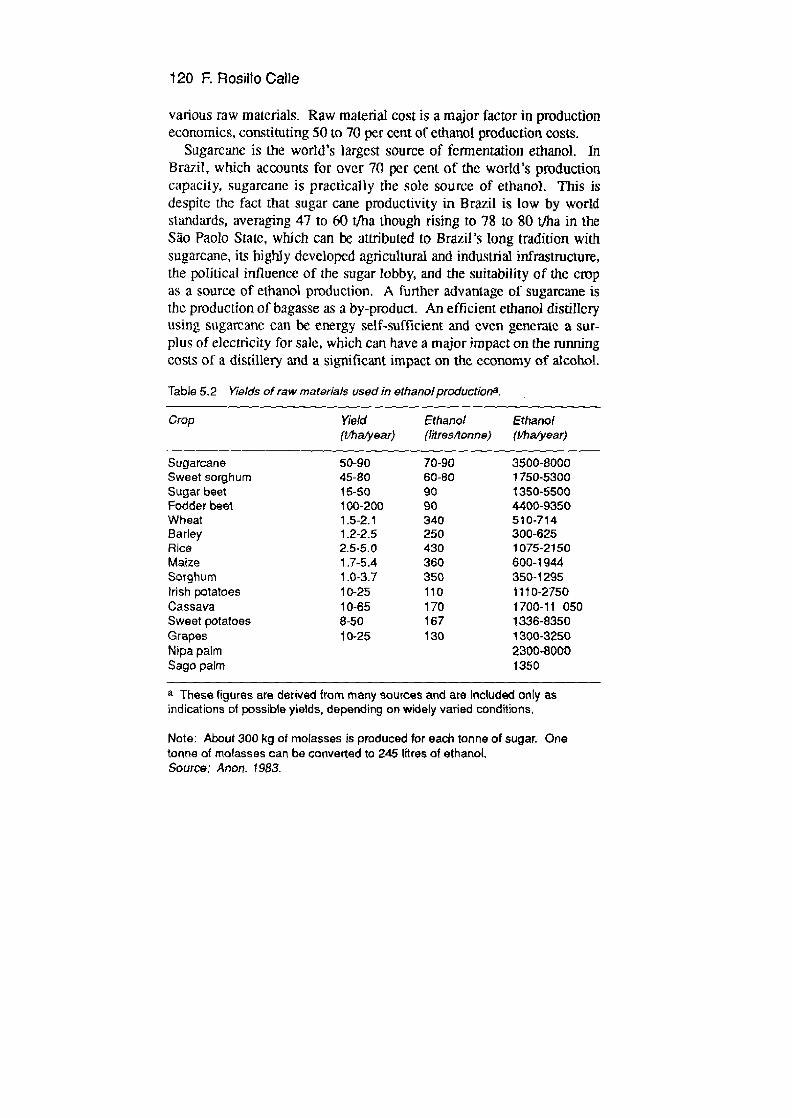
120 F. FRosiflo Calle
various raw materials. Raw material cost is a major factor in production economics, constituting 50 to 70 per cent of ethanol production costs.
Sugarcane is the world's largest source of fermentation ethanol. In Brazil, which accounts for over 70 per cent of the world's production capacity, sugarcane is practically the sole source of ethanol. This is despite the fact that sugar cane productivity in Brazil is low by world standards, averaging 47 to 60 tIha though rising to 78 to 80 tlha in the So Paolo State, which can be attributed to Brazil's long tradition with sugarcarie, its highly developed agricultural and industrial infrastructure, the political influence of the sugar lobby, and the suitability of the crop as a source of ethanol production. A further advantage of sugarcane is the production of bagasse as a by-product. An efficient ethanol distillery using sugareane can be energy self-sufficient and even generate a sur-plus of electricity for sale, which can have a major impact on the running costs of a distillery and a significant impact on the economy of alcohol.
Table 5.2 Yields of raw materials used in ethanol productions
Crop Yield (tMa')'ear)
Ethano( (Ji!res/lonne)
Ethanol (llhaiyear)
Sugarcane 50-90 70-90 3500-8000 Sweet sorghum 45-80 60-80 1750-5300 Sugar beet 15-50 90 1350-5500 Fodder beet 100-200 90 4400-9350 Wheat 1.5-2.1 340 510-714 Barley 1.2-2.5 250 300-625 Rice 2.5-5.0 430 1075-2150 Maize 1.7-5.4 360 600-1944 Sorghum 1.0-3.7 350 350-1295 irish potatoes 10-25 110 1110-2750 Cassava 10-65 170 1700-11 050 Sweet potatoes 8-50 167 1336-8350 Grapes 10-25 130 1300-3250 Nipa palm 2300-8000 Saga palm 1350
a These figures are derived from many sources and are included only as indications of possible yields, depending on widely varied conditions,
Note: About 300 kg of molasses is produced for each tonne of sugar. One tonno of molasses can be converted to 245 litres of ethanol. Source: Anon. 1983.
Liquid Fuels 121
There are in addition other economic by-products: in Brazil, the sugar-cane sector has been transformed into a multi-product industry compris-ing sugar production, alcohol, bagasse, electricity, animal feeds, CO2 and a range of chemical-based products.
Cassava also has great potential as a raw material for ethanol produc-tion in warm climates, once a number of agricultural and technical prob-lems have been overcome (these include low agricultural productivity, low efficiency and ethanol losses). In Brazil, cassava has so far failed to make any impact because of the lack of its use in large-scale industrial plants, low levels of productivity (around 12 to 14 t/ha), the adverse political influence of the sugarcane interests, and social problems stem-ming from the fact that it is a staple food and cultivated on small plots. An attempt to grow cassava on a large modem plantation in Curvelo (Minas Gerais) failed for a combination of technical, agricultural, and political reasons (Rosillo-Calle and Rotbman 1986). Another country which has produced ethanol from cassava in significant quantities, though not for fuels, is Thailand, which already produces 200 mIllion litres per year.
Sorghum is also regarded as a potential energy crop because of its short growing cycle of 3 to 4 months, and the fact that ethanol can be manufactured using basically the same equipment as is used for sugar-cane. It is currently grown on every continent for food production, for-age, fuel and a number of secondary products. Several types of sorghum are culcivated; it is an adaptable plant, responsive to genetic and cultural improvements (Monk and Kresovich 1987).
Environmental considerations
It is important to recognize that 'environment' means c1iffrent things to different people. Whereas environmental problems in the industrial nations primarily centre on the notion of pollution, environmental dis. ruption in developing countries means something quite different—popu-lation growth and urban migration, slums and sewage problems, lack of fresh clean water, and so on. Developing countries are generally so engrossed in such problems that they often cannot afford to pay attention to the long-term issues; there are, however, encouraging signs that this short-term perspective is starting to give way to a long-term environ-mental awareness. Even so, the creation of employment and the starting
122 F. RosiHo CaJie
of new industries are still usually the objectives given priority, and envi-ronmental implications are forced into second place. Unless environ-mental awareness is consciously encouraged, effective change and control measures will not occur. In addition, developing countries often do not have the infrastructure or the experience to assess adequately potential environmental risks. Because of the absence of both monitor -ing agencies and environmental standards and the lack of ecological awareness, the governments of many developing countries face many constraints. There is also an influential school of thought which consid-ers that environmentalism is an obstacle to economic development. This is particularly important in Brazil (a country which suffers severely from all these problems) where in the past two decades the authorities were chiefly concerned with building up the country's industrial base as rapidly as possible (and with as few safeguards as possible), leaving lit-tle room for environmental concern. This attitude was evident during the early days of the alcohol programme, when it was often regarded as more convenient to pollute with stillage than use it as a resource. Government officials have nearly always publicly argued that the worst pollution is poverty and rapid industrialization was the best answer.
The environmental impact of bomass production Biornass is potentially an energy source that produces significant envi-ronmental problems but which also yields some important environmental benefits. For a number of reasons, the wholesale expansion of bioenergy might cause serious environmental damage because of poorly managed feedstock supplies and inadequately controlled conversion technologies. It has been pointed Out by Morris and Grimshaw (see chapter 13) that biom ass energy plantations could cause significant changes to local, regional, and global climates, since, historically, agriculture has been the most important means of anthropogenically induced climate modifica-tion.
Some uncertainties also remain about the long-term effect of intensive biomass harvest on soil productivity. The potential damage from biomass energy development includes substantial increases in soil ero-sion and in the sedimentation of rivers and lakes, and subsequent dam-age to land and water resourccs; adverse effects on, or loss of, important ecosystems; local air and water pollution problems; and occupational hazards. Different biomass feecistocks have, none the less, sharply dif-
Liquid Fuels 123
Yerent tendencies to produce environmental damage; for example, sugar-cane can be grown for long periods without causing adverse effect on sod erosion, although it has been reported that in Australia losses of between 100 and 500 t/ha per year have occurred (Edwards 1988).
There are several ways to achieve significant reductions in the envi-ronmental problems associated with obtaining and converting the feed-stock to alcohol. These include legislation to protect the environment; the increased availability of information and technical assistance; and careful assessment of the possible effects of various kinds of biornass and of alternative environmental control strategies. Some adverse envi-ronmental effects of varying significance may still occur for a variety of reasons. Even with accepted management practices, significant environ-mental damage may be unavoidable if large areas of annual crops are grown for, say, alcohol production, However, a large proportion of the potential available biomass may be obtained with few adverse effects on the environment. It is not possible, on the basis of what is currently known, to assess accurately how the various positive and negative aspects will balance each other (Office of Technology Assessment 1980).
Soil erosion and its subsequent impact on land and water quality is another example of a possible major consequence of an expansion of intensive agricultural production of the kind needed for energy planta-tions. Serious soil erosion is occurring in most of the world's major agricultural regions, and the problem is growing as more marginal land is brought into production. Soil loss rates, generally ranging from 10 to 100 tfha per year on cultivated lands, are exceeding soil formation rates by at least ten times. World-wide degradation of agricultural land by erosion, salinization and waterlogging is causing the irretrievable loss of an estimated six million ha annually. In the USA, soil erosion and asso-ciated water runoff cost about US$43.5 billion annually in direct and indirect effects (Pimentel et al. 1987). Sustained soil erosion can dam-age not only land productivity but cause other additional problems such as the filling of reservoirs and lakes, and the transportation of pesticides. Intensively managed cropland would require greater quantities of chemi-cal fertilizers and pesticides. Depending on the specific situation, the large-scale production of alcohol from either grain or sugar crops may require large areas of land to be put under intensive cultivation.
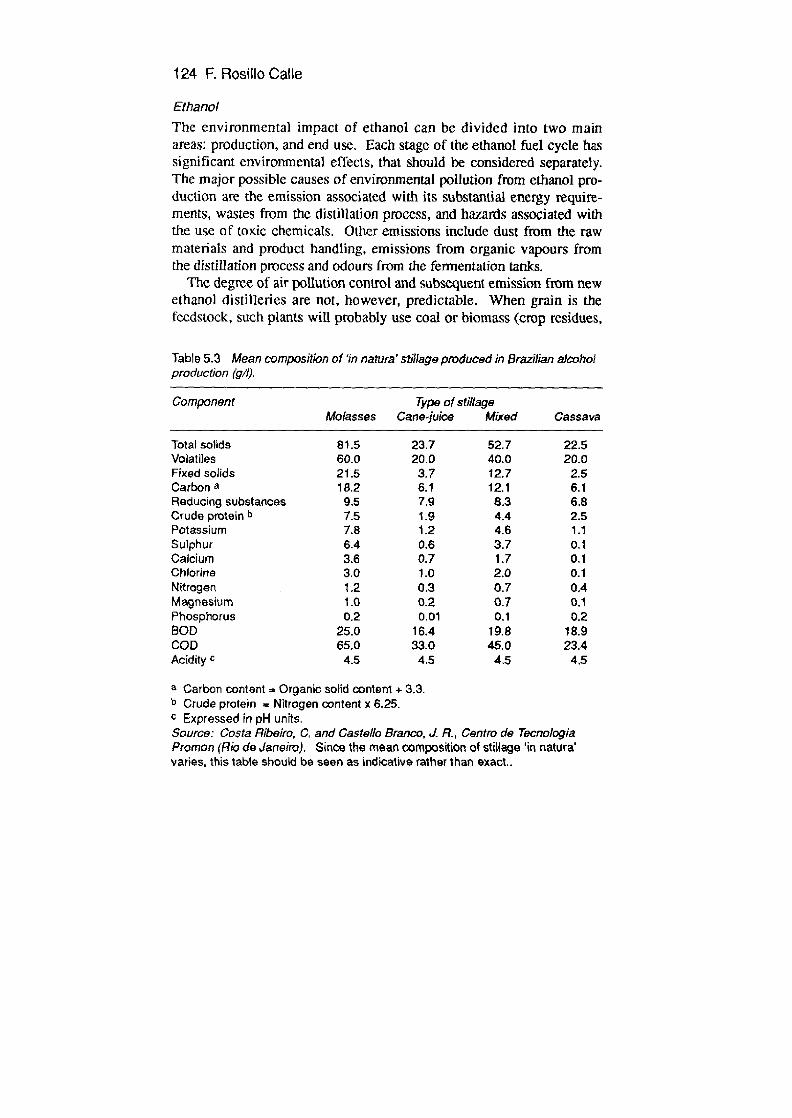
124 F. Rosillo Catle
EThanol The environmental impact of ethanol can be divided into two main areas: production, and end use. Each stage of the ethanol fuel cycle has significant environmental effects, that should be considered separately. The major possible causes of environmental pollution from ethanol pro-duction are the emission associated with its substantial energy require-ments, wastes from the distillation process, and hazards associated with the use of toxic chemicals. Other emissions include dust from the raw materials and product handling, emissions from organic vapours from the distillation process and odours from the femientation tanks.
The degree of air pollution control and subsequent emission from new ethanol distilleries are not, however, predictable. When grain is the feedstock, such plants will probably use coal or biomass (crop residues,
Table 5.3 Mean composition of 'in natura' stillage produced in 9raziIian alcohol production (g/l).
Component Mo (asses
Typo of sti/lage Cane.juice Mixed Cassava
Total solids 81.5 23.7 52.7 22.5 Volatiles 60.0 20.0 40.0 20.0 Fixed solids 21.5 3.7 12.7 2.5 Carbon a 18.2 6.1 12.1 6.1 Reducing substances 9.5 7.9 8.3 6.8 Crude protein b 7.5 1.9 4.4 2.5 Potassium 7.8 1.2 4.6 1.1 Sulphur 6.4 0.6 3.7 0.1 Calcium 3.6 0.7 1.7 0.1 Chlorine 3.0 1.0 2.0 0.1 Nitrogen 1.2 0.3 0.7 0,4 Magnesium 1,0 0.2 0.7 0.1 Phosphorus 0.2 0.01 0.1 0.2 SOD 25.0 16.4 19.8 18.9 COD 65.0 33.0 45.0 23.4 Acidity C 4.5 4.5 4.5 4.5
a Carbon content Organic solid conleni + 3.3. b Crude protein = Nitrogen content x 6.25. C Expressed in pH units. Source: Costa Ribeiro, C, and Casteio Branco, J. A., Centro de Teonologia Pro mon (Rio do ,Janeiro). Since the mean composition of stiUage 'in natura' varies, this table should be seen as indicative rather Ihan exact..
Liquid Fuels 125
wood) as fuel. In such cases the major source of any air pollution prob-lems will be particulate emission, and the same may apply to a certain extent when sugarcane bagasse is used as a fuel. Fortunately, most dis-tilleries are located in rural areas and this means that total popuJation exposure to any harmful pollutants is reduced. However, a variety of controls and design alternatives are available to reduce or eliminate adverse effects. Thus actual impacts will depend more on such factors as the design and operation of plants, and on relevant legislation, than on any inevitable problems with the production process, in contrast with many other polluting industries.
The by-products of ethanol production depend on the nature of the raw material, the harvest method, the type of pre-treatment, and the fer-mentation process. In turn the by-products can be regarded as a waste to be disposed of as a process fuel or as a saleable by-product. The value of by-products and the cost of waste disposal can have a major impact on the economics of ethanol production. The main by-products of ethanol production are 'stillage', carbon dioxide and fuel oils. 'Stillage' —the waste product from the first still (or 'beer still')—is the most important waste stream. It is a low-solids liquid waste having a high biological oxygen demand (BOD) and also a high chemical oxygen demand (COD). It also contains inorganic solids and other pollutants. Table 5.3 illustrates the mean composition of stillage from a Brazilian alcohol distillery.
Stillage and other wastes from ethanol plants can cause serious dam-age to aquatic ecosystems if they are mishandled; the high BOD and COD levels in the stillage could result in oxygen depletion in waters receiving the waste. Control technologies are available for reducing the impacts from these waste streams: biological treatment methods (such as activated sludge, biological filters and anaerobic digestion, and land dis-posal techniques used in the brewing industry are suitable for ethanol production, but controls for stillage from some crop materials still require further research and development work (Office of Technology Assessment 1980).
When maize is used, as in the USA, the stillage is the source of DDG (distillery grain), which is a valuable cattle feed essential to the eco-nomies of the process. DDG is recovered as an integral part of the plant operation and thus does not represent an environmental hazard. Sugarcane stillage, on the other hand, has lower economic potential as a
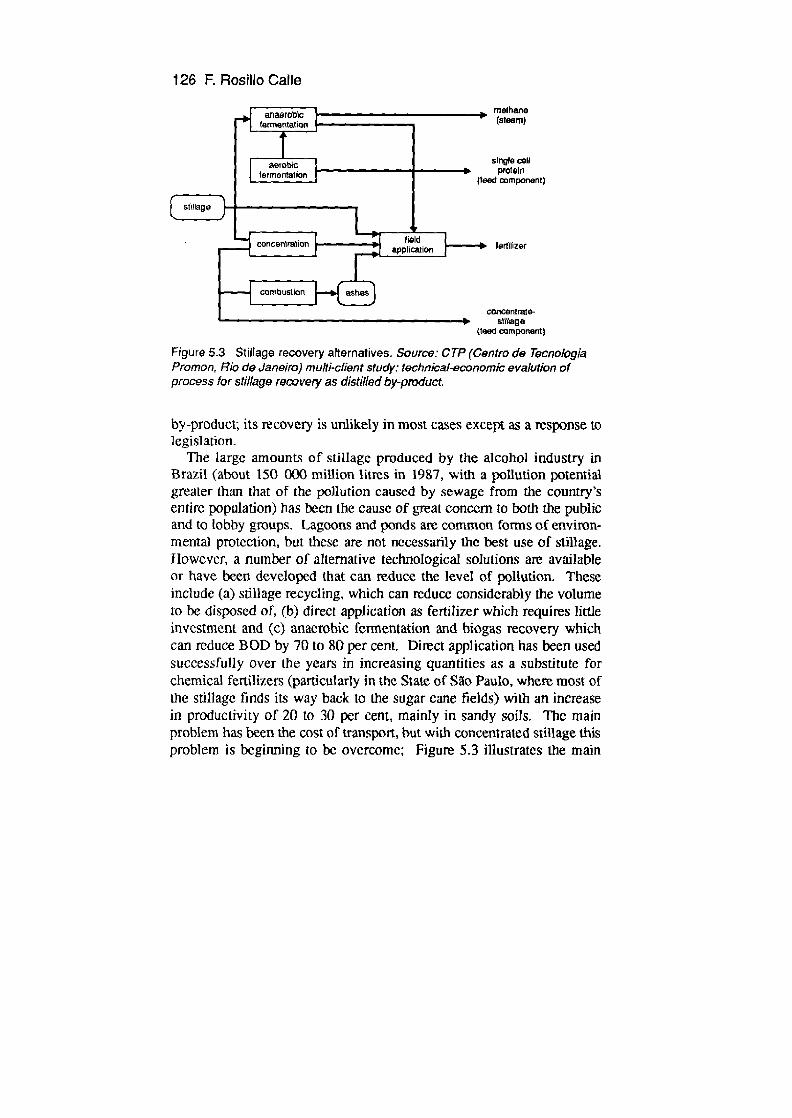
126 ERosUloCafle
methane termentatmn
--- I - .. protein :t-ro-I f.nIQCi-I- heed mponent)
slillage
_____________ field concenlretion F __.__Ei application j ________ fertilizer
combustion I—..l ashes
Concentrate- sluflage
(teed component
Figure 5.3 StiFage recovery alternatives. Source. CTP (Centro de Tecnologia Promon, Rio de Janeiro) mull/-client study: technical-economic eva/ut/on of process for stillage recoverj as distilled by-product
by-product; its recovery is unlikely in most cases except as a response to legislation.
The large amounts of stillage produced by the alcohol industry in Brazil (about 150 000 million litres in 1987, with a pollution potential greater than that of the pollution caused by sewage from the countrys entire population) has been the cause of great concern to both the public and to lobby groups. Lagoons and ponds are common forms of environ-mental protection, but these are not necessarily the best use of stillage. However, a number of alternative technological solutions are available or have been developed that can reduce the level of pollution. These include (a) stillage recycling, which can reduce considerably the volume to be disposed of, (b) direct application as fertilizer which requires little investment and (c) anaerobic fermentation and biogas recovery which can reduce BOD by 70 to 80 per cent. Direct application has been used successfully over the years in increasing quantities as a substitute for chemical fertilizers (particularly in the State of So Paulo, where most of the stillage finds its way back to the sugar cane fields) with an increase in productivity of 20 to 30 per cent, mainly in sandy soils. The main problem has been the cost of transport, but with concentrated still age this problem is beginning to be overcome; Figure 5.3 illustrates the main
LiqudFues 127
stillage recovery and utilization alternatives feasible under Brazilian conditions.
Of particular interest is the Biostil process, originally developed in Sweden by Alfa Laval in the mid-1970s and mainly directed at reducing the pollution effects of the molasses distilleries. Conventional distil-leries produced about ten times as much stillage as alcohol, which is a consequence of the need to limit final alcohol to 8 per cent. In the Biostil process alcohol is stripped off at the same rate as it is produced; it is the alcohol concentration and osmotic pressure which constitute the fundamental difference between Biostil and conventional systems.
Unfortunately, a proliferation of ethanol plants does not provide a favourable setting for the careful monitoring of environmental condi-tions, nor for enforcement of the environmental protection requirements, particularly in developing countncS. This problem is further compli-cated by the fact that many such plants may be located in remote rural areas where access is difficult.
Methanol Very little of the energy required for methanol production processes is supplied by external combustion sources. Most of the energy is obtained from the heat generated during gasification of the feedstock and from the final methanol synthesis step, and comparisons with similarly sized power plants used for ethanol distillation are irrelevant. The gasification process, the major source of pollutants, will generate a variety of com-pounds, such as hydrogen sulphate and cyanide, water, carbonyl sul-phate, tars, and oils containing a multitude of oxygenated organic compounds (such as organic acids, aldehydes, ketones), aromatic deriva-tives of benzine (such as phenols), and particulate matter (Office of Technology Assessment 1980).
The concentrations of most of these pollutants are dependent on pro-cess conditions, and improved control of the gasification process may be an important pollution control mechanism. As with low-output wood gasification, the air quality concerns of a biomass-to-meihanol plant focus on accidental leakage rather than stack emissions. The small con-centrations of toxic inorganic and organic compounds in the gas stream that forms in the gasifier will make raw gas leakage a substantial hazard. The water effluent may also require substantial control to avoid damage to water quality.

128 F. losiHo Calle
Environmental impacts of alcohols: end use
The use of alcohol fuels and gasoline-alcohol blends in automobiles will have a number of environmental impacts associated with changes in automotive emissions as well as differences in the toxicity and handling characteristics of the fuels. However, the effects of alcohol-gasoline blends on automobile emissions also depend on how the engine is tuned and whether or not it has a carburettor with feedback control. Because the emission changes are extime1y mixed (some pollutants increase and others decrease), it is difficult to assign either a beneficial or detrimental net pollution effect to these blends. In contrast to the rather ambiguous
Table 5A Emission changes (compared to gasoline) from use of alcohol fuels and blends.
Pollutant/fuel Methanol Meiha not/gasoline
Hydrocarbon or unburned fuels
Carbon monoxide
Nitrogen oXKles
Oxygenated compounds
Particutates
Other
About the same or slightly higher, but much less photochemIcaily reactive, and virtual elimination of PNAs; can be catalytically controlled
About the same, shghtiy tess for rich mixtures: can be catalytically controlled: pnmarity a function of -.
1/3 to 213 less at same A/I: ratio, can be lowered lurther by going very lean: can be controlled
Much higher akiehydes; particularly significant with precatalyst vehicles
Wtuafly none
No sulphur compounds, no 1-1CM or ammonia
May go up or down in unmodihed vehicles, unchanged when -. remains constant. Composition changes, though, and PNAs go down. Can be controlled. Higher evaporative emissions
essentially unchanged if - remains Constant, tower if 'leaning is allowed to occur
Mixed; decreases when -. is held constant, but may increase from fuel 'leaning' effect in unnmodifled vehicles
Aldehydes increase somewhat; most significant in precatalyst vehicles
Few data
Unknown
a = equivalence ratio cont.
Liquid Fuels 129
emission effects of the blends, the use of pure alcohols as gasoline sub-stitutes will have a generally positive effect on emissions.
Table 5.4 provides a summary of emission changes between gasoline and alcohols according to Office of Technology Assessment (OTA) experimental data. The most significant changes and their environmen-tal implications are (a) a substantial reduction in reactive HC and NO exhaust emissions when using 100 per cent methanol, and to a lesser extent when using ethanol; (b) an increase in aldthyde emissions with neat alcohol and blends; (c) a substantial reduction in particulate emis-sions if neat alcohol fuels are used; and (d) a substantial reduction in PNA (polynuclear aromatic) compounds with neat alcohols and blends (Office of Technology Assessment 1980). Recent Environmental Protection Agency (EPA) studies show that with vehicles designed and optimized specially for methanol use (high compression, lean combus-
Table 5.4 cont.
Poflutanf/(uel Ethanol Ethanob'gasoline 'gasoho4"
Hydrocarbon Not very many data, or unburned should be about the fuels same or higher but less
reactive. Expected reduc-tion in PNA
May go up or down in unmodified vehicles, about the same when 0 remains constant; composition may change, expected reckjction in PNAs. Evaporative emissions up
Carbon monoxide
Nitrogen oxides
Oxygenated compounds
Particulates
Other
About the same, can be controfled; primarily a function of 0
Lower, but not as low as with methanol; can be contrelled
Much higher aldehydes; particularly significant with precatalyst vehicles
Expected to be near zero
No sulphur compounds
Decrease in unmodified vehcles (i.e. leaning occurs); about the same when 0 remains constant
Slight effect, small decrease when 0 is held constant, but may increase or decrease further from fuel ieaning' effect in unmodified vehicles
Aldehydes increase; most significant in precatatyst vehicles
Few data, no significant change expected
No data
Source: Office of Technology Assessment 1980. equivalence ratio,
130 F. Rosiflo Calle
tion, advanced fuel injection, and emission control systems optimized for formaldehyde reductions), the potential reduction will be 50 to 90 per cent for CO. and an increase of 20 to 80 per cent in the case of NO. EPA's estimates for oxygenated blends are a reduction of 10 to 30 per cent of CO in the case of ethanol and methanol with 33 per cent oxygen. and 5 to 16 per cent in the case of MTBE with 2 per cent oxygen. There is an increase of NO in all cases. These are per vehicle estimates and appear as comparisons to gasoline-fuelled vehicles meeting current EPA standards on emissions (Anon I 987b).
Imponant changes in fuel content are already under way in various states in the USA: for example, Colorado passed a law making manda-tory the winter time use of high oxygen gasoline from 1 January 1988. The programme is aimed at reducing CO levels. California has about 700 methanol-fuelled vehicles in use, and plans to replace 30 per cent of its current gasoline consumption with methanol by the year 2000. The California Energy Commission (CEC) maintains that the net ozone for -mation from methanol emission is about 50 per cent less than from gaso-line (Miskell 1988).
Hydrocarbon emissions from gasoline consist of the original hydro-carbon fuel components, which may number over 200, along with oxy-genated species (aldehydes, ketones), PNA and hydrogen cyanide (HCN). Some of the hydrocarbon species are extremely toxic and car -cinogenic (PNAs), while some are very active in the formation of photo-chemical smog. Devices to reduce HC emissions include oxidation catalysts and thermal exhaust reactor-s.
Hydrocarbon emissions from methanol-fuelled engines are not true hydrocarbon species. Instead, about 99 per Cent of the unburned fuel emissions are methanol with a small amount of methane, ethylene, and acetylene. CO emissions from methanol are primarily a function of equivalence ratio as they are for gasoline; methanol emits the same amount as gasoline for lean mixtures and slightly less for rich mixtures. NO emissions from methanol are only one-third to two-thirds of those from gasoline at the same equivalence ratio.
Methanol-gasoline blends could lead to both short- and long-term increases in evaporative emissions. Methanol can be blended with gaso-line in two different ways: (a) it can be added at the refinery and the volatility characteristics of the final product adjusted so they are not sig-nificanily different from those of typical gasoline; (b) on the other hand, considerably different volatility characteristics and higher vapour gener-
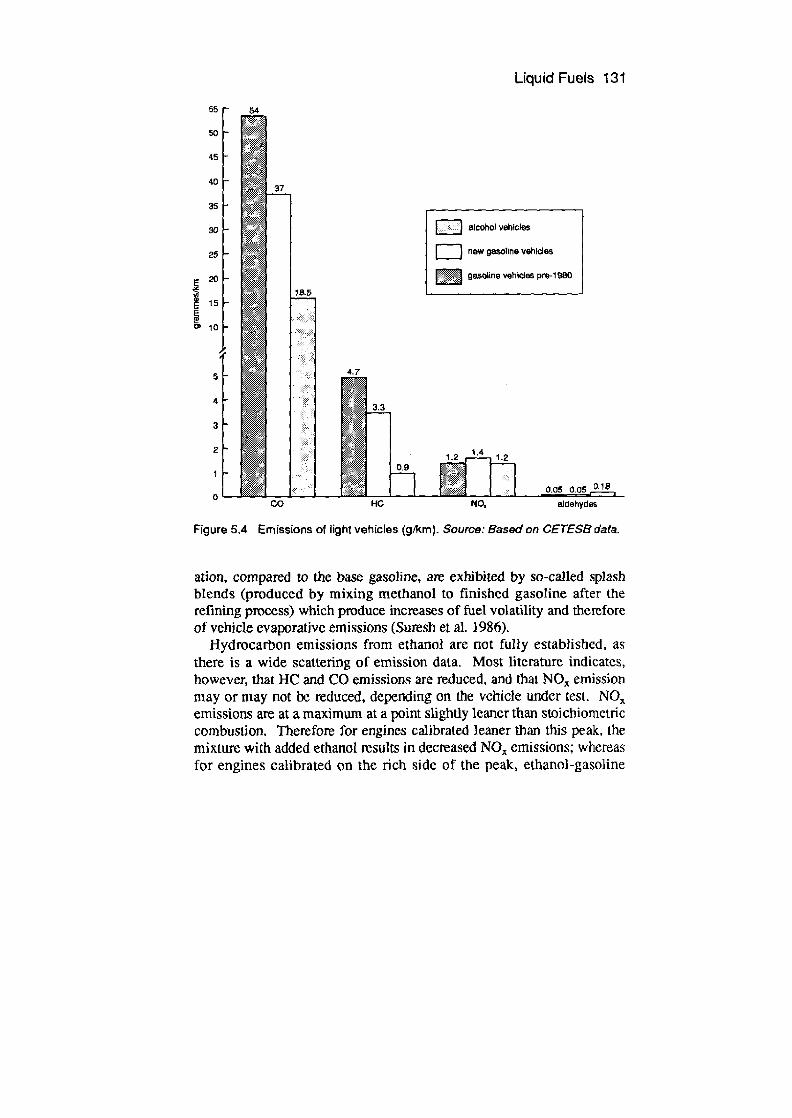
Liquid Fue's 131
55
50
45
2 1.2 L2
0-18 Lih [Till CO HC NO, adehydes
Figure 5.4 Emissions of light vehicles (g/km). Source: Based on CETESB oata.
ation, compared to the base gasoline, are exhibited by so-called splash blends (produced by mixing methanol to finished gasoline after the refining process) which produce increases of fuel volatility and therefore of vehicle evaporative emissions (Suresh et al. 1986).
Hydrocarbon emissions from ethanol are not fully established, as there is a wide scattering of emission data. Most literature indicates, however, that HC and CO emissions are reduced, and that NO emission may or may not be reduced, depending on the vehicle under test. NO emissions are at a maximum at a point slightly leaner than stoictiiometric combustion. Therefore for engines calibrated leaner than this peak, the mixture with added ethanol results in decreased NO emissions; whereas for engines calibrated on the rich side of the peak, ethanol-gasoline
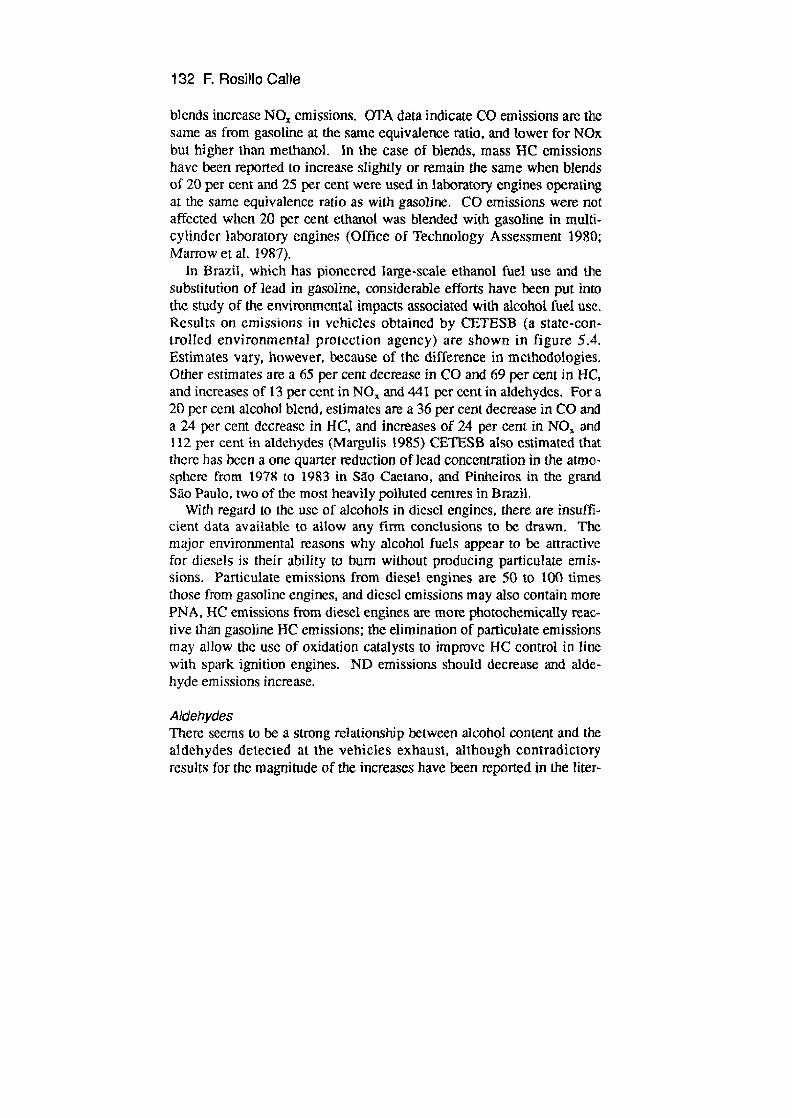
132 F. Rosfllo Cafle
blends increase NO emissions. OTA data indicate CO emissions are the same as from gasoline at the same equivalence ratio, and lower for NOx but higher than methanol. In the case of blends, mass HC emissions have been reported to increase slightly or remain the same when blends of 20 per cent and 25 per cent were used in laboratory engines operating at the same equivalence ratio as with gasoline. CO emissions were not affected when 20 per cent ethanol was blended with gasoline in multi-cylinder laboratory engines (Office of Technology Assessment 1980; Marrowetal. 1987).
In Brazil, which has pioneered large-scale ethanol fuel use and the substitution of lead in gasoline, considerable efforts have been put into the study of the environmental impacts associated with alcohol fuel use. Results on emissions in vehicles obtained by CETESB (a state-con-trolled environmental protection agency) are shown in figure 5.4. Estimates vary, however, because of the difference in methodologies. Other estimates are a 65 per cent decrease in CO and 69 per cent in HC, and increases of 13 per cent in NO and 441 per cent in aldehydes. For a 20 per cent alcohol blend, estimates are a 36 per cent decrease in CO and a 24 per cent decrease in HC, and increases of 24 per cent in NO and 112 per cent in aldehydes (Margulis 1985) CETESB also estimated that there has been a one quarter reduction of lead concentration in the atmo-sphere from 1978 to 1983 in So Caetano, and Pinheiros in the grand So Paulo, two of the most heavily polluted centres in Brazil.
With regard to the use of alcohols in diesel engines, there are insuffi-cient data available to allow any firm conclusions to be drawn, The major environmental reasons why alcohol fuels appear to be attractive for diesels is their ability to burn without producing particulate emis-sions. Particulate emissions from diesel engines are 50 to 100 times those from gasoline engines, and diesel emissions may also contain more PNA, HC emissions from diesel engines are more photochemicalty reac-tive than gasoline HC emissions; the elimination of particulate emissions may allow the use of oxidation catalysts to improve HC control in line with spark ignition engines. ND emissions should decrease and aide-hyde emissions increase.
Aldehydes There seems to be a strong relationship between alcohol content and the aldehydes detected at the vehicles exhaust, although contradictory results for the magnitude of the increases have been reported in the liter-
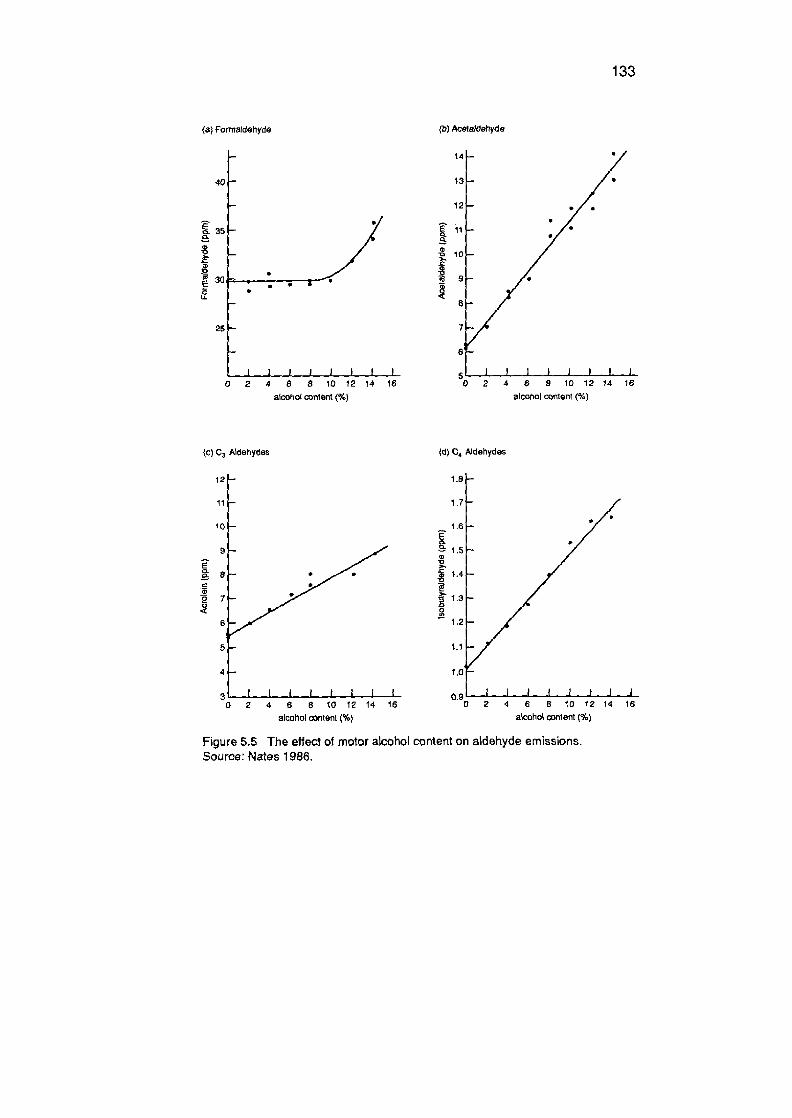
133
a) Formdehyde Cb Ace1akehye
II
CL
30
25
E
I
0 2 4 6 8 10 12 14 16
alcohol content (%)
O 2 4 6 8 10 12 14 16
alcohol content (%)
(c) C AdehydeS (d) 04 PJdhyd9s
12
11
10
9
E 0- 8 C
07
6
5
4
31 1 1 L L 1
0 2 4 6 8 10 12 14 16 0 2 4 6 6 19 12 14 16
alcohol content (%) alcoho content (%)
Figure 5.5 The effect of motor alcohol content on aldehyde emissions. Source: Nates 1986.
E 0-
ii

134 F. Rosiflo CaHe
ature. Experimental data indicate, in some cases, an extremely high increase in the level of aldehydes. Although CO and }IC are more seri-ous pollutants than aldehydes, because of the strong alcohol-aldehyde relationship, further attention is merited. Figire 5.5 illustrates this rela-tionship: (5a) shows that formaldehyde remained unaffected by the addi-tion of alcohol to gasoline until a blend of 8 per cent was reached, after which point a signilicant increase was observed, the result of the oxida-tion of the relatively high content concentration of higher aldehydes; (Sb) shows that the aldehyde emissions are directly proportional to the alcohol contents of the fuel; (Sc) illustrates the direct relationship between C aldehydes and the alcohol content of the fuel, and (5d) shows the linear relationship between C 4 aldehydes and the alcohol con-tent of the fuel.
These data indicate that under urban driving conditions, a methanol-fuelled vehicle produces over six times as much formaldehyde as one running on neat gasoline. A blend containing 10 per cent methanol would result in an 81 per cent increase in aldehydes, 10 per cent ethanol causes an increase of over 200 per cent in the aldehyde emissions together with an increase in other aldehydes, the most severe case seems to be a blend of higher alcohols (Nates 1986).
Health and safuty considerations The use of alcohol fuels in motor vehicles requires the consideration of many safety aspects, including those relating to potential flammability, fire and explosion hazards, and health hazards. It has been recognized that flammable mixtures of air and neat alcohols can exist in fuel tanks at normal ambient temperatures, in contrast to the case of gasoline where the vapour to air ratio is generally too rich to permit ignition. For methanol-fuelled cars, Ford Motors, for example, recommend that 15 per cent gasoline containing 40 per cent aromatics be added to the methanol, not only to improve cold starling but also to reduce the flammability, to limit the vapours in the vehicle fuel tanks, and to improve flame lurni-riosity. The use of various fire-fighting foams has been evaluated in Sweden for a variety of solvents and fuels in large-scale trials; aqueous film-forming foams gave the best results with polar solvents (Piquette et al. 1986).
Overall there does not appear to be any major factor which suggests that alcohol fuels are inherently unsafe to use. There are no special
liquid Fuels 135
safety requirements associated with the use of low-level methanol blends with gasoline. With high level methanol blends, several safety aspects merit further consideraftons concerning fuel tanks which could maintain explosive vapours, and fuel leakage on to hot manifolds that may create additional hazards to those associated with the use of gasoline only. However, no special fire-fighting requirements appear to be required with respect to fires involving low-level methanol blends.
Much work has also been done on the health aspects of alcohol fuels, the results being generally more favourable to alcohols than to gasoline. Methanol hazards are more pronounced than those from ethanol. Methanol is a toxic substance that can enter the body through ingestion, inhalation, or by absorption through the skin; it produces both acute and chronic effects on the human body, and has a long history of causing serious health problems. Ethanol effects are not so serious, but it too is absorbed directly into the blood and is then distributed almost uniformly in the body. The greatest effect is on the brain: levels exceeding 5 mg per ml of blood can cause death (Mill and Ecklund 3987; Massad et al. 1986).
Thus far, only formaldehyde is of special concern since more of it is produced by alcohol-fuelled engines. Recently, however, a Toyota car, using methanol fuel in a new lean-bum engine with a modified exhaust catalyst, has been tested by the California Air Resources Boaixl and was found to emit no more formaldehyde than gasoline-powered cars (Miskell 1988). Formaldehyde is the dominant aldehyde in motor vehi-cle exhaust gases, although ethanol use results in acetaldehyde emis-sions; it is an irritant to the eye, nose, throat, and respiratory tract, but it is unstable in air and decomposes rapidly so that its effects are localized.
Overall, the toxic effects of methanol and ethanol are judged to be less hazardous than those of gasoline and gasoline components. Alcohol fuels also appear to be less toxic than oil in the initial acute phase of spills and seem to have fewer long-term effects. Alcohols are extremely bio-degradable and any toxic effects may be eliminated in hours, whereas the effects of fuel oils can last for years.
Main alcohol fuel programmes
Global interest in alcohol fuels has increased considerably over the last decade. A number of countries are pioneering both large and small-scale
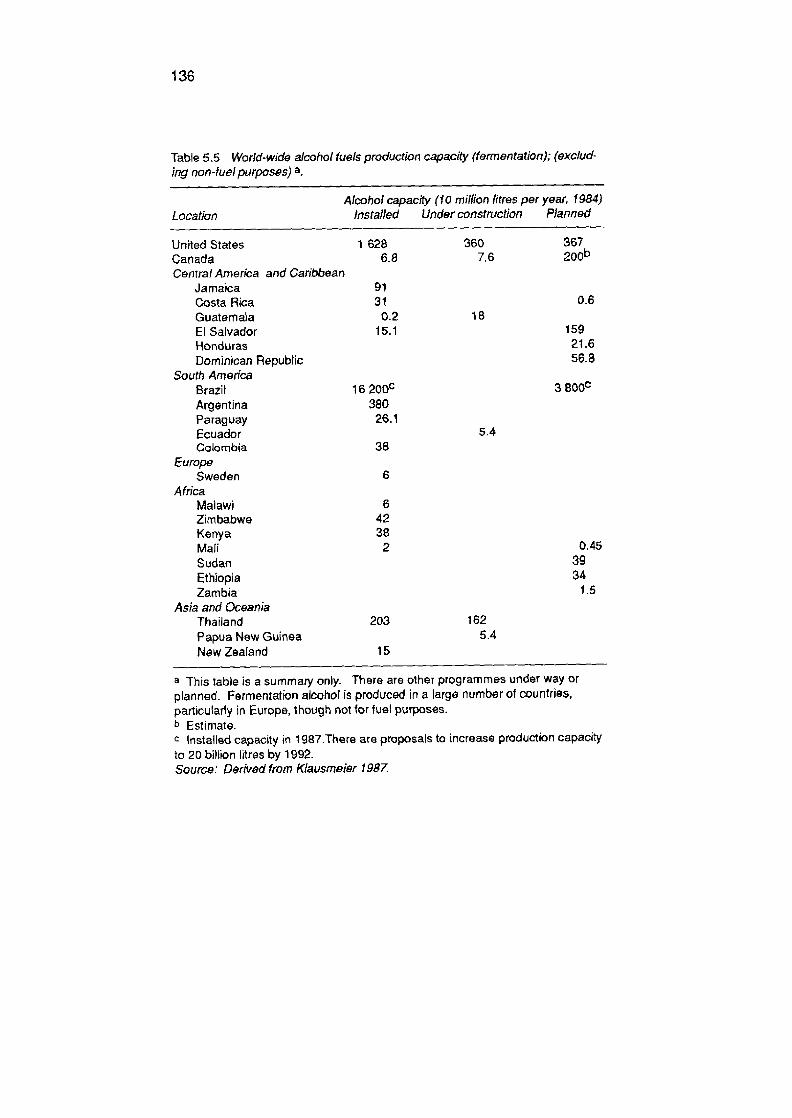
136
Table 5.5 World-wide alcohol fuels production capacity (fermentation); (exclud-ing non-fuel purposes) a
Location Alcohol capacity (10 million litres per year, 1984)
Installed Under construction Planned
United States 1 828 360 367 Canada 6.8 7.6 200b
Central America and Caribbean Jamaica 91 Costa Rca 31 0.6 Guatemala 0.2 18 El Salvador 15.1 159 Honduras 21.6 Dominican Republic 56.8
South Amenca Brazil 16200° 3800c
Argentina 380 Paraguay 26.1 Ecuador 5.4 Colombia 38
Europe Sweden 6
Africa Malawi 6 Zimbabwe 42 Kenya 38 Mali 2 0.45 Sudan 39 Ethiopia 34 Zambia 1.5
Asia and Oceania Thailand 203 162 Papua New Guinea 5.4 New Zealand 15
a This table is a summary only. There are other programmes under way or planned. Fermentation alcohol is produced in a large number of countries, particular'y in Europe, though not for fuel purposes. b Estimate.
installed capacity in 1987.There are proposals to increase production capacity to 20 billion litres by 1992. Source: Derived from Klausmeier 1987.
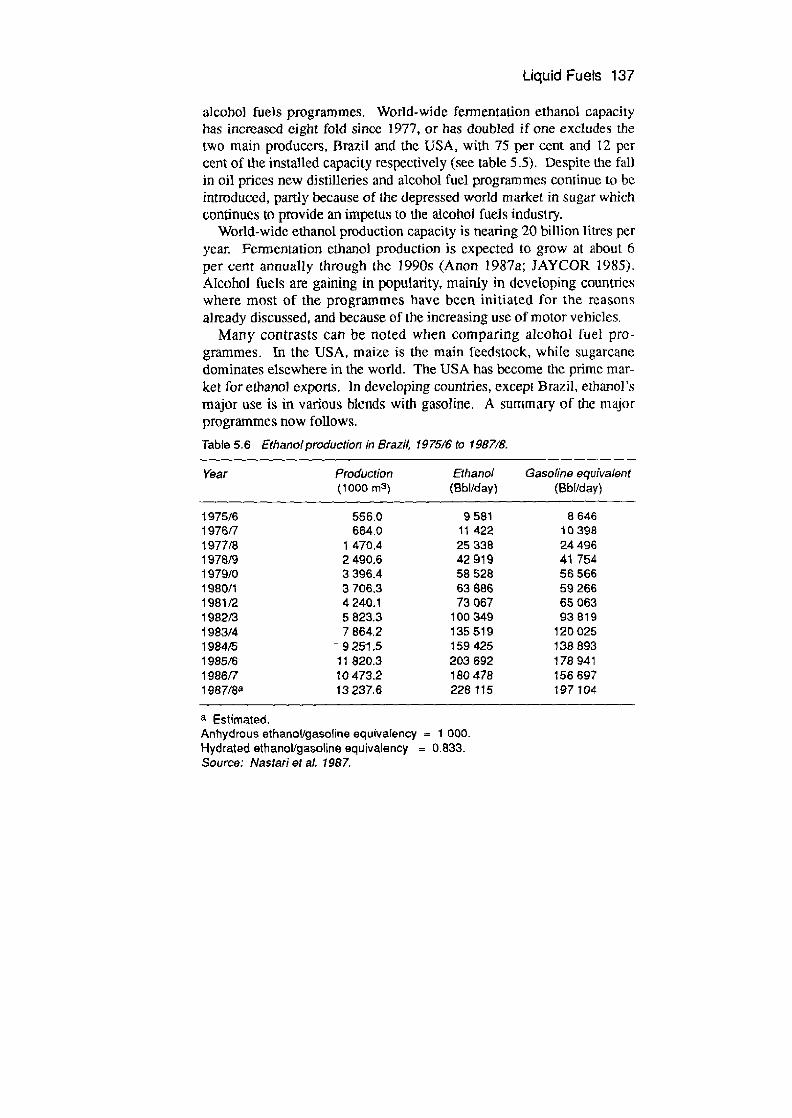
Liquid Fuels 137
alcohol fuels programmes. World-wide fermentation ethanol capacity has increased eight fold since 1977, or has doubled if one excludes the two main producers, Brazil and the USA, with 75 per cent and 12 per cent of the installed capacity respectively (see table 5.5). Despite the fall in oil prices new distilleries and alcohol fuel programmes Continue to be introduced, partly because of the depressed world market in sugar which continues to provide an impetus to the alcohol fuels industry.
World-wide ethanol production capacity is nearing 20 billion litres per year. Fermentation ethanol production is expected to grow at about 6 per Cent annually through the 1990s (Anon 1987a; JAYCOR 1985). Alcohol fuels are gaining in popularity, mainly in developing countries where most of the programmes have been initiated for the reasons already discussed, and because of the increasing use of motor vehicles.
Many contrasts can be noted when comparing alcohol fuel pro -grammes. In the USA, maize is the main feedstock, whiTe sugarcane dominates elsewhere in the world. The USA has become the prime mar-ket for ethanol exports. In developing countries, except Brazil, ethanol's major use is in various blends with gasoline. A summary of the major programmes now follows. Table 5.6 Ethanol production in Brazil, 197516 to 198718.
Year Production Ethanol Gasoline equivalent (1000 m3 ) (Bbl/day) (Bbi/day)
1975/6 556.0 9581 8646 1976,7 664.0 11422 10398 197718 1 470.4 25 338 24 496 1978/9 2490.6 42 919 41 754 1979/0 3396.4 58528 56566 1980/1 3706.3 63886 59266 1981/2 4240.1 73067 65063 198213 5823.3 100349 93819 1983/4 7864.2 135519 120025 1984/5 - 9251.5 - - 159425 138893 1985/6 11820.3 203692 178941 198617 10473.2 180478 156697 1987/8a 13237.6 228115 197104
a Estimated. Anhydrous ethanol/gasoline equivalency = 1 000. Hyd rated ethanol/gasoline equivalency 0.833. Source: Nastari et al. 1987.
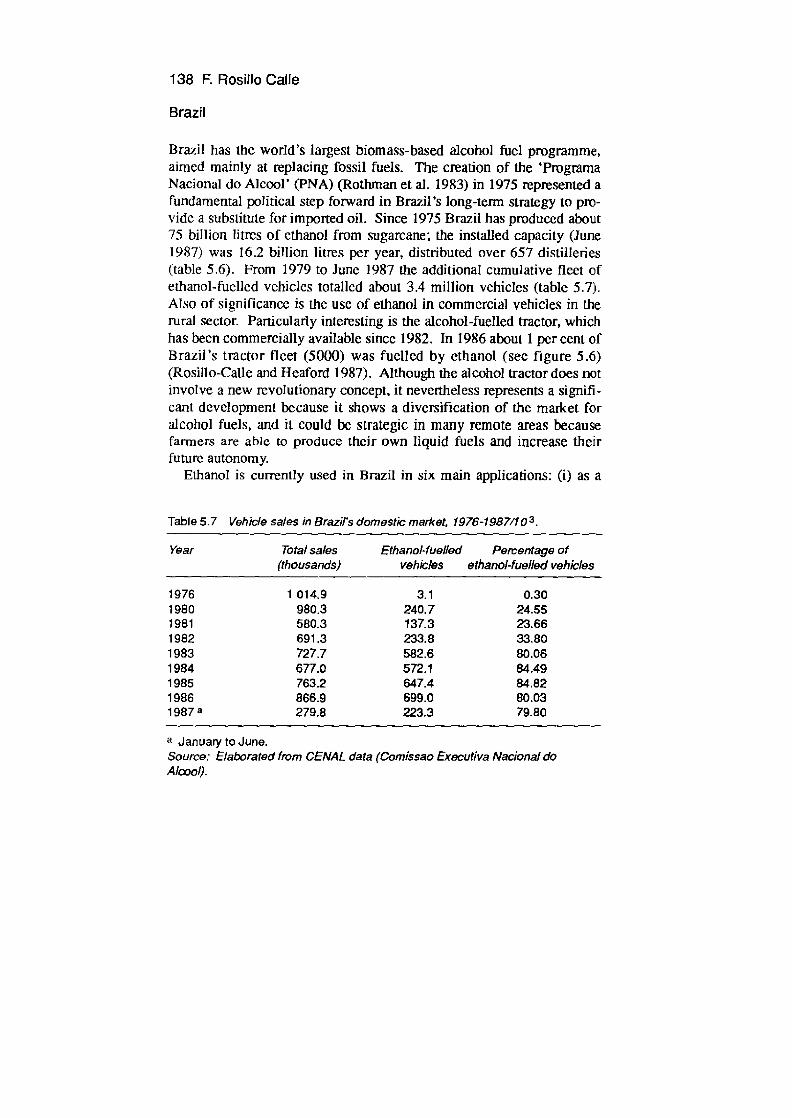
138 F. Rosillo Calle
BrazU
Brazil has the world's largest biomass-based alcohol fuel programme, aimed mainly at replacing fossil fuels. The creation of the 'Programa Nacional do Alcool' (PNA) (Rothman et al. 1983) in 1975 represented a fundamental political step forward in Brazil's long-term strategy to pro-vide a substitute for imported oil. Since 1975 Brazil has produced about 75 billion litres of ethanol from sugarcane; the installed capacity (June 1987) was 16.2 billion litres per year, distributed over 657 distilleries (table 5.6). From 1979 to June 1987 the additional cumulative fleet of ethanol-fuelled vehicles totalled about 3.4 million vehicles (table 5.7). Also of significance is the use of ethanol in commercial vehicles in the rural sector. Particularly interesting is the alcohol-fuelled tractor, which has been commercially available since 1982. In 1986 about I per cent of Brazil's tractor fleet (5000) was fuelled by ethanol (see figure 5.6) (Rosillo-Calle and Heaford 1987). Although the alcohol tractor does not involve a new revolutionary concept, it nevertheless represents a signifi-cant development because it shows a diversification of the market for alcohol fuels, and it could be strategic in many remote areas because farmers are able to produce their own liquid fuels and increase their future autonomy.
Ethanol is currently used in Brazil in six main applications: (1) as a
Table 5.7 Vehicle sales in Brazil's domestic market, 1976-1987110.
Year Total sales Ethanol-fuelled Percentage of (thousands) vehicles ethanol-fuelled vehicles
1976 1 014.9 3.1 0.30 1980 980.3 240.7 24.55 1981 580.3 137.3 23.66 1982 691.3 233.8 33.80 1983 727.7 582.6 80.06 1984 677.0 572.1 84.49 1985 7632 647.4 84.82 1986 866.9 699.0 80.03 1987 a 279.8 223.3 79.80
a January to June. Source: Elaborated from CENAL data (Comissao Executiva Nacionaf do Alcool).
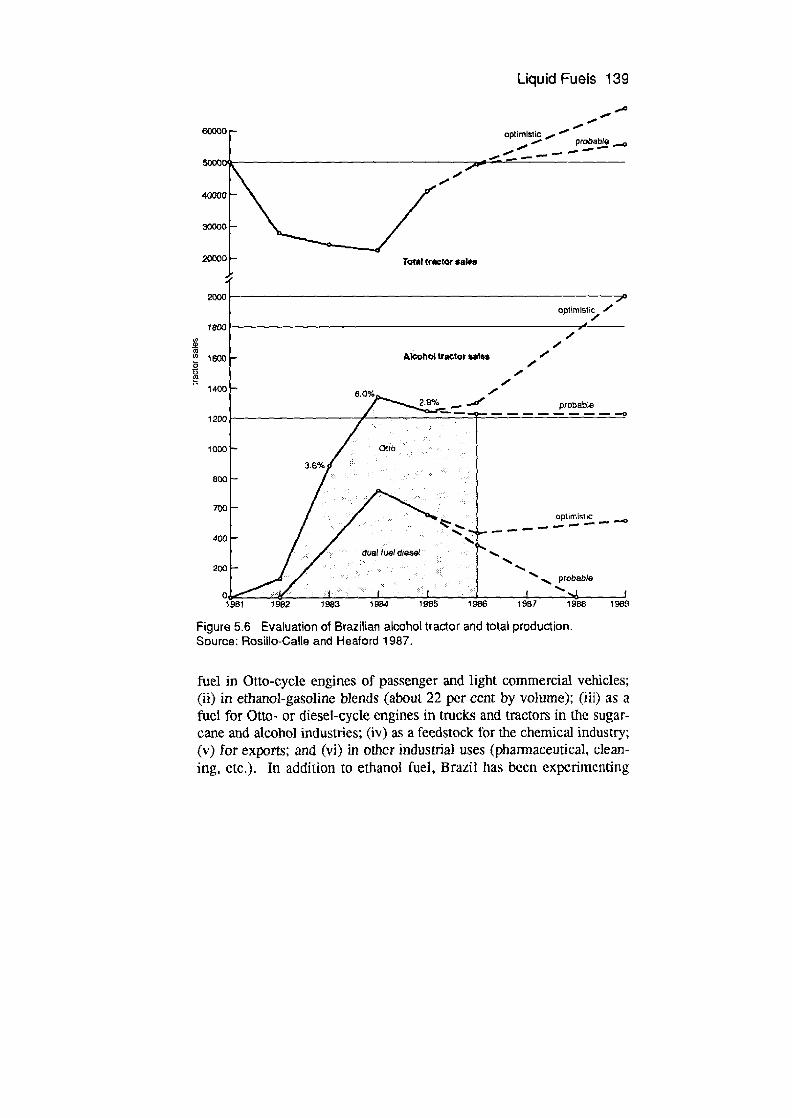
Liquid Fue's 139
— - — - optimistic - — — probable -
- - — — —
0 - Total tractor 5&e
- optmistic / ,
, Alcohol tractor satas /
/
0 60% — pf0babe
0 1
- O Otto
3.6%
0 L — - — — — —
: duat tua dlas
/ proaie
1981 1982 1983 1984 1985 1986 1987 1988 198
Figure 5.6 Evaluation of Brazilian alcohol tractor and total production. Source: Rosillo-Calle and Heaford 1987.
fuel in Otto-cycle engines of passenger and light commercial vehicles; (ii) in ethanol-gasoline blends (about 22 per cent by volume); (iii) as a fuel for Otto- or diesel-cycle engines in trucks and tractors in the sugar-cane and alcohol industries; (iv) as a feedstock for the chemical industry; (v) for exports; and (vi) in other industrial uses (pharmaceutical, clean-ing, etc.). In addition to ethanol fuel, Brazil has been experimenting
6000
5000
4000
3000
2000
200
180
0 160
0 1) 0
140
120
100
80
70
40
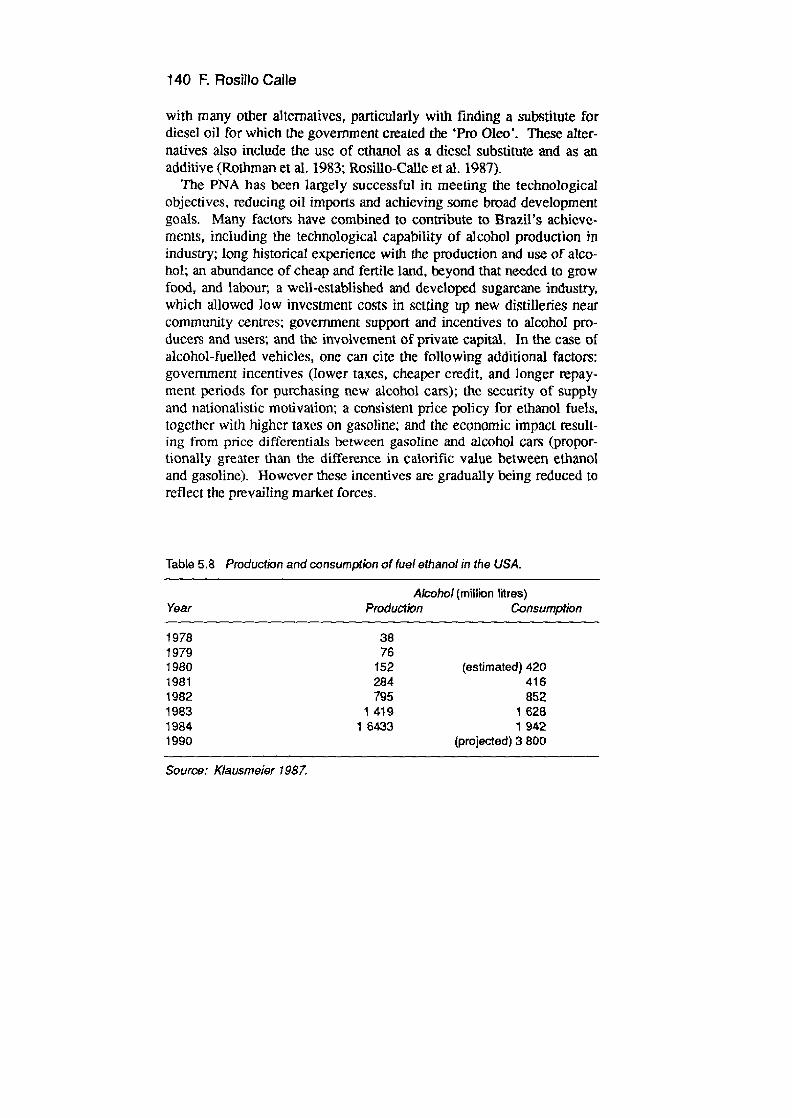
140 F. Rosillo CaUe
with many other alternatives, particularly with finding a substitute for diesel oil for which the government created the Pro Olco'. These alter -natives also include the use of ethanol as a diesel substitute and as an additive (Rothman et aL 1983; Rosillo-Calle et al. 1987).
The PNA has been largely successful in meeting the technological objectives, reducing oil imports and achieving some broad development goals. Many factors have combined to contribute to Brazil's achieve-ments, including the technological capability of alcohol production in industry; long historical experience with the production and use of alco-[iot; an abundance of cheap and fertile land, beyond that needed to grow food, and labour, a well-established and developed sugarcane industry, which allowed low investment costs in setting up new distilleries near community centres; government support and incentives to alcohol pro-ducers and users; and the involvement of private capital. In the case of alcohol-fuelled vehicles, one can cite the following additional factors: government incentives (lower taxes, cheaper credit, and longer repay-ment periods for purchasing new alcohol cars); the security of supply and nationalistic motivation; a consistent price policy for ethanol fuels, together with higher taxes on gasoline; and the economic impact result-ing from price differentials between gasoline and alcohol cars (propor-tionally greater than the difference in calorific value between ethano' and gasoline). However these incentives are gradually being reduced to reflect the prevailing market forces.
Table 5.8 Production and consumption of fuel ethanol in the USA.
Alcohol (million i1res) Year Production Consumption
1978 38 1979 76 1980 152 (estimated) 420 1981 284 416 1982 795 852 1983 1419 1628 1984 1 6433 1942 1990 (projected) 3 800
Source: K/ausmeier 1987.
Liquid Fuels 141
USA
The passage of the Energy Act of 1978 announced the political birth of fuel alcohol in the USA. The Act provided economic incentives for the production of liquid fuels from solid fossil fuels and renewable energy sources, and was further consolidated by the Windfall Tax Act of 1980 which included the temporary gasoline tax exception up until 1992, and offered further encouragement to prospective producers. The key incen-tive was exception from the Federal Motor Excise Tax of $0.04 per gal-lon, which for a 10 per cent ethanol in gasoline blend amounted to $0.40 per gallon of ethanol (Schwandt 1984). Ethanol production in 1986 ben-efited from a $0.60 per gallon Federal Tax Subsidy, and subsidies from some 30 states ranging from $0.10 to $1.40 per gallon (Grrnnell 1987).
The US ethanol industry has evolved rapidly (see table 5.8); in 1986 about 3.5 billion litres were consumed displacing 26.8 million barrels of cmde oil. If all gasoline used in the USA in 1990 was required to con-tain 10 per cent ethanol about 32 billion litres would be needed. Ethanol has gained recognition as an effective octane enhancer rather than merely as an extender for gasoline, and this has became the principal market for fermentation ethanol, it appears that this market will stabilize at about 3 to 4 billion litres per year. The EPA's ruling that lead in gaso-line must be reduced from 0.29 g/l to 0.03 g/l from 1986 stimulated the demand for an alternative octane enhancer (Anon 1987b; Klausmeier 1987).
Some critics see the ethanol industry as being unable to survive through to 1995 without very large government subsidies, unless a world oil market disturbance causes a sharp jump in oil prices. If federal subsi-dies are not extended, US fuel ethanol production will be sharply cur-tailed after 1993. Ethanol production is not an efficient use of resources and the only compelling argument for subsidizing ethanol is that petroleum prices might increase faster than forecast (Grinnell 1987).
However, President Bush's proposals to overhaul the antiquated Clean Mr Act of 1970, and to introduce a Clean Air Bill which will require the gradual phasing in of cars built to run on 'clean fuels' could increase the market for alcohol fuels by 50 per cent immediately. The president has called for the production of one million cars annually that can run on pure ethanol or methanol by 1997 (Anon 1989).
142 F. Rosillo Calle
The EEC
As yet there is no significant use of ethanol fuel in Europe. Numerous studies have concluded that, although production is technically possible, there are no economic justifications for an ethanol fuel programme. The EEC is in a difficult position. The Community is faced with the need to adjust its agricultural policy in order to achieve a number of objectives that are difficult to reconcile: the disposal of surplus stocks which cost sterling £19 billion in 1987 and the prevention of their re-emergence, the avoidance of disturbance to international agricultural community mar-kets; the maintenance of individual farm incomes; and the conservation of the fabric of rural society and the protection of the natural environ-ment. During the past few years increasing pressure has been exerted by the agricultural sector, particularly for legislation that would favour the production of ethanol from agricultural surpluses—which is seen by some as one way of tackling the problem of the surpluses. Under pre-vailing market conditions and without subsidies, ethanol Cannot compete as a transport fuel until crude oil prices reach US$55 to $65 per barrel (Marrow et at. 1987). The cost of the subsidies required to enable ethanol to compete in the transport fuel market are still disputed. The petrochemical industries and in particular manufacturers of synthetic ethanol and other oxygenates which might be used as petrol extenders, do not endorse the production of bioethanol. The production of bioethanol on a large scale would require the establishment of a new industrial process involving major investment. Any substantial new investment to produce ethanol is essentially political, and this is not likely to be achieved easily, if at all, given that at present there is no con-sensus among member states.
However, despite the economic arguments against setting up a fuel ethanol industry assured of public subsidy in some member states there exists some resistance against the views of the Commission, wtiicli must be taken into account. France, for example, has carried out a good deal of research into the production and use of ethanol; France is the EEC's largest cereal producer. The EEC must envisage a long-term policy solution to the 20 to 30 million tonne surplus problem, and the door must not be closed to bioethanol. It is important that policies are pur-sued which protect the present infrastructure of EEC agriculture so that it is still in a position to exploit the ethanol opportunity when it becomes
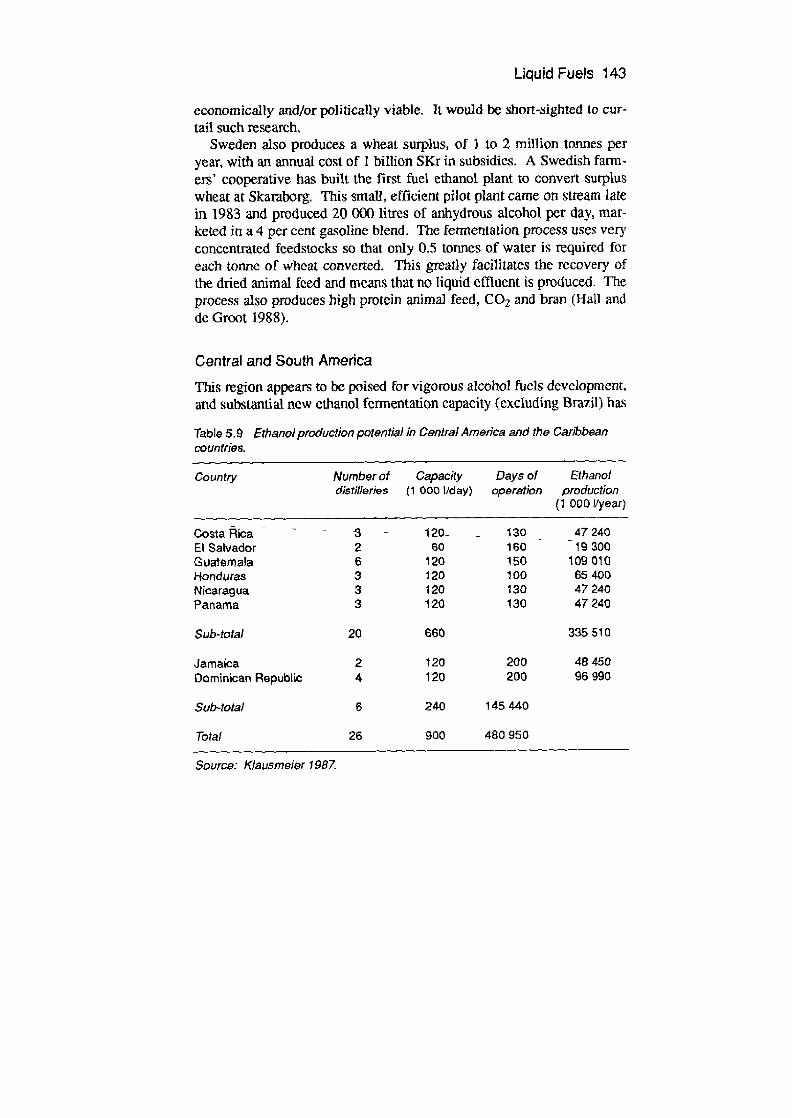
Liquid Fue's 143
economically and/or politically viable. It would be short-sighted to cur-tail such research.
Sweden also produces a wheat surplus, of 1 to 2 million tonnes per year, with an annual cost of I billion SKr in subsidies. A Swedish farm-ers' cooperative has built the first fuel ethanol plant to convert surplus wheat at Skaraborg. This small, efficient pilot plant came on stream late in 1983 and produced 20 000 litres of anhydrous alcohol per day, mar-keted in a 4 per cent gasoline blend. The fermentation process uses very concentrated feedstocks so that only 0.5 tonnes of water is required for each tonne of wheat converted. This greatly facilitates the recovery of the dried animal feed and means that no liqiid effluent is produced. The process also produces high protein animal feed, CO2 and bran (Hall and ne (Iroot 1988).
Central and South America This region appears to be poised for vigorous alcohol fuels development, and substantial new ethanol fermentation capacity (excluding Brazil) has
Tab 5.9 Ethanol procitiction potential in Central Amørica and the Caribbean countries.
Country Number of distilleries
Capacity (1 000 l]day)
Days of operation
Ethanol pro duct/on
(10001/year)
Costa Rica - - 5 - - 120- - 130 - 47240 El Salvador 2 60 160 19300 Guatemala 6 120 150 109 010 l-londuras 3 120 100 65 400 Nicaragua 3 120 130 47240 Panama 3 120 130 47240
Sub-total 20 660 335510
Jamaica 2 120 200 48 450 Dominican Republic 4 120 200 96990
Sub-total 6 240 145 440
Total 26 900 480 950
Source: Klausmeior 1987 .

144 F. Rosiflo Cafle
already been introduced, particularly in Central America and the Caribbean. There are a number of reasons for this, including heavy reliance on oil imports; foreign exchange problems; low earnings from sugar exports, far exceeded by the cost of oil imports; the availability of technology at low cost (US$4.1 to 5.1 million for a distillery with a capacity of 120 000 litres per year) supplied by Brazilian finns; and the existence of the Caribbean Basic initiative which allows for duty-free imports of alcohol to the USA. Exports of ethanol would generate more revenue than would the sale of sugar on the world market at current prices.
Central America and the Caribbean Nearly half a billion litres per year of alcohol could be produced in this region using idle capacity, along with a total additional distillery invest-ment of US$227 to 284 million, which is about the same as the capital investment for a single large corn-based distillery in the USA (see table 5.9) (Klausmeier 1987).
Despite the lack of coherent national policies in most countries, and the Jack of investment capital, there are a number of factors beyond those already mentioned that might favour the implementation of alcohol fuel programmes in this region. The first is the need to protect the sugar industry, which is a major earner of foreign exchange and directly employs 12.5 million people. The second is the fear that protectionist measures by the USA may create the feeling that ethanol production is best assured by the creation of domestic alcohol fuel markets. Although in most areas ethanol-gasoline blends will require some tax exemptions to be competitive with gasoline, this could be counterbalanced by other socio-economic benefits such as the generation of additional employ-ment.
Guatemala, El Salvador and Costa Rica have initiated alcohol pro-grammes, and most of the other countries in the region are also actively considering this option (see table 5.5). This might mean the expansion of sug arcane plantations since some of these countries, for example, Costa Rica, produce sugarcane on a small scale only, and the programme is therefore faced with difficulties.
South America Alcohol fuel development in this area has been dominated by Brazil (see above) but other countries, such as Argentina, already have a pro-
Liquid Fu&s 145
gramme. Paraguay too has announced a national alcohol fuel pro-gramme. Sugarcane is the basic feedstock for alcohol production in this region. The most practical means currently used for starting up alcohol production is to add distilleries to existing cane processing plants to use either molasses by-product or cane juice obtained by taking advantages of idle cane crushing capacity. This method saves at least 30 per cent of the capital investment needed to start an autonomous distillery.
Africa
The production and use of alcohol fuels have been aggressively pursued in a number of African countries currently producing sugar. Some coun-tries have modernized their sugarcane industry and now have low pro-duction costs. In addition, many of these countries are landlocked which means that it is not feasible for them to sell by-product molasses on the world market, and that oil imports are very expensive. These conditions, combined with a relatively low total demand for liquid transportation fuels, make ethanol fuel most attractive to many parts of Africa.
The two most successful alcohol fuel programmes are those of Zimbabwe and Malawi, and these stand in sharp contrast with Kenya where the first ethanol distillery was plagued with difficulties. These cases offer excellent examples of the effects of the different strategies for introducing alcohol fuel programmes. Approaches that employed the simplest technology and that maximized the use of the existing infras-tructure have been successful, while those like Kenya's that attempted to use more sophisticated technology failed, although Kenya's later plans have been successful and today all cars in urban areas use a blend of 90 per cent gasoline and 10 per Cent ethanol. From 1980 to 1984 Zimbabwe produced about 150 million litres of ethanol, to be blended with gasoline in a proportion of 12 per cent (25 per cent is being consid-ered). The total cost of ethanol production (1986) was Z$050 per litre, while the landed cost of imported gasoline came to Z$0.75 per litre, all in foreign exchange (Stuckey and Juma 1985; Siddiqui 1987).
Malawi commenced its successful gasohol programme in 1982, utiliz-ing ethanol from a distillery located at Dwangwa sugar mill with the capacity to produce 10 million litres per year. Ethanol is blended with petrol in a proportion of about 20 per cent. Malawi's incentives for ethanol fuel have been the continuous deterioration of the regional irans-
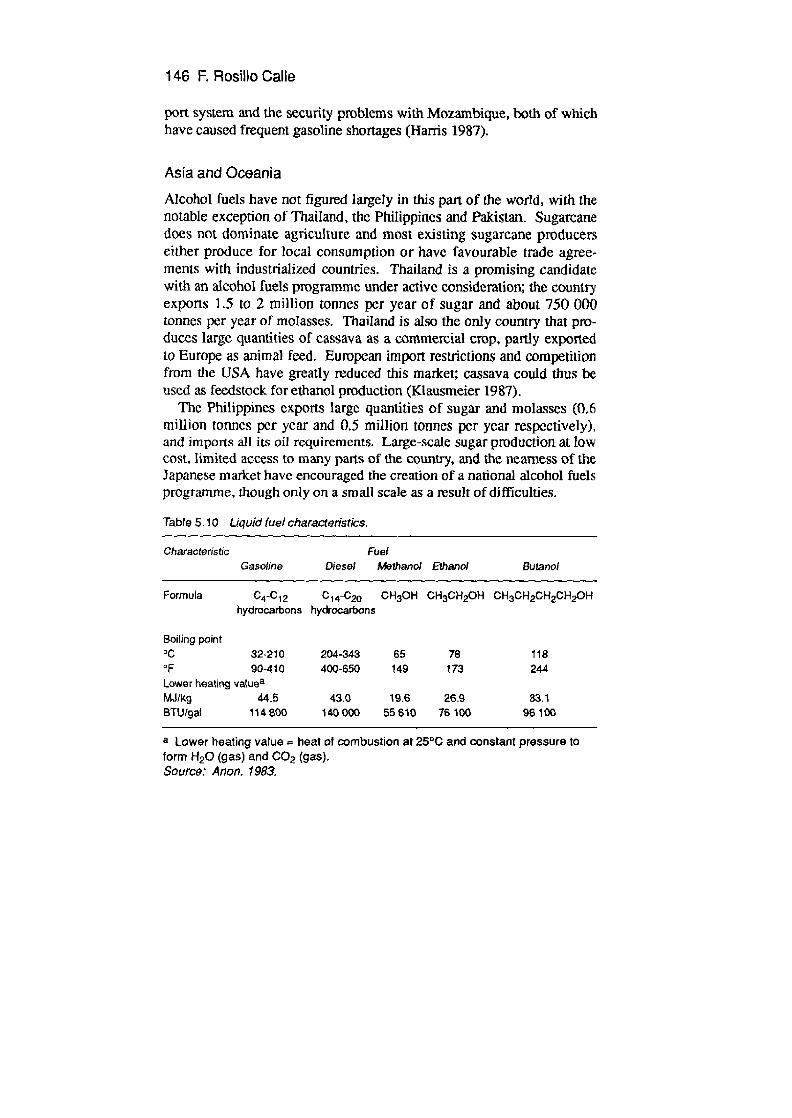
146 F. Rosillo Calle
port system and the security problems with Mozambique, both of which have caused frequent gasoline shortages (Harris 1987).
Asia and Oceania Alcohol fuels have not figured largely in this part of the world, with the notable exception of Thailand, the Philippines and Pakistan. Sugaitane does not dominate agriculture and most existing sugarcane producers either produce for local consumption or have favourable trade agree.. ments with industrialized countries. Thailand is a promising candidate with an alcohol fuels programme under active consideration; the country exports 1.5 to 2 million tomuies per year of sugar and about 750 000 tonnes per year of molasses. Thailand is also the only country that pro-duces large quantities of cassava as a commercial crop, partly exported to Europe as animal feed. European import restrictions and competition from the USA have greatly reduced this market; cassava could thus be used as feedstock for ethanol production (Klausmeier 1987).
The Philippines exports large quantities of sugar and molasses (0.6 million tonnes per year and 0.5 million tonnes per year respectively), and imports all its oil requirements. Large-scale sugar production at low cost, limited access to many parts of the country, and the nearness of the Japanese market have encouraged the creation of a national alcohol fuels programme, though only on a small scale as a result of difficulties.
Table 5.10 Liquid fuel characteristics.
Characteristic Fuel
Gasoline Diesel Methanol Ethanol Butano$
Formula C4-C 12 C 1 4-c2o CH30H CH3CH20H CH3Cl2Ck2CH20k hydrocarbons hydrocarbons
Boiling point 'C 32-210 'F 90-410 Lower heating va!uea MJIk9 44.5 BtUIgal 114 800
204-343 65 78 118
400-650 149 173 244
43.0 19.6 26.9 $3.1 140000 55810 76100 96100
a Lower heating value = heat of combustion at 25 0C and constant pressure to form H20 (gas) and CO2 (gas). Source: Anon. 1983.
Liquid Fue's 147
Alcohols as fuel substitutes
The use of ethanol as an automotive fuel is as old as the combustion engine itself. Nicolas A. Otto used pure alcohol in 1897 in his first engine. In 1907 the US Department of Agriculture published a report called 'The use of alcohol and gasoline in farm engines', and in Brazil in 1902 a document was published on the industrial applications of ethanol.
The biomass-based fuels appropriate for transport applications are ethanol, methanol, producer gas from the gasification of biomass, and biogas from anaerobic digestion (with methane the primary fuel com-pound). Butanol, a four-carbon alcohol, which can also be produced from non-petroleum sources, is a less likely contender because of its comparatively high cost. Table 5.10 compares the characteristics of some liquid fuels, The main differences between petroleum fuels and alcohol are: (a) alcohols are essentially pure chemicals, boiling at one temperature, while petroleum fuels are mixtures of many different chem-icals with wide boiling ranges; (b) alcohols contain oxygen, whereas the petroleum fuels do not and (c) heating values for the alcohol are signifi-cantly lower than for petroleum fuels. Currently the only serious con-tender among the biomass-based fuels is ethanol.
Engine modifications
Engines are designed to use petroleum fuels; these are economical, widely available, and have standard characteristics. Fuel research usu-ally focuses on existing engine technology, and engine research assumes fuels similar to those currently in use. Indeed the transition to a new fuel has long been viewed as a major obstacle primarily because of the huge existing petroleum-oriented infrastructure, and the so-called 'chicken and egg dilemma' whereby there is no demand for alternative fuels because there are no vehicles to use them and no demand for non-petroleum-fuelled vehicles because there is no infrastructure.
Perhaps the most far-reaching changes in approach to engine design in recent years have been initiated by the need to conform to the new vehi-cle exhaust emission regulations, particularly in Western Europe and the USA. The development of 'lean burn' engine technology and higher gasoline-to-air ratios are good examples. During the past decade a sub-stantial research effort has also gone into increasing the engine's fuel tol-erance. A wider tolerance would allow present gasoline and diesel

148
Table 5.11 Summary of the ma/ri technical approaches to the use of alcohol fuels.
1 Alcohol and gasoline blends (ethanol or methanol). Up to a maximum of 25 per cent in spark ignition engines. A high-grade, water-free alcohol is required for a stable mix. The main advantage of the low mixture over conventional fuels is that the blending component does not imply additional costs on vehicles, and in the case of ethanol to the fuel service industries. An octane-boosting effect in low and medium engine speed range is possible. With minor engine modifications the blend can be increased.
2 Neat alcohols (ethanol) in specially modified spark-ignition engines. There are over 3.5 million such vehicles in Brazil. The compression ratio can be higher than with gasoline. Though fuel consumption is higher, the calorific efficiency is better. A further advantage is that the alcohol does not need to be totally free of water, which means lower distillation costs.
3 Diesel and ethanol blends. Up to 15 per cent ethanol in a diesel-ethanol blend for serial diesel motors without any additive. In Natal (South Africa) it has been shown to be usable in normal tractors. For safety reasons a 2 per cent solvent aid can be added.
4 Up to 5 per cent ethanol as a cosolveni for methanol, or in the form of an ether.
5 Up to 40 per cent ethanol with cetane number improver and solvent; 40 per cent is the limit for blends in normal diesel engines. For practical applications on farms, 30 per cent is more likely to guarantee trouble-free operation.
6 Up to 80 per cent ethanol in dual-fuel diesel engines. This method has been tested for a number of years by MWM in Brazil. A dual-fuel engine is filled with a second injection system. To start combustion a small amount of conventional diesel fuel is needed, but the main energy comes from alcohol.
7 Methyl ester of soya bean + alcohol. Engine modifications are required to prevent the fuel becoming too diluted in the lubricating oil.
8 Diesel oil + vegetable oil (in natura) + alcohol. Further research is still required, but the blend seems feasible.
9 Alcohol + a new patented additive (5 per cent) in slightly rebuilt diesel engines. Successful trials have been performed in South Africa. Engine adaptations are needed.
Liquid Fuels 149
engines to overcome some of the specific limitations, such as octane and cetane numbers, that now severely limit their ability to use other fuels or poorer quality fuels. A number of experimental vehicles now incorpo-rate the so-called 'flexible-fuel systems', and variations in devices and systems are under development. For example, a relatively new system that has been proven effective allows vehicles that normally run on gaso-line to use methanol effectively when it is available. The system uses a device in the fuel line that detects the fuel composition, and takes advan-tage of the recent incorporation into vehicles of fuel injectors and elec-tronic fuel control systems. It permits optimal results at a selected compression ratio, whether the fuel is gasoline, methanol, or any combi-nation of the two. Only a single fuel tank is required, and motorists are not confined to areas of methanol availability; the cost differential is small (Mill and Ecklurid 1987: Massad et al. 1986; Weide and Wineland 1984).
More specific engine innovations have been made to accommodate the new ethanol fuel in Brazil. There, the automobile industry was able to transfer over 60 years of gasoline engine experience to the alcohol car in just a few years. Although the current economic engines are still Otto-cycle engines adapted to burn alcohol, they incorporate new mechanical ideas, with some 300 engine parts differing from those in conventional gasoline-fuelled engines. Early research efforts went into improving fuel efficiency, blending, coating and so on. The first alcohol cars received minor modifications, the vehicle industry making the mini-mum changes necessary to existing gasoline vehicles to enable them to run satisfactorily. These initial changes included the replacement of materials incompatible with ethanol, an increase in engine compression ratios, the adjustment of carburettors, and the installation of small tanks under the hood to assist in cold starts. Gradually automobile technology was improved to increase fuel efficiency, ease ignition problems and enhance performance. Today the alcohol-fuelled vehicle rivals gasoline-fuelled equivalents in performance (Rosillo-Calle and Heaford 1987). Table 5.11 summarizes the main technical approaches to the use of ethanol fueL
Present oil prices have undoubtedly depressed alcohol fuel marketing activity, except in areas where the market had already been estab-lished—Brazil, the US Mid-west, Zimbabwe—or where environmental considerations are of paramount importance—for example, California.

150 F. RosiHo Calle
Unlike methanol, which depends on establishing a supply infrastructure integrated within existing service stations, ethanol is well suited to local-ized production in both small and large distilleries in agricultural regions. Transport costs may be minimized with decentralized produc-tion and local use on farms for vehicles, machinery, small electrical gen-eration or irrigation and the like. Local production and utilization does not need the traditional fuel infrastructure and could be independent of oil companies.
Alcohols as octane boosters
The demand for unleaded gasoline, precipitated by legislation environ-mental concern, has created a new market for alcohols because of their ability as additives to boost octane ratings to the level required for cur-rent engine technology. However, oil companies in Western Europe and USA, the two largest markets for unleaded gasoline, have changed to comply with the new legislative requirements and to defend their share of the market. Faced with the prospect of major changes in product and specification, the refining industry has adapted and revamped existing plants, is adding extra units and is upgrading operating procedures over the whole infrastructure. Thus the oil industry is trying to fill the 'octane gap with petroleum-based oxygenates in an attempt to inhibit the use of alcohol as an octane booster, and is aided in some cases by adverse media comment (Du Cane and Ockkerbloom 1986).
The octane-boosting properties of ethanol can be exploited in either of two ways to save energy: either by reducing the oil refinery energy requirements by producing a low octane gasoline, or by increasing the octane rating of all motor fuels so that automobile manufactures can increase the compression ratios and thus the efficiency of new cars. There is, however, considerable uncertainty and variability in the amount of premium fuel that can be saved at the refineries by using ethanol as an octane-boosting additive. Reported or derived values vary from nearly zero to more than 60 000 BTU per gallon of ethanol, depending on such factors as the average octane rating of the refinery gasoline pool; the octane rating assumed from ethanol; the type of gasoline; and the ratio of gasoline to middle distillates produced by the refinery technology (Office of Technology Assessment 1980).
Methanol too offers good prospects as a raw material for the produc-
Liquid Fuels 151
tion of MTBE and mixtures of methanol and gasoline, MTBE is gaining increasing importance as a synthetic gasoline component, because of its high octane number and other physical properties, and its relatively low price.
The position in the USA and EEC
The USA is currently the most important market for oxygenates. The estimated use of oxygenates in motor gasoline in 1987 was between 130 000 and 140 000 barrels per day, of which 80 000 to 85 000 barrels per day were MTBE and over 55 000 barrels per day were ethanol. US pro-duction capacity for MTBE is 3.6 million tonnes per year, with other plants under construction; MTBE offers the option to refiners to make or buy octane as circumstances dictate (Du Cane and Ockkerbloom 1986). Methanol from natural gas or even from coal is receiving increasing attention because although more expensive than gasoline, it appears to be one of the less expensive options. The US government has not inter-vened directly, as it did in the case of ethanol, to encourage methanol blends through tax actions that would alter competitive economics. Federal interest in alcohol fuel use centres on fuel methanol (Mill and Ecklund 3987; Massad et al. 3986).
Although the EEC programme requires lead-free gasoline to be avail-able in all member countries from 1989 onwards, it appears likely that for a variety of reasons the ultimate goal of a totally lead-free gasoline market may not be achieved before the end of this century. There exists so many different approaches at government levels that progress is likely to be painfully slow (see figure 5.7); the long phase-out programme gives refiners much more opportunity to revamp or add to their produc-tion capacity, which, combined with the effects of excess capacity, has already allowed refiners to produce lead-free and low-lead gasoline to current specifications. The additional demand for octane boosters is estimated to be 3.5 million tonnes by 1990, rising to 5.5 to 6 million ronnes by 1995. By 1990 EEC domestic oxygenates production is fore-cast to be 3.1 million tonnes of T-Amyl Methyl Ether (TAME), 0.95 mil-lion tonnes of Gasoline-grade Tertiary Butyl Alcohol (GTBA), and 50 to 60 000 tonnes of TAME; to this must be added methanol which is avail-able from excess capacity (Du Cane and Ockkerbloom 1986). Therefore the availability of oxygenates makes penetration of the European mar-kets more difficult.
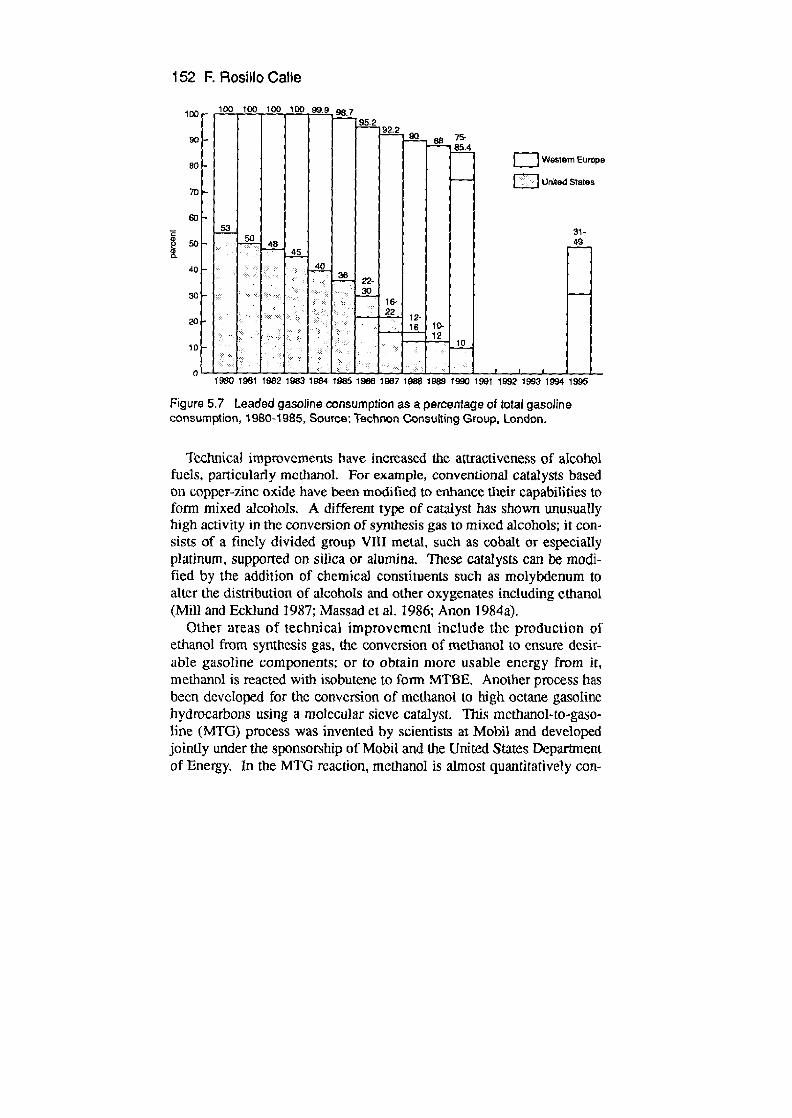
100
90
80
70
60
50 a
40
30
20
10
1980 1981 1982 1983 1984 1985 1986 1987 1988 1989 1990 1991 1992 1993 1994 1995
152 F. RosiUo Calle
Figure 57 Leaded gasoline consumption as a percentage of total gasoline consumption, 1980-1985, Source: Tuchnon Consulting Group, London.
Technical improvements have incitased the attractiveness of alcohol fuels, particularly methanol. For example, conventional catalysts based on copper-zinc oxide have been modified to enhance their capabilities to form mixed alcohols. A different type of catalyst has shown unusually high activity in the conversion of synthesis gas to mixed alcohols; it con-sists of a finely divided group VIII metal, such as cobalt or especially platinum, supported on silica or alumina. These catalysts can be modi-fied by the addition of chemical constituents such as molybdenum to alter the distribution of alcohols and other oxygenates including ethanol (Mill and Ecklund 1987; Massad et al. 1986; Anon 1984a).
Other areas of technical improvement include the production of ethanol from synthesis gas, the conversion of methanol to ensure desir -able gasoline components; or to obtain more usable energy from it, methanol is reacted with isobutene to form MTBE. Another process has been developed for the conversion of methanol to high octane gasoline hydrocarbons using a molecular sieve catalyst. This methanol-to-gaso-line (MTG) process was invented by scientists at Mobil and developed jointly under the sponsorship of Mobil and the United States Department of Energy. in the MTG reaction, methanol is almost quantitatively con-
Liquid Fuels 153
verted to gasoline hydrocarbons, with an energy loss of just 4 per cent; the gasoline that results also has a very high octane rating (96 RON without lead). The advantage of MTG gasoline over neat methanol is that whether used directly or blended into the gasoline pool, it can fuel unmodified cars, and no new distribution system is required as it would be with methanol (Mill and Ecldund 1987; Massad et al, 1986; Marten and Camps 1986).
In summary, alcohol fuels are steadily moving towards an important source of transportation fuels, either neat or blended with gasoline or as octane boosters. However, the high cost of biomass-based alcohols makes it unlikely that these fuels will be used on a large scale (other than in Brazil) before the end of this century. The potential market for alco-hols as octane boosters is very large, particularly in the USA and EEC, but the existence of other alternatives and institutional barriers makes the oxygenates market uncertain.
Socio-economic effects
A major criticism that has been made of energy cttp programmes, par-ticularly those for large-scale alcohol fuel production, is that they could divert agricultural production away from food crops, especially in devel-oping countries. The basic argument is that energy crop programmes compete with food crops in a number of ways (agricultural land, rural investment, infrastructure, water, fertilizers, skilled manpower and so on), and thus will cause food shortages and price increases.
Food versus fuel
By far the most intensively debated issue with regard to biomass-based alcohol fuels has been that of 'food versus fuel' competition. This is an issue that has been studied in detail (see Hall 1984; de Groot and Hall 1986) and therefore I will only consider it briefly. It seems clear that early fears of possible food-versus-fuel competition overlooked some important factors. There are currently over 450 million tonries of surplus grain in the world. Although in some cases the surplus may reflect the lack of purchasing power of the population, it also reflects the new agri-cultural-situation. Agriculture has reached a point where given the right incentives, infrastructure and sufficient research and development fund-
154 F. Rosillo Catle
ing, farmers and scientists can now ensure ample food surpluses for the first time in history, despite rapid population growth. The fact that mit. lions of people are starving throughout the world, and that many more have yet to reap the benefits of agricultural-evolution, reflect the widely recognized fact that food production and distribution are highly political matters and it remains an essentially socio-economic problem to ensure that no one goes hungry.
Brazil provides, once again, a good example of the possible social and economic ramifications of this new phenomenon of food versus fuel, despite the fact that the country possesses available land beyond that needed for both food and fuel. Thus far studies (Rosillo.-Calle and Hall 1987, 1988) show that the possible effects of the PNA on food produc-tion have been exaggerated and the real implications largely overlooked. The food problem in Brazil, contrary to what critics of the PNA might suggest, is embedded in its socio-economic and political system. Brazil is among the world's top exporters of agricultural products, yet at the same time about 40 million people are undernourished, unable to afford the available food. The reasons are varied and historical, and can be found in the economic policies of successive governments concerning both agriculture and industry.
Often not considered is the fact that about 64 per cent of sugarcane expansion has taken place in pasture land. The controversy within Brazil appears to have been excessively restricted to the competition for funds used to grow the sugarcane and food crops. Often machinery and equipment used for growing sugarcane is also used for food crops in the same areas and in rotational cropping practices. The increase in produc-tivity has been a major factor in keeping the required land area down, particularly in So Paulo state, despite the continuous increase in alcohol production in the area. However, this is not to deny that in some areas, such as the Riberao Preto region, there exists very high concentrations of sugarcane production and that sugarcane expansion has also taken good agricultural land; in some cases food prices might have increased.
Overall, the 'food versus fuel' controversy appears to have been exag-gerated. The subject is far more complex than has generally been pre-sented since agricultural policy and the politicization of food availability are factors of far greater importance. The discussion should be analysed against the background of the world's real food situation of increasing food surpluses and their use for animal feed, the under-utilized agricul-
Liquid Fuels 155
tural production potential, and the advantages and disadvantages of pro-ducing bio-fuels.
Economic considerations This study would not be completed without considering, if only in pass-ing, some of the economic aspects of alcohol fuels. The cost of produc-ing biomass-based alcohol fuels (ethanol) continues to be the stumbling block for further expansion. There are other non-economic factors which also contribute, but usually only in a minor way. The energy bal-ance of ethanol production from crops has been the object of contro-versy, but it is widely accepted that in the case of sugarcane and maize it is positive, and I do not intend to consider the matter here.
The cost of producing ethanol depends on many different factors such as the location of the manufacturing plant and its design, the type of raw materials utilized, relative labour costs, the scale of production, and the total investment. There is no fixed 'alcohol cost' since it will vary from plant to plant. It is also often the case that there exists relatively little public information on the cost of producing fuel ethanol. In addition many ethanol plants have avoided significant costs by using existing facilities, or have lower capital costs because of Government loans or loan guarantees. It is a complex issue which can not be dealt with prop-erly here.
Cost estimates vary considerably and are not uncontroversial. These include US $26 to 60 barrels (oil equivalent) from sugarcane in Brazil, and US$60 to US$65 from grain, in the EEC. There are a number of other factors that can significantly influence the cost of ethanol produc-tion, including the use of by-products, technological advances, and mar-ket and institutional barriers. By-products can have a major impact on ethanol production costs, depending on the choice of feedstock. Higher-value by-products include fermentation products, fermented animal feeds or developed food products, energy, and fertilizers. Ethanol can also be produced as one of a number of co-products among which raw materials and capital costs are shared.
When maize is the feedstock, for example, the stock is hydrolysed to glucose which is then fermented to alcohol and CO 2 . leaving in the residue the fibre, fat and protein of the original maize. During the fer-mentation process, about one-third of the weight of the maize is con-'erted to alcohol, one-third is converted to CO 2 which can be used in the
156 F. Rosillo Calle
soft drinks, dry ice and other industries; and the other third is the fer -mentation residues of the maize and yeast cells and vitamins for live-stock feeding (Anon 1984b). Thus at the same time, maximum advantage can be taken of the feedstock, and the environmentally related problems can be eliminated.
In the case of sugarcane, the potential for by-products has not yet been fully achieved, partly because sugarcane is a feedstock used in develop-ing countries which Jack technical and financial capabilities. In Brazil, however, a multi-product industry is emerging, based on sugarcane-alco-hol-bagasse products, that will have a major impact on ethanol costs.
Technological advances can significantly reduce costs in both the pro-duction and utilization phases. Feedstock costs remain too high, but agricultural commodities are becoming increasingly competitive with respect to traditional sources of energy. For example, in 1950 energy derived from maize cost 14 times as much as petroleum-derived energy, whereas today it only costs 1.4 times as much. This balance will be fur-ther improved in the future when scientific research will peimit new varieties of energy crops specially tailored for energy use (Fortis 1987).
On the end-use side, and taking Otto-cycle engines as an example, higher compression ratios, the introduction of new materials, and large reductions in vehicle weights, will undoubtedly result in better energy-efficient engines. Finally, market penetration barriers are additional costs opposing the introduction of new fuels and need to be overcome.
Conclusions
Many of the problems related to the production and utilization of alcohol fuels have been overcome, excluding those related to the pmduction of alcohol from cellulose-based raw materials and the utilization of alcohol in diesel engines. Technological advances will none the less have less of an impact on market penetration of alcohol fuels than will the availabil-ity and cost of feedstock, and the cost of competing energy options (that is, oil). The only realistic biomass alternative in the short-term still appears to be ethanol from sugarcarie.
Most engine developments in the industrial countries have been undertaken to confonn with exhaust emission requirements. Brazil has been the only major user of ethanol which has carried out large-scale specific engine changes to accommodate alcohol fuels. The demand for
Liquid Fuels 157
unleaded gasoline creates a potential new market for alcohols, particu-larly in the EEC and USA, where there is already a sizeable market; it is none the less clouded with uncertainties because of the high cost of biomass feedstocks and the speed by which the 'octane gap' is being filled by petroleum-derived alternatives such as MTBE. However, world-wide interest in alcohol fuels is increasing, particularly in devel-oping nations, particularly because of the combination of low feedstock cost (sugarcane) and low sugar prices in the international market, and for strategic reasons: environmental considerations play a secondary role in developing nations.
it is clear that the environmental impacts of the use of alcohol fuels are less than those of oil, and that most of the environmental problems can be avoided or greatly reduced. A variety of control and design alter-natives are available to reduce or eliminate adverse effects, including biological treatment methods such as anaerobic digestion, Biotil and oxi-dation catalysts. Actual impacts will depend more on the design and operation of manufacturing plants, the enforcement of legislation, emis-sion control and the like than on any inevitable problem. And alcohol fuels, particularly ethanol, are judged to be less hazardous than the more environmentally disruptive and poisonous gasoline and gasoline compo-nents.
Fear about the social implications of large-scale alcohol fuel pro-grammes, particularly concerning food production and food prices, have it seems been exaggerated. This is a complex issue in which agricultural policy and the politicization of food availability are more important fac-tors, and needs to be analysed against the background of the world's real food situation. The Cost of biom ass-based alcohol fuels remains the main obstacle to their more widespread use. There are a number of alterna-tives, including better use of by-products, that if pursued further could significantly reduce production costs.
It is difficult to forecast what will be the major fuel of the future, since energy and transport predictions vary considerably. It appears, however, that the market for alcohol fuels is expanding steadily and will always be governed by a mix of political, technical and commercial factors. The Brazilian and Zimbabwean cases have demonstrated the political issues, and the perseverance with which government must act to assist the establishment of a large-scale alcohol fuel programme. Without the sta-bilizing influence of a coherent public sector, uncertainty in the market place will be so great as to discourage investment in non-petroleum
158 F. RosHo CaI!e
fuels. The indications are that by the end of this century, crude oil will still be the prevalent fuel in the industrial countiies (and in oil-producing developing countries) together with coal and natural gas (or methanol derived from natural gas or coal). The use of ethanol fuel may increase significantly in tropical developing nations, particularly in America, Africa and parts of Asia. It is perhaps unrealistic to envisage the growth of large-scale Brazilian-style alcohol fuel programmes, but a large num-ber of small-scale programmes may come into being.
No single policy exists or can be applied; thus each country needs to formulate its own energy policy and strategies. There, are, however some specific points which merit further attention concerning the intru-ducilon of alcohol fuels. These include the development of commercial processes for converting cellulose and hemicellulose to ethanol; greater emphasis on simple technology and on equipment more suitable to the developing countries; increased productivity of sugarcane as a feedstock; and greater use of by-products to reduce costs, as when stiiiage is used as a fertilizer. In the case of sugarcane a new concept, 'sugarcane-alco-hol-bagasse', needs to be formulated; there should be less emphasis on vehicle fuels, and instead other uses such as for cooking, lighting, agri-cultural machinery, and irrigation should be stimulated. Other matters needing attention are the greater use of alcohol blends instead of neat alcohol; greater emphasis on environmental matters, particularly in developing countries, with regard to effluent and pollution control; more research into engine design for alcohol fuel use, particularly with respect to diesel engines; more research into 'flexible fuel systems'; and, above all, greater attention to energy conservation at all stages of the prothic-tion and processing of the feedstock.
References Anon. (1983) Alcohol Fuels: Options for Developing Countries. Board
of Science and Technology for International Development. Office of International Affairs, National Research Council, National Academic Press, Washington, DC.
Anon. (1984a) 'Getting mixed alcohols from synthesis gas', Chemical Wood, 135(19)28.
Anon. (1984b) 'Energy use and production in agriculture', Council for Agricultural Science and Technology, USA, Report no.99.
Anon. (1987a) International Market Evaluations: Biomass Energy

Liquid Fuels 159
Prospects, The California Energy Commission, Sacramento, California, USA.
Anon. (1987b) 'Air quality benefits of alternative fuels', Energy, 12(5)7- 9 (EPA, June 1987). (See also Rudolph, T. W. and Thomas, J. J. (1988) 'NOX , NHMC and CO emissions from biomass-deriveci gasoline extenders', Biomass 16(1) 33-49.
Anon. (1987c) 'Transportation fuels', Rio-Joule, 10(1) 23. Anon. (1989) New York Times, 15 June 1989, P. 4; The Economist, 17
June 1989, p.48. Bremen, L. V. (1987) 'The use of biomass for the production of bulk
chemicals: An economic assessment', FAST Occasional Papers, no.185.
Coombs, J. (1987) 'Biotechnology and biomass energy'. in Hall and Overend (eds) Biomass Regenerable Energy, John Wiley & Sons, 307-325.
de Groot, P. and Hall, D. 0. (1986) 'Power from the farmers', New Scientist, 112 (1529), 50-5.
Du Cane, M. and Ockkerbloom, N. E. (1986) 'Oxygenates—A problem or an opportunity for Europe?' Alcohol Wood Conference: 'The European fuel oxygenetes market', Tara Hotel, London, 1-2 July.
Edwards, K. (1988) 'World soil erosion and conservation: Status and policies. Soil erosion and conservation in Australia', in World Soil Conservation Strategy, IUCN (fonhcoming).
Fortis, M. (1987) 'Agricultural Overview' Proceed. Conf., UK-ISES, (CSO) November, King's College, London.
Grirmell, G. E. (1987) 'Impacts of ethanol fuel on US agiiculwre', in Grassi et al. (eds) Biomass for Energy and Industry, 4th EC Conference, London, 164-6.
Hall, D. 0. (1984) Biomass: Food versus fuel, a world problem?' in Hall, Myers and Margoris (eds) Economics of Ecosystem Management, Junk, Dordrecht, 207-25.
Hall, D. 0. and de Groot, P. (1988) 'Biomass—A source of energy for ever?' in N. Al-Hamdani et al. (eds) Proc. 3rd, Arab Intern. Solar Energy Coaf., 2 1-24 February, Scientific Research Council/Solar Energy Research Centre, Baghdad, Iraq, 0.30-43.
Harris, J. (1987) 'Alcohol fuel development in Malawi', Proc. 2nd, Intern. Conf. on Small Engines and their Fuels in Developing Countries, University of Reading, 23-24 September, 79-84.

160 F. Rosillo Cafle
JAYCOR (1985) Worldwide Revtew of Biomass Based Ethanol Activities, Meridian Corporation, Alexandria, Virginia, USA.
Klausmeier, W. H. (1987) 'Worldwide review of alcohol fuel markets', in D. L. Kiass (ed) Energy from iliomass and Wastes X, Elsevier Appd. Science/Inst. of Gas Technology, Chicago, 1417-37.
Margulis, S. (1985) 'Environmental impacts of the National Alcohol Programme', Conferonce on the Brazilian PNA: Issues and Prospects, University College, London, 24 May.
Marrow, J. E., Coombs, J. and Lees, E. W. (1987) An Assessment of Bio-Ethanol as a Transport Fuel in the UK, HMSO, London,
Marten, J. H. and Camps, J. A. (1986) 'Process for the production of ethanol by acetate esters', 21st State-of-the-Art Symposiwn: Methanol as Raw Material for Fuel and Chemicals, Marco Island, Florida, USA.
Massad, G. M. et al. (1986) 'Toxicity assessment of the Brazilian ethanol autoengine fuel program, in Hartmann (ed) Proc. 7th World Clean Air Congress, Clean Air Society of Australia and New Zealand, 247-54.
Milgrom, L. (1987) 'Methanol takes up the fuel challenge', New Scientist, 115(1578) 43.
Mill, G. A. and Ecklund, E. E. (1987) 'Alcohols as components of transportation fuels', Annual Review of Energy, 112, 47-80.
Miskell, J. T. (1988) 'Composition of vehicle fuels to change significantly', Energy, 13(1) 7-8.
Monk, R. U. and Kresovieh, S. (1987) 'New crops: Exploring the options', in Hall and Overend (eds) Biomass Regenerable Energy, John Wiley & Sons, 103-18.
Nastari, P. M., Coelho, A. R. and Navarro, L. Junior (1987) 'Alcool noo contexto dos combusliveis liquidos no Brasil', IV SIMEA-Simposio de Engenharia Automotiva, Säo Paulo, 9-11 September.
Nates, R. J. (1986) The effect of alcohol species on aldehyde emissions from alcohol/gasoline fuelled vehicles', Proc. VII Intern. Svmp. Alcohol Fuels, Paris, 20-23 October, 4 15-19.
Office of Technology Assessment (1980) Energy from Biological Processes, vol.2, Technical and EnvimnentaL Analysis, Congress of the USA.
Pimentel, D. et al. (1987) 'World agriculture and soil erosion', BioScience 37(4) 277-83,
Piquette, R., Lawson, A., Simmons, E. W. and Batista, V. (1986) 'Safely

Liquid Fuels 161
aspects of the use of alcohol fuels in road vehicles', Proc. VII Intern. Symp. Alcohol Fuels, Pans, 20-23 October, 421-6.
Quadflieg, H. 91986) 'Fuel products or additives originating from agriculture: Comparison of the various technical solutions'; in Raymond and Larvor (eds) Alternative Uses for Agricultural Surpluses, Elsevier Appd. Science, London, 16-40.
Rosillo-Calle, F. and Hall, D. 0. (1987) 'Brazilian alcohol: Food versus fuel?' Biomass 12(2), 97-128.
Rosillo-Calle, E and Hall, D. 0. (1988) 'Brazil finds a sweet solution to fuel shortages', New ScientLt, 118(1613) 41-4.
Rosillo-Calle, E and Heaford, J. (1987) 'Alternative to fuels for transport: Brazilian experience', Science and Public Policy, 14(6) 337-45.
Rosillo-Calle, E and Rothman, H. (1986) 'The Brazilian National Alcohol Programme: Some technological and socioeconomic aspects', Outlook on Agriculture, 15(4) 196-201.
Rothman, H., Greenshields, R. and Rosillo-Calle, E (1983) The Ethanol Economy: Fuel Ethanol and the Brazilian Experience, Kentucky University Press, Lexington, USA.
Schwandt, W. R. (1984) 'Political, economic and technical aspects of the US fuel ethanol progrdm', Proc. BIOTECH 84 Europe, vol.1, Online, London, 5 19-28.
Siddiqui, K. M. (1987) 'Technical and economic studies of running two-stroke engines on gasohol blends', Proc. 2nd. Intern. Conf. on Small Engines and their Fuels in Developing Countries, University of Reading, 23-24 September, 85-90.
Stuckey, D. and Juma, C. (1985) 'Power Alcohol in Kenya and Zimbabwe: A case study in the transfer of a renewable energy technology', UNCTADJTT 61.
Suresh, K., Overby, J. K. and Refley, R. K. (1986) 'Evaporative emissions and volatility studies with methanol/gasoline blends', Proc. VII intern. Symp. on Alcohol Fuels, Pans, 20-23 October, 459-65.
Weide, J. V. D. and Wineland, R. J. (1984) 'Vehicle operation with variable methanol/gasoline mixtures', Proc. VI intern. Symp. Alcohol Fuels Technology, Ottawa, Canada, May, 380-6.
A. Ellegárd
During the past two decades, considerable attention has been devoted to anaerobic processes forming methane during the degradation of organic material ('biogas' processes). Since biogas is a versatile fuel the interest was enhanced during the period of increased oil prices in the 1970s, but it has become increasingly clear that energy production is not enough to make biogas a viable alternative. Other effects of biogas production, such as nutrient recycling and mineralization, the reduction of pathogens in wastes and reduced air pollution at combustion, are equally important when considering this choice as one among other renewable energy sources.
This chapter concentrates on the application of anaerobic digestion from agricultural produce, especially in developing countries. Technical considerations are only dealt with briefly, as is the application of anaero-bic digestion from sewage and industrial waste water.
Biogas formation and properties
Biogas is formed through anaerobic (oxygen-free) bacterial digestion of organic matter. The process occurs naturally on the bottom of stagnant lakes and in swamps. In man-made systems, anaerobic digestion is used for the stabilization of waste-water sludge from sewage treamient plants and industry, and for energy production from animal manures and animal wastes.
Biogas is a mixture of different gases, and is one end product of a long chain of enzymatic digestion of organic matter (see table 6.1). The
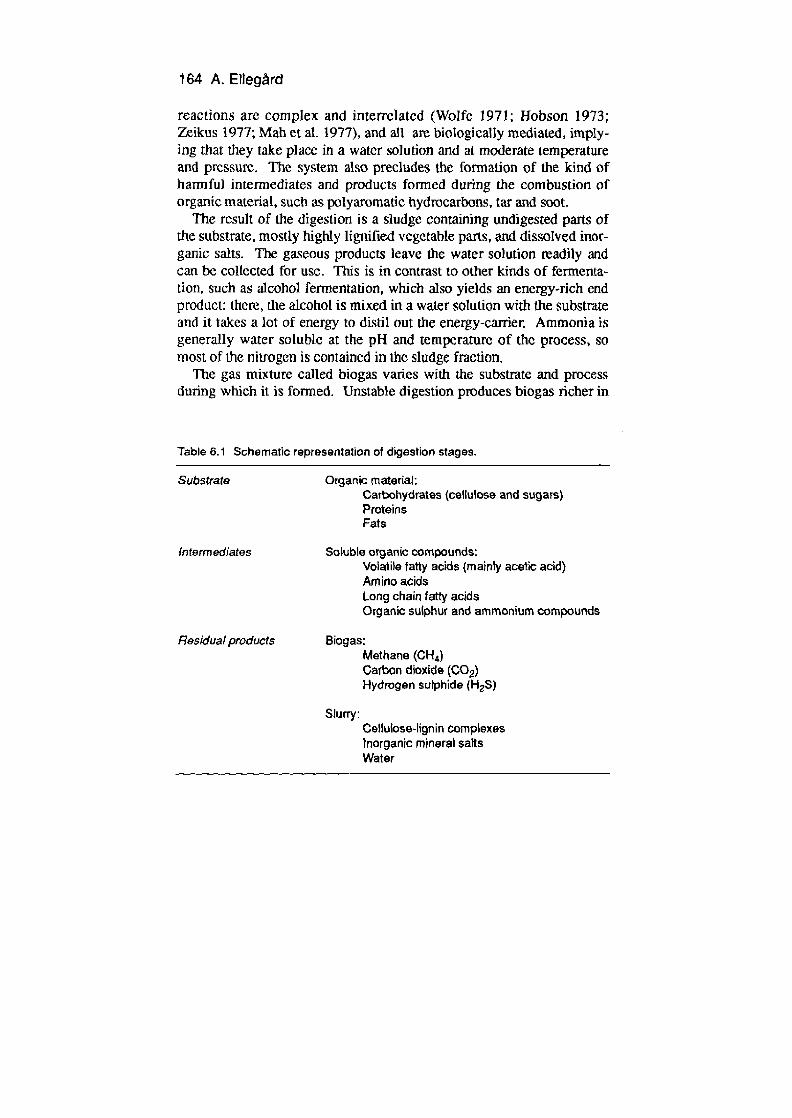
164 A. Etlegàrd
reactions are complex and interrelated (Wolfe 1971; Hobson 1973; Zeikus 1977; Mali et al. 1977), and all are biologically mediated, imply-ing that they take place in a water solution and at moderate temperature and pressure. The system also precludes the formation of the kind of harmful intermediates and products formed during the combustion of organic material, such as polyaromatic hydrocarbons, tar and soot.
The result of the digestion is a sludge containing undigested parts of the substrate, mostly highly lignified vegetable parts, and dissolved inor-ganic salts. The gaseous products leave the water solution iadily and can be collected for use. This is in contrast to other kinds of fermenta-tion, such as alcohol fermentation, which also yields an energy-rich end product: there, the alcohol is mixed in a water solution with the substrate and it takes a lot of energy to distil out the energy-carrier. Ammonia is generally water soluble at the pH and temperature of the process, so most of the nitrogen is contained in the sludge fraction.
The gas mixture called biogas vanes with the substrate and process during which it is formed. Unstable digestion produces biogas richer in
Table 6.1 Schematic representation of digestion stages.
Substrate Organic material: Carbohydrates (cellulose and sugars) Proteins Fats
Intermediates Soluble organic compounds: Volalile fatty acids (mainly acetic acid) Amino acids Long chain fatty acids Organic sulphur and ammonium compounds
Residual products Biogas: Methane (CH4 )
Carbon dioxide (G02) Hydrogen sulphide (H2S)
Slurry: Cellulose-hgnin complexes Inorganic mineral salts Water
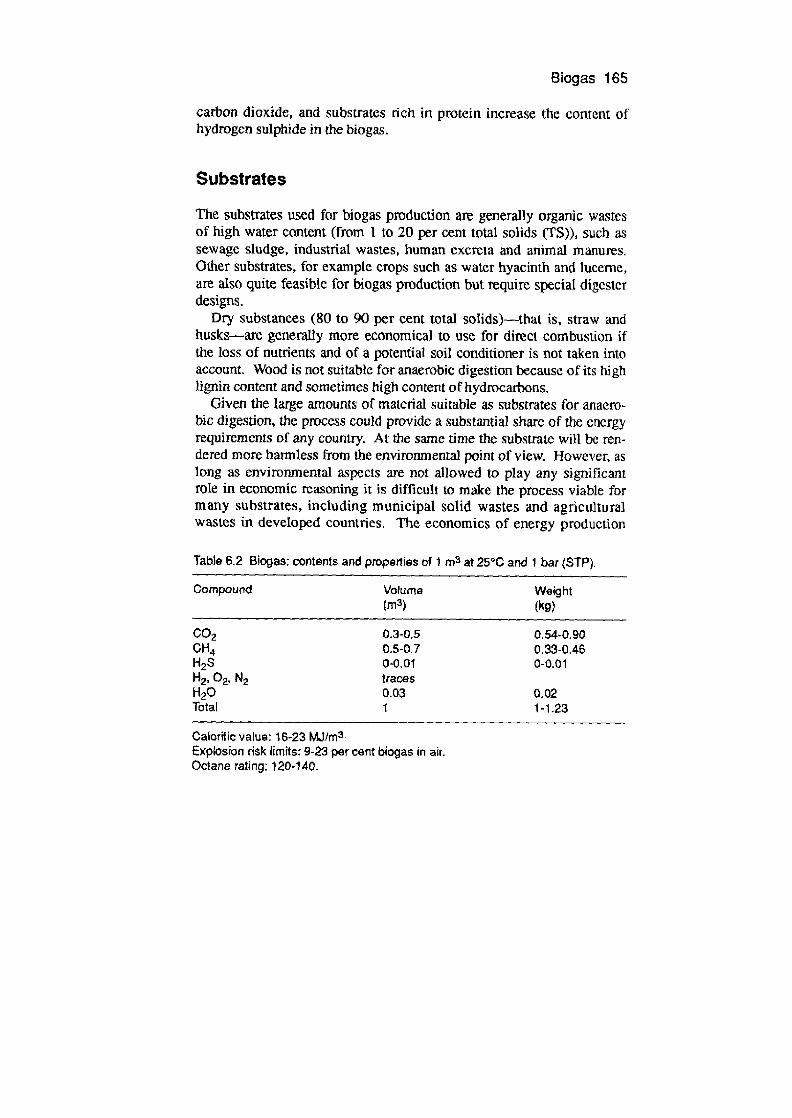
Biogas 165
carbon dioxide, and substrates rich in protein increase the content of hydrogen suiphide in the biogas.
Substrates
The substrates used for biogas production are generally organic wastes of high water content (from Ito 20 per cent total solids (TS)), such as sewage sludge, industrial wastes, human excreta and animal manures. Other substrates, for example crops such as water hyacinth and lucerne, are also quite feasible for biogas production but require special digester designs.
Dry substances (80 to 90 per cent total solids)—that is, straw and husks—are generally more economical to use for direct combustion if the loss of nutrients and of a potential soil conditioner is not taken into account. Wood is not suitable for anaerobic digestion because of its high lignin content and sometimes high content of hydrocarbons.
Given the large amounts of material suitable as substrates for anaero-bic digestion, the process could provide a substantial share of the energy requirements of any country. At the same time the substrate will be ren-dered more harmless from the environmental point of view. However, as long as environmental aspects are not allowed to play any significant role in economic reasoning it is difficult to make the process viable for many substrates, including municipal solid wastes and agricultural wastes in developed countries, The economics of energy production
Table 6.2 Blogas. contents and properties of I m3 at 25°C and 1 bar (STP).
Compound Volume Weight (m3 ) (kg)
c02 0.3-0.5 0.54-0.90 OH4 0.5-0.7 0.33-0.46 H2S 0-0.01 0-0.01 H2 , 02, N2 traces H20 0,03 0.02 Total 1 1-1.23
Calorif ic value: 16-23 MJIm3 Explosion risk limits: 9-23 per cent biogas in air. Octane rating: 120-140.
166 A. Eltegârd
only rarely provide sufficient reason for the construction of a biogas plant.
Biogas plants
One of the great attractions of anaerobic digestion is the very simple nature of the process. All that is required is a gas-proof container for the material to stay in for the appropriate time period. A number of different designs and operation regimes have been tried in order to increase the yield and to improve ease of handling.
Biogas plants or anaerobic digesters have been developed along dif-ferent lines during the past 90 years. Plants for treating sewage, indus-trial and municipal wastes have developed into highly sophisticated biotechnical units (Stafford et al. 1980; van den Berg et al. 1980). Plants for treating agricultural wastes have been developed in industrialized countries, but economic viability is not yet apparent (Edelmann 198).
The simplest pmcess is batch operation, where the plant is filled with the substrate material, together with a suitable inoculation to enable the appropriate bacterial populations to predominate. When digestion is considered complete (that is, when gas production has fallen to a low level) the material is removed from the digester and a new batch is started. Thus gas production is variable. In order to achieve constant gas production from a batch system, it is necessary to have two or more digesters operating Out of phase. Batch operation is feasible for such non-liquid materials as vegetable matter, straw, leaves and drier manures. The process is sometimes referred to as 'dry anaerobic diges-tion', and has been proved feasible at TS concentrations as high as 30 per cent. Using substrates of higher solids content would bring down reactor costs greatly (Wong-Chong 1975; Wujcik and Jewell 1980).
The most common operation in small-scale biogas plants is the semi-continuous process, where fresh material is fed once or twice per day, and an equal volume is dispelled from the digester. This mode of opera-tion is appropriate when the material is a fluid and moves through the digester by gravity or by pumping.
Other developments include tubular flow (plug-flow) designs to reduce the necessity of mixing (see Hayes et al. 1979; Hawkes et al. 1980; Bulmer et al. 1985b); two-stage designs, where a short-retention primary step for acid hydrolysis is placed before the biogas-producing
Biogas 167
step (see Pohiand and Ohosh 1971; (ihosh and Klass 1978; Smith et al. 1977; Ng and Chin 1986); and plants in which the anaerobic digester is coupled with an aerobic digester either before or after the biogas pro-cess. The aerobic digester increases the temperature of the material and reduces the amount of harmful micro-organisms in it (Appleton et al. 1986).
For dilute waste waters an anaerobic filter has been devised, in which the methanogenic bacteria are settled on a solid phase in the digester (Stevens and van den Berg 1981; Roy and Baumann 1985). Another new development for waste water is the anaerobic 'sludge blanket' pro-cess, where the bacteria are attached to a carrier that is suspended in the digester liquid (Lettinga et at. 1980, 1983).
The anaerobic digestion of solid municipal waste has been tried as a part of the waste-handling system (Wise et al. 1975; Pfeffer 1978), but most commonly the spontaneous process of methane formation in old waste dumps is used, in which case the plant is merely a tube drilled into the landfill (Stone 1974).
In developed countries, anaerobic digestion and biogas production is almost exclusively applied to sewage treatment. The sizes of sewage treatment plants range from a few hundred to several thousand cubic metres of digester volume, with an output of between 100 and 5000 m 3 of biogas per day (2 to 100 GJ/d).
In most developing countries some biogas plants have been built in different applications, most commonly in rather small sizes for family farms, with digester sizes of between 5 and 10 m 3, and a biogas output of from 2 to 4 m3 per day (40 to 80 MJ per day) (El-Haiwagi 1986). Biogas plants are generally installed for improved sanitation and energy production; however they are frequently too expensive for individual ownership in developing countries (see Prasad et al. 1974; Stuckey 1983; Lichtman 1987).
The main impact of small-scale biogas plants has been in the People's Republic of China and in India. Although 7 million biogas plants were built in China in the mid-1970s (Smil 1977), there has since been a strong decline in new installations (Jiazao and Heli 1986; Bhatia et al. 1988). India had 280 000 biogas plants in 1983 and the present five-year plan (1985 to 1990) aims at 6 million plants before 1990 (Moulik et al. 1986), with about 700 000 built by 1988.
The most common type of digester in China is the so-called fixed-dome plant (van Buren 1979; Ru-Chen and Thi-Ping 1981), where the

168 A. El!egârd
whole digester is built from bricks or stone. In India the predominant model until recently has been the floating-drum plant, where the gas is collected on top of the digester under a floating steel drum (Singh 1972; KVIC 1977).
Biogas use
In general, the most economic use of biogas is for heating through direct combustion in a stove or furnace. The heat is used for cooking or space-heating. Another very attractive end-use is for illumination, especially in rural areas of developing countries where other light sources are scarce. If a barium chloride impregnated mantle is placed over the Tamp-burner a relatively bright light results.
If electricity is required, biogas can be used for propelling an internal combustion engine which in turn drives the electric generator. Otto engines (four-stroke with electric ignition) can be used after very minor alteration. Diesel engines can be used but still require some oil (5 to 15 per cent) for satisfactory operation. The amount of hydrogen suiphide produced means that wear on both types of engines can be quite heavy.
In some developing countries (for example, China and India) biogas plant utensils are produced. These include burners, lamps, valves and gas engines appropriate for use with small biogas plants.
It is costly to purify and compress biogas to high pressures, both from the economic and energetic point of view (Stafford et al. 1980), and this makes it difficult to use biogas as a mobile fuel in most applications. Biogas may be stored in a large plastic or rubber bag for mobile applica-tions.
Table 6.3 Use of biogas.
I m3 of biogas is enough for:
Cooking: three meals for a family of 5 (China) Lighting: equal to a 60 watt bulb for 6 hours Driving: a 3 tonne lorry for 2.8 km Running: a I hp engine for 2 hours Generating: 1.2 kWh of electricity
Source: after van Buren 1979.
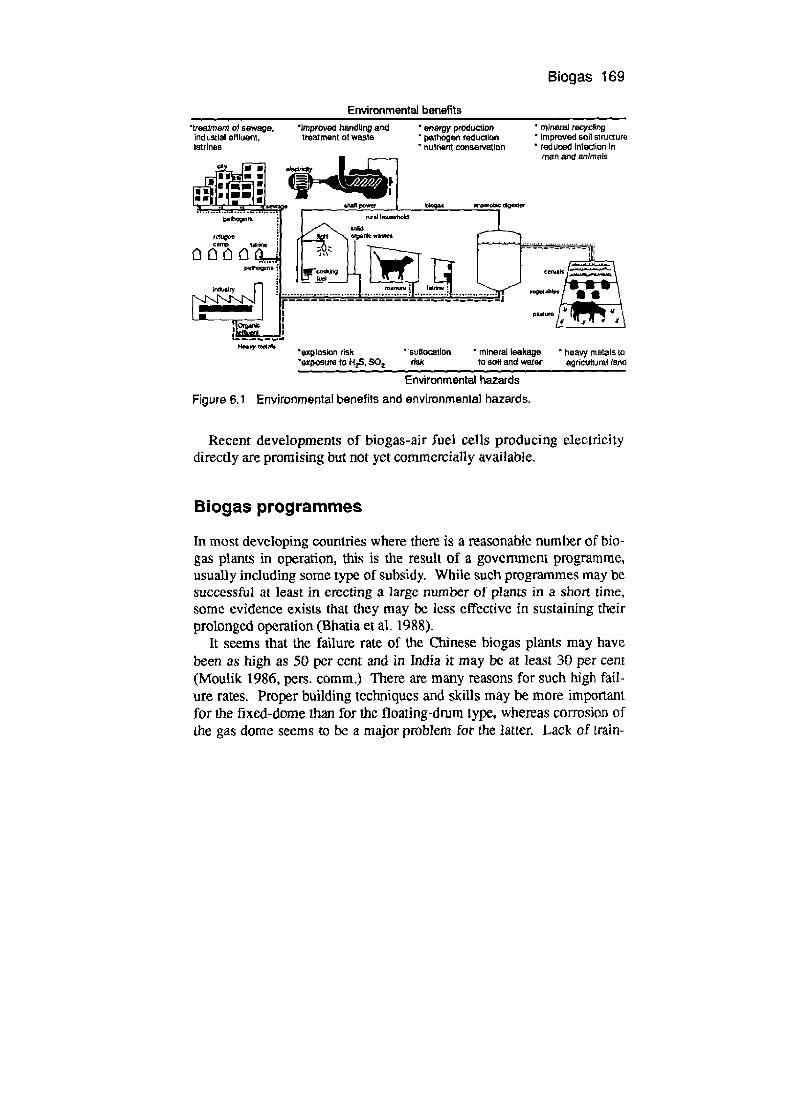
Biogas 169
Environmental benefits ireanani of sewage, improved handing and industial effLuent, treatment of waste latrines
energy production 'mineral reycrrg pathogen reduction improved soil struure nutrient conservation • reduced infection in
man and animals
UnSet nbC ligate!
1 I
rc(ç44
T* IattUy fl
Je,eyThliaIe exploslon risk sutlocation • mineral leakage heavy metals to exposura to 112S, $02 risk to salt and water agricultural two
Environmental hazards Figure 6.1 Environmental benefits and environmenlal hazards.
Recent developments of biogas-air fuel cells producing electricity directly are promising but not yet commercially available.
Biogas programmes
In most developing countries where there is a reasonable number of bio-gas plants in operation, this is the result of a government programme, usually including some type of subsidy. While such programmes may be successful at least in erecting a large number of plants in a short time, some evidence exists that they may be less effective in sustaining their prolonged operation (Bhatia et al. 1988).
It seems that the failure rate of the Chinese biogas plants may have been as high as 50 per cent and in India it may be at least 30 per cent (Moulik 1986, pers. comm.) There are many reasons for such high fail-ure rates, Proper building techniques and skills may be more important for the fixed-dome than for the floating-drum type, whereas corrosion of the gas dome seems to be a major problem for the latter. Lack of train-
170 A. Ellegârd
ing and support of the extension officers, and thus of the users, may also be important factors leading to improper operating practices and failure.
A commercial approach to biogas implementation has been tried in Nepal, and in this case it seems to have been successful, although the numerical target of the programme is limited when compared to those in China and India.
Research and the development of new techniques and system applica-tions goes on in many developing countries (Buliner et al. 1985a,b; Jiazao and Heli 1986; UNES 1987). Experimentation covers new digester designs and materials (such as plug-flow processes, plastic membrane covers), different heating and insulation measures, biotechni-cal improvements to increase the digestion rate, and biogas installations in social environments other than family faims (these include commu-nity plants, and biogas plants in connection with latrines).
The ecological setting
Biogas is produced from biomass, and the compounds set free do not add to the net pollution of air, soil and water, in marked contrast to pro-cesses using fossil fuels. The combustion of biogas is cleaner and more effective than the burning of biomass, and harmful hydrocarbons are not formed. The end product, the sludge, retains the ammoriium and other minerals contained in the original biomass, which makes it an excellent fertilizer. In addition, the process provides a public health benefit because the reduction of pathogens present in the substrates goes beyond that of any other treatment likely to be used in rural areas of developing countries (NAS 1977).
Air pollution
Air pollution from the combustion of biomass is a major threat to the health of millions of women in developing countries (Smith 1986; Vohra 1981): wood and agricultural wastes are often burned in low-efficiency stoves, and often indoors without adequate facilities for smoke extrac-tion. Where it is possible to substitute biogas for biom ass fuels for cook-ing and heating, air pollution problems are reduced. This is often cited as one of the major advantages of biogas, especially in those cases where women have had a say in the matter (PRAD 1980).

Biogas 171
Fertilizer
The biological process of anaerobic digestion mineralizes organic mate-rial during the fonnation of methane and carbon dioxide. Thus, mainly carbon is extracted during the anaerobic process, leaving the minerals for use as fertilizer after the digestion is complete.
During the anaerobic process, organically bound minerals are freed to some extent. As organic matter is digested during the process, the resulting slurry contains a higher concentration of minerals than the input material on a dry weight basis (Moawad et aL 1986). Mineraliza-tion of nitrogen from digested slurry has been observed to be greater than from composted slurry (Laura and Idnani 1972). It may be noted, though, that the process does not add any minerals to the slurry: it merely changes their chemical composition.
The mineralization of nutrients is advantageous when the slurry is used immediately and correctly. Then it can be shown that crop yields increase compared to plots fertilized with farmyard manure (van Buren 1979; Krishnappa et al 1979; Alaa-el-Din et al. 1986), or at least equal that yield (Nemming 1980). The utilization of nitrogen also seems to be greater from digested slurry than from farmyard manure. However, allowing the slurry to dry prior to application may result in excessive nitrogen losses from evaporation. This is especially the case in basic soils, where more of the ammonium will be convened to ammonia. Moreover, if the effluent is badly managed, the minerals may constitute an environmental hazard through leakage and contamination of ground water and wells.
The handling of effluent is sometimes a problem, since it is water-logged and heavy to carry. It is easier to handle if it has been left to dry and the water (and minerals) allowed to trickle away before spreading on the fields (Laura and Idnani 1972). In fact, persons from higher-income groups have been observed to take less responsibility for the care of the slurry (Subranianian 1977).
Another aspect of the utilization of organic fertilizers such as biogas slurry is the positive effect they have on the physical properties of the soil; infiltration properties, bulk density, aggregate stability (Kladivko and Nelson 1979) and cation exchange capacity (Epstein et al 1976). Alaa-ei-Din et al. (1986) reported that long-term application of organic manures (over 36 years) improved the yield by 30 to 300 per Cent over a similar amount of nitrogen supplied through chemical fertilizer. This

172 A. Ellegârd
effect was attributed both to improved physical properties and to the application of micronutrients with the organic fertilizer.
In spite of the cited benefits of the slurry, there is also some evidence of reduced crop yield from the use of the digested slurry supematant, or the slurry itself in some instances. This effect may be the result of the excessive application of minerals, especially sulphur from 11 2S (Moawad et al. 1986; Zohdy et al. 1986), or excessive ammonia volatilization (Korkman 1980; Field et al. 1986). Dahiya and Vasudevan (1986) observed lower crop yield from biogas manure when compared to the yield from the corresponding amount of nitrogen added as chemical fer-tilizer.
When municipal and industrial waste water is the origin of the digested slurry, other environmental effects of the application on agricul-tural land must be considered. In such sludges the content of hannful elements may be discouragingly high because of the poor design of sewage networks and the chemical treatment steps of sewage plants. Thus Fitzgerald (1980) found an increase in heavy metal content in soils where sewage sludge had been applied, in grass grown on such soils, and in the tissues of animals feeding on that grass (Chicago sewage sludge, Illinois) In these applications it is nccessary to monitor the composition of the sludge prior to utilization on agricultural land.
The anaerobic process is one of the few processes known to degrade harmful organic compounds, e.g. chlorinated aromatic and alifatic com-pounds (Dolfing and Tiedje 1988, Egli et al. 1988).
In conclusion, the practice of biogas production from organic matter must be viewed as beneficial from the point of nutrient supply to agricul-tural lands. When compared to composting it is superior because the evaporation of ammonia and the leakage of nitrates are reduced. When compared to combustion of organic matter it is superior since nutrients are recycled, and since the residual organic matter improves the structure of the soil.
The correct management of the effluent is crucial to the acquisition of these benefits, however. Biogas slurry should be applied to the land quickly, and preferable injected or immediately ploughed down to mini-mize risks of evaporization. In the meantime, it should be stored so that minimal leaks of minerals occur to ground water and wells.

Biogas 173
The hea'th aspects of biogas production
The anaerobic digestion of waste products reduces the risk of spreading pests with infected wastes (primarily faecal material, sewage and infected manures). There are two reasons for this. The first is that the anaerobic digestion bacteria reduce the amount of prime substrates (such as fatty acids) for other bacteria to thrive upon, and there is competition for essential compounds, such as amino acids (Langley et at. 1959). The other reason is that the pests are trapped in the process-parasite eggs by sedimentation and viruses by aggregation to sludge particles (McGarry and Stainforth 1978; Sanders et al. 1979). This increases the time of exposure to the digestion process and thus the chance of destruction of the pests. The hygienization is better at higher temperatures (above 50°C) and at longer digestion times, but it is not complete. Most of the experience has been gained with sewage treatment processes, and care should be taken in applying the results to ambient temperature digesters.
While some pathogenic bacteria (Vibrio choleraca, Salmonella spp., Shigella spp., Escherichia coil) are almost completely destroyed during mesophilic anaerobic digestion, others are more resistant (Clostridia spp., Mycobacteria) (Langley et at 1959; Howard and Lloyd 1978; El-Dassel et a! 1986: TawIlk et al. 1986a).
Helminthic parasite eggs of, for example, roundworm (Ascaris), tape-worm and hookworm seem to be more resistant, though in general their viability is reduced (Fitzgerald and Ashley 1977; McGarry and Stainforth 1978; Marti et at. 1980; Hansen 1981; Tawfik 1986).
The protozoan Entamoeba histolytica failed to survive sewage treat-ment, according to Fitzgerald (1979).
Poliovirus are inactivated in sewage treatment to a degree, but for complete removal mesophilic digestion is not enough; heat treatment must be added (at above 50°C) (Ward and Ashley 1976; Sanders et al. 1979). Reovirus type 1 and bovine Enteroviruses were inactivated at mesophilic digestion for 20 days, but bovine Parvovirus was not com-pletely inactivated even with pasteurization (Wekerle et al. 1985).
In order to completely remove pathogens from the spent slurry from biogas plants it is necessary to employ further treatment (Foo and Foo 1979). Composting of the effluent at temperatures higher than 60°C seems to be completely effective in destroying pathogens (Fitzgerald 1979; Wiley and Westerberg 1969), but there is some disagreement con-
174 A. Ellegârd
cerning the need to guarantee complete hygienization (Appleton et al 1986; Leclerc 1973).
In general, the substrates for anaerobic digestion are not sufficiently infected to warrant any special precautions regarding the handling of effluent. In some cases, however, this is necessary—for example, when the biogas process is fed substrates that can be suspected of containing large amounts of pathogens, like faecal material in areas where enteric and parasitic diseases prevail, manure from infected animals, sewage from hospitals or refugee camps.
However, in most cases the pathogens are quite quickly killed when the slurry is applied in natural ecosystems and the risk of reinfection is greatly reduced if grazing or the consumption of fresh vegetables grown on the land is not allowed for some time after the application of sludge (Tawfik 1986; Edmonds 1976).
The hazards of bogas
Biogas, like all combustible gases, carries with it a danger of explosions if it is mixed with an oxidant in critical proportions (see table 6.2). Thus, care must be taken to close valves when the gas is not in use, and to avoid the installation of gas lines in places where they may be exposed to wear and tear. Explosions are fortunately extremely rare in connection with biogas installations, but explosions, sometimes with fatal results, resulting from methane formation in landfills have been reported (Martyny et al. 1979)
The main constituents of biogas—methane and carbon dioxide—are not poisonous. The main risk is of suffocation while entering a space which contains biogas. It is very dangerous to enter the digestion com-partment of a biogas plant, which might be necessary from time to time for cleaning or repair.
Biogas sometimes contains rather high concentrations of hydrogen sulphide (112S), which is a very poisonous, foul-smelling gas. The latter is also very corrosive, both in the reduced state as H2S and after combus-tion when it is oxidized to form sulphur dioxide (SO2), which is later converted to sulphuric acid (H2SO4). Staying in a room with a leak of biogas containing H 2S is initially very unpleasant due to the smell; fur -ther exposure leads to a headache, then to loss of consciousness and
Biogas 175
finally to death if the concentration is high enough for sufficient time. Cooking with biogas containing J12S may also cause eye irritation if the kitchen is not adequately ventilated.
The amount of H2S in the biogas depends on the amount of sulphuric compounds (mainly proteins containing cysteine and methionirie) in the substrates. In biogas plants in developing countries using manures from ruminants as the substrate, the amount of H 2S is generally very low because of the low protein content of the fodder. When human excreta or manure from one-stomach animals (such as pigs) is included, the amount of hydrogen suiphide increases.
In small installations in developing countries it is generally impossi-ble (and luckily often unnecessary) to scrub the gas. The gas may be cleaned either by passing it over bog-ore (Fe (OH)3) or iron oxide to take away the H2S, and through a hydroxide solution to take away the CO 2 .
In larger installations it is possible to use differentially permeable mem-brane techniques (Stookey et aT. 1985).
A biogas plant is generally a new type of structure in any surrounding, and it must be appropriately designed. There have been instances where biogas plants have collapsed as a result of faulty design and construc-tion, creating risks to the operator or other persons in the vicinity. The risk of contaminating ground water through direct leakage from the plant should also be taken into account.
Summary
Biogas production through anaerobic digestion must generally be viewed as a sound technology from the environmental point of view, it will not cause any net increase in the circulation of minerals since it only makes use of those that are already incorporated in the free circujation. It does not cause concentration of harmful solid or liquid compounds that can be hazardous for humans or animals. On the contrary, a well-managed plant reduces environmental degradation by recycling nutrients and the substitution of biom ass and fossil fuels. In addition, the spread of pests and patbogens through infected manure and excreta is reduced.
The main environmental risk of biogas production is probably con-nected with the handling of effluent, which could contaminate waters (with mineral salts) if it is not stored and distributed properly. The hydrogen su1phide content of the gas is poisonous and corrosive, which
176 A. Eflegard
calls for care when installing gas pipes in buildings. The gas can cause explosions when mixed with air in critical proportions. Finally, there is a risk of suffocation for persons entering the digestion chamber for cleaning or maintenance.
Negative large-scale effects of biogas production are primarily linked with very large plants, where there may be a risk of a large above-ground digester collapsing causing damage and contamination. This must, however, be considered a quite unlikely event because such plants are usually designed and supervised by skilled personnel.
References Alaa El-Din, M. N., Abd El-Aziz, R., Mabmoud, M. H. and El-Shimi, S.
A. (1986) 'Biogas manure as a complete fertilizer: Feasibility for Egyptian farmers', in M. M. El-Haiwagi (ed.) Biogas Technology, Transfer and Dffusion, Applied Science.
Appleton, A. R., Leong, C. J. and Venosa, A. D. (1986) 'Pathogen and indicator organism destruction by the dual digestion system', Journal Water Pollution Control Federation, 58(10), pp. 992-.
Bhatja, R., Lictttman, R., Pereira, A. and Tentscher, A. (1988) 'The diffusion of biogas systems: A review of some experience', LW (Mimeo, forthcoming).
Bulmer, A., Firilay, J., Futford, U. and Lau-Wong, M. (1985a) 'tetailed designs and financial analysis', Biogas Challenges and Eperiences from Nepal, Vol 2, United Mission to Nepal, Kathmaridu.
Bulmer, A., Finlay, J., Fulford, D. and Lau-Wong, M. (1985b) 'Theoretical treatise', Biogas Challenges and Experiences from Nepal, Vol 1, United Mission to Nepal, Kathmandu.
Dahiya, A. K. and Vasudevan, P. (1986) 'Biogas plant slurry as an alternative to chemical fertilizers', Biomass, (1) pp. 67-.
DNES (1987) 'Research and development in biogas', Annual Report (1986-87), Dept of Non-conventional Energy Sources, Ministry of Energy, Government of India.
Doffing, J. and Tiedje, J.M. (1988) 'Microbial degradation of chlorinated aromatic compounds: The anaerobic option' in: Poster Papers, 5th Ira. Symph. on Anaerobic Digestion, eds A. Tilche and A. Rozzi, Bologna, Monduzzi Editori.
Edclmann, W. E. (1985) 'The feasibility of biogas production on modem

Biogas 177
farms', in H. Egneus and A. Eilegãrd (eds), Bioenergy 84, Vol 1, pp 297-304, Applied Science.
Edmonds, R. L. (1976) 'Survival of coliform bacteria', Applied and Environmental Microbiology 32(4).
Egli, C., Scholts, R., Tschan, T, Thi:ier, M., Cook, A. M. and Leisinger, T. (1988) 'Complete anaerobic degradation of tetrachloromethane, monoctiloroacetate and dichioroacetate' in: Poster Papers, 5th Tnt. Symp. on Anaerobic Digestion, eds A. Tilche and A. Rozzi, Bologna, Monduzzi Editori.
El-BasseT, A., Gamal-el-Din, H., Ohazi, I. M. and Soodi, 0. (1986) 'Survival of pathogens and parasites during the anaerobic digestion of organic wastes', in M. M. E1-Halwagi (ed.), Biogas Technology, Transfer and Diffusion, Applied Science.
El-Haiwagi, M. M. (ed.) (1986) Biogas Technology, Transfer and Diffusion, Applied Science.
Field, J. A., Reneau, R. B., Kmontje, W. and Caidwell, J. S. (1986) 'Utilization of anaerobically digested poultry manure effluent nitrogen as fertilizer', Transactions of the ASAE, 29(1), pp. 223-.
Fitzgerald, P. R. (1979) 'Potential impact on the public health due to parasites in soil/sludge systems', Proc. 8th Nat. Conf. Municip. Sludge Management, pp. 2 14-221, Miami Beach, Florida.
Fitzgerald, P. R. (1980) 'Observations on the health of animals exposed to anaerobically digested sludge originating in the metropolitan sanitary district of Greater Chicago', Sludge... Health Risks of Land Application, pp. 267-, Ann Arbor Science.
Fitzgerald, P. R. and Ashley, R. F. (1977) 'Differential survival of Ascaris ova in wastewater sludge', Journal Water Pollution Control Federation, July, pp. 1722-.
Foo, E. L. and Foo, A. S. (1979) 'Health aspects of the use of wastes for biogas production: Survival of bacterial pathogens in a biogas digester', MIRCEN Newsletter.
Ghosh, S. and Kiass, D. L. (1978) 'Two-phase anaerobic digestion', Process Biochemistry, April, 15-24.
Hansen, S. (1981) 'Viability of pathogenic parasites and bacteria in the anaerobic process', Stub Programme, 2nd Tnt. Symp. on Anaer. Dig. Travemunde.
Hawkes, F. R., Floyd, J. R. S. and Hawkes, D. L. (1980) 'Operation of a laboratory-scale plug flow type of digester on pig manure', Energy from Biomass Conference, Brighton, 4-7 Nov. 1980.
178 A. EIIegrd
Hayes, J. D., Jewell, W. J., Dell'Orto, S., Fanfoni, K. J., Leuschner, A. P. and Sherman, D. F. (1979) 'Anaerobic digestion of cattle manure', 1st mt. Syrnp. on Anaerobic Digestion, Cardiff, UK, 17-21 Sept.
Hobson, P. N. (1973) 'The bacteriology of anaerobic sewage digestion', Process Biochemistry, January, 19-25.
Howard, J. and Lloyd, B. J. (1978) 'Sanitation and disease in Bangladesh urban slums and refugee camps', Progress in Water Technology, 11(1-2), pp. 191-200.
Jiazao, L. and Hell, D. (1986) 'The experience of the development and research of biogas technology in the rural areas of China', in M. M. E!-Halwagi (ed), Biogas Technology, Transfer andDffusion, Applied Science Pub!.
Kladivko, E. J. and Nelson, D. W. (1979) 'Changes in soil properties from application of anaerobic sludge', Journal Water Pollution Control Federation, 5](2), 325-32.
Korkman, J. (1980) 'Metanjäsning och Slanimets Gödselvärde', Biogas fran Gädsel ac/i Slam, 4, 87-90, Nordforsk, Esbo, Finland.
Krishnappa, A. M., Ranganna, B., Dcshpande, P. B. and Venkatrao, B. V. (1979) 'Gobar gas plant sludge is superior to fann yard manure', Current Research 8, 41-2.
KVIC (1977) 'Gobar gas why and how', Kliadi and Village Industries Commission, Bombay, India.
Langley, H. E., McKinney, R. E. and Campbell, H. (1959) 'Survival of Salmonella typhosa during anaerobic digestion, II, The mechanism of survival', Sewage and Industrial Wastes, 31(l).
Leclerc, H. (1973), 'Sanitary aspects of sludge treatment', Water Research, 7, 355-60.
Lettinga, 0., Roersma, R. and Grin, P. (1983) 'Anaerobic treatment of raw domestic sewage at ambient temperatures using a granular bed UASB reactor', Biotechnology and Bioengineering, 25, 170 1-23.
Lettinga, G., Van Velsen, A. F, Hobma, S. W, De Zeeuw, W. and Klapwijk, A. (1980) 'Use of the uptiow sludge blanket (USB) reactor concept for biological wastewater treatment, especially for anaerobic treatment', Biotechnology and Bioengineering, 22(4), 699-734.
Lichtman, R. (1987) 'Toward the diffusion of rural energy technologies', World Development, 15(3), 347-74,
McGarry, M. G. and Stainforth, J. (eds) (1978) 'Compost, fertilizer and
Biogas 179
biogas production from human and farm wastes in the People's Republic of China', IDRC TS8E.
Mah, R. A., Ward, D. M., Baresi, L. and Glass, T. L. (1977) 'Biogenesis of methane', Annual Review of Microbiology, 31, 309-41.
Marti, 0. G., Booram, C. V. and Hale, 0. M. (1980) 'Survival of eggs and larvae of swine nematode parasites in aerobic and anaerobic waste treatment systems', Journal of Environmental Quality. 9(3), pp. 401-.
Martyny, J. W., Kennerson, D., Wilson, B and Lott, C. E. (1979) 'Landfill-associated methane gas a threat to public safety', Journal of Environmental Health, 41(4), 194-7.
Moawad, H., Zohdy, L. I., Badr El-Din, S., Khalafallah, M. and Abdel-Maksoud, H. (1986) 'Assessment of anaerobically digested slurry as a fertilizer and soil conditioner', in M. M. El-Halwagi (ed), Biogas Technology, Transfer and Diffusion, Applied Science.
Moulik, T. K., Singh, J. B. and Vyas, S. K. (1986) 'The biogas program in India', in M. M. El-Haiwagi (ed.), Biogas Technology, Transfer and Diffusion, Applied Science.
NAS (1977) 'Methane generation from human, animal and agricultural wastes', Report of an ad hoc panel on technology innovation, National Academy of Sciences, Washington DC.
Nemming, 0. (1980) 'Markforsög med afgasset gyfle', Biogasfrn Gödsel och SIam, 4, pp. 91-4, Nordforsk, Esbo, Finland 24 Sept.
Ng, W. J. and Chin, K. K. (1986) '2-stage anaerobic digestion of piggery wastewaters', Water Science and Technology, 18(3), pp. 149-.
Pfeffer, J. T. (1978) 'Methane from urban solid waste-the Repcom Project', Process Biochemistry, June, 8-11.
Poliland, F. G. and Ghosh, S. (1971) 'Developments in anaerobic stabilization of organic wastes-the two-phase concept', Environmental Letters, 1(4), 255-66.
PRAD (1980) 'India's first community biogas plant, Fateh Singh-Ka-Purwa, distr, Etawah, U.P.', Gobar Gas Research Station, Planning Research and Action Division,
Prasad, C. R., Prasad, K. K. and Reddy, A. K. N. (1974) 'Biogas plants: prospects problems and tasks', Economic and Political Weekly, August, pp. 1347-64.
Rijkens, B. A. (1981) 'A novel two-step process for the anaerobic digestion of solid wastes', Symp. Energy from Biomass and Wastes V. Lake Buena Vista, Florida.
180 A. EHegrd
Roy, D. and Baumann, R. H. (1985) 'Attached growth anaerobic conversion process', H. Egneus and A. EllegArd (eds), Bloenergy 84, Applied Science.
RuChen, C. and Thi-Ping, X. (1981) 'The use of water pressure digesters in China', Fuel Gas Production from Biomass, vol. 1, pp. 147-, CRC Press.
Sanders, D. A., Malina, J. F., Moore, B. E., Sagik, B. P. and Sorber, C. A. (1979) 'Fate of poliovirus during anaerobic digestion', Journal Water Pollution Control Federation, vol. 51(2).
Singh, R. B. (1972) 'The biogas plant generating methane from organic wastes', Compost Science, March.
Smil, V. (1977) 'China claims lead in biogas energy supply', Energy International, June, 25-7,
Smith, K. R. (1986) 'Biomass combustion and indoor air pollution; The bright and dark sides of small is beautiful', Environmental Management, 10(1), 61-74.
Smith, R. E., Reed, M. J., and Kiker, J. T. (1975) 'Two-phase anaerobic diges- tion of poultry waste', American Soc. of Agricultural Engineers (ASAE).
Smith, R. E., Reed, M. J. and Kiker, J. T. (1977) 'Two-phase anaerobic digestion of swine waste, Transactions of the ASAE, 20, 1123-8.
Stafford, D. A., Hawkes, D. L. and Horton, R. (1980) '1. What is a digester?' Methane Production from Waste Organic Matter, pp. 1-29, CRC Press.
Stevens, T. G. and van den Berg, L. (1981) 'Anaerobic treatment of food processing wastes using a fixed-film reactor', Purdue International Waste Conference 1981, May 12-14, Purdue Univ., Lafayette, iN.
Stone, R. (1974) 'Methane reclaimed from an old landfill', Public Works, May, pp. 70-.
Stookey, D. J., Boustaky, K. and Kilgour, R. L. (1985) 'Recovery of methane from biogas with monsantos prism (TM) separators', in R. Egneus and A. Ellegârd (eds), Bioenergy 84, vol. 3, pp. 49-, Applied Science.
Stuckey, D. C, (1983) 'Technology assessment study of biogas in developing countries', IRCWD, UNDP/World Bank Project GLO/80/003.
Subrarnanian, S, K. (1977) 'Biogas systems and sanitation in developing countries', Symp. Sanitation in Developing Countries Today, Oxfam, Ross Inst. of Tropical Hygiene, Oxford, 5-9 July.

Biogas 181
Tawflk, M. A. (1986) 'Health risks associated with the use of biogas slurry: an introductory mote', in M. M. El-Halwagi (ed.), Biogas Technology, Transfer and Diffision, Applied Science.
Tawlik, M. A., Hegazi, A. C., Soufy, H. and Alui, L. (1986) 'Incidence, persistence and control of some pathogens during anaerobic digestion of organic wastes', in M. M. Ef-Haiwagi (ed.), Biogas Technology, Transfer and Diffusion, Applied Science.
van Buren, E. A. (1979)A Chinese Biogas Manual, IT Publications. van den Berg, L., Lent, C. P. and Armstrong, D. W. (1980), 'Anaerobic
waste treatment efficiency comparisons between fixed film reactors, contact digesters and fully mixed continuously fed digesters', 35th Purdue International Waste Conference 1980, 13-15 May, Purdue Univ., Lafayette, IN.
Vobra, K. (1981) 'Rural and urban energy scenario of the developing countries and related health assessment', Health Impacts of Different Sources of Energy: IAEA Symp., pp79-97, IAEA Paper, Nashville.
Ward, R. L. and Ashley, C. S. (1976) 'Inactivation of poliovirus in digested sludge', Applied and Environmental Microbiology, 31(6), pp. 921-.
Wekerle, J., Leuze, M. and Koch, K. (1985) 'Virus inactivating effect of anaerobic mesophilic digestion of municipal sludge with or without different preceding types of treatment', Water Science and Technology. 17, 175-84.
Wiley, B. B., Westerberg, S. C. (1969) 'Survival of human pathogens in composted sewage', Applied Mwrobiology, 18(6).
Wise, D. L., Sadek, S. E., Kispert, R. C., Anderson, L. C. and Walker, D. H. (1975) 'Fuel gas production from solid waste', Biotechnology and Bioengineering Symposium, pp 285-301.
Wolfe, R. S. (1971) 'Microbial formation of methane', Advances in Microbial Physiology, 6, 107-45.
Wong-Chong, G. M. (1975) 'Dry anaerobic digestion', in W. J. Jewell (ed.), Energy Agriculture and Waste Management, Ann Arbor.
Wujeik, W. J. and Jewell, W. J. (1980) 'Dry anaerobic fermentation', Biotechnol. and Bioeng. Symp. No. 10, pp. 43-65.
Zeikus, J. G. (1977), 'The biology of methanogenic bacteria', Bacteriological Reviews, 41(2), 514-41.
7 Producer gas
B. Kjellström
Applications and economics
Producer gas is generated by the pyrolysis and partial oxidation of biomass sources such as wood and crop residues. It can be considered as one of the possible substitutes for petroleum fuels in both engines and furnaces where either a 'clean fuel' or accurate temperature control is important.
Gasifiers were extensively used for the generation of fuel gas from solid fuels at the beginning of this century. During the Second World War many countries utilized gasifiers to enable vehicle engines to run on domestic solid fuels. When gasoline and diesel oil became available at reasonable cost after the war, the use of gasifiers was rapidly abandoned, but increasing petroleum prices during the 1970s brought a renewed interest in this technology as a means of reducing the dependency on imported petroleum fuels.
The total number of operating producer gas installations is still fairly small—probably less than a few thousand world-wide. The current applications range from large industrial fuel gas generators of 30 000 kW (thermal) for lime kiins in the paper and pulp industry in Sweden and Finland, to small gasifier-operated engines of a few kilowatts for irrigation pumps used by individual farmers in rural areas in developing countries. Figure 7.1 shows flow diagrams for these two main types of application, and table 7.1 shows examples of installations operating in different parts of the world.
Large gasiuiers for boilers and furnaces are used primarily in industri-alized countries, whereas most of the gasifiers used for engine operation
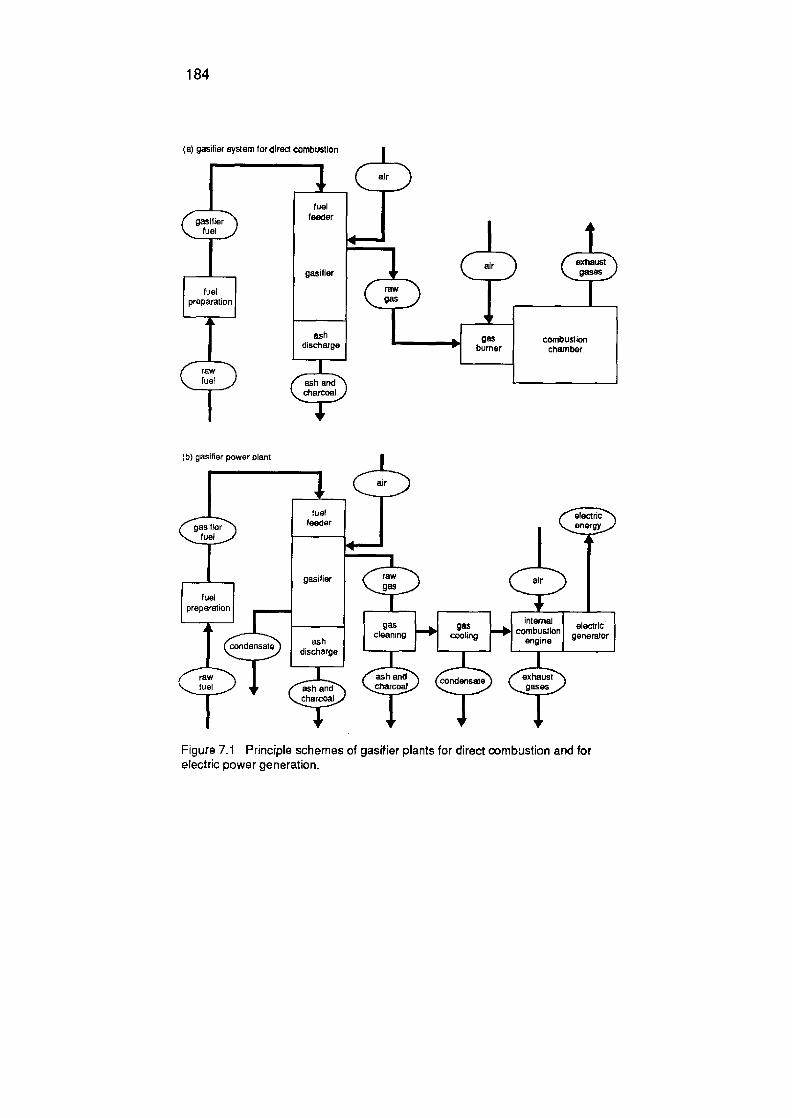
184
a) gasifier system for direct combustion
air
fuel
gasifier feeder *j fue'
gasilier
fuel preparation g
rLV7 ash
discharge
raw fuel ash and
charcoal
(b) gasifier power plant
asifier feeder
fuel
fuef
I raw gas
tuel preparation
I gas J[ccong
gas 1 rntomai combustion
I electric I
asifier
ash cleaning
engine generator
discharge
raw
nde
fuel ash and charcoal gases t 11 charcoai
Figure 7.1 Principle schemes of gasifier plants for direct combustion and for electric power generation.
air
etectric

185
Table 7.1 Exam pies of producer gas plants operating in different paits of the world (1988).
Country Producer gas plants for fuel Producer gas plants for engine
gas generation to furnace or operation boiler
Brazil
China
Lime kiln, Espera Feliz. Two down-draught wood gasiflers, each 640 KW(t). Operating time each more than 19 000 hours.
Furniture factory near Beijing, three 175 kW(t) dowridraught gasifiers using wood waste generating fuel gas for dryers. Operating time unknown. Several other installations for similar purposes and heating of greenhouses are reported to be operating
A few hundred dowridraught wood gasifiers of 30-120 kW reported to be operating. About 1000 crossdraught charcoal gasif lets installed on vehicles. Some also installed for operation of stationary engines. Operating records covering up to 5200 hours available for one installation with 3 units
An unknown number of downdraught wood gasifiers reported to be used for operation of irrigation pump engines in the range 20-100 kW. Operating times unknown
France At least three sawmills with downdraught wood gasiflers for operation of generator sets of 85-1 75 kW(a). Accumulating operating times 600-9000 hours
India
More than 100 downdraught wood gasiflers for engine operation in the power range 5-100kW reported to be installed. Operating records available for 3 kW pumpset, over 1200 hours; 70 kW generator set, over 800 hours
Indonesia Cacao dryer at Rajarnandala, Java, downdraught wood gasifier of about 200 kW(t), over 2500 operating hours
A few village power plants with engines operated by downdraught wood gasifiers; examples: Kebon Belong 14 kW(e), over 11000 hours, Jambi 35 kW(e). over 1800 hours
con.

10 Table 7.1 (continued) Examples of producer gas p/ants operating in different parts of the world (1988).
Country
Mali
Paraguay
Producer gas plants for fuel gas generation to furnace or boiler
Producer gas plants for engine operation
Rice mill, Dogofin. Downdraught throatless rice husk gasifier of Chinese design for 160 W(e) generator set. More than 55 000 operating hours
SawmiN in Loma Plata, two downdraught wood gasiflers of about 2.3 MW(t) each, feeding three generator sets of about 300 W(e) each. Operating record covers more than 21 000hours
Thailand Several gas producers for fuel gas generation reported to be operating. Documented experiences are not available
143 installations for 12 W(e) village power'plants using downdraught charcoal gasifier. Some of these are reported to operate successfully; many suffer from problems.
Tanzania
Sawmill in Arusha.Downdraught charcoal gasifler used to operate 30 kW engine. More than 4000 operating hours
Sweden Three updraught wood gasifiers each Two experimental installations, one about 5 MW(t) used for generation of with downdraught wood gasilier for fuel gas for boilers; operating record engine of about 120 kW, one with for each about 10 000 hours circulating fluidized bed gasier for
engine about 500 kW
Three circulating fluidized bed gasifiers of about 30 MW(t) each for generation of fuel gas to time kilns in paper and pulp industry. Operating records from 15000 to 5000 hours
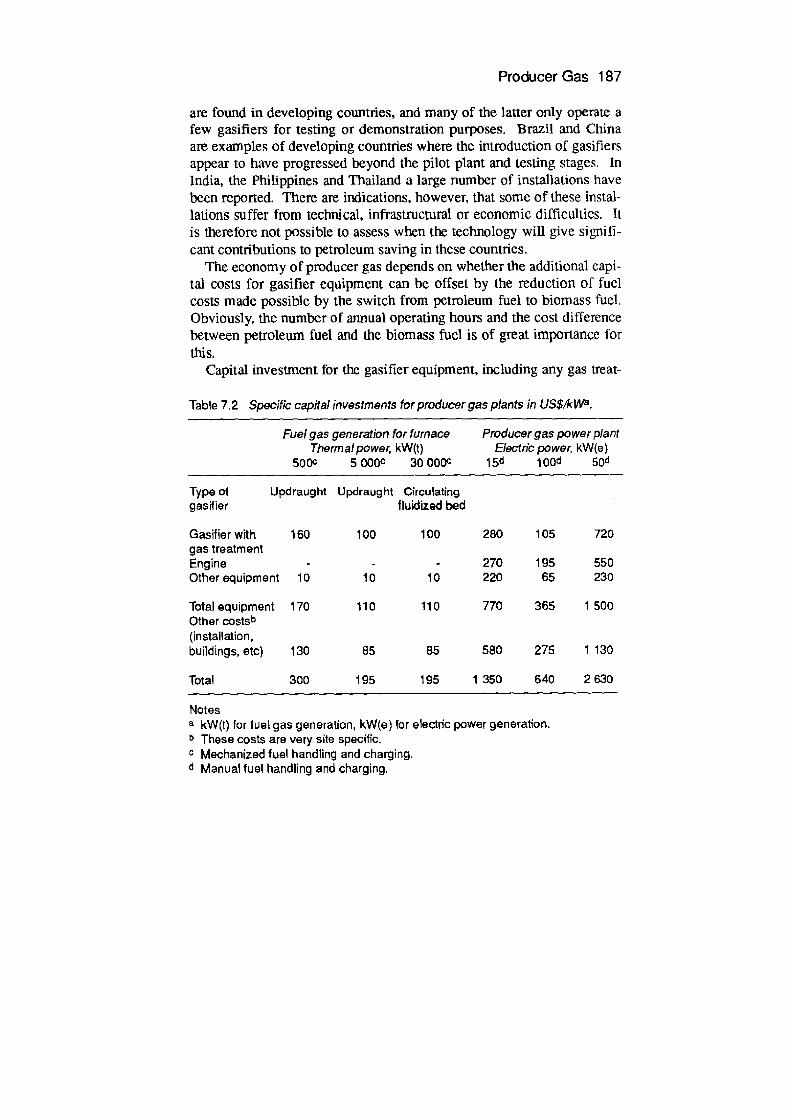
Producer Gas 187
are found in developing countries, and many of the latter only operate a few gasifiers for testing or demonstration purposes. Brazil and China are examples of developing countries where the introduction of gasifiers appear to have progressed beyond the pilot plant and testing stages. In India, the Philippines and Thailand a large number of installations have been reported. There are indications, however, that some of these instal-lations suffer from tecimical, infrastructural or economic difficulties. It is therefore not possible to assess when the technology will give signifi-cant contributions to petroleum saving in these countries.
The economy of producer gas depends on whether the additional capi-tal costs for gasifier equipment can be offset by the reduction of fuel costs made possible by the switch from petroleum fuel to biom ass fuel. Obviously, the number of annual operating hours and the cost difference between petroleum fuel and the biomass fuel is of great importance for this.
Capital investment for the gasifier equipment, including any gas treat-
Table 7.2 Specific capital investments for producer gas plants in US$,kWa.
Fuel gas generation for furnace Thermal power, kW(t)
500C 5 000c 30 000C
Producer gas power plant Electric power, kW(e
lSd lOad 50d
Type of Updraught Updraught Circulating gasifier fluidized bed
Gasilier with 160 100 100 280 105 720 gas treatment Engine - - - 270 195 550 Other equipment 10 10 10 220 65 230
Total equipment 170 110 110 770 365 1 500 Other costsb (installation, buildings, etc) 130 85 85 580 275 1130
Total 300 195 195 1 350 640 2 630
Notes a kW(t) for fuel gas generation, W(e) for electric power generation. D These Costs are very site specific.
Mechanized fuel handling and charging. d Manual fuel handling and charging.
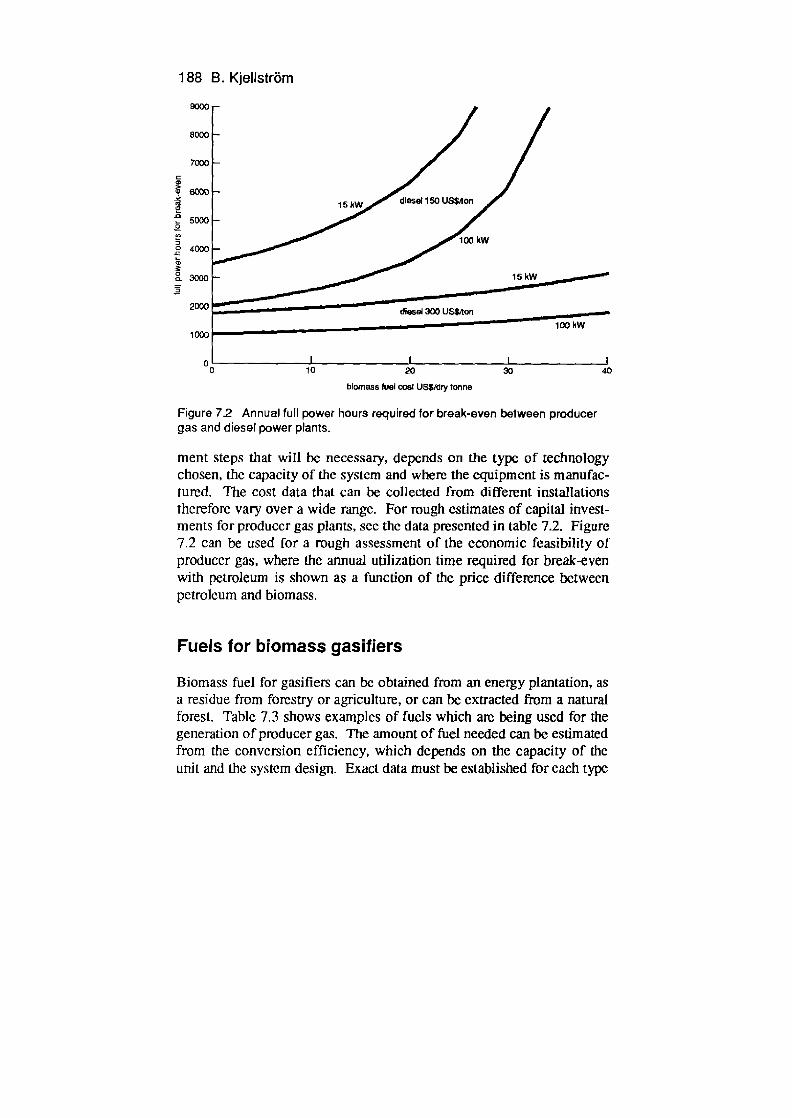
5000 0
.3000 =
188 B. Klellstrom 9000
8000
7000
4000
2000
1000
L_ I 0 10 20 30 40
bomass fu& cost US$fdrytonne
Figure 72 Annual full power hours required for break-even belween producer gas and diesel power plants.
ment steps that will be necessary, depends on the type of technology chosen, the capacity of the system and where the equipment is manufac-tured. The cost data that can be collected from different installations therefore vary over a wide range. For rough estimates of capital invest-ments for producer gas plants, sec the data presented in table 7.2. Figure 7.2 can be used for a rough assessment of the economic feasibility of producer gas, where the annual utilization time required for break-even with petroleum is shown as a function of the price difference between petroleum and biomass.
Fuels for biomass gasifiers
Biomass fuel for gasifiers can be obtained from an energy plantation, as a residue from forestry or agriculture, or can be extracted from a natural forest. Table 7.3 shows examples of fuels which are being used for the generation of producer gas. The amount of fuel needed can he estimated from the conversion efficiency, which depends on the capacity of the unit and the system design. Exact data must be established for each type
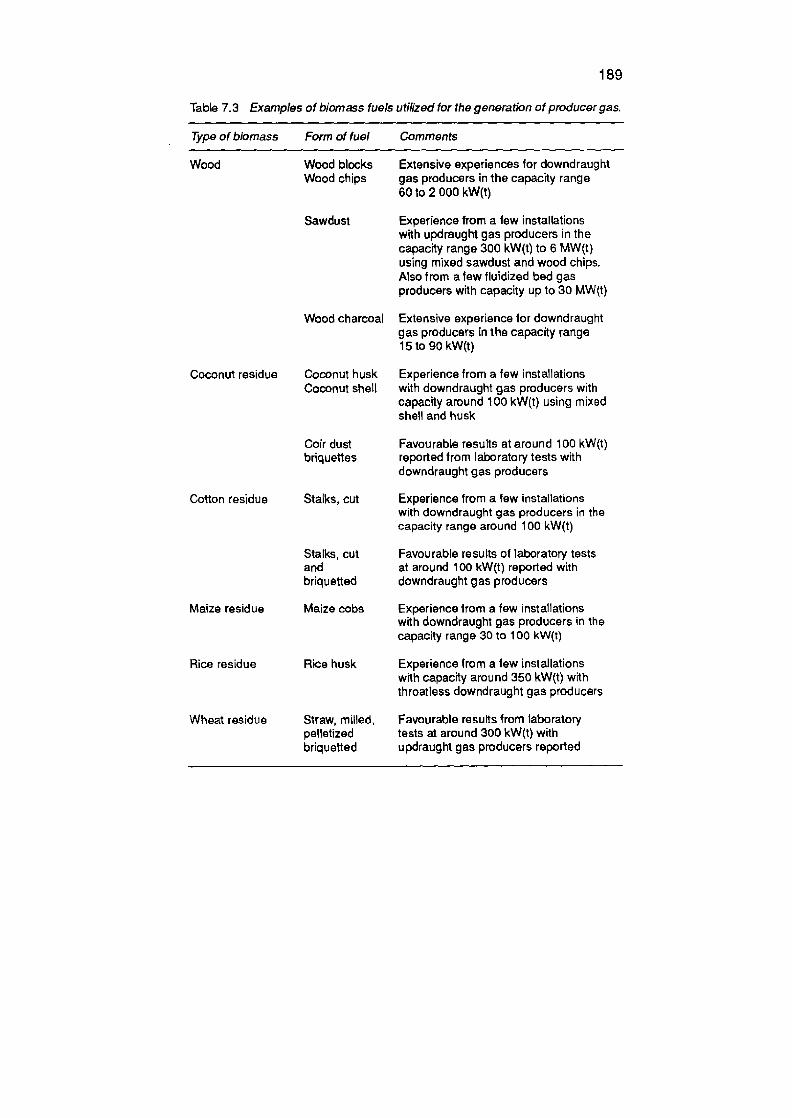
189
Table 7.3 Examples of biom ass fuels utilized for the generation of producer gas.
Type of biomass Form of fuel Comments
Wood Wood blocks Extensive experiences for downdraught Wood chips
gas producers in the capacity range 60 to 2 000 kW(t)
Sawdust Experience from a few installations with updraught gas producers in the capacity range 300 kW(t) to 6 MWt) using mixed sawdust and wood chips. Also from a Jew flu idized bed gas producers with capacity up to 30 MW(t)
Wood charcoal Extensive experience for downdraught gas producers in the capacity range 15 to 90 kW(t)
Coconut residue Coconut husk Experience from a few installations Coconut shell with downdraught gas producers with
capacity around 100 kW(t) using mixed shell and husk
Coir dust briquettes
Cotton residue Stalks, cut
Stalks, cut and briquetted
Maize residue Maize cobs
Rice residue Rice husk
Wheat residue Straw, milled, pelletized briquetted
Favourable results at around 100 kW(t) reported from laboratory tests with downdraught gas producers
Experience from a few installations with downdraught gas producers in the capacity range around 100 kW(t)
Favourable results of laboratory tests at around 100 kW(t) reported with downdraught gas producers
Experience from a few installations with downdraught gas producers in the capacity range 30 to 100 kW(t)
Experience from a few installations with capacity around 350 kW(t) with throatless downdraught gas producers
Favourable results from laboratory tests at around 300 kW(t) with updraught gas producers reported
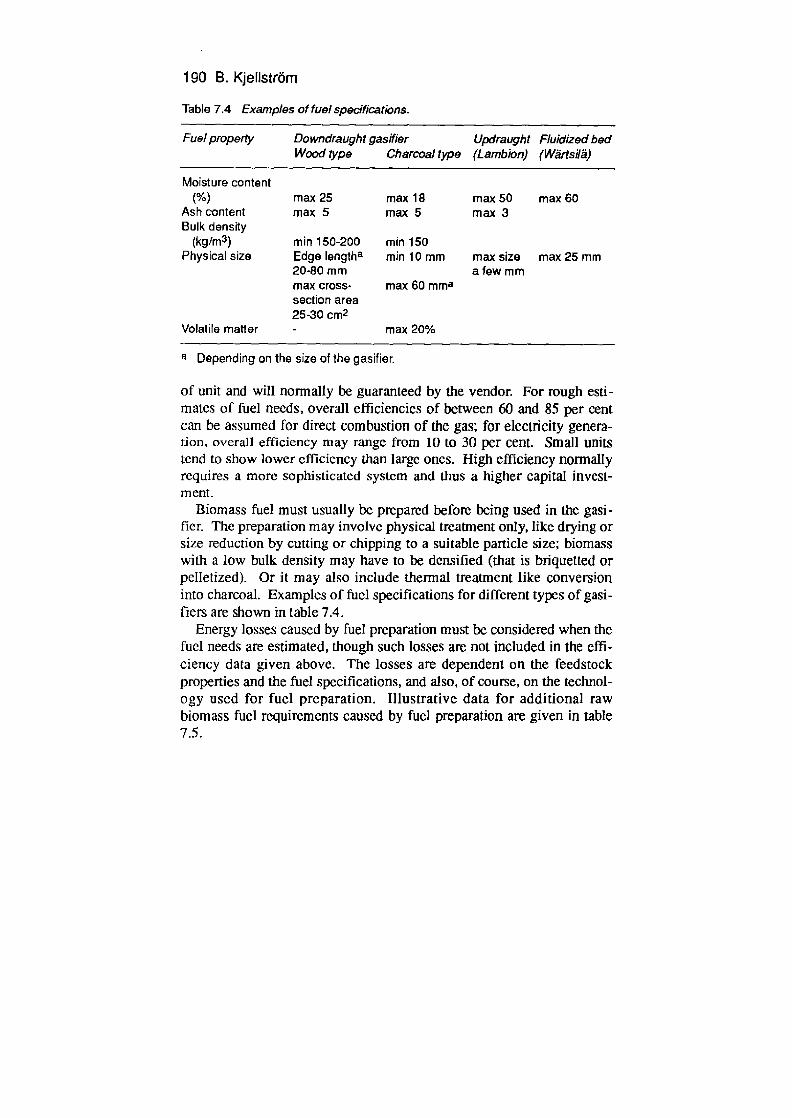
190 B. KjellstrOm
Table 7.4 Examples of fuel specifications.
Fuel property Downdraught gas/tier Updraught Fluidized bed Wood type Charcoal type (Lamb/on) (Wärtsilä)
Moisture content (%) max 25
Ash content max 5 Bulk density
(kg/rn3 ) min 150-200 Physical size Edge lengtha
20-80 mm max cross- section area 25-30 cm2
Volatile matter -
max 18 max 50 max 60 max5 max3
min 150 min 10mm max size max 25 mm
a few mm max 60 mma
max 20%
a Depending on the size of the gasifier.
of unit and will normally be guaranteed by the vendor. For rough esti-mates of fuel needs, overall efficiencies of between 60 and 85 per cent can be assumed for direct combustion of the gas; for electricity genera-tion, overall efficiency may range from 10 to 30 per cent. Small units tend to show lower efficiency than large ones. High efficiency normally requires a more sophisticated system and thus a higher capital invest-ment.
Biomass fuel must usually be prepared before being used in the gasi-11cr. The preparation may involve physical treatment only, like drying or size reduction by cutting or chipping to a suitable particle size; biomass with a low bulk density may have to be densified (that is bnquetted or pelletized). Or it may also include thermal treatment like conversion into charcoal. Examples of fuel specifications for different types of gasi-fiers are shown in table 7.4.
Energy losses caused by fuel preparation must be considered when the fuel needs are estimated, though such losses are not included in the effi-ciency data given above. The losses are dependent on the feedstock properties and the fuel specifications, and also, of course, on the technol-ogy used for fuel preparation. Illustrative data for additional raw biomass fuel requirements caused by fuel preparation are given in table 7.5.

updraught downdraught to
gas - pyrolysis reduction
eIr oxldallon r11-
Producer Gas 191
crossdraught
... .
pyroiys
oxidation roduclior
reduction oxidation
gas Iluidized circulating bed TIukilzed bed Cyclone
gas cle- Figure7.3 Sketches of five types of biomass gasiliers.
The gasification process In the gasifier, the biom ass is subjected to drying, pyrolysis and gasifica-tion. Five major types of gasifiers are currently being used, as shown in figure 7.3. In updraught gasifiers the gas and the fuel flow is counter-current through the gasifler. In downdraught gasfiers the gas and the fuel flow in the same direction. In crossdraught gasifiers the gas flows perpendicularly to the fuel flow. In conventionaifluidized bed gasfiers
Table 7.5 Biomass fuel consumption for the preparation of gasifier fuel.
Type of preparation Ratio of total biomass fuel need to fuel consumption of gasifier
Dryinga 1.15-1.20 Briquettingb 1.1 0-1 .20 Chippingb About 1.02 Charcoal preparation 2.0-3.5
a Drying from 50 per cent to 20 per cent moisture content. b Mechanical energy assumed to be supplied by gasifier operated engine. Efficiency of gasifier engine system 20 per cent.

192 B. Kjellström
the fuel particles are kept suspended in the upward gas flow. In circulat-ing fluidized bed gasiflers the fuel particles arc carried with the gas stream upwards in the gasifier, separated from the gas, and then recircu-lated to the bottom of the fuel bed. These differences in the flow arrangement result in somewhat different reaction conditions, in particu-lar as far as the pyrolysis conditions are concerned. Downdraught gasi-fiers are often equipped with a throat where pyrolysis gases from the upper part of the gasifier reach a high temperature; this reduces the amount of condensible organic vapours in the gas. Downdraught gasi-fiers without a throat are used for fuels like rice husk: such gasifiers gen-erate a gas with a fairly high content of condensible organic vapours.
For all types of gasifiers, the gas which is generated is composed mainly of carbon monoxide, hydrogen, carbon dioxide, water vapour, methane and nitrogen. There are also small amounts of condensible organic vapours in the gas, these amounts depending on the gasifier type and the operating conditions. Typical gas compositions are shown in
Table 7.6 Typical gas composition at different locations in a producer gas plant.
Gas component Producer gas after gash Jar
(% volume)a
Stack gas emitted to the atmosphere Direct combustion Use of gas as
in a furnace engine fuel (kg/kg dry biomass) (kg/kg dry biornass)
H2 4-20 d d
Co 17-30 Lessthari0.SxlO-3 2x10⁻³ -0.1 CH4 1-3 d d Organic vapours (see table 6.7) 0.001-1 d d H20 b C C
CO2 3-15 1.8-2.0 1.8-2.0 NOx About 0.0015 0.8x10⁻³ - 6x10⁻³ 1 .5x10-3-35x1 -3
SO> Less than 0.02 Less than 10- Less than io N2 Balance Dust -
10-10 4 10-10
a 1.7 to 2.5 m3 N of dry gas generated per kg of dry fuel. b Volume fractions are given for dry gas content of the fuel. Water vapour is of no environmental significance. The content is therefore not important in this context. c Moisture supplied with fuel must be added. d Virtually zero. No data available.
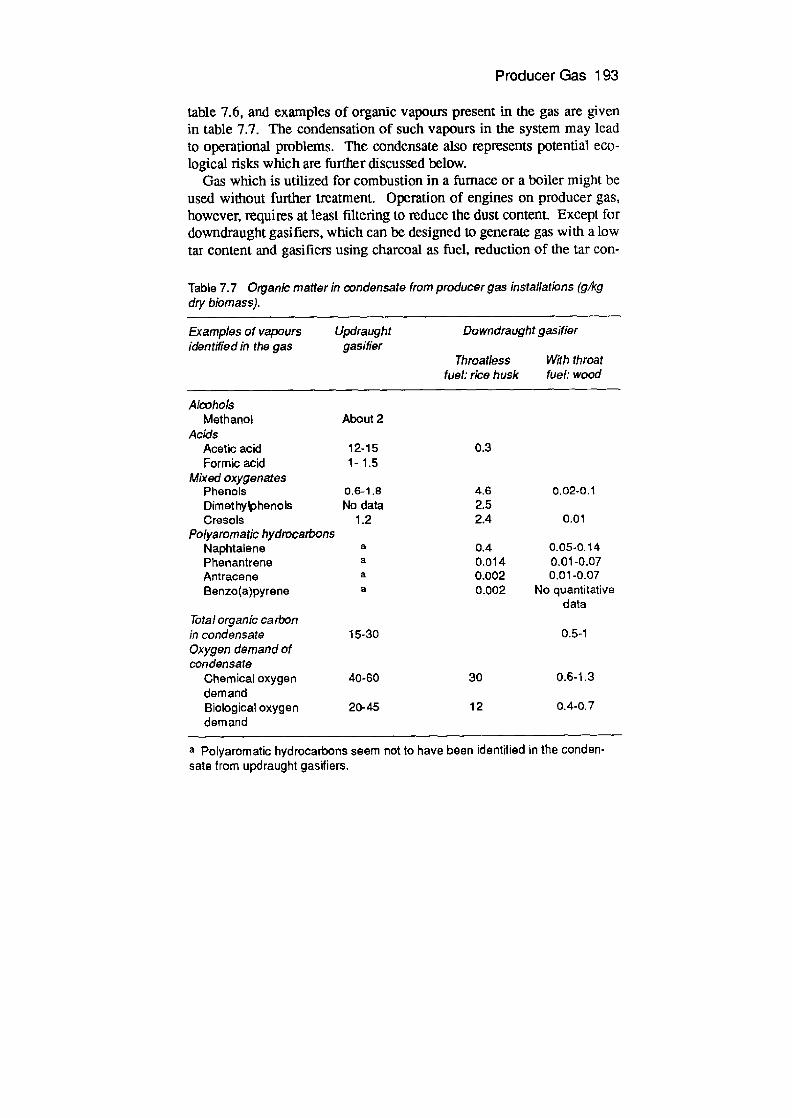
Producer Gas 193
table 7.6, and examples of organic vapours present in the gas are given in table 7.7. The condensation of such vapours in the system may lead to operational problems. The condensate also represents potential eco-logical risks which are further discussed below.
Gas which is utilized for combustion in a furnace or a boiler might be used without further treatment. Operation of engines on producer gas, however, requires at least filtering to reduce the dust content. Except for downdraught gasiflers, which can be designed to generate gas with a low tar content and gasifiers using charcoal as fuel, reduction of the tar con-
Table 7.7 Organic matter in condensate from producer gas installations (g/kg dry biomass).
Examples of vapours identified in the gas
Updra ugh! gasifier
Downdraught gash Jar
Throatless With throat fuel: rice husk fuel: wood
Alcohols Methanol About 2
Acids Acetic acid 12-15 0.3 Formic acid 1- 1.5
Mixed oxygenates Phenols 0.6-1.8 4.6 0.02-0.1 Dimethyiphenols No data 2.5 Cresols 1.2 2.4 0.01
Polyaromatic hydrocarbons Naphtalene a 0.4 0.05-0.14 Phenantrene a 0.014 0.01-0.07 Antracene a 0.002 0.01 -0.07 Benzo(a)pyrene a 0.002 No quantitative
data Total organic carbon in condensate 15-30 0.5-1 Oxygen demand of condensate
Chemical oxygen 40-60 30 0.6-1.3 demand Biological oxygen 20-45 12 0.4-0.7 demand
a Potyarornatic hydrocarbons seem not to have been identified in the conden-sate from updraught gasfiers.

194
Table 7.8 Major impacts of producer gas utilization.
Impact Agent or Data for quantitative assessments. mechanism Possble control measures
Potentially increased impact in comparison with use of pefroleum fuels
Acute health Explosion in vessels The nsk affects the operators. Accidents are only pos- effects containing sible as a result of equipment malfunction or improper
combustitle gas handling
Poisoning by inhalation Rtsk can be controlled by use of adequate safety of carbon monoxide devices and correct operational procedures
Delayed health Poisoning by inhalation The risk affects the operators. By adequate ventilation effects of carbon monoxide (plant design) and correct operating procedures, the
concentration of CO on the premises can be kept below 20 to 50 ppm, which is considered harmless
Exposure to organic Operators may be exposed to akin contact with tarry condensates (like condensates with a potential carcinogenic effect. Risk phenol or can be avoided by use of protective clothing during polyaromatics) maintenance and by correct procedures
The general public may be exposed to contaminated drinking water if organic condensates from the plant are not collected and disposed of properly
Amounts in condensates: Phenols 0.02-5 g/kg dry teedsiocic Polyaromatic matter Up to 0.2 g/kg dry feedstock The amounts depend very much on gasifier design and operating conditions
Soil erosion Depletion of biornass The conversion efficiency from biomass fuel to combus Local climate resources tible gas is 65 to 90%, dependIng on system design. change This amounts to the following biomass requirements for
different applications: Fuel gas generation 60-85 kg DSh3J(t) Electric power generation 1.0-1.7kg DS/kWh(e)
Potentially reduced impacts in comparison with use cr(petroleum fuels
Acidification of NO 5 in exhaust gases Approximate amountS of NOx in exhaust gases: soil and water contrt,ute to Combustion of producer gas 0.04-0.3 g/MJ(tuel)
aciditication Producer gas engine 008-2 g/MJ(fuel
Global climate CO2 in exhaust gas change
Ocean Reduced use of oil pollution by will reduce risk oil spills
No net addition of CO2 to the atmosphere

Producer Gas 195
tent in the gas by scrubbing or thermal cracking will be necessary. The gas is also often cooled in order to increase its volumetric energy con-tent.
Environmental impacts and hazards
The major potential impacts of producer gas utilization are summarized in table 7.8.
Hazards Explosion hazards The gas is combustible, thus if it is mixed with air and ignited in a closed vessel or pipe system a damaging explosion may occur. The reports of the UNDP/World Bank Gasifier Monitoring Programme contain accounts of internal explosions, but no personal injuries resulted from these incidents. A few cases of serious injuries caused by explosions were reported from the extensive use of wood and charcoal gasifiers for vehicles in Sweden from 1939 to 1945.
Carbon monoxide poisoning The high content of carbon monoxide (see table 7.6) makes the gas highly toxic. Prolonged exposure to concentrations of CO above 0.1 to 0.5 per cent in air may lead to death. Neurological effects of less severe cases of CO poisoning are possible. Adequate designs, and the use of safety devices and proper operating procedures, enable the concentration of CO in the air on the plant premises to be kept below the level which is considered harmful (about 30 ppm).
A few cases of mild transitory CO poisoning were reported from the UNDPIWor1d Bank Gasifier Monitoring Programme. About forty fatal poisoning cases were reported from the extensive use of wood and char-coal gasifiers for vehicles in Sweden between 1939 and 1945, though the number of less serious transitory cases was probably much larger: some 10 000 cases of delayed neurological effects of CO poisoning were recorded during the same period. This illustrates the need for strict safety regulations regarding design and installation of gasifiers as well as great care in operation of gasifier plants.
196 B. KjellstrOrri
Cancer risks The organic vapours present in the gas include a number of substances which are considered harmful to the environment and/or carcinogenic (see table 7.7). These substances are destroyed to a large extent when the gas is burned. If the gas is cooled, as for instance when it is used for engine operation, the organic vapours will condense. The condensate, often mainly water with organic liquids dissolved or in a separate 'tar phase', will then represent a certain hazard for the operator's health and the environment if not handled properly. The amounts of condensible organic vapours will depend on gasitier design and operation conditions, as I have remarked above.
Ames tests made with gasifier condensates have shown no mutagenic activity for any aqueous phase condensates, even those containing PAH. Mouse skin-painting tests, however, show an increased skin tumour inci-dence with increased PAH content in the condensate.
Environmental effects
The consumption of biomass at a gasifier plant may obviously contribute to local deforestation at sites where local utilization of biomass fuels exceeds the regeneration. This implies that a careful evaluation of the sustainable fuel supply should always be made before the installation of a biomass gasifier. Among different options for small-scale generation of mechanical or electrical power from biomass, wood gasifiers appear as the least resource-consuming (see table 7.9). Charcoal gasifiers, Steam engines and engines operating on ethanol from wood all show at least twice the fuel consumption.
Table 7.9 Biomass fuel consumption for small scale (50kw) generation of mechanical or electricalpower.
Technology Biomass fuel consumption Solid m3 per Relative
MWh consumption
Wood gasifier with spark-ignition engine 2.7 1 Charcoat gasifier with spark-ignition engine 5.1 1.9 Steam engine (condensing) 5.4 2.0 Spark-ignition engine operating on ethanol from wood 5.9 2.2

Producer Gas 197
A gasification plant will always generate solid residue and combus-tion products. Some plants will also generate a liquid residue consisting of condensate, including condensed organic vapours, from the gas stream or scrubber water. Examples of substances found in condensate from producer gas plants are given in table 7.7; the amounts of such organic condensates will depend on the fuel used, the design of the gasi-fier and the operating conditions. Tests will normally be necessary to determine the amounts present in the condensate. Treatment of the liq-uid residue from a gasifier plant can be quite costly, so it is therefore advisable to establish for each site the amounts and types of organic liq-uids which may be released to the environment, and to minimize the need for waste water treatment by choosing a gasifler system design which has been verified to meet the environmental requirements.
The solid residue from the gasifier will consist of the ashes in the biomass fuel mixed with highly carbonized fuel. Disposal of this solid residue will not lead to any net addition to the amounts of potentially harmful metals like cadmium, lead, nickel, and chromium circulating in the ecosystem. However, leakage of metals from large ash deposits may lead to locally increased concentrations. For large installations, or when a large number of small installations use the same dump site for solid residue, the impacts of leakage of metals may have to be studied.
Combustion of the gas in a furnace or an engine will mainly result in the emission of carbon dioxide and water vapour. The latter is com-pletely harmless to the environment, although condensing steam from a chimney obviously represents a visual impact. The carbon dioxide released will compensate the environment for the carbon dioxide taken up by the biomass when it was growing, using photosynthesis. There is obviously a certain time delay between uptake and release, but this is of no significance with the time spans involved in practice. This represents an important difference from fossil fuels, where extensive use can lead to such increases of the carbon dioxide content in the atmosphere that severe long-term climatic changes are possible.
This does not mean that the combustion products are completely harmless. Combustion with air will always lead to some formation of nitrous oxides; pressurized combustion, as in an engine, leads to larger amounts than atmospheric combustion in a furnace (see table 7.6). The emission is very dependent on the combustion process, and large varia-tions must therefore be expected between different furnace and engine designs. Compared to direct combustion of biomass in a furnace, the
198 B. Kjellsträm
emission of nitrous oxides can be kept lower when the biomass is first gasified and the gas is used for combustion. As is discussed further in part II of this book, the nitrous oxides lead to certain health effects in high concentrations, and contribute to the acidification of the environ-ment. compared to the use of fossil fuels, where sulphur oxides are emitted together with nitrous oxides, the acidification effect of burning producer gas from biom ass is relatively small.
Some carbon monoxide should be expected to be emitted as well. The amounts are much less than for direct combustion of the biomass. Dust (in the form of soot and fly-ash), which is generally present in the stack gas when biomass is burned directly, should only be expected in extremely small amounts when producer gas is burned.
A comparison with the environmentar impacts and hazards associated with petroleum fuels Compared to use of petroleum fuels, biomass gasification is associated with greater risks or impacts with respect to (1) occupational hazards to operators: these hazards caimot be eliminated for biomass gasification but can probably be kept at an acceptable level by administrative mea-sures and operator training; (2) impacts caused by local deforestation (soil erosion, local climate change); these impacts can be eliminated for biom ass gasification by the use of true residues, or fuelwood from spe-cial plantations.
The use of biomass gasification is associated with lower risks or impacts than petroleum fuels with respect to (1) risk of pollution caused by oil spills; (2) the contribution of acidification; (3) the contribution of global climatic change resulting from an increased concentration of CO 2 in the atmosphere.
Industrial and institutional aspects
(3asifiers operate at about atmospheric pressure which implies that the requirements on the manufacturer are not so strict. Still, high quality is important, since leaks in the system can lead to dangerous situations. The material required for the gasifier and the gas treatment steps must be imported in many countries. Reasonably big, successfully operating gasifiers have been built in Brazil and China. Many other countries like
Producer Gas 199
India, Indonesia, the Philippines, Thailand and Vietnam have built smaller gasifiers with capacities of up to a few hundred thermal kilo-walls. It is probably feasible, with some technical support from maim-facturers with earlier experience, to build at least updraught or downdraught gasifiers in most developing countries.
In many developing countries, the engines needed for producer gas power plants must be imported. Standard natural gas or diesel engines can easily be converted to producer gas, and there will be little differ-ence from the present reliance on imported diesel engines. Local manu-facturing appears to be a requirement for economic use; it will therefore be necessary to build local technical competence in the technology.
Gasifiers for fuel gas generation will find the main market in indus-tries to be as a substitute for fuel oil. This means that the owners will probably be able to organize training of operators as well as service and maintenance in an adequate way. The potential users of small producer gas power plants can in general be expected to need substantial technical support for training and back-up services. Failure to provide this has been an important reason why many producer gas projects in developing countries have not been successful.
Since gasifier installations are potentially dangerous (gas poisoning, explosion risks) it is important that safety regulations covering system design and operating procedures are formulated and enforced. This can only be achieved by government bodies.
References Biomass Technology Group, TH Twente, Enschede, Netherlands.
Baseline monitoring report: Chevet gasfier installation in the Seychelles, UNDP/World Bank (Jasifier Monitoring Programme, Washington D.C. 1986.
Biomass Technology Group, TH Twente, Enschede, Netherlands. Baseline monitoring report: Hon gyan ga.c(fier installation in Mali, UNDP/World Bank Gasifier Monitoring Programme, Washington D.C. 1986.
Coovattanachai, N., Biomass Gasification—Experiences from Thailand. Producer Gas Round Table Meeting, Trosa, Sweden, August 1988.
Furtado, P., and E. C. Vasconcelos, Biomass gasifier monitoring project in Brazil, UNDP/World Bank Gasifier Monitoring Programme, Washington D. C. 1986.
Gen gas—The Swedish experience from the period 1939-1945. Swedish

200 B. Kjellström
Academy of Engineering Sciences, Stockholm 1950 (in Swedish). Kjellstrm, B. and A. Barriga, Review and evaluation of reports on
biomass gasifier performance monitoring, The Beijer Institute, Stockholm, Sweden, August 1988.
Krioef, H. A. M. and U. W. R. Siagian, Baseline monitoring report: Wood gasfier installation in Balong, UNDPIW0r1d Bank (3asifier monitoring programme, Report REP!KLN/87/01 -3, October 1988.
Knoef, H. A. M. and U. W. R. Siagian, Baseline monitoring report: Wood gas jfier installation in Jambi, UNDP/World Bank (3asifier monitoring programme, Report REP/KLN/87/----, October 1988.
Palm, L. and J. Ngeleja, Experiences from efficient charcoal production as well as utilization of charcoal gasiflers for operation of a sawmill, a generator set and a Landrover, TWICO/SIDA gasification project, Final report, August 1988.
Zerbin, W. 0., Bericht ber die Imbert Holzgas Kraftanlage in Loma Plata im Chasco von Paraguay, Imbert GmbH ft Energie und Umvelt, Weilerswist, Federal Republic of Germany, 1986.
The modern combustion of dry biomass
Arno Strehier
The combustion of solid fuel is based primarily on a gasification pro-cess, after which the resulting gases bum and deliver heat at tempera-tures between 1 200 and 1 800 °C. This oxidation takes place in combustion chambers that can be anything from very small to very large; hot (dry) chambers or cool (wet) chambers both have a consider-able effect on combustion quality. Depending on the design of the chambers, combustion proceeds as a one- or two-stage process. Fuel can be charged discontinuously or continuously. In the following sections the most important types of furnaces will be described and consideration given to their performance and environmental impacts.
The main influences on combustion quality are the temperature in the combustion chamber, and the gas-retention time. Solid biomass fuel has to be dry to attain a high combustion quality (i.e. high temperature). More than 40 per cent moisture content will lead to critically low tem-peratures in the combustion chamber, followed by emissions of CO, higher carbon hydrates, soot, tar and different components of dust.
Different varieties of biomass can be used as fuel. The most impor-tant are straw and wood from conventional production, as a by-product from processing, or complete from energy plantations. Straw and ker -nels from cereals can also be used together as solid fuel. The advantage of this is that the production methods are already well known to farmers. Higher-yielding Miscanthus sinesis varieties and different types of reeds have been tested in several research stations. All these biomass fuels have a very high content (between 70 and 75 per cent) of volatiles; the rest is fixed carbon and minerals (05 to 5 per cent).
In different countries there are several requirements on combustion

202 ArnoStrehier
quality that regulate the upper limits of emission of CO. CH, dust, SO2 , and NO. Table 8.1 shows the range of maximum penniued emissions in various European countries.
Furnaces for small units Stoves for space heating and cooking
Single stoves used for space heating, and furnaces for domestic cooking and space heating, have capacities ranging from 5 to 15 kW. It is only
Table 8.1 Regulations for straw and wood combustion in Europe, relative to B per cent CO2 (= 13 per cent 02) in flue gas.
Austria Belgium Denmark W. Germany Switzerland ° Spain Sweden b
(125-1000kW) (200 kW)
Wood Sootc 2 1 - 40mgtar -
Dust (mg/rn3) 200 225 80d 150 -(70) 61-210 -
400 120(70) 4(50) -
CO(g/m3) - -(500kW) 6 2(150) 12.5(70) 0.5(>500kW) 1(500) 3.1(1-5MW)
CR (mg/rn3) 67 - - - -(1MW) -
40(1-5MW) NO (mg/rn3) - - - - -(1MW) 50-200 -
400(1-5MW)
Straw SoOtc 2 - 1 - -
Dust (mg/rn 3) 200 225 480 150 - -
- - - 4(100) - -
CO (g/rn3) - -(500kW) 24 2(150) - -
starting 0.5(500kW) 12 1(500) - -
running CH (mg/rn 3) 67 - - - - -
NO, (mg/rn3 ) 1500 - - - -
a no regulations for air pollution by furnaces under 70 kW. b installations of less than 200 mW previously unregulated, but regulations now under consideration.
Ririglemann scale. d when the next house is nearer than 300 m. ° large units.
Numbers in parentheses means regulation applies up to that power (kW unless otherwise stated).
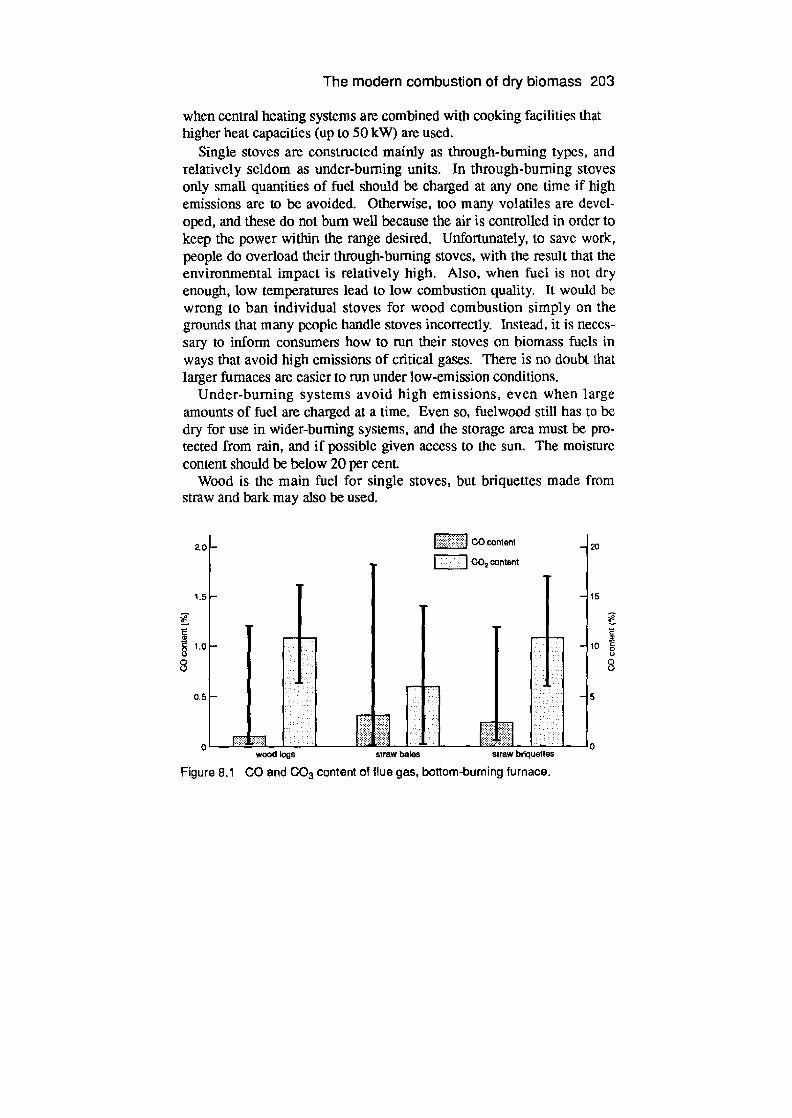
The modern combustion of dry biomass 203
when central heating systems are combined with cooking facilities that higher heat capacities (up to 50 kW) are used.
Single stoves are constructed mainly as through-burning types, and relatively seldom as under-burning units. In through-burning stoves only small quantities of fuel should be charged at any one time if high emissions are to be avoided. Otherwise, too many volatiles are devel-oped, and these do not bum well because the air is controlled in order to keep the power within the range desired. Unfortunately, to save work, people do overload their through-burning stoves, with the result that the environmental impact is relatively high. Also, when fuel is not dry enough, low temperatures lead to low combustion quality. It would be wrong to ban individual stoves for wood combustion simply on the grounds that many people handle stoves incorrectly. Instead, it is neces-sary to inform consumers how to run their stoves on biomass fuels in ways that avoid high emissions of critical gases. There is no doubt that larger furnaces are easier to run under low-emission conditions.
Under-burning systems avoid high emissions, even when large amounts of fuel are charged at a time. Even so, fuelwood still has to be dry for use in wider-burning systems, and the storage area must be pro-tected from rain, and if possible given access to the sun. The moisture content should be below 20 per cent.
Wood is the main fuel for single stoves, but bnquettes made from straw and bark may also be used.
2.0
1.5
el = 5 1.0 U
8
0.5
Ku
15
= 10
wood logs straw bales siraw b1quettes
Figure 8.1 CO and CO3 Content of flue gas, bottom-burning turnace.
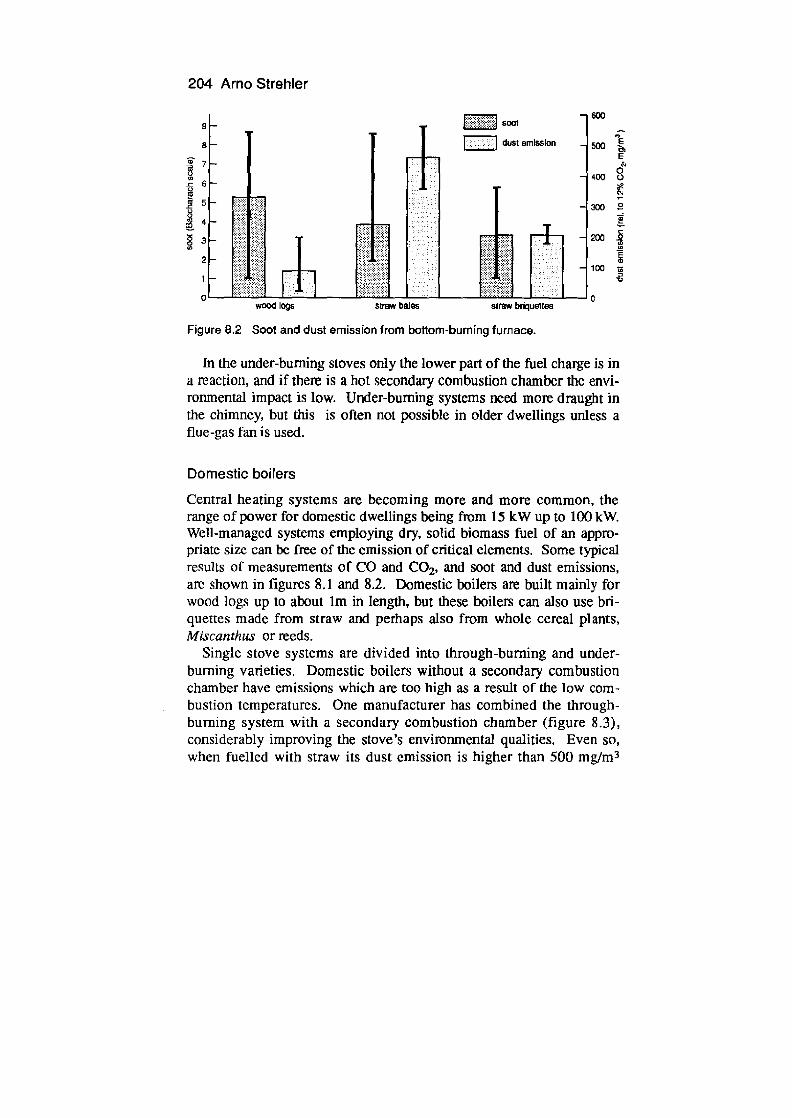
204 Arno Strehier
j
0 a
600
500k C
400
300 '5
200
E
100
wDod logs Straw bales strew brtquettes
Figure 8.2 Soot and dust emission from bollom-burning furnace.
In the under-burning stoves only the lower part of the fuel charge is in a reaction, and if there is a hot secondary combustion chamber the envi-ronmental impact is low. Under-burning systems need more draught in the chimney, but this is often not possible in older dwellings unless a flue-gas fan is used.
Domestic boilers Central heating systems are becoming more and more common, the range of power for domestic dwellings being from 15 kW up to 100 kW. Well-managed systems employing dry, solid biomass fuel of an appro-priate size can be free of the emission of critical elements. Some typical results of measurements of CO and CO 2. and soot and dust emissions, are shown in figures 8.1 and 8.2. Domestic boilers are built mainly for wood logs up to about im in length, but these boilers can also use bn-quettes made from straw and perhaps also from whole cereal plants, Miscanthus or reeds.
Single stove systems are divided into through-burning and under-burning varieties. Domestic boilers without a secondary combustion chamber have emissions which are too high as a result of the low com-bustion temperatures. One manufacturer has combined the through-burning system with a secondary combustion chamber (figure 8.3), considerably improving the stove's environmental qualities. Even so, when fuelled with straw its dust emission is higher than 500 mg/rn 3
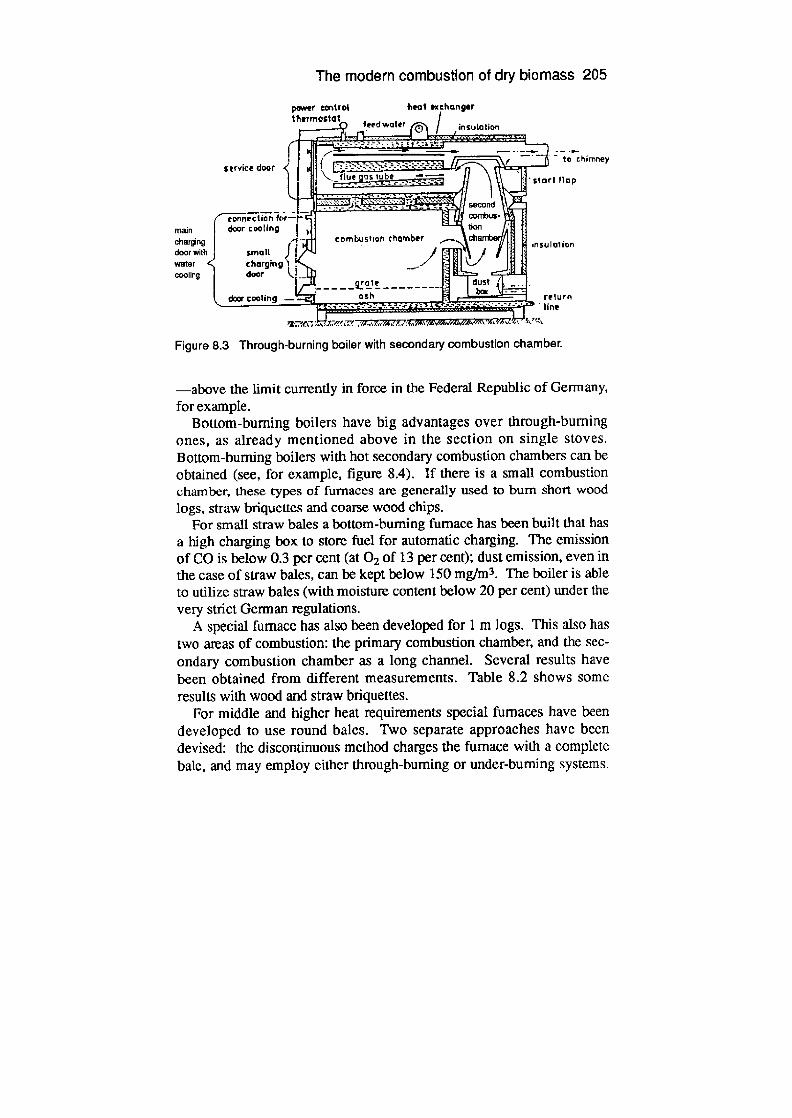
inSLilOtiOn
—. - to chimney
start flop
second con!us• tion charter
insulalin
dust bom
return line
The modern combustion of dry biomass 205
pGwer control heal e thermostat
teed water
service door .c
I 77-74,
\Me
(tnr._r oaTh door cooling charging combustion chamber
door with small J water
LI < charging
cooling door -- grate
door cooling — - ash
Figure 8.3 Through-burning boiler with secondaty combustion chamber.
—above the limit currently in force in the Federal Republic of Germany, for example.
Bottom-burning boilers have big advantages over through-burning ones, as already mentioned above in the section on single stoves. Bottom-burning boilers with hot secondary combustion chambers can be obtained (see, for example, figure 8.4). If there is a small combustion chamber, these types of furnaces are generally used to bum short wood logs, straw briquettes and coarse wood chips.
For small straw bales a bottom-burning furnace has been built that has a high charging box to store fuel for automatic charging. The emission of CO is below 0.3 per cent (at 02 of 13 per cent); dust emission, even in the case of straw bales, can be kept below 150 mg/rn 3 . The boiler is able to utilize straw bales (with moisture content below 20 per cent) under the very strict German regulations.
A special furnace has also been developed for 1 m logs. This also has two areas of combustion: the primary combustion chamber, and the sec-ondary combustion chamber as a long channel. Several results have been obtained from different measurements. Table 8.2 shows some results with wood and straw briquettes.
For middle and higher heat requirements special furnaces have been developed to use round bales. Two separate approaches have been devised: the discontinuous method charges the furnace with a complete bale, and may employ either through-burning or under-burning systems.
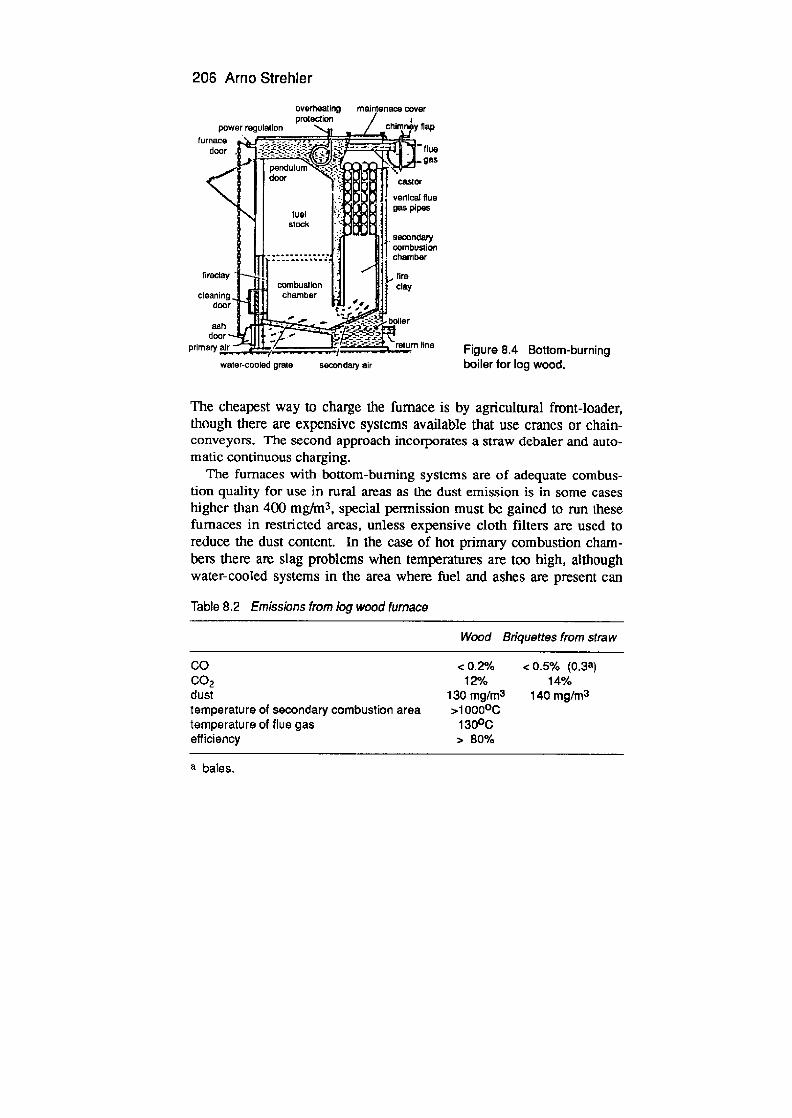
206 ArnoStrehier
overtleating msjntonaco cover protection
power regulation '-41 Chimney flap
furnacø .................. door - flue
pendulum gas
door castor
verllcal flue gas fuel pipes
stock secondary combusdon
- ::::.! . chamber
fireclay 1 fIre
combustion 1 clay
cleaning chamber door
ash
- .---- Oii-
- -
door .-
primary air - -reJm line
waler-cooled grate secondary air Figure 8.4 Bottom-burning boiler for log wood.
The cheapest way to charge the furnace is by agricultural front-loader, though there are expensive systems available that use cranes or chain-conveyors. The second approach incorporates a straw debaler and auto-matic Continuous charging.
The furnaces with bottom-burning systems are of adequate combus-tion quality for use in rural areas as the dust emission is in some cases higher than 400 mg/rn 3 , special pemlission must be gained to run these furnaces in restricted areas, unless expensive cloth filters are used to reduce the dust content. In the case of hot primary combustion cham-bers there are slag problems when temperatures are too high, although water-cooled systems in the area where fuel and ashes are present can
Table 8.2 Emissions from log wood furnace
Wood Briquettes from straw
Co <0.2% <0.5% (0.3a) CO2 12% 14% dust 130 mg/rn3 140 mg/rn3 temperature of secondary combustion area >10000C temperature of flue gas 1300C efficiency > 80%
a bales.

The modern combustion of dry biomass 207
solve these problems. Emissions from these discontinuously charged big-bale furnaces are: CO, 0.4 per cent ± 0.2 per cent, CO 2 12 ± 4 per cent, and dust 200-400 mg/m3(relative to 12 per cent CO 2 in the flue gas). Older furnaces produce dust emissions of 300-500 mg4i 3 . The temperature in the secondary combustion area is 1 000°C ± 100°C.
Most big-bale furnaces employ a debaler and a continuous charging system. Fuel and combustion air can therefore be accurately controlled to achieve high efficiency and the desired power, and environmental impacts are reduced. These units are built both in small sizes, combined with domestic boilers, and also on a much larger scale; they can be used to run district heating systems.
When wood furnaces are intended to be charged automatically, wood chips have to be used. Wood chips vary in size from 5 mm up to 100 mm (coarse chips or chunk wood).
When using dry chips, the CO content is below 0.4 per cent, CO2 is in the order of 8 to 12 per cent; soot is below 1.5 mg/rn 3 , and dust is below 100 mg/rn3 (relative to 12 per cent CO 2 in the flue gas).
Preliminary work has been carried out on special big-bale furnaces, using complete cereals (kernels and straw together). One such furnace uses a debaler and fire-protection system against return burning. The primary combustion area is water-cooled and the chamber for the com-bustion of volatiles is well-insulated. Even using cereals with a higher nitrngen content than straw and wood gave no more NO emission than is the case in furnaces using coal and fuel oil. First measurements show CO levels of 150 to 6 000 ppm (0.6 per cent), CO 2 at 8 ±2 per cent, NO at 50 to 500 ppm, and NO2 at 0 ppm; the flue gas temperature before the heat exchanger is 1 000°C ± 100°C, and after it 220°C to 300 °C. A larger heat exchanger could reduce this second temperature even further. This furnace will be further improved in combustion quality by the develop-ment of a new system of air-inlet control that will be directly linked to oxygen content of the flue gas.
Large-scale units (district heating and power stations)
Large furnaces are in use in Scandinavian countries, Austria, Switzer- land, Canada, USA, West Gemiany, and in several developing countries where there are good potential sources of biomass for fueL Fuels used

208 Arno Strehier
include wood, straw, and processing by-products such as rice-hulls, bagasse and bark. Wood chips have proved to be the best option for wood combustion with low labour demand and functional effectiveness.
When storage is necessary, it is important to ensure that the wood is maintained in a dry condition. Even so, in Sweden, some demonstration plants (running district heating systems) are able to use wet fresh wood chips all the year round. The furnaces am adapted to the high moisture content (more than 50 per cent), but some problems with combustion quality still remain.
Storage in big, open-air piles is common in the case of large-scale dis-trict heating units. Wood chip utilization can be combined with the thin-ning of forests, which has the environmental advantage that no wood of more than about 6 cm in diameter is left in the forest (with the attendant risks of fire and infestation by bark beetles).
Denmark has demonstration district heating plants that use surplus agricultural straw. Large cubic high-density bales have proved to be the best option for both handling and storing purposes.
In West Gennany there are three large wood chip furnaces with capac-ities ranging from 4 to 7 MW, installed in grass-drying units. The wood industry too employs many large furnaces.
In many commercial and demonstration sites, large-scale plants for the combustion of straw and wood chips have been installed; features may include automatic fuel charging, ash removal, and flue gas cleaning. A typical Danish district heating plant uses big straw bales, chopped for precise fuel control, and a flue gas cleaning system with bag filters. With such a system, dust emission can be kept below 10 mg/rn 3 ,
although the flue gas cleaning units cost as much as the boiler itself. To avoid slag problems, the grate is usually water-cooled and/or motive.
For wood chip combustion less effort is expended on the control of dust emission, but there is a strong correlation between dust emission and chip quality (bark content). In rice mills, rice-hulls are used as fuel, mainly for steam and power-generation, in systems using moving grates or fluidized bed systems; these are expensive and difficult to handle. Good examples can be found in Italy (south and south-west of Milan), and in such typical rice-producing countries as the USA, Brazil, India and the Philippines. The range of power is typically from 0.5 MW to about 10 MW.
The steam can be used for power generation, either by a steam-turbine (minimum size 1 000 kW for low cost), or by a reciprocating steam
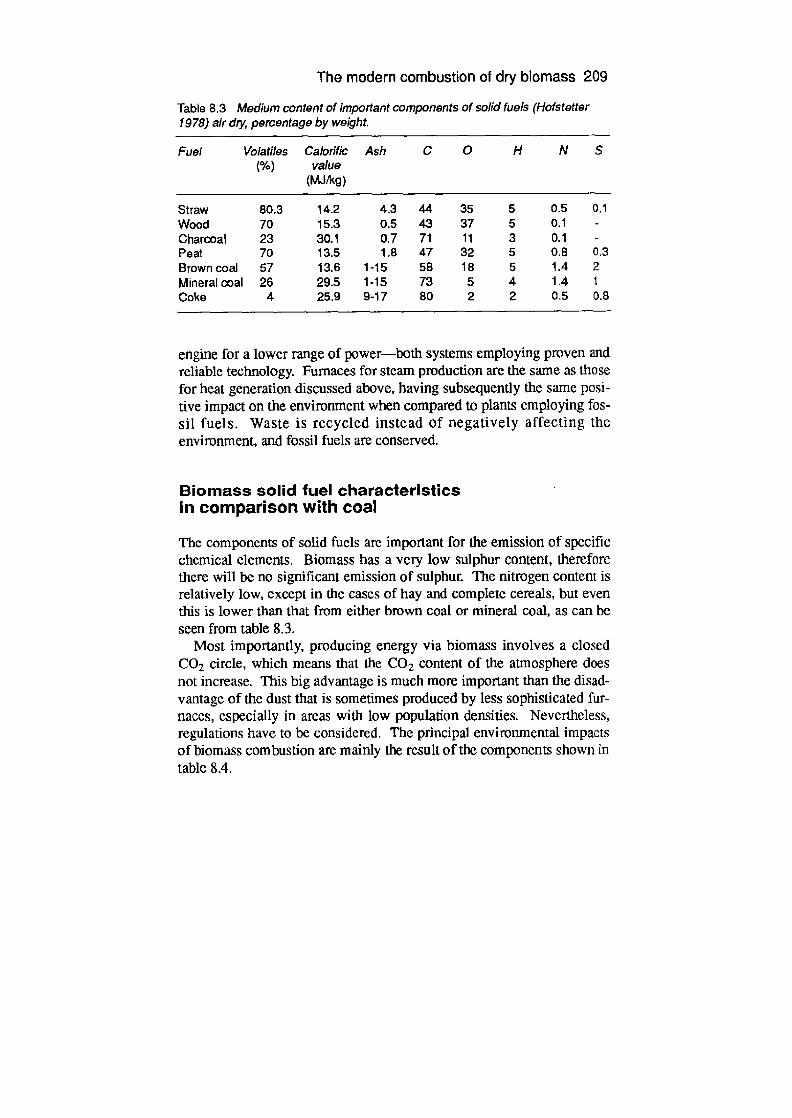
The modern combustion of dry biomass 209
Table 83 Medium content of important components of solid fuels (Hofstetter 1978) air dry, percentage by weight.
Fuel Volatiles Ca/or/f/c Ash C 0 H N S (%) value
(MJ/kg)
Straw 80.3 14.2 4.3 44 35 5 0.5 0.1 Wood 70 15.3 0.5 43 37 5 0.1 Charcoal 23 30.1 0.7 71 11 3 0.1 -
Peat 70 13.5 1.8 47 32 5 0.8 0.3 Brown coai 57 13.6 1-15 58 18 5 1.4 2 Mineral coal 26 29.5 1-15 73 5 4 1.4 1 Coke 4 25.9 9-17 80 2 2 0.5 0.8
engine for a lower range of power—both systems employing proven and reliable technology. Furnaces for steam production are the same as those for heat generation discussed above, having subsequently the same posi-tive impact on the environment when compared to plants employing fos-sil fuels. Waste is recycled instead of negatively affecting the environment, and fossil fuels are conserved.
Biomass solid fuel characteristics in comparison with coal
The components of solid fuels are important for the emission of specific chemical elements. Biomass has a very low sulphur content, therefore there will be no significant emission of sulphur. The nitrogen content is relatively low, except in the cases of hay and complete cereals, but even this is lower than that from either brown coal or mineral coal, as can be seen from table 8.3.
Most importantly, producing energy via biomass involves a closed CO2 circle, which means that the CO 2 content of the atmosphere does not increase. This big advantage is much more important than the disad-vantage of the dust that is sometimes produced by less sophisticated fur-naces, especially in areas with low population densities. Nevertheless, regulations have to be considered. The principal environmental impacts of biomass combustion are mainly the result of the components shown in table 8.4.
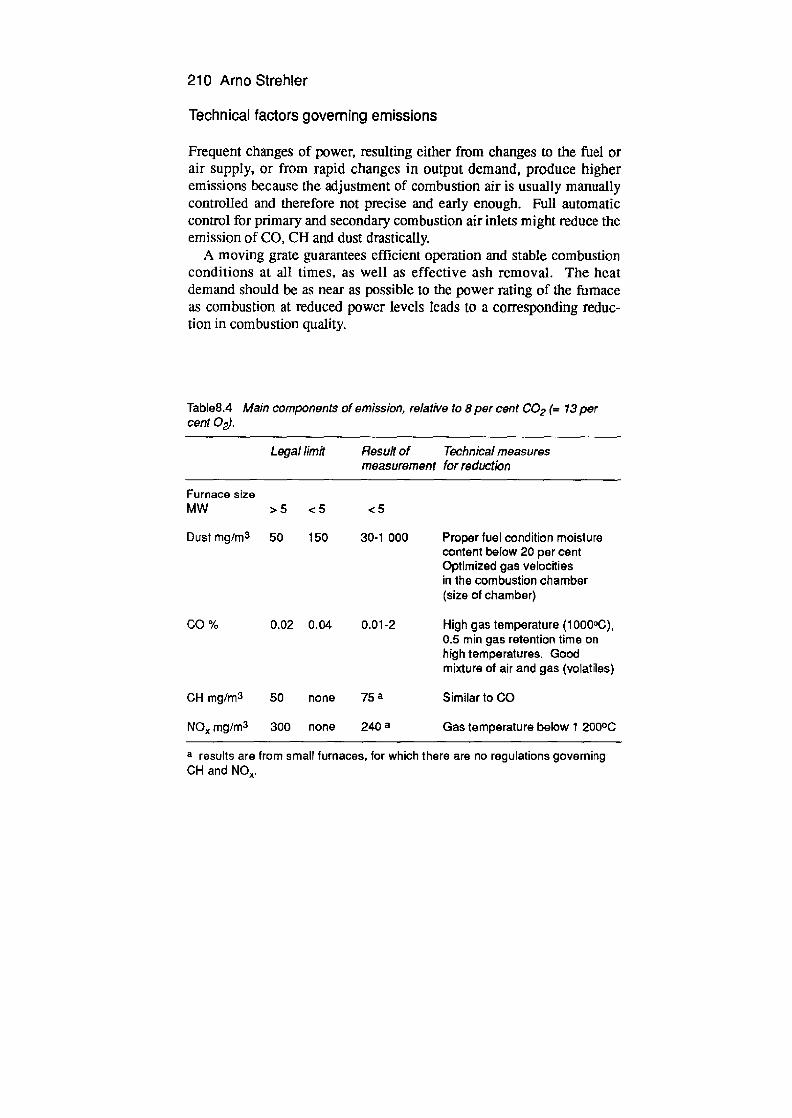
210 Arno Strehier
Technical factors governing emissions
Frequent changes of power, resulting either from changes to the fuel or air supply, or from rapid changes in output demand, produce higher emissions because the adjustment of combustion air is usually manually controlled and therefore not precise and early enough. Full automatic control for primary and secondary combustion air inlets might reduce the emission of CO. CH and dust drastically.
A moving grate guarantees efficient operation and stable combustion conditions at all times, as well as effective ash removal. The heat demand should be as near as possible to the power rating of the furnace as combustion at reduced power levels leads to a corresponding reduc-tion in combustion quality.
Table8.4 Main components of emission, relative to 8 per cent 002 (m 13 per cent 02).
Legal limit Result of Technical measures measurement for reduction
Furnace size MW >5 <5 <5
Dust mg/rn 3 50 150 30-1 000 Proper fuel condition moislure content below 20 per cent Optimized gas velocities in the combustion chamber (size of chamber)
CO % 0.02 0.04 0.01-2 High gas temperature (1000°C), 0.5 min gas retention time on high temperatures. Good mixture of air and gas (volatiles)
CH mg/rn 3
50 none 75 Similar to CO
NO mg/rn3
300 none 240a
Gas temperature below 1 200°C
a results are from small furnaces, for which there are no regulations governing CH and NO.

The modern combustion of dry biomass 211
Fuel conditions governing emissions
A low moisture content in the fuel—between 16 and 30 per cent, depending on the type of fumace---is fundamental to low emission pro-ducUon and efficient operation. Such factors as solid fuel size and the density of bales also influence combustion quality. Bnquette and pellet size and density have a great influence on emissions. Manufacturers' instmctions concerning the operation of furnaces must also be followed precisely.
Measurement of emissions
Environmental impact has been assessed mainly at the boiler test station at Weihenstephan in West Gennany. The test assembly is shown in fig-ure 8.5.
Recent advances
The main factors governing high combustion quality are a hot secondary
tee I,mperoturt
ratU fl 05Urflt 10 Ihe cPwnrey
r ---
w = i'dlcatc recorder
inlet
Lr-J LII JambenI air
weigflt ir,dicaion ©arreolrng bed flue gas fan
and recorthng secondavycambuS1iCfl flu, go,
dUSI .mi,aion ISslec dTQ saC! ,0Ie I.ter regufat
- I
,p.icai caeinm pump
coolef
COflltfluO4ls flue gas trlinç •nelrurnent
Figure 8.5 Boiler-furnace test assembly.
212 Arno Strehier
combustion chamber of the correct size, resulting in a gas retention time of half a second at more than 1 000°C; adjustable and thorough mixing of gas and air. and optimized gas and air inputs.
Large-scale furnaces have moving grates or a fluidized bed, a proper control system, and, if necessary, flue gas cleaning systems. These can be either wet (gas washers) or dry (cloth filters, electrostatic filters, or multicyclones). Filters are able to keep the dust emission below 10 mg/rn3 , but usually have a higher price than the boilers themselves.
Discontinuously charged boilers should be connected to a heat store (a water tank of at least 100 11kW), in order to keep the furnace running at its optimal power seuing (usually 60 to 80 per cent of full power). This will secure the highest efficiency and lowest emission, combined with lower labour demand.
Political issues
As long as the price of fuel oil remains relatively low, there is a need for the establishment of demonstration plants, under government subsidy if necessary, to use both biomass by-products from forestry, agriculture and processing industries, and also energy crops from plantations. Heating installations and power stations set up in this way will help to improve the prospecis for the more widespread use of renewable fuels.
References Hellwig, M.: Zum Abbrand von Holzbrennstoffen untewr besonderer
Berucksichtigung der zeitlichen Ablaufe, Diss., Weihenstephen, D-8050 Freising, LA fUr Landtechnik, 12/88, MEG 145.
Keller, Poul: Danish Experience Concerning Combustion of Straw and Wood Chips, Danish Agricultural Institute, Byhoim, DK8700 Horsens.
Strehier, A. CNRE Guideline No. 1, 1989, FAO Rome, Europ. Office. Strehier, A. Waf,ne aus Stroh und Holz, DLO-Manuskiipt Nr. 045, Mai
1987, DLG Frankfurt/Main 1, Ziminerweg 16, FRG. WOrgetter, M. Biomass fired district heating systems in Austria, A -3250
Wieselburg, Workshop of the CNRE on Heat and Biom ass in Ormea, Oct. 1988, FAO Rome, Intern. Office.

PART II: 9 Land-use impacts
D. R. Newman and D. 0. HaIl
People differ in their attitudes to land use. At one extreme are those who put biomass exploitation (for its various uses) above all; whereas others are primarily concerned with environmental conservation. This is the age-old conflict between mining land and its sustainable exploitation, found wherever people make use of biomass. Whether we use this biomass for food, fodder, materials or energy the same questions arise: is the land-use system sustainable? Are we using more or less wood than the annual increase in tree biomass? Will the soil continue to maintain crop production, or will it erode or become infertile?
Biomass energy has become a concern of aid agency experts, govern-ment planners, and policy makers; it has always been a concern of rural people in underdeveloped parts of the world—after all, biom ass makes up 43 per cent of the energy used in developing countries, and a half of the world's people depend upon biomass for most of their energy needs (Hall et al. 1982). These people have had to find ways of resolving the land-use conflicts between high and sustainable yields, and between food, fodder, fuel, fibre and fertility. Now there are such things as biom ass energy programmes, and they too have to find their place in these complex relationships.
How might an energy planner deal with bioenergy land use? One way is to start from a need for energy, choose a biological source, identify sites to grow it, and then list the environmental impacts of this land use at each site. This technocratic approach commonly leads to failure: fail-ure of the project or the environment. In assuming a need for energy alone, it ignores other needs for biomass. Thus we find many tree-plant-ing programmes that fail for lack of local cooperation where fodder is

214 D. R. Newman and D. 0. Hall
needed more than fuelwood. In choosing a single species of biomass, this approach ignores systems that harvest natural biomass and those that mix species on the same site—both to the benefit of the environment. And, by selecting sites on the basis of biomass productivity and the on-site environmental effects, the approach also ignores effects remote from the site, such as the erosion caused by livestock displaced from an energy forest to graze on hillsides, or the deforestation of parts of Amazonia caused by peasants displaced from SAo Paulo State by the expansion of plantation cash crop production. Most importantly, the technocratic approach ignores the expertise of the local farmers, who know the local conditions intimately through trying to adapt the sites to the bioenergy system, rather than adapting the programme to specific local conditions. Such approaches have doomed many soil conservation programmes over the years (Blaikie 1985), so we need to avoid repeat-ing them in biomass energy projects.
Let us start from the basic resource available in rural areas of develop-ing countries—land—and ask how it can best be used for the sustainable development of these areas. Instead of asking whether land should be used for fuel or food, we shall consider what mixture of land use and cropping patterns will make optimum use of a particular piece of land to meet multiple objectives: perhaps food, fuel, timber, fodder and contin-ued fertility at the same time. Some of the more interesting biomass energy systems do allow us to do this; they include small-scale systems, such as farm forestry (in which trees are often planted as security against future needs), as well as systems suitable for use on large farms and common land.
This requires a hull understanding of the complexity of land use—a critically important issue for all biofuel programmes. In this chapter, we shall consider the variety of things wanted from the land, discuss the conflicts that arise from trying to meet these different objectives, and outline some solutions
Land-use objectives
Rural development
What do farmers and rural Communities want from their land? Obviously food—the staple food (such as maize, rice and potatoes) food

Land-use impacts 215
to eat when all else fails, such as cassava; smaller amounts of foods to add essential nutrients and flavour to the diet (beans, greens, fruit, meat, and so on); and fodder for their animals. They also need fuel for cook-ing, heating, ironing, brewing, dyeing and soap making; for this they use firewood and agricultural residues such as straw, sometimes dung and occasionally charcoal. And they get their building materials from the land, for example as poles, bamboo, thatch, reeds, mud.
With this, a farmer's family can subsist. But most have been or are being drawn into the cash economy. So they need to produce something for sale—a crop surplus, a cash crop, livestock or charcoal for sale in the cities. More developed areas have rural industries which further trans-form these products, adding value locally and employing the landless. Depending on the local social and economic arrangements, the cash income can be used for security (tiding over bad times), celebrations, local development or removed to urban areas through low prices.
Finally, the farmer wants land for security. For the house and the fam-ily's future. Hence the importance of ownership of the land, or control of its use and the crops on it. Farmers without guaranteed tenure are reluctant to make investments of time or money in things that will only provide long-term benefits, such as planting trees, or soil conservation. In this way, agrarian reform (or the lack of it) affects bioenergy produc-tion.
Thus there are many land-use objectives in rural communities, and all communities have some system of allocating the land between people and uses. It is important to understand exactly how land is allocated in practice—so often rural development projects have been designed upon nominal land ownership rather than actual use rights to the land, some-times leading to unintentional land alienation (from the poor to the rich or from communities to the government). The social mechanisms for allocating land are dynamic. So land use is a frequent ground of conflict within and between communities, and outsiders can be used by particular interest groups.
National development Governments have land-use objectives beyond, and sometimes in con-flict with, those of the individual farmer. Many nations are now aiming for food independence, at least in the staple foods. This leads to stronger support for food production in the form of credit, subsidies, extension
216 D. R. Newman and D. 0. Hall
services and prices. Some, like the EEC and the USA, carry this to extremes. Others wish to keep urban dwellers happy, so they enforce low food prices, resulting in the impoverishment of farmers who are forced to degrade the environment in order to survive. Depending upon who supports the government, this may encourage large landowners or smallholders, and leads to different patterns of land ownership and crop production (since smaliholders often use mixed cultivation and obtain higher yields, except for mechanized crops, according to World Bank surveys).
Some countries, like Mauritius, grow cash crops for export, counting on earning enough money to pay for food imports as well as everything else. In these countries, the best land is used for cash crop production, often in large plantations, while food production is carried out on marginal land—those most ecologically vulnerable. Or a country may depend on timber and pulp exports or tourism, so it controls access to and use of forests or game parks.
From these multiple objectives a government determines its land-use policies—or in the absence of an overall policy, the sum of its pressures creates one.
Now add to this the objective of getting energy from the land. Clearly, this has to be considered together with the other land-use objec-tives; unfortunately, it rarely is. We frequently find biomass energy pro-grammes designed to meet a single objective, and run by a single ministry (so incorporating the implementing organization's land-use prejudices). Thus we get alcohol for car pivgrammes that rely on large plantations in only one region, and forestry department woodlot pro-grainmes that produce timber for pulp mills instead of firewood or fod-der for local people.
Sustainable development People want many things from the land; what does the land want in return? In other words, what does the land need to sustain biomass growth over a long period? Obviously, plant growth must match har -vesting rates. When we cut trees at a greater rate than they regenerate, we are no longer harvesting a renewable resource, we are mining the forests. But the biomass harvesting not only removes the products of photosynthesis, it also removes nutrients. Any sustainable system must maintain soil fertility otherwise yields will decrease, as they do when
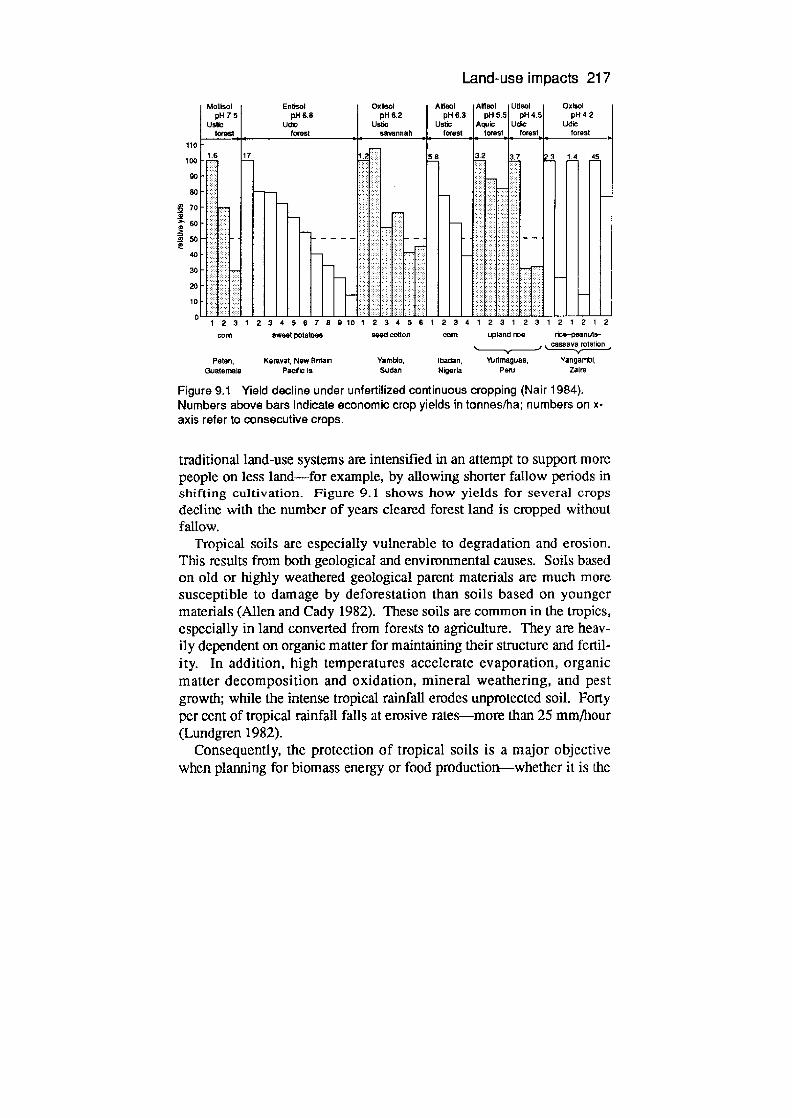
Land-use impacts 217
Moffisol pH 7.5
Ustic fost
Entisol pH 6.8
Udlo forest
Ontool pH 6.2
Ustic Savannah
MISDI p116.3
tJstic treat
Alfisol p11 5.5
Ac forest
Utisol pH 4.5
Udic I fo,est
OxIsol pH 4,2
Udic forest
110 U T
100 16 17 I.M 5.8 32 3.7 2.3 1.4 45
SO
80 -- -
73 - -
6O - -
50 ----- -
40
30
20
10
1 2 3 1 2 3 4 5 6 7 8 010 1 2 3 4 5 6 1 2 3 4 1 2 3 1 2 3 1 2 1 2 1 2
corn sweet potatoes n.ed cotton corn uplartd rice rice-peanuts- va tn
Pates, Pceravat. New Eritain Yamblo, Ibadan, 'tritrra9uas, Yangaribi, Guatemabl Pacific I& Sudan togerla Peru ZSirS
Figure 9.1 Yield decline under unfertilized continuous cropping (Nair 1984). Numbers above bars indicate economic crop yields in tonnes/ha; numbers on x- axis refer to consecutive crops.
traditional land-use systems are intensified in an attempt to support more people on less land—for example, by allowing shorter fallow periods in shifting cultivation. Figure 9.1 shows how yields for several crops decline with the number of years cleared forest land is cropped without fallow.
Tropical soils are especially vulnerable to degradation and erosion. This results from both geological and environmental causes. Soils based on old or highly weathered geological parent materials are much more susceptible to damage by deforestation than soils based on younger materials (Allen and Cady 1982). These soils are common in the tropics, especially in land converted from forests to agriculture. They are heav-ily dependent on organic matter for maintaining their structure and fertil-ity. In addition, high temperatures accelerate evaporation, organic matter decomposition and oxidation, mineral weathering, and pest growth; while the intense tropical rainfall erodes unprotected soil. Forty per cent of tropical rainfall falls at erosive rates—more than 25 mm/hour (Lundgren 1982).
Consequently, the protection of tropical soils is a major objective when planning for biomass energy or food pmduction—whether it is the

218 D. R. Newman and D. 0. HaIl
energy crop itself which is being harvested from the vulnerable marginal soils, or another crop which has been displaced to marginal lands by the bioenergy programme. Indeed, in any climate, biological energy pro-duction will often be based on less fertile, environmentally vulnerable, land. Add to this the desire to produce this energy at low cost, with min-imal chemical fertilizer inputs, and it becomes clear how difficult it can be to obtain sustainable biomass energy production.
Land-use patterns
To meet the multiple objectives in using the land, many systems have been developed over the years. These patterns of land use can be distin-guished according to the decisions made upon: 1) Land allocation to different crops
i By area—e.g. monoculture, mixed farming, intercropping; ii In time—e.g. shifting cultivation, crop rotations, fallows.
2) Land management i Weed and pest control—e.g. clearing all growth or leaving vege-
tation to reduce evaporation and prevent soil erosion; ii Fertilizing—e.g. manure, compost or chemicals; iii Water supply—e.g. rainfed, water harvesting or irrigation; iv Soil conservation—e.g. windbreaks, shade trees, terraces,
mulches. 3) Biomass separation into products and by-products, e.g. grain and
straw; bark, leaves and stems; manure and meat; shells, fruits, tubers, and chemicals.
4) Biomass use of the products and by-products for food, fodder, fuel, fibre, furniture and building; or returned to the soil as fertilizer or mulch.
There are many possible land-use patterns that could include biomass energy production among their objectives. Before considering the con-flicts that arise Out of these ways of using land, we will briefly explain some of these patterns, starting with low intensity systems, which require low chemical and energy inputs but support only low population densities. As the population density increases, each system becomes overloaded until it is no longer environmentally sustainable. Then more intensive systems have to be used, despite the increased inputs required

Land-use impacts 219
(labour, chemicals or energy), and the smaller proportion of the land that can sustain high intensity systems (which need fertile, flat land with the right amount of water).
Low-intensity systems These are used for survival. In all of them there are maximum carrying capacities for the land. When the population is higher than the carrying capacity, deforestation, erosion or desertification starts.
Hunter-gatherers adapt to the natural environment rather than modify the environment to their own needs, and consequently do not degrade the environment. However, the productivity per hectare of this system is low, so it only persists in places where no other land-use system is viable, such as the Kalahari Desert and the Arctic. Labour productivity, on the other hand, is high: Richard Lee calculated that the !Kung spend an average of only 2 hours 20 minutes a day hunting animals and gather-ing plants (Leakey 1981).
Pastoral nomads survive in and areas through similar mobility. The irregularity of rainfall means that people have to move their animals to whatever water and pasture can be found. This makes better use of the land than settlement around the few permanent water sources, since nomads can use pasture far from the water. The problems of erosion and desertification that arise when many people settle around the water sources are discussed later.
Shjfting cultivation is a common form of land use in wooded areas. It covers 30 per cent of the exploitable soils in the world-360 million haand supports 250 million people (Nair 1984). Trees are cut down and burnt, then crops are grown on the land until the yield goes down, perhaps after three years. The people then move on to another area, leaving the land to recover through natural processes. When the popula-tion density is not too high this is a perfectly rational form of land use, as the clearings are small enough to limit erosion. However, when the pop-ulation increases the fallow periods get shorter (leading to erosion and loss of fertility), and the cleared areas get larger (leading to deforesta-tion). So on one hand, in north-east India, regrowth is fast enough that satellite photographs show more tree cover than the forestry department calculated (CSE 1985). On the other, deforestation is spreading very rapidly from the roads into Pará and Rondonia in Brazil, as more people are encouraged to go there.

220 D. R. Newman and D. 0. HaIl
Home gardens are systems which combine the use of trees and food crops and/or livestock. People in south-east Asia use a multi-storey mix-ture of trees, shrubs, climbers, palms, tubers, pigs and poultry. The Chagga home gardens on the slopes of Mt. Kilimanjaro are planted to a mixture of at least 50 species, which produce all the fodder needs, between a quarter and a third of the fuelwood needed, and poles, timber, medicines, mulch, pesticides, fruit and shade (Femandes et al. 1984). Home gardens support more people/hectare than does shifting cultiva-tion.
Subsistence agriculture is the system used by most people on less pro-ductive land around the world. It requires extra inputs in the foim of fer -tilizers (organic and/or chemical), water and weed control to maintain production levels. Typically, there are fields around the house or village, while animals are grazed in common pastures further away. Wood is collected from the same outer area, or further away when goats have destroyed tree seedlings. When the population is greater than the carry-ing capacity, the people are forced to cut into wood stocks and use straw and dung as fuels. Once the trees have gone, the soil dries out and/or erodes unless adequate soil conservation measures are taken.
High-intensity systems These aim for high yields of at least some of the crops grown, substitut-ing fossil fuel and/or labour for land. We shall concentrate on their application to biomass energy.
Energy forestry—woodlots have been set up for energy over the cen-turies. Today, government forestry departments are setting up fuelwood lots and larger projects designed to maximize biomass production (including branches, not just the stem wood) to supply cities and facto-ries. The wood may be transported as it is, or first made into charcoal.
Energy plantations of agricultural crops can be grown in ways that maximize useful fuel production. The largest energy plantations in the world are the Brazilian sugarcane plantations around autonomous distil-leries, producing ethanol for blending with gasoline. The food-versus-fuel debate that these plantations have caused is discussed below. Other food crops, such as maize, sweet sorghum and oilseeds have been used to produce fuel, but are not necessarily planted only for energy. Experimental energy plantations have used other crops, such as cassava and even seaweed (Newman 1979).
Land-use impacts 221
Energy crops can be grown in between food crops (as catch crops), or as part of a crop rotation. Such systems have been suggested for the UK. A number of agroforestry systems, for example the chitemene system in Zambia (Chidumayo 1987), include a woody fallow, which supplies energy and also restores the soil fertility. Energy and food crops can be intercropped. Experiments in Mauritius and Cuba have shown that food crops can be planted between rows of sugarcane. Many traditional and new agroforestry systems rely on interplanting trees or shnibs and food crops. The trees provide shade, fuel, fodder and soil fertility (particu-larly if they fix nitrogen). Other systems combine animal keeping and forestry.
Land-use conflicts
These arise between users (for example women and men, foresters and farmers), between uses (for example food and fuel) and between biomass production and environmental degradation. We start by exam-ining two conflicts between different uses: food versus fuel in Brazil, and fodder and fuel versus timber in India.
Food versus fuel: Proalcool in Brazil After the oil price increases of the 1970s, many countries planned large biofuel programmes with the object of substituting a large proportion of their gasoline consumption with alcohols. The programmes that went ahead were those that produced ethanol from sugarcane (as in Brazil and Zimbabwe) or food grains (as in the USA). The grain crops are used for food, and sugarcane grows on fertile land which can be used for food production; so does biofuel production lead to less food being grown?
Brown (1980) calculated that a European car would need 28 tonnes of grain to make the alcohol needed to drive it for a year. This grain would need 13 ha of land to grow it, which is over three times the area needed to feed someone in a developed country, and more than 16 times that needed to feed each person in a developing country. Large-scale use of biomass ethanol might therefore have a very large impact on fertile land use: he thought that 10 per cent of the 44.97 million ha of agricultural land in Brazil might be needed to produce 10 million litres of alcohol each year.

222 D. R. Newman and D. 0. HaIl
What has actually happened in Brazil? By 1984, 38 million ha (8.4 per cent of the land under arable crops in Brazil) was used to produce sugarcane; 47.2 per cent of the cane was crushed to produce 9.2 billion litres of alcohol. Even in the state of São Paulo, which produced 68 per cent of Brazil's fuel alcohol in 1985 (7.6 out of 11.2 billion litres), only 12.5 per cent, 1.7 million ha of the land under arable crops (or 5.5 per Cent of São Paulo's total arable land) was under sugarcane for ethanol production in 1982-3. Less arable land has been diverted to alcohol pro-duction than predicted, because much of the land needed has come from former pastures, while the sugarcane productivity has increased (Rosillo Calle and Hall 1987). The lost arable land has been made up by bring-ing new land into cultivation in other areas.
The main competition to the use of fertile land for local food produc-tion continues to be from cash crops for export. Sugarcane for alcohol is only one of a number of cash crops favoured by government policy over food production. The economic pressures on small farmers (such as the difficulty of getting credit, and low food prices), continue to force them to sell their land to large groups who use it for plantation crops. As a result, the small farmers either give up farming to seek work in the cities, or go inland to cut down forests and cultivate virgin soil in Mato Grosso de Sul and Rondonia. After a few years the soil is often exhausted and they have to move on, having destroyed a bit of the envi-ronment—an environmental effect not often charged to the energy plan-tation. The only direct effects upon food availability are in areas with a high concentration of sugarcane production, such as RiberAo Preto, which depend on local food because of poor long-distance food distribu-tion.
The reduction in international oil prices has reduced the need for ethanol as an automotive fuel in Brazil—indeed, recently introduced price changes may favour the consumption of gasoline and diesel fuel instead of alcohol. Until oil prices increase enough to make bioethanol production economic once more, there is an opportunity to reduce land-use impacts by decentralizing production to other parts of the country, using different crops and smaller-scale technology, and rethinking the policies of food versus cash crop production. These considerations are important: although present effects are minimal, further increases in bioalcohol production on current lines would have a major effect upon Brazilian agriculture. According to a mathematical model developed at the Universidade Federal de Rio Grande do Sul (Dagord et al. 1987),
Land-use impacts 223
doubling production from current levels to 30 billion litres annually would have serious effects upon Brazilian agriculture. The model pre-dicted lower meat, wheat, bean and soya production in Brazil, and higher food prices in nearly all regions (despite assuming that alcohol will be produced from wood as well as sugarcane and cassava, so reducing the potential impact on highly productive land). Clearly, all such land-use models are sensitive to the assumptions made. In particular, increasing the cane yields, sugar content and fermentation yields would reduce the land needed for such an increase, while decentralized production would result in less displacement of other crops. Fortunately, there is no imme-diate need to increase fuel alcohol production in Brazil, given the low international and Brazilian oil prices, so there is time to test the models and, if necessary, change the land-use systems for alcohol production.
In short, large-scale fuel plantations require that the country first arrives at a policy on how to use its land. Such a policy would go far beyond energy policy to include policies on food prices, land reform, food export and import, and the environment. Lacking such an inte-grated policy, potential conflicts between food and fuel land use could be avoided by:
a slow decentralized growth of biomass energy production; high field and conversion plant productivity; small production units drawing feedstocks from a small area; and integrated food-energy systems.
Industrial versus communal use: social forestry in Karnataka
One of India's many controversies is that of social forestry. Much as the Green Revolution was criticized for the inequity of the distribution of its benefits, so have the social forestry programmes been attacked for not benefiting those whom they were designed to help.
Social forestry was designed as a strategy 4 to regenerate forest resources through the participation of the community in the protection and management of forests for ecological rehabilitation and basic needs satisfaction' (Shiva and Bandyopadhyay). An obvious basic need is that of firewood supply. The emphasis was on woodlots—on private and communal land. What happened? In Kamataka, the main result was that richer farmers planted eucalyptus on their own land, on parts which had previously been under food crops. In particular, the production of
224 D. R. Newman and D. 0. HaIl
ragi—the staple millet used by the rural poor—has gone down. Kilar district produced 175 195 tonnes in 1977-78, but only 13 340 tonnes in 1980-1. The price of ragi has increased threefold. This decline in pro-duction has also reduced the availability of crop residues used for animal feed, and employment for farm labourers. Nor have the rural poor got any firewood from the trees, since the Eucalyptus is sold to timber and pulp mills, at prices higher than those paid for fuelwood (Shiva and B andyopadhyay).
Some 26 per cent of the daily labour of an average rural family is spent tending animals and collecting fodder, compared with 10 per cent on fuelwood collection, and 20 per cent on agriculture (Shepherd 1988). Poorer families do not have enough land to grow their own fodder, so they depend upon common land. Yet, under the social forestry pro-gramme, in many places the good cover of native trees on common lands has been cut down and replaced with Eucalyptus, which cannot be grazed. Indeed, some common lands defined as 'wastelands' are being transferred to pulp-based industries by the Kamataka State Forestry Department (EDF 1987).
Against these problems must be set the benefit to small farmers of the farm forestry part of the programme. Some farmers, with holdings as small as 0.4 ha, planted trees to generate income on remote or less pro-ductive parts of their land (Shepherd 1988). However, this does not ben-efit the landless, who need the common lands.
In addition to this conflict between industrial and local use, there are environmental conflicts (Shiva and Bandyopadhyay). The Eucalyptus species chosen for Karnataka (E. tereticormis) evolved in a wetter cli-mate, so in dry years it continues high rates of evapotranspiration, while its wide root system allows it to intercept soil moisture before it reaches the water table—leaving none for other crops. It has a high demand for nutrients, and thus it needs fertile soil. After death it decays very slowly (because of the toxins it contains), so the organic matter and fertility is only slowly returned to the soil. In all, there is a conflict between this species and the environment in which it has been planted. By using other species (indigenous and exotic), and by interplanting, the ecologi-cal problems have been avoided elsewhere in India. For example, at Auroville (near Pondicherry) more than a million trees have been planted, using a mixture of species which includes Tectona grandis, Dalbergia latifolia and Pserocarpus marsupium for sale; Acacia auri-culiforrnis, Acacia holosericea and Casuarina equisetifolia for fuel-
Land-use impacts 225
wood; and leguminous hedge plants such as Sesbania, Leucaena, Gliricidia, Tephrosia and Prosopis for planting in and around fields as windbreaks, soil builders, and in coppices for compost making (Reed 1987).
This shows the importance of adapting programmes to local condi-tions, rather than forcing people to use the same species and techniques everywhere. In fact, nearly all the conflicts in the Kamataka programme derive from the way it was designed with minimal input from the origi-nally intended beneficiaries, whose interests are consequently not served. To claim, as some have done, that the programme is a success since it has generated farm income, highlights the fact that the 'social' forestry programme was designed by foresters as if the aim were to pro-duce industrial wood, despite being justified in social terms. It provides a good example of what happens when land-use planning is reduced to promoting high biom ass yields for industrial types of use.
Fuel versus the environment: deforestation, desertification and erosion Problems of deforestation, erosion or desertification arise when the envi-ronment is marginal for plant growth and soil stability (for example, in semi-arid zones and on hill slopes) and/or the pressure of use is particu-larly high (from population or commercial interests). Biofuel production can be part of the problem or part of the solution, depending upon the local circumstances.
Deforestation
When local wood extraction exceeds local production deforestation is the result. Note that even when a country or district has sufficient wood supply to cover all needs, deforestation may be occurring in certain localities. It is the supply and demand within economic transportation distance (often walking distance) that matters. Digemes (1979) shows how the demand for biomass energy in growing population centres quickly strips the land nearby, leading to higher prices and the incentive to transport compact biomass fuels over long distances (figure 9.2). Wood and charcoal are trucked hundreds of miles in Africa, and railed across India—from Assam to Delhi (CSE 1985)—to meet urban demand.
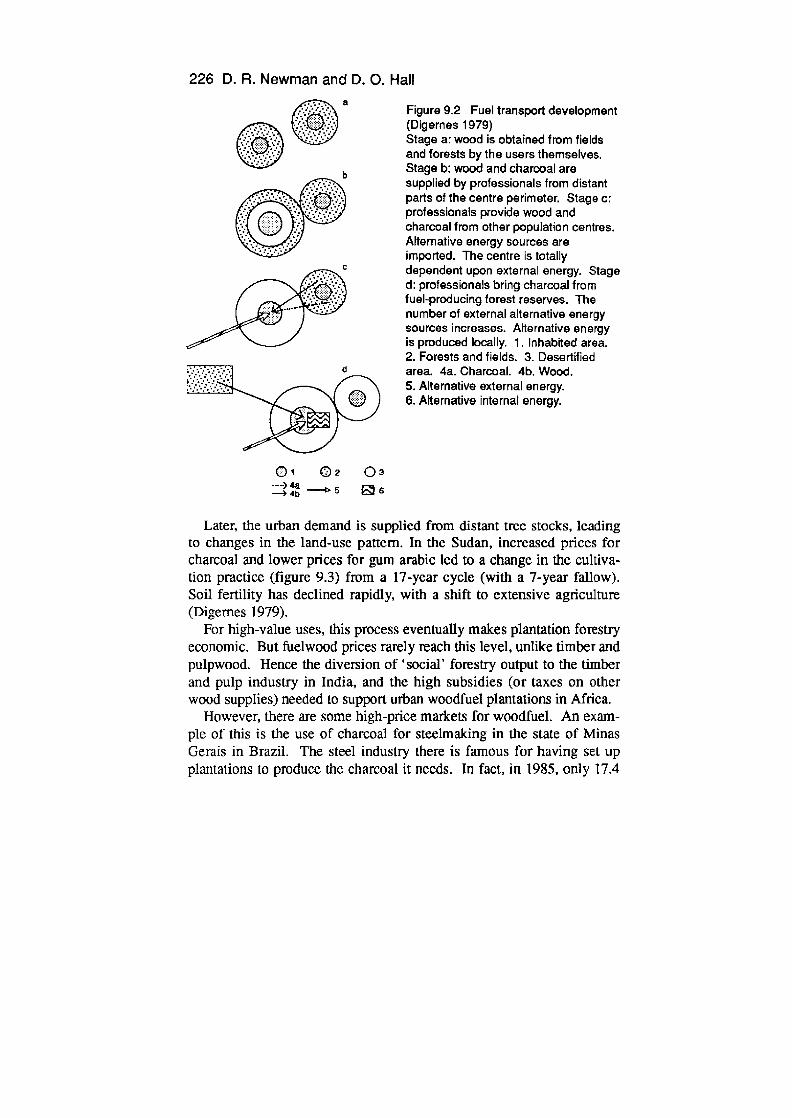
226 D. R. Newman and D. 0. Hall
@ @ a
c5 Figure 9.2 Fuel transport development (Dig ames 1979) Stage a: wood is obtained from fields and forests by the users themselves. Stage b: wood and charcoal are supplied by professionals from distant parts of the centre perimeter. Stage c: professionals provide wood and charcoal from other population centres. Alternative energy sources are imported. The centre is totally dependent upon external energy. Stage d: professionals bring charcoal from fuel-producing forest reserves. The number of external alternative energy sources increases. Alternative energy is produced locally. 1. Inhabited area. 2. Forests and fields. 3. Desertified area 4a. Charcoal. 4b, Wood.
Alternative external energy. Alternative internal energy.
01 02 Qs 5 06
Later, the urban demand is supplied from distant tree stocks, leading to changes in the land-use pattern. In the Sudan, increased prices for charcoal and lower prices for gum arabic led to a change in the cultiva-tion practice (figure 9.3) from a 17-year cycle (with a 7-year fallow). Soil fertility has declined rapidly, with a shift to extensive agriculture (Digernes 1979).
For high-value uses, this process eventually makes plantation forestry economic. But fuelwood prices rarely reach this level, unlike timber and pulpwood. Hence the diversion of 'social' forestry output to the timber and pulp industry in India, and the high subsidies (or taxes on other wood supplies) needed to support urban woodfuel plantations in Africa.
However, there are some high-price markets for woodfuel. An exam-ple of this is the use of charcoal for steelmaking in the state of Minas Gerais in Brazil. The steel industry there is famous for having set up plantations to produce the charcoal it needs. In fact, in 1985, only 17.4
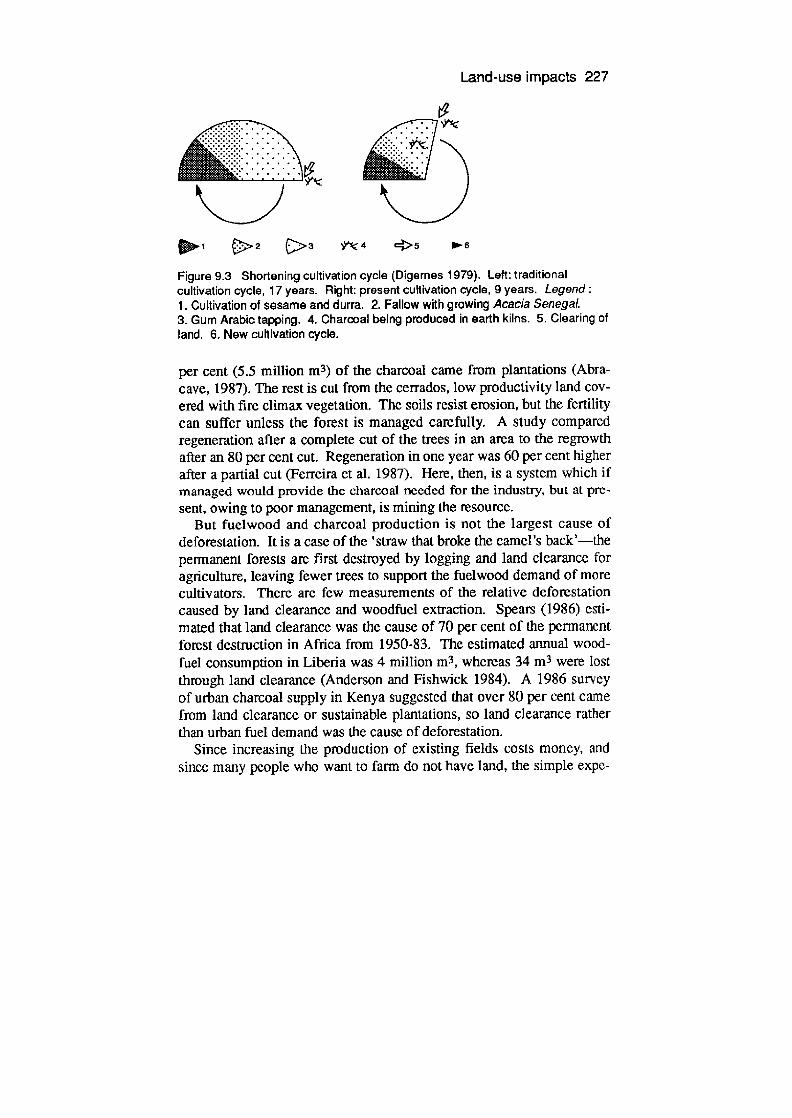
Land-use impacts 227
2 > 3 VV 4 5 - 6
Figure 9.3 Shortening cultivation cycle (Digernes 1979). Left: traditional cultivation cycle, 17 years. Right: present cultivation cycle, 9 years. Legend: 1. Cultivation of sesame and durra. 2. Fallow with growing Acacia Senegal. 3. Gum Arabic tapping. 4. Charcoal being produced in earth kilns. 5. Clearing of land. 6. New cultivation cycle.
per cent (5.5 million m3) of the charcoal came from plantations (Abra-cave, 1987). The rest is Cut from the cerrados, low productivity land cov-ered with fire climax vegetation. The soils resist erosion, but the fertility can suffer unless the forest is managed carefully. A study compared regeneration after a complete cut of the trees in an area to the regrowth after an 80 per cent cut. Regeneration in one year was 60 per cent higher after a partial cut (Ferreira et al. 1987). Here, then, is a system which if managed would provide the charcoal needed for the industry, but at pre-sent, owing to poor management, is mining the resource.
But fuelwood and charcoal production is not the largest cause of deforestation. It is a case of the 'straw that broke the camel's back'—the permanent forests are first destroyed by logging and land clearance for agriculture, leaving fewer trees to support the fuelwood demand of more cultivators. There are few measurements of the relative deforestation caused by land clearance and woodfuel extraction. Spears (1986) esti-mated that land clearance was the cause of 70 per cent of the permanent forest destruction in Africa from 1950-83. The estimated annual wood-fuel consumption in Liberia was 4 million m 3 , whereas 34 m3 were lost through land clearance (Anderson and Fishwick 1984). A 1986 survey of urban charcoal supply in Kenya suggested that over 80 per cent came from land clearance or sustainable plantations, so land clearance rather than urban fuel demand was the cause of deforestation.
Since increasing the production of existing fields costs money, and since many people who want to farm do not have land, the simple expe-
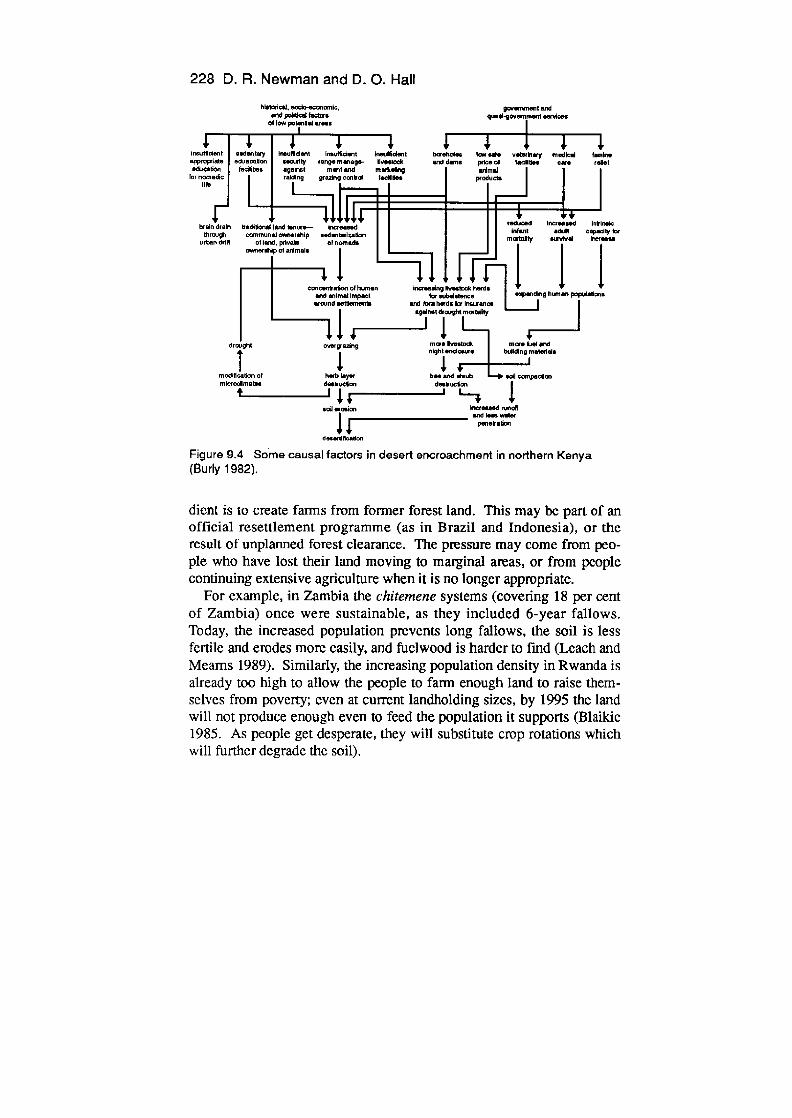
228 D. R. Newman and D. 0. HaIl
hlatndcal. snc10c,o,nlc 9ansmmsnt and and idosi facta . 1id90rnm.nt abrss
oI0P0wnbr4arsea I
inimincient I asdsmty Insullident lr*ufidant insollident bnsetrds. Iaarsoès oatsrlay IMIM
aypropiate eduncaton socuity ,angsmana9s. Ibeak and darns pdceoI Iddidso cars relet
odon I lantbes against rnunt and narlts&ç aidmal I
LIES pandl
Jar norneidc I aIding granbrgcsobrd ledibsa produda lift L rp= reusd Inas.I.d aiyinslc
bran drab, badidonal land lanLa.— Increased I thrncr ccrnrnuoai esoarrabip todsedon I and uatr br
urband,IP otIand.pdva
i ________
martalty strudnal cerise.
arlrIp 01 stdrnsle _________
41
s,nsnd setdsrn. ft bards Instz
nonnsrtaadon othurnen 9 hutton ycpadrrns
and animal Impact for subdslsncs
against dvt,t martaldy
113 I1L aM
drwght 0nSrWng enutut. bundrrgrnale,lais
1 1 1+
moddlcabon at harD Iayar baa and abnt sdl ucenpadimi
miccocimatse daSpvcdon dssbucdon
IJr 'L
adlarouia, lalSdruncl!
14 partebibon
d..arshoabon
Figure 9.4 Some causal factors in deserL encroachment in northern Kenya (Burly 1982).
dient is to create farms from former forest land. This may be part of an official resettlement programme (as in Brazil and Indonesia), or the result of unplanned forest clearance. The pressure may come from peo-ple who have lost their land moving to marginal areas, or from people continuing extensive agriculture when it is no longer appropriate.
For example, in Zambia the chitemene systems (covering 18 per cent of Zambia) once were sustainable, as they included 6-year fallows. Today, the increased population prevents long fallows, the soil is less fertile and erodes more easily, and fuelwood is harder to find (Leach and Meams 1989). Similarly, the increasing population density in Rwanda is already too high to allow the people to farm enough land to raise them-selves from poverty; even at current landholding sizes, by 1995 the land will not produce enough even to feed the population it supports (Blaikie 1985. As people get desperate, they will substitute crop rotations which will further degrade the soil).
Land-use impacts 229
Since so much deforestation results from agricultural land clearance, the problem of growing food as well as fuel has to be solved.
Desertification Pastoralists who live in semi-arid lands have a very good appreciation of the environment in which they live. Indeed, their whole life is based upon adapting quickly to a changing environment, as they take animals to new areas of grazing that spring up with the irregular rains. A study of the Ngisonyoka Turkana, a nomadic people in northern Kenya (Coughenour Ct al. 1985) has shown that:
they have directed solar energy through a food web so effectively as to permit the maintenance of a relatively high density and biomass of humans on marginal and variably productive land-scapes, without introducing discernible degradation of the ecosys-tem.
However, there is a fine balance between sustainable use of such an environment, and overuse. When the human and animal populations are concentrated through environmental (drought) or social (settlement) changes, they can overwhelm the local carrying capacity, leading to desertification (figure 9.4), particularly around water soumes.
Nomadic pastoralists use very little wood; almost none for cooking (about 0.1 m 3/ha per year in the areas of northern Kenya studied by the Integrated Project for Arid Lands)—since they eat mainly uncooked foods such as blood and milk—and rather more for the overnight fencing of livestock (1.5-3.0 m 3/ha per year per person—a low figure per hectare, given the low population density). But in semi-arid zones agri-culturalists use wood for cooking, and in addition sell firewood or char-coal to urban merchants for cash income in dry seasons. Here is the biomass energy conflict of semi-arid lands: the continuing increase in fuelwood demand as more people move there (the landless from less and zones, and drought-stricken pastoralists from more arid zones).
Under such conditions it becomes necessary to protect growing trees, and plant others to make up for the increased use. Protection of young trees can be enforced by local traditions, as is done for shea-nut (Karite) trees in Burkina Faso, and used to be done for gum arabic in the Sudan. However, these trees are valuable—usually more valuable than fuel-wood. We shall see later that it requires a conscious effort on the part of
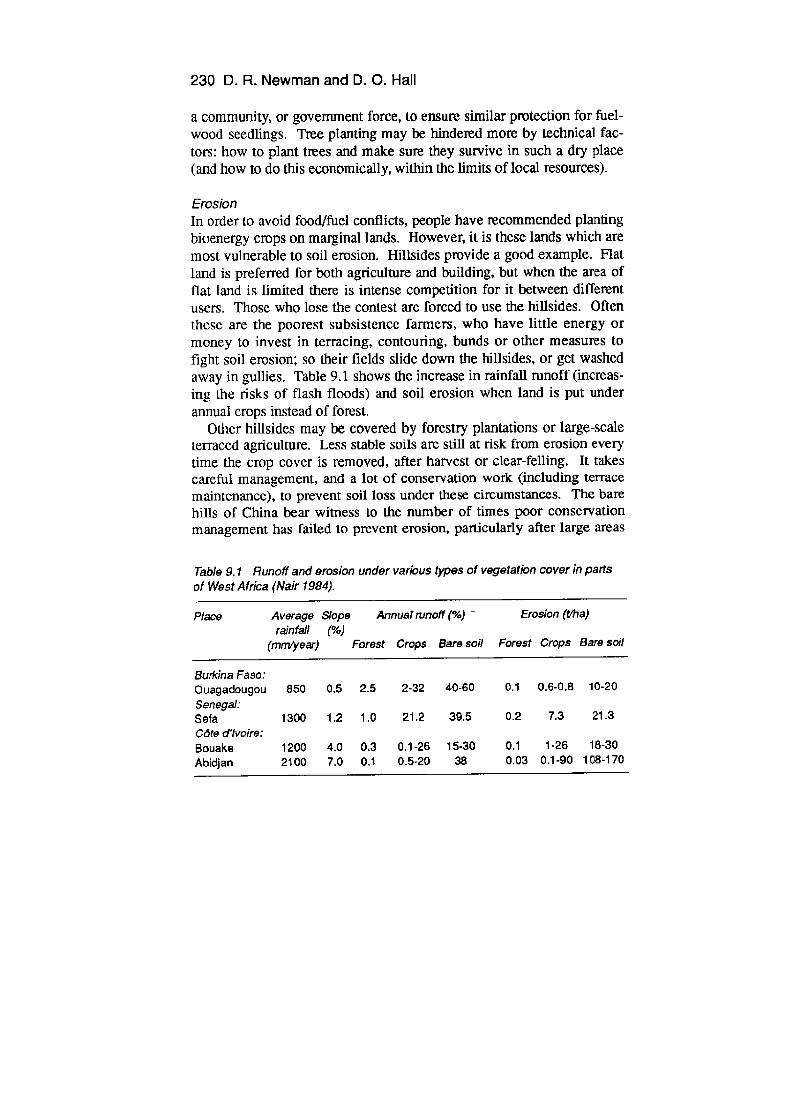
230 D. R. Newman and D. 0. HaIl
a community, or government force, to ensure similar protection for fuel-wood seedlings. Tree planting may be hindered more by technical fac-tors: how to plant trees and make sure they survive in such a dry place (and how to do this economically, within the limits of local resources).
Erosion In order to avoid food/fuel conflicts, people have recommended planting bicenergy crops on marginal lands. However, it is these lands which are most vulnerable to soil erosion. Hillsides provide a good example. Flat land is preferred for both agriculture and building, but when the area of flat land is limited there is intense competition for it between different users. Those who lose the contest are forced to use the hillsides. Often these are the poorest subsistence farmers, who have little energy or money to invest in terracing, contouring, bunds or other measures to fight soil erosion; so their fields slide down the hillsides, or get washed away in gullies. Table 9.1 shows the increase in rainfall runoff (increas-ing the risks of flash floods) and soil erosion when land is put under annual crops instead of forest.
Other hillsides may be covered by forestry plantations or large-scale terraced agriculture. Less stable soils are still at risk from erosion every time the crop cover is removed, after harvest or clear-felling. It rakes careful management, and a lot of conservation work (including terrace maintenance), to prevent soil loss under these circumstances. The bare hills of China bear witness to the number of times poor conservation management has failed to prevent erosion, particularly after large areas
Table 9.1 Runoff and erosion under various types of vegetation cover in parts of West Africa (Nair 1984).
Place Average Slope rainfall (%)
(mm/year)
Annual runoff (%) - -
Forest Crops Bare soil
- Erosion (t/ha)
Forest Crops Bare soil
Burkina Faso: Ouagadougou 850 0.5 2.5 2-32 40-60 0.1 0.6-0.8 10-20 Senegal: Sefa 1300 1.2 1.0 21.2 39.5 0.2 7.3 213 COts dlvofre: Bouake 1200 4.0 0.3 0.1-26 15-30 0.1 1-26 18-30 Abidjan 2100 7.0 0.1 0.5-20 38 0.03 0.1-90 108-170
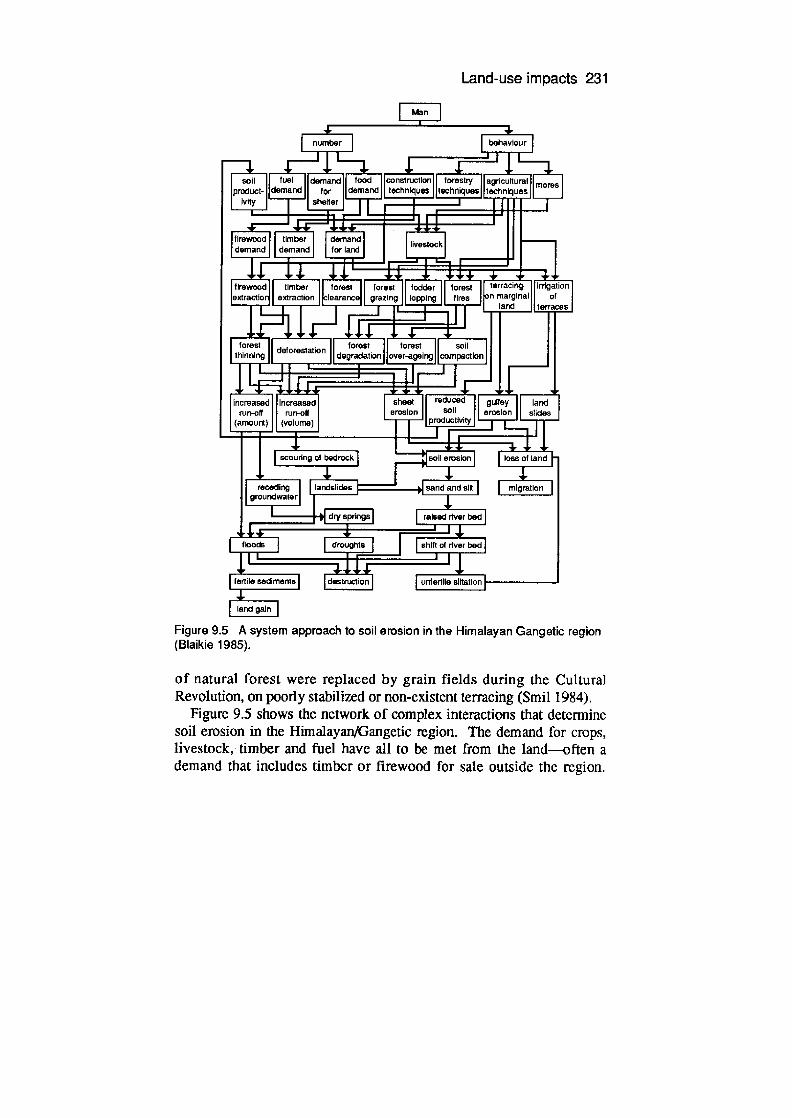
Land-use impacts 231
I Man I
nr.snber I I behaviour
soil I Idemand[ Ilconstructionli forestry hlabdhlmhllmoms oduct- 1 fordemandj
•techniques Ijthnkue6lLtechn1queaJ__
IVY shelter _______________
firewood I I
timber I
I demand demand demand for land I I livestock I
firewood11 timber 11 forest 11 bomat 11 fodder ejl terracing IIlrratior sxtractlor extraction learanco graaing lopping fires Jo' marginal I of
,, land F1 terraces
forest II II forest II forest II soil deforestation thinning II degradation Ijover-ageingllcompaction
Increasedi llncreasodl I sheet II reaucea II gutrey I land wit-ott orosion II erosion II slides
(amount) ii (volume) I I I productivIty I LiiIl i
Jsoil erosion
re I sand arid silt
Oacouring
grou
raed rIver bed
bloods I [sliut of riv1
fertile sediments I I destruction L5ift5ti0J______________i
londgai]
Figure 9.5 A system approach to soil erosion in the Himalayan Gangetic region (Blaikie 1985).
of natural forest were replaced by grain fields during the Cultural Revolution, on poorly stabilized or non-existent terracing (Smil 1984).
Figure 9.5 shows the network of complex interactions that determine soil erosion in the Himalayan/Gangetic igion. The demand for crops, livestock, timber and fuel have all to be met from the land—often a demand that includes timber or firewood for sale outside the region.
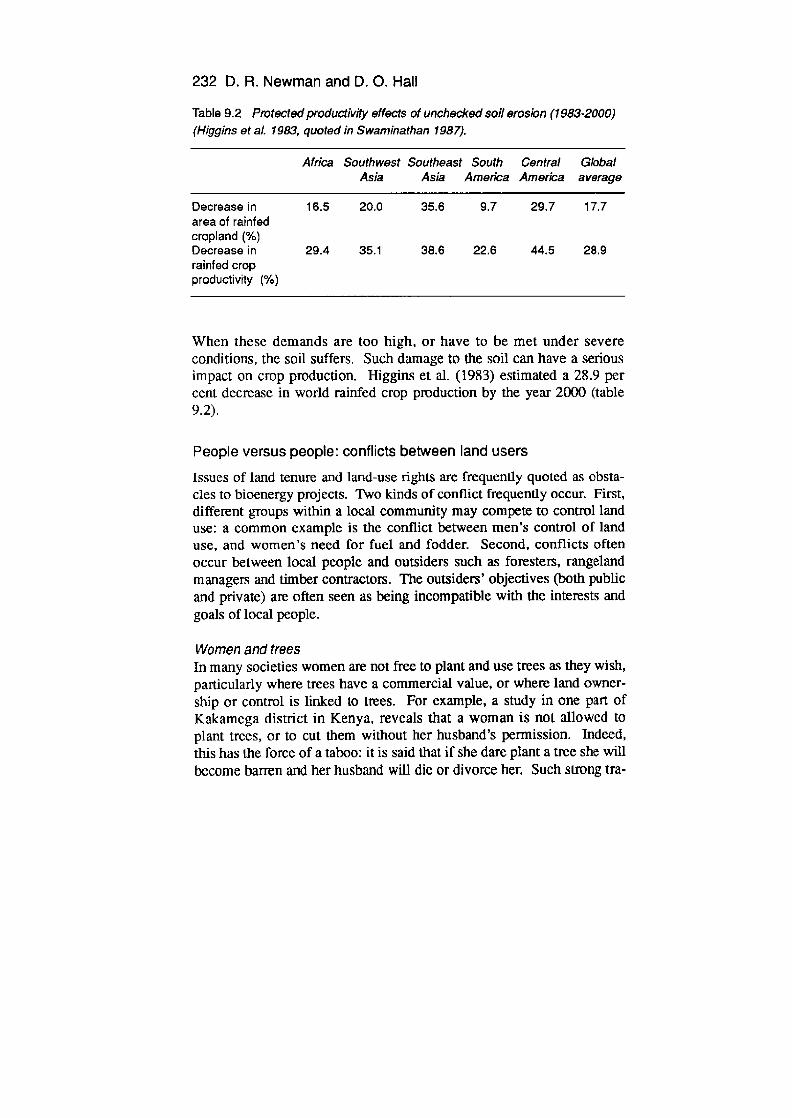
232 D. H. Newman and D. 0. HaIl
Table 9.2 Protected productivity effects of unchecked soil erosion (1983-2000) (Higgins et al. 1983, quoted in Swaminathan 1987).
Africa Southwest Southeast South Central Global Asia Asia America America average
Decrease in 16.5 20.0 35.6 9.7 29.7 177 area of rainfed cropland (%) Decrease in 29.4 35.1 38.6 22.6 44.5 28.9 rainfed crop productivity (%)
When these demands are too high, or have to be met under severe conditions, the soil suffers. Such damage to the soil can have a serious impact on crop production. Higgins et al. (1983) estimated a 28.9 per cent decrease in world rainfed crop production by the year 2000 (table 9.2).
People versus people: conflicts between land users Issues of land tenure and land-use rights are frequently quoted as obsta-cles to bioenergy projects. Two kinds of conflict frequently occur. First, different groups within a local community may compete to control land use: a common example is the conflict between men's control of land use, and women's need for fuel and fodder. Second, conflicts often occur between local people and outsiders such as foresters, rangeland managers and timber contractors. The outsiders' objectives (both public and private) are often seen as being incompatible with the interests and goals of local people.
Women and trees In many societies women are not free to plant and use trees as they wish, particularly where trees have a commercial value, or where land owner-ship or control is linked to trees. For example, a study in one part of Kakamega district in Kenya, reveals that a woman is not allowed to plant trees, or to cut them without her husband's permission. Jndeed, this has the force of a taboo: it is said that if she dare plant a tree she will become barren and her husband will die or divorce her. Such strong Ira-

Land-use impacts 233
ditions reflect how seriously Luyia men take their land ownership and control—and why they do not want women to allocate household resources. Men grow trees for sale, house construction and fencing, whereas women use wood for fuel and fodder. Since the women are expected to collect this wood, rather than cut trees grown for sale, they have to strip common land (Kerkhof and May 1988).
Clearly, this conflict between farm workers and their husbands can hinder any programme which aims to reduce deforestation through encouraging tree planting on farms for fuelwood. However, there are certain shrubs that are not considered by the men as trees (since they cannot produce useful timber), yet that provide enough wood for cook-ing—notably Sesbania sesban (Chavangi 1984). So the Kenya Woodfuel Development Programme promoted mixed cropping of Sesbania with food crops—a technical fix to this social problem. For other species, social solutions have been tried: women may get their sons to do the actual planting, or work through a women's group.
Conflicts between men and women over trees are common, even where trees are not so closely tied to land ownership. For throughout the developing world the difference in men's and women's use of trees (money and timber versus fuel and fodder) leads to different attitudes, as was shown in many incidents in the Chipko movement, where it was often the women who hugged the trees to prevent logging. In 1977, at Kangad in the Himalayas, the Forest Department offered men work in felling the already degraded forest. The women launched a resistance campaign, since they were already walking long distances for fuel, fod-der and water. The campaign succeeded, and the women later went on to guard the forest against damage and help the Forest Department plant trees—fodder trees to meet their needs, rather than the poplars preferred by the Forest Department (Bandyopadhyay and Shiva 1988).
Even in some agroforestry projects the conflicting needs of women and men can be ignored. In an integrated rural development project, Plan Sierra in the Dominican Republic, agroforestry and soil conserva-tion were emphasized, including multipurpose shaded coffee plantations. Despite the participation of women trainers and horticulturalists, local women were not involved in the project design, so fuelwood and fibre producing species were ignored: the aim was to help men produce coffee (Fortmann 1985).

234 D. R. Newman and D. 0. HaIl
Officials versus the people The land-use objectives of government agencies and rural people are often different, and they can come into conflict especially when govern-ments, claiming ownership of land traditionally used by local residents, assert control of the land, or assign it to outside commercial interests.
Such conflicts have frequently arisen over logging. Governments have allocated land to timber companies, ignoring the way local people (sometimes called 'tribals') depend upon the forest for their survival. In Sarawak, the damage to their land and forests by timber companies caused the Penan, Kelabit and Kayan to put barricades across logging roads in March 1987 (Apin 1987). One of them, Rosylin Nyagong, explained why:
They mowed down our forest and they levelled our hills. The sacred graves of our ancestors were desecrated. Our waters and streams are contaminated, our plant life is destroyed. And the for-est animals are killed or have run away.
The forest provides us with wild sago and fruits for food, 10 kinds of wood for our blowpipes, and many different types of plants as medicines for headaches, sprains, wounds and other ailments. We women collect uwai (rattan) and daun (leaves) to make our shelters and baskets. The forest is our source of survival. Without the for-est we'll all be dead and now there is hardly anything left. That's why we'll stay at this blockade till they listen to us. We want them to leave our land.
Land-use conflicts in which forest officials favour loggers over local people (incidentally reducing the availability of woodfuel) are common: Agarwal (1986) gives many examples. Forest guards demanded tributes, forced people to work without wages and beat people for the slightest incursion into reserved forests. Landless people were harassed and fined by local police and forest officials. Merchants bribed forest officers so that they could take illegally felled trees out of the forest. And in many places, forest departments have cut mixed forests in order to replant with monoculture commercial timber trees on land that is used by local peo-ple for collecting forest produce, fodder and fuel.
At the root of this conflict between government agencies and local

Land-use impacts 235
people is the question of who controls the land. Farmers and forest dwellers have a clear idea of their customary rights to use different areas which often bears little relation to the legal title to the lands. In many parts of the Third World, national 'government' land was established by laws that ignored or denied traditional land-use rights. The act of 1864 that started the Indian Forestry Department gave the state monopoly rights over land, and turned villagers' customary forest use from a right to a privilege at the discretion of the local rulers (Agarwal 1986). The Philippines classed as 'public land' all land that had not been registered in Manila by the plot owner between 1902 and 1905, while the 1934 Malay State Forest Enactments went so far as to refuse to recognize shifting cultivation land rights (Hurst 1987).
Government forest control has been justified on environmental grounds, with claims that the government has to protect forests from the effects of shifting cultivation, grazing and fuel harvesting by local peo-ple. Forest legislation has followed this line of keeping people out of the forests. Yet at low population densities, these practices do not damage the forest. And when the population densities increase to the point where very many people want to settle in the forests, the resulting politi-cal pressure leads to (official or unofficial) land clearance.
A case can be made for the strict control, by foresters and rangeland management officials, of land use in heavily deforested and eroded areas. For example, the HADO project in Tanzania succeeded in the forced destocking of the Kondoa Eroded Area in 1979. Since then, farmers have found that they could use land that had previously been covered with sand flows, and native vegetation has regrown (55 per cent of ground cover returned in two years) providing dead wood for fuel col-lection where there was none before (Leach and Mearns 1989). However, it seems that this is unlikely to continue. In the same part of Tanzania, forced soil conservation measures in the 1950s had disap-peared by 1961 (Nshumbeki 1985). Authoritarian measures lead to so much resentment that the victims abandon the project as soon as they can—whether or not it benefits them. You can get a villager to plant a tree, but you cannot force her to care for it. In Senegal, foresters had ordered residents to plant cashew trees as a firebreak around a national forest. The residents destroyed the cashew trees, yet the forest service nurseries could not meet the demand for purchase of fruit tree seedlings, which had 100 per cent survival (Agarwal 1986).
236 D. A. Newman and D. 0. HaIl
Today, the emphasis is upon designing projects with local participa-tion, aiming to meet both local and national objectives. In this way, long-term sustainable development is possible, rather than the short -term relief from environmental problems that land policing provides.
Solutions
How can we solve the problems of land use and avoid conflicts? We can either reduce the size of the problem by reducing the land area needed for a given purpose; or we can use the same piece of land for more than one purpose. Below are some possible solutions where the production of biofuels is one of the land-use objectives.
Energy conservation It is often quicker and cheaper to save energy than to produce more. The saved energy can be used for other tasks, or to reduce the biomass energy harvest. At best, this will bring biom ass regeneration and harvest into balance; at worst, it will at least provide time to take action to improve the biomass energy supply (by planting trees, for example). There are three ways to conserve biomass energy:
1 Reduce biomass conversion losses Large amounts of energy are lost in producing charcoal from wood. In traditional charcoal production as much as 12 tonnes of wood (or as little as six tonnes when well managed) are used to make a tonne of charcoal. In an efficient kiln, only 4 tonnes of wood are needed, so, in principle, two-thirds of the wood used to provide charcoal in east African towns could be saved by improved kilns. However, in many places the char-coal is made by itinerant charcoal makers who would not be able to transport the wood to a central kiln. Improved fixed kilns are therefore limited to concentrated biomass sources—agricultural and wood wastes, land clearance schemes, and plantations (such as those set up to provide charcoal for the Brazilian steel industry).
Other biom ass energy conversion processes can be improved; these include alcoholic fermentation and anaerobic digestion yields (through micro-organism selection and genetic manipulation, and continuous fermentation processes).
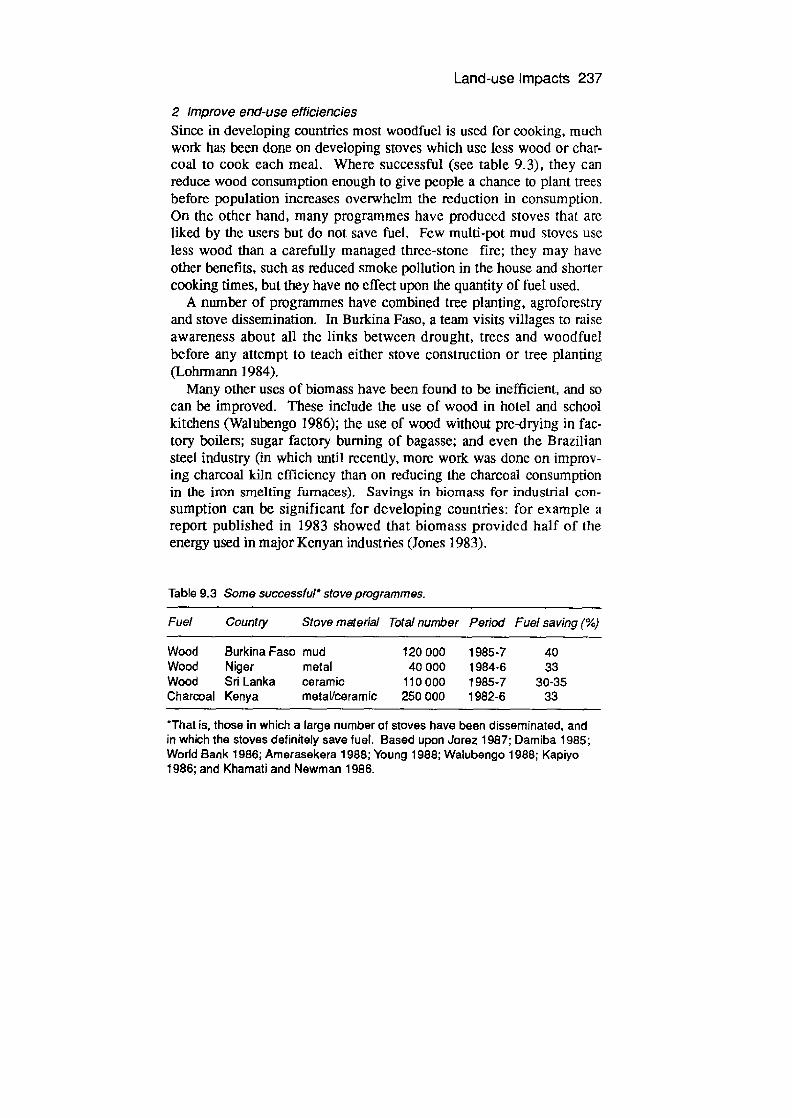
Land-use impacts 237
2 Improve end-use efficiencies Since in developing countries most woodfuel is used for cooking, much work has been done on developing stoves which use less wood or char -coal to cook each meal. Where successful (see table 9.3), they can reduce wood consumption enough to give people a chance to plant trees before population increases overwhelm the reduction in consumption. On the other hand, many programmes have produced stoves that are liked by the users but do not save fuel. Few multi-pot mud stoves use less wood than a carefully managed three-stone fire; they may have other benefits, such as reduced smoke pollution in the house and shorter cooking times, but they have no effect upon the quantity of fuel used.
A number of programmes have combined tree planting, agroforestry and stove dissemination. In Burkina Faso, a team visits villages to raise awareness about all the links between drought, trees and wooclfuel before any attempt to teach either stove construction or tree planting (Lohrmann 1984).
Many other uses of biom ass have been found to be inefficient, and so can be improved. These include the use of wood in hotel and school kitchens (Walubengo 1986); the use of wood without pre-drying in fac-tory boilers; sugar factory burning of bagasse; and even the Brazilian steel industry (in which until recently, more work was done on improv -ing charcoal kiln efficiency than on reducing the charcoal consumption in the iron smelting furnaces). Savings in biomass for industrial con-sumption can be significant for developing countries: for example a report published in 1983 showed that biomass provided half of the energy used in major Kenyan industries (Jones 1983).
Table 9.3 Some success ful* stove programmes.
Fuel Country Stove material Total number Period Fuel saving (%)
Wood Burkina Faso mud 120 000 1985-7 40 Wood Niger metal 40 000 1984-6 33 Wood Sri Lanka ceramic 110 000 1985-7 30-35 Charcoal Kenya metal/ceramic 250 000 1 982-6 33
That is, Ihose in which a large number of stoves have been disseminated, and in which the stoves definitely save fuel. Based upon Jorez 1987; Damiba 1985; World Bank 1986; Amerasekera 1988; Young 1988; Walubengo 1988; Kapiyo 1986; and Khamati and Newman 1986.
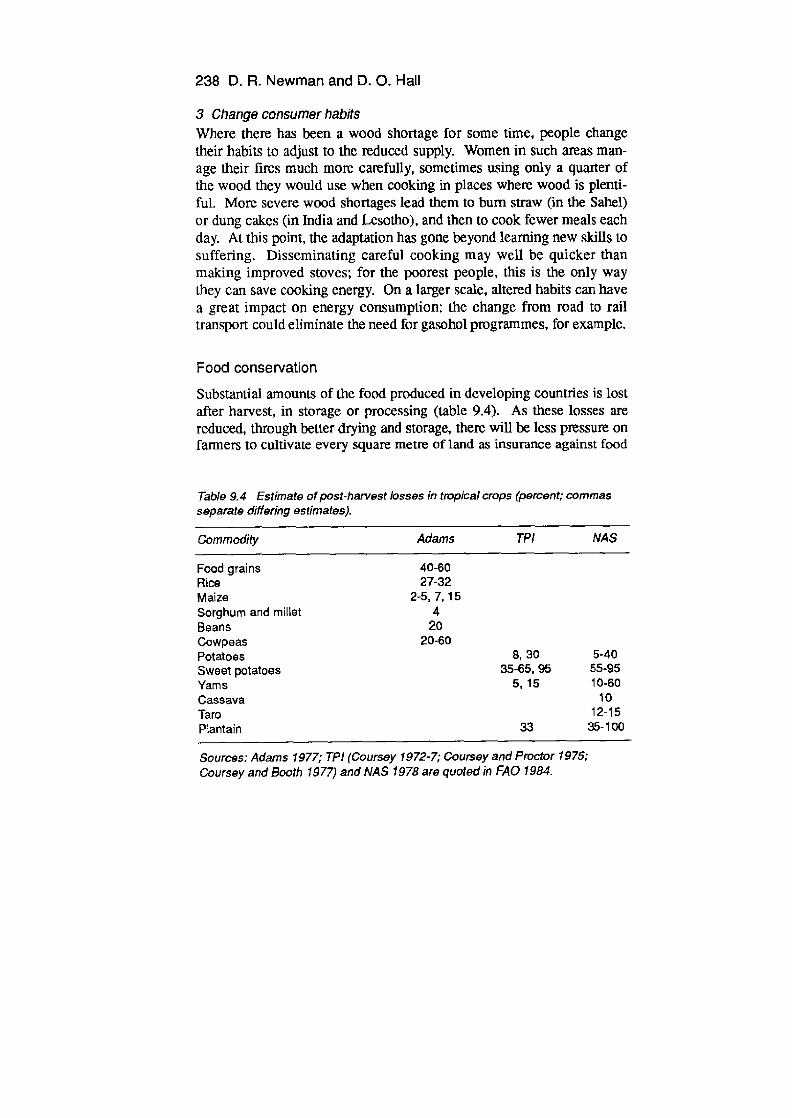
238 D. R. Newman and D. 0. HaIl
3 Change consumer habits Where there has been a wood shortage for some time, people change their habits to adjust to the reduced supply. Women in such areas man-age their fires much more carefully, sometimes using only a quarter of the wood they would use when cooking in places where wood is plenti-ful. More severe wood shortages lead them to burn straw (in the Sahel) or dung cakes (in India and Lesotho), and then to cook fewer meals each day. At this point, the adaptation has gone beyond learning new skills to suffering. Disseminating careful cooking may well be quicker than making improved stoves; for the poorest people, this is the only way they can save cooking energy. On a larger scale, altered habits can have a great impact on energy consumption: the change from road to rail transport could eliminate the need for gasohol pmgrammes, for example.
Food conservation Substantial amounts of the food produced in developing countries is lost after harvest, in storage or processing (table 9.4). As these losses are reduced, through better drying and storage, there will be less pressure on farmers to cultivate every square metre of land as insurance against food
Table 9.4 Estimate of post-haivest losses in tropical crops (percent; commas separate differing estimates).
Commodity Adams TPI NAS
Food grains 40-60 Rice 27-32 Maize 2-5, 7, 15 Sorghum and miltet 4 Beans 20 Cowpeas 20-60 Potatoes 8,30 5-40 Sweet potatoes 35-65, 95 55-95 Yams 5,15 10-60 Cassava 10 Taro 12-15 Pantain 33 35-100
Sources: Adams 1977; TP! (Coursey 1972-7; Coursey and Proctor 1975; Coursey and Booth 1977) and NAS 1978 are quoted in FAQ 1984.
Land-use impacts 239
losses. It may therefore be possible to grow more energy crops on the land. This is particularly important for the perishable (non-grain) crops that are often planted as a reserve against poor harvests yet suffer greater losses in storage than diy grains (FAO 1984)—indeed, some surveys of farm-level, post-harvest losses of grain have found them to be so low that no loss-reduction programme was necessary (Boxall and Gillett 1982).
Where food is conserved by drying, there is an interesting potential for integrated land management—growing both crops and the fuel to dry them. At present, this approach is used mainly for cash crops: for exam-ple, British American Tobacco have a scheme in Kenya to require farm-ers to plant woodlots alongside their tobacco.
Productivity improvement
Increasing the yield of land, either through better management or the use of improved plants, will reduce land-use conflicts. If both food and fuel can be grown in an area originally used for the food alone, the conflict disappears. Such methods include:
Plant breeding The Green Revolution shows the potential of plant breeding for improv - ing crop yields, for example of wheat in India, where production has increased from 11.4 million tonnes in 1966-67 to 37.8 million tonnes in 1981-2 (Hall and de Groot, 1989). A similar potential exists for improv -ing native tree species (Boon and Bunders 1987). Plants can also be bred to perform better in hostile environments, so that, for example, salt tolerant plants can be developed for saline lands.
Changing and breeding animals In many parts of Africa the productivity of wild game is higher than that of cattle on marginal lands, so in Kenya and Zimbabwe game species are being ranched experimentally. On more conventional lines, high-yield-ing cattle, sheep and goats can be crossed with tough local stock to enable livestock owners to get the same income from fewer, better qual-ity, animals thereby reducing overgrazing.
The optimization of organic and inorganic fertillzer use The Green Revolution increased food supply by planting varieties which

240 D. R. Newman and D. 0. RaIl
responded well to increased levels of artificial fertilizer. This in turn freed land for planting energy crops. (Is this why larger Indian landown-ers are planting trees on land that was formerly used for food crops?) Such methods could be used for other crops, though the use of energy-intensive chemical fertilizer on energy crops clearly has to be kept within reasonable bounds.
If conditions allow, biogas digesters can make nutrients more readily available by reducing the time needed for soil micro-organisms to pro-duce soluble N, P and K. This is why many integrated food-energy sys-tems include biogas digesters (see below).
Forest management for woodfuel Foresters need mature trees with large stem volumes for timber, but when trees are grown for fuelwood, branches and twigs are as useful, so harvesting can therefore be on shorter rotations, and since younger trees often grow faster, this can increase the productivity of woodlots. Small farmers in Kamataka (India) are already planting seedlings close together to get early thinnings for firewood (Shepherd 1988). The pro-ductivity of some tree species can be fUrther increased by coppicing or poll arding, resulting in the growth of sticks which can be easily used for firewood or poles.
But forest management can be taken further than merely increasing the yield of branches and twigs. At Guesselbodi in Niger, a full land-use plan for a 5 000 ha natural forest has been developed, based upon the needs and preferences of local residents and soil and vegetation map-ping. It is to be managed into 10 parcels of 10-year rotations based upon Combretum coppicing, protected from grazing on a three-year rotation during which gum, food, medicines and cut hay can be removed. A vil-lage cooperative is responsible for firewood cutting and the sale of graz-ing permits (Leach and Meams 1989).
Livestock management Livestock management systems can be used to prevent animals eating tree seedlings. At Mwenezi, in Masvingo Province Zimbabwe, from 1982 land was divided into fenced paddocks for use on a 56-day fallow, 14-day grazing cycle. The cattle were also released on to the arabic fields after harvest to graze the stalks. Cattle prices have increased three-fold, increasing cash earnings. The trees are protected from the cattle, permitting cashew and macadamia plantations, and are allowed to
Land-use impacts 241
grow into live fences around the fields. In Gujarat woodlots are pro-tected by simple single-strand 'psychological' fences: villagers chase away animals that approach the fence, and after a while the animals learn not to cross the wire (Leach and Mearns 1989).
Water management As deserts grow both crops and trees suffer: yields drop and people have to choose between using the land for crops or trees; since people need to eat the cropped area is extended. By 1976, in many densely populated villages in north-west Burkina Faso 50 to 75 per cent of all land was under permanent cultivation. The soil suffered and crop yields fell dan-gerously. In 1979, Oxfam began to encourage farm tree planting in micro catchrnents, concentrating what rain there was in the soil around the trees' roots. The techniques were also used on the local sorghum and millet crops, increasing yields by 50 per cent over crops planted in fields with no water catchrnent (Reij 1987). Microcatchments need a lot of work, so the villagers started to build rock bunds—half-metre-liigh rows of rock and stone placed along the contours. The bunds slow runoff, so more rainwater soaks into the soil. By 1986 about 2 500 ha of land had been treated in this way, and crop yields had increased by between 40 and 180 per cent (Kramer 1987). Once trees are established they pro-vide windbreaks which reduce evaporation, so maintaining soil moisture in and areas. This has been the main success of windbreak planting in Niger.
Under more extreme conditions in the Negev Desert in Israel, an old Canaanite water harvesting system was recreated. Rain falls near Sde Boker on one or two days a yeat It is collected in ditches dug slightly downhill from the contour lines and led to the bottom of a valley, where it soaks into the soil over an area of one-tenth the size of the catchment. Here the water maintains quite thirsty crops, even fruit trees, until the next rains.
Over shorter thy seasons, certain agricultural residues can be added to the soil to increase its water-retaining capacity, notably coir dust which is notoriously difficult to dry because it holds water so well. And soil drying through evaporation can be reduced by mulching.
Small-scale production By using smaller biomass energy production units, the land devoted to
242 D. R. Newman and D. 0. HaIl
energy production is broken up into smaller units. It is always easier to find a little land than a large area, so biomass energy production can often be shoehorned into the existing land-use pattern. Where energy plantations are being set up, this also reduces energy losses from land clearance (for example, when charcoal is made from scrub before the desired crop is planted).
An example of small-scale production is the microdistillery. This has been developed in Brazil for farms that want to grow their own tractor fuel. It is a small distillery producing 500 litres a day of 90 to 95 per cent alcohol daily from sugarcane or sweet sorghum juice. After the original design by the institut de Pesquisas Tecnologicas in São Paulo, it has been taken up and improved by private engineering companies, and is spreading throughout the cane growing regions of Brazil. Capital costs are low enough for the plant to pay for itself in a year—or six months if it is run to produce cane spirit (pinga) to drink. One company in São Paulo has already sold more than 40 microdistilleries. Since the alcohol yield of a microdistillery is lower than that of large distilleries, more land is put under cane per litre of alcohol produced. However, a microdistillery does not need a large plantation to supply it, so the farmer can choose which small part of his land is to be put under sugar- cane for alcohol production.
Soil conservation Soil conservation techniques can be used to resolve the conflict between maximum productivity and environmental sustainability—at a price. Because of their high labour or capital costs, many of these techniques are only of interest to large-scale biomass energy production schemes (and to those who want to understand why so many poor people are hos-tile to tree planting). Some soil conservation techniques are given in table 9.5.
The soil conservation techniques that were successful in colonial Tanganyika were those that were developed locally. The practice of many colonial governments was to seize native land for forest reserves, settler farms and plantations, and it comes as no surprise that local peo-ple rejected soil conservation measures promoted by such governments. Indeed, soil erosion was often caused by the forced crowding together of people into 'native' reservations or villages with no access to large areas of fertile land.

Land-use impacts 243
In contrast to this, adaptations of local soil conservation practices have been more successful. At Yatenga in Burkina Faso, Oxfam have worked with local farmers since 1979 to improve the traditional stone lines.
Table 9.5 Some soil conservation measures in colonial Tanganyika (Blaikie 1985).
Measure Whether Description adopted
Contour hedging L + Planting trees, bush and/or tall grass along the contour to slop soil moving downhill
Contour ridging L + Building top soil ridges along the countour, and planting crops on the ridges to slow downslope water movement and maintain moisture for the plants
Pit system L + Cut grass is laid in a grid of 7-10 ft squares. The centre is dug out and piled up on the grass lines. Water and the washed-off soil collect in the pit
Tied ridging L + Tying together contour ridges by building ridges at right angles
Trash ridging L + Lines of trash are laid along the contours and plants are grown uphill from the trash
Contour banks L + A bank formed from soil deposited on trash burids or by the farmer removing soil
Narrow-based L + Small terraces formed on steep slopes terraces
Broad-based and G - Larger terraces dug out from the hillside, bench terraces Disturbed the soil profile and topsoil washed away
Boxed terraces G - Like tied ridging but with difficult construction work
Check dams and L + Brushwood, sometimes with stones, is pushed into the gully stopping gully floor to trap sediment. Then grass stabilizes it
Ditches and drains L + Ditches alongside reads, or on contour-banked or terraced slopes
L = local G = government initiative + = accepted by farmers - very unpopular with farmers

244 D. A. Newman and D. 0. HaIl
Figure 9.6 Agroforestry systems, by components (Nair 1985).
They developed a cheap plastic tube level that enables farmers to lay stone lines accurately along the contours even on gentle slopes, so that dammed rainwater stays behind the lines and soaks into the soil. Now crop yields have gone up by 50 per cent (Harrison 1988).
Multipurpose land use: agroforestry One way of avoiding land-use conflicts is through systems which pro- vide more than one product from a given piece of land: crops can be planted that have several uses, such as multi-purpose trees; or several
Land-use impacts 245
plant species can be grown on the same land. Sanchez has described a fertilizer-based Continuous cultivation technology which successfully sustains crop production in Amazonia. This uses minimum tillage and rotations which maintain continuous crop cover to control erosion (Sanchez et aL 1982). Sustainable systems with lower inputs (Sanchez and Benites 1987) can be set up by including trees or shrubs in an agro-forestry system:
Agroforestry is a collective name for land use systems and tech-nologies where woody perennials (trees, shrubs, palms, bamboos) are deliberately used in the same land management unit as agricul-tural crops and/or animals, either in some form of spatial arrange-ment or temporal sequence. In agmforestry systems there are both ecological and economical interactions between the different com-ponents (Lundgren 1982).
Agroforestry includes those shifting cultivation and traditional subsis-tence agroforestry systems already mentioned. What interests us here are the more productive agroforestry systems designed to meet multiple land-use objectives. Figure 9.6 classifies some of the types of agro-forestry. We will concentrate on a few agroforestry systems, of particu-lar interest to biomass energy production. In forested areas, agroforestry systems have been designed to give greater sustainable yields than tradi-tional shifting cultivation techniques. In agricultural areas, trees can be integrated into agricultural production through farm forestry or commu-nity forestry. And plantations can be managed to produce a mix of crops and products on the same land.
Commercial agro forestry Commercial agroforestry systems are medium- to large-scale operations whose main aim is the production of crops for sale. Commercial tree crops may be grown above food crops or grazing animals, shrub crops may be grown under shade trees, or food crops may be used in rotation with timber production. Coconut growing is frequently combined with animal grazing (in south-east Asia and Oceania) or crop production (in India), which adds to the multi-purpose use of the coconut itself for food, fuel and fibre. In Sri Lanka, fast-growing shade trees such as Gliricidia are grown over some tea plantations, yielding an annual cut of fuelwood. And in many places farm/forest labourers grow crops in the

246 D. A. Newman and D. 0. Hall
first few years of the establishment of timber plantations—the 'taungya' system. Modifying this system to increase the food crop time in the rotation could accommodate many more people in the forest lands (Lundgren 1982).
In other agroforestry systems, small to medium farmers produce perennial cash crops and subsistence crops together. In east Africa, cof-fee is mixed with beans and bananas, and shaded by timber trees such as Atbizzia and Grevillea; and Catha edulis (that) is grown over food crops. In west Africa oil palm and cocoa are grown together, while in the Sahel Acacia albida is allowed to grow above crop fields for fuel and fodder.
Such agroforestry systems not only diversify land use, but also can maintain soil fertility and structure under long-term cultivation. A coconut/cacao system in India was found to reduce K losses to 55 kg/ha compared with 114 kg/ha for monoculture coconut plantations (Nair 1984). Since biomass energy programmes aim for sustainable, low-input production (to maintain a positive energy balance), more attention should be paid to agroforestry, mixed cropping systems and rotations which achieve this, than to the sole reliance on monoculture plantations of early afforestation and alcohol programmes.
Farm forestry and the use of mufti-purpose trees As trees and common land get scarcer in rural areas trees become more valuable. Farmers are planting trees on their land as security against future needs. For example, they plant casuarina in south India to provide for dowries; eucalyptus, cypress and pine in western Kenya to pay school fees; and a cooperative plantation in Benin as security for old age (Chambers 1988). These trees are fitted into the farmland as windbreaks and live fences, as boundary markers, as shade trees near houses and in small orchards and woodlots.
Farm forestry is being supported as part of many soil conservation, biomass energy, and rural development programmes. Agroforestry con-tributes through developing systems which allow crops and trees to grow together to their mutual benefit, such as the alley cropping of annual crops with nitrogen-fixing trees (Yamoah 1988); and by identifying multi-purpose trees that serve the farmer in many ways.
To a forester trees are for timber or pulp. To a horticulturalist a tree produces fruit. To an energy planner a tree is worth 15 MJ/kg when air dry. Each tends to ask villagers and farmers to grow trees chosen for a
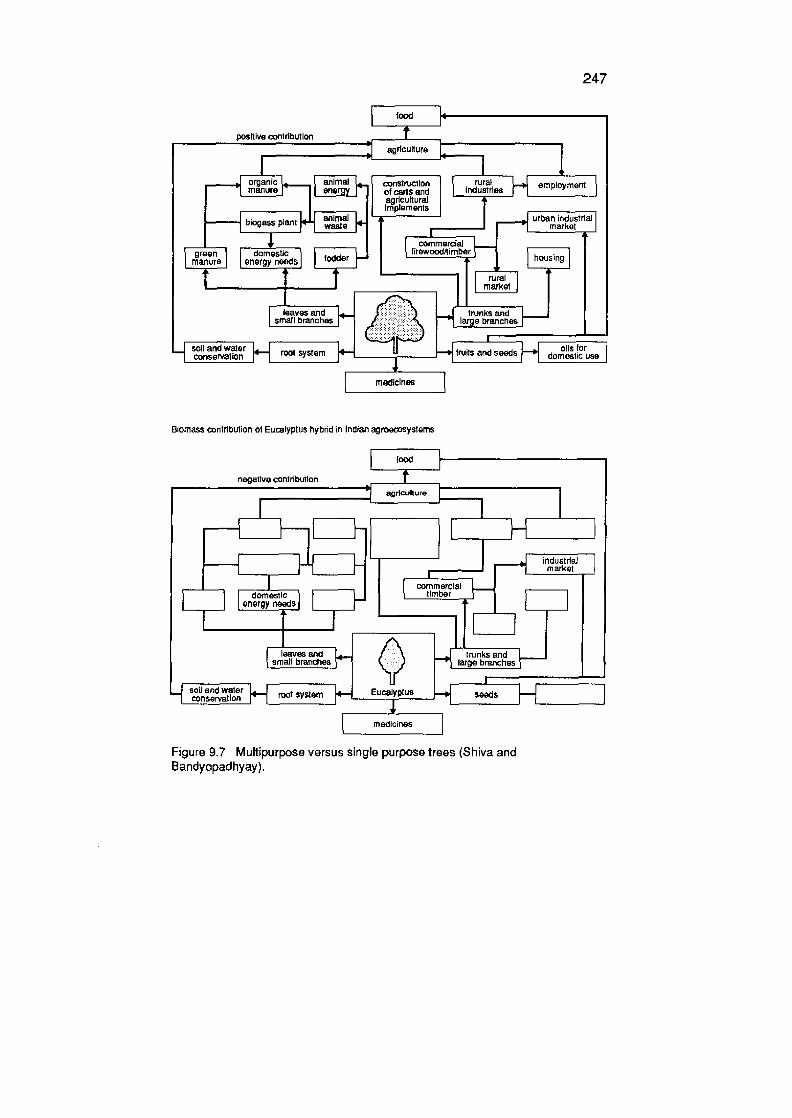
247
food
positive contribution 1 - agriculture
—H animal construction manure energy of calls and
ani1
I agricultural L pIaments biogass plant waste lw-I
I 4 rJI groan 1 1 domestic I manure I I enerav needs I
employment
urban industrial I
ru market
trunks and large branches
fruits and seeds —+ oils for domeatc use
Biomass contribution of Euiyptus hybrid in Indian agroecosystems
Ltood
negativo contribution agriculture
I commercial I I energy needS I
market
I leaves and small branches
soil and water 4-- root system conservation QbU trunks and large branches
ucelyptus seeds
medicines
Figure 9.7 Multipurpose versus single purpose trees (Shiva and Bandyopadhyay).
248 D. R. Newman and D. 0. HaIl
single purpose. These specialists are then surprised when farmers lose interest in selected trees which do not serve the farmers' own purposes. Why should the people who grow the trees be as narrow-minded as the specialists? There are many trees which serve more than one purpose (see figure 9.7).
Legumes, such as Leucaena leucocephala, fix nitrogen, provide leaves and pods which make good food and fodder, and produce good fuelwood. Leucaena was rapidly taken up by coastal farmers in Kenya when introduced as part of an alley cropping system, alternating with rows of food crops, especially maize. Although promoted as a way of increasing soil fertility and improving crop yields, Leucaena was adopted for its production of animal fodder in the dry season (Leach and Meams 1989), leading to improved milk yields. There are also good examples of Leucaena use for fodder in India and Sri Lanka.
Acacia albida, in the Sahel, is in leaf during the dry season when there is little other fodder, grows in very dry areas and also provides fuel. It also fertilizes the nearby soil through its leaf Utter, and does not compete with food crops for water since it does not transpire in the crop season (when it is leafless) and draws its water from a deep tap root (Beets 1985). The neem tree Azardirachta indica survives droughts, makes good timber and fuelwood, is a good windbreak, and produces tannins, an insect repellent and a lubricating oil (Lundgren 1982).
The importance of multi-purpose trees is that they produce something fairly quickly, without the grower having to wait for the tree to reach full size. People therefore take more care of such trees, and are less likely to think of them as 'the forester's tree'. This is particularly noticeable where foresters recommend Eucalyptus spp. instead of multi-purpose native trees. The result is often poor tree survival, unless a choice of other species is provided at the same time to meet individual preferences (Leach and Meams 1989).
Community forestry and biomass management Farm forestry has two major limitations. As we have seen in the case of the Kamataka social forestry programme, it does not necessarily benefit the landless. And there are certain problems which cannot be easily solved at the scale of a single small farm, such as large-scale soil ero-sion, overgrazing, and conflicting land-use rights (nomads versus farm-ers, for example). Such problems have to be solved at the community level.

Land-use impacts 249
Given the difficult problems of land-use rights and conflicting inter-ests within communities, it is not surprising that farm forestry has gener-ally been more successful than community forestry based upon the management of common lands. Nevertheless, when projects survive long enough to demonstrate benefits to the local community they have often been welcomed enthusiastically, as happened with the Majjia Valley Windbreak project in Niger. There 500 km of windbreaks have been set up, resulting in a 23 per cent grain yield increase in 1980 and an end to wind erosion. Although popular participation was limited at first, the windbreaks are now spreading spontaneously (Leach and Meams 1989).
Better results have been achieved when community forestry or vegeta-tion management programmes have been developed with heavy commu-nity involvement. In the Baringo district of Kenya, Roberts has worked with the local communities to help regenerate eroded lands and provide fuel and fodder, through grazing management, erosion control and tree planting. This has slowly gained community support, with the result that larger areas of land are being put aside for community management under the Fuel and Fodder Project (Roberts 1985-8; Dc Groot and Hall 1989).
To generalize, community forestry and biomass management pro-grammes work best when the local people participate in the pro-grammes, when they help choose the species to be planted, and when there is a clear mechanism to allocate land-use rights over the products of the community programme.
As Shepherd (1988) explains, despite the difficulties common-land planting has to be made to work for the sake of the large landless group of rural inhabitants, in places like India, who still need fuel, fodder and fruit. The challenge for agroforestry is to design and develop systems that match the varied needs and objectives of rural communities living in fragile environments around the world. Such communities need Sustain-able (and preferably high) yields of food, fodder, fuel, timber and cash.
Multi-purpose biomass use One way of making a piece of land serve for both energy and food pro- duction is to employ a plant or animal for several purposes through the use of crop and livestock residues. These are often produced in substan-
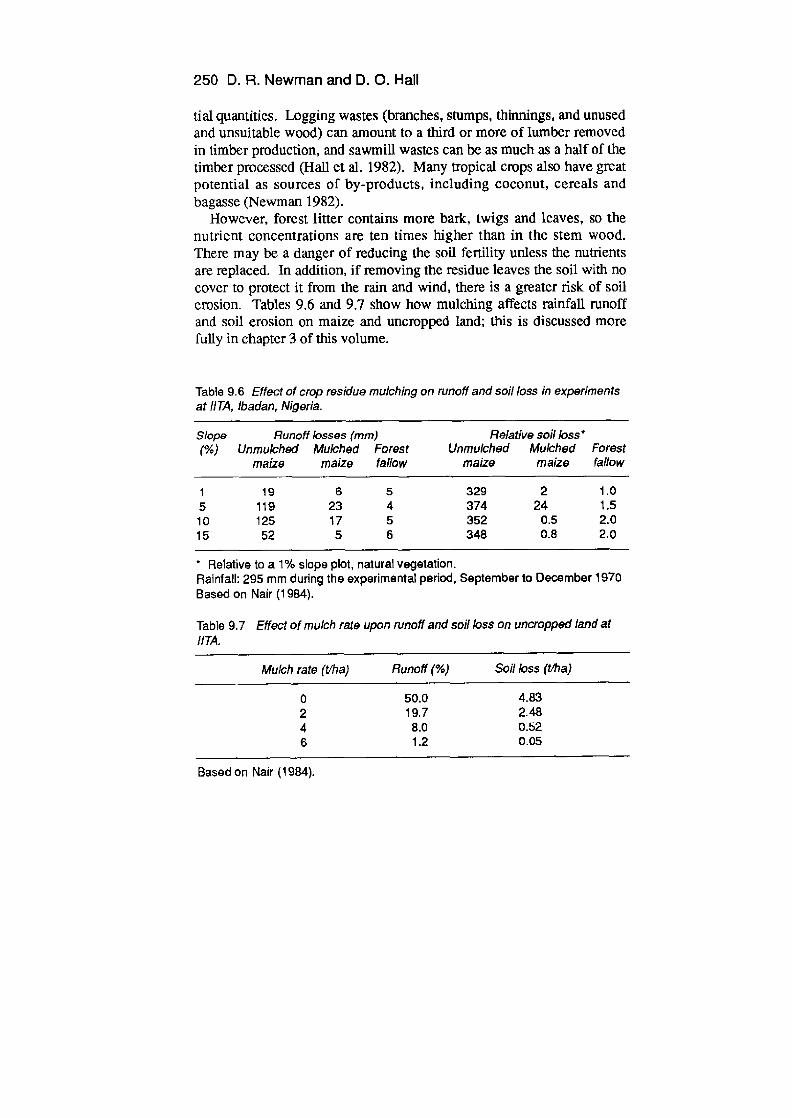
250 D. R. Newman and D. 0. Hall
tial quantities. Logging wastes (branches, stumps, thinnings, and unused and unsuitable wood) can amount to a third or more of lumber removed in timber production, and sawmill wastes can be as much as a half of the timber processed (Hail et al. 1982). Many tropical crops also have great potential as sources of by-products, including coconut, cereals and bagasse (Newman 1982).
However, forest litter contains more bark, twigs and leaves, so the nutrient concentrations are ten times higher than in the stem wood. There may be a danger of reducing the soil fertility unless the nutrients are replaced. In addition, if removing the residue leaves the soil with no cover to protect it from the rain and wind, there is a greater risk of soil erosion. Tables 9.6 and 9.7 show how mulching affects rainfall runoff and soil erosion on maize and uncropped land; this is discussed more fully in chapter 3 of this volume.
Table 9.6 Effect of crop residue mulching on runoff and soil loss in experiments at i/TA, Ibadan, Nigeria.
Slope Runoff losses (mm) Relative so!! loss *
(%) Unmu/ched Mulched Forest Unmuiched Mulched Forest maize maize fallow maize maize fallow
1 19 6 5 329 2 1.0 5 119 23 4 374 24 1.5 10 125 17 5 352 0.5 2.0 15 52 5 6 348 0.8 2.0
Relative to a 1% slope plot, natural vegetation. Rainfall: 295 mm during the experimental period, September to December 1970 Based on Nair (1984).
Table 9.7 Effect of mulch rate upon runoff and soil loss on uncropped land at i/TA.
Mulch rate (ti/ia) Runoff (%) Soil loss (tha)
0 50.0 4.83 2 19.7 2.48 4 8.0 0.52 6 1.2 0.05
Based on Nair (1984).
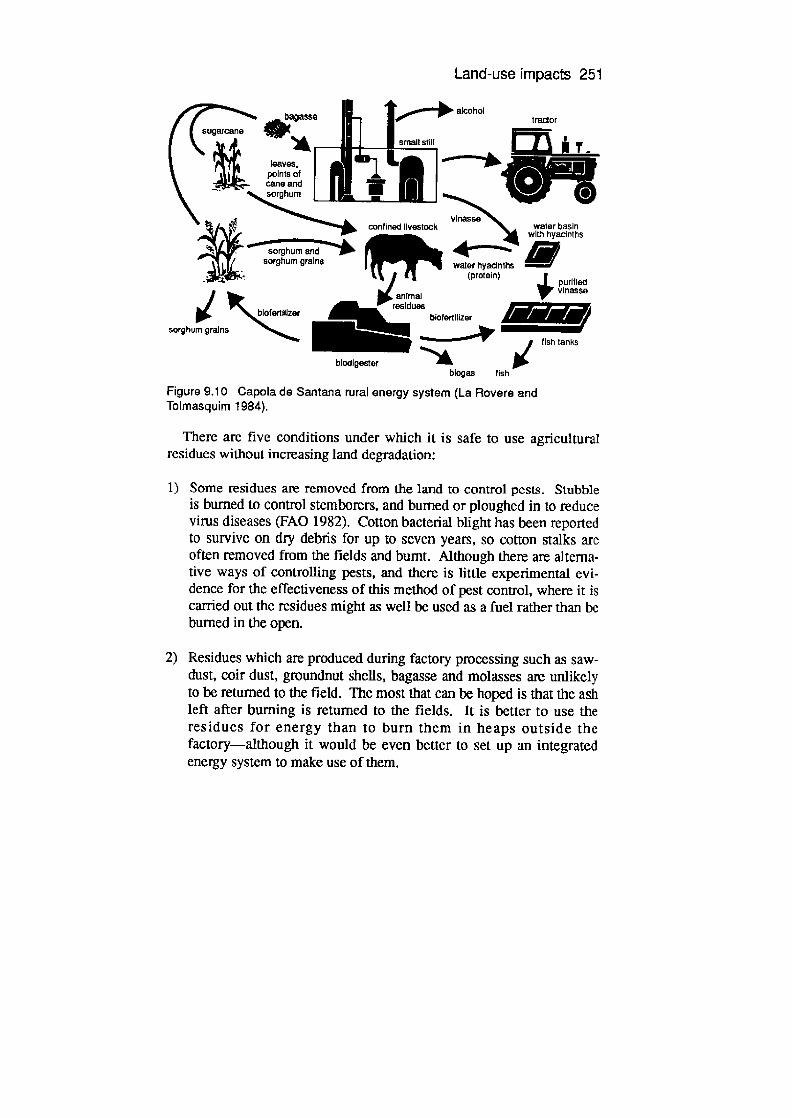
Land-use impacts 251
sugarcane
ug
—1 il anin
j'sorghum grains N_______________ blodigestor
alcohol tractor
__*
9"0 Ina sse
wate basin with hyacinths
waler hyadnths Aff (protein)
purified vinasse
ues blofertilizer
fish tanks
ftoll-A W blogas fish
Figure 9.10 Capola de Santana rural energy system (La Rovere and Tolmasquini 1984).
There are five conditions under which it is safe to use agricultural residues without increasing land degradation:
Some residues are removed from the land to control pests. Stubble is burned to control stemborers, and burned or ploughed in to reduce virus diseases (FAO 1982). Cotton bacterial blight has been reported to survive on thy debris for up to seven years, so cotton stalks are often removed from the fields and burnt. Although there are alterna-tive ways of controlling pests, and there is little experimental evi-dence for the effectiveness of this method of pest control, where it is carried out the residues might as well be used as a fuel rather than be burned in the open.
Residues which are produced during factory processing such as saw -dust, coir dust, groundnut shells, bagasse and molasses are unlikely to be returned to the field. The most that can be hoped is that the ash left after burning is returned to the fields. It is better to use the residues for energy than to burn them in heaps outside the factory—although it would be even better to set up an integrated energy system to make use of them.
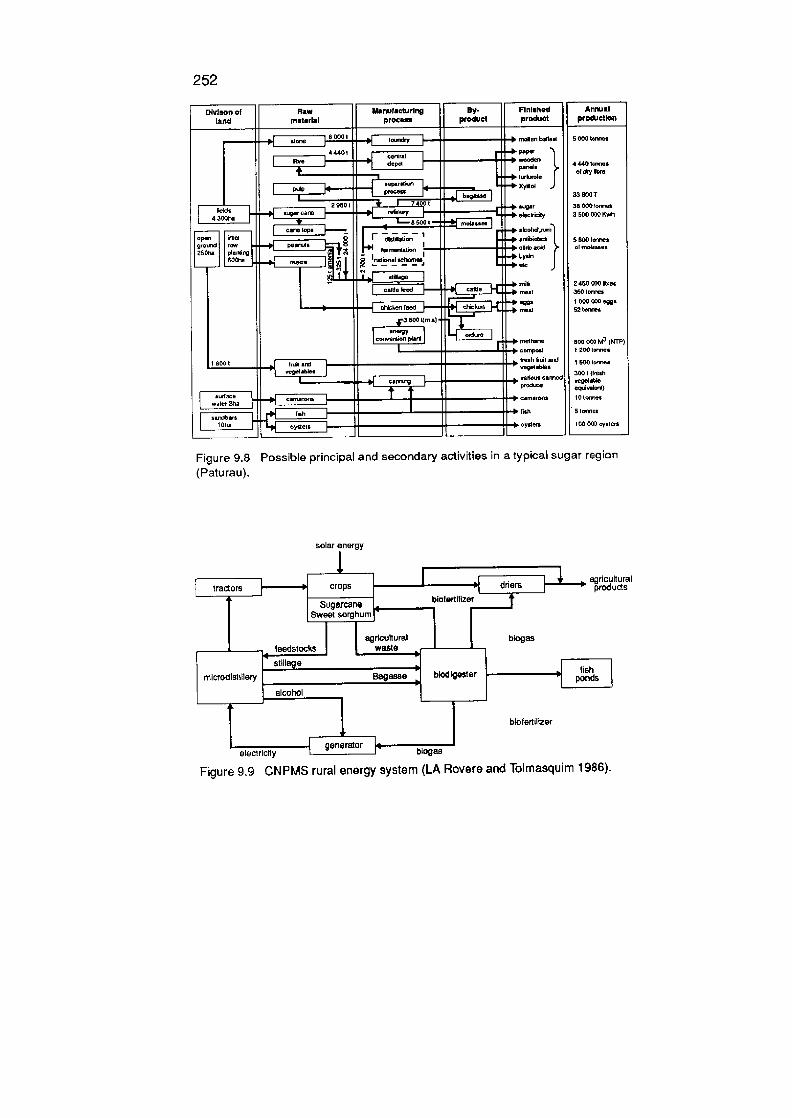
252
DIvlon of flaw Mpraif.cturing By- la*d matarlal procem prooct
44401
III': _ I _0*
L___J !! t
i
r rnoiis.o. —
;;:-i I 4 °° I
row poaWts I PO!
J] 0 I
—EJ- ,ç35001{rlu.l
I
L{ J I
I 8001
_ -.4_ c.rnrsj-
r,00aro I
flrIIih*d product
Annuaf production
.4 inolon bifloe 5000 torwu
.*p.p0, 'I yn L 4445Io.wwl
f oIyibre .4 ft.001. .4 xyNtol
336001
.4. .r 38 000 1000wo
.4. eteolñc0y 3500000 Kwl,
—d.rrwr)
I 5SOOIonnes .4.ctdcod 0 olwrol.,,eI
—, L.0Ur .4. 040
..oilr 2450000010$
.4 no.1 350 tornu -4 ...4 nut
I 500500 096. 52 totwe.
*00110,r. 600 00* M3 (NTP) .4 compool I 200 tenon. _40othub.0d 15001-- ne-s -+
18000 oer.rod 3001
prodenO c.mlrbWU *0507,00
Olonite -4 oydor. 100002 nycIero
Figure 9.8 Possible principal and secondary activities in a typical sugar region
(Patu rau).
solar energy
+ agrIcultural
r crops w ra products
i4
Sugarcane bl&ertlllze
sorghum
lrlcullurat 1
mlcrodistillery Bagasse blodlgester lish
biofert*Iizer
electricity I gener__aj4-
biogas
Figure 9.9 CNPMS rural energy system (LA Rovere and Tolmasquim 1988).

Land-use impacts 253
firewood and timber
MIT_____
treefood crops ho
crops
abourJ vegetableser I
9etJ
It I labour 1
cash crops
manure
oreen manure
Figure 9.11 Intensive home garden cultivation in Kerala (Arnold 1987).
Certain energy conversion processes—biogasification in particu-lar—preserve nutrients. Biogasification separates the energy (hydro-gen and carbon) from the minerals, which can be returned to the fields as fertilizer, losing only some N in the process. Indeed, bio-gasification plants should really be called biofertilizer plants, since the gas is a minor by-product, while the effluent concentrates the nutrients three times and makes them more quickly available to the soil.
Some more woody, high C/N ratio, residues actually reduce soil nitrogen levels while they are being broken down by soil micro-organisms. Their nutrient content can be returned more quickly to the soil via compostirig or burning.
Where erosion can be controlled, and fertility restored without leav-ing all the residue in the field. This may be done by other plants in an agroforestry system, by leaving part of the residue on the soil, or by mechanical soil conservation and fertilizer addition.
Integrated projects Finally, all of these approaches to multiple biomass use can be combined

254 D. R. Newman and D. 0. HaIl
into integrated food-energy systems. Such integrated systems go beyond the simple monocultures often recommended by agriculturalists and energy planners.
For a long time people have proposed setting up integrated biomass projects that would allow not only the planning of integrated land use, but also the use of the by-products of one process as the input to another. Glesinger's (1953) integrated forest industries proposal has since been partly realized, in that sawmills, veneer and particle board mills are often built next to each other to make use of timber wastes. Paturau's (1976) vision of integrated satellite industries around a sugar factory (figure 9.8) has yet to be realized (although some might argue that the whole of Cuba has been developed like Paturau's sugar region).
Smaller scale integrated rural energy systems have been proposed for remote or island rural communities (Chan). These typically arrange for a flow of organic matter through animals and through bloenergy conver-sion devices such as biogas digesters, to permit some degree of both food and energy self-sufficiency. Experimental integrated systems are now being tried out in Brazil, India and China under the United Nations University Food Energy Nexus, and shortly, in Africa, under the Cairo Plan of Action (which proposed making 50 villages self-sufficient in food and energy).
In Brazil there are two types of integrated energy scheme. Embrapa, a state farming company, has set up energy self-sufficiency projects at a number of its research centres. These are more like Paturau's idea of making full use of all products and by-products that arise on a plantation or farm. One such project has been set up at the National Corn and Sorghum Research Centre (CNPMS) at Sete Lagoas, Minas Gerais (see figure 9.9) (La Rovere and Tolmasquim 1986). Sugarcane or sweet sorghum (depending upon the season) is crushed in an ordinary small cane mill. The juice is fermented, then distilled in a microdistillery with energy from burning bagasse. The stillage is fed to a biogas digester. An electricity generator can be run from either biogas or alcohol, while the Centre's tractors are run on alcohol. The system produces so much energy that in August 1987 the Centre only ran the microdistillery part-time.
Other agencies in Brazil are producing projects for planned rural set-tlements that will give the landless a better chance than they get in their unplanned settlements. At present, the lack of planning creates severe marketing and supply difficulties: after occupation, the land is farmed

Land-use impacts 255
until it loses fertility—perhaps after three years; then the peasants leave. As Reinaldo Adams says, 'They have two happy days, the day they arrive and the day they leave' (Adams 1987). One such scheme was tested at the experimental station of Capola de Santana, Rio Grande de Sul (figure 9.10). In this system, 25 ha of sugarcane and 41 ha of sweet sorghum provide sugar for a 500 litre per day microdistillery, while the cane tops and sorghum grains, together with some of the bagasse and water hyacinth, are fed to 80 zero-grazed cattle. The vinasse (stillage) is passed through water hyacinth beds; these reduce the mineral nutrient content of the vinasse, while bacteria reduce the BOD, so that the water can then be used in fish ponds. Finally, a biogas digester completes the integration, providing gas for the people and fertilizer for the cane and sorghum fields (La Rovere and Tolmasquim 1986).
It is too early to say how successful such projects will be, or whether ordinary farmers will be able to copy them. Integration of both land and by-product use requires careful management of a complex system. A particular problem is that many systems are designed to work at fixed capacity ratios: when the demand for one output is less than that for another, it can be difficult to adjust the system to produce less of just one product. The more complex the system, the more likely it is to fail in this way. As Shearer (1988) pointed out, it is necessary to optimize for survival under the least favourable conditions, rather than for maximum yields under the best conditions. Consequently, the systems need redun-dancies or duplications to provide food and energy security, leading to oversupply in good years.
Nevertheless, large plantations are capable of managing systems of this kind, so integration should be part of any large-scale bioenergy plan-tation. Many large alcohol distilleries in Brazil are insufficiently inte-grated, both in not making use of the stillage, and in not integrating food production with the cane (for example, by inter-row planting when a new cane crop is planted and sometimes with the first ratoon, on the lines of experiments in Mauritius, Brazil and Cuba).
Many integrated food-energy system projects share this Jack of pro-duction integration. The emphasis has been on fully using by-products from one process as the input to another, while biomass has been pro-duced by monoculture in separate fields. Biomass production has been integrated in time, through planned rotations, but not in Space. Compare this with home garden farming systems (figure 9.11), in which not only the products but also the production is fully integrated. A mixture of

256 D. R. Newman and D. 0. Hall
annual or perennial species are grown in associaiion—commonly trees, shrubs and ground-cover plants. This makes effective use of the land area, protects the soil from erosion, and promotes nutrient recycling (Arnold 1987). Such benefits need to be integrated into integrated food-energy systems—at present, the most successful integrated food-energy systems are home gardens and other traditional forms of agroforestry.
Land-use planning
Since land use for biomass energy production is so tied up with food production and environmental protection, they cannot be treated sepa-rately. Swaminathan (1987) has pointed out that 'enduring food and nutrition security can be built only on the foundation of ecological security, i.e. the security of the basic life-support systems of land, water, flora, fauna and the atmosphere'. The same applies to sustainable biomass energy production.
It has often been argued that there are rural energy crises all over the world, caused by the gap between biomass energy supply and energy demand. Increased biomass energy production is championed as the obvious solution to this problem. But is this the real problem, or a symptom of the underlying causes of environmental, nutritional and energy problems in the Third World? Incomplete diagnoses lead to incomplete solutions—so what are the real problems of biomass energy users? Their problems are those of surviving on marginal or environ-mentally vulnerable lands. They have to minimize their risks while attempting to meet their needs, often through planting a mixture of cash and subsistence crops, against a complex background of conflicts in land tenure and land-use objectives. Farmers and communities plan their land use to reconcile these objectives and conditions; but when they fail someone or something suffers—the people or the land. Deforestation, soil erosion, desertification, landlessness, food, fodder and fuel shortages are all consequences of failure in land-use planning. The particular form these problems take depends upon local environmental, economic and social conditions.
The challenge is to plan land use so that these problems are avoided, but general solutions are hard to find because land use is very site-spe-cific. Instead, we need to ask 'How do we do all the things we want to do with this bit of land—and how can we keep on doing them?' Local
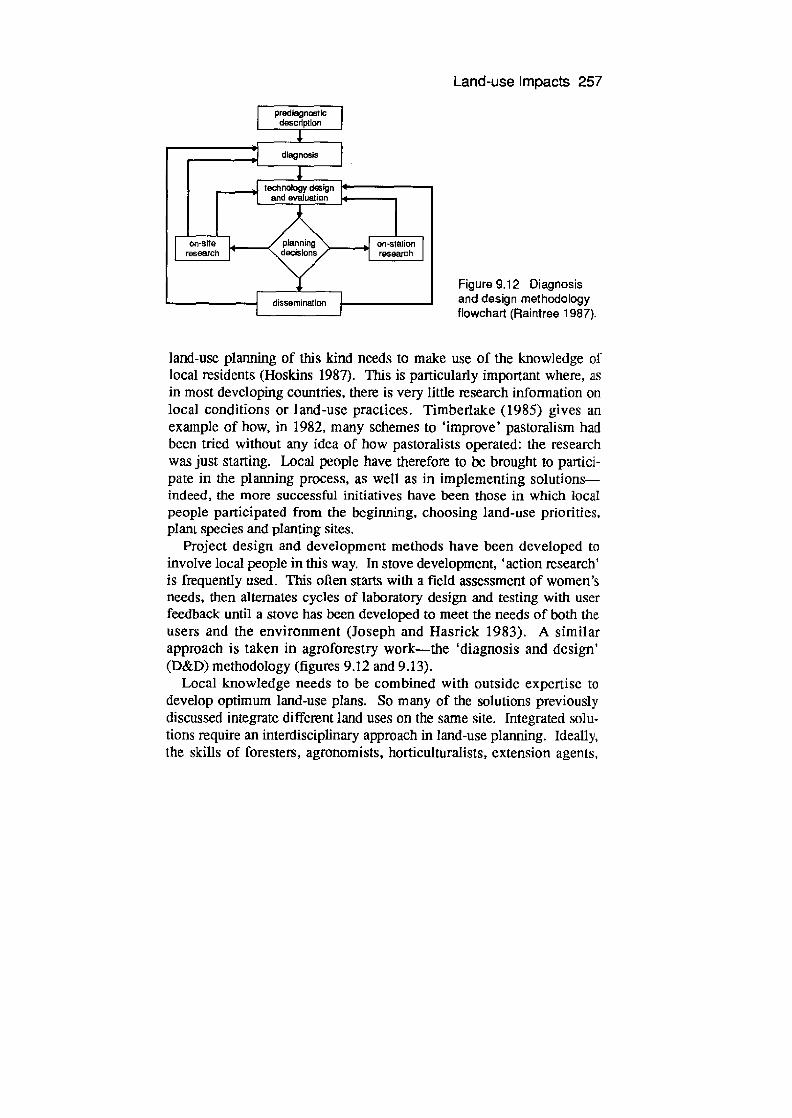
Land-use impacts 257
diagnosis I
tediflOkgy design and evaluation
on-site planning )) •I on-station research decisions I research
Figure 9.12 Diagnosis dissemination and design methodology
flowchart (Raintree 1987).
land-use planning of this kind needs to make use of the knowledge of local residents (1-loskins 1987). This is particularly important where, as in most developing countries, there is very little research information on local conditions or land-use practices. Timberlake (1985) gives an example of how, in 1982, many schemes to 'improve' pastoralism had been tried without any idea of how pastoralists operated: the research was just starting. Local people have therefore to be brought to partici-pate in the planning process, as well as in implementing solutions-indeed, the more successful initiatives have been those in which local people participated from the beginning, choosing land-use priorities, plant species and planting sites.
Project design and development methods have been developed to involve local people in this way. In stove development, 'action research' is frequently used. This often starts with a field assessment of women's needs, then alternates cycles of laboratory design and testing with user feedback until a stove has been developed to meet the needs of both the users and the environment (Joseph and Hasrick 1983). A similar approach is taken in agroforestry work—the 'diagnosis and design' (D&D) methodology (figures 9.12 and 9.13).
Local knowledge needs to be combined with outside expertise to develop optimum land-use plans. So many of the solutions previously discussed integrate different land uses on the same site. Integrated solu-tions require an interdisciplinary approach in land-use planning. Ideally, the skills of foresters, agronomists, horticulturalists, extension agents,
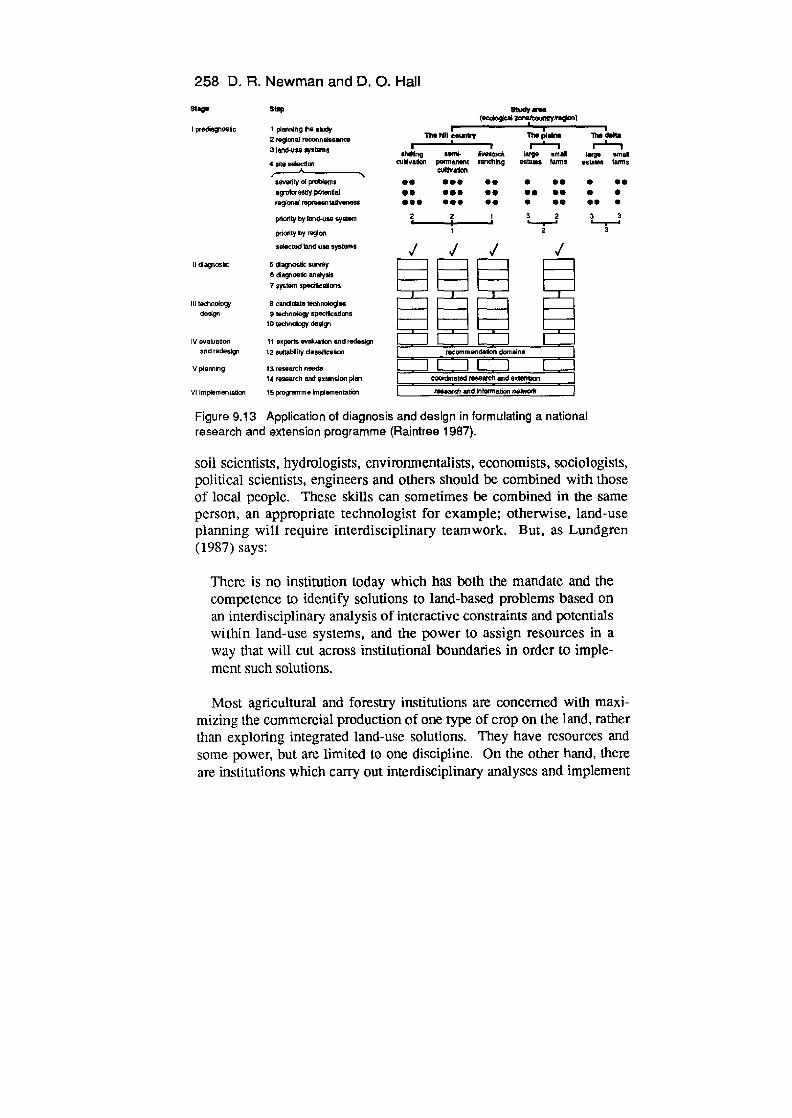
258 D. R. Newman and D. 0. Hall
stva Stup Study areas. plcaud fttunayft,an)
I pcoa1o5c 1 plannIng 11e slady I I I
2 r.9cnai reconnaianance Thuplilnu Thu hu I1 r 3 land-usa stosa sl qatu.d lacga siSal liagu sisal
4 site selection cUlSvflon p6ffarwnt ranthkig a8l8s hums 851*5 tainis Curdwallon
saveiityO*ema •• ••• •• U •S • U* aotorsa5ypotsn8ai •• ••• u• •IS• • • epnlatasnsa5 ••U •,U go U •U •U U
2 2 1 3 2 3 - - • 3 J
1 2 3
nelaclad land use syatains
11 daguosX 5 tlagnoads alr8y o clagnoadc aflelyds 7 system spedks8ons
III tednldogy 8 canddate tethndoglae design 9 tethndUgy selficadans
10 ledinnIogy dodgy
iv evaluaton ii enpal-ta avatuadon and redealgy L...._......J I I and redesIgn 12 sidlablity daneltcailisi rectinmendadon domaina
V planning 13r8588t541 needs i 14 reseancli and anlevalon plan - COOIderat8d research and estenalon ]
VI imptemenladcr in prQtiSma hlptomornailmi msrdi and Ivolmeson fleMSV$t I
Figure 9.13 Application of diagnosis and design in formulating a national research and extension programme (Raintree 1987).
soil scientists, hydrologists, environmentalists, economists, sociologists, political scientists, engineers and others should be combined with those of local people. These skills can sometimes be combined in the same person, an appropriate technologist for example; otherwise, land-use planning will require interdisciplinary teamwork. But, as Luncigren (1987) says:
There is no institution today which has both the mandate and the competence to identify solutions to land-based problems based on an interdisciplinary analysis of interactive constraints and potentials within land-use systems, and the power to assign resources in a way that will cut across institutional boundaries in order to imple-ment such solutions.
Most agricultural and forestry institutions are concerned with maxi-mizing the commercial production of one type of crop on the land, rather than exploring integrated land-use solutions. They have resources and some power, but are limited to one discipline. On the other hand, there are institutions which carry out interdisciplinary analyses and implement
Land-use impacts 259
integrated solutions, such as appropriate technology centres, agroforestry institutions and non-governmental organizations (NODs). These, how-ever, lack the resources and power to change national land-use policies, or to introduce new land-use systems to large areas.
How, then, can institutions be brought to work together on integrated land-use systems? There are two promising (and complementary) approaches: governmental and intergovernmental land-use policies; and NGO networking.
Sahelian governments have set up an Interstate Commission for the Struggle against Drought in the Sahel (CILSS). This coordinates gov -ernment policies on desertification throughout the six member couri-tries—they have chosen to disseminate only three basic woodstove designs in their countries, for example.
In Kenya, tree planting and improved stoves have been encouraged by many NOOs. The scale of their impact has been enhanced by coopera-tion between the NGOs and government agencies. The improved char-coal stove, the Kenya Ceramic Jiko, was designed, tested and developed by collaboration between many NOOs, research institutions, entrepreneurs and the Ministry of Energy, coordinated by the Kenya Clayslove Working Group, and later the Kenya Energy NOD association (KENGO). This interdisciplinary cooperation resulted in an acceptable and efficient design (Newman 1985).
Finally, intergovernmental and inter-NGO networking can be interna-tionalized, through organizations such as REECA (Renewable Energy and Environmental Conservation Association), BUN (Biomass Users Network), ENDA (Environment and Development Association), ANEN (African Network for the Environment), the EIA (Energy Initiatives for Africa) regional stoves programme, and the UNU IFES (Integrated Food-Energy Systems) programme. These networks allow members to learn from each other, and from experiences in other parts of the world. Unfortunately, such networking has a low priority for funding, so it is likely we will continue to see land-use mistakes repeated in country after country throughout the world.
References Abracave (1987) ABRACAVE figures quoted by Ferreira (1987) at IV
Congresso Brasileiro de Energia. Adams, J. M. (1977) 'Review of the literature concerning losses in
stored cereals and pulses', Trop. Sci., 19/1, 12-15.

260 D. R. Newman and D. 0. HaIl
Adams, Reinaldo (1987) Personal communication, POrto Alegre, Brazil. Agarwal, Bina (1986) Cold Hearths and Barren Slopes, Zed Books,
London. Allen, Julia C. and Cady, John G. (1982) Impact of Forest Soils on the
Bioenergy Outlook in Developing Countries, Resources for the Future, Washington DC.
Amerasekera, R. M. (1988) 'National fuelwood conservation programme', Roiling Point, ITDG, Rugby, UK, 15, 24-7.
Anderson, D. and Fishwick, R. (1984) Fiwlwood Consumption and Deforestation in African Countries, World Bank Staff Working Paper No. 704, World Bank, Washington DC.
Apin, Teresa (1987) 'The Sarawak timber blockade', The Ecologist, 17(4/5), 186-9.
Arnold, J. E. M. (1987) 'Economic considerations in agroforestry', in Steppler and Nair (eds), Agroforestry: A Decade of Development.
Bandyopadhyay, J. and Shiva, Vandana (1987) 'Chipko: rekindling India's forest culture', The Ecologist, 17(1), 26-34.
Bandyopadhyay, J. and Shiva, Vandana (1988) 'People's control over forest resources in the Himalayas', Appropriate Technology, 15(1), 8-10.
Barnard, Geoffrey and Knstoferson, Lars (1985) Agricultural Residues as a Fuel in the Third World, Intl. Institute for Environment and Development, London.
Beets, Willem C. (1985) Agroforestry in African Farming Systems, Energy/Development International for USA ID, Washington DC.
Blaikie, Piers (1985) The Political Economy of Soil Erosion in Developing Countries, Longman, London.
Boon, L. J. and Bunders, J. (1987) 'What can plant biotechnologists learn from the Green Revolution?' in 0. M. Neijssel et al. (eds), Proceedings of the Fourth European Congress on Biotechnology, 4, 439-48, Elsevier, Amsterdam.
Boxall, R. A. and Gillett, R. (1982) Farm Level Storage Losses in Nepal, Report G157, Tropical Products Institute, London.
Brown, Lester R. (1980) Food or Fuel: New Competition for the World's Crop land, Worldwatch Paper 35, Woridwatch Institute, Washington, D.C.
Burley, Jeffery (1982) Obstacles to Tree Planting in Arid and Semi-arid Lands. Comparative Case Studies from India and Kenya, UN University, Tokyo.

Land-use impacts 261
Chambers, Robert (1988) 'Trees as savings and security for the rural poor', Appropriate Technology, 15(1), 20-1.
Chan, George L. (ed) Waste Utilization in Rural Industrialization, 6th Waigani seminar: Priorities in Melanesian development, quoted in Newman (1982).
Charreau, C. (1972) 'Problems poses par l'utilisation agricole des sols tropicaux par des cultures annuelles', Agron. Trop., 27, 905-29,
Chavangi, N. A. (1984) Cultural Aspects of Fuelwood Procurement in Kakainega District, Working paper no. 4, Kenya Woodfuel Development Project, Beijer Institute, Nairobi.
Chidumayo, E. N. (1987) 'A shifting cultivation land use system under population pressure in Zambia', Agroforestry Systems, 5, 15-25,
Coichester, Marcus (1987) 'Native protests stifled in Malaysian Government crack-down', The Ecologist, 17, 189.
Coughenour, M. B. et al. (1985) 'Energy extraction and use in a nomadic pastoral ecosystem', Science, 230, 619-25.
Coursey, D. G. (1972) 'The civilization of the yams', A rchael, Phys. Antropol., Oceania, 7, 215-33.
Coursey, D. G. and Proctor, F. J. (1975) 'Towards the quantification of post-harvest loss in tropical horticulture produce', Acta Hort., 49, 55-66.
Coursey, D. G. and Booth, R. H. (1977) 'Post-harvest problems of non-grain staples', Acta Hort., 53, 23-33.
CSE (1985) The State of India's Environment 1984-5: The Second Citizen's Report, Centre for Science and Environment, New Delhi, 80.
Dagord, Cesar, J. L., Adams, R. L., Stuip, V. I., Rohr, E. (1987) Politica Energetica e alocacao espacial da producao agricola, IV Congresso Brasileiro de Energia, COPPE, University Federale of Rio de Janeiro, 1080-6.
Damiba, T. E. (1985) Etude comparative des performances dufoyer 3 pierres-traditionel et dufoyer 3 pierres-amelioré, Institut Burkinabe d'Energie, Ouagadougou.
De Groot, P. J. and Hail, D.O. (1989) 'Back to grassroots in Kenya' New Scientist 121 (1646)44-47.
Digernes, T. Hammer (1979) 'Fuelwood crisis causing unfortunate land use—and the other way around', Norsk Geogr. Tidsskr., 33, 23-32.
EDF (1987) 'The failure of social forestry in Kamataka', The Ecologist, 17, 151-4.

262 D. H. Newman and D. 0. HaIl
FAO (1982) Integrated Pest Control in Agriculture Report of the 11th Session of the FAO/UNEP Panel of Experts on Integrated Pest Control, Kuala Lumpur, 5-10 March 1982, FAO, Rome.
FAO (1984) Traditional Post-Harvest Technology of Perishable Tropical Staples, Ag. Serv. Bull, no. 59, FAO. Rome.
Femandes, E. C. M., O'Rting'ati, A. and Maghembe, J. (1984) The Chagga home gardens: a multistoried agmforestry system on Mount Kiimanjaro', A groforestry Systems, 2, 73-86.
Ferreira, Carlos R. 0., Fonseca, Enio M. B. and Fonseca, Jose M. (1987) Manejo Sustentado de Cerrada uma necessidade de Minas Gerais, IV Congresso Brasileiro de Energia, COPPE, University Federale of Rio de Janeiro, 997-1003.
Foley, Gerald and Barnard, Geoffrey (1984) Farm and Community Forestry, Earthscan, London.
Fortmann, Louise and Rochelau, Dianne (1985) 'Women and agroforestry: four myths and three case studies', Agroforestry Systems, 2, 253-72.
Glesinger, Egon (1953) The Coming Age of Wood, Secker and Warburg, London.
Hall, D. 0. and de Groot, P. J. (1987) 'Biomass for fuel and wood—a parallel necessity', in K. W. Boer (ed), Advances in Solar Energy, 4, Plenum Press, New York.
Hall, D. 0., Barnard, G. W. and Moss, P. A. (1982) Biomass for Energy in the Developing Countries, Pergamon Press, Oxford.
Harrison, Paul (1988) 'The magic stones', in Fragile Future, Oxiani, Oxford and The Observer, London.
Higgins, G. M. et al. (1983) Potential Population-Supporting Capacities of Lands in the Developing World, FAO, Rome
Hoskins, Marilyn W. (1987) 'Agroforestry and the social milieu', in Steppler and Nair (eds), Agroforestry: A Decade of Development, 191-203.
Hughes, Cohn (1988) 'Exotic and native trees for social forestry', Appropriate Technology, 15(1), 22-3.
Hurst, Philip (1987) 'Forest destruction in South-East Asia', The Ecologist, 17(415), 170-4.
Jones, H. Mike (1983) industrial Energy Use in Kenya. Results and Analysis of a Survey of Major Industries, Mm. of Energy and Regional Development, Naimbi.
Land-use impacts 263
Jorez, Jean-Philhipe (1987) CILSS, Ougadougou, Persona! communication.
Joseph, Steven and Hasrick, Phil (1983) Burning Issues, UNICEF, Nairobi.
Kapiyo, Raphael J. (1986) The Jiko Field Test Study, KENGO (Kenya Energy Non-Governmental Organizations), Nairobi.
Kay, Robin (1987) 'New blood for African farms', New Scientist, 116(1584), 54-7.
Kerkhof, Paul and May, Nicky (1988) 'Sex roles in agro-forestry in Kakamega', Appropriate Technology, 15(1), 11-1
Khamati, B. and Newman, D. R. (1986) Research and Development on Imp roved Stoves, National Improved Stoves Workshop, 24-26 Sept. 1986, Min. of Energy, Naimbi.
Kramer, J. M. (1987) 'Sustainable resource management', Only One Earth Conference on Sustainable Development, Intl. Institute for. Environment and Development, London.
La Rovere, E. L. and Yolmasquim, M. T. (1984) 'Integrated food energy systems in Brazil', in Capacitacao para a tomada de decisOes na area de energia, Proc. mt. Seminar on Ecosystems, Food and Energy, Brasilia (vol. 1: Synthesis report), FinepfL.JNESCO.
La Rovere, E. L. and Yolmasquim, M. T (1986) Integrated Food-Energy Production System in Brazil, 2nd mt. Symp. on Food-Energy Nexus and Ecosystem, Feb. 12-14, 1986, New Delhi, Indian Institute of Management, Ahmedabad.
Leach, and Mearns, R. (1989) Beyond the Woodfuel Crises: people, land and trees in Africa, Earthscan Pubi, London.
Leakey, Richard E. (1981) The Making of Mankind, Michael Joseph, London, 97-109.
Lohrmann, Gudrun (1984) L'acceptabilité sociale des foyers ameliorés au Burkina Faso, GTZ, Eschborn, Germany.
Lundgren, Bjom (1982) The use ofAgroforestry to Imp rove the Productivity of Converted Tropical Land, ICRAF (Intl. Council Research Agroforestry), Nairobi.
Lundgren, Bjom 0. (1987) 'Institutional aspects of agroforestry research and development', in Steppler and Nair (eds), Agroforestry: A Decade of Development, 43-51.
Nair, P. K. R. (1983) 'Agroforestry with coconuts and other tropical plantation crops', in Plant Research and Agroforestry, ICRAF (Intl. Council Research Agroforestry), Nairobi.
264 D. R. Newman and D. 0. HaIl
Nair, P. K. R. (1984) Soil Productivity Aspects ofAgroforestiy, ICRAF (Intl. Council Research Agroforestry), Nairobi.
Nair, P. K. R. (1985) 'Classification of agroforestry systems', Agroforestry Systems, 5, 97-128.
NAS (1978) Post-Harvest Food Losses in Developing Countries, National Academy of Sciences, Washington DC.
Newman, D. R. (1979) Aquatic Plants as an Energy Crop in the UK (Scientific Report: ETSU fuels from biological materials programme, project 8), Energy Technology Support Unit, Harwell, UK.
Newman, D. R. (1982) Utilization of Sugarcane By-products: Appropriate and Inappropriate Technologies in Mauritius, Ph.D. thesis, Univ. of Edinburgh.
Newman, D. R. (1985) A Case Study of Successful University—NGO--4ndustry Cooperation: The Kenya Ceramic Jiko, Seminar on University-Industry Cooperation, Univ. of Nairobi (Mech. Eng. Dept.), Nairobi.
Nshumbeki, L. and Mugasha, A. G. (1985) 'The modification of traditional shifting cultivation brought about by the forest development project in the HADO area, Kondoa, Tanzania', in FAO, Changes in Shfting Cultivation in Africa: Seven Case Studies, FAO Forestry papers 50/1, FAO, Rome, 14 1-62.
Paturau, J. M. (1976) 'La satellisation industrielle des sucreries, est-elle possible?', Revue Agricole er Sucriere de l'Ile Maurice, 55, 6-16.
Raintree, J. B. and Lundgren, B. (1985) Agroforestry PotentiaLc for J3iomass Production in Integrated Land Use Systems, Symp. on biomass energy systems: building blocks for sustainable agriculture, Jan. 29-Feb. 1, 1985, Airlie VA. World Resources Institute, Washington, D.C.
Raintree, J. (ed) (1987) D&D User's Manual: An Introduction to Agroforestry Diagnosis and Design, ICRAF (Intl. Council Research Agroforestry), Nairobi.
Reed, Tom (1987) 'The Auroville forest: reclaiming a desert', The Ecologist, 17, 20334.
Raij, C. (1987) The Agroforestry Project in Burkina Faso: an Analysis of Popular Participation in Soil and Water Conservation, Only One Earth Conference on Sustainable Development, Intl. Institute for Environment and Development, London.
Land-use impacts 265
Roberts, Murray (1985-8) Progress Reports, Fuel and Fodder Project, Baringo District, Lake Banngo, Kenya.
Rosillo Calle, F. and Hall, D. 0. (1987) 'Brazilian alcohol: food versus fuel?', Biomass, 12, 97-128.
Sanchez, P. A., Bandy, D. E., Villachica, J. H. and Nicholaides, J. J. (1982) Science, 216, 821-6.
Sanchez, Pedm A. and Benites, Jose R. (1987) 'Low-input cropping for acid soils of the humid tropics', Science, 238, 1521-7.
Shearer, Walter (1988) 'Integrated rural energy systems', Work in Progress (UNU), 11(1), 2.
Shepherd, Gill (1988) 'Social forestry and the poor in Kamataka: prospects and problems', Appropriate Technology, 15(1), 17-19.
Shiva, Vandana and Bandyopadhyay, J. (ed) Ecological Audit of Euc- alyptus Cultivation, The English Book Depot, Dehra Dun, India.
Smil, V. (1984) The Bad Earth: Environment Degradation in China, M. E. Sharpe, Armonk, NY.
Spears, John (1987) Agroforestry: A Development-bank Perspective in Steppler and Nair (eds), Agroforestry: A Decade of Development, 53-66.
Steppler, Howard A. and Nair, P. K. Ramachandran (eds) (1987) Agroforesty: A Decade of Development, ICRAF (Intl. Council Research Agroforestry), Nairobi.
Swaminathan, M. S. (1987) 'The promise of agroforestry for ecological and nutritional security', in Steppler and Nair (eds), Agroforestry: A Decade of Development, 25-41.
Timberlake, Lloyd (1985) Africa in Crisis: The Causes, The Cures of Environ,nentalBan/cruptcy, Earthscan, London, pp. 91-2.
Walubengo, Dominic (1986) 'Institutional stoves in Kenya: the present and the future', Boiling Point, ITDG, Rugby, UK, 10, 2-4.
Walubengo, Dominic (1988) 'Improved stoves programmes in Kenya', Boiling Point, ITDG, Rugby, UK, 15, 3-7.
Wisner, Ben (1986) Food-Energy Nexus and Ecosystem, UNU/FEN, Paris; UN University, Tokyo.
World Bank (1986) Niger Improved Stoves Project: Mid-Term Progress Report, UNDPIWorId Bank Energy Sector Management Assistance Programme, Washington, DC.
Yamoah, Charles (1988) 'The potential of alley-cropping for hillside farming in Rwanda', Appropriate Technology, 15, 28-30.
Young, Peter (1988) ITDG, Rugby, UK, Personal communication.
10 Air pollution
M. J. Chadwick
Introduction
Attempts to link the production, processing, storage and use of biomass fuels to impacts on first-order environmental components, such as air quality, must take account of the nature and range of biomass fuels; the different methods of their conversion and utilization; the large number of compounds that result that are potentially toxic air pollutants; and the range of receptor systems existing within various scales of possible impact. In addition, the time that elapses between a pollutant emanating from a source and its being transported to a sink and then adversely affecting a receptor, or the time period involved in detecting an effect, further complicate the recognition of linkages between exposure and risk characterization. The data available that specifically relate to biomass fuels are very limited and often pollution processes and trends have to be derived from work on other fuels (usually fossil fuels), more specific indicators being developed from these.
The complexity of the situation may be approached by considering the linkages between biomass conversion and utilization, and environmental impact in terms of the fuel cycle. This framework for the consideration of air pollution effects of biomass fuel use will be developed first. The features of scale of the environmental impacts will be considered next and local, regional and global issues addressed. It is necessary to draw on generic principles elicited from experience with other fuels to put impacts of biom ass fuels in context. Finally, areas of specific concern for biom ass fuel-use impacts and areas of uncertainty will be discussed.
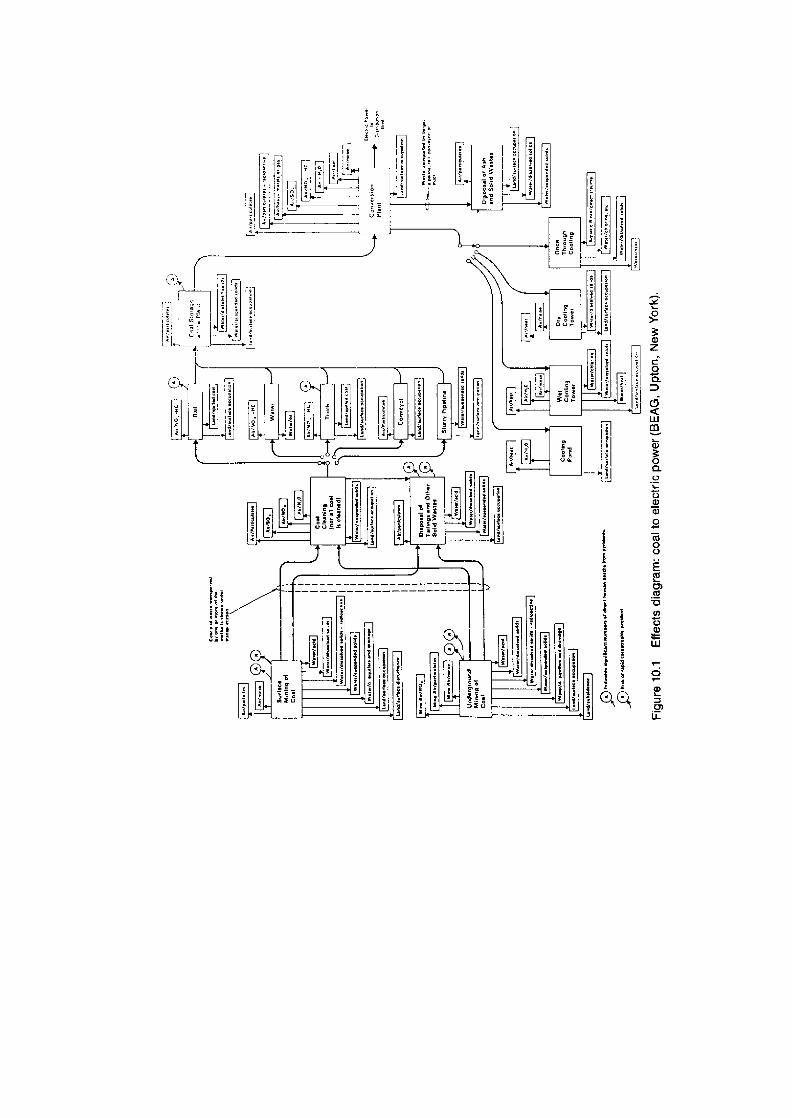
4niJ jII4J
io
cl
ti
co
EIII;;E iiH I
Air Pollution 269
Fuel cycles
No fuel has zero environmental impact when developed, procured and utilized. The total environmental impacts of fuel use should encompass the exploration and assessment of the resource, the resource develop-ment operations—production, storage, transport and fuel processing, and fuel conversion and utilization. This sequential series of stages con-stitutes a fuel cycle. At each stage of the fuel cycle, the operations will engender disturbance and produce waste; these wastes and disturbances give rise to the environmental impact.
For a conventional fuel, like coal, the fuel cycle is relatively easily defined and its stages recognized. Prospecting and exploration, opencast or deep mining of the resource, transport by road, rail, water or pipeline, storage at the mine or point of use, coal treatment, and utilization tech-nologies (such as combustion to generate electricity) all cause distur-bance and generate effluents to be disposed of on land, by water or in the air. A coal fuel cycle, where electricity is generated, is depicted in figure 10.1. In terms of the impacts on the atmosphere it can be seen that dur-ing mining particulates and gases (NO) are vented to the air; during transportation particulates, NO and hydrocarbons enter the atmosphere; coal storage can add further to aerial dust burdens; coal treatment may produce water vapour and particulates; the conversion plant produces particulates, radionuclides, heavy metals, SO 2 , NOR , hydrocarbons, CO 2 and water vapour that are added to the atmosphere. An analogous gen-eral fuel cycle—environmental impact diagram, relevant to biomass fuels, can be seen in figure 10.2. It is applicable to primary biomass fuels such as dry crop residues, animal wastes, human waste products (such as municipal waste), traditional wood-fuels and biomass from forestry, short-rotation energy plantations, catch crops and natural vege-tation; and also to fuels derived secondarily from wet or dry biomass, by thermochemical conversion or bioconversion, such as alcohol, methane, vegetable oils, biogas, producer gas and hydrogen.
Recognition of potential environmental impacts at each stage of a biom ass fuel cycle does not give a balanced and considered assessment of the degree and scale of the impact. It is necessary to have some assessment of the significance of the various impacts as some may be serious and others trivial; some may contribute only to local problems but others may be of global importance. Eventually it is necessary to
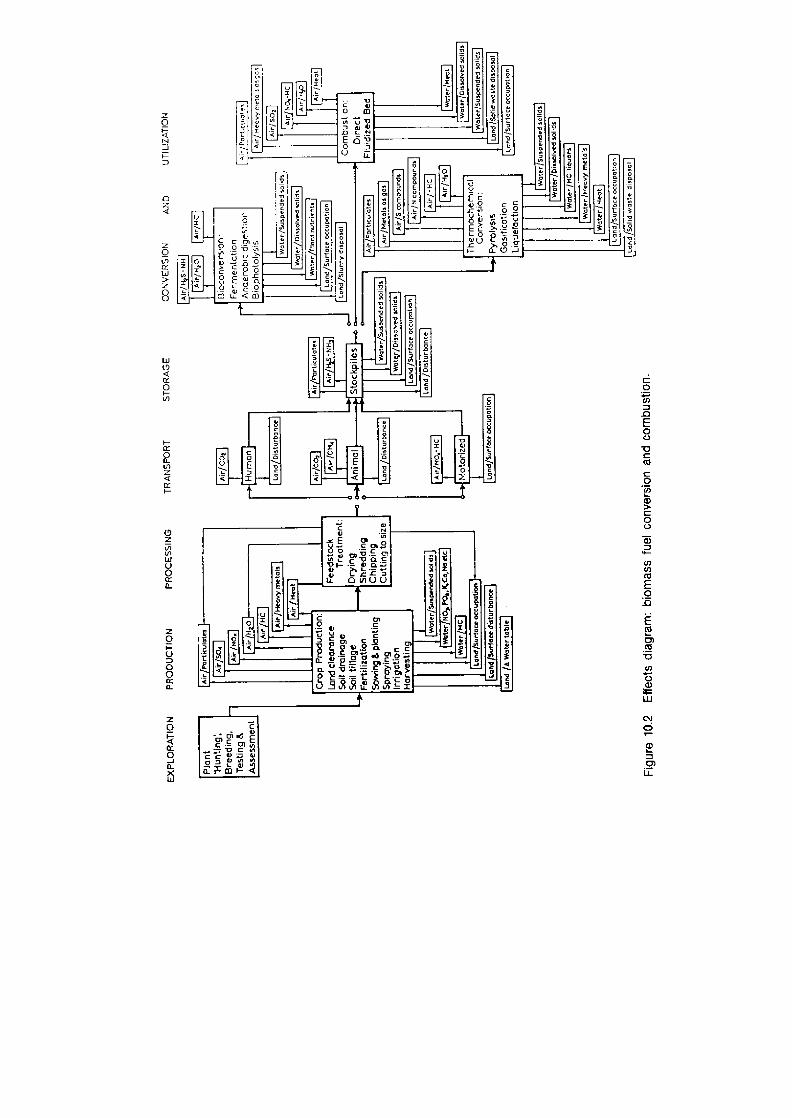
0 U)
E 0 0
C (U C 0 U)
> C 0 0
a)
U) U, (U E 0
E (U
(U
U) 0 ti) w
C%J
a)
a) U-
-1!i 2 0
NJ -J
91
i
2 0
Ix IJJ > 2
B
w
Ln
( -J
Ix 0
I- Ix 0 U- U, 2
I-
(!3 2
U, Ut U 0 Ix U-
2 0 I- U a 0 Ix U-
2 0
0 -J U-
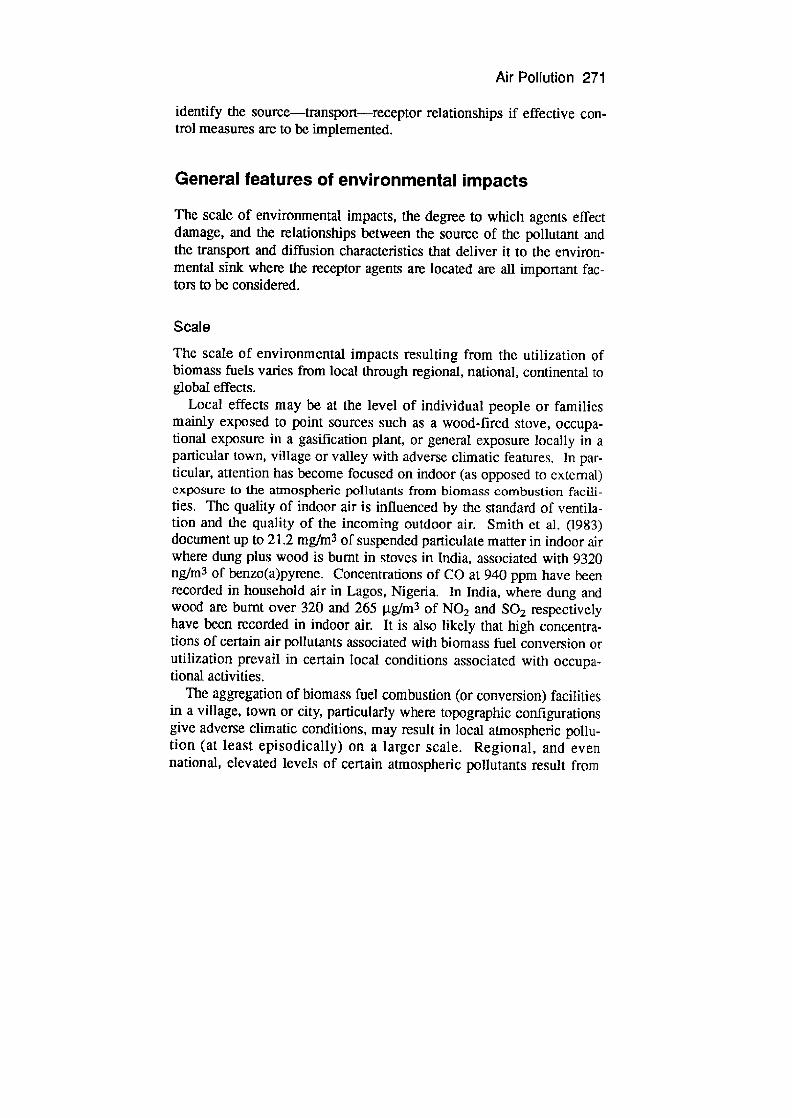
Air Pollution 271
identify the source—transport—receptor relationships if effective con-trol measures are to be implemented.
General features of environmental impacts
The scale of environmental impacts, the degree to which agents effect damage, and the relationships between the source of the pollutant and the transport and diffusion characteristics that deliver it to the environ-mental sink where the receptor agents are located are all important fac-tors to be considered.
Scale
The scale of environmental impacts resulting from the utilization of biomass fuels varies from local through regional, national, continental to global effects.
Local effects may be at the level of individual people or families mainly exposed to point sources such as a wood-fired Stove, occupa-tional exposure in a gasification plant, or general exposure locally in a particular town, village or valley with adverse climatic features. In par-ticular, attention has become focused on indoor (as opposed to external) exposure to the atmospheric pollutants from biomass combustion facili- ties. The quality of indoor air is influenced by the standard of ventila-tion and the quality of the incoming outdoor air. Smith et al. (1993) document up to 21.2 mg4 3 of suspended particulate matter in indoor air where dung plus wood is burnt in stoves in India, associated with 9320 ng/m3 of benzo(a)pyrene. Concentrations of CO at 940 ppm have been recorded in household air in Lagos, Nigeria. In India, where dung and wood are burnt over 320 and 265 J.tg/m3 of NO2 and SO2 respectively have been recorded in indoor air. It is also likely that high concentra-tions of certain air pollutants associated with biom ass fuel conversion or utilization prevail in certain local conditions associated with occupa-tional activities.
The aggregation of biomass fuel combustion (or conversion) facilities in a village, town or city, particularly where topographic configurations give adverse climatic conditions, may result in local atmospheric pollu-tion (at least episodically) on a larger scale. Regional, and even national, elevated levels of certain atmospheric pollutants result from
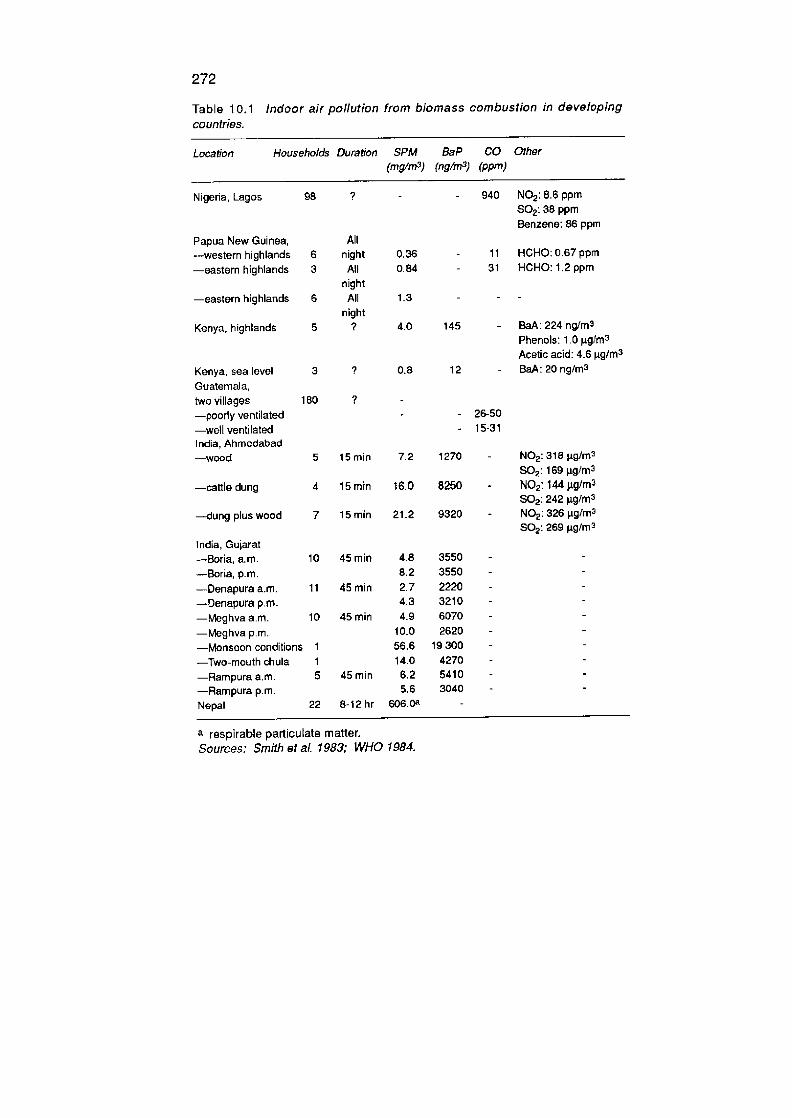
272
Table 10.1 Indoor air pollution from biomass combustion in developing countries.
Location Households Duration SPM (mg/rn3)
BaP (rig/rn3)
CO (ppm)
Other
Nigeria, Lagos 98 ? - - 940 NO2 : 8.6 ppm 502: 38 ppm Benzene: 86 ppm
Papua New Guinea, All ..-westennhighlands 6 night 0.36 - 11 HCHO:0.67ppm
—eastern highlands 3 All 084 - 31 HCHO: 1.2 ppm
night —eastern highlands 6 All 1.3 - - -
night Kenya, highlands 5 ? 4.0 145 - BaA: 224 ng/m 3
Phenols: 1.0 pgJM3
Acetic acid: 4.6 ig/m3
Kenya, sea level 3 ? 0.8 12 - BaA: 20 ng/m 3
Guatemala, two villages 180 ? -
—poorly ventilated - - 26-50
—weilventilated - 15-31 India, Ahmedabad —wood 5 15 miii 7.2 1270 - NO2 : 318
S02 . 169 ig/m 3 —cattle dung 4 15 min 16.0 8250 - NO2 : 144 J.Lg/m
S02. 242 tglm 3 —dung plus wood 7 15 miii 21.2 9320 - NO2 : 326 igIm3
S02 : 269 gfm3
India, Gujarat —Boriaa.m. 10 45niufl 4.8 3550 - -
—Boria, p.ni. 8.2 3550 - -
—Denapura an'. 11 45 miii 2.7 2220 - -
—Denapura p.m. 4.3 3210 - -
—Meghvaa.m. 10 45 min 4.9 6070 - -
—Meghvap.m. 10.0 2620 - -
—Monsoon conditions 1 56.6 19 300 - -
—Two-mouth chula 1 14.0 4270 - -
—Rampuraa.m. 5 45 miii 6.2 5410 - -
—Rampurap.m. 5.6 3040 - -
Nepal 22 8-12 hr 606.0 -
a respirable particulate matter. Sources: Smith et at. 1983; WHO 1984.
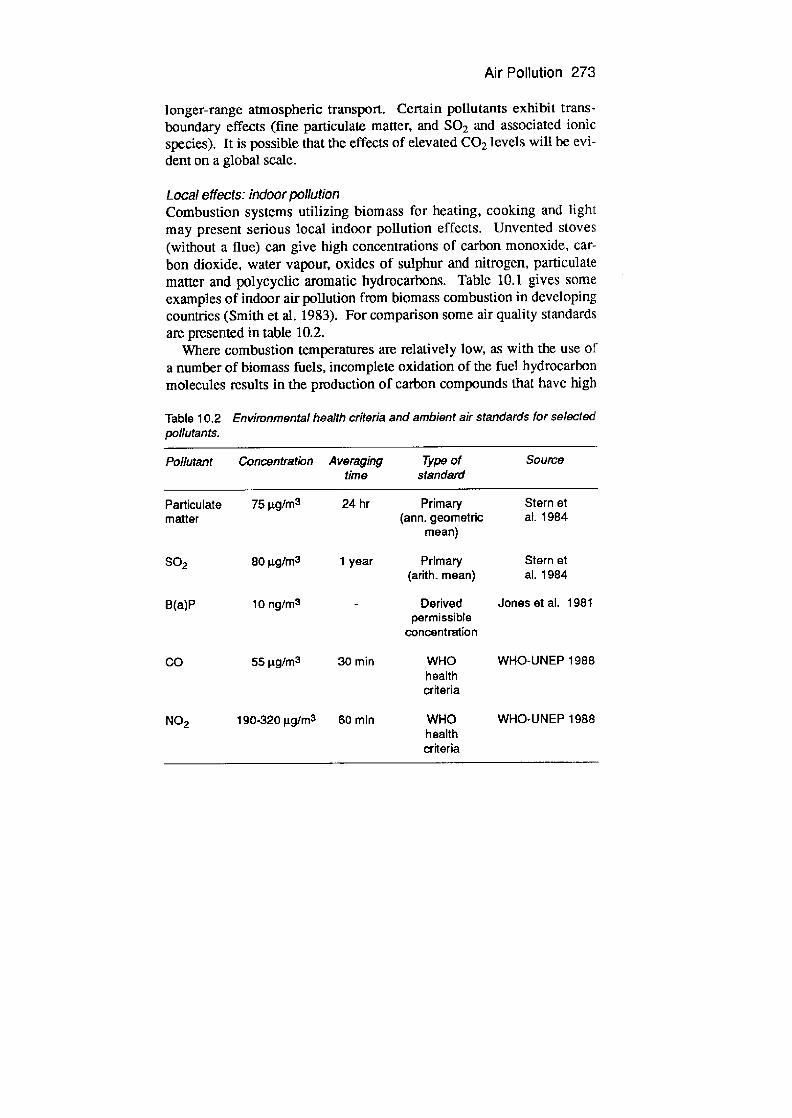
Air Pollution 273
longer-range atmospheric transport. Certain pollutants exhibit trans-boundary effects (fine particulate matter, and SO 2 and associated ionic species). It is possible that the effects of elevated CO 2 levels will be evi-dent on a global scale.
Local effects: indoor pollution Combustion systems utilizing biomass for heating, cooking and light may present serious local indoor pollution effects. Unvented stoves (without a flue) can give high concentrations of carbon monoxide, car-bon dioxide, water vapour, oxides of sulphur and nitrogen, particulate matter and polycyclic aromatic hydrocarbons. Table 10.1 gives some examples of indoor air pollution from biom ass combustion in developing countries (Smith et al. 1983). For comparison some air quality standards are presented in table 10.2.
Where combustion temperatures are relatively low, as with the use of a number of biom ass fuels, incomplete oxidation of the fuel hydrocarbon molecules results in the production of carbon compounds that have high
Table 10.2 Environmental health criteria and ambient air standards for selected pollutants.
Pollutant Concentration Averaging time
Type of standard
Source
Particulate 75 pglm3 24 hr Primary Stern et matter (ann. geometric al. 1984
mean)
502 80 ig/m3 1 year Primary Stern et (arith. mean) al. 1984
B(a)P 10 ng/n13 - Derived Jones et al. 1981 permissible
concentration
CO 55 .tg/m3 30 min WHO WHO-UNEP 1988 health criteria
NO2 190-320 jig/rn3 60 min WHO WHO-UNEP 1988 health criteria

274 M. J. Chadwick
biological and pathological activities. Polycyclic aromatic hydmcarbons (PAHs) are a major group of such substances. They are of particular interest as many are known to be mutagenic and some have been demon-strated to have carcinogenic effects on animal systems. Rather high con-centrations of some of the most toxic of these compounds have been detected around cooking stoves, particularly where wood and dung are being used as a fuel (table 10.1).
Benzo(a)pyrene (RaP) is one of the most carcinogenic PAH com-pounds and also the most widely distributed environmentally. It origi-nates not only from cooking stoves; most of the documentation on effects, in relation to dose, originates from work on the exhaust gases of automobiles, aircraft and motorized ships (see Chadwick et al. 1987). Coal- and oil-fired furnaces are known to emit more than gas-fired facil-ities (Brasser 1979). BaP may induce skin or lung cancers and incidence is broadly related to the product of concentration and time of exposure. It is probable that a linear-no-threshold relationship exists between expo-sure and effect.
Evidence of effects from the use of biomass fuels is only slowly becoming available. Recent work in the Xuan Wei region of China (Murnford et al. 1987) has investigated the high incidence of lung cancer mortality in humans that cannot be attributed to tobacco use or occupa-tional exposure. Open, unvented coal and wood fires are used for cook-ing and heating. However, it was from homes where 'smoky' coal was burnt that the higher lung cancer rates occurred. Indoor air particles had approximately a five times higher concentration of BaP within houses using smoky coal than within those burning wood. Mutagenicity tests gave a rate over five times greater with indoor air particles from smoky coal, but indoor air particles from wood burning stoves gave, in turn, a six times higher mutagenicity than when 'smokeless' coal was used. It is evident that serious attention to these local pollution effects needs to be given with some focus on the role of PAHs.
Regional effects: sulphur dioxide (SO2) and nitrogen oxides (NOX) Fuel combustion, particularly fossil fuel combustion, has resulted in sig-nificant emissions of sulphur dioxide to the atmosphere in recent decades. Coal and oil may contain up to 6 per cent and 3 per cent sul-phur respectively (figure 10.3) and, on combustion, much of this is con-veiled to sulphur dioxide gas that is emitted, through flues, to the
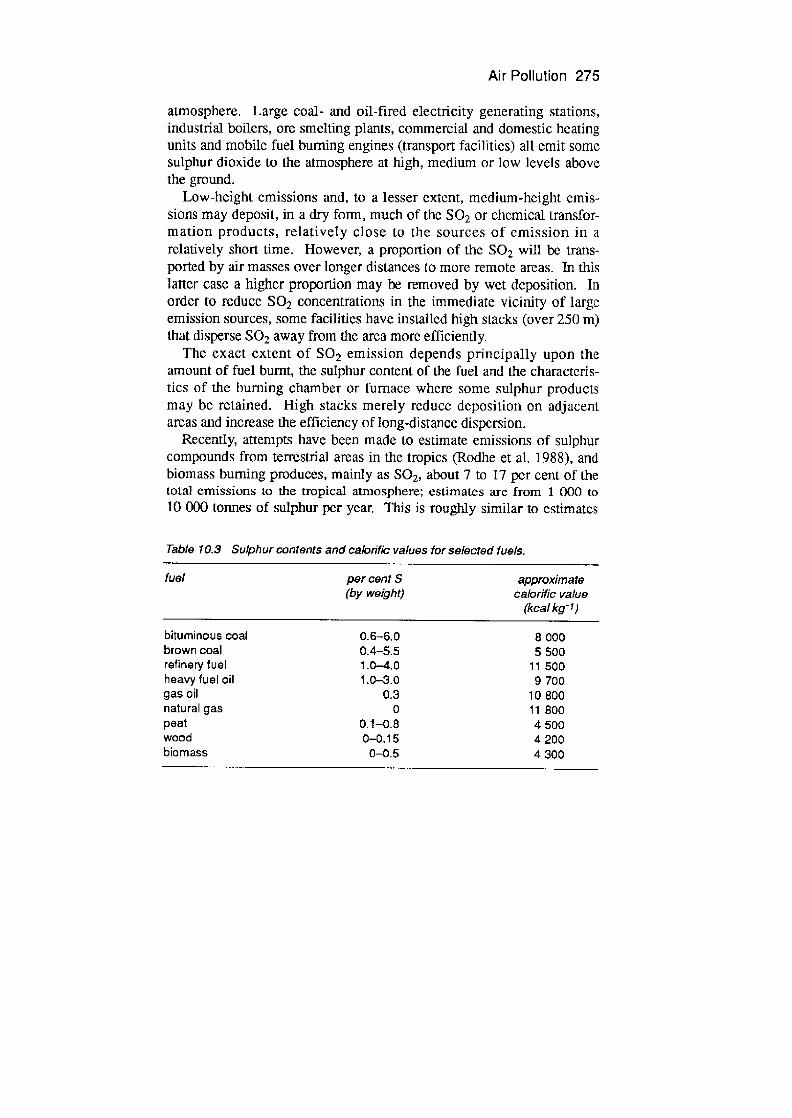
Air Pollution 275
atmosphere. Large coal- and oil-fired electricity generating stations, industrial boilers, ore smelting plants, commercial and domestic heating units and mobile fuel burning engines (transport facilities) all emit some sulphur dioxide to the atmosphere at high, medium or low levels above the ground.
Low-height emissions and, to a lesser extent, medium-height emis-sions may deposit, in a dry form, much of the SO 2 or chemical transfor-mation products, relatively close to the sources of emission in a relatively short time. However, a proportion of the SO 2 will be trans-ported by air masses over longer distances to more remote areas. In this latter case a higher proportion may be removed by wet deposition. In order to reduce SO2 concentrations in the immediate vicinity of large emission sources, some facilities have installed high stacks (over 250 m) that disperse SO2 away from the area more efficiently.
The exact extent of SO2 emission depends principally upon the amount of fuel burnt, the sulphur content of the fuel and the characteris-tics of the burning chamber or furnace where some sulphur products may be retained. High stacks merely reduce deposition on adjacent areas and increase the efficiency of long-distance dispersion.
Recently, attempts have been made to estimate emissions of sulphur compounds from terrestrial areas in the tropics (Rodhe et al. 1988), and biomass burning produces, mainly as SO 2, about 7 to 17 per cent of the total emissions to the tropical atmosphere; estimates are from 1 000 to 10 000 tonnes of sulphur per year. This is roughly similar to estimates
Table 10.3 Sulphur contents and calorific values for selected fuels.
fuel per cent S (by weight)
approximate calorific value
(kcal kg- I)
bituminous coal 0.6-6.0 8 000 brown coal 0.4-5.5 5 500 refinery fuel 1.0-4.0 11 500 heavy fuel oil 1.0-3.0 9 700 gas oil 0.3 10 800 natural gas 0 11 800 peat 0.1-0.8 4 500 wood 0-0.15 4200 biomass 0-0.5 4 300

276 M. J. Chadwick
of emissions from volcanoes and less than equivalent amounts of H 2S from forest soils and weflands and SO2 from fossil fuel burning and industrial processes in the tropics. However, biomass burning may con-tribute up to 25 per cent of NO emissions to the atmosphere from terres-trial sources in the tropics.
Transport of SO 2, or the conversion products such as sulphate aerosols, may occur over long distances (greater than 1 000 km). This gives rise to the deposition of emission products across national bound-aries and may also result in ecologically sensitive systems receiving depositions of sulphur, as SO 2, S042- or in other forms, in excess of the buffering rate or capacity of the system and above the threshold limit of damage (Nilsson 1986). Direct effects of SO 2 gas may result in the degradation of plant cuticular surfaces, leading to decreased powers of water loss resistance or, after SO 2 solvation and entry into plant cells, metabolic disturbances, particularly effects on the photosynthetic system through the degradation of chioroplasts. Deposition of sulphate ions causes soil acidification and, through drainage and run-off water, the acidification of streams, rivers and lakes. Lake acidification in many lakes in southern Scandinavia and in the north-eastern USA has resulted in toxic aluminium ion species in lake water, damage to fish popuIations and the eventual elimination of fish in many hundreds of lakes. Aluminium concentrations at phytotoxic levels in soils and the reduction of the Ca:A1 cation ratio has been implicated in forest damage and tree death in parts of central Europe.
So far, rapid soil acidification has only been demonstrated for one tropical site (Pamell 1986). Many tropical soils have a high S0 42-adsorption capacity. In addition, tropical soils are acidic, highly weath-ered, and have high concentrations of Fe and Al (Sanchez 1976). These features together make it likely that many tropical soils will show rela-tively low sensitivity to acidification (Johnson et al. 1982; McDowell 1988). For similar reasons, rivers and lakes in tropical catchments are also unlikely to show rapid acidification. However, when the onset of acidification occurs, the ecological changes are likely to be rapid and extensive (Galloway 1988).
Human health effects related to elevated sulphur dioxide concentra-tions in the atmosphere, and associated pollution phenomena, have been noted. Acidified well-water is suspected of effecting certain adverse health conditions, especially in infants; and SO 2 , particulate sulphate
Air Pollution 277
aerosols and particle borne acid are known to have effects on human res-piratory function.
Control of emissions can be effected either before combustion (use of low sulphur fuel), during combustion (by combining CaO or CaCO 3 powder with coat in the combustion chamber) or by flue-gas desuiphur-ization whereby SO2 is removed from the flue gases to produce either gypsum (CaSO4) or sulphuric acid (H2SO4).
Biomass fuels generally contain relatively low levels of sulphur. For example, wood hardly ever contains more than 0.1 per cent sulphur of fuel dry weight. However, certain crop residues, and dung, may contain substantially more sulphur. In addition, biomass heating value is sub-stantially lower than the fossil fuels that have higher sulphur contents. A rough guide to the calonfic value of wood, coal and petroleum is in the relationship 1, 2 and 3 (figure 10.3). The fuel burnt to supply the same energy output as coal or oil is therefore much greater.
The use of biomass fuels, in place of coal or oil (if this were possible), would substantially reduce overall sulphur emissions. Certainly, the increased use of biomass will not give rise to major regional sulphur emission and deposition problems. The main (but not only) regional sul-phur deposition problems today are in the northern hemisphere. Increased biomass substitution for fossil fuels would alleviate environ-mental problems linked to sulphur emissions. In addition, it is not antic-ipated that increased biomass utilization in developing countries would result in major regional sulphur deposition environmental effects there. Nevertheless, areas where relatively sensitive soils are combined with high emissions of acidifying substances from other sources would need to be monitored carefully. Perhaps switching to biomass fuels could have some ameliorating effect in these areas, recently identified (Rodhe et al. 1988) as the northern coast of South America, bordering the Caribbean; a region centred on Buenos Aires; part of equatorial West Africa; southern and western parts of India; an area centred on the Philippines; and a considerable area in the east of China. It must be borne in mind in any attempt at fuel substitution that certain combina-tions of biomass fuels, particularly wood and dung, can give severe indoor sulphur dioxide pollution and may also result in localized pollu-tion where stove density is high.
Nitrogen oxide (NO) emissions to the atmosphere also result from fuel combustion and may potentially contribute significantly, on a regional scale, to the total acidic depositions. They also play a part in

278 M. J. Chadwick
photochemical smog formation and have direct adverse effects on living organisms, including man, at elevated concentrations. On a global scale, only about 20 per cent of emissions are man-induced but on a regional basis, in some heavily industrialized areas, up to 50 per cent of emis-sions are of anthropogenic origin. Brimblecombe and Stedman (1982) have demonstrated an overall rise in the nitrate ion content of precipita-tion over non-urban areas of North America and western Europe since about the middle of the last century, during which period ammonium ion concentration has remained relatively stable. The increase in nitrate concentrations are consistent with emissions of NO1 from fossil fuel combustion processes over this time.
When fuels undergo combustion, NO1 forms from the oxidation of nitrogen compounds in the fuel, known as fuel NOX and from nitrogen in the air, known as thermal NON. Thermal NO1 only contributes small amounts to the total figure at combustion temperatures below 1 500°C so it is generally fuel NO 1 at is most significant. Although fossil fuels may have rather low nitrogen contents (coal = 0.5-2.1 per cent N), some biomass fuels are often higher in nitrogen (dung, leafy material and some woods). Thus although NO 2 concentrations in rural areas are about 0.4-9.4 j.tgfm3 , rising to 20-90 .tg/m 3 in urban areas, where higher nitrogen- containing fuels are burnt in a confined space, such as near a cooking stove, concentrations as high as 2 000 .tg/m 3 may be detected (WHO 1977).
Global effects: carbon dioxide (CO2) Whilst the dry weight of wood contains less than 0.1 per cent sulphur, most wood exceeds 50 per cent carbon content on a dry weight basis. Other biomass fuels will also reflect this difference. Although some of the carbon content of biomass, on incomplete combustion, will combine with hydrogen to give emissions of hydrocarbons, toxic at very low con-centrations, most of the carbon will be oxidized and emitted as carbon monoxide and carbon dioxide.
The increase in atmospheric concentrations of CO2 and other trace gases over the past three or four decades has given cause for some con-cern. As well as measured increases in CO 2 concentration, nitrous oxide (N20), methane (Cl 4) and chiorofluorocarbons (CFCs) have shown increases. Although present in low concentrations these gases play an important role in climatic regulation: they are transparent to incoming solar radiation but retain the longer wave heat back-radiation near the
Air Pollution 279
Earth's surface, giving the Earth a mean temperature of about +15°C rather than one of approximately -10 °C which would prevail if these gases were absent. This 'trapping' of heat, near the Earth's surface, is known as the 'greenhouse effect'.
Fossil fuel combustion and, to a lesser extent, the smelting of carbon-ate ores and the destruction of forests have increased the global atrno-spheric concentration of CO 2 . The annual CO2 output from these sources has been in excess of 2 ppm during the last decade but the amlo-spheric CO2 increase during this time has been only about I ppm. The increase since pre-industrial times has been from about 290 ppm CO2 (Or even lower acconling to some authorities) to about 345 ppm in 1985. This measured increase in concentration has resulted in an assessment that the Earth's surface temperatures are rising and that associated cli-matic changes are also taking place. Models simulating global meteoro-logical conditions suggest that surface mean temperature rises will occur with the increased CO2 concentrations to give rises from 1.5 and 5.5°C with a doubling of CO2. Increases in CO 2 up to now are thought to have resulted in mean surface temperature increases of between 0.3 and 1.1°C (Bolin et al. 1987). Related climatic changes will also occur and an analysis of recent rainfall pattern changes suggests that it is not improba-ble that the overall decrease of mean annual rainfall between latitudes 5° and 35 ° N and the increase between 35° and 65° N are related to temper-ature changes.
The projected global climate change could have severe repercussions on land-use patterns due to direct effects of climate or due to other changes such as rises in mean global sea-level.
Wood and other biomass fuels are attractive substitutes for fossil fuels as, although CO2 is generated on combustion of biomass fuels, CO2 is absorbed, and fixed in photosynthesis, during their production. Thus to reverse the trend of forest loss, to establish and expand energy planta-tions, to create catch crop areas where land would otherwise have been without a crop cover, would all create a sink for carbon dioxide. Reafforestation on a significant scale is likely, however, to be a slow process and the areas that would need to be planted would be enormous.
Increases in the utilization of biomass as fuel, without linking this to increased feedstock production on a significant scale, could have many adverse environmental impacts. Normalizing the release of carbon from fuels on the basis of energy production, yields a conversion efficiency

280 M.J.Chadwick
for wood that falls between that of oil and coal. Thus, if coal was substi-tuted by a wood-based biomass fuel, a small (7 per cent) improvement in CO2 emissions might result. However, a 13 per cent worsening might result from the use of wood-based biom ass fuels in place of oil.
Range of damage Air pollutants have adverse effects directly on the atmosphere itself (for example, affecting visibility) and, by eventual deposition from the atmo-sphere, on living and inert objects. Air pollutions affect adversely mate-rials and structures (such as metals, stone buildings, monuments and other structures, and fabrics, dyes, paint, leather and other materials). Toxic air pollutants also have effects on managed and natural aquatic and terrestrial ecosystems (animals, plants, soil and water) and on the health and welfare of humans. Damage ranges from minor effects to severe malfunctioning and almost total destruction, and to death and elimination. Examples of minor effects are eye and nose irritations in humans caused by low concentrations of some pollutant gases in the atmosphere, and small reductions in annual growth increments in plants. Severe malfunctioning of the respiratory function may result from aerosol burdens of atmospheric reactants resulting from elevated SO 2 levels, such as ammonium sulphate particles; and almost total destruc-tion may result from increased levels of SO 2 , where whole strata of plant communities are eradicated leaving only very species-poor stands. Death and elimination of fish populations in lakes, the result of acidifica-tion from atmospheric pollutants, are now well-documented phenomena.
Direct atmospheric effects Visibility is affected by the presence of gases and particles in the atmo-sphere that absorb or scatter light, or both. For example, elevated NO2 (nitrogen dioxide) concentrations are responsible for the red or brownish colours in polluted air, particularly around dusk, as NO 2 preferentially absorbs the blue wavelengths of light. Carbonaceous particles in the atmosphere also absorb light. On the other hand, fine particles (between 0.1 and 1.0 pm in diameter) of sulphate scatter light, as do some gaseous molecules. Visibility is obviously affected by this scattering, as both the direction of the light and frequency of its wavelength are altered. Fine particles of sulphate, fly ash, organic material and elevated NO 2 concen-
Air Pollution 281
trations in the atmosphere combine to give atmospheric haze that reduces visibility.
Effects on materials and structures Metals are corroded by gaseous pollutants; they lose surface material and their properties may be altered. Particles form foci of condensation for water vapour and thus enhance corrosion.
The stonework of buildings and structures like bridges, monuments and statues suffers from the long-term effects of atmospheric pollutants, particularly smoke, SO2, NO2 and CO2. Limestone is particularly sus-ceptible and sculptures and facades of buildings may be affected to the point where all detail is lost.
Fabrics and dyes are also affected by aerial pollutants. Particles soil the fabric and discolour, SO2 causes a loss of tensile strength of fibre material, and gases that are strong oxidants, like ozone (0 3), cause bleaching and loss of dye colour. Leather and paper may show a marked deterioration.
Effects on aquatic and terrestrial ecosystems it is not possible to give a general account of the effects of air pollutants on aquatic and terrestrial plant and animal communities as the pollutants have diverse effects. However, as Woodwell (1965) has pointed out, many pollutants seem to act on living systems by affecting function so that those elements of the system with a low maintenance efficiency (a high level of respiration of carbon products required to maintain the sys-tem in comparison with the level of carbon products fixed) seem to be removed first (Or at the lower prevailing pollutant levels). This diversity is reduced, sequentially from woody species to lower plants. A conse-quence of this loss may be an increased rate of nutrient loss from the system, thus further reducing productivity.
Pollutants in the atmosphere have their effects either directly, by dry deposition on plant surfaces or absorption through stomata, or indirectly, usually by wet deposition and by acting on soil characteristics and hence plant roots or, after drainage or runoff, on aquatic ecosystems. Soil buffering systems mean that acid depositions, for example, may occur at chronic levels for a considerable period of time before effects become manifest, this occurring only when the buffering rate is exceeded or the buffering capacity exhausted. Damage resulting from these depositions may show as small reductions in annual rates of production, the elimina-
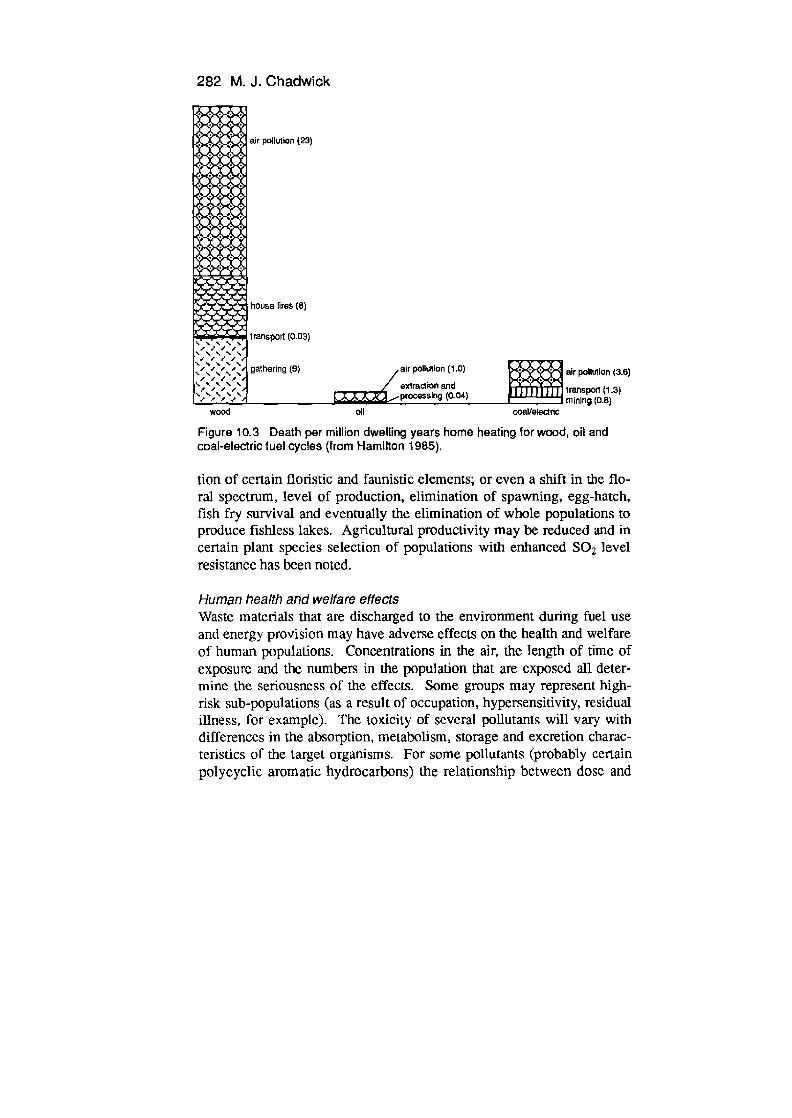
282 M. J. Chadwick
air pollution (23)
house fires (8)
transport (0.03)
gatharin (9)
wood oil
air pollution (1.0)
exirautlOn and procosaing (0.04)
coal/eiectflc
air pollution (3.6)
transport (1.3) mining (0.6)
Figure 10.3 Death per million dwelling years home heating for wood, oil and coal-electric fuel cycles from Hamilton 1985),
tion of certain floristic and faunistic elements; or even a shift in the flo-ral spectrum, level of production, elimination of spawning, egg-hatch, fish fry survival and eventually the elimination of whole populations to produce fishless lakes. Agricultural productivity may be reduced and in certain plant species selection of populations with enhanced SO 2 level resistance has been noted.
Human health and welfare effects Waste materials that are discharged to the enviwnment during fuel use and energy provision may have adverse effects on the health and welfare of human populations. Concentrations in the air, the length of time of exposure and the numbers in the population that are exposed all deter-mine the seriousness of the effects. Some groups may represent high-risk sub-populations (as a result of occupation, hypersensitivity, residual illness, for example). The toxicity of several pollutants will vary with differences in the absorption, metabolism, storage and excretion charac-teristics of the target organisms. For some pollutants (probably certain polycyclic aromatic hydrocarbons) the relationship between dose and
Air Pollution 283
effect will be a stochastic one. Other substances may only engender an adverse response above a certain threshold concentration or dose.
Carbon monoxide (CO) is a common atmospheric waste gas resulting from fuel combustion. The gas enters the body as air, and is inhaled and absorbed through the lungs into the blood stream. Carbon monoxide interferes with the normal ability of the haemoglobin in the blood to take up oxygen and release carbon dioxide, because CO forms a complex carboxyhaemoglobin, thus reducing the availability of haemoglobin molecules. Higher carboxyhaemoglobin levels have been found in per-Sons frequently exposed to stoves where CO is generated, and adverse respiratory conditions have been noted in those exposed in this way. Increased carboxyhaemoglobin levels in the blood produce conditions ranging from increased disability in persons with cardiovascular disease (at about 2.5 per cent carboxyhaemoglobin in the blood) through decline in oxygen uptake (5 per cent), headaches and fatigue (30 per cent), through collapse (at about 40 per cent) to death at 60 to 80 per cent. NO2 gives increased susceptibility to respiratory disease, and SO 2 and particulates also increase the prevalence of respiratory conditions such as emphysema.
Source-receptor relationships Pollutants discharged to the atmosphere from pollutant sources are usu-ally transported away from the emission source in the air mass, undergo chemical and physical transformation and are eventually deposited, wet or dry, where they reach a receptor to which harm may be done. The receptor may be soil, vegetation, water bodies, animals and humans or buildings and structures. Receptors are often referred to as sinks.
The relatively simple concept of a pollutant source, linked to a sink composed of receptors that may be adversely affected by transport and diffusion is in reality fraught with complications. Linearity between level of emission and deposition may not exist; the relationship between dose concentration and response may be a complicated one affected by pollutant interactions and effect time lags. Long-range transport, from multiple sources to a range of receptors, may give rise to a matrix of relationships. All these factors must be taken into account and incorpo-rated in any assessment of environmental impacts resulting from biomass fuels.
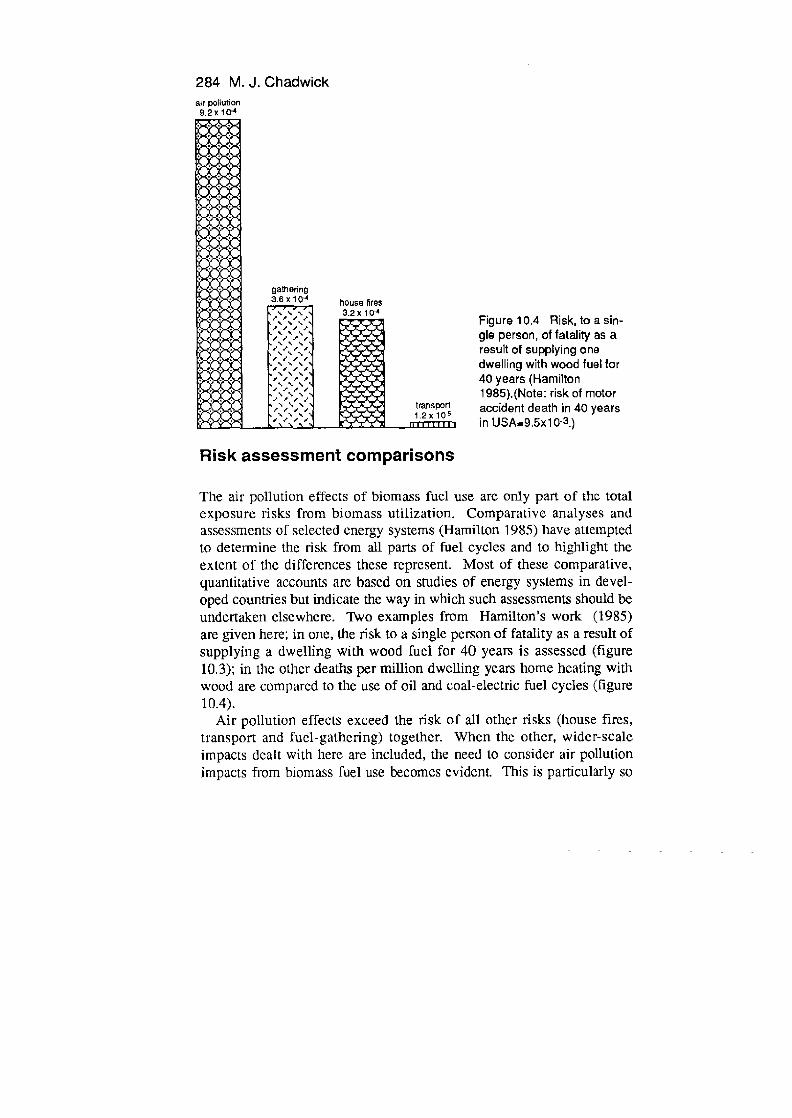
284 M.J.Chadwjck ar poUtion 9.2 Xl O
Figure 10.4 Risk, to a Sin-gle person, of fatality as a result of supplying one dwelling with wood fuel for 40 years (Hamilton 1985). (Note: risk of motor accident death in 40 years in USA=9.5x1 0-3 .)
Risk assessment comparisons
The air pollution effects of biomass fuel use are only part of the total exposure risks from biomass utilization. Comparative analyses and assessments of selected energy systems (Hamilton 1985) have attempted to determine the risk from all parts of fuel cycles and to highlight the extent of the differences these represent. Most of these comparative, quantitative accounts are based on studies of energy systems in devel-oped countries but indicate the way in which such assessments should be undertaken elsewhere. Two examples from Hamilton's work (1985) are given here; in one, the risk to a single person of fatality as a result of supplying a dwelling with wood fuel for 40 years is assessed (figure 10.3); in the other deaths per million dwelling years home heating with wood are compared to the use of oil and coal-electric fuel cycles (figure 10.4).
Air pollution effects exceed the risk of all other risks (house fires, transport and fuel-gathering) together. When the other, wider-scale impacts dealt with here are included, the need to consider air pollution impacts from biomass fuel use becomes evident. This is particularly so

Air Pollution 285
in relation to quantification of risks for situations outside the conditions for which existing estimates have been made. Under different condi-tions relative exposure to risks may show changes in rank order in such a way that biomass fuels emerge favourably.
References Bolin, B., DoOs, B. R., Jager, J. and Warwick, R. A. (1987) (eds), The
Greenhouse Effect, Climatic Change, and Ecosystems, Wiley, Chichester.
Brasser, L. J. (1979). 'PAH concentrations in the Netherlands', Polycyclic Aromatic Hydrocarbons, Colloquium Summaries, VDI, Kommission Reinhaltung der Luff.
Brimblecombe, P. and Steadman, D. H. (1982). 'Historical evidence for a dramatic increase in the nitrate component of acid rain'. Nature, 298, 460-2.
Chadwick, M. J., Highton, N. H. and Lindman, N. (1987) Environmental impacts of Coal Mining and Utilization, Perganion, Oxford.
Galloway, J. N. (1988) 'Effects of acid deposition on tropical aquatic ecosystems', H. Rodhe and R. Herrera (eds) inAcidflcation in Tropical Countries, Wiley, Chichester.
Hamilton, L. D. (1985) Overview of Health Risk Analysis and Assessment for Selected Energy Systems, 35463 -R, Biomedical and Environmental Assessment Division, Brookhaven National Laboratory, Upton, New Yoit.
Jones, T. D., Griffin, F. D., Dudney, C. S. and Walsh, P. J. (1981) 'Empirical observations in support of "carcinogenic promotion" as a tool for screening and regulation of toxic agents', M. Cooke and A. J. Dennis (eds.), in ChemicalAnalysis andRiological Fate: Polynuclear Aromatic Hydrocarbons, 5th International Symposium on Polynuclear Aromatic Hydrocarbons, Battelle, USA.
Johnson, D. W., Thmer, J. and Kelly, J. M. (1982) 'The effects of acid rain on forest nutrient status'. Water Resources Research, 18, 449-61.
McDowell, W. H. (1988) 'Potential effects of acid deposition on tropical terrestrial ecosystems'. H. Rodhe and R. Herrera (eds), in Acid4fication in Tropical Countries, Wiley, Chichester.
Mumford, J. L. et al. (1987) 'Lung cancer and indoor exposure of

286 M. J. Chadwick
unvented coal and wood combustion emissions in Xuan Wel, China', B. Seifert (ed.) in Indoor Air, Vol. 3, Institute of Water, Soil and Air Hygiene, Berlin,
Parnell, R. A, Jr. (1986) 'Processes of soil acidification in tropical durandepts, Nicaragua', Soil Science, 142, 43-55.
Rodhe, H. et al. (1986) 'Acidification and regional air pollution in the tropics', H. Rodhe and R. Herrera (eds), in Acidtfi cation in Tropical Countries, Wiley, Chichester.
Sanchez, P. A. (1976), Properties and Management of Soils in the Tropics, Wiley, New York.
Smith, K. L., Aggarwal, A. L. and Dave, R. M. (1983), 'Air pollution and rural biomass fuels in developing countries: a pilot village study in India and implications for research and policy'. Atmospheric Environment, 17, 2343-62,
Stem, A. C., Boubel, R. W., Turner, D. B. and Fox, D. L. (1984) Fundamentals of Air Pollution, 2nd edition, Academic, Orlando.
Woodwell, G. M. (1965) Radiation and the Patterns of Nature, BNL 924 (T-381), Brookhaven National Laboratory, USA.
WHO (1977) Environmental Health Criteria 4—Oxides of Nitrogen, World Health Organization, Geneva.
WHO (1984) Biomass Fuel Combustion and Health, EFP/84.64, World Health Organization, Geneva.
WHO-UNEP (1988) Indoor Environment: A Guidebook on the Health Aspects of Air Quality, Thermal Environment, Light and Noise (ed. by J. K. Page), World Health Organization and United Nations Environment Programme, Geneva.
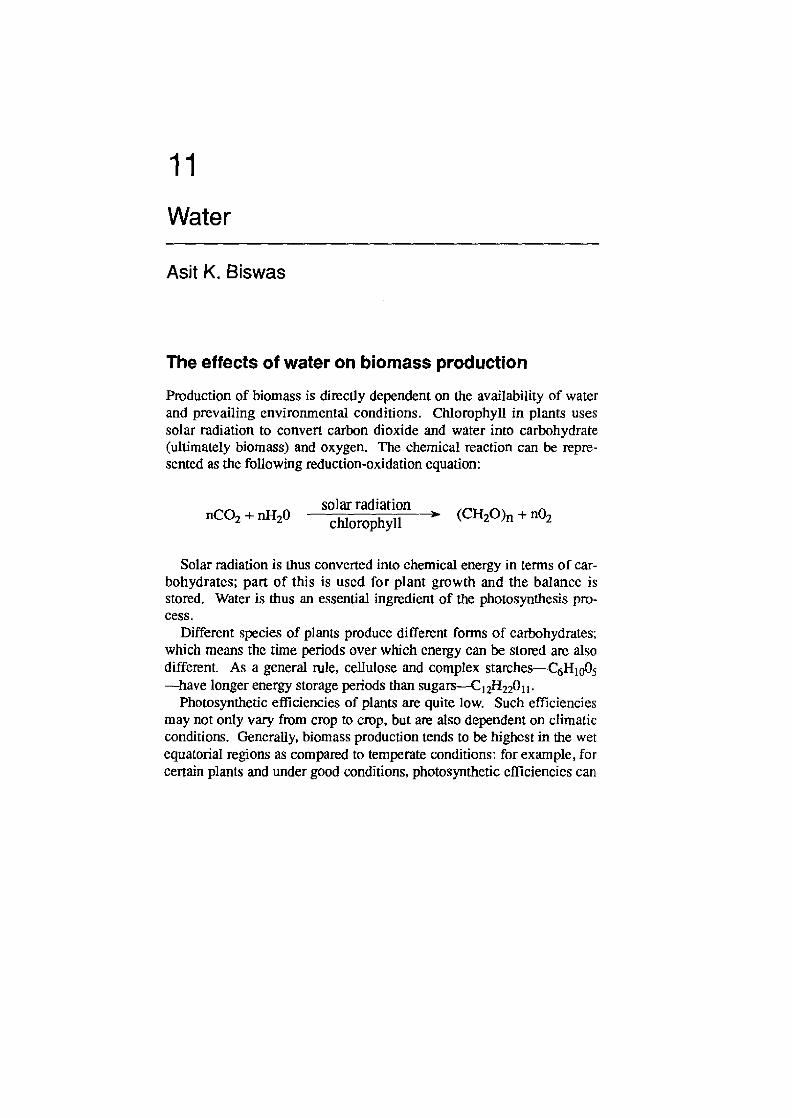
11 Water
Asit K. Biswas
The effects of water on biomass production Production of biomass is directly dependent on the availability of water and prevailing environmental conditions. Chlorophyll in plants uses solar radiation to convert carbon dioxide and water into carbohydrate (ultimately biomass) and oxygen. The chemical reaction can be repre-sented as the following reduction-oxidation equation:
solar radiation nCO2 + nH20 chlorophyll (CH20)n + nO2
Solar radiation is thus converted into chemical energy in terms of car -bohydrates; part of this is used for plant growth and the balance is stored. Water is thus an essential ingredient of the photosynthesis pro-cess.
Different species of plants produce different forms of carbohydrates; which means the time periods over which energy can be stored are also different. As a general rule, cellulose and complex starches—C 6H 1005 —have longer energy storage periods than sugars—C 12H220 11 .
Photosynthetic efficiencies of plants are quite low. Such efficiencies may not only vary from crop to crop, but are also dependent on climatic conditions. Generally, biom ass production tends to be highest in the wet equatorial regions as compared to temperate conditions: for example, for certain plants and under good conditions, photosynthetic efficiencies can
288 Asit K. Biswas
be as high as 2.5 per cent in tropical conditions but only about 1.5 per cent in temperate regions.
There is enough scientific evidence at present to indicate that biomass production suffers if plants are under water stress, since this reduces the photosynthetic process. This relationship is neither one-to-one, nor is it possible at the present state of our knowledge to quantify the linkages accurately because they are dependent on many factors like the type of plants, different growth stages of the same plant, and the duration and severity of the water stress. While even a mild water stress is likely to contribute to reduction in biomass production, the question remains by how much. The problem becomes even more difficult when economic crops like cotton, cereals or tubers are considered, where only a part of the total biom ass production is considered to be the yield. As a general rule, it can be said that under such conditions, percentage reduction in the yield of the economic parts of the plants is less than in the total biomass production.
There is no question that proper water control has a significant impact on biomass production. The yields of paddy rice, on the basis of avail-able data, under different degrees of water control from different parts of the world are shown in table 11.1 (Biswas and Biswas, 1984). The total biomass production figures under corresponding conditions are likely to be proportionately higher.
Day (1981) reports an experiment where biomass yields for Hordeum sativwn under irrigated and unirrigated conditions were compared. The unirrigated crop had much less biomass because of the decrease in green leaf area as well as a shorter growing season. This resulted in a 40 per cent reduction in light interception. Furthermore, the estimated effect of stomatal closure in irrigated plants was a rate of photosynthesis that was 7 per cent higher than in unirrigated plants.
Biomass energy, water and environment
Production and use of biom ass energy have direct impacts on the quality and quantity of water as well as on other environmental factors. Equally water and environmental issues could influence the production and use of biomass energy.
The pathways linking biomass energy use, water resources and the environment are many, and only two major ones will be discussed here.
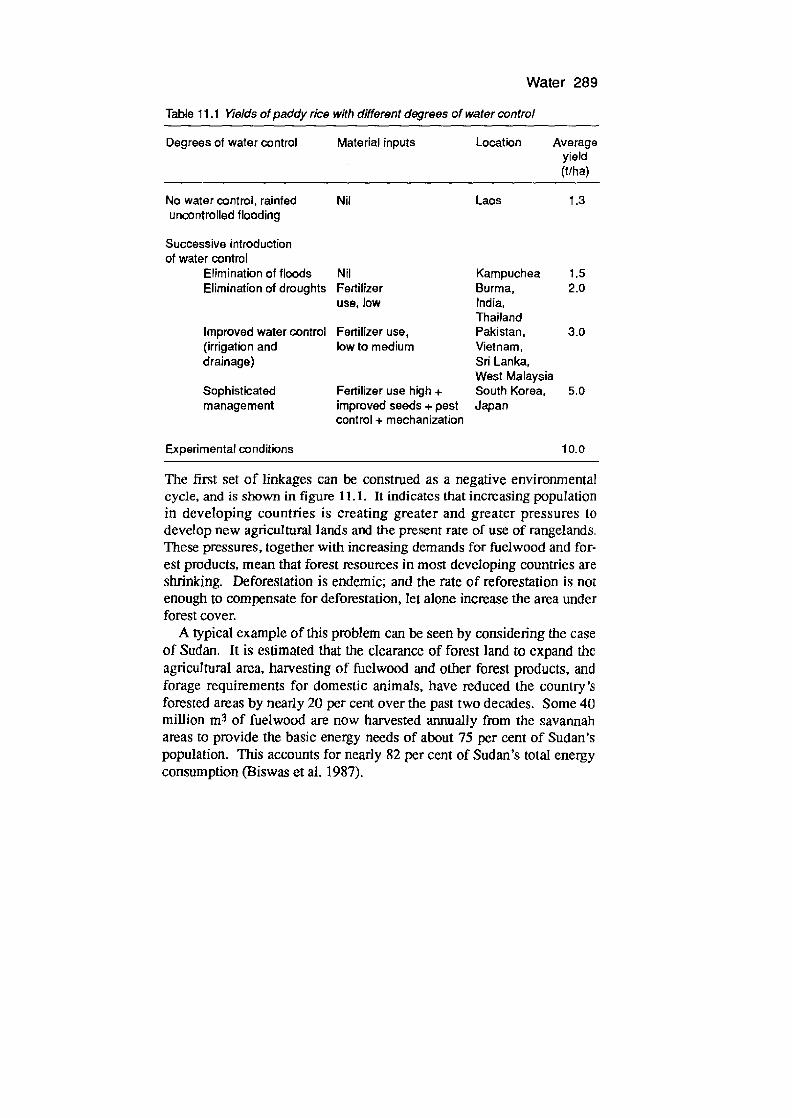
Water 289
Table 11.1 Yields of paddy rice with different degrees of water control
Degrees of water control Material inputs Location Average yield (ttha)
No water control, rainf ad Nil Laos 1.3 uncontrolled flooding
Successive introduction of water control
Elimination of floods Nil Kampuchea 1.5 Elimination of droughts Fertilizer Burma. 2.0
use, low India, Thailand
Improved water control Fertilizer use, Pakistan, 3.0 (irrigation and low to medium Vietnam, drainage) Sri Lanka,
West Malaysia Sophisticated Fertilizer use high + South Korea, 5.0 management improved seeds + pest Japan
control + mechanization
Experimental conditions 10.0
The first set of linkages can be construed as a negative environmental cycle, and is shown in figure 11.1. It indicates that increasing population in developing countries is creating greater and greater pressures to develop new agricultural lands and the present rate of use of rangelands. These pressures, together with increasing demands for fuelwood and for-est pmducts, mean that forest resources in most developing countries are shrinking. Deforestation is endemic; and the rate of reforestation is not enough to compensate for deforestation, let alone increase the area under forest cover.
A typical example of this problem can be seen by considering the case of Sudan. It is estimated that the clearance of forest land to expand the agricultural area, harvesting of fuelwood and other forest products, and forage requirements for domestic animals, have reduced the country's forested areas by nearly 20 per cent over the past two decades. Some 40 million m 3 of fuelwood are now harvested annually from the savannah areas to provide the basic energy needs of about 75 per cent of Sudan's population. This accounts for nearly 82 per cent of Sudan's total energy consumption (Biswas et al. 1987).
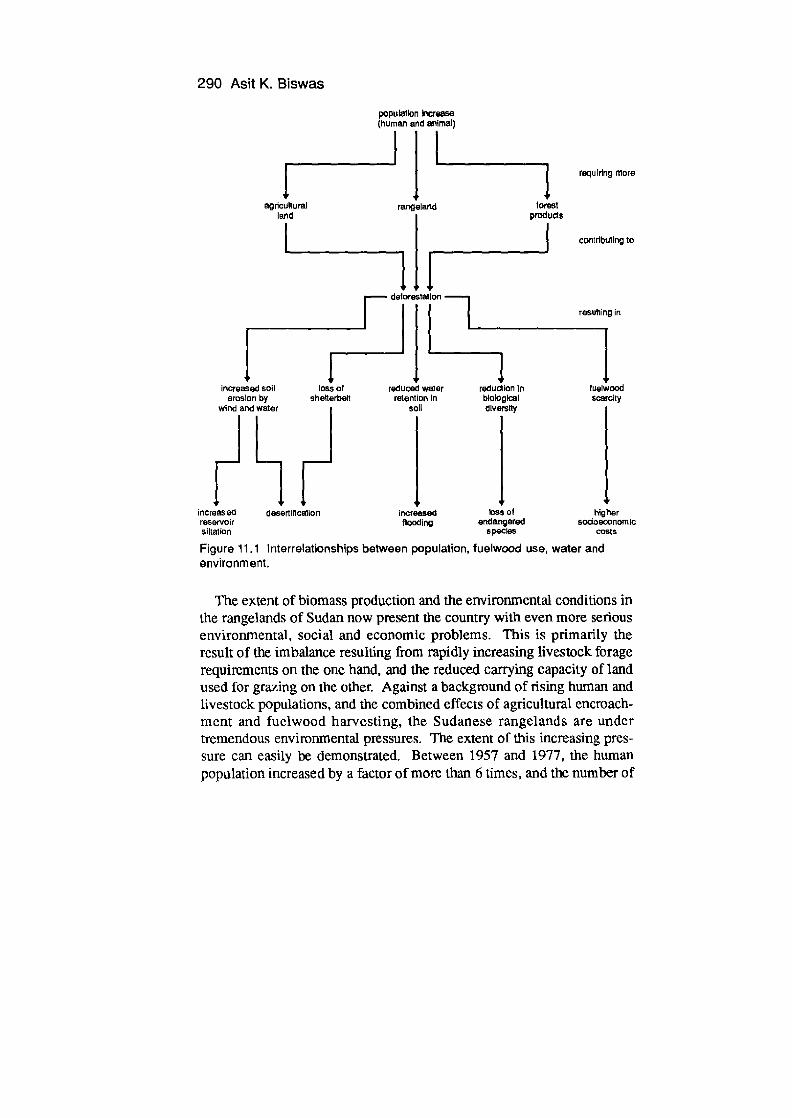
290 Asit K. Biswas
population kcrease (human and animal)
1 1 requiring more
agricultural rangolanct forest land products
contributing to
H deforestation
resulting in
increased soil to of reduced walor reduction in 1 teIwood erosion by shellerbelt retention In biological Scarcity
wind and water soil diversity
11 1 increased desertlttcstlon Increased loss of higher reservoir flooding endangered socioeconomic siltation species costs
Figure 11.1 interrelationships between population, fuelwood use, water and environment.
The extent of biomass production and the environmental conditions in the rangelands of Sudan now present the country with even more serious environmental, social and economic problems. This is primarily the result of the imbalance resulting from rapidly increasing livestock forage requirements on the one hand, and the reduced carrying capacity of land used for grazing on the other. Against a background of rising human and livestock populations, and the combined effects of agricultural encroach-ment and fuelwood harvesting, the Sudanese rangelands are under tremendous environmental pressures. The extent of this increasing pres-sure can easily be demonstrated. Between 1957 and 1977, the human population increased by a factor of more than 6 times, and the number of
Water 291
cattle by a factor of 21 times, camels 16 times, sheep 12 times and goats 8 times. The recurring drought has further contributed to the deteriora-tion of the environmental and productive conditions. The total seasonal forage production in the Sudan was estimated in 1979 at about 77.7 mil-lion tonnes, which could meet the grazing requirements of 22.1 million Animal Units (AU). The livestock population in 1980/81 was estimated at 27.7 million AU, which means that some 5.6 million AU could not be supported on a long-term sustainable basis.
Forests in Sudan are disappearing, especially near centres of popula-tion. The natural savannah vegetation surrounding major cities like Khartoum has largely disappeared as a result of constantly increasing demands for fuelwood. Charcoal is currently being transported 500 km or more to urban centres.
If the present deforestation process in Sudan continues uncontrolled, an additional 10 million ha of savannah woodland in the north, repre-senting about two-thirds of the remaining resources in the region, will be lost by the year 2000. This would mean the displacement of at least 30 000 nomadic families, accounting for some 6 per cent of the total nomadic population of the country and their livestock. The average haulage distance for fuelwood and charcoal to Khartoum and to urban centres in the Central Province would increase from 500 km to 1000 km, which would further intensify the currently emerging fuelwood supply crisis in the north. The average cost of fuelwood would increase, further degrading the quality of life of the poor. Total elimination of on-farm trees and shelter belts would necessitate the use of agricultural residues as fuel; this would lead to the reduction of organic matter in soil, which is likely to reduce crop and livestock yields by 15 per cent. Wind ero-sion and desertification would increase, and so would the siltation in the reservoirs. Imports of manufactured industrial wood products would increase to US$50 million annually, and Sudan would be faced with an enormous investment programme in the future. If the estimated 20 mil-lion ha of forest that is expected to be lost by the year 2000 is to be replaced, investment of at least US$1500 million would be required which is beyond the financial resources of the government at present.
The disparity between available biomass energy and overall demand is still growing in Africa. The present status of fuelwood availability in Africa and the potential status in the future is shown in figure 11.2. Such continuing unsustainable biomass exploitation in many parts of sub-Sabaran Africa has serious environmental repercussions for the
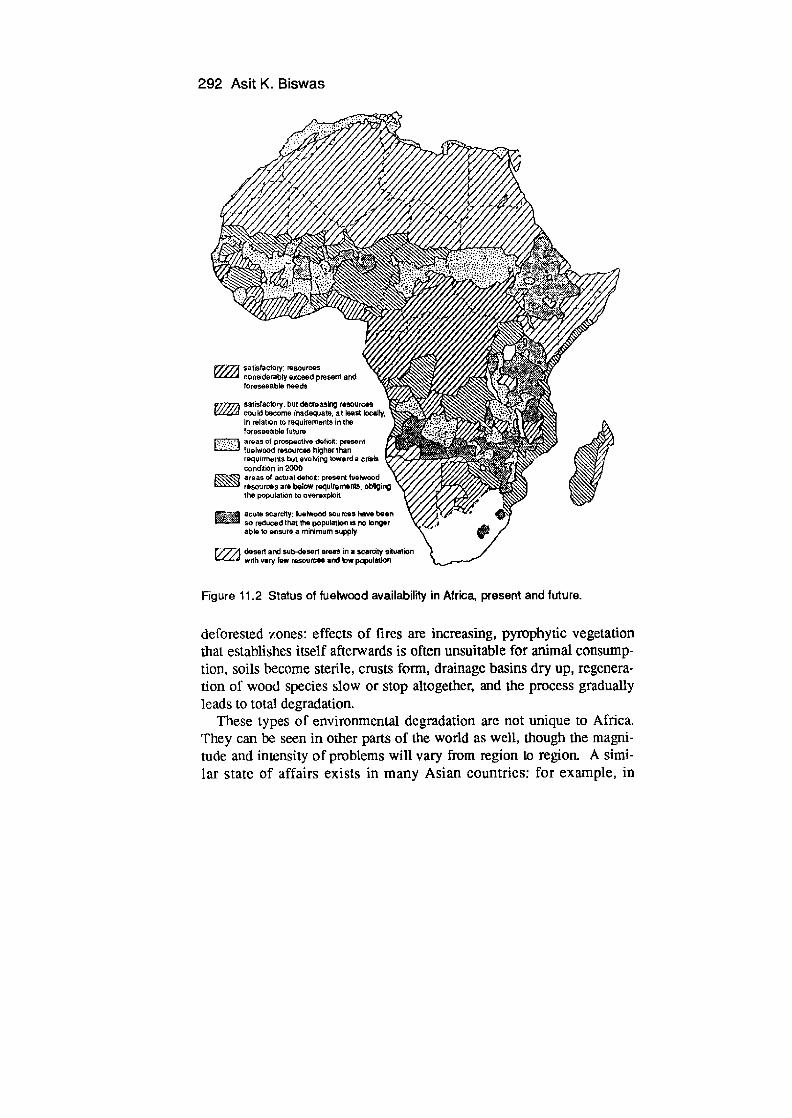
292 Asit K. Biswas
p7)94 satisfactory: resources tLLA considerably exceed present and
foreseeable needs
'77r7j satisfactory: but domoasing resources cou la become inadeqate, at least iscally in relation to requirements in the foreseeable futttro areas of prospective defrcit: present ¶selwood resources higher than requirments but evolving towerd a crisis - condition in 2000
5 areas of actual deficit: present tuetwood resou roes are b&ow requirements, obliging the population to overexploit
acute scarcity: luetwooci sources have been A. so reduced that the population is no lenger able to ensure a minimum supply
desert and sub-desert areas in a scarcitty situation with very few rasourcee and low population
Figure 11.2 Status of fuelwood availability in Africa, present and future.
deforested zones: effects of fires are increasing, pyrophytic vegetation that establishes itself afterwards is often unsuitable for animal consump-tion, soils become sterile, crusts form, drainage basins dry up, regenera-tion of wood species slow or stop altogether, and the process gradually leads to total degradation.
These types of environmental degradation are not unique to Africa. They can be seen in other parts of the world as well, though the magni-tude and intensity of problems will vary from region to region. A simi-lar state of affairs exists in many Asian countries: for example, in
Water 293
Pakistan current estimates indicate that its overall forest resource-base is shrinking. With an annual timber production rate of 1.1 million m 3 , and an annual fuelwood consumption rate of 20 million m 3 , the present annual growth of wood of 11.3 million m 3 accounts for only about 54 per cent of total annual wood harvest (Biswas 1988). This means the forest resources of Pakistan are being continually mined. Because of such scarcities, fuelwood prices have increased at a much faster rate than the general inflation rate, by about 45 per cent during the decade 1969/70 to 1979/80. If, as expected, the price of fuelwood continues to increase in real terms, as it has in the past decade, it will account for an increasing share of the household expenditure of the rural poor, thus making their life even more difficult. Present agricultural development trends mean that there is a real danger that while Pakistan may become self-sufficient or even an exporter of many food grains in the near future, the rural poor may not have adequate fuelwood to cook their food. Lack of such biomass energy for the rural poor will further contribute to the deterioration of their overall quality of life.
While nearly all of the recent discussions have focused on the nega-tive interrelationships between the use of biomass for energy, water resources and the environment, there is no question that there are posi-tive linkages as well. Unfortunately, not enough field data have been collected on these positive linkages, even though conceptually the latter can be justified; moreover, their presence is indicated in the very few case studies that have so far been undertaken.
During the past two decades, much emphasis has been placed on the development of irrigation projects, mainly in Asia, Latin America and north of the Sahara, to increase agricultural production. Unfortunately, realistic and regular evaluations of the impacts of these irrigation pro-jects are few and far between. Even in those few cases where irrigated agricultural projects were evaluated, the main emphasis was placed on the efficiency of the irrigation systems and crop yields. Significantly fewer projects have any detailed information on environmental impacts or energy use patterns over a period of years. While during the past two to three years there has been some progress towards including various environmental impacts in evaluating the effects of irrigated agricultural projects, albeit in a somewhat superficial fashion, regrettably there is no sign of the inclusion of energy impacts in such studies. To the best of my knowledge, currently only one study exists which collected any data
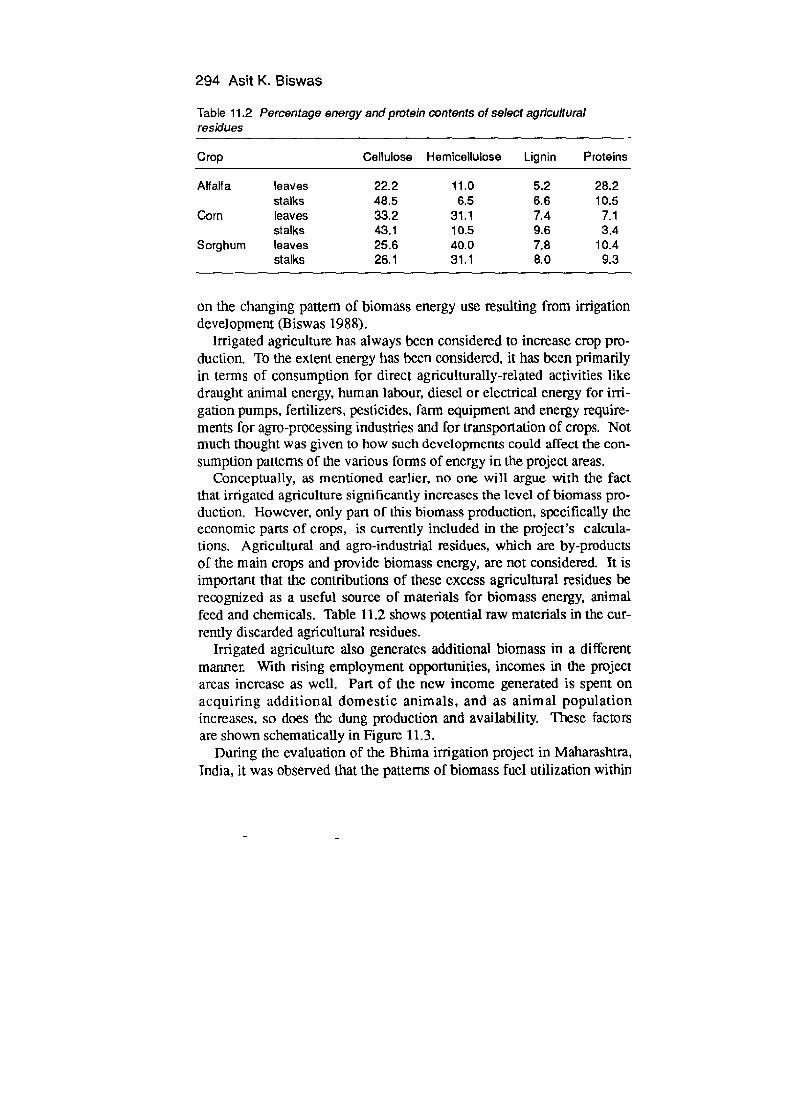
294 Asit K. Biswas
Table 11.2 Percentage energy and protein contents of select agricultural residues
Crop Cellulose Hemicellulose Lignin Proteins
Alfalfa leaves 22.2 11.0 5.2 28.2 stalks 48.5 6.5 6.6 10.5
Corn leaves 33.2 31.1 7.4 7.1 stalks 43.1 10.5 9.6 3.4
Sorghum leaves 25.6 40.0 7.8 10.4 stalks 26.1 31.1 8.0 9.3
on the changing pattern of biom ass energy use resulting from irrigation development (Biswas 1988).
Irrigated agriculture has always been considered to increase crop pro-duction. To the extent energy has been considered, it has been primarily in terms of consumption for direct agriculturally-related activities like draught animal energy, human labour, diesel or electrical energy for irri-gation pumps, fertilizers, pesticides, farm equipment and energy require-ments for agro-processing industries and for transportation of crops. Not much thought was given to how such developments could affect the con-sumption patterns of the various forms of energy in the project areas.
Conceptually, as mentioned earlier, no one will argue with the fact that irrigated agriculture significantly increases the level of biomass pro-duction. However, only part of this biom ass production, specifically the economic parts of crops, is currently included in the project's calcula-tions. Agricultural and agro-industrial residues, which are by-products of the main crops and provide biomass energy, are not considered. It is important that the contributions of these excess agricultural residues be recognized as a useful source of materials for biomass energy, animal feed and chemicals. Table 11.2 shows potential raw materials in the cur-rently discarded agricultural residues.
Irrigated agriculture also generates additional biomass in a different manner. With rising employment opportunities, incomes in the project areas increase as well. Part of the new income generated is spent on acquiring additional domestic animals, and as animal population increases, so does the dung production and availability. These factors are shown schematically in Figure 11.3.
During the evaluation of the Bhima irrigation project in Maharashtra, India, it was observed that the patterns of biomass fuel utilization within
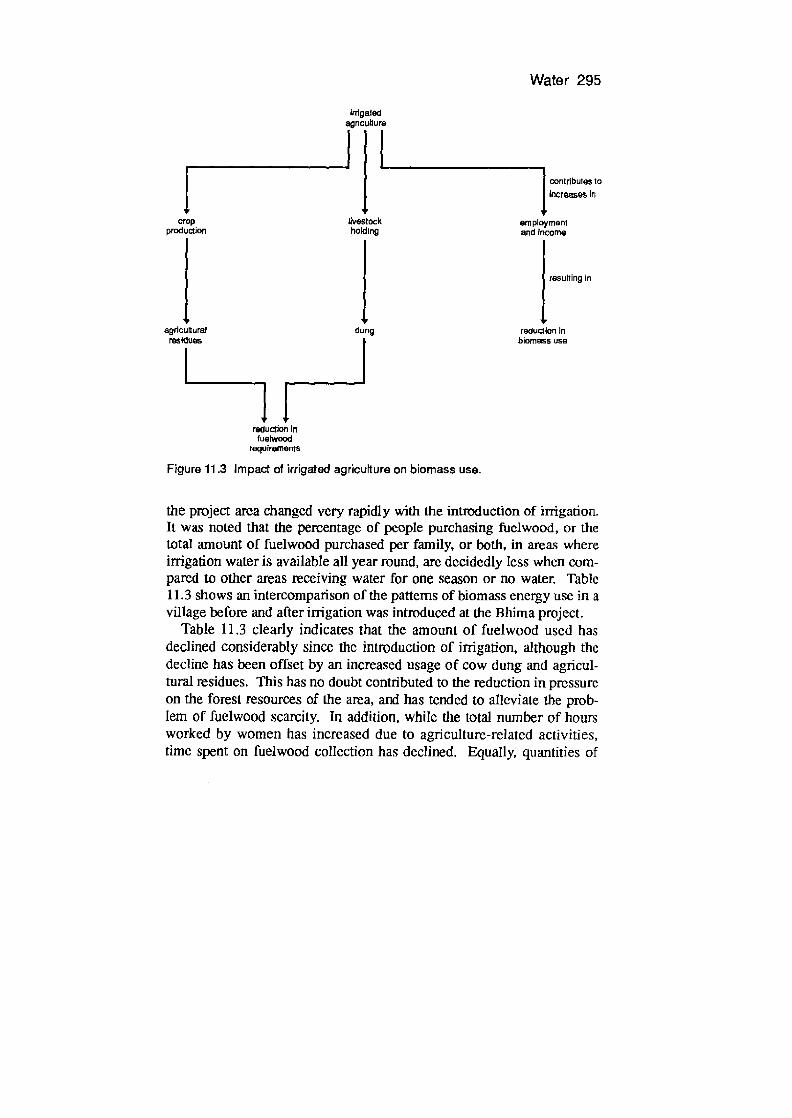
Water 295
Iffigated agriculture
ii. F COntributes to
Increases in
crop livestock employment production holding and Income
II resulting In
agilcctlurat dun9 reduction In residues biomass use
I1 rsductlon In fuetwood
requirements
Figure 11 .3 Impact of irrigated agncufture on biomass use.
the project area changed very rapidly with the introduction of irrigation. It was noted that the percentage of people purchasing fuelwood, or the total amount of fuelwood purchased per family, or both, in areas where inigation water is available all year round, are decidedly less when com-pared to other areas receiving water for one season or no water. Table 11.3 shows an intercomparison of the patterns of biomass energy use in a village before and after irrigation was introduced at the Bhima project.
Table 11.3 clearly indicates that the amount of fuelwood used has declined considerably since the introduction of irrigation, although the decline has been offset by an increased usage of cow dung and agricul-tural residues. This has no doubt contributed to the reduction in pressure on the forest resources of the area, and has tended to alleviate the prob-lem of fuelwood scarcity. In addition, while the total number of hours worked by women has increased due to agriculture-related activities, time spent on fuelwood collection has declined. Equally, quantities of
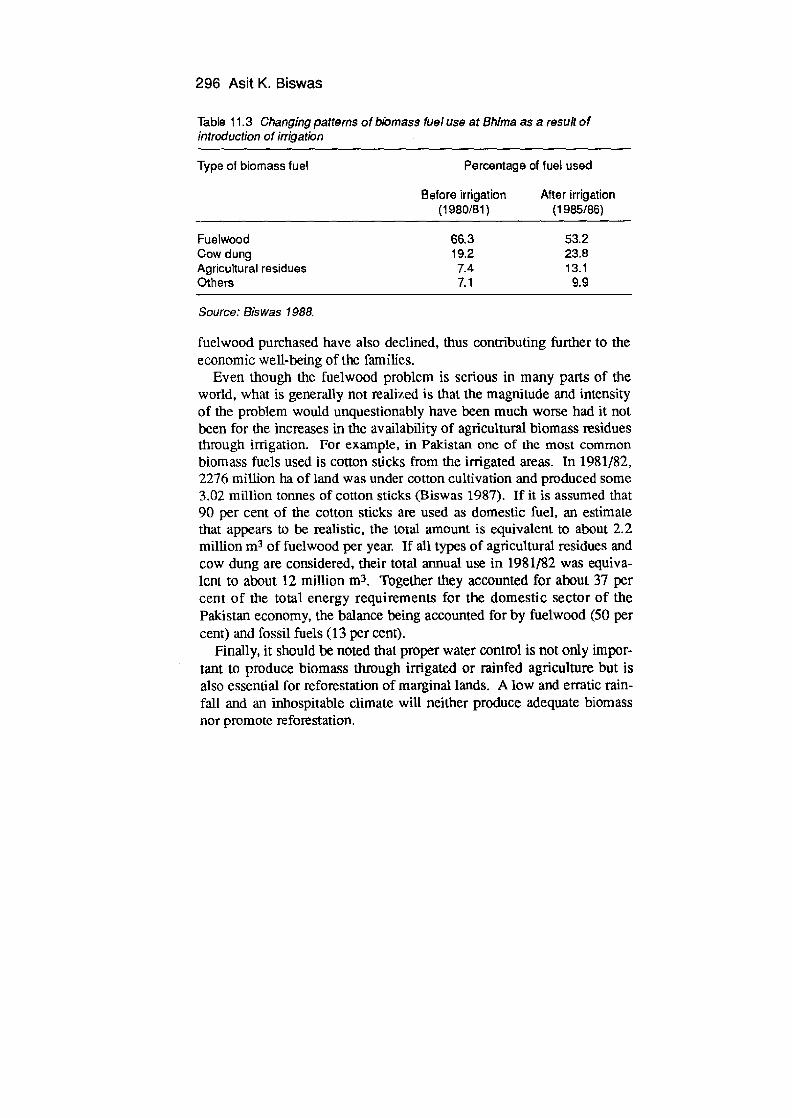
296 Asit K. Biswas
Table 11.3 Changing patterns of biomass fuel use at Shima as a result of introduction of irrigation
Type of biornass fuel Percentage of fuel used
Before irrigation (1980/81)
After irrigation (1985/86)
Fuelwood 66.3 53.2 Cow dung 19.2 23.8 Agricultural residues 7.4 13.1 Others 7.1 9.9
Source: Biswas 1988.
fuelwood purchased have also declined, thus contributing further to the economic well-being of the families.
Even though the fuelwood problem is serious in many parts of the world, what is generally not realized is that the magnitude and intensity of the problem would unquestionably have been much worse had it not been for the increases in the availability of agricultural biomass residues through irrigation. For example, in Pakistan one of the most common biomass fuels used is cotton sticks from the irrigated areas. In 1981/82, 2276 million ha of land was under cotton cultivation and produced some 3.02 million tonnes of cotton sticks (Biswas 1987). If it is assumed that 90 per cent of the cotton sticks are used as domestic fuel, an estimate that appears to be realistic, the total amount is equivalent to about 2.2 million m3 of fuelwood per year. If all types of agricultural residues and cow dung are considered, their total annual use in 1981/82 was equiva-lent to about 12 million m 3 . Together they accounted for about 37 per cent of the total energy requirements for the domestic sector of the Pakistan economy, the balance being accounted for by fuelwood (50 per cent) and fossil fuels (13 per cent).
Finally, it should be noted that proper water control is not only impor-tant to produce biomass through irrigated or rainfed agriculture but is also essential for reforestation of marginal lands. A low and erratic rain-fall and an inhospitable climate will neither produce adequate biom ass nor promote reforestation.
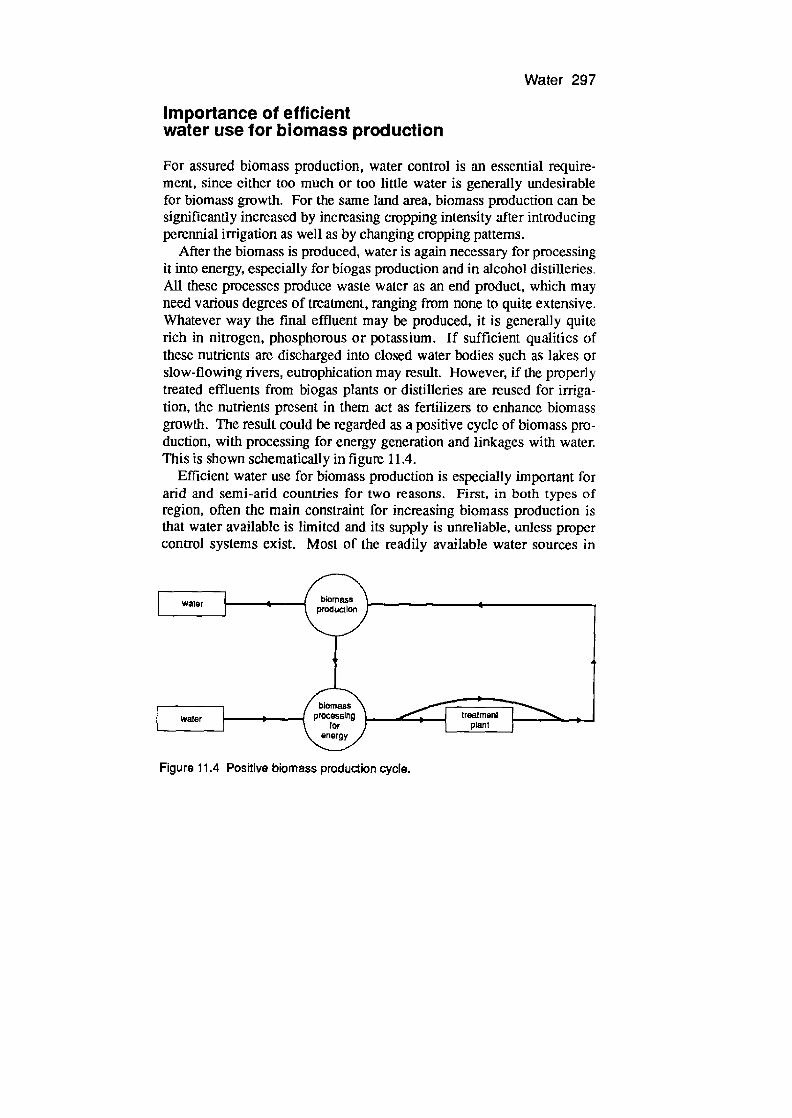
Water 297
Importance of efficient water use for biomass production
For assured bioniass production, water control is an essential require-ment, since either too much or too little water is generally undesirable for biomass growth. For the same land area, biomass production can be significantly increased by increasing cropping intensity after introducing perennial irrigation as well as by changing cropping patterns.
After the biomass is produced, water is again necessary for processing it into energy, especially for biogas production and in alcohol distilleries, All these processes produce waste water as an end product, which may need various degrees of treatment, ranging from none to quite extensive. Whatever way the final effluent may be produced, it is generally quite rich in nitrogen, phosphorous or potassium. If sufficient qualities of these nutrients are discharged into closed water bodies such as lakes or slow-flowing rivers, eutrophication may result. However, if the properly treated effluents from biogas plants or distilleries are reused for irriga-tion, the nutrients present in them act as fertilizers to enhance biomass growth. The result could be regarded as a positive cycle of biom ass pro-duction, with processing for energy generation and linkages with water. This is shown schematically in figure 11.4.
Efficient water use for biom ass production is especially important for and and semi-arid countries for two reasons. First, in both types of region, often the main constraint for increasing biomass production is that water available is limited and its supply is unreliable, unless proper control systems exist. Most of the readily available water sources in
Figure 11.4 Positive bio mass production cycle.
298 Asit K. Biswas
such countries as Egypt, Jordan, China and India are already being uti-lized. The potential for developing new sources of water economically in such water-short countries to increase biomass production is now very limited. Accordingly, it is important that policies are formulated to pro-mote the more efficient use of existing water supplies so that they can be used or reused for agricultural production. This is especially important in most major developing countries, where agricultural water use often accounts for more than 90 per cent of total water use, and is generally inefficient. A 20 per cent increase in the present agricultural water use efficiency, which can be achieved with improved management tech-niques but with existing knowledge and technology, can save a substan-tial amount of water that can then be used for additional biomass production. Existing socio-cultural practices and institutional constraints mean that signifIcant increases in water use efficiency will not come overnight; there is, however, no question that this has to be the future direction.
Second, and ironically, poor water use patterns in irrigated areas are now contributing to a decrease in total biomass production in the long term. In all developing countries, where significant amounts of land area are under irrigation excessive water use by farmers, poor overall design and construction of the system components, and inadequate operation and maintenance procedures have meant that groundwater tables are ris-ing in many project areas. This is contributing not only to waterlogging but also to a steady increase in soil salinity, both of which are responsi-ble for reductions in biomass production. There are now many cases all over the world where biom ass production has stopped completely as a result of very high groundwater tables and increased soil salinity. Efficient water use is therefore not only important to provide a new source of water that can then be used to increase biomass production but also to ensure that these production levels are sustainable on a long-term basis.
A direct benefit of increased biomass production through efficient water use will be the simultaneous increases in the availability of both agricultural residues that can then be used as an alternative source of energy, and raw materials such as corn, sugarcane or sugar-beet for alco-hol production. A secondary benefit, which is equally important from an energy viewpoint, is that enhanced agricultural activity contributes to the improvement in the economic well-being of the area This enables peo-ple to purchase cattle, both as draught animals and as a source of milk,
Water 299
that can be consumed or marketed. Increases in the number of cattle in turn ensure a concomitant increase in dung production, which then becomes an important source of biom ass energy. So far, these secondary benefits and links have generally not been appreciated by project plan-ners. The case of the Bhima Project in India, where such links were clearly observed, is referred to elsewhere in this chapter.
Cropping patterns may also have important implications in terms of water use. For example, the average annual water requirements of main food crops vary from 3000 m 3/ha for the countries of humid Central Africa to 16 000 m 3fha for countries in North Africa. However, if energy crops are considered, the main controversy in terms of water requirements has so far primarily concerned eucalyptus. Opposition to eucalyptus as an energy crop has come mainly from India, where a vociferous group of people has claimed that water requirements for eucalyptus trees are abnormally high, and that accordingly eucalyptus plantations reduce groundwater tables and thereby make production of other crops difficult. There are currently not enough results from con-trolled experiments to draw definite conclusions about the truth of this claim.
One of the very few experimental results that is at present available comes from the study conducted during the first rotation of Eucalyptus globulus in the Nilgiri hills, India, by the Central Soil and Water Conservation Research and Training Institute (1987) of the Indian Ministry of Agriculture. This indicated a reduction of about 16 per cent in the expected water yield from eucalyptus plantations during the first ten-year rotation period from 1972 to 1981, when compared with open grasslands used as the control. The reduction in water yield can be mini-mized by adopting suitable silvicultural practices such as wider plant spacing and reduction of the rotation periods. If the eucalyptus is to be raised over a significant area, water losses can be further minimized by staggering the maturity periods of the plantations. This will reduce simultaneous peak water consumption, which appears to occur during the second half of the ten-year rotation, probably due to the lack of enough canopy in the initial stages.
Other experiments that are currently under way in India appear to indicate that loss due to evapotranspiration from eucalyptus plantations is very much a function of water availability: the higher the water avail-ability, the greater are the evapotranspiration losses. This means that the possibility of the effective development of eucalyptus plantations in

300 Asit K. Biswas
areas requiring some drainage may have considerable potential, in terms of both water management and biom ass production.
References Biswas, Asit K. (1987) 'Environmental concerns in Pakistan, with
special reference to water and forests', Environmental Conservation, 144 pp. 319-28.
Biswas, Asit K. (1988) 'Bhima revisited: Impact evaluation of a large irrigation project', Water International, 13 1 pp. 17-24.
Biswas, Asit K., Masakhalia, Y. F. 0., Odero-Ogwel, L. A. and Pallangyo, E. 0. (1987) 'Land use and farming systems in the Horn of Africa', Land Use Policy, 4 4 pp 4 19-43.
Biswas, Margaret R. and Biswas, Asit K. (1984) 'Cornplementarity between environment and development processes', Environmental Conservation, 111 pp 35-44.
Central Soil and Water Conservation Research and Training Institute (1987) 'Effect of bluegum plantation of water yield in Nilgiri hills', Central Soil and Water Conservation Research and Training Institute, Research Centre, Udhagamandalam, Tamil Nadu, India, 107 pp.

12 Health effects in developing countries
Kirk R. Smith
In contrast to developed countries, most biofuel in developing countries is used in households, which are the principal focus of this chapter. Small-scale commercial and industrial activities, however, also utilize biofuels in many areas. Although there are few studies that focus specif-ically on their health and safety factors, these non-household uses can be expected to have many of the same dangers as accompany the use of biofuel domestic stoves. In some cases, of course, these activities take place near or within the household, or even on the same stove that is used for cooking and space heating. The few la!ge-scale uses of biofuels in developing countries have similar impacts as those discussed elsc-where in this volume.
While there are many anecdotal accounts linking village stoves to bums, fires, and lung and eye problems, few systematic studies have directly addressed these issues. This is partly because of the difficulties of doing such research in a scientific manner and partly because of a lack of concern in the scientific and medical establishments that conduct such work. This lack of concern was not without some justification in the past. As with other traditional forms of hazard such as water con-taminated by human waste, there may have seemed to be little argument about the need to eliminate the fire and smoke hazards characterizing decentralized biofuel use in less-developed regions. Since in the past there has been a natural evolution away from open biofuel-fired stoves during economic development, it may thus have seemed unnecessary to spend much effort to characterize the health effects that were, in any case, on the way Out.
The changes in relative fuel costs and availabilities characterizing the
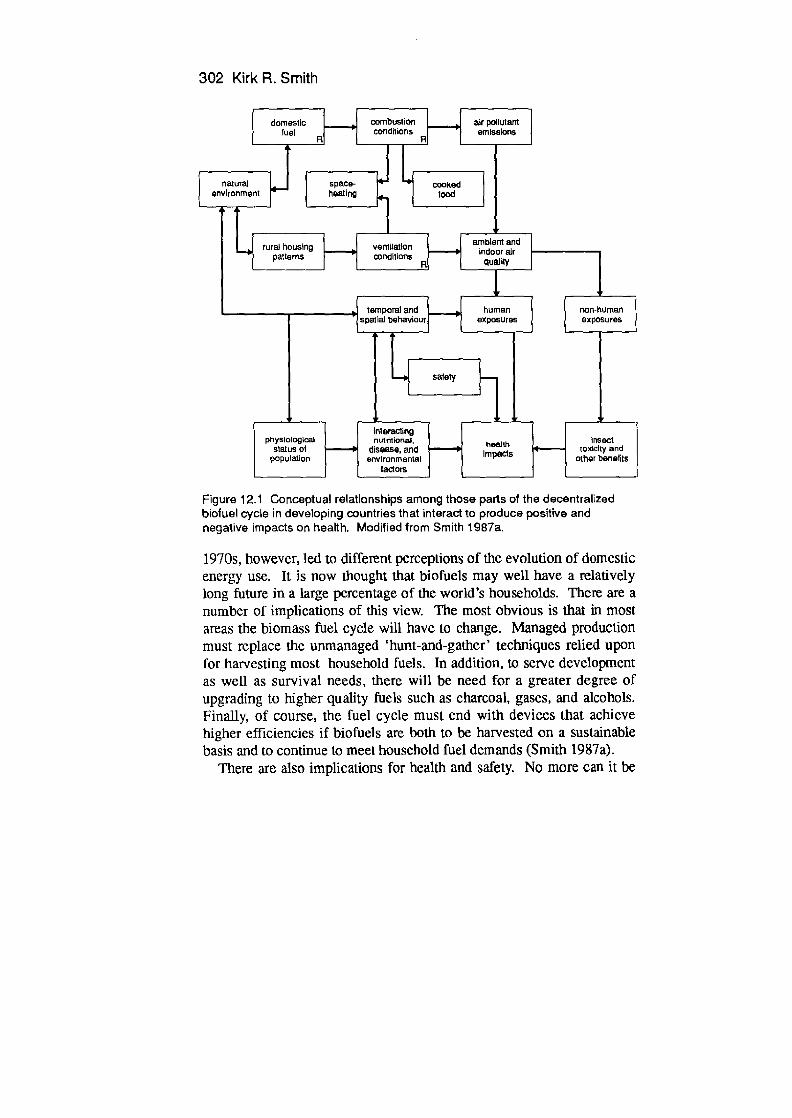
302 Kirk R. Smith
domestIc combustion k- sir pollutant luel - conditions - emissions
natural ,,J Space- cooked environment heating toed I 1L
rural housing ventilation f ambient and
patterns conditions indoor air quality
temporal and _____ human non-human spatial behaviourl exposures exposures
sarety
physioIoglI H nutellonal, I insect status of disease, and
health _______ ioxlchty and
intonsutingL I H other benefits population environmental 1 I Impacts
tactors I
Figure 12.1 Conceptual relationships among those parts of the decentralized biofuel cycle in developing countries that interact to produce positive and negative impacts on health. Modified from Smith 1987a.
1970s, however, led to different perceptions of the evolution of domestic energy use. It is now thought that biofuels may well have a relatively long future in a large percentage of the world's households. There are a number of implications of this view. The most obvious is that in most areas the biomass fuel cycle will have to change. Managed production must replace the unmanaged 'hunt-and-gather' techniques relied upon for harvesting most household fuels. In addition, to serve development as well as survival needs, there will be need for a greater degree of upgrading to higher quality fuels such as charcoal, gases, and alcohols. Finally, of course, the fuel cycle must end with devices that achieve higher efficiencies if biofuels are both to be harvested on a sustainable basis and to continue to meet household fuel demands (Smith 1987a).
There are also implications for health and safety. No more can it be

Health effects in developing countries 303
expected that existing problems will go away by themselves. They must be directly addressed at each step of the fuel cycle. Because there may well be difficult trade-offs among the desires for economy, efficiency, cleanliness, safety, and other characteristics, increased quantification of the impacts will be required to make rational choices.
Such factors as economy, efficiency, and, to some extent, safety are fairly easily perceived by the users themselves. It can thus be argued that, given the opportunity, users are best qualified to choose among alternatives in a way that best serves their own interests. Environmental contaminants, however, present a more difficult problem. Their impacts are often delayed and otherwise difficult to link directly to exposures. Indeed, some of the most damaging pollutants cannot be perceived at all by human senses. Neither are the health effects easily distinguishable from those with other causes. Thus, to pin down effects, it is necessary to rely on instrumentation, statistical judgments, and expert opinion. This is sometimes even true when the effects are great, as they are, for example, with tobacco smoking.
Direct impacts on health
The most direct impacts on health relate to fires, burns, and air pollution exposure resulting from household use of biofuel-fired stoves.
Air pollution
A direct answer to the question about air pollution effects from decen-tralized use of biofuels is not yet possible because so little direct work has so far been done. It is possible, however, to break down the question into a series of subquestions that can be partially answered and, taken together, give some indication of the extent of the problem. Figure 12.1 shows the framework within which the components can be linked.
How widespread is bio fuel usage? Biofuel is the most important household fuel in the world. As has been true since the discovery of fire, most people rely most of the time on such fuels for household energy needs. While it is difficult to be precise and there are many local and seasonal variations, it seems that the vast

304 Kirk R. Smith
majority of such use occurs in open stoves that do not vent the smoke away from the user.
How much smoke is produced by bio fuel combustion? Unlike many fossil fuels, most biofuels contain few contaminants that cannot, in principle, be converted to non-toxic products during combustion. indeed, in some circumstances biofuels can be burned with little smoke production, but, unfortunately, it is quite difficult to do so in simple small-scale stoves (that is, of less than 10 kW, or using about 2 kg of wood per hour). Instead, a wide range of pollutants are nonnafly emitted in several major categories: carbon monoxide, particulates, hydrocarbons, and nitrogen dioxide (table 12.1). The rate of production is generally substantially higher than with the combustion of gaseous or liquid fuels and is only rivalled by burning of other high-volatile solid fuels such as coal.
How dangerous is bia fuel smoke compared to that from other fuels? Biofuel smoke, like tobacco smoke, contains hundreds and probably thousands of individual carbon-containing chemicals, many of which have been shown to be damaging to health in either human or animal studies. These include potentially cancer-causing polyarornatic hydro-carbons (such as benzo(a)pyrene), aldehydes (such as formaldehyde), and aromatics (such as benzene). In addition, the size of the particles is such that they can penetrate deep into the lungs where it is thought the most damage can occur. Laboratory studies show that, gram for gram, wood smoke seems to have about the same potential for producing turn ours as smoke from the burning of tobacco or vehicle fuels. This contrasts, for example, with the smokes from certain coals that seem to have much greater activity (Lewtas 1986).
How much smoke are people exposed to? Only a small number of studies have been done in which actual expo-sures have been measured. Indeed, it has only been in recent years that the techniques and equipment for such studies have been developed, largely in response to the growing concern about indoor air quality in developed countries. Moreover, only a limited number of geographic and social conditions, fuels, stoves, house types, and time periods have been studied in developing countries in spite of the large population potentially at risk. No standard methods have yet been developed. For
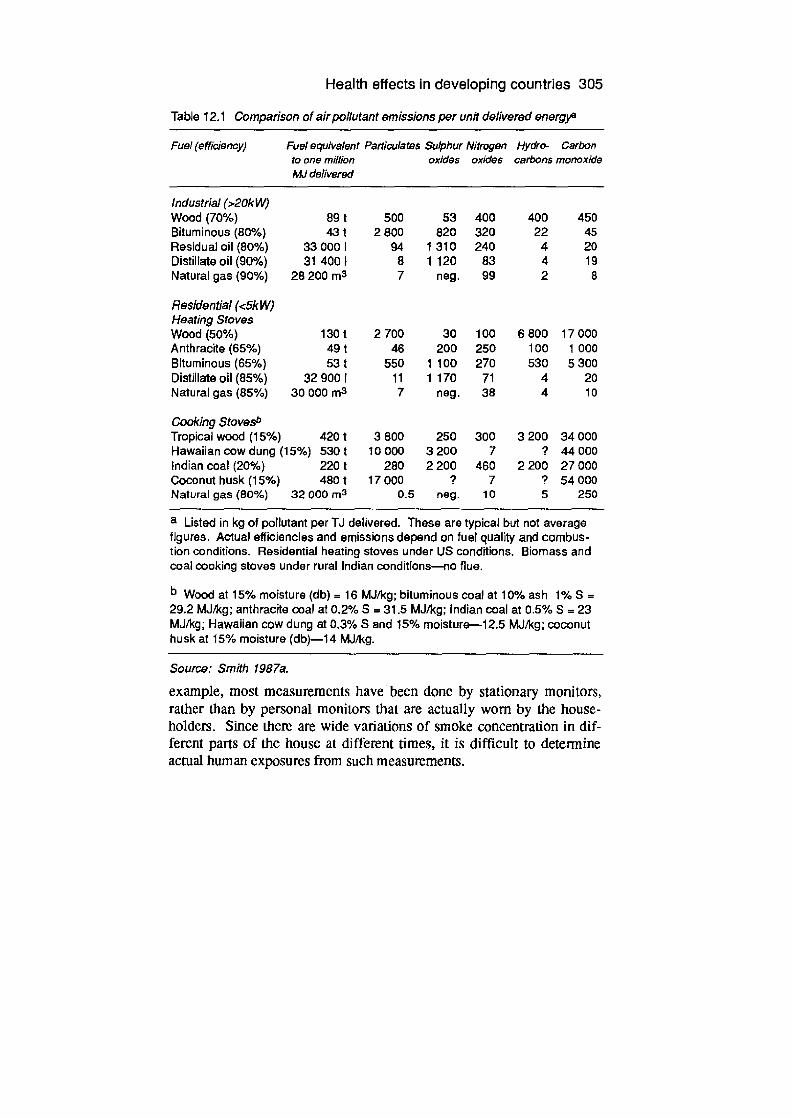
Health effects in developing countries 305
Table 12.1 Comparison of afr pollutant emissions per unit delivered energya
Fuel fafficiency) Fuel equivalent Particulates Sulphur Nitrogen to one million oxides oxides MJ delivered
Hydro- Carbon carbons monoxide
Industrial (>20kW) Wood (70%) 89 1 500 53 400 400 450 Bituminous (80%) 431 2 800 820 320 22 45 Residual oil (80%) 330001 94 1 310 240 4 20 Distillate oil (905%) 31 400 1 8 1120 83 4 19 Natural gas (90%) 28 200 m3 7 neg. 99 2 8
Residential (<5kW) Heating Stoves Wood (50%) 1301 2700 30 100 6800 17000 Anthracite (65%) 49 t 46 200 250 100 1 000 Bituminous (65%) 53 t 550 1100 270 530 5 300 Distillate oil (85%) 329001 11 1170 71 4 20 Natural gas (85%) 30 000 m3 7 neg. 38 4 10
Cooking Stovesb Tropical wood (15%) 420 1 3 800 250 300 3200 34 000 Hawaiian cow dung (15%) 530t 10000 3200 7 ? 44000 Indian coal (20%) 220 t 280 2200 460 2200 27 000 Coconut husk (150%) 480t 17000 ? 7 ? 54000 Natural gas (80%) 32 000 m3 0.5 neg. 10 5 250
a Listed in kg of pollutant per TJ delivered. These are typical but not average figures. Actual efficiencies and emissions depend on fuel quality and combus-tion conditions. Residential heating Stoves under US conditions. Biomass and coal cooking Stoves under rural Indian conditions—no flue.
b Wood at 15% mOisture (db) = 16 MJlkg; bituminous coal at 10% ash 1% S = 29.2 MJ/kg; anthracta coal at 0.2% S = 31.5 MJ/kg; Indian coal at 0.5% S = 23 MJIkg; Hawaiian cow dung at 0.3% S and 15% moisture-12.5 MJ/kg; coconut husk at 15% moisture (db)-14 MJ/kg.
Source: Smith 1987a.
example, most measurements have been done by stationary monitors, rather than by personal monitors that are actually worn by the house-holders. Since there are wide variations of smoke concentration in dif-ferent parts of the house at different times, it is difficult to determine actual human exposures from such measurements.

306 Kirk R. Smith
In general, where open combustion occurs indoors, such measure-ments have found high levels of particulates and some of the limited number of organic compounds that have been measured. Typical con-centrations greatly exceed those in any but the dirtiest urban outdoor environments. Maximum levels exceed anything measured in cities. Carbon monoxide and nitrogen dioxide levels are often above the stan-dards set to protect public health, but, except very near the fire, not to the extent demonstrated by particulates and organic compounds. Compounds that have caused cancer in animals and are known to be in mixtures that cause cancer in humans (such as tobacco smoke and coal tar) have also been found at extremely high levels compared to urban sit-uations (Smith 1987a).
Since people spend a considerable amount of time indoors, exposures as well as concentrations can also be high. It has been difficult to demonstrate strong associations of exposures with household parameters such as volume and area of window, but roof type does seem to have an effect as well as the proximity to nearby houses (Menon 1988). Statistical tests tend to show greater exposure variation within homes than between homes with the same stove and fuel characteristics (WHO 1987a). In general, however, people in households at higher elevation will have higher exposures because of tighter ventilation conditions and the increased use of the stove for space heating (Dary et al. 1981).
What health effects would be expected, and which have been found? Based on studies of the same compounds but in different mixtures, populations, and exposure patterns (that is, cities, occupational settings, and tobacco smoking), there are five major types of health effects that might be expected from such exposures (Smith 1987 a):
I Acute respiratory infections (ART): The most conclusively demon-strated health effect of passive tobacco smoking is the increase of ARI in children (USNRC 1986). In village houses, however, typical exposure to most pollutants greatly exceed the levels resulting from passive smoking exposures in developed countries. Preliminary studies in rural Nepal have shown a relationship between hours per day spent near the stove and the incidence and severity of ART among very young children (Pandey 1985). A study in Papua New Guinea failed to find a relationship for school-age children (Ander-son 1978).

Health effects in developing countries 307
It is quite important to understand this connection since AR! is now one of the principal causes of illness and death among the world's young children, even exceeding diarrhoea in many estimates. As many as one-third of the world's childhood deaths can be attributed to ART (Leowski 1986). There are a number of risk factors for AR! of which smoke exposure may be important in some regions (WhO l987b).
2 Chronic obstructive lung diseases (COLD): chronic bronchitis and other forms of COLD have been associated with long-term expo-sures to air pollution of various kinds, including active tobacco smoking. Preliminary studies in Nepal (Pandey 1984) and India (Padmavati and Arora 1976) have shown, for women, an association of COLD and associated heart problems with cooking, while other studies in Papua New Guinea have led to conflicting results (Smith 1987a). Such studies are difficult to interpret, however, because of the need to determine the history of exposure over many years.
3 Low birth weights: Evidence from both active and passive smoking studies indicates that the pollutant exposures to pregnant women in village households may be sufficient to be a factor along with nutri-tion and other influences in low birth weight. Low birth weight, of course, is highly correlated with infant mortality and lifelong disabil-ity, and is a serious problem in developing countries. No studies of the impact of household smoke, however, seem to have been done.
4 Cancer: There seems to be little concrete evidence of excess cancer from biofuel smoke, although such smoke contains a number of sus-pected carcinogens. In the past, some studies in Kenya and among various populations of southern Chinese have pointed to nasopharyn-geal cancer, but more recent analysis has played down the role of smoke (Smith 1987a). Age-adjusted lung cancer rates are generally thought to be low in those areas of the world with high biofuel smoke exposures, although no systematic studies of the connection seem to have been done. Recent evidence from China does point to a possible impact, but not nearly to the same extent as the effects of smoke from the local coal burned in the village stoves (Mumford et al. 1987). The impact of biofuel smoke exposures on cancer remains elusive, although it can probably be said not to be large, in spite of
308 Kirk H. Smith
large theoretical risks based on extrapolations from other known car-cinogenic mixtures such as tobacco smoke. As life expect.ancies lengthen, however, cancer, which is mainly a disease of the old, will become more prominent. If biofuel smoke exposures persist to that time, the impact on cancer rates may be more critical.
Eye problems: While anecdotal accounts of eye problems related to smoke are common, there seem to be no systematic studies of the problem.
Although the existing studies referred to above are suggestive, no epi-demiological study has yet been done that actually measures both health outcomes as well as smoke exposures. Neither have any before-and-after (intervention) studies been done to determine the health improve-ment resulting from exposure reduction measures such as the introduction of improved stoves. Clearly, however, such studies are war-ranted given the large exposures, large population, and preliminary results of the semi-quantitative studies done to date. Easiest will be studies of AR! and low birth weight, in which exposures and outcomes are most closely connected in time. The wide variation in household exposures argues for utilizing a control group that is similar in all respects except smoke exposure. This is difficult in practice because so many cultural and economic parameters also correlate with smoke expo-sures. The best approach, therefore, is to employ studies designed to produce their own control group through intervention (Pandey et al. 1989).
Fires and burns
Safety clearly plays important roles in user perceptions of household stoves and fuels. In the Terai (lowlands) of Nepal, for example, the introduction of improved stoves with flues has reportedly been ham-pered because of the increased perceived risk of roof fires started by sparks from the flues. An often mentioned advantage to improved stoves, on the other hand, is that they are less likely to bum young chil-dren who may bump into them. This results partly from the enclosure and, sometimes, insulation of the combustion chamber, and partly from the raising of the Stove from the floor and more fIrmly secured pots mak-ing spillage of hot food less likely (Seth 1987). A further important
Health effects in developing countries 309
safety advantage accrues in those parts of the world where tragic and often fatal fires of women's clothing occur (Raggett 1987).
Indirect impacts on health
Other impacts on health indirectly attributable to the use of biofuels in simple open stoves. Some, like human exposures to smoke, are nega-tive, but others may be positive.
Inefficiency and fuel shortages
A set of interconnected problems relate to the domestic biofuel cycle in those many parts of the developing world where harvesting is done by household members. As has been documented by many authors 1 , the time spent in the combined efforts of harvesting and cooking often takes a significant fraction of the day. In addition, the decreasing availability of biofuels in many areas has resulted in an increase and sometimes a shift in the relative duration of these tasks because of greater distances that must be travelled to obtain fuels and the decline in the average qual-ity of fuels—which tend to increase the net weight of fuel to be carried and the cooking time (as well as smoke production). This created sev-eral kinds of health-related problems2 .
The inefficient use of women's working time, reducing the time spent on family care and income-generating activities.
Li The appropriation of children's time that might otherwise be occu-pied in more productive or educational pursuits.
D Pressure on cooking patterns, leading to practices that may lower nutritional status such as reducing the number of meals per day, the type of food preparation, the thoroughness of cooking, or the kind of food cooked. Women and children may be encouraged to shoulder physical loads of an unhealthy size and quantity.
U Additional food energy is required for the least well nourished fam-ily members—women and children.
L The loss of household income-generating opportunities from food preparation and other fuel-using enterprises may result. Studies have shown that, particularly when earned by women, such income is
310 Kirk R. Smith
often important in maintaining family nutrition and access to health care.
D Household income may be lowered by encouraging use of more expensive pre-prepared foods (as well as purchase of alternative fuels). Water-boiling, cleaning, bathing, and other activities necessary to maintain a sanitary home may be discouraged.
Li The risk of increased rates of malaria, infections from injuries and parasites (such as leeches), or victimization by crime of women and children forced to forage in marginal areas.
LI The possibility of decreased efficiency and increased ill-health resulting from inability to heat homes properly in upland or temper-ate areas.
LI Male migration may be encouraged, leading to an increase in the already usual double burden on women (home and farm). Indeed, one study has linked local environmental deterioration to female sui-cide (Agarwal 1986, p.24).
The health benefits of smoke
Anecdotal accounts of the benefits of household biofuel smoke are nearly as common as those describing ill effects. As indicated in figure 12.1, an analysis of the overall interaction of smoke exposure and human welfare should take these factors into account. Unfortunately, however, it seems that once again few if any systematic studies have been done to verify and quantify these benefits.
The most important benefit ascribed to such exposures is mosquito repellence. Certainly, with the rise in malaria occurring in some parts of the world along with pesticide and drug resistance, such a benefit needs to be carefully considered (Sloof 1987). As with the other aspects of the overall problem, however, the absence of scientific interest has meant that there are no standard methods available to test the effects of smoke on mosquito behaviour. The work that has been done to develop such a method has not been yet applied to malaria-carrying mosquitoes. Preliminary results seem to show that effective mosquito repellence can occur at smoke concentrations substantially below what is often found in village houses (Jelich 1987).
These early results are consistent with evidence from interviews with village women who have adopted improved stoves with flues. They

Health effects in developing countries 311
report the ability to continue mosquito repellence by burning small amounts of specific local biom ass forms such as neem leaves (Grainge and Ahmed 1988). This is analogous to the use of a mosquito coil, which results in much lower concentrations of smoke but releases com-pounds of particular impact on mosquitoes. Again, however, while there is a substantial amount of anecdotal evidence, more systematic research would be needed to pin down these relationships with confidence.
The second most commonly noted benefit of smoke is preservation of household thatch. Again, although certainly amenable to experimental validation, only anecdotal evidence seems to be available at present. Neither is this evidence consistent: many surveys indicate that villagers actually perceive little such advantage to smoke, or point out that fumi-gallon with smoke can be done in ways that minimize human exposures, or describe the negative impacts of smoke on household materials. Potential health benefits include reducing the numbers of vermin in the household and sterilization and preservation of food. More systematic investigation is clearly needed to pin down these relationships (Shanaban 1987).
What can be done?
Even though it is not yet possible to produce precise estimates of the health effects caused by decentralized biofuel use, enough is known of the effects to warrant efforts to reduce them. An integrated approach to control would include economic, managerial, political and social issues, but for now it may be most valuable to discuss this question briefly with regard to two of the technical 'fixes': changes in fuels and stoves to achieve lower smoke emissions, and higher fuel utilization. (Options for improving biofuel production and harvesting techniques were discussed in Part 1).
There have been problems in developing standard techniques for mea-suring both fuel efficiency and smoke emissions from open stoves, and for determining the fuel use and human smoke exposures that result. Individual differences in tending the fire can make large differences in all these factors. As a result, not only do laboratory results often differ substantially from field data but, unless great care is taken, from one test to another. Nevertheless, it is possible to make some tentative general-izations (Baldwin 1987; Ahuja et al. 1987; Smith 1987a).

312 Kirk R. Smith
Fuel
In general, there seems to be more variation in fuel use and smoke emis-sions among different combustion conditions than among different types of unprocessed biofuel. Few studies have been done of the many differ-ent types of crop residues, but, under common conditions in small stoves, residues seem to be somewhat smokier and less efficient than wood, but less smokey and more efficient than animal dung (see chapter 4 above). It does seem to be possible to make some generalizations about some physical parameters. For example, for any stove and fuel type there seems to be an optimum ratio of surface area to volume (size of fuel pieces), and optimum fuel moisture content for either emissions or efficiency, but not necessarily at the same points. In general, these optima seem to lie in the range of sticks of 2 to 4 cm in diameter and air-dried moisture levels, but tests would have to be done on any one stove/fuel combination to be more specific. Indeed, stove arrangements have been found in which the highest combustion efficiency and lowest emissions occur with wood of 50 per cent moisture (Islam et al. 1986).
It is generally true to say that the combustion of upgraded biofuels such as charcoal will create less pollution in the household than the com-bustion of unprocessed biofuels (Islam 1987). More wood will have to be harvested, but substantially less weight (although about the same vol-ume) will have to be carried to the house (Bormann et al. 1988). At the risk of some oversimplification, it can be said that from an air pollution emissions standpoint charcoal making separates the two major categories of biofuel air pollutants. Instead of releasing particulates/hydrocathons and carbon monoxide (CO) together as does wood when burned, the first is mostly released when making the charcoal and the second mostly when burning it. This would seem to be an advantage in that at least a great part of the noxious material is now released outdoors at the char-coal kiln and probably far away from the house.
In the case of charcoal emissions, however, this apparent benefit can some-times actually create extra risk. CO exposure is a hazard not only on a long-term basis but also over the short term if exposures are high enough. Normally, however, it is impossible to succumb to CO poison-ing from the smoke of wood or other forms of natural biofuel. This is because the concentrations of hydrocarbons in the smoke increase along with CO. and long before CO exposures have reached dangerous levels people will be awakened and driven from the room because of the

Health effects in developing countries 313
intense irritation caused by the aldehydes and other organic chemicals in the smoke. While many of the hydrocarbons are long-term hazards, therefore, their presence can be beneficial in the short term because they act as a warning for build-up of CO concentrations. However, low-volatile solid fuels, which do not produce this hydrocarbon alarm can and do cause CO poisoning, as in Korea, Iran, Afghanistan, northern China, and elsewhere where coal and/or charcoal is used as heating fuel.
Thus a programme to replace biofuels with a low-volatile solid fuel (whether charcoal or coal) must be careful to take safety into account. The stove and ventilation conditions should be examined to be sure that CO poisoning does not occur. In addition, the public must somehow be informed of the danger because CO by itself is essentially not detectable by normal human senses.
Stoves
Even less work has been done to determine how modifications in cook-ing stove design affect emissions, although considerable effort has gone into studies of efficiency. Much information can be gleaned, however, from the extensive research done with wood-fired metal heating stoves that have recently become popular again in many developed countries. Indeed, many developed countries have rapidly developed and promul-gated rigid air pollution controls for household wood Stoves because of the high emission levels characterizing most traditional designs. In the USA, for example, the Environmental Protection Agency, pushed by a lawsuit brought by the Natural Resources Defense Council, has recently announced wood stove emission standards to be enforced on new stoves. This has been justified because, by the mid-1980s, wood stoves had probably become the largest source of several important categories of air pollution in the country—exceeding, for example, the CO emissions of all US industry and matching the entire power industry in particulate emissions (USEPA 1987).
The concern in developed countries, of course, relates to outdoor air quality since metal heating stoves essentially all have flues or chimneys. The village cooking stove, on the other hand, typically does not and emits directly into the household environment. Many of the improved stove programmes around the world have promoted stoves with flues. Sometimes these stoves are called 'smokeless', although they are not designed to emit less smoke but to direct the smoke out of the house.
314 Kirk R. Smith
Indeed, the most common designs probably actually increase total smoke output compared to the traditional open-combustion stove.
The history of improved village stoves since the middle of the tweriti-eth century has been characterized by three overlapping periods. The earliest of 'Classic' period focussed on reducing smoke exposures, but generally did not apply scientific approaches to design, promotion, and testing. The Energy period stoves, which came about during the 1970s in response to energy-environment concerns, focused on improving fuel efficiency. All too often, however, these programmes also failed to apply scientific and critical methods.
At present, a new stage is appearing, although programmes represent-ing both older approaches are still active. The new period, which here will be called 'Phoenix', auempts to learn from the past and to incorpo-rate the lessons learned in both earlier periods (Smith 1989). Some of the important lessons are:
Both improved fuel utilization and reduced smoke exposures need to be considered as primary goals. Indeed, most post-dissemination sur-veys of improved stoves introduced to areas where traditional Stoves cause large exposures have found that reduced smoke exposure is cited more often than improved efficiency as the largest benefit to users.
Considerable engineering and market research is needed before a new model can be successfully disseminated. Field research must incor -porate study designs that are capable of providing statistical state-ments of user perceptions and stove performance. More work needs to go into development of standard methods for measuring efficiency and exposures under laboratory, simulated, and field conditions.
Social niches exist for both locally made stoves of local materials as well as centrally made devices of metal or ceramic in which stricter quality control and economies of scale apply. Both welfare and mar -ket approaches to dissemination must be developed as they will both be appropriate.
Stove programmes should not expect to be able to optimize one or two aspects of traditional stoves while maintaining all their other charac-teristics such as portability, flexibility, zero cost, insect fumigation,

Health effects in developing countries 315
and room lighting. This is not to argue that such functions are unim-portant but that they will need to be addressed by other means. Economic and technological development has nearly always been accompanied by specialization and there is no reason why the evolu-tion of the cooking stove should be any different.
There are trade-offs between efficiency and emissions in many stove designs. Efficiency and low exposures may seem to be and indeed are, in general, compatible goals. After all, the source of most emis-sions from biofuel combustion is incomplete combustion, thus high combustion efficiency means low emission factors (emissions per unit fuel). Unfortunately, however, some of the principal techniques used by stove designers to increase efficiency actually increase emis-sion factors as well. This comes about because overall stove effi-ciency is a combination of two separable internal efficiencies: those of combustion and heat transfer. Enclosing the combustion chamber and reducing airflow—two common approaches in improved stoves—may increase overall efficiency by increasing heat transfer efficiency. This may, however, actually decrease the combustion effi-ciency because of poorer turbulence and a lower air:fuel ratio. Therefore the result can be increases in both overall thermal effi-ciency and emission factors, so care must be taken to improve or at least maintain combustion efficiency when seeking modifications to improve overall fuel utilization.
The prediction of the health impacts of changes in heat transfer, com-bustion and overall efficiencies is not straightforward because exposure is not a direct function of emission factors and fuel utilization is not a direct function of efficiency. Both are also affected by the emissions rate, food cooked, cooking time, room ventilation, mariner of tending stove, and other factors that may themselves by changed by modifica-tions in stoves designed to improve fuel utilization or lower exposures. In some cases, for example, an increased emission factor per unit fuel may be more than compensated for by a decrease in total fuel usage and cooking time. On the other hand, lower emission factors themselves do not guarantee decreases in exposures.
What about smokeless stoves? It might be thought that the above discussion refers only to stove
316 Kirk R. Smith
improvements that do not incorporate flues. Unfortunately, this is not so. It is clear from several studies in India, for example, that the exis-tence of a flue is not sufficient to guarantee a significant reduction in human exposures under field conditions. A number of factors seem to be involved, but in general it is unfortunately true to say that stoves in the field are often not built, operated, or maintained in the ways intended by their designers. In addition, users may frequently substitute fuels and pots in ways that lead to smoke releases. Thus, field tests are needed to verify the extent of exposure reductions. Even user perceptions can be misleading because not all of the critical pollutants are readily sensed, although surveying such perceptions is obviously important for other reasons.
Another factor that tends to limit the exposure reduction benefits of flued stoves is the entry of smoke from outside the house. Since smoke is still produced (even, in some cases, in greater amounts) by flued stoves, the outside air can become heavily polluted. When houses are close together, stoves are used at the same time of day, and outdoor ven-tilation is low (as in the dry winter season characterizing many Continen-tal areas) local ambient air pollution can reach high levels. In these cases, the relatively high ventilation rates of village housing can lead to a significant indoor concentration even when the flued stoves are still working well. In such conditions, homes using biogas for cooking can experience nearly as high concentrations as nearby homes using tradi-tional fuels even though biogas combustion itself contributes very little (Ramakrishna et al. 1989). A study in Nepal, on the other hand, where houses were widely spaced horizontally and vertically, found signifi-cantly lower exposures among women cooking on smokeless stoves (Reid et al. 1986).
To be truly smokeless, stoves need to incorporate features such as sec-ondary combustion chambers that directly decrease emissions. Unfortunately, it has turned Out to be difficult to design such devices to operate reliably. This is true even for metal heating stoves in developed countries, which cost many hundreds of dollars. In what might be called the 'wood stove dilemma', the rate of energy (power) needed by typical houses occurs just at the lower limit of wood bum rates at which high combustion efficiency and low emissions can be easily maintained. Unfortunately, the typical power needs for household cooking creates this same problem.
One approach to accomplishing the sometimes conflicting goals of
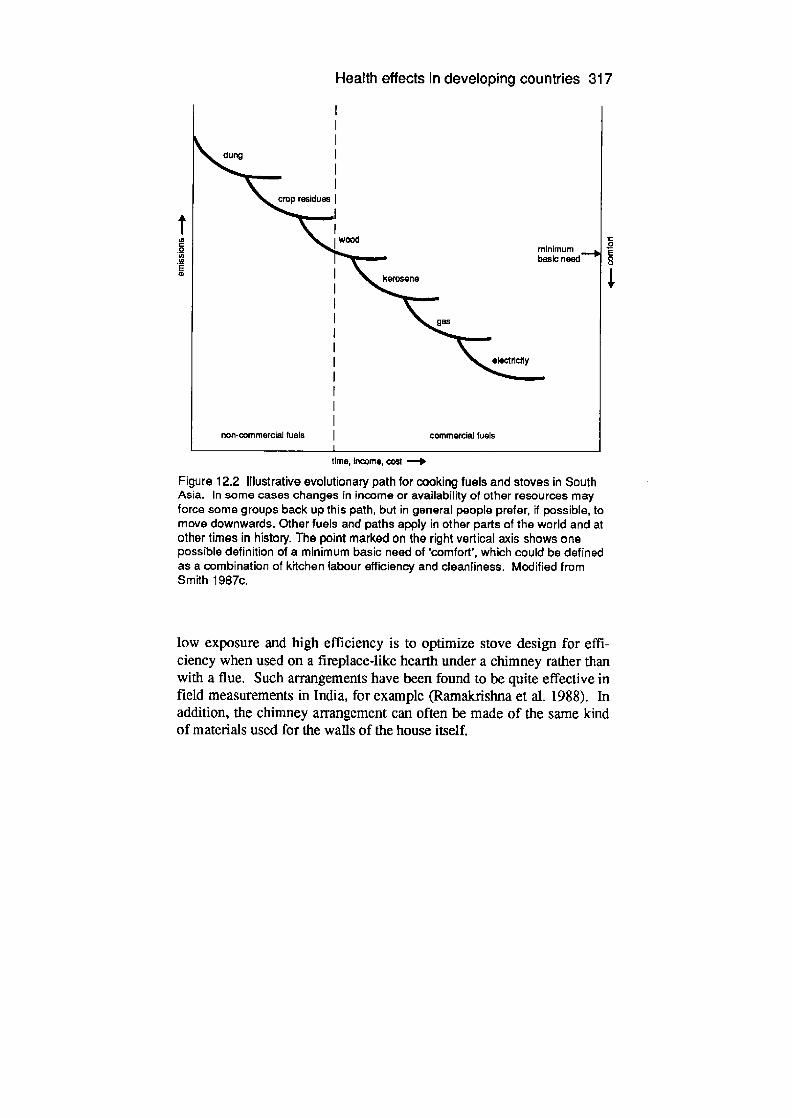
Health effects in developing countries 317
II In
0 to to E ID
0 E 8
'I,
time, inoome, cost —$'
Figure 12.2 Illustrative evolutionary path for cooking fuels and stoves in South Asia. In some cases changes in income or availability of other resources may force some groups back up this path, but in general peopie prefer, if possible, to move downwards. Other fuels and paths apply in other parts of the world and at other times in history. The point marked on the right vertical axis shows one possible definition of a minimum basic need of comfort', which could be defined as a combination of kitchen labour efficiency and cleanliness. Modified from Smith 1987c.
low exposure and high efficiency is to optimize stove design for effi-ciency when used on a fireplace-like hearth under a chimney rather than with a flue. Such arrangements have been found to be quite effective in field measurements in India, for example (Ramakrishna et al. 1988). In addition, the chimney arrangement can often be made of the same kind of materials used for the walls of the house itself.
318 XirkR.Smith
Conclusion
Although the smell of dilute biofuel smoke and the sight of open flames apparently evoke nostalgia in many people, the high smoke levels and risk of bums experienced by much of humanity are clearly not con-ducive to a sustained high quality of life. A range of fuel, stove, and ven-tilation strategies are available for reducing the hazards, but require efforts at village as well as government level to be successful (Caceres et al. l98). More effort will be needed to understand how biofuel use, household labour efficiency and health interact so that such strategies can be most effective.
The history of the world has shown that at every occasion where alter-natives have been available and affordable, people eagerly turn away from unprocessed solid fuels for cooking. Jndeed, as illustrated by fig-ure 12.2, it is possible to identify local evolutionary paths for cooking stove technology that over time generally lead away from biofuels used in open combustion towards stove/fuel combinations that produce improved kitchen working conditions through increased efficiency and cleanliness (Smith 1987c). For a substantial number of years to come, large populations will unavoidably remain reliant on simple biofuels that are inconvenient, dirty, bulky, hard to control, inefficient, and otherwise unsuited to cooking. It is to be hoped that the improved stoves of the Phoenix Period will mitigate the impact of these characteristics and thus help make the use of simple biofuels more comfortable and sustainable. Jndeed, it may be appropriate to establish a minimum degree of kitchen comfort (efficiency and cleanliness) as a basic human need analogous to needs for food, shelter, and education. This might correspond in some areas, for exampl, to a high-efficiency woodstove with flue, as indi-cated in figure 12.2. Given the number of workers in the 'occupation' of cooking (second only to farm workers) and the direct and indirect bene-fits to small children of improved kitchens, such an effort would seem well worthwhile.
Notes See, for example, the studies summarized in Smith 1987a, and the
many valuable working papers commissioned by the Rural Employment Policy Research programme of the International Labour Office, Geneva.
Evidence and discussions of this network of problems can be found in

Health effects in developing countries 319
the increasingly sophisticated and compelling literature on women, rural development, and energy. See, for example, excellent discussions in Agarwal 1986; Bajracharya et al. 1985; Ceceiski 1985; Ceceiski et al. 1986; Hoskins 1979, 1983; Sarin 1987; and Tinker 1987.
References Agarwal, B. (1986) Cold Hearths and Barren Slopes: The Woodfuel
Crisis in the Third World, Zed Books, London. Ahuja, D., Joshi, V. and Smith, K. R. (1987) 'Thermal performance and
emission characteristics of unvented, metal, biomass-burning cookstoves: A proposed standard method for measurement, evaluation and performance', Biomass 12,247-70.
Anderson, H. R. (1978) 'Respiratory abnormalities in Papua New Guinea children: the effects of locality and domestic wood smoke pollution', International Journal of Epidemiology 7, 127-35.
Bajracharya, D., Standal, B. R., Setboonsarng, S. et a! (1985) 'Fuel use, nutrition intake and rural activities: emerging patterns in Pangma and Madheli, East Nepal', Report to the International Labour Office, East-West Resource Systems Institute and University of Hawaii, Honolulu, HI.
Baldwin, S. F. (1987) Biomass Stoves: Engineering Design, Development and Dissemination, Volunteers in Technical Assistance, Arlington, VA.
Bormann, F. H., Bormann, B. T. and Smith, K. R. (1988) 'From earth to hearth: A microcomputer model for comparing biofuel systems', East-West Environment and Policy Institute, Honolulu.
Caceres, E., Caceres, A., Ramaknshna, I. and Smith, K. R. (eds) (1988) Stoves for People, Centro Mesoamericano de Estudios Sobre Technolgia Appropiada (CEMAT), Guatemala City (AP 1160).
Cecelski, E. (1985) 'The rural energy crisis, women's work and basic needs: Perspectives and approaches to action', International Labour Office Technical Cooperation Report, International Labour Office, Geneva.
Ceceiski, E., Kamminga, E. and Tarrant, J. (eds) (1986) 'Energy and rural women's work: Proceedings of a preparatory meeting on energy and rural women's work', volume I; 'Energy and rural women's work: Papers of a preparatory meeting on energy and
320 Kirk R. Smith
rural women's work', volume II; lntemationa:1 Labour Office, Geneva.
Dary, 0., Pineda, 0. and Belizan, J. M. (1981) 'Carbon monoxide contamination in dwellings in poor rural areas of Guatemala', Bulletin of Environmental Contamination and Toxicology 26, 24-30.
Grainge, M. and Ahmed, S. (1988) Handbook of Plants with Pest-Control Properties, John Wiley & Sons, New York.
Hoskins, M. (1979) 'Women in forestry for local community development: A programming guide', paper prepared for the Office of Women in Development, Agency for International Development, Washington, DC.
Hoskins, M. (1983) 'Rural women, forest outputs and forestry projects', discussion draft paper No. MISC/83/3, Food and Agricultural Organization, Rome.
Islam, N. (1987) 'Test of combustion properties and pollutant emissions of lignite briquettes', East-West Resource Systems Institute for the Energy Division, Oak Ridge National Lab, TN.
Islam, N., Fox, J. S., Antal, M. J. et al. (1986) 'Study of a concurrent biom ass combuster for combustion efficiency and air pollution', Tenth Conference on Energy from Biomass and Wastes, Institute of Gas Technology, Chicago.
Jelich, A. (1987) 'Mosquito repellency of biomass smoke: development of a standard test and its use on smokes from Leucaena wood, cow dung, and neem leaves', Masters Thesis, College of Human Resources and Education, West Virginia University, Morgantown, WV.
Leowski, J. (1986) 'Mortality from acute respiratory infections in children under 5 years of age: Global estimates', Statistical Quarterly 39, 13844.
Lewtas, J. (1986) 'A quantitative cancer risk assessment methodology using short-term genetic bioassays: The comparative potency method', in P. Oftedal and A. Brogger(eds), Risk and Reason, Alan R. Liss, New York.
Menon, P. (1988) 'Indoor spatial monitoring of combustion generated pollutants by Indian cookstoves', UHMET 88-01, Meteorology Department, University of Hawaii, Honolulu.
Mumford, J. L., He, X. Z., Chapman, R. S. et al. (1987) 'Lung cancer and indoor pollution in Xuan Wei, China', Science 235, 2 17-35.

Health effects in developing countries 321
Pacimavati, S. and Arora, S. (1976) 'Sex differences in chronic cor pulmonale in Delhi', British Journal of Diseases of the Chest 70, 251-59.
Pandey, M. R. (1984) 'Domestic smoke pollution and chronic bronchitis in a rural community of the hill region of Nepal', Thorax 39, 337-39.
Pandey, M. R. (1985) 'Acute respiratory infections among infants and young children', Annual Report to UNICEF, Mrigendra Medical Trust, Katmandu.
Pandey, M. R., Boleij, J. S. M., Smith, K. R. and Wafula, E. M. (1989) 'Indoor air pollution in developing countries and acute respiratory infection in children', Lancet (Feb. 25 1989), 427-429.
Raggett, S. (1987) 'Sarvodaya gives priority to health and safety in Sri Lanka kitchens', Boiling Point 13, 11-13.
Ramakrishna, I., Durgaprasad, M. B. and Smith, K. R. (1989) 'Indoor air pollution and village stoves in India', Environment international (forthcoming).
Reid, H., Smith, K. R. and Sharchand, B. (1986) 'Indoor smoke exposures from traditional and improved cookstoves: Comparisons among rural Nepali women', Mountain Research and Development 6(4), 293-304.
Sarin, M. (1987) 'An evolutionary survey of the Nada Chula system', Second international Workshop on Stove Dissemination, Guatemala, Foundation for Woodstove Dissemination, Utrecht.
Sefu, A. (1987) 'Improved stoves: Safety is important too', Boiling Point 13, 19-20,
Shanahan, Y. J. (ed) (1987) 'Statement of the meeting', Second International Workshop on Stove Dissemination, Guatemala, Foundation for Woodstove Dissemination, Utrecht.
Sloof, R. (1987) 'The control of malaria vectors in the context of the Health for All by the Year 2000 global strategy', Journal of the American Mosquito Control Association 3(4), 551-5.
Smith, K. R. (1987a) Biofuels, Air Pollution, and Health: A Global Review, Plenum Press, New York.
Smith, K. R. (1987b) 'The biofuel transition', Pac(fic and Asian Journal of Energy 1(1), 13-32.
Smith, K. R. (1987c) 'Indoor air quality and the pollution transition', Council on Environment and Health, International Conference on

322 Kirk H. Smith
indoor Air Quality, Tokyo (forthcoming in international Archives of Occupational and Environmental Health).
Smith, K. R. (1989) 'The dialectics of improved stoves', Economic and Political Weekly (Bombay) 24 (10), 517-522
Tinker, L (1987) 'The real rural energy crisis: Women's time', The Energy Journal 8, 125-46.
USEPA (1987) US Environmental Protection Agency, 'Standards of performance for new stationary sources; standards of performance for new sources; residential wood heaters', Federal Register 52(32), 4994-5066.
USNRC (1986) US National Research Council, Committee on Passive Smoking, Environmental Tobacco Smoke: Measuring Exposures and Assessing Health Effects, National Academy Press, Washington, DC.
WHO (1987a) 'Indoor air pollution study, Maragua Area, Kenya', GEMS (Global Environment Monitoring System), Human Exposure Assessment Location, HEAL Project, WHO/PEP/87. 1, WHO/RSD/87.32, World Health Organization, Geneva.
WHO (1987b) 'Dossier on acute respiratory infections in children', Respiratory Infections Programme, World Health Organization, Geneva.

13 Health effects in developed countries
S. C. Morris with C. A. Grimshaw
Introduction Biom ass fuels are the oldest and, at the same time, among the newest energy sources used by humans. Wood fires were used by Homo erectus before Homo sapiens emerged. Chulas used for cooking in rural India are similar to those preserved in Pompeii from over 1 000 years ago. Yet, while primitive methods of using biomass fuels are still in wide use throughout the world, new methods of producing and using biom ass are at the cutting edge of scientific and technological development. These include the identification and development of new and more efficient plant species and agricultural methods; and new combustion, gasification and liquefaction technologies.
In this chapter we focus on the health effects of biomass use in devel-oped countries, drawing primarily on data and analysis from the United States. The US database is more detailed and extensive than the databases of most other countries, although Sweden and the Federal Republic of Germany, for example, have greater experience with specific technologies. Much of the information on new technologies is applica-ble world-wide with minor modifications. The decentralized use of wood and other biomass fuels for home heating, however, is a com-pletely different technology in Europe and America than in developing countries. The nature of collection and use and the character of the exposure and health risk all differ. (Decentralized biomass fuel use in developing countries is covered by Kirk Smith in chapter 12 above).
The wide diversity in the way biomass fuels are used means a cone- spondingly wide diversity in the kinds and circumstances of health risk
324 S. C. Morris with C. A. Grimshaw
associated with biomass production and use. This broad range is divided here into three general categories: U Centralized technologies. These are generally newer, high-
technology applications for producing electricity or liquid or gaseous fuels. The large quantities of biomass necessary to operate central-ized facilities requires a very high-intensity biomass production method such as short-rotation intensive-culture silviculture.
U Alcohol motor fuels. In some cases, the centralized technologies above produce energy forms essentially the same as those in routine use derived from other sources, such as electricity and methane gas. Once these are produced, they lose their biomass' identity and health effects associated with their use are the same as if they had been generated from coal, natural gas, or other energy source. Alcohol motor fuels are an important difference. In this case, biomass technologies produce a fuel different from that in conven-tional use and its particular effects must be addressed.
EU Wood fuel use in developed countries. This is a decentralized appli-cation but generally involves modem equipment including chain-saws and modem design wood stoves.
To the extent appropriate within these general categories, effects will generally be considered on a fuel-cycle basis. That is, production, pro-cessing, and combustion phases will be considered. This is important because the total effect can then be seen and compared on a unit basis with conventional (that is, fossil and nuclear) technologies to aid in deci-sion-making involving the replacement of conventional fuels by biomass fuels, or to assist technological development decisions involving the rel-ative health effects of different biomass technologies.
In developed countries, the health risks of biomass energy represent a potential constraint on its development and use. In less developed coun-tries where biomass is the conventional fuel, especially in rural areas, high health effects are an incentive to develop new technologies and also new ways of using biomass in order to reduce these effects. Recognition of the health costs of traditional use of biomass in less-developed coun-tries in relation to the environmental health effects of centralized fossil fuel use in those same countries may lead to rethinking about the alloca-tion of resources devoted to environmental protection.

Health effects in developed countries 325
Health risk assessment
Health risk is one of several factors that must be considered in decisions about future energy sources. Information from various sources must be gathered and organized into a coherent framework, and must include the full range of potential health impact, including occupational injury and disease, the public health impact of pollution, and the role of accidents. Potential damage from each part of the energy cycle must be assessed. Estimates usually require extrapolation or other forms of 'pushing' the state of knowledge; particular attention must therefore be given to uncer -tainties.
One approach A four step risk assessment process is used, including (1) hazard identifi-cation, (2) exposure assessment, (3) dose-response assessment, and (4) risk characterization (NAS 1983). Hazard identification is a qualitative evaluation of the ability of a technology or a particular pollutant to pro-duce health effects. Exposure assessment evaluates the routes by which people are exposed to the pollutants emitted by the technology—if there is no potential for exposure, there is no risk.
Dose-response assessment provides the means to translate exposures into health effect estimates. Pollutant exposures are always part of a complex mixture, but appropriate dose-response information is generally not available for the particular exposure mix of concern. For assessment purposes, dose-response functions are generally drawn from various sources which match the given exposure as closely as possible. For acute effects, such as accidental injury, empirical dose-response relation-ships are well quantified, and uncertainties are introduced primarily by the extrapolation of the dose-response function from one situation to another, for example, applying the known accident rate for professional wood cutters to non professionals who Cut their own wood and who may have lower skill-levels, work under different circumstances, and use dif-ferent equipment. For chronic effects, such as increased respiratory dis-ease or cancer from exposure to wood smoke, dose-response relationships are not well quantified and results can reflect important uncertainties in the underlying studies as well as uncertainties involved in extrapolations. In this chapter, the dose-response function for expo-sure to airborne organic particles is taken as a range 0 to 1 increased
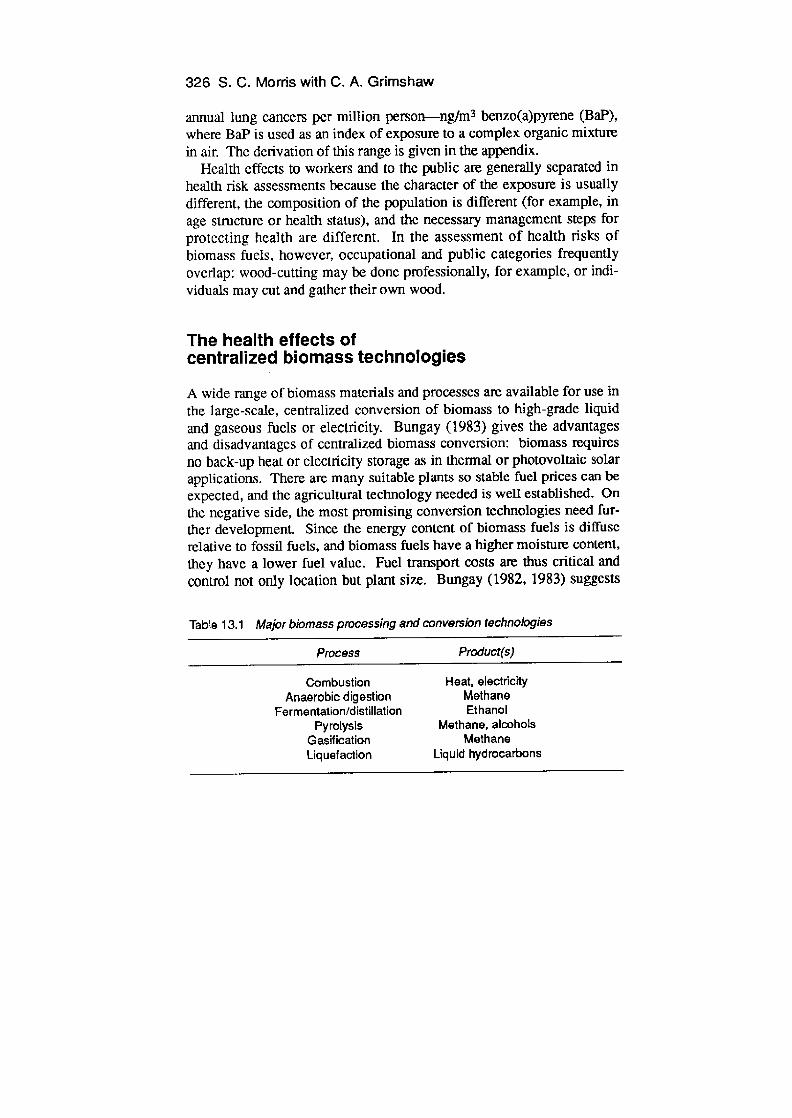
326 S. C. Morris with C. A. Grimshaw
annual lung cancers per million person—ng/m3 benzo(a)pyrene (HaP), where BaP is used as an index of exposure to a complex organic mixture in air. The derivation of this range is given in the appendix.
Health effects to workers and to the public are generally separated in health risk assessments because the character of the exposure is usually different, the composition of the population is different (for example, in age structure or health status), and the necessary management steps for protecting health are different. In the assessment of health risks of biomass fuels, however, occupational and public categories frequently overlap: wood-cutting may be done professionally, for example, or indi-viduals may cut and gather their own wood.
The health effects of centralized biomass technologies
A wide range of biomass materials and processes are available for use in the large-scale, centralized conversion of biomass to high-grade liquid and gaseous fuels or electricity. Bungay (1983) gives the advantages and disadvantages of centralized biomass conversion: biomass requires no back-up heat or electricity storage as in thermal or photovoltaic solar applications. There are many suitable plants so stable fuel prices can be expected, and the agricultural technology needed is well established. On the negative side, the most promising conversion technologies need fur -ther development. Since the energy content of biom ass fuels is diffuse relative to fossil fuels, and biomass fuels have a higher moisture content, they have a lower fuel value. Fuel transport costs are thus critical and control not only location but plant size. Bungay (1982, 1983) suggests
Tab'e 13.1 Major biomass processing and conversion technologies
Process Product(s)
Combustion Heat, electricity Anaerobic digestion Methane
Fermentation/distillation Ethanol Pyrolysis Methane, alcohols
Gasification Methane Liquefaction Liquid hydrocarbons

Health effects in developed countries 327
that a suitably sized plant would process 1 000 tonne/ctay (dry weight basis) and would draw feedstock from a 50 to 80 km radius. Although both terrestrial and aquatic plants are potential sources of feedstock, only terrestrial plants are available now and in the short tenn. Processing and conversion technologies are given in table 13.1.
Biomass production Centralized processing cannot rely on the cutting of natural forests or vegetation. In specialized cases, residues of existing agriculture or forestry practices, otherwise considered as waste, may be turned into a biomass fuel product. In most cases, however, crops will be planted specifically for energy production on land either brought into production for that purpose or converted from other agricultural uses.
Agricultural wastes All agricultural processes produce 'wastes' which cannot be used as a food or fibre product. Some may be used for animal bedding, others left to replenish the soil. Some must be disposed of in ways which add extra costs to the process or produce environmental degradation. Using these materials as energy sources increases the agricultural 'product', but to the extent that they would otherwise go to return nutrients to the soil, improve its general condition and prevent erosion, turning them to energy use has a negative effect on the environment (Pimentel et al. 1981). The links between this environmental degradation and potential health effects are indirect, but both the resulting environmental pollution and the reduction in agricultural resources can affect public health. Thrning agricultural wastes which now cause environmental problems into energy uses may be beneficial in this regard. Manure from large feedlots is an example: manure from cattle raised on pasture or on small farms is returned to the field to benefit the soil on which the cattle's food is grown. When cattle are raised in feedlots far from the fields where their food is grown, however, this is impractical, and disposal of the manure is a problem which can have health implications. Another example is the bagasse remaining after sugar is extracted from cane, which once created a major water pollution problem. Similarly, cane residues left in the field were burned, adding nutrients to the soil but pro-ducing an air pollution problem and a significant danger of spreading

328 S. C. Morris with C. A. Grimshaw
fire (Bungay 1983). Eliminating these environmental problems can result in indirect health benefits.
Forestry wastes Only a portion of the tree is useful for lumber. Foliage, tree tops, branches, stump and root system are left behind. Even where trees are grown for paper, when a greater portion is productively used, some is left behind. As with agricultural wastes, these residuals help to replenish the soil. They also may have detrimental effects, however, increasing the hazard of forest fire and blocking drainage and stream flow patterns. The net effect is unclear, and probably varies with the circumstances. Again, any public health effects resulting from the removal of these residues for energy use are the indirect result of environmental degradation. Occupational health effects resulting from gathering residues are studied below.
Energy plantations These involve land dedicated to agriculture or silviculture specifically for energy production. Although specialized technologies and production methods may develop, the environmental effects are similar to those of agriculture and forestry pmducing food, fibre, lumber, and paper, and stem from the use of fertilizer, pesticides and herbicides (Calif 1976). Biomass energy plantations have the potential to cause significant changes to local, regional and global climate; agriculture has been the most important means of anthropogenically induced climate modification in the past (Morris 1980). The public health effects
Table 13.2 Air pollution emissions from an industrial wood-fired boiler with an 80 per cent efficient mechanical collector followed by a 90 per cent efficient elec-trostatic precipitator.
Pollutant kg per million GJ wood in
Particles 110 000 Nitrogen oxides 230 000 Hydrocarbons 1 800 000 Sulphur dioxide <100 000 Polycyclic organic matter <800
Source: From DOE 1982a.
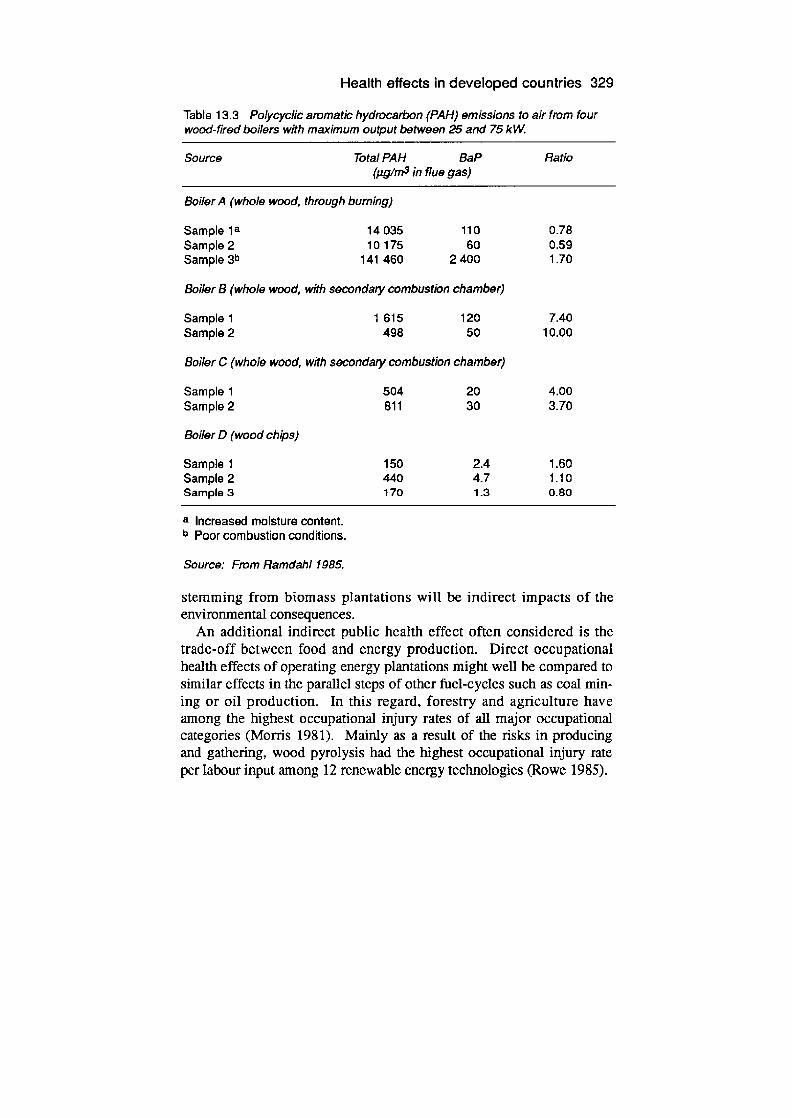
Health effects in developed countries 329
Tablo 13.3 Polycyclic aromatic hydrocarbon (PAH) emissions to air from four wood-fired boilers with maximum output between 25 and 75kW.
Source Total PAH BaP (ug/m3 in flue gas)
Ratio
Boiler A (whole wood, through burning)
Sample ia 14035 110 0.78 Sample 2 10 175 60 0.59 Sample 3b 141 460 2 400 1.70
Boiler B (whole wood, with secondaiy combustion chamber)
Sample 1 1 615 120 7.40 Sample 2 498 50 10.00
Boiler C (whole wood, with secondary combustion chamber)
Sample 1 504 20 4.00 Sample 2 811 30 3.70
Boiler 0 (wood chips)
Sample 1 150 2.4 1.60 Sample 2 440 4.7 1.10 Sample 3 170 1.3 0.80
a Increased moisture content. b Poor combustion conditions
Source: From Ramdahl 1985.
stemming from biomass plantations will be indirect impacts of the environmental consequences.
An additional indirect public health effect often considered is the trade-off between food and energy production. Direct occupational health effects of operating energy plantations might well be compared to similar effects in the parallel steps of other fuel-cycles such as coal min-ing or oil production. In this regard, forestry and agriculture have among the highest occupational injury rates of all major occupational categories (Morris 1981). Mainly as a result of the risks in producing and gathering, wood pyrolysis had the highest occupational injury rate per labour input among 12 renewable energy technologies (Rowe 1985).
330 S. C. Morris with C. A. Grimshaw
Processing and conversion
Combustion
Biomass (principally wood) is burnt directly in central facilities to produce industrial and district heat and, in some cases, electricity. In the United States and in Europe, wood-fired boilers are most often found in the pulp and paper and wood-working industries (Martin and Koenigs-hofer 1983). Wood fuel for these boilers may be in the fomi of whole wood or wood chips. DOE (1982a) described the environmental, health and safety aspects of a sp re ader- stoker, water-tube boiler used for industrial process heat. Data on accidental injury were not available for industrial wood boilers, but were estimated to be 0 to 0.02 deaths and 0.24 to 0.29 injuries per million GJ wood at 50 per cent moisture content by extrapolating from coal. Use of coal plant statistics may not be appropriate since the wood plant is considerably smaller and fuel handling is different. Air pollutant emissions are given in table 13.2. Uncontrolled particle size distribution was over 50 per cent of less than 10 mm and about 20 per cent of less than 2 mm, so a substantial fraction of the particulate air emissions were respirable.
Polycycic hydrocarbon emissions from small wood-fired boilers vary greatly among boiler types and operating conditions (table 13.3). Emissions from larger biomass boilers may be lower. Ramdahl (1985) reports PAH emissions of less than 50 gfm3 in flue gas from a 4 MW district heating plant. Variation in the ratio of BaP to total PAH among the different samples (table 13.3) demonstrates one of the problems introduced by using BaP as an index of health effects for the complex mixture. Fluidized bed incinerators have been used to burn biomass wastes and have been proposed as a method of converting biomass fuels to useful heat. Vijil Ct al. (1984) report that PAH emissions from flu-idized bed combustion are low: naphthalene, phenanthrene, and fluoran-thene emissions total about 1 .tg/MJ, and other heavy aromatic compounds are below the limit of detection.
The health effect of these emissions depends greatly on the location of the facility and the size of the surrounding population. In one example, a plant with an annual heat energy production of 0.5 million (JJ was esti-mated to produce 0 to 0.0008 annual excess lung cancers in the sur-rounding population for a rate of less than 0.002 lung cancers per GJ heat produced.
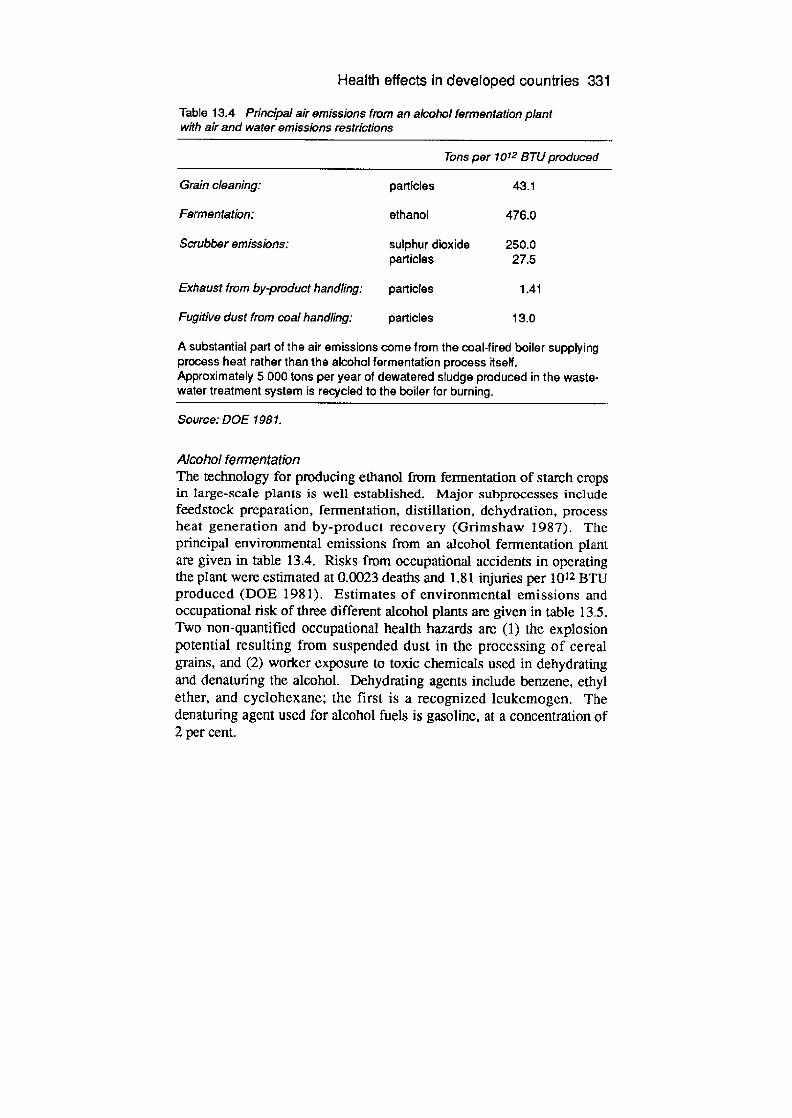
Health effects in developed countries 331
Table 13.4 Principal air emissions from an alcohol fermentation plant with air and water emissions restrictions
Tons per 1012 BTU produced
Grain cleaning: particles 43.1
Fermentation: ethanol 476.0
Scrubber emissions: sulphur dioxide 250.0 particles 27.5
Exhaust from by-product handling: particles 1.41
Fugitive dust from coal handling: particles 13.0
A substantial part of the air emissions come from the coal-fired boiler supplying process heat rather than the alcohol fermentation process itself. Approximately 5 000 tons per year of dewatared sludge produced in the waste-water treatment system is recycled to the boiler for burning.
Source: DOE 1981.
Alcohol fermentation The technology for producing ethanol from fermentation of starch crops in large-scale plants is well cstablished. Major subprocesses include feedstock preparation, fermentation, distillation, dehydration, process heat generation and by-product recovery (Grimshaw 1987). The principal environmental emissions from an alcohol fermentation plant are given in table 13.4. Risks from occupational accidents in operating the plant were estimated at 0.0023 deaths and 1.81 injuries per 10 12 BTU produced (DOE 1981). Estimates of environmental emissions and occupational risk of three different alcohol plants are given in table 13.5. Two non-quantified occupational health hazards are (1) the explosion potential resulting from suspended dust in the processing of cereal grains, and (2) worker exposure to toxic chemicals used in dehydrating and denaturing the alcohol. Dehydrating agents include benzene, ethyl ether, and cyclohexane; the first is a recognized leukemogen. The denaturing agent used for alcohol fuels is gasoline, at a concentration of 2 per cent.
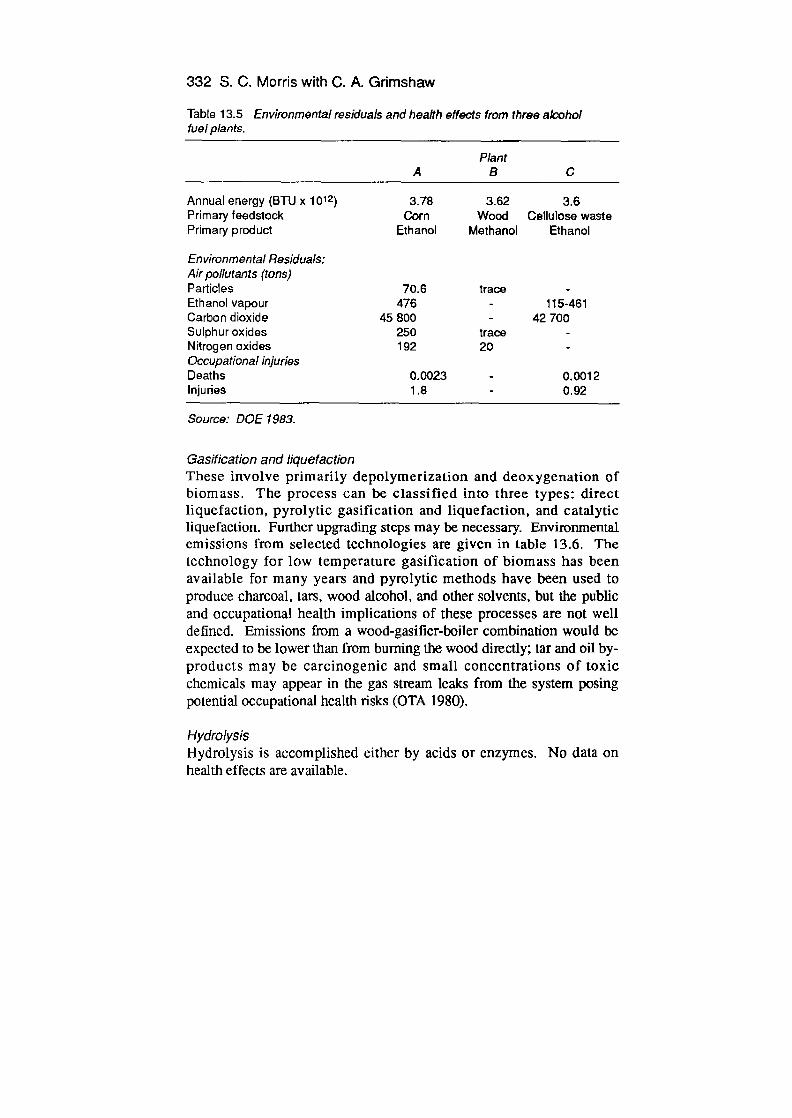
332 S. C. Morris with C. A. Grimshaw
Table 13.5 Environmental residuals and health effects from three alcohol fuel plants.
Plant A B C
Annual energy (BTU x 10 12 ) 3.78 3.62 3.6 Primary feedstock Corn Wood Cellulose waste Primary product Ethanol Methanol Ethanol
Environmental Residuais: Air pollutants (tons) Particles 70.6 trace -
Ethanol vapour 476 - 115-461 Carbon dioxide 45 800 - 42 700 Sulphur oxides 250 trace -
Nitrogen oxides 192 20 -
Occupational injuries Deaths 0.0023 - 0.0012 Injuries 1.8 - 0.92
Source: DOE 1983.
Gasification and liquefaction These involve primarily depolymerization and deoxygenation of biomass. The process can be classified into three types: direct liquefaction, pyrolytic gasification and liquefaction, and catalytic liquefaction. Further upgrading steps may be necessary. Environmental emissions from selected technologies are given in table 13.6. The technology for low temperature gasification of biomass has been available for many years and pyrolytic methods have been used to produce charcoal, tars, wood alcohol, and other solvents, but the public and occupational health implications of these processes are not well defined. Emissions from a wood-gasifier-boiler combination would be expected to be lower than from burning the wood directly; tar and oil by-products may be carcinogenic and small concentrations of toxic chemicals may appear in the gas stream leaks from the system posing potential occupational health risks (OTA 1980).
Hydrolysis Hydrolysis is accomplished either by acids or enzymes. No data on health effects are available.
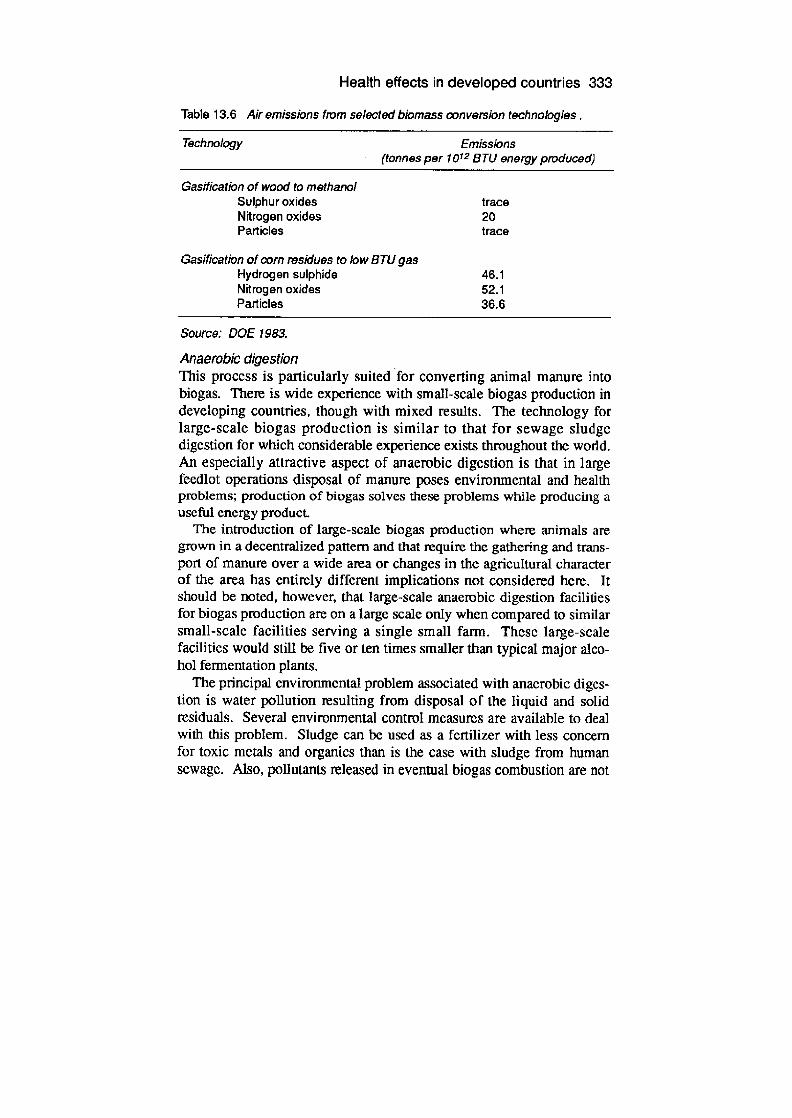
Health effects in developed countries 333
Table 13.6 Air emissions from selected biomass conversion technologies.
Technology Emissions (tonnes per 102 BTU energy produced)
Gasification of wood to methanol Sulphur oxides trace Nitrogen oxides 20 Particles trace
Gasification of corn residues to low BTU gas Hydrogen sulphide 46.1 Nitrogen oxides 52.1 Particles 36.6
Source: DOE 1983.
Anaerobic digestion This process is particularly suited for converting animal manure into biogas. There is wide experience with small-scale biogas production in developing countries, though with mixed results. The technology for large-scale biogas production is similar to that for sewage sludge digestion for which considerable experience exists throughout the world. An especially attractive aspect of anaerobic digestion is that in large feedlot operations disposal of manure poses environmental and health problems; production of biogas solves these problems while producing a useful energy product.
The introduction of large-scale biogas production where animals are grown in a decentralized pattern and that require the gathering and trans-port of manure over a wide area or changes in the agricultural character of the area has entirely different implications not considered here. It should be noted, however, that large-scale anaerobic digestion facilities for biogas production are on a large scale only when compared to similar small-scale facilities serving a single small farm. These large-scale facilities would still be five or ten times smaller than typical major alco-hol fermentation plants.
The principal environmental problem associated with anaerobic diges-tion is water pollution resulting from disposal of the liquid and solid residuals. Several environmental control measures are available to deal with this problem. Sludge can be used as a fertilizer with less concern for toxic metals and organics than is the case with sludge from human sewage. Also, pollutants released in eventual biogas combustion are not

334 S. C. Morris with C. A. Grimshaw
Table 13.7 Air and water emissions from biogas production by anaerobic digestion.
Pollutant Emission (tonnes per 1012 PTU energy produced)
Air pollutants Hydrogen sulphide 69000 140 000 Sulphur oxdes 143 - 267 Nitrogen oxides 140
Water pollutants Suspended solids 1 200 Biochemical oxygen demand 1100
Source: DOE 1983.
expected to be of public health consequence (OTA 1980). Accidental leaks of raw product gas can pose toxic (hydrogen sulphide) and explo-sive (methane) hazards to the work-force and, to a much lesser extent, to the nearby public.
Air and water emissions from a central anaerobic digestion facility using municipal sludge are shown in table 13.7. The toxic metal content of solid wastes from this source are not applicable to the digestion of animal manures. Quantitative estimates of occupational health and safety effects were not determined.
System-wide effects of centralized biomass processing
Systems analysis of centralized biomass technologies has not been undertaken. Some parallels may be drawn from an analysis of coal gasi-fication and liquefaction (Morris et aT. 1978). This study found that (a) the conversion facility mduced overall system efficiency in compan son with direct combustion, requiring more coal to be mined: (b) despite this, overall reductions in some pollutants could be achieved because of the increased ability to remove pollutants at the conversion step: and (c) locations of pollutant emissions were shifted from the point of end-use to the point of conversion, leaving end-use emissions similar to the higher-grade fuels, oil and gas. In developed countries, conversion of biom ass to gaseous or liquid fuels does not replace the use of wood for home heating; it makes available a substitute for petroleum-based fuels, primarily as motor fuels. Emissions and effects at end-use change, but

Health effects in developed countries 335
not necessarily markedly. These changes at point of end-use, however, affect large numbers of people. More apparent effects are at the points of production and conversion of biomass, and are generally in low-popu-lation areas.
The health effects of decentralized wood-fuel use for home heating in developed countries
Wood fuels are essentially the only use of biomass for residential use in the United States where annual use is about 1 x 10 GJ (Lipfert and Dungan 1983; Mueller Associates 1985). As with other instances of decentralized biomass use, it is difficult to provide accurate estimates of consumption since much of it is not commercial fuel, and even wood-fuel that is sold is often sold in non-standard units. Harvesting, trans-port, and storage may be done commercially; in the north-western USA, about 50 per cent of wood-fuel is cut commercially (Petty and Hopp 1982). The rest is performed by non-professionals for their own use. In all cases, on-site storage and combustion is left to the residents.
Wood-fuel harvesting Wood is cut with gasoline-powered chain saws and various hand saws and axes. It is split in place or after transport by axes, wedges and mauls, or by power splitting machinery. Wood-cutting and gathering is a high-injury-risk job in north America, rivalling underground coal min-ing. Using data developed by the US Forest Service on wood-cutting in national forests, Morris (1981) estimated injury rates in wood-cutting and gathering (table 13.8), although somewhat higher estimates have
Table 13.8 Estimates of injury rates in woodcutting and gathering.
Type Injuries per 106 Gd
Commercial 13 (10-17) Non-commercial 17 (16-18)
95 per cent Poisson confidence limits shown in parentheses.
Source: Morris 1981.

336 S. C. Morris with C. A. Grimshaw
also been published. Because of uncertainties in extrapolating data from limited studies of firewood cutting and from lumbering, and in estimat-ing the energy value of wood produced, these estimates are probably accurate to no more than a factor of 2. Comparing these rates with underground coal mining, an alternative energy source with high acci-dent rates in fuel extraction, the accident rates are lower in underground mining but the average severity of injuries is higher. Accidental injury appears 3 to 10 times greater per unit energy from wood than from underground coal mining. This results from an equivalent or higher individual risk, the lower energy content of wood and its more dispersed nature, and less mechanization. For additional perspective, one might imagine an individual cutting wood to heat his home over a period of 40 years. The risk from wood cutting over that period would be about (I per cent chance of injury and 0.04 per cent chance of death. By comparison, the risk of accidental injury or death over the same period from all sources would be 90 per cent and 2 per cent respectively, and from auto-mobile accidents 30 per cent and 0.8 per cent.
Although chain saws and other power equipment used in wood cutting emit the exhaust products of gasoline-powered internal combustion engines, these emissions are an insignificant contribution to environmen-tal air pollution or health (DOE 1982b).
There are beneficial indirect effects of wood-cutting that, although not quantified, must be noted. Wood-cutting and splitting, even with power equipment, gets one outdoors and provides exercise. There can be a sense of satisfaction in supplying even part of one's living needs in this way. This can have beneficial effects in decreasing risk of heart disease and in improving mental health.
Fuelwood transport Wood must be transported from forest to the point of storage and/or use. Commercially cut wood is typically transported to some intermediate point to be split, dried and, stored for later distribution, and is usually hauled in larger loads for longer distances than is wood cut by individu-als for their own use. Commercial and individual transport will be anal-ysed separately.
Commercial transport Transport distance and load size vary considerably. Accident risks for a

Health effects in developed countries 337
typical situation are estimated to be 0.004 deaths and 0.1 injury per mil-lion GJ, although these estimates are probably low (see appendix). Comparisons with other fuels are difficult. While wood is commonly carried by truck, coal is carried by rail, barge and truck and coal is usu-ally carried greater distances.
Individual transport Individual transport is assumed to be by automobile or light duty truck for a haul distance of 23 km. Risk due to accidents is estimated to be 0.2 deaths and 9 injuries per million GJ. The higher rates in comparison to commercial transport are almost entirely the result of the much greater vehicle-km driven per unit energy delivered in individual transport.
Wood fuel storage Wood fuel is stored on commercial sites to be sized, split and seasoned, and to wait for distribution. It is also stored at home locations to be split, seasoned and held ready for use. In either location, wood storage can cause water and soil pollution from bark decomposition products and tannic acid if not protected from rainfall leaching (Dunwoody et al. 1980). Runoff water and leachate is not well characterized, but may have moderate to high biological oxygen demand (BOD), chemical oxy- gen demand (COD), potassium, phosphate and nitrogen (DOE 1982b). Bark generally has a higher percentage of extractable materials than wood; these include tannins, simple sugars, glycosides, polysaccharides, gums, and pectins (Schuytema and Shankland 1976). While large com-mercial storage areas may require protection from rainwater to avoid water pollution, there does not appear to be a direct threat to health from this source.
Residential combustion Residential combustion takes place in a variety of appliances ranging from fireplaces to Franklin stoves to airtight baffled stoves. The princi-pal differences between the technologies are efficiency and indoor pollu-tant discharges. In this analysis, an airtight baffled stove is assumed: this is the choice for wood as a heat source as opposed to burning in a fireplace for aesthetic reasons. The sources of health effects associated with combustion of wood fuel in residences are: (a) fires, (b) bums, (c)
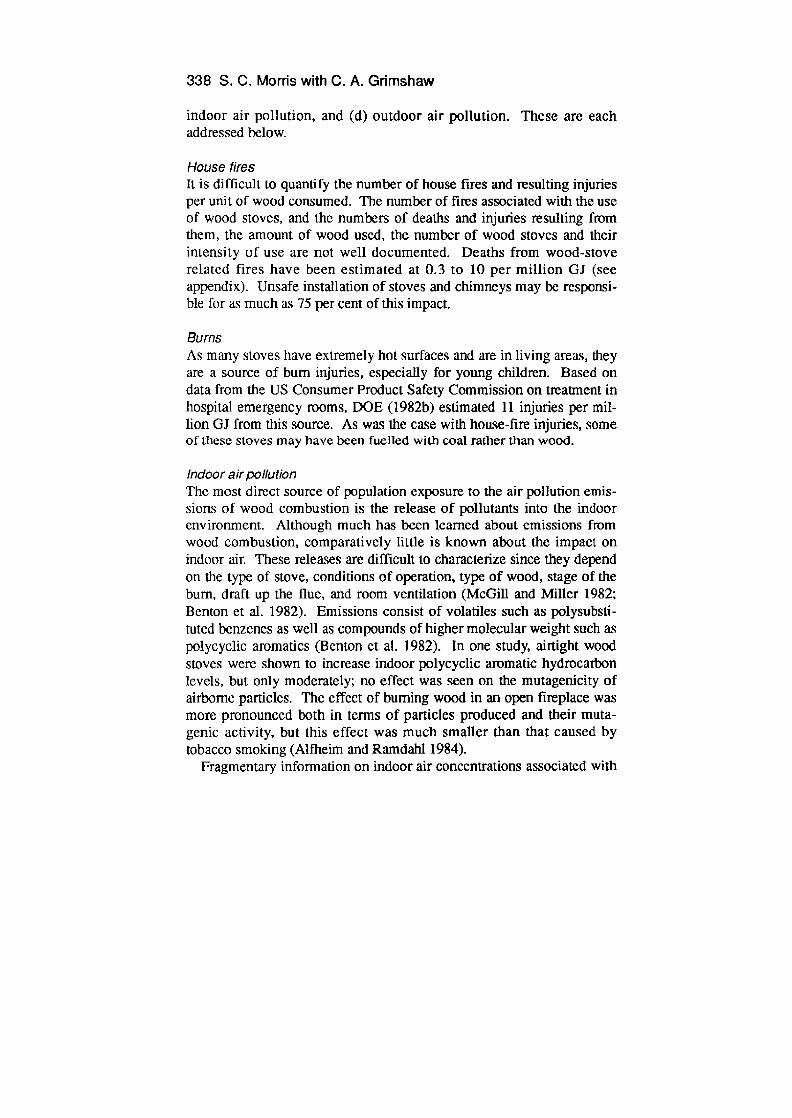
338 S. C. Morris with C. A. Grimshaw
indoor air pollution, and (d) outdoor air pollution. These are each addressed below.
House fires It is difficult to quantify the number of house tires and resulting injuries per unit of wood consumed. The number of fires associated with the use of wood stoves, and the numbers of deaths and injuries resulting from them, the amount of wood used, the number of wood stoves and their intensity of use are not well documented. Deaths from wood-stove related fires have been estimated at 0.3 to 10 per million GJ (see appendix). Unsafe installation of stoves and chimneys may be responsi-ble for as much as 75 per cent of this impact.
Burns As many stoves have extremely hot surfaces and are in living areas, they are a source of bum injuries, especially for young children. Based on data from the US Consumer Product Safety Commission on trealment in hospital emergency rooms, DOE (1982b) estimated 11 injuries per mu-lion GJ from this source. As was the case with house-fire injuries, some of these stoves may have been fuelled with coal rather than wood.
Indoor air pollution The most direct source of population exposure to the air pollution emis-sions of wood combustion is the release of pollutants into the indoor environment. Although much has been learned about emissions from wood combustion, comparatively little is known about the impact on indoor air. These releases are difficult to characterize since they depend on the type of stove, conditions of operation, type of wood, stage of the bum, draft up the flue, and room ventilation (McGill and Miller 1982; Benton et al. 1982). Emissions consist of volatiles such as polysubsti-tuted benzenes as well as compounds of higher molecular weight such as polycyclic aromatics (Benton et at. 1982). In one study, airtight wood stoves were shown to increase indoor polycyclic aromatic hydrocarbon levels, but only moderately: no effect was seen on the mutagenicity of airborne particles. The effect of burning wood in an open fireplace was more pronounced both in terms of particles produced and their muta-genic activity, but this effect was much smaller than that caused by tobacco smoking (Altheim and Ramdahl 1984).
Fragmentary information on indoor air concentrations associated with
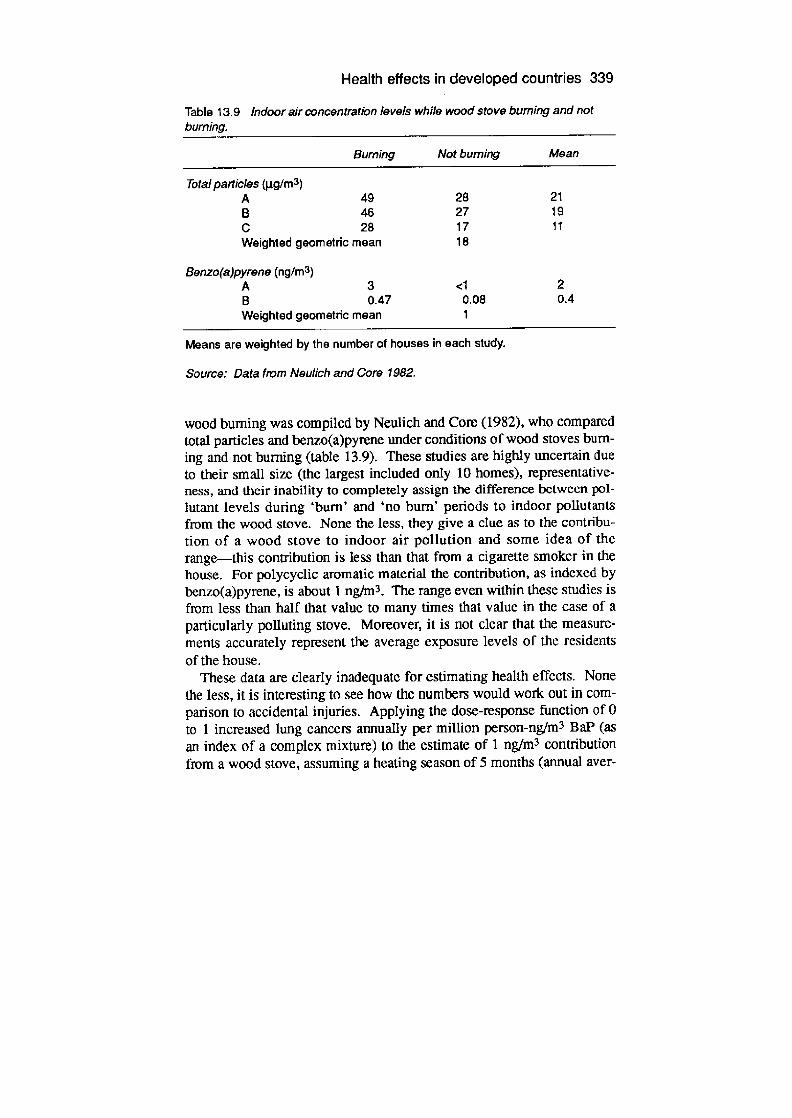
Health effects in developed countries 339
Table 13.9 Indoor air concentration levels while wood stove burning and not burning.
Burning Not burning Mean
Total particles (iglm 3 )
A 49 28 21 B 46 27 19 C 28 17 11 Weighted geometric mean 18
Benzo(a)pyrene (ng/m 3 )
A 3 <1 2 B 0.47 0.08 0.4 Weighted geometric mean 1
Means are weighted by the number of houses in each study.
Source: Data from Neulich and Core 1982.
wood burning was compiled by Neulich and Core (1982), who compared total particles and benzo(a)pyrene under conditions of wood stoves burn-ing and not burning (table 13.9). These studies are highly uncertain due to their small size (the largest included only 10 homes), representative-ness, and their inability to completely assign the difference between pol-lutant levels during 'burn' and 'no burn' periods to indoor pollutants from the wood stove. None the less, they give a clue as to the contribu-tion of a wood stove to indoor air pollution and some idea of the range—this contribution is less than that from a cigarette smoker in the house. For polycyclic aromatic material the contribution, as indexed by benzo(a)pyrene, is about 1 ng/m 3 . The range even within these studies is from less than half that value to many times that value in the case of a particularly polluting stove. Moreover, it is not clear that the measure-ments accurately represent the average exposure levels of the residents of the house.
These data are clearly inadequate for estimating health effects. None the less, it is interesting to see how the numbers would work out in com-parison to accidental injuries. Applying the dose-response function of 0 to 1 increased lung cancers annually per million person-ng/m 3 BaP (as an index of a complex mixture) to the estimate of 1 ngfm3 contribution from a wood stove, assuming a heating season of 5 months (annual aver-

340 S. C. Morris with C. A. Grimshaw
age exposure 0.4 nglm 3) and 3 people in a household gives 0 to 0.02 lung cancers per million GJ.
In addition to the chronic disease risk of long-term exposure to wood smoke, there is the risk of an acute exposure to carbon monoxide result-ing from improper installation or from the operating conditions in the stove. This risk is small for wood stoves compared to other kinds of space heaters. DOE (1982b) report data from the US Consumer Product Safety Commission which suggest the risk of a fatality from carbon monoxide exposure associated with a wood stove is 0.003 deaths per million GJ. This estimate is, of course, highly dependent upon the kind of stoves and the quality of their installation. Uncertainty associated with this estimate is at least a factor of four.
Outdoor air pollution Wood is generally considered a clean fuel, but its combustion for home heating results in higher emission rates than oil heating for several pollutants. These include particles, polycyclic organic matter, carbon monoxide, and possibly nitrogen oxides. The air pollution problem associated with wood combustion was stated succinctly by Cooper (1980) as follows:
Both the chemical potency and deliverability of the emissions from this course are of concern. The emissions are almost entirely in the inhalable size range and contain toxic and priority pollutants, car-cinogens, co-carcinogens, cilia toxic, mucus coagulating agents, and other respiratory irritants such as phenols, aldehydes, etc. This source is contributing substantially to the non-attainment of current particulate, carbon monoxide, and hydrocarbon ambient air quality standards.
The impact of wood fuel use on air quality was easily observed. Cannon (1984) describes the situation in Missoula, Montana, a city of 66 000. In the 1950s and 1960s, Missoula was polluted by industrial sources such as pulp and paper mills; daily particulate levels exceeded 300 j.tg/m 3 . Regulation under the Clean Air Act brought this under con-trol from the early to mid-1970s, and ambient particulate levels met national standards. At this time, however, the shift to wood fuel began. By 1980 almost 12 000 Missoula households were burning wood; daily particulate levels over 500 jig/rn 3 were not uncommon. It was clear that
Health effects in developed countries 341
in large parts of the United States, wood fuel use was contributing to ambient air pollution levels that were potentially hazardous to human health.
Two different approaches have been taken when assessing the quanti-tative contribution of wood stoves to ambient air pollution. The first uses measurements of ambient air quality coupled with source appor-tionment methods. These methods attempt to find a 'fingerprint' of the source in measurements made at sampling (or receptor) sites through ratios of different pollutants or isotopic ratios, indicator or tracer pollu-tants which are particularly associated with specific sources, or more general patterns within the pollutant mix. Daisey et al. (1986), pioneers in this field, defined fingerprints of various combustion sources in terms of ratios of a variety of polycyclic aromatic hydrocarbons to benzo(e)pyrene. They concluded that wood smoke produced a much wider variation in this profile than other combustion sources because of a wider variation in emissions and because wood smoke can undergo rel-atively rapid reactions in the atmosphere.
They suggested that wood smoke be identified through the use of unique markers such as retene or levo-glucosan. Cooper (1982) described a chemical mass balance (CMB) technique for source-receptor modelling which uses a vector of ambient measurement data supported by carbon-14 measurements to verify the fraction from modem carbon sources—that is wood. This method was applied in an extensive sam-pling programme in the Pacific northwest where 68 to 84 per cent of the fine particulate mass was found to come from wood burning (Core et al. 1984). Klouda et al. (1982) attributed 44 per cent of the fine particulate material in Portland, Oregon, to residential wood combustion. The same group reported 10 to 100 per cent of particulates were attributable to wood smoke at various urban and rural sites (Currie et al. 1982).
The second approach to quantifying the effects of wood smoke in out-door air pollution begins with emissions from wood burning and uses air dispersion models to estimate impact. Lipfert (1982), based on county-level estimates of wood fuel use in the USA (Lipfert and Dungan 1983), modelled air dispersion in different US cities and, in spite of large uncer-tainties in emissions rates, found that, except in localized situations including those with terrain characteristics which trap air pollution in the community, residential wood fuel use in urban areas was unlikely to con-tribute more than a small fraction of ambient particulate or carbon monoxide levels. Predicted levels of total suspended particulates ranged
342 S. C. Morris with C. A. Grimshaw
from less than I per cent to 13 per cent of ambient. Contributions of organic compounds could be significant, however (BaP levels ranged from 0.01 to 0.82 ng/m 3 , or from less than 1 per cent to 82 per cent of ambient levels, with an overall geometric mean of six reported cities 0.09 ngfm3). The importance of the contribution to organics was demon-strated in a detailed study of emission rates and ambient benzo(a)pyrene levels in New Jersey (Harkov and Greenberg 1985). This study con-cluded that wood combustion was the major source of BaP in New Jersey, and during the heating season contributed 98 per cent. BaP lev-els were directly correlated with heating degree days and indirectly cor-related with solar insolation. The geometric mean of monthly average BaP levels for October through March were 0.64 ng/m 3 , double the annual level of 0.32 ngfm 3 and a net increment of 0.32 ngfm 3 , and three times higher than Lipfert's mean value (above), but well within his range.
Particulate emissions of wood stoves to the outdoor air have been shown to be mutagenic (Alfheim and Ramdalil 1984). In an analysis of 10 cities in Montana, it was found that four of the five in terms of muta-genicity of ambient particulates in the Ames test had high levels of mutagens present in the winter months and low levels in the summer months; these four were located in the forested portion of Montana, where wood is commonly used by industry and by residents for space heating, strongly indicating wood combustion as the source (Carison 1982). The fifth city was the Site of three oil refineries.
A comparison of the mutagenic activity of particle-bound organics in wood stove emissions with other sources found that relative activity for wood stove emissions per mg of organic material was lower than resi-dential oil combustion emissions and about the same as for coke-oven emissions and cigarette-smoke extract (Lewtas 1982). Since wood stoves emit up to 1 000 times more mass of organic particulate matter than oil per unit energy produced, however, their contribution to muta-genic particulates in the air is much higher on a unit energy basis. The character of the mutagenicity is different: wood-combustion particulates required metabolic activation, indicating that the source of mutagenicity of the wood smoke was chemicals such as polycyclic aromatic hydrocar -bons or aromatic amines that require activation; while diesel emissions, for example, contain direct-acting mutagens such as nitroaromatics. The risk in comparison to oil combustion was further increased since, in addition to containing more mutagenic activity per unit mass in the par-
Health effects in developed countries 343
ticulate emissions, wood stoves emit a greater mass of particulate matter per unit energy than oil burners.
The question arises of the effect of atmospheric chemistry on the risk of wood-combustion products as they mix with other pollutants present in the air. A series of reports on chamber experiments (Kamens et al. 1984, Kamens et al. 1985; Kleindienst et al. 1986) found that: (a) wood-smoke particles were in the 0.07 to 0.23 im size range; (b) particle size distribution did not change during a 4-hour reaction period; (c) direct-acting bacterial mutagenicity of wood smoke extracts rapidly increased by 2 to 10 times after reaction with ozone and nitrogen dioxide; (d) indi-rect-acting bacterial mutagenicity also increased, but to a lesser extent; (e) the effect on particulate mutagenicity appeared to be the result of the formation of nitrogenateci and oxygenated species; (f) gas-base products showed equal or greater mutagenicity than particulate phase products on a unit mass basis.
These findings of bacterial mutagenicity provide a limited basis for the application of dose-response functions derived from occupational exposure to organic mixtures indexed by benzo(a)pyrene. These esti-mates must be tempered with the caveats discussed above. Health effects per unit energy depend upon (1) the geographical distribution of the exposure generated by the emissions; (2) the overlaying geographical distribution of the exposed population; and (3) the exposure-response relationship. The first depends to some degree on atmospheric condi-tions, but to a greater degree on terrain. Although distributional effects can be important in the second, the overwhelming factor is simply the number of people exposed. In the third, it will he assumed that the dose-response function is linear within the range of background ambient exposure levels.
Quantitative health risk estimates of exposure to air pollution from wood stoves range from 0 to 0.001 cancers per million GJ wood (Morris 1981), to 0 to 0.16 cancers per million GJ wood (see appendix).
The health effects of biomass-derived alcohol motor fuel use 1
Biom ass is readily converted to alcohol, as already described above. An important potential end-use of bio-generated alcohol is as motor fuel; it can also be mixed with gasoline to extend the fuel and boost the octane
344 S. C. Morris with C. A. Grimshaw
number. Gasoline/alcohol blend emissions are similar to their gasoline counterparts; the most pronounced difference is a higher level of aide-hyde emissions. Both ethanol and methanol have been used in motor-fuel blends; their properties can be enhanced by dispersing some water in the blend. The principal interest in research programmes has centred on gasoline-methanol blends containing about 10 per cent methanol, and on 'neat' methanol containing about 85 to 90 per cent methanol. Blends with less than 10 per cent are of special interest because they can be used in automobiles without major redesign of the engine, and because the addition of such small amounts of methanol make only small changes in most of the properties of gasoline. Such 10 per cent blends reduce the fuel cost, but the cost reduction is nearly matched by the reduced energy content of the methanol blend.
It is of interest that the first modem internal combustion engine, the Otto cycle engine built in 1876, could run on either ethanol or gasoline. Henry Ford designed his Model A and Model T with adjustable carbu-rettors, permitting them to run on gasoline, ethanol, or combinations of the two. In the mid-1930s, Hiram Walker marketed 'Alcoline', a gaso-line/ethanol blend. During this period, ethanol was the primary motor fuel used in New Zealand. Alcohol fuels continued to be used during World War II. After the war, use of alcohol fuels virtually disappeared with the advent of cheap sources of petroleum. Interest returned, how-ever, after the oil crisis of the early 1970s. In November 1975, Brazil began an ambitious, and so far highly successful, alcohol-fuels pro-gramme aimed at replacing all automotive fuels with sugarcane-derived ethanol by the turn of the century (Andrade and Rosa 1984).
Emissions Substitution of alcohol for gasoline generally has favorable impacts on air pollution. There are no lead or sulphur emissions from alcohol-fuelled vehicles, carbon monoxide and hydrocarbon emissions are slightly lower, and nitrogen oxide emissions are markedly lower. Aldehyde emissions are greater from ethanol, but this pollutant is pro-duced in relatively small quantities and catalytic converters can greatly reduce emissions.
Neat methanol is an exceptionally clean-burning fuel. It produces no particulate matter, no polycyclic aromatic hydrocarbons, and no sulphur dioxides. It yields fewer nitrogen oxides than gasoline and about the

Health effects in developed countries 345
same amount of carbon monoxide. Because methanol does not produce compounds that poison catalytic converters, an automobile burning methanol and equipped with a catalytic converter would produce extremely low levels of any pollutant. No measurements of full life-cycle emissions characteristics are available for automobiles equipped with current catalysts and exhaust gas recirculation, but limited measure-ments in California suggest hydrocarbon emissions are from 0 to 30 per cent less and nitrogen dioxide emissions between 33 and 67 per cent less than from gasoline-fuelled automobiles (Hall 1985). In addition, unburned methanol is less photochemically reactive than unburned gaso-line and would produce less photochemical smog. Experimental evi-dence supports methanol's low photochemical reactivity compared to typical hydrocarbons found in urban air (DOE 1984). Hall (1985) esti-mates that converting 25 per cent of the 1982 gasoline-powered fleet in the South Coast Air Basin (southern California) would have led to a reduction in reactive hydrocarbon emissions of 73 tonnes per day. This is about a 5 per cent reduction in total reactive hydrocarbon emissions, but large compared to other available control measures. For example, controlling all small refinery relief valves would reduce reactive hydro-carbon emissions by only 0.2 tonnes per day.
Because methanol has a high octane rating, engines can be set to oper-ate at higher compression ratios andleaner air/fuel ratios. These modifi-cations further reduce carbon monoxide emissions. Emissions of unburned methanol and aldehyde would, however, tend to increase under these operating conditions. Although aldehyde emissions may increase by up to 75 per cent when methanol blends are used, three-way oxida-tion catalysts are effective in reducing aldehyde emissions to low levels.
Emissions from ethanol blends are similar to those from methanol. Ethanol produces a natural 'leaning' effect, making emissions sensitive to the engine air/fuel ratio. Evaporative emissions can be expected to increase slightly, and aldehyde emissions may increase by as much as 25 per cent. Hydrocarbon emissions from ethanol and ethanol blends appear to be less photochemically reactive than those from gasoline.
Health and safety
Safety Safety concerns for motor fuels include fire or explosion in storage, or following leakage or accident, or during misuse (for example as a clean-

346 S. C. Morris with C. A. Grimshaw
ing fluid, solvent, or for starting fires). Alcohol fuels present some haz-ard in each of these areas, but they must be judged against the existing risks of gasoline. The hazards of gasoline, ethanol, and methanol are all described as the same by Sax (1975) in regard to fire, explosion, and dis-aster hazard. The flash points of ethanol and methanol, however, are higher than that of gasoline, and their lower explosive limits and auto-ignition temperatures are higher. Quantitatively the alcohol fuels would seem to present a lesser hazard than gasoline. This could result in a lower fire-related injury rate in automobile accidents (currently over 1 000 injuries per year in the USA) and fewer fire-related injuries from the improper storage of motor fuel in homes.
Direct toxicity effects Concern for direct toxicity focuses on (1) direct exposure to evaporative emissions at gas Stations and (2) in homes; (3) accidental consumption of the fuel, particularly by children; and (4) direct contact with the fuel on the skin. As with safety effects, these are all hazards associated with gasoline and alcohol fuels must be judged in comparison.
The exposure of gasoline station attendants, and of individuals pump-ing their own gasoline, has beenof concern primarily because of the benzene in gasoline. Methanol may present a greater chronic low-level toxicity hazard in this respect. Ethanol in itself probably presents a lesser hazard, though if a denaturing agent is added (which is likely) the toxicity may be increased. Toxicity comparisons are difficult, mainly as a result of the scant information available on gasoline and the fact that gasoline is a variable mixture. Gasoline-alcohol mixtures or even 'pure' alcohol fuels will undoubtedly contain additives which will affect their toxicity.
Exposure in homes Studies of indoor air pollution have demonstrated that homes with attached garages have higher levels of organic air pollutants associated with evaporative emissions from gasoline in the automobile. Changes in population exposure with-alcohol fuels should be qualitatively similar to those described above for gasoline station attendants.
Accidental consumption In the USA there are currently over 1 000 cases of poisoning annually from gasoline consumption, resulting in less than 70 deaths. The acute

Health effects in developed countries 347
toxicity for ingestion should be similar or somewhat less for ethanol than for gasoline (although denaturing agents or other additives may make it more toxic) and higher for methanol. The seriousness of the outcome in these cases will presumably increase with a switch to methanol fuel.
Skin contact Methanol is moderately toxic in contact with the skin and ethanol is slightly toxic (Sax 1975). The gasoline in a methanol blend removes fat from the skin; this enhances dermal contact with the alcohol fraction and thus facilitates the onset of toxic effects.
Cancer Gasoline Contains benzene, a recognized leukemogen. The risk to the public of exposure to low levels of gasoline vapours, if any, is not clear. Ethanol is considered a carcinogen because of the relation between alco-holic beverage consumption and cancer. Exposure to ethanol motor fuels via inhalation or skin contact may not carry this risk. One of the intermediate metabolic products of exposure to methanol is formalde-hyde, which is recognized by some agencies as a carcinogen. Formaldehyde is a common indoor pollutant throughout the developed world, as it is emitted from insulating materials and from glues used in furniture, carpeting, plywood and other materials. The extent of increased formaldehyde exposure resulting from use of methanol fuels, and the increment this would produce over existing exposures, have not been determined.
Sum mary
Little comparative information is available on centralized bIomass com-bustion and conversion technologies, and similar fossil-fuel technolo-gies. For centralized wood combustion, available information is sufficient to conclude that emissions of all pollutants except polycyclic organics are low compared to those from coal combustion, and that in large units even these are probably similar to or less than those from coal. Decentralized wood combustion for home heating can result in indoor and outdoor exposures to particles and organic air pollutants suf-ficient to pose health risks in some cases. For outdoor pollution, this

348 S. C. Morris with C. A. Grimshaw
occurs primarily in trapping terrain where pollutants build up and com-munity air pollution levels can exceed ambient standards.
The health effects of biomass conversion to higher grade fuels are unclear because sufficient experience is lacking. It would appear, how-ever, that, assuming modem pollution control and industrial hygiene practice is maintained, public and occupational health risks are minimal; the latter might be comparable to the occupational risks in electric power plants or oil refineries.
The health effect of urban air pollution is uncertain and controversial. Changes in this effect resulting from the introduction of biomass-pro-duced alcohol fuels are also uncertain. These uncertainties are of espe-cial importance because of the large numbers of people exposed.
Biomass gathering and handling is the one area with reasonably clear and relatively high health effects resulting from accidental injury. Advanced methods of agriculture and silviculture will very probably reduce this risk through greater concentration of the energy source and greater mechanization.
Note 1 This section draws in part on Gnmshaw 1987.
Health effects in developed countries 349
Appendix: quantitative risk calculations
Dose-response function for exposure to polycyclic organic air pollutants
Polycyclic organic matter (POM), including polycyclic aromatic hydro-carbons (PAH), are, from the health standpoint, the most important class of air pollutants associated with most biomass energy sources. Dose-response functions commonly used to quantify cancer risk from expo-sure to these pollutants will be described here so they may be applied in appropriate sections below. Benzo(a)pyrene (BaP) is frequently used as an index of exposure to a complex organic mixture. Pike et a!, (1975) derived a simple dose-response function based on a study of gas-retort workers: 4 increased lung cancers annually per million person-ng/m 3 BaP. Considering also the dose-response functions derived by others, Myers et al. (1982) suggested an annual rate of 10 to 40 fatal cancers per million person-nglm 3 Bar There are difficulties in using BaP as an indi-cator (Gammage 1979): (1) BaP may be a minor constituent compared to other POM compounds; (2) the biological activity of a POM mix may be primarily in other fractions; (3) the fraction of BaP in the POM mix varies from one situation to another, and (4) BaP may be less chemically stable than other POM compounds. The overall mixture of pollutants associated with exposure to biomass emissions is clearly different from the occupational exposure from which the dose-response function was derived. Further, Pike et al. (1979) have shown that this dose-response function substantially overestimated risk when applied to general popu-lations exposed to ambient air.
A different set of doseresponse functions based on occupational exposure of coke-oven workers has been based on coal tar pitch volatiles (CTPV), an aggregate measure of POM. This may be a better index of exposure, but data are not as readily available in these terms. Translating the coke-oven worker dose-response into BaP terms gives an equivalent of 0.8 annual increased cancers per million person-ng/m 3 flaP (Cuddihy et al. 1980). In the light of the findings of Pike et al. (1979) this may be more appropriate for estimating the effects of exposures to
350 S. C. Morris with C. A. Grimshaw
general populations at ng levels. The uncertainty range of this estimate must include zero; to simplify calculations, the range used here will be 0 to 1 increased annual lung cancers per million person-ng/m 3 BaP
Centralized technologies Combustion A plant with an annual heat energy production of 0.5 million GJ and efficiency of 65 per cent emits <263 kg/y PAH (DOE 1983). Extrapo-lation from Gaussian plume modelling at a coal gasification plant (Morris et al. 1984) yields a population exposure of 79 person-jig/rn 3 PAH within a 50 km radius, assuming a population density of 50 persons/km2 (a density twice that of Washington State or Maine, but half Pennsylvania). Assuming the PAH is I per cent BaP (see table 13.3) and applying the dose-response function of 0 to 1 increased lung cancers per million person-ng/m3 BaP yields 0 to 0.0008 annual excess lung cancers in the population surrounding the facility or 0.0016 lung cancers per GJ heat produced.
Alcohol fermentation Data on occupational safety and health in alcohol fuel production were not available, so DOE (1981) reviewed data on fires and accidents in the alcohol beverage industry. The major source of fires was in non-sprinklered barrelled whiskey warehouses—a source not applicable to alcohol fuels since they are stored in bulk rather than in barrels. There was also an explosion potential in the distilling area which has to be controlled by venting and the control of ignition sources. Using these data and data on the industrial chemical manufacturing industry, DOE (1981) estimated occupational accidents in operating the plant would result in 0.0023 deaths and 1.81 injuries per 1012 BTU produced.
Decentralized wood fuel use for home heating in developed countries The standard unit, the cord, is defined as a stack of wood 4 by 4 by 8 feet, but the mass of wood in a cord and the energy content per unit mass can vary considerably. Wood is often sold by the 'face cord' or other

Health effects in developed countries 351
teims which have almost no meaning whatever. For calculations here, it will be assumed that there are 90 ft3 (2.5 m3) of solid wood per cord hay-ing a moisture content of 50 per cent when freshly cut. The wood has a dry-weight density of 34 lb/ft3 (550 kg/rn3) and a heating value of 8800 BTU/lb dry weight (0.02 GJ/kg) (DOE 1982b). DOE (1982b), assuming wood supplies half the heat energy required for a home, 50 per cent stove efficiency, and 20 per cent moisture content in the seasoned wood, estimated 56 GJ/year heat input. Morris (1981, 1982) assumed 88 GJlyear heat input required. For comparison purposes, it is necessary to select a common base for health effects estimates; here estimates are reported as effects per GJ heat energy in wood delivered.
Wood-fuel harvesting Petty and Hopp (1982) estimated risks of wood cutting based on State of Washington statistics on occupational injuries. They identified the occu-pational group 'fallers and buckers' within the general category of log-gers as carrying out tasks most nearly equivalent to non-professional woodcutters. Injury risks in this group were 0.16 deaths, 26 injuries, and
Table 1 3A- 1 Reasons to believe non-professional woodcutters have higher or lower risk than professional loggers.
Higher 1. Not as likely to be skilled with equipment and techniques. Inexperienced workers in all industries have been found to be 10 times more likely to experience a work-related injury than experienced workers. 2. Less efficient. While injury rates may be proportional to time spent, non-professionals spend more time to collect the same amount of wood.
Lower 1. Commercial loggers use heavy equipment which is not available to the non-professional but may be associated with a large portion of their injury rate.
Loggers spend longer hours on the lob and may be more subject to fatigue than the non-professional.
Commercial loggers work in all kinds of terrain, including sleep slopes which may increase the risk, while non-professionals may tend to cut more accessible wood.
Source: Petty and Hopp 1982.
352 S. C. Morris with C. A. Grimshaw
190 lost workdays per million GJ harvested. They cite several reasons which might lead one to believe that non-professional woodcutters are either at greater or lesser risk than professional loggers (table 13A-1).
Fuelwood transport
Commercial transport The following assumptions were made for analysis: wood is hauled in large trucks carrying 27 tonnes (570 Gi) over an 80 km haul distance (Von Foerster 1978). Common carrier truck fleets average 4.4 accidents per million km (NSC 1978). Since the truck must probably return empty, there are 160 km travelled per 570 GJ. The average rate from all motor vehicle accidents is 0.003 deaths and 0.08 injuries per accident (NSC 1976). This yields 0.004 deaths and 0.1 injury per million GJ. Approximately half of these effects are among truck occupants and might be considered occupational. These estimates are probably low for application to wood hauling. Limited data on trucks carrying logs, poles, and lumber indicate accidental death rates may be ten times higher (DOT 1977).
Individual transport Estimates follow assumptions from DOE (1982b). Individual transport is assumed to be by automobile or light-duty truck for a haul distance of 24 km. Haul distance and size of load are probably more variable than for commercial transport. Risks are assumed to be the same as the average risks for the general driving public on a distance-travelled basis. It is estimated that 12 trips per year are required to deliver 56 GJ, enough to meet 50 per cent of a home's heating requirement (DOE 1982b); in other words, this requires 30 vehicle km per year to supply 56 GJ. Using a database of accident rates in the southern United States (DOE (1982b) estimated deaths and injuries to drivers only in individual wood ftiel transport to be equivalent to 0.05 deaths and 2.8 injuries per million GJ. Applying national average rates of 3.5 x 10⁻⁸ deaths and 4.6 x 10 -6 injuries per vehicle mile (NSC 1976) yields estimates of total effects of 0.2 deaths and 9 injuries per million GJ. The higher rates in comparison to commercial transport are almost entirely the result of the much greater vehicle-km driven per unit energy delivered in individual transport.

Health effects in developed countries 353
Residential combustion
House fires
Although in many areas a permit and inspection are required for a wood stove installatiOfl, Stoves are often installed without necessary permits, and in some areas permits are still not required. The National Fire Data Base maintained by the US Department of Commerce recorded a signifi-cant increase in fires for the classification of causes that includes wood stoves during the rapid increase in use of wood fuel during the 1970s, but the database is inadequate to link fires with wood stoves specifically. The unsafe installation of stoves and chimneys are important contribu-tors to fire risk. One study found 75 per cent of wood stove fires in Massachusetts were from this source (Shelton 1975).
Based on separate data on woodstove fires (Vermont 1979) and wood consumption in home wood stoves and furnace (Bailey and Wheeling 1980), Morris (1981) estimated 40 deaths per million GJ, which may be reduced to 10 deaths per million GJ to account for unsafe installations which presumably will be reduced as the practice becomes more stabi-lized and building code enforcement catches up. By comparison, there were no deaths associated with oil-fired furnaces (the principal alterna-tive home heating source) in the same area during the same period. Using a wider-scale database developed by the US Consumer Produce Safety Commission on injuries associated with solid fuel stoves and chimneys, and national estimates of wood fuel use, DOE (1982b) esti-mated the equivalent of 0.3 deaths and 2.7 injuries associated with woodfuel related house fires per million GJ. Some of these stoves may have been fuelled with coal rather than wood.
Outdoor air pollution
Morris (1981) assumed a population exposure of 2 900 person-ng/m 3 BaP from an annual average contribution of wood smoke of 0.3 ng/m 3 BaP in an area of 83 km2 with a population of about 9 600 burning 2.2 million CJJ wood. Applying the dose-response function of 0 to I annual excess lung cancers per million person-ng/m 3 BaP yields 0 to 0.001 annual cancers per million CiJ. The upper end of the range is equivalent to a 0.06 per cent increase in the background lung cancer rate in the local population.
Preliminary estimates of the lung cancer risk in Missoula, the highest

354 S. C. Morris with C. A. Grimshaw
ranking city in the Montana study, were increases of 0.2 to 8 lung can-cers per year in 62 000 people. This was associated with the combustion of 15 000 cords of wood (equivalent to a heat input of 0.35 million Gi), or 0.6 to 20 cancers per million GJ wood fuel in this community (Carlson 1982). This is one of the localized situations excepted from the Lipfert (1982) analysis.
Meyer (1982) analysed a hypothetical square community 2 km on a side and containing 2 000 homes, of which 200 used wood Stoves as a primary heating source and 400 used fireplaces on an intermittent basis. He estimated an annual average outdoor concentration of 0.45 ngfm 3 at the centre of the community, then reduced this by 50 per cent to account for indoor-outdoor differences. This reduction is a reasonable approach to the estimation of actual population exposure as people spend most of their time indoors during the heating season, but is inappropriate here since he applied a dose-response function derived from an ecological study reported by the National Academy of Sciences (NAS 1972) which does not take indoor-outdoor differences into account. Correcting for this error yields 10 additional cancers annually per 100 000 exposed per -Sons in the centre of the community. The overall population exposure was not reported,but taking the geometric mean of the centre and corner concentrations and assuming 3.5 persons per household yields 8 700 per-son-ng/m 3 . Applying the dose-response function of 0 to 1 cancers per million person-ng/m 3 yields an estimated 0 to 0.009 additional lung can-cers annually in the population. Considering the contributions of wood stoves only (70 per cent of the total), this is equivalent to 0 to 0.16 can-cers per million GJ. Since the dose-response function used here is derived from occupational exposure and does not have the indoor-out-door factor built-in, the additional 50 per cent exposure reduction sug-gested by Meyer might be appropriate; it would result in halving the number of cancers per million (JJ.
References Alfheim, I. and Ramdahl, T. (1984) 'Contribution of wood combustion
to indoor air pollution as measured by mutagenicity in Salmonella and polycyclic aromatic hydrocarbon concentration', Environmental Mutagenesis 6, 12 1-30.
Andrade, C. S. and Rosa, L. P. (1984) 'Potential and limitations of biomass production for energy purposes' (IAEA-SM-273/1), in
Health effects in developed countries 355
Risks and Benefits of Energy Systems, International Atomic Energy Agency, Vienna, 537-51.
Benton, G., Miller, D. P. Reimold, M. and Sisson, R. (1982) 'A study of occupant exposure to particulates and gases from woodstoves in homes', in I. A. Cooper and D. Malek (eds), Residential Solid Fuels, Oregon Graduate Center, Beaverton, Oregon, 456-68.
Bungay, H. R. III (1982) 'Biomass refining', Science 2, 643-6. Bungay, H. R. III (1983) 'Commercializing biomass conversion',
Environmental Science and Technology 17, 24A-31A. Calif. C. E. (1976) 'Not out of the woods', Environment 18, 17-25. Cannon, J. A. (1984) 'Air quality effects of residential wood
combustion', J. Air Pollution Control Association 34, 895-7. Carison, J. H. (1982) 'Residential wood combustion in Missoula,
Montana: An overview of its air pollution contributions, health effects and proposed regulatory solutions', in J. A. Cooper and D. Malek (eds), Residential Solid Fuels, Oregon Graduate Center, Beaverton, Oregon, 539-50.
Cooper, J. A. (1980) 'Environmental impact of residential wood combustion emissions and its implications', J. Air Pollution Control Association 30, 855-6 1.
Cooper, J. A. (1982) 'Chemical and physical methods of apportioning the contributions of emissions from residential solid fuels to reductions in air quality', in J. A. Cooper and D. Malek (eds), Residential Solid Fuels, Oregon Graduate Center, Beaverton, Oregon, 349-64.
Core, J. E., Cooper, J. A. and Neulich, R. M. (1984) 'Current and projected impacts of residential wood combustion on Pacific northwest air quality', J. Air Pollution Control Assocation 31, 138-43.
Cuddihy, R. G. et al. (1980) 'Potential health and environmental effects of diesel light duty vehicles', Inhalation Toxicology Research Institute Report LMF-82, Lovelace Biomedical and Environmental Research Institute, Albuquerque, New Mexico.
Curne, L. A., Klouda, G. A. and Gerlach, R. W. (1982) 'Radiocarbon: Nature's tracer for carbonaceous pollutants', in J. A. Cooper and D. Malek (eds), Residential Solid Fuels, Oregon Graduate Center, Beaverton, Oregon, 365- 85.
Daisey, J. M., Cheney, J. L. and Lioy, P. J. (1986) 'Profiles of organic particulate emissions from air pollution sources: Status and needs

356 S. C. Morris with C. A. Grimshaw
for receptor source apportionment modelling', J. Air Pollution Control Association 36, 17-33.
DOE (1981) 'Alcohol fermentation plant, environmental characterization information report', US Department of Energy, Office of Environmental Analysis (included as an appendix in DOE 1983).
DOE (1982a) 'Industrial wood-fired boiler, environmental characterization information report', US Department of Energy, Office of Environmental Analysis, Washington DC.
DOE (1982b) 'Residential wood stoves, environmental characterization information report', US Department of Energy, Office of Environmental Analysis, Washington DC.
DOE (1983) Energy Technology Characterizations Handbook, Environmental Pollution and Control Factors (3rd edn) (DOEJEP -0093). US Department of Energy, Office of Environmental Analysis, Washington DC.
DOE (1984) 'The impact of alcohol fuels on urban air pollution: Methanol photochemistry study', (DOE/CE/50035-1), Alcohol Fuels program, US Department of Energy, Washington DC.
Dunwoody, J. E., Atkins, T. W. and Costello, R. (1980) 'Environmental impacts of the utilization of solar biomass', Mitteihauser Corp, Downers Grove, IL.
Gammage, R. B. (1979) 'Preliminary thoughts on proxy PNA compounds in the vapour and solid phase', in 0. White (ed), Proceedings of the Symposiwn on Assessing the Industrial Hygiene Monitoring Needs for the Coal Conversion and Oil Shale industries (BNL 51002), Brookhaven National Laboratory, Upton, NY 173-88.
Grimshaw, C. (1987) 'Alcohol fuels from biomass', (BNL 39841), Brookhaven National Laboratory, Upton, NY.
Hall, J. V. (1985) 'Potential air quality benefits of methanol as a vehicle fuel', energy 10, 733-6.
Harkov, R. and Greenberg, A. (1985) 'Benzo(a)pyrene in New Jersey—results from a twenty-seven site study', J. of the Air Pollution Control Association 35, 238-43.
Kamens, R. M. et al. (1984) 'Mutagenic changes in dilute wood smoke as it ages and reacts with ozone and nitrogen dioxide: An outdoor

Health effects in developed countries 357
chamber study', Environmental Science and Technology 18, 523-30.
Kamens, R. et al. (1985) 'Mutagenic transformations of dilute wood smoke systems in the presence of ozone and nitrogen dioxide. Analysis of selected high-pressure liquid chromatography fractions from wood smoke particle extracts', Environmental Science and Technology 19, 63-9.
Kleindienst, T. E. Ct al. (1986) 'Wood smoke: Measurement of the mutagenic activities of its gas- and particulate-phase photooxidation products', Environmental Science and Technology 20,493-501.
Klouda, G. A. et al. (1982) 'Estimating the impact of atmospheric carbonaceous particulates on urban and rural environments by radiocarbon measurements', in Residential Wood and Coal Combustion, Air Pollution Control Association, Pittsburgh, Pennsylvania, 189-203.
Lewtas, J. (1982) 'Comparison of the mutagenic and potentially carcinogenic activity of particle bound organics from wood stoves, residential oil furnaces, and other combustion sources', in J. A. Cooper and D. Malek (eds), Residential Solid Fuels, Oregon Graduate Center, Beaverton, Oregon, 606-19.
Lipfert, F W. (1982) 'A national assessment of the air quality impacts of residential firewood use', in Residential Wood and Coal Combustion, Air Pollution Control Association, Pittsburgh, PA, 226-37.
Lipfert, F. W. and Dungan, J. L. (1983) 'Residential firewood use in the United States', Science 219, 1425-6.
McGill, K. C. and Miller, D. P. (1982) 'Indoor exposure to carbon containing particulates and vapours in homes which use wood for heating', in Proceedings, Residential Wood and Coal Combustion Speciality Conference, Air Pollution Control Association, Pittsburgh, PA, 28 1-9.
Martin, W. and Koenigshofer, D. R. (1983) 'Survey and analysis of current European technologies for wood combustion', (EPA-600/S7-83-006), US Environmental Protection Agency, Research Triangle Park, North Carolina.
Meyer, H. R. (1982) 'The contribution of residential wood combustion local airshed pollutant concentrations', in J. A. Cooper and D.

358 S. C. Morris with C. A. Grimshaw
Malek (eds), Residential Solid Fuels, Oregon Graduate Center, Beaverton, Oregon, 386-97.
Morris, G. (1980) 'Integrated-assessment issues raised by the environmental effects of biomass energy systems: A case study', (ERG-WP-80-6), Energy and Resources Group, University of California, Berkeley, Calif.
Morris, S. C. (1981) 4 Residential wood fuel use: Quantifying health effects of cutting, transport, and combustion', (BNL 30735R), presented at American Public Health Association Meeting, Los Angeles, Calif.
Morris, S. C. (1982) 'Health aspects of wood-fuel use in the United States of America' (IAEA-SM-254J71), in Health Impacts of D(fferent Energy Sources, International Atomic Energy Agency, Vienna.
Morris, S. C. (1983) 'Health risks of coal technology', chapter 3 in C. C. Travis and E. L. Etnier (eds), Health Risks of Energy Technologies, (AAAS Selected Symposium 82), Westview Press, Boulder, Col., 77- 139.
Morris, S. C. et al. (1979) 'Coal conversion technologies: Some health and environmental effects', Science 206, 654-62.
Morris, S. C. et al. (1984) 'Extrapolation to health risk: Use of comparative approaches', chapter 14 in K. E. Cowser (ed), Synthetic Fossil Fuel Technologies: Results of Health and Environmental Studies, Butterworth Publishers, Boston, 323-41.
Mueller Associates, Inc. (1985) 'Wood biomass combustion'. Prepared for US Department of Energy.
Myers, D. K., Gentner, N. E., Johnson, J. R. and Mitchel, R. E. J. (1982) 'Carcinogenic potential of various energy sources', (IAEA-SM-254/2), in Health impacts of Dferen: Sources of Energy, International Atomic Energy Agency, Vienna.
NAS (1972) Particulate Polycyclic Organic Matter, Report of the Committee on Biological Effects of Atmospheric Pollutants, National Research Council, National Academy of Science, Washington DC.
NAS (1983) Risk Assessment in the Federal Government Managing the Process. Committee on the Institutional Means for Assessment of Risk to Public Health, National Research Council. National Academy Press, Washington DC.
Petty, P. N. and Hopp, W. J. (1982) 'A comparative risk analysis of

Health effects in developed countries 359
fuelwood use in the Pacific northwest', Energy 7, 359-65. Pike, M. C. et al. (1975) 'Air pollution', chapter 14 in J. F. Fraumeni, jr.
(ed), Persons at High Risk of Cancer, Academic Press, New York, 225-38.
Pike, M. C. et al. (1979) 'Occupation: "Explanation" of an apparent air pollution related localized excess of lung cancer in Los Angeles County', in N. E. Breslow and A. S. Whittemore (eds), Energy and Health, SIAM, Philadelphia, 3-16.
Pimentel, D. et al. (1981) 'Biomass energy from crop and forest residues',Science 212, 1110-15.
Ramdahl, T. (1985) 'PAH emissions from combustion of biomass', chapter 3 in A. Bjorseth and T. Ramdahl (eds), Handbook of Polycyclic Aromatic Hydrocarbons, volume 2, Marcel Dekker Inc., New York, 61-85.
Rowe, M. D. (1981) 'Human exposure to particulate emissions from power plants', (BNL 51304), Brookhaven National Laboratory, Upton, NY.
Rowe, M. D. (1985) 'Assessing occupational health and safety risks of renewable energy technologies at the national level', in P. F. Ricci and M. D. Rowe (eds), Health and Environmental Risk Assessment, Pergamon Press, New York, 237-57.
Sax, N. 1. (1975) Dangerous Properties of Industrial Materials (4th edn), Van Nostrand Reinhold Company, New York.
Scarberry, R. M., Papai, M. P. and Braun, M. A. (1982) 'Source test and evaluation report: alcohol facility for Gasohol production', (EPA-600/S7-82-018), US Environmental Protection Agency, Industrial Environmental Research Laboratory, Cincinnati, Ohio.
Schuytema, G. S. and Shankland, R. D. 91976) 'Effects of log handling and storage on water quality', (EPA-600f2-76-262), US Environmental Protection Agency, Cincinnati, Ohio.
Vijil, J., Amand, L. E., Leckner, B. and Ljungstmm, E. (1984) 'Fluidised bed combustion—a comparison between biom ass and coal', Biomass 84, 113-18,
Von Foerster, T. (1978) 'On the use of wood as an energy source in the state of Maine', (BNL 50898), Brookhaven National Laboratory, Upton, NY.
14 Socioeconomic aspects
Ramesh K. Bhatia and Armand F. Pereira
In this chapter we attempt to supplement the previous chapters with a general review of socioeconomic aspects. Given the focus of the book, biomass-related technologies are given prominence, but broader issues concerning renewable energy technologies (RETs) in general are also discussed, including comparative evaluation of alternative technologies. This approach is justified here because, from the standpoint of investors/users and policy makers, biomass technologies often compete against other RETs.
Conceptual and general methodological issues are reviewed in the first section, followed by an analysis of available methodologies for eco-nomic evaluation of RETs together with summaries of selected results from their application in developing countries. Finally, some basic guidelines for improving economic evaluation methodologies including the incorporation of environmental criteria are provided in the fmal sec-tion.
It could be genuinely argued that socioeconomic and environmental aspects should not be addressed separately, since the latter ought to be incorporated into socioeconomic analyses of technologies. The partial separation in this book is justified for two key reasons, however. One of them is the need for expanding the knowledge base on environmental aspects, as these have been among the most neglected. The second rea-son is that most socioeconomic analyses of RETs and other technologies have not taken adequate account of environmental aspects, as a result of both methodological difficulties and lack of suitable information.

362 Ramesh K. Bhatia and Armand F. Pereira
The relative importance of environmental aspects of RETs
The environmental effects of alternative energy sources need to be given more emphasis in planning and project evaluation. However, it is per -haps just as important for planners to place environmental questions into a correctly conceived hierarchy of factors likely to determine the relative failure or success of applying different technologies for a specific end use and particular categories of end-user conditions. This is in itself a difficult task, since some aspects are more important in some situations than in others. We shall try to suggest a general hierarchy of factors as a starting point for the discussion which follows on socioeconomic aspects.
The RETs most socially desirable and most likely to be successfully adopted and diffused are those which, for specific end-use situations,' are technically efficient, financially viable, economically profitable, cul-turally acceptable, and environmentally benign. A RET is considered technically efficient if it can operate as expected when the required inputs are available. It is financially viable if, from the standpoint of users (at market prices), it produces a higher rate of return on investment than other alternatives for the same purpose over the expected lifetime of a related project. It is economically profitable (or 'economic') if, from the standpoint of society, the present value of benefits from its use is higher than the present value of costs (when both are valued at so-called 'economic', 'accounting' or 'shadow' prices).
Many projects involving the use of RETs may perform relatively well for some time when only technical efficiency and financial viability cri-teria are met. This can happen, for example, in situations where other technology options are more economic but subsidies and/or other finan-cial incentives make such RETs more attractive to users (although the opposite case has been far more common). In the long run, however, successful diffusion cannot be continued without economic viability including an acceptable environmental performance.
Environmental performance indicators are much less objective and therefore require more qualification. The previous chapters and other literature suggest, however, that most RETs have a more limited ecologi-cal impact than conventional energy alternatives such as oil, coal and shale oil. Some have a much better impact, including improved cooking stoves (compared to open fires and inefficient stoves) and biogas sys-tems. Other RETs can have very minor or neutral effects: for example,
Socioeconomic aspects 363
gasifiers using wood, bagasse and other agricultural residues can cause considerable air pollution, but its extent is rarely unacceptable in an open rural environment and, in some cases, may be positively compensated by an associated decrease in solid waste. Large-scale hydropower, ethanol and methanol plants are potentially the most problematic, but their nega-tive effects can be avoided or minimized through careful siting, plant design and project planning: to take one example, hydro plants may imply a certain loss of tree cover and displacement of fauna s but this may be positively compensated in some cases by the promotion of new fishery activity, irrigation facilities or even tourism.
The case of ethanol production deserves a more elaborate explanation here. A large-scale ethanol plant using sugarcane as raw material yields about 12 litres of effluent (commonly referred to as stillage) for every litre of ethanol. If thrown into rivers and lakes stillage has a highly pol-luting effect, but it may be treated in closed reservoirs and partly used for direct irrigation and fertilization. It can also be used to produce bio-gas for utilization in adjacent communities and rural industries. Bagasse from sugarcane is used for heat generation, but there is usually a surplus varying with burning efficiency. Both surplus bagasse and biogas from stillage may be used to generate electricity. Surplus bagasse may be used as animal feed and/or as input to chipboard industries. Potassium ash can also be produced and used as an input to the fertilizer industry. Unicellular protein can be made from stillage concentrate for the animal-feed market.
The financial viability of these applications depends on the scale of their production, the varying chemical composition of the stillage, and market competitiveness compared to other conventional alternatives. The last of the above applications is constrained by the limited use of processed animal feed and the potentially high cost of stillage evapora-tion, especially in the case of large-scale distilleries. These issues have been widely discussed in technical symposia, but very little investment had been made in stillage reprocessing in Brazil until at least 1988. To avoid water pollution, the Brazilian distilleries have been required to have a minimum capacity for the chemical treatment of stillage. Many of them use a small portion of it for irrigating some of their own lands, but occasional disposal into rivers and lakes had been reported from time to time during the late 1970s and early 1980s. Ecological considerations alone may justify investments in stillage reprocessing, but financial and economic benefits are possible depending on the location of distilleries.
364 Ramesh K. Bhatia and Armand F. Pereira
In summary, RETs are favourable environmental performers com-pared with conventional energy sources, but there is another important dimension to this, besides comparative pollution and other environnien-tal degradation effects. The relatively decentralized nature of these tech-nologies is a significant advantage when considering not only their low capital requirements and gestation periods, but also their potential for promoting a more balanced and more evenly distributed pattern of investment and resource use. The biom ass group of RETs, on which this book is focused, has the additional feature of promoting a more efficient use of available resources including by-products of forestry, agricultural and livestock production.
From a socioeconomic perspective, the enviromnental advantages of RETs, and bioenergy in particular, are evidently not a sufficient condi-tion for the selection of such technologies. What is important is that these advantages are not neglected as they have been in the past, and that they are properly assessed through the comparative evaluation of alter-native technologies.
This brief attempt to relate environmental aspects to other aspects of RET utilization and diffusion needs an additional qualification. Although we have only mentioned technical, financial, economic and environmental aspects, the success of RET-related projects also depends on other factors of an institutional and organizational nature, including the adequate selection of RET installation sites; the availability of suit-able repair and maintenance facilities and related manpower, and ade-quate incentives and organizational arrangements among RET producers and adopters and government and/or non-government agencies involved in the provision of financial and technical assistance. 2
Types of socioeconomic analyses, their roles and limitations 3
Many studies have focused on various socioeconomic aspects of RETs—for example production costs, employment, income distribution, environmental impact—but frequently these aspects are analysed sepa-rately. The resulting findings often provide good information, but their usefulness is limited. Few studies, however, have attempted to address socioeconomic aspects of RETs within a framework of analysis that enables investors/users and policy makers to conclude how different
Socioeconomic aspects 365
technologies rank in terms of overall performance, or whether a particu-lar project was or is likely to be economically successful.
To meet either of these objectives, the main role of economic evalua-tions is to try to arrive at an overall 'bottom line'—necessarily a capital-related indicator, since capital is usually the most scarce resource in developing countries, and most potential investors will give most weight to financial criteria in their choice of technology. Because of some diffi-culties briefly discussed below, it is sometimes inappropriate or impossi-ble to arrive at such a bottom line. In such cases, methodological adjustments have to be made in order to make the evaluations realistic and helpful to investors or policy makers. We will expand on these issues, by distinguishing between basic types of economic evaluation, their problems and limitations.
Economic evaluations are only as good as the methods used. For this reason, the types of analysis and methodological details should always be explicit, although this is often not the case. In principle, any large project with pervasive economic effects, including Keynesian-type mul-tiplier effects and other significant indirect effects, should be analysed through a general, or at least a partial, equilibrium approach rather than a strictly microeconomic one. In practice, due to methodological and data-related difficulties, the starting point is usually a microeconomic approach that is sometimes adjusted to reflect some indirect costs and benefits of crucial variables. Even this extended type of cost-benefit analysis faces difficulties in estimation of some basic cost components, as discussed below.
Financial versus economic analysis The microeconomic cost-benefit analyses can be cx ante or cx post. The former are carried Out prior to investments to indicate their feasibility, whereas the latter are done to assess project impacts and to adjust opera-tions or policies affecting the project. These analyses are also divided into financial and economic types, the former reflecting the standpoint of users, and the latter that of the whole economy or society. Financial analysis uses market prices of production inputs and outputs since these prices reflect the costs and benefits to users.
In most developing countries, however, market prices of inputs and outputs do not reflect their true costs/benefits to society (because of trade restrictions, administered prices and/or minimum wage legisla-

366 Ramesh K. Bhatia and Armand F. Pereira
tiori). Economic analysis should therefore use 'shadow prices', exclud-ing taxes, import duties and subsidies since these have to be regarded as income transfers, although it is often not possible to adequately estimate shadow prices for all costs and benefits and, as a result, only the most important ones (that is, capital, labour, land, fuels, electricity, cement, fertilizers, steel and so on) are priced to reflect their opportunity costs, whereas market prices may often be used for other less important inputs as a proxy of their real economic cost. Such second-best methods (of using shadow prices for some inputs but not for others) have evident flaws, but at times they can be more appropriate than overall shadow pricing based on excessive guesswork. Different methods are also used to estimate annual costs, particularly annualized capital costs.
Given these methodological limitations (which are illustrated in the case studies section) both financial and economic analyses have there-fore to be strictly regarded as an aid to investment decisions. They give an indication of performance from the perspectives of users and society, assuming certain key parameters including gestation period, productive lifetime of equipment, estimates of repair and maintenance costs, mode of operation, and discount rates reflecting certain critical assumptions about inflation. As all these assumptions may change throughout a given project, ex ante evaluations often include sensitivity analysis of variations in key parameters to provide a range of probable performance scenarios. In some cases where it is important to minimize risk, a proba-bility analysis of the different scenarios may be also carried out to give some indication of the most likely one. Both sensitivity and probability analyses do not, however, do away with all the limitations of cost-benefit analysis in dealing with the uncertainties regarding project performance. The two following subsections will call attention to some typical prob-lems in economic evaluation and ways of dealing with them.
Measurable versus immeasurable costs and benefits It is important for analysts and policy makers to distinguish explicitly between measurable and immeasurable costs and benefits. In cases where the latter are significant (for example, the health benefits of improved stoves due to smoke reduction or biodigestion of animal waste, the increased educational opportunities for children due to reduced labour time in fetching wood, and reduced drudgery for women) it is important to use non-economic criteria, although we would argue
Socioeconomic aspects 367
that such criteria ought to be clearly specified, preferably with the appli-cation of a weight or point system. For example, a 5 per cent increase in the value of benefits as a result of the impact of improved stoves on health and reduced drudgery might in some cases be justified. But since this percentage is uncertain, one might include slightly different percent-ages under different scenarios, the most likely scenario being therefore chosen partly on the basis of political criteria.
Employment and income distribution effects Employment created directly and indirectly by the use of a particular technology is a crucial consideration from the perspective of society/ government, but usually not from that of investors. Thus, whereas finan-cial analysis normally treats employment simply as labour costs at mar -ket prices, economic analysis gives it a special value which attempts to reflect the social value of job creation.
Two ways of evaluating employment effects can be found in theory and in practice. One is to shadow price labour, according to the relative surplus or scarcity of specific categories of workers. Thus, if unskilled labour is in surplus in a given country (as it is in Brazil or India) or region within a country (as in north-east Brazil), the hourly or daily wage used in the overall cost accounting will be lower than the prevail-ing market wage. If labour is scarce, the respective wage used will be higher.
Some governments have consistent estimates of shadow wage rates that are sometimes used to help them evaluate alternative projects or select the regional location of a project. Also, private institutions such as national and international development banks have their own esti-mates, which they use for the same purpose: for example, the World Bank has often used, for unskilled labour, a shadow wage rate of 0.7 for north-east Brazil (that is, 30 per cent lower than the market rate). The cost accounting is as follows. If biogas is evaluated against kerosene for cooking, or electricity for sawmilling, or if ethanol is evaluated against gasoline or oil-derived ethylene, the much higher employment-generat-ing effects of the biom ass alternatives will be reflected in a much higher proportion of labour costs (vis-à-vis other cost components). However, labour costs will still be at a lower accounting rate than the market wage, thus improving the attractiveness of the biomass options from the costs side of the analysis. It is noteworthy that RETs are, in general, more
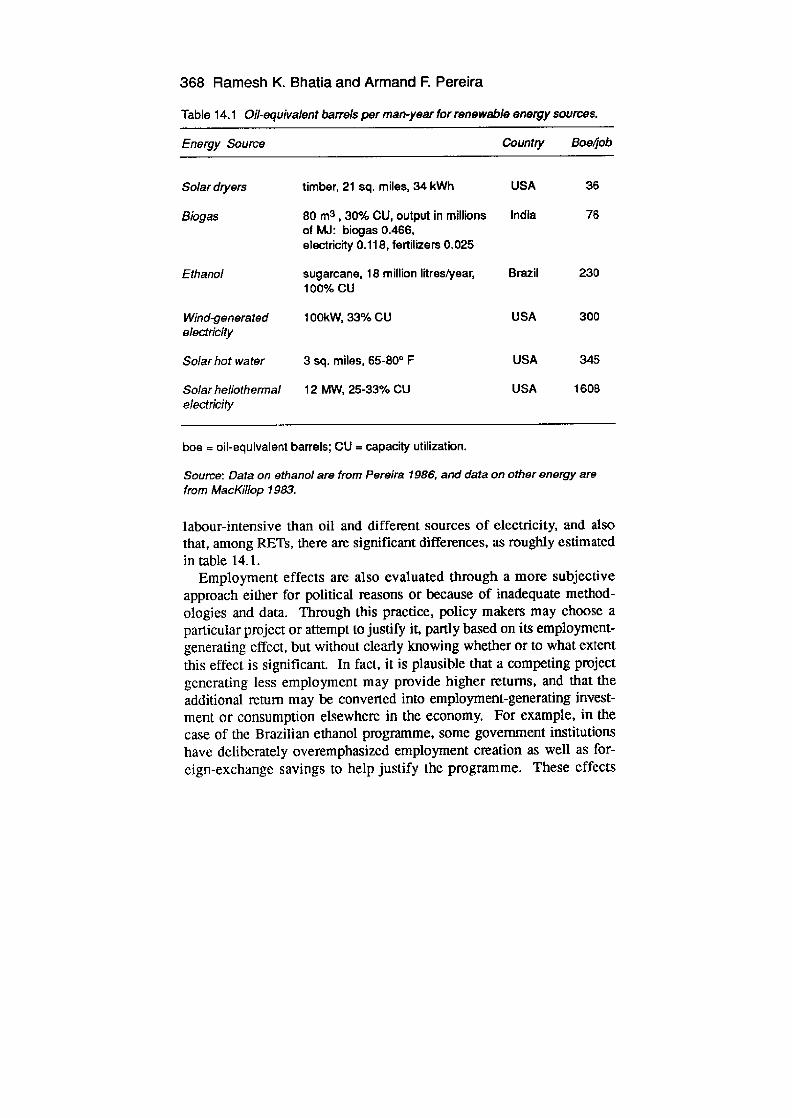
368 Ramesh K. Bhatia and Armand F. Pereira
Table 14.1 Oil-equivalent barrels per man-year for renewable energy sources.
Energy Source Country Boe/job
Solar dryers timber, 21 sq. miles, 34 kWh USA 36
Biogas 80 m3 , 30% CU, output in millions India 76 of MJ: biogas 0.466, electricity 0.118, fertilizers 0.025
Ethanol sugarcane, 18 million litres/year, Brazil 230 100% CU
Wind-generated 100kW, 33% CU USA 300 electricity
Solar hot water 3 sq. miles, 65-80° F USA 345
Solar heliothermal 12 MW, 25-33% CU USA 1608 electricity
bce oil-equivalent barrels; CU = capacity utilization.
Source: Data on ethanol are from Pereira 1986, and data on other energy are from MacKillop 1983.
labour-intensive than oil and different sources of electricity, and also that, among RETs, there are significant differences, as roughly estimated in table 14.1.
Employment effects are also evaluated through a more subjective approach either for political reasons or because of inadequate method-ologies and data. Through this practice, policy makers may choose a particular project or attempt to justify it, partly based on its employment-generating effect, but without clearly knowing whether or to what extent this effect is significant. In fact, it is plausible that a competing project generating less employment may provide higher returns, and that the additional return may be converted into employment-generating invest-ment or consumption elsewhere in the economy. For example, in the case of the Brazilian ethanol programme, some government institutions have deliberately overemphasized employment creation as well as for-eign-exchange savings to help justify the programme. These effects

Socioeconomic aspects 369
have been very beneficial and, indeed, have gone a long way to help jus-tify the ambitious Proalcool, but they Cannot obscure the fact that ethanol production has become uneconomic in recent years as a result of depressed world oil prices.
Income distribution effects are usually given limited attention in microeconomic evaluations because they do not immediately affect the fmancial viability and social profitability of competing technologies and related projects. But this is one limitation of cost-benefit methodologies in general, and it must be taken into account when such methodologies are applied from the standpoint of society. RET-related projects (among many others) can have different effects on income distribution, depend-ing on the end uses, the localized energy options and the users' incomes. In principle, RET-related projects may help redistribute income in cases where they compete with conventional options that have high hooking-up costs such as grid electricity in remote villages. As a result of their much lower capital cost and gestation period, RET-related projects can accelerate income-generating activities for low- and middle-income groups. In practice, however, it is not these groups that tend to reap the benefits of RET-related projects.
There is in fact an observed tendency to promote income transfers from the society at large to upper-income groups—for example, rela-tively rich cattle owners in rural India in the case of biogas; richer farm-ers in the cases of water wheels in Nepal, and of solar photovoltaics (PV) and windmills in various countries; urban upper classes in the case of Brazilian ethanol, and so on. These income transfers occur through the direct allocation of subsidies to users who are often among the richer strata and, indirectly, through government investments in research and development and other infrastructure associated with the production and diffusion of the technologies. However, it would be incorrect always to associate RETs with an income-concentrating effect, since grid electric-ity and other conventional energy sources often have the same effect whenever their tariffs do not reflect their real resource costs and hook-up charges restrain the poor from using such energy.
It is therefore important for policy makers to give special attention to income distribution effects at both the interregional and interpersonal levels. However, different policy mechanisms should be considered, as some will be much more effective than others. At the interpersonal level, it is possible to mitigate negative effects by promoting collective projects and by designing tax/subsidy schemes for individual projects
370 Ramesh K. Bhatia and Armand F. Pereira
that discriminate users according to their income levels and energy end uses. Better financing conditions to lower-income groups should be offered, in so far as it may be desirable to promote greater social equal-ity—for either purely political reasons and/or strategic structural changes in the patterns of consumption, savings, investment and production. Some lessons may again be drawn from ethanol production in Brazil, based on details in Pereira 1986. The government planners had intro-duced a number of measures to avoid negative income distribution effects at both interregional and interpersonal levels. These measures included more favourable interest rates on loans for investments in poor regions and for cooperative investments, as well as various means of promoting benefits to small farmers. Yet, by the end of the first five-year period, the Outcomes suggested that these measures had not been effective. Proalcool had clearly contributed to landownership concentra-tion and, despite the regional incentives, most of the highly subsidized investments over that period had gone to the richest region and richest state.
Effects on women
When dealing with effects of biomass technologies and other RETs on income distribution at the interpersonal level, it is also important to dis-tinguish gender-related effects for a number of reasons worthy of atten-tion here. In one way or another, energy and environmental problems in rural areas affect women and men differently because of role differences.
Fuelwood collection for cooking is a major responsibility of rural women in developing countries. As subsistence agriculture becomes less viable, women's need for cash income becomes greater. Yet most of women's traditional income-generating activities also rely on energy-intensive, inefficient techniques using traditional biomass fuels. For example, as reported by the ILO (1987, p. 10) pottery-making in Tanzania consumes as much as 1 m 3 of wood for 100 large clay pots, which is nearly equivalent to the annual average consumption in Africa, and fish smoking requires about 0.8 m 3 per tonne. Another issue is that this overwhelming reliance of poor rural communities on traditional biomass fuels has severe negative effects on women's working condi-tions and health. For example, a study in India sponsored by the World Health Organization estimated that 'women cooks were inhaling as
Socioeconomic aspects 371
much benzopyrene, a pollutant which causes cancer, as if they smoked 20 packs of cigarettes per day' ([LO 1987, p. 14).
Because of the relationship between rural women's work and energy use, the dissemination of new and upgraded small-scale biomass tech-nologies and other RETs in replacement of traditional biomass conver -sion techniques is of potentially greater benefit to women than men. For example, while contributing to a reduction of fuelwood consumption and alleviating environmental stress, improved stoves can reduce the time women spend collecting fuelwood by as much as 30 per cent. Improved stoves are therefore a technology for the benefit of women, and experi-ence has shown that the success of stove dissemination programmes in rural areas, in particular, depends critically on the involvement of women in designing and evaluating stove models (a pattern also found in programmes for village water pumps). 4 In the hills of Nepal, locally made water turbines increasingly provide mechanical power for such tra-ditional women's activities as grinding corn, hulling rice and pressing oil seeds. An evaluation of the water mills revealed that they saved between 800 and 5000 hours per household per year with a mean of 3000 compared to traditional methods, 5
The literature6 does suggest, however, that as men usually have more power and search for activities that earn more cash income in rural areas, there is a tendency for men to take advantage of technological innova-tions through privileged access to the technologies and possibly related changes in their occupational roles vis-â-vis women. This is therefore another reason why some development projects involving the diffusion of technologies in rural areas need to have specific gender-related objec-tives.
Evaluation methodologies and selected case studies
In this Section we review methodologies of the economic evaluation of biomass and other energy technologies with the aid of summaries from selected case studies, including alternative technologies for a given end use, ethanol production, biogas and improved stoves. The objective is neither to update findings nor to fill methodological gaps, but simply to point Out major methodological difficulties and controversies and, at places, to suggest some improvements for future evaluations. Details
372 Ramesh K. Bhatia and Armand F. Pereira
have necessarily been kept to a minimum as they can be found in the original studies.
A bnef justification of our selection is required. Many recent studies have analysed the technical, economic and social aspects of a given tech-nology,7 but few have presented comparative economic evaluations of alternative technologies available for a given end use. Even where these evaluations have been made, technology choice has been narrowly defined and the methodologies adopted have varied from one author to another. As a result, the literature is full of conflicting fmdings on finan-cial and economic feasibility, and this of course deserves some clarifica-tions. Many studies have also analysed different aspects of ethanol production but only a few have offered comprehensive evaluations. We have therefore selected one ex ante and one ex post study to bring out some contrasts in approach, focus and findings. The discussion of bio-gas and stoves is very brief as the literature has already covered the major issues.
The comparative evaluation of energy technologies for a specific end use Water pumping for irrigation is a good case for analysis because it is a widespread activity for which there are several alternative technologies with acceptable levels of technical maturity. Three evaluation approaches can be distinguished in the literature.
In the first approach, the financial and/or economic profitability of a technology is assessed by comparing the benefits with the costs of using that technology. For example, the benefits from a biogas or solar-ther-mal system or a windmill are calculated in terms of the value of output of rice, maize or wheat produced by using the irrigation water supplied by the solar system or windmill. This method is termed as 'viewed strictly in its own terms ... without reference to competing systems', 8 but it is not appropriate if the farmer (or the society) can choose between a biogas system and a diesel pumpset to provide water, regardless of the additional benefits from irrigation. The introduction of a biogas system would replace an existing (or potential) diesel pumpset. Thus the true benefit of the biogas technology is the savings in resources (that is, fuel, skilled labour, and possibly capital) that would otherwise have been used in the diesel pumpsei It is incorrect to attribute benefits from the use of irrigation water to the biogas system, when in fact the same quantity and

Socioeconomic aspects 373
quality of irrigation water could be provided by competing technologies. In the second approach, the cost per cubic metre of water output of a
technology is compared with that of an alternative technology (for exam-ple, a gasifier versus a diesel pumpset). If the unit cost of the technology in question is lower than that of the alternative being considered, it is concluded that the former is economic. One problem with this approach is that interest rates and life of equipment can always be chosen to favour a particular technology. Another problem is that it assumes that the technologies are comparable in terms of water output and utilization rate. A human-powered lift with a daily water output of 30 m 3 can be compared with a diesel pumpset with a daily output of 1 400 m3 per day. However, it may not be possible to fully utilize available water because of a number of factors such as farm size, availability of water in the source (such as a dugwell), cropping pattern, availability of fuel or electricity, equipment breakdown, seasonability of water output (due to resource availability) which may not match the demand pattern and so on. For example, for a 0.5 ha farm it would not be possible to use 1 400 m3/day of water pumped continuously over a 63-day period. This may not even be possible or needed for a 14 ha farm, because of crop season-ability, rainfall, and water requirements. Hence, a comparison between the cost per cubic metre of the two devices, without taking farm size explicitly into account, will lead to wrong conclusions about the eco-nomics of a diesel pumpsct.
In this context, it is important to consider that some technologies can be used at low output (for example, human- or animal-powered lifts, PV systems and some windmills); but that it may not be possible for other technologies to be scaled down (for example, some gasifiers and diesel pumpsets) or if they can be scaled down, their capital costs are reduced only marginally. In these circumstances, the possible underutilization of oversized technology options should be considered when comparatively evaluating different technologies. Another alternative may be to include in the analysis technologies that can be scaled down (such as petrol or electric pumpsets) and then do the cost comparison. Even here it is nec-essary to specify whether the alternatives are considered under their 'best' performance conditions or under average field conditions. There is a tendency to compare the techno-economic characteristics of one technology as it is expected to perform in the field against those of the alternative technology as it has actually performed. A lack of clarity on these issues is likely to distort the comparison.

374 Ramesh K. Bhatia and Armand F. Pereira
In a third approach, the economic evaluation and ranking of technolo-gies is done in terms of cost-effectiveness criteria for 'equivalent' sys-tems. For example, as in the case study summarized in table 14.2, each individual technology is designed to provide the same output perfor -mance over the period under consideration and have similar levels of technical reliability. The options are 'equivalent' in the sense that each one provides the same quantity and quality (time pattern) of water, thus giving the same benefits from irrigation. To use this approach—the most accurate one—it is necessary to determine:
a few representative cropping patterns and their monthly water requirements on the basis of agro-climatic conditions and effective rainfall; the availability and pattern of biomass, solar and wind energy (daily and monthly); the critical month for each crop rotation (the month that shows the highest ratio between monthly water requirement and monthly gross solar radiation or monthly mean wind speed); and the capacities of equipment required to deliver the amount of water needed in the critical month(s).
Based on this assessment, the optional systems are then compared and ranked in terms of the sum of the present value of capital costs and oper-ating costs (including maintenance) incurred over a fixed period (such as 10 years). The cost accounting is done at market prices to reflect the viewpoint of investors, but the economic analysis (to reflect the stand-point of society) includes shadow pricing for at least major inputs such as electricity, diesel oil and foreign exchange required for imported com-ponents of the costs. The present values are estimated by using an appropriate social discount rate for each system. Since the life of each component of capital equipment may vary from one technology to another, replacement costs for some types of capital equipment must be included. The alternative with the lowest present value of total costs is considered the best, in the sense of yielding the highest benefit/cost ratio.
The third approach just described was used for a comparative eco-nomic evaluation of alternative energy technologies for Ghazipur (a vil-lage in Uttar Pradesh, northern India) for two farm sizes (1 ha and 0.4 ha) and three crop rotations. The key results are given in table 14.2, based on a detailed analysis in Bhatia and Pemira 1988.
For a baseline I ha farm, the use of diesel and biogas in a dual-fuel
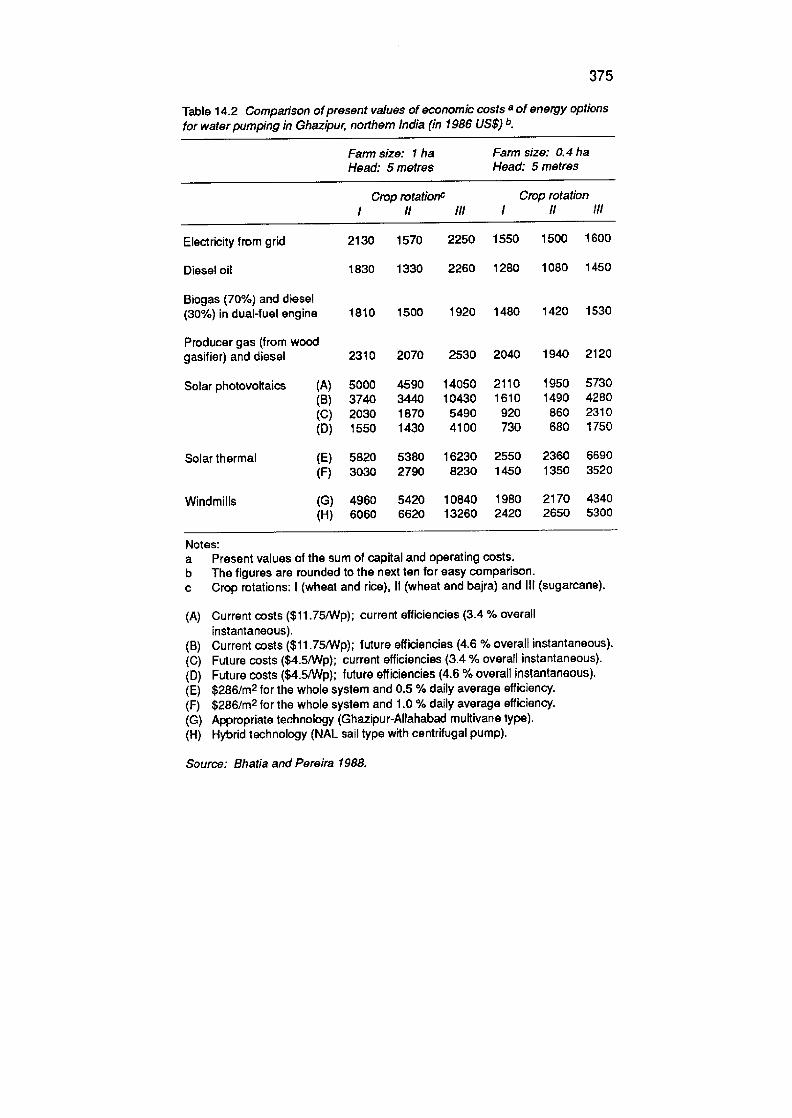
375
Table 14.2 Comparison of present values of economic costs a of energy options for water pumping in Ghazipur northern India (in 1986 US$) b
Farm size: iha Farm size: O.4ha Head: 5 metres Head: 5 metres
Crop rotationc Crop rotation I II Ill I I! III
Electricity from grid 2130 1570 2250 1550 1500 1600
Diesel oil 1830 1330 2260 1280 1080 1450
Biogas (70%) and diesel (30%) indual-fuel engine 1810 1500 1920 1480 1420 1530
Producer gas (from wood gasifier) and diesel 2310 2070 2530 2040 1940 2120
Solar photovoltaics 5000 4590 14050 2110 1950 5730 3740 3440 10430 1610 1490 4280 2030 1870 5490 920 860 2310 1550 1430 4100 730 680 1750
Solarthermal 5820 5380 16230 2550 2360 6690 3030 2790 8230 1450 1350 3520
Windmills 4960 5420 10840 1980 2170 4340 6060 6620 13260 2420 2650 5300
Notes: a Present values of the sum of capital and operating costs. b The figures are rounded to the next ten for easy comparison. c Crop rotations: I (wheat and rice). II (wheat and bajra) and Ill (sugarcane).
Current costs ($11.75/Wp); current efficiencies (3.4% overall instantaneous). Current costs ($11 .75IWp); future efficiencies (4.6 % overall instantaneous). Future costs ($4.5/Wp); current efficiencies (3.4 % overall instantaneous). Future costs ($4.5/Wp); future efficiencies (4.6 % overall instantaneous). $286/rn2 for the whole system and 0.5 % daily average efficiency. $286/rn2 for the whole system and 1.0 % daily average efficiency. Appropriate technology (Ghazipur-Allahabad multivane type). Hybrid technology (NAL sail type with centrifugal pump).
Source: Bhatia and Pereira 1988.

376 Ramesh K. Bhatia and Armand F. Per&ra
engine is the most economic option for crop rotations I (wheat and rice) and III (sugarcane). The diesel pumpset ranks first for crop rotation II (wheat and bafra) followed by the dual-fuel system. The solar PV sys-tem under assumption D, of future cost and future efficiency, ranks even better than the dual-fuel system for crop rotations I and II.
The use of electricity from the regional grid is consistently more expensive, as the real resource costs of supplying electricity to rural areas are taken into account. Although the differences in present values of costs between the biogas-cum-diesel option and conventional sources range from 10 to 25 per cent, the present analysis shows the need for a thorough investigation of the socioeconomic and management aspects of using biogas for irrigation pumping. In particular, pricing and tax/subsi-dies on energy sources must be studied carefully. Given the subsidized rates of electricity and no charges for electricity connections, farmers prefer grid electricity to diesel pumpsets and dual-fuel systems using biogas and diesel. They might not prefer electric pumpsets if they were charged the real costs of providing grid electricity. If this were the case, investments in a biogas plant along with a dual-fuel engine might be financially feasible. However, if subsidies on electricity cannot be removed, there is a need to give an equivalent subsidy to biogas plants used for irrigation.
The costs of producer gas (from a gasifier) with diesel oil are found to be higher than those for grid electricity and diesellbiogas options, pri-marily because of high costs of repair and maintenance and of fuelwood. However, apart from the high costs, the technical parameters of using wood-based (and even charcoal-based) gasifiers in India have yet to be firmed up. There is a need to sponsor field studies to document various technical and economic aspects of using gasifiers for pumping. 9
The PV option, under the assumptions of future cost and future effi-ciency (case D), is much cheaper than the average of the first four alter-natives in respect of crop rotations I and II. It is much more expensive for crop rotation III (sugarcane) because the capacity for meeting water requirements in the critical month (May) is very high. The high costs of the Ghazipur windmills mean simply that areas like Ghazipur in northern India do not have suitable wind conditions for these types of windmill.
For a smaller farm of 0.4 ha, diesel pumpsets rank first, but the PV option ranks far better than in the 1 ha farm. In fact, the figures suggest that PV might be the best option for very small farms in isolated villages beyond a certain radius from the grid or in areas with limited infrastruc-
Socioeconomic aspects 377
ture for repairs and maintenance of conventional mechanical systems. Biogas with diesel remains competitive with conventional energy options but producer gas with diesel is more expensive in the 0.4 ha farm. Even for crop rotation III, which requires relatively more pump-ing, the savings in diesel oil do not outweigh the capital costs of a biodi-gester or gasifier or of extending grid electricity.
The findings are based on the assumption that the average costs of providing grid electricity are about US$2000 per pumpset (of 4 kW). However, the results change in favour of the RETs, especially PV, if an average of $3 700 per pumpset is taken, as estimated by the Rural Electrification Corporation for the Seventh Plan (1986-90) for a variety of situations beyond 10 km from the nearest distribution network and connected load. Using the $3 700 figure for extension of grid electricity, our calculations conclude that, for a 0.4 ha farm, the PV option is more economic than the electric jximpset in all three crop rotations even under current Cost and current efficiency (assumption A), whereas for the 1 ha farm, PV at future cost and current efficiency (assumption C) is also more economic than grid electricity for crop rotations I and II. The gasifier/diesel and the biogas/diesel options are also economic compared with the grid for farms of 0.4 and 1.0 ha.
An evaluation of energy alternatives for irrigation pumping should also consider the risk of depending on large-scale centralized sources (power plants, refineries) vjs-à-vis decentralized ones. Furthermore, the direct and indirect environmental effects of the above RETs are gener-ally more favourable than those of competing conventional systems. In the study of Ghazipur, this issue is particularly important, as electricity is produced mainly from coal thermal plants. We did not try to quantify those effects because of lack of data and firm parameters regarding the capital costs of installing additional equipment in coal-based power plants for reducing air and water pollution to desirable standards, costs of installing equipment to reduce adverse health effects of coal mining, and costs of improving methods of coal transportation and handling in order to minimize health effects.
The estimation of such costs is constrained by the uncertain meaning of 'acceptable' or 'desirable' standards of pollution, and 'adverse' health effects of coal mining. These concepts have first to be established by the political process before economists can incorporate them into economic analyses. However, we could have attributed to such costs a symbolic value in one scenario, as part of sensitivity analysis to give an idea of
378 Hamesh K. Bhatia and Armand F. Pereira
how those costs would affect the comparative performance of the tech-nologies considered.
The macroeconomic evaluation of ethanol production
The economics of ethanol production have been analysed elsewhere 1 10 and we therefore limit our discussion to some general issues and selected findings from case studies of Brazil and India. These countries have been the largest ethanol producers, Brazil producing it mainly for sup-plying its large fleet of hydrous ethanol cars and for normal cars using blends of gasoline and anhydrous ethanol, and India for the chemical market. Plans for expanding production for fuel purposes in India had been contemplated during the second oil shock, but were given up. An ex ante analysis of this expansion and an ex post evaluation of Brazil's programme (Proalcool) are included in Bhatia and Pereira 1988 and are summarized below together with other selected literature. Some general remarks about the methodologies of those two studies are in order.
As done by Pereira for Brazil, an expost evaluation with the objective of drawing lessons from experience and improve future policies requires some uncertain assumptions because of the lack of some data, but on the whole the analysis can be based on observed events. Ex ante assess-ments, however, require an analysis of different scenarios, based on vari-ous assumptions about
the supply, demand, and prices of oil products; the input requirements for producing ethanol including technology, capital, land, labour, and so on; the opportunity costs of these inputs; and organization in the supply of ethanol and inputs, which will deter -mine the distribution of benefits from production. Since the conclu-sions of these types of assessments depend on the assumptions made, these must be explicitly stated and sensitivity analysis should be included. We shall keep details to a minimum, however, since these can be found in the original studies.
The two studies differ in focus as a result of their different types of analysis. For Brazil, the impact in selected years is estimated whereas, for India, the objective is to assess the social profitability of a new ethanol programme. This implies some differences in relative emphasis on issues. For Brazil, balance of payments, employment and income distribution are given detailed analysis since they are the key effects

Socioeconomic aspects 379
whereas, for India, the emphasis is on overall social costs and benefits. Their emphasis also implies different methodologies and limitations.
In the ex ante evaluation for India, the social costs and benefits of the programmes are expressed in local currency for comparison and estima-tion of net present values. This requires the use of a shadow exchange rate (that is, the official exchange rate plus a standard premium of 25 per cent, as used by the government) to reflect the scarcity of foreign exchange. The shadow exchange rate is used to convert into local cur-rency the prices (in foreign exchange) of traded goods associated with the programmes (that is, fertilizer, fuels and other inputs imported at the margin, as well as oil import savings and fuel exports resulting from ethanol production). In the ex post analysis of Brazil, the focus requires a different method. Inputs imported at the margin and benefits in foreign exchange are expressed in US dollars, and thus do not require the use of shadow exchange rate for this purpose, whereas costs of other inputs and capital costs in local currency are expressed in dollars by using a stan-dard conversion factor that takes into account the relative overvaluation or undervaluation of local currency during specified periods."
Brazil's ex post analysis Proalcool reached its first five-year period with significantly positive effects on the balance of payments and employment. The production of 3 500 million litres (22.6 million barrels) of ethanol in 1980 required under one million ha of harvested land, 207 distilleries of varying scale and a total investment of about US$2000 million in mid-1980 prices excluding land purchases (about $0.57 per litre). This output level (in 1980 alone) had a net impact on the balance of payments of about $520 million, and created 41 000 permanent jobs (16 000 in industry and 25 000 in agriculture) and 83 000 seasonal ones (6500 in industry and 76 500 in agriculture). This is equal to an investment of about $15 000 per worker or $22 000 per job-year, which is considerably lower than the sum required in most energy subsectors including oil. This very pos-itive impact was partly offset by a negative effect on income distribution through the allocation of subsidized loans and related changes in both the pattern of landownership and crop cultivation. 12
Proalcool's environmental impact is uncertain. On the one hand, it has contributed to a reduction of air pollution in major urban areas, but this has not been quantified. On the other hand, it has caused severe water pollution in some major producing states and has probably pro-
380 Ramesh K. Bhatia and Armand F. Pereira
moted excessive soil erosion in some micro areas. Both the extent of these effects and their implications remain unclear.
The economics of Proalcool are, however, largely determined by the opportunity Costs of investments, and these are mainly tied to world oil price fluctuations. The opportunity cost of land use for ethanol would be a critical factor for most countries, but not so for Brazil as a result of various factors, including arable land resources, cropping patterns, and trade- and price-related limitations on output expansion.
Proalcool's cost has been a controversial issue, partly because it is vir -tually impossible to carry Out an overall ex post cost-benefit analysis. Such an evaluation is constrained by uncertainties about the total amount and origin of public investments both directly in ethanol-related infras-tructure and indirectly in the form of subsidies to private investments. Ethanol supply is also partly responsible for investments in oil-refining adjustments that have been and are required to increase the oil-substitu-tion effect of ethanol, and these cannot be clearly estimated. In addition, there are many factors that affect both direct and indirect costs, including wide variations in inflation and exchange rates observed since 1975 when Proalcool began; variations in the gestation periods of invest-ments; and overlaps between ethanol- and sugar-related investments for agricultural production, research and development and other government services, as well as substitutions of sugarcane for food and export crops, which may have some negative implications for food price inflation, bal-ance of payments and income distribution. Similar difficulties also emerge in the economic valuation of benefits for the balance of pay -ments, employment and income effects, and spillover effects on other sectors.
Pereira (1986) provided a comprehensive analysis of costs by type of distilleries and regions based on secondary and primary data. Table 14.3 offers a summary of the comparative costs of gasoline and ethanol at the end of Proalcool's first five-year period, suggesting that during the sec-ond oil shock, anhydrous ethanol was cheaper than gasoline. The decrease in real oil prices after 1981 reduced the cost advantages of ethanol in Brazil. Oil prices of US$29 per barrel (f.o.b) in 1983 resulted in decreases of c.i.f import prices and ex-refinery costs of gasoline (per barrel) from $44.2 and $45.9 in 1981 to about $36 and $39 in 1983, respectively. The economic costs of producing ethanol may have been a bit higher than these in 1983, but significantly so after the oil price fall in 1986. Levinson (1987) reviews the findings of another study by a for-
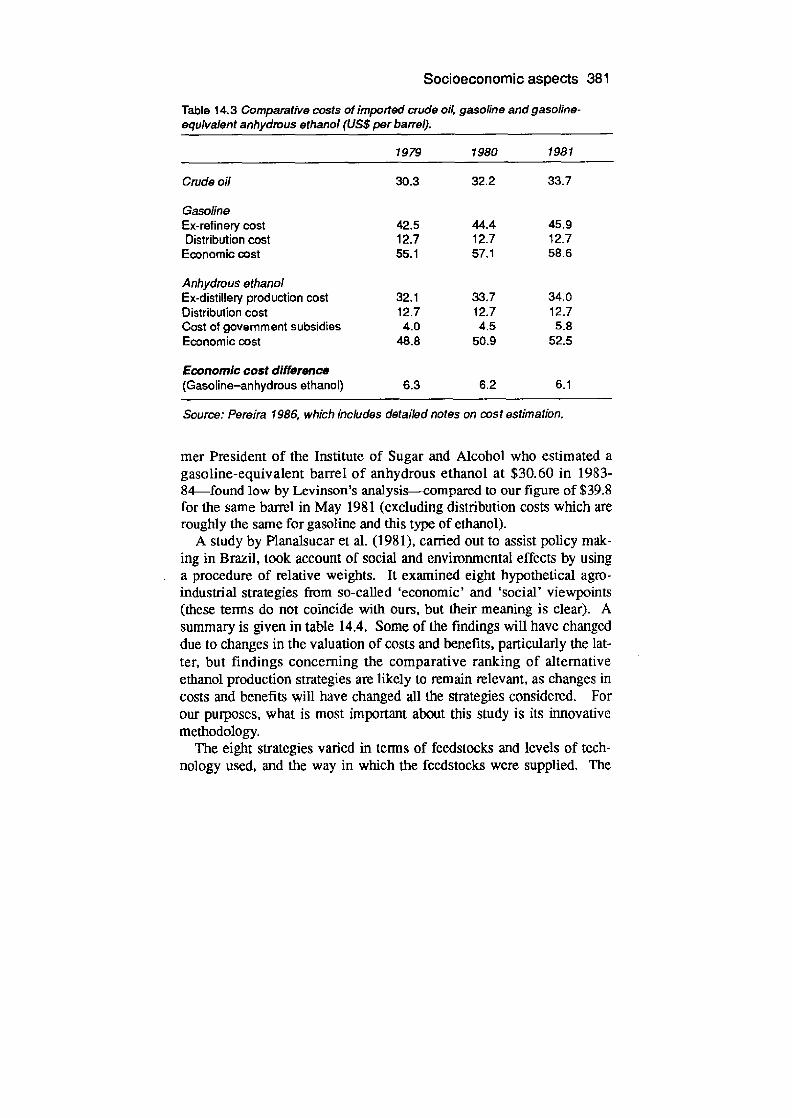
Socioeconomic aspects 381
Table 14.3 Comparative costs of imported crude oii gasoline and gasoline-equivalent anhydrous ethanol (&JS$ per barrel).
1979 1980 1981
Crude oil 30.3 32.2 33.7
Gasoline Ex-refinery cost 42.5 44.4 45.9 Distribution cost 12.7 12.7 12.7
Economic cost 55.1 57.1 58.6
Anhydrous ethanol Ex-distillery production cost 32.1 33.7 34.0 Distribution cost 12.7 12.7 12.7 Cost of government subsidies 4.0 4.5 5.8 Economic cost 48.8 50.9 52.5
Economic cost difference (Gasolirie–anhydrous ethanol) 6.3 6.2 6.1
Source: Pereira 1986, which includes detailed notes on cost estimation.
mer President of the Institute of Sugar and Alcohol who estimated a gasoline-equivalent barrel of anhydrous ethanol at $30.60 in 1983-84—found low by Levinson's analysis—compared to our figure of $39.8 for the same barrel in May 1981 (excluding distribution costs which are roughly the same for gasoline and this type of ethanol).
A study by Planalsucar et al. (1981), camed out to assist policy mak-ing in Brazil, took account of social and envimnmental effects by using a procedure of relative weights. It examined eight hypothetical agro-industrial strategies from so-called 'economic' and 'social' viewpoints (these terms do not coincide with ours, but their meaning is clear). A summary is given in table 14.4. Some of the findings will have changed due to changes in the valuation of costs and benefits, particularly the lat-ter, but findings concerning the comparative ranking of alternative ethanol production strategies are likely to remain relevant, as changes in costs and benefits will have changed all the strategies considered. For our pulposes, what is most important about this study is its innovative methodology.
The eight strategies varied in terms of feedsiocks and levels of tech-nology used, and the way in which the feedstocks were supplied. The
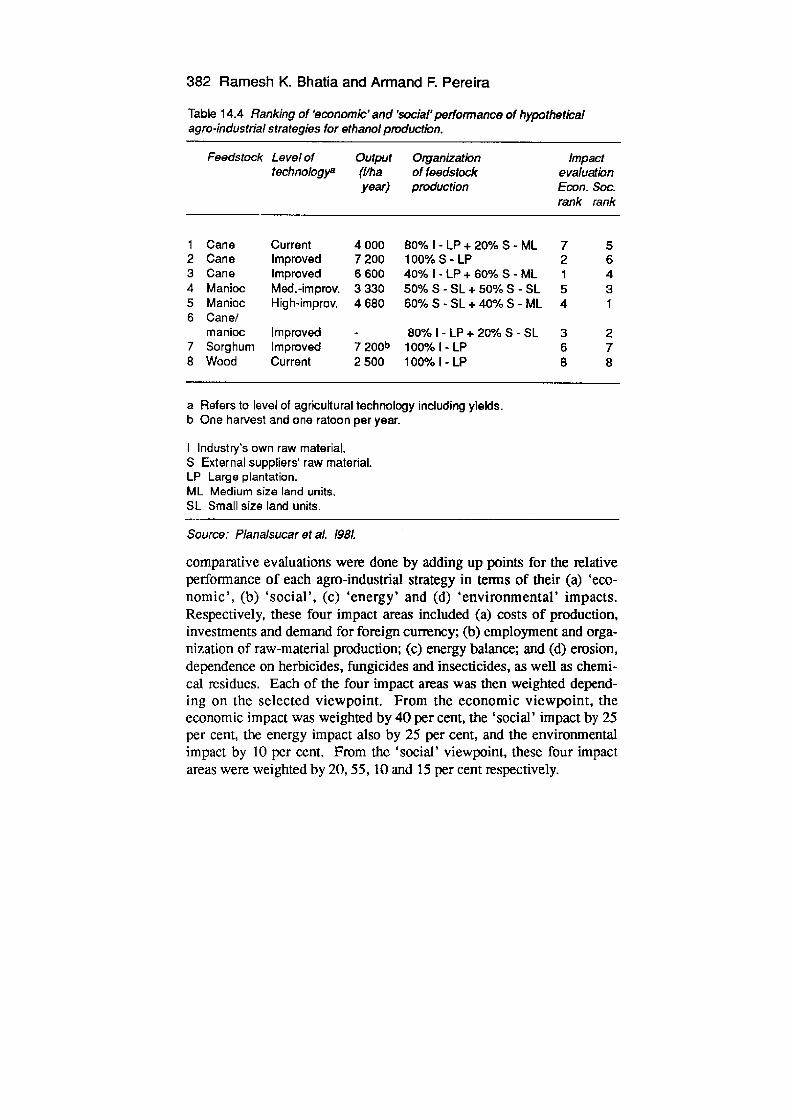
382 Ramesti K. Bhatia and Armand F. Pereira
Table 14.4 Ranking of 'economic' and 'social' performance of hypothetical agro-industrial strategies for ethanol production.
Feedsiock Level of technologya
Output (1/ha year)
Organization of feedstock production
Impact evaluation Econ. Soc. rank rank
1 Cane Current 4 000 80% I - LP + 20% S - ML 7 5 2 Cane Improved 7200 100% S - LP 2 6 3 Cane Improved 6 600 40% I - LP + 60% S - ML 1 4 4 Manioc Med.-improv. 3 330 50% S - SL + 50% S - SL 5 3 5 Maniac High-improv. 4 680 60% S - SL + 40% S - ML 4 1 6 Canef
manioc Improved - 80% I - LP + 20% S - SL 3 2 7 Sorghum Improved 7200b 100%I-LP 6 7 8 Wood Current 2 500 100% I - LP 8 8
a Refers to level of agricultural technology including yields. b One harvest and one raloon per year.
I Industry's own raw material. S External suppliers' raw material. LP Large plantation. ML Medium size land units. SL Small size land units.
Source: Planalsucar et al. 1981.
comparative evaluations were done by adding up points for the relative performance of each agro-industrial strategy in temis of their (a) 'eco-nomic', (b) 'social', (c) 'energy' and (d) 'environmental' impacts. Respectively, these four impact areas included (a) costs of production, investments and demand for foreign currency; (b) employment and orga-nization of raw-material production; (c) energy balance; and (d) erosion, dependence on herbicides, fungicides and insecticides, as well as chemi-cal residues. Each of the four impact areas was then weighted depend-ing on the selected viewpoint. From the economic viewpoint, the economic impact was weighted by 40 per cent, the 'social' impact by 25 per cent, the energy impact also by 25 per cent, and the environmental impact by 10 per cent. From the 'social' viewpoint, these four impact areas were weighted by 20, 55, 10 and 15 per cent respectively.
Socioeconomic aspects 383
The study reached the following conclusions. From the 'economic' viewpoint, the highest ranking strategies were numbers 3, 2 and 6 which, in decreasing order, also had the lowest cost per litre The only signifi-cant difference between strategies 3 and 2 was the larger number of jobs created and the more equitable production of raw material. The strategy using sweet sorghum (which assumed current techniques but slightly higher crop yields, and all of the raw material produced from the dis-tillery's own lands) was reported to have a good energy balance and a good economic performance, but had a comparatively low social impact. From the 'social' viewpoint (with the 'economic' impact weighted by 20 per cent and the 'social' one by 55 per cent), the three highest ranking strategies were numbers 5, 6, and 4, but with little difference in points; all are manioc based, the cane/manioc consortium ranking second. The best strategy from the 'economic' viewpoint ranked fourth in this assess-ment, and sweet sorghum and wood scored last, as in the 'economic' assessment.
The Planalsucar study is an interesting attempt to take into account not only employment creation but also income distribution effects (in terms of the share of small farmers in total raw-material supply). The attention given to environmental effects and potential improvements in crop yields that depend on technology are also innovations worthy of attention.
An ex-ante evaluation of alternative ethanol programmes in India Bhatia's study—carried Out in 1984—analyses the economics of two optional production scenarios of 2000 million litres and 3000 million litres of ethanol from sugarcane as a substitute for oil fuels and petro-chemicals in India. According to this extended cost-benefit analysis, the benefits from ethanol production are estimated in terms of its impact on foreign trade in oil products. Similarly, the cost of ethanol production is estimated in terms of the economic costs of resources (land, water, fertil-izer, labour and so on) that are used for producing sugarcane and ethanol. The estimation of benefits and costs at shadow prices is described in detail in Shatia and Pereira 1988. Some of the results are given below.
Evaluation results: the results are presented under two assumptions: (i) unlimited sugar exports, and (ii) sugar exports limited to 1.0 million tonnes per year. Assuming unlimited exports, an additional 2.9 million
384 Ramesh K. Bhatia and Armand F. Pereira
tonnes of sugar will be available for exports if not diverted to produce 2000 million litres of ethanol in 1990. The international sugar market is very volatile, with large-scale fluctuations in prices that have ranged between US$0.07 to 0.08 and $0.40 per pound. A price of $0.16 per pound or $350 per tonne in 1990 is used, based on a long-term projec-tion of world sugar prices by the World Bank (1980). Given the ISA export quotas, India may not be able to export more than about I million tonnes at the estimated price, which may earn $350 million. The esti-mated benefit from use of ethanol as a substitute for gasoline/diesel is $503 million, giving a total benefit of $853 million. In contrast, the total benefit from exporting 3.9 million tonnes of sugar at $350 per tonne is $1365 million. However, it may not be possible to export additional quantities (if permitted under the ISA) at the stipulated price of $350 per tonne, and prices may have to be reduced to export more. The estimated benefits from sugar exports will be higher than those from sugar exports plus ethanol production if the average export price of sugar is higher than $220 per tonne or $0.10 per pound. Thus, the crucial variables that determine the profitability of ethanol programmes from the viewpoint of society are the price and quantity of sugar that can be exported by India in 1990 and beyond. This analysis does not depend on the costs of pro-duction of sugarcane as long as the export price is high enough to pro-vide incentives for farmers and mills or distilleries to produce the required quantities.
General considerations on the economics of biogas
Some general issues deserve emphasis here to supplement the previous findings on biogas and other energy options for water pumping. 13 The financial viability of biogas systems can vary significantly from one situ-ation to another, depending on the end uses of biogas and, therefore, on the prices of the fuels it replaces. It also depends on whether part of the biodigestion inputs are by-products of agricultural production or not, and whether biogas slurry can be productively used as fertilizer or processed into feeds. Some crop mixes yield more agricultural residues than oth-ers. In some cases, the residues are sufficient to be stored and used as the major source of animal feed, thus allowing animals to be stabled longer and make more dung available and easier to collect. The benefits of a family-scale biodigester for two farmers of similar income and in the same region will be much higher for the one who uses biogas for

Socioeconomic aspects 385
productive activities, and whose cattle are largely stabled and fed by agricultural residues throughout most of the year. The benefits are lower for the farmer who uses biogas exclusively for cooking and lighting, and whose cattle are pasture fed and dung supply is largely dispersed.
From the standpoint of society, the benefits of biogas are equally detennined by the end uses of biogas and slurry, whereas the costs are additionally related to direct public investments and/or to subsidies to private investments. The benefits are evidently significant if, for exam-ple, biogas is a substitute for kerosene in cooking and lighting and for diesel in productive activities, and if slurry is a substitute for oil-derived fertilizers, in cases where the unit costs of biogas/slurry are lower than the economic costs (shadow prices) of those conventional products. If the market prices of these products are subsidized to a point where bio-gas plants for the above end uses are not financially attractive, corrective subsidies for investments in those plants are clearly justifiable. If, as in some cases of community biogas plants directed at the needs of poor households, biogas is used mainly as a substitute for firewood in cook-ing, and slurry for dung in crop fertilization, the benefits are less signifi-cant than in the above case, and will consist of some additional income (if some firewood is purchased) or savings in labour time, which can be used for productive activities or additional leisure. But, since firewood may be partly collected free and at zero or low opportunity cost, and since slurry for dung substitution probably has limited financial advan- tages to households, the biogas plant will have to be highly subsidized for consumers to fmd it attractive. For some of these plants, the amount of subsidies required for their successful installation and operation may make their social costs exceed their measurable social benefits. However, there may be specific micro regions marked by acute scarcities of fuelwood and by soil erosion from excessive rates of deforestation where the social benefit from reducing fuelwood consumption may be much higher than what may be conceivably estimated as the shadow price of fuelwood, bearing in mind the prevailing market price in the surrounding regions and other parameters determining the shadow price.
The financial aspects of improved stoves Although many studies have analysed various aspects of the develop- ment and diffusion of stoves, very few have attempted to carry Out finan- cial and economic analyses. An ex post financial analysis of bell-bottom
386 Ramesh K. Bhatia and Armand F. Pereira
jikos manufactured and used around Nairobi has been carried out by Hyman (1986). These charcoal Stoves are more expensive than a tradi-tional stove, but last longer and have a short payback period. Based on an observed fuel saving of 25 per cent (as opposed to 34 per cent in lab-oratory tests) and other cost parameters, Hyman calculated that the net present value over a two-year period to a household adopting an improved jiko ranged from KS 257 to KS 884 if charcoal was purchased in tins, or KS 109 to 518 if charcoal was purchased in sacks. The varia-tion is due to differences in the price and quantity of charcoal consumed in Nairobi, other urban areas and rural areas.
The social benefits of a programme to encourage small-scale informal sector production of charcoal stoves are large, even after accounting for the administrative costs. Such a programme may also provide limited employment and income gains for producers. In addition, the environ-mental impact may be significant because of the energy loss in convert-ing wood to charcoal and the fact that charcoal is usually made from felling whole trees. If 80 per cent of the Kenyan households that used charcoal in 1985 adopted improved jikos, as much as 116 100 tonnes of charcoal could be saved annually. With traditional charcoal conversion methods, this saving is equivalent to 967 000 tonnes of wood per year. By the year 2000, an 80 per cent adoption rate for improved charcoal stoves might save nearly 3.5 million tonnes of wood per year.
Hyman does not incorporate these employment and environmental benefits into a complete economic analysis, although he goes a step fur-ther from the financial analysis to take account of the administrative costs of a jiko programme. However, in order to establish some bench-marks for the efficient allocation of financial incentives including subsi-dies, it would be appropriate to calculate the social profitability of such stoves. This economic analysis should shadow price labour, capital and production inputs, but should also shadow price charcoal in a way that would truly reflect the social cost of replenishing the wood required to produce it. Any negative side effects which might be attributed to excessive deforestation in the short run should also be reflected.
A summary of conclusions for research and policy
This review of socioeconomic aspects of biomass and other renewable technologies, including economic evaluation methodologies and selected
Socioeconomic aspects 387
results, brings out several important issues. We suggest, first, that envi-ronmental, employment and income distribution aspects of biomass and other energy sources and technologies have been neglected and that these issues should be integrated in a framework of comparative evalua-tion of technologies. We must emphasize, however, that the objective of economic evaluations should not be to 'recommend' or 'reject' a particu-lar technology or project, but rather to provide a tool for helping to select a technology. They can help to identify situations in which a particular technology is more attractive than other technologies from the view -points of users and society. When such evaluations are applied to RETs vis-à-vis conventional technologies, such as electric grid extension, they can bring out hidden costs that are usually underestimated. They also allow planners to visualize the role that RETs can or cannot play in delivering benefits to populations that could not be pmvided by the con-ventional technologies because of their greater centralization and related constraints. When some costs or benefits are uncertain or difficult to measure, the evaluations can include different scenarios and sensitivity analysis to give readers the means to carry out alternative calculations under slightly different assumptions and to reach their own conclusions, or to adjust the methodological rationale to another situation where con-ditions would be differeni
In our discussion of energy technologies for a specific end use we purposely try to show how alternative evaluation methods can lead to different conclusions about the comparative attractiveness of competing technologies. We also try to point out that even minor differences in methods can significantly alter results, and that methodological details should therefore not be overlooked (although to keep this chapter within a reasonable length, many such important details had to be omitted).
The type of evaluation selected for the case of water pumping in Ghazipur is required for helping investors choose the best technology. However, the favourable findings for dual-fuel engines using biogas and diesel oil in (Jhazipur are extremely site-specific. In fact, windmills for water pumping in Ghazipur ranked worse than diesel and electric pumpsets mainly because of an unfavourable match between windmill design and local conditions of wind regime, cropping pattern and monthly variation in underground water supply.
The evaluation discussed is also essential for planners, to aid the for-mulation of correct policies which affect investors' choices. Based on such evaluation findings, one can outline the tax/subsidy and energy

388 Ramesh K. Bhatia and Armand F. Pereira
pricing policies required to promote private investments in technologies and related projects that are found profitable from the society's view-point.
Regarding the tax/subsidy issue, the biogas/diesel option was found the most economically attractive one for Ghazipur. Yet this option is hardly in use in northern India, partly because the subsidies that have been offered to biogas plants (about 25 per cent of the capital cost plus a reduced interest rate on a bank loan) have been insufficient to make an investment in a biogas plant for irrigation financially feasible. Also there have been no explicit subsidies for investments in PV systems and windmills. The use of gasifiers and ethanol for irrigation has not even been considered for government subsidies. The findings thus suggest a need to assess:
the amount of subsidies being provided to various users of electric-ity in different regions; the costs that will be incurred in providing electricity to new areas; and the amount of subsidies that will make investment in renewables socially profitable and financially feasible. Planners should try to ensure, however, that such tax/subsidy schemes do not lead to a net transfer of resources from the society at large to higher income households.
Regarding pricing policy, governments usually administer electricity, kerosene, diesel and other fuel prices, and some of these involve differ -ent subsidies. For example, in the case of grid electricity in India, the electricity tariff paid by farmers is a small fraction (on average about 15 to 20 per cent) of the real cost of supplying electricity. But as discussed in the illustrative study of Ghazipur, this cost is uncertain. For this rea-son, it was shown to be important to carry out sensitivity analysis, involving a recalculation of the relative economic attractiveness of the technological options under different estimates of the real cost of supply-ing electricity. The sensitivity analysis carried out with respect to tech-nical parameters can also indicate areas to which research and development efforts should be directed.
Among the biomass technologies that can play an important role in centralized (rather than decentralized) energy supply, ethanol production systems continue to deserve attention, even though they are generally not competitive at recent world oil prices. The controversial Brazilian ethanol programme provides some useful lessons, the main one being
Socioeconomic aspects 389
that it was a planning mistake in 1978/80 to orient production to the sup-ply of new hydrous-ethanol cars. Independently of the uncertain oil price path, it would have been much wiser to target production to a full 20 per cent of the total demand for car fuel. This would mean that only anhydrous ethanol would have been produced until at least 1982. And since this type of ethanol would be mixed with gasoline and would not require new and specially designed vehicles, it would be possible, in the event of a sudden drop in oil prices, to reduce the percentage of ethanol, making it further available for non-fuel markets.
The unnecessary fast growth rates of ethanol production also led to an undesirable disorganization in sugarcane supply, in turn leading to a con-centration of landownership in large pmducing areas and a related aggra-vation of income distribution. A lower growth rate of ethanol production could have allowed the government agencies and sugar/ethanol complexes to plan for production arrangements that would optimize on the uses of by-products.
The ex ante analysis carried Out in 1985 of two ethanol programmes in India produced findings that have been evidently altered by world oil price movements and other changes, but they are useful both as a base for future analysis and as a methodological reference. The analysis sug-gested that converting sugarcane into ethanol for use as substitutes for oil fuels and petrochemicals was economic at oil prices of $300 to $400 per tonne (1983 US dollars) and assuming a limited quota on sugar exports and estimated economic costs of producing sugarcane. As expected, the results are sensitive to changes in the economic costs of sugarcane cultivation and estimated benefits from ethanol. If the eco-nomic costs of sugarcane are 15 per cent higher than those estimated in the reference solution, ethanol production is not economical. It is found to be economical if benefits are 7 per cent lower than those estimated there.
The social profitability of the programme considered (2000 million litres and 3000 million litres) is not seriously affected even if capital costs are higher by about 20 per cent. In addition, the ethanol pro-grammes will have significant impacts on employment and income dis-tribution in several regions. Both programmes are much more sensitive to changes in benefits than to changes in the costs of sugarcane and capi-tal costs.
Given the limitations of the data, some of the parameter values used in this study may be overestimates or underestimates and the sensitivity

390 Ramesh K. Bhatia and Armand F. Pereira
analysis may not be correct for all possible distortions. Nevertheless, this evaluation suggests that the earlier policy decision of not producing ethanol for fuel uses should be reconsidered, particularly if world oil prices recover to 1979-1983 levels. Any coherent policy on ethanol pro-duction should not be based on general notions about the economics of converting sugarcane to ethanol or sugar. There is a need for detailed follow-up studies regarding fluctuations in export prices of sugar, fluctu-ations in sugarcane output; impact on crop substitution; effects on employment; and the real economic value of foreign exchange earnings from either increased exports or reduced imports of oil products.
In this review we have suggested, in common with other recent litera-ture, that some RETs have been economically attractive for certain end-use conditions, and can continue to play an important role in assisting rural development, regardless of erratic fluctuations in world oil prices. Biomass and other RETs have a number of key advantages that have been neglected in comparative evaluations. Invariably, these technolo-gies have lower gestation periods than conventional ones (for example, a gasifier or windmill may become operational in one year while the extension of an electric grid may take three to ten years depending on distance). In an economy where there are power/energy shortages and the opportunity costs of additional supply are quite high (as in many African countries), the economic analysis should reflect this advantage of 'early' benefits. Furthermore, some RETs use resources which have no escalation in fuel costs (for example, solar, wind, water). In the case of biomass technologies, the cost escalation may be different from that of conventional fuels and should be given explicit consideration. Another issue worthy of attention is that current capital costs of RETs are not representative since these reflect early attempts at research and development, low efficiency, low scale of output, high infrastructural costs, and so on. Economic analyses should therefore include scenarios reflecting the effect of a probable technological breakthrough which can significantly reduce the capital cost of one or more of the competing technologies or costs of materials, or bring about efficiency improve-ments, much higher scale of output, lower per-unit costs of infrastructure and the like, as illustrated for solar technologies in the study of Ghazipur.
The incorporation of environmental costs and benefits in economic evaluations will help improve the comparative ranking of small-scale rural-oriented RETs as well as improved stoves in urban and semi-urban
Socioeconomic aspects 391
areas. Unlike conventional practice, an evaluation focusing on, for example, conventional grid electricity versus alternative RETs could include quantitative measures of the capital Costs of reducing emissions in coal-, oil- or gas-based thermal power stations; capital and operating costs of reducing risks of nuclear power plants to acceptable levels; costs of reducing adverse health effects and other costs of environmental effects of coal or uranium mining, lransportation and handling; aquatic effects of discharge of cooling water; physical, biological and related socioeconomic (particularly, rehabilitation) costs of large-scale hydropower projects, including any beneflt forgone' of forest wealth and flora and fauna lost due to submergence of land, and the costs of rehabilitation of families uprooted as a result of the large hydro project; benefits in terms of irrigation and fisheries which may be involved in the creation of an artificial lake in the hydro plant; environmental aspects of transmission lines, wind generators or any other competing technology involved (including aesthetic effects, noise and accidents); overall costs of using and replenishing woodftLels for gasifiers; and the health benefits of biogas and improved stoves. Also, comparative evaluations of ethanol versus gasoline or other liquid fuels should take account of costs of stillage treatment (and/or reprocessing) versus benefits from the reduction of hydrocarbon and carbon monoxide emissions.
Gaps still remain precisely in this incorporation of environmental costs and benefits, but not simply because of difficulties in measuring them. As we have pointed out in this paper, many such costs can be measured. Others cannot but, given the 'advising' role of economic evaluation, it would be useful to incorporate them through sensitivity analysis that may employ a weight system in terms of percentages of overall costs and benefits.
Notes 1 The concept of end-use situation is important for the analysis of
RETs because their technical, financial and economic feasibility varies from one situation to another. The concept refers to the end uses as well as the resource conditions and other characteristics of the users.
2 For a comprehensive analysis of these issues based on country and project experiences, see, for example, Pereira and Bhatia forthcoming.
3 There is a comprehensive literature on this topic, including

392 Ramesh K. Bhatia and Armand F. Pereira
methods of general and partial equilibrium analysis and socioeconomic analysis. For a more detailed discussion of financial versus economic analysis see, for example, Gittinger 1982 and Ray 1984.
4 The World Bank ESMAP reports give details of experience with stove-related projects; see also Pereira and Bhatia forthcoming, and Smith 1989. On village water pumps, see, for example, Jorgensen 1980 and Smith 1985.
5 For details and evaluation of water turbines, see ITDG 1987, Sharma 1988, and Pereira and Bhatia forthcoming.
6 See, for example, Smith 1985 for a review of some project experience and ILO 1987 for an analysis of some implications for project design.
7 See, for example, El-Hinnawi et al. 1983, Bhatia and Pereira 1988, Pereira et al. 1987. Also various energy-related journals offer literature reviews. Asset (published by the United Nations University and Unesco) has pmvided valuable abstracts of studies on RETs.
8 French 1979 applies this methodology to the economic evaluation of a 40 FIP solar-thermal pump and a 5.5 kW PV pump.
9 See Bhatia 1987, Bhatia and Pereira 1988 and chapter 7. 10 See references in Chapter 5, and Koide et al. 1982, Geller 1984,
Levinson 1987 and Pereira 1986, for a review of recent literature. 11 See, for example, Little and Mirrlees 1974, and Gittinger 1982 for
details on these accounting methods. 12 See Pereira 1986 for details on these changes, and estimates of
capital and operating costs, government investments, and costs of subsidies.
13 The economics of biogas have been analysed in a number of studies including Lichtman 1987, and Bhatia 1987. Case studies and a review of country experiences are included in Pereira and Bhatia, forthcoming.
References Bhatia, Ramesh (1987) Diffusion of Renewable Energy Technologies in
India: A Case Study of Dual-fuel Engines, ILO, Geneva; mimeographed World Employment working paper n. 178; restricted.
Bhatia, R. and Pereira, A. (eds) (1988) Socioeconomic Aspects of
Socioeconomic aspects 393
Renewable Energy Technologies, Praeger, New York, London. Bhatia, R., Lichtman, R., Pereira, A., and Tentscher, W. (forthcoming)
The DWusion of Biogas Systems: A Review of Some Experience, Pereira and Bhatia (eds) (forthcoming).
El-Hinnawi, E., Biswas, X., Margaret, R., and A. Biswas (eds) (1983) New and Renewable Sources of Energy, 1)'cooly International Publishing Limited, Dublin.
French, David (1979) The Economics of Renewable Energy Systems for Developing Countries, USAID, Washington. DC; mimeographed, Jan.
Geller, Howard (1984) Ethanol from Sugarcane in Brazil: An investigation of Some Critical issues, CESP, So Paulo; mimeographed.
Gittinger, J. P. (1982) Economic Analysis ofAgricultural Projects, Johns Hopkins University Press, Baltimore.
Hyman, Eric (198) 'The economics of improved charcoal stoves in Kenya', Energy Policy, April.
ILO (1987) Linking Energy with Sun'ival: A Guide to Energy, Environment and Rural Women's Work, Geneva.
ITDG (1987) Energy as if People Mattered, J.TDG, London; mimeographed, Sept.
Jorgensen, K. (1980) Water Supply Problems in Rural Africa: the Implications For Women, Centre for Development Research Copenhagen.
Koide, S., Brooks, R, and Vicharangsan, T. (1982) Regional Study on Production of Fuel Etha nol from Agro-products (Economic and Social Commission for Asia and Pacific, Bangkok,).
Levinson, Mark (1987) 'Alcohol fuels revisited: The costs and benefits of energy independence in Brazil', Journal ofDeveloping Areas, April.
Lichtman, Rob (1987) 'Socioeconomic and organizational aspects of biogas programmes: A study of India's experience', World Development, April.
Little, I. and Mirrlees, J. (1974). Project Appraisal and Planning for Developing Countries Heinemann Educational Books, London.
MacKillop, Andrew (1983) Technology, Employment and Development implications of New and Renewable Sources of Energy, 1LO, Geneva ; mimeographed World Employment working paper n, 114; restricted.

394 Ramesh K. Bhatia and Armand F. Pereira
Pereira, Armand (1986) Ethanol, Employment and Development: Lessons from Brazil, ILO, Geneva.
Pereira, A., Ulph, A., and Tims, W. (1987) Socioeconomic and Policy Implications of Energy Price increases, Gower Publication Co., London, for the JLO.
Pereira, A. and Bhatia R. (eds) (forthcoming) Renewable Energy Technologies For Rural Development: Lessons from Country Experiences (prepublication draft).
Planalsucar, 'Previsao e Analise Tecnologica do Piracicabo', USP, Centrd de Technologia, Maya, S.P., PLANALSUCAR, 1981; May, mimeographed.
Ray, Anandarup (1984) Cost-benefit Analysis: Issues and Methodologies The Johns Hopkins University Press, Baltimore.
Sharma, S. N. (1987) Institutional Aspects of Promoting the Use of Water Turbines in Nepal, ILO, Geneva: mimeographed World Employment working paper no. 181; restricted.
Smith, Douglas (1985) PhotovoUaics: Socioeconomic impact and Policy implications, ILO, Geneva; mimeographed World Employment working paper no. 151; restricted.
Smith, Kirk (1989) 'Dialectics of impruved stoves', Economic and Political Weekly, March 11.
World Batik (1980) Alcohol Production from Biomass in the Developing Countries, Washington D.C., World Bank, September.

Appendix: energy and power units
Prefixes
E (exa) = 1015
T (tera) = 1012 G (giga) = 10 M (mega) = 106 k (kilo) = 10 m (miii) = 10 p. (micro) = 10-6 n (nano) = 10 -9 p (pico) = 10-12
Units
1 joule (J) = I newton 1 metre (N m) = 1 watt-second (Ws)
1 watt (W) = I J s - i (joule per second) 1 kWh (kilowatt-hour) = 3.6 x 10 J
1 tonne air-dry biomass (wood) = 15 MJ/kg 1 tonne fuelwood = approximately 1.4 m3 wood 1 tonne charcoal is derived from 7-12 tonnes of wood
I Mtoe (million tonnes oil equivalent) =44 x 106 GJ
1. The newton (N) is the basic unit of force in the Système International des Unites (SI). It is the force needed to give a mass of 1kg an acceleration of 1 m s-2.
Contributors G. W. Barnard, Panos Institute, London, UK R. K. Bhatia, Institute of Economic Growth, New Delhi, India A. K. Biswas, International Water Resources Association, Oxford, UK M. J. Chadwick, Stockholm Environment Institute, York Centre, York University, Heslington, UK A. Ellegârd, Bioquest, Gothenburg, Sweden
A. Grimshaw, Brookhaven National Laboratory, Upton, New York, USA
0. Hall, Department of Biology, King's College, London, UK B. K. Kaale, Regional Woocifuel Expert, Energy Sector, Southern Africa Development Cooperation Council (SADCC), Luanda, Angola B. Kjellstriini, Department of Steam Technology, Royal institute of Technology, Stockholm, Sweden
Kristoferson, Vice Executive Director, Stockholm Environment Institute, Sweden S. C. Morris, Brookhaven National Laboratory, Upton, New York, USA D. R. Newman, Department of Biology, King's College, London, UK
Pasztor, Programme Officer Energy, United Nations Environment Programme (UNEP), Nairobi, Kenya (until May 1989) and Associate Scientist, Stockholm Environment Institute, Boston Center (since June 1989) A. F. Pereira, Employment and Development Department, International Labour Office (ILO), Geneva, Switzerland F. Rosillo Calle, Department of Biology, King's College, London, UK
R. Smith, Environment and Policy Institute, East West Center, Honolulu, Hawaii I. Stjernquist, Environmental Studies Programme, Lund University, Sweden A. Strehier, Bayer. Landesanstalt für Landtechnik, Technical University of Munich, Freising, F R. Gemiany

Index Acacia trees, 65, 246, 248 Accidents. See Safety issues Acidification, 21, 50, 51, 58, 76, 78,
198, 276 Acute respiratory infections (ARt),
306-307 Adams, Reinaldo, 255 Aesthetic issues, 54 Afghanistan, 313 Africa, 145-146, 225, 226, 227, 246,
254, 291-292, 292(fig.) Agriculture, 6, 40-41, 44, 96
Brazilian, 222-223 and climate modification, 328 developing countries, 26 farming systems, 18-19 high-input, 101-102 low-input dryland, 100-101 subsistence. 220 wetlands, 93, 101 See also Food issues
Agroforestry, 6, 19, 20, 233, 244-246, 244(fig.). See also Farm forestry
Alcohol(s), 114-118, 133(fig.) beverages, 347, 350 distilleries, 24, 27, 242 environmental residuals, 332(table) fermentation plant emissions,
33l(table) fuel programs, 135, 137-146, 221 fuels, 14-15, 113-114, 147, 148(table),
324. See also Ethanol; Methanol grain amounts required, 221 as octane boosters, 141, 150-153 petroleum fuels comparison, 147 production capacity world-wide,
1 36(table) socioeconomic issues, 153-156. See
also Socioeconomic issues Aldehydes, 10, 15, 21, 129, 132,
03(fig.). 134, 135, 304, 313, 344, 345
Alder trees, 61 Aluminium, 276 Amazon Basin/Amazonia, 39, 214, 245.
See also Brazil Ames tests, 196, 342 Ammonia, 76, 164, 171 Anaerobic digestion, 89, 114, 147, 163-
165, 164(table), 171, 172, 240, 333-334
mesophilic, 173
See also Biogas Animals. See Livestock Argentina, 144 ARI. See Acute respiratory infections Ash, 76, 77, 77(table), 197, 363 Asia, 23, 31, 61(table), 146, 292-293,
31 7(fig.) Aspen trees, 59 Auroville, India, 224 Australia, 51, 71 Austria, 116, 207 Automobiles, 128, 141, 149, 150, 221,
344. See also Emissions, vehicle; Engines
Bacteria, 173 Bagasse, 14, 71, 87, 120, 125, 156, 158,
250, 327, 363 Bangladesh, 9, 31, 89, 101, 102 BaR See Benzo(a)pyrene Bark, 337 Beer, 33 Benefits, 2, 3, 27-28, 384-385, 389,
390-391 measurable vs. immeasurable, 366-
367 See also Cost-benefit analysis
Benin, 246 Benzene(s), 331, 338, 346, 347 Benzo(a)pyrene (BaP), 20, 90, 271, 274,
304, 326, 330, 339, 339(table), 341, 342, 343, 349, 350, 353, 371
Berry production, 58 Bhima irrigation project (India), 294-
295, 296(table), 299 Biogas, 12-13, 27, 147, 363
economics of, 384-385 emisions from production of, 334,
334(table) environmental issues, 169(fig.), 170-
172, 333 formation/properties, 163-165,
165(table) health/safety aspects, 173-175 production plants, 166-168 programs, 169-170 research and development, 170 substrates, 165, 170. See also
Producer gas use, 168-169, 168(table) See also Anaerobic digestion;
Biogasification

400 Index
Biogasifleation, 253. See also Biogas; Gasification
B iomass combustion. See Combustion,
biomass demand, 7 energy conservation, 236-238 fuel consumption, 196(table),
296(table) fuel conversion technologies, 114,
236, 269(fig.), 326(table) fUel cycle, 302-303, 302(fig.) fuel resource levels, 34-36 production and water use, 297-300,
297(6g.) solid fuel. See Solid fuels
Biostil process, 127 Birch trees, 61 Birth rates. 307 Boilers, 204-207, 328-329(tables), 330.
See also Furnaces; Stoves Boreal zone, 57-58, 61-63, 66-68 Botswana, 37 Bracken, 75 Braiil, 14. IS, 37, 51, 71, 113, 157, 187,
198, 208, 219, 242, 367 agriculture, 222-223 balance of payments. 379 CETESB agency. 132 ethanol production/use. 116. 117,
120, 122, 124(table), 132, 137, 37-139(tables), 138-140, 147, 148(lablc), 149, 155, 344, 368, 370.388-389. See also Brazil, Programa Nacional do Alcool
and food vs. fueL, 154, 221-223 integrated energy systems, 254-255 Programa Nacional do Alcool (PNA).
138. 140. 154, 369, 370, 378, 379-381
steelmaking in, 226 stillage reprocessing in, 363 sugar cane in, 120-121, 155, 156,
220, 222. 255 vehicle sales in, 138(table)
Briquettcs, 203, 211 British American Tobacco, 239 Bungay, H. R. III, 326-327 Burkina Faso, 30, 33, 229, 237, 241,
243 Burma, 93 Bush, George, 141 Bushes, 36 Butanol. 114. 147
Cacao, 246
Cadmium, 77, 77(iable) Cairo Plan of Action, 254 Calcereous compounds, 76 Calcium, 59 California, 71, 74, 130, 149, 345 California Energy Commission (CEC),
130 Caloric values, 275(table), 277 Canada, 96, 207 Cancer, 196, 274, 304, 306, 307-308,
326, 339-340, 347, 349, 350, 353-354
Cannon, J. A., 340 Capola de Santana rural energy system.
251(fig.), 255 Carbohydrates, 70, 287 Carbon, 171, 253, 280. See also Soil,
carbon content Carbon dioxide, 2, 4, 14, 15, 21-22,
43, 76-77, 79, 155, 165, 197, 202(tablc), 203(11g.), 207, 209, 210(table), 269, 278-280
Carbon monoxide, 8, 10, 13, 15, 17, 20, 117, 130, 131, 132, 195, 198, 201,203(fig.), 205, 207, 210, 271, 283, 304, 306, 312-313, 340, 344, 345
Carboxyhaemoglobin, 283 Cash crops, 216, 222, 246 Cassava, 71, 119, 121, 146, 220 Catalysts, 152 Catalytic converters, 344, 345 Catch crops, 70, 72, 75, 221, 279 CEC. See California Energy
Commission Cellulose, 119. 332(table) Central Soil and Water Conservation
Research and Training Institute (India). 299
Central/South America/Caribbean countries, 143-145, 1 43(table). 277
Cereals, 74, 86, 142, 201, 204, 207, 209, 250, 288, 331
Charcoal, 6, 7, 8, 10, 32, 42, 43, 190, 197, 225, 226-227, 236, 291, 312,313, 386
Chemical mass balance (CMB), 341 Children, 10, 30, 37, 306-307, 309,
310, 338, 366 Chimneys, 317, 338, 353 China. See People's Republic of China Chipko movement, 233 Chitemene system, 221. 228 Chlorolluorocarbons, 278 Chronic obstructive lung diseases
(COLD). 307

Index 401
('ILSS. See Interstate Commission for the Struggle against Drought in the Sahel
Climate, 50, 122, 197, 198, 278-279, 328
zones, 52(fig. 3.1), 53(6g.). See also individual zones
CMB. See Chemical mass balance CNPMS. See National Corn and
Sorghum Research Centre Coal, 21, 76, 77, 209(table), 268(fig.),
269, 274, 277, 278, 280, 304, 313, 330, 336, 337, 350, 362, 377
Coal tar pitch volatiles (CTPV), 349 Cobalt, 152 Cocoa, 246 Coconuts, 245, 246, 250 Coke-oven workers, 349 COLD. See Chronic obstructive lung
diseases Colorado, 130 Combustion
biomass, 10-Il, 17, 270(fig.), 272(table)
efficiency/quality, 201-202, 210, 211- 212, 312, 315, 337
health issues, 330. See also Emissions
regulations, 202(table), 205 residential, 337-343, 353 source fingerprints, 341 See also Pyrolysis
Composting, 172, 173 Compression ratios, ISO Computer models, 96-99, 104 Condensates, 193(table), 197 Cooking practices, 38, 43, 90, 175, 237,
238, 274, 309, 317(fig.), 318. See also Pollution, indoor; Residues, as domestic fuel; Stoves
Cooper, J. A., 341 Coppicing, 68, 240 Corn, 14, 22, 73, 103, 103(table). See
also Maize Cor pulmonale, 90 Corrosion, 281 Costa Rica, 144 Cost-benefit analysis, 4, 369, 372-373,
383 financial vs. economic analysis, 365-
366 See also Benefits; Costs
Costs, 2, 27, 366, 381(table) capital, 389, 390, 391 measurable vs. immeasurable, 366-
367
opportunity, 9 1-92, 380 sugarcane, 389 and technology evaluations, 372-378,
375(table), 390-391 See also Cost-benefit analysis
Cotton, 93, 251, 288 sticks, 296
Cropping patterns, 299 CTPV. See Coal tar pitch volatiles Cuba, 221, 254, 255 Cultivation, continuous, 245 Cultivation cycle, 227(fig.)
Daisey, J. M., 341 Dakar, 32 Data availability, 3 1-32, 94, 267, 308,
377 DDG. See Distillery grain Deforestation, 198, 217, 225-229, 289
African, 291-292, 292(flg.) and carbon dioxide, 77 causes, 6, 7, 8, 26, 37, 39, 44, 196,
214 of mountain slopes, 23 and urban demands, 42
Denmark, 208 Desertilication, 6, 39, 61, 228(6g.),
229-230, 259 Developing countries, 6, 9, 20, 26, 104,
121-122, 158 agricultural water use, 298 biogas plants, 167 and biomass energy, 213 health effects in, 301-318. See also
Health issues indoor air pollution, 272(table). See
also Pollution, indoor industrial fuel use, 33-34 residue use, 88-89, 88(table) rural domestic fuel use, 30-31, 88 urban fuel use, 31-33, 42-43 See also Third World
Diagnosis and design methodology, 257-258(figs.)
Diesel engines. See Engines, diesel Diesel power plants, 188(fig.) Distillery grain (DDG), 125 DOE. See United States, Department
of Energy Dominican Republic, 233 Dose-response assessment, 325, 343,
349-350, 353, 354 Drought, 72, 229, 259, 291. See also
Desertification

402 Index
Dung, 31, 36, 38, 41, 86, 87, 89, 90-91, 92-93, 94, 102, 271, 277, 294, 296, 385. See also Manure
Dust, 193, 201, 204, 204(6g.), 205, 206, 207, 209, 269, 331
Economic analysis, 390-391. See Ethanol, macroeconomic evaluation; Socioeconomic issues, analyses
EEC. See European Economic Community
Efficiency issues, 19, 298-299, 312, 315, 334, 362, 364
Effluents, 171, 363. See also Stillage Egypt, 31, 298 Electricity, 120, 168, 169, 184(fig.), 190,
268(6g.), 275, 363, 369, 376,377, 388, 390, 391
El Salvador, 144 Emissions
air pollution comparisons, 305(table) alcohol fermentation, 331(table) alcohol fuel, 344-345 biogas production, 334. 334(table) diesel, 342 vs. efficiency, 312, 315 evaporative, 346 gasification. 333(table) industrial bioniass, 330, 331(table) low-/medium-height. 275 nitrous oxide, 197-198 stove/furnace, 203, 205, 206(table),
210-212, 210(table), 328-329(tables), 338, 340, 342
vehicle, 129-132, 131 (fig.), I 33(fig.), 134, 135, 147, 274
See also Pollution; Smoke; Stoves Emphysema. 283 Employment, 367, 368-369, 387, 389.
See also Labour Energy crops, 69-75 Energy systems, 251(6g.), 252(fig. 9.9) Energy units, 395 Engines
biogas use, 374, 376, 377, 387 diesel. 132, 139, 148(table), 168, 199,
342, 376 dual-fuel. 374, 376, 377, 387 ethanol-from-wood fuel. 196 modifications, 147, 148(table), 149,
156 Otto-cycle, 139, 149, 156, 168, 344 and producer gas, 193, 196, 199 steam. 196
Environmental effects/impacts, 1-3, 7, 26, 55(fig.), 271, 387
beneficial. See Benefits biogas, 165, 169, 170-172, 175 cultivated crops, 72-75 effects diagram, 270(fig.) forest residues, 57-58 and health effects, 327-328, 328-329.
See also Health issues internalization of, 4, 27 and liquid fuels, 121-135 micro-, 43 non-cultivated crops, 75 and petroleum fuels. 198 policy implications, 106-108, 158 pollution. See Pollution and producer gas, 194(table), 198 reductions, 123 renewable energy technologies, 362-
364. See also Renewable energy technologies
residues, 9-10, 57-58, 73-74, 73(table), 89-91
reversible/irreversible, 2, 3, 4, 79 short-rotation forestry, 66-69 silvicultural methods, 56(6g.) subjective assessment of, 51, 54. See
also Landscape issues traditional fuels, 39-43 wood fuel conversion, 75-78 wood fuel production, 53(table) See also Deforestation;
Desertification; Erosion; Healthissues; Safety issues
EPA See United States, Environmental Protection Agency
Erosion, 23, 39, 50, 69, 72, 102-105, 122, 123, 242
and annual/perennial crops, 74 and greenhouse gasses, 22 hazard areas, 52(6g. 3.2) hillside, 230 and mulching, 250(tables) and productivity, 232(table) and rainfall, 103, 217, 230(table) and residue removal/recycling, 9, 59,
73, 73(table), 103(table), 107 system approach to, 231(6g.) universal soil loss equation, 103 water-caused, 75, 103. See also
Erosion, and rainfall Ethanol, 113, 114, 220
by-products, 125, 155, 156 costs, 380-381, 381(table) emissions, 131-132, 331 (table), 344,
345

Index 403
environmental impacts, 124-127, 332(table)
gasoline blends, 131-132 health/safety issues, 134-135,
332(table), 346, 347 hydrous vs. anhydrous, 389 macroeconomic evaluation, 378-384 as octane enhancer, 141. See also
Alcohol(s), as octane boosters production, 14-15, 70, 71, 115-121,
I 16(11g.), 120(tablc), 143(table),150, 151, 152, 155, 363. See also Brazil, ethanol production/use
raw materials, 70, 71, 118-121, 1 20(table)
socioeconomic performance, 382(table)
See also Alcohol(s) Ethical issues, 79 Ethiopia, 30, 31, 89, 107 Eucalyptus trees, 19, 223, 224, 247(11g.),
248, 299 Euphorbia lathyris, 71 European Economic Community (EEC),
142-143, 151-153, 155, 216 Eutrophication, 297 Evapotranspiration, 22, 23, 224, 299 Exchange rates, 379 Excieta, human, 175
Farm forestry, 245, 246, 248. See also Agroforestry
Federal Republic of Germany, 116, 205, 207, 208
Fermentation, 115-116, 119-120 anaerobic, 126 integrated cyclic system, I 19(11g.)
Fertilizers, 12, 27, 63-64, 74, 77, 78, 100, 101, 107, 126, 170, 171-172, 239-240, 253, 333, 363, 385
Finland, 183 Fire-fighting foams, 134 Fire hazard, 59-60, 134, 308-309, 328.
See also Safety issues, fires/burns Firewood. See Fuelwood Fish, 280, 282, 370 Floods, 23 Flue gas. 76, 207, 208 Flues. See Stoves, smokeless Fodder, 93-94, 224, 248 Food issues, 153-155, 157, 214-215,
215-216, 220. 221-223 conservation, 238-239 food-energy systems, 253-256 post-harvest losses, 238(table) See also Agriculture
Ford, Henry, 344 Ford Motors, 134 Forest energy, 55-60 Forests
continuous cropping, 217(11g.) conversion to farmlands, 96. See also
Deforestation energy, 2, 15-17, 62(table), 220 monocultures, 19, 54 plantations, 61 -62(tables), 64(table) short-rotation, 60-69, 64(table), 78 tropical rainforests, 55, 60 See also Social forestry
Formaldehyde, 134, 135, 347 Fossil fuels, 26, 77-78, 77(table), 197,
278, 279. See also Coal; Petroleum France, 143 Fuel and Fodder Project (Kenya), 249 Fuel cycles, 268(11g.), 269, 270(11g.),
271, 282(11g.), 324 Fuelwood, 6, 7, 29, 32, 43, 203, 223,
224, 240, 289, 290(11g.), 295-296 availibility in Africa, 292(11g.) transport, 336-337, 352 See also Wood fuels
Furnaces big-bale, 207 bottom-burning, 203, 203-204(figs.),
204, 205, 206-207, 206(11g.) large-scale, 207-209 for small units, 202-207 test assembly, 211(11g.) wood-fired industrial, 328-329(tables)
Gardens. See Home gardens Gasification, 127, 191-193, 201, 332,
333(table), 350. See also Biogasification; Gasifiers
Gasifters, 13, 183, 184(11g.), 185-186(table), 191-192, 191(fig.)
charcoal, 196 fi.iels for, 188, 189-191(tables) See also Gasification; Producer gas,
plants Gasohol, 14, IS, 129(table) Gasoline, 15, 114, 128, 128-129(table),
130-131, 135, 141, 145, 147, 148(table), 150, 151, 152(fig.), 157, 331, 344, 345, 346, 381(tablc)
Gasoline-grade tertiary butyl alcohol (GTBA), 151
Ghana, 51 Ghazipur, India, 375(table), 387 Glesinger, Egon, 254 Global warming, 39. See also
Greenhouse effect/gasses

404 Index
Glucose, 155 Grain surpluses, 153 Grasses, 71, 74, 75 Grazing, 6 Greenhouse effect/gasses, 21, 22, 77,
278-279 Green Revolution, 101, 223, 239-240 GTBA. See Gasoline-grade tertiary
butyl alcohol Guatemala, 38, 144 Guesselbodi, Niger, 240 Gum arabic, 226 Guyana, 51 Gypsum, 277
HADO project (Tanzania), 235 Hall, J. V., 345 Hamilton, L. D., 284 Hay, 209 Health isSueS, 20-21
air pollution, 280, 282-283, 303-308. See also Pollution, air; Pollution, indoor; Smoke
alcohol fuels. 135, 331 -332(iables), 343-347
ambient air standards, 273(table) benefits of smoke, 310-311 hiogas, 170 biomass combustion, 10-11, 20-21,
43 centralized biomass technology. 324,
326-335 charcoal Use, 8, 43 in developed countries, 329-348 in dcveloping countries, 301-318,
302(fig.), 324 dung usc, 90-91 energy plantation occupations, 329 and home heating, 282(fig.), 335-343 indirect impacts, 309-311, 327-328.
328-329 nitrous oxides, 198, 283 producer gas, 195-196 risk assessment. 325-326. See also
Risk assessment wood fuel, 284(fig.), 335-343. 370-
371 See also Safety issues
Heating systems. 202-203, 204, 208, 282(6g.)
wood-fuel home heating. 335-343, 350-351
Heavy metals. 12. 13, 76. 77, 79. 172, 269
H imalavan/Gangetic region, 231(11g.) Home gardens. 220, 253(6g.), 255-256
Hordeu,n salivupn, 288 Hunter-gatherers, 219 Hydrocarbons, 10, 15, 70, 74, 75, 76,
129, 130, 131, 132, 164, 210, 269, 273, 278, 312-313, 344, 345. See also Polycyclic aromatic hydrocarbons
Hydrogen, 117 Hydrogen cyanide, 130 Hydrogen suiphide, 12, 165, 168, 174-
175, 175-176, 334 Hydrolysis, 114-115, 155 Hydropower plants, 363 I-lyman, Eric, 386
Illumination, 168 Incinerators, 330 Income distribution, 369-370, 379, 387
389 India, 31, 89, 90, 91, 96, 101, 107, 167,
168, 169, 187, 199, 208, 219, 223-225, 226, 239, 246, 248, 254, 271, 294, 298, 299, 316, 317, 369,370, 383
Forestry Department, 235 Ghazipur, 374, 375(table) Rural Electrification Corporation,
377 Indonesia, 93, 199, 228 Inflation, 32-33, 366 Insects/pests, Il, 41, 65, 93, 251 Institut de Pesquisas Technologicas,
242 Integrated Project for Arid Lands, 229 Interstate Commission for the Struggle
against Drought in the Sahel (CILSS). 259
Iran, 313 Irrigation, 23, 24, 288, 293-296,
295(fig.), 296(table), 298, 363 water pumping for, 372-378,
375(table) Isobutene, 152 Isopropanol, 114 Israel, 241 Italy, 208
Japanese knotweed, 71 Java, 51, 92 Jerusalem artichoke, 71, 74, 119 Jordan, 41, 298
Kamataka, 223-225, 240 Kampala, 32 Kangad, 233

Index 405
Kenya, 33, 42, 145, 227, 228(11g.), 229, 232-233, 237, 239, 246, 248, 249, 259, 307
Kenya Ceramic Jiko stove, 259 Kenya Woodfuel Development
Programme, 233 Kerala, 253(fig.) Khartoum, 291 Kilimanjaro, Mount, 220 Kitchens. See Cooking practices Kiouda, G. A, 341 Korea. 313 !Kung people, 219
Labour, 224, 309, 367-369, 371, 386, 387, 389
Lagos, Nigeria, 271 Landscape issues, 54, 68 Land use, 6, 18-20, 44, 54, 213-214
conflicts, 221-236, 242 integrated projects, 253-256 and international organizational
networking, 259 objectives, 214-216, 245 patterns, 218-221, 279 planning, 225, 254, 256-259 and residues, 249-251, 253 sustainable systems, 213, 216-218
Latin America, 61(table), 293 Laval, Alfa, 127 Leaching, 67, 72, 75, 77. See also Soil,
fertility/nutrients Lead, 132, 141, ISO, 151, 152(fig.), 157,
344 Leaves, 294(table) Lee, Richard, 219 Legumes, 248 Lesotho, 31, 90 Leukemogens, 331, 347 Levinson, Mark, 380 Liberia, 227 Limestone, 281 Lipfert, F. W., 341 Liquefaction, 332 Liquid fuels, 146(table). See also
individual fuels Livestock, 224, 239, 240-241, 290-291,
294 Logging, 6, 37, 227, 233, 234, 250,
351-352, 351(table) Logs. See Wood fuels, logs Lundgren, Bjorn, 258 Lusaka, 42
Maize, 119, 125, 137, 155, 156, 220, 250(table 9.6). See also Corn
Majjia Valley Windbreak project, 249 Malawi, 30, 33, 145-146 Malaysia, 51, 93 Malay State Forest Enactments, 235 Maleria, 310 Mali, 43 Manure, 24, 171, 175, 327, 333
nutrient content, 101(table) See also Dung
Marsh plants, 75 Massachusetts, 353 Mauritius, 216, 221, 255 Mediterranean area. Sec Temperate!
Mediterranean zones Mercury, 76, 77(table) Methane, 70, 71, 72, 167, 174, 278, 334 Methanol, 114, 117-118, 118(table), 127,
129, 134, 135, 150-151, 344-345, 363
gasoline blends, 128(table), 130-131, 344
health/safety issues, 134-135, 332(table), 346, 347
-to-gasoline (MTB) process, 152-153 See also Alcohol(s)
Methodology, 257-258(figs.), 365, 371-386
Methyl tertiary butyl ether (MTBE), 114, 130, 151, 157
Mexico, 38 Meyer, H. R., 354 Microdistilleries, 242 Minas Gerais, 226-227, 254 Minerals, 171 Miscanthus, 204 Missoula, Montana, 340, 353-354 Mobil, 152 Molasses, 127, 145, 146 Monocultures, 255. See also Forests,
monocultures Mosquitoes, 310, 311 MTB. See Methanol, -to-gasoline
process MTHE. See Methyl tertiary butyl ether Mulching, 250(tables) Mutagens, 274, 342, 343 Mwenczi, Zimbabwe, 240 Myers, D. K., 349
Nairobi, 32, 386 National Academy of Sciences, 354 National Corn and Sorghum Research
Centre (CNPMS), 254 rural energy system, 252(11g. 9.9)
Natural gas, 117 Neem trees, 248

406 Index
Negev Desert, 241 Peru, 89 Nepal, 30, 37, 38, 92, 107. 170, 306, Pesticides, 74, 75, 123
307, 308, 316, 369, 371 Pests, See Insects/pests Nettles, 75 Petroleum, 142, 147, 149, 274, 277, New Jersey, 342 280, 362, 381(table). See also New Zealand, 344 Gasoline: Prices, oil Ngisonyoka Turkana people, 229 Philippines, 146, 187, 199, 208, 235 NGOs. See Non-governmental Phosphorus, 59, 95, 100
organizations Photochemical reactivity, 345 Nicaragua, 30 Photosynthesis, 287, 288 Niger, 240, 241, 249 Photovoltaics (PV), 375(table), 376, Nigeria, 51, 98, 271 377, 388 Nitrogen, 57, 58, 63, 70, 74, 93, 95, Pike, M. C., 349
100, 164, 209, 253 Pine trees, 56, 58, 60 -fixers, 61, 65, 69, 78, 248 Planalsucar, 381-383 leaching, 67, 78 Plan Sierra, 233 mineralization of, 171 Plantations oxides, 10, 14, 75, 76, 129, 130, 131- energy, 22, 23, 61(table), 220-221,
132, 197-198, 207, 269, 271, 274, 328-329. See also Forests, energy 277-278, 280, 283, 304, 306, 340, pen-urban, 44-45 343. 344, 345 Platinum 152
Nomads, 219, 229, 291 PNA. See Brazil, Programa Nacional Non-governmental organizations do Alcool; Polynuclear aromatic
(NOOs), 259 compounds Nyagong, Rosylin. 234 Podzols, 51
Poisonings, 346-347 Oceania, 146 Policy issues, 7, 106-108, 158, 213-214, Octane, 141, 149, 150-153, 157 215-216, 223, 259, 298, 369-370, Oil. See Petroleum 387-388 Oil palm, 71, 246 Pollution Oliseed, 74, 220 air, 20-22, 76, 78-79, 107, 124-125, OTA. See United States, Office of 127, 170, 267-285, 328(table), 340-
Technology Assessment 343, 347-348, 352-354, 363, 379 Otto, Nicolas A.. 147. See also atmospheric effects, 280-281
Engines, Otto-cycle indoor, 91(table), 170, 271, Otto-cycle engines. See Engines, Otto- 272(table3), 273-274, 313-317, 337,
cycle 338-340, 339(table), 346. See also Oxfam, 241, 243 Cooking practices: Stoves Oxygenates, 150, 151 and materials and structures, 281 Oxygen/oxygen demand, 125, 126, 147, source-receptor relationships, 283
337 water. See Water issues, pollution Ozone, 130, 281, 343 See also Emissions
Polycyclic aromatic hydrocarbons PAHs. See Polycyclic aromatic (PAHs), 196, 274, 282, 329(Iable),
hydrocarbnons 330, 338, 339, 341, 342, 349 Pakistan, 146, 293. 296 Polycyclic organic matter (POM), 349- Paper/pulp industry, 183, 330, 340 350 Papua New Guinea, 307 Polynuclear aromatic (PNA) Particulates, 132, 269, 271, 283. 304, compounds, 129, 130, 132
312. 313, 340, 341-342 POM. See Polycyclic organic matter Pastoralists. 229 Population issues, 26, 44, 218, 225. Pathogens, 170, 173-174 228, 289, 290, 290(table) Paturau, J. M., 254 Portland, Oregon, 341 People's Republic of China. 9, 31, 37. Power units, 395
89, 92, 167, 168, 169, 187, 230- Prices 231, 254, 274, 298, 307. 313 food. 216

Index 407
oil, 142, 149, 183, 222, 380, 389 pricing policy, 388 shadow, 362, 366, 367, 374, 386 sugar, 384 wood filet, 33, 226
Proalcool. See Brazil, Programa Nacional do Alcool
Producer gas, 13-14 applications, 183, 185-186(table) composition, 192(table) costs, 376 environmental impacts, 1 94(table),
195-198 investments, 187-188, 187(lable) plants, 187(table), 188(11g.), 192-
193(tables). See also Gasifiers Pruning. See Trees, pruning Puddling, 101 PV. See Photovoltaics Pyrolysis, 13, 117, 183. See also
Combustion
Rainfall, 23, 50, 217, 241, 279 run-off, 2 3-24, 230(table)
Reeds, 75, 201, 204 Refi.igees, 32 Renewable energy technologies (RETs),
361-364, 367-368, 368(table), 387,390-391, 391(n)
Research and development, 170 Residues, 9-10, 23, 36, 38, 277, 296
benefits, 384-385 burning in fields, 93 collection, 73-74, 73(table) crop, 9, 24, 70-71 as domestic ftiel, 31, 87-91, 312 energy/protein content, 294(table) environmental impacts, 41-42, 89-91 and erosion. See Erosion, and
residue collection/recycling food processing, 88(table) forest, 56-58, 328 as industrial fuel, 106 and land use, 249-251, 253 non-fuel use, 94 nutrient content, 100(table) and producer gas, 188, 189(table) recycling, 92-106 safe use of, 251, 253 types of agricultural, 86-87, 107 uses of, 87-89, 87-88(tables) water-retaining capacity, 241
RETs, See Renewable energy technologies
Rice, 101, 289(table)
straw/husks, 23, 71, 74, 86, 90, 93, 208
Risk assessment, 284-285, 284(fig.), 325-326, 343, 349-354, 366. See also Safefty issues
Roberts, Murray, 249 Rondonia, 219, 222 Roots, 98, 99 Rothamsted, 96 Rwanda, 228
Safety issues alcohol beverage industry, 350 alcohol filels, 134-135, 331,
332(table), 345-3 47 biogas, 174-175, 176 fires/burns, 308-309, 318, 337-338,
346, 350, 353. See also Fire hazard
forestry/logging, 16-17, 20, 329, 351-352, 351(table)
producer gas, 195, 198 wood fuels, 335-337, 335(table), 337-
338, 351-352, 351(table). See also Safety issues, forestry/logging
See also Health issues Sahelian countries, 31, 89, 248, 259 Salinity, 123, 298 São Caetano, 132 São Paulo, 120, 126, 132, 154, 214,
222, 242 Sarawak, 234 Sax, N. L, 346 Scandinavia, 71, 74, 75, 207, 276 Senegal, 32, 235 Sewage, 163, 167, 333 Shea-nut trees, 229 Shearer, Walter, 255 Shifting cultivation, 219 Shrubs, 36, 41, 233 Sierra Leone, 96 Silviculture, 54, 56(fig.), 62 Skaraborg, Sweden, 143 Sludge, 12, 24, 164, 170, 333 Slurry, 171-172, 385 Smog, 345 Smoke, 43, 90-91, 107, 170, 304, 306,
312, 341, 353. See also Emissions; Stoves; Tobacco, smoke
Social forestry, 223-225, 226 Socioeconomic issues, 24-26, 153-156,
3 86-3 91 analyses, 364-371 evaluation methodologies, 371-386
Soil, 50, 51 acidification. See Acidification

408 Index
and air pollution, 281-282 buffering systems, 281 carbon content, 96, 97-98(ligs.), 98-
99 cation exchange capacity, 95, 171 compaction, 59 conservation, 242-244, 243(table) erosion. See Erosion fertility/nutrients, 6-7, 9, 41, 59, 69,
70, 75, 94-102, 105, 216-217, 250 improvement, 66, 68-69 and mulching, 250(tables) organisms/fungi in, 58 physical properties, 95, 105, 171 productivity, 74, 122, 217(6g.) and residues, 91-102, 105-106 salinity, 123, 298 tropical, 217-218, 276. See also
Tropical zones waterlogging, 123, 298 See also Leaching
Solar technologies, 375(table), 390. See also Photovoltaics
Solid fuels, 201, 209(table), 209-211, 313. See also indvidual fuels
Somalia, 38 Soot, 201, 204(6g.) Sorghum, 119, 121, 220, 242, 254 South America. See Central/South
America/Caribbean countries Soviet Union, 51 Spruce trees, 56, 58, 60 Sri Lanka, 245, 248 Stalks, 31, 36, 89, 294(table) Starches, 119 Steelmaking, 226 Stillage, 15, 122, 124(table), 125-127,
126(table), 255, 363. See also Effluents
Stoves, 107, 170, 202, 204-207, 237, 312, 313-318, 317(6g.), 362
charcoal, 386. See also Charcoal efficiency vs. emissions, 312, 315 financial aspects of improved, 385.-
386 installation, 338, 353 jikos, 386 lessons concerning, 314-315 open domestic, 301, 304, 309, 314 programmes, 237, 314-315, 371, 386 research and development, 257, 259,
314 safety of, 308-309 smokeless, 313, 315-317 through-burning, 203, 205(fig.) See also Furnaces
Straw, 31, 36, 38, 70, 86, 88, 98, 165, 201, 202(table), 203(lIg.), 204, 205, 208
Subsidies, 141, 142, 215, 226, 362, 369, 370, 376, 380, 385, 388
Substrates. See Biogas, substrates Sudan, 226, 229, 289-291 Sugar, 119, 137, 144, 146, 157, 384,
390 Sugar beet, 74, 119 Sugar cane, 14, 71, 113, 119, 120-121,
123, 125-126, 138, 145, 154, 155,156, 220, 221, 242, 254, 255, 327, 383, 389-390
-alcohol-bagasse concept, 156, 158 Sugar regions, 252(6g. 9.8) Sulphur, Il, 21, 76, 17(table), 95, 100,
209, 274, 275(table), 277, 344 aerosols, 276-277 oxides, 14, 17, 76, 174, 198, 269, 271,
274, 275-277, 280, 283 See also Hydrogen sulphide;
Sulphuric acid Sulphuric acid, 174, 277 Sustainable systems. See Land use,
sustainable systems Swaminathan, M. S., 256 Sweden, 117, 127, 143, 183, 195, 208
Forestry Board, 78-79 Switzerland, 207 Sythesis gas, 117, 152
TAME. See T-Amyl Methyl Ether T-Amyl Methyl Ether (TAME), 151 Tanganyika, 242, 243(table) Tanzania, 30, 34, 37, 38, 91, 235, 370 Taxation, 369, 388 Technology, 78
abatement, 4 biomass conversion, 114, 326(table) centralized biomass, 324, 326-335,
350-352 evaluations of water pumping, 372-
378, 375(table), 387 fermentation, 115-116 See also Renewable energy
technologies Temperate/Mediterranean zones, 58-60,
63-64, 66-68, 287-288 Terracing, 105, 230, 231 Thailand, 93, 121, 146, 187, 199 Thatch, household, 311 Third World, 30, 85-86, 88, 90, 235,
256. See also Developing countries Tillage, 103, 104 Timberlake, Lloyd, 257

Index 409
Tobacco, 33, 34, 93 smoke, 304, 306, 307, 308, 338, 339,
342 Toxicity, 346-347 Tractors, 138, 139(fig.) Traditional fuels, 29-45 Tranportation, 225, 226(fig.), 326, 336-
337, 352 Trees, 232-233
cultivating, 61-66 harvesting, 16-17, 61-66 multi-purpose, 246, 247(fig.), 248 planting, 8, 44, 224, 230, 232, 259 protecting young, 229-230, 241 pruning, 6, 34-35 thinning, 60 and women, 232-233 See also Forests; Wood; Wood fuels
Tropical zones, 55, 60, 64-65, 68-69, 70, 75, 104, 158, 217-218, 275- 276, 287-288
Tsetse fly, 41 Tubers, 288
Uganda, 30, 37, 51 UK. See United Kingdom Ukara (island), 92 UNDP/World Bank Gasifier
Monitoring Programme, 195 United Kingdom (UK), 71 United Nations, 195, 254 United Nations University Food Energy
Nexus, 254 United States, 14, 116, 149, 151, 207,
208, 216 Clean Air Act of 1970, 141, 340 Consumer Product Safety
Commission, 338, 340. 353 corn production, 73, 103, 103(table),
144 Department of Agriculture, 103, 147 Department of Commerce, 353 Department of Energy (DOE), 152,
330, 338, 340, 350, 351, 352, 353 Energy Act of 1978, 141 Environmental Protection Agency
(EPA), 129-130, 141, 313 ethanol production, 137, 140(tabte),
141 Federal Motor Excise Tax, 141 Forest Service, 335 fuel content changes in, 130 National Fire Data Base, 353 Natural Resources Defense Council,
313
Office of Technology Assessment (OTA), 129, 132
Windfall Tax Act of 1980, 141 Universidade Federal de Rio Grande
do Sul, 222 USSR. See Soviet Union
Vietnam, 199 Viruses, 173
Wages, 367 Walker, Hiram, 344 Wastelands, 61, 75 Waste products, 6, 12, 15, 125
agriculturaL, 327-328. See also Residues
municipal, 167, 172. See also Sewage See also Dung; Residues; Stillage
Water issues, 22-24, 123, 290(fig.) aquatic ecosystems, 67-68, 74, 78,
122, 125, 281-282 and biogas technology, 13 and biomass production, 29 7-300,
297(fig.) catchments, 241 elficiency of use, 298-299 evapotranspiration. See
Evapotranspiration management, 24, 241, 289(table) oxygen depletion, 125, 126 pollution, 23, 24, 122, 126, 127, 327,
333, 379 run-oft, 23-24, 230(table) waste water, 172 waterlogging, 123, 298 watershed management, 24 water stress, 288 See also Irrigation; Rainfall
Weeds, 62-63, 66-67, 75, 78 West Germany. See Federal Republic
of Germany Wheat, 143, 239 Willow trees, 61 Windbreaks, 241, 249 Windmills, 376, 387, 388 Women, 7, 10, 11, 30, 37, 43, 90-91,
170, 232-233, 238, 257, 295, 307, 309, 310, 316, 366, 370-371
Wood combustion regulations, 202(table) composition, 119, 165, 278 energy content, 350-351 See also Wood fuels
Wood fuels, 53(table), 201, 277, 284(fig.), 312, 324, 328-329(tables), 386

410 Index
chips, 207, 208, 330 conversion, 75-80 definitions. 29, 49-50 gap concept, 37-39 harvesting, 335-336, 351-352 health effects, 284(11g.), 335-343,
370-371 irreversible effects, 79 logs, 203(fig.), 204, 206(fig., table) storage, 337 See also Charcoal; Euelwood
Woodwell, G. M., 281
World Bank. 195, 216, 367, 384 World Commission on Environment
and Development, 4 World Health Organization, 43, 370 World War II, 183
Yeasts, 115
Zaire, 51 Zambia, 42, 221, 228 Zimbabwe, 14, 35, 145, 149, 157, 221,
239, 240
BIOENERGY and the ENVIRONMENT edited by Janos Pasztor and Lars A. Kristoferson
Atter Ls'oi L,ok, hiomass fueIs -. ood animal and cron wastes, a]- çuuoo - - - : eoresen: tht_o largest source of energy used throughout the world. What is the impact of these renewable fuels en the environment, and hew ran they most ertectivelv be used? B wrrtr oti the Eut'troume?zt addresses these qutsttons showing the cuntrhutions of well-managed and environmemailv sound biornass systems to sustainable development. Focusing on Dioenergv-aepenaer.t countries, the authors examine the overall impacts of btoenerv systems versus conventional fossil fuels. They show that hioenerrn systems may he less damaging to the environment because ot the many reiatit Cl smaii imttacts on tne surrounding environment to currwartscr with 053g fuels which have' fewer but inure set are lrroscn affecting greater areas. The Importance of bioenergy as a Senign, renewable, and inexpensive resource for developing countries should not be underestimated, the authors conclude, not only in terms of the local economy and environment but also globally. Janos Pasztor is senior environiitent and development officer at the Secretariat of the United Nations Conference on Environment and Deve!opment in .Geneva, Switzerland. Lars A. Kristoferson is the vice-executive director of the Stockholm Environment Institute in Stockholm, Sweden.
For order and other information, please write to: WEST VIEW PRESS 5500 Central Avenue Boulder, Colorado
Cover design: Polly Christensen ISBN G133-Db-6


