Embed Size (px)
Citation preview
i
Recent Advances in Bioenergy Research Volume II
Edited by
SACHIN KUMAR, S.K. TYAGI
Sardar Swaran Singh National Institute of Renewable Energy, Kapurthala, India
ii
ISBN 978-81-927097-1-0
© Sardar Swaran Singh National Institute of Renewable Energy, Kapurthala-2013
Electronic version published by SSS-NIRE
ALL RIGHTS RESERVED
iii
CONTENTS
Preface x
Contributors xii
Part-I: Biomass and Energy Management 1
1 A method to assess and analyze biomass at state level as 2 cooking fuel using efficient stoves
Ashwini Kumar B.K., Indranil Kundu, G.S. Sheshagiri and N.K.S. Rajan Abstract 2 1.1 Introduction 2 1.2 Methodology 4 1.3 Analysis 8 1.4 Inference 11 References 12
2 Web based geographical assessment of biomass under circle of Interest 13 G.S. Sheshagiri, N. Balsubramanya Raju and N.K.S. Rajan Abstract 13
2.1 Introduction 13 2.2 The architecture 15 2.3 Design and development 16 2.4 Deployment 23 2.5 A comparison of assessment of biomass in admin boundaries and COI 23 2.6 Inference 23 References 24
3 A methodology to assess biomass geographically from irrigated areas 25 Indranil Kundu, Rashmi N. Raj, G.S. Sheshagiri and N.K.S. Rajan Abstract 25 3.1 Introduction 25 3.2 Methodology 28 3.3 Comparison and analysis 31 3.4 Inference 33 References 33
4 Nation-wide rainfall based geographical classification of 34 agricultural lands
Indranil Kundu, Kaviprabha N., G.S. Sheshagiri and N.K.S. Rajan Abstract 34 4.1 Introduction 35 4.2 Methodology 37 4.3 Application 40 4.4 Inference 42 References 42
5 GIS based RSD analysis for biomass based energy potential 44 using a unique ‘ray trace’ approach
iv
N. Balasubramanya Raju, Ashwini Kumar B.K., G.S. Sheshagiri and N.K.S. Rajan Abstract 44 5.1 Introduction 45 5.2 Methodology 46 5.3 Design 47 5.4 Grid Formation 47 5.5 Results 48 5.6 Inference 51 References 51
6 Appraisal of plants of Jalandhar to assess their potential to act 53 as biofuel crops Navjot Kaur and Anjana Bhatia Abstract 53 6.1 Introduction 53 6.2 Experimental 56 6.3 Results 58 References 60
7 Clean Energy Generation from Biomass: A Case Study of 62 CDM Project by Chambal Power Limited, Rajasthan Sanjeev Prashar and Shalini Mathur Abstract 62 7.1 Introduction 63 7.2 Environmental Issues 68 7.3 Technological Aspects 70 7.4 Conclusions 75 References 76
8 Thermodynamic analysis of 1TR biogas based NH3-H2O 79 vapor absorption system S. Anand, A. Gupta and S.K. Tyagi Abstract 79 8.1 Introduction 80 8.2 System Description 85 8.3 Thermodynamic analysis 86 8.4 Assumptions 90 8.5 Results and discussion 91 8.6 Conclusions 96 References 97
9 Energetic and Exergetic Performance Analysis of 99 Various Renewable Energy Systems A.K. Pandey, M. Chahal and S.K. Tyagi Abstract 99 9.1 Introduction 99 9.2 Materials and methods 102 9.3 Analysis 103
v
9.4 Results and discussion 105 9.5 Conclusions 111 References 112
Part-II: Biochemical Conversion 113
10 Inferences in saccharification of lignocellulosic biomass 114 for biofuel production
Ishan Sharma, Ajay Bansal and Sachin Kumar Abstract 114 10.1 Introduction 115 10.2 Pretreatment 117 10.3 Detoxification 124 10.4 Hydrolysis 127 10.5 Conclusion 133 References 133
11 Bioprospecting plant pathogen Xanthomonas axonopodis pv. punicae 144 for production of cellulases and xylanases for lignocellulosic biomass hydrolysis
Dolamani Amat, Rameshwar Tiwari, Anju Arora, Lata and A.K. Saxena Abstract 144 11.1 Introduction 145 11.2 Materials and Method 147 11.3 Results and Discussion 151 References 156
12 Ethanol production from xylose- current state, challenges 160 and future prospects
Loveleen Kaur Sarao and Harinder Singh Oberoi Abstract 160 12.1 Introduction 160 12.2 Challenges in yeast fermentation of lignocellulosics 162 with respect to xylose 12.3 Effect of inhibitors on pentose fermentation in hydrolysates 167 12.4 Xylose metabolism in Saccharomyces cerevisiae-The limiting factors 171 12.5 Metabolic engineering for efficient fermentation and anaerobic growth 171 on pentose sugars 12.6 Adaptation of Saccharomyces cerevisiae strains for efficient 173 xylose metabolism 12.7 Recommendations for future studies 174 12.8 Concluding remarks 175 References 175
13 Weedy lignocellulosic biomass, a potential feedstock for 183 bioethanol production: a future perspective
Sarika Rana, Rameshwar Tiwari, Pandiyan Kuppusamy, Anju Arora, Surender Singh, Anil Kumar Saxena and Lata Nain
vi
Abstract 183 13.1 Introduction 183 13.2 Lignocellulosic biomass 185 13.3 Lignocellulosic pretreatment 186 13.4 Future prospects 187 13.5 Conclusions 189 References 189
14 Chitosan- Ca Alginate Immobilized Saccharomyces cerevisiae: 183 A novel technique for bioethanol production from mahula (Madhuca latifolia L.) flowers
Preeti K. Dash, S.S. Behera, H. N. Thatoi and M.R. Swain Abstract 183 14.1 Introduction 183 14.2 Materials and Method 195 14.3 Results and Discussion 196 14.4 Conclusions 200 References 200
15 Co-utlization of agro industrial wastes and cynodon dactylon 202 for biogas production
H.V. Deshmukh Abstract 202 15.1 Introduction 202 15.2 Material and method 204 15.3 Methods 205 15.4 Results 207 15.5 Discussion 210 15.6 Summary and conclusion 212 References 213
16 Evaluation cum feasibility study of an on-campus biogas operation plant 215 at punjabi university, Patiala Jaideep Singh and Sandeep Singh Virdi Abstract 215 16.1 Introduction 216 16.2 Review of Literature 219 16.3 Need of Study 223 16.4 Objectives 224 16.5 Research Methodology 224 16.6 Data analysis 225 16.7 Findings 228 16.8 Suggestions / Recommendations 235 16.9 Conclusion 236 16.10 Limitations 236 16.11 Agenda for future research 237 References 237
vii
17 Technology Demonstration projects on Biogas bottling 240 under RDD&D Policy of MNRE
M.L. Bamboriya
18 Various ways of improving hydrogen production from biomass 248 S. Meenu Krithika and R. Nagendran Abstract 248 18.1 Introduction 248 18.2 Production of hydrogen by fermentation process 249 18.3 Challenges of fermentation process 250 18.4 Different ways of improving fermentation process 250 18.5 Conclusions 253 References 253
19 Photo fermentative hydrogen production: energy solution for the future 257 Neha Srivastava and Harinder Singh Oberoi Abstract 257 19.1 Introduction 258 19.2 Comparative accounts of biohydrogen production technologies 259 and energy analysis 19.3 Photosynthetic non-sulphur (PNS) bacteria 260 19.4 Photosynthetic biohydrogen production 261 19.5 Theoretical consideration of photo fermentative hydrogen production 265 19.6 Results Effect of substrate and its concentration on 266 photofermentative hydrogen production 19.7 Energy and cost analysis 269 19.8 Future prospects 270 References 271
Chapter 19 deleted due to violation of copyright.
Part-III: Chemical Conversion 274
20 Carbon sequestration potential of Jatrophacurcas in 275 semiarid regions of southern India G.R. Rao, J.V.N.S. Prasad, P. Sathi Reddy and P. Sharath Kumar
Abstract 275 20.1 Introduction 275 20.2 Materials and Methods 277 20.3 Results 279 20.4 Discussion 279 20.5 Conclusions 280 References 283
21 Estimation of biocrude from Euphorbia continifolia 287 Punam Devi, Anjana Bhatia and Amita Mahajan
Abstract 287 21.1 Introduction 287 21.2 Material and methods 288
viii
21.3 Results and Discussion 291 21.4 Conclusions 291 References 292
22 The potential of algal species for integrated biofuel production 294 and its applications
Vivekprakashpankaj and Mamta Awasthi Abstract 294 22.1 Introduction 294 22.2 Algae cultivation 295 22.3 Harvesting Algae 297 22.4 Algal drying 297 22.4 Algae Oil Extraction 298 22.4 Biodiesel from oilgae 299 22.4 Other application of Algae 299 22.4 Conclusion 301 References 302
23 Isolation of indigenous microalgae and biomass collection for 304 biofuel production Rajib Bandopadhyay, Chiranjib Banerjee, Arunabh Sarkar and Pratibha Gupta
Abstract 304 23.1 Introduction 304 23.2 Material and methods 307 23.3 Results and Discussion 308 23.4 Conclusions 312 References 312
24 Factors influencing algal growth 315 Jeewan Jyoti and Mamta Awasthi
Abstract 315 24.1 Introduction 315 24.2 Factors affecting algal growth 316 24.3 Microalgae Cultivation Methods 320 24.4 Harvesting 321 24.5 Conclusions 322
References 322
25 Growth characteristics of Chlorella pyrenoidosa cultured in 324 nutrient enriched dairy wastewater for pollutant reduction and lipid productivity
Vinayak V. Pathak, A.K. Chopra, Richa Kothari and V.V. Tyagi Abstract 324 25.1 Introduction 324 25.2 Material and methods 325 25.3 Results and Discussion 327 25.4 Conclusions 329 References 329
ix
26 Assessment of lipid productivity of Chlamydomonas polypyrenoideum 332 cultured in tannery industry wastewater
Neetu Verma, Richa Kothari, Tanu Allen and D.P. Singh Abstract 332 26.1 Introduction 332 26.2 Material and methods 333 26.3 Results and Discussion 335 26.4 Conclusion and future recommendations 337 References 337
27 Treatment of leachate by using natural adsorbents 339 Navneet Sood, Rajeev Kumar Garg, M.K Jha and Amit Arora Abstract 339 27.1 Introduction 339 27.2 Leachate Formation 340 27.3 Results and discussion 342 27.4 Conclusions 345 References 345
Part-IV: Thermochemical Conversion 347
28 Prospectus of improved cookstoves in reduction in deforestation 348 N.S. Rathore, Surendra Kothari and Arti Verma
Abstract 348 28.1 Introduction 349 28.2 Modifications in existing traditional cookstoves 349 28.3 Double pot improved cookstove- Udairaj 350 References 353
Part-V: Electrochemical Processes 355
29 Performance comparison of air-breathing cathode and 356 aqueous cathode earthen pot microbial fuel cell Pritha Chatterjee, Soumya Pandit, A.N. Ghadge and M.M. Ghangrekar
Abstract 356 29.1 Introduction 356 29.2 Materials and methods 358 29.3 Results and Discussion 360 29.4 Conclusions 367 References 367
x
Preface
The increasing high price of oil and the fuel insecurity have sparked the revolution globally
to produce the bioenergy from renewable resources. Agriculture biomass is an abundant
renewable resource, which can be converted not only into liquid biofuels but also into other
forms such as solid and gaseous biofuels. The natural biomass is consisted of highly compact
polymer called lignocelluloses and hence, there are several key barrier and limiting step in
the processing of biomass to biofuel, which need the advance conversion technologies.
Apart from the agricultural residues, other biomass such as forest residue, agro-
industrial wastes, animal excreta and municipal wastes, etc. are also available in abundance
and can play a major role in supplementing the energy resources around the globe. Waste
biomass materials including various natural and derived materials, such as woody and
herbaceous species, bagasse, agricultural waste, waste from paper, municipal solid waste,
industrial waste, sawdust, grass, food processing waste, waste oil, non-edible oil or shell of
oil-bearing seed, aquatic plants and algae, etc., have the potential to be converted into useful
fuels and chemicals through advanced conversion technologies. The average majority of
biomass energy is produced from wood and wood wastes (64%), followed by municipal solid
waste (24%), agricultural waste (5%) and landfill gases (5%). Waste and degraded lands are
generally used for energy plantation and biomass production.
There is no debate on the issue that renewable energy is the only sustainable energy in
nature. Biomass energy in particular is one of the cleanest form of energy gifted by nature.
This is also the ‘waste to wealth’ making weapons for the farmers as well. Because, all forms
of derived agricultural waste can be converted to useful energy that directly contribute to the
income of farmers in particular and the Nation in general. Moreover, they are highly
beneficial from the point of view of the environmental pollution control and also an asset for
carbon credit.
Keeping in view the need and importance of bioenergy research in our country, we
express our pleasure to introduce the second volume of ‘Recent Advances in Bioenergy
Research- Volume-II’ in the form of a book. The book is divided in five parts viz. Part-I:
Biomass and Energy Management; Part-II: Biochemical Conversion; Part-III: Chemical
Conversion; Part-IV: Thermo-chemical Conversion; and Part-V: Electrochemical Processes.
Each section includes respective chapters from Eminent Academician, Scientists and
Researchers in the field. We are grateful for their commendable contribution for this book.

xi
Emphasis is given in such a way that the current trends of research and investigation
in the bioenergy sector can easily be worked out from the in-depth study of this book. Our
efforts will be successful if the readers dig up the expected gain out of these articles.
Sachin Kumar S.K. Tyagi SSS-NIRE SSS-NIRE
xii
Contributors
Allen Tanu, Amity Institute of Biotechnology, Amity University, Noida
Amat Dolamani, Division of Microbiology, Indian Agricultural Research Institute, New Delhi
Anand S., School of Infrastructure Technology & Resource Management, Shri Mata Vaishno Devi University, Katra
Arora Amit, Department of Chemical Engineering, Shaheed Bhagat Singh State Technical Campus, Ferozepur
Arora Anju, Division of Microbiology, Indian Agricultural Research Institute, New Delhi
Arti Verma, Department of Renewable Energy Engineering, College of Technology and Engineering, Maharana Pratap University of Agriculture and Technology, Udaipur, Rajasthan
Awasthi Mamta, Centre for Excellence in Energy and Environment, National Institute of Technology, Hamirpur, Himachal Pradesh
Bamboriya M.L., MNRE, New Delhi
Bandopadhyay Rajib, Department of Biotechnology, Birla Institute of Technology, Mesra, Ranchi, Jharkhand
Banerjee Chiranjib, Department of Biotechnology, Birla Institute of Technology, Mesra, Ranchi, Jharkhand
Bansal Ajay, Department of Chemical Engineering, Dr. B. R. Ambedkar National Institute of Technology, Jalandhar
Behera S.S., Department of Biotechnology, College of Engineering and Technology, (A Constituent College of Biju Patnaik University of Technology), Bhubaneswar
Bhatia Anjana, Department of Botany, Hans Raj Mahila Maha Vidyalaya, Jalandhar, Punjab
Chahal M., Sardar Swaran Singh National Institute of Renewable Energy, Kapurthala
Chatterjee Pritha, Department of Civil Engineering, Indian Institute of Technology, Kharagpur
Chopra A.K., Department of Zoology and Environmental Science, Gurukula Kangri Vishwavidyalaya, Haridwar
Dash Preeti K., Department of Biotechnology, College of Engineering and Technology, (A Constituent College of Biju Patnaik University of Technology), Bhubaneswar
Devi Punam, Department of Botany, HMV, Jalandhar & Department of Bio-chemistry, RBIEBT, Kharar
Garg Rajeev Kumar, Department of Chemical Engineering, Shaheed Bhagat Singh State Technical Campus, Ferozepur
Ghadge A.N., Department of Civil Engineering, Indian Institute of Technology, Kharagpur
Ghangrekar M.M., Department of Civil Engineering, Indian Institute of Technology, Kharagpur
xiii
Gupta A., School of Infrastructure Technology & Resource Management, Shri Mata Vaishno Devi University, Katra
Gupta Pratibha, Department of Biotechnology, Birla Institute of Technology, Mesra, Ranchi, Jharkhand
H.V. Deshmukh, Department of Microbiology, Yashawantrao Chavan Institute of Science, Satara, Maharashtra
Jha M.K., Department of Chemical Engineering, Dr. B. R. Ambedkar National Institute of Technology, Jalandhar
Jyoti Jeewan, Centre for Excellence in Energy and Environment, National Institute of Technology, Hamirpur, Himachal Pradesh
Kaur Navjot, Department of Botany, Hans Raj Mahila Maha Vidyalaya, Jalandhar, Punjab
Kaviprabha N., Combustion, Gasification & Propulsion Laboratory (CGPL), Dept. of Aerospace Engineering, Indian Institute of Science, Bangalore
Kothari Richa, Department of Environmental Science, Babasaheb Bhimrao Ambedkar University, Lucknow
Kothari Surendra, Department of Renewable Energy Engineering, College of Technology and Engineering, Maharana Pratap University of Agriculture and Technology, Udaipur, Rajasthan
Krithika S. Meenu, Centre for Environmental Studies, Anna University, Chennai
Kumar Ashwini B.K., Combustion, Gasification & Propulsion Laboratory (CGPL), Dept. of Aerospace Engineering, Indian Institute of Science, Bangalore
Kumar P. Sharath, Central Research Institute for Dryland Agriculture, Santoshnagar, Hyderabad
Kumar Sachin, Sardar Swaran Singh National Institute of Renewable Energy, Kapurthala
Kundu Indranil, Combustion, Gasification & Propulsion Laboratory (CGPL), Dept. of Aerospace Engineering, Indian Institute of Science, Bangalore
Kuppusamy Pandiyan, Division of Microbiology, Indian Agricultural Research Institute, New Delhi
Mahajan Amita, Department of Botany, HMV, Jalandhar & Department of Bio-chemistry, RBIEBT, Kharar
Mathur Shalini, National Law University, Jodhpur
Nagendran R., National Green Tribunal, New Delhi
Nain Lata, Division of Microbiology, Indian Agricultural Research Institute, New Delhi
Oberoi Harinder Singh, Central Institute of Post-Harvest Engineering and Technology, P.O. PAU, Ludhiana
Pandey A.K., School of Energy Management, Shri Mata Vaishno Devi University, Katra
Pandit Soumya, Department of Biotechnology, Indian Institute of Technology, Kharagpur
xiv
Pankaj Vivek Prakash, Centre for Excellence in Energy and Environment, National Institute of Technology, Hamirpur, Himachal Pradesh
PathakVinayak V., Department of Environmental Science, Babasaheb Bhimrao Ambedkar University, Lucknow & Department of Zoology and Environmental Science, Gurukula Kangri Vishwavidyalaya, Haridwar
Prasad J.V.N.S., Central Research Institute for Dryland Agriculture, Santoshnagar, Hyderabad
Prashar Sanjeev, Indian Institute of Management, Raipur
Raj Rashmi N., Combustion, Gasification & Propulsion Laboratory (CGPL), Dept. of Aerospace Engineering, Indian Institute of Science, Bangalore
Rajan N.K.S., Combustion, Gasification & Propulsion Laboratory (CGPL), Dept. of Aerospace Engineering, Indian Institute of Science, Bangalore
Raju Balsubramanya N., Combustion, Gasification & Propulsion Laboratory (CGPL), Dept. of Aerospace Engineering, Indian Institute of Science, Bangalore
Rana Sarika, Division of Microbiology, Indian Agricultural Research Institute, New Delhi
Rao G.R., Central Research Institute for Dryland Agriculture, Santoshnagar, Hyderabad
Rathore N.S., College of Technology and Engineering, Maharana Pratap University of Agriculture and Technology, Udaipur, Rajasthan
Reddy P. Sathi, Central Research Institute for Dryland Agriculture, Santoshnagar, Hyderabad
Sarao Loveleen Kaur, Central Institute of Post-Harvest Engineering and Technology, P.O. PAU, Ludhiana
Sarkar Arunabh, Department of Biotechnology, Birla Institute of Technology, Mesra, Ranchi, Jharkhand
Saxena A.K., Division of Microbiology, Indian Agricultural Research Institute, New Delhi
Sharma Ishan, Department of Chemical Engineering, Dr. B. R. Ambedkar National Institute of Technology, Jalandhar
Sheshagiri G.S., Combustion, Gasification & Propulsion Laboratory (CGPL), Dept. of Aerospace Engineering, Indian Institute of Science, Bangalore
Singh D.P., Department of Environmental Science, Babasaheb Bhimrao Ambedkar University, Lucknow
Singh Jaideep, School of Management Studies Punjabi University, Patiala
Singh Surender, Division of Microbiology, Indian Agricultural Research Institute, New Delhi
Sood Navneet, Quality Manager, Nivia Synthetics Pvt Ltd., Jalandhar, Punjab
Srivastava Neha, Central Institute of Post-Harvest Engineering and Technology, P.O. PAU, Ludhiana

xv
Swain M.R., Department of Biotechnology, College of Engineering and Technology, (A Constituent College of Biju Patnaik University of Technology), Bhubaneswar
Thatoi H.N., Department of Biotechnology, College of Engineering and Technology, (A Constituent College of Biju Patnaik University of Technology), Bhubaneswar
Tiwari Rameshwar, Division of Microbiology, Indian Agricultural Research Institute, New Delhi
Tyagi S.K., Sardar Swaran Singh National Institute of Renewable Energy, Kapurthala
Tyagi V.V., Department of Physics, Manav Rachna College of Engineering, Haryana
Verma Neetu, Department of Environmental Science, Babasaheb Bhimrao Ambedkar University, Lucknow
Virdi Sandeep Singh, School of Management Studies Punjabi University, Patiala

1
Part I
Biomass and Energy Management
2
CHAPTER 1
A METHOD TO ASSESS AND ANALYZE BIOMASS AT
STATE LEVEL AS COOKING FUEL USING EFFICIENT
STOVES
Ashwini Kumar B.K., Indranil Kundu, G.S. Sheshagiri and N.K.S. Rajan
Abstract
Biomass stoves for cooking are gaining momentum. It is now relevant to assess biomass at
state level, which is used traditionally. This is now done for the state of Karnataka where
biomass stoves are being adopted for cooking. Biomass being a by-product of agricultural
crop produce, assessment of biomass for cooking can help the industry to plan its use. Reports
of survey sponsored by MNRE for the domestic fuel usage (mostly in rural India) is used for
getting an estimate of the pattern of usage. Domestic biomass fuel is geographically assessed
to understand its impact on domestic fuel surplus due to improved high efficiency stoves. The
power requirement for cooking in the urban area is assessed by knowing the household
consumption (there by per capita needs) and analyze its potential to biomass based cooking
power in the urban areas if popularized. Such an analysis would help the industry to convert
the otherwise inefficient use of domestic fuel residues into surplus to help the rural
population.
Key words: Domestic Biomass Fuel, Biomass stove, Biomass surplus
1.1 Introduction
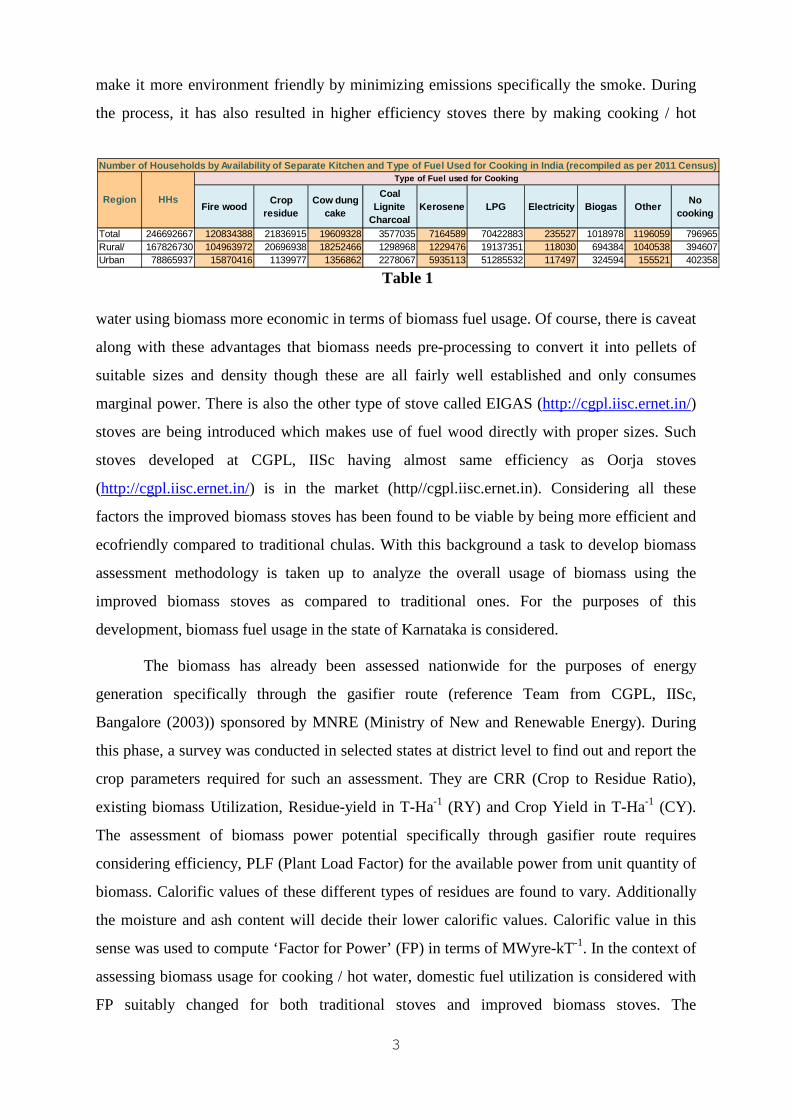
There has been a deficit in electrical energy to rural areas especially for cooking. This has not
changed much according to 2011 census compared to that in 2001 (refer tables 1 and 2;
reference http://www.Indiastat.com). Also cooking using traditional chulas with biomass
combustion is quite common in rural India since ages. Even the water required for bathing is
heated using biomass fuel. These chulas can also be used for water heating. In fact the
efficiencies of stoves are determined based on water boiling. Here afterwards cooking is also
used as water heating included. Studies have shown that smoke emission has adverse effects
on health among the people who use traditional chulas (‘ole’ as it is called in Karnataka
state). This has triggered scientific community to redesign these traditional ole or chula to
3
make it more environment friendly by minimizing emissions specifically the smoke. During
the process, it has also resulted in higher efficiency stoves there by making cooking / hot
water using biomass more economic in terms of biomass fuel usage. Of course, there is caveat
along with these advantages that biomass needs pre-processing to convert it into pellets of
suitable sizes and density though these are all fairly well established and only consumes
marginal power. There is also the other type of stove called EIGAS (http://cgpl.iisc.ernet.in/)
stoves are being introduced which makes use of fuel wood directly with proper sizes. Such
stoves developed at CGPL, IISc having almost same efficiency as Oorja stoves
(http://cgpl.iisc.ernet.in/) is in the market (http//cgpl.iisc.ernet.in). Considering all these
factors the improved biomass stoves has been found to be viable by being more efficient and
ecofriendly compared to traditional chulas. With this background a task to develop biomass
assessment methodology is taken up to analyze the overall usage of biomass using the
improved biomass stoves as compared to traditional ones. For the purposes of this
development, biomass fuel usage in the state of Karnataka is considered.
The biomass has already been assessed nationwide for the purposes of energy
generation specifically through the gasifier route (reference Team from CGPL, IISc,
Bangalore (2003)) sponsored by MNRE (Ministry of New and Renewable Energy). During
this phase, a survey was conducted in selected states at district level to find out and report the
crop parameters required for such an assessment. They are CRR (Crop to Residue Ratio),
existing biomass Utilization, Residue-yield in T-Ha-1 (RY) and Crop Yield in T-Ha-1 (CY).
The assessment of biomass power potential specifically through gasifier route requires
considering efficiency, PLF (Plant Load Factor) for the available power from unit quantity of
biomass. Calorific values of these different types of residues are found to vary. Additionally
the moisture and ash content will decide their lower calorific values. Calorific value in this
sense was used to compute ‘Factor for Power’ (FP) in terms of MWyre-kT-1. In the context of
assessing biomass usage for cooking / hot water, domestic fuel utilization is considered with
FP suitably changed for both traditional stoves and improved biomass stoves. The
Table 1
Fire woodCrop
residueCow dung
cake
Coal Lignite
CharcoalKerosene LPG Electricity Biogas Other
No cooking
Total 246692667 120834388 21836915 19609328 3577035 7164589 70422883 235527 1018978 1196059 796965Rural/ 167826730 104963972 20696938 18252466 1298968 1229476 19137351 118030 694384 1040538 394607Urban 78865937 15870416 1139977 1356862 2278067 5935113 51285532 117497 324594 155521 402358
Type of Fuel used for Cooking
HHsRegion
Number of Households by Availability of Separate Kitchen and Type of Fuel Used for Cooking in India (recompiled as per 2011 Census)
4
Residue yield (RY) in T-Ha-1 = Biomass generated in sample area in T / Sample area in Ha
Crop yield (CY) in T-Ha-1 = Crop production in sample area in T / Sample area in Ha
Crop Residue Ratio (CRR) = RY / CY
Societal usage = Biomass used in T for (Domestic fuel + Thatching + Manure + Fodder)
Utilization ratio (UR) = Societal usage of biomass in sample area in T / Biomass generation in sample area in T
Biomass Generation in kT = Crop production in kT * CRR
Biomass Generation in kT = Crop Area in kHa * RY
Biomass surplus in kT = Biomass Generation in kT * (1-UR)
Biomass Power in Mwyre = Biomass surplus in kT * Factor for Power in Mwyre-kT-1
OR
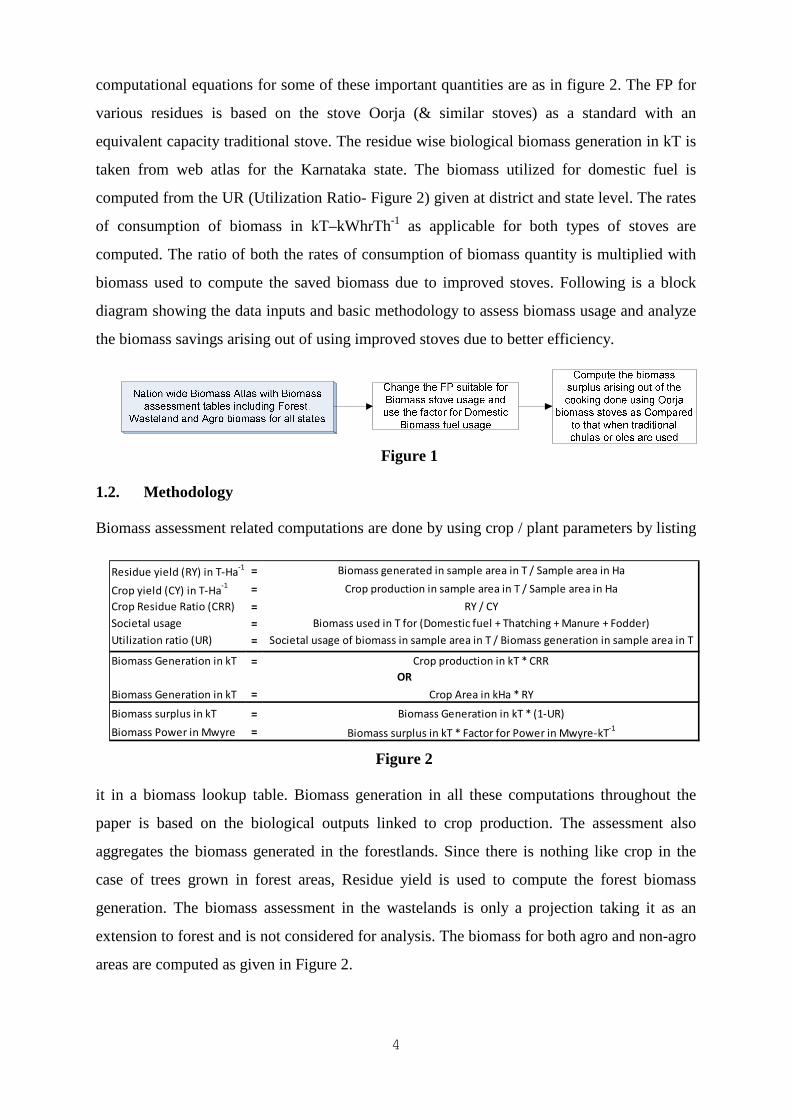
computational equations for some of these important quantities are as in figure 2. The FP for
various residues is based on the stove Oorja (& similar stoves) as a standard with an
equivalent capacity traditional stove. The residue wise biological biomass generation in kT is
taken from web atlas for the Karnataka state. The biomass utilized for domestic fuel is
computed from the UR (Utilization Ratio- Figure 2) given at district and state level. The rates
of consumption of biomass in kT–kWhrTh-1 as applicable for both types of stoves are
computed. The ratio of both the rates of consumption of biomass quantity is multiplied with
biomass used to compute the saved biomass due to improved stoves. Following is a block
diagram showing the data inputs and basic methodology to assess biomass usage and analyze
the biomass savings arising out of using improved stoves due to better efficiency.
Figure 1
1.2. Methodology
Biomass assessment related computations are done by using crop / plant parameters by listing
it in a biomass lookup table. Biomass generation in all these computations throughout the
paper is based on the biological outputs linked to crop production. The assessment also
aggregates the biomass generated in the forestlands. Since there is nothing like crop in the
case of trees grown in forest areas, Residue yield is used to compute the forest biomass
generation. The biomass assessment in the wastelands is only a projection taking it as an
extension to forest and is not considered for analysis. The biomass for both agro and non-agro
areas are computed as given in Figure 2.
Figure 2
5
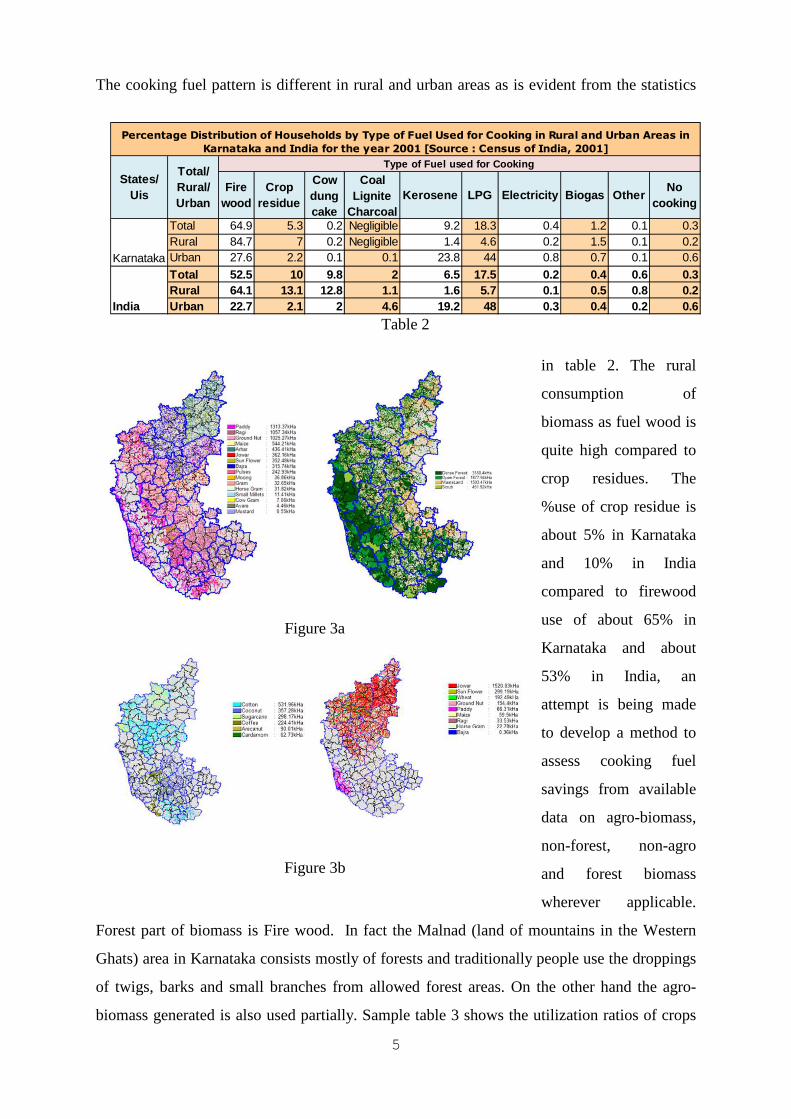
The cooking fuel pattern is different in rural and urban areas as is evident from the statistics
in table 2. The rural
consumption of
biomass as fuel wood is
quite high compared to
crop residues. The
%use of crop residue is
about 5% in Karnataka
and 10% in India
compared to firewood
use of about 65% in
Karnataka and about
53% in India, an
attempt is being made
to develop a method to
assess cooking fuel
savings from available
data on agro-biomass,
non-forest, non-agro
and forest biomass
wherever applicable.
Forest part of biomass is Fire wood. In fact the Malnad (land of mountains in the Western
Ghats) area in Karnataka consists mostly of forests and traditionally people use the droppings
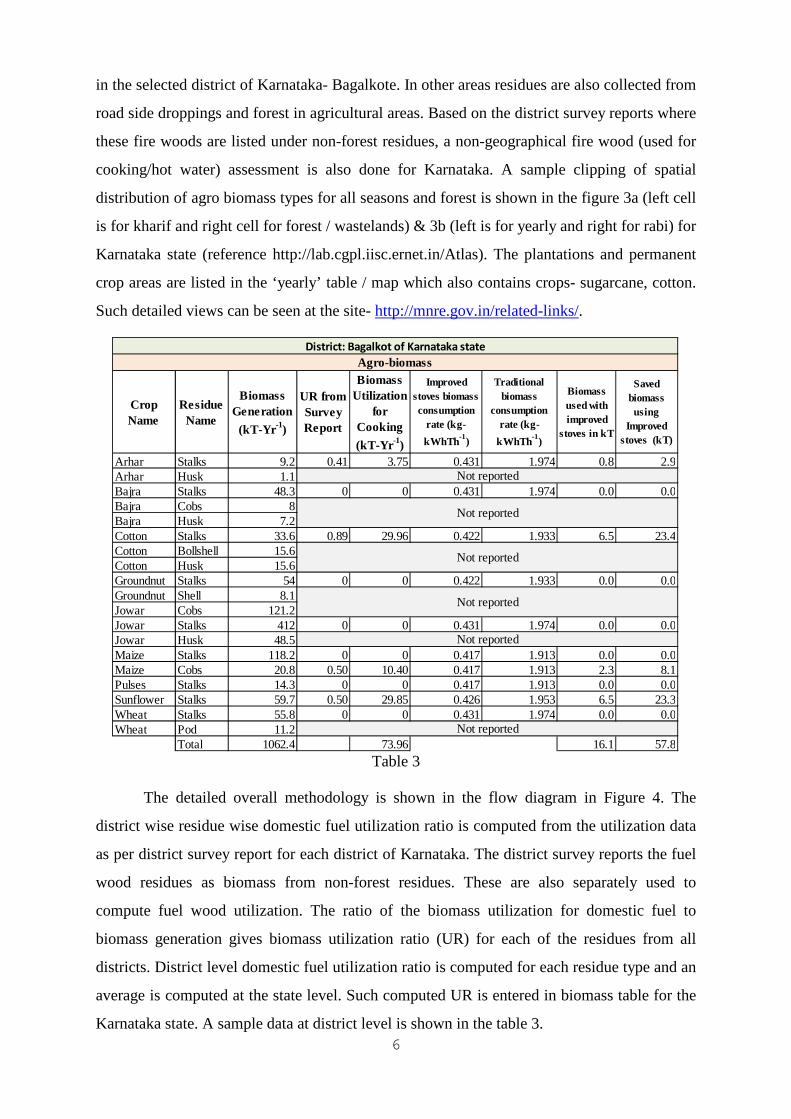
of twigs, barks and small branches from allowed forest areas. On the other hand the agro-
biomass generated is also used partially. Sample table 3 shows the utilization ratios of crops
Figure 3a
Figure 3b
Table 2
Fire wood
Crop residue
Cow dung cake
Coal Lignite
CharcoalKerosene LPG Electricity Biogas Other
No cooking
Total 64.9 5.3 0.2 Negligible 9.2 18.3 0.4 1.2 0.1 0.3Rural 84.7 7 0.2 Negligible 1.4 4.6 0.2 1.5 0.1 0.2Urban 27.6 2.2 0.1 0.1 23.8 44 0.8 0.7 0.1 0.6
Total 52.5 10 9.8 2 6.5 17.5 0.2 0.4 0.6 0.3Rural 64.1 13.1 12.8 1.1 1.6 5.7 0.1 0.5 0.8 0.2Urban 22.7 2.1 2 4.6 19.2 48 0.3 0.4 0.2 0.6
Percentage Distribution of Households by Type of Fuel Used for Cooking in Rural and Urban Areas in
Karnataka and India for the year 2001 [Source : Census of India, 2001]
Type of Fuel used for CookingTotal/ Rural/ Urban
States/ Uis
India
Karnataka
6
Crop Name
Residue Name
Biomass Generation
(kT-Yr -1)
UR from Survey Report
Biomass Utilization
for Cooking
(kT-Yr -1)
Improved stoves biomass consumption
rate (kg-
kWhTh -1)
Traditional biomass
consumption rate (kg-
kWhTh -1)
Biomass used with improved
stoves in kT
Saved biomass using
Improved stoves (kT)
Arhar Stalks 9.2 0.41 3.75 0.431 1.974 0.8 2.9Arhar Husk 1.1Bajra Stalks 48.3 0 0 0.431 1.974 0.0 0.0Bajra Cobs 8Bajra Husk 7.2Cotton Stalks 33.6 0.89 29.96 0.422 1.933 6.5 23.4Cotton Bollshell 15.6Cotton Husk 15.6Groundnut Stalks 54 0 0 0.422 1.933 0.0 0.0Groundnut Shell 8.1Jowar Cobs 121.2Jowar Stalks 412 0 0 0.431 1.974 0.0 0.0Jowar Husk 48.5Maize Stalks 118.2 0 0 0.417 1.913 0.0 0.0Maize Cobs 20.8 0.50 10.40 0.417 1.913 2.3 8.1Pulses Stalks 14.3 0 0 0.417 1.913 0.0 0.0Sunflower Stalks 59.7 0.50 29.85 0.426 1.953 6.5 23.3Wheat Stalks 55.8 0 0 0.431 1.974 0.0 0.0Wheat Pod 11.2
Total 1062.4 73.96 16.1 57.8
Not reported
Not reported
District: Bagalkot of Karnataka state
Agro-biomass
Not reported
Not reported
Not reported
Not reported
in the selected district of Karnataka- Bagalkote. In other areas residues are also collected from
road side droppings and forest in agricultural areas. Based on the district survey reports where
these fire woods are listed under non-forest residues, a non-geographical fire wood (used for
cooking/hot water) assessment is also done for Karnataka. A sample clipping of spatial
distribution of agro biomass types for all seasons and forest is shown in the figure 3a (left cell
is for kharif and right cell for forest / wastelands) & 3b (left is for yearly and right for rabi) for
Karnataka state (reference http://lab.cgpl.iisc.ernet.in/Atlas). The plantations and permanent
crop areas are listed in the ‘yearly’ table / map which also contains crops- sugarcane, cotton.
Such detailed views can be seen at the site- http://mnre.gov.in/related-links/.
Table 3
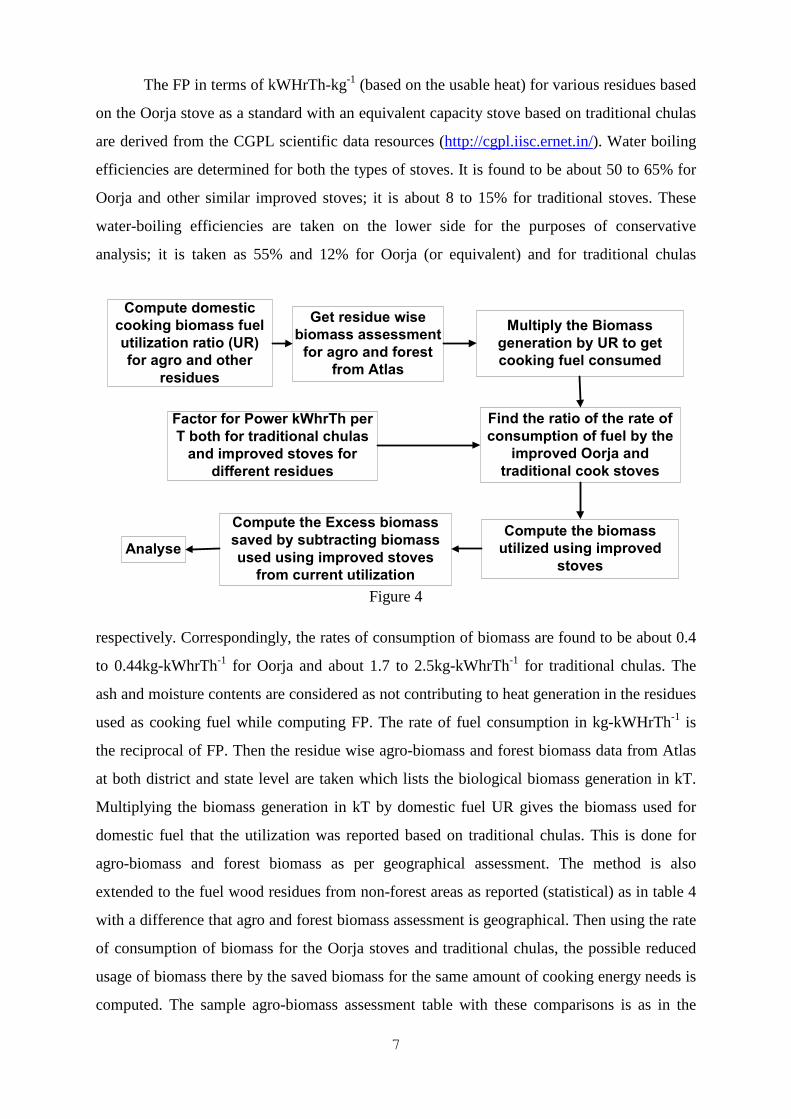
The detailed overall methodology is shown in the flow diagram in Figure 4. The
district wise residue wise domestic fuel utilization ratio is computed from the utilization data
as per district survey report for each district of Karnataka. The district survey reports the fuel
wood residues as biomass from non-forest residues. These are also separately used to
compute fuel wood utilization. The ratio of the biomass utilization for domestic fuel to
biomass generation gives biomass utilization ratio (UR) for each of the residues from all
districts. District level domestic fuel utilization ratio is computed for each residue type and an
average is computed at the state level. Such computed UR is entered in biomass table for the
Karnataka state. A sample data at district level is shown in the table 3.
7
Compute domestic
cooking biomass fuel
utilization ratio (UR)
for agro and other
residues
Get residue wise
biomass assessment
for agro and forest
from Atlas
Multiply the Biomass
generation by UR to get
cooking fuel consumed
Find the ratio of the rate of
consumption of fuel by the
improved Oorja and
traditional cook stoves
Compute the biomass
utilized using improved
stoves
Compute the Excess biomass
saved by subtracting biomass
used using improved stoves
from current utilization
Analyse
Factor for Power kWhrTh per
T both for traditional chulas
and improved stoves for
different residues
The FP in terms of kWHrTh-kg-1 (based on the usable heat) for various residues based
on the Oorja stove as a standard with an equivalent capacity stove based on traditional chulas
are derived from the CGPL scientific data resources (http://cgpl.iisc.ernet.in/). Water boiling
efficiencies are determined for both the types of stoves. It is found to be about 50 to 65% for
Oorja and other similar improved stoves; it is about 8 to 15% for traditional stoves. These
water-boiling efficiencies are taken on the lower side for the purposes of conservative
analysis; it is taken as 55% and 12% for Oorja (or equivalent) and for traditional chulas
respectively. Correspondingly, the rates of consumption of biomass are found to be about 0.4
to 0.44kg-kWhrTh-1 for Oorja and about 1.7 to 2.5kg-kWhrTh-1 for traditional chulas. The
ash and moisture contents are considered as not contributing to heat generation in the residues
used as cooking fuel while computing FP. The rate of fuel consumption in kg-kWHrTh-1 is
the reciprocal of FP. Then the residue wise agro-biomass and forest biomass data from Atlas
at both district and state level are taken which lists the biological biomass generation in kT.
Multiplying the biomass generation in kT by domestic fuel UR gives the biomass used for
domestic fuel that the utilization was reported based on traditional chulas. This is done for
agro-biomass and forest biomass as per geographical assessment. The method is also
extended to the fuel wood residues from non-forest areas as reported (statistical) as in table 4
with a difference that agro and forest biomass assessment is geographical. Then using the rate
of consumption of biomass for the Oorja stoves and traditional chulas, the possible reduced
usage of biomass there by the saved biomass for the same amount of cooking energy needs is
computed. The sample agro-biomass assessment table with these comparisons is as in the
Figure 4
8
table 3 for the Bagalkot district in Karnataka. In table 3, the column ‘Biomass Utilization for
cooking’ shows the agro-biomass in use for the respective residue types in Bagalkot district of
Karnataka using traditional chulas; the column ‘Biomass used with improved stoves’ is
computed on the basis of its representative rate of consumption per kWhrTh; the column
‘Saved biomass using Improved stoves’ is computed by taking the ratio of both the rates of
consumption (of improved stoves to traditional chulas) and multiplying with biomass being
used.
1.3. Analysis
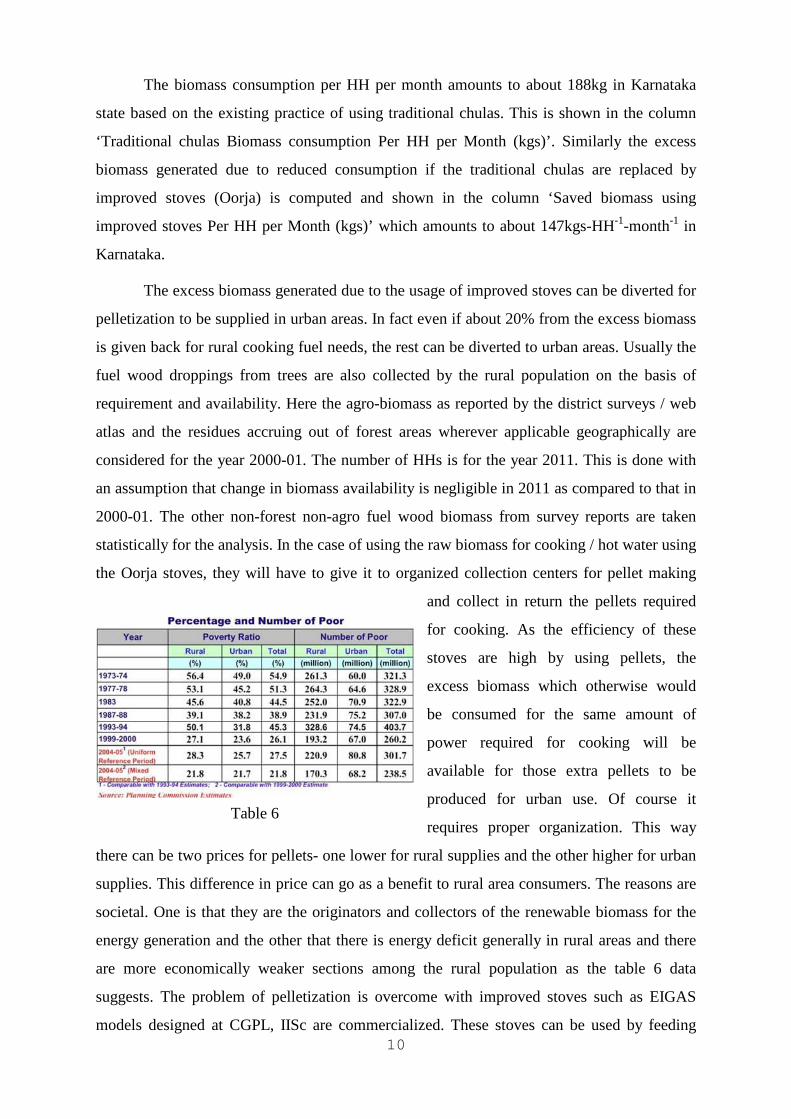
The following table 4 lists the geographically computed agro-biomass, forest biomass
aggregated with statistical non-forest and non-agro biomass used as domestic fuel in the state
of Karnataka. The Biomass generation in kT-yr-1 is taken for agro-residues, non-forest non-
agro-biomass, others and Forest biomass. The average UR is also found from district level
data which is then multiplied by Biomass generation to get current biomass utilization in kT-
yr-1. Then multiplying the ratio between rates of biomass consumption of improved stoves
and traditional chulas with current biomass utilization gives biomass used with improved
stoves. Then the difference between current biomass utilization and biomass used with
improved stoves gives the saved biomass after using improved stoves. The current biomass
utilization in the state of Karnataka amounts to about 18MT (equivalent fossil fuel would be
about 4.5MT) as per table 4. The saved biomass by replacing traditional chulas with
improved stoves amounts to about 14MT. The equivalent fossil fuel amounts to about 3.5MT
savings.
The fuel wood biomass consumption including domestic and other purposes out of
non-forest and non-agro areas (which includes- Cultivable waste Land, Miscellaneous tree
crops & grooves, Tank Bund Plantation Area) amounts to about 25MT as reported by the
survey teams in Feb 2002 for the Karnataka state. The agro-biomass utilized for domestic
purposes amounts to about 4.5MT for the year 2000-01 as per the biomass web atlas.
Similarly biomass from non-reserve forest (which is about 25% of the total forest area in
Karnataka) amounts to about 2MT as per the biomass web atlas. The per capita consumption
figures are for fuelwood at 250 kg, 50 kg for animal dung and 134 kg for crop residues (Preeti
Malhotra et al). This means that the fuel wood and crop residues put together amounts to
about 384kgs of per capita consumption. By taking 5 to 6 persons per HH (house hold) it
amounts about 160 to 192kgs-HH-1-month-1. If we take 32MT (25+4.5+2MT) of residue
consumption in Karnataka the domestic consumption by the population of about
9
Biomass being used
with traditional
chulas in kT
Biomass used with improved
stoves in kT
Excess available
biomass in kT
Urban HHs using
biomass
Urban Population
using biomass
Rural HHs using
biomass
Rural Population
using biomass
Traditional chulas Biomass
consumption
kgs-HH-1-month-1
Saved biomass using Improved
stoves
kgs-HH-1-month-1
17989.7 3925.0 14064.7 1176837 5884185 6784196 33920980 188.3 147.2
Karnataka State Saved biomass in each HH every month
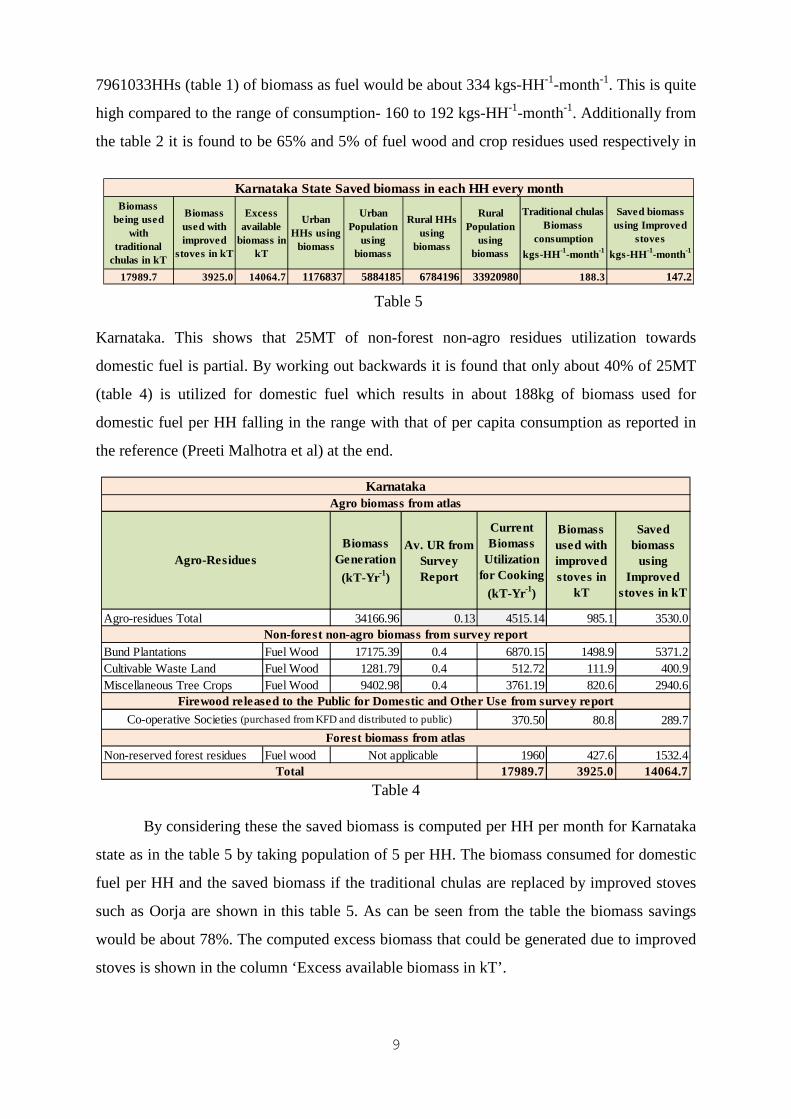
7961033HHs (table 1) of biomass as fuel would be about 334 kgs-HH-1-month-1. This is quite
high compared to the range of consumption- 160 to 192 kgs-HH-1-month-1. Additionally from
the table 2 it is found to be 65% and 5% of fuel wood and crop residues used respectively in
Karnataka. This shows that 25MT of non-forest non-agro residues utilization towards
domestic fuel is partial. By working out backwards it is found that only about 40% of 25MT
(table 4) is utilized for domestic fuel which results in about 188kg of biomass used for
domestic fuel per HH falling in the range with that of per capita consumption as reported in
the reference (Preeti Malhotra et al) at the end.
Biomass Generation
(kT-Yr -1)
Av. UR from Survey Report
Current Biomass
Utilization for Cooking
(kT-Yr -1)
Biomass used with improved stoves in
kT
Saved biomass
using Improved
stoves in kT
34166.96 0.13 4515.14 985.1 3530.0
Bund Plantations Fuel Wood 17175.39 0.4 6870.15 1498.9 5371.2Cultivable Waste Land Fuel Wood 1281.79 0.4 512.72 111.9 400.9Miscellaneous Tree Crops Fuel Wood 9402.98 0.4 3761.19 820.6 2940.6
370.50 80.8 289.7
Non-reserved forest residues Fuel wood 1960 427.6 1532.417989.7 3925.0 14064.7
KarnatakaAgro biomass from atlas
Agro-Residues
TotalNot applicable
Co-operative Societies (purchased from KFD and distributed to public)
Agro-residues TotalNon-forest non-agro biomass from survey report
Firewood released to the Public for Domestic and Other Use from survey report
Forest biomass from atlas
Table 4
By considering these the saved biomass is computed per HH per month for Karnataka
state as in the table 5 by taking population of 5 per HH. The biomass consumed for domestic
fuel per HH and the saved biomass if the traditional chulas are replaced by improved stoves
such as Oorja are shown in this table 5. As can be seen from the table the biomass savings
would be about 78%. The computed excess biomass that could be generated due to improved
stoves is shown in the column ‘Excess available biomass in kT’.
Table 5
10
The biomass consumption per HH per month amounts to about 188kg in Karnataka
state based on the existing practice of using traditional chulas. This is shown in the column
‘Traditional chulas Biomass consumption Per HH per Month (kgs)’. Similarly the excess
biomass generated due to reduced consumption if the traditional chulas are replaced by
improved stoves (Oorja) is computed and shown in the column ‘Saved biomass using
improved stoves Per HH per Month (kgs)’ which amounts to about 147kgs-HH-1-month-1 in
Karnataka.
The excess biomass generated due to the usage of improved stoves can be diverted for
pelletization to be supplied in urban areas. In fact even if about 20% from the excess biomass
is given back for rural cooking fuel needs, the rest can be diverted to urban areas. Usually the
fuel wood droppings from trees are also collected by the rural population on the basis of
requirement and availability. Here the agro-biomass as reported by the district surveys / web
atlas and the residues accruing out of forest areas wherever applicable geographically are
considered for the year 2000-01. The number of HHs is for the year 2011. This is done with
an assumption that change in biomass availability is negligible in 2011 as compared to that in
2000-01. The other non-forest non-agro fuel wood biomass from survey reports are taken
statistically for the analysis. In the case of using the raw biomass for cooking / hot water using
the Oorja stoves, they will have to give it to organized collection centers for pellet making
and collect in return the pellets required
for cooking. As the efficiency of these
stoves are high by using pellets, the
excess biomass which otherwise would
be consumed for the same amount of
power required for cooking will be
available for those extra pellets to be
produced for urban use. Of course it
requires proper organization. This way
there can be two prices for pellets- one lower for rural supplies and the other higher for urban
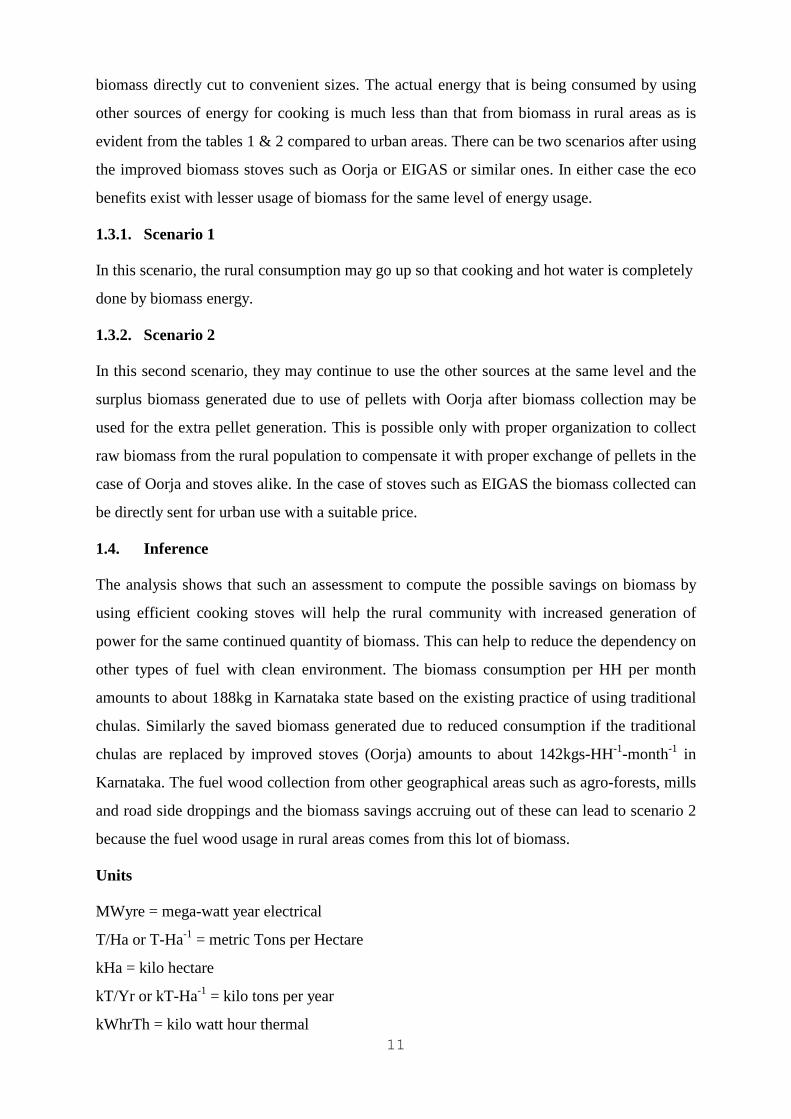
supplies. This difference in price can go as a benefit to rural area consumers. The reasons are
societal. One is that they are the originators and collectors of the renewable biomass for the
energy generation and the other that there is energy deficit generally in rural areas and there
are more economically weaker sections among the rural population as the table 6 data
suggests. The problem of pelletization is overcome with improved stoves such as EIGAS
models designed at CGPL, IISc are commercialized. These stoves can be used by feeding
Table 6
11
biomass directly cut to convenient sizes. The actual energy that is being consumed by using
other sources of energy for cooking is much less than that from biomass in rural areas as is
evident from the tables 1 & 2 compared to urban areas. There can be two scenarios after using
the improved biomass stoves such as Oorja or EIGAS or similar ones. In either case the eco
benefits exist with lesser usage of biomass for the same level of energy usage.
1.3.1. Scenario 1
In this scenario, the rural consumption may go up so that cooking and hot water is completely
done by biomass energy.
1.3.2. Scenario 2
In this second scenario, they may continue to use the other sources at the same level and the
surplus biomass generated due to use of pellets with Oorja after biomass collection may be
used for the extra pellet generation. This is possible only with proper organization to collect
raw biomass from the rural population to compensate it with proper exchange of pellets in the
case of Oorja and stoves alike. In the case of stoves such as EIGAS the biomass collected can
be directly sent for urban use with a suitable price.
1.4. Inference
The analysis shows that such an assessment to compute the possible savings on biomass by
using efficient cooking stoves will help the rural community with increased generation of
power for the same continued quantity of biomass. This can help to reduce the dependency on
other types of fuel with clean environment. The biomass consumption per HH per month
amounts to about 188kg in Karnataka state based on the existing practice of using traditional
chulas. Similarly the saved biomass generated due to reduced consumption if the traditional
chulas are replaced by improved stoves (Oorja) amounts to about 142kgs-HH-1-month-1 in
Karnataka. The fuel wood collection from other geographical areas such as agro-forests, mills
and road side droppings and the biomass savings accruing out of these can lead to scenario 2
because the fuel wood usage in rural areas comes from this lot of biomass.
Units
MWyre = mega-watt year electrical
T/Ha or T-Ha-1 = metric Tons per Hectare
kHa = kilo hectare
kT/Yr or kT-Ha-1 = kilo tons per year
kWhrTh = kilo watt hour thermal
12
MT = million ton
kgs-HH-1-month-1 = kilograms per house hold per month
References
1. http://cgpl.iisc.ernet.in/.
2. Web atlas at http://lab.cgpl.iisc.ernet.in/Atlas/.
3. http://www.Indiastat.com.
4. Malhotra P., Rehman I.H., Bhandari P., Khanna R. and Upreti R. Rural energy data
sources and estimations in India (http://iis-
db.stanford.edu/evnts/3920/REHMAN_data_ppr.pdf).
5. Team from CGPL, IISc, Bangalore (2003) Book on “Biomass to Energy the Science
and Technology of the IISc Bioenergy system”.
Acknowledgements
The authors like to acknowledge that the project on Nation-wide agro-residue assessment
with a potential for power generation was initiated and sponsored by MNRE (Ministry for
New and Renewable Energy), GOI (Government of India) with an asserted reference to its use
in the power generation through Gasifier route.
13
CHAPTER 2
WEB BASED GEOGRAPHICAL ASSESSMENT OF BIOMASS UNDER CIRCLE OF INTEREST
G.S. Sheshagiri, N. Balsubramanya Raju and N.K.S. Rajan
Abstract
Biomass has been assessed geographically across the nation using GIS (Geographical
Information System). The web atlas is already available on internet for remote use. Presently
the biomass is assessed on the regions decided by admin boundaries such as Taluk, District
and State. This is many times not sufficient due to the fact that the power generation centers
are chosen near the regional borders. Under such conditions, it is relevant to enable remote
assessment of biomass surplus under the COI (circle of interest) where the biomass is
procured from multiple taluks. Additionally the biomass transportation limits to a distance
depending on the terrain, transportation costs, which lead to such partial assessment under
different admin boundaries. This is then summed up for different regions residue wise to help
transportation and planning of biomass purchase. Such a Biomass assessment is done
separately for each season and also that accrued out of forest and wastelands.
Key words: COI, Biomass surplus, Admin boundary, GIS, Web atlas
2.1 Introduction
Assessment of biomass and the potential to generate power using the surplus biomass has
been done region wise extracting the crop distributed land-use information geographically
from the maps where the authors were also involved. Such information on the availability of
biomass is useful while implementing the project to generate power via gasifier route both for
thermal and electrical energy supplies. It is necessary to understand the overall methodology
used to develop web biomass atlas before we understand the need for the COI assessment of
biomass remotely by any client. The following paragraph briefly describes the process.
Biomass atlas was evolved by using agro-data reported by MoA and RSD by ISRO on
GIS. Some demographic digital data was procured from private sources and some others were
digitized at CGPL by referring to rasters available through web and other printed sources
because the demographic details given by ISRO-RRSSC were incomplete. Though this
digitization were not having navigational accuracies, it was sufficient for biomass assessment
14
tolerances. The assessment of biomass power potential specifically through gasifier route
requires considering efficiency, PLF for the available power from unit quantity of biomass.
Calorific values of these different types of residues are found to vary. Additionally the
moisture and ash content will decide their lower calorific values. Calorific value in this sense
was used to compute ‘Factor for Power’ (FP) in MWyre-kT-1. Considering all these factors,
the FP, scientifically tabulated at CGPL has been used for various biomass types. It was also
necessary to compute biomass surplus by knowing Crop to Residue Ratio (CRR), Residue
yield (T-Ha-1), Utilization Ratio (UR), the crop area (kHa), crop production (kT-yr-1 or kT-
season-1) and crop yield (T-Ha-1) as reported by MoA at district level for each year. By
knowing the ratio of residue yield to crop yield, the crop residue generation is computed from
crop production at district level because most of the residue yields are based on crop yields.
For some of the residues the generation doesn’t depend on their crops such as fronds, cotton
stalks. In such cases residue yield will be directly used to compute the biomass generation.
These Residues are traditionally used in society as domestic fuel, fodder, thatching and
manure. It will be more scientific and society friendly if these factors are consolidated
regionally because the usages of different residues vary regionally. These factors were taken
from the survey reports both at taluk and district level. It was also found that bagasse is
already being used for co-generation in the sugar mills and therefore is not assessed. Using
the utilization reported by the consultants, a dimensionless utilization ratio was found to
enable the computation of biomass surplus that is finally available for power generation. The
factor for power is multiplied with biomass surplus to get power potential per residue in each
district. A GIS layer was introduced for central electrical grid in the background of land-use
layers. The digital atlas and web atlas were launched capable of providing geographical agro-
biomass assessment. During the second phase of development the nationwide biomass
assessment for both forest and wastelands were also introduced. The plants/trees in forest
lands are not orderly, not homogeneous and there is no crop grown. Basically the types of
residues are bark, twigs, small branches, leaves and stem. The species grown at state level is
given by FSI (Forest Survey of India). The forest area in each district is also given. The land
use map contains forest geographical vectors. After a detailed web research it was found that
some research papers published jointly by FSI were found to contain broadly the residue
generations. In the absence of information about the allowed usage of stems, it is considered
as not available for biomass power generation. Part of the leaves (about 30%) is taken as
available for power because the rest of the droppings will go as manure fed back. For the
other residues, only natural droppings were considered as available for power potential
15
computations. Additionally FSI has classified the forest area into 3 sub classes- dense, open,
scrub depending on the density of canopy. These factors were used to assess the biomass
generation resulting out of forest area. Wasteland was considered as an extension to the
forestland and was assessed for biomass only as a projection if similar pattern is used to grow
the trees/plants.
At this stage, as the web atlas was used by many entrepreneurs, a need arose to
provide biomass information in specific areas of interest which would include two or more
taluk areas partially. The biomass assessment till now can only provide information to the
remote client geographically for specific admin boundaries as a whole. Such a query works at
different network layers to take in the details from the client and dispatch the resulting
information back to the client. This needed a separate set of geographical utilities. Inputs for
such a geographical assessment would be the latitude, longitude and the radius of the circle of
interest. Circle is chosen instead of polygonal area of interest because the biomass movement
to the specific location is naturally from all directions with equal distances. If necessary
multiple such graphical queries can be done to find out the biomass in any region of interest.
This has to be done remotely by the client. Basic geographical data output of such graphical
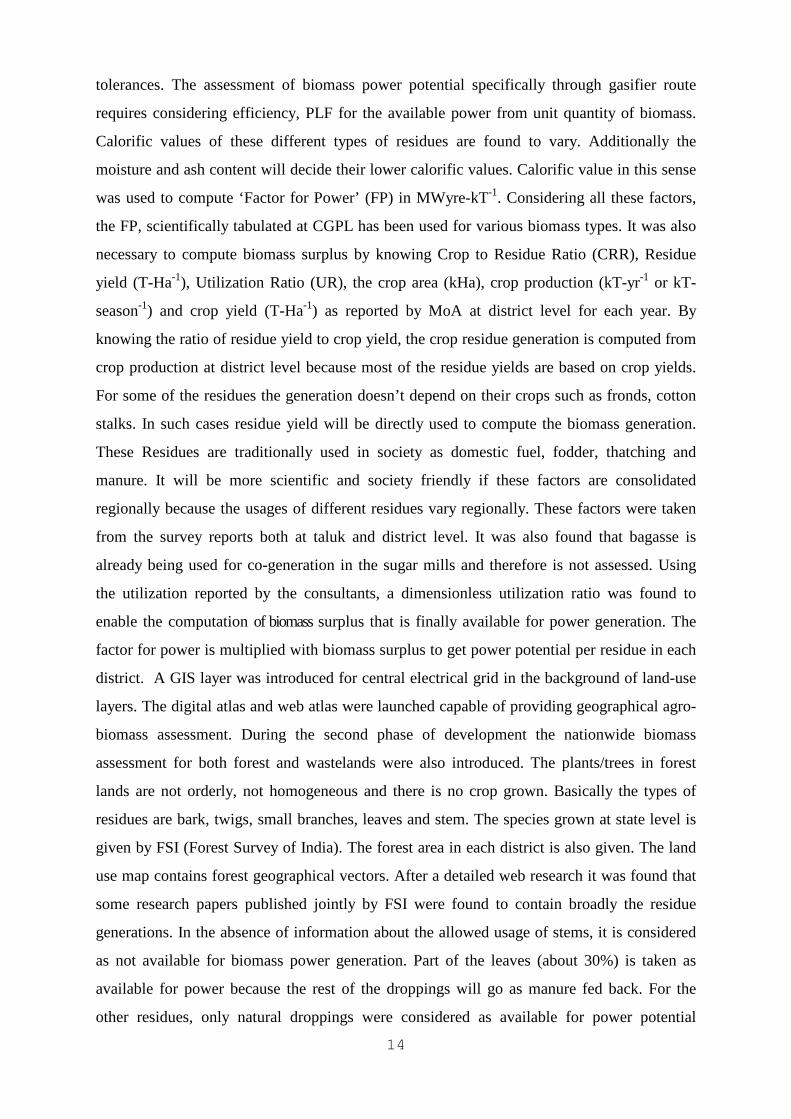
queries will contain biomass from crops / plants from different admin boundaries. This is
aggregated for each of the taluks and districts. Block diagram in Figure 1 shows the COI
feature as an additional tool to augment the remote biomass assessment.
Figure 1
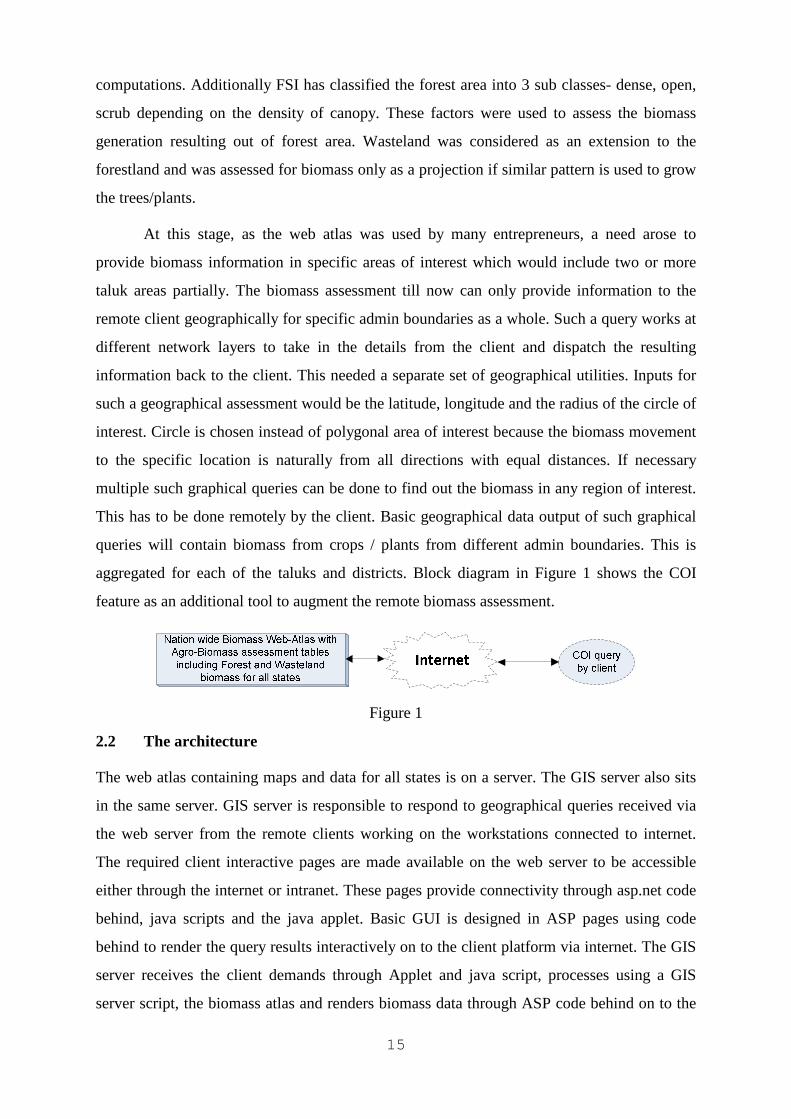
2.2 The architecture
The web atlas containing maps and data for all states is on a server. The GIS server also sits
in the same server. GIS server is responsible to respond to geographical queries received via
the web server from the remote clients working on the workstations connected to internet.
The required client interactive pages are made available on the web server to be accessible
either through the internet or intranet. These pages provide connectivity through asp.net code
behind, java scripts and the java applet. Basic GUI is designed in ASP pages using code
behind to render the query results interactively on to the client platform via internet. The GIS
server receives the client demands through Applet and java script, processes using a GIS
server script, the biomass atlas and renders biomass data through ASP code behind on to the
16
Network
Architecture
Atlas
GIS / SQL server
GIS script / ASP
code
Internet / Intranet
Client
Workstation
Web Server /
Html pages
ASP pages of the client in html format. The biomass atlas includes the
geo biomass data base attached to sql server. The network architecture to
implement geographical COI assessment of biomass is shown in the
Figure 2. Though basically network is always a 3tier architecture
containing client, internet and web server, additional 3 layers do exist as
shown at the application level on the server side. These layers will help
to interact with the biomass atlas which has its own organization of
maps, data and functionalities. These are recognized by the GIS server
which sits between the server code and atlas. ASP code & GIS script
sitting between web server and GIS server help to decode the client
queries and also helps to dispatch the response back to client. GIS server
responds to an executable script provided by the GIS platform. The ASP
code page contains java scripts, the linked java class and the code
behind. The extended java class to enable client side atlas navigation is
designed specifically by the authors to provide Atlas connectivity. This is inherited from the
parent java class called JUMP provided by the GIS platform. Client side Java scripts contain
some additional code to respond to user triggers or events and communicate with the
extended java class called ‘Atlas’. The navigator is configurable through an attached xml file.
The desktop and various components to render the map by providing user interaction are
configured through xml. This atlas applet works as a client side navigator and at the same
time contextually interacts with application layers on the server side to achieve COI
assessment of biomass.
2.3 Design and development
2.3.1 Classes and Objects
This has different parts- map display, navigator display, user interface and biomass data
display. Additionally functional parts need map navigation, client map events, map
processing events, client events, defining point of interest, define radius of interest,
algorithms to process COI, SQL queries to aggregate the residues (for area, biomass
generation, biomass surplus and biomass power potential) and graphical selection. The
classes designed for this purpose are as shown in the Figure 3 with run time object
interactions. For e.g. when the browser wants the map view to be changed it interacts through
applet class object with the map through GIS server to set and get the view for the user
session. Similarly to provide inputs to the page it does interact through client side Javascript
Figure 2
17
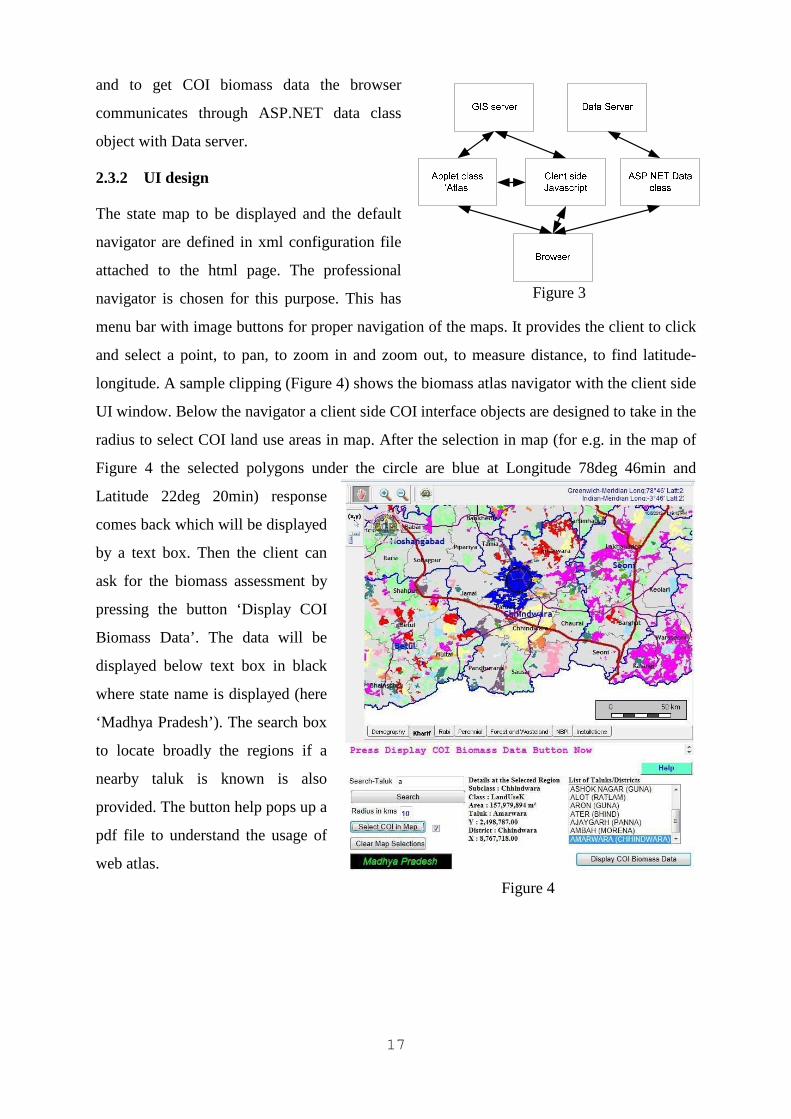
and to get COI biomass data the browser
communicates through ASP.NET data class
object with Data server.
2.3.2 UI design
The state map to be displayed and the default
navigator are defined in xml configuration file
attached to the html page. The professional
navigator is chosen for this purpose. This has
menu bar with image buttons for proper navigation of the maps. It provides the client to click
and select a point, to pan, to zoom in and zoom out, to measure distance, to find latitude-
longitude. A sample clipping (Figure 4) shows the biomass atlas navigator with the client side
UI window. Below the navigator a client side COI interface objects are designed to take in the
radius to select COI land use areas in map. After the selection in map (for e.g. in the map of
Figure 4 the selected polygons under the circle are blue at Longitude 78deg 46min and
Latitude 22deg 20min) response
comes back which will be displayed
by a text box. Then the client can
ask for the biomass assessment by
pressing the button ‘Display COI
Biomass Data’. The data will be
displayed below text box in black
where state name is displayed (here
‘Madhya Pradesh’). The search box
to locate broadly the regions if a
nearby taluk is known is also
provided. The button help pops up a
pdf file to understand the usage of
web atlas.
Figure 3
Figure 4
18
2.3.4 Events and Functions
There are three types of events- User events, Map events and ASP events. The user events are
designed to provide inputs and to remotely query the server. Map events are generated by the
GIS server during user queries. The ASP events are generated for the Data server connectivity
in response to user queries. The client map events are captured as defined by the
configuration and the mouse modes as defined dynamically by the java codes. Similarly map
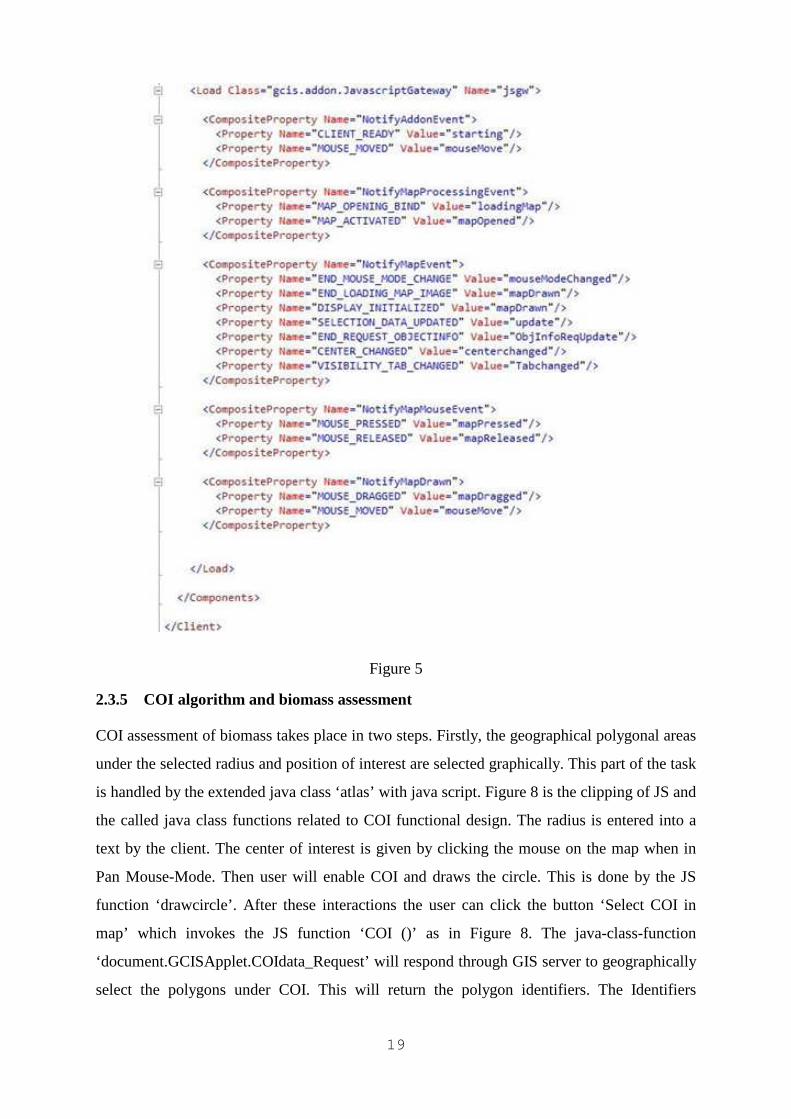
process events are defined and enabled in the configuration file. Figure 5 shows the excerpt of
the xml file to define events. This is classified into different events called ‘composite
property’. For e.g. when the page is loaded the applet class will receive ‘client ready’ message
and will invoke a java script function ‘starting’. The property ‘NotifyMapProcessingEvent’
will invoke ‘loadingmap’ JS function so that client side initializations can be done. Since the
map takes time for opening, an event is raised by the GIS server after the map is ready to be
rendered on client window where further enabling of COI UI interface can be handled.
The COI geographical biomass assessment is designed with a sequence of client
interactions. This sequence of client-server interactions has been designed as shown in the
sequence diagram of Figure 6. The user has to choose the location of interest by knowing
latitude and longitude of the point. For this purpose a java applet function is written. The
latitude and longitude will be provided by the applet on the navigator tool bar both w.r.t
Indian meridian and GW meridian. Map can be panned to the location of interest by reading
the position. Another method for navigation is also designed where if taluk is known its first
letter is typed and search can be invoked. A software program is developed in map java class
(atlas of Applet) to get the list of taluks starting from the alphabet. By selecting the required
region in the list, the map is centered to the required region by a javascript function, which
cascades to call a javaclass function to operate on the map. Then the radius of interest has to
be supplied to the COI processor for which the UI is designed on the client page. If necessary,
the client may have to bring the map location to the viewing screen limits. For this purpose
depending on the present position and zoom level of map, the basic region search may have to
be done by him so that the required area is visible. After this he can request the assessment
which will be handled by the server and the response in terms of biomass data in a tabular
form will be sent back to the client. Figure 7 is a sample of the data rendered for the COI on
the client window.
19
Figure 5
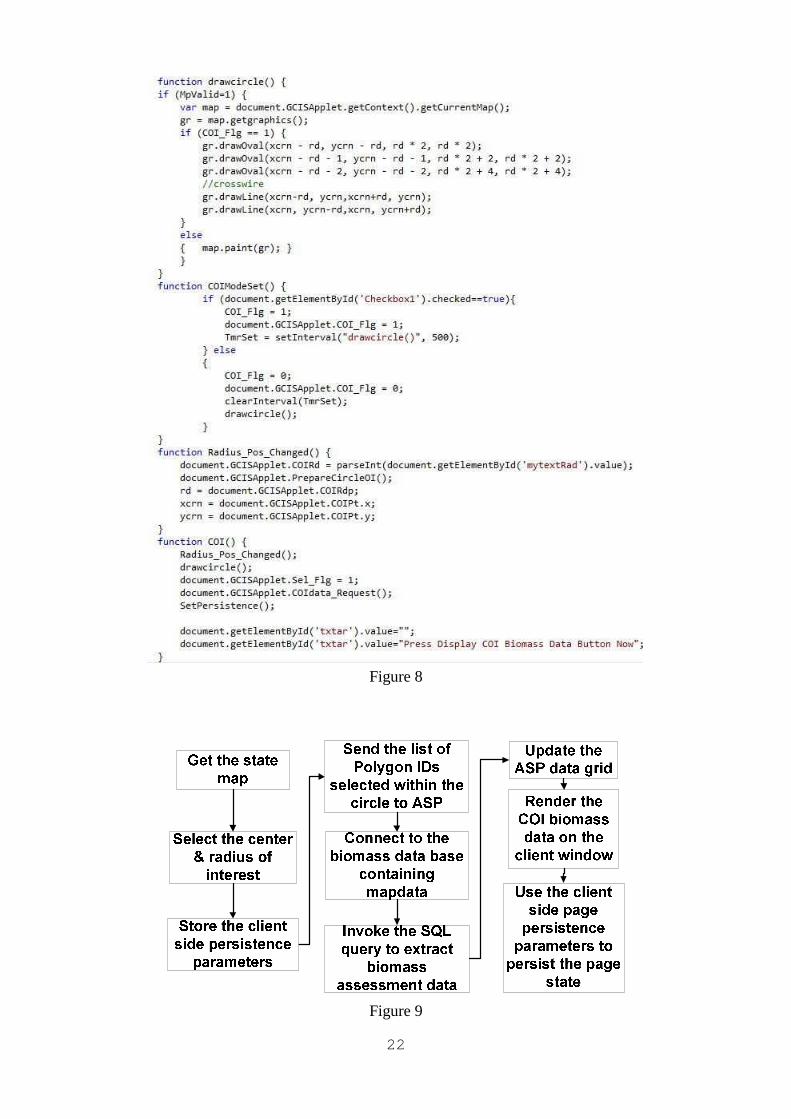
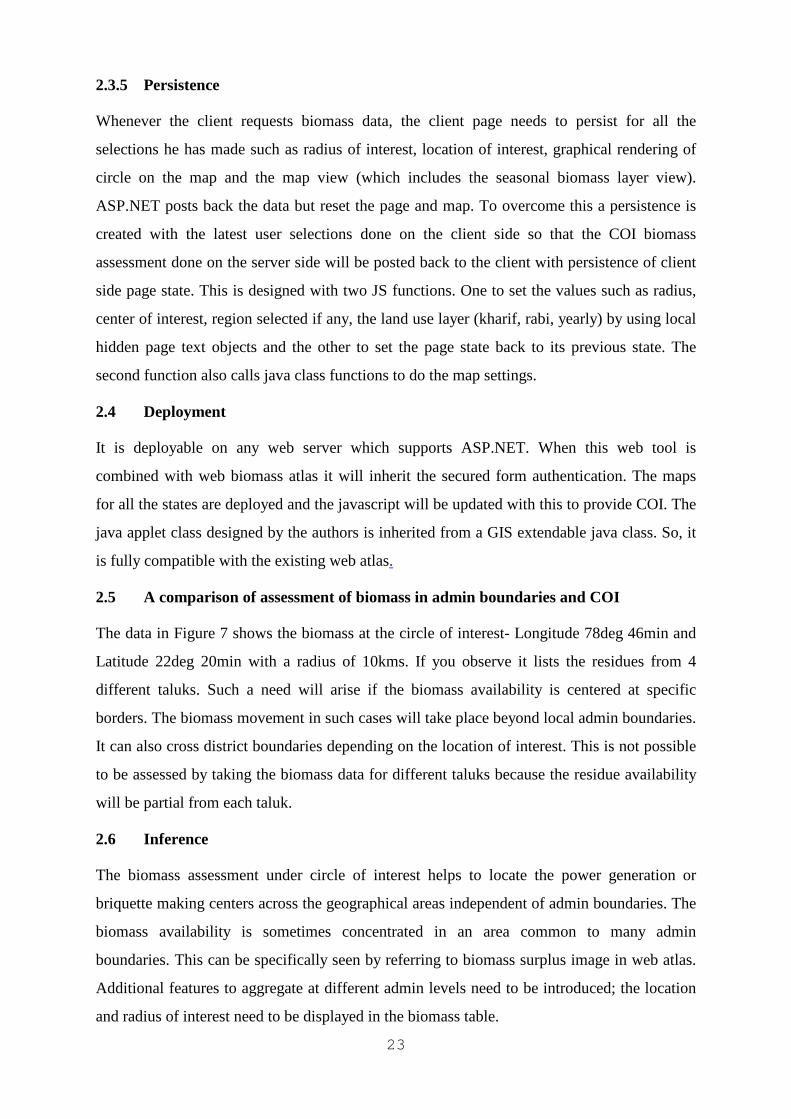
2.3.5 COI algorithm and biomass assessment
COI assessment of biomass takes place in two steps. Firstly, the geographical polygonal areas
under the selected radius and position of interest are selected graphically. This part of the task
is handled by the extended java class ‘atlas’ with java script. Figure 8 is the clipping of JS and
the called java class functions related to COI functional design. The radius is entered into a
text by the client. The center of interest is given by clicking the mouse on the map when in
Pan Mouse-Mode. Then user will enable COI and draws the circle. This is done by the JS
function ‘drawcircle’. After these interactions the user can click the button ‘Select COI in
map’ which invokes the JS function ‘COI ()’ as in Figure 8. The java-class-function
‘document.GCISApplet.COIdata_Request’ will respond through GIS server to geographically
select the polygons under COI. This will return the polygon identifiers. The Identifiers

20
BrowserWeb
server
Atlas page
GIS
server
Data
server
Atlas page returned
Initialize navigator Initialize navigator
Default Map
returned
Applet transmitted
Map navigator initialized
Draw circle of interestDraw
Circle of interest
Select center &
Radius of interest
Circle returnedCircle rendered
Select Kharif or Rabi or
Yearly view in the map Ask the view
Map view returnedMap view rendered
Select COI land use in mapAsk COI
ASP
code
Select Land useRender the selection
Enable COI data button
Press COI data buttonSend the selected list
Assess COI biomass
Return COI Data
Return COI Data GridRender COI Data
Type in first few
characters of the taluk
name
Press search buttonAsk for the names
Names returnedRender the names
Click on the taluk in the listAsk for the view
View returnedRender the region view
representing each of these biomass areas are then sent to data server. Each of the COI selected
polygonal crop areas has a unique identity. The data server will receive these IDs via ASP.
This is used to select the biomass data pertaining to these polygons. This is then aggregated
by a stored procedure in SQL server to update the ASP.NET data grid which is then rendered
on the client window. This part of the processing is handled by ASP.NET code. The block
diagram in Figure 9 explains the COI processing. Biomass generation is computed in two
ways depending on the type of crop residue. For e.g. coconut fronds is not directly related to
crop yield so in such cases the residue generation is directly calculated by multiplying crop
Figure 6
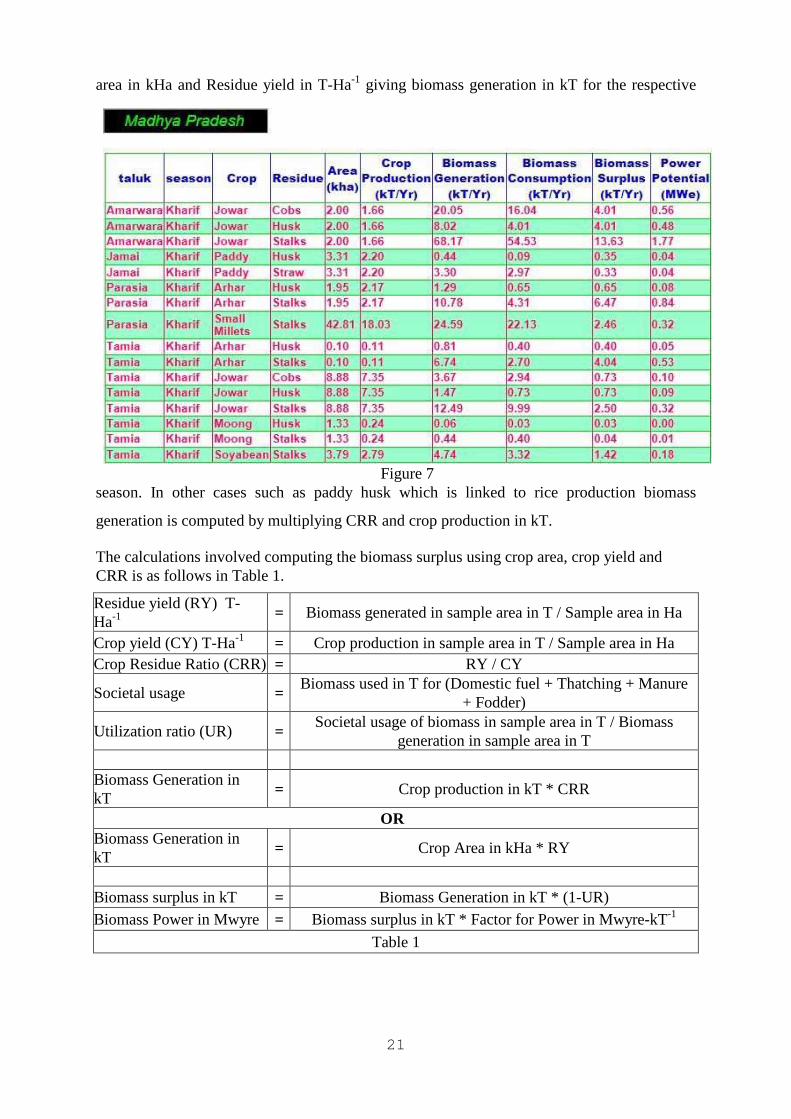
21
area in kHa and Residue yield in T-Ha-1 giving biomass generation in kT for the respective
season. In other cases such as paddy husk which is linked to rice production biomass
generation is computed by multiplying CRR and crop production in kT.
The calculations involved computing the biomass surplus using crop area, crop yield and CRR is as follows in Table 1.
Residue yield (RY) T-Ha-1
= Biomass generated in sample area in T / Sample area in Ha
Crop yield (CY) T-Ha-1 = Crop production in sample area in T / Sample area in Ha Crop Residue Ratio (CRR) = RY / CY
Societal usage = Biomass used in T for (Domestic fuel + Thatching + Manure
+ Fodder)
Utilization ratio (UR) = Societal usage of biomass in sample area in T / Biomass
generation in sample area in T Biomass Generation in kT
= Crop production in kT * CRR
OR Biomass Generation in kT
= Crop Area in kHa * RY
Biomass surplus in kT = Biomass Generation in kT * (1-UR) Biomass Power in Mwyre = Biomass surplus in kT * Factor for Power in Mwyre-kT-1
Table 1
Figure 7
22
Figure 8
Figure 9
23
2.3.5 Persistence
Whenever the client requests biomass data, the client page needs to persist for all the
selections he has made such as radius of interest, location of interest, graphical rendering of
circle on the map and the map view (which includes the seasonal biomass layer view).
ASP.NET posts back the data but reset the page and map. To overcome this a persistence is
created with the latest user selections done on the client side so that the COI biomass
assessment done on the server side will be posted back to the client with persistence of client
side page state. This is designed with two JS functions. One to set the values such as radius,
center of interest, region selected if any, the land use layer (kharif, rabi, yearly) by using local
hidden page text objects and the other to set the page state back to its previous state. The
second function also calls java class functions to do the map settings.
2.4 Deployment
It is deployable on any web server which supports ASP.NET. When this web tool is
combined with web biomass atlas it will inherit the secured form authentication. The maps
for all the states are deployed and the javascript will be updated with this to provide COI. The
java applet class designed by the authors is inherited from a GIS extendable java class. So, it
is fully compatible with the existing web atlas.
2.5 A comparison of assessment of biomass in admin boundaries and COI
The data in Figure 7 shows the biomass at the circle of interest- Longitude 78deg 46min and
Latitude 22deg 20min with a radius of 10kms. If you observe it lists the residues from 4
different taluks. Such a need will arise if the biomass availability is centered at specific
borders. The biomass movement in such cases will take place beyond local admin boundaries.
It can also cross district boundaries depending on the location of interest. This is not possible
to be assessed by taking the biomass data for different taluks because the residue availability
will be partial from each taluk.
2.6 Inference
The biomass assessment under circle of interest helps to locate the power generation or
briquette making centers across the geographical areas independent of admin boundaries. The
biomass availability is sometimes concentrated in an area common to many admin
boundaries. This can be specifically seen by referring to biomass surplus image in web atlas.
Additional features to aggregate at different admin levels need to be introduced; the location
and radius of interest need to be displayed in the biomass table.
24
Units
MWyre = mega-watt year electrical
T/Ha or T-Ha-1 = metric Tons per Hectare
kHa = kilo hectare
kT/Yr or kT-Yr-1 = kilo tons per year
deg min = degree and minutes of an arc
References
1. Web atlas at http://lab.cgpl.iisc.ernet.in/Atlas/.
Acknowledgements
The authors like to acknowledge that the project on Nation-wide agro-residue assessment
with a potential for power generation was initiated and sponsored by MNRE (Ministry for
New and Renewable Energy), GOI (Government of India) with an asserted reference to its use
in the power generation through Gasifier route. Additionally books- “Geography Information
Systems & Environmental Modeling”, PHI by Keith.C.Clarke, Bradley.O.Parks,
Michael.P.Cranes (2002) and “Biomass to Energy the Science and Technology of the IISc
Bioenergy system” by Team from CGPL, IISc, Bangalore (2003) were used as references in
general.
25
CHAPTER 3
A METHODOLOGY TO ASSESS BIOMASS
GEOGRAPHICALLY FROM IRRIGATED AREAS
Indranil Kundu, Rashmi N. Raj, G.S. Sheshagiri and N.K.S. Rajan
Abstract
The irrigated area is continually increasing since 1950. Currently in India about 60% of the
agriculture contributing to biomass is by irrigation and the rest by rain fed water. That means
irrigation do major contribution to agriculture. Agriculture/Biomass geography has been
already used for the purposes of crop and biomass assessments. Agro-biomass assessment in
the irrigated areas can further help entrepreneurs to plan up the agro-biomass movement
seasonally either to stock or for continuing power generation. The major part of plantation
crops such as coffee, tea would not fall into the irrigation category though in some cases it is
supported by sprinklers. The feeder canals are digitized using the NRSC (National Remote
Sensing Center) satellite map- Bhuvan as an overlay in GIS (Geographical Information
System) system. These feeders and sub-feeder vectors are then suitably buffered along their
length. This can vary from ±0 to ±6kms along the sub feeders. The agricultural crop polygons
under these buffer vector polygons are picked up and assessed region wise for biomass
surplus. Such assessment would also help to understand the contribution of biomass from
irrigated and rain fed areas.
Key words: Irrigated area, Satellite map, Biomass-Geography, Agricultural-geography,
Surface Water absorption, Rain fed area
3.1 Introduction
Biomasses are of different types. They get generated as a byproduct from agro-crops such as
paddy husk and cotton stalks. The crops are grown in both direct rain fed areas and irrigated
areas. Irrigation can be from various types of water bodies- Lakes, dams, anicuts from where
the water is fed using feeder channels. The availability of water in these water bodies depends
on the seasonal rainfall. Usually wet crops such as paddy are grown under these irrigations
during the kharif. Depending on the availability of the stored water the wet crops are also
grown in rabi season as well. Dry crops are preferred for non-irrigated areas or during rabi
26
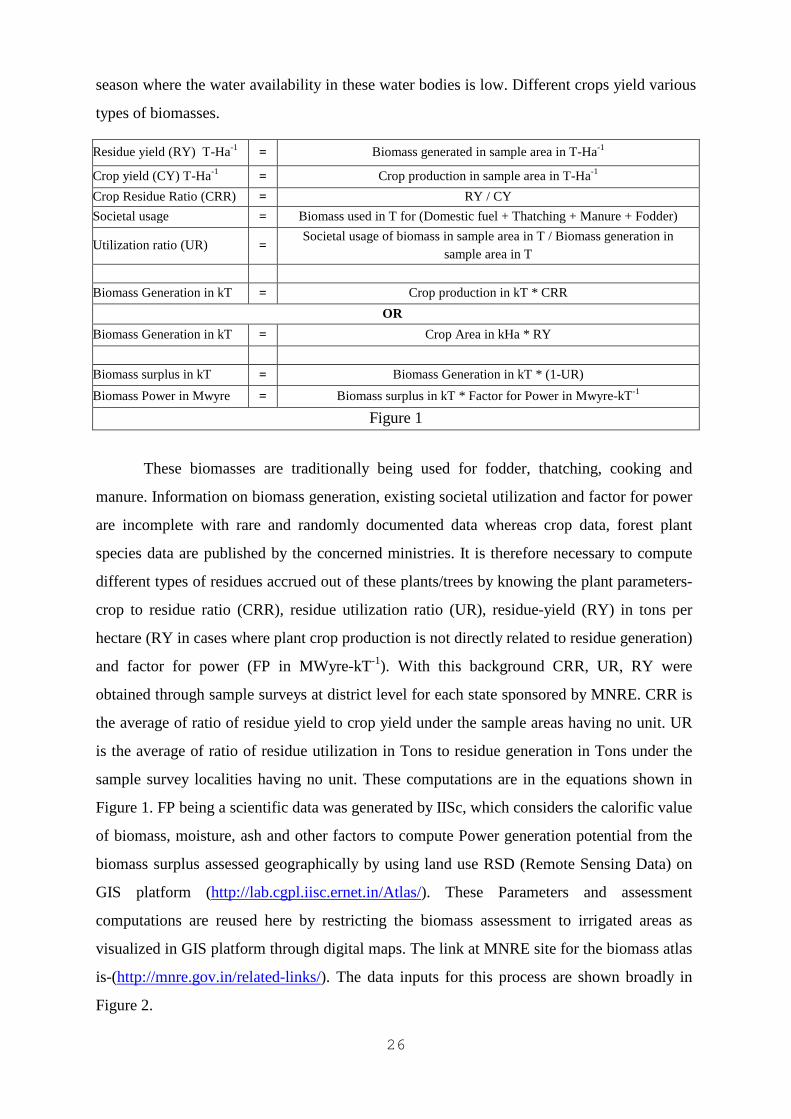
season where the water availability in these water bodies is low. Different crops yield various
types of biomasses.
Residue yield (RY) T-Ha-1 = Biomass generated in sample area in T-Ha-1
Crop yield (CY) T-Ha-1 = Crop production in sample area in T-Ha-1
Crop Residue Ratio (CRR) = RY / CY
Societal usage = Biomass used in T for (Domestic fuel + Thatching + Manure + Fodder)
Utilization ratio (UR) = Societal usage of biomass in sample area in T / Biomass generation in
sample area in T
Biomass Generation in kT = Crop production in kT * CRR
OR
Biomass Generation in kT = Crop Area in kHa * RY
Biomass surplus in kT = Biomass Generation in kT * (1-UR)
Biomass Power in Mwyre = Biomass surplus in kT * Factor for Power in Mwyre-kT-1
Figure 1
These biomasses are traditionally being used for fodder, thatching, cooking and
manure. Information on biomass generation, existing societal utilization and factor for power
are incomplete with rare and randomly documented data whereas crop data, forest plant
species data are published by the concerned ministries. It is therefore necessary to compute
different types of residues accrued out of these plants/trees by knowing the plant parameters-
crop to residue ratio (CRR), residue utilization ratio (UR), residue-yield (RY) in tons per
hectare (RY in cases where plant crop production is not directly related to residue generation)
and factor for power (FP in MWyre-kT-1). With this background CRR, UR, RY were
obtained through sample surveys at district level for each state sponsored by MNRE. CRR is
the average of ratio of residue yield to crop yield under the sample areas having no unit. UR
is the average of ratio of residue utilization in Tons to residue generation in Tons under the
sample survey localities having no unit. These computations are in the equations shown in
Figure 1. FP being a scientific data was generated by IISc, which considers the calorific value
of biomass, moisture, ash and other factors to compute Power generation potential from the
biomass surplus assessed geographically by using land use RSD (Remote Sensing Data) on
GIS platform (http://lab.cgpl.iisc.ernet.in/Atlas/). These Parameters and assessment
computations are reused here by restricting the biomass assessment to irrigated areas as
visualized in GIS platform through digital maps. The link at MNRE site for the biomass atlas
is-(http://mnre.gov.in/related-links/). The data inputs for this process are shown broadly in
Figure 2.
27
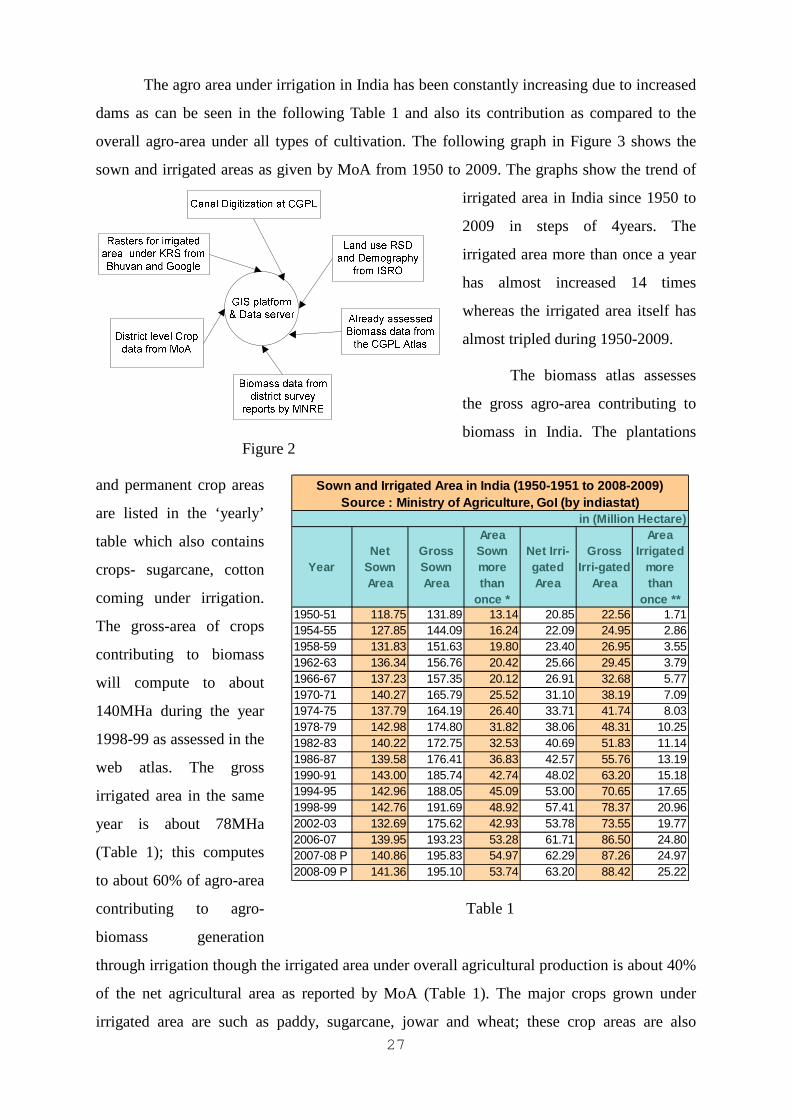
The agro area under irrigation in India has been constantly increasing due to increased
dams as can be seen in the following Table 1 and also its contribution as compared to the
overall agro-area under all types of cultivation. The following graph in Figure 3 shows the
sown and irrigated areas as given by MoA from 1950 to 2009. The graphs show the trend of
irrigated area in India since 1950 to
2009 in steps of 4years. The
irrigated area more than once a year
has almost increased 14 times
whereas the irrigated area itself has
almost tripled during 1950-2009.
The biomass atlas assesses
the gross agro-area contributing to
biomass in India. The plantations
and permanent crop areas
are listed in the ‘yearly’
table which also contains
crops- sugarcane, cotton
coming under irrigation.
The gross-area of crops
contributing to biomass
will compute to about
140MHa during the year
1998-99 as assessed in the
web atlas. The gross
irrigated area in the same
year is about 78MHa
(Table 1); this computes
to about 60% of agro-area
contributing to agro-
biomass generation
through irrigation though the irrigated area under overall agricultural production is about 40%
of the net agricultural area as reported by MoA (Table 1). The major crops grown under
irrigated area are such as paddy, sugarcane, jowar and wheat; these crop areas are also
Figure 2
YearNet
Sown Area
Gross Sown Area
Area Sown more than
once *
Net Irri-gated Area
Gross Irri-gated
Area
Area Irrigated
more than
once **1950-51 118.75 131.89 13.14 20.85 22.56 1.711954-55 127.85 144.09 16.24 22.09 24.95 2.861958-59 131.83 151.63 19.80 23.40 26.95 3.551962-63 136.34 156.76 20.42 25.66 29.45 3.791966-67 137.23 157.35 20.12 26.91 32.68 5.771970-71 140.27 165.79 25.52 31.10 38.19 7.091974-75 137.79 164.19 26.40 33.71 41.74 8.031978-79 142.98 174.80 31.82 38.06 48.31 10.251982-83 140.22 172.75 32.53 40.69 51.83 11.141986-87 139.58 176.41 36.83 42.57 55.76 13.191990-91 143.00 185.74 42.74 48.02 63.20 15.181994-95 142.96 188.05 45.09 53.00 70.65 17.651998-99 142.76 191.69 48.92 57.41 78.37 20.962002-03 132.69 175.62 42.93 53.78 73.55 19.772006-07 139.95 193.23 53.28 61.71 86.50 24.802007-08 P 140.86 195.83 54.97 62.29 87.26 24.972008-09 P 141.36 195.10 53.74 63.20 88.42 25.22
Sown and Irrigated Area in India (1950-1951 to 2008-2009)Source : Ministry of Agriculture, GoI (by indiastat)
in (Million Hectare)
Table 1
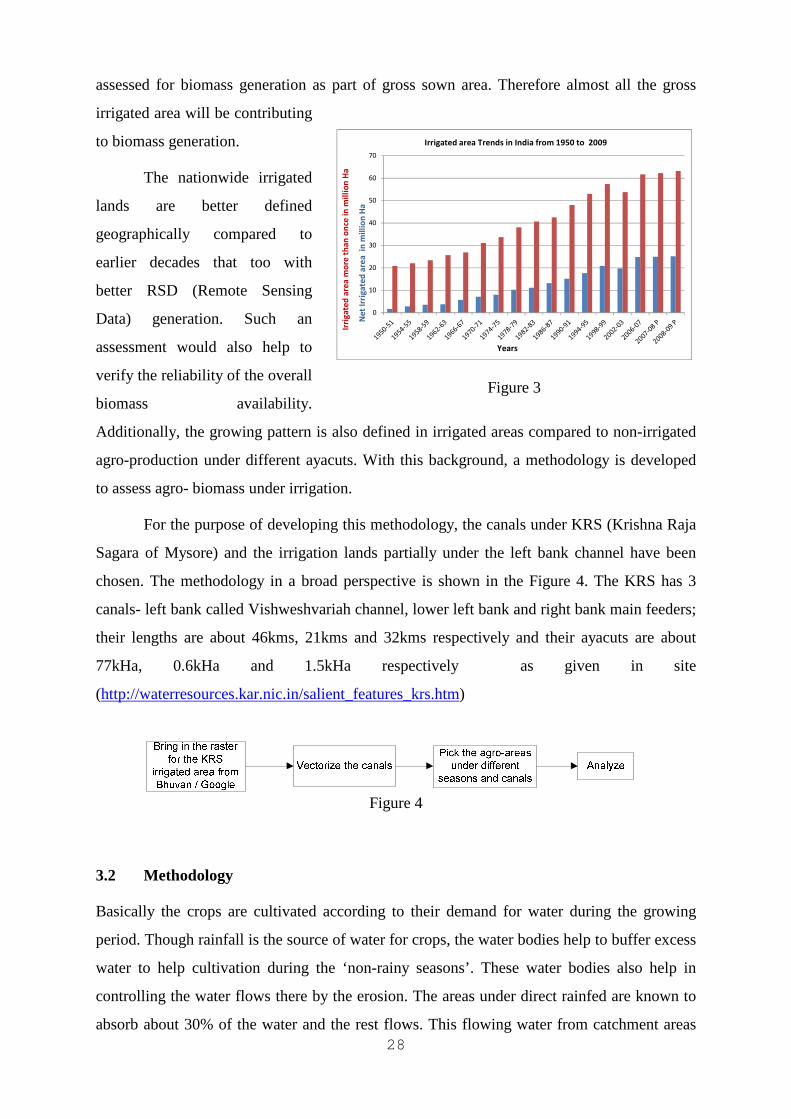
28
assessed for biomass generation as part of gross sown area. Therefore almost all the gross
irrigated area will be contributing
to biomass generation.
The nationwide irrigated
lands are better defined
geographically compared to
earlier decades that too with
better RSD (Remote Sensing
Data) generation. Such an
assessment would also help to
verify the reliability of the overall
biomass availability.
Additionally, the growing pattern is also defined in irrigated areas compared to non-irrigated
agro-production under different ayacuts. With this background, a methodology is developed
to assess agro- biomass under irrigation.
For the purpose of developing this methodology, the canals under KRS (Krishna Raja
Sagara of Mysore) and the irrigation lands partially under the left bank channel have been
chosen. The methodology in a broad perspective is shown in the Figure 4. The KRS has 3
canals- left bank called Vishweshvariah channel, lower left bank and right bank main feeders;
their lengths are about 46kms, 21kms and 32kms respectively and their ayacuts are about
77kHa, 0.6kHa and 1.5kHa respectively as given in site
(http://waterresources.kar.nic.in/salient_features_krs.htm)
3.2 Methodology
Basically the crops are cultivated according to their demand for water during the growing
period. Though rainfall is the source of water for crops, the water bodies help to buffer excess
water to help cultivation during the ‘non-rainy seasons’. These water bodies also help in
controlling the water flows there by the erosion. The areas under direct rainfed are known to
absorb about 30% of the water and the rest flows. This flowing water from catchment areas
0
10
20
30
40
50
60
70
YearsIr
rig
ate
d a
rea
mo
re t
ha
n o
nce
in
mil
lio
n H
a
Irrigated area Trends in India from 1950 to 2009
Ne
t Ir
rig
ate
d a
rea
in
mil
lio
n H
a
Figure 3
Figure 4
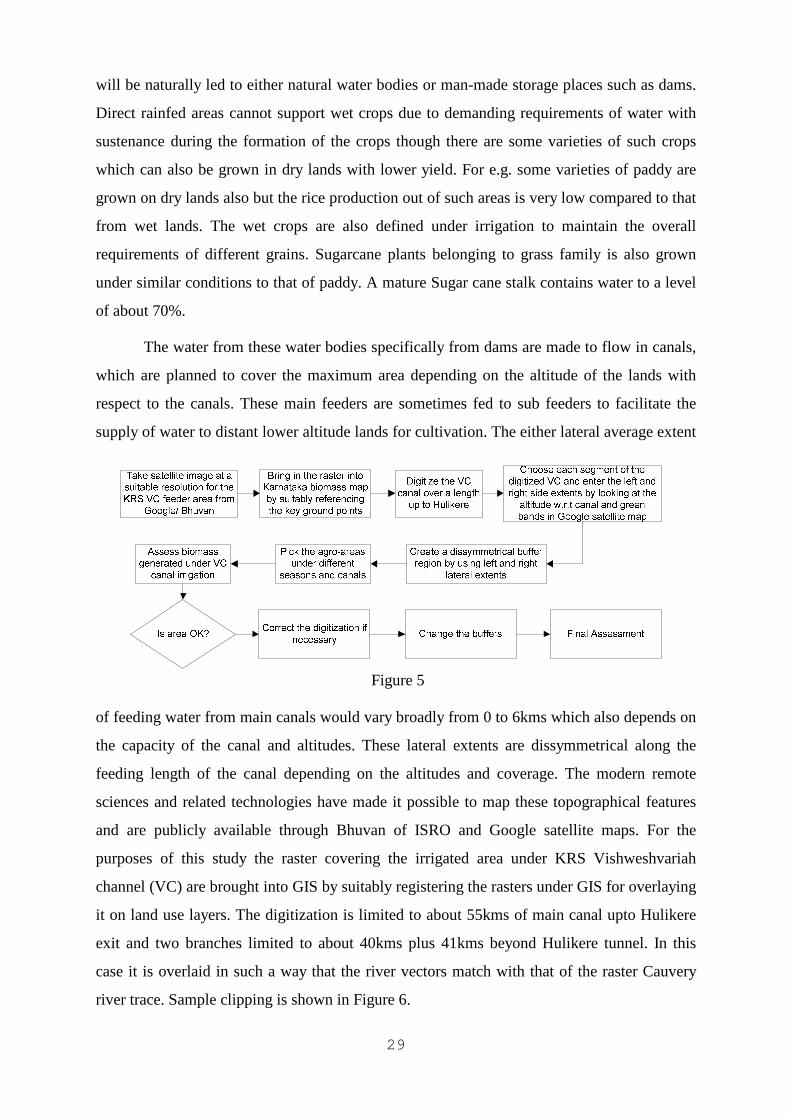
29
will be naturally led to either natural water bodies or man-made storage places such as dams.
Direct rainfed areas cannot support wet crops due to demanding requirements of water with
sustenance during the formation of the crops though there are some varieties of such crops
which can also be grown in dry lands with lower yield. For e.g. some varieties of paddy are
grown on dry lands also but the rice production out of such areas is very low compared to that
from wet lands. The wet crops are also defined under irrigation to maintain the overall
requirements of different grains. Sugarcane plants belonging to grass family is also grown
under similar conditions to that of paddy. A mature Sugar cane stalk contains water to a level
of about 70%.
The water from these water bodies specifically from dams are made to flow in canals,
which are planned to cover the maximum area depending on the altitude of the lands with
respect to the canals. These main feeders are sometimes fed to sub feeders to facilitate the
supply of water to distant lower altitude lands for cultivation. The either lateral average extent
of feeding water from main canals would vary broadly from 0 to 6kms which also depends on
the capacity of the canal and altitudes. These lateral extents are dissymmetrical along the
feeding length of the canal depending on the altitudes and coverage. The modern remote
sciences and related technologies have made it possible to map these topographical features
and are publicly available through Bhuvan of ISRO and Google satellite maps. For the
purposes of this study the raster covering the irrigated area under KRS Vishweshvariah
channel (VC) are brought into GIS by suitably registering the rasters under GIS for overlaying
it on land use layers. The digitization is limited to about 55kms of main canal upto Hulikere
exit and two branches limited to about 40kms plus 41kms beyond Hulikere tunnel. In this
case it is overlaid in such a way that the river vectors match with that of the raster Cauvery
river trace. Sample clipping is shown in Figure 6.
Figure 5

30
In GIS a new layer is created for canal digitization and another layer to create a
polygon to cover the irrigated areas laterally along the lengths of these canals (detailed
methodology is given in
the Figure 5). The GIS
provides a ‘buffering’
tool to create a region
around the canal. The
VC’s ayacut being about
770sqkm and the main
VC length being about
45kms, the average
lateral width must be
about 8.5kms on either
side; similarly the
average lateral width for
LLBC and RBC would
be about 0.15km and
0.5km respectively. But
VC has extended lengths in terms of branched feeders beyond Hulikere. This results in
reduction of average lateral width which has been found to be about 3kms after digitization.
In this study a dissymmetrical buffer zone (GIS tools call the process of creating an area along
any line as buffering) is defined along the length of the VC canal up to Hulikere exit point
and beyond limited to digitized vectors. Buffer in this paper means an area created along the
chosen length of the canal covering Irrigated agro-area. Buffer zone is the land use area
covered on either side of the canals along their lengths for irrigation. The VC has a tunnel in
Hulikere over a length of about 2.8kms and the canal beyond this point feeds the agro-areas
along two split sub channels. The Figure 6 is the clipping of the buffer zone (transparent grey)
along the canal (Pink line) with land use laid below it.
The dissymmetry is decided by altitude of each canal segment (here about 1km segments are
chosen) w.r.t the agro-lands on either side of the canal. The digitization is purely for
developing the methodology following the satellite raster and has not been verified / validated
otherwise. So, the assessment out of this exercise can neither be used as an authenticated data
Figure 6
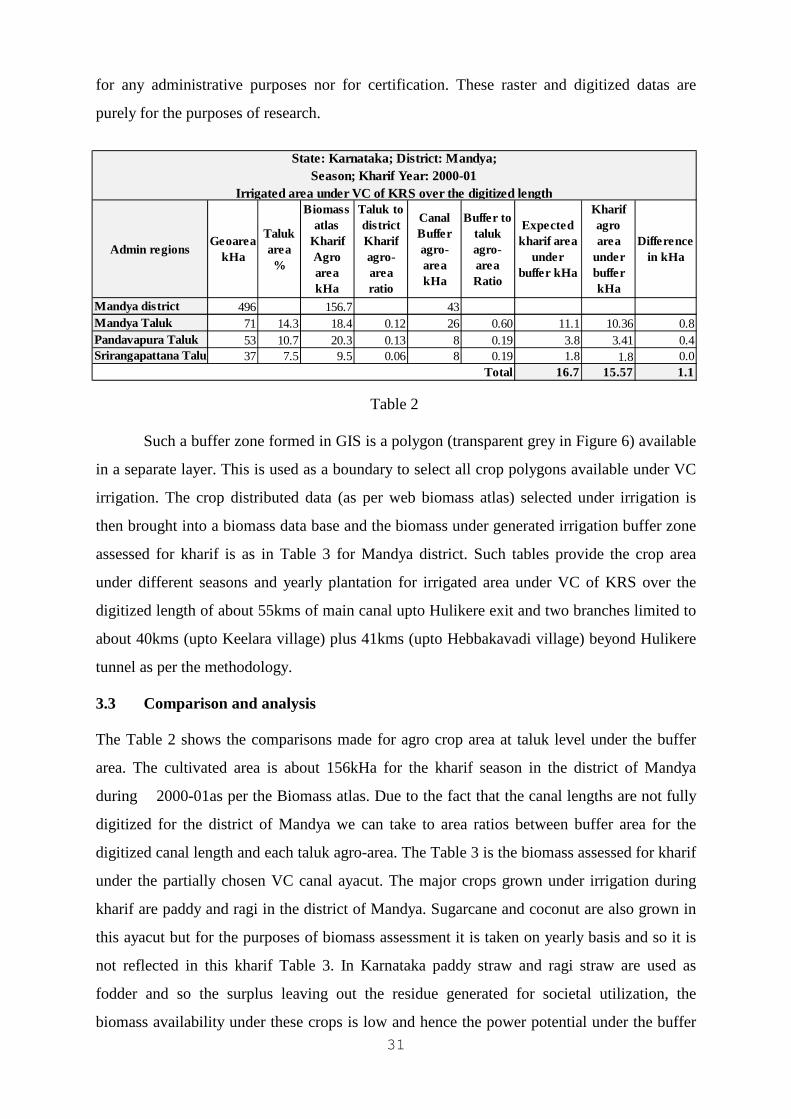
31
Admin regionsGeoarea
kHa
Taluk area %
Biomass atlas
Kharif Agro area kHa
Taluk to district Kharif agro-area ratio
Canal Buffer agro-area kHa
Buffer to taluk agro-area Ratio
Expected kharif area
under buffer kHa
Kharif agro area
under buffer kHa
Difference in kHa
Mandya district 496 156.7 43Mandya Taluk 71 14.3 18.4 0.12 26 0.60 11.1 10.36 0.8Pandavapura Taluk 53 10.7 20.3 0.13 8 0.19 3.8 3.41 0.4Srirangapattana Taluk 37 7.5 9.5 0.06 8 0.19 1.8 1.8 0.0
16.7 15.57 1.1Total
State: Karnataka; District: Mandya; Season; Kharif Year: 2000-01
Irrigated area under VC of KRS over the digitized length
for any administrative purposes nor for certification. These raster and digitized datas are
purely for the purposes of research.
Such a buffer zone formed in GIS is a polygon (transparent grey in Figure 6) available
in a separate layer. This is used as a boundary to select all crop polygons available under VC
irrigation. The crop distributed data (as per web biomass atlas) selected under irrigation is
then brought into a biomass data base and the biomass under generated irrigation buffer zone
assessed for kharif is as in Table 3 for Mandya district. Such tables provide the crop area
under different seasons and yearly plantation for irrigated area under VC of KRS over the
digitized length of about 55kms of main canal upto Hulikere exit and two branches limited to
about 40kms (upto Keelara village) plus 41kms (upto Hebbakavadi village) beyond Hulikere
tunnel as per the methodology.
3.3 Comparison and analysis
The Table 2 shows the comparisons made for agro crop area at taluk level under the buffer
area. The cultivated area is about 156kHa for the kharif season in the district of Mandya
during 2000-01as per the Biomass atlas. Due to the fact that the canal lengths are not fully
digitized for the district of Mandya we can take to area ratios between buffer area for the
digitized canal length and each taluk agro-area. The Table 3 is the biomass assessed for kharif
under the partially chosen VC canal ayacut. The major crops grown under irrigation during
kharif are paddy and ragi in the district of Mandya. Sugarcane and coconut are also grown in
this ayacut but for the purposes of biomass assessment it is taken on yearly basis and so it is
not reflected in this kharif Table 3. In Karnataka paddy straw and ragi straw are used as
fodder and so the surplus leaving out the residue generated for societal utilization, the
biomass availability under these crops is low and hence the power potential under the buffer
Table 2
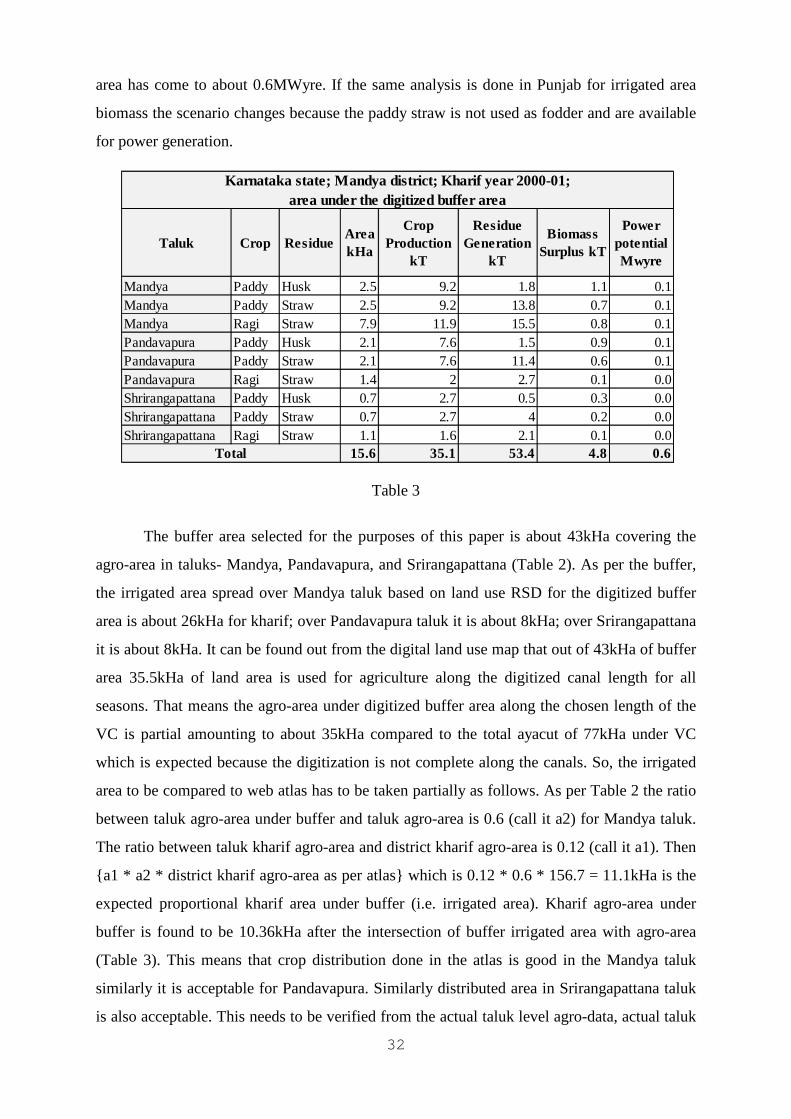
32
area has come to about 0.6MWyre. If the same analysis is done in Punjab for irrigated area
biomass the scenario changes because the paddy straw is not used as fodder and are available
for power generation.
The buffer area selected for the purposes of this paper is about 43kHa covering the
agro-area in taluks- Mandya, Pandavapura, and Srirangapattana (Table 2). As per the buffer,
the irrigated area spread over Mandya taluk based on land use RSD for the digitized buffer
area is about 26kHa for kharif; over Pandavapura taluk it is about 8kHa; over Srirangapattana
it is about 8kHa. It can be found out from the digital land use map that out of 43kHa of buffer
area 35.5kHa of land area is used for agriculture along the digitized canal length for all
seasons. That means the agro-area under digitized buffer area along the chosen length of the
VC is partial amounting to about 35kHa compared to the total ayacut of 77kHa under VC
which is expected because the digitization is not complete along the canals. So, the irrigated
area to be compared to web atlas has to be taken partially as follows. As per Table 2 the ratio
between taluk agro-area under buffer and taluk agro-area is 0.6 (call it a2) for Mandya taluk.
The ratio between taluk kharif agro-area and district kharif agro-area is 0.12 (call it a1). Then
a1 * a2 * district kharif agro-area as per atlas which is 0.12 * 0.6 * 156.7 = 11.1kHa is the
expected proportional kharif area under buffer (i.e. irrigated area). Kharif agro-area under
buffer is found to be 10.36kHa after the intersection of buffer irrigated area with agro-area
(Table 3). This means that crop distribution done in the atlas is good in the Mandya taluk
similarly it is acceptable for Pandavapura. Similarly distributed area in Srirangapattana taluk
is also acceptable. This needs to be verified from the actual taluk level agro-data, actual taluk
Taluk Crop ResidueArea kHa
Crop Production
kT
Residue Generation
kT
Biomass Surplus kT
Power potential Mwyre
Mandya Paddy Husk 2.5 9.2 1.8 1.1 0.1Mandya Paddy Straw 2.5 9.2 13.8 0.7 0.1Mandya Ragi Straw 7.9 11.9 15.5 0.8 0.1Pandavapura Paddy Husk 2.1 7.6 1.5 0.9 0.1Pandavapura Paddy Straw 2.1 7.6 11.4 0.6 0.1Pandavapura Ragi Straw 1.4 2 2.7 0.1 0.0Shrirangapattana Paddy Husk 0.7 2.7 0.5 0.3 0.0Shrirangapattana Paddy Straw 0.7 2.7 4 0.2 0.0Shrirangapattana Ragi Straw 1.1 1.6 2.1 0.1 0.0
15.6 35.1 53.4 4.8 0.6Total
Karnataka state; Mandya district; Kharif year 2000-01; area under the digitized buffer area
Table 3
33
level irrigation agro-data, the buffering area created along the canal running in the taluk (i.e.
whether the lateral extents used on the basis of altitudes are alright) and then the distributor
can be tuned further by introducing logics for taluk level crop distribution.
3.4 Inference
The assessment of biomass under irrigated areas will help in many ways. Firstly it will
provide the information on the extent of cultivation under the water fed areas which can be
verified with the data available under each ayacut of different water bodies more specifically
for dams and anicuts. Secondly it helps to validate the crop distribution. For e.g. the crop
distribution done at district level is found to be accurate at taluk level to above 75% except in
few cases. This tool will now help to assess it further for irrigated areas. This way the
distributor algorithms can be further improved with additional logics. It would also help for a
quick assessment of agro-biomass generated under irrigation given the biomass atlas.
Units
MWyre = mega-watt year electrical
T-Ha-1 = Tons per Hectare
kHa = kilo hectare
MHa = million hectare
kT-Yr-1 = kilo tons per year
References
1. http://lab.cgpl.iisc.ernet.in/Atlas/
2. http://mnre.gov.in/related-links/
3. http://waterresources.kar.nic.in/salient_features_krs.htm
Acknowledgements
The authors like to acknowledge that the project on Nation-wide agro-residue assessment
with a potential for power generation was initiated and sponsored by MNRE (Ministry for
New and Renewable Energy), GOI (Government of India) with an asserted reference to its use
in the power generation through Gasifier route. Additionally books- “Geography Information
Systems & Environmental Modeling”, PHI by Keith.C.Clarke,Bradley.O.Parks,
Michael.P.Cranes (2002) and “Biomass to Energy the Science and Technology of the IISc
Bioenergy system” by Team from CGPL, IISc, Bangalore (2003) were used as references in
general. The authors also like to acknowledge the Bhuvan and Google earth satellite maps.
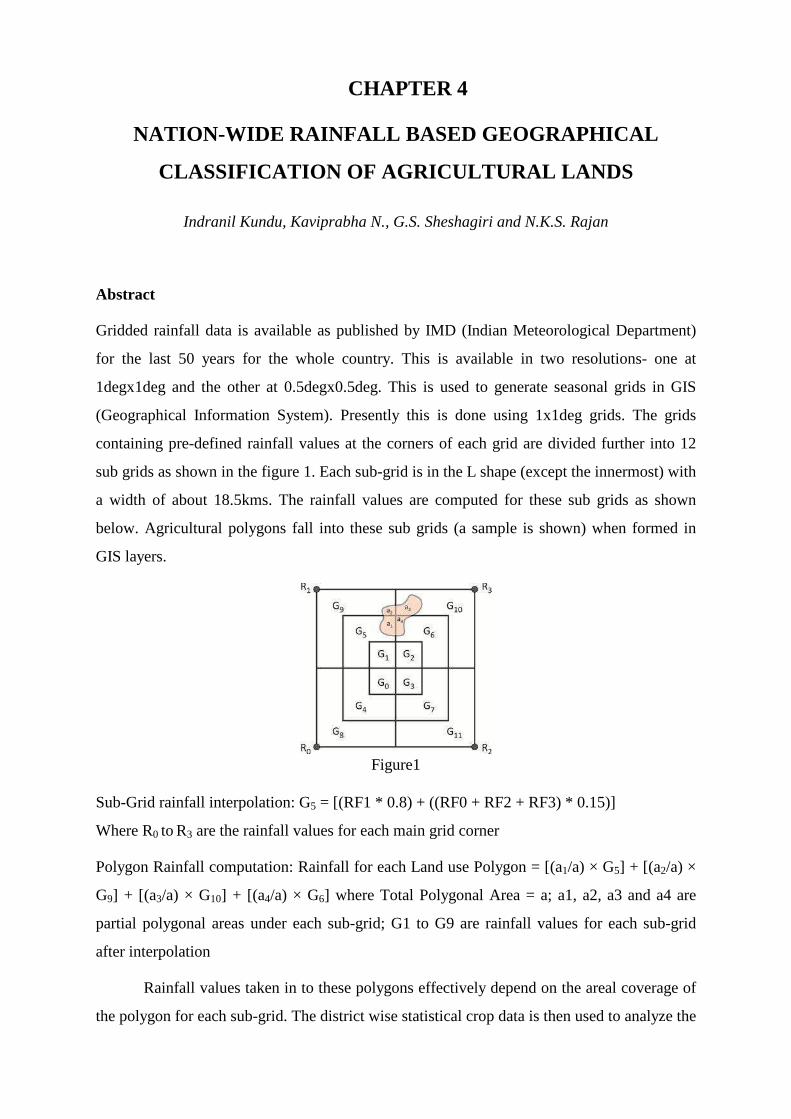
34
CHAPTER 4
NATION-WIDE RAINFALL BASED GEOGRAPHICAL
CLASSIFICATION OF AGRICULTURAL LANDS
Indranil Kundu, Kaviprabha N., G.S. Sheshagiri and N.K.S. Rajan
Abstract
Gridded rainfall data is available as published by IMD (Indian Meteorological Department)
for the last 50 years for the whole country. This is available in two resolutions- one at
1degx1deg and the other at 0.5degx0.5deg. This is used to generate seasonal grids in GIS
(Geographical Information System). Presently this is done using 1x1deg grids. The grids
containing pre-defined rainfall values at the corners of each grid are divided further into 12
sub grids as shown in the figure 1. Each sub-grid is in the L shape (except the innermost) with
a width of about 18.5kms. The rainfall values are computed for these sub grids as shown
below. Agricultural polygons fall into these sub grids (a sample is shown) when formed in
GIS layers.
Figure1
Sub-Grid rainfall interpolation: G5 = [(RF1 * 0.8) + ((RF0 + RF2 + RF3) * 0.15)]
Where R0 to R3 are the rainfall values for each main grid corner
Polygon Rainfall computation: Rainfall for each Land use Polygon = [(a1/a) × G5] + [(a2/a) ×
G9] + [(a3/a) × G10] + [(a4/a) × G6] where Total Polygonal Area = a; a1, a2, a3 and a4 are
partial polygonal areas under each sub-grid; G1 to G9 are rainfall values for each sub-grid
after interpolation
Rainfall values taken in to these polygons effectively depend on the areal coverage of
the polygon for each sub-grid. The district wise statistical crop data is then used to analyze the
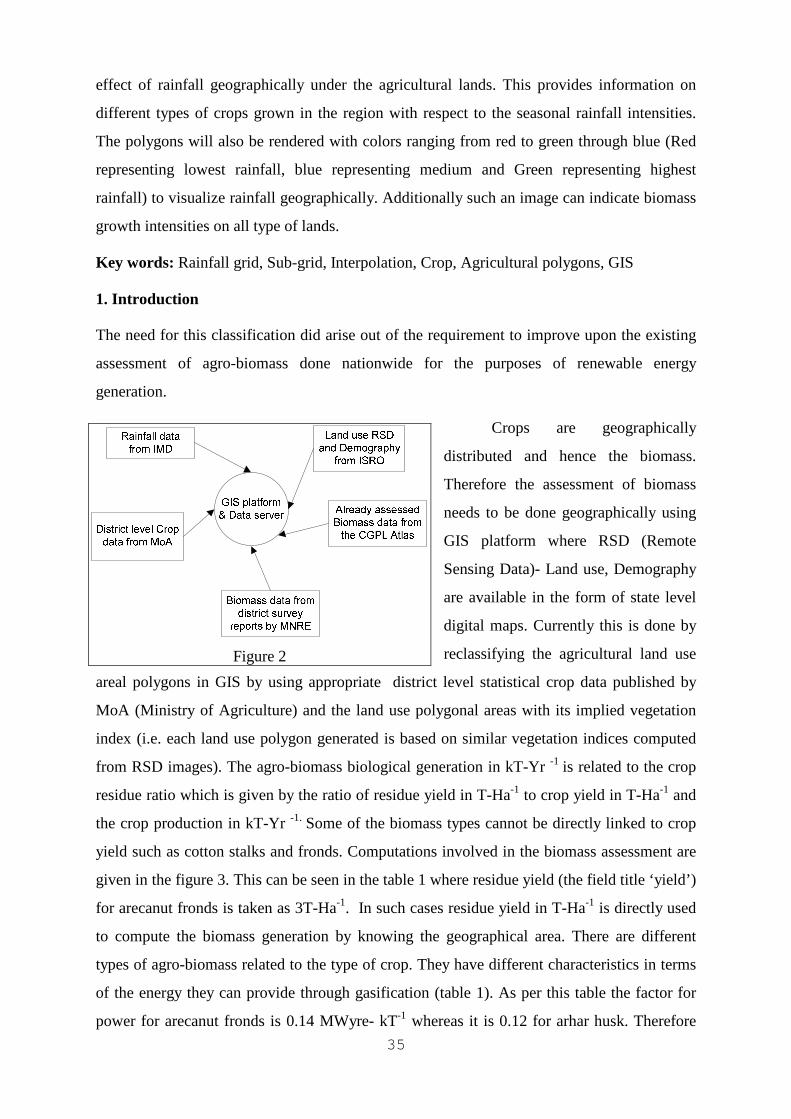
35
effect of rainfall geographically under the agricultural lands. This provides information on
different types of crops grown in the region with respect to the seasonal rainfall intensities.
The polygons will also be rendered with colors ranging from red to green through blue (Red
representing lowest rainfall, blue representing medium and Green representing highest
rainfall) to visualize rainfall geographically. Additionally such an image can indicate biomass
growth intensities on all type of lands.
Key words: Rainfall grid, Sub-grid, Interpolation, Crop, Agricultural polygons, GIS
1. Introduction
The need for this classification did arise out of the requirement to improve upon the existing
assessment of agro-biomass done nationwide for the purposes of renewable energy
generation.
Crops are geographically
distributed and hence the biomass.
Therefore the assessment of biomass
needs to be done geographically using
GIS platform where RSD (Remote
Sensing Data)- Land use, Demography
are available in the form of state level
digital maps. Currently this is done by
reclassifying the agricultural land use
areal polygons in GIS by using appropriate district level statistical crop data published by
MoA (Ministry of Agriculture) and the land use polygonal areas with its implied vegetation
index (i.e. each land use polygon generated is based on similar vegetation indices computed
from RSD images). The agro-biomass biological generation in kT-Yr -1 is related to the crop
residue ratio which is given by the ratio of residue yield in T-Ha-1 to crop yield in T-Ha-1 and
the crop production in kT-Yr -1. Some of the biomass types cannot be directly linked to crop
yield such as cotton stalks and fronds. Computations involved in the biomass assessment are
given in the figure 3. This can be seen in the table 1 where residue yield (the field title ‘yield’)
for arecanut fronds is taken as 3T-Ha-1. In such cases residue yield in T-Ha-1 is directly used
to compute the biomass generation by knowing the geographical area. There are different
types of agro-biomass related to the type of crop. They have different characteristics in terms
of the energy they can provide through gasification (table 1). As per this table the factor for
power for arecanut fronds is 0.14 MWyre- kT-1 whereas it is 0.12 for arhar husk. Therefore
Figure 2
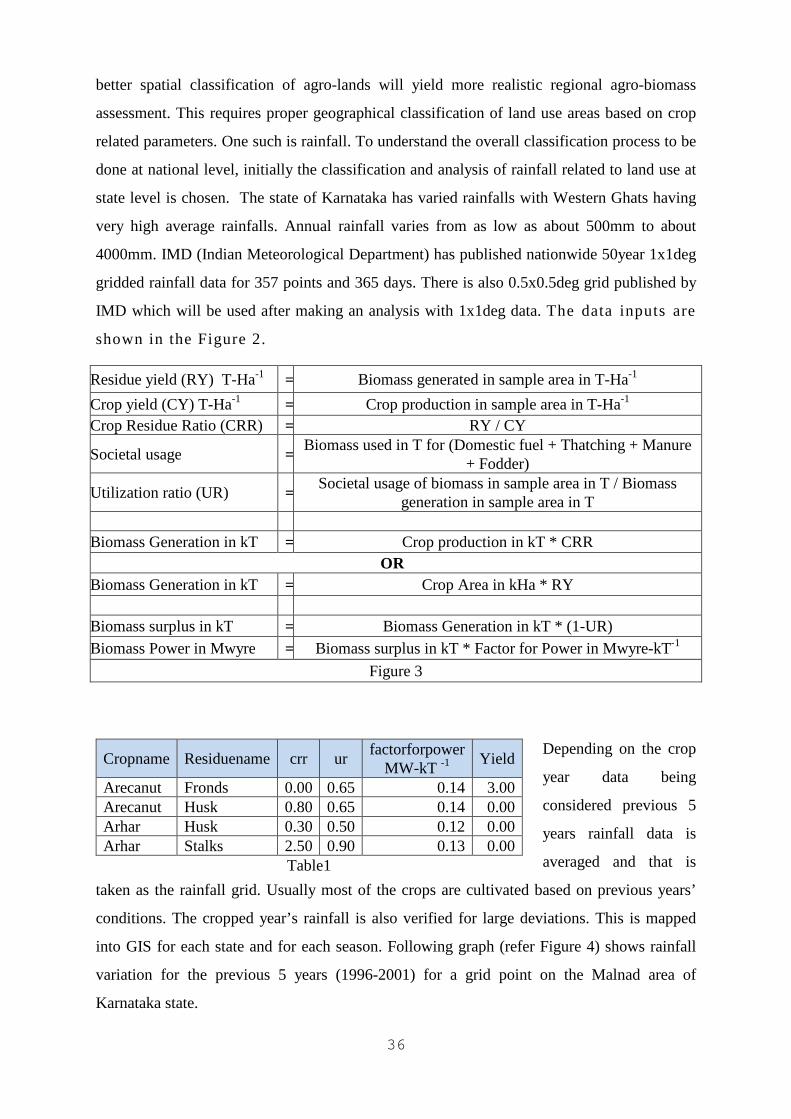
36
better spatial classification of agro-lands will yield more realistic regional agro-biomass
assessment. This requires proper geographical classification of land use areas based on crop
related parameters. One such is rainfall. To understand the overall classification process to be
done at national level, initially the classification and analysis of rainfall related to land use at
state level is chosen. The state of Karnataka has varied rainfalls with Western Ghats having
very high average rainfalls. Annual rainfall varies from as low as about 500mm to about
4000mm. IMD (Indian Meteorological Department) has published nationwide 50year 1x1deg
gridded rainfall data for 357 points and 365 days. There is also 0.5x0.5deg grid published by
IMD which will be used after making an analysis with 1x1deg data. The data inputs are
shown in the Figure 2.
Residue yield (RY) T-Ha-1 = Biomass generated in sample area in T-Ha-1
Crop yield (CY) T-Ha-1 = Crop production in sample area in T-Ha-1 Crop Residue Ratio (CRR) = RY / CY
Societal usage =Biomass used in T for (Domestic fuel + Thatching + Manure
+ Fodder)
Utilization ratio (UR) =Societal usage of biomass in sample area in T / Biomass
generation in sample area in T Biomass Generation in kT = Crop production in kT * CRR
OR Biomass Generation in kT = Crop Area in kHa * RY Biomass surplus in kT = Biomass Generation in kT * (1-UR) Biomass Power in Mwyre = Biomass surplus in kT * Factor for Power in Mwyre-kT-1
Figure 3
Depending on the crop
year data being
considered previous 5
years rainfall data is
averaged and that is
taken as the rainfall grid. Usually most of the crops are cultivated based on previous years’
conditions. The cropped year’s rainfall is also verified for large deviations. This is mapped
into GIS for each state and for each season. Following graph (refer Figure 4) shows rainfall
variation for the previous 5 years (1996-2001) for a grid point on the Malnad area of
Karnataka state.
Cropname Residuename crr ur factorforpower
MW-kT -1 Yield
Arecanut Fronds 0.00 0.65 0.14 3.00 Arecanut Husk 0.80 0.65 0.14 0.00 Arhar Husk 0.30 0.50 0.12 0.00 Arhar Stalks 2.50 0.90 0.13 0.00
Table1
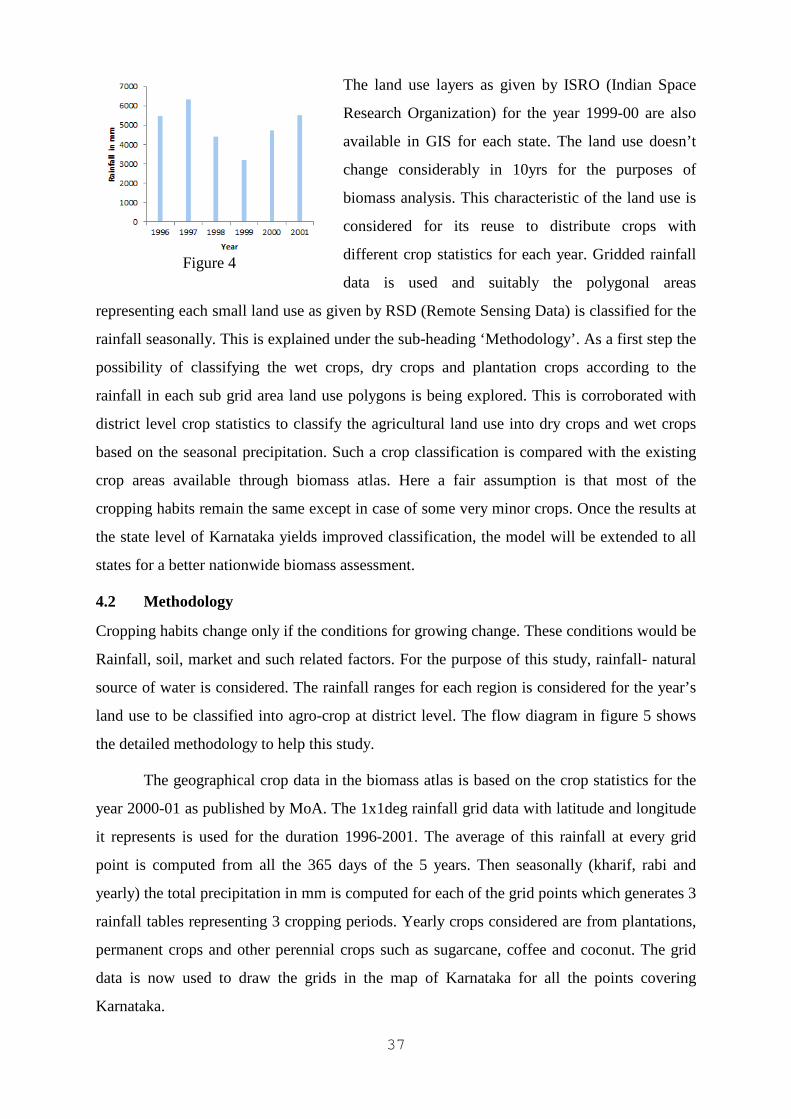
37
The land use layers as given by ISRO (Indian Space
Research Organization) for the year 1999-00 are also
available in GIS for each state. The land use doesn’t
change considerably in 10yrs for the purposes of
biomass analysis. This characteristic of the land use is
considered for its reuse to distribute crops with
different crop statistics for each year. Gridded rainfall
data is used and suitably the polygonal areas
representing each small land use as given by RSD (Remote Sensing Data) is classified for the
rainfall seasonally. This is explained under the sub-heading ‘Methodology’. As a first step the
possibility of classifying the wet crops, dry crops and plantation crops according to the
rainfall in each sub grid area land use polygons is being explored. This is corroborated with
district level crop statistics to classify the agricultural land use into dry crops and wet crops
based on the seasonal precipitation. Such a crop classification is compared with the existing
crop areas available through biomass atlas. Here a fair assumption is that most of the
cropping habits remain the same except in case of some very minor crops. Once the results at
the state level of Karnataka yields improved classification, the model will be extended to all
states for a better nationwide biomass assessment.
4.2 Methodology
Cropping habits change only if the conditions for growing change. These conditions would be
Rainfall, soil, market and such related factors. For the purpose of this study, rainfall- natural
source of water is considered. The rainfall ranges for each region is considered for the year’s
land use to be classified into agro-crop at district level. The flow diagram in figure 5 shows
the detailed methodology to help this study.
The geographical crop data in the biomass atlas is based on the crop statistics for the
year 2000-01 as published by MoA. The 1x1deg rainfall grid data with latitude and longitude
it represents is used for the duration 1996-2001. The average of this rainfall at every grid
point is computed from all the 365 days of the 5 years. Then seasonally (kharif, rabi and
yearly) the total precipitation in mm is computed for each of the grid points which generates 3
rainfall tables representing 3 cropping periods. Yearly crops considered are from plantations,
permanent crops and other perennial crops such as sugarcane, coffee and coconut. The grid
data is now used to draw the grids in the map of Karnataka for all the points covering
Karnataka.
Figure 4
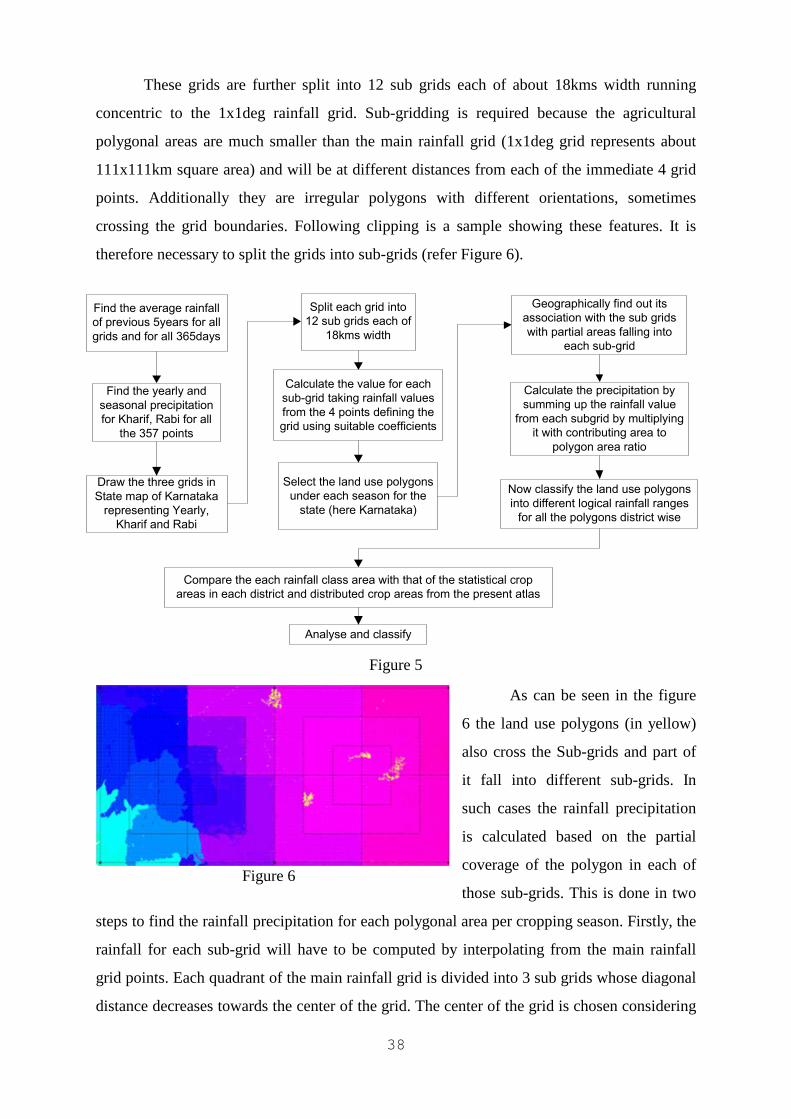
38
These grids are further split into 12 sub grids each of about 18kms width running
concentric to the 1x1deg rainfall grid. Sub-gridding is required because the agricultural
polygonal areas are much smaller than the main rainfall grid (1x1deg grid represents about
111x111km square area) and will be at different distances from each of the immediate 4 grid
points. Additionally they are irregular polygons with different orientations, sometimes
crossing the grid boundaries. Following clipping is a sample showing these features. It is
therefore necessary to split the grids into sub-grids (refer Figure 6).
As can be seen in the figure
6 the land use polygons (in yellow)
also cross the Sub-grids and part of
it fall into different sub-grids. In
such cases the rainfall precipitation
is calculated based on the partial
coverage of the polygon in each of
those sub-grids. This is done in two
steps to find the rainfall precipitation for each polygonal area per cropping season. Firstly, the
rainfall for each sub-grid will have to be computed by interpolating from the main rainfall
grid points. Each quadrant of the main rainfall grid is divided into 3 sub grids whose diagonal
distance decreases towards the center of the grid. The center of the grid is chosen considering
Figure 5
Figure 6
Calculate the value for each
sub-grid taking rainfall values
from the 4 points defining the
grid using suitable coefficients
Find the average rainfall
of previous 5years for all
grids and for all 365days
Find the yearly and
seasonal precipitation
for Kharif, Rabi for all
the 357 points
Draw the three grids in
State map of Karnataka
representing Yearly,
Kharif and Rabi
Split each grid into
12 sub grids each of
18kms width
Select the land use polygons
under each season for the
state (here Karnataka)
Geographically find out its
association with the sub grids
with partial areas falling into
each sub-grid
Calculate the precipitation by
summing up the rainfall value
from each subgrid by multiplying
it with contributing area to
polygon area ratio
Now classify the land use polygons
into different logical rainfall ranges
for all the polygons district wise
Compare the each rainfall class area with that of the statistical crop
areas in each district and distributed crop areas from the present atlas
Analyse and classify
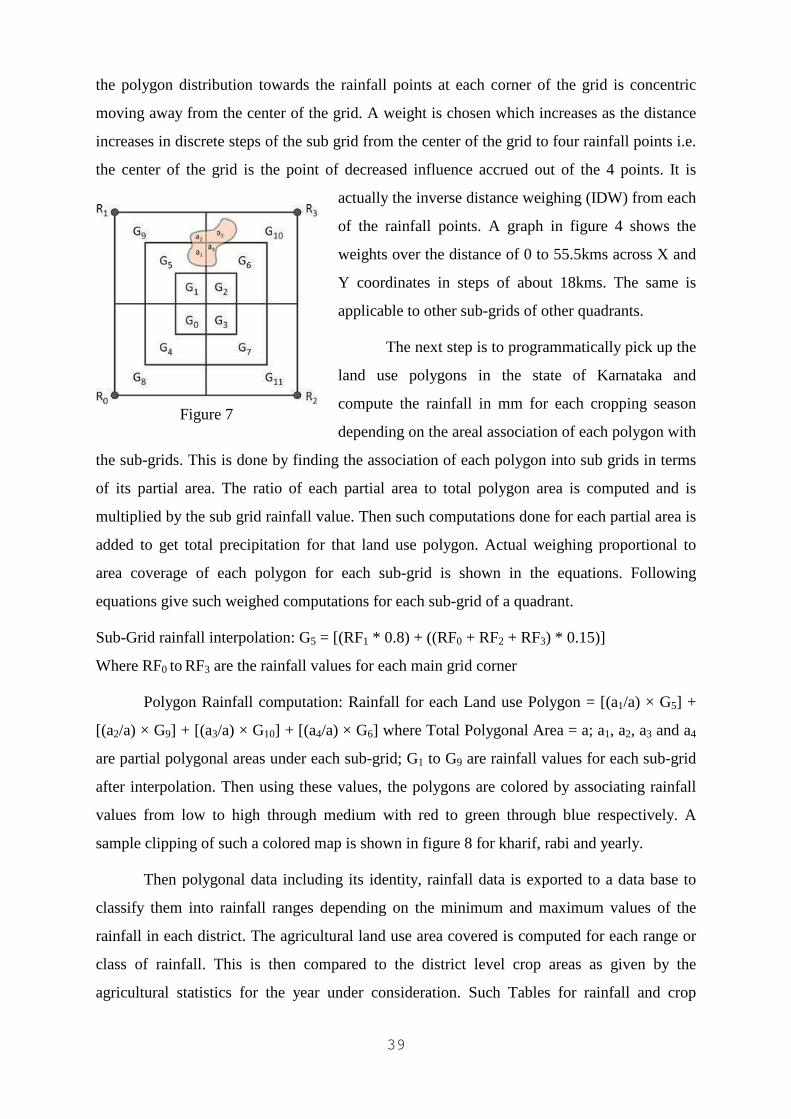
39
the polygon distribution towards the rainfall points at each corner of the grid is concentric
moving away from the center of the grid. A weight is chosen which increases as the distance
increases in discrete steps of the sub grid from the center of the grid to four rainfall points i.e.
the center of the grid is the point of decreased influence accrued out of the 4 points. It is
actually the inverse distance weighing (IDW) from each
of the rainfall points. A graph in figure 4 shows the
weights over the distance of 0 to 55.5kms across X and
Y coordinates in steps of about 18kms. The same is
applicable to other sub-grids of other quadrants.
The next step is to programmatically pick up the
land use polygons in the state of Karnataka and
compute the rainfall in mm for each cropping season
depending on the areal association of each polygon with
the sub-grids. This is done by finding the association of each polygon into sub grids in terms
of its partial area. The ratio of each partial area to total polygon area is computed and is
multiplied by the sub grid rainfall value. Then such computations done for each partial area is
added to get total precipitation for that land use polygon. Actual weighing proportional to
area coverage of each polygon for each sub-grid is shown in the equations. Following
equations give such weighed computations for each sub-grid of a quadrant.
Sub-Grid rainfall interpolation: G5 = [(RF1 * 0.8) + ((RF0 + RF2 + RF3) * 0.15)]
Where RF0 to RF3 are the rainfall values for each main grid corner
Polygon Rainfall computation: Rainfall for each Land use Polygon = [(a1/a) × G5] +
[(a2/a) × G9] + [(a3/a) × G10] + [(a4/a) × G6] where Total Polygonal Area = a; a1, a2, a3 and a4
are partial polygonal areas under each sub-grid; G1 to G9 are rainfall values for each sub-grid
after interpolation. Then using these values, the polygons are colored by associating rainfall
values from low to high through medium with red to green through blue respectively. A
sample clipping of such a colored map is shown in figure 8 for kharif, rabi and yearly.
Then polygonal data including its identity, rainfall data is exported to a data base to
classify them into rainfall ranges depending on the minimum and maximum values of the
rainfall in each district. The agricultural land use area covered is computed for each range or
class of rainfall. This is then compared to the district level crop areas as given by the
agricultural statistics for the year under consideration. Such Tables for rainfall and crop
Figure 7
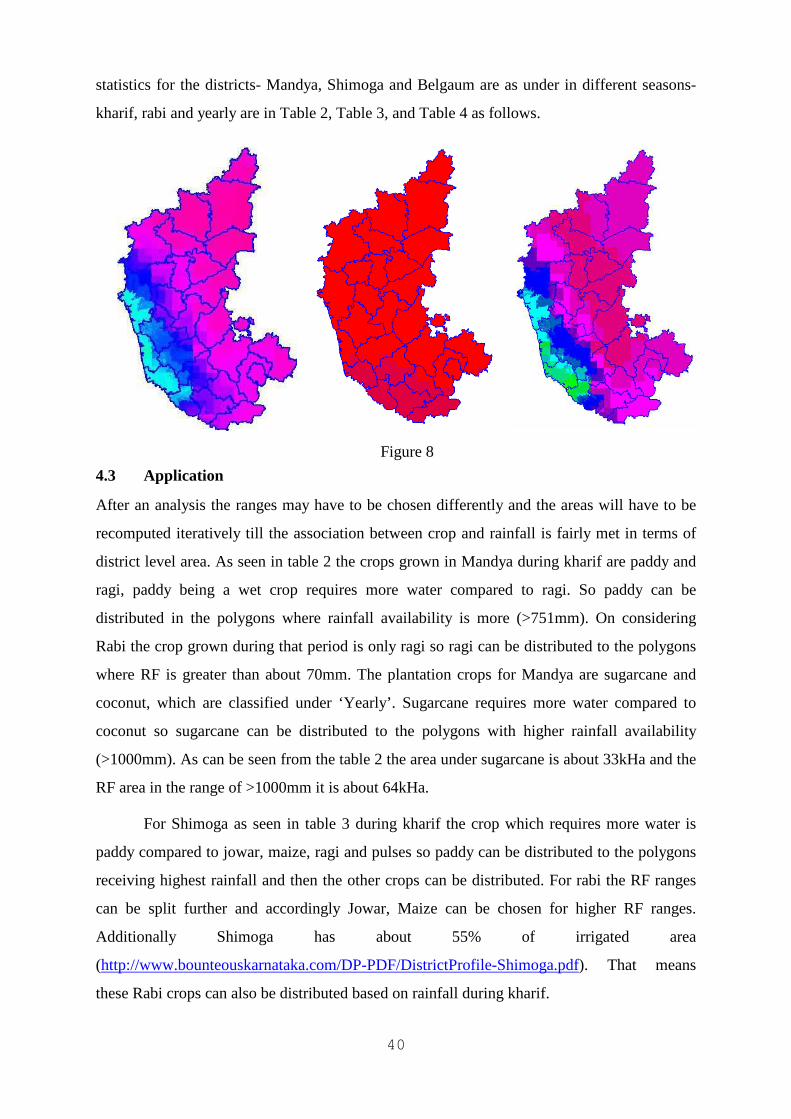
40
statistics for the districts- Mandya, Shimoga and Belgaum are as under in different seasons-
kharif, rabi and yearly are in Table 2, Table 3, and Table 4 as follows.
4.3 Application
After an analysis the ranges may have to be chosen differently and the areas will have to be
recomputed iteratively till the association between crop and rainfall is fairly met in terms of
district level area. As seen in table 2 the crops grown in Mandya during kharif are paddy and
ragi, paddy being a wet crop requires more water compared to ragi. So paddy can be
distributed in the polygons where rainfall availability is more (>751mm). On considering
Rabi the crop grown during that period is only ragi so ragi can be distributed to the polygons
where RF is greater than about 70mm. The plantation crops for Mandya are sugarcane and
coconut, which are classified under ‘Yearly’. Sugarcane requires more water compared to
coconut so sugarcane can be distributed to the polygons with higher rainfall availability
(>1000mm). As can be seen from the table 2 the area under sugarcane is about 33kHa and the
RF area in the range of >1000mm it is about 64kHa.
For Shimoga as seen in table 3 during kharif the crop which requires more water is
paddy compared to jowar, maize, ragi and pulses so paddy can be distributed to the polygons
receiving highest rainfall and then the other crops can be distributed. For rabi the RF ranges
can be split further and accordingly Jowar, Maize can be chosen for higher RF ranges.
Additionally Shimoga has about 55% of irrigated area
(http://www.bounteouskarnataka.com/DP-PDF/DistrictProfile-Shimoga.pdf). That means
these Rabi crops can also be distributed based on rainfall during kharif.
Figure 8
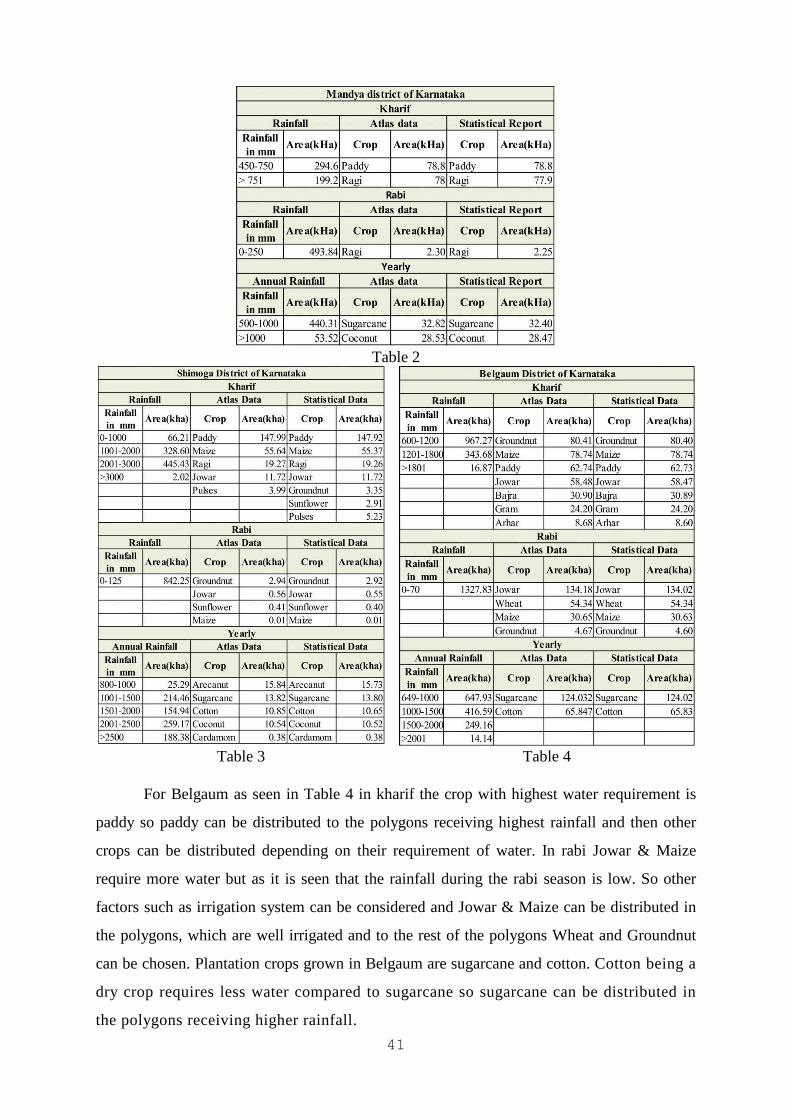
41
Table 3 Table 4
For Belgaum as seen in Table 4 in kharif the crop with highest water requirement is
paddy so paddy can be distributed to the polygons receiving highest rainfall and then other
crops can be distributed depending on their requirement of water. In rabi Jowar & Maize
require more water but as it is seen that the rainfall during the rabi season is low. So other
factors such as irrigation system can be considered and Jowar & Maize can be distributed in
the polygons, which are well irrigated and to the rest of the polygons Wheat and Groundnut
can be chosen. Plantation crops grown in Belgaum are sugarcane and cotton. Cotton being a
dry crop requires less water compared to sugarcane so sugarcane can be distributed in
the polygons receiving higher rainfall.
Table 2
42
The crops distributed using the current method where rainfall is not considered would
get redistributed if rainfall ranges were to be used during distribution within the district
chosen. This is because within the same region if the rainfall ranges are more matching to
either wet / dry crops in an order then if the distributor looks for rainfall range matching with
that of the polygon then crop more related to the rainfall range would be selected for the
polygon.
4.4 Inference
In cases where rainfall ranges is available matching more with the type of crop, the rainfall
classification of agricultural areas would work effectively. Another effect that can be
observed is that the irrigated areas such as Mandya district grow wet crops during Rabi also
though the local rainfall is low. This has to be carefully distributed by any classifier
considering rainfall under the irrigated areas i.e. the rainfall under related catchment areas
have also to be considered during crop distribution. Definitely wherever rainfall ranges are
closely matching with that of the crops, the crop distribution should improve. This also
improves the accuracy of resolving district level statistical data into taluk level biomass data
spatially.
Units
MWyre = mega-watt year electrical
T-Ha-1 = Tons per Hectare
kHa = kilo hectare
kT-Yr-1 = kilo tons per year
References
1. http://www.bounteouskarnataka.com/DP-PDF/DistrictProfile-Shimoga.pdf.
2. Web atlas at http://lab.cgpl.iisc.ernet.in/Atlas/.
Acknowledgements
The authors like to acknowledge that the project on Nation-wide agro-residue assessment
with a potential for power generation was initiated and sponsored by MNRE (Ministry for
New and Renewable Energy), GOI (Government of India) with an asserted reference to its use
in the power generation through Gasifier route. Additionally books- “Geography Information
Systems & Environmental Modeling”, PHI by Keith.C.Clarke, Bradley.O.Parks,
Michael.P.Cranes (2002) and “Biomass to Energy the Science and Technology of the IISc
Bioenergy system” by Team from CGPL, IISc, Bangalore (2003) , publication Ground water

43
information booklet Belgaum District, Karnataka– Ministry of Water Resources, Central
Ground Water Board, GOI document. The authors would also like to acknowledge the rainfall
data provided by India Meteorological Department (IMD) Pune.
44
CHAPTER 5
GIS BASED RSD ANALYSIS FOR BIOMASS BASED ENERGY
POTENTIAL USING A UNIQUE ‘RAY TRACE’ APPROACH
N. Balasubramanya Raju, Ashwini Kumar B.K., G.S. Sheshagiri and N.K.S. Rajan
Abstract
It is established that there is a high potential for renewable energy and Biomass is one such
resource. In view of this, assessment of biomass availability is an important study. Among
many known methods remote sensing data (RSD) is known for more scientific and reliable
source of information. Analysis of RSD and deriving essential inferences out, this analysis
turns out to be critical activity and an involved exercise that is quite promising if
appropriately made. In the current approach, a method is evolved where the data derived is
analyzed for a decision making system and a is novel approach described further in the Work
reported.
The following work adopts a ray trace concept and estimates at a point of interest. A
factor evolved providing a measure of biomass potential that is derived based on intensity of
growth & the radial distance covered. It is expressed in
Pi=Point of Interest
Gi=Net growth
Ri= Radial distance from point of Interest
C=Constant
By integrating over the region the solution for the Potential Index Ei for an element
considered works out to be
n=Number of elements considered for analysis
This framework is built using .NET latest technologies like WCF (Windows
Communication Foundation) and C# 4.0. This paper describes the above work in detail.
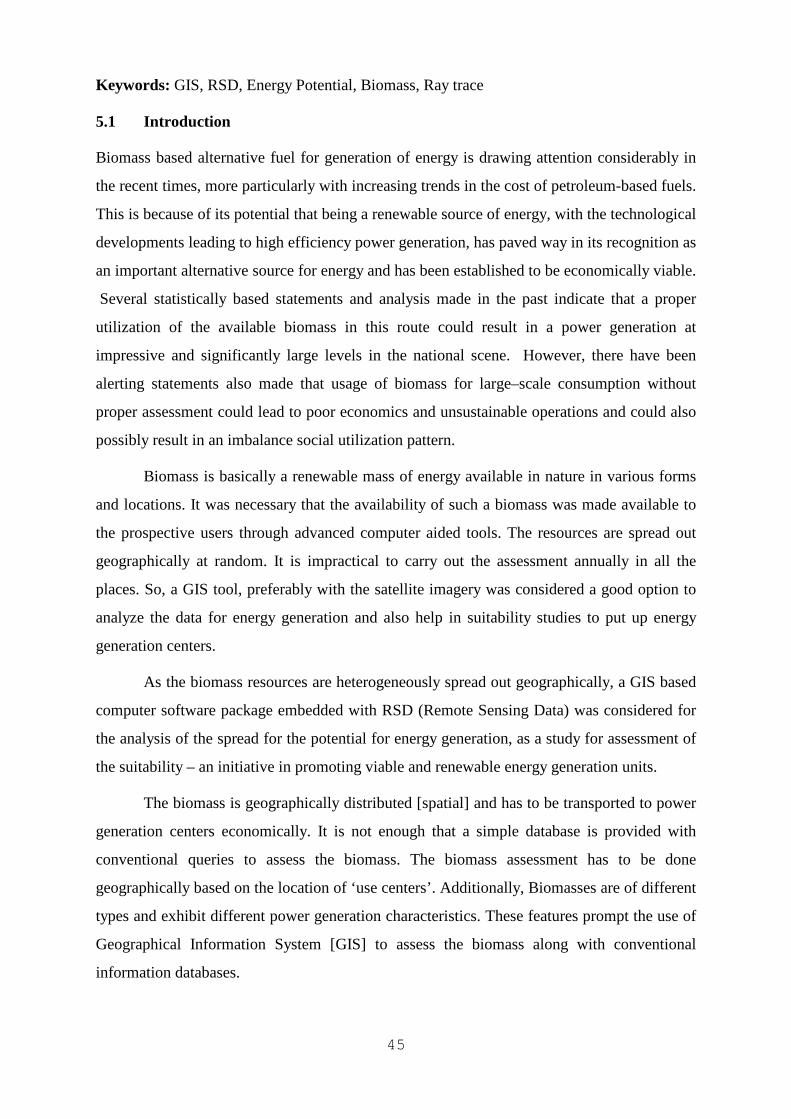
45
Keywords: GIS, RSD, Energy Potential, Biomass, Ray trace
5.1 Introduction
Biomass based alternative fuel for generation of energy is drawing attention considerably in
the recent times, more particularly with increasing trends in the cost of petroleum-based fuels.
This is because of its potential that being a renewable source of energy, with the technological
developments leading to high efficiency power generation, has paved way in its recognition as
an important alternative source for energy and has been established to be economically viable.
Several statistically based statements and analysis made in the past indicate that a proper
utilization of the available biomass in this route could result in a power generation at
impressive and significantly large levels in the national scene. However, there have been
alerting statements also made that usage of biomass for large–scale consumption without
proper assessment could lead to poor economics and unsustainable operations and could also
possibly result in an imbalance social utilization pattern.
Biomass is basically a renewable mass of energy available in nature in various forms
and locations. It was necessary that the availability of such a biomass was made available to
the prospective users through advanced computer aided tools. The resources are spread out
geographically at random. It is impractical to carry out the assessment annually in all the
places. So, a GIS tool, preferably with the satellite imagery was considered a good option to
analyze the data for energy generation and also help in suitability studies to put up energy
generation centers.
As the biomass resources are heterogeneously spread out geographically, a GIS based
computer software package embedded with RSD (Remote Sensing Data) was considered for
the analysis of the spread for the potential for energy generation, as a study for assessment of
the suitability – an initiative in promoting viable and renewable energy generation units.
The biomass is geographically distributed [spatial] and has to be transported to power
generation centers economically. It is not enough that a simple database is provided with
conventional queries to assess the biomass. The biomass assessment has to be done
geographically based on the location of ‘use centers’. Additionally, Biomasses are of different
types and exhibit different power generation characteristics. These features prompt the use of
Geographical Information System [GIS] to assess the biomass along with conventional
information databases.
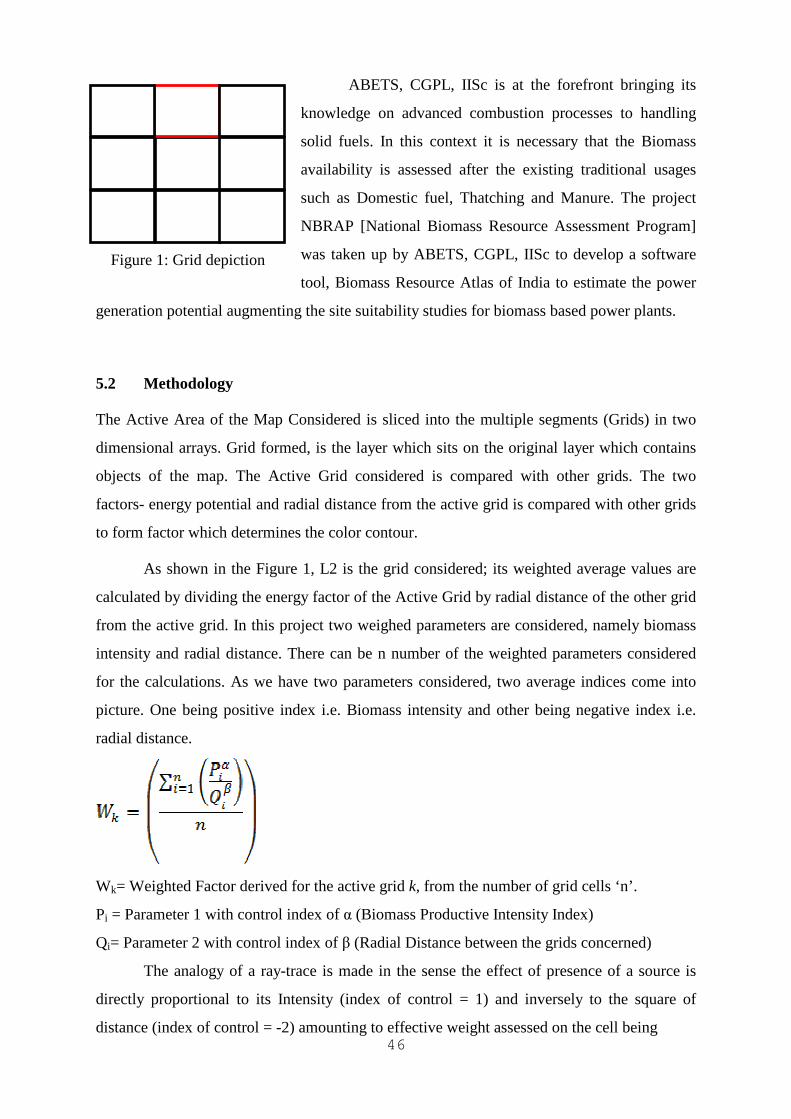
46
ABETS, CGPL, IISc is at the forefront bringing its
knowledge on advanced combustion processes to handling
solid fuels. In this context it is necessary that the Biomass
availability is assessed after the existing traditional usages
such as Domestic fuel, Thatching and Manure. The project
NBRAP [National Biomass Resource Assessment Program]
was taken up by ABETS, CGPL, IISc to develop a software
tool, Biomass Resource Atlas of India to estimate the power
generation potential augmenting the site suitability studies for biomass based power plants.
5.2 Methodology
The Active Area of the Map Considered is sliced into the multiple segments (Grids) in two
dimensional arrays. Grid formed, is the layer which sits on the original layer which contains
objects of the map. The Active Grid considered is compared with other grids. The two
factors- energy potential and radial distance from the active grid is compared with other grids
to form factor which determines the color contour.
As shown in the Figure 1, L2 is the grid considered; its weighted average values are
calculated by dividing the energy factor of the Active Grid by radial distance of the other grid
from the active grid. In this project two weighed parameters are considered, namely biomass
intensity and radial distance. There can be n number of the weighted parameters considered
for the calculations. As we have two parameters considered, two average indices come into
picture. One being positive index i.e. Biomass intensity and other being negative index i.e.
radial distance.
Wk= Weighted Factor derived for the active grid k, from the number of grid cells ‘n’.
Pi = Parameter 1 with control index of α (Biomass Productive Intensity Index)
Qi= Parameter 2 with control index of β (Radial Distance between the grids concerned)
The analogy of a ray-trace is made in the sense the effect of presence of a source is
directly proportional to its Intensity (index of control = 1) and inversely to the square of
distance (index of control = -2) amounting to effective weight assessed on the cell being
Figure 1: Grid depiction
L5
L2 L3 L1
L8 L7
L4
L9
L6
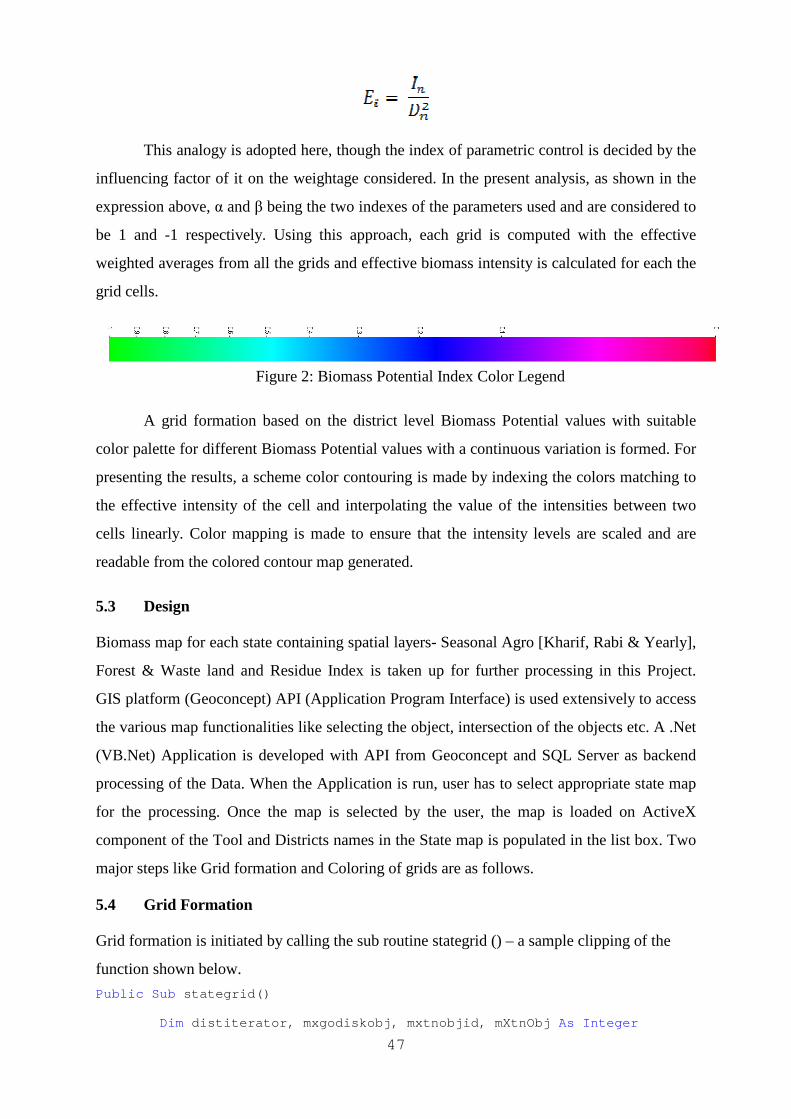
47
This analogy is adopted here, though the index of parametric control is decided by the
influencing factor of it on the weightage considered. In the present analysis, as shown in the
expression above, α and β being the two indexes of the parameters used and are considered to
be 1 and -1 respectively. Using this approach, each grid is computed with the effective
weighted averages from all the grids and effective biomass intensity is calculated for each the
grid cells.
Figure 2: Biomass Potential Index Color Legend
A grid formation based on the district level Biomass Potential values with suitable
color palette for different Biomass Potential values with a continuous variation is formed. For
presenting the results, a scheme color contouring is made by indexing the colors matching to
the effective intensity of the cell and interpolating the value of the intensities between two
cells linearly. Color mapping is made to ensure that the intensity levels are scaled and are
readable from the colored contour map generated.
5.3 Design
Biomass map for each state containing spatial layers- Seasonal Agro [Kharif, Rabi & Yearly],
Forest & Waste land and Residue Index is taken up for further processing in this Project.
GIS platform (Geoconcept) API (Application Program Interface) is used extensively to access
the various map functionalities like selecting the object, intersection of the objects etc. A .Net
(VB.Net) Application is developed with API from Geoconcept and SQL Server as backend
processing of the Data. When the Application is run, user has to select appropriate state map
for the processing. Once the map is selected by the user, the map is loaded on ActiveX
component of the Tool and Districts names in the State map is populated in the list box. Two
major steps like Grid formation and Coloring of grids are as follows.
5.4 Grid Formation
Grid formation is initiated by calling the sub routine stategrid () – a sample clipping of the
function shown below.
Public Sub stategrid()
Dim distiterator, mxgodiskobj, mxtnobjid, mXtnObj As Integer
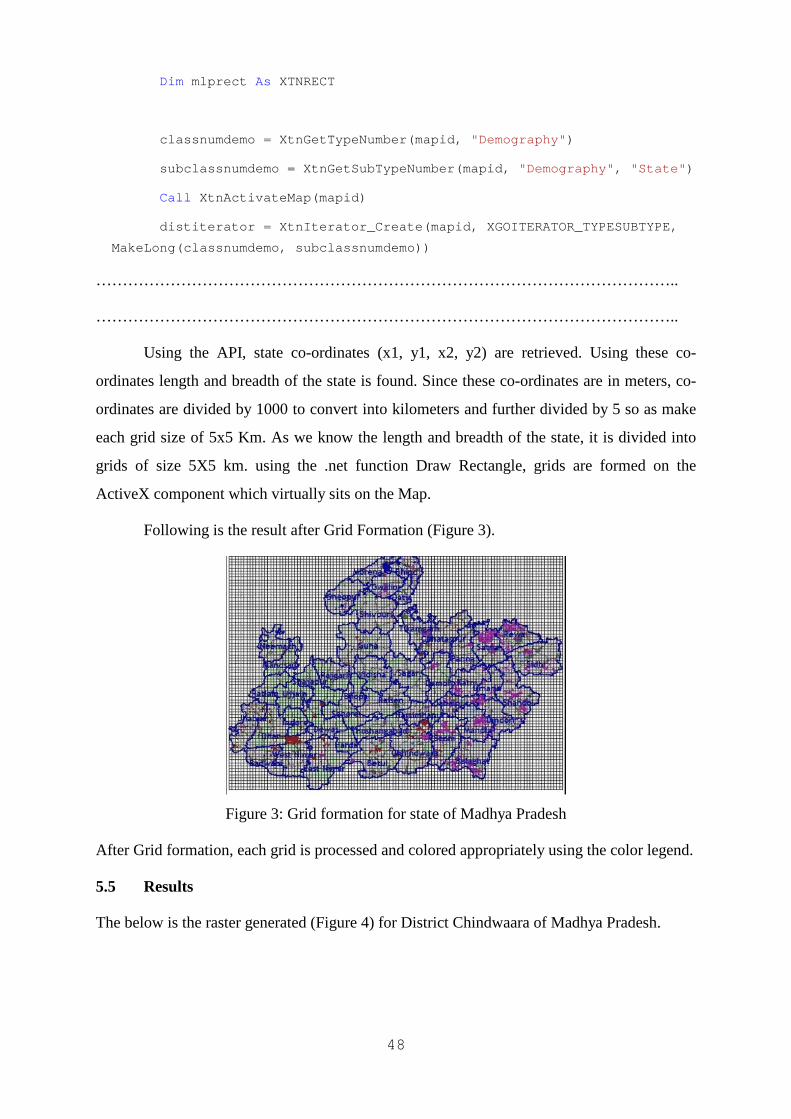
48
Dim mlprect As XTNRECT
classnumdemo = XtnGetTypeNumber(mapid, "Demography")
subclassnumdemo = XtnGetSubTypeNumber(mapid, "Demography", "State")
Call XtnActivateMap(mapid)
distiterator = XtnIterator_Create(mapid, XGOITERATOR_TYPESUBTYPE,
MakeLong(classnumdemo, subclassnumdemo))
………………………………………………………………………………………………..
………………………………………………………………………………………………..
Using the API, state co-ordinates (x1, y1, x2, y2) are retrieved. Using these co-
ordinates length and breadth of the state is found. Since these co-ordinates are in meters, co-
ordinates are divided by 1000 to convert into kilometers and further divided by 5 so as make
each grid size of 5x5 Km. As we know the length and breadth of the state, it is divided into
grids of size 5X5 km. using the .net function Draw Rectangle, grids are formed on the
ActiveX component which virtually sits on the Map.
Following is the result after Grid Formation (Figure 3).
Figure 3: Grid formation for state of Madhya Pradesh
After Grid formation, each grid is processed and colored appropriately using the color legend.
5.5 Results
The below is the raster generated (Figure 4) for District Chindwaara of Madhya Pradesh.

49
Figure 4: Raster Generated for District Chindwaara
As the process is District wise, raster of individual districts is combined to form a
raster for state. Below is the Biomass Potential raster generated (Figure 5) for the state of
Madhya Pradesh. On this there are two circles shown in each of the districts- “Chindwaara”
and “Guna“ where a sample biomass assessment has been done to show the relevance of hot-
spots for selection of high biomass surplus available site. (Web atlas at
http://lab.cgpl.iisc.ernet.in/Atlas/ )
Following are the biomass tables for the two areas of interest where one represents
‘greenish’ area (Hot-spot) and the other ‘reddish’ area (Low Biomass).
Crop Residue Area kHa
Crop Production kT
Residue Generation kT
Surplus kT
Power Mwyre
Arhar Stalks 10.8 18.3 45.8 27.5 3.6 Cotton Stalks 0.8 0.4 8.1 6.4 0.9 Ground Shell 16.9 19.5 5.8 0.6 0.1 Ground Stalks 16.9 19.5 39.0 3.9 0.5 Jowar Cobs 1.5 1.0 0.5 0.1 0.01 Jowar Husk 1.5 1.0 0.2 0.1 0.01 Jowar Stalks 1.5 1.0 1.7 0.3 0.1 Maize Cobs 0.6 1.2 0.4 0.04 0.01 Maize Stalks 0.6 1.2 2.5 0.3 0.03 Paddy Husk 2.4 1.6 0.3 0.3 0.03 Paddy Stalks 2.4 1.6 2.3 0.2 0.03 Soyabean Stalks 9.3 5.7 9.7 2.9 0.4 Total 42.3 47.7 121.7 45.4 5.9
Table 1: Biomass Data in Circle of Radius 25kms Biomass Hot-spot in Chindwara District
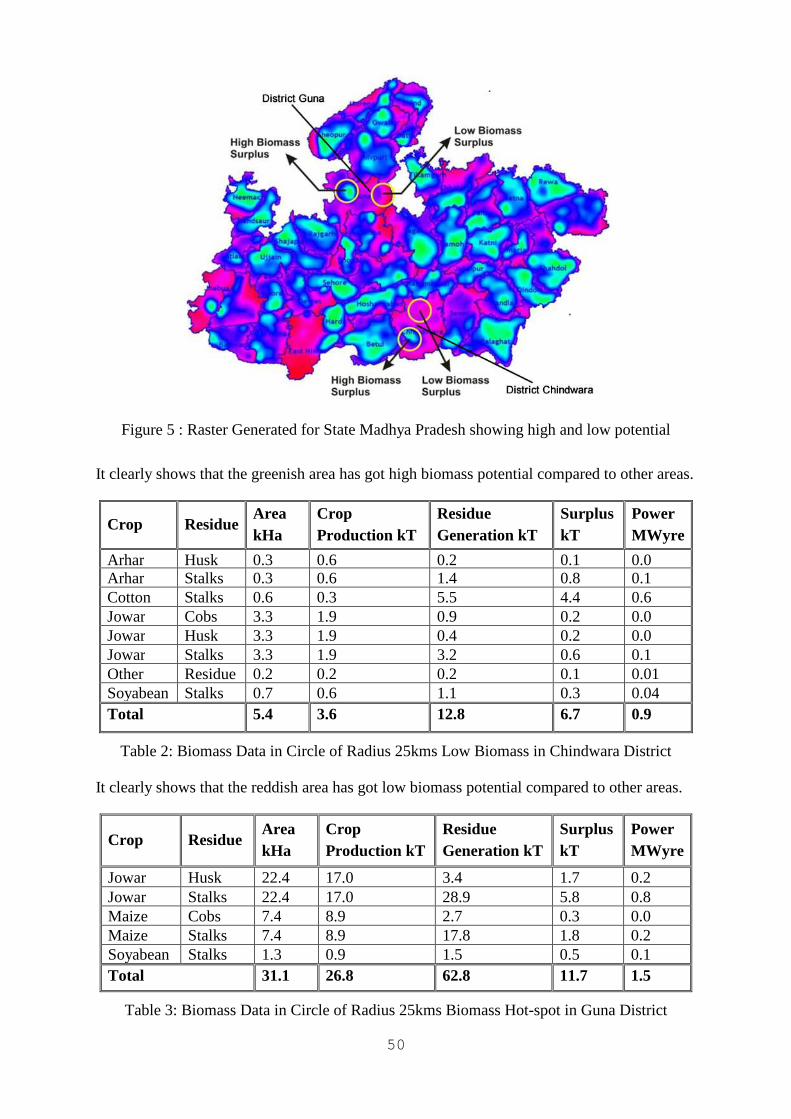
50
Figure 5 : Raster Generated for State Madhya Pradesh showing high and low potential
It clearly shows that the greenish area has got high biomass potential compared to other areas.
Crop Residue Area kHa
Crop Production kT
Residue Generation kT
Surplus kT
Power MWyre
Arhar Husk 0.3 0.6 0.2 0.1 0.0 Arhar Stalks 0.3 0.6 1.4 0.8 0.1 Cotton Stalks 0.6 0.3 5.5 4.4 0.6 Jowar Cobs 3.3 1.9 0.9 0.2 0.0 Jowar Husk 3.3 1.9 0.4 0.2 0.0 Jowar Stalks 3.3 1.9 3.2 0.6 0.1 Other Residue 0.2 0.2 0.2 0.1 0.01 Soyabean Stalks 0.7 0.6 1.1 0.3 0.04 Total 5.4 3.6 12.8 6.7 0.9
Table 2: Biomass Data in Circle of Radius 25kms Low Biomass in Chindwara District
It clearly shows that the reddish area has got low biomass potential compared to other areas.
Crop Residue Area kHa
Crop Production kT
Residue Generation kT
Surplus kT
Power MWyre
Jowar Husk 22.4 17.0 3.4 1.7 0.2 Jowar Stalks 22.4 17.0 28.9 5.8 0.8 Maize Cobs 7.4 8.9 2.7 0.3 0.0 Maize Stalks 7.4 8.9 17.8 1.8 0.2 Soyabean Stalks 1.3 0.9 1.5 0.5 0.1 Total 31.1 26.8 62.8 11.7 1.5
Table 3: Biomass Data in Circle of Radius 25kms Biomass Hot-spot in Guna District
51
Crop Residue Area kHa
Crop Production kT
Residue Generation kT
Surplus kT
Power MWyre
Jowar Husk 0.02 0.02 0.00 0.00 0.00 Jowar Stalks 0.02 0.02 0.03 0.01 0.00 Total 0.02 0.02 0.03 0.01 0.00
Table 4: Biomass Data in Circle of Radius 25kms Low Biomass in Guna District
The red region in the image is low biomass surplus area and that towards green is high
biomass surplus area. This can be clearly verified in the two tables representing these areas.
5.6 Inference
The technique of generating an image geographically to visualize biomass availability
represents the underlying geographical vector data quite satisfactorily. The district level
biomass availability will help any entrepreneur to select biomass ‘hot spots’ during initial site
suitability studies before setting up biomass based energy generation centers. The coloring
scheme from green to red through blue satisfactorily renders the biomass availability intensity
geographically at district level with a good resolution. The gridding resolution of 5x5kms
used to compute the intensity of each color at each pixel proportional to the biomass
availability intensity and its distance from the area of generation seems to help rendering the
image realistically.
Units
MWyre = mega-watt year electrical
kHa = kilo hectare
kT-Yr-1 = kilo tons per year
kWhrTh = kilo watt hour thermal
MT = million ton
References
1. Burrough P. (1986) Principles of Geographic Information Systems for Land Resource
Assessment. Clarendon Press, New York,. p. 193.
2. Congalton R. and Green K. (1992) The ABCs of GIs: An introduction to geographic
information systems. Journal of Forestry, 90(11):13-20.
3. Güting R.H. (1994) An Introduction to Spatial Database Systems. VLDB Journal, 3:
357-399.
4. Web atlas at http://lab.cgpl.iisc.ernet.in/Atlas/

52
Acknowledgements
The authors like to acknowledge that the project on Nation-wide agro-residue assessment
with a potential for power generation was initiated and sponsored by MNRE (Ministry for
New and Renewable Energy), GOI (Government of India) with an asserted reference to its use
in the power generation through Gasifier route.
53
CHAPTER 6
APPRAISAL OF PLANTS OF JALANDHAR TO ASSESS
THEIR POTENTIAL TO ACT AS BIOFUEL CROPS
Navjot Kaur and Anjana Bhatia
Abstract
India is an agricultural country having ideal geographic and climatic conditions for growing a
wide range of biofuel crops. The present research is undertaken to study the hydrocarbon
content of plants collected from & around areas of Jalandhar. The plants being assessed
belong to the families Euphorbiaceae, Asclepiadaceae, Apocyanaceae, Sapotaceae, Moraceae,
Compositae, etc. Ten plants have been assessed till now viz. Euphorbia thymifolia,
Euphorbia cotinifolia, Ficus microcarpa, Synadenium grantii, Ficus racemosa, Sonchus
oleraceus, Ficus benjamina, Excoecaria cochinchinensis, Convolvulus arvensis, Ipomoea
pestigridis & out of them three plants Euphorbia thymifolia, Euphorbia cotinifolia & Ficus
microcarpa gave promising biocrude yield . The plants collected were shade dried for 3-4
weeks and were then grinded in a mixer grinder. The powder then obtained was sieved with
the help of muslin cloth. Thimbles were prepared which were then oven dried at 700 C for
48hours. Sequential soxhlet extractions were then performed with acetone and petroleum
ether. The acetone & petroleum ether extractables were further analyzed for presence of
different kinds of lipids, carbohydrates, sterols & carotenoids.
Keywords: Biofuel, Euphorbiaceae, Biocrude, Hydrocarbon, Jalandhar.
6.1 Introduction
The production of biofuels from petrocrops as a renewable & alternative energy source to
fossil fuels is gaining worldwide attention. Biofuels are a product of an agriculturally grown
feedstock with a great advantage that they are non-polluting, locally available & reliable fuel.
The major concerns which demanded the production of biofuels are the recent increase in oil
prices, worldwide concern over global climate change, improvement of energy security, an
opportunity for increasing economic development in many developing countries (Banse et al.,
2007). The various environmental benefits which demanded the need to shift to biofuels are
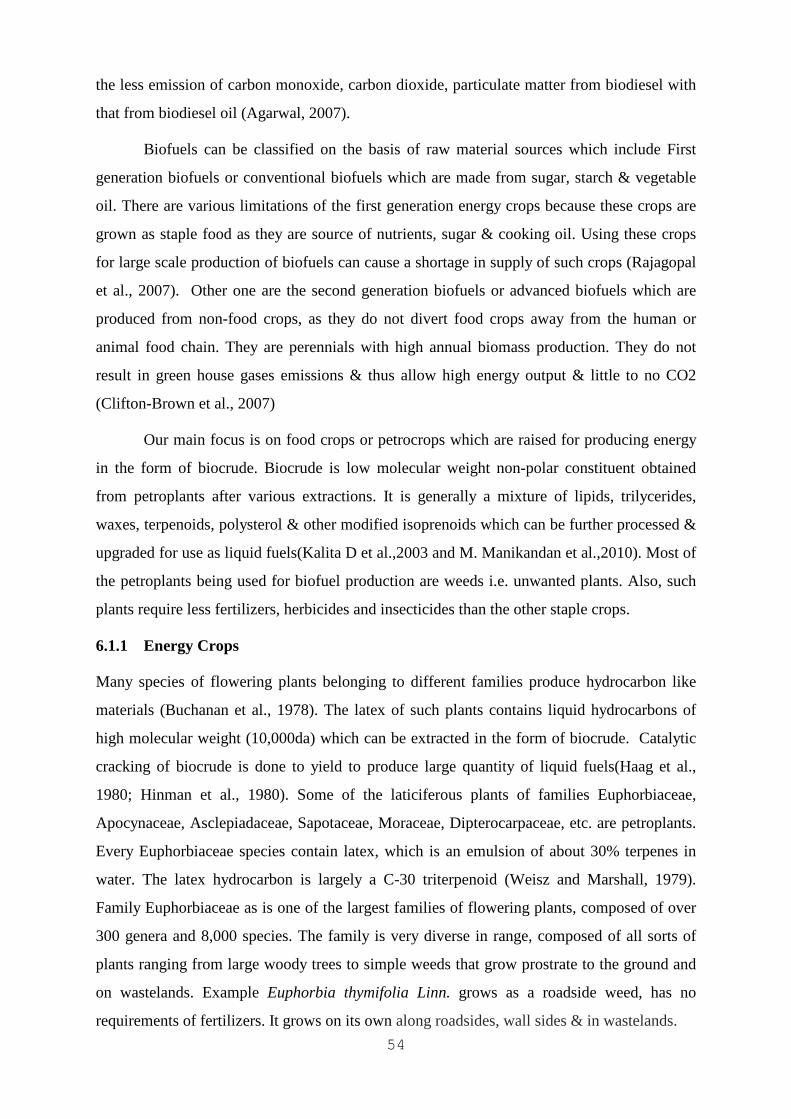
54
the less emission of carbon monoxide, carbon dioxide, particulate matter from biodiesel with
that from biodiesel oil (Agarwal, 2007).
Biofuels can be classified on the basis of raw material sources which include First
generation biofuels or conventional biofuels which are made from sugar, starch & vegetable
oil. There are various limitations of the first generation energy crops because these crops are
grown as staple food as they are source of nutrients, sugar & cooking oil. Using these crops
for large scale production of biofuels can cause a shortage in supply of such crops (Rajagopal
et al., 2007). Other one are the second generation biofuels or advanced biofuels which are
produced from non-food crops, as they do not divert food crops away from the human or
animal food chain. They are perennials with high annual biomass production. They do not
result in green house gases emissions & thus allow high energy output & little to no CO2
(Clifton-Brown et al., 2007)
Our main focus is on food crops or petrocrops which are raised for producing energy
in the form of biocrude. Biocrude is low molecular weight non-polar constituent obtained
from petroplants after various extractions. It is generally a mixture of lipids, trilycerides,
waxes, terpenoids, polysterol & other modified isoprenoids which can be further processed &
upgraded for use as liquid fuels(Kalita D et al.,2003 and M. Manikandan et al.,2010). Most of
the petroplants being used for biofuel production are weeds i.e. unwanted plants. Also, such
plants require less fertilizers, herbicides and insecticides than the other staple crops.
6.1.1 Energy Crops
Many species of flowering plants belonging to different families produce hydrocarbon like
materials (Buchanan et al., 1978). The latex of such plants contains liquid hydrocarbons of
high molecular weight (10,000da) which can be extracted in the form of biocrude. Catalytic
cracking of biocrude is done to yield to produce large quantity of liquid fuels(Haag et al.,
1980; Hinman et al., 1980). Some of the laticiferous plants of families Euphorbiaceae,
Apocynaceae, Asclepiadaceae, Sapotaceae, Moraceae, Dipterocarpaceae, etc. are petroplants.
Every Euphorbiaceae species contain latex, which is an emulsion of about 30% terpenes in
water. The latex hydrocarbon is largely a C-30 triterpenoid (Weisz and Marshall, 1979).
Family Euphorbiaceae as is one of the largest families of flowering plants, composed of over
300 genera and 8,000 species. The family is very diverse in range, composed of all sorts of
plants ranging from large woody trees to simple weeds that grow prostrate to the ground and
on wastelands. Example Euphorbia thymifolia Linn. grows as a roadside weed, has no
requirements of fertilizers. It grows on its own along roadsides, wall sides & in wastelands.
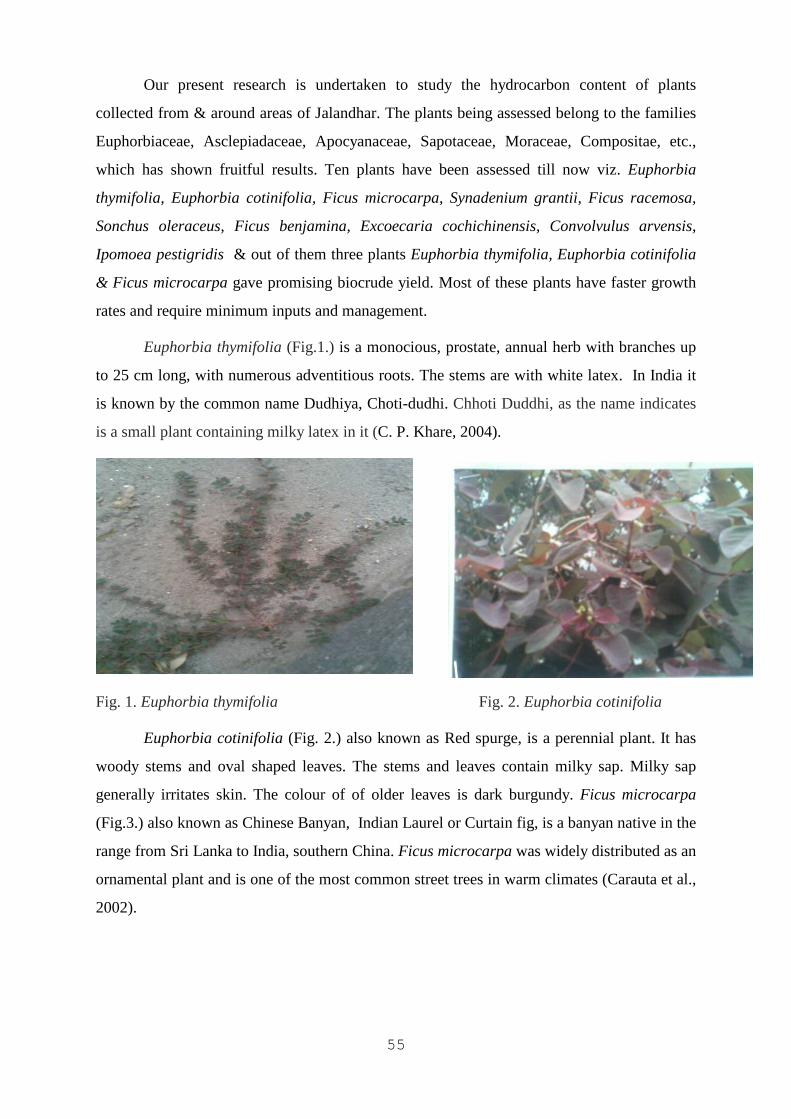
55
Our present research is undertaken to study the hydrocarbon content of plants
collected from & around areas of Jalandhar. The plants being assessed belong to the families
Euphorbiaceae, Asclepiadaceae, Apocyanaceae, Sapotaceae, Moraceae, Compositae, etc.,
which has shown fruitful results. Ten plants have been assessed till now viz. Euphorbia
thymifolia, Euphorbia cotinifolia, Ficus microcarpa, Synadenium grantii, Ficus racemosa,
Sonchus oleraceus, Ficus benjamina, Excoecaria cochichinensis, Convolvulus arvensis,
Ipomoea pestigridis & out of them three plants Euphorbia thymifolia, Euphorbia cotinifolia
& Ficus microcarpa gave promising biocrude yield. Most of these plants have faster growth
rates and require minimum inputs and management.
Euphorbia thymifolia (Fig.1.) is a monocious, prostate, annual herb with branches up
to 25 cm long, with numerous adventitious roots. The stems are with white latex. In India it
is known by the common name Dudhiya, Choti-dudhi. Chhoti Duddhi, as the name indicates
is a small plant containing milky latex in it (C. P. Khare, 2004).
Fig. 1. Euphorbia thymifolia Fig. 2. Euphorbia cotinifolia
Euphorbia cotinifolia (Fig. 2.) also known as Red spurge, is a perennial plant. It has
woody stems and oval shaped leaves. The stems and leaves contain milky sap. Milky sap
generally irritates skin. The colour of of older leaves is dark burgundy. Ficus microcarpa
(Fig.3.) also known as Chinese Banyan, Indian Laurel or Curtain fig, is a banyan native in the
range from Sri Lanka to India, southern China. Ficus microcarpa was widely distributed as an
ornamental plant and is one of the most common street trees in warm climates (Carauta et al.,
2002).
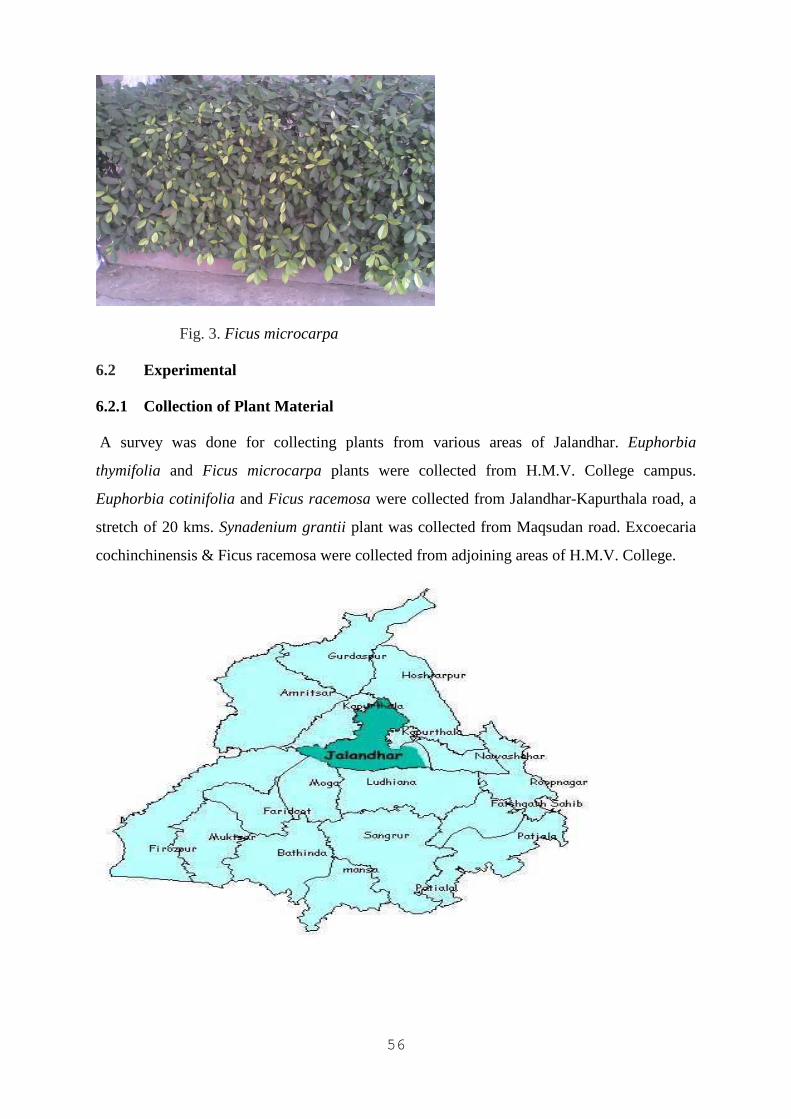
56
Fig. 3. Ficus microcarpa
6.2 Experimental
6.2.1 Collection of Plant Material
A survey was done for collecting plants from various areas of Jalandhar. Euphorbia
thymifolia and Ficus microcarpa plants were collected from H.M.V. College campus.
Euphorbia cotinifolia and Ficus racemosa were collected from Jalandhar-Kapurthala road, a
stretch of 20 kms. Synadenium grantii plant was collected from Maqsudan road. Excoecaria
cochinchinensis & Ficus racemosa were collected from adjoining areas of H.M.V. College.
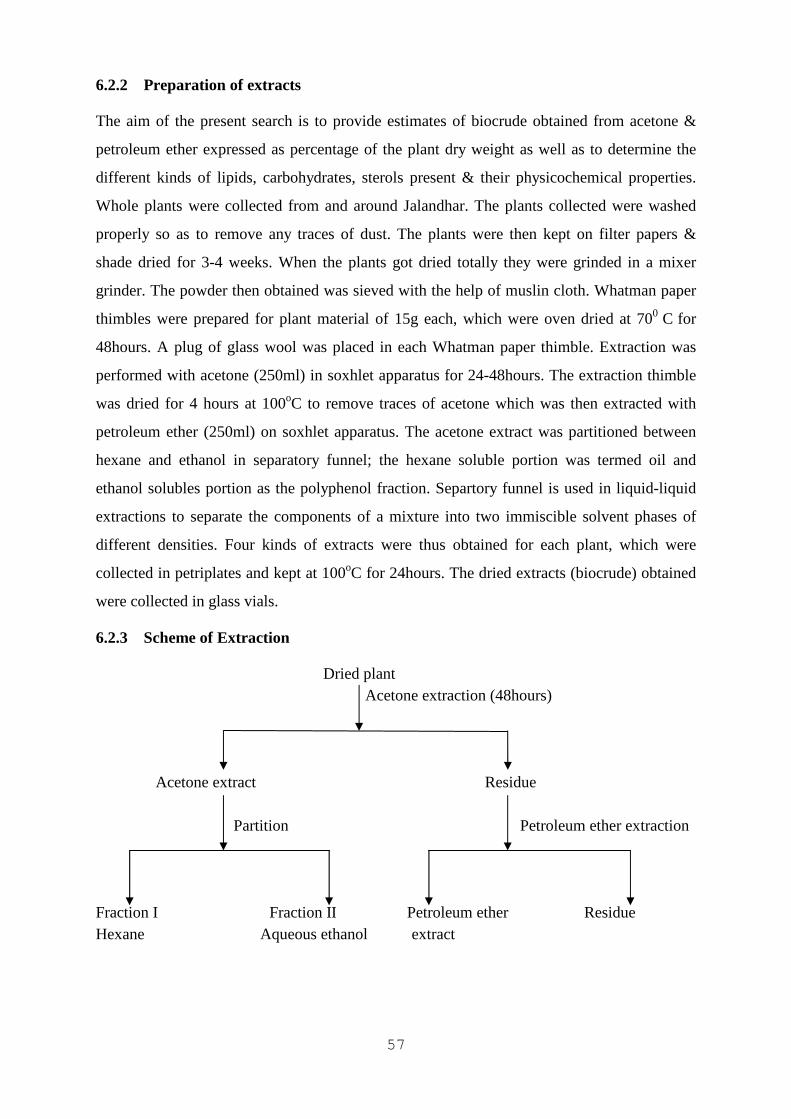
57
6.2.2 Preparation of extracts
The aim of the present search is to provide estimates of biocrude obtained from acetone &
petroleum ether expressed as percentage of the plant dry weight as well as to determine the
different kinds of lipids, carbohydrates, sterols present & their physicochemical properties.
Whole plants were collected from and around Jalandhar. The plants collected were washed
properly so as to remove any traces of dust. The plants were then kept on filter papers &
shade dried for 3-4 weeks. When the plants got dried totally they were grinded in a mixer
grinder. The powder then obtained was sieved with the help of muslin cloth. Whatman paper
thimbles were prepared for plant material of 15g each, which were oven dried at 700 C for
48hours. A plug of glass wool was placed in each Whatman paper thimble. Extraction was
performed with acetone (250ml) in soxhlet apparatus for 24-48hours. The extraction thimble
was dried for 4 hours at 100oC to remove traces of acetone which was then extracted with
petroleum ether (250ml) on soxhlet apparatus. The acetone extract was partitioned between
hexane and ethanol in separatory funnel; the hexane soluble portion was termed oil and
ethanol solubles portion as the polyphenol fraction. Separtory funnel is used in liquid-liquid
extractions to separate the components of a mixture into two immiscible solvent phases of
different densities. Four kinds of extracts were thus obtained for each plant, which were
collected in petriplates and kept at 100oC for 24hours. The dried extracts (biocrude) obtained
were collected in glass vials.
6.2.3 Scheme of Extraction
Dried plant Acetone extraction (48hours) Acetone extract Residue Partition Petroleum ether extraction Fraction I Fraction II Petroleum ether Residue Hexane Aqueous ethanol extract
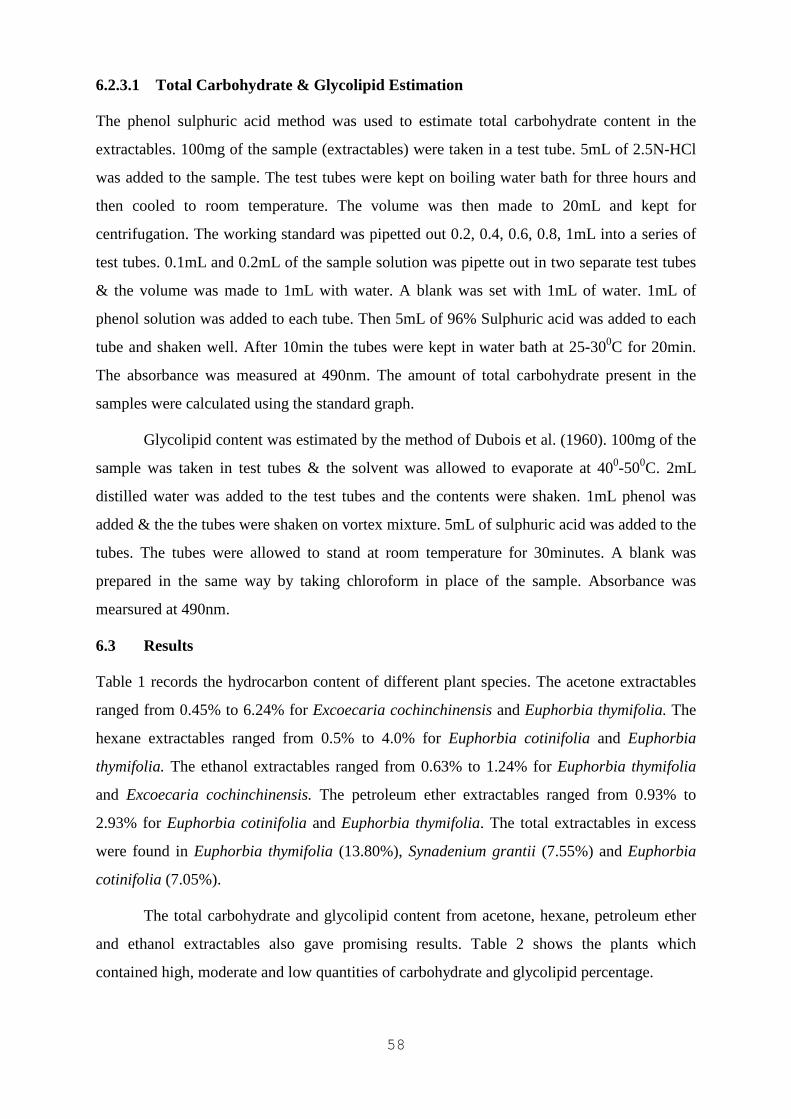
58
6.2.3.1 Total Carbohydrate & Glycolipid Estimation
The phenol sulphuric acid method was used to estimate total carbohydrate content in the
extractables. 100mg of the sample (extractables) were taken in a test tube. 5mL of 2.5N-HCl
was added to the sample. The test tubes were kept on boiling water bath for three hours and
then cooled to room temperature. The volume was then made to 20mL and kept for
centrifugation. The working standard was pipetted out 0.2, 0.4, 0.6, 0.8, 1mL into a series of
test tubes. 0.1mL and 0.2mL of the sample solution was pipette out in two separate test tubes
& the volume was made to 1mL with water. A blank was set with 1mL of water. 1mL of
phenol solution was added to each tube. Then 5mL of 96% Sulphuric acid was added to each
tube and shaken well. After 10min the tubes were kept in water bath at 25-300C for 20min.
The absorbance was measured at 490nm. The amount of total carbohydrate present in the
samples were calculated using the standard graph.
Glycolipid content was estimated by the method of Dubois et al. (1960). 100mg of the
sample was taken in test tubes & the solvent was allowed to evaporate at 400-500C. 2mL
distilled water was added to the test tubes and the contents were shaken. 1mL phenol was
added & the the tubes were shaken on vortex mixture. 5mL of sulphuric acid was added to the
tubes. The tubes were allowed to stand at room temperature for 30minutes. A blank was
prepared in the same way by taking chloroform in place of the sample. Absorbance was
mearsured at 490nm.
6.3 Results
Table 1 records the hydrocarbon content of different plant species. The acetone extractables
ranged from 0.45% to 6.24% for Excoecaria cochinchinensis and Euphorbia thymifolia. The
hexane extractables ranged from 0.5% to 4.0% for Euphorbia cotinifolia and Euphorbia
thymifolia. The ethanol extractables ranged from 0.63% to 1.24% for Euphorbia thymifolia
and Excoecaria cochinchinensis. The petroleum ether extractables ranged from 0.93% to
2.93% for Euphorbia cotinifolia and Euphorbia thymifolia. The total extractables in excess
were found in Euphorbia thymifolia (13.80%), Synadenium grantii (7.55%) and Euphorbia
cotinifolia (7.05%).
The total carbohydrate and glycolipid content from acetone, hexane, petroleum ether
and ethanol extractables also gave promising results. Table 2 shows the plants which
contained high, moderate and low quantities of carbohydrate and glycolipid percentage.
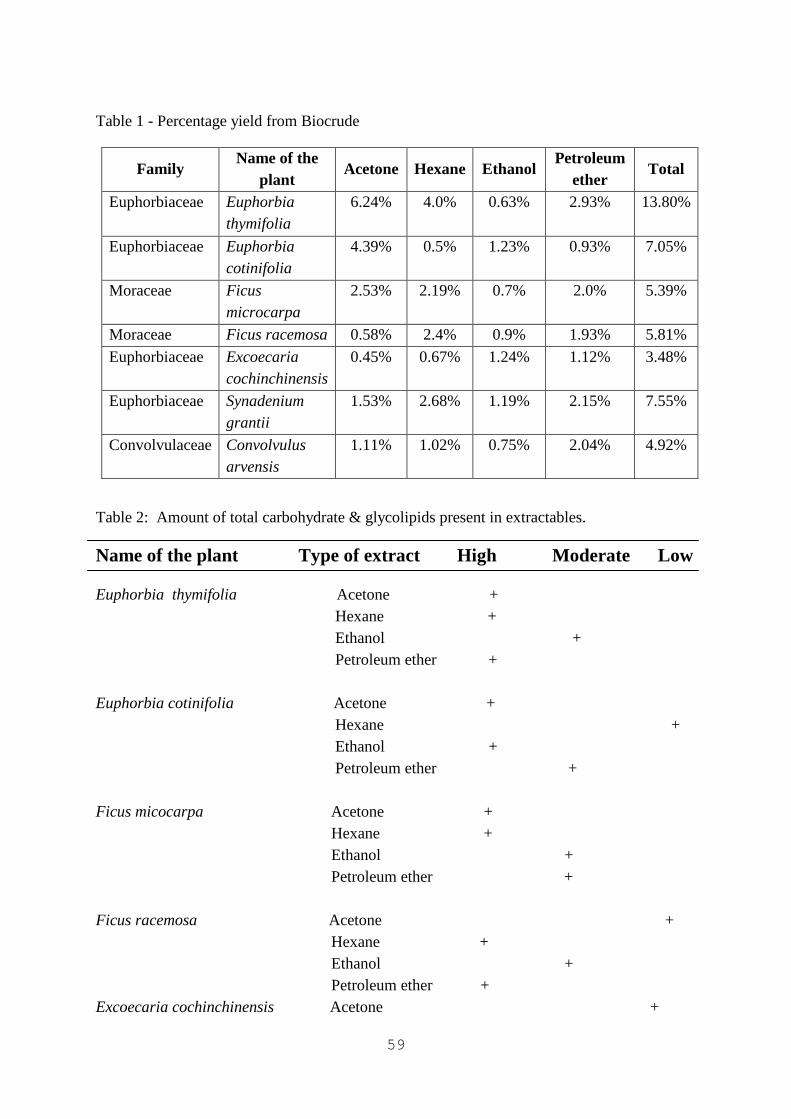
59
Table 1 - Percentage yield from Biocrude
Family Name of the
plant Acetone Hexane Ethanol
Petroleum ether
Total
Euphorbiaceae
Euphorbia thymifolia
6.24% 4.0% 0.63% 2.93% 13.80%
Euphorbiaceae
Euphorbia cotinifolia
4.39% 0.5% 1.23% 0.93% 7.05%
Moraceae Ficus microcarpa
2.53% 2.19% 0.7% 2.0% 5.39%
Moraceae Ficus racemosa 0.58% 2.4% 0.9% 1.93% 5.81%
Euphorbiaceae
Excoecaria cochinchinensis
0.45% 0.67% 1.24% 1.12% 3.48%
Euphorbiaceae
Synadenium grantii
1.53% 2.68% 1.19% 2.15% 7.55%
Convolvulaceae Convolvulus arvensis
1.11% 1.02% 0.75% 2.04% 4.92%
Table 2: Amount of total carbohydrate & glycolipids present in extractables.
Name of the plant Type of extract High Moderate Low
Euphorbia thymifolia Acetone + Hexane + Ethanol + Petroleum ether + Euphorbia cotinifolia Acetone + Hexane + Ethanol + Petroleum ether + Ficus micocarpa Acetone + Hexane + Ethanol + Petroleum ether + Ficus racemosa Acetone + Hexane + Ethanol + Petroleum ether + Excoecaria cochinchinensis Acetone +
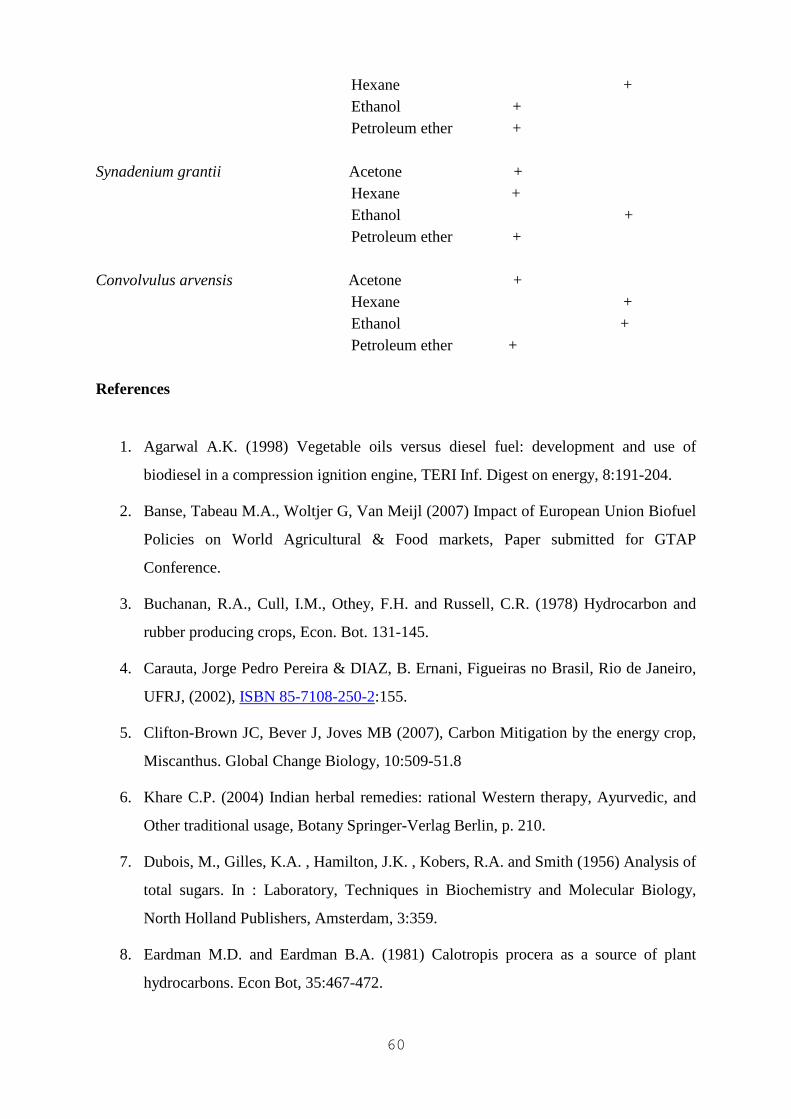
60
Hexane + Ethanol + Petroleum ether + Synadenium grantii Acetone + Hexane + Ethanol + Petroleum ether + Convolvulus arvensis Acetone + Hexane + Ethanol + Petroleum ether + References
1. Agarwal A.K. (1998) Vegetable oils versus diesel fuel: development and use of
biodiesel in a compression ignition engine, TERI Inf. Digest on energy, 8:191-204.
2. Banse, Tabeau M.A., Woltjer G, Van Meijl (2007) Impact of European Union Biofuel
Policies on World Agricultural & Food markets, Paper submitted for GTAP
Conference.
3. Buchanan, R.A., Cull, I.M., Othey, F.H. and Russell, C.R. (1978) Hydrocarbon and
rubber producing crops, Econ. Bot. 131-145.
4. Carauta, Jorge Pedro Pereira & DIAZ, B. Ernani, Figueiras no Brasil, Rio de Janeiro,
UFRJ, (2002), ISBN 85-7108-250-2:155.
5. Clifton-Brown JC, Bever J, Joves MB (2007), Carbon Mitigation by the energy crop,
Miscanthus. Global Change Biology, 10:509-51.8
6. Khare C.P. (2004) Indian herbal remedies: rational Western therapy, Ayurvedic, and
Other traditional usage, Botany Springer-Verlag Berlin, p. 210.
7. Dubois, M., Gilles, K.A. , Hamilton, J.K. , Kobers, R.A. and Smith (1956) Analysis of
total sugars. In : Laboratory, Techniques in Biochemistry and Molecular Biology,
North Holland Publishers, Amsterdam, 3:359.
8. Eardman M.D. and Eardman B.A. (1981) Calotropis procera as a source of plant
hydrocarbons. Econ Bot, 35:467-472.

61
9. Gabriëlla Harriet Schmelzer, Ameenah Gurib-Fakim,Medicinal plants Plant
Resources of Tropical Africa (Program) p. 294-296.
10. Haag, W.O., Rodewald, P.G. and Weisz, P.B. (1980) Catalytic production of
aromatics and olefins from plant materials. Symposium on alternative feedstocks for
petrochemicals. Amer. Chem. Soc. Meeting Los Vegas, N.V. August, pg. 24-25.
11. Hinman, C.W., Hoffman, S.P., McLaughlin, S.P. and Peoples, T.R. (1980),
Hydrocarbon Production from arid land plant species. Annual meeting, Amer. Sect.
Int. Solar Energy Soc. Proc. 3.1: 110-114.
12. Kalita D., Saikia C.N. (2003) Chemical constituents and energy content of some latex
bearing plants. Bioresource Tech., 92 (3):219 -227.
13. Manikandan M. and Arumugam R. (2010) Potentiality of Calotropis Procera on the
yield of Biocrudes and Biogas Production, 2(4): 33–40.
14. Rajagopal D., Sexton S.E., Holst D.R. and Zilberman D. (2007) Challenge of biofuel:
filling the tank without emptying the stomach. p. 1-6.
15. Weisz P.B. and Marshall J.F. (1979), Catalytic production of high grade fuel
(gasoline) from biomass compounds by shape-selective catalysis, Science, 206:57-58.
62
CHAPTER 7
CLEAN ENERGY GENERATION FROM BIOMASS: A CASE
STUDY OF CDM PROJECT BY CHAMBAL POWER
LIMITED, RAJASTHAN
Sanjeev Prashar and Shalini Mathur
Abstract
Biomass – the fourth largest energy source after coal, oil and natural gas - is an important
renewable energy option at present and can be used to produce different forms of energy
carriers. Biomass provides around 46 EJ (1EJ = 1018J) of bio-energy estimated to be 10% of
global primary energy (IEA, 2006). Bio-energy (where biomass is combusted off-site for
energy) to replace fossil fuels can be generated from forest, agricultural and live stock
residues, short-rotation forest plantations, dedicated herbaceous energy crops, organic
component of municipal solid wastes. Certainly, Biomass power projects are fast catching up
in India. Clean Development Mechanism (CDM) is one of the three mechanisms proposed by
Kyoto Protocol of United Nations Framework Convention on Climate Change (UNFCCC) for
Annex I countries to meet their emission caps. Under this arrangement, an Annex I country
can invest in emission reduction projects in any non-Annex I country and gain carbon credits
out of these projects. Total numbers of registered CDM projects from India are 888, out of
which 222 (25%) are related to biomass energy till August 2012. Out of these registered
projects, about 54% projects are concentrated in four states – Uttar Pradesh, Andhra Pradesh,
Maharashtra and Punjab while Rajasthan contributing only 5%.This paper demonstrates a
case of 7.5 MW biomass based modern power project at Kota, showing the energy potential
of available agricultural wastes. It uses mustard husk and stalks, corncobs, bagasse, Julia flora
and soya husk, etc. as fuel to produce energy. The power plant is based on Rankine cycle and
the steam generator is designed to operate on any biomass and bagasse to ensure consistent
plant efficiency even in times of specific biomass deficiency. The project activity located in a
rural belt, contributes positively to the four pillars of sustainable development i.e. social,
economic, environmental and technological well being. Registered with UNFCCC as small-
scale CDM project in 2006, the project has earned around 1.72 Lakh carbon credits till June
2012, with expected operational lifetime of 25 years.
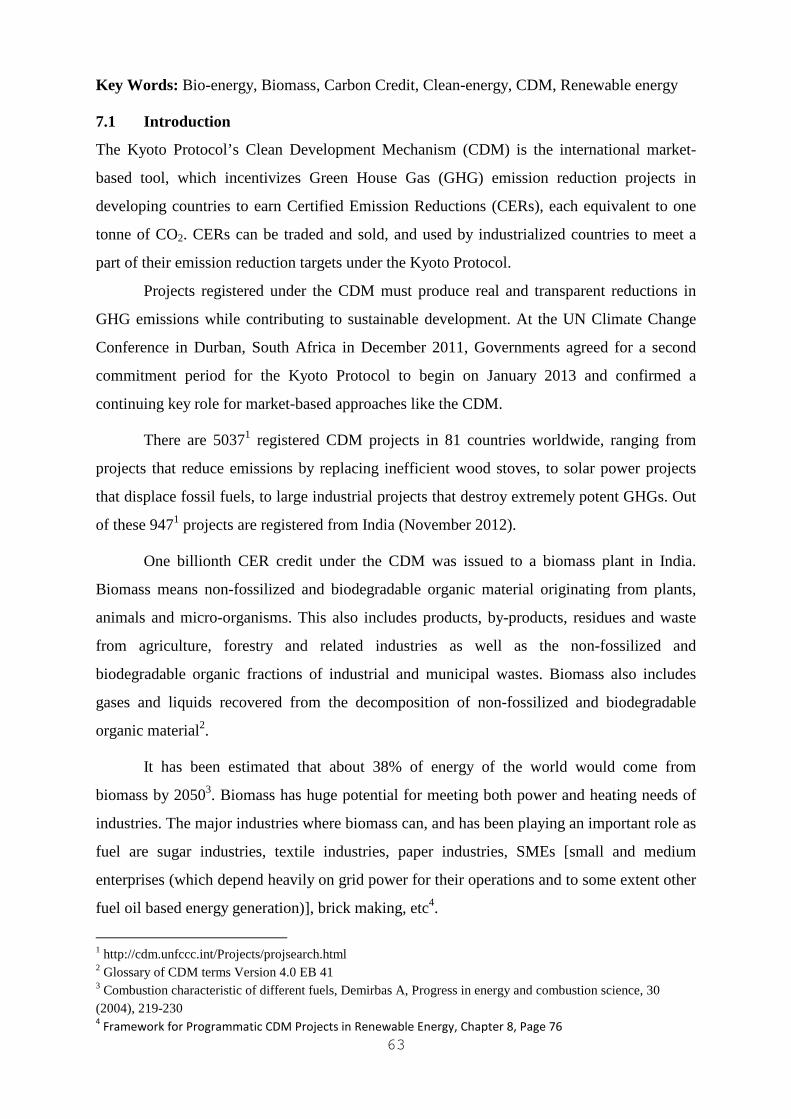
63
Key Words: Bio-energy, Biomass, Carbon Credit, Clean-energy, CDM, Renewable energy
7.1 Introduction
The Kyoto Protocol’s Clean Development Mechanism (CDM) is the international market-
based tool, which incentivizes Green House Gas (GHG) emission reduction projects in
developing countries to earn Certified Emission Reductions (CERs), each equivalent to one
tonne of CO2. CERs can be traded and sold, and used by industrialized countries to meet a
part of their emission reduction targets under the Kyoto Protocol.
Projects registered under the CDM must produce real and transparent reductions in
GHG emissions while contributing to sustainable development. At the UN Climate Change
Conference in Durban, South Africa in December 2011, Governments agreed for a second
commitment period for the Kyoto Protocol to begin on January 2013 and confirmed a
continuing key role for market-based approaches like the CDM.
There are 50371 registered CDM projects in 81 countries worldwide, ranging from
projects that reduce emissions by replacing inefficient wood stoves, to solar power projects
that displace fossil fuels, to large industrial projects that destroy extremely potent GHGs. Out
of these 9471 projects are registered from India (November 2012).
One billionth CER credit under the CDM was issued to a biomass plant in India.
Biomass means non-fossilized and biodegradable organic material originating from plants,
animals and micro-organisms. This also includes products, by-products, residues and waste
from agriculture, forestry and related industries as well as the non-fossilized and
biodegradable organic fractions of industrial and municipal wastes. Biomass also includes
gases and liquids recovered from the decomposition of non-fossilized and biodegradable
organic material2.
It has been estimated that about 38% of energy of the world would come from
biomass by 20503. Biomass has huge potential for meeting both power and heating needs of
industries. The major industries where biomass can, and has been playing an important role as
fuel are sugar industries, textile industries, paper industries, SMEs [small and medium
enterprises (which depend heavily on grid power for their operations and to some extent other
fuel oil based energy generation)], brick making, etc4.
1 http://cdm.unfccc.int/Projects/projsearch.html 2 Glossary of CDM terms Version 4.0 EB 41 3 Combustion characteristic of different fuels, Demirbas A, Progress in energy and combustion science, 30 (2004), 219-230 4 Framework for Programmatic CDM Projects in Renewable Energy, Chapter 8, Page 76
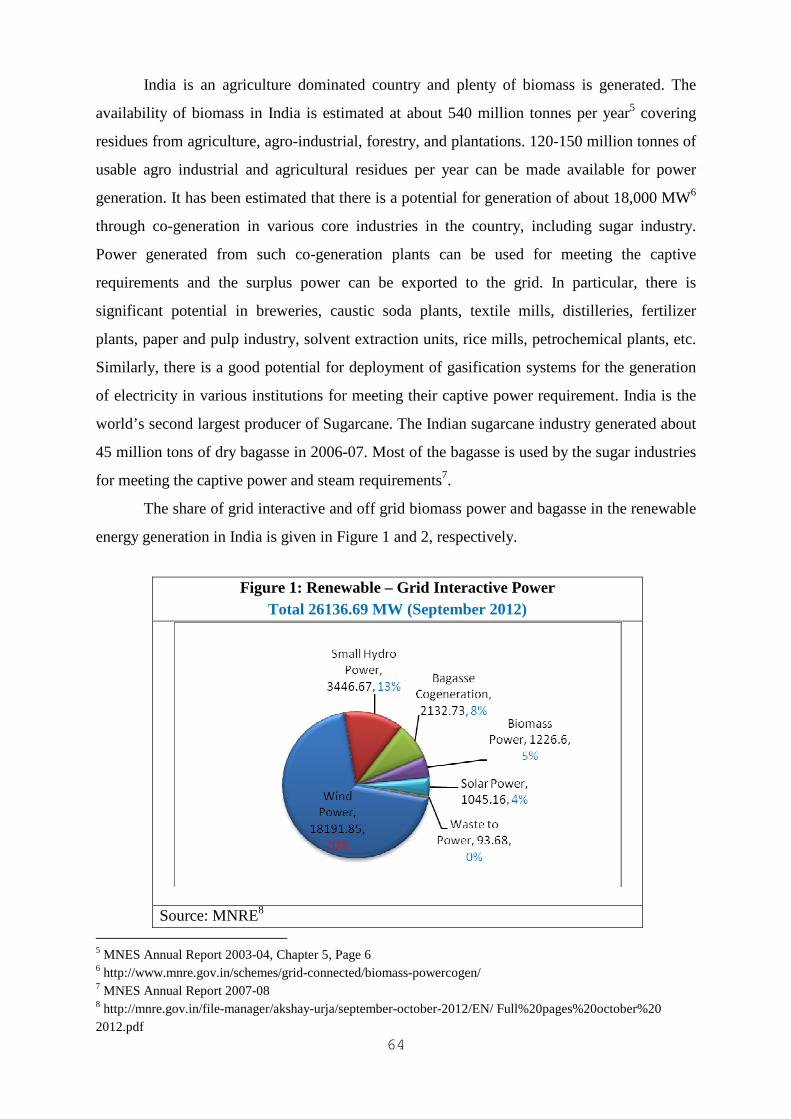
64
India is an agriculture dominated country and plenty of biomass is generated. The
availability of biomass in India is estimated at about 540 million tonnes per year5 covering
residues from agriculture, agro-industrial, forestry, and plantations. 120-150 million tonnes of
usable agro industrial and agricultural residues per year can be made available for power
generation. It has been estimated that there is a potential for generation of about 18,000 MW6
through co-generation in various core industries in the country, including sugar industry.
Power generated from such co-generation plants can be used for meeting the captive
requirements and the surplus power can be exported to the grid. In particular, there is
significant potential in breweries, caustic soda plants, textile mills, distilleries, fertilizer
plants, paper and pulp industry, solvent extraction units, rice mills, petrochemical plants, etc.
Similarly, there is a good potential for deployment of gasification systems for the generation
of electricity in various institutions for meeting their captive power requirement. India is the
world’s second largest producer of Sugarcane. The Indian sugarcane industry generated about
45 million tons of dry bagasse in 2006-07. Most of the bagasse is used by the sugar industries
for meeting the captive power and steam requirements7.
The share of grid interactive and off grid biomass power and bagasse in the renewable
energy generation in India is given in Figure 1 and 2, respectively.
Figure 1: Renewable – Grid Interactive Power Total 26136.69 MW (September 2012)
Source: MNRE8 5 MNES Annual Report 2003-04, Chapter 5, Page 6 6 http://www.mnre.gov.in/schemes/grid-connected/biomass-powercogen/ 7 MNES Annual Report 2007-08 8 http://mnre.gov.in/file-manager/akshay-urja/september-october-2012/EN/ Full%20pages%20october%20 2012.pdf
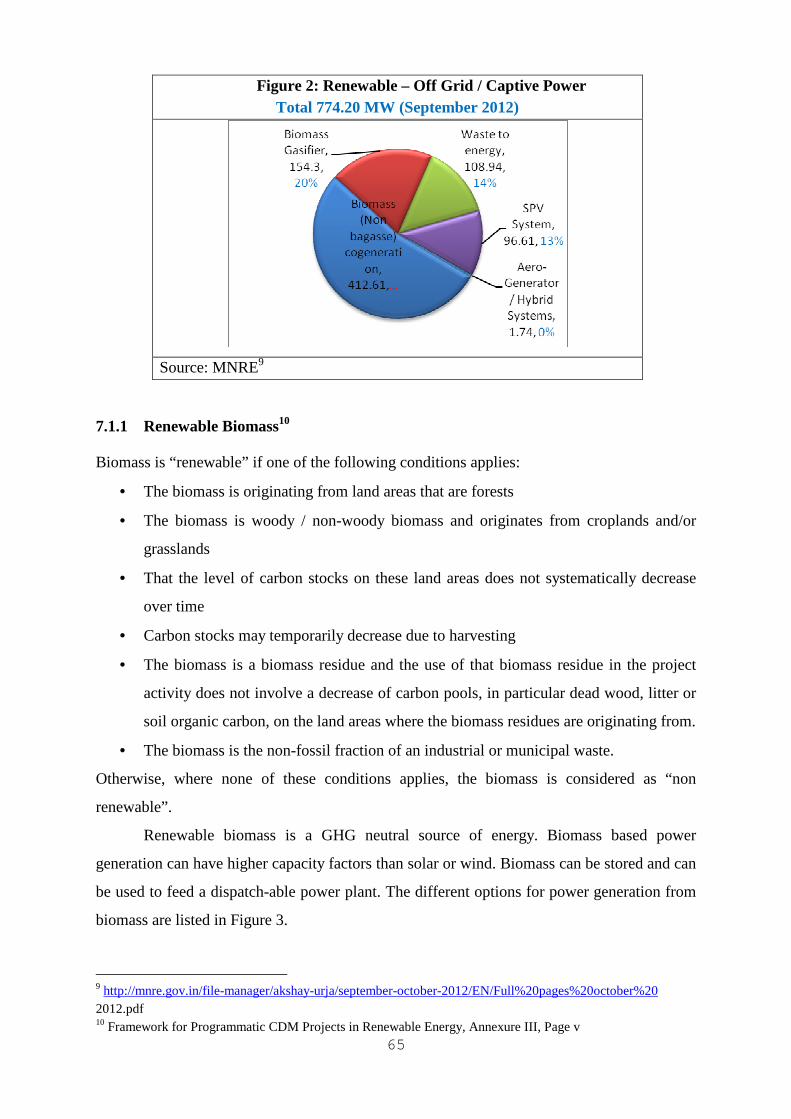
65
Figure 2: Renewable – Off Grid / Captive Power Total 774.20 MW (September 2012)
Source: MNRE9
7.1.1 Renewable Biomass10
Biomass is “renewable” if one of the following conditions applies:
• The biomass is originating from land areas that are forests
• The biomass is woody / non-woody biomass and originates from croplands and/or
grasslands
• That the level of carbon stocks on these land areas does not systematically decrease
over time
• Carbon stocks may temporarily decrease due to harvesting
• The biomass is a biomass residue and the use of that biomass residue in the project
activity does not involve a decrease of carbon pools, in particular dead wood, litter or
soil organic carbon, on the land areas where the biomass residues are originating from.
• The biomass is the non-fossil fraction of an industrial or municipal waste.
Otherwise, where none of these conditions applies, the biomass is considered as “non
renewable”.
Renewable biomass is a GHG neutral source of energy. Biomass based power
generation can have higher capacity factors than solar or wind. Biomass can be stored and can
be used to feed a dispatch-able power plant. The different options for power generation from
biomass are listed in Figure 3.
9 http://mnre.gov.in/file-manager/akshay-urja/september-october-2012/EN/Full%20pages%20october%20 2012.pdf 10 Framework for Programmatic CDM Projects in Renewable Energy, Annexure III, Page v
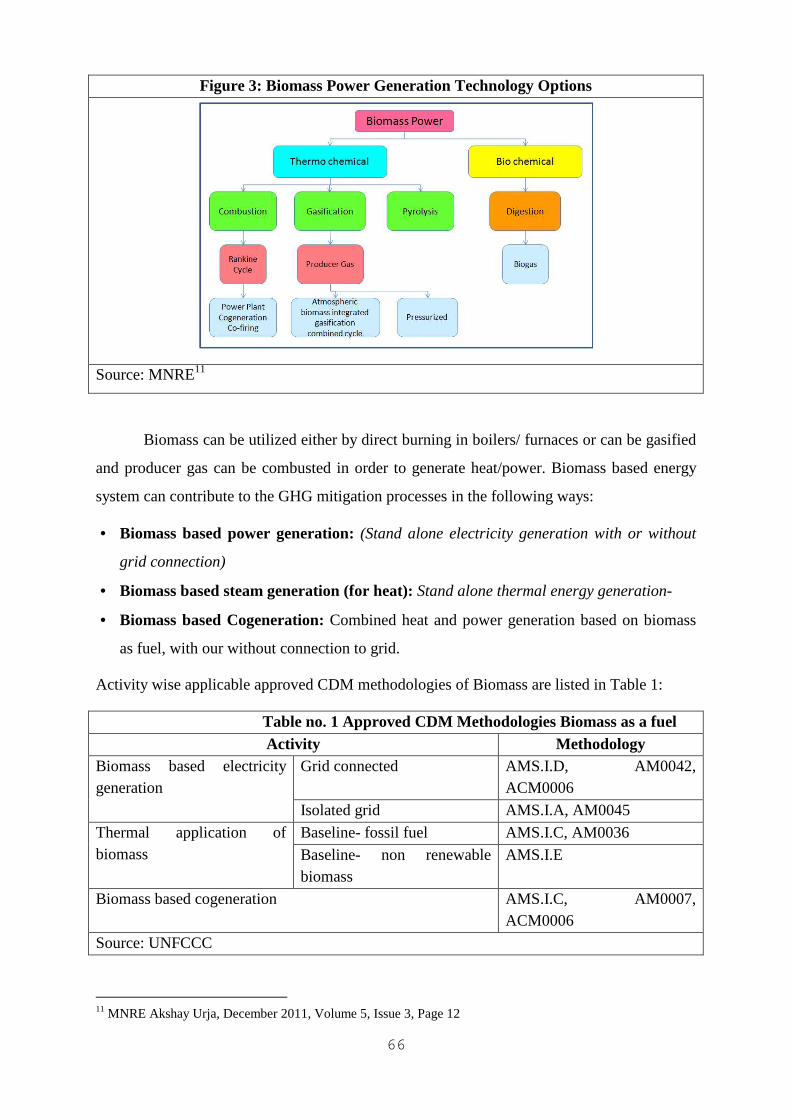
66
Figure 3: Biomass Power Generation Technology Options
Source: MNRE11
Biomass can be utilized either by direct burning in boilers/ furnaces or can be gasified
and producer gas can be combusted in order to generate heat/power. Biomass based energy
system can contribute to the GHG mitigation processes in the following ways:
• Biomass based power generation: (Stand alone electricity generation with or without
grid connection)
• Biomass based steam generation (for heat): Stand alone thermal energy generation-
• Biomass based Cogeneration: Combined heat and power generation based on biomass
as fuel, with our without connection to grid.
Activity wise applicable approved CDM methodologies of Biomass are listed in Table 1:
Activity MethodologyTable no. 1 Approved CDM Methodologies Biomass as a fuel Activity Methodology
Biomass based electricity generation
Grid connected AMS.I.D, AM0042, ACM0006
Isolated grid AMS.I.A, AM0045
Thermal application of biomass
Baseline- fossil fuel AMS.I.C, AM0036
Baseline- non renewable biomass
AMS.I.E
Biomass based cogeneration AMS.I.C, AM0007, ACM0006
Source: UNFCCC
11 MNRE Akshay Urja, December 2011, Volume 5, Issue 3, Page 12
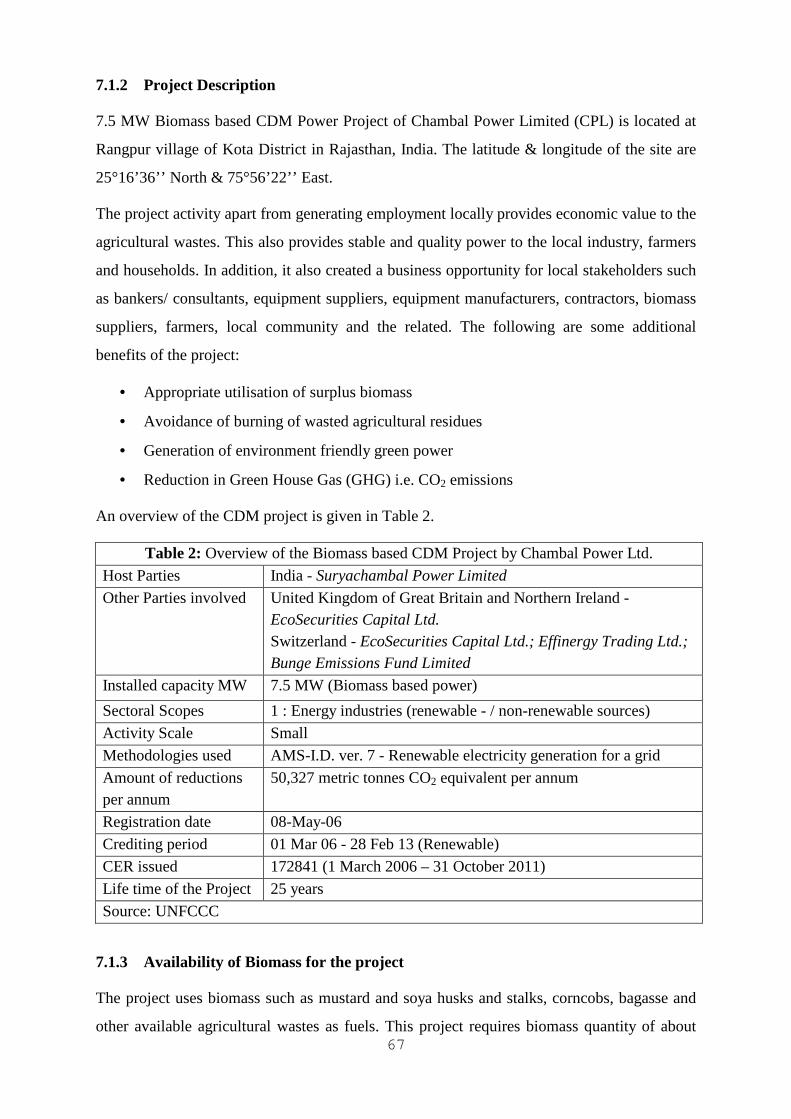
67
7.1.2 Project Description
7.5 MW Biomass based CDM Power Project of Chambal Power Limited (CPL) is located at
Rangpur village of Kota District in Rajasthan, India. The latitude & longitude of the site are
25°16’36’’ North & 75°56’22’’ East.
The project activity apart from generating employment locally provides economic value to the
agricultural wastes. This also provides stable and quality power to the local industry, farmers
and households. In addition, it also created a business opportunity for local stakeholders such
as bankers/ consultants, equipment suppliers, equipment manufacturers, contractors, biomass
suppliers, farmers, local community and the related. The following are some additional
benefits of the project:
• Appropriate utilisation of surplus biomass
• Avoidance of burning of wasted agricultural residues
• Generation of environment friendly green power
• Reduction in Green House Gas (GHG) i.e. CO2 emissions
An overview of the CDM project is given in Table 2.
Table 2: Overview of the Biomass based CDM Project by Chambal Power Ltd. Host Parties India - Suryachambal Power Limited
Other Parties involved United Kingdom of Great Britain and Northern Ireland - EcoSecurities Capital Ltd. Switzerland - EcoSecurities Capital Ltd.; Effinergy Trading Ltd.; Bunge Emissions Fund Limited
Installed capacity MW 7.5 MW (Biomass based power)
Sectoral Scopes 1 : Energy industries (renewable - / non-renewable sources)
Activity Scale Small
Methodologies used AMS-I.D. ver. 7 - Renewable electricity generation for a grid
Amount of reductions per annum
50,327 metric tonnes CO2 equivalent per annum
Registration date 08-May-06
Crediting period 01 Mar 06 - 28 Feb 13 (Renewable)
CER issued 172841 (1 March 2006 – 31 October 2011)
Life time of the Project 25 years
Source: UNFCCC
7.1.3 Availability of Biomass for the project
The project uses biomass such as mustard and soya husks and stalks, corncobs, bagasse and
other available agricultural wastes as fuels. This project requires biomass quantity of about
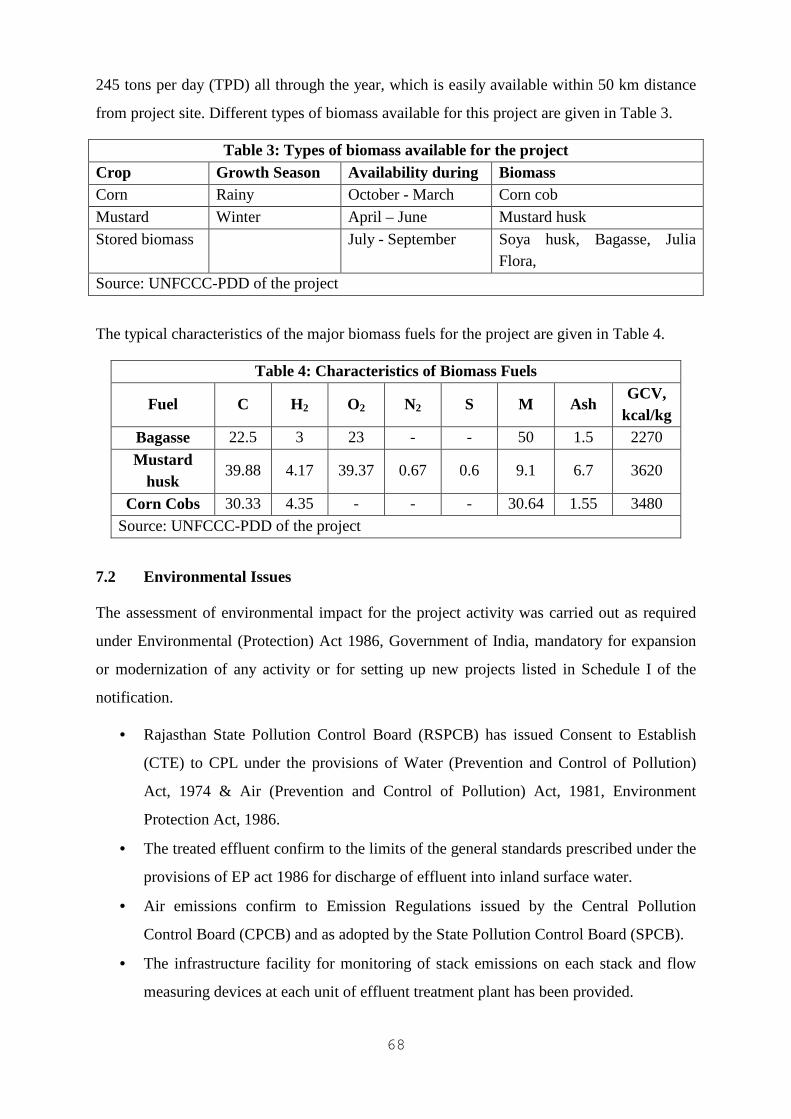
68
245 tons per day (TPD) all through the year, which is easily available within 50 km distance
from project site. Different types of biomass available for this project are given in Table 3.
Table 3: Types of biomass available for the project Crop Growth Season Availability during Biomass Corn Rainy October - March Corn cob
Mustard Winter April – June Mustard husk
Stored biomass July - September Soya husk, Bagasse, Julia Flora,
Source: UNFCCC-PDD of the project
The typical characteristics of the major biomass fuels for the project are given in Table 4.
Table 4: Characteristics of Biomass Fuels
Fuel C H2 O2 N2 S M Ash GCV,
kcal/kg Bagasse 22.5 3 23 - - 50 1.5 2270
Mustard husk
39.88 4.17 39.37 0.67 0.6 9.1 6.7 3620
Corn Cobs 30.33 4.35 - - - 30.64 1.55 3480
Source: UNFCCC-PDD of the project
7.2 Environmental Issues
The assessment of environmental impact for the project activity was carried out as required
under Environmental (Protection) Act 1986, Government of India, mandatory for expansion
or modernization of any activity or for setting up new projects listed in Schedule I of the
notification.
• Rajasthan State Pollution Control Board (RSPCB) has issued Consent to Establish
(CTE) to CPL under the provisions of Water (Prevention and Control of Pollution)
Act, 1974 & Air (Prevention and Control of Pollution) Act, 1981, Environment
Protection Act, 1986.
• The treated effluent confirm to the limits of the general standards prescribed under the
provisions of EP act 1986 for discharge of effluent into inland surface water.
• Air emissions confirm to Emission Regulations issued by the Central Pollution
Control Board (CPCB) and as adopted by the State Pollution Control Board (SPCB).
• The infrastructure facility for monitoring of stack emissions on each stack and flow
measuring devices at each unit of effluent treatment plant has been provided.
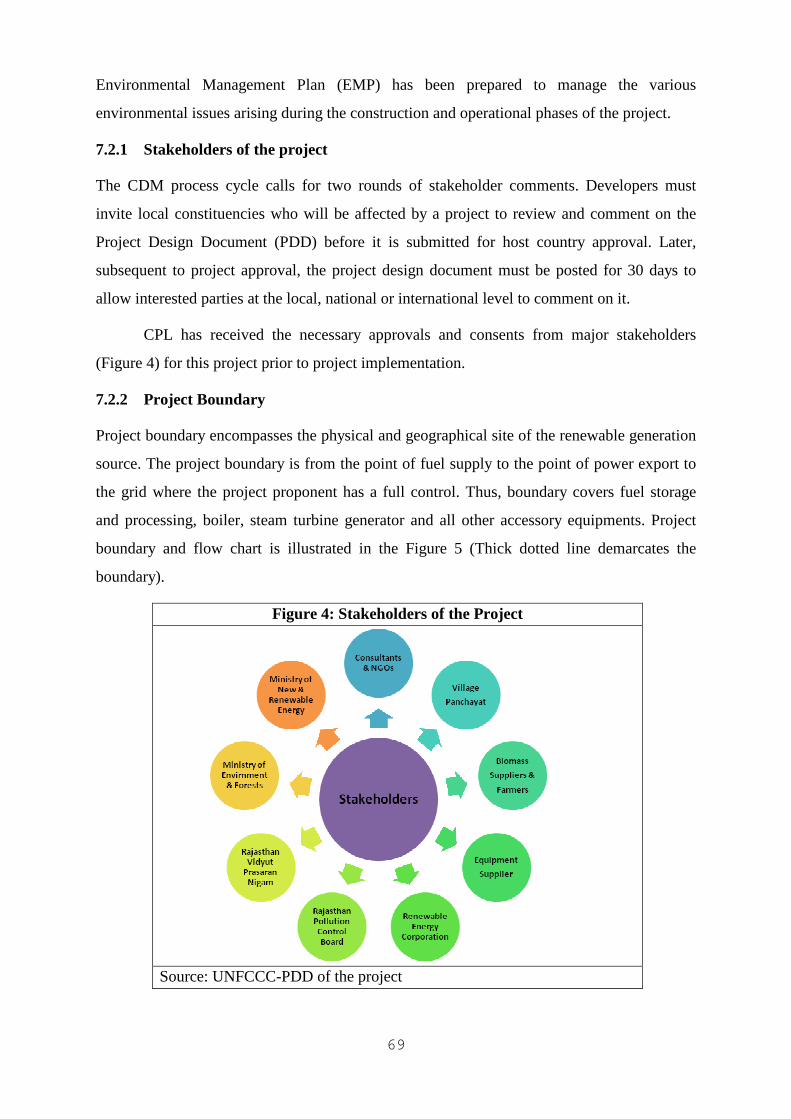
69
Environmental Management Plan (EMP) has been prepared to manage the various
environmental issues arising during the construction and operational phases of the project.
7.2.1 Stakeholders of the project
The CDM process cycle calls for two rounds of stakeholder comments. Developers must
invite local constituencies who will be affected by a project to review and comment on the
Project Design Document (PDD) before it is submitted for host country approval. Later,
subsequent to project approval, the project design document must be posted for 30 days to
allow interested parties at the local, national or international level to comment on it.
CPL has received the necessary approvals and consents from major stakeholders
(Figure 4) for this project prior to project implementation.
7.2.2 Project Boundary
Project boundary encompasses the physical and geographical site of the renewable generation
source. The project boundary is from the point of fuel supply to the point of power export to
the grid where the project proponent has a full control. Thus, boundary covers fuel storage
and processing, boiler, steam turbine generator and all other accessory equipments. Project
boundary and flow chart is illustrated in the Figure 5 (Thick dotted line demarcates the
boundary).
Figure 4: Stakeholders of the Project
Source: UNFCCC-PDD of the project
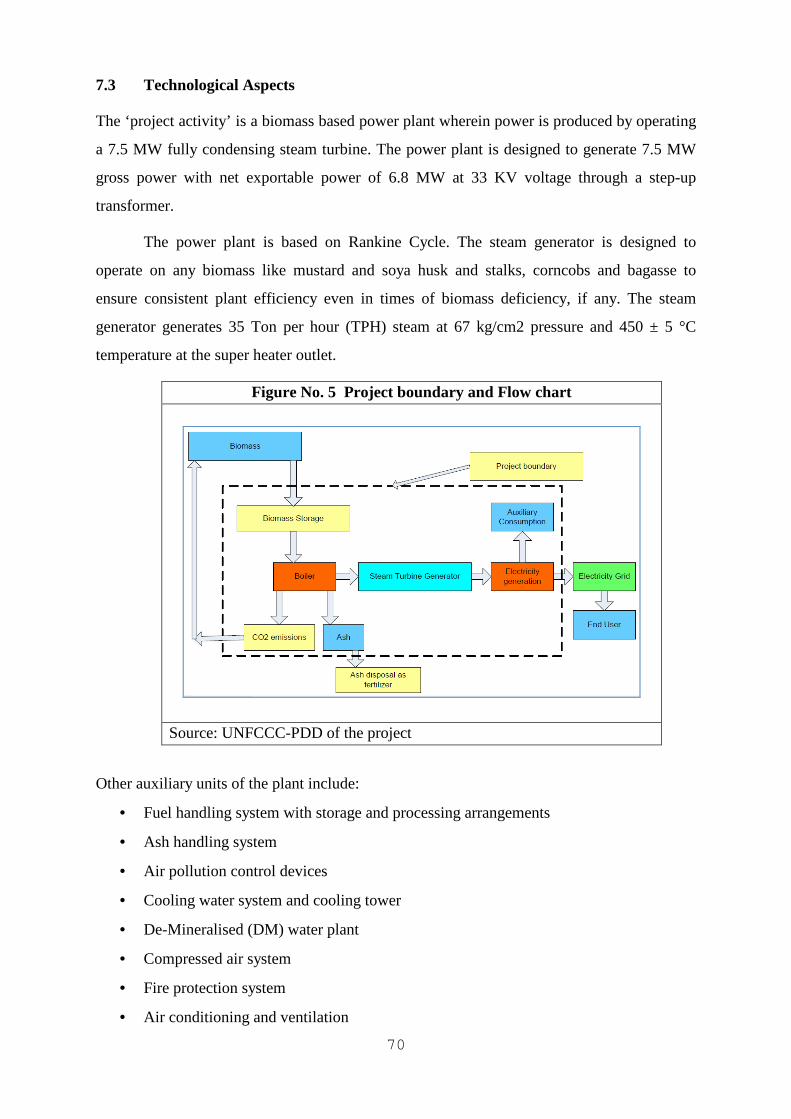
70
7.3 Technological Aspects
The ‘project activity’ is a biomass based power plant wherein power is produced by operating
a 7.5 MW fully condensing steam turbine. The power plant is designed to generate 7.5 MW
gross power with net exportable power of 6.8 MW at 33 KV voltage through a step-up
transformer.
The power plant is based on Rankine Cycle. The steam generator is designed to
operate on any biomass like mustard and soya husk and stalks, corncobs and bagasse to
ensure consistent plant efficiency even in times of biomass deficiency, if any. The steam
generator generates 35 Ton per hour (TPH) steam at 67 kg/cm2 pressure and 450 ± 5 °C
temperature at the super heater outlet.
Figure No. 5 Project boundary and Flow chart
Source: UNFCCC-PDD of the project
Other auxiliary units of the plant include:
• Fuel handling system with storage and processing arrangements
• Ash handling system
• Air pollution control devices
• Cooling water system and cooling tower
• De-Mineralised (DM) water plant
• Compressed air system
• Fire protection system
• Air conditioning and ventilation
71
• Complete electrical system for power plant and grid interconnection including power
evacuation, instrumentation and control systems, etc.
Mustard husk has a peculiar burning characteristic, as it catches fire instantly. Due to
this CPL conducted studies on the design of boiler along with their suppliers. The outlet
temperature of the boiler was brought down to 440° c as against conventional outlet
temperature of 510° c. The boiler design was also modified to avoid any ash fusion due to
above fuel characteristic.
Biomass (mustard and soya husk and stalk, corncobs, bagasse and agricultural wastes)
getting wet in the monsoon pose a serious problem in its use as boiler fuel.
The project uses modern energy efficient technology with high pressure and
temperature configuration. A coal based thermal power plant would be a less technologically
advanced alternative with lower risks associated with performance uncertainty, but would
lead to higher GHG emissions.
7.3.1 Leakage: GHG Emissions from the Project
Leakages due to the project can be categorised as follows:
Direct On-Site Emissions: arise from the burning of biomass in the boiler. These emissions
mainly include CO2. Since the biomass is formed by fixing the atmospheric CO2 by the action
of photosynthesis in the presence of sunlight, the CO2 released due to combustion of biomass
is assumed to be equal to the CO2 fixed by the photosynthesis. Hence, the project does not
lead to GHG emissions.
CPL has made provisions to use coal as fuel during extreme situations of drought. If
coal is used then the quantity of coal used is accounted for as CPL has an on-line weighing
system to measure coal.
Direct Off-Site Emissions: arise from the biomass transport. Sufficient biomass is available
within 15 km radius from the project site of CPL (Table 5). Direct off site emissions are very
less or negligible compared to the baseline.
Table 5: Transportation of Biomass fuel Distance covered Vehicles used
Within 5 KMs of Project 70% Truck 85%
6-10 KMs from the project 15% Tractor 15%
11-15 KMs from the project 15%
Source: UNFCCC-PDD of the project
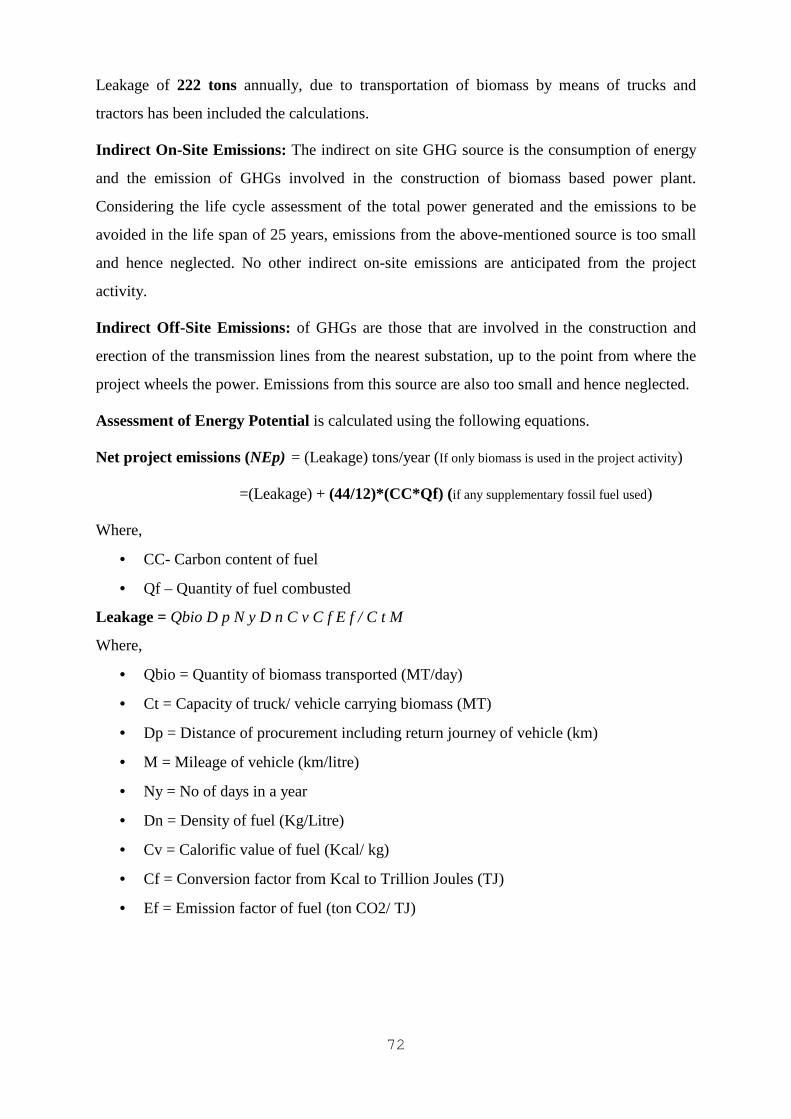
72
Leakage of 222 tons annually, due to transportation of biomass by means of trucks and
tractors has been included the calculations.
Indirect On-Site Emissions: The indirect on site GHG source is the consumption of energy
and the emission of GHGs involved in the construction of biomass based power plant.
Considering the life cycle assessment of the total power generated and the emissions to be
avoided in the life span of 25 years, emissions from the above-mentioned source is too small
and hence neglected. No other indirect on-site emissions are anticipated from the project
activity.
Indirect Off-Site Emissions: of GHGs are those that are involved in the construction and
erection of the transmission lines from the nearest substation, up to the point from where the
project wheels the power. Emissions from this source are also too small and hence neglected.
Assessment of Energy Potential is calculated using the following equations.
Net project emissions (NEp) = (Leakage) tons/year (If only biomass is used in the project activity)
=(Leakage) + (44/12)*(CC*Qf) (if any supplementary fossil fuel used)
Where,
• CC- Carbon content of fuel
• Qf – Quantity of fuel combusted
Leakage = Qbio D p N y D n C v C f E f / C t M
Where,
• Qbio = Quantity of biomass transported (MT/day)
• Ct = Capacity of truck/ vehicle carrying biomass (MT)
• Dp = Distance of procurement including return journey of vehicle (km)
• M = Mileage of vehicle (km/litre)
• Ny = No of days in a year
• Dn = Density of fuel (Kg/Litre)
• Cv = Calorific value of fuel (Kcal/ kg)
• Cf = Conversion factor from Kcal to Trillion Joules (TJ)
• Ef = Emission factor of fuel (ton CO2/ TJ)
73
7.3.2 Power generation and export by project activity (TP gen)
TP gen =TP exp +TP aux TP loss
Where,
• TPgen - Total power generated
• TPexp - Total clean power export to grid per annum by project activity
• TPaux - Auxiliary consumption of the power plant
• TPloss - T & D Loss
(all power units are in Million kWh)
The plant will meter power export to grid.
Baseline Emissions (BE)
BE = TPexp * NEFB
Where,
BE - Baseline Emissions per annum (tones/year)
TPexp - Total clean power export to grid per annum
Emissions Reduction (ER)
ER = BE - NEP
Where,
ER - CO2 Emission reduction per annum by project activity (tones/year)
BE - Baseline Emissions per annum (tones/year)
NEp - Net emissions by project activity (tones/year)
7.3.3 Monitoring & Verification
The Monitoring and Verification (M&V) procedures define a project-specific standard against
which the project's performance (i.e. GHG reductions) and conformance with all relevant
criteria is monitored and verified. It includes developing suitable data collection methods and
data interpretation techniques for monitoring and verification of GHG emissions with specific
focus on technical / efficiency / performance parameters. It also allows scope for review,
scrutiny and benchmarking of all these information against reports pertaining to M & V
protocols.
Different parameters being monitored are given in the Table no. 6.
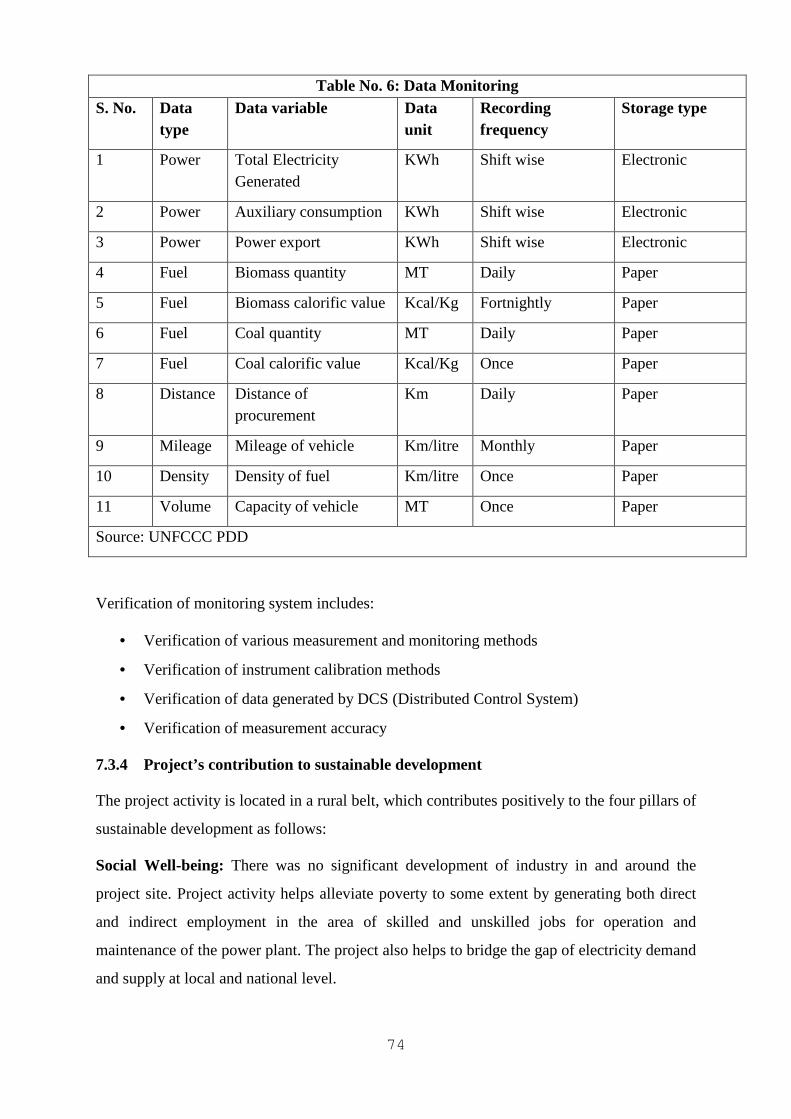
74
Table No. 6: Data Monitoring S. No. Data
type Data variable Data
unit Recording frequency
Storage type
1 Power Total Electricity Generated
KWh Shift wise Electronic
2 Power Auxiliary consumption KWh Shift wise Electronic
3 Power Power export KWh Shift wise Electronic
4 Fuel Biomass quantity MT Daily Paper
5 Fuel Biomass calorific value Kcal/Kg Fortnightly Paper
6 Fuel Coal quantity MT Daily Paper
7 Fuel Coal calorific value Kcal/Kg Once Paper
8 Distance Distance of procurement
Km Daily Paper
9 Mileage Mileage of vehicle Km/litre Monthly Paper
10 Density Density of fuel Km/litre Once Paper
11 Volume Capacity of vehicle MT Once Paper
Source: UNFCCC PDD
Verification of monitoring system includes:
• Verification of various measurement and monitoring methods
• Verification of instrument calibration methods
• Verification of data generated by DCS (Distributed Control System)
• Verification of measurement accuracy
7.3.4 Project’s contribution to sustainable development
The project activity is located in a rural belt, which contributes positively to the four pillars of
sustainable development as follows:
Social Well-being: There was no significant development of industry in and around the
project site. Project activity helps alleviate poverty to some extent by generating both direct
and indirect employment in the area of skilled and unskilled jobs for operation and
maintenance of the power plant. The project also helps to bridge the gap of electricity demand
and supply at local and national level.
75
Economic Well-being: The project has created jobs locally. The increase in demand of
biomass exerted by the project has generated additional revenue for the biomass suppliers and
farmers. Generation of electricity using the same (biomass) as fuel contributes to the
economic well - being by generating revenue and inflow of funds.
Environmental Well-being: The electricity generation by this project substitute the power
generation by Rajasthan Rajya Vidyut Utpadan Nigam Ltd. (RRVUNL), dominated by
conventional fossil fuel based projects. The project by utilisation of renewable energy source
positively contributes towards reduction in finite natural resource like coal/ gas/ oil thereby
minimizing the depletion. The project helps to reduce the CO2 emissions by reducing
equivalent quantity of conventional fuel, which is a carbon emissive non-renewable resource.
Technological well-being: The project activity uses energy efficient and environment
friendly technology in the renewable energy sector which includes a modern boiler designed
to operate with biomass like mustard and soya husk and stalks, corncobs, bagasse and other
available agricultural wastes.
7.4 Conclusion
Over the last two and a half decades, biomass power has become an industry, which attracts
annual investments of over Rs 4,000 crores, generates more than 700 crore units of electricity
and creates employment opportunities of more than 15 million man days in rural areas. The
potential estimated for power generation from the present surplus materials could be further
increased with development of technology and consequent increase in biomass conversion
efficiencies. Intensive cultivation of waste and marginal lands for energy crops, with use of
advanced plantation techniques could enable the country to increase its biomass power
potential even more.
In less than 10 years, the CDM has attracted more than USD 215 billion in investment
in mitigation and has proven that carbon markets and market-based mechanisms have the
ability to bring in substantial private sector support for mitigation and sustainable
development. The CDM is estimated to have provided between USD 9.5 and 13.5 billion
dollars of direct benefit to developing countries through the sale of CERs. Total numbers of
registered CDM projects from India are 888, out of which 222 (25%) are related to biomass
energy till August 2012.
The driving forces to this ‘climate change initiative’ are:
76
• Rural development of the region by creating a new demand for the waste biomass
thereby carving a source of additional revenue for the farmers involved in sourcing the
raw material
• Demonstrating to other entrepreneurs the un-tapped potential of generating clean
power from combustion of mustard and soya husks and stalks, corncobs, bagasse and
other agricultural wastes
• Export of 6.8 MW power to the northern regional grid and thereby replacing the
generation of equivalent quantity of power using conventional fuel
• Conserving fossil fuels like coal/ gas which are non-renewable natural resources
• Making fossil fuels like coal/ gas available for other important applications
• Reducing GHG i.e. CO2 emissions
• Contributing to a small increase in the local employment in the area of skilled and
non-skilled jobs, for operation and maintenance of the power plant.
• Capacity building of local people towards operation of modern technology power
generation for long-term benefits
It is apparent that biomass is an important energy resource for enhancing power
generation capacity in India. Biomass prices are subject to high volatility and therefore over a
period biomass power tariff has become an unviable proposition for many developers12. With
an objective to offer solution to various problems faced by Developers, Investors and other
utilities, Government of Rajasthan has introduced a Policy for Promoting Generation of
Electricity from Biomass13 in 2010. Incentives provided under this policy are exemption from
electricity duty, grant of incentives available to industries, availability of water for Power
Generation, Land on concessional rates, reservation of area to avoid unhealthy competition,
etc.
This CDM project has earned additional revenue by selling more than 1.72 Lakh
CERs and is expected to do a lot more during its operational lifetime of 25 years.
References
1. Benefits of the Clean Development Mechanism 2011, United Nations Framework
Convention on Climate Change
2. CDM Methodology Booklet, United Nations Framework Convention on Climate
Change, November 2011
12 MNRE Akshay Urja, December 2011, Volume 5, Issue 3, Page 17 13 http://www.rrecl.com/PDF/Policy_Biomass.pdf
77
3. CDM Rulebook, “Host Party”, http://cdmrulebook.org/441, accessed May 2012
4. Central Electricity Authority (CEA) website, Ministry of Power, Govt. of India,
www.cea.nic.in
5. Central Pollution Control Board website cpcb.nic.in/
6. Clean Development Mechanism and Carbon Credits – A Primer, 2009
7. Combustion characteristic of different biomass fuels. Demirbas A., Progress in Energy
and Combustion Science, 30 (2004), 219-230
8. Definition of renewable biomass. EB 23 Annex 18.
9. Framework for Programmatic CDM Projects in Renewable Energy, Ministry of New
and Renewable Energy, Government of India, May 2009
10. Glossary of CDM terms Version 4.0. EB 41
11. Interim Report of the Expert Group on Low Carbon Strategies for Inclusive Growth,
Planning Commission, Govt. of India, May 2011
12. Meshram, JR, (2011), Biomass Power in India: An overview, Akshay Urja Vol 5, Issue
3, pages 10-19
13. Ministry of Environment and Forests, Government of India website envfor.nic.in/
14. MNRE website http://www.mnre.gov.in/
15. National CDM Authority, Ministry of Environment and Forests, Government of India
website www.cdmindia.in/
16. Northern Regional Electricity Board (NREB) website, http://www.nreb.nic.in
17. PDD Version 2 of Chambal Power Limited’s (CPL) 7.5 MW biomass based power
project at Rangpur, Kota District, Rajasthan, India, December 2005
18. PoA Blueprint Book, KfW Bankengruppe, 2010
19. Practical Baseline Recommendations for Green House Gas Mitigation Projects in the
Electric Power Sector, OECD and IEA Information
20. Punjab Energy Development Agency website http://peda.gov.in/eng/index.html
21. Rajasthan Electricity Regulatory Commission (RREC) website http://www.rerc.gov.in
22. Rajasthan Renewable Energy Corporation Limited Website www.rrecl.com/
23. Rajasthan State Energy Department website, Rajasthan Rajya Vidyut Prasaran Nigam
Ltd (RRVPNL) http://www.rajenergy.com/ticap_1.htm
24. Rajasthan State Pollution Control Board website rpcb.nic.in/
25. Report of the Conference of the Parties on its seventeenth session, held in Durban
from 28 November to 11 December 2011
78
26. Report of the Working Group on National Action Plan for Operationalising Clean
Development Mechanism (CDM) in India, Planning Commission, Govt. of India,
December 2003
27. Sagar, Ambuj, Technological Cooperation and Climate Change: Issues and
Perspectives, 2011, Published by UNDP India
28. Shukla et al, 2008. 25 years of Renewable energy in India. MNRE.
29. The Clean Development Mechanism: A User’s Guide, Energy & Environment Group,
Bureau of Development Policy, United Nations Development Programme, 2003
30. UNFCCC Decision 17/CP.7: Modalities and procedures for a clean development
mechanism
31. United Nations Framework Convention on Climate Change (UNFCCC) website,
http://unfccc.int
79
CHAPTER 8
THERMODYNAMIC ANALYSIS OF 1TR BIOGAS BASED
NH3-H2O VAPOR ABSORPTION SYSTEM
S. Anand, A. Gupta and S.K. Tyagi
Abstract
This article suggests a numerical study of a biogas fired Ammonia-Water absorption
refrigeration system. The hot biogas coming from the biogas furnace having a temperature
range of 50-75oC is used as an energy input to the generator of absorption system. A
computational model has been developed for the parametric investigation of this system and
the thermodynamic properties of the fluids have been used from the computer code. The
analysis involves the determination of effects of generator temperature on various
performance parameters. The performance parameters studied are exergy losses in the
different components, COP cooling, COP heating and the exergy efficiency. The results
indicate that COP cooling as well as COP heating lies in the range of 0.20-0.93 and 1.20-1.93
respectively for same variation in generator temperature ranging from 50-75oC. The exergetic
efficiency of the system lies in the range of 0.092-0.1275.The maximum exergy loss is found
to be in case of generator and the lowest in case of condenser. It is also found that with an
increase in the evaporator as well as absorber and condenser temperature, the COP increases
as well as decreases respectively. The effect of ambient temperature on exergy loss in
different components is also studied.
Keywords: Absorption refrigeration system, Exergy analysis, Coefficient of performance,
exergetic efficiency, Evacuated tube collector
Nomenclature
COP Coefficient of Performance
m& Mass flow rate (Kg/s)
h Enthalpy(kJ/kg)
s Entropy(kJ/kg-K)
Q& Heat flow (kW)
p Pressure (bar)
80
T Temperature (K)
W& Power consumption (kW)
xΞ Exergy (kW)
1-10 Different state points in a system
PR-valve Pressure reducing valve
Abbreviation
EES Engineering Equation Solver
Subscripts
A, abs Absorber
C, cond Condenser
G, gen Generator
E, evap Evaporator
p Pump
i, in Inside
o, out Ambient, Outside
ex Exergy
Greek symbol
η Efficiency
8.1 Introduction
The depletion of the premium energy sources however has a universal, overall impact and it
adversely affects all our commerce as well as our daily lives. The increase in the energy
demand leads to increase in its supply, however, the increased energy demand poses a
pressure on the energy sources, which are mostly conventional, and hence their exploration
increases which would gradually deplete the energy resources pool if immediate saving steps
are not taken. Also with the increase in energy demand, the prices also start off showing many
folds toll and this has raised an alarm to save energy, by using minimum energy from the
conventional resources like crude-oil, natural gas, oil shale etc. The ever increasing energy
demand can be reduced to some extent by using energy sources other than conventional
sources like solar energy, biomass, geothermal energy, wind energy etc. It is well known that
cooling systems are required in our daily lives and represents a substantial fraction of world’s
total energy and power consumption. All living beings especially humans are very much
concerned about the suitable climate and thermal comfort both, mentally and physically so
that they can work efficiently. In the excessively hot climates it is necessary to reduce the
81
temperature and humidity whereas in the excessively cold climate there is a need to increase
the temperature with the presence of suitable moisture content. Thermal comfort plays a very
important role on the health and working efficiency of human beings. If the temperature drops
below thermal comfort level, the heating devices such as heat pump systems are employed to
produce heating. In some countries, where the atmospheric temperature is very low, natural
heating like solar energy is not sufficient and therefore refrigeration and fuel fired systems are
proven to be more suitable heating devices. The energy consumption in buildings,
commercial installations and space air conditioning constitutes a huge share of the total
energy consumption not only in the developed but also in the developing countries. Facing the
ever increasing pressure of energy demand, the environmental degradation, global warming
and depletion of ozone layer due to the various reasons, most commonly the industrialization,
the efficient use of the energy is a hot topic of research after the Kyoto and Montreal Protocol.
Absorption refrigeration systems have been adopted for many years. These systems
are becoming more and more important nowadays, especially because of their environmental
friendliness. Recent developments in cooling and heating system show a growing interest in
the application of absorption systems. Absorption system is a thermally activated system with
natural refrigerants such as water–lithium bromide and ammonia-water pairs. The absorption
cooling represents a practical means of decreasing the electrical energy consumption
associated with the peak cooling energy demand in the summer and for recovering the waste
energy from the industrial plants or other sources (Kim and Park, 2007). Heat input to the
generator drives part of a volatile refrigerant out of a solution and in to the vapor phase, with
the reverse process carried out at the absorber (Gordon and Cool, 2000). The condenser and
evaporator serve the same function as in mechanical chiller. It can also use solar energy as the
energy input. In addition to that, it has fewer moving parts mean lower noise levels, high
reliability and improved durability.
In the present era, there has been a significant interest in the energy conservation that
has prompted a new methodology. This has brought a relative change to the critical analysis
of almost all thermodynamic processes and installations. There has been a development in the
concept of second law of thermodynamics (Talbi and Agnew, 2000). In recent years, there has
been growing interest in the use of principles of Second law of thermodynamics for analyzing
and evaluating the thermodynamic performance of thermal systems as well as their
technologies (Lee and Sherif, 2001). This is a well established method and is used to study
the energy conversion processes (Kotas, 1985). The second law analysis also called as exergy
method is used to calculate the loss caused by irreversibility. The analysis based on exergy
82
provides information for each component of the system and pin points where the real
inefficiencies in a system lies. For the last two decades, numbers of researchers have used
Second law analysis for thermodynamic optimization of refrigeration plants based on the
theoretical analysis (Bejan et al., 1995).
The rapid cycling study of the solar/biomass powered adsorption refrigeration system
was carried out (Critoph, 1999) and stated that there is a need of heat operated refrigeration
systems in the areas which either have warm climate or irregular supply of electricity. He
stated that the research is underway on carbon - ammonia refrigeration systems driven by the
heat of steam condensing in a thermosyphon heat pipe. He also stated that the heat source to
run the refrigeration system can be solar energy, biomass, or some combination of the two.
He stated that new developed monolithic carbon adsorbent-aluminium composites promise
power densities of 1kW cooling per kg carbon. The high power density leads to much lower
first costs.
A review on the automobile air-conditioning system using palm oil based activated
carbon was carried out (Abdullah et al., 2011). In the review they stated that Refrigeration
and air-conditioning technology are required to evolve in accordance to Montreal Protocol
adopted in 1987 and Kyoto Protocol in 1997. These regulations are concerned about phasing
out the applications of chloro-fluoro carbons in the refrigeration systems because of the
climate change done by the use of the chloro-fluoro carbons, hydro chloro-fluoro carbons
(HCFCs). This trend leads to a strong demand of new systems for air-conditioning, especially
in automobile. Adsorption cooling system, among other proposed cooling technologies, has a
very good potential for automobile applications but there is a need for a creative design and
innovation to allow adsorption technology to be practical for air-conditioning in automobile
in a near future. They also stated that the present work aims to investigate the
physicochemical properties of oil palm shell-based activated carbon and its feasibility for
application in adsorption air-conditioning system. They point out that the oil palm shell-based
activated carbon has been widely applied in various environmental pollution control
technologies, mainly due to its high adsorption performance as well as low cost. However,
limited studies have been carried out on the characteristics and application of oil palm shell-
based activated carbon in adsorption air-conditioning system. This paper is to present a
comprehensive review on the past efforts in the field of adsorption air-conditioning systems
for automobile. Some of the limitations are outlined and suggestions for future improvements
are also pointed out.
83
An economic evaluation of the biogas for a pump less LiBr-H20 biogas operated
absorption system for optimizing generator temperature in a vapor absorption refrigeration
was carried out (Siddiqui et al., 1986). The generator temperature and pressure, evaporator
temperature, precooler and preheater effectivenesses were used as system variables. The
optimum generator temperature so obtained has been graphically presented for a wide range
of operating conditions. Multipliers have also been obtained for evaporator temperatures
other than 5°C.
The thermo-economic analysis of the biomass for tri-generation was conducted (Lian
et al., 2010). The thermo-economic analysis of the steam turbine plant operated with biomass
namely waste wood is based on the principle of second law of thermodynamics. The four
different configurations are assessed and presented. The cost effectiveness is evaluated with
varying economic and operating parameters, because only the fuel price as well as electricity
price is varied. In the case 1, the high pressure superheated steam generated is used to meet
the demand for process heat as well chilled water production in an absorption chiller. In cases
2 & 3 the steam is extracted at the appropriate stages of the absorption chiller to meet the
demand for process heat and chilled water production in the absorption chiller. In case 2, the
steam generated is having sufficient potential to meet the internal demands but in case 4, the
steam generates electricity which can be sold to the utility. In case 4, the low pressure
saturated steam generated can be used to meet the demand for process heat and electricity is
bought from utilities which can be used to power the electric vapor compression chiller. From
the results it is noticeable that furnace accounts for the maximum exergy destruction (60%)
followed by the steam drum where exergy destruction lies in the range of 11-16%. It is also
observed that the overall cost decreases with the steam pressure and increases with the steam
temperature.
The performance analysis of a cold production plant using biomass residuals from an
agrarian exploitation as the primary energy source was conducted (Gomez et al., 2006). The
residuals are generated in the pruning and renovation of fruit trees and are used in a boiler to
recover heat for an absorption refrigeration system. The study carries out the characterization
and quantification of the energy produced by the residuals and its viability for converting that
energy in cold by means of an absorption machine. The estimated thermal power sourced
from the biomass generated in the exploitation (approx. 4216 ton) is of approximately 56.92 ×
106 MJ/year. The energy so generated is found to be greater than that required to keep the
fruits at suitable low temperature, confirming the use of non- conventional refrigeration
systems rather than conventional system consuming high energy.
84
An experiment for the development of absorption refrigeration units for cold storage
of agricultural products was done (Borde and Jelinek, 1987). They stated that in order to meet
the requirements of continuous refrigeration systems powered by low grade energy coming
from waste heat, flat-plate solar collectors meant for the sub-zero cooling, there is a proper
need of selection of refrigeration–absorbent pair. They also stated that the use of R22 and
suitable organic solvent systems is desirable in absorption refrigeration installations. As no
data were available on the vapour-liquid equilibria of these combinations, they were
measured over a broad range of pressures, temperatures and concentrations. For the purpose a
rational selection was made using results obtained from a computerized simulation model
giving the performance characteristics of a specific refrigeration system operating with
selected refrigerant-absorbent combinations. An efficient thermodynamic cycle has been
constructed for the chosen refrigerant-absorbent pairs and within the region of feasible
operation of the cycle, optimal operating conditions are determined. In the selection of the
operating conditions, the heat transferred in the heat exchangers is also taken in to account.
On the basis of the research a prototype of 15 ton capacity is constructed for the cooling
application of agricultural products which operates on hot water supply in the range of 95-
98oC and cooling water in the range of 26oC maintains the temperature of cooling chamber at
5oC, when the coil temperature is maintained at -3oC.
A simulation of an air-conditioning absorption refrigeration system in a co-generation
process combining a proton exchange membrane fuel cell (PEMFC) was done (Pilatowsky et
al., 2007). A computer simulation program was developed to determine the optimum
operating conditions of an air conditioning system during the co-generation process. A 1 kW
PEMFC was considered in this study with a chemical/electrical theoretical efficiency of 40%
and a thermal efficiency of 30% applying an electrical load of 100%. A refrigeration-
absorption cycle operating with monomethylamine–water solutions with low vapor
generation temperatures up to 80 °C is used in this work. The analysis was based on the
refrigeration production capacity at the maximum power capacity of PEMFC. The heat losses
between the air-conditioning system and PEMFC were considered negligible at the standard
operating conditions during the analysis. Results indicate the feasibility of the PEMFC for
cooling applications there by increasing the total efficiency of the fuel cell.
An experimental investigation of a10 kW natural gas fired commercially available
absorption refrigeration system using ammonia- water as working pair was conducted (Horuz
and Callander, 2004). The system was modified to allow fluid pressures and temperatures to
be measured at strategic state points. The system as supplied incorporates air-cooled
85
condenser and absorber units. Water-cooled absorber and condenser units were fitted to
extend the VAR unit's range of operating conditions by varying the cooling water inlet
temperature and/or flow rates to these units. The response of the refrigeration unit to
variations in chilled water inlet temperature, chilled water level in the evaporator drum,
chilled water flow rate, and variable heat input are also presented.
In the present communication, we have carried out the energy and exergy analysis of a
novel biogas based 1TR single effect low temperature ammonia-water absorption
refrigeration system. The effects of the various operating parameters on the performance
parameters have been calculated. The variation of exergy loss in each component, exergy
efficiency with respect to the generator temperature as well as ambient temperature has been
calculated to find out its contribution on the performance of system. The effect of the
evaporator temperatures as well as absorber and condenser temperatures on the coefficient of
performance has also been calculated and discussed.
8.2 System Description
The system to be analyzed is 1 TR single-effect ammonia water vapor absorption refrigeration
system and is shown in Fig.1.The system employs biogas as source of energy to the generator.
Ammonia is used as refrigerant and water is used as absorbent. The system consists of the
generator, condenser, an absorber, an evaporator solution heat exchanger, throttling device,
pressure reducing valve and pump.
The solution rich in refrigerant exits the absorber (7) and is pumped through the
solution pump (8) to the solution heat exchanger and is heated by the weak solution that
comes from the generator. The strong solution enters the generator (1) where the ammonia is
raised in to vapors by the external heat supply and is separated from the solution. The
ammonia vapor exits the generator (2) and the weak solution returns to the absorber through
the solution heat exchanger (3-9) and lowers its pressure through the pressure reducing valve
(9-10). The ammonia vapors are condensed in the condenser and the latent heat of
condensation is released in to the cooling water flowing through the condenser. The ammonia
liquid is produced in the condenser (4) is at higher pressure and is passed through the
throttling device (4-5) to reduce its pressure. At this low pressure saturated liquid ammonia
enters the evaporator and is again converted to vapors by absorbing the latent heat from the
chilled water circulated between the evaporator and the cooling space. The refrigerant vapor
produced enters the absorber (6) and absorbed by the strong solution in the absorber where
the heat of absorption is released to the surrounding fluid (water or air) and the strong
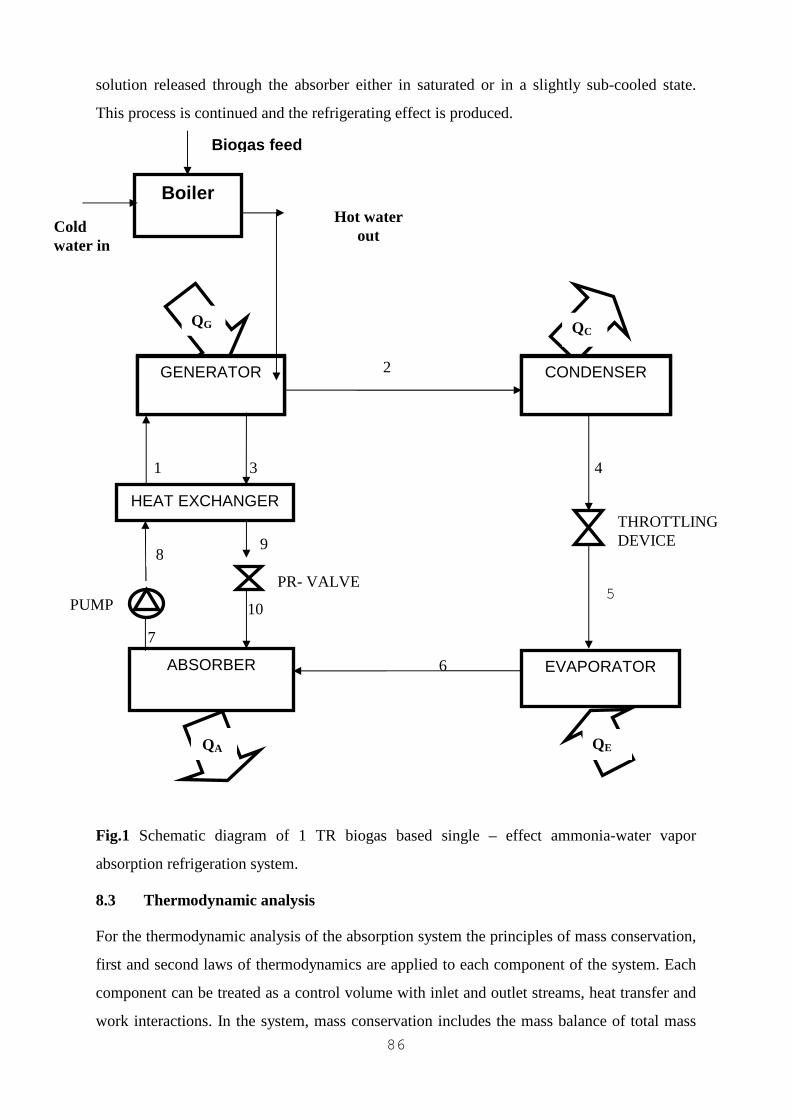
86
solution released through the absorber either in saturated or in a slightly sub-cooled state.
This process is continued and the refrigerating effect is produced.
2
1 3 4
10
7
6
Fig.1 Schematic diagram of 1 TR biogas based single – effect ammonia-water vapor
absorption refrigeration system.
8.3 Thermodynamic analysis
For the thermodynamic analysis of the absorption system the principles of mass conservation,
first and second laws of thermodynamics are applied to each component of the system. Each
component can be treated as a control volume with inlet and outlet streams, heat transfer and
work interactions. In the system, mass conservation includes the mass balance of total mass
QC QE
QG QC
HEAT EXCHANGER
ABSORBER
CONDENSER
GENERATOR GENERATOR CONDENSER
9 8
5
THROTTLING DEVICE
PUMP
PR- VALVE
EVAPORATOR
QE QA
Cold water in
Hot water out
Biogas feed
Boiler
87
and each material of the solution. The governing equation of mass and type of material
balance for steady state operation of the system are given below:
0=− ∑∑ oi mm && (1)
( ) ( ) 0=− ∑∑ oi xmxm &&
(2)
Where, ''m& is the mass flow rate and ''x is concentration of LiBr in the solution. The first
law of thermodynamic yields the energy balance of each component of the absorption system
as below:
( ) ( ) [ ] 0=±−+− ∑ ∑∑∑ WQQhmhm oioi&&&&&
(3)
8.3.1 Energy analysis
For the thermodynamic analysis of vapor absorption refrigeration system, the energy balance
equation of various components is calculated on the basis of various assumed parameters
given in table 1 and is given in the table 2. The refrigeration system can be considered as a
perfectly reversible system and the net refrigerating effect is the heat absorbed by the
refrigerant in evaporator and therefore the theoretical COP is given as-
G
E
Q
QCOP
&
&
= (4)
Where, '' EQ& is the cooling effect and '' GQ& is the energy supplied to the generator/ heat source.
Whereas in case of absorption refrigeration system, the total energy supplied to the system is
the total of the heat supplied in the generator and work consumed by the pump. The actual
COP of absorption chillers is calculated from the equation given below
( )PG
E
WQ
QCOP
&&
&
+=
(5)
Where “ PW& ” is the pump work calculated to be very small as compared to the heat supplied
to the generator and hence neglected in the calculation part for the calculation of the COP of
the system.
In case of absorption refrigeration system heat rejected from the condenser as well as
absorber can also be utilized for heating purposes either by allowing water or air to flow
through the condenser as well as absorber. The system can be used for heating purposes also
and the COP the system is given below:
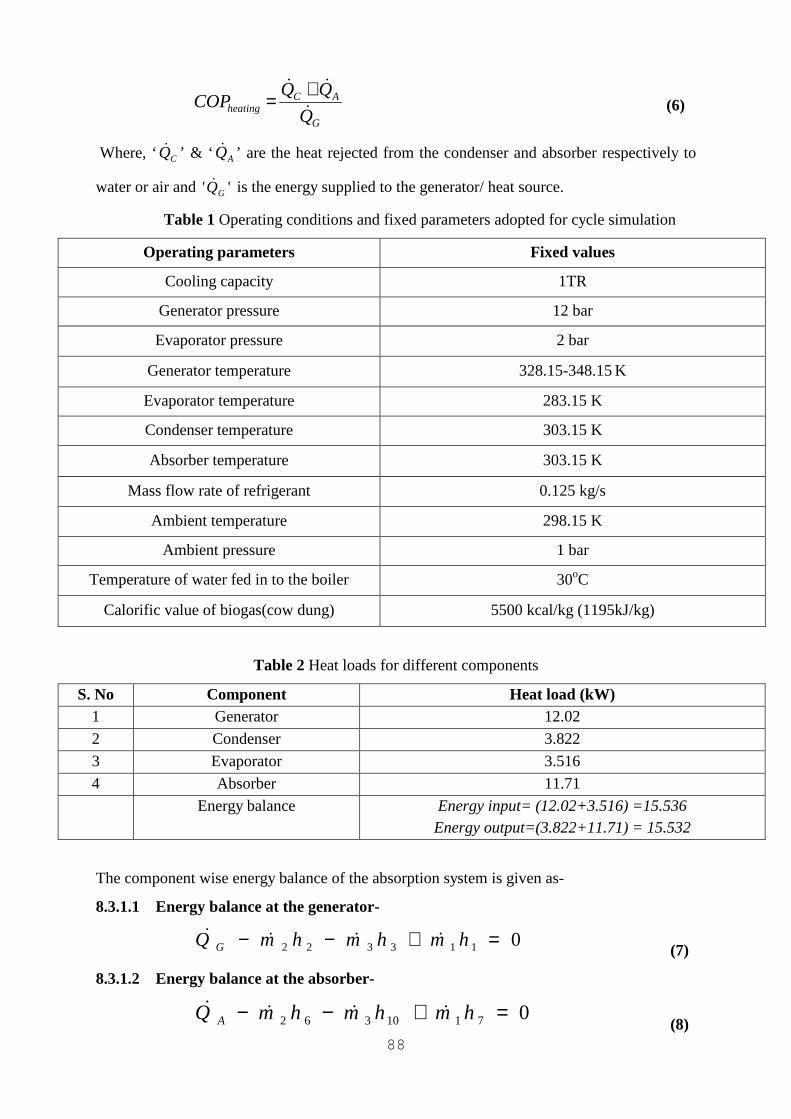
88
G
ACheating Q
QQCOP
&
&& += (6)
Where, ‘ CQ& ’ & ‘ AQ& ’ are the heat rejected from the condenser and absorber respectively to
water or air and '' GQ& is the energy supplied to the generator/ heat source.
Table 1 Operating conditions and fixed parameters adopted for cycle simulation
Operating parameters Fixed values
Cooling capacity 1TR
Generator pressure 12 bar
Evaporator pressure 2 bar
Generator temperature 328.15-348.15 K
Evaporator temperature 283.15 K
Condenser temperature 303.15 K
Absorber temperature 303.15 K
Mass flow rate of refrigerant 0.125 kg/s
Ambient temperature 298.15 K
Ambient pressure 1 bar
Temperature of water fed in to the boiler 30oC
Calorific value of biogas(cow dung) 5500 kcal/kg (1195kJ/kg)
Table 2 Heat loads for different components
S. No Component Heat load (kW) 1 Generator 12.02
2 Condenser 3.822
3 Evaporator 3.516
4 Absorber 11.71
Energy balance Energy input= (12.02+3.516) =15.536 Energy output=(3.822+11.71) = 15.532
The component wise energy balance of the absorption system is given as-
8.3.1.1 Energy balance at the generator-
0113322 =+−− hmhmhmQ G &&&& (7)
8.3.1.2 Energy balance at the absorber-
07110362 =+−− hmhmhmQ A &&&& (8)
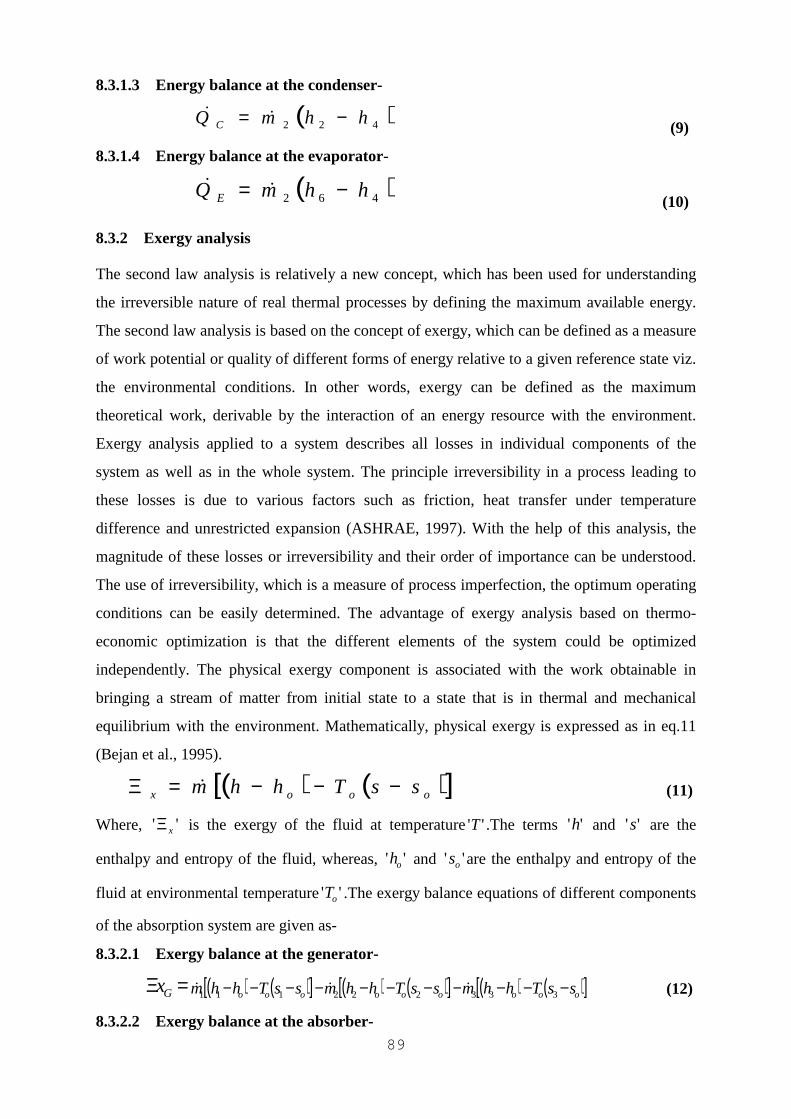
89
8.3.1.3 Energy balance at the condenser-
( )422 hhmQ C −= && (9)
8.3.1.4 Energy balance at the evaporator-
( )462 hhmQ E −= && (10)
8.3.2 Exergy analysis
The second law analysis is relatively a new concept, which has been used for understanding
the irreversible nature of real thermal processes by defining the maximum available energy.
The second law analysis is based on the concept of exergy, which can be defined as a measure
of work potential or quality of different forms of energy relative to a given reference state viz.
the environmental conditions. In other words, exergy can be defined as the maximum
theoretical work, derivable by the interaction of an energy resource with the environment.
Exergy analysis applied to a system describes all losses in individual components of the
system as well as in the whole system. The principle irreversibility in a process leading to
these losses is due to various factors such as friction, heat transfer under temperature
difference and unrestricted expansion (ASHRAE, 1997). With the help of this analysis, the
magnitude of these losses or irreversibility and their order of importance can be understood.
The use of irreversibility, which is a measure of process imperfection, the optimum operating
conditions can be easily determined. The advantage of exergy analysis based on thermo-
economic optimization is that the different elements of the system could be optimized
independently. The physical exergy component is associated with the work obtainable in
bringing a stream of matter from initial state to a state that is in thermal and mechanical
equilibrium with the environment. Mathematically, physical exergy is expressed as in eq.11
(Bejan et al., 1995).
( ) ( )[ ]ooox ssThhm −−−=Ξ & (11)
Where, '' xΞ is the exergy of the fluid at temperature''T .The terms ''h and ''s are the
enthalpy and entropy of the fluid, whereas, '' oh and '' os are the enthalpy and entropy of the
fluid at environmental temperature'' oT .The exergy balance equations of different components
of the absorption system are given as-
8.3.2.1 Exergy balance at the generator-
=Ξ Gx ( ) ( )[ ] ( ) ( )[ ] ( ) ( )[ ]ooooooooo ssThhmssThhmssThhm −−−−−−−−−−− 333222111 &&& (12)
8.3.2.2 Exergy balance at the absorber-
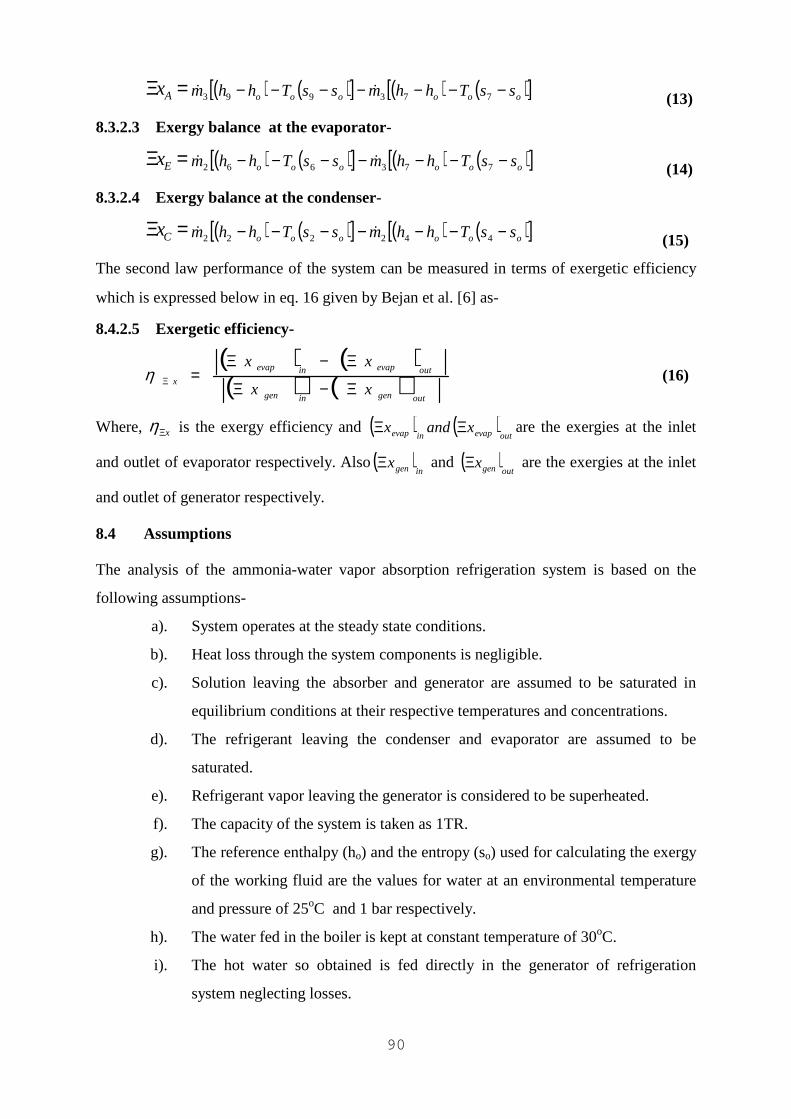
90
=Ξ Ax ( ) ( )[ ] ( ) ( )[ ]oooooo ssThhmssThhm −−−−−−− 773993 && (13)
8.3.2.3 Exergy balance at the evaporator-
=Ξ Ex ( ) ( )[ ] ( ) ( )[ ]oooooo ssThhmssThhm −−−−−−− 773662 && (14)
8.3.2.4 Exergy balance at the condenser-
=Ξ Cx ( ) ( )[ ] ( ) ( )[ ]oooooo ssThhmssThhm −−−−−−− 442222 && (15)
The second law performance of the system can be measured in terms of exergetic efficiency
which is expressed below in eq. 16 given by Bejan et al. [6] as-
8.4.2.5 Exergetic efficiency-
( ) ( )( ) ( )
outgeningen
outevapinevap
xxx
xx
Ξ−Ξ
Ξ−Ξ=Ξη
(16)
Where, xΞη is the exergy efficiency and ( ) ( )outevapinevap xandx ΞΞ are the exergies at the inlet
and outlet of evaporator respectively. Also( )ingenxΞ and ( )
outgenxΞ are the exergies at the inlet
and outlet of generator respectively.
8.4 Assumptions
The analysis of the ammonia-water vapor absorption refrigeration system is based on the
following assumptions-
a). System operates at the steady state conditions.
b). Heat loss through the system components is negligible.
c). Solution leaving the absorber and generator are assumed to be saturated in
equilibrium conditions at their respective temperatures and concentrations.
d). The refrigerant leaving the condenser and evaporator are assumed to be
saturated.
e). Refrigerant vapor leaving the generator is considered to be superheated.
f). The capacity of the system is taken as 1TR.
g). The reference enthalpy (ho) and the entropy (so) used for calculating the exergy
of the working fluid are the values for water at an environmental temperature
and pressure of 25oC and 1 bar respectively.
h). The water fed in the boiler is kept at constant temperature of 30oC.
i). The hot water so obtained is fed directly in the generator of refrigeration
system neglecting losses.
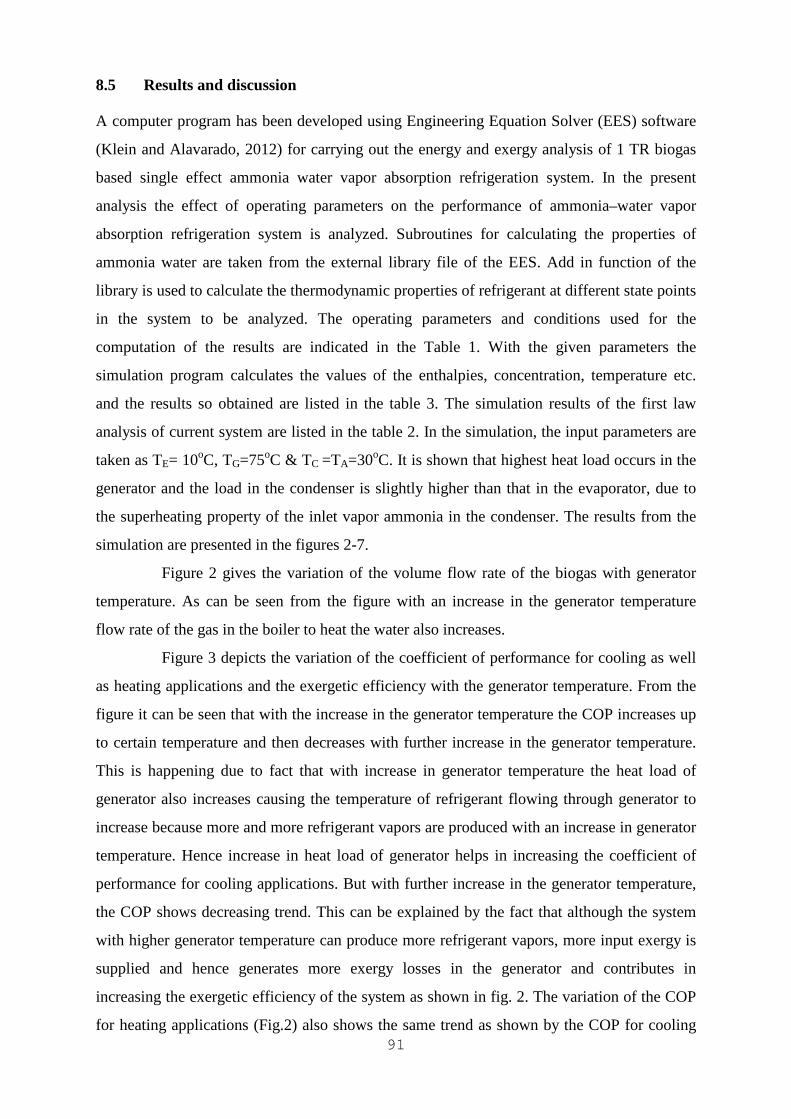
91
8.5 Results and discussion
A computer program has been developed using Engineering Equation Solver (EES) software
(Klein and Alavarado, 2012) for carrying out the energy and exergy analysis of 1 TR biogas
based single effect ammonia water vapor absorption refrigeration system. In the present
analysis the effect of operating parameters on the performance of ammonia–water vapor
absorption refrigeration system is analyzed. Subroutines for calculating the properties of
ammonia water are taken from the external library file of the EES. Add in function of the
library is used to calculate the thermodynamic properties of refrigerant at different state points
in the system to be analyzed. The operating parameters and conditions used for the
computation of the results are indicated in the Table 1. With the given parameters the
simulation program calculates the values of the enthalpies, concentration, temperature etc.
and the results so obtained are listed in the table 3. The simulation results of the first law
analysis of current system are listed in the table 2. In the simulation, the input parameters are
taken as TE= 10oC, TG=75oC & TC =TA=30oC. It is shown that highest heat load occurs in the
generator and the load in the condenser is slightly higher than that in the evaporator, due to
the superheating property of the inlet vapor ammonia in the condenser. The results from the
simulation are presented in the figures 2-7.
Figure 2 gives the variation of the volume flow rate of the biogas with generator
temperature. As can be seen from the figure with an increase in the generator temperature
flow rate of the gas in the boiler to heat the water also increases.
Figure 3 depicts the variation of the coefficient of performance for cooling as well
as heating applications and the exergetic efficiency with the generator temperature. From the
figure it can be seen that with the increase in the generator temperature the COP increases up
to certain temperature and then decreases with further increase in the generator temperature.
This is happening due to fact that with increase in generator temperature the heat load of
generator also increases causing the temperature of refrigerant flowing through generator to
increase because more and more refrigerant vapors are produced with an increase in generator
temperature. Hence increase in heat load of generator helps in increasing the coefficient of
performance for cooling applications. But with further increase in the generator temperature,
the COP shows decreasing trend. This can be explained by the fact that although the system
with higher generator temperature can produce more refrigerant vapors, more input exergy is
supplied and hence generates more exergy losses in the generator and contributes in
increasing the exergetic efficiency of the system as shown in fig. 2. The variation of the COP
for heating applications (Fig.2) also shows the same trend as shown by the COP for cooling
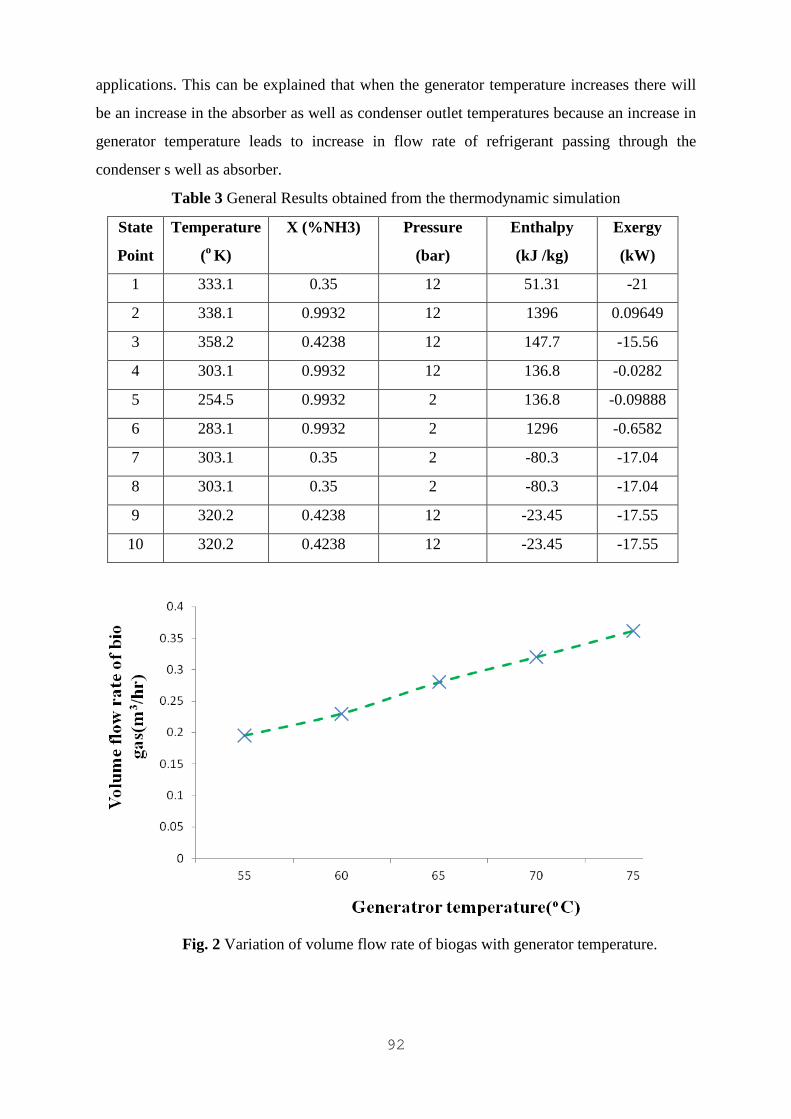
92
applications. This can be explained that when the generator temperature increases there will
be an increase in the absorber as well as condenser outlet temperatures because an increase in
generator temperature leads to increase in flow rate of refrigerant passing through the
condenser s well as absorber.
Table 3 General Results obtained from the thermodynamic simulation
State
Point
Temperature
(o K)
X (%NH3) Pressure
(bar)
Enthalpy
(kJ /kg)
Exergy
(kW)
1 333.1 0.35 12 51.31 -21
2 338.1 0.9932 12 1396 0.09649
3 358.2 0.4238 12 147.7 -15.56
4 303.1 0.9932 12 136.8 -0.0282
5 254.5 0.9932 2 136.8 -0.09888
6 283.1 0.9932 2 1296 -0.6582
7 303.1 0.35 2 -80.3 -17.04
8 303.1 0.35 2 -80.3 -17.04
9 320.2 0.4238 12 -23.45 -17.55
10 320.2 0.4238 12 -23.45 -17.55
Fig. 2 Variation of volume flow rate of biogas with generator temperature.
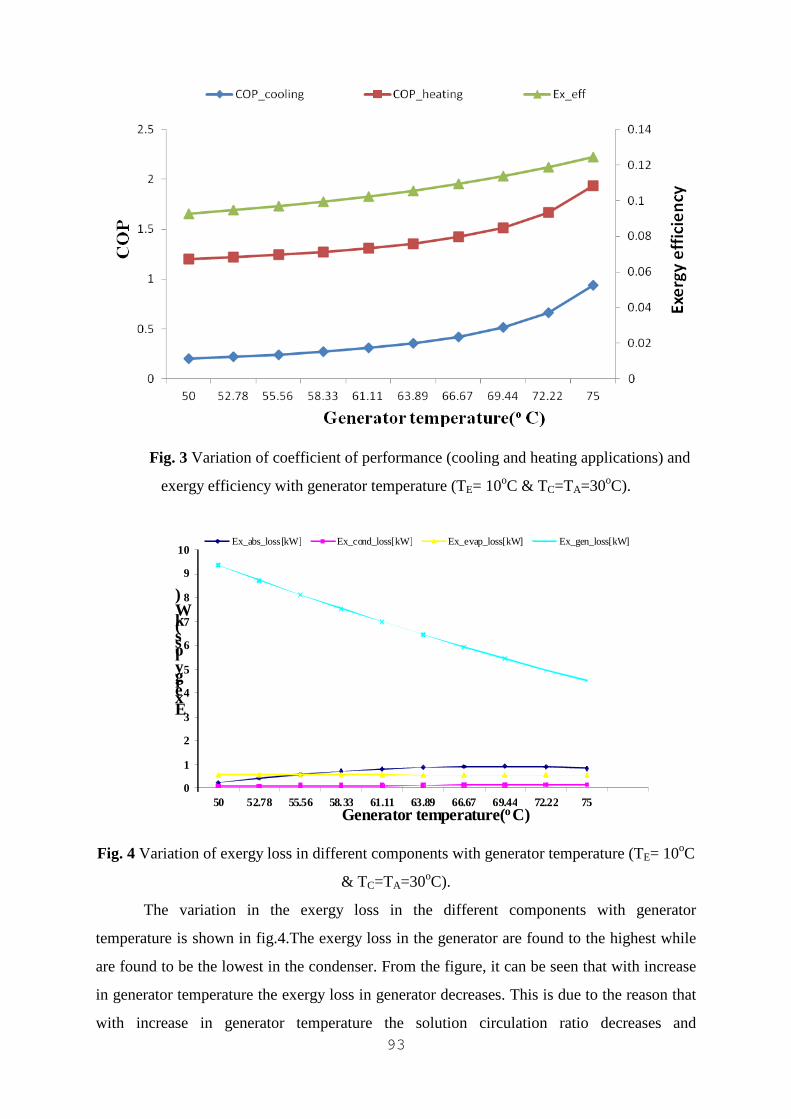
93
Fig. 3 Variation of coefficient of performance (cooling and heating applications) and
exergy efficiency with generator temperature (TE= 10oC & TC=TA=30oC).
Fig. 4 Variation of exergy loss in different components with generator temperature (TE= 10oC
& TC=TA=30oC).
The variation in the exergy loss in the different components with generator
temperature is shown in fig.4.The exergy loss in the generator are found to the highest while
are found to be the lowest in the condenser. From the figure, it can be seen that with increase
in generator temperature the exergy loss in generator decreases. This is due to the reason that
with increase in generator temperature the solution circulation ratio decreases and
0
1
2
3
4
5
6
7
8
9
10
50 52.78 55.56 58.33 61.11 63.89 66.67 69.44 72.22 75
Exergy loss (kW)
Generator temperature(o C)
Ex_abs_loss[kW] Ex_cond_loss[kW] Ex_evap_loss[kW] Ex_gen_loss[kW]
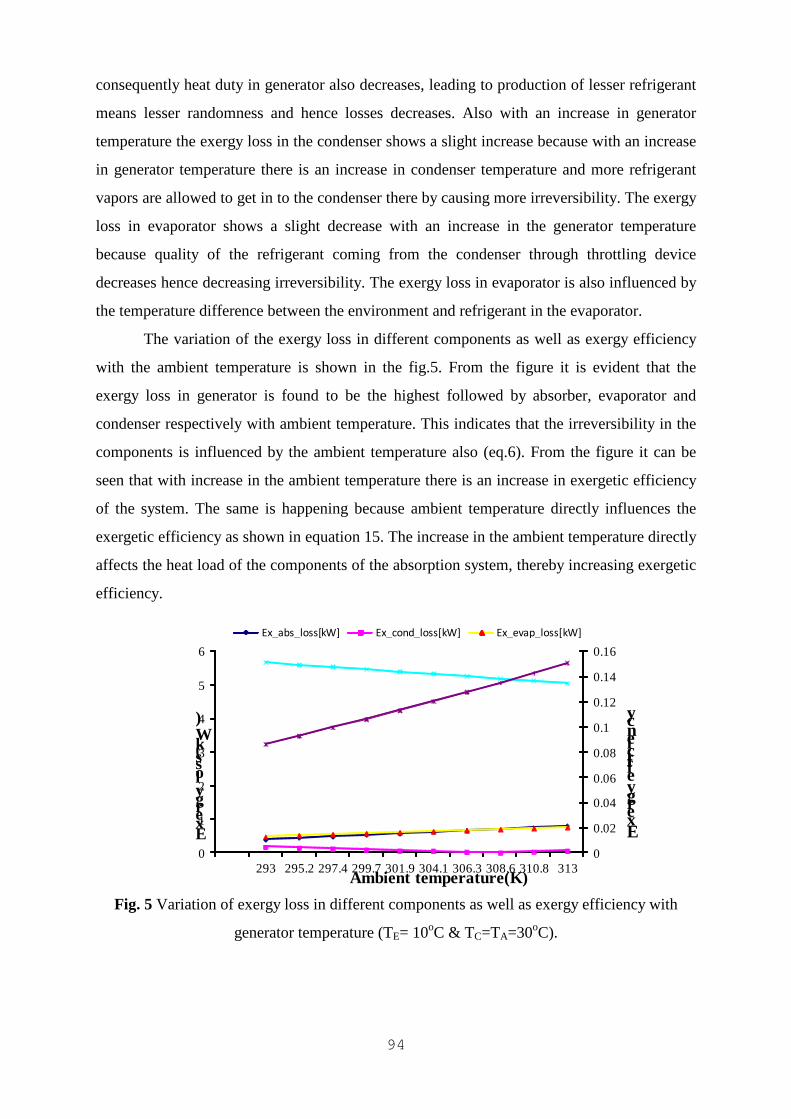
94
consequently heat duty in generator also decreases, leading to production of lesser refrigerant
means lesser randomness and hence losses decreases. Also with an increase in generator
temperature the exergy loss in the condenser shows a slight increase because with an increase
in generator temperature there is an increase in condenser temperature and more refrigerant
vapors are allowed to get in to the condenser there by causing more irreversibility. The exergy
loss in evaporator shows a slight decrease with an increase in the generator temperature
because quality of the refrigerant coming from the condenser through throttling device
decreases hence decreasing irreversibility. The exergy loss in evaporator is also influenced by
the temperature difference between the environment and refrigerant in the evaporator.
The variation of the exergy loss in different components as well as exergy efficiency
with the ambient temperature is shown in the fig.5. From the figure it is evident that the
exergy loss in generator is found to be the highest followed by absorber, evaporator and
condenser respectively with ambient temperature. This indicates that the irreversibility in the
components is influenced by the ambient temperature also (eq.6). From the figure it can be
seen that with increase in the ambient temperature there is an increase in exergetic efficiency
of the system. The same is happening because ambient temperature directly influences the
exergetic efficiency as shown in equation 15. The increase in the ambient temperature directly
affects the heat load of the components of the absorption system, thereby increasing exergetic
efficiency.
Fig. 5 Variation of exergy loss in different components as well as exergy efficiency with
generator temperature (TE= 10oC & TC=TA=30oC).
0
0.02
0.04
0.06
0.08
0.1
0.12
0.14
0.16
0
1
2
3
4
5
6
293 295.2 297.4 299.7 301.9 304.1 306.3 308.6 310.8 313
Exergy efficiency
Exergy loss(kW)
Ambient temperature(K)
Ex_abs_loss[kW] Ex_cond_loss[kW] Ex_evap_loss[kW]
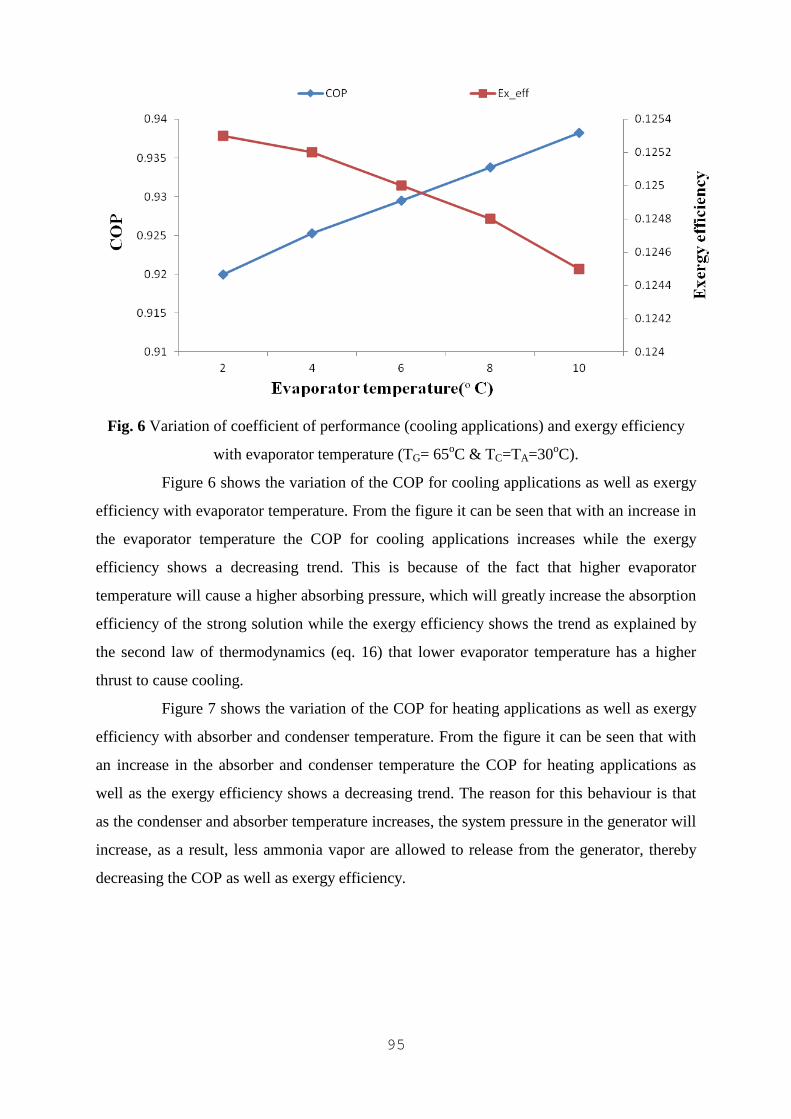
95
Fig. 6 Variation of coefficient of performance (cooling applications) and exergy efficiency
with evaporator temperature (TG= 65oC & TC=TA=30oC).
Figure 6 shows the variation of the COP for cooling applications as well as exergy
efficiency with evaporator temperature. From the figure it can be seen that with an increase in
the evaporator temperature the COP for cooling applications increases while the exergy
efficiency shows a decreasing trend. This is because of the fact that higher evaporator
temperature will cause a higher absorbing pressure, which will greatly increase the absorption
efficiency of the strong solution while the exergy efficiency shows the trend as explained by
the second law of thermodynamics (eq. 16) that lower evaporator temperature has a higher
thrust to cause cooling.
Figure 7 shows the variation of the COP for heating applications as well as exergy
efficiency with absorber and condenser temperature. From the figure it can be seen that with
an increase in the absorber and condenser temperature the COP for heating applications as
well as the exergy efficiency shows a decreasing trend. The reason for this behaviour is that
as the condenser and absorber temperature increases, the system pressure in the generator will
increase, as a result, less ammonia vapor are allowed to release from the generator, thereby
decreasing the COP as well as exergy efficiency.

96
Fig. 7 Variation of coefficient of performance (heating applications) and exergy efficiency
with condenser as well as absorber temperature (TG= 65oC & TE = 10oC).
8.6 Conclusion
A computer program using EES has been developed to predict the performance of 1 TR
biogas based single effect ammonia water vapor absorption system. The thermodynamic
analysis of absorption system using ammonia water as working fluid has been carried out
using the concept of energy as well as exergy analysis. The hot water has been used as energy
source to run the vapor absorption system. The exergy analysis shows that the operating
parameters affect the system performance. The cooling as well as heating coefficient of
performance along with exergetic efficiency has been calculated. The effect of the ambient
temperature, evaporator temperature and absorber as well as condenser temperature on the
performance parameters has also been analyzed.
• Result shows that as expected with an increase in generator temperature, the COP
(cooling and heating applications) as well as exergetic efficiency also increases.
• The cooling as well as heating coefficient of performance lies in the range of 0.20-
0.93 and 1.20-1.93 respectively for same variation in generator temperature ranging
from 50-75oC. The exergetic efficiency of the system lies in the range of 0.092-
0.1275.
• The irreversibility rate in generator is found to be the highest while it is found to be
the lowest in case of condenser. The exergy losses in absorber are more in
comparison to condenser which is the actual case.
97
• It is also established that with an increase in the evaporator temperature the COP
increases where as exergy efficiency decreases for cooling applications while with the
increase in absorber as well as condenser temperature the COP as well as exergy
efficiency for heating applications decreases.
• It is also established that the ambient temperature also affects the exergy loss in the
components. The exergy loss in generator as well as condenser shows a decrease
while the exergy loss in evaporator as well absorber shows an increase with the
increase in the ambient temperature.
• The results also indicate that with an increase in the generator temperature the
consumption of the biogas also increases in the boiler.
• It is also established that there should be proper matching of heat source and
generator temperature as well as evaporator and space to be cooled so that more
efficiency from the system can be drawn out. Also there is a need to improve the
effectiveness of solution heat exchanger so that more heat that circulates in the
system which can be utilized for the improvement of the performance of the system.
Acknowledgement
The financial assistance under Project No. 22/541/10-EMR-II from the Council for Scientific
and Industrial Research (CSIR), New Delhi, India for this study is highly appreciated.
References
1. Byongjoo Kim and Jongil Park (2007) Dynamic simulation of a single – effect
ammonia water absorption chiller. Int. J. Refrig., 30:535-545.
2. Jeffrey M. Gordon and Kim C. Ng. Cool (2000) Thermodynamics: Engineering and
Physics of Predictive, Diagnostic and Optimization methods for cooling systems.
Cambridge International Science Publishing.
3. Talbi M.M. and Agnew B. (2000) Exergy analysis: An absorption refrigerator using
lithium Bromide and water as the Working fluids. App. Therm. Engg., 20: 619-630.
4. Lee S.F. and Sherif S. A. (2001) ASHRAE Trans., 664-673.
5. Kotas T. J. (1985) The exergy method of thermal plant analysis. Butterworth, London.
6. Bejan A., Tsatsaronis G. and Moran M. (1995) Thermal Design and Optimization.
Wiley, New York, USA.
7. Critoph R.E. (1999) Rapid cycling solar/biomass powered adsorption refrigeration
system. Renewable Energy, 16(1-4):673-678.
98
8. Mohammad Omar Abdullah, Ivy Ai Wei Tan and Leo Sing Lim (2011) Automobile
adsorption air-conditioning system using oil palm biomass-based activated carbon: A
Review. Renew. and Sust. Energy Rev., 15(4):2061-2072.
9. Altamush Siddiqui M., Prasad M. and Sahay B. (1986) Economic evaluation of biogas
for optimizing generator temperature for a vapor absorption system. Energy Convers.
and Mgmt., 26(1):83-89.
10. Lian Z.T., Chua K.J. and Chou S.K. (2010) A thermo-economic analysis of Biomass
for trigeneration. App. Energy, 87(1): 84-95.
11. Gañán Gómez J., Miranda A., González J.F., Turegano J.P. and Román S. (2006)
Viability study of cold generation from biomass in an agrarian exploitation. Fuel Proc.
Tech., 87(2):129-133.
12. Borde I. and Jelinek M. (1987) Development of absorption refrigeration units for cold
storage of agricultural products. Int. J. Refrig., 10 (1):53-56.
13. Pilatowsky I., Romero R.J., Isaza C.A., Gamboa S.A., Rivera W, Sebastian P.J. and
Moreira J. (2007) Simulation of an air conditioning absorption refrigeration system in
a co-generation process combining a proton exchange membrane fuel cell. Int. J. Hyd.
Energy, 32(15):3174-3182.
14. Horuz I. and Callander T.M.S. (2004) Experimental investigation of a vapor
absorption refrigeration system. Int. J. Refrig., 27(1):10-16.
15. ASHRAE (1997). American Society of Heating, Refrigeration and Air-conditioning
Engineers. Fundamentals Handbook Inc., SI edition.
16. Klein S.A. and Alvarado F. (2012) Engineering Equation Solver, Version 9.083. F-
Chart Software, Middleton, WI.
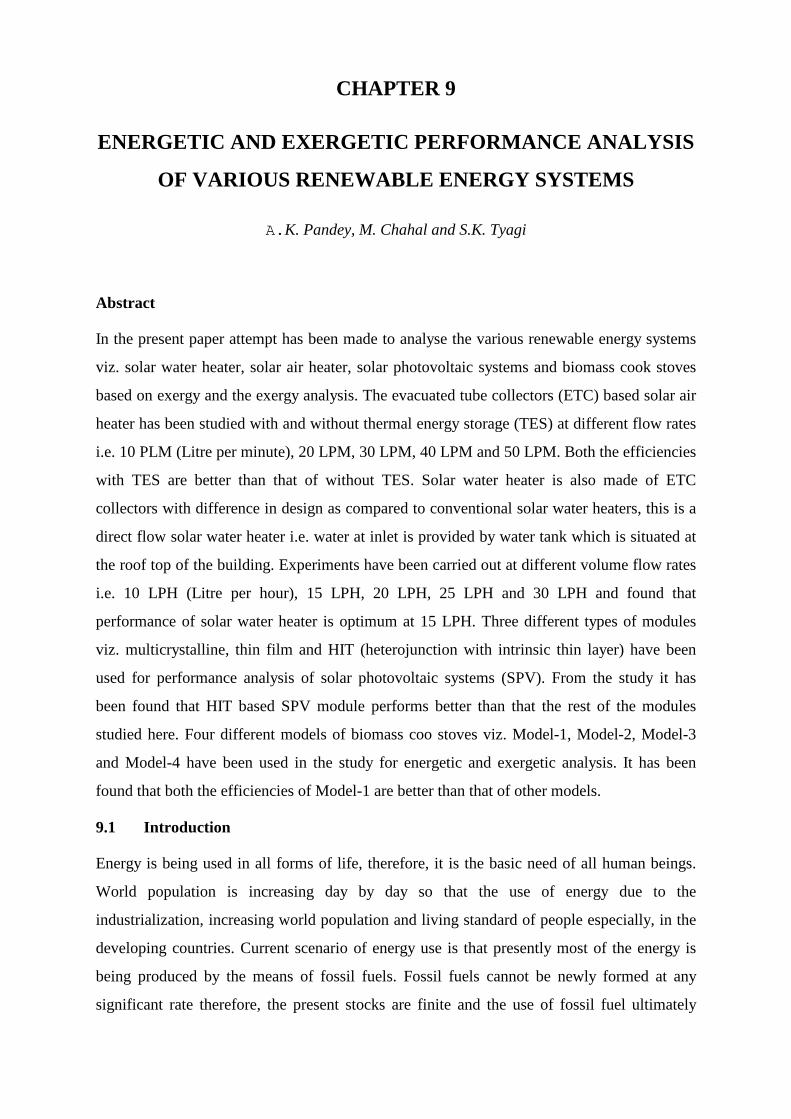
99
CHAPTER 9
ENERGETIC AND EXERGETIC PERFORMANCE ANALYSIS
OF VARIOUS RENEWABLE ENERGY SYSTEMS
A.K. Pandey, M. Chahal and S.K. Tyagi
Abstract
In the present paper attempt has been made to analyse the various renewable energy systems
viz. solar water heater, solar air heater, solar photovoltaic systems and biomass cook stoves
based on exergy and the exergy analysis. The evacuated tube collectors (ETC) based solar air
heater has been studied with and without thermal energy storage (TES) at different flow rates
i.e. 10 PLM (Litre per minute), 20 LPM, 30 LPM, 40 LPM and 50 LPM. Both the efficiencies
with TES are better than that of without TES. Solar water heater is also made of ETC
collectors with difference in design as compared to conventional solar water heaters, this is a
direct flow solar water heater i.e. water at inlet is provided by water tank which is situated at
the roof top of the building. Experiments have been carried out at different volume flow rates
i.e. 10 LPH (Litre per hour), 15 LPH, 20 LPH, 25 LPH and 30 LPH and found that
performance of solar water heater is optimum at 15 LPH. Three different types of modules
viz. multicrystalline, thin film and HIT (heterojunction with intrinsic thin layer) have been
used for performance analysis of solar photovoltaic systems (SPV). From the study it has
been found that HIT based SPV module performs better than that the rest of the modules
studied here. Four different models of biomass coo stoves viz. Model-1, Model-2, Model-3
and Model-4 have been used in the study for energetic and exergetic analysis. It has been
found that both the efficiencies of Model-1 are better than that of other models.
9.1 Introduction
Energy is being used in all forms of life, therefore, it is the basic need of all human beings.
World population is increasing day by day so that the use of energy due to the
industrialization, increasing world population and living standard of people especially, in the
developing countries. Current scenario of energy use is that presently most of the energy is
being produced by the means of fossil fuels. Fossil fuels cannot be newly formed at any
significant rate therefore, the present stocks are finite and the use of fossil fuel ultimately
100
pollutes the environment. Development of any country must be sustainable which means that
using a technology, which is socially, economically and environmentally sound. Renewable
energy can be formed at a significant rate, therefore, renewable energies should be used for
the sustainable development of any country. However, the efficiency of renewable energy
systems are low therefore it is necessary to work on the improvement of efficiency of such
systems. Energy is based on the first law of thermodynamics i.e. the law of conservation of
energy while exergy, is based on the second law of thermodynamics which deals with the
quality of energy rather than the quantity. Exergy considers the losses in the systems while
analysing unlike the energy (Dincer and Rosen, 2007).
Solar radiation emitted by the sun can be utilised for different applications and by two
ways, by heating the medium using solar collectors for low/medium temperature heating
applications such as solar dryer and solar water heating and by converting directly into
electricity using solar photovoltaic (SPV) modules. The use of solar energy for drying the end
products is very important application for their safe storage to maintain the quality and
nutrient values of the product. Normally thermal storage systems are employed to store
thermal energy, which includes sensible heat storage, chemical energy storage and latent heat
storage. The solar drier is an energy efficient option in the drying processes (Pangavhane and
Sawhney 2002) and the use of forced convection solar driers seems to be an advantage as
compared to the traditional methods because it improves the quality of the product
considerably (Midilli, 2001, Shanmugam and Natarajan, 2007, Hawlader et al., 2003).
Prommas et al. (2010) worked on the energy and exergy analyses of drying process in porous
media using hot air. From the study it was found that as the drying time increases, the exergy
efficiency of the drying chamber also increases which is due to the fact that as the drying time
increases the available energy in the drying chamber also increases. They also presented the
effect of the other particle size on the drying time as well as the exergy efficiency of the
drying system.
Solar energy can also be utilized for heating the water mostly three types of solar
collectors based solar water heaters (SWH) are available in the market viz. flat plate collector
(FPC), evacuated tube collector (ETC), compound parabolic collectors (CPC). Dharuman et
al. (2006), designed, fabricated and carried out the experimental study of water heating device
under various operating conditions. Rakesh and Rosen (2010) worked on the thermal
performance evaluation of an integrated solar water heater with a corrugated absorber surface.
Ceylan (2012) studied the temperature controlled solar water heater (TCSWH) based on
101
energy and exergy analysis. The highest amount of water had was found to be 108 kg by
setting the control device at 40 ºC. The average energetic efficiency was found to be 65% for
the TCSWH and 60% for the thermosiphon system respectively and hence, the TCSWH was
found to be better than that of the thermosiphon system for the same set of operating
parameters.
In other way, solar can be utilized directly by converting it into the electricity using
solar photovoltaic (SPV) modules. Sahin et al. (2007) worked on the thermodynamic
characteristics of the solar photovoltaic (PV) cells using exergy analysis. They found that the
energy efficiency was varying between 7-12% during the day while, the exergy efficiency was
found to be varying between 2-8%. Vats and Tiwari (2012) worked on the performance study
of a building integrated semitransparent photovoltaic thermal (BISPVT) system integrated on
the roof of a room based on energy and exergy analysis. Six different types of SPV modules
viz. monocrstallne Silicon (m-Si), polycrystalline Silicon (p-Si), amorphous silicon (a-Si),
Cd-Te, CIGS and heterojunction with intrinsic thin layer (HIT) have been used for
comparative performance evaluation. However, maximum annual thermal energy produced
by a-Si was found to be 464 kW h and it was also found that to be suitable for space heating
applications while the efficiency was found to be 16.0% for HIT and 6.0% for a-Si
respectively.
Solar cookers use solar energy as a fuel which is intermittent in nature and available
only in day time, so it is important to explore other renewable energies such as biomass for
cooking applications during the late evening hours and/or night time. Majority of households
in rural areas of developing countries like India still use biomass as fuel for cooking and
heating purposes because the percentage of households using LPG is mere 9 % (TERI, 2011).
Coal or biomass like wood, crop residues, cattle dung and charcoal for their cooking and
heating needs is used by almost half of the world population and about 90% of rural
population in the developing nation like India. However, biomass is replaced by the gaseous
fuels like LPG and natural gas in developed countries and most urban homes in the
developing world (TERI, 1998). Saidur et al. (2012) worked on the literature survey on the
exergy analysis of various biomass viz. herbaceous and agricultural biomass, woody biomass,
contaminated biomass and industrial biomass, aquatic biomass. In their study they found that
the gasification, methanation and CO2 removal were the main sources of exergy losses.

102
Present paper investigates the energy and exergy analysis of different renewable
energy systems viz. ETC based solar air heater, ETC based solar water heater, solar
photovoltaic systems and biomass cookstoves.
9.2 Materials and Methods
Materials and methods used in the present study is given as below:
Case I- Solar Air Heater
• A total of 12 ETC collector tubes (four for PCM, four for hytherm oil and four
without TES individually) have been arranged in the series.
• The copper tube inserted inside the ETC tube
• Glass wool for insulation
• Rotameter for the measurement of mass flow rate
• Thermocouples for the measurement of temperatures at different state of points
• Digital temperature displayer for displaying temperatures
• Pyranometer for the measurement of solar radiation
Case II- Solar Water Heater
• A total of 9 ETC collector tubes
• The copper tube inserted inside the ETC tube and inside water tank
• Water tank for collecting hot water
• PVC pipes
• Thermocouples
• Solarimeter
Case III- Solar Photovoltaic System
Weather station includes a meteorological measurement system and data acquisition
system. Meteorological measurement system composed of following equipments.
• Pyranometers for the measurement of solar radiation
• Spectroradiometers
• Wind monitoring for the measurement of wind speed
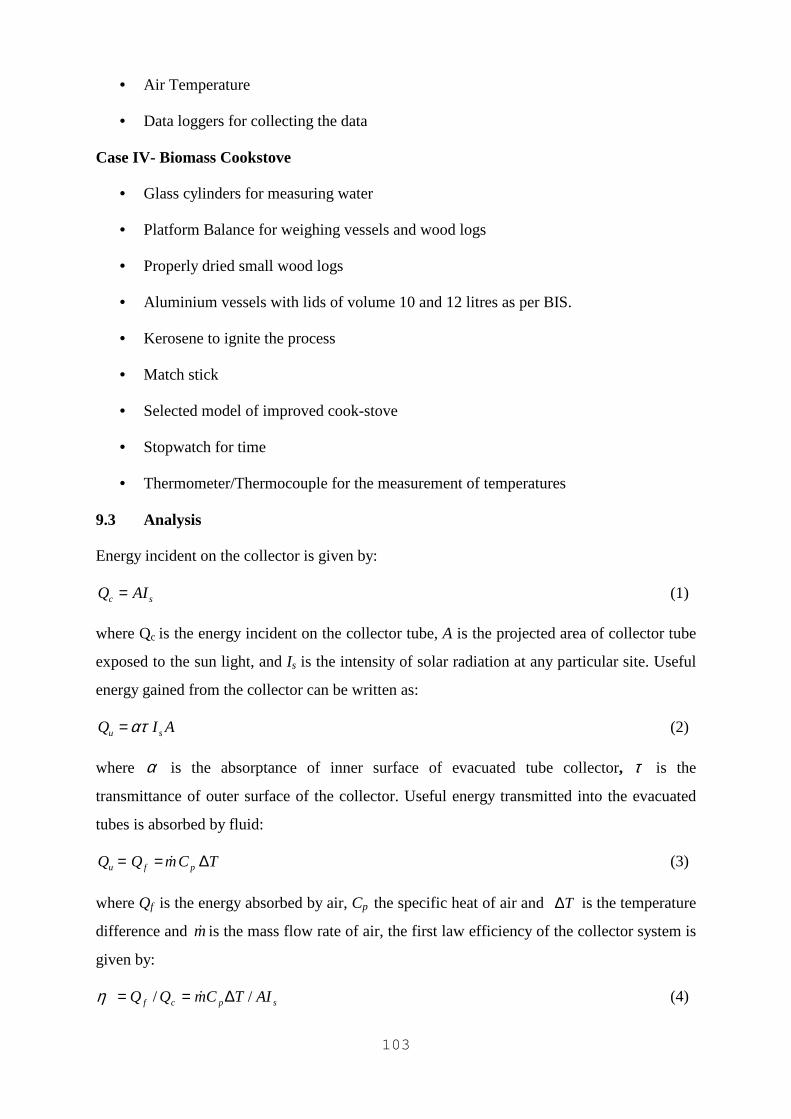
103
• Air Temperature
• Data loggers for collecting the data
Case IV- Biomass Cookstove
• Glass cylinders for measuring water
• Platform Balance for weighing vessels and wood logs
• Properly dried small wood logs
• Aluminium vessels with lids of volume 10 and 12 litres as per BIS.
• Kerosene to ignite the process
• Match stick
• Selected model of improved cook-stove
• Stopwatch for time
• Thermometer/Thermocouple for the measurement of temperatures
9.3 Analysis
Energy incident on the collector is given by:
sc AIQ = (1)
where Qc is the energy incident on the collector tube, A is the projected area of collector tube
exposed to the sun light, and Is is the intensity of solar radiation at any particular site. Useful
energy gained from the collector can be written as:
AIQ su ατ= (2)
where α is the absorptance of inner surface of evacuated tube collector, τ is the
transmittance of outer surface of the collector. Useful energy transmitted into the evacuated
tubes is absorbed by fluid:
TCmQQ pfu ∆== & (3)
where Qf is the energy absorbed by air, Cp the specific heat of air and T∆ is the temperature
difference and m& is the mass flow rate of air, the first law efficiency of the collector system is
given by:
spcf AITCmQQ // ∆== &η (4)
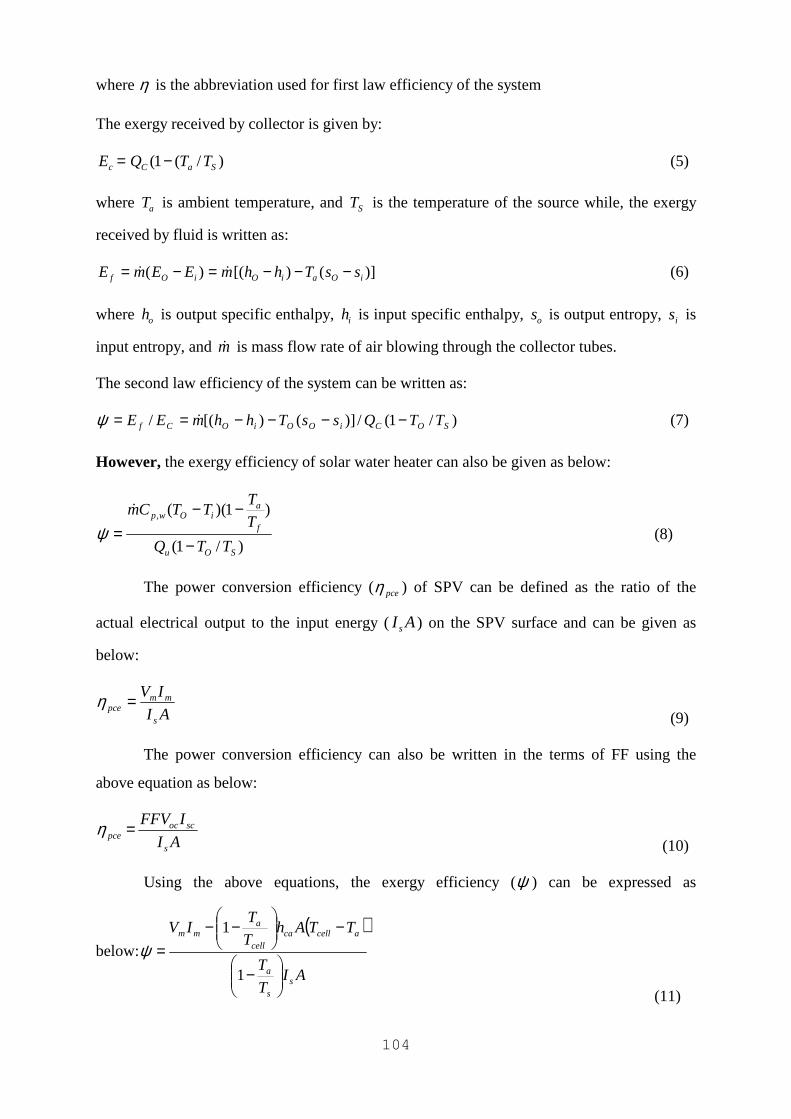
104
where η is the abbreviation used for first law efficiency of the system
The exergy received by collector is given by:
)/(1( SaCc TTQE −= (5)
where aT is ambient temperature, and ST is the temperature of the source while, the exergy
received by fluid is written as:
)]()[()( iOaiOiOf ssThhmEEmE −−−=−= && (6)
where oh is output specific enthalpy, ih is input specific enthalpy, os is output entropy, is is
input entropy, and m& is mass flow rate of air blowing through the collector tubes.
The second law efficiency of the system can be written as:
)/1(/)]()[(/ SOCiOOiOCf TTQssThhmEE −−−−== &ψ (7)
However, the exergy efficiency of solar water heater can also be given as below:
)/1(
)1)((,
SOu
f
aiOwp
TTQ
T
TTTCm
−
−−=
&
ψ (8)
The power conversion efficiency (pceη ) of SPV can be defined as the ratio of the
actual electrical output to the input energy (AI s ) on the SPV surface and can be given as
below:
AI
IV
s
mmpce =η
(9)
The power conversion efficiency can also be written in the terms of FF using the
above equation as below:
AI
IFFV
s
scocpce =η
(10)
Using the above equations, the exergy efficiency (ψ ) can be expressed as
below:
( )
AIT
T
TTAhT
TIV
ss
a
acellcacell
amm
−
−
−−
=1
1
ψ
(11)
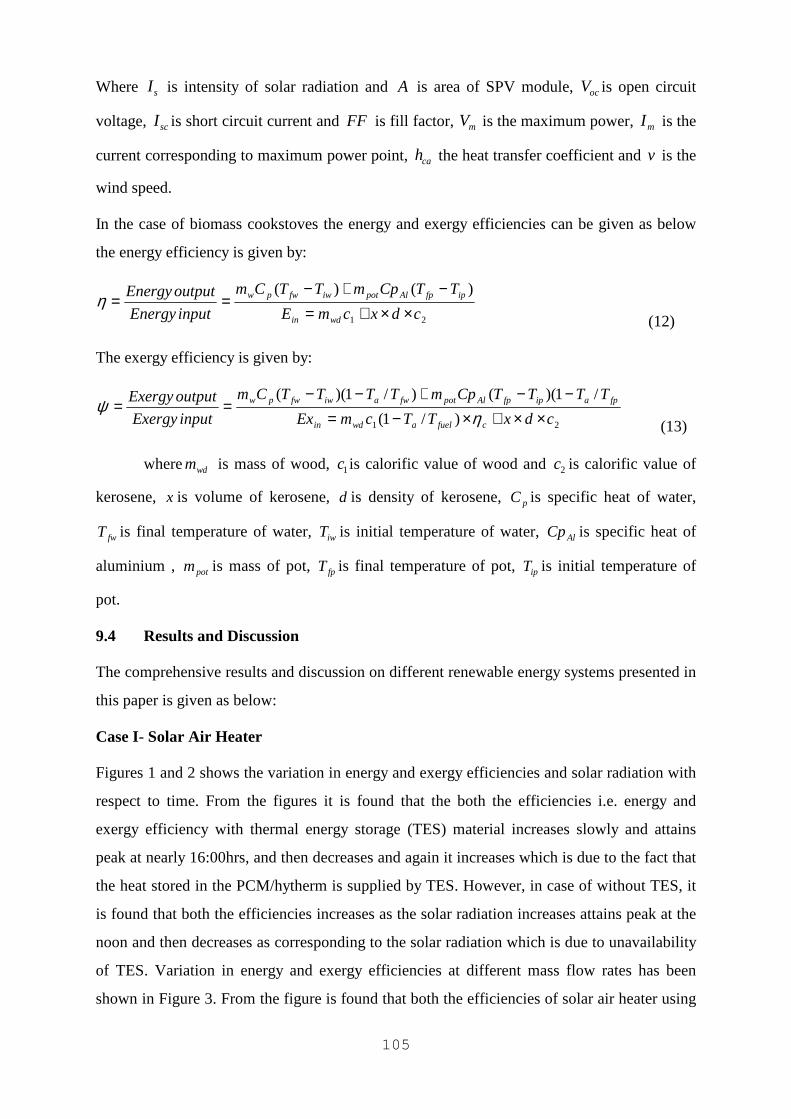
105
Where sI is intensity of solar radiation and A is area of SPV module, ocV is open circuit
voltage, scI is short circuit current and FF is fill factor, mV is the maximum power, mI is the
current corresponding to maximum power point, cah the heat transfer coefficient and v is the
wind speed.
In the case of biomass cookstoves the energy and exergy efficiencies can be given as below
the energy efficiency is given by:
21
)()(
cdxcmE
TTCpmTTCm
inputEnergy
outputEnergy
wdin
ipfpAlpotiwfwpw
××+=−+−
==η (12)
The exergy efficiency is given by:
21 )/1(
/1)(()/1)((
cdxTTcmEx
TTTTCpmTTTTCm
inputExergy
outputExergy
cfuelawdin
fpaipfpAlpotfwaiwfwpw
××+×−=−−+−−
==η
ψ (13)
where wdm is mass of wood, 1c is calorific value of wood and 2c is calorific value of
kerosene, x is volume of kerosene, d is density of kerosene, pC is specific heat of water,
fwT is final temperature of water, iwT is initial temperature of water, AlCp is specific heat of
aluminium , potm is mass of pot, fpT is final temperature of pot, ipT is initial temperature of
pot.
9.4 Results and Discussion
The comprehensive results and discussion on different renewable energy systems presented in
this paper is given as below:
Case I- Solar Air Heater
Figures 1 and 2 shows the variation in energy and exergy efficiencies and solar radiation with
respect to time. From the figures it is found that the both the efficiencies i.e. energy and
exergy efficiency with thermal energy storage (TES) material increases slowly and attains
peak at nearly 16:00hrs, and then decreases and again it increases which is due to the fact that
the heat stored in the PCM/hytherm is supplied by TES. However, in case of without TES, it
is found that both the efficiencies increases as the solar radiation increases attains peak at the
noon and then decreases as corresponding to the solar radiation which is due to unavailability
of TES. Variation in energy and exergy efficiencies at different mass flow rates has been
shown in Figure 3. From the figure is found that both the efficiencies of solar air heater using
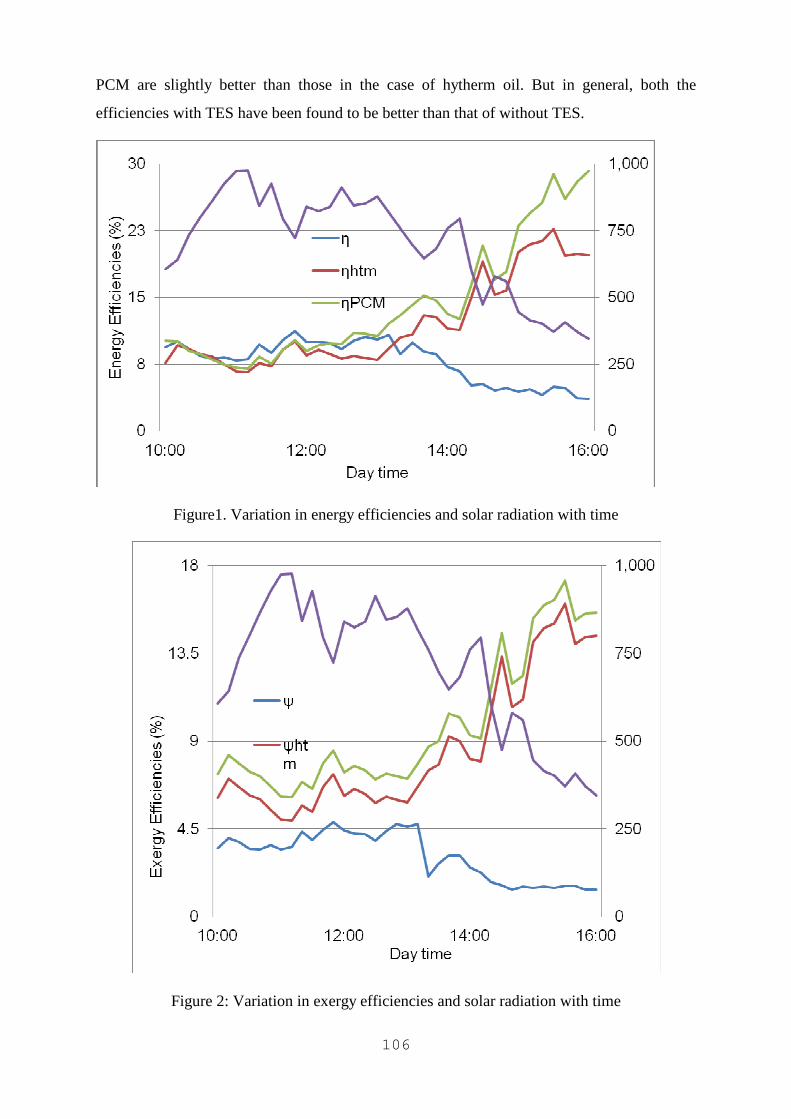
106
PCM are slightly better than those in the case of hytherm oil. But in general, both the
efficiencies with TES have been found to be better than that of without TES.
Figure1. Variation in energy efficiencies and solar radiation with time
Figure 2: Variation in exergy efficiencies and solar radiation with time
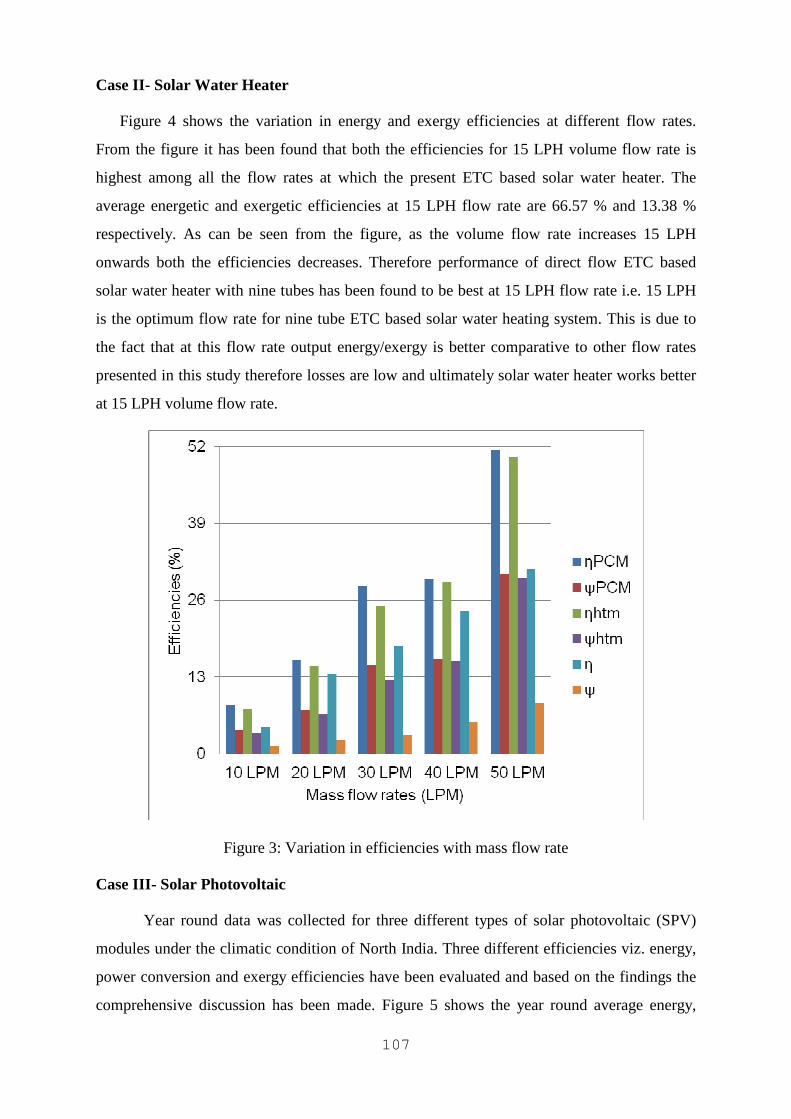
107
Case II- Solar Water Heater
Figure 4 shows the variation in energy and exergy efficiencies at different flow rates.
From the figure it has been found that both the efficiencies for 15 LPH volume flow rate is
highest among all the flow rates at which the present ETC based solar water heater. The
average energetic and exergetic efficiencies at 15 LPH flow rate are 66.57 % and 13.38 %
respectively. As can be seen from the figure, as the volume flow rate increases 15 LPH
onwards both the efficiencies decreases. Therefore performance of direct flow ETC based
solar water heater with nine tubes has been found to be best at 15 LPH flow rate i.e. 15 LPH
is the optimum flow rate for nine tube ETC based solar water heating system. This is due to
the fact that at this flow rate output energy/exergy is better comparative to other flow rates
presented in this study therefore losses are low and ultimately solar water heater works better
at 15 LPH volume flow rate.
Figure 3: Variation in efficiencies with mass flow rate
Case III- Solar Photovoltaic
Year round data was collected for three different types of solar photovoltaic (SPV)
modules under the climatic condition of North India. Three different efficiencies viz. energy,
power conversion and exergy efficiencies have been evaluated and based on the findings the
comprehensive discussion has been made. Figure 5 shows the year round average energy,
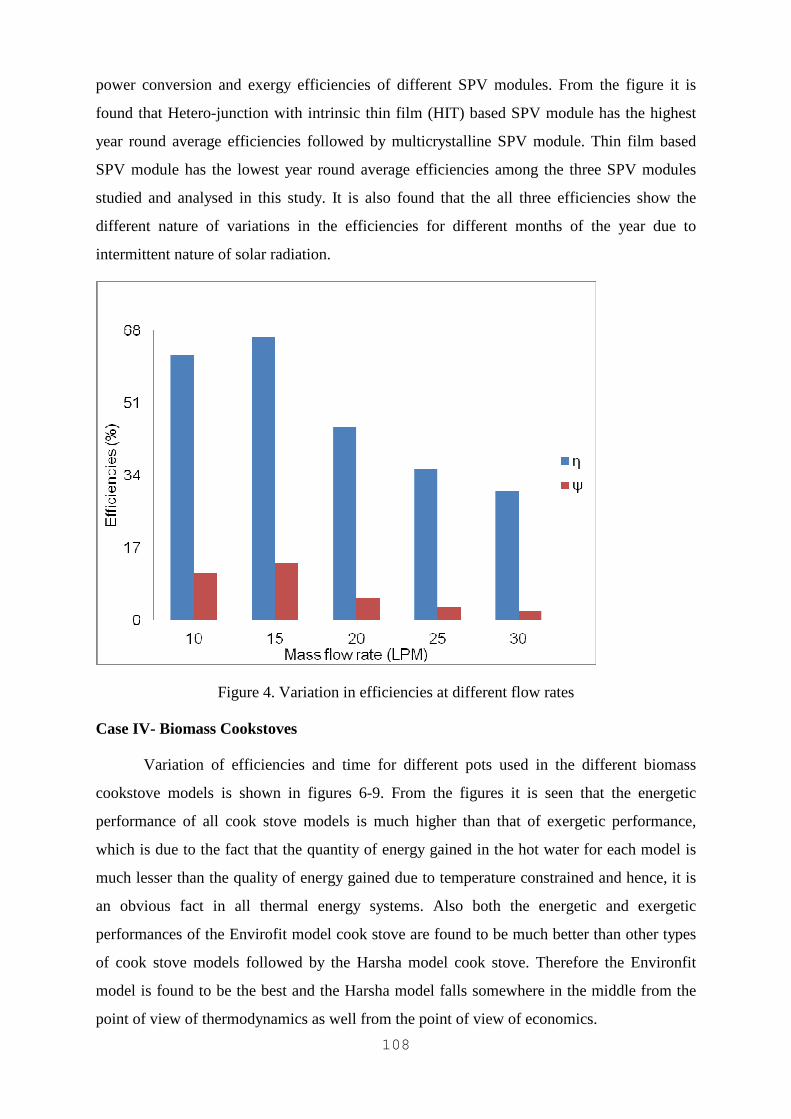
108
power conversion and exergy efficiencies of different SPV modules. From the figure it is
found that Hetero-junction with intrinsic thin film (HIT) based SPV module has the highest
year round average efficiencies followed by multicrystalline SPV module. Thin film based
SPV module has the lowest year round average efficiencies among the three SPV modules
studied and analysed in this study. It is also found that the all three efficiencies show the
different nature of variations in the efficiencies for different months of the year due to
intermittent nature of solar radiation.
Figure 4. Variation in efficiencies at different flow rates
Case IV- Biomass Cookstoves
Variation of efficiencies and time for different pots used in the different biomass
cookstove models is shown in figures 6-9. From the figures it is seen that the energetic
performance of all cook stove models is much higher than that of exergetic performance,
which is due to the fact that the quantity of energy gained in the hot water for each model is
much lesser than the quality of energy gained due to temperature constrained and hence, it is
an obvious fact in all thermal energy systems. Also both the energetic and exergetic
performances of the Envirofit model cook stove are found to be much better than other types
of cook stove models followed by the Harsha model cook stove. Therefore the Environfit
model is found to be the best and the Harsha model falls somewhere in the middle from the
point of view of thermodynamics as well from the point of view of economics.
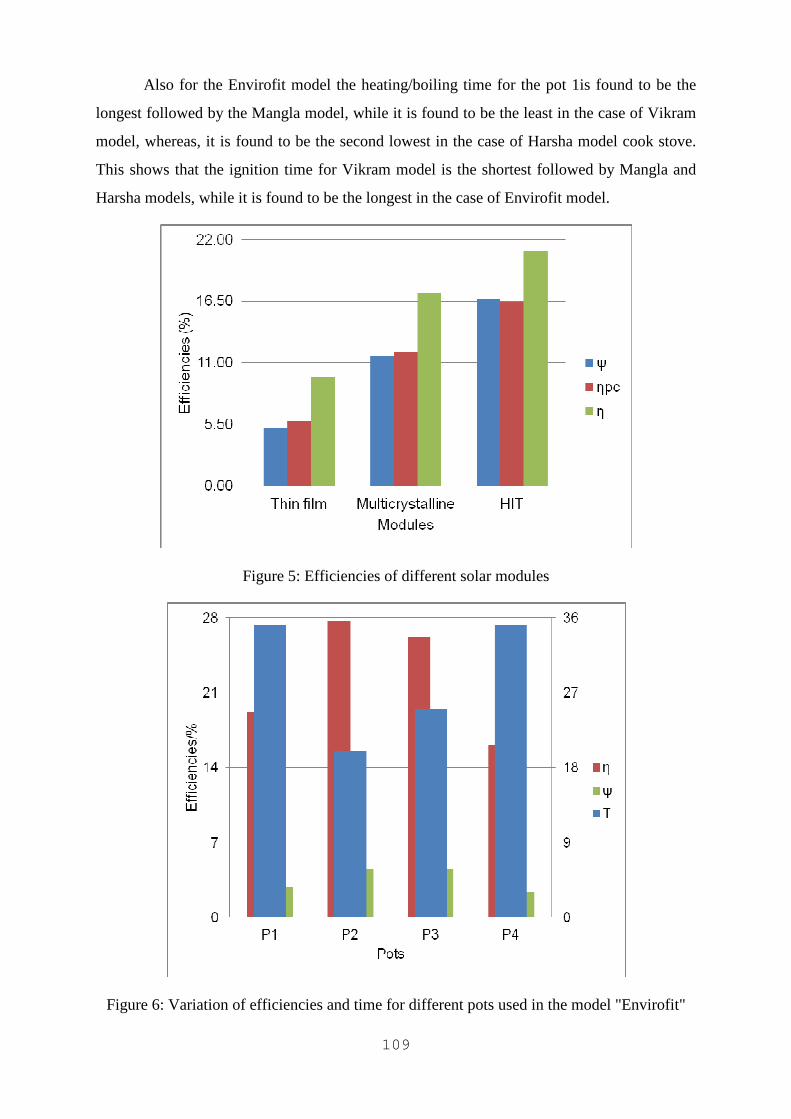
109
Also for the Envirofit model the heating/boiling time for the pot 1is found to be the
longest followed by the Mangla model, while it is found to be the least in the case of Vikram
model, whereas, it is found to be the second lowest in the case of Harsha model cook stove.
This shows that the ignition time for Vikram model is the shortest followed by Mangla and
Harsha models, while it is found to be the longest in the case of Envirofit model.
Figure 5: Efficiencies of different solar modules
Figure 6: Variation of efficiencies and time for different pots used in the model "Envirofit"
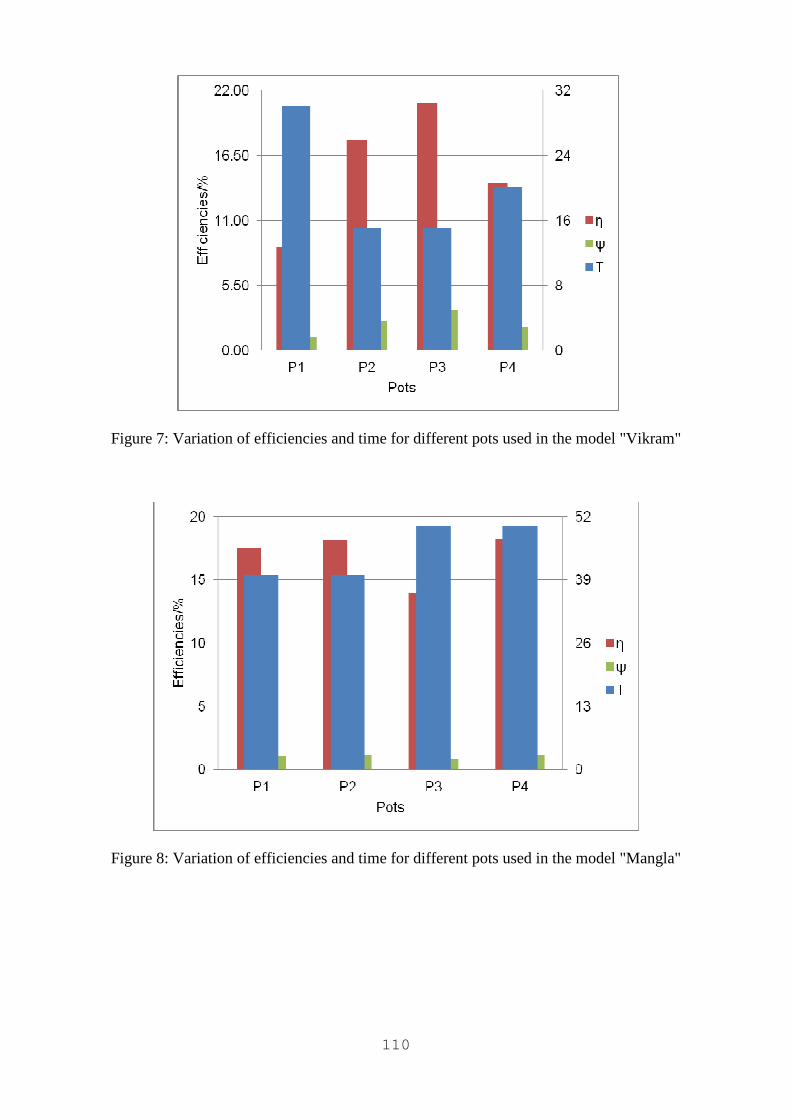
110
Figure 7: Variation of efficiencies and time for different pots used in the model "Vikram"
Figure 8: Variation of efficiencies and time for different pots used in the model "Mangla"
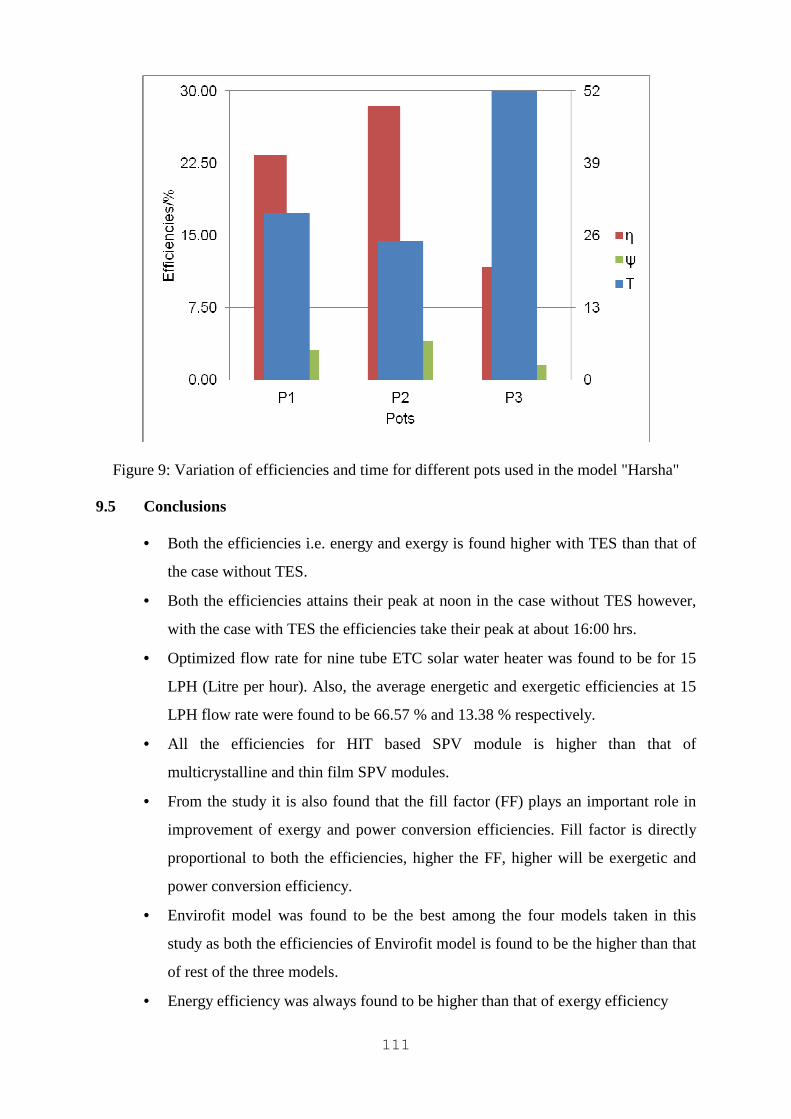
111
Figure 9: Variation of efficiencies and time for different pots used in the model "Harsha"
9.5 Conclusions
• Both the efficiencies i.e. energy and exergy is found higher with TES than that of
the case without TES.
• Both the efficiencies attains their peak at noon in the case without TES however,
with the case with TES the efficiencies take their peak at about 16:00 hrs.
• Optimized flow rate for nine tube ETC solar water heater was found to be for 15
LPH (Litre per hour). Also, the average energetic and exergetic efficiencies at 15
LPH flow rate were found to be 66.57 % and 13.38 % respectively.
• All the efficiencies for HIT based SPV module is higher than that of
multicrystalline and thin film SPV modules.
• From the study it is also found that the fill factor (FF) plays an important role in
improvement of exergy and power conversion efficiencies. Fill factor is directly
proportional to both the efficiencies, higher the FF, higher will be exergetic and
power conversion efficiency.
• Envirofit model was found to be the best among the four models taken in this
study as both the efficiencies of Envirofit model is found to be the higher than that
of rest of the three models.
• Energy efficiency was always found to be higher than that of exergy efficiency
112
References
1. Ceylan I. (2012) Energy and exergy analyses of a temperature controlled solar water
heater. Energy and Build., 47:630–35.
2. Dharuman C., Arakeri J.H., Srinivasan K. (2006) Performance evaluation of an
integrated solar water heater as an option for building energy conservation. Energy
and Build., 38:214–219.
3. Dincer I., Rosen M.A. (2007) Exergy, energy, environment and sustainable
development. Elsevier.
4. Hawlader M.N.A., Uddin M.S., Khin M.M. (2003) Microencapsulated PCM thermal
energy storage system. Appl Energy., 74:195-202.
5. Midilli A. (2001) Determination of pistachio drying behavior and conditions in a solar
drying system. Int J of Energy Res., 25:715-725.
6. Pangavhane D.R., Sawhney R.L. (2002) Review of research and development work on
solar driers for grape drying. Energy Convers & Manag., 43:45–61.
7. Prommas R., Rattanadecho P., Cholaseuk D. (2010) Energy and exergy analyses in
drying process of porous media using hot air. Int Comm in Heat and Mass Transf.,
37:372–78.
8. Rakesh K., Rosen M.A. (2010) Thermal performance of integrated collector storage
solar water heater with corrugated absorber surface. Appl Therm Eng., 30:1764–1768.
9. Saidur R., BoroumandJazi G., Mekhilef S., Mohammed H.A. (2012) A review on
exergy analysis of biomass based fuels. Renew and Sustain Energy Rev., 16(2):1217-
22.
10. Sahin A.D., Dincer I., Rosen M.A. (2007) Thermodynamic analysis of solar
photovoltaic cell systems. Sol Energy Mater & Sol Cells., 91:153–59.
11. Shanmugam V., Natarajan E. (2007) Experimental study of regenerative desiccant
integrated solar dryer with and without reflective mirror. Appl Therm Eng., 27:1543-
1551.
12. Teri Energy Data Directory Yearbook (TEDDY). TERI (2011).
13. Vats K., Tiwari G.N. (2012) Energy and exergy analysis of a building integrated
semitransparent photovoltaic thermal (BISPVT) system. Appl Energy., 96:409–16.
14. WRI (World Resources Institute) (1998). UNEP, UNDP, World Bank. 1998–99 world
resources: a guide to global environment. Oxford, UK: Oxford University Press.

113
Part II
Biochemical Conversion
114
CHAPTER 10
INFERENCES IN SACCHARIFICATION OF
LIGNOCELLULOSIC BIOMASS FOR BIOFUEL
PRODUCTION
Ishan Sharma, Ajay Bansal and Sachin Kumar
Abstract
Biofuels are recognized as the potential alternative to petroleum-derived transportation fuels
and overcome the drawback of greenhouse gases and other pollutants emitted by the
combustion of fossil fuels. Biofuels like bioethanol, biobutanol, biohydrogen etc. and can be
produced by the fermentation of biomass. But there are many physical and chemical barriers
which influences the production of biofuels. These barriers strongly influence the amount of
fermentable sugars which subsequently influence the yield of biofuels. There are different
solutions to remove these barriers like Pretreatment, Detoxification and Hydrolysis.
Pretreatment is the treatment of the biomass with acid, alkali, microorganisms to make
cellulose accessible to hydrolysis for conversion into sugars. Different methods of
pretreatment are discussed here which influences the biofuel production. Combined
pretreatment methods like ultrasonic with heat or acid yielded very high product as compared
to single pretreatment methods. Pretreatment of biomass results in the production of different
types of inhibitors like 2-furaldehyde (furfural) and 5-(hydroxymethyl)-2-furaldehyde (HMF)
which inhibits the production of biofuel. Therefore prior to fermentation, detoxification is
done to remove these inhibitors. The hydrolysis is the process of converting cellulose into
fermentable sugars by enzymes or chemicals. The type of hydrolysis also influences the
production of biofuels. This paper reviews the most important factors that should be targeted
for the efficient production of biofuels.
Keywords: Biofuels; Pretreatment; Detoxification; Hydrolysis; Cellulose; Fermentable
sugars
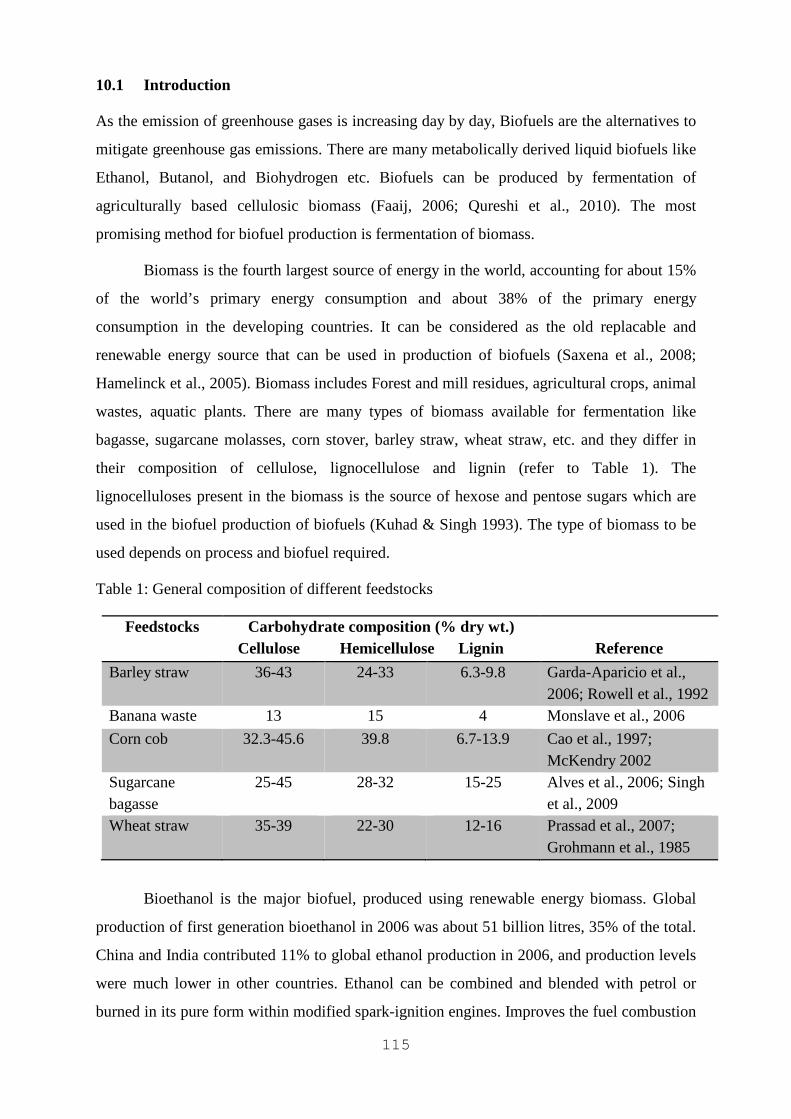
115
10.1 Introduction
As the emission of greenhouse gases is increasing day by day, Biofuels are the alternatives to
mitigate greenhouse gas emissions. There are many metabolically derived liquid biofuels like
Ethanol, Butanol, and Biohydrogen etc. Biofuels can be produced by fermentation of
agriculturally based cellulosic biomass (Faaij, 2006; Qureshi et al., 2010). The most
promising method for biofuel production is fermentation of biomass.
Biomass is the fourth largest source of energy in the world, accounting for about 15%
of the world’s primary energy consumption and about 38% of the primary energy
consumption in the developing countries. It can be considered as the old replacable and
renewable energy source that can be used in production of biofuels (Saxena et al., 2008;
Hamelinck et al., 2005). Biomass includes Forest and mill residues, agricultural crops, animal
wastes, aquatic plants. There are many types of biomass available for fermentation like
bagasse, sugarcane molasses, corn stover, barley straw, wheat straw, etc. and they differ in
their composition of cellulose, lignocellulose and lignin (refer to Table 1). The
lignocelluloses present in the biomass is the source of hexose and pentose sugars which are
used in the biofuel production of biofuels (Kuhad & Singh 1993). The type of biomass to be
used depends on process and biofuel required.
Table 1: General composition of different feedstocks
Feedstocks Carbohydrate composition (% dry wt.) Cellulose Hemicellulose Lignin
Reference
Barley straw 36-43 24-33 6.3-9.8 Garda-Aparicio et al., 2006; Rowell et al., 1992
Banana waste 13 15 4 Monslave et al., 2006
Corn cob 32.3-45.6 39.8 6.7-13.9 Cao et al., 1997; McKendry 2002
Sugarcane bagasse
25-45 28-32 15-25 Alves et al., 2006; Singh et al., 2009
Wheat straw 35-39 22-30 12-16 Prassad et al., 2007; Grohmann et al., 1985
Bioethanol is the major biofuel, produced using renewable energy biomass. Global
production of first generation bioethanol in 2006 was about 51 billion litres, 35% of the total.
China and India contributed 11% to global ethanol production in 2006, and production levels
were much lower in other countries. Ethanol can be combined and blended with petrol or
burned in its pure form within modified spark-ignition engines. Improves the fuel combustion
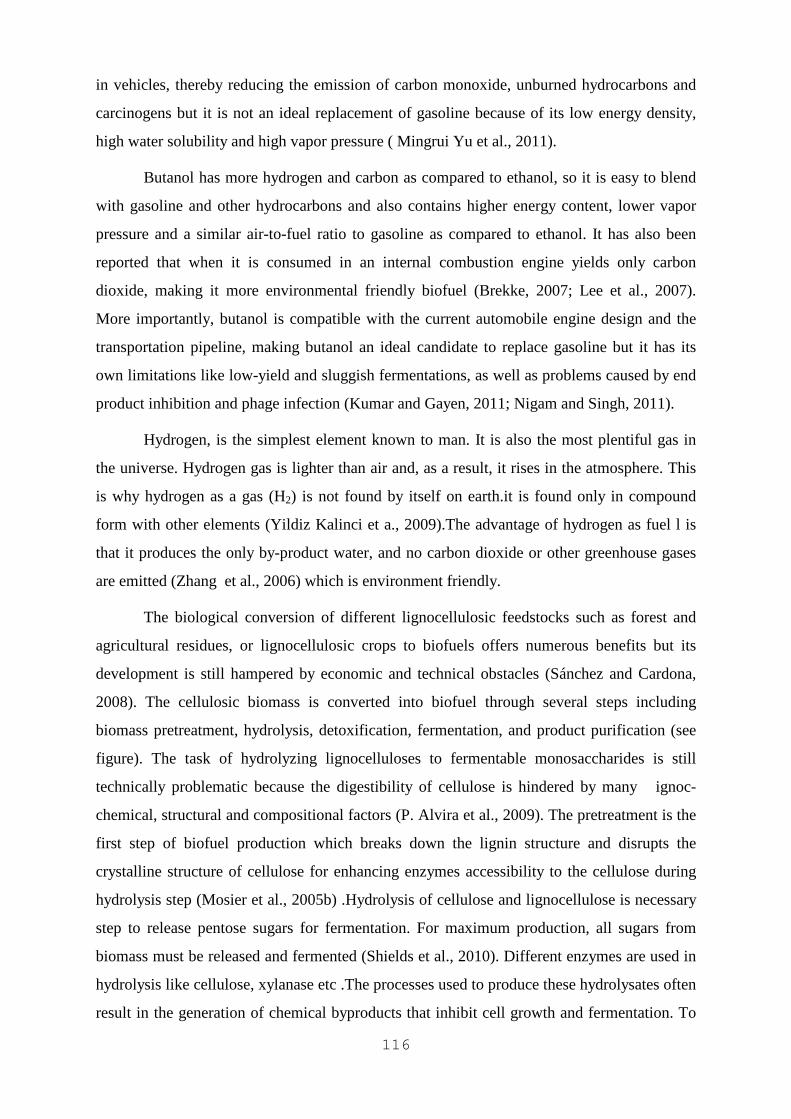
116
in vehicles, thereby reducing the emission of carbon monoxide, unburned hydrocarbons and
carcinogens but it is not an ideal replacement of gasoline because of its low energy density,
high water solubility and high vapor pressure ( Mingrui Yu et al., 2011).
Butanol has more hydrogen and carbon as compared to ethanol, so it is easy to blend
with gasoline and other hydrocarbons and also contains higher energy content, lower vapor
pressure and a similar air-to-fuel ratio to gasoline as compared to ethanol. It has also been
reported that when it is consumed in an internal combustion engine yields only carbon
dioxide, making it more environmental friendly biofuel (Brekke, 2007; Lee et al., 2007).
More importantly, butanol is compatible with the current automobile engine design and the
transportation pipeline, making butanol an ideal candidate to replace gasoline but it has its
own limitations like low-yield and sluggish fermentations, as well as problems caused by end
product inhibition and phage infection (Kumar and Gayen, 2011; Nigam and Singh, 2011).
Hydrogen, is the simplest element known to man. It is also the most plentiful gas in
the universe. Hydrogen gas is lighter than air and, as a result, it rises in the atmosphere. This
is why hydrogen as a gas (H2) is not found by itself on earth.it is found only in compound
form with other elements (Yildiz Kalinci et a., 2009).The advantage of hydrogen as fuel l is
that it produces the only by-product water, and no carbon dioxide or other greenhouse gases
are emitted (Zhang et al., 2006) which is environment friendly.
The biological conversion of different lignocellulosic feedstocks such as forest and
agricultural residues, or lignocellulosic crops to biofuels offers numerous benefits but its
development is still hampered by economic and technical obstacles (Sánchez and Cardona,
2008). The cellulosic biomass is converted into biofuel through several steps including
biomass pretreatment, hydrolysis, detoxification, fermentation, and product purification (see
figure). The task of hydrolyzing lignocelluloses to fermentable monosaccharides is still
technically problematic because the digestibility of cellulose is hindered by many ignoc-
chemical, structural and compositional factors (P. Alvira et al., 2009). The pretreatment is the
first step of biofuel production which breaks down the lignin structure and disrupts the
crystalline structure of cellulose for enhancing enzymes accessibility to the cellulose during
hydrolysis step (Mosier et al., 2005b) .Hydrolysis of cellulose and lignocellulose is necessary
step to release pentose sugars for fermentation. For maximum production, all sugars from
biomass must be released and fermented (Shields et al., 2010). Different enzymes are used in
hydrolysis like cellulose, xylanase etc .The processes used to produce these hydrolysates often
result in the generation of chemical byproducts that inhibit cell growth and fermentation. To
117
reduce this effect detoxification is done. Detoxification is basically to neutralize the acids
produce during Pretreatment and hydrolysis. Fermentation is done to convert fermentable
sugar to biofuel. After fermentation product purification is done to separate the biofuel from
impurities. The productivity of biofuel largely depends on pretreatment, hydrolysis and
detoxification steps.
Fig.1.The overall process flow diagram of biofuel production from biomass.
The production process for biofuels using biomass feedstocks contains a number of
unknowns in terms of technology and costs. The effects of harvesting technology and raw
material conversion techniques on end-product costs are examples (Grado et al., 1998). A
review is presented in the present paper to analyze the factors, which could affect the
sachharification of biomass for the production of biofuel. The overall result would improve
the production process by making it more efficient and cost competitive.
10.2 Pretreatment
The lignocellulosic biomass is converted into biofuel by a process which involves hydrolysis
of cellulose into fermentable sugars and subsequently into biofuel. Ligoncellulosic biomass
contains cellulose, hemicelluloses and lignin which are packed in a complex crystalline
118
structure which reduces the efficiency of hydrolysis by limiting the accesebilty of the enzyme
to substrate. So pretreatment is a necessary step to alter some structural characteristics of
lignocelluloses, which increases glucan and xylan accessibility to the enzymatic attack. These
structural modifications of the lignocelluloses are highly dependent on the type of
pretreatment employed and have a great effect on the enzymatic hydrolysis (Kumar et al.,
2009b). It is also recognized as a technological bottleneck for the cost-effective development
of bioprocesses from lignocellulosic materials (Mejía.etal, 2012). The potential of
pretreatment largely depends on the type of biomass used as substrate because of their
complex arrangement of lignocelluloses. Harsh conditions during pretreatment lead to a
partial lignocellulose degradation and generation of toxic compounds derived from sugar
decomposition that could affect the proceeding hydrolysis and fermentation steps (Oliva et
al., 2003). An effective pretreatment is characterized by several criteria. It avoids the need for
reducing the size of biomass particles, preserves the pentose (lignocellulose) fractions, limits
formation of degradation products that inhibit growth of fermentative microorganism,
minimizes energy demands and limits cost (National Research Council, 1999). The effects of
pretreatment applied on the lignicellulosic biomass are shown in Tables 2-4.
In general classification we can divide pretreatment methods into Biological, Physical,
Chemical Physiochemical pretreatments. These are classified on the basis of the method
applied for pretreatment like heat, acid, alkali, microorganism etc.
10.2.1 Physical Pretreatment
Physical pretreatment can increase the accessible surface area and size of pores, and decrease
the crystallinity and degrees of polymerization of cellulose. There are different types of
physical treatment like milling, high pressure, irradiation etc. which can be used to improve
biofuel production (Taherzadeh et al., 2008). For mechanical pretreatment factors like capital
costs, operating costs, scale-up possibilities and depreciation of equipment are very
important. The method of ultrasonication for lignocellulosic biomass is a well-known
technique for treatment of sludge from waste water treatment plants. The experimental results
showed that when a suspension of cellulose is provided with energy by irradiation, the
reaction rate of the subsequent enzymatic hydrolysis is increased by approximately 200%
(Imai et al., 2004) Saccharification of more than 50% of straw cellulose with minimal glucose
degradation becomes possible at mild hydrolytic conditions by crystallinity reduction using
ball milling (Sidiras et al., 1989). Hydrogen was barely produced from unpretreated platensis
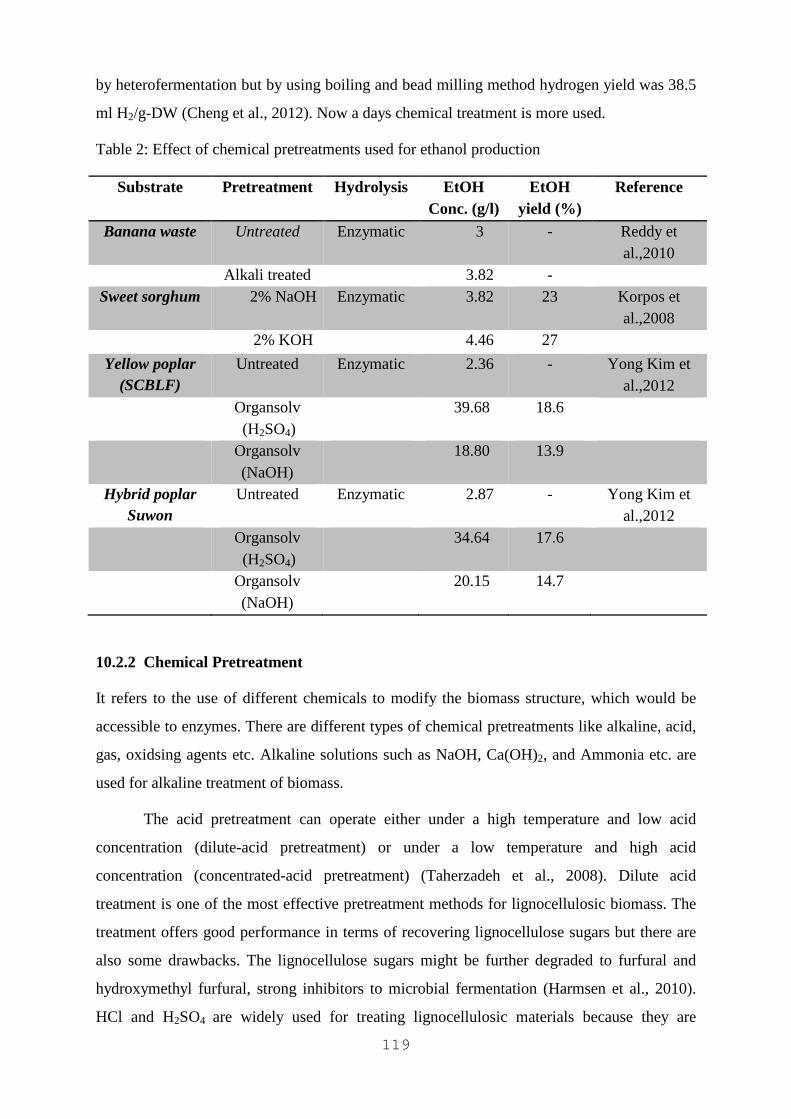
119
by heterofermentation but by using boiling and bead milling method hydrogen yield was 38.5
ml H2/g-DW (Cheng et al., 2012). Now a days chemical treatment is more used.
Table 2: Effect of chemical pretreatments used for ethanol production
10.2.2 Chemical Pretreatment
It refers to the use of different chemicals to modify the biomass structure, which would be
accessible to enzymes. There are different types of chemical pretreatments like alkaline, acid,
gas, oxidsing agents etc. Alkaline solutions such as NaOH, Ca(OH)2, and Ammonia etc. are
used for alkaline treatment of biomass.
The acid pretreatment can operate either under a high temperature and low acid
concentration (dilute-acid pretreatment) or under a low temperature and high acid
concentration (concentrated-acid pretreatment) (Taherzadeh et al., 2008). Dilute acid
treatment is one of the most effective pretreatment methods for lignocellulosic biomass. The
treatment offers good performance in terms of recovering lignocellulose sugars but there are
also some drawbacks. The lignocellulose sugars might be further degraded to furfural and
hydroxymethyl furfural, strong inhibitors to microbial fermentation (Harmsen et al., 2010).
HCl and H2SO4 are widely used for treating lignocellulosic materials because they are
Substrate Pretreatment Hydrolysis EtOH Conc. (g/l)
EtOH yield (%)
Reference
Banana waste Untreated Enzymatic 3 - Reddy et al.,2010
Alkali treated 3.82 - Sweet sorghum 2% NaOH Enzymatic 3.82 23 Korpos et
al.,2008 2% KOH 4.46 27
Yellow poplar (SCBLF)
Untreated Enzymatic 2.36 - Yong Kim et al.,2012
Organsolv (H2SO4)
39.68 18.6
Organsolv (NaOH)
18.80 13.9
Hybrid poplar Suwon
Untreated Enzymatic 2.87 - Yong Kim et al.,2012
Organsolv (H2SO4)
34.64 17.6
Organsolv (NaOH)
20.15 14.7
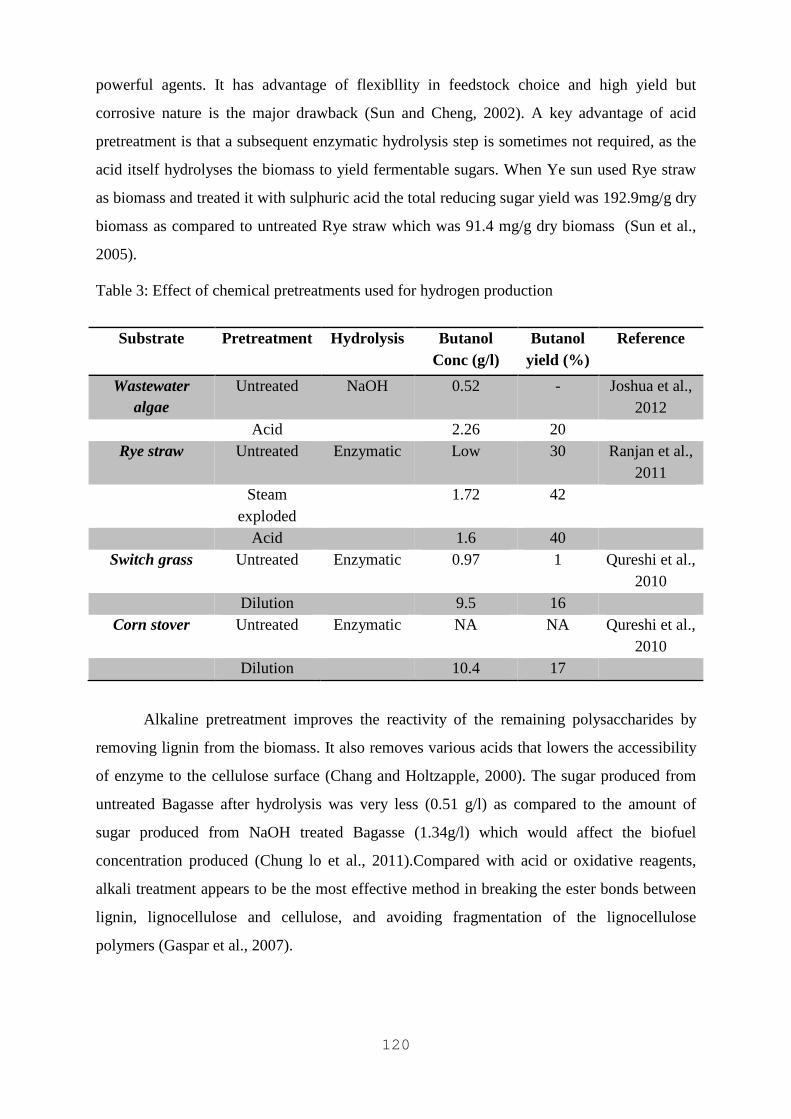
120
powerful agents. It has advantage of flexibllity in feedstock choice and high yield but
corrosive nature is the major drawback (Sun and Cheng, 2002). A key advantage of acid
pretreatment is that a subsequent enzymatic hydrolysis step is sometimes not required, as the
acid itself hydrolyses the biomass to yield fermentable sugars. When Ye sun used Rye straw
as biomass and treated it with sulphuric acid the total reducing sugar yield was 192.9mg/g dry
biomass as compared to untreated Rye straw which was 91.4 mg/g dry biomass (Sun et al.,
2005).
Table 3: Effect of chemical pretreatments used for hydrogen production
Alkaline pretreatment improves the reactivity of the remaining polysaccharides by
removing lignin from the biomass. It also removes various acids that lowers the accessibility
of enzyme to the cellulose surface (Chang and Holtzapple, 2000). The sugar produced from
untreated Bagasse after hydrolysis was very less (0.51 g/l) as compared to the amount of
sugar produced from NaOH treated Bagasse (1.34g/l) which would affect the biofuel
concentration produced (Chung lo et al., 2011).Compared with acid or oxidative reagents,
alkali treatment appears to be the most effective method in breaking the ester bonds between
lignin, lignocellulose and cellulose, and avoiding fragmentation of the lignocellulose
polymers (Gaspar et al., 2007).
Substrate Pretreatment Hydrolysis Butanol Conc (g/l)
Butanol yield (%)
Reference
Wastewater algae
Untreated NaOH 0.52 - Joshua et al., 2012
Acid 2.26 20 Rye straw Untreated Enzymatic Low 30 Ranjan et al.,
2011 Steam
exploded 1.72 42
Acid 1.6 40 Switch grass Untreated Enzymatic 0.97 1 Qureshi et al.,
2010 Dilution 9.5 16
Corn stover Untreated Enzymatic NA NA Qureshi et al., 2010
Dilution 10.4 17
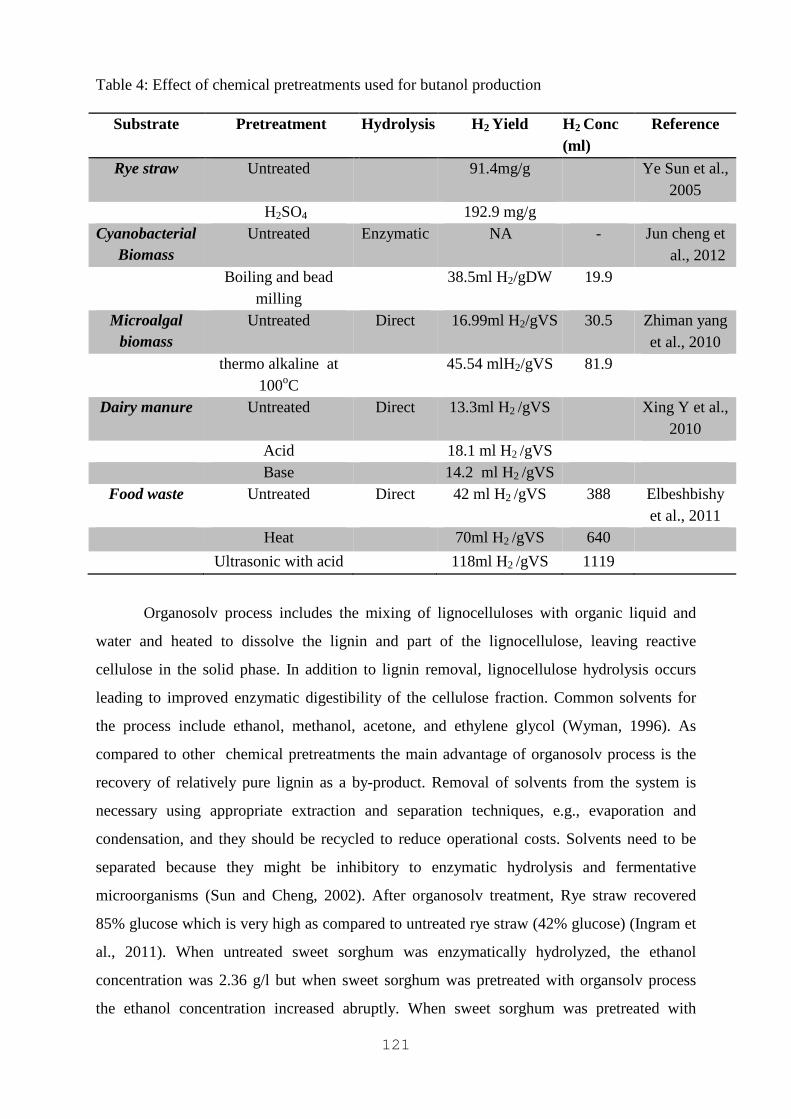
121
Table 4: Effect of chemical pretreatments used for butanol production
Organosolv process includes the mixing of lignocelluloses with organic liquid and
water and heated to dissolve the lignin and part of the lignocellulose, leaving reactive
cellulose in the solid phase. In addition to lignin removal, lignocellulose hydrolysis occurs
leading to improved enzymatic digestibility of the cellulose fraction. Common solvents for
the process include ethanol, methanol, acetone, and ethylene glycol (Wyman, 1996). As
compared to other chemical pretreatments the main advantage of organosolv process is the
recovery of relatively pure lignin as a by-product. Removal of solvents from the system is
necessary using appropriate extraction and separation techniques, e.g., evaporation and
condensation, and they should be recycled to reduce operational costs. Solvents need to be
separated because they might be inhibitory to enzymatic hydrolysis and fermentative
microorganisms (Sun and Cheng, 2002). After organosolv treatment, Rye straw recovered
85% glucose which is very high as compared to untreated rye straw (42% glucose) (Ingram et
al., 2011). When untreated sweet sorghum was enzymatically hydrolyzed, the ethanol
concentration was 2.36 g/l but when sweet sorghum was pretreated with organsolv process
the ethanol concentration increased abruptly. When sweet sorghum was pretreated with
Substrate Pretreatment Hydrolysis H2 Yield H2 Conc (ml)
Reference
Rye straw Untreated 91.4mg/g
Ye Sun et al., 2005
H2SO4 192.9 mg/g Cyanobacterial
Biomass Untreated
Enzymatic NA - Jun cheng et
al., 2012 Boiling and bead
milling 38.5ml H2/gDW 19.9
Microalgal biomass
Untreated Direct 16.99ml H2/gVS 30.5 Zhiman yang et al., 2010
thermo alkaline at 100oC
45.54 mlH2/gVS 81.9
Dairy manure Untreated Direct 13.3ml H2 /gVS Xing Y et al., 2010
Acid 18.1 ml H2 /gVS Base 14.2 ml H2 /gVS
Food waste Untreated Direct 42 ml H2 /gVS 388 Elbeshbishy et al., 2011
Heat 70ml H2 /gVS 640
Ultrasonic with acid 118ml H2 /gVS 1119
122
organsolv process using sulphuric acid, the ethanol concentration produced after enzymatic
hydrolysis was 39.68 g/l which was much higher than the ethanol concentration after the
fermentation of sweet sorghum pretreated with organsolv process using sodium hydroxide
which was 18.80 g/l (Kim et al., 2012).
Ionic liquids solvents are a promising new approach in the pretreatment of
lignocellulosic biomass because they have the ability to dissolve cellulose at considerably
mild conditions with close to 100% recovery. That would result in separation of lignin and
increase of cellulose accessibility under ambient conditions and with no use of acid or
alkaline solution. They are organic salts which has cations and anions like Imidazolium, Tetra
alkylphosphonium, Pyrrolidinium, Quaternary ammonium, Pyridinium etc. The major
drawback of ionic liquids is their tendency to denature enzyme, so the cellulose produced
after pretreatment with ionic liquids need to be washed before hydrolysis (Heinze, 2005;
Vancov et al., 2012). In a pretreatment study using 1-ethyl-3-methyl imidazolium diethyl
phosphate, the yield of reducing sugars from wheat straw pretreated with this ionic liquid at
130 oC for 30 min was 54.8% after being enzymatically hydrolyzed for 12 h (Li et al., 2009).
10.2.3 Biological Pretreatment
In biological pretreatment microorganisms are used to treat with biomass and to enhance
biofuel production. Microorganisms attacks the lignocelluloses structure of the biomass with
help of ligninolytic enzymes present in them which opens the structure make cellulose
available for hydrolysis. Many microorganisms have been used in biological pretreatment e.g.
brown-, white- and soft-rot fungi. Brown rots mainly attack cellulose, whereas white and soft
rots attack both cellulose and lignin. Lignin degradation by white-rot fungi occurs through the
action of lignin-degrading enzymes such as peroxidases and laccase (Lee et al., 2007). White-
rot fungi are among the most effective microorganisms for biological pretreatment of
lignocelluloses (Sun et al., 2002). When Water hyacinth was pretreated with white rot fungi
and dilute acid ethanol yield increased by 1-2 fold over single acid pretreatment (Ma et al.,
2010). The effects of biological pretreatment on the Japanese red pine Pinus densiflora, after
exposure to a white-rot fungi, Stereum hirustum were studied. S. hirsutum was considered as
an effective potential fungus for biological pretreatment. When, Japanese red pine chips
treated with S. hirsutum were enzymatically saccharified using commercial enzymes
(Celluclast 1.5 L and Novozyme 188), the sugar yield was increased to 21.0%, compared to
nonpretreated control samples ( Lee et al., 2007). When white rot fungal pretreatment was
combined with the physical/chemical pretreatment, fungal pretreatment improved the
123
performance of subsequent non-fungal pretreatment. A pressurized hot water treatment
(170 oC for 3 min at 110 psi), altered the cell wall structure, finally facilitated the fungal
degradation of soybean straw and the glucose yield of the combined liquid hot water and
fungal pretreatment reached about 65%. As compared to current leading thermal or chemical
pretreatment processes, fungal pretreatment with white rot fungi is an environmental friendly
and energy efficient process ( Wan and Li, 2011; Wan and Li, 2012). In general, such
processes offer advantages such as low-capital cost, low energy, no chemicals requirement,
and mild environmental conditions. However, the main drawback to develop biological
methods is the low hydrolysis rate and it requires careful control of growth conditions with
large amount of space as compared to other technologies (Alvira et al., 2010).
10.2.4 Physiochemical Pretreatment
In physiochemical pretreatment both chemical and physical processes are combined to
improve the biofuel production. The most important processes are steam explosion, catalyzed
(SO2 or CO2) steam explosion, ammonia fiber explosion (AFEX), liquid hotwater,
microwave-chemical pretreatment.
Steam Explosion is the most widely used method for the pretreatment of
lignocellulosic materials. In this method, biomass is treated with high-pressure saturated
steam, and then the pressure is suddenly reduced, which makes the materials undergo an
explosive decompression. The process causes lignocellulose degradation and lignin
transformation due to high temperature, thus, increasing the potential of cellulose hydrolysis.
(Macmillan et al., 1994; Sun and Cheng, 2002). When untreated Rye straw was hydrolyzed,
butanol was barely produced but when steam exploded rye straw was hydrolyzed, butanol
concentration rises to 1.72 g/l which shows that after steam explosion pretreatment biofuel
concentration increased (Ranjan et al., 2011). The efficiency of enzymatic hydrolysis was
90%, which was achieved in 24 h for poplar chips pretreated by steam explosion, compared to
only 15% hydrolysis of untreated chips was reported (Grous et al., 1986). Limitations of
steam explosion include destruction of a portion of the xylan fraction, incomplete disruption
of the lignin-carbohydrate matrix, and generation of compounds that might be inhibitory to
microorganisms used in downstream processes (Parveen et al., 2009).
Ammonia fiber explosion(AFEX) is another type of physicochemical pretreatment in
which lignocellulosic materials are exposed to liquid ammonia at high temperature and
pressure for a period of time, and then the pressure is swiftly reduced (Talebnia et al., 2010).
At optimal conditions AFEX can achieve more than 90% conversion of cellulose and
124
lignocellulose to fermentable sugars for a broad variety of lignocellulosic materials. In fact,
despite of little removal of lignin or lignocellulose in the AFEX process, enzymatic digestion
at low enzyme loadings results very high comparing other pretreatment alternatives (Wyman
et al., 2005b).
In Ultrasound pretreatment, the effects of ultrasound on lignocellulosic biomass are
employed for extracting hemicelluloses, cellulose and lignin. When ultrasound effect is
combined with the chemical effects the yield were very high like, when Food waste was
treated with ultrasonic and acid it yielded 118ml H2 /gVS which was higher than the yield
with heat treatment (70ml H2 /gVS) and untreated food waste (42ml H2 /gVS) (Elbeshbishy et
al., 2011). The reason of high biofuel yield after ultrasound pretreatment can be the cavitation
effects caused by the introduction of ultrasound field into the enzyme processing solution
greatly enhance the transport of enzyme macromolecules toward the substrate surface
(Yachmenev et al., 2009) This shows that pretreatment increases hydrolysate production
which enhances the biofuel production.
10.3 Detoxification
The products of pretreatment and hydrolysis also contains some toxic compounds which
decreases the biofuel productivity by inhibiting cell growth and fermentation. These toxic
compounds are classified into three groups: aliphatic acids (acetic, formic and levulinic acid),
furan derivatives (furfural and HMF) and phenolic compounds. Lignocellulosic hydrolysates
vary in their degree of inhibition, and different microorganisms have different inhibitor
tolerances (Ezeji et al., 2007; Palmqvist et al., 2000; Huang et al., 2008). While the amount of
these toxic compounds may be minimized by optimizing the severity of the pretreatment i.e.
concentration, time and temperature, but production of these compounds cannot be
completely eliminated (Bower et al., 2008). There are many approaches available to reduce
toxic effects of these byproducts on cultures including lignocellulose, overliming with
calcium hydroxide, activated charcoal, ion exchange resins and enzymatic detoxification
using laccase (Qureshi et al., 2008; Chandel et al., 2007). These methods can be classified
into biological, physical and chemical methods based on the methods applied for
detoxification.
10.3.1 Biological Methods
It is the treatment of hydrolysates with the different microorganisms or enzymes like
peroxidase and laccase, obtained from the ligninolytic fungus Trametes versicolor,
125
Trichoderma reesei etc. Trametes versicolor has been shown to increase the maximum
ethanol productivity in a lignocellulose hydrolysate of willow two to three times (Jönsson et
al., 1998). The laccase treatment led to selective and virtually complete removal of phenolic
monomers (2.6 g lÿ1 in the crude hydrolysate) and phenolic acids (Palmqvist et al., 2000).
When sugarcane Bagasse was treated with laccase enzyme yield of ethanol increased from
3.46g/l (neutralized) to 6.50g/l (Chandel et al., 2007). Acetic acid, furfural and benzoic acid
derivatives are removed by these enzymes. The biological methods are more feasible and
environment friendly with fewer side reactions and less energy requirements but the major
drawback of biological methods is the slow reaction time and loss of fermentable sugars
(Parawira and Tekere, 2011; Yang & Wyman, 2008).
Table 5: Effect of detoxified hydrolysate on biofuel production
The microorganisms can be grown in lignocelluloses hydrolysate to detoxify the
inhibitory substances by transforming their chemical nature, this is called in situ microbial
Substrate Detoxification Hydrolysis Biofuel Conc. Reference
Barley straw Untreated Enzymatic 7.09g/l ABE Qureshi et al., 2010
Dilution 17.42g/l ABE Overliming 26.64g/l ABE
Corn Fiber XAD-4 0.5% H2SO4 8.8g/l ABE Ezeji et al., 2007 Overliming 15.6g/l ABE - Acetate 20.3g/l ABE
Sugarcane Baggase
Neutralization HCl 3.46g/l EtOH Chandel et al., 2007
Overliming 5.19g/l EtOH Laccase 6.50g/l EtOH
Activated- charcoal
7.43g/l EtOH
Ion Exchange 8.67g/l EtOH Sugarcane Baggase
NH4OH H2SO4 0 Van Zyl et al., 1988
NaOH 0 MgCO3 5.8g/l EtOH Ca(OH)2 11.1g/l EtOH
Brewery spentgrain
Hydrolysate
Overliming 0.40g/g xylitol Carvalheiroa et al.,2005
Activated
charcoal 0.50g/g xylitol
126
detoxification (López et al., 2004). The in-situ detoxification of impurities could be achieved
at higher rate that may economize the overall ethanol production. Several attempts were made
to detoxify the hydrlysate directly with the microorganism, Trichoderma reesei was used to
degrade the inhibitors from willow hemicellulosic hydrolysate that directly assisted
improvements in ethanol productivity by three fold and yield four fold (Palmqvist et al.,
1997). A yeast strain Issatchenkia occidentalis CCTCC M 206097 has been reported to
metabolize syringaldehyde(66.67%), ferulic acid (73.33%), furfural (62%), and 5-HMF (85%)
present in the sugarcane bagasse (Fonesca et al., 2011). Enzymes are also used to detoxify the
inhibitors present in the hydrolysate like laccase and peroxidases enzymes derived from white
rot fungi (Trametes versicolor, Phenorochete chrysosporium, Cythus bulleri, C. stercoreous,
and Pycnoporous cinnabarinus) are found effective for the removal of phenolics from the
lignocellulosic hydrolysates. The ethanol production efficiency was superior in the laccase
treated hydrolysate (6.50 g/l, 0.37 g/g) compared to the untreated hydrolysate(3.46 g/l, 0.22
g/g) (Chandel et al. 2007a).
10.3.2 Physical Methods
When detoxification is carried out with help of different physical processes to detoxify the
inhibitors from the hydrolysate, there are different methods, which can be applied like
evaporation, membrane extraction, etc. Evaporation can be used to remove volatile
components like acetic acid, furfural and vanillin from lignocellulosic hydrolysate.
Membrane extraction was used for the removal of sulfuric acid, acetic acid, 5-
hydroxymethyl furfural and furfural from corn stover hydrolysate. Microporous
polypropylene hollow fiber membranes were used with different chemicals like Oleyl alcohol,
ammonium hydroxide etc ethanol produced was 46.4 g/l and 45.9 g/l respectively. It shows
that membrane extraction could be a feasible unit operation for detoxification of biomass
hydrolysates (Grzenia et al., 2012). Ion exchange treatment when applied on sugarcane
Bagasse it was more efficient (8.67g/l ethanol) than activated charcoal and overliming which
produced 7.43 g/l and 5.19 g/l ethanol respectively (Chandel et al., 2007)
10.3.3 Chemical Methods
Detoxification of biomass hydrolysates can be done by different chemicals like alkali, acids,
with reducing agents etc. There are different chemical methods like neutralization,
overliming, activated charcoal etc. Different alkali like sodium hydroxide, calcium hydroxide
etc are used to neutralize the acidic nature of hydrolysates, this process is called
127
neutralization. Sugarcane bagasse hydrolysate when neutralized with an alkali and the biofuel
production reached to 3.46 g/l, which was barely produced from untreated sugarcane bagasse
(Chandel et al., 2007). When sugarcane Bagasse hydrolysate detoxified with NH4OH and
NaOH, there was no fermentation but when it was treated with MgCO3 and Ca(OH)2 ethanol
yield increased to 5.8 and 11.1 g/l, respectively. Neutralization with calcium compounds
allowed fermentation to proceed (Carina et al., 1988).
Overliming is a method of detoxification in which the pH of hydrolysate is increased
to 9-10 with Ca(OH)2 and readjustment to 5.5 with H2SO4 (Palmqvist et al., 2000). Untreated
Barley straw hydrolysate produced 7.09g/l ABE and after detoxification with Ca(OH)2
(Overliming) production increased to 26.64g/l ABE which shows that there were inhibitors
and detoxified after overliming (Qureshi et al., 2010). Overliming helps in the removal of
volatile inhibitory compounds such as furfural and hydroxymethyl furfural (HMF) from the
hydrolysate additionally causing a sugar loss (~10%) by adsorption (Chandel et al., 2011a).
Activated charcoal can be used to remove different toxic compounds from the
hydrolysate with the property of adsorption. When sugarcane bagasse hydrolysate was
detoxified with activated charcoal the concentration of ethanol reached 7.43 g/l, which was
higher than other detoxification methods applied on the hydrolysate (Chandel et al., 2007).
Two separate detoxification methods were applied on H205 Bagasse hydrolysate. The
enzymatic treatment had a marked effect upon the removal of phenolic compounds: ~80% of
the phenols were removed from the hydrolysate, it had no effect on other inhibitors. And
overliming affected the concentration of acetic acid, furfural, HMF, phenols. Around 18% of
the acetic acid was removed in hydrolysate H205 and furan derivatives were reduced to 25%
and 17% of the phenols were removed. This shows the effects of different detoxification
treatments on inhibitors of hydrolysate (Martin et al., 2002). Efficient detoxification method
is required to remove the toxic compounds from the hydrolysate. Among all the methods
discussed above, biological methods are most promising but they have their own drawbacks
like cost and slow reaction rate.
10.4 Hydrolysis
Hydrolysis is also an important step in biofuel production. It increases the fuel yield by ten
fold. It is a process of converting pretreated biomass to sugars by breaking the glycosidic
bonds present in cellulose. Its major product is glucose with some by products. There are two
conventional methods of hydrolysis (1) Direct hydrolysis, (2) Enzymatic hydrolysis. There are
several pros and cons of Direct and Enzymatic hydrolysis (Table 5). Enzymatic hydrolysis has
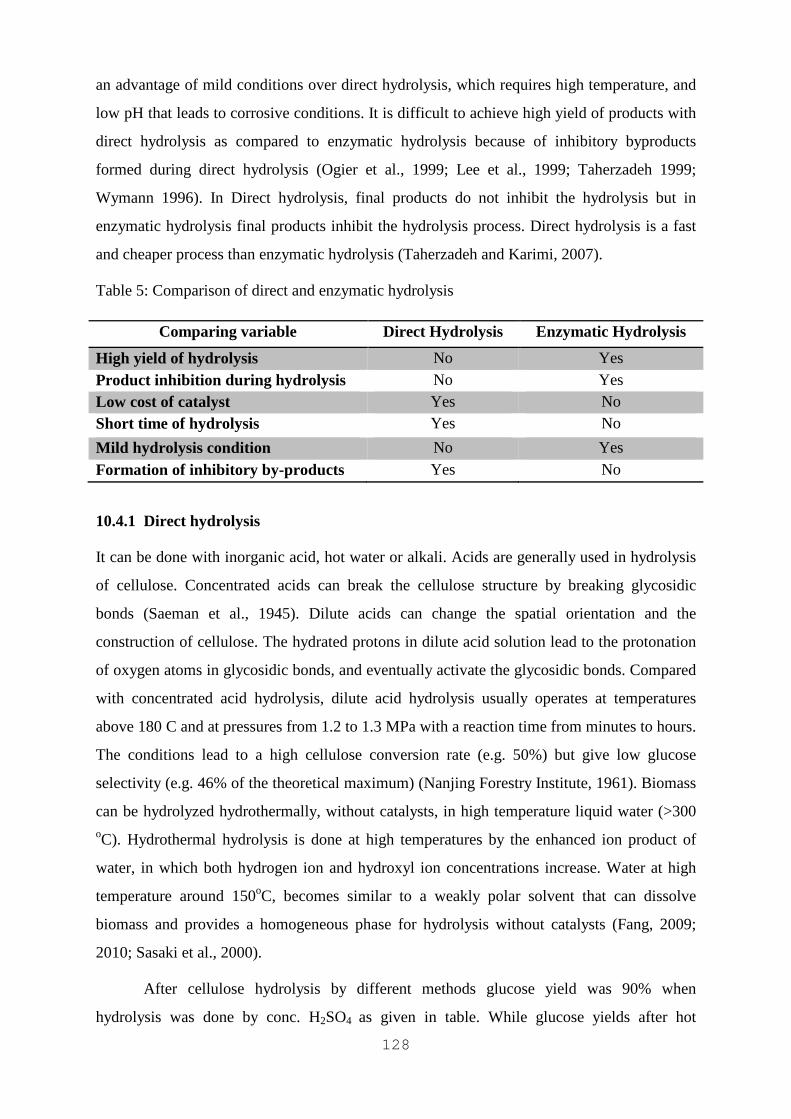
128
an advantage of mild conditions over direct hydrolysis, which requires high temperature, and
low pH that leads to corrosive conditions. It is difficult to achieve high yield of products with
direct hydrolysis as compared to enzymatic hydrolysis because of inhibitory byproducts
formed during direct hydrolysis (Ogier et al., 1999; Lee et al., 1999; Taherzadeh 1999;
Wymann 1996). In Direct hydrolysis, final products do not inhibit the hydrolysis but in
enzymatic hydrolysis final products inhibit the hydrolysis process. Direct hydrolysis is a fast
and cheaper process than enzymatic hydrolysis (Taherzadeh and Karimi, 2007).
Table 5: Comparison of direct and enzymatic hydrolysis
10.4.1 Direct hydrolysis
It can be done with inorganic acid, hot water or alkali. Acids are generally used in hydrolysis
of cellulose. Concentrated acids can break the cellulose structure by breaking glycosidic
bonds (Saeman et al., 1945). Dilute acids can change the spatial orientation and the
construction of cellulose. The hydrated protons in dilute acid solution lead to the protonation
of oxygen atoms in glycosidic bonds, and eventually activate the glycosidic bonds. Compared
with concentrated acid hydrolysis, dilute acid hydrolysis usually operates at temperatures
above 180 C and at pressures from 1.2 to 1.3 MPa with a reaction time from minutes to hours.
The conditions lead to a high cellulose conversion rate (e.g. 50%) but give low glucose
selectivity (e.g. 46% of the theoretical maximum) (Nanjing Forestry Institute, 1961). Biomass
can be hydrolyzed hydrothermally, without catalysts, in high temperature liquid water (>300 oC). Hydrothermal hydrolysis is done at high temperatures by the enhanced ion product of
water, in which both hydrogen ion and hydroxyl ion concentrations increase. Water at high
temperature around 150oC, becomes similar to a weakly polar solvent that can dissolve
biomass and provides a homogeneous phase for hydrolysis without catalysts (Fang, 2009;
2010; Sasaki et al., 2000).
After cellulose hydrolysis by different methods glucose yield was 90% when
hydrolysis was done by conc. H2SO4 as given in table. While glucose yields after hot
Comparing variable Direct Hydrolysis Enzymatic Hydrolysis
High yield of hydrolysis No Yes Product inhibition during hydrolysis No Yes Low cost of catalyst Yes No Short time of hydrolysis Yes No
Mild hydrolysis condition No Yes
Formation of inhibitory by-products Yes No
129
compressed water and alkaline hydrolysis is 30-40 %, which is very less than acid hydrolysis.
In alkaline hydrolysis, hydroxide ions attacks the glycosidic bonds but sugar molecules are
severely attacked in alkali solutions leading to degradation (Tanksale et al., 2010; Knill et al.,
2002).When Chlorella biomass was hydrolyzed with 2% HCl , sugar yield was 43.78% and
when it was separately hydrolyzed with 2.5% MgCl2 the sugar yield was 8.62 % . When
Chlorella biomass was hydrolyzed with both HCl and MgCl2 sugar yield was almost two fold
the sum of the sugar yield when 2% HCl or 2.5% MgCl2 were used individually. The results
indicated in table shows that adding moderate amount of inorganic MgCl2 into low
concentration of HCl could have some synergic effect with HCl for Chlorella biomass
decomposition (Zhou et al., 2011).
Solid acids catalyst, which can donate protons or accept electrons during reactions and
mediated hydrolysis can overcome many of the disadvantages of homogenous catalysts, and
also have many unique properties and advantages. There are different types of solid catalysts
like Activated hydrotalcite (HT-OHCa); Sulfonated activated-carbon (AC-SO3 H); Sulfonic
group functionalized magnetic SBA-15 catalyst (Fe3O4-SBA-SO3 H); Ru-mesoporous carbon
materials (Ru-CMKs); Cellulase immobilized mesoporous silica nanocatalysts (Cellulase-
MSNs) etc. Solid acid catalysts have numerous advantages over liquid catalysts regarding
activity, selectivity, catalyst life and ease in recovery and reuse (Guo et al.,2012).When
cellulose was hydrolyzed with Fe3 O4 –SBA-SO3 H or Hetropoly acids ,the sugar yield was
51%. Maximum sugar yield was obtained when cellulose was hydrolyzed with Cellulase-
MSNs, which was 90% as given in table. This shows that solid acid mediated hydrolysis is
more efficient than liquid catalysts as they have distinct advantages in recycling, separation,
and environmental friendliness.
The biofuel yield and productivity obtained during fermentation of lignocellulosic
hydrolysates is decreased due to the presence of inhibiting compounds, such as weak acids,
furans and phenolic compounds formed or released during acid/alkali hydrolysis. Inhibition of
fermentation can be removed by treatment with the ligninolytic enzyme laccase, pre-
fermentation by the filamentous fungus Trichoderma reesei, removal of non-volatile
compounds, extraction with ether or ethyl acetate, and treatment with alkali or sulfite
(Palmqvist et al., 2000). These methods of Detoxification are already discussed above.
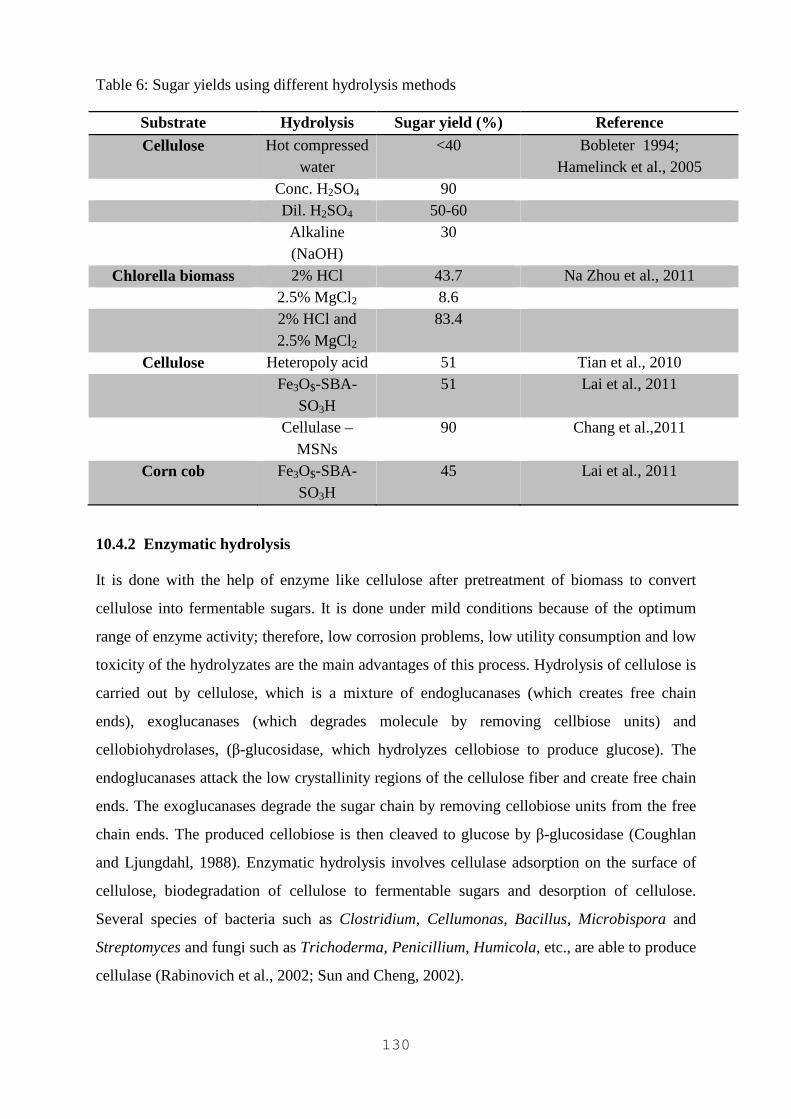
130
Table 6: Sugar yields using different hydrolysis methods
Substrate Hydrolysis Sugar yield (%) Reference Cellulose Hot compressed
water <40 Bobleter 1994;
Hamelinck et al., 2005 Conc. H2SO4 90 Dil. H2SO4 50-60 Alkaline
(NaOH) 30
Chlorella biomass 2% HCl 43.7 Na Zhou et al., 2011 2.5% MgCl2 8.6 2% HCl and
2.5% MgCl2
83.4
Cellulose Heteropoly acid 51 Tian et al., 2010 Fe3O$-SBA-
SO3H 51 Lai et al., 2011
Cellulase –MSNs
90 Chang et al.,2011
Corn cob Fe3O$-SBA-SO3H
45 Lai et al., 2011
10.4.2 Enzymatic hydrolysis
It is done with the help of enzyme like cellulose after pretreatment of biomass to convert
cellulose into fermentable sugars. It is done under mild conditions because of the optimum
range of enzyme activity; therefore, low corrosion problems, low utility consumption and low
toxicity of the hydrolyzates are the main advantages of this process. Hydrolysis of cellulose is
carried out by cellulose, which is a mixture of endoglucanases (which creates free chain
ends), exoglucanases (which degrades molecule by removing cellbiose units) and
cellobiohydrolases, (β-glucosidase, which hydrolyzes cellobiose to produce glucose). The
endoglucanases attack the low crystallinity regions of the cellulose fiber and create free chain
ends. The exoglucanases degrade the sugar chain by removing cellobiose units from the free
chain ends. The produced cellobiose is then cleaved to glucose by β-glucosidase (Coughlan
and Ljungdahl, 1988). Enzymatic hydrolysis involves cellulase adsorption on the surface of
cellulose, biodegradation of cellulose to fermentable sugars and desorption of cellulose.
Several species of bacteria such as Clostridium, Cellumonas, Bacillus, Microbispora and
Streptomyces and fungi such as Trichoderma, Penicillium, Humicola, etc., are able to produce
cellulase (Rabinovich et al., 2002; Sun and Cheng, 2002).
131
There are many factors in enzymatic hydrolysis which would affect the yield of sugars
like substrate concentration, cellulose activity, applied pretreatment methods and hydrolysis
conditions such as temperature, pH etc. Increasing the dosage of cellulases in the process, to a
certain extent, can enhance the yield and rate of the hydrolysis, but would significantly
increase the cost of the process. It depends on the ratio of total enzyme to total substrate. The
highest glucose yield of ~64% was found at 0.02 g enzyme/g substrate and the lowest yield of
~26% was displayed at 0.1 g enzyme/g substrate (table). Enzymatic activity also depends on
the pH and temperature. When microalgae Chlorococum humicola, was hydrolyzed with
cellulose, the glucose yield was very high for a particular range of pH and temperature. The
activity of enzyme is retarded in strongly acidic or alkaline conditions, which could unfold
and denature the enzyme. The highest glucose yield of 64% was obtained at pH 4.8.
Temperature also affects the yield as the increasing temperature affects the molecular kinetic
energy of the hydrolysis process by increasing the collisions between the substrate and
enzyme molecules, thus accumulating heat that could denature the structure of the enzyme.
Highest glucose yield of 68% was obtained at 40C .It shows that highest glucose yield of
68.2% (w/w) was obtained when the hydrolysis process was performed using 10 g/L of
biomass at pH 4.5 and 40C (Shuler et al.,1991; Harun and Danquah 2011; Sun and Cheng
2002).
Use of a cellulase mixture from different microorganisms or a mixture of cellulases
and other enzymes in the hydrolysis of cellulosic materials increases the yield of sugar
(Beldman et al., 1988; Excoffier et al., 1991; Xin et al., 1993). The addition of β-glucosidase
into the T. reesei cellulases system achieved better saccharification than the system without β-
glucosidase (Excoffier et al., 1991; Xin et al., 1993). Β-Glucosidase hydrolyzes the
cellobiose, which is an inhibitor of cellulose activity. A mixture of hemicellulases or
pectinases with cellulases exhibited a significant increase in the extent of cellulose conversion
(Ghose and Bisaria, 1979; Beldman et al., 1984). A cellulose conversion yield of 90% was
achieved in the enzymatic saccharification of 8% alkali-treated sugar-cane bagasse when a
mixture of cellulases (dose, 1.0 FPU/g substrate) from Aspergillus ustus and Trichoderma
viride was used (Mononmani and Sreekantiah, 1987). A nearly complete saccharification of
steamexplosion Eucalyptus viminalis chips (substrate concentration of 6% and enzyme
loading of 10 FPU/g cellulase) was obtained using a cellulase mixture of commercial
Celluclast and Novozym preparations (Ramos et al., 1993). (Baker et al., 1994) found that a
new thermostable endoglucanase, Acidothermus cellulolyticus E1, and another bacterial
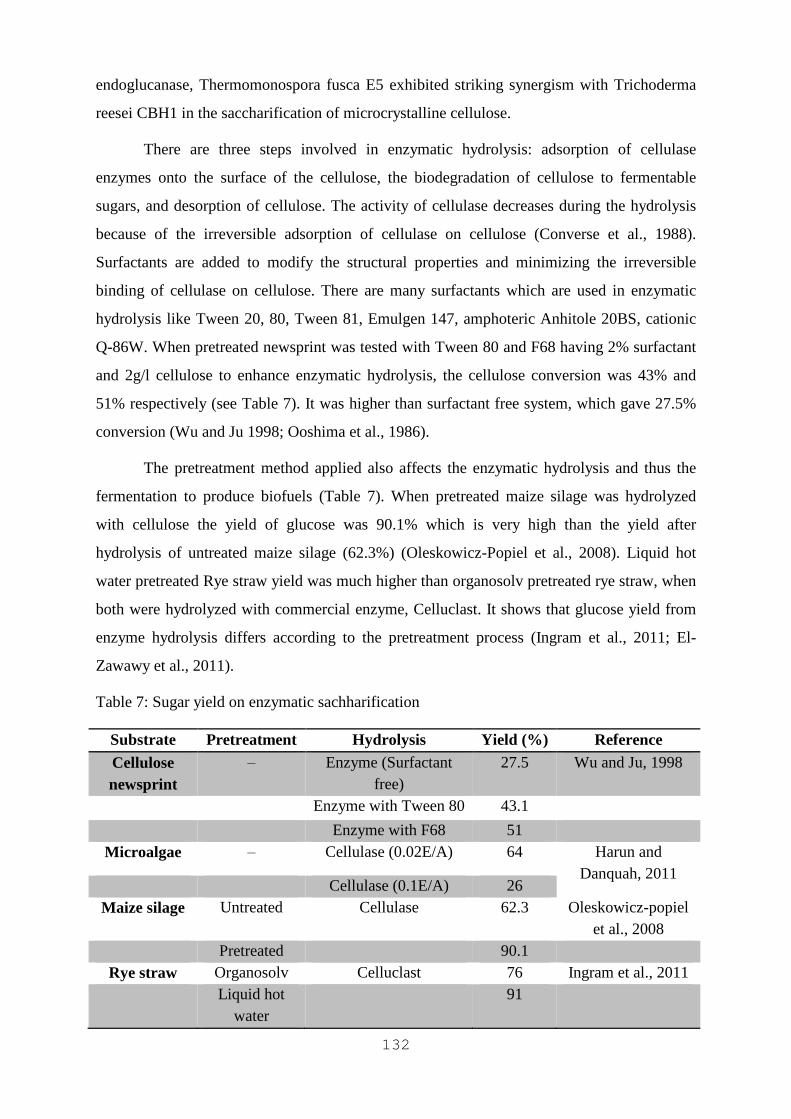
132
endoglucanase, Thermomonospora fusca E5 exhibited striking synergism with Trichoderma
reesei CBH1 in the saccharification of microcrystalline cellulose.
There are three steps involved in enzymatic hydrolysis: adsorption of cellulase
enzymes onto the surface of the cellulose, the biodegradation of cellulose to fermentable
sugars, and desorption of cellulose. The activity of cellulase decreases during the hydrolysis
because of the irreversible adsorption of cellulase on cellulose (Converse et al., 1988).
Surfactants are added to modify the structural properties and minimizing the irreversible
binding of cellulase on cellulose. There are many surfactants which are used in enzymatic
hydrolysis like Tween 20, 80, Tween 81, Emulgen 147, amphoteric Anhitole 20BS, cationic
Q-86W. When pretreated newsprint was tested with Tween 80 and F68 having 2% surfactant
and 2g/l cellulose to enhance enzymatic hydrolysis, the cellulose conversion was 43% and
51% respectively (see Table 7). It was higher than surfactant free system, which gave 27.5%
conversion (Wu and Ju 1998; Ooshima et al., 1986).
The pretreatment method applied also affects the enzymatic hydrolysis and thus the
fermentation to produce biofuels (Table 7). When pretreated maize silage was hydrolyzed
with cellulose the yield of glucose was 90.1% which is very high than the yield after
hydrolysis of untreated maize silage (62.3%) (Oleskowicz-Popiel et al., 2008). Liquid hot
water pretreated Rye straw yield was much higher than organosolv pretreated rye straw, when
both were hydrolyzed with commercial enzyme, Celluclast. It shows that glucose yield from
enzyme hydrolysis differs according to the pretreatment process (Ingram et al., 2011; El-
Zawawy et al., 2011).
Table 7: Sugar yield on enzymatic sachharification
Substrate Pretreatment Hydrolysis Yield (%) Reference Cellulose newsprint
‒ Enzyme (Surfactant free)
27.5 Wu and Ju, 1998
Enzyme with Tween 80 43.1
Enzyme with F68 51 Microalgae ‒ Cellulase (0.02E/A) 64 Harun and
Danquah, 2011 Cellulase (0.1E/A) 26
Maize silage Untreated Cellulase 62.3 Oleskowicz-popiel et al., 2008
Pretreated 90.1 Rye straw Organosolv Celluclast 76 Ingram et al., 2011
Liquid hot water
91
133
10.5 Conclusions
Current efforts to develop these methods do not guarantee economic viability yet. All these
methods should make the lignocellulose accessible to enzymatic reactions, where crystallinity
of cellulose, its accessible surface area, and lignin and hemicellulose disposal are the main
substrate-related factors affecting the enzymatic hydrolysis. It can be concluded that
pretreatments like concentrated acids, wet oxidation, solvents and metal complexes are
effective, but too expensive compared to the value of glucose. Steam pretreatment, lime
pretreatment, LHW systems and ammonia-based pretreatments are the ones that are
economically better. Enzymatic hydrolysis gives high yield of hydrolysis and done under mild
conditions as compared to direct hydrolysis. Direct hydrolysis is a cheap and fast process
while enzymatic hydrolysis is expensive process because the enzymes used in the hydrolysis
are very costly as compared to the chemicals used in the direct hydrolysis. The detoxification
methods we have discussed here are very effective in removing the inhibitory compounds
from the hydrolyzate. Overliming and activated charcoal method of detoxification are used
widely and give best result possible
References
1. Amrita Ranjan, Vijayanand S. Moholkar, 2011. “Comparative study of various
pretreatment techniques for rice straw saccharification for the production of alcoholic
biofuels”. Fuel xxx (2011).
2. Alves FF, Bose SK, Francis RC, Colodette JL, Iakovlev M, Heiningen AV., 2010.
“Carbohydrate composition of eucalyptus, bagasse and bamboo by a combination of
methods”. Carbohyd Polym 82 (1097-1101).
3. Anuj Kumar Chandel, Rajeev Kumar Kapoor, Ajay Singh, Ramesh Chander Kuhad,
2007. “Detoxification of sugarcane bagasse hydrolysate improves ethanol production
by Candida shehatae NCIM 3501”. Bioresource Technology 98 (1947–1950).
4. A. Tanksale, Jorge Norberto Beltramini, Gaoqing Max Lu., 2010. “A review of
catalytic hydrogen production processes from biomass”. Renewable and sustainable
energy reviews 14(166-182).
5. Beldman, G., Voragen, A.G.J., Rombouts, F.M., Pilnik, W., 1988. “Synergism in
cellulose hydrolysis by endoglucanases and exoglucanases purified from Trichoderma
viride”. Biotechnol. Bioeng. 31, 173–178.
134
6. Baker, J.O., Adney, W.S., Nieves, R.A., 1994. “A new thermostable endoglucanase,
Acidothermus cellulolyticus E1: synergism with Trichoderma reesei CBH1 and
comparison to Thermomonospora fusca E5”. Appl. Biochem. Biotechnol. 45/46, 245–
256.
7. Bower, S.E., Wickramasinghe, S.R., Nagel, N.J., Schell, D.J., 2008. Modeling sucrose
hydrolysis in dilute sulfuric acid solutions at pretreatment conditions for
lignocellulosic biomass. Bioresour. Technol. 99 (15), 7354–7362
8. Brekke K. Butanol an energy alternative? Ethanol Today; March 2007:36-9.
9. C.N. Hamelinck, G. Van Hooijdonk, A.P.C. Faaij, 2005. “Ethanol from
lignocellulosic biomass: techno-economic performance in short-, middle- and long-
term”. Biomass Bioenergy, 28 pp. (384–410).
10. C.J. Knill, J.F. Kennedy., 2002. “Degradation of cellulose under alkaline conditions”.
Carbohydr Polym, 51 (pp. 281–300).
11. Cao N, Xia Y, Gong CS, Tsao GT., 1997. “Production of 2,3-butanediol from
pretreated corn cob by Klebsiella oxytoca in the presence of a fungal cellulase”. Appl
Biochem Biotech 63-65(129-39).
12. Carlos Martin, Mats Galbe, C. Fredrik Wahlbom, Bärbel Hahn-Hägerdal, Leif J.
Jönsson, 2002. “Ethanol production from enzymatic hydrolysates of sugarcane
bagasse using recombinant xylose-utilising Saccharomyces cerevisiae”. Enzyme and
Microbial Technology 31 (274–282).
13. Carina Van Zyl, Bernard A. Prior, and James C. Du Preez, 1988. “ Production of
Ethanol from Sugarcane Bagasse Hemicellulose Hydrolyzate by Pichia stipites”. The
Humana Press Inc.
14. Carolina Conde-Mejia, Arturo Jimenez-Gutierrez,., Mahmoud El-Halwagi. A
comparison of pretreatment methods for bioethanol production from lignocellulosic
materials. Process Safety and Environmental Protection 9 0 ( 2 0 1 2 ) 189–202
15. Chang RHY, Jang J, Wu KCW., 2011. “Cellulase immobilized mesoporous silica
nanocatalysts for efficient cellulose-to-glucose conversion”. Green Chem 13:2844-50.
16. Converse, A.O., Matsuno, R., Tanaka, M., Taniguchi, M., 1988. “A model for enzyme
adsorption and hydrolysis of microcrystalline cellulose with slow deactivation of the
adsorbed enzyme”. Biotechnol. Bioeng. 32, 38–45.
135
17. Coughlan, M.P., Ljungdahl, L.G., 1988. “Comparative biochemistry of fungal and
bacterial cellulolytic enzyme system”. In: Aubert J.–P., Beguin, P., Millet, J. (Eds.),
Biochemistry and genetics of cellulose degradation. pp. 11-30.
18. Chandel, A.K., Kapoor, R.K., Singh, A. & Kuhad, R.C. (2007a) Detoxification of
sugarcane bagasse hydrolysate improves ethanol production by Candida shehatae
NCIM 3501. Bioresource Technol., Vol. 98, pp. 1947–1950.
19. Chandel, A.K., Singh, O.V., Chandrasekhar, G., Rao, L.V. & Narasu, M.L. (2011a)
Bioconversion of novel substrate, Saccharum spontaneum, a weedy material into
ethanol by Pichia stipitis NCIM3498. Bioresource Technol., Vol. 102, pp. 1709 1714.
20. David L. Grzenia, Daniel J. Schell, S. Ranil Wickramasinghe, 2012. “Membrane
extraction for detoxification of biomass hydrolysates”. Bioresource Technology 111
(248–254).
21. Elsayed Elbeshbishy, Hisham Hafez, Bipro Ranjan Dhar, George Nakhla, 2011.”
Single and combined effect of various pretreatment methods for biohydrogen
production from food waste”. International journal of hydrogen energy 36 (11379-
11387)
22. Eva Palmqvist, Bärbel Hahn-Hägerdal, 2000. “Fermentation of lignocellulosic
hydrolysates. I: inhibition and detoxification”. Bioresource Technology Volume 74,
Issue 1, Pages 17–24.
23. Excoffier, G., Toussaint, B., Vignon, M.R., 1991. “Saccharification of steam-
exploded poplar wood”. Biotechnol. Bioeng. 38, 1308–1317.
24. Faaij, A.P.C.,2006. “Bio-energy in Europe : Changing Technology Choices”. Energy
Policy 34, 322–342.
25. F. Carvalheiro, L.C. Duarte, S. Lopes, J.C. Parajó, H. Pereira, F.M. Gi´rio, 2005.
“Evaluation of the detoxification of brewery’s spent grain hydrolysate for xylitol
production by Debaryomyces hansenii CCMI 941”. Process Biochemistry Volume 40,
Issues 3–4, Pages (1215–1223).
26. Feng Guo, Zhen Fang, C. Charles Xu, Richard L. Smith Jr.,2012. “Solid acid
mediated hydrolysis of biomass for producing biofuels”. Progress in Energy and
Combustion Science 38 (672-690).
27. Farid Talebnia, Dimitar Karakashev, Irini Angelidaki. Production of bioethanol from
wheat straw: An overview on pretreatment, hydrolysis and fermentation. Bioresource
Technology 101 (2010) 4744–4753
136
28. Fang Z.,2009. “Complete dissolution and oxidation of organic wastes in water”.
Germany: VDM Verlag 1st ed.
29. Fang Z., 2010. “Rapid production of micro- and nano-particles using supercritical
water”. Germany: Springer-Verlag 1st ed.
30. Fonseca, B.G., Moutta, R.O., Ferraz, F.O., Vieira, E.R., Nogueira, A.S., Baratella,
B.F., Rodrigues, L.C., Hou-Rui, Z. and Silva, S.S. (2011) Biological detoxification of
different hemicellulosic hydrolysates using Issatchenkia occidentalis CCTCC M
206097 yeast. J. Ind. Microbiol. Biotechnol. Vol. 38, pp. 199–207.
31. Garda-Aparicio MAP, Ballesteros I, Gonzalez A, Oliva JwM, Ballesteros M, Negro
MAJ,. 2006. “Effect of inhibitors released during steam-explosion pretreatment of
barley straw on enzymatic hydrolysis”. Appl Biochem 129-32:278-88.
32. Gaspar, M.; Kalman, G.; Reczey, K. Corn fiber as a raw material for hemicellulose
and ethanol production. Process Biochem. 2007, 42, 1135-1139.
33. Grous, W. R.; Converse, A. O.; Grethlein, H. E. Effect of steam n explosion
pretreatment on pore size and enzymatic hydrolysis of poplar. Enzyme Microb.
Technol. 1986, 8, 274–280.
34. Ghose, T.K., Bisaria, V.S., 1979. “Studies on mechanism of enzymatic hydrolysis of
cellulosic substances”. Biotechnol. Bioeng. 21, 131–146.
35. Grohmann K, Torget R, Himmel M., 1985. “Optimization of dilute acid pretreatment
of biomass”. Biotechnol Bioeng Symp 15(59-80).
36. Harish Kumar Reddy Y., Srijana M., Madhusudhan Reddy D.2 and Gopal Reddy,
2010”. Coculture fermentation of banana agro-waste to ethanol by cellulolytic
thermophilic Clostridium thermocellum CT2”. African Journal of Biotechnology Vol.
9 (13), pp. 1926-1934
37. Haroon S. Kheshgi, Roger C. Prince, and Gregg Marland, 2000. “THE POTENTIAL
OF BIOMASS FUELS IN THE CONTEXT OF GLOBAL CLIMATE CHANGE:
Focus on Transportation Fuels”. Annu. Rev. Energy Environ.25:199–244.
38. Ho-Yong Kim, Ki-Seob Gwak, Su-Yeon Lee, Han-Seob Jeong, Keun-Ok Ryu, In-Gyu
Choi, 2012. “Biomass characteristics and ethanol production of yellow poplar
(Liriodendron tulipifera) treated with slurry composting and biofiltration liquid as
fertilizer”. Biomass and Bioenergy 42 (10-17).
137
39. Huang, H.-J., Ramaswamy, S., Tschirner, U.W., Ramarao, B.V., 2008. A review of
separation technologies in current and future biorefineries. Sep. Purif. Technol. 62 (1),
1–21.
40. Imai, M., K. Ikari, et al. (2004). "High-performance hydrolysis of cellulose using
mixed cellulase species and ultrasonication pretreatment." Biochemical Engineering
Journal 17(2): 7983.
41. Jones, D.T., Woods, D.R., 1986. “Acetone–butanol fermentation revisited.
Microbiol”. Rev. 50, 484–524.
42. Jun Cheng, Ao Xia, Wenlu Song , Huibo Su, Junhu Zhou, Kefa Cen, 2012 .
“Comparison between heterofermentation and autofermentation in hydrogen
production from Arthrospira (Spirulina) platensis wet biomass”. International journal
of hydrogen energy 37 (6536-6544).
43. Joshua T. Ellis, Neal N. Hengge, Ronald C. Sims, Charles D. Miller, 2012. “Acetone,
butanol, and ethanol production from wastewater algae”. Bioresource Technology 111
(491–495).
44. Kuhad, R. C., and Singh, A., 1993. “Lignocellulosic Biotechnology: Current and
Future prospects”. Crit. Rev. Biotechnol. 13, (151-172).
45. Kumar, R., Wyman, C.E., 2009b. Does change in accessibility with conversion
depend on both the substrate and pretreatment technology? Bioresour. Technol. 100,
4193–4202.
46. L.J. Jönsson, E. Palmqvist, N.O. Nilvebrant, B. Hahn-Hägerdal, 1998. “Detoxification
of wood hydrolysates with laccase and peroxidase from the white rot fungus Trametes
versicolor”. Appl. Microbiol. Biotechnol., 49 (pp. 691–697).
47. Lee, Y.Y.; Iyer, P.; Torget, R.W.,1999. “Dilute-acid hydrolysis of lignocellulosic
biomass”. Adv. Biochem. Eng. Biotechnol. 65, (93-115).
48. Lee, J.-W.; Gwak, K.-S.; Park, J.-Y.; Park, M.-J.; Choi, D.-H.; Kwon, M.; Choi., I.-G.
Biological pretreatment of softwood Pinus densiflora by three white rot fungi. J.
Microbiol. 2007, 45 (6), 485–491.
49. Li, Q., He, Y.C., Xian, M., Jun, G., Xu, X., Yang, J.M., Li, L.Z., 2009. Improving
enzymatic hydrolysis of wheat straw using ionic liquid 1-ethyl-3-methyl imidazolium
diethyl phosphate pretreatment. Bioresour. Technol. 100, 3570–3575.
138
50. López, M.J., Nichols, N.N., Dien, B.S., Moreno, J. & Bothast, R.J. (2004) Isolation of
microorganisms for biological detoxification of lignocellulosic hydrolysates. Appl.
Microbiol. Biotechnol., Vol. 64, pp.125–131.
51. Lai DM, Deng L, Guo QX, Fu Y., 2011. “Hydrolysis of biomass by magnetic solid
acid”. Energy Environ Sci 4:3552-7.
52. Ma F,Yang N,Xu C, Yu H, Wu J,Zhang X. Combination of biological pretreatment
with mild acid pretreatment for enzymatic hydrolysis and ethanol production from
water hyacinth. Bioresour Technol 2010; 1011:9600-4.
53. McMillan, J. D. Pretreatment of lignocellulosic biomass. In Enzymatic ConVersion of
Biomass for Fuels Production; Himmel, M. E., Baker, J. O., Overend, R. P., Eds.;
American Chemical Society: Washington, DC, 1994; pp 292-324.
54. Mingrui Yu, YaliZhang, I-ChingTang, Shang-TianYang., 2011. “Metabolic
engineering of Clostridium tyrobutyricum for n-butanol production”. Metabolic
Engineering 13(373–382).
55. Mosier, N., Wyman, C.E., Dale, B.D., Elander, R.T., Lee, Y.Y., Holtzapple, M.,
Ladisch, C.M., 2005b. “Features of promising technologies for pretreatment of
lignocellulosic biomass”. Bioresour. Technol. 96, (673–686).
56. Mononmani, H.K., Sreekantiah, K.R., 1987. “Saccharification of sugar-cane bagasse
with enzymes from Aspergillus ustus and Trichoderma viride”. Enzyme Microb.
Technol. 9, 484–488.
57. M. Gayali Korpos, J. Feczak, K. Reczey, 2008. “ Sweet sorghum juice and Baggase as
a possible feedstock for bioethanol production”. Hungarian journal of industrial
chemistry Veszprem. Vol. 36(1-2) pp. 43-48.
58. M.L. Shuler, F. Kargi, 1991. “Bioprocess Engineering: Basic Concepts”. Prentice-Hall
College Div.
59. Monsalve G, John F, Medina PIV, Ruiz CAA, Adriana A. 2006. “Ethanol production
of banana shell and cassava starch”. Dyna Rev fac nac minas 73(21-27).
60. McKendry P., 2002. “Energy production from biomass (part 1): overview of
biomass”. Bioresour Technol 83(37-43).
61. Na Zhou, Yimin Zhang, Xiaobin Wu, Xiaowu Gong, Qinhong Wang, 2011.
“Hydrolysis of Chlorella biomass for fermentable sugars in the presence of HCl and
MgCl2“.Bioresource Technology 102 (10158–10161).
139
62. Nasib Qureshi, Badal C. Saha, Ronald E. Hector, Bruce Dien, Stephen Hughes, Siqing
Liu, Loren Iten, Michael J. Bowman, Gautam Sarath, Michael A. Cotta, 2010.
“Production of butanol (a biofuel) from agricultural residues: Part II – Use of corn
stover and switchgrass hydrolysates”. Biomass and Bioenergy 34 ( 566–571).
63. Nasib Qureshi, Badal C. Saha, Bruce Dien, Ronald E. Hector, Michael A. Cotta.,
2010. “Production of butanol (a biofuel) from agricultural residues: Part I – Use of
barley straw hydrolysate”. Biomass and Bioenergy 34(5 5 9 – 5 6 5).
64. Nasib Qureshi, Badal C. Saha, Bruce Dien, Ronald E. Hector, Michael A. Cotta, 2010.
“Production of butanol (a biofuel) from agricultural residues: part I – Use of barley
straw hydrolysate”. Biomass and Bioenergy 34(559–565).
65. Nanjing Forestry Institute.,1961. “Plant hydrolysis technology”. 1st ed. Beijing:
Agricultural Press.
66. National Research Council, 1999. Committee on Biobased Industrial Products,
Biobased Industrial Products––Priorities for Research and Commercialization.
National Academy Press.
67. Ooshima, H., Sakata, M., Harano, Y., 1986. “Enhancement of enzymatic hydrolysis of
cellulose by surfactant”. Biotechnol. Bioeng. 28, 1727–1734.
68. O. Bobleter, 1994. “Hydrothermal degradation of polymers derived from plants”.
Prog Polym Sci, 19 (pp. 797–841).
69. Ogier, J.C.; Ballerini, D.; Leygue, J.P.; Rigal, L.; Pourquie, J.,1999. “Ethanol
production from lignocellulosic biomass”. Oil Gas Sci. Technol. 54, (67-94).
70. Oliva, J.M., Sáez, F., Ballesteros, I., Gónzalez, A., Negro, M.J., Manzanares, P.,
Ballesteros, M., 2003. Effect of lignocellulosic degradation compounds from steam
explosion pretreatment on ethanol fermentation by thermotolerant yeast
Kluyveromyces marxianus. Appl. Microbiol. Biotechnol. 105, 141–154.
71. P. Alvira, E. Tomás-Pejó, M. Ballesteros, M.J. Negro.,2009. “Pretreatment
technologies for an efficient bioethanol production process based on enzymatic
hydrolysis: A review”. Bioresource Technology 101(4851–4861).
72. Palmqvist, E., Hahn-Hagerdal, B., Szengyel, Z., Zacchi, G. & Reczey, K. (1997)
Simultaneous detoxification and enzyme production of hemicelluloses hydrolysates
obtained after steam pretreatment. Enzyme Microbial Technol. Vol. 20, pp. 286–293.

140
73. Paulien Harmsen, Wouter Huijgen, Laura Bermudez, Robert Bakker(2010). “
Literature review of physical and chemical pretreatment processes for lignocellulosic
biomass”. Wageningen UR Food & Biobased Research
74. Parveen Kumar, Diane M. Barrett, Michael J. Delwiche, and Pieter Stroeve, 2009.
“Methods for pretreatment of lignocellulosic biomass for efficient hydrolysis and
biofuel production”. Industrial & Engineering Chemistry Research.
75. Parawira, W. & Tekere, M. (2011) Biotechnological strategies to overcome inhibitors
in lignocellulose hydrolysates for ethanol production: review. Crit. Rev. Biotechnol.,
Vol. 31, pp. 20-31.
76. Poonam Singh Nigam, Anoop Singh, 2011. “Production of liquid biofuels from
renewable resources” Progress in Energy and Combustion Science 37 (2011) 52-68.
77. Piotr Oleskowicz-Popiel, Przemyslaw Lisiecki, Jens Bo Holm Nielsen, Anne Belinda
Thomsen, Mette Hedegaard Thomsen, 2008. “Ethanol production from maize silage
as lignocellulosic biomass in anaerobically digested and wet-oxidized manure”.
Bioresource Technology, Vol. 99, No. 13, p. 5327-5334.
78. Prassad S, Singh A, Joshi HC., 2007. “Ethanol as an alternative fuel from agricultural,
industrial and urban residues”. Resour Conserv Recycl 50(1-39).
79. Razif Harun, Michael K. Danquah, 2011. “Enzymatic hydrolysis of microalgal
biomass for bioethanol production”. Chemical Engineering Journal 168 (1079–1084).
80. Rabinovich, M. L., Melnik, M. S., and Boloboba, A. V. (2002). “ Microbial cellulases
(Review),” Appl. Biochem. Micrbiol. 38(4), 305-321.
81. Ramos, J.P., Breuil, C., Saddler, J.N., 1993. “The use of enzyme recycling and the
influence of sugar accumulation on cellulose hydrolysis by Trichoderma cellulases”.
Enzyme Microb. Technol. 15,19–25.
82. Rowell MR., 1992 “Emerging technologies for material and chemicals from biomass”.
Proceedings of symposium. Washington, DC: American Chemical Society pp. 26-31.
83. Sánchez, Ó.J., Cardona, C.A., 2008. “Trends in biotechnological production of fuel
ethanol from different feedstocks”. Bioresour. Technol. 99, 5270–5295.
84. Sasaki M, Fang Z, Fukushima Y, Adschiri T, Arai K., 2000. “Dissolution and
hydrolysis of cellulose in subcritical and supercritical water”. Ind Eng Chem Res 39:
2883-90.
85. Sara Shields, Raj Boopathy., 2011. “Ethanol production from lignocellulosic biomass
of energy cane”. International Biodeterioration & Biodegradation 65(142-146).
141
86. Saxena RC, Seal D, Kumar S, Goyal HB., 2008. “Thermo-chemical routes for
hydrogen rich gas from biomass: a review”. Renewable and Sustainable Energy
Reviews 12:1909–27.
87. Singh R, Varma AJ, Laxman RS, Rao M., 2009. “Hydrolysis of cellulose derived
from steam exploded bagasse by Penicillium cellulases: comparison with commercial
cellulase”. Bioresour Technol 100(6679-81).
88. Saeman JF, Bubl JL, Harris EE.,1945. “Quantitative saccharification of wood and
cellulose”. Ind Eng Chem Anal Ed 17:35-7.
89. Sidiras, D.K.; Koukios, E.G. Acid saccharification of ball-milled straw. Biomass
1989, 19, 289-306.
90. Stephen C. Grado and M. Jeya Chandra. “ A Factorial Design Analysis of a Biomass
to Ethanol Production system”. Biomass and Bioenergy Vol. 15, No. 2, pp. 115-124.
91. Taherzadeh, M.J.,1999. “Ethanol from lignocellulose: physiological effects of
inhibitors and fermentation strategies”. Ph.D thesis in Biotechnology, Chemical
Reaction Engineering, Chalmers University of Technology.
92. Taherzadeh, M.J., and Karimi, K., 2007. “Enzyme based hydrolysis processes for
ethanol from lignocellulosic materials: A review”. Bioresources 2(4), (707-738).
93. Taherzadeh, M.J., and Karimi, K.(2008). “Pretreatment of lignocellulosic wastes to
improve ethanol and biogas production: A review,” Int. J. Mol. Sci. 9, 1621-1651.
94. Thomas Heinze KSSB. Ionic liquids as reaction medium in cellulose
functionalization. Macromol Biosci 2005;5:520-5.
95. Tony Vancov, Amy-Sue Alston, Trevor Brown, Shane McIntosh, 2012. “Use of ionic
liquids in converting lignocellulosic material to biofuels”. Renewable Energy 45
(2012) 1-6
96. Tian J, Wang J, Zhao S, Jiang C, Zhang X, Wang X., 2010. “Hydrolysis of cellulose
by the heteropoly acid H3PW12O40 ”. Cellulose 17:587-94.
97. Thaddeus Chukwuemeka Ezeji, Nasib Qureshi and Hans Peter Blaschek, 2007.
“Butanol Production From Agricultural Residues: Impact of Degradation Products on
Clostridium beijerinckii Growth and Butanol Fermentation”. Biotechnology and
Bioengineering, Vol. 97, No. 6.
98. Thomas Ingram, Kai Wormeyer, Juan Carlos Ixcaragua Lima, Vera Bockemuhl,
Garabed Antranikian, Gerd Brunner, Irina Smirnova, 2011.” Comparison of different
142
pretreatment methods for lignocellulosic materials. Part I: Conversion of rye straw to
valuable products”. Bioresource Technology 102(5221–5228).
99. Waleed K. El-Zawawy, Maha M. Ibrahim, Yasser R. Abdel-Fattah, Nadia A. Soliman,
Morsi M. Mahmoud, 2011. “Acid and enzyme hydrolysis to convert pretreated
lignocellulosic materials into glucose for ethanol production”. Carbohydrate Polymers
Volume 84, Issue 3, Pages 865–871.
100. Wu, J., Ju, L.K., 1998. “Enhancing enzymatic saccharification of waste newsprint by
surfactant addition”. Biotechnol. Prog. 14, 649–652.
101. Wyman, C.E., Dale, B.E., Elander, R.T., Holtzapple, M., Ladisch, M.R., Lee, Y.Y.,
2005b. Comparative sugar recovery data from laboratory scale application of leading
pretreatment technologies to corn stover. Bioresour. Technol. 96, 2026–2032.
102. Wymann, C.E., 1996. “Handbook on bioethanol: Production and
Utilization”.Washington, DC, Taylor and Francis.
103. Xin, Z., Yinbo, Q., Peiji, G., 1993. “Acceleration of ethanol production from paper
mill waste fiber by supplementation with β-glucosidase”. Enzyme Microb. Technol.
15, 62–65
104. Yang, B. & Wyman, C.E. (2008) Pretreatment: the key to unlocking low-cost
cellulosic ethanol. Biofuels Bioproduct Bioref., Vol. 2, pp. 26–40.
105. Yung-Chung Lo , Yi-Chen Su, Chieh-Lun Cheng, Jo-Shu Chang, 2011. “Biohydrogen
production from pure and natural lignocellulosic feedstock with chemical pretreatment
and bacterial hydrolysis.” international journal of hydrogen energy 36 (13955-13963).
106. Ye Sun, Jay J. Cheng, 2005. “Dilute acid pretreatment of rye straw and bermudagrass
for ethanol production”. Bioresource Technology 96 (1599–1606).
107. Ye Sun, Jiayang Cheng, 2002.” Hydrolysis of lignocellulosic materials for ethanol
production: a review”. Bioresource Technology Volume 83, Issue 1, Pages 1–11.
108. Yan Xing, Zhuo Li, Yaoting Fan, Hongwei Hou, 2010. “Biohydrogen production
from dairy manures with acidification pretreatment by anaerobic fermentation”.
Environ Sci Pollut Res (17:392–399).
109. Yachmenev, V., Condon, B., Klasson, T., Lambert, A., 2009. Acceleration of the
enzymatic hydrolysis of corn stover and sugar cane bagasse celluloses by low intensity
uniform ultrasound. J. Biobased Mater. Bioenergy 3, 25–31.
110. Ye Sun, Jiayang Cheng, 2002. “Hydrolysis of lignocellulosic materials for ethanol
production: a review”. Bioresource Technology 83 (1–11).
143
111. Yildiz Kalinci, Arif Hepbasli, Ibrahim Dincer., 2009. “Biomass-based hydrogen
production: A review and analysis”. International journal of hydrogen energy
34(8799–8817).
112. Zhu, H., Beland, M., 2006. “Evaluation of alternative methods of preparing hydrogen
producing seeds from digested wastewater sludge”. International Journal of Hydrogen
Energy 31(1980-1988).
113. Zhao, X., Cheng, K., Liu, D., 2009a. Organosolv pretreatment of lignocellulosic
biomass for enzymatic hydrolysis. Appl. Microbiol. Biotechnol. 82, 815–827.
114. Chang, V. S. and M. T. Holtzapple (2000). "Fundamental factors affecting biomass
enzymatic reactivity." Applied Biochemistry and Biotechnology - Part A Enzyme
Engineering and Biotechnology 84-86: 5-37.

144
CHAPTER 11
BIOPROSPECTING PLANT PATHOGEN XANTHOMONAS
AXONOPODIS PV. PUNICAE FOR PRODUCTION OF
CELLULASES AND XYLANASES FOR LIGNOCELLULOSIC
BIOMASS HYDROLYSIS
Dolamani Amat, Rameshwar Tiwari, Anju Arora, Lata and A.K. Saxena
Abstract
Xanthomonas sp., a known plant pathogen, produces several hydrolytic enzymes, which help
the organism in invasion and cause disease in many agriculturally important crops like rice,
tomato, citrus etc. In the present study Xanthomonas axonopodis pv. punicae strain isolated
from infected pomegranate fruit from Sholapur, Maharastra, India, was used to produce
cellulolytic and xylanolytic enzymes. The specific activities (IU/mg protein) of enzymes
produced by Xanthomonas axonopodis were CMCase (0.056), FPase (0.86), xylanase (0.86)
and cellobiase (0.418). Effect of C and N sources and surfactants showed that CMC was good
inducer for FP, CMCase and xylanase activities while starch was better for cellobiase
production. Soyameal and yeast extract were superior N sources for CMCase, FP activity and
xylanase while peptone was better for cellobiase. Surfactants had no effect on extracellular
levels of these activities except cellobiase. Under optimized conditions, enzyme production
increased 2- 10.8 fold. FP activity, CMCase and Cellobiase showed temperature optimum
55°C and Xylanase 45°C. Optimal activity for all the enzymes was seen at pH 8 and more
than one optimum was observed for FP activity and cellobiase showing more isoforms.
Xylanase and cellobiase activities were found to be more thermostable than FP activity and
CMCase when heated at 75°C for 1hr. Saccharification of different substrates (α-cellulose,
filter paper and biologically pretreated rice straw showed increased release of sugars till 96
hrs. Highest saccharification yields with Xanthomonas enzyme extracts were obtained from
biologically pretreated paddy straw amongst all the substrates.
Key words: Xanthomonas, biomass hydrolyzing enzymes, plant pathogen, cellulases,
xylanase.
145
11.1 Introduction
Development of biofuels is important not only for reducing dependence on petroleum based
fuels but also for mitigation of climate change, as they offer C neutral alternative. Biofuels are
biomass derived fuels and include solid biomass, liquid fuels and biogas. Biofuels employ
recycling of agricultural byproducts and dedicated energy crops, which offer opportunities for
mitigation of greenhouse gas emission as growing these leads to C sequesteration through
photosynthesis. Transport sector consumes major portion of petroleum-based fuels, therefore,
liquid biofuels which include biodiesel, bioethanol and biobutanol are the most important.
Biofuels are derived from plant matter like grains (Ist generation) and lignocellulosic biomass
(IInd generation). A wide range of lignocellulosic substrates have been proposed as feedstock
for biofuel production including crop and forestry residues, grasses and tree species. During
bioconversion of biomass to ethanol, the complex lignin- cellulose- hemicellulose matrix has
to be disintegrated and the carbohydrate polymers undergo hydrolysis to yield fermentable
sugars. There has been a tremendous interest in the enzymatic hydrolysis of pretreated
lignocellulosic biomass as it has demonstrated better results during the fermentation of simple
sugars because no inhibitory degradation products are formed although the process is
inherently slower. The other prominent advantages of enzymatic hydrolysis are: mild process
conditions which do not require expensive materials of construction and low process energy
requirements. This hydrolysis step is typically catalysed by cocktails of enzymes including
cellulases, hemicellulases and other accessory enzymes that target and degrade specific
constituents of cell wall. Enzymatic hydrolysis has renewed and increased the focus on
several aspects of cellulases as they play a key role in determining the economics of
operation. It has been extremely difficult to achieve high saccharification yields and sugar
recoveries, because of various factors like cellulose recalcitrance, product inhibition and
enzyme deactivation (Cantarella et al., 2004; Kumar and Wyman, 2008 and Ximenes et al.,
2011). There is decrease in hydrolysis efficiency due to deactivation of cellulase components
by reaction environment factors like thermal and mechanical mechanisms also (Ye et al.,
2012). The impediments, which include, development of robust biocatalysis and cost of
cellulases, have to be overcome for successful commercialization of biofuels. Therefore,
research on enzyme optimisation with a goal of reducing the cost of biomass conversion into
sugars is being actively pursued. A cost effective enzyme technology to degrade
polysaccharides into fermentable sugars is imperative for economically viable biofuels.
146
The main strategies to reduce the cost of enzymes include screening new organisms and
bioprospecting for superior versions of key enzymes, and for enzymes that act synergistically
with existing commercial cellulases, protein engineering and high level expression in plants
(Banerjee et al., 2010). Thus, search for hyper cellulase producing organisms, developing
superior cellulases with improved characteristics such as higher efficiencies, increased stability
at elevated temperatures and higher tolerance to end product inhibition and also inhibition by
pretreatment byproducts using advanced biotechnologies is on (Bon and Ferrera, 2007).
Synthetic mixtures of hydrolytic enzymes have to be developed in proper ratio of constituent
enzymes. For this purpose, a library of hydrolases from diverse sources and characteristics is
required to tailor such mixtures. Microorganisms are able to degrade lignocellulosics in a
diverse range of habitats whether it is forest floor, termite gut or rumen of cattle.
A wide range of microorganisms including fungi, bacteria, actinomycetes, and yeasts
produce biomass degrading enzymes cellulases and hemicellulases in nature. Currently
available commercial cellulases are sourced from saprophytic fungal strains of Trichoderma
and Aspergillus. Many plant pathogens are known to produce arsenal of plant cell wall
degrading enzymes, which can be more potent as the plant pathogens have to overcome plant
defenses (King et al., 2011). Plant pathogens have greater capabilities of attacking and thriving
on plant lignocellulosic biomass and may possess unique set of enzymes or individual
cocktails, which may complement commercial cellulases for faster and more complete
saccharification of biomass carbohydrates. The enzymes elaborated by the plant pathogenic
organisms may be more suitable for biochemical conversion of biomass in biorefineries as
their host species include potential lignocellulosic feedstocks for biofuel production. Thus, to
achieve full potential of biorefineries, there is a pressing need to discover novel and
unexploited microbes and their enzyme arsenals. A comprehensive study of cellulases
expressed by plant pathogenic bacteria may yield promising enzyme candidates for application
in bioethanol industry. Thus, they present opportunities for bioprospecting of organisms
producing lignolytic and cellulolytic enzymes (Alper and Steaphanopoulous, 2009).
Xanthomonas spp. a group of G-ve proteobacteria are potent plant pathogen of number of
agriculturally important crops like rice, tomato etc. and produce a variety of hydrolytic
enzymes like celllulases, xylanases and pectinases which helps the organism in pathogenesis.
Xanthomonas axonopodis pv. punicae is the pathogen involved in infection of pomegranate
and was responsible for epidemic in Karnataka and Maharashtra. The present study was
conducted to produce cellulolytic and xylanolytic enzymes using Xanthomonas axonopodis
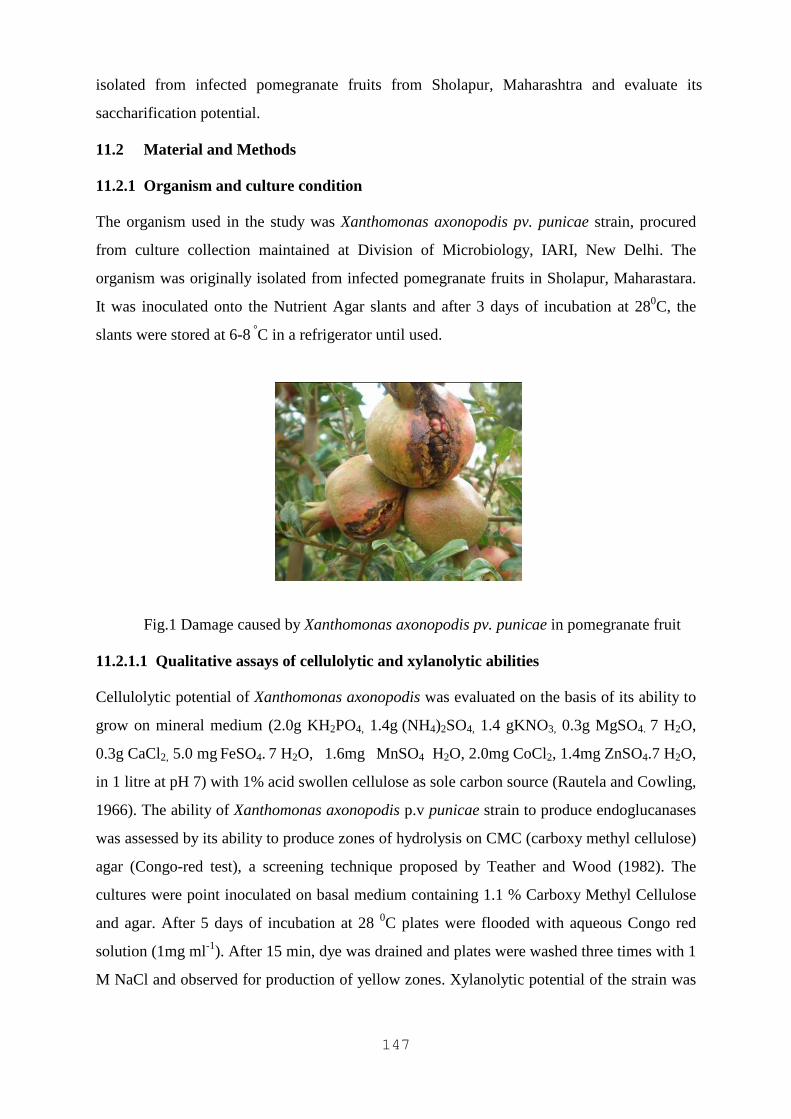
147
isolated from infected pomegranate fruits from Sholapur, Maharashtra and evaluate its
saccharification potential.
11.2 Material and Methods
11.2.1 Organism and culture condition
The organism used in the study was Xanthomonas axonopodis pv. punicae strain, procured
from culture collection maintained at Division of Microbiology, IARI, New Delhi. The
organism was originally isolated from infected pomegranate fruits in Sholapur, Maharastara.
It was inoculated onto the Nutrient Agar slants and after 3 days of incubation at 280C, the
slants were stored at 6-8 °C in a refrigerator until used.
Fig.1 Damage caused by Xanthomonas axonopodis pv. punicae in pomegranate fruit
11.2.1.1 Qualitative assays of cellulolytic and xylanolytic abilities
Cellulolytic potential of Xanthomonas axonopodis was evaluated on the basis of its ability to
grow on mineral medium (2.0g KH2PO4, 1.4g (NH4)2SO4, 1.4 gKNO3, 0.3g MgSO4. 7 H2O,
0.3g CaCl2, 5.0 mg FeSO4. 7 H2O, 1.6mg MnSO4 H2O, 2.0mg CoCl2, 1.4mg ZnSO4.7 H2O,
in 1 litre at pH 7) with 1% acid swollen cellulose as sole carbon source (Rautela and Cowling,
1966). The ability of Xanthomonas axonopodis p.v punicae strain to produce endoglucanases
was assessed by its ability to produce zones of hydrolysis on CMC (carboxy methyl cellulose)
agar (Congo-red test), a screening technique proposed by Teather and Wood (1982). The
cultures were point inoculated on basal medium containing 1.1 % Carboxy Methyl Cellulose
and agar. After 5 days of incubation at 28 0C plates were flooded with aqueous Congo red
solution (1mg ml-1). After 15 min, dye was drained and plates were washed three times with 1
M NaCl and observed for production of yellow zones. Xylanolytic potential of the strain was
148
adjuged by observing their growth on mineral medium containing xylan (0.1 % w /v) as sole
carbon source (Rautela and Cowling, 1966).
11.2.1.2 Quantitative assays of cellulolytic and xylanolytic abilities
Quantitative assay of the production of cellulolytic and xylanolytic enzymes by the
Xanthomonas axonopodis strain was done by growing the organism in 25 ml basal mineral
medium dispensed in 100 ml Erlenmeyer flasks containing 1% carboxy methyl cellulose as
sole C source supplemented with 0.1% peptone and yeast extract under submerged culture at
280C. Inoculum used was 10% (v/v) overnight grown culture in nutrient broth. After 7 days of
growth the contents of flasks were centrifuged at 10,000 rpm for 10 min and the supernatants
were used for estimation of different enzyme activities.
Filter paper (exo-β-glucanase) activity and CMCase activity (endo-β-1, 4-glucanase)
were assayed by the method described by Ghose (1987) and xylanase activity, as described by
Ghose and Bisaria (1987). The reducing sugars released were measured by the DNSA method
(Miller, 1959). One unit of Filter Paper activity or CMCase corresponded to 1 µmole of
glucose formed per minute during hydrolysis and one enzyme unit of xylanase was expressed
as 1 µmole of xylose formed per minute during hydrolysis. β -glucosidase assay was
performed using p-nitrophenyl-β-D-glucopyranoside as substrate (Wood and Bhat, 1988) and
the activity was calculated in terms of µmoles of p-nitrophenol produced per ml of culture
filtrate per minute.
11.2.2 Optimisation of production of cellulolytic and xylanolytic enzymes
11.2.2.1 Effect of different carbon sources
To study the effect of various carbon sources on the production of enzymes, basal medium
was supplemented with 1% of either carbon substrates i.e. carboxy methyl cellulose,
cellulose, starch or xylan. Cultures were incubated at 280C under shaking conditions at 150
rpm. After 7 days of incubation, the enzyme activities were assayed using above mentioned
methods.
11.2.2.2 Effect of various Nitrogen sources
Different organic sources of nitrogen were tested for their effect on the enzyme production.
Basal medium was supplemented with either of soyameal, yeast extract, urea or peptone at a
rate of 0.5%. Incubation and enzyme assay were done as mention above.
149
11.2.2.3 Effects of surfactants on extracellular level of cellulolytic and Xylanolytic
enzymes
To study the effect of different surfactants on extracellular levels of enzymes produced by
Xanthomonas axonopodis p.v punicae, basal medium was amended with surfactants like
Tween-20, Tween-80, Triton X-100 at a concentration 0.1 % (w/v or v/v ), after incubation,
the enzyme activities were assayed as mentioned above.
11.2.2.4 Effect of temperature and pH on production of extracellular levels of
cellulolytic and Xylanolytic enzymes
To study the effect of temperature on the production of extracellular enzymes, culture broth
containing basal medium supplemented with 1% CMC, 0.1% peptone and 0.1% yeast extract
were incubated at 280C and 370C. After 7days incubation enzyme assays were performed
using culture supernatant as enzyme. To determine the optimum pH leading to maximum
enzyme production, broth containing basal medium with 1% CMC , 0.1% peptone and 0.1%
yeast extract ,was prepared final with pH value of the broth ranging from 4-8 by adding 1N
HCl or 1N NaOH.
11.2.3 Growth and enzyme production by Xanthomonas axonopodis under optimised
conditions
Organism was grown and enzyme was produced under optimum condition by providing 1%
CMC as sole carbon source in basal medium with 0.5% soyameal and 0.5% yeast extract as
nitrogen source at pH 7.0 under shaking condition with 150 rpm at 280C and activities were
assayed after 7 days.
11.2.4 Physico-chemical characterisation of enzyme activities
Crude supernatants were used for characterisation of enzyme activities present. Their
durability upon heating was also studied.
11.2.4.1 Determination pH and temperature optima of enzyme activities
To determine the optimum pH for the enzyme activities, the enzyme reactions were
performed in buffers between pH 4-8. 0.05M Citrate Phosphate buffer with pH ranging from
4-8 and was used to dissolve the substrate and make up the reaction mixtures and incubated at
50°C. The effect of temperature on the enzyme activities was determined by incubating the
standard reaction mixtures at 45, 55, 65 and 75°C.
150
11.2.4.2 Thermal stability of enzyme activities
To test the thermal stability of enzymes, supernatant was kept at 75°C for 1hr in a water bath.
It was then cooled and residual activities determined by performing enzyme assays were done
using standard protocols.
11.2.5 Saccharification of different substrates using enzyme extract produced by
Xanthomonas axonopodis pv. punicae
Saccharification of different substrates i.e. biologically pretreated paddy straw, α-cellulose
and filter paper was carried out following procedure given by Saritha et al., (2012). Substrate
at concentration 0.1-1g were taken in 50 ml plastic bottles to which 1ml of enzyme extract
was added and volume made up to 10 ml by adding 0.05 M citrate buffer pH (4.8). The
reaction mixtures in bottles were incubated in shaker water bath at 500C and 0.5 ml aliquots
were withdrawn periodically, heated in boiling water bath for 2 minutes to stop the reaction
and total reducing sugars estimated by DNSA method.
11.2.5.1 Enzymatic saccharification of biologically pretreated paddy straw
Biologically pretreated paddy straw was obtained from the laboratory which was previously
prepared by solid state fermentation of paddy straw with isolated strain of Aspergillus niger
for 10 days at 300C following method of Saritha et al. (2012). It had 68% cellulose content.
Saccharification or hydrolysis of the biologically pretreated paddy straw samples was carried
out according to the NREL LAP-009 (Brown and Torget, 1996), with some modifications.
Pretreated samples were used in wet form for the enzymatic digestibility test. 1 gm of
biologically pretreated paddy straw was taken in 50 ml plastic bottles to which 1ml of enzyme
extract was added to the bottle and volume made up to 10 ml by adding 0.05 M citrate buffer
pH (4.8) and incubated as described above.
11.2.5.2 Filter paper and α-Cellulose
Two sets of experiments were carried out with filter paper (Whatman No.1) and α cellulose
substrates. Filter paper was added at 1 and 5% loading while α- cellulose was added at 5 and
10% loading. 1 ml of enzyme extract was added to each bottle containing appropriate amount
of substrate and volume was made up to 10 ml by adding 0.05 M citrate buffer (pH 4.8).
Saccharification was carried out under shaking condition at 500C and aliquots were
withdrawn periodically and reducing sugars released were estimated periodically by DNSA
method.
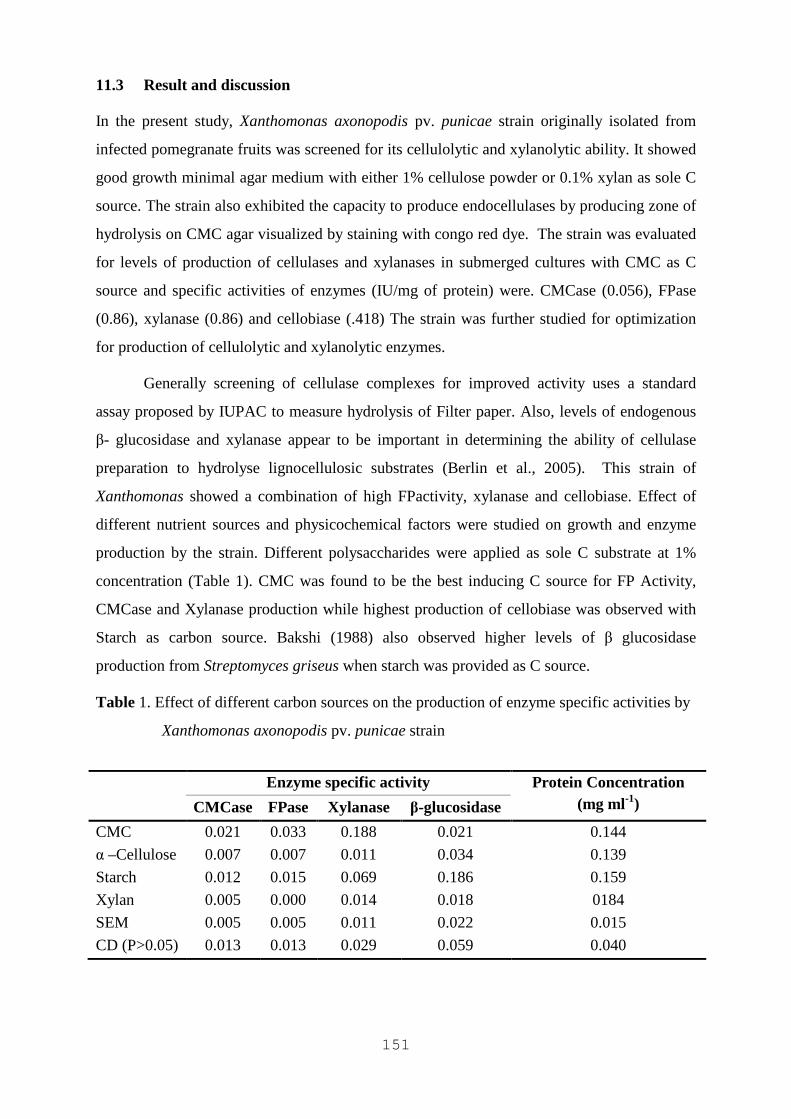
151
11.3 Result and discussion
In the present study, Xanthomonas axonopodis pv. punicae strain originally isolated from
infected pomegranate fruits was screened for its cellulolytic and xylanolytic ability. It showed
good growth minimal agar medium with either 1% cellulose powder or 0.1% xylan as sole C
source. The strain also exhibited the capacity to produce endocellulases by producing zone of
hydrolysis on CMC agar visualized by staining with congo red dye. The strain was evaluated
for levels of production of cellulases and xylanases in submerged cultures with CMC as C
source and specific activities of enzymes (IU/mg of protein) were. CMCase (0.056), FPase
(0.86), xylanase (0.86) and cellobiase (.418) The strain was further studied for optimization
for production of cellulolytic and xylanolytic enzymes.
Generally screening of cellulase complexes for improved activity uses a standard
assay proposed by IUPAC to measure hydrolysis of Filter paper. Also, levels of endogenous
β- glucosidase and xylanase appear to be important in determining the ability of cellulase
preparation to hydrolyse lignocellulosic substrates (Berlin et al., 2005). This strain of
Xanthomonas showed a combination of high FPactivity, xylanase and cellobiase. Effect of
different nutrient sources and physicochemical factors were studied on growth and enzyme
production by the strain. Different polysaccharides were applied as sole C substrate at 1%
concentration (Table 1). CMC was found to be the best inducing C source for FP Activity,
CMCase and Xylanase production while highest production of cellobiase was observed with
Starch as carbon source. Bakshi (1988) also observed higher levels of β glucosidase
production from Streptomyces griseus when starch was provided as C source.
Table 1. Effect of different carbon sources on the production of enzyme specific activities by
Xanthomonas axonopodis pv. punicae strain
Enzyme specific activity Protein Concentration (mg ml-1) CMCase FPase Xylanase β-glucosidase
CMC 0.021 0.033 0.188 0.021 0.144
α –Cellulose 0.007 0.007 0.011 0.034 0.139
Starch 0.012 0.015 0.069 0.186 0.159
Xylan 0.005 0.000 0.014 0.018 0184
SEM 0.005 0.005 0.011 0.022 0.015
CD (P>0.05) 0.013 0.013 0.029 0.059 0.040
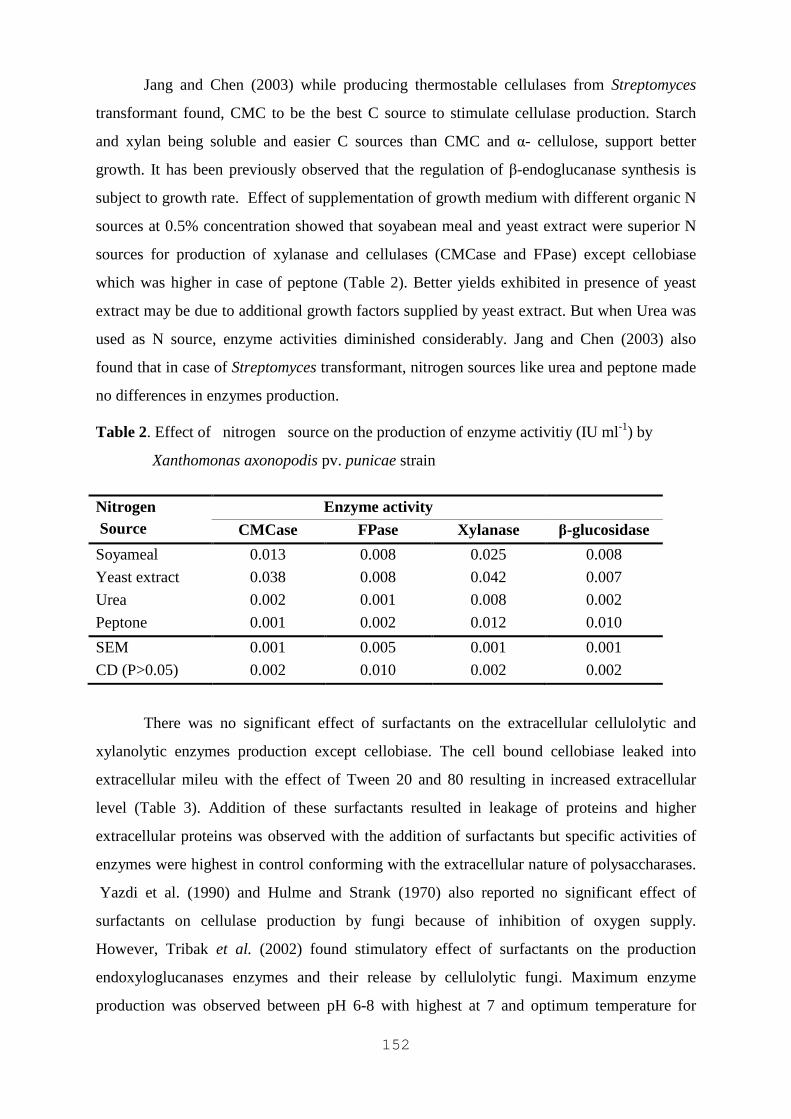
152
Jang and Chen (2003) while producing thermostable cellulases from Streptomyces
transformant found, CMC to be the best C source to stimulate cellulase production. Starch
and xylan being soluble and easier C sources than CMC and α- cellulose, support better
growth. It has been previously observed that the regulation of β-endoglucanase synthesis is
subject to growth rate. Effect of supplementation of growth medium with different organic N
sources at 0.5% concentration showed that soyabean meal and yeast extract were superior N
sources for production of xylanase and cellulases (CMCase and FPase) except cellobiase
which was higher in case of peptone (Table 2). Better yields exhibited in presence of yeast
extract may be due to additional growth factors supplied by yeast extract. But when Urea was
used as N source, enzyme activities diminished considerably. Jang and Chen (2003) also
found that in case of Streptomyces transformant, nitrogen sources like urea and peptone made
no differences in enzymes production.
Table 2. Effect of nitrogen source on the production of enzyme activitiy (IU ml-1) by
Xanthomonas axonopodis pv. punicae strain
There was no significant effect of surfactants on the extracellular cellulolytic and
xylanolytic enzymes production except cellobiase. The cell bound cellobiase leaked into
extracellular mileu with the effect of Tween 20 and 80 resulting in increased extracellular
level (Table 3). Addition of these surfactants resulted in leakage of proteins and higher
extracellular proteins was observed with the addition of surfactants but specific activities of
enzymes were highest in control conforming with the extracellular nature of polysaccharases.
Yazdi et al. (1990) and Hulme and Strank (1970) also reported no significant effect of
surfactants on cellulase production by fungi because of inhibition of oxygen supply.
However, Tribak et al. (2002) found stimulatory effect of surfactants on the production
endoxyloglucanases enzymes and their release by cellulolytic fungi. Maximum enzyme
production was observed between pH 6-8 with highest at 7 and optimum temperature for
Nitrogen Source
Enzyme activity CMCase FPase Xylanase β-glucosidase
Soyameal 0.013 0.008 0.025 0.008
Yeast extract 0.038 0.008 0.042 0.007
Urea 0.002 0.001 0.008 0.002
Peptone 0.001 0.002 0.012 0.010
SEM 0.001 0.005 0.001 0.001
CD (P>0.05) 0.002 0.010 0.002 0.002
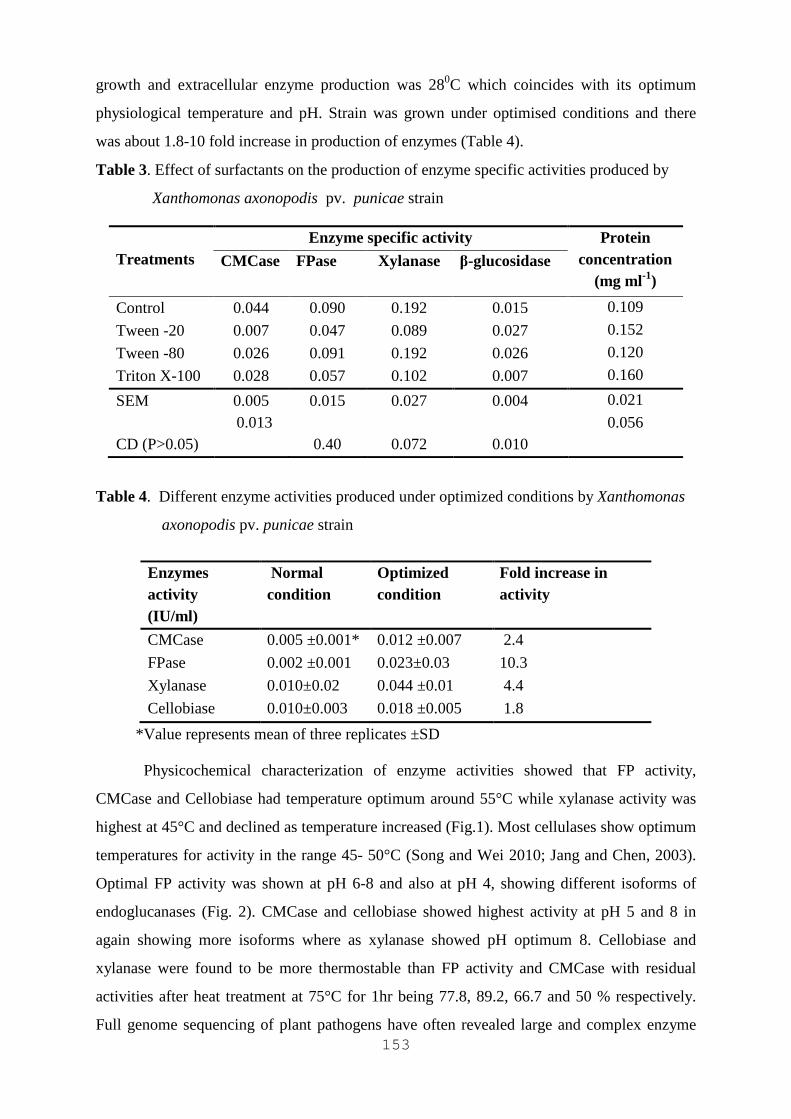
153
growth and extracellular enzyme production was 280C which coincides with its optimum
physiological temperature and pH. Strain was grown under optimised conditions and there
was about 1.8-10 fold increase in production of enzymes (Table 4).
Table 3. Effect of surfactants on the production of enzyme specific activities produced by
Xanthomonas axonopodis pv. punicae strain
Table 4. Different enzyme activities produced under optimized conditions by Xanthomonas
axonopodis pv. punicae strain
*Value represents mean of three replicates ±SD
Physicochemical characterization of enzyme activities showed that FP activity,
CMCase and Cellobiase had temperature optimum around 55°C while xylanase activity was
highest at 45°C and declined as temperature increased (Fig.1). Most cellulases show optimum
temperatures for activity in the range 45- 50°C (Song and Wei 2010; Jang and Chen, 2003).
Optimal FP activity was shown at pH 6-8 and also at pH 4, showing different isoforms of
endoglucanases (Fig. 2). CMCase and cellobiase showed highest activity at pH 5 and 8 in
again showing more isoforms where as xylanase showed pH optimum 8. Cellobiase and
xylanase were found to be more thermostable than FP activity and CMCase with residual
activities after heat treatment at 75°C for 1hr being 77.8, 89.2, 66.7 and 50 % respectively.
Full genome sequencing of plant pathogens have often revealed large and complex enzyme
Treatments
Enzyme specific activity Protein concentration
(mg ml-1) CMCase FPase Xylanase β-glucosidase
Control 0.044 0.090 0.192 0.015 0.109
Tween -20 0.007 0.047 0.089 0.027 0.152
Tween -80 0.026 0.091 0.192 0.026 0.120
Triton X-100 0.028 0.057 0.102 0.007 0.160
SEM 0.005 0.015 0.027 0.004 0.021
CD (P>0.05) 0.013 0.40 0.072 0.010
0.056
Enzymes activity (IU/ml)
Normal condition
Optimized condition
Fold increase in activity
CMCase 0.005 ±0.001* 0.012 ±0.007 2.4
FPase 0.002 ±0.001 0.023±0.03 10.3
Xylanase 0.010±0.02 0.044 ±0.01 4.4
Cellobiase 0.010±0.003 0.018 ±0.005 1.8

154
systems with a number of families (Gibson et al., 2011). Thermostable cellulolytic and
xylanolytic enzymes with high activities at alkaline pH have been reported from novel
bacterial strains like Paenibacillus and Bacillus subtilis (Maki et al., 2009).
Fig. 1 pH optima of different enzyme activities
Fig. 2 Temperature optima of different enzyme activities
Saccharification studies on three different substrates i.e. biologically pretreated paddy
straw, Filter paper and α-cellulose with substrate loading ranging from 1-10%, were
performed using crude enzyme extracts produced under optimized conditions by the strain
(Table 5). The results of the saccharification showed that sugar yields from filter paper at 1%
loading were higher than with 5% loading and for α-cellulose 5% loading gave better sugar
levels than 10%. This may be due to better enzyme to substrate ratio at lower substrate
loadings. Sugar yields increased with time of incubation with highest at 72 h in Filter paper
with 1% loading but in case of 5% α-cellulose there was no significant change in sugar levels
with increased incubation and high level was achieved within 24 hrs. This may be due to
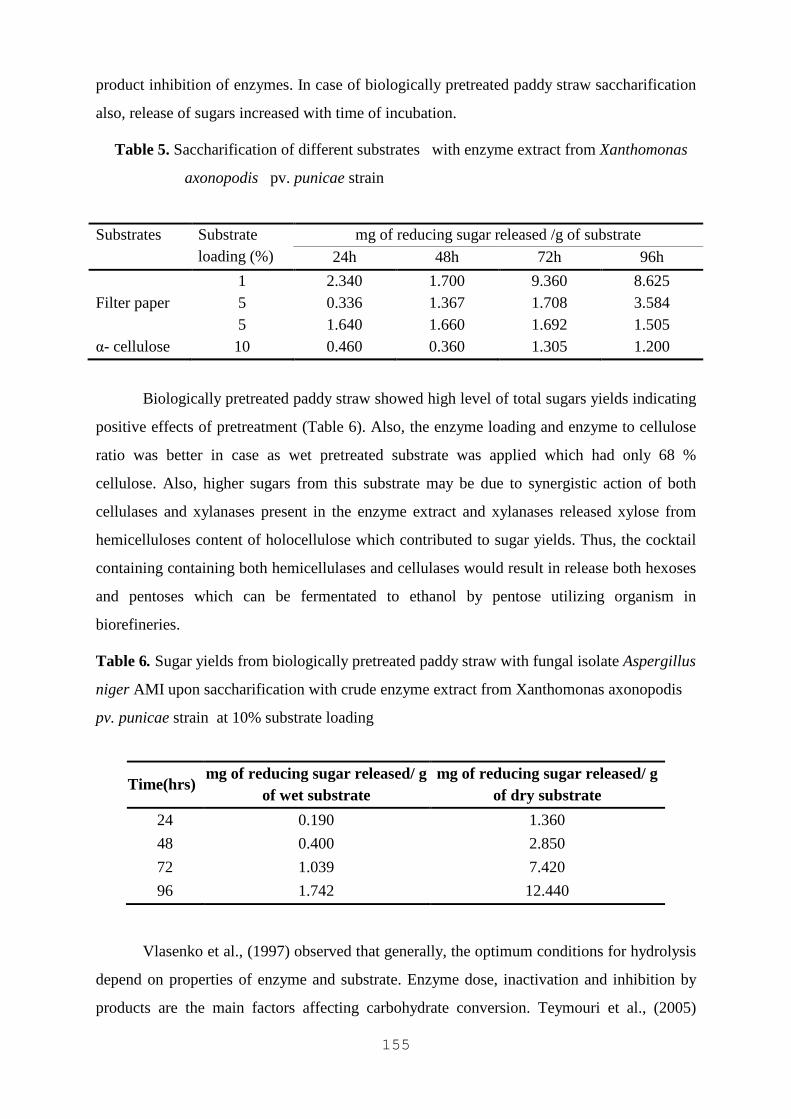
155
product inhibition of enzymes. In case of biologically pretreated paddy straw saccharification
also, release of sugars increased with time of incubation.
Table 5. Saccharification of different substrates with enzyme extract from Xanthomonas
axonopodis pv. punicae strain
Biologically pretreated paddy straw showed high level of total sugars yields indicating
positive effects of pretreatment (Table 6). Also, the enzyme loading and enzyme to cellulose
ratio was better in case as wet pretreated substrate was applied which had only 68 %
cellulose. Also, higher sugars from this substrate may be due to synergistic action of both
cellulases and xylanases present in the enzyme extract and xylanases released xylose from
hemicelluloses content of holocellulose which contributed to sugar yields. Thus, the cocktail
containing containing both hemicellulases and cellulases would result in release both hexoses
and pentoses which can be fermentated to ethanol by pentose utilizing organism in
biorefineries.
Table 6. Sugar yields from biologically pretreated paddy straw with fungal isolate Aspergillus
niger AMI upon saccharification with crude enzyme extract from Xanthomonas axonopodis
pv. punicae strain at 10% substrate loading
Vlasenko et al., (1997) observed that generally, the optimum conditions for hydrolysis
depend on properties of enzyme and substrate. Enzyme dose, inactivation and inhibition by
products are the main factors affecting carbohydrate conversion. Teymouri et al., (2005)
Substrates Substrate loading (%)
mg of reducing sugar released /g of substrate
24h 48h 72h 96h
1 2.340 1.700 9.360 8.625 Filter paper 5 0.336 1.367 1.708 3.584 5 1.640 1.660 1.692 1.505 α- cellulose 10 0.460 0.360 1.305 1.200
Time(hrs) mg of reducing sugar released/ g
of wet substrate mg of reducing sugar released/ g
of dry substrate
24 0.190 1.360
48 0.400 2.850
72 1.039 7.420
96 1.742 12.440
156
observed that enzyme loading in saccharification step determines the rate and extent of
polysaccharide hydrolysis. In the present study since crude preparation was used to include all
the enzymes, the units of enzymes loaded vs substrate were less resulting in less sugar yields
during hydrolysis. Jeya et al. (2009) also found enzyme concentration to be a critical factor
for sugar yields.
Thus, this study presents production of cellulolytic and xylanolytic enzymes by
Xanthomonas axonopodis, their characteristics and potential to hydrolyse biomass and
insoluble substrates. This is amongst few reports on optimization of production of these
enzymes from potent plant pathogenic bacterium. Bacteria present an attractive potential for
production of cellulases and hemicellulases due to their rapid growth rate, enzyme complexity
and habitat variability. These enzymes offer a framework for enhancement of cellulases
including specific activity, thermal stability or end product inhibition due to vast diversity
among bacteria, the identification of novel cellulases remain a currently explored route to
improvement of enzyme cocktails for biorefineries (Maki et al., 2009). The Xanthomonas
axonopodis strain produced good levels of both cellulases and xylanases, thus preparation
from such organisms may be useful because of presence of accessory enzymes. Role of
accessory enzyme xylanase have a significant effect on performance of cellulase (Berlin et al.,
2005).
Xanthomonas axonopodispv. Punicae strain produced FP activity, β-glucosidase and
xylanases, it was able to hydrolyse different substrates. Use of concentrated enzyme
preparation from Xanthomonas containing more units of enzyme activities would give higher
saccharification and yield higher levels of sugars. Xanthomonas axonopodis p.v punicae
strain also showed high production of xylanases with better characteristics i.e thermal
stability, better pH and temperature optima which can be used for supplementing enzyme
cocktail for bioethanol production from lignocellulosic biomass. Genes responsible for
producing superior xylanases from Xanthomonas can be transferred to more tractable/non
pathogenic organisms for over production of enzymes for use in bioethanol industry.
References
1. Alper H. and Stephanopoulous G. (2009) Engineering for Biofuel: exploiting innate
microbial capacity or importing biosynthetic potential? Nat. Rev. Microbiol., 7 (10):
715-723.
157
2. Bakshi,A.1988. Lignocellulytic activity of soil actinomycetes and its mutant.M.sc.
thesis,Panjab University ,Chandigarh,India:47-50.
3. Banerjee G., Scott-Craig J.S. and Walton J.D. (2010) Improving enzymes for biomass
conversion: a basic research perspective. Bioenerg. Res. 3(1): 82-92.
4. Berlin A., Gilkes N., Kilburn D., Bura R., Markov A., Skomarovsky A. and Saddler J.
(2005) Evaluation of novel fungal cellulase preparations for ability to hydrolyze
softwood substrates – evidence for the role of accessory enzymes. Enzyme. Microb.
Technol., 37 (2): 175-184.
5. Bon E.P. and Ferrara M.A. (2007) Bioethanol production via enzymatic hydrolysis of
cellulosic biomass. In seminar on "The Role of Agricultural biotechnologies for
production of bioenergy in developing countries", held in Rome on 12th October ,
http://www.fao.org/biotech/seminaroct2007.htm)
6. Cantarella M., Cantarella L., Gallifuoco A., Spera A. and Alfani, F. (2008) Effect of
inhibitors released during steam-explosion treatment of Poplar Wood on Subsequent
Enzymatic Hydrolysis and SSF. Biotechno.l Progr., 20(1), 200-206.
7. Ghose T.K. (1987) Measurement of cellulase activities. Pure. Appl. Chem., 59: 257-
268.
8. Ghose T.K. and Bisaria V.S. (1987) Measurement of hemicellulase activities part 1:
xylanases. Pure. Appl. Chem. 59: 1739-1752.
9. Gibson D.M., King B.C., Hayes M.L. and Bergstrom G.C. (2011) Plant pathogens as a
source of diverse enzymes for lignocellulose digestion. Curr. Opin. Microbiol., 14 (3):
264-270.
10. Hulme M.A. and Stranks D.W. (1970) Induction and regulation of production of
cellulase by fungi. Nature 226: 469-470.
11. Jang H.D. and Chen K.S. (2003) Production and characterization of thermostable
cellulases from Streptomyces transformant T3-1. World J. Microbiol. Biotechnol.,
19(3): 263-268.
12. Jeya M., Zhang Y.W., Kim I.W. and Lee J.K. (2009) Enhanced saccharification of
alkali treated rice straw by cellulase from Trametes hirsuta and statistical optimisation
of hydrolysis conditions by RSM. Bioresour. Technol., 100 (21): 5155-5161.
158
13. King B.C., Waxman K.D., Nenni N.V., Walker L. P., Bergstrom G.C. and Gibson
D.M. (2011) Arsenal of plant cell wall degrading enzymes reflects host preference
among plant pathogenic fungi. Biotechnol. Biofuels. 4: 4.
14. Kumar R. and Wyman C. (2008) Effect of enzyme supplementation at moderate
cellulase loading on initial glucose and xylose release from corn stover solid
pretreated by leading technologies. Biotechnol. Bioeng., 102 (2): 457-467.
15. Maki M., Leung K. T. and Qin, W. (2009) The prospects of cellulase-producing
bacteria for the bioconversion of lignocellulosic biomass. Int. J. Biol. Sci. 5(5): 500
16. Miller G.L. (1959) Use of dinitrosalicylic acid reagent for determination of reducing
sugar. Anal. Chem., 31(3): 426-428.
17. Rautela G. S. and Cowling E. B. (1966) Simple cultural test for relative cellulolytic
activity of fungi. Appl. Environ. Microbiol. 14: 892-898.
18. Saritha M., Arora A. and Lata (2012) Pretreatment of paddy straw with Trametes
hirsuta for improved enzymatic saccharification. Bioresource Technology 104; 459–
465
19. Song, J .M. and Wei, D.Z. (2010) Production and characterization of cellulases and
xylanases of Cellulomicrobium cellulans grown in pretreated and extracted bagasse
and mineral nutrient medium M9. Biomass Bioenerg., 34 (12):1930-1934.
20. Teather R. M. and Wood, P. J. (1982) Use of Congo red-polysaccharide interactions
in enumeration and characterization of cellulolytic bacteria from the bovine rumen.
Appl. Environ. Microb. 43(4): 777-780
21. Teymouri F., Laureano-Perez L., Alizadeh H. and Dale B.E. (2005) Optimization of
ammonia fiber explosion (AFEX) treatment parameters for enzymatic hydrolysis.
Bioresour. Technol., 96(18): 2014-2018.
22. Tribak M., Ocampo J.A. and Gracia- Romera I.G. (2002) Production of
xyloglucanolytic enzymes by Trichoderma viridae, Paecilomyces
farinosus,Wardomyces inflatus and Pleurotus Ostreatus. Mycologia., 94(3): 404-410.
23. Vlasenko E.Y., Ding H., Labavitch J.M. and Shoemaker S. P. (1997). Enzymatic
hydrolysis of pretreated rice straw. Bioresour. Technol. 59(2): 109-119
24. Wood T.M. and Bhat K.M. (1988) Methods for measuring cellulase activities.
Methods. Enzymol., 160: 87-112.

159
25. Ximenes E., Kim Y., Mosier N., Dien B. and Ladisch M. (2011) Deactivation of
cellulases by phenols. Enzyme Microb. Technol., 46(1): 170-176
26. Yazdi T., Woodward J.R. and Radford A. (1990) The cellulase complex of
Neurospora crassa activity, stability and release. J. Gen. Microbiol. 136(7): 1313-
1319
27. Ye Z., Hatfield K.M. and Eric Berson R. (2012) Deactivation of individual cellulase
components. Bioresour. Technol. 106: 133-137.
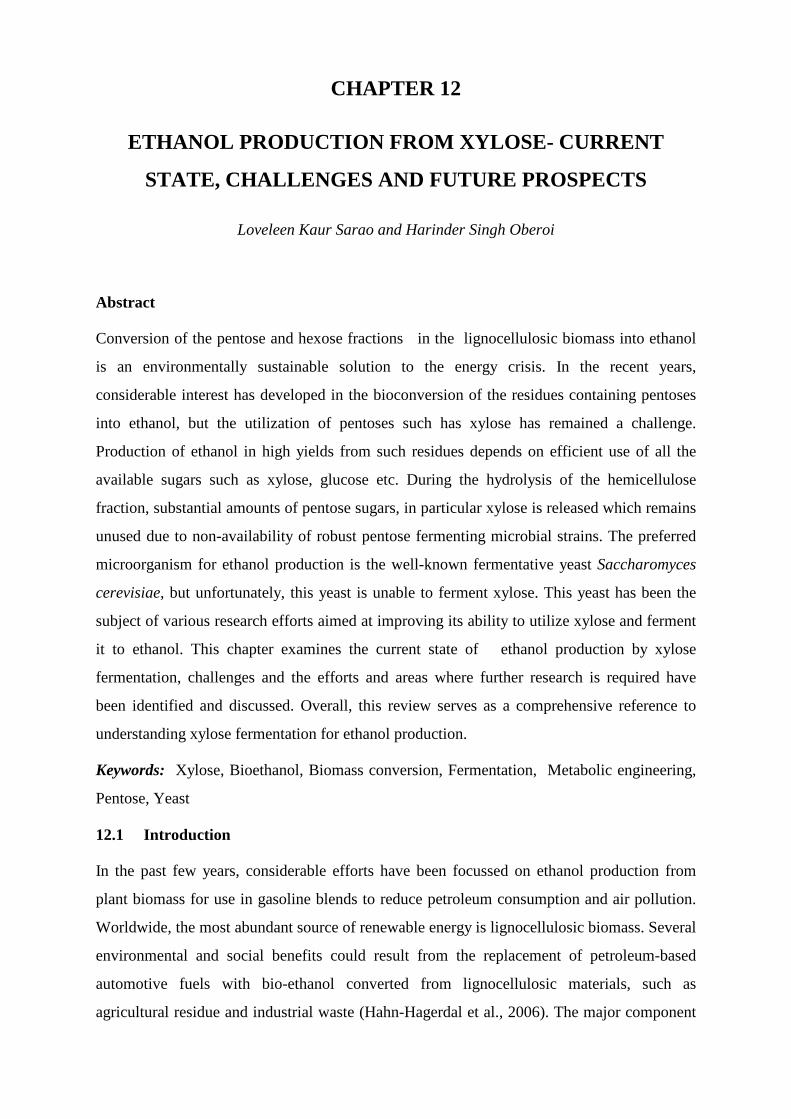
160
CHAPTER 12
ETHANOL PRODUCTION FROM XYLOSE- CURRENT
STATE, CHALLENGES AND FUTURE PROSPECTS
Loveleen Kaur Sarao and Harinder Singh Oberoi
Abstract
Conversion of the pentose and hexose fractions in the lignocellulosic biomass into ethanol
is an environmentally sustainable solution to the energy crisis. In the recent years,
considerable interest has developed in the bioconversion of the residues containing pentoses
into ethanol, but the utilization of pentoses such has xylose has remained a challenge.
Production of ethanol in high yields from such residues depends on efficient use of all the
available sugars such as xylose, glucose etc. During the hydrolysis of the hemicellulose
fraction, substantial amounts of pentose sugars, in particular xylose is released which remains
unused due to non-availability of robust pentose fermenting microbial strains. The preferred
microorganism for ethanol production is the well-known fermentative yeast Saccharomyces
cerevisiae, but unfortunately, this yeast is unable to ferment xylose. This yeast has been the
subject of various research efforts aimed at improving its ability to utilize xylose and ferment
it to ethanol. This chapter examines the current state of ethanol production by xylose
fermentation, challenges and the efforts and areas where further research is required have
been identified and discussed. Overall, this review serves as a comprehensive reference to
understanding xylose fermentation for ethanol production.
Keywords: Xylose, Bioethanol, Biomass conversion, Fermentation, Metabolic engineering,
Pentose, Yeast
12.1 Introduction
In the past few years, considerable efforts have been focussed on ethanol production from
plant biomass for use in gasoline blends to reduce petroleum consumption and air pollution.
Worldwide, the most abundant source of renewable energy is lignocellulosic biomass. Several
environmental and social benefits could result from the replacement of petroleum-based
automotive fuels with bio-ethanol converted from lignocellulosic materials, such as
agricultural residue and industrial waste (Hahn-Hagerdal et al., 2006). The major component
161
of lignocellulosic biomass is glucose, which can be easily and efficiently converted to
ethanol. However, lignocellulosic biomass contains not only glucose but also various other
sugars, including xylose, mannose and arabinose. Indeed, xylose is the second most common
sugar component of lignocellulose. Thus, efficient use of lignocellulose as a substrate for
ethanol production requires effective utilization of xylose. To improve the economics of any
biomass conversion process, it is imperative that potential bioconversion microorganisms
efficiently convert both hexoses and pentoses found in industrially relevant lignocellulosic
hydrolysates into the desired end product(s). While many microorganisms can convert
glucose efficiently into fuel ethanol and other value-added chemicals, the utilization and
bioconversion of pentoses remain relatively inefficient.
The steps involved in the production of fuel ethanol from biomass includes
prehydrolysis, hydrolysis, fermentation, and distillation. The hydrolysate resulting after the
prehydrolysis and the hydrolysis, contain varying amounts of monosaccharides, both pentoses
and hexoses, and a broad range of substances either derived from the raw material or resulting
as reaction products from sugar and lignin degradation. Many of these substances may have
an inhibitory effect on the microorganisms in subsequent fermentation steps (Nishikawa et
al., 1988; Van Zyl et al., 1991).
A milestone that generated worldwide interest in pentose fermentation and biomass
conversion is the discovery of pentose-fermenting yeasts by Canadian (Schneider et al., 1981)
and US (Slininger et al., 1982) researchers in the early 1980s. Many pentose-fermenting
yeasts were identified by the mid-1980s, and several studies were undertaken on the
physiology and biochemistry of these yeasts. The general outcome of these studies was that
the rate and yield of ethanol production from xylose is considerably lower than the analogous
glucose fermentation. Also, unfortunately, the well-known hexose-fermenting yeast
Saccharomyces cerevisiae is unable to efficiently utilize xylose as the sole carbon source or
ferment it to ethanol, despite the existence of xylose transport in this yeast and all the
subsequent enzymes needed for a full xylose metabolic pathway (Batt et al., 1986). Because
of high fermentation rate and high ethanol tolerance, Saccharomyces cerevisiae has been the
focus of many researchers in order to improve its pentose fermenting ability. Among the
xylose fermenting yeasts Pichia stipitis has shown promise for industrial application; because
it ferments xylose rapidly with a high ethanol yield and apparently produces no xylitol
(Dominguez et al., 1993) and is able to ferment a wider range of sugars (including cellobiose)
in comparison to Candida shehatae (Du Preez et al., 1986).
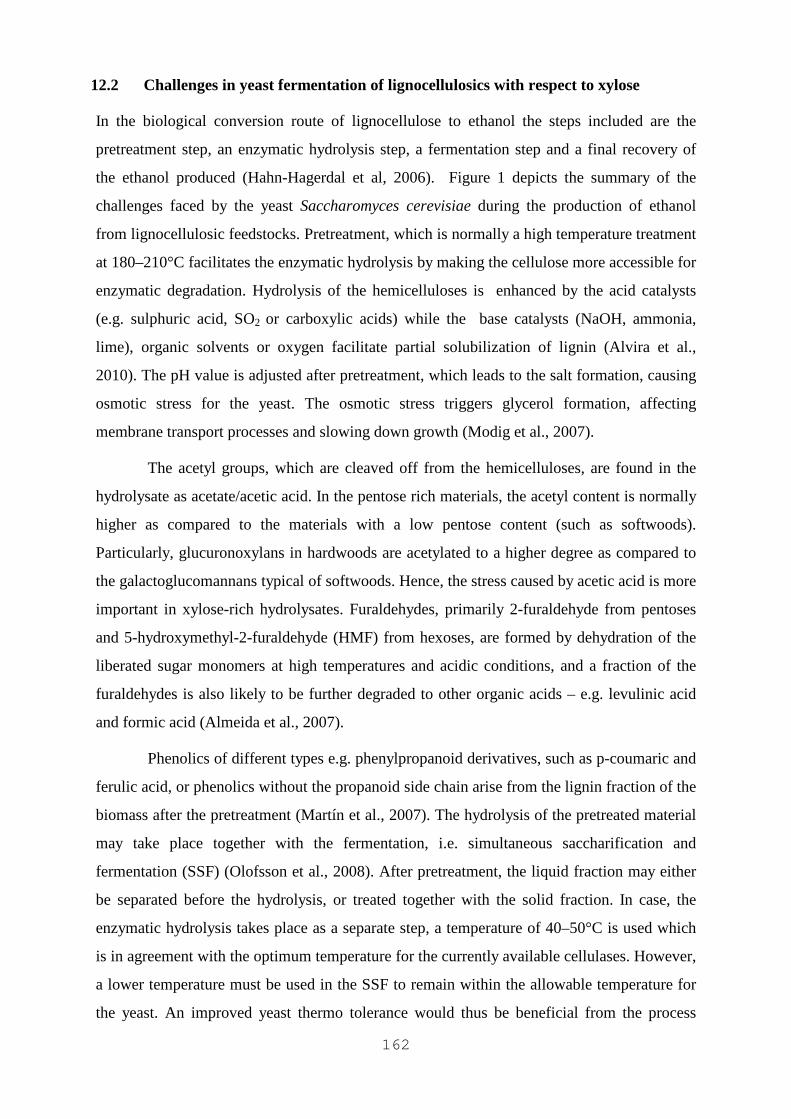
162
12.2 Challenges in yeast fermentation of lignocellulosics with respect to xylose
In the biological conversion route of lignocellulose to ethanol the steps included are the
pretreatment step, an enzymatic hydrolysis step, a fermentation step and a final recovery of
the ethanol produced (Hahn-Hagerdal et al, 2006). Figure 1 depicts the summary of the
challenges faced by the yeast Saccharomyces cerevisiae during the production of ethanol
from lignocellulosic feedstocks. Pretreatment, which is normally a high temperature treatment
at 180–210°C facilitates the enzymatic hydrolysis by making the cellulose more accessible for
enzymatic degradation. Hydrolysis of the hemicelluloses is enhanced by the acid catalysts
(e.g. sulphuric acid, SO2 or carboxylic acids) while the base catalysts (NaOH, ammonia,
lime), organic solvents or oxygen facilitate partial solubilization of lignin (Alvira et al.,
2010). The pH value is adjusted after pretreatment, which leads to the salt formation, causing
osmotic stress for the yeast. The osmotic stress triggers glycerol formation, affecting
membrane transport processes and slowing down growth (Modig et al., 2007).
The acetyl groups, which are cleaved off from the hemicelluloses, are found in the
hydrolysate as acetate/acetic acid. In the pentose rich materials, the acetyl content is normally
higher as compared to the materials with a low pentose content (such as softwoods).
Particularly, glucuronoxylans in hardwoods are acetylated to a higher degree as compared to
the galactoglucomannans typical of softwoods. Hence, the stress caused by acetic acid is more
important in xylose-rich hydrolysates. Furaldehydes, primarily 2-furaldehyde from pentoses
and 5-hydroxymethyl-2-furaldehyde (HMF) from hexoses, are formed by dehydration of the
liberated sugar monomers at high temperatures and acidic conditions, and a fraction of the
furaldehydes is also likely to be further degraded to other organic acids – e.g. levulinic acid
and formic acid (Almeida et al., 2007).
Phenolics of different types e.g. phenylpropanoid derivatives, such as p-coumaric and
ferulic acid, or phenolics without the propanoid side chain arise from the lignin fraction of the
biomass after the pretreatment (Martín et al., 2007). The hydrolysis of the pretreated material
may take place together with the fermentation, i.e. simultaneous saccharification and
fermentation (SSF) (Olofsson et al., 2008). After pretreatment, the liquid fraction may either
be separated before the hydrolysis, or treated together with the solid fraction. In case, the
enzymatic hydrolysis takes place as a separate step, a temperature of 40–50°C is used which
is in agreement with the optimum temperature for the currently available cellulases. However,
a lower temperature must be used in the SSF to remain within the allowable temperature for
the yeast. An improved yeast thermo tolerance would thus be beneficial from the process
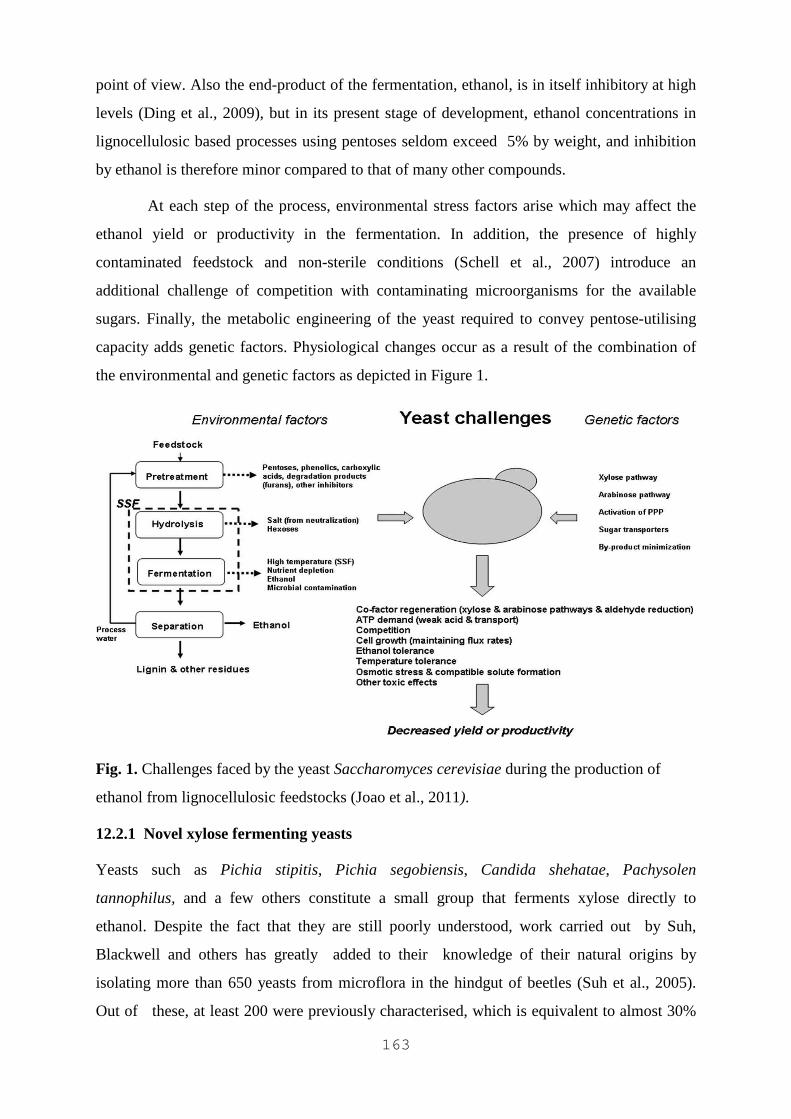
163
point of view. Also the end-product of the fermentation, ethanol, is in itself inhibitory at high
levels (Ding et al., 2009), but in its present stage of development, ethanol concentrations in
lignocellulosic based processes using pentoses seldom exceed 5% by weight, and inhibition
by ethanol is therefore minor compared to that of many other compounds.
At each step of the process, environmental stress factors arise which may affect the
ethanol yield or productivity in the fermentation. In addition, the presence of highly
contaminated feedstock and non-sterile conditions (Schell et al., 2007) introduce an
additional challenge of competition with contaminating microorganisms for the available
sugars. Finally, the metabolic engineering of the yeast required to convey pentose-utilising
capacity adds genetic factors. Physiological changes occur as a result of the combination of
the environmental and genetic factors as depicted in Figure 1.
Fig. 1. Challenges faced by the yeast Saccharomyces cerevisiae during the production of
ethanol from lignocellulosic feedstocks (Joao et al., 2011).
12.2.1 Novel xylose fermenting yeasts
Yeasts such as Pichia stipitis, Pichia segobiensis, Candida shehatae, Pachysolen
tannophilus, and a few others constitute a small group that ferments xylose directly to
ethanol. Despite the fact that they are still poorly understood, work carried out by Suh,
Blackwell and others has greatly added to their knowledge of their natural origins by
isolating more than 650 yeasts from microflora in the hindgut of beetles (Suh et al., 2005).
Out of these, at least 200 were previously characterised, which is equivalent to almost 30%
164
of all the currently recognized yeast species. Enteroramus dimorbhus, a novel xylose-
fermenting yeast belonging to the same clade as Pichia stipitis is found frequently in the
hindgut of Odontotaenius disjunctus, which feeds on fungi in white-rotted hardwood (Suh et
al., 2004).
Several new species remain to be isolated and characterized from beetles (Suh et al.,
2004), and it seems likely that new xylose fermenting yeasts will emerge from these studies.
Metabolic engineering of xylose fermentation has proceeded more readily since completion of
the Pichia stipitis genome and the development of a new transformation system (Laplaza et
al., 2006).
12.2.2 Xylose metabolism in yeasts
The induction of metabolism of xylose occurs after the transport of xylose into the yeast
cells having the ability to grow on xylose (Fig. 2). It was established clearly by the early
studies involving the yeasts Pichia stipitis, Pichia heedii and Candia shehatae that there is
the involvement of two import systems in xylose transport: a high capacity low-affinity
facilitated diffusion system that is shared by xylose and glucose; and a high-affinity xylose–
proton symport system (Laplace et al., 1991). The SUT1 (sugar transporter 1) gene from P.
stipitis and GXF1 (glucose/xylose facilitator 1) gene from C. intermedia code for
constitutively expressed glucose/ xylose transporters that mediate the low-affinity uptake of
xylose (Leandro et al., 2006).
It has been recently shown that Saccharomyces cerevisiae has the ability to grow
weakly on xylose as a sole carbon source under aerobic conditions (Attfield and Bell, 2006).
Historically, it was thought that this yeast was unable to grow on xylose (Barnett, 1976)
despite possessing a full xylose metabolic pathway (Batt et al., 1986). Saccharomyces
cerevisiae takes up xylose by facilitated diffusion when grown on complex media with
multiple carbon sources (Batt et al., 1986; van Zyl et al., 1989).
Facilitated diffusion of xylose occurs through the hexose transporters encoded by the
HXT (hexose transporter) gene family. The high affinity system (Km glucose≅1.5 mM) is
glucose repressible, while the low affinity system (Km glucose≅20–35 mM) is constitutively
expressed (Bisson, 1988; Bisson and Fraenkel, 1984; Kotter and Ciriacy, 1993). The high-
and low-affinity Hxt transporters have Km values for xylose ∼137–190 mM and ∼1.5 M,
respectively. These high values indicate that xylose uptake through these transporters is
significantly less efficient compared to glucose (Kotter and Ciriacy, 1993).
165
Once inside the yeast cell, xylose is converted by a two-step oxidoreductive
isomerization to xylulose (Webb and Lee, 1990). Xylose is first reduced to xylitol by a
NADH- or NADPH-dependent xylose (aldose) reductase (EC 1.1.1.21; XR). Xylitol is then
oxidized to xylulose by NAD-dependent xylitol dehydrogenase (XDH), a Zn2+-dependent
medium chain alcohol/sorbitol dehydrogenase (EC 1.1.1.14). Xylulose is phosphorylated at
the C5–OH position by xylulokinase (XK) to yield xylulose-5-phosphate (X5P), which is
further channeled into glycolytic intermediates such as glyceraldehyde-3-phosphate (GA3P)
and fructose-6-phosphate (F6P) via the pentose phosphate pathway (PPP). These
intermediates are converted to pyruvate in the Embden–Meyerhof– Parnas pathway (Hahn-
Hägerdal et al., 1991).
12.2.3 Ethanol Production from Xylose
Although, the environmental concerns may govern the replacement of petrol by ethanol from
renewable resources, the production of ethanol fuel must be economically competitive to
constitute a sustainable alternative. Obtaining high product yield is an important criterion for
all industrial processes. For fuel ethanol production, it is crucial since the product has a low
value and the raw material constitutes a major part of the production cost (Zacchi et al, 1988).
Hemicellulose is one of the major components of lignocellulosic biomass. Depending on the
nature of the raw material, the hemicellulose fraction contains varying levels of xylose-based
hemicelluloses, xylans (Table 1). As a result, a substantial fraction of the monosaccharides in
lignocelluloses hydrolysates from hardwood and agricultural residues consists of xylose.
Consequently, ethanolic fermentation of xylose is of major concern for the efficient
utilization of lignocellulosic hydrolysates to produce fuel ethanol.
Table 1 Xylan content in wood and agricultural residues
Raw material Xylan (%DW) Reference Corn fibre 37 Hespell (1998)
Sugarcane bagasse 21 Puls (1993) Wheat straw 19 Puls (1993) Hardwood 15-30 Sjostrom (1993) Softwood 5-10 Sjostrom (1993)
12.2.4 Ethanol production by xylose fermenting yeasts
Microorganisms such as bacteria, yeasts, and fungi are able to ferment xylose to ethanol.
However, yeasts have been found to have higher ethanol yields and productivities from xylose
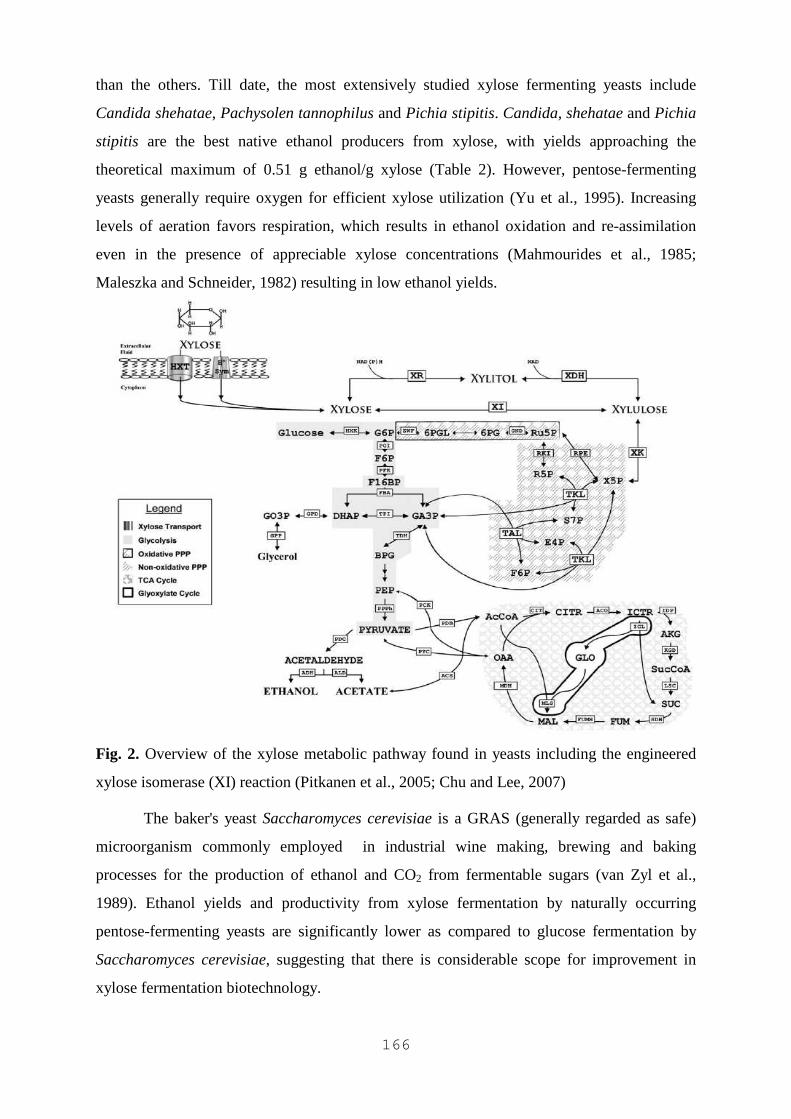
166
than the others. Till date, the most extensively studied xylose fermenting yeasts include
Candida shehatae, Pachysolen tannophilus and Pichia stipitis. Candida, shehatae and Pichia
stipitis are the best native ethanol producers from xylose, with yields approaching the
theoretical maximum of 0.51 g ethanol/g xylose (Table 2). However, pentose-fermenting
yeasts generally require oxygen for efficient xylose utilization (Yu et al., 1995). Increasing
levels of aeration favors respiration, which results in ethanol oxidation and re-assimilation
even in the presence of appreciable xylose concentrations (Mahmourides et al., 1985;
Maleszka and Schneider, 1982) resulting in low ethanol yields.
Fig. 2. Overview of the xylose metabolic pathway found in yeasts including the engineered
xylose isomerase (XI) reaction (Pitkanen et al., 2005; Chu and Lee, 2007)
The baker's yeast Saccharomyces cerevisiae is a GRAS (generally regarded as safe)
microorganism commonly employed in industrial wine making, brewing and baking
processes for the production of ethanol and CO2 from fermentable sugars (van Zyl et al.,
1989). Ethanol yields and productivity from xylose fermentation by naturally occurring
pentose-fermenting yeasts are significantly lower as compared to glucose fermentation by
Saccharomyces cerevisiae, suggesting that there is considerable scope for improvement in
xylose fermentation biotechnology.
167
Metabolic engineering of Saccharomyces cerevisiae with genes for xylose metabolism from
other xylose-fermenting yeasts has conferred the ability to utilize xylose as a sole carbon
source. Recombinant Saccharomyces cerevisiae strains can produce ethanol from xylose at
near theoretical yields of 0.51 g g−1 but with low maximal productivities (Ostergaard et al.,
2000). The current understanding of xylose metabolism in native and recombiant
Saccharomyces cerevisiae is a result of many rational metabolic engineering efforts that have
modified metabolism at localized areas in efforts to improve ethanol production.
Certain non-genetic approaches have also been explored and they involve the
adaptation of native and recombinant strains of Saccharomyces cerevisiae to xylose
utilization. A careful assessment of these endeavors is critical as they provide insight into the
bottlenecks and limitations of xylose metabolism in this model microorganism and suggest
targets for future modifications to improve xylose fermentation.
12.3 Effect of inhibitors on pentose fermentation in hydrolysates
In the studies reporting the evaluation of pentose-fermenting strains of Saccharomyces
cerevisiae in undetoxified pentose-rich lignocellulosic hydrolysates, the maximum ethanol
concentrations obtained did not exceed 45 g L-1 and in many cases, the xylose conversion was
not complete even after a long period of time (Joao et al., 2011). The specific xylose
consumption rates obtained in hydrolysates were also clearly lower than those on synthetic
media.
12.3.1 Effect of aldehyde inhibitors on xylose fermentation
The toxicity of lignocellulosic hydrolysates has been correlated with the presence and
concentration of various aldehydes, such as furfural (Heer and Sauer, 2008). Among 60
identified phenolic compounds in lignocellulosic hydrolysates, the phenylaldehydes were
found to be more toxic than the phenolic acids and alcohols (Larsson et al., 2000) underlining
the importance of the aldehydes as inhibitors. Aldehydes can interact with cellular structures,
generate reactive oxygen species and inhibit enzymes in the central carbon metabolism (Allen
et al., 2010). This results in reduction of fermentation rate, cessation of growth, extension of
lag-phase of yeast, and reduction of ethanol productivity and/or yield (Klinke et al., 2004).
12.3.2 Metabolically engineered microorganisms for aldehyde reduction
It has been commonly observed that as long as certain aldehydes – e.g. furfural, HMF,
vanillin, veratraldehyde are present in the medium, yeasts are not able to grow and show
reduced metabolic activity (Endo et al., 2008). However, at permissive levels, the yeast can
168
usually slowly convert the aldehydes to less toxic compounds and growth and metabolic
activity is restored (Liu et al., 2004). For instance Saccharomyces cerevisiae, for instance, can
reduce furfural and HMF to their corresponding alcohols; 2-furan methanol (FM or furfuryl
alcohol) and furan 2,5-dimethanol (FDM or HMF alcohol). Overexpression of the
transcription factor-encoding gene YAP1, known to be involved in oxidative stress response,
has also been shown resulting in an increased tolerance to hydrolysate and specific model
inhibitors and an increased reduction capacity of furaldehydes (Alriksson et al., 2010).
12.3.3 Pentose fermentation in the presence of weak acids
Ethanol fermentation from lignocellulosic feedstocks is also challenged by the presence of
weak acids in the medium, at concentrations that can be inhibitory to Saccharomyces
cerevisiae metabolism. Acetic acid originates from the deacetylation of the hemicelluloses
fraction, whereas formic and levulinic acids are formed during the breakdown of HMF and
furfural (Palmqvist and Hahn-Hägerdal, 2000).The innate levels of acetic acid are highly
dependent on the raw material. Reported acetyl contents in some pentose rich materials are in
the range 1.7–4.2 g/100 g DM .The concentrations of weak acids obtained in the fermentation
broth will vary even more widely depending on both the method of pretreatment as well as
the solids loading used in the pretreatment. It can be estimated that the concentration of acetic
acid may easily be above 10 g L-1 after a typical steam pretreatment of poplar (Lu et al.,
2009). Weak acids are also produced during the fermentation stage, since acetic acid is a
minor by-product of yeast fermentation.
12.3.4 Effect of weak acids on yeast metabolism
It has been observed that both acetic and lactic acid increase the lag phase and reduce the
specific growth rate of Saccharomyces cerevisiae, thereby affecting ethanol productivity
(Graves et al., 2006). The effects of weak acids are strongly pH dependent. At pH value
below the pKa-value of the acid, the undissociated form of weak acids predominates. It is this
form, which enters the cell and once inside it dissociates (due to the higher intracellular pH),
thereby releasing protons. In order to maintain a proper intracellular pH, protons must be
transported out of the cells with the help of the plasma membrane ATPase and at the expense
of ATP. Whereas, low levels of acids activate the glycolytic rate by stimulating ATP
production (Pampulha and Loureiro-Dias, 2000) higher levels become inhibitory due to the
acidification of the cytosol after depletion of the available ATP. Also, as less ATP becomes
available for biomass formation, ethanol productivity decreases. In addition, high levels of
weak acids may result in the intracellular accumulation of anions (Russell 1992), which has
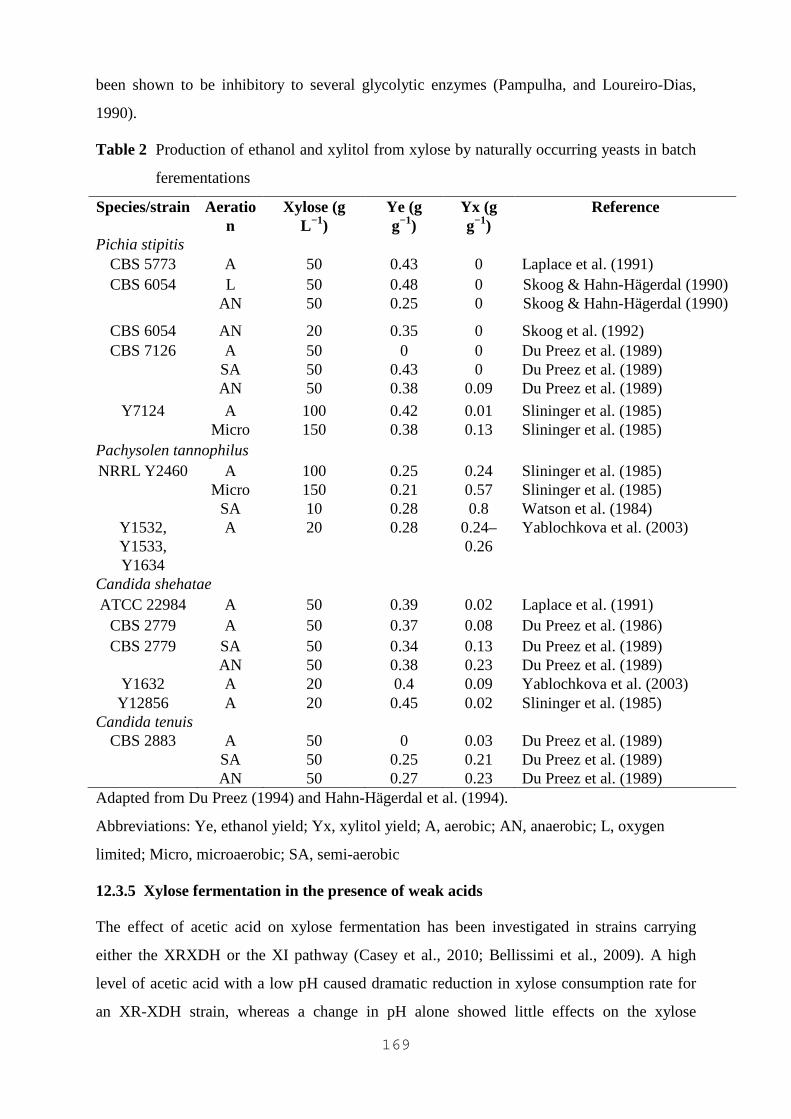
169
been shown to be inhibitory to several glycolytic enzymes (Pampulha, and Loureiro-Dias,
1990).
Table 2 Production of ethanol and xylitol from xylose by naturally occurring yeasts in batch
ferementations
Species/strain Aeration
Xylose (g L−1)
Ye (g g−1)
Yx (g g−1)
Reference
Pichia stipitis CBS 5773 A 50 0.43 0 Laplace et al. (1991) CBS 6054 L
AN 50 50
0.48 0.25
0 0
Skoog & Hahn-Hägerdal (1990) Skoog & Hahn-Hägerdal (1990)
CBS 6054 AN 20 0.35 0 Skoog et al. (1992) CBS 7126 A
SA AN
50 50 50
0 0.43 0.38
0 0
0.09
Du Preez et al. (1989) Du Preez et al. (1989) Du Preez et al. (1989)
Y7124 A Micro
100 150
0.42 0.38
0.01 0.13
Slininger et al. (1985) Slininger et al. (1985)
Pachysolen tannophilus NRRL Y2460 A
Micro SA
100 150 10
0.25 0.21 0.28
0.24 0.57 0.8
Slininger et al. (1985) Slininger et al. (1985) Watson et al. (1984)
Y1532, Y1533, Y1634
A 20 0.28 0.24–0.26
Yablochkova et al. (2003)
Candida shehatae ATCC 22984 A 50 0.39 0.02 Laplace et al. (1991)
CBS 2779 A 50 0.37 0.08 Du Preez et al. (1986) CBS 2779 SA
AN 50 50
0.34 0.38
0.13 0.23
Du Preez et al. (1989) Du Preez et al. (1989)
Y1632 A 20 0.4 0.09 Yablochkova et al. (2003) Y12856 A 20 0.45 0.02 Slininger et al. (1985)
Candida tenuis CBS 2883 A
SA AN
50 50 50
0 0.25 0.27
0.03 0.21 0.23
Du Preez et al. (1989) Du Preez et al. (1989) Du Preez et al. (1989)
Adapted from Du Preez (1994) and Hahn-Hägerdal et al. (1994).
Abbreviations: Ye, ethanol yield; Yx, xylitol yield; A, aerobic; AN, anaerobic; L, oxygen
limited; Micro, microaerobic; SA, semi-aerobic
12.3.5 Xylose fermentation in the presence of weak acids
The effect of acetic acid on xylose fermentation has been investigated in strains carrying
either the XRXDH or the XI pathway (Casey et al., 2010; Bellissimi et al., 2009). A high
level of acetic acid with a low pH caused dramatic reduction in xylose consumption rate for
an XR-XDH strain, whereas a change in pH alone showed little effects on the xylose
170
consumption. Growth and ethanol production from xylose were also impaired in a
recombinant XI-expressing strain at low pH (3.5) and in the presence of 3 g L-1 acetic acid
(Bellissimi et al., 2009), whereas the glucose consumption rate was only slightly affected
under similar conditions. The lower rate of xylose consumption, typically three to six fold
lower than for glucose in engineered Saccharomyces cerevisiae (Bellissimi et al.,2009; Casey
et al., 2010) affects the maximum specific ATP production rate, which explains why weak
acids have a more dramatic effect on yeast growth on xylose than on glucose (Bellissimi et
al,2009; Casey et al, 2010, Helle, et al, 2003). Indeed xylose fermentation could be restored in
a recombinant XI-strain at pH 3.5 and in the presence of 3 g L-1 acetic acid by applying a
continuous low feeding of glucose to the medium (Bellissimi et al., 2009).
Acetic acid decreases ethanol productivity but its effect on ethanol yield is less clear.
In some reports, the ethanol yield was shown to increase as the metabolism was redirected
from anabolic (biomass) to dissimilatory (ethanol) pathway in the presence of acetic acid
(Bellissimi et al., 2009; Casey et al., 2010, Helle et al., 2003). In contrast, a lower ethanol
yield from glucose and xylose was also reported in the presence of a more complex medium
such as spent sulphite liquor (SSL) (Helle et al., 2004). However, it is unclear whether the
reported yield relates to the consumed or the initial sugar level, since the tested XR and XDH-
engineered strains displayed low xylitol and unchanged glycerol yields in acetic acid rich-
hydrolysate media (Helle et al., 2004; Lu et al., 2009).
12.3.6 Overcoming the weak acid inhibition- Engineering approaches
A simple strategy to overcome or limit the inhibition by acids is to run fermentations at a pH
value sufficiently high to keep the undissociated acids at low levels. In practice however, it
may be difficult to implement this strategy as fermentation of lignocellulosic hydrolysates are
preferably run at a low pH to limit bacterial contaminations. Recently, Saccharomyces
cerevisiae was metabolically engineered allowing acetate to replace dihydroxyacetone
phosphate (DHAP) as a redox sink during anaerobic growth in a glycerol mutant strain. This
was achieved by introducing a bacterial NAD+-dependent acetylating acetaldehyde
dehydrogenase, by which acetyl-CoA may be reduced to acetaldehyde (and CoA). The
engineered strain was able to grow anaerobically and acetate was reduced to ethanol in the
process (Medina et al., 2010). Such approach may pave the way to other strategies enabling
the conversion of the inhibitory acetate during fermentation.
171
12.4 Xylose metabolism in Saccharomyces cerevisiae-The limiting factors
An ideal microorganism envisioned to be employed in biomass conversion should produce
ethanol with a high yield and specific productivity; possess a broad substrate range and high
ethanol tolerance; and should be tolerant to the inhibitors present in lignocellulosic
hydrolysates (Aristidou and Penttila, 2000). Saccharomyces cerevisiae is the preferred
microorganism for industrial ethanol production and meets many of the criteria for
lignocellulose bioconversion, but it is unable to effectively utilize xylose as a sole carbon
source (Barnett, 1976; Batt et al., 1986). Recombinant Saccharomyces cerevisiae strains
expressing the Pichia stipitis xylose reductase (XYL1) gene are able to metabolize xylose;
however, most of the xylose is converted to xylitol (Amore et al., 1991). This recombinant
strain has served as a starting point for the development of other mutant Saccharomyces
cerevisiae strains and its success gave the first indication that a metabolic engineering
approach could be used to improve xylose utilization. Another important early recombinant
strain, Saccharomyces cerevisiae TMB3001, was constructed by integrating the Pichia stipitis
genes XYL1 and XYL2 (encoding the Pichia stipitis xylitol dehydrogenase) and the
endogenous XKS1 (encoding the Saccharomyces cerevisiae xylulokinase). Significantly, this
strain was the first to demonstrate aerobic growth on 2% xylose as the sole carbon source
(Eliasson et al., 2000). This strain provided an important starting point for subsequent
experiments aimed at identifying the bottlenecks in xylose transport and metabolism by
Saccharomyces cerevisiae.
The identification of rate-limiting steps in xylose utilization by Saccharomyces
cerevisiae is important with respect to ethanol production. The inability of Saccharomyces
cerevisiae to grow on xylose has been attributed to inefficient xylose uptake (Kotter and
Ciriacy, 1993), a redox imbalance generated in the first two steps of xylose metabolism
(Bruinenberg, 1986), insufficient XK activity, and an inefficient PPP (Walfridsson et al.,
1995). The inability of pentose sugar metabolism to activate the lower part of glycolysis has
also been suggested to be the reason for the inability of Saccharomyces cerevisiae to grow on
xylose (Boles et al., 1993; Muller et al., 1995).
12.5 Metabolic engineering for efficient fermentation and anaerobic growth on
pentose sugars
12.5.1 Xylose utilization
172
Utilization of the pentose sugar xylose has been enabled in Saccharomyces cerevisiae by
expression of the heterologous enzymes xylose reductase (XR) and xylitol dehydrogenase
(XDH) or xylose isomerase (XI) (van Maris et al., 2007). Following sections present a brief
discussion of both non-targeted and targeted metabolic engineering approaches that have been
followed to further improve xylose utilization.
12.5.1.1 Improvement in xylose utilization by non-target approaches
Random mutagenesis and evolutionary engineering has been successfully applied to enhance
xylose utilization in several recombinant Saccharomyces cerevisiae strains. The strains
H2490-4 (Pitkanen et al., 2007), TMB3400 (Wahlbom et al., 2003) and C1 (Sonderegger and
Sauer, 2003) were constructed based on the oxido-reductive XR/XDH pathway and were
selected during prolonged chemostat cultivation following chemical mutagenesis (TMB3400
and C1). The strain RWB218 was constructed using the XI pathway and was selected in
chemostat followed by sequential batch cultivation (Kuyper et al, 2005). Significantly
improved ethanol productivity and growth rate on xylose was shown by all strains, compared
to their parental strains.
12.5.1.2 Improvement in xylose utilization by rational pathway design
The basis of the rational design of the xylose utilization pathway in Saccharomyces
cerevisiae is identifying, altering and ultimately moving metabolic control points. A major
controlling step in xylose utilization is the expression level of the heterologous enzymes
XR/XDH and XI. Specifically, the low enzyme activity and substrate affinity of XR and XI
requires high intracellular xylose concentration to push the rate of the reaction, which leads to
decreased ethanol productivity as substrate is consumed (Kotter and Ciriacy, 1993).
Overexpression of XR somewhat alleviated this problem and increased the rate of xylose
consumption substantially (Jeppsson et al., 2003). Similarly, very high expression level of XI
encoding gene from episomal plasmids was required for anaerobic growth on xylose by the
strain RWB202-AFX (Kuyper et al., 2004).
Additional control points in xylose metabolism are the endogenous phosphorylating
enzyme xylulokinase (XK), and the PPP, respectively. Since XK uses ATP as a cofactor, the
expression level of this enzyme needs to be carefully optimized (Jin et al., 2003).
Overexpression of XK improved the conversion of xylulose (Eliasson et al., 2000). However,
without concurrent overexpression of XR, xylose utilization was decreased (Jin et al., 2003).
173
Fermentation of xylulose to ethanol in native Saccharomyces cerevisiae is thus orders
of magnitude slower than that of glucose (Wang and Schneider, 1980; Eliasson et al., 2000).
When all genes of the non-oxidative PPP were overexpressed, the xylulose utilization
increased, but xylose conversion was not improved unless XR and XDH activities were raised
(Karhumaa et al., 2005; Johansson and Hahn-Hägerdal, 2002). In Saccharomyces cerevisiae,
xylose is transported via the hexose transporters, however with a much lower affinity, which
limits its utilization in the presence of glucose (Leandro et al, 2009).
The cofactor specificity of XR and/or XDH has thus been modified by protein
engineering for balanced cofactor usage of the two enzymes (Watanabe et al., 2005; Jeppsson
et al., 2006; Matsushika et al., 2008). In this way the ethanol productivity, and consequently
the anaerobic growth rate, was drastically improved for strains TMB 3415, TMB 3420 and
TMB 3421 utilizing mutant XRs (Watanabe et al., 2007).
12.6 Adaptation of Saccharomyces cerevisiae strains for efficient xylose metabolism
In order to adapt or evolve Saccharomyces cerevisiae for xylose fermentation, selective
pressure has been successfully employed. These methods are particularly useful since they are
non-invasive and can identify bottlenecks in the xylose metabolic pathway that can then be
targeted for genetic engineering. Three separate approaches to adaptation have been applied,
with the first two utilizing recombinant Saccharomyces cerevisiae strains and the third a
native strain. The first adaptive approach involves growing the recombinant strain in an
aerobic environment and gradually adapting the strain to an anaerobic environment
(Sonderegger and Sauer, 2003). This approach generated two distinct populations, with
different phenotypes. The smaller population (class I) exhibited increased xylose uptake rates
and could ferment xylose/glucose mixtures to ethanol, while the larger population (class II)
was able to grow anaerobically on xylose (Sonderegger and Sauer, 2003).
The second adaptive approach involves cultivating a recombinant strain on xylose
only, then switching to xylose–glucose mixture and switching back again to xylose (Pitkanen
et al., 2005). This approach generated a Saccharomyces cerevisiae strain capable of
fermenting 4.5% xylose to ethanol under anaerobic conditions with a yield of 0.14 g g−1
(Pitkanen et al., 2005). The intracellular metabolite concentrations from chemostat isolates
were analyzed under both aerobic and anaerobic conditions. The results revealed that the
metabolism of xylose was accompanied by increasing levels of the glyoxylate cycle
metabolite, glyoxylate (GLO), through increased activity of isocitrate lyase (ICL), as well as
an increase in the tricarboxylic acid (TCA) cycle intermediate malate. The accumulation of
174
malate suggests that the TCA cycle could be limiting to xylose fermentation. The results
indicated that S. cerevisiae does not treat xylose as a fermentable substrate like glucose, and
as a result is unable to repress respiration and other related cycles. Extensive fine-tuning of
the xylose metabolic pathway downstream of the XK, XDH and XK reactions is likely to be
required in order for xylose fermentation in Saccharomyces cerevisiae to reach the ethanol
yields and productivities required for commercial bioethanol processes.
The third adaptive approach relies on the recent discovery that under intense selection
pressure, Saccharomyces cerevisiae mutants will spontaneously arise that can grow slowly on
xylose. Attfield and Bell (2006) obtained microscopic Saccharomyces cerevisiae colonies on
xylose containing minimal media after several weeks of incubation. By breeding and natural
selection over 23 mating cycles and 1463 selection days, respectively, a non-genetically
modified Saccharomyces cerevisiae strain (MBG- 2303) was created. Strain MBG-2303 was
capable of aerobic growth on 5% xylose with trace amounts of xylitol, glycerol and ethanol
(maximum 0.58 g L−1) being produced.
12.7 Recommendations for future studies
When attempting to develop recombinant strains for industrial bioethanol production process,
genetic stability and environmental acceptability should be considered. There is no research
that has been conducted to test and improve the stability of recombinant strains in continuous
fermentation so far. Future research should be directed at testing the suitability of these
recombinant strains to ferment ethanol in industrially relevant lignocellulose hydrolysates.
Due to its importance on xylose fermentation, it is necessary to build a genome-scale
metabolic network model for Pichia stipitis. Since the complete genome of Pichia stipitis has
been sequenced and annotated in 2007 (Jeffries, 2007), it is possible to set up a genome-scale
metabolic model for it. With the availability of genome sequences for more and more
ethanologenic microorganisms, such as Zymomonas mobilis, Candida shehatae and
Pachysolen tannophilis, building genome-scale metabolic network model for each of them
will be possible in the future. Different strain combinations for co-culture systems should be
studied along with effect of different fermentation parameters on fermentation performance in
different co-culture systems. Kinetic model and metabolic model for the co-culture system
can be worked on. Future improvements in ethanol productivity from Saccharomyces
cerevisiae will require the identification of enzymatic targets through metabolic flux analysis
and a clear understanding of their reaction mechanisms and molecular determinants of
substrate and cofactor specificity.
175
12.8 Concluding remarks
The bioconversion of cellulose and hemicellulose to biofuels and chemicals is being actively
researched with the aim of developing technically and economically viable processes.
Recombinant Saccharomyces cerevisiae strains provide a successful example of how
significant improvements in ethanol productivity can be achieved through metabolic
engineering. Both targeted and non-targeted approaches have been applied to generate
efficient pentose-fermenting Saccharomyces cerevisiae strains. Considerable research effort
has been focused on the development of xylose-fermenting recombinant Saccharomyces
cerevisiae through the over-expression of XR and XDH enzymes from other xylose-
fermenting yeasts, and increasing the expression of non-oxidative PPP enzymes. The creation
of recombinant Saccharomyces cerevisiae strains expressing XI represents a promising area
of research. In a short time span, researchers have been able to overcome many hurdles
associated with engineering a suitable enzyme and introducing a new metabolic pathway into
Saccharomyces cerevisiae. A central issue in converting pentoses from hydrolysates is also
the presence of aldehydes - not least the furaldehydes. Recent identification of enzymes with
aldehyde reduction activity has enabled targeted approaches for improving the in-situ
reduction capacity of Saccharomyces cerevisiae strains. Similarly, genetic engineering
approaches are emerging to cope with the problem of weak acid inhibition. In both cases,
however, it is important to understand how these modifications impact pentose metabolism.
References
1. Allen S. A., Clark W., McCaffery J. M. and Cai Z. (2010) Furfural induces reactive
oxygen species accumulation and cellular damage in Saccharomyces cerevisiae.
Biotechnol. Biofuels, 23: 2.
2. Almeida J. R. M., Modig T., Petersson A. and Hahn-Hägerdal B. (2007) Increased
tolerance and conversion of inhibitors in lignocellulosic hydrolysates by
Saccharomyces cerevisiae.J. Chem.Technol. Biotechnol., 82:340–349.
3. Alriksson B., Horváth I.S. and Jönsson L. J. (2010) Overexpression of
Saccharomyces cerevisiae transcription factor and multidrug resistance genes conveys
enhanced resistance to lignocellulose-derived fermentation inhibitors. Process
Biochem.,45: 264–271.
176
4. Alvira P., Tomás-Pejó E., Ballesteros M. and Negro M. J.(2010) Pretreatment
technologies for an efficient bioethanol production process based on enzymatic
hydrolysis: A review. Bioresour. Technol., 101: 4851–4861.
5. Amore R., Kotter P., Kuster C., Ciriacy M. and Hollenberg C.P.(1991) Cloning and
expression in Saccharomyces cerevisiae of the NAD(P)H-dependent xylose reductase-
encoding gene (XYL1) from the xylose-assimilating yeast Pichia stipitis. Gene,
109:89–97.
6. Aristidou A. and Penttila M. (2000) Metabolic engineering applications to renewable
resource utilization. Curr. Opin. Biotechnol.,11:187–98.
7. Attfield P.V. and Bell P.J. (2006) Use of population genetics to derive
nonrecombinant Saccharomyces cerevisiae strains that grow using xylose as a sole
carbon source. FEMS Yeast. Res.,6: 862–8.
8. Barnett J.A. (1976) The utilization of sugars by yeasts. Adv Carbohydr Chem
Biochem., 32:125 234.
9. Batt C.A., Carvallo S., Easson D.D, Akedo M. and Sinskey A.J. (1986) Direct
evidence for a xylose metabolic pathway in Saccharomyces cerevisiae. Biotechnol.
Bioeng., 28:549–53.
10. Bellissimi E., van Dijken J.P., Pronk J.T. and van Maris A. J. A. (2009) Effects of
acetic acid on the kinetics of xylose fermentation by an engineered, xylose-isomerase-
based Saccharomyces cerevisiae strain. FEMS Yeast Res., 9: 358–364.
11. Bisson L.F. (1988) High-affinity glucose transport in Saccharomyces cerevisiae is
under general glucose repression control. J. Bacteriol., 170: 4838–45.
12. Bisson L.F. and Fraenkel D.G. (1984) Expression of kinase-dependent glucose uptake
in Saccharomyces cerevisiae. J. Bacteriol., 159:1013–7.
13. Boles E., Lehnert W. and Zimmermann F.K. (1993) The role of the NADdependent
glutamate dehydrogenase in restoring growth on glucose of a Saccharomyces
cerevisiae phosphoglucose isomerise mutant. Eur. J. Biochem., 217:469–77.
14. Bruinenberg P.M. (1986) The NADP(H) redox couple in yeast metabolism. Antonie
Van Leeuwenhoek., 52:411–29.
15. Casey E., Sedlak M., Ho N. W. Y. and Mosier N. S.(2010) Effect of acetic acid and
pH on the cofermentation of glucose and xylose to ethanol by a genetically engineered
strain of Saccharomyces cerevisiae. FEMS Yeast Res., 10: 385–393.
16. Chu Byron C.H. and Lee Hung (2007) Genetic improvement of Saccharomyces
cerevisiae strain. FEMS Yeast Res., 9: 358–364.
177
17. Ding J., Huang X., Zhang L. and Zhao N. (2009) Tolerance and stress response to
ethanol in the yeast Saccharomyces cerevisiae. Appl. Microbiol. Biotechnol. 85: 253–
263.
18. Dominguez H., Nunez M.J., Chamy R. and Lema J., (1993) Determination of
kinetic parameters of fermentation processes by a continuous unsteady-state method:
application to the alcoholic fermentation of D-xylose by Pichia stipitis. Biotechnol.
Bioeng., 41:1129–1132.
19. Du Preez J.C., Bosch M. and Prior B.A. (1986) The fermentation of hexose and
pentose sugars by Candida shehatae and Pichia stipitis. Appl. Microbiol. Biotechnol.,
23: 228– 233.
20. Du Preez J.C., Vandriessel B. and Prior B.A. (1989) Effect of aerobiosis on
fermentation and key enzyme levels during growth of Pichia stipitis, Candida
shehatae and Candida tenuis on D-xylose. Arch. Microbiol., 152:143–7.
21. Eliasson A., Christensson C., Wahlbom C.F. and Hahn-Hägerdal B. (2000)
Anaerobic xylose fermentation by recombinant Saccharomyces cerevisiae carrying
XYL1, XYL2, and XKS1 in mineral medium chemostat cultures. Appl. Environ.
Microbiol., 66:3381–6.
22. Endo A., Nakamura T., Ando A., Tokuyasu K. and Shima, J (2008) Genome-wide
screening of the genes required for tolerance to vanillin, which is a potential inhibitor
of bioethanol fermentation, in Saccharomyces cerevisiae. Biotechnol. Biofuels,1:3.
23. Graves T., Narendranath N.V., Dawson K. and Power R. (2006) Effect of pH and
lactic or acetic acid on ethanol productivity by Saccharomyces cerevisiae in corn
mash. J. Ind. Microbiol. Biotechnol., 33: 469–474.
24. Hahn-Hägerdal B., Linden T., Senac T. and Skoog K. (1991) Ethanolic fermentation
of pentoses in lignocellulose hydrolysates. Appl. Biochem. Biotechnol., 28–29:131–
44.
25. Hahn-Hägerdal, B., Galbe M., Gorwa-Grauslund M. F., Lidén G., Zacchi G. (2006)
Bio-ethanol – the fuel of tomorrow from the residues of today. Trends Biotechnol.,
24:549–556.
26. Heer D. and Sauer U. (2008) Identification of furfural as a key toxin in lignocellulosic
hydrolysates and evolution of a tolerant yeast strain. Microb. Biotechnol.1: 497–506.
27. Helle S.S., Murray A., Lam J., Cameron D. R. and Duff S. J. (2004) Xylose
fermentation by genetically modified Saccharomyces cerevisiae 259ST in spent sulfite
liquor. Bioresour. Technolnol., 92: 163–171.
178
28. Helle S., Cameron D., Lam J., White B. and Duff S. (2003) Effect of inhibitory
compounds found in biomass hydrolysates on growth and xylose fermentation by a
genetically engineered strain of S. cerevisiae. Enzyme Microb. Technol. 33: 786–792.
29. Hespell R.B. (1998) J Agric Food Chem 46:2615.
30. Jeffries T.W. and Jin Y.S. (2000) Ethanol and thermotolerance in the bioconversion of
xylose by yeasts. Adv. Appl. Microbiol., 47:221–68.
31. Jeppsson M., Bengtsson O., Franke K. and Lee, H. (2006) The expression of a Pichia
stipitis xylose reductase mutant with higher K(M) for NADPH increases ethanol
production from xylose in recombinant Saccharomyces cerevisiae. Biotechnol.
Bioeng. 93: 665–673.
32. Jeppsson M., Träff K., Johansson B., Hahn-Hägerdal B. and Grauslund M. F. (2003)
Effect of enhanced xylose reductase activity on xylose consumption and product
distribution in xylose-fermenting recombinant Saccharomyces cerevisiae. FEMS
Yeast Res.3:167–175.
33. Jin, Y. S., Ni, H. Y., Laplaza, J. M. and Jeffries, T. W. (2003) Optimal growth and
ethanol production from xylose by recombinant Saccharomyces cerevisiae require
moderate D-xylulokinase activity. Appl. Environ. Microbiol., 69: 495–503.
34. João R. M., Almeida David Runquist, Violeta Sànchez i Nogué, Gunnar Lidén and
Marie F. Gorwa-Grauslund (2011) Stress-related challenges in pentose fermentation
to ethanol by the yeast Saccharomyces cerevisiae. Biotechnol. J. 6: 286–299.
35. Johansson B., and Hahn-Hägerdal B. (2002) The non-oxidative pentose hosphate
pathway controls the fermentation rate of xylulose but not of xylose in Saccharomyces
cerevisiae TMB3001. FEMS Yeast Res., 2: 277–282.
36. Karhumaa K., Hahn-Hägerdal B. and Gorwa-Grauslund M.F., (2005) Investigation of
limiting metabolic steps in the utilization of xylose by recombinant Saccharomyces
cerevisiae using metabolic engineering. Yeast, 22: 359–368.
37. Klinke H. B., Thomsen A. B. and Ahring B. K. (2004) Inhibition of ethanol-producing
yeast and bacteria by degradation products produced during pre-treatment of biomass.
Appl. Microbiol. Biotechnol. 66: 10–26.
38. Kötter P. and Ciriacy M. (1993) Xylose fermentation by Saccharomyces cerevisiae.
Appl. Microbiol. Biotechnol., 38: 776–783.
39. Kuyper M., Toirkens M. J., Diderich J. A. and Winkler A. A. (2005) Evolutionary
engineering of mixed-sugar utilization by a xylose-fermenting Saccharomyces
cerevisiae strain. FEMS Yeast Res., 5:925–934.
179
40. Kuyper M., Winkler A. A., van Dijken J. P. and Pronk J.T. (2004) Minimal metabolic
engineering of Saccharomyces cerevisiae for efficient anaerobic xylose fermentation:
A proof of principle. FEMS Yeast Res., 4: 655–664.
41. Laplace J.M., Delgenes J.P., Moletta R., Navarro J.M.(1991) Alcoholic fermentation
of glucose and xyloseby Pichia stipitis, Candida shehatae, Saccharomyces cerevisiae
and Zymomonas mobilis—oxygen requirement as a key factor. Appl. Microbiol.
Biotechnol., 36:158–62.
42. Laplaza J.M., Torres B.M., Jin Y.S. and Jeffries T.W. (2006) She ble and Cre adapted
for functional genomics and metabolic engineering of Pichia stipitis. Enzyme Microb.
Technol., 38:741-747.
43. Larsson S., Quintana-Sainz A., Reimann A, Nilvebrant N. O. and Jönsson L. J
(2000) Influence of lignocellulose-derived aromatic compounds on oxygen-limited
growth and ethanolic fermentation by Saccharomyces cerevisiae. Appl. Biochem.
Biotechnol. 84–86: 617–632.
44. Leandro M. J., Fonseca C. and Goncalves P. (2009) Hexose and pentose transport in
ascomycetous yeasts: An overview. FEMS Yeast Res., 9: 511–525.
45. Liu Z. L., Slininger P. J., Dien B. S. and Berhow M. A.(2004) Adaptive response of
yeasts to furfural and 5-hydroxymethylfurfural and new chemical evidence for HMF
conversion to 2,5-bis-hydroxymethylfuran. J. Ind. Microbiol. Biotechnol., 31: 345–
352.
46. Lu Y.,Warner R., Sedlak M., Ho N. and Mosier, N. S. (2009) Comparison of
glucose/xylose cofermentation of poplar hydrolysates processed by different
pretreatment technologies. Biotechnol. Prog., 25: 349–356.
47. Mahmourides G., Lee H., Maki N. and Schneider H. (1985) Ethanol accumulation in
cultures of Pachysolen tannophilus on D-xylose is associated with a transition to a
state of low oxygen consumption. Biotechnology,3:59–62.
48. Maleszka R. and Schneider H. (1982) Concurrent production and consumption of
ethanol by cultures of Pachysolen tannophilus growing on Dxylose. Appl. Environ.
Microbiol., 44:909–12.
49. Martín C, Klinke H. B., Marcet M. and García L. (2007) Study of the phenolic
compounds formed during pretreatment of sugarcane bagasse by wet oxidation and
steam explosion. Holzforschung., 61: 483–487.
50. Matsushika A., Watanabe S., Kodaki T. and Makino K. (2008) Expression of protein
engineered NADP+-dependent xylitol dehydrogenase increases ethanol production
180
from xylose in recombinant Saccharomyces cerevisiae. Appl. Microbiol. Biotechnol.,
81:243–255.
51. Medina V.G., Almering M. J. H., van Maris A. J. A. and Pronk J. T. (2010)
Elimination of glycerol production in anaerobic cultures of a Saccharomyces
cerevisiae strain engineered to use
52. Modig T., Granath K., Adler L. and Lidén, G. (2007) Anaerobic glycerol production
by Saccharomyces cerevisiae strains under hyperosmotic stress. Appl. Microbiol.
Biotechnol. 75: 289–296.
53. Muller S., Boles E., May M. and Zimmermann F.K. (1995) Different internal
metabolites trigger the induction of glycolytic gene-expression in Saccharomyces
cerevisiae. J. Bacteriol., 177:4517–9.
54. Nishikawa N., Sutcliffe R. and Saddler J.N. (1988) The influence of lignin
degradation products on xylose fermentation by Klebsiella pneumoniae. Appl.
Microbiol. Biotechnol., 27:549–552.
55. Olofsson K., Bertilsson M. and Lidén G. (2008) A short review on SSF – an
interesting process option for ethanol production from lignocellulosic feedstocks.
Biotechnol. Biofuels, 1:7.
56. Ostergaard S., Olsson L. and Nielsen J. (2000) Metabolic engineering of
Saccharomyces cerevisiae. Microbiol. Mol. Biol. Rev., 64: 34–50.
57. Palmqvist E. and Hahn-Hägerdal B. (2000) Fermentation of lignocellulosic
hydrolysates. II: Inhibitors and mechanisms of inhibition. Bioresour. Technol., 74: 25–
33.
58. Pampulha M. E. and Loureiro-Dias M. C. (1990) Activity of glycolytic enzymes of
Saccharomyces cerevisiae in the presence of acetic acid. Appl. Microbiol.
Biotechnol., 34: 375–380.
59. Pitkanen J.P., Rintala E., Aristidou A., Ruohonen L. and Penttila M. (2005) Xylose
chemostat isolates of Saccharomyces cerevisiae show altered metabolite and enzyme
levels compared with xylose, glucose, and ethanol metabolism of the original strain.
Appl. Microbiol. Biotechnol., 67:827–37.
60. Puls J. (1993) Substrate analysis of forest and agricultural wastes. In: Saddler JN (ed)
Bioconversion of forest and agricultural plant residues. CAB
International,Wallingford, p 13.
61. Sjöström E. (1993) Wood chemistry: fundamentals and applications. Academic Press,
San Diego, CA.
181
62. Skoog K. and Hahn-Hägerdal B. (1990) Effect of oxygenation on xylose fermentation
by Pichia stipitis. Appl. Environ. Microbiol., 56:3389–94.
63. Skoog K., Jeppsson H. and HahnHägerdal B. (1992) The effect of oxygenation on
glucose fermentation with Pichia stipitis — Scientific Note. Appl. Biochem.
Biotechnol., 34–5:369–75.
64. Slininger P.J., Bothast R.J., Okos M.R. and Ladisch M.R. (1985) Comparative
evaluation of ethanol production by xylose-fermenting yeasts presented high xylose
concentrations. Biotechnol Lett., 7:431–6.
65. Sonderegger M. and Sauer U. (2003) Evolutionary engineering of Saccharomyces
cerevisiae for anaerobic growth on xylose. Appl. Environ. Microbiol., 69: 1990–1998..
66. Suh S.O., McHugh J.V. and Blackwell M (2004) Expansion of the Candida
tanzawaensis yeast clade: 16 novel Candida species from basidiocarp-feeding beetles.
Int. J. Syst. Evol. Microbiol., 54:2409-2429.
67. Suh S.O., White M.M., Nguyen N.H. and Blackwell M. (2004) The status and
characterization of Enteroramus dimorbhus: a xylose-fermenting yeast attached to the
gut of beetles. Mycologia., 96:756-760.
68. van Maris A. J.,Winkler A. A., Kuyper M., de Laat W.T. (2007) Development of
efficient xylose fermentation in Saccharomyces cerevisiae: Xylose isomerase as a key
component. Adv. Biochem. Eng./Biotechnol.,108:179–204.
69. Van Zyl C., Prior B.A. and du Preez, J.C. (1991) Acetic acid inhibition of D-xylose
fermentation by Pichia stipitis. Enzyme Microb. Technol., 13: 82–86.
70. Van Zyl W.H., Eliasson A., Hobley T. and Hahn-Hägerdal B. (1989) Xylose
utilisation by recombinant strains of Saccharomyces cerevisiae on different carbon
sources. Appl. Microbiol. Biotechnol., 52:829–33.
71. Wahlbom C. F., Otero R. R. C., van Zyl W. H., Hahn-Hägerdal B. and Jönsson L. J.
(2003) Molecular analysis of a Saccharomyces cerevisiae mutant with improved
ability to utilize xylose shows enhanced expression of proteins involved in transport,
initial xylose metabolism, and the pentose phosphate pathway. Appl. Environ.
Microbiol.69: 740–746.
72. Walfridsson M., Hallborn J., Penttila M., Keranen S. and Hahn-Hägerdal B.(1995)
Xylose-metabolizing Saccharomyces cerevisiae strains overexpressing the TKL1 and
TAL1 genes encoding the pentose phosphate pathway enzymes transketolase and
transaldolase. Appl. Environ. Microbiol.61:4184–90.
182
73. Wang P.Y. and Schneider H. (1980) Growth of yeasts on D-xylulose. Can. J.
Microbiol., 26: 1165–1168.
74. Watanabe S., Kodaki T. and Makino K. (2005) Complete reversal of coenzyme
specificity of xylitol dehydrogenase and increase of thermostability by the
introduction of structural zinc.J. Biol. Chem., 280:10340–10349.
75. Watanabe S., Abu Saleh A., Pack S. P. and Annaluru N. (2007) Ethanol production
from xylose by recombinant Saccharomyces cerevisiae expressing protein-engineered
NADHpreferring xylose reductase from Pichia stipitis. Microbiology.153: 3044–
3054.
76. Watson N.E., Prior B.A., Du Preez J.C., Lategan P.M.(1984) Oxygen requirements for
D-xylose fermentation to ethanol and polyols by Pachysolen tannophilus. Enzyme
Microb. Technol., 6:447–50.
77. Webb S.R. and Lee H. (1990) Regulation of D-xylose utilization by hexoses in
pentose-fermenting yeasts. Biotechnol. Adv., 8:685–97.
78. Yu S., Jeppsson H. and Hahn-Hägerdal B. (1995) Xylulose fermentation by
Saccharomyces cerevisiae and xylose-fermenting yeast strains. Appl. Microbiol.
Biotechnol., 44:314–20.

CHAPTER 13
WEEDY LIGNOCELLULOSIC BIOMASS, A POTENTIAL
FEEDSTOCK FOR BIOETHANOL PRODUCTION: A
FUTURE PERSPECTIVE
Sarika Rana, Rameshwar Tiwari, Pandiyan Kuppusamy, Anju Arora, Surender Singh, Anil
Kumar Saxena and Lata Nain
Abstract
Lignocellulosic biomass has been recognized as the most abundant renewable energy resource
throughout world. Feedstock availability, its variability and sustainability are the main
limitations of bioethanol commercialization. Apart from conventional lignocellulosic biomass
resources there is large availability of weedy biomass, which needs to be tapped as potential
feedstock resource for future biofuel resource which does not compete with food and feed.
Parthenium sp., a noxious weed grows luxuriantly in many parts of world, has invaded
approximately 2 million hectares of land in India. Feasibility of these weedy biomass as cheap
resource can make legitimate and beneficial prospects as biofuel resources and processing of
lignocellulosic materials to ethanol comprises of four major steps; pretreatment, hydrolysis,
fermentation, and product separation/purification. Pretreatment is a prerequisite step to
overcome recalcitrant and increase overall fermentable sugar yield. Conventional
pretreatment methods, such as steam explosion, organic solvent, sulfuric acid, hot alkali and
combination of steam with acid or alkali, require a lot of energy or they often lead to the
losses of carbohydrates and generate some inhibitors to the subsequent enzymatic hydrolysis.
Biological pretreatment is attracting extensive interest worldwide as the cheep and
environmental friendly method due to advantages of low cost, energy requirement,
fermentation compatibility, water use, ease of process control and other factors. Thus, this
study focuses on prospects of weedy biomass as promising feedstock with biological
pretreatment as a suitable option to improve enzymatic digestibility of substrate.
13.1 Introduction
The worldwide escalation of energy demand, depletion in fossil fuel supply has demonstrated
as an urgent need for the development of alternative fuel sources. It is considered that
184
lignocellulosic biomass comprises about 50% of world biomass with annual production of 1
X 1010 MT worldwide (Sa´nchez and Cardona, 2008).
The production of first generation biofuel from food crops has its own limitation like
competition for land and water for food crop production and high cost for production and
processing. Biomass has been recognized as a major renewable energy resource and therefore
great emphasis has to be placed on lignocellulosic dependent second generation bioethanol
production. The bioethanol from lignocellulosic wastes avoids the existing competition of
food versus fuel caused by food based bioethanol production (Sukumaran and Pandey, 2009).
Fossils fuel dependent transport consumes major share of fuel resulting in increased
fuel prices, vehicular pollution and greenhouse gas emission. These are the key reason for
India to embrace biofuel production on its own (Ravindranath et al., 2005). Thus the selection
of lignocellulosic biomass for bioethanol production itself needs careful planning.
Lignocellulosic biomass such as agricultural residues, herbaceous and woody crops, weeds
and waste papers can be used for second generation biofuel production as they represent a
more carbon-balanced alternative to fossil fuel.
The process from biomass to biofuel has important steps: biomass deconstruction,
fuels synthesis and technologies for fuel recovery. Lignocellulosic biomass is a complex
matrix of cellulose (40-50%), hemicelluloses (25-35%) and lignins (15-20%). Therefore, it
has to be physicochemically pretreated to break the matrix of cellulose and lignin, reduce the
degree of crystalinity of the cellulose and increase the fraction of amorphous cellulose to
make it vulnerable to attack by saccharifying and fermenting organisms. All the conventional
pretreatments processes produces high amount of chemical inhibitor and results in loss of
hemicelluloses. On the contrary, the biological pretratment can be brought about with the help
of white rot fungi through the action of lignin-degrading enzymes such as peroxidases and
laccases, without production of chemical inhibitors or loss of hemicellulosic fraction
(Malherbe and Cloete , 2003).
Pretreatment, enzyme production, and enzymatic hydrolysis, contributes major cost of
bioethanol production. Hence, bringing down these costs will be of prime concern if we
desire to make lignocellulosic ethanol commercially viable. The review discusses the
legitimate use of weedy lignocellulosic biomass as the promising prospective feedstock for
bioethanol production and biological pretreatment as a suitable option to improve enzymatic
digestibility of substrate.

185
13.2 Lignocellulosic Biomass
The costs of ethanol production are highly sensitive to the cost of lignocellulosic biomass and
the operating expenditure which play a vital role in process development. Similarly the
selection of biomass affects the bioethanol yield because of variability of biochemical
components like lignin, cellulose and hemicelluloses in the raw material. Recently, municipal
solid wastes are also considered for third generation bioethanol production (Singh et al.,
2011, Haris et al., 2011). All these substrates are of low cost and available throughout the
year as well as generated through low quality land. According to a recent survey on the
generation and availability of various biomass residues employed by the NIIST (National
Institute for Interdisciplinary Science and Technology, India), the major agro-residues in
terms of volumes generated (in million metric tons-MMT) were found to be rice straw (112),
rice husk, (22.4) wheat straw (109.9), sugarcane tops (97.8) and bagasse (101.3) (Sukumaran
and Pandey, 2009). In India, bioethanol is primarily produced by sugercane molasses and
sweet sorghum but poor dimension, commercial feasibility and other industrial uses make
theses substrates potentially unfeasible (Ghosh and Ghose , 2003). Therefore, it is imperative
to diversify the selection of lignocellulosic agro-waste by including more crop, forestry
residues and native herbaceous perennial feedstock.
13.2.1 Weedy biomass
Apart from the crop biomass (e.g. rice straw, cane bagasse, wheat straw, corn strove, rice
hulls barley straw, sweet sorghum bagasse, olive stones) (Sarkar et al., 2012), there is a large
availability of weedy lignocellulosic biomass which can be utilized as the potential feedstock.
Eicchornia crassipes, Lantana camara, Prosopis juliflora, Saccharum spontaneum, Crofton
and Chromolaena odorata etc are some most common weedy feedstocks explored with their
efficiency for bioethanol production. (Chandel et al., 2011; Huber and Dale, 2009). Weedy
lignocellulosic biomass may be explored as next generation biofuel due to their growth
sustainability. Parthenium sp., also known as carrot grass is widely distributed in India and
many other parts of world. It has significantly disrupted the native plant diversity and also
creating agricultural and health hazards. Till now, investigations on Parthenium sp. have
mainly focused on its environmental impact, control measures and only a few on its use for
methane (Gunaseelan, 1995), vermicomposting (Yadav and Garg, 2009) or enzyme
production (Dwivedi et al., 2012). Parthenium sp. as feedstock for bioethanol production can
make the legitimate use of this noxious weed.
186
13.3 Lignocellulosic pretreatment
The major challenge in biomass conversion to ethanol is the pretreatment step (Kumar and
Murthy, 2011).The main aim of pretreatment is to remove lignin and hemicelluloses, decrease
the crystalinity of cellulose and increase the accessible surface area by pretreatment
technology for achieving acceptable enzymatic digestibility (Taherzadeh and Karimi, 2008).
A multitude of different pretreatment technologies have been suggested during the last
decades. They can be classified into physical,chemical and physico-chemical and biological
pretreatments, according to the different forces or energy requireremnent in the pretreatment
process.Combination of these methods has been also studied. Thermochemical pretreatment
processes have been widely used for the enzymatic conversion of lignocelluloses, such as
alkaline pretreatment, acid pretreatment, steam explosion organosolvent extraction (Galbe
and Zacchi 2007).When the alkaline pretreatment combined with other physical or chemical
processes, the treatment efficiency was usually improved. For example, microwave treatment
can improve the alkaline pretreatment of wheat straw including the decrease of pretreatment
time and increase of delignification efficiency (Keshwani and Cheng , 2011).
Furthermore, the choice of certain pretreatment has a large impact on all subsequent
steps in the overall conversion scheme in terms of cellulosic digestibility, generation of toxic
compounds potentially inhibitory for yeast, stirring power requirements, energy demand in
the downstream process and waste wastewater treatment (Klinke et al., 2004).
13.3.1 Biological pretreatment
Fungal pretreatment has been previously explored to upgrade lignocellulosic materials for
feed and paper applications, and recently this environment friendly approach has received
renewed attention as a pretreatment technique for enhancing enzymatic saccharification and
fermentation of lignocellulosic biomass to ethanol (Sánchez, 2009). Several basidiomycetes
such as Phanerochaete chrysosporium, Ceriporiopsis subvermispora, Phlebia subserialis,
and Pleurotus ostreatus have been examined on different lignocellulosic biomass to evaluate
their delignification efficiencies (Kumar et al., 2009). P. chrysosporium has been studied for
biological delignification of cotton stalks by solid state fermentation and also conversion into
the ethanol (Shi J et al., 2008). Microorganisms other than fungi are also reported for the
treatment of bionmass mainly bacteria and actinomycetes. Studies have shown that Lentinus
edodes , Pleurotes spp. ,Penicillium camemberti grown at 25–35° C for 3–22 days resulted
lignin degradation. Studies also conducted on solid-state fermentation of hardwood and
softwood substrates at 37° C by Streptomyces griseus B1, isolated from leaf litter, caused
187
much higher loss of lignin (Arora et al., 2005). Microbial pretreatment has been previously
explored to upgrade lignocellulosic materials for feed and paper applications. In bio-pulping
where lignocellulolytic enzymes were used, tensile, tear and burst indices of the resultant
paper improved, brightness of pulp was increased with an improved energy saving of 30–38%
(Scott et al., 1998).
It has been highlighted that microbial pretreatment has potential advantages over the
prevailing physiochemical pretreatment technologies due to reduced energy and material
costs, relatively simple equipment, and use of biological catalysts. However, the feasibility of
microbial pretreatment is still questioned, mainly due to the extremely long treatment time as
well as the difficulty in selectively degrading lignin and also feedstock flexibility.
In our laboratory, we have explored the potential of white rot fungi Trametes hirsuta
and micromycetes Myrothecium roridum for biological delignification of Parthenium sp
(NFBSFARA Annual report-2011).
An evaluation of weedy lignocellulosic biomass as potential feedstocks for bioethanol
production has been summarized in the Table 1.
13.4 Future prospects
Different technologies are reported for lignocellulosic conversion by different
physicochemical and biological treatments, however, many problems still remained
unresolved. Many treatments have been discussed but the biomass variability in the content of
lignin and hemicelluloses is one of the major obstacle for its pretreatment and hydrolysis.
Many factors influence this variability as the type of plant from which the biomass is
obtained, crop age, method of harvesting, moisture content, particle size of biomass etc.
Therefore, no pretreatment method could be applied in a standard way for different
lignocellulosic biomass conversion. The production of genetically modified plant materials is
one of the novel future trends for improving the pretreatment of lignocellulosic biomass via
higher carbohydrate content or modified plant structure. This method can facilitate the
pretreatment with milder conditions or using hemicellulases and could reduce the ethanol cost
from lignocellulosic biomass. An essential feature of lignocellulosic biomass conversion via
different pretreatment processes is the co-production of higher value chemicals from lignin
and hemicellulosic components. During the biological pretreatment high amount of lignin
recovery is also reported (Saritha et al., 2012). Current and potential commertial applications
of lignin have been reviewed in several reports like power, fuel and syngas products,
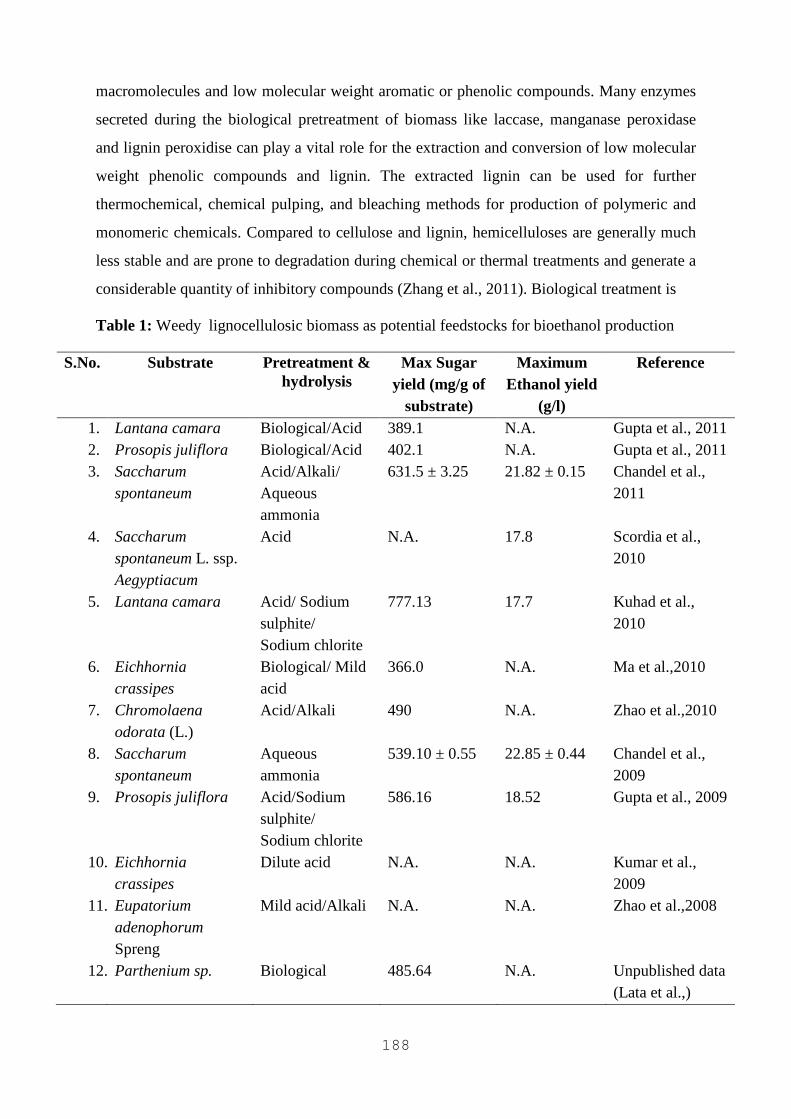
188
macromolecules and low molecular weight aromatic or phenolic compounds. Many enzymes
secreted during the biological pretreatment of biomass like laccase, manganase peroxidase
and lignin peroxidise can play a vital role for the extraction and conversion of low molecular
weight phenolic compounds and lignin. The extracted lignin can be used for further
thermochemical, chemical pulping, and bleaching methods for production of polymeric and
monomeric chemicals. Compared to cellulose and lignin, hemicelluloses are generally much
less stable and are prone to degradation during chemical or thermal treatments and generate a
considerable quantity of inhibitory compounds (Zhang et al., 2011). Biological treatment is
Table 1: Weedy lignocellulosic biomass as potential feedstocks for bioethanol production
S.No. Substrate Pretreatment & hydrolysis
Max Sugar yield (mg/g of
substrate)
Maximum Ethanol yield
(g/l)
Reference
1. Lantana camara Biological/Acid 389.1 N.A. Gupta et al., 2011 2. Prosopis juliflora Biological/Acid 402.1 N.A. Gupta et al., 2011 3. Saccharum
spontaneum
Acid/Alkali/ Aqueous ammonia
631.5 ± 3.25 21.82 ± 0.15 Chandel et al., 2011
4. Saccharum spontaneum L. ssp. Aegyptiacum
Acid N.A. 17.8 Scordia et al., 2010
5. Lantana camara
Acid/ Sodium sulphite/ Sodium chlorite
777.13 17.7 Kuhad et al., 2010
6. Eichhornia crassipes
Biological/ Mild acid
366.0 N.A. Ma et al.,2010
7. Chromolaena odorata (L.)
Acid/Alkali 490 N.A. Zhao et al.,2010
8. Saccharum spontaneum
Aqueous ammonia
539.10 ± 0.55 22.85 ± 0.44 Chandel et al., 2009
9. Prosopis juliflora Acid/Sodium sulphite/ Sodium chlorite
586.16 18.52 Gupta et al., 2009
10. Eichhornia crassipes
Dilute acid N.A. N.A. Kumar et al., 2009
11. Eupatorium adenophorum Spreng
Mild acid/Alkali N.A. N.A. Zhao et al.,2008
12. Parthenium sp. Biological 485.64 N.A. Unpublished data (Lata et al.,)
189
milder then other treatment processes and can pre extract the hemicellulose from the biomass.
This extraction could be a probable target for commercialization the mixture of solubilised
material obtained like furfurol, xylitol, acetic acid and lactic acid and latter can be converted
to acrylic acid, a precursor for plastics (Varadarajan and Miller, 1999).
13.5 Conclusion
Weedy lignocellulosic biomass may be explored as next generation biofuel due to their
growth sustainability. Cellulose crystalinity, accessible surface area, protection by lignin, and
cellulose sheathing by hemicelluloses and all these factors limits the use of lignocellulosic
biomass for enzymatic hydrolysis. The development of unique pretreatment strategy for wide
range of biomass with minimal cost is still needed. The crucial aim of the biomass conversion
is to increase the accessible sites of low crystalline cellulose, the efficient fractionation of
lignocelluloses into certain value added products to make the process economically feasible.
Biological pretreatment is a way to reduce the use of chemicals, generation of inhibitors such
as furfural, 5-HMF and acetic acid which could significantly inhibit enzymatic hydrolysis and
fermentation of biomass. Biological delignification is also a clean process yielding benefits of
co-fermentation of hexose and pentose sugars with improved economics of pretreatment
(Saritha et al., 2012).There is a need to select microorganisms for biological pretreatment
process with broad range of action along with low level of cellulases. Furthermore,
fundamental understanding of biological pretreatment mechanisms and the relationship
between the biomass structural features can lead to overcome the limitation of broad substrate
variability. Much have to be learnt concerning biopretreatment of lignocellulosic biomass and
global market could require these contributions that can be implemented on motivational eco-
friendly process leading towards biological process based second generation bioethanol
production. Therefore, this review emphasises weedy biomass as promising prospective
feedstock for biofuel production and biological pretreatment as a suitable option to improve
enzymatic digestibility of substrate.
References
1. Arora A., Nain L., Gupta J.K. (2005) Solid-state fermentation of wood residues by
Streptomyces griseus B1, a soil isolate, and solubilisation of lignins. World J.
Microbiol. Biotechnol., 21: 303–308.
190
2. Chandel A.K. and Singh O.V. (2011) Weedy lignocellulosic feedstock and microbial
metabolic engineering,advancing the generation of ‘Biofuel’. Appl. Microbiol.
Biotechnol., 89:1289–1303.
3. Chandel A.K., Narasu M.L., Chandrasekar G., Manikyam A., Rao L.V. (2009) Use of
Saccharum spontaneum (wild sugarcane) as biomaterial for cell immobilization and
modulated ethanol production by thermotolerant Saccharomyces cerevisiae VS3.
Bioresour. Technol., 100:2404-2410.
4. Chandel A.K., Singh O.V., Rao L.V., Chandrasekar G., Narasu M.L. (2011)
Bioconversion of novel substrate Saccharum spontaneum, a weedy material, into
ethanol by Pichia stipitis NCIM3498. Bioresour. Technology., 102:1709-1714.
5. Dwivedi P., Vivekanand V., Ganguly R., Singh R.P. (2009) Parthenium sp. as a plant
biomass for the production of alkalitolerant xylanase from mutant Penicillium
oxalicum SAU(E)-3.510 in submerged fermentation. Biomass Bioenerg., 33 (4):581-
588.
6. Galbe M. and Zacchi G. (2007) Pretreatment of lignocellulosic materials for efficient
bioethanol production. Adv. Biochem. Eng. Biotechnol., 108:41-65.
7. Ghosh P. and Ghose T.K. (2003) Bioethanol in India: recent past and emerging future.
Adv. Biochem. Eng. Biotechnol., 85: 1-27.
8. Gunaseelan V.N. (1995). Effect of inoculum/substrate ratio and pretreatment on
methane yield from Parthenium. Biomass Bioenergy, 8 (1):39-44.
9. Gupta R., Mehta G., Khasa Y.P., Kuhad R.C. (2011) Fungal delignification of
lignocellulosic biomass improves the saccharification of cellulosics. Biodegradation,
22:797-804.
10. Gupta R., Sharma K.K., Kuhad R.C. (2009) Separate hydrolysis and fermentation
(SHF) of Prosopis juliflora, a woody substrate, for the production of cellulosic
ethanol by Saccharomyces cerevisiae and Pichia stipitis-NCIM 3498. Bioresour.
Technol., 100:1214-1220.
11. Haris Nalakath Abubackar., María C. Veiga., Christian Kennes (2011) Biological
conversion of carbon monoxide: rich syngas or waste gases to bioethanol. Biofuels,
Bioproducts and Biorefining. 5:93-114.
12. Huber G.W.and Dale B.E.(2009) Grassoline at the pump. Sci. Am., 301:52–59.
13. Keshwani D.R. and Cheng J.J. (2011) Microwave-based alkali pretreatment of
switchgrass and coastal bermuda grass for bioethanol production. Biotechnol.
Prog., 26(3):644-52.
191
14. Klinke H.B., Thomsen A.B., Ahring B.K. (2004) Inhibition of ethanol producing yeast
and bacteria by degradation products produced during pre-treatment of biomass. Appl.
Microbiol. Biotechnol., 66(1):10-26.
15. Kuhad R.C., Gupta R., Khasa Y.P., Singh A. (2010) Bioethanol production from
Lantana camara (red sage): Pretreatment, saccharification and fermentation.
Bioresour. Technol., 101:8348-8354.
16. Kumar A., Singh L.K., Ghosh S. (2009) Bioconversion of lignocellulosic fraction of
water-hyacinth (Eichhornia crassipes) hemicelluloses acid hydrolysate to ethanol by
Pichia stipitis. Bioresour. Technol., 100:3293-3297.
17. Kumar D., Murthy G.S. (2011) Impact of pretreatment and downstream processing
technologies on economics and energy in cellulosic ethanol production. Biotechnol.
Biofuels., 4:27
18. Kumar P., Barrett D.M., Delwiche M. J., Stroeve P. (2009) Methods for pretreatment
of lignocellulosic biomass for efficient hydrolysis and biofuel production. Ind. Eng.
Chem. Res., 48: 3713–3729.
19. Ma F., Yang N., Xu C., Yu H., Wu J., Zhang X. (2010) Combination of biological
pretreatment with mild acid pretreatment for enzymatic hydrolysis and ethanol
production from water hyacinth. Bioresour. Technol., 101:9600-9604.
20. Malherbe S, Cloete T.E. (2003) Lignocellulosic biodegradation: fundamentals and
applications: a review. Environ. Sci. Biotechnol., 1:105–114.
21. Ravindranath N.H., Somashekhar H.I., Nagaraja M.S., Sudha P., Sangeeta G., et al.
(2005) Assessment of sustaintial nonplantation biomass resources potential for energy
in India. Biomass Bioenergy, 29 (3): 178-190.
22. Sa´nchez O. J., Cardona C.A. (2008) Trends in biological production of fuel ethanol
from different feedstocks. Bioresour. Technol., 99:5270–5295.1
23. Sánchez C. (2009) Lignocellulosic residues: biodegradation and bioconversion by
fungi Biotechnol. Adv., 27: 185–194.
24. Saritha M., Arora A., Lata (2012) Biological pretreatment of lignocellulosic substrates
for enhanced delignification and enzymatic digestibility. Indian J. Microbiol., 2: 122-
130.
25. Saritha M., Arora A., Nain L.(2012) Pretreatment of paddy straw with Trametes
hirsuta for improved enzymatic saccharification. Bioresour. Technol., 104: 459–465.
26. Sarkar N, Ghosh SK, Bannerjee S, Aikat K. (2012) Bioethanol production from
agricultural wastes: as overview. Renewable Energy. 37: 19-27.
192
27. Scordia D., Cosentino S.L., Jeffries T.W. (2010) Second generation bioethanol
production from Saccharum spontaneum L. ssp. aegyptiacum (Willd.) Hack.
Bioresour. Technol., 101:5358-5365.
28. Scott GM., Aktar M., Lentz MJ (1998) New technology for paper making:
commercalising biopulping. Tappi J 81:220–225.
29. Shi J., Sharma-Shivappa RR., Chinn M., Howell N. (2009). Effect of microbial
pretreatment on enzymatic hydrolysis and fermentation of cotton stalks for ethanol
production. Biomass and Bioenergy, 33 88-96.
30. Singh A., Oslen S.I. and Nigam P.S. (2011) A viable technique to generate third
generation biofuel. J. Chem. Technol. Biotechnol., 86: 1349-1353.
31. Sukumaran R.K. and Pandey A. (2009). Ethanol from Biomass. In: Biswas, S., Basak,
P.R., Kaushik, N. (Eds.), Bioprocess and Bioproducts–Emerging Trends. TIFAC,
New Delhi, pp. 13–36.
32. Taherzadeh J.M. and Karimi K. (2008) Pretreatment of lignocellulosic wastes to
improve ethanol and biogas production: a review. Int. J. Mol. Sci., 9:1621–1651.
33. Varadarajan S.and Miller D.J. (1999) Catalytic upgrading of fermentation-derived
organic acids. Biotechnol. Progr., 15: 845-854.
34. Yadav A. and Garg V.K. (2011) Vermicomposting, An effective tool for the
management of invasive weed Parthenium hysterophorus. Bioresour. Technol.,
102(10):5891-5895.
35. Zhang X., Tu Maobing., Paice M.G. (2011) Routes to potential bioproducts from
lignocellulosic biomass lignin and hemicelluloses. Bioenerg. Res., 4: 246-257.
36. Zhao X., Zhang L., Liu D. (2008) Comparative study on chemical pretreatment
methods for improving enzymatic digestibility of crofton weed stem. Bioresour.
Technol., 99:3729-3736.
37. Zhao X., Zhang L., Liu D. (2010) Pretreatment of Siam weed stem by several
chemical methods for increasing the enzymatic digestibility. Biotechnol. J., 5:493-
504.
193
CHAPTER 14
CHITOSAN- CA ALGINATE IMMOBILIZED
SACCHAROMYCES CEREVISIAE: A NOVEL TECHNIQUE
FOR BIOETHANOL PRODUCTION FROM MAHULA
(MADHUCA LATIFOLIA L.) FLOWERS
Preeti K. Dash, S.S. Behera, H. N. Thatoi and M.R. Swain
Abstract
Corolla, the edible part of Mahula flower, is rich in fermentable sugars (37±0.23%; in dry
weight basis). Mahula trees are deciduous in nature and commonly found in India
subcontinent. In this present study, batch fermentation was carried out to compare bio-ethanol
production from Mahula flowers using chitosan- Ca alginate and Ca alginate immobilized
Saccharomyces cerevisiae. The ethanol yields were 266 and 220 g/kg from mahula flowers
using chitosan Ca- alginate and Ca- alginate immobilized cells, respectively. Cell entrapment
in chitosan Ca- alginate matrix was found to be superior (15.06% more) to Ca- alginate as
regard to ethanol yield from mahula flowers. Higher bioethanol production is due to addition
of chitosan, an elicitator in Ca alginate beads, which increase the efficiency of the
fermentation process. Further, the chitosan Ca- alginate immobilized cells were
physiologically active at least for three conjugative cycles (266, 264 and 258g/kg for first,
second and third cycle, respectively) of ethanol fermentation without lowering the
productivity. The chitosan Ca-alginate immobilized cell entrapment is a novel technique for
production of ethanol from mahula flower, a non-agricultural environment based product.
Key words: Bio-ethanol, Chitosan, Ca- alginate, Mahula flower, Saccharomyces cerevisiae,
Immobilization
14.1 Introduction
There is worldwide interest to utilise ethanol as biofuel for automobiles. The increasing need
for ethanol as an energy source has stimulated worldwide investigations in search of cheaper
substrates for bulk ethanol production (Swain et al., 2007). Bioethanol generally is produced
from sugar crops (sugar cane or sugar beet) and corn. However, utilization of these food grade
194
substrates for ethanol production has also resulted in increase price of food commodities.
Hence, the other alternative is to search for non-food grade sugar/starchy crops from non-
agricultural environment (Mohanty et al., 2008). Biotechnology has played a major role in the
microbial fermentation of cheap raw materials. Microorganisms are used as a tool by
fermentation biotechnologists for the conversion of sugar into ethyl alcohol.
Mahula (Madhuca latifolia L.) is a forest tree found in abundance in the tropical rain
forests of Asian and Australian continents (Mohanty et al., 2008). Mahula tree are abudantely
found in various parts of Andhra Pradesh , Maharashtra, Chhattisgarh, Odisha and some of
the tribal communities at the locality collecting and harvesting mahula flowers for alcoholic
beverage production (Yadav et al.,2009). Mahula flowers are source of sugars 72.9%,
proteins 4.4%, fat 0.5%, calcium 150mg, iron 15mg/100gm, magnesium, copper and vitamins
(Yadav et al., 2009). The Corolla, the edible part of its flower basically rich in fermentable
sugars (37%; on dry weight basis and 40-47% on fresh weight basis), which can be used as a
carbohydrate source for bioethanol production (Swain et al., 2007). The annual production of
Mahula flowers in India during 1997-1998 was about 45,000 mtonnes, which has remained
constant during 2006-2007(Swain et al., 2007).
Yeasts, particularly Saccharomyces spp., are usually the choice for industrial ethanol
production, because of their good fermentative capacity, high tolerance to ethanol and other
inhibitors (either formed during raw-materials pre-treatments or produced during
fermentation) and the capacity to grow rapidly under the anaerobic conditions that are
characteristically established in large-scale fermentation vessels (Watanabe et al.,2007).
Bioethanol can be produced using either free or immobilized cells (Carvalho et al.,
2002). Use of immobilized cells is advantageous over free cell due to enhanced yield, easy to
separate cell mass from the bulk liquid, reduced risk of contamination, better operational
stability and cell viability for several cycles of separation (Behera et al., 2007). The most
significant advantages of immobilized yeast cell systems are the ability to operate with high
productivity at dilution rates exceeding the maximum specific growth rate, the increase of
ethanol yield and cellular stability and the decrease of process expenses due to the cell
recovery and reutilization (Lin and Tanaka, 2006). Sodium alginate, being the precussor of
calcium chloride, is readily available and is a nontoxic chemical. Therefore is most suitable as
an immobilization matrix for entrapping bio molecules and microorganisms.
The cell immobilization methods can be classified into 4 categories: carrier-binding,
cross-linking, entrapping, and a combination of these 3 methods (Kierstan and Bucke, 1997).
195
Several natural polysaccharides, such as alginates, κ-carrageenan, agar, and agarose, are
excellent gel materials and are widely used for entrapment. Many other support materials for
cell immobilization have been reported including delignified cellulosic material, chitosan
(Krajewska, 2004), natural zeolite (Sakaguchi et al., 2005), g-alumina etc. Several theories
have been proposed to explain the enhanced fermentation capacity of microorganisms as a
result of immobilization (Lin and Tanaka, 2006).
Considering the above facts, this study was carried out to compare the fermentation
efficiency of chitosan Ca alginate immobilized and Ca alginate immobilized cells of
Saccharomyces cerevisiae using mahula flowers as substrate for bioethnaol production in
submerged fermentation condition.
14.2 Materials and methods
14.2.1 Mahula flowers
Fresh mahula flowers were collected from the forests in the tribal areas of Mayurbhanj
district, of Odisha, India, during March–April, 2012. The flower were brought to the
Laboratory of College of Engineering and Technology, Bhubaneswar, washed in tap water to
get rid of dust and other debris and sun-dried in open for 7 days to reduce the moisture
content to 11-12.5%. The sundried flowers were used for fermentation studies.
14.2.2 Microorganism and culture condition
The yeast S. cerevisiae (CTCRI strain) was earlier used for ethanol fermentation, maintained
on Potato Dextrose Agar (PDA) medium [(g/L): Potato, 200; Dextrose, 20; agar, 15] and the
pH was adjusted to 7. The culture was stored at 40C for further use.
14.2.3 Immobilization method
The yeast cell suspension (105x CFU/ ml) was added to 2% (w/w) sodium alginate solutions
in a 1:1 volume ratio and mixed thoroughly and similarly in another experiment chitosan
(0.05%) was added to the sodium alginate yeast cell suspension. Both the cell alginate
mixture was then cast into beads by dropping from a hypodermic syringe into 0.1M CaCl2
solution. These beads had a diameter of approximately 3.0mm and were hardened by keeping
in dilute (0.1 M) CaCl2 solution for 24 h in refrigerator (Yu et al., 1996) and washed with
sterile distilled water before being used for the fermentation process.
14.2.4 Multiplication of immobilized yeast cells
The gel beads containing the immobilized yeast cells were immersed in the MYGP [(g/l):
malt extract, 3; yeast extract, 5; peptone,5; glucose, 20; agar, 15; pH 5.5]) medium having a
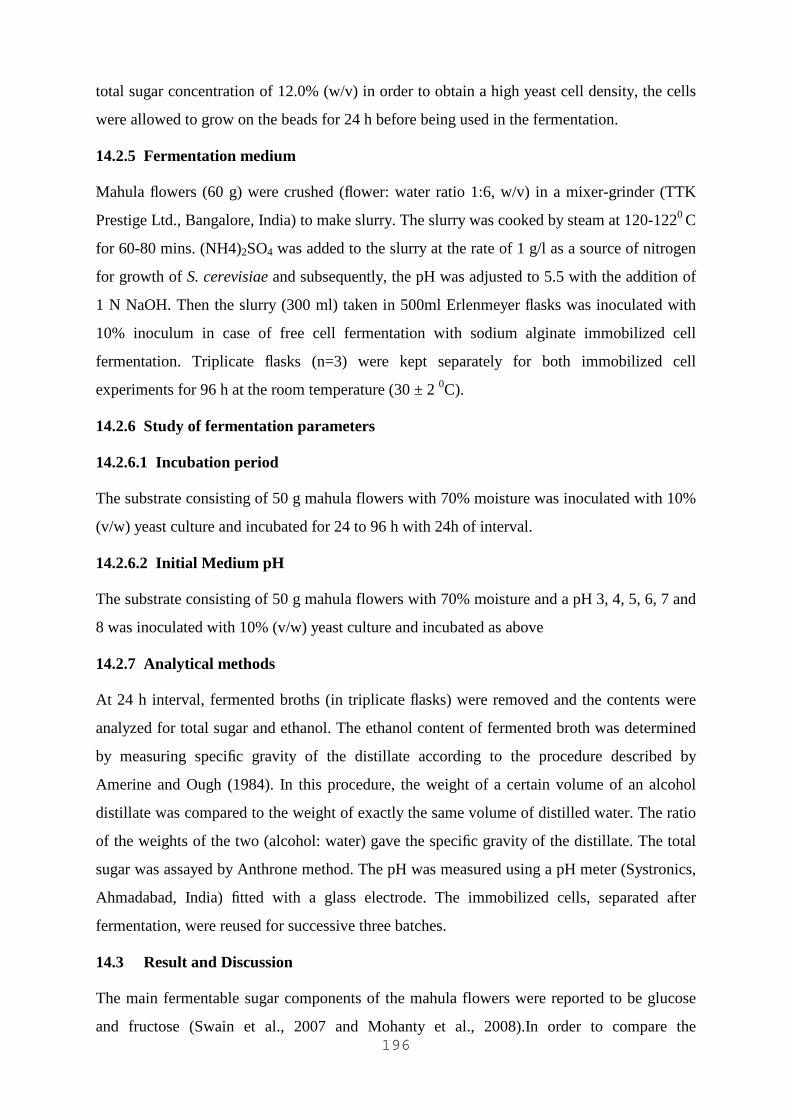
196
total sugar concentration of 12.0% (w/v) in order to obtain a high yeast cell density, the cells
were allowed to grow on the beads for 24 h before being used in the fermentation.
14.2.5 Fermentation medium
Mahula flowers (60 g) were crushed (flower: water ratio 1:6, w/v) in a mixer-grinder (TTK
Prestige Ltd., Bangalore, India) to make slurry. The slurry was cooked by steam at 120-1220 C
for 60-80 mins. (NH4)2SO4 was added to the slurry at the rate of 1 g/l as a source of nitrogen
for growth of S. cerevisiae and subsequently, the pH was adjusted to 5.5 with the addition of
1 N NaOH. Then the slurry (300 ml) taken in 500ml Erlenmeyer flasks was inoculated with
10% inoculum in case of free cell fermentation with sodium alginate immobilized cell
fermentation. Triplicate flasks (n=3) were kept separately for both immobilized cell
experiments for 96 h at the room temperature (30 ± 2 0C).
14.2.6 Study of fermentation parameters
14.2.6.1 Incubation period
The substrate consisting of 50 g mahula flowers with 70% moisture was inoculated with 10%
(v/w) yeast culture and incubated for 24 to 96 h with 24h of interval.
14.2.6.2 Initial Medium pH
The substrate consisting of 50 g mahula flowers with 70% moisture and a pH 3, 4, 5, 6, 7 and
8 was inoculated with 10% (v/w) yeast culture and incubated as above
14.2.7 Analytical methods
At 24 h interval, fermented broths (in triplicate flasks) were removed and the contents were
analyzed for total sugar and ethanol. The ethanol content of fermented broth was determined
by measuring specific gravity of the distillate according to the procedure described by
Amerine and Ough (1984). In this procedure, the weight of a certain volume of an alcohol
distillate was compared to the weight of exactly the same volume of distilled water. The ratio
of the weights of the two (alcohol: water) gave the specific gravity of the distillate. The total
sugar was assayed by Anthrone method. The pH was measured using a pH meter (Systronics,
Ahmadabad, India) fitted with a glass electrode. The immobilized cells, separated after
fermentation, were reused for successive three batches.
14.3 Result and Discussion
The main fermentable sugar components of the mahula flowers were reported to be glucose
and fructose (Swain et al., 2007 and Mohanty et al., 2008).In order to compare the
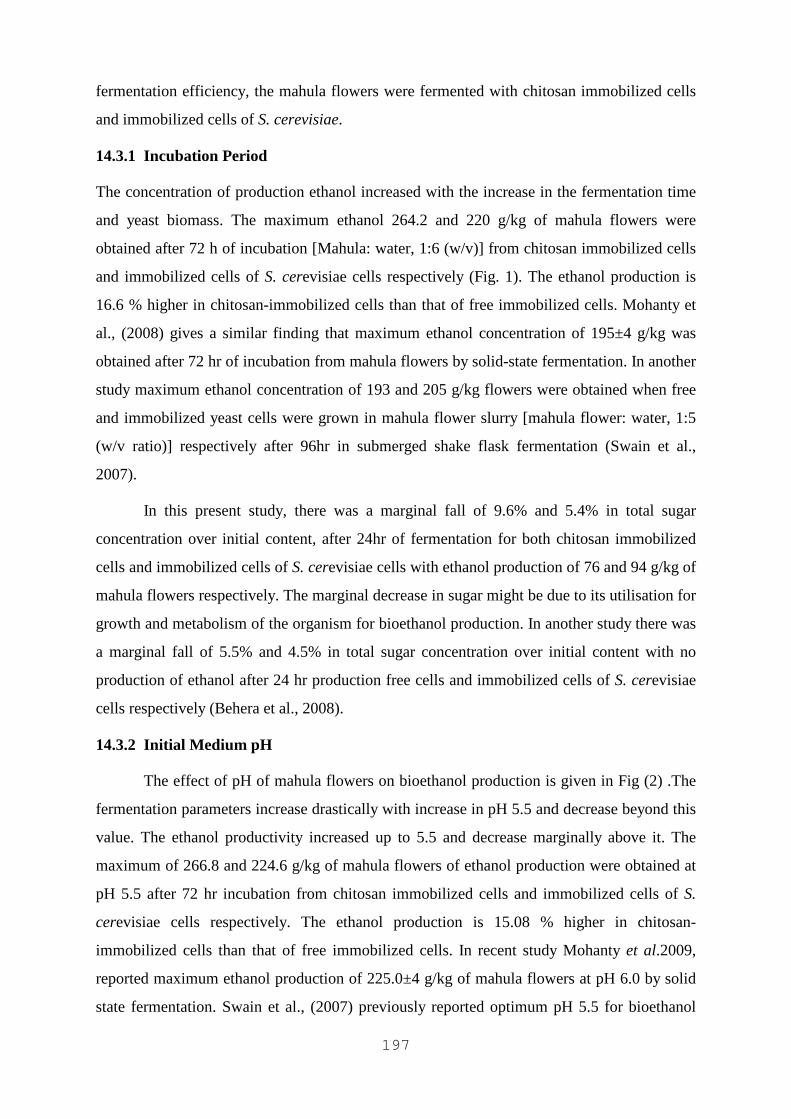
197
fermentation efficiency, the mahula flowers were fermented with chitosan immobilized cells
and immobilized cells of S. cerevisiae.
14.3.1 Incubation Period
The concentration of production ethanol increased with the increase in the fermentation time
and yeast biomass. The maximum ethanol 264.2 and 220 g/kg of mahula flowers were
obtained after 72 h of incubation [Mahula: water, 1:6 (w/v)] from chitosan immobilized cells
and immobilized cells of S. cerevisiae cells respectively (Fig. 1). The ethanol production is
16.6 % higher in chitosan-immobilized cells than that of free immobilized cells. Mohanty et
al., (2008) gives a similar finding that maximum ethanol concentration of 195±4 g/kg was
obtained after 72 hr of incubation from mahula flowers by solid-state fermentation. In another
study maximum ethanol concentration of 193 and 205 g/kg flowers were obtained when free
and immobilized yeast cells were grown in mahula flower slurry [mahula flower: water, 1:5
(w/v ratio)] respectively after 96hr in submerged shake flask fermentation (Swain et al.,
2007).
In this present study, there was a marginal fall of 9.6% and 5.4% in total sugar
concentration over initial content, after 24hr of fermentation for both chitosan immobilized
cells and immobilized cells of S. cerevisiae cells with ethanol production of 76 and 94 g/kg of
mahula flowers respectively. The marginal decrease in sugar might be due to its utilisation for
growth and metabolism of the organism for bioethanol production. In another study there was
a marginal fall of 5.5% and 4.5% in total sugar concentration over initial content with no
production of ethanol after 24 hr production free cells and immobilized cells of S. cerevisiae
cells respectively (Behera et al., 2008).
14.3.2 Initial Medium pH
The effect of pH of mahula flowers on bioethanol production is given in Fig (2) .The
fermentation parameters increase drastically with increase in pH 5.5 and decrease beyond this
value. The ethanol productivity increased up to 5.5 and decrease marginally above it. The
maximum of 266.8 and 224.6 g/kg of mahula flowers of ethanol production were obtained at
pH 5.5 after 72 hr incubation from chitosan immobilized cells and immobilized cells of S.
cerevisiae cells respectively. The ethanol production is 15.08 % higher in chitosan-
immobilized cells than that of free immobilized cells. In recent study Mohanty et al.2009,
reported maximum ethanol production of 225.0±4 g/kg of mahula flowers at pH 6.0 by solid
state fermentation. Swain et al., (2007) previously reported optimum pH 5.5 for bioethanol
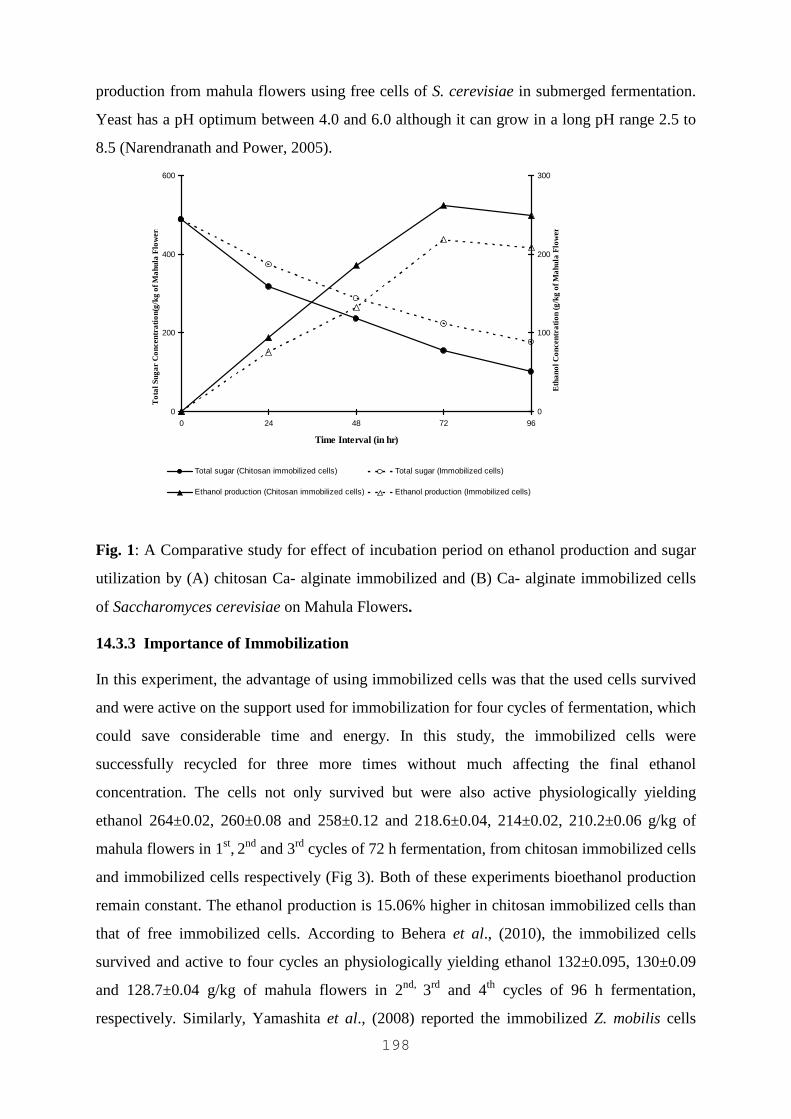
198
production from mahula flowers using free cells of S. cerevisiae in submerged fermentation.
Yeast has a pH optimum between 4.0 and 6.0 although it can grow in a long pH range 2.5 to
8.5 (Narendranath and Power, 2005).
0
200
400
600
0 24 48 72 96
Time Interval (in hr)
To
tal S
uga
r C
onc
entr
atio
n(g
/kg
of M
ahu
la F
low
ers)
0
100
200
300
Eth
ano
l Co
ncen
tra
tion
(g/k
g o
f Ma
hula
Flo
wer
s)
Total sugar (Chitosan immobilized cells) Total sugar (Immobilized cells)
Ethanol production (Chitosan immobilized cells) Ethanol production (Immobilized cells)
Fig. 1: A Comparative study for effect of incubation period on ethanol production and sugar
utilization by (A) chitosan Ca- alginate immobilized and (B) Ca- alginate immobilized cells
of Saccharomyces cerevisiae on Mahula Flowers.
14.3.3 Importance of Immobilization
In this experiment, the advantage of using immobilized cells was that the used cells survived
and were active on the support used for immobilization for four cycles of fermentation, which
could save considerable time and energy. In this study, the immobilized cells were
successfully recycled for three more times without much affecting the final ethanol
concentration. The cells not only survived but were also active physiologically yielding
ethanol 264±0.02, 260±0.08 and 258±0.12 and 218.6±0.04, 214±0.02, 210.2±0.06 g/kg of
mahula flowers in 1st, 2nd and 3rd cycles of 72 h fermentation, from chitosan immobilized cells
and immobilized cells respectively (Fig 3). Both of these experiments bioethanol production
remain constant. The ethanol production is 15.06% higher in chitosan immobilized cells than
that of free immobilized cells. According to Behera et al., (2010), the immobilized cells
survived and active to four cycles an physiologically yielding ethanol 132±0.095, 130±0.09
and 128.7±0.04 g/kg of mahula flowers in 2nd, 3rd and 4th cycles of 96 h fermentation,
respectively. Similarly, Yamashita et al., (2008) reported the immobilized Z. mobilis cells
199
entrapped in Ca-alginate gel beads could produce ethanol from paper sludge under repeated
batch fermentation conditions. While in the first cycle the ethanol production was 17.9 g/l, it
decreased to 5.3 g/l in the fourth cycle. However, there was a gradual but significant decline
in ethanol concentration observed after each cycle of operation.
0
200
400
600
3 3.5 4 4.5 5 5.5 6
Fermentation Medium pH
Tota
l Sug
ar C
onc
ent
ratio
n (g
/kg o
f Mahu
la F
low
ers
)
0
100
200
300
Eth
ano
l Conc
ent
ratio
n (g
/kg o
f Mahu
la F
low
ers
)
Total sugar (Chitosan immobilized cells) Total sugar (Immobilized cells)
Ethanol production (Chitosan immobilized cells) Ethanol production (Immobilized cells)
Fig. 2: A Comparative study for effect of pH on ethanol production and sugar utilization by
chitosan Ca- alginate immobilized and Ca- alginate immobilized cells of Saccharomyces
cerevisiae on Mahula Flowers.
Fig. 3: A Comparative study of ethanol production by chitosan Ca- alginate immobilized ( )
and Ca- alginate immobilized ( ) cells of S. cerevisiae on Mahula Flowers after four cycles.
0
50
100
150
200
250
300
1 2 3
Fermentation Cycles
Eth
ano
l pro
duct
ion
(g/k
g o
f Mahu
la F
low
ers
)
200
14.3.4 Importance of Chitosan
The influence of chitosan (support materials) in Ca-alginate beads on cellular metabolism has
been studied by several researchers under various contexts. Cell respiration was observed
quite early, after the development of supported (chitosan) cell immobilization techniques. In
this present study, addition of 0.05% (w/v) chitosan into the medium considerably increased
the rate of ethanol production from mahula flowers .The support material added to the
immobilization induced cell anchorage as well as respiration. From the results it is obvious
that the characteristics of the supports are important to derive maximum benefit from
fermentation.
14.4 Conclusion
The present study led to postulate that incorporation of a small quantity of chitosan to Ca-
alginate beads promote cell anchorage, which will advantageous over cell immobilized
systems for bioethanol production. Chitosan immobilized cells produce 15.06% more ethanol
than free immobilized cells from mahula flowers. In the further study detailed experiments
are going on in our laboratory for optimization of ethanol production from mahula flowers
using chitosan immobilized cells.
Acknowledgments: The Department of Science and Technology-Govt. of Orissa is gratefully
acknowledged for its financial support of this project (Project no.3897/ST, Bhubaneswar
dated 07/08/10).
References
1. Amerine M.A. and Ough C.S. (1984) Wine and Must Analysis., Wiley, New York,
USA.
2. Carvalho W., Silva S.S., Converti A and Vitolo M. (2002) Metabollic behaviour of
immobilized Candida guillirmondii cells during batch xylitol production from
sugarcane bagasse acid hydrolysate. Biotechnol. Bioeng.,79:165-169.
3. Hartmeier, W. (1988) Immobilized Biocatalysts Springer, Berlin.
4. Kierstan M. and Bucke C. (1977) The immobilization of microbial cells, subcellular
organelles, and enzymes in calcium alginate gels. Biotechnol. Bioeng. 19 :387–397.
5. Krajewska, B. (2004) Application of chitin- and chitosan-based materials for enzyme
immobilizations. Enzyme Microb. Technol., 35: 126–139.
6. Lin Y. and Tanaka S. (2006) Ethanol fermentation from biomass resources: current
state and prospects. Appl. Microbiol. Biotechnol., 69: 627–642.
201
7. Mohany S.K., Behera S., Swain M.R. and Ray, R.C. (2008) Bioethanol production
from mahula (Madhuca latifolia L.) flowers by solid-state fermentation. Appli. Ener.,
86:640-644 .
8. Narendranath N.V. and Power, R.( 2005) Relationship between pH and medium
dissolved solids in terms of growth and metabolism of lactobacilli and
Saccharomyces cerevisiae during ethanol production. Appl. Environ. Microbiol.,
71:2239-2243.
9. Sakaguchi K., Matsui M. and Mizukami F. (2005) Applications of zeolite inorganic
composites in biotechnology: current state and perspectives. Appl. Microb.
Biotechnol., 67 : 306–311.
10. Sakai Y., Tamiya Y. and Takahashi F. (1994) Enhancement of ethanol formation by
immobilized yeast containing iron powder or Ba-ferrite due to eddy current or
hysteresis. J. Ferment. Bioeng., 77: 169–172.
11. Swain M.R., Kar S., Sahoo A.K. and Ray, R.C.( 2007) Ethanol fermentation of
mahula (Madhuca latifolia L.) flowers using free and immobilized yeast
Saccharomyces cerevisiae. Microbiol. Res.,162:16293-16298 .
12. Tanaka T. and Kawamoto L. (1999) Manual of Industrial Microbiology and
Biotechnology (2nd ed., Washington, D.C., American Society forMicrobiology Press,
pp. 94-102.
13. Yadav P., Garg N. and Diwedi D.H. (2009) Effect of loca tion of cultivar,
Fermentation temperature and additives in the physico-chemical and sensory qualities
on mahua (Madhuca latifolia J.F. Gmel) wine Preparation. Natural Product radiance
8:406-408.
14. Yamashita Y., Kurosumi A., Sasaki C. and Nakamura Y.( 2008) Ethanol production
from paper sludge by immobilized Zymomonas mobilis. Biochem. Eng., 42:314-319.
15. Yu, B., Zhang, F., Zheng, Y., Wang, P.U.( 1996) Alcohol fermentation from the mash
of dried sweet potato with its drags using immobilized yeast. Process. Biochem., 31:1-
6.
202
CHAPTER 15
CO-UTLIZATION OF AGRO INDUSTRIAL WASTES AND
CYNODON DACTYLON FOR BIOGAS PRODUCTION
H.V. Deshmukh
Abstract
The cost of oil in the world market increases because of over dependence of different
countries on fossil fuels. To overcomes the energy problem the countries have to give extra
emphasis on indigenous and renewable energy sources. The present paper includes the study
of biogas production from Agro- based industrial wastes (Distillery, Sugar industry, Dairy
and Farm house) and commonly occurring grass Cynodon dactylon. The untreated and
pretreated grass was used, there was marked increase in biogas production after pretreatment.
Experiments were carried out in 1-l digester flasks in the batch process; measurement of
biogas was done by water displacement method. The biogas production was recorded up to
30 days. In general Distillery waste and pretreated Cynodon dactylon showed the best biogas
production results. The use of Cynodon dactylon and Distillery waste can be made to
supplement the conventional substrate like dung in urban and rural areas to augment the
biogas production.
Key words – Renewable energy, Biogas, Biomass.
15.1 Introduction
Biomass is an organic reserve produced at the cost of solar energy due to photosynthesis in
green plants, many countries have turned their attention to utilization of biomass, a renewable
resource to satisfy the increasing energy demand. Approx13-14% of worlds primary energy
supply was derived from biomass (Scurlocka and Hall, 1987). The use of biomass as a source
of energy has number of attractive aspects (Wood and Hall, 1994).Direct combustion,
gasification, carbonization, pyrolysis anaerobic fermentation are the major conversion
technologies of biomass of which the last one is a biochemical process involving action of
microorganisms on the biomass resulting in the production of fuel energy,
Biogas is a mixture of methane (65-75%) and CO2 (30-35%) together with other gases
like NH3, H2S, H2 and N2, etc. in trace quantities, produced from organic matter by microbial
203
decay under anaerobic condition. The biogas is highly combustible and can be used for
generation of heat, electricity and mechanical energy.
Almost 70% of population of India lives in villages, Where the plant and animal
biomass in the form of cattle dung, dry leaves, agricultural residues and plant weeds is
available in plenty, which can be easily converted into biogas. To meet the daily biogas needs
of family of four persons on an average, twenty five kg/day of dung will be required and
hence the technology even today by and large caters to the need of rich farmers only In order
to replace dung other resources commonly present in rural areas, has to be made to
supplement the biogas production (Bose et.el, 1983).
In order to augment the resource for biogas generation tapping of other resources has
become necessity to supplement gas production (Acharya 1958 ; Annonymous 1981) in the
light of this a series of publications have appeared in the last two to three decades to test the
potentiality of other forms of biomass. Methane produced by anaerobic digestion of animal
excreta like camel, horse, pig, poultry has been compared with that of cow dung (Biswas,
1997; Malik et.al, 1990).
Agricultural wastes like rice straw (Acharya, 1958), Tomato plants and Potato stems
(Lim et.al, 1986) have been tested. In most of the cases pretreatment in the form of soaking in
water, acid or alkali was found to increase the biogas content on digestion mixed with cow
dung or any other animal waste the yield was highe
Several researchers have suggested an integrated approach to Biomethanogenesis
Sharma and Madan (1992) used sericulture wastes of Morus alba to grow mushrooms and
then the subsequent mycotic lingo cellulose residue for biogas production, Brahma (2001)
used petrochemical waste for biogas production, the waste from distillery sugar factory,
cellulose pulp, fishery waste used in India for biogas production. This type of production is
quite cost effective (Cheremisinoff and Ovellettee, 1985).The literature survey thus reveals
that majority cases investigated have yielded positive information and a vast plant biomass
and agricultural industry wastes still awaits screening.
Cynodon dactylon also known Bermuda grass, Dub.Bahama grass. Devils grass is a
grass native to north and South Africa, Asia and Australia.Althoughit is not native to
Bermuda, It is an abundant invasive species there. It is an excellent fodder grass for cattle
and horses. It grows in very diverse conditions of soil and moisture. Withstanding drought
well and It is also valuable for soil conservations. It is difficult to eradicate and can become a
204
serious weed in cultivated land. In many areas it is used for lawn and turf. It is having
medicinal value it has folk remedy for cancer, cough, cramps, cystitis, diarrhea, dysentery,
epilepsy, headache, hemorrhage, snakebite, urinogenital disorders etc
Cynodon (100 gm dry wt) contains11.6 g protein, 2.1 g fat, 75.9 g total carbohydrates,
25.9 g fiber, 10.4 g ash, 530 mg Ca, 220 mg P, 112.00 mg Fe, 1630 mg K, 28 ug betacarotene
equivalent (Miiller,1958). Burmuda grass reported to tolerate alkali, disease, drought, frost,
grazing, herbicide, high pH, nematodes, heavy metals, heavy soil, insects, low pH, poor soil,
sand, slop, smog, SO2,ultra violet light, water logging, and weeds .Plant vary greatly in habit
according to soil and climate, Method of cultivation is by cutting and rutting. Common
method is to plant rooting, spread very quickly from the rooted runners, which grow more
than 7.5 cm day. In others, propagation is by seeds, sown at rate of 7 - 9 kg/ha. It was
determined to fix nitrogen at a rate of 33 kg/ha/100 days.
It can become a serious pest in cultivated lands; difficult to eradicate; its thick
network of runners can starve out crops and vast areas of land may become unfit for
cultivation Harvesting is done when in full bloom, Normally 4 cuttings per year are possible.
When properly made and stocked, hay keeps well for many years. According to the
Phytomass files (Duke,1981), Annual productivity ranges from 4 to 52 MT /ha (13 - 17 in
Australia, 7 - 11 in India, 23 in Pakistan, 26 in S.Africa) Average yields of hay ranges from14
- 28 MT/ha.The present investigation is aimed to study more abundantly growing Cynodon
dactylon and Agricultural wastes to reveal their potential of biogas with special reference to
its methane content.
15.2 Material and method
15.2.1 Agro-industrial wastes
S.No. Industry Remarks
1) Distillery of Ajinkyatara Sahakari Sakhar Karkhana, Satara (distillery waste)
Rich in organic material, deep brown, Jaggary smell, acidic in nature.
2) Ajinkyatara Sahakari Sakhar Karkhana, Satara (Sugar plant waste)
Organic in nature, putrefaction leads to odor nuisance.
3) Government Dairy, M.I.D.C., Satara. Organic in nature, slightly alkaline, anaerobic condition leads to odorous black sludge.
4) Local ongoing gobar gas plant, Degaon, Satara.
Plant based on animal excreta and human waste. Rich in organic matter.
205
15.2.2 Cynodon dactylon Pers - Dub grass also called Harali entire plant material was used
collected from Satara region
15.2.3 Slurry of cattle dung based biogas plant - Cattle dung based biogas plant slurry
was collected from a biogas plant situated at Degaon, M.I.D.C. region Satara,
15.2.4 Biogas digesters - Preliminary screening studies regarding biomethanation potential of
cynodon biomass was carried out by using 1 liter capacity glass flasks and plastic carboys.
15.3 Methods
15.3.1 Collection, preparation and storage of grass material
The entire cynodon grass material free of soil, were collected from selected sites / localities in
sterile plastic bags using sterile hand gloves and a knife. This plant material was then processed
in laboratory, where it was chopped and cut into pieces of about 2 cm sizes. The pieces were
powdered in a mixer, dried at room temperature (300C – 350C) for 96 hrs, and then stored at
refrigeration for further use. The dried biomass was soaked in water (for studies on untreated
biomass) or dilute alkali (for studies on pretreated biomass) to form a slurry at the time of
further use.
15.3.2 Pretreatment of wed biomass- Alkali treatment
The 25-g of the air dried grass sample was treated with 1% NaOH solution for 8 days, using 10
parts of alkali solution to one part of the substrate i.e., 25-g of grass sample in 250 mL 1%
NaOH solution at room temperature. Untreated and pretreated grass material was stored at
refrigeration and used for further studies as and when required.
15.3.3 Collection and storage of wastes
The distillery, sugar industry, Dairy and Farm house wastes were collected as fresh composite
samples in disinfected plastic carboys of 5-L capacity and stored at refrigeration till further use.
15.3.4 Chemical analysis of grass biomass and agro based industrial wastes
Chemical reagents, apparatus and methods used for chemical analyses of grass material and
agro based industrial wastes were as per APHA (1985), Trivedy and Goel (1984) and AOAC
(1990).
15.3.5 Biomethanation study
15.3.5.1 Control set- Using only cattle dung slurry as substrate
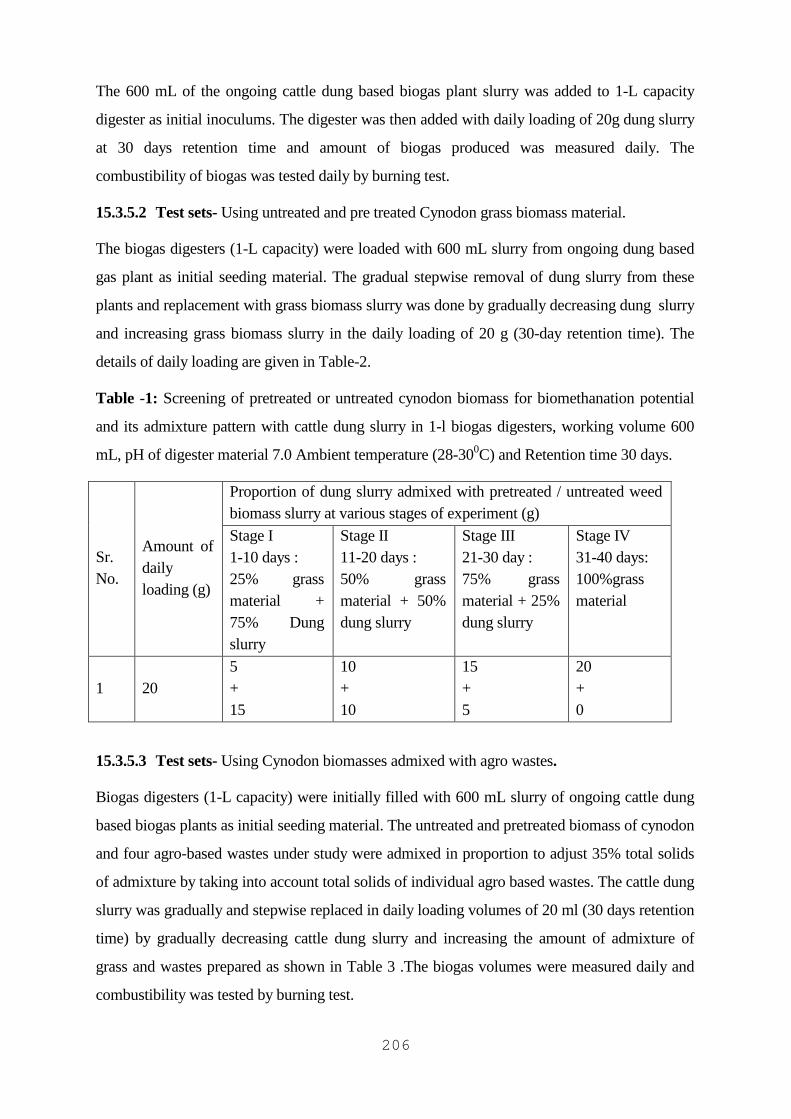
206
The 600 mL of the ongoing cattle dung based biogas plant slurry was added to 1-L capacity
digester as initial inoculums. The digester was then added with daily loading of 20g dung slurry
at 30 days retention time and amount of biogas produced was measured daily. The
combustibility of biogas was tested daily by burning test.
15.3.5.2 Test sets- Using untreated and pre treated Cynodon grass biomass material.
The biogas digesters (1-L capacity) were loaded with 600 mL slurry from ongoing dung based
gas plant as initial seeding material. The gradual stepwise removal of dung slurry from these
plants and replacement with grass biomass slurry was done by gradually decreasing dung slurry
and increasing grass biomass slurry in the daily loading of 20 g (30-day retention time). The
details of daily loading are given in Table-2.
Table -1: Screening of pretreated or untreated cynodon biomass for biomethanation potential
and its admixture pattern with cattle dung slurry in 1-l biogas digesters, working volume 600
mL, pH of digester material 7.0 Ambient temperature (28-300C) and Retention time 30 days.
Sr. No.
Amount of daily loading (g)
Proportion of dung slurry admixed with pretreated / untreated weed biomass slurry at various stages of experiment (g)
Stage I 1-10 days : 25% grass material + 75% Dung slurry
Stage II 11-20 days : 50% grass material + 50% dung slurry
Stage III 21-30 day : 75% grass material + 25% dung slurry
Stage IV 31-40 days: 100%grass material
1 20 5 + 15
10 + 10
15 + 5
20 + 0
15.3.5.3 Test sets- Using Cynodon biomasses admixed with agro wastes.
Biogas digesters (1-L capacity) were initially filled with 600 mL slurry of ongoing cattle dung
based biogas plants as initial seeding material. The untreated and pretreated biomass of cynodon
and four agro-based wastes under study were admixed in proportion to adjust 35% total solids
of admixture by taking into account total solids of individual agro based wastes. The cattle dung
slurry was gradually and stepwise replaced in daily loading volumes of 20 ml (30 days retention
time) by gradually decreasing cattle dung slurry and increasing the amount of admixture of
grass and wastes prepared as shown in Table 3 .The biogas volumes were measured daily and
combustibility was tested by burning test.
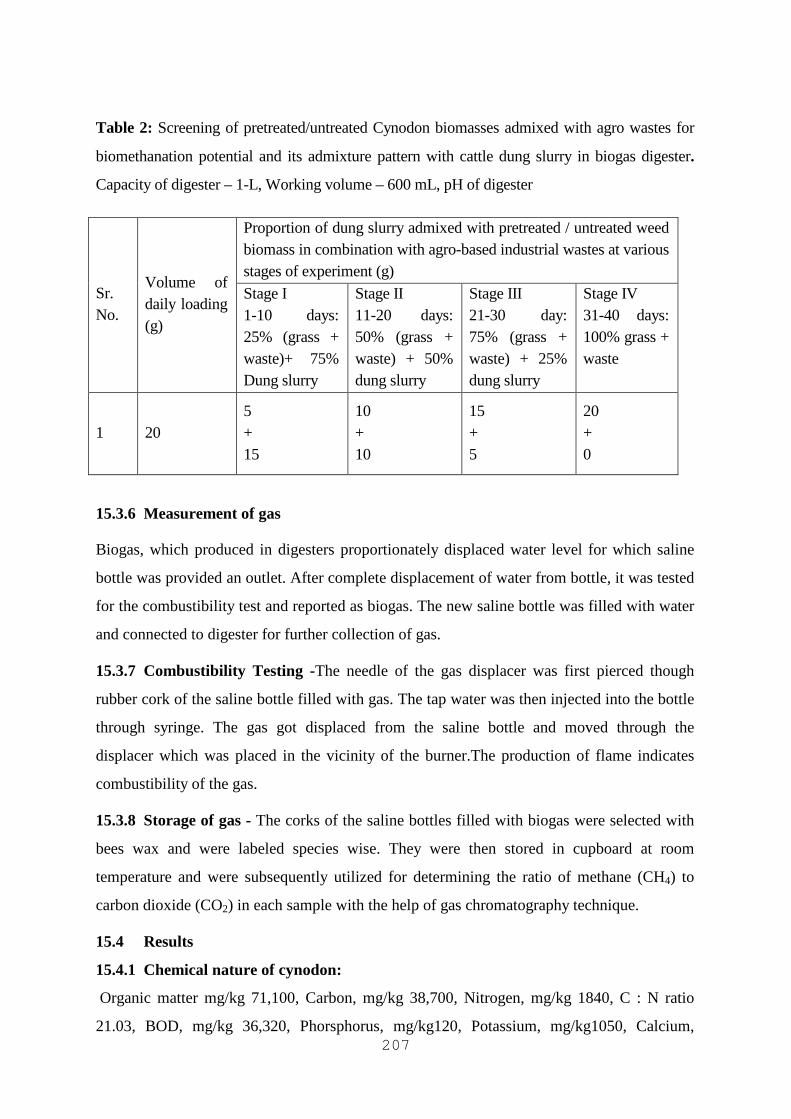
207
Table 2: Screening of pretreated/untreated Cynodon biomasses admixed with agro wastes for
biomethanation potential and its admixture pattern with cattle dung slurry in biogas digester.
Capacity of digester – 1-L, Working volume – 600 mL, pH of digester
15.3.6 Measurement of gas
Biogas, which produced in digesters proportionately displaced water level for which saline
bottle was provided an outlet. After complete displacement of water from bottle, it was tested
for the combustibility test and reported as biogas. The new saline bottle was filled with water
and connected to digester for further collection of gas.
15.3.7 Combustibility Testing -The needle of the gas displacer was first pierced though
rubber cork of the saline bottle filled with gas. The tap water was then injected into the bottle
through syringe. The gas got displaced from the saline bottle and moved through the
displacer which was placed in the vicinity of the burner.The production of flame indicates
combustibility of the gas.
15.3.8 Storage of gas - The corks of the saline bottles filled with biogas were selected with
bees wax and were labeled species wise. They were then stored in cupboard at room
temperature and were subsequently utilized for determining the ratio of methane (CH4) to
carbon dioxide (CO2) in each sample with the help of gas chromatography technique.
15.4 Results
15.4.1 Chemical nature of cynodon:
Organic matter mg/kg 71,100, Carbon, mg/kg 38,700, Nitrogen, mg/kg 1840, C : N ratio
21.03, BOD, mg/kg 36,320, Phorsphorus, mg/kg120, Potassium, mg/kg1050, Calcium,
Sr. No.
Volume of daily loading (g)
Proportion of dung slurry admixed with pretreated / untreated weed biomass in combination with agro-based industrial wastes at various stages of experiment (g)
Stage I 1-10 days: 25% (grass + waste)+ 75% Dung slurry
Stage II 11-20 days: 50% (grass + waste) + 50% dung slurry
Stage III 21-30 day: 75% (grass + waste) + 25% dung slurry
Stage IV 31-40 days: 100% grass + waste
1 20 5 + 15
10 + 10
15 + 5
20 + 0
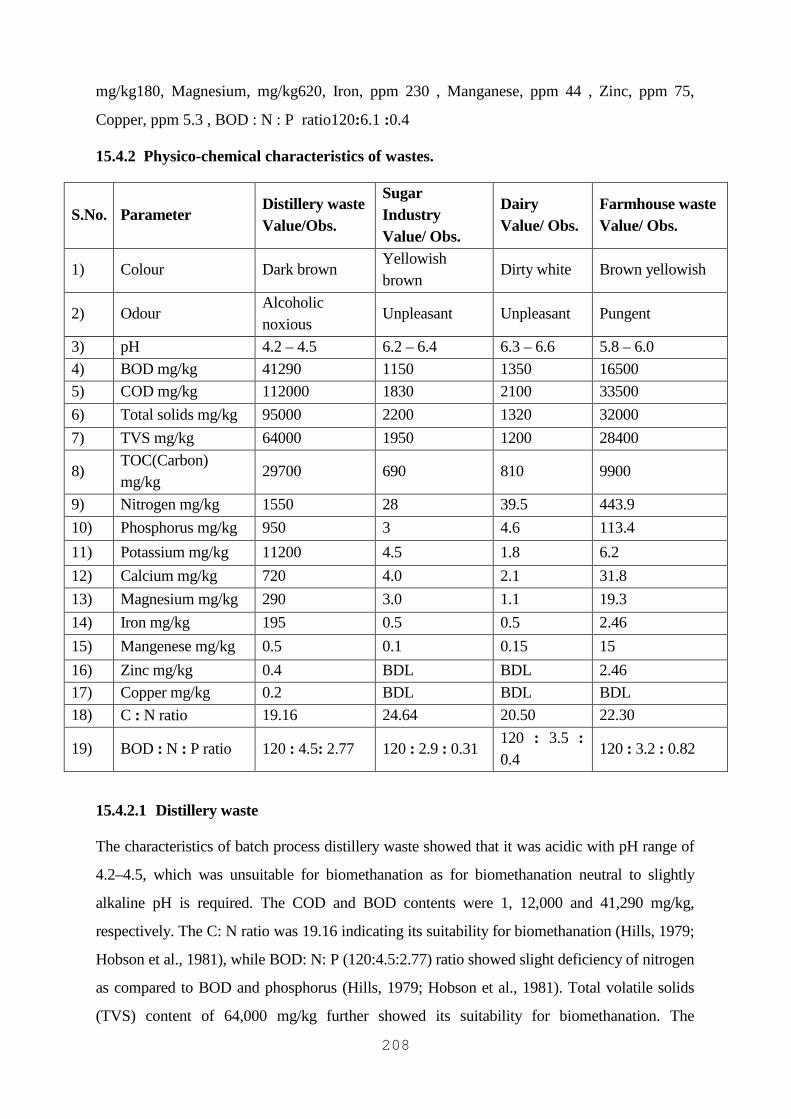
208
mg/kg180, Magnesium, mg/kg620, Iron, ppm 230 , Manganese, ppm 44 , Zinc, ppm 75,
Copper, ppm 5.3 , BOD : N : P ratio120:6.1 :0.4
15.4.2 Physico-chemical characteristics of wastes.
S.No. Parameter Distillery waste Value/Obs.
Sugar Industry Value/ Obs.
Dairy Value/ Obs.
Farmhouse waste Value/ Obs.
1) Colour Dark brown Yellowish brown
Dirty white Brown yellowish
2) Odour Alcoholic noxious
Unpleasant Unpleasant Pungent
3) pH 4.2 – 4.5 6.2 – 6.4 6.3 – 6.6 5.8 – 6.0
4) BOD mg/kg 41290 1150 1350 16500
5) COD mg/kg 112000 1830 2100 33500
6) Total solids mg/kg 95000 2200 1320 32000
7) TVS mg/kg 64000 1950 1200 28400
8) TOC(Carbon) mg/kg
29700 690 810 9900
9) Nitrogen mg/kg 1550 28 39.5 443.9
10) Phosphorus mg/kg 950 3 4.6 113.4
11) Potassium mg/kg 11200 4.5 1.8 6.2
12) Calcium mg/kg 720 4.0 2.1 31.8
13) Magnesium mg/kg 290 3.0 1.1 19.3
14) Iron mg/kg 195 0.5 0.5 2.46
15) Mangenese mg/kg 0.5 0.1 0.15 15
16) Zinc mg/kg 0.4 BDL BDL 2.46
17) Copper mg/kg 0.2 BDL BDL BDL
18) C : N ratio 19.16 24.64 20.50 22.30
19) BOD : N : P ratio 120 : 4.5: 2.77 120 : 2.9 : 0.31 120 : 3.5 : 0.4
120 : 3.2 : 0.82
15.4.2.1 Distillery waste
The characteristics of batch process distillery waste showed that it was acidic with pH range of
4.2–4.5, which was unsuitable for biomethanation as for biomethanation neutral to slightly
alkaline pH is required. The COD and BOD contents were 1, 12,000 and 41,290 mg/kg,
respectively. The C: N ratio was 19.16 indicating its suitability for biomethanation (Hills, 1979;
Hobson et al., 1981), while BOD: N: P (120:4.5:2.77) ratio showed slight deficiency of nitrogen
as compared to BOD and phosphorus (Hills, 1979; Hobson et al., 1981). Total volatile solids
(TVS) content of 64,000 mg/kg further showed its suitability for biomethanation. The
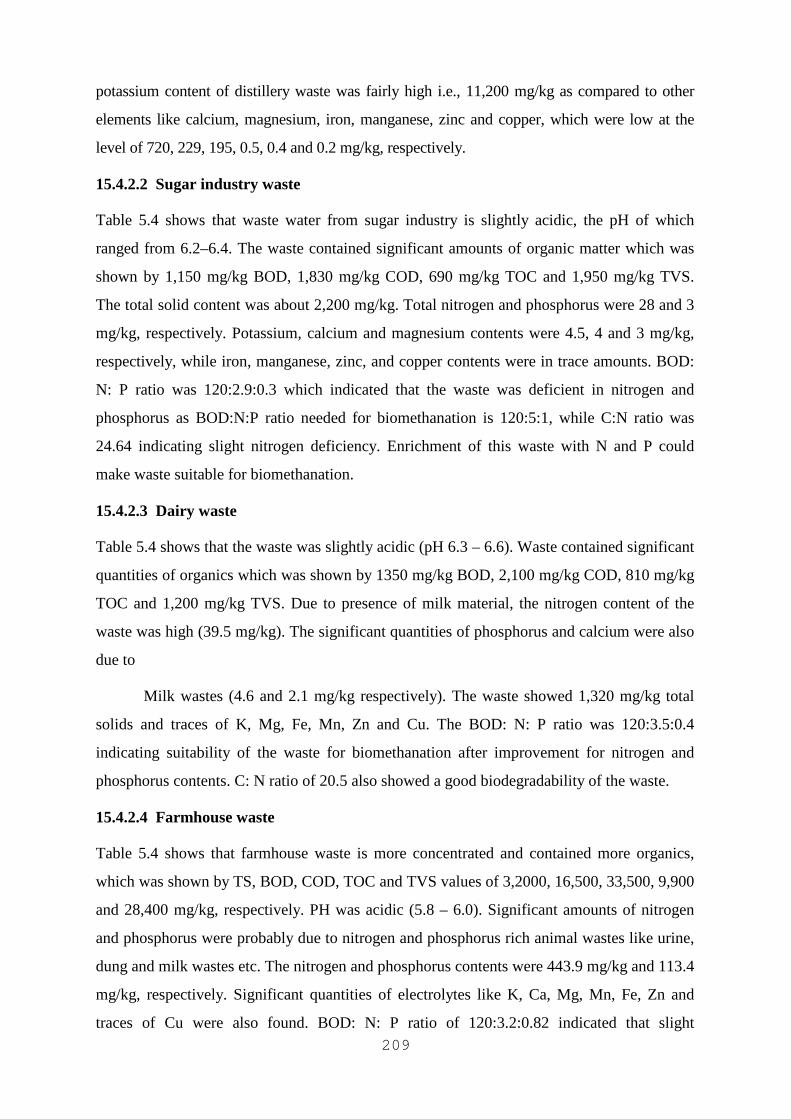
209
potassium content of distillery waste was fairly high i.e., 11,200 mg/kg as compared to other
elements like calcium, magnesium, iron, manganese, zinc and copper, which were low at the
level of 720, 229, 195, 0.5, 0.4 and 0.2 mg/kg, respectively.
15.4.2.2 Sugar industry waste
Table 5.4 shows that waste water from sugar industry is slightly acidic, the pH of which
ranged from 6.2–6.4. The waste contained significant amounts of organic matter which was
shown by 1,150 mg/kg BOD, 1,830 mg/kg COD, 690 mg/kg TOC and 1,950 mg/kg TVS.
The total solid content was about 2,200 mg/kg. Total nitrogen and phosphorus were 28 and 3
mg/kg, respectively. Potassium, calcium and magnesium contents were 4.5, 4 and 3 mg/kg,
respectively, while iron, manganese, zinc, and copper contents were in trace amounts. BOD:
N: P ratio was 120:2.9:0.3 which indicated that the waste was deficient in nitrogen and
phosphorus as BOD:N:P ratio needed for biomethanation is 120:5:1, while C:N ratio was
24.64 indicating slight nitrogen deficiency. Enrichment of this waste with N and P could
make waste suitable for biomethanation.
15.4.2.3 Dairy waste
Table 5.4 shows that the waste was slightly acidic (pH 6.3 – 6.6). Waste contained significant
quantities of organics which was shown by 1350 mg/kg BOD, 2,100 mg/kg COD, 810 mg/kg
TOC and 1,200 mg/kg TVS. Due to presence of milk material, the nitrogen content of the
waste was high (39.5 mg/kg). The significant quantities of phosphorus and calcium were also
due to
Milk wastes (4.6 and 2.1 mg/kg respectively). The waste showed 1,320 mg/kg total
solids and traces of K, Mg, Fe, Mn, Zn and Cu. The BOD: N: P ratio was 120:3.5:0.4
indicating suitability of the waste for biomethanation after improvement for nitrogen and
phosphorus contents. C: N ratio of 20.5 also showed a good biodegradability of the waste.
15.4.2.4 Farmhouse waste
Table 5.4 shows that farmhouse waste is more concentrated and contained more organics,
which was shown by TS, BOD, COD, TOC and TVS values of 3,2000, 16,500, 33,500, 9,900
and 28,400 mg/kg, respectively. PH was acidic (5.8 – 6.0). Significant amounts of nitrogen
and phosphorus were probably due to nitrogen and phosphorus rich animal wastes like urine,
dung and milk wastes etc. The nitrogen and phosphorus contents were 443.9 mg/kg and 113.4
mg/kg, respectively. Significant quantities of electrolytes like K, Ca, Mg, Mn, Fe, Zn and
traces of Cu were also found. BOD: N: P ratio of 120:3.2:0.82 indicated that slight
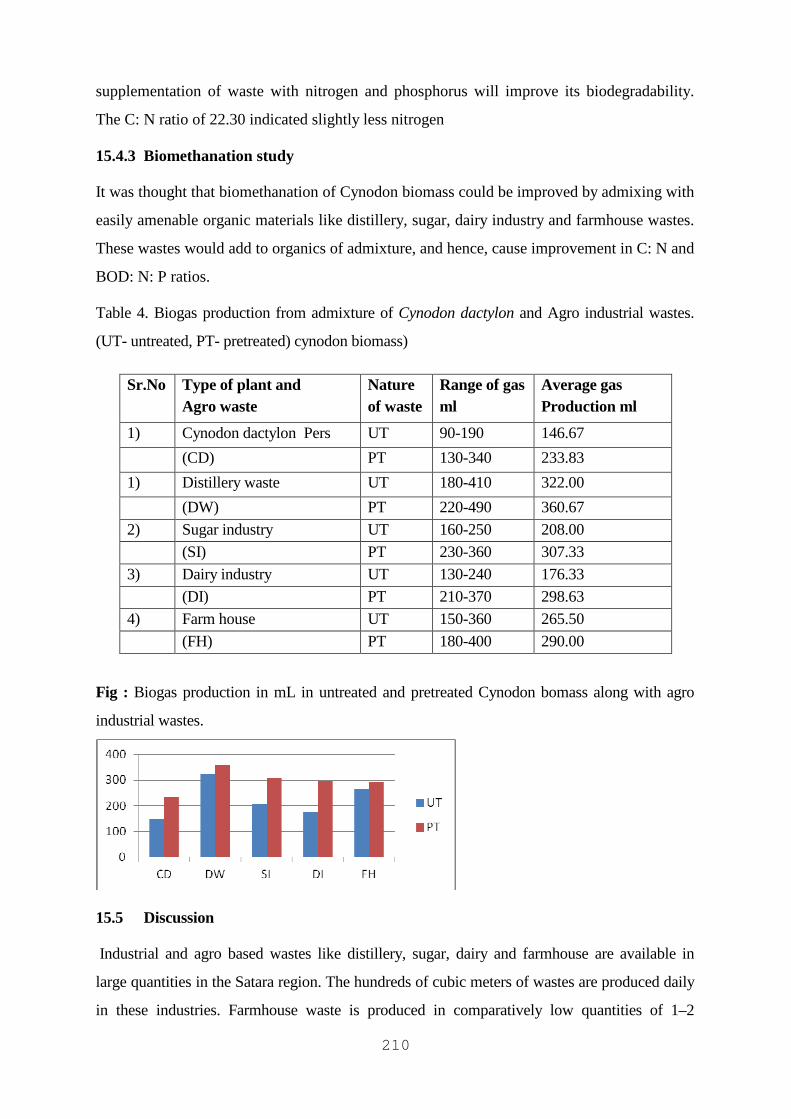
210
supplementation of waste with nitrogen and phosphorus will improve its biodegradability.
The C: N ratio of 22.30 indicated slightly less nitrogen
15.4.3 Biomethanation study
It was thought that biomethanation of Cynodon biomass could be improved by admixing with
easily amenable organic materials like distillery, sugar, dairy industry and farmhouse wastes.
These wastes would add to organics of admixture, and hence, cause improvement in C: N and
BOD: N: P ratios.
Table 4. Biogas production from admixture of Cynodon dactylon and Agro industrial wastes.
(UT- untreated, PT- pretreated) cynodon biomass)
Fig : Biogas production in mL in untreated and pretreated Cynodon bomass along with agro
industrial wastes.
15.5 Discussion
Industrial and agro based wastes like distillery, sugar, dairy and farmhouse are available in
large quantities in the Satara region. The hundreds of cubic meters of wastes are produced daily
in these industries. Farmhouse waste is produced in comparatively low quantities of 1–2
Sr.No Type of plant and Agro waste
Nature of waste
Range of gas ml
Average gas Production ml
1) Cynodon dactylon Pers UT 90-190 146.67
(CD) PT 130-340 233.83
1) Distillery waste UT 180-410 322.00
(DW) PT 220-490 360.67
2) Sugar industry UT 160-250 208.00
(SI) PT 230-360 307.33
3) Dairy industry UT 130-240 176.33
(DI) PT 210-370 298.63
4) Farm house UT 150-360 265.50
(FH) PT 180-400 290.00
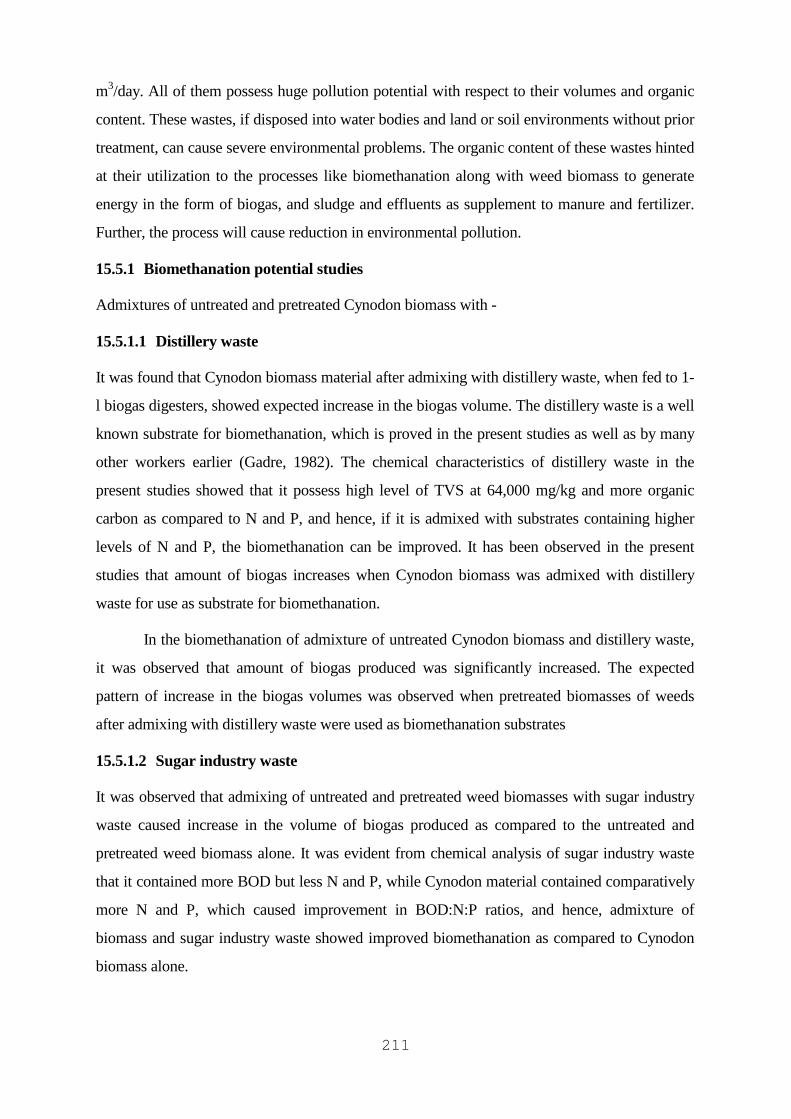
211
m3/day. All of them possess huge pollution potential with respect to their volumes and organic
content. These wastes, if disposed into water bodies and land or soil environments without prior
treatment, can cause severe environmental problems. The organic content of these wastes hinted
at their utilization to the processes like biomethanation along with weed biomass to generate
energy in the form of biogas, and sludge and effluents as supplement to manure and fertilizer.
Further, the process will cause reduction in environmental pollution.
15.5.1 Biomethanation potential studies
Admixtures of untreated and pretreated Cynodon biomass with -
15.5.1.1 Distillery waste
It was found that Cynodon biomass material after admixing with distillery waste, when fed to 1-
l biogas digesters, showed expected increase in the biogas volume. The distillery waste is a well
known substrate for biomethanation, which is proved in the present studies as well as by many
other workers earlier (Gadre, 1982). The chemical characteristics of distillery waste in the
present studies showed that it possess high level of TVS at 64,000 mg/kg and more organic
carbon as compared to N and P, and hence, if it is admixed with substrates containing higher
levels of N and P, the biomethanation can be improved. It has been observed in the present
studies that amount of biogas increases when Cynodon biomass was admixed with distillery
waste for use as substrate for biomethanation.
In the biomethanation of admixture of untreated Cynodon biomass and distillery waste,
it was observed that amount of biogas produced was significantly increased. The expected
pattern of increase in the biogas volumes was observed when pretreated biomasses of weeds
after admixing with distillery waste were used as biomethanation substrates
15.5.1.2 Sugar industry waste
It was observed that admixing of untreated and pretreated weed biomasses with sugar industry
waste caused increase in the volume of biogas produced as compared to the untreated and
pretreated weed biomass alone. It was evident from chemical analysis of sugar industry waste
that it contained more BOD but less N and P, while Cynodon material contained comparatively
more N and P, which caused improvement in BOD:N:P ratios, and hence, admixture of
biomass and sugar industry waste showed improved biomethanation as compared to Cynodon
biomass alone.
212
15.5.1.3 Dairy industry waste
The dairy industry waste contained more BOD and TVS but comparatively low N and P, hence
alone it was not much suitable for biomethanation. It was found that when untreated or
pretreated weed biomass was admixed with dairy waste and used as substrates for
biomethanation, it improved the biomethanation efficiency as compared to use of weed biomass
alone.
15.5.1.4 Farmhouse waste
It was found that the farmhouse waste consisted of large amount of bioamenable organics and
TVS but insufficient of N and P contents. When this waste was admixed with weed biomasses,
the biomethanation efficiency was increased as compared to weed biomasses alone
In the present studies regarding screening of combined substrates for biomethanation
viz., grass biomasse (untreated and pretreated) admixed with industrial and agro based wastes
(distillery, sugar, dairy and farm house wastes), it was observed that more biogas production
was obtained in pretreated grass alone as compared to untreated one, and in the admixture of
pretreated grass biomass and other waste as compared to untreated grass biomass and wastes.
Taking into account the amount of biogas produced, both in the pretreated and untreated
Cynodon biomass in the admixture with distillery waste, it was observed that only a slightly
higher amount of biogas production was obtained after pretreatment biomass, and hence, it
seems uneconomical to use pretreated biomass due to additional cost of alkali needed and time
required for pretreatment (7 days). Hence, it was decided to use untreated biomass admixed
with Distillery waste as the best combination amongst the lot for all the further studies.
15.6 Summary and conclusion
1) The Batch process was used for biomethanation and the process was studied up to
30 days at ambient temperature (37–380C)
2) Untreated Cynodon biomass was proved comparatively a poor substrate for
biomethanation than pretreated (dilute alkali) biomass.
3) Cow dung alone was not found to be good substrate for biomethanation but when
admixed with Cynodon biomass and Agro-based industrial waste gives good
potential.
4) Chemical analysis of Cynodon and distillery waste show C:N and C:N:P ratio was
in desirable range for biogas production.
213
5) In the present studies pretreated Cynodon biomass and distillery waste admixture
proved to be the best substrate.
6) The large volume of biogas production from pretreated Cynodon and Distillery
waste was 360.67 ml.
7) The project could help to remove cynodon and agro industrial wastes from the area
and could be eco-friendly that can achieve the goal of the zero pollution.
8) In the present study, some Agro-based industrial wastes and Cynodon sample
proved to be the best substrate for biomethanation. However, some other additional
plant biomasses and organic wastes available should also be tried and studied for
their disposal through biomethanation process, which could be economical,
acceptable one and fulfils energy need of rural area.
References
1. Acharya C.N. (1958) Preparation of fuel gas and manure by Anaerobic fermentation of
organic material. ICAR Series Bulletin, No.5, ICAR, New Delhi, pp. 1-58.
2. Annonymous (1981) Biogas, Vol II, A United Nations Publication, New York.
3. AOAC (1990). Official Methods of Analysis of Association of Official Agricultural
Chemists, 15th edition, published by A.O.A.C. INC, Suite 400, 2200, Wilson Bodevard
Arlington, Virginia, 22201, USA.
4. APHA (1985) Standard methods for examination of water and waste Water, Americal
Public Health Association, 15th edition.
5. Biswas T. D. (1997) Utilization of animal excreta and other agricultural Wastes for
manure and fuel. Proc. of 64th Ind. Sci. Congress, Bhubaneshwar, Pt. 3, Sec. X, p. 116
6. Bose, P. R., Vashist, U. N. and Gupta, B. M. (1983) Viability of biomass as an
alternative source of energy in India. Research and Industry, 98 (9): 195.
7. Brahma N. K. (2001) Proposed biomethanations for petroleum crude waste. In. Pathade
G. R..and Goel P. K. (Ed.) Environmental Pollution and Management of Waste waters
by Microbial Techniques. ABD Publishers, Jaipur.
8. Cheremisinoff P. N. and Ovellettee, R. P. (Ed.) (1985) Biotechnology: Applications and
Research. Technomic Publications Co. Inc., Lancester
214
9. Duke, J.A. (1981) The gene revolution.Paper 1.p.89- 150.In:Office of Technoly
Assessment, Background papers for innovative biologicalTechnologies for lesser
developed countries.USGPO.Washington.
10. Gadre, R. V. (1982) Studies on the microbial degradation of distillery Waste (spent
wash) Ph. D. Thesis, University of Poona.
11. Hill, D. J. and Roberts, D. W. (1979) Agri wastes, 1: 267.
12. Hobson P. N., Bousfield, S. and Summens (1981) Methane production From
agricultural and domestic
13. Malik, M. K., Singh U. K. and Ahmad, N. (1990) Batch digester studies On biogas
production from Cannabis sativa, water hyacinth and crop Wastes mixed with dung and
poultry litter. Biological Wastes, 31 (4): 315-319.
14. Scurlocka and Hall (1987) The contribution of biomass to global energy use (1987).
15. Sharma, S. and Madan, M. (1992) Organic wastes from sericulture for mushroom
growth and residue for methane production. Resour. Conser Recycl., 7 (1): 295-304
16. Miiller, D.F. (1958) Composition of cereal grains andforages.National Academy Of
Sciences.National Council, Washigton,DC.Pub.585.
17. Trivedy, R. K. and Goel, P. K. (1984) Chemical and Biological Methods for Water
Pollution Studies. Environmental Publications, Karad.
215
CHAPTER 16
EVALUATION CUM FEASIBILITY STUDY OF AN ON-
CAMPUS BIOGAS OPERATION PLANT AT PUNJABI
UNIVERSITY, PATIALA
Jaideep Singh and Sandeep Singh Virdi
Abstract
Anaerobic digestion of solid organic waste such as biowaste, sludge, cattle manure, energy
crops and other biomasses, for bio-energy production is a widely applied technology. In India,
A feasibility study was conducted in the context of installation of an on-campus Biogas plant
aimed at identifying operational prospects and analyzing potential & scope of biogas as an
energy source on the campus. The research was carried out to find out possible avenues to
produce Biogas from Plant wastes generated in routine on the campus and also market
garbage amongst others. The establishment of a biogas station is possible only with a large
investment and a reasonable answer to main questions regarding capital investment, source of
funding, gestation period, operational expenses, profitability, risks etc.
It was our intent to implement an Organics Processing Facility on the campus of
Punjabi University. Creating an Organics Processing Facility to generate biogas will be more
cost effective, cut down on landfill waste, generate a high-quality renewable fuel, and reduce
carbon dioxide and methane emissions.
Furthermore, it creates learning opportunities, both theoretically & practically, for
various faculties such as Environment Sciences, Engineering, Management and Biology to
name a few. Overall, by creating a biogas operation on campus it promises to be a win-win
situation for all stakeholders. This paper investigates prospect, opportunity and potential of
biogas energy and technology for setting up of a biogas plant at Punjabi University Patiala.
Key Words: Anaerobic, Renewable Energy, Biomass, Environment, Biogas
Acknowledgement
It was a pleasure to conduct this study on the evaluation study of an on-campus biogas
operation plant at punjabi university, patiala. I received full cooperation during the interviews
216
and, field visits, providing us with valuable information and opinions. I like to extend
gratitude to all respondents and informants for their constructive contributions and hope the
outcome of this assessment will serve its purpose
Abbreviations and Acronyms
ARTI – appropriate rural technology of India
AD- Anaerobic Digestion
BG- Biogas
BU- Billion Units
CBP-Conventional Bio Gas Plant
CEA-Central Electricity Authority
CSTR- Continuously Stirred Tank Reactor
GHG-Green House Gas
IRR- Internal Rate of Return
LGBR- Load Generation Balance Report
LPG- Liquefied petroleum gas
MSW-Municipal Solid Waste
PFR - Plug-flow like reactor
PIB-Press Information Bureau
PTS- Percentage Total Solids
RES-Renewable Energy Source
RoI-Return on Investment
TS- Total Solids
VS- Volatile Solids
Physical units
m-meter
m2-square metre
m3-CUM-cubic meter
kg-kilogram
tpd- Tons Per Day (1 tpd = 0.9072 mega gram per day)
16.1 Introduction
16.1.1 Energy Scenario
India is facing a deficit in the achieving energy production targets let’s not say anything about
meeting demand. The power generation combining both non renewable and renewable energy

217
sources is insufficient to meet the demand for the nation. Although RES have a contribution
too however its not substantial enough that we can depend on RES to meet our demands
RES contribution in India's overall Installed capacity energy production
209276.03MW is 24998.46 MW (11.94%) (CEA, 2012a). This renewable component has 25
to 30% plant load factor thereby making available very less energy supply against installed
capacity.
Presently, the targets set for production also falls short due to various reasons leading
to energy deficit. The country is growing and production conceived to increase into the next
century, as demand for energy is extrapolated to grow at an annual rate. The various factors
cited for this increasing demand are Energy requirement for developing industries, for
transport, and a thrust for the electrification of India over the last three decades. The imports
have contributed to the energy but can not wipe out the wide gap of production deficit
The electricity generation in the country during the month of September’12 has been
73.08 BU with a growth rate of 3.66% corresponding to generation of 70.5 BU during the
same month last year. Overall electricity generation was 96.19% (2.89 BU shortfalls) of the
program for the month. (CEA 2012b)
The LGBR report clearly shows the deficit of 79313 MW for the year 2011-12
For the year 2012-13 the anticipated energy and peaking shortage in the country would be
8.0% and 10.6% respectively. The peaking shortage would prevail in all the regions varying
from 3.2% in the Western region to 26.3% in the Southern region. There would be surplus
energy of 0.3% in the Western region and all others regions would face energy shortage
varying from 4.8% in the Eastern region to 19.5% in the Southern region.( CEA 2012c)
There is therefore a marked deficiency in energy supply in the country. This can however be
met through Bio mass as agriculture is practiced by over 70% of the population with record
food output this year. Bio mass is also available in abundance through kitchen waste from
university complex. There is a case for utilization of biomass in its entire chain for production
of energy in other clean forms
16.1.2 Bio-gas
Biogas is a clean, non-polluting and low - cost fuel. It contains about 55 to 75 per cent
methane, which is inflammable. Biogas can be produced from cattle dung, human waste and
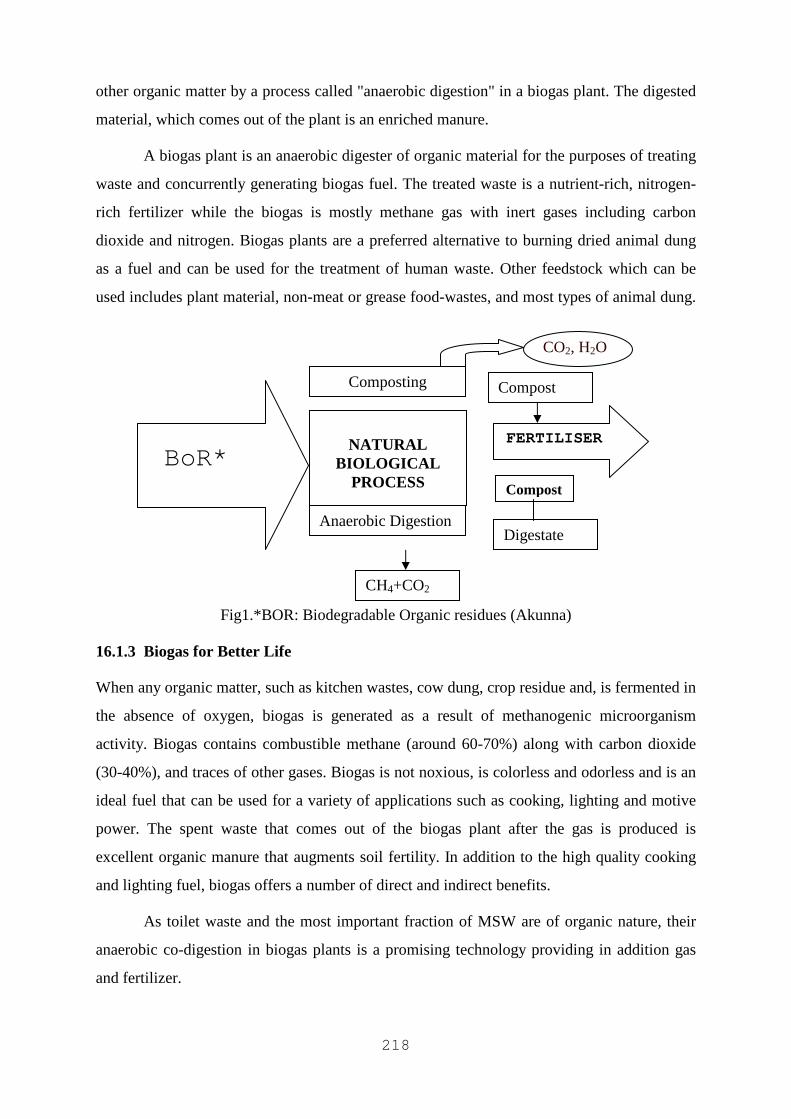
218
CO2, H2O
other organic matter by a process called "anaerobic digestion" in a biogas plant. The digested
material, which comes out of the plant is an enriched manure.
A biogas plant is an anaerobic digester of organic material for the purposes of treating
waste and concurrently generating biogas fuel. The treated waste is a nutrient-rich, nitrogen-
rich fertilizer while the biogas is mostly methane gas with inert gases including carbon
dioxide and nitrogen. Biogas plants are a preferred alternative to burning dried animal dung
as a fuel and can be used for the treatment of human waste. Other feedstock which can be
used includes plant material, non-meat or grease food-wastes, and most types of animal dung.
Fig1.*BOR: Biodegradable Organic residues (Akunna)
16.1.3 Biogas for Better Life
When any organic matter, such as kitchen wastes, cow dung, crop residue and, is fermented in
the absence of oxygen, biogas is generated as a result of methanogenic microorganism
activity. Biogas contains combustible methane (around 60-70%) along with carbon dioxide
(30-40%), and traces of other gases. Biogas is not noxious, is colorless and odorless and is an
ideal fuel that can be used for a variety of applications such as cooking, lighting and motive
power. The spent waste that comes out of the biogas plant after the gas is produced is
excellent organic manure that augments soil fertility. In addition to the high quality cooking
and lighting fuel, biogas offers a number of direct and indirect benefits.
As toilet waste and the most important fraction of MSW are of organic nature, their
anaerobic co-digestion in biogas plants is a promising technology providing in addition gas
and fertilizer.
Composting
NATURAL
BIOLOGICAL PROCESS
Anaerobic Digestion
Compost
Compost
Digestate
CH4+CO2
FERTILISER
BoR*
219
16.1.4 Study Rationale
The Ministry of New and Renewable Energy has proposed specific targets for capacity
addition from wind power, small hydropower, solar power and bio-power in the country for
the period 2012-17 in its Twelfth Five Year Plan proposals submitted to
PlanningCommission.
A proposed target of 29,800 MW comprising 15,000 MW wind power, 2,100 MW
small hydropower, 10,000 MW solar power and 2,700 MW bio-power has been proposed for
capacity addition of grid-interactive renewable power during the Twelfth Five Year Plan
(2012-2017). PIB (2012)
The deficit can be reduced if the renewable energy available in form of wind, solar or
biomass can be utilized at an optimum level and the conventional sources can be increasingly
compensated.
The evaluation study was taken to find out the acceptance and feasibility of the biogas
at the campus as the large quantities of organic matter available at the campus and nearby
habitations. Co-digestion as the most advance technology is taken for study.
The workable and effective implementation of a plan is based upon the ground reality
of the sector. These include retrieving information on existing functional biogas plants, users’
insight of the technology, impact of biogas plants on the users, and capability of the people to
adopt and ascribing the technology. The collection of cow dung from the villages and solely
depending on that for the operation of plant may refute the whole process as the people here
rely on LPG and do not accept the biogas plants as they are quite unaware of all the facts.
The factors like ‘biogas in return of cow dung’ is not viable for long term and for all.
Information on these matters helped in deciding best suitable implementation modality for the
program. A study was felt needed to collect information on these issues so that the findings
can be absorbed and are reflected in the plan. Once the rural people experience the benefits of
biogas plant then they may also start contributing or setup the community plants for a better
utilization of organic waste and protect the environment to contribute in sustainability as well
as reduction in energy deficit.
16.2 Review of literature
Chronology of Technology evolution in related field of Bioresearch
1859/97 –Matunga(human waste)c.
220
1910 –R&D initiated IISc, Bangalore
1921 –fermentation of cellulosic biomass
1935 –PusaInstitute (animal dung)
1939 –Acharya-Desai, AD for N holding
1952 –Gramalaxmi Gobar gas plant
1977 –Adapted fixed dome designs
1995 –Solid state BIOMASS fermenter
1998 –Plug-flow like reactor (PFR)
2000 –2-stage digestion2003-7 Field tested
PFR2009 –PFRs built in Sri Lanka /Haiti /Tanzania (ongoing) (Chanakya)
Major Contribution in advancement of technology:
ARTI – appropriate rural technology of India, pune (2003) has developed a compact
biogas plant which uses waste food rather than any cow dung as feedstock, to supply biogas
for cooking. The plant is sufficiently compact to be used by urban households, and about
2000 are currently in use – both in urban and rural households in Maharashtra. The design
and development of this simple, yet powerful technology for the people, has won ARTI the
Ashden Award for sustainable Energy 2006 in the Food Security category. Dr. Anand Karve
(ARTI) developed a compact biogas system that uses starchy or sugary feedstock (waste grain
flour, spoilt grain, overripe or misshapen fruit, nonedible seeds, fruits and rhizomes, green
leaves, kitchen watse, leftover food, etc). Just 2 kg of such feedstock produces about 500 g of
methane, and the reaction is completed with 24 hours. The conventional biogas systems,
using cattle dung, sewerage, etc. use about 40 kg feedstock to produce the same quantity of
methane, and require about 40 days completing the reaction. Thus, from the point of view of
conversion of feedstock into methane, the system developed by Dr. Anand Karve is 20 times
as efficient as the conventional system, and from the point of view of reaction time, it is 40
times as efficient. Thus, overall, the new system is 800 times as efficient as the conventional
biogas system. (Karve .A.D. 2007), (Karve of Pune A.D 2006)
Hilkiah Igoni (2008) studied the Effect of Total Solids Concentration of Municipal
Solid Waste on the Biogas Produced in an Anaerobic Continuous Digester. The total
solids (TS) concentration of the waste influences the pH, temperature and effectiveness of the
microorganisms in the decomposition process. They investigated various concentrations of
the TS of MSW in an anaerobic continuously stirred tank reactor (CSTR) and the
corresponding amounts of biogas produced, in order to determine conditions for optimum gas
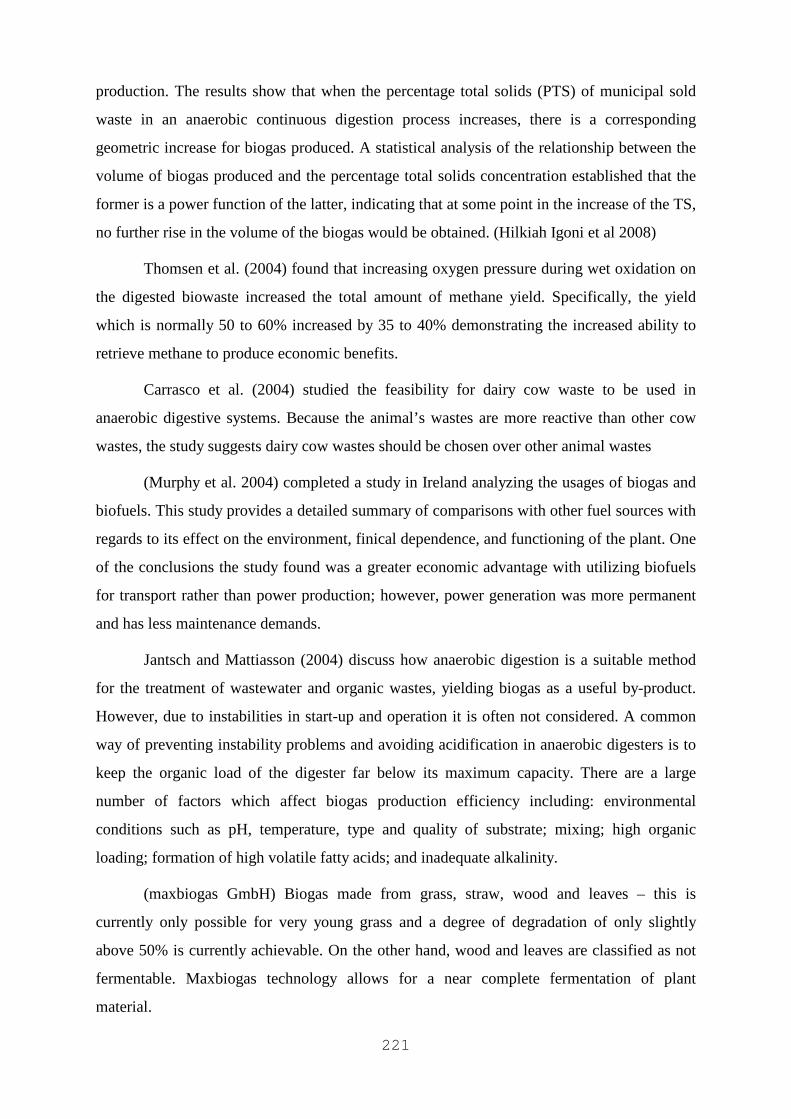
221
production. The results show that when the percentage total solids (PTS) of municipal sold
waste in an anaerobic continuous digestion process increases, there is a corresponding
geometric increase for biogas produced. A statistical analysis of the relationship between the
volume of biogas produced and the percentage total solids concentration established that the
former is a power function of the latter, indicating that at some point in the increase of the TS,
no further rise in the volume of the biogas would be obtained. (Hilkiah Igoni et al 2008)
Thomsen et al. (2004) found that increasing oxygen pressure during wet oxidation on
the digested biowaste increased the total amount of methane yield. Specifically, the yield
which is normally 50 to 60% increased by 35 to 40% demonstrating the increased ability to
retrieve methane to produce economic benefits.
Carrasco et al. (2004) studied the feasibility for dairy cow waste to be used in
anaerobic digestive systems. Because the animal’s wastes are more reactive than other cow
wastes, the study suggests dairy cow wastes should be chosen over other animal wastes
(Murphy et al. 2004) completed a study in Ireland analyzing the usages of biogas and
biofuels. This study provides a detailed summary of comparisons with other fuel sources with
regards to its effect on the environment, finical dependence, and functioning of the plant. One
of the conclusions the study found was a greater economic advantage with utilizing biofuels
for transport rather than power production; however, power generation was more permanent
and has less maintenance demands.
Jantsch and Mattiasson (2004) discuss how anaerobic digestion is a suitable method
for the treatment of wastewater and organic wastes, yielding biogas as a useful by-product.
However, due to instabilities in start-up and operation it is often not considered. A common
way of preventing instability problems and avoiding acidification in anaerobic digesters is to
keep the organic load of the digester far below its maximum capacity. There are a large
number of factors which affect biogas production efficiency including: environmental
conditions such as pH, temperature, type and quality of substrate; mixing; high organic
loading; formation of high volatile fatty acids; and inadequate alkalinity.
(maxbiogas GmbH) Biogas made from grass, straw, wood and leaves – this is
currently only possible for very young grass and a degree of degradation of only slightly
above 50% is currently achievable. On the other hand, wood and leaves are classified as not
fermentable. Maxbiogas technology allows for a near complete fermentation of plant
material.
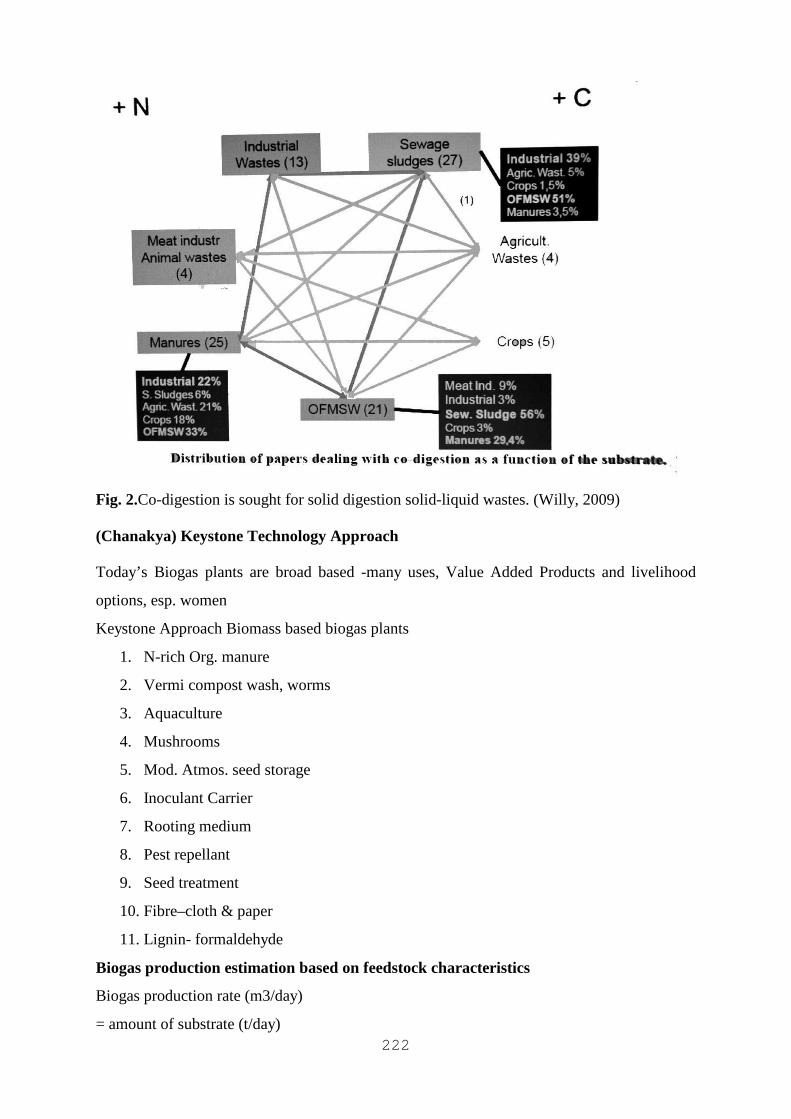
222
Fig. 2.Co-digestion is sought for solid digestion solid-liquid wastes. (Willy, 2009)
(Chanakya) Keystone Technology Approach
Today’s Biogas plants are broad based -many uses, Value Added Products and livelihood
options, esp. women
Keystone Approach Biomass based biogas plants
1. N-rich Org. manure
2. Vermi compost wash, worms
3. Aquaculture
4. Mushrooms
5. Mod. Atmos. seed storage
6. Inoculant Carrier
7. Rooting medium
8. Pest repellant
9. Seed treatment
10. Fibre–cloth & paper
11. Lignin- formaldehyde
Biogas production estimation based on feedstock characteristics
Biogas production rate (m3/day)
= amount of substrate (t/day)
223
x dry matter content or total solids, TS (%)
x organic matter content, or volatile solids, VS (% of TS)
x Biogas yield (m3/t VS)
Note: Biogas yield is determined from laboratory methane production potential tests
Biogas yield: Examples (Akunna)
• Manure: 200500 m3/t VS
• Cow: 200400 m3/t VS Pig and Chicken: 350550 m3/t VS
• Organic wastes: 400800 m3/t VS
• Household: 100200 m3/t VS
• Green (vegetable/garden): 400500 m3/VS
• Sewage sludge ~ 500 m3/t VS
• Farm residues: 500900 m3/t VS
• Corn, grass, barley and wheat silage
Fig. 3. Chanakya MSW based PFR Plant
16.3 NEED OF STUDY
Punjabi University has since evolved into the largest University in the state. The university
campus is spread over 600 acres of land. The University has employed 250 gardeners and 200
sweepers other than gleaning and dumping support staff for the maintenance of the campus.
With the sprawling campus full of greenery the campus has developed immense potential for
the bio energy to be harnessed.
224
The plant waste accumulates to a whooping amount that is sufficient to generate
energy which can reduce the energy requirements of university and compensate the
environment is getting dumped in pits which if fermented under anaerobic conditions lead to
methanization and biogas thus produced has diverse uses and university has the opportunity
to set standards for the community and other institutions to follow and give the essence of
being a green citizen.
(Akunna) Energy equivalent of 1 m3 CH4
• 1.7 l methylated spirit
• 9.7 kWh electricity
• 1.3 kg charcoal
• 1.15 liter petrol
• 1 liter fuel oil
• 2.1kg wood
• 0.94 m3 natural gas
The bottling of the gas as a commercial aspect for getting a fast payback and the employment
opportunities generated for the persons linked with various operations from operation,
feeding, cleaning of the plant to repairing and maintenance.
16.4 Objectives
The main objectives of the evaluation cum feasibility studies are :
1. To propagandize the use of advance biogas technology as a cogent source of
clean energy, organic manure, and environmental protection in India.
2. To make the functions clear and working familiar to the society.
3. To create economic, social and technological viability for Biogas Technology.
4. To establish a common arena for Institutions, organizations, industries, farmers and
beneficiaries to contribute in the area of research and development.
5. To mitigate Climate Change by preventing black carbon and methane emissions in the
environment and promoting research and development of Biogas Technology
6. To reduce the use the other conventional fuels.
16.5 Research methodology
16.5.1 Methodology
The whole study was divided into three major phases based upon the activities carried out:
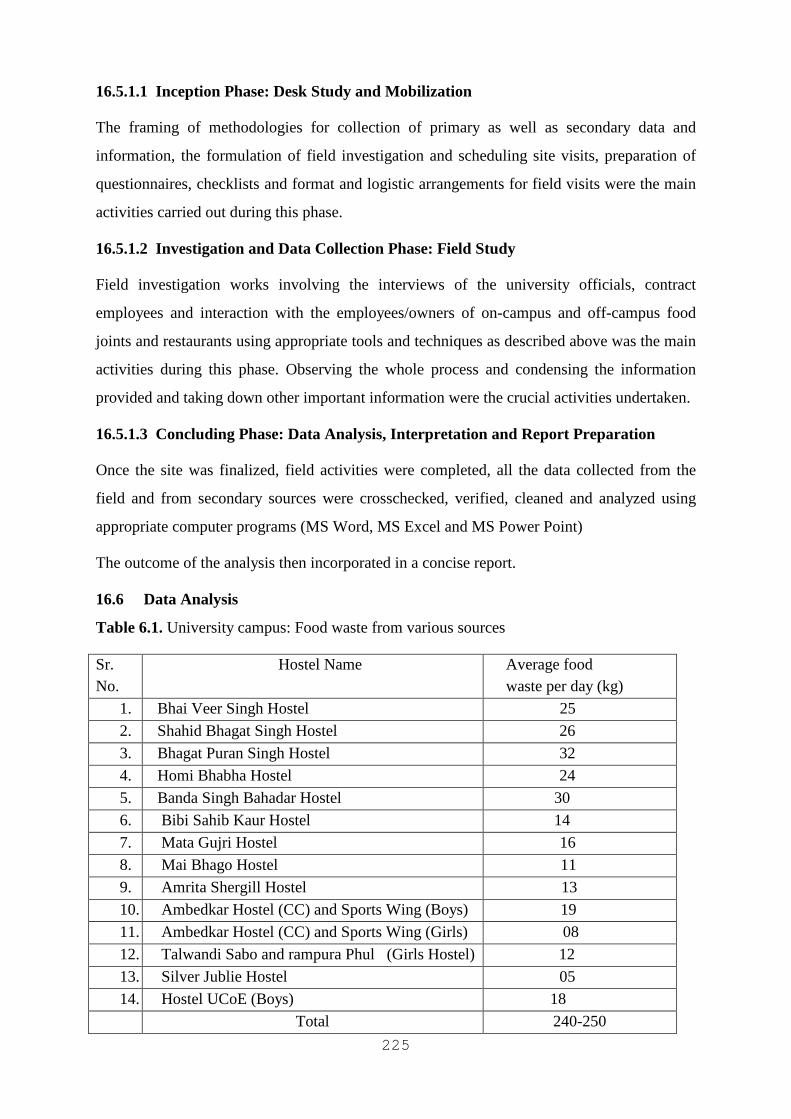
225
16.5.1.1 Inception Phase: Desk Study and Mobilization
The framing of methodologies for collection of primary as well as secondary data and
information, the formulation of field investigation and scheduling site visits, preparation of
questionnaires, checklists and format and logistic arrangements for field visits were the main
activities carried out during this phase.
16.5.1.2 Investigation and Data Collection Phase: Field Study
Field investigation works involving the interviews of the university officials, contract
employees and interaction with the employees/owners of on-campus and off-campus food
joints and restaurants using appropriate tools and techniques as described above was the main
activities during this phase. Observing the whole process and condensing the information
provided and taking down other important information were the crucial activities undertaken.
16.5.1.3 Concluding Phase: Data Analysis, Interpretation and Report Preparation
Once the site was finalized, field activities were completed, all the data collected from the
field and from secondary sources were crosschecked, verified, cleaned and analyzed using
appropriate computer programs (MS Word, MS Excel and MS Power Point)
The outcome of the analysis then incorporated in a concise report.
16.6 Data Analysis
Table 6.1. University campus: Food waste from various sources
Sr. No.
Hostel Name Average food waste per day (kg)
1. Bhai Veer Singh Hostel 25
2. Shahid Bhagat Singh Hostel 26
3. Bhagat Puran Singh Hostel 32
4. Homi Bhabha Hostel 24
5. Banda Singh Bahadar Hostel 30
6. Bibi Sahib Kaur Hostel 14
7. Mata Gujri Hostel 16
8. Mai Bhago Hostel 11
9. Amrita Shergill Hostel 13
10. Ambedkar Hostel (CC) and Sports Wing (Boys) 19
11. Ambedkar Hostel (CC) and Sports Wing (Girls) 08
12. Talwandi Sabo and rampura Phul (Girls Hostel) 12
13. Silver Jublie Hostel 05
14. Hostel UCoE (Boys) 18
Total 240-250
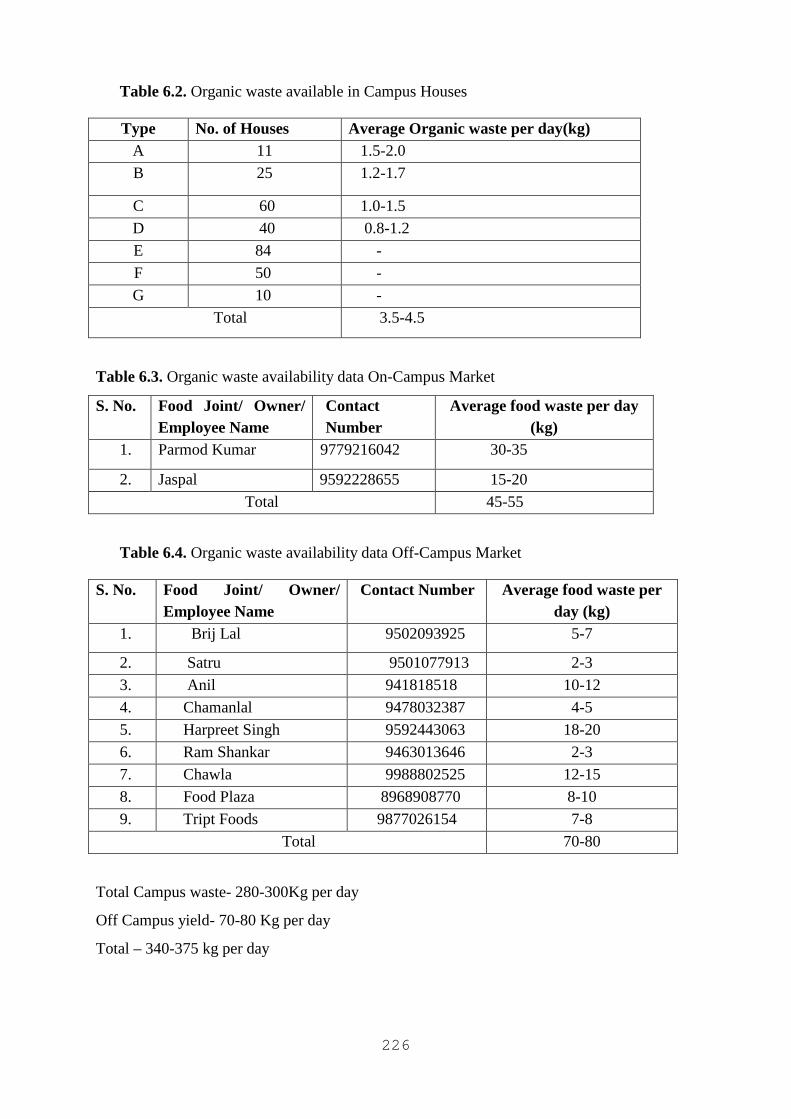
226
Table 6.2. Organic waste available in Campus Houses
Type No. of Houses Average Organic waste per day(kg) A 11 1.5-2.0
B 25 1.2-1.7
C 60 1.0-1.5
D 40 0.8-1.2
E 84 -
F 50 -
G 10 -
Total 3.5-4.5
Table 6.3. Organic waste availability data On-Campus Market
S. No. Food Joint/ Owner/ Employee Name
Contact Number
Average food waste per day (kg)
1. Parmod Kumar 9779216042 30-35
2. Jaspal 9592228655 15-20
Total 45-55
Table 6.4. Organic waste availability data Off-Campus Market
S. No. Food Joint/ Owner/ Employee Name
Contact Number Average food waste per day (kg)
1. Brij Lal 9502093925 5-7
2. Satru 9501077913 2-3
3. Anil 941818518 10-12
4. Chamanlal 9478032387 4-5
5. Harpreet Singh 9592443063 18-20
6. Ram Shankar 9463013646 2-3
7. Chawla 9988802525 12-15
8. Food Plaza 8968908770 8-10
9. Tript Foods 9877026154 7-8
Total 70-80
Total Campus waste- 280-300Kg per day
Off Campus yield- 70-80 Kg per day
Total – 340-375 kg per day
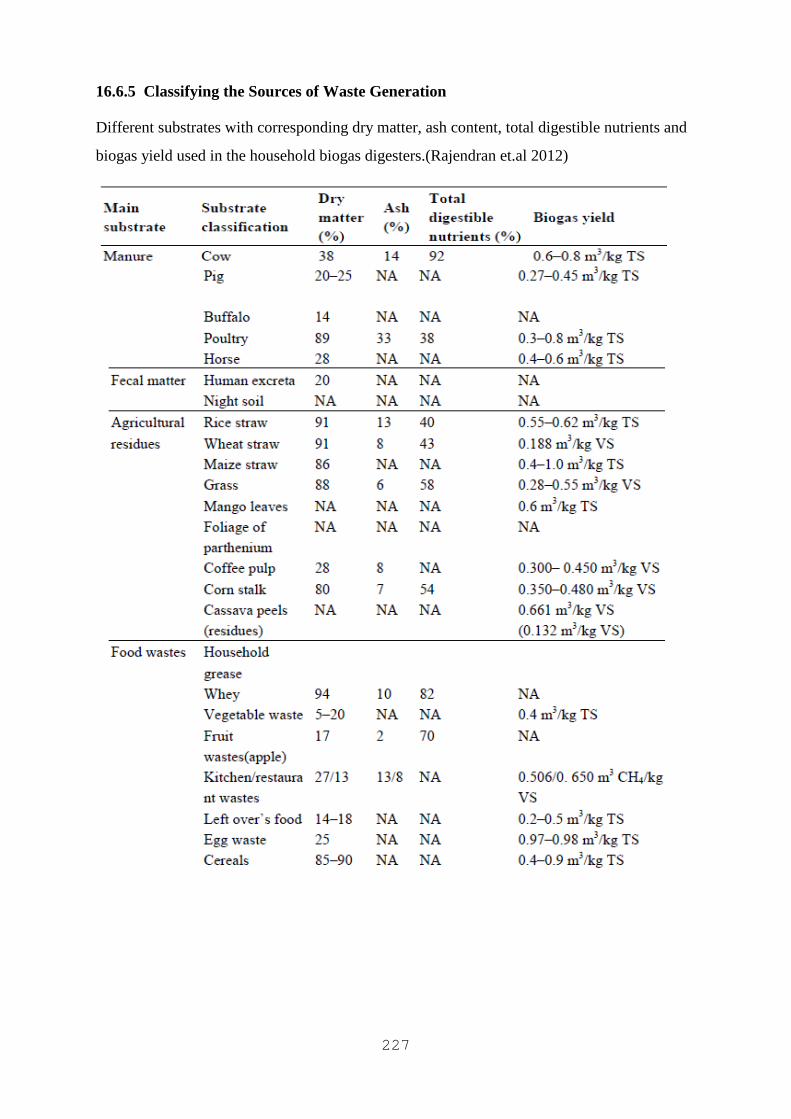
227
16.6.5 Classifying the Sources of Waste Generation
Different substrates with corresponding dry matter, ash content, total digestible nutrients and
biogas yield used in the household biogas digesters.(Rajendran et.al 2012)

228
16.6.6 Analysis of substrates
Sr. No. Constituent Percentage Value
1. Cooked Rice 23-32.5
2. Cereals 12.76-19.68
3. Cooked Vegetable 7.32-15.36
4. Chapati 21.85-42.37
5. Vegetable waste residue 19.54-32.71
6. Salad 3.62-4.18
7. Non Putrefying Materials 0.87-2.43
16.6.7 University Cleaning and Sweeping Staff
1. Manpreet 8437145552
2. Gurvinder 9041409893
3. Suuny 9781361386
4. Sandeep -
The above respondent were questioned and found that
Road cleaning - 60Kg per day (3rounds of 20Kg each)
Departments - 400Kg per day
Miscellaneous - 100Kg per day
Total - 560 Kg per day
Assuming 10% variance 500Kg organic waste
Plant waste per day on the campus collected amounts to be
350 Kg food waste + 500 Kg Plant waste = 850 Kg per day.
16.7 Findings
16.7.1 Comparison of 3-zone PFR with Conventional Plant
Fig. 7.1. 3-zone PFRs
CST-astraplug-flow digester
PFRs With this technology many soft biomass residues can now be fermented to biogas
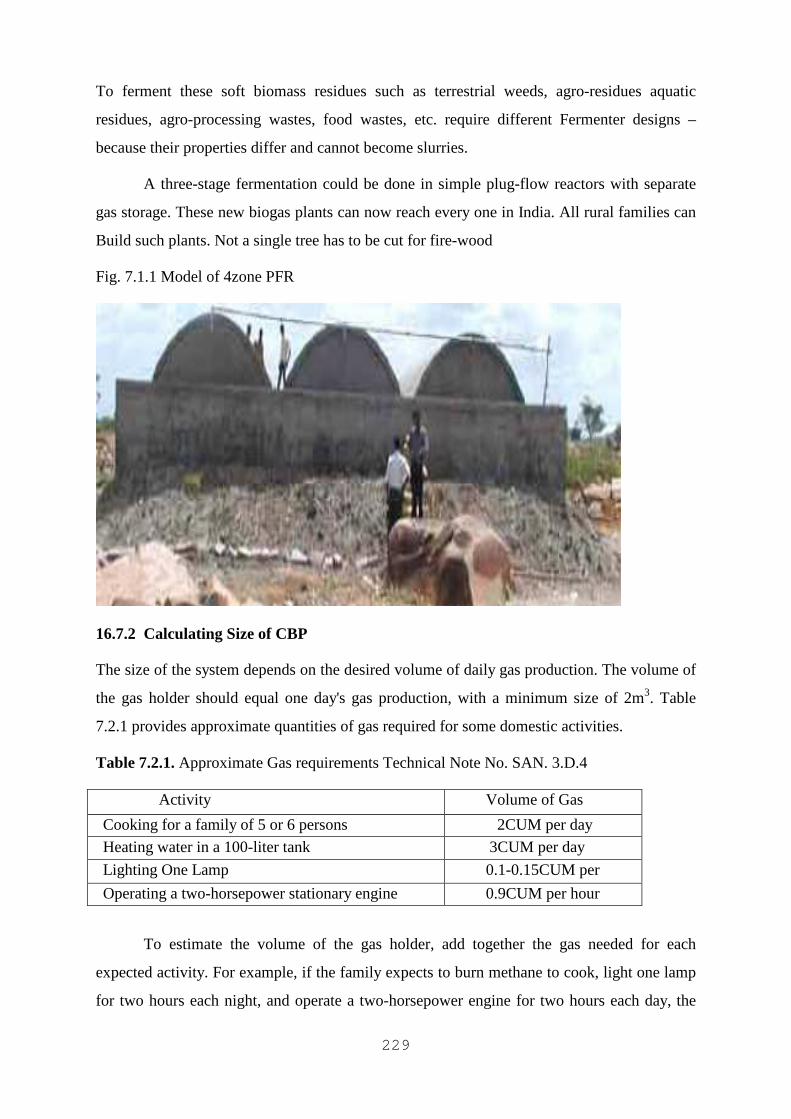
229
To ferment these soft biomass residues such as terrestrial weeds, agro-residues aquatic
residues, agro-processing wastes, food wastes, etc. require different Fermenter designs –
because their properties differ and cannot become slurries.
A three-stage fermentation could be done in simple plug-flow reactors with separate
gas storage. These new biogas plants can now reach every one in India. All rural families can
Build such plants. Not a single tree has to be cut for fire-wood
Fig. 7.1.1 Model of 4zone PFR
16.7.2 Calculating Size of CBP
The size of the system depends on the desired volume of daily gas production. The volume of
the gas holder should equal one day's gas production, with a minimum size of 2m3. Table
7.2.1 provides approximate quantities of gas required for some domestic activities.
Table 7.2.1. Approximate Gas requirements Technical Note No. SAN. 3.D.4
Activity Volume of Gas
Cooking for a family of 5 or 6 persons 2CUM per day
Heating water in a 100-liter tank 3CUM per day
Lighting One Lamp 0.1-0.15CUM per
Operating a two-horsepower stationary engine 0.9CUM per hour
To estimate the volume of the gas holder, add together the gas needed for each
expected activity. For example, if the family expects to burn methane to cook, light one lamp
for two hours each night, and operate a two-horsepower engine for two hours each day, the
230
size of the gas holder should be:
2m3 + (2 x 0.1m3) + (2 x 0.9m3) = 2m3 + 0.2m3 + 1.8m3 = 4.0 m3
The floating cover of the gas holder should have a volume equal to at least 4.0m3, The
volume of a circular cover equals 3.1 times the radius squared times the height. One
configuration which would contain the required volume would be 1.6m In diameter and
2.02m in height:
radius = diameter/2 so radius = 1.6/2m = 0.8m
3.1 x 0.8m x 0.8m x 2.02m = 4.0m3
Worksheet A, Lines l-5
The actual height of the cover equals the calculated height plus 150mm to allow for
placement of the weep-holes, which will provide an escape for an excessive amount of gas.
Designing a Biogas System Technical Note No. SAN. 3.D.4
1. Expected daily volume of gas = 4.0 m3
2. Minimum volume of gas holder = Line 1 = 4.0 m3
3. Proposed diameter of floating cover = 1.6 m
4. Proposed radius of cover = Line 3/2 = (1.6m/2) = 0.8 m
5. Calculated height of cover = Line 2 /(3.1 x Line 4 x Line 4 )=
4.0m3/(3.1*0.8m*0.8m)=4.0m3/1.98m2=2.02m
6. Design height of cover = Line 5 + 0.15m = 2.02m + 0.15m =2.17 m
7. Inside height of gas holder = Line 6 + 0.25m = 2.17 m + 0.25m = 2.42m
8. Inside diameter of gas holder = Line 3 + 0.15m = 1.6 m + 0.15m = 1.75m
9. Volume of each digester volume should not exceed 8.0m3 = 2 x Line 1
= 2 x 4.0 m3 =8.0m3
10. Proposed length of digester = 2.0 m
11. Proposed width of digester = 2.0 m
12. Height of digester = Line 9/(Line 10 x Line 11)= (8.0 m3)/(2.0 m x 2.0 m)=
(8.0 m3)/(2.0m*2.0m) = 8.0m3/4.0m2=2.0 m
In the example given, the actual, or the design height is:
2.02m + 0.15m = 2.17m Worksheet A, Line 6
The inside height of gas holder equals the design height of floating cover plus 250mm. The
inside height of this example is:

231
2.17m + 0.25m = 2.42m Worksheet A, Line 7
The inside diameter of the gas holder equals the diameter of cover plus 150mm. The inside
diameter for this example is:
1.6m + 0.15m = 1.75m Worksheet A, Line 8
When the dimensions of the gas holder have been calculated, prepare a design drawing
similar to Figure below and give it to the construction foreman.
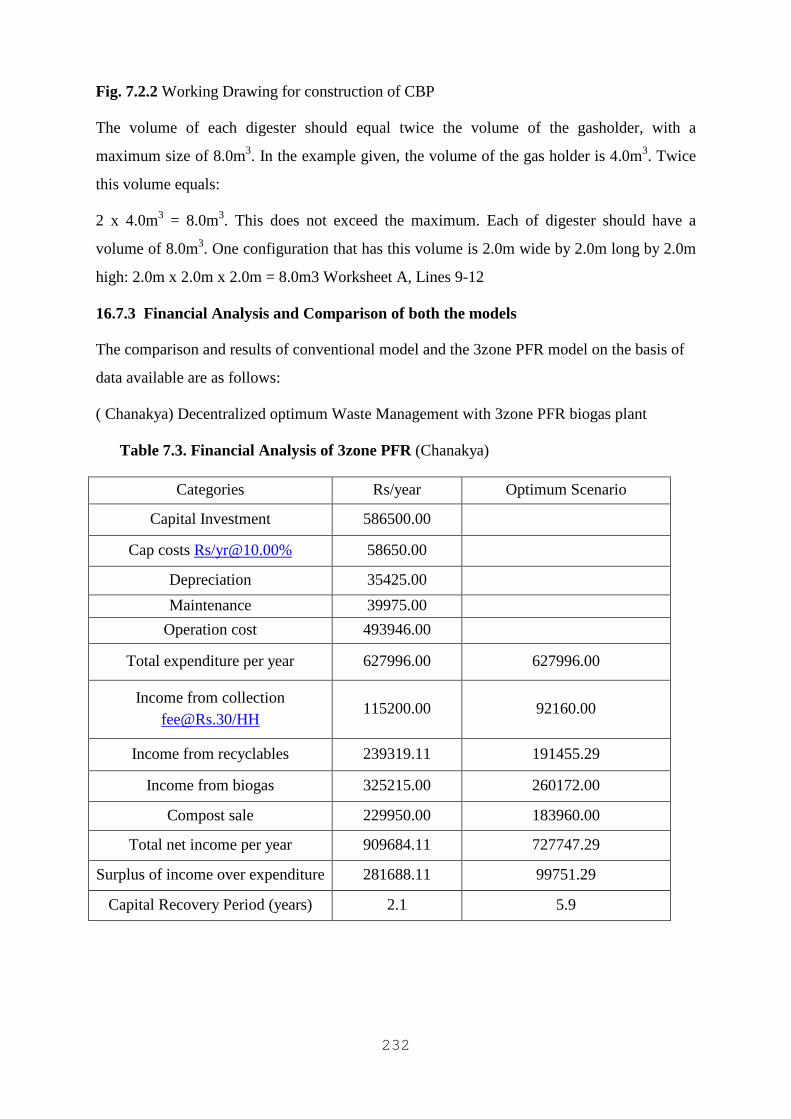
232
Fig. 7.2.2 Working Drawing for construction of CBP
The volume of each digester should equal twice the volume of the gasholder, with a
maximum size of 8.0m3. In the example given, the volume of the gas holder is 4.0m3. Twice
this volume equals:
2 x 4.0m3 = 8.0m3. This does not exceed the maximum. Each of digester should have a
volume of 8.0m3. One configuration that has this volume is 2.0m wide by 2.0m long by 2.0m
high: 2.0m x 2.0m x 2.0m = 8.0m3 Worksheet A, Lines 9-12
16.7.3 Financial Analysis and Comparison of both the models
The comparison and results of conventional model and the 3zone PFR model on the basis of
data available are as follows:
( Chanakya) Decentralized optimum Waste Management with 3zone PFR biogas plant
Table 7.3. Financial Analysis of 3zone PFR (Chanakya)
Categories Rs/year Optimum Scenario
Capital Investment 586500.00
Cap costs Rs/[email protected]% 58650.00
Depreciation 35425.00
Maintenance 39975.00
Operation cost 493946.00
Total expenditure per year 627996.00 627996.00
Income from collection [email protected]/HH
115200.00 92160.00
Income from recyclables 239319.11 191455.29
Income from biogas 325215.00 260172.00
Compost sale 229950.00 183960.00
Total net income per year 909684.11 727747.29
Surplus of income over expenditure 281688.11 99751.29
Capital Recovery Period (years) 2.1 5.9
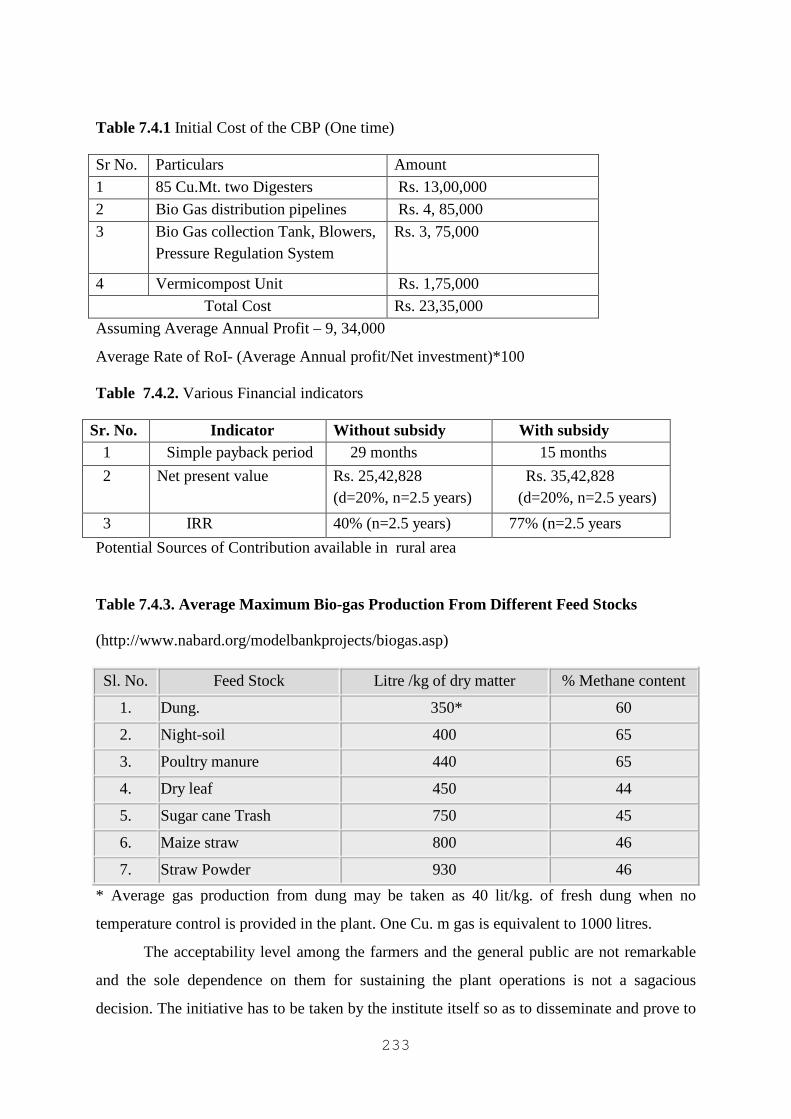
233
Table 7.4.1 Initial Cost of the CBP (One time)
Sr No. Particulars Amount
1 85 Cu.Mt. two Digesters Rs. 13,00,000
2 Bio Gas distribution pipelines Rs. 4, 85,000
3 Bio Gas collection Tank, Blowers, Pressure Regulation System
Rs. 3, 75,000
4 Vermicompost Unit Rs. 1,75,000
Total Cost Rs. 23,35,000
Assuming Average Annual Profit – 9, 34,000
Average Rate of RoI- (Average Annual profit/Net investment)*100
Table 7.4.2. Various Financial indicators
Sr. No. Indicator Without subsidy With subsidy 1 Simple payback period 29 months 15 months
2
Net present value
Rs. 25,42,828 (d=20%, n=2.5 years)
Rs. 35,42,828 (d=20%, n=2.5 years)
3 IRR 40% (n=2.5 years) 77% (n=2.5 years
Potential Sources of Contribution available in rural area
Table 7.4.3. Average Maximum Bio-gas Production From Different Feed Stocks
(http://www.nabard.org/modelbankprojects/biogas.asp)
Sl. No. Feed Stock Litre /kg of dry matter % Methane content
1. Dung. 350* 60
2. Night-soil 400 65
3. Poultry manure 440 65
4. Dry leaf 450 44
5. Sugar cane Trash 750 45
6. Maize straw 800 46
7. Straw Powder 930 46
* Average gas production from dung may be taken as 40 lit/kg. of fresh dung when no
temperature control is provided in the plant. One Cu. m gas is equivalent to 1000 litres.
The acceptability level among the farmers and the general public are not remarkable
and the sole dependence on them for sustaining the plant operations is not a sagacious
decision. The initiative has to be taken by the institute itself so as to disseminate and prove to
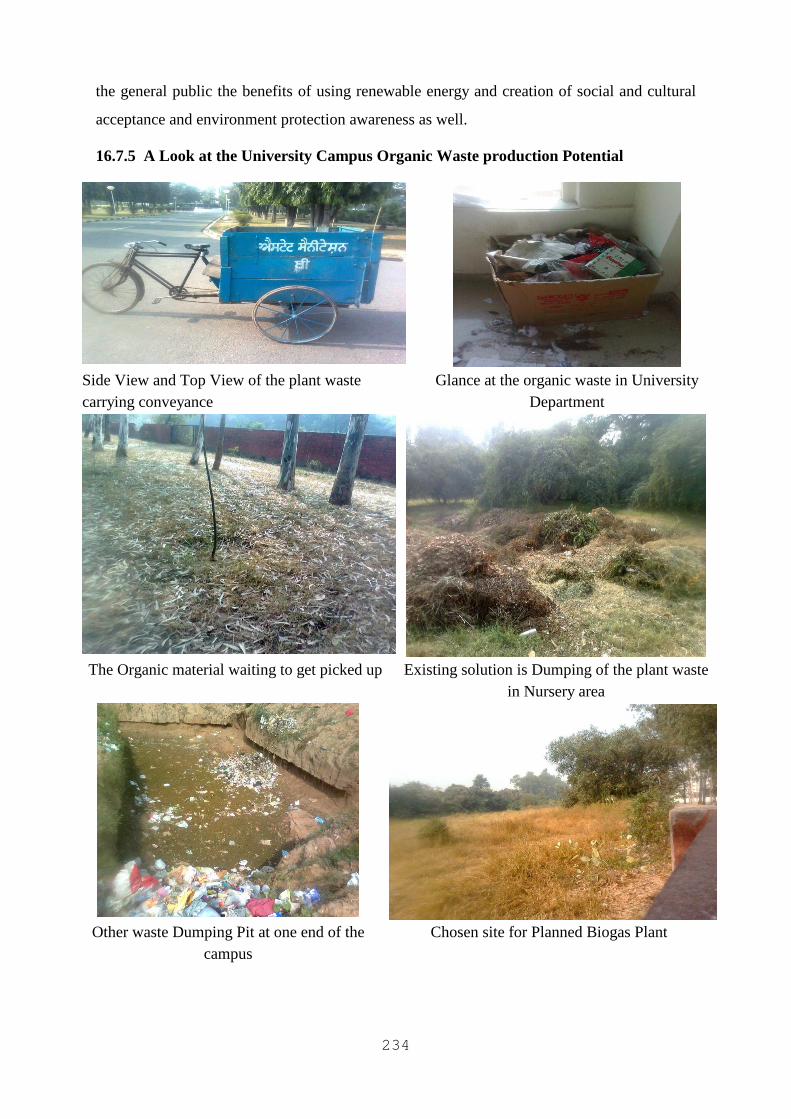
234
the general public the benefits of using renewable energy and creation of social and cultural
acceptance and environment protection awareness as well.
16.7.5 A Look at the University Campus Organic Waste production Potential
Side View and Top View of the plant waste carrying conveyance
Glance at the organic waste in University Department
The Organic material waiting to get picked up Existing solution is Dumping of the plant waste
in Nursery area
Other waste Dumping Pit at one end of the
campus Chosen site for Planned Biogas Plant
235
16.8 Suggestions / Recommendations
8.1 As it is a social endeavor to set up plants and co-ordinate, it is necessary for
stakeholders to understand the importance of renewable sources and can link this
to development and sustainability.
8.2 All the stakeholders must participate in decision making regarding proper
functioning and utilization of biogas plants ensuring availability of feeding
material and improvement in the technology and quality of construction.
8.3 The advanced technology plants should be set up and measures should be taken
both by the government and people to make a contribution towards the healthy and
improved living conditions of poor people.
8.4 A program or schedule integrating all the functions and operations including
formulation of Repair and Maintenance Mechanisms should be framed and
executed through an effective partnership between local stakeholders and
enterprises in a cohesive manner.
8.5 Advanced and modern techniques should be used for increasing efficiency. It is
capable of giving greater value than merely biogas or compost ad lot more value
added products can be obtained.
8.6 Further observation and monitoring for determining various substrates potential
should be undertaken and keep checking latest developments in this field.
8.7 The social awareness regarding Orientation on Toilet Attachment and Effective
Use of Slurry should be spread amongst themselves so as the orthodoxies can be
liberated.
8.8 Environmental safety aspects should be taken care and people should know how
there are various organizations are active in curbing GHG, reducing Carbon
Footprints and bring in CDM finances to mitigate the effects of Climate Change
and promoting Renewable energy
8.9 The government has taken initiatives however the regulatory infrastructure should
be present in scenario of changing policy investment friendliness. Social problems
also need to be tackled
236
16.9 Conclusions
The campus has a potential to harness the renewable sources and compensate the ecological
imbalance and energy deficit. Co-digestion is the key concept as the conventional biogas
plant in the campus are not socially and economic viable. The feasibility is not favorable
citing orthodoxies relating to dung and faecal waste has been still persisting for long the area.
The use of kitchen waste and plant waste as a source of energy is not objectionable to the
endemic people. The cultural acceptance has to be created for the various substrates besides
basic chemical, microbiological, engineering, and, with the concomitant assurances of
economic success. A screening of the literature indicates that the technical and technological
advancement is necessary so that the various substrates can be fermented and the 3zone PFR
plant is optimum for the campus.
If the people learn that the modern technology is giving an opportunity for clean and
natural fuel plus the fertilizers and other value added products then slowly they will keep on
bolstering their thought process so that cultural factors and social acceptance do not pose a
hindrance and they get adapt to the need of the hour. The awareness regarding Carbon
footprints and CDM will ease people to open the barriers.
The university campus does not have enough substrates for a CBP however plant
waste is available in large quantities and can sustain the modern 3zone PFR plant.
The payback period is not big but a initial investment is required as the plant value is
the major contributor besides installation and commissioning of the plant.
The university authorities if cannot allocate that much fund exclusively can definitely
succeed in getting a subsidy from the government to establish the plant and can setup the
plant which in turn give immense benefits to the institution as the garbage will turn into a
source and besides setting an example for other institutions, it can host as learning centre to
create awareness regarding various aspects and operating the biogas plants.
16.10 Limitations
Time constraints were the impetus as well as impediment the research. The average has been
taken on the basis of limited duration which can vary and the sample size was also small.
Money as the universal driver of processes was a limiting factor as the text was
available however the practicalities can not studied due to distance and the non availability of
resources.
237
Questionnaire was a rudimentary one focusing on the economic and cultural aspects
rather than technology and impetus for protecting environment awareness as the major
respondents were either illiterates or less educated.
Studying Technical feasibility was also a limitation as the theoretical and practical
proceedings have a variance and the substrate behavior can be observed in the practical
condition of the specific area only.
16.11 Agenda for future research
The country has enormous biomass and the potential can be throttled using modern
technology, techniques, planning for investment and sustainable policies leading to energy
security and estimating the use and availability of feedstock like algae, application of other
feed stocks, Reduction of Landfills as well as logistics and storage of feedstock for optimum
utilisation.
The future research can be taken up in the areas from socio-economic awareness, for
improving the efficiency, critical analysis for financial viability, optimum production and
scope of the biogas in the long run. The application areas of large scale plants and strategies
for imploding policies and identification for other significant and prospect uses.
It is worth mentioning that the students carrying research in this area can carry
research in gas purification methods; auxiliary heating systems; insulator materials;
development of appropriate appliances for efficient biogas utilization (e.g. burners, lamps,
mini tractors, etc), deployment of methane to strengthening small-scale industries, e.g., brick-
making, welding, quicker de-watering of sludge etc, composition of gas as a function of
variables - pH, temperature, agitation - with relation to substrates - manure, algae, water
hyacinths will be of substantial help to the society.
References
1. Carrasco, E.F., Omil, F., Garrido, J.M., Arrojo, B., Mendez, R. (2004). Advanced
Monitoring and Aupervision of Biological Treatment of Complex Dairy Effluents in a
Full-Scale Plant. Biotechnology Program. 20: 992-997.
2. CEA (2012b), “Operation Performance Monitoring Division,
No.CEA/OPM/PPI/6/1/2012”, New capacity in anaerobic digestion processes. Water
Research. 38: 3645-3650
238
3. CEA (2012c), Load Generation Balance Report 2012-13, New Delhi.
4. CEA(2012a)Monthly Report – All India Installed Capacity-State Wise/Utility Wise,
New Delhi, as on 31 October Delhi
5. Hilkiah Igoni, M. F. N. Abowei, M. J. Ayotamuno and C. L. Eze (2008), Effect of
Total Solids Concentration of Municipal Solid Waste on the Biogas Produced in an
Anaerobic Continuous Digester.
6. H N Chanakya, Advances and modern concepts in Anaerobic digestion in and Biogas
Technology
7. Jantsch, T.G., Matttiason, B. (2004). An automated spectropphoyometric system for
monitoring buffer
8. Kale, S.P and Mehele, S.T. kitchen waste based biogas plant.pdf. Nuclear agriculture
and Biotechnology/ Division.
9. Karthik Rajendran , Solmaz Aslanzadeh and Mohammad J. Taherzadeh Household
Biogas Digesters—A Review
10. Karthik Rajendran , Solmaz Aslanzadeh and Mohammad J. Taherzadeh
11. Karve .A.D. (2007), Compact biogas plant, a low cost digester for biogas from waste
starch. http://www.arti-india.org.
12. Karve of Pune A.D (2006). Compact biogas plant compact low-cost digester from
waste starch. www.bioenergylists.org.
13. Kumar, S., Gaikwad, S.A., Shekdar, A.K., Kshirsagar, P.K., Singh, R.N. (2004).
Estimation method for national methane emission from solid waste landfills.
Atmospheric Environment. 38: 3481–3487
14. Kumar, S., Mondal, A.M., Gaikwad, S.A., Devotta1, S., Singh, R.N. (2004).
Qualitative assessment of methane emission inventory from municipal solid waste
disposal sites: a case study. Atmospheric Environment. 38: 4921–4929
15. Lissens, G.,Verstraete, W., Albrecht, T., Brunner, G., Creuly, C., Seon, J., Dussap, G.,
Lasseur, C. (2004). Advanced anaerobic bioconversion of lignocellulosic waste for
bioregenerative life support following thermal water treatment and biodegradation by
Fibrobacter succinogenes. Biodegradation. 15: 173-183.
16. maxbiogas GmbH Managing Director: Dr. Katrin Streffer, www.maxbiogas.com
17. Murphy, J.D., McKeogh D., Kiely, G. (2004). Technical/economic/environmental
analysis of biogas utilization. Applied Energy 77: 407–427.
18. http://www.nabard.org/modelbankprojects/biogas.asp
19. PIB (2012), “Capacity Addition of Renewable Energy”, 21 May.

239
20. Shalini sing, sushil kumar, M.C. Jain, Dinesh kumar (2000), the increased biogas
production using microbial stimulants.
21. Thomsen, A.B., Lissens, G., Baere, L., Verstraete, W., Ahring, B. (2004). Thermal
wet oxidation improves anaerobic biodegradability of raw and digested biowaste.
Environmental Science and Technology. 38: 3418-3424.
240
CHAPTER 17
TECHNOLOGY DEMONSTRATION PROJECTS ON BIOGAS
BOTTLING UNDER RDD&D POLICY OF MNRE
M.L. Bamboriya
Energy is the key input for socio-economic development of any Nation. The fast
industrialization and rapid urbanization besides mechanized farming have generated a high
demand of energy in all forms i.e. thermal, mechanical and electrical. To meet this ever-
increasing demand, fossil fuels such as coal, oil and natural gas have been overexploited in an
unsustainable manner. The overexploitations of fossil fuels have been posing serious
environmental problems such as global warming and climate change. While we have shortage
of energy and more dependent on imports in case of petroleum, we are fortunate enough to be
blessed with plenty of natural sources of energy (renewable) such as solar, wind, biomass and
hydro. These sources are environmentally benign and non-depleting in nature as well as are
available in most parts of the country throughout the year.
Today, renewable energy has become an important component of India’s energy
planning process. The Ministry of New and Renewable Energy (MNRE) is the nodal Ministry
of the Government of India at the Federal level for all matters relating to new and renewable
energy. Renewable energy is supporting the government agenda of ‘inclusive growth’ and
will be part of the solution to meet the nation’s energy needs. The extension programme of
the Ministry is largely implemented through the State Renewable Energy Development
Agencies. However, increasingly the channels are being opened out to move in market mode
through other partners.
There has been consistent increase in the pace of renewable energy development and
the sector has grown at an annual rate of 23%, rising from about 3900MW in 2002-03 to
about 26,137 MW in September, 2012. Wind Energy continues to dominate India’s renewable
energy industry, accounting for 70% of installed capacity (18,192MW), followed by small
hydropower (3,447), biomass power (3,359 MW) and solar power (1045MW). In terms of
electricity generation, with normative capacity utilization factors, the renewable power
installed capacity is generating around 50 BU per year corresponding to about 6.5% in the
241
total electricity mix and 12% of total capacity. Significantly, off-grid applications of
renewable energy have also made significant head way.
A capacity addition of about 30,000 MW is planned from various renewable energy
technologies in the next five years. In this, Wind energy would contribute about 15,000 MW,
followed by solar power (10,000 MW), small hydropower (2100 MW) and biomass power
(2700 MW).
The Ministry has set up the Solar Energy Center (SEC) Gwalpahari, Gurgaon,
Haryana, with state-of-art facilities for testing of solar thermal and solar photovoltaic
materials, devices and systems. SEC also resort to applied research and training. A Centre for
Wind Energy Technolgy (CWET) has been set up in Chennai for providing technical support
to the Ministry for implementation of its wind energy programmes. Sardar Swaran Singh
National Institute of Renewable Energy (SSS-NIRE), at Wadala Kalan, Dist. – Kapurthala
(Punjab) is focused on biomass energy research and development. For market development
and financing of renewable energy projects, a separate financing institution called the Indian
Renewable Energy Development Agency (IREDA) has been set up as a public sector
undertaking. During the year 2011-12, Solar Energy Corporation of India (SECI), another
public sector undertaking, has also been set up to assist the Ministry in development,
promotion and commercialization of solar energy technologies in the country.
The country has an estimated renewable energy potential of around 85,000 MW from
commercially exploitable sources of Wind, Small Hydro and Biomass. In addition, India has
the potential to generate around 50MW per square km using solar photovoltaic and solar
thermal energy. The potential is under reassessment and is likely to increase substantially. In
addition, there is an estimated potential for around 140 million square meter solar thermal
collector area and also 12 million household biogas plants.
India is implementing one of the world’s largest programmes in renewable energy.
The country ranks second in biogas utilization, fifth in wind power, fifth in small hydro and
seventh in photovoltaic production in the world. Renewable sources already contribute to
about 12% of the total power generating capacity in the country.
As you aware that India is the second largest country in the world for implementation
of biogas programme. Under this programme about 4.54 million biogas plants have been
installed against the potential of 12 million of biogas plants in the country for cooking,
242
lighting and pumping application and it is of 38% of the potential estimated for installation of
biogas plants in the country.
Biomass resources such as cattle dung, agriculture wastes and other organic wastes
have been one of the main energy sources for the mankind since the dawn of civilization.
There is a vast scope to convert these energy sources into biogas. Biogas production is a clean
low carbon technology for efficient management and conversion of organic wastes into clean
renewable biogas and organic/bio manure. It has the potential for leveraging sustainable
livelihood development as well as tackling local and global land, air and water pollution.
Biogas obtained by anaerobic digestion of cattle dung and other loose and leafy organic
matters/ biomass wastes can be used as an energy source for various applications namely,
cooking, heating, space cooling/ refrigeration, electricity generation and gaseous fuel for
vehicular application. Based on the availability of cattle dung alone from about 304 million
cattle, there exists an estimated potential of about 18,240 million cubic meter of biogas
generation annually. The increasing number of poultry farms is another source and can
generate biogas of 2173 million cubic meters annually with 649 million numbers of birds.
Non-edible de-oiled cake from Jatropha and other plants also has a big potential. In addition,
kitchens of all the institutions, universities, restaurants, barat ghars, industries, parks and
gardens in urban and semi-urban areas also offer a very large potential. There is a need for
treating these wastes for better environmental condition and reducing methane emission
affecting climatic change. In addition to gaseous fuel, biogas plants do provide high quality
organic manure with soil nutrients which improves its fertility required for sustainable
production and improving productivity. Thus, there is a huge potential for the installation of
medium size biogas plants in the country.
Biogas comprises of 60-65% methane, 35-40% carbon dioxide, 0.5-1.0% hydrogen
sulphide, rests of water vapors etc. It is almost 20% lighter than air. Biogas, like Liquefied
Petroleum Gas (LPG) cannot be converted into liquid state under normal temperature and
pressure. Removing carbon dioxide, Hydrogen Sulfide, moisture and compressing it into
cylinders makes it easily usable for transport applications & also for stationary applications.
Already CNG technology has become easily available and therefore, bio-methane (purified
biogas) which is nearly same as CNG, can be used for all applications for which CNG are
used. Purified biogas (bio-methane) has a high calorific value in comparison to raw biogas.
During the year 2008-09, a new initiative was taken for technology demonstration on
biogas bottling projects in entrepreneurial mode, for installation of medium size mixed feed
243
biogas plants for generation, purification and bottling of biogas under RDD&D policy of
MNRE. Installation of such plants aims at production of CNG quality of Compressed Biogas
(CBG) to be used as vehicular fuel in addition to meeting stationary & motive power and
electricity generation needs in a decentralized manner through establishment of a sustainable
business model in this sector. There is a huge potential for installation of such plants in
various areas. Under the demonstration phase, the Ministry has sanctioned a central financial
assistance for a limited number of such projects for implementation following an
entrepreneurial mode in ten states namely Chhattisgarh, Gujarat, Haryana, Karnataka,
Maharashtra, Punjab, Madhya Pradesh, Andhra Pradesh, Uttar Pradesh and Rajasthan.
The main components of biogas bottling projects are given below:
i. Pre-treatment system
ii. Biogas generation system
iii. Biogas Storage system
iv. Biogas purification system
v. Biogas Bottling system
vi. Slurry handling system etc.
Six no. of biogas bottling projects of various capacities have been commissioned by
the promoters upto September, 2012 after obtaining licenses for filling and storage of
compressed biogas in CNG cylinders from Petroleum & Explosives Safety Organization
(PESO).
The purity of biogas is about 98% Methane and this has being corroborated through
tests conducted by National Accreditation Board for Testing and Calibration Laboratories
(NABL) and compressed to 150-bar pressure for filling in cylinders. The purified biogas is
equivalent/ similar to CNG.
The purified biogas is filled in CNG cylinder and supplied to mid-day meal scheme,
mess, Hotels for cooking food and plastic tank manufacturing industries for heating purposes.
The slurry/manure of biogas plant is being sold to the farmers and used in liquid form by
them in agricultural crops. The field trials have indicated the excellent growth in agro-
production and substantial improvements in the quality. The slurry which comes out of the
biogas plant is directly or after drying used as organic/bio manure for improving soil-fertility
and reducing use of chemical fertilizers. It is also non-pollutant because it is free from weed-
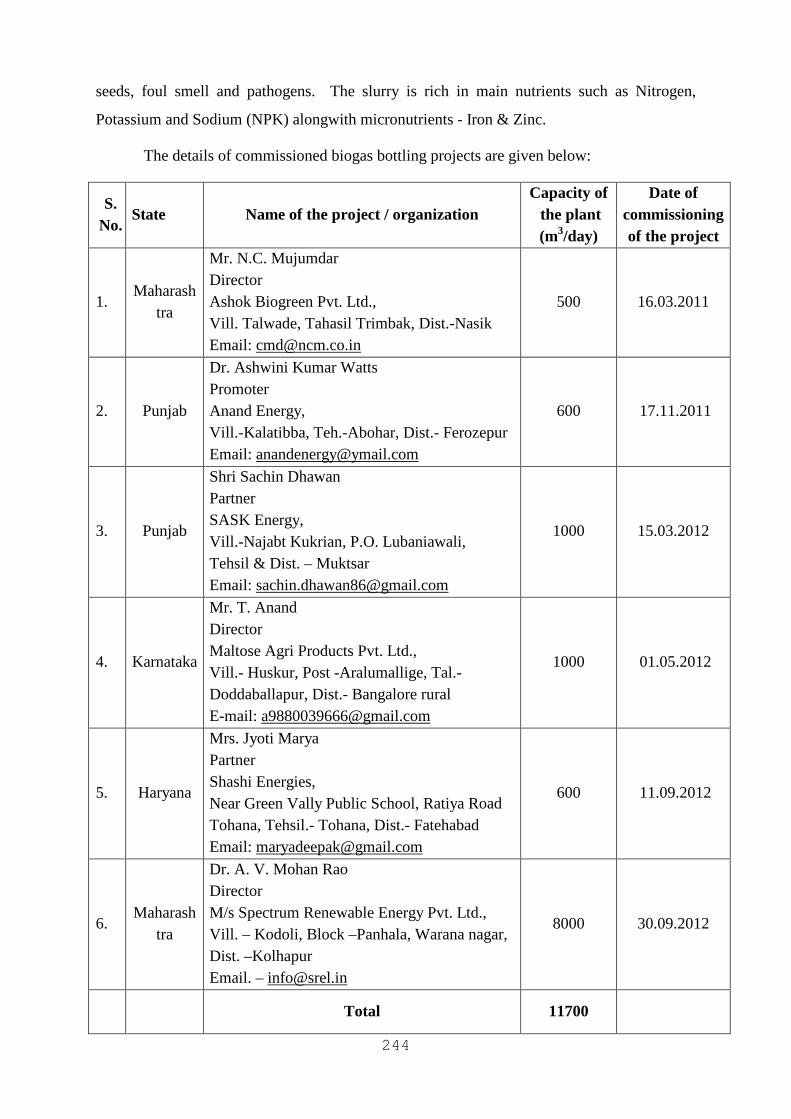
244
seeds, foul smell and pathogens. The slurry is rich in main nutrients such as Nitrogen,
Potassium and Sodium (NPK) alongwith micronutrients - Iron & Zinc.
The details of commissioned biogas bottling projects are given below:
S. No.
State Name of the project / organization Capacity of the plant (m3/day)
Date of commissioning of the project
1. Maharash
tra
Mr. N.C. Mujumdar Director Ashok Biogreen Pvt. Ltd., Vill. Talwade, Tahasil Trimbak, Dist.-Nasik Email: [email protected]
500 16.03.2011
2. Punjab
Dr. Ashwini Kumar Watts Promoter Anand Energy, Vill.-Kalatibba, Teh.-Abohar, Dist.- Ferozepur Email: [email protected]
600 17.11.2011
3. Punjab
Shri Sachin Dhawan Partner SASK Energy, Vill.-Najabt Kukrian, P.O. Lubaniawali, Tehsil & Dist. – Muktsar Email: [email protected]
1000 15.03.2012
4. Karnataka
Mr. T. Anand Director Maltose Agri Products Pvt. Ltd., Vill.- Huskur, Post -Aralumallige, Tal.-Doddaballapur, Dist.- Bangalore rural E-mail: [email protected]
1000 01.05.2012
5. Haryana
Mrs. Jyoti Marya Partner Shashi Energies, Near Green Vally Public School, Ratiya Road Tohana, Tehsil.- Tohana, Dist.- Fatehabad Email: [email protected]
600 11.09.2012
6. Maharash
tra
Dr. A. V. Mohan Rao Director M/s Spectrum Renewable Energy Pvt. Ltd., Vill. – Kodoli, Block –Panhala, Warana nagar, Dist. –Kolhapur Email. – [email protected]
8000 30.09.2012
Total 11700
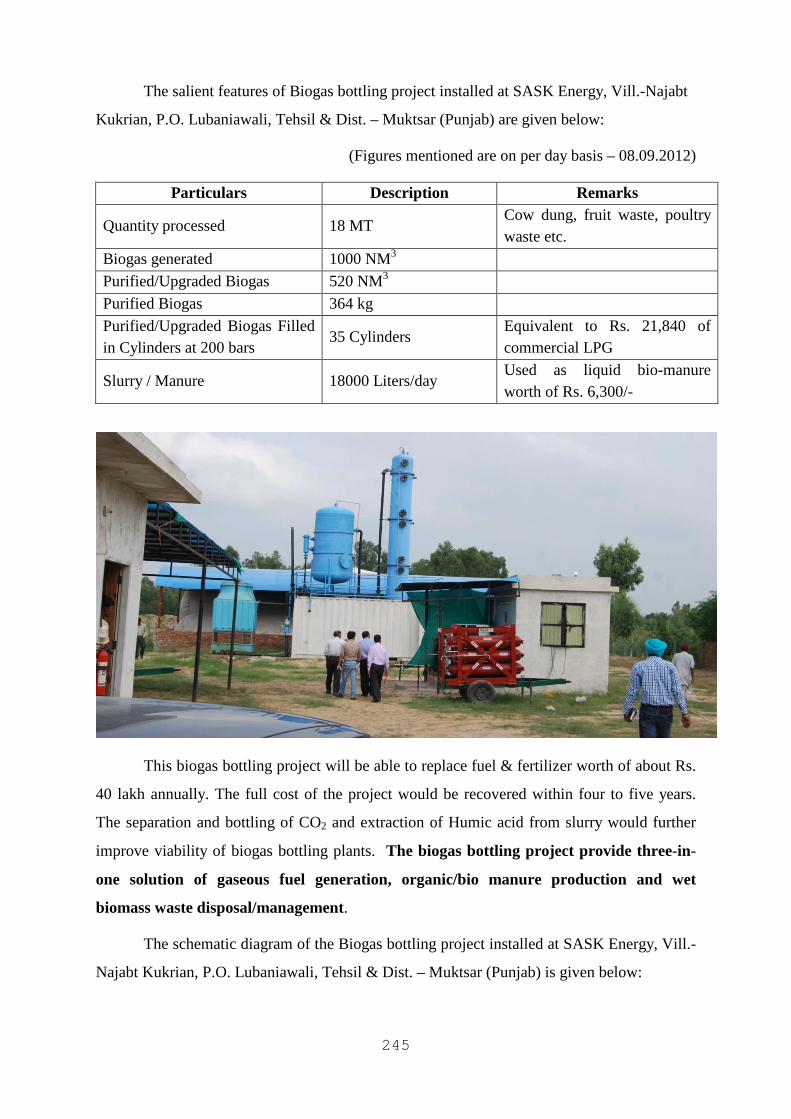
245
The salient features of Biogas bottling project installed at SASK Energy, Vill.-Najabt
Kukrian, P.O. Lubaniawali, Tehsil & Dist. – Muktsar (Punjab) are given below:
(Figures mentioned are on per day basis – 08.09.2012)
Particulars Description Remarks
Quantity processed 18 MT Cow dung, fruit waste, poultry waste etc.
Biogas generated 1000 NM3
Purified/Upgraded Biogas 520 NM3
Purified Biogas 364 kg
Purified/Upgraded Biogas Filled in Cylinders at 200 bars
35 Cylinders Equivalent to Rs. 21,840 of commercial LPG
Slurry / Manure 18000 Liters/day Used as liquid bio-manure worth of Rs. 6,300/-
This biogas bottling project will be able to replace fuel & fertilizer worth of about Rs.
40 lakh annually. The full cost of the project would be recovered within four to five years.
The separation and bottling of CO2 and extraction of Humic acid from slurry would further
improve viability of biogas bottling plants. The biogas bottling project provide three-in-
one solution of gaseous fuel generation, organic/bio manure production and wet
biomass waste disposal/management.
The schematic diagram of the Biogas bottling project installed at SASK Energy, Vill.-
Najabt Kukrian, P.O. Lubaniawali, Tehsil & Dist. – Muktsar (Punjab) is given below:
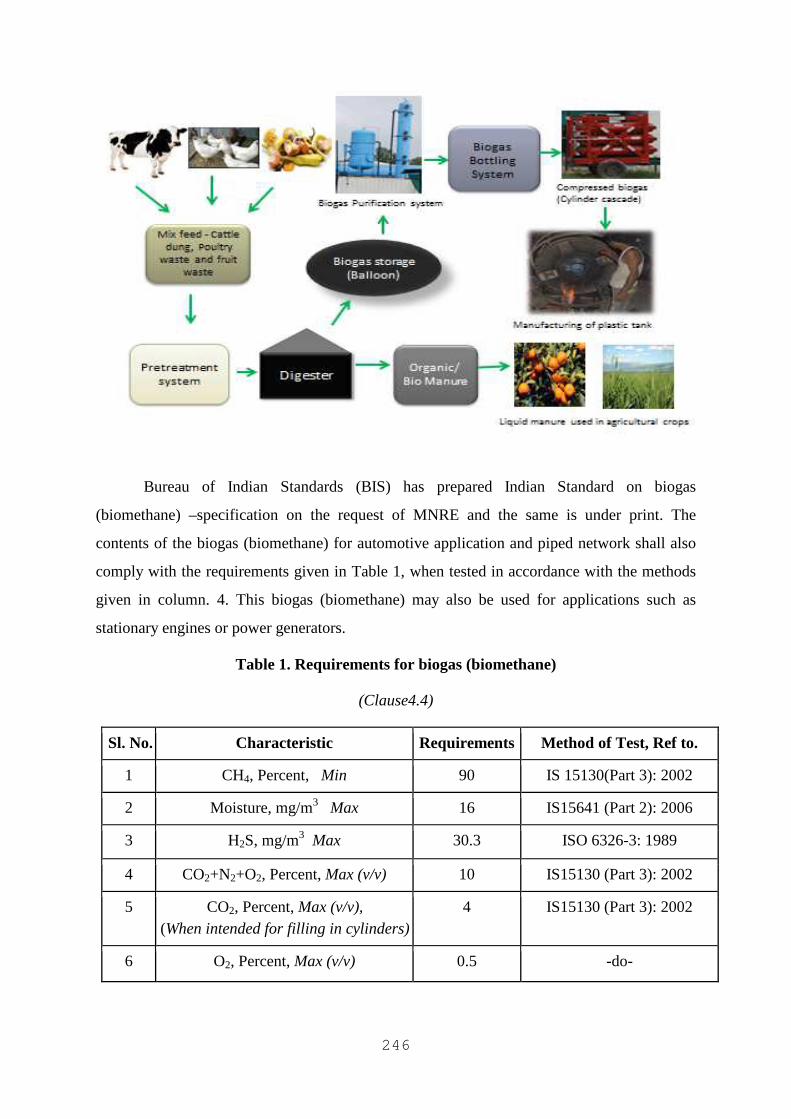
246
Bureau of Indian Standards (BIS) has prepared Indian Standard on biogas
(biomethane) –specification on the request of MNRE and the same is under print. The
contents of the biogas (biomethane) for automotive application and piped network shall also
comply with the requirements given in Table 1, when tested in accordance with the methods
given in column. 4. This biogas (biomethane) may also be used for applications such as
stationary engines or power generators.
Table 1. Requirements for biogas (biomethane)
(Clause4.4)
Sl. No. Characteristic Requirements Method of Test, Ref to.
1 CH4, Percent, Min 90 IS 15130(Part 3): 2002
2 Moisture, mg/m3 Max 16 IS15641 (Part 2): 2006
3 H2S, mg/m3 Max 30.3 ISO 6326-3: 1989
4 CO2+N2+O2, Percent, Max (v/v) 10 IS15130 (Part 3): 2002
5 CO2, Percent, Max (v/v), (When intended for filling in cylinders)
4 IS15130 (Part 3): 2002
6 O2, Percent, Max (v/v) 0.5 -do-

247
As such there is no pollution from biogas bottling plant. As a matter of fact, the biogas-
bottling plants are one of the most potent tools for mitigating climatic change by preventing
black carbon emission from biomass chulha since biogas is used as a cooking fuel and methane
emissions from untreated cattle dung and biomass wastes are also avoided. The purified biogas
can be bottled in CNG cylinders and wherever CNG is currently used, biogas bottling can be
used as an alternative.
248
CHAPTER 18
VARIOUS WAYS OF IMPROVING HYDROGEN
PRODUCTION FROM BIOMASS
S. Meenu Krithika and R. Nagendran
Abstract
Due to increase in energy demand and over use of energy, the depletion of fossil fuels and
other conventional fuel become inevitable. Besides these, the combustion of fossil fuel emits
lots of noxious gases such as CO2, NOx, SOx etc which leads to continuous increase in the
global temperature. In response to these problems, whole world is looking for an alternative
fuel which should be clean and green. One of the potential alternatives considered is, use of
hydrogen as a fuel, since it is clean, carbon dioxide neutral and can be produced from
renewable sources. Hydrogen can be produced by conventional physicochemical processes
such as reformation of hydrocarbons and electrolysis of water which are not cost effective. In
addition to the costs, these cause serious environmental pollution. On the other hand,
hydrogen produced by biological methods such as fermentation and biophotolysis employing
algae has demonstrated advantages. In biophotolysis, atmospheric carbon dioxide is fixed by
the algae and certain bacteria. Fermentation process also has advantages as it makes use of
wastes and residues as a substrate to produce hydrogen. Conversely, biological processes
have certain limitations too. The limitations include low hydrogen yield, rate of production
and presence of impurities. But this can be overcome by adapting certain methods such as
increase in hydrogen yield can be done by treating the substrate in a proper way. Further
increase can be improved by choosing proper reaction parameters. In this paper, some of the
challenges faced during hydrogen production from biological ways along with the potential
options to improve the same are discussed.
Key words: hydrogen production, fermentation, biomass, biohydrogen, renewable energy,
sustainable fuel
18.1 Introduction
Hydrogen is the lightest and abundantly available element on earth (Uhrig, 2004). The
exhaust of hydrogen fuel is only water vapour therefore, it is considered as the zero carbon
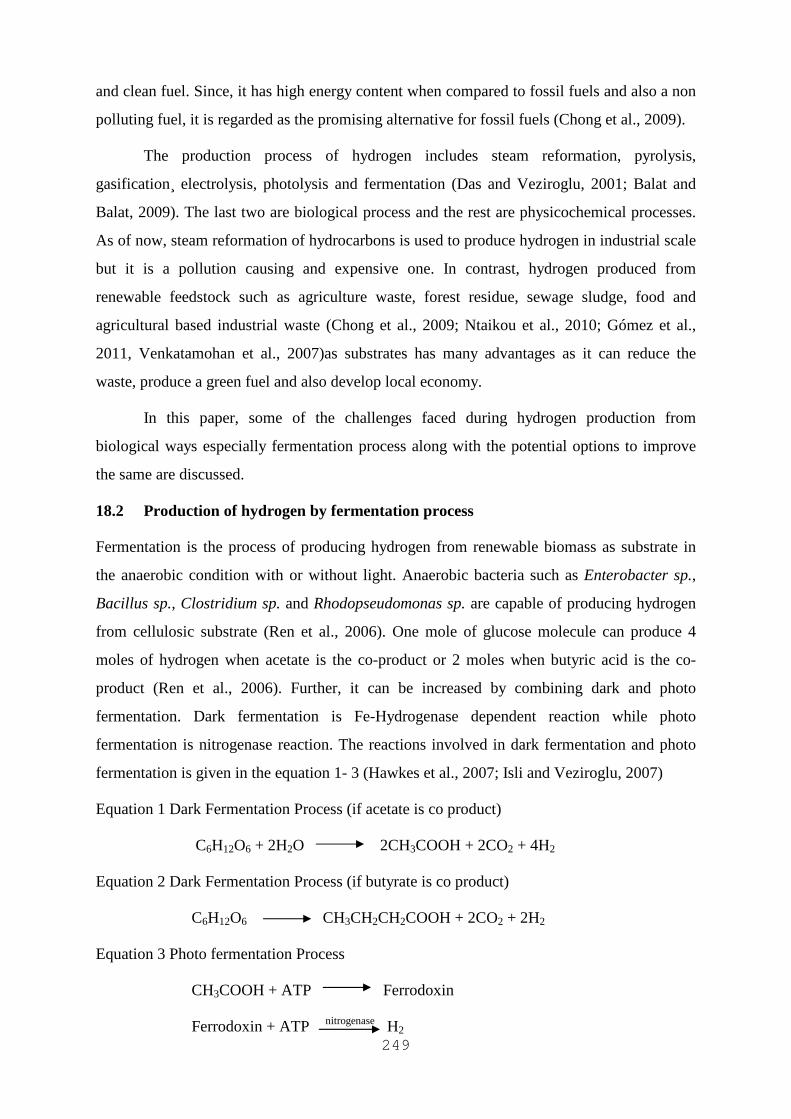
249
and clean fuel. Since, it has high energy content when compared to fossil fuels and also a non
polluting fuel, it is regarded as the promising alternative for fossil fuels (Chong et al., 2009).
The production process of hydrogen includes steam reformation, pyrolysis,
gasification electrolysis, photolysis and fermentation (Das and Veziroglu, 2001; Balat and
Balat, 2009). The last two are biological process and the rest are physicochemical processes.
As of now, steam reformation of hydrocarbons is used to produce hydrogen in industrial scale
but it is a pollution causing and expensive one. In contrast, hydrogen produced from
renewable feedstock such as agriculture waste, forest residue, sewage sludge, food and
agricultural based industrial waste (Chong et al., 2009; Ntaikou et al., 2010; Gómez et al.,
2011, Venkatamohan et al., 2007)as substrates has many advantages as it can reduce the
waste, produce a green fuel and also develop local economy.
In this paper, some of the challenges faced during hydrogen production from
biological ways especially fermentation process along with the potential options to improve
the same are discussed.
18.2 Production of hydrogen by fermentation process
Fermentation is the process of producing hydrogen from renewable biomass as substrate in
the anaerobic condition with or without light. Anaerobic bacteria such as Enterobacter sp.,
Bacillus sp., Clostridium sp. and Rhodopseudomonas sp. are capable of producing hydrogen
from cellulosic substrate (Ren et al., 2006). One mole of glucose molecule can produce 4
moles of hydrogen when acetate is the co-product or 2 moles when butyric acid is the co-
product (Ren et al., 2006). Further, it can be increased by combining dark and photo
fermentation. Dark fermentation is Fe-Hydrogenase dependent reaction while photo
fermentation is nitrogenase reaction. The reactions involved in dark fermentation and photo
fermentation is given in the equation 1- 3 (Hawkes et al., 2007; Isli and Veziroglu, 2007)
Equation 1 Dark Fermentation Process (if acetate is co product)
C6H12O6 + 2H2O 2CH3COOH + 2CO2 + 4H2
Equation 2 Dark Fermentation Process (if butyrate is co product)
C6H12O6 CH3CH2CH2COOH + 2CO2 + 2H2
Equation 3 Photo fermentation Process
CH3COOH + ATP Ferrodoxin
Ferrodoxin + ATP nitrogenase H2
250
18.3 Challenges of fermentation process
Hydrogen from biomass has lots of benefits which can reduce the cost of waste management,
increases the local revenue, produce clean energy, controls carbon dioxide emission into the
atmosphere. However, it has some challenges too. Hydrogen production from biological
processes is a very complex process as it engages different microorganisms, substrate, growth
condition and other factors.
Fermentation process has obstruction in many forms. The substrate used in the process
plays a major role. Substrates which are rich in carbohydrates hydrolysed faster than the
others (Cakır et al., 2010). The other inhibiting factor is the selection of microorganism.
When a mixed culture such as sludge is used as inoculum the other group of organism such as
methanogens control the growth of hydrogen producing organism which results in lower or
nil production of hydrogen (Nandi and Sengupta, 1998) . The growth conditions play vital
role in hydrogen production as unmaintained pH, temperature, retention time leads to reduced
gas production (Sinha and Pandey, 2011). The production of certain by-products such as
butyric acids reduces the hydrogen production (as shown in Equation 2) while lactic acid
results in no hydrogen production (Hawkes et al., 2007). The increase in partial pressure of
hydrogen in the system leads to decrease in the hydrogen production (Mandal et al., 2006).
The other obstruction is complete separation of hydrogen from other gases without any loss
(Beggel et al., 2010). The dimension of the reactor also causes certain problems especially in
photo fermentation (Morweiser et al., 2010). The larger reactor leads to reduced light
penetration which results in low production. The tubular reactors are efficient in light
penetration but they are not cost effective.
In each step of the hydrogen production processes, there are certain difficulties, which
are needed to be addressed. The process of hydrogen production by fermentation and
challenges of the each step is given in Figure 1.
18.4 Different ways of improving fermentation process
Hydrogen production from biomass is the most economical way but it has many challenges to
address. The different types of counteractive methods are given in the subsequent paragraphs
under various headings. The challenges and the overcome mechanisms in the fermentation
process are given in the Table 1.
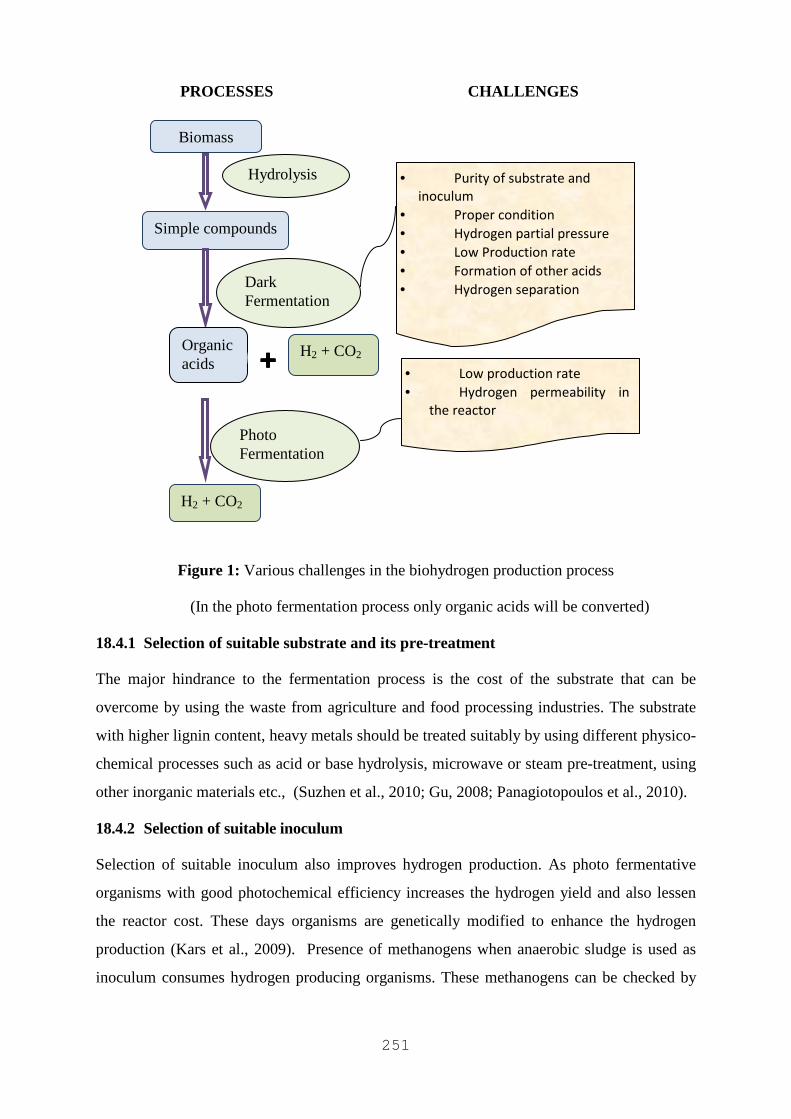
251
PROCESSES CHALLENGES
Figure 1: Various challenges in the biohydrogen production process
(In the photo fermentation process only organic acids will be converted)
18.4.1 Selection of suitable substrate and its pre-treatment
The major hindrance to the fermentation process is the cost of the substrate that can be
overcome by using the waste from agriculture and food processing industries. The substrate
with higher lignin content, heavy metals should be treated suitably by using different physico-
chemical processes such as acid or base hydrolysis, microwave or steam pre-treatment, using
other inorganic materials etc., (Suzhen et al., 2010; Gu, 2008; Panagiotopoulos et al., 2010).
18.4.2 Selection of suitable inoculum
Selection of suitable inoculum also improves hydrogen production. As photo fermentative
organisms with good photochemical efficiency increases the hydrogen yield and also lessen
the reactor cost. These days organisms are genetically modified to enhance the hydrogen
production (Kars et al., 2009). Presence of methanogens when anaerobic sludge is used as
inoculum consumes hydrogen producing organisms. These methanogens can be checked by
Biomass
H2 + CO2
H2 + CO2
Simple compounds
Hydrolysis
Photo Fermentation
Dark Fermentation
• Purity of substrate and
inoculum
• Proper condition
• Hydrogen partial pressure
• Low Production rate
• Formation of other acids
• Hydrogen separation
• Low production rate
• Hydrogen permeability in
the reactor
Organic acids
++++
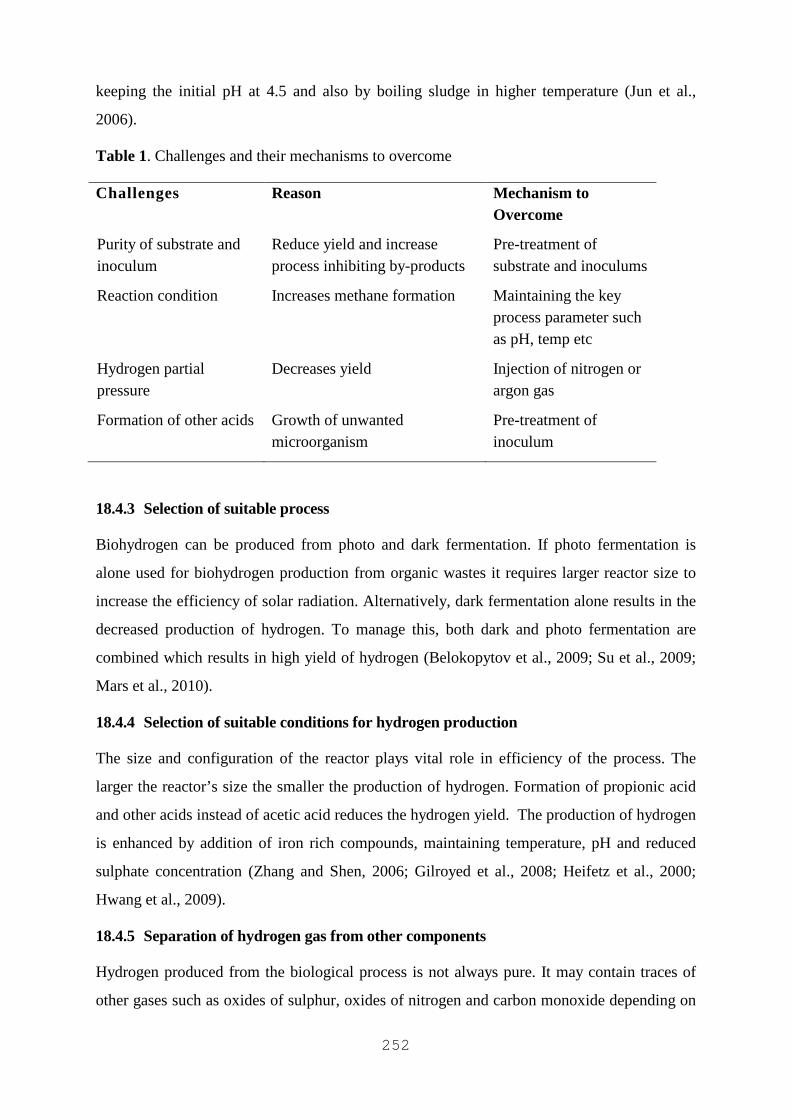
252
keeping the initial pH at 4.5 and also by boiling sludge in higher temperature (Jun et al.,
2006).
Table 1. Challenges and their mechanisms to overcome
Challenges Reason Mechanism to Overcome
Purity of substrate and inoculum
Reduce yield and increase process inhibiting by-products
Pre-treatment of substrate and inoculums
Reaction condition Increases methane formation Maintaining the key process parameter such as pH, temp etc
Hydrogen partial pressure
Decreases yield Injection of nitrogen or argon gas
Formation of other acids Growth of unwanted microorganism
Pre-treatment of inoculum
18.4.3 Selection of suitable process
Biohydrogen can be produced from photo and dark fermentation. If photo fermentation is
alone used for biohydrogen production from organic wastes it requires larger reactor size to
increase the efficiency of solar radiation. Alternatively, dark fermentation alone results in the
decreased production of hydrogen. To manage this, both dark and photo fermentation are
combined which results in high yield of hydrogen (Belokopytov et al., 2009; Su et al., 2009;
Mars et al., 2010).
18.4.4 Selection of suitable conditions for hydrogen production
The size and configuration of the reactor plays vital role in efficiency of the process. The
larger the reactor’s size the smaller the production of hydrogen. Formation of propionic acid
and other acids instead of acetic acid reduces the hydrogen yield. The production of hydrogen
is enhanced by addition of iron rich compounds, maintaining temperature, pH and reduced
sulphate concentration (Zhang and Shen, 2006; Gilroyed et al., 2008; Heifetz et al., 2000;
Hwang et al., 2009).
18.4.5 Separation of hydrogen gas from other components
Hydrogen produced from the biological process is not always pure. It may contain traces of
other gases such as oxides of sulphur, oxides of nitrogen and carbon monoxide depending on
253
the type of waste is used (Levin et al., 2004). Nowadays, membranes are used to separate
hydrogen from carbon dioxide which has good success rate but they are not cost effective
(Shalygin and Teplyakov, 2010; Modigell, 2010).
18.5 Conclusion
Hydrogen is an environmental friendly alternate for conventional fuels. Hydrogen is one of
the non fossil fuel can be used for any purposes such as transportation, production of
electricity etc. Automobile manufacturing industries initiated production of hydrogen vehicle.
By using the above options for improvement of hydrogen production, drawbacks can be
overcome. However, biohydrogen has been considered as effective replacement, it has not yet
been used for commercial purposes since the biological processes are mostly on laboratory
scale. As the research in this field is fast growing, commercialisation is round the corner.
References
1. Balat M, and Mehmet B (2009) Political, Economic and Environmental Impacts of
Biomass-based Hydrogen, International Journal of Hydrogen Energy 34 (9): 3589–
3603.
2. Beggel F, Isabella J N, Michael M, Maxim G S, Vladimir V T and Victor B. Z (2010)
A Novel Gas Purification System for Biologically Produced Gases, Journal of
Cleaner Production 18: S43–S50.
3. Belokopytov B F, Kestutis S L, Tatyana V L, Maria L G, Michael S, and Anatoly A T
(2009). Towards the Integration of Dark- and Photo-fermentative Waste Treatment .
2 . Optimization of Starch-dependent Fermentative Hydrogen Production.
International Journal of Hydrogen Energy 34 (8): 3324–3332.
4. Cakır A, Serpil O and Fikret K (2010) Comparison of Bio-hydrogen Production from
Hydrolyzed Wheat Starch by Mesophilic and Thermophilic Dark Fermentation.
International Journal of Hydrogen Energy 35 (24) : 13214–13218.
5. Chong M, Vikineswary S, Yoshihito S, and Mohd A H (2009) Biohydrogen
Production from Biomass and Industrial Wastes by Dark Fermentation. International
Journal of Hydrogen Energy 34 (8) : 3277–3287.
6. Das D, and N Veziroglu (2001) Hydrogen Production by Biological Processes : a
Survey of Literature. International Journal of Hydrogen Energy 26: 13–28.
254
7. Gilroyed B, C Chang Chu, and X Hao (2008) Effect of Temperature on Anaerobic
Fermentative Hydrogen Gas Production from Feedlot Cattle Manure Using Mixed
Microflora. International Journal of Hydrogen Energy 33 (16): 4301–4308.
8. Gu U, (2008) Effect of Clay Pretreatment on Photofermentative Hydrogen Production
from Olive Mill Wastewater 99: 6799–6808.
9. Gómez, X, C Fernández, J Fierro, M E Sánchez, a Escapa, and a Morán (2011)
Hydrogen Production: Two Stage Processes for Waste Degradation. Bioresource
Technology 102 (18): 8621–7.
10. Hawkes F, I Hussy, G Kyazze, R Dinsdale, and D Hawkes (2007) Continuous Dark
Fermentative Hydrogen Production by Mesophilic Microflora: Principles and
Progress. International Journal of Hydrogen Energy 32 (2): 172–184.
11. Heifetz P B, B Förster, C B Osmond, L J Giles, and J E Boynton (2000) Effects of
Acetate on Facultative Autotrophy in Chlamydomonas Reinhardtii Assessed by
Photosynthetic Measurements and Stable Isotope Analyses. Plant Physiology 122 (4)
: 1439–45.
12. Hwang J, Jeong-A. Choi, R.a.I. Abou-Shanab, Amit B, Booki M, Hocheol S, Eva K,
Jaeyoung C, Eung S L, and Yong J K (2009) Effect of pH and Sulfate Concentration
on Hydrogen Production Using Anaerobic Mixed Microflora. International Journal of
Hydrogen Energy 34 (24) : 9702–9710.
13. Isli A I, and T.N Veziroglu (2007) Sustainable Biological Hydrogen Production. In
Renewable Resources and Renewable Energy, 215–224.
14. Jun C, Zhou J, Qi F, Xie B, and Cen K. (2006) Bio-hydrogen Production from
Hyacinth by Anaerobic Fermentation (38): 1–5.
15. Kars G, Ufuk G, Meral Y, Gabor R, Kornel L K, and İnci E (2009) Evaluation of
Hydrogen Production by Rhodobacter Sphaeroides O.U.001 and Its hupSL Deficient
Mutant Using Acetate and Malate as Carbon Sources. International Journal of
Hydrogen Energy 34 (5) : 2184–2190.
16. Levin D B, Lawrence P and Murray L (2004) Biohydrogen Production : Prospects and
Limitations to Practical Application 29: 173–185.
17. Mandal B, Kaushik N, and Debabrata D (2006) Improvement of Biohydrogen
Production Under Decreased Partial Pressure of H 2 by Enterobacter Cloacae.
Biotechnology Letters 28: 831–835
18. Mars A E, Annemarie L, and Meral Y (2010) Biohydrogen Production from Beet
Molasses by Sequential Dark and Photofermentation 35: 511–517.
255
19. Modigell, M. 2010. Membranes and Membrane Contactors for Gas Separation.
20. Morweiser M, Olaf K, Ben H, and Clemens P (2010) Developments and Perspectives
of Photobioreactors for Biofuel Production. Applied Microbiology and Biotechnology
87: 1291–1301.
21. Nandi R, and S Sengupta (1998). Microbial Production of Hydrogen: An Overview.
Critical Reviews in Microbiology 24 (1): 61–84.
22. Ntaikou I, G. Antonopoulou, and G. Lyberatos (2010) Biohydrogen Production from
Biomass and Wastes via Dark Fermentation: A Review. Waste and Biomass
Valorization 1 (1): 21–39.
23. Panagiotopoulos J A, Robert R B, and Emmanuel G K (2010) Dilute-acid
Pretreatment and Enzymatic Hydrolysis of Barley Straw with Low Enzyme Loadings
for Biofuel Production. In ABIC 2010.
24. Ren N Q, Y F Li, A J Wang, J Z Li, J Ding, and M Zadsar (2006) Hydrogen
Production by Fermentation : Review of a New Approach to Environmentally Safe
Energy Production. Aquatic Ecosystem Health & Management 9 (1): 39–42.
25. Shalygin M, and Vladimir T (2010) Non-porous Gas-liquid Membrane Contactors for
CO2 Recovery from Gas Mixtures.
26. Shi X, Temperature Effect on H2 Fermentation from Laminaria Japonica Without
Pretreatment : 133–134.
27. Sinha P and Anjana P (2011) An Evaluative Report and Challenges for Fermentative
Biohydrogen Production. International Journal of Hydrogen Energy 36: 7460–7478.
28. Su H, Jun C, Junhu Z, Wenlu S, and Kefa C (2009) Improving Hydrogen Production
from Cassava Starch by Combination of Dark and Photo Fermentation. International
Journal of Hydrogen Energy 34 (4): 1780–1786.
29. Suzhen W E I, Xiao B, and L I U Junxin (2010) Impact of Alkali and Heat
Pretreatment on the Pathway of Hydrogen 55 (8): 777–786.
30. Uhrig R E (2004) Engineering Challenges of the Hydrogen Economy. The Bent of
Tau Beta Pi.
31. Venkatamohan S, Y Vijayabhaskar, P Muralikrishna, N Chandrasekhararao, V
Lalitbabu, and P Sarma. (2007) Biohydrogen Production from Chemical Wastewater
as Substrate by Selectively Enriched Anaerobic Mixed Consortia: Influence of
Fermentation pH and Substrate Composition. International Journal of Hydrogen
Energy 32 (13): 2286–2295.

256
32. Zhang Y, and J Shen (2006) Effect of Temperature and Iron Concentration on the
Growth and Hydrogen Production of Mixed Bacteria. International Journal of
Hydrogen Energy 31 (4): 441–446.
257
CHAPTER 19
PHOTO FERMENTATIVE HYDROGEN PRODUCTION:
ENERGY SOLUTION FOR THE FUTURE
Neha Srivastava and Harinder Singh Oberoi
Abstract
Hydrogen, the most abundant and lightest element in the universe, has enormous potential as
a solution to the energy problems of the world. High conversion efficiency, recyclability and
non-polluting nature of hydrogen makes it an ideal fuel for the future. Hydrogen can be
produced from renewable raw materials such as organic wastes and can serve as a suitable
substitute for fossil fuels. Dark-fermentation bacteria, photo-fermentation bacteria and algae
are main functional microorganism employed in the hydrogen production. Biological
hydrogen production has several advantages such as low energy requirements, reduced
investment costs and high-energy conversion efficiency. Hydrogen production by
photosynthetic non-sulphur bacteria (PNS) is found to be the promising organism due to high
substrate to product conversion yield, lack of oxygen evolving activity, ability to use a wide
wavelength range, and capability to use organic substrates derived from wastes.
Photosynthetic non-sulphur bacteria (PNS) produce hydrogen under light in anaerobic
conditions by utilization of organic acid malate, butyrate, acetate and lactate which are the
important component of organic waste. Photosynthetic non-sulphur bacteria can completely
convert most of the organic acids to hydrogen and helps in waste management.
The present chapter discusses about the biological hydrogen production in PNS
bacteria through photo fermentation, advantages of photo fermentation, microbiology of
hydrogen production in photo fermentation, different physical factors affecting its production
and other aspects for the enhancement of the hydrogen production in PNS bacteria through
photo fermentation. A theoretical consideration and cost analysis for enhancement of
hydrogen production to overcome different limitation have been also summarized.
Keywords: Biohydrogen, photofermentation, dark fermentation, PNS, C/N ratio,
Rhodobacter sphaeroides.
This chapter (page no. 257-273) has been withdrawn by the authors due to violation of copyright.
Editors

258
19.1 Introduction
Hydrogen is regarded as an optimal energy carrier and fuel and it has become a topic of
intensive research efforts worldwide. Due to utilization of renewable energy resources and
operation at ambient temperature and atmospheric pressure, biological hydrogen production is
becoming an important method of fuel production and attracting the attention of many
researchers. Due to its environmental friendliness, biohydrogen production from organic
wastes has been attracted increased attention (Akkerman et al., 2002; Adams, 1990). Organic
wastes are considered as potential substances for economical biohydrogen production because
they are rich in carbohydrates and organic acids. Biohydrogen production has been evaluated
from many organic wastes, including waste molasses (Benemann et al., 1997), dairy
wastewater (Brock et al., 2003) and sewage sludge (Block and Melody, 1992; Claassen and
Vrije, 2005). The hydrogen yields from these wastes differ due to the different organic
composition of such wastes and the primary organic components in these wastes are usually
carbohydrates and or proteins. Systemic and continuous efforts to address scale up issues and
optimization of different parameters and reactor design may likely result in viable bio
hydrogen production processes in future.
19.1.1 Climate change and biofuels
Impending climate change and increased concern about dwindling fossil fuel reserves have
focused the world’s attention on a search for alternative energy sources. Although the
magnitude of the near and long term effects due to global warming is somewhat uncertain,
and whether or not we have reached “peak oil” is still being debated (Witze, 2007) there is a
general consensus emerging that large environmental changes are imminent and that fossil
fuels are getting rapidly depleted (Pielke et al., 2008). Worldwide biofuel production has
quickly ramped up, spurred on by government incentives; subsidies and alternative fuel
mandates. In 2007, worldwide production of ethanol reached 50 billion liters, biodiesel stood
at 9 billion liters. However, it has become obvious that first generation technologies
producing biofuels from food crops are untenable in the long term (Waldrop, 2007; Cassman
et al., 2007). In fact, it is apparent that greatly expanded biofuels production requires
thoughtful consideration of the many social, economic, and environmental impacts that might
arise (Scharlemann and Laurance, 2008; Ruth, 2008). However, it is only somewhat belatedly
that some of these issues are starting to be addressed (Laurance, 2007). A large variety of
biofuel options are possible for use as mobile energy carriers (Wackett, 2008) but it is not
clear at present which one is to be preferred in the long term, or indeed perhaps a restricted
This chapter (page no. 257-273) has been withdrawn by the authors due to violation of copyright.
Editors

259
variety of biofuels would more appropriately match locally available resources and needs.
Nevertheless, biologically produced hydrogen would seem to have a number of advantages.
First, it can be converted to useful power using fuel cells at about twice the efficiency of
burning a biofuel in an internal combustion engine. Secondly, its use leads to near zero levels
of pollution whereas the use of some other biofuels is predicted to lead to appreciable levels
of air pollution; for example in the case of ethanol, ozone and peroxyacetyl nitrate (photo
chemical smog), and acetaldehyde and formaldehyde (carcinogens). Thirdly, other biofuels
emit CO2 when combusted whereas the CO2 associated with bio hydrogen is released at
source during fermentation, thus more easily allowing its potential capture and sequestration
which could even make bio hydrogen carbon negative.
19.1.2 Advantage of biological hydrogen production
Biological hydrogen production has several advantages over hydrogen production by photo-
electro or thermo-chemical processes. Both thermo-chemical and electrochemical hydrogen
generation processes are energy intensive and not always eco-friendly. Electrochemical
hydrogen production via solar battery-based water splitting requires the use of solar batteries
with high-energy requirements. On the other hand, biological hydrogen production processes
are mostly operated at ambient temperatures and atmospheric pressure, and thus are less
energy intensive (Claassen and Vrije, 2005). Hydrogen can be generated using various
carbohydrates coming out from distillery wastes. Photo production of hydrogen by
photosynthetic microorganisms requires the use of a simple solar reactor or artificial
illumination, which is low in energy requirements.
Biological hydrogen production may be classified as follows (Cammack, 1999) and
different methods of hydrogen production are shown in Fig. 1.
1. Bio photolysis of water using algae and cyano-bacteria
2. Fermentative hydrogen production from organic compounds
3. Photodecomposition of organic compounds by photosynthetic bacteria
4. Hybrid systems using photosynthetic and fermentative bacteria
19.2 Comparative accounts of biohydrogen production technologies and energy
analysis
All biohydrogen production technologies depend on either hydrogenase or nitrogenase for
hydrogen evolution and derive energy either directly from light energy or indirectly by
consuming photosynthetically derived carbon compounds. Each approach has positive and
This chapter (page no. 257-273) has been withdrawn by the authors due to violation of copyright.
Editors

260
negative aspect and each approach has serious technical barrier that need to be overcome
before it could become practical. Hypothetically, it is possible that the quantity or inherent
activity of this enzyme could limit the overall process. However, even though the catalytic
activity of the various enzymes differs enormously. There is no evidence for the quantity of
hydrogen producing enzyme being the limiting factor in any system currently under study
(Brock et al., 2003). Biological hydrogen production (BHP) processes are viable from net and
green house gases (GHG) reduction point of view (Sinha and Pandey, 2011). It has been
proved that integrated process of dark and photo fermentation has maximum efficiency
(Scott, 2004). Therefore, mixed culture and integrated two steps or three steps processes
combining dark and photo fermentation could be viable in future. Systemic and continuous
efforts to address scale up issues and optimization of reactor design may likely result in viable
bio hydrogen production processes in future (Das and Veziroglu, 2001; Das, 2009).
Fig. 1. Classification of biological hydrogen production
19.3 Photosynthetic non-sulphur (PNS) bacteria
Purple non-sulfur (PNS) photosynthetic bacteria are included in a non-taxonomic group of
versatile organisms which can grow as photoheterotrophs, photoautotrophs or
chemoheterotroph switching from one mode to another depending on available conditions
(Basak and Das, 2007). The photosynthetic bacteria are aquatic gram-negative organisms
found in a wide range of environments, including marine and freshwater system (Pfenning
and Truper, 1974; Truper and Pfenning, 1981). This taxonomic group give purple to dark red
pigments in facultative anaerobic conditions while no pigments can be observed in aerobic
conditions. As compared to other hydrogen producing microorganisms, PNS bacteria require
less free energy for the production of hydrogen by complete decomposition of organic acids.
Photosynthetic non-sulphur bacteria are the most metabolically diverse organisms known,
being capable of growing in a wide variety of growth condition. The family of PNS includes
Rhodospirillum, Rhodocyclus, Rhodopseudomonas, Rhodomicrobium and Rhodobacter.
Because of considerable hydrogen production, the studies are mostly concentrated on
Rhodobacter genera.
19.4 Photosynthetic biohydrogen production
This chapter (page no. 257-273) has been withdrawn by the authors due to violation of copyright.
Editors

261
Production of hydrogen occurs from the breakdown of organic substrates in the presence of
an inert, anaerobic atmosphere such as argon under illumination in-vitro conditions. The cells
obtain carbon from organic substrates and energy from light. Nitrogen should be limited and
ammonia should be absent from the culture medium for the hydrogen production. Photo-
heterotrophic bacteria, such as Rhodobacter sphaeroides, can grow anaerobically to produce
hydrogen either from reduced substrates such as organic acids (purple non-sulfur bacteria)
or from reduced sulfur compounds (green and purple sulfur bacteria). The hydrogen
production system involves three important components; the TCA cycle, the photosynthetic
membrane apparatus and the enzyme complex. The carbon substrate (intermediate of the
TCA cycle) is fed into the TCA cycle where it is oxidized to produce CO2 and electrons.
Light energy is converted to the potential energy of the electron, which then forms ATP by
photosynthetic membrane apparatus. In another process, the elevated electron is needed to
reduce ferrodoxin (Fd), a typical electron carrier to the hydrogen-producing enzyme,
nitrogenase. ATPs produced are supplied to the enzyme together with the electron carried.
Photons activate the photosystem in the reaction center to pump protons. Proton transport
couples with the generation of ATPs. It has not been well elucidated how many photons are
required to give a mole of ATP (Oasawa et al., 1984; Miyake et al.).
These bacteria use enzyme nitrogenase to catalyze nitrogen fixation for reduction of
molecular nitrogen to ammonia. Nitrogenase has interesting property that it can evolve
hydrogen simultaneously with nitrogen reduction. Stressful concentrations of nitrogen are
therefore required for hydrogen evolution. The efficiency of conversion of light energy to
hydrogen in the presence of an appropriate substrate and optimum cell growth conditions are
key factor for economic photo-fermentative bio hydrogen production (Brock et al., 2003). The
main hurdle, however, is the large area requirements due to low light efficiency of the
process. Design guidelines for photo bioreactors for efficient utilization of light are still
lacking (Block and Melody, 1992). Since, the growth rate of bacteria is a function of both
light intensity and substrate concentration, kinetic models relating the three can be of value
in designing the process and in identifying the underlying rate-determining and
significant factors. Most photo fermentative bio hydrogen studies have used malic acid as the
substrate and R. sphaeroides O.U.001 as the organisms, under optimum carbon-to-nitrogen
(C/N) ratio (Claassen and Vrije, 2005; Cammack, 1999; Das and Veziroglu, 2001) in batch
reactors. Growth characteristics of PNS bacteria have been studied by Koku and Gunduz
(2003). Dependence of their growth rate on substrate has been studied by Eroglu et al., (1999)
This chapter (page no. 257-273) has been withdrawn by the authors due to violation of copyright.
Editors

262
m while their dependence on light intensity has been studied by Sasikala et al., (1993).
However, little information has been reported on kinetic models integrating growth of PNS
bacteria with light utilization and hydrogen production (Das and Veziroglu, 2001). A brief
classification of different microorganism producing hydrogen through biological routes is
shown in Table 1.
19.4.1 Role of hydrogenase and nitrogenase in hydrogen production
In PNS bacteria, no oxygen is produced during photosynthesis, hence in anaerobic conditions
both hydrogenase and nitrogenase (both are oxygen labile) present in the bacterial membrane
are active. There are various PNS bacteria that participate in biological hydrogen generation
by photofermentation such as Rhodobacter sphaeroides O.U 001, Rhodobacter sphaeroides
RV, Rhodobacter capsulatus, Rhodobacter sulfidophilus, Rhodopseudomonas palustris,
Rhodospirillum rubrum etc. Table 1 shows a non exhaustive list of various PNS bacteria
being used in bio hydrogen production by photo fermentation.[Fe]-Hydrogenase plays an
important role in the fermentative hydrogen production (Woodward et al., 2000) while
nitrogenase plays a key role in photo fermentative hydrogen production. The effects of [Fe]-
hydrogenase and glucose dehydrogenase for hydrogen production from glucose have been
studied extensively by Woodward et al. (2000). Hydrogenase plays the main role for
hydrogen and organic acid production in dark fermentation process. Although hydrogenases
are present in PNS bacteria, photoproduction of hydrogen by these bacteria is mainly
mediated by nitrogenase.
Table 1. Classification of hydrogen-producing bacteria
This chapter (page no. 257-273) has been withdrawn by the authors due to violation of copyright.
Editors

263
19.4.2 Microbiology and biochemistry of photofermentative hydrogen production
Available energy form
Enzyme for H 2 generation
Class of bacteria
Sub-class of bacteria
Genus of bacteria Electron donor
References
Photosynthesis
Hydrogenase
Green algae
– Chlamydomonas Water Basak and Das, 2007
Chlorella Water Basak and Das, 2007
Cyano-bacteria
Heterocyst Anabaena Water Basak and Das, 2007
Photo-synthetic
Bacteria
Purple-non-sulfur
Rhodobacter Organic acids
Basak and Das, 2007
(PNS) bacteria
Rhodopseudomonas palustris
Sugar refinery waste
Vincezini et al., 1982
(Facultative anaerobe)
Rhodospirillum Organic acids
Basak and Das, 2007
Purple sulfur bacteria
Chromatium Sulfates Basak and Das, 2007
(PNS) Rhodobacter sphroides O.U.001
Organic acid
Eroglu et al., 1995
(PNS) Rhodobacter sphroidesO.U.001
Organic acid
Nath et al., 2005
(PNS) Rhodobacter sphroides NMBL1
Orgainc acid
Pandey et al., 2011
Non-photosynthesis
Hydrogenase
Obligate anaerobe
– Clostridium Sugars Basak and Das, 2007
Facultative anaerobe
– Methanobacterium Sugars Basak and Das, 2007
– Escherichia Sugars Basak and Das, 2007
Nitrogenase
Nitrogen fixing
Bacteria
Facultative aerobes
Azotobacter Sugars Basak and Das, 2007
Faculative anaerobes
Klebsiella Sugar Basak and Das,2007
This chapter (page no. 257-273) has been withdrawn by the authors due to violation of copyright.
Editors

264
The photosynthetic system in PNS bacteria lies in the cell membrane and contains the light-
harvesting vesicular, lamella of stacked photosynthetic pigments (bacteriochlorophyll,
carotenoids, keto carotenoids, rhodovibrin, spirilloxanthin etc.) and an associated electron
transport chain (Das and Veziroglu, 2001). Nitrogenase is responsible for producing hydrogen
from protons and simultaneously fixing nitrogen in the PNS bacteria. Three different types of
nitrogenase have been identified so far, and their mode of hydrogen-producing activity using
ATPs by them is given below:
Mo _ nitrogenase : N2 +8H+ +8e_ 2NH3 +H2
V _ nitrogenase : N2 + 12H+ + 12e_ 2NH3 + 3H2
Fe _ nitrogenase : N2 + 21H++ 21e_ 2NH3 + 7:5H2
Hydrogen production by nitrogenase is an irreversible reaction and four ATPs are required
per mole of H2 produced, making this reaction energy inefficient. Under anaerobic conditions
in the hydrogenase system, photosynthetic reduction may occur in two pathways: CO2
fixation and H2 production. The competition for photosynthetic reduction favours the CO2-
fixation pathway. However, in the absence of CO2, the steady state of H2 production rate is
down regulated, due to non-dissipation of the proton gradient caused by the lack of ATP
utilization. Nitrogenase systems use ATP in the production of H2 and thus do not have the
above-cited problem. But, the ATP requirement reduces the theoretical efficiency of
nitrogenase systems by approximately a factor of three as compared to the hydrogenase
systems.
19.4.3 Hydrogenase enzymes
Hydrogenase catalyzes the following simplest redox reaction:
H2 2H++ 2e_
Three different classes of hydrogenases have been identified so far: [Fe]-hydrogenase, [NiFe]-
hydrogenase, and [NiFeSe]-hydrogenase. In major cases, it is evident that [NiFe]-hydrogenase
is responsible for hydrogen uptake while [Fe]-hydrogenase catalyses the hydrogen production
processes (Sinha and Pandey, 2011). [Fe]-Hydrogenase is highly sensitive towards oxygen
and possesses 100-fold more activity than [NiFe]-hydrogenase (Eroglu et al., 1998).
This chapter (page no. 257-273) has been withdrawn by the authors due to violation of copyright.
Editors

265
Fig. 2. Mechanism for hydrogen production by photosynthetic bacteria (Basak and Das, 2006)
19.5 Theoretical consideration of photo fermentative hydrogen production
Little information is available on the kinetics of biological hydrogen production by PNS
bacteria. However, the cell growth characteristics of Rhodobacter sphaeroides O.U.001 was
studied by Koku et al., 2003 with the help of the Monod equation and the logistic model for
the cell growth is being proposed as follows (Guo et al., 2008):
dx/dt = µx (1)
But the growth curve was found to deviate from that of normal cell growth governed by the
Monod equation. A constant specific growth rate in the exponential phase (le) can be written
as follows:
µe = ln(x2/x1)/(t2-t1) (2)
The proposed logistic model to represent the entire growth curve, including lag phase,
exponential growth and stationary phases is given as follows:
µ = Kc (1-x/xmax) (3)
where, kc = apparent specific growth rate (h–1), xmax = maximum cell dry mass conc (g l–1).
From Eq. (3) and (1) and upon integration, the following equation for cell concentration can
be obtained:
x = x0 exp.(kct)/[1-(x0/xmax).(1- ekct)] (4)
The predictive power of Eq. (4) may be limited, as it does not involve a substrate term. In
batch hydrogen production study, where the initial substrate concentration and inoculation
volume are kept constant, the Logistic model is a fair approximation of the growth curve.
This chapter (page no. 257-273) has been withdrawn by the authors due to violation of copyright.
Editors

266
19.6 Effect of substrate and its concentration on photofermentative hydrogen
production
The main aim of biohydrogen generation studies using PNS bacteria is to develop
commercially viable hydrogen production processes. Several attempts have already been
made by various researchers to find out the suitability of different processes and the
optimization of the different parameters. Critical analysis of the research work may generate
ideas regarding the efficacies of PNS bacteria for producing bio hydrogen.
19.6.1 Types of substrate and its concentration
Hydrogen production by photosynthetic bacteria (eg.Rhodobacter sphaeroides) occurs under
illumination in the presence of anaerobic atmosphere through the breakdown of organic
substrates (Block and Melody, 1992) by the process known as photo fermentation. A range of
organic substrates such as carbohydrates (Claassen and Vrije, 2005) lactate, malate, etc. are
utilized by different species of phototrophic bacteria as electron donors during hydrogen
production. It has been reported that the substrate specificity for hydrogen production varied
with the species of the bacteria and the performance of photofermentation are highly
dependent on the composition and the concentration of the substrate used for photo
fermentation (Cammack, 1999; Das and Veziroglu ,2001). The efficacy of Rhodospirillum
rubrum and Rhodobacter capsulatus KU002 to utilize different organic substrates for
hydrogen production was investigated (Guo et al., 2008). Purple non-sulfur bacteria such as
Rhodospirillum sp. or Rhodobacter sp. can use different substrates (Fig. 3).
Attempts are being made to find the best organic acids (for an individual PNS
bacterial strain) and its optimum concentration for producing maximum amount of hydrogen.
Organic wastes are considered as potential substances for economical biohydrogen
production, because the carbohydrates and organic acids are main components of organic
wastes. Previous investigations indicate that an optimum hydrogen production appears in
acidic conditions to carbohydrates, or in neutral condition to organic acids. However, in
practice, the treatment of these organic wastes by anaerobic fermentation usually is done at
neutral pH condition, in which biohydrogen production is only a middle process. The
hydrogen yields from these wastes differ due to their different organic composition and the
primary organic components in these wastes are usually carbohydrates and organic acids.
Malic acid is found to be most suitable (at pH 6.8) for the higher yield hydrogen generation
using Rhodobacter sphaeroides O.U.001(Eroglu et al., 1999; Hawkes et al., 2002; Hall et al.,
1995 ) and malic acid as well as butyric acid at pH 8.0 in Rhodobacter sphaeroides
This chapter (page no. 257-273) has been withdrawn by the authors due to violation of copyright.
Editors

267
NMBL01( Pandey et al., 2011). Butyric acid is one of the potential substrate in waste for the
production of bio hydrogen in chain of organic acids. Pandey et al. (2011) concluded that
butyrate is one of the potential substrate for efficient hydrogen production and total
cumulative hydrogen is 1450±31 ml l-1 with H2 rate 12.5 ml h-1 other than malic acid. The
PNS bacteria used in previous investigation utilized succinate, malate and butyrate as
preferable carbon source than acetate for hydrogen production (Table 2). The analysis of fatty
acid end metabolites has shown the presence of lactate in conditions where bacteria used the
substrates (malate, butyrate and acetate) except succinate in which the end product was
pyruvate. The final pH observed was near 7.0 (on lower side) in all, except acetate in which
the final pH was 7.52. It was because of high concentration of poly beta hydroxy butyrate
shown by HPLC analysis that is a storage material, which resulted in the increase of the pH
(alkaline). The cumulative hydrogen production and hydrogen production rate were
monitored for 25 days. Malic acid (4 gm_3) produced 2755± 32 cm3 H2 m_3 with 68.3%
conversion, while succinic acid (3 gm_3) and butyric acid (3 gm_3) produced 1980 ± 25 cm3
H2m_3 with 58% conversion and 1400 ± 17 cm3 H2m
_3 with 14.1% conversion efficiency,
Fig. 3. Effect of substrate types and concentration (Pandey et al., 2011)
respectively (Pandey et al., 2011). The variation in carbon sources influences hydrogen
production through nitrogenase enzyme by causing variation in electron donation capabilities
of the cofactor compounds to nitrogenise (Scott, 2004) resulting in differences in hydrogen
production rates. Hydrogen production is also affected significantly by varying the
This chapter (page no. 257-273) has been withdrawn by the authors due to violation of copyright.
Editors

268
concentration of the specific substrates, which throws light on the use of the bacteria for
organic acid containing waste conversion, but at different rates and efficiency for its
utilization. Hence, differences in hydrogen production rates with different carbon sources
(succinate, butyrate, malate and acetate) were reported (Pandey et al., 2011).
Table 2. Effect of initial substrate (succinate, malate, butyrate and acetate) concentration on
which maximum total hydrogen produced, medium final pH, duration of hydrogen
production, maximum rate of hydrogen production, biomass, substrate conversion efficiency
and end metabolites formed by Rhodobacter sphaeroides NMBL-01. Medium volume: 100
cm3, temperature 320C±2 0C under illumination of light intensity of 1.8 klux in a temperature
controlled growth chamber.
S. No.
Carbon substrate
(gm-3)
Final pH
Total hydrogen produced (cm3m-3 culture)
Total duration of hydrogen
production (days)
Maximum rate of
hydrogen production (cm3m-3 h-1)
Biomass (gm-3
culture)
Substrate conversion efficiency
(%)
End metabolites
formed
1. Succinate 3 gm-3
6.95 1980 ± 25
12 11.6 0.46 58 Pyruvate
2.
Acetate 2 gm-3
7.17 650 ± 12 8 5 9.8 23.2 Lactate and PHB
3. Acetate 2 gm-3
7.17 650 ± 12 8 5 9.8 23.2 Lactate and PHB
4.
Malate 4 gm-3
6.78 2755 ± 32
15 12.9 0.32 68.3 Lactate
19.6.2 Ratio of carbon and nitrogen source in the production media
The ratio of carbon and nitrogen source as substrate plays an important role for the hydrogen
production process. Eroglu et al., (1999) has shown that the best ratio of carbon source (malic
acid) and nitrogen source (glutamic acid) is in 15 mM: 2 mM proportions in the production
medium leading to a hydrogen generation rate of 10 ml l–1 h–1. Again, the presence of NH4 +
ion as nitrogen source may reduce the rate of hydrogen production and cumulative hydrogen
production, since the activity of nitrogenase enzyme is hampered (Hall, 1995). In the recent
investigation of Pandey et al., 2011, the best C/N ratio was 25 mM in the production medium
and the amount of cumulative hydrogen was 1450±31 ml/l culture was obtained when
butyrate is used as substrate.
19.7 Energy and cost analysis
This chapter (page no. 257-273) has been withdrawn by the authors due to violation of copyright.
Editors

269
The economy of hydrogen as an effective fuel depends on the cost related to production of H2,
transportation of H2, fuel cells, storage of H2 and safety related issues. The cost of
biologically produced hydrogen depends on economy of substrate requirement in dark
fermentation and the light conversion efficiency in the photo fermentative process. The initial
price of the substrate required for the dark fermentation is not of much concern as the organic
waste material from distillery or brewery or sewage sludge can be used. But light conversion
efficiencies plays an important role in determining cost of photo biological hydrogen
production, since it is one of the main deciding factors for the cost of a photo bioreactor.
Reducing the antenna sizes of the photosynthetic pigments is a method for increasing
photosynthetic efficiency, and this is a central R&D need in photo biological hydrogen
production. The efficiency of light energy conversion (Eeff) in percentage to hydrogen is
calculated using the following correlation (Chen et al., 2002) and by assuming that the entire
incident light is absorbed (the energy content of both the organic substrate and biomass is
neglected in the calculation):
Eeff = (Combustion enthalpy of H2/100) × (H2 production rate/Absorbed light energy)
Here, the combustion enthalpy of hydrogen is assumed to be the gross calorific value
of hydrogen, i.e., 12.7 J ml–1 at standard temperature and pressure (Miyake and Kawamura,
1987) but the light conversion efficiency (%) decreased with the increasing light intensity
(Mohan et al., 2008). The reason is the large amount of light harvesting pigments, which
capture more photons at higher light intensity than the photosynthetic apparatus can actually
handle. Considering 10% conversion efficiency for the photo biological hydrogen generation
the unit cost of the energy content of hydrogen is calculated to be 10 US $/MBTU or 9 US
$/GJ (Claassen and Vrije, 2005). However, the calculated cost of biohydrogen production by
photo fermentation using PNS bacteria may vary from country to country because of the
differences in socio economic scenario, cost of electricity and wages for the skilled workers.
An economic survey, based on fuel cost estimation, turns out to be somewhat
complicated when applied in practical terms. This is due to the fact that when any new fuel is
brought into the market, other factors (such as pollution and other short-term and long-term
environmental costs, as well as direct and indirect health costs) also play important role while
determining actual cost of the new fuel. Considering all these factors together with the initial
cost competitiveness, hydrogen is surely one of the better options as a worldwide energy
medium. Hydrogen production through biological means represents a thrust area for
bioenergy generation. However there are so many parameters required to be optimized for
This chapter (page no. 257-273) has been withdrawn by the authors due to violation of copyright.
Editors

270
getting a higher yield of hydrogen. Possibilities are being explored to optimize the process
parameters e.g. optimization in bioreactor configuration, creation of genetically modified
PNS bacteria capable of producing hydrogen at higher rate even at higher temperature (i.e., at
higher light intensity) and speedy removal of generated hydrogen gas from the bioreactor
system. Development of such systems will serve as an intermediate step in the scale-up of
hydrogen production from the laboratory scale to the commercial sector. More engineering
research is required (i) to give practical solutions to the problems related to the photo
bioreactor configuration, (ii) to increase the light energy conversion efficiency by genetically
modified PNS bacteria and (iii) to develop transparent glass beads or acrylic-based copolymer
beads for use as an immobilized system in continuous biohydrogen production by PNS
bacteria.
19.8 Future prospects
The smallest known biological substrate, Hydrogen has an enormous potential to replace
limited fossil fuel resources. Microbes have evolved unique mechanism for hydrogen
generation, and some of these mechanisms are being explored for biotechnological
applications including nitrogenase mediated and photo fermentative hydrogen production.
Efforts to improve hydrogen production have been focused mainly on substrate utilization,
pathway redirection, identification and engineering of oxygen-tolerant hydrogenases,
improvement in hydrogen molar yields and development of efficient hydrogen separation
techniques from bioreactor head space. Hydrogen production through biological processes
represents an exciting new avenue of technology development for bioenergy generation.
However, the lower yield obtained with fermentation with respect to other methods of
hydrogen production continues to be the principal issue to be addressed. Significant
improvement can be made through rapid gas removal and separation, hybrid system, reverse
micelles and by metabolic engineering. Identifying novel hydrogenases and metabolic
pathways through genetic engineering, high through put genomic sequencing, environmental
genomics and/or metagenomic technologies may assist to make biological hydrogen
production more economical, practical and commercially feasible.
References
1. Akkerman I., Janssen M., Rocha J. and Wijffels R.H. (2002) Photobiological
hydrogen production: photochemical efficiency and bioreactor design. Int J Hydrogen
Energy, 27:1195–1208.
This chapter (page no. 257-273) has been withdrawn by the authors due to violation of copyright.
Editors

271
2. Adams M.W.W. (1990) The structure and mechanism of [Fe]-hydrogenase. Bioch
Biophys Acta. 1020:115–145.
3. Benemann J.R. (1997) Feasibility analysis of photobiological hydrogen production.
Int. J. Hydrogen Energy., 22:979–987.
4. Brock T.D., Madigan M.T., Martinko J.M. and Parker J. (2003) Biology of
microorganisms.10th edn. Prentice Hall, New Jersey. ISBN. 0-130-66271-2.
5. Block D.L. and Melody I. (1992) Efficiency and cost goals for photoenhanced
hydrogen production processes. Int. J. Hydrogen Energy., 17:853e61.
6. Claassen P.A.M. and Vrije T. de. (2005) Integrated bioprocess for hydrogen
production from Biomass: Hyvolution. In: Proceedings International Hydrogen Energy
Congress and Exhibition IHEC 2005, Istanbul, Turkey.
7. Cammack R. (1999) Hydrogenase sophistication. Nature. 397:214–215.
8. Cassman K.G. and Liska A.J. (2007) Food and fuel for all: realistic or foolish?
Biofuels Bioprod Bioref., 1:18 -23.
9. Das D. and Veziroglu T.N. (2001) Hydrogen production by biological processes: a
survey of literature. Int. J. Hydrogen Energy., 26:13–28.
10. Das D. (2009) Advances in biohydrogen production processes: an approach towards
commercialization. Int. J. Hydrogen Energy., 34:7349e57.
11. Eroglu I., Aslan K., Gunduz U., Yucel M., and Turker L. (1998) Continuous hydrogen
production by Rhodobacter sphaeroides O.U. 001. In: Zaborsky OR (ed) Biohydrogen
held in London. Plenum press pp., 143–151 ISBN 0-306-46057-2.
12. Eroglu I., Aslan K., Gunduz U., Yucel M., and Turker L. (1999) Substrate
consumption rates for hydrogen production by Rhodobacter sphaeroides in a column
photobioreactor. J Biotechnol., 70:103–113.
13. Guo L., Li X.M. , Bo X., Yang Q., Zeng G.M. and Liao D.X. (2008). Impacts of
sterilization, microwave and ultrasonication pretreatment on hydrogen producing
using wastes ludge. Bioresource Technol., 99:3651e8.
14. Guo W.Q., Ren N.Q., Wang X.J., Xiang W.S., Meng Z.H. and Ding J. (2008)
Biohydrogen production from ethanol-type fermentation of molasses in an expanded
granular ludge bed (EGSB) reactor. Int J. Hydrogen Energy., 33:4981e8.
15. Hawkes F.R., Dinsdale R., Hawkes D.L. and Hussy I. (2002) Sustainable fermentative
hydrogen production:challenges for process optimization. Int. J. Hydrogen Energy.,
27:1339e47.
This chapter (page no. 257-273) has been withdrawn by the authors due to violation of copyright.
Editors

272
16. Hall D.O., Markov S.A., Watanable Y. and Rao K.K. (1995) The potential
applications of cyanobacterial photosynthesis for clean technologies. Photosynth Res.,
46:159–167.
17. Koku H., Gunduz U., Yucel M. and Turkr L. (2003) Kinetics of biological hydrogen
production by the photosynthetic bacterium Rhodobacter sphaeroides O.U.001. Int J
Hydrogen Energy., 28:381–388.
18. Keasling J.D. and Chou H. (2008) Metabolic engineering delivers next-generation
biofuels. Nat Biotech., 26:298–299.
19. Lee C.M., Chen P.C., Wang C.C. and Tung Y.C. (2002) Photohydrogen production
using purple non-sulfur bacteria with hydrogen fermentation reactor effluent. Int. J.
Hydrogen Energy., 27:1308–1314.
20. Laurance W. (2007) Switch to Corn Promotes Amazon Deforestation Science.,
318:1721.
21. Miyake J. and Kawamura S. (1987) Efficiency of light energy conversion to hydrogen
by photosynthetic bacteria Rhodobacter sphaeroides. Int. J. Hydrogen Energy.,
12:147–149.
22. Mohan V.S., Babu V.L. and Sarma P.N. (2008) Effect of various pretreatment
methods on an aerobic mixed microflora to enhance biohydrogen production utilizing
dairy waste water as substrate. Bioresource Technol., 99:59e67.
23. Pandey A., Srivastava N. and Sinha P. (2011) Optimization of hydrogen production by
Rhodobacter sphaeroides NMBL-01, Biomass & Bioenergy., 1-6.
24. Pielke Jr. R., Wigley T. and Green C. (2008) Dangerous assumptions: How big is the
energy challenge of climate change?. Nature., 452:531–532.
25. Ruth L. (2008) Bio or bust? The economic and ecological cost of biofuels. EMBO
reports. 9:130-133.
26. Sen U., Shakdwipee M. and Banarjee R. Status of biological hydrogen production. J
Scient Indust Res; 67:980-993.
27. Singleton P. and Sainsbury D. (2002) Dictionary of microbiology and molecular
biology, 3rd edn. John Wiley & Sons Inc., New York., ISBN 0-471-49064-4.
28. Scott D.S. (2004) Int. J. Hydrogen Energy., 29:563–567.
29. Sinha P. and Pandey A. (2011) An evaluative report and challenges for fermentative
biohydrogen production, Int. J. Hydrogen Energy. 2011;36:7460-7478.
30. Scharlemann J.P.W. and Laurance W.F. (2008) How Green Are Biofuels? Science.,
319:43–44.
This chapter (page no. 257-273) has been withdrawn by the authors due to violation of copyright.
Editors

273
31. Woodward J., Orr M., Corday K. and Greenbaum E. (2000) Enzymatic production of
biohydrogen. Nature., 405:1014–1015.
32. Witze A. (2007) That’s oil, folks. Nature., 345:14–17.
33. Wackett L.P. (2008) Microbial-based motor fuels: science and technology. Micro
Biotech., 1:211–225.
This chapter (page no. 257-273) has been withdrawn by the authors due to violation of copyright.
Editors

274
Part III
Chemical Conversion
275
CHAPTER 20
CARBON SEQUESTRATION POTENTIAL OF JATROPHA
CURCAS IN SEMIARID REGIONS OF SOUTHERN INDIA
G.R. Rao, J.V.N.S. Prasad, P. Sathi Reddy and P. Sharath Kumar
Abstract
An attempt has been made to estimate the potential of biofuel crop, Jatropha curcas in
sequestering CO2 in drylands. The plantation was divided into 4 diameters (collar diameter)
classes (5-10cm; 10-15cm; 15-20cm & 20-25cm). Four plants were selected randomly from
each diameter class for destructive sampling. The growth parameters like plant height,
number of branches, canopy width and crown depth were recorded. The fresh and dry
biomass (leaves; stem, fruit, litter fall and branches) was also recorded per each plant. The
plants were cut with saw as per the established procedure. The above ground biomass was
separated into different components (leaves, stem, fruit, and branches) and their fresh and dry
weights were recorded. The roots were simultaneously excavated by carefully loosening and
digging the soil. Root biomass at 4 depths (0-25cm; 25-50cm; 50-75cm & 75-100cm) was
recorded. Apart from this, root dia. (base & tip), number of lateral roots (<1, 1-2, 2-4, & >4
cm); largest root length & dia., root canopy (N-S & E-W), number of roots (primary &
secondary) were also recorded. As the diameter of the trees increases the above and below
ground biomass increased. The dry biomass of leaves, stem and branches was 11.87%,
47.04% and 41.10% of above ground biomass respectively. In the below ground dry biomass
75.47%, 18.73%, 5.50% and 0.30 % root biomass was recorded at 0-25 cm,25-50 cm,50-75
cm and 75-100 cm depths respectively from ground level. The contribution of leaves, stem,
branch and root was 11.34 t/ha, 44.25 t/ha, 38.99 t/ha and 32.63 t/ha of carbon respectively.
The share of total carbon by above ground parts and below ground parts of the tree was
74.35% and 25.65% respectively.
Key words: biomass, carbon sequestration, Jatropha curcas, destructive sampling
20.1 Introduction
Alarming levels of depletion of world’s fossil fuel reserves, their escalating cost and the
global warming problems caused by the fossil fuel combustion have attracted the attention of
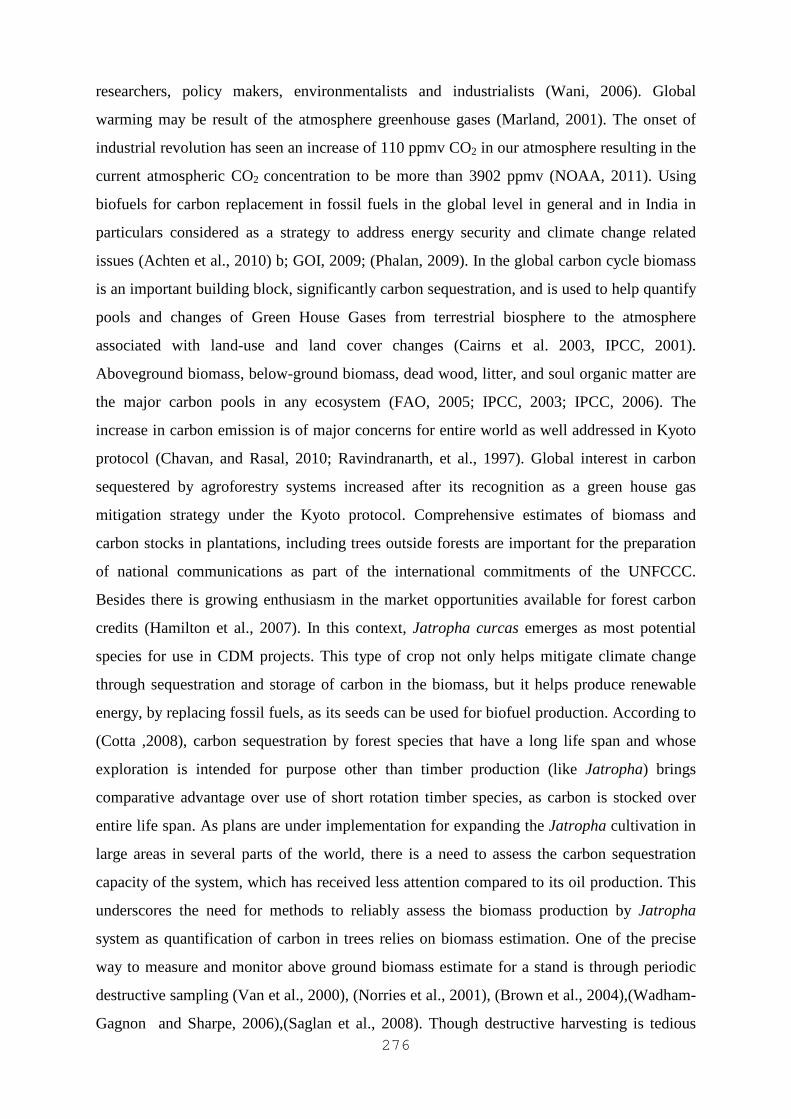
276
researchers, policy makers, environmentalists and industrialists (Wani, 2006). Global
warming may be result of the atmosphere greenhouse gases (Marland, 2001). The onset of
industrial revolution has seen an increase of 110 ppmv CO2 in our atmosphere resulting in the
current atmospheric CO2 concentration to be more than 3902 ppmv (NOAA, 2011). Using
biofuels for carbon replacement in fossil fuels in the global level in general and in India in
particulars considered as a strategy to address energy security and climate change related
issues (Achten et al., 2010) b; GOI, 2009; (Phalan, 2009). In the global carbon cycle biomass
is an important building block, significantly carbon sequestration, and is used to help quantify
pools and changes of Green House Gases from terrestrial biosphere to the atmosphere
associated with land-use and land cover changes (Cairns et al. 2003, IPCC, 2001).
Aboveground biomass, below-ground biomass, dead wood, litter, and soul organic matter are
the major carbon pools in any ecosystem (FAO, 2005; IPCC, 2003; IPCC, 2006). The
increase in carbon emission is of major concerns for entire world as well addressed in Kyoto
protocol (Chavan, and Rasal, 2010; Ravindranarth, et al., 1997). Global interest in carbon
sequestered by agroforestry systems increased after its recognition as a green house gas
mitigation strategy under the Kyoto protocol. Comprehensive estimates of biomass and
carbon stocks in plantations, including trees outside forests are important for the preparation
of national communications as part of the international commitments of the UNFCCC.
Besides there is growing enthusiasm in the market opportunities available for forest carbon
credits (Hamilton et al., 2007). In this context, Jatropha curcas emerges as most potential
species for use in CDM projects. This type of crop not only helps mitigate climate change
through sequestration and storage of carbon in the biomass, but it helps produce renewable
energy, by replacing fossil fuels, as its seeds can be used for biofuel production. According to
(Cotta ,2008), carbon sequestration by forest species that have a long life span and whose
exploration is intended for purpose other than timber production (like Jatropha) brings
comparative advantage over use of short rotation timber species, as carbon is stocked over
entire life span. As plans are under implementation for expanding the Jatropha cultivation in
large areas in several parts of the world, there is a need to assess the carbon sequestration
capacity of the system, which has received less attention compared to its oil production. This
underscores the need for methods to reliably assess the biomass production by Jatropha
system as quantification of carbon in trees relies on biomass estimation. One of the precise
way to measure and monitor above ground biomass estimate for a stand is through periodic
destructive sampling (Van et al., 2000), (Norries et al., 2001), (Brown et al., 2004),(Wadham-
Gagnon and Sharpe, 2006),(Saglan et al., 2008). Though destructive harvesting is tedious
277
and labor intensive (Kale et al., 2004) (Delitti et al., 2006), (Telenius and Verwijs, 1995) but
it gives correct estimation of biomass for a specific location.
As carbon sequestration studies in Jatropha plantations are lacking particularly for
Indian conditions. Hence, field experiments were conducted with an objective to quantify
carbon sequestration potential of Jatropha curcas by destructive sampling methods.
Figure 1. Meteorological data of experimental site
20.2 Materials and methods
20.2.1 Description of experimental site
The experiment was conducted during 2003-2011 at the Hayatnagar Research farm of Central
Research Institute for Dryland Agriculture (17°27′N latitude and 78°35′E longitude and about
515 m above sea level), Hyderabad in Southern part of India. The climate is semi-arid with
hot summers and mild winters. The mean maximum air temperature during summer (March,
April and May) ranges from 35.6 to 38.6°C, where as in winter (December, January and
February) ranges from 13.5 to 16.8 °C. The meteorological parameters of the experimental
site are presented in Figure 1. Annual long-term rainfall for the site is about 746.2 mm
received predominantly from June to October. The soils are medium-textured, red soil with
shallow depth (Typic Haplustalf as per USDA soil classification).
278
20.2.2 Experimental design
20.2.2.1 Tree establishment
In the year 2003, 4 weeks old nursery raised Jatropha plants of single elite line were planted in
the pits of 45 cm3 size during the month of August. The pit mixture contained good dugout soil
+ 2 kg compost + N, P and K at 10 g, 120 g and 16 g respectively. The date of planting of
Jatropha was 18.08.2003 with a spacing of 3 x 3m resulting a population of 1111 plants /ha.
The total plantation area was 1.5 ha, which was divided into 3 blocks of 0.5 ha each
representing each replication.
20.2.2.2 Tree growth and biomass production/ Biomass sampling
Data on tree growth such as height, DBH, crown diameter, number of branches and crown
depth were measured at 6 monthly interval. The entire field was divided in to plots of equal
size and within each plot, 25% of trees were marked representing the population and the
growth parameters of these trees were monitored at regular intervals. Trees were harvested at
the end of 8th year during July-August 2011. Entire plantation of 1.5 ha was divided into four
diameter classes viz, 5 -10 cm, 10 -15 cm, 15 -20 cm and 20 -25 cm. Four plants representing
the respective diameter class were selected for destructive sampling. In total 16 plants were
selected for sampling. The growth parameters of the selected 16 plants were given Table 1.
20.2.2.3 Total Carbon Content
Carbon content (%) in composite samples (leaves, stem, branch and root) was determined by
TOC Analyzer.
20.2.2.4 Destructive sampling
20.2.2.4.1 Above ground
Each randomly selected tree was cut at 10 cm above the soil surface, biomass partitioned in to
three fractions- stem, branches, and leaves, manually. Total above ground fresh weight was
measured by using a system of bi-pod frame, pulleys and scales. Components of subsamples
of 100 gram were collected and weighed at the time of sampling and placed in bags for oven
drying at 700 C to a constant weight. Dry weight of subsamples was used to calculate to
moisture ratios, which then applied to tree component fresh weights (Porte et al.,
2002),(Ritson and Sochaki, 2003). Measurement was made to an accuracy of 0.01kg to
determine the dry biomass per ha.
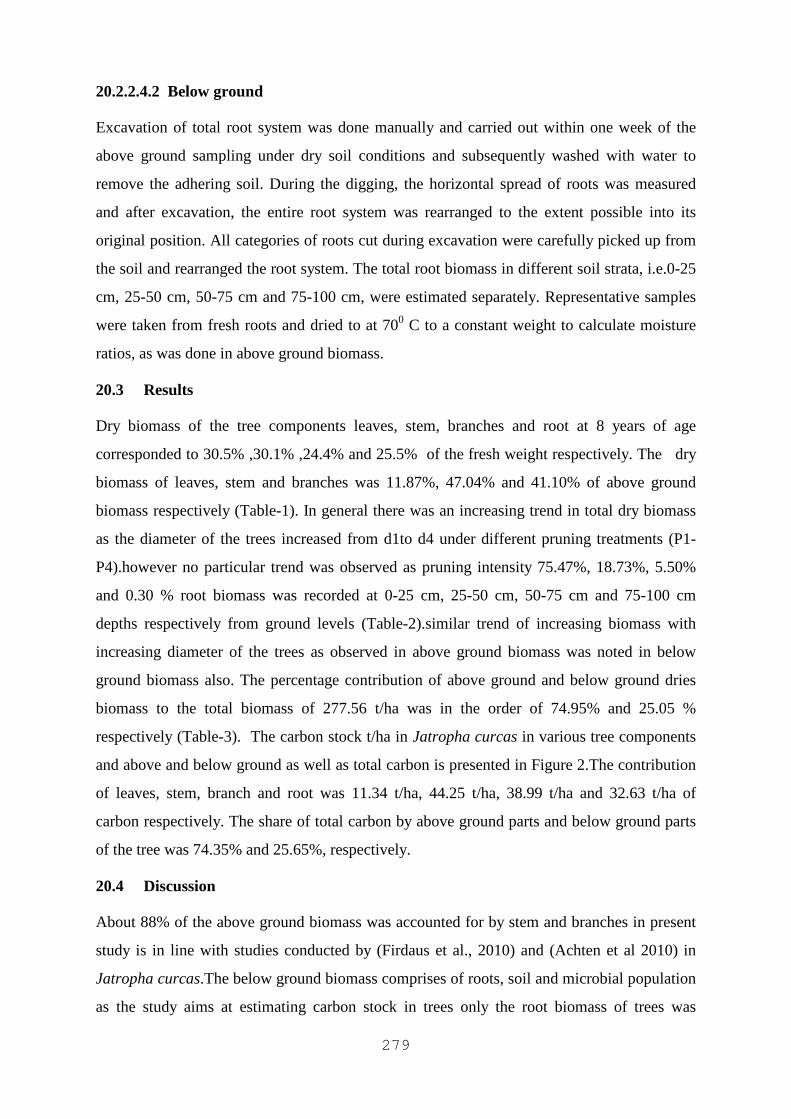
279
20.2.2.4.2 Below ground
Excavation of total root system was done manually and carried out within one week of the
above ground sampling under dry soil conditions and subsequently washed with water to
remove the adhering soil. During the digging, the horizontal spread of roots was measured
and after excavation, the entire root system was rearranged to the extent possible into its
original position. All categories of roots cut during excavation were carefully picked up from
the soil and rearranged the root system. The total root biomass in different soil strata, i.e.0-25
cm, 25-50 cm, 50-75 cm and 75-100 cm, were estimated separately. Representative samples
were taken from fresh roots and dried to at 700 C to a constant weight to calculate moisture
ratios, as was done in above ground biomass.
20.3 Results
Dry biomass of the tree components leaves, stem, branches and root at 8 years of age
corresponded to 30.5% ,30.1% ,24.4% and 25.5% of the fresh weight respectively. The dry
biomass of leaves, stem and branches was 11.87%, 47.04% and 41.10% of above ground
biomass respectively (Table-1). In general there was an increasing trend in total dry biomass
as the diameter of the trees increased from d1to d4 under different pruning treatments (P1-
P4).however no particular trend was observed as pruning intensity 75.47%, 18.73%, 5.50%
and 0.30 % root biomass was recorded at 0-25 cm, 25-50 cm, 50-75 cm and 75-100 cm
depths respectively from ground levels (Table-2).similar trend of increasing biomass with
increasing diameter of the trees as observed in above ground biomass was noted in below
ground biomass also. The percentage contribution of above ground and below ground dries
biomass to the total biomass of 277.56 t/ha was in the order of 74.95% and 25.05 %
respectively (Table-3). The carbon stock t/ha in Jatropha curcas in various tree components
and above and below ground as well as total carbon is presented in Figure 2.The contribution
of leaves, stem, branch and root was 11.34 t/ha, 44.25 t/ha, 38.99 t/ha and 32.63 t/ha of
carbon respectively. The share of total carbon by above ground parts and below ground parts
of the tree was 74.35% and 25.65%, respectively.
20.4 Discussion
About 88% of the above ground biomass was accounted for by stem and branches in present
study is in line with studies conducted by (Firdaus et al., 2010) and (Achten et al 2010) in
Jatropha curcas.The below ground biomass comprises of roots, soil and microbial population
as the study aims at estimating carbon stock in trees only the root biomass of trees was
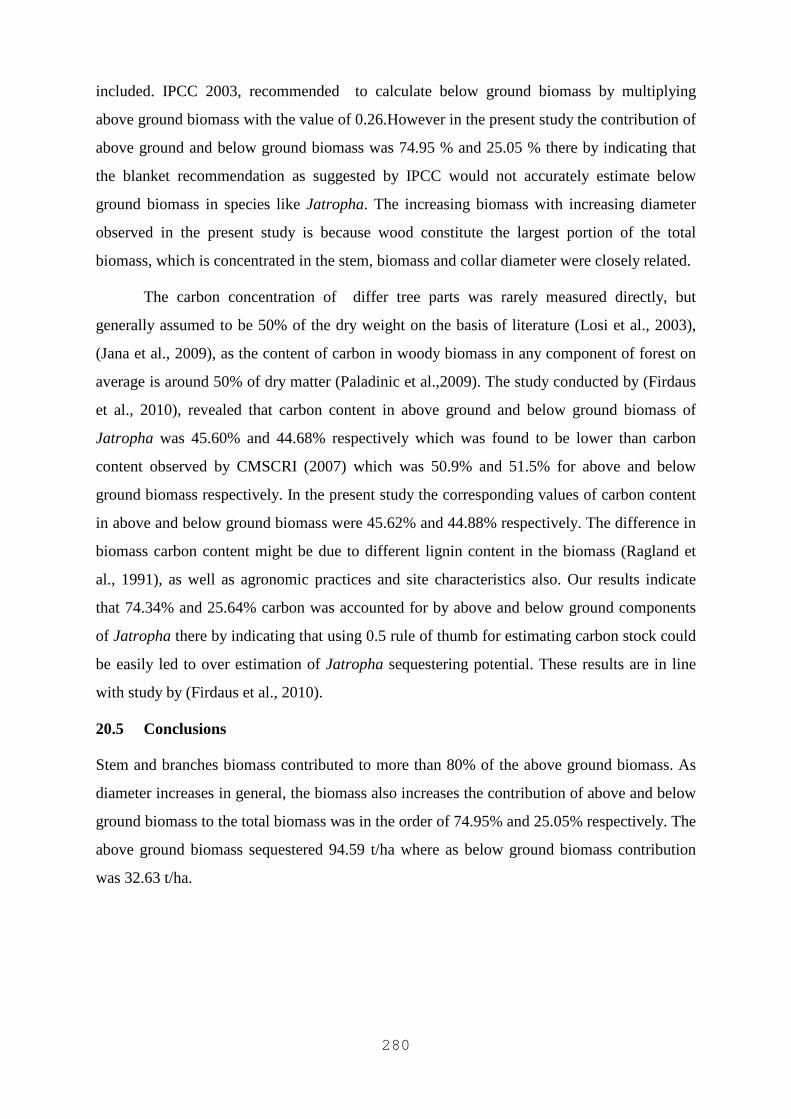
280
included. IPCC 2003, recommended to calculate below ground biomass by multiplying
above ground biomass with the value of 0.26.However in the present study the contribution of
above ground and below ground biomass was 74.95 % and 25.05 % there by indicating that
the blanket recommendation as suggested by IPCC would not accurately estimate below
ground biomass in species like Jatropha. The increasing biomass with increasing diameter
observed in the present study is because wood constitute the largest portion of the total
biomass, which is concentrated in the stem, biomass and collar diameter were closely related.
The carbon concentration of differ tree parts was rarely measured directly, but
generally assumed to be 50% of the dry weight on the basis of literature (Losi et al., 2003),
(Jana et al., 2009), as the content of carbon in woody biomass in any component of forest on
average is around 50% of dry matter (Paladinic et al.,2009). The study conducted by (Firdaus
et al., 2010), revealed that carbon content in above ground and below ground biomass of
Jatropha was 45.60% and 44.68% respectively which was found to be lower than carbon
content observed by CMSCRI (2007) which was 50.9% and 51.5% for above and below
ground biomass respectively. In the present study the corresponding values of carbon content
in above and below ground biomass were 45.62% and 44.88% respectively. The difference in
biomass carbon content might be due to different lignin content in the biomass (Ragland et
al., 1991), as well as agronomic practices and site characteristics also. Our results indicate
that 74.34% and 25.64% carbon was accounted for by above and below ground components
of Jatropha there by indicating that using 0.5 rule of thumb for estimating carbon stock could
be easily led to over estimation of Jatropha sequestering potential. These results are in line
with study by (Firdaus et al., 2010).
20.5 Conclusions
Stem and branches biomass contributed to more than 80% of the above ground biomass. As
diameter increases in general, the biomass also increases the contribution of above and below
ground biomass to the total biomass was in the order of 74.95% and 25.05% respectively. The
above ground biomass sequestered 94.59 t/ha where as below ground biomass contribution
was 32.63 t/ha.
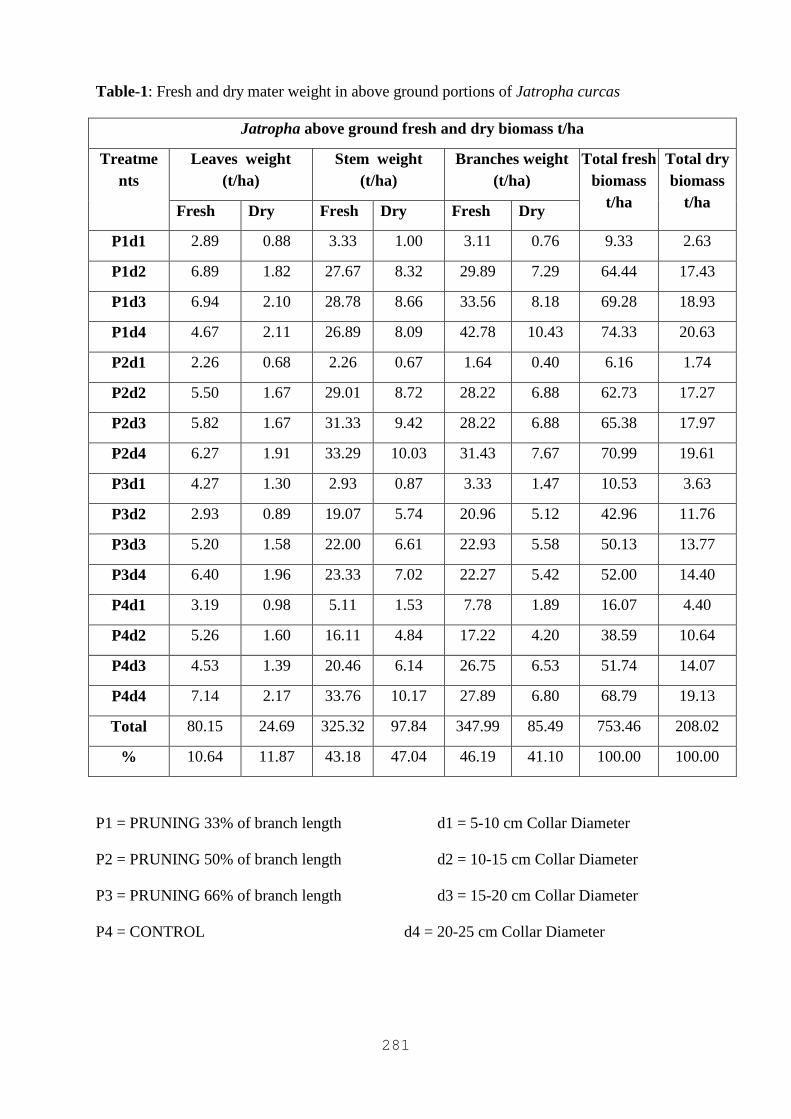
281
Table-1: Fresh and dry mater weight in above ground portions of Jatropha curcas
Jatropha above ground fresh and dry biomass t/ha
Treatments
Leaves weight (t/ha)
Stem weight (t/ha)
Branches weight (t/ha)
Total fresh biomass
t/ha
Total dry biomass
t/ha Fresh Dry Fresh Dry Fresh Dry
P1d1 2.89 0.88 3.33 1.00 3.11 0.76 9.33 2.63
P1d2 6.89 1.82 27.67 8.32 29.89 7.29 64.44 17.43
P1d3 6.94 2.10 28.78 8.66 33.56 8.18 69.28 18.93
P1d4 4.67 2.11 26.89 8.09 42.78 10.43 74.33 20.63
P2d1 2.26 0.68 2.26 0.67 1.64 0.40 6.16 1.74
P2d2 5.50 1.67 29.01 8.72 28.22 6.88 62.73 17.27
P2d3 5.82 1.67 31.33 9.42 28.22 6.88 65.38 17.97
P2d4 6.27 1.91 33.29 10.03 31.43 7.67 70.99 19.61
P3d1 4.27 1.30 2.93 0.87 3.33 1.47 10.53 3.63
P3d2 2.93 0.89 19.07 5.74 20.96 5.12 42.96 11.76
P3d3 5.20 1.58 22.00 6.61 22.93 5.58 50.13 13.77
P3d4 6.40 1.96 23.33 7.02 22.27 5.42 52.00 14.40
P4d1 3.19 0.98 5.11 1.53 7.78 1.89 16.07 4.40
P4d2 5.26 1.60 16.11 4.84 17.22 4.20 38.59 10.64
P4d3 4.53 1.39 20.46 6.14 26.75 6.53 51.74 14.07
P4d4 7.14 2.17 33.76 10.17 27.89 6.80 68.79 19.13
Total 80.15 24.69 325.32 97.84 347.99 85.49 753.46 208.02
% 10.64 11.87 43.18 47.04 46.19 41.10 100.00 100.00
P1 = PRUNING 33% of branch length d1 = 5-10 cm Collar Diameter
P2 = PRUNING 50% of branch length d2 = 10-15 cm Collar Diameter
P3 = PRUNING 66% of branch length d3 = 15-20 cm Collar Diameter
P4 = CONTROL d4 = 20-25 cm Collar Diameter
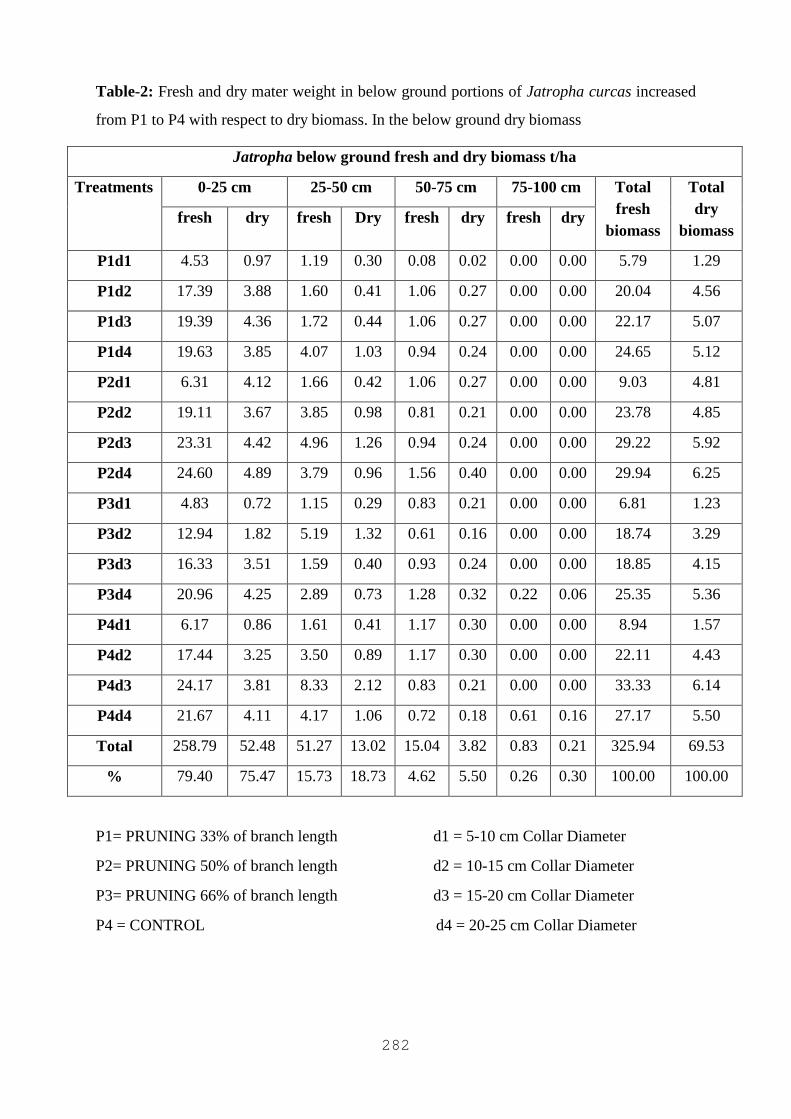
282
Table-2: Fresh and dry mater weight in below ground portions of Jatropha curcas increased
from P1 to P4 with respect to dry biomass. In the below ground dry biomass
Jatropha below ground fresh and dry biomass t/ha
Treatments 0-25 cm 25-50 cm 50-75 cm 75-100 cm Total fresh
biomass
Total dry
biomass fresh dry fresh Dry fresh dry fresh dry
P1d1 4.53 0.97 1.19 0.30 0.08 0.02 0.00 0.00 5.79 1.29
P1d2 17.39 3.88 1.60 0.41 1.06 0.27 0.00 0.00 20.04 4.56
P1d3 19.39 4.36 1.72 0.44 1.06 0.27 0.00 0.00 22.17 5.07
P1d4 19.63 3.85 4.07 1.03 0.94 0.24 0.00 0.00 24.65 5.12
P2d1 6.31 4.12 1.66 0.42 1.06 0.27 0.00 0.00 9.03 4.81
P2d2 19.11 3.67 3.85 0.98 0.81 0.21 0.00 0.00 23.78 4.85
P2d3 23.31 4.42 4.96 1.26 0.94 0.24 0.00 0.00 29.22 5.92
P2d4 24.60 4.89 3.79 0.96 1.56 0.40 0.00 0.00 29.94 6.25
P3d1 4.83 0.72 1.15 0.29 0.83 0.21 0.00 0.00 6.81 1.23
P3d2 12.94 1.82 5.19 1.32 0.61 0.16 0.00 0.00 18.74 3.29
P3d3 16.33 3.51 1.59 0.40 0.93 0.24 0.00 0.00 18.85 4.15
P3d4 20.96 4.25 2.89 0.73 1.28 0.32 0.22 0.06 25.35 5.36
P4d1 6.17 0.86 1.61 0.41 1.17 0.30 0.00 0.00 8.94 1.57
P4d2 17.44 3.25 3.50 0.89 1.17 0.30 0.00 0.00 22.11 4.43
P4d3 24.17 3.81 8.33 2.12 0.83 0.21 0.00 0.00 33.33 6.14
P4d4 21.67 4.11 4.17 1.06 0.72 0.18 0.61 0.16 27.17 5.50
Total 258.79 52.48 51.27 13.02 15.04 3.82 0.83 0.21 325.94 69.53
% 79.40 75.47 15.73 18.73 4.62 5.50 0.26 0.30 100.00 100.00
P1= PRUNING 33% of branch length d1 = 5-10 cm Collar Diameter
P2= PRUNING 50% of branch length d2 = 10-15 cm Collar Diameter
P3= PRUNING 66% of branch length d3 = 15-20 cm Collar Diameter
P4 = CONTROL d4 = 20-25 cm Collar Diameter
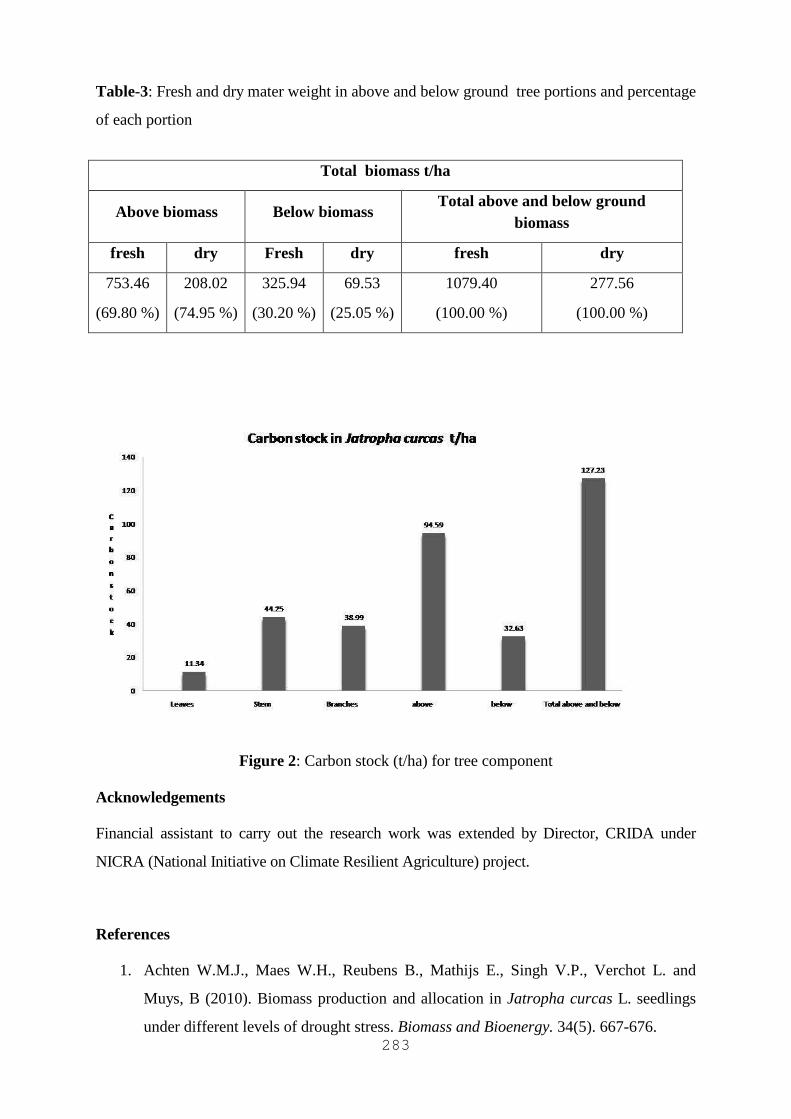
283
Table-3: Fresh and dry mater weight in above and below ground tree portions and percentage
of each portion
Figure 2: Carbon stock (t/ha) for tree component
Acknowledgements
Financial assistant to carry out the research work was extended by Director, CRIDA under
NICRA (National Initiative on Climate Resilient Agriculture) project.
References
1. Achten W.M.J., Maes W.H., Reubens B., Mathijs E., Singh V.P., Verchot L. and
Muys, B (2010). Biomass production and allocation in Jatropha curcas L. seedlings
under different levels of drought stress. Biomass and Bioenergy. 34(5). 667-676.
Total biomass t/ha
Above biomass Below biomass Total above and below ground
biomass
fresh dry Fresh dry fresh dry
753.46
(69.80 %)
208.02
(74.95 %)
325.94
(30.20 %)
69.53
(25.05 %)
1079.40
(100.00 %)
277.56
(100.00 %)
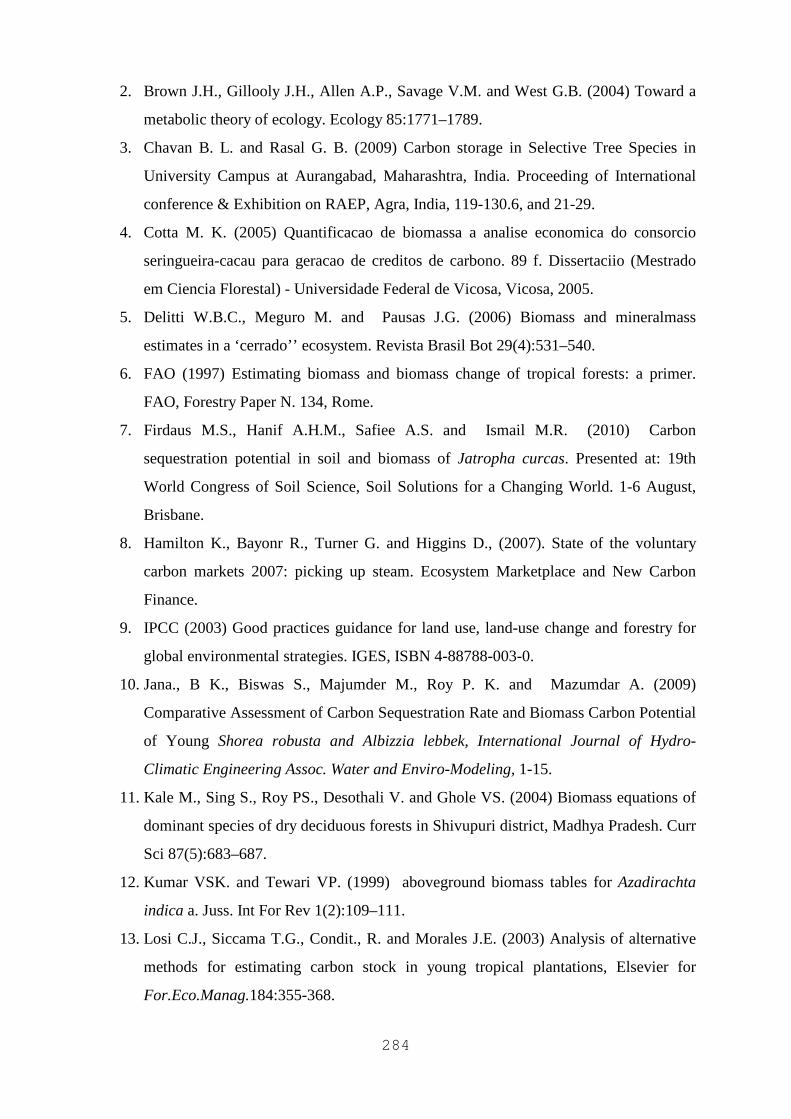
284
2. Brown J.H., Gillooly J.H., Allen A.P., Savage V.M. and West G.B. (2004) Toward a
metabolic theory of ecology. Ecology 85:1771–1789.
3. Chavan B. L. and Rasal G. B. (2009) Carbon storage in Selective Tree Species in
University Campus at Aurangabad, Maharashtra, India. Proceeding of International
conference & Exhibition on RAEP, Agra, India, 119-130.6, and 21-29.
4. Cotta M. K. (2005) Quantificacao de biomassa a analise economica do consorcio
seringueira-cacau para geracao de creditos de carbono. 89 f. Dissertaciio (Mestrado
em Ciencia Florestal) - Universidade Federal de Vicosa, Vicosa, 2005.
5. Delitti W.B.C., Meguro M. and Pausas J.G. (2006) Biomass and mineralmass
estimates in a ‘cerrado’’ ecosystem. Revista Brasil Bot 29(4):531–540.
6. FAO (1997) Estimating biomass and biomass change of tropical forests: a primer.
FAO, Forestry Paper N. 134, Rome.
7. Firdaus M.S., Hanif A.H.M., Safiee A.S. and Ismail M.R. (2010) Carbon
sequestration potential in soil and biomass of Jatropha curcas. Presented at: 19th
World Congress of Soil Science, Soil Solutions for a Changing World. 1-6 August,
Brisbane.
8. Hamilton K., Bayonr R., Turner G. and Higgins D., (2007). State of the voluntary
carbon markets 2007: picking up steam. Ecosystem Marketplace and New Carbon
Finance.
9. IPCC (2003) Good practices guidance for land use, land-use change and forestry for
global environmental strategies. IGES, ISBN 4-88788-003-0.
10. Jana., B K., Biswas S., Majumder M., Roy P. K. and Mazumdar A. (2009)
Comparative Assessment of Carbon Sequestration Rate and Biomass Carbon Potential
of Young Shorea robusta and Albizzia lebbek, International Journal of Hydro-
Climatic Engineering Assoc. Water and Enviro-Modeling, 1-15.
11. Kale M., Sing S., Roy PS., Desothali V. and Ghole VS. (2004) Biomass equations of
dominant species of dry deciduous forests in Shivupuri district, Madhya Pradesh. Curr
Sci 87(5):683–687.
12. Kumar VSK. and Tewari VP. (1999) aboveground biomass tables for Azadirachta
indica a. Juss. Int For Rev 1(2):109–111.
13. Losi C.J., Siccama T.G., Condit., R. and Morales J.E. (2003) Analysis of alternative
methods for estimating carbon stock in young tropical plantations, Elsevier for
For.Eco.Manag.184:355-368.
285
14. Marland G., Fruit K. and Sedjo R. (2001) Accounting for sequestered carbon: the
question of permanence. Environ Sci Policy 4:259-68.
15. Norris DN., Blair JM., Johnson LC. and McKane RB (2001) Assessing changes in
biomass, productivity, and carbon stores following Juniperus virgiana forest
expansion into tall grass prairie. Can J For Res 31:1940–1946.
16. Paladinic, E., Vuletic, D., Martinic, I., Marjanovic, H., Indir, K., Benko, M., and
Novotny, V., (2009) Forest biomass and sequestered carbon estimation according to
main tree components on the forest stand scale. Periodicum Biologorum, Vol.111,
No.4, 459-466.
17. Phalan B. (2009) The social and environment impacts in Asia. An overview. Appl.
Energy 8.
18. Porte A., Trichetp P., Bert D. and Loustau D., (2002). Allometric relationships for
branch and tree woody biomass of Maritime pine (Pinus pinaster Ait.). Forest
Ecology and Management 158, 71-83.
19. Ragland KW.,Aerts DJ. and Baker AJ. (1991) Properties of wood for combustion
analysis. Bioresource Technology. 37(2):161-168.
20. Ravindranath, N.H., Somashekhar B.S. and Gadgil M. (1997) Carbon flows in Indian
forests. Climate change. 35: 297-320.
21. Ritson P. and Sochackis S., (2003). Measurement and prediction of biomass and
carbon content of Pinus pinaster trees in farm forestry plantations, south-western
Australia. Forest Ecology and Management 175, 103-117.
22. Saglan B, Kucuki O., Bilgili E., Durmaz D. and Basal I. (2008) Estimating fuel
biomass of some shrub species (Maquis) in Turkey. Turk J Agric 32:349–356.
23. Telenius B. and Verwijs T. (1995) The influence of allometric variation, vertical
biomass distribution and sampling procedure on biomass estimates in commercial
short rotation forests. Bioresource Technology 51: 247–253.
24. Ter-Mikaelian MT. and Korzukhin M. (1997). Biomass equations of sixty-five North
American tree species. Forest Ecology and Management 97: 1–24.
25. Van TK. and Rayachhetry MB, Centre D (2000) Estimating aboveground biomass of
Melaleuca quinquenenervia in Florida, USA. J Aqua Plant Manag 38:62–67.
26. Vann DR, Palmiotto PA, and Strimbeck GR. (1998). Allometric equations for two
South American conifers: test of a non-destructive method. Forest Ecology and
Management 106: 55–71.

286
27. Verwijst T. and Telenius B. (1999) Biomass estimation procedures in short rotation
forestry. Forest Ecology and Management 121:137–146.
28. Wadham-Gagnon B. and Sharpe D (2006) Estimating carbon stocks in tropical
hardwood plantations: using species-specific and non-destructive parameters to
estimate aboveground Biomass for six native species in Panama. Internship Report,
Smithsonian Trop Res Inst ENVR 451.
287
CHAPTER 21
ESTIMATION OF BIOCRUDE FROM EUPHORBIA
CONTINIFOLIA
Punam Devi, Anjana Bhatia and Amita Mahajan
Abstract
Biodiesel is renewable, eco-friendly and produces less Green House Gas (GHG) emissions. In
recent years biodiesel is getting more attention because of rising demand in fuel worldwide,
rush in oil prices of crude oil, reserves of crude oil are limited and its harmful effects on
environment. Biodiesel is an alternative source for petroleum fuels. It is derived from various
petro-oil crops which are a potential renewable source and also carbon neutral. It is also
obtained from waste cooking oil, animal fat etc, but the oil obtained is not logically good.
Because it contains high amounts of saturated fat; biodiesel made from this feedstock tends to
coagulate, limiting well-known function of this type of fuel particularly in chill season.
Potential feedstock includes conventional crops and forestry products, agricultural residues
etc. Latex bearing plants particularly Euphorbia spp. has received more attention due to high
percentage of energy extracts. The plants with high calorific value can be grown as petro-
crops (energy-crops). Euphorbia species contain methyl esters and derivatives as well as
diterpene polyesters and other terpene compounds. The oil consists mainly of sesquiterpenes,
and a small percentage of monoterpenes and aliphatic compounds. Eleinol (57.5%) was found
to be the major constituent among the 24 compounds. Other constituents found in Euphorbia
species include ingenol 3-angelate kaempferol, scopoletin, kaempferol 3-O-glucopyranoside,
quercetin, vanillic acid. Euphorbia continifolia is also one of the potential sources for
biodiesel production.
Keywords: Renewable energy source, Biomass, Biocrude, Petrocrops Euphorbia continifolia.
21.1 Introduction
The rise in price of the fossil fuel and the ecological concerns about pollution coming from
the car gases, biofuel is becoming a developing area of high concerns. There are different
ways of production, with different kinds of raw materials. The advantage of this fuel is that
the raw materials used to produce are natural and renewable source (1).The gas generated
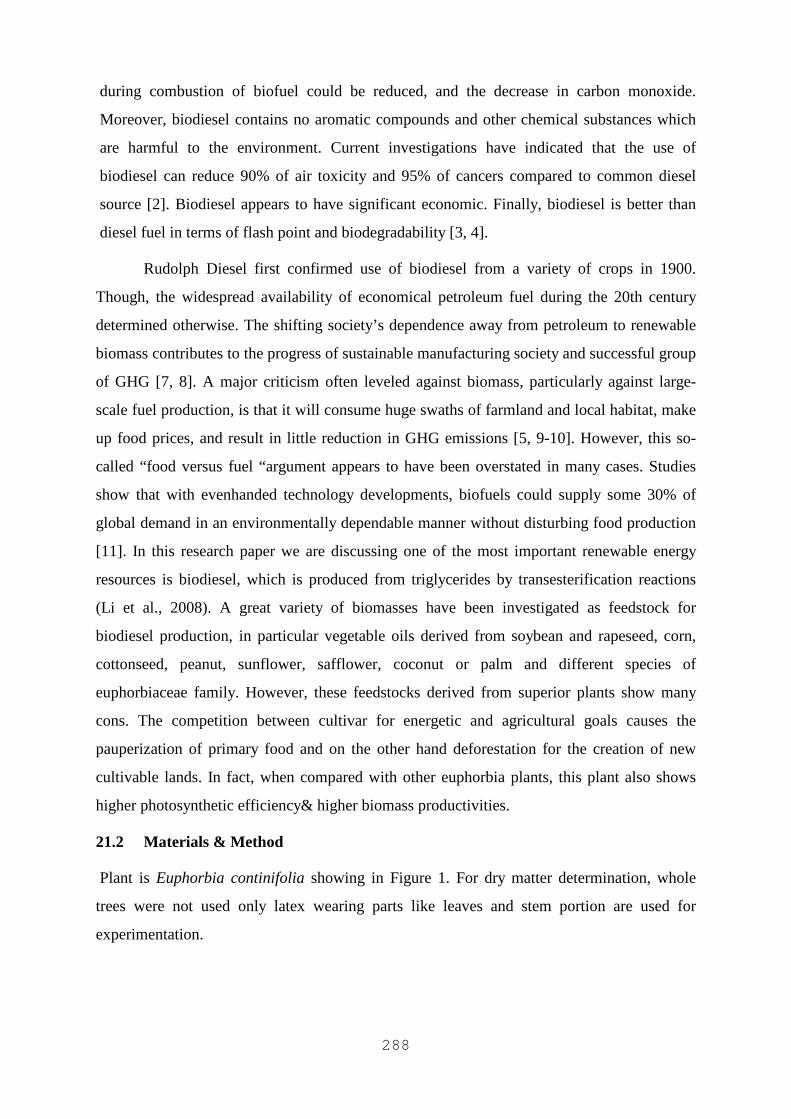
288
during combustion of biofuel could be reduced, and the decrease in carbon monoxide.
Moreover, biodiesel contains no aromatic compounds and other chemical substances which
are harmful to the environment. Current investigations have indicated that the use of
biodiesel can reduce 90% of air toxicity and 95% of cancers compared to common diesel
source [2]. Biodiesel appears to have significant economic. Finally, biodiesel is better than
diesel fuel in terms of flash point and biodegradability [3, 4].
Rudolph Diesel first confirmed use of biodiesel from a variety of crops in 1900.
Though, the widespread availability of economical petroleum fuel during the 20th century
determined otherwise. The shifting society’s dependence away from petroleum to renewable
biomass contributes to the progress of sustainable manufacturing society and successful group
of GHG [7, 8]. A major criticism often leveled against biomass, particularly against large-
scale fuel production, is that it will consume huge swaths of farmland and local habitat, make
up food prices, and result in little reduction in GHG emissions [5, 9-10]. However, this so-
called “food versus fuel “argument appears to have been overstated in many cases. Studies
show that with evenhanded technology developments, biofuels could supply some 30% of
global demand in an environmentally dependable manner without disturbing food production
[11]. In this research paper we are discussing one of the most important renewable energy
resources is biodiesel, which is produced from triglycerides by transesterification reactions
(Li et al., 2008). A great variety of biomasses have been investigated as feedstock for
biodiesel production, in particular vegetable oils derived from soybean and rapeseed, corn,
cottonseed, peanut, sunflower, safflower, coconut or palm and different species of
euphorbiaceae family. However, these feedstocks derived from superior plants show many
cons. The competition between cultivar for energetic and agricultural goals causes the
pauperization of primary food and on the other hand deforestation for the creation of new
cultivable lands. In fact, when compared with other euphorbia plants, this plant also shows
higher photosynthetic efficiency& higher biomass productivities.
21.2 Materials & Method
Plant is Euphorbia continifolia showing in Figure 1. For dry matter determination, whole
trees were not used only latex wearing parts like leaves and stem portion are used for
experimentation.
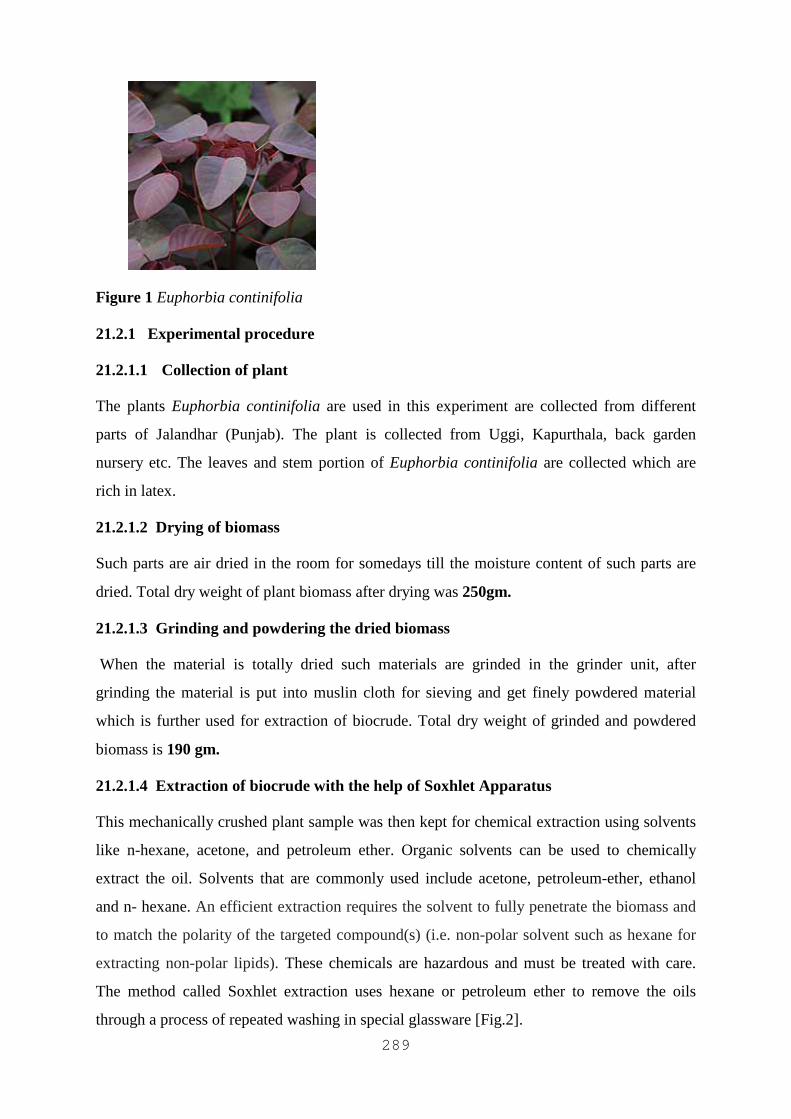
289
Figure 1 Euphorbia continifolia
21.2.1 Experimental procedure
21.2.1.1 Collection of plant
The plants Euphorbia continifolia are used in this experiment are collected from different
parts of Jalandhar (Punjab). The plant is collected from Uggi, Kapurthala, back garden
nursery etc. The leaves and stem portion of Euphorbia continifolia are collected which are
rich in latex.
21.2.1.2 Drying of biomass
Such parts are air dried in the room for somedays till the moisture content of such parts are
dried. Total dry weight of plant biomass after drying was 250gm.
21.2.1.3 Grinding and powdering the dried biomass
When the material is totally dried such materials are grinded in the grinder unit, after
grinding the material is put into muslin cloth for sieving and get finely powdered material
which is further used for extraction of biocrude. Total dry weight of grinded and powdered
biomass is 190 gm.
21.2.1.4 Extraction of biocrude with the help of Soxhlet Apparatus
This mechanically crushed plant sample was then kept for chemical extraction using solvents
like n-hexane, acetone, and petroleum ether. Organic solvents can be used to chemically
extract the oil. Solvents that are commonly used include acetone, petroleum-ether, ethanol
and n- hexane. An efficient extraction requires the solvent to fully penetrate the biomass and
to match the polarity of the targeted compound(s) (i.e. non-polar solvent such as hexane for
extracting non-polar lipids). These chemicals are hazardous and must be treated with care.
The method called Soxhlet extraction uses hexane or petroleum ether to remove the oils
through a process of repeated washing in special glassware [Fig.2].
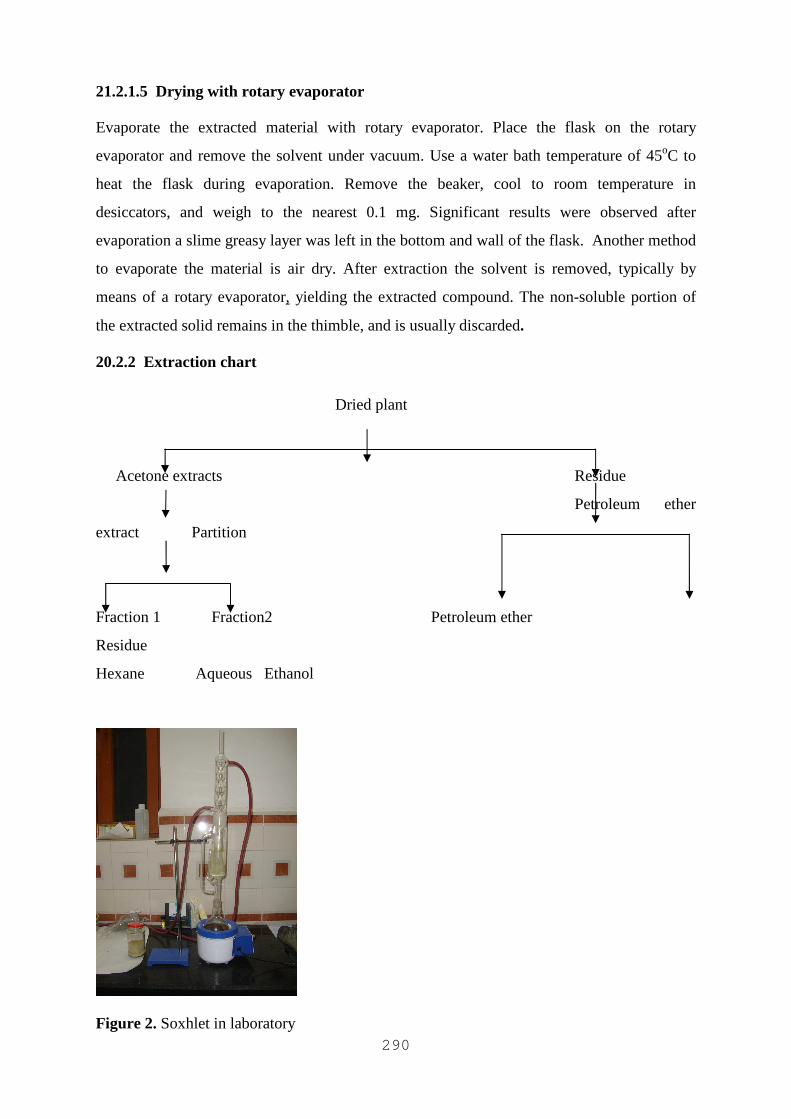
290
21.2.1.5 Drying with rotary evaporator
Evaporate the extracted material with rotary evaporator. Place the flask on the rotary
evaporator and remove the solvent under vacuum. Use a water bath temperature of 45oC to
heat the flask during evaporation. Remove the beaker, cool to room temperature in
desiccators, and weigh to the nearest 0.1 mg. Significant results were observed after
evaporation a slime greasy layer was left in the bottom and wall of the flask. Another method
to evaporate the material is air dry. After extraction the solvent is removed, typically by
means of a rotary evaporator, yielding the extracted compound. The non-soluble portion of
the extracted solid remains in the thimble, and is usually discarded.
20.2.2 Extraction chart
Dried plant
Acetone extracts Residue
Petroleum ether
extract Partition
Fraction 1 Fraction2 Petroleum ether
Residue
Hexane Aqueous Ethanol
Figure 2. Soxhlet in laboratory
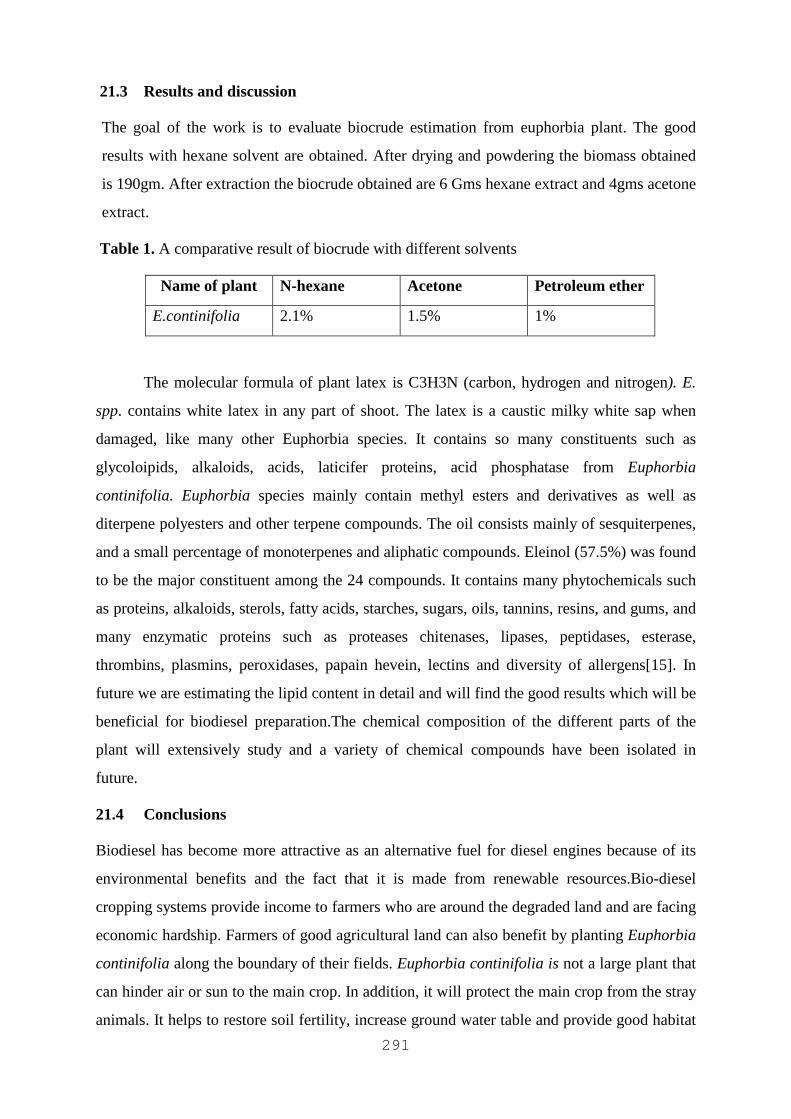
291
21.3 Results and discussion
The goal of the work is to evaluate biocrude estimation from euphorbia plant. The good
results with hexane solvent are obtained. After drying and powdering the biomass obtained
is 190gm. After extraction the biocrude obtained are 6 Gms hexane extract and 4gms acetone
extract.
Table 1. A comparative result of biocrude with different solvents
Name of plant N-hexane Acetone Petroleum ether
E.continifolia 2.1% 1.5% 1%
The molecular formula of plant latex is C3H3N (carbon, hydrogen and nitrogen). E.
spp. contains white latex in any part of shoot. The latex is a caustic milky white sap when
damaged, like many other Euphorbia species. It contains so many constituents such as
glycoloipids, alkaloids, acids, laticifer proteins, acid phosphatase from Euphorbia
continifolia. Euphorbia species mainly contain methyl esters and derivatives as well as
diterpene polyesters and other terpene compounds. The oil consists mainly of sesquiterpenes,
and a small percentage of monoterpenes and aliphatic compounds. Eleinol (57.5%) was found
to be the major constituent among the 24 compounds. It contains many phytochemicals such
as proteins, alkaloids, sterols, fatty acids, starches, sugars, oils, tannins, resins, and gums, and
many enzymatic proteins such as proteases chitenases, lipases, peptidases, esterase,
thrombins, plasmins, peroxidases, papain hevein, lectins and diversity of allergens[15]. In
future we are estimating the lipid content in detail and will find the good results which will be
beneficial for biodiesel preparation.The chemical composition of the different parts of the
plant will extensively study and a variety of chemical compounds have been isolated in
future.
21.4 Conclusions
Biodiesel has become more attractive as an alternative fuel for diesel engines because of its
environmental benefits and the fact that it is made from renewable resources.Bio-diesel
cropping systems provide income to farmers who are around the degraded land and are facing
economic hardship. Farmers of good agricultural land can also benefit by planting Euphorbia
continifolia along the boundary of their fields. Euphorbia continifolia is not a large plant that
can hinder air or sun to the main crop. In addition, it will protect the main crop from the stray
animals. It helps to restore soil fertility, increase ground water table and provide good habitat
292
for insect fauna. Other plant species must be also investigated for their viability for the
production of bio-diesel on cost-effective basis. About 65 million hectare total wasteland is
available including 14 million hectares of wasteland in forests under Joint Forest
Management as per the Planning Commission Report. There is a potential to cover this
wasteland with these bio-diesel plant species. Therefore, bio-sources are expected to be
potential options for the production of fuel in order to ensure a continuity of fuel supply to
our transportation and industrial sectors. We are getting the good results of Euphorbia
continifolia. This will be the future petroplant which becomes the potential source for
biodiesel.
References
1. Microalgae for biodiesel production and other applications. A review
2. Cadenas A, Cabezndo S. Biofuels as sustainable technologies: perspectives for less
developed countries. Technol Forecast Social Change 1998;58:83–103.
3. Ma F, Hanna MA. Biodiesel production: a review. Bioresource Technol 1999; 70:1–
15.
4. Sharp CA. Emissions and lubricity evaluation of rapeseed derived biodiesel fuels [R].
Final Report for Montana Department of Environmental Quality. Southwest Research
Institute; November 1996.
5. Campbell cj (1997) the coming oil crisis multiscience publishing company& petro
consultant S.A.essex, England.
6. Chaistic Y (2007) Biodiesel from microalgae biotechnol Adv 25: 294-306. Do me:
10.1016/j – biotech adv. 2007.02.001.
7. Chiastic Y (2008) Biodiesel from merely beats bioethanol. Trends biotechnology 26:
126-131 doi.10.1016/j tibtech.2007.12.002
8. Demirbas, A. H.; Demirbas, I. Importance of Rural Bioenergy for Developing
Countries. Energy Convers. Manage 2007, 48, 2386-2398.
9. Ragauskas, A.J.; Williams, C.K.; Davison, B.H.; Britovsek, G.; Cairney, J.; Eckert,
C.A.; Frederick, Jr.W.J.; Hallett, J.P.; Leak, D.J.; Liotta, C.L.; Mielenz, J.R.; Murphy,
R.; Templer, R.;Tschaplinski, T. The Path Forward for Biofuels and Biomaterials.
Science 2006, 311, 484-489.
293
10. Crutzen, P.J.; Moiser, A.R.; Smith, K.A.; Winiwarter, W. N2O Release from Agro-
biofuel production Negates Global Warming Reduction by Replacing Fossil Fuels.
Atmos. Chem. Phys. Discuss. 2007, 7, 11191-11205.
11. Righelato, R.; Spracklen, D.V. Carbon Mitigation by Biofuels or by Saving and
Restorin
12. Koonin, S.E. Getting Serious About Biofuels. Science 2006, 311, 435.
13. Missouri Botanical Gardens
14. Laurence M. Harwood, Christopher J. Moody. Experimental organic chemistry:
Principles and Practice (Illustrated edition). pp. 122–125. ISBN 978-0-632-02017-1.
15. Pintus F, Spanò D, Medda R, Floris G. Calcium ions and a secreted peroxidase in
Euphorbia characias latex are made for each other. Protein J 2011; 30:115-23.
294
CHAPTER 22
THE POTENTIAL OF ALGAL SPECIES FOR INTEGRATED
BIOFUEL PRODUCTION AND ITS APPLICATIONS
Vivek Prakash Pankaj and Mamta Awasthi
Abstract
The massive need for sustainable energy has led to an increased interest in new energy
resources, such as production of algae, for use as biofuel and other by-product. There are
advantages to using algae, for example, land use is much less than in terrestrial biofuel
production, and several algae species can double their mass in 1 day under optimized
conditions. Most algae are phototrophs and some are nitrogen-fixing. Algae production
therefore requires only small amounts of amendments such as carbon sources and nutrients. In
this paper, try to identity the potential algal species for integrated biofuel and its applications.
Keywords: Biofuels; biodiesel; lipids; microalgae; oil production
22.1 Introduction
A growing demand for energy has led to an increased interest in renewable energy sources,
such as the extraction of biofuels such as biodiesel from algae. The advantages algae have
over other biological sources of energy are many. For example, algae have far lower space
requirements than land-based plant production and several algal species can double their
biomass in 1 day. Most algae are phototrophs and some are nitrogen-fixing, meaning that
algae cultivation requires few additives such as carbon sources or nutrients.
Algae can be cultivated in open ponds or in closed systems such as photobioreactors.
The choice of reactor system depends upon a series of factors where there is a trade off
between capital costs and rate and reliability of biomass production. Commercial outdoor
systems mostly consist of large open ponds, tanks or raceway systems. The advantages of
such systems are their simplicity and low cost, while their disadvantages are related to limited
control of the growth conditions, water evaporation and invasion of undesired species. The
cultivation of algae for energy production requires efficient methods for quantifying and
characterizing the composition of the biomass. Algal growth can easily be established through
optical density (OD) measurements with a spectrophotometer. One of the simplest and
295
cheapest ways to monitor algal community development during the cultivation period is
through microscopic assays of algae samples. As the macromolecular composition of the
biomass is an integrated indication of the organisms’ physiological state and reflects the
influence of cultivation conditions on cell regulatory mechanisms, it is important to accurately
assess this throughout cultivation. In this paper, try to identity the potential algal species for
integrated biofuel and its applications.
22.1.1 Why Algae
1. Photosynthetic organisms
2. High growth rate productivity
3. Combined with wastewater treatment and nutrient recycling
4. Range from unicellular microscopic to giant seaweeds
5. Lack specialization associated with typical terrestrial plant life
6. Widely distributed (fresh water- marine)
7. Does not take toll for the land under cultivation.
22.1.2 Advantages of Microalgae
1. Synthesis and accumulate large quantities of neutral lipids (20 to 50 % of Dry Cell
Weight).
2. Multiply at higher rate (1-3 doubling time in a day).
3. Utilize nutrients from variety of waste water; provide an additional benefit of waste
water bioremediation.
4. Sequester CO2 from flue gases, thereby reducing emission of major green house gas.
5. Produce as a value added by-products (Proteins, Polysaccrides, pigments animal,
feed, manure, Hydrogen and biopolymers).
6. Grow in suitable culture vessels (Photo-bioreactors) throughout the year with annual
biomass productivity, on an area basis exceeding that of terrestrial plants by
approximately tenfold etc.
22.2 Algae cultivation
The necessary technology for developing profitable algae-based fuel is still in various
states of development and the final configuration is yet to be determined and
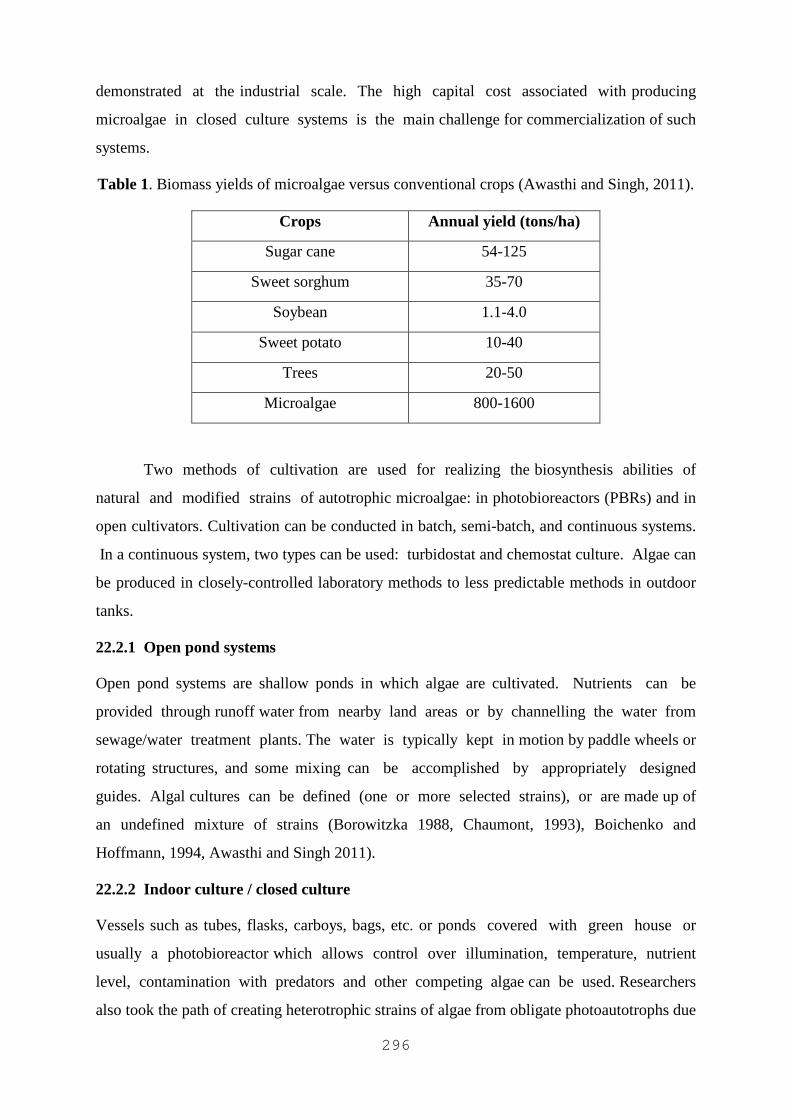
296
demonstrated at the industrial scale. The high capital cost associated with producing
microalgae in closed culture systems is the main challenge for commercialization of such
systems.
Table 1. Biomass yields of microalgae versus conventional crops (Awasthi and Singh, 2011).
Crops Annual yield (tons/ha)
Sugar cane 54-125
Sweet sorghum 35-70
Soybean 1.1-4.0
Sweet potato 10-40
Trees 20-50
Microalgae 800-1600
Two methods of cultivation are used for realizing the biosynthesis abilities of
natural and modified strains of autotrophic microalgae: in photobioreactors (PBRs) and in
open cultivators. Cultivation can be conducted in batch, semi-batch, and continuous systems.
In a continuous system, two types can be used: turbidostat and chemostat culture. Algae can
be produced in closely-controlled laboratory methods to less predictable methods in outdoor
tanks.
22.2.1 Open pond systems
Open pond systems are shallow ponds in which algae are cultivated. Nutrients can be
provided through runoff water from nearby land areas or by channelling the water from
sewage/water treatment plants. The water is typically kept in motion by paddle wheels or
rotating structures, and some mixing can be accomplished by appropriately designed
guides. Algal cultures can be defined (one or more selected strains), or are made up of
an undefined mixture of strains (Borowitzka 1988, Chaumont, 1993), Boichenko and
Hoffmann, 1994, Awasthi and Singh 2011).
22.2.2 Indoor culture / closed culture
Vessels such as tubes, flasks, carboys, bags, etc. or ponds covered with green house or
usually a photobioreactor which allows control over illumination, temperature, nutrient
level, contamination with predators and other competing algae can be used. Researchers
also took the path of creating heterotrophic strains of algae from obligate photoautotrophs due
297
to inadequate illuminance. Heterotrophic cultivation of micro algae for lipids production does
not involve CO2 mitigation and wastewater treatment programme along with production of
algal biofuel. A photo bioreactor is equipment that is used to harvest algae. Photo bioreactors
can be set up to be continually harvested (the majority of the larger cultivation systems),
or by harvesting a batch at a time (like polyethylene bag cultivation).
Some photo bioreactors types include: tubular photo bioreactors, flat-plated photo
bioreactors, an inclined triangular tubular photo bioreactor, rectangular tanks, continuous
stirred tank reactors (CSTR), helical coils made of plastic tubing placed across a
column-like structure, square tubular reactors consist of plastic tubing arranged in a
series of squares (Awasthi and Singh, 2011).
22.3 Harvesting Algae
Conventional processes used to harvest micro-algae include concentration through
centrifugation (Briens et al., 2008), foam fractionation (Brown et al., 1997), flocculation
(Brown et al., 1997, Canakci et al., 2001), membrane filtration (Chisti, 2007) and
ultrasonic separation (Chynoweth et al., 1993). However, most harvesting methods still
involve economic or technical drawbacks, such as a high energy cost, flocculant
toxicity, or non-feasibility of scaling-up. The harvesting of algal cells by flocculation is
more convenient than centrifugation or gravity filtration, because it allows large
quantities of culture to be treated. A variety of chemicals have been tested as flocculants
and the most effective was found to be aluminum sulfate followed by certain cationic
polyelectrolyte (Conover, 1975). The flocculating reactions of an algal biomass are
particularly sensitive to the pH, properties of the cellular surface, concentrations of the
flocculants and divalent cations, ionic strength of the culture solution and other factors
(Craggs et al., 1996, Csordas and Wang, 2004, and Awasthi and Singh, 2011). High-density
algal cultures can be concentrated by either chemical flocculation or centrifugation.
22.4 Algal drying
Dewatering/drying process reduces the water content of the algae prior to oil extraction
process. The algae paste obtained from filtration/centrifugation contains as much as ca.
90% water content. Drying algae to ca. 50% water content is necessary to produce a solid
material that can be easily handled. Solar drying, a popular and inexpensive method, is used
commercially in grains and timber drying. However, it requires a considerable area of land. A
more efficient method would make use of the low grade waste heat from the power
298
plant to dry the algae contained in a vessel. The biomass harvested from the attached culture
system is paste-like pulpy slurry having a water content to that of the cell pellet
centrifuged from the suspension culture system. This implies a great advantage of the
attached algal culture system in terms of ease of biomass harvesting (Das and Veziroglu,
2001).
22.5 Algae Oil Extraction
Oil extraction from algae is a hotly debated topic currently because this process is one of the
more costly processes, which can determine the sustainability of algae-based biodiesel. In
terms of the concept, the idea is quite simple: Harvest the algae from its growth medium
(using an appropriate separation process), and extract the oil out of it. Extraction can be
broadly categorized into two methods:
22.5.1 Mechanical methods
The mechanical methods are further classified into:
• Expression/Expeller press
• Ultrasonic-assisted extraction
22.5.2 Chemical methods
The chemical methods are further classified into:
• Hexane Solvent Method
• Soxhlet extraction
• Supercritical fluid Extraction
Each of these methods has drawbacks:
1. The mechanical press generally requires drying the algae, which is energy intensive
2. The use of chemical solvents present safety and health issues
3. Supercritical extraction requires high pressure equipment that is both expensive and
energy intensive. Apart from these, there are some other methods which are not well-
known. This includes the following:
i. Enzymatic extraction - Enzymatic extraction uses enzymes to degrade the
cell walls with water acting as the solvent, this makes fractionation of the oil
much easier. The costs of this extraction process are estimated to be much
greater than hexane extraction.
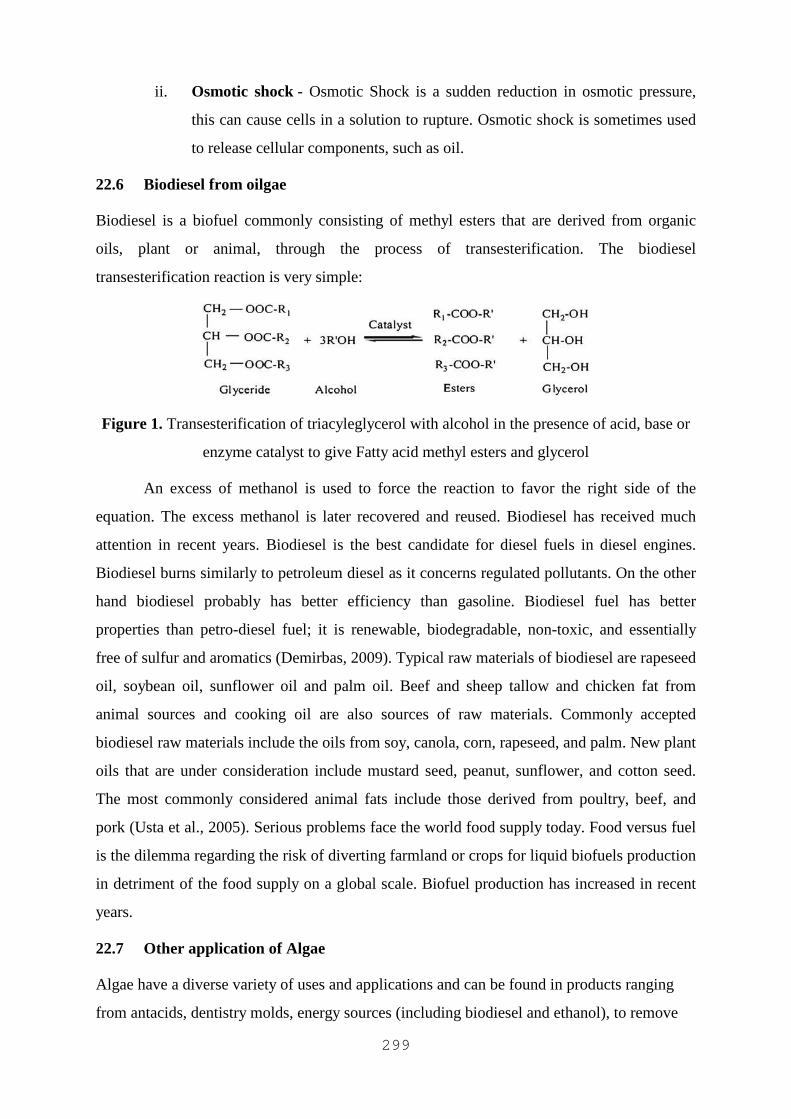
299
ii. Osmotic shock - Osmotic Shock is a sudden reduction in osmotic pressure,
this can cause cells in a solution to rupture. Osmotic shock is sometimes used
to release cellular components, such as oil.
22.6 Biodiesel from oilgae
Biodiesel is a biofuel commonly consisting of methyl esters that are derived from organic
oils, plant or animal, through the process of transesterification. The biodiesel
transesterification reaction is very simple:
Figure 1. Transesterification of triacyleglycerol with alcohol in the presence of acid, base or
enzyme catalyst to give Fatty acid methyl esters and glycerol
An excess of methanol is used to force the reaction to favor the right side of the
equation. The excess methanol is later recovered and reused. Biodiesel has received much
attention in recent years. Biodiesel is the best candidate for diesel fuels in diesel engines.
Biodiesel burns similarly to petroleum diesel as it concerns regulated pollutants. On the other
hand biodiesel probably has better efficiency than gasoline. Biodiesel fuel has better
properties than petro-diesel fuel; it is renewable, biodegradable, non-toxic, and essentially
free of sulfur and aromatics (Demirbas, 2009). Typical raw materials of biodiesel are rapeseed
oil, soybean oil, sunflower oil and palm oil. Beef and sheep tallow and chicken fat from
animal sources and cooking oil are also sources of raw materials. Commonly accepted
biodiesel raw materials include the oils from soy, canola, corn, rapeseed, and palm. New plant
oils that are under consideration include mustard seed, peanut, sunflower, and cotton seed.
The most commonly considered animal fats include those derived from poultry, beef, and
pork (Usta et al., 2005). Serious problems face the world food supply today. Food versus fuel
is the dilemma regarding the risk of diverting farmland or crops for liquid biofuels production
in detriment of the food supply on a global scale. Biofuel production has increased in recent
years.
22.7 Other application of Algae
Algae have a diverse variety of uses and applications and can be found in products ranging
from antacids, dentistry molds, energy sources (including biodiesel and ethanol), to remove
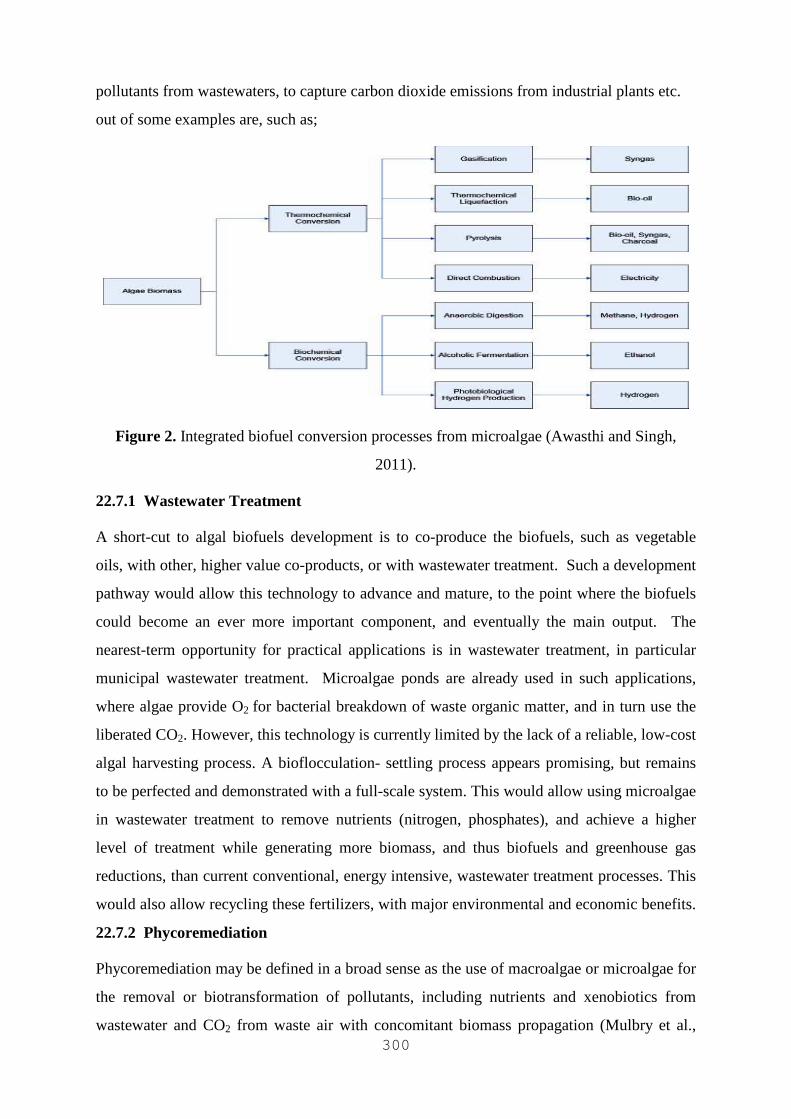
300
pollutants from wastewaters, to capture carbon dioxide emissions from industrial plants etc.
out of some examples are, such as;
Figure 2. Integrated biofuel conversion processes from microalgae (Awasthi and Singh,
2011).
22.7.1 Wastewater Treatment
A short-cut to algal biofuels development is to co-produce the biofuels, such as vegetable
oils, with other, higher value co-products, or with wastewater treatment. Such a development
pathway would allow this technology to advance and mature, to the point where the biofuels
could become an ever more important component, and eventually the main output. The
nearest-term opportunity for practical applications is in wastewater treatment, in particular
municipal wastewater treatment. Microalgae ponds are already used in such applications,
where algae provide O2 for bacterial breakdown of waste organic matter, and in turn use the
liberated CO2. However, this technology is currently limited by the lack of a reliable, low-cost
algal harvesting process. A bioflocculation- settling process appears promising, but remains
to be perfected and demonstrated with a full-scale system. This would allow using microalgae
in wastewater treatment to remove nutrients (nitrogen, phosphates), and achieve a higher
level of treatment while generating more biomass, and thus biofuels and greenhouse gas
reductions, than current conventional, energy intensive, wastewater treatment processes. This
would also allow recycling these fertilizers, with major environmental and economic benefits.
22.7.2 Phycoremediation
Phycoremediation may be defined in a broad sense as the use of macroalgae or microalgae for
the removal or biotransformation of pollutants, including nutrients and xenobiotics from
wastewater and CO2 from waste air with concomitant biomass propagation (Mulbry et al.,
301
2008, Olguın, 2003, Moreno, 2008, and Olguın et al., 2004).There are numerous processes of
treating water, industrial effluents and solid wastes using microalgae aerobically as well as
anaerobically. Remediation is generally subject to an array of regulatory requirements, and
also can be based on assessments of human health and ecological risks where no legislative
standards exist. Recent studies have shown that microalgae can indeed support the aerobic
degradation of various hazardous contaminants (Munoz and Guieysse, 2008, Safonova et al.,
2004).
22.7.3 Biofixation of carbon dioxide by microalgae
Biofixation of CO2 by microalgae mass cultures represents an advanced, climate friendly
biological process that enables the direct utilization of fossil CO2 streams produced from
concentrated sources. Mitigation of GHG emissions would result from the conversion of the
algal biomass to renewable biofuels (Demirbas, 2009, Demirbas, 2009, Demirbas and
Demirbas, 2010 and Demirbas, 2010). Fossil-fuel-fired power plants contribute
approximately one third of the total human-caused emissions of CO2. Fossil fuels will remain
the mainstay of energy production well into the 21st century. However, increased
concentrations of CO2 due to carbon emissions are expected unless energy systems reduce the
carbon emissions to the atmosphere.
22.8 Conclusions
Globally the principles of environmental sustainability and economic development are
intertwined. One cannot ignore the fact that a holistic approach is required to achieve targets
associated with management of natural resources. Decreased dependence on fossil based fuels
has set the foundation for research on alternative cleaner energy sources. To this end hyper
lipid producing microalgae as a resource has gained much attention. The spent biomass can
subsequently be used for the production of various other value added products such as
bioethanol or biomethane. Alternatively the biomass can be subjected to thermal conversion
for liquid fuel production. Microalgae cultivation for wastewater treatment coupled with
biofuel generation is therefore an attractive option in terms of reducing the energy cost, GHG
emissions, and the nutrient (fertiliser) and freshwater resource costs of biofuel generation
from microalgae. Biofixation of carbon dioxide (CO2) by microalgae mass cultures represents
an advanced, climate friendly biological process that enables the direct utilization of fossil
CO2 streams produced from fossil fueled-power plants. Algal oil could be the only quick
solution for solving global warming problem in short term.
302
This paper encompasses the potential algal species for integrated biofuel/ other
application. All these options have attracted much attention currently from researchers and
scientist globally, as the benefits of an environmentally friendly approach has been in the
forefront of sustainable development.
Acknowledgements
First and second authors thanks to their Institute, Centre of Energy and Environment,
National Institute of Technology, Hamirpur, Himachal Pradesh, for their support.
References
1. Awasthi M. and Singh R. K. (2011) Development of algae for the production of
bioethanol, biomethane, biohydrogen and biodiesel. Int J Curr Sci., 1: 14-23.
2. Borowitzka M.A. (1988) Fats, Oils and hydrocarbons. Microalgal biotechnology, 257-
287.
3. Boichenko A. and Hoffmann P. (1994) Photosynthetic hydrogen production in
prokaryotes and eukaryotes-occurrence, mechanism and functions. Photosynthetica,
30: 527-552.
4. Brown et al., (1997) Nutritional properties of microalgae for Mariculture.
Aquaculture, 151: 315-331.
5. Briens et al., (2008) Biomass valorization for fuel and chemicals production-a review.
Int J Chem React Eng. 6: 1-49.
6. Conover S.A.M. (1975) Partitioning of Nitrogen and Carbon in Cultures of the
Marin Diatom Thalassiosira Fluviatilis Supplied with Nitrate, Ammonium or
Urea. Mar. Biol, 32: 231.
7. Chaumont D. (1993) Biotechnology of algal biomass production: a review of
systems for outdoor mass culture. Journal of Applied Phycology, 5: 593-604.
8. Chynoweth et al., (1993) Biochemical methane potential of biomass and waste
feedstocks. Biomass and Bioenergy, 5: 95-111.
9. Craggs et al., (1996), Phosphorus removal from wastewater using an algal turf
scrubber. Water Sci. Technol, 33: 191-98.
10. Canakci et al., (2001) Biodiesel production from oils and fats with high free
fatty acids. Trans ASAE, 44: 1429-36.
303
11. Csordas A. and Wang J.K. (2004) An integrated photobioreactor and foam
fractionation unit for the growth and harvest of Chaetoceros spp. in open systems.
Aquacultural Engineering, 30: 15-30
12. Chisti Y. (2007) Biodiesel from microalgae. Biotechnology Advances, 25: 294-306.
13. Das D. and Veziroglu T.N. (2001) Hydrogen production by biological processes: a
survey of literature. Intern J Hydrogen Energy, 26: 13-28
14. Demirbas A.H. (2009) Inexpensive oil and fats feedstocks for production of biodiesel.
Energy Educ. Sci. Technol., 23:1–13.
15. Demirbas A.H. (2009) Inexpensive oil and fats feedstocks for production of biodiesel.
Energy Educ. Sci. Technol., 23:1–13.
16. Demirbas A. (2009) Production of biodiesel from algae oils. Energy Sources, 31:163–
8.
17. Demirbas A. and Demirbas M.F. (2010) Algae energy: algae as a new source of
biodiesel. London: Springer-Verlag.
18. Demirbas A.H. (2010) Biofuels for future transportation necessity. Energy Educ. Sci.
Technol., 26:13–23.
19. Moreno-Garrido I. (2008) Microalgae immobilization: current techniques and uses.
Bioresource Technol., 99:3949–64.
20. Mulbry et al., (2008) Treatment of dairy manure effluent using freshwater algae: algal
productivity and recovery of manure nutrients using pilot-scale algal turf scrubbers.
Bioresource Technol., 99:8137–42.
21. Munoz R. and Guieysse B. (2008) Algal–bacterial processes for the treatment of
hazardous contaminants: a review. Water Res., 40:2799–815.
22. Olguın E.J. (2003) Phycoremediation: key issues for cost-effective nutrient removal
processes. Biotechnol, 22:81–91.
23. Olguın et al., (2004) Cleaner production and environmentally sound biotechnology for
the prevention of upstream nutrient pollution in the Mexican coast of the Gulf of
Mexico. Ocean Coast Manage, 47: 641–70.
24. Safonova et al., (2004) Biotreatment of industrial waste–water by selected algal–
bacterial consortia. Eng Life Sci., 4:347–53.
25. Usta et al., (2005) Combustion of biodiesel fuel produced from hazelnut
soapstock/waste sunflower oil mixture in a diesel engine. Energy Convers Manag,
46:741–55.
304
CHAPTER 23
ISOLATION OF INDIGENOUS MICROALGAE AND BIOMASS COLLECTION FOR BIOFUEL PRODUCTION
Rajib Bandopadhyay, Chiranjib Banerjee, Arunabh Sarkar and Pratibha Gupta
Abstract
The present size of human civilization in terms of population and footprint has never been
witnessed before. The sustenance of this civilization at the present standard of living requires
huge amount of resources in terms of agricultural biomass, minerals and fossil fuels
(petroleum and coal). Minerals and fossil fuels are non renewable and their mining,
processing and use cause considerable disruption to the delicate processes of this planet
system, responsible for the well being of the entire biosphere. Algal biomass is a huge
resource as biomaterial feedstock, waiting to be harvested not only for fuel production but
also as animal feed and even human food, protein and vitamins. First micro algae were
cultured at the laboratory by O. Warburg in 1919. We have isolated and identified four fresh
water microalgae from nature. Biomass collection from microalgae is a big challenge for all
of us. There are few techniques like centrifugation, filtration, electro coagulation, dispersed
air electro coagulation and salt precipitation. We have demonstrated new technique like
flocculation using starch grafted polymer, cationic guar gum plant source. These biomasses
have been further used for downstream processing like bio hydrogen production and lipid
estimations. We used TAP-S media for hydrogen production. Almost all the microalgae
produced hydrogen but Chlamydomonas sp CRP7 showed better result. The total lipid was
found increase with nitrogen deprivation. All the microalgae have been characterized using
SEM, ITS studies for their genus and species confirmation.
23.1 Introduction
Irreversible depletion of traditional fossil fuels because of the rapid development of new
growing economics coupled with accumulation of green house gases (GHG) derived from
there burning has not only created energy insecurity but also a major problem of global
warming to this planet [Amaro et al., 2012]. Comparing to other forms of renewable energy
(eg; wind, tidal and solar) the chemical energy of biodiesel make it more suitable to be used
in the existing diesel engines or after blending it to certain ratios with petrodiesel. First
generation biofuel i.e. biodiesel and bioethanol are derive from food and oil crops which
305
includes sugarcane, maize, palm, soybean, rape seed, canola etc. Although the production
methods, conversion technologies, and markets are well established, producing the first
generation biodiesel at required scale have generated lots of issues like redirecting food crops,
arable land, freshwater, and fertilizer to fuel production. Second generation biofuel are
derived from non-food biofeed stocks like Jatropa, agriculture forestry and municipal solid
wastes, these fuel resolves food vs. fuel problem, more efficient and environmental friendly,
with less requirement of farm land but still it faces the scalable problem to meet our desired
requirement[ de Boer et al., 2012]. These issues have resulted in the development of the third
generation biofuel derived from microalgae.
23.1.1 Advantages of microalgae for biodiesel production includes
Microalgae can be grown on non arable land and waste water in this way it resolves
food vs. fuel issues. Microalgae can be grown all the year round; therefore the oil production
from microalgae exceeds the best oil seed crops. Microalgae have high growth potential and
even the oil content of many species ranges from 20-50% dry weight of biomass.Algae do not
require any herbicide, pesticide and weedicide for their cultivation.Microalgal biomass
production fixes waste CO2 and therefore improves the air quality also.Even the metabolic
pathway of the the microalgae can be easily modulated by just varying the culture condition.
This phenomenon can be adopted for critical R&D to enhance the oil production from
microalgae [Brennan and Owende, 2009; Mata et al., 2010]. Not only the appropriate site and
the type of production system is only responsible for the better productivity but also selection
of specific algae also plays an critical role in determining the overall productivity both
qualitatively and quantitatively. Following are the criterias that are generally considered for
the selection of microalgae’s for the biodiesel production [Lam and Lee, 2012]:
• Lipid content in percentage dry biomass.
• Growth rate in per unit time in per unit volume.
• Resistance to environmental changes and contamination.
• Simplicity for biomass separation and processing.
• Possibility of getting other valuable compounds.
A major hurdle for large scale economical production for the biofuel and other valued
products is the harvesting of relatively dilute algae from the medium in which they are grown
as it is one of the major energy input step during the whole process. Numerous techniques
have been available to harvest algae from the media or solution. Centrifugation, filtration and
settling are commonly employed where centrifugation is highly effective, for the conventional
306
filtration systems microalgae are too small as they clog filters [Schlesinger et al., 2012], both
centrifugation and filtration is costly and energy intensive and therefore economically not
feasible for large scale production, and settling is a very slow and time consuming process
which works on large diameter algae only [Scholz et al., 2011].
Flocculation either by natural means or by chemically induced is one of the promising
approaches for the harvesting of algae. In our research up we found that microalgaes have
shown excellent aggregation with cationic polymers derived from tamarind, cassia (data not
published).and guar gum [Banerjee et al, 2013].
Most of the algal cells are small in size, even though they are larger than true colloids,
algae posses many surface properties similar to true colloids. Scattered algal cells form a
stable microbial suspension which possesses chemically reactive cellular surface charge
because of the ionizable functional group present on the cellular surface. Since the stability of
algal suspension depends on the forces interacting among algal cells and also between algal
cells and water, algae can be considered a hydrophilic biocolloids. A better flocculation of
such negatively charged colloidal practical by cationic polymer is possible. These polymer
molecules attach themselves to one or more site on the surface of algae and a part of the
polymer also attaches itself to other algae in this way it forms an algae polymer matrix and
gets flocculated [Tenney et al., 1969].
The variation in the flocculation efficiency differs not only with the different algae but
also with the dosage of polymer [Wyatt et al., 2012]. We have also studied the harvesting of
freshwater microalgae (Chlorella sp. CB4) biomass by using polyacrylamide grafted starch
(St-g-PAM) St-g-PAM [Banerjee et al., 2012a] has been synthesized by microwave-assisted
method (i.e. synthesis based on free radical mechanism using microwave radiation in
synergism with ceric ammonium nitrate, to generate free radicals on the starch backbone).
Various grades of the graft copolymer were synthesized and optimized by varying the ceric
ammonium nitrate (CAN) and acrylamide (monomer) concentration. The process of synthesis
involved microwave irradiation of the reaction mixture until it sets into a viscous gel like
mass. The flocculation efficacy of polyacrylamide grafted starch has been investigated
through standard ‘Jar test’ procedure, in algal culture solution. The flocculation efficacy has
been determined in terms of decrease in optical density (at 750 nm) of the supernatant
collected after completion of the jar test protocol and found 85% recovery of algal biomass
with just using 0.8 ppm dosage of St-g-PAM .The use of this polymer even does not interfere
with the quality of the harvested algal biomass and can be used for extraction of desired
307
compounds on large scale. But for flocculating using St-g-PAM is time taking so another
flocculating technique using cationic guar gum was also studied.
Cationic guar gum was carried out by the insertion of cationic moiety N-(3-chloro-2-
hydroxyl propyl) trimethyl ammonium chloride (CHPTAC) onto the polysaccharide backbone
of base polymer, which has shown better flocculation activity then St-g-PAM.
23.2 Materials and methods
23.2.1 Isolation and culturing
Chlorella sp CB4 and Chlamydomonas sp CRP7 were isolated through phototaxis followed
by plating in TAP agar medium (Banerjee et al., 2012b). Chlorella sp CB2 was isolated by
serial dilution technique and Desmodesmus sp CB1 was isolated by using microscopic
manipulation technique.
23.2.2 Scanning Electron Microscopy (SEM)
Scanning electron microscopy was performed using the isolated four microalgae. 500 µl of
the algal solution was diluted with 500 µl of water. The cells were washed three times using
distilled water by centrifugation at 3000 rpm for 3 minutes. Fixative glutaraldehyde was used
and dehydrated using series of acetone [Kaur et al., 2012].
23.2.3 Isolation of DNA and ITS region amplification
Before DNA isolation the algal cells were pelleted at 3000 rpm and washed for 3 to 4 times
with distilled water to remove the adhering salts and metabolites so that they don’t inhibit in
downstream processing of DNA. Algal DNA was isolated [Alvarez et al., 2006].
PCR amplification of ITS1, 5.8S, and ITS2 regions was performed by PCR using the
following primers: Forward: 5´- GAAGTCGTAACAAGGTTTCC-3´ and Reverse: 5´-
TCCTGGTTAGTTTCTTTTCC-3´ [Timmins et al., 2009] The amplification conditions were
95 ºC for 4 min followed by 35 cycles of 45 s denaturation at 94 ºC, 1 min at 60 ºC as
annealing temperature and 1 min extension at 72 ºC with a final extension of 72ºC for 10 min.
The amplified products were separated by size on 1.0 % agarose gels found to in the range of
700–800 bp and are purified according to pure link PCR purification kit (Invitrogen).
23.2.4 Hydrogen production
For hydrogen production all the isolated algae (Chlorella sp CB2, Desmodesmus sp CB1,
Chlamydomonas sp CRP7 and Chlorella sp CB4) were harvested at its mid log phase during
their growth. The culture was flushed with nitrogen for 15 minutes to remove all the dissolve
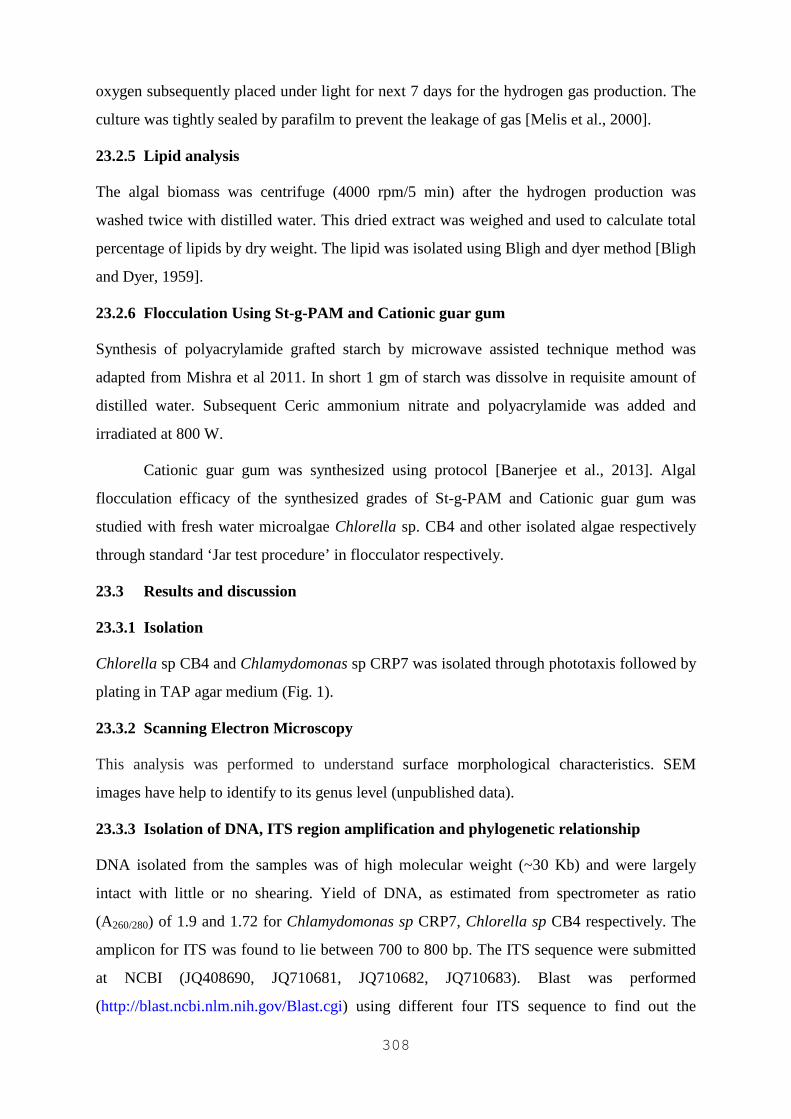
308
oxygen subsequently placed under light for next 7 days for the hydrogen gas production. The
culture was tightly sealed by parafilm to prevent the leakage of gas [Melis et al., 2000].
23.2.5 Lipid analysis
The algal biomass was centrifuge (4000 rpm/5 min) after the hydrogen production was
washed twice with distilled water. This dried extract was weighed and used to calculate total
percentage of lipids by dry weight. The lipid was isolated using Bligh and dyer method [Bligh
and Dyer, 1959].
23.2.6 Flocculation Using St-g-PAM and Cationic guar gum
Synthesis of polyacrylamide grafted starch by microwave assisted technique method was
adapted from Mishra et al 2011. In short 1 gm of starch was dissolve in requisite amount of
distilled water. Subsequent Ceric ammonium nitrate and polyacrylamide was added and
irradiated at 800 W.
Cationic guar gum was synthesized using protocol [Banerjee et al., 2013]. Algal
flocculation efficacy of the synthesized grades of St-g-PAM and Cationic guar gum was
studied with fresh water microalgae Chlorella sp. CB4 and other isolated algae respectively
through standard ‘Jar test procedure’ in flocculator respectively.
23.3 Results and discussion
23.3.1 Isolation
Chlorella sp CB4 and Chlamydomonas sp CRP7 was isolated through phototaxis followed by
plating in TAP agar medium (Fig. 1).
23.3.2 Scanning Electron Microscopy
This analysis was performed to understand surface morphological characteristics. SEM
images have help to identify to its genus level (unpublished data).
23.3.3 Isolation of DNA, ITS region amplification and phylogenetic relationship
DNA isolated from the samples was of high molecular weight (~30 Kb) and were largely
intact with little or no shearing. Yield of DNA, as estimated from spectrometer as ratio
(A260/280) of 1.9 and 1.72 for Chlamydomonas sp CRP7, Chlorella sp CB4 respectively. The
amplicon for ITS was found to lie between 700 to 800 bp. The ITS sequence were submitted
at NCBI (JQ408690, JQ710681, JQ710682, JQ710683). Blast was performed
(http://blast.ncbi.nlm.nih.gov/Blast.cgi) using different four ITS sequence to find out the
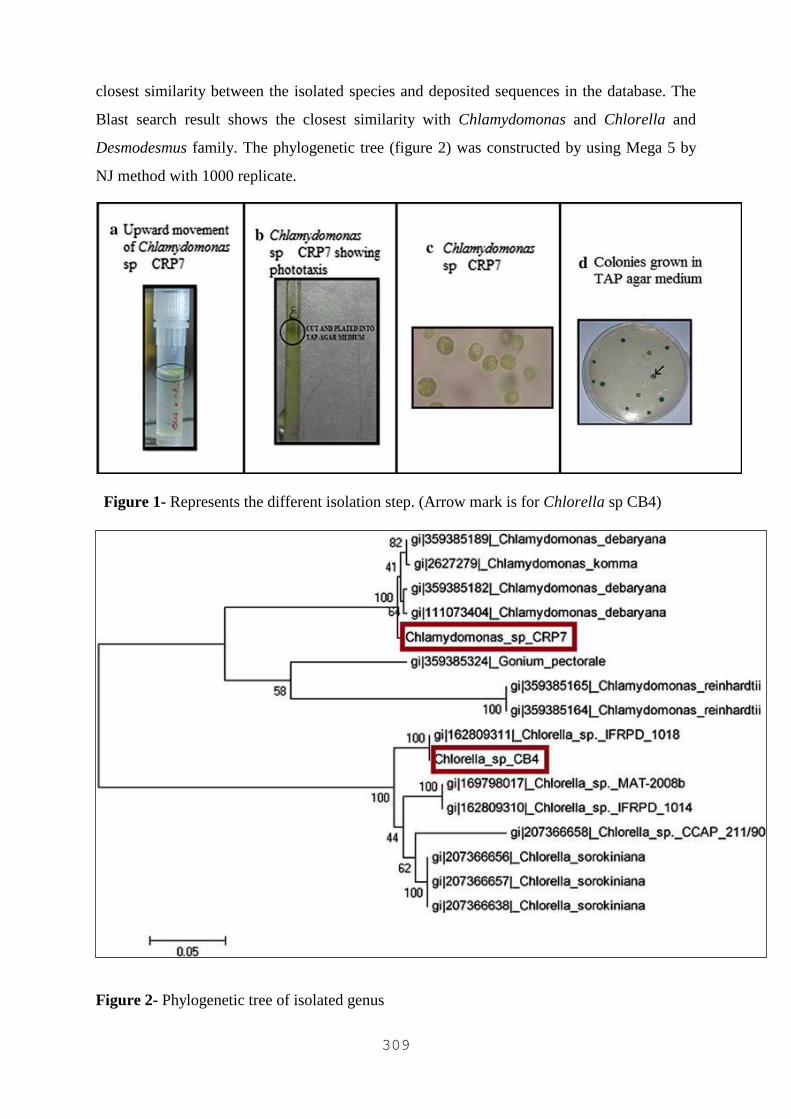
309
closest similarity between the isolated species and deposited sequences in the database. The
Blast search result shows the closest similarity with Chlamydomonas and Chlorella and
Desmodesmus family. The phylogenetic tree (figure 2) was constructed by using Mega 5 by
NJ method with 1000 replicate.
Figure 1- Represents the different isolation step. (Arrow mark is for Chlorella sp CB4)
Figure 2- Phylogenetic tree of isolated genus
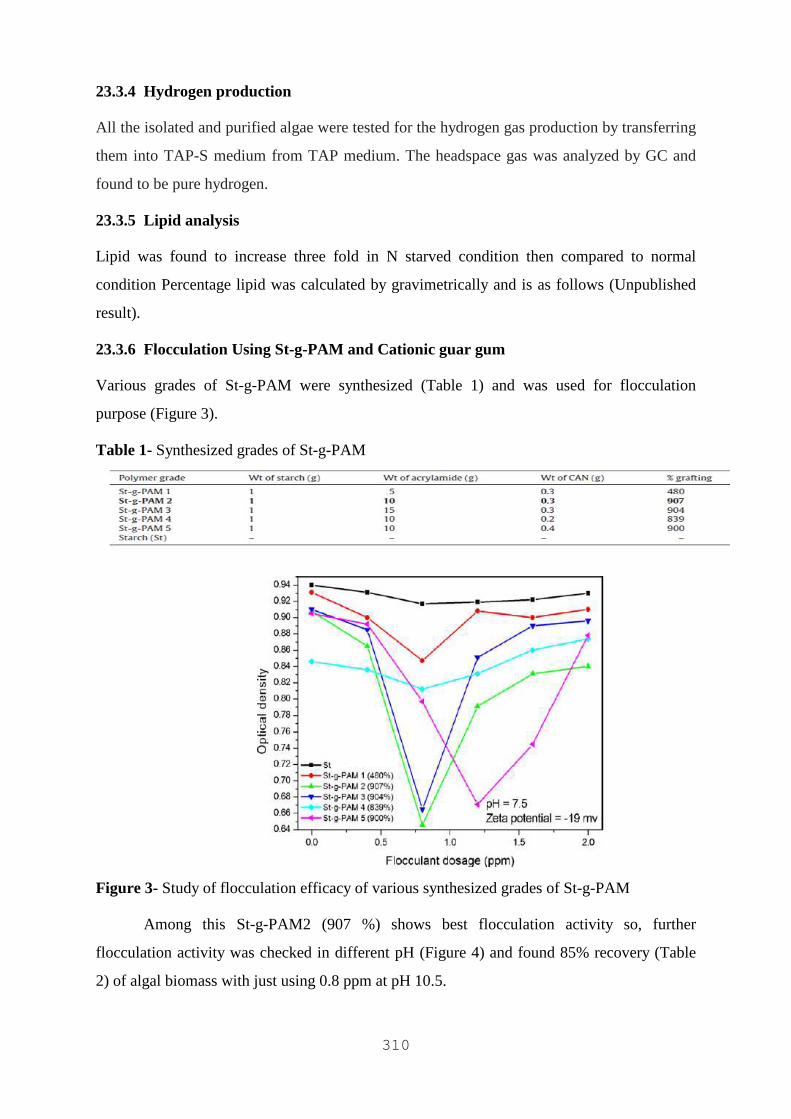
310
23.3.4 Hydrogen production
All the isolated and purified algae were tested for the hydrogen gas production by transferring
them into TAP-S medium from TAP medium. The headspace gas was analyzed by GC and
found to be pure hydrogen.
23.3.5 Lipid analysis
Lipid was found to increase three fold in N starved condition then compared to normal
condition Percentage lipid was calculated by gravimetrically and is as follows (Unpublished
result).
23.3.6 Flocculation Using St-g-PAM and Cationic guar gum
Various grades of St-g-PAM were synthesized (Table 1) and was used for flocculation
purpose (Figure 3).
Table 1- Synthesized grades of St-g-PAM
Figure 3- Study of flocculation efficacy of various synthesized grades of St-g-PAM
Among this St-g-PAM2 (907 %) shows best flocculation activity so, further
flocculation activity was checked in different pH (Figure 4) and found 85% recovery (Table
2) of algal biomass with just using 0.8 ppm at pH 10.5.
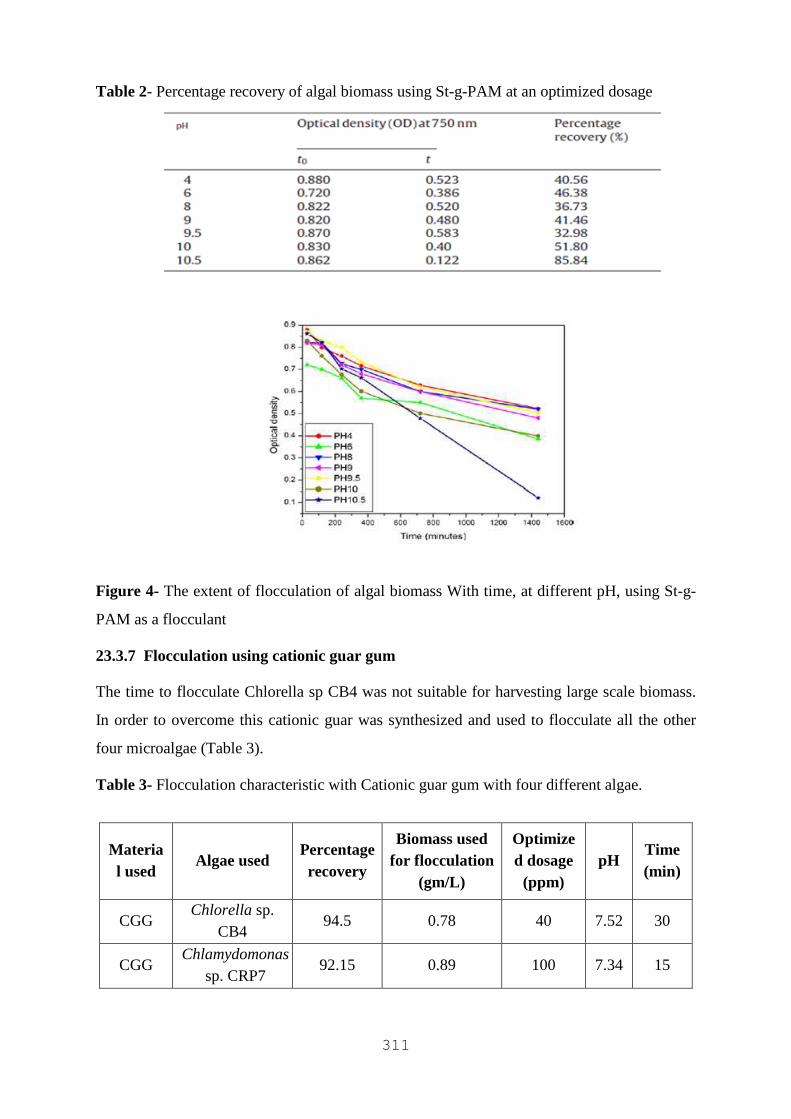
311
Table 2- Percentage recovery of algal biomass using St-g-PAM at an optimized dosage
Figure 4- The extent of flocculation of algal biomass With time, at different pH, using St-g-
PAM as a flocculant
23.3.7 Flocculation using cationic guar gum
The time to flocculate Chlorella sp CB4 was not suitable for harvesting large scale biomass.
In order to overcome this cationic guar was synthesized and used to flocculate all the other
four microalgae (Table 3).
Table 3- Flocculation characteristic with Cationic guar gum with four different algae.
Material used
Algae used Percentage recovery
Biomass used for flocculation
(gm/L)
Optimized dosage (ppm)
pH Time (min)
CGG Chlorella sp.
CB4 94.5 0.78 40 7.52 30
CGG Chlamydomonas
sp. CRP7 92.15 0.89 100 7.34 15
312
23.4 Conclusions
In present study we have characterize different microalgal strains through Molecular,
microscopical, bioharvesting and lipid techniques. All the isolated strain is able to produce
hydrogen in TAP-S medium. Morphological features through light microscopy are usually not
reliable to identify the microalgae. Therefore, SEM studies and molecular characterization are
needed to identify into its genus level. A phylogenetic analysis was done on basis of ITS1-
5.8s-ITS2 region. Though, algal harvesting is also a challenging task for its further processing
towards many downstream applications. St-g-PAM and cationic guar gum (CGG) was
synthesized and used it for the flocculation purpose which bypass the energy consuming
centrifugation step. CGG neutralize negative charge of the algae cells resulting in
neutralization to form floc. The algal flocculation efficacy of CGG can be well explored for
commercial algal harvesting. Cationic guar gum was proved to be a better flocculant than St-
g-PAM towards harvesting.
References
1. Alvarez E.V., Lago-Leston, A., Pearson G.A., Serrao E.A., Procaccini G., Duarte
C.M. and Marba N (2006) Genomic DNA isolation from green and brown algae
(Caulerpales and Fucales) for microsatellite library construction. J Phycol., 42:741–
745.
2. Amaro H.M., Macedo A.C. and Malcata F.X. (2012) Microalgae: An alternative as
sustainable source of biofuels? Energy, 44:158-166.
3. Banerjee C., Bandopadhyay R. and Shukla P. (2012b) A simple novel agar diffusion
method for isolation of indigenous microalgae Chlamydomonas sp. CRP7 and
Chlorella sp. CB4 from operational swampy top soil. Indian J Microbiol, ISSN: 0046-
8991, DOI 10.1007/s12088-012-0295-6.
4. Banerjee C., Ghosh S., Sen G., Mishra S., Shukla P. and Bandopadhyay R. (2013)
Study of algal biomass harvesting using cationic guar gum from the natural plant
source as flocculant. Carbohydr. Polym., 92:675-681.
5. Banerjee C., Gupta P., Mishra S., Sen G., Shukla P. and Bandopadhyay R. (2012a)
Study of polyacrylamide grafted starch based algal flocculation towards applications
in algal biomass harvesting. Int J Biol Macromol, 51:456– 461.
313
6. Bhatnagar S.K., Saxena A. and Kraan, S. (2011) Algae based biofuels: A Review of
Challenges and Opportunities for Developing Countries. Food and Agriculture
Organization of the United Nations. Italy
7. Bligh E.G. and Dyer W.J. (1959) A rapid method of total lipid extraction and
purification. Can. J. Biochem. Physiol., 37:912–917.
8. Brennan L. and Owende P. (2009) Biofuels from microalgae—A review of
technologies for production, processing, and extractions of biofuels and co-products.
Renewable Sustainable Energy Rev., 14:557-577.
9. De Boer K., Moheimani N.R., Borowitzka M.A. and Bahri P.A. (2012) Extraction and
conversion pathways for microalgae. J Appl Phycol. DOI 10.1007/s10811-012-9835-
z.
10. Kaur S., Sarkar M., Srivastava R.B., Gogoi H.K. and Kalita M.C. (2011) Fatty acid
profiling and molecular characterization of some freshwater microalgae from India
with potential for biodiesel production. New Biotechnol, 29:332-344.
11. Lam M.K. and Lee K.T. (2012) Microalgae biofuels: A critical review of issues,
problems and the way forward. Biotechnol Adv., 30:673–690.
12. Mata T.M., Martins A.M. and Caetano N.S. (2010) Microalgae for biodiesel
production and other applications: A review. Renewable Sustainable Energy Rev.,
14:217–232.
13. Melis A., Zhang L., Forestier M., Ghirardi M.L. and Seibert M. (2000) Sustained
photobiological hydrogen gas production upon reversible inactivation of oxygen
evolution in the green alga Chlamydomonas reinhardtii. Plant Physiol., 122:127–136.
14. Mishra S., Mukul A., Sen G. and Jha U. (2011) Microwave assisted synthesis of poly-
acrylamide grafted starch (St-g-PAM) and its applicability as flocculant for water
treatment. Int. J. Biol. Macromol., 48:106-111.
15. Müller T., Philippi N., Dandekar T., Schultz J., Wolf M. (2007) Distinguishing
species. RNA, 13:1469-1472.
16. Schlesinger A., Eisenstadt D., Bar-Gil A., Carmely H., Einbinder S. and Gressel J.
(2012) Inexpensive non-toxic flocculation of microalgae contradicts theories;
overcoming A major hurdle to bulk algal production Biotechnol Adv., 30:1023–1030.
17. Scholz M., Hoshino T., Johnson D., Riley M.R. and Cuello J. (2011) Flocculation of
wall-deficient cells of Chlamydomonas reinhardtii mutant cw15 by calcium and
methanol. Biomass Bioenerg, 35: 4835–4840.

314
18. Tenney M.W., JR W.F.E.,.Schuessler R.G. and.Pavoni J.L.(1969) Algal Flocculation
with Synthetic Organic Polyelectrolytes. Appl Microbiol., 18:965–971.
19. Timmins M., Thomas-Hall S.R., Darling A., Zhang E., Hankamer B., Marx U.C. and
Schenk P.M. (2009) Phylogenetic and molecular analysis of hydrogen-producing
green algae. J. Exp. Bot., 60:1691-1702.
20. Wyatt N.B., Gloe L.M., Brady P.V., Hewson J.C., Grillet A.M., Hankins M.G. and Pohl
P.I. (2012) Critical Conditions for Ferric Chloride-Induced Flocculation of Freshwater
Algae. Biotechnol. Bioeng., 109:493–501.
315
CHAPTER 24
FACTORS INFLUENCING ALGAL GROWTH
Jeewan Jyoti and Mamta Awasthi
Abstract
Algae, plant-like organisms that capture light energy through photosynthesis and use it to
convert inorganic substances into organic matter. Algae can be used for biodiesel production,
ethanol production, hydrogen production and also have varied applications as food
supplements, fertilizers, pharmaceuticals, cosmetics, aquaculture and pollution control
systems. The wastewater treatments with microalgae require good algal growth but there are
various factors that influence it. Some significant factors affecting the growth of algae are
light, temperature, pH, buoyancy, nutrients and biological factors. The growth limiting factor
is rather light, especially at higher latitudes. Besides physical, chemical and biological factors,
operational factors also play an important role. The aim is mainly to explain the most
important factors that affect algal growth and to provide some recommendation on cultivation
methods employed for algal growth.
24.1 Introduction
Algae are as one of the oldest life-forms. They are plant like organisms (thallophytes), i.e.
lacking roots, stems and leaves, with no disinfected covering of cells around the reproductive
cells and have chlorophyll a as their primary photosynthetic pigment. (Darmarki, 2012).
Algae are found in all water bodies (i.e. fresh-water and sea-water). They are also found in
soils, on plants (terrestrial and aquatic) and form symbiotic associations with a very wide
range of plants and animals. Two kinds of algae exist: macroalgae, also known as seaweed
and microalgae. Microalgae covers all unicellular and simple multi-cellular microorganisms,
including both prokaryotic microalgae, i.e. cyanobacteria (Chloroxybacteria), and eukaryotic
microalgae, e.g. green algae (Chlorophyta) and it can be seen with the aid of a microscope.
Unlike higher plants, microalgae do not have roots, stems and leaves. Microalgae, capable to
perform photosynthesis, are important for life on earth; they produce around half of the
atmospheric oxygen and use at the same time the greenhouse gas carbon dioxide to grow
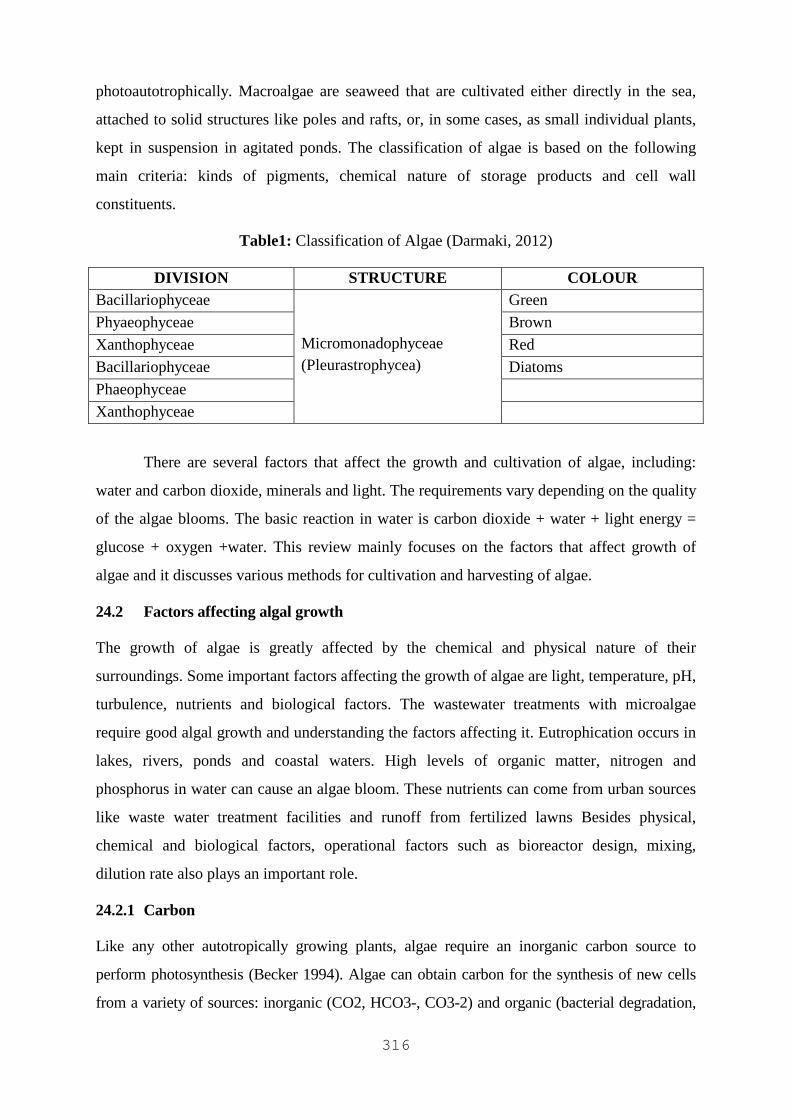
316
photoautotrophically. Macroalgae are seaweed that are cultivated either directly in the sea,
attached to solid structures like poles and rafts, or, in some cases, as small individual plants,
kept in suspension in agitated ponds. The classification of algae is based on the following
main criteria: kinds of pigments, chemical nature of storage products and cell wall
constituents.
Table1: Classification of Algae (Darmaki, 2012)
DIVISION STRUCTURE COLOUR Bacillariophyceae
Micromonadophyceae (Pleurastrophycea)
Green
Phyaeophyceae Brown
Xanthophyceae Red
Bacillariophyceae Diatoms
Phaeophyceae
Xanthophyceae
There are several factors that affect the growth and cultivation of algae, including:
water and carbon dioxide, minerals and light. The requirements vary depending on the quality
of the algae blooms. The basic reaction in water is carbon dioxide + water + light energy =
glucose + oxygen +water. This review mainly focuses on the factors that affect growth of
algae and it discusses various methods for cultivation and harvesting of algae.
24.2 Factors affecting algal growth
The growth of algae is greatly affected by the chemical and physical nature of their
surroundings. Some important factors affecting the growth of algae are light, temperature, pH,
turbulence, nutrients and biological factors. The wastewater treatments with microalgae
require good algal growth and understanding the factors affecting it. Eutrophication occurs in
lakes, rivers, ponds and coastal waters. High levels of organic matter, nitrogen and
phosphorus in water can cause an algae bloom. These nutrients can come from urban sources
like waste water treatment facilities and runoff from fertilized lawns Besides physical,
chemical and biological factors, operational factors such as bioreactor design, mixing,
dilution rate also plays an important role.
24.2.1 Carbon
Like any other autotropically growing plants, algae require an inorganic carbon source to
perform photosynthesis (Becker 1994). Algae can obtain carbon for the synthesis of new cells
from a variety of sources: inorganic (CO2, HCO3-, CO3-2) and organic (bacterial degradation,
317
direct utilization). Microalgae assimilate inorganic carbon in photosynthesis. The overall
stoichiometric formula for photosynthesis is:
6H2O+6CO2+light=> C6H12O6+6O2
The organic carbon sources are assimilated either chemo or photoheterotrophically.
Atmospheric carbondioxide is provided to algal cultures by means of aeration. Ambient
atmospheric concentration of carbondioxide is 0.033%, which is below optimum value for the
algal growth, therefore, extra carbondioxide can be provided with air enriched with 1-5%
carbondioxide. Addition of carbondioxide results in decrease of pH i.e. inorganic carbon in
form of CO3-2, which is not assimilated by algae. Therefore, decreased availability of
carbondioxide may act limiting on algal growth.
Table 2: Factors that influence algal growth (Becker,1988)
Abiotic factors Light (quality and quantity)
Biotic factors Pathogens( bacteria, fungi, viruses), predation by zooplanktons, competition between the species.
Physical and chemical factors Temperature, Nutrients concentration, oxygen, carbon dioxide, pH, salinity, Toxic chemicals
Operational factors Mixing, dilution rate, depth, Addition of bicarbonates , harvesting frequency
24.2.2 Nutrients
Growth medium for algae must supply the inorganic elements that form algal cells. Besides
carbon, nitrogen and phosphorus are other very important nutrients to microalgae. Microalgae
have high nutrients requirement and are exhibiting this in high content of N and P, about 10%
and 1% respectively on a dry weight basis (Rosch, 2009). Ammonia, nitrate, nitrates and much
other dissolved organic nitrogen (urea, free- ammonia, peptides) are regarded as main sources of
nitrogen for microalgae. Nitrate can also be used, but it can be toxic at higher concentrations.
Some cyanobacteria are also capable of assimilating nitrogen in its elemental form from the
atmosphere. The average Nitrogen requirement for many green algae is approx 5-10% dry
weight or 5-50mM (Becker 1994). The increased levels of dissolved nutrients can change the
aquatic ecosystem by stimulating algal growth. Extensive nutrients discharged into the stream
will lead to eutrophication. Phosphorus is taken up by algae in form of orthophosphate which
require energy. When inorganic phosphorus is supplied for short span, the organic phosphorus is
converted to orthophosphate in presence of phosphates at cell surface. Microalgae stores excess
of phosphates within the cells in form of polyphosphates granules. It works in the absence of
318
available phosphorus for growth mechanism. Other than macronutrients (N and P), there are
some micronutrients essential for algal species such as Cu, Fe, Na, Si, Co, I, Se (Sriram, 2012)
24.2.3 Light
Light is an essential resource often limiting the growth rate of algae and is also a major factor
determining photosynthetic rate in algae. "Photosynthesis is a process that utilizes the light
energy to chemically synthesize molecules". Microalgae are phototroph’s which means they
obtain energy from light. Oswald 1988 reports that in outdoor ponds, more than 90% of total
incident solar energy can be converted into heat and less than 10% into chemical energy and
conversion efficiency is about only 2%. All microalgae are not able to float near the surface
therefore; the microalgae in deeper zone are least prone to light as water absorbs photosynthetic
active radiation (PAR). As a culture of microalgae grows and cell density increases, a higher
proportion of the photosynthetically active radiation is intercepted by algal cells close to the
surface of the cultivation vessel or pond before it can penetrate more deeply into the culture.
This reduction of the incident irradiance causes light limitation in the centre or bottom of the
culture which severely limits overall productivity. In addition, cells overexposed to light are
prone to photosystem damage via photoinhibition which can be repaired in the short term, but
only at the cost of metabolic resources (Campbell, 1995). Thus, phenomenon reduces the
efficiency of photon capture and ultimately limit solar energy conversion into biomass product.
This is the main reason why open raceway ponds are generally limited to a depth of no more
than 30 cm. Indeed, the occurrence of the saturation effect is one of the most serious limitations
for the efficiency of solar energy transformation by microalgae (Burlew, 1953). Moreover, in
dense cultures, the algal itself decreases the light availability due to internal shading therefore,
to prevent this , turbulence is essential as it exposes all cells to light for short period of time
making productivity high. Too much light can also affect the photosynthetic activity of algae
known as photoinhibition.
24.2.4 Temperature
Temperature increased to optimum level enhances algal growth rate. It is well known that
temperature exerts strong control over metabolic rate processes with cooling temperatures
causing an overall slowing of biological reaction kinetics. Overheating of algal cultures or algal
cultures cultivated in outdoor conditions at low temperature inhibits algal growth. Generally,
temperature around 15-25 deg cel seems to be suitable for algal species. To enable higher
temperatures in algal cultures, greenhouse can be used at higher latitudes. In temperate regions,
fluctuations in temperature occur on both daily and seasonal time scales. In peak summer
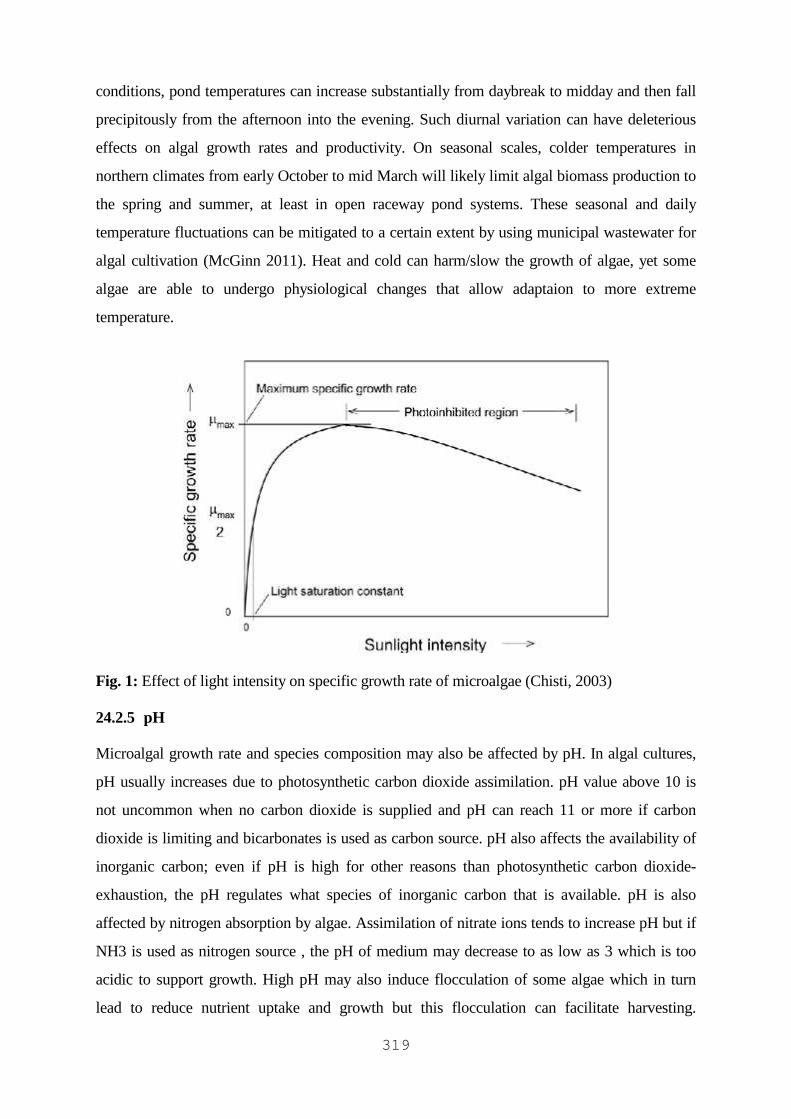
319
conditions, pond temperatures can increase substantially from daybreak to midday and then fall
precipitously from the afternoon into the evening. Such diurnal variation can have deleterious
effects on algal growth rates and productivity. On seasonal scales, colder temperatures in
northern climates from early October to mid March will likely limit algal biomass production to
the spring and summer, at least in open raceway pond systems. These seasonal and daily
temperature fluctuations can be mitigated to a certain extent by using municipal wastewater for
algal cultivation (McGinn 2011). Heat and cold can harm/slow the growth of algae, yet some
algae are able to undergo physiological changes that allow adaptaion to more extreme
temperature.
Fig. 1: Effect of light intensity on specific growth rate of microalgae (Chisti, 2003)
24.2.5 pH
Microalgal growth rate and species composition may also be affected by pH. In algal cultures,
pH usually increases due to photosynthetic carbon dioxide assimilation. pH value above 10 is
not uncommon when no carbon dioxide is supplied and pH can reach 11 or more if carbon
dioxide is limiting and bicarbonates is used as carbon source. pH also affects the availability of
inorganic carbon; even if pH is high for other reasons than photosynthetic carbon dioxide-
exhaustion, the pH regulates what species of inorganic carbon that is available. pH is also
affected by nitrogen absorption by algae. Assimilation of nitrate ions tends to increase pH but if
NH3 is used as nitrogen source , the pH of medium may decrease to as low as 3 which is too
acidic to support growth. High pH may also induce flocculation of some algae which in turn
lead to reduce nutrient uptake and growth but this flocculation can facilitate harvesting.
320
Therefore, to avoid extreme pH values, turbulence can be employed between water and air
which regulates pH, Most species are favoured by neutral pH, some species are tolerant to
higher pH ( Spirulina platensis at pH 9) or lower pH (Chlorococcum littorale at pH 4).
Increasing carbon dioxide concentration can lead to higher biomass productivity but will also
decrease pH, which can affect microalgal physiology.
24.2.6 Turbulence
Turbulence is defined as an eddy-like state of fluid motion. Local motion has important
consequences to microalgal cells. If it is too large, viscous stresses may mechanically damage
the cells or otherwise interfere with growth processes. If it is too small, vital mass transfer of
nutrients and wastes may be impeded. Thus the flow parameters that may be most important
to algal survival are the rate-of strain y and the shear stress . For algal cultures to succeed y
and values must be balanced. Large-scale turbulence is important in algal culturing in that it
can intermittently mix cells in dense cultures into lighted zones for maximum photosynthesis
and growth (Thomas and Gibson 1990).
24.3 Microalgae Cultivation Methods
There are two main groups of systems for cultivation of microalgae: Open and Closed
systems. Closed systems allow greater control of growth conditions, whereas open systems
largely depend on external factors and have contact with the open air.
24.3.1 Open ponds system
Microalgae can be cultivated in open ponds system such as lakes, lagoons, ponds and
artificial ponds or containers. Microalgae cannot be grown under control in open ponds
system. One of the major advantages of open ponds is that they are easier to construct and
operate than most closed systems. However, major defects in open ponds include poor light
utilization by the cells, evaporative losses, diffusion of CO2 to the atmosphere, and
requirement of large areas of land. Microalgae growth is effected by all pollutants in open
ponds system. However, it is not possible to control the productivity and the quantity of the
microalgae. In addition, microalgae can only be grown during certain period of the year when
all the conditions required for their growth are available. Also, another one of the major
problems of microalgae cultivation in open ponds system is the difficulty to harvest them.
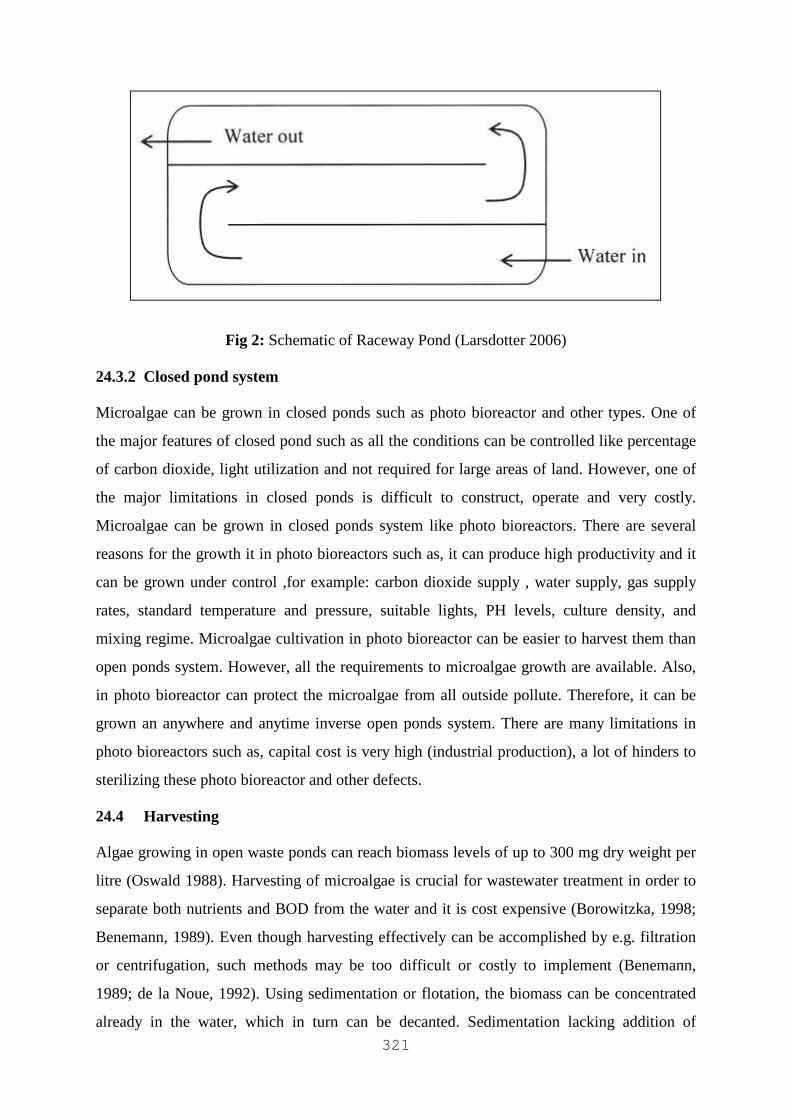
321
Fig 2: Schematic of Raceway Pond (Larsdotter 2006)
24.3.2 Closed pond system
Microalgae can be grown in closed ponds such as photo bioreactor and other types. One of
the major features of closed pond such as all the conditions can be controlled like percentage
of carbon dioxide, light utilization and not required for large areas of land. However, one of
the major limitations in closed ponds is difficult to construct, operate and very costly.
Microalgae can be grown in closed ponds system like photo bioreactors. There are several
reasons for the growth it in photo bioreactors such as, it can produce high productivity and it
can be grown under control ,for example: carbon dioxide supply , water supply, gas supply
rates, standard temperature and pressure, suitable lights, PH levels, culture density, and
mixing regime. Microalgae cultivation in photo bioreactor can be easier to harvest them than
open ponds system. However, all the requirements to microalgae growth are available. Also,
in photo bioreactor can protect the microalgae from all outside pollute. Therefore, it can be
grown an anywhere and anytime inverse open ponds system. There are many limitations in
photo bioreactors such as, capital cost is very high (industrial production), a lot of hinders to
sterilizing these photo bioreactor and other defects.
24.4 Harvesting
Algae growing in open waste ponds can reach biomass levels of up to 300 mg dry weight per
litre (Oswald 1988). Harvesting of microalgae is crucial for wastewater treatment in order to
separate both nutrients and BOD from the water and it is cost expensive (Borowitzka, 1998;
Benemann, 1989). Even though harvesting effectively can be accomplished by e.g. filtration
or centrifugation, such methods may be too difficult or costly to implement (Benemann,
1989; de la Noue, 1992). Using sedimentation or flotation, the biomass can be concentrated
already in the water, which in turn can be decanted. Sedimentation lacking addition of
322
chemicals is the most common technique in complete facilities. Flotation processes operate
more efficiently and rapidly than sedimentation and achieve a higher solids fraction (up to 7
%) in the concentrate, but these on the other hand can be more expensive (Mohn, 1988). To
ease sedimentation or flotation, prior flocculation is desirable. Many algal species are
particularly difficult to sediment without treatment due to their natural tendency to float in
order to catch enough light. Algae can be flocculated by addition of various chemical
flocculants such as alum, lime, FeCl3, cationic polyelectrolytes, and Ca(OH)2 (Benemann,
1989).
24.5 Conclusions
Microalgae are one of the most important bio-resources that are currently receiving a lot of
attention due to a variety of reasons. This paper provides us information about algae and its
classification. There are several factors influencing algal growth: abiotic factors such as light
(quality, quantity), temperature, nutrient concentration, O2, CO2, pH, salinity, and toxic
chemicals; biotic factors such as pathogens (bacteria, fungi, viruses) and competition by other
algae; operational factors such as mixing, dilution rate, depth. It also discuss about various
cultivation methods and harvesting methods.
References
1. Becker, E.W. (1988) Micro-algae for human and animal consumption, in Micro-algal
biotechnology, M.A. Borowitzka and L.J. Borowitzka, Editors. Cambridge University
press: Cambridge. p. 222–256.
2. Becker, E.W. (1994) Microalgae, Biotechnology and Microbiology. Cambridge:
Cambridge University Press.
3. Benemann, J.R. (1989) The future of microalgal biotechnology,min Algal and
cyanobacterial biotechnology, R.C. Cresswell,mT.A.V. Rees, and N. Shah, Editors.
Longman scientific & technical: Harlow, Essex, England. p. 317–337.
4. Borowitzka, M.A. (1998) Limits to growth, in Wastewater treatment with algae, Y.-S.
Wong and N.F.Y. Tam, Editors. Springer Verlag. p. 203–226.
5. Burlew, J.S. (1953) Current status of the large-scale culture of algae. In: Burlew JS
(ed) Algal culture from laboratory to pilot plant. Carnegie Institute of Washington
Publication 600, Washington, pp 3–23
323
6. Chisti et. al. (2003) A mechanistic model of photosynthesis in microalgae. Biotechnol
Bioeng , 81, p 459–73.)
7. Campbell D, Zhou G, Gustafsson P, Oquist G, Clarke AK (1995) Electron transport
regulates exchange of two forms of photosystem II D1 protein in the cyanobacterium
Synechococcus. EMBO J 14:5457–5466
8. Darmaki et. al. (2012) Cultivation and Characterization of Microalgae for Wastewater
Treatment. Proceedings of the World Congress on Engineering Vol I. ISBN: 978-988-
19251-3-8 ISSN: 2078-0958 (Print); ISSN: 2078-0966 (Online)
9. de la Noüe, J., Laliberté, G., and Proulx, D. (1992) Algae and waste water. J. Appl.
Phycol. 4: p. 247–254.
10. Larsdotter (2006). Wastewater treatment with microalgae – a literature review.
VATTEN 62:31–38
11. McGinn et. al ( 2011). Integration of microalgae cultivation with industrial waste
remediation for biofuel and bioenergy production: opportunities and limitations.
Photosynth Res. 109:231–247 , DOI 10.1007/s11120-011-9638-0.
12. Mohn, F.H. (1988) Harvesting of micro-algal biomass, in Micro-algal biotechnology,
M.A. Borowitzka and L.J. Borowitzka, Editors. Cambridge University Press:
Cambridge. P. 395-414.
13. Oswald, W.J. (1988) The role of microalgae in liquid waste treatment and
reclamation, in Algae and human affairs, C.A. Lembi and J.R. Waaland, Editors.
Cambridge University press: Cambridge. p. 255-281.
14. Richmond, A. (2004) Handbook of Microalgal Culture: Biotechnology and Applied
Phycology . Blackwell Science Ltd. ISBN 0–632–05953–2
15. Rosch et al. (2009) Microalgae-Opportunities and Challenges of an Innovative Energy
Source. 17th European Biomass conference and Exhibition, Hamburg, Germany.
16. S. Sriram and R. Seenivasan (2012) Microalgae Cultivation in Wastewater for
Nutrient Removal, J. Algal Biomass Utln. 3 (2): 9- 13
17. Thomas Weisse and Peter Stadler (2006). Effect of pH on growth, cell volume, and
production .p. 1708–1715.
18. William H. Thomas and Carl H. Gibson (1990). Effects of small-scale turbulence on
microalgae. Journal of Applied Phycology. 2: 71-77
324
CHAPTER 25
GROWTH CHARACTERISTICS OF CHLORELLA
PYRENOIDOSA CULTURED IN NUTRIENT ENRICHED
DAIRY WASTEWATER FOR POLLUTANT REDUCTION
AND LIPID PRODUCTIVITY
Vinayak V. Pathak, A.K. Chopra, Richa Kothari and V.V. Tyagi
Abstract
Culture of Chlorella pyrenoidosa (Unicellular microalga) was cultivated in batch culture
using Dairy wastewater (DWW) as a medium without supply of additional nutrients.
Characterization of wastewater was done just after sampling to measure the available
nutrients and organic load. Experiments were designed in batch mode for growth study, lipid
productivity and pollutant reduction efficiency. At initial level DWW was showing the
parametric range of higher side for most of parameters, like nitrate (66.4 mg/l) phosphate (21
mg/l), higher than permissible limit of discharge (BIS). Algal cell suspension (1% V/V) of
exponential phase was inoculated in different concentrations of wastewater in each set of
experiment. Significant amount of algal biomass was produced with efficient pollutant
reduction and lipid productivity.
Keywords: DWW, Pollutant reduction, lipid productivity
25.1 Introduction
Increasing awareness towards global climate change and sharp increase in fossil fuel price has
lead to interest in algal based biofuel production; however, algal biodiesel is still debatable in
terms of economic viability and sustainability. To reduce the price and enhance the
sustainability of algal biofuel, many processes like algal mediated wastewater treatment with
biodiesel production is introduced by many researchers. Coupling wastewater treatment with
algae cultivation for biofuel production may offer an economically viable and
environmentally friendly means for sustainable renewable algal based energy production
since enormous amount of water and nutrient (e.g. nitrogen and phosphorus) required for
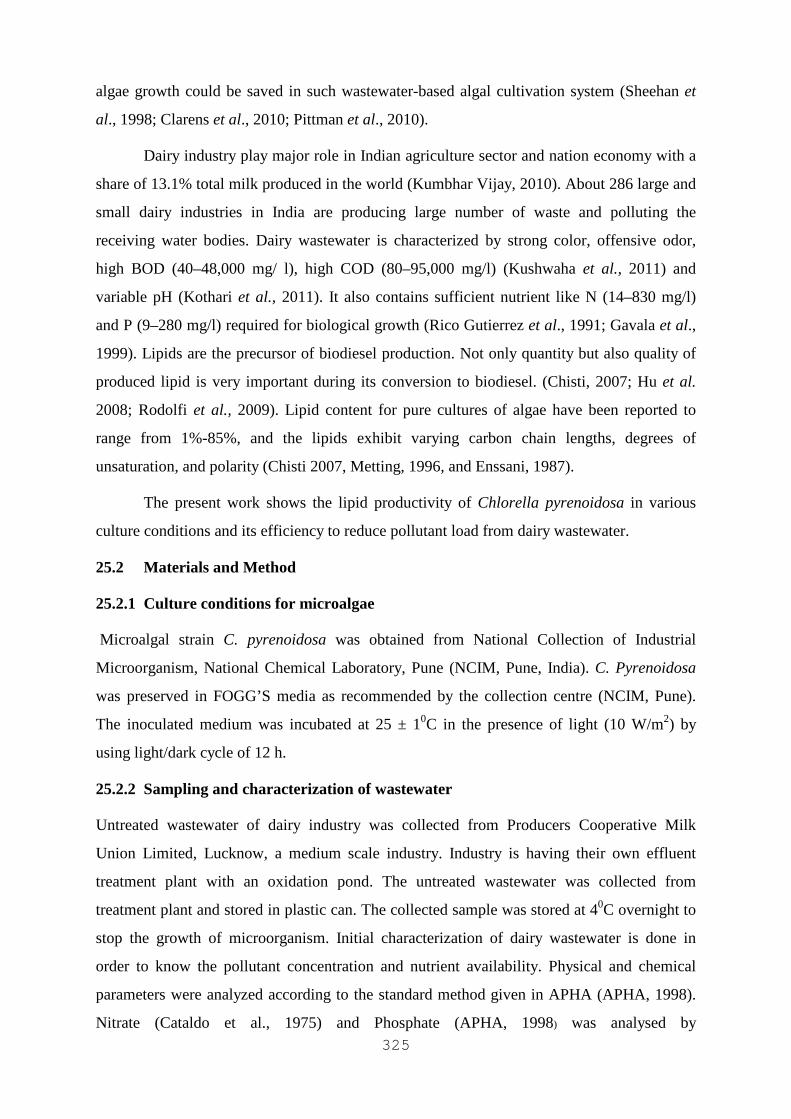
325
algae growth could be saved in such wastewater-based algal cultivation system (Sheehan et
al., 1998; Clarens et al., 2010; Pittman et al., 2010).
Dairy industry play major role in Indian agriculture sector and nation economy with a
share of 13.1% total milk produced in the world (Kumbhar Vijay, 2010). About 286 large and
small dairy industries in India are producing large number of waste and polluting the
receiving water bodies. Dairy wastewater is characterized by strong color, offensive odor,
high BOD (40–48,000 mg/ l), high COD (80–95,000 mg/l) (Kushwaha et al., 2011) and
variable pH (Kothari et al., 2011). It also contains sufficient nutrient like N (14–830 mg/l)
and P (9–280 mg/l) required for biological growth (Rico Gutierrez et al., 1991; Gavala et al.,
1999). Lipids are the precursor of biodiesel production. Not only quantity but also quality of
produced lipid is very important during its conversion to biodiesel. (Chisti, 2007; Hu et al.
2008; Rodolfi et al., 2009). Lipid content for pure cultures of algae have been reported to
range from 1%-85%, and the lipids exhibit varying carbon chain lengths, degrees of
unsaturation, and polarity (Chisti 2007, Metting, 1996, and Enssani, 1987).
The present work shows the lipid productivity of Chlorella pyrenoidosa in various
culture conditions and its efficiency to reduce pollutant load from dairy wastewater.
25.2 Materials and Method
25.2.1 Culture conditions for microalgae
Microalgal strain C. pyrenoidosa was obtained from National Collection of Industrial
Microorganism, National Chemical Laboratory, Pune (NCIM, Pune, India). C. Pyrenoidosa
was preserved in FOGG’S media as recommended by the collection centre (NCIM, Pune).
The inoculated medium was incubated at 25 ± 10C in the presence of light (10 W/m2) by
using light/dark cycle of 12 h.
25.2.2 Sampling and characterization of wastewater
Untreated wastewater of dairy industry was collected from Producers Cooperative Milk
Union Limited, Lucknow, a medium scale industry. Industry is having their own effluent
treatment plant with an oxidation pond. The untreated wastewater was collected from
treatment plant and stored in plastic can. The collected sample was stored at 40C overnight to
stop the growth of microorganism. Initial characterization of dairy wastewater is done in
order to know the pollutant concentration and nutrient availability. Physical and chemical
parameters were analyzed according to the standard method given in APHA (APHA, 1998).
Nitrate (Cataldo et al., 1975) and Phosphate (APHA, 1998) was analysed by
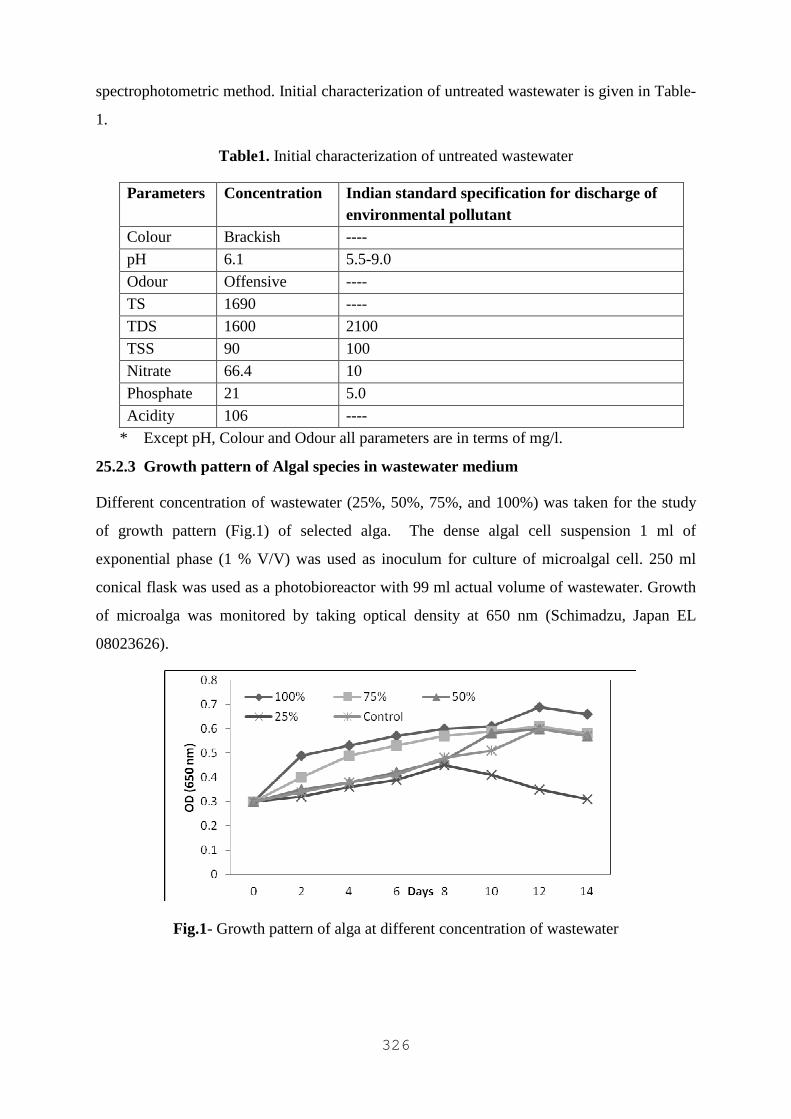
326
spectrophotometric method. Initial characterization of untreated wastewater is given in Table-
1.
Table1. Initial characterization of untreated wastewater
Parameters Concentration Indian standard specification for discharge of environmental pollutant
Colour Brackish ----
pH 6.1 5.5-9.0
Odour Offensive ----
TS 1690 ----
TDS 1600 2100
TSS 90 100
Nitrate 66.4 10
Phosphate 21 5.0
Acidity 106 ----
* Except pH, Colour and Odour all parameters are in terms of mg/l.
25.2.3 Growth pattern of Algal species in wastewater medium
Different concentration of wastewater (25%, 50%, 75%, and 100%) was taken for the study
of growth pattern (Fig.1) of selected alga. The dense algal cell suspension 1 ml of
exponential phase (1 % V/V) was used as inoculum for culture of microalgal cell. 250 ml
conical flask was used as a photobioreactor with 99 ml actual volume of wastewater. Growth
of microalga was monitored by taking optical density at 650 nm (Schimadzu, Japan EL
08023626).
Fig.1- Growth pattern of alga at different concentration of wastewater
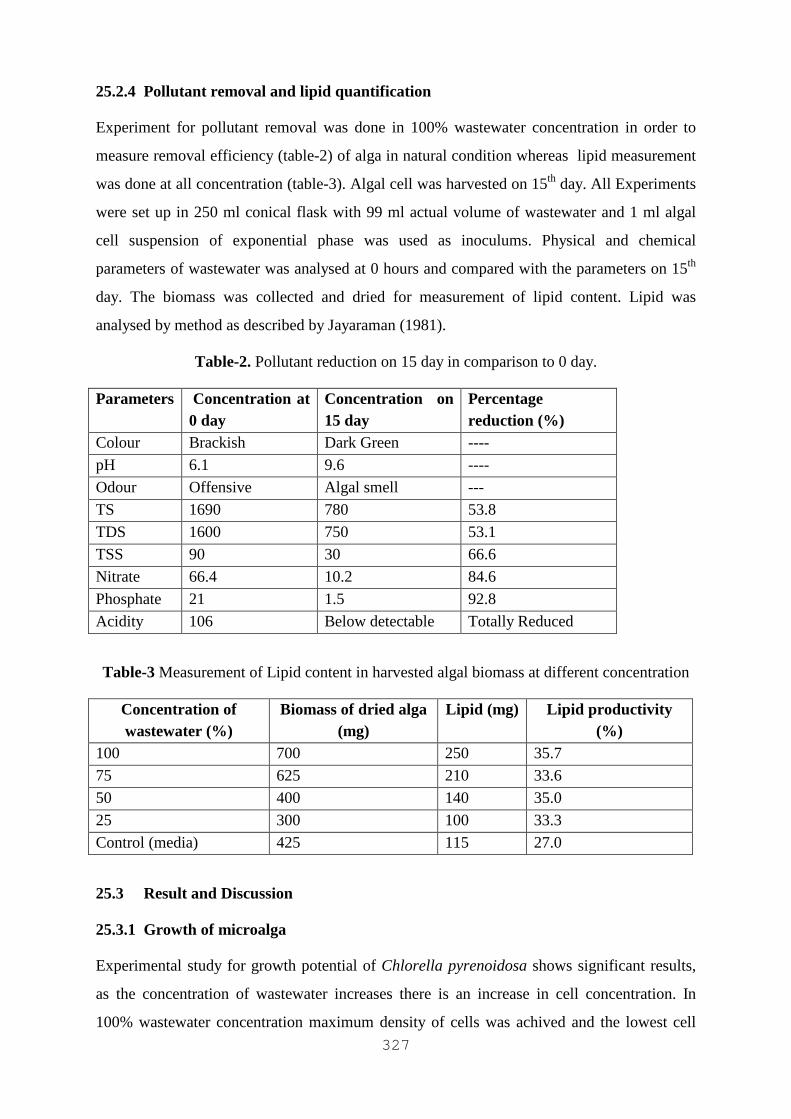
327
25.2.4 Pollutant removal and lipid quantification
Experiment for pollutant removal was done in 100% wastewater concentration in order to
measure removal efficiency (table-2) of alga in natural condition whereas lipid measurement
was done at all concentration (table-3). Algal cell was harvested on 15th day. All Experiments
were set up in 250 ml conical flask with 99 ml actual volume of wastewater and 1 ml algal
cell suspension of exponential phase was used as inoculums. Physical and chemical
parameters of wastewater was analysed at 0 hours and compared with the parameters on 15th
day. The biomass was collected and dried for measurement of lipid content. Lipid was
analysed by method as described by Jayaraman (1981).
Table-2. Pollutant reduction on 15 day in comparison to 0 day.
Parameters Concentration at 0 day
Concentration on 15 day
Percentage reduction (%)
Colour Brackish Dark Green ----
pH 6.1 9.6 ----
Odour Offensive Algal smell ---
TS 1690 780 53.8
TDS 1600 750 53.1
TSS 90 30 66.6
Nitrate 66.4 10.2 84.6
Phosphate 21 1.5 92.8
Acidity 106 Below detectable Totally Reduced
Table-3 Measurement of Lipid content in harvested algal biomass at different concentration
Concentration of wastewater (%)
Biomass of dried alga (mg)
Lipid (mg) Lipid productivity (%)
100 700 250 35.7
75 625 210 33.6
50 400 140 35.0
25 300 100 33.3
Control (media) 425 115 27.0
25.3 Result and Discussion
25.3.1 Growth of microalga
Experimental study for growth potential of Chlorella pyrenoidosa shows significant results,
as the concentration of wastewater increases there is an increase in cell concentration. In
100% wastewater concentration maximum density of cells was achived and the lowest cell
328
density was achieved in 25 percent wastewater concentration. This pattern is due to the direct
relationship between the nitrate concentration and cell growth, higher the nitrate
concentration higher the cell growth.
25.3.2 Removal of pollutant load from wastewater
Pollutant concentration was checked at 0 day and on 15 day. Significant reduction was
achieved in nitrate and phosphate concentration the known agent for the eutrophication in
water bodies. Nitrate and Phosphate is the growth agent for the microalga and it is utilized as
a growth supplement. Total solid (TS) was also reduced by 53.8 percent, Acidity of
wastewater is removed 100 percent, as below pH 8.5 it is not detectable (APHA 1998). The
pH of wastewater after 15 day was found alkaline (9.6), this is due to decrease in CO2
concentration.
25.3.3 Lipid productivity at different concentration
Lipid productivity of microalga was measured on 15 day of the experiment after cultivation of
algal biomass. The duration of the experiment was based on the growth pattern of algal
species. Lipid productivity was highest (35.7%) in 100 % wastewater concentration medium
and lowest in (27%) in Control (FOGG’S medium).
Lipid content is very important for economical production of biofuel, from the above
results it is clear that growth is directly proportional to the available nutrient concentration in
medium and nitrate plays significant role in the algal growth. The diluted wastewater
concentration showed relatively less concentration of cell due to decrease in nitrate
concentration. The results are in accordance with Chittra and Benjamas (2011). They have
reported loss of biomass when green alga, Botrycoccus spp. was exposed to nitrogen deficient
conditions (Yeesang and Cheirsilp, 2011). Mandal and Mallick, (2009) also reported
decreased growth pattern in Scenedesmus obliquus, under nitrogen deficient conditions
(Gouveia and Oliveira, 2009). Decrease in algal biomass concentration in low nitrate
concentration was also seen by Hanhua and Gao in Nannochloropsis sp. (Hu and Gao, 2005).
Recently, for biodiesel production, researchers are working on growing Chlorella sp
heterotrophically by providing an organic carbon source. Miaoa and Wu (2006) cultured
Chlorella protothecoides autotrophically and found 14.57% lipid. In the same study, they
reported lipid of 55.20% in heterotrophic growth (Miaoa and Wu, 2006).
329
25.4 Conclusions
The present study found dairy wastewater medium was efficient for the growth of Chlorella
pyrenoidosa. Alga has the potential to remove pollutant load from the wastewater with
significant lipid productivity. The study also indicates towards relationship between nutrient
availability and biomass production. Thus alga is found potential feedstock for the Biodiesel
production and suitable species for wastewater treatment in order to establish the sustainable
biodiesel production.
References
1. APHA (American Public Health Association), (1998). Standard Methods for the
Examination of Water and Waste Water, 20th ed. American Public Health
Association/American water works Association/Water environment Federation,
Washington, D C.
2. Cataldo, D.A., Haroon, M., Schrader, L.E., Youngs, V.L., (1975). “Rapid colorimetric
determination of nitrate in plant tissue by nitration of salicylic acid”. Communications
in Soil Science and Plant Analysis 6 (1), 71–80.
3. Chisti, Y., (2007). “Biodiesel form microalgae”. Biotechnology Advances 25, 294–
306.
4. Clarens, A.F., Resurreccion, E.P., White, M.A., Colosi, L.M., (2010). “Environmental
life cycle comparison of algae to other bioenergy feedstocks”. Environ. Sci. Technol.
44 (5), 1813–1819.
5. Enssani, E. (1987). “Fundamental Parameters in Extraction of Lipids from
Wastewater-grown Microalgal Biomass”. Ph.D. dissertation, Department of Civil
Engineering, University of California, Berkeley, 194.
6. Gavala, N., Kopsinis, H., Skiadas, I.V., Stamatelatou, K., Lyberatos, G., (1999).
“Treatment of dairy wastewater using an upflow anaerobic sludge blanket reactor”.
Journal of Agriculture Engineering Research 73, 59–63.
7. Gouveia, L. and A.C. Oliveira, (2009). “Microalgae as a raw material for biofuels
production”. J. Ind. Microbiol. Biotechnol., 36: 269-274.
8. Hu, H. and K. Gao, (2005). “Response of Growth and Fatty Acid Compositions of
Nannochloropsis sp. To Environmental Factors Under Elevated CO2 Concentration”.
Biotechnol Lett., 28: 987-992.
330
9. Hu, Q., Sommerfeld, M., Jarvis, E., Ghirdi, M., Posewitz, M., Seibert, M., (2008).
“Microalgal triacylglycerol as feedstock for biofuel production: perspective and
advances”. Plant Journal 54, 621–639
10. Jayaraman J. Laboratory manual bin biochemistry, (1981). New Delhi; Wiley eastern
limited, New Delhi.
11. Kothari, R., Kumar, Virendra., Tyagi, V.V., (2011). “Assessment of waste treatment
and energy recovery from dairy industrial waste by anaerobic digestion”. IIOAB,
Special issue on Environmental Management for Sustainable development 2, 1– 6.
12. Kumbhar, Vijay., April 14, (2010). “Livestock sector in India–recent trends and
progress”. Business: International Business. Article source: http://
EzineArticles.com/?expert=vijay_kumbhar.
13. Kushwaha, J.P., Srivastava, V.C., Mall, I.D., (2011). “ An overview of various
technologies for the treatment of dairy wastewaters”. Critical Reviews in Food
Science and Nutrition. 51, 442–452.
14. Mandal, S. and N. Mallick, (2009). “Microalga Scenedesmus obliquus as a potential
source for biodiesel production”. Appl. Microbiol. Biotechnol. 84: 281-291.
15. Metting, F.B. (1996). “Biodiversity and application of microalgae.” Journal of
Industrial Microbiology, 17, 477-489.
16. Miaoa, X. and Q. Wu, (2006). “Biodiesel production from heterotrophic microalgal
oil”. Bioresource Technol., 97: 841-846.
17. Pittman, J.K., Dean, A.P., Osundeko, O., (2011). “The potential of sustainable algal
biofuel production using wastewater resources. Bioresource Technology”. 102, 17–25.
18. Rico Gutierrez, J.L., Garcia Encina, P.A., Fdz-Polanco, F., (1991). “Anaerobic
treatment of cheese-production wastewater using a UASB reactor”. Bioresource
Technology. 37, 271–276.
19. Rodolfi, L., Zittelli, G.C., Bassi, N., Padovani, G., Biondi, N., Bonini, G., Tredici,
M.R., (2009) “Microalgae for oil: strain selection, induction of lipid synthesis and
outdoor mass cultivation in a low-cost photobioreactor”. Biotechnology,
Bioengineering. 102, 100–112.
20. Sheehan, J., Dunahay, T., Benemann, J., Roessler, P., (1998). “A look back at the US
Department of Energy’s Aquatic Species Program: Biodiesel from algae”. Close-Out
Report, National Renewable Energy Laboratory, NREL/TP-580-24190.
21. Thompson, G.A. (1996). “Lipids and membrane function in green algae.” Biochemica
et Biophysica, 1306, 17-45.

331
22. Tsuzuki, M., Ohnuma, E., Sato, N., Takaku, T., and Kayguchi., A. (1990). “Effects of
CO2 concentration during growth on fatty acid composition in microalgae.” Plant
Physiology, 93, 851-856.
23. Yeesang, C. and B. Cheirsilp, (2011). “Effect of nitrogen, salt, and iron content in the
growth medium and light intensity on lipid production by microalgae isolated from
freshwater sources in Thailand”. Bioresource Technol., 102: 3034-3040.
332
CHAPTER 26
ASSESSMENT OF LIPID PRODUCTIVITY OF
CHLAMYDOMONAS POLYPYRENOIDEUM CULTURED IN
TANNERY INDUSTRY WASTEWATER
Neetu Verma, Richa Kothari, Tanu Allen and D.P. Singh
Abstract
A fifteen-day batch study has been done to assess lipid productivity by the algal strain
Chlamydomonas polypyrenoideum using tannery industry wastewater as a nutrient source.
Physico-chemical parametric analysis of selected wastewater supports the adequate amount of
nutrient availability for microalgae growth. On the other hand, lipid content also measured in
this batch type study, which may be helpful to assess the potential of bio-oil as an alternative
energy source.
Keywords: Wastewater, lipid productivity.
26.1 Introduction
As we know that lipid is energy containing molecule and is the base of bioenergy production
in the form of biofuels, as an alternative energy source. A number of recent laboratory based
studies where microalgae have been grown either in small batch cultures, small semi
continuous culture or bioreactors have reported reasonable lipid accumulation in waste water
grown microalgae ranging from low (<10% DW) to moderate (25-30% DW) lipid content,
and in some studies this can translate to relatively high lipid productivity when coupled to
high biomass (Chinnasamy et al., 2010). Algae grown on wastewater media are a potential
source of low-cost lipids for production of liquid biofuels. Algal production has been
estimated to yield from 3200 to 14,600 gallons of oil/acre/year (Hu Q et al., 2008; Chisti Yet
al., 2007) a 130 fold increase over soybean, the leading feedstock for biodiesel production.
Microalgae are sunlight-driven cell factories that convert carbon dioxide to potential biofuels,
foods, feeds and high-value bioactives (Walter et al., 2005). Growing algae requires
consideration of three primary nutrients: carbon, nitrogen, and phosphorus. Micronutrients
required in trace amounts include silica, calcium, magnesium, potassium, iron, manganese,
sulfur, zinc, copper, and cobalt, although the supply of these essential micronutrients rarely
333
limits algal growth when wastewater is used (Knud-Hansen et al., 1998). Earlier it has been
reported that the alga Chlorella vulgaris, reduced ammonium by 72%, phosphorus by 28%,
and COD by 61%, while dissolving a microbial biofilm after 5 days of incubation in
wastewater (Adey et al., 1996). Chlorella pyrenoidosa is found to remove about 80-85%
phosphorus and 60-80% of nitrogen from the dairy wastewater. (Kothari et al, 2012).
In general, tannery wastewaters are alkaline have a dark brown colour and contain a
high content of organic substances that vary according to the chemicals used in processing
(Kongjao et al., 2008). Tanneries have been noted as producing the most polluting wastes of
any industry (Tsotsos, 1986 and Thorstensen, 1984) but some studies show the efficient
biological treatment of its waste. According to the Durai and Rajasiman, 2011 tannery waste
water having the N- 237 mg/l and P is 21 mg/l as phosphate and theoretically algal biomass
production is 2.4 gm. with N: P molar ratio 29. This context show the major nutrient source
for algal production is available in tannery waste water. In this work Chlamydomonas
polypyrenoideum was used to produce algal lipid using tannery waste water as medium.
26.2 Material and methods
26.2.1 Algal strain and culture medium
Chlamydomonas polypyrenoideum was collected from NBRI (National Botanical Research
Institute) Lucknow for this study. All the cultures are maintained in recommended culture
media and tannery waste water for the optimizing the growth period. The algal strain was
preserved in the BG11 medium containing following chemicals: NaNO3 (1.5 g/l),
K2HPO4.3H2O (0.04 g/l), MgSO4.7H2O (0.075 g/l), CaCl2.2H2O (0.036 g/l), Na2CO3 (0.02
g/l), citric acid (0.006 g/l), Ferric ammonium citrate (0.006 g/l), EDTA (0.001 g/l), and A5 +
Co solution (1 ml/l) that consists of H3BO3 (2.86 g/l), MnCl2.H2O (1.81 g/l), ZnSO4.7H2O
(0.222 g/l), CuSO4.5H2O (0.079 g/l), Na2MoO4.2H2O (0.390 g/l) and Co(NO3)2.6H2O (0.049
g/l). Chlamydomonas polypyrenoideum was inoculated at 1% (v/v) in 1 litre Erlenmeyer
flasks containing 500 ml BG11 medium. The flasks were incubated under stationary
condition at 30ᴏC with 3000 lx continuous cool-white fluorescent light illumination, and were
hand shaken three to five times daily to avoid sticking.
26.2.2 Optimization of growth period of Chlamydomonas polypyrenoideum in the BG-11
Media
Chlamydomonas polypyrenoideum grown on the freshly prepared BG-11 media with
sufficient inoculums 1% (v/v) and Growth period of algae determined by spectrophotometeric
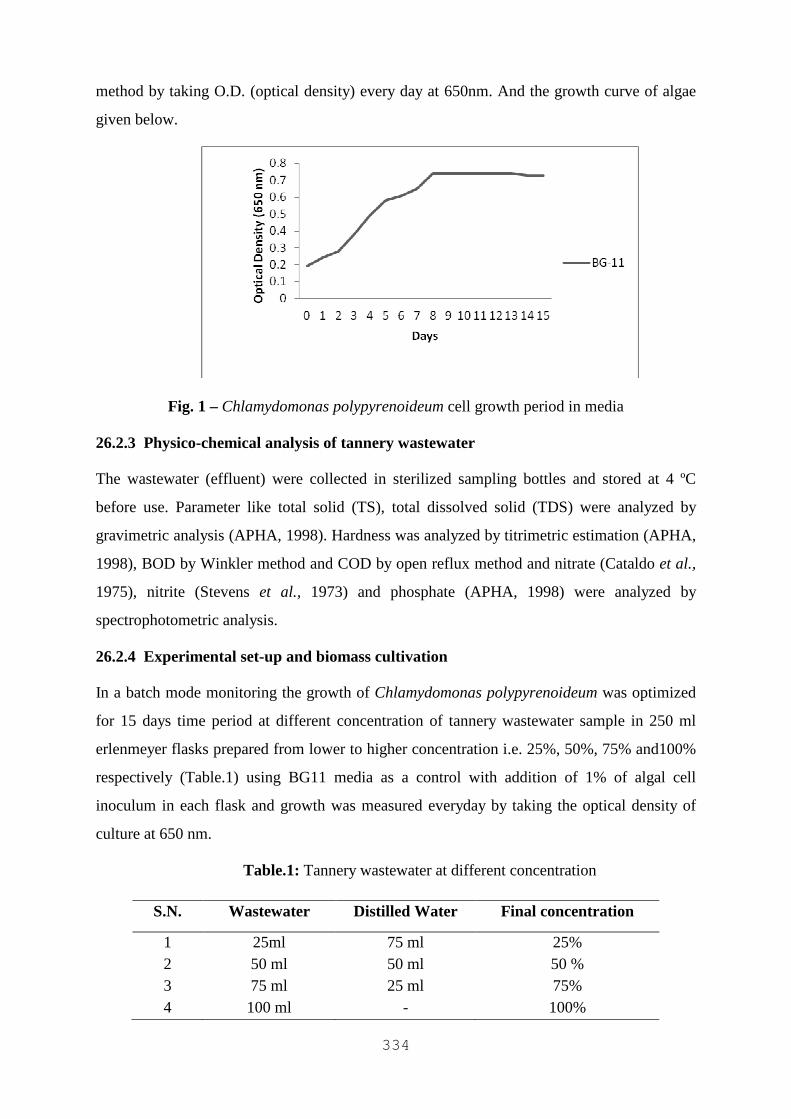
334
method by taking O.D. (optical density) every day at 650nm. And the growth curve of algae
given below.
Fig. 1 – Chlamydomonas polypyrenoideum cell growth period in media
26.2.3 Physico-chemical analysis of tannery wastewater
The wastewater (effluent) were collected in sterilized sampling bottles and stored at 4 ºC
before use. Parameter like total solid (TS), total dissolved solid (TDS) were analyzed by
gravimetric analysis (APHA, 1998). Hardness was analyzed by titrimetric estimation (APHA,
1998), BOD by Winkler method and COD by open reflux method and nitrate (Cataldo et al.,
1975), nitrite (Stevens et al., 1973) and phosphate (APHA, 1998) were analyzed by
spectrophotometric analysis.
26.2.4 Experimental set-up and biomass cultivation
In a batch mode monitoring the growth of Chlamydomonas polypyrenoideum was optimized
for 15 days time period at different concentration of tannery wastewater sample in 250 ml
erlenmeyer flasks prepared from lower to higher concentration i.e. 25%, 50%, 75% and100%
respectively (Table.1) using BG11 media as a control with addition of 1% of algal cell
inoculum in each flask and growth was measured everyday by taking the optical density of
culture at 650 nm.
Table.1: Tannery wastewater at different concentration
S.N. Wastewater Distilled Water Final concentration
1 25ml 75 ml 25% 2 50 ml 50 ml 50 % 3 75 ml 25 ml 75% 4 100 ml - 100%
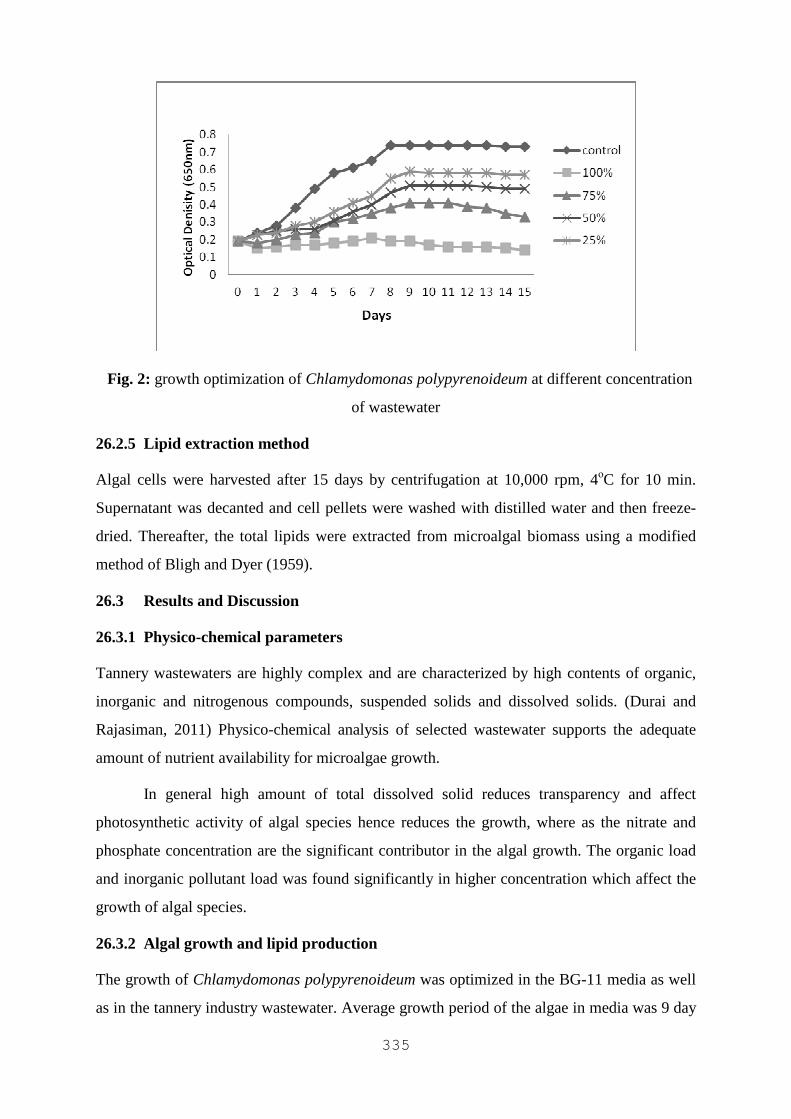
335
Fig. 2: growth optimization of Chlamydomonas polypyrenoideum at different concentration
of wastewater
26.2.5 Lipid extraction method
Algal cells were harvested after 15 days by centrifugation at 10,000 rpm, 4ᴏC for 10 min.
Supernatant was decanted and cell pellets were washed with distilled water and then freeze-
dried. Thereafter, the total lipids were extracted from microalgal biomass using a modified
method of Bligh and Dyer (1959).
26.3 Results and Discussion
26.3.1 Physico-chemical parameters
Tannery wastewaters are highly complex and are characterized by high contents of organic,
inorganic and nitrogenous compounds, suspended solids and dissolved solids. (Durai and
Rajasiman, 2011) Physico-chemical analysis of selected wastewater supports the adequate
amount of nutrient availability for microalgae growth.
In general high amount of total dissolved solid reduces transparency and affect
photosynthetic activity of algal species hence reduces the growth, where as the nitrate and
phosphate concentration are the significant contributor in the algal growth. The organic load
and inorganic pollutant load was found significantly in higher concentration which affect the
growth of algal species.
26.3.2 Algal growth and lipid production
The growth of Chlamydomonas polypyrenoideum was optimized in the BG-11 media as well
as in the tannery industry wastewater. Average growth period of the algae in media was 9 day
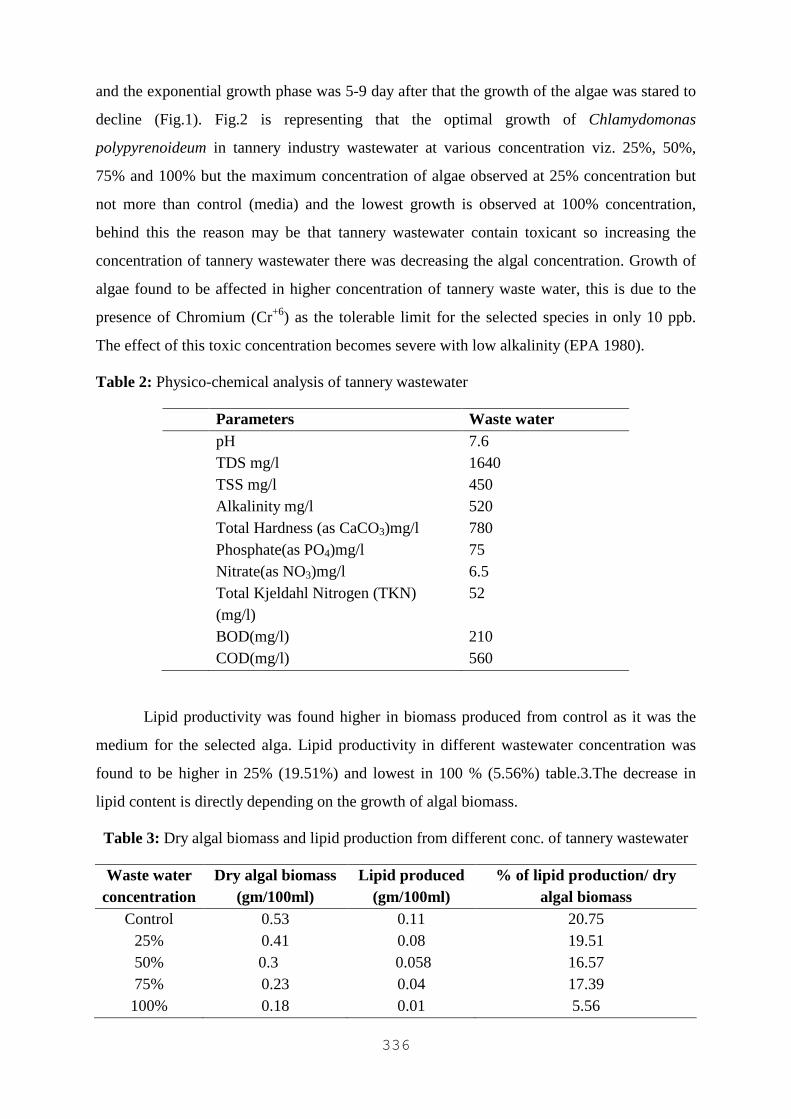
336
and the exponential growth phase was 5-9 day after that the growth of the algae was stared to
decline (Fig.1). Fig.2 is representing that the optimal growth of Chlamydomonas
polypyrenoideum in tannery industry wastewater at various concentration viz. 25%, 50%,
75% and 100% but the maximum concentration of algae observed at 25% concentration but
not more than control (media) and the lowest growth is observed at 100% concentration,
behind this the reason may be that tannery wastewater contain toxicant so increasing the
concentration of tannery wastewater there was decreasing the algal concentration. Growth of
algae found to be affected in higher concentration of tannery waste water, this is due to the
presence of Chromium (Cr+6) as the tolerable limit for the selected species in only 10 ppb.
The effect of this toxic concentration becomes severe with low alkalinity (EPA 1980).
Table 2: Physico-chemical analysis of tannery wastewater
Parameters Waste water pH 7.6 TDS mg/l 1640 TSS mg/l 450 Alkalinity mg/l 520 Total Hardness (as CaCO3)mg/l 780 Phosphate(as PO4)mg/l 75 Nitrate(as NO3)mg/l 6.5 Total Kjeldahl Nitrogen (TKN)
(mg/l) 52
BOD(mg/l) 210 COD(mg/l) 560
Lipid productivity was found higher in biomass produced from control as it was the
medium for the selected alga. Lipid productivity in different wastewater concentration was
found to be higher in 25% (19.51%) and lowest in 100 % (5.56%) table.3.The decrease in
lipid content is directly depending on the growth of algal biomass.
Table 3: Dry algal biomass and lipid production from different conc. of tannery wastewater
Waste water concentration
Dry algal biomass (gm/100ml)
Lipid produced (gm/100ml)
% of lipid production/ dry algal biomass
Control 0.53 0.11 20.75 25% 0.41 0.08 19.51 50% 0.3 0.058 16.57 75% 0.23 0.04 17.39 100% 0.18 0.01 5.56
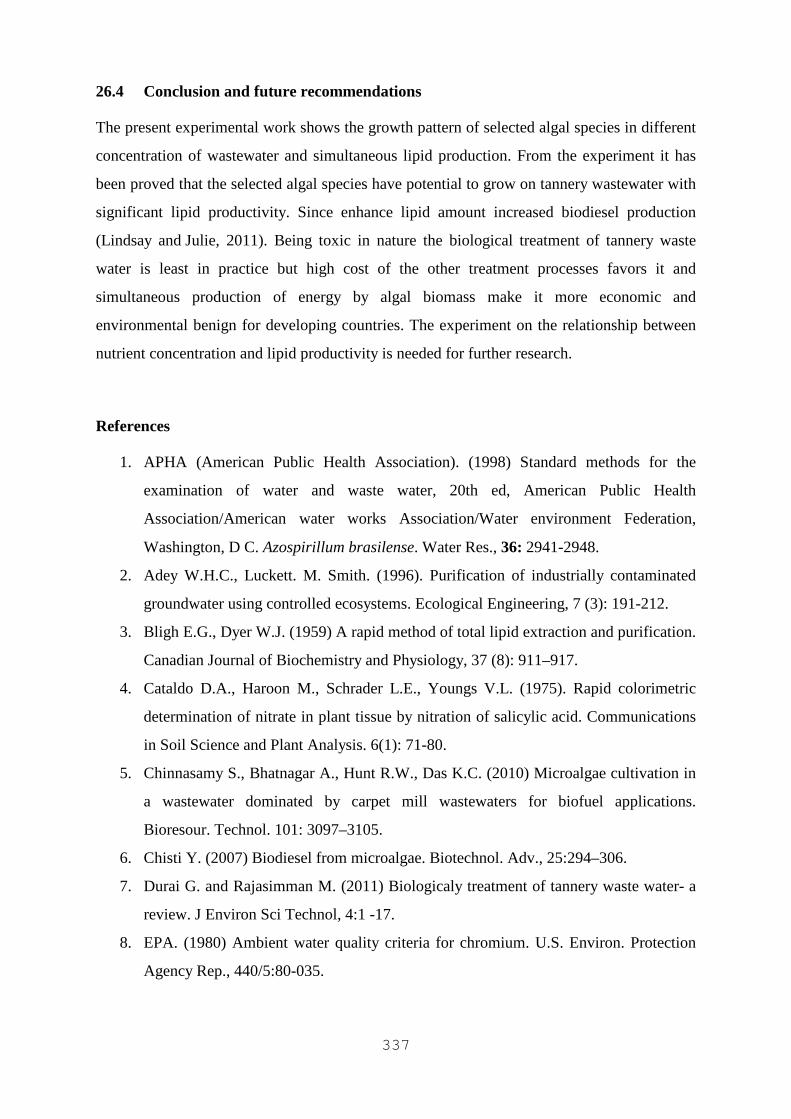
337
26.4 Conclusion and future recommendations
The present experimental work shows the growth pattern of selected algal species in different
concentration of wastewater and simultaneous lipid production. From the experiment it has
been proved that the selected algal species have potential to grow on tannery wastewater with
significant lipid productivity. Since enhance lipid amount increased biodiesel production
(Lindsay and Julie, 2011). Being toxic in nature the biological treatment of tannery waste
water is least in practice but high cost of the other treatment processes favors it and
simultaneous production of energy by algal biomass make it more economic and
environmental benign for developing countries. The experiment on the relationship between
nutrient concentration and lipid productivity is needed for further research.
References
1. APHA (American Public Health Association). (1998) Standard methods for the
examination of water and waste water, 20th ed, American Public Health
Association/American water works Association/Water environment Federation,
Washington, D C. Azospirillum brasilense. Water Res., 36: 2941-2948.
2. Adey W.H.C., Luckett. M. Smith. (1996). Purification of industrially contaminated
groundwater using controlled ecosystems. Ecological Engineering, 7 (3): 191-212.
3. Bligh E.G., Dyer W.J. (1959) A rapid method of total lipid extraction and purification.
Canadian Journal of Biochemistry and Physiology, 37 (8): 911–917.
4. Cataldo D.A., Haroon M., Schrader L.E., Youngs V.L. (1975). Rapid colorimetric
determination of nitrate in plant tissue by nitration of salicylic acid. Communications
in Soil Science and Plant Analysis. 6(1): 71-80.
5. Chinnasamy S., Bhatnagar A., Hunt R.W., Das K.C. (2010) Microalgae cultivation in
a wastewater dominated by carpet mill wastewaters for biofuel applications.
Bioresour. Technol. 101: 3097–3105.
6. Chisti Y. (2007) Biodiesel from microalgae. Biotechnol. Adv., 25:294–306.
7. Durai G. and Rajasimman M. (2011) Biologicaly treatment of tannery waste water- a
review. J Environ Sci Technol, 4:1 -17.
8. EPA. (1980) Ambient water quality criteria for chromium. U.S. Environ. Protection
Agency Rep., 440/5:80-035.
338
9. Hu Q., Sommerfeld M., Jarvis E., Ghirardi M., Posewitz M., Seibert M. (2008)
Microalgal triacylglycerols as feedstocks for biofuel production: perspectives and
advances. Plant J, 54:621–39.
10. Kongjao S., Damronglerd, S. and Hunsom M. (2008) Simultaneous removal of
organic and inorganic pollutants in tannery wastewater using electrocoagulation
technique. Korean J. Chem. Eng., 25: 703-709.
11. Kothari R., Kumar V., Tyagi V.V. (2011) Assessment of waste treatment and energy
recovery from dairy industrial waste by anaerobic digestion, IIOAB. Special issue on
Environmental Management for Sustainable development. 2:1-6.
12. Knud-Hansen, C.F., McElwee K., Baker, J., Clair, D., 1998. Pond fertilization:
ecological approach and practical application. Pond Dynamics/Aquaculture
Collaborative Research Support Program, Oregon State University.
13. Thorstensen T. (1984) Practical Leather Technology. Krieger Inc., Florida, USA.
14. Tsotsos D. (1986) Tanneries: A short survey of the methods applied for waste water
treatment. Water Science Technology, 18: 69-76.
15. Walter T.L., Purton S., Becker D.K., Collet C. (2005) Microalgae as bioreactor. Plant
Cell Rep. 24:629–41.
16. Lindsay S. and Julie Z. (2011) Biodiesel production: the potential
of algal lipids extracted with supercritical carbon dioxide. Green Chemistry .13:1422-
29.
339
CHAPTER 27
TREATMENT OF LEACHATE BY USING NATURAL
ADSORBENTS
Navneet Sood, Rajeev Kumar Garg, M.K Jha and Amit Arora
Abstract
As water of good quality is a precious commodity and is available in limited amounts, it has
become highly imperative to make all efforts to conserve it. The generation of leachate from
landfills is one source that should be treated for removal of heavy metals. In addition, the
rapid modernization of society has also led to the generation of huge amount of materials of
little value that have no fruitful use. Such materials are generally considered as waste, and
their disposal is a problem. Also, there are some materials that are available in nature that
have little or no use. The utilization of all such materials as low-cost adsorbents for the
treatment of wastewater may make them of some value. In this work, low cost adsorbent for
the treatment of leachate has been used, like waste tea leaves, jute, modified jute, bentonite
and tamarind shell. An effort has been made to give a brief idea of an approach to leachate
treatment, particularly discussing and highlighting in brief the low-cost alternative adsorbents
with a view to utilizing these waste/low-cost materials, which is found to be highly effective
in removing the heavy metals.
27.1 Introduction
The generation of leachate is caused principally by precipitation percolating through waste
deposited in a landfill. Rainfall is the contributor to generation of leachate. The precipitation
percolates through the waste and gains dissolved and suspended components from the
biodegrading waste through several physical and chemical reactions. Other contributors to
leachate generation include groundwater inflow, surface water runoff, and biological
decomposition (Reinhart et al., 1996). Liquid fractions in the waste will also add to the
leachate as well as moisture in the cover material. Moisture can be removed from the landfill
by water consumed in the formation of landfill gas, water vapor removed in the landfill gas,
and leachate leaking through the liner (Tchobanoglous et al., 1993).
340
Once in contact with decomposing solid waste, the percolating water becomes
contaminated and if it then flows out of the waste material it is termed leachate. Additional
leachate volume is produced during this decomposition of carbonaceous material producing a
wide range of other materials including methane, carbon dioxide and a complex mixture of
organic acids, aldehydes, alcohols and simple sugars. The risks of leachate generation can be
mitigated by properly designed and engineered landfill sites, such as sites that are constructed
on geologically impermeable materials or sites that use impermeable liners made
of geotextiles or engineered clay.
27.2 Leachate Formation
A generalized pattern of leachate formation is presented in Fig. 1. Precipitation (P) falls on
the landfill and some of it becomes runoff (RO). Some of P infiltrates (I) the surface
(uncovered refuse, intermediate cover, or final cover). Some of I evaporates (E) from the
surface and (or) transpires (T) through the vegetative cover if it exists. Some of I may make
up a deficiency in soil moisture storage (S) (the difference between field capacity (FC) and
the existing moisture content (MC). The remainder of I, after E, T, and S have been satisfied,
moves downward forming percolate (PERC) arid eventually leachate (L) as it reaches the
base of the landfill. PERC may be augmented by infiltration of groundwater (G). The
procedure used to analyze these processes is referred to as a water balance (WB), various
forms of which are commonly used for the simulation of surface water hydrology.
27.2.1 Composition of Leachate
An understanding of leachate composition is critical for making projections on the long-
term impacts of landfills. Even after a landfill stops accepting waste and a final cover
is placed over the landfill, the refuse will continue to decompose. The quantity of
leachate could actually increase long after landfill closure. A landfill is considered to be
Young when it is 1 year old, Medium when it is 1-1.5 year older and old which is more than
6 years old. As landfill age increased, organics concentration (COD) in leachate decreased
and increase of ammonia nitrogen concentration (Adyemi et al., 2007). Landfill leachates
from old sites are usually highly contaminated with ammonia resulting from the hydrolysis
and fermentation of nitrogen containing fractions of biodegradable refuse substrates (Cheung
et al., 1997). The existing relation between the age of the landfill and the organic matter
composition may provide useful criteria to choose a suited treatment process. In general,
leachates may contain large amounts of organic matter (biodegradable, but also refractory to
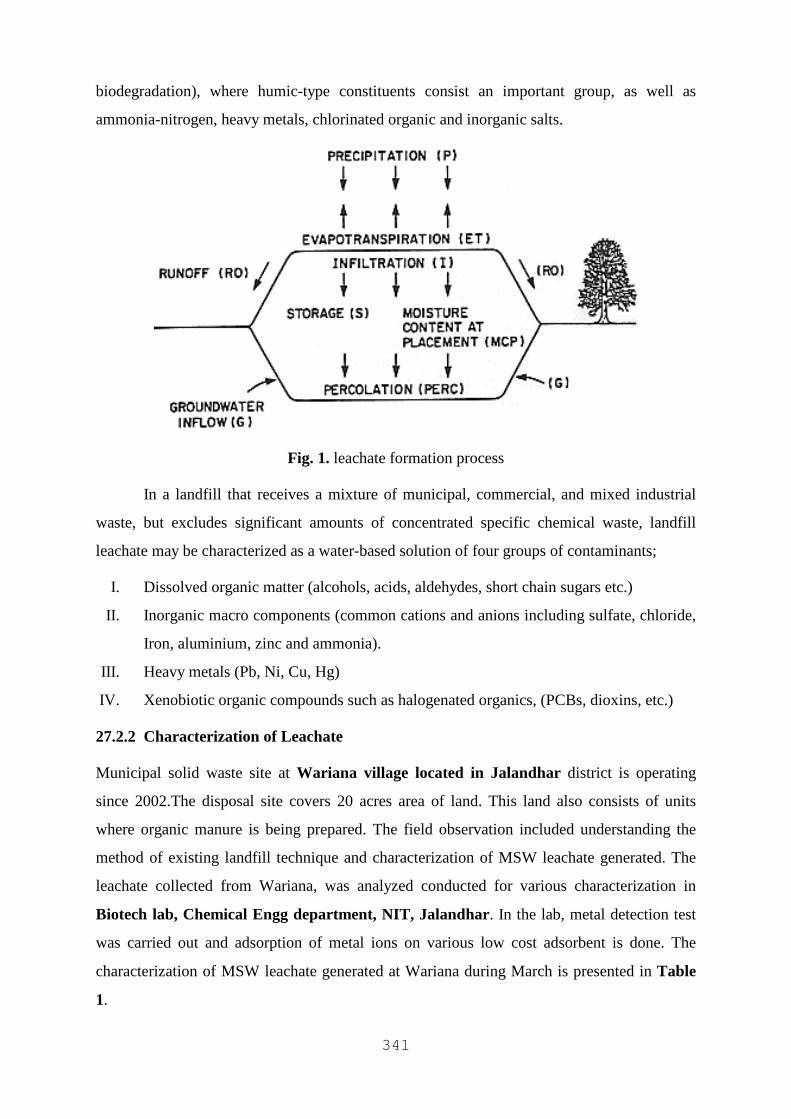
341
biodegradation), where humic-type constituents consist an important group, as well as
ammonia-nitrogen, heavy metals, chlorinated organic and inorganic salts.
Fig. 1. leachate formation process
In a landfill that receives a mixture of municipal, commercial, and mixed industrial
waste, but excludes significant amounts of concentrated specific chemical waste, landfill
leachate may be characterized as a water-based solution of four groups of contaminants;
I. Dissolved organic matter (alcohols, acids, aldehydes, short chain sugars etc.)
II. Inorganic macro components (common cations and anions including sulfate, chloride,
Iron, aluminium, zinc and ammonia).
III. Heavy metals (Pb, Ni, Cu, Hg)
IV. Xenobiotic organic compounds such as halogenated organics, (PCBs, dioxins, etc.)
27.2.2 Characterization of Leachate
Municipal solid waste site at Wariana village located in Jalandhar district is operating
since 2002.The disposal site covers 20 acres area of land. This land also consists of units
where organic manure is being prepared. The field observation included understanding the
method of existing landfill technique and characterization of MSW leachate generated. The
leachate collected from Wariana, was analyzed conducted for various characterization in
Biotech lab, Chemical Engg department, NIT, Jalandhar. In the lab, metal detection test
was carried out and adsorption of metal ions on various low cost adsorbent is done. The
characterization of MSW leachate generated at Wariana during March is presented in Table
1.
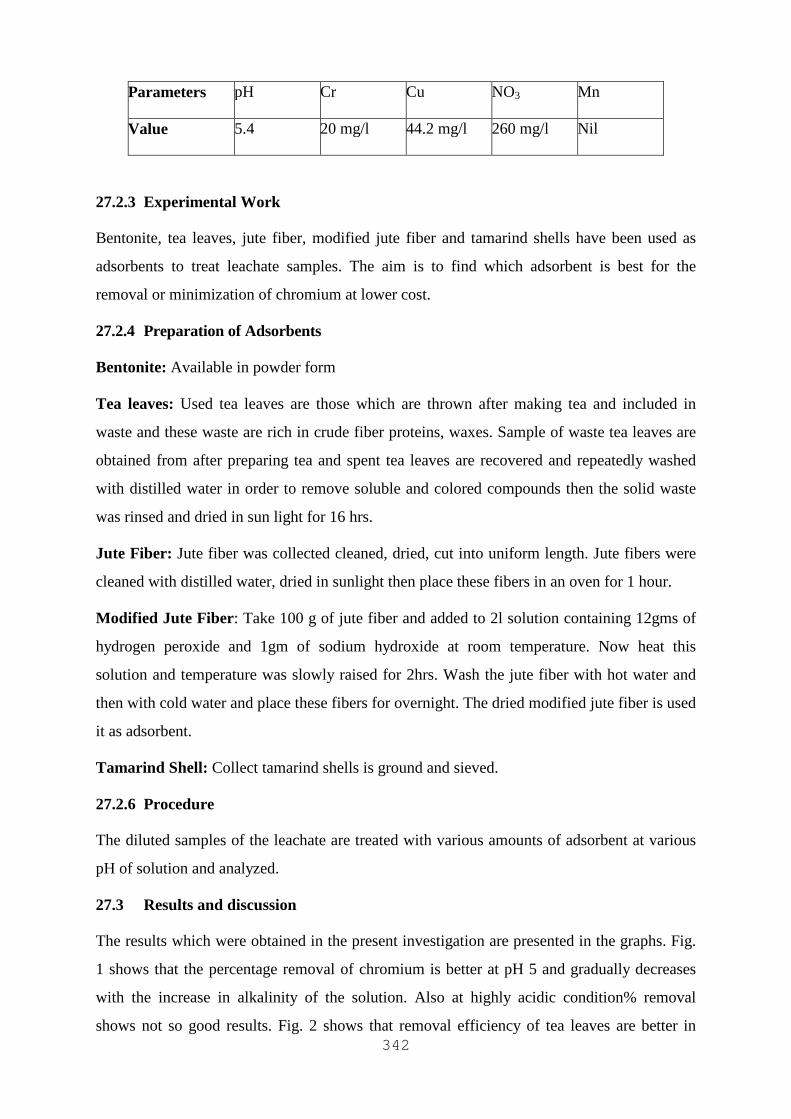
342
Parameters pH Cr Cu NO3 Mn
Value 5.4 20 mg/l 44.2 mg/l 260 mg/l Nil
27.2.3 Experimental Work
Bentonite, tea leaves, jute fiber, modified jute fiber and tamarind shells have been used as
adsorbents to treat leachate samples. The aim is to find which adsorbent is best for the
removal or minimization of chromium at lower cost.
27.2.4 Preparation of Adsorbents
Bentonite: Available in powder form
Tea leaves: Used tea leaves are those which are thrown after making tea and included in
waste and these waste are rich in crude fiber proteins, waxes. Sample of waste tea leaves are
obtained from after preparing tea and spent tea leaves are recovered and repeatedly washed
with distilled water in order to remove soluble and colored compounds then the solid waste
was rinsed and dried in sun light for 16 hrs.
Jute Fiber: Jute fiber was collected cleaned, dried, cut into uniform length. Jute fibers were
cleaned with distilled water, dried in sunlight then place these fibers in an oven for 1 hour.
Modified Jute Fiber: Take 100 g of jute fiber and added to 2l solution containing 12gms of
hydrogen peroxide and 1gm of sodium hydroxide at room temperature. Now heat this
solution and temperature was slowly raised for 2hrs. Wash the jute fiber with hot water and
then with cold water and place these fibers for overnight. The dried modified jute fiber is used
it as adsorbent.
Tamarind Shell: Collect tamarind shells is ground and sieved.
27.2.6 Procedure
The diluted samples of the leachate are treated with various amounts of adsorbent at various
pH of solution and analyzed.
27.3 Results and discussion
The results which were obtained in the present investigation are presented in the graphs. Fig.
1 shows that the percentage removal of chromium is better at pH 5 and gradually decreases
with the increase in alkalinity of the solution. Also at highly acidic condition% removal
shows not so good results. Fig. 2 shows that removal efficiency of tea leaves are better in
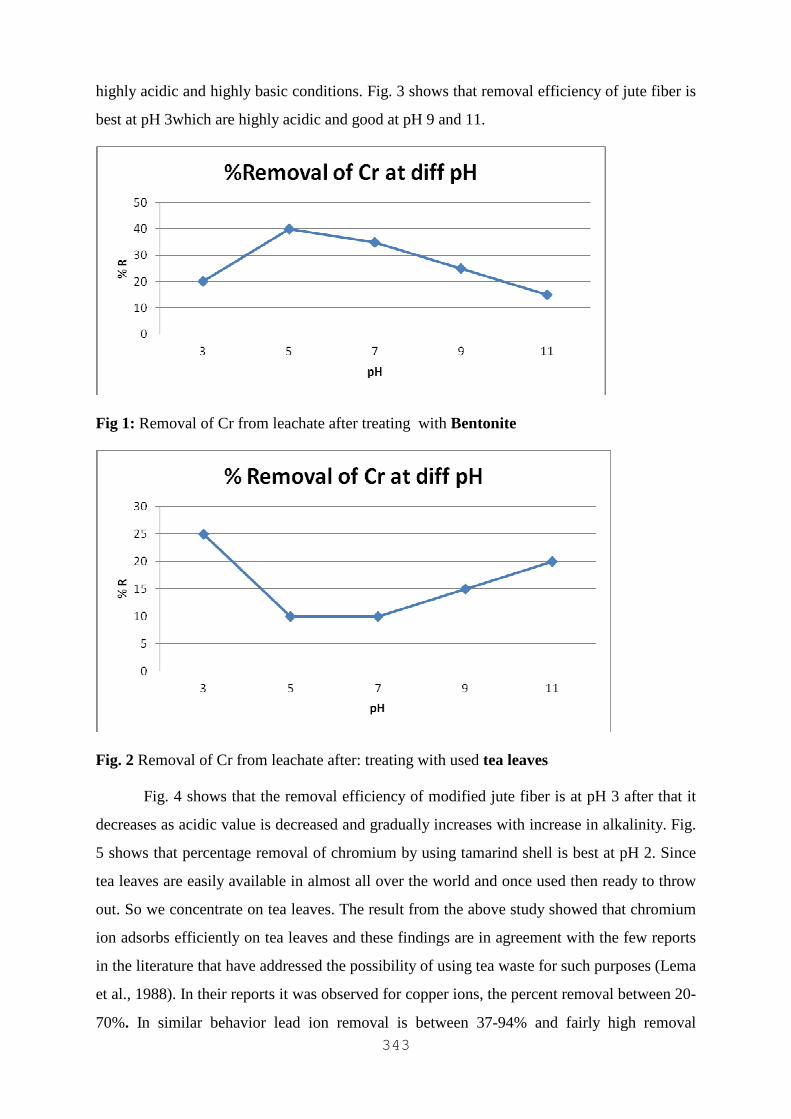
343
highly acidic and highly basic conditions. Fig. 3 shows that removal efficiency of jute fiber is
best at pH 3which are highly acidic and good at pH 9 and 11.
Fig 1: Removal of Cr from leachate after treating with Bentonite
Fig. 2 Removal of Cr from leachate after: treating with used tea leaves
Fig. 4 shows that the removal efficiency of modified jute fiber is at pH 3 after that it
decreases as acidic value is decreased and gradually increases with increase in alkalinity. Fig.
5 shows that percentage removal of chromium by using tamarind shell is best at pH 2. Since
tea leaves are easily available in almost all over the world and once used then ready to throw
out. So we concentrate on tea leaves. The result from the above study showed that chromium
ion adsorbs efficiently on tea leaves and these findings are in agreement with the few reports
in the literature that have addressed the possibility of using tea waste for such purposes (Lema
et al., 1988). In their reports it was observed for copper ions, the percent removal between 20-
70%. In similar behavior lead ion removal is between 37-94% and fairly high removal
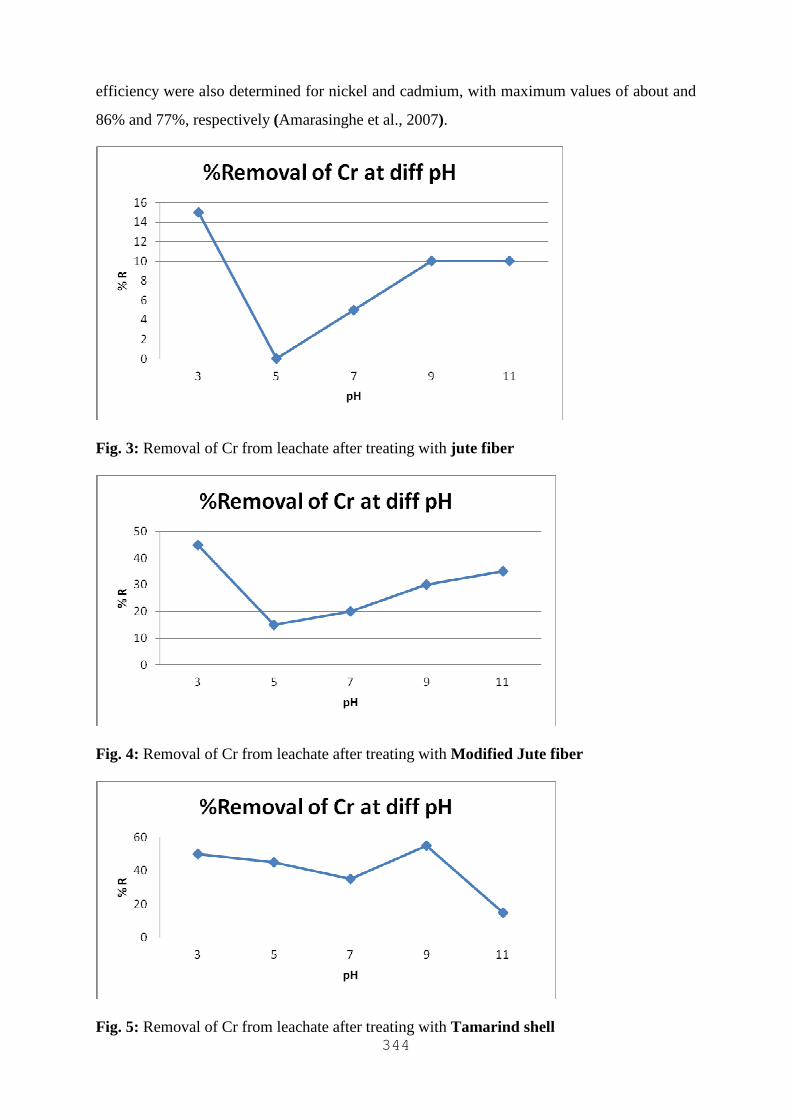
344
efficiency were also determined for nickel and cadmium, with maximum values of about and
86% and 77%, respectively (Amarasinghe et al., 2007).
Fig. 3: Removal of Cr from leachate after treating with jute fiber
Fig. 4: Removal of Cr from leachate after treating with Modified Jute fiber
Fig. 5: Removal of Cr from leachate after treating with Tamarind shell
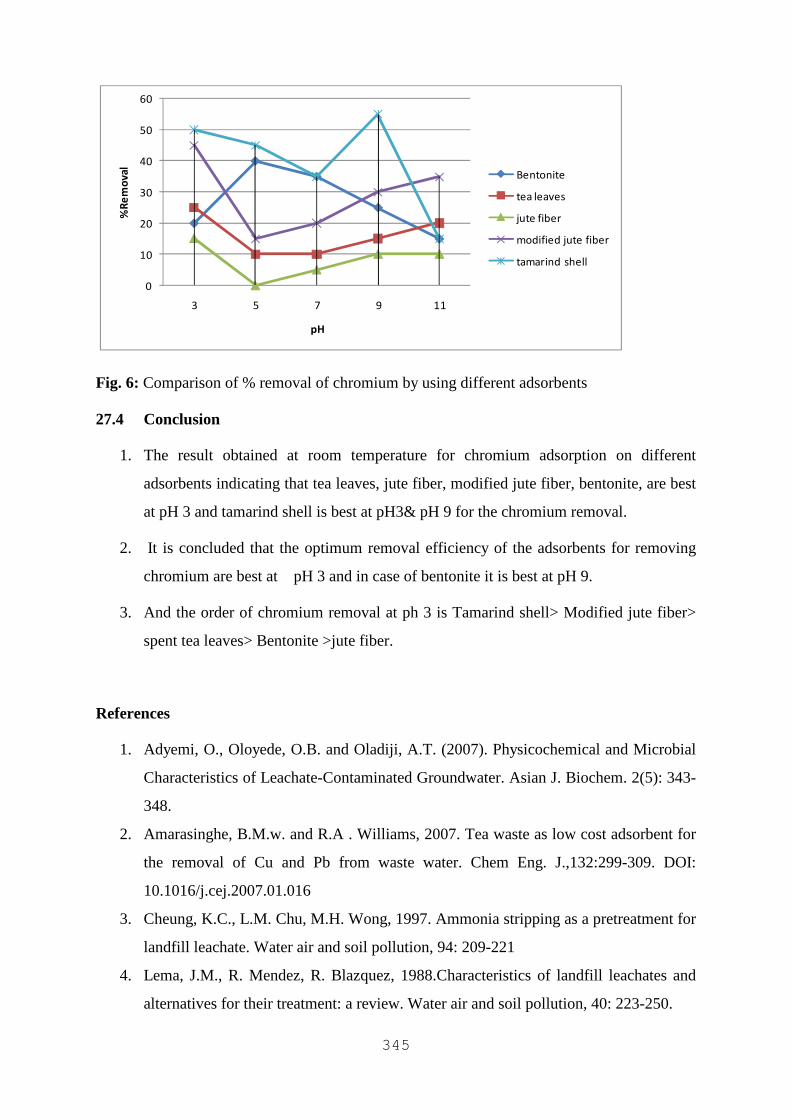
345
0
10
20
30
40
50
60
3 5 7 9 11
%R
em
ov
al
pH
Bentonite
tea leaves
jute fiber
modified jute fiber
tamarind shell
Fig. 6: Comparison of % removal of chromium by using different adsorbents
27.4 Conclusion
1. The result obtained at room temperature for chromium adsorption on different
adsorbents indicating that tea leaves, jute fiber, modified jute fiber, bentonite, are best
at pH 3 and tamarind shell is best at pH3& pH 9 for the chromium removal.
2. It is concluded that the optimum removal efficiency of the adsorbents for removing
chromium are best at pH 3 and in case of bentonite it is best at pH 9.
3. And the order of chromium removal at ph 3 is Tamarind shell> Modified jute fiber>
spent tea leaves> Bentonite >jute fiber.
References
1. Adyemi, O., Oloyede, O.B. and Oladiji, A.T. (2007). Physicochemical and Microbial
Characteristics of Leachate-Contaminated Groundwater. Asian J. Biochem. 2(5): 343-
348.
2. Amarasinghe, B.M.w. and R.A . Williams, 2007. Tea waste as low cost adsorbent for
the removal of Cu and Pb from waste water. Chem Eng. J.,132:299-309. DOI:
10.1016/j.cej.2007.01.016
3. Cheung, K.C., L.M. Chu, M.H. Wong, 1997. Ammonia stripping as a pretreatment for
landfill leachate. Water air and soil pollution, 94: 209-221
4. Lema, J.M., R. Mendez, R. Blazquez, 1988.Characteristics of landfill leachates and
alternatives for their treatment: a review. Water air and soil pollution, 40: 223-250.

346
5. Reinhart, D.R., A.B. Al-Yousfi, 1996. The impact of leachate recirculation on
municipal solid waste landfill operating characteristics. Waste Management and
Research, 14: 337-346.
6. Tchobanoglous, G., H. Theisen, S. Vigil, 1993. Integrated Solid Waste Management:
Engineering Principles and Management Issues. McGraw-Hill, Inc New York, New
York.

347
Part IV
Thermo-Chemical Conversion
348
CHAPTER 28
PROSPECTUS OF IMPROVED COOKSTOVES IN
REDUCTION IN DEFORESTATION
N.S. Rathore, Surendra Kothari and Arti Verma
Abstract
Biomass constitutes the biggest source of energy in rural India. However, its utilization in the
domestic sector is mostly inefficient and polluting, resulting in resource wastage and indoor
air pollution. Traditional cook stoves, predominantly used in the households for domestic
cooking, have been a major contributor to these ill effects. Improved cookstove programmes
implemented in the developing world attempt to address these problems. Improved
cookstoves including biomass gasifier cookstoves are having higher thermal efficiencies upto
41% compared to 9% for traditional cookstoves. Biomass, Cooking in India about 150 ton of
oil equivalent of biomass is consumed for cooking energy. Further, there is scope of 15 to 20
per cent saving in oil consumption through improved and efficient techniques. However,
about 60 per cent of fuel wood can be saved with improved technology. A number of
improved cookstoves which are more efficient than traditional stoves and are almost smoke-
free, have been developed and demonstrated in different regions of India. The design is based
on the cooking requirement based on the regional food habits and power rating of the
cookstoves. Single pot Chetak Chulha and double pot Udairaj Chulha designed and
developed at CTAE, Udaipur are best adopted by the rural community in the region. The
gasifier cookstoves provide industrial heat for various purposes and in large sized cooking in
hotels and food processing centers. The design of community cookstove depends on height of
combustion chamber, pot Openings, fuel openings, connecting ducts between the pots, air
inlet parts for grated stoves, vessel mounting system. The power rating of this cook stove is
10 KW at the fuel burning rate of 8.00 kg/hr. These cookstoves are suitable for firewood,
densified briquetted fuel, dung cakes and agro-waste reducing the burden on the forest for
firewood and helps in restoring the local ecology.
Keywords: Improved cookstove, Gasification stove.
349
28.1 Introduction
Biomass constitutes the biggest source of energy in rural India. However, its utilization in the
domestic sector is mostly inefficient and polluting, resulting in resource wastage and indoor
air pollution. Traditional cook stoves, predominantly used in the households for domestic
cooking, have been a major contributor to these ill effects. Improved cookstove programmes
implemented in the developing world attempt to address these problems. Improved
cookstoves including biomass gasifier cookstoves are having higher thermal efficiencies upto
41% compared to 9% for traditional cookstoves. Biomass, Cooking in India about 150 ton of
oil equivalent of biomass is consumed for cooking energy. Further, there is scope of 15 to 20
per cent saving in oil consumption through improved and efficient techniques. However,
about 60 per cent of fuel wood can be saved with improved technology.
Cooking for the Indian is still a full time occupation. Kitchens in rural areas are
usually dark, dingy, ill-ventilated and poorly planned with inadequate cooking stoves,
consume more energy and time. Effectiveness of various activities in the kitchen depends
mainly upon the efficiency of cook stoves used for cooking. The energy efficiency of
firewood and the pollution menace created the need to improve the design of cook stoves.
Improved cookstoves creates better working condition in rural kitchen, reduction in fuel wood
consumption and minimizes the indoor air pollution. A study conducted on better utilization
of fuel wood revealed that an increase of 1% of efficiency of traditional cook stove could
result in saving of energy equivalent to 4 million tonnes of coal in the country every year.
28.1.1 Characteristics of improved cookstove
1. It should have higher overall energy efficiency as compared to traditional cookstoves.
2. It should reduce the fuel consumption for given task.
3. It should be available in requiresd power rating foe different activities.
4. It should be pollution free, less smoke, soot and radiation.
5. It should have higher useful stove life and reduce the frequency of repairs.
28.2 Modifications in existing traditional cookstoves
Improved cookstoves are designed with modification in existing traditional cookstoves in the
region. These modifications are based on the food habits of the region, capacity of the
cookstove and availability of the fuel. The purposes for the modification are as follows:
1. Dimensioning of the stove in such a manner as to maximize the efficiency.
2. Power rating of cook stoves based on principles of complete combustion.
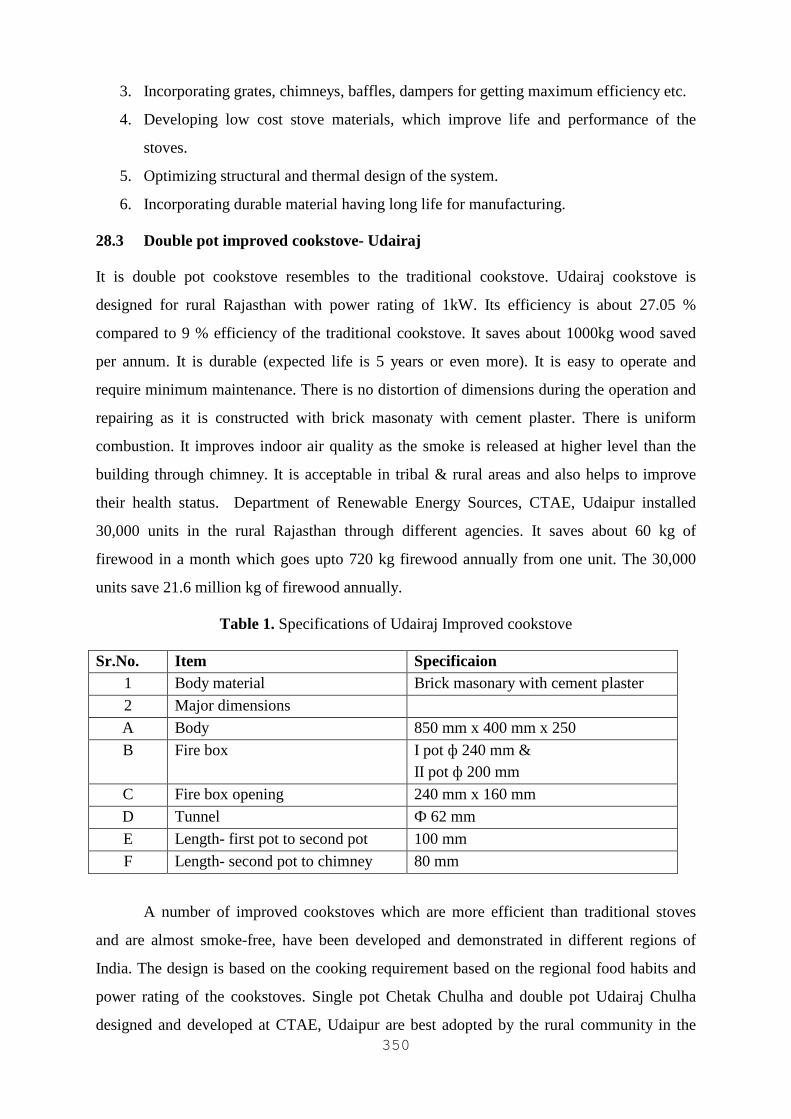
350
3. Incorporating grates, chimneys, baffles, dampers for getting maximum efficiency etc.
4. Developing low cost stove materials, which improve life and performance of the
stoves.
5. Optimizing structural and thermal design of the system.
6. Incorporating durable material having long life for manufacturing.
28.3 Double pot improved cookstove- Udairaj
It is double pot cookstove resembles to the traditional cookstove. Udairaj cookstove is
designed for rural Rajasthan with power rating of 1kW. Its efficiency is about 27.05 %
compared to 9 % efficiency of the traditional cookstove. It saves about 1000kg wood saved
per annum. It is durable (expected life is 5 years or even more). It is easy to operate and
require minimum maintenance. There is no distortion of dimensions during the operation and
repairing as it is constructed with brick masonaty with cement plaster. There is uniform
combustion. It improves indoor air quality as the smoke is released at higher level than the
building through chimney. It is acceptable in tribal & rural areas and also helps to improve
their health status. Department of Renewable Energy Sources, CTAE, Udaipur installed
30,000 units in the rural Rajasthan through different agencies. It saves about 60 kg of
firewood in a month which goes upto 720 kg firewood annually from one unit. The 30,000
units save 21.6 million kg of firewood annually.
Table 1. Specifications of Udairaj Improved cookstove
Sr.No. Item Specificaion 1 Body material Brick masonary with cement plaster
2 Major dimensions
A Body 850 mm x 400 mm x 250
B Fire box I pot ф 240 mm & II pot ф 200 mm
C Fire box opening 240 mm x 160 mm
D Tunnel Ф 62 mm
E Length- first pot to second pot 100 mm
F Length- second pot to chimney 80 mm
A number of improved cookstoves which are more efficient than traditional stoves
and are almost smoke-free, have been developed and demonstrated in different regions of
India. The design is based on the cooking requirement based on the regional food habits and
power rating of the cookstoves. Single pot Chetak Chulha and double pot Udairaj Chulha
designed and developed at CTAE, Udaipur are best adopted by the rural community in the
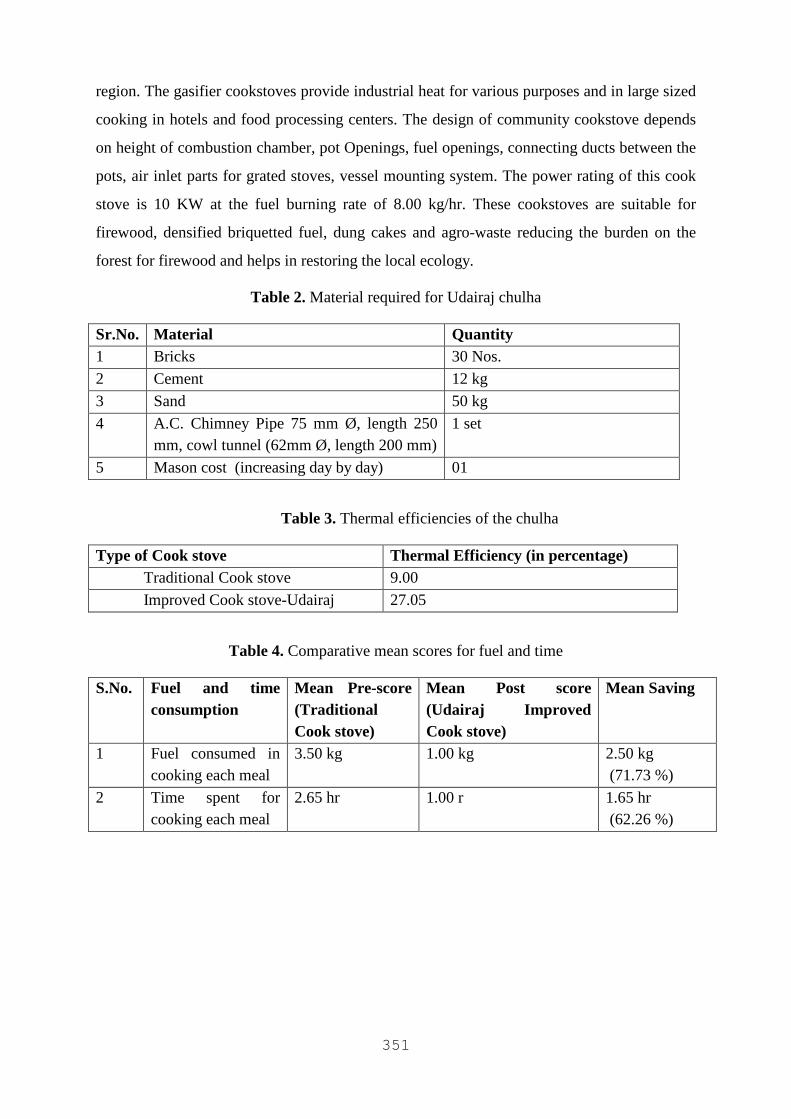
351
region. The gasifier cookstoves provide industrial heat for various purposes and in large sized
cooking in hotels and food processing centers. The design of community cookstove depends
on height of combustion chamber, pot Openings, fuel openings, connecting ducts between the
pots, air inlet parts for grated stoves, vessel mounting system. The power rating of this cook
stove is 10 KW at the fuel burning rate of 8.00 kg/hr. These cookstoves are suitable for
firewood, densified briquetted fuel, dung cakes and agro-waste reducing the burden on the
forest for firewood and helps in restoring the local ecology.
Table 2. Material required for Udairaj chulha
Sr.No. Material Quantity 1 Bricks 30 Nos.
2 Cement 12 kg
3 Sand 50 kg
4 A.C. Chimney Pipe 75 mm Ø, length 250 mm, cowl tunnel (62mm Ø, length 200 mm)
1 set
5 Mason cost (increasing day by day) 01
Table 3. Thermal efficiencies of the chulha
Type of Cook stove Thermal Efficiency (in percentage) Traditional Cook stove 9.00
Improved Cook stove-Udairaj 27.05
Table 4. Comparative mean scores for fuel and time
S.No. Fuel and time consumption
Mean Pre-score (Traditional Cook stove)
Mean Post score (Udairaj Improved Cook stove)
Mean Saving
1 Fuel consumed in cooking each meal
3.50 kg 1.00 kg 2.50 kg (71.73 %)
2 Time spent for cooking each meal
2.65 hr 1.00 r 1.65 hr (62.26 %)
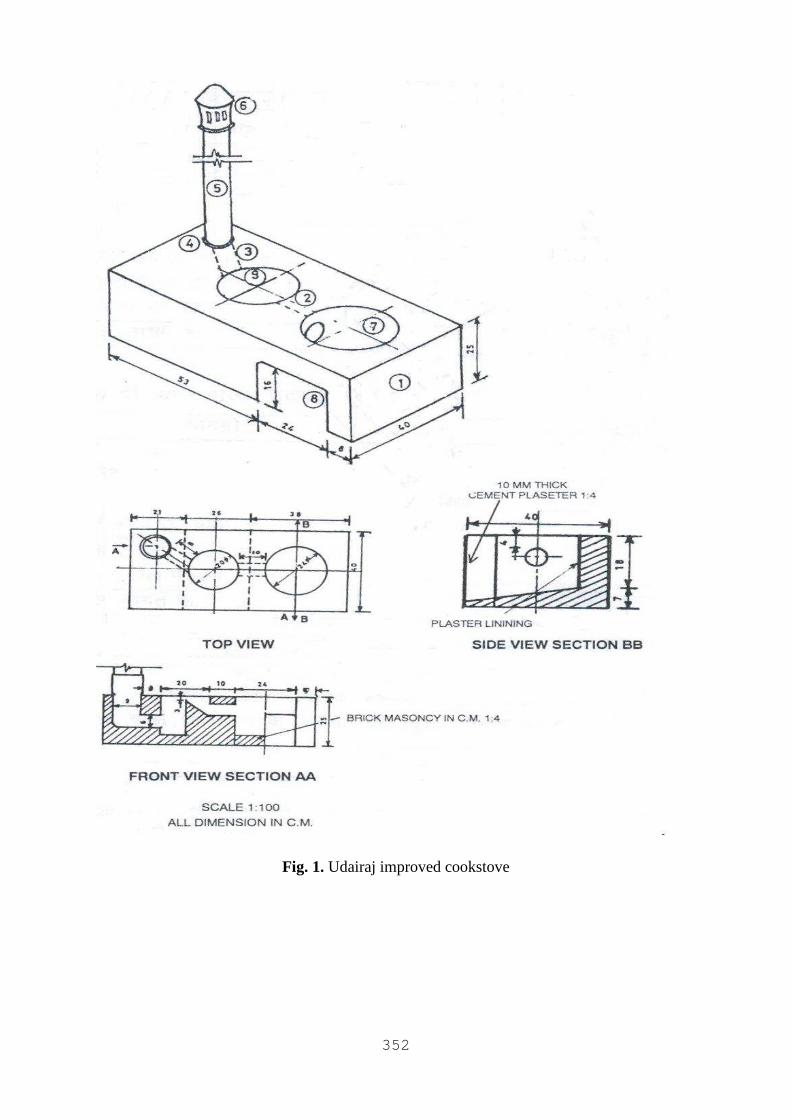
352
Fig. 1. Udairaj improved cookstove
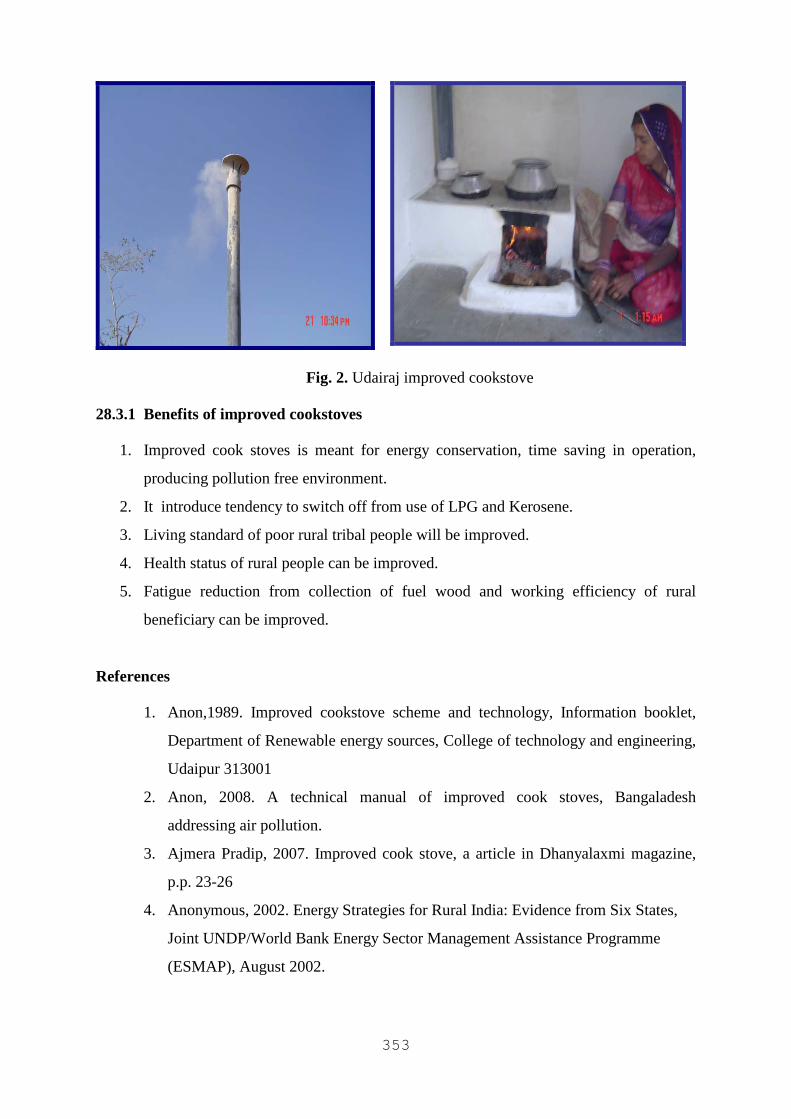
353
Fig. 2. Udairaj improved cookstove
28.3.1 Benefits of improved cookstoves
1. Improved cook stoves is meant for energy conservation, time saving in operation,
producing pollution free environment.
2. It introduce tendency to switch off from use of LPG and Kerosene.
3. Living standard of poor rural tribal people will be improved.
4. Health status of rural people can be improved.
5. Fatigue reduction from collection of fuel wood and working efficiency of rural
beneficiary can be improved.
References
1. Anon,1989. Improved cookstove scheme and technology, Information booklet,
Department of Renewable energy sources, College of technology and engineering,
Udaipur 313001
2. Anon, 2008. A technical manual of improved cook stoves, Bangaladesh
addressing air pollution.
3. Ajmera Pradip, 2007. Improved cook stove, a article in Dhanyalaxmi magazine,
p.p. 23-26
4. Anonymous, 2002. Energy Strategies for Rural India: Evidence from Six States,
Joint UNDP/World Bank Energy Sector Management Assistance Programme
(ESMAP), August 2002.

354
5. Goldemberg, J., 2000 Rural Energy in Developing Countries Chapter 10 in UNDP
World Energy Assessment: Energy and the Challenge of Sustainability, UNDP,
New York.
6. Rathore, N.S., Panwar, N.L. and Kothari, S.2000. Biomass production and
utilization technology, Himanshu Publication, Udaipur.

355
Part V
Electrochemical Processes
356
CHAPTER 29
PERFORMANCE COMPARISON OF AIR-BREATHING
CATHODE AND AQUEOUS CATHODE EARTHEN POT
MICROBIAL FUEL CELL
Pritha Chatterjee, Soumya Pandit, A.N. Ghadge and M.M. Ghangrekar
Abstract
Performance of five MFCs, made from baked clayware, was evaluated with different cathode
configurations. MFC-1, MFC-4 and MFC-5 were dual chambered MFC with aqueous cathode
and MFC-2 and MFC-3 were single chambered air cathode MFCs, each with volume ranging
from 350 ml to 420 ml. Carbon cloth having a projected surface area of 100 cm2 reinforced
with stainless steel (SS) mesh was used as anode in all these MFCs. Two graphite plates of
surface area 68 cm2 each were used as cathode for MFC-1. The other four pots were coated
with carbon powder applied at a loading of 0.5 mg/cm2 with platinum catalyst (loading =
0.005 mg/cm2). Only the outer surfaces of MFC-2 and MFC-4 were coated with carbon
powder while both the inner and outer surfaces of MFC-3 and MFC-5 were coated with
carbon powder. MFC-3 performed best in terms of sustainable power generated followed by
MFC-5 and then by MFC-1. Sustainable volumetric power densities of 956.83 mW/m3,
731.43 mW/m3, 1173.43 mW/m3, 686.43 mW/m3, 1131.52 mW/m3 at an external resistance
of 100 Ω were obtained respectively for MFC-1, MFC-2, MFC-3, MFC-4, and MFC-5.
Experimental results showed feasibility of using an air cathode MFC over an aqueous cathode
MFC.
Keywords: Microbial Fuel Cell, Single chambered MFC, Air-cathode, Clayware separator,
Power Density, COD removal, Coulombic Effiiency.
29.1 Introduction
The two major problems that human beings are now facing are environmental pollution and
depletion of non-renewable sources of energy. Generation of energy from waste is best
solution to both these problems (Angenent et al., 2004). Microbial fuel cell (MFC) can offer
solution to these problems. The MFC converts the energy stored in chemical bonds of organic
waste to electrical energy, through the catalytic reactions by microorganisms under anaerobic
357
conditions while accomplishing the biodegradation of organic matters (Du et al., 2007). It can
be thus used in wastewater treatment facilities to break down organic matter and
simultaneously generate electric power.
There has been a lot of research on MFC in the past few decades. However large scale
commercial application of MFCs is not yet possible due to low power yields and high
fabrication costs. Various configurations of MFCs have been used by researchers; the most
common being a double chambered MFC consisting of an anode and a cathode chamber
partitioned by a proton exchange membrane (PEM) (Du et al., 2007). These segmented parts
make it difficult to scale up the MFCs for practical use (Kim et al., 2009). In addition to two-
chambered MFCs, it is also possible to design single-chambered MFCs with air breathing
cathodes, which do not require cathode to be placed in water. The single-chambered air
cathode offers several advantages over two-chambered systems such as; (a) the cathode does
not need to be aerated, oxygen in the air can directly react at the electrode, (b) recycling or
chemical regeneration of the catholyte is not required, and (c) higher volumetric power
density is easily achievable due to smaller cell volume (Liu and Logan, 2004). Air cathode is
an efficient and sustainable option for MFC fabrication today (Duteanu et al., 2010). Many
researchers have generated air cathode MFCs. A volumetric power density of as high as 1550
W/m3 was reported by Fan et al. (2007a) using acetate as substrate with bicarbonate buffer at
operating pH of 9. Carbon cloth was used as cathode and anode with a double layer in this
study.
The membrane or the separator used in a MFC is a very important component. It acts
as a separator for the aerobic and anaerobic compartments in a MFC as well as allows passage
of ions through it (Kim et al., 2009). Although membrane-less MFCs are being designed to
reduce cost, have simple configuration and have high power density but membrane-less
MFCs often experience low Coulombic efficiencies (CE) and oxygen intrusion into the anode
(Fan et al., 2007b; Kim et al., 2009). Moreover, omitting a membrane can lead to deactivation
of catalyst in the cathode from the contaminated environment of the anode (Sun et al., 2009).
Therefore researchers tried to develop new membranes that can reduce the oxygen diffusion
without greatly affecting the internal resistance or power density (Fan et al., 2007b). An ideal
membrane must have the following characteristics: (a) a high proton transfer coefficient to
ensure that it does not inhibit protons from reaching the cathode, (b) low oxygen transfer
coefficient to improve CE, and (c) relatively non-biodegradable (Zhang et al., 2009). If the
pore sizes and porosities of a membrane are too small, proton transfer to the cathode is
358
restricted, reducing current and power densities. If the porosity is too large then oxygen
diffuses into the anode from the cathode. Thus oxygen then acts as the terminal electron
acceptor instead of the anode in the oxidation of organic matter in the anodic chamber,
thereby reducing CE (Zhang et al., 2009).
Commercially available polymer membranes make a MFC very costly to be used for
wastewater treatment. So researchers are trying to find out cheaper options for proton
exchange membranes. Nafion is the most widely used membrane in MFCs. But it has certain
disadvantages like (a) it has higher affinity to cations like Na+ and K+ than H+ ions, (b) it is an
expensive material therefore it increases the cost of MFC, and (c) it is acidic in nature which
is problematic for the growth of bacteria (Prakash et al., 2010). Behera et al. (2010) used an
earthen pot as a membrane and obtained a maximum power density of 16.8 W/m3. This MFC
with manufacturing cost less than 1 US$ gave a quiet good performance compared to other
MFCs prepared using expensive materials.
In this study the feasibility of air cathode MFC fabricated using an earthen pot is
investigated. The earthen pot itself served as the anode chamber and the wall material served
as PEM. The performance of this MFC with aqueous cathode and air cathode is compared.
The effect of carbon powder coating on anode is also studied by comparing the performance
of two MFCs one with carbon powder coating only on cathode and the other with carbon
powder coating both on anode and cathode.
29.2 Materials and Methods
29.2.1 MFC Construction
The study was carried out with five laboratory scale MFCs. The experimental conditions are
provided in details in Table 1. MFC-1 was a dual chambered MFC with aqueous cathode and
MFC-2 and MFC-3 were single chambered air cathode MFCs; whereas, MFC-4 and MFC-5
were operated under aqueous catholyte mode using aerated tap water. The five MFCs were
made up of earthen pot having respective working volume of 350 ml, 350 ml, 420 ml, 350 ml
and 420 ml. Commercially available earthen pot prepared using locally available soil was
used for anode chamber. The pot served both as the anode chamber and the wall material of
the pot worked as a separator. Carbon cloth having a projected surface area of 100 cm2
reinforced with stainless steel (SS) mesh was used as anode in all these MFCs. Two graphite
plates having surface area of 68 cm2 each were used as cathode for MFC-1. The earthen pot
anode was placed in a plastic container working as a cathode chamber. The other pots were
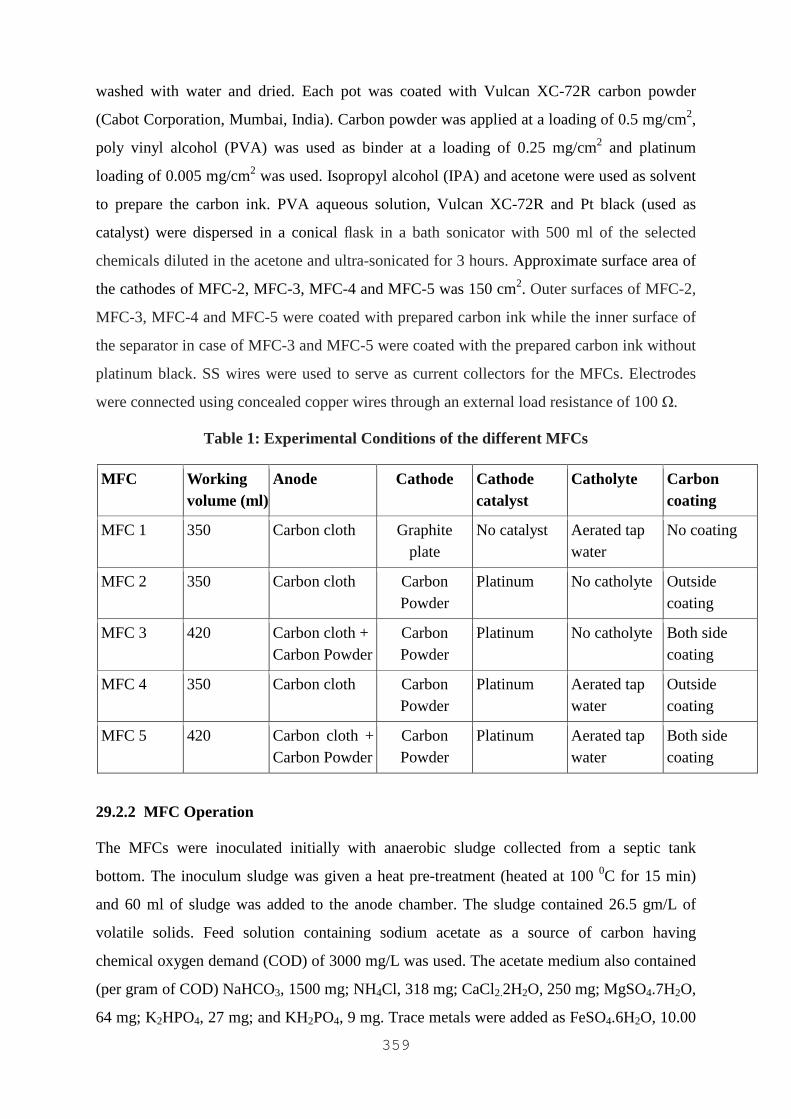
359
washed with water and dried. Each pot was coated with Vulcan XC-72R carbon powder
(Cabot Corporation, Mumbai, India). Carbon powder was applied at a loading of 0.5 mg/cm2,
poly vinyl alcohol (PVA) was used as binder at a loading of 0.25 mg/cm2 and platinum
loading of 0.005 mg/cm2 was used. Isopropyl alcohol (IPA) and acetone were used as solvent
to prepare the carbon ink. PVA aqueous solution, Vulcan XC-72R and Pt black (used as
catalyst) were dispersed in a conical flask in a bath sonicator with 500 ml of the selected
chemicals diluted in the acetone and ultra-sonicated for 3 hours. Approximate surface area of
the cathodes of MFC-2, MFC-3, MFC-4 and MFC-5 was 150 cm2. Outer surfaces of MFC-2,
MFC-3, MFC-4 and MFC-5 were coated with prepared carbon ink while the inner surface of
the separator in case of MFC-3 and MFC-5 were coated with the prepared carbon ink without
platinum black. SS wires were used to serve as current collectors for the MFCs. Electrodes
were connected using concealed copper wires through an external load resistance of 100 Ω.
Table 1: Experimental Conditions of the different MFCs
MFC Working volume (ml)
Anode Cathode Cathode catalyst
Catholyte Carbon coating
MFC 1 350 Carbon cloth Graphite plate
No catalyst Aerated tap water
No coating
MFC 2 350 Carbon cloth Carbon Powder
Platinum No catholyte Outside coating
MFC 3 420 Carbon cloth + Carbon Powder
Carbon Powder
Platinum No catholyte Both side coating
MFC 4 350 Carbon cloth Carbon Powder
Platinum Aerated tap water
Outside coating
MFC 5 420 Carbon cloth + Carbon Powder
Carbon Powder
Platinum Aerated tap water
Both side coating
29.2.2 MFC Operation
The MFCs were inoculated initially with anaerobic sludge collected from a septic tank
bottom. The inoculum sludge was given a heat pre-treatment (heated at 100 0C for 15 min)
and 60 ml of sludge was added to the anode chamber. The sludge contained 26.5 gm/L of
volatile solids. Feed solution containing sodium acetate as a source of carbon having
chemical oxygen demand (COD) of 3000 mg/L was used. The acetate medium also contained
(per gram of COD) NaHCO3, 1500 mg; NH4Cl, 318 mg; CaCl2.2H2O, 250 mg; MgSO4.7H2O,
64 mg; K2HPO4, 27 mg; and KH2PO4, 9 mg. Trace metals were added as FeSO4.6H2O, 10.00
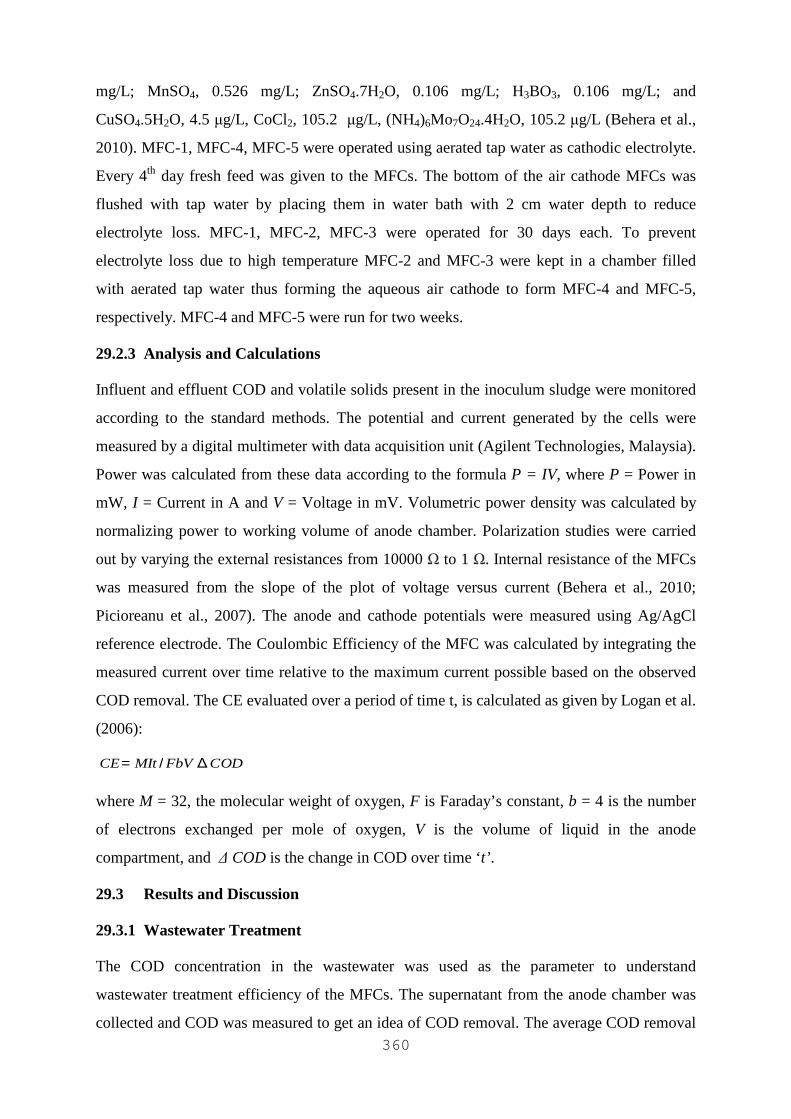
360
mg/L; MnSO4, 0.526 mg/L; ZnSO4.7H2O, 0.106 mg/L; H3BO3, 0.106 mg/L; and
CuSO4.5H2O, 4.5 µg/L, CoCl2, 105.2 µg/L, (NH4)6Mo7O24.4H2O, 105.2 µg/L (Behera et al.,
2010). MFC-1, MFC-4, MFC-5 were operated using aerated tap water as cathodic electrolyte.
Every 4th day fresh feed was given to the MFCs. The bottom of the air cathode MFCs was
flushed with tap water by placing them in water bath with 2 cm water depth to reduce
electrolyte loss. MFC-1, MFC-2, MFC-3 were operated for 30 days each. To prevent
electrolyte loss due to high temperature MFC-2 and MFC-3 were kept in a chamber filled
with aerated tap water thus forming the aqueous air cathode to form MFC-4 and MFC-5,
respectively. MFC-4 and MFC-5 were run for two weeks.
29.2.3 Analysis and Calculations
Influent and effluent COD and volatile solids present in the inoculum sludge were monitored
according to the standard methods. The potential and current generated by the cells were
measured by a digital multimeter with data acquisition unit (Agilent Technologies, Malaysia).
Power was calculated from these data according to the formula P = IV, where P = Power in
mW, I = Current in A and V = Voltage in mV. Volumetric power density was calculated by
normalizing power to working volume of anode chamber. Polarization studies were carried
out by varying the external resistances from 10000 Ω to 1 Ω. Internal resistance of the MFCs
was measured from the slope of the plot of voltage versus current (Behera et al., 2010;
Picioreanu et al., 2007). The anode and cathode potentials were measured using Ag/AgCl
reference electrode. The Coulombic Efficiency of the MFC was calculated by integrating the
measured current over time relative to the maximum current possible based on the observed
COD removal. The CE evaluated over a period of time t, is calculated as given by Logan et al.
(2006):
CE= MIt / FbV ∆ COD
where M = 32, the molecular weight of oxygen, F is Faraday’s constant, b = 4 is the number
of electrons exchanged per mole of oxygen, V is the volume of liquid in the anode
compartment, and ∆ COD is the change in COD over time ‘t’ .
29.3 Results and Discussion
29.3.1 Wastewater Treatment
The COD concentration in the wastewater was used as the parameter to understand
wastewater treatment efficiency of the MFCs. The supernatant from the anode chamber was
collected and COD was measured to get an idea of COD removal. The average COD removal
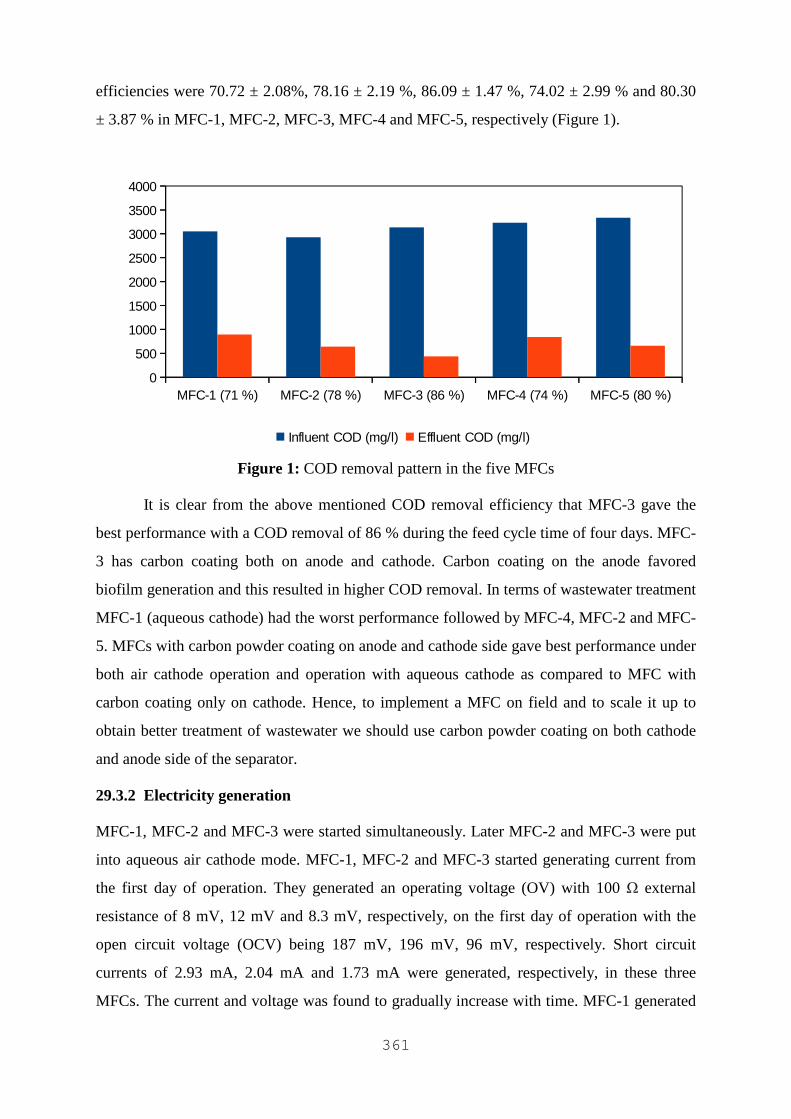
361
efficiencies were 70.72 ± 2.08%, 78.16 ± 2.19 %, 86.09 ± 1.47 %, 74.02 ± 2.99 % and 80.30
± 3.87 % in MFC-1, MFC-2, MFC-3, MFC-4 and MFC-5, respectively (Figure 1).
Figure 1: COD removal pattern in the five MFCs
It is clear from the above mentioned COD removal efficiency that MFC-3 gave the
best performance with a COD removal of 86 % during the feed cycle time of four days. MFC-
3 has carbon coating both on anode and cathode. Carbon coating on the anode favored
biofilm generation and this resulted in higher COD removal. In terms of wastewater treatment
MFC-1 (aqueous cathode) had the worst performance followed by MFC-4, MFC-2 and MFC-
5. MFCs with carbon powder coating on anode and cathode side gave best performance under
both air cathode operation and operation with aqueous cathode as compared to MFC with
carbon coating only on cathode. Hence, to implement a MFC on field and to scale it up to
obtain better treatment of wastewater we should use carbon powder coating on both cathode
and anode side of the separator.
29.3.2 Electricity generation
MFC-1, MFC-2 and MFC-3 were started simultaneously. Later MFC-2 and MFC-3 were put
into aqueous air cathode mode. MFC-1, MFC-2 and MFC-3 started generating current from
the first day of operation. They generated an operating voltage (OV) with 100 Ω external
resistance of 8 mV, 12 mV and 8.3 mV, respectively, on the first day of operation with the
open circuit voltage (OCV) being 187 mV, 196 mV, 96 mV, respectively. Short circuit
currents of 2.93 mA, 2.04 mA and 1.73 mA were generated, respectively, in these three
MFCs. The current and voltage was found to gradually increase with time. MFC-1 generated
MFC-1 (71 %) MFC-2 (78 %) MFC-3 (86 %) MFC-4 (74 %) MFC-5 (80 %)0
500
1000
1500
2000
2500
3000
3500
4000
Influent COD (mg/l) Effluent COD (mg/l)
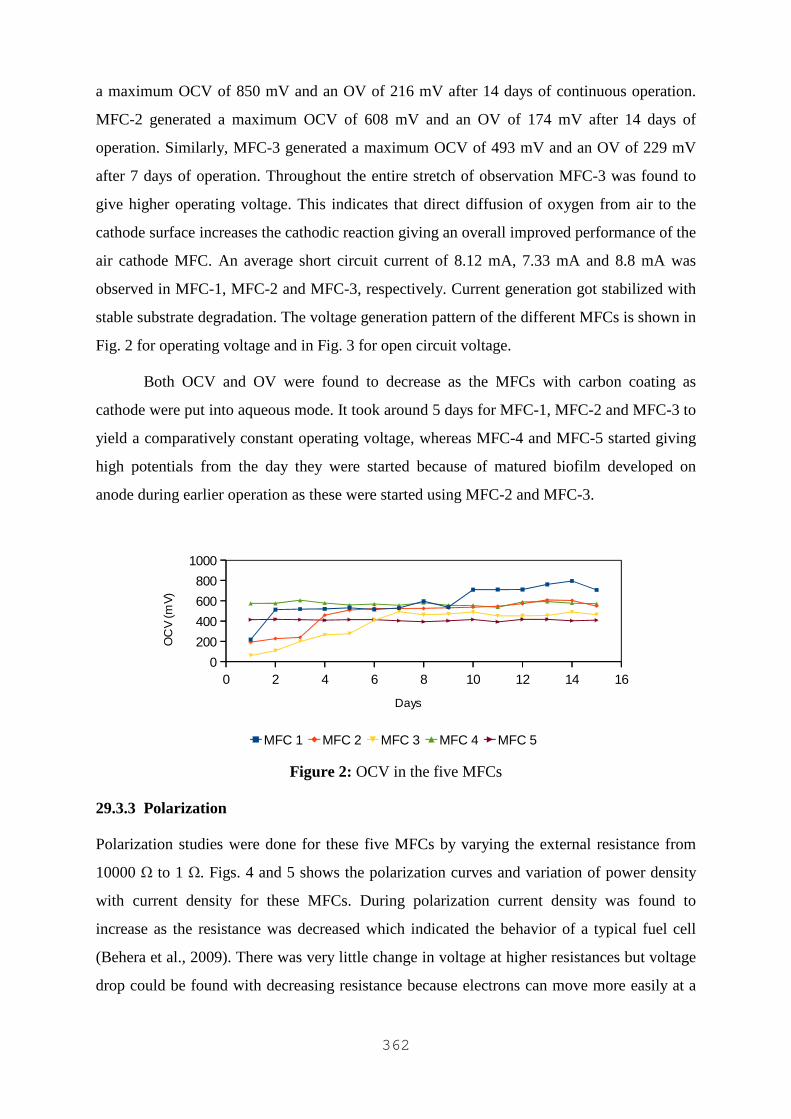
362
a maximum OCV of 850 mV and an OV of 216 mV after 14 days of continuous operation.
MFC-2 generated a maximum OCV of 608 mV and an OV of 174 mV after 14 days of
operation. Similarly, MFC-3 generated a maximum OCV of 493 mV and an OV of 229 mV
after 7 days of operation. Throughout the entire stretch of observation MFC-3 was found to
give higher operating voltage. This indicates that direct diffusion of oxygen from air to the
cathode surface increases the cathodic reaction giving an overall improved performance of the
air cathode MFC. An average short circuit current of 8.12 mA, 7.33 mA and 8.8 mA was
observed in MFC-1, MFC-2 and MFC-3, respectively. Current generation got stabilized with
stable substrate degradation. The voltage generation pattern of the different MFCs is shown in
Fig. 2 for operating voltage and in Fig. 3 for open circuit voltage.
Both OCV and OV were found to decrease as the MFCs with carbon coating as
cathode were put into aqueous mode. It took around 5 days for MFC-1, MFC-2 and MFC-3 to
yield a comparatively constant operating voltage, whereas MFC-4 and MFC-5 started giving
high potentials from the day they were started because of matured biofilm developed on
anode during earlier operation as these were started using MFC-2 and MFC-3.
Figure 2: OCV in the five MFCs
29.3.3 Polarization
Polarization studies were done for these five MFCs by varying the external resistance from
10000 Ω to 1 Ω. Figs. 4 and 5 shows the polarization curves and variation of power density
with current density for these MFCs. During polarization current density was found to
increase as the resistance was decreased which indicated the behavior of a typical fuel cell
(Behera et al., 2009). There was very little change in voltage at higher resistances but voltage
drop could be found with decreasing resistance because electrons can move more easily at a
0 2 4 6 8 10 12 14 160
200
400
600
800
1000
MFC 1 MFC 2 MFC 3 MFC 4 MFC 5
Days
OC
V (
mV
)
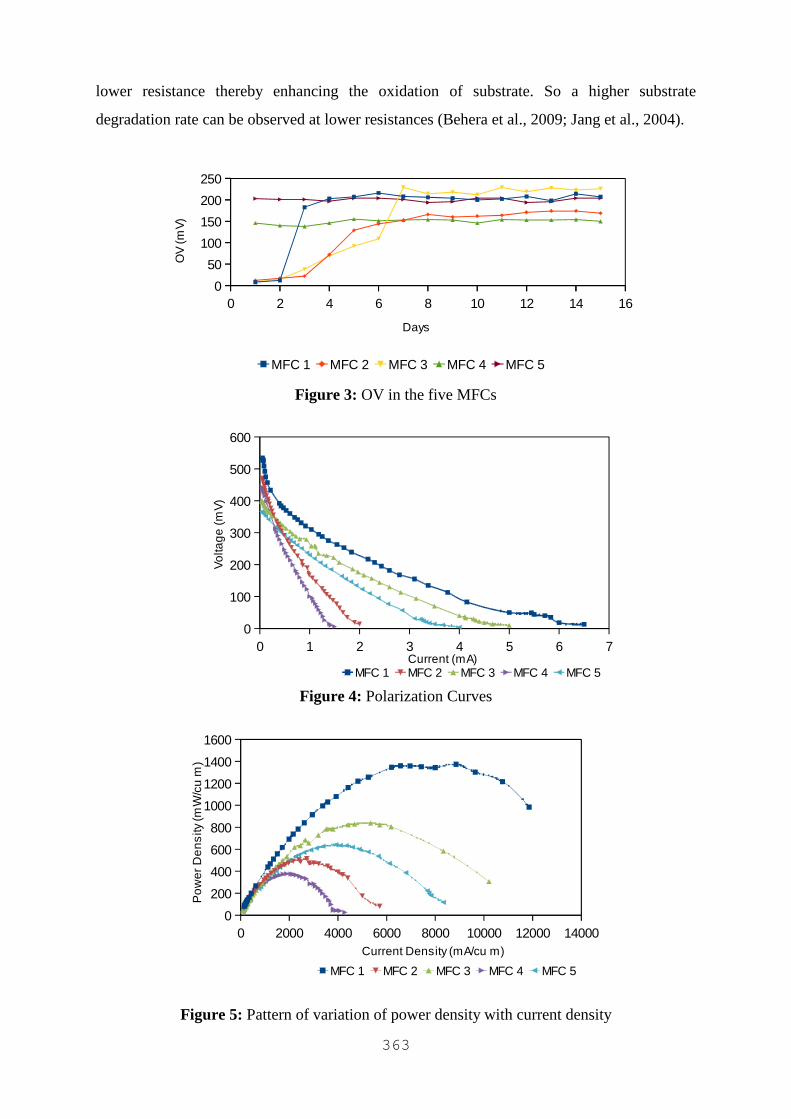
363
lower resistance thereby enhancing the oxidation of substrate. So a higher substrate
degradation rate can be observed at lower resistances (Behera et al., 2009; Jang et al., 2004).
Figure 3: OV in the five MFCs
Figure 4: Polarization Curves
Figure 5: Pattern of variation of power density with current density
0 1 2 3 4 5 6 70
100
200
300
400
500
600
MFC 1 MFC 2 MFC 3 MFC 4 MFC 5Current (mA)
Vol
tag
e (m
V)
0 2 4 6 8 10 12 14 160
50
100
150
200
250
MFC 1 MFC 2 MFC 3 MFC 4 MFC 5
Days
OV
(mV)
0 2000 4000 6000 8000 10000 12000 140000
200
400
600
800
1000
1200
1400
1600
MFC 1 MFC 2 MFC 3 MFC 4 MFC 5
Current Density (mA/cu m)
Po
wer
De
nsi
ty (m
W/c
u m
)
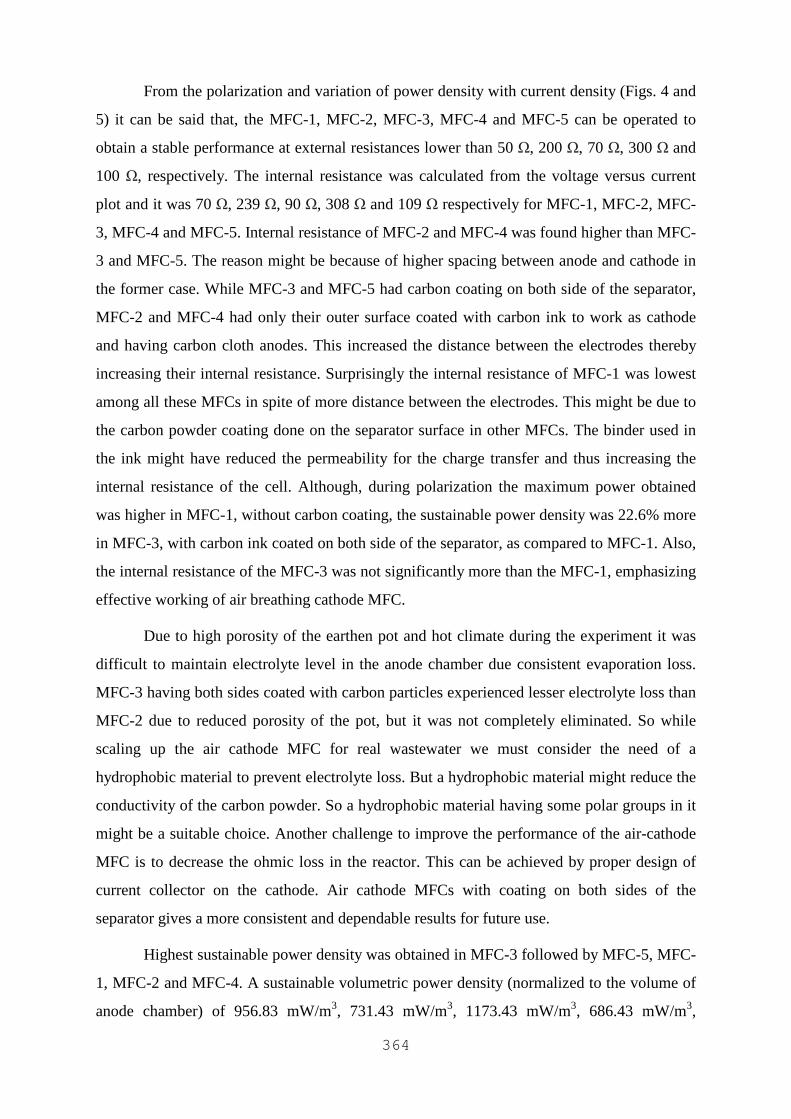
364
From the polarization and variation of power density with current density (Figs. 4 and
5) it can be said that, the MFC-1, MFC-2, MFC-3, MFC-4 and MFC-5 can be operated to
obtain a stable performance at external resistances lower than 50 Ω, 200 Ω, 70 Ω, 300 Ω and
100 Ω, respectively. The internal resistance was calculated from the voltage versus current
plot and it was 70 Ω, 239 Ω, 90 Ω, 308 Ω and 109 Ω respectively for MFC-1, MFC-2, MFC-
3, MFC-4 and MFC-5. Internal resistance of MFC-2 and MFC-4 was found higher than MFC-
3 and MFC-5. The reason might be because of higher spacing between anode and cathode in
the former case. While MFC-3 and MFC-5 had carbon coating on both side of the separator,
MFC-2 and MFC-4 had only their outer surface coated with carbon ink to work as cathode
and having carbon cloth anodes. This increased the distance between the electrodes thereby
increasing their internal resistance. Surprisingly the internal resistance of MFC-1 was lowest
among all these MFCs in spite of more distance between the electrodes. This might be due to
the carbon powder coating done on the separator surface in other MFCs. The binder used in
the ink might have reduced the permeability for the charge transfer and thus increasing the
internal resistance of the cell. Although, during polarization the maximum power obtained
was higher in MFC-1, without carbon coating, the sustainable power density was 22.6% more
in MFC-3, with carbon ink coated on both side of the separator, as compared to MFC-1. Also,
the internal resistance of the MFC-3 was not significantly more than the MFC-1, emphasizing
effective working of air breathing cathode MFC.
Due to high porosity of the earthen pot and hot climate during the experiment it was
difficult to maintain electrolyte level in the anode chamber due consistent evaporation loss.
MFC-3 having both sides coated with carbon particles experienced lesser electrolyte loss than
MFC-2 due to reduced porosity of the pot, but it was not completely eliminated. So while
scaling up the air cathode MFC for real wastewater we must consider the need of a
hydrophobic material to prevent electrolyte loss. But a hydrophobic material might reduce the
conductivity of the carbon powder. So a hydrophobic material having some polar groups in it
might be a suitable choice. Another challenge to improve the performance of the air-cathode
MFC is to decrease the ohmic loss in the reactor. This can be achieved by proper design of
current collector on the cathode. Air cathode MFCs with coating on both sides of the
separator gives a more consistent and dependable results for future use.
Highest sustainable power density was obtained in MFC-3 followed by MFC-5, MFC-
1, MFC-2 and MFC-4. A sustainable volumetric power density (normalized to the volume of
anode chamber) of 956.83 mW/m3, 731.43 mW/m3, 1173.43 mW/m3, 686.43 mW/m3,
365
1131.52 mW/m3 at an external resistance of 100 Ω were obtained, respectively, for MFC-1,
MFC-2, MFC-3, MFC-4 and MFC-5 (Table 2). The aqueous cathode MFC was found to
perform better than the air cathode MFC-2, but performance of the air-cathode MFC-3 was
the best among all. MFC-3 had coating on both the anode and cathode side of the separator.
The observations indicate that this both sided coating had an added advantage over all the
other reactor configurations. It helped in better formation of biofilm and also reduced the
distance between anode and cathode as mentioned earlier.
Table 2: Electricity generated in the different MFCs
MFC No. of days of operation
Operating Voltage (mV)
Open circuit potential (mV)
Max Power Density (mW/m3)
Sustainable Power Density
at 100 Ώ resistance (mW/m3)
Internal resista-nce (Ώ) Max. Avg. Standard
deviation Max.
Avg. Standard deviation
MFC-1 30 216 183 ±71 850 775 ±150 1372.8 956.83 76
MFC-2 15 174 160 ±44 608 548 ±104 515.7 731.43 239
MFC-3 15 227 222 ±18 493 463 ±77 838.4 1173.43 90
MFC-4 15 155 150 ±20 605 571 ±65 377.1 686.43 308
MFC-5 15 204 218 ±15 417 409 ±31 635.5 1131.52 109
29.3.4 Electrode Potentials
Electrode Potential was measured by Ag/AgCl reference electrode during polarization. Very
little change in anode potential was observed during the process but cathode potential was
found to decrease rapidly with decrease in resistance turning negative after a particular
current (Figure 6 and 7). It is clear from the pattern of cathode potential varying with
resistance that at resistances higher than 4000 Ω, the cathode of MFC-1 performed better than
MFC-2 and MFC-3. Although MFC-3 gave a better performance than MFC-2, the cathode
potential of MFC-2 was found to be slightly higher than MFC-3. So the better performance of
MFC-3 can be attributed to a better performing anode. Similarly MFC-4 and MFC-5 had poor
performing cathodes because of low availability of oxygen for reduction in aqueous medium.
Lower potential of MFCs with carbon ink coated cathode can also be attributed to the small
amount of oxidation reaction on the cathode by heterotrophs, because of migration of organic
matter from anodic chamber to the cathode.
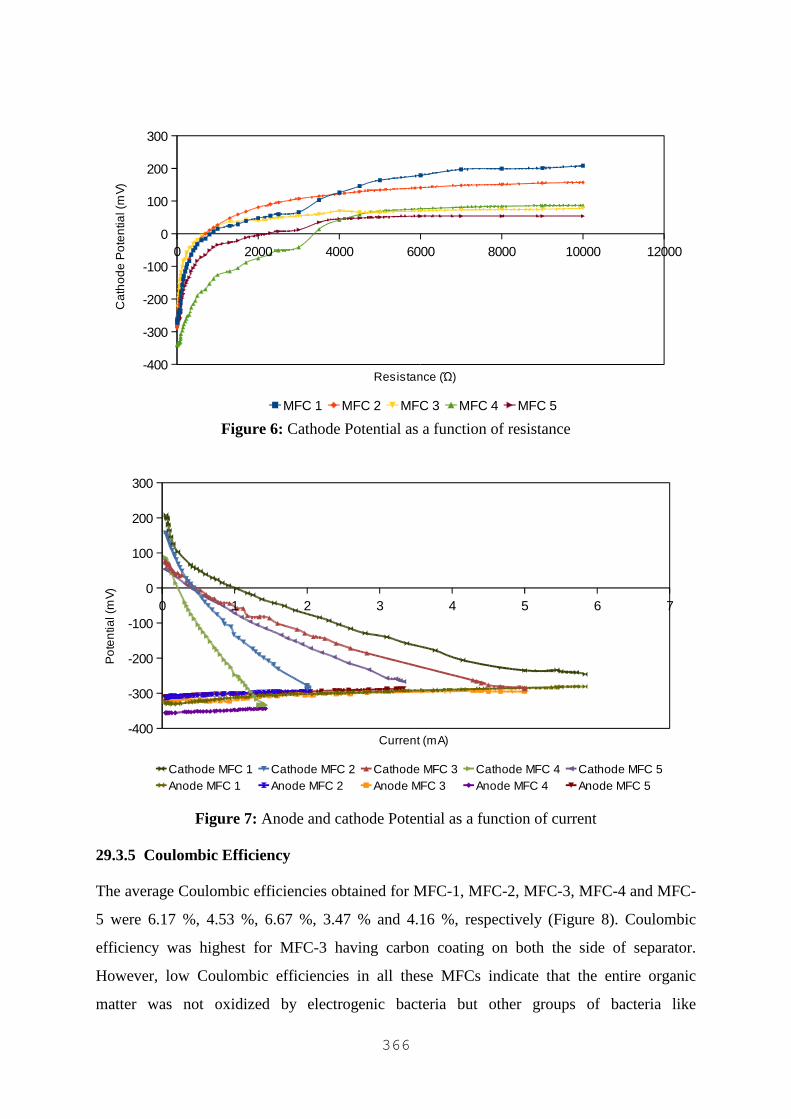
366
Figure 6: Cathode Potential as a function of resistance
Figure 7: Anode and cathode Potential as a function of current
29.3.5 Coulombic Efficiency
The average Coulombic efficiencies obtained for MFC-1, MFC-2, MFC-3, MFC-4 and MFC-
5 were 6.17 %, 4.53 %, 6.67 %, 3.47 % and 4.16 %, respectively (Figure 8). Coulombic
efficiency was highest for MFC-3 having carbon coating on both the side of separator.
However, low Coulombic efficiencies in all these MFCs indicate that the entire organic
matter was not oxidized by electrogenic bacteria but other groups of bacteria like
0 2000 4000 6000 8000 10000 12000
-400
-300
-200
-100
0
100
200
300
MFC 1 MFC 2 MFC 3 MFC 4 MFC 5
Resistance (Ώ)
Cat
hod
e P
ote
ntia
l (m
V)
0 1 2 3 4 5 6 7
-400
-300
-200
-100
0
100
200
300
Cathode MFC 1 Cathode MFC 2 Cathode MFC 3 Cathode MFC 4 Cathode MFC 5Anode MFC 1 Anode MFC 2 Anode MFC 3 Anode MFC 4 Anode MFC 5
Current (mA)
Po
ten
tial (
mV
)
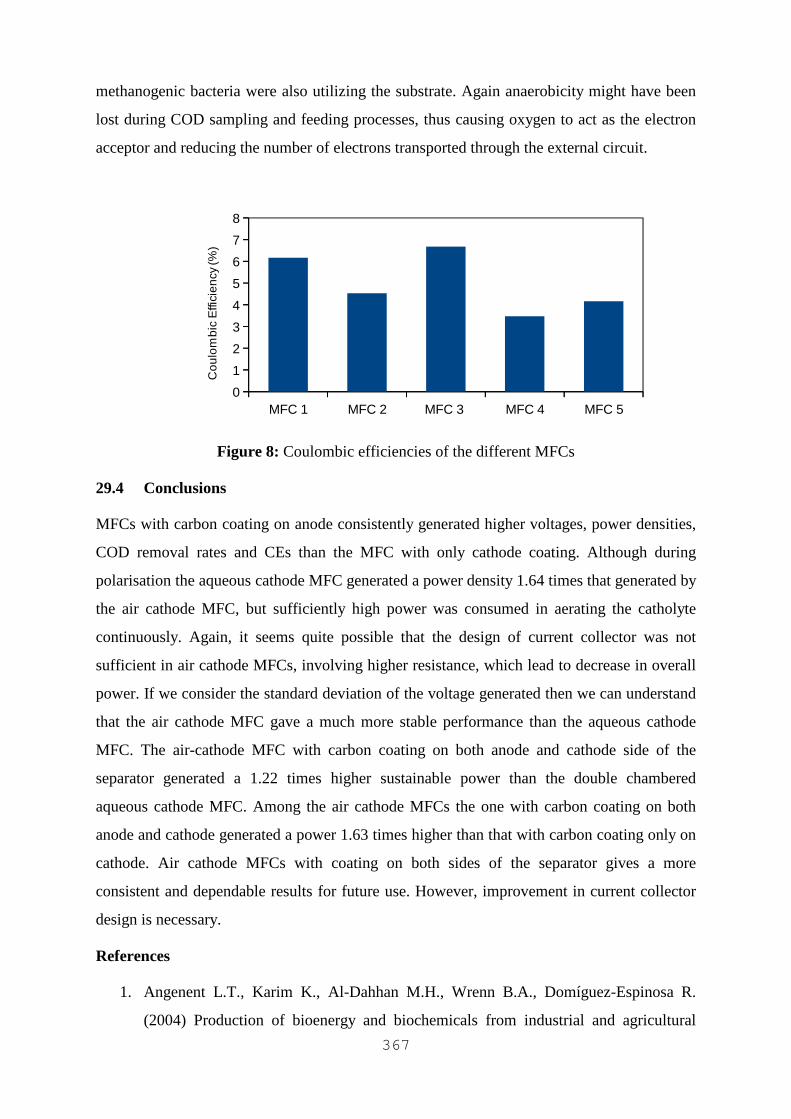
367
methanogenic bacteria were also utilizing the substrate. Again anaerobicity might have been
lost during COD sampling and feeding processes, thus causing oxygen to act as the electron
acceptor and reducing the number of electrons transported through the external circuit.
Figure 8: Coulombic efficiencies of the different MFCs
29.4 Conclusions
MFCs with carbon coating on anode consistently generated higher voltages, power densities,
COD removal rates and CEs than the MFC with only cathode coating. Although during
polarisation the aqueous cathode MFC generated a power density 1.64 times that generated by
the air cathode MFC, but sufficiently high power was consumed in aerating the catholyte
continuously. Again, it seems quite possible that the design of current collector was not
sufficient in air cathode MFCs, involving higher resistance, which lead to decrease in overall
power. If we consider the standard deviation of the voltage generated then we can understand
that the air cathode MFC gave a much more stable performance than the aqueous cathode
MFC. The air-cathode MFC with carbon coating on both anode and cathode side of the
separator generated a 1.22 times higher sustainable power than the double chambered
aqueous cathode MFC. Among the air cathode MFCs the one with carbon coating on both
anode and cathode generated a power 1.63 times higher than that with carbon coating only on
cathode. Air cathode MFCs with coating on both sides of the separator gives a more
consistent and dependable results for future use. However, improvement in current collector
design is necessary.
References
1. Angenent L.T., Karim K., Al-Dahhan M.H., Wrenn B.A., Domíguez-Espinosa R.
(2004) Production of bioenergy and biochemicals from industrial and agricultural
MFC 1 MFC 2 MFC 3 MFC 4 MFC 50
1
2
3
4
5
6
7
8C
ou
lom
bic
Effi
cie
ncy
(%
)
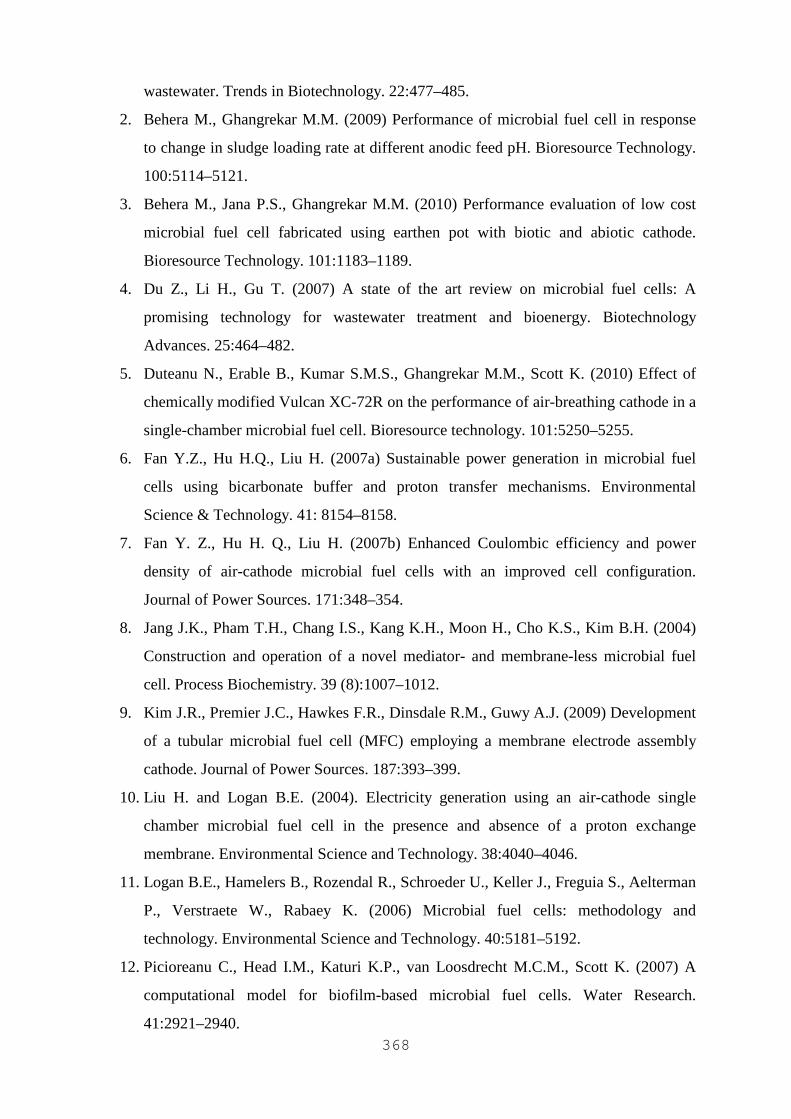
368
wastewater. Trends in Biotechnology. 22:477–485.
2. Behera M., Ghangrekar M.M. (2009) Performance of microbial fuel cell in response
to change in sludge loading rate at different anodic feed pH. Bioresource Technology.
100:5114–5121.
3. Behera M., Jana P.S., Ghangrekar M.M. (2010) Performance evaluation of low cost
microbial fuel cell fabricated using earthen pot with biotic and abiotic cathode.
Bioresource Technology. 101:1183–1189.
4. Du Z., Li H., Gu T. (2007) A state of the art review on microbial fuel cells: A
promising technology for wastewater treatment and bioenergy. Biotechnology
Advances. 25:464–482.
5. Duteanu N., Erable B., Kumar S.M.S., Ghangrekar M.M., Scott K. (2010) Effect of
chemically modified Vulcan XC-72R on the performance of air-breathing cathode in a
single-chamber microbial fuel cell. Bioresource technology. 101:5250–5255.
6. Fan Y.Z., Hu H.Q., Liu H. (2007a) Sustainable power generation in microbial fuel
cells using bicarbonate buffer and proton transfer mechanisms. Environmental
Science & Technology. 41: 8154–8158.
7. Fan Y. Z., Hu H. Q., Liu H. (2007b) Enhanced Coulombic efficiency and power
density of air-cathode microbial fuel cells with an improved cell configuration.
Journal of Power Sources. 171:348–354.
8. Jang J.K., Pham T.H., Chang I.S., Kang K.H., Moon H., Cho K.S., Kim B.H. (2004)
Construction and operation of a novel mediator- and membrane-less microbial fuel
cell. Process Biochemistry. 39 (8):1007–1012.
9. Kim J.R., Premier J.C., Hawkes F.R., Dinsdale R.M., Guwy A.J. (2009) Development
of a tubular microbial fuel cell (MFC) employing a membrane electrode assembly
cathode. Journal of Power Sources. 187:393–399.
10. Liu H. and Logan B.E. (2004). Electricity generation using an air-cathode single
chamber microbial fuel cell in the presence and absence of a proton exchange
membrane. Environmental Science and Technology. 38:4040–4046.
11. Logan B.E., Hamelers B., Rozendal R., Schroeder U., Keller J., Freguia S., Aelterman
P., Verstraete W., Rabaey K. (2006) Microbial fuel cells: methodology and
technology. Environmental Science and Technology. 40:5181–5192.
12. Picioreanu C., Head I.M., Katuri K.P., van Loosdrecht M.C.M., Scott K. (2007) A
computational model for biofilm-based microbial fuel cells. Water Research.
41:2921–2940.

369
13. Prakash G.K.S., Viva F.A., Bretschger O., Yang B., El-Naggar M., Nealson K. (2010)
Inoculation procedures and characterization of membrane electrode assemblies for
microbial fuel cells. Journal of Power Sources. 195:111–117.
14. Sun J., Hu Y., Bi Z., Cao Y. (2009) Improved performance of air-cathode single-
chamber microbial fuel cell for wastewater treatment using microfiltration membranes
and multiple sludge inoculation. Journal of Power Sources. 187:471–479.
15. Zhang X.Y., Cheng S.A., Wang X., Huang X., Logan B.E. (2009) Separator
characteristics for increasing performance of microbial fuel cells. Environmental
Science & Technology. 43: 8456–8461.


