Embed Size (px)
Citation preview
Application of the Composition of Probabilistic Preferences in Modal Choice for Freight Transportation of Hazardous Materials
Pauli Adriano de Almada Garcia
Programa de Pós-Graduação em Administração – PPGA/UFF Rua Desemb. Ellis Hermydio Figueira, 783, Bloco A, Sala 304, Aterrado, Volta Redonda, RJ.
Ilton Curty Leal Junior Programa de Pós-Graduação em Administração – PPGA/UFF
Rua Desemb. Ellis Hermydio Figueira, 783, Bloco A, Sala 304, Aterrado, Volta Redonda, RJ. [email protected]
Vanessa de Almeida Guimarães
Programa de Pós-Graduação em Administração – PPGA/UFF Rua Desemb. Ellis Hermydio Figueira, 783, Bloco A, Sala 305, Aterrado, Volta Redonda, RJ.
RESUMO Considerando-se os impactos ambientais ocasionados pelo transporte de carga, especificamente para o caso de produtos perigosos, o presente artigo propõe uma aplicação da composição probabilística de preferências como método de escolha modal considerando medidas associadas a riscos de acidentes e de eco-eficiência. O propósito do método de escolha modal é estabelecer uma ordem de prioridade entre os modos de transporte, permitindo que o tomador de decisões escolha o que melhor lhe convier. Tradicionalmente, no Brasil, a avaliação dos modos de transporte não considera os riscos e os impactos ambientais, sendo o custo o principal critério de decisão. Diante disso, no presente trabalho escolheu-se um conjunto de indicadores de eco-eficiência e um indicador de risco, custo de acidente, e lançou-se mão da composição probabilística de preferência para estabelecer uma ordem de prioridade entre as alternativas disponíveis. O caso de aplicação refere-se ao transporte para exportação de bioetanol, produzido na região Centro-Sul do país. Os resultados obtidos indicam que, independente do perfil do decisor, o modo puramente rodoviário não deveria ser o preferível. Esse resultado prevalece mesmo para um perfil médio de decisor.
PALAVARAS CHAVE. Transporte de carga, Eco-eficiênia, Composição probabilística de preferências
Área principal (ADM - Multicriteria Decision Support // ADM - Apoyo a la Decisión Multicriterio // ADM - Apoio à Decisão Multicritério L & T - Logistics and Transport // L & T - Logística y Transporte // L&T - Logística e Transportes)
ABSTRACT Considering the environmental impacts caused by freight transportation activities, especially in the case of hazardous materials, this paper proposes the application of the Composition of Probabilistic Preferences (CPP) to the Modal Choice Method (MCM), considering the risk of accident and eco-efficiency measures. The purpose of the MCM is to establish a ranking among the transportation modes, allowing the decision makers to choose that one with best performance. Traditionally, in Brazil, transportation modal choice doesn’t consider risks or environmental impacts, being the cost the main considered factor. Then, we selected a set of eco-efficiency

measures and applied the CPP, a multi-criteria tool, to establish the priority ranking among the transportation modes. We applied this method specifically to analyze the transport for exportation of Brazilian bio-ethanol produced from the country's South-Central region. The obtained results show that, independently of the decision maker profiling, the simplest roadway transportation mode is not the preferable one. This result stills the same if one considers a mean profile for decision making.
.
KEYWORDS. Freight transportation, ecoefficiency, Composition of probabilistic preferences.
Main area (ADM - Multicriteria Decision Support // ADM - Apoyo a la Decisión Multicriterio // ADM - Apoio à Decisão Multicritério L & T - Logistics and Transport // L & T - Logística y Transporte // L&T - Logística e Transportes)

1. Introduction Due to its importance and potential impacts, the performance of transport activities
must be evaluated (Guimarães, Leal Jr and Garcia, 2014). It become even more important when we are dealing with dangerous freight due to its intrinsic characteristics and the severe impacts related to accidents. Although, performance assessment of freight transport is not simple, since it is a process involving complex decision due to the number of variables and subjects' judgments involved (Leal Jr and D’Agosto, 2009).
Besides, in order to be competitive, without compromising the environment, organizations need to consider the eco-efficiency concept to evaluate the performance of their activities (WBCSD, 2000 and 2006). In the transport, this consideration is essential due to the amount of resources they moved and to the environmental influences related to their activities (Pereira, 2005; Mickwitz et al, 2006; Leal Jr., 2010; Leal Jr. and D'Agosto, 2011; Leal Jr. et al, 2012; Leal Jr. and Guimarães, 2013).
Regarding about hazardous goods, adopting eco-efficiency concept become even more relevant because their transportation may cause negative environmental impact (due to goods’ characteristics). Besides, accident risks must be considered since some accidents can be really severe and increase negative impacts in environment. So, the use of a method to guide the decision-making process, such as Modal Choice Method - MCM is critical.
MCM, proposed by Leal Jr. and D'Agosto (2011), assist in decision making regarding the choice of transportation mode, based on its performance evaluation. The MCM, for being flexible, allows the use of a structure that uses eco-efficiency measures that have a differential for companies that value the environmental issues (Leal Jr and D’Agosto, 2011). In this context, this work is based on the following question: Can the consideration of accident risk influence the decision by the transportation mode?
To answer this question, this paper aims to apply the MCM in a real situation, considering the eco-efficiency measures combined with accident risks of each transportation mode under evaluation. For this study, we conducted a case of transport of ethanol produced in the Brazil’s South-Central region to a port for export. The main hypothesis states that the use of accident risks in the analysis of eco-efficiency improve the performance of the transportation alternatives and interferes in the decision making process.
For the data analysis we used Composition of Probabilistic Preferences to support the identification of the most appropriate alternatives. The results show that the current practice for bio-ethanol transportation used in Brazil is never the best one, if considering the measures and method here discussed. From this introduction, this paper has four other sectons: (i) considerations about modal choice method and eco-efficiency, (ii) method application, (iii) discussion of results, and (iv) final considerations.
2. Modal Choice Method and Eco-Efficiency Measures In order to better meet the demand, companies evaluate new forms of transport, which
may involve the choice of different transport modes, or combinations of them in the form of intermodal transport. This choice may strongly interfere in the way that company will serve customers and concur with its competitors and should be aligned with business strategy. The development of tools that assist in this choice is of fundamental importance to the business strategy (Manheim, 1980; Morlok, 1980; D´Agosto, 1999).
The Modal Choice Method - MCM (Leal Jr and D'Agosto, 2011) details the process of decision making in transportation design and apply the modal choice of transport in general. This method is essentially dynamic and the results can be reviewed over time, because the final result can be used to power a new cycle of assessment. All details of the method can be accessed at Leal Jr and D'Agosto (2011).
In this work the MCM uses the concept as a basis for establishing eco-efficiency measures. This approach focuses on the proper use of material and energy resources, in order to reduce costs and / or to improve profits (WBCSD, 2000 and 2006; Pereira, 2005; Mickwitz et al, 2006; Leal Jr., 2010; EPA, 2011; Leal Jr. and D'Agosto, 2011; Leal Jr. et al, 2012; Leal Jr. and Guimarães, 2013). Then, eco-efficiency can be understood as the ability to simultaneously meet production goals and cost with quality and performance, reduce environmental impacts and conserve natural resources. The eco-efficiency allows companies to become more responsible environmentally and more profitable in the economic, encouraging them to innovation and competitiveness (WBCSD, 2000 and 2006)
The eco-efficiency indicators can be used for all general and business activities, or specific to a particular sector (WBCSD, 2000 and 2006). Regarding transportation sector, ecoefficiency concept has been applied in: Kuosmanen and Kortelainen, 2005; Lee et al, 2011; Usón et al, 2011; Leal Jr. Garcia and D’Agosto, 2012; Leal Jr and Guimarães, 2013; Guabiroba et al, 2014; Guimarães, Leal Jr and Garcia, 2014; Song, 2014. WBCSD (2000 and 2006) presents a methodology for assessing eco-efficiency that can be used by some businesses to measure the economic and environmental aspects. To determine the eco-efficiency in transport, this paper proposes a structure based on WBCSD (2000 and 2006).
The use of eco-efficiency indicators generates specific measures based on the ratio value of the product or service with the environmental influence and which are represented by equation 1, according to WBCSD (2000 and 2006).
𝐸𝑐𝑜𝑒𝑓𝑓𝑖𝑐𝑖𝑒𝑛𝑐𝑦 = !"#$% !" !!! !"#$%&' !" !"#$%&"
!"#$%&"'(")*+ !"#$%&"'&( (1)
As suggested by Leal Jr. and D'Agosto (2011) and WBSCD (2000 and 2006), it is
possible to use only one indicator for the value of service (as numerator), combining it with the most representative indicators of environmental influences considered.
3. Method Application To apply the methodology proposed, we present a case study of bio-ethanol produced in
the Brazil’s South-Central region and intended for export. From TRANSPETRO (2008), we identified the network for transportation of ethanol (Figure 1) which has the terminals, the Tietê-Paraná waterway project, the ethanol pipeline connecting Senador Canedo (in Goiás state) and the Port of San Sebastian in São Paulo. We considered the current rail and road networks, based on ANTT (2008). For export we consider the port of São Sebastião, because it has a TRANSPETRO terminal and should be the main exporter terminal of ethanol (Rodrigues, 2007).
For the application of the MCM, we considered the municipality of Turvelândia – GO as the point of origin, which is among the 10 largest producers of ethanol from Brazil (Rodrigues, 2007). Its choice is due to the geographical position that allows the use of different modal alternatives to apply the MCM. It was established that all the bio-ethanol produced is collected via road until arriving at a terminal in the network shown, as the practice adopted by most producers. The road is more used to transport ethanol accounts for 96% of the movement (Rodrigues, 2007). The transportation alternatives considered are presented in Figure 1.
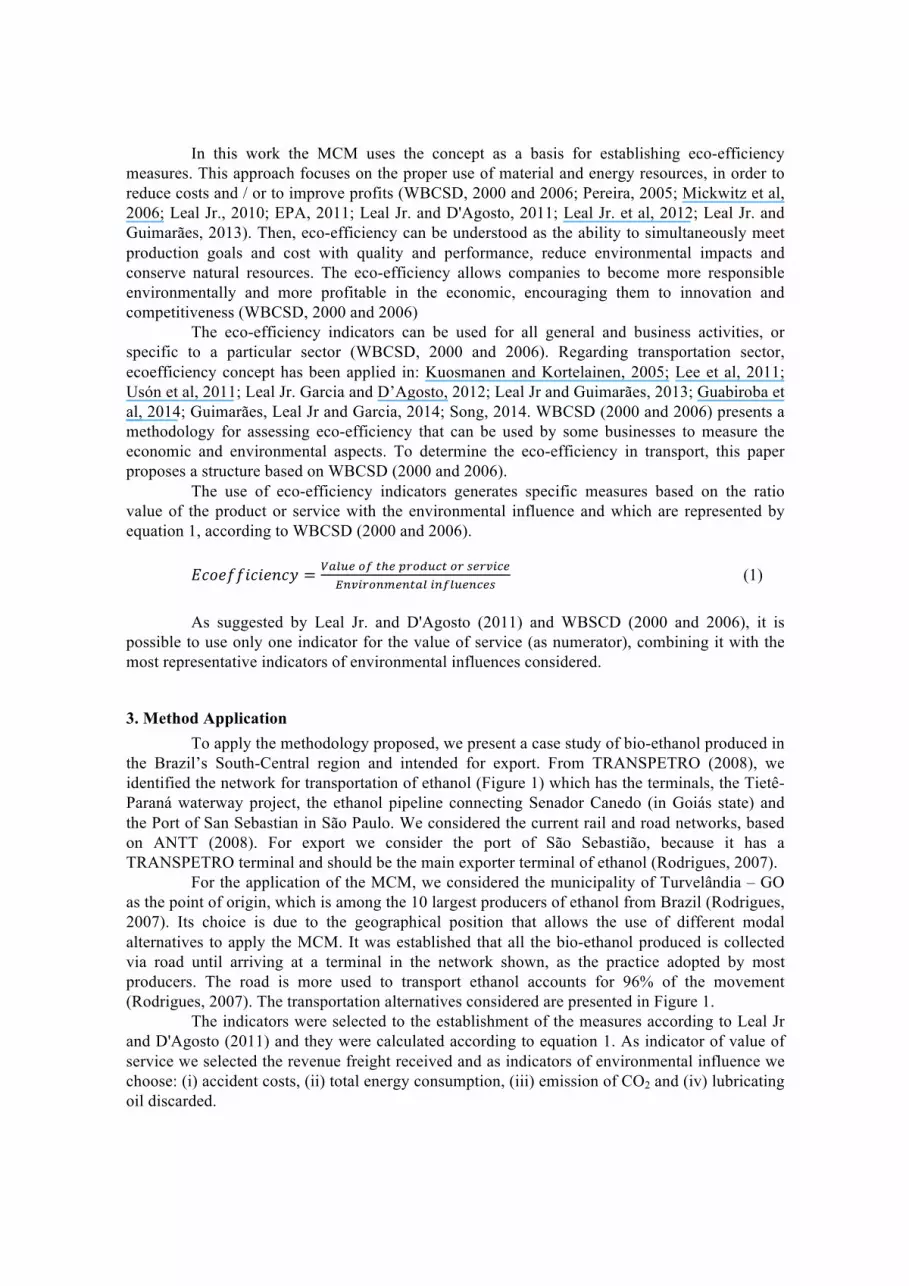
The indicators were selected to the establishment of the measures according to Leal Jr and D'Agosto (2011) and they were calculated according to equation 1. As indicator of value of service we selected the revenue freight received and as indicators of environmental influence we choose: (i) accident costs, (ii) total energy consumption, (iii) emission of CO2 and (iv) lubricating oil discarded.
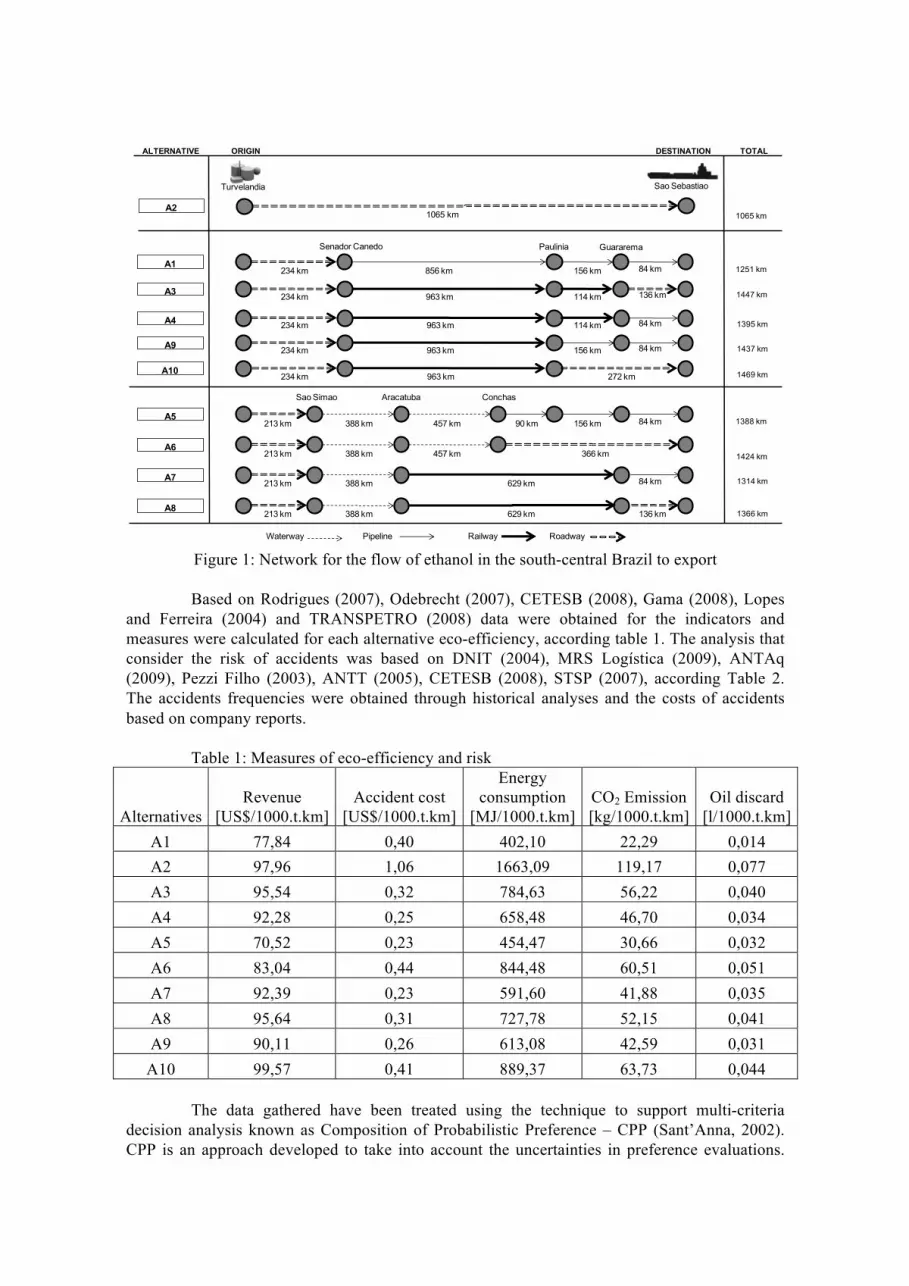
Figure 1: Network for the flow of ethanol in the south-central Brazil to export
Based on Rodrigues (2007), Odebrecht (2007), CETESB (2008), Gama (2008), Lopes
and Ferreira (2004) and TRANSPETRO (2008) data were obtained for the indicators and measures were calculated for each alternative eco-efficiency, according table 1. The analysis that consider the risk of accidents was based on DNIT (2004), MRS Logística (2009), ANTAq (2009), Pezzi Filho (2003), ANTT (2005), CETESB (2008), STSP (2007), according Table 2. The accidents frequencies were obtained through historical analyses and the costs of accidents based on company reports.
Table 1: Measures of eco-efficiency and risk
Alternatives Revenue
[US$/1000.t.km] Accident cost
[US$/1000.t.km]
Energy consumption
[MJ/1000.t.km] CO2 Emission [kg/1000.t.km]
Oil discard [l/1000.t.km]
A1 77,84 0,40 402,10 22,29 0,014 A2 97,96 1,06 1663,09 119,17 0,077 A3 95,54 0,32 784,63 56,22 0,040 A4 92,28 0,25 658,48 46,70 0,034 A5 70,52 0,23 454,47 30,66 0,032 A6 83,04 0,44 844,48 60,51 0,051 A7 92,39 0,23 591,60 41,88 0,035 A8 95,64 0,31 727,78 52,15 0,041 A9 90,11 0,26 613,08 42,59 0,031
A10 99,57 0,41 889,37 63,73 0,044 The data gathered have been treated using the technique to support multi-criteria
decision analysis known as Composition of Probabilistic Preference – CPP (Sant’Anna, 2002). CPP is an approach developed to take into account the uncertainties in preference evaluations.
RailwayPipelineWaterway Roadway
ALTERNATIVE
A1
A3
A4
A9
A10
A5
A6
A7
A8
ORIGIN
Turvelandia
Senador Canedo
Sao Simao Aracatuba Conchas
Paulinia Guararema
234 km
234 km
234 km
234 km
234 km
856 km 156 km 84 km
963 km 114 km 136 km
963 km 114 km 84 km
963 km 156 km 84 km
963 km 272 km
213 km
213 km
213 km
213 km
388 km
388 km
388 km
388 km
457 km
457 km
90 km 156 km 84 km
366 km
84 km629 km
629 km 136 km
DESTINATION
Sao Sebastiao
A21065 km
TOTAL
1065 km
1251 km
1447 km
1395 km
1437 km
1469 km
1388 km
1424 km
1314 km
1366 km

According to Roy (1985), multi-criteria support to decisions is an attempt to provide answers, through a clearly specified model, to questions raised by the entities involved in the decision-making process. By considering the uncertainties in the model specification, the CPP model more nearly reflects the reality.
CPP, according to Sant’Anna (2005), permits objectively combining classifications according to different criteria. In CPP, the classification of options is the result of the composing preferences according to each of the multiple criteria involved in the analysis measured as probabilities. After assessing the preferences based on each criterion by means of probabilities, the overall preference can be evaluated by comparing joint probabilities (Sant’Anna, Nogueira & Rabelo, 2011). So, this technique is developed in two stages: (1) Defining the probability of being the best or worst option and (2) Composition of the probabilistic preferences.
In the first one, it is possible to establish an order of priority by means of determining the preferences, depending on the type of criterion – the higher the better, the smaller the better or the closer to some chosen value the better. After determining the ranking of the options based on each criterion, the next step is to calculate the probability that the option is the best according to each criterion individually.
According to Sant’Anna (2010), this probabilistic transformation is the key point for the composition of the preferences considering the uncertainties. For this purpose, one must consider that the relative position obtained in the preceding step is, for each option, a measure of the location of the probability distribution of the preference for the same according to the criterion under analysis. Simple distributions are considered preferentially, such as the uniform, triangular or normal. In the present case we considered a triangular distribution.
The probability of an option being the best according to each criterion is computed by the integral of the joint density function of the option under analysis, considering an interval for which this option is the best among all options. To compute this probability, we recommend considering the amplitude of the data for the criterion, taking into account the interest in enabling the switching of position among all the options. Equation (2) presents this computation.
𝑀!" = 𝑓!!" 𝑥
! 𝑑𝑥!!!"!!"
!!!! 𝑓!!" 𝑥 𝑑𝑥!!"
!!" (2)
In Equation (2), Lik and Uik are, respectively, the lower and upper bounds of the
domain of a random variable Xik that represents the preference for option k according to criterion i, while n is the number of options being analyzed and is the probability density function. The product sequence inside the brackets is the product of the probabilities that the variables are lower than Xik, 𝑃(𝑋∙! < 𝑋!"), for all the other options involved in the analysis.
Another probability measures is the minimum one, which represent the probability of been the last preferable alternative in the criterion.
𝑚!" = 𝑓!!" 𝑥
! 𝑑𝑥!!!"!!"
!!!! 𝑓!!" 𝑥 𝑑𝑥!!"
!!" (3)
Notice that, in both equations, the product carries the implicit hypothesis of
independence of the disturbances of the evaluations of different options. Note that Xik is compared to the distributions of the other positions, Xjk. After making this comparison for each possible value of Xi, since it is a random variable, the next step is to calculate the expected value of this product sequence according to the distribution of Xi. This calculation must be performed for each option in each criterion. Therefore, Mik is the probability that option k is the best one according to criterion i, and mik is the probability that option k is the worst one, according to the same criterion i.

Having calculated the values of the options’ probabilities according to each criterion, the next step is to combine the probabilistic preferences to generate an overall probabilistic preference (Stage 2).
A way to calculate a general average preference from the probabilities of the option being chosen according to each criterion is by considering these probabilities as being conditional on the choice of the respective criterion and calculating the total probability of preference. The difficulty of this approach is to determine the marginal selection probabilities of each criterion, and this difficulty increases if the criteria are correlated. The problem can be overcome if it is possible to establish a ranking of the criteria and to model the joint distribution of these ranks. In this case, the probabilities of choosing each criterion can be computed in the same way as the probabilities of the option being chosen according to each criterion individually.
The dependence between the criteria can be considered directly to determine the overall preferences in terms of joint probabilities of preference. Modeling the dependence is also subject to distortions, while the probabilistic assessment to the preferences allows for developing and comparing evaluations based on simple assumptions on dependence. Different joint probabilities can be employed, depending on the point of view considered. The viewpoints can be characterized in terms of the choices between extreme positions in two basic orientations, or axes: optimistic versus pessimistic and progressive versus conservative.
With respect to the progressive versus conservative axis, the analyst pays more attention to the probabilities of maximizing the preference. The progressive evaluator looks at the options that are first in excellence, while the conservative evaluator examines them by their ability of not minimizing the preference. The term conservative can be defined as being risk averse, while the term progressive applies to the aim of attaining higher standards.
In the optimistic versus pessimistic axis, the optimistic evaluator is considered satisfied if at least one of the criteria is the best. All the criteria are considered, but the composition employs the conjunction “or”. The joint probability is computed so as to maximize the preference according to at least one of the criteria. On the other hand, the pessimistic evaluator prefers options that satisfy all the criteria simultaneously. In this case, the conjunction “and” is used and the joint probability is that which maximizes (or does not minimize) simultaneously the preference according to all the criteria. The expressions optimistic and pessimistic are related to the idea of believing that the most favorable, or least favorable, criterion will prevail, respectively.
By combining the positions at the extremes of the two axes, four measures are generated: (i) optimistic-conservative (OC) – 𝑂𝐶! = 1 − 𝑚!"
!!!! , (ii) optimistic-progressive
(OP) – 𝑂𝑃! = 1 − (1 −𝑀!")!!!! , (iii) pessimistic-conservative (PC) – 𝑃𝐶! = (1 −𝑚!")!
!!! , and (iv) pessimistic-progressive (PP) – 𝑃𝑃! = 𝑀!"
!!!! . For all the cases, the product sequence
varies in i, i.e., along the criteria considered. As described before, Mik is the probability that option i is the best for criterion k and mik is the probability that option i is the worst criterion k. All the general probabilities described are based on the premise of independence of the criteria. For the case of dependent criteria, see Sant’Anna (2010).
4. Discussion of results Following the procedures proposed by Sant’Anna (2013), observing the data from
Table 1, we obtain the following Tables. The first step consists on establishing a priority rank for each criteria. These criteria are
those presented in Table 1. Table 2 present these ranking.
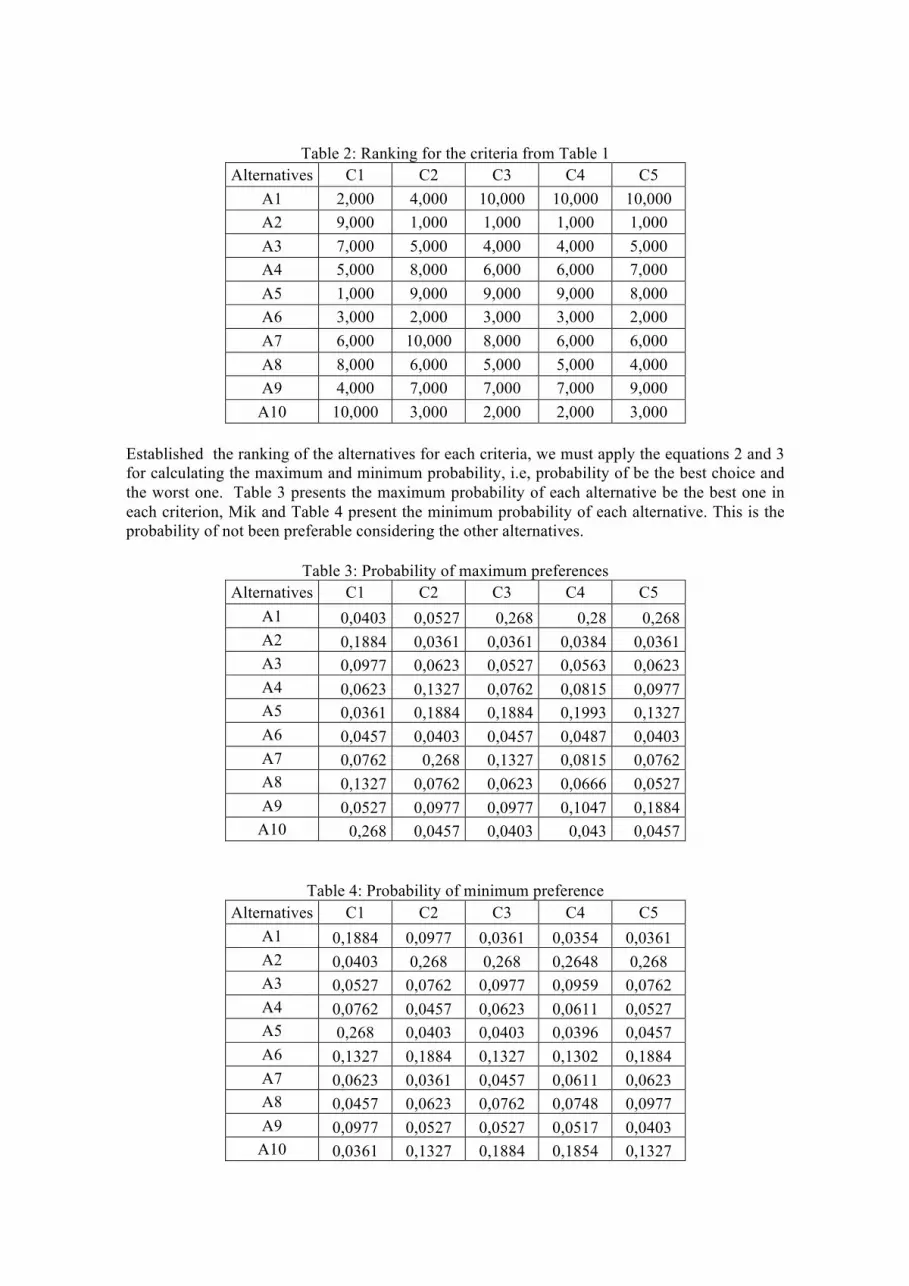
Table 2: Ranking for the criteria from Table 1 Alternatives C1 C2 C3 C4 C5
A1 2,000 4,000 10,000 10,000 10,000 A2 9,000 1,000 1,000 1,000 1,000 A3 7,000 5,000 4,000 4,000 5,000 A4 5,000 8,000 6,000 6,000 7,000 A5 1,000 9,000 9,000 9,000 8,000 A6 3,000 2,000 3,000 3,000 2,000 A7 6,000 10,000 8,000 6,000 6,000 A8 8,000 6,000 5,000 5,000 4,000 A9 4,000 7,000 7,000 7,000 9,000
A10 10,000 3,000 2,000 2,000 3,000
Established the ranking of the alternatives for each criteria, we must apply the equations 2 and 3 for calculating the maximum and minimum probability, i.e, probability of be the best choice and the worst one. Table 3 presents the maximum probability of each alternative be the best one in each criterion, Mik and Table 4 present the minimum probability of each alternative. This is the probability of not been preferable considering the other alternatives.
Table 3: Probability of maximum preferences
Alternatives C1 C2 C3 C4 C5 A1 0,0403 0,0527 0,268 0,28 0,268 A2 0,1884 0,0361 0,0361 0,0384 0,0361 A3 0,0977 0,0623 0,0527 0,0563 0,0623 A4 0,0623 0,1327 0,0762 0,0815 0,0977 A5 0,0361 0,1884 0,1884 0,1993 0,1327 A6 0,0457 0,0403 0,0457 0,0487 0,0403 A7 0,0762 0,268 0,1327 0,0815 0,0762 A8 0,1327 0,0762 0,0623 0,0666 0,0527 A9 0,0527 0,0977 0,0977 0,1047 0,1884
A10 0,268 0,0457 0,0403 0,043 0,0457
Table 4: Probability of minimum preference
Alternatives C1 C2 C3 C4 C5 A1 0,1884 0,0977 0,0361 0,0354 0,0361 A2 0,0403 0,268 0,268 0,2648 0,268 A3 0,0527 0,0762 0,0977 0,0959 0,0762 A4 0,0762 0,0457 0,0623 0,0611 0,0527 A5 0,268 0,0403 0,0403 0,0396 0,0457 A6 0,1327 0,1884 0,1327 0,1302 0,1884 A7 0,0623 0,0361 0,0457 0,0611 0,0623 A8 0,0457 0,0623 0,0762 0,0748 0,0977 A9 0,0977 0,0527 0,0527 0,0517 0,0403
A10 0,0361 0,1327 0,1884 0,1854 0,1327

Combining these two probability figures to each alternative, considering all criteria under analysis, we obtain four decision maker profiles: optimistic-conservative (OC); optimistic-progressive (OP); pessimistic-conservative (PC); and pessimistic-progressive (PP).
Table 5: Composition of Probabilistic Preferences Alternatives OC OP PC PP
A1 0,999999151 0,64927 0,65630 4,2711E-05 A2 0,999794587 0,30107 0,27674 3,4036E-07 A3 0,999997133 0,29075 0,65949 1,1251E-06 A4 0,999999301 0,37735 0,73525 5,0161E-06 A5 0,999999212 0,55908 0,61790 3,3888E-05 A6 0,999918621 0,20208 0,43097 1,6519E-07 A7 0,999999609 0,50236 0,75939 1,6830E-05 A8 0,999998415 0,33570 0,69010 2,2111E-06 A9 0,999999435 0,43960 0,73690 9,9226E-06
A10 0,999977796 0,38775 0,47935 9,6993E-07 Observing the OC profile, all the alternatives are equally good, i.e, the differences are practically imperceptible. Mathematically speaking, alternative A2 is the worst one. Considering the other profiles, the alternative A2, which represent the common mode considered in Brazil, is not observed among the best. In spite that, we can consider a mean profile for decision making. This mean profile is calculated through the mean probability of preference.
Table 6: Mean Probability of Preference
Alternatives Mean Profile
A1 0,7685 A2 0,525869 A3 0,65008 A4 0,7042 A5 0,725662 A6 0,544322 A7 0,753916 A8 0,675266 A9 0,725498
A10 0,622361 Observing this mean profile, again the alternative A2 is not among the preferable. Reflecting that, considering the composition of probabilistic preference and measures of risk and eco-efficiency, the transportation of bio-ethanol by roadway lonely is not recommended.
5. Final Considerations and Suggestions This paper proposed the use of the composition of probabilistic preference for ranking
the transportation mode for bio-ethanol. This approach can be considered interesting because it considers the uncertainty in the preference ranking. These uncertainties are important because the data are not easily available, so it is important to carries them to the results and represent the preference through a probability figure.
The work presented shows how a structured approach can bring benefits to decision-makers in the selection of modes of transport of dangerous goods. The transport of ethanol has particularities that make it different from others in terms of evaluation, mainly by the volume transported and the environmental influences.
The pipeline transport is a better classification than the others by having low costs and lower environmental influences. Despite the initial investment for implementation of the pipeline to be high, with the high volume transported the recovery of that capital may be feasible with the operation.
Note that for the pipeline a good risk management can bring advantages due to its low probability of accidents. It is important to observe that roadway is not the preferable alternative, but still been the choice in Brazil. May be this can be explained by others measures not considered in the present work.
The eco-efficiency measures for a modal choice are a strategic alternative for organizations that want to improve their playing and contributing positively to the surrounding environment. By its flexibility, the method allows the eco-efficiency measures, including considerations of risk of accidents, are used, making it feasible for decision making.
A limitation is that the results presented here reflect only the case investigated. A more comprehensive and detailed work can better reflect reality and serve to other situations involving other dangerous goods.
For additional work is proposed to using of a wider network for the case of ethanol, other alternatives to disposal for export and domestic distribution. Nowadays the transportation of nuclear wastes is a very sensitive topic from an environmental angle. The proposed method could be appropriate in that case, for example. A sensitivity analysis of results in relation to weights and values used is recommended in a future work.
REFERENCES ANTAq (2009). Agência Nacional de Transporte Aquaviários. Empresas autorizadas. Internet,
available on: http://www.antaq.gov.br/Portal/default.asp ANTT (2008). Mapas das Rodovias e Ferrovias Brasileiras. Agência Nacional de Transporte
Terrestre. Internet, Available on http://www.antt.gov.br/. Accessed on 01/12/08. ANTT (2005). Relatório Anual de Acompanhamento das Concessões Ferroviárias. Agência
Nacional de Transportes Terrestre. Available on: http://www.antt.gov.br/relatorios/ferroviario/concessionarias2005/index.asp. Accessed on: 28/03/2010.
CETESB (2008). Estatísticas de Acidentes Ambientais – Companhia de Tecnologia e Saneamento Ambiental. Available on: http://www.cetesb.sp.gov.br/emergencia/estatisticas/estatisticas.asp. Accessed on: 07/11/2008.
D’Agosto, M. de A. (1999). Avaliação do Desempenho Operacional de Sistemas de Transportes Urbanos em Vias Segregadas. Dissertação de Mestrado, Instituto Militar de Engenharia, Rio de Janeiro, RJ, Brasil.
DNIT (2004). Departamento Nacional de Infra-estrutura de Transportes. Custos de acidentes de trânsito nas rodovias federais: sumário executivo. - Rio de Janeiro.
EPA (2011) Developing a Green Enterprise. United Kingdon. Gama, R B. (2008). A decisão entre os modos rodoviário e ferroviário no transporte dos bens
siderúrgicos visando a ecoeficiência. UFF. Monografia, Escola de Ciências Humanas e Sociais. Volta Redonda, RJ.
Guabiroba, R.C. S.; D’Agosto, M. A.; Leal Jr, I. C.; Silva, M. A. (2014) V. Eco-efficiency as an auxiliary measure for the definition of interregional public consortia responsible for the collection of recyclable domestic waste. Journal of Cleaner Production, v.68, p.36-45.

Guimarães, V. A.; Leal Jr., I. C.; Garcia, P. A. (2014) Environmental Performance of Brazilian Container Terminals: A Data Envelopment Analysis Approach. Procedia: Social and Behavioral Sciences, v. 160, p. 178-187, 2014
Kuosmanen, T.; Kortelainen, M. (2005) Measuring Eco-efficiency of Production with Data Envelopment Analysis. Journal of Industrial Ecology, Volume 9, Number 4.
Leal Jr, I. C. (2010) Método de Escolha Modal para transporte de produtos perigosos com base em medidas de ecoeficiência.Tese de doutorado. Rio de Janeiro: UFRJ/COPPE.
Leal Jr, I. C., D'Agosto, M. de A. (2009). Escolha modal para transporte de produtos perigosos com base em aspectos ambientais: caso dos modos terrestres para o etanol no Brasil. VII Rio de Transportes, Rio de Janeiro.
Leal Jr, I. C., D'Agosto, M. de A. (2011). Modal choice for transportation of hazardous materials: the case of land modes of transport of bio-ethanol in Brazil. Journal of Cleaner Production. v.19, p.229-240.
Leal Jr., I. C.; Garcia, P. A, D'Agosto, M. A. (2012) A data envelopment analysis approach to choose transport modes based on eco-efficieny. Environment, Development e Sustainability, v.14, n.5, p. 767-183
Leal Jr, I. C.; Guimarães, V. A. (2013) Análise da ecoeficiência nas operações de terminais portuários com a aplicação da técnica de auxílio multicritério à decisão. TRANSPORTES, v.1, n.3, p.40-47.
Lee, J. Y., Cha, K. H., Lim, T. W., & Hur, T. (2011) Eco-efficiency of H2 and fuel cell buses. International Journal of Hydrogen Energy, v. 36, pp. 1754-1765
Lopes, M. S. e Ferreira, J. C. F. (2004) Viabilidade de operação do transporte de contêineres nas hidrovias Tietê-Paraná e Paraguai. XVIII SOBENA, Rio de Janeiro – RJ
Manhein, L. M. (1980) Understanding Supply in Transportation Systems. Transportation Res. 14A, Great Britain, 119-135.
Mickwitz, P.; Melanen, M., Rosenströ, U; Seppälä, J (2006) Regional eco-efficiency indicators e a participatory approach. Journal of Cleaner Production, v.19, p.1603 – 1611.
Morlok, E. K. (1980) Types of Transportation Supply Functions and Their Applications. Transportation Res. 14B, Great Britain, 9-27
MRS Logística (2009) Relatório de Acidentes em 2009. Documentos Internos da MRS Logística. Accessed on 05/02/2010.
Odebrecht (2007) A Logística do Etanol – Perspectivas dos Produtores. Available on: http://www.anebrasil.org.br/periodico/Logistica%20do%20Etanol.pdf. Acesso em 05/06/08.
Pereira, L. F. R. (2005) Aspectos Conceituais da Ecoeficiência no Contexto do Desenvolvimento Sustentável.
Pezzi Filho, M. (2003) Aplicação de IBR, Inspeção Baseada em Risco, a oleodutos segundo o API 581 BRD. Verificação de consistência com as práticas usuais da indústria para avaliação de risco. PUC-RIO, Master’s Thesis, Mechanic Engineering Program, Rio de Janeiro.
Rodrigues, S. B. M. (2007) Avaliação das alternativas de transporte de etanol para exportação na região centro-sul. USP, Dissertação de Mestrado, Escola de Engenharia de São Carlos, São Carlos – SP.
Roy, B. (1968) Classement et choice en presence de points de vue multiple (la methode Electre), Revue Française d’Automatique Information et Recherche Operationelle, Vol. 8, pp. 57-75.
Sant’Anna, A. P. (2013) Detalhamento de uma metodologia de classificação baseada na composição probabilística de preferências, Relatórios de Pesquisa em Engenharia de Produção, Vol.13, Série C, n. 2, p. 12-21.
Sant’Anna, A. P. (2012) Probabilistic priority numbers for failure modes and effects analysis, International Journal of Quality & Reliability Management, Vol. 29 Iss: 3 pp. 349 - 362
Sant’Anna, A. P. (2010) Probabilistic Composition of Criteria for Schedule Monitoring. Pesquisa Operacional, 30 (3), pp. 751-767
Sant’Anna, A. P. (2005) Composição probabilística de critérios na avaliação de cursos. RPG, 2 (3), pp. 40-54.
Sant’Anna, A. P. (2002). Aleatorização e composição de medidas de preferência. Pesquisa Operacional, 22, pp. 87-103.
Sant’Anna, A. P., Nogueira, H. D. & Rabelo, L. M. (2011). Comparação entre métodos multicritérios em um modelo para avaliação da qualidade de ativos de renda variável. Revista de Finanças Aplicadas, vol, nº, pp. 1-21.
Song, S. (2014) Ship emissions inventory, social cost and eco-efficiency in Shanghai Yangshan port. Atmospheric Environment, v. 82, pp. 288-297.
STSP (2007) Os transportes no estado de São Paulo - balanço anual dos transportes – 2007. Secretaria de Estado dos Transportes de São Paulo, São Paulo, Brasil.
Transpetro (2008) Projeto Multimodal da hidrovia Tietê-Paraná. VI Simpósio Internacional e Mostra de Tecnologia da Agroindústria Sucroalcooleira. Piracicaba – SP.
Unica (2008) Estatísticas da União da Indústria de cana-de-açúcar. Available on: http://www.unica.com.br/dadosCotacao/estatistica/. Accessed on: 22/12/2008.
Usón, A. A., Capilla, A. V., Bribián, I. Z., Scarpellini, S., & Sastresa, E. L. (2011). Energy efficiency in transport and mobility from an eco-efficiency viewpoint. Energy, v. 36, pp. 1916-1923.
WBCSD (2000) Measuring Eco-Efficiency. A Guide to Reporting Company Performance, Word Business Council for Sustainable Development, Geneva, Switzerland.
WBCSD (2006) Eco-efficiency learning module. Alemanha.