Embed Size (px)
Citation preview

APPLICATION OF GLOBAL POSITIONING SYSTEM (GPS) DATA
FOR ATMOSPHERIC WATER VAPOUR VARIATION IN THAILAND
Mr. Nithiwatthn Choosakul
A Thesis Submitted in Partial Fulfillment of the Requirements
for the Degree of Master of Science in Earth Sciences
Department of Geology
Faculty of Science
Chulalongkorn University
Academic year 2005
ISBN 974-53-1707-1

การประยกุตขอมูลจากระบบบอกพิกัดตําแหนงทัว่โลก (จีพีเอส) เพื่อหาการเปลี่ยนแปลงปรมิาณไอน้ําในบรรยากาศในประเทศไทย
นายนิธิวัฒน ชูสกุล
วิทยานพินธนี้เปนสวนหนึ่งของการศึกษาตามหลักสูตรปริญญาวิทยาศาสตรมหาบัณฑิต
สาขาวิชาโลกศาสตร ภาควิชาธรณีวิทยา คณะวิทยาศาสตร จุฬาลงกรณมหาวิทยาลยั
ปการศึกษา 2548
ISBN 974-53-1707-1
ลิขสิทธิ์ของจุฬาลงกรณมหาวิทยาลัย

Thesis Title APPLICATION OF GLOBAL POSITIONING SYSTEM (GPS) DATA FORATMOSPHERIC WATER VAPOUR VARIATION IN THAILAND
By Mr. Nithiwatthn Choosakul Field of study Earth Sciences Thesis Advisor Assistant Professor Chalermchon Satirapod, Ph.D. Thesis Co-advisor Miss Boossarasiri Thana, M.Sc.
Accepted by the Faculty of Science, Chulalongkorn University in Partial Fulfillment of the Requirements for the Master’s Degree …………………………………….. Deputy Dean for Administrative Affairs, Acting Dean, The Faculty of Science (Associate Professor Tharapong Vitidsant, Ph.D.) THESIS COMMITTEE ……………………………………… Chairman (Assistant Professor Veerote Daorerk, M.Sc. ) ……………………………………… Thesis Advisor (Assistant Professor Chalermchon Satirapod, Ph.D.) ……………………………………… Thesis Co-advisor (Miss. Boossarasiri Thana, M.Sc.) ……………………………………… Member (Assistant Professor Somchai NaKapadungrat, Ph.D.) ……………………………………… Member (Professor Michio Hashizume, D.Sc.)

iv นิธิวัฒน ชูสกลุ : การประยกุตขอมูลจากระบบบอกพกิัดตําแหนงทัว่โลก (จีพีเอส) เพื่อหาการเปลี่ยนแปลงปริมาณไอน้ําในบรรยากาศในประเทศไทย. (APPLICATION OF GLOBAL POSITIONING SYSTEM (GPS) DATA FOR ATMOSPHERIC WATER VAPOUR VARIATION IN THAILAND) อ.ที่ปรึกษา : ผศ.ดร.เฉลิมชนม สถิระพจน, อ.ที่ปรึกษารวม : น.ส. บุศราศิริ ธนะ, 62 หนา. ISBN 974-53-1707-1.
วัตถุประสงคของการทําวิจยัคือหาการเปลี่ยนแปลงปรมิาณไอน้ําในบรรยากาศ สําหรับ กําหนดชวงฤดูมรสุมตะวันตกเฉียงใตของประเทศไทย โดยการประยุกตใชขอมลูที่ไดจากจพีีเอส พรอมทั้งใชขอมูลดังกลาวสมทบกับขอมูลทางอุตุนิยมวทิยาที่มีอยูเดิม ในการพจิารณาลักษณะการเคล่ือนที่ของความกดอากาศสูงทางตอนบนของประเทศไทย และการเคลื่อนที่ของไอน้ําตามแนวลมพัดสอบจากอาวไทยทีเ่ขาสูแผนดิน
การใชงานจพีีเอสในทางอุตุนิยมวิทยา เปนการประยกุตใชขอมูลจีพีเอสแนวใหม โดยอาศัยการปรับเปลี่ยน คาปรับแกคาคลาดเคลื่อน ของสัญญาณจีพีเอส เนื่องจากปริมาณไอน้ําในชั้นบรรยากาศใหอยูในรูปคาคลาดเคลื่อนแนวดิ่งจากบรรยากาศชื้น (Zenith Wet Delay, ZWD) แลวนําคาดังกลาว มาเปลี่ยนกลับไปเปนคาไอน้ําในบรรยากาศรวมเหนอืเครื่องจีพีเอส (Integrated
Water Vapour, IWV) โดยเลือกใช Bernese GPS Software version 4.2 (B-GPS_IWV) เปนโปรแกรมประมวลผลหลัก ความถูกตองของการประมวลผลดูไดจากคาความตางของผลของการประมวลผลจาก Bernese (B-GPS_IWV) กับผลจากเครื่องมาตรฐาน Water vapour
Microwave Radiometer (WMR_IWV) ซ่ึงมีคาประมาณ 1.34 มม และสัมประสิทธิ์สหสัมพัทธ ซ่ึงมีคา 0.81 สําหรับการนาํ B-GPS_IWV มาหาชวงฤดูมรสุมตะวันตกเฉียงใต โดยดจูากคา B-
GPS_IWV รวมกับขอมูลการเปลี่ยนทิศทางของลมและฝนที่ตก พบวาชวงเขาและออกฤดมูรสุม กําหนดไดดวยการเปลี่ยนแปลงขึ้นและลงตามลําดับของระดับ B-GPS_IWVที่สอดคลองกับชวงที่ลมมีการเปลี่ยนทิศ จํานวนและความถี่ของฝนที่ตก สวนการแผกระจายของความกดอากาศสูงกําลังแรงที่พิจารณาจาก B-GPS_IWV พบวามแีบบแผนของการลดลงของB-GPS_IWV กอนที่ความกดอากาศสูงจะเขามาประมาณ 3-5วัน นอกจากนีย้ังพบวา การกระตกุของขอมูล B-GPS_IWV ในวันที่มีลมสอบ สามารถอธิบายไดวามีการนําพาความชื้นดวยลมสอบเขาสูแผนดิน
ภาควิชา ธรณีวิทยา ลายมือช่ือนิสิต.........................................................
สาขาวิชา โลกศาสตร ลายมือช่ืออาจารยที่ปรึกษา........................................ ปการศึกษา 2548 ลายมือช่ืออาจารยทีปรึกษารวม..................................

v# # 4672304323 : MAJOR GEOLOGY KEY WORD: ZTD / IWV / GPS / ATMOSPHERIC DELAY / WATER VAPOUR
NITHIWATTHN CHOOSAKUL : APPLICATION OF GLOBAL POSITIONING SYSTEM (GPS) DATA FOR ATMOSPHERIC WATER VAPOUR VARIATION IN THAILAND. THESIS ADVISOR : ASST. PROF. CHALERMCHON SATIRAPOD, Ph.D., THESIS COADVISOR : MISS. BOOSSARASIRI THANA, M.Sc., 62 pp. ISBN 974-53-1707-1.
The purpose of this research is to identify the period of southwest monsoon
season in Thailand by using IWV value obtained from GPS together with other
meteorological data. In addition, the obtained IWV value are used to study the effect
of high pressure area and the transfer of confluence wind in the winter and summer
season.
A new application of GPS in Thailand is the GPS-Meteorology. GPS signal
propagation delayed by atmospheric water vapour is conversed into the term of
zenith wet delay (ZWD), the retrieved ZWD can be transformed to the integrated
water vapour (IWV) over that GPS receiver by using Bernese GPS software version
4.2 (B-GPS_IWV). The accuracy of B-GPS_IWV can be measured by the
difference between B-GPS_IWV value and the IWV obtained from the Water
vapour Microwave Radiometer (MWR_IWV).The result shows that the difference is
1.34 mm and its correlation coefficient is 0.81. The southwest monsoon period can
be identified by the relationship of B-GPS_IWV, wind direction change, and rainfall
where the onset and withdrawal are represented by the increase and decrease of B-
GPS_IWV, respectively. In addition, the passage of high pressure area can be
explained by decreasing of B-GPS_IWV in 3-5 days before the high pressure area
move down. Moreover, it is found that the occurrent spike of B-GPS_IWV in the
day of the dominative confluence wind can be used to explain the transfer of moist
air into the land.
Department Geology Student’s.................................................... Field of study Earth Sciences Advisor’s.................................................... Academic year 2005 Co-advisor’s...............................................

vi
ACKNOWLEDGEMENTS
This thesis is based on the M. Sc. program carried out by the author
under the guidance of his supervisor Assistant Professor Dr. Chalermchon Satirapod,
Department of Survey Engineering, Faculty of Engineering, Chulalongkorn
University and his co-advisor Miss. Boossarasiri Thana, Department of Geology,
Faculty of Science, Chulalongkorn University, who gave precious suggestion
throughout this thesis work and provided every knowledge in the field. The author is
indebted to Professor Dr. Michio Hashizume and Mr. Akkaneewut Chabangborn for
their suggestions. The author would like to express his gratitude to Dr. Peiming Wu,
Frontier Observation Research System for Global Change, Yokohama City, Japan for
his GIPSY-OASIS II GPS data. The author is indebted to Dr. Teruyuki Kato,
Earthquake Research Institute, University of Tokyo, Japan for providing his GPS and
Professor Dr. Tamio Takamura, Center for Environmental Remote Sensing, Chiba
University, Japan for providing his Microwave radiometer.
The author would like to acknowledge Miss Jirawan Siramanon for her
help and love. Special thanks are also to Mr. Anurat Saringkarnphasit, Mr. Chamnong
Kaeochada, Miss. Apantree Yuttaphan, and Miss. Jiraporn Tonsuwapat from Thai
Meteorological Department for meteorological data. Thanks are also extended to
Miss. Pawadee Srimukda, Mr. Sumet Phantuwongraj, and Mr. Preeda
Patcharamaneepakorn for proof reading the thesis and Mr. Pichet Klompanya for his
help in preparing the data. The author thanks his family who always encourages and
cheers up the author all the time.
Many persons who are not mentioned above but concerned and helpful
in this thesis are also deeply appreciated.

CONTENTS Page
ABSTRACT IN THAI………………………………………………………….
ABSTRACT IN ENGLISH…………………………………………………….
ACKNOWLEDGEMENTS…………………………………………………….
LIST OF FIGURES…………………………………………………………….
LIST OF TABLES……………………………………………………………...
LIST OF ABBREVIATIONS …………………………………………………
CHAPTER I : INTRODUCTION………………………………………………
1.1 Statement of Problem…………………………………………...
1.2 Objectives...……………………………………………………..
1.3 Scope of the Investigation………………………………………
CHAPTER II : THEORY AND LITERATURE REVIEW…………………….
2.1 Meteorological Theory …………………………………………
2.1.1. Temperature at the Tropospheric Layer………………...
2.1.2. The vertical atmospheric pressure………………………
2.1.3. Dry air, Moist air, and Air Masses……………………...
2.1.4. Wind and Circulation …………………………………
2.1.5. Convergence and Divergence and High Pressure Area...
2.1.6. Monsoon………………………………………………...
2.2 The Water vapour Microwave Radiometer (WMR)…………….
2.3 Basic concept of GPS……………………………………………
2.3.1. Space segment …………………………………………
2.3.2. Control segment ………………………………………
2.3.3. User segment……………………………………………
2.4.4. Tropospheric propagation delay ………………………
2.4 GPS for Meteorological Purposes ……………………………
2.4.1. Some of the use of GPS in Meteorological Studies……
CHAPTER III : EXPERIMENT.....…………………………………………….
3.1 Equipment………………………………………………………
3.1.1 GPS …………………………………………………….
3.1.2 Water vapour Microwave Radiometer (WMR) ………
3.2 Data Acquisition ……………………………………………….
3.3 Data Processing…………………………………………………
iv
v
vi
ix
xi
xii
1
1
2
2
3
3
3
4
5
5
6
7
10
12
13
14
14
15
16
17
19
19
19
20
22
22

viii
Page
3.3.1 Preparation of GPS_IWV data………………………….
3.3.2 Preparation of WMR_IWV data………………………..
3.3.3 Preparation of Meteorological data.....…………………
22
24
24
26
28
28
35
40
44
45
50
62
3.4 The test of data accuracy …………………………………...…
CHAPTER IV : RESULTS AND DISCUSSION………………………………
4.1 Identification of the period of Southwest Monsoon of
Thailand…………………………………………………………
4.2 Consideration of the passage of the high pressure area ………
4.3 Consideration of the confluence wind from the Gulf of
Thailand into the land…………………………………………..
CHAPTER V : CONCLUSIONS AND SUGGESTIONS……………………...
REFERENCES………………………………………………………………….
APPENDICES…………………………………………………………………..
VITAE…………………………………………………………………………..

ix
LIST OF FIGURES
Figure Page
2.1
2.2
2.3
2.4
2.5
2.6
3.1
3.2
3.3
3.4
3.5
3.6
3.7
4.1
4.2
4.3
4.4
4.5
4.6
4.7
The Barometric Formula ……………………………………………
A view of air motions in high and low pressure systems……………
The monsoon of Asia. (Left: during winter, Right: during summer)..
Seasonal cycle of the HOWI ………………………………………
The large error points (covered by boxes) from WMR data taken
during rain is in this case further increased by water drops forming
on the covers of the horn antennas…………………………………..
GPS Satellites Orbits………………………………………………..
The locations of GPS permanent stations (modified) ………………
The Water vapour Microwave Radiometer 1100 Model (WMR) …
The GPS_IWV data ………………………………………………..
The WMR_IWV data………………………………………………..
The raw Ts data ……………………………………………………
The raw Ps data ……………………………………………………
Comparisons of the B-GPS_IWV (Gray Line) and WMR_IWV
(Green Line) of SISM station in year 2001 …………………………
The B-GPS_IWV, Wind Direction and Rainfall of year 2002. Top:
BNKK station. Middle: CHMI station. Bottom: PHKT station
Difference values (Bias) of each station ……………………………
Comparisons of B-GPS_IWV, Wind Direction and Rainfall of year
2002 (Onset). Top: BNKK station. Middle: CHMI station. Bottom:
PHKT station ………………………………………………………
Comparisons of B-GPS_IWV, Wind Direction and Rainfall of year
2001 (withdrawal). Top: BNKK station. Middle: CHMI station.
Bottom: PHKT station………………………………………………
Comparison of B-GPS_IWV (Black color) and Surface Pressure
(Gray color) of Year 2001 to 2002. Top: BNKK station. Bottom:
CHMI station…………………………………………………………
The Synoptic Map day 319, year 2001………………………………
The Synoptic Map day 320, year 2001………………………………
The Synoptic Map day 321, year 2001………………………………
4
6
8
10
12
13
20
21
23
24
25
26
27
29
31
34
36
38
38
39

x
Figure Page
4.8
4.9
4.10
4.11
4.12
A-1
A-2
A-3
B-1
B-2
C-1
C-2
C-3
C-4
The Synoptic Map day 322, year 2001………………………………
The Synoptic Map day 323, year 2001………………………………
Comparisons of B-GPS_IWV, Wind Direction and Wind Speed.
Top: CHMI station. Bottom: BNKK station…………………………
The Synoptic Map day 080, year 2003………………………………
The UPPER WINDS AT 600 METERS map of day 080, year
2003…………………………………………………………………
The relationship between Tm and Ts and Its regression coefficient of
BNKK station ………………………………………………………
The relationship between Tm and Ts and Its regression coefficient of
CHMI station…………………………………………………………
The relationship between Tm and Ts and Its regression coefficient of
PHKT station…………………………………………………………
The WMR_IWV with non-eliminated by the 2SD value……………
The comparison between WMR_IWV data with eliminated by 2SD
value and the RAW-WMR_IWV data ………………………………
Comparisons of B-GPS_IWV, Wind Direction and Rainfall of year
2002. (Withdrawal)Top: BNKK station. Middle: CHMI station.
Bottom: PHKT station………………………………………………
The B-GPS_IWV, Wind Direction and Rainfall of year 2003. Top:
BNKK station. Middle: CHMI station. Bottom: PHKT
station…………………………………………………………………
Comparisons of B-GPS_IWV, Wind Direction and Rainfall of year
2003. (Onset)Top: BNKK station. Middle: CHMI station. Bottom:
PHKT station…………………………………………………………
Comparisons of B-GPS_IWV, Wind Direction and Rainfall of year
2003. (Withdrawal)Top: BNKK station. Middle: CHMI station.
Bottom: PHKT station ………………………………………………
39
40
41
42
42
52
53
53
55
55
58
59
60
61

xi
LIST OF TABLES
Table Page
3.1
3.2
3.3
4.1
4.2
GPS permanent stations in Thailand ………………………………
Characteristics of the Water vapour Microwave Radiometer,
model: WVR-1100 …………………………………………………
The data set of each instrument ……………………………………
Summary of results of the investigation of Southwest Monsoon
period base on B-GPS_IWV data …………………………………
The days of year 2003 that the effect of confluence wind occurred..
19
21
22
35
43

xii
LIST OF ABBREVIATIONS
C/A-code
CSOC
DoD
DOY
ECMWF OA
GPS
HOWI
IGS
IWV
OCS
P-code
PRN
RINEX
RH
RAOBs
TMD
VIMT
WMR
ZHD
ZTD
ZWD
: Coarse/Acquisition-code
: Consolidation Space Operation Center
: Department of Defense
: Day Of Year
: European Centre for Medium – Range Weather Forecasts’
Operational Analyses
: Global Positioning System
: Hydrologic Onset and Withdrawal Index
: International GPS Services
: Integrated Water Vapour
: Operational Control System
: Precision-code
: PseudoRandom Noise
: Receiver INdependent EXchange
: Relative Humidity
: Radiosonds
: Thai Meteorological Department
: Vertically Integrated Moisture Transport
: Water vapour Microwave Radiometer
: Zenith Hydrostatic Delay
: Zenith Total Delay
: Zenith Wet Delay

CHAPTER I
INTRODUCTION
1.1 Statement of Problem
GPS: the Global Positioning System is the navigation system developed by the
U. S. Department of Defense (DoD). Whilst this system is fully used by U.S. military,
civilian users widely used this system with some limitations of some signals.
The using of GPS by civilian users can be applied for many areas. For
example, GPS can be used for the survey, navigation and recreation etc.
The GPS can be applied for meteorology as one of the applications of GPS.
The GPS signals, which propagate from GPS satellites to the receivers, are delayed by
atmospheric water vapour. Then the signal delay can be observed and retrieved into
the term of Integrated Water Vapour (IWV) value above the position of receiver.
Consequently, the variation of water vapour can be represented by the IWV obtained
from GPS (hereafter referred to as GPS_IWV).
Presently, many countries use the IWV value for meteorological activities
such as modeling, monitoring, and weather forecasting. The Ground-based water
vapour microwave radiometer [1] and the Ground-based radar [2] are another main
instrument that can be estimated the IWV value. However, in Thailand, users are
limited by the high cost. Therefore, the increasing of IWV users, GPS application is
the best choice for IWV value because GPS instrument is less expensive than the
IWV value. Moreover, in case of the usefulness, the GPS permanent stations that
install and use for meteorological purpose are also utilized for the position monitoring
of crustal deformation studies [3].
However, there are the doubtful points about the use of GPS_IWV concerning
whether the one can use and develop for Thai meteorology or not, and what kinds of
the activities that the GPS_IWV can be applied. All of these become the main
problems of this research.
In order to prove the hypothesis stated that GPS_IWV can be used for the
application of meteorology in Thailand, three case studies are introduced to study the
possible and simple ways of the use of IWV obtained from GPS. First, the experiment
of the use of GPS_IWV for identifying the period of southwest monsoon in the rainy
season is considered. This section referred to [4] that the first study of the southwest
monsoon in Thailand by using GPS_IWV. The re-analyzing with another element and

2
GPS software is chosen. Second, the experiment of GPS_IWV for investigating the
passage of high pressure area in the winter season is considered. This section referred
to [5] that the GPS_IWV is increased during the passage of a typhoon, the opposite
result with the passage of high pressure area should be displayed. Finally, the
experiment of the GPS_IWV for studying the effect of confluence wind in the
summer season is investigated. The last section referred to [6] that explains the
phenomenon of water vapour under the condition of confluence wind, thus the
GPS_IWV could make the clear explanation for that phenomenon.
1.2 Objectives
This research aims to identify the period of southwest monsoon season in
Thailand by using IWV value obtained from GPS together with other meteorological
data. In addition, the obtained IWV value are used to study the effect of high pressure
area and the transfer of confluence wind in the winter and summer season.
1.3 Scope of the Investigation
The scope of this research comprises of 5 steps below 1. Literature reviews of related the research topic.
2. Gather the GPS data and meteorological data between year 2001 and 2003
from CHMI (Longitude 98.973˚N, Latitude 18.771˚E Chiang Mai),
BNKK (Longitude 100.607˚N Latitude 13.668˚E Bangkok), PHKT
(Longitude 98.308˚N Latitude 8.105˚E Phuket), and SISM (Longitude
99.862˚N, Latitude 17.161˚E Sukhothai). All stations are located in
Thailand. Another one is microwave radiometer data of the year 2001 from
SISM station that also use in this study.
3. Process the GPS data with the Bernese GPS Software version 4.2 and
convert data to the GPS_IWV values.
4. Determine the accuracy of the obtained GPS_IWV values.
5. Apply the obtained GPS_IWV values in meteorology.

CHAPTER II
THEORY AND LITERATURE REVIEW
2.1 Meteorological Theory
Meteorological theory can be used to explain the characteristic of atmosphere.
Troposphere is the atmospheric layer that has the water vapour. Therefore, the
atmospheric processes due to water vapour only occurs in this layer such as rain,
snow, fog, cloud formation, Thunderstorms, etc[7].
The meteorological theory that related to the water vapour in the troposphere
is described following subsection below.
2.1.1. Temperature at the Tropospheric Layer
Davis et al. [8], reported that the weighted mean temperature (Tm) of the
troposphere (unit K) as shown in equation (1)
∫
∫=
dzTP
dzTP
Tv
v
m
)(
)(
2
, ……………………… (1)
where is the pressure of water vapour, Pv, [hPa], and T is the temperature of
the atmosphere, [K].
With radiosonde sounding, T is directly observed and can be retrieved the Tm
values along the path of the sounding which is called as tropospheric temperature
profile. Bevis et al. [9] suggested that Tm can be approximated by the surface
temperature Ts and Liou and Yang [10] described the Tm - Ts relationship determined
by minimizing the Chi-square error statistic as
, ……………………… (2) CaTT sm +=
where a is the regression coefficients and C is the constant value.
The accuracy of a and C values depend on the retrieval of Tm and Ts. Tm
obtains from the more than ten years data observed by the sounding, and also Ts. Ross
and Rosenfeld [11] suggested in the study of an accuracy of Tm - Ts relationship

4
method that the Tm values are the site – specific values. They are dependent on the
location of station.
2.1.2. The vertical atmospheric pressure
The static fluid pressure is dependent only upon density and depth. Choosing a
liquid of standard density like mercury or water allows expressing the pressure in
units of height or depth, e.g., mmHg. The mercury barometer is the standard
instrument for atmospheric pressure measurement in weather reporting. The
decreasing in atmospheric pressure with height can be predicted from the barometric
formula (see figure 2.1) [12,13].
Figure 2.1 The Barometric Formula [13]

5
Figure 2.2 shows that the Barometric Formula, yields as equation (3)
kTmgh
h ePP−
= 0 , …………………… (3)
where Ph (unit hPa) is the atmospheric pressure with height h, P0 (unit hPa) is
the atmospheric pressure at mean sea level, m is the mass of molecule and equals to
29 atomic mass unit (amu), g (unit ms-2) is the gravitational acceleration, k is the
Boltzmann’s constant, and T (unit K) is the mean temperature.
2.1.3. Dry air, Moist air, and Air Masses
Atmosphere consists of two basic components, dry air and moist air [2]. Dry
air exists when all the contaminants and water vapour are removed from atmospheric
air. By volume, dry air contains about 78 percent nitrogen, 21 percent oxygen, and 1
percent other gases. Moist air is a mixture of dry air and water vapour [14]. The
measurement of water vapour in the air is called the mixing ratio. This is due to the
fact that it specifies how much water vapour is mixed with the other atmospheric
gases. Vapour pressure and mixing ratio are two of more common ways of specifying
the water vapour concentration of the air [15].
Air mass is a large body that has similar temperature and moisture properties
throughout. The best source regions for air masses are large flat areas where air can be
stagnant long enough to be able to take in the characteristics of the surface below. The
influence that air masses have on the temperature of a place depends on the location
with respect to the source of the air mass and the trajectory of the air mass as it moves
from its source region [15].
2.1.4. Wind and Circulation
Wind is defined as the horizontal movement of air relative to the earth surface.
Air above hot areas expands and rises. Air from cooler areas then flows into replace
the heated air. This process is called circulation. There are three types of wind
circulation. Circulation over the entire earth is the general circulation. Smaller-scale
circulations that cause day-to-day wind changes are known as synoptic-scale
circulations. Winds that occur only in one place are called local winds [14].

6
For the near-surface wind, the wind speed must be reduced with friction such
as mountain, building, tree, etc. Therefore, the air mass movement is also reduced. On
the other hand, in the upper atmosphere such as the height at 850 hPa (around 1.5 km
above sea level), the air flow from the source area to another place without the
frictional influence.[15]
The wind and circulation are related to the atmospheric pressure. The
movement of air mass is introduced by the difference of the atmospheric pressure.
Therefore, the wind is occurred by the flowing of air mass. In general, where air is
found to descend, high pressure develops, for example at the subtropical latitudes and
again near the poles. Where air is rising, atmospheric pressure is low, as at the equator
and in the mid-latitudes where storms or frontal systems develop [15].
2.1.5. Convergence, Divergence and High Pressure Area
In addition to air pressure changes caused by variations of temperature and
water vapour content, air pressure can also be influenced by circulation patterns that
cause divergence or convergence.
Figure 2.2 A view of air motions in high and low pressure systems [14].
Figure 2.2 shows that if air is converging above and diverging below, it must
be sinking. The circulation is in virtually all high pressure cells. If convergence aloft
exactly balances divergence below, then the surface air pressure will not change.
However, if the convergence exceeds the divergence, then air is entering the column
faster than it is being removed. The surface air pressure must increase as a result, and

7
the high pressure area intensifies. Similarly, if divergence exceeds convergence, more
air is leaving the column than entering it. The surface pressure must decrease and
weaken [14].
High Pressure Area
The high pressure area is defined by the low-level wind flow pattern within a
high pressure cell or the high pressure center. Notice that the air moves around the
high in an anticyclonic direction while spiraling away from the high pressure center.
[14]
2.1.6. Monsoon
Monsoon is a regional scale wind system that predictably changes direction
with the passing of the seasons. The monsoon is occurred by the difference of
temperature between the oceans and continents on each season. In the winter season,
temperature over the continents is lower than the temperature over the oceans then the
air mass over the oceans is uplifted and the cold air mass over the continent flow to
supplant it. Consequently, the flowing wind from the continents is occurred. In the
summer, temperature over the continents is higher than the temperature over the
oceans then the opposite flowing wind of winter season is occurred [7].
Figure 2.3 is shown the monsoon of Asia results from a reversal of the winds
between the winter and summer. During winter, dry air flows southward from the
Himalayas. When summer arrives, moist air is drawn northward from the equatorial
oceans. Surface heating, convergence, and strong orographic effect caused heavy
rains over the southern part of the continent [15].

8
Figure 2.3 The monsoon of Asia. (Left: during winter, Right: during summer)[15]
Matsumoto [16] investigated the mean onset and withdrawal of summer rainy
season over the Indochina Peninsula using the pattern of rainfall data. In Thailand, the
effect of southwest monsoon is dominated at onset around early May to mid-May. In
case of withdrawal, the post – monsoon rain occurs in late September at the period of
the wind field turns to winter time situation.
Kiguchi [17] suggested the change of wind direction from northeast direction
to southwest direction in early or middle May can be used to be the one of the onset of
Asian summer monsoon factor and [18] expanded the main summer monsoon of
Thailand is in the southwest wind direction. So, it can be called southwest monsoon.
TMD [19] suggested the rules on the consideration of southwest monsoon
onset and withdrawal of the southern part of Thailand. It is followed below:
- In the any 5 days interval, it must have 3 days of rainfall and more than 5
mm rainfall of each day. Consequently, the total rainfall of those 5 days
interval must be 25 mm minimum.
- Using the consideration of the beginning and the end of monsoon season
in Thailand together with the consideration of the onset and withdrawal
of them.
TMD [20] reported the rainy season of Thailand is around mid – May to mid –
October normally. It is the same period of southwest wind dominated then the period
of rainy season of Thailand is the period of the dominative southwest wind. On the
other hand, the dominative northeast wind is occurred around mid – October to mid –

9
February as the same period of winter season in Thailand. So, the winter season can
be represented by the period of the dominative northeast wind.
Lockwood [21], McGregor and Nieuwolt [22] expanded the monsoon climates
of southern Asia that the season of the northeast monsoon can be divided into two
sections. First, it is the winter season around January and February. The last one is
hot-weather season around March to May. Another is the season of the southwest
monsoon also can be divided into two sections. First, it is the season of general rains
around June to September and Matsumoto [17] suggested that the pre – monsoon
rainfall is around March to May. Final, it is the Post – monsoon season around
October to December.
Fasullo and Webster [23] investigated the large-scale Indian Monsoon Onset
that the hydrologic cycle with the roles of water vapour, clouds, and rainfall can be
chosen as a key physical basis for monitoring the monsoon.
To diagnose onset and withdrawal, Vertically Integrated Moisture Transport
(VIMT) was used instead of rainfall. Vertically integrated moisture transport is
defined as equation (4)
∫=hPa
surface
qUdpVIMT300
, …………………….. (4)
where p is the precipitation (unit: mm), q is the specific humidity (unit: grams
of water vapour per kilogram of air, gkg-1) , and U is the wind vector. Figure 2.4
shows the time series of the annual cycle of VIMT averaged over the regions of
particularly rapid VIMT fluctuations during monsoon onset. An index, the Hydrologic
Onset and Withdrawal Index (HOWI), is formed from those regions where VIMT
variability is pronounced at the beginning and end of the monsoon season. The data
based on the satellite sounder data such as humidity and temperature, surface
pressure, horizontal wind, and specific humidity are provided to analyse the VIMT.
The HOWI Index is used to track the monsoon hydrology. This index is
created by The National Centers for Environmental Prediction– National Center for
Atmospheric Research (NCEP–NCAR), U.S.A., Reanalysis project with using the
large scale of winds and humidity about 50-yr.

10
However, the HOWI index is intended to be for regional scale use. It reflects
the large-scale hydrologic cycle rather than rainfall at a single point. This study is
focused on the local scale where the rainfall data come from the single station.
Figure 2.4 Seasonal cycle of the HOWI [23].
2.2 The Water vapour Microwave Radiometer (WMR)
The Water vapour Microwave Radiometer (WMR) receives microwave
radiation from the sky at 23.8 GHz (K band) and 31.4 GHz (Ka band). It is a passive
system. The two frequencies allow simultaneous determination of integrated liquid
water and integrated water vapour along a selected path. The 23.8 GHz frequency was
selected to observe the atmospheric water vapour because it is in the reserved
frequency band, free from satellite downlink transmissions that could cause erroneous
results in the sky observation and this frequency, water vapour are dominated in this
channel. In the same way, the 31.4 GHz was selected to observe the cloud liquid in
the atmosphere. [1]
By calculating sky brightness temperature, the cloud liquid water and
integrated water vapour can be obtained.
11
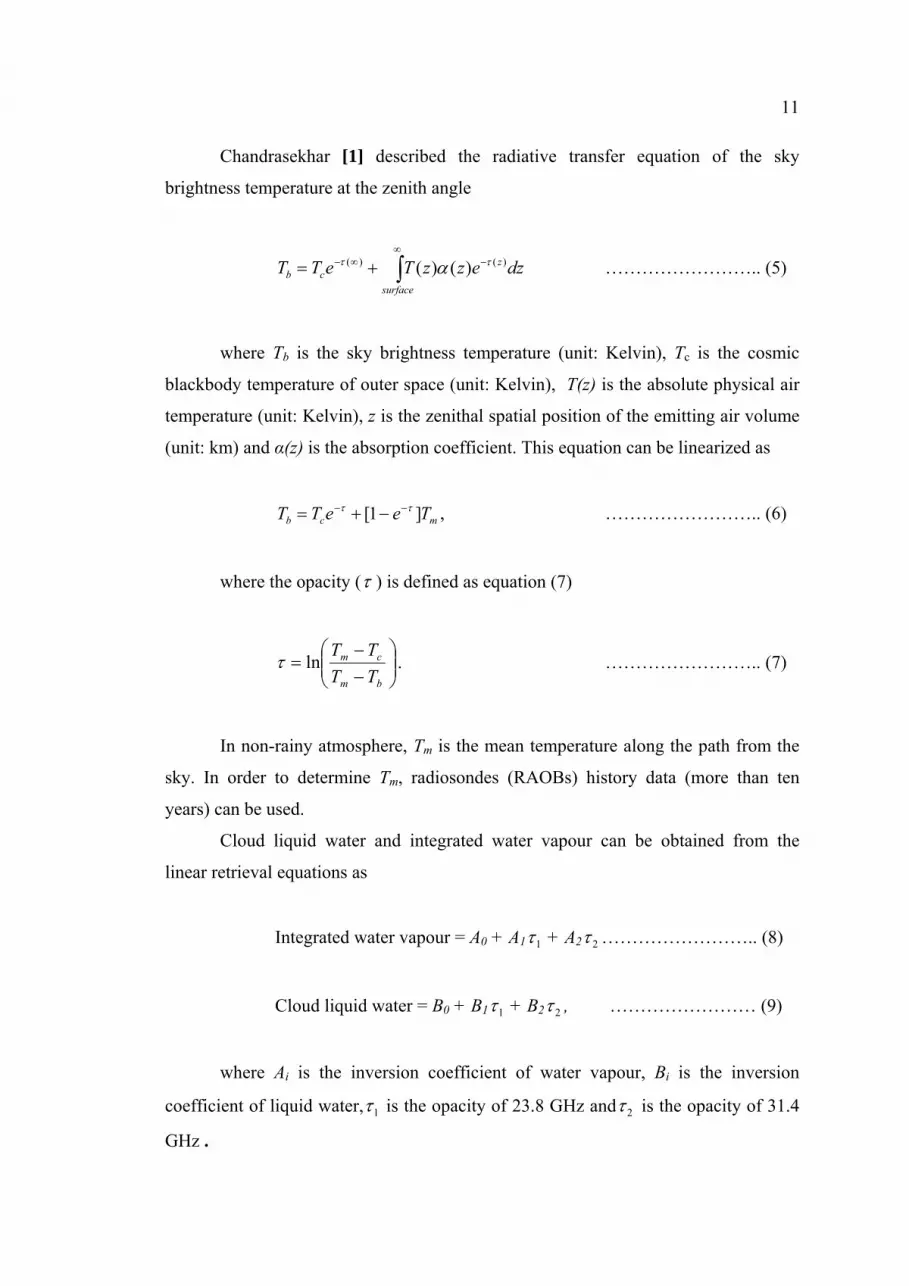
Chandrasekhar [1] described the radiative transfer equation of the sky
brightness temperature at the zenith angle
∫∞
−∞− +=surface
zcb dzezzTeTT )()( )()( ττ α …………………….. (5)
where Tb is the sky brightness temperature (unit: Kelvin), Tc is the cosmic
blackbody temperature of outer space (unit: Kelvin), T(z) is the absolute physical air
temperature (unit: Kelvin), z is the zenithal spatial position of the emitting air volume
(unit: km) and α(z) is the absorption coefficient. This equation can be linearized as
mcb TeeTT ]1[ ττ −− −+= , …………………….. (6)
where the opacity (τ ) is defined as equation (7)
⎟⎟⎠
⎞⎜⎜⎝
⎛−−
=bm
cm
TTTT
lnτ . …………………….. (7)
In non-rainy atmosphere, Tm is the mean temperature along the path from the
sky. In order to determine Tm, radiosondes (RAOBs) history data (more than ten
years) can be used.
Cloud liquid water and integrated water vapour can be obtained from the
linear retrieval equations as
Integrated water vapour = A0 + A1 1τ + A2 2τ …………………….. (8)
Cloud liquid water = BB0 + B1 1τ + B2 2τ , …………………… (9)
where Ai is the inversion coefficient of water vapour, BBi is the inversion
coefficient of liquid water, 1τ is the opacity of 23.8 GHz and 2τ is the opacity of 31.4
GHz .

12
Elgered [24] found that one algorithm error of the water vapour radiometer is
due to errors in the attenuation coefficients. Figure 2.5 shows the effect of water drops
forming on the covers of the horn antenna during rain. The error points with covered
by boxes for the WMR data have been omitted.
Coster [25] further explained that the errors in the WMR estimation of zenith
wet delay (ZWD) might be introduced in the retrieval algorithms, in the absorption
models for water vapor emission at the WMR frequencies, and/or in the calibration of
the radiometer. It is expected that IWV retrieval biases is 1mm for dry conditions (6.5
mm zenith wet delay) and 2.5 mm of IWV (16-20 mm ZWD) for very humid
conditions.
Figure 2.5 The large error points (covered by boxes) from WMR data taken during
rain is in this case further increased by water drops forming on the covers of the horn
antennas [24].
2.3 Basic concept of GPS
About fifty years ago, the U.S. military developed the positioning system for
the navy navigation based on the satellite system as called TRANSIT system. It was
the important system for the U.S. military activities. However, the TRANSIT system
was not the good system because some problems occurred and low navigation

13
accuracy. The next generation was the Global Positioning System (GPS). It was
developed for retrieve all problems in TRANSIT system. This system was higher
accuracy than the old one and widely used until now. [26]
The GPS consists of three segments; the space segment, the control segment,
and the user segment. The following subsections will describe each segment.
2.3.1. Space segment
The space segment is the part of satellite and signal of GPS. The GPS
satellites have the orbits with an altitude of about 20,200 km above the earth surface.
Figure 2.6 shows the satellites orbits, 24-satellites are operated and 4-satellites are
reserved. By this reason, all locations on the earth surface are covered by GPS
satellite signals. The satellite signal consists of two fundamental frequencies, L1 =
1575.42 MHz and L2 = 1227.60 MHz respectively. [26]
Figure 2.6 GPS Satellites Orbits [27]

14
Each frequency of L1 and L2 is modulated by the several codes that called
pseudorandom noise (PRN) code. The PRN code has 2 types; C/A-code
(Coarse/Acquisition-code) and P-code (Precision-code)
The P-code, which has the wavelength 30m, is modulated on both L1 and L2.
It can be used by U.S. military only. For C/A-code, which has the wavelength 300m,
it is modulated only on L1 and it is available for civilian users.
2.3.2. Control segment
The control segment consists of 3 parts. First part is the master control station.
It is located at the Consolidation Space Operation Center (CSOC), Colorado Spring,
Colorado. The function of this station is the calculation of the satellite orbit and clock
parameters for upload to the GPS satellites. The second part is the monitor stations
that have the function for sending the necessary data of GPS satellite to the master
control station for calculating all parameters. There are five monitor stations located
around the world. Their locations are in; Hawaii, Colorado Springs, Ascension Island,
Diego Garcia, and Kwajilein Island. The final part is ground control stations that are
located at Ascension Island, Diego Garcia, and Kwajilein Island. These stations have
the direct communication links to the satellites. [26]
2.3.3. User segment
The user segments are GPS receivers and users. GPS receivers can be
described by a term of the receiver types. For example, the C/A-code receiver is the
receiver that measures this C/A-code, and also the P-code receiver is the receiver that
measures the P-code. For the users, the U.S. military can use all signals while the
civilian users can use this system with the limitation of the signal use. [26]
Today, the GPS is widely used by civilian users compared to military users.
The accuracy of GPS data is used to identify the “level of usage”. For example, the
navigation of the car on the road requires only the standard GPS data [28] but the high
accuracy of GPS data is applied for crustal deformation studies [3], etc.
In order to obtain the high accuracy GPS positioning, the reduction of the error
source is considered. The biases in the GPS consist of three groups; the satellites
group, the signal group, and the receiver group, respectively. First, the satellite error

15
source involves the Clock bias and Orbital errors. Second, the signal propagation error
source consists of Ionospheric refraction, Tropospheric refraction, and Multipath.
Finally, the receiver error source consists of Antenna phase center variation and Clock
bias. [26]
For the propagation errors, they are the refraction of the signal propagation
through the atmosphere. Therefore, two atmospheric layers, Ionosphere and
Troposphere, are related to this refraction. The result of signal refraction is the signal
spends time for propagating to the receiver as called the propagation delay. [9]
The delay by the Ionospheric layer can be removed by using the comparison
of the propagational difference of both frequencies (L1 and L2) [29]. In case of the
delay by the tropospheric layer (hereafter referred to as tropospheric propagation
delay), water vapour in this layer is the mainly cause to the delay. However, the
standard model or mathematical method is used to remove this delay. [9]
2.3.4. Tropospheric propagation delay
Physics of the tropospheric propagation delay is defined by equation (10)
∫ −=ΔL
dsnL )1( , …………………… (10)
where n is the refractive index along the path L.[26] In general, n should be
adjusted into the term of refractivity N. [9] It is shown as equation (11)
)1(106 −= nN . …………………… (11)
So that Equation (10) becomes equation (12) [26]
∫−=ΔL
NdsL 610 . …………………… (12)
In 1969 Hopfield showed that the refractivity N can be derived into 2
components. These components consist of dry and wet component that is showed as
equation (13) [9,26] :

16
wd NNN += , …………………… (13)
where the dry part results from the dry atmosphere and the wet part from the
water vapour. Then, equation (12) becomes equation (14)
∫ ∫−− +=ΔL L
wd dSNdSNL 66 1010 . …………………… (14)
2.4 GPS for Meteorological purposes
According to Saastamoinen [26] and following to equation (14), LΔ can be
partitioned into a large quantity which depends only on surface pressure, so-called the
“hydrostatic delay” (dry delay) and a smaller quantity which is a function of water
vapour distribution, so-called “wet delay”. Elgered [24] found that the dry and wet
delays which along the zenith angle can be called in sequences that the Zenith
Hydrostatic Delay (ZHD) and Zenith Wet Delay (ZWD), and the term of ZHD can be
calculated using the equation (14)
),()0024.02779.2(
HfPZHDL s
h λ±==Δ , …………………….. (15)
where Ps is the surface pressure (hPa) and f(λ, H) is defined as equation (16)
)00028.02cos00266.01(),( HHf −−= λλ …………………….. (16)
where ),( Hf λ is a factor close to unity that accounts for the variation in
gravitational acceleration, with latitude ( λ) and height (H) in kilometers.
Bevis [9] concluded that the LΔ along the zenith angle, so-called the Zenith
Total Delay (ZTD), comprises of 2 part, ZHD and a ZWD respectively. Thus, ZTD
can be represented as
ZTD = ZHD + ZWD. …………………….. (17)

17
The term ZWD depends upon the vertical distribution of water vapour and can
be directly related to the Integrated Water Vapour (IWV) using equation (18)
ZWDIWV OH ×=× κρ2
…………………….. (18)
with a proportional coefficient κ yielded from equation (19)
Vm
RcTc
⎟⎟⎠
⎞⎜⎜⎝
⎛+= −
216101
κ, …………………….. (19)
where c1 = (3.776 ± 0.030) 105 K2hPa-1 and c2 = (17 ± 10) KhPa-1, RV is the
specific gas constant for water vapour (461.45 J kg-1 K-1) and OH2ρ is the density of
water (1000 kg m-3). Tm is the weighted mean temperature which obtained from
equations (6) and (7).
In order to investigate the accuracy of the Integrated Water Vapour obtained
from GPS data, the ground – based Water vapour Microwave radiometer can be used
for comparisons since it provides the Integrated Water Vapour. Most results of the
comparison were shown good relationships in Europe and America regions. For
example, in Italy [30], the bias of the comparison is around 4 mm. In U.S. [9], the bias
is around 2 to 6 mm. Also in the region of Asia, for example, the bias is less than 2
mm in Japan [31], Taiwan around 3 mm [10], Thailand, around 6 mm [32].
2.4.1. Some of the use of GPS in Meteorological Studies
During 1998 - 2000 Takiguchi and Kato delineated the Asian monsoon onset
based on the observation of water vapour by using GPS in Thailand. In a comparison
of the IWV estimated from radiosonde data (Sonde_IWV) and the IWV estimated
from GPS data (GPS_IWV), the trends of both GPS_IWV and Sonde_IWV are rapid
increase of water vapour is around May. It is represented to onset of the monsoon.
The differences between GPS_IWV and Sonde_IWV were eminent. About 8.7 mm is
the RMS of the difference between both of them. However, the RMS of the difference
is about 5 mm when removed some unreliable radiosonde data and made a linear
correction to Sonde_IWV. In order to judge the onset of the monsoon, a correlation

18
between the GPS-IWV rapid increment and rainfall of Bangkok and Chiang Mai was
investigated. It is shows the strong correlation between both of them [4].
Hageman and Bengtsson [33] shown that the success of the global scale-
comparison of IWV from GPS by using ZTD data from the GPS global network and
IWV from European Centre for Medium – Range Weather Forecasts’ Operational
Analyses (ECMWF OA). The IWV simulated from GPS is the quality control as well
as GPS and pressure stations. The good agreement of the comparison between both of
them illustrates the GPS_IWV can validated for OA of IWV. The erroneous values in
the GPS_IWV come from the ZTD measurements, the surface pressure
measurements, and the estimation of integrate mean temperature from the OA, are
induced to the analysis error. The comparison shows the small bias and standard
deviation of most GPS stations for the both of summer and winter months. On the
other hand, the winter months in some regions shows the large dry systematic bias
which is the ECMWF OA_IWV lower than the GPS_IWV. In this case, the effect of
humidity for winter season dominated.

CHAPTER III
EXPERIMENT
3.1 Equipment
For this study, GPS and microwave radiometer are used as primary source of
data. The information about these instruments is detailed below.
3.1.1 GPS
The 4 GPS permanent stations are shown in table 3.1, occupied by dual-
frequency GPS receivers (Ashtech Z-Xtreme for CHMI, BNKK and PHKT provided
by Institute of Observational Research for Global Change (IORGC) and Japan
Agency for Marine – Earth Science and Technology (JAMSTEC), Japan since 1998
and Trimble 4000SSE Geodetic System Surveyor for SISM station that provided by
the GEWEX Asian Monsoon Experiment – Tropics project (GAME – T), Japan since
1997). In order to investigate the atmospheric water vapour, data were collected in
static mode for 24 hours at 30-second data rate. Figure 3.1 shows the 4 GPS
permanent stations’ locations used in this study (white circle).
Table 3.1 GPS permanent stations in Thailand [34]
GPS
Station
Name
Location Longitude
(ºN)
Latitude
(ºE)
Height
at MSL
(m)
Data
Format
Data
sampling
CHMI
BNKK
PHKT
SISM
Chiang Mai
Bangkok
Phuket
Sukhothai
98.973
100.607
98.308
99.862
18.771
13.668
8.105
17.161
290
0
10
50
Ashtech
Ashtech
Ashtech
Trimble
30 sec.
30 sec.
30 sec.
30 sec.

20
Figure 3.1 The locations of GPS permanent stations (modified) [35].
3.1.2 Water vapour Microwave Radiometer (WMR)
The Radiomatrics WVR – 1100 portable water vapour radiometer (see Figure
3.2) was used to collect water vapour microwave radiometer data (WMR_IWV) with
high accuracy. In Thailand, there is only one WMR which is located at SISM
provided by the GEWEX Asian Monsoon Experiment – Tropics project (GAME – T)
since 1997. Table 3.2 shows the characteristics of the microwave radiometer (WVR-
1100). The 24-hr observation at the zenith angle is selected to collect the data [1].

21
Table 3.2 Characteristics of the Water vapour Microwave Radiometer, model: WVR-
1100. [1]
Specifications Value
Operating frequencies:
Angular coverage:
Power requirement:
Accuracy:
Resolution:
Radiometric range:
Output:
Dimensions:
Weight:
Pointing slew rate:
23.8-31.4 GHz
All Sky
120 watts maximum
0.30 K
0.25 K
0 K to 700 K
RS232 at 1200 baud
50X28X76 cm.
21 kg with azimuth steering mount
3 degree/sec, azimuth greater than 90 degree/sec, elevation
Figure 3.2 The Water vapour Microwave Radiometer WVR 1100 Model (WMR)

22
3.2 Data Acquisition
All of GPS and WMR data were collected in static mode. This study used
three years data set (2001 to 2003) from each instrument (see Table 3.3). The
meteorological data such as surface temperature, surface pressure, wind speed and
other meteorological data are used together with GPS data. These meteorological data
are provided by Thai Meteorological Department (TMD).
Table 3.3 The data set of each instrument.
Instrument Station Data Type/Format
GPS
CHMI
BNKK
PHKT
SISM
RAW GPS data/Ashtech
RAW GPS data/Ashtech
RAW GPS data/Ashtech
RAW GPS data/Trimble
WMR SISM RAW WMR data/WMR .los file
3.3 Data Processing
The primary data obtained from each instrument were not directly used. It
must be selected or converted before analysis. The raw GPS data was converted into
the term of GPS_IWV whilst the raw WMR data was converted into the term of
WMR_IWV and also the raw meteorological data was selected and prepared. The
detail how to obtain these data above is shown in the following subsections.
3.3.1 Preparation of GPS_IWV data
The RAW GPS data were converted into the Receiver INdependent EXchange
(RINEX) format. After that, they were processed by the Bernese software version 4.2
[36]. The main characteristics are:
- use of International GPS Service (IGS) precise ephemeris.
- apply Saastamoinen a-priori troposphere model.
- ambiguity float solutions using the ionosphere–free linear
combination (L3).
- estimation of 1 ZTD per hour and station using “dry Niell”
mapping function.

23
A ZWD data from Bernese software was subsequently derived by subtracting
ZHD from the ZTD. Finally, ZWD has been converted to the estimate of the
GPS_IWV. Figure 3.3 shows the example GPS_IWV of each station without the
erroneous subtraction and filtering.
Figure 3.3 the GPS_IWV data

24
3.3.2 Preparation of WMR_IWV data
The RAW WMR data were directly converted into WMR_IWV data because
the instrument firmware automatically created a final data format. (See the Appendix
B for the selection of WMR_IWV data). Figure 3.4 shows the example of
WMR_IWV data without erroneous subtraction and filtering.
Figure 3.4 The WMR_IWV data
3.3.3 Preparation of Meteorological data
Mean temperature (Tm) and surface pressure (Ps) are the meteorological data
that were selected and prepared. These datasets will be used to estimate the IWV
value.
3.3.3.1 The vertically integrated mean temperature (Tm)
Tm can be approximated by the surface temperature (Ts) using the Tm -
Ts linear relationship. The ten years Tm and Ts observed at each GPS station were used
to determine the correlation (see Appendix A) [37,38].
The Tm - Ts relationship derived from ten years of data show small
correlation coefficient and hence the Tm - Ts relationship will not be used to compute
the IWV value. The global π value (0.15) is adopted for calculation of IWV value.
Figure 3.5 shows an example of Ts that used to determine the Tm - Ts relationship.

25
Figure 3.5 The raw Ts data.
3.3.3.2 The surface pressure at the level of GPS station height (Ps)
All of pressure data from TMD are the mean sea level pressure data. In
the order to use it at the height of each GPS station, the pressure data were retrieved
by the Barometric Formula as equation (10). Figure 3.6 shows an example of Ps data
that will use to convert the GPS_IWV value.

26
Figure 3.6 The raw Ps data
3.4 The test of data accuracy
The GPS data was brought to process by the Bernese software version 4.2.
The ZTD is the result from this process. After that, by using equation (15), (17), and
(18), the IWV can be estimated. (hereafter referred to as B-GPS_IWV)
To test the B-GPS_IWV data accuracy, the WMR_IWV data was used to
compare with B-GPS_IWV because the WMR is the main observational instrument
on IWV value and also the WMR_IWV itself is the high accuracy data. The trend of
this comparison, the different value of them, and the correlation coefficient were
investigated.

27
The accuracy of the B-GPS_IWV is shown in Figure 3.7. Figure 3.7 shows the
comparison between the B-GPS_IWV (Gray line) and the WMR_IWV (Green line)
from day 219 to day 318 of year 2001, where Y-axis is IWV (mm) and X-axis is the
day of year (DOY). The B-GPS_IWV shows good compatibility with the
WMR_IWV. Most of B-GPS_IWV values are overlapped by the WMR_IWV, the
average different value of them is 1.34 mm and the correlation coefficient is 0.81.
Figure 3.7 Comparison of the B-GPS_IWV (Gray Line) and WMR_IWV (Green
Line) of SISM station in year 2001.

CHAPTER IV
RESULTS AND DISCUSSION
The results of this research are separated into 3 sections. The details are shown
below.
4.1 Identification of the period of Southwest Monsoon of Thailand
This section is the use of IWV to identify the southwest monsoon period of the
rainy season of Thailand. The B-GPS_IWV data was chosen together with wind
direction and rain fall data to consider the relation of them during the transition
period. The consideration was divided into two cases, onset and withdrawal. The
period of southwest monsoon was obtained by combination of both cases.
Generally, water vapour always varies in the troposphere. Therefore, the IWV
are also varied. Figure 4.1 shows the variation of IWV (Pink line) together with the
daily wind direction observed at 0700 local time (Blue points) and the daily rainfall
(Green bars) of year 2002 of BNKK (Top), CHMI (Middle), and PHKT (Bottom).
Primary-Y-axis is IWV (mm), Secondary-Y-axis consists of wind direction (degree)
and rainfall (mm), and X-axis is DOY.
In Figure 4.1, at BNKK and CHMI station, the IWV is around 30 mm in the
beginning of the year and 50 mm in the middle of the year. The IWV slightly
decreases in later part of the year. On the other hand, the IWV value at the PHKT
station remains unchanged throughout the year. This may be the fact that the PHKT
station is located on the Island surrounded by the ocean. Therefore, the air mass over
the station is the moist air from the ocean. Consequently, the IWV value remains in
the high level all the year.
From the IWV data above, the consideration can be divided into two parts.
The first one is the period between February and June for the southwest monsoon
onset. Another period is between August and December for the southwest monsoon
withdrawal. The details of each part are shown below.

29
Figure 4.1 The B-GPS_IWV, Wind Direction and Rainfall of year 2002.
Top: BNKK station. Middle: CHMI station. Bottom: PHKT station.
30
4.1.1. The onset In the onset period, the southwest wind brings the moist air from the ocean
into the land and it is the cause of the rainfall [16].
From the reason that expended in chapter II (section 2.1.6), the onset of the
southwest monsoon can be identified by two factors as:
- the change of wind direction to the southwest direction.
- the increase of rainfall.
According to the use of B-GPS_IWV together with the conditions above, the
southwest monsoon onset period should start around day 138 (See Figure 4.2). Figure
4.2 shows the variation of B-GPS_IWV (pink line), wind direction (blue points), and
rainfall (green bars) of day 30 to day 200 of year 2002. The details of the
consideration are shown below.
- The wind direction data of PHKT station was used to consider the change
of wind direction because it was clearly seen on this station. Thus, the
change of wind direction was around day 130.
- All stations have the rainfall during day 120-140 and the first continuous -
3 days rainfall is around day 125 to day 130.
- The level change of B-GPS_IWV from “low to high” level and the
extension at high level.
- At BNKK station, B-GPS_IWV completely changed its level from low
level (about 30 mm) to high level (about 50 mm) around day 127.
Similarly at CHMI station, B-GPS_IWV completely changed its level
around day 149. Therefore, the average was around day 138.
According to the Annual report of the year 2002 by TMD, the onset of
southwest monsoon was around early May [40]. Then, the B-GPS_IWV was suitable
used to identify the precise day of the onset.

31
Figure 4.2 Comparisons of B-GPS_IWV, Wind Direction and Rainfall of year 2002
(Onset). Top: BNKK station. Middle: CHMI station. Bottom: PHKT station.

32
In addition, another method which could be used as a guide-line for
determining the onset is the average-lines of B-GPS_IWV (red line). The average line
is applied from the average value of B-GPS_IWV of each level which is the start and
the end point of IWV data of each level are considered by the condition rule of onset
and withdrawal, respectively, and the cross point can be identified by creating the line
of join between the high level – average line and low level – average line over the
transition period. In Figure 4.2, the cross point at the high level of the average line
was around day 119 at BNKK and around 132 at CHMI. In fact, this method was not
guaranteed in its accuracy because the personal error was dominated.
4.1.2. The Withdrawal
In the withdrawal period, most of the wind is northeast wind. The cold and dry
air flow from the main land China reduces the water vapour in the atmosphere [15].
Consequently, the rainfall and the IWV are decreased and also with the reason that
expended in chapter II (section 2.1.6), the factors of the withdrawal of the southwest
monsoon can be shown below.
- the change of wind direction from the southwest direction.
- the decrease of rainfall.
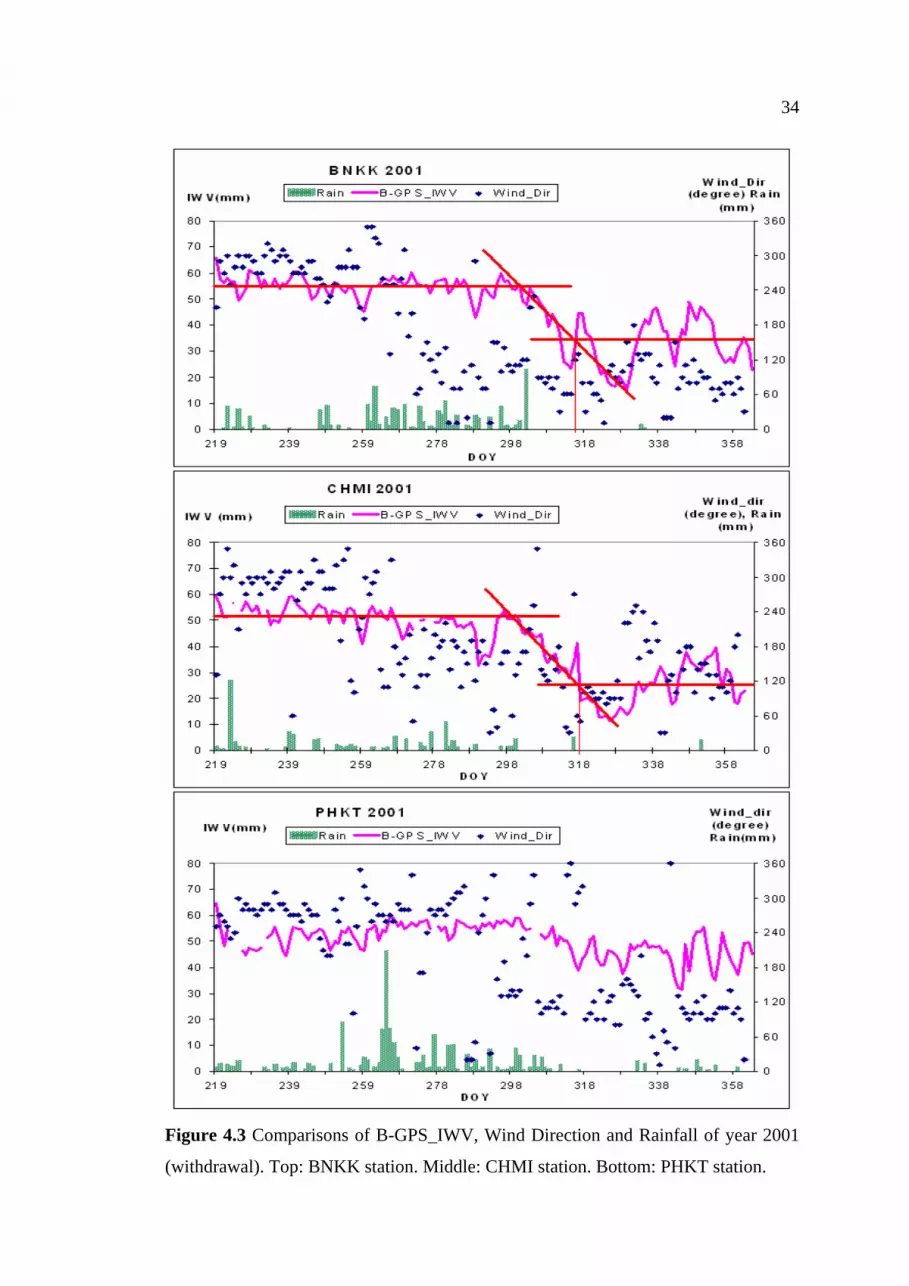
According to the use of B-GPS_IWV together with the conditions above, the
withdrawal period should start around day 328 (see Figure 4.3). Figure 4.3 shows the
variation of B-GPS_IWV (Pink line), wind direction (Blue points), and rainfall
(Green bars) of day 218 – 365 of the year 2001. The details of the consideration are
shown below.
- The change of wind direction from southwest to northeast and southeast
directions of PHKT station is around day 296
- The rainfall decreases around the period between day 290 and 320 for all
stations.
- The change level of B-GPS_IWV from “high to low” level and the
extension at low level.

33
- At the BNKK station, B-GPS_IWV completely changed its level from
high to low level around day 329. Similarly to CHMT station, B-
GPS_IWV completely changed its level around day 327. Therefore, the
average was around day 328.
Referring to the annual report of year 2001 from TMD, the withdrawal of
southwest monsoon was around late November [39]. Then, the precise day of
withdrawal can be identify by using B-GPS_IWV.
Furthermore, the average-lines method can also be used as a guide-line for
determining the withdrawal as same as the onset. In Figure 4.3, the cross point at low
level were around day 316 at BNKK station and around day 318 at CHMI station.
34
Figure 4.3 Comparisons of B-GPS_IWV, Wind Direction and Rainfall of year 2001
(withdrawal). Top: BNKK station. Middle: CHMI station. Bottom: PHKT station.

35
With the information from the onset and withdrawal, the period of southwest
monsoon can be identified. Table 4.1 shows the period of southwest monsoon for year
2001 to 2003. It is seen from table 4.1 that the period of southwest monsoon in
Thailand is around 6 months with the onset around day 138 (May) and the withdrawal
around day 320 (November)
Table 4.1 Summary of results of the investigation of Southwest Monsoon period base
on B-GPS_IWV data.
Year Onset withdrawal
2001
2002
2003
-
Day 138
-
Day 328
Day 302
Day 330
Mean Day 138 Day 320
According to the change of B-GPS_IWV level at “low-to-high” and “high-to-
low” for onset and withdrawal, respectively, this change can be called as the transition
period. In order to explain the transitions period, the slope of the level change of B-
GPS_IWV can be chosen.
In this research, the method which obtained the transition period slope cannot
be done because the B-GPS_IWV dataset does not support (the DOY cannot be used
for slope calculation). In the present knowledge, we do not have any methods or the
other data for the DOY conversion into the suitable value. The future research, we
will have to find the way how to convert the DOY for the transition period slope
consideration.
4.2 Consideration of the passage of high pressure area
This section is the use of B-GPS_IWV to prove the possibility in Thai
meteorological use. The use of B-GPS_IWV was divided into two terms for the
explanation of winter season in Thailand. First, The B-GPS_IWV was used to
consider its phenomenon of each station for explaining the winter seasonal behavior.

36
Second, the consideration of B-GPS_IWV during the passage of high pressure area
was used to explain the influence of high pressure area. In this study, the B-
GPS_IWV was used together with pressure data and Synoptic Map.
Generally, the winter season of Thailand is around November to February
[6].The weather is cold and dry because the cold and dry air mass flowing from the
main land China to Thailand. However, the characteristic of cold air is also different
due to the location of each region.
In case of high pressure area move down to Thailand, the weather under this
condition is cold and dry air [18]. Then, it is the cause to the decrease of water vapour
content in the atmosphere as shows in Figure 4.4.
Figure 4.4 shows the comparison between B-GPS_IWV (Black line) and the
surface pressure (Gray line) of BNKK (Top) and CHMI (Bottom) in the period of
winter season, where primary-Y-axis is IWV (mm), secondary-Y-axis is surface
pressure (hPa), and X-axis is DOY. In Figure 4.4, the B-GPS_IWV at both BNKK
and CHMI stations change its level from about 60 to 10 mm, around day 325. It is
clearly illustrated from the B-GPS_IWV to the influence of dry air in the winter
season of Thailand.
Figure 4.4 Comparison of B-GPS_IWV (Black color) and Surface Pressure (Gray
color) of Year 2001 to 2002. Top: BNKK station. Bottom: CHMI station.

37
Thus, the characteristic of the cold air for each location can be explained by
using B-GPS_IWV. At the BNKK station after day 325, the B-GPS_IWV slightly
increases from around 10 mm to 40 mm during the winter period. On the other hand,
it seems that the B-GPS_IWV is in “stable state” around 10 mm with some variational
occurrence at CHMI station.
The B-GPS_IWV shows different characteristic due to the location of each
station. The BNKK station is located closer to the Gulf of Thailand than CHMI
station and the moist air is easily transferred to the BNKK station. Therefore, the
slightly increment characteristic is shown at BNKK station whilst the more stable
characteristic is presented with the lack of water vapour supply at CHMI station.
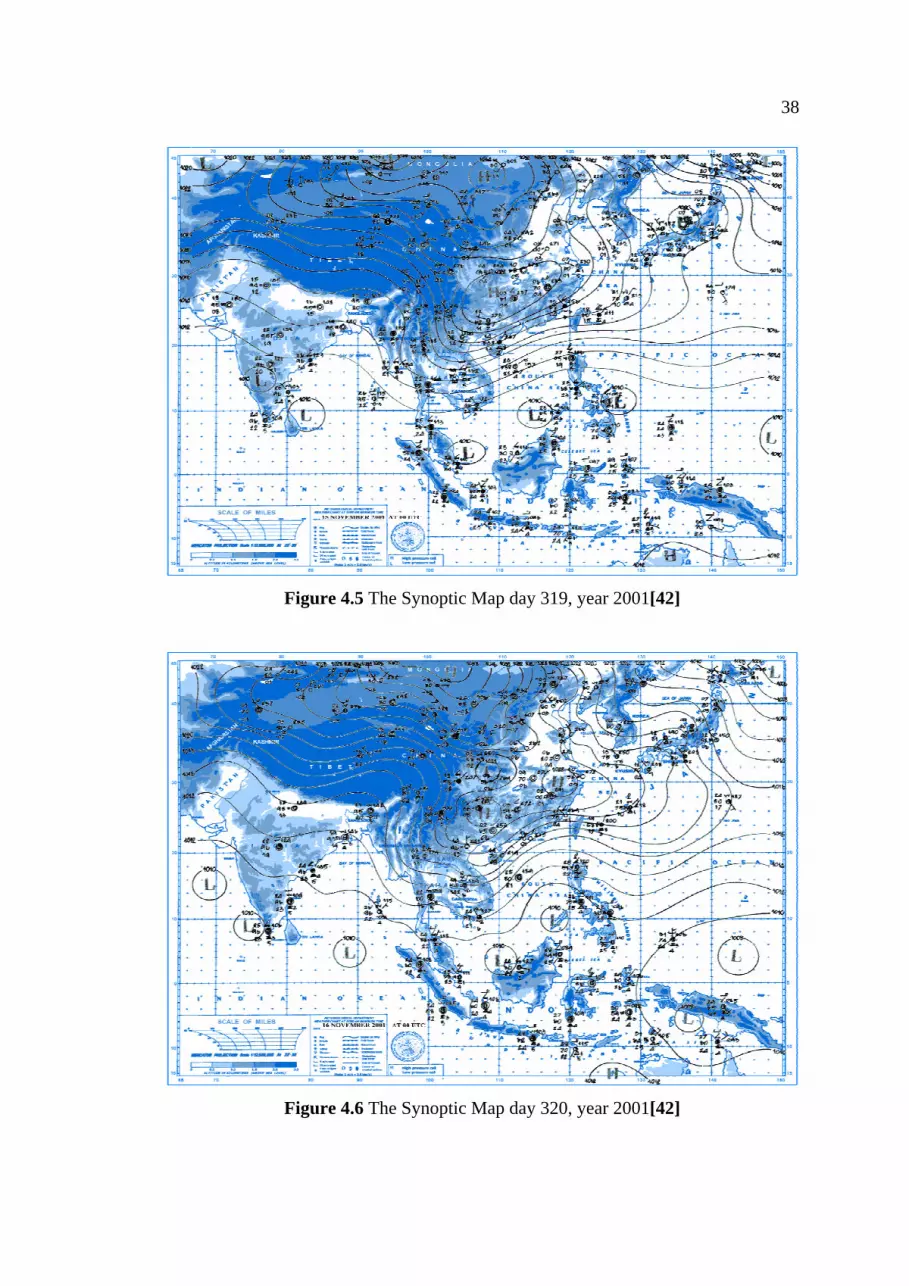
The passage of high pressure area can be explained by the B-GPS_IWV. This
leads to another application of B-GPS_IWV. According to the studies of the
GPS_IWV during the passage of a Typhoon by Yuei et al. [5], the GPS_IWV was
increased by a lot of water vapour from the passage of Typhoon. Then, the
oppositional result of their studies is illustrated when the passage of high pressure
area event is occurred. For example, the B-GPS_IWV had been decreasing for 5 days
before the high pressure area moved down to Thailand area in day 323. (See Figure
4.4 for the B-GPS_IWV and Figure 4.5 – 4.9 for the Synoptic map [42] with the
passage of high pressure area of day 323, the isobar 1012 hPa line was covered the
BNKK station)
The same phenomenon was found again when the high pressure area moved
down to BNKK station between day 343 and 357, the decremental B-GPS_IWV was
occurred around 4 days before day 343 and around 5 days before day 357,
respectively.
Furthermore, the slopes of the decremental B-GPS_IWV of the day span
before the day that high pressure area move down such as the day 323, 343, and 357
were around -0.19, -0.19, and -0.16, respectively. These slopes are about the same
value. (The average value is -0.18) Therefore, the passage of the high pressure area
may be illustrated by the slope value is around -0.18.
38
Figure 4.5 The Synoptic Map day 319, year 2001[42]
Figure 4.6 The Synoptic Map day 320, year 2001[42]

39
Figure 4.7 The Synoptic Map day 321, year 2001[42]
Figure 4.8 The Synoptic Map day 322, year 2001[42]

40
Figure 4.9 The Synoptic Map day 323, year 2001[42]
4.3 Consideration of the confluence wind from the Gulf of Thailand into the
land
This section is the use of B-GPS_IWV together with wind direction, wind
speed, and the Synoptic Map to consider the confluence wind. The inner-relation of
the data for one station and the relation among the stations were investigated.
The air mass over some areas can be transferred to the other areas by the wind.
Therefore, the moist air from the ocean can be transferred into the land [15]. In
Thailand, the wind that flows from the Gulf of Thailand into the land is in the south-
to-east direction range, namely “the confluence wind from the Gulf of Thailand” [6].
Referring to the Bureau of Royal Rain-making and Agricultural Aviation
(BRRAA), the confluence wind dominates around January to April and the most
appearance is in March. This wind may cause the heavy rain or the hailstone if the
combination between high pressure area and confluence wind is occurred [6].
The air over the land which is saturated by moist air is influenced by the
confluence wind. Thus, it can be explained by a spike of B-GPS_IWV appearing in

41
the days of the dominative confluence wind. Figure 4.10 illustrates the B-GPS_IWV
spike of BNKK and CHMI station of year 2003, where left-Y-axis consists of IWV in
mm (Blue line) and wind speed in km per hour (Black bars), right-Y-axis is wind
direction in degree (Orange points), and X-axis is DOY.
For example, the day of the dominative confluence wind was day 80. (See
Figure 4.11, the Synoptic Map day 080, year 2003 [44] and Figure 4.12, the UPPER
WIND at 600 METERS of the same day [45]) The spike at BNKK station is 52.83
mm with the wind direction was 180 degrees and wind speed was 8 km per hour. At
the same day in CHMI station, the spike also occurred with the maximum peak 27.62
mm, wind direction was 320 degrees, and wind speed was 3 km per hour.
Figure 4.10 Comparisons of B-GPS_IWV, Wind Direction and Wind Speed.
Top: CHMI station. Bottom: BNKK station

42
Figure 4.11 The Synoptic Map day 080, year 2003 [44]
Figure 4.12 The UPPER WIND at 600 METERS of day 080, year 2003 [45]

43
Other days that the confluence wind dominates are shown in table 4.2. It is
shown that the wind direction range was around 100 – 180 degrees at BNKK station
and around 200 – 300 degrees at CHMI station. In this case, it can illustrate that the
wind from the Gulf of Thailand flows to CHMI by passing though the BNKK station.
However, the wind speed does not seem to the close relationship with the other
information. This may be due to the unreliable wind seed data which is obtained only
one time per day.
Table 4.2 The days of year 2003 that the effect of confluence wind occurred.
BNKK CHMI
Wind Wind
DOY
Dire
ctio
n (d
egre
e)
Spee
d (k
m/h
rs)
Min.
IWV
(mm)
Max.
peak
(mm) D
irect
ion
(deg
ree)
Spee
d (k
m/h
rs)
Min.
IWV
(mm)
Max.
peak
(mm)
069
072
073
080
086
80
100
90
180
100
3
20
3
8
11
37.75
38.99
28.91
44.22
38.81
47.72
57.49
46.51
52.83
58.48
200
240
240
320
290
18
12
11
3
7
16.81
20.73
21.51
11.15
21.14
31.40
33.08
34.38
27.62
45.83
From reasons above, the phenomenon of the occurrent spike for both stations
can be used to explain the transfer of moist air by confluence wind from the Gulf of
Thailand.

CHAPTER V
CONCLUSIONS AND SUGGESTIONS
GPS can be applied to many fields of studies. The one of the GPS applications
is the conversion of “the geodetic noise” to “the meteorological signals” for the use of
meteorological field [9].
The IWV is the value obtained from GPS which is the same value obtained
from the WMR instrument. The accuracy of GPS_IWV is to be equivalent to the
WMR_IWV because the results of their comparison show a good agreement, but the
advantage of GPS is a low cost instrument.
For the use of GPS-meteorology in Thailand, it is clearly seen from the three
case studies that the results introduce the good possibility and suitability to fully use
in Thailand. The first one illustrates the next step of the study on southwest monsoon
period in Thailand. The precise days of the monsoon that are indicated by using
GPS_IWV respond to the success of the water budget management. The second one
can display the difference of winter season of each Thailand area and the effect of
high pressure area. Thus, it will provide that the GPS_IWV can be used as the one of
fundamental data for meteorology. The last one shows the good way to develop the
monitoring system because the GPS_IWV can be used to identify the transferential
characteristic of the moist air. It may be useful to the BRRAA for rain-making
activity.
This research uses the history dataset only 3 consecutive years. Therefore, the
results will be more significance if we have more the dataset. Moreover, this research
only used GPS data from 4 permanent stations. Then, they cannot represent an entire
Thailand area. If there are more GPS permanent stations in the future, these GPS data
will be vary useful for meteorological studies.
In comparing of GPS and WMR, it is found that the advantage of GPS is less
expensive than WMR and it can be used for many applications in the same time (e.g.
for meteorological and geodetical purpose) but the disadvantage of GPS is the method
to obtain IWV data is difficult than WMR.

REFERENCES 1. Radiometrics Corporation. WVR-1100 Water vapor and Liquid Water Radiometer,
June 12, 1997.
2. Tsonis, A.A. An Introduction to Atmospheric Thermodynamics. U.K. : Cambridge
University, 2002.
3. Michel, G.W.; Becker, M.; Angermann, D.; Reigber, C. ; and Reinhart, E. Crustal
motion in E-and SE-Asia from GPS measurements. Earth Planets Space 52
(2000) : 713-720.
4. Takiguchi, H.; Kato, T.; Kobayashi, H.; and Nakaegawa, T. GPS observations in
Thailand for hydrological application. Earth Planets Space 52 (2000) : 913-919.
5. Liou, Y. A. and Huang, C. Y. GPS observations of PW during the passage of a
typhoon. Earth Planets Space 52 (2000) : 709-712.
6. The Royal Rainmaking and Agricultural Aviation, Bureau. Chalermprakiat Royal
Rain - making Research Center. Bangkok : Ministry of Agriculture and
Cooperatives, 2001.
7. Moran, J.M., and Morgan, M.D. Meteorology the Atmosphere and the Science of
Weather. 2nd ed. New York : Collier Macmilan Canada, 1989.
8. Davis, J.L.; Herring, T.A.; Shapiro, I.I.; Rogers, A.E.; and Elgered, G. Geodesy by
radio interferometry : effects of atmospheric modeling errors on estimates of
baseline length. Journal of Radio Science 20 (1985): 1593-1607.
9. Bevis, M.; Businger, S.; Herring, T.A.; Anthes, R.A.; Rocken, C; Anthes, R.A.; and
Ware, R.H.GPS Meteorology: Remote sensing of atmospheric water vapor using
the Global Positioning System. Journal of Geophysical Research 97 (October
1992) : 15787-15801.
10. Liou, Y.A, and Yang, M. GPS Sensing of Precipitable Water Vapor. The 3rd
Symposium on GPS Technology. (1998): 43-49.

46
11. Ross, R. J., and Rosenfeld, S. Estimating mean weighted temperature of the
atmosphere for Global Positioning System applications. Journal of Geophysical
Research 102 (September 1997): 21719-21730.
12. Stull, R. B. Meteorology for Scientists and Engineers. 2nd ed. USA: BROOKS
/COLE, 2000.
13. Nave, R. The Barometric Formula [Online]. (n.d.). Available from : http://
hyperphysics .phy-astr.gsu.edu/hbase/kinetic/barfor.html#c5 [2004, October 21].
14. Danielson, E. W.; Levin, J.; and Abrams, E. Meteorology. 2nd ed. New York : Von
Hoffmann Press, 2003.
15. Edward, A., and James, E. B. Understanding weather and climate. 2nd ed. New
Jersey : Prentice-Hall, 2001.
16. Matsumoto, J. Seasonal Transition of Summer Rainy Season over Indochina and
Adjacent Monsoon Region. Advances in Atmospheric Sciences 14 (May 1997)
: 231-245.
17. Kiguchi, M., and Matsumoto, J. The Rainfall Phenomena during the Pre-monsoon
Period over the Indochina Peninsula in the GAME-IOP Year, 1998. Journal of
the Meteorological Society of Japan 83 No. 1 (February 2005) : 89 - 106.
18. Rangsun Arpakupphakul. Introduction to Meteorology. Bangkok : Chulalongkorn
University, 2004.
19. Climatology, Division. (2002). The onset and withdrawal of southwest monsoon in
the southern part of Thailand. Thai Meteorological Department [Online]. 2002
Available from : http: // www.tmd.go.th / knowledge / listpublication18.html
[2004, October 21].
20. Meteorology, Department. (2002). The season of Thailand. Thai Meteorological
Department [Book - Online]. 2002 Available from : http://www.tmd.go.th
/knowledge/book_weather03.html [2004, October 21].
21. Lockwood, J. G. World Climatic System. U.K. : Edward Arnold, 1985.

47
22. McGregor, G. R., and Nieuwolt, S. Tropical Climatology. 2nd New York : John
Wiley& Sons, 1998.
23. Fasullo, J., and Webster, P.J. A Hydrological Definition of Indian Monsoon Onset
and Withdrawal. Journal of Climate 16 (December 2002): 3200-3211.
24. Elgered, G.; Davis, J. L.; Herring, T. A. ; and Shapiro, I. I. Geodesy by Radio
Interferometry : Water Vapor Radiometry for Estimation of the Wet Delay.
Journal of Geophysical Research 96 (April 1992) : 6541-6555.
25. Coster, A. J.; Niell, A. E.; Solheim, F. S.; Mendes, V.B.; Toor, P.C.; and Langley,
R.B. The Effect of Gradients in the GPS Estimation of Tropospheric Water
Vapor. The ION 53rd Annual Meeting, Albuquerque, NM, June 30 to July 1,
1997. New Mexico, 1997.
26. Wellenhof, B.H.; Lichtenegger, H.; and Collins, J. GPS Theory and Practice. 5thed.
New York : Springer-Verlag Wien, 2001.
27. Dana, P. H. Global Positioning System Overview [Online]. (n.d.). Available from:
http:// www.colorado.edu / geography / gcraft / notes / gps / gps_f.html [2004,
September 10].
28. Nunthawut Kayankarnnavee. GPS Technology. COMNOW 5 (April 2005): 43-48.
29. Simon, M. Getting Started with GPS surveying. Translated by Chalermchon
Satirapod. Bangkok : Chulalongkorn University, 2003.
30. Pacione, R.; Fionda, E,; Sciarretta, C.; Vespe, F.; and Ferrara, R. GPS and Ground-
Based Microwqave Radiometer IPWV : A Case at Cagliari Astronomical Station,
Italy. ION GPS 2001, pp. 1148-1157, Salt Lake City, UT, September 11-14,
2001. Utah, 2001.
31. Shoji, Y.; Nakamura, H.; Aonashi, K.; Ichiki, A.; and Seko, H. Semi-diurnal and
diurnal variation of errors in GPS precipitable water vapor at Tsukuba, Japan
caused by site displacement due to ocean tidal loading. Earth Planets Space 52
(2000) : 685-690.

48
32. Satomura, M.; Fujita, K.; Kato, T.; Nakaegawa, T.; and Terada, M. Seasonal change
of Precipitable water vapor obtained from GPS data in Thailand, Fifth study
conference on GEWEX in Asia and GAME, pp. 235-239. Nagoya, Japan, 2001.
33. Hagemann, S., and Bengtsson, L. On the Determination of Atmospheric Water
Vapor from GPS Measurement. Journal of Geophysical Research 108
(November 2003) : 11-1 – 11-14.
34. Chulalongkorn University. Observatory for Atmospheric Radiation Research At
Srisamrong [Brochure], June, 2003.
35. Mapmart. Satellite Maps and Photos of Thailand [Online]. (n.d.). Available from :
http://www.mapmart.com/WorldSatelliteImagery/Countries/Thailand.htm [2004,
August 8].
36. Hugentobler, U. ; Schaer, S.; and Fridez, P. Bernese GPS Software Version 4.2.
Switzerland : Univ. of Berne, 2001.
37. Chulalongkorn University. Faculty of Science, Department of Mathematics. The
probability and Statistics. 9th. Bangkok : Phitakkarnpim, 2001.
38. Jarun Junthalukana, and Anunchai kerntum. Introduction to Statistics. 4th. Bangkok:
Thaiwatthanapanich, 1997.
39. Metrology, Department. The annual rainy season of Thailand of year 2001. Bangkok
: Meteorological Department, 2001.
40. Metrology, Department. The annual rainy season of Thailand of year 2002. Bangkok
: Meteorological Department, 2002.
41. Metrology, Department. The annual rainy season of Thailand of year 2003. Bangkok
: Meteorological Department, 2003.
42. Metrology, Department. Meteorological Department weather chart at 0700 am.
Bangkok time [CD-ROM]. Division of Climatology : Meteorological
Department, 2001.

49
43. Metrology, Department. Meteorological Department weather chart at 0700 am.
Bangkok time [CD-ROM]. Division of Climatology : Meteorological
Department, 2002.
44. Metrology, Department. Meteorological Department weather chart at 0700 am.
Bangkok time [CD-ROM]. Division of Climatology : Meteorological
Department, 2003.
45. Metrology, Department. Upper winds at 600 METERS map [CD-ROM].
Division of Climatology : Meteorological Department, 2003.

APPENDICES

Appendix A
The Mean Temperature Tm

52
APPENDIX A
The Mean Temperature Tm
For each station Tm can be obtained by the Tm-Ts relationship can be
determined by minimizing the Chi-square error statistic as
CaTsTm += ……………………… (2)
The Tm-Ts relationship equations for each station are given by
BNKK Tm = 041 Ts + 142.73 with correlation coefficient 0.41 …… (A-1)
CHMI Tm = 0.35 Ts + 159.36 with correlation coefficient 0.76 …… (A-2)
PHKT Tm = 0.48Ts + 121.27 with correlation coefficient 0.56 …… (A-3)
Yuei and Yang [14] suggested that the correlation coefficient should be 0.85.
Therefore, all of equations cannot be used.
By this reason, Bevis et al. [10] showed the proportional coefficient κ per OH2ρ is
the density of water was about 0.15 in general. Then, equation (18) becomes to
equation (A1)
ZWDIWV ×= π ……………………… (A1)
where π is about 0.15
Figure A-1 The relationship between Tm and Ts and Its regression coefficient of
BNKK station.

53
Figure A-2 The relationship between Tm and Ts and Its regression coefficient of
CHMI station.
Figure A-3 The relationship between Tm and Ts and Its regression coefficient of
PHKT station.

Appendix B
On the accuracy of WMR data

55APPENDIX B
On the accuracy of WMR data
According to the WMR instrument was automatically created the WMR_IWV,
generally this data can be immediately used. However, several errors were combined
inside this data.
Elgered et al. [24], found the one of error was the algorithm error due to liquid
water or the presence raindrops. In the rainy day condition, the raindrops on the horn
antennas was made the error of WMR_IWV data when the signal was over- scattered
by the liquid water drops before go to the sensor. Then, it is clearly seen why the peak
of data was occurred under the condition of rainy day.
In order to remove the error data with a condition of rainy day, the double-
standard deviation (2SD) was chosen. The SD value calculated from the real
WMR_IWV and then the RAW data with over the 2SD was eliminated.
Figure B-1 The WMR_IWV with non-eliminated by the 2SD value.
Figure B-2 The comparison between WMR_IWV data with eliminated by 2SD value
and the RAW-WMR_IWV data.

56Figure B-1 shows that the error peaks of WMR_IWV data in the rainy day
with non-eliminated by 2SD value of year 2001 and the SD of this data was about
9.14 and the mean value about 50.69 mm.
When filtered by the 2SD values, the new WMR_IWV data was smooth than
the old one. The new SD was about 7.02 and the mean value was about 49.68 mm.

Appendix C
The B-GPS_IWV data

58APPENDIX C
The B-GPS_IWV data
Figure C-1 Comparisons of B-GPS_IWV, Wind Direction and Rainfall of year 2002.
(Withdrawal)Top: BNKK station. Middle: CHMI station. Bottom: PHKT station.

59
Figure C-2 The B-GPS_IWV, Wind Direction and Rainfall of year 2003.
Top: BNKK station. Middle: CHMI station. Bottom: PHKT station.

60
Figure C-3 Comparisons of B-GPS_IWV, Wind Direction and Rainfall of year 2003.
(Onset)Top: BNKK station. Middle: CHMI station. Bottom: PHKT station.

61
Figure C-4 Comparisons of B-GPS_IWV, Wind Direction and Rainfall of year 2003.
(Withdrawal)Top: BNKK station. Middle: CHMI station. Bottom: PHKT station

62
VITAE
Nithiwatthn CHOOSAKUL was born in Chaiyaphum, Thailand, on August
5th, 1980. He received Bachelor Degree of Science (Physics) in 2003 from
Department of Physics, Faculty of Science, Chulalongkorn University. He started as a
Master Degree student with a major of Earth Science, Department of Geology,
Faculty of Science, Chulalongkorn University in 2003 and completed the program in
August 2005.


