Embed Size (px)
Citation preview
Appendix GProjects and Project Evaluation
SJATSO 2045 Metropolitan Transportation Plan
Appendix G – Project Evaluation 1
Appendix G – Project Evaluation
Introduction This appendix summarizes the project evaluation of the potential 2045 MTP
improvements. As described in Appendix E, Needs and Opportunities, the project list
includes a range of project needs that have been identified as part of the SJATSO 2045
MTP planning process. The evaluation process leads to the identification of priority
projects and strategies that are considered further as part of the cost feasible plan (see
Appendix H).
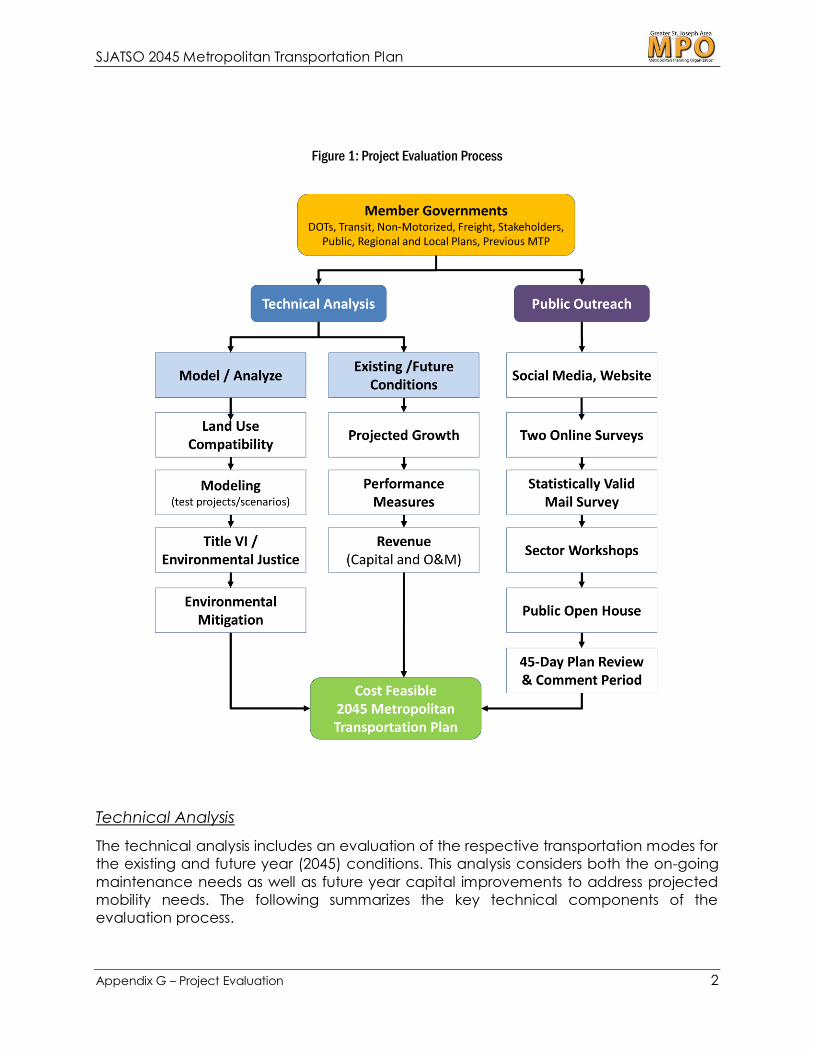
Overview of the Evaluation Process SJATSO uses a combination of technical evaluation and stakeholder outreach to
identify, screen and prioritize multimodal improvements within the region (see Figure 1).
This appendix summarizes the 2045 MTP screening results. The screening process focuses
on two primary tasks—a technical analysis and public input. Both tasks inform each
other throughout the evaluation process to ultimately determine which improvements:
• Achieve the stated goals and objectives of the MTP
• Address existing and future year needs, deficiencies, and opportunities
Plan and Project Review
The evaluation process starts with a review of the projects included in the 2040 MTP.
SJATSO staff reviewed the 2040 MTP project list to identify projects that had been
completed or may no longer be needed. It also includes a review of recently
completed and on-going studies within the MPA to identify specific projects, strategies,
or other recommendations that might impact the 2045 MTP development.
There are two recent studies that will have a significant impact on the 2045 MTP. The first
is the I-229 EA study, which is currently on-going and expected to be completed by
early 2020. This project will identify a long-term solution for the elevated structure of I-
229, located just west of downtown St. Joseph. Depending on the preferred alternative,
this improvement could have significant impacts on local and regional traffic, including
regional freight movements. The second study is a riverfront development plan which
was recently completed in Spring 2019. This study identified opportunities to better
connect downtown St. Joseph with the riverfront. It includes several non-motorized
improvements that are important to include in the MTP.
SJATSO 2045 Metropolitan Transportation Plan
Appendix G – Project Evaluation 2
Figure 1: Project Evaluation Process
Technical Analysis
The technical analysis includes an evaluation of the respective transportation modes for
the existing and future year (2045) conditions. This analysis considers both the on-going
maintenance needs as well as future year capital improvements to address projected
mobility needs. The following summarizes the key technical components of the
evaluation process.
SJATSO 2045 Metropolitan Transportation Plan
Appendix G – Project Evaluation 3
Travel Demand Forecasting Model
The regional travel demand forecasting model was used to evaluate the potential
impacts of select roadway projects. The travel demand model is a tool to project year
2045 conditions by using socioeconomic forecasts (see Appendix B). The model results
are included later in this appendix.
Environmental Justice
Environmental Justice (EJ) is a federal policy that requires agencies receiving federal
funds to set up processes that consider impacts of plans, projects, and activities on
minority and low-income populations. FHWA and FTA establish policy guidelines that
focus on the following:
• Limited Effects – Avoid, minimize, or mitigate disproportionally high and adverse
effects on human health and the local environment. This includes social and
economic effects on minority and low-income populations;
• Inclusion – Ensure that all communities that would potentially be affected by the
transportation decision making process have the opportunity to participate and
be represented; and
• Guarantee of Benefits – Prevent the denial, reduction, or significant delay of the
receipt of benefits to minority and low-income population.
The EJ analysis is included in Appendix I.
Land Use Compatibility
The SJATSO area has continued to grow over the past two decades. As this growth
occurs, the planning area experiences changes in land use which have a direct impact
on transportation patterns and infrastructure decisions. Land use changes, such as new
housing developments and employment centers, often increase travel demand,
creating the need for additional transportation accommodations for all modes. As the
area responds with new supply (new roadways, additional travel lanes, new or expanded
bus routes, new non-motorized facilities, etc.), the demand is addressed and there is
improved accessibility to land. This accessibility results in new land uses, leading to new
transportation demand and so on. This cycle of improvements and demand is known as
the Land Use/Transportation Cycle. Potential land use impacts are considered in the
evaluation process.
Performance Measures
MAP-21, and continuing with FAST Act, placed an emphasis on establishing national
performance standards. DOTs and MPOs must address these performance measures as
part of the MTP process. These measures have been incorporated into the planning
evaluation process. A system performance report is provided in Appendix F.
Operations and Maintenance
The on-going preservation of existing transportation infrastructure is a critical—and
costly—component of maintaining a safe, efficient, and reliable transportation system. A
primary focus of the region, at least for the foreseeable future, is on maintaining the
existing infrastructure and other transportation assets in a state of good repair. As
SJATSO 2045 Metropolitan Transportation Plan
Appendix G – Project Evaluation 4
previously documented, addressing the short-term and long-term needs of the elevated
segment of I-229 is critical to addressing the overall operations and maintenance (O&M)
needs of the region. Projects that help preserve existing transportation assets are
considered in the evaluation process.
Public Input
Public input is another critical aspect of the planning process that informs the project
identification and screening. The following summarizes key public outreach efforts during
the 2045 MTP update.
Online Surveys
Two online surveys were conducted as part of the 2045 MTP update. The first survey was
conducted between April 29, 2018, and June 16, 2018, and was designed to help confirm
the MTP goals and priorities, as well as assess public support for potential new funding
sources and spatially identify multimodal issues and concerns. The survey had nearly 400
visitors and 255 participants, logging over 1,000 priorities.
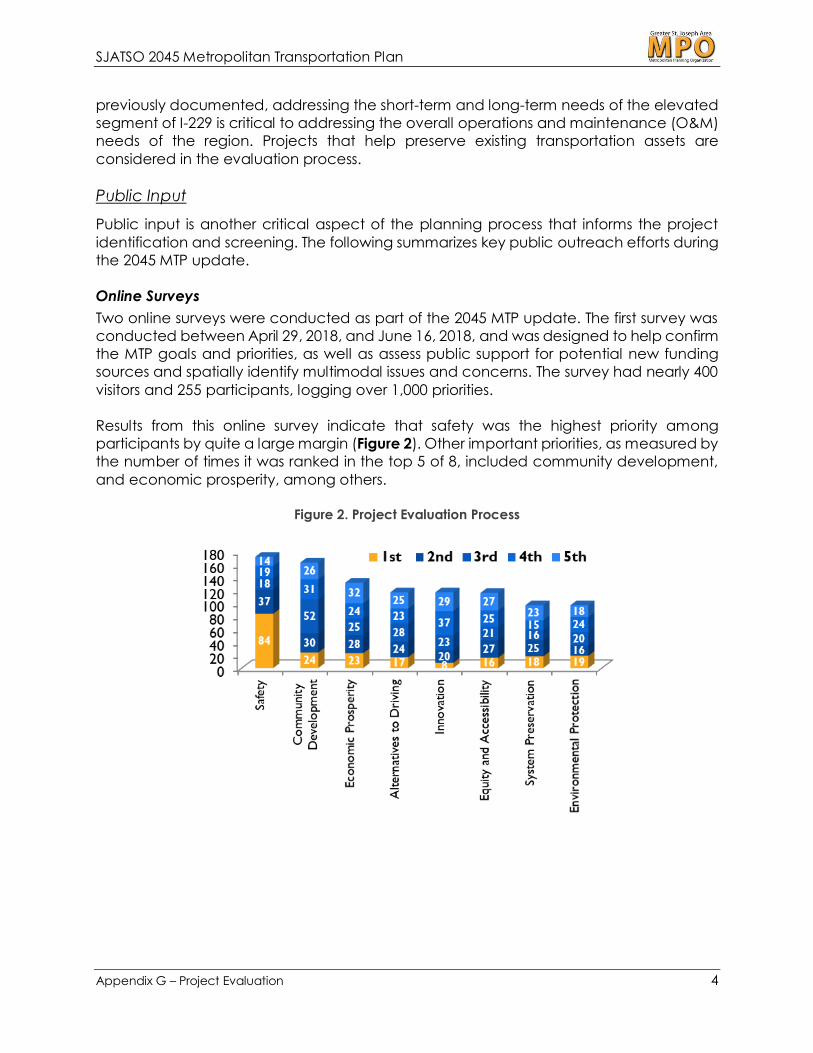
Results from this online survey indicate that safety was the highest priority among
participants by quite a large margin (Figure 2). Other important priorities, as measured by
the number of times it was ranked in the top 5 of 8, included community development,
and economic prosperity, among others.
Figure 2. Project Evaluation Process
SJATSO 2045 Metropolitan Transportation Plan
Appendix G – Project Evaluation 5
On the topic of growing revenues to best address these priorities, various potential
funding sources were put forward and participants selected the ones they would support
for an increase to fund transportation improvements. By a large margin, a state gas tax
garnered the most support, followed by new local road and bridge taxes and state motor
vehicles sales tax. It is notable that participants support “user taxes”—i.e., transportation-
related tax revenues—to support transportation projects. Sales tax and property taxes
received much less support.
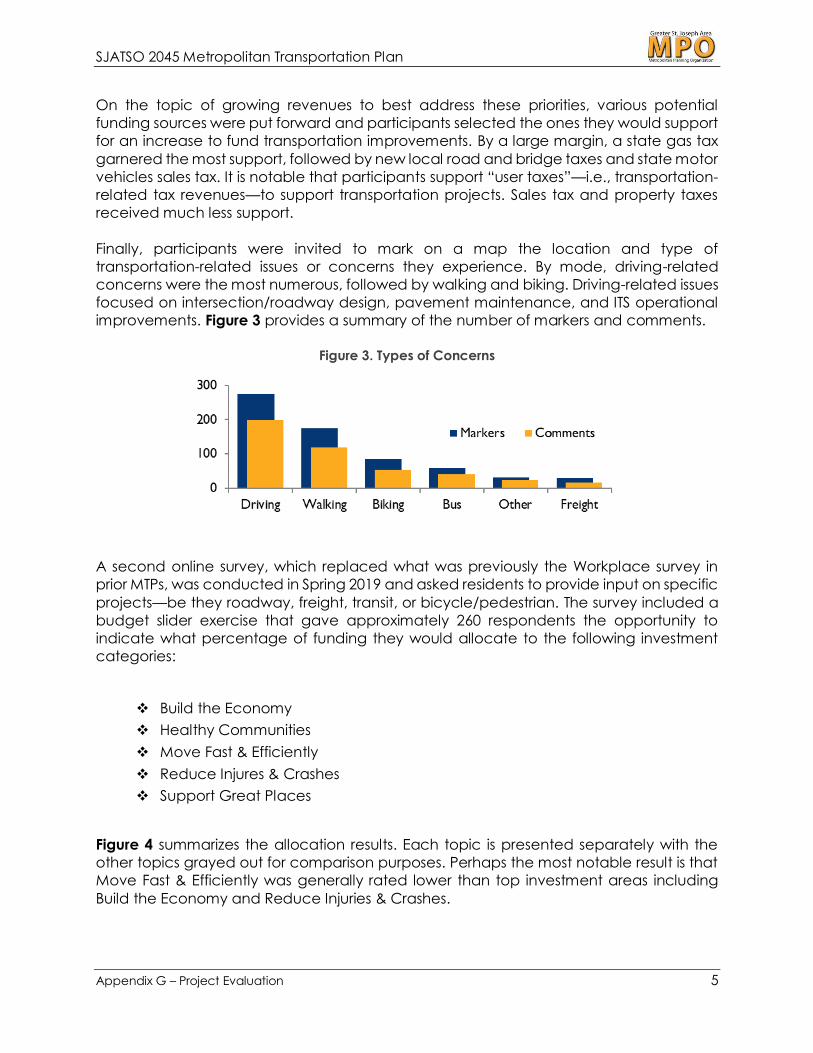
Finally, participants were invited to mark on a map the location and type of
transportation-related issues or concerns they experience. By mode, driving-related
concerns were the most numerous, followed by walking and biking. Driving-related issues
focused on intersection/roadway design, pavement maintenance, and ITS operational
improvements. Figure 3 provides a summary of the number of markers and comments.
Figure 3. Types of Concerns
A second online survey, which replaced what was previously the Workplace survey in
prior MTPs, was conducted in Spring 2019 and asked residents to provide input on specific
projects—be they roadway, freight, transit, or bicycle/pedestrian. The survey included a
budget slider exercise that gave approximately 260 respondents the opportunity to
indicate what percentage of funding they would allocate to the following investment
categories:
❖ Build the Economy
❖ Healthy Communities
❖ Move Fast & Efficiently
❖ Reduce Injures & Crashes
❖ Support Great Places
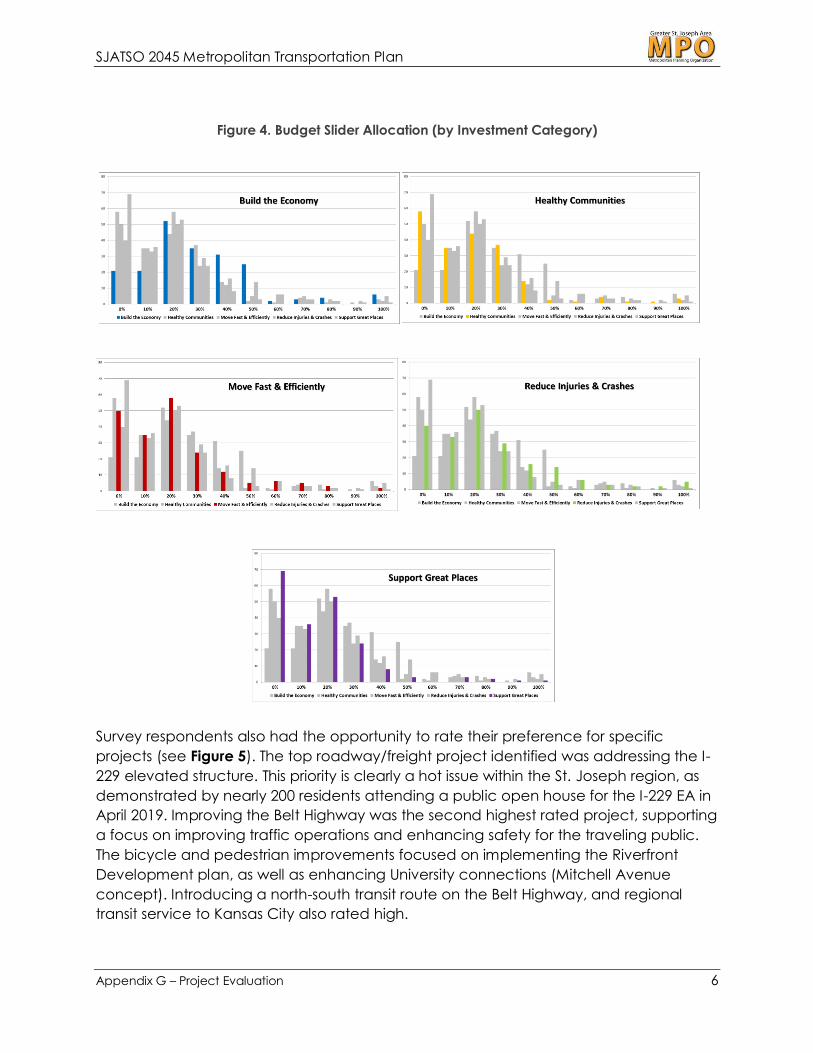
Figure 4 summarizes the allocation results. Each topic is presented separately with the
other topics grayed out for comparison purposes. Perhaps the most notable result is that
Move Fast & Efficiently was generally rated lower than top investment areas including
Build the Economy and Reduce Injuries & Crashes.
SJATSO 2045 Metropolitan Transportation Plan
Appendix G – Project Evaluation 6
Figure 4. Budget Slider Allocation (by Investment Category)
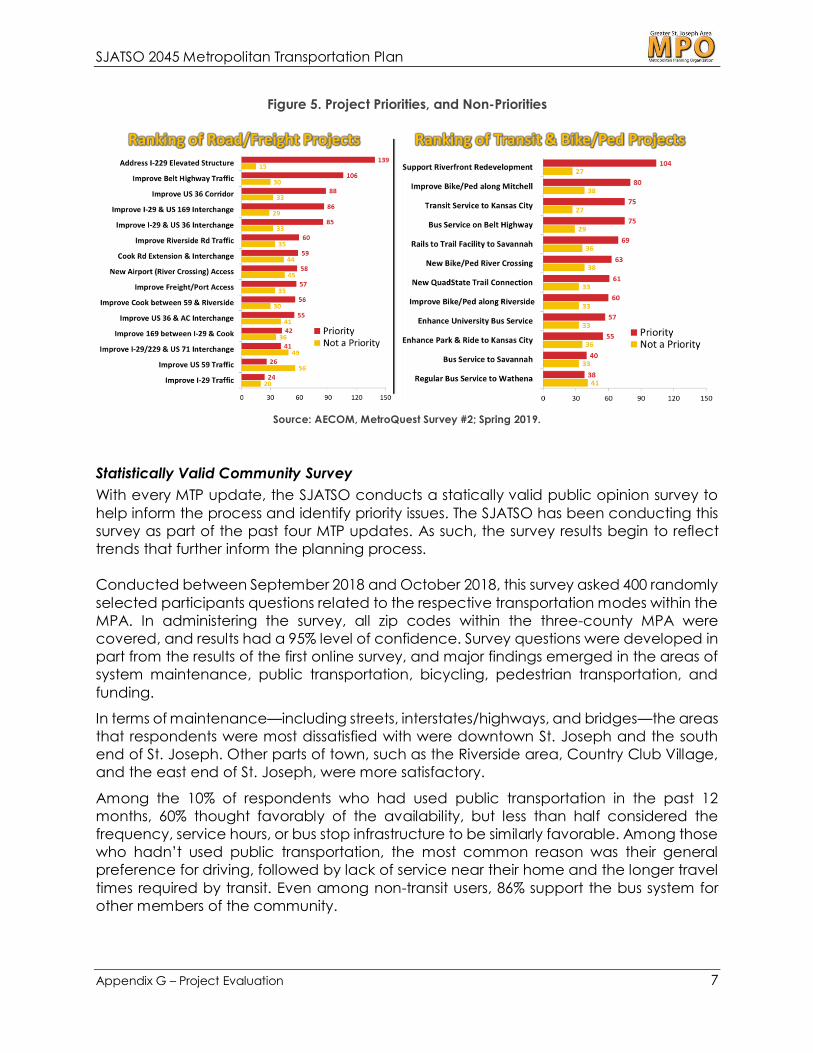
Survey respondents also had the opportunity to rate their preference for specific
projects (see Figure 5). The top roadway/freight project identified was addressing the I-
229 elevated structure. This priority is clearly a hot issue within the St. Joseph region, as
demonstrated by nearly 200 residents attending a public open house for the I-229 EA in
April 2019. Improving the Belt Highway was the second highest rated project, supporting
a focus on improving traffic operations and enhancing safety for the traveling public.
The bicycle and pedestrian improvements focused on implementing the Riverfront
Development plan, as well as enhancing University connections (Mitchell Avenue
concept). Introducing a north-south transit route on the Belt Highway, and regional
transit service to Kansas City also rated high.
SJATSO 2045 Metropolitan Transportation Plan
Appendix G – Project Evaluation 7
Figure 5. Project Priorities, and Non-Priorities
Source: AECOM, MetroQuest Survey #2; Spring 2019.
Statistically Valid Community Survey
With every MTP update, the SJATSO conducts a statically valid public opinion survey to
help inform the process and identify priority issues. The SJATSO has been conducting this
survey as part of the past four MTP updates. As such, the survey results begin to reflect
trends that further inform the planning process.
Conducted between September 2018 and October 2018, this survey asked 400 randomly
selected participants questions related to the respective transportation modes within the
MPA. In administering the survey, all zip codes within the three-county MPA were
covered, and results had a 95% level of confidence. Survey questions were developed in
part from the results of the first online survey, and major findings emerged in the areas of
system maintenance, public transportation, bicycling, pedestrian transportation, and
funding.
In terms of maintenance—including streets, interstates/highways, and bridges—the areas
that respondents were most dissatisfied with were downtown St. Joseph and the south
end of St. Joseph. Other parts of town, such as the Riverside area, Country Club Village,
and the east end of St. Joseph, were more satisfactory.
Among the 10% of respondents who had used public transportation in the past 12
months, 60% thought favorably of the availability, but less than half considered the
frequency, service hours, or bus stop infrastructure to be similarly favorable. Among those
who hadn’t used public transportation, the most common reason was their general
preference for driving, followed by lack of service near their home and the longer travel
times required by transit. Even among non-transit users, 86% support the bus system for
other members of the community.
SJATSO 2045 Metropolitan Transportation Plan
Appendix G – Project Evaluation 8
Nearly a quarter of respondents had ridden a bike in the past 12 months, primarily for
recreation rather than practical purposes. Those who rode on roadways felt safe in many
parts of the MPA, but less safe in the east and south ends of St. Joseph. The main wishes
for biking were an expanded network (e.g., in south and east ends of St. Joseph and
Country Club Village) and increased focus on safety—features like separated bike lines
on roadways, increased driver education, and additional lighting on trails. Forty-five
percent of these respondents said that they would support a bike-share program, 18%
were unsure, and the remainder in opposition.
About half of respondents reported walking on a roadway or path in the past 12 months
and felt that those areas considered “uncomfortable” would benefit from increased
visibility and the construction of new sidewalks or paths.
Much like the findings from the first survey, the funding sources that garnered the most
support as potential new revenue for transportation projects were transportation-related,
with the state gas tax again receiving the most support, followed by local road and
bridge and local gas taxes.
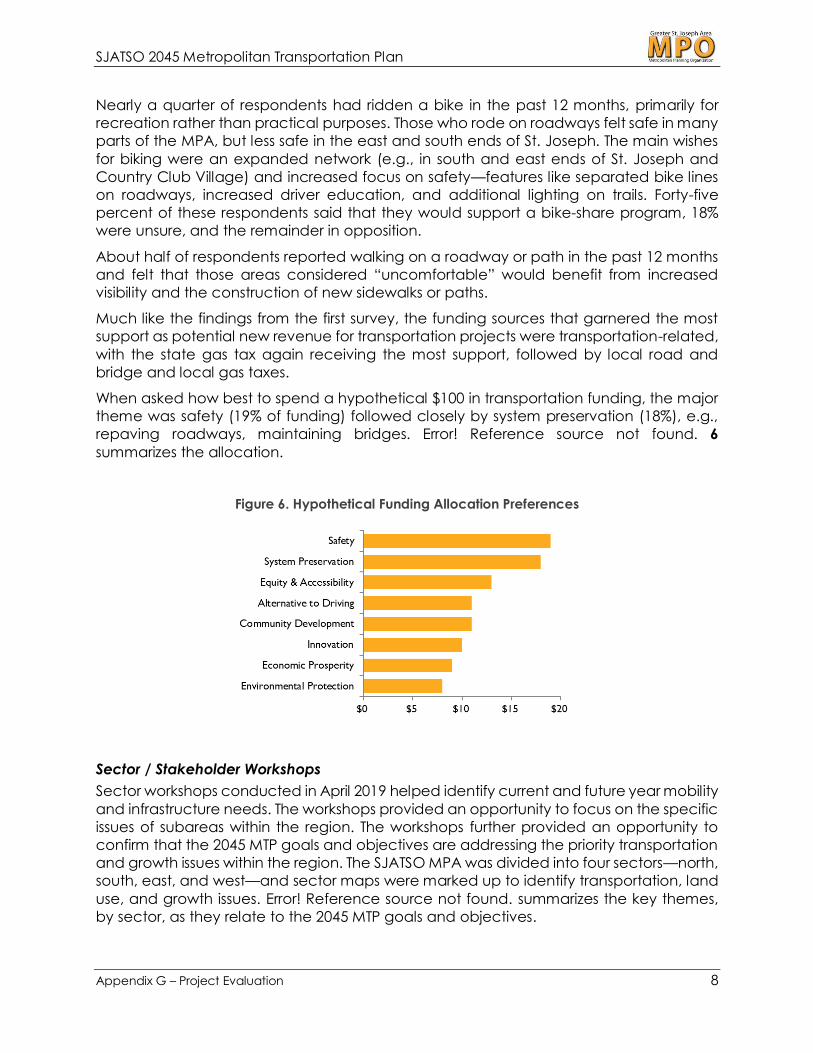
When asked how best to spend a hypothetical $100 in transportation funding, the major
theme was safety (19% of funding) followed closely by system preservation (18%), e.g.,
repaving roadways, maintaining bridges. Error! Reference source not found. 6
summarizes the allocation.
Figure 6. Hypothetical Funding Allocation Preferences
Sector / Stakeholder Workshops
Sector workshops conducted in April 2019 helped identify current and future year mobility
and infrastructure needs. The workshops provided an opportunity to focus on the specific
issues of subareas within the region. The workshops further provided an opportunity to
confirm that the 2045 MTP goals and objectives are addressing the priority transportation
and growth issues within the region. The SJATSO MPA was divided into four sectors—north,
south, east, and west—and sector maps were marked up to identify transportation, land
use, and growth issues. Error! Reference source not found. summarizes the key themes,
by sector, as they relate to the 2045 MTP goals and objectives.

SJATSO 2045 Metropolitan Transportation Plan
Appendix G – Project Evaluation 9
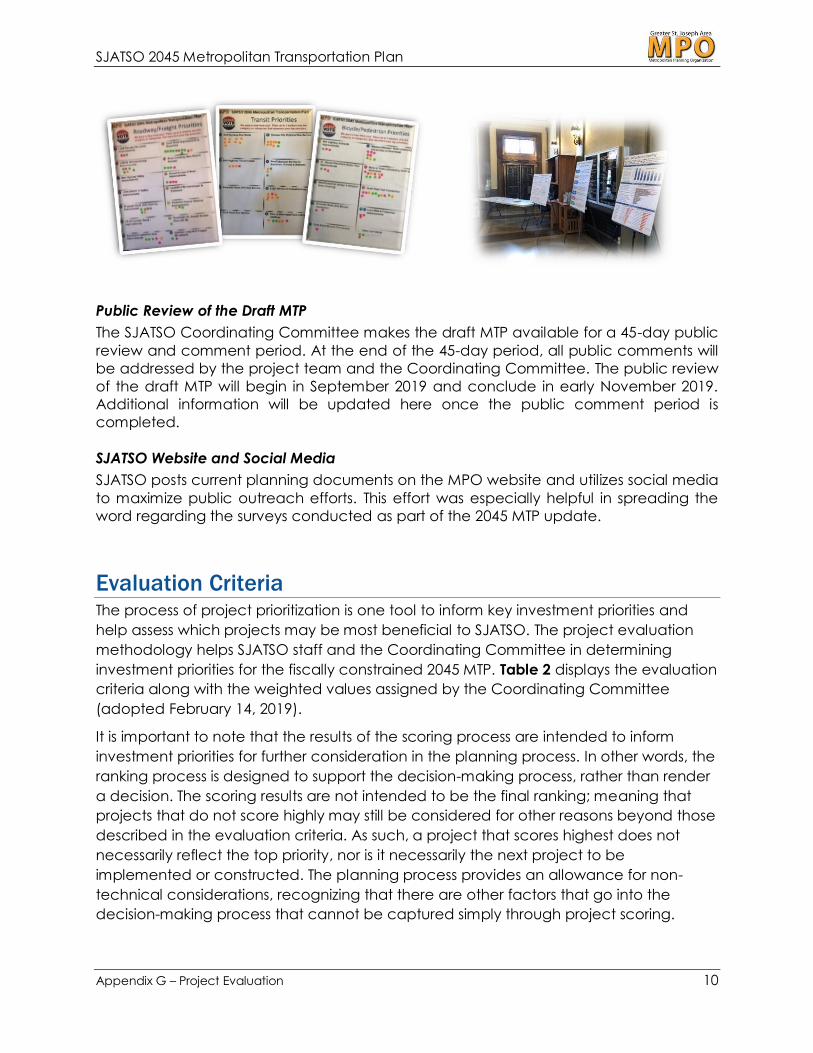
Public Open House
SJATSO conducted a public open house on July 10, 2019, to present the draft MTP
recommendations. The open house was held at the St. Joseph City Hall and
approximately 25 individuals attended. Participants were given the opportunity to review
the preliminary transportation needs and issues, and could indicate their top
roadway/freight, transit, and bicycle/pedestrian concerns by placing stickers next to
their highest priority projects. Consistent with other outreach efforts, desire to expand
transportation choice was a priority of attendees.
Table 1: Sector Workshop Key Themes
North
• Focus on maintaining/upgrading existing roads
• School district is rapidly growing, which in turn impacts transportation needs
• Safety concerns, specifically the I-29/229/71 interchange (MoDOT is reviewing)
• Focus on expanding alternative transportation:
– Need more sidewalks throughout the area, increase mobility for low-income individuals who rely heavily on walking
– Support for expanding fixed-route bus service to Savannah (focus on connecting people with jobs)
– Support for expanding bicycle facilities, including the rail-to-trails connection to the St. Joseph urbanized area
East
• Focus on improving infrastructure and traffic operations
– I-29 @ US-169 (heavy truck traffic)
– US-36 @ Riverside (bridge, capacity) – I-29 @ US-36 (freight impacts) – I-229 @ Route A (accommodate new
development) – Cook Road Improvements (accommodate
development, important east-west connectivity)
• Create “Gateway” to City at Frederick Avenue interchange area
• Study long-term future of US-36
– Safety, operational improvements – Support development east of I-29
• Belt Highway improvements
– Improve traffic operations/safety – Add transit service, connected sidewalks
• Enhance bicycle connections from WMSU to downtown
South
• Improve circulation, access to industries
– Enhance traffic flow and safety at the intersection of US-59 and Alabama
– Accommodate truck parking – Improve access to US-36 and I-229,
including MO-752 connection
• Study long-term future of US-36 corridor
– Safety, operational improvement – Maintenance of I-229/US-36/US-59
interchange
• Enhance transportation alternatives:
– Later bus service to area – Develop Quad State Trails
West
• Enhance airport access
– Potential new river crossing – Second access (causeway) east of existing
airport access on Kansas side
• Support future airport development – Air National Guard moving creates
business development opportunity
• Address US-36 corridor issues
– Maintenance of I-229/US-36/US-59 interchange
– Safely accommodate traffic through Wathena (during major events)
• Improve bike/pedestrian facilities
SJATSO 2045 Metropolitan Transportation Plan
Appendix G – Project Evaluation 10
Public Review of the Draft MTP
The SJATSO Coordinating Committee makes the draft MTP available for a 45-day public
review and comment period. At the end of the 45-day period, all public comments will
be addressed by the project team and the Coordinating Committee. The public review
of the draft MTP will begin in September 2019 and conclude in early November 2019.
Additional information will be updated here once the public comment period is
completed.
SJATSO Website and Social Media
SJATSO posts current planning documents on the MPO website and utilizes social media
to maximize public outreach efforts. This effort was especially helpful in spreading the
word regarding the surveys conducted as part of the 2045 MTP update.
Evaluation Criteria The process of project prioritization is one tool to inform key investment priorities and
help assess which projects may be most beneficial to SJATSO. The project evaluation
methodology helps SJATSO staff and the Coordinating Committee in determining
investment priorities for the fiscally constrained 2045 MTP. Table 2 displays the evaluation
criteria along with the weighted values assigned by the Coordinating Committee
(adopted February 14, 2019).
It is important to note that the results of the scoring process are intended to inform
investment priorities for further consideration in the planning process. In other words, the
ranking process is designed to support the decision-making process, rather than render
a decision. The scoring results are not intended to be the final ranking; meaning that
projects that do not score highly may still be considered for other reasons beyond those
described in the evaluation criteria. As such, a project that scores highest does not
necessarily reflect the top priority, nor is it necessarily the next project to be
implemented or constructed. The planning process provides an allowance for non-
technical considerations, recognizing that there are other factors that go into the
decision-making process that cannot be captured simply through project scoring.

SJATSO 2045 Metropolitan Transportation Plan
Appendix G – Project Evaluation 11
3 2 1 0
Safety Potential to reduce
crashes, or enhance safety
for the traveling public
20% Targeted safety
project/improvement, or
project enhances geometric
design
Project has potential safety
benefits, to roadway users
or alternative transportation
modes
Project has limited safety
benefits, to roadway users
or alternative transportation
modes
Does not target or address a
safety issue/need
System Management Potential to improve
existing infrastructure, or
more efficient operations
20% High pavement or bridge
priority, or specifically
targets other infrastructure
need
Identified pavement or
bridge need, or other
infrastructure need
Routine treatment to
improve pavement, or other
infrastructure need
No effect on pavement or
bridge condition, or other
infrastructure
Funding Project readiness,
including overall project
cost and potential for
available funding
20% Project ready to build, or in
design. Project funding (full
or partial) has been
identified.
Some analysis/design
completed, project requires
further study. Project
funding has been partially
addressed/identified.
Limited analysis/design,
project is mostly in the
planning stage. Project
funding is mostly
conceptual, or needs to be
addressed.
Project is mostly conceptual,
does not address an
immediate concern. No
funding available, or funding
has not been identified.
Economic Vitality Potential Economic
Benefits 15% Potential to enhance
regional economic
development and
competitiveness
Potential to enhance local
economic development
within the MPA
Limited or speculative
economic benefits within
the MPA
Does not directly support
economic development
within the MPA
Accessibility, Regionalism Congestion reduction,
reduce VHT, reduce VMT,
Connectivity
15% Targets roadway with ‘over
capacity’ v/c ratio and/or a
freight corridor
Targets roadway with ‘at
capacity’ v/c ratio and/or a
freight corridor or emerging
freight corridor
Targets roadway with
‘approaching capacity’ v/c
ratio and/or an emerging
freight corridor
Does not target congested
roadway and/or no
discernable freight benefit
Environmental Protection,
Natural Environment,
Transportation / Land Use
Consistency with
growth/land use patterns,
supports environmental
protection
5% Supports targeted
development areas, avoids
negative environmental
impacts
Supports development in
existing or planned
infrastructure service areas,
minimizes negative
environmental impacts
Potential land use
compatibility /
environmental concerns
Is not consistent with
desired growth patterns,
and/or could have
significant environmental
impacts
Public Involvement General support from the
public5% High priority support for
existing or proposed
regionally significant
investments
Complements existing or
proposed regionally
significant investments
Minimal existing or
proposed support for
transportation investment
No support or significant
opposition to proposed
transportation improvement
Rating
MTP Goals Evaluation Criteria
Weighted
Value
Table 2. Evaluation Criteria NOTE: 0 (little, or no impact) to 3 (highest, or most significant impact)
Weight values adopted by SJATSO Coordinating Committee – February 14, 2019
SJATSO 2045 Metropolitan Transportation Plan
Appendix G – Projects and Evaluation 12
Evaluation Process Following is a brief summary of the evaluation process used for the SJATSO 2045 MTP
planning process:
1. Develop evaluation criteria that reflect the MTP goals and objectives.
2. Develop weighted evaluation criteria, with input from the SJATSO Technical and
Coordinating Committee. The committees ultimately approve the weights
considering feedback from of the public surveys.
3. For each criterion, a rating scale from 3 (highest) to 0 (lowest) is used to assess
how well a project would perform. These ratings are applied to each
roadway/freight project contained in the potential project list.
4. When a project is scored, the numeric ratings are multiplied by their respective
criterion’s weight and then summed to create a weighted score that reflects the
relative importance of each criterion.
5. SJATSO committee members had one month to review the initial scoring of the
potential projects. No comments or edits were provided.
Highways and roadways facilitate the highest percentage of travel within the region,
and providing an efficient and effective roadway system is critical to support the
region’s economy, quality of life, mobility, and social equity. While primarily serving
vehicular traffic, roadways also accommodate public transit, bicycling, pedestrians,
and freight movements. As such, it is critical to consider the secondary impacts and
benefits that roadway improvements can have on improving other travel modes and
the regional multimodal transportation system—essentially looking at the roadway
system from a complete streets perspective.
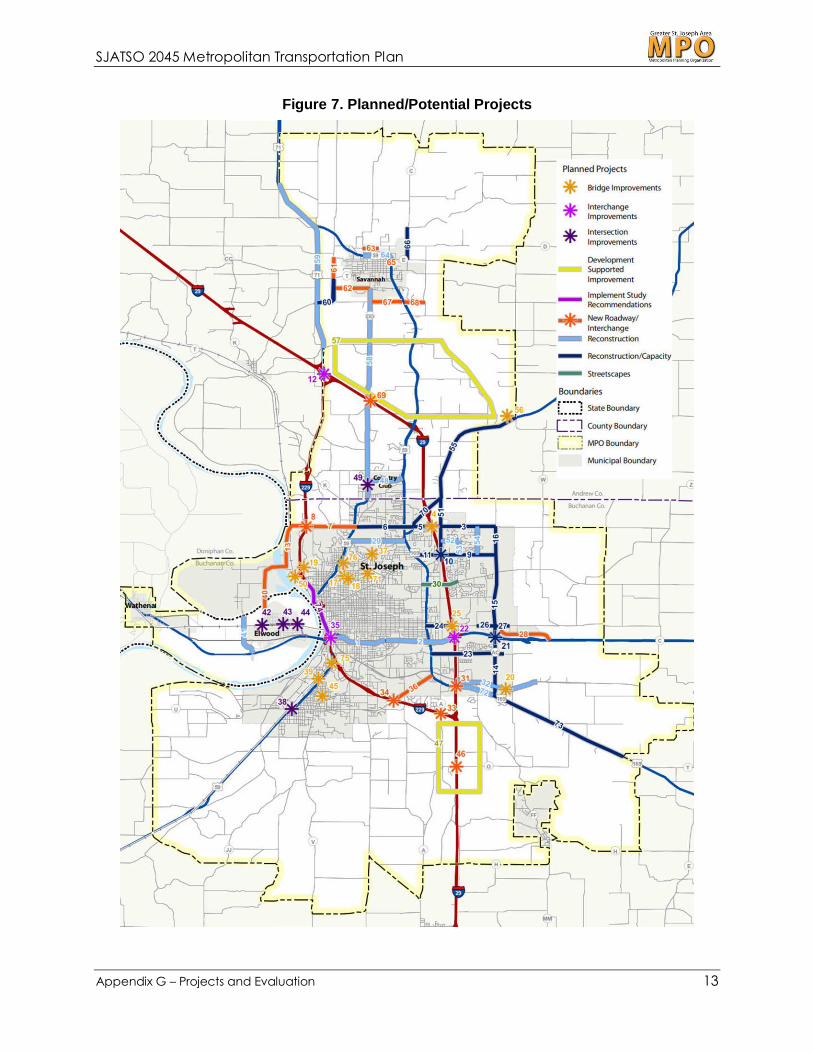
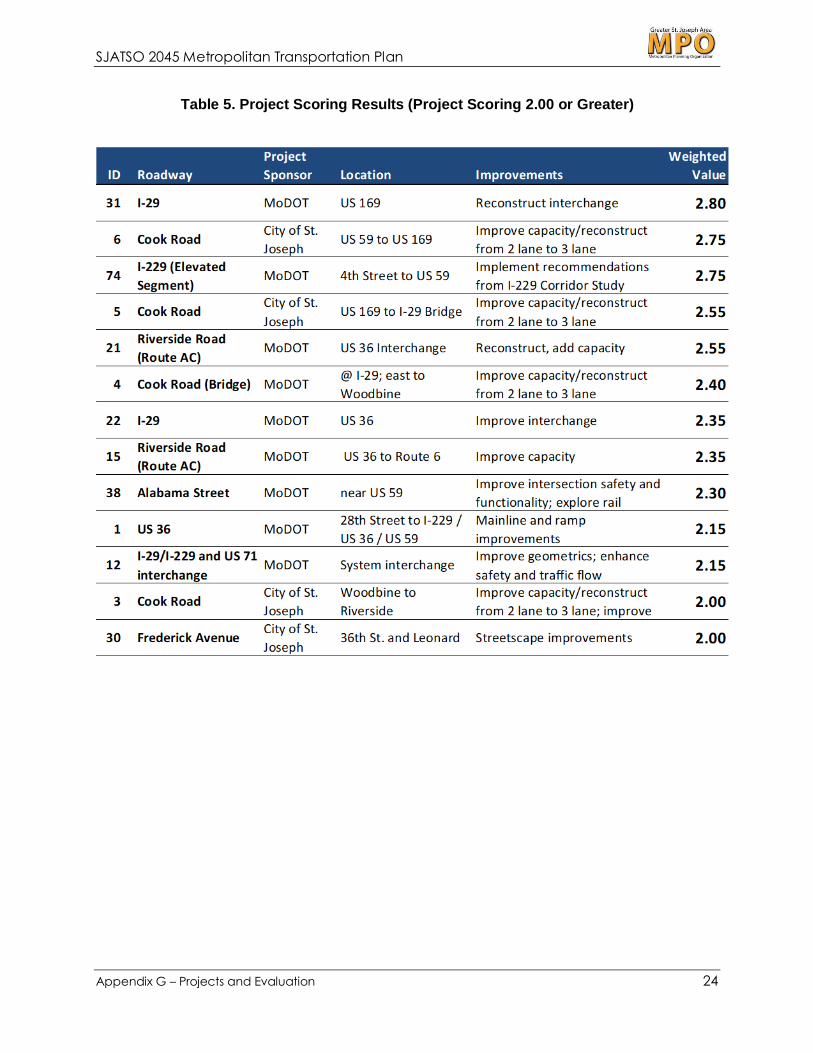
Evaluation Results Figure 7 displays the potential or planned projects within the SJATSO MPA. Some of the
projects are proposed studies as there may not be enough information to identify a
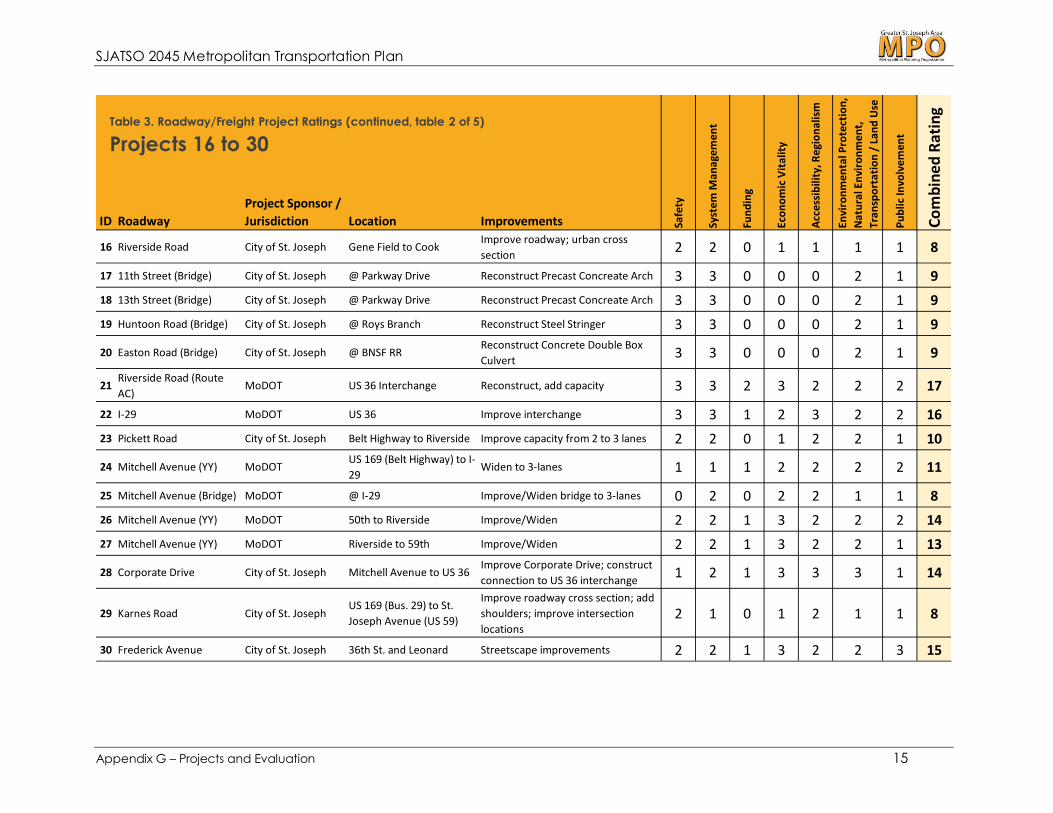
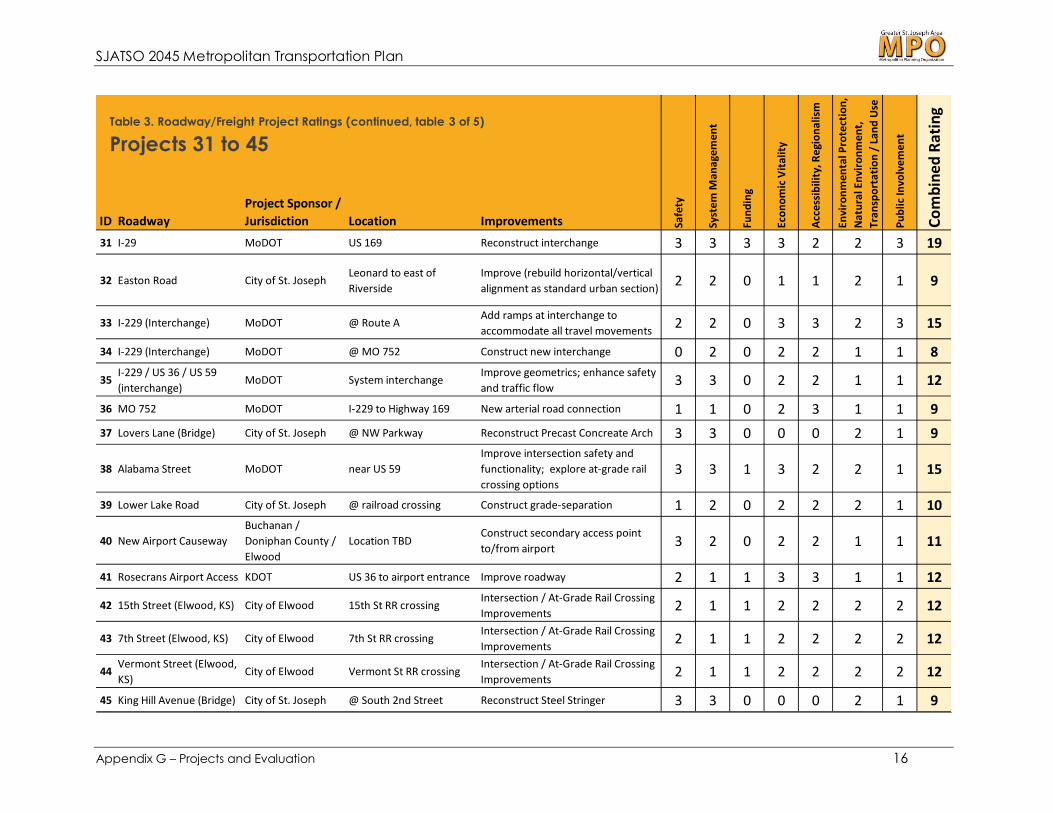
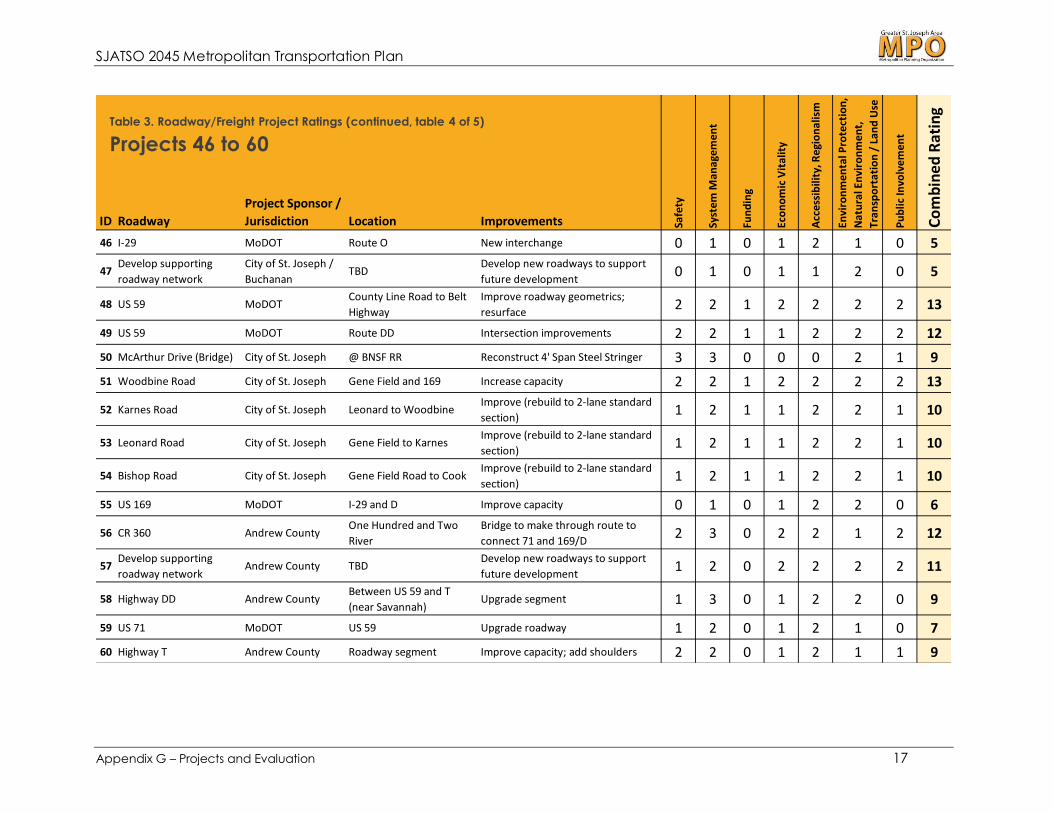
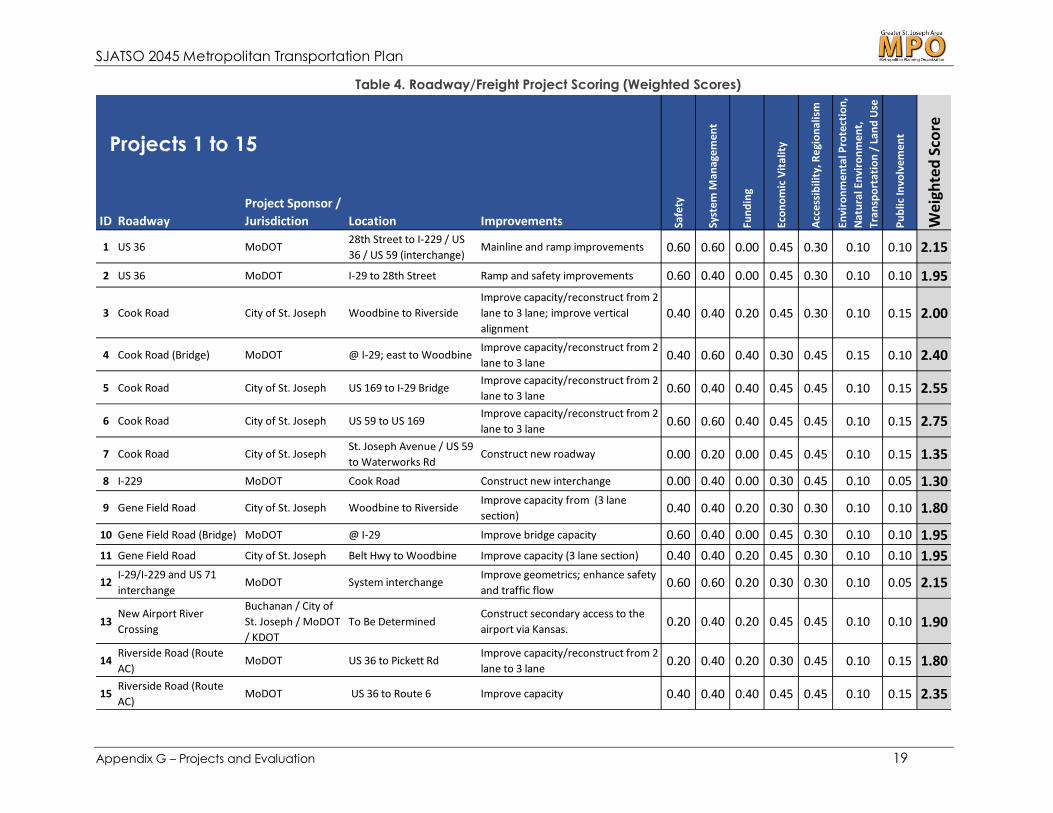
specific improvement. Table 3 (pages 14 to 18) summarizes the results of the project
ratings. Table 4 (pages 19 to 23) summarizes the results of the project scoring with the
weighted factors taken into consideration. Table 5 (page 24) summarizes the projects
that scored with 2.00 or greater and represent the projects that are first to be
considered in the cost feasible analysis (see Appendix H).
SJATSO 2045 Metropolitan Transportation Plan
Appendix G – Projects and Evaluation 13
Figure 7. Planned/Potential Projects

SJATSO 2045 Metropolitan Transportation Plan
Appendix G – Projects and Evaluation 14
ID Roadway
Project Sponsor /
Jurisdiction Location Improvements Safe
ty
Syst
em M
anag
emen
t
Fun
din
g
Eco
no
mic
Vit
alit
y
Acc
essi
bili
ty, R
egio
nal
ism
Envi
ron
men
tal P
rote
ctio
n,
Nat
ura
l En
viro
nm
ent,
Tra
nsp
ort
atio
n /
Lan
d U
se
Pu
blic
Invo
lvem
ent
Co
mb
ined
Rat
ing
1 US 36 MoDOT28th Street to I-229 / US
36 / US 59 (interchange)Mainline and ramp improvements 3 3 0 3 2 2 2 15
2 US 36 MoDOT I-29 to 28th Street Ramp and safety improvements 3 2 0 3 2 2 2 14
3 Cook Road City of St. Joseph Woodbine to Riverside
Improve capacity/reconstruct from 2
lane to 3 lane; improve vertical
alignment2 2 1 3 2 2 3 15
4 Cook Road (Bridge) MoDOT @ I-29; east to WoodbineImprove capacity/reconstruct from 2
lane to 3 lane2 3 2 2 3 3 2 17
5 Cook Road City of St. Joseph US 169 to I-29 BridgeImprove capacity/reconstruct from 2
lane to 3 lane3 2 2 3 3 2 3 18
6 Cook Road City of St. Joseph US 59 to US 169Improve capacity/reconstruct from 2
lane to 3 lane3 3 2 3 3 2 3 19
7 Cook Road City of St. JosephSt. Joseph Avenue / US 59
to Waterworks RdConstruct new roadway 0 1 0 3 3 2 3 12
8 I-229 MoDOT Cook Road Construct new interchange 0 2 0 2 3 2 1 10
9 Gene Field Road City of St. Joseph Woodbine to RiversideImprove capacity from (3 lane
section)2 2 1 2 2 2 2 13
10 Gene Field Road (Bridge) MoDOT @ I-29 Improve bridge capacity 3 2 0 3 2 2 2 14
11 Gene Field Road City of St. Joseph Belt Hwy to Woodbine Improve capacity (3 lane section) 2 2 1 3 2 2 2 14
12I-29/I-229 and US 71
interchangeMoDOT System interchange
Improve geometrics; enhance safety
and traffic flow3 3 1 2 2 2 1 14
13New Airport River
Crossing
Buchanan / City of
St. Joseph / MoDOT
/ KDOT
To Be DeterminedConstruct secondary access to the
airport via Kansas.1 2 1 3 3 2 2 14
14Riverside Road (Route
AC)MoDOT US 36 to Pickett Rd
Improve capacity/reconstruct from 2
lane to 3 lane1 2 1 2 3 2 3 14
15Riverside Road (Route
AC)MoDOT US 36 to Route 6 Improve capacity 2 2 2 3 3 2 3 17
Projects 1 to 15
Table 3. Roadway/Freight Project Ratings
SJATSO 2045 Metropolitan Transportation Plan
Appendix G – Projects and Evaluation 15
ID Roadway
Project Sponsor /
Jurisdiction Location Improvements Safe
ty
Syst
em
Man
age
me
nt
Fun
din
g
Eco
no
mic
Vit
alit
y
Acc
ess
ibili
ty, R
egi
on
alis
m
Envi
ron
me
nta
l Pro
tect
ion
,
Nat
ura
l En
viro
nm
en
t,
Tra
nsp
ort
atio
n /
Lan
d U
se
Pu
blic
Invo
lve
me
nt
Co
mb
ined
Rat
ing
16 Riverside Road City of St. Joseph Gene Field to CookImprove roadway; urban cross
section2 2 0 1 1 1 1 8
17 11th Street (Bridge) City of St. Joseph @ Parkway Drive Reconstruct Precast Concreate Arch 3 3 0 0 0 2 1 9
18 13th Street (Bridge) City of St. Joseph @ Parkway Drive Reconstruct Precast Concreate Arch 3 3 0 0 0 2 1 9
19 Huntoon Road (Bridge) City of St. Joseph @ Roys Branch Reconstruct Steel Stringer 3 3 0 0 0 2 1 9
20 Easton Road (Bridge) City of St. Joseph @ BNSF RRReconstruct Concrete Double Box
Culvert3 3 0 0 0 2 1 9
21Riverside Road (Route
AC)MoDOT US 36 Interchange Reconstruct, add capacity 3 3 2 3 2 2 2 17
22 I-29 MoDOT US 36 Improve interchange 3 3 1 2 3 2 2 16
23 Pickett Road City of St. Joseph Belt Highway to Riverside Improve capacity from 2 to 3 lanes 2 2 0 1 2 2 1 10
24 Mitchell Avenue (YY) MoDOTUS 169 (Belt Highway) to I-
29Widen to 3-lanes 1 1 1 2 2 2 2 11
25 Mitchell Avenue (Bridge) MoDOT @ I-29 Improve/Widen bridge to 3-lanes 0 2 0 2 2 1 1 8
26 Mitchell Avenue (YY) MoDOT 50th to Riverside Improve/Widen 2 2 1 3 2 2 2 14
27 Mitchell Avenue (YY) MoDOT Riverside to 59th Improve/Widen 2 2 1 3 2 2 1 13
28 Corporate Drive City of St. Joseph Mitchell Avenue to US 36Improve Corporate Drive; construct
connection to US 36 interchange1 2 1 3 3 3 1 14
29 Karnes Road City of St. JosephUS 169 (Bus. 29) to St.
Joseph Avenue (US 59)
Improve roadway cross section; add
shoulders; improve intersection
locations2 1 0 1 2 1 1 8
30 Frederick Avenue City of St. Joseph 36th St. and Leonard Streetscape improvements 2 2 1 3 2 2 3 15
Table 3. Roadway/Freight Project Ratings (continued, table 2 of 5)
Projects 16 to 30
SJATSO 2045 Metropolitan Transportation Plan
Appendix G – Projects and Evaluation 16
ID Roadway
Project Sponsor /
Jurisdiction Location Improvements Safe
ty
Syst
em
Man
age
me
nt
Fun
din
g
Eco
no
mic
Vit
alit
y
Acc
ess
ibili
ty, R
egi
on
alis
m
Envi
ron
me
nta
l Pro
tect
ion
,
Nat
ura
l En
viro
nm
en
t,
Tra
nsp
ort
atio
n /
Lan
d U
se
Pu
blic
Invo
lve
me
nt
Co
mb
ined
Rat
ing
31 I-29 MoDOT US 169 Reconstruct interchange 3 3 3 3 2 2 3 19
32 Easton Road City of St. JosephLeonard to east of
Riverside
Improve (rebuild horizontal/vertical
alignment as standard urban section)2 2 0 1 1 2 1 9
33 I-229 (Interchange) MoDOT @ Route AAdd ramps at interchange to
accommodate all travel movements2 2 0 3 3 2 3 15
34 I-229 (Interchange) MoDOT @ MO 752 Construct new interchange 0 2 0 2 2 1 1 8
35I-229 / US 36 / US 59
(interchange)MoDOT System interchange
Improve geometrics; enhance safety
and traffic flow3 3 0 2 2 1 1 12
36 MO 752 MoDOT I-229 to Highway 169 New arterial road connection 1 1 0 2 3 1 1 9
37 Lovers Lane (Bridge) City of St. Joseph @ NW Parkway Reconstruct Precast Concreate Arch 3 3 0 0 0 2 1 9
38 Alabama Street MoDOT near US 59
Improve intersection safety and
functionality; explore at-grade rail
crossing options3 3 1 3 2 2 1 15
39 Lower Lake Road City of St. Joseph @ railroad crossing Construct grade-separation 1 2 0 2 2 2 1 10
40 New Airport Causeway
Buchanan /
Doniphan County /
Elwood
Location TBDConstruct secondary access point
to/from airport3 2 0 2 2 1 1 11
41 Rosecrans Airport Access KDOT US 36 to airport entrance Improve roadway 2 1 1 3 3 1 1 12
42 15th Street (Elwood, KS) City of Elwood 15th St RR crossingIntersection / At-Grade Rail Crossing
Improvements2 1 1 2 2 2 2 12
43 7th Street (Elwood, KS) City of Elwood 7th St RR crossingIntersection / At-Grade Rail Crossing
Improvements2 1 1 2 2 2 2 12
44Vermont Street (Elwood,
KS)City of Elwood Vermont St RR crossing
Intersection / At-Grade Rail Crossing
Improvements2 1 1 2 2 2 2 12
45 King Hill Avenue (Bridge) City of St. Joseph @ South 2nd Street Reconstruct Steel Stringer 3 3 0 0 0 2 1 9
Table 3. Roadway/Freight Project Ratings (continued, table 3 of 5)
Projects 31 to 45
SJATSO 2045 Metropolitan Transportation Plan
Appendix G – Projects and Evaluation 17
ID Roadway
Project Sponsor /
Jurisdiction Location Improvements Safe
ty
Syst
em M
anag
emen
t
Fun
din
g
Eco
no
mic
Vit
alit
y
Acc
essi
bili
ty, R
egio
nal
ism
Envi
ron
men
tal P
rote
ctio
n,
Nat
ura
l En
viro
nm
ent,
Tra
nsp
ort
atio
n /
Lan
d U
se
Pu
blic
Invo
lvem
ent
Co
mb
ined
Rat
ing
46 I-29 MoDOT Route O New interchange 0 1 0 1 2 1 0 5
47Develop supporting
roadway network
City of St. Joseph /
BuchananTBD
Develop new roadways to support
future development0 1 0 1 1 2 0 5
48 US 59 MoDOTCounty Line Road to Belt
Highway
Improve roadway geometrics;
resurface2 2 1 2 2 2 2 13
49 US 59 MoDOT Route DD Intersection improvements 2 2 1 1 2 2 2 12
50 McArthur Drive (Bridge) City of St. Joseph @ BNSF RR Reconstruct 4' Span Steel Stringer 3 3 0 0 0 2 1 9
51 Woodbine Road City of St. Joseph Gene Field and 169 Increase capacity 2 2 1 2 2 2 2 13
52 Karnes Road City of St. Joseph Leonard to WoodbineImprove (rebuild to 2-lane standard
section)1 2 1 1 2 2 1 10
53 Leonard Road City of St. Joseph Gene Field to KarnesImprove (rebuild to 2-lane standard
section)1 2 1 1 2 2 1 10
54 Bishop Road City of St. Joseph Gene Field Road to CookImprove (rebuild to 2-lane standard
section)1 2 1 1 2 2 1 10
55 US 169 MoDOT I-29 and D Improve capacity 0 1 0 1 2 2 0 6
56 CR 360 Andrew CountyOne Hundred and Two
River
Bridge to make through route to
connect 71 and 169/D2 3 0 2 2 1 2 12
57Develop supporting
roadway networkAndrew County TBD
Develop new roadways to support
future development1 2 0 2 2 2 2 11
58 Highway DD Andrew CountyBetween US 59 and T
(near Savannah)Upgrade segment 1 3 0 1 2 2 0 9
59 US 71 MoDOT US 59 Upgrade roadway 1 2 0 1 2 1 0 7
60 Highway T Andrew County Roadway segment Improve capacity; add shoulders 2 2 0 1 2 1 1 9
Table 3. Roadway/Freight Project Ratings (continued, table 4 of 5)
Projects 46 to 60

SJATSO 2045 Metropolitan Transportation Plan
Appendix G – Projects and Evaluation 18
ID Roadway
Project Sponsor /
Jurisdiction Location Improvements Safe
ty
Syst
em
Man
age
me
nt
Fun
din
g
Eco
no
mic
Vit
alit
y
Acc
ess
ibili
ty, R
egi
on
alis
m
Envi
ron
me
nta
l Pro
tect
ion
,
Nat
ura
l En
viro
nm
en
t,
Tra
nsp
ort
atio
n /
Lan
d U
se
Pu
blic
Invo
lve
me
nt
Co
mb
ined
Rat
ing
61 Route T / (CR 428) Andrew County CR 424 and CR 427 Extend roadway 0 1 0 1 2 2 1 7
62 E. Swenson Drive Savannah 7th Street to Route T Extend Roadway 2 2 1 2 2 2 1 12
63 Duncan Dr City of Savannah North side of Savannah Extend to connect west 2 2 1 1 2 2 2 12
64 Business 71 (Savannah) MoDOT 5th, 7th, and 10th Streets Add turning lanes, sidewalks 2 2 1 2 2 2 2 13
65 Business 71 (Savannah) MoDOTNorth from approximately
Market Street to Route E
Extend existing four-lane section;
include non-motorized facilities in
design and construction2 2 1 2 2 2 1 12
66 Highway C Andrew County Roadway segment Improve capacity, resurface & install
shoulders2 2 1 1 2 2 1 11
67 CR 366 Andrew County Business 71Connect segment between DD and
Business 711 1 0 3 2 2 2 11
68 CR 366 Andrew CountyBusiness 71 east to Route
332 Extend CR 366 eastward to connect 1 2 1 1 2 2 2 11
69 I-29 MoDOT Route DDConstruct new interchange to
accommodate future development0 0 0 1 2 1 0 4
70 US 169 MoDOT Cook Road to I-29Improve (increase capacity from 2 to
4 lanes) and modify interchange2 2 1 2 3 2 2 14
71 22nd Street (Bridge) City of St. Joseph @ Corby ParkwayReconstruct Prestressed Concreate
Arch3 3 0 0 0 2 1 9
72 US 169 MoDOT I-29 to Route FFIncrease capacity; 4-lane section
with access management3 2 1 2 2 2 1 13
73 US 169 MoDOTRoute FF to MPO
boundary
Improve roadway cross section; add
turn-lanes1 2 0 1 2 1 0 7
74 I-229 (Elevated Segment) MoDOT 4th Street to US 59 Implement recommendations from I-
229 Corridor Study2 3 3 3 3 2 3 19
75 6th Avenue (Bridge) City of St. Joseph @ King Hill Avenue Reconstruct Concreate Stringer 3 3 0 0 0 2 1 9
76 5th Avenue (Bridge) City of St. Joseph @ just west of 12th Reconstruct Reinforced Box Culvert 3 3 0 0 0 2 1 9
Table 3. Roadway/Freight Project Ratings (continued, table 5 of 5)
Projects 61 to 76
SJATSO 2045 Metropolitan Transportation Plan
Appendix G – Projects and Evaluation 19
ID Roadway
Project Sponsor /
Jurisdiction Location Improvements Safe
ty
Syst
em M
anag
emen
t
Fun
din
g
Eco
no
mic
Vit
alit
y
Acc
essi
bili
ty, R
egio
nal
ism
Envi
ron
men
tal P
rote
ctio
n,
Nat
ura
l En
viro
nm
ent,
Tra
nsp
ort
atio
n /
Lan
d U
se
Pu
blic
Invo
lvem
ent
Wei
ghte
d S
core
1 US 36 MoDOT28th Street to I-229 / US
36 / US 59 (interchange)Mainline and ramp improvements 0.60 0.60 0.00 0.45 0.30 0.10 0.10 2.15
2 US 36 MoDOT I-29 to 28th Street Ramp and safety improvements 0.60 0.40 0.00 0.45 0.30 0.10 0.10 1.95
3 Cook Road City of St. Joseph Woodbine to Riverside
Improve capacity/reconstruct from 2
lane to 3 lane; improve vertical
alignment
0.40 0.40 0.20 0.45 0.30 0.10 0.15 2.00
4 Cook Road (Bridge) MoDOT @ I-29; east to WoodbineImprove capacity/reconstruct from 2
lane to 3 lane0.40 0.60 0.40 0.30 0.45 0.15 0.10 2.40
5 Cook Road City of St. Joseph US 169 to I-29 BridgeImprove capacity/reconstruct from 2
lane to 3 lane0.60 0.40 0.40 0.45 0.45 0.10 0.15 2.55
6 Cook Road City of St. Joseph US 59 to US 169Improve capacity/reconstruct from 2
lane to 3 lane0.60 0.60 0.40 0.45 0.45 0.10 0.15 2.75
7 Cook Road City of St. JosephSt. Joseph Avenue / US 59
to Waterworks RdConstruct new roadway 0.00 0.20 0.00 0.45 0.45 0.10 0.15 1.35
8 I-229 MoDOT Cook Road Construct new interchange 0.00 0.40 0.00 0.30 0.45 0.10 0.05 1.30
9 Gene Field Road City of St. Joseph Woodbine to RiversideImprove capacity from (3 lane
section)0.40 0.40 0.20 0.30 0.30 0.10 0.10 1.80
10 Gene Field Road (Bridge) MoDOT @ I-29 Improve bridge capacity 0.60 0.40 0.00 0.45 0.30 0.10 0.10 1.95
11 Gene Field Road City of St. Joseph Belt Hwy to Woodbine Improve capacity (3 lane section) 0.40 0.40 0.20 0.45 0.30 0.10 0.10 1.95
12I-29/I-229 and US 71
interchangeMoDOT System interchange
Improve geometrics; enhance safety
and traffic flow0.60 0.60 0.20 0.30 0.30 0.10 0.05 2.15
13New Airport River
Crossing
Buchanan / City of
St. Joseph / MoDOT
/ KDOT
To Be DeterminedConstruct secondary access to the
airport via Kansas.0.20 0.40 0.20 0.45 0.45 0.10 0.10 1.90
14Riverside Road (Route
AC)MoDOT US 36 to Pickett Rd
Improve capacity/reconstruct from 2
lane to 3 lane0.20 0.40 0.20 0.30 0.45 0.10 0.15 1.80
15Riverside Road (Route
AC)MoDOT US 36 to Route 6 Improve capacity 0.40 0.40 0.40 0.45 0.45 0.10 0.15 2.35
Projects 1 to 15
Table 4. Roadway/Freight Project Scoring (Weighted Scores)
SJATSO 2045 Metropolitan Transportation Plan
Appendix G – Projects and Evaluation 20
ID Roadway
Project Sponsor /
Jurisdiction Location Improvements Safe
ty
Syst
em
Man
age
me
nt
Fun
din
g
Eco
no
mic
Vit
alit
y
Acc
ess
ibili
ty, R
egi
on
alis
m
Envi
ron
me
nta
l Pro
tect
ion
,
Nat
ura
l En
viro
nm
en
t,
Tra
nsp
ort
atio
n /
Lan
d U
se
Pu
blic
Invo
lve
me
nt
Wei
ghte
d S
core
16 Riverside Road City of St. Joseph Gene Field to CookImprove roadway; urban cross
section0.40 0.40 0.00 0.15 0.15 0.05 0.05 1.20
17 11th Street (Bridge) City of St. Joseph @ Parkway Drive Reconstruct Precast Concreate Arch 0.60 0.60 0.00 0.00 0.00 0.10 0.05 1.35
18 13th Street (Bridge) City of St. Joseph @ Parkway Drive Reconstruct Precast Concreate Arch 0.60 0.60 0.00 0.00 0.00 0.10 0.05 1.35
19 Huntoon Road (Bridge) City of St. Joseph @ Roys Branch Reconstruct Steel Stringer 0.60 0.60 0.00 0.00 0.00 0.10 0.05 1.35
20 Easton Road (Bridge) City of St. Joseph @ BNSF RRReconstruct Concrete Double Box
Culvert0.60 0.60 0.00 0.00 0.00 0.10 0.05 1.35
21Riverside Road (Route
AC)MoDOT US 36 Interchange Reconstruct, add capacity 0.60 0.60 0.40 0.45 0.30 0.10 0.10 2.55
22 I-29 MoDOT US 36 Improve interchange 0.60 0.60 0.20 0.30 0.45 0.10 0.10 2.35
23 Pickett Road City of St. Joseph Belt Highway to Riverside Improve capacity from 2 to 3 lanes 0.40 0.40 0.00 0.15 0.30 0.10 0.05 1.40
24 Mitchell Avenue (YY) MoDOTUS 169 (Belt Highway) to I-
29Widen to 3-lanes 0.20 0.20 0.20 0.30 0.30 0.10 0.10 1.40
25 Mitchell Avenue (Bridge) MoDOT @ I-29 Improve/Widen bridge to 3-lanes 0.00 0.40 0.00 0.30 0.30 0.05 0.05 1.10
26 Mitchell Avenue (YY) MoDOT 50th to Riverside Improve/Widen 0.40 0.40 0.20 0.45 0.30 0.10 0.10 1.95
27 Mitchell Avenue (YY) MoDOT Riverside to 59th Improve/Widen 0.40 0.40 0.20 0.45 0.30 0.10 0.05 1.90
28 Corporate Drive City of St. Joseph Mitchell Avenue to US 36Improve Corporate Drive; construct
connection to US 36 interchange0.20 0.40 0.20 0.45 0.45 0.15 0.05 1.90
29 Karnes Road City of St. JosephUS 169 (Bus. 29) to St.
Joseph Avenue (US 59)
Improve roadway cross section; add
shoulders; improve intersection
locations
0.40 0.20 0.00 0.15 0.30 0.05 0.05 1.15
30 Frederick Avenue City of St. Joseph 36th St. and Leonard Streetscape improvements 0.40 0.40 0.20 0.45 0.30 0.10 0.15 2.00
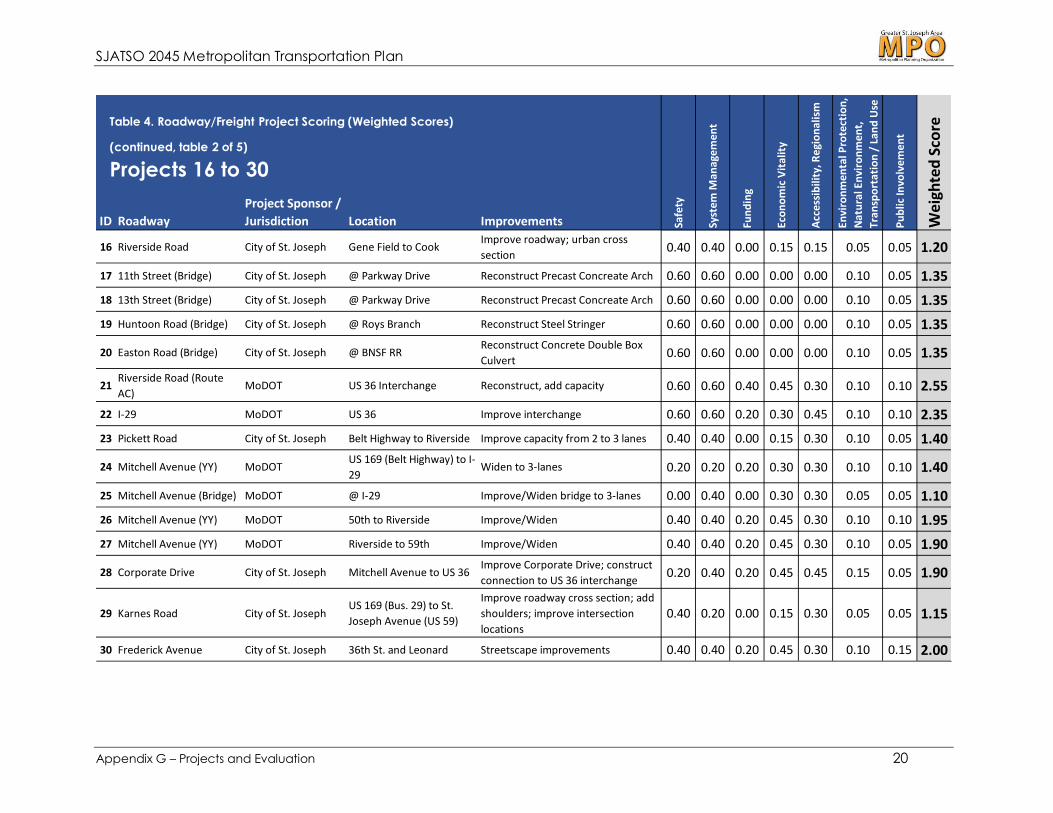
Table 4. Roadway/Freight Project Scoring (Weighted Scores)
(continued, table 2 of 5)
Projects 16 to 30

SJATSO 2045 Metropolitan Transportation Plan
Appendix G – Projects and Evaluation 21
ID Roadway
Project Sponsor /
Jurisdiction Location Improvements Safe
ty
Syst
em
Man
age
me
nt
Fun
din
g
Eco
no
mic
Vit
alit
y
Acc
ess
ibili
ty, R
egi
on
alis
m
Envi
ron
me
nta
l Pro
tect
ion
,
Nat
ura
l En
viro
nm
en
t,
Tra
nsp
ort
atio
n /
Lan
d U
se
Pu
blic
Invo
lve
me
nt
Wei
ghte
d S
core
31 I-29 MoDOT US 169 Reconstruct interchange 0.60 0.60 0.60 0.45 0.30 0.10 0.15 2.80
32 Easton Road City of St. JosephLeonard to east of
Riverside
Improve (rebuild horizontal/vertical
alignment as standard urban section)0.40 0.40 0.00 0.15 0.15 0.10 0.05 1.25
33 I-229 (Interchange) MoDOT @ Route AAdd ramps at interchange to
accommodate all travel movements0.40 0.40 0.00 0.45 0.45 0.10 0.15 1.95
34 I-229 (Interchange) MoDOT @ MO 752 Construct new interchange 0.00 0.40 0.00 0.30 0.30 0.05 0.05 1.10
35I-229 / US 36 / US 59
(interchange)MoDOT System interchange
Improve geometrics; enhance safety
and traffic flow0.60 0.60 0.00 0.30 0.30 0.05 0.05 1.90
36 MO 752 MoDOT I-229 to Highway 169 New arterial road connection 0.20 0.20 0.00 0.30 0.45 0.05 0.05 1.25
37 Lovers Lane (Bridge) City of St. Joseph @ NW Parkway Reconstruct Precast Concreate Arch 0.60 0.60 0.00 0.00 0.00 0.10 0.05 1.35
38 Alabama Street MoDOT near US 59
Improve intersection safety and
functionality; explore at-grade rail
crossing options
0.60 0.60 0.20 0.45 0.30 0.10 0.05 2.30
39 Lower Lake Road City of St. Joseph @ railroad crossing Construct grade-separation 0.20 0.40 0.00 0.30 0.30 0.10 0.05 1.35
40 New Airport Causeway
Buchanan /
Doniphan County /
Elwood
Location TBDConstruct secondary access point
to/from airport0.60 0.40 0.00 0.30 0.30 0.05 0.05 1.70
41 Rosecrans Airport Access KDOT US 36 to airport entrance Improve roadway 0.40 0.20 0.20 0.45 0.45 0.05 0.05 1.80
42 15th Street (Elwood, KS) City of Elwood 15th St RR crossingIntersection / At-Grade Rail Crossing
Improvements0.40 0.20 0.20 0.30 0.30 0.10 0.10 1.60
43 7th Street (Elwood, KS) City of Elwood 7th St RR crossingIntersection / At-Grade Rail Crossing
Improvements0.40 0.20 0.20 0.30 0.30 0.10 0.10 1.60
44Vermont Street (Elwood,
KS)City of Elwood Vermont St RR crossing
Intersection / At-Grade Rail Crossing
Improvements0.40 0.20 0.20 0.30 0.30 0.10 0.10 1.60
45 King Hill Avenue (Bridge) City of St. Joseph @ South 2nd Street Reconstruct Steel Stringer 0.60 0.60 0.00 0.00 0.00 0.10 0.05 1.35
Table 4. Roadway/Freight Project Scoring (Weighted Scores)
(continued, table 3 of 5)
Projects 31 to 45

SJATSO 2045 Metropolitan Transportation Plan
Appendix G – Projects and Evaluation 22
ID Roadway
Project Sponsor /
Jurisdiction Location Improvements Safe
ty
Syst
em M
anag
emen
t
Fun
din
g
Eco
no
mic
Vit
alit
y
Acc
essi
bili
ty, R
egio
nal
ism
Envi
ron
men
tal P
rote
ctio
n,
Nat
ura
l En
viro
nm
ent,
Tra
nsp
ort
atio
n /
Lan
d U
se
Pu
blic
Invo
lvem
ent
Wei
ghte
d S
core
46 I-29 MoDOT Route O New interchange 0.00 0.20 0.00 0.15 0.30 0.05 0.00 0.70
47Develop supporting
roadway network
City of St. Joseph /
BuchananTBD
Develop new roadways to support
future development0.00 0.20 0.00 0.15 0.15 0.10 0.00 0.60
48 US 59 MoDOTCounty Line Road to Belt
Highway
Improve roadway geometrics;
resurface0.40 0.40 0.20 0.30 0.30 0.10 0.10 1.80
49 US 59 MoDOT Route DD Intersection improvements 0.40 0.40 0.20 0.15 0.30 0.10 0.10 1.65
50 McArthur Drive (Bridge) City of St. Joseph @ BNSF RR Reconstruct 4' Span Steel Stringer 0.60 0.60 0.00 0.00 0.00 0.10 0.05 1.35
51 Woodbine Road City of St. Joseph Gene Field and 169 Increase capacity 0.40 0.40 0.20 0.30 0.30 0.10 0.10 1.80
52 Karnes Road City of St. Joseph Leonard to WoodbineImprove (rebuild to 2-lane standard
section)0.20 0.40 0.20 0.15 0.30 0.10 0.05 1.40
53 Leonard Road City of St. Joseph Gene Field to KarnesImprove (rebuild to 2-lane standard
section)0.20 0.40 0.20 0.15 0.30 0.10 0.05 1.40
54 Bishop Road City of St. Joseph Gene Field Road to CookImprove (rebuild to 2-lane standard
section)0.20 0.40 0.20 0.15 0.30 0.10 0.05 1.40
55 US 169 MoDOT I-29 and D Improve capacity 0.00 0.20 0.00 0.15 0.30 0.10 0.00 0.75
56 CR 360 Andrew CountyOne Hundred and Two
River
Bridge to make through route to
connect 71 and 169/D0.40 0.60 0.00 0.30 0.30 0.05 0.10 1.75
57Develop supporting
roadway networkAndrew County TBD
Develop new roadways to support
future development0.20 0.40 0.00 0.30 0.30 0.10 0.10 1.40
58 Highway DD Andrew CountyBetween US 59 and T
(near Savannah)Upgrade segment 0.20 0.60 0.00 0.15 0.30 0.10 0.00 1.35
59 US 71 MoDOT US 59 Upgrade roadway 0.20 0.40 0.00 0.15 0.30 0.05 0.00 1.10
60 Highway T Andrew County Roadway segment Improve capacity; add shoulders 0.40 0.40 0.00 0.15 0.30 0.05 0.05 1.35
Table 4. Roadway/Freight Project Scoring (Weighted Scores)
(continued, table 4 of 5)
Projects 46 to 60
SJATSO 2045 Metropolitan Transportation Plan
Appendix G – Projects and Evaluation 23
ID Roadway
Project Sponsor /
Jurisdiction Location Improvements Safe
ty
Syst
em
Man
age
me
nt
Fun
din
g
Eco
no
mic
Vit
alit
y
Acc
ess
ibili
ty, R
egi
on
alis
m
Envi
ron
me
nta
l Pro
tect
ion
,
Nat
ura
l En
viro
nm
en
t,
Tra
nsp
ort
atio
n /
Lan
d U
se
Pu
blic
Invo
lve
me
nt
Wei
ghte
d S
core
61 Route T / (CR 428) Andrew County CR 424 and CR 427 Extend roadway 0.00 0.20 0.00 0.15 0.30 0.10 0.05 0.80
62 E. Swenson Drive Savannah 7th Street to Route T Extend Roadway 0.40 0.40 0.20 0.30 0.30 0.10 0.05 1.75
63 Duncan Dr City of Savannah North side of Savannah Extend to connect west 0.40 0.40 0.20 0.15 0.30 0.10 0.10 1.65
64 Business 71 (Savannah) MoDOT 5th, 7th, and 10th Streets Add turning lanes, sidewalks 0.40 0.40 0.20 0.30 0.30 0.10 0.10 1.80
65 Business 71 (Savannah) MoDOTNorth from approximately
Market Street to Route E
Extend existing four-lane section;
include non-motorized facilities in
design and construction
0.40 0.40 0.20 0.30 0.30 0.10 0.05 1.75
66 Highway C Andrew County Roadway segment Improve capacity, resurface & install
shoulders0.40 0.40 0.20 0.15 0.30 0.10 0.05 1.60
67 CR 366 Andrew County Business 71Connect segment between DD and
Business 710.20 0.20 0.00 0.45 0.30 0.10 0.10 1.35
68 CR 366 Andrew CountyBusiness 71 east to Route
332 Extend CR 366 eastward to connect 0.20 0.40 0.20 0.15 0.30 0.10 0.10 1.45
69 I-29 MoDOT Route DDConstruct new interchange to
accommodate future development0.00 0.00 0.00 0.15 0.30 0.05 0.00 0.50
70 US 169 MoDOT Cook Road to I-29Improve (increase capacity from 2 to
4 lanes) and modify interchange0.40 0.40 0.20 0.30 0.45 0.10 0.10 1.95
71 22nd Street (Bridge) City of St. Joseph @ Corby ParkwayReconstruct Prestressed Concreate
Arch0.60 0.60 0.00 0.00 0.00 0.10 0.05 1.35
72 US 169 MoDOT I-29 to Route FFIncrease capacity; 4-lane section
with access management0.60 0.40 0.20 0.30 0.30 0.10 0.05 1.95
73 US 169 MoDOTRoute FF to MPO
boundary
Improve roadway cross section; add
turn-lanes0.20 0.40 0.00 0.15 0.30 0.05 0.00 1.10
74 I-229 (Elevated Segment) MoDOT 4th Street to US 59 Implement recommendations from I-
229 Corridor Study0.40 0.60 0.60 0.45 0.45 0.10 0.15 2.75
75 6th Avenue (Bridge) City of St. Joseph @ King Hill Avenue Reconstruct Concreate Stringer 0.60 0.60 0.00 0.00 0.00 0.10 0.05 1.35
76 5th Avenue (Bridge) City of St. Joseph @ just west of 12th Reconstruct Reinforced Box Culvert 0.60 0.60 0.00 0.00 0.00 0.10 0.05 1.35
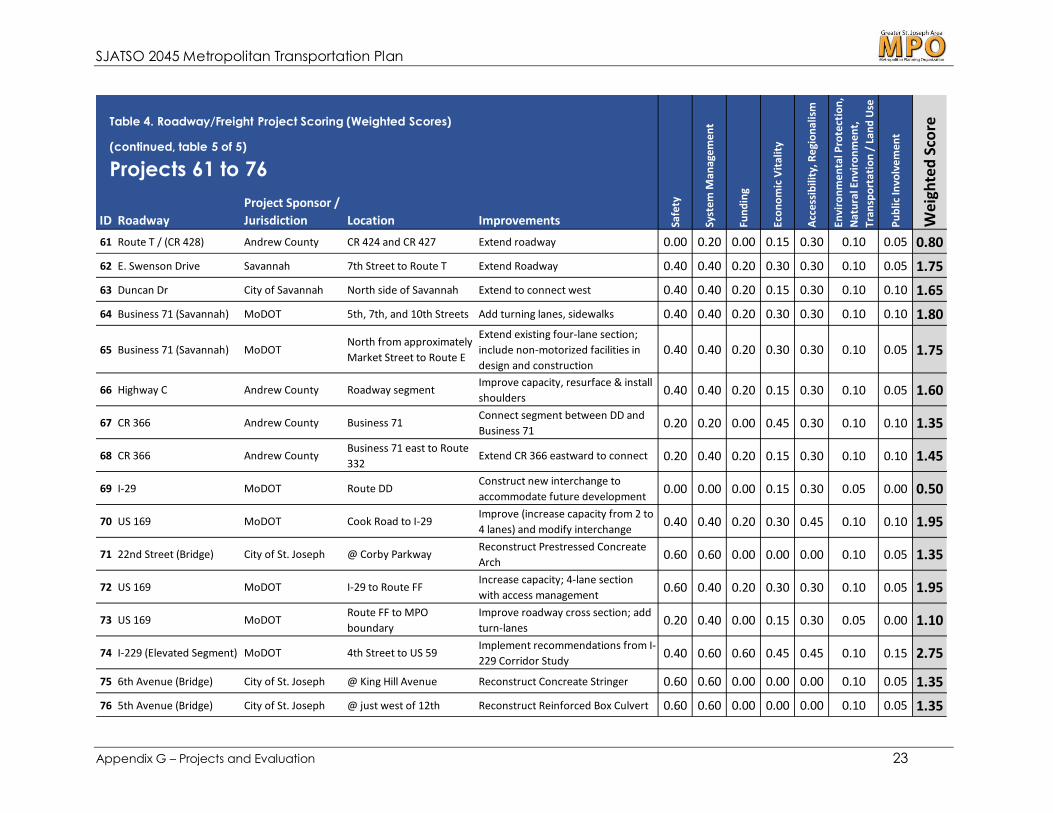
Table 4. Roadway/Freight Project Scoring (Weighted Scores)
(continued, table 5 of 5)
Projects 61 to 76
SJATSO 2045 Metropolitan Transportation Plan
Appendix G – Projects and Evaluation 24
Table 5. Project Scoring Results (Project Scoring 2.00 or Greater)
SJATSO 2045 Metropolitan Transportation Plan
Appendix G – Projects and Evaluation 25
Travel Demand Modeling The travel demand model is one tool used to evaluate potential roadway/freight
improvements. The model uses future year socioeconomic data for the year 2045 as
described in Appendix D. For the purpose of the 2045 MTP update, the 2040
socioeconomic data was used (with no changes except network refinement). SJATSO
plans to update the travel model as part of the next MTP update, at which time 2020
U.S. Census data should be available to also update base year socioeconomic data.
For the most part, the travel demand model is used to evaluate the impact of more
significant regional roadway investments. For the 2045 MTP update, three projects were
evaluated:
• Cook Road improvement/extension
• New Missouri River crossing
• Removal of the I-229 elevated structure (tested in conjunction with the two previous
scenarios)
These scenarios are also compared to a 2045 base year model run. The following
summarizes the modeling process and results. These results help inform the project
evaluation process, which was summarized earlier in this appendix.
Defining Roadway Capacity Roadway capacity is generally determined by the amount of traffic that a roadway
segment can accommodate, its functional classification, and the number of lanes
(through-lanes and turn-lanes). The Highway Capacity Manual (HCM) defines the
capacity of a road segment as:
“… the maximum hourly rate of flow at which persons or vehicles can
reasonably be expected to traverse a point or uniform segment of a lane or
roadway during a specific time period under prevailing roadway, traffic and
control conditions.”
Factors such as access control (or lack thereof) and on-street parking impact roadway
capacity but are generally not major factors in analyzing daily capacity—or level of
service (LOS)—at the regional level. LOS is a qualitative analysis that compares the
vehicle flow of traffic on a roadway with the capacity of the roadway. The resulting ratio,
referred to as the volume-to-capacity (V/C) ratio, is used to classify the LOS from “A” to
“F”, or from free-flow traffic operations to heavy congestion. General LOS definitions are
displayed in Figure 8.
SJATSO 2045 Metropolitan Transportation Plan
Appendix G – Projects and Evaluation 26
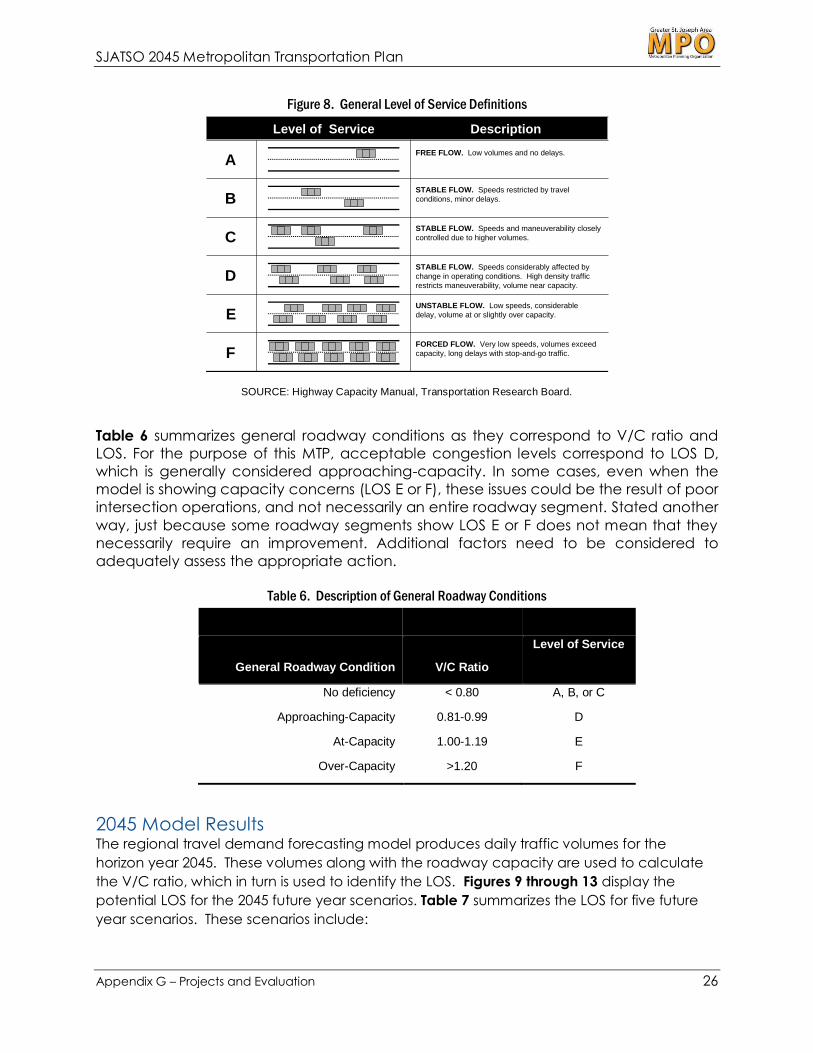
Figure 8. General Level of Service Definitions
SOURCE: Highway Capacity Manual, Transportation Research Board.
Table 6 summarizes general roadway conditions as they correspond to V/C ratio and
LOS. For the purpose of this MTP, acceptable congestion levels correspond to LOS D,
which is generally considered approaching-capacity. In some cases, even when the
model is showing capacity concerns (LOS E or F), these issues could be the result of poor
intersection operations, and not necessarily an entire roadway segment. Stated another
way, just because some roadway segments show LOS E or F does not mean that they
necessarily require an improvement. Additional factors need to be considered to
adequately assess the appropriate action.
Table 6. Description of General Roadway Conditions
General Roadway Condition
V/C Ratio
Level of Service
No deficiency < 0.80 A, B, or C
Approaching-Capacity 0.81-0.99 D
At-Capacity 1.00-1.19 E
Over-Capacity >1.20 F
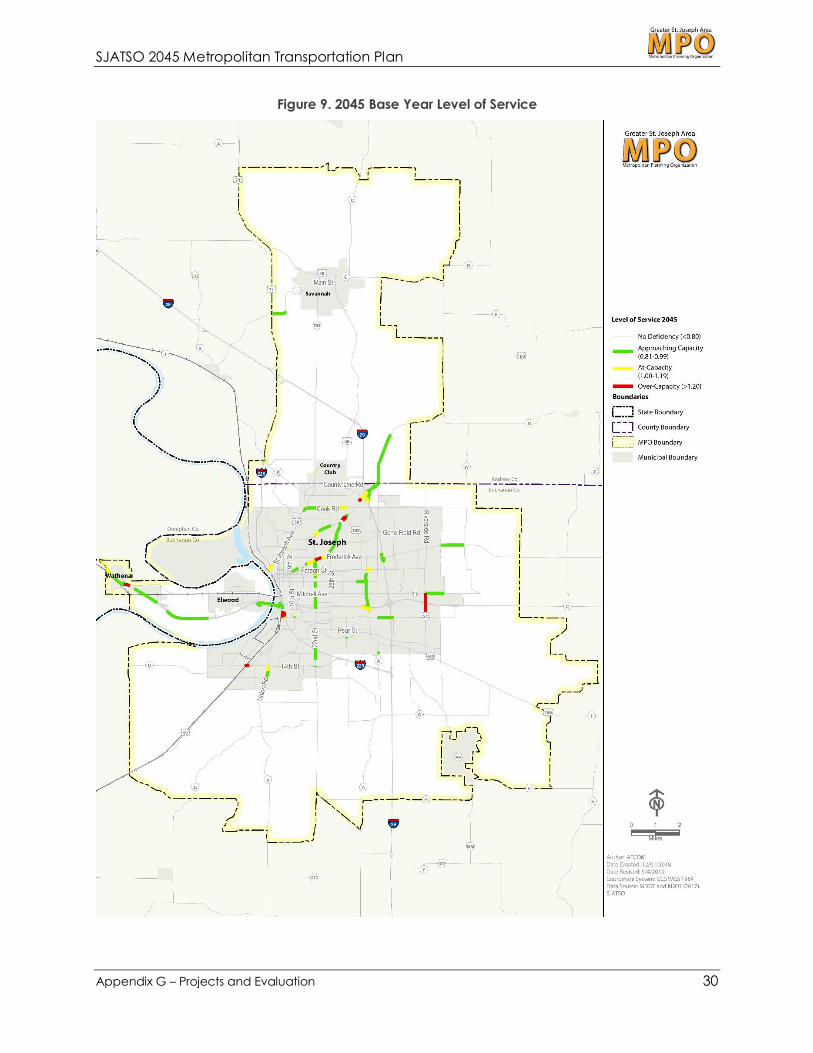
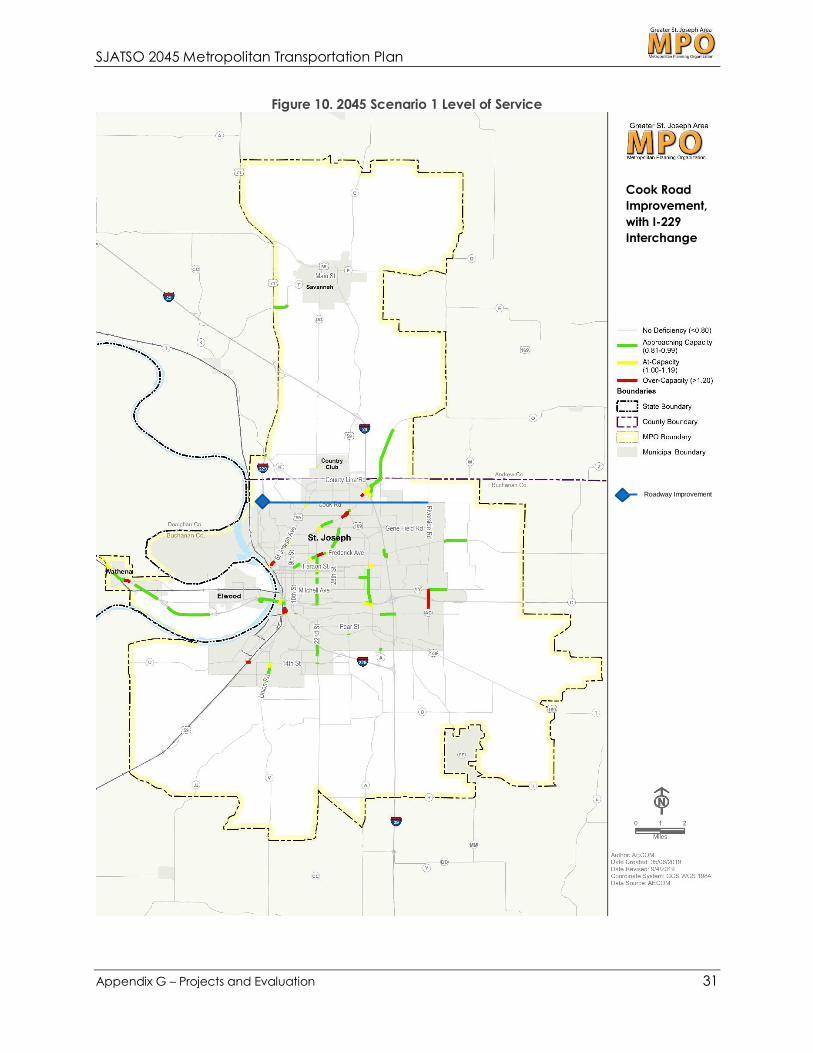
2045 Model Results The regional travel demand forecasting model produces daily traffic volumes for the
horizon year 2045. These volumes along with the roadway capacity are used to calculate
the V/C ratio, which in turn is used to identify the LOS. Figures 9 through 13 display the
potential LOS for the 2045 future year scenarios. Table 7 summarizes the LOS for five future
year scenarios. These scenarios include:
A
B
C
D
E
FREE FLOW. Low volumes and no delays.
Level of Service Description
STABLE FLOW. Speeds restricted by travel
conditions, minor delays.
STABLE FLOW. Speeds and maneuverability closely
controlled due to higher volumes.
STABLE FLOW. Speeds considerably affected by
change in operating conditions. High density traffic
restricts maneuverability, volume near capacity.
UNSTABLE FLOW. Low speeds, considerable
delay, volume at or slightly over capacity.
FORCED FLOW. Very low speeds, volumes exceed
capacity, long delays with stop-and-go traffic.F
Level of Service Description
SJATSO 2045 Metropolitan Transportation Plan
Appendix G – Projects and Evaluation 27
• 2045 Base Year Scenario – existing network with 2045 socioeconomic data.
• 2045 Improvement Scenario 1 – Improved Cook Road connection, with next
roadway connecting west to tie in at a new I-229 interchange.
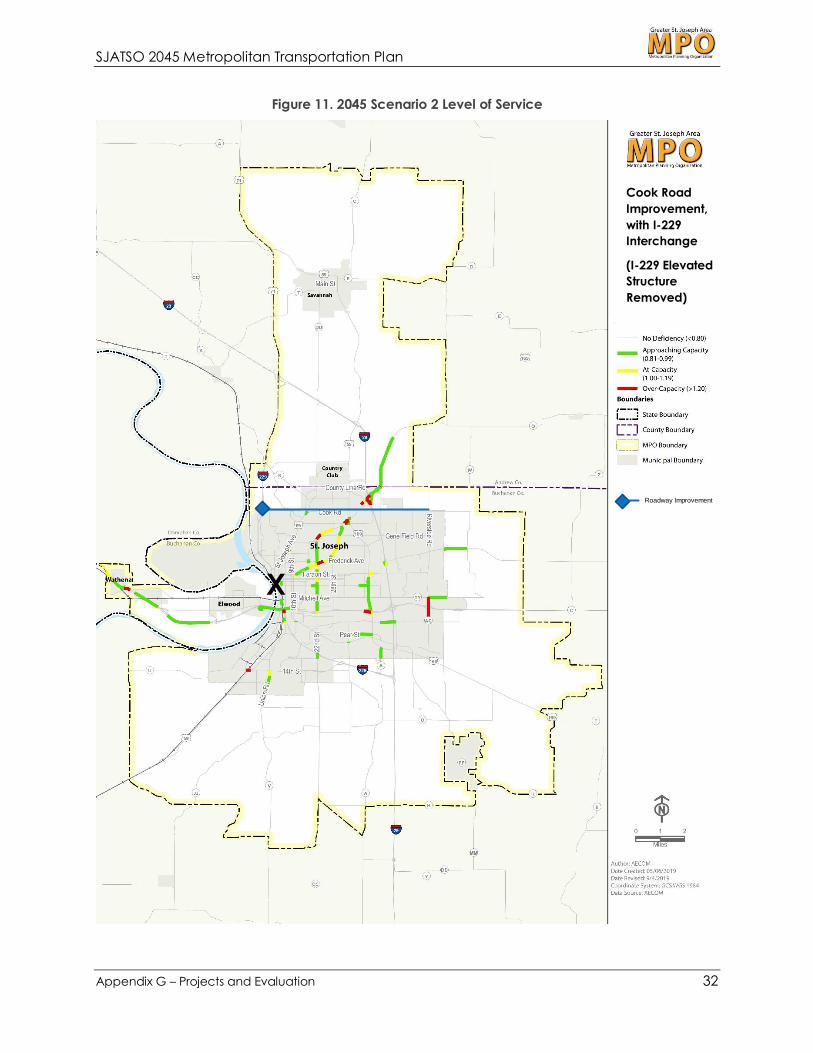
• 2045 Improvement Scenario 2 – Same as Scenario 1, but the I-229 elevated
structure just west of downtown St. Joseph is removed.
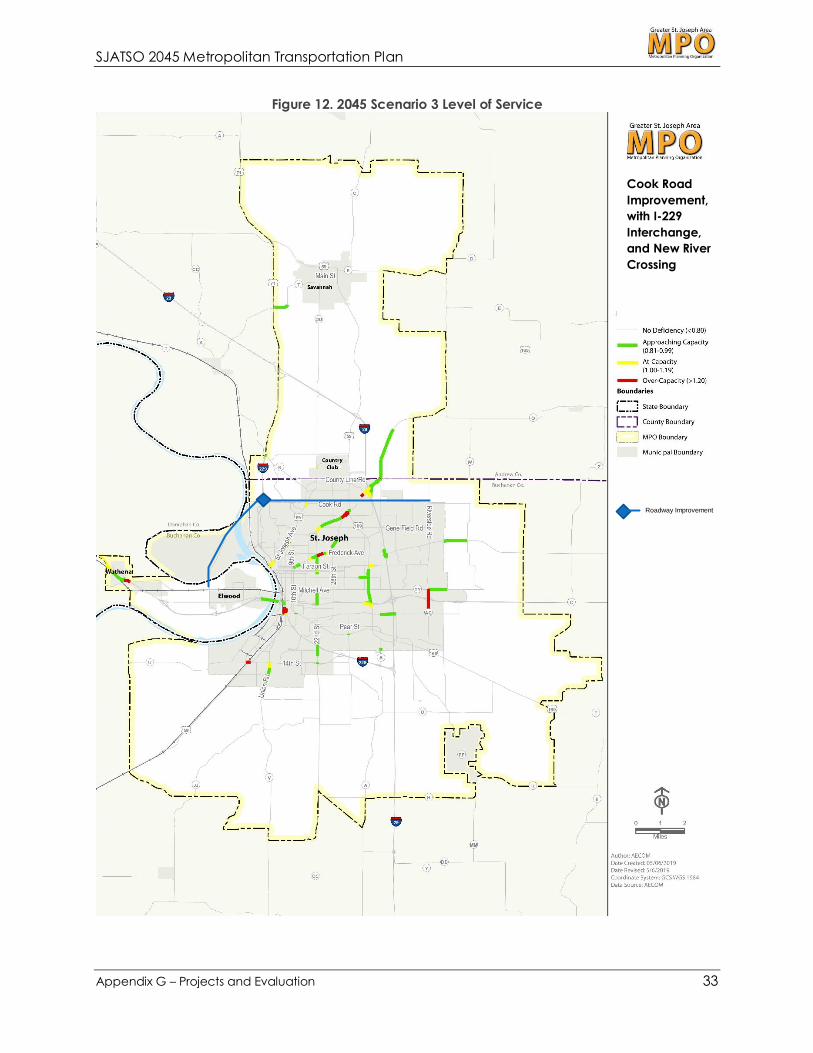
• 2045 Improvement Scenario 3 – Same as Scenario 1, but also includes a new
Missouri River crossing that would tie into the new I-229/Cook Road interchange.
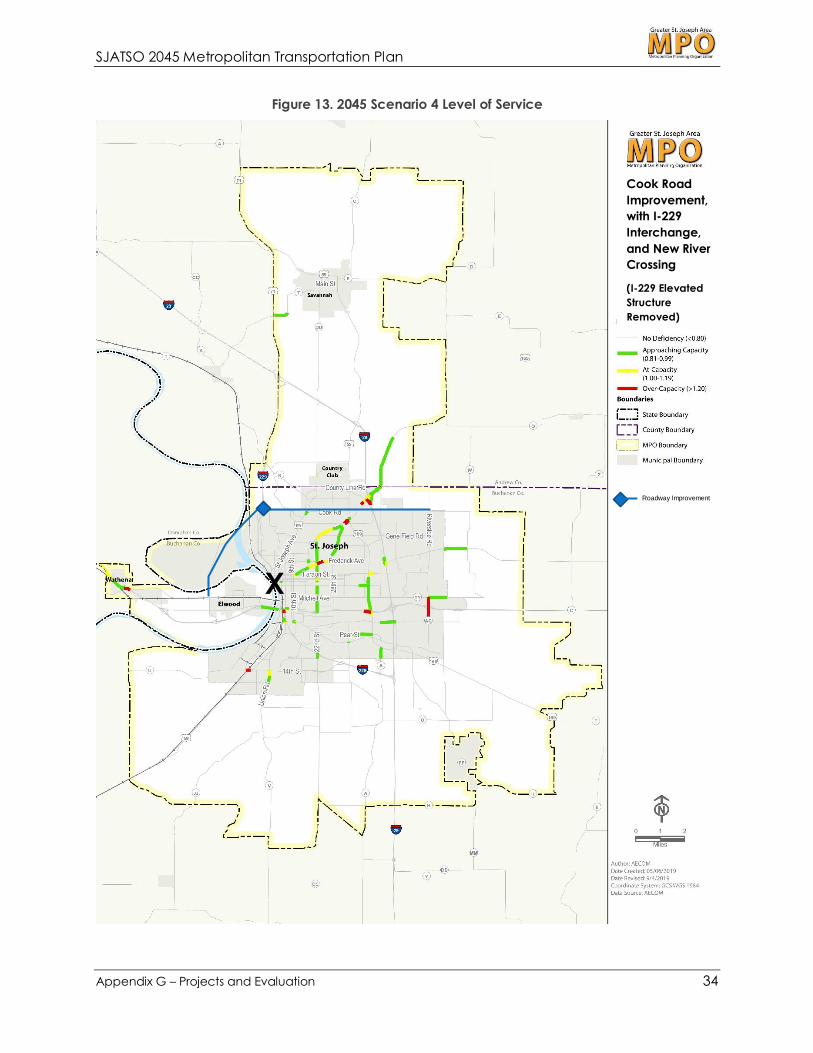
• 2045 Improvement Scenario 4 – Same as Scenario 3, but the I-229 elevated
structure just west of downtown St. Joseph is removed.
Generally speaking, the travel model does not highlight any significant capacity
deficiencies in the SJATSO MPA. The one main area of concern is the US 36/Riverside Road
interchange area. This area along Riverside Road is currently experiencing congestion,
especially during the a.m. and p.m. peak hours. As such, this location is on MoDOT’s radar
screen and is being monitored for potential capacity improvements. Furthermore, this is a
priority area identified for improvement in the MTP.
The 2045 traffic projections indicate the largest increases in traffic are expected along
regional corridors including I-29 and US 36. Based on the model projections, the I-29 corridor
could see traffic volumes approaching 50,000 vpd, with the highest volumes observed
between Mitchell Avenue and Faraon Street, which currently can reach 40,000 vpd. Traffic
along the I-29 corridor is also expected to increase in the northern portion of the study area
just north of the Andrew-Buchanan County line.
The US 36 corridor is also likely to see volumes increase. A review of recent traffic volumes
has shown increasing volumes, including increasing truck volumes as this becomes a more
important freight corridor. In all likelihood, the US 36 corridor will continue to be an
important regional corridor and the MTP highlights a long-term concept of a possible
upgrade to interstate standards. SJATSO should continue to monitor future traffic levels
along US 36 to identify potential improvements to accommodate future volumes.
In addition to the regional corridors, arterial roadways will see traffic growth over the next 25
years. The Riverside Road corridor could see increasing volumes, and roadways in the near
the County line could also see increases related to continued growth and development.
The Cook Road corridor has been identified as an important east-west connection to help
facilitate travel movement in the area. The model scenarios show this corridor potentially
carrying between 15,000 vpd to 20,000 vpd (depending on model scenario).
Potential River Crossing
As part of the Cook Road improvement, a new Missouri River crossing was coded in the
model as part of scenario 3. This scenario was developed through the MTP planning process
as a potential option to increase access to the airport and surrounding land that could be
available for redevelopment once the Air National Guard completes a move of their
facilities to the north. To reflect development near the airport, 500 employees were added
to this traffic analysis zone.
SJATSO 2045 Metropolitan Transportation Plan
Appendix G – Projects and Evaluation 28
The river crossing attracted approximately 6,000 vpd. This volume is relatively encouraging,
given that no additional employment impacts beyond the airport area were considered.
Prior to the next MTP update, it might be helpful for SJATSO to conduct a more detailed
study to identify potential employment impacts a river crossing could have on the region,
and in particular in the airport area and Kansas portion of the MPA.
Table 7 shows the model results, highlighting that the potential river crossing with connection
to a new I-229/Cook Road interchange (Scenario 3) is expected to have the greatest
impact on enhancing LOS throughout the region, while the river crossing combined with
removal of the elevated I-229 structure (scenario 4) shows the greatest impact to reduce
vehicle hours of travel. As such, the new river crossing is a potential long-term improvement
worth exploring in more detail.
I-229 Elevated Structure Impacts
As documented throughout the 2045 MTP update, addressing the I-229 elevated structure is
a critical issue for the SJATSO region. Scenarios 2 and 4 include a model run that looked at
the potential impacts of removing the I-229 structure. From a high-level perspective, the
“removal” of the I-229 elevated structure could represent a concept that would replace
the structure with an at-grade facility, or could potentially use local streets to provide a
north-south connection. Regardless of the recommended I-229 action, there are regional
impacts observed on I-29 and US-36, which would see increased traffic volumes as a result
of some travel patterns shifting away from I-229. Scenario 4, which includes a new river
crossing connecting to Cook Road, would also see an increase of approximately 800 vpd to
1,000 vpd on the bridge crossing (bringing the total to approximately 7,000 vpd). The I-229
EA is currently studying traffic impacts associated with a select number of concepts. The
results of the EA should be incorporated into future MTP updates.

SJATSO 2045 Metropolitan Transportation Plan
Appendix G – Projects and Evaluation 29
Table 7. Miles of Congestion
Table 8. Vehicle Hours of Travel and Vehicle Miles of Travel
2015 Base Year 7.3 1.1 0.8 9.2 - - - -
2045 (E+C) Base Year 19.6 4.6 3.4 27.6 - - - -
2045 Scenario 1 17.8 4.4 3.1 25.3 -1.8 -0.2 -0.3 -2.3
2045 Scenario 2 19.5 4.9 3.6 28.0 -0.1 0.3 0.2 0.4
2045 Scenario 3 15.3 3.7 3.0 22.0 -4.3 -0.9 -0.4 -5.6
2045 Scenario 4 17.3 3.7 3.1 24.1 -2.3 -0.9 -0.3 -3.5
SOURCE: SJATSO Travel Demand Model
Total
Miles of Level of Service Change (compared to 2045 Base)
LOS D LOS E LOS F TotalScenario LOS D LOS E LOS F
2015 Base Year 2,352,546 45,366 - -
2045 (E+C) Base Year 2,779,811 55,926 - -
2045 Scenario 1 2,780,405 55,865 594 (61)
2045 Scenario 2 2,767,878 56,173 (11,933) 247
2045 Scenario 3 2,772,028 55,732 (7,783) (194)
2045 Scenario 4 2,761,815 55,996 (17,996) 70
SOURCE: SJATSO Travel Demand Model
ScenarioVehicle Miles
of Travel
Vehicle Hours
of Travel
Total Network Change (compared to 2045 Base)Vehicle Miles of
Travel
Vehicle Hours of
Travel
SJATSO 2045 Metropolitan Transportation Plan
Appendix G – Projects and Evaluation 30
Figure 9. 2045 Base Year Level of Service
SJATSO 2045 Metropolitan Transportation Plan
Appendix G – Projects and Evaluation 31
Figure 10. 2045 Scenario 1 Level of Service
Cook Road
Improvement,
with I-229
Interchange
Roadway Improvement
SJATSO 2045 Metropolitan Transportation Plan
Appendix G – Projects and Evaluation 32
Figure 11. 2045 Scenario 2 Level of Service
Cook Road
Improvement,
with I-229
Interchange
(I-229 Elevated
Structure
Removed)
X
Roadway Improvement
SJATSO 2045 Metropolitan Transportation Plan
Appendix G – Projects and Evaluation 33
Figure 12. 2045 Scenario 3 Level of Service
Cook Road
Improvement,
with I-229
Interchange,
and New River
Crossing
Roadway Improvement
SJATSO 2045 Metropolitan Transportation Plan
Appendix G – Projects and Evaluation 34
Figure 13. 2045 Scenario 4 Level of Service
Cook Road
Improvement,
with I-229
Interchange,
and New River
Crossing
(I-229 Elevated
Structure
Removed)
X
Roadway Improvement


