Embed Size (px)
Citation preview
Project for Capacity Development in Basic Water Environment Management and
EIA System in the Republic of the Union of Myanmar
Final Report
Appendix 13:
Pollution Survey Report
Japan International Cooperation Agency
Republic of the Union of Myanmar Ministry of Natural Resources and Environmental Conservation
Pollution Source Survey Report
PROJECT FOR CAPACITY DEVELOPMENT IN BASIC WATER
ENVIRONMENT MANAGEMENT AND EIA SYSTEM IN THE REPUBLIC
OF THE UNION OF MYANMAR
POLLUTION SOURCE SURVEY REPORT
June 2018
PREPARED BY:
ENVIRONMENTAL CONSERVATION DEPARTMENT, MINISTRY OF NATURAL RESOURCES AND
ENVIRONMENTAL CONSERVATION
YANGON CITY DEVELOPMENT COMMITTEE
MANDALAY CITY DEVELOPMENT COMMITTEE
JICA EXPERT TEAM
The Project for Capacity Development in Basic Water Environment
Management and EIA System in the Republic of the Union of Myanmar
Pollution Source Survey Report
PREFACE
This report summarizes the results of the pollution source survey implemented in August – October 2016 and August – September 2017 as part of the bilateral technical cooperation project between Myanmar and Japan entitled “Project for Capacity Development in Basic Water Environment Management and EIA System in the Republic of the Union of Myanmar”. In total 200 factories in industrial zones in Yangon and Mandalay were surveyed using a questionnaire. In addition, wastewaters from 50 factories were collected and analyzed both in 2016 and 2017. We hope this report will help environmental authorities review the current status of environmental management in manufacturing and subsequently develop and enforce effective water environment management policies.
JICA Expert Team
The Project for Capacity Development in Basic Water Environment
Management and EIA System in the Republic of the Union of Myanmar
Pollution Source Survey Report
i
Table of Contents Executive Summary ................................................................................................................................. 1 1. Introduction ................................................................................................................................... 1
1.1. Survey Areas ............................................................................................................................ 1 1.2. Objectives ................................................................................................................................ 2 1.3. Methodology ........................................................................................................................... 2
1.3.1. Questionnaire Survey (Period 1) ...................................................................................... 3 1.3.2. Wastewater Sampling and Analysis (Period 1 and 2) ...................................................... 4
1.4. Survey Periods ......................................................................................................................... 8 1.5. Quality Control ......................................................................................................................... 8
1.5.1. General Quality Control ................................................................................................... 8 1.5.2. Comparison between the Analysis Results in Period 1 and 2 ........................................ 10
2. Survey Results .............................................................................................................................. 13 2.1. Hlaing River Basin .................................................................................................................. 13
2.1.1. Questionnaire Survey in 2016 ........................................................................................ 13 2.1.2. Wastewater Sampling and Analysis in Period 1 (2016) and Period 2 (2017) ................. 21 2.1.3. Summary ........................................................................................................................ 34
2.2. Doke Hta Waddy River Basin ................................................................................................. 36 2.2.1. Questionnaire Survey in 2016 ........................................................................................ 36 2.2.2. Wastewater Sampling and Analysis in Period 1 (2016) and Period 2 (2017) ................. 51 2.2.3. Summary ........................................................................................................................ 65
3. Conclusions and Recommendations ............................................................................................ 67 3.1. Conclusions ............................................................................................................................ 67 3.2. Recommendations ................................................................................................................. 69
Attachment - Attachment 1: Questionnaire Form for Survey of Manufacturing Industries (English Version)
The Project for Capacity Development in Basic Water Environment
Management and EIA System in the Republic of the Union of Myanmar
Pollution Source Survey Report
ii
List of Tables Table 1.3-1 Summary of Pollution Source Survey ......................................................................... 2
Table 1.3-2 Data Type of Pollution Source Survey ........................................................................ 3
Table 1.3-3 Field Equipment for Wastewater Sampling and Analysis ........................................... 5
Table 1.3-4 Methodologies for On-site and Laboratory Analysis .................................................. 6
Table 1.4-1 Field Survey Schedule in Industrial Zones in Yangon and Mandalay ......................... 8
Table 1.5-1 Risks and Measures for Quality Control ..................................................................... 8
Table 1.5-2 Water Quality Analysis in Period 1 and 2 ................................................................. 10
Table 1.5-3 Comparison of Results of Toxic Substances in Japan and Thailand ......................... 12
Table 2.1-1 Summary of Results for Questionnaire Survey in Yangon (2016) ............................ 14
Table 2.1-2 Sectors of Existing/Target Factories in Hlaing River Basin ....................................... 18
Table 2.1-3 Information on Target Factories of Wastewater Sampling in Yangon (Period 1) .... 23
Table 2.1-4 Information on Target Factories of Wastewater Sampling in Yangon (Period 2) .... 24
Table 2.1-5 Summary Table of Distribution of Outlet Concentrations of Selected Parameters and Comparison of Outlet Concentrations with Guideline Values ..................................... 33
Table 2.2-1 Sectors of Target Factories in Questionnaire Survey in Mandalay in 2016 ............. 38
Table 2.2-2 Information about Target Factories of Wastewater Sampling and Analysis in Mandalay in 2016 ................................................................................................................ 52
Table 2.2-3 Information about Target Factories of Wastewater Sampling and Analysis in Mandalay in 2017 ................................................................................................................ 53
Table 2.2-4 Summary Table of Distribution of Outlet Concentrations of Selected Parameters and Comparison of Outlet Concentrations with Guideline Values ..................................... 64
List of Figures Figure 1.1-1 Location Maps of Industrial Zones in Target River Basins......................................... 1 Figure 1.3-1 Questionnaire Survey with Representatives of Target Factories .............................. 4 Figure 1.3-2 Wastewater Sampling and In-situ Measurement in Target Factories ...................... 5 Figure 1.5-1 Results Comparison (COD) ...................................................................................... 11 Figure 1.5-2 Results Comparison Result (TN) .............................................................................. 12 Figure 1.5-3 Results Comparison (TP) ......................................................................................... 12 Figure 2.1-1 Sectors of Factories in Hlaing River Basin in Yangon .............................................. 13 Figure 2.1-2 Number of Employees of Factories in Hlaing River Basin in Yangon by Sector ...... 14 Figure 2.1-3 Yearly Production Value of Existing Factories in Yangon ........................................ 16 Figure 2.1-4 Sector of Target Factories for Questionnaire Survey in Yangon in 2016 ................ 19 Figure 2.1-5 Location Map of 100 Target Factories for Questionnaire Survey in Yangon in 2016
............................................................................................................................................. 19 Figure 2.1-6 Size of Target Factories According to DISI’s Classification ...................................... 20 Figure 2.1-7 Difficulties in Installing WWTP ................................................................................ 20 Figure 2.1-8 Environmental-Friendliness of Product .................................................................. 21 Figure 2.1-9 Sectors of Target Factories for Wastewater Sampling in Yangon ........................... 21 Figure 2.1-10 Location Map of Target Factories of Wastewater Sampling in Yangon (Period 1)22 Figure 2.1-11 Location Map of Target Factories of Wastewater Sampling in Yangon (Period 2)22 Figure 2.1-12 Wastewater Flow Rate Estimated on Site ............................................................. 25 Figure 2.1-13 Comparison of Self-Declared Flow Rate and Flow Rate Estimated on Site .......... 26 Figure 2.1-14 BOD Concentration of Target Factories in 2016 ................................................... 26 Figure 2.1-15 Distribution of Outlet BOD Concentrations .......................................................... 27 Figure 2.1-16 Outlet BOD Concentrations in Different Industrial Sectors in 2016 ..................... 27 Figure 2.1-17 NEQEG Compliance Status for BOD ...................................................................... 28 Figure 2.1-18 COD Concentrations of Target Factories in 2016 .................................................. 28 Figure 2.1-19 Distributions of Outlet COD Concentrations in 2016 and 2017 ............................ 29
The Project for Capacity Development in Basic Water Environment
Management and EIA System in the Republic of the Union of Myanmar
Pollution Source Survey Report
iii
Figure 2.1-20 NEQEG Compliance Status for COD ...................................................................... 29 Figure 2.1-21 T-N Concentrations of Target Factories ................................................................ 30 Figure 2.1-22 Distribution of Outlet TN Concentrations ............................................................. 30 Figure 2.1-23 NEQEG Compliance Status for TN ......................................................................... 31 Figure 2.1-24 T-P Concentrations of Target Factories ................................................................. 31 Figure 2.1-25 Distributions of Outlet T-P Concentrations ........................................................... 32 Figure 2.1-26 NEQEG Compliance Status for TP .......................................................................... 33 Figure 2.2-1 Sectors of Factories in Pyi Gyee Tagong IZ in Mandalay ......................................... 36 Figure 2.2-2 Number of Employees of Factories in Pyi Gyee Tagong IZ in Mandalay by Sector . 36 Figure 2.2-3 Sectors of Target Factories in Questionnaire Survey in Mandalay in 2016 ............ 39 Figure 2.2-4 Location Map of 100 Target Factories of Questionnaire Survey in Mandalay........ 39 Figure 2.2-5 Size of Target Factories According to DISI’s Classification ...................................... 40 Figure 2.2-6 Number of Employee in Target Factories ............................................................... 40 Figure 2.2-7 Land Area of Each Target Factory ........................................................................... 41 Figure 2.2-8 Water Usage of Each Factory .................................................................................. 41 Figure 2.2-9 Sources of Water ..................................................................................................... 42 Figure 2.2-10 Wastewater Discharge Rate of Each Factory ........................................................ 42 Figure 2.2-11 Ratio of Wastewater/ Water Usage of Each Factory ............................................ 43 Figure 2.2-12 Connection to 10” MCDC Pipeline ........................................................................ 43 Figure 2.2-13 Measures to Minimize Pollution ........................................................................... 44 Figure 2.2-14 Existence of Wastewater Treatment Facilities ...................................................... 44 Figure 2.2-15 Regular Self-Monitoring of Wastewater Quality by Factory ................................. 45 Figure 2.2-16 Primary Treatment ................................................................................................ 45 Figure 2.2-17 Secondary Treatment ............................................................................................ 46 Figure 2.2-18 Generation of General Garbage ............................................................................ 46 Figure 2.2-19 Generation of Industrial Waste from Production Line.......................................... 47 Figure 2.2-20 Generation of Hazardous Waste ........................................................................... 47 Figure 2.2-21 Factories’ Answers to Questions Regarding Environmental Management System
............................................................................................................................................. 48 Figure 2.2-22 Recent Inspection by Relevant Authorities ........................................................... 49 Figure 2.2-23 Self-Assessment of Adequacy of Environmental Management ............................ 49 Figure 2.2-24 Awareness of National Environment Quality (Emission) Guideline ...................... 50 Figure 2.2-25 Difficulties in Installing WWTP .............................................................................. 50 Figure 2.2-26 Environmental-Friendliness of Product ................................................................ 51 Figure 2.2-27 Sector of Target Factories for Wastewater Sampling in Mandalay in 2016 ......... 51 Figure 2.2-28 Location Map of Target Factories of Wastewater Sampling in Mandalay in 201652 Figure 2.2-29 Wastewater Flow Rate Estimated on Site (2016) ................................................. 55 Figure 2.2-30 Comparison of Self-Declared Flow Rate and Flow Rate Estimated on Site (2016)55 Figure 2.2-31 BOD Concentrations of Target Factories in 2016 .................................................. 56 Figure 2.2-32 Distribution of Outlet BOD Concentrations in 2016 ............................................. 56 Figure 2.2-33 Comparison of Outlet BOD Concentration and Guideline Value in 2016 ............. 57 Figure 2.2-34 Comparison of Effluent BOD Concentrations and NEQEG (2015) in 2016 and 2017
............................................................................................................................................. 57 Figure 2.2-35 Efficiency of BOD Reduction by Wastewater Treatment Facilities in 2016 .......... 58 Figure 2.2-36 Outlet BOD Load of Target Factories in 2016 ....................................................... 59 Figure 2.2-37 Comparison of Measured Outlet BOD Concentration and Self-Monitored BOD
Concentration ...................................................................................................................... 59 Figure 2.2-38 COD Concentrations of Target Factories ............................................................... 60 Figure 2.2-39 Outlet COD Concentrations of Target Factories in 2016 and 2017 ....................... 60 Figure 2.2-40 Comparison of Effluent COD Concentrations and NEQEG (2015) in 2016 and 2017
............................................................................................................................................. 61
The Project for Capacity Development in Basic Water Environment
Management and EIA System in the Republic of the Union of Myanmar
Pollution Source Survey Report
iv
Figure 2.2-41 Outlet TN Concentrations of Target Factories in 2017 ......................................... 61 Figure 2.2-42 Comparison of Effluent TN Concentrations and NEQEG (2015) in 2017 .............. 62 Figure 2.2-43 Total Phosphorus Concentrations of Target Factories in 2016 ............................. 62 Figure 2.2-44 Outlet TP Concentrations of Target Factories in 2017 .......................................... 63 Figure 2.2-45 Comparisons of Effluent TP Concentrations and NEQEG (2015) in 2016 and 2017
............................................................................................................................................. 63
The Project for Capacity Development in Basic Water Environment
Management and EIA System in the Republic of the Union of Myanmar
Pollution Source Survey Report
v
List of Abbreviations
BOD Biochemical Oxygen Demand C/P Counterpart COD Chemical Oxygen Demand DISI Directorate of Industrial Supervision and Inspection DO Dissolved Oxygen EC Electrical Conductivity ECD Environmental Conservation Department EIA Environment Impact Assessment GIS Geographic Information System GPS Global Positioning System IZ Industrial Zone IZMC Industrial Zone Management Committee JET JICA Expert Team JICA Japan International Cooperation Agency MCDC Mandalay City Development Committee MOECAF Ministry of Environmental Conservation and Forestry MOI Ministry of Industry MONREC Ministry of Natural Resources and Environmental Conservation SS Suspended Solid USEPA United States Environmental Protection Agency YCDC Yangon City Development Committee
The Project for Capacity Development in Basic Water Environment
Management and EIA System in the Republic of the Union of Myanmar
Pollution Source Survey Report
1
EXECUTIVE SUMMARY In order to understand the current status of water environment especially the impact of industrial wastewater in Myanmar, the pollution source survey was implemented in 2016 (Period 1) and 2017 (Period 2). Industrial Zones in the Hlaing River basin in Yangon and the Doke Hta Waddy River basin in Mandalay were selected as the pilot area, and questionnaire survey and wastewater sampling were implemented.
A questionnaire survey of 200 factories and sampling and analysis of wastewaters of 50 factories were conducted in 2016. The results provided valuable insight into the current status of environmental control at factories in the target areas. However, some of the results, such as the analytical results of total nitrogen, were deemed not reliable. Thus, a follow-up survey consisting of effluent sampling and analysis at 50 factories, of which 33 factories overlapped with the ones in 2016 survey, was implemented from August to September 2017. In the follow-up survey, some effluent samples were analyzed not only in Myanmar and Thailand but also in Japan to confirm data reliability.
Purpose: To collect information of pollution source
Survey Area: Hlaing River basin in Yangon and the Doke Hta Waddy River basin in Mandalay
Scope (1): Questionnaire survey for 200 factories in 2016
Scope (2): Wastewater sampling for 50 factories each in 2016 and 2017
Target parameter of water quality analysis were decided based on the National Environmental Quality Emission Guideline (NEQEG) in 2015.
All samples were analyzed in Myanmar/Thailand.
18 samples out of 50 were analyzed in Japan in 2017.
(1) Outline of Existing/Target Factories in Survey Area
The outline of existing/target factories in the survey areas were investigated through the data collection and questionnaire survey in 2016. The examples are described as follows.
There are 1,083 factories in the target river basin in Yangon and 1,228 factories in Mandalay according to the list prepared by Directorate of Industrial Supervision and Inspection (DISI), Ministry of Industry (MOI) and/or Industrial Zone Management Committee (IZMC).
In terms of the number of factories, food and beverage sector is the leading sector, accounting for 415 factories, followed by domestic materials (178), clothing (167) and accommodation (106) in Yangon. On the other hand, general mechanics sector such as “mechanics and welding business” and “car workshop” is the leading sector accounting for 592 factories, followed by minerals (224) and food and beverages (178) in Mandalay.
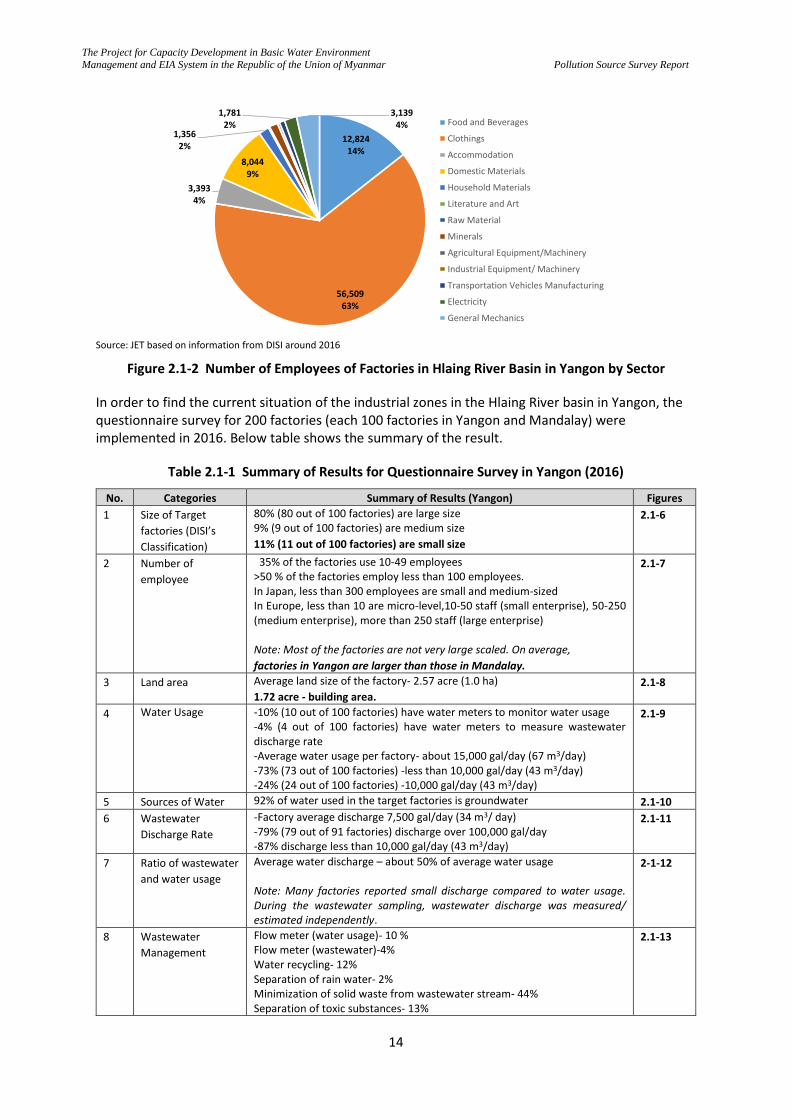
In terms of the number of employees, in total, there are 90,105 employees in Yangon, of which 63% are employed by the clothing sector. On the other hand, there are total 16,150 employees in Mandalay, of which 24.1% are employed by the food and beverage sector, followed by general mechanics (16.6%), accommodation (13.0%), domestic materials (11.9%) and clothing (11.7%).
The Project for Capacity Development in Basic Water Environment
Management and EIA System in the Republic of the Union of Myanmar
Pollution Source Survey Report
2
(2) Environmental Management by Target Factories
The questionnaire survey in 2016 revealed different aspects of environmental management by the target factories.
With respect to measures to minimize pollution, it was found that only 10% of factories in Yangon and 2% in Mandalay were equipped with water meters to monitor water usage. Apparently, many factories are not aware of how much water they are consuming. On the other hand, about a half of the 200 factories replied that they are trying to minimize solid waste from entering wastewater stream.
Roughly half of the 200 factories investigated replied that they have no wastewater treatment.
With respect to primary treatment, 54% of 100 factories surveyed in the Hlaing River basin replied that they were equipped with some kind of primary treatment facilities. In Pyi Gyi Tagon IZ, only 35% of the factories said they were equipped with a primary treatment facility. Screens to remove large solids and settling basin to remove settleable solids are among the most common wastewater treatment facilities in these factories.
With respect to secondary treatment to remove organic matter, 6% of the factories in IZs in Hlaing River basin were equipped with facilities. In Pyi Gyi Tagon IZ in Mandalay, 5 % of factories were equipped with such facilities.
With respect to the difficulties factories are facing to install an adequate wastewater treatment plant (WWTP), the results of questionnaire survey in the Hlaing River basin were mixed and none of the reasons stood out as the main reasons common to most factories. In Mandalay, lack of expertise, unrealistic regulation and limited land appeared to be the main difficulties factories are facing to install treatment facilities.
(3) Comparison Result of Wastewater with NEQEG (2015)
National Environmental Quality Emission Guidelines (NEQEG) were established in December 2015 by Ministry of Environmental Conservation and Forestry (MOECAF) which was reorganized as Ministry of Natural Resources and Environmental Conservation (MONREC). Though they are not legally-binding at the moment, these guidelines define the required value of each parameter for each sector, and the results of wastewater analysis were compared against the requirements of NEQEG (2015).
According to the results of the wastewater analysis in 2017, many of the wastewaters did not meet the guideline values for different parameters (e.g. 89% for BOD, 64% for COD, 43% for Total Nitrogen and 45% for Total Phosphorus, etc.). This is largely because these factories are not equipped with adequate wastewater treatment facilities. Most likely, these factories have to improve their wastewater treatment in near future.
With respect to toxic substances, lead (4.3 mg/L), zinc (168 mg/L), mercury (0.014 mg/L) fluoride (5.2-16 mg/L) were found from battery factories in 2017 at levels higher than the NEQEG (2015). Similarly, phenols (1.0 - 8.4 mg/L) and total chromium (3.2 mg/L) from some of tanning factories were higher than NEQEG (2015). Zinc (3.0 mg/L) was also detected from a textile factory and phenols (0.96 mg/L) from a pharmaceutical company.
It should be noted that a concentration of pollutant in industrial effluent is highly dependent on production and wastewater treatment processes at the time of sampling. Thus, a one or two-time survey is not enough to evaluate compliance with NEQEG (2015).
The Project for Capacity Development in Basic Water Environment
Management and EIA System in the Republic of the Union of Myanmar
Pollution Source Survey Report
3
To evaluate compliance, regular monitoring is essential (the guidelines require the values to be satisfied in 95% of operation time). Another difficulty encountered was the reliability of laboratory data. This issue is discussed in (5) below.
(4) Difference of Water Quality by Sector
Due to the limited number of samples, variabilities within a sector, and uncertainties of some analytical data, it has been difficult to clarify differences in water qualities by sector. Nevertheless, the general observation, based on analytical results of 18 factories in a certified laboratory in Japan, are as follows.
There is a trend that “Breweries and Distilleries”, “Tanning and Leather Finishing” and “Pulp and / or Paper Mills“ sectors have higher COD concentration than other sectors.
“Tanning and Leather Finishing” and “Fish Processing” sectors have higher TN than other sectors. In addition, both two factories of these sectors have similar value.
“Fish Processing” sector also has higher TP concentration. “Breweries and Distilleries”, “Food and Beverage Processing” and “Tanning and Leather Finishing” also have higher TP concentration, however, results in each sector varied in wide range.
As explained above, elevated levels of phenols, sulfate, and total chromium were detected from “Tanning and Leather Finishing” factories. It was noted that many tanneries in Myanmar employ vegetable tanning method. Lead, zinc and mercury were detected from the wastewaters of battery factories. Zinc was also detected from a “Textiles Manufacturing” factory and phenols from a pharmaceutical factory.
(5) Reliability of Laboratory Data
Reliability of analytical data was one of the main concerns in the Period 1 (2016) survey. Thus, the follow-up survey was designed in such way that some target factories of wastewater sampling and analysis in Period 1 and Period 2 (2017) overlap in order to compare analytical results in Period 1 in Myanmar/Thailand, Period 2 in Myanmar/Thailand, and Period 2 in Japan. The results can be summarized as follows:
Generally speaking, there are still significant differences between the laboratory results in Myanmar and those in Japan. While COD and TP data are more consistent than TN data, closer examination of each data reveal that variability is significant even for COD and TP. Differences in analytical methodologies and analytical quality control practice appeared to be the most important reasons for the variability.
The results of toxic substances in Japan and Thailand were more or less consistent, but further investigation is needed to ensure reliability.
In order to regulate industrial wastewater using an effluent standard, these issues should be resolved first. Environmental authorities are suggested to standardize the analytical methodologies, introduce a laboratory certification system, and have all certified environmental laboratories to practice a set of QA/QC procedures.
(6) Pollution Load from Industrial Wastewater in Survey Areas
It was noted that a majority of factories are not significant dischargers of pollution load (amount of pollutant discharged a day = concentration x flow rate), though there are factories that account for a significant amount of pollution load.
The Project for Capacity Development in Basic Water Environment
Management and EIA System in the Republic of the Union of Myanmar
Pollution Source Survey Report
4
Both the concentration factor and the flow rate factor are important. Distilleries are among the main dischargers of organic pollution in Yangon and Mandalay. Wastewater from a distillery usually contains very high concentrations of organic matter (BOD and COD), and many of them use a sizable amount of water. However, the situation might change once they introduce efficient wastewater treatment systems, typically UASB + aerobic process. Some of food and beverage factories, rubber factories, etc., are also important sources of organic pollution.
For conventional pollutants, such as BOD, COD, T-N and T-P, one should be aware of the importance of other pollution sources, such as domestic wastewater (sewage) and non-point sources (e.g., agricultural field).
In order to compute a pollution load associated with a factory, both concentration of pollutant and wastewater flow rate have to be evaluated. Unfortunately, both entail significant uncertainties. The uncertainty associated with wastewater flow may be even larger than the one associated with concentration, as most factories in Myanmar are not monitoring water usage.
(7) General Recommendations/Suggestions
1) Gathering Information from Factories
Issues: Right now, environmental authorities generally do not have detailed information about factories required for environmental management, such as production volume, water usage, pollution prevention and control measures taken, use of toxic substances, monitoring results, environmental issues encountered, emergency plan, etc. Such information is not contained in the data set of DISI and/or IZMCs. Without such information, it is difficult to know which factories are subject to different requirements or which factories should be considered environmental priorities.
Suggestions: Environmental authorities should collect such information from factories in relation to ECC and/or business licensing/registration. As MONREC has already issued an order to factories in nine priority sectors to submit EMPs, an EMP is a good place to start. However, basic information should be collected every year, as the situation of factories could change. Thus, submission of such information should be incorporated into the reporting requirements of ECC and/or business licensing/registration. If gathering information through EMPs takes too much time, it is suggested to implement a questionnaire survey, similar to the one implemented in this project.
2) Development of Database of Pollution Sources
Issues: As demonstrated in this project, an electronic database is very useful for managing environmental information. However, the pollution source database developed in this project was designed largely to analyze the current situation of pollution sources, and was not designed specifically for ECC and business licensing/registration. Thus, once the frameworks of environmental requirements related to ECC and business licensing/registration are set, a new database should be designed.
Suggestions: In principle, they should be designed considering the licensing scheme, and end use of the database, e.g., tracking official and unofficial correspondence, managing inspection activities, managing information submitted by factories, and analyzing information to prepare reports to top management. For ECC, perhaps it is more appropriate to expand the EIA database, rather than developing a new database. It is important to note that digitizing of non-digitized information is very labor intensive. Thus, for the time being, it is probably wise to limit the information to be managed by a database, and manage other information in hard copies. In the future, perhaps the regulated communities can submit information in electronic format.
The Project for Capacity Development in Basic Water Environment
Management and EIA System in the Republic of the Union of Myanmar
Pollution Source Survey Report
5
3) Improving Reliability of Measurement of Water Usage and Wastewater Qualities
Issues: Volume of wastewater and concentrations of pollutants in wastewater are among the most important parameters in managing water pollution, but the project encountered serious difficulties in measuring these parameters. Water usage in a factory is known to fluctuate significantly during production, and one or two-time on-site measurement does not give accurate estimate of water usage (and wastewater volume). Less than 10% of factories are equipped with flow meters to measure water usage, and very often water usage had to be estimated based on the size of water tanks and other means. As for water quality, laboratory data were not always reliable, and this problem necessitated the project to analyze wastewater samples in Japan. This issue should also be considered serious because environmental authorities are going to regulate pollution based on water quality data.
Suggestions: With respect to water usage, installation of water meters and measurement of water usage should be incorporated into the requirements of ECC and/or business licensing/registration, at least for major dischargers. As for reliability of laboratory data, environmental authorities should standardize the analytical methodologies, introduce a system of certification of environmental laboratories, and also make certified laboratories to regularly practice quality assurance/quality control measures. See section on Output 2.
4) Improving Environmental Measures by Factories
Issues: The pollution source surveys revealed a glimpse of primitive environmental management by many pollution sources in Myanmar. Most factories lack secondary treatment. Moreover, the whole management of resources, including water and other raw materials, seems rudimentary.
Suggestions: To control pollution, the environmental authorities should impose realistic regulations and support measures, perhaps based on sector studies. These are discussed elsewhere, and are not repeated here. In addition, regulation of water usage, especially groundwater usage seems necessary. In Yangon region, saltwater intrusion is a concern, and uncontrolled withdrawal of groundwater should be controlled. Aside from these government-side regulations, the industry side should also implement some studies about their management of resources and environment in order not only to control pollution, but also to improve efficiency of production and to make the workplace safe. Such studies may be spearheaded by MOI and/or industrial associations.
The Project for Capacity Development in Basic Water Environment
Management and EIA System in the Republic of the Union of Myanmar
Pollution Source Survey Report
1
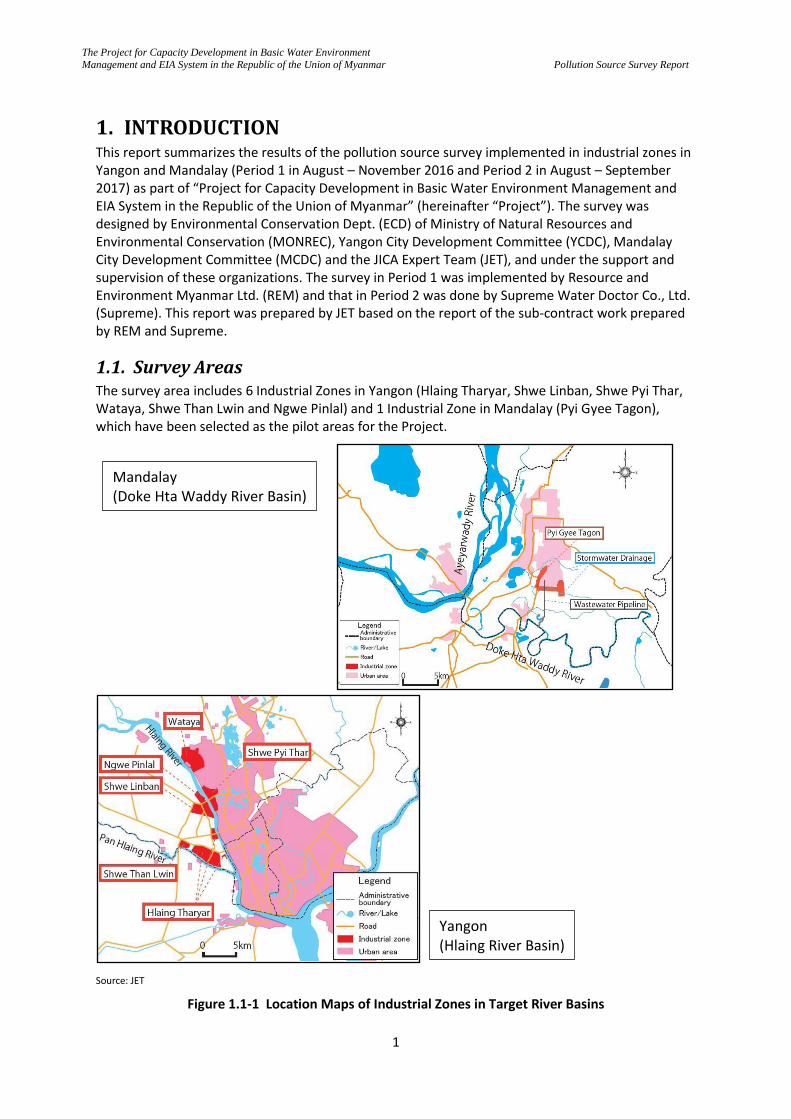
1. INTRODUCTION This report summarizes the results of the pollution source survey implemented in industrial zones in Yangon and Mandalay (Period 1 in August – November 2016 and Period 2 in August – September 2017) as part of “Project for Capacity Development in Basic Water Environment Management and EIA System in the Republic of the Union of Myanmar” (hereinafter “Project”). The survey was designed by Environmental Conservation Dept. (ECD) of Ministry of Natural Resources and Environmental Conservation (MONREC), Yangon City Development Committee (YCDC), Mandalay City Development Committee (MCDC) and the JICA Expert Team (JET), and under the support and supervision of these organizations. The survey in Period 1 was implemented by Resource and Environment Myanmar Ltd. (REM) and that in Period 2 was done by Supreme Water Doctor Co., Ltd. (Supreme). This report was prepared by JET based on the report of the sub-contract work prepared by REM and Supreme.
1.1. Survey Areas The survey area includes 6 Industrial Zones in Yangon (Hlaing Tharyar, Shwe Linban, Shwe Pyi Thar, Wataya, Shwe Than Lwin and Ngwe Pinlal) and 1 Industrial Zone in Mandalay (Pyi Gyee Tagon), which have been selected as the pilot areas for the Project.
Source: JET
Figure 1.1-1 Location Maps of Industrial Zones in Target River Basins
Mandalay (Doke Hta Waddy River Basin)
Yangon (Hlaing River Basin)
The Project for Capacity Development in Basic Water Environment
Management and EIA System in the Republic of the Union of Myanmar
Pollution Source Survey Report
2
1.2. Objectives The objectives of the survey were:
i. To obtain data and information concerning wastewater discharged from factories located in six Industrial Zones in the Hlaing River basin, one Industrial Zone in the Doke Hta Waddy River basin and other major pollution sources located outside of the Industrial Zones and,
ii. To develop pollution source database based on the data and information collected above for water pollution control management activities by ECD, YCDC and MCDC.
In order to achieve the objectives, a questionnaire survey of, in total, 200 factories as well as sampling and analysis of wastewater from 100 factories (each 50 factories in Period 1 and Period 2) located in these industrial zones in Yangon and Mandalay, were implemented.
1.3. Methodology
Pollution source survey was implemented as Period 1 (2016) and Period 2 (2017). The summary of the survey and collected data type are described in the below tables.
Table 1.3-1 Summary of Pollution Source Survey
Item Period 1 (2016) Period 2 (2017)
Purpose /Activity
To collect additional information of pollution source (especially factories in Industrial Zones in target river basin)
Same as Period 1
Survey Area
- Hlaing River Basin in Yangon - Doke Hta Waddy River Basin in Mandalay
Same as Period 1
Scope - Questionnaire Survey: total 200 factories (each 100 factories in Yangon and Mandalay)
- On-site investigation of wastewater management: total 50 factories (each 25 factories in Yangon and Mandalay)
- Estimation of wastewater flow rate: total 50 factories (each 25 factories in Yangon and Mandalay, same factories of on-site investigation)
- Wastewater Sampling and Analysis: total 50 factories (each 25 factories in Yangon and Mandalay)
- Wastewater Sampling and Analysis: total 50 factories (each 25 factories in Yangon and Mandalay, same factories of on-site investigation)
*Wastewater samples were analyzed in Myanmar or Thailand *All target factories of wastewater sampling and analysis are included in the target factories of questionnaire survey.
*18 wastewater samples out of 50 were analyzed not only in Myanmar nor Thailand but in Japan. *Some target factories are overlapped with those in Period 1.
Schedule - June to 1st half of August 2016: Finalization of Questionnaire and Terms of Reference (TOR) for Sub-Contract Work
- 2nd half of August to 1st half of Nov 2016: Implementation of Survey (both Questionnaire Survey and Wastewater Sampling)
- Jul 2017: Finalization of Terms of Reference (TOR) for Sub-Contract Work
- 2nd half of August to Sep 2017: Implementation of Survey
Attendance - Yangon: Staff from PCCD-YCDC and ECD Yangon
- Mandalay: Staff from WSD-MCDC, ECD Mandalay
Same as Period 1
Others Workshops for explanation and prior announcement to target factories were held as follows. In Yangon, PCCD in YCDC, ECD Yangon, each Industrial Zone Management Committee and JET, on the other hand, in Mandalay, WSD in MCDC, ECD Mandalay, Industrial Zone Management Committee and JET. [Yangon]
- 24 Aug 2016 for Shwe Pyi Tar and Wataya Industrial Zone
- 5 Sept 2016 for Hlaing Tharyar and other Industrial Zone
[Mandalay]
Workshops for explanation and prior announcement to target factories were held as follows. In Yangon, PCCD in YCDC, ECD Yangon, each Industrial Zone Management Committee and JET, on the other hand, in Mandalay, WSD in MCDC, ECD Mandalay, Industrial Zone Management Committee and JET. [Yangon]
- 10 Aug 2017 for all target factories in Yangon [Mandalay]
- 15 Aug 2017 for all target factories in Mandalay
The Project for Capacity Development in Basic Water Environment
Management and EIA System in the Republic of the Union of Myanmar
Pollution Source Survey Report
3
Item Period 1 (2016) Period 2 (2017)
- 23 Aug 2016 for all target factories in Mandalay
Source: JET
Table 1.3-2 Data Type of Pollution Source Survey
Data Type Number of Data (Factory / Sample)
Remarks Total
Yangon Mandalay Period 1 Period 2 Period 1 Period 2
(i) Basic Information collected by Questionnaire Survey1)
202 100 0 100 2 Two additional factories were selected as target in Mandalay in Period 2.
(ii)-1 Wastewater Analysis Result by Wastewater Sampling and Analysis (Myanmar/Thailand)
100 25 25 25 25
33 factories (17 factories in Yangon and 16 factories in Mandalay) are overlapped..
(ii)-2 Wastewater Analysis Result by Wastewater Sampling and Analysis (Japan)
18 0 9 0 9 18 factories out of 50 were selected in Period 2.
Source: JET
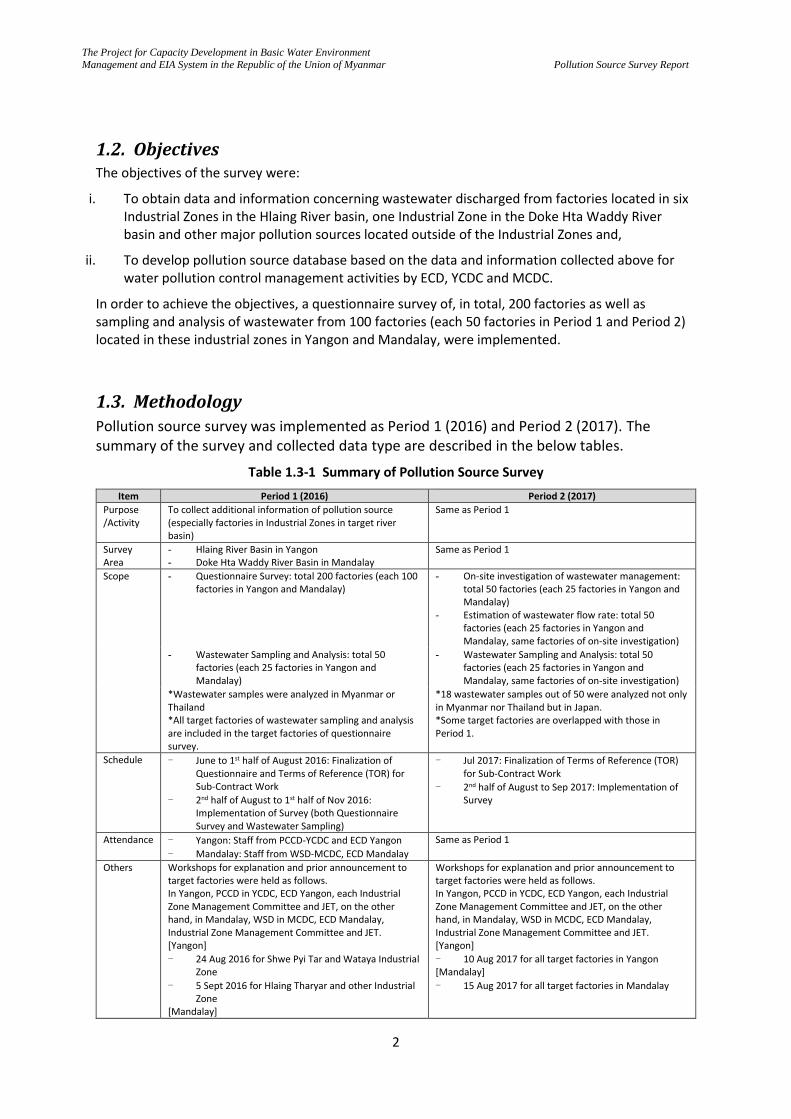
1.3.1. Questionnaire Survey (Period 1)
The questionnaire survey was carried out by using a questionnaire in Myanmar language, prepared jointly by relevant authorities, JET and the Norwegian project for hazardous waste management. The Norwegian project had different objectives, but many of the questions to factories were the same, and both projects decided to use a common questionnaire in order to avoid unnecessary duplication of work and to maximize the coverage of pollution sources among the two projects. Before developing the questionnaire, JET reviewed the inspection forms of ECD, YCDC, MCDC and DISI, and most of items in these forms were incorporated into the questionnaire so that information pertinent to environmental management by these organizations become available in the results. In addition, JET and the Norwegian team added a broad range of questions considering the objectives of each project.
In the questionnaire, there are about 47 questions in 6 categories as follows:
- Basic Information (15 questions)
- Raw Materials and Utility (4 questions)
- Layout of Factory and Manufacturing Process (2 questions)
- Wastewater (9 questions)
- Solid Waste (4 questions)
- Environmental Management (13 questions)
The English version of the questionnaire is attached to this report (Attachment 1). In accordance with local practice, English units, such as acre and UK gallon, were used in the survey.
The questionnaire was hand-delivered to each of the target 200 factories, answered by the management of each factory, and collected during the visit to each factory by the joint team of REM, ECD, YCDC, MCDC and JET. During the visit, the answers were confirmed by interviewing the managers or operators of the factory. In addition, a GIS coordinate of each factory was recorded. The collected data and information were then digitized and the answers were translated into English for analysis.
The Project for Capacity Development in Basic Water Environment
Management and EIA System in the Republic of the Union of Myanmar
Pollution Source Survey Report
4
Source: JET
Figure 1.3-1 Questionnaire Survey with Representatives of Target Factories
The Norwegian team implemented essentially the same survey using the same questionnaire, but their results are not reported in this report.
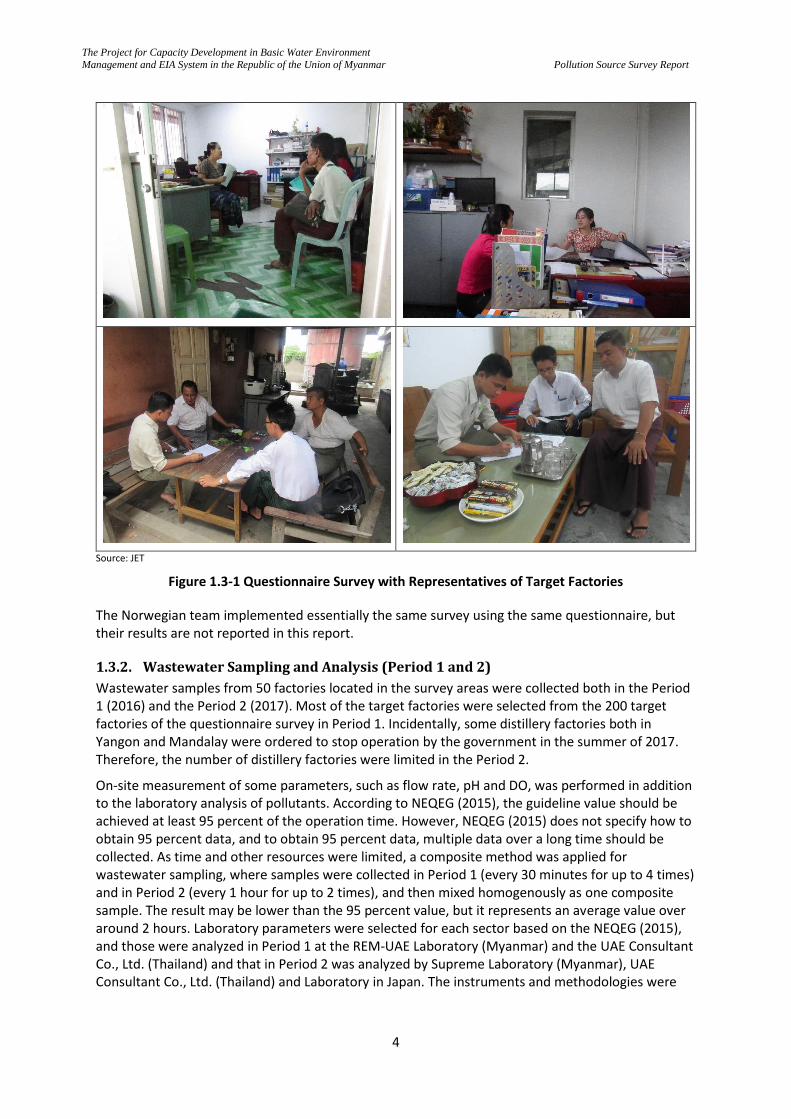
1.3.2. Wastewater Sampling and Analysis (Period 1 and 2)
Wastewater samples from 50 factories located in the survey areas were collected both in the Period 1 (2016) and the Period 2 (2017). Most of the target factories were selected from the 200 target factories of the questionnaire survey in Period 1. Incidentally, some distillery factories both in Yangon and Mandalay were ordered to stop operation by the government in the summer of 2017. Therefore, the number of distillery factories were limited in the Period 2.
On-site measurement of some parameters, such as flow rate, pH and DO, was performed in addition to the laboratory analysis of pollutants. According to NEQEG (2015), the guideline value should be achieved at least 95 percent of the operation time. However, NEQEG (2015) does not specify how to obtain 95 percent data, and to obtain 95 percent data, multiple data over a long time should be collected. As time and other resources were limited, a composite method was applied for wastewater sampling, where samples were collected in Period 1 (every 30 minutes for up to 4 times) and in Period 2 (every 1 hour for up to 2 times), and then mixed homogenously as one composite sample. The result may be lower than the 95 percent value, but it represents an average value over around 2 hours. Laboratory parameters were selected for each sector based on the NEQEG (2015), and those were analyzed in Period 1 at the REM-UAE Laboratory (Myanmar) and the UAE Consultant Co., Ltd. (Thailand) and that in Period 2 was analyzed by Supreme Laboratory (Myanmar), UAE Consultant Co., Ltd. (Thailand) and Laboratory in Japan. The instruments and methodologies were
The Project for Capacity Development in Basic Water Environment
Management and EIA System in the Republic of the Union of Myanmar
Pollution Source Survey Report
5
utilized for on-site measurement and laboratory analysis in Period 1 and Period 2 were mentioned in the attachments.
Source: JET
Figure 1.3-2 Wastewater Sampling and In-situ Measurement in Target Factories
Table 1.3-3 Field Equipment for Wastewater Sampling and Analysis
No. Equipment Manufacturer Originate Country Model
1 Dissolved Oxygen YSI USA YSI 550A
2 Salinity, Conductivity and Temperature
YSI USA YSI Model 30
3 Portable pH, mV and Temperature
Eco Sense USA PH 100 A
4 Turbidity Eutech Instruments Netherlands TN-100
5 Flow meter Global Water USA FP111
6 ORP meter HANNA Instrument USA HI 9125
Source: JET based on information from REM
The Project for Capacity Development in Basic Water Environment
Management and EIA System in the Republic of the Union of Myanmar
Pollution Source Survey Report
6
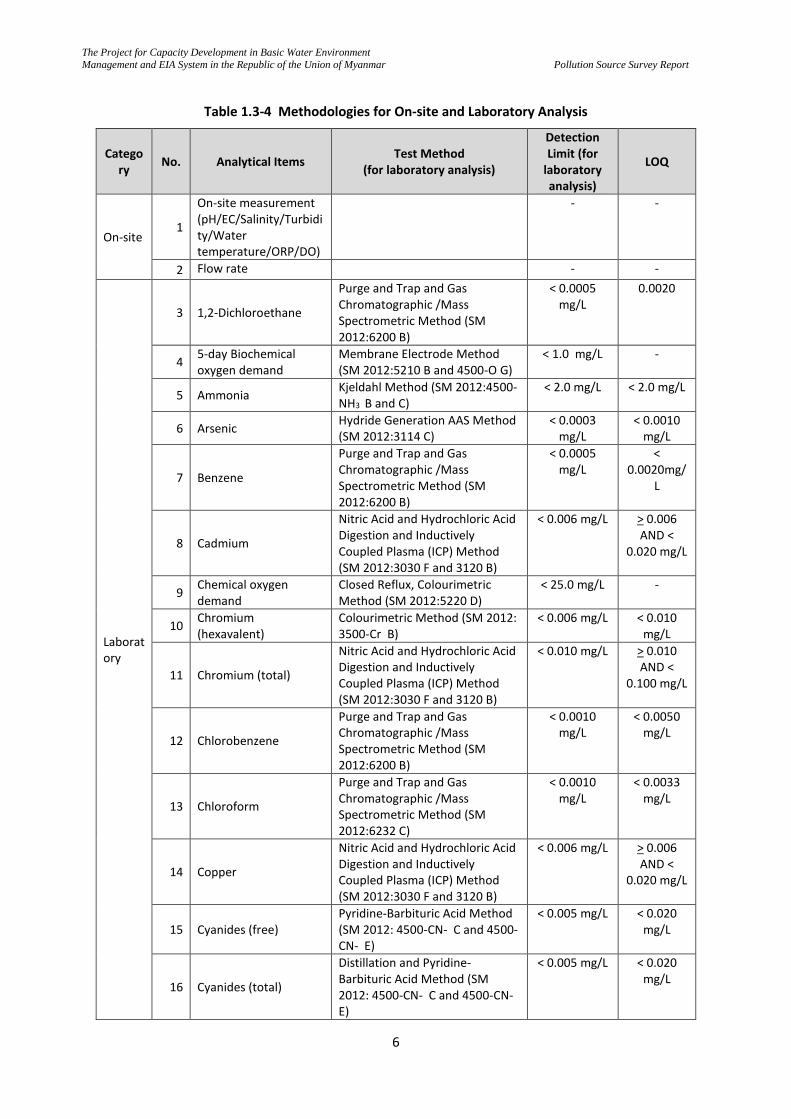
Table 1.3-4 Methodologies for On-site and Laboratory Analysis
Category
No. Analytical Items Test Method
(for laboratory analysis)
Detection Limit (for
laboratory analysis)
LOQ
On-site 1
On-site measurement (pH/EC/Salinity/Turbidity/Water temperature/ORP/DO)
- -
2 Flow rate - -
Laboratory
3 1,2-Dichloroethane
Purge and Trap and Gas Chromatographic /Mass Spectrometric Method (SM 2012:6200 B)
< 0.0005 mg/L
0.0020
4 5-day Biochemical oxygen demand
Membrane Electrode Method (SM 2012:5210 B and 4500-O G)
< 1.0 mg/L -
5 Ammonia Kjeldahl Method (SM 2012:4500-NH3 B and C)
< 2.0 mg/L < 2.0 mg/L
6 Arsenic Hydride Generation AAS Method (SM 2012:3114 C)
< 0.0003 mg/L
< 0.0010 mg/L
7 Benzene
Purge and Trap and Gas Chromatographic /Mass Spectrometric Method (SM 2012:6200 B)
< 0.0005 mg/L
< 0.0020mg/
L
8 Cadmium
Nitric Acid and Hydrochloric Acid Digestion and Inductively Coupled Plasma (ICP) Method (SM 2012:3030 F and 3120 B)
< 0.006 mg/L > 0.006 AND <
0.020 mg/L
9 Chemical oxygen demand
Closed Reflux, Colourimetric Method (SM 2012:5220 D)
< 25.0 mg/L -
10 Chromium (hexavalent)
Colourimetric Method (SM 2012: 3500-Cr B)
< 0.006 mg/L < 0.010 mg/L
11 Chromium (total)
Nitric Acid and Hydrochloric Acid Digestion and Inductively Coupled Plasma (ICP) Method (SM 2012:3030 F and 3120 B)
< 0.010 mg/L > 0.010 AND <
0.100 mg/L
12 Chlorobenzene
Purge and Trap and Gas Chromatographic /Mass Spectrometric Method (SM 2012:6200 B)
< 0.0010 mg/L
< 0.0050 mg/L
13 Chloroform
Purge and Trap and Gas Chromatographic /Mass Spectrometric Method (SM 2012:6232 C)
< 0.0010 mg/L
< 0.0033 mg/L
14 Copper
Nitric Acid and Hydrochloric Acid Digestion and Inductively Coupled Plasma (ICP) Method (SM 2012:3030 F and 3120 B)
< 0.006 mg/L > 0.006 AND <
0.020 mg/L
15 Cyanides (free) Pyridine-Barbituric Acid Method (SM 2012: 4500-CN- C and 4500-CN- E)
< 0.005 mg/L < 0.020 mg/L
16 Cyanides (total)
Distillation and Pyridine-Barbituric Acid Method (SM 2012: 4500-CN- C and 4500-CN- E)
< 0.005 mg/L < 0.020 mg/L
The Project for Capacity Development in Basic Water Environment
Management and EIA System in the Republic of the Union of Myanmar
Pollution Source Survey Report
7
Category
No. Analytical Items Test Method
(for laboratory analysis)
Detection Limit (for
laboratory analysis)
LOQ
17 Fluorides Ion Selective Electrode (SM 2012:4500- F C)
< 0.04 mg/L < 0.02 mg/L
18 Lead
Nitric Acid and Hydrochloric Acid Digestion and Inductively Coupled Plasma (ICP) Method (SM 2012:3030 F and 3120 B)
< 0.031 mg/L > 0.031 AND <
0.150 mg/L
19 Mercury Cold Vapour-AAS Method (SM 2012:3112 B)
< 0.0005 mg/L
< 0.0010 mg/L
20 Methylene chloride
Purge and Trap and Gas Chromatographic /Mass Spectrometric Method (SM 2012:6200 B)
< 0.0005 mg/L
< 0.0017 mg/L
21 Nickel
Nitric Acid and Hydrochloric Acid Digestion and Inductively Coupled Plasma (ICP) Method (SM 2012:3030 F and 3120 B)
< 0.020 mg/L > 0.020 AND <
0.100 mg/L
22 Oil and grease Partition-Gravimetric Method (SM 2012:5520 B)
<1 mg/L > 1 AND < 3 mg/L
23 Organochlorine Pesticide
Liquid-Liquid Extraction and Gas Chromatographic (ECD) Method (SM 2012:6630 C)
< 0.00002 mg/L
< 0.00010 mg/L
24 Organophosphate Pesticide
Liquid-Liquid Extraction and Gas Chromatographic (PFPD) Method (U.S. EPA 1996:3510 C and U.S. EPA 2007:8141 B)
< 0.02 mg/L < 0.10 mg/L
25 Phenol Distillation, 4-Aminoantipyrine Method (SM 2012:5530 B and 5530 D)
< 0.1 mg/L < 0.1 mg/L
26 Sulfate
Turbidimetric Method (SM 2012:4500-SO4
2- E) or Gravimetric with Ignition of Residue Method (SM 2012:4500-SO4
2-C)
< 0.3 mg/L < 0.3 mg/L
27 Sulfide Iodometric Method (SM 2012:4500-S2- F)
< 0.13 mg/L < 0.13 mg/L
28 Total coliform bacteria Multiple Tube Fermentation Technique (SM 2012:9221 B)
< 1.8 MPN/100 mL
< 1.8 MPN/100
mL
29 Total nitrogen Persulphate Method (SM 2012:4500-N C)
< 0.02 mg/L < 0.10 mg/L
30 Total phosphorus Persulphate Digestion and Ascorbic Method (SM 2012:4500-P E)
< 0.01 mg/L < 0.25 mg/L
31 Total suspended solids Total Suspended Solids Dried at 103-105 oC (SM 2012:2540 D)
< 2.4 mg/L > 2.4 AND < 5.0 mg/L
32 Zinc
Nitric Acid and Hydrochloric Acid Digestion and Inductively Coupled Plasma (ICP) Method (SM 2012:3030 F and 3120 B)
< 0.007 mg/L > 0.007 AND <
0.050 mg/L
Source: JET based on information from REM and Supreme
The Project for Capacity Development in Basic Water Environment
Management and EIA System in the Republic of the Union of Myanmar
Pollution Source Survey Report
8
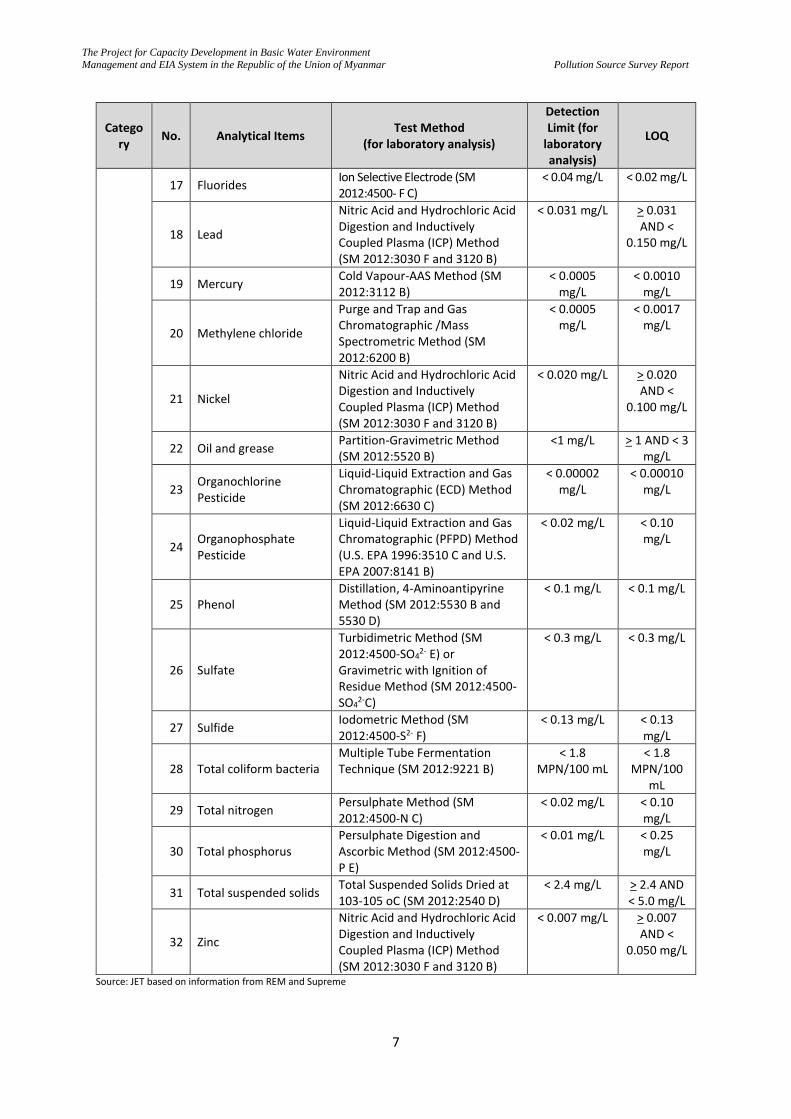
1.4. Survey Periods Both the questionnaire survey and the wastewater sampling survey in the Period 1 in Yangon and Mandalay were conducted during August to November 2016. The wastewater sampling survey in the Period 2 was conducted during July to September 2017.
Table 1.4-1 Field Survey Schedule in Industrial Zones in Yangon and Mandalay
Period Type of Survey Industrial Zones
in Yangon Industrial Zones
in Mandalay
Period 1 (2016) Questionnaire
survey 29-8-2016 to 13-102016 23-8-2016 to 15-9-2016
Period 1 (2016) Wastewater
sampling survey 31-10-2016 to 5-11-2016 11-10-2016 to 15-10-2016
Period 2 (2017) Wastewater
sampling survey 23-8-2017 to 31-8-2017 16-8-2017 to 22-9-2017
Source: JET
1.5. Quality Control
1.5.1. General Quality Control
In order to ensure data quality and to minimize errors, the following quality control measures were taken.
Table 1.5-1 Risks and Measures for Quality Control
No. Risk Measure
Questionnaire Survey Period 1 (2016) Period 2 (2017)
1-1 Data and information provided by the factories are not highly reliable because those who answer the questionnaire are not experts. This is probably true for the following items
- Usage of water, details of wastewater treatment facility, wastewater qualities, usage of hazardous substances
Surveyor will explain detail about questionnaire to the responsible person of each factory to get the reliable answer. If needed, surveyor will ask the factory to provide the necessary documents and confirm it.
Surveyor will confirm about questionnaire to the responsible person during site visit (only for target 50 factories in Period 2).
1-2 Factory does not provide enough information saying it is classified (e.g., layout of factory, information on raw material)
Surveyor will observe the operation of factory to get the adequate information, as well as mark the GPS coordinate of each building/facilities to prepare the factory layout.
Some factories have only permanent workers but some have part- time workers. Surveyor will record the employee of each factory especially for calculation of pollution load. Surveyor will observe the operation of wastewater treatment system and mark GPS coordinate for final discharge point.
1-3 Mix up in units causes confusion All data will be carefully recorded during every step, and
Same as Period 1
The Project for Capacity Development in Basic Water Environment
Management and EIA System in the Republic of the Union of Myanmar
Pollution Source Survey Report
9
No. Risk Measure
Questionnaire Survey Period 1 (2016) Period 2 (2017)
team manager will check and approve the data.
1-4 Data of factories in the same sector do not match (e.g., water usage of garment industry varies significantly from factory to factory)
Surveyor will record carefully the questionnaire during interview survey with the factory for same sector, and confirm the data/information shall be matched each other.
Same as Period 1
Wastewater sampling
2-1 Fail to take a representative sample because quality and quantity of wastewater fluctuate significantly
Composite method will be applied for wastewater sampling. Wastewater will be collected every 30 minutes or 1 hour, 4 times. Each composite sample will be mixed homogeneously as 1 sample.
Both Composite and Grab method will be applied for wastewater sampling in Period 2. Wastewater will be collected directly for grab and every 1 hours, 2 times for composite. Each composite sample will be mixed homogeneously as 1 sample.
2-2 Use of poorly calibrated equipment on site
Prior each field sampling, the equipment will be calibrated with QC standards.
Same as Period 1
2-3 Settling matter in wastewater causes large difference in the result (issue of how to take wastewater sample that contains settling matter at the site and whether to thoroughly mix the collected sample before the analysis or take only supernatant)
Before any analysis, wastewater samples will be mixed homogeneously using stirrer.
Before any analysis, wastewater samples will be mixed homogeneously using glass stick.
2-4 Collected sample is left in the field for a long time, because it is not possible to transport each sample immediately after it is collected
Specific parameters, such as BOD and TCB, will be collected in separate containers, kept at 0-6 oC using ice or ice pack all the time, and sent to the laboratory as soon as possible.
Specific parameters, such as BOD, TCB and Heavy metals, will be collected in separate containers, adjustment of pH for heavy metals with additional primary Preservation.
2-5 Problem in data consistency (e.g., NH4-N > T-N, Cr (VI) > Total Cr, BOD is a lot higher than COD)
Survey information will be considered to know characteristics of wastewater before sampling. Interferences, if any, will be removed interferences using the reference standard method before analysis. The quality control standard will be also used to check the accuracy.
Same as Period 1
The Project for Capacity Development in Basic Water Environment
Management and EIA System in the Republic of the Union of Myanmar
Pollution Source Survey Report
10
No. Risk Measure
Questionnaire Survey Period 1 (2016) Period 2 (2017)
2-6 Problem in measurement of flow rate (flow meter)
Surveyor will measure the wastewater flow rate using the flow meter at the final discharge point. Some discharge points are narrow and not able to use the flow meter for measurement. In that case, wastewater discharge volume was calculated on the final tank of treatment system and operation hours of each factory.
2-7 Mix up of samples during analysis and mix up in analytical result (e.g., a relatively clean sample exhibits unusually high pollution level)
Quality control (QC) in field and laboratory will be performed carefully. - In the field, sampling
equipment will be cleaned and rinsed with the sample as indicated in the reference standard method.
- In the laboratory, new method blank will be prepared and rechecked when analyzing samples with high concentration.
Same as Period 1
2-7 Errors in reporting unit (e.g., confusion between ug and mg, mS/cm and mS/m, etc.)
Sampling team leader will check and approve recording data for every sample. The method of converting units will be demonstrated in the data worksheet.
JET also checked and recorded the data for every sample.
2-8 Difficulty in tracing the problem (e.g., original laboratory notebook not available)
All data will be recorded for every step from the beginning to the end of the process (field sampling to analysis reporting). Technical management and quality manager will approve all data. Client can request to see all data. All electronic file will be backed up regularly to prevent data loss.
Same as Period 1
Source: JET based on information from REM and Supreme
1.5.2. Comparison between the Analysis Results in Period 1 and 2
Wastewater quality was analyzed both in Period 1 (2016) and Period 2 (2017) as follows:
Table 1.5-2 Water Quality Analysis in Period 1 and 2
Period Type of Survey Laboratory Remarks
Period 1 (2016)
50 factories (25 factories each in Yangon and Mandalay)
Myanmar / Thailand
-
The Project for Capacity Development in Basic Water Environment
Management and EIA System in the Republic of the Union of Myanmar
Pollution Source Survey Report
11
Period 2 (2017)
50 factories (25 factories each in Yangon and Mandalay)
Myanmar / Thailand
Some factories are overlapped those in Period 1
18 factories (9 factories each in Yangon and Mandalay)
Japan 18 factories out of 50 are excluded
Source: JET
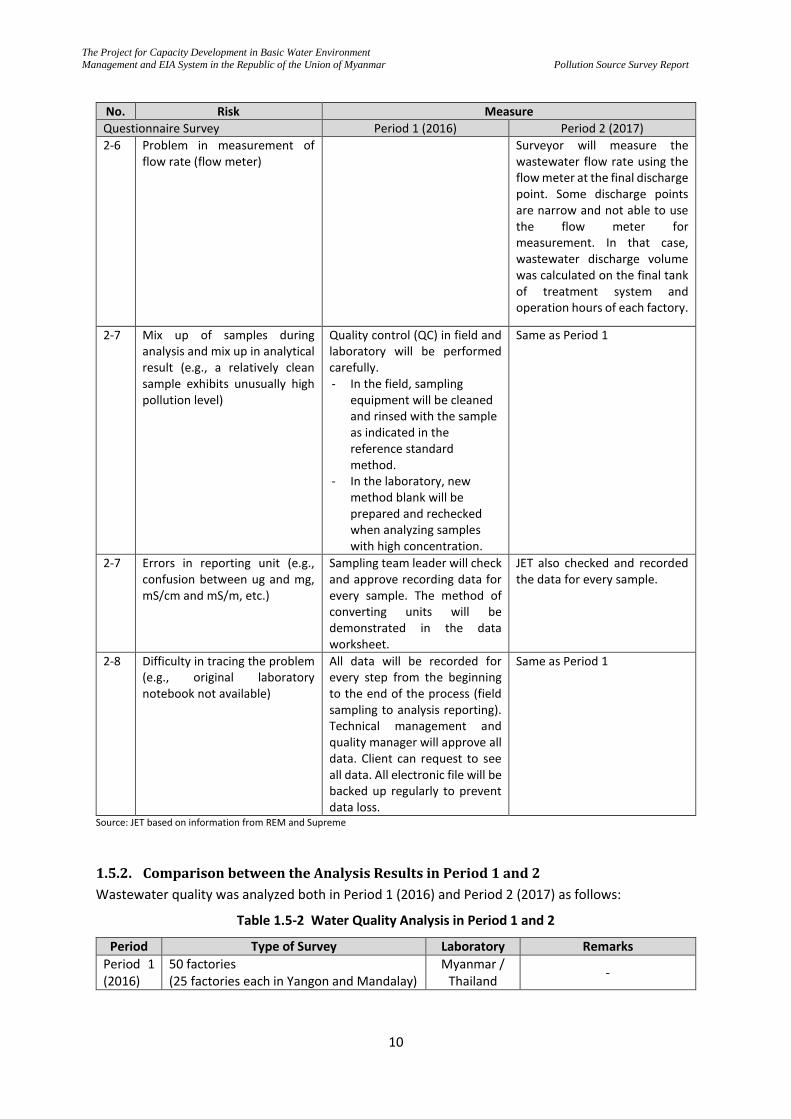
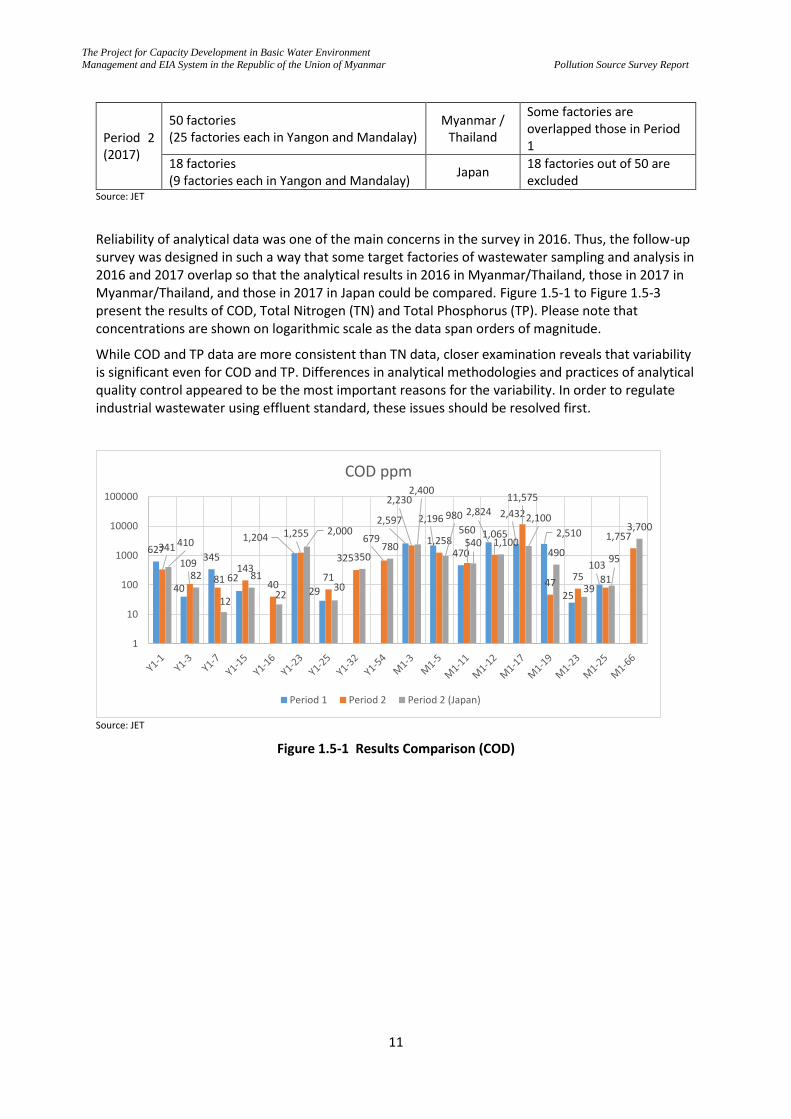
Reliability of analytical data was one of the main concerns in the survey in 2016. Thus, the follow-up survey was designed in such a way that some target factories of wastewater sampling and analysis in 2016 and 2017 overlap so that the analytical results in 2016 in Myanmar/Thailand, those in 2017 in Myanmar/Thailand, and those in 2017 in Japan could be compared. Figure 1.5-1 to Figure 1.5-3 present the results of COD, Total Nitrogen (TN) and Total Phosphorus (TP). Please note that concentrations are shown on logarithmic scale as the data span orders of magnitude.
While COD and TP data are more consistent than TN data, closer examination reveals that variability is significant even for COD and TP. Differences in analytical methodologies and practices of analytical quality control appeared to be the most important reasons for the variability. In order to regulate industrial wastewater using effluent standard, these issues should be resolved first.
Source: JET
Figure 1.5-1 Results Comparison (COD)
627
40
345
62
1,204
29
2,597 2,196
470
2,824 2,432
2,510
25
103
341
109
81143
40
1,255
71
325
679
2,230
1,258560 1,065
11,575
4775 81
1,757410
82
12
81
22
2,000
30
350780
2,400
980
540 1,100
2,100
490
39
95
3,700
1
10
100
1000
10000
100000
COD ppm
Period 1 Period 2 Period 2 (Japan)
The Project for Capacity Development in Basic Water Environment
Management and EIA System in the Republic of the Union of Myanmar
Pollution Source Survey Report
12
Source: JET
Figure 1.5-2 Results Comparison Result (TN)
Source: JET
Figure 1.5-3 Results Comparison (TP)
Table 1.5-3 lists the results of analyses of toxic substances in Japan and Thailand. Only the data above NEQEG (2015) are listed. It seems the results were comparable, though more formal assessment is needed as the number of samples was limited.
Table 1.5-3 Comparison of Results of Toxic Substances in Japan and Thailand
Code Product Pollutant Unit Japan Thailand
Y1-16 Battery Lead mg/L 6.8 4.09
M1-11 Garment/Textile Zinc mg/L 2.7 2.97
M1-12 Leather Tanning Phenols mg/L 4.6 3.97
M1-17 Leather Tanning Phenols mg/L 9.6 8.43
M1-17 Leather Tanning Chromium (Total) mg/L 4.5 3.22
M1-25 Battery Zinc mg/L 170 166
Source: JET
0.3
36.4
2.42
0.17
7.82
0.050.13
12.9
0.040.07
0.21
10.3
35.2
29.2
1.6
10.2
1.1
15.1
7.8
2.5
10.4 20.412.6
12.8
2.86.4
1
7.3
25.716.5
76110
1 0.78
1.8
1311
7.2
130 36 2729
120250
3.6
7.4
81
3.2
0.01
0.1
1
10
100
1000
T-N ppm
Period 1 Period 2 Period 2 (Japan)
7.35
7.07
0.18
22
0.261.52 3.6
19.6 4.37
1.57
5.96
0.27
3.45
256.6
0.1
6
0.8
9.52.6
0.9
7.69.5
7.83.8
0.4
2.50.6
3.3
0.30.6
34
6.93
0.073
0.71
2
0.48
123.1
23
3.4
0.75
6.5
0.28
3
2.4
0.27
0.01
0.1
1
10
100
T-P ppm
Period 1 Period 2 Period 2 (Japan)
The Project for Capacity Development in Basic Water Environment
Management and EIA System in the Republic of the Union of Myanmar
Pollution Source Survey Report
13
2. SURVEY RESULTS
2.1. Hlaing River Basin
2.1.1. Questionnaire Survey in 2016
(1) Target Factories
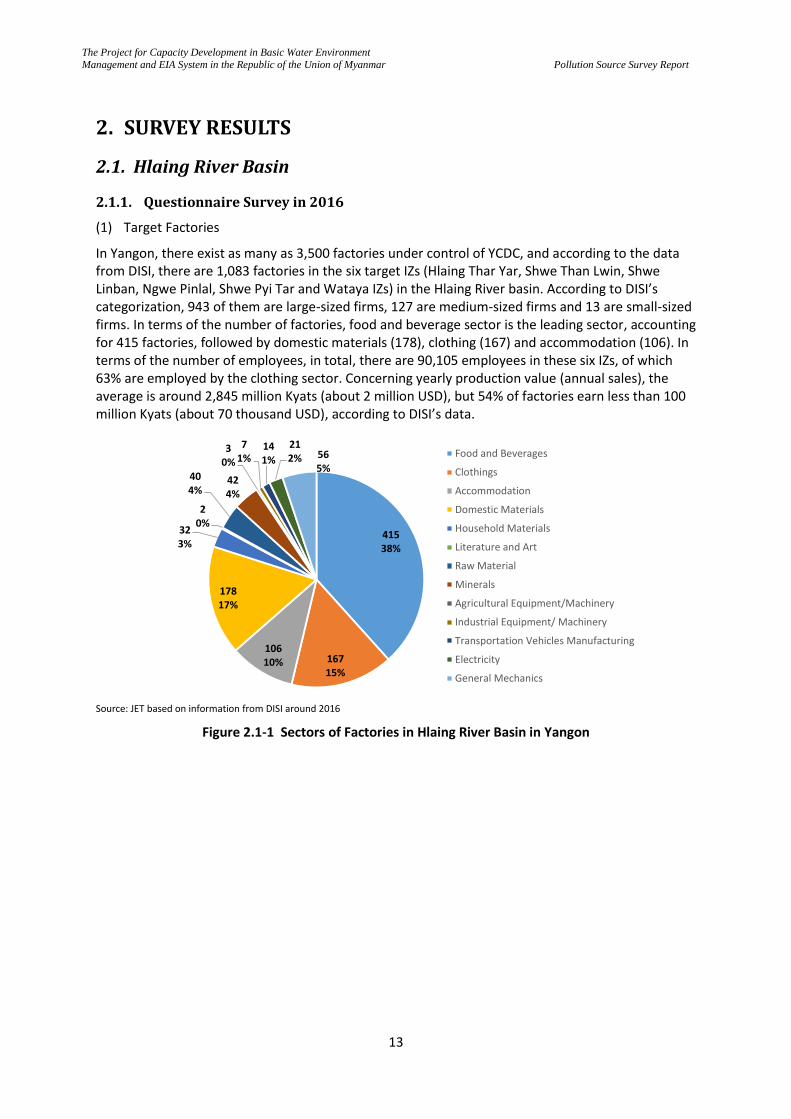
In Yangon, there exist as many as 3,500 factories under control of YCDC, and according to the data from DISI, there are 1,083 factories in the six target IZs (Hlaing Thar Yar, Shwe Than Lwin, Shwe Linban, Ngwe Pinlal, Shwe Pyi Tar and Wataya IZs) in the Hlaing River basin. According to DISI’s categorization, 943 of them are large-sized firms, 127 are medium-sized firms and 13 are small-sized firms. In terms of the number of factories, food and beverage sector is the leading sector, accounting for 415 factories, followed by domestic materials (178), clothing (167) and accommodation (106). In terms of the number of employees, in total, there are 90,105 employees in these six IZs, of which 63% are employed by the clothing sector. Concerning yearly production value (annual sales), the average is around 2,845 million Kyats (about 2 million USD), but 54% of factories earn less than 100 million Kyats (about 70 thousand USD), according to DISI’s data.
Source: JET based on information from DISI around 2016
Figure 2.1-1 Sectors of Factories in Hlaing River Basin in Yangon
41538%
16715%
10610%
17817%
323%
20%
404%
424%
30%
71%
141%
212% 56
5%
Food and Beverages
Clothings
Accommodation
Domestic Materials
Household Materials
Literature and Art
Raw Material
Minerals
Agricultural Equipment/Machinery
Industrial Equipment/ Machinery
Transportation Vehicles Manufacturing
Electricity
General Mechanics
The Project for Capacity Development in Basic Water Environment
Management and EIA System in the Republic of the Union of Myanmar
Pollution Source Survey Report
14
Source: JET based on information from DISI around 2016
Figure 2.1-2 Number of Employees of Factories in Hlaing River Basin in Yangon by Sector
In order to find the current situation of the industrial zones in the Hlaing River basin in Yangon, the questionnaire survey for 200 factories (each 100 factories in Yangon and Mandalay) were implemented in 2016. Below table shows the summary of the result.
Table 2.1-1 Summary of Results for Questionnaire Survey in Yangon (2016)
No. Categories Summary of Results (Yangon) Figures
1 Size of Target
factories (DISI’s
Classification)
80% (80 out of 100 factories) are large size 9% (9 out of 100 factories) are medium size
11% (11 out of 100 factories) are small size
2.1-6
2 Number of
employee
35% of the factories use 10-49 employees >50 % of the factories employ less than 100 employees. In Japan, less than 300 employees are small and medium-sized In Europe, less than 10 are micro-level,10-50 staff (small enterprise), 50-250 (medium enterprise), more than 250 staff (large enterprise) Note: Most of the factories are not very large scaled. On average,
factories in Yangon are larger than those in Mandalay.
2.1-7
3 Land area Average land size of the factory- 2.57 acre (1.0 ha)
1.72 acre - building area. 2.1-8
4 Water Usage
-10% (10 out of 100 factories) have water meters to monitor water usage -4% (4 out of 100 factories) have water meters to measure wastewater discharge rate -Average water usage per factory- about 15,000 gal/day (67 m3/day) -73% (73 out of 100 factories) -less than 10,000 gal/day (43 m3/day) -24% (24 out of 100 factories) -10,000 gal/day (43 m3/day)
2.1-9
5 Sources of Water 92% of water used in the target factories is groundwater 2.1-10
6 Wastewater
Discharge Rate
-Factory average discharge 7,500 gal/day (34 m3/ day) -79% (79 out of 91 factories) discharge over 100,000 gal/day -87% discharge less than 10,000 gal/day (43 m3/day)
2.1-11
7 Ratio of wastewater
and water usage
Average water discharge – about 50% of average water usage Note: Many factories reported small discharge compared to water usage. During the wastewater sampling, wastewater discharge was measured/ estimated independently.
2-1-12
8 Wastewater
Management
Flow meter (water usage)- 10 % Flow meter (wastewater)-4% Water recycling- 12% Separation of rain water- 2% Minimization of solid waste from wastewater stream- 44% Separation of toxic substances- 13%
2.1-13
12,82414%
56,50963%
3,3934%
8,0449%
1,3562%
1,7812%
3,1394% Food and Beverages
Clothings
Accommodation
Domestic Materials
Household Materials
Literature and Art
Raw Material
Minerals
Agricultural Equipment/Machinery
Industrial Equipment/ Machinery
Transportation Vehicles Manufacturing
Electricity
General Mechanics
The Project for Capacity Development in Basic Water Environment
Management and EIA System in the Republic of the Union of Myanmar
Pollution Source Survey Report
15
No. Categories Summary of Results (Yangon) Figures
Other -1% Note: The respondents to the questionnaires are not necessarily experts in different environmental measures.
9 Existence of
Wastewater
Treatment Facilities
(%)
53% of the factories have wastewater treatment facilities. 47% of the factories does not have wastewater treatment facilities.
2.1-14
10 Regular Self-
monitoring of
Wastewater Quality
62% of the factories monitor wastewater qualities (once/year). Note: Reported values were often different from the results of wastewater sampling carried out.
2.1-15
11 Wastewater
treatment
Primary treatment- removal of solid (screen, settling basin, oil separator, and chemical coagulation) 36% of the factories has screen 7% of the factories has equalization tank 50% of the factories has settling basin 9% of the factories has oil separator 4% of the factories has chemical coagulation 1% of the factories has other
2.1-16
Secondary treatment – removal of biodegradable organic matter 1% - Septic tank 2% - Activated sludge 1%- UASB 2%- other biological
2.1-17
Tertiary treatment – removal of nutrients, etc. 53% of the factories remove settle-able solid and floating waste 50% of the factories have settling basin/ sedimentation tank 4% of the factories remove biodegradable organic matter 1% of the factories have septic tank Some factories have screen and oil separator. Very few factories have modern biological treatment systems (activated sludge and UASB) Note: Most of the factories have traditional system based on sand filter and charcoal.
12 Solid Waste
Management
General garbage from office and canteen Most factories generate less than 2 ton/month (reported only solid waste is less than 0.1 ton/month) Garbage picked up by YCDC, some factories dispose waste in their own yard.
2.1-18
Solid waste from production line Most factories generate less than 5 ton /month of solid waste Some factories generate over 100 tons/ month of waste (fish head from some cold storage factories) 50% of factories generate sludge. 50% of factories recycle and reuse solid waste (recycling of used paper and plastics). Methods of industrial waste disposal- landfilling and incineration by YCDC
2.1-19
13 Hazardous waste 14 % of the factories – produce hazardous wastes 10 % of the factories- sharp objects (broken glass, 2% of the factories- toxic and corrosive substances (lead, sulfuric acid and biocide) 1% of the factories- infectious waste (blood) 1% of the factories- other material (agricultural) Note: The number of factories discharging hazardous waste is larger, and more detailed investigation is needed. Norwegian team is currently investigating situation of hazardous waste in Yangon and Mandalay.
2.1-20
The Project for Capacity Development in Basic Water Environment
Management and EIA System in the Republic of the Union of Myanmar
Pollution Source Survey Report
16
No. Categories Summary of Results (Yangon) Figures
14 Environmental
Management
system and
Enforcement
Answers to Questions on Environmental Management 11%- Submitted EMPs to ECD 10%-ISO 14001 or ISO9001 or FSSC22000 or similar 80%- Plans for emergency 74%- CSR 2%- Environmental accidents in last 3 years 3%- Environmental complaint in last 3 years
2.1-21
Inspection by Relevant Authorities 75% of the factories- YCDC visited 17% of the factories- ECD visited 72% of the factories- DISI visited 22% of the factories- EI, MIC, Department of Health, ASEAN-OSHNET Note: YCDC and DISI visited many of these factories in 2016 for renewing of
business license and registration and they receive some basic instruction about environmental issues.
2.1-22
Adequacy of Environmental Management 58% of the factories- wastewater management is adequate 91% of the factories- waste management is adequate
2.1.23
Source: JET
Source: JET based on information from DISI
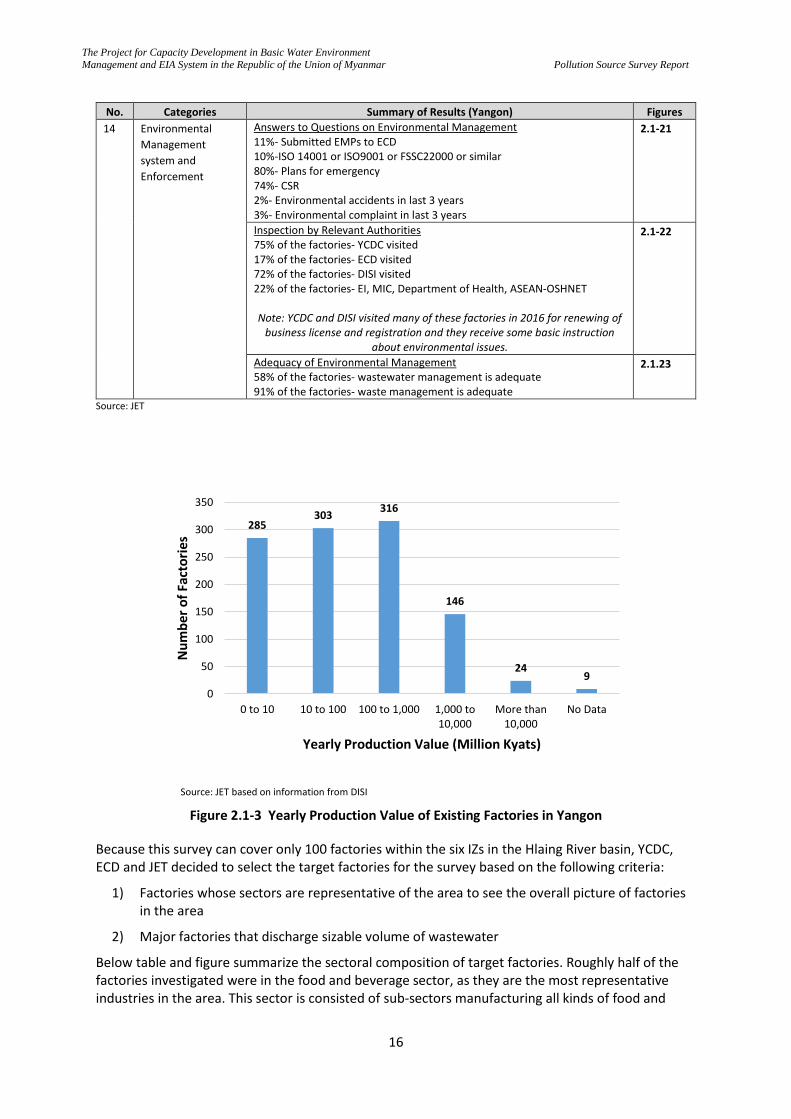
Figure 2.1-3 Yearly Production Value of Existing Factories in Yangon
Because this survey can cover only 100 factories within the six IZs in the Hlaing River basin, YCDC, ECD and JET decided to select the target factories for the survey based on the following criteria:
1) Factories whose sectors are representative of the area to see the overall picture of factories in the area
2) Major factories that discharge sizable volume of wastewater
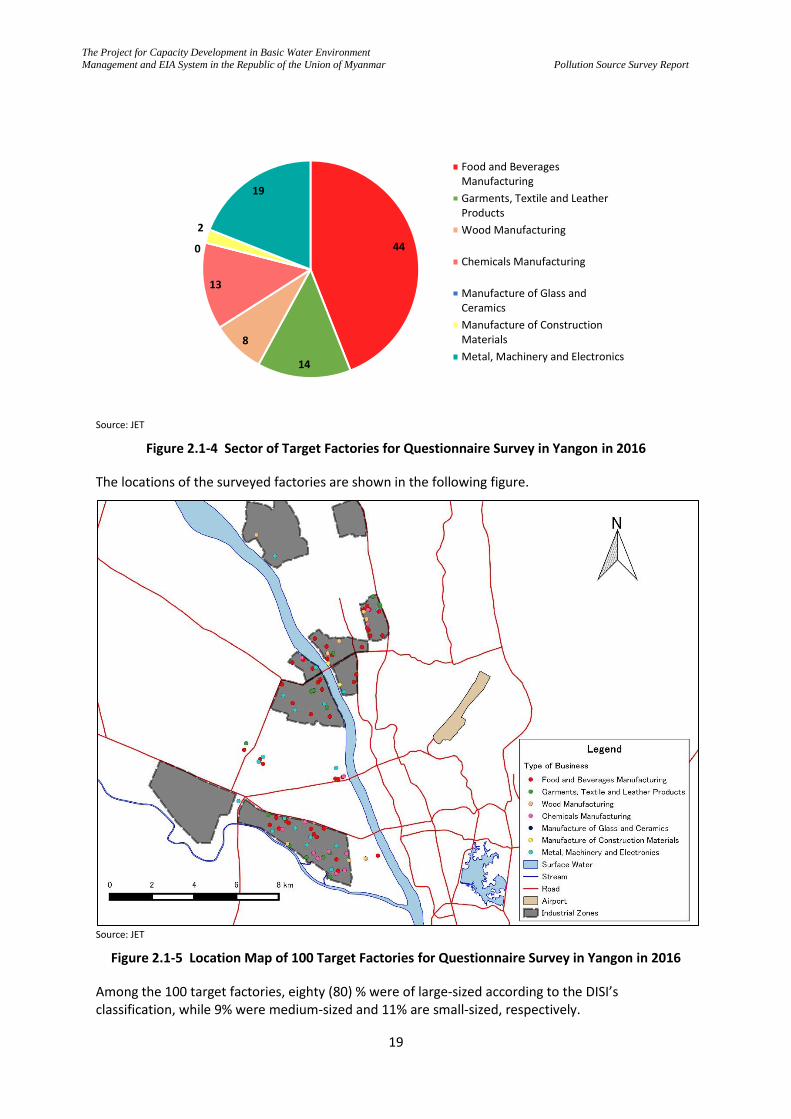
Below table and figure summarize the sectoral composition of target factories. Roughly half of the factories investigated were in the food and beverage sector, as they are the most representative industries in the area. This sector is consisted of sub-sectors manufacturing all kinds of food and
285303
316
146
249
0
50
100
150
200
250
300
350
0 to 10 10 to 100 100 to 1,000 1,000 to10,000
More than10,000
No Data
Nu
mb
er o
f Fa
cto
ries
Yearly Production Value (Million Kyats)
The Project for Capacity Development in Basic Water Environment
Management and EIA System in the Republic of the Union of Myanmar
Pollution Source Survey Report
17
beverage products, such as alcohol, sea food, noodle, etc. Aside from the food and beverage, factories in diverse industrial sectors were selected as the targets. It was noted that DISI’s classification system used for classification of industrial sectors is not consistent with neither the sector classification of NEQEG (2015) nor the system of International Standard Industrial Classification of All Economic Activities (ISIC) (It is suggested to re-organize the classification system based on ISIC system). Also, some of the industrial sectors were represented only by a few factories, or sometime by only one factory. Thus, the data should be interpreted with care.
The Project for Capacity Development in Basic Water Environment
Management and EIA System in the Republic of the Union of Myanmar
Pollution Source Survey Report
18
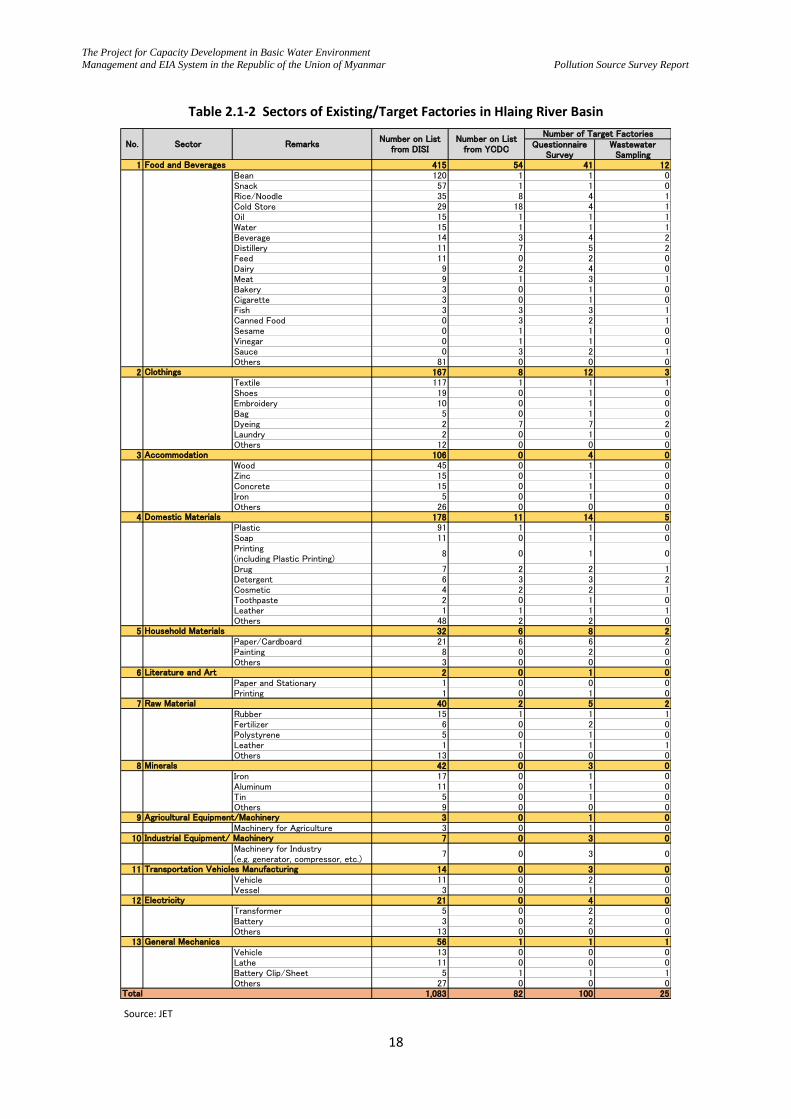
Table 2.1-2 Sectors of Existing/Target Factories in Hlaing River Basin
Source: JET
QuestionnaireSurvey
WastewaterSampling
1 415 54 41 12Bean 120 1 1 0Snack 57 1 1 0Rice/Noodle 35 8 4 1Cold Store 29 18 4 1Oil 15 1 1 1Water 15 1 1 1Beverage 14 3 4 2Distillery 11 7 5 2Feed 11 0 2 0Dairy 9 2 4 0Meat 9 1 3 1Bakery 3 0 1 0Cigarette 3 0 1 0Fish 3 3 3 1Canned Food 0 3 2 1Sesame 0 1 1 0Vinegar 0 1 1 0Sauce 0 3 2 1Others 81 0 0 0
2 167 8 12 3Textile 117 1 1 1Shoes 19 0 1 0Embroidery 10 0 1 0Bag 5 0 1 0Dyeing 2 7 7 2Laundry 2 0 1 0Others 12 0 0 0
3 106 0 4 0Wood 45 0 1 0Zinc 15 0 1 0Concrete 15 0 1 0Iron 5 0 1 0Others 26 0 0 0
4 178 11 14 5Plastic 91 1 1 0Soap 11 0 1 0Printing(including Plastic Printing)
8 0 1 0
Drug 7 2 2 1Detergent 6 3 3 2Cosmetic 4 2 2 1Toothpaste 2 0 1 0Leather 1 1 1 1Others 48 2 2 0
5 32 6 8 2Paper/Cardboard 21 6 6 2Painting 8 0 2 0Others 3 0 0 0
6 2 0 1 0Paper and Stationary 1 0 0 0Printing 1 0 1 0
7 40 2 5 2Rubber 15 1 1 1Fertilizer 6 0 2 0Polystyrene 5 0 1 0Leather 1 1 1 1Others 13 0 0 0
8 42 0 3 0Iron 17 0 1 0Aluminum 11 0 1 0Tin 5 0 1 0Others 9 0 0 0
9 3 0 1 0Machinery for Agriculture 3 0 1 0
10 7 0 3 0Machinery for Industry(e.g. generator, compressor, etc.)
7 0 3 0
11 14 0 3 0Vehicle 11 0 2 0Vessel 3 0 1 0
12 21 0 4 0Transformer 5 0 2 0Battery 3 0 2 0Others 13 0 0 0
13 56 1 1 1Vehicle 13 0 0 0Lathe 11 0 0 0Battery Clip/Sheet 5 1 1 1Others 27 0 0 0
1,083 82 100 25
No. Sector RemarksNumber on List
from DISINumber on List
from YCDC
Number of Target Factories
Food and Beverages
Clothings
Accommodation
Domestic Materials
Household Materials
Literature and Art
Raw Material
Minerals
Total
Agricultural Equipment/Machinery
Industrial Equipment/ Machinery
Transportation Vehicles Manufacturing
Electricity
General Mechanics
The Project for Capacity Development in Basic Water Environment
Management and EIA System in the Republic of the Union of Myanmar
Pollution Source Survey Report
19
Source: JET
Figure 2.1-4 Sector of Target Factories for Questionnaire Survey in Yangon in 2016
The locations of the surveyed factories are shown in the following figure.
Source: JET
Figure 2.1-5 Location Map of 100 Target Factories for Questionnaire Survey in Yangon in 2016
Among the 100 target factories, eighty (80) % were of large-sized according to the DISI’s classification, while 9% were medium-sized and 11% are small-sized, respectively.
44
14
8
13
0
2
19
Food and BeveragesManufacturing
Garments, Textile and LeatherProducts
Wood Manufacturing
Chemicals Manufacturing
Manufacture of Glass andCeramics
Manufacture of ConstructionMaterials
Metal, Machinery and Electronics
The Project for Capacity Development in Basic Water Environment
Management and EIA System in the Republic of the Union of Myanmar
Pollution Source Survey Report
20
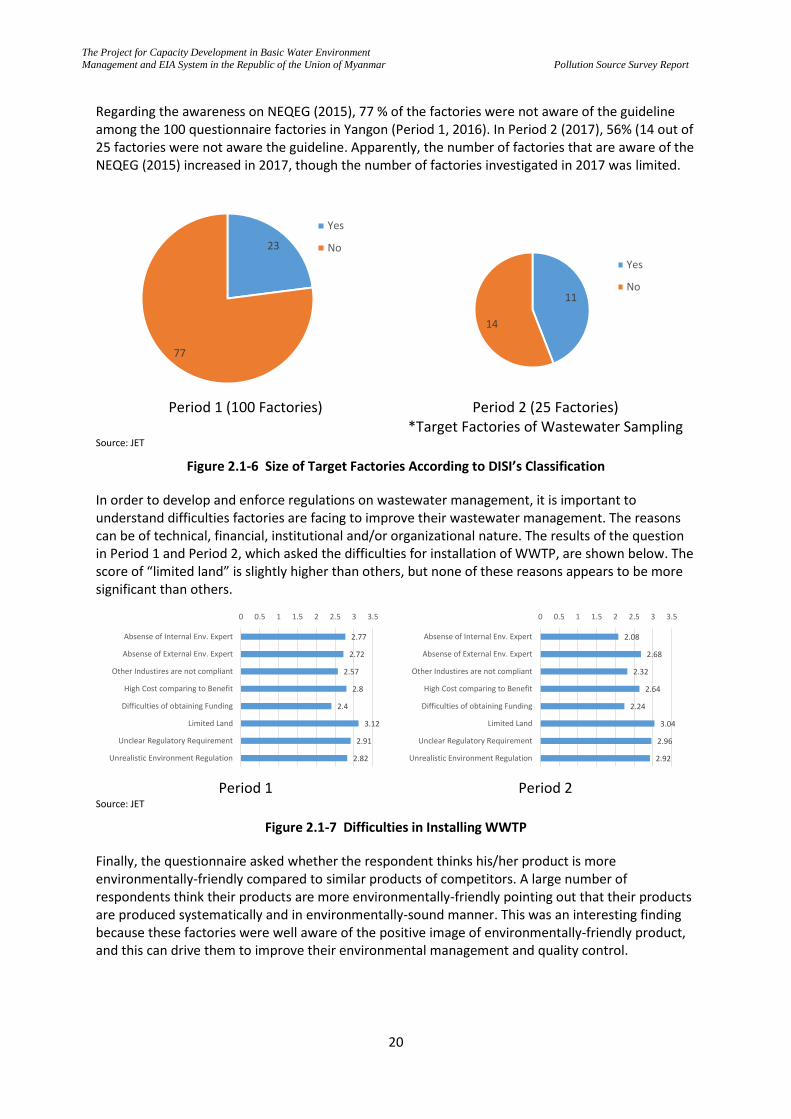
Regarding the awareness on NEQEG (2015), 77 % of the factories were not aware of the guideline among the 100 questionnaire factories in Yangon (Period 1, 2016). In Period 2 (2017), 56% (14 out of 25 factories were not aware the guideline. Apparently, the number of factories that are aware of the NEQEG (2015) increased in 2017, though the number of factories investigated in 2017 was limited.
Period 1 (100 Factories) Period 2 (25 Factories)
*Target Factories of Wastewater Sampling Source: JET
Figure 2.1-6 Size of Target Factories According to DISI’s Classification
In order to develop and enforce regulations on wastewater management, it is important to understand difficulties factories are facing to improve their wastewater management. The reasons can be of technical, financial, institutional and/or organizational nature. The results of the question in Period 1 and Period 2, which asked the difficulties for installation of WWTP, are shown below. The score of “limited land” is slightly higher than others, but none of these reasons appears to be more significant than others.
Period 1 Period 2
Source: JET
Figure 2.1-7 Difficulties in Installing WWTP
Finally, the questionnaire asked whether the respondent thinks his/her product is more environmentally-friendly compared to similar products of competitors. A large number of respondents think their products are more environmentally-friendly pointing out that their products are produced systematically and in environmentally-sound manner. This was an interesting finding because these factories were well aware of the positive image of environmentally-friendly product, and this can drive them to improve their environmental management and quality control.
23
77
Yes
No
11
14
Yes
No
2.77
2.72
2.57
2.8
2.4
3.12
2.91
2.82
0 0.5 1 1.5 2 2.5 3 3.5
Absense of Internal Env. Expert
Absense of External Env. Expert
Other Industires are not compliant
High Cost comparing to Benefit
Difficulties of obtaining Funding
Limited Land
Unclear Regulatory Requirement
Unrealistic Environment Regulation
2.08
2.68
2.32
2.64
2.24
3.04
2.96
2.92
0 0.5 1 1.5 2 2.5 3 3.5
Absense of Internal Env. Expert
Absense of External Env. Expert
Other Industires are not compliant
High Cost comparing to Benefit
Difficulties of obtaining Funding
Limited Land
Unclear Regulatory Requirement
Unrealistic Environment Regulation
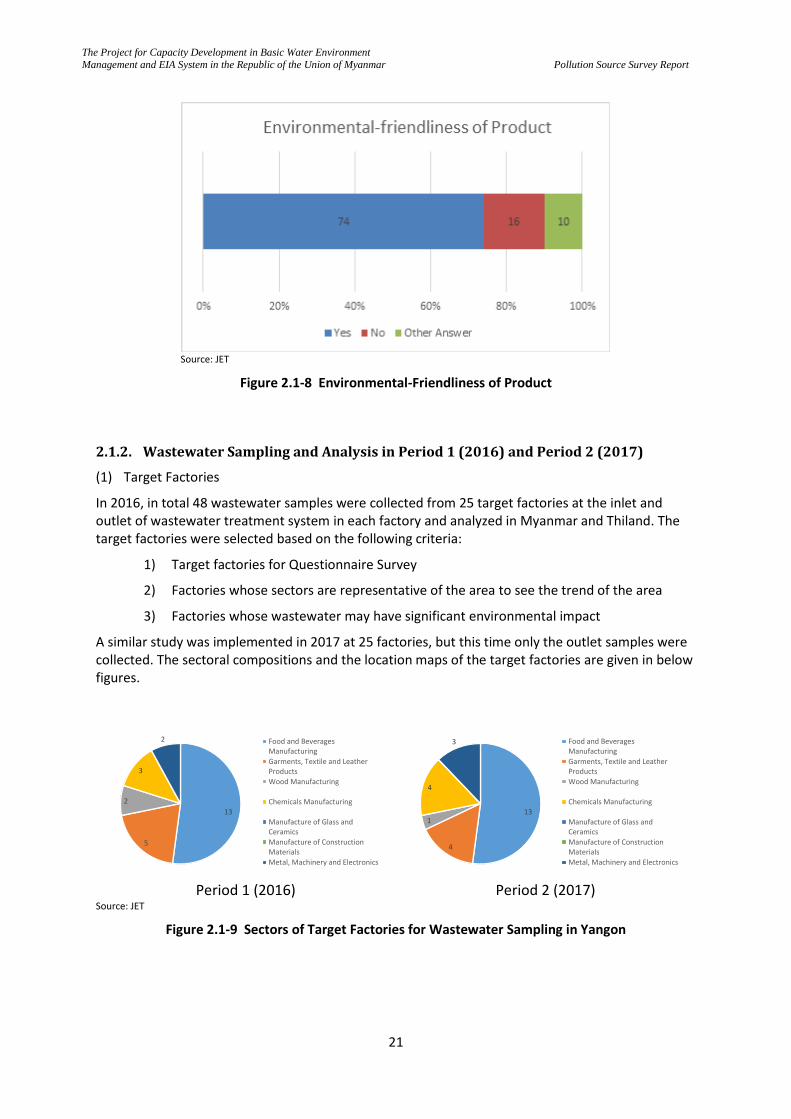
The Project for Capacity Development in Basic Water Environment
Management and EIA System in the Republic of the Union of Myanmar
Pollution Source Survey Report
21
Source: JET
Figure 2.1-8 Environmental-Friendliness of Product
2.1.2. Wastewater Sampling and Analysis in Period 1 (2016) and Period 2 (2017)
(1) Target Factories
In 2016, in total 48 wastewater samples were collected from 25 target factories at the inlet and outlet of wastewater treatment system in each factory and analyzed in Myanmar and Thiland. The target factories were selected based on the following criteria:
1) Target factories for Questionnaire Survey
2) Factories whose sectors are representative of the area to see the trend of the area
3) Factories whose wastewater may have significant environmental impact
A similar study was implemented in 2017 at 25 factories, but this time only the outlet samples were collected. The sectoral compositions and the location maps of the target factories are given in below figures.
Period 1 (2016) Period 2 (2017)
Source: JET
Figure 2.1-9 Sectors of Target Factories for Wastewater Sampling in Yangon
13
5
2
3
2 Food and BeveragesManufacturing
Garments, Textile and LeatherProducts
Wood Manufacturing
Chemicals Manufacturing
Manufacture of Glass andCeramics
Manufacture of ConstructionMaterials
Metal, Machinery and Electronics
13
4
1
4
3 Food and BeveragesManufacturing
Garments, Textile and LeatherProducts
Wood Manufacturing
Chemicals Manufacturing
Manufacture of Glass andCeramics
Manufacture of ConstructionMaterials
Metal, Machinery and Electronics
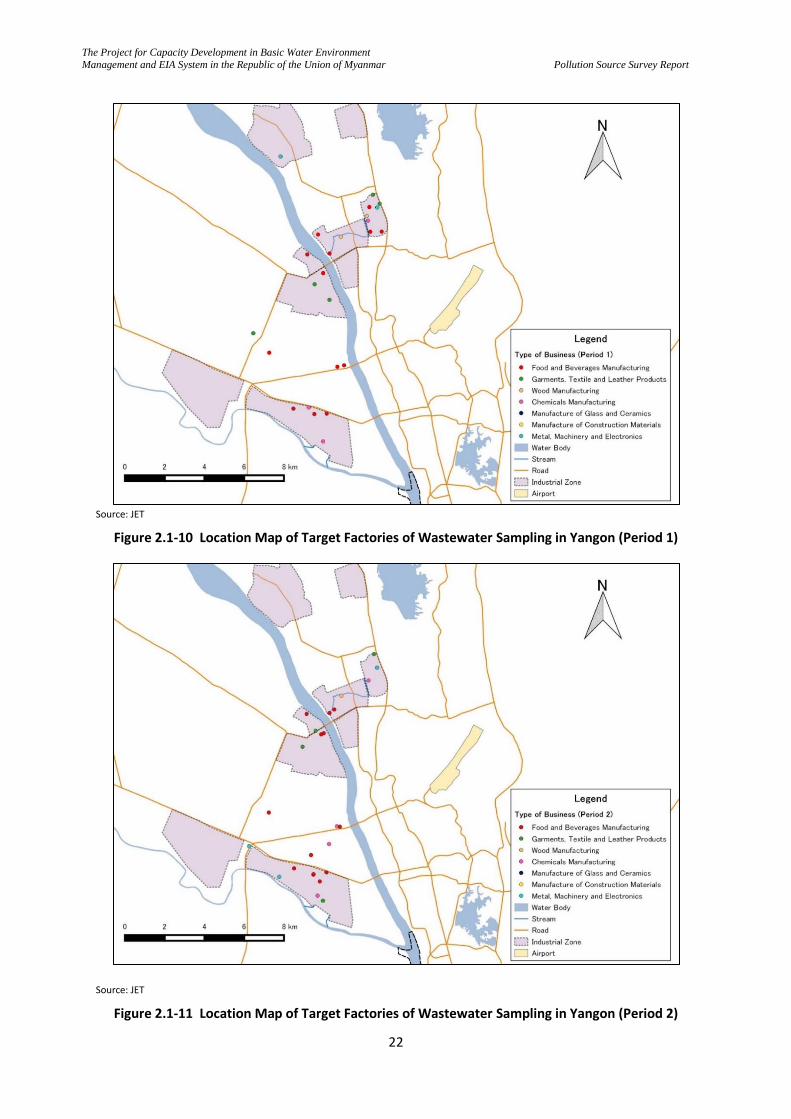
The Project for Capacity Development in Basic Water Environment
Management and EIA System in the Republic of the Union of Myanmar
Pollution Source Survey Report
22
Source: JET
Figure 2.1-10 Location Map of Target Factories of Wastewater Sampling in Yangon (Period 1)
Source: JET
Figure 2.1-11 Location Map of Target Factories of Wastewater Sampling in Yangon (Period 2)
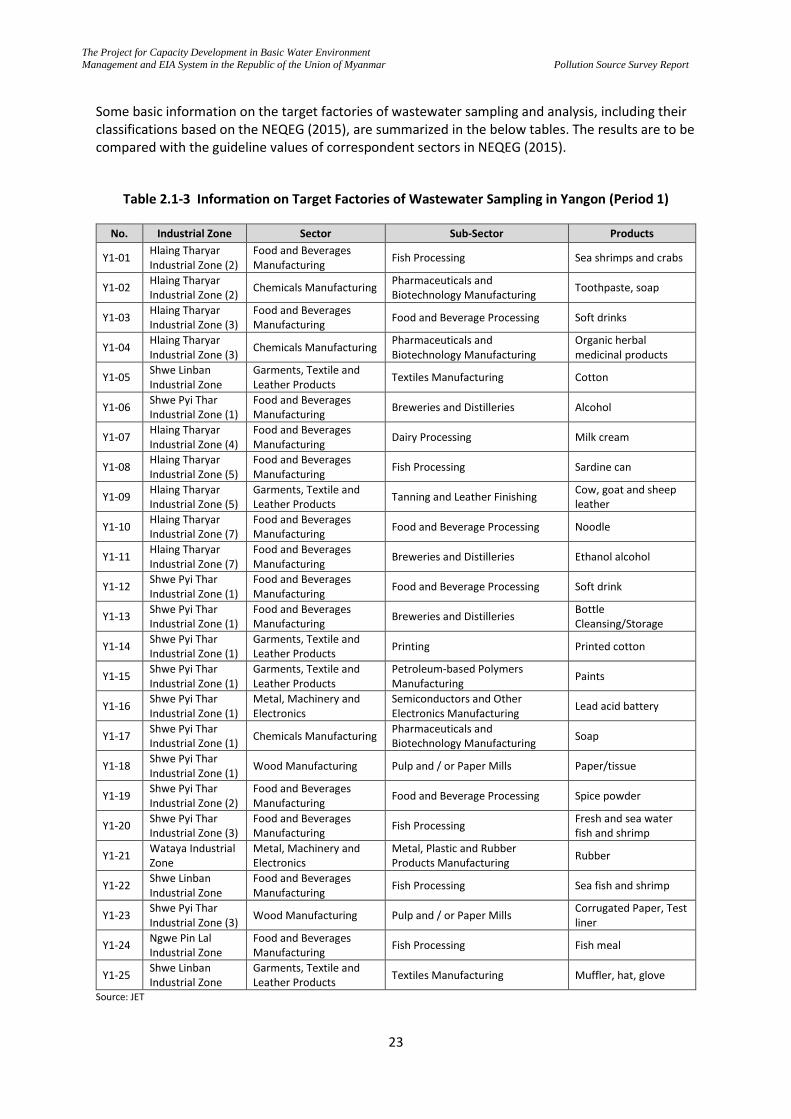
The Project for Capacity Development in Basic Water Environment
Management and EIA System in the Republic of the Union of Myanmar
Pollution Source Survey Report
23
Some basic information on the target factories of wastewater sampling and analysis, including their classifications based on the NEQEG (2015), are summarized in the below tables. The results are to be compared with the guideline values of correspondent sectors in NEQEG (2015).
Table 2.1-3 Information on Target Factories of Wastewater Sampling in Yangon (Period 1)
No. Industrial Zone Sector Sub-Sector Products
Y1-01 Hlaing Tharyar Industrial Zone (2)
Food and Beverages Manufacturing
Fish Processing Sea shrimps and crabs
Y1-02 Hlaing Tharyar Industrial Zone (2)
Chemicals Manufacturing Pharmaceuticals and Biotechnology Manufacturing
Toothpaste, soap
Y1-03 Hlaing Tharyar Industrial Zone (3)
Food and Beverages Manufacturing
Food and Beverage Processing Soft drinks
Y1-04 Hlaing Tharyar Industrial Zone (3)
Chemicals Manufacturing Pharmaceuticals and Biotechnology Manufacturing
Organic herbal medicinal products
Y1-05 Shwe Linban Industrial Zone
Garments, Textile and Leather Products
Textiles Manufacturing Cotton
Y1-06 Shwe Pyi Thar Industrial Zone (1)
Food and Beverages Manufacturing
Breweries and Distilleries Alcohol
Y1-07 Hlaing Tharyar Industrial Zone (4)
Food and Beverages Manufacturing
Dairy Processing Milk cream
Y1-08 Hlaing Tharyar Industrial Zone (5)
Food and Beverages Manufacturing
Fish Processing Sardine can
Y1-09 Hlaing Tharyar Industrial Zone (5)
Garments, Textile and Leather Products
Tanning and Leather Finishing Cow, goat and sheep leather
Y1-10 Hlaing Tharyar Industrial Zone (7)
Food and Beverages Manufacturing
Food and Beverage Processing Noodle
Y1-11 Hlaing Tharyar Industrial Zone (7)
Food and Beverages Manufacturing
Breweries and Distilleries Ethanol alcohol
Y1-12 Shwe Pyi Thar Industrial Zone (1)
Food and Beverages Manufacturing
Food and Beverage Processing Soft drink
Y1-13 Shwe Pyi Thar Industrial Zone (1)
Food and Beverages Manufacturing
Breweries and Distilleries Bottle Cleansing/Storage
Y1-14 Shwe Pyi Thar Industrial Zone (1)
Garments, Textile and Leather Products
Printing Printed cotton
Y1-15 Shwe Pyi Thar Industrial Zone (1)
Garments, Textile and Leather Products
Petroleum-based Polymers Manufacturing
Paints
Y1-16 Shwe Pyi Thar Industrial Zone (1)
Metal, Machinery and Electronics
Semiconductors and Other Electronics Manufacturing
Lead acid battery
Y1-17 Shwe Pyi Thar Industrial Zone (1)
Chemicals Manufacturing Pharmaceuticals and Biotechnology Manufacturing
Soap
Y1-18 Shwe Pyi Thar Industrial Zone (1)
Wood Manufacturing Pulp and / or Paper Mills Paper/tissue
Y1-19 Shwe Pyi Thar Industrial Zone (2)
Food and Beverages Manufacturing
Food and Beverage Processing Spice powder
Y1-20 Shwe Pyi Thar Industrial Zone (3)
Food and Beverages Manufacturing
Fish Processing Fresh and sea water fish and shrimp
Y1-21 Wataya Industrial Zone
Metal, Machinery and Electronics
Metal, Plastic and Rubber Products Manufacturing
Rubber
Y1-22 Shwe Linban Industrial Zone
Food and Beverages Manufacturing
Fish Processing Sea fish and shrimp
Y1-23 Shwe Pyi Thar Industrial Zone (3)
Wood Manufacturing Pulp and / or Paper Mills Corrugated Paper, Test liner
Y1-24 Ngwe Pin Lal Industrial Zone
Food and Beverages Manufacturing
Fish Processing Fish meal
Y1-25 Shwe Linban Industrial Zone
Garments, Textile and Leather Products
Textiles Manufacturing Muffler, hat, glove
Source: JET
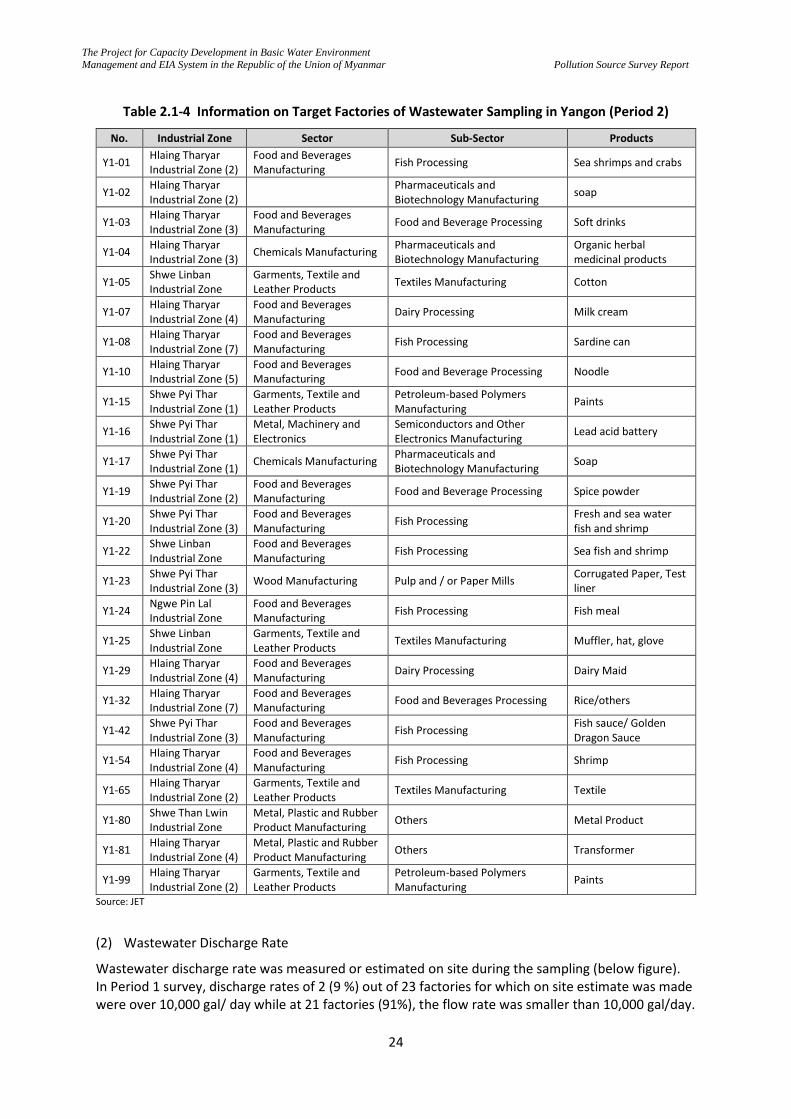
The Project for Capacity Development in Basic Water Environment
Management and EIA System in the Republic of the Union of Myanmar
Pollution Source Survey Report
24
Table 2.1-4 Information on Target Factories of Wastewater Sampling in Yangon (Period 2)
No. Industrial Zone Sector Sub-Sector Products
Y1-01 Hlaing Tharyar Industrial Zone (2)
Food and Beverages Manufacturing
Fish Processing Sea shrimps and crabs
Y1-02 Hlaing Tharyar Industrial Zone (2)
Pharmaceuticals and Biotechnology Manufacturing
soap
Y1-03 Hlaing Tharyar Industrial Zone (3)
Food and Beverages Manufacturing
Food and Beverage Processing Soft drinks
Y1-04 Hlaing Tharyar Industrial Zone (3)
Chemicals Manufacturing Pharmaceuticals and Biotechnology Manufacturing
Organic herbal medicinal products
Y1-05 Shwe Linban Industrial Zone
Garments, Textile and Leather Products
Textiles Manufacturing Cotton
Y1-07 Hlaing Tharyar Industrial Zone (4)
Food and Beverages Manufacturing
Dairy Processing Milk cream
Y1-08 Hlaing Tharyar Industrial Zone (7)
Food and Beverages Manufacturing
Fish Processing Sardine can
Y1-10 Hlaing Tharyar Industrial Zone (5)
Food and Beverages Manufacturing
Food and Beverage Processing Noodle
Y1-15 Shwe Pyi Thar Industrial Zone (1)
Garments, Textile and Leather Products
Petroleum-based Polymers Manufacturing
Paints
Y1-16 Shwe Pyi Thar Industrial Zone (1)
Metal, Machinery and Electronics
Semiconductors and Other Electronics Manufacturing
Lead acid battery
Y1-17 Shwe Pyi Thar Industrial Zone (1)
Chemicals Manufacturing Pharmaceuticals and Biotechnology Manufacturing
Soap
Y1-19 Shwe Pyi Thar Industrial Zone (2)
Food and Beverages Manufacturing
Food and Beverage Processing Spice powder
Y1-20 Shwe Pyi Thar Industrial Zone (3)
Food and Beverages Manufacturing
Fish Processing Fresh and sea water fish and shrimp
Y1-22 Shwe Linban Industrial Zone
Food and Beverages Manufacturing
Fish Processing Sea fish and shrimp
Y1-23 Shwe Pyi Thar Industrial Zone (3)
Wood Manufacturing Pulp and / or Paper Mills Corrugated Paper, Test liner
Y1-24 Ngwe Pin Lal Industrial Zone
Food and Beverages Manufacturing
Fish Processing Fish meal
Y1-25 Shwe Linban Industrial Zone
Garments, Textile and Leather Products
Textiles Manufacturing Muffler, hat, glove
Y1-29 Hlaing Tharyar Industrial Zone (4)
Food and Beverages Manufacturing
Dairy Processing Dairy Maid
Y1-32 Hlaing Tharyar Industrial Zone (7)
Food and Beverages Manufacturing
Food and Beverages Processing Rice/others
Y1-42 Shwe Pyi Thar Industrial Zone (3)
Food and Beverages Manufacturing
Fish Processing Fish sauce/ Golden Dragon Sauce
Y1-54 Hlaing Tharyar Industrial Zone (4)
Food and Beverages Manufacturing
Fish Processing Shrimp
Y1-65 Hlaing Tharyar Industrial Zone (2)
Garments, Textile and Leather Products
Textiles Manufacturing Textile
Y1-80 Shwe Than Lwin Industrial Zone
Metal, Plastic and Rubber Product Manufacturing
Others Metal Product
Y1-81 Hlaing Tharyar Industrial Zone (4)
Metal, Plastic and Rubber Product Manufacturing
Others Transformer
Y1-99 Hlaing Tharyar Industrial Zone (2)
Garments, Textile and Leather Products
Petroleum-based Polymers Manufacturing
Paints
Source: JET
(2) Wastewater Discharge Rate
Wastewater discharge rate was measured or estimated on site during the sampling (below figure). In Period 1 survey, discharge rates of 2 (9 %) out of 23 factories for which on site estimate was made were over 10,000 gal/ day while at 21 factories (91%), the flow rate was smaller than 10,000 gal/day.
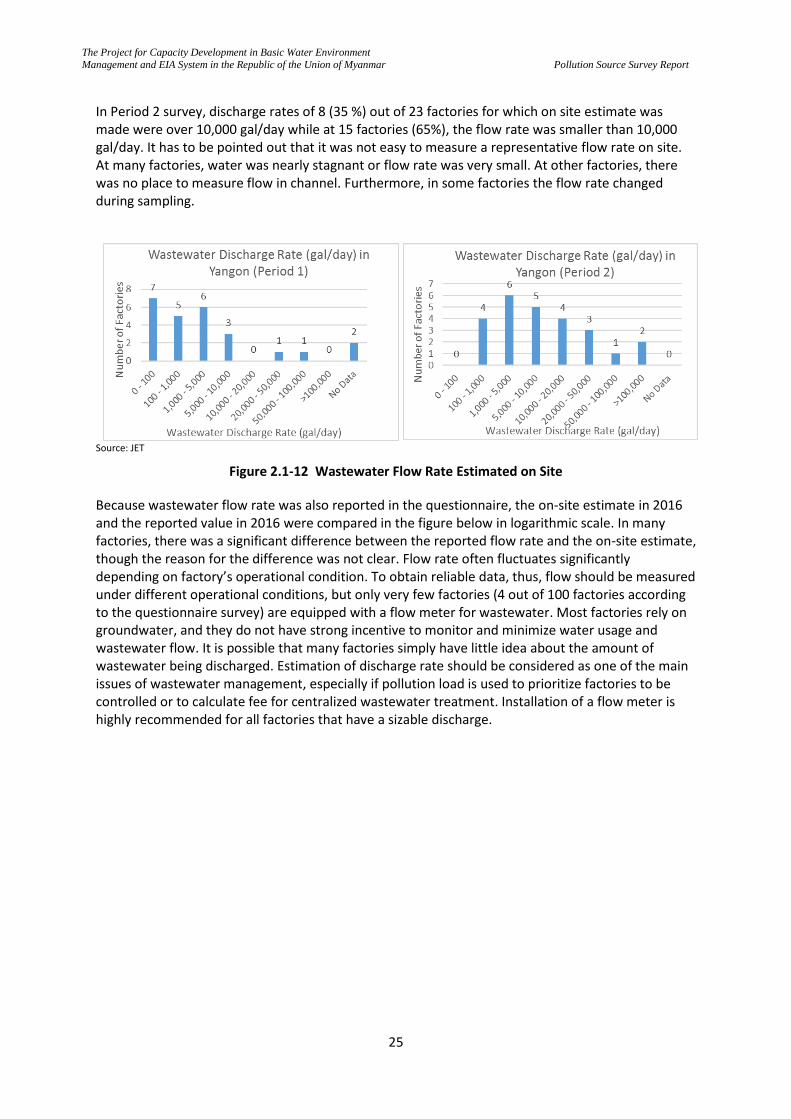
The Project for Capacity Development in Basic Water Environment
Management and EIA System in the Republic of the Union of Myanmar
Pollution Source Survey Report
25
In Period 2 survey, discharge rates of 8 (35 %) out of 23 factories for which on site estimate was made were over 10,000 gal/day while at 15 factories (65%), the flow rate was smaller than 10,000 gal/day. It has to be pointed out that it was not easy to measure a representative flow rate on site. At many factories, water was nearly stagnant or flow rate was very small. At other factories, there was no place to measure flow in channel. Furthermore, in some factories the flow rate changed during sampling.
Source: JET
Figure 2.1-12 Wastewater Flow Rate Estimated on Site
Because wastewater flow rate was also reported in the questionnaire, the on-site estimate in 2016 and the reported value in 2016 were compared in the figure below in logarithmic scale. In many factories, there was a significant difference between the reported flow rate and the on-site estimate, though the reason for the difference was not clear. Flow rate often fluctuates significantly depending on factory’s operational condition. To obtain reliable data, thus, flow should be measured under different operational conditions, but only very few factories (4 out of 100 factories according to the questionnaire survey) are equipped with a flow meter for wastewater. Most factories rely on groundwater, and they do not have strong incentive to monitor and minimize water usage and wastewater flow. It is possible that many factories simply have little idea about the amount of wastewater being discharged. Estimation of discharge rate should be considered as one of the main issues of wastewater management, especially if pollution load is used to prioritize factories to be controlled or to calculate fee for centralized wastewater treatment. Installation of a flow meter is highly recommended for all factories that have a sizable discharge.
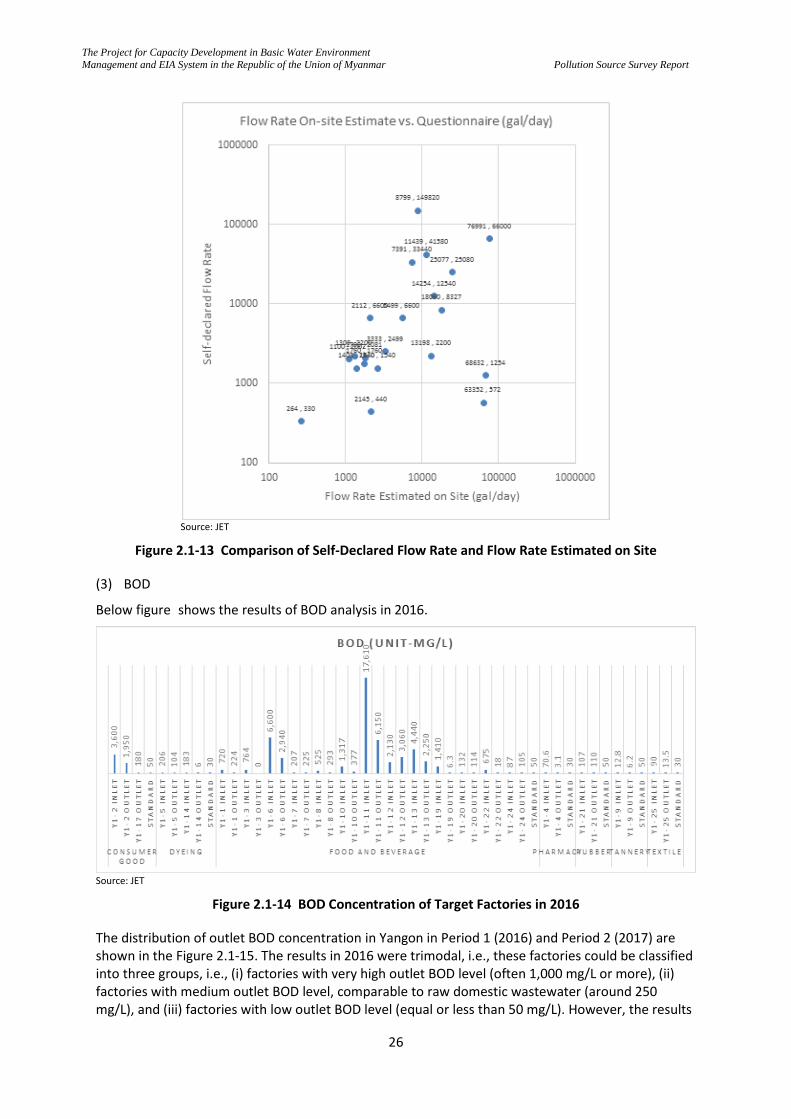
The Project for Capacity Development in Basic Water Environment
Management and EIA System in the Republic of the Union of Myanmar
Pollution Source Survey Report
26
Source: JET
Figure 2.1-13 Comparison of Self-Declared Flow Rate and Flow Rate Estimated on Site
(3) BOD
Below figure shows the results of BOD analysis in 2016.
Source: JET
Figure 2.1-14 BOD Concentration of Target Factories in 2016
The distribution of outlet BOD concentration in Yangon in Period 1 (2016) and Period 2 (2017) are shown in the Figure 2.1-15. The results in 2016 were trimodal, i.e., these factories could be classified into three groups, i.e., (i) factories with very high outlet BOD level (often 1,000 mg/L or more), (ii) factories with medium outlet BOD level, comparable to raw domestic wastewater (around 250 mg/L), and (iii) factories with low outlet BOD level (equal or less than 50 mg/L). However, the results
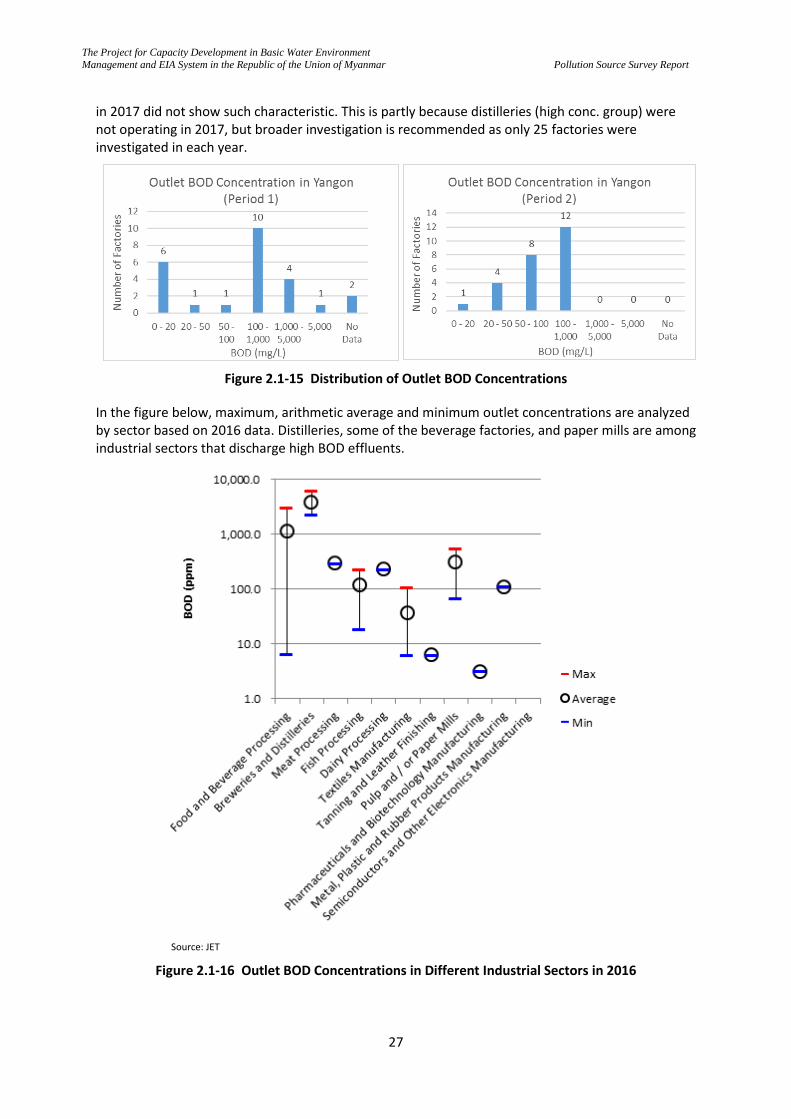
The Project for Capacity Development in Basic Water Environment
Management and EIA System in the Republic of the Union of Myanmar
Pollution Source Survey Report
27
in 2017 did not show such characteristic. This is partly because distilleries (high conc. group) were not operating in 2017, but broader investigation is recommended as only 25 factories were investigated in each year.
Figure 2.1-15 Distribution of Outlet BOD Concentrations
In the figure below, maximum, arithmetic average and minimum outlet concentrations are analyzed by sector based on 2016 data. Distilleries, some of the beverage factories, and paper mills are among industrial sectors that discharge high BOD effluents.
Source: JET
Figure 2.1-16 Outlet BOD Concentrations in Different Industrial Sectors in 2016
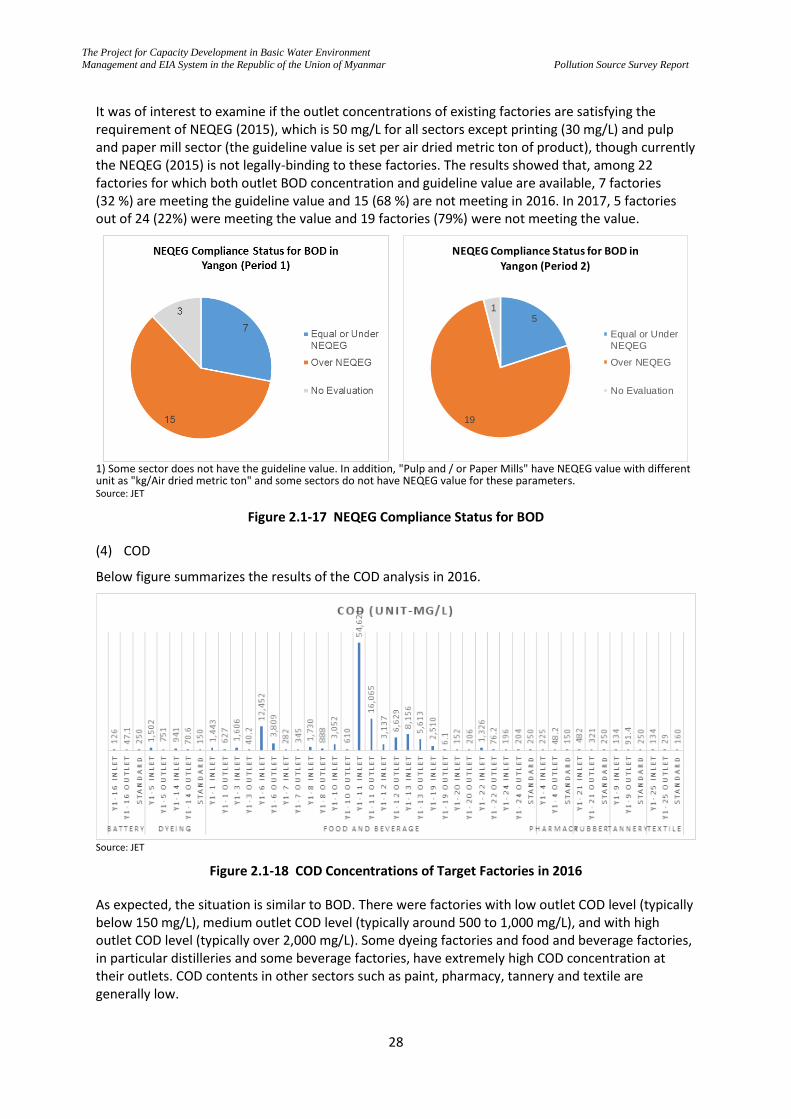
The Project for Capacity Development in Basic Water Environment
Management and EIA System in the Republic of the Union of Myanmar
Pollution Source Survey Report
28
It was of interest to examine if the outlet concentrations of existing factories are satisfying the requirement of NEQEG (2015), which is 50 mg/L for all sectors except printing (30 mg/L) and pulp and paper mill sector (the guideline value is set per air dried metric ton of product), though currently the NEQEG (2015) is not legally-binding to these factories. The results showed that, among 22 factories for which both outlet BOD concentration and guideline value are available, 7 factories (32 %) are meeting the guideline value and 15 (68 %) are not meeting in 2016. In 2017, 5 factories out of 24 (22%) were meeting the value and 19 factories (79%) were not meeting the value.
1) Some sector does not have the guideline value. In addition, "Pulp and / or Paper Mills" have NEQEG value with different unit as "kg/Air dried metric ton" and some sectors do not have NEQEG value for these parameters. Source: JET
Figure 2.1-17 NEQEG Compliance Status for BOD
(4) COD
Below figure summarizes the results of the COD analysis in 2016.
Source: JET
Figure 2.1-18 COD Concentrations of Target Factories in 2016
As expected, the situation is similar to BOD. There were factories with low outlet COD level (typically below 150 mg/L), medium outlet COD level (typically around 500 to 1,000 mg/L), and with high outlet COD level (typically over 2,000 mg/L). Some dyeing factories and food and beverage factories, in particular distilleries and some beverage factories, have extremely high COD concentration at their outlets. COD contents in other sectors such as paint, pharmacy, tannery and textile are generally low.
5
19
1
NEQEG Compliance Status for BOD in
Yangon (Period 2)
Equal or Under
NEQEG
Over NEQEG
No Evaluation
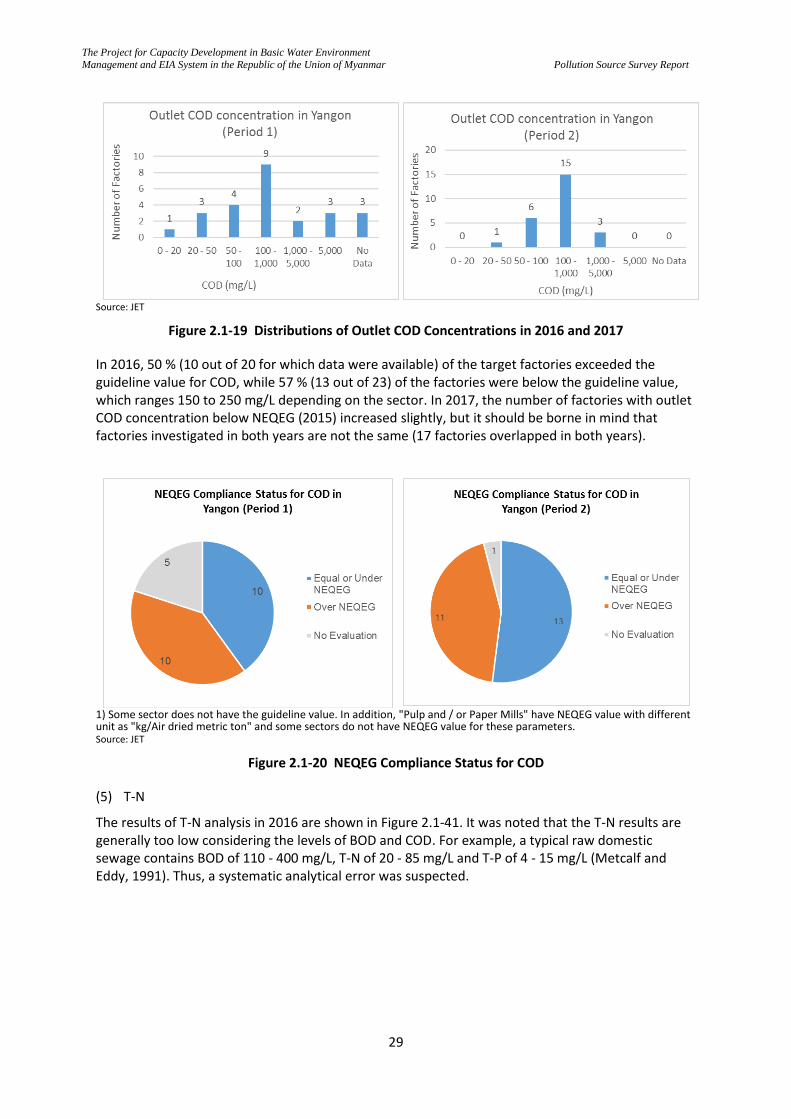
The Project for Capacity Development in Basic Water Environment
Management and EIA System in the Republic of the Union of Myanmar
Pollution Source Survey Report
29
Source: JET
Figure 2.1-19 Distributions of Outlet COD Concentrations in 2016 and 2017
In 2016, 50 % (10 out of 20 for which data were available) of the target factories exceeded the guideline value for COD, while 57 % (13 out of 23) of the factories were below the guideline value, which ranges 150 to 250 mg/L depending on the sector. In 2017, the number of factories with outlet COD concentration below NEQEG (2015) increased slightly, but it should be borne in mind that factories investigated in both years are not the same (17 factories overlapped in both years).
1) Some sector does not have the guideline value. In addition, "Pulp and / or Paper Mills" have NEQEG value with different unit as "kg/Air dried metric ton" and some sectors do not have NEQEG value for these parameters. Source: JET
Figure 2.1-20 NEQEG Compliance Status for COD
(5) T-N
The results of T-N analysis in 2016 are shown in Figure 2.1-41. It was noted that the T-N results are generally too low considering the levels of BOD and COD. For example, a typical raw domestic sewage contains BOD of 110 - 400 mg/L, T-N of 20 - 85 mg/L and T-P of 4 - 15 mg/L (Metcalf and Eddy, 1991). Thus, a systematic analytical error was suspected.
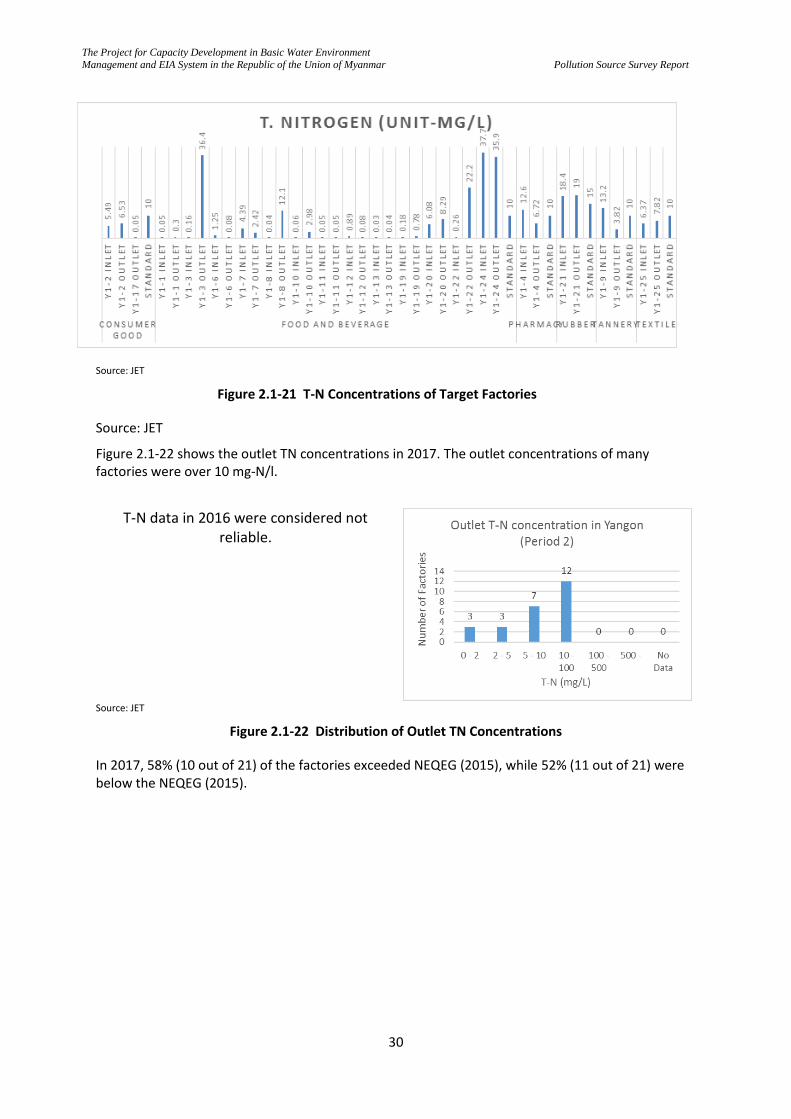
The Project for Capacity Development in Basic Water Environment
Management and EIA System in the Republic of the Union of Myanmar
Pollution Source Survey Report
30
Source: JET
Figure 2.1-21 T-N Concentrations of Target Factories
Source: JET
Figure 2.1-22 shows the outlet TN concentrations in 2017. The outlet concentrations of many factories were over 10 mg-N/l.
T-N data in 2016 were considered not
reliable.
Source: JET
Figure 2.1-22 Distribution of Outlet TN Concentrations
In 2017, 58% (10 out of 21) of the factories exceeded NEQEG (2015), while 52% (11 out of 21) were below the NEQEG (2015).
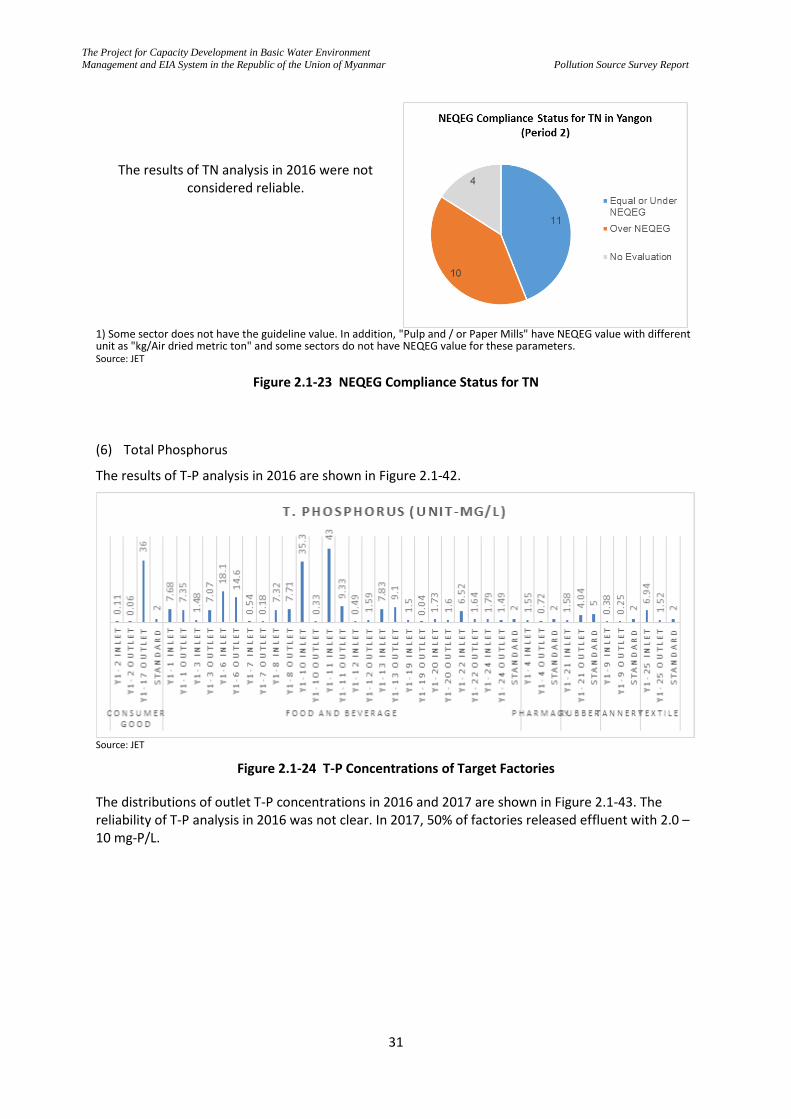
The Project for Capacity Development in Basic Water Environment
Management and EIA System in the Republic of the Union of Myanmar
Pollution Source Survey Report
31
The results of TN analysis in 2016 were not considered reliable.
1) Some sector does not have the guideline value. In addition, "Pulp and / or Paper Mills" have NEQEG value with different unit as "kg/Air dried metric ton" and some sectors do not have NEQEG value for these parameters. Source: JET
Figure 2.1-23 NEQEG Compliance Status for TN
(6) Total Phosphorus
The results of T-P analysis in 2016 are shown in Figure 2.1-42.
Source: JET
Figure 2.1-24 T-P Concentrations of Target Factories
The distributions of outlet T-P concentrations in 2016 and 2017 are shown in Figure 2.1-43. The reliability of T-P analysis in 2016 was not clear. In 2017, 50% of factories released effluent with 2.0 – 10 mg-P/L.
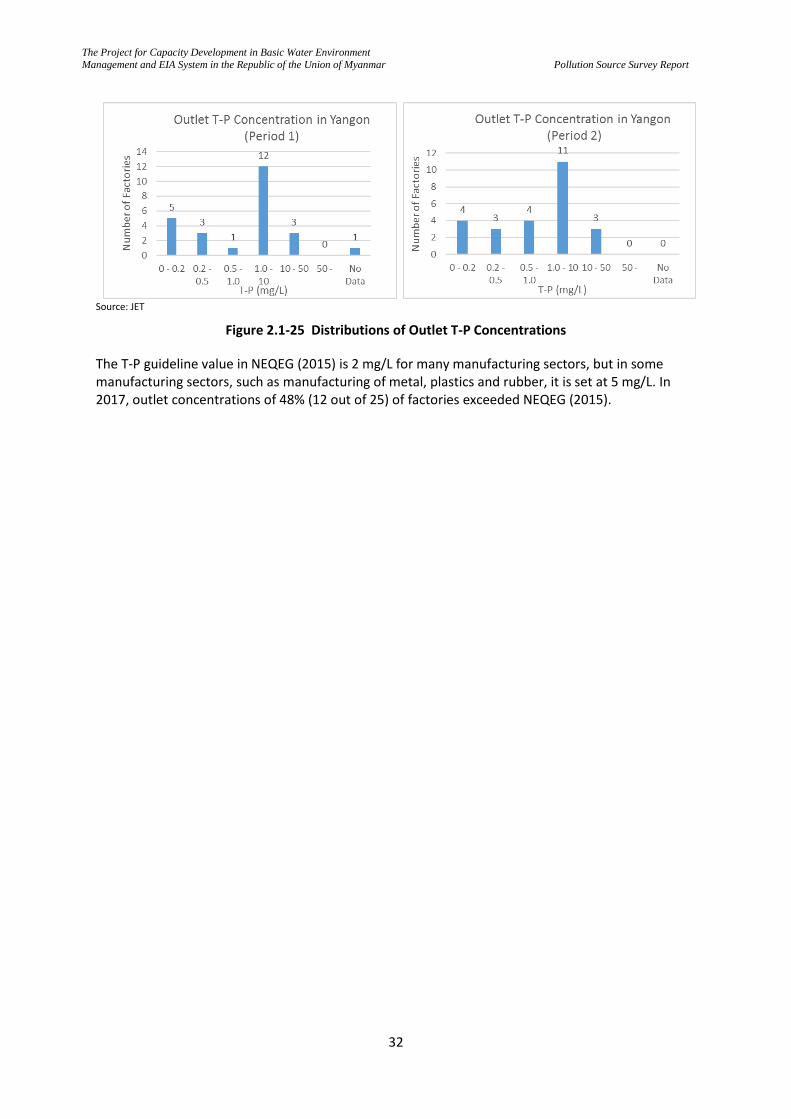
The Project for Capacity Development in Basic Water Environment
Management and EIA System in the Republic of the Union of Myanmar
Pollution Source Survey Report
32
Source: JET
Figure 2.1-25 Distributions of Outlet T-P Concentrations
The T-P guideline value in NEQEG (2015) is 2 mg/L for many manufacturing sectors, but in some manufacturing sectors, such as manufacturing of metal, plastics and rubber, it is set at 5 mg/L. In 2017, outlet concentrations of 48% (12 out of 25) of factories exceeded NEQEG (2015).
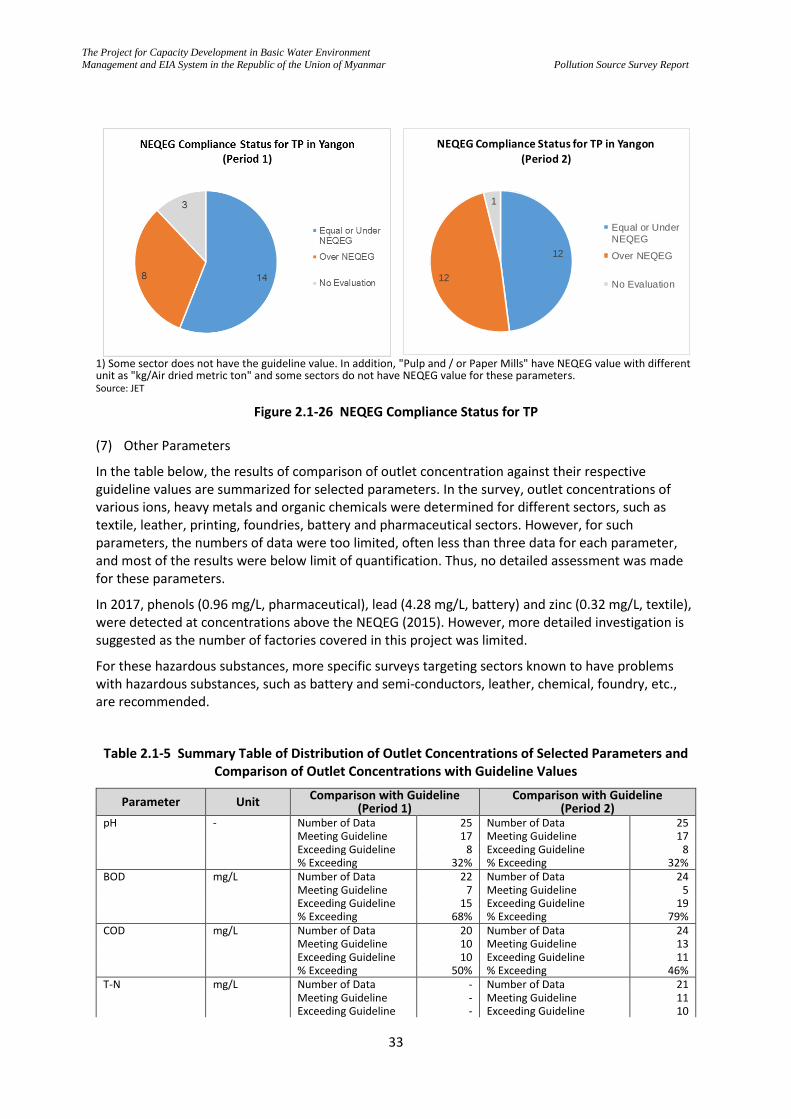
The Project for Capacity Development in Basic Water Environment
Management and EIA System in the Republic of the Union of Myanmar
Pollution Source Survey Report
33
1) Some sector does not have the guideline value. In addition, "Pulp and / or Paper Mills" have NEQEG value with different unit as "kg/Air dried metric ton" and some sectors do not have NEQEG value for these parameters. Source: JET
Figure 2.1-26 NEQEG Compliance Status for TP
(7) Other Parameters
In the table below, the results of comparison of outlet concentration against their respective guideline values are summarized for selected parameters. In the survey, outlet concentrations of various ions, heavy metals and organic chemicals were determined for different sectors, such as textile, leather, printing, foundries, battery and pharmaceutical sectors. However, for such parameters, the numbers of data were too limited, often less than three data for each parameter, and most of the results were below limit of quantification. Thus, no detailed assessment was made for these parameters.
In 2017, phenols (0.96 mg/L, pharmaceutical), lead (4.28 mg/L, battery) and zinc (0.32 mg/L, textile), were detected at concentrations above the NEQEG (2015). However, more detailed investigation is suggested as the number of factories covered in this project was limited.
For these hazardous substances, more specific surveys targeting sectors known to have problems with hazardous substances, such as battery and semi-conductors, leather, chemical, foundry, etc., are recommended.
Table 2.1-5 Summary Table of Distribution of Outlet Concentrations of Selected Parameters and Comparison of Outlet Concentrations with Guideline Values
Parameter Unit Comparison with Guideline (Period 1)
Comparison with Guideline (Period 2)
pH - Number of Data 25 Number of Data 25 Meeting Guideline 17 Meeting Guideline 17 Exceeding Guideline 8 Exceeding Guideline 8 % Exceeding 32% % Exceeding 32% BOD mg/L Number of Data 22 Number of Data 24 Meeting Guideline 7 Meeting Guideline 5 Exceeding Guideline 15 Exceeding Guideline 19 % Exceeding 68% % Exceeding 79% COD mg/L Number of Data 20 Number of Data 24 Meeting Guideline 10 Meeting Guideline 13 Exceeding Guideline 10 Exceeding Guideline 11 % Exceeding 50% % Exceeding 46% T-N mg/L Number of Data - Number of Data 21 Meeting Guideline - Meeting Guideline 11 Exceeding Guideline - Exceeding Guideline 10
12
12
1
NEQEG Compliance Status for TP in Yangon
(Period 2)
Equal or Under
NEQEG
Over NEQEG
No Evaluation
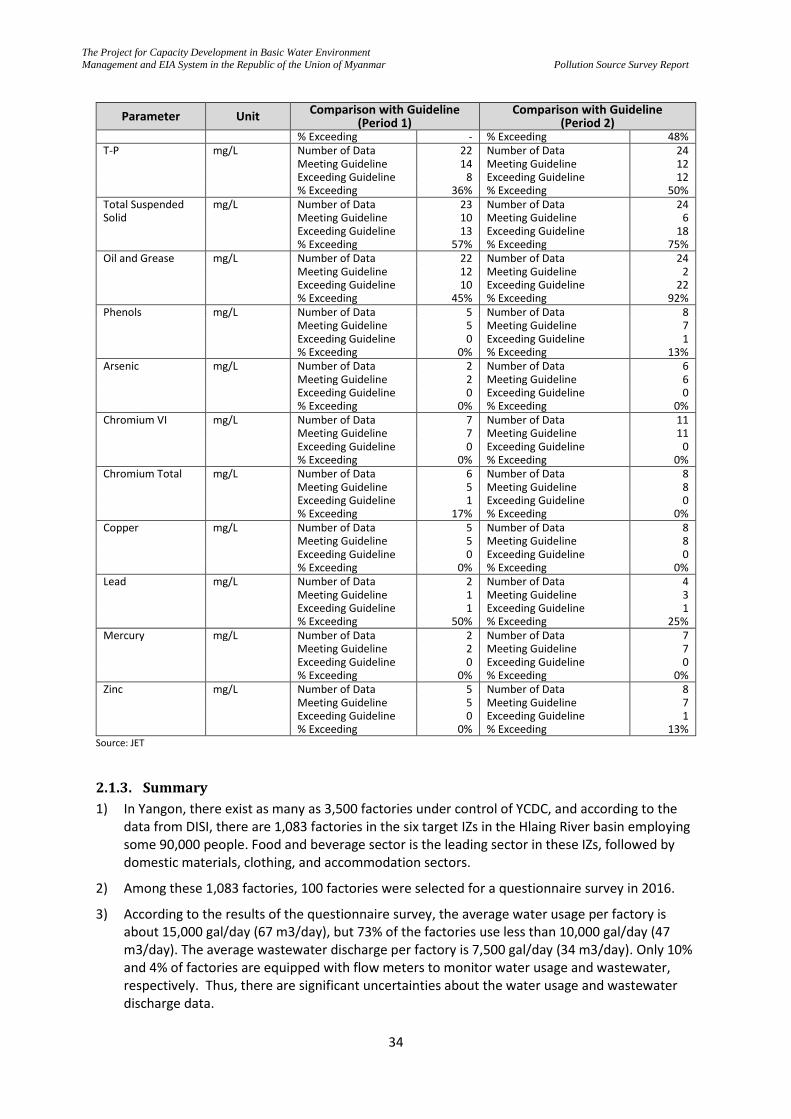
The Project for Capacity Development in Basic Water Environment
Management and EIA System in the Republic of the Union of Myanmar
Pollution Source Survey Report
34
Parameter Unit Comparison with Guideline (Period 1)
Comparison with Guideline (Period 2)
% Exceeding - % Exceeding 48% T-P mg/L Number of Data 22 Number of Data 24 Meeting Guideline 14 Meeting Guideline 12 Exceeding Guideline 8 Exceeding Guideline 12 % Exceeding 36% % Exceeding 50% Total Suspended mg/L Number of Data 23 Number of Data 24 Solid Meeting Guideline 10 Meeting Guideline 6 Exceeding Guideline 13 Exceeding Guideline 18 % Exceeding 57% % Exceeding 75% Oil and Grease mg/L Number of Data 22 Number of Data 24 Meeting Guideline 12 Meeting Guideline 2 Exceeding Guideline 10 Exceeding Guideline 22 % Exceeding 45% % Exceeding 92% Phenols mg/L Number of Data 5 Number of Data 8 Meeting Guideline 5 Meeting Guideline 7 Exceeding Guideline 0 Exceeding Guideline 1 % Exceeding 0% % Exceeding 13% Arsenic mg/L Number of Data 2 Number of Data 6 Meeting Guideline 2 Meeting Guideline 6 Exceeding Guideline 0 Exceeding Guideline 0 % Exceeding 0% % Exceeding 0% Chromium VI mg/L Number of Data 7 Number of Data 11 Meeting Guideline 7 Meeting Guideline 11 Exceeding Guideline 0 Exceeding Guideline 0 % Exceeding 0% % Exceeding 0% Chromium Total mg/L Number of Data 6 Number of Data 8 Meeting Guideline 5 Meeting Guideline 8 Exceeding Guideline 1 Exceeding Guideline 0 % Exceeding 17% % Exceeding 0% Copper mg/L Number of Data 5 Number of Data 8 Meeting Guideline 5 Meeting Guideline 8 Exceeding Guideline 0 Exceeding Guideline 0 % Exceeding 0% % Exceeding 0% Lead mg/L Number of Data 2 Number of Data 4 Meeting Guideline 1 Meeting Guideline 3 Exceeding Guideline 1 Exceeding Guideline 1 % Exceeding 50% % Exceeding 25% Mercury mg/L Number of Data 2 Number of Data 7 Meeting Guideline 2 Meeting Guideline 7 Exceeding Guideline 0 Exceeding Guideline 0 % Exceeding 0% % Exceeding 0% Zinc mg/L Number of Data 5 Number of Data 8 Meeting Guideline 5 Meeting Guideline 7 Exceeding Guideline 0 Exceeding Guideline 1 % Exceeding 0% % Exceeding 13%
Source: JET
2.1.3. Summary
1) In Yangon, there exist as many as 3,500 factories under control of YCDC, and according to the data from DISI, there are 1,083 factories in the six target IZs in the Hlaing River basin employing some 90,000 people. Food and beverage sector is the leading sector in these IZs, followed by domestic materials, clothing, and accommodation sectors.
2) Among these 1,083 factories, 100 factories were selected for a questionnaire survey in 2016.
3) According to the results of the questionnaire survey, the average water usage per factory is about 15,000 gal/day (67 m3/day), but 73% of the factories use less than 10,000 gal/day (47 m3/day). The average wastewater discharge per factory is 7,500 gal/day (34 m3/day). Only 10% and 4% of factories are equipped with flow meters to monitor water usage and wastewater, respectively. Thus, there are significant uncertainties about the water usage and wastewater discharge data.
The Project for Capacity Development in Basic Water Environment
Management and EIA System in the Republic of the Union of Myanmar
Pollution Source Survey Report
35
4) Only 53% of the factories replied that they have wastewater treatment facilities. Most of them are rudimentary primary treatment facilities, such as screen or sedimentation tank, to remove solid waste and settleable particles. Only several percent of factories are equipped with secondary treatment facilities to reduce level of organic matter, such as BOD and COD. Nine (9) % of the factories have oil separators.
5) Many factories believe their wastewater and solid waste management is adequate. Meanwhile, seventy-seven (77) % of factories were not aware of NEQEG (2015) in 2016.
6) Among the 100 target factories for the questionnaire survey, 25 factories were selected for wastewater sampling and analysis in 2016, and, in total, 48 samples from 25 target factories were collected and analyzed. In 2017, 25 samples from 25 factories were collected and analyzed.
7) The results of wastewater sampling and analysis in 2017 revealed that 79% (BOD), 46% (COD), 48% (TN), 50% (TP), 75% (TSS) and 92% (oil and grease) of the factories were not meeting the NEQEG (2015) requirements. Some factories are meeting the requirements, but this is largely because raw wastewaters of such factories (e.g., cold storage) are not very strong, and not because these factories are actively treating their wastewaters.
8) In 2017, phenols (0.96 mg/L, pharmaceutical), lead (4.28 mg/L, battery) and zinc (0.32 mg/L, textile), were detected at concentrations above the NEQEG (2015). Such sectors/factories should be monitored closely.
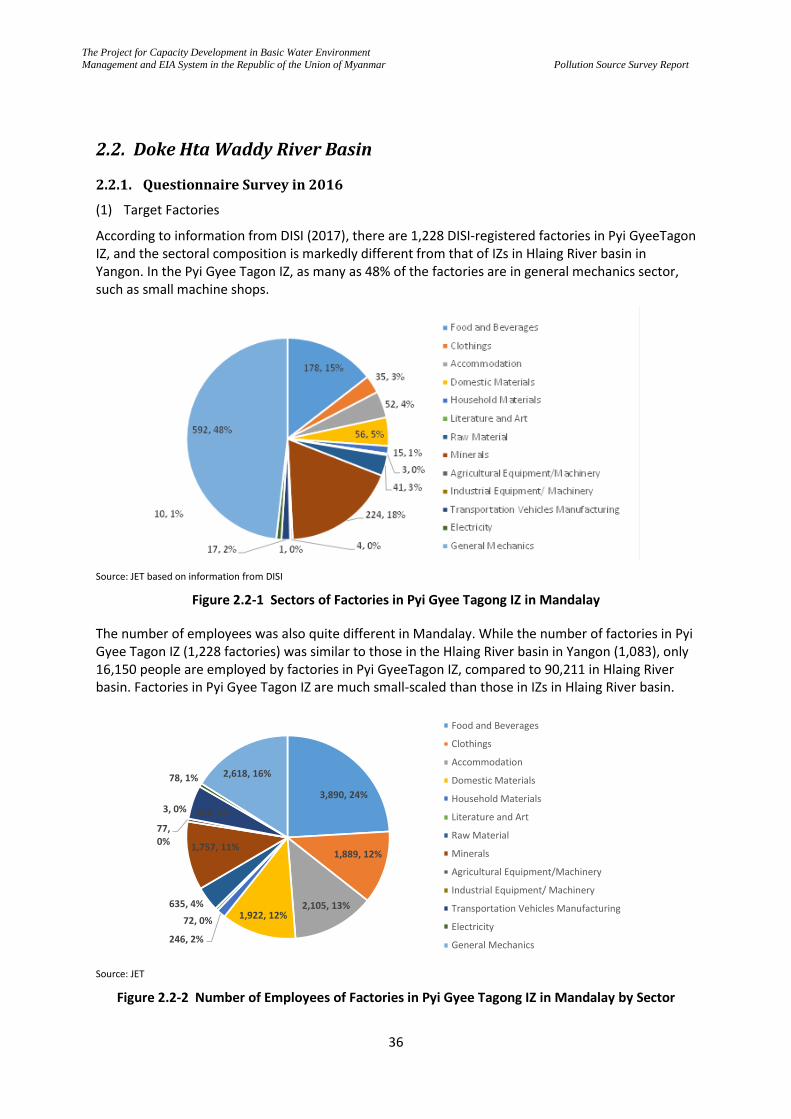
The Project for Capacity Development in Basic Water Environment
Management and EIA System in the Republic of the Union of Myanmar
Pollution Source Survey Report
36
2.2. Doke Hta Waddy River Basin
2.2.1. Questionnaire Survey in 2016
(1) Target Factories
According to information from DISI (2017), there are 1,228 DISI-registered factories in Pyi GyeeTagon IZ, and the sectoral composition is markedly different from that of IZs in Hlaing River basin in Yangon. In the Pyi Gyee Tagon IZ, as many as 48% of the factories are in general mechanics sector, such as small machine shops.
Source: JET based on information from DISI
Figure 2.2-1 Sectors of Factories in Pyi Gyee Tagong IZ in Mandalay
The number of employees was also quite different in Mandalay. While the number of factories in Pyi Gyee Tagon IZ (1,228 factories) was similar to those in the Hlaing River basin in Yangon (1,083), only 16,150 people are employed by factories in Pyi GyeeTagon IZ, compared to 90,211 in Hlaing River basin. Factories in Pyi Gyee Tagon IZ are much small-scaled than those in IZs in Hlaing River basin.
Source: JET
Figure 2.2-2 Number of Employees of Factories in Pyi Gyee Tagong IZ in Mandalay by Sector
3,890, 24%
1,889, 12%
2,105, 13%1,922, 12%
246, 2%
72, 0%
635, 4%
1,757, 11%
77, 0%
3, 0% 858, 5%
78, 1% 2,618, 16%
Food and Beverages
Clothings
Accommodation
Domestic Materials
Household Materials
Literature and Art
Raw Material
Minerals
Agricultural Equipment/Machinery
Industrial Equipment/ Machinery
Transportation Vehicles Manufacturing
Electricity
General Mechanics
The Project for Capacity Development in Basic Water Environment
Management and EIA System in the Republic of the Union of Myanmar
Pollution Source Survey Report
37
Because this questionnaire survey could cover only 100 factories in and around Pyi Gyee Tagon IZ, MCDC, ECD and JET decided to select the target factories based on the following criteria, which are same as the ones in Yangon:
1) Factories whose sectors are representative of the area to see the trend of the area
2) Major factories that discharge sizable volume of wastewater
Table 2.2-1 summarizes the sectoral composition of the target factories of the questionnaire survey in Mandalay. Food and beverage sector, including distilleries, soft drinks, noodle, sesame seed, etc., is the most popular manufacturing sector investigated. Aside from the food and beverage sector, tanneries, consumer goods, foundries and paper production sectors were also included in the survey. Only limited numbers of factories were investigated in other sectors, such as battery, fertilizer, pharmacy, etc., and data for such sectors should be treated with care, as they may or may not be representative of each sector.
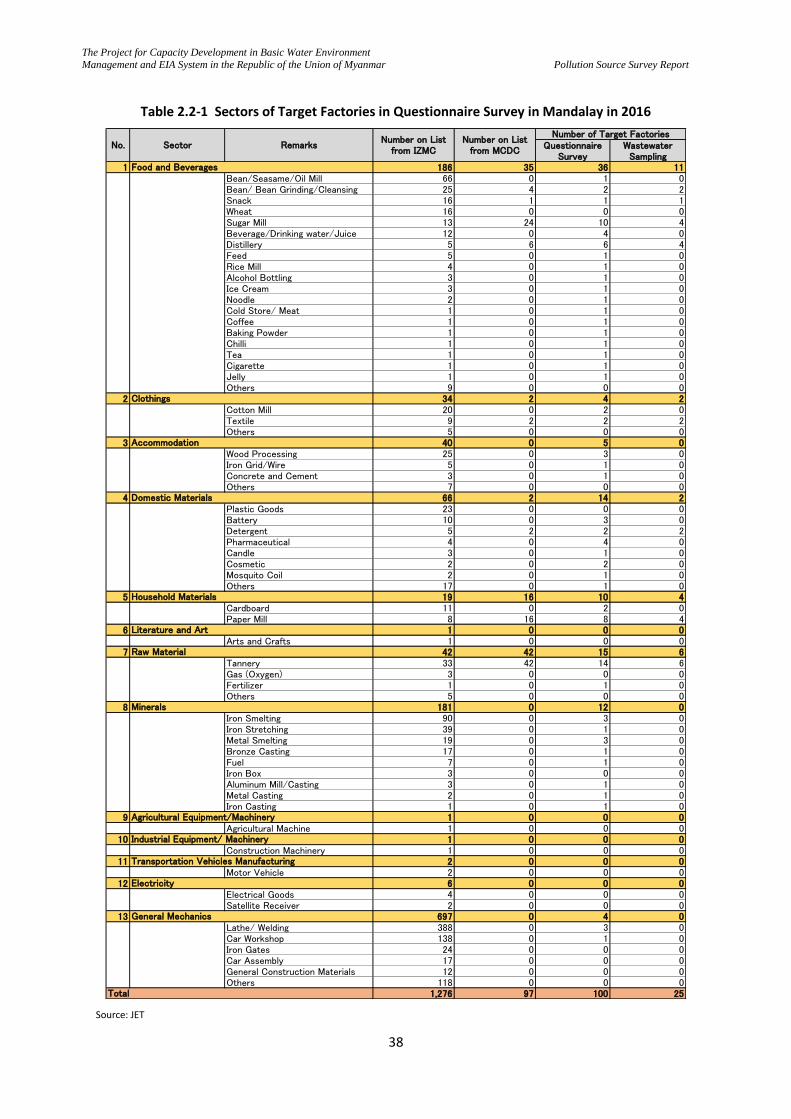
The Project for Capacity Development in Basic Water Environment
Management and EIA System in the Republic of the Union of Myanmar
Pollution Source Survey Report
38
Table 2.2-1 Sectors of Target Factories in Questionnaire Survey in Mandalay in 2016
Source: JET
QuestionnaireSurvey
WastewaterSampling
1 186 35 36 11Bean/Seasame/Oil Mill 66 0 1 0Bean/ Bean Grinding/Cleansing 25 4 2 2Snack 16 1 1 1Wheat 16 0 0 0Sugar Mill 13 24 10 4Beverage/Drinking water/Juice 12 0 4 0Distillery 5 6 6 4Feed 5 0 1 0Rice Mill 4 0 1 0Alcohol Bottling 3 0 1 0Ice Cream 3 0 1 0Noodle 2 0 1 0Cold Store/ Meat 1 0 1 0Coffee 1 0 1 0Baking Powder 1 0 1 0Chilli 1 0 1 0Tea 1 0 1 0Cigarette 1 0 1 0Jelly 1 0 1 0Others 9 0 0 0
2 34 2 4 2Cotton Mill 20 0 2 0Textile 9 2 2 2Others 5 0 0 0
3 40 0 5 0Wood Processing 25 0 3 0Iron Grid/Wire 5 0 1 0Concrete and Cement 3 0 1 0Others 7 0 0 0
4 66 2 14 2Plastic Goods 23 0 0 0Battery 10 0 3 0Detergent 5 2 2 2Pharmaceutical 4 0 4 0Candle 3 0 1 0Cosmetic 2 0 2 0Mosquito Coil 2 0 1 0Others 17 0 1 0
5 19 16 10 4Cardboard 11 0 2 0Paper Mill 8 16 8 4
6 1 0 0 0Arts and Crafts 1 0 0 0
7 42 42 15 6Tannery 33 42 14 6Gas (Oxygen) 3 0 0 0Fertilizer 1 0 1 0Others 5 0 0 0
8 181 0 12 0Iron Smelting 90 0 3 0Iron Stretching 39 0 1 0Metal Smelting 19 0 3 0Bronze Casting 17 0 1 0Fuel 7 0 1 0Iron Box 3 0 0 0Aluminum Mill/Casting 3 0 1 0Metal Casting 2 0 1 0Iron Casting 1 0 1 0
9 1 0 0 0Agricultural Machine 1 0 0 0
10 1 0 0 0Construction Machinery 1 0 0 0
11 2 0 0 0Motor Vehicle 2 0 0 0
12 6 0 0 0Electrical Goods 4 0 0 0Satellite Receiver 2 0 0 0
13 697 0 4 0Lathe/ Welding 388 0 3 0Car Workshop 138 0 1 0Iron Gates 24 0 0 0Car Assembly 17 0 0 0General Construction Materials 12 0 0 0Others 118 0 0 0
1,276 97 100 25
No. Sector RemarksNumber on List
from IZMCNumber on List
from MCDC
Number of Target Factories
Food and Beverages
Clothings
Minerals
Accommodation
Domestic Materials
Household Materials
Literature and Art
Raw Material
Agricultural Equipment/Machinery
Industrial Equipment/ Machinery
Total
Electricity
General Mechanics
Transportation Vehicles Manufacturing
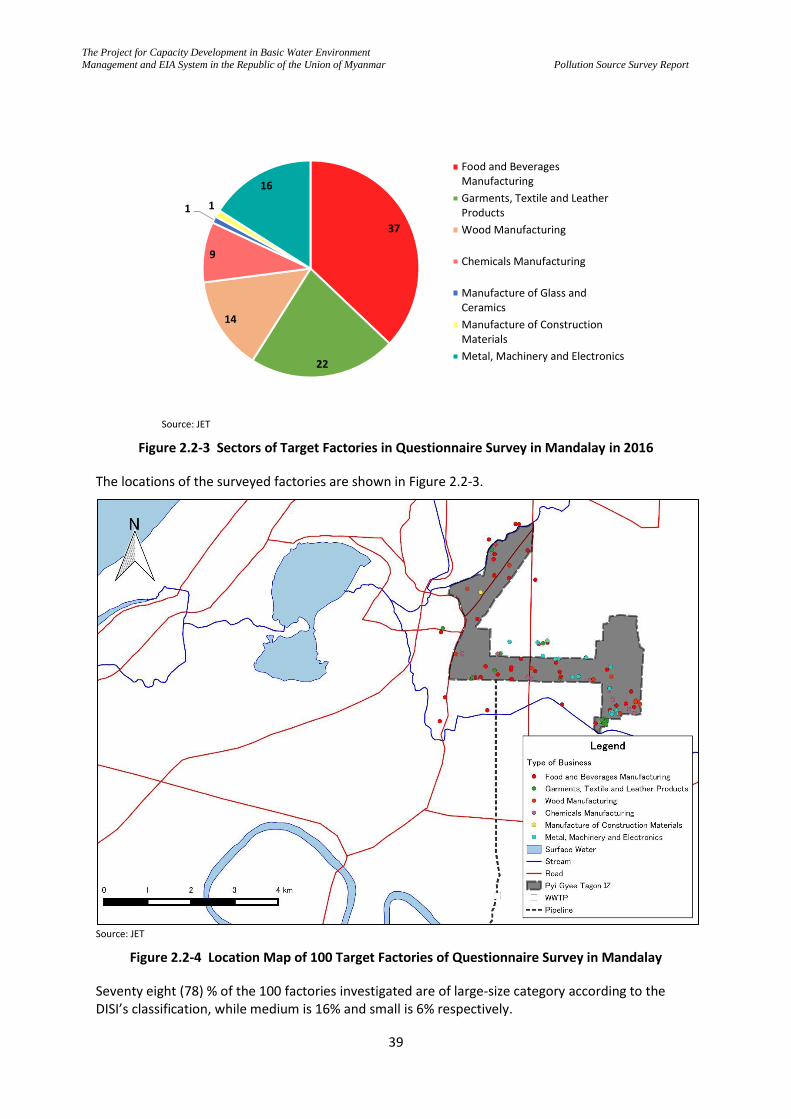
The Project for Capacity Development in Basic Water Environment
Management and EIA System in the Republic of the Union of Myanmar
Pollution Source Survey Report
39
Source: JET
Figure 2.2-3 Sectors of Target Factories in Questionnaire Survey in Mandalay in 2016
The locations of the surveyed factories are shown in Figure 2.2-3.
Source: JET
Figure 2.2-4 Location Map of 100 Target Factories of Questionnaire Survey in Mandalay
Seventy eight (78) % of the 100 factories investigated are of large-size category according to the DISI’s classification, while medium is 16% and small is 6% respectively.
37
22
14
9
1 1
16
Food and BeveragesManufacturing
Garments, Textile and LeatherProducts
Wood Manufacturing
Chemicals Manufacturing
Manufacture of Glass andCeramics
Manufacture of ConstructionMaterials
Metal, Machinery and Electronics
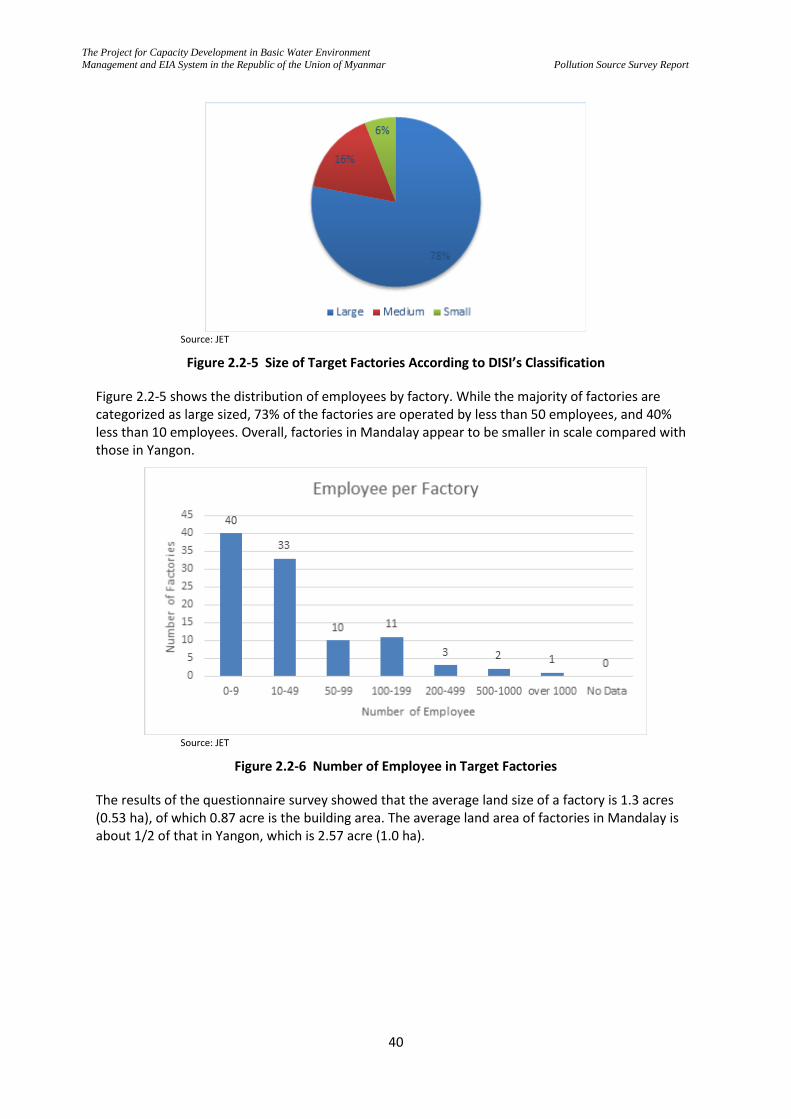
The Project for Capacity Development in Basic Water Environment
Management and EIA System in the Republic of the Union of Myanmar
Pollution Source Survey Report
40
Source: JET
Figure 2.2-5 Size of Target Factories According to DISI’s Classification
Figure 2.2-5 shows the distribution of employees by factory. While the majority of factories are categorized as large sized, 73% of the factories are operated by less than 50 employees, and 40% less than 10 employees. Overall, factories in Mandalay appear to be smaller in scale compared with those in Yangon.
Source: JET
Figure 2.2-6 Number of Employee in Target Factories
The results of the questionnaire survey showed that the average land size of a factory is 1.3 acres (0.53 ha), of which 0.87 acre is the building area. The average land area of factories in Mandalay is about 1/2 of that in Yangon, which is 2.57 acre (1.0 ha).
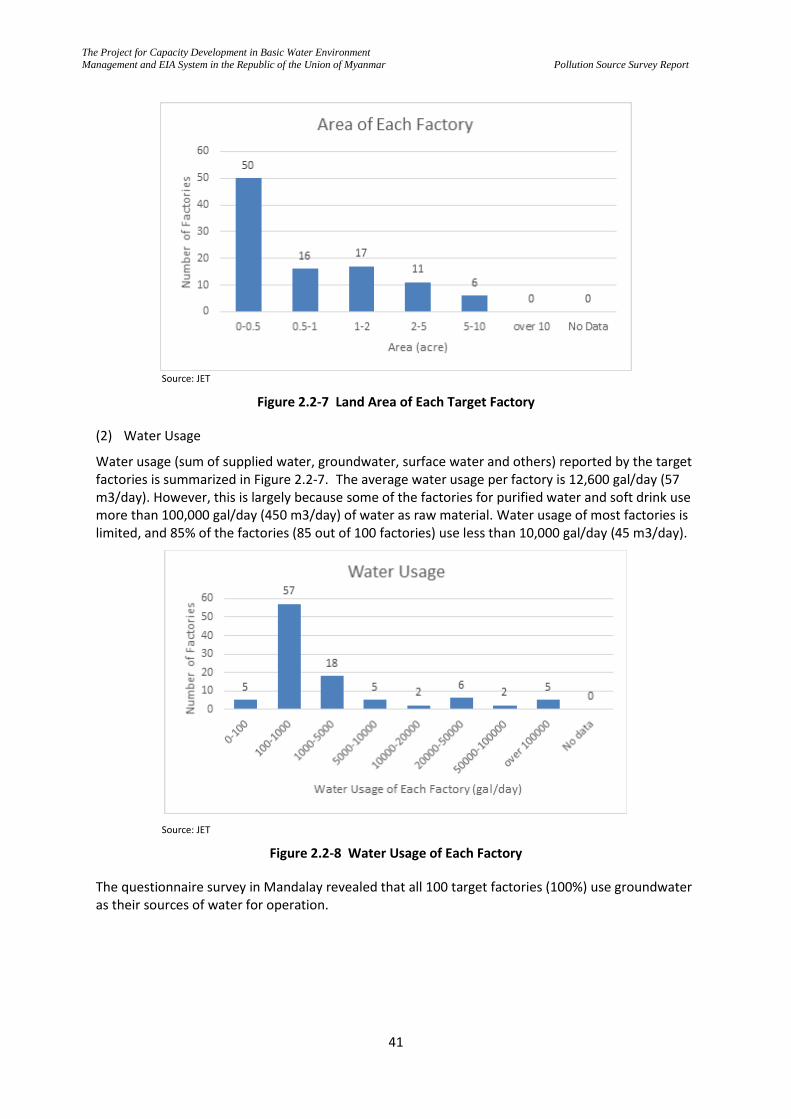
The Project for Capacity Development in Basic Water Environment
Management and EIA System in the Republic of the Union of Myanmar
Pollution Source Survey Report
41
Source: JET
Figure 2.2-7 Land Area of Each Target Factory
(2) Water Usage
Water usage (sum of supplied water, groundwater, surface water and others) reported by the target factories is summarized in Figure 2.2-7. The average water usage per factory is 12,600 gal/day (57 m3/day). However, this is largely because some of the factories for purified water and soft drink use more than 100,000 gal/day (450 m3/day) of water as raw material. Water usage of most factories is limited, and 85% of the factories (85 out of 100 factories) use less than 10,000 gal/day (45 m3/day).
Source: JET
Figure 2.2-8 Water Usage of Each Factory
The questionnaire survey in Mandalay revealed that all 100 target factories (100%) use groundwater as their sources of water for operation.
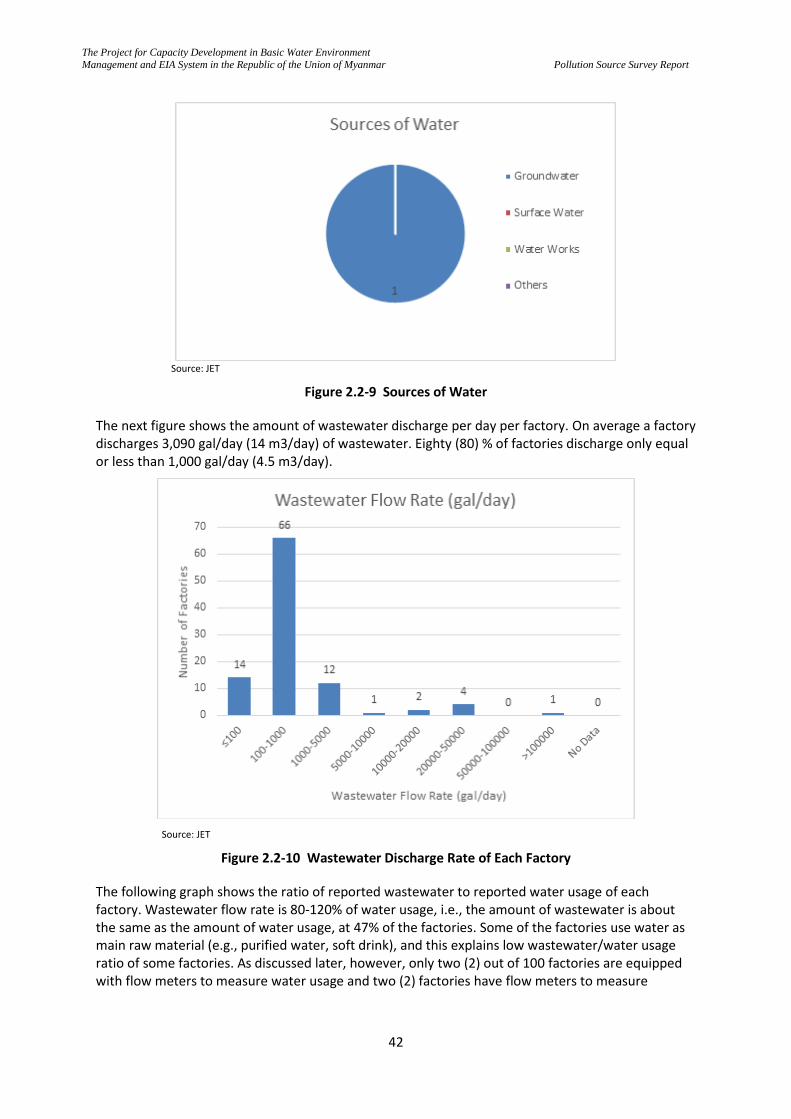
The Project for Capacity Development in Basic Water Environment
Management and EIA System in the Republic of the Union of Myanmar
Pollution Source Survey Report
42
Source: JET
Figure 2.2-9 Sources of Water
The next figure shows the amount of wastewater discharge per day per factory. On average a factory discharges 3,090 gal/day (14 m3/day) of wastewater. Eighty (80) % of factories discharge only equal or less than 1,000 gal/day (4.5 m3/day).
Source: JET
Figure 2.2-10 Wastewater Discharge Rate of Each Factory
The following graph shows the ratio of reported wastewater to reported water usage of each factory. Wastewater flow rate is 80-120% of water usage, i.e., the amount of wastewater is about the same as the amount of water usage, at 47% of the factories. Some of the factories use water as main raw material (e.g., purified water, soft drink), and this explains low wastewater/water usage ratio of some factories. As discussed later, however, only two (2) out of 100 factories are equipped with flow meters to measure water usage and two (2) factories have flow meters to measure
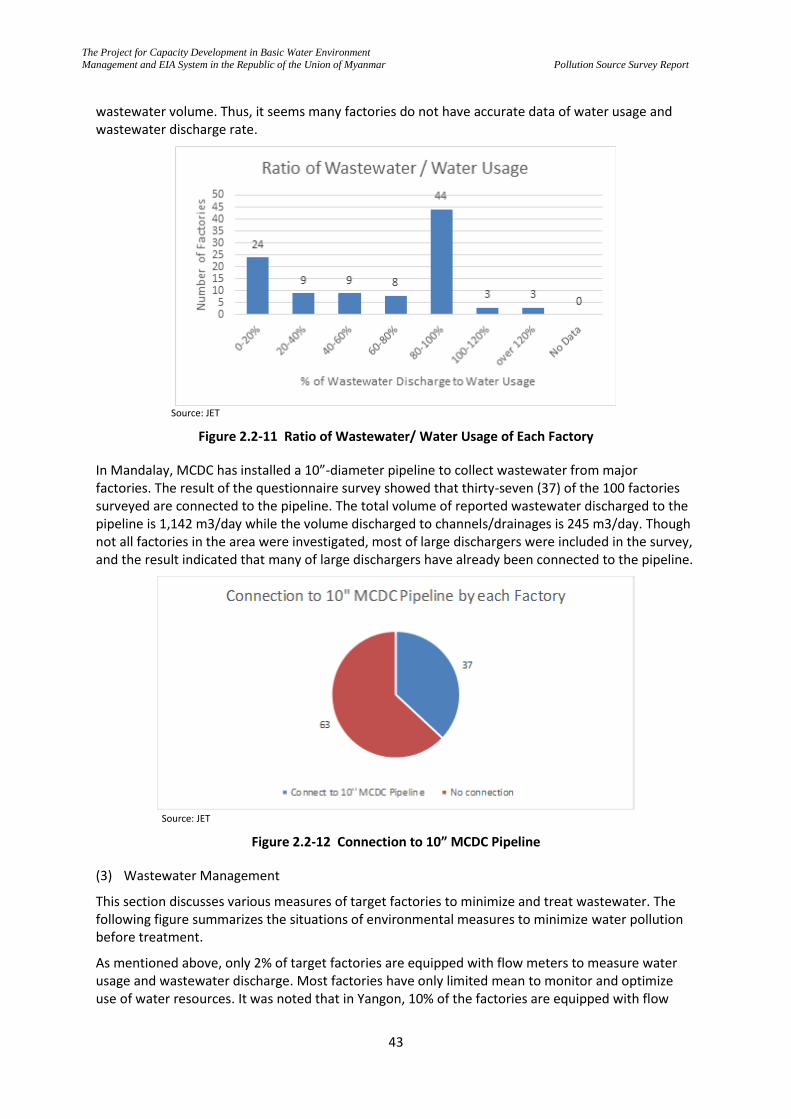
The Project for Capacity Development in Basic Water Environment
Management and EIA System in the Republic of the Union of Myanmar
Pollution Source Survey Report
43
wastewater volume. Thus, it seems many factories do not have accurate data of water usage and wastewater discharge rate.
Source: JET
Figure 2.2-11 Ratio of Wastewater/ Water Usage of Each Factory
In Mandalay, MCDC has installed a 10”-diameter pipeline to collect wastewater from major factories. The result of the questionnaire survey showed that thirty-seven (37) of the 100 factories surveyed are connected to the pipeline. The total volume of reported wastewater discharged to the pipeline is 1,142 m3/day while the volume discharged to channels/drainages is 245 m3/day. Though not all factories in the area were investigated, most of large dischargers were included in the survey, and the result indicated that many of large dischargers have already been connected to the pipeline.
Source: JET
Figure 2.2-12 Connection to 10” MCDC Pipeline
(3) Wastewater Management
This section discusses various measures of target factories to minimize and treat wastewater. The following figure summarizes the situations of environmental measures to minimize water pollution before treatment.
As mentioned above, only 2% of target factories are equipped with flow meters to measure water usage and wastewater discharge. Most factories have only limited mean to monitor and optimize use of water resources. It was noted that in Yangon, 10% of the factories are equipped with flow
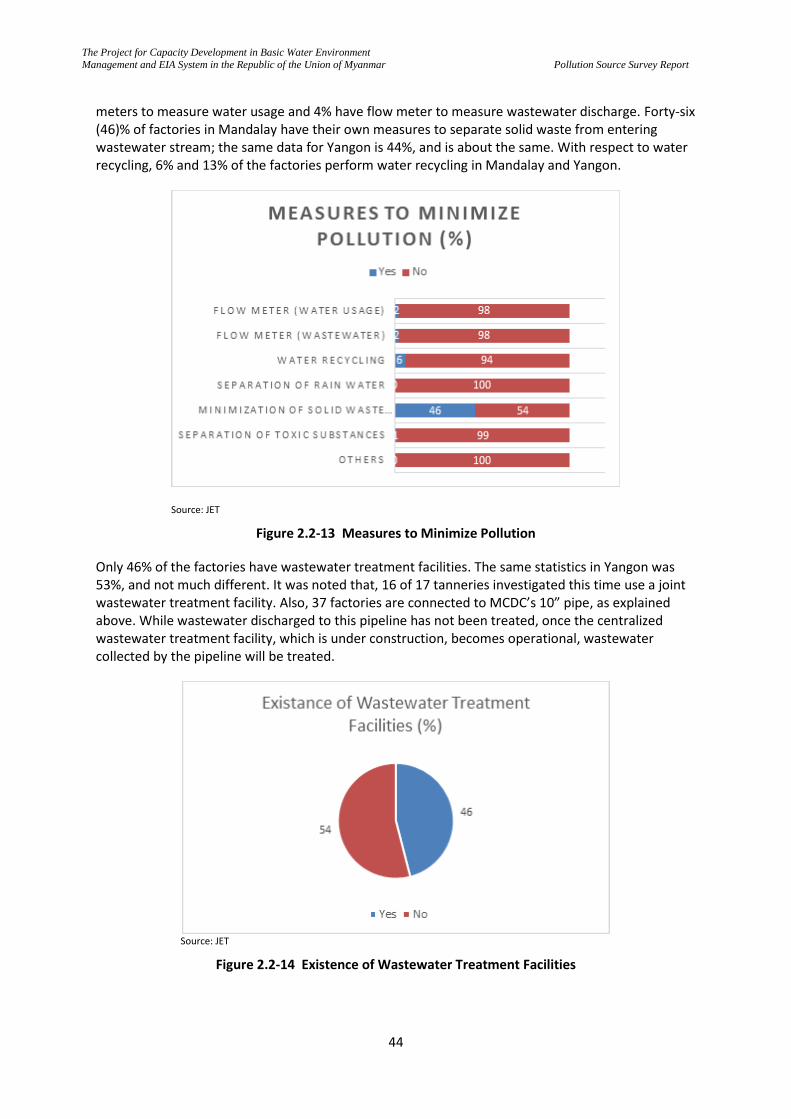
The Project for Capacity Development in Basic Water Environment
Management and EIA System in the Republic of the Union of Myanmar
Pollution Source Survey Report
44
meters to measure water usage and 4% have flow meter to measure wastewater discharge. Forty-six (46)% of factories in Mandalay have their own measures to separate solid waste from entering wastewater stream; the same data for Yangon is 44%, and is about the same. With respect to water recycling, 6% and 13% of the factories perform water recycling in Mandalay and Yangon.
Source: JET
Figure 2.2-13 Measures to Minimize Pollution
Only 46% of the factories have wastewater treatment facilities. The same statistics in Yangon was 53%, and not much different. It was noted that, 16 of 17 tanneries investigated this time use a joint wastewater treatment facility. Also, 37 factories are connected to MCDC’s 10” pipe, as explained above. While wastewater discharged to this pipeline has not been treated, once the centralized wastewater treatment facility, which is under construction, becomes operational, wastewater collected by the pipeline will be treated.
Source: JET
Figure 2.2-14 Existence of Wastewater Treatment Facilities
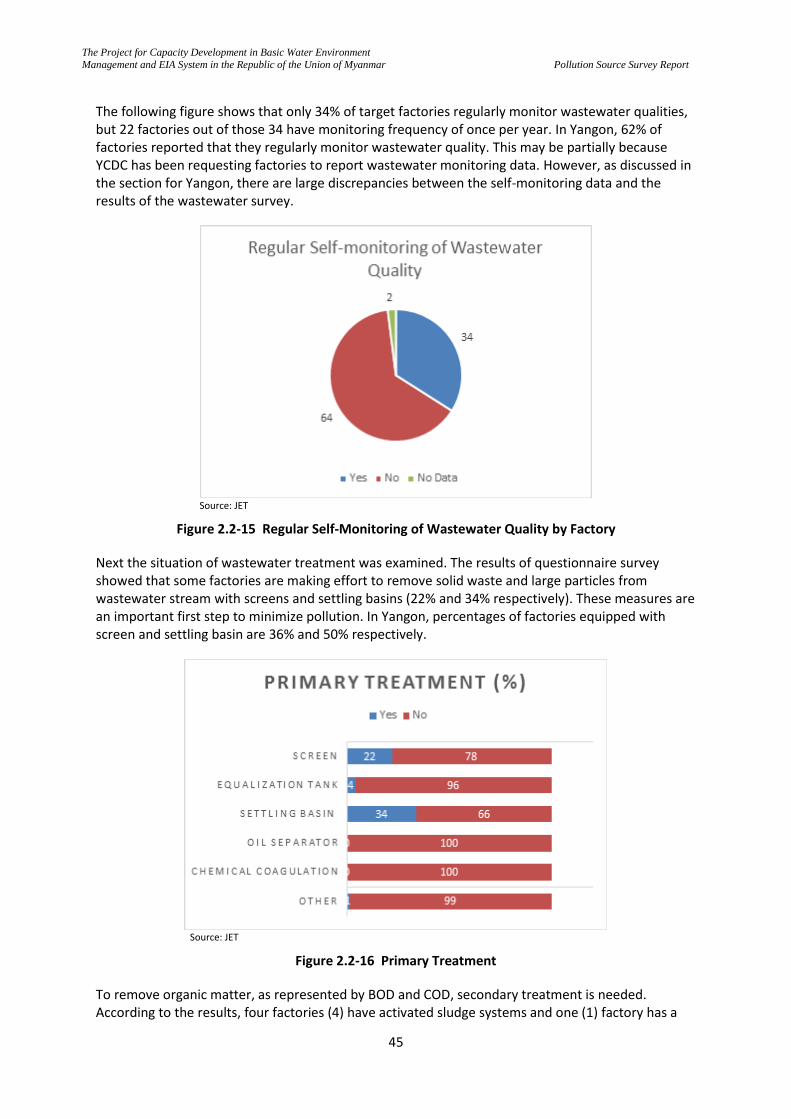
The Project for Capacity Development in Basic Water Environment
Management and EIA System in the Republic of the Union of Myanmar
Pollution Source Survey Report
45
The following figure shows that only 34% of target factories regularly monitor wastewater qualities, but 22 factories out of those 34 have monitoring frequency of once per year. In Yangon, 62% of factories reported that they regularly monitor wastewater quality. This may be partially because YCDC has been requesting factories to report wastewater monitoring data. However, as discussed in the section for Yangon, there are large discrepancies between the self-monitoring data and the results of the wastewater survey.
Source: JET
Figure 2.2-15 Regular Self-Monitoring of Wastewater Quality by Factory
Next the situation of wastewater treatment was examined. The results of questionnaire survey showed that some factories are making effort to remove solid waste and large particles from wastewater stream with screens and settling basins (22% and 34% respectively). These measures are an important first step to minimize pollution. In Yangon, percentages of factories equipped with screen and settling basin are 36% and 50% respectively.
Source: JET
Figure 2.2-16 Primary Treatment
To remove organic matter, as represented by BOD and COD, secondary treatment is needed. According to the results, four factories (4) have activated sludge systems and one (1) factory has a
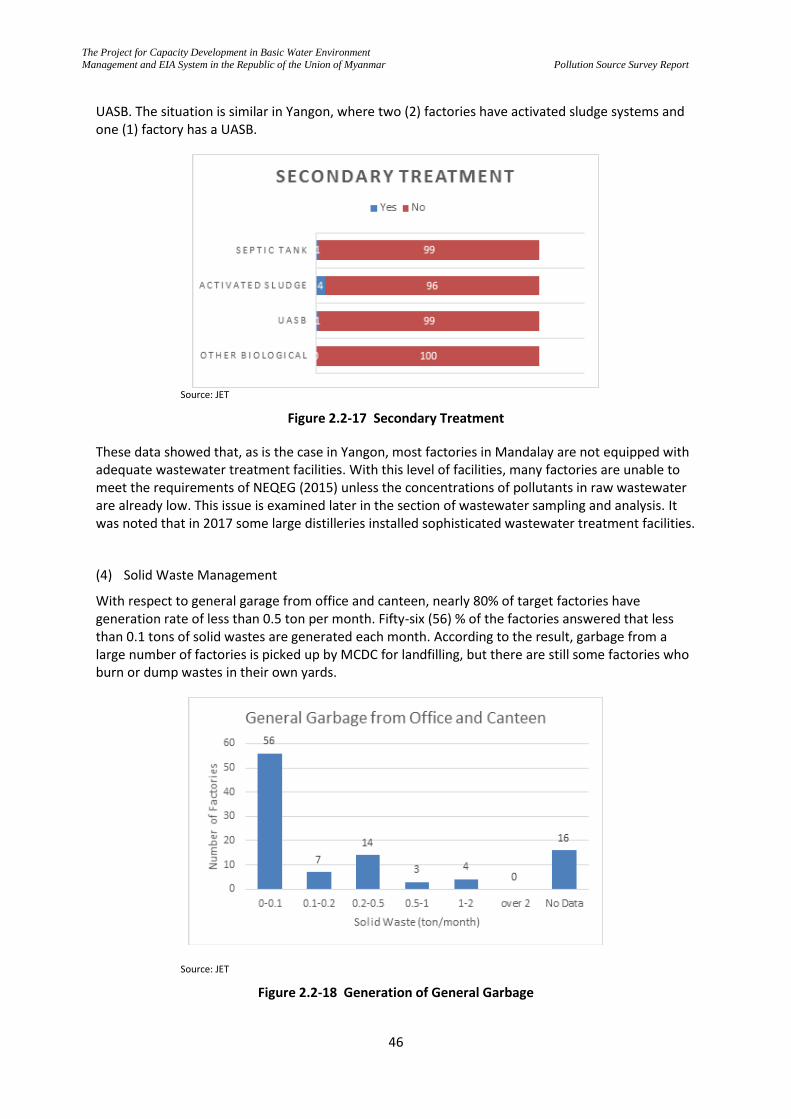
The Project for Capacity Development in Basic Water Environment
Management and EIA System in the Republic of the Union of Myanmar
Pollution Source Survey Report
46
UASB. The situation is similar in Yangon, where two (2) factories have activated sludge systems and one (1) factory has a UASB.
Source: JET
Figure 2.2-17 Secondary Treatment
These data showed that, as is the case in Yangon, most factories in Mandalay are not equipped with adequate wastewater treatment facilities. With this level of facilities, many factories are unable to meet the requirements of NEQEG (2015) unless the concentrations of pollutants in raw wastewater are already low. This issue is examined later in the section of wastewater sampling and analysis. It was noted that in 2017 some large distilleries installed sophisticated wastewater treatment facilities.
(4) Solid Waste Management
With respect to general garage from office and canteen, nearly 80% of target factories have generation rate of less than 0.5 ton per month. Fifty-six (56) % of the factories answered that less than 0.1 tons of solid wastes are generated each month. According to the result, garbage from a large number of factories is picked up by MCDC for landfilling, but there are still some factories who burn or dump wastes in their own yards.
Source: JET
Figure 2.2-18 Generation of General Garbage
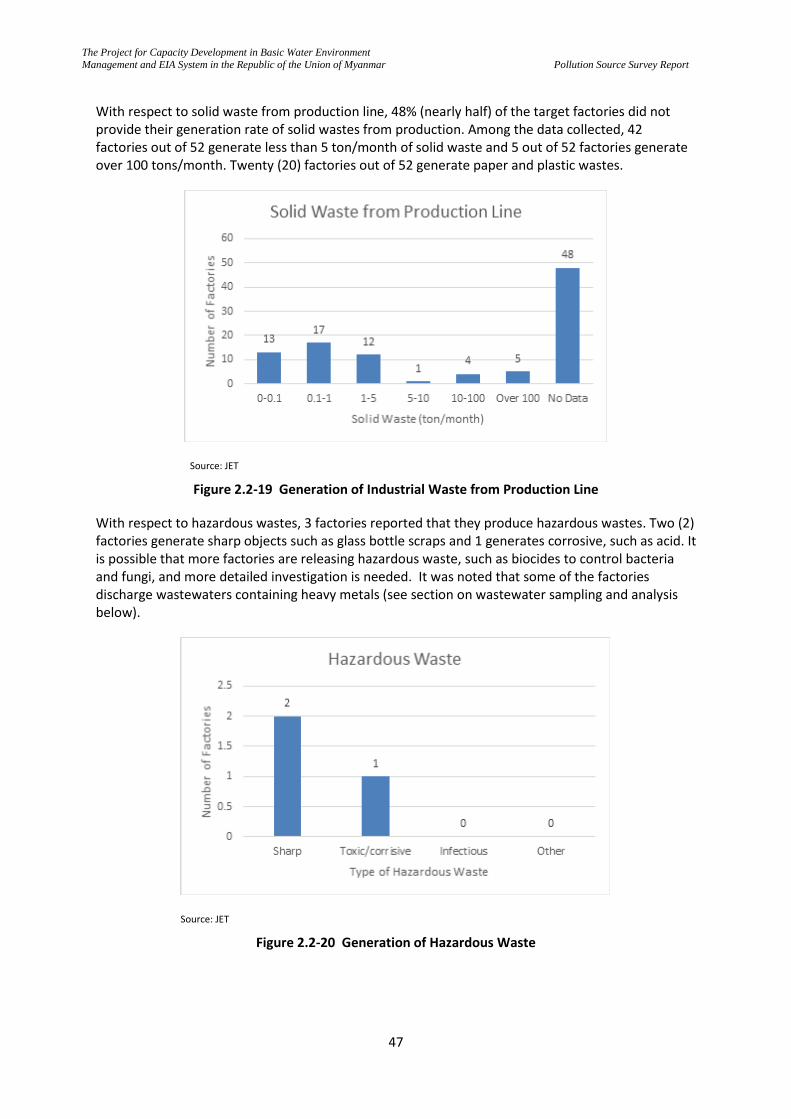
The Project for Capacity Development in Basic Water Environment
Management and EIA System in the Republic of the Union of Myanmar
Pollution Source Survey Report
47
With respect to solid waste from production line, 48% (nearly half) of the target factories did not provide their generation rate of solid wastes from production. Among the data collected, 42 factories out of 52 generate less than 5 ton/month of solid waste and 5 out of 52 factories generate over 100 tons/month. Twenty (20) factories out of 52 generate paper and plastic wastes.
Source: JET
Figure 2.2-19 Generation of Industrial Waste from Production Line
With respect to hazardous wastes, 3 factories reported that they produce hazardous wastes. Two (2) factories generate sharp objects such as glass bottle scraps and 1 generates corrosive, such as acid. It is possible that more factories are releasing hazardous waste, such as biocides to control bacteria and fungi, and more detailed investigation is needed. It was noted that some of the factories discharge wastewaters containing heavy metals (see section on wastewater sampling and analysis below).
Source: JET
Figure 2.2-20 Generation of Hazardous Waste
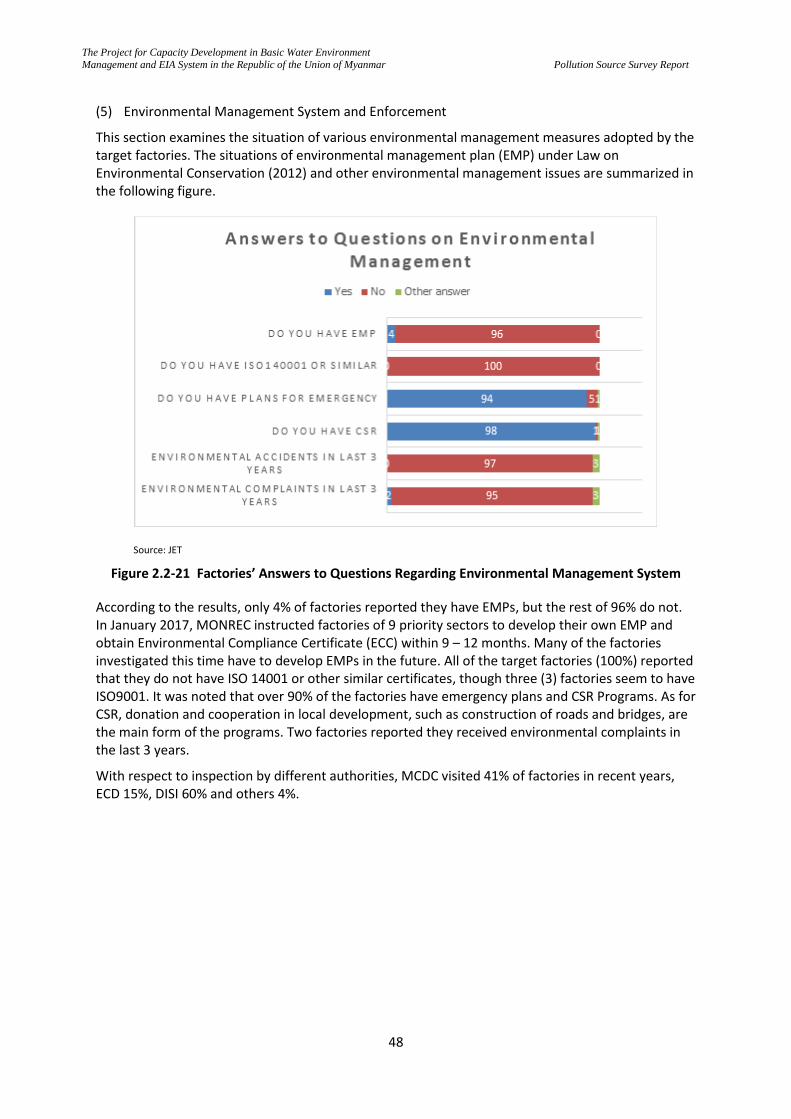
The Project for Capacity Development in Basic Water Environment
Management and EIA System in the Republic of the Union of Myanmar
Pollution Source Survey Report
48
(5) Environmental Management System and Enforcement
This section examines the situation of various environmental management measures adopted by the target factories. The situations of environmental management plan (EMP) under Law on Environmental Conservation (2012) and other environmental management issues are summarized in the following figure.
Source: JET
Figure 2.2-21 Factories’ Answers to Questions Regarding Environmental Management System
According to the results, only 4% of factories reported they have EMPs, but the rest of 96% do not. In January 2017, MONREC instructed factories of 9 priority sectors to develop their own EMP and obtain Environmental Compliance Certificate (ECC) within 9 – 12 months. Many of the factories investigated this time have to develop EMPs in the future. All of the target factories (100%) reported that they do not have ISO 14001 or other similar certificates, though three (3) factories seem to have ISO9001. It was noted that over 90% of the factories have emergency plans and CSR Programs. As for CSR, donation and cooperation in local development, such as construction of roads and bridges, are the main form of the programs. Two factories reported they received environmental complaints in the last 3 years.
With respect to inspection by different authorities, MCDC visited 41% of factories in recent years, ECD 15%, DISI 60% and others 4%.
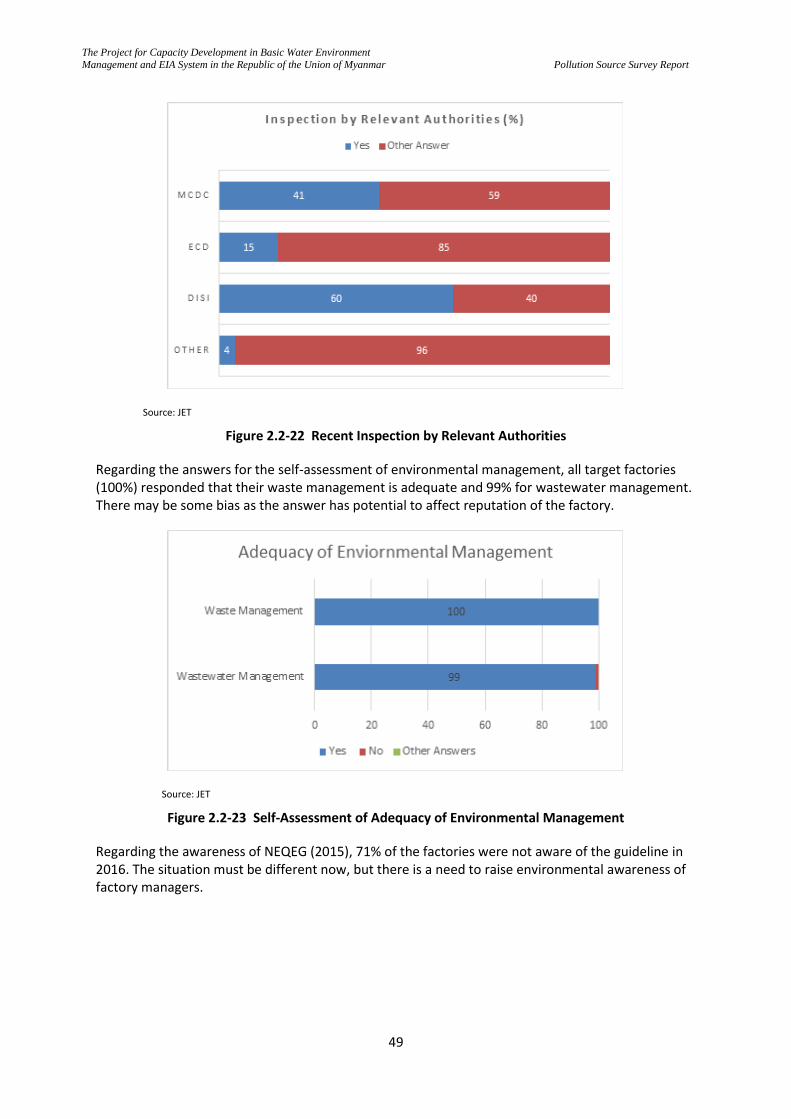
The Project for Capacity Development in Basic Water Environment
Management and EIA System in the Republic of the Union of Myanmar
Pollution Source Survey Report
49
Source: JET
Figure 2.2-22 Recent Inspection by Relevant Authorities
Regarding the answers for the self-assessment of environmental management, all target factories (100%) responded that their waste management is adequate and 99% for wastewater management. There may be some bias as the answer has potential to affect reputation of the factory.
Source: JET
Figure 2.2-23 Self-Assessment of Adequacy of Environmental Management
Regarding the awareness of NEQEG (2015), 71% of the factories were not aware of the guideline in 2016. The situation must be different now, but there is a need to raise environmental awareness of factory managers.
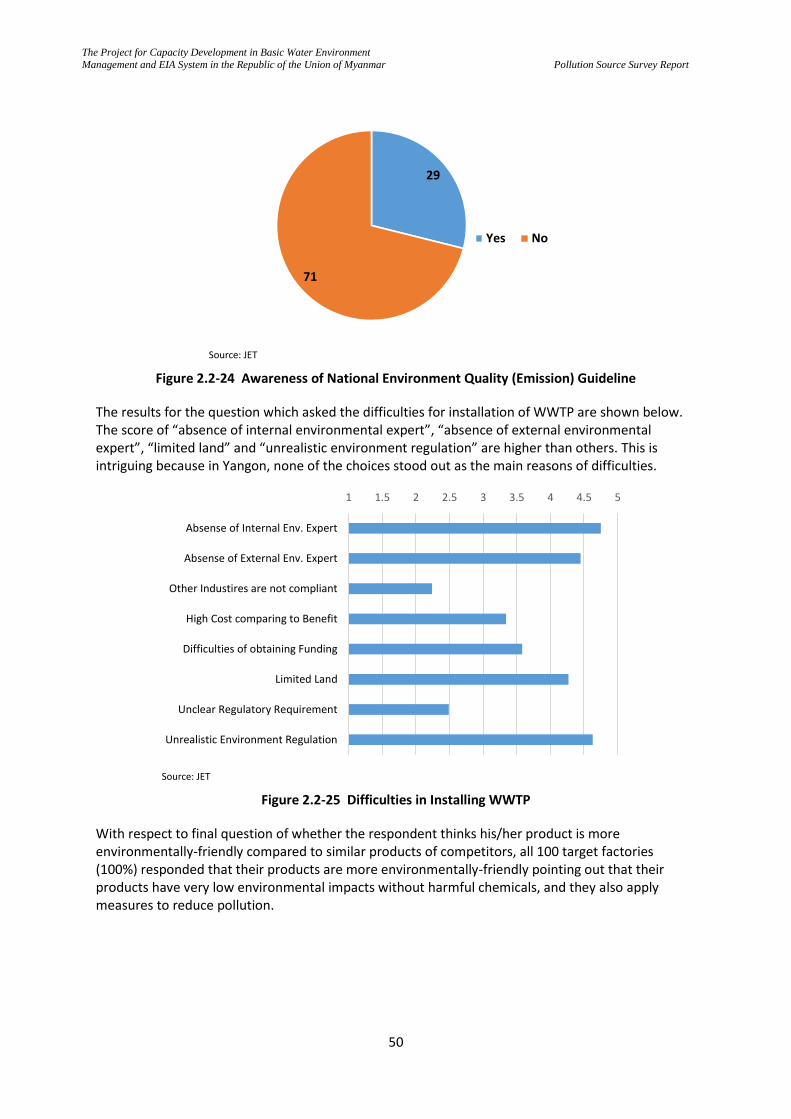
The Project for Capacity Development in Basic Water Environment
Management and EIA System in the Republic of the Union of Myanmar
Pollution Source Survey Report
50
Source: JET
Figure 2.2-24 Awareness of National Environment Quality (Emission) Guideline
The results for the question which asked the difficulties for installation of WWTP are shown below. The score of “absence of internal environmental expert”, “absence of external environmental expert”, “limited land” and “unrealistic environment regulation” are higher than others. This is intriguing because in Yangon, none of the choices stood out as the main reasons of difficulties.
Source: JET
Figure 2.2-25 Difficulties in Installing WWTP
With respect to final question of whether the respondent thinks his/her product is more environmentally-friendly compared to similar products of competitors, all 100 target factories (100%) responded that their products are more environmentally-friendly pointing out that their products have very low environmental impacts without harmful chemicals, and they also apply measures to reduce pollution.
29
71
Yes No
1 1.5 2 2.5 3 3.5 4 4.5 5
Absense of Internal Env. Expert
Absense of External Env. Expert
Other Industires are not compliant
High Cost comparing to Benefit
Difficulties of obtaining Funding
Limited Land
Unclear Regulatory Requirement
Unrealistic Environment Regulation
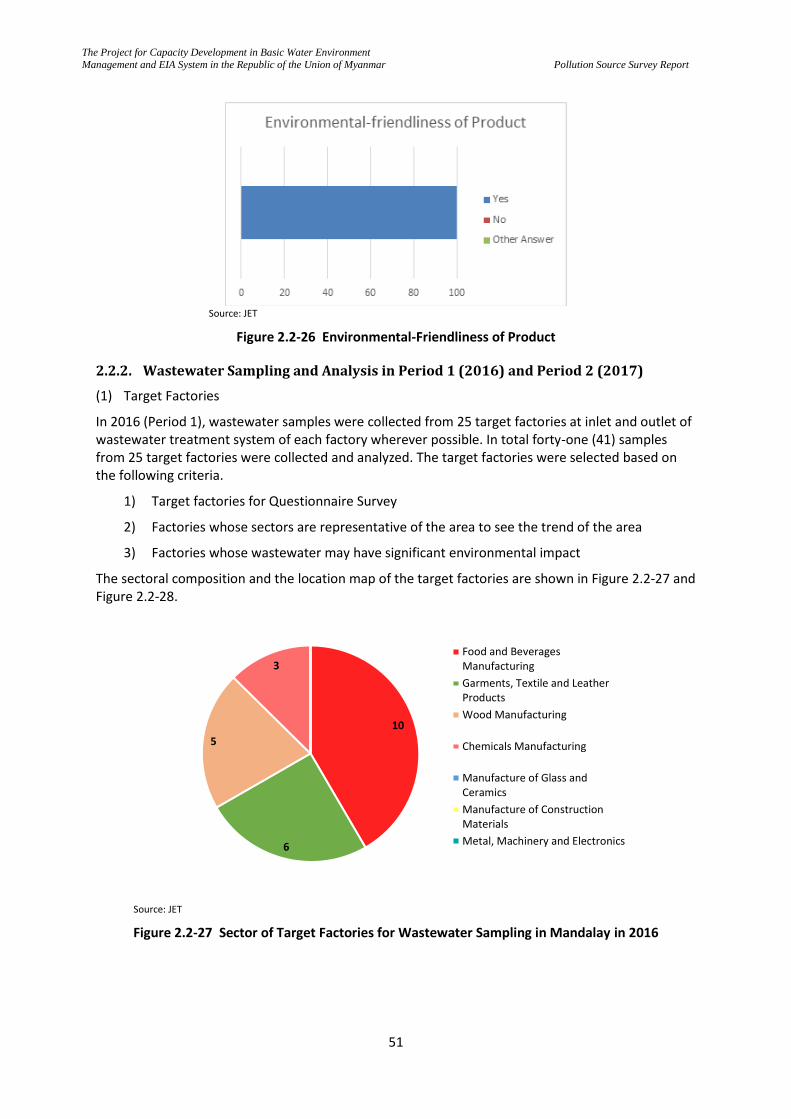
The Project for Capacity Development in Basic Water Environment
Management and EIA System in the Republic of the Union of Myanmar
Pollution Source Survey Report
51
Source: JET
Figure 2.2-26 Environmental-Friendliness of Product
2.2.2. Wastewater Sampling and Analysis in Period 1 (2016) and Period 2 (2017)
(1) Target Factories
In 2016 (Period 1), wastewater samples were collected from 25 target factories at inlet and outlet of wastewater treatment system of each factory wherever possible. In total forty-one (41) samples from 25 target factories were collected and analyzed. The target factories were selected based on the following criteria.
1) Target factories for Questionnaire Survey
2) Factories whose sectors are representative of the area to see the trend of the area
3) Factories whose wastewater may have significant environmental impact
The sectoral composition and the location map of the target factories are shown in Figure 2.2-27 and Figure 2.2-28.
Source: JET
Figure 2.2-27 Sector of Target Factories for Wastewater Sampling in Mandalay in 2016
10
6
5
3Food and BeveragesManufacturing
Garments, Textile and LeatherProducts
Wood Manufacturing
Chemicals Manufacturing
Manufacture of Glass andCeramics
Manufacture of ConstructionMaterials
Metal, Machinery and Electronics
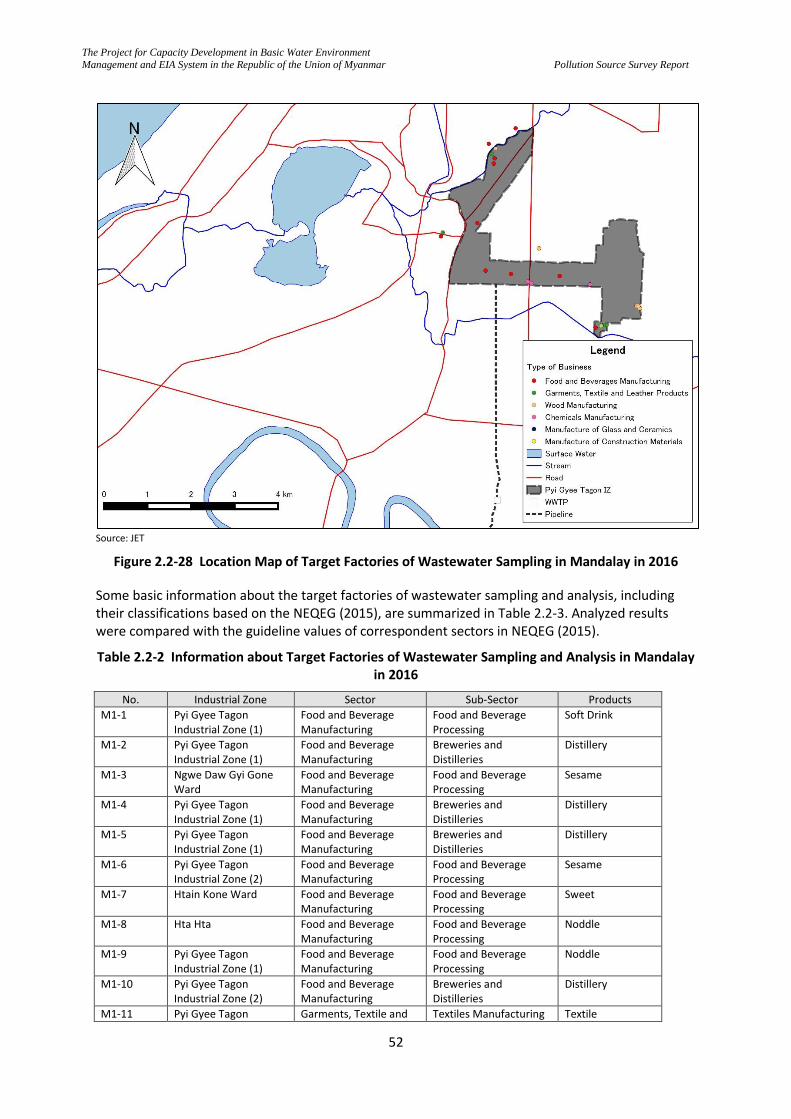
The Project for Capacity Development in Basic Water Environment
Management and EIA System in the Republic of the Union of Myanmar
Pollution Source Survey Report
52
Source: JET
Figure 2.2-28 Location Map of Target Factories of Wastewater Sampling in Mandalay in 2016
Some basic information about the target factories of wastewater sampling and analysis, including their classifications based on the NEQEG (2015), are summarized in Table 2.2-3. Analyzed results were compared with the guideline values of correspondent sectors in NEQEG (2015).
Table 2.2-2 Information about Target Factories of Wastewater Sampling and Analysis in Mandalay in 2016
No. Industrial Zone Sector Sub-Sector Products
M1-1 Pyi Gyee Tagon Industrial Zone (1)
Food and Beverage Manufacturing
Food and Beverage Processing
Soft Drink
M1-2 Pyi Gyee Tagon Industrial Zone (1)
Food and Beverage Manufacturing
Breweries and Distilleries
Distillery
M1-3 Ngwe Daw Gyi Gone Ward
Food and Beverage Manufacturing
Food and Beverage Processing
Sesame
M1-4 Pyi Gyee Tagon Industrial Zone (1)
Food and Beverage Manufacturing
Breweries and Distilleries
Distillery
M1-5 Pyi Gyee Tagon Industrial Zone (1)
Food and Beverage Manufacturing
Breweries and Distilleries
Distillery
M1-6 Pyi Gyee Tagon Industrial Zone (2)
Food and Beverage Manufacturing
Food and Beverage Processing
Sesame
M1-7 Htain Kone Ward Food and Beverage Manufacturing
Food and Beverage Processing
Sweet
M1-8 Hta Hta Food and Beverage Manufacturing
Food and Beverage Processing
Noddle
M1-9 Pyi Gyee Tagon Industrial Zone (1)
Food and Beverage Manufacturing
Food and Beverage Processing
Noddle
M1-10 Pyi Gyee Tagon Industrial Zone (2)
Food and Beverage Manufacturing
Breweries and Distilleries
Distillery
M1-11 Pyi Gyee Tagon Garments, Textile and Textiles Manufacturing Textile
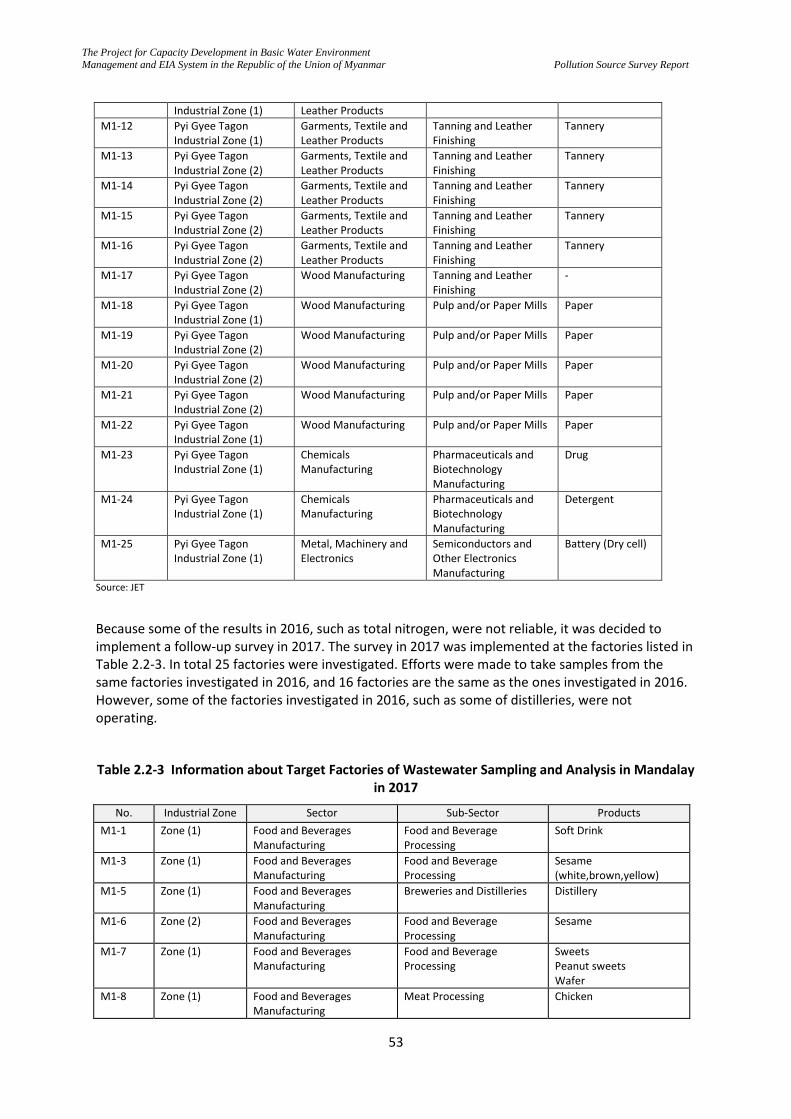
The Project for Capacity Development in Basic Water Environment
Management and EIA System in the Republic of the Union of Myanmar
Pollution Source Survey Report
53
Industrial Zone (1) Leather Products
M1-12 Pyi Gyee Tagon Industrial Zone (1)
Garments, Textile and Leather Products
Tanning and Leather Finishing
Tannery
M1-13 Pyi Gyee Tagon Industrial Zone (2)
Garments, Textile and Leather Products
Tanning and Leather Finishing
Tannery
M1-14 Pyi Gyee Tagon Industrial Zone (2)
Garments, Textile and Leather Products
Tanning and Leather Finishing
Tannery
M1-15 Pyi Gyee Tagon Industrial Zone (2)
Garments, Textile and Leather Products
Tanning and Leather Finishing
Tannery
M1-16 Pyi Gyee Tagon Industrial Zone (2)
Garments, Textile and Leather Products
Tanning and Leather Finishing
Tannery
M1-17 Pyi Gyee Tagon Industrial Zone (2)
Wood Manufacturing Tanning and Leather Finishing
-
M1-18 Pyi Gyee Tagon Industrial Zone (1)
Wood Manufacturing Pulp and/or Paper Mills Paper
M1-19 Pyi Gyee Tagon Industrial Zone (2)
Wood Manufacturing Pulp and/or Paper Mills Paper
M1-20 Pyi Gyee Tagon Industrial Zone (2)
Wood Manufacturing Pulp and/or Paper Mills Paper
M1-21 Pyi Gyee Tagon Industrial Zone (2)
Wood Manufacturing Pulp and/or Paper Mills Paper
M1-22 Pyi Gyee Tagon Industrial Zone (1)
Wood Manufacturing Pulp and/or Paper Mills Paper
M1-23 Pyi Gyee Tagon Industrial Zone (1)
Chemicals Manufacturing
Pharmaceuticals and Biotechnology Manufacturing
Drug
M1-24 Pyi Gyee Tagon Industrial Zone (1)
Chemicals Manufacturing
Pharmaceuticals and Biotechnology Manufacturing
Detergent
M1-25 Pyi Gyee Tagon Industrial Zone (1)
Metal, Machinery and Electronics
Semiconductors and Other Electronics Manufacturing
Battery (Dry cell)
Source: JET
Because some of the results in 2016, such as total nitrogen, were not reliable, it was decided to implement a follow-up survey in 2017. The survey in 2017 was implemented at the factories listed in Table 2.2-3. In total 25 factories were investigated. Efforts were made to take samples from the same factories investigated in 2016, and 16 factories are the same as the ones investigated in 2016. However, some of the factories investigated in 2016, such as some of distilleries, were not operating.
Table 2.2-3 Information about Target Factories of Wastewater Sampling and Analysis in Mandalay in 2017
No. Industrial Zone Sector Sub-Sector Products
M1-1 Zone (1) Food and Beverages Manufacturing
Food and Beverage Processing
Soft Drink
M1-3 Zone (1) Food and Beverages Manufacturing
Food and Beverage Processing
Sesame (white,brown,yellow)
M1-5 Zone (1) Food and Beverages Manufacturing
Breweries and Distilleries Distillery
M1-6 Zone (2) Food and Beverages Manufacturing
Food and Beverage Processing
Sesame
M1-7 Zone (1) Food and Beverages Manufacturing
Food and Beverage Processing
Sweets Peanut sweets Wafer
M1-8 Zone (1) Food and Beverages Manufacturing
Meat Processing Chicken
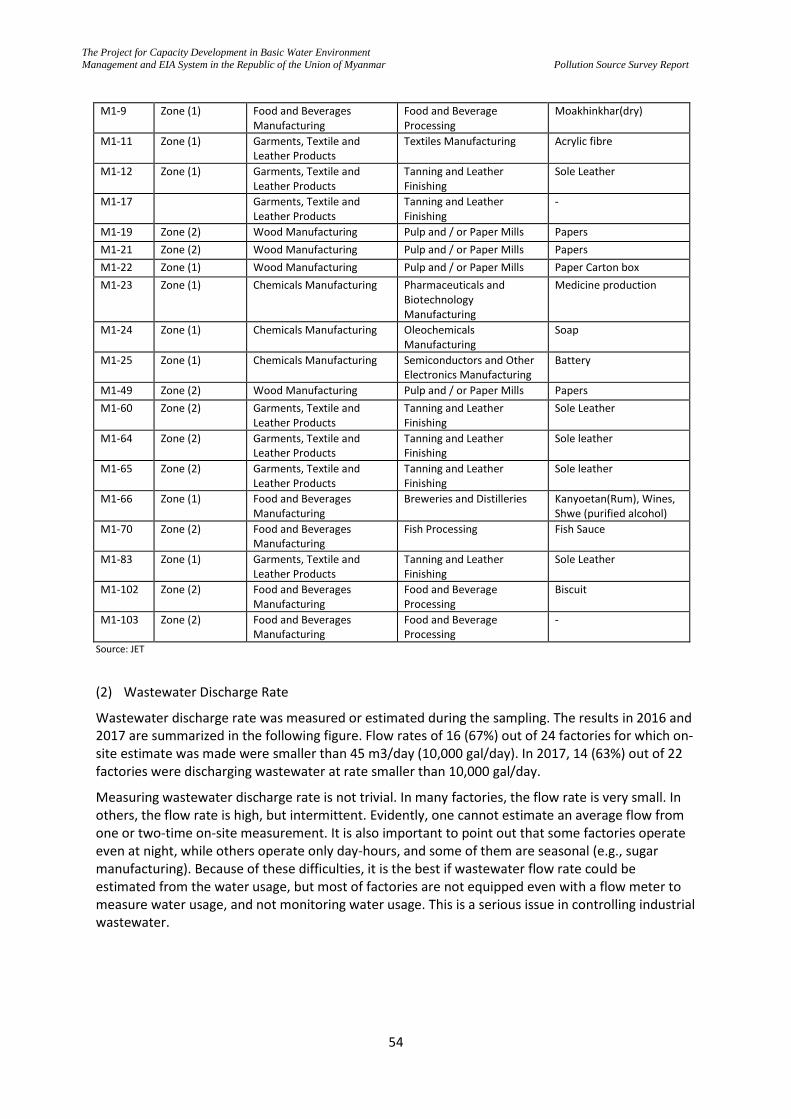
The Project for Capacity Development in Basic Water Environment
Management and EIA System in the Republic of the Union of Myanmar
Pollution Source Survey Report
54
M1-9 Zone (1) Food and Beverages Manufacturing
Food and Beverage Processing
Moakhinkhar(dry)
M1-11 Zone (1) Garments, Textile and Leather Products
Textiles Manufacturing Acrylic fibre
M1-12 Zone (1) Garments, Textile and Leather Products
Tanning and Leather Finishing
Sole Leather
M1-17 Garments, Textile and Leather Products
Tanning and Leather Finishing
-
M1-19 Zone (2) Wood Manufacturing Pulp and / or Paper Mills Papers
M1-21 Zone (2) Wood Manufacturing Pulp and / or Paper Mills Papers
M1-22 Zone (1) Wood Manufacturing Pulp and / or Paper Mills Paper Carton box
M1-23 Zone (1) Chemicals Manufacturing Pharmaceuticals and Biotechnology Manufacturing
Medicine production
M1-24 Zone (1) Chemicals Manufacturing Oleochemicals Manufacturing
Soap
M1-25 Zone (1) Chemicals Manufacturing Semiconductors and Other Electronics Manufacturing
Battery
M1-49 Zone (2) Wood Manufacturing Pulp and / or Paper Mills Papers
M1-60 Zone (2) Garments, Textile and Leather Products
Tanning and Leather Finishing
Sole Leather
M1-64 Zone (2) Garments, Textile and Leather Products
Tanning and Leather Finishing
Sole leather
M1-65 Zone (2) Garments, Textile and Leather Products
Tanning and Leather Finishing
Sole leather
M1-66 Zone (1) Food and Beverages Manufacturing
Breweries and Distilleries Kanyoetan(Rum), Wines, Shwe (purified alcohol)
M1-70 Zone (2) Food and Beverages Manufacturing
Fish Processing Fish Sauce
M1-83 Zone (1) Garments, Textile and Leather Products
Tanning and Leather Finishing
Sole Leather
M1-102 Zone (2) Food and Beverages Manufacturing
Food and Beverage Processing
Biscuit
M1-103 Zone (2) Food and Beverages Manufacturing
Food and Beverage Processing
-
Source: JET
(2) Wastewater Discharge Rate
Wastewater discharge rate was measured or estimated during the sampling. The results in 2016 and 2017 are summarized in the following figure. Flow rates of 16 (67%) out of 24 factories for which on-site estimate was made were smaller than 45 m3/day (10,000 gal/day). In 2017, 14 (63%) out of 22 factories were discharging wastewater at rate smaller than 10,000 gal/day.
Measuring wastewater discharge rate is not trivial. In many factories, the flow rate is very small. In others, the flow rate is high, but intermittent. Evidently, one cannot estimate an average flow from one or two-time on-site measurement. It is also important to point out that some factories operate even at night, while others operate only day-hours, and some of them are seasonal (e.g., sugar manufacturing). Because of these difficulties, it is the best if wastewater flow rate could be estimated from the water usage, but most of factories are not equipped even with a flow meter to measure water usage, and not monitoring water usage. This is a serious issue in controlling industrial wastewater.
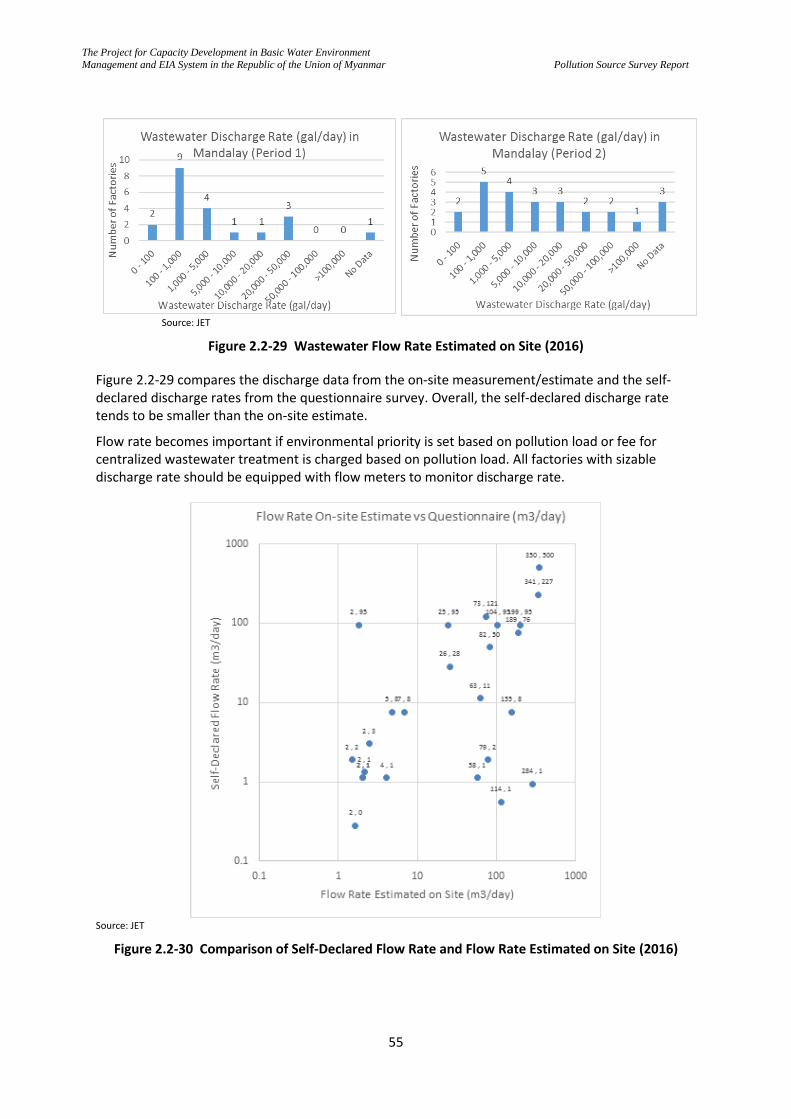
The Project for Capacity Development in Basic Water Environment
Management and EIA System in the Republic of the Union of Myanmar
Pollution Source Survey Report
55
Source: JET
Figure 2.2-29 Wastewater Flow Rate Estimated on Site (2016)
Figure 2.2-29 compares the discharge data from the on-site measurement/estimate and the self-declared discharge rates from the questionnaire survey. Overall, the self-declared discharge rate tends to be smaller than the on-site estimate.
Flow rate becomes important if environmental priority is set based on pollution load or fee for centralized wastewater treatment is charged based on pollution load. All factories with sizable discharge rate should be equipped with flow meters to monitor discharge rate.
Source: JET
Figure 2.2-30 Comparison of Self-Declared Flow Rate and Flow Rate Estimated on Site (2016)
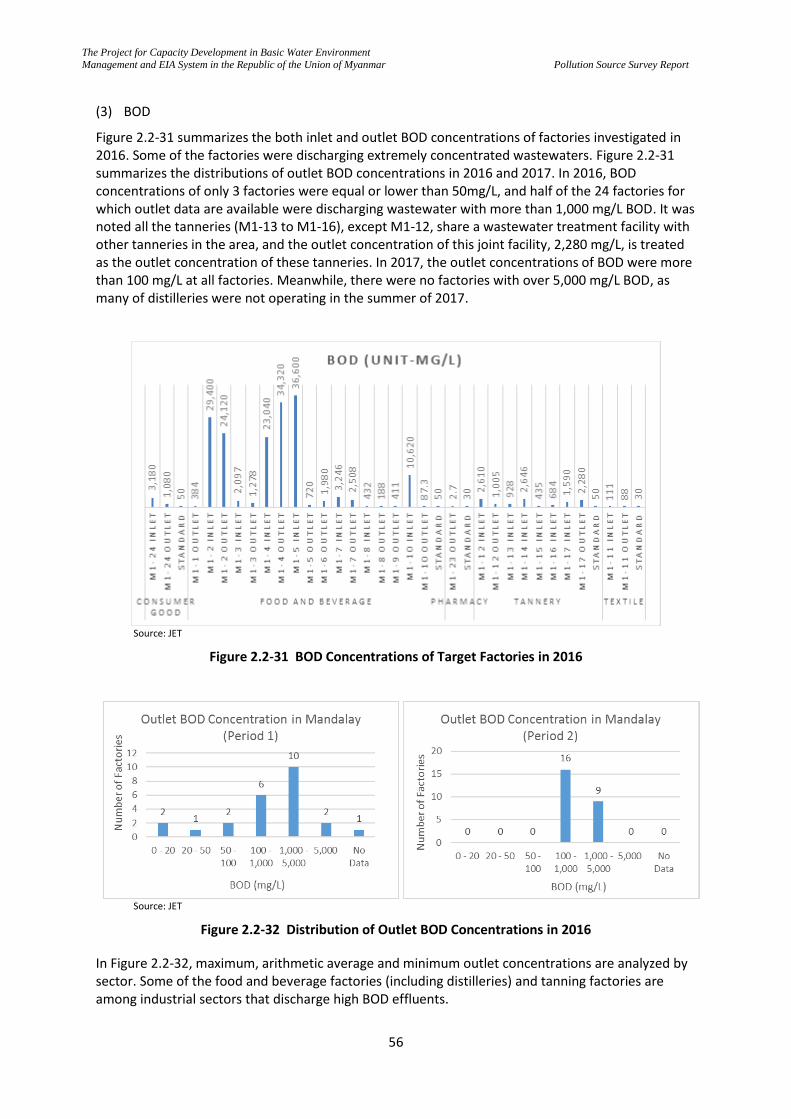
The Project for Capacity Development in Basic Water Environment
Management and EIA System in the Republic of the Union of Myanmar
Pollution Source Survey Report
56
(3) BOD
Figure 2.2-31 summarizes the both inlet and outlet BOD concentrations of factories investigated in 2016. Some of the factories were discharging extremely concentrated wastewaters. Figure 2.2-31 summarizes the distributions of outlet BOD concentrations in 2016 and 2017. In 2016, BOD concentrations of only 3 factories were equal or lower than 50mg/L, and half of the 24 factories for which outlet data are available were discharging wastewater with more than 1,000 mg/L BOD. It was noted all the tanneries (M1-13 to M1-16), except M1-12, share a wastewater treatment facility with other tanneries in the area, and the outlet concentration of this joint facility, 2,280 mg/L, is treated as the outlet concentration of these tanneries. In 2017, the outlet concentrations of BOD were more than 100 mg/L at all factories. Meanwhile, there were no factories with over 5,000 mg/L BOD, as many of distilleries were not operating in the summer of 2017.
Source: JET
Figure 2.2-31 BOD Concentrations of Target Factories in 2016
Source: JET
Figure 2.2-32 Distribution of Outlet BOD Concentrations in 2016
In Figure 2.2-32, maximum, arithmetic average and minimum outlet concentrations are analyzed by sector. Some of the food and beverage factories (including distilleries) and tanning factories are among industrial sectors that discharge high BOD effluents.
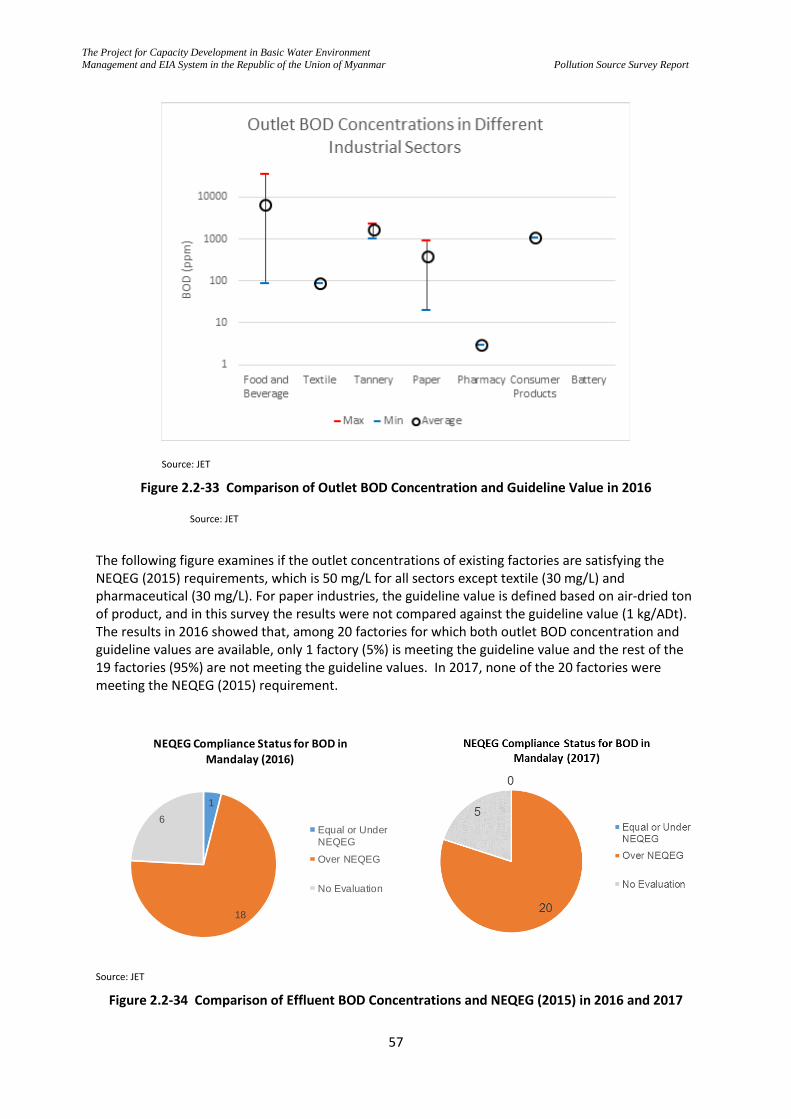
The Project for Capacity Development in Basic Water Environment
Management and EIA System in the Republic of the Union of Myanmar
Pollution Source Survey Report
57
Source: JET
Figure 2.2-33 Comparison of Outlet BOD Concentration and Guideline Value in 2016
Source: JET
The following figure examines if the outlet concentrations of existing factories are satisfying the NEQEG (2015) requirements, which is 50 mg/L for all sectors except textile (30 mg/L) and pharmaceutical (30 mg/L). For paper industries, the guideline value is defined based on air-dried ton of product, and in this survey the results were not compared against the guideline value (1 kg/ADt). The results in 2016 showed that, among 20 factories for which both outlet BOD concentration and guideline values are available, only 1 factory (5%) is meeting the guideline value and the rest of the 19 factories (95%) are not meeting the guideline values. In 2017, none of the 20 factories were meeting the NEQEG (2015) requirement.
Source: JET
Figure 2.2-34 Comparison of Effluent BOD Concentrations and NEQEG (2015) in 2016 and 2017
1
18
6
NEQEG Compliance Status for BOD in Mandalay (2016)
Equal or Under
NEQEG
Over NEQEG
No Evaluation
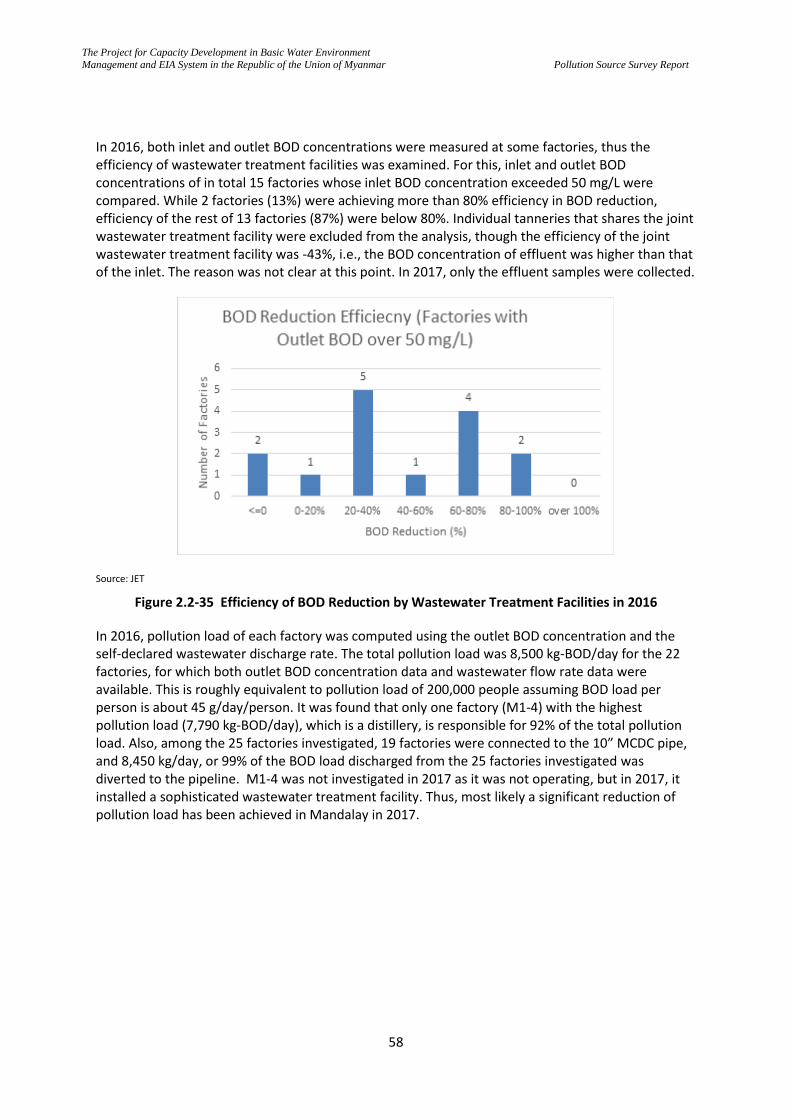
The Project for Capacity Development in Basic Water Environment
Management and EIA System in the Republic of the Union of Myanmar
Pollution Source Survey Report
58
In 2016, both inlet and outlet BOD concentrations were measured at some factories, thus the efficiency of wastewater treatment facilities was examined. For this, inlet and outlet BOD concentrations of in total 15 factories whose inlet BOD concentration exceeded 50 mg/L were compared. While 2 factories (13%) were achieving more than 80% efficiency in BOD reduction, efficiency of the rest of 13 factories (87%) were below 80%. Individual tanneries that shares the joint wastewater treatment facility were excluded from the analysis, though the efficiency of the joint wastewater treatment facility was -43%, i.e., the BOD concentration of effluent was higher than that of the inlet. The reason was not clear at this point. In 2017, only the effluent samples were collected.
Source: JET
Figure 2.2-35 Efficiency of BOD Reduction by Wastewater Treatment Facilities in 2016
In 2016, pollution load of each factory was computed using the outlet BOD concentration and the self-declared wastewater discharge rate. The total pollution load was 8,500 kg-BOD/day for the 22 factories, for which both outlet BOD concentration data and wastewater flow rate data were available. This is roughly equivalent to pollution load of 200,000 people assuming BOD load per person is about 45 g/day/person. It was found that only one factory (M1-4) with the highest pollution load (7,790 kg-BOD/day), which is a distillery, is responsible for 92% of the total pollution load. Also, among the 25 factories investigated, 19 factories were connected to the 10” MCDC pipe, and 8,450 kg/day, or 99% of the BOD load discharged from the 25 factories investigated was diverted to the pipeline. M1-4 was not investigated in 2017 as it was not operating, but in 2017, it installed a sophisticated wastewater treatment facility. Thus, most likely a significant reduction of pollution load has been achieved in Mandalay in 2017.
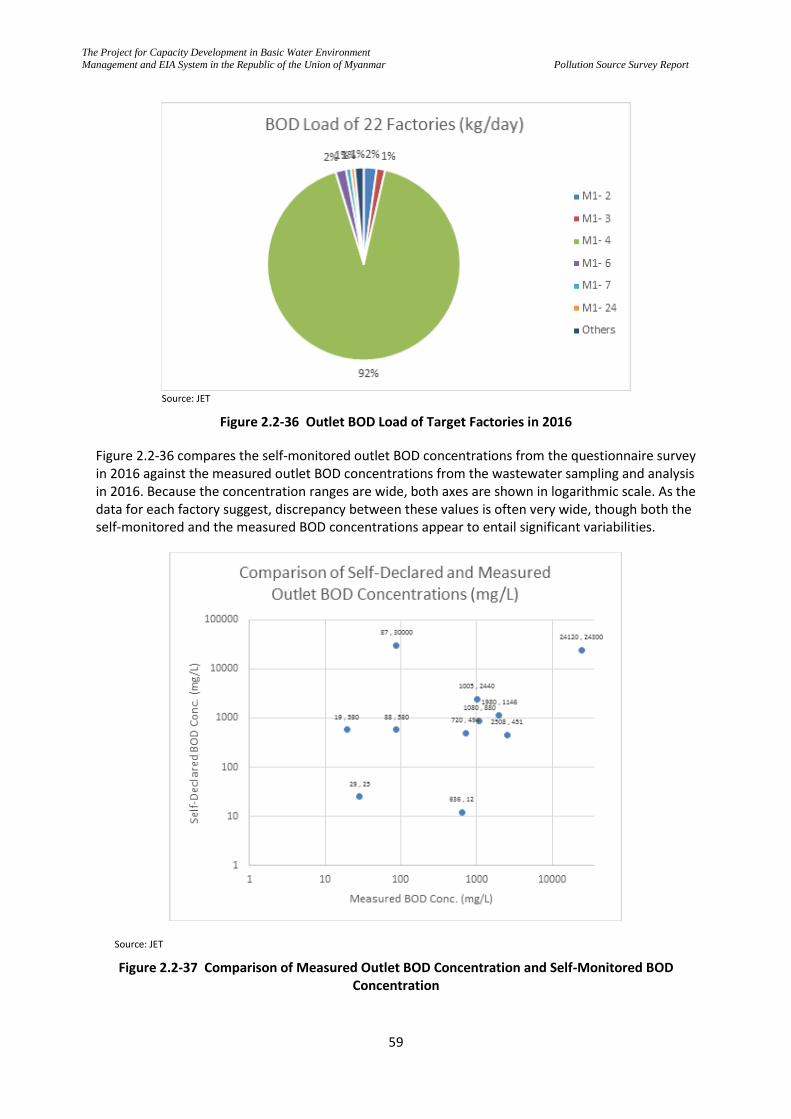
The Project for Capacity Development in Basic Water Environment
Management and EIA System in the Republic of the Union of Myanmar
Pollution Source Survey Report
59
Source: JET
Figure 2.2-36 Outlet BOD Load of Target Factories in 2016
Figure 2.2-36 compares the self-monitored outlet BOD concentrations from the questionnaire survey in 2016 against the measured outlet BOD concentrations from the wastewater sampling and analysis in 2016. Because the concentration ranges are wide, both axes are shown in logarithmic scale. As the data for each factory suggest, discrepancy between these values is often very wide, though both the self-monitored and the measured BOD concentrations appear to entail significant variabilities.
Source: JET
Figure 2.2-37 Comparison of Measured Outlet BOD Concentration and Self-Monitored BOD Concentration
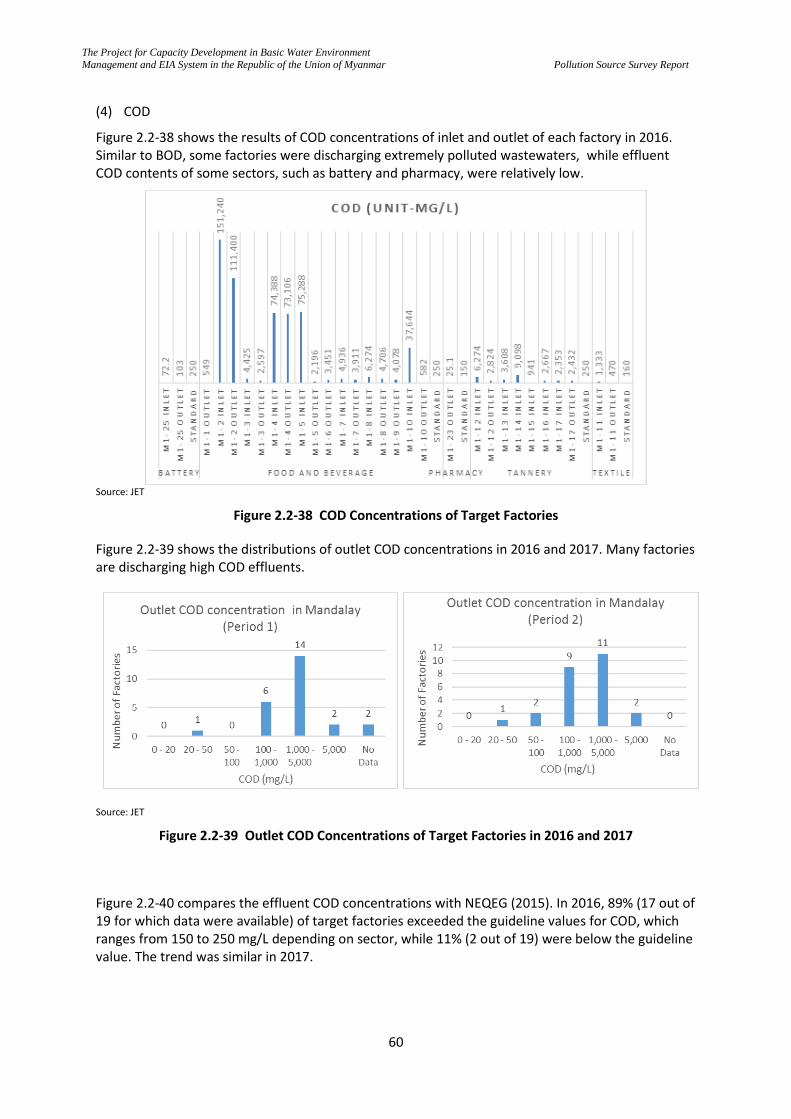
The Project for Capacity Development in Basic Water Environment
Management and EIA System in the Republic of the Union of Myanmar
Pollution Source Survey Report
60
(4) COD
Figure 2.2-38 shows the results of COD concentrations of inlet and outlet of each factory in 2016. Similar to BOD, some factories were discharging extremely polluted wastewaters, while effluent COD contents of some sectors, such as battery and pharmacy, were relatively low.
Source: JET
Figure 2.2-38 COD Concentrations of Target Factories
Figure 2.2-39 shows the distributions of outlet COD concentrations in 2016 and 2017. Many factories are discharging high COD effluents.
Source: JET
Figure 2.2-39 Outlet COD Concentrations of Target Factories in 2016 and 2017
Figure 2.2-40 compares the effluent COD concentrations with NEQEG (2015). In 2016, 89% (17 out of 19 for which data were available) of target factories exceeded the guideline values for COD, which ranges from 150 to 250 mg/L depending on sector, while 11% (2 out of 19) were below the guideline value. The trend was similar in 2017.
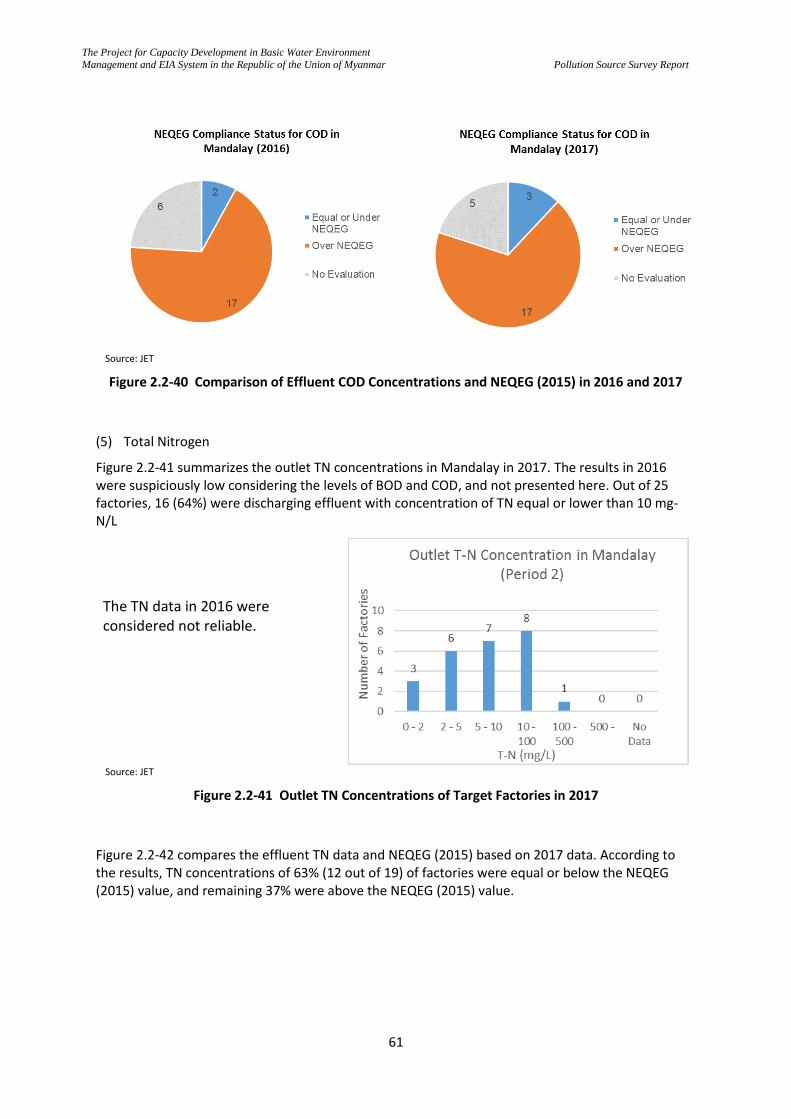
The Project for Capacity Development in Basic Water Environment
Management and EIA System in the Republic of the Union of Myanmar
Pollution Source Survey Report
61
Source: JET
Figure 2.2-40 Comparison of Effluent COD Concentrations and NEQEG (2015) in 2016 and 2017
(5) Total Nitrogen
Figure 2.2-41 summarizes the outlet TN concentrations in Mandalay in 2017. The results in 2016 were suspiciously low considering the levels of BOD and COD, and not presented here. Out of 25 factories, 16 (64%) were discharging effluent with concentration of TN equal or lower than 10 mg-N/L
The TN data in 2016 were considered not reliable.
Source: JET
Figure 2.2-41 Outlet TN Concentrations of Target Factories in 2017
Figure 2.2-42 compares the effluent TN data and NEQEG (2015) based on 2017 data. According to the results, TN concentrations of 63% (12 out of 19) of factories were equal or below the NEQEG (2015) value, and remaining 37% were above the NEQEG (2015) value.
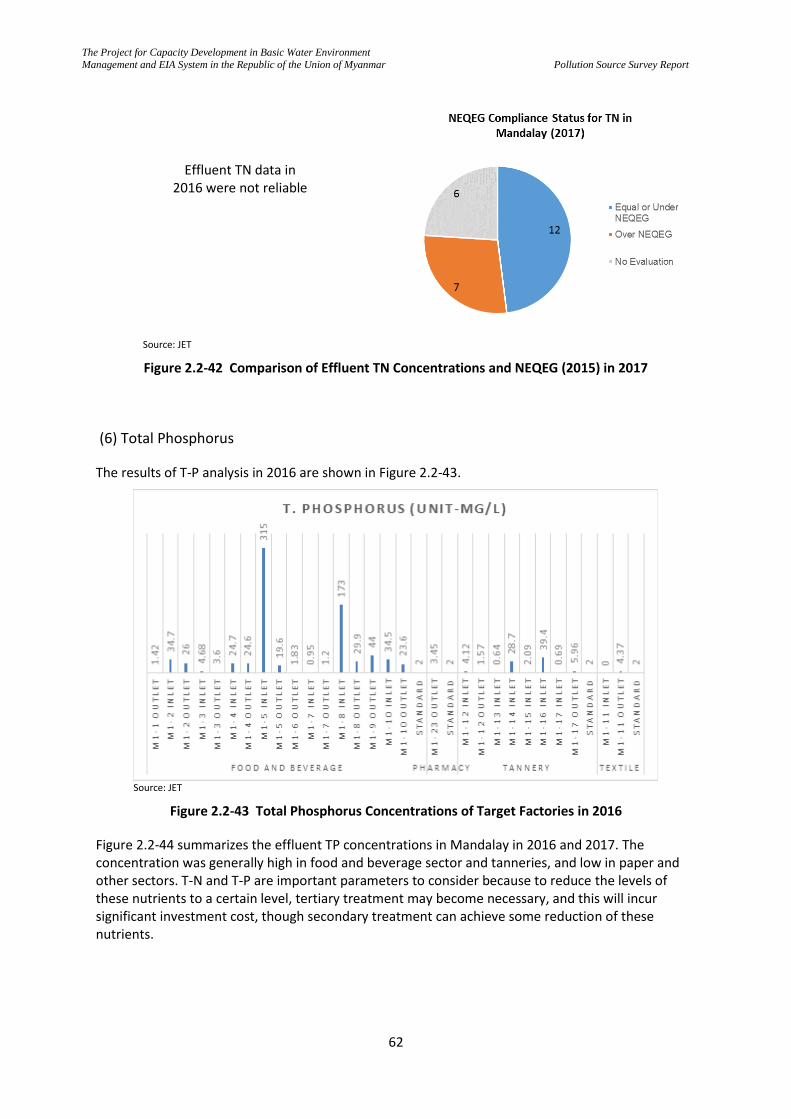
The Project for Capacity Development in Basic Water Environment
Management and EIA System in the Republic of the Union of Myanmar
Pollution Source Survey Report
62
Effluent TN data in 2016 were not reliable
Source: JET
Figure 2.2-42 Comparison of Effluent TN Concentrations and NEQEG (2015) in 2017
(6) Total Phosphorus
The results of T-P analysis in 2016 are shown in Figure 2.2-43.
Source: JET
Figure 2.2-43 Total Phosphorus Concentrations of Target Factories in 2016
Figure 2.2-44 summarizes the effluent TP concentrations in Mandalay in 2016 and 2017. The concentration was generally high in food and beverage sector and tanneries, and low in paper and other sectors. T-N and T-P are important parameters to consider because to reduce the levels of these nutrients to a certain level, tertiary treatment may become necessary, and this will incur significant investment cost, though secondary treatment can achieve some reduction of these nutrients.
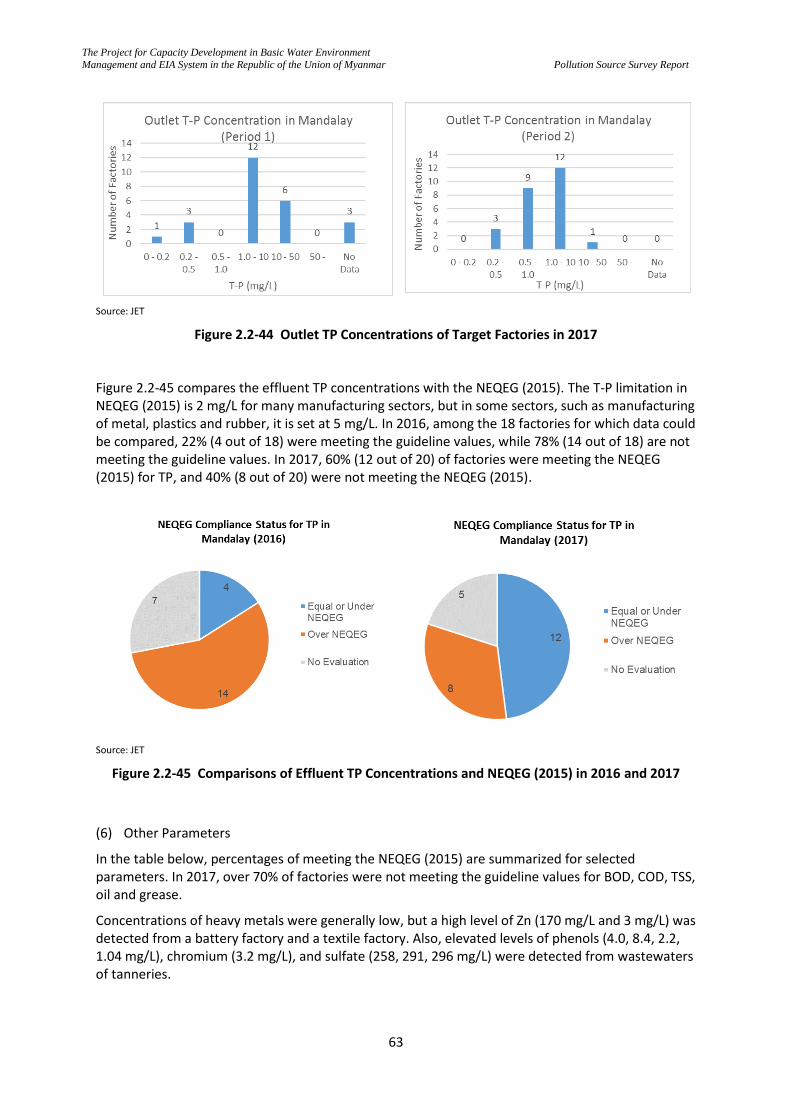
The Project for Capacity Development in Basic Water Environment
Management and EIA System in the Republic of the Union of Myanmar
Pollution Source Survey Report
63
Source: JET
Figure 2.2-44 Outlet TP Concentrations of Target Factories in 2017
Figure 2.2-45 compares the effluent TP concentrations with the NEQEG (2015). The T-P limitation in NEQEG (2015) is 2 mg/L for many manufacturing sectors, but in some sectors, such as manufacturing of metal, plastics and rubber, it is set at 5 mg/L. In 2016, among the 18 factories for which data could be compared, 22% (4 out of 18) were meeting the guideline values, while 78% (14 out of 18) are not meeting the guideline values. In 2017, 60% (12 out of 20) of factories were meeting the NEQEG (2015) for TP, and 40% (8 out of 20) were not meeting the NEQEG (2015).
Source: JET
Figure 2.2-45 Comparisons of Effluent TP Concentrations and NEQEG (2015) in 2016 and 2017
(6) Other Parameters
In the table below, percentages of meeting the NEQEG (2015) are summarized for selected parameters. In 2017, over 70% of factories were not meeting the guideline values for BOD, COD, TSS, oil and grease.
Concentrations of heavy metals were generally low, but a high level of Zn (170 mg/L and 3 mg/L) was detected from a battery factory and a textile factory. Also, elevated levels of phenols (4.0, 8.4, 2.2, 1.04 mg/L), chromium (3.2 mg/L), and sulfate (258, 291, 296 mg/L) were detected from wastewaters of tanneries.
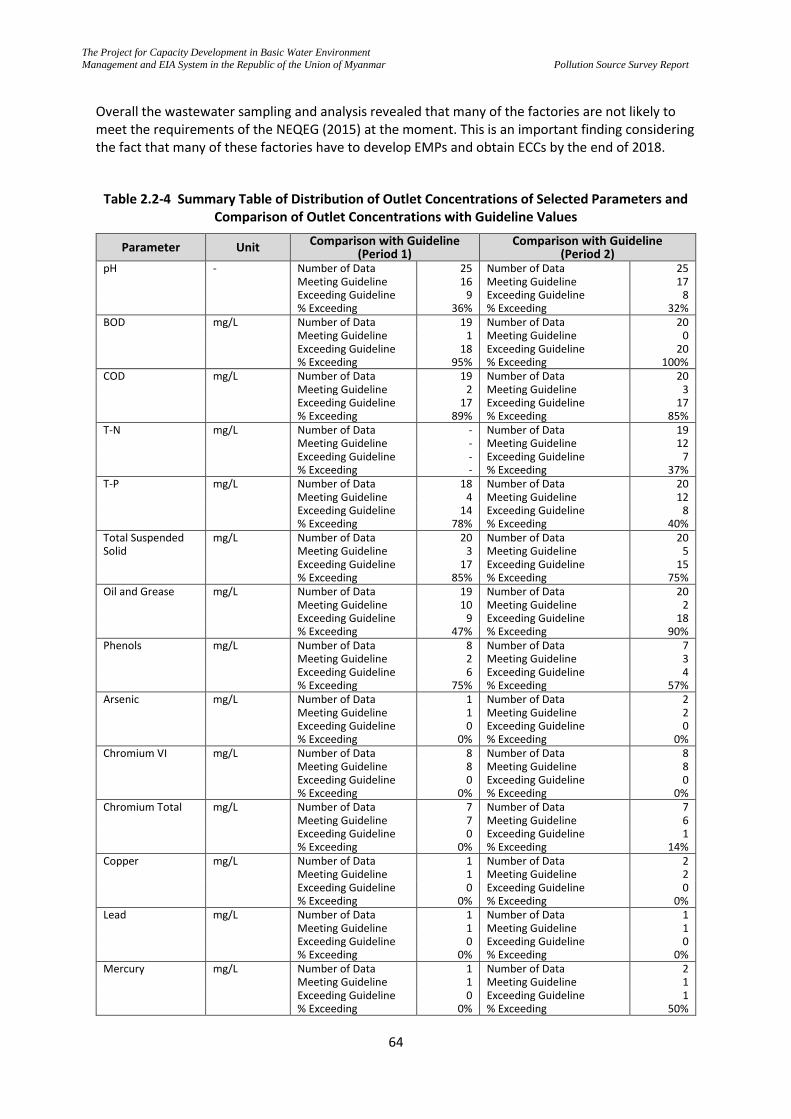
The Project for Capacity Development in Basic Water Environment
Management and EIA System in the Republic of the Union of Myanmar
Pollution Source Survey Report
64
Overall the wastewater sampling and analysis revealed that many of the factories are not likely to meet the requirements of the NEQEG (2015) at the moment. This is an important finding considering the fact that many of these factories have to develop EMPs and obtain ECCs by the end of 2018.
Table 2.2-4 Summary Table of Distribution of Outlet Concentrations of Selected Parameters and Comparison of Outlet Concentrations with Guideline Values
Parameter Unit Comparison with Guideline (Period 1)
Comparison with Guideline (Period 2)
pH - Number of Data 25 Number of Data 25 Meeting Guideline 16 Meeting Guideline 17 Exceeding Guideline 9 Exceeding Guideline 8 % Exceeding 36% % Exceeding 32% BOD mg/L Number of Data 19 Number of Data 20 Meeting Guideline 1 Meeting Guideline 0 Exceeding Guideline 18 Exceeding Guideline 20 % Exceeding 95% % Exceeding 100% COD mg/L Number of Data 19 Number of Data 20 Meeting Guideline 2 Meeting Guideline 3 Exceeding Guideline 17 Exceeding Guideline 17 % Exceeding 89% % Exceeding 85% T-N mg/L Number of Data - Number of Data 19 Meeting Guideline - Meeting Guideline 12 Exceeding Guideline - Exceeding Guideline 7 % Exceeding - % Exceeding 37% T-P mg/L Number of Data 18 Number of Data 20 Meeting Guideline 4 Meeting Guideline 12 Exceeding Guideline 14 Exceeding Guideline 8 % Exceeding 78% % Exceeding 40% Total Suspended mg/L Number of Data 20 Number of Data 20 Solid Meeting Guideline 3 Meeting Guideline 5 Exceeding Guideline 17 Exceeding Guideline 15 % Exceeding 85% % Exceeding 75% Oil and Grease mg/L Number of Data 19 Number of Data 20 Meeting Guideline 10 Meeting Guideline 2 Exceeding Guideline 9 Exceeding Guideline 18 % Exceeding 47% % Exceeding 90% Phenols mg/L Number of Data 8 Number of Data 7 Meeting Guideline 2 Meeting Guideline 3 Exceeding Guideline 6 Exceeding Guideline 4 % Exceeding 75% % Exceeding 57% Arsenic mg/L Number of Data 1 Number of Data 2 Meeting Guideline 1 Meeting Guideline 2 Exceeding Guideline 0 Exceeding Guideline 0 % Exceeding 0% % Exceeding 0% Chromium VI mg/L Number of Data 8 Number of Data 8 Meeting Guideline 8 Meeting Guideline 8 Exceeding Guideline 0 Exceeding Guideline 0 % Exceeding 0% % Exceeding 0% Chromium Total mg/L Number of Data 7 Number of Data 7 Meeting Guideline 7 Meeting Guideline 6 Exceeding Guideline 0 Exceeding Guideline 1 % Exceeding 0% % Exceeding 14% Copper mg/L Number of Data 1 Number of Data 2 Meeting Guideline 1 Meeting Guideline 2 Exceeding Guideline 0 Exceeding Guideline 0 % Exceeding 0% % Exceeding 0% Lead mg/L Number of Data 1 Number of Data 1 Meeting Guideline 1 Meeting Guideline 1 Exceeding Guideline 0 Exceeding Guideline 0 % Exceeding 0% % Exceeding 0% Mercury mg/L Number of Data 1 Number of Data 2 Meeting Guideline 1 Meeting Guideline 1 Exceeding Guideline 0 Exceeding Guideline 1 % Exceeding 0% % Exceeding 50%
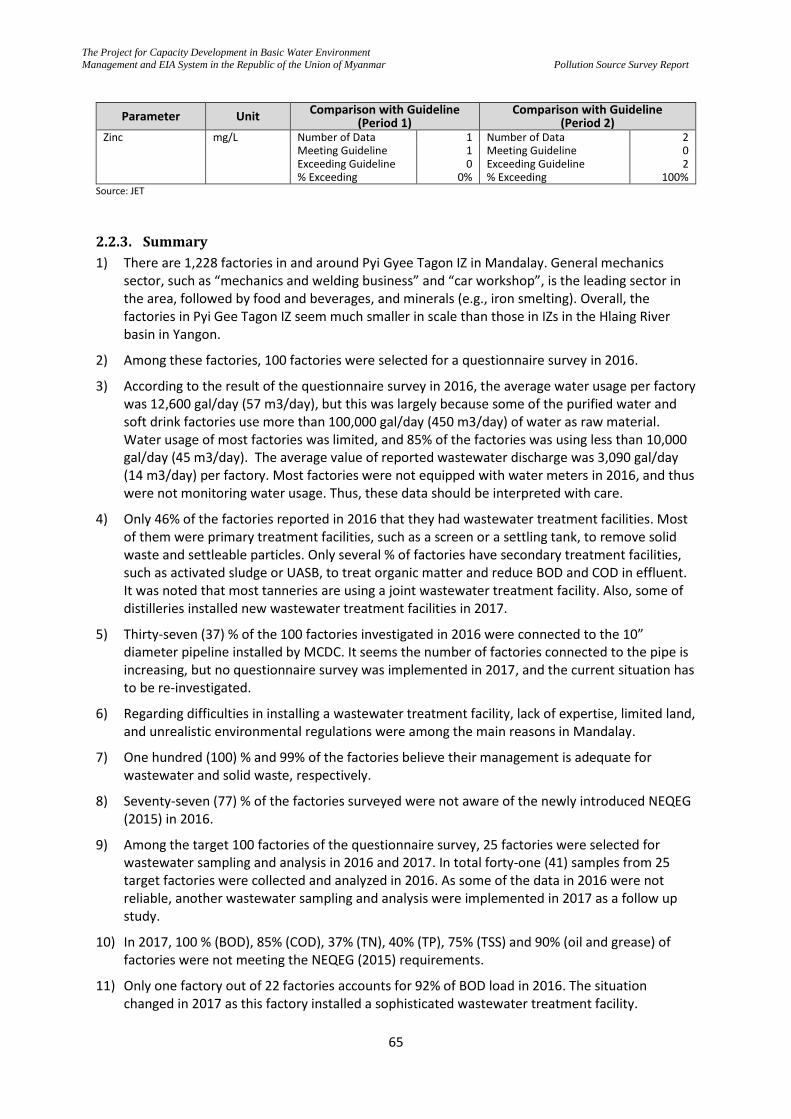
The Project for Capacity Development in Basic Water Environment
Management and EIA System in the Republic of the Union of Myanmar
Pollution Source Survey Report
65
Parameter Unit Comparison with Guideline (Period 1)
Comparison with Guideline (Period 2)
Zinc mg/L Number of Data 1 Number of Data 2 Meeting Guideline 1 Meeting Guideline 0 Exceeding Guideline 0 Exceeding Guideline 2 % Exceeding 0% % Exceeding 100%
Source: JET
2.2.3. Summary
1) There are 1,228 factories in and around Pyi Gyee Tagon IZ in Mandalay. General mechanics sector, such as “mechanics and welding business” and “car workshop”, is the leading sector in the area, followed by food and beverages, and minerals (e.g., iron smelting). Overall, the factories in Pyi Gee Tagon IZ seem much smaller in scale than those in IZs in the Hlaing River basin in Yangon.
2) Among these factories, 100 factories were selected for a questionnaire survey in 2016.
3) According to the result of the questionnaire survey in 2016, the average water usage per factory was 12,600 gal/day (57 m3/day), but this was largely because some of the purified water and soft drink factories use more than 100,000 gal/day (450 m3/day) of water as raw material. Water usage of most factories was limited, and 85% of the factories was using less than 10,000 gal/day (45 m3/day). The average value of reported wastewater discharge was 3,090 gal/day (14 m3/day) per factory. Most factories were not equipped with water meters in 2016, and thus were not monitoring water usage. Thus, these data should be interpreted with care.
4) Only 46% of the factories reported in 2016 that they had wastewater treatment facilities. Most of them were primary treatment facilities, such as a screen or a settling tank, to remove solid waste and settleable particles. Only several % of factories have secondary treatment facilities, such as activated sludge or UASB, to treat organic matter and reduce BOD and COD in effluent. It was noted that most tanneries are using a joint wastewater treatment facility. Also, some of distilleries installed new wastewater treatment facilities in 2017.
5) Thirty-seven (37) % of the 100 factories investigated in 2016 were connected to the 10” diameter pipeline installed by MCDC. It seems the number of factories connected to the pipe is increasing, but no questionnaire survey was implemented in 2017, and the current situation has to be re-investigated.
6) Regarding difficulties in installing a wastewater treatment facility, lack of expertise, limited land, and unrealistic environmental regulations were among the main reasons in Mandalay.
7) One hundred (100) % and 99% of the factories believe their management is adequate for wastewater and solid waste, respectively.
8) Seventy-seven (77) % of the factories surveyed were not aware of the newly introduced NEQEG (2015) in 2016.
9) Among the target 100 factories of the questionnaire survey, 25 factories were selected for wastewater sampling and analysis in 2016 and 2017. In total forty-one (41) samples from 25 target factories were collected and analyzed in 2016. As some of the data in 2016 were not reliable, another wastewater sampling and analysis were implemented in 2017 as a follow up study.
10) In 2017, 100 % (BOD), 85% (COD), 37% (TN), 40% (TP), 75% (TSS) and 90% (oil and grease) of factories were not meeting the NEQEG (2015) requirements.
11) Only one factory out of 22 factories accounts for 92% of BOD load in 2016. The situation changed in 2017 as this factory installed a sophisticated wastewater treatment facility.
The Project for Capacity Development in Basic Water Environment
Management and EIA System in the Republic of the Union of Myanmar
Pollution Source Survey Report
66
12) Concentrations of heavy metals and organic chemicals were generally low, but a high level of Zn (170 mg/L and 3 mg/L) was detected from a battery factory and a textile factory. Also, elevated levels of phenols (4.0, 8.4, 2.2, 1.04 mg/L), chromium (3.2 mg/L), and sulfate (258, 291, 296 mg/L) were detected from wastewaters of tanneries.
The Project for Capacity Development in Basic Water Environment
Management and EIA System in the Republic of the Union of Myanmar
Pollution Source Survey Report
67
3. CONCLUSIONS AND RECOMMENDATIONS A pollution source survey was implemented in industrial zones in the Hlaing River basin in Yangon and the Doke Hta Waddy River basin in Mandalay in order to develop a pollution source database for the Hlaing River basin and the Doke Hta Waddy River basin. The survey consisted of a questionnaire survey targeting 200 factories in 2016 and wastewater sampling and analysis at 50 factories in these basins in 2016 and 2017. While not all factories in these basins were investigated, the survey revealed overall picture of diverse environmental management issues of manufacturing industries in these areas. As improvement of water environment management is the main focus of this project, this section discusses the findings on the following issues:
- Current status of wastewater management at factories
- Comparison of effluent concentrations and requirements of NEQEG (2015)
- Sizes of factories, environmental impacts and capacity to improve environmental performance
- Awareness of factory managers about environmental requirements
- Issues in improving environmental performance
Then, at the end a set of recommendations are provided for environmental authorities, such as ECD, YCDC, MCDC and others.
3.1. Conclusions
(1) Current status of wastewater management at factories
- Overall only half of the factories, 53% in Yangon and 46% in Mandalay investigated in 2016, had wastewater treatment facilities. Most of such facilities were rudimentary primary treatment facilities to remove large particles and solid waste, such as screens and settling basins.
- Only several percent of factories (5% or less in both Yangon and Mandalay) in 2016 were equipped with modern secondary treatment facilities to remove biodegradable organic matter, such as activated sludge and UASB. Oil separator was available at 10 % of factories in Yangon and none in Mandalay. Essentially none of the factories were equipped with facilities specifically designed to remove nutrients (e.g., T-N and T-P). Similarly, most factories were not controlling other pollutants, such as coliform bacteria and toxic substances.
- Perhaps a more alarming fact was that in 2016 only 10% of the factories in Yangon and 2% of factories had flow meters to monitor water usage, and only 4% of factories in Yangon and 2% in Mandalay have flow meters to monitor wastewater flow rate. Majority of factories (92% in Yangon and 100% in Mandalay) were using groundwater (rather than supplied water) as the sources of water, and perhaps there was little incentive to optimize water usage and wastewater discharge.
(2) Comparison of effluent concentrations and requirements of NEQEG (2015)
- Because most of the factories were not equipped with adequate wastewater treatment facilities, it was not surprising that many of them were not meeting the effluent guideline values of NEQEG (2015), although NEQEG (2015) has not been legally mandated to most existing factories.
- In 2017, 79% (BOD), 46% (COD), 48% (TN), 50% (TP), 75% (TSS) and 92% (oil and grease) of factories in the Hlaing River basin in Yangon were not meeting the NEQEG (2015) requirements. In the same year, 100% (BOD), 85% (COD), 37% (TN), 40% (TP), 75% (TSS) and 90% (oil and grease) of factories in the Doke Hta Waddy River basin in Mandalay were again not meeting the NEQEG (2015) requirements. To meet the NEQEG (2015) requirements, these factories
The Project for Capacity Development in Basic Water Environment
Management and EIA System in the Republic of the Union of Myanmar
Pollution Source Survey Report
68
probably have to newly install a primary and secondary treatment facilities. Some of them might need a tertiary treatment to remove nutrients.
- There are factories that were satisfying NEQEG (2015) requirements for many parameters. However, most of them were able to achieve this only because their raw wastewater is rather weak (e.g., some of the cold storage in Yangon), and not because they were actively and efficiently removing pollutants.
- Those sectors that discharge highly concentrated organic wastewater, such as distilleries, are expected to face serious difficulties in meeting the requirements, if the requirements are imposed.
- With respect to toxic substances, lead (4.3 mg/L), zinc (168 mg/L), mercury (0.014 mg/L) fluoride (5.2-16 mg/L) were found from battery factories in 2017 at levels higher than the NEQEG (2015). Similarly, phenols (1.0 - 8.4 mg/L) and total chromium (3.2 mg/L) from some of tanning factories were higher than NEQEG (2015). Zinc (3.0 mg/L) was also detected from a textile factory and phenols (0.96 mg/L) from a pharmaceutical company.
(3) Sizes of Factories, Environmental Impacts and Capacity of Factory to Improve Environmental Performance
- While most factories investigated this time were categorized as large factories according to DISI’s classification, many of them are considered small to medium-scaled with respect to the number of employees and the amount of wastewater.
- Though effluents of many of these factories did not satisfy the concentration-based requirements of NEQEG (2015), only a small fraction of factories were responsible for the large part of industrial pollution load. In Yangon, three factories (distilleries and rubber) are responsible for 92% of BOD load discharged from the 25 factories investigated in 2016, and in Mandalay only one factory (distillery) was responsible for 92% of BOD load from the 25 factories investigated in 2016. Many of distilleries have been shut down and/or installed sophisticated wastewater treatment facilities in 2017. Thus, the situation has probably improved significantly.
- One should note that in order to estimate pollution load accurately, estimates of both wastewater flow rate and effluent concentration of pollutant should be accurate. However, there are significant variabilities and uncertainties in both estimates, and further investigation is needed.
(4) Awareness about Environmental Requirements
- Essentially all of the respondents in 2016 believed environmental performance of their factories was satisfactory and their products were environmentally-friendly. On the other hand, the survey revealed that 77% of factory managers in Yangon and 71% in Mandalay were not aware of the newly introduced NEQEG (2015).
- While many of the factory managers probably did not want to give answers that could attract attention of local authorities, it seems there is a significant gap in expectation of modern environmental management, as represented by NEQEG (2015), and awareness of many factory managers.
(5) Issues in Improving Environmental Performance
- If factories are required to improve environmental performance and satisfy requirements of NEQEG (2015), they might face various difficulties in technical, financial and organizational aspects. As an attempt to examine factory managers’ view on such problems, especially on wastewater management, respondents were asked what would be the difficulties in installing a wastewater treatment plant.
The Project for Capacity Development in Basic Water Environment
Management and EIA System in the Republic of the Union of Myanmar
Pollution Source Survey Report
69
- While respondents in both Yangon and Mandalay did not select cost as the main problem, cost is undoubtedly one of the most important problems. As discussed at the workshops on wastewater treatment, which was implemented after the questionnaire survey, installation of a new wastewater treatment facility would cost in the order of tens to hundreds of thousands of dollars for initial investment and operation cost of several to tens of thousand dollars in the first 10 years or so; actual cost is dependent on the volume and characteristics of wastewater. Large factories might be able to absorb such cost, but for smaller factories, whose annual sales is often less than 100 million MMK, it would be a significant cost.
- Limited land is another major concern for many factories both in Yangon and Mandalay. The problem is especially acute in small-scaled factories whose land area is often smaller than 0.5 acre (0.2 ha).
- Many factories in Mandalay pointed out lack of expertise, both in-house and external, is a major concern. Perhaps the demand for such expertise was limited in the past because effluent was not regulated strictly. However, to improve environmental performance, advices from experts on both technical and financial matters are essential.
- Some respondents commented that unrealistic environmental regulation is a concern. The requirements of NEQEG (2015) are very demanding, and many factories may not be able to satisfy the requirements, if NEQEG (2015) are mandated without adjustment.
- Discussions above have focused on installation of wastewater treatment facility as an end-of-pipe measure. However, these factories need to meet much broader environmental requirements, including air pollution control, noise control, waste management, hazardous substance management, resource conservation, emergency response, etc. To deal with such broad issues, an end-of-pipe approach is not sufficient. They have to go more strategic, adopt an environmental management system, and explore various options to improve efficiency of production and at the same time minimize pollution.
3.2. Recommendations The following issues and suggestions were drawn from the experiences of the pollution source survey.
(1) Gathering Information from Factories
Issues: Right now, environmental authorities generally do not have detailed information about factories required for environmental management, such as production volume, water usage, pollution prevention and control measures taken, use of toxic substances, monitoring results, environmental issues encountered, emergency plan, etc. Such information is not contained in the data set of DISI and/or IZMCs. Without such information, it is difficult to know which factories are subject to different requirements or which factories should be considered environmental priorities.
Suggestions: Environmental authorities should collect such information from factories in relation to ECC and/or business licensing/registration. As MONREC has already issued an order to factories in nine priority sectors to submit EMPs, an EMP is a good place to start. However, basic information should be collected every year, as the situation of factories could change. Thus, submission of such information should be incorporated into the reporting requirements of ECC and/or business licensing/registration. If gathering information through EMPs takes too much time, it is suggested to implement a questionnaire survey, similar to the one implemented in this project.
(2) Development of Database of Pollution Sources
Issues: As demonstrated in this project, an electronic database is very useful for managing environmental information. However, the pollution source database developed in this project was designed largely to analyze the current situation of pollution sources, and was not designed
The Project for Capacity Development in Basic Water Environment
Management and EIA System in the Republic of the Union of Myanmar
Pollution Source Survey Report
70
specifically for ECC and business licensing/registration. Thus, once the frameworks of environmental requirements related to ECC and business licensing/registration are set, a new database should be designed.
Suggestions: In principle, they should be designed considering the licensing scheme, and end use of the database, e.g., tracking official and unofficial correspondence, managing inspection activities, managing information submitted by factories, and analyzing information to prepare reports to top management. For ECC, perhaps it is more appropriate to expand the EIA database, rather than developing a new database. It is important to note that digitizing of non-digitized information is very labor intensive. Thus, for the time being, it is probably wise to limit the information to be managed by a database, and manage other information in hard copies. In the future, perhaps the regulated communities can submit information in electronic format.
(3) Improving Reliability of Measurement of Water Usage and Wastewater Qualities
Issues: Volume of wastewater and concentrations of pollutants in wastewater are among the most important parameters in managing water pollution, but the project encountered serious difficulties in measuring these parameters. Water usage in a factory is known to fluctuate significantly during production, and one or two-time on-site measurement does not give accurate estimate of water usage (and wastewater volume). Less than 10% of factories are equipped with flow meters to measure water usage, and very often water usage had to be estimated based on the size of water tanks and other means. As for water quality, laboratory data were not always reliable, and this problem necessitated the project to analyze wastewater samples in Japan. This issue should also be considered serious because environmental authorities are going to regulate pollution based on water quality data.
Suggestions: With respect to water usage, installation of water meters and measurement of water usage should be incorporated into the requirements of ECC and/or business licensing/registration, at least for major dischargers. As for reliability of laboratory data, environmental authorities should standardize the analytical methodologies, introduce a system of certification of environmental laboratories, and also make certified laboratories to regularly practice quality assurance/quality control measures. See section on Output 2.
(4) Improving Environmental Measures by Factories
Issues: The pollution source surveys revealed a glimpse of primitive environmental management by many pollution sources in Myanmar. Most factories lack secondary treatment. Moreover, the whole management of resources, including water and other raw materials, seems rudimentary.
Suggestions: To control pollution, the environmental authorities should impose realistic regulations and support measures, perhaps based on sector studies. These are discussed elsewhere, and are not repeated here. In addition, regulation of water usage, especially groundwater usage seems necessary. In Yangon region, saltwater intrusion is a concern, and uncontrolled withdrawal of groundwater should be controlled. Aside from these government-side regulations, the industry side should also implement some studies about their management of resources and environment in order not only to control pollution, but also to improve efficiency of production and to make the workplace safe. Such studies may be spearheaded by MOI and/or industrial associations.
End of Document
The Project for Capacity Development in Basic Water Environment
Management and EIA System in the Republic of the Union of Myanmar
Pollution Source Survey Report
71
ATTACHMENT 1
Questionnaire Form for Survey of Manufacturing Industries
1. Basic Information (1) Name of Factory:
(2) Owner: Name ( ) Contact ( )
(3) Address (see “Attachment 1”):
(4) Name of Industrial Zone:
(5) YCDC licensing number: No. Date of Issue
(6) DISI registration number: No. Date of Issue
(7) Size of business according to DISI’s classification?: Large Medium Small
(8) Currently in operation?: Yes No
(9) Type of business/sector:
(According to DISI’s classification :)
(10) Certification of the industry : ISO 9001.....ISO 14001.......ISO 18001......MRCC........Others..........
(11) Type and amount of products:
Name of Products Present Amount Possible Future Expansion
ton or gal /year ton or gal /year
ton or gal /year ton or gal /year
ton or gal /year ton or gal /year
ton or gal /year ton or gal /year
(12) Area: Total acre (Building acre)
(13) Number of employees: Total (Male: Female: )
(14) Operation hours: Total hours (From am/pm, To am/pm)
(15) GPS coordinate of main office of the factory: Latitude ̊ ‘ “ Longitude ̊ ‘ “
The Project for Capacity Development in Basic Water Environment
Management and EIA System in the Republic of the Union of Myanmar
Pollution Source Survey Report
72
2. Raw Materials and Utility (1) Main Raw Materials:
Type of Main Raw Material Amount (Unit)
ton or gal /day
ton or gal /day
ton or gal /day
ton or gal /day
ton or gal /day
(2) Water Usage:
Water Source Volume of Water Usage (gal/day)
Ground Water gal/day
Surface Water gal/day
Waterworks gal/day
Others ( ) gal/day
Total gal/day
(3) Consumption of Electricity: kWh/day
(4) Fuel Usage
Type Fuel Usage (gal/day)
Heavy oil gal/day
Coal ton/day
Wood, saw dust ton/day
Others ( )
3. Layout of Factory and Manufacturing Process (1) Manufacturing Process Diagram
Attach general process diagram (see the example, “Attachment-3”).
(2) Layout of the Factory
Attach diagram showing layout of the factory. Please indicate the locations of main facilities Please also indicate the following items:
locations of storm water channels locations of wastewater lines discharging points to nearby river, channel or soak away points location of smokestacks stage at which waste is generated
The Project for Capacity Development in Basic Water Environment
Management and EIA System in the Republic of the Union of Myanmar
Pollution Source Survey Report
73
4. Wastewater (1) Volume of Wastewater:
Discharge Point after treatment Volume of Wastewater (m3/day)
Natural River (Name: )
Channel or creek (Name: )
Pipeline (to central wastewater treatment facility; only in Mandalay)
Others ( )
Total
(2) Water Conservation and Minimization of Wastewater:
Measures Yes or No
Installation of flow meters to measure water usage Yes No
Installation of flow meter to measure wastewater volume Yes No
Recycling of water Yes No
Separation of rainwater from wastewater Yes No
Minimization of solid waste entering wastewater stream Yes No
Separation of wastewater containing toxic substance from regular wastewater stream
Yes No
Others ( ) Yes No
(3) Did you know MONREC issued National Environmental Quality (Emission) Guideline in December 2015,which contains effluent guideline values for your industrial sector?: Yes No
(4) Monitoring of Wastewater Quality
Details Answer
Do you regularly monitor wastewater quality? Yes No
How often do you monitor wastewater quality? times/year
Name of laboratory that analyzes the wastewater? Name: ( )
Do you submit your results to the following organization?
YCDC/MCDC Yes No ECD Yes No DISI Yes No
(5) Monitoring of Wastewater Quality
The new Environmental Quality (Emission) Guideline lists effluent guideline values of the following parameters. If you have monitored effluent concentrations of any of these parameters, please provide the results. Breweries and Distilleries
Parameter Unit Value Parameter Unit Value
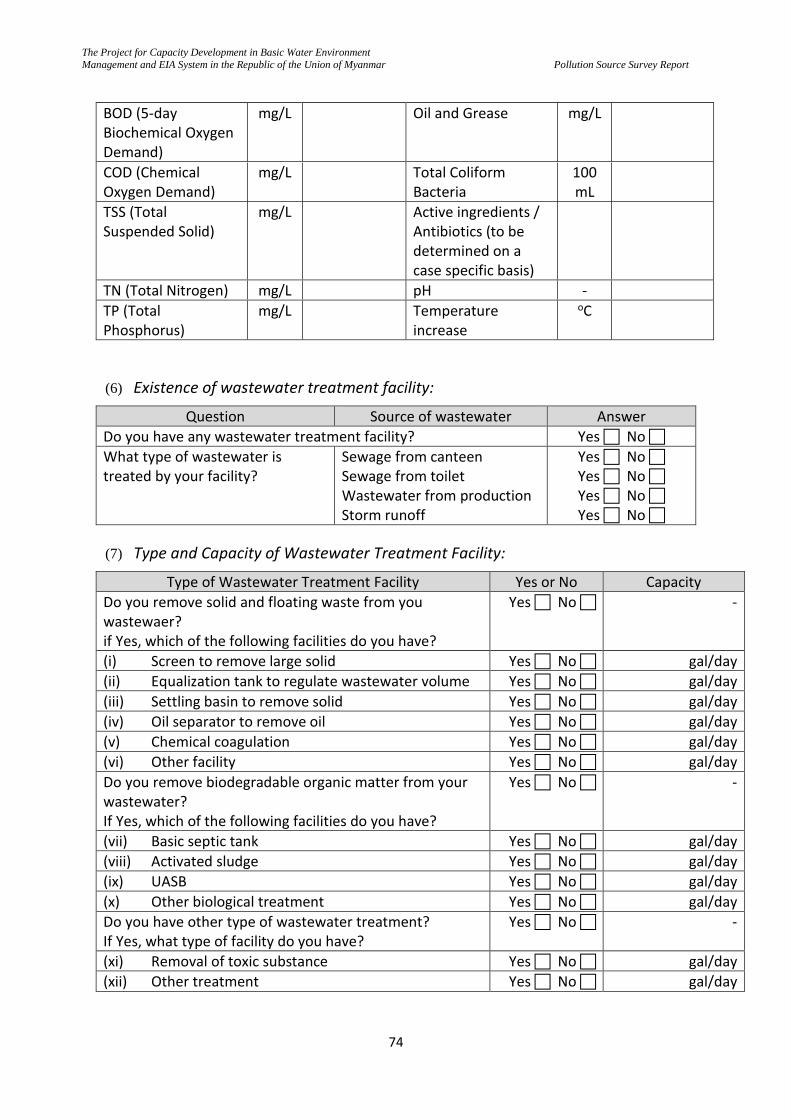
The Project for Capacity Development in Basic Water Environment
Management and EIA System in the Republic of the Union of Myanmar
Pollution Source Survey Report
74
BOD (5-day Biochemical Oxygen Demand)
mg/L Oil and Grease mg/L
COD (Chemical Oxygen Demand)
mg/L Total Coliform Bacteria
100 mL
TSS (Total Suspended Solid)
mg/L Active ingredients / Antibiotics (to be determined on a case specific basis)
TN (Total Nitrogen) mg/L pH -
TP (Total Phosphorus)
mg/L Temperature increase
oC
(6) Existence of wastewater treatment facility:
Question Source of wastewater Answer
Do you have any wastewater treatment facility? Yes No
What type of wastewater is treated by your facility?
Sewage from canteen Sewage from toilet Wastewater from production Storm runoff
Yes No Yes No Yes No Yes No
(7) Type and Capacity of Wastewater Treatment Facility:
Type of Wastewater Treatment Facility Yes or No Capacity
Do you remove solid and floating waste from you wastewaer? if Yes, which of the following facilities do you have?
Yes No -
(i) Screen to remove large solid Yes No gal/day
(ii) Equalization tank to regulate wastewater volume Yes No gal/day
(iii) Settling basin to remove solid Yes No gal/day
(iv) Oil separator to remove oil Yes No gal/day
(v) Chemical coagulation Yes No gal/day
(vi) Other facility Yes No gal/day
Do you remove biodegradable organic matter from your wastewater? If Yes, which of the following facilities do you have?
Yes No -
(vii) Basic septic tank Yes No gal/day
(viii) Activated sludge Yes No gal/day
(ix) UASB Yes No gal/day
(x) Other biological treatment Yes No gal/day
Do you have other type of wastewater treatment? If Yes, what type of facility do you have?
Yes No -
(xi) Removal of toxic substance Yes No gal/day
(xii) Other treatment Yes No gal/day
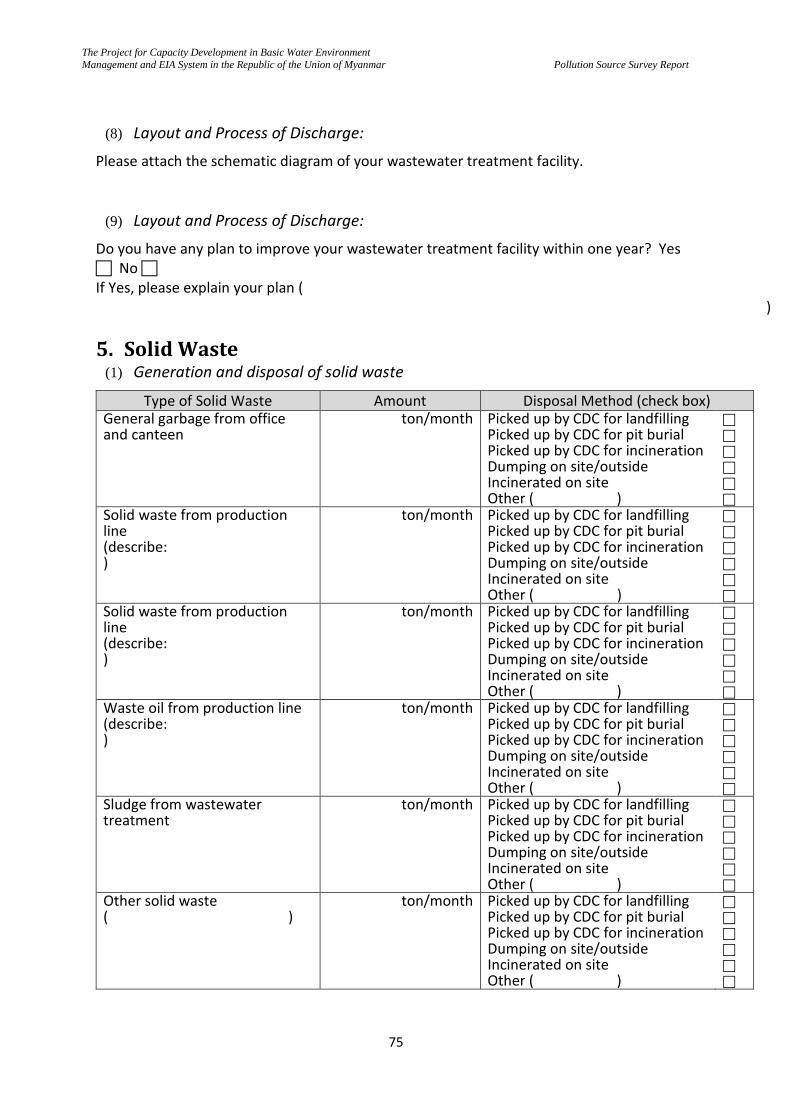
The Project for Capacity Development in Basic Water Environment
Management and EIA System in the Republic of the Union of Myanmar
Pollution Source Survey Report
75
(8) Layout and Process of Discharge:
Please attach the schematic diagram of your wastewater treatment facility.
(9) Layout and Process of Discharge:
Do you have any plan to improve your wastewater treatment facility within one year? Yes No If Yes, please explain your plan (
)
5. Solid Waste (1) Generation and disposal of solid waste
Type of Solid Waste Amount Disposal Method (check box) General garbage from office and canteen
ton/month Picked up by CDC for landfilling Picked up by CDC for pit burial Picked up by CDC for incineration Dumping on site/outside Incinerated on site Other ( )
Solid waste from production line (describe: )
ton/month Picked up by CDC for landfilling Picked up by CDC for pit burial Picked up by CDC for incineration Dumping on site/outside Incinerated on site Other ( )
Solid waste from production line (describe: )
ton/month Picked up by CDC for landfilling Picked up by CDC for pit burial Picked up by CDC for incineration Dumping on site/outside Incinerated on site Other ( )
Waste oil from production line (describe: )
ton/month Picked up by CDC for landfilling Picked up by CDC for pit burial Picked up by CDC for incineration Dumping on site/outside Incinerated on site Other ( )
Sludge from wastewater treatment
ton/month Picked up by CDC for landfilling Picked up by CDC for pit burial Picked up by CDC for incineration Dumping on site/outside Incinerated on site Other ( )
Other solid waste ( )
ton/month Picked up by CDC for landfilling Picked up by CDC for pit burial Picked up by CDC for incineration Dumping on site/outside Incinerated on site Other ( )
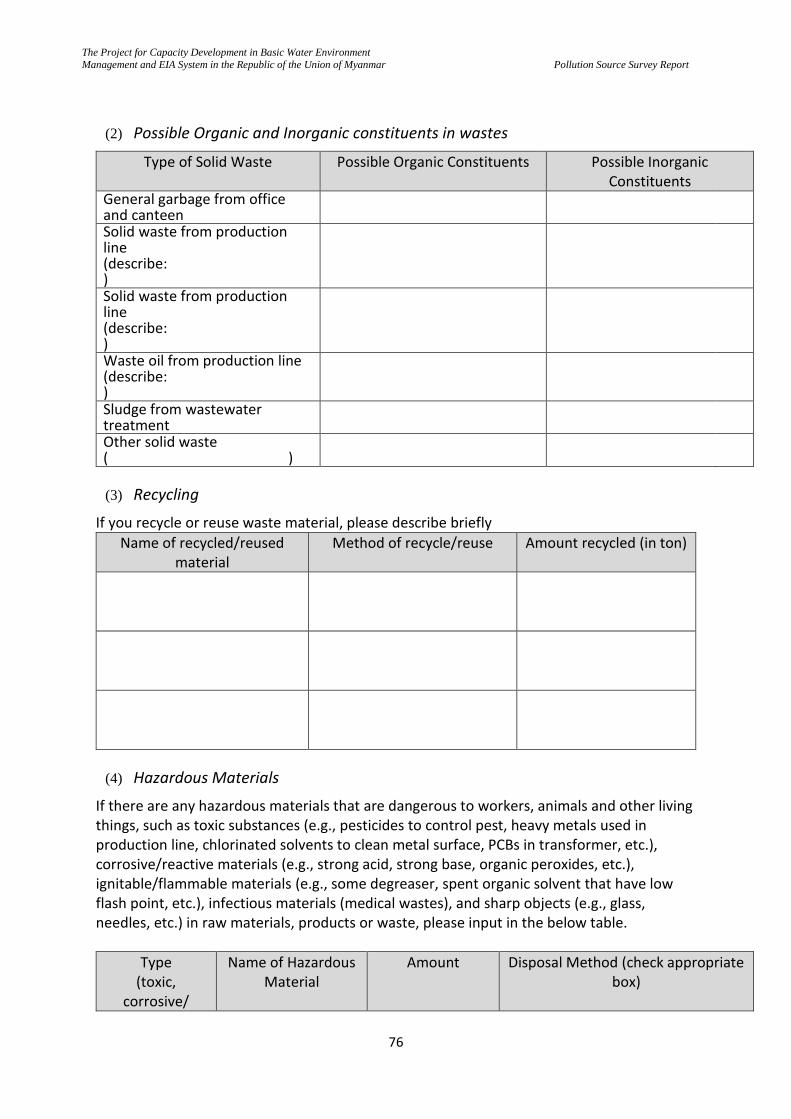
The Project for Capacity Development in Basic Water Environment
Management and EIA System in the Republic of the Union of Myanmar
Pollution Source Survey Report
76
(2) Possible Organic and Inorganic constituents in wastes
Type of Solid Waste Possible Organic Constituents Possible Inorganic Constituents
General garbage from office and canteen
Solid waste from production line (describe: )
Solid waste from production line (describe: )
Waste oil from production line (describe: )
Sludge from wastewater treatment
Other solid waste ( )
(3) Recycling
If you recycle or reuse waste material, please describe briefly
Name of recycled/reused material
Method of recycle/reuse Amount recycled (in ton)
(4) Hazardous Materials
If there are any hazardous materials that are dangerous to workers, animals and other living things, such as toxic substances (e.g., pesticides to control pest, heavy metals used in production line, chlorinated solvents to clean metal surface, PCBs in transformer, etc.), corrosive/reactive materials (e.g., strong acid, strong base, organic peroxides, etc.), ignitable/flammable materials (e.g., some degreaser, spent organic solvent that have low flash point, etc.), infectious materials (medical wastes), and sharp objects (e.g., glass, needles, etc.) in raw materials, products or waste, please input in the below table.
Type (toxic,
corrosive/
Name of Hazardous Material
Amount Disposal Method (check appropriate box)
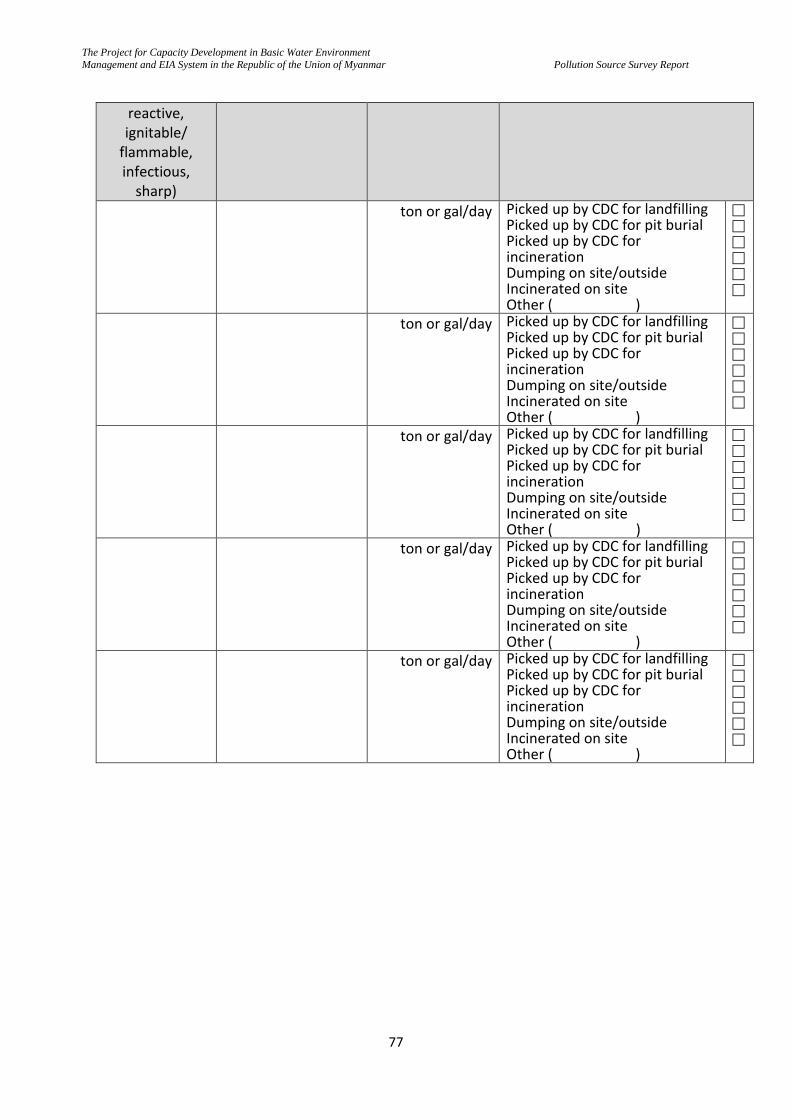
The Project for Capacity Development in Basic Water Environment
Management and EIA System in the Republic of the Union of Myanmar
Pollution Source Survey Report
77
reactive, ignitable/
flammable, infectious,
sharp)
ton or gal/day Picked up by CDC for landfilling Picked up by CDC for pit burial Picked up by CDC for incineration Dumping on site/outside Incinerated on site Other ( )
ton or gal/day Picked up by CDC for landfilling Picked up by CDC for pit burial Picked up by CDC for incineration Dumping on site/outside Incinerated on site Other ( )
ton or gal/day Picked up by CDC for landfilling Picked up by CDC for pit burial Picked up by CDC for incineration Dumping on site/outside Incinerated on site Other ( )
ton or gal/day Picked up by CDC for landfilling Picked up by CDC for pit burial Picked up by CDC for incineration Dumping on site/outside Incinerated on site Other ( )
ton or gal/day Picked up by CDC for landfilling Picked up by CDC for pit burial Picked up by CDC for incineration Dumping on site/outside Incinerated on site Other ( )
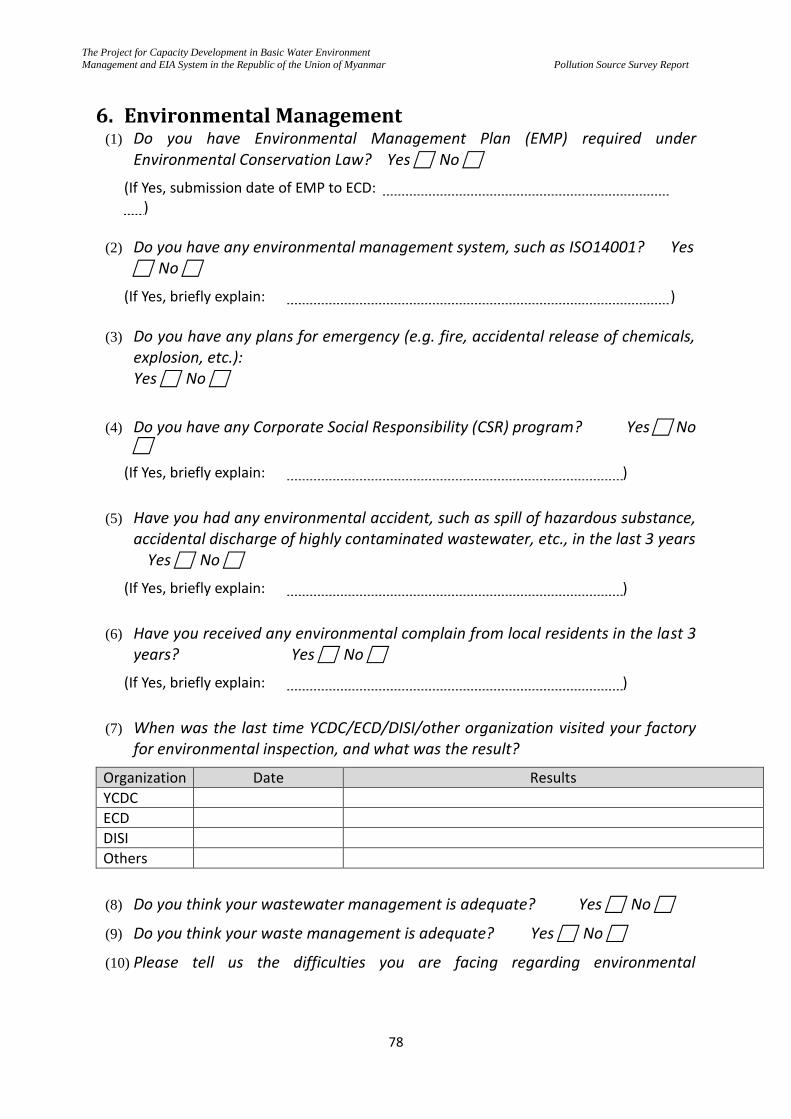
The Project for Capacity Development in Basic Water Environment
Management and EIA System in the Republic of the Union of Myanmar
Pollution Source Survey Report
78
6. Environmental Management (1) Do you have Environmental Management Plan (EMP) required under
Environmental Conservation Law? Yes No
(If Yes, submission date of EMP to ECD: )
(2) Do you have any environmental management system, such as ISO14001? Yes No
(If Yes, briefly explain: )
(3) Do you have any plans for emergency (e.g. fire, accidental release of chemicals, explosion, etc.): Yes No
(4) Do you have any Corporate Social Responsibility (CSR) program? Yes No
(If Yes, briefly explain: )
(5) Have you had any environmental accident, such as spill of hazardous substance, accidental discharge of highly contaminated wastewater, etc., in the last 3 years Yes No
(If Yes, briefly explain: )
(6) Have you received any environmental complain from local residents in the last 3 years? Yes No
(If Yes, briefly explain: )
(7) When was the last time YCDC/ECD/DISI/other organization visited your factory for environmental inspection, and what was the result?
Organization Date Results
YCDC
ECD
DISI
Others
(8) Do you think your wastewater management is adequate? Yes No
(9) Do you think your waste management is adequate? Yes No
(10) Please tell us the difficulties you are facing regarding environmental
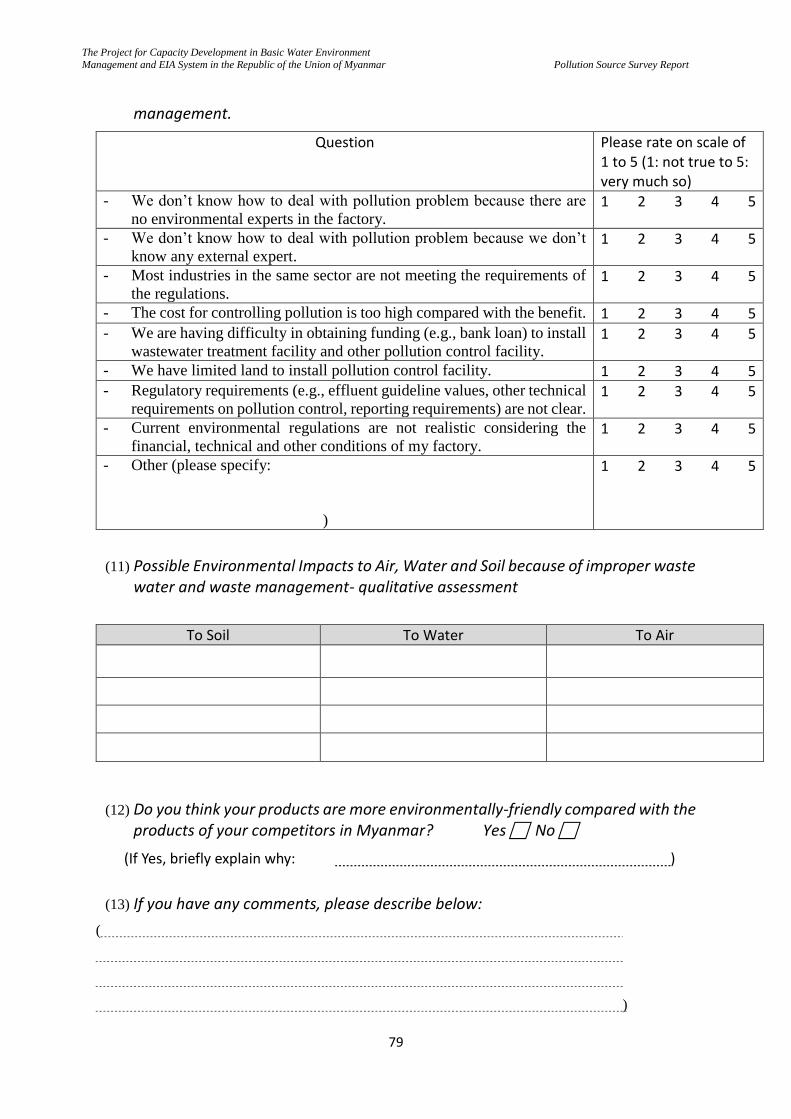
The Project for Capacity Development in Basic Water Environment
Management and EIA System in the Republic of the Union of Myanmar
Pollution Source Survey Report
79
management.
Question Please rate on scale of 1 to 5 (1: not true to 5: very much so)
- We don’t know how to deal with pollution problem because there are
no environmental experts in the factory. 1 2 3 4 5
- We don’t know how to deal with pollution problem because we don’t
know any external expert. 1 2 3 4 5
- Most industries in the same sector are not meeting the requirements of
the regulations. 1 2 3 4 5
- The cost for controlling pollution is too high compared with the benefit. 1 2 3 4 5
- We are having difficulty in obtaining funding (e.g., bank loan) to install
wastewater treatment facility and other pollution control facility. 1 2 3 4 5
- We have limited land to install pollution control facility. 1 2 3 4 5
- Regulatory requirements (e.g., effluent guideline values, other technical
requirements on pollution control, reporting requirements) are not clear. 1 2 3 4 5
- Current environmental regulations are not realistic considering the
financial, technical and other conditions of my factory. 1 2 3 4 5
- Other (please specify:
)
1 2 3 4 5
(11) Possible Environmental Impacts to Air, Water and Soil because of improper waste water and waste management- qualitative assessment
To Soil To Water To Air
(12) Do you think your products are more environmentally-friendly compared with the products of your competitors in Myanmar? Yes No
(If Yes, briefly explain why: )
(13) If you have any comments, please describe below:
(
)
Project for Capacity Development in Basic Water Environment Management and
EIA System in the Republic of the Union of Myanmar
Final Report
Appendix 14:
Materials from Seminars and Workshops
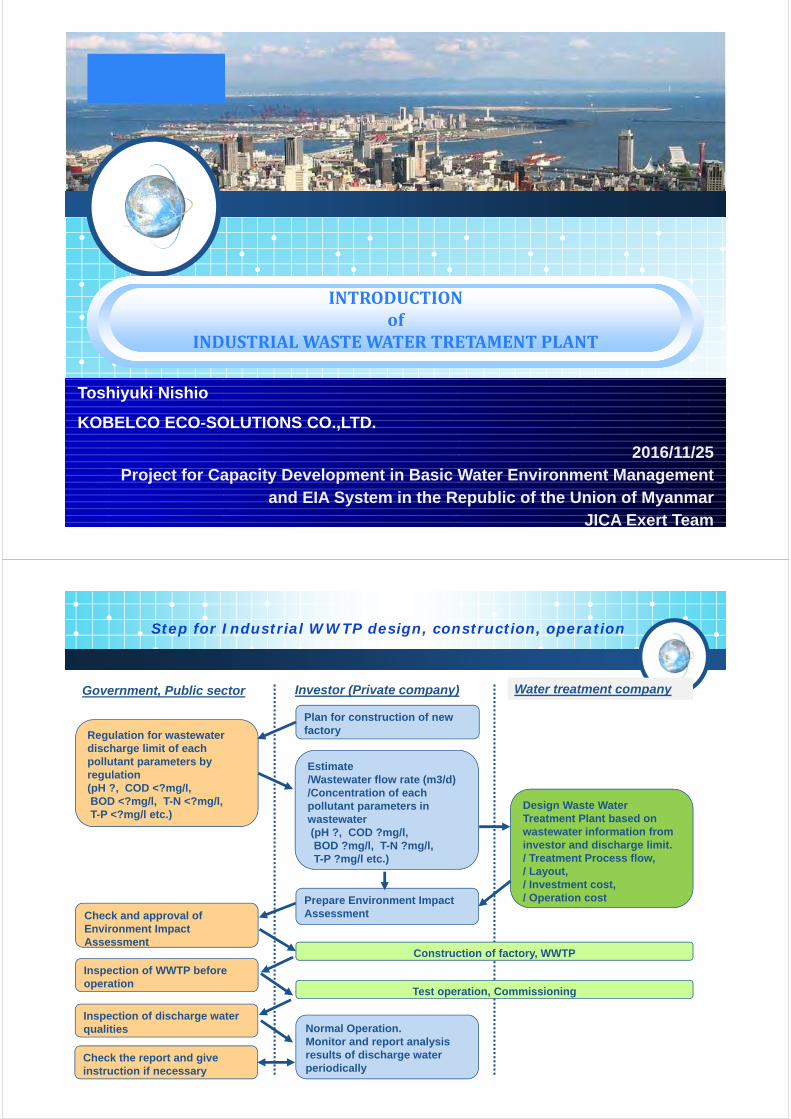
INTRODUCTIONof
INDUSTRIALWASTEWATERTRETAMENTPLANT
Toshiyuki Nishio
KOBELCO ECO-SOLUTIONS CO.,LTD.
2016/11/25
Project for Capacity Development in Basic Water Environment Management
and EIA System in the Republic of the Union of Myanmar
JICA Exert Team
Step for Industrial WWTP design, construction, operation
3
4
4
5
Plan for construction of new
factory
Estimate
/Wastewater flow rate (m3/d)
/Concentration of each
pollutant parameters in
wastewater
(pH ?, COD ?mg/l,
BOD ?mg/l, T-N ?mg/l,
T-P ?mg/l etc.)
Regulation for wastewater
discharge limit of each
pollutant parameters by
regulation
(pH ?, COD <?mg/l,
BOD <?mg/l, T-N <?mg/l,
T-P <?mg/l etc.)Design Waste Water
Treatment Plant based on
wastewater information from
investor and discharge limit.
/ Treatment Process flow,
/ Layout,
/ Investment cost,
/ Operation cost Prepare Environment Impact
AssessmentCheck and approval of
Environment Impact
AssessmentConstruction of factory, WWTP
Inspection of WWTP before
operation
Inspection of discharge water
qualities Normal Operation.
Monitor and report analysis
results of discharge water
periodically
Test operation, Commissioning
Government, Public sector Investor (Private company) Water treatment company
Check the report and give
instruction if necessary
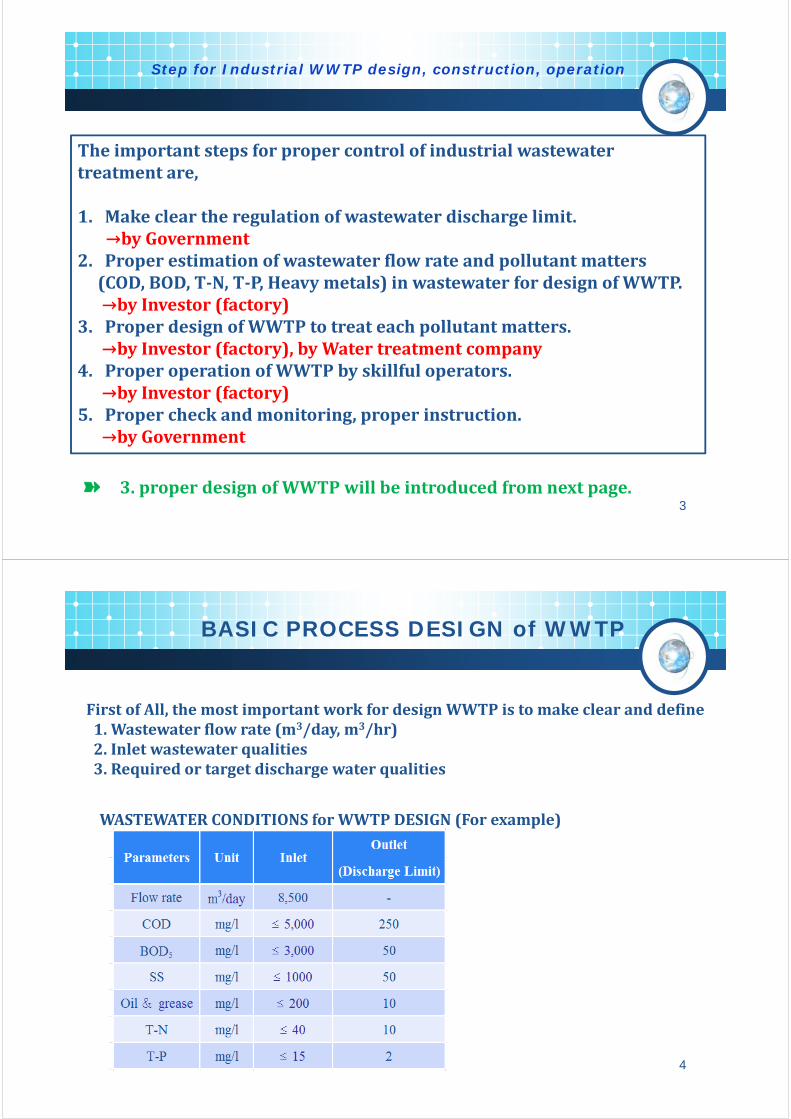
Step for Industrial WWTP design, construction, operation
3
Theimportantstepsforpropercontrolofindustrialwastewatertreatmentare,
1. Make clear the regulation of wastewater discharge limit.→by Government
2. Proper estimation of wastewater flow rate and pollutant matters(COD, BOD, T‐N, T‐P, Heavy metals) in wastewater for design of WWTP.→by Investor (factory)
3. Proper design of WWTP to treat each pollutant matters.→by Investor (factory), by Water treatment company
4. Proper operation of WWTP by skillful operators.→by Investor (factory)
5. Proper check and monitoring, proper instruction.→by Government
➽ 3.properdesignofWWTPwillbeintroducedfromnextpage.
BASIC PROCESS DESIGN of WWTP
4
WASTEWATERCONDITIONSforWWTPDESIGN(Forexample)
FirstofAll,themostimportantworkfordesignWWTPistomakeclearanddefine1.Wastewaterflowrate(m3/day,m3/hr)2.Inletwastewaterqualities3.Requiredortargetdischargewaterqualities
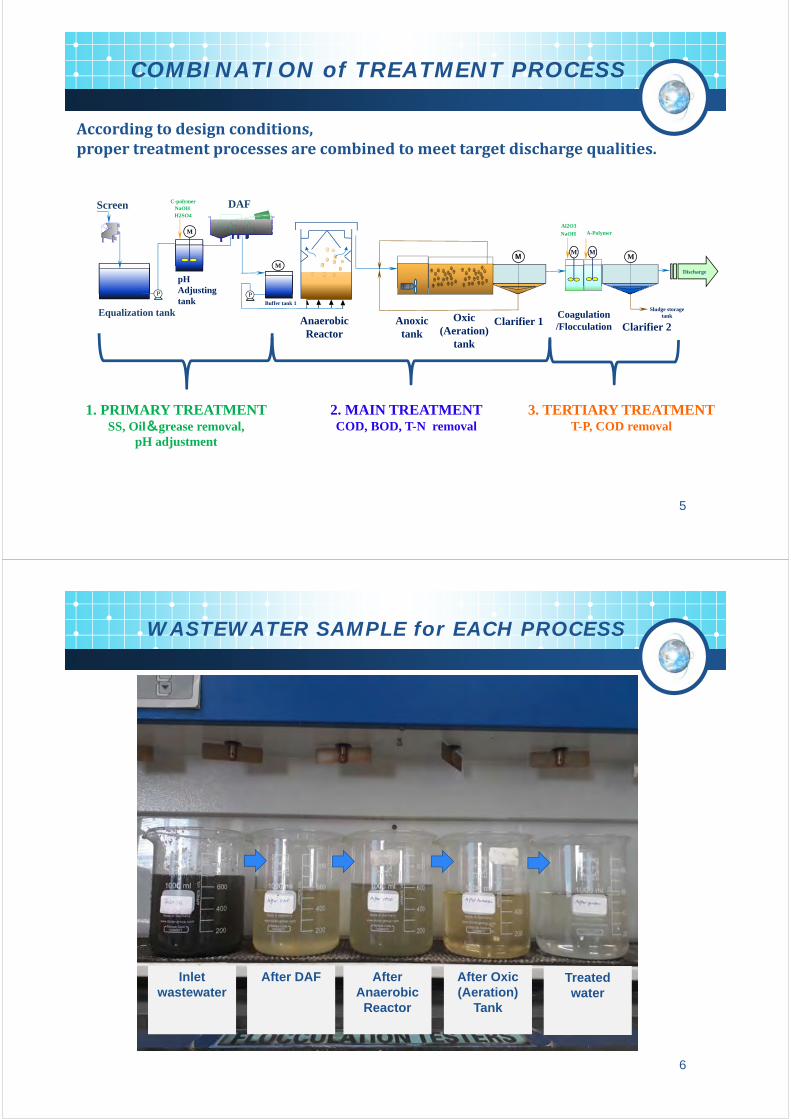
COMBINATION of TREATMENT PROCESS
5
1. PRIMARY TREATMENTSS, Oil&grease removal,
pH adjustment
2. MAIN TREATMENTCOD, BOD, T-N removal
3. TERTIARY TREATMENTT-P, COD removal
Oxic(Aeration)
tank
Anaerobic Reactor
Equalization tank
pH Adjusting tank
Discharge
M
DAF
P
Buffer tank 1
M
P
M
Clarifier 2
Sludge storage tankCoagulation
/Flocculation
M
Al2O3
M
NaOH A-Polymer
H2SO4NaOH
C-polymerScreen
M
Clarifier 1
Accordingtodesignconditions,propertreatmentprocessesarecombinedtomeettargetdischargequalities.
Anoxic tank
WASTEWATER SAMPLE for EACH PROCESS
6
Inlet
wastewater
After DAF After
Anaerobic
Reactor
After Oxic
(Aeration)
Tank
Treated
water
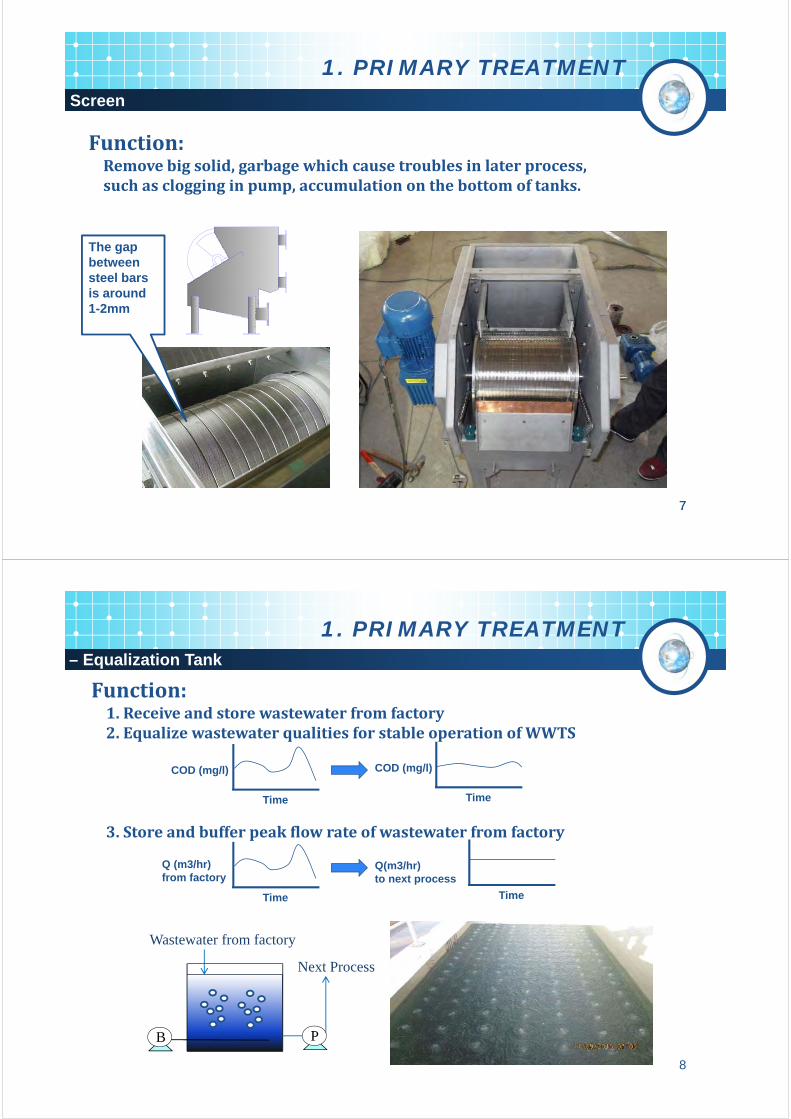
77
1. PRIMARY TREATMENTScreen
Function:Removebigsolid,garbagewhichcausetroublesinlaterprocess,suchasclogginginpump,accumulationonthebottomoftanks.
The gap
between
steel bars
is around
1-2mm
8
1. PRIMARY TREATMENT– Equalization Tank
Function:1.Receiveandstorewastewaterfromfactory2.EqualizewastewaterqualitiesforstableoperationofWWTS
3.Storeandbufferpeakflowrateofwastewaterfromfactory
COD (mg/l)
Time
COD (mg/l)
Time
Q (m3/hr)
from factory
Time
Q(m3/hr)
to next process
Time
PB
Wastewater from factory
Next Process
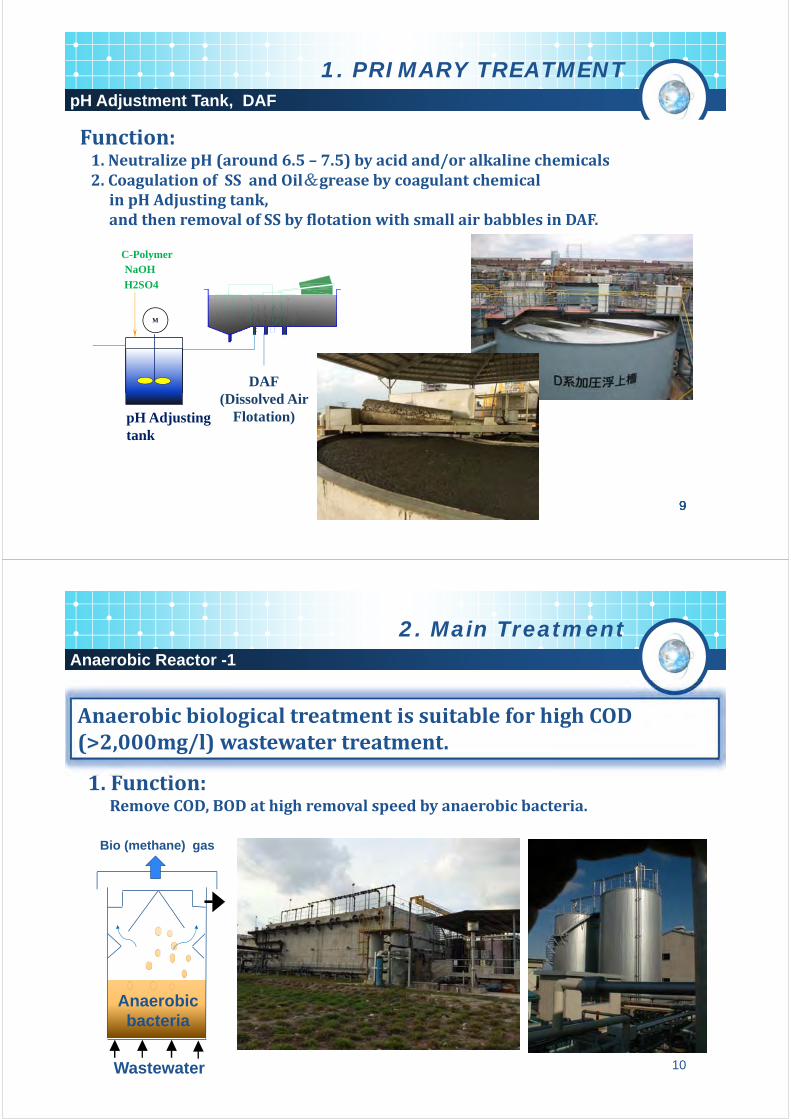
9999
1. PRIMARY TREATMENTpH Adjustment Tank, DAF
Function:1.NeutralizepH(around6.5– 7.5)byacidand/oralkalinechemicals2.CoagulationofSSandOil&greasebycoagulantchemicalinpHAdjustingtank,andthenremovalofSSbyflotationwithsmallairbabblesinDAF.
pH Adjusting tank
M
H2SO4
NaOHC-Polymer
DAF(Dissolved Air
Flotation)
10
2. Main TreatmentAnaerobic Reactor -1
1.Function:RemoveCOD,BODathighremovalspeedbyanaerobicbacteria.
AnaerobicbiologicaltreatmentissuitableforhighCOD(>2,000mg/l)wastewatertreatment.
Wastewater
Anaerobic
bacteria
Bio (methane) gas
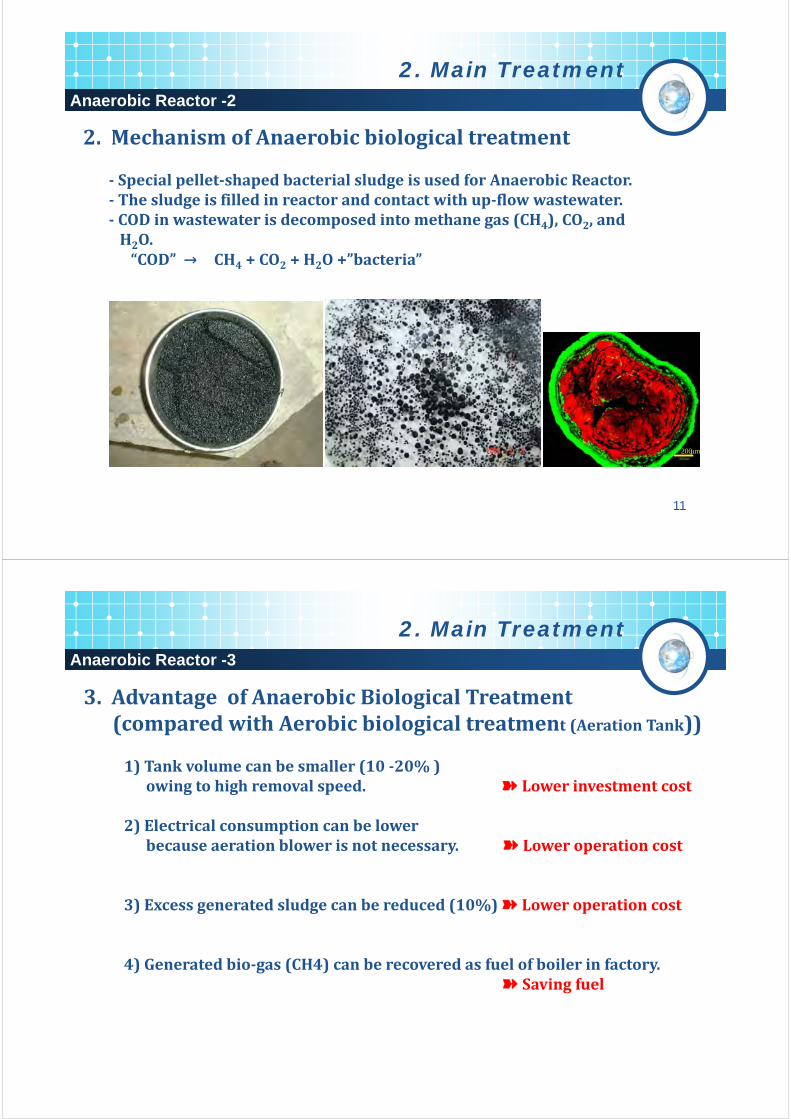
11
2. Main TreatmentAnaerobic Reactor -2
200m
2.MechanismofAnaerobicbiologicaltreatment
‐ Specialpellet‐shapedbacterialsludgeisusedforAnaerobicReactor.‐ Thesludgeisfilledinreactorandcontactwithup‐flowwastewater.‐ CODinwastewaterisdecomposedintomethanegas(CH4),CO2,andH2O.“COD”→ CH4 +CO2 +H2O+”bacteria”
2. Main TreatmentAnaerobic Reactor -3
3.AdvantageofAnaerobicBiologicalTreatment(comparedwithAerobicbiologicaltreatment(AerationTank))
1)Tankvolumecanbesmaller(10‐20%)owingtohighremovalspeed.➽ Lowerinvestmentcost
2)Electricalconsumptioncanbelowerbecauseaerationblowerisnotnecessary.➽ Loweroperationcost
3)Excessgeneratedsludgecanbereduced(10%)➽ Loweroperationcost
4)Generatedbio‐gas(CH4)canberecoveredasfuelofboilerinfactory.➽ Savingfuel
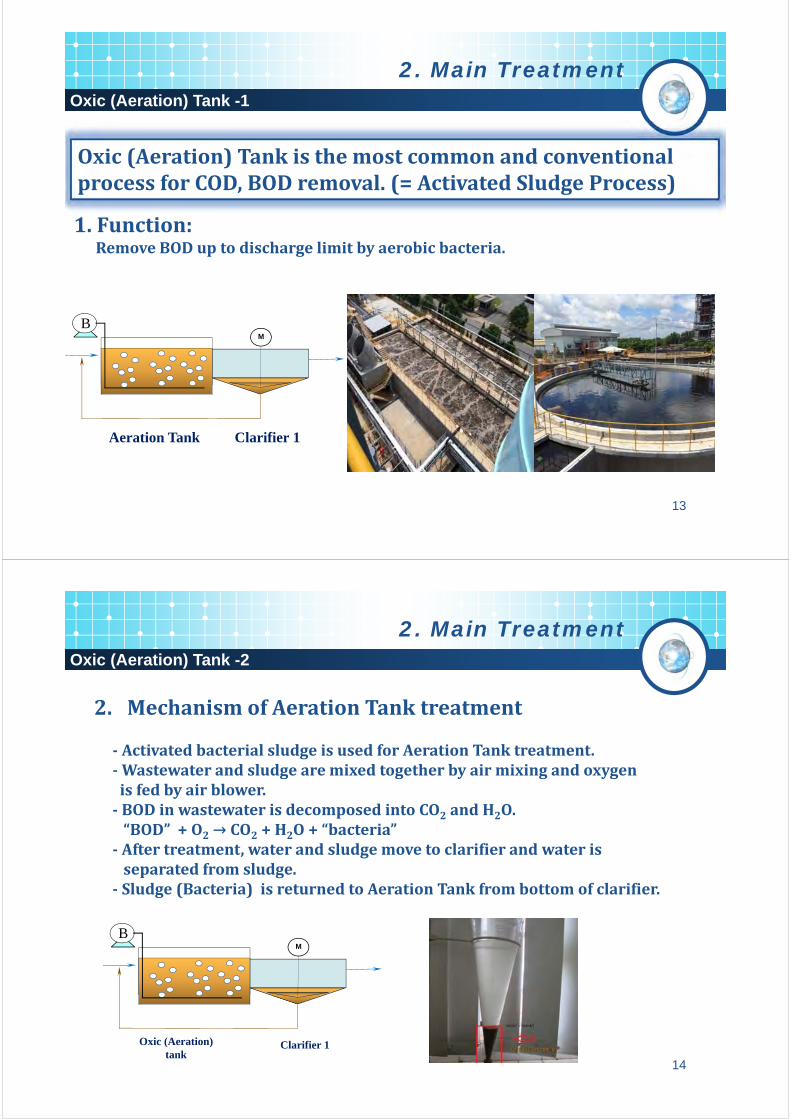
13
2. Main TreatmentOxic (Aeration) Tank -1
Oxic (Aeration)TankisthemostcommonandconventionalprocessforCOD,BODremoval.(=ActivatedSludgeProcess)
1.Function:RemoveBODuptodischargelimitbyaerobicbacteria.
Aeration Tank
M
Clarifier 1
B
14
2. Main TreatmentOxic (Aeration) Tank -2
Oxic (Aeration) tank
M
Clarifier 1
B
2. MechanismofAerationTanktreatment
‐ ActivatedbacterialsludgeisusedforAerationTanktreatment.‐Wastewaterandsludgearemixedtogetherbyairmixingandoxygenisfedbyairblower.‐ BODinwastewaterisdecomposedintoCO2 andH2O.“BOD”+O2→CO2 +H2O+“bacteria”
‐ Aftertreatment,waterandsludgemovetoclarifierandwaterisseparatedfromsludge.
‐ Sludge(Bacteria)isreturnedtoAerationTankfrombottomofclarifier.
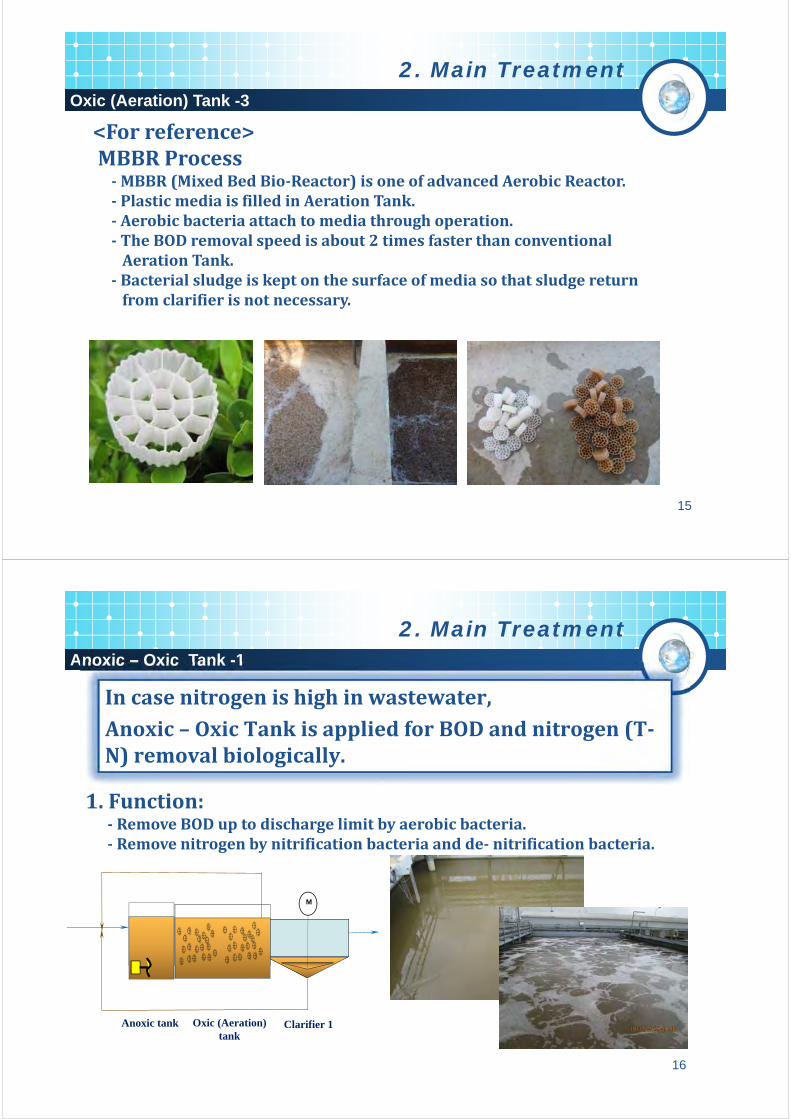
15
2. Main TreatmentOxic (Aeration) Tank -3
<For reference>MBBR Process‐MBBR (Mixed Bed Bio‐Reactor) is one of advanced Aerobic Reactor.‐ Plastic media is filled in Aeration Tank.‐ Aerobic bacteria attach to media through operation.‐ The BOD removal speed is about 2 times faster than conventionalAeration Tank.
‐ Bacterial sludge is kept on the surface of media so that sludge returnfrom clarifier is not necessary.
2. Main Treatment
16
Anoxic – Oxic Tank -1
Incasenitrogenishighinwastewater,Anoxic– Oxic TankisappliedforBODandnitrogen(T‐N)removalbiologically.
Oxic (Aeration) tank
M
Clarifier 1Anoxic tank
1.Function:‐ RemoveBODuptodischargelimitbyaerobicbacteria.‐ Removenitrogenbynitrificationbacteriaandde‐ nitrificationbacteria.
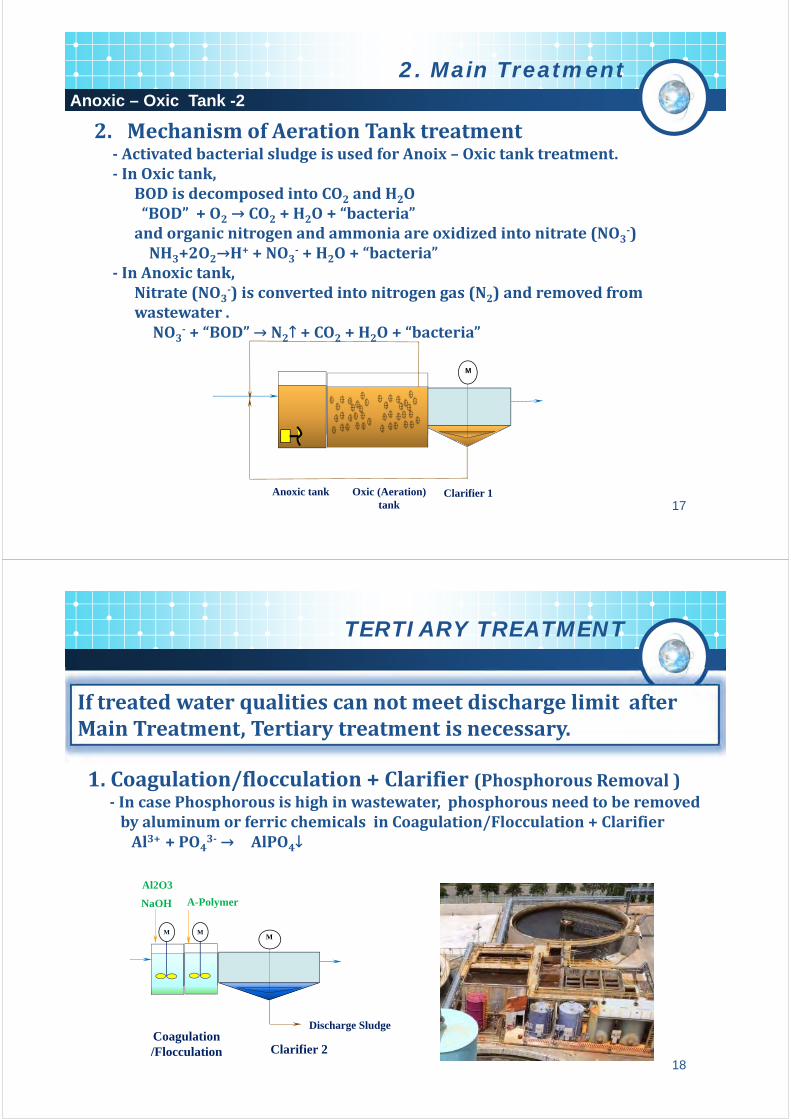
2. Main Treatment
17
M
Clarifier 1Anoxic tank
2. MechanismofAerationTanktreatment‐ ActivatedbacterialsludgeisusedforAnoix – Oxic tanktreatment.‐ InOxic tank,
BODisdecomposedintoCO2 andH2O“BOD”+O2→CO2 +H2O+“bacteria”andorganicnitrogenandammoniaareoxidizedintonitrate(NO3‐)NH3+2O2→H+ +NO3‐ +H2O+“bacteria”
‐ InAnoxictank,Nitrate(NO3‐)isconvertedintonitrogengas(N2)andremovedfromwastewater.NO3‐ +“BOD”→N2↑+CO2 +H2O+“bacteria”
Anoxic – Oxic Tank -2
Oxic (Aeration) tank
18
TERTIARY TREATMENT
1. Coagulation/flocculation + Clarifier (Phosphorous Removal )‐ In case Phosphorous is high in wastewater, phosphorous need to be removedby aluminum or ferric chemicals in Coagulation/Flocculation + ClarifierAl3+ + PO43‐ → AlPO4↓
IftreatedwaterqualitiescannotmeetdischargelimitafterMainTreatment,Tertiarytreatmentisnecessary.
M
Clarifier 2
Discharge Sludge Coagulation/Flocculation
M
Al2O3
M
NaOH A-Polymer
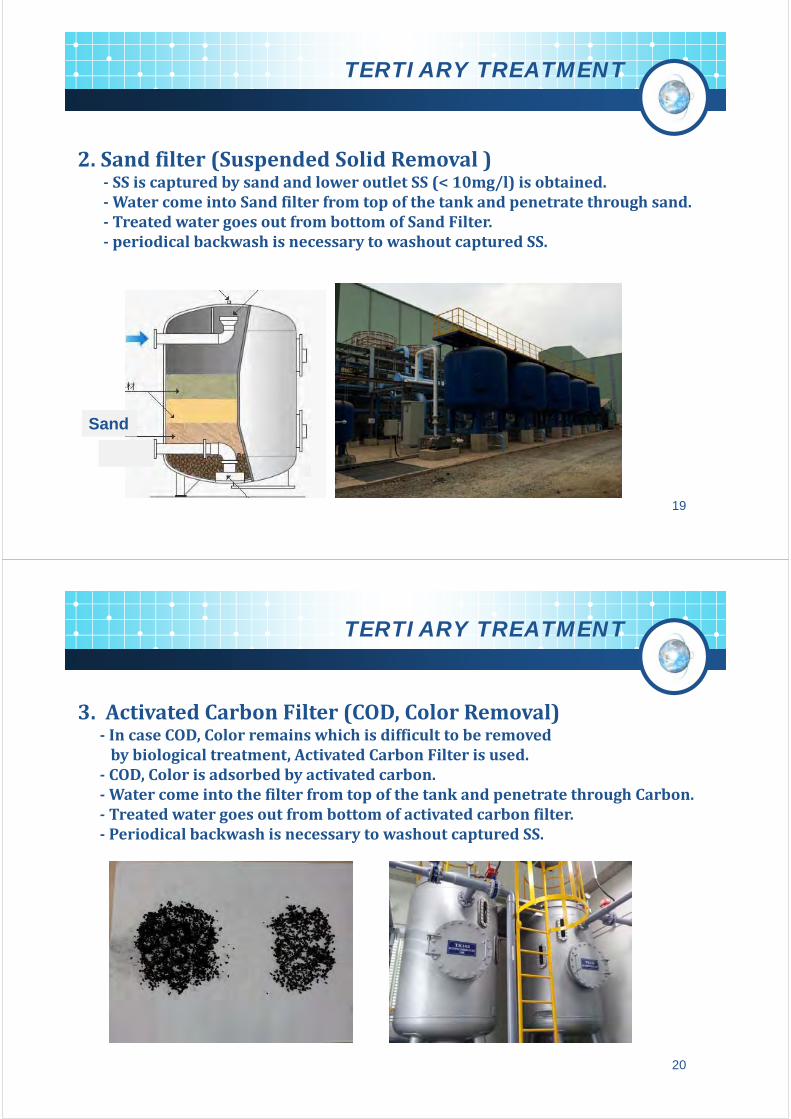
TERTIARY TREATMENT
19
2. Sand filter (Suspended Solid Removal )‐ SS is captured by sand and lower outlet SS (< 10mg/l) is obtained.‐Water come into Sand filter from top of the tank and penetrate through sand.‐ Treated water goes out from bottom of Sand Filter.‐ periodical backwash is necessary to washout captured SS.
Sand
20
TERTIARY TREATMENT
3. Activated Carbon Filter (COD, Color Removal)‐ In case COD, Color remains which is difficult to be removedby biological treatment, Activated Carbon Filter is used.
‐ COD, Color is adsorbed by activated carbon.‐Water come into the filter from top of the tank and penetrate through Carbon.‐ Treated water goes out from bottom of activated carbon filter.‐ Periodical backwash is necessary to washout captured SS.
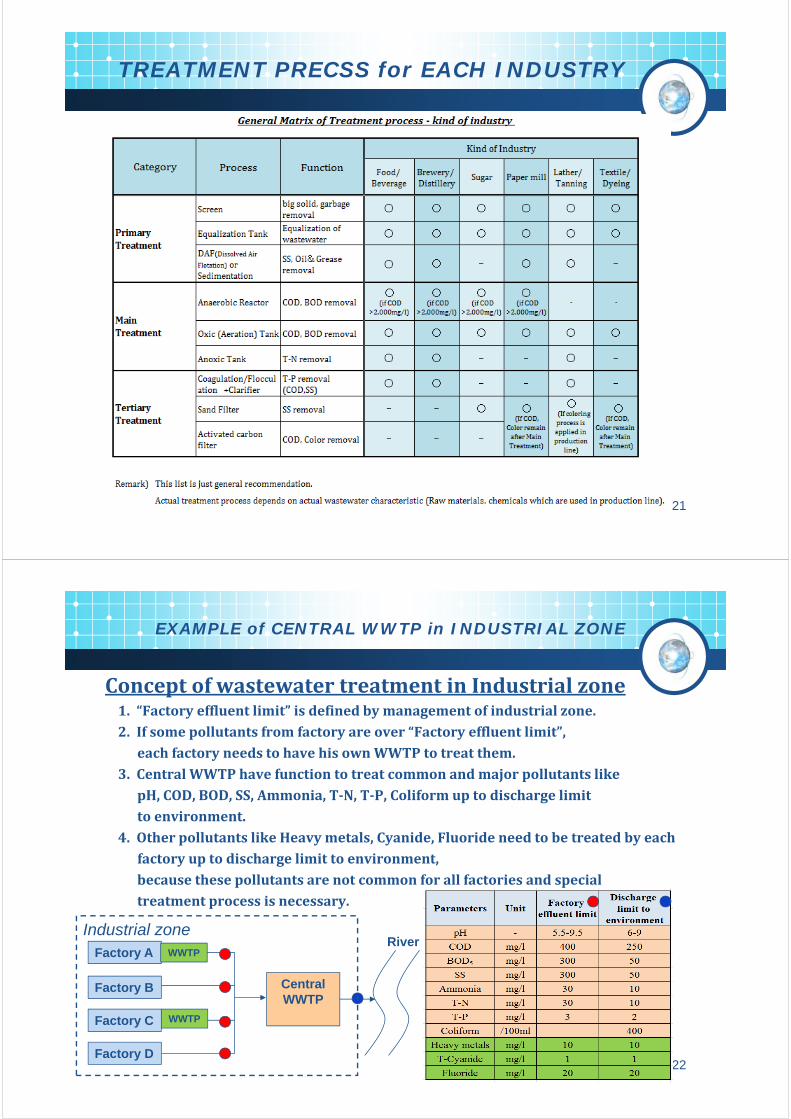
21
TREATMENT PRECSS for EACH INDUSTRY
EXAMPLE of CENTRAL WWTP in INDUSTRIAL ZONE
ConceptofwastewatertreatmentinIndustrialzone1.“Factoryeffluentlimit”isdefinedbymanagementofindustrialzone.2.Ifsomepollutantsfromfactoryareover“Factoryeffluentlimit”,eachfactoryneedstohavehisownWWTPtotreatthem.
3.CentralWWTPhavefunctiontotreatcommonandmajorpollutantslikepH,COD,BOD,SS,Ammonia,T‐N,T‐P,Coliformuptodischargelimittoenvironment.
4.OtherpollutantslikeHeavymetals,Cyanide,Fluorideneedtobetreatedbyeachfactoryuptodischargelimittoenvironment,becausethesepollutantsarenotcommonforallfactoriesandspecialtreatmentprocessisnecessary.
22
Factory A
Factory B
Factory C
Factory D
Central
WWTP
RiverWWTP
WWTP
Industrial zone
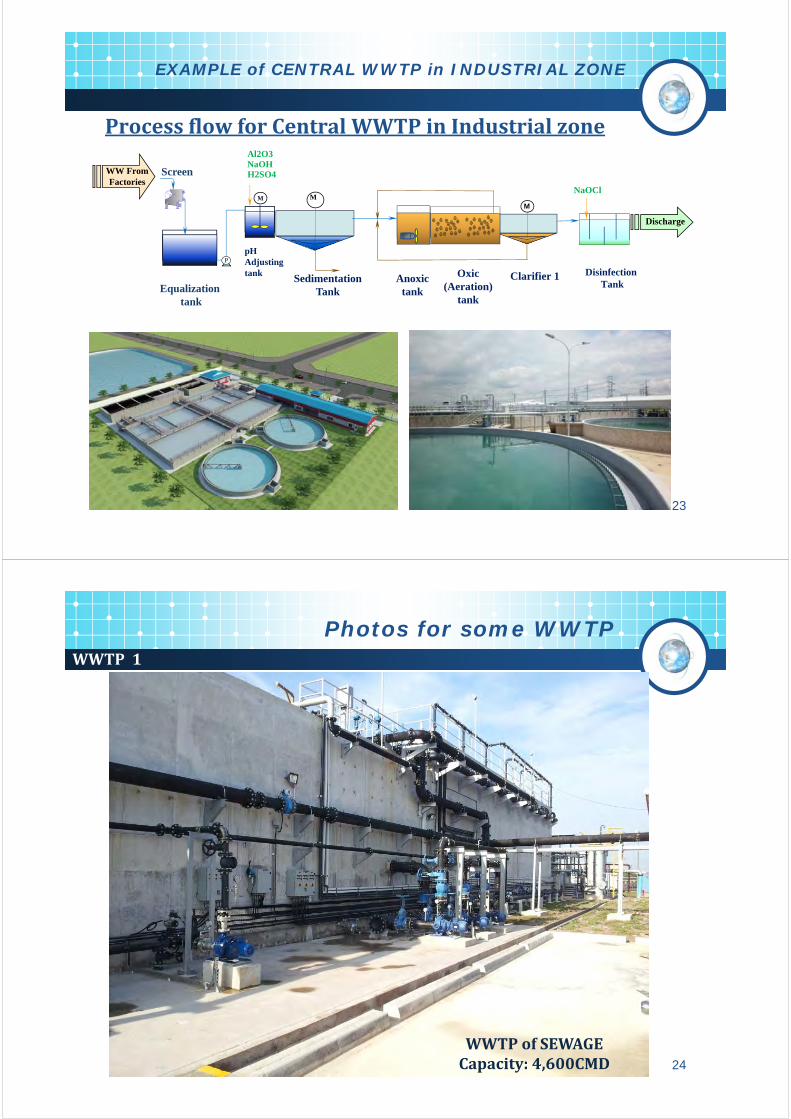
23
EXAMPLE of CENTRAL WWTP in INDUSTRIAL ZONE
ProcessflowforCentralWWTPinIndustrialzone
Equalizationtank
pH Adjusting tank
Discharge
M
P
Sedimentation Tank
M
DisinfectionTank
H2SO4NaOHAl2O3
Screen
Oxic(Aeration)
tank
M
Clarifier 1Anoxic tank
NaOCl
WW From Factories
24
Photos for some WWTPWWTP1
WWTPofSEWAGECapacity:4,600CMD
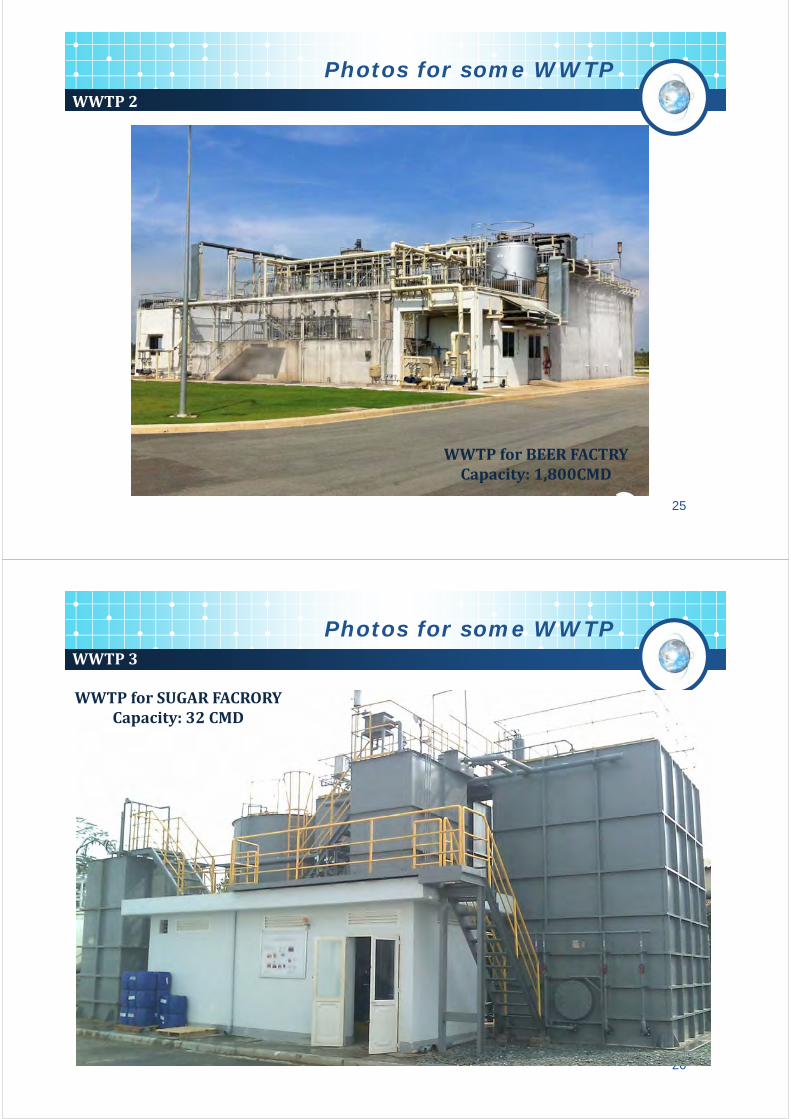
25
Photos for some WWTP
WWTPforBEERFACTRYCapacity:1,800CMD
WWTP2
26
WWTPforSUGARFACRORYCapacity:32CMD
Photos for some WWTPWWTP3
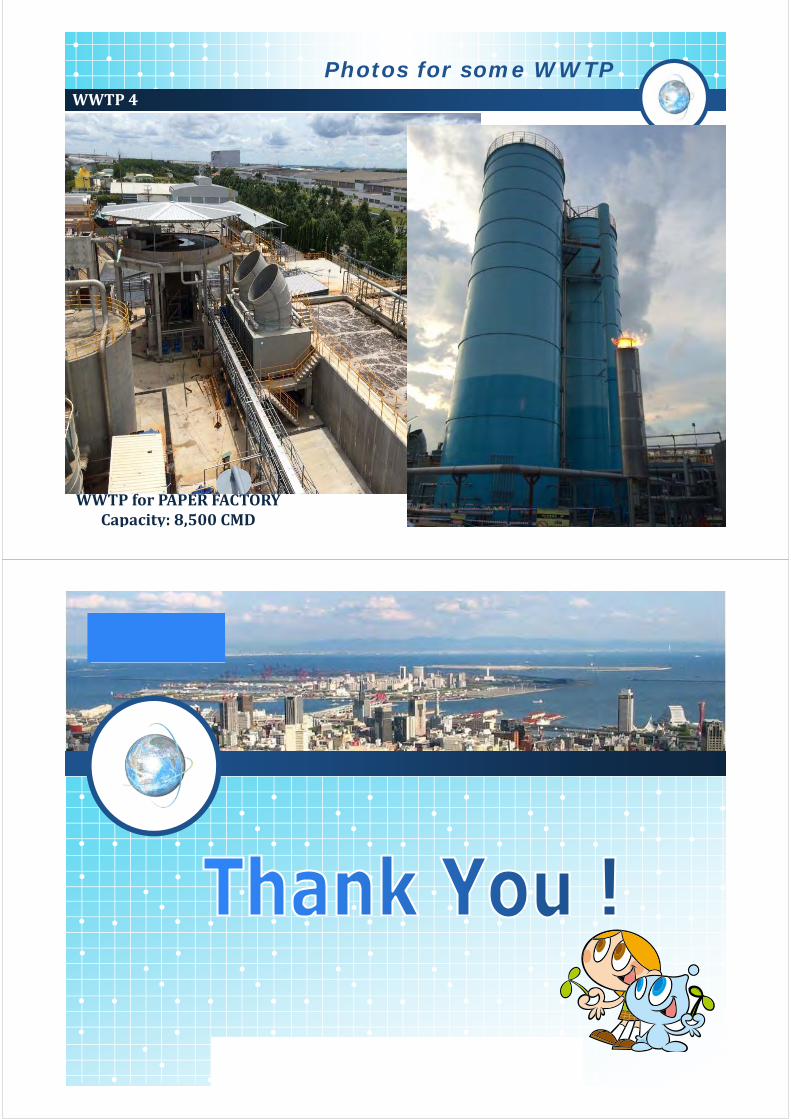
27
Photos for some WWTPWWTP4
WWTPforPAPERFACTORYCapacity:8,500CMD
Ideas for Improvement of
Industrial Zone Waste Water Treatment Plant
Toshiyuki Nishio
KOBELCO ECO-SOLUTIONS CO.,LTD.
2017/ 1/10
Project for Capacity Development in Basic Water Environment Management
and EIA System in the Republic of the Union of Myanmar
JICA Expert Team
1. There are many existing small factories in IZ.
The amount of water use is less than 50m3/day (50,000Liter/day)
at most of these factories, which means the amount of waste water is same
or less that 50m3/day.
50 m3/day is generally very small scale for WWTP.
2
1.Current Situation -1
70 important factories in Hlaing Thar Ya IZ, Shwe Lin Pan IZ and Pyi Thar IZ in Hlaing River Basin, Yangon city
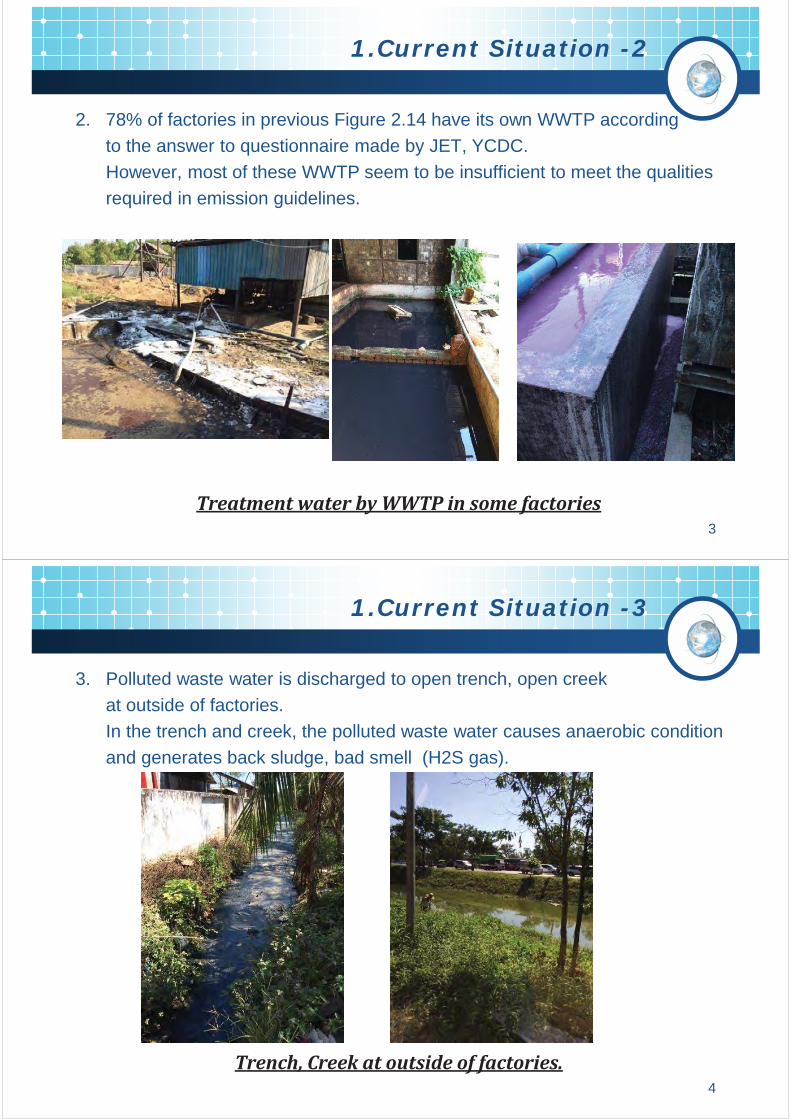
2. 78% of factories in previous Figure 2.14 have its own WWTP according
to the answer to questionnaire made by JET, YCDC.
However, most of these WWTP seem to be insufficient to meet the qualities
required in emission guidelines.
3
1.Current Situation -2
Treatment water by WWTP in some factories
4
1.Current Situation -3
3. Polluted waste water is discharged to open trench, open creek
at outside of factories.
In the trench and creek, the polluted waste water causes anaerobic condition
and generates back sludge, bad smell (H2S gas).
Trench, Creek at outside of factories.
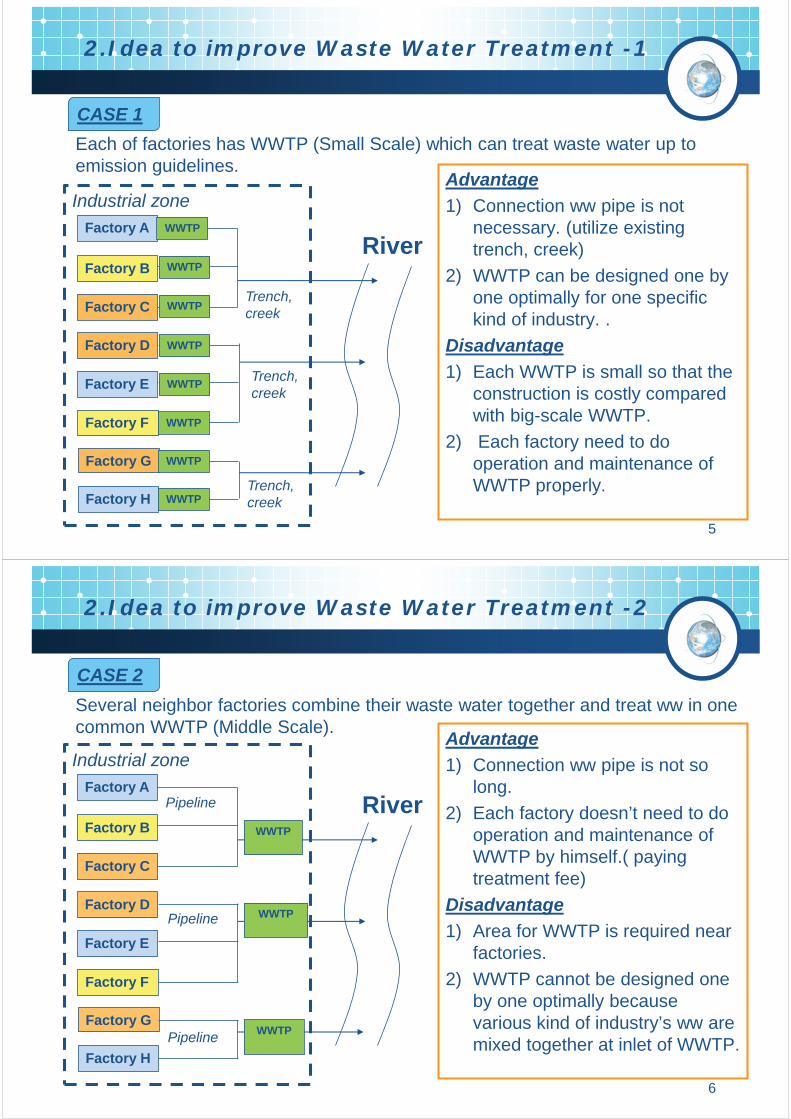
5
2.Idea to improve Waste Water Treatment -1
Each of factories has WWTP (Small Scale) which can treat waste water up to
emission guidelines.
Factory A
Factory B
Factory C
Factory D
RiverWWTP
WWTP
Industrial zone
Factory E
Factory F
Factory G
Factory H
WWTP
WWTP
WWTP
WWTP
WWTP
WWTP
Advantage
1) Connection ww pipe is not
necessary. (utilize existing
trench, creek)
2) WWTP can be designed one by
one optimally for one specific
kind of industry. .
Disadvantage
1) Each WWTP is small so that the
construction is costly compared
with big-scale WWTP.
2) Each factory need to do
operation and maintenance of
WWTP properly.
Trench, creek
Trench, creek
Trench, creek
CASE 1
6
2.Idea to improve Waste Water Treatment -2
CASE2:
Several neighbor factories combine their waste water together and treat ww in one
common WWTP (Middle Scale). Advantage
1) Connection ww pipe is not so
long.
2) Each factory doesn’t need to do
operation and maintenance of
WWTP by himself.( paying
treatment fee)
Disadvantage
1) Area for WWTP is required near
factories.
2) WWTP cannot be designed one
by one optimally because
various kind of industry’s ww are
mixed together at inlet of WWTP.
Factory A
Factory B
Factory C
Factory D
RiverWWTP
Industrial zone
Factory E
Factory F
Factory G
Factory H
WWTP
WWTP
Pipeline
Pipeline
Pipeline
CASE 2
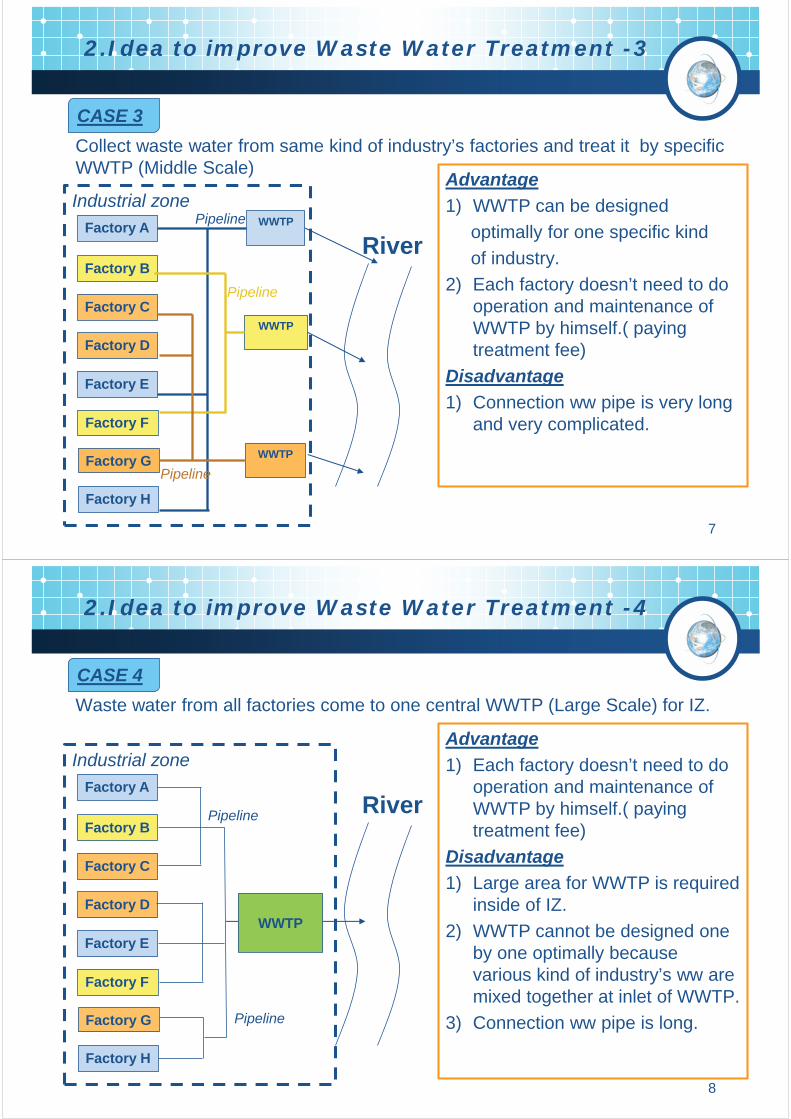
7
2.Idea to improve Waste Water Treatment -3
CASE3:
Collect waste water from same kind of industry’s factories and treat it by specific
WWTP (Middle Scale)Advantage
1) WWTP can be designed
optimally for one specific kind
of industry.
2) Each factory doesn’t need to do
operation and maintenance of
WWTP by himself.( paying
treatment fee)
Disadvantage
1) Connection ww pipe is very long
and very complicated.
Factory A
Factory B
Factory C
Factory D
River
WWTP
Industrial zone
Factory E
Factory F
Factory G
Factory H
WWTP
WWTP
Pipeline
Pipeline
Pipeline
CASE 3
8
2.Idea to improve Waste Water Treatment -4
CASE4:
Waste water from all factories come to one central WWTP (Large Scale) for IZ.
Advantage
1) Each factory doesn’t need to do
operation and maintenance of
WWTP by himself.( paying
treatment fee)
Disadvantage
1) Large area for WWTP is required
inside of IZ.
2) WWTP cannot be designed one
by one optimally because
various kind of industry’s ww are
mixed together at inlet of WWTP.
3) Connection ww pipe is long.
Factory A
Factory B
Factory C
Factory D
River
Industrial zone
Factory E
Factory F
Factory G
Factory H
WWTP
Pipeline
Pipeline
CASE 4
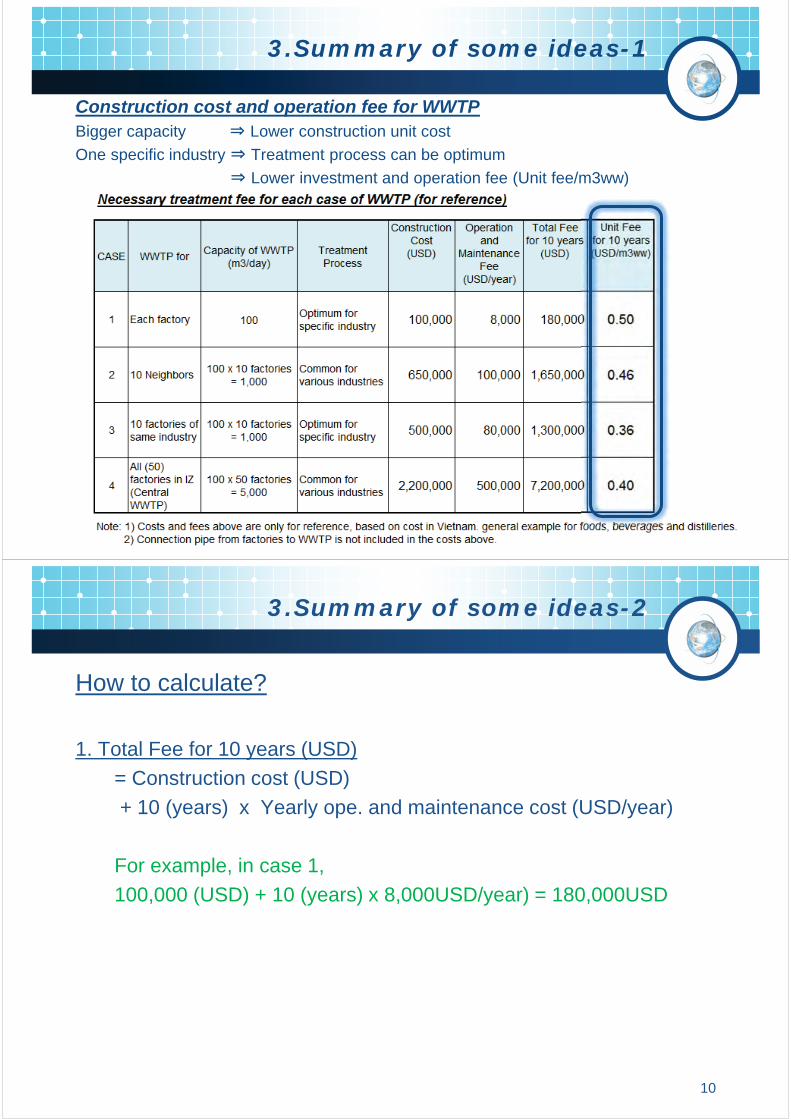
9
3.Summary of some ideas-1
Construction cost and operation fee for WWTP Bigger capacity Lower construction unit cost
One specific industry Treatment process can be optimum
Lower investment and operation fee (Unit fee/m3ww)
How to calculate?
1. Total Fee for 10 years (USD)
= Construction cost (USD)
+ 10 (years) x Yearly ope. and maintenance cost (USD/year)
For example, in case 1,
100,000 (USD) + 10 (years) x 8,000USD/year) = 180,000USD
10
3.Summary of some ideas-2
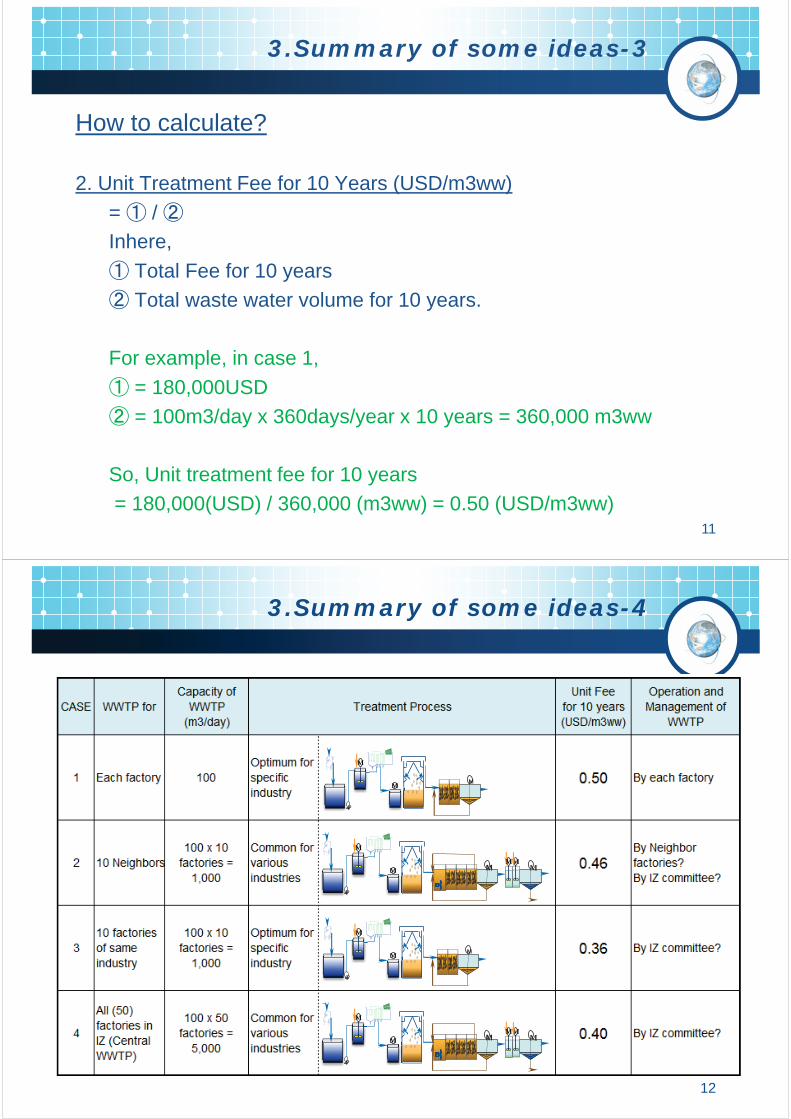
11
3.Summary of some ideas-3
How to calculate?
2. Unit Treatment Fee for 10 Years (USD/m3ww)
= /
Inhere,
Total Fee for 10 years
Total waste water volume for 10 years.
For example, in case 1,
= 180,000USD
= 100m3/day x 360days/year x 10 years = 360,000 m3ww
So, Unit treatment fee for 10 years
= 180,000(USD) / 360,000 (m3ww) = 0.50 (USD/m3ww)
12
3.Summary of some ideas-4
M
P
M MMM
M
M
P
MM
M
P
M MMM
M
M
P
MM
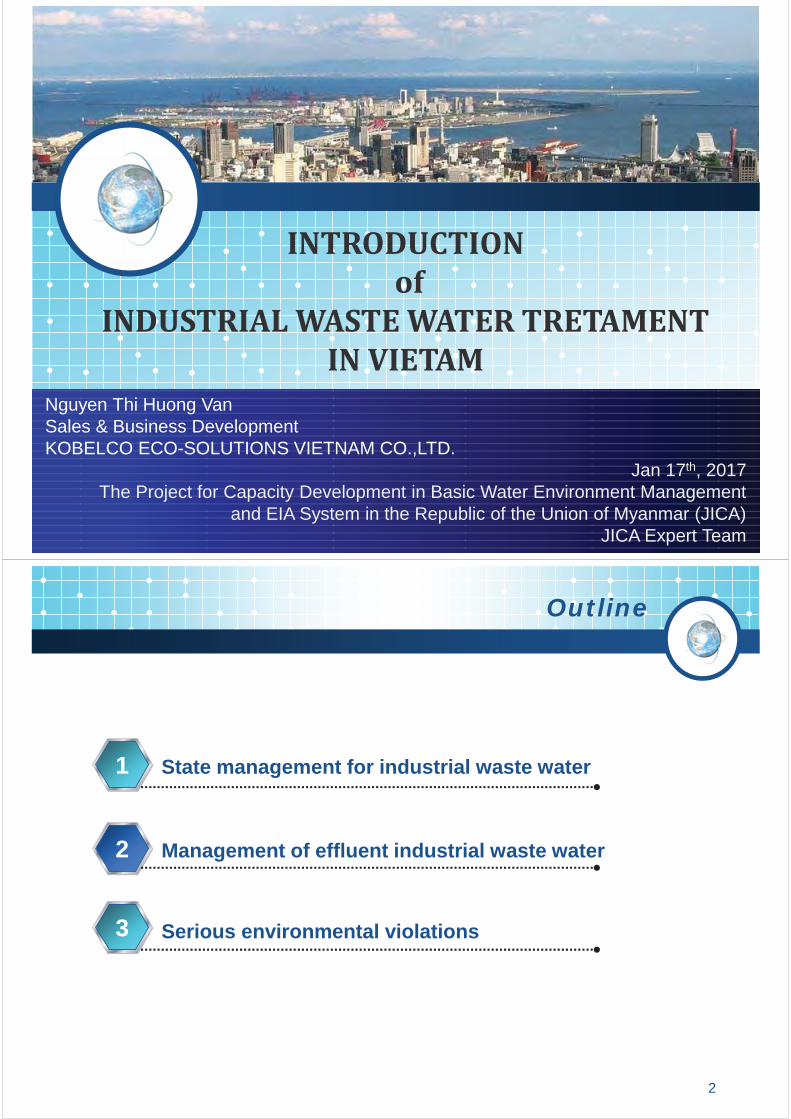
Nguyen Thi Huong Van
Sales & Business Development
KOBELCO ECO-SOLUTIONS VIETNAM CO.,LTD.
Jan 17th, 2017
The Project for Capacity Development in Basic Water Environment Management
and EIA System in the Republic of the Union of Myanmar (JICA)
JICA Expert Team
INTRODUCTIONof
INDUSTRIAL WASTE WATER TRETAMENT IN VIETAM
State management for industrial waste water1
Management of effluent industrial waste water2
4
Serious environmental violations3
Outline
2
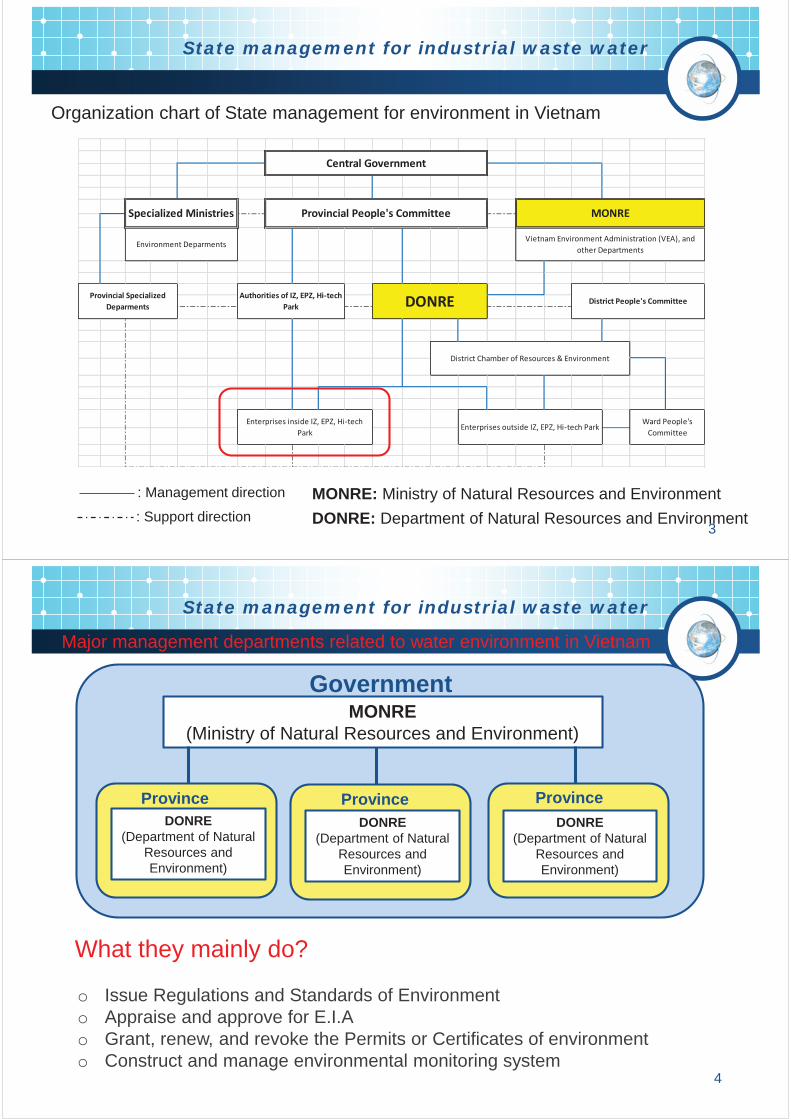
State management for industrial waste water
: Management direction
: Support direction3
Organization chart of State management for environment in Vietnam
Central Government
Ward People's Committee
Enterprises outside IZ, EPZ, Hi-tech Park
DONREAuthorities of IZ, EPZ, Hi-tech Park
Enterprises inside IZ, EPZ, Hi-tech Park
MONRE
Vietnam Environment Administration (VEA), and other Departments
District People's Committee
District Chamber of Resources & Environment
Provincial Specialized Deparments
Specialized Ministries Provincial People's Committee
Environment Deparments
MONRE: Ministry of Natural Resources and Environment
DONRE: Department of Natural Resources and Environment
State management for industrial waste water
4
Major management departments related to water environment in Vietnam
MONRE
(Ministry of Natural Resources and Environment)
DONRE
(Department of Natural
Resources and
Environment)
Government
Province
DONRE
(Department of Natural
Resources and
Environment)
Province
DONRE
(Department of Natural
Resources and
Environment)
Province
o Issue Regulations and Standards of Environment
o Appraise and approve for E.I.A
o Grant, renew, and revoke the Permits or Certificates of environment
o Construct and manage environmental monitoring system
What they mainly do?
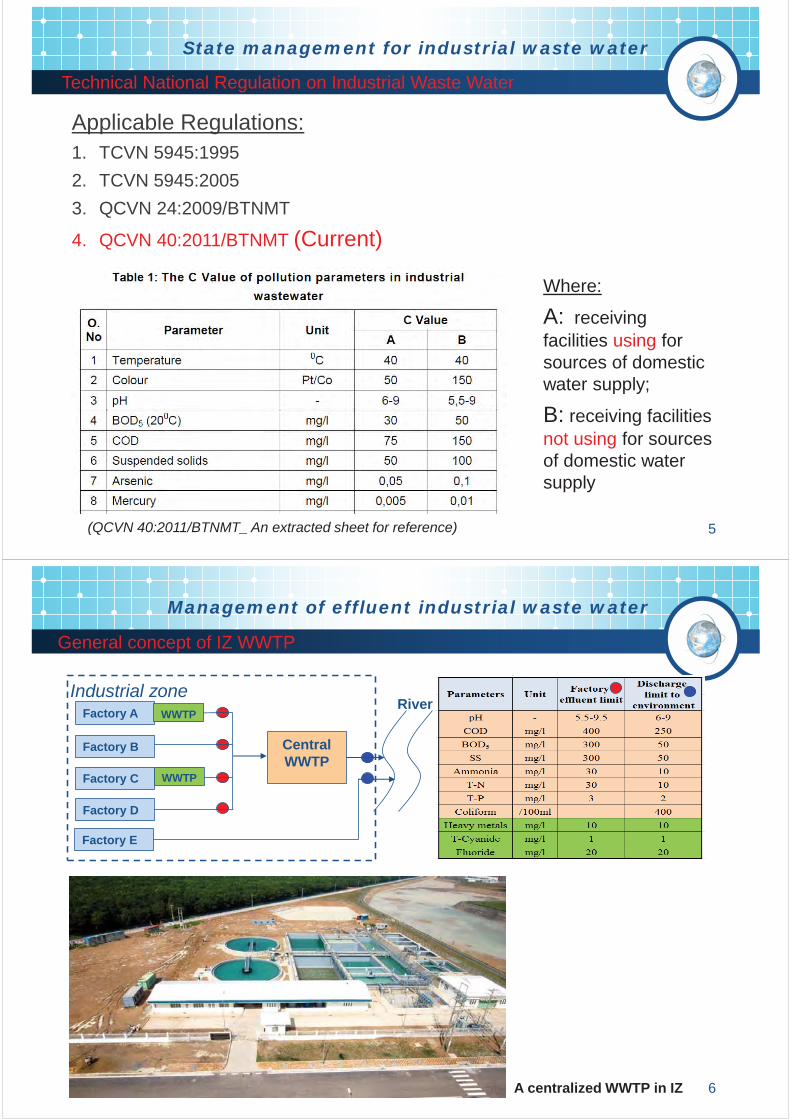
5
Applicable Regulations:
1. TCVN 5945:1995
2. TCVN 5945:2005
3. QCVN 24:2009/BTNMT
4. QCVN 40:2011/BTNMT (Current)
State management for industrial waste water
Technical National Regulation on Industrial Waste Water
Where:
A: receiving
facilities using for
sources of domestic
water supply;
B: receiving facilities
not using for sources
of domestic water
supply
(QCVN 40:2011/BTNMT_ An extracted sheet for reference)
Management of effluent industrial waste water
6
General concept of IZ WWTP
Industrial zoneFactory A
Factory B
Factory C
Factory D
Central
WWTP
RiverWWTP
WWTP
Factory E
A centralized WWTP in IZ
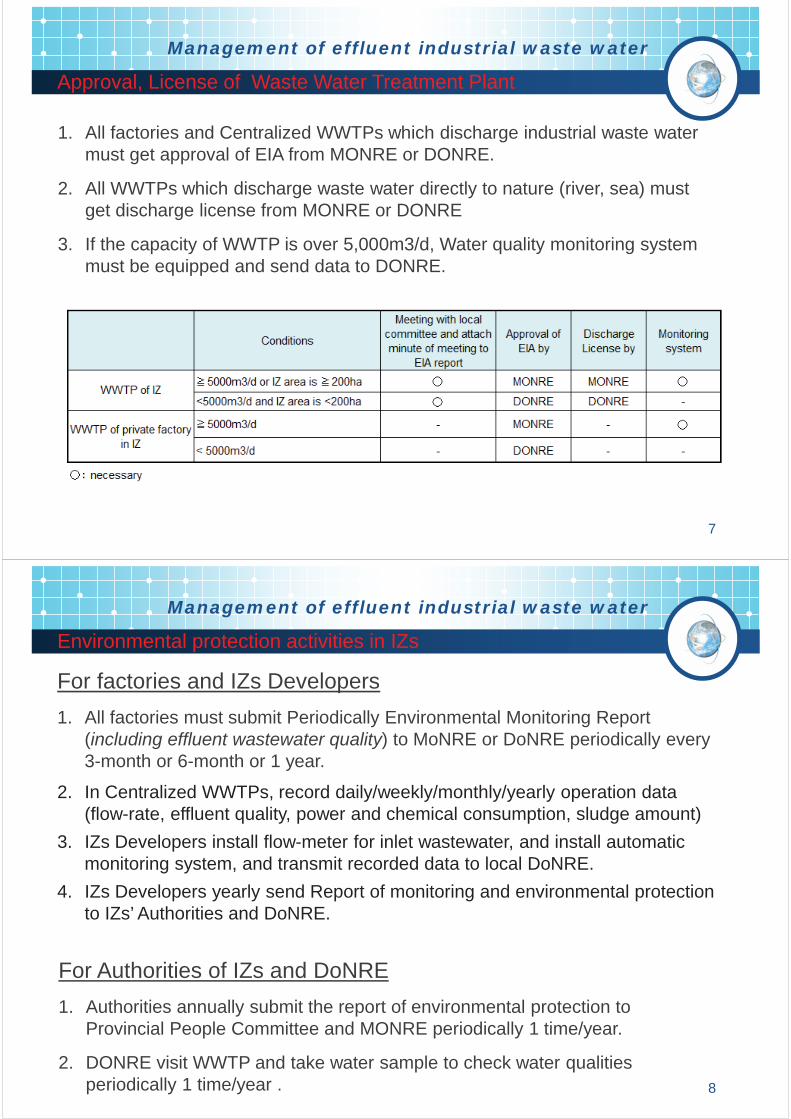
7
Approval, License of Waste Water Treatment Plant
1. All factories and Centralized WWTPs which discharge industrial waste water
must get approval of EIA from MONRE or DONRE.
2. All WWTPs which discharge waste water directly to nature (river, sea) must
get discharge license from MONRE or DONRE
3. If the capacity of WWTP is over 5,000m3/d, Water quality monitoring system
must be equipped and send data to DONRE.
Management of effluent industrial waste water
8
For factories and IZs Developers
1. All factories must submit Periodically Environmental Monitoring Report
(including effluent wastewater quality) to MoNRE or DoNRE periodically every
3-month or 6-month or 1 year.
2. In Centralized WWTPs, record daily/weekly/monthly/yearly operation data
(flow-rate, effluent quality, power and chemical consumption, sludge amount)
3. IZs Developers install flow-meter for inlet wastewater, and install automatic
monitoring system, and transmit recorded data to local DoNRE.
4. IZs Developers yearly send Report of monitoring and environmental protection
to IZs’ Authorities and DoNRE.
Environmental protection activities in IZs
For Authorities of IZs and DoNRE
1. Authorities annually submit the report of environmental protection to
Provincial People Committee and MONRE periodically 1 time/year.
2. DONRE visit WWTP and take water sample to check water qualities
periodically 1 time/year .
Management of effluent industrial waste water
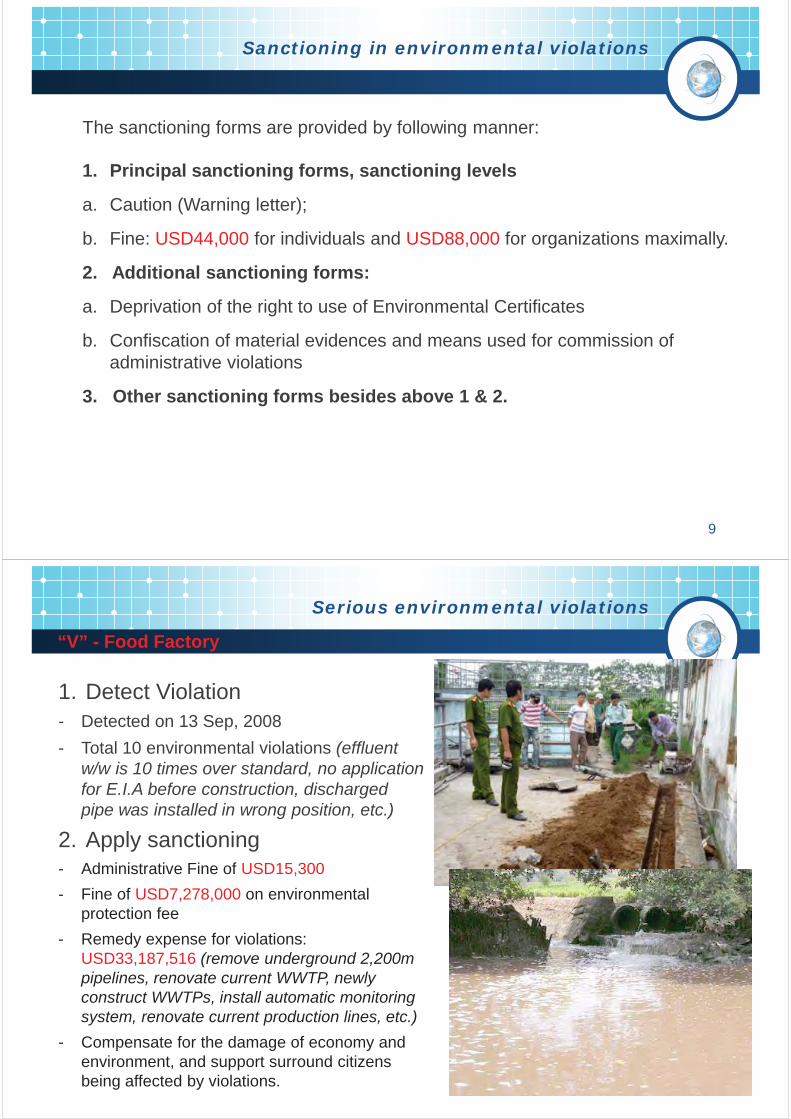
Sanctioning in environmental violations
9
1. Principal sanctioning forms, sanctioning levels
a. Caution (Warning letter);
b. Fine: USD44,000 for individuals and USD88,000 for organizations maximally.
2. Additional sanctioning forms:
a. Deprivation of the right to use of Environmental Certificates
b. Confiscation of material evidences and means used for commission of
administrative violations
3. Other sanctioning forms besides above 1 & 2.
The sanctioning forms are provided by following manner:
Serious environmental violations
10
1. Detect Violation
- Detected on 13 Sep, 2008
- Total 10 environmental violations (effluent w/w is 10 times over standard, no application for E.I.A before construction, discharged pipe was installed in wrong position, etc.)
2. Apply sanctioning
- Administrative Fine of USD15,300
- Fine of USD7,278,000 on environmental
protection fee
- Remedy expense for violations:
USD33,187,516 (remove underground 2,200m pipelines, renovate current WWTP, newly construct WWTPs, install automatic monitoring system, renovate current production lines, etc.)
- Compensate for the damage of economy and
environment, and support surround citizens
being affected by violations.
“V” - Food Factory
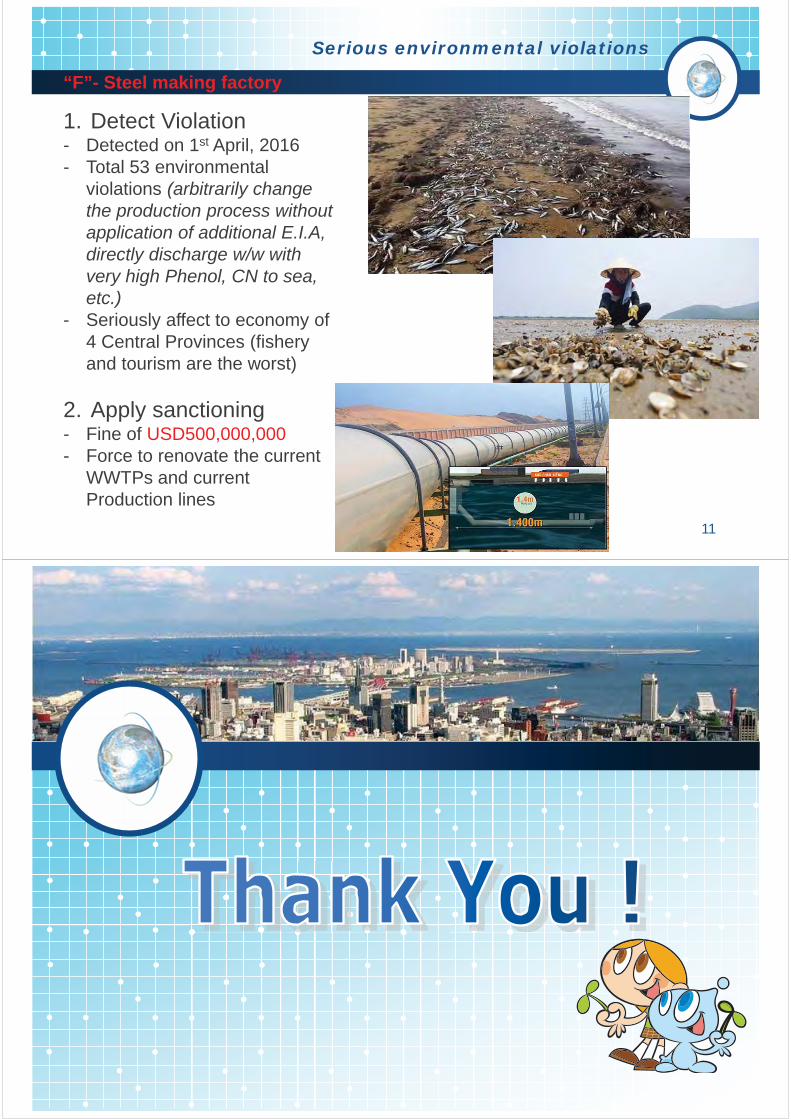
Serious environmental violations
11
1. Detect Violation- Detected on 1st April, 2016
- Total 53 environmental
violations (arbitrarily change the production process without application of additional E.I.A, directly discharge w/w with very high Phenol, CN to sea, etc.)
- Seriously affect to economy of
4 Central Provinces (fishery
and tourism are the worst)
2. Apply sanctioning- Fine of USD500,000,000
- Force to renovate the current
WWTPs and current
Production lines
“F”- Steel making factory
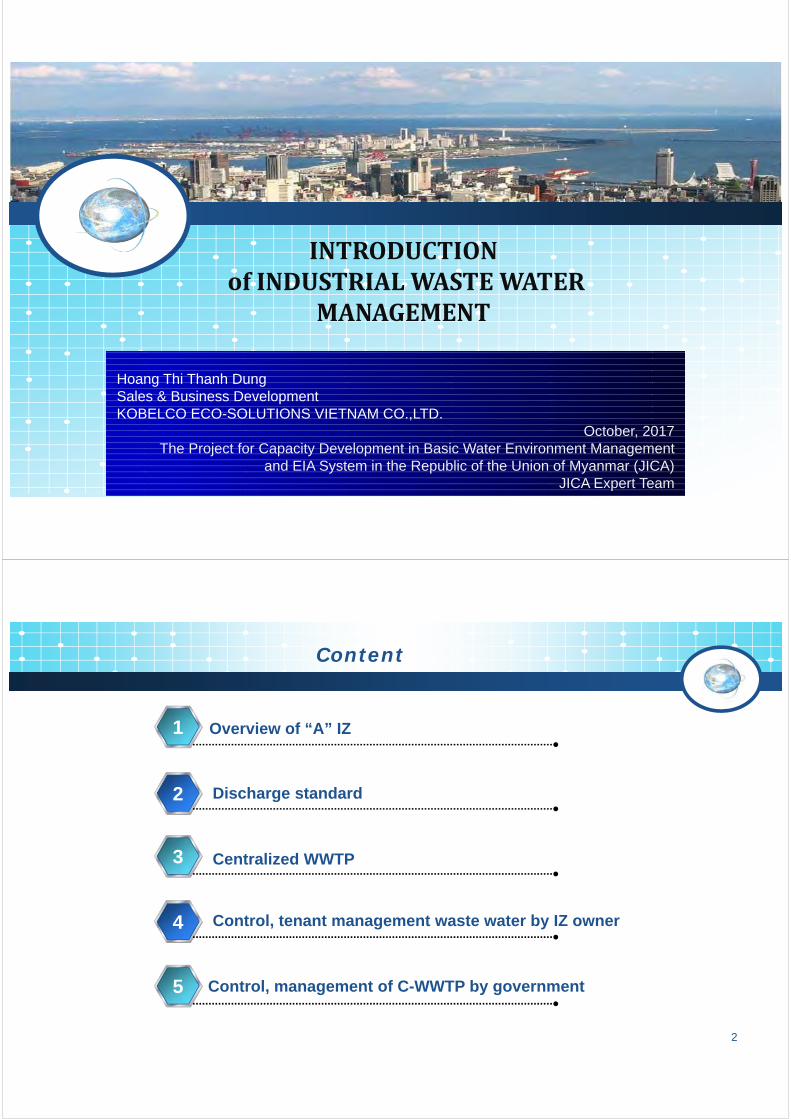
Hoang Thi Thanh Dung
Sales & Business Development
KOBELCO ECO-SOLUTIONS VIETNAM CO.,LTD.
October, 2017
The Project for Capacity Development in Basic Water Environment Management
and EIA System in the Republic of the Union of Myanmar (JICA)
JICA Expert Team
INTRODUCTIONofINDUSTRIALWASTEWATER
MANAGEMENT
Overview of “A” IZ1
Discharge standard 2
4
3
Content
2
Centralized WWTP
4 Control, tenant management waste water by IZ owner
5 Control, management of C-WWTP by government
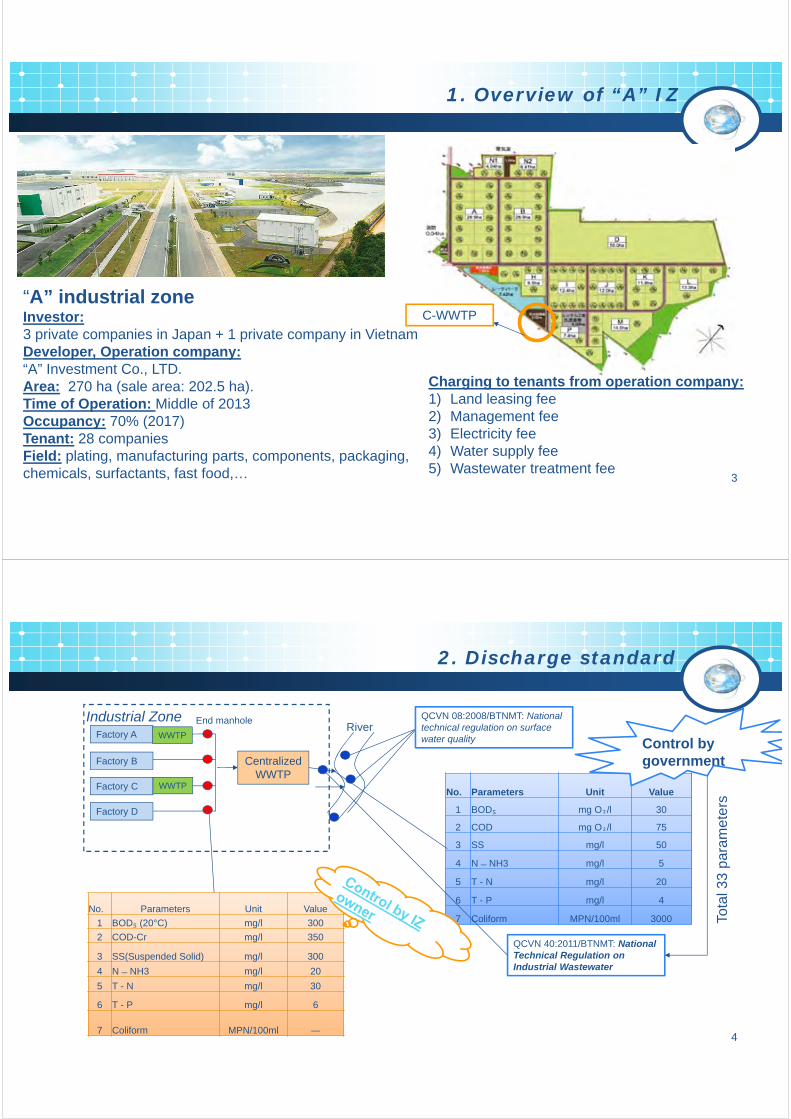
3
1. Overview of “A” IZ
“A” industrial zoneInvestor:
3 private companies in Japan + 1 private company in Vietnam
Developer, Operation company:
“A” Investment Co., LTD.
Area: 270 ha (sale area: 202.5 ha).
Time of Operation: Middle of 2013
Occupancy: 70% (2017)
Tenant: 28 companies
Field: plating, manufacturing parts, components, packaging,
chemicals, surfactants, fast food,…
C-WWTP
Charging to tenants from operation company:
1) Land leasing fee
2) Management fee
3) Electricity fee
4) Water supply fee
5) Wastewater treatment fee
4
Industrial ZoneFactory A
Factory B
Factory C
Factory D
Centralized
WWTP
RiverWWTP
WWTP
2. Discharge standard
No. Parameters Unit Value
1 BOD₅ (20°C) mg/l 300
2 COD-Cr mg/l 350
3 SS(Suspended Solid) mg/l 300
4 N ̶ NH3 mg/l 20
5 T - N mg/l 30
6 T - P mg/l 6
7 Coliform MPN/100ml ―
No. Parameters Unit Value
1 BOD₅ mg O₂/l 30
2 COD mg O₂/l 75
3 SS mg/l 50
4 N ̶ NH3 mg/l 5
5 T - N mg/l 20
6 T - P mg/l 4
7 Coliform MPN/100ml 3000
Control by
government
QCVN 08:2008/BTNMT: National technical regulation on surface water quality
QCVN 40:2011/BTNMT: National Technical Regulation on Industrial Wastewater
Tota
l 33 p
ara
mete
rsEnd manhole
5
3. Centralized WWTP of “A” IZ
Wastewater treatment plant of “A” IZ
1. Total capacity : 9,000 m3/day
2. Completion date : 8/2013
3. Influent : follow IZ owner regulation
4. Effluent : QCVN 40:2011/BTNMT, Column A
Water supply fee: 62 cent/m3
Waste water fee: 33 cent/m3
Waste water amount = 80% water supply for charging.
In Vietnam, tube well is not allowed inside IZ. So, IZ
owner easily check water supply capacity which
tenant use.
6
3. Centralized WWTP of “A” IZ
Flowsheet – Treatment process
Aeration
tankSedimentation 1
P
M
Coagulation
Flocculation disinfection
M
P
EQ tankAnoxic
tank
M M
Pump pit
Screen
Sedimentation 2
Waste water
(from tenants)Treated water
(discharge)
Because various industrial operations are carried out in the industrial estate,
it is necessary to dispose of various kinds of wastewater.
It is necessary to stably and reliably process.
1. This WWTP can treat organic matter (BOD, COD) and phosphorous (P) and
Nitrogen (N) stably.
2. Can economical operation by managing equipment based on WW amount
and its pollution load.
3. In case of equipment trouble, stand by equipment starts run automatically
and keep WWTP operation.
7
3. Centralized WWTP of “A” IZ
Layout
O&M Service & Electrical room
Outlet & Monitoring system
Design concept
Vietnamese government keen on protecting
environment, accordingly environmental
regulation of this country is more strict
compare with other developing countries.
In “A” IZ, they apply KESV’s high performance
WWTP and running IZ with considering eco,
environment friendly.
O&M
A IZ's WWTP is managed by KESV’s
specialized engineers, they optimize system
operation, detect problem and fix it quickly, and
conduct appropriate safety operation.
78m
105m
8
Wastewater management in IZ
Tenant
A
Tenant
B
Tenant
C
WWTPWWTPWWTP C - WWTP
Kobelco Vietnam
(On behalf of “A” IZ)
Guide / Management
“A” IZ Operation
Company
MONRE
DONRE, IZA**
Environmental policeReport
Technical support
Report
Guide/
Management
Operation &
Maintenance
**:
MONRE: Ministry of natural
Resource and Environment
DONRE: Department of
natural Resource and
Environment
IZA: Industrial zone
authority
KESV: Water treatment
company. KESV manage C-
WWTP, and tenant WWTP
on behalf of IZ owner based
on O&M service contract.
IZ WW Management
4. Control, tenant management waste water by IZ owner
4. Control, tenant management waste water by IZ owner
IZ owner manage and control wastewater of tenant by their Regulation from
construction stage to discharging.
9
Septic Tank or
Sedimentation Tank with Screen
Domestic
Wastewater
Industrial Wastewater Treatment Plant
Industrial
Wastewater
End Manhole
To A IZ’s Wastewater
Drainage Network
Primary Wastewater Treatment System
Tenant's ST
& WWDN
The diagram of the Tenant's Primary Wastewater Treatment System (Tenant's WWTP and
Tenant's ST & WWDN) is shown below.
Note) In case of separating the treatment process between domestic and industrial wastewater.
Need to meet discharge
standard for tenant
Tenant’s boundary
Tenant’s b
oundary
10
Date submitted of the applications on the
Tenant's Primary Wastewater Treatment
System before running WWTP.
Tenant's ST & WWDN:
Application of completion inspection of the work
3. On provisional discharging
4. On discharging
2. On completion
1.Before construction
Tenant's WWTP:
Application for final inspection of discharged wastewater quality
Tenant's WWTP:
Application for Design Approval
Industrial Wastewater
Tenant's WWTP:
Application of completion inspection of the work & provisional inspection of discharged wastewater quality
4. Control, tenant management waste water by IZ owner
11
②The Operations and Maintenance Plan:
•Daily maintenance target values•Daily inspection plan•Comprehensive inspection plan•Management organization
③Daily and Comprehensive Inspections• Exterior appearance, operational & functional
status• Comprehensive inspections
(two or more times annually)Water quality analysis by self-measurement
• Retain records for three years
(1) Summary of Self-maintenance/ Self - management
①Preparing an “Operation Manual for the Tenant’s WWTS”
②Submitting an “Operations and Maintenance Plan of the Tenant’s WWTS” to “A” IZ at the time of stage 3.
on provisional discharging.
③Recording and retaining “Daily & Comprehensive Inspections”
Tenant wastewater control by IZ owner.
Regulation of Self- maintenance and Self-measurement after running WWTP
4. Control, tenant management waste water by IZ owner
12
Sample for Daily inspection plan
4. Control, tenant management waste water by IZ owner
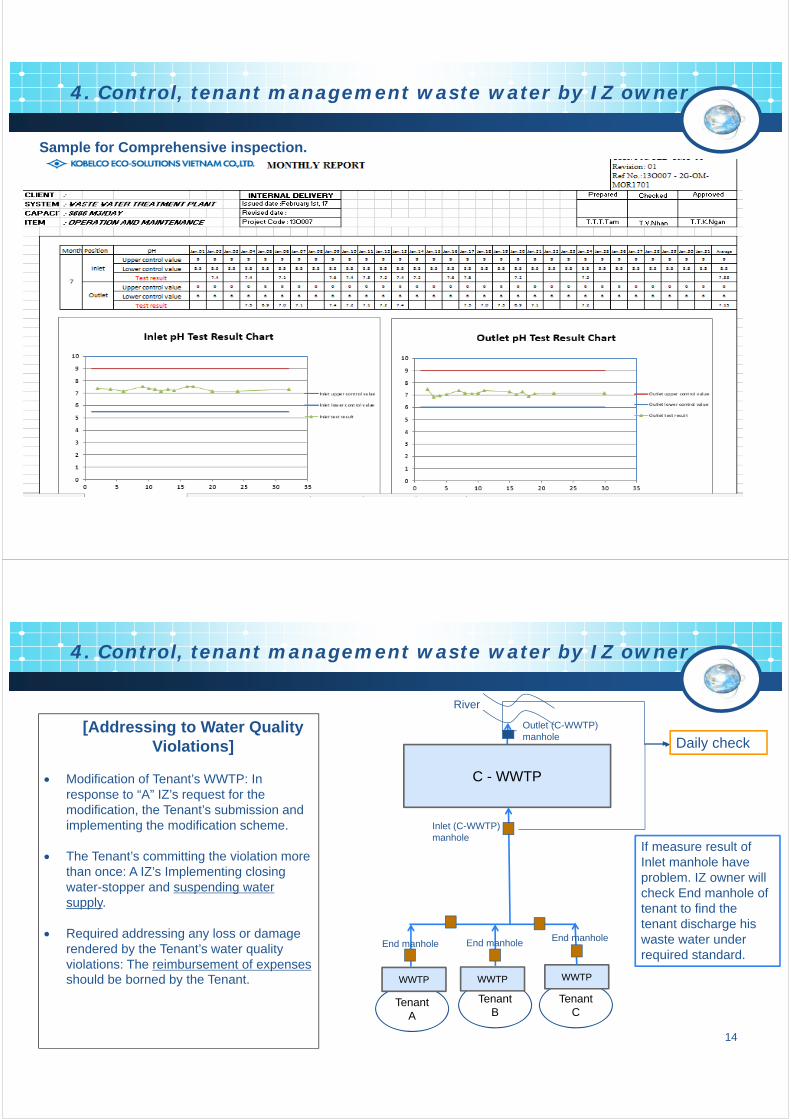
13
Sample for Comprehensive inspection.
4. Control, tenant management waste water by IZ owner
14
[Addressing to Water Quality
Violations]
Modification of Tenant’s WWTP: In
response to “A” IZ’s request for the
modification, the Tenant’s submission and
implementing the modification scheme.
The Tenant’s committing the violation more
than once: A IZ’s Implementing closing
water-stopper and suspending water
supply.
Required addressing any loss or damage
rendered by the Tenant’s water quality
violations: The reimbursement of expenses should be borned by the Tenant.
4. Control, tenant management waste water by IZ owner
Tenant
A
Tenant
B
Tenant
C
WWTPWWTPWWTP
C - WWTP
End manhole End manholeEnd manhole
Inlet (C-WWTP)
manhole
River
Outlet (C-WWTP)
manholeDaily check
If measure result of
Inlet manhole have
problem. IZ owner will
check End manhole of
tenant to find the
tenant discharge his
waste water under
required standard.
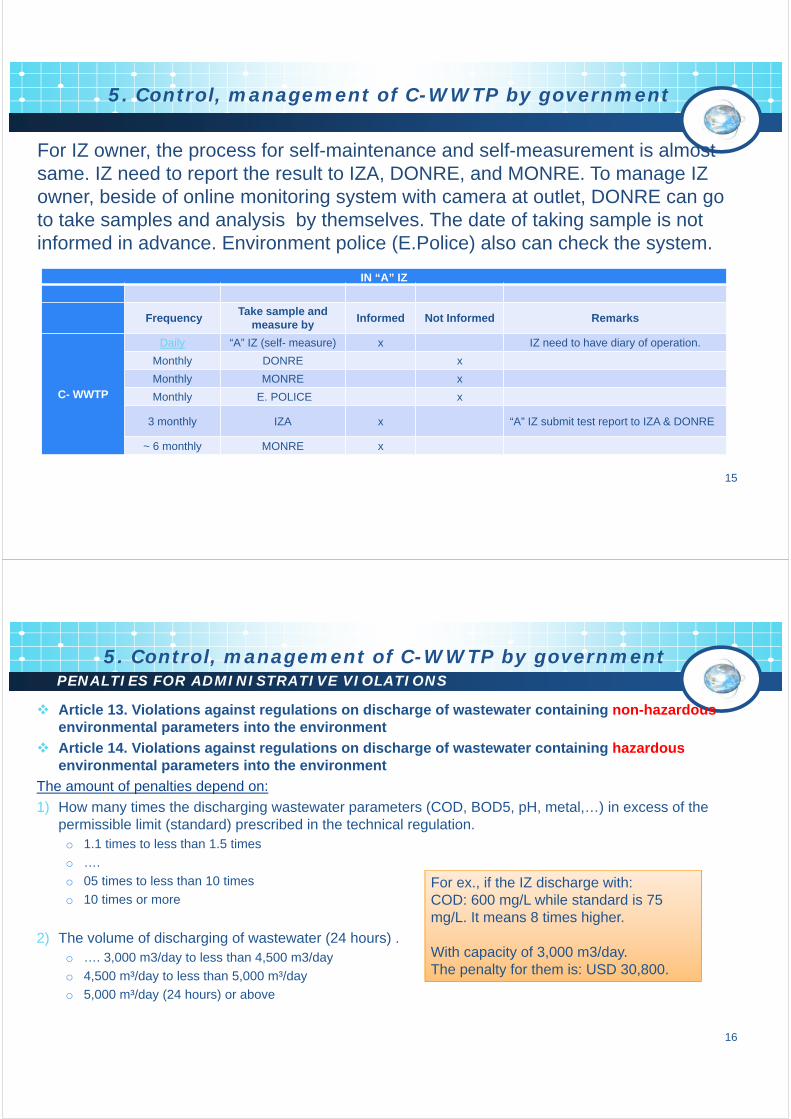
15
5. Control, management of C-WWTP by government
IN “A” IZ
FrequencyTake sample and
measure by Informed Not Informed Remarks
C- WWTP
Daily “A” IZ (self- measure) x IZ need to have diary of operation.
Monthly DONRE x
Monthly MONRE x
Monthly E. POLICE x
3 monthly IZA x “A” IZ submit test report to IZA & DONRE
~ 6 monthly MONRE x
For IZ owner, the process for self-maintenance and self-measurement is almost
same. IZ need to report the result to IZA, DONRE, and MONRE. To manage IZ
owner, beside of online monitoring system with camera at outlet, DONRE can go
to take samples and analysis by themselves. The date of taking sample is not
informed in advance. Environment police (E.Police) also can check the system.
16
Article 13. Violations against regulations on discharge of wastewater containing non-hazardous
environmental parameters into the environment
Article 14. Violations against regulations on discharge of wastewater containing hazardous
environmental parameters into the environment
The amount of penalties depend on:
1) How many times the discharging wastewater parameters (COD, BOD5, pH, metal,…) in excess of the
permissible limit (standard) prescribed in the technical regulation.
o 1.1 times to less than 1.5 times
o ….
o 05 times to less than 10 times
o 10 times or more
2) The volume of discharging of wastewater (24 hours) .
o …. 3,000 m3/day to less than 4,500 m3/day
o 4,500 m³/day to less than 5,000 m³/day
o 5,000 m³/day (24 hours) or above
For ex., if the IZ discharge with:
COD: 600 mg/L while standard is 75
mg/L. It means 8 times higher.
With capacity of 3,000 m3/day.
The penalty for them is: USD 30,800.
PENALTIES FOR ADMINISTRATIVE VIOLATIONS
5. Control, management of C-WWTP by government
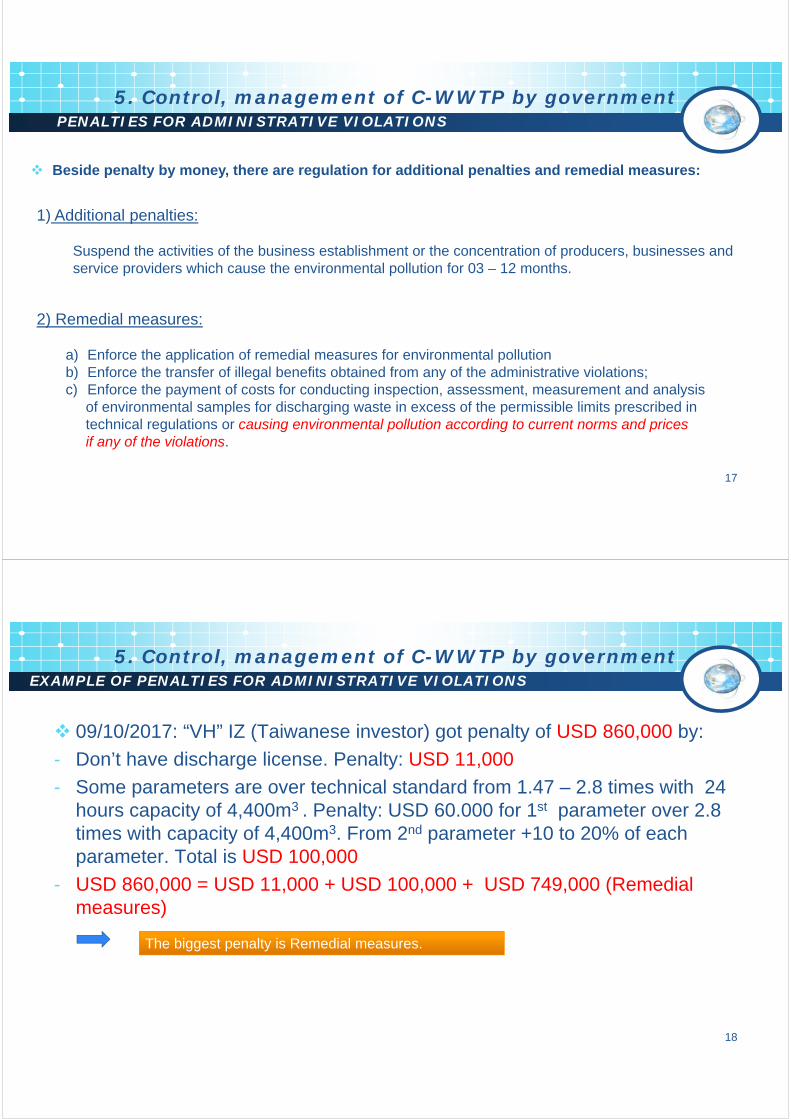
17
Beside penalty by money, there are regulation for additional penalties and remedial measures:
2) Remedial measures:
a) Enforce the application of remedial measures for environmental pollution
b) Enforce the transfer of illegal benefits obtained from any of the administrative violations;
c) Enforce the payment of costs for conducting inspection, assessment, measurement and analysis
of environmental samples for discharging waste in excess of the permissible limits prescribed in
technical regulations or causing environmental pollution according to current norms and prices if any of the violations.
1) Additional penalties:
Suspend the activities of the business establishment or the concentration of producers, businesses and
service providers which cause the environmental pollution for 03 – 12 months.
PENALTIES FOR ADMINISTRATIVE VIOLATIONS
5. Control, management of C-WWTP by government
09/10/2017: “VH” IZ (Taiwanese investor) got penalty of USD 860,000 by:
- Don’t have discharge license. Penalty: USD 11,000
- Some parameters are over technical standard from 1.47 – 2.8 times with 24
hours capacity of 4,400m3 . Penalty: USD 60.000 for 1st parameter over 2.8
times with capacity of 4,400m3. From 2nd parameter +10 to 20% of each
parameter. Total is USD 100,000
- USD 860,000 = USD 11,000 + USD 100,000 + USD 749,000 (Remedial
measures)
18
EXAMPLE OF PENALTIES FOR ADMINISTRATIVE VIOLATIONS
5. Control, management of C-WWTP by government
The biggest penalty is Remedial measures.
19
EXAMPLE OF PENALTIES FOR ADMINISTRATIVE VIOLATIONS
5. Control, management of C-WWTP by government
In this event, the biggest penalty is Remedial
measures.
1. Detect Violation- Detected on 1st April, 2016
- Total 53 environmental violations (arbitrarily change the production process without application of additional E.I.A, directly discharge w/w with very high Phenol, CN to sea, etc.)
- Seriously affect to economy of 4 Central
Provinces (fishery and tourism are the worst)
2. Apply sanctioning- Fine of USD500,000,000
- Force to renovate the current WWTPs and
current Production lines
“F”- Steel making factory
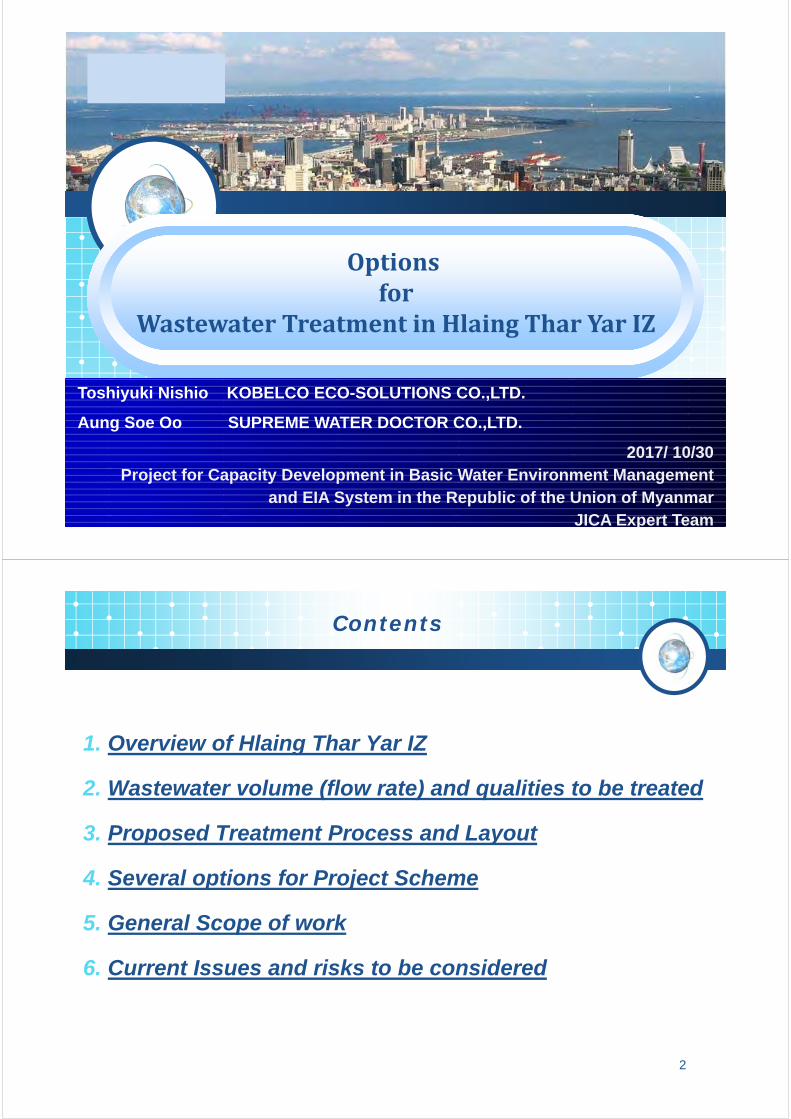
Optionsfor
WastewaterTreatmentinHlaing TharYar IZ
Toshiyuki Nishio KOBELCO ECO-SOLUTIONS CO.,LTD.
Aung Soe Oo SUPREME WATER DOCTOR CO.,LTD.
2017/ 10/30
Project for Capacity Development in Basic Water Environment Management
and EIA System in the Republic of the Union of Myanmar
JICA Expert Team
1. Overview of Hlaing Thar Yar IZ
2. Wastewater volume (flow rate) and qualities to be treated
3. Proposed Treatment Process and Layout
4. Several options for Project Scheme
5. General Scope of work
6. Current Issues and risks to be considered
2
Contents
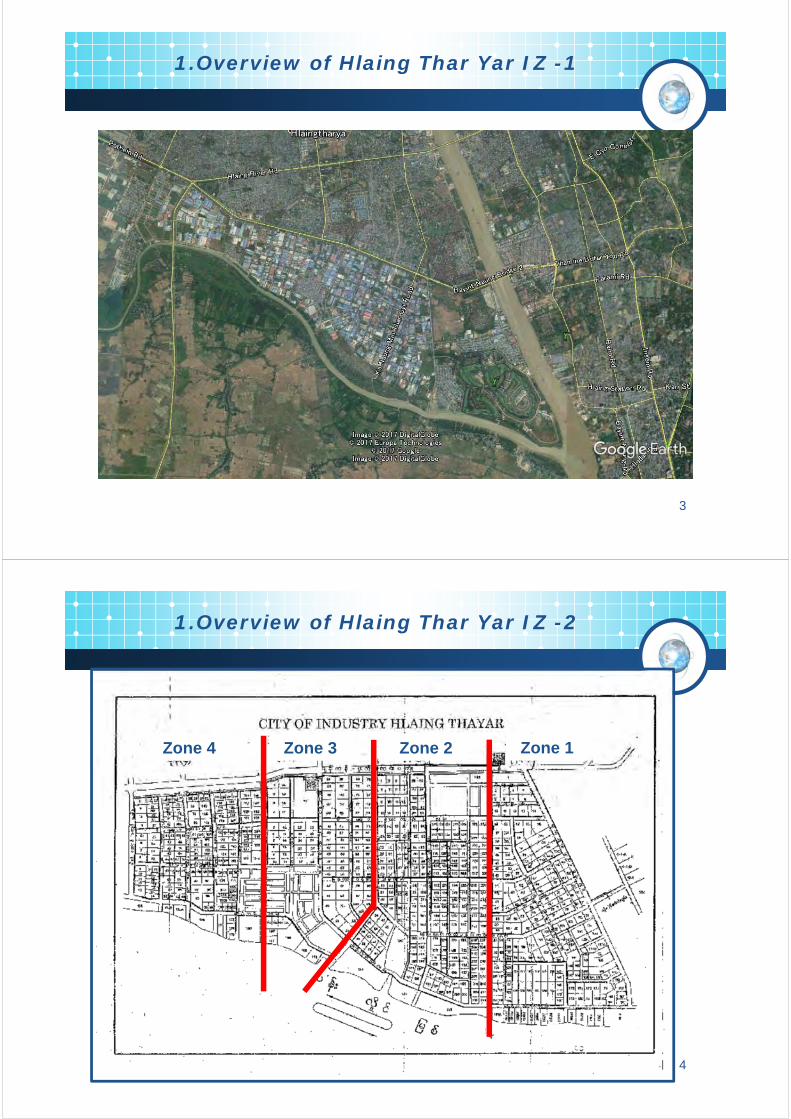
1.Overview of Hlaing Thar Yar IZ -1
3
1.Overview of Hlaing Thar Yar IZ -2
4
Zone 2 Zone 1 Zone 3 Zone 4
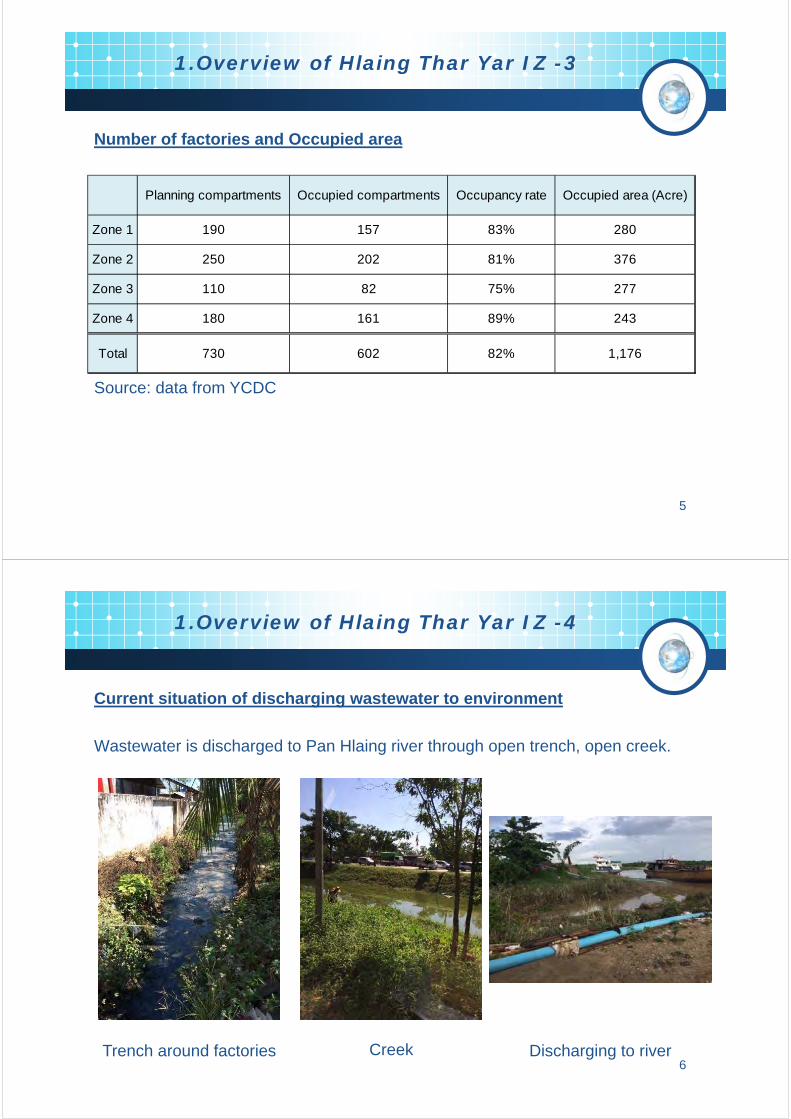
1.Overview of Hlaing Thar Yar IZ -3
5
Planning compartments Occupied compartments Occupancy rate Occupied area (Acre)
Zone 1 190 157 83% 280
Zone 2 250 202 81% 376
Zone 3 110 82 75% 277
Zone 4 180 161 89% 243
Total 730 602 82% 1,176
Source: data from YCDC
Number of factories and Occupied area
1.Overview of Hlaing Thar Yar IZ -4
6
Current situation of discharging wastewater to environment
Wastewater is discharged to Pan Hlaing river through open trench, open creek.
Trench around factories Creek Discharging to river
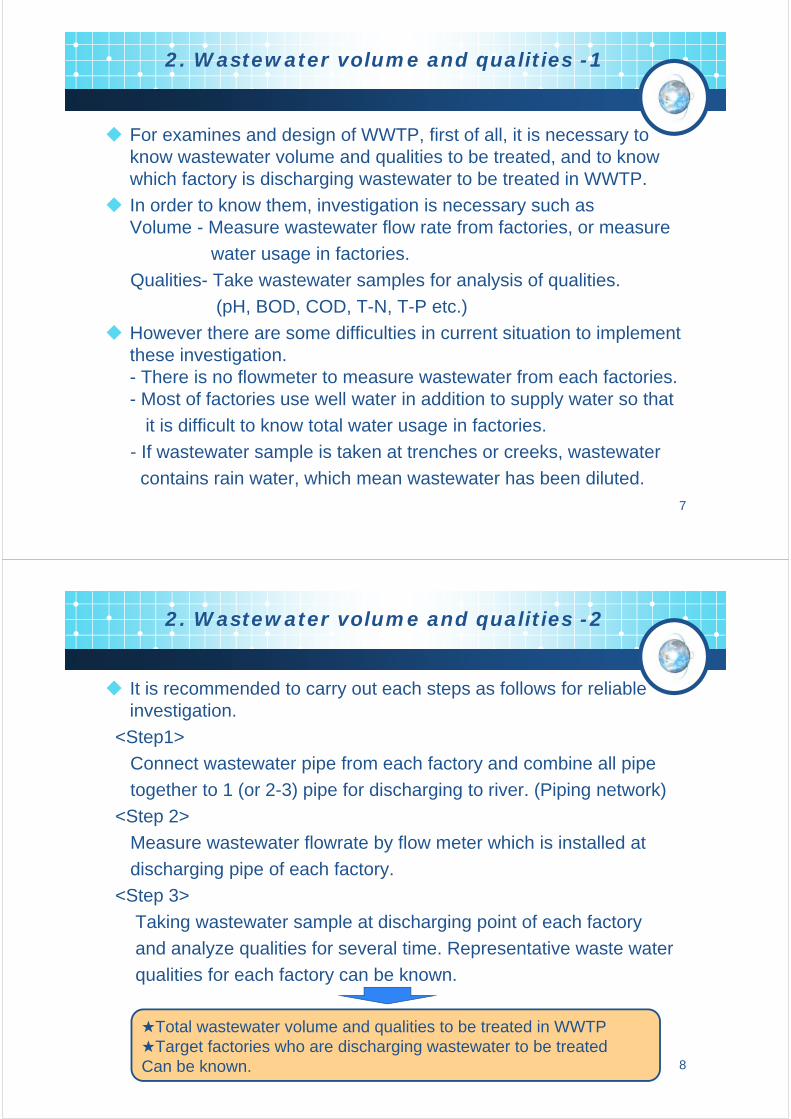
2. Wastewater volume and qualities -1
7
For examines and design of WWTP, first of all, it is necessary to
know wastewater volume and qualities to be treated, and to know
which factory is discharging wastewater to be treated in WWTP.
In order to know them, investigation is necessary such as
Volume - Measure wastewater flow rate from factories, or measure
water usage in factories.
Qualities- Take wastewater samples for analysis of qualities.
(pH, BOD, COD, T-N, T-P etc.)
However there are some difficulties in current situation to implement
these investigation.
- There is no flowmeter to measure wastewater from each factories.
- Most of factories use well water in addition to supply water so that
it is difficult to know total water usage in factories.
- If wastewater sample is taken at trenches or creeks, wastewater
contains rain water, which mean wastewater has been diluted.
2. Wastewater volume and qualities -2
8
It is recommended to carry out each steps as follows for reliable
investigation.
<Step1>
Connect wastewater pipe from each factory and combine all pipe
together to 1 (or 2-3) pipe for discharging to river. (Piping network)
<Step 2>
Measure wastewater flowrate by flow meter which is installed at
discharging pipe of each factory.
<Step 3>
Taking wastewater sample at discharging point of each factory
and analyze qualities for several time. Representative waste water
qualities for each factory can be known.
★Total wastewater volume and qualities to be treated in WWTP
★Target factories who are discharging wastewater to be treated
Can be known.
9
Wastewater piping network is also beneficial
★To separate wastewater from rain water in open trench, creek.
In current situation
・Wastewater in existing trench, creek generate bad odor and it affects
badly to atmosphere in IZ.
・When flood from trench, creek occurs due to heavy rain, rain water and
wastewater flood together and then wastewater come into factory area.
It would be not sound for employees and residents from sanitary point
of view.
★To connect to Centralized WWTP later.
★To monitor and record wastewater flowrate from each factory by
flowmeter for determining treatment fee.
2. Wastewater volume and qualities -3
For this proposal of WWTP, waste water volume and qualities are
assumed based on IZ data from YCDC and KOBELCO experience
in Vietnam.
2. Wastewater volume and qualities -4
10
Summary of factory data in Hlaing Thar Yar zone 1
No Kind of industryQ’ty existing
company
Q’ty plan
company
Occupancy rate Employee
Existing Company area
% Acre
Zone 1 157 190 82% 13,540 280
1 Garment 17 6,267 31
2 Dyeing 0 - -
3 Ice storage 2 96 2
4 Chemical (Painting) 7 765 17
5 Chemical (Fertilizer) 0 - -
6 Paper mill 3 223 3
7 Paper (no mill) 2 122 6
8 Food 13 654 23 9 Other
-People 29 3,060 45
-Ware house 50 843 74
-Electric 0 - -
-Forest 3 120 11
-Bean 17 294 32
-Construction 9 602 26
-General 1 64 2
-Machinery 4 430 7 Source: data from YCDC
2. Wastewater volume and qualities -5
11
Summary of factory data in Hlaing Thar Yar zone 1-4
No Kind of industryQ’ty existing
company
Q’ty plan
company
Occupancy rate Employee
Existing Company area
% Acre
Zone 1+2+3+4 602 730 82% 68,352 1,177
1 Garment 87 36,656 156
2 Dyeing 6 409 9
3 Ice storage 14 1,771 22
4 Chemical (Painting) 15 1,221 41
5 Chemical (Fertilizer) 4 46 6.6
6 Paper mill 13 1,007 16
7 Paper (no mill) 2 122 6.3
8 Food 61 6,918 1149 Other
-People 92 12,155 147
-Ware house 158 2,100 260
-Electric 8 721 22
-Forest 17 602 32
-Bean 54 1,047 105
-Construction 37 1,993 96
-General 21 915 124
-Machinery 13 669 21Source: data from YCDC
2. Wastewater volume and qualities -6
12
Mainly there are 7 kinds of wastewater in this area with difference characteristic.
Type 1: Domestic wastewater
Type 2: Garment Industrial wastewater
Type 3: Dyeing industrial wastewater
Type 4: Ice storage industrial wastewater
Type 5: Chemical industrial wastewater
Type 6: Paper factory industrial wastewater (with and without paper mill)
Type 7: Food industrial wastewater
Wastewater volume and qualities
Wastewater volume and qualities for each type is assumed
respectively.
13
Domestic WW : 80 l/person/day
Quantity of employee in zone 1 = 13,540
Quantity of employee in 4 zones = 68,352
WW in zone 1 = 1,083 m3/d
WW in 4 zones = 5,468 m3/d
Source: Vietnamese Department of Science and Technology
No ParameterFactory domestic
concentration
With septic tank
(mg/l)
1 COD 405
2 S-COD 182
3 BOD 225
4 SS 667
5 TN 64
6 TP 12
7 Oil and grease 125
2. Wastewater volume and qualities -7
Type 1: Domestic wastewater
14
Garment WW = 103.7 m3/acre/day
Garment factory area in zone 1 = 31 acre
Garment factory in 4 zones = 156 acre
WW in zone 1 = 1,616 m3/d
WW in 4 zones = 8,062 m3/d
Source: Vietnamese Garment + Dyeing factory
No ParameterGarment Dyeing
mg/l mg/l
1 COD 1,300 2,500
2 s-COD 1,040 2,000
3 BOD 260 1000
4 SS 61 200
5 TN 150 130
6 TP 5 10
Dyeing WW = 480 m3/acre/day
Dyeing factory area in zone 1 = 0 acre
Dyeing factory area in 4 zones = 9 acre
WW in zone 1 = 0 m3/d
WW in 4 zones = 4,325 m3/d
2. Wastewater volume and qualities -8
(50% of garment factories discharge washing ww)
Type 2 + 3: Garment + Dyeing industrial wastewater
15
Ice storage WW= 1.5 m3/employee/day
Ice factory people in zone 1 = 96 person
Ice factory people in 4 zones = 1,771 person
WW in zone 1 = 144.7 m3/d
WW in 4 zones = 2,670 m3/d
Source: Water usage and effluent treatment in the fish industrial - Sea fish report No.412 – J P MacNamara H Teepsoo
No Parameter mg/l
1 COD 2,000
2 s-COD 900
3 BOD 1500
4 SS 500
5 TN 100
6 TP 31
2. Wastewater volume and qualities -9
Type 4: Ice storage industrial wastewater
16
Painting WW = 50 m3/acre/day
Painting factory area in zone 1 = 17.4 acre
Painting factory area in 4 zones = 40.8 acre
WW in zone 1 = 871 m3/d
WW in 4 zones = 2,038 m3/d
Source: Painting + fertilizer factory – Ho Chi Minh, Vietnam
No ParameterPainting Fertilizer
mg/l mg/l
1 COD 3,000 355
2 s-COD 540 160
3 BOD 600 178
4 SS 2000 463
5 TN 50 200
6 TP 2 2
Fertilizer WW = 62.5 m3/acre/day
Fertilizer factory area in zone 1 = 0 acre
Fertilizer factory area in 4 zones = 6.6 acre
WW in zone 1 = 0 m3/d
WW in 4 zones = 415 m3/d
2. Wastewater volume and qualities -10
Type 5: Chemical (Painting, Fertilizer) industrial wastewater
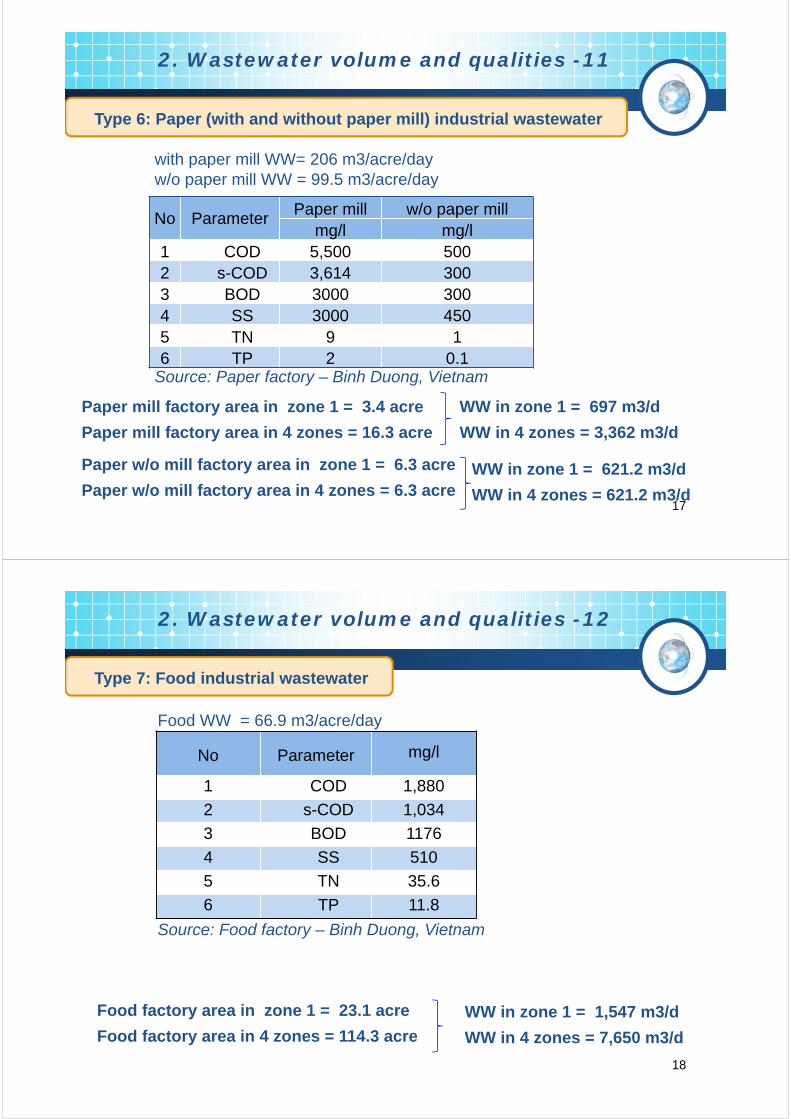
17
with paper mill WW= 206 m3/acre/day
Paper mill factory area in zone 1 = 3.4 acre
Paper mill factory area in 4 zones = 16.3 acre
WW in zone 1 = 697 m3/d
WW in 4 zones = 3,362 m3/d
Source: Paper factory – Binh Duong, Vietnam
No ParameterPaper mill w/o paper mill
mg/l mg/l
1 COD 5,500 500
2 s-COD 3,614 300
3 BOD 3000 300
4 SS 3000 450
5 TN 9 1
6 TP 2 0.1
w/o paper mill WW = 99.5 m3/acre/day
Paper w/o mill factory area in zone 1 = 6.3 acre
Paper w/o mill factory area in 4 zones = 6.3 acre
WW in zone 1 = 621.2 m3/d
WW in 4 zones = 621.2 m3/d
2. Wastewater volume and qualities -11
Type 6: Paper (with and without paper mill) industrial wastewater
18
Food WW = 66.9 m3/acre/day
Food factory area in zone 1 = 23.1 acre
Food factory area in 4 zones = 114.3 acre
WW in zone 1 = 1,547 m3/d
WW in 4 zones = 7,650 m3/d
Source: Food factory – Binh Duong, Vietnam
No Parameter mg/l
1 COD 1,880
2 s-COD 1,034
3 BOD 1176
4 SS 510
5 TN 35.6
6 TP 11.8
2. Wastewater volume and qualities -12
Type 7: Food industrial wastewater
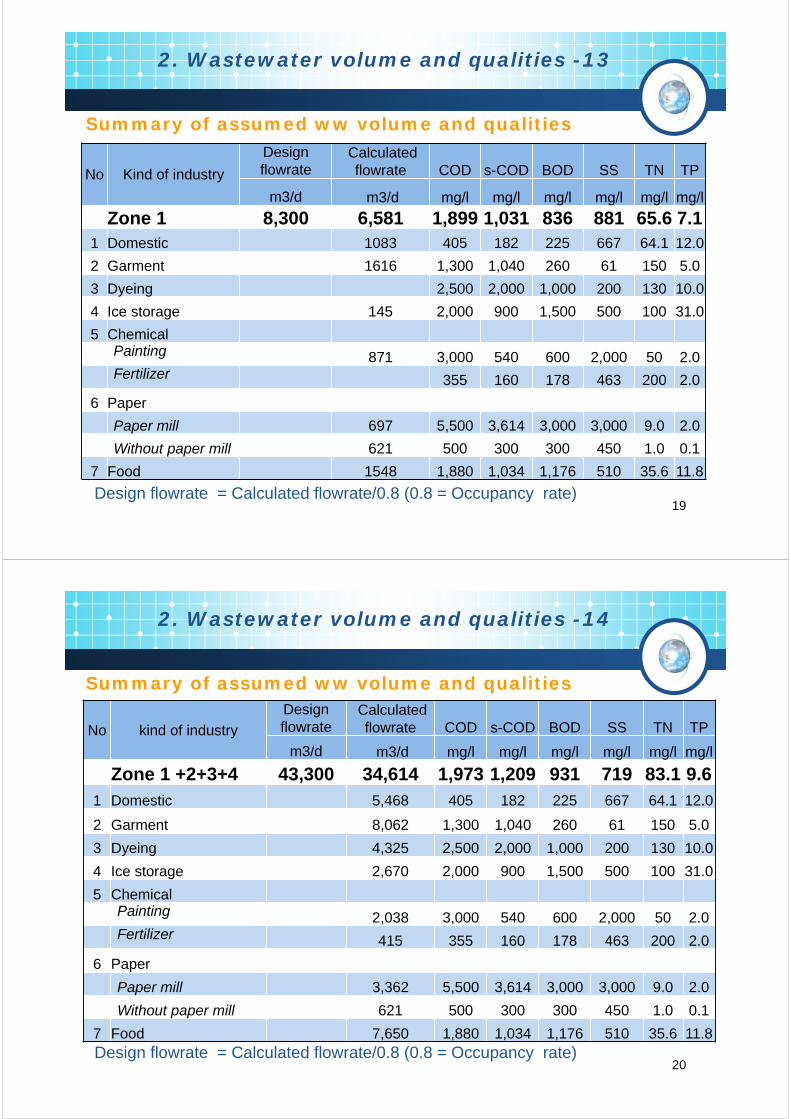
19Design flowrate = Calculated flowrate/0.8 (0.8 = Occupancy rate)
2. Wastewater volume and qualities -13
No Kind of industry
Design
flowrateCalculated
flowrate COD s-COD BOD SS TN TP
m3/d m3/d mg/l mg/l mg/l mg/l mg/l mg/l
Zone 1 8,300 6,581 1,899 1,031 836 881 65.6 7.1
1 Domestic 1083 405 182 225 667 64.1 12.0
2 Garment 1616 1,300 1,040 260 61 150 5.0
3 Dyeing 2,500 2,000 1,000 200 130 10.0
4 Ice storage 145 2,000 900 1,500 500 100 31.0
5 Chemical Painting 871 3,000 540 600 2,000 50 2.0Fertilizer 355 160 178 463 200 2.0
6 Paper
Paper mill 697 5,500 3,614 3,000 3,000 9.0 2.0
Without paper mill 621 500 300 300 450 1.0 0.1
7 Food 1548 1,880 1,034 1,176 510 35.6 11.8
Summary of assumed ww volume and qualities
20
No kind of industry
Design
flowrateCalculated
flowrate COD s-COD BOD SS TN TP
m3/d m3/d mg/l mg/l mg/l mg/l mg/l mg/l
Zone 1 +2+3+4 43,300 34,614 1,973 1,209 931 719 83.1 9.6
1 Domestic 5,468 405 182 225 667 64.1 12.0
2 Garment 8,062 1,300 1,040 260 61 150 5.0
3 Dyeing 4,325 2,500 2,000 1,000 200 130 10.0
4 Ice storage 2,670 2,000 900 1,500 500 100 31.0
5 ChemicalPainting 2,038 3,000 540 600 2,000 50 2.0Fertilizer 415 355 160 178 463 200 2.0
6 Paper
Paper mill 3,362 5,500 3,614 3,000 3,000 9.0 2.0
Without paper mill 621 500 300 300 450 1.0 0.1
7 Food 7,650 1,880 1,034 1,176 510 35.6 11.8
2. Wastewater volume and qualities -14
Summary of assumed ww volume and qualities
Design flowrate = Calculated flowrate/0.8 (0.8 = Occupancy rate)
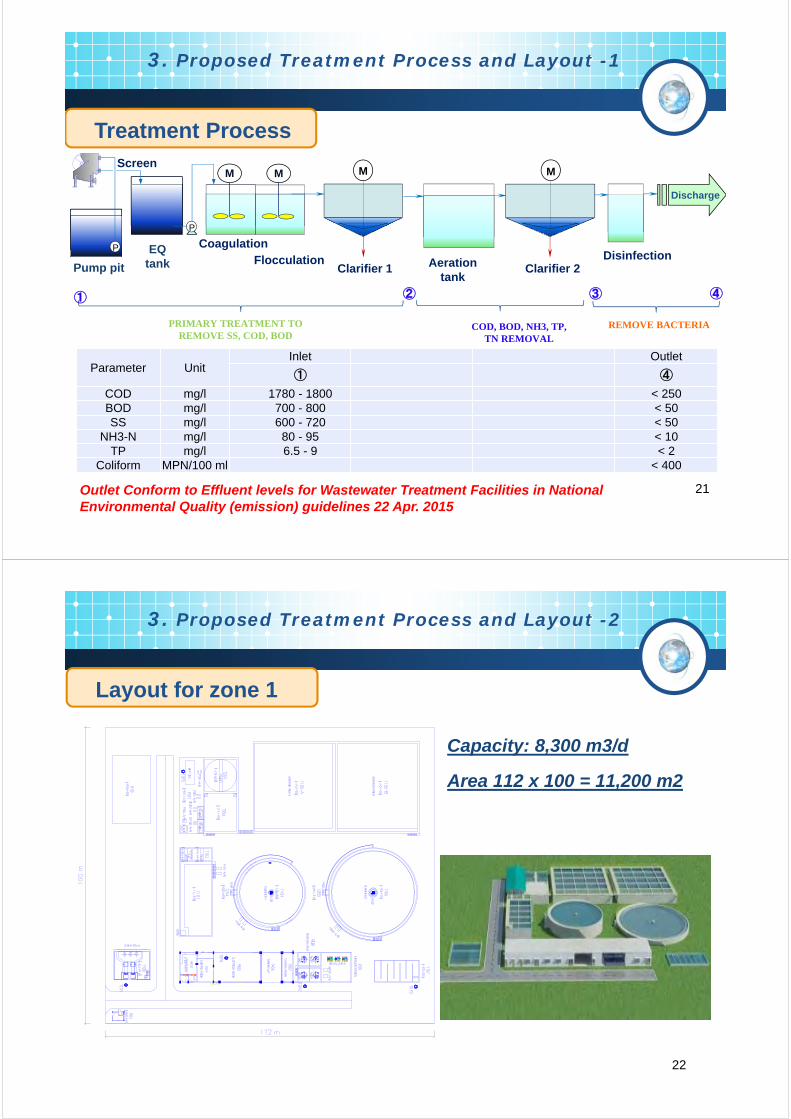
21
PRIMARY TREATMENT TO REMOVE SS, COD, BOD
COD, BOD, NH3, TP, TN REMOVAL
REMOVE BACTERIA
② ③
Aeration
tankPump pit
Discharge
Clarifier 1
P
MM
Flocculation
CoagulationDisinfection
①
M
Clarifier 2
Parameter Unit Inlet Outlet
① ④
COD mg/l 1780 - 1800 < 250
BOD mg/l 700 - 800 < 50
SS mg/l 600 - 720 < 50
NH3-N mg/l 80 - 95 < 10
TP mg/l 6.5 - 9 < 2
Coliform MPN/100 ml < 400
Outlet Conform to Effluent levels for Wastewater Treatment Facilities in National Environmental Quality (emission) guidelines 22 Apr. 2015
3. Proposed Treatment Process and Layout -1
Screen
④
P
M
EQ
tank
Treatment Process
22
Capacity: 8,300 m3/d
Area 112 x 100 = 11,200 m2
3. Proposed Treatment Process and Layout -2
Layout for zone 1
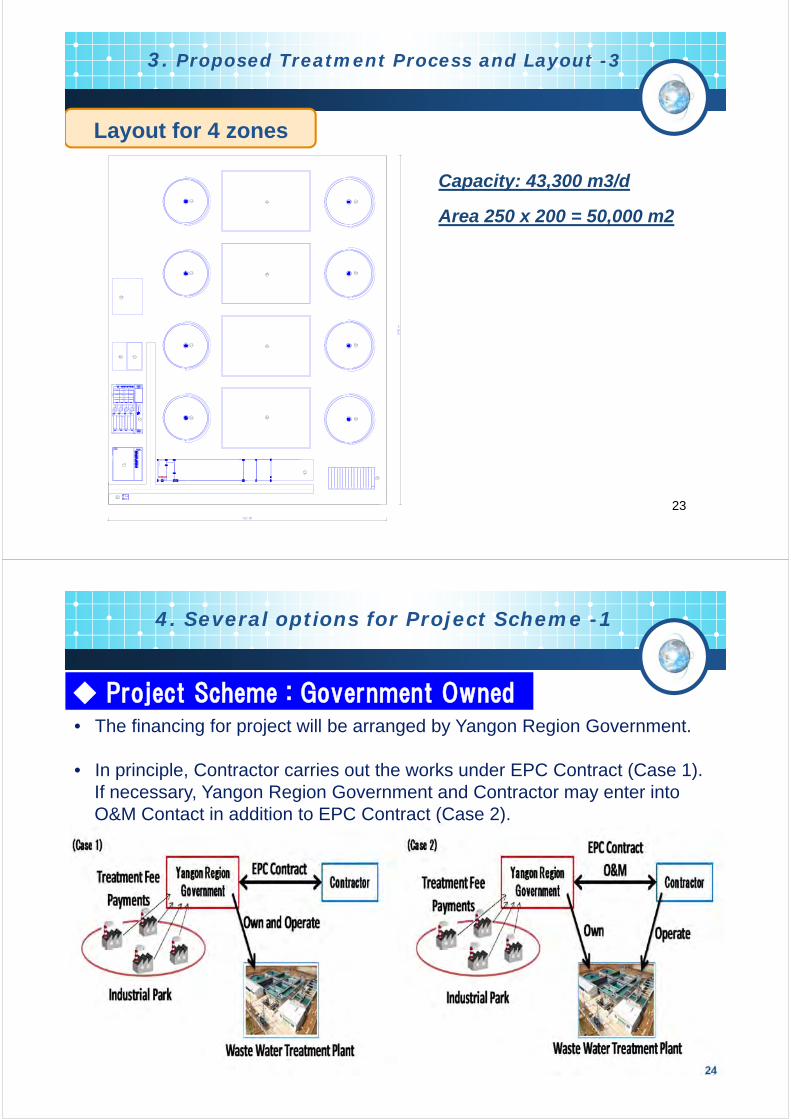
23
3. Proposed Treatment Process and Layout -3
Capacity: 43,300 m3/d
Area 250 x 200 = 50,000 m2
Layout for 4 zones
[Government Owned]◆ Project Scheme : Government Owned
24
4. Several options for Project Scheme -1
• The financing for project will be arranged by Yangon Region Government.
• In principle, Contractor carries out the works under EPC Contract (Case 1).
If necessary, Yangon Region Government and Contractor may enter into
O&M Contact in addition to EPC Contract (Case 2).
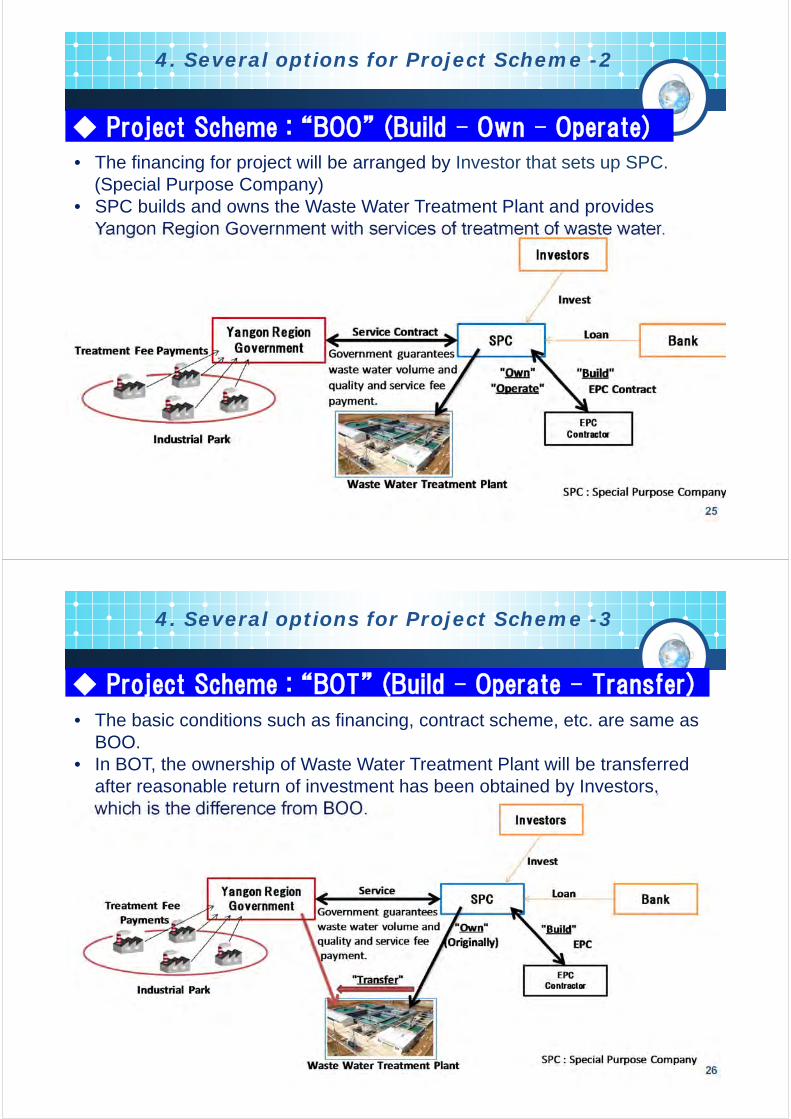
◆ Project Scheme : “BOO” (Build – Own – Operate)
25
4. Several options for Project Scheme -2
• The financing for project will be arranged by Investor that sets up SPC.
(Special Purpose Company)
• SPC builds and owns the Waste Water Treatment Plant and provides
Yangon Region Government with services of treatment of waste water.
◆ Project Scheme : “BOT” (Build – Operate – Transfer)
26
4. Several options for Project Scheme -3
• The basic conditions such as financing, contract scheme, etc. are same as
BOO.
• In BOT, the ownership of Waste Water Treatment Plant will be transferred
after reasonable return of investment has been obtained by Investors,
which is the difference from BOO.
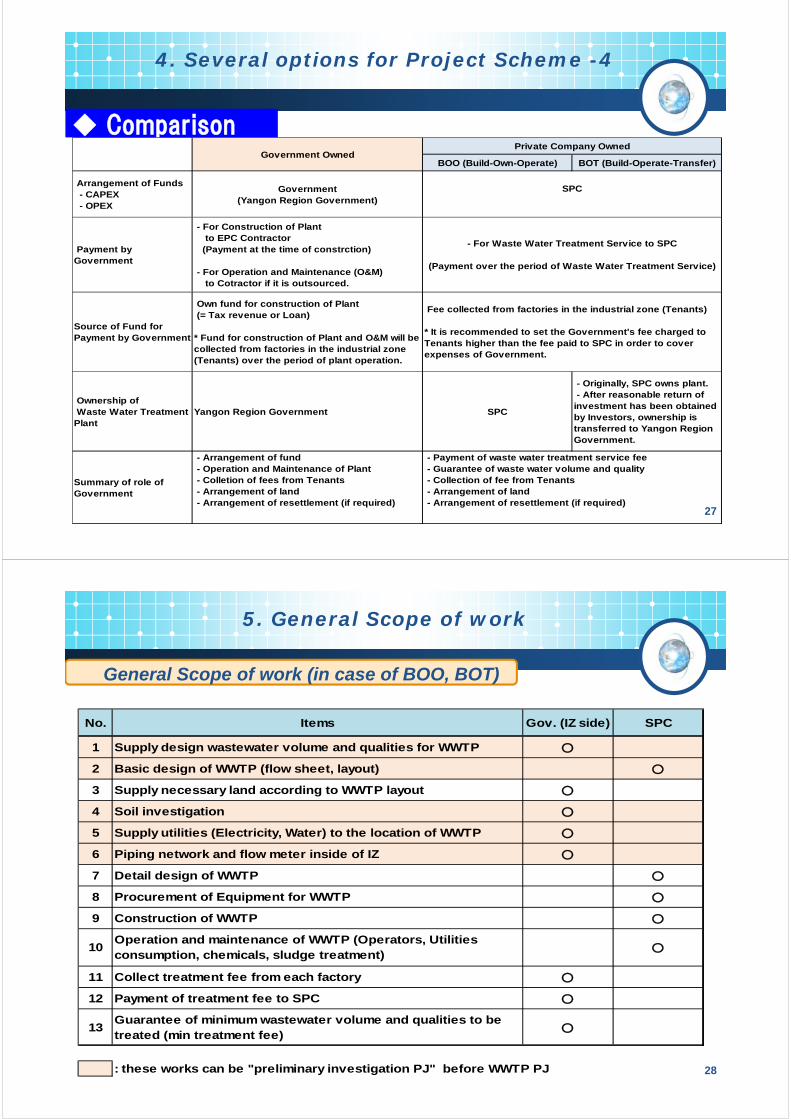
◆ Comparison
27
4. Several options for Project Scheme -4
BOO (Build-Own-Operate) BOT (Build-Operate-Transfer)
Arrangement of Funds
- CAPEX
- OPEX
Government
(Yangon Region Government)
Payment by
Government
- For Construction of Plant
to EPC Contractor
(Payment at the time of constrction)
- For Operation and Maintenance (O&M)
to Cotractor if it is outsourced.
Source of Fund for
Payment by Government
Own fund for construction of Plant
(= Tax revenue or Loan)
* Fund for construction of Plant and O&M will be
collected from factories in the industrial zone
(Tenants) over the period of plant operation.
Ownership of
Waste Water Treatment
Plant
Yangon Region Government SPC
- Originally, SPC owns plant.
- After reasonable return of
investment has been obtained
by Investors, ownership is
transferred to Yangon Region
Government.
Summary of role of
Government
- Arrangement of fund
- Operation and Maintenance of Plant
- Colletion of fees from Tenants
- Arrangement of land
- Arrangement of resettlement (if required)
Private Company Owned
SPC
- For Waste Water Treatment Service to SPC
(Payment over the period of Waste Water Treatment Service)
Government Owned
- Payment of waste water treatment service fee
- Guarantee of waste water volume and quality
- Collection of fee from Tenants
- Arrangement of land
- Arrangement of resettlement (if required)
Fee collected from factories in the industrial zone (Tenants)
* It is recommended to set the Government's fee charged to
Tenants higher than the fee paid to SPC in order to cover
expenses of Government.
28
5. General Scope of work
General Scope of work (in case of BOO, BOT)
No. Items Gov. (IZ side) SPC
1 Supply design wastewater volume and qualities for WWTP ○
2 Basic design of WWTP (flow sheet, layout) ○
3 Supply necessary land according to WWTP layout ○
4 Soil investigation ○
5 Supply utilities (Electricity, Water) to the location of WWTP ○
6 Piping network and flow meter inside of IZ ○
7 Detail design of WWTP ○
8 Procurement of Equipment for WWTP ○
9 Construction of WWTP ○
10Operation and maintenance of WWTP (Operators, Utilities
consumption, chemicals, sludge treatment)○
11 Collect treatment fee from each factory ○
12 Payment of treatment fee to SPC ○
13Guarantee of minimum wastewater volume and qualities to be
treated (min treatment fee)○
: these works can be "preliminary investigation PJ" before WWTP PJ
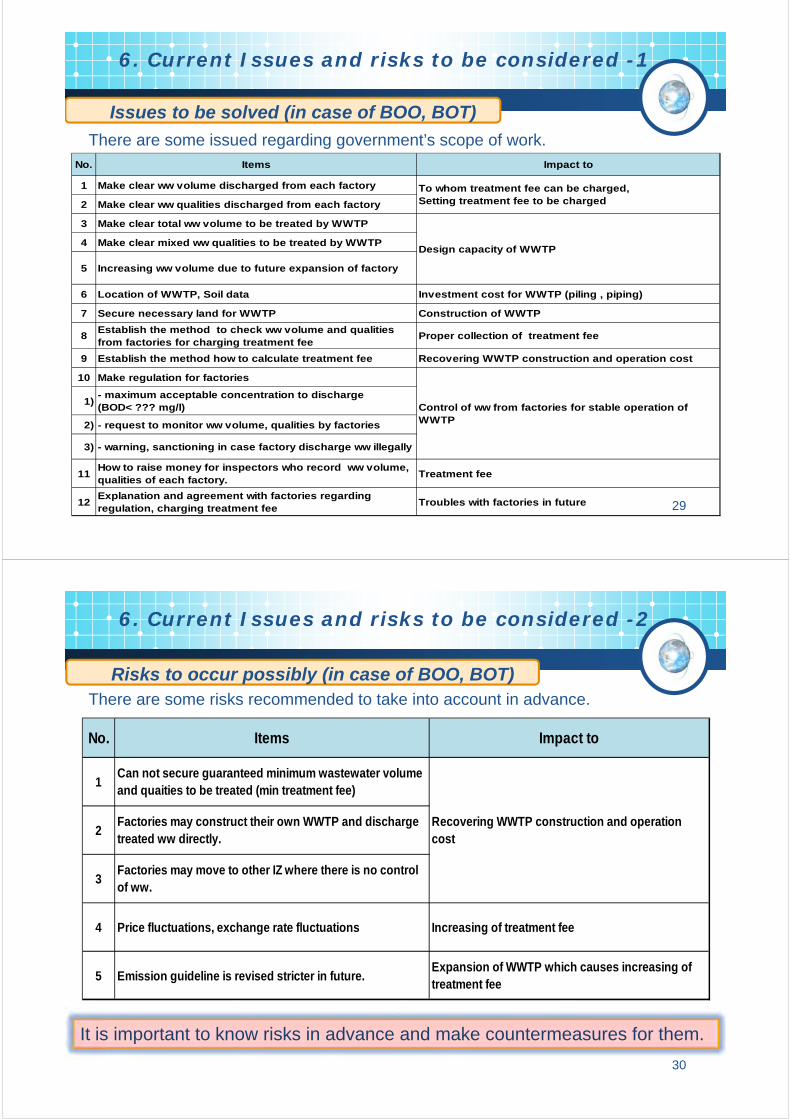
29
6. Current Issues and risks to be considered -1
Issues to be solved (in case of BOO, BOT)
No. Items Impact to
1 Make clear ww volume discharged from each factory
2 Make clear ww qualities discharged from each factory
3 Make clear total ww volume to be treated by WWTP
4 Make clear mixed ww qualities to be treated by WWTP
5 Increasing ww volume due to future expansion of factory
6 Location of WWTP, Soil data Investment cost for WWTP (piling , piping)
7 Secure necessary land for WWTP Construction of WWTP
8Establish the method to check ww volume and qualities
from factories for charging treatment feeProper collection of treatment fee
9 Establish the method how to calculate treatment fee Recovering WWTP construction and operation cost
10 Make regulation for factories
1)- maximum acceptable concentration to discharge
(BOD< ??? mg/l)
2) - request to monitor ww volume, qualities by factories
3) - warning, sanctioning in case factory discharge ww illegally
11How to raise money for inspectors who record ww volume,
qualities of each factory.Treatment fee
12Explanation and agreement with factories regarding
regulation, charging treatment feeTroubles with factories in future
To whom treatment fee can be charged,
Setting treatment fee to be charged
Design capacity of WWTP
Control of ww from factories for stable operation of
WWTP
There are some issued regarding government’s scope of work.
30
6. Current Issues and risks to be considered -2
Risks to occur possibly (in case of BOO, BOT)
It is important to know risks in advance and make countermeasures for them.
No. Items Impact to
1Can not secure guaranteed minimum wastewater volume
and quaities to be treated (min treatment fee)
2Factories may construct their own WWTP and discharge
treated ww directly.
3Factories may move to other IZ where there is no control
of ww.
4 Price fluctuations, exchange rate fluctuations Increasing of treatment fee
5 Emission guideline is revised stricter in future.Expansion of WWTP which causes increasing of
treatment fee
Recovering WWTP construction and operation
cost
There are some risks recommended to take into account in advance.
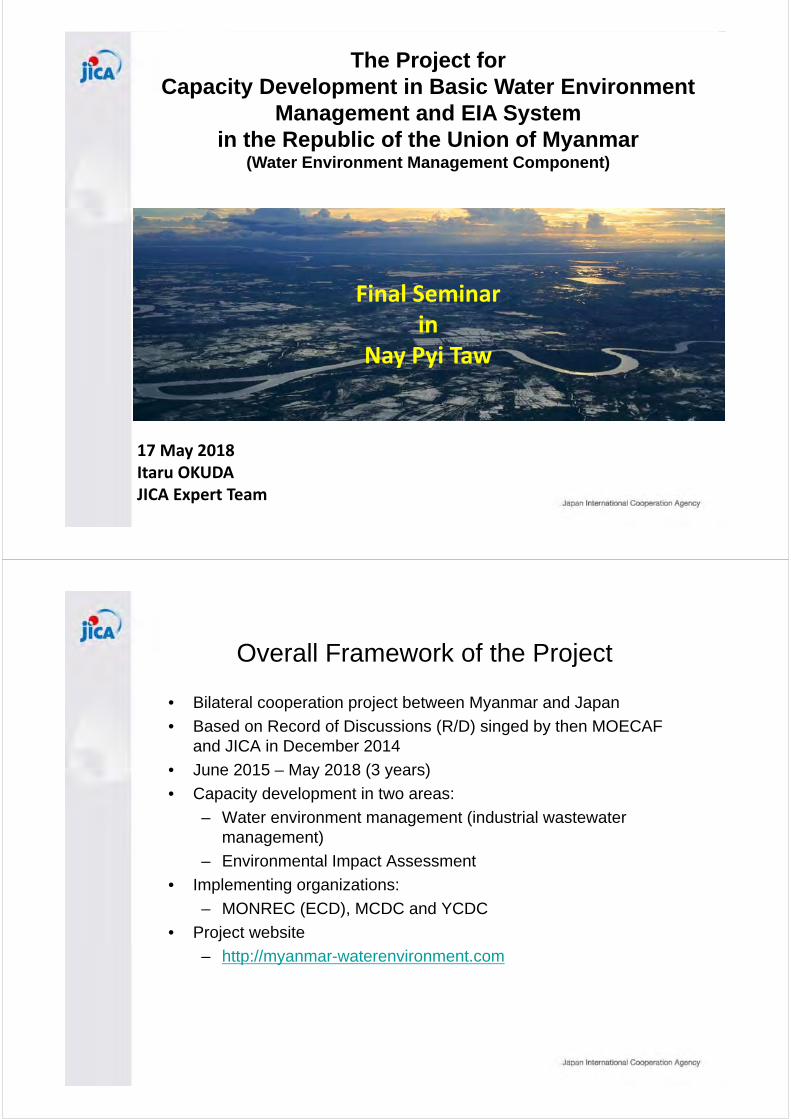
The Project for
Capacity Development in Basic Water Environment
Management and EIA System
in the Republic of the Union of Myanmar(Water Environment Management Component)
17 May 2018Itaru OKUDAJICA Expert Team
SUDP‐2
Final Seminarin
Nay Pyi Taw
Overall Framework of the Project
• Bilateral cooperation project between Myanmar and Japan
• Based on Record of Discussions (R/D) singed by then MOECAF
and JICA in December 2014
• June 2015 – May 2018 (3 years)
• Capacity development in two areas:
– Water environment management (industrial wastewater
management)
– Environmental Impact Assessment
• Implementing organizations:
– MONREC (ECD), MCDC and YCDC
• Project website
– http://myanmar-waterenvironment.com
Overall
Goal
Impact of industrial effluents from industrial zones on river water quality is alleviated, and
advanced EIA approach for complicated issues are taken into account.
Project
Purpose
Capacity for developing basic water pollution control measures based on obtained and
interpreted information is enhanced and the institutional framework of the EIA review works
is established.
Outputs Output 1 Inspection procedure is standardized. Water
environment
management
Output 2 Capacity for implementing water quality survey to obtain
reliable information is enhanced.
Water
environment
management
Output 3 Database of water pollution sources and river water
quality is developed.
Water
environment
management
Output 4 Capacity of interpreting the information for water pollution
control measures is enhanced.
Water
environment
management
Output 5 Necessary technical manuals and forms for the EIA
review are developed.
EIA
Output 6 Capacity of MONREC and the EIA Report Review Body
on the EIA review is enhanced.
EIA
Overall Goal, Project Purpose and Outputs
Organizational Structure of the Project
4
JCC Meetings
5
No. Date Summary
No.1 8 Jul 2015 Kick-off JCC
Appointment of JCC Members
No.2 18 Dec 2015 Amendment of PDM and PO
No.3 9 Nov 2016 Mid-term Review
Amendment of PDM
No.4 22 Feb 2017 Terminal Evaluation
No.5 17 May 2018 Final JCC
Results of Terminal Evaluation
6
Criteria Concept Result Reasons
Relevancy Whether Project’s design and
approach are appropriate to
key policies and beneficiary’s
needs
High The project was consistent with policies
and needs, and the project design was
appropriate.
Effectiveness Whether six outputs all
together have achieved
Project’s primary objective
High Given the context and achievements, the
project was successful.
Efficiency Whether inputs and activities
are managed efficiently
Relatively
High
Although the project lacked some inputs
and coordination in the first year, the
members were highly committed, and the
project was managed well.
Impact Impact over time and across
sectors
Relatively
High
Because the Overall Goals are likely to
be achieved, and knowledge-sharing has
been observed.
Sustainability Whether activities and
outcomes of this Project will
last
Moderate For some CPs, the mandate and the staff
assignment still need to be clarified, and
capacity development should continue.
Industrial Pollution Sources
Framework of Output 3 Activities
Output 3 - Database Development
Output: Database of water pollution sources and river water
quality is developed.
Indicator: At least 150 factories’ information is accessible on the
database.
Results of water quality survey is accessible on the
database.
8
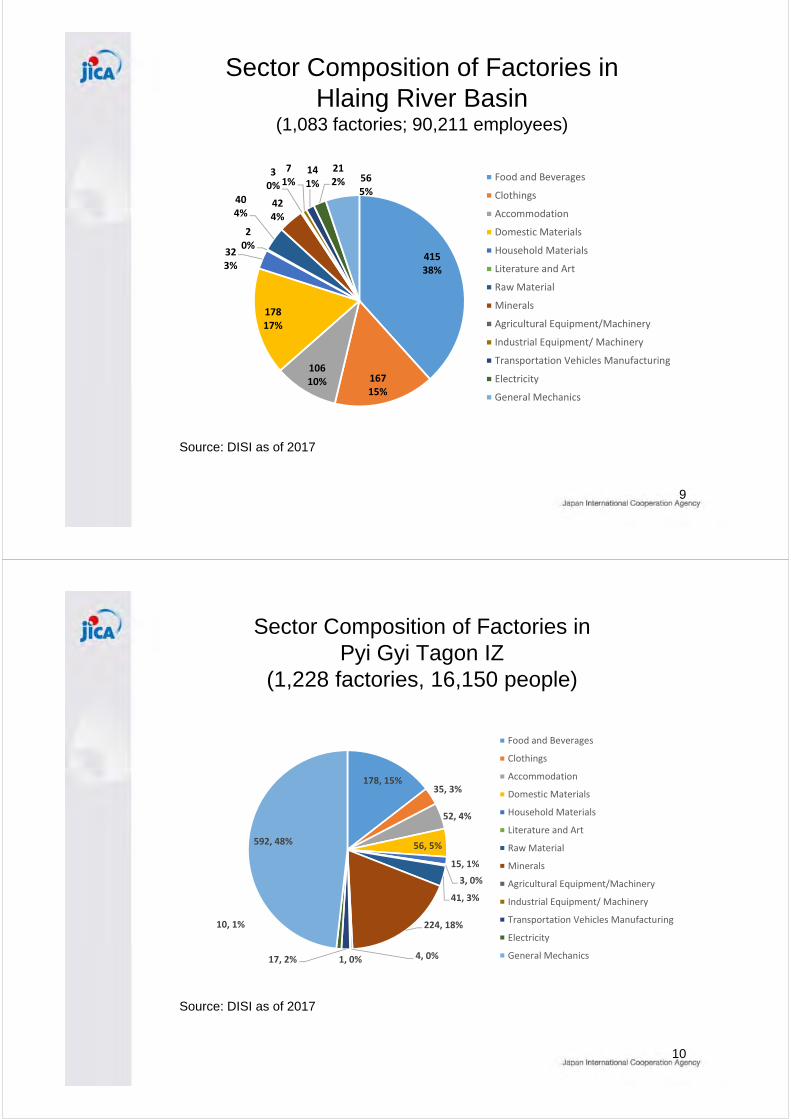
Sector Composition of Factories in
Hlaing River Basin(1,083 factories; 90,211 employees)
Source: DISI as of 2017
9
41538%
16715%
10610%
17817%
323%
20%
404%
424%
30%
71%
141%
212% 56
5%
Food and Beverages
Clothings
Accommodation
Domestic Materials
Household Materials
Literature and Art
Raw Material
Minerals
Agricultural Equipment/Machinery
Industrial Equipment/ Machinery
Transportation Vehicles Manufacturing
Electricity
General Mechanics
Sector Composition of Factories in
Pyi Gyi Tagon IZ
(1,228 factories, 16,150 people)
Source: DISI as of 2017
10
178, 15%35, 3%
52, 4%
56, 5%
15, 1%
3, 0%
41, 3%
224, 18%
4, 0%1, 0%17, 2%
10, 1%
592, 48%
Food and Beverages
Clothings
Accommodation
Domestic Materials
Household Materials
Literature and Art
Raw Material
Minerals
Agricultural Equipment/Machinery
Industrial Equipment/ Machinery
Transportation Vehicles Manufacturing
Electricity
General Mechanics
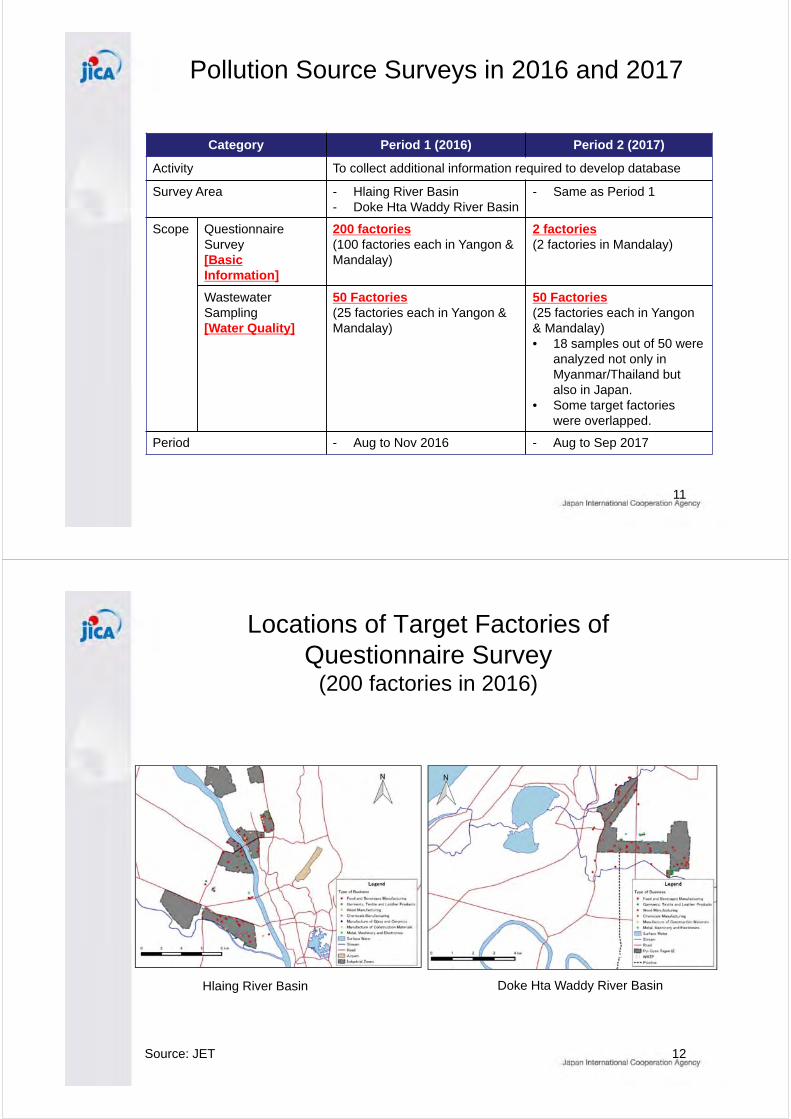
Pollution Source Surveys in 2016 and 2017
Category Period 1 (2016) Period 2 (2017)
Activity To collect additional information required to develop database
Survey Area - Hlaing River Basin
- Doke Hta Waddy River Basin
- Same as Period 1
Scope Questionnaire
Survey
[Basic
Information]
200 factories
(100 factories each in Yangon &
Mandalay)
2 factories
(2 factories in Mandalay)
Wastewater
Sampling
[Water Quality]
50 Factories
(25 factories each in Yangon &
Mandalay)
50 Factories
(25 factories each in Yangon
& Mandalay)
• 18 samples out of 50 were
analyzed not only in
Myanmar/Thailand but
also in Japan.
• Some target factories
were overlapped.
Period - Aug to Nov 2016 - Aug to Sep 2017
11
Locations of Target Factories of
Questionnaire Survey (200 factories in 2016)
12Source: JET
Hlaing River Basin Doke Hta Waddy River Basin
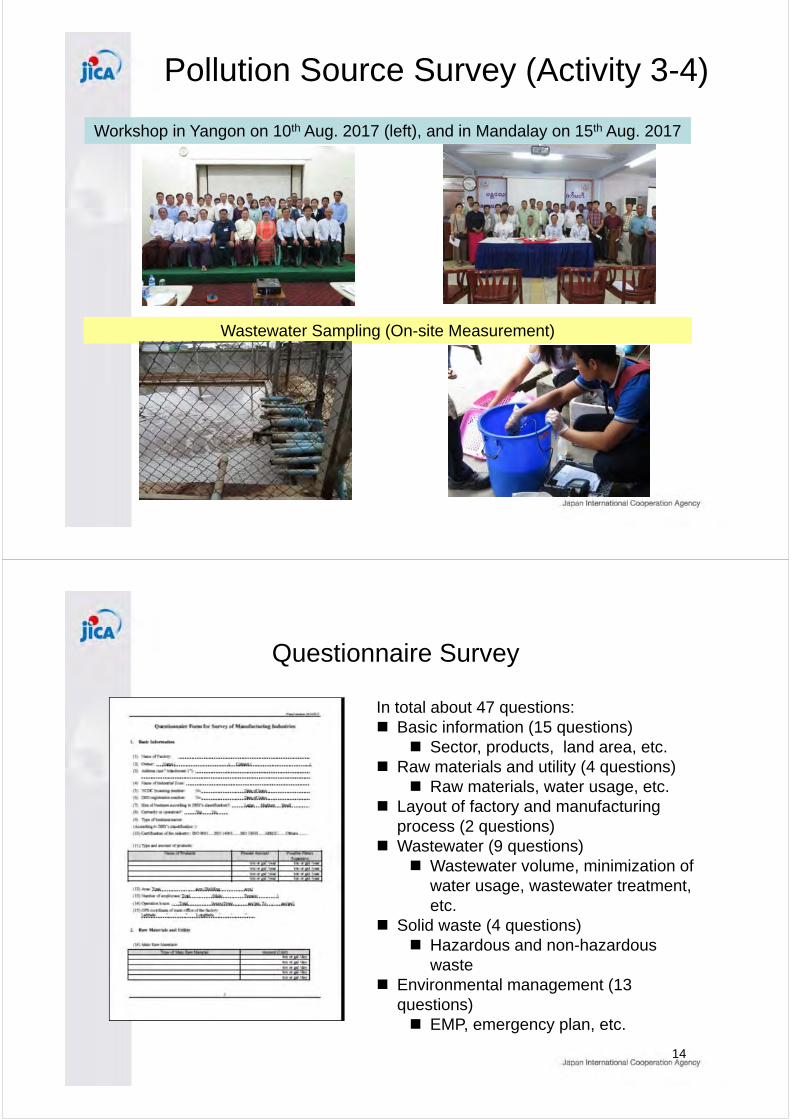
Pollution Source Survey (Activity 3-4)
Workshop in Yangon on 10th Aug. 2017 (left), and in Mandalay on 15th Aug. 2017
Wastewater Sampling (On-site Measurement)
Questionnaire Survey
14
In total about 47 questions:
Basic information (15 questions)
Sector, products, land area, etc.
Raw materials and utility (4 questions)
Raw materials, water usage, etc.
Layout of factory and manufacturing
process (2 questions)
Wastewater (9 questions)
Wastewater volume, minimization of
water usage, wastewater treatment,
etc.
Solid waste (4 questions)
Hazardous and non-hazardous
waste
Environmental management (13
questions)
EMP, emergency plan, etc.
Water Usage in 2016(200 factories in Yangon and Mandalay)
15
Most factories use little water, but there are some factories that use a lot
of water.
Source: JET, 2016
Based on questionnaire survey of 200 factories in Yangon and Mandalay in 2016.
11
82
50
13 1216
58
3
0
20
40
60
80
100
Num
be
r o
f F
acto
rie
s
Water Usage (gal/day)
Measures to Minimize Pollution in 2016(200 factories in Yangon and Mandalay)
16
Source: JET, 2016
Based on questionnaire survey of 200 factories in Yangon and Mandalay in 2016.
Most factories do not have accurate information about the amount of
water they are using/discharging.
There are some efforts to minimize pollution, but they are not
implemented in a structured manner.
12
6
18
2
90
14
1
188
194
182
198
110
186
196
Flow Meter (Water Usage)
Flow Meter (Wastewater)
Water Recycling
Separation of Rain Water
Minimization of Solid Waste from…
Separation of Toxic Substances
Others
Yes No
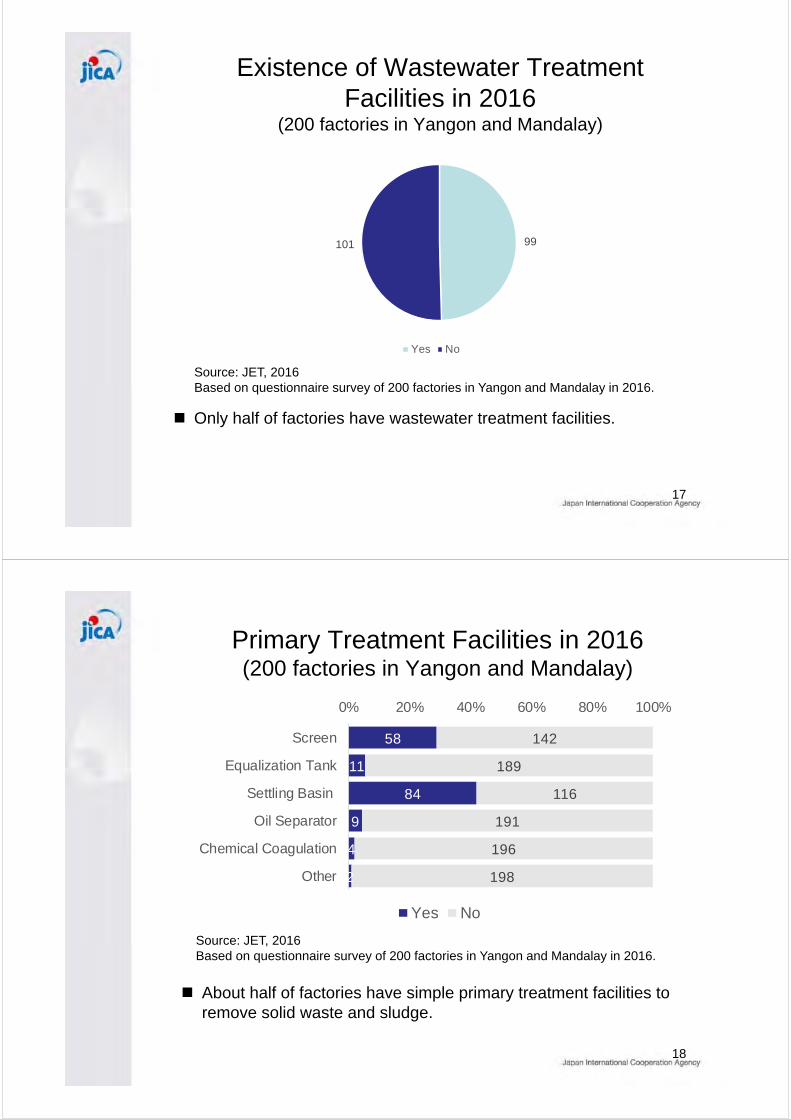
99101
Yes No
Existence of Wastewater Treatment
Facilities in 2016(200 factories in Yangon and Mandalay)
17
Source: JET, 2016
Based on questionnaire survey of 200 factories in Yangon and Mandalay in 2016.
Only half of factories have wastewater treatment facilities.
Primary Treatment Facilities in 2016 (200 factories in Yangon and Mandalay)
18
Source: JET, 2016
Based on questionnaire survey of 200 factories in Yangon and Mandalay in 2016.
About half of factories have simple primary treatment facilities to
remove solid waste and sludge.
58
11
84
9
4
2
142
189
116
191
196
198
0% 20% 40% 60% 80% 100%
Screen
Equalization Tank
Settling Basin
Oil Separator
Chemical Coagulation
Other
Yes No
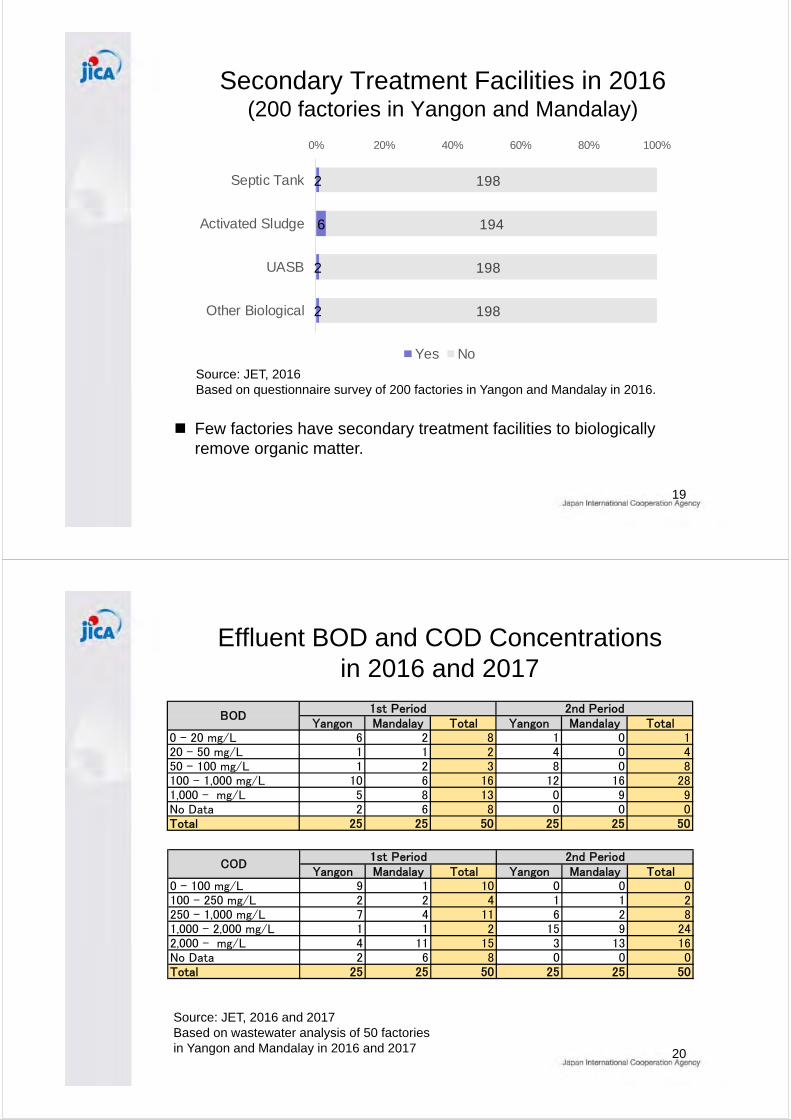
2
6
2
2
198
194
198
198
0% 20% 40% 60% 80% 100%
Septic Tank
Activated Sludge
UASB
Other Biological
Yes No
Secondary Treatment Facilities in 2016 (200 factories in Yangon and Mandalay)
19
Source: JET, 2016
Based on questionnaire survey of 200 factories in Yangon and Mandalay in 2016.
Few factories have secondary treatment facilities to biologically
remove organic matter.
Effluent BOD and COD Concentrations
in 2016 and 2017
Yangon Mandalay Total Yangon Mandalay Total0 - 20 mg/L 6 2 8 1 0 120 - 50 mg/L 1 1 2 4 0 450 - 100 mg/L 1 2 3 8 0 8100 - 1,000 mg/L 10 6 16 12 16 281,000 - mg/L 5 8 13 0 9 9No Data 2 6 8 0 0 0Total 25 25 50 25 25 50
2nd Period1st PeriodBOD
Yangon Mandalay Total Yangon Mandalay Total0 - 100 mg/L 9 1 10 0 0 0100 - 250 mg/L 2 2 4 1 1 2250 - 1,000 mg/L 7 4 11 6 2 81,000 - 2,000 mg/L 1 1 2 15 9 242,000 - mg/L 4 11 15 3 13 16No Data 2 6 8 0 0 0Total 25 25 50 25 25 50
2nd Period1st PeriodCOD
Source: JET, 2016 and 2017
Based on wastewater analysis of 50 factories
in Yangon and Mandalay in 2016 and 2017 20
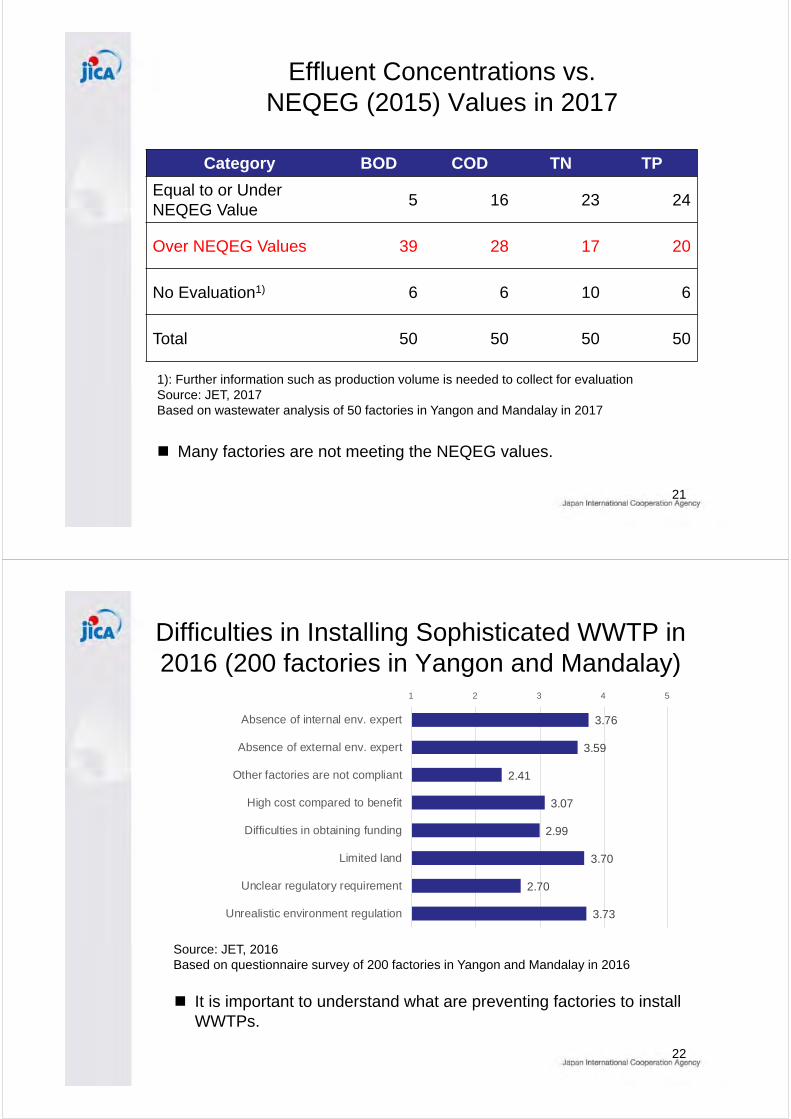
Effluent Concentrations vs.
NEQEG (2015) Values in 2017
21
1): Further information such as production volume is needed to collect for evaluation
Source: JET, 2017
Based on wastewater analysis of 50 factories in Yangon and Mandalay in 2017
Category BOD COD TN TP
Equal to or Under
NEQEG Value5 16 23 24
Over NEQEG Values 39 28 17 20
No Evaluation1) 6 6 10 6
Total 50 50 50 50
Many factories are not meeting the NEQEG values.
Difficulties in Installing Sophisticated WWTP in
2016 (200 factories in Yangon and Mandalay)
Source: JET, 2016
Based on questionnaire survey of 200 factories in Yangon and Mandalay in 2016
22
It is important to understand what are preventing factories to install
WWTPs.
3.76
3.59
2.41
3.07
2.99
3.70
2.70
3.73
1 2 3 4 5
Absence of internal env. expert
Absence of external env. expert
Other factories are not compliant
High cost compared to benefit
Difficulties in obtaining funding
Limited land
Unclear regulatory requirement
Unrealistic environment regulation
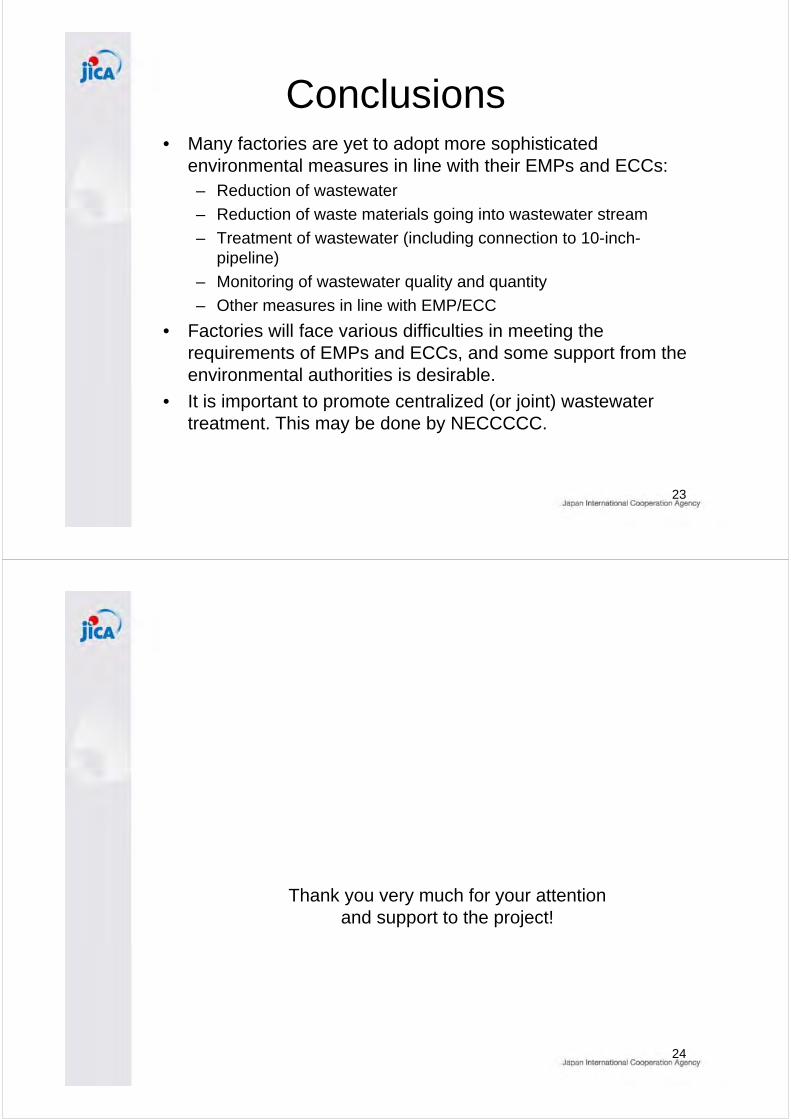
Conclusions• Many factories are yet to adopt more sophisticated
environmental measures in line with their EMPs and ECCs:
– Reduction of wastewater
– Reduction of waste materials going into wastewater stream
– Treatment of wastewater (including connection to 10-inch-
pipeline)
– Monitoring of wastewater quality and quantity
– Other measures in line with EMP/ECC
• Factories will face various difficulties in meeting the
requirements of EMPs and ECCs, and some support from the
environmental authorities is desirable.
• It is important to promote centralized (or joint) wastewater
treatment. This may be done by NECCCCC.
23
24
Thank you very much for your attention
and support to the project!
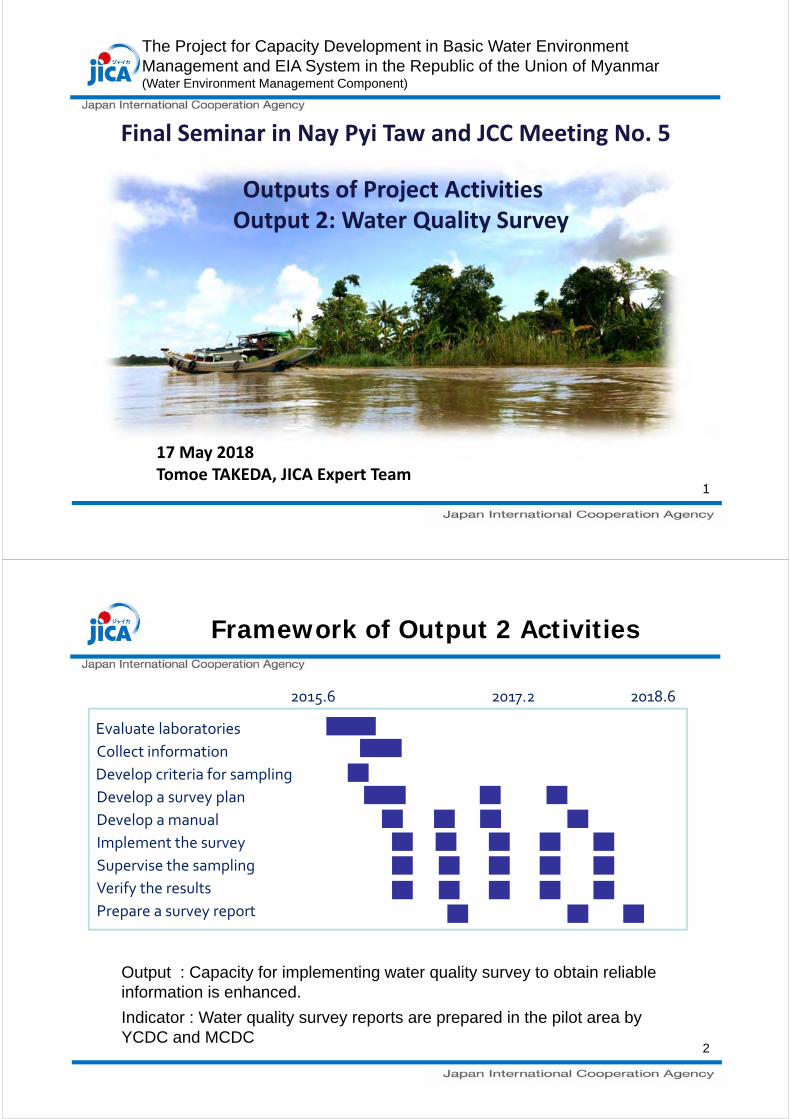
1
Outputs of Project Activities Output 2: Water Quality Survey
The Project for Capacity Development in Basic Water Environment
Management and EIA System in the Republic of the Union of Myanmar(Water Environment Management Component)
Final Seminar in Nay Pyi Taw and JCC Meeting No. 5
17 May 2018Tomoe TAKEDA, JICA Expert Team
Framework of Output 2 Activities
Output : Capacity for implementing water quality survey to obtain reliable
information is enhanced.
Indicator : Water quality survey reports are prepared in the pilot area by
YCDC and MCDC
Collect information
Develop criteria for sampling
Develop a survey plan
Develop a manual
Implement the survey
Supervise the sampling
Prepare a survey report
Evaluate laboratories
Verify the results
2015.6 2017.2 2018.6
2
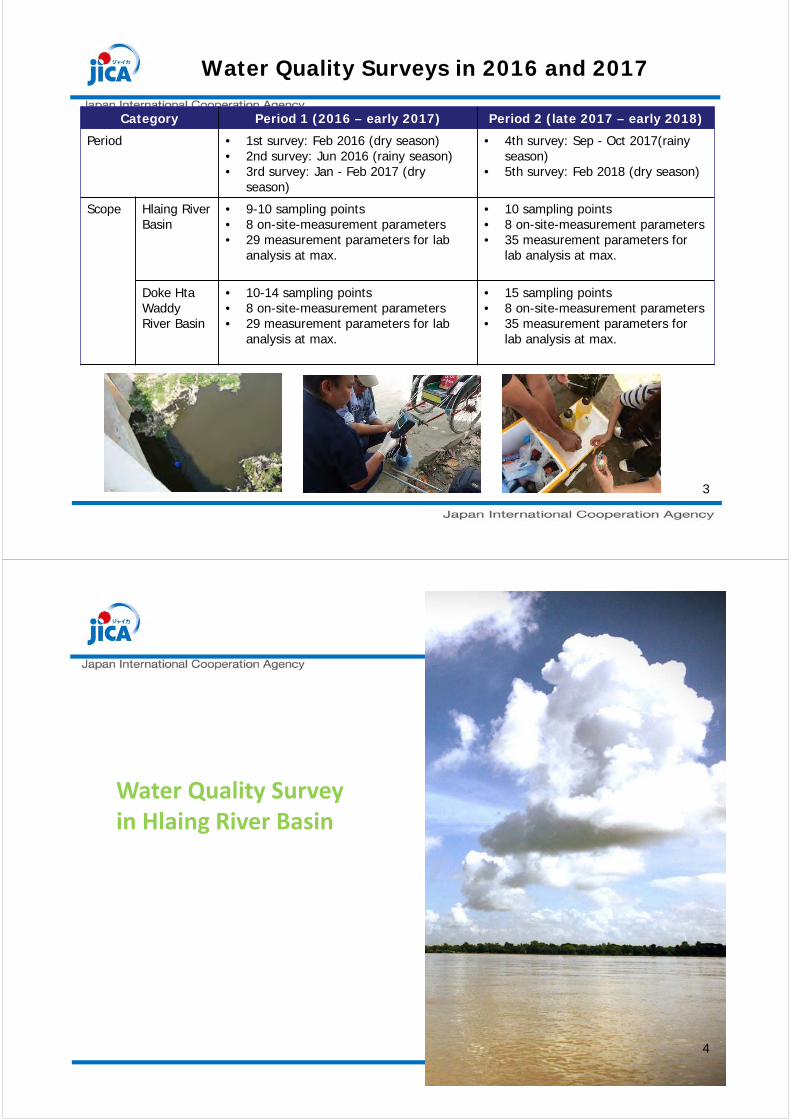
3
Water Quality Surveys in 2016 and 2017
Category Period 1 (2016 – early 2017) Period 2 (late 2017 – early 2018)
Period • 1st survey: Feb 2016 (dry season)• 2nd survey: Jun 2016 (rainy season)• 3rd survey: Jan - Feb 2017 (dry
season)
• 4th survey: Sep - Oct 2017(rainy season)
• 5th survey: Feb 2018 (dry season)
Scope Hlaing River Basin
• 9-10 sampling points• 8 on-site-measurement parameters• 29 measurement parameters for lab
analysis at max.
• 10 sampling points• 8 on-site-measurement parameters• 35 measurement parameters for
lab analysis at max.
Doke HtaWaddyRiver Basin
• 10-14 sampling points• 8 on-site-measurement parameters• 29 measurement parameters for lab
analysis at max.
• 15 sampling points• 8 on-site-measurement parameters• 35 measurement parameters for
lab analysis at max.
Water Quality Surveyin Hlaing River Basin
4
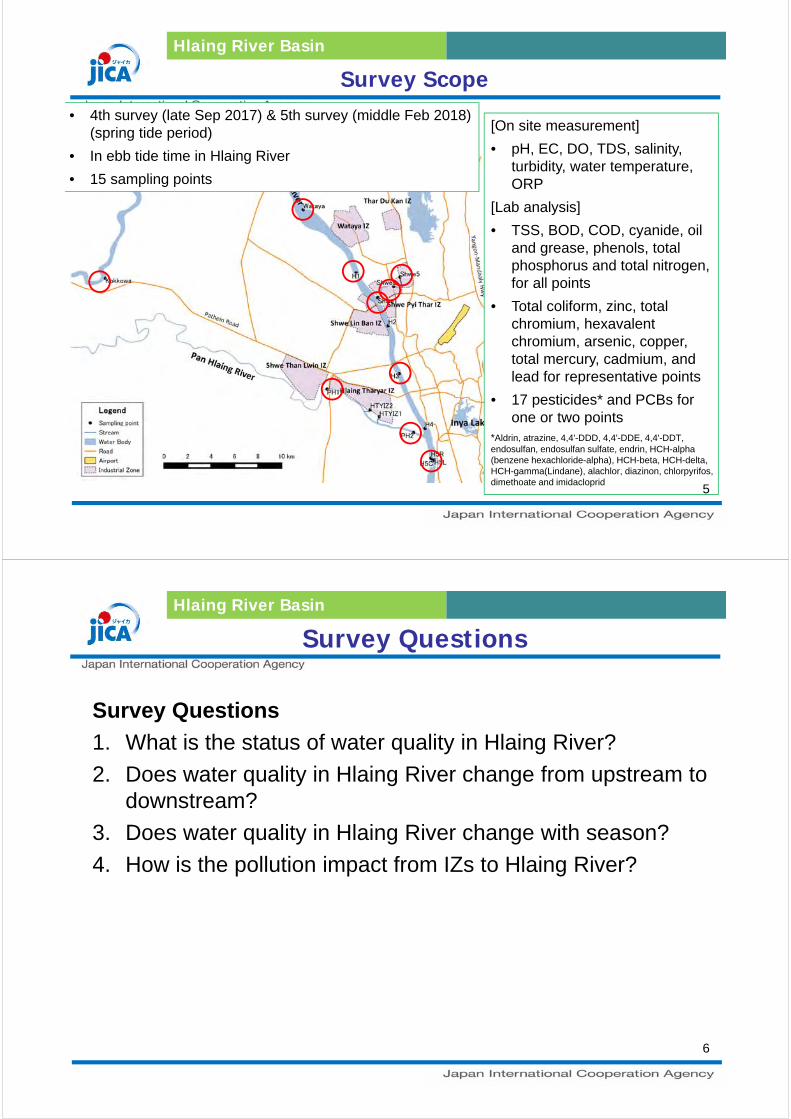
Survey Scope
Hlaing River Basin
• 4th survey (late Sep 2017) & 5th survey (middle Feb 2018)
(spring tide period)
• In ebb tide time in Hlaing River
• 15 sampling points
[On site measurement]
• pH, EC, DO, TDS, salinity,
turbidity, water temperature,
ORP
[Lab analysis]
• TSS, BOD, COD, cyanide, oil
and grease, phenols, total
phosphorus and total nitrogen,
for all points
• Total coliform, zinc, total
chromium, hexavalent
chromium, arsenic, copper,
total mercury, cadmium, and
lead for representative points
• 17 pesticides* and PCBs for
one or two points
*Aldrin, atrazine, 4,4'-DDD, 4,4'-DDE, 4,4'-DDT,
endosulfan, endosulfan sulfate, endrin, HCH-alpha
(benzene hexachloride-alpha), HCH-beta, HCH-delta,
HCH-gamma(Lindane), alachlor, diazinon, chlorpyrifos,
dimethoate and imidacloprid5
Survey QuestionsHlaing River Basin
Survey Questions
1. What is the status of water quality in Hlaing River?
2. Does water quality in Hlaing River change from upstream to
downstream?
3. Does water quality in Hlaing River change with season?
4. How is the pollution impact from IZs to Hlaing River?
6
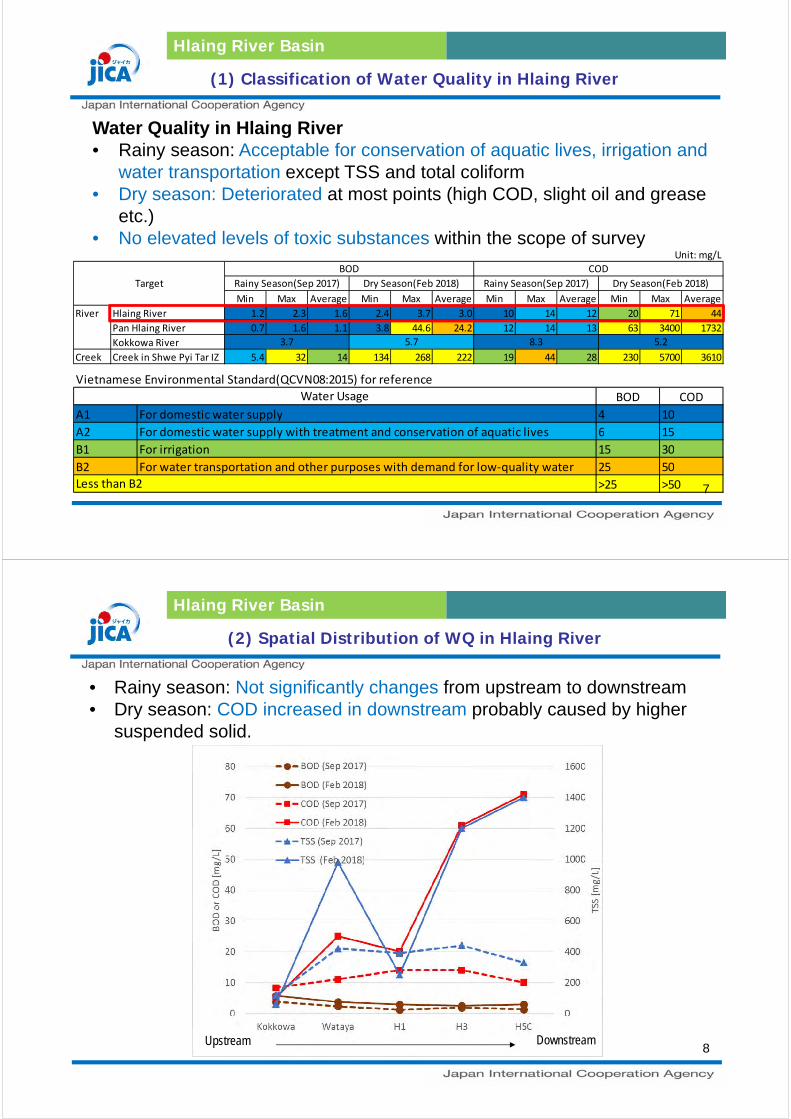
(1) Classification of Water Quality in Hlaing River
Hlaing River Basin
Water Quality in Hlaing River
• Rainy season: Acceptable for conservation of aquatic lives, irrigation and
water transportation except TSS and total coliform
• Dry season: Deteriorated at most points (high COD, slight oil and grease
etc.)
• No elevated levels of toxic substances within the scope of surveyUnit: mg/L
Min Max Average Min Max Average Min Max Average Min Max Average
Hlaing River 1.2 2.3 1.6 2.4 3.7 3.0 10 14 12 20 71 44
Pan Hlaing River 0.7 1.6 1.1 3.8 44.6 24.2 12 14 13 63 3400 1732
Kokkowa River
Creek Creek in Shwe Pyi Tar IZ 5.4 32 14 134 268 222 19 44 28 230 5700 3610
8.3 5.23.7 5.7
COD
Rainy Season(Sep 2017) Dry Season(Feb 2018)
River
Target Rainy Season(Sep 2017) Dry Season(Feb 2018)
BOD
Vietnamese Environmental Standard(QCVN08:2015) for reference
BOD COD
A1 For domestic water supply 4 10
A2 For domestic water supply with treatment and conservation of aquatic lives 6 15
B1 For irrigation 15 30
B2 For water transportation and other purposes with demand for low‐quality water 25 50
>25 >50Less than B2
Water Usage
7
(2) Spatial Distribution of WQ in Hlaing River
Hlaing River Basin
DownstreamUpstream
• Rainy season: Not significantly changes from upstream to downstream
• Dry season: COD increased in downstream probably caused by higher
suspended solid.
8
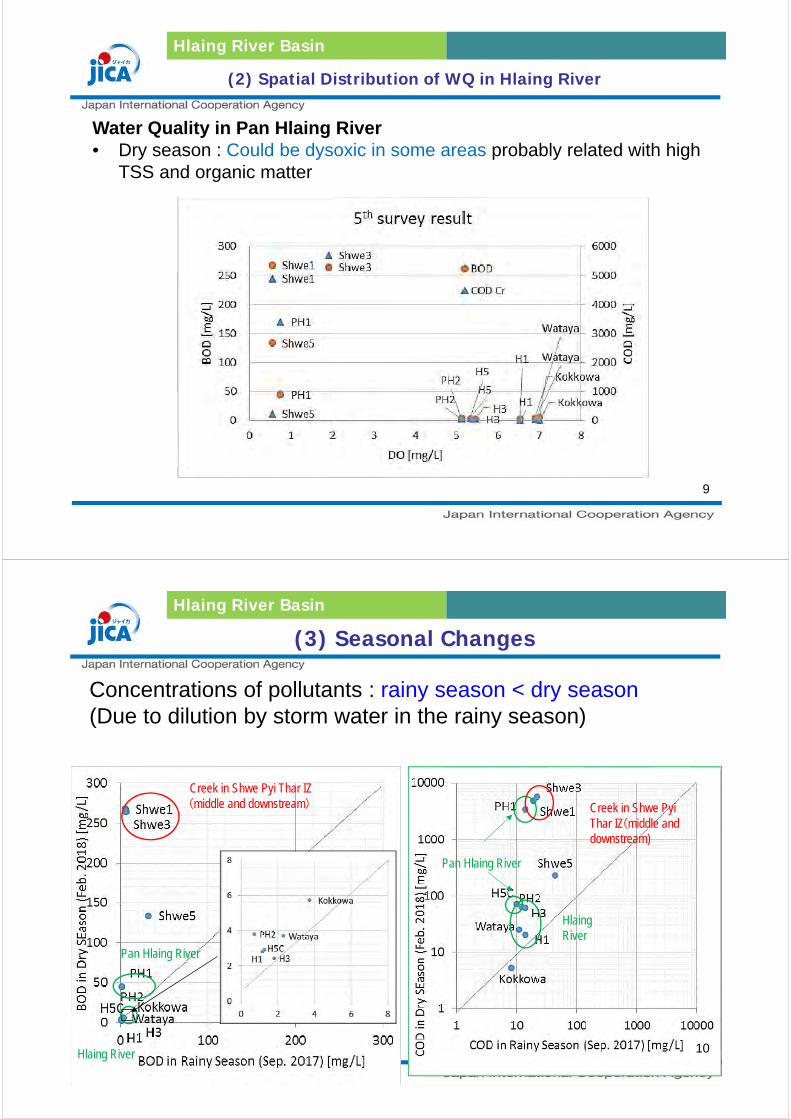
(2) Spatial Distribution of WQ in Hlaing River
Hlaing River Basin
Water Quality in Pan Hlaing River
• Dry season : Could be dysoxic in some areas probably related with high
TSS and organic matter
9
(3) Seasonal Changes
Hlaing River Basin
Concentrations of pollutants : rainy season < dry season
(Due to dilution by storm water in the rainy season)
Creek in Shwe Pyi Thar IZ(middle and downstream)
Hlaing River
Pan Hlaing River
HlaingRiver
Pan Hlaing River
Creek in Shwe PyiThar IZ(middle and downstream)
10
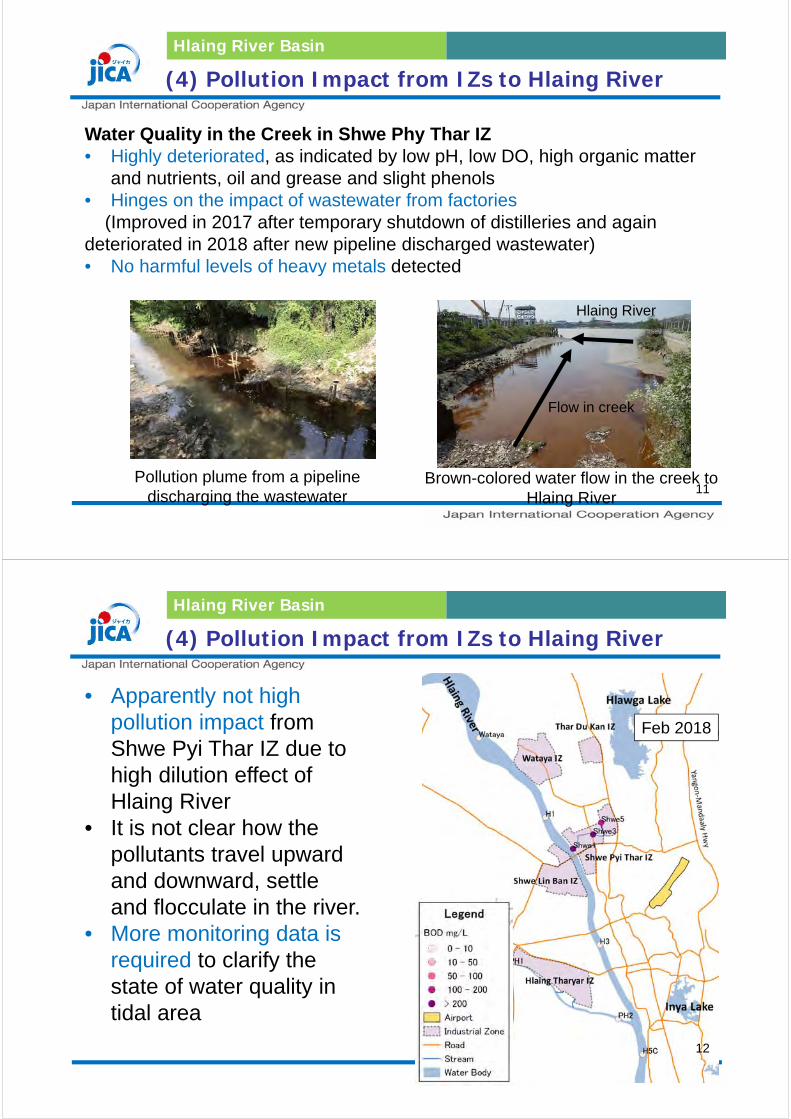
(4) Pollution Impact from IZs to Hlaing River
Hlaing River Basin
Hlaing River
Flow in creek
Brown-colored water flow in the creek to
Hlaing River
Pollution plume from a pipeline
discharging the wastewater
Water Quality in the Creek in Shwe Phy Thar IZ
• Highly deteriorated, as indicated by low pH, low DO, high organic matter
and nutrients, oil and grease and slight phenols
• Hinges on the impact of wastewater from factories
(Improved in 2017 after temporary shutdown of distilleries and again
deteriorated in 2018 after new pipeline discharged wastewater)
• No harmful levels of heavy metals detected
11
(4) Pollution Impact from IZs to Hlaing River
Hlaing River Basin
• Apparently not high
pollution impact from
Shwe Pyi Thar IZ due to
high dilution effect of
Hlaing River
• It is not clear how the
pollutants travel upward
and downward, settle
and flocculate in the river.
• More monitoring data is
required to clarify the
state of water quality in
tidal area
Feb 2018
12
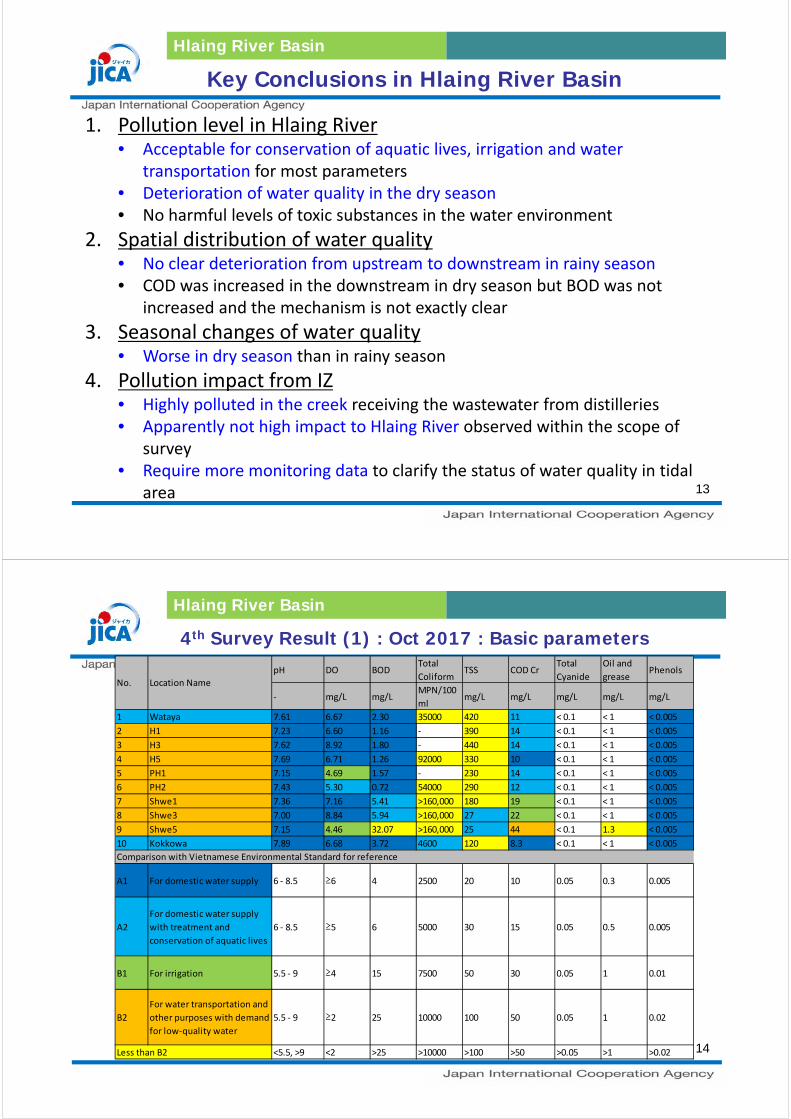
Key Conclusions in Hlaing River Basin
Hlaing River Basin
1. Pollution level in Hlaing River• Acceptable for conservation of aquatic lives, irrigation and water
transportation for most parameters• Deterioration of water quality in the dry season• No harmful levels of toxic substances in the water environment
2. Spatial distribution of water quality• No clear deterioration from upstream to downstream in rainy season• COD was increased in the downstream in dry season but BOD was not
increased and the mechanism is not exactly clear
3. Seasonal changes of water quality • Worse in dry season than in rainy season
4. Pollution impact from IZ• Highly polluted in the creek receiving the wastewater from distilleries• Apparently not high impact to Hlaing River observed within the scope of
survey• Require more monitoring data to clarify the status of water quality in tidal
area 13
4th Survey Result (1) : Oct 2017 : Basic parameters
Hlaing River Basin
pH DO BODTotal
ColiformTSS COD Cr
Total
Cyanide
Oil and
greasePhenols
‐ mg/L mg/LMPN/100
mlmg/L mg/L mg/L mg/L mg/L
1 Wataya 7.61 6.67 2.30 35000 420 11 < 0.1 < 1 < 0.005
2 H1 7.23 6.60 1.16 ‐ 390 14 < 0.1 < 1 < 0.005
3 H3 7.62 8.92 1.80 ‐ 440 14 < 0.1 < 1 < 0.005
4 H5 7.69 6.71 1.26 92000 330 10 < 0.1 < 1 < 0.005
5 PH1 7.15 4.69 1.57 ‐ 230 14 < 0.1 < 1 < 0.005
6 PH2 7.43 5.30 0.72 54000 290 12 < 0.1 < 1 < 0.005
7 Shwe1 7.36 7.16 5.41 >160,000 180 19 < 0.1 < 1 < 0.005
8 Shwe3 7.00 8.84 5.94 >160,000 27 22 < 0.1 < 1 < 0.005
9 Shwe5 7.15 4.46 32.07 >160,000 25 44 < 0.1 1.3 < 0.005
10 Kokkowa 7.89 6.68 3.72 4600 120 8.3 < 0.1 < 1 < 0.005
A1 For domestic water supply 6 ‐ 8.5 ≥6 4 2500 20 10 0.05 0.3 0.005
A2
For domestic water supply
with treatment and
conservation of aquatic lives
6 ‐ 8.5 ≥5 6 5000 30 15 0.05 0.5 0.005
B1 For irrigation 5.5 ‐ 9 ≥4 15 7500 50 30 0.05 1 0.01
B2
For water transportation and
other purposes with demand
for low‐quality water
5.5 ‐ 9 ≥2 25 10000 100 50 0.05 1 0.02
<5.5, >9 <2 >25 >10000 >100 >50 >0.05 >1 >0.02
Comparison with Vietnamese Environmental Standard for reference
Less than B2
Location NameNo.
14
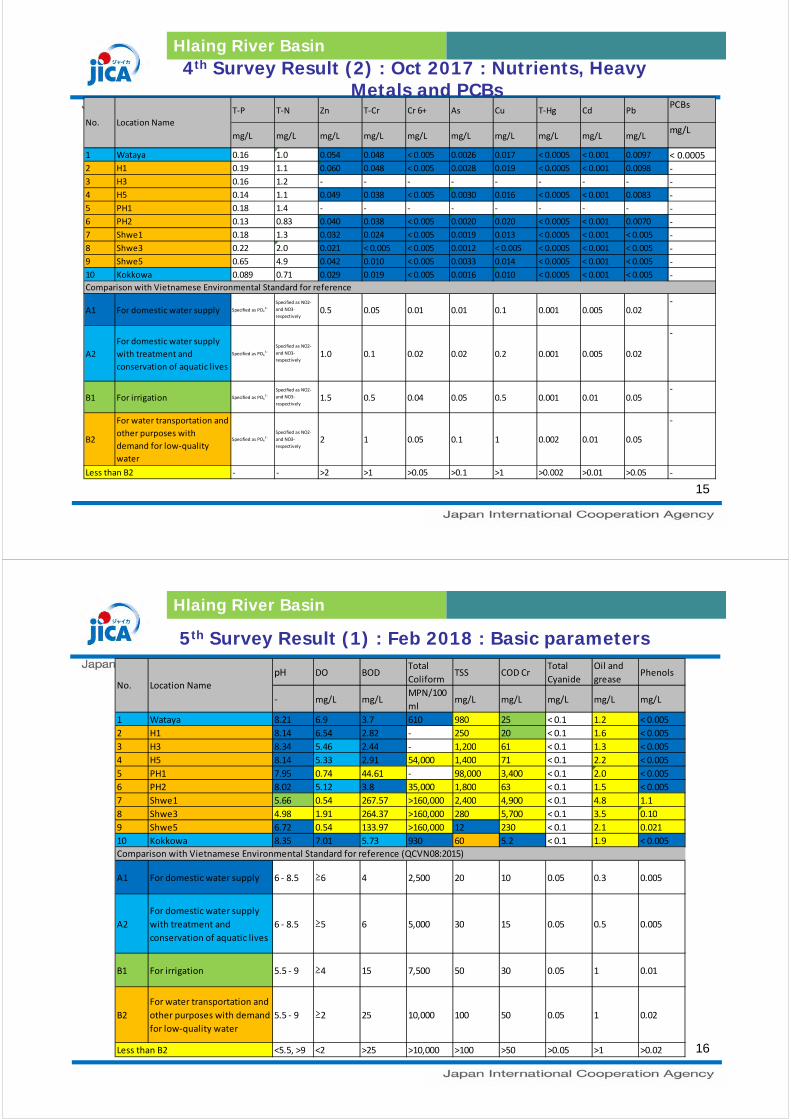
4th Survey Result (2) : Oct 2017 : Nutrients, Heavy Metals and PCBs
Hlaing River Basin
T‐P T‐N Zn T‐Cr Cr 6+ As Cu T‐Hg Cd PbPCBs
mg/L mg/L mg/L mg/L mg/L mg/L mg/L mg/L mg/L mg/Lmg/L
1 Wataya 0.16 1.0 0.054 0.048 < 0.005 0.0026 0.017 < 0.0005 < 0.001 0.0097 < 0.0005
2 H1 0.19 1.1 0.060 0.048 < 0.005 0.0028 0.019 < 0.0005 < 0.001 0.0098 ‐
3 H3 0.16 1.2 ‐ ‐ ‐ ‐ ‐ ‐ ‐ ‐ ‐
4 H5 0.14 1.1 0.049 0.038 < 0.005 0.0030 0.016 < 0.0005 < 0.001 0.0083 ‐
5 PH1 0.18 1.4 ‐ ‐ ‐ ‐ ‐ ‐ ‐ ‐ ‐6 PH2 0.13 0.83 0.040 0.038 < 0.005 0.0020 0.020 < 0.0005 < 0.001 0.0070 ‐
7 Shwe1 0.18 1.3 0.032 0.024 < 0.005 0.0019 0.013 < 0.0005 < 0.001 < 0.005 ‐
8 Shwe3 0.22 2.0 0.021 < 0.005 < 0.005 0.0012 < 0.005 < 0.0005 < 0.001 < 0.005 ‐
9 Shwe5 0.65 4.9 0.042 0.010 < 0.005 0.0033 0.014 < 0.0005 < 0.001 < 0.005 ‐
10 Kokkowa 0.089 0.71 0.029 0.019 < 0.005 0.0016 0.010 < 0.0005 < 0.001 < 0.005 ‐
A1 For domestic water supply Specified as PO43 ‐
Specified as NO2‐
and NO3‐
respectively0.5 0.05 0.01 0.01 0.1 0.001 0.005 0.02
‐
A2
For domestic water supply
with treatment and
conservation of aquatic lives
Specified as PO43 ‐
Specified as NO2‐
and NO3‐
respectively1.0 0.1 0.02 0.02 0.2 0.001 0.005 0.02
‐
B1 For irrigation Specified as PO43 ‐
Specified as NO2‐
and NO3‐
respectively1.5 0.5 0.04 0.05 0.5 0.001 0.01 0.05
‐
B2
For water transportation and
other purposes with
demand for low‐quality
water
Specified as PO43 ‐
Specified as NO2‐
and NO3‐
respectively2 1 0.05 0.1 1 0.002 0.01 0.05
‐
‐ ‐ >2 >1 >0.05 >0.1 >1 >0.002 >0.01 >0.05 ‐
No. Location Name
Less than B2
Comparison with Vietnamese Environmental Standard for reference
15
5th Survey Result (1) : Feb 2018 : Basic parameters
Hlaing River Basin
pH DO BODTotal
ColiformTSS COD Cr
Total
Cyanide
Oil and
greasePhenols
‐ mg/L mg/LMPN/100
mlmg/L mg/L mg/L mg/L mg/L
1 Wataya 8.21 6.9 3.7 610 980 25 < 0.1 1.2 < 0.005
2 H1 8.14 6.54 2.82 ‐ 250 20 < 0.1 1.6 < 0.005
3 H3 8.34 5.46 2.44 ‐ 1,200 61 < 0.1 1.3 < 0.005
4 H5 8.14 5.33 2.91 54,000 1,400 71 < 0.1 2.2 < 0.005
5 PH1 7.95 0.74 44.61 ‐ 98,000 3,400 < 0.1 2.0 < 0.005
6 PH2 8.02 5.12 3.8 35,000 1,800 63 < 0.1 1.5 < 0.005
7 Shwe1 5.66 0.54 267.57 >160,000 2,400 4,900 < 0.1 4.8 1.1
8 Shwe3 4.98 1.91 264.37 >160,000 280 5,700 < 0.1 3.5 0.10
9 Shwe5 6.72 0.54 133.97 >160,000 12 230 < 0.1 2.1 0.021
10 Kokkowa 8.35 7.01 5.73 930 60 5.2 < 0.1 1.9 < 0.005
A1 For domestic water supply 6 ‐ 8.5 ≥6 4 2,500 20 10 0.05 0.3 0.005
A2
For domestic water supply
with treatment and
conservation of aquatic lives
6 ‐ 8.5 ≥5 6 5,000 30 15 0.05 0.5 0.005
B1 For irrigation 5.5 ‐ 9 ≥4 15 7,500 50 30 0.05 1 0.01
B2
For water transportation and
other purposes with demand
for low‐quality water
5.5 ‐ 9 ≥2 25 10,000 100 50 0.05 1 0.02
<5.5, >9 <2 >25 >10,000 >100 >50 >0.05 >1 >0.02Less than B2
Location NameNo.
Comparison with Vietnamese Environmental Standard for reference (QCVN08:2015)
16
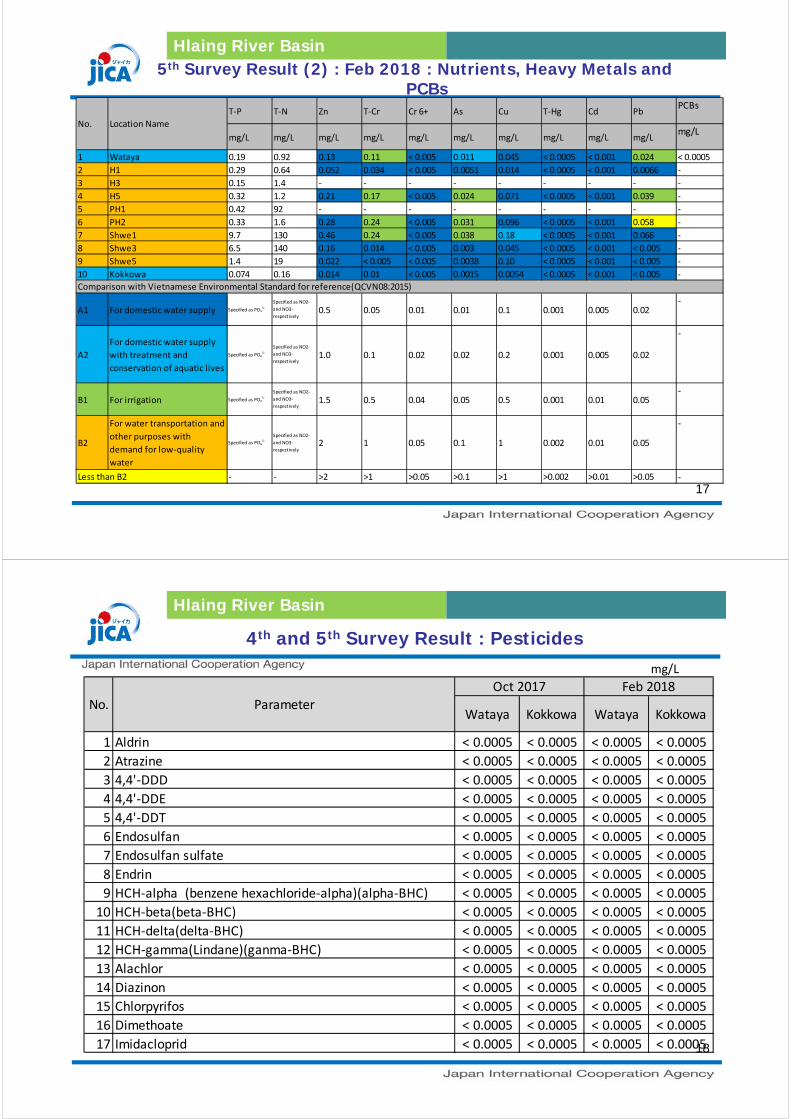
5th Survey Result (2) : Feb 2018 : Nutrients, Heavy Metals and PCBs
Hlaing River Basin
T‐P T‐N Zn T‐Cr Cr 6+ As Cu T‐Hg Cd PbPCBs
mg/L mg/L mg/L mg/L mg/L mg/L mg/L mg/L mg/L mg/Lmg/L
1 Wataya 0.19 0.92 0.13 0.11 < 0.005 0.011 0.045 < 0.0005 < 0.001 0.024 < 0.0005
2 H1 0.29 0.64 0.052 0.034 < 0.005 0.0051 0.014 < 0.0005 < 0.001 0.0066 ‐
3 H3 0.15 1.4 ‐ ‐ ‐ ‐ ‐ ‐ ‐ ‐ ‐
4 H5 0.32 1.2 0.21 0.17 < 0.005 0.024 0.071 < 0.0005 < 0.001 0.039 ‐
5 PH1 0.42 92 ‐ ‐ ‐ ‐ ‐ ‐ ‐ ‐ ‐
6 PH2 0.33 1.6 0.28 0.24 < 0.005 0.031 0.096 < 0.0005 < 0.001 0.058 ‐
7 Shwe1 9.7 130 0.46 0.24 < 0.005 0.038 0.18 < 0.0005 < 0.001 0.066 ‐
8 Shwe3 6.5 140 0.16 0.014 < 0.005 0.003 0.045 < 0.0005 < 0.001 < 0.005 ‐
9 Shwe5 1.4 19 0.022 < 0.005 < 0.005 0.0038 0.10 < 0.0005 < 0.001 < 0.005 ‐
10 Kokkowa 0.074 0.16 0.014 0.01 < 0.005 0.0015 0.0054 < 0.0005 < 0.001 < 0.005 ‐
A1 For domestic water supply Specified as PO43 ‐
Specified as NO2‐
and NO3‐
respectively0.5 0.05 0.01 0.01 0.1 0.001 0.005 0.02
‐
A2
For domestic water supply
with treatment and
conservation of aquatic lives
Specified as PO43 ‐
Specified as NO2‐
and NO3‐
respectively1.0 0.1 0.02 0.02 0.2 0.001 0.005 0.02
‐
B1 For irrigation Specified as PO43 ‐
Specified as NO2‐
and NO3‐
respectively1.5 0.5 0.04 0.05 0.5 0.001 0.01 0.05
‐
B2
For water transportation and
other purposes with
demand for low‐quality
water
Specified as PO43 ‐
Specified as NO2‐
and NO3‐
respectively2 1 0.05 0.1 1 0.002 0.01 0.05
‐
‐ ‐ >2 >1 >0.05 >0.1 >1 >0.002 >0.01 >0.05 ‐Less than B2
No. Location Name
Comparison with Vietnamese Environmental Standard for reference(QCVN08:2015)
17
4th and 5th Survey Result : Pesticides
Hlaing River Basin
mg/L
1 Aldrin < 0.0005 < 0.0005 < 0.0005 < 0.0005
2 Atrazine < 0.0005 < 0.0005 < 0.0005 < 0.0005
3 4,4'‐DDD < 0.0005 < 0.0005 < 0.0005 < 0.0005
4 4,4'‐DDE < 0.0005 < 0.0005 < 0.0005 < 0.0005
5 4,4'‐DDT < 0.0005 < 0.0005 < 0.0005 < 0.0005
6 Endosulfan < 0.0005 < 0.0005 < 0.0005 < 0.0005
7 Endosulfan sulfate < 0.0005 < 0.0005 < 0.0005 < 0.0005
8 Endrin < 0.0005 < 0.0005 < 0.0005 < 0.0005
9 HCH‐alpha (benzene hexachloride‐alpha)(alpha‐BHC) < 0.0005 < 0.0005 < 0.0005 < 0.0005
10 HCH‐beta(beta‐BHC) < 0.0005 < 0.0005 < 0.0005 < 0.0005
11 HCH‐delta(delta‐BHC) < 0.0005 < 0.0005 < 0.0005 < 0.0005
12 HCH‐gamma(Lindane)(ganma‐BHC) < 0.0005 < 0.0005 < 0.0005 < 0.0005
13 Alachlor < 0.0005 < 0.0005 < 0.0005 < 0.0005
14 Diazinon < 0.0005 < 0.0005 < 0.0005 < 0.0005
15 Chlorpyrifos < 0.0005 < 0.0005 < 0.0005 < 0.0005
16 Dimethoate < 0.0005 < 0.0005 < 0.0005 < 0.0005
17 Imidacloprid < 0.0005 < 0.0005 < 0.0005 < 0.0005
No.Wataya KokkowaWataya Kokkowa
Oct 2017 Feb 2018Parameter
18
Water Quality Survey inDoke Hta Waddy River Basin
19
15 sampling points
in the 4th survey (2-3 Oct 2017) and 5th
survey (26-27 Feb 2018)
Sampling Points and Analytes
Doke Hta Waddy River Basin
[On site measurement]
• pH, EC, DO, TDS, salinity, turbidity,
water temperature, ORP
[Lab analysis]
• TSS, BOD, COD for all points
• Cyanide, oil and grease, phenols, total
phosphorus, and total nitrogen, total
coliform, zinc, total chromium,
hexavalent chromium, arsenic, copper,
total mercury, cadmium, and lead for
representative points
• 17 pesticides* and PCBs for one or
two points
*Aldrin, atrazine, 4,4'-DDD, 4,4'-DDE, 4,4'-DDT, endosulfan,
endosulfan sulfate, endrin, HCH-alpha (benzene hexachloride-
alpha), HCH-beta, HCH-delta, HCH-gamma(Lindane), alachlor,
diazinon, chlorpyrifos, dimethoate and imidacloprid20
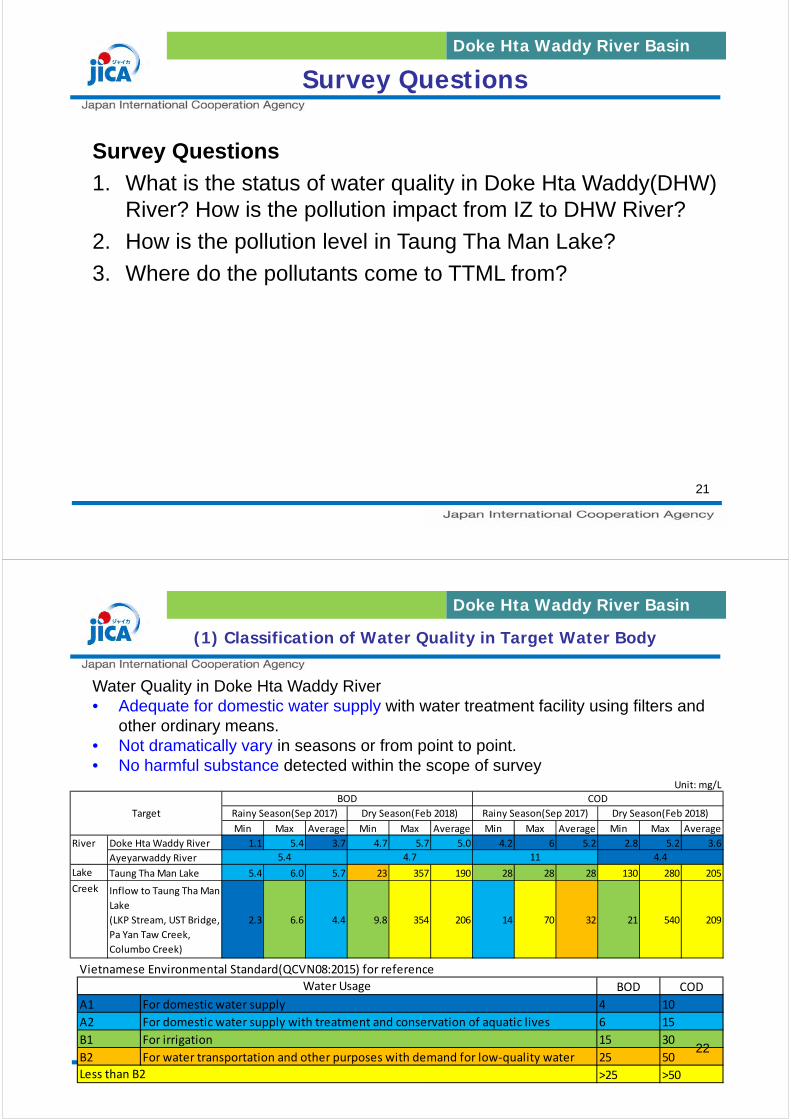
Survey Questions
Survey Questions
1. What is the status of water quality in Doke Hta Waddy(DHW)
River? How is the pollution impact from IZ to DHW River?
2. How is the pollution level in Taung Tha Man Lake?
3. Where do the pollutants come to TTML from?
21
Doke Hta Waddy River Basin
(1) Classification of Water Quality in Target Water Body
Doke Hta Waddy River Basin
Unit: mg/L
Min Max Average Min Max Average Min Max Average Min Max Average
Doke Hta Waddy River 1.1 5.4 3.7 4.7 5.7 5.0 4.2 6 5.2 2.8 5.2 3.6
Ayeyarwaddy River
Lake Taung Tha Man Lake 5.4 6.0 5.7 23 357 190 28 28 28 130 280 205
Creek Inflow to Taung Tha Man
Lake
(LKP Stream, UST Bridge,
Pa Yan Taw Creek,
Columbo Creek)
2.3 6.6 4.4 9.8 354 206 14 70 32 21 540 209
River
Target
BOD COD
Rainy Season(Sep 2017) Dry Season(Feb 2018) Rainy Season(Sep 2017) Dry Season(Feb 2018)
5.4 4.7 11 4.4
Water Quality in Doke Hta Waddy River
• Adequate for domestic water supply with water treatment facility using filters and
other ordinary means.
• Not dramatically vary in seasons or from point to point.
• No harmful substance detected within the scope of survey
Vietnamese Environmental Standard(QCVN08:2015) for reference
BOD COD
A1 For domestic water supply 4 10
A2 For domestic water supply with treatment and conservation of aquatic lives 6 15
B1 For irrigation 15 30
B2 For water transportation and other purposes with demand for low‐quality water 25 50
>25 >50Less than B2
Water Usage
22
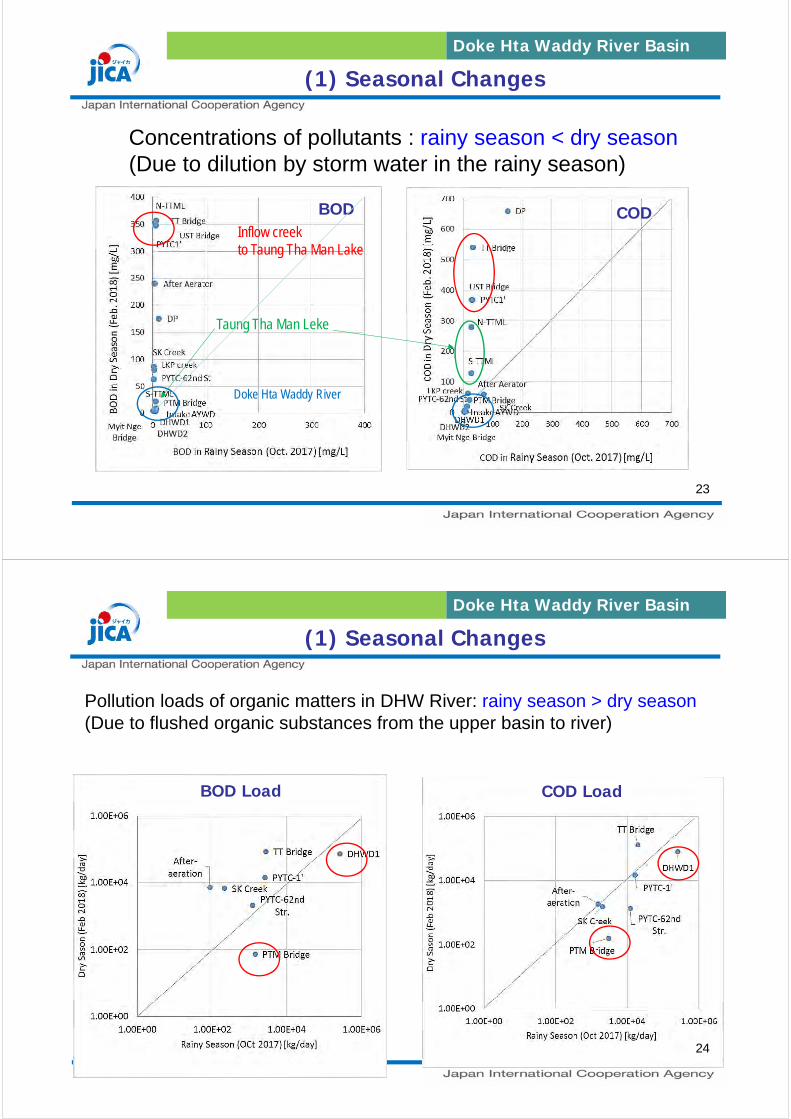
(1) Seasonal Changes
Doke Hta Waddy River Basin
Doke Hta Waddy River
Taung Tha Man Leke
BOD CODInflow creek to Taung Tha Man Lake
Concentrations of pollutants : rainy season < dry season
(Due to dilution by storm water in the rainy season)
23
(1) Seasonal Changes
Doke Hta Waddy River Basin
Pollution loads of organic matters in DHW River: rainy season > dry season
(Due to flushed organic substances from the upper basin to river)
BOD Load COD Load
24
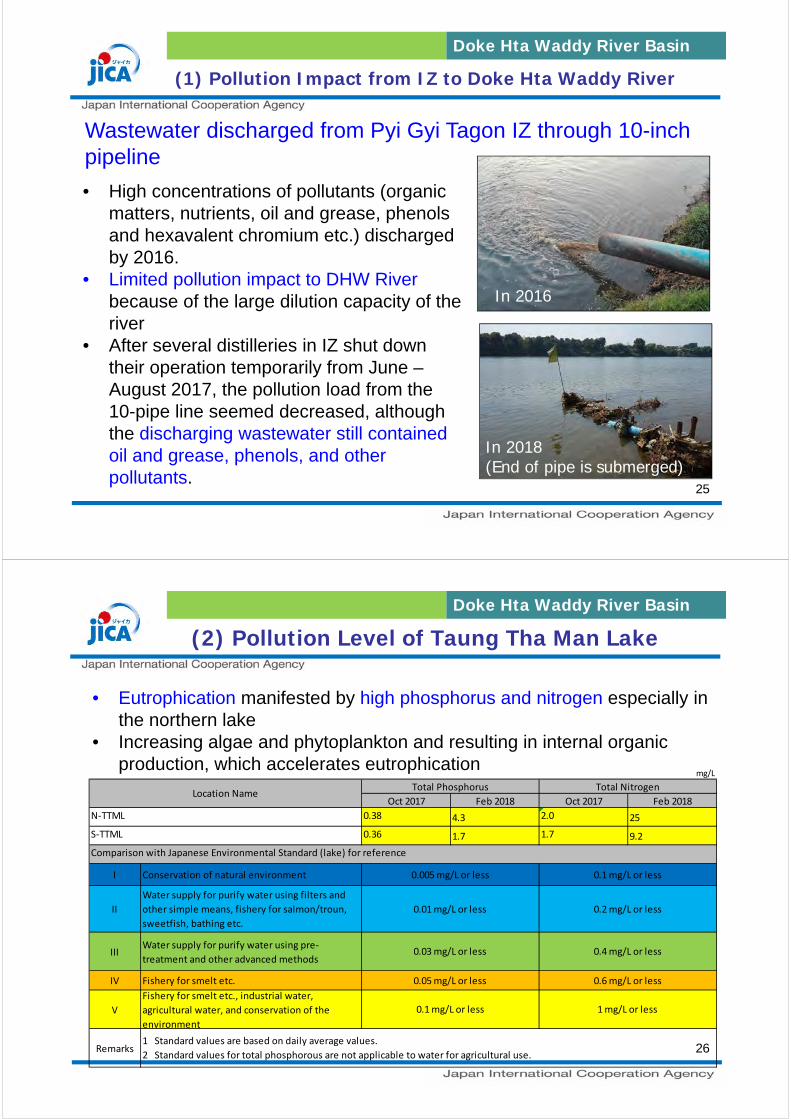
(1) Pollution Impact from IZ to Doke Hta Waddy River
Doke Hta Waddy River Basin
• High concentrations of pollutants (organic
matters, nutrients, oil and grease, phenols
and hexavalent chromium etc.) discharged
by 2016.
• Limited pollution impact to DHW River
because of the large dilution capacity of the
river
• After several distilleries in IZ shut down
their operation temporarily from June –
August 2017, the pollution load from the
10-pipe line seemed decreased, although
the discharging wastewater still contained
oil and grease, phenols, and other
pollutants.
In 2016
In 2018(End of pipe is submerged)
Wastewater discharged from Pyi Gyi Tagon IZ through 10-inch
pipeline
25
(2) Pollution Level of Taung Tha Man Lake
Doke Hta Waddy River Basin
• Eutrophication manifested by high phosphorus and nitrogen especially in
the northern lake
• Increasing algae and phytoplankton and resulting in internal organic
production, which accelerates eutrophicationmg/L
Oct 2017 Feb 2018 Oct 2017 Feb 2018
0.38 4.3 2.0 25
0.36 1.7 1.7 9.2
I Conservation of natural environment
II
Water supply for purify water using filters and
other simple means, fishery for salmon/troun,
sweetfish, bathing etc.
IIIWater supply for purify water using pre‐
treatment and other advanced methods
IV Fishery for smelt etc.
V
Fishery for smelt etc., industrial water,
agricultural water, and conservation of the
environment
Remarks
Comparison with Japanese Environmental Standard (lake) for reference
S‐TTML
N‐TTML
Total Phosphorus Total NitrogenLocation Name
0.005 mg/L or less
0.01 mg/L or less
0.03 mg/L or less
0.05 mg/L or less
1 Standard values are based on daily average values.
2 Standard values for total phosphorous are not applicable to water for agricultural use.
0.1 mg/L or less
0.2 mg/L or less
0.4 mg/L or less
0.6 mg/L or less
1 mg/L or less
0.1 mg/L or less
26
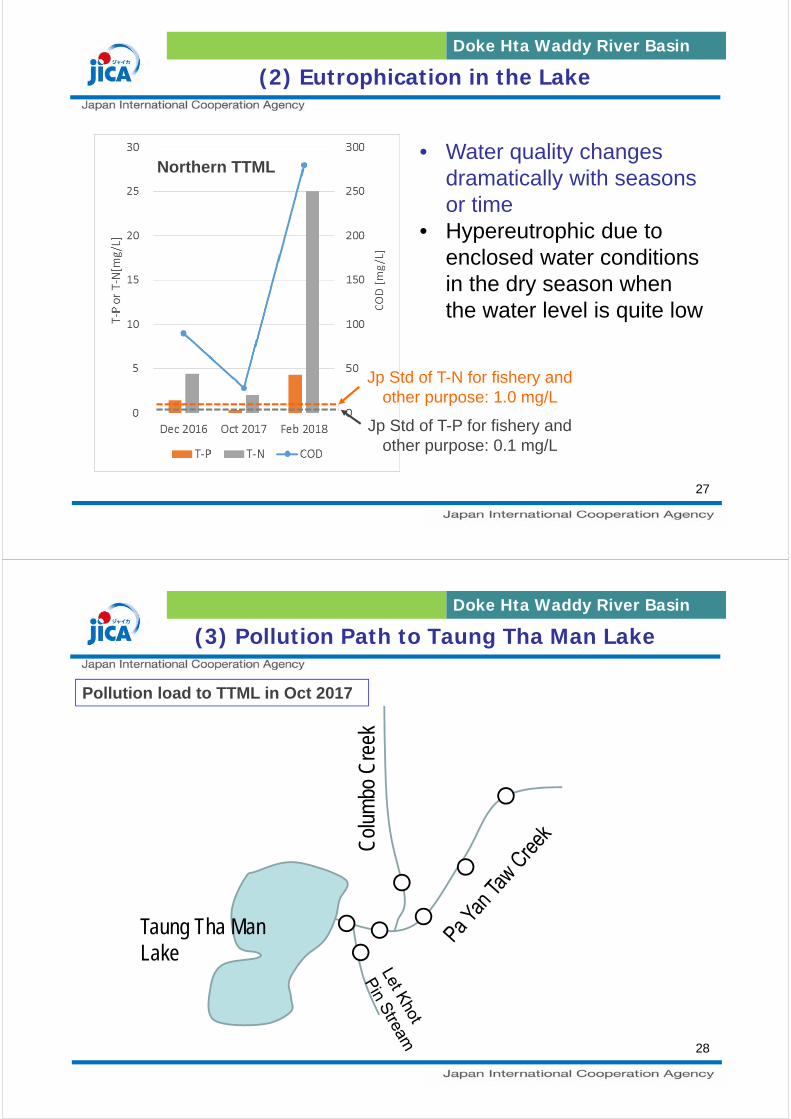
27
Jp Std of T-N for fishery and
other purpose: 1.0 mg/L
Jp Std of T-P for fishery and
other purpose: 0.1 mg/L
• Water quality changes
dramatically with seasons
or time
• Hypereutrophic due to
enclosed water conditions
in the dry season when
the water level is quite low
Doke Hta Waddy River Basin
(2) Eutrophication in the Lake
Northern TTML
Doke Hta Waddy River Basin
(3) Pollution Path to Taung Tha Man Lake
Pollution load to TTML in Oct 2017
Col
umbo
Cre
ek
Taung Tha Man Lake
28
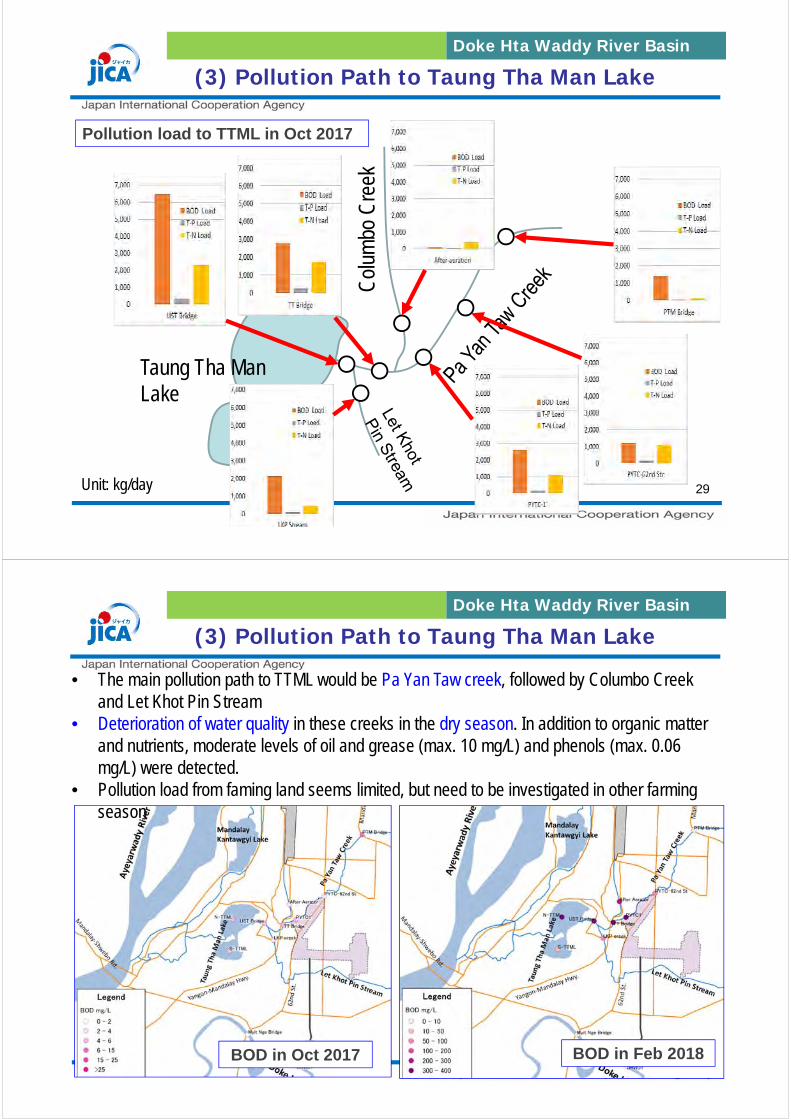
Doke Hta Waddy River Basin
(3) Pollution Path to Taung Tha Man Lake
Pollution load to TTML in Oct 2017
Col
umbo
Cre
ekTaung Tha Man Lake
Unit: kg/day 29
30
Doke Hta Waddy River Basin
(3) Pollution Path to Taung Tha Man Lake
BOD in Feb 2018BOD in Oct 2017
• The main pollution path to TTML would be Pa Yan Taw creek, followed by Columbo Creek and Let Khot Pin Stream
• Deterioration of water quality in these creeks in the dry season. In addition to organic matter and nutrients, moderate levels of oil and grease (max. 10 mg/L) and phenols (max. 0.06 mg/L) were detected.
• Pollution load from faming land seems limited, but need to be investigated in other farming season
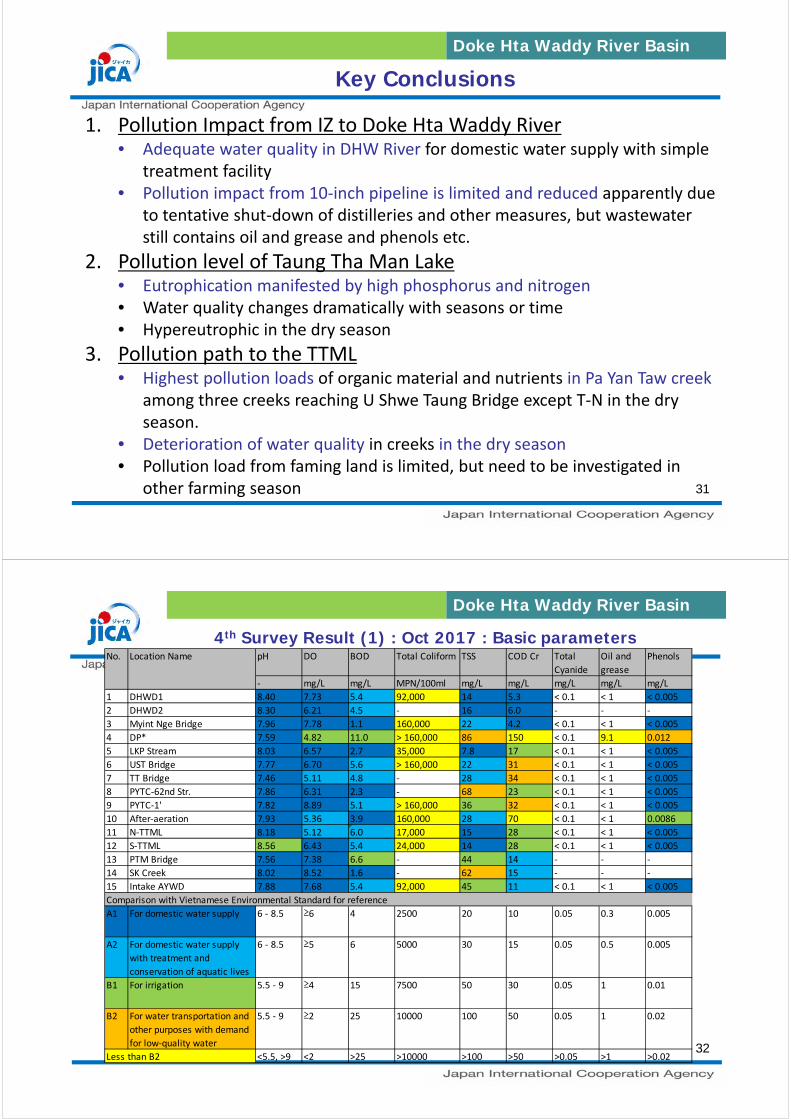
Key Conclusions
1. Pollution Impact from IZ to Doke Hta Waddy River• Adequate water quality in DHW River for domestic water supply with simple
treatment facility• Pollution impact from 10‐inch pipeline is limited and reduced apparently due
to tentative shut‐down of distilleries and other measures, but wastewater still contains oil and grease and phenols etc.
2. Pollution level of Taung Tha Man Lake • Eutrophication manifested by high phosphorus and nitrogen• Water quality changes dramatically with seasons or time• Hypereutrophic in the dry season
3. Pollution path to the TTML • Highest pollution loads of organic material and nutrients in Pa Yan Taw creek
among three creeks reaching U Shwe Taung Bridge except T‐N in the dry season.
• Deterioration of water quality in creeks in the dry season• Pollution load from faming land is limited, but need to be investigated in
other farming season
Doke Hta Waddy River Basin
31
4th Survey Result (1) : Oct 2017 : Basic parameters
Doke Hta Waddy River Basin
pH DO BOD Total Coliform TSS COD Cr Total
Cyanide
Oil and
grease
Phenols
‐ mg/L mg/L MPN/100ml mg/L mg/L mg/L mg/L mg/L
1 DHWD1 8.40 7.73 5.4 92,000 14 5.3 < 0.1 < 1 < 0.005
2 DHWD2 8.30 6.21 4.5 ‐ 16 6.0 ‐ ‐ ‐
3 Myint Nge Bridge 7.96 7.78 1.1 160,000 22 4.2 < 0.1 < 1 < 0.005
4 DP* 7.59 4.82 11.0 > 160,000 86 150 < 0.1 9.1 0.012
5 LKP Stream 8.03 6.57 2.7 35,000 7.8 17 < 0.1 < 1 < 0.005
6 UST Bridge 7.77 6.70 5.6 > 160,000 22 31 < 0.1 < 1 < 0.005
7 TT Bridge 7.46 5.11 4.8 ‐ 28 34 < 0.1 < 1 < 0.005
8 PYTC‐62nd Str. 7.86 6.31 2.3 ‐ 68 23 < 0.1 < 1 < 0.005
9 PYTC‐1' 7.82 8.89 5.1 > 160,000 36 32 < 0.1 < 1 < 0.005
10 After‐aeration 7.93 5.36 3.9 160,000 28 70 < 0.1 < 1 0.0086
11 N‐TTML 8.18 5.12 6.0 17,000 15 28 < 0.1 < 1 < 0.005
12 S‐TTML 8.56 6.43 5.4 24,000 14 28 < 0.1 < 1 < 0.005
13 PTM Bridge 7.56 7.38 6.6 ‐ 44 14 ‐ ‐ ‐
14 SK Creek 8.02 8.52 1.6 ‐ 62 15 ‐ ‐ ‐
15 Intake AYWD 7.88 7.68 5.4 92,000 45 11 < 0.1 < 1 < 0.005
A1 For domestic water supply 6 ‐ 8.5 ≥6 4 2500 20 10 0.05 0.3 0.005
A2 For domestic water supply
with treatment and
conservation of aquatic lives
6 ‐ 8.5 ≥5 6 5000 30 15 0.05 0.5 0.005
B1 For irrigation 5.5 ‐ 9 ≥4 15 7500 50 30 0.05 1 0.01
B2 For water transportation and
other purposes with demand
for low‐quality water
5.5 ‐ 9 ≥2 25 10000 100 50 0.05 1 0.02
<5.5, >9 <2 >25 >10000 >100 >50 >0.05 >1 >0.02Less than B2
Comparison with Vietnamese Environmental Standard for reference
No. Location Name
32
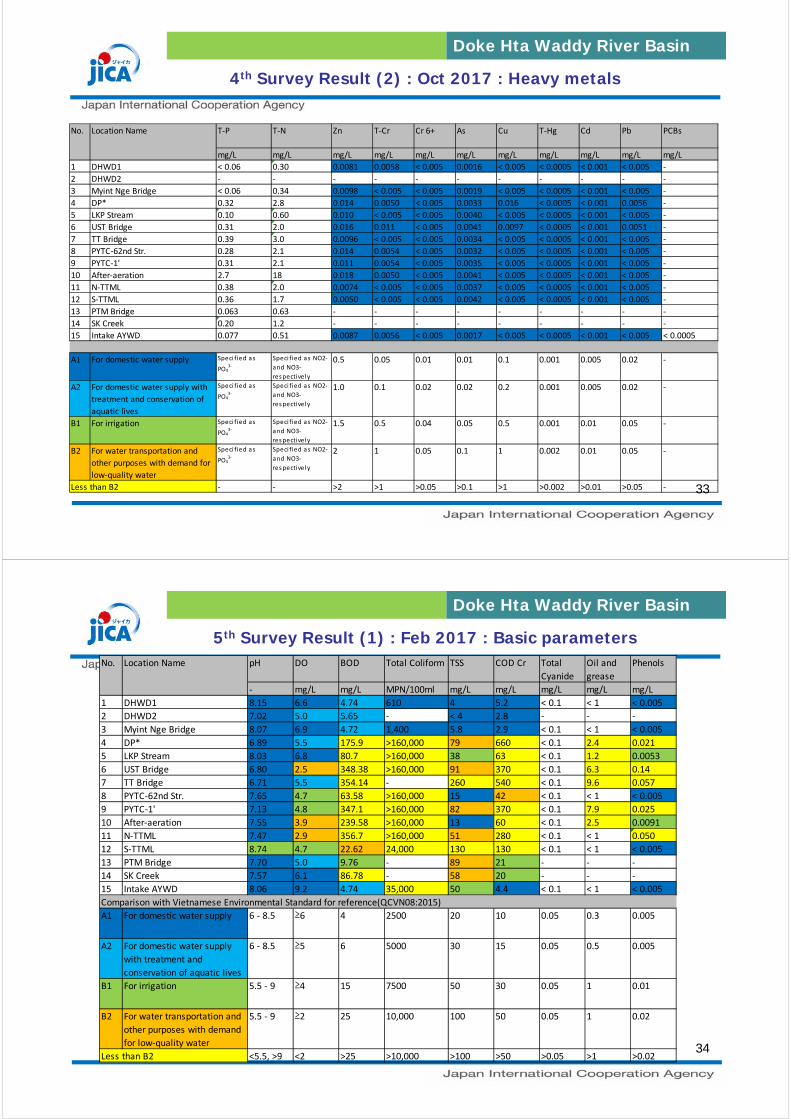
4th Survey Result (2) : Oct 2017 : Heavy metals
Doke Hta Waddy River Basin
T‐P T‐N Zn T‐Cr Cr 6+ As Cu T‐Hg Cd Pb PCBs
mg/L mg/L mg/L mg/L mg/L mg/L mg/L mg/L mg/L mg/L mg/L
1 DHWD1 < 0.06 0.30 0.0081 0.0058 < 0.005 0.0016 < 0.005 < 0.0005 < 0.001 < 0.005 ‐
2 DHWD2 ‐ ‐ ‐ ‐ ‐ ‐ ‐ ‐ ‐ ‐ ‐
3 Myint Nge Bridge < 0.06 0.34 0.0098 < 0.005 < 0.005 0.0019 < 0.005 < 0.0005 < 0.001 < 0.005 ‐
4 DP* 0.32 2.8 0.014 0.0050 < 0.005 0.0033 0.016 < 0.0005 < 0.001 0.0056 ‐
5 LKP Stream 0.10 0.60 0.010 < 0.005 < 0.005 0.0040 < 0.005 < 0.0005 < 0.001 < 0.005 ‐
6 UST Bridge 0.31 2.0 0.016 0.011 < 0.005 0.0041 0.0097 < 0.0005 < 0.001 0.0051 ‐
7 TT Bridge 0.39 3.0 0.0096 < 0.005 < 0.005 0.0034 < 0.005 < 0.0005 < 0.001 < 0.005 ‐
8 PYTC‐62nd Str. 0.28 2.1 0.014 0.0054 < 0.005 0.0032 < 0.005 < 0.0005 < 0.001 < 0.005 ‐
9 PYTC‐1' 0.31 2.1 0.011 0.0054 < 0.005 0.0035 < 0.005 < 0.0005 < 0.001 < 0.005 ‐
10 After‐aeration 2.7 18 0.018 0.0050 < 0.005 0.0041 < 0.005 < 0.0005 < 0.001 < 0.005 ‐
11 N‐TTML 0.38 2.0 0.0074 < 0.005 < 0.005 0.0037 < 0.005 < 0.0005 < 0.001 < 0.005 ‐
12 S‐TTML 0.36 1.7 0.0050 < 0.005 < 0.005 0.0042 < 0.005 < 0.0005 < 0.001 < 0.005 ‐
13 PTM Bridge 0.063 0.63 ‐ ‐ ‐ ‐ ‐ ‐ ‐ ‐ ‐
14 SK Creek 0.20 1.2 ‐ ‐ ‐ ‐ ‐ ‐ ‐ ‐ ‐
15 Intake AYWD 0.077 0.51 0.0087 0.0056 < 0.005 0.0017 < 0.005 < 0.0005 < 0.001 < 0.005 < 0.0005
A1 For domestic water supply Speci fied as
PO43‐
Speci fied as NO2‐
and NO3‐
respectively
0.5 0.05 0.01 0.01 0.1 0.001 0.005 0.02 ‐
A2 For domestic water supply with
treatment and conservation of
aquatic lives
Speci fied as
PO43‐
Speci fied as NO2‐
and NO3‐
respectively
1.0 0.1 0.02 0.02 0.2 0.001 0.005 0.02 ‐
B1 For irrigation Speci fied as
PO43‐
Speci fied as NO2‐
and NO3‐
respectively
1.5 0.5 0.04 0.05 0.5 0.001 0.01 0.05 ‐
B2 For water transportation and
other purposes with demand for
low‐quality water
Speci fied as
PO43‐
Speci fied as NO2‐
and NO3‐
respectively
2 1 0.05 0.1 1 0.002 0.01 0.05 ‐
‐ ‐ >2 >1 >0.05 >0.1 >1 >0.002 >0.01 >0.05 ‐
Location Name
Less than B2
No.
33
5th Survey Result (1) : Feb 2017 : Basic parameters
Doke Hta Waddy River Basin
pH DO BOD Total Coliform TSS COD Cr Total
Cyanide
Oil and
grease
Phenols
‐ mg/L mg/L MPN/100ml mg/L mg/L mg/L mg/L mg/L
1 DHWD1 8.15 6.6 4.74 610 4 5.2 < 0.1 < 1 < 0.005
2 DHWD2 7.02 5.0 5.65 ‐ < 4 2.8 ‐ ‐ ‐
3 Myint Nge Bridge 8.07 6.9 4.72 1,400 5.8 2.9 < 0.1 < 1 < 0.005
4 DP* 6.89 5.5 175.9 >160,000 79 660 < 0.1 2.4 0.021
5 LKP Stream 8.03 6.8 80.7 >160,000 38 63 < 0.1 1.2 0.0053
6 UST Bridge 6.80 2.5 348.38 >160,000 91 370 < 0.1 6.3 0.14
7 TT Bridge 6.71 5.5 354.14 ‐ 260 540 < 0.1 9.6 0.057
8 PYTC‐62nd Str. 7.65 4.7 63.58 >160,000 15 42 < 0.1 < 1 < 0.005
9 PYTC‐1' 7.13 4.8 347.1 >160,000 82 370 < 0.1 7.9 0.025
10 After‐aeration 7.55 3.9 239.58 >160,000 13 60 < 0.1 2.5 0.0091
11 N‐TTML 7.47 2.9 356.7 >160,000 51 280 < 0.1 < 1 0.050
12 S‐TTML 8.74 4.7 22.62 24,000 130 130 < 0.1 < 1 < 0.005
13 PTM Bridge 7.70 5.0 9.76 ‐ 89 21 ‐ ‐ ‐
14 SK Creek 7.57 6.1 86.78 ‐ 58 20 ‐ ‐ ‐
15 Intake AYWD 8.06 9.2 4.74 35,000 50 4.4 < 0.1 < 1 < 0.005
A1 For domestic water supply 6 ‐ 8.5 ≥6 4 2500 20 10 0.05 0.3 0.005
A2 For domestic water supply
with treatment and
conservation of aquatic lives
6 ‐ 8.5 ≥5 6 5000 30 15 0.05 0.5 0.005
B1 For irrigation 5.5 ‐ 9 ≥4 15 7500 50 30 0.05 1 0.01
B2 For water transportation and
other purposes with demand
for low‐quality water
5.5 ‐ 9 ≥2 25 10,000 100 50 0.05 1 0.02
<5.5, >9 <2 >25 >10,000 >100 >50 >0.05 >1 >0.02Less than B2
Comparison with Vietnamese Environmental Standard for reference(QCVN08:2015)
No. Location Name
34
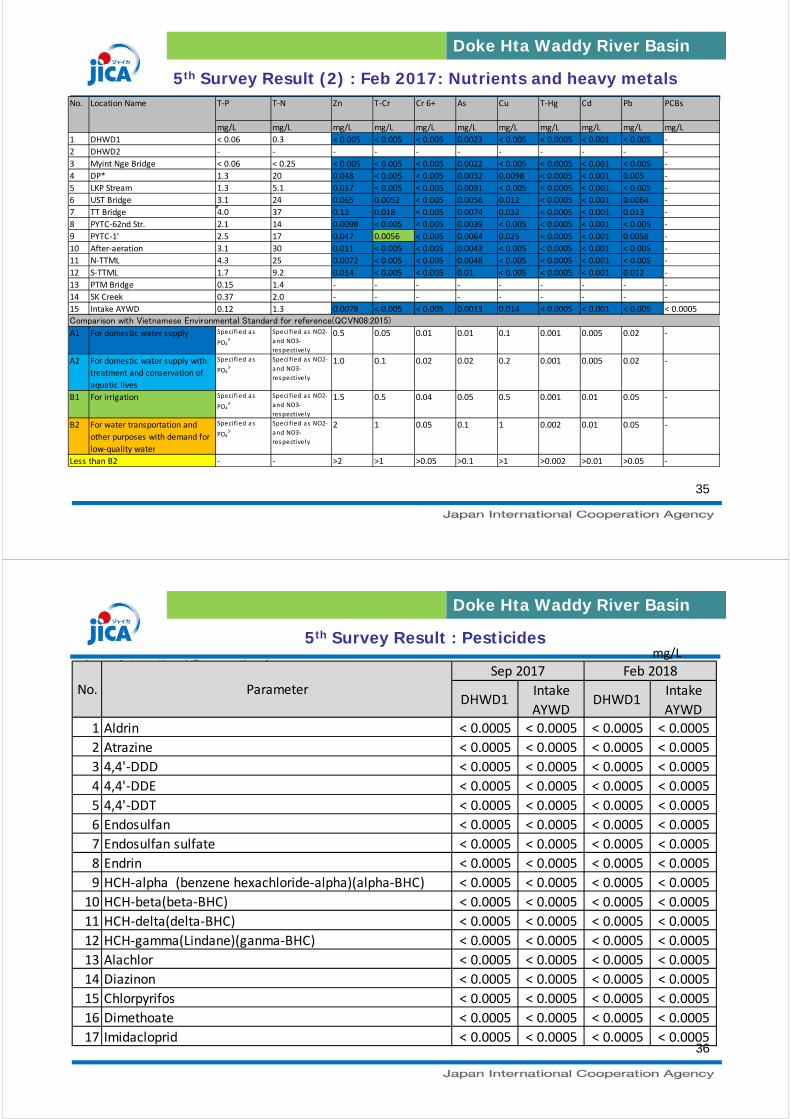
5th Survey Result (2) : Feb 2017: Nutrients and heavy metals
Doke Hta Waddy River Basin
T‐P T‐N Zn T‐Cr Cr 6+ As Cu T‐Hg Cd Pb PCBs
mg/L mg/L mg/L mg/L mg/L mg/L mg/L mg/L mg/L mg/L mg/L
1 DHWD1 < 0.06 0.3 < 0.005 < 0.005 < 0.005 0.0023 < 0.005 < 0.0005 < 0.001 < 0.005 ‐
2 DHWD2 ‐ ‐ ‐ ‐ ‐ ‐ ‐ ‐ ‐ ‐ ‐
3 Myint Nge Bridge < 0.06 < 0.25 < 0.005 < 0.005 < 0.005 0.0022 < 0.005 < 0.0005 < 0.001 < 0.005 ‐
4 DP* 1.3 20 0.048 < 0.005 < 0.005 0.0032 0.0098 < 0.0005 < 0.001 0.005 ‐
5 LKP Stream 1.3 5.1 0.017 < 0.005 < 0.005 0.0091 < 0.005 < 0.0005 < 0.001 < 0.005 ‐
6 UST Bridge 3.1 24 0.065 0.0052 < 0.005 0.0056 0.012 < 0.0005 < 0.001 0.0064 ‐
7 TT Bridge 4.0 37 0.12 0.018 < 0.005 0.0074 0.032 < 0.0005 < 0.001 0.013 ‐
8 PYTC‐62nd Str. 2.1 14 0.0098 < 0.005 < 0.005 0.0039 < 0.005 < 0.0005 < 0.001 < 0.005 ‐
9 PYTC‐1' 2.5 17 0.047 0.0056 < 0.005 0.0064 0.025 < 0.0005 < 0.001 0.0058 ‐
10 After‐aeration 3.1 30 0.011 < 0.005 < 0.005 0.0043 < 0.005 < 0.0005 < 0.001 < 0.005 ‐
11 N‐TTML 4.3 25 0.0072 < 0.005 < 0.005 0.0048 < 0.005 < 0.0005 < 0.001 < 0.005 ‐
12 S‐TTML 1.7 9.2 0.014 < 0.005 < 0.005 0.01 < 0.005 < 0.0005 < 0.001 0.012 ‐
13 PTM Bridge 0.15 1.4 ‐ ‐ ‐ ‐ ‐ ‐ ‐ ‐ ‐
14 SK Creek 0.37 2.0 ‐ ‐ ‐ ‐ ‐ ‐ ‐ ‐ ‐
15 Intake AYWD 0.12 1.3 0.0078 < 0.005 < 0.005 0.0013 0.014 < 0.0005 < 0.001 < 0.005 < 0.0005
Comparison with Vietnamese Environmental Standard for reference(QCVN08:2015)
A1 For domestic water supply Speci fied as
PO43‐
Speci fied as NO2‐
and NO3‐
respectively
0.5 0.05 0.01 0.01 0.1 0.001 0.005 0.02 ‐
A2 For domestic water supply with
treatment and conservation of
aquatic lives
Speci fied as
PO43‐
Speci fied as NO2‐
and NO3‐
respectively
1.0 0.1 0.02 0.02 0.2 0.001 0.005 0.02 ‐
B1 For irrigation Speci fied as
PO43‐
Speci fied as NO2‐
and NO3‐
respectively
1.5 0.5 0.04 0.05 0.5 0.001 0.01 0.05 ‐
B2 For water transportation and
other purposes with demand for
low‐quality water
Speci fied as
PO43‐
Speci fied as NO2‐
and NO3‐
respectively
2 1 0.05 0.1 1 0.002 0.01 0.05 ‐
‐ ‐ >2 >1 >0.05 >0.1 >1 >0.002 >0.01 >0.05 ‐
Location Name
Less than B2
No.
35
5th Survey Result : Pesticides
Doke Hta Waddy River Basin
36
mg/L
1 Aldrin < 0.0005 < 0.0005 < 0.0005 < 0.0005
2 Atrazine < 0.0005 < 0.0005 < 0.0005 < 0.0005
3 4,4'‐DDD < 0.0005 < 0.0005 < 0.0005 < 0.0005
4 4,4'‐DDE < 0.0005 < 0.0005 < 0.0005 < 0.0005
5 4,4'‐DDT < 0.0005 < 0.0005 < 0.0005 < 0.0005
6 Endosulfan < 0.0005 < 0.0005 < 0.0005 < 0.0005
7 Endosulfan sulfate < 0.0005 < 0.0005 < 0.0005 < 0.0005
8 Endrin < 0.0005 < 0.0005 < 0.0005 < 0.0005
9 HCH‐alpha (benzene hexachloride‐alpha)(alpha‐BHC) < 0.0005 < 0.0005 < 0.0005 < 0.0005
10 HCH‐beta(beta‐BHC) < 0.0005 < 0.0005 < 0.0005 < 0.0005
11 HCH‐delta(delta‐BHC) < 0.0005 < 0.0005 < 0.0005 < 0.0005
12 HCH‐gamma(Lindane)(ganma‐BHC) < 0.0005 < 0.0005 < 0.0005 < 0.0005
13 Alachlor < 0.0005 < 0.0005 < 0.0005 < 0.0005
14 Diazinon < 0.0005 < 0.0005 < 0.0005 < 0.0005
15 Chlorpyrifos < 0.0005 < 0.0005 < 0.0005 < 0.0005
16 Dimethoate < 0.0005 < 0.0005 < 0.0005 < 0.0005
17 Imidacloprid < 0.0005 < 0.0005 < 0.0005 < 0.0005
No. Parameter
Sep 2017 Feb 2018
DHWD1Intake
AYWDDHWD1
Intake
AYWD
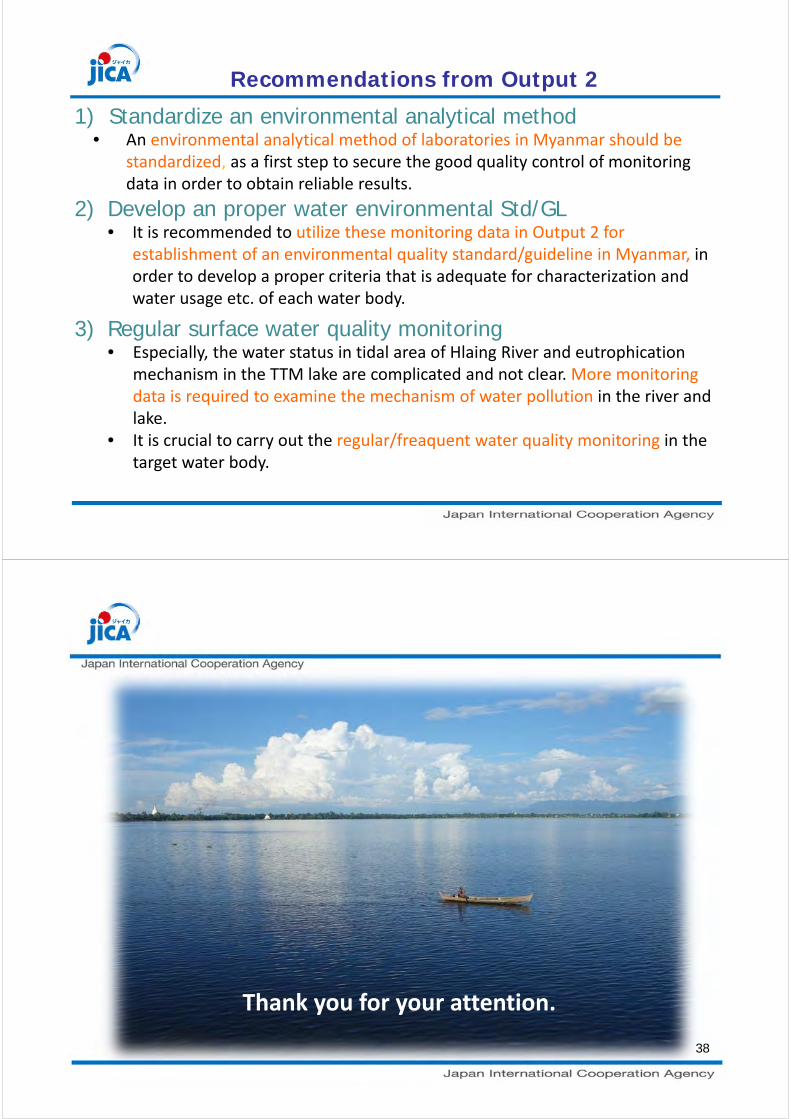
1) Standardize an environmental analytical method• An environmental analytical method of laboratories in Myanmar should be
standardized, as a first step to secure the good quality control of monitoring data in order to obtain reliable results.
2) Develop an proper water environmental Std/GL• It is recommended to utilize these monitoring data in Output 2 for
establishment of an environmental quality standard/guideline in Myanmar, in order to develop a proper criteria that is adequate for characterization and water usage etc. of each water body.
3) Regular surface water quality monitoring• Especially, the water status in tidal area of Hlaing River and eutrophication
mechanism in the TTM lake are complicated and not clear. More monitoring data is required to examine the mechanism of water pollution in the river and lake.
• It is crucial to carry out the regular/freaquent water quality monitoring in the target water body.
Recommendations from Output 2
38
Thank you for your attention.
The Project forCapacity Development in Basic Water Environment
Management and EIA Systemin the Republic of the Union of Myanmar
(Water Environment Management Component)
17 May 2018Shunsuke HIEDAJICA Expert Team
Final Seminar
Water quality status and case studies for water environment management in Myanmar
Water Quality Status of Hlaing River Basin in Yangon
1. Pollution Load Analysis in the Pilot Area in Yangon
Pollution
Pathways
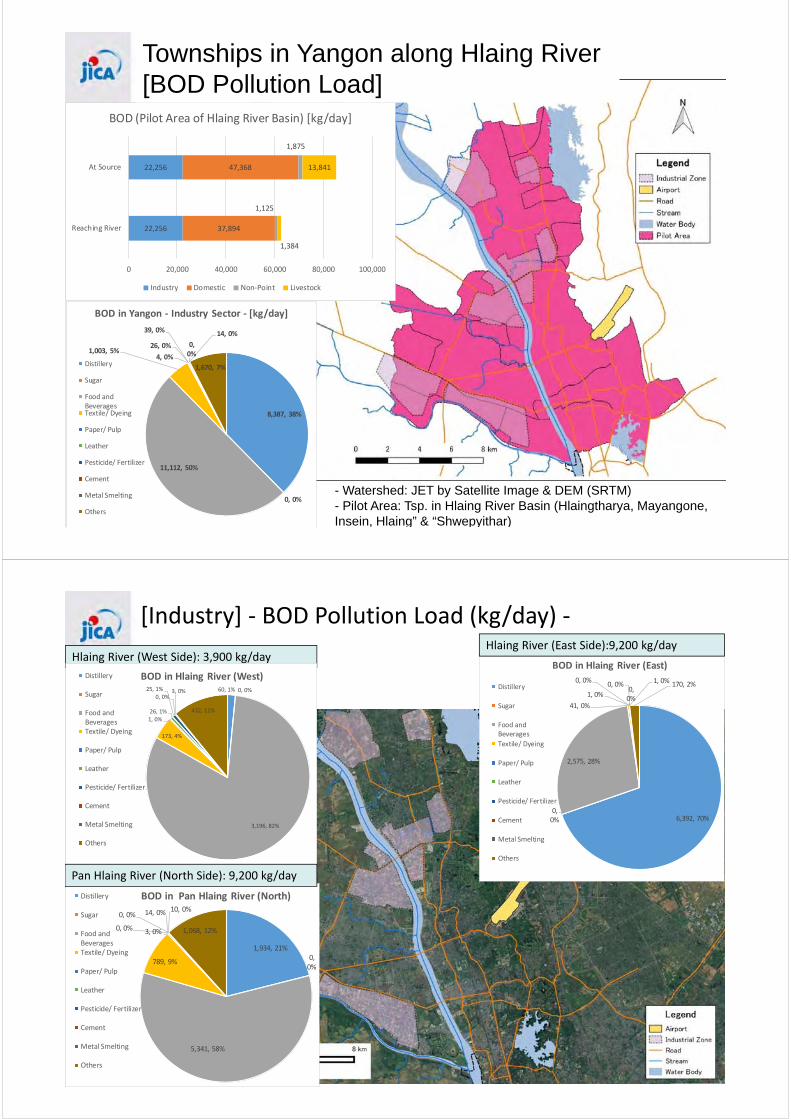
- Watershed: JET by Satellite Image & DEM (SRTM)
- Pilot Area: Tsp. in Hlaing River Basin (Hlaingtharya, Mayangone,
Insein, Hlaing” & “Shwepyithar)
8,387, 38%
0, 0%
11,112, 50%
1,003, 5%4, 0%
26, 0%
39, 0%
0, 0%
14, 0%
1,670, 7%
BOD in Yangon ‐ Industry Sector ‐ [kg/day]
Distillery
Sugar
Food andBeveragesTextile/ Dyeing
Paper/ Pulp
Leather
Pesticide/ Fertilizer
Cement
Metal Smelting
Others
22,256
22,256
37,894
47,368
1,125
1,875
1,384
13,841
0 20,000 40,000 60,000 80,000 100,000
Reaching River
At Source
BOD (Pilot Area of Hlaing River Basin) [kg/day]
Industry Domestic Non‐Point Livestock
Townships in Yangon along Hlaing River
[BOD Pollution Load]
[Industry] ‐ BOD Pollution Load (kg/day) ‐
Hlaing River (West Side): 3,900 kg/day
6,392, 70%0, 0%
2,575, 28%
41, 0%
1, 0%
0, 0%0, 0%
0, 0%
1, 0% 170, 2%
BOD in Hlaing River (East)
Distillery
Sugar
Food andBeverages
Textile/ Dyeing
Paper/ Pulp
Leather
Pesticide/ Fertilizer
Cement
Metal Smelting
Others
1,934, 21%0, 0%
5,341, 58%
789, 9%
3, 0%0, 0%
14, 0%0, 0%10, 0%
1,068, 12%
BOD in Pan Hlaing River (North)Distillery
Sugar
Food andBeveragesTextile/ Dyeing
Paper/ Pulp
Leather
Pesticide/ Fertilizer
Cement
Metal Smelting
Others
60, 1% 0, 0%
3,196, 82%
173, 4%
1, 0%
26, 1%
25, 1%0, 0%
3, 0%
432, 11%
BOD in Hlaing River (West)Distillery
Sugar
Food andBeveragesTextile/ Dyeing
Paper/ Pulp
Leather
Pesticide/ Fertilizer
Cement
Metal Smelting
Others
Pan Hlaing River (North Side): 9,200 kg/day
Hlaing River (East Side):9,200 kg/day
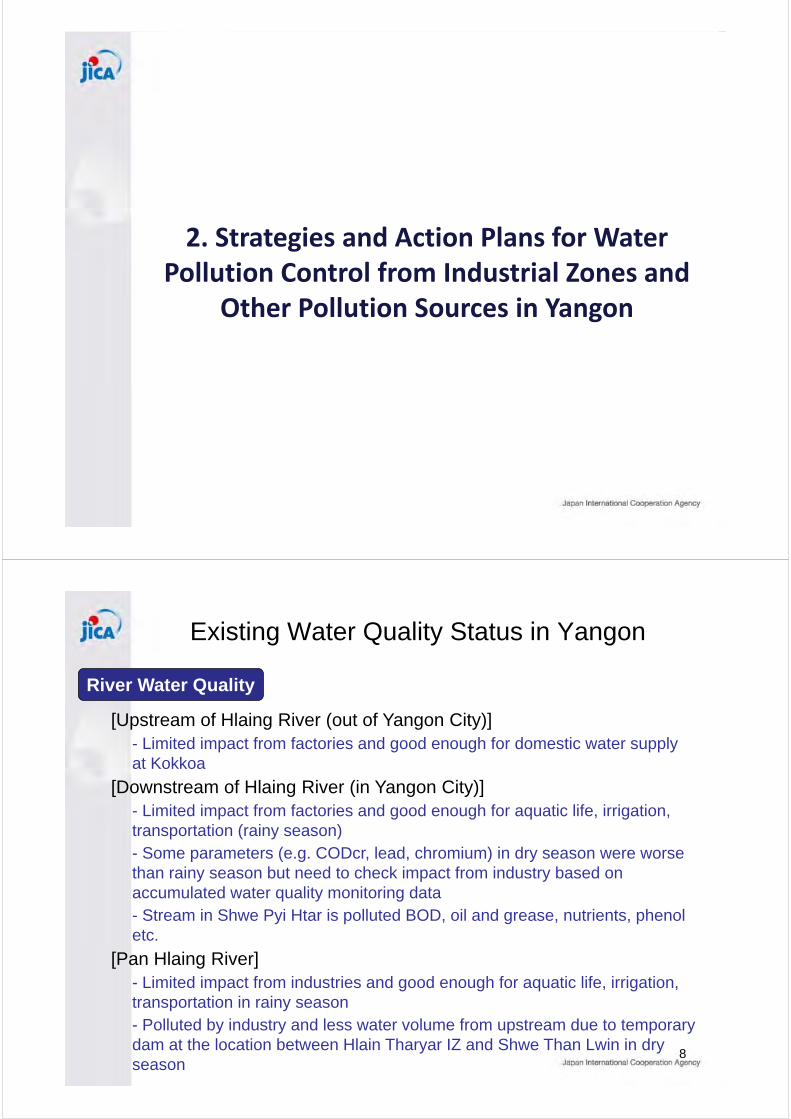
2. Strategies and Action Plans for Water Pollution Control from Industrial Zones and
Other Pollution Sources in Yangon
8
Existing Water Quality Status in Yangon
River Water Quality
[Upstream of Hlaing River (out of Yangon City)]
- Limited impact from factories and good enough for domestic water supply
at Kokkoa
[Downstream of Hlaing River (in Yangon City)]
- Limited impact from factories and good enough for aquatic life, irrigation,
transportation (rainy season)
- Some parameters (e.g. CODcr, lead, chromium) in dry season were worse
than rainy season but need to check impact from industry based on
accumulated water quality monitoring data
- Stream in Shwe Pyi Htar is polluted BOD, oil and grease, nutrients, phenol
etc.
[Pan Hlaing River]
- Limited impact from industries and good enough for aquatic life, irrigation,
transportation in rainy season
- Polluted by industry and less water volume from upstream due to temporary
dam at the location between Hlain Tharyar IZ and Shwe Than Lwin in dry
season
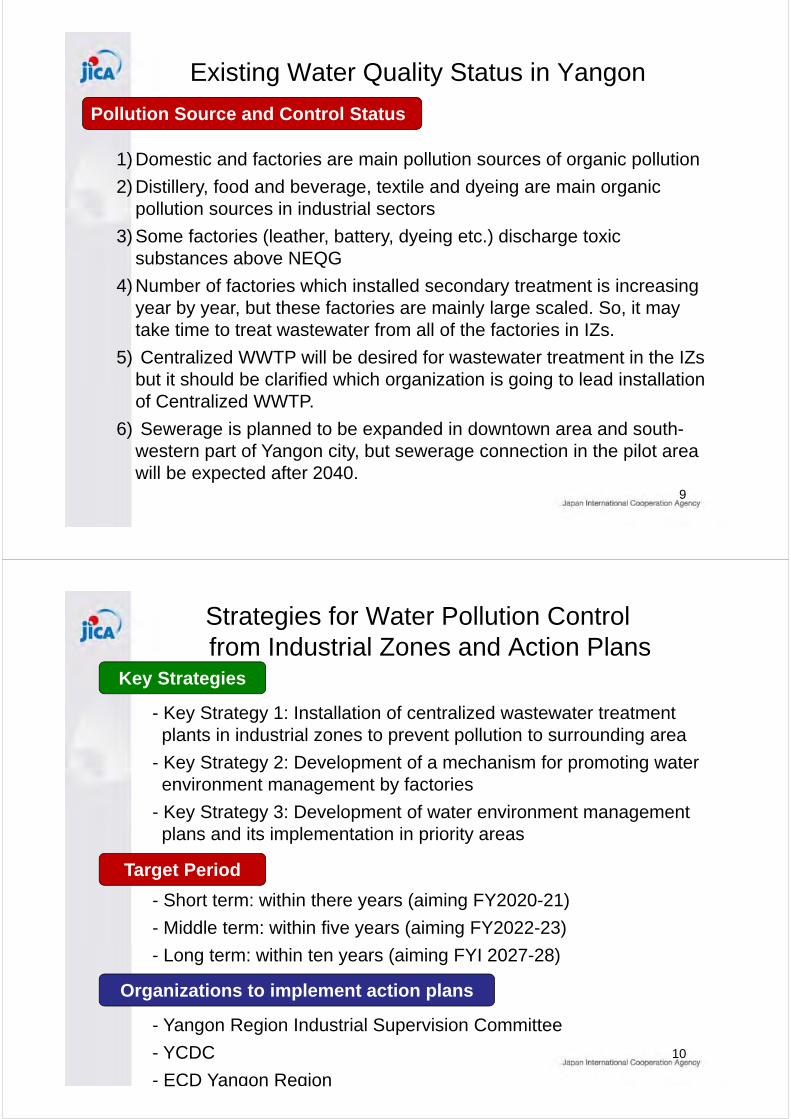
9
Existing Water Quality Status in Yangon
Pollution Source and Control Status
1) Domestic and factories are main pollution sources of organic pollution
2) Distillery, food and beverage, textile and dyeing are main organic
pollution sources in industrial sectors
3) Some factories (leather, battery, dyeing etc.) discharge toxic
substances above NEQG
4) Number of factories which installed secondary treatment is increasing
year by year, but these factories are mainly large scaled. So, it may
take time to treat wastewater from all of the factories in IZs.
5) Centralized WWTP will be desired for wastewater treatment in the IZs
but it should be clarified which organization is going to lead installation
of Centralized WWTP.
6) Sewerage is planned to be expanded in downtown area and south-
western part of Yangon city, but sewerage connection in the pilot area
will be expected after 2040.
10
Strategies for Water Pollution Control
from Industrial Zones and Action PlansKey Strategies
- Key Strategy 1: Installation of centralized wastewater treatment
plants in industrial zones to prevent pollution to surrounding area
- Key Strategy 2: Development of a mechanism for promoting water
environment management by factories
- Key Strategy 3: Development of water environment management
plans and its implementation in priority areas
Target Period
- Short term: within there years (aiming FY2020-21)
- Middle term: within five years (aiming FY2022-23)
- Long term: within ten years (aiming FYI 2027-28)
Organizations to implement action plans
- Yangon Region Industrial Supervision Committee
- YCDC
- ECD Yangon Region
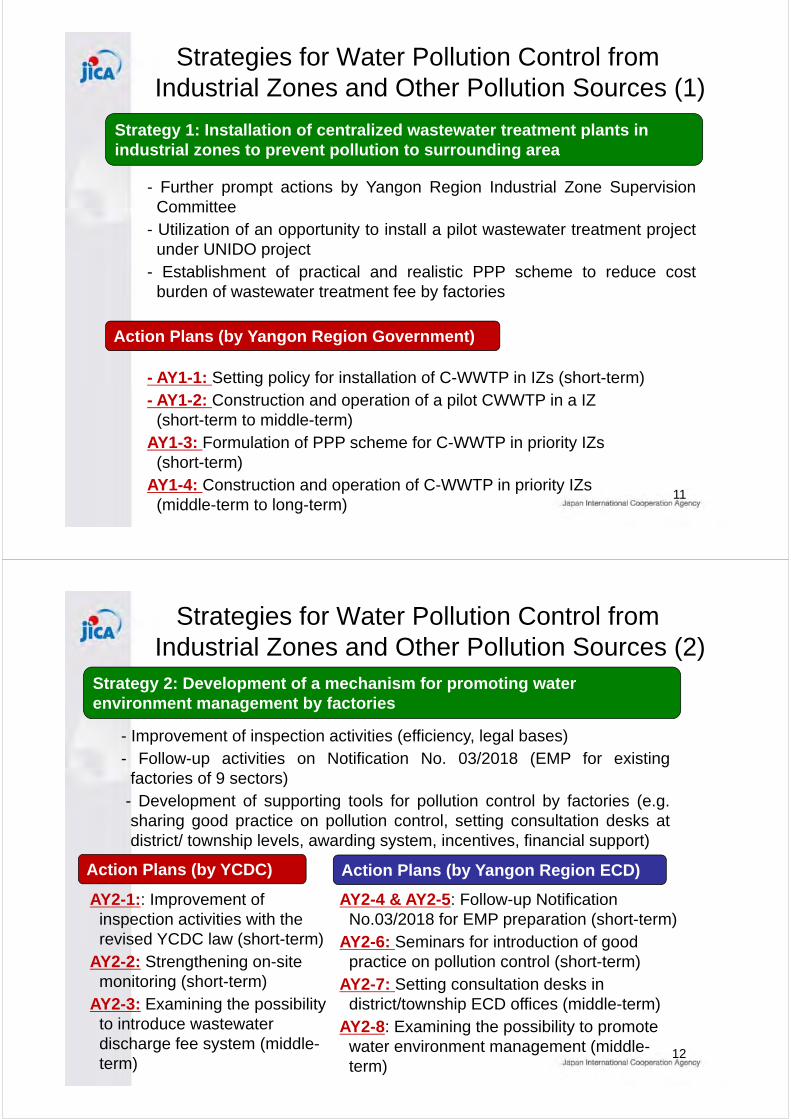
11
Strategies for Water Pollution Control from
Industrial Zones and Other Pollution Sources (1)
Strategy 1: Installation of centralized wastewater treatment plants in
industrial zones to prevent pollution to surrounding area
Action Plans (by Yangon Region Government)
- Further prompt actions by Yangon Region Industrial Zone Supervision
Committee
- Utilization of an opportunity to install a pilot wastewater treatment project
under UNIDO project
- Establishment of practical and realistic PPP scheme to reduce cost
burden of wastewater treatment fee by factories
- AY1-1: Setting policy for installation of C-WWTP in IZs (short-term)
- AY1-2: Construction and operation of a pilot CWWTP in a IZ
(short-term to middle-term)
AY1-3: Formulation of PPP scheme for C-WWTP in priority IZs
(short-term)
AY1-4: Construction and operation of C-WWTP in priority IZs
(middle-term to long-term)
12
Strategies for Water Pollution Control from
Industrial Zones and Other Pollution Sources (2)
Strategy 2: Development of a mechanism for promoting water
environment management by factories
Action Plans (by YCDC)
- Improvement of inspection activities (efficiency, legal bases)
- Follow-up activities on Notification No. 03/2018 (EMP for existing
factories of 9 sectors)
- Development of supporting tools for pollution control by factories (e.g.
sharing good practice on pollution control, setting consultation desks at
district/ township levels, awarding system, incentives, financial support)
AY2-1:: Improvement of
inspection activities with the
revised YCDC law (short-term)
AY2-2: Strengthening on-site
monitoring (short-term)
AY2-3: Examining the possibility
to introduce wastewater
discharge fee system (middle-
term)
Action Plans (by Yangon Region ECD)
AY2-4 & AY2-5: Follow-up Notification
No.03/2018 for EMP preparation (short-term)
AY2-6: Seminars for introduction of good
practice on pollution control (short-term)
AY2-7: Setting consultation desks in
district/township ECD offices (middle-term)
AY2-8: Examining the possibility to promote
water environment management (middle-
term)
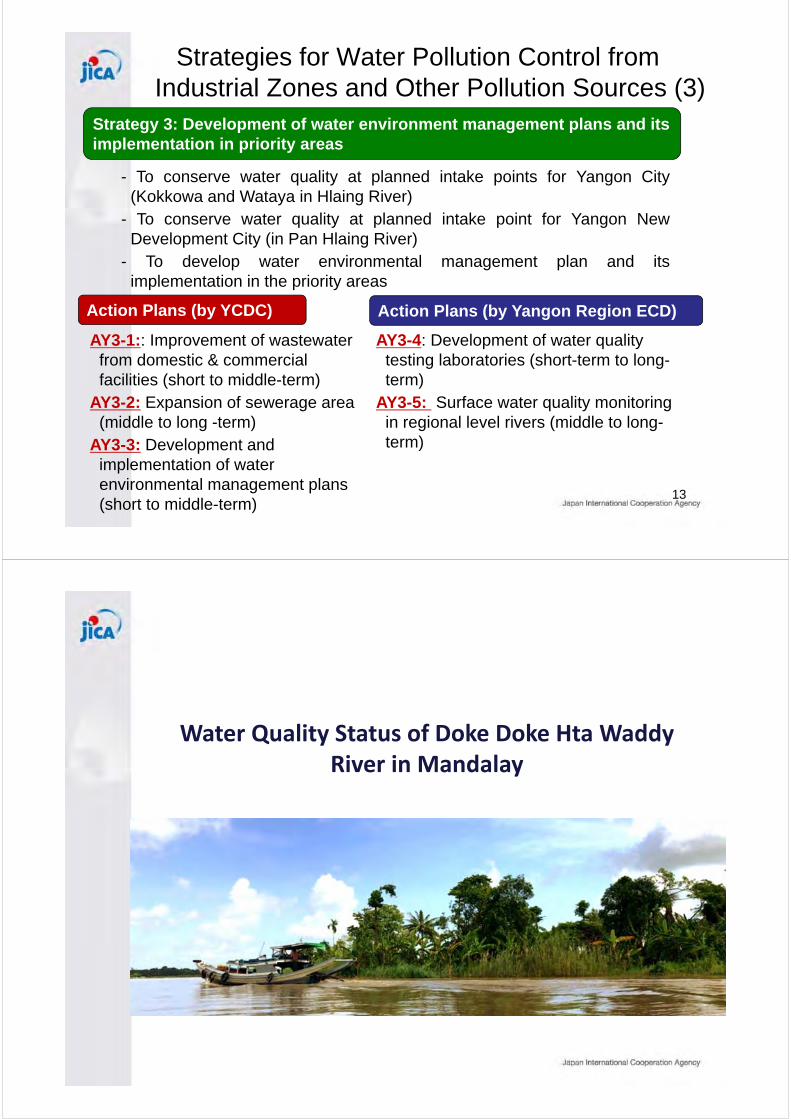
13
Strategies for Water Pollution Control from
Industrial Zones and Other Pollution Sources (3)
Strategy 3: Development of water environment management plans and its
implementation in priority areas
Action Plans (by YCDC)
- To conserve water quality at planned intake points for Yangon City
(Kokkowa and Wataya in Hlaing River)
- To conserve water quality at planned intake point for Yangon New
Development City (in Pan Hlaing River)
- To develop water environmental management plan and its
implementation in the priority areas
AY3-1:: Improvement of wastewater
from domestic & commercial
facilities (short to middle-term)
AY3-2: Expansion of sewerage area
(middle to long -term)
AY3-3: Development and
implementation of water
environmental management plans
(short to middle-term)
Action Plans (by Yangon Region ECD)
AY3-4: Development of water quality
testing laboratories (short-term to long-
term)
AY3-5: Surface water quality monitoring
in regional level rivers (middle to long-
term)
Water Quality Status of Doke Doke Hta WaddyRiver in Mandalay
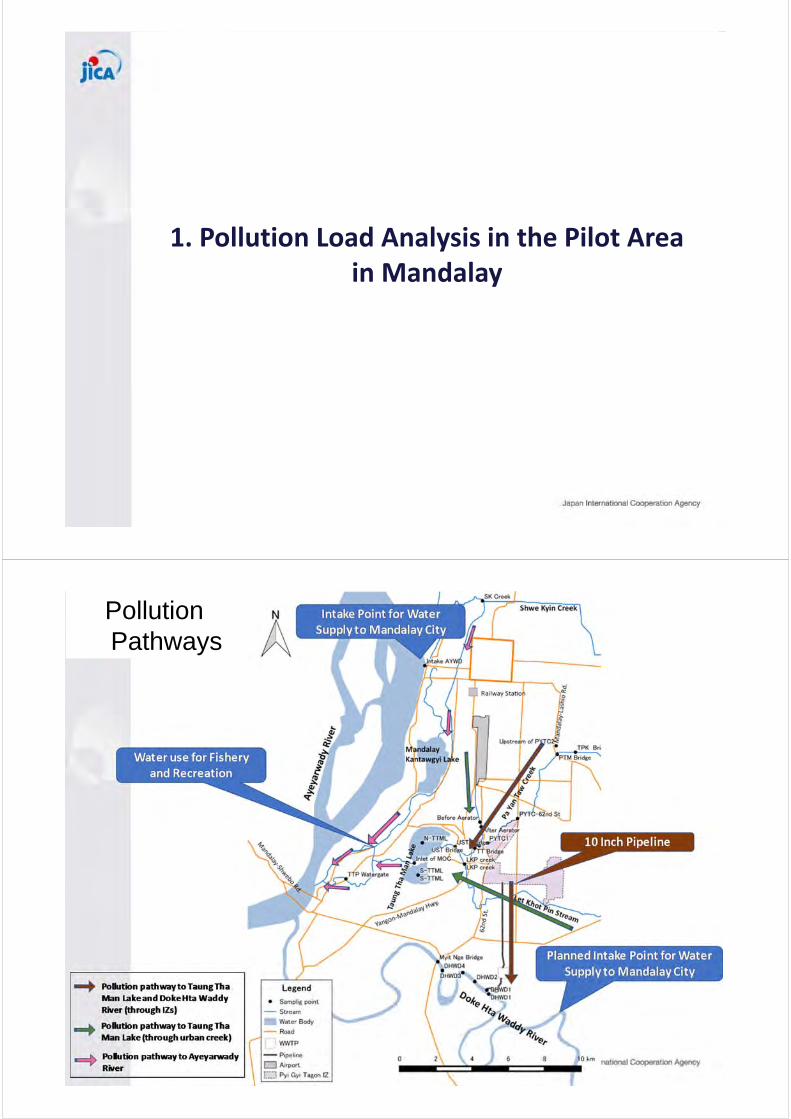
1. Pollution Load Analysis in the Pilot Area in Mandalay
Pollution
Pathways
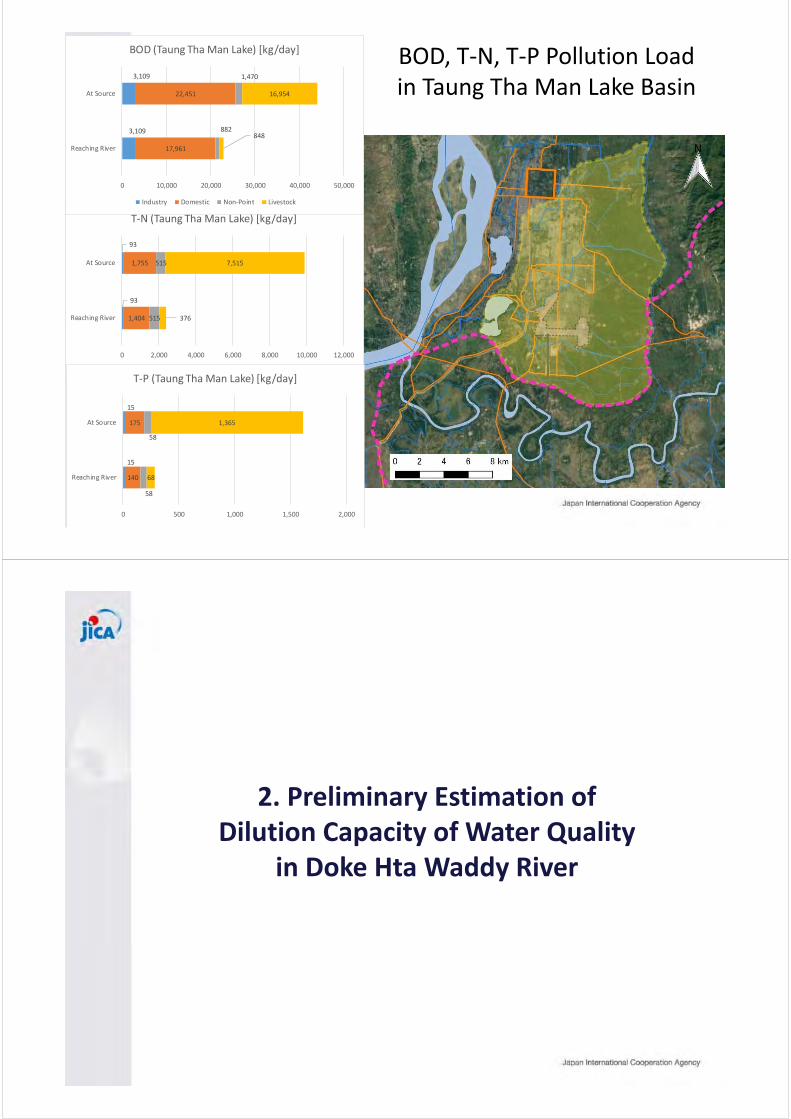
93
93
1,404
1,755
515
515
376
7,515
0 2,000 4,000 6,000 8,000 10,000 12,000
Reaching River
At Source
T‐N (Taung Tha Man Lake) [kg/day]
Industry Domestic Non‐Point Livestock
3,109
3,109
17,961
22,451
882
1,470
848
16,954
0 10,000 20,000 30,000 40,000 50,000
Reaching River
At Source
BOD (Taung Tha Man Lake) [kg/day]
Industry Domestic Non‐Point Livestock
15
15
140
175
58
58
68
1,365
0 500 1,000 1,500 2,000
Reaching River
At Source
T‐P (Taung Tha Man Lake) [kg/day]
BOD, T‐N, T‐P Pollution Load in Taung Tha Man Lake Basin
2. Preliminary Estimation of Dilution Capacity of Water Quality
in Doke Hta Waddy River
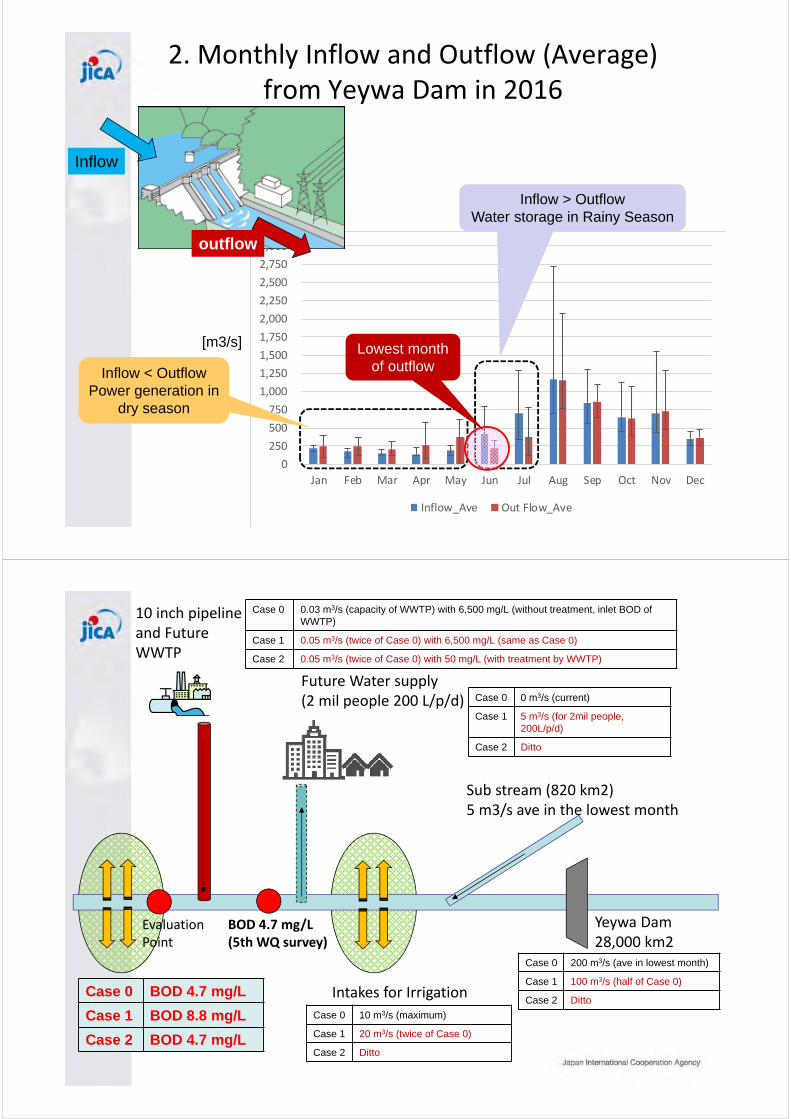
2. Monthly Inflow and Outflow (Average) from Yeywa Dam in 2016
19
0
250
500
750
1,000
1,250
1,500
1,750
2,000
2,250
2,500
2,750
3,000
Jan Feb Mar Apr May Jun Jul Aug Sep Oct Nov Dec
Inflow_Ave Out Flow_Ave
[m3/s]
Inflow
outflow
Inflow < Outflow
Power generation in
dry season
Inflow > Outflow
Water storage in Rainy Season
Lowest month
of outflow
Yeywa Dam28,000 km2
Sub stream (820 km2)5 m3/s ave in the lowest month
Intakes for Irrigation
10 inch pipelineand Future WWTP
Future Water supply(2 mil people 200 L/p/d)
BOD 4.7 mg/L(5th WQ survey)
Evaluation Point
Case 0 200 m3/s (ave in lowest month)
Case 1 100 m3/s (half of Case 0)
Case 2 Ditto
Case 0 0 m3/s (current)
Case 1 5 m3/s (for 2mil people,
200L/p/d)
Case 2 Ditto
Case 0 10 m3/s (maximum)
Case 1 20 m3/s (twice of Case 0)
Case 2 Ditto
Case 0 0.03 m3/s (capacity of WWTP) with 6,500 mg/L (without treatment, inlet BOD of
WWTP)
Case 1 0.05 m3/s (twice of Case 0) with 6,500 mg/L (same as Case 0)
Case 2 0.05 m3/s (twice of Case 0) with 50 mg/L (with treatment by WWTP)
Case 0 BOD 4.7 mg/L
Case 1 BOD 8.8 mg/L
Case 2 BOD 4.7 mg/L
3. Strategies and Action Plans for Water Pollution Control from Industrial Zones and
Other Pollution Sources in Mandalay
22
Existing Water Quality Status in Mandalay
River and Lake Water Quality
1) Good enough for domestic water supply at Doke Hta Waddy River
2) Stream reaching TTML is polluted by organic materials, nutrients,
moderate level of oil & grease, phenols are found in dry season.
3) No heavy metals, pesticide are found
4) Eutrophication was found in TTML
1) Domestic is main pollution source on organic pollution
2) Industry is second largest pollution source on organic pollution
3) In TTML, agriculture is also main pollution source on TN and TP
4) Distillery, food and beverage, textile and dyeing, paper and pulp are
main organic pollution source in industrial sector
5) Some factory (leather, battery, dyeing etc.) discharge toxic
substance against NEQG
6) Sewerage in catchment of TTML will be expected after 2020
7) WWTP will be functionable facility for Doke Hta Waddy River Water
Quality
Pollution Source and Control Status
23
Strategies for Water Pollution Control
from Industrial Zones and Action Plans
Key Strategies
- Key Strategy 1: Water environment conservation for future water
use of Doke Hta Waddy River
- Key Strategy 2: Improvement of water quality of Taung Tha Man
Lake to increase value of the lake for tourism, recreation, fisheries,
etc.
Target Period
- Short term: within there years (aiming FY2020-21)
- Middle term: within five years (aiming FY2022-23)
- Long term: within ten years (aiming FYI 2027-28)
Organizations to implement action plans
- MCDC
- ECD Mandalay Region
24
Strategies for Water Pollution Control from
Industrial Zones and Other Pollution Sources (1)
Strategy 1: Water environment conservation for future water use of Doke
Hta Waddy River
Action Plans (by MCDC)
- Increasing the capacity to treat industrial wastewater from Pyi Gyi
Tagon IZ for future
- Setting regulations or rules for investment in large-volume water
intake and/or discharging of wastewater from/to Doke Hta Waddy
River for future
AM1-1: Setting a coordination
committee among stakeholders for
water use right and setting the
maintenance flow of Doke Hta Waddy
River (short-term)
AM1-2: Completion of construction and
starting operation of C-WWTP (on-
going, short-term to middle-term)
AM1-3: Installation of the water supply
system from Doke Hta Waddy River
(middle-term)
Action Plans (by Mandalay ECD)
AM1-4 & AY1-5: Follow-up Notification
No.03/2018 for EMP preparation (short-
term)
AY1-6: Starting-up and implementation of
surface water quality monitoring in rivers
in the Region out of Mandalay City
(middle-term to long-term)
25
Strategies for Water Pollution Control from
Industrial Zones and Other Pollution Sources (2)
Strategy 2: Improvement of water quality of Taung Tha Man Lake to
increase value of the lake for tourism, recreation, fisheries, etc.
Action Plans (by MCDC)
- Domestic wastewater is critical pollution source
- Improvement of lake water will be benefit for water user
- Some activities for pollution control have been already implemented
- Water pollution reduction plan will be developed based on further water
quality and hydrological data
AM2-1: Monitoring of connection status of
the 10-inch-pipeline (started, short-term)
AM2-2: Issuing a notification of installation of
WWT system to new large scaled facilities,
(drafting, short-term)
AM2-3: Participation in awareness raising
activities for farmers by DOA (short-term)
AM2-4: Monitoring of eutrophication status
in TTML (short-term)
AM2-5: Expansion of the sewerage area in
Mandalay City (middle-term to long-term)
Action Plans (by Mandalay ECD)
AM2-5 & AM2-6: Follow-up
Notification No.03/2018 for
EMP preparation (short-term)
26
Strategies for Water Pollution Control from
Industrial Zones and Other Pollution Sources (3)
Other Supportive Activities
Action Plans (by Mandalay ECD)
AM3-1: Organizing seminars for introduction of good practice on
pollution control in Myanmar (short-term)
AM3-2: Setting consultation desks in district/township ECD offices to
provide advices/information to factories on pollution control (middle-
term)
AM3-3: Examining the possibility to promote water environment
management (e.g. awarding system with some incentives,
establishment of low interest fund, consultation on cleaner production)
in Yangon Region, through research for similar systems in ASEAN
countries (middle-term)
AM3-4: Arrangement of ad hoc coordination meetings to exchange
information on pollution sources and results of inspections among DISI,
MCDC, ECD Mandalay Region (short-term)
Strategies and Action Plans for Water Pollution Control from Industrial Zones and
Other Pollution Sources at National Level
28
Functions of Regional and National
Water Environment Management Strategies
- To understand regional issues and take actions (e.g.
wastewater from IZs, priority sector to be controlled)
- To conserve water environment for water use (e.g. water
supply for Mandalay City, Yangon City/ Region)
- To improve current water quality in important area in Regional
Level (e.g. TTML)
Regional Water Environment Management Strategies
National Water Environment Management Strategies
- To understand nation wide/ cross border issues and take actions
(e.g. Ayeyawaddy river, import/ export of waste)
- To identify priorities areas to be controlled among state and regions
- To provide environment management tools to support env
management at regional level by unified policies/ regulations/
systems
- To strengthening organization in ECD HQ and Regional ECD
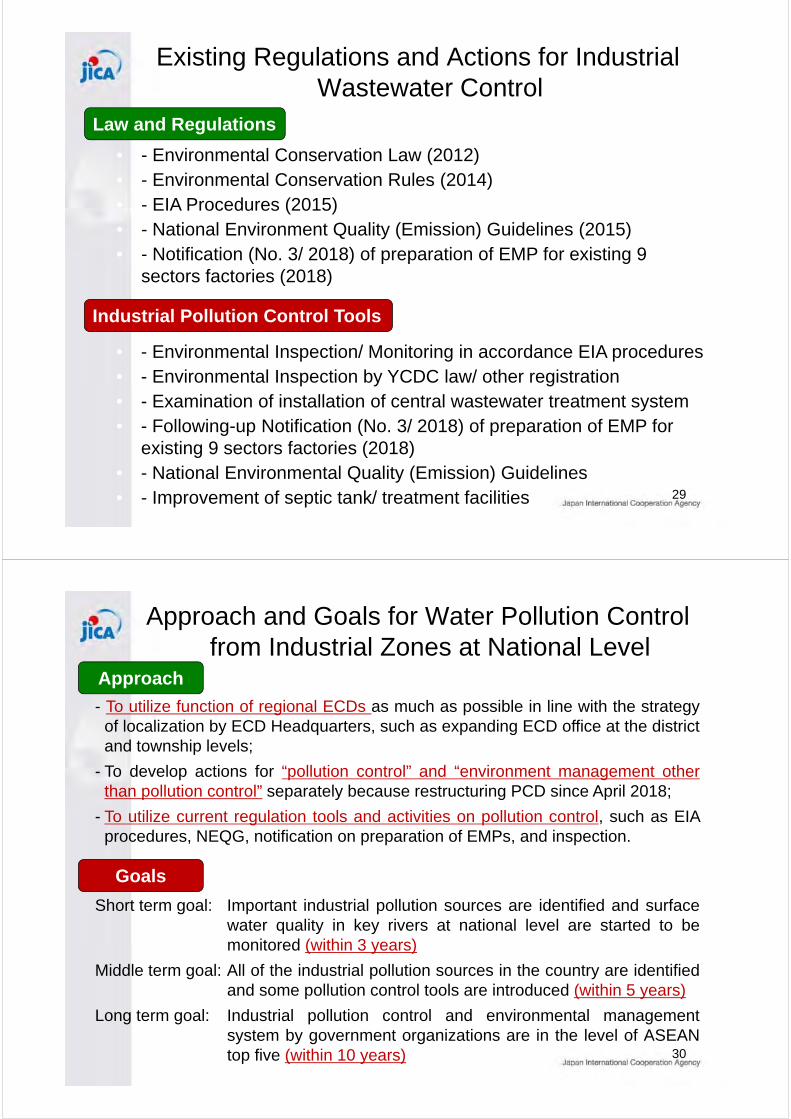
29
Existing Regulations and Actions for Industrial
Wastewater Control
Law and Regulations
• - Environmental Conservation Law (2012)
• - Environmental Conservation Rules (2014)
• - EIA Procedures (2015)
• - National Environment Quality (Emission) Guidelines (2015)
• - Notification (No. 3/ 2018) of preparation of EMP for existing 9
sectors factories (2018)
Industrial Pollution Control Tools
• - Environmental Inspection/ Monitoring in accordance EIA procedures
• - Environmental Inspection by YCDC law/ other registration
• - Examination of installation of central wastewater treatment system
• - Following-up Notification (No. 3/ 2018) of preparation of EMP for
existing 9 sectors factories (2018)
• - National Environmental Quality (Emission) Guidelines
• - Improvement of septic tank/ treatment facilities
30
Approach and Goals for Water Pollution Control
from Industrial Zones at National Level
- To utilize function of regional ECDs as much as possible in line with the strategy
of localization by ECD Headquarters, such as expanding ECD office at the district
and township levels;
- To develop actions for “pollution control” and “environment management other
than pollution control” separately because restructuring PCD since April 2018;
- To utilize current regulation tools and activities on pollution control, such as EIA
procedures, NEQG, notification on preparation of EMPs, and inspection.
Approach
Goals
Short term goal: Important industrial pollution sources are identified and surface
water quality in key rivers at national level are started to be
monitored (within 3 years)
Middle term goal: All of the industrial pollution sources in the country are identified
and some pollution control tools are introduced (within 5 years)
Long term goal: Industrial pollution control and environmental management
system by government organizations are in the level of ASEAN
top five (within 10 years)
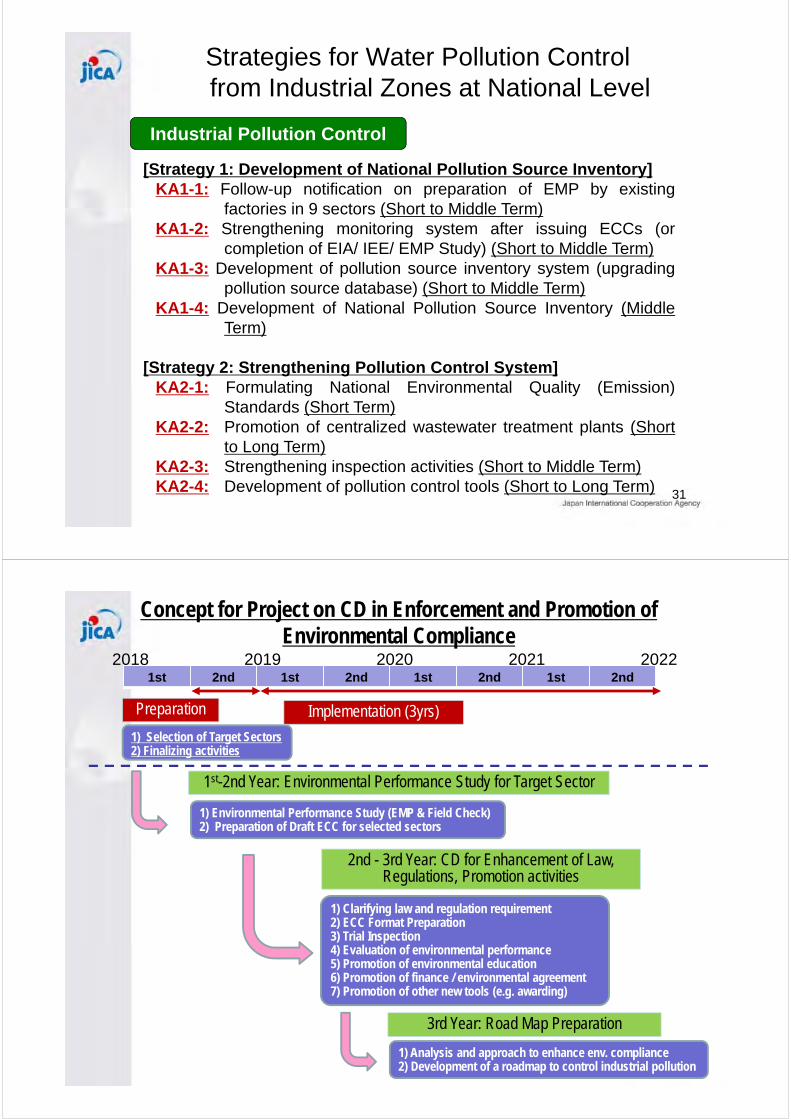
31
Strategies for Water Pollution Control
from Industrial Zones at National Level
Industrial Pollution Control
[Strategy 1: Development of National Pollution Source Inventory]
KA1-1: Follow-up notification on preparation of EMP by existing
factories in 9 sectors (Short to Middle Term)
KA1-2: Strengthening monitoring system after issuing ECCs (or
completion of EIA/ IEE/ EMP Study) (Short to Middle Term)
KA1-3: Development of pollution source inventory system (upgrading
pollution source database) (Short to Middle Term)
KA1-4: Development of National Pollution Source Inventory (Middle
Term)
[Strategy 2: Strengthening Pollution Control System]
KA2-1: Formulating National Environmental Quality (Emission)
Standards (Short Term)
KA2-2: Promotion of centralized wastewater treatment plants (Short
to Long Term)
KA2-3: Strengthening inspection activities (Short to Middle Term)
KA2-4: Development of pollution control tools (Short to Long Term)
2018 2019 2020 2021 2022
Preparation
1) Selection of Target Sectors2) Finalizing activities
1) Environmental Performance Study (EMP & Field Check)2) Preparation of Draft ECC for selected sectors
Concept for Project on CD in Enforcement and Promotion of Environmental Compliance
1st 2nd 1st 2nd 1st 2nd 1st 2nd
Implementation (3yrs)
1st-2nd Year: Environmental Performance Study for Target Sector
2nd - 3rd Year: CD for Enhancement of Law, Regulations, Promotion activities
1) Clarifying law and regulation requirement2) ECC Format Preparation3) Trial Inspection4) Evaluation of environmental performance5) Promotion of environmental education6) Promotion of finance / environmental agreement7) Promotion of other new tools (e.g. awarding)
3rd Year: Road Map Preparation
1) Analysis and approach to enhance env. compliance2) Development of a roadmap to control industrial pollution
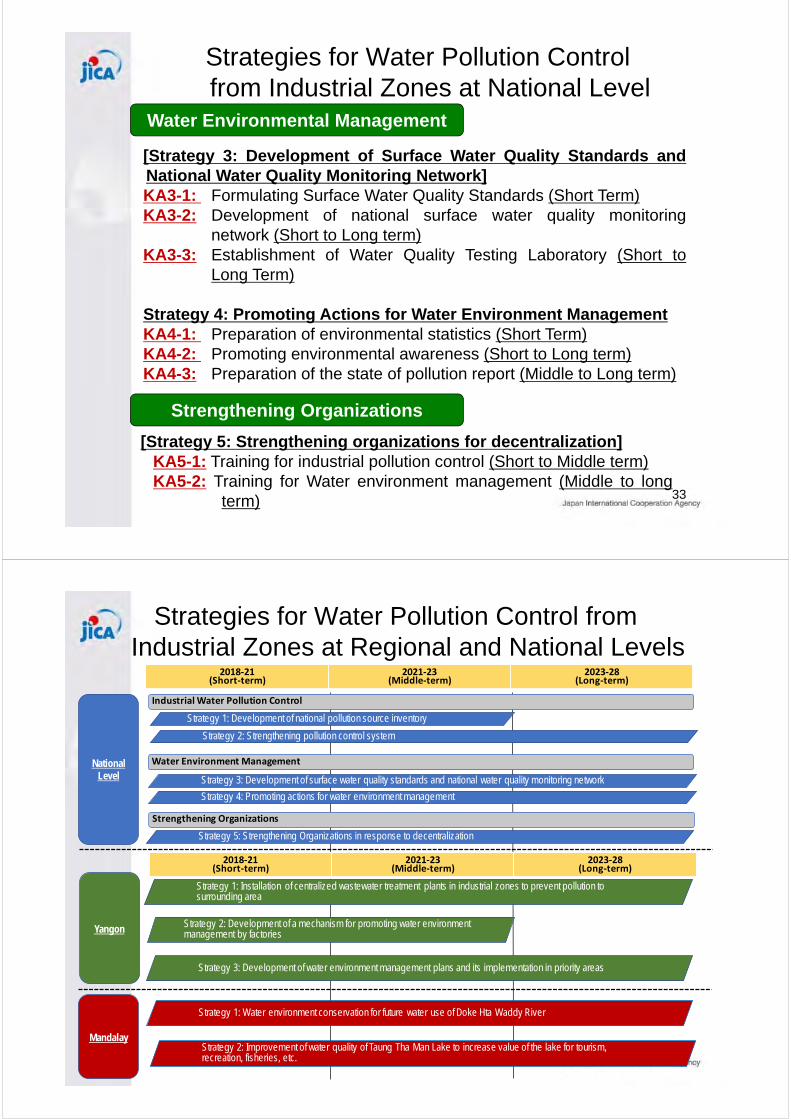
33
Strategies for Water Pollution Control
from Industrial Zones at National Level
Water Environmental Management
[Strategy 3: Development of Surface Water Quality Standards and
National Water Quality Monitoring Network]
KA3-1: Formulating Surface Water Quality Standards (Short Term)
KA3-2: Development of national surface water quality monitoring
network (Short to Long term)
KA3-3: Establishment of Water Quality Testing Laboratory (Short to
Long Term)
Strategy 4: Promoting Actions for Water Environment Management
KA4-1: Preparation of environmental statistics (Short Term)
KA4-2: Promoting environmental awareness (Short to Long term)
KA4-3: Preparation of the state of pollution report (Middle to Long term)
Strengthening Organizations
[Strategy 5: Strengthening organizations for decentralization]
KA5-1: Training for industrial pollution control (Short to Middle term)
KA5-2: Training for Water environment management (Middle to long
term)
Strategies for Water Pollution Control from
Industrial Zones at Regional and National Levels
NationalLevel
2018‐21 (Short‐term)
2021‐23 (Middle‐term)
2023‐28 (Long‐term)
Yangon
Mandalay
Industrial Water Pollution Control
Water Environment Management
Strategy 2: Strengthening pollution control system
Strengthening Organizations
Strategy 1: Development of national pollution source inventory
Strategy 3: Development of surface water quality standards and national water quality monitoring network
Strategy 4: Promoting actions for water environment management
Strategy 5: Strengthening Organizations in response to decentralization
Strategy 3: Development of water environment management plans and its implementation in priority areas
Strategy 2: Development of a mechanism for promoting water environment management by factories
Strategy 1: Water environment conservation for future water use of Doke Hta Waddy River
Strategy 2: Improvement of water quality of Taung Tha Man Lake to increase value of the lake for tourism, recreation, fisheries, etc.
Strategy 1: Installation of centralized wastewater treatment plants in industrial zones to prevent pollution to surrounding area
2018‐21 (Short‐term)
2021‐23 (Middle‐term)
2023‐28 (Long‐term)
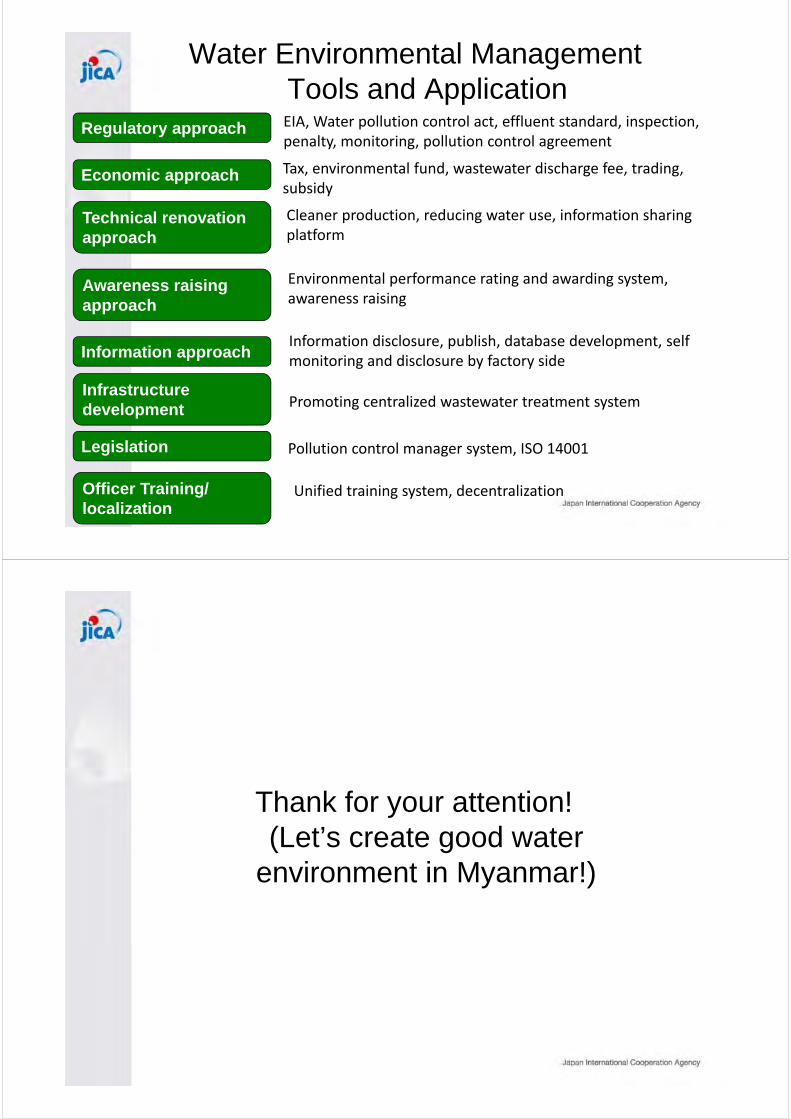
Water Environmental Management
Tools and Application
Regulatory approach
Economic approach
Technical renovation
approach
Awareness raising
approach
Infrastructure
development
Information approach
Officer Training/
localization
Legislation
EIA, Water pollution control act, effluent standard, inspection, penalty, monitoring, pollution control agreement
Tax, environmental fund, wastewater discharge fee, trading, subsidy
Cleaner production, reducing water use, information sharing platform
Environmental performance rating and awarding system, awareness raising
Pollution control manager system, ISO 14001
Promoting centralized wastewater treatment system
Information disclosure, publish, database development, self monitoring and disclosure by factory side
Unified training system, decentralization
Thank for your attention!
(Let’s create good water
environment in Myanmar!)
Project for Capacity Development in Basic Water Environment Management and
EIA System in the Republic of the Union of Myanmar
Final Report
Appendix 15:
Publicity Documents
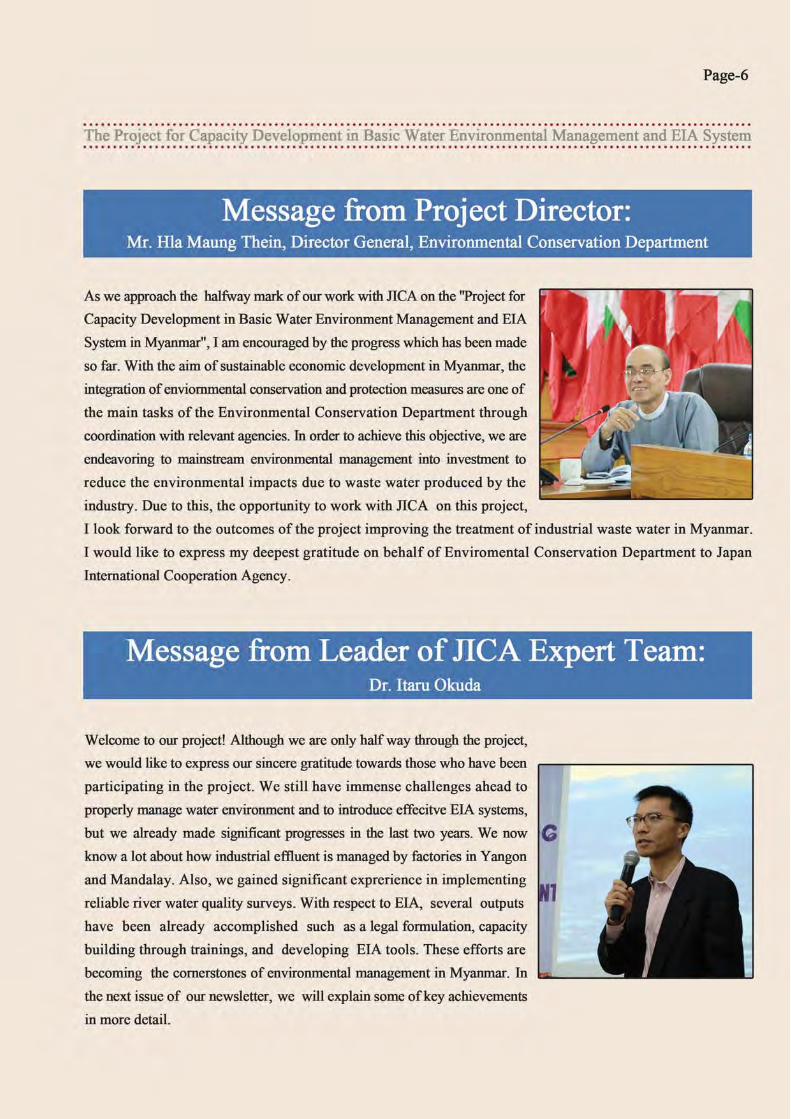
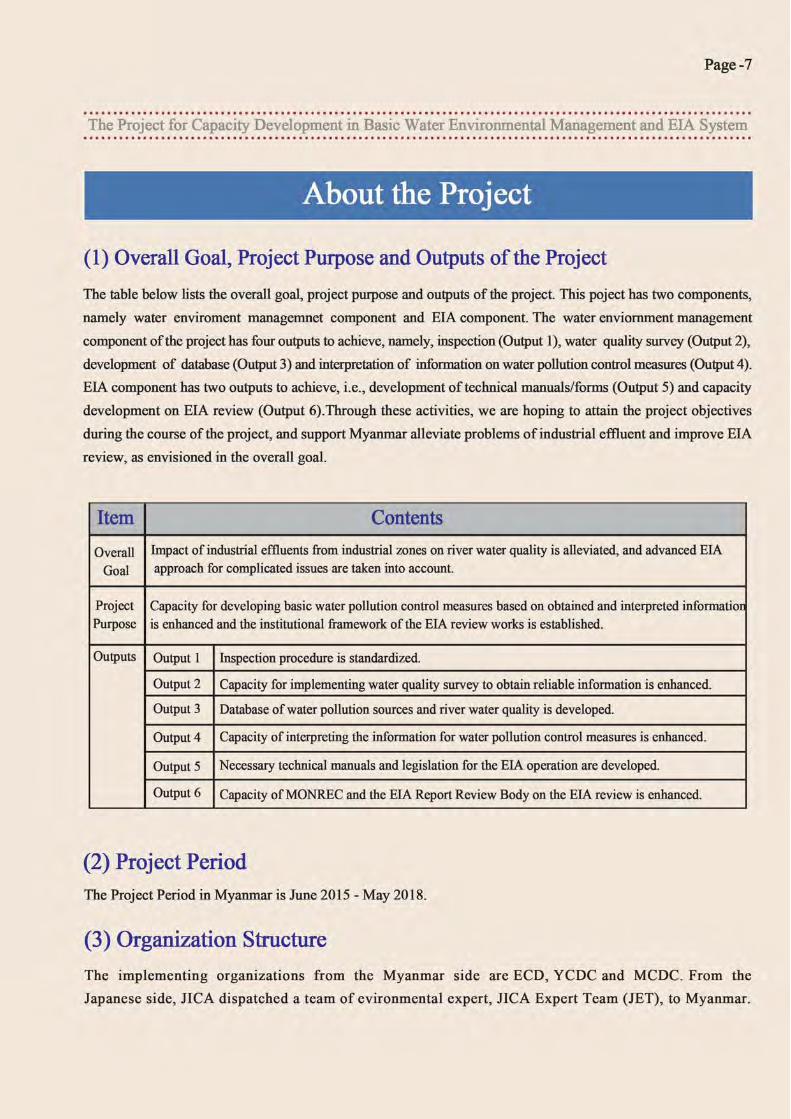
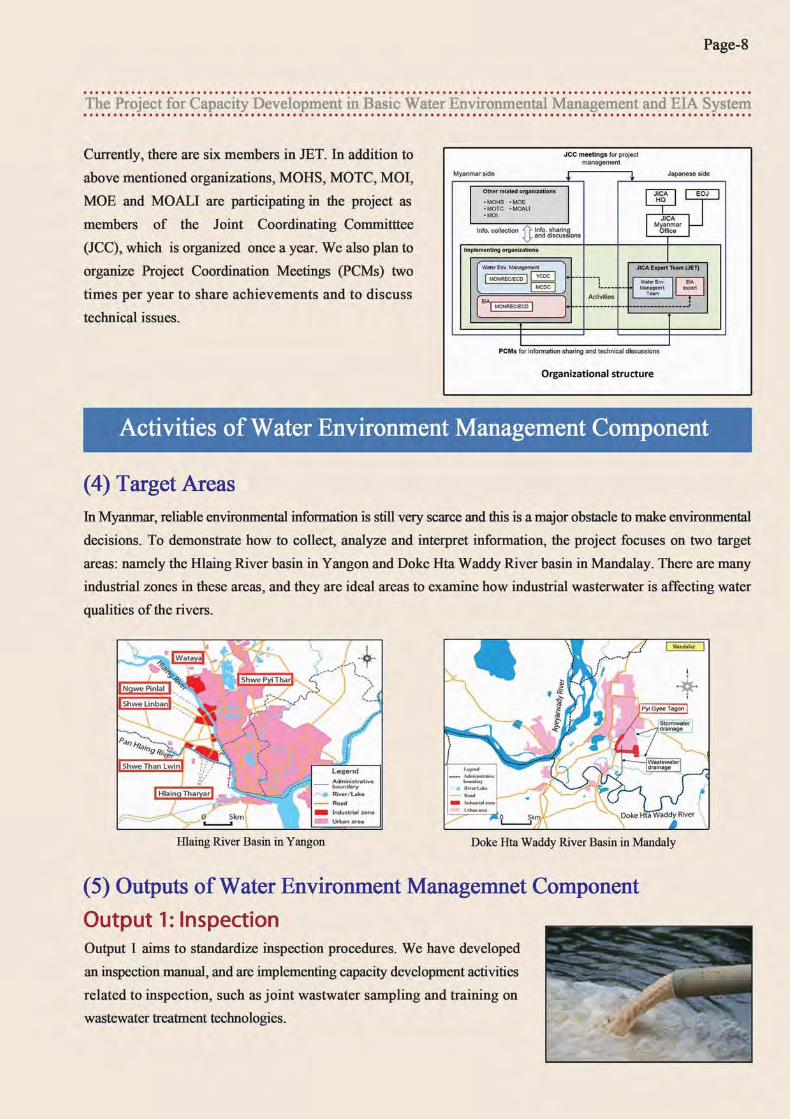
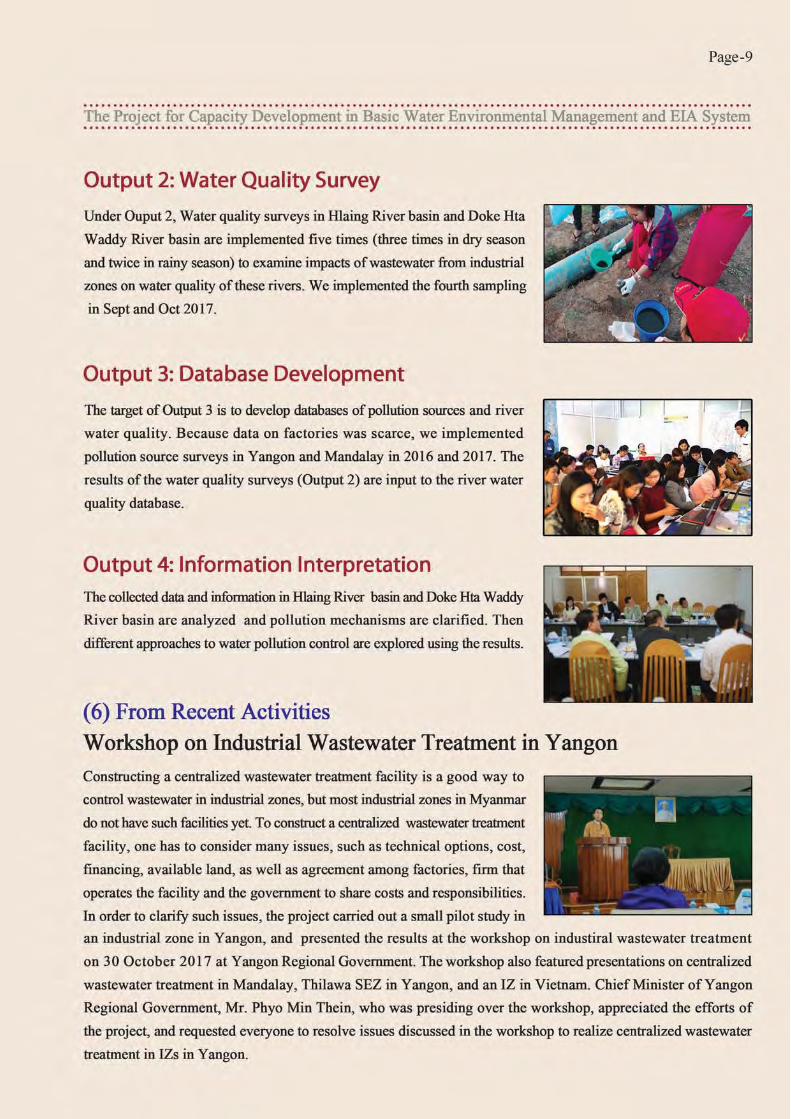
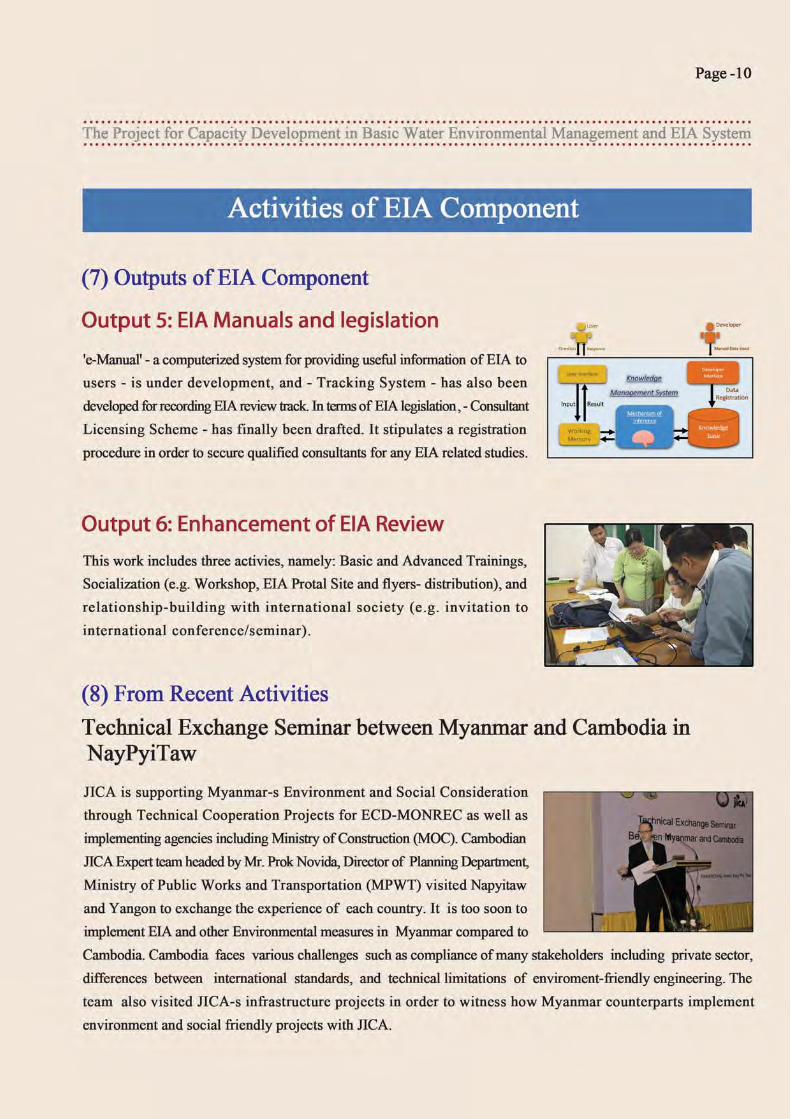
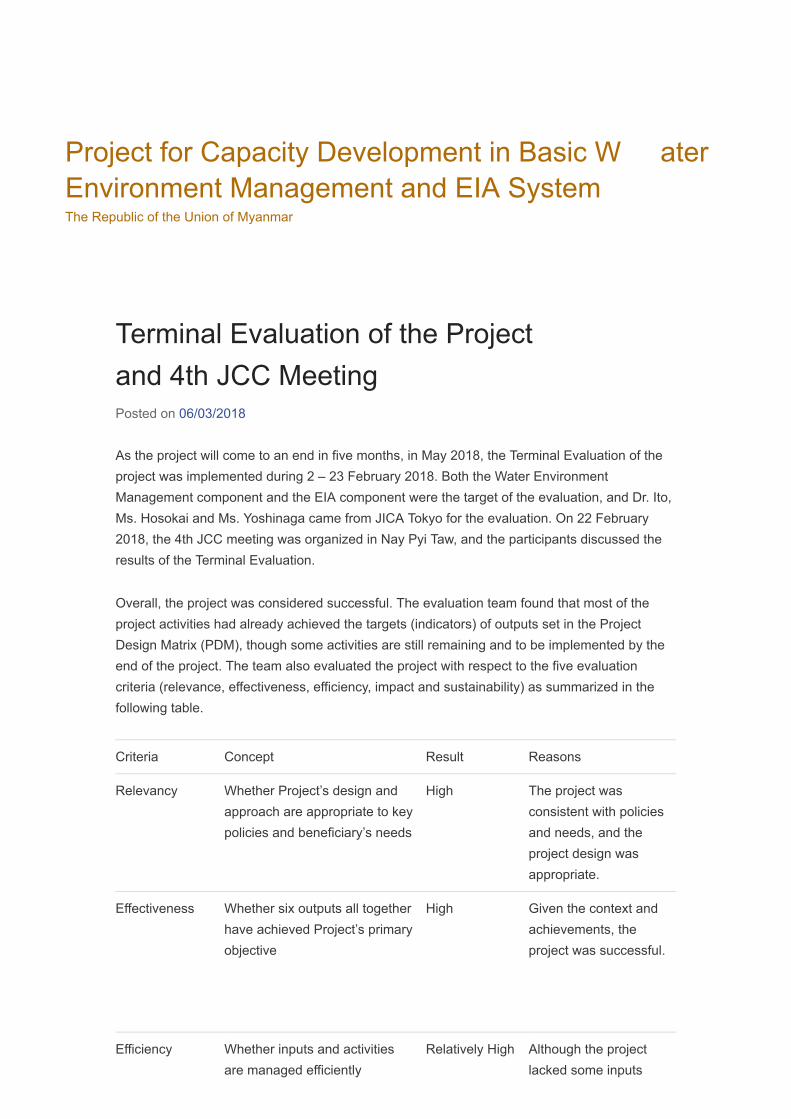
Terminal Evaluation of the Projectand 4th JCC MeetingPosted on 06/03/2018
As the project will come to an end in five months, in May 2018, the Terminal Evaluation of theproject was implemented during 2 – 23 February 2018. Both the Water EnvironmentManagement component and the EIA component were the target of the evaluation, and Dr. Ito,Ms. Hosokai and Ms. Yoshinaga came from JICA Tokyo for the evaluation. On 22 February2018, the 4th JCC meeting was organized in Nay Pyi Taw, and the participants discussed theresults of the Terminal Evaluation.
Overall, the project was considered successful. The evaluation team found that most of theproject activities had already achieved the targets (indicators) of outputs set in the ProjectDesign Matrix (PDM), though some activities are still remaining and to be implemented by theend of the project. The team also evaluated the project with respect to the five evaluationcriteria (relevance, effectiveness, efficiency, impact and sustainability) as summarized in thefollowing table.
Criteria Concept Result Reasons
Relevancy Whether Project’s design andapproach are appropriate to keypolicies and beneficiary’s needs
High The project wasconsistent with policiesand needs, and theproject design wasappropriate.
Effectiveness
Whether six outputs all togetherhave achieved Project’s primaryobjective
High Given the context andachievements, theproject was successful.
Efficiency Whether inputs and activitiesare managed efficiently
Relatively High Although the projectlacked some inputs
Project for Capacity Development in Basic W aterEnvironment Management and EIA SystemThe Republic of the Union of Myanmar
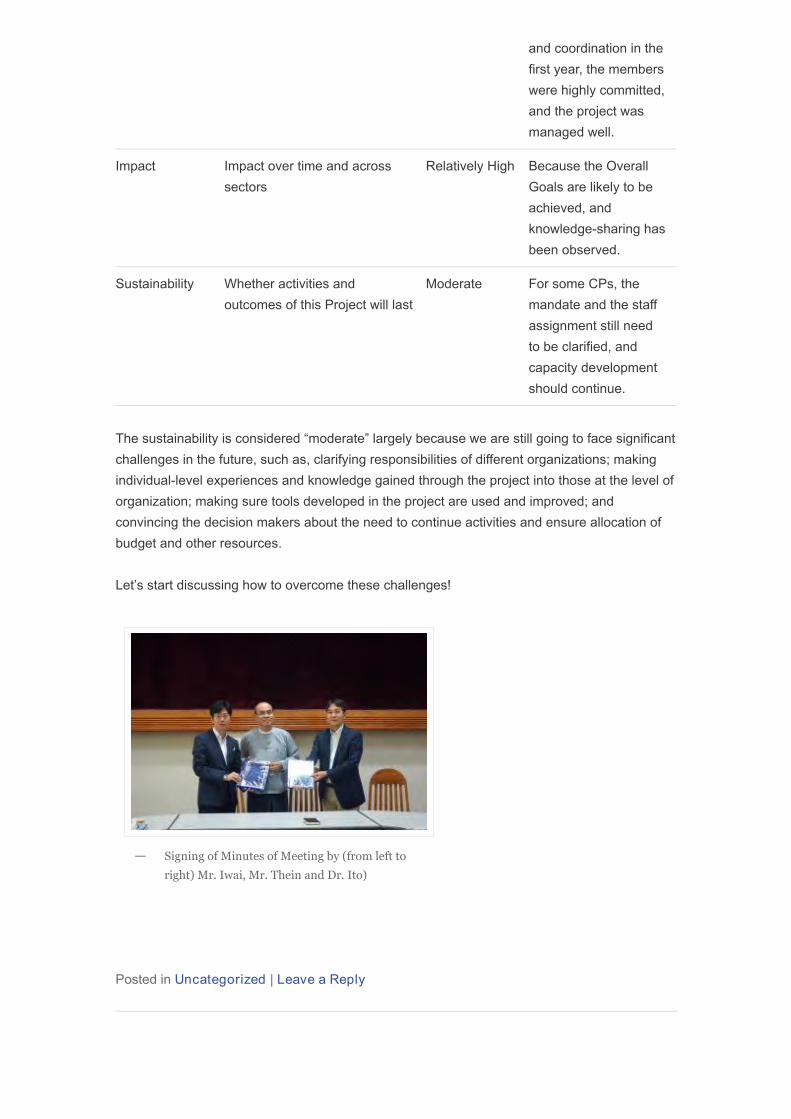
and coordination in thefirst year, the memberswere highly committed,and the project wasmanaged well.
Impact Impact over time and acrosssectors
Relatively High Because the OverallGoals are likely to beachieved, andknowledge-sharing hasbeen observed.
Sustainability Whether activities andoutcomes of this Project will last
Moderate For some CPs, themandate and the staffassignment still needto be clarified, andcapacity developmentshould continue.
The sustainability is considered “moderate” largely because we are still going to face significantchallenges in the future, such as, clarifying responsibilities of different organizations; makingindividual-level experiences and knowledge gained through the project into those at the level oforganization; making sure tools developed in the project are used and improved; andconvincing the decision makers about the need to continue activities and ensure allocation ofbudget and other resources.
Let’s start discussing how to overcome these challenges!
Posted in Uncategorized | Leave a Reply
Signing of Minutes of Meeting by (from left to
right) Mr. Iwai, Mr. Thein and Dr. Ito)
—
Seminar on Development of W aterQuality Survey ReportPosted on 01/12/2017
In the second half of November 2017, seminar on development of water quality survey reportwas held in Yangon and Mandalay, each for two days. Its objectives, schedule and program aredescribed as follows.
Objectives
To provide an opportunity to develop a water quality survey report on trial basis.To deliver and improve a technical reporting skill for water environmental survey
Schedule
[Yangon] 17th & 20th Nov. 2017 at YCDC (9am to 4pm)[Mandalay] 22nd & 23rd Nov. 2017 at MCDC (9am to 4pm)
Program
1st Day: Practice on writing a water quality survey report (e.g. how to set the objective ofthe report & evaluate the water quality data, basic ethic of scientific writing, reportstructure, etc.)2nd Day: Database development by using Excel & Map Preparatiion by QGIS
Around 10 participants (from ECD, YCDC & MCDC) joined each seminar and learned the basictechnical reporting skill including the basic practice of Word/Excel/QGIS. Next seminar will beheld in December 2017 and/or January 2018.
Discussion (to set the objectives)—
Posted in Uncategorized | Leave a Reply
Evaluation of Water Quality Data—
Presentation (discussion result)—
Workshop on Industrial W astewaterTreatment in Y angon on 30th Oct2017Posted on 08/11/2017
On 30th Oct. 2017, the workshop on industrial wastewater treatment was held at the meetinghall in Yangon Regional Government (YRG). Around 60 participants including the ChiefMinister of YRG joined from various kinds of organizations (e.g. Industrial Zone SteeringCommittee in YRG, MONREC-ECD, MOI-DISI, MOHA-GAD, YCDC, MCDC, Industrial ZoneManagement Committee, UMFCCI, Embassy of Japan, JICA Myanmar Office, etc.). The mainobjectives are as follows.
1. To learn how industrial wastewater is managed in industrial zones (IZs)
2. To examine options for industrial wastewater management in Hlaing Tar Yar IZ3. To discuss effective & realistic industrial wastewater treatment in IZs in Myanmar
At the meeting, activities by MONREC-ECD and treatment systems in Mandalay, Thilawa IZ &Vietnam were introduced in conjunction with the options of wastewater treatment in Hlaing TharYar IZ. It was a good opportunities for different organizations to share the current situationof water environment in Myanmar and options in the future.
Opening Remarks by Chief Minister of YRG—
Options in Hlaing Thar Yar IZ by Mr. Nishio,
KOBELCO ECO-SOLUTIONS
—
Posted in Uncategorized | Leave a Reply
Introduction of Wastewater Treatment System in
Thilawa
—
Introduction of WWTP in Vietnam—
UMFCCI Industrial W astewaterManagement ForumPosted on 22/10/2017
On 12th and 13th October, JET participated in the Industrial Wastewater Management Forumorganized by UMFCCI. This was one of the first dialogues between representatives ofindustries, environmental authorities and civil society on the issue of industrial wastewatermanagement, and our counterpart organizations, i.e., ECD and YCDC, also took part in theforum. JET made a short presentation on the current situation of pollution control by factories inYangon and Mandalay based on the results of the pollution source survey implemented in2016. Our survey revealed that many factories are lagging very much behind in their effort tocontrol environmental pollution and also are facing different obstacles to improve environmentalperformance. We are currently implementing the 2nd pollution source survey in order to confirm
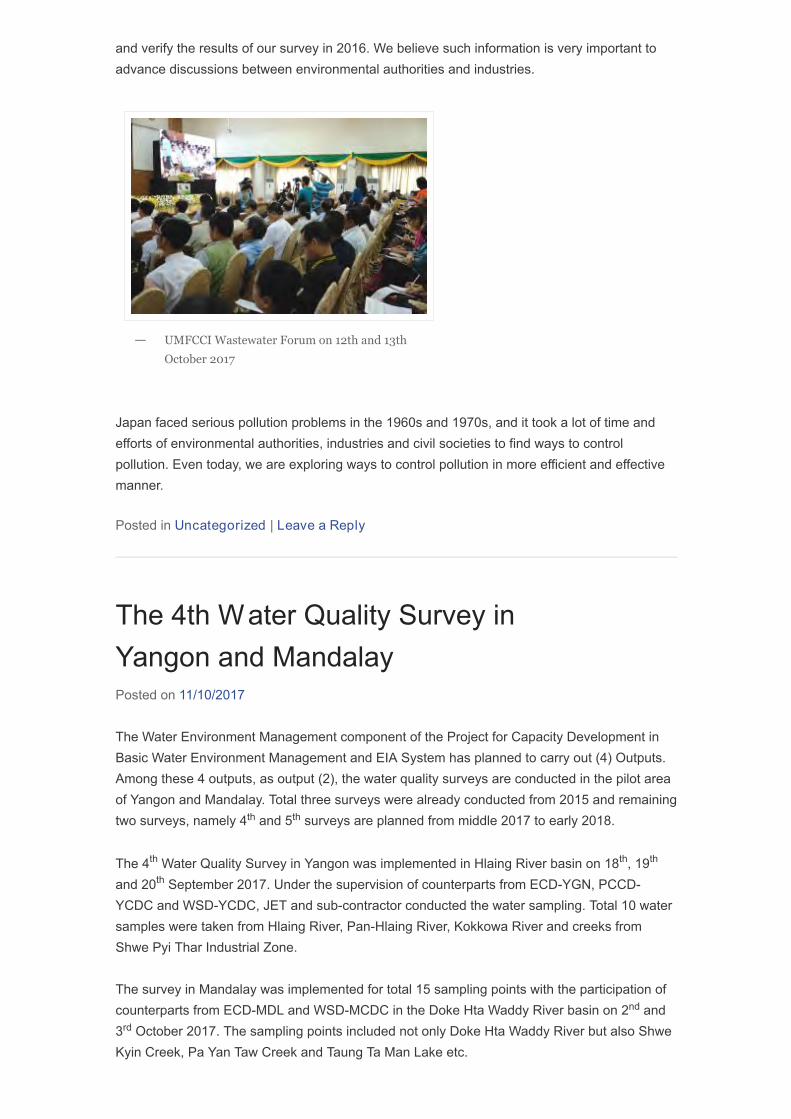
and verify the results of our survey in 2016. We believe such information is very important toadvance discussions between environmental authorities and industries.
Japan faced serious pollution problems in the 1960s and 1970s, and it took a lot of time andefforts of environmental authorities, industries and civil societies to find ways to controlpollution. Even today, we are exploring ways to control pollution in more efficient and effectivemanner.
Posted in Uncategorized | Leave a Reply
UMFCCI Wastewater Forum on 12th and 13th
October 2017
—
The 4th Water Quality Survey inYangon and MandalayPosted on 11/10/2017
The Water Environment Management component of the Project for Capacity Development inBasic Water Environment Management and EIA System has planned to carry out (4) Outputs.Among these 4 outputs, as output (2), the water quality surveys are conducted in the pilot areaof Yangon and Mandalay. Total three surveys were already conducted from 2015 and remainingtwo surveys, namely 4 and 5 surveys are planned from middle 2017 to early 2018.
The 4 Water Quality Survey in Yangon was implemented in Hlaing River basin on 18 , 19and 20 September 2017. Under the supervision of counterparts from ECD-YGN, PCCD-YCDC and WSD-YCDC, JET and sub-contractor conducted the water sampling. Total 10 watersamples were taken from Hlaing River, Pan-Hlaing River, Kokkowa River and creeks fromShwe Pyi Thar Industrial Zone.
The survey in Mandalay was implemented for total 15 sampling points with the participation ofcounterparts from ECD-MDL and WSD-MCDC in the Doke Hta Waddy River basin on 2 and3 October 2017. The sampling points included not only Doke Hta Waddy River but also ShweKyin Creek, Pa Yan Taw Creek and Taung Ta Man Lake etc.
th th
th th th
th
nd
rd
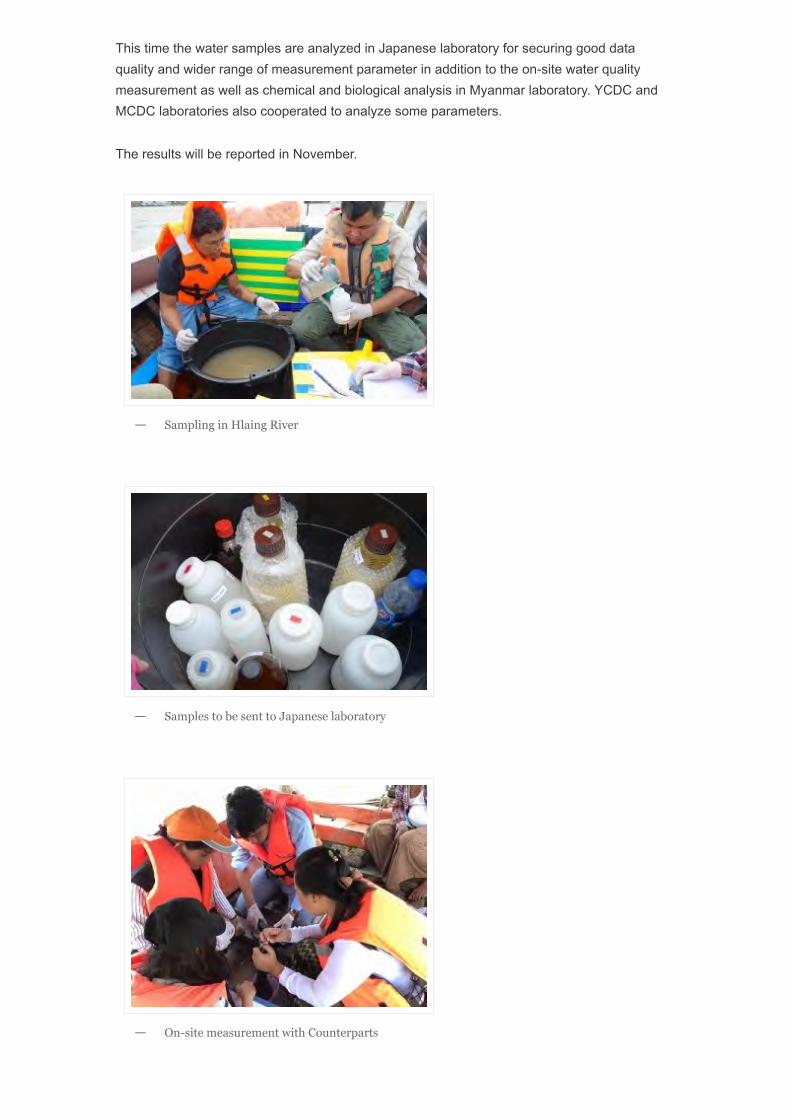
This time the water samples are analyzed in Japanese laboratory for securing good dataquality and wider range of measurement parameter in addition to the on-site water qualitymeasurement as well as chemical and biological analysis in Myanmar laboratory. YCDC andMCDC laboratories also cooperated to analyze some parameters.
The results will be reported in November.
Sampling in Hlaing River—
Samples to be sent to Japanese laboratory—
On-site measurement with Counterparts—
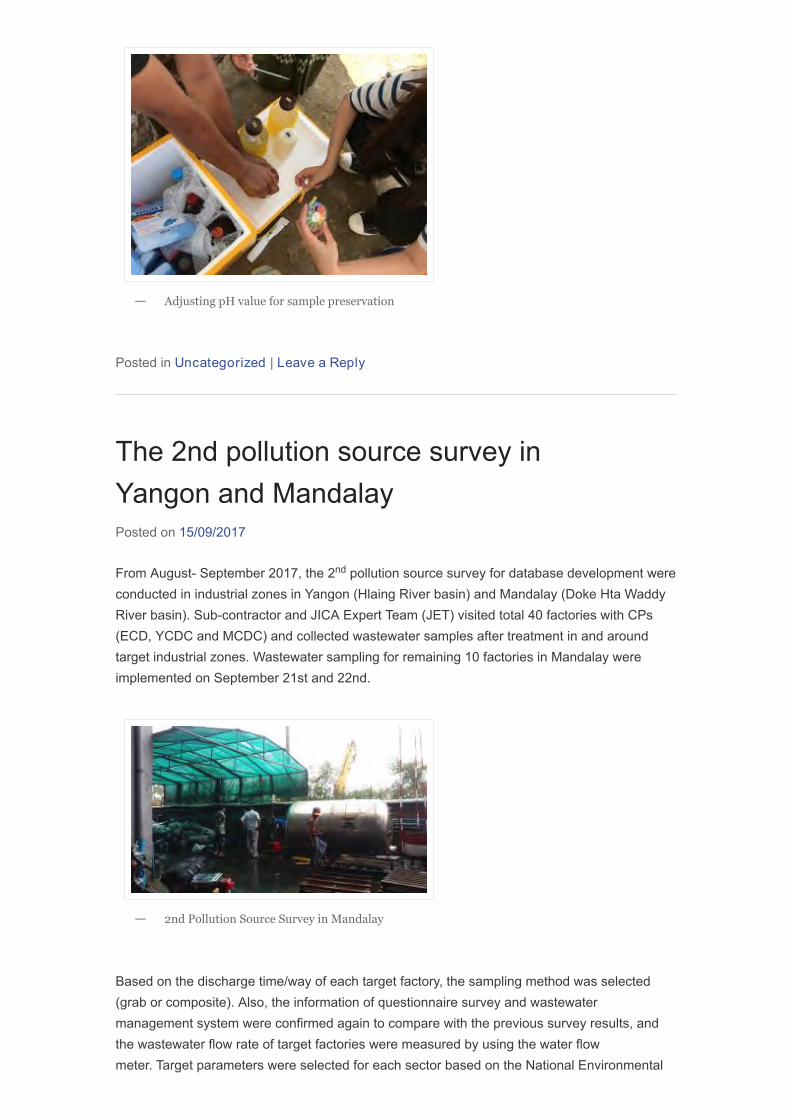
Posted in Uncategorized | Leave a Reply
Adjusting pH value for sample preservation—
The 2nd pollution source survey inYangon and MandalayPosted on 15/09/2017
From August- September 2017, the 2 pollution source survey for database development wereconducted in industrial zones in Yangon (Hlaing River basin) and Mandalay (Doke Hta WaddyRiver basin). Sub-contractor and JICA Expert Team (JET) visited total 40 factories with CPs(ECD, YCDC and MCDC) and collected wastewater samples after treatment in and aroundtarget industrial zones. Wastewater sampling for remaining 10 factories in Mandalay wereimplemented on September 21st and 22nd.
Based on the discharge time/way of each target factory, the sampling method was selected(grab or composite). Also, the information of questionnaire survey and wastewatermanagement system were confirmed again to compare with the previous survey results, andthe wastewater flow rate of target factories were measured by using the water flowmeter. Target parameters were selected for each sector based on the National Environmental
nd
2nd Pollution Source Survey in Mandalay—
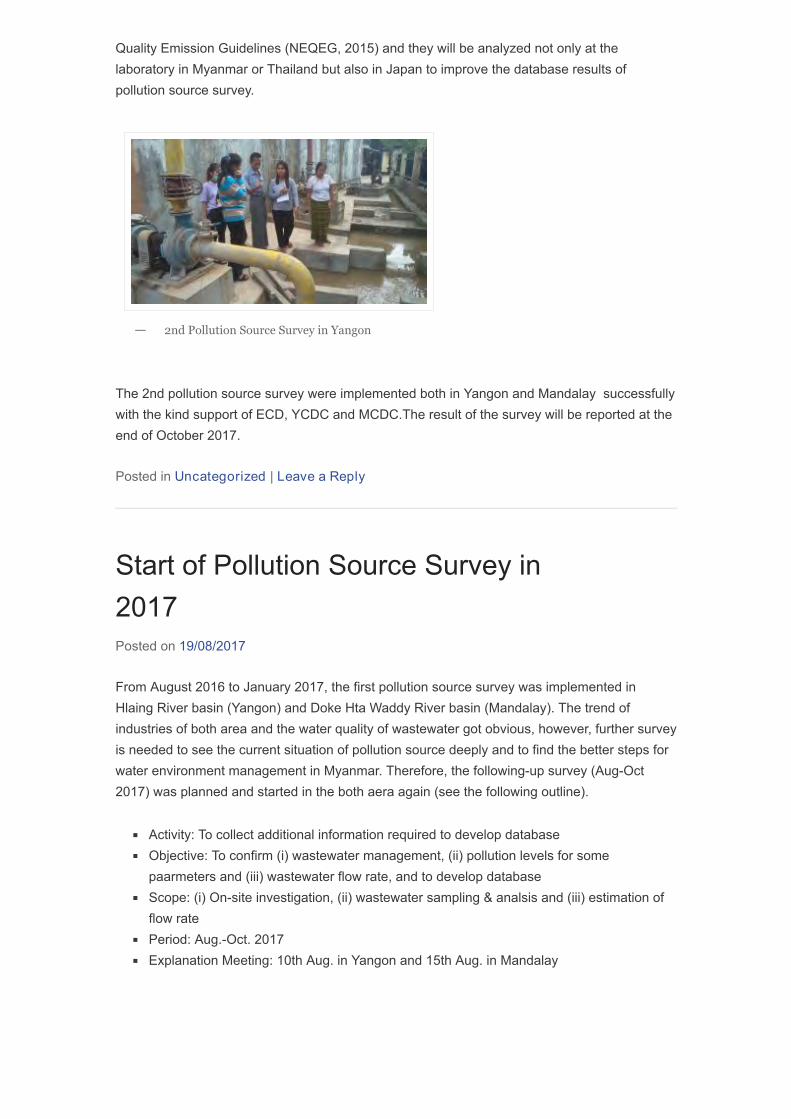
Quality Emission Guidelines (NEQEG, 2015) and they will be analyzed not only at thelaboratory in Myanmar or Thailand but also in Japan to improve the database results ofpollution source survey.
The 2nd pollution source survey were implemented both in Yangon and Mandalay successfullywith the kind support of ECD, YCDC and MCDC.The result of the survey will be reported at theend of October 2017.
Posted in Uncategorized | Leave a Reply
2nd Pollution Source Survey in Yangon—
Start of Pollution Source Survey in2017Posted on 19/08/2017
From August 2016 to January 2017, the first pollution source survey was implemented inHlaing River basin (Yangon) and Doke Hta Waddy River basin (Mandalay). The trend ofindustries of both area and the water quality of wastewater got obvious, however, further surveyis needed to see the current situation of pollution source deeply and to find the better steps forwater environment management in Myanmar. Therefore, the following-up survey (Aug-Oct2017) was planned and started in the both aera again (see the following outline).
Activity: To collect additional information required to develop databaseObjective: To confirm (i) wastewater management, (ii) pollution levels for somepaarmeters and (iii) wastewater flow rate, and to develop databaseScope: (i) On-site investigation, (ii) wastewater sampling & analsis and (iii) estimation offlow ratePeriod: Aug.-Oct. 2017Explanation Meeting: 10th Aug. in Yangon and 15th Aug. in Mandalay
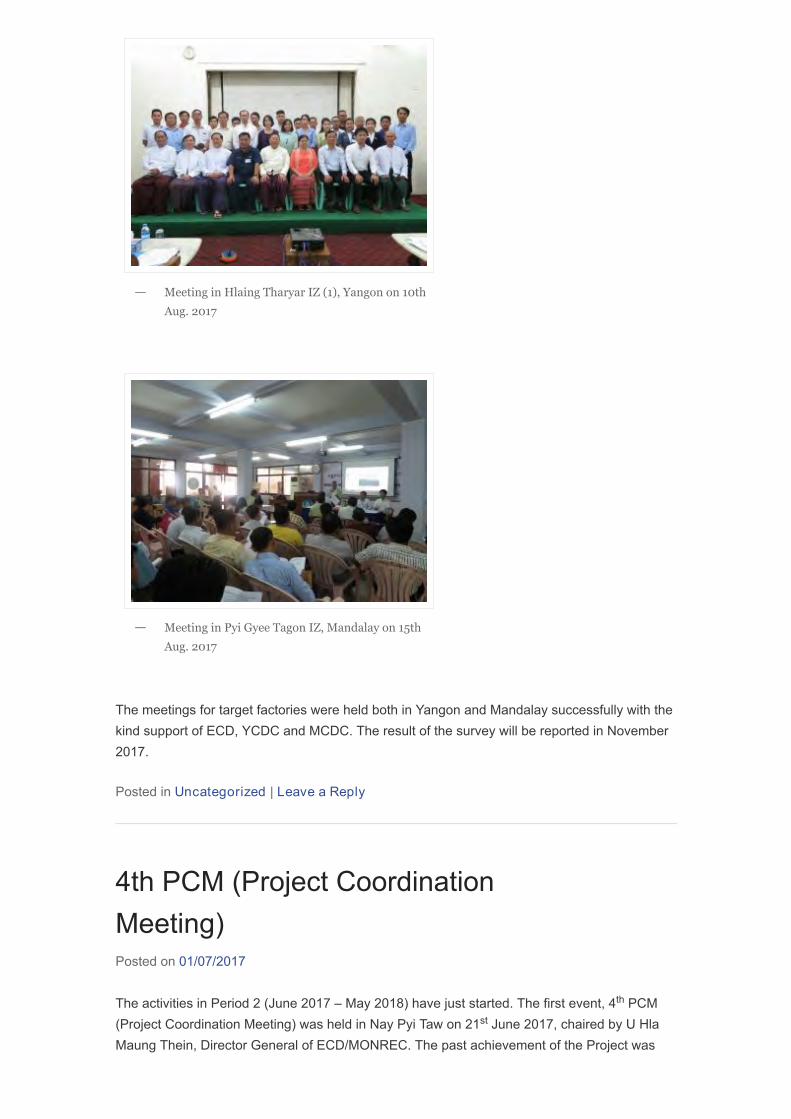
The meetings for target factories were held both in Yangon and Mandalay successfully with thekind support of ECD, YCDC and MCDC. The result of the survey will be reported in November2017.
Posted in Uncategorized | Leave a Reply
Meeting in Hlaing Tharyar IZ (1), Yangon on 10th
Aug. 2017
—
Meeting in Pyi Gyee Tagon IZ, Mandalay on 15th
Aug. 2017
—
4th PCM (Project CoordinationMeeting)Posted on 01/07/2017
The activities in Period 2 (June 2017 – May 2018) have just started. The first event, 4 PCM(Project Coordination Meeting) was held in Nay Pyi Taw on 21 June 2017, chaired by U HlaMaung Thein, Director General of ECD/MONREC. The past achievement of the Project was
th
st
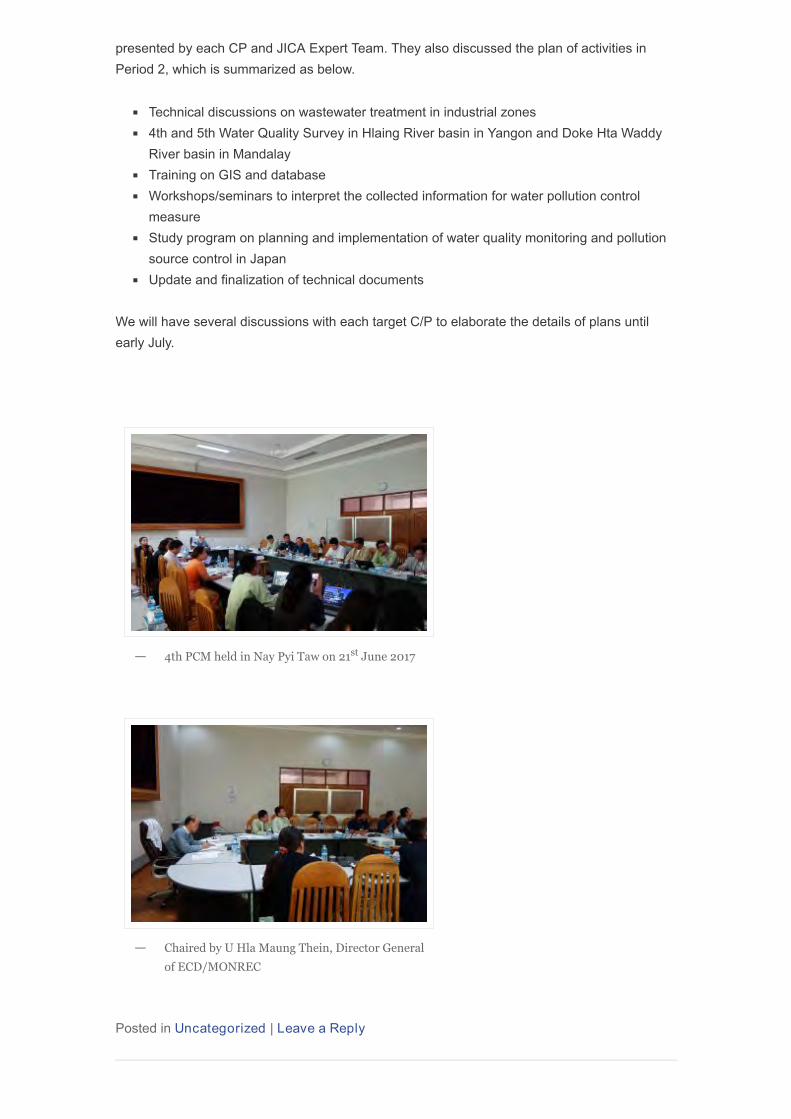
presented by each CP and JICA Expert Team. They also discussed the plan of activities inPeriod 2, which is summarized as below.
Technical discussions on wastewater treatment in industrial zones4th and 5th Water Quality Survey in Hlaing River basin in Yangon and Doke Hta WaddyRiver basin in MandalayTraining on GIS and databaseWorkshops/seminars to interpret the collected information for water pollution controlmeasureStudy program on planning and implementation of water quality monitoring and pollutionsource control in JapanUpdate and finalization of technical documents
We will have several discussions with each target C/P to elaborate the details of plans untilearly July.
Posted in Uncategorized | Leave a Reply
4th PCM held in Nay Pyi Taw on 21 June 2017— st
Chaired by U Hla Maung Thein, Director General
of ECD/MONREC
—
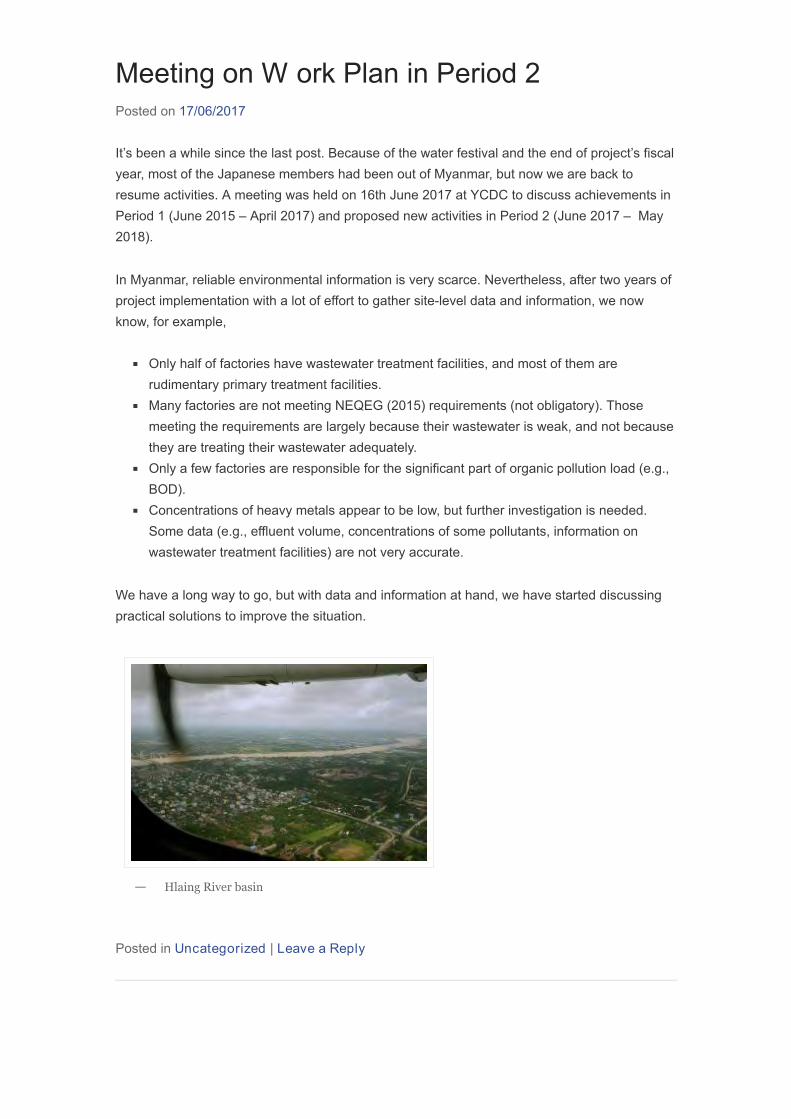
Meeting on W ork Plan in Period 2Posted on 17/06/2017
It’s been a while since the last post. Because of the water festival and the end of project’s fiscalyear, most of the Japanese members had been out of Myanmar, but now we are back toresume activities. A meeting was held on 16th June 2017 at YCDC to discuss achievements inPeriod 1 (June 2015 – April 2017) and proposed new activities in Period 2 (June 2017 – May2018).
In Myanmar, reliable environmental information is very scarce. Nevertheless, after two years ofproject implementation with a lot of effort to gather site-level data and information, we nowknow, for example,
Only half of factories have wastewater treatment facilities, and most of them arerudimentary primary treatment facilities.Many factories are not meeting NEQEG (2015) requirements (not obligatory). Thosemeeting the requirements are largely because their wastewater is weak, and not becausethey are treating their wastewater adequately.Only a few factories are responsible for the significant part of organic pollution load (e.g.,BOD).Concentrations of heavy metals appear to be low, but further investigation is needed. Some data (e.g., effluent volume, concentrations of some pollutants, information onwastewater treatment facilities) are not very accurate.
We have a long way to go, but with data and information at hand, we have started discussingpractical solutions to improve the situation.
Posted in Uncategorized | Leave a Reply
Hlaing River basin—
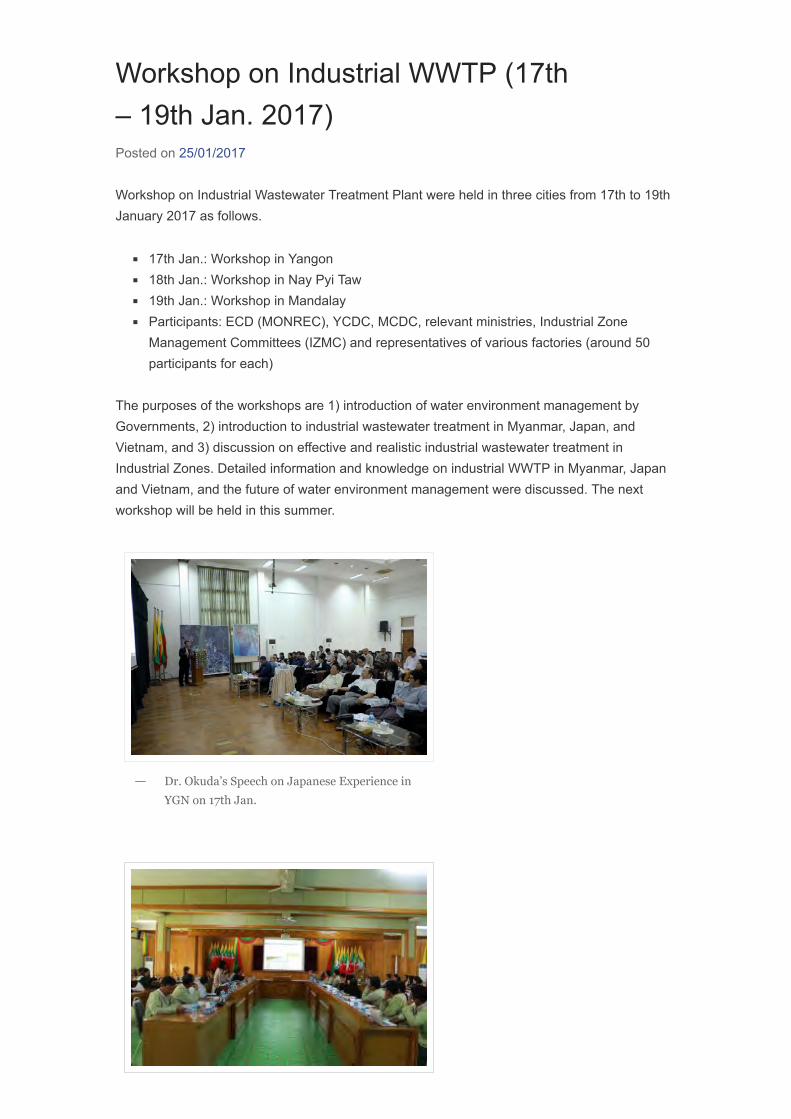
Workshop on Industrial WWTP (17th– 19th Jan. 2017)Posted on 25/01/2017
Workshop on Industrial Wastewater Treatment Plant were held in three cities from 17th to 19thJanuary 2017 as follows.
17th Jan.: Workshop in Yangon18th Jan.: Workshop in Nay Pyi Taw19th Jan.: Workshop in MandalayParticipants: ECD (MONREC), YCDC, MCDC, relevant ministries, Industrial ZoneManagement Committees (IZMC) and representatives of various factories (around 50participants for each)
The purposes of the workshops are 1) introduction of water environment management byGovernments, 2) introduction to industrial wastewater treatment in Myanmar, Japan, andVietnam, and 3) discussion on effective and realistic industrial wastewater treatment inIndustrial Zones. Detailed information and knowledge on industrial WWTP in Myanmar, Japanand Vietnam, and the future of water environment management were discussed. The nextworkshop will be held in this summer.
Dr. Okuda’s Speech on Japanese Experience in
YGN on 17th Jan.
—
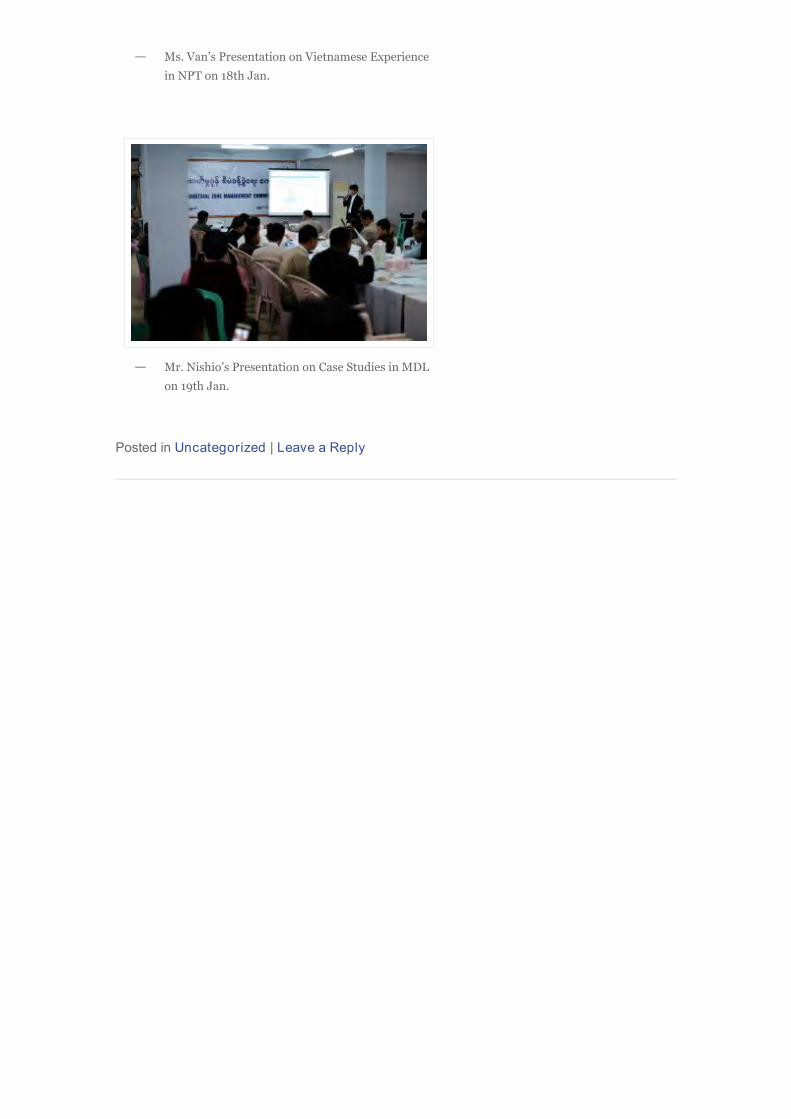
Posted in Uncategorized | Leave a Reply
Ms. Van’s Presentation on Vietnamese Experience
in NPT on 18th Jan.
—
Mr. Nishio’s Presentation on Case Studies in MDL
on 19th Jan.
—
← Older posts Newer posts →
Meeting and GIS T raining inMandalay on 12th Jan. 2017Posted on 15/01/2017
A Happy New Year !!
The meeting on Inspection & WWTP and Database Training by using GIS were held inMandalay on 12th January 2017 as follows:
Discussion on Inspection Manual (Dr. Okuda)Lecture on WWTP (Mr. Nishio)Database Training (Mr. Nakagawara)
Many officers and staff from WSD & CD of MCDC and ECD Mandalay joined and made adiscussion. Also, one flow meter were handed over directly to the Mayor of MCDC and Head ofWSD from Dr. Okuda. On 19th Jan., the workshop on WWTP will be held inviting IZMC,factories and other related organizations.
Project for Capacity Development in Basic W aterEnvironment Management and EIA SystemThe Republic of the Union of Myanmar
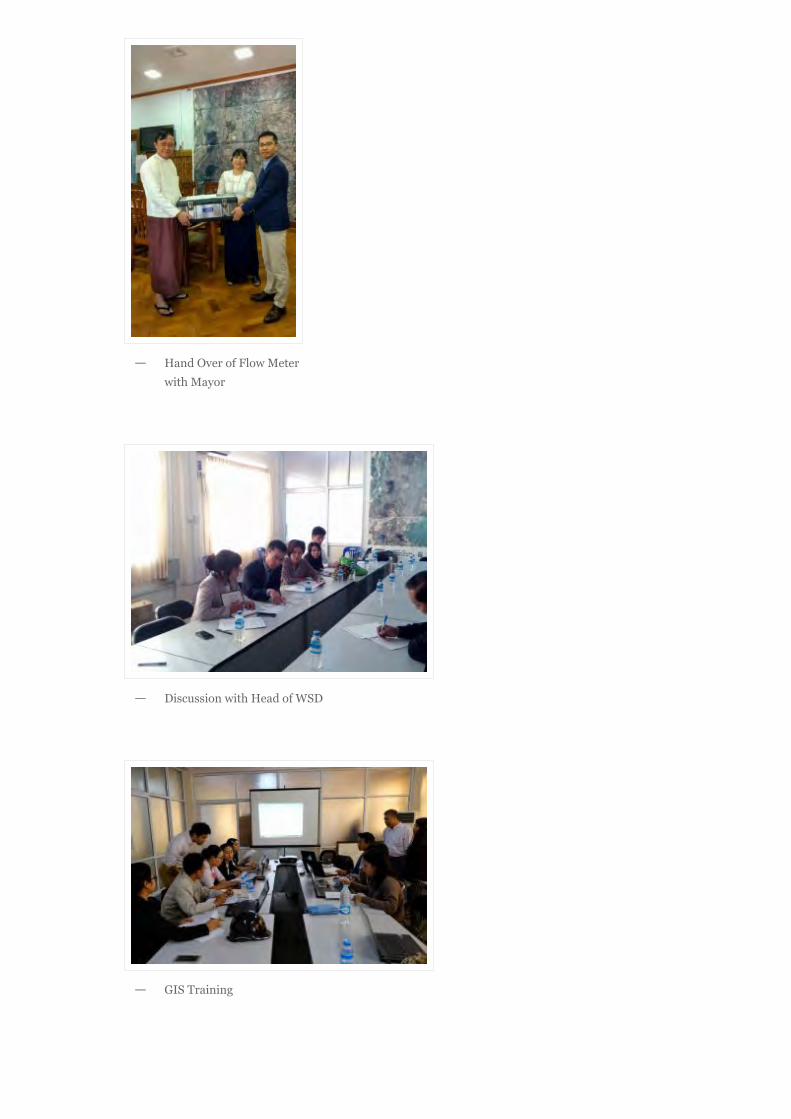
Hand Over of Flow Meter
with Mayor
—
Discussion with Head of WSD—
GIS Training—
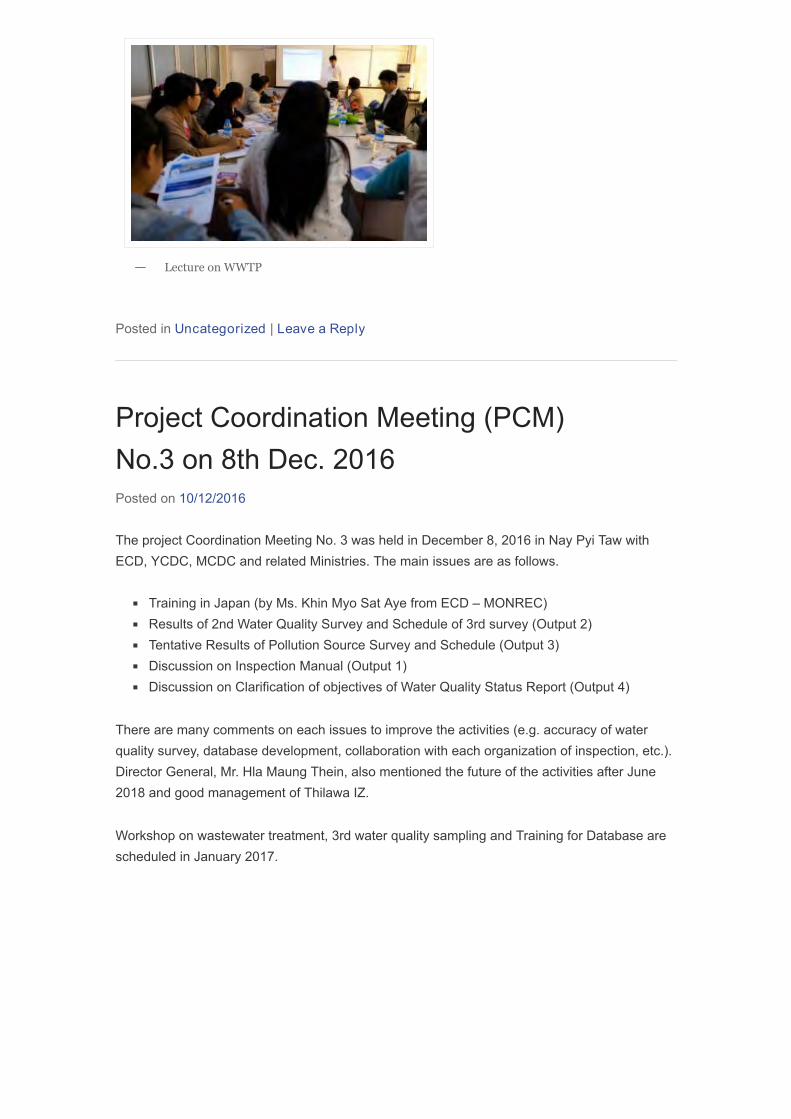
Posted in Uncategorized | Leave a Reply
Lecture on WWTP—
Project Coordination Meeting (PCM)No.3 on 8th Dec. 2016Posted on 10/12/2016
The project Coordination Meeting No. 3 was held in December 8, 2016 in Nay Pyi Taw withECD, YCDC, MCDC and related Ministries. The main issues are as follows.
Training in Japan (by Ms. Khin Myo Sat Aye from ECD – MONREC)Results of 2nd Water Quality Survey and Schedule of 3rd survey (Output 2)Tentative Results of Pollution Source Survey and Schedule (Output 3)Discussion on Inspection Manual (Output 1)Discussion on Clarification of objectives of Water Quality Status Report (Output 4)
There are many comments on each issues to improve the activities (e.g. accuracy of waterquality survey, database development, collaboration with each organization of inspection, etc.).Director General, Mr. Hla Maung Thein, also mentioned the future of the activities after June2018 and good management of Thilawa IZ.
Workshop on wastewater treatment, 3rd water quality sampling and Training for Database arescheduled in January 2017.
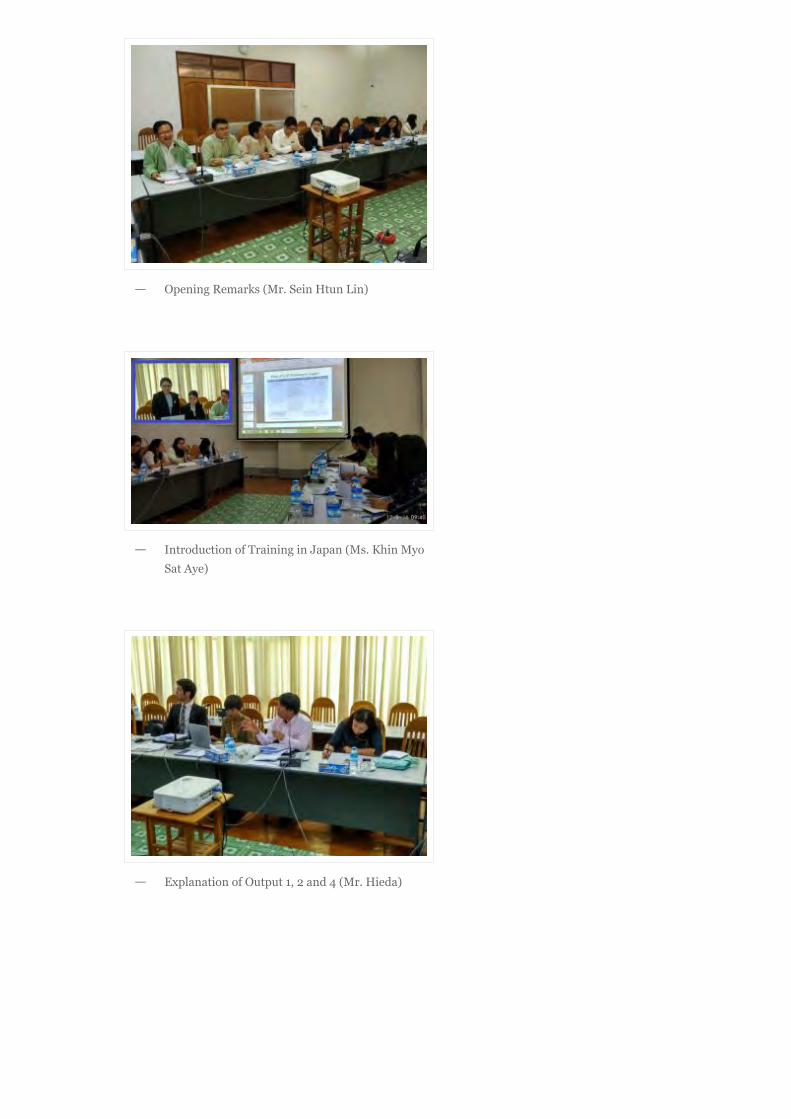
Opening Remarks (Mr. Sein Htun Lin)—
Introduction of Training in Japan (Ms. Khin Myo
Sat Aye)
—
Explanation of Output 1, 2 and 4 (Mr. Hieda)—
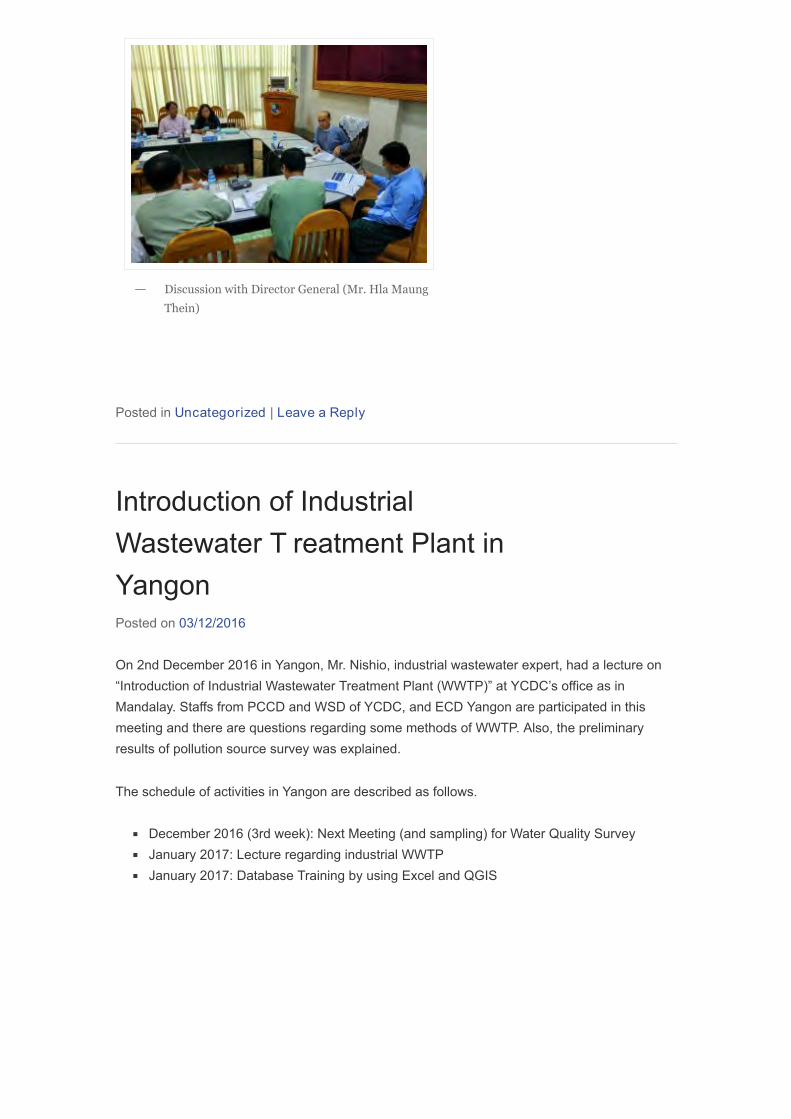
Posted in Uncategorized | Leave a Reply
Discussion with Director General (Mr. Hla Maung
Thein)
—
Introduction of IndustrialWastewater T reatment Plant inYangonPosted on 03/12/2016
On 2nd December 2016 in Yangon, Mr. Nishio, industrial wastewater expert, had a lecture on“Introduction of Industrial Wastewater Treatment Plant (WWTP)” at YCDC’s office as inMandalay. Staffs from PCCD and WSD of YCDC, and ECD Yangon are participated in thismeeting and there are questions regarding some methods of WWTP. Also, the preliminaryresults of pollution source survey was explained.
The schedule of activities in Yangon are described as follows.
December 2016 (3rd week): Next Meeting (and sampling) for Water Quality SurveyJanuary 2017: Lecture regarding industrial WWTPJanuary 2017: Database Training by using Excel and QGIS
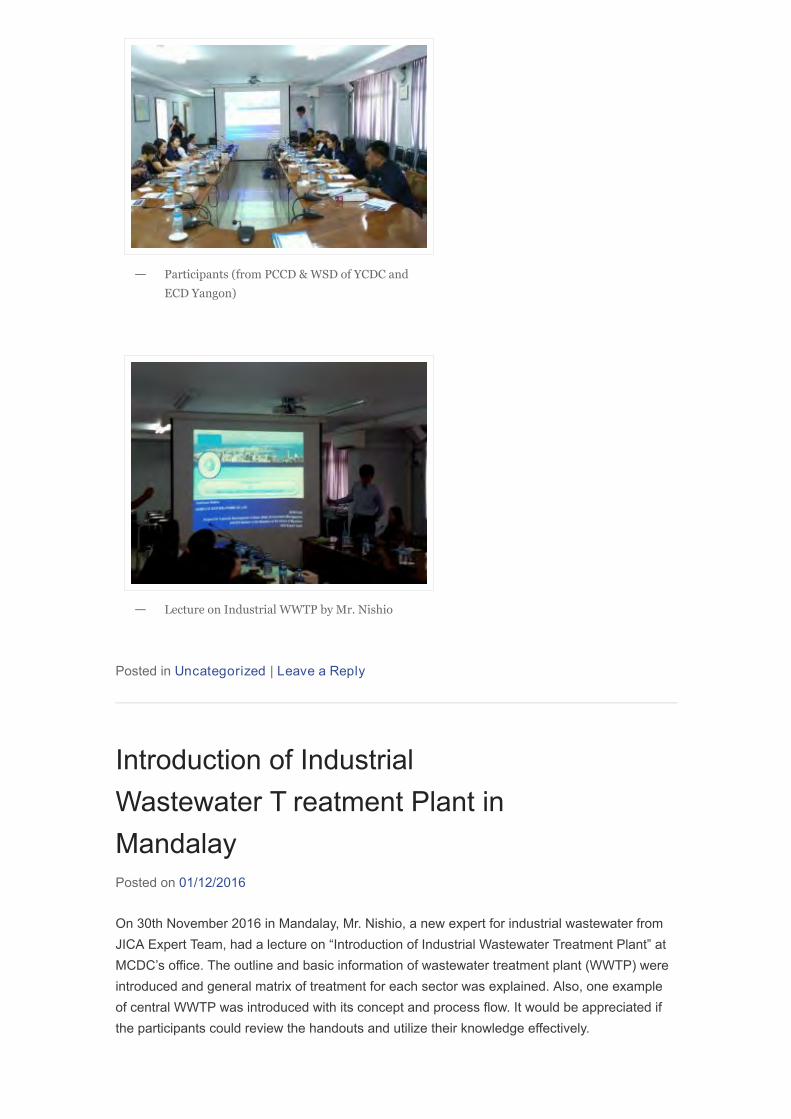
Posted in Uncategorized | Leave a Reply
Participants (from PCCD & WSD of YCDC and
ECD Yangon)
—
Lecture on Industrial WWTP by Mr. Nishio—
Introduction of IndustrialWastewater T reatment Plant inMandalayPosted on 01/12/2016
On 30th November 2016 in Mandalay, Mr. Nishio, a new expert for industrial wastewater fromJICA Expert Team, had a lecture on “Introduction of Industrial Wastewater Treatment Plant” atMCDC’s office. The outline and basic information of wastewater treatment plant (WWTP) wereintroduced and general matrix of treatment for each sector was explained. Also, one exampleof central WWTP was introduced with its concept and process flow. It would be appreciated ifthe participants could review the handouts and utilize their knowledge effectively.
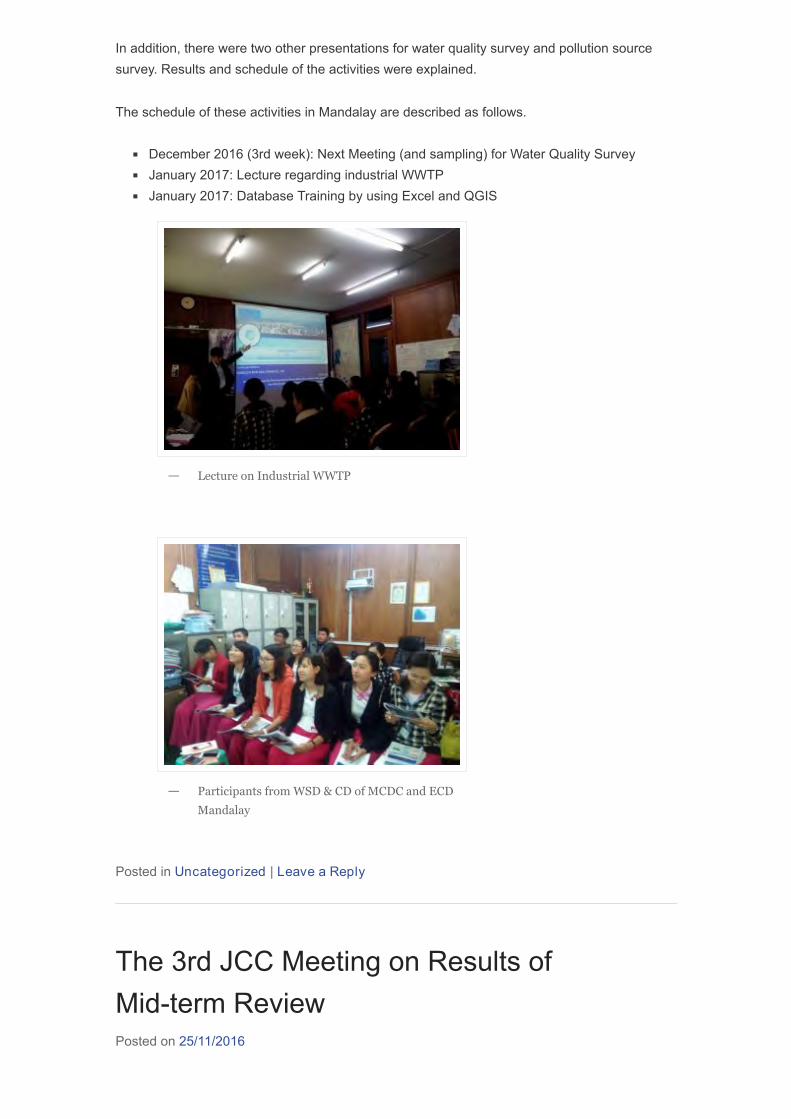
In addition, there were two other presentations for water quality survey and pollution sourcesurvey. Results and schedule of the activities were explained.
The schedule of these activities in Mandalay are described as follows.
December 2016 (3rd week): Next Meeting (and sampling) for Water Quality SurveyJanuary 2017: Lecture regarding industrial WWTPJanuary 2017: Database Training by using Excel and QGIS
Posted in Uncategorized | Leave a Reply
Lecture on Industrial WWTP—
Participants from WSD & CD of MCDC and ECD
Mandalay
—
The 3rd JCC Meeting on Results ofMid-term ReviewPosted on 25/11/2016
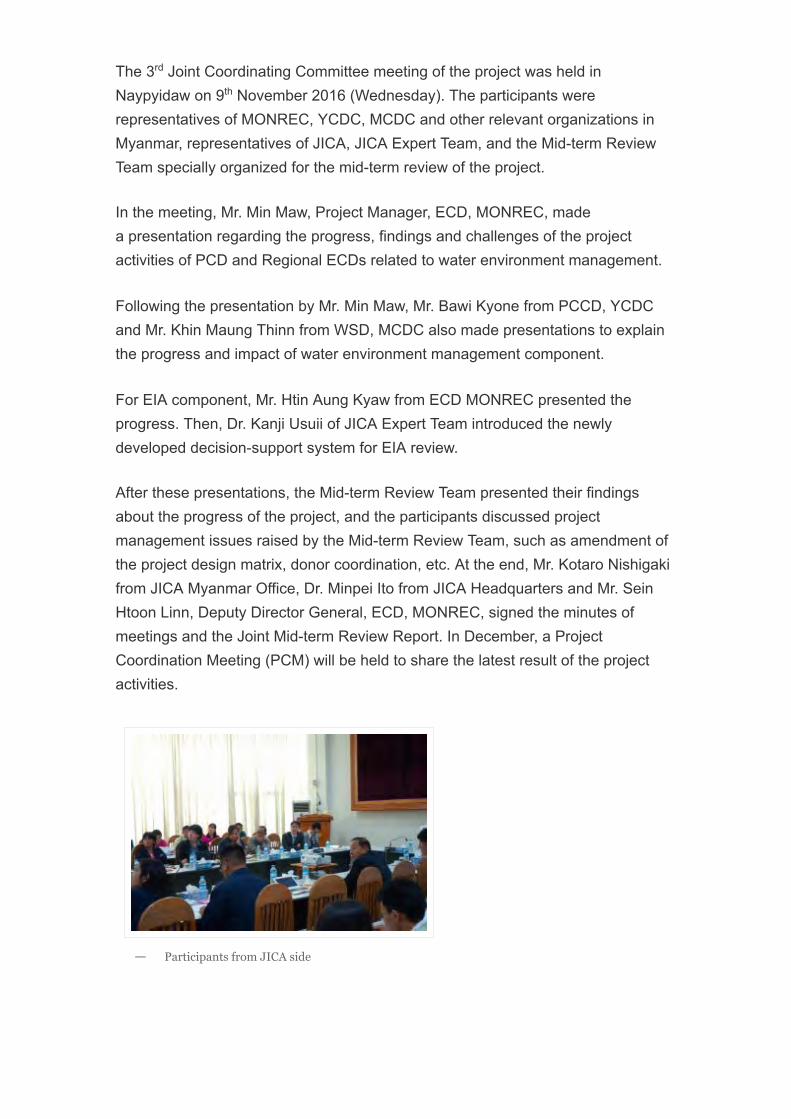
The 3 Joint Coordinating Committee meeting of the project was held inNaypyidaw on 9 November 2016 (Wednesday). The participants wererepresentatives of MONREC, YCDC, MCDC and other relevant organizations inMyanmar, representatives of JICA, JICA Expert Team, and the Mid-term ReviewTeam specially organized for the mid-term review of the project.
In the meeting, Mr. Min Maw, Project Manager, ECD, MONREC, madea presentation regarding the progress, findings and challenges of the projectactivities of PCD and Regional ECDs related to water environment management.
Following the presentation by Mr. Min Maw, Mr. Bawi Kyone from PCCD, YCDCand Mr. Khin Maung Thinn from WSD, MCDC also made presentations to explainthe progress and impact of water environment management component.
For EIA component, Mr. Htin Aung Kyaw from ECD MONREC presented theprogress. Then, Dr. Kanji Usuii of JICA Expert Team introduced the newlydeveloped decision-support system for EIA review.
After these presentations, the Mid-term Review Team presented their findingsabout the progress of the project, and the participants discussed projectmanagement issues raised by the Mid-term Review Team, such as amendment ofthe project design matrix, donor coordination, etc. At the end, Mr. Kotaro Nishigakifrom JICA Myanmar Office, Dr. Minpei Ito from JICA Headquarters and Mr. SeinHtoon Linn, Deputy Director General, ECD, MONREC, signed the minutes ofmeetings and the Joint Mid-term Review Report. In December, a ProjectCoordination Meeting (PCM) will be held to share the latest result of the projectactivities.
rd
th
Participants from JICA side—
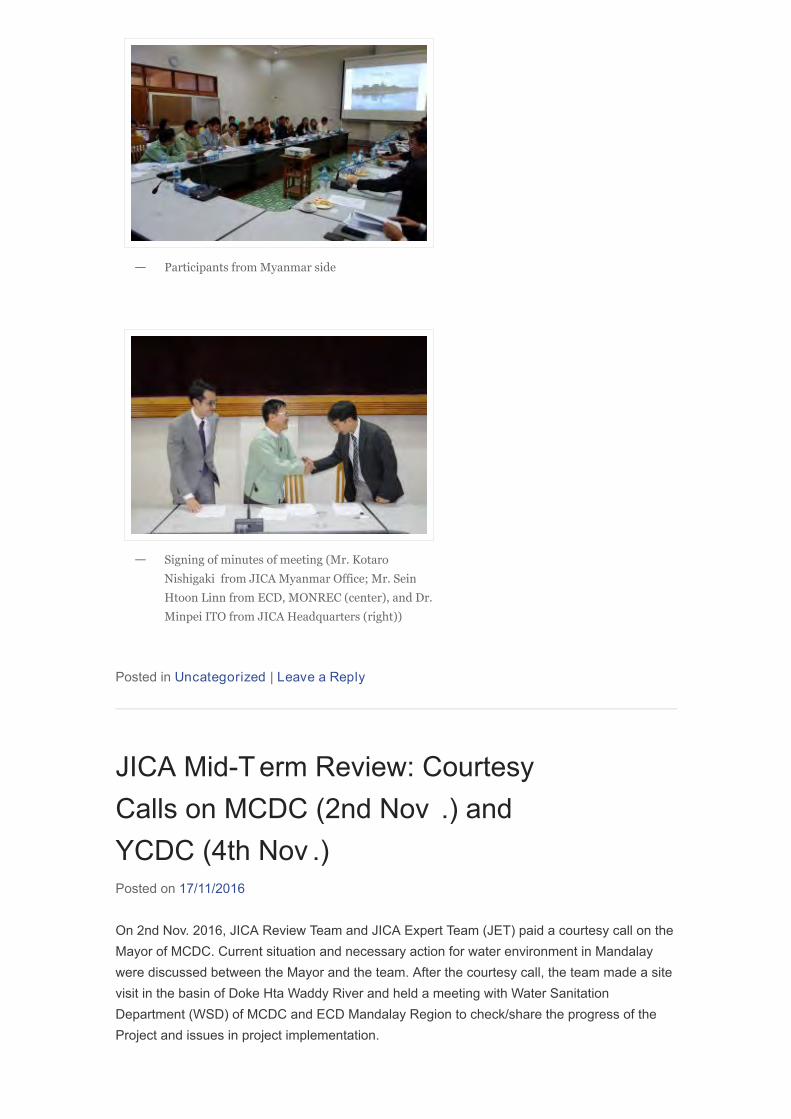
Posted in Uncategorized | Leave a Reply
Participants from Myanmar side—
Signing of minutes of meeting (Mr. Kotaro
Nishigaki from JICA Myanmar Office; Mr. Sein
Htoon Linn from ECD, MONREC (center), and Dr.
Minpei ITO from JICA Headquarters (right))
—
JICA Mid-T erm Review: CourtesyCalls on MCDC (2nd Nov .) andYCDC (4th Nov .)Posted on 17/11/2016
On 2nd Nov. 2016, JICA Review Team and JICA Expert Team (JET) paid a courtesy call on theMayor of MCDC. Current situation and necessary action for water environment in Mandalaywere discussed between the Mayor and the team. After the courtesy call, the team made a sitevisit in the basin of Doke Hta Waddy River and held a meeting with Water SanitationDepartment (WSD) of MCDC and ECD Mandalay Region to check/share the progress of theProject and issues in project implementation.
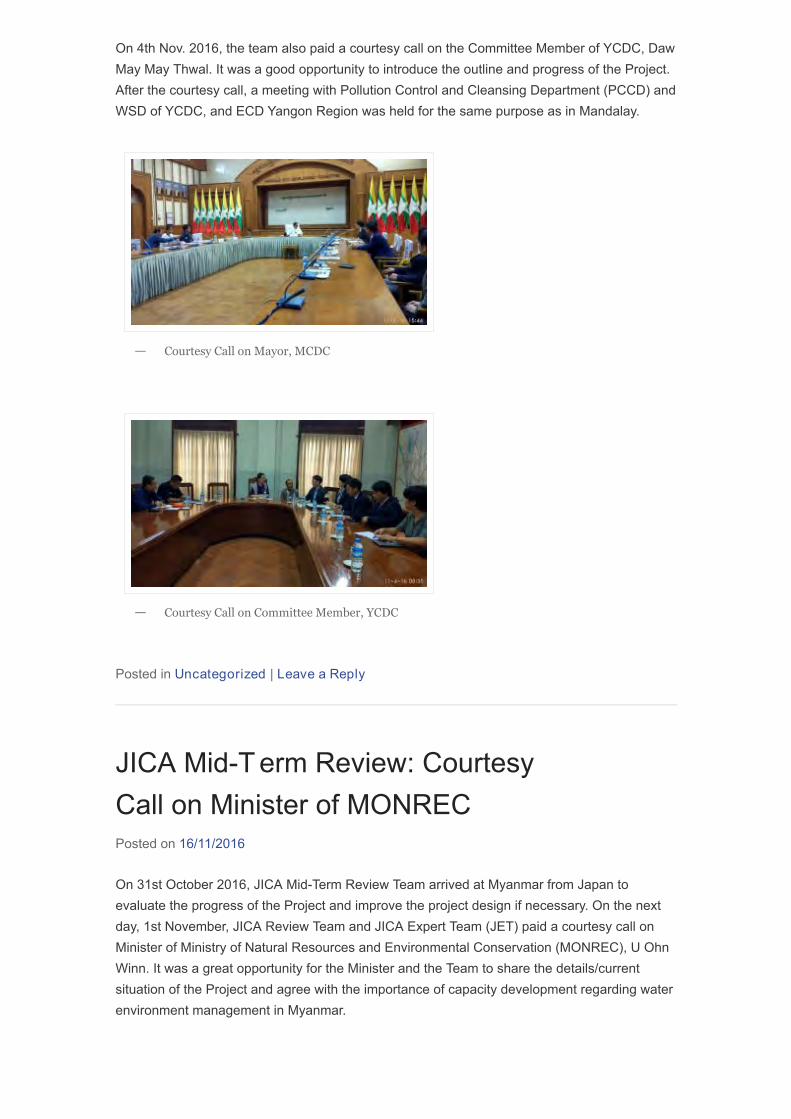
On 4th Nov. 2016, the team also paid a courtesy call on the Committee Member of YCDC, DawMay May Thwal. It was a good opportunity to introduce the outline and progress of the Project.After the courtesy call, a meeting with Pollution Control and Cleansing Department (PCCD) andWSD of YCDC, and ECD Yangon Region was held for the same purpose as in Mandalay.
Posted in Uncategorized | Leave a Reply
Courtesy Call on Mayor, MCDC—
Courtesy Call on Committee Member, YCDC—
JICA Mid-T erm Review: CourtesyCall on Minister of MONRECPosted on 16/11/2016
On 31st October 2016, JICA Mid-Term Review Team arrived at Myanmar from Japan toevaluate the progress of the Project and improve the project design if necessary. On the nextday, 1st November, JICA Review Team and JICA Expert Team (JET) paid a courtesy call onMinister of Ministry of Natural Resources and Environmental Conservation (MONREC), U OhnWinn. It was a great opportunity for the Minister and the Team to share the details/currentsituation of the Project and agree with the importance of capacity development regarding waterenvironment management in Myanmar.
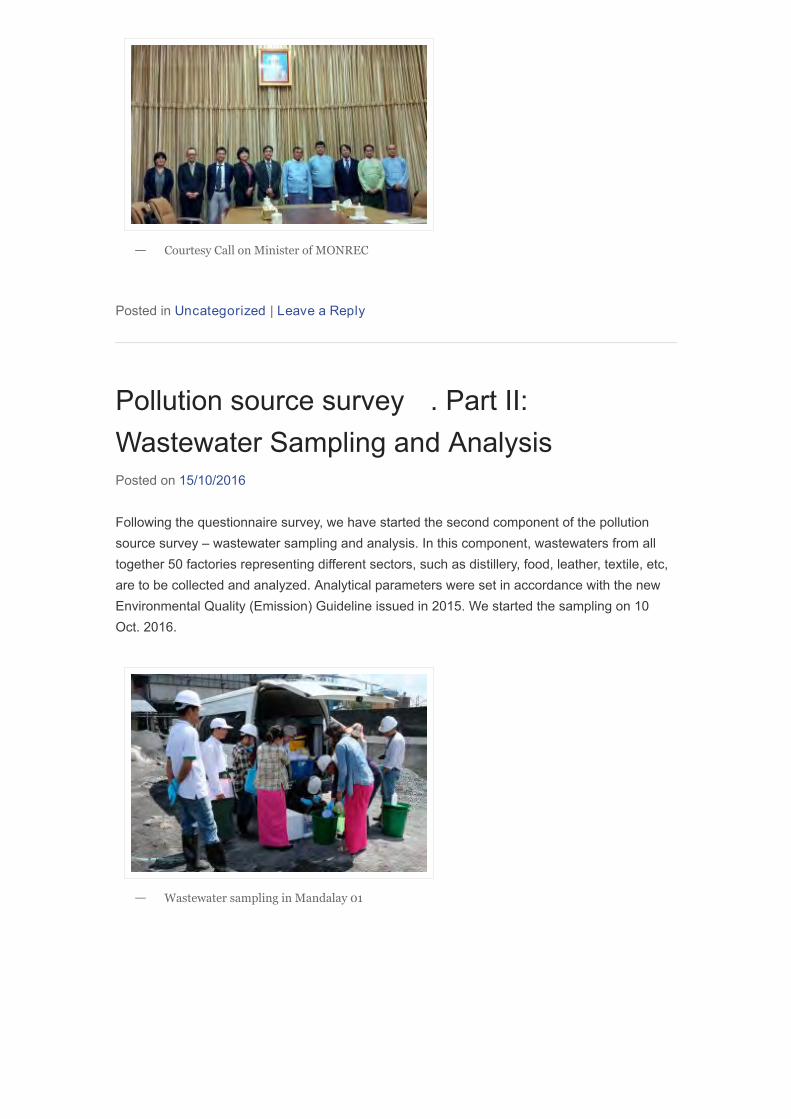
Posted in Uncategorized | Leave a Reply
Courtesy Call on Minister of MONREC—
Pollution source survey . Part II:Wastewater Sampling and AnalysisPosted on 15/10/2016
Following the questionnaire survey, we have started the second component of the pollutionsource survey – wastewater sampling and analysis. In this component, wastewaters from alltogether 50 factories representing different sectors, such as distillery, food, leather, textile, etc,are to be collected and analyzed. Analytical parameters were set in accordance with the newEnvironmental Quality (Emission) Guideline issued in 2015. We started the sampling on 10Oct. 2016.
Wastewater sampling in Mandalay 01—
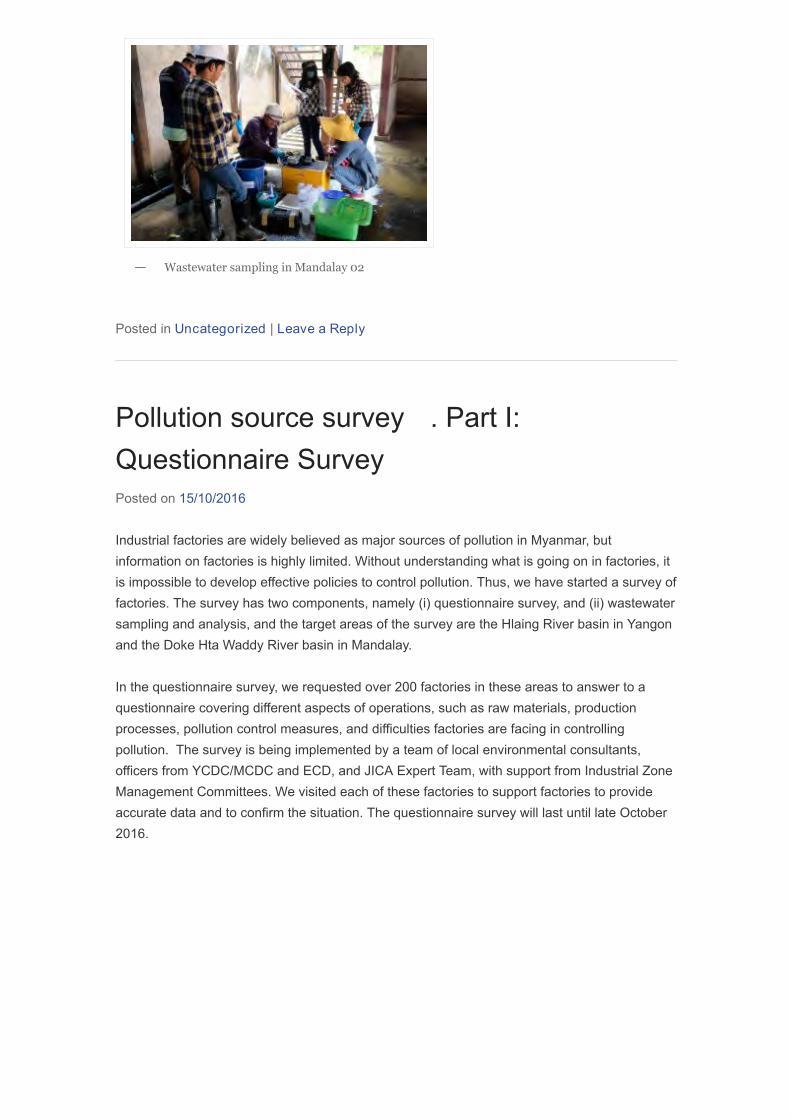
Posted in Uncategorized | Leave a Reply
Wastewater sampling in Mandalay 02—
Pollution source survey . Part I:Questionnaire SurveyPosted on 15/10/2016
Industrial factories are widely believed as major sources of pollution in Myanmar, butinformation on factories is highly limited. Without understanding what is going on in factories, itis impossible to develop effective policies to control pollution. Thus, we have started a survey offactories. The survey has two components, namely (i) questionnaire survey, and (ii) wastewatersampling and analysis, and the target areas of the survey are the Hlaing River basin in Yangonand the Doke Hta Waddy River basin in Mandalay.
In the questionnaire survey, we requested over 200 factories in these areas to answer to aquestionnaire covering different aspects of operations, such as raw materials, productionprocesses, pollution control measures, and difficulties factories are facing in controllingpollution. The survey is being implemented by a team of local environmental consultants,officers from YCDC/MCDC and ECD, and JICA Expert Team, with support from Industrial ZoneManagement Committees. We visited each of these factories to support factories to provideaccurate data and to confirm the situation. The questionnaire survey will last until late October2016.
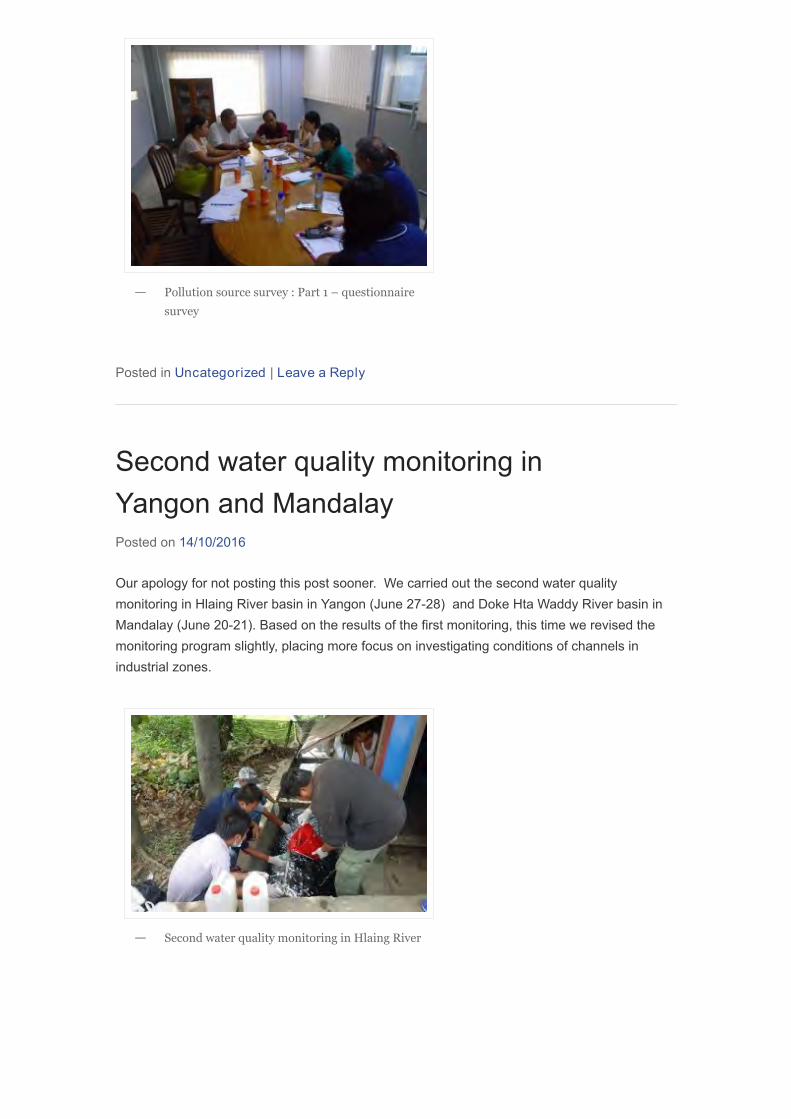
Posted in Uncategorized | Leave a Reply
Pollution source survey : Part 1 – questionnaire
survey
—
Second water quality monitoring inYangon and MandalayPosted on 14/10/2016
Our apology for not posting this post sooner. We carried out the second water qualitymonitoring in Hlaing River basin in Yangon (June 27-28) and Doke Hta Waddy River basin inMandalay (June 20-21). Based on the results of the first monitoring, this time we revised themonitoring program slightly, placing more focus on investigating conditions of channels inindustrial zones.
Second water quality monitoring in Hlaing River—
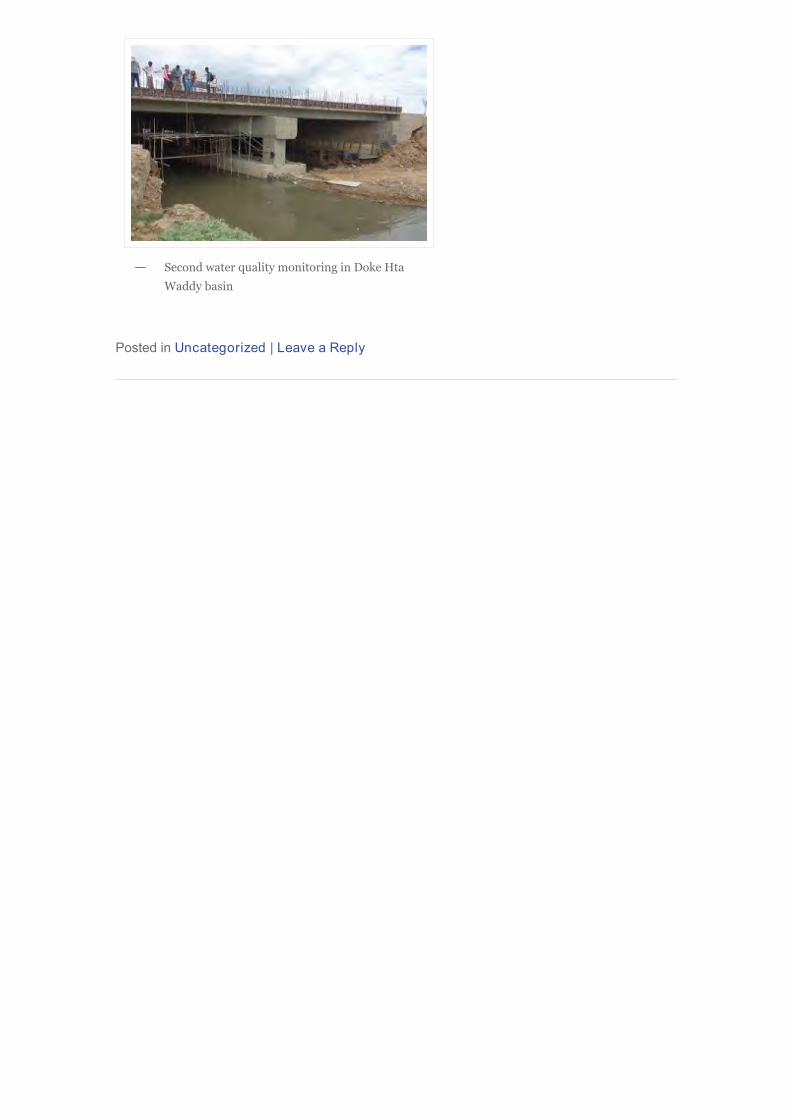
Posted in Uncategorized | Leave a Reply
Second water quality monitoring in Doke Hta
Waddy basin
—
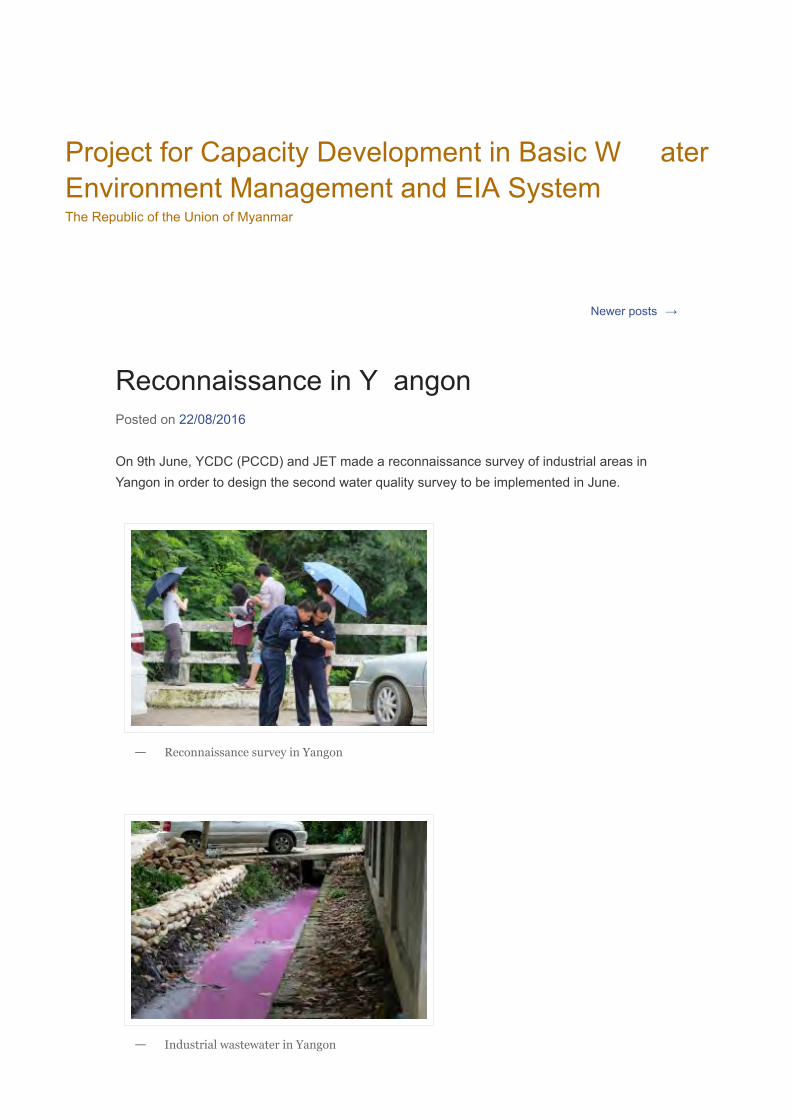
Newer posts →
Reconnaissance in Y angonPosted on 22/08/2016
On 9th June, YCDC (PCCD) and JET made a reconnaissance survey of industrial areas inYangon in order to design the second water quality survey to be implemented in June.
Reconnaissance survey in Yangon—
Industrial wastewater in Yangon—
Project for Capacity Development in Basic W aterEnvironment Management and EIA SystemThe Republic of the Union of Myanmar
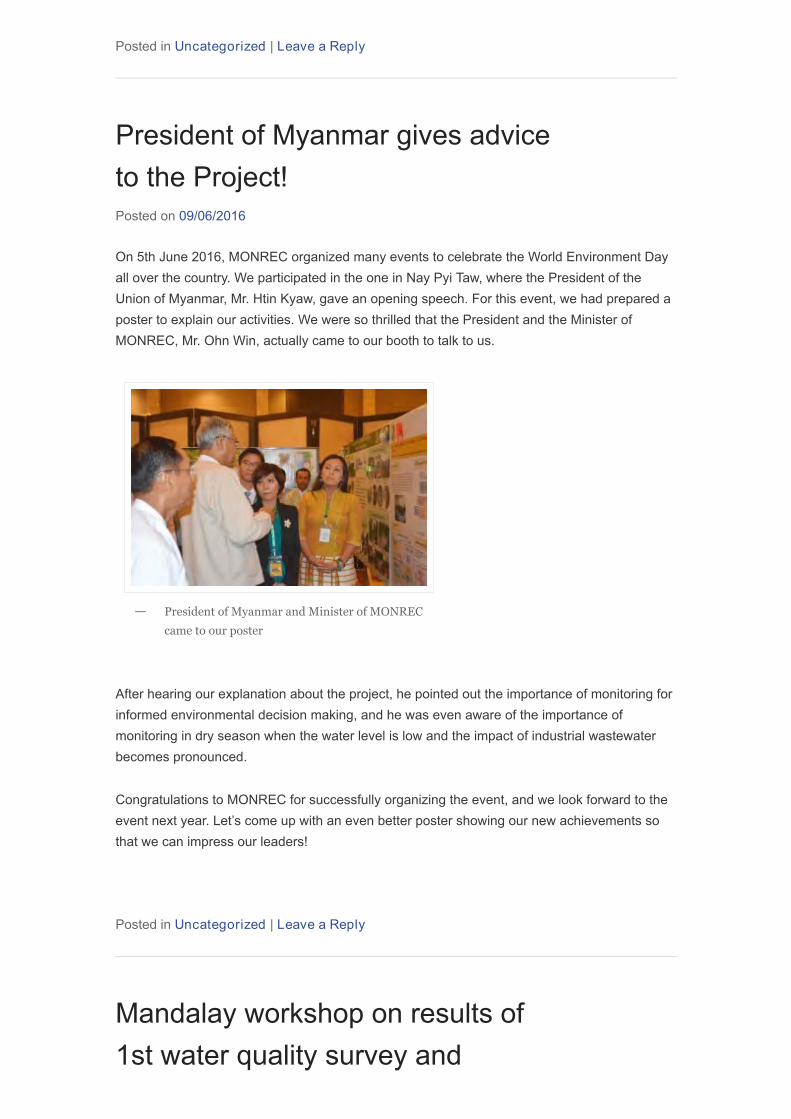
Posted in Uncategorized | Leave a Reply
President of Myanmar gives adviceto the Project!Posted on 09/06/2016
On 5th June 2016, MONREC organized many events to celebrate the World Environment Dayall over the country. We participated in the one in Nay Pyi Taw, where the President of theUnion of Myanmar, Mr. Htin Kyaw, gave an opening speech. For this event, we had prepared aposter to explain our activities. We were so thrilled that the President and the Minister ofMONREC, Mr. Ohn Win, actually came to our booth to talk to us.
After hearing our explanation about the project, he pointed out the importance of monitoring forinformed environmental decision making, and he was even aware of the importance ofmonitoring in dry season when the water level is low and the impact of industrial wastewaterbecomes pronounced.
Congratulations to MONREC for successfully organizing the event, and we look forward to theevent next year. Let’s come up with an even better poster showing our new achievements sothat we can impress our leaders!
Posted in Uncategorized | Leave a Reply
President of Myanmar and Minister of MONREC
came to our poster
—
Mandalay workshop on results of1st water quality survey and
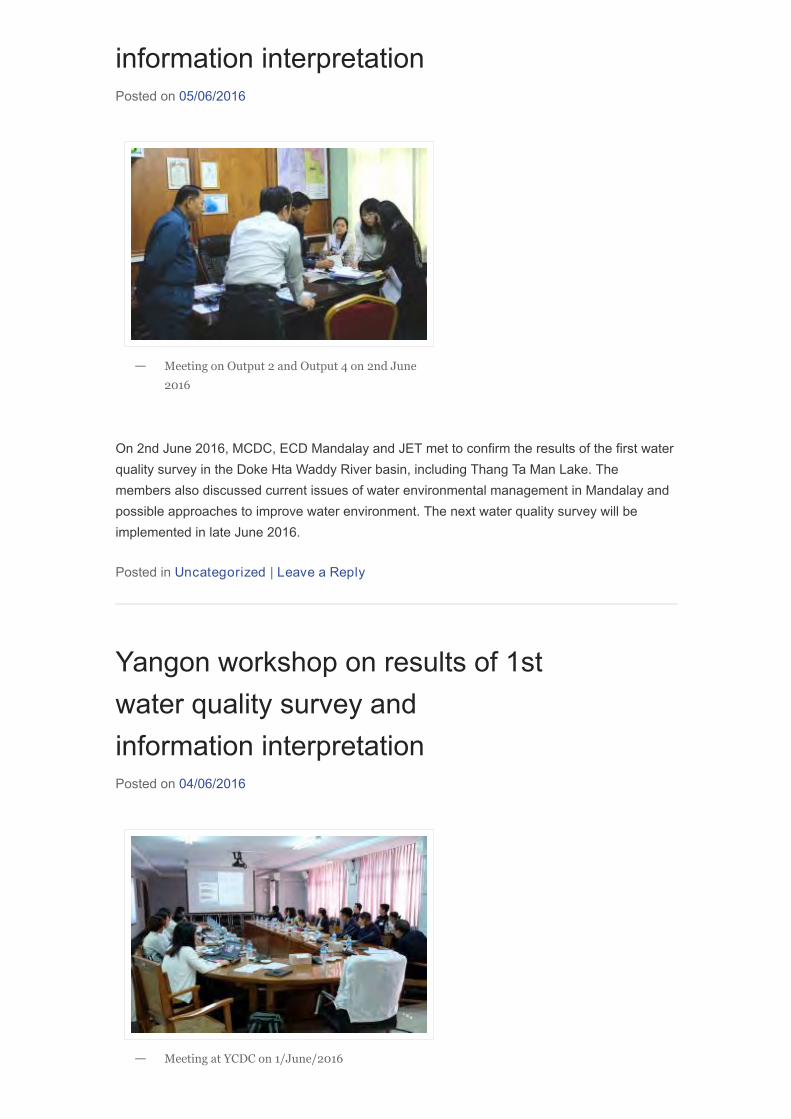
information interpretationPosted on 05/06/2016
On 2nd June 2016, MCDC, ECD Mandalay and JET met to confirm the results of the first waterquality survey in the Doke Hta Waddy River basin, including Thang Ta Man Lake. Themembers also discussed current issues of water environmental management in Mandalay andpossible approaches to improve water environment. The next water quality survey will beimplemented in late June 2016.
Posted in Uncategorized | Leave a Reply
Meeting on Output 2 and Output 4 on 2nd June
2016
—
Yangon workshop on results of 1stwater quality survey andinformation interpretationPosted on 04/06/2016
Meeting at YCDC on 1/June/2016—
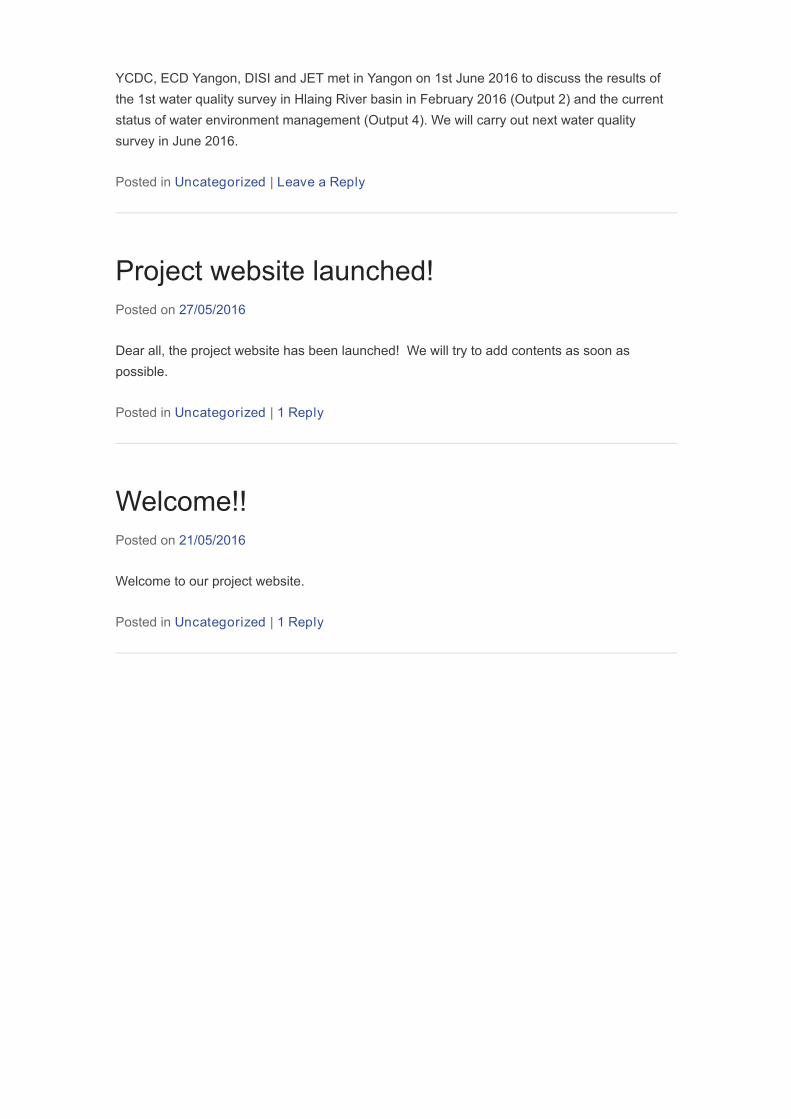
YCDC, ECD Yangon, DISI and JET met in Yangon on 1st June 2016 to discuss the results ofthe 1st water quality survey in Hlaing River basin in February 2016 (Output 2) and the currentstatus of water environment management (Output 4). We will carry out next water qualitysurvey in June 2016.
Posted in Uncategorized | Leave a Reply
Project website launched!Posted on 27/05/2016
Dear all, the project website has been launched! We will try to add contents as soon aspossible.
Posted in Uncategorized | 1 Reply
Welcome!!Posted on 21/05/2016
Welcome to our project website.
Posted in Uncategorized | 1 Reply
About Project
Overall Framework of the Project
This project is a bilateral technical cooperation project between Myanmar and Japan with theaim to support and enhance capacities of Ministry of Natural Resources and EnvironmentalConservation (MONREC) and other organizations concerned to manage water environment(water environmental management component) and to implement EIA reviews (EIAcomponent). It is being implemented based on the Record of Discussions (R/D) signed on 23rdDecember, 2014 between then MOECAF and Japan International Cooperation Agency (JICA).The project activities in Myanmar started in June 2015, and will last until May 2018.
Table below summarizes the overall framework of the project in accordance with the ProjectDesign Matrix (PDM) and the Plan of Operation (PO) contained in the original R/D agreed inDecember, 2014.
Item Contents Component
OverallGoal
Impact of industrial effluents from industrial zones on river water quality isalleviated, and advanced EIA approach for complicated issues are taken intoaccount.
JCC Meeting on 8th July 2015—
Project for Capacity Development in Basic W aterEnvironment Management and EIA SystemThe Republic of the Union of Myanmar
ProjectPurpose
Capacity for developing basic water pollution control measures based onobtained and interpreted information is enhanced and the institutionalframework of the EIA review works is established.
Outputs Output 1 Inspection procedure is standardized. Water environmentmanagement
Output 2 Capacity for implementing water qualitysurvey to obtain reliable information isenhanced.
Water environmentmanagement
Output 3 Database of water pollution sources and riverwater quality is developed.
Water environmentmanagement
Output 4 Capacity of interpreting the information forwater pollution control measures isenhanced.
Water environmentmanagement
Output 5 Necessary technical manuals and forms forthe EIA review are developed.
EIA
Output 6 Capacity of MONREC and the EIA ReportReview Body on the EIA review is enhanced.
EIA
Source: JET
Project Activities of Water Environment Management Component
The project activities are divided into two components: namely (i) the water environmentmanagement component and (ii) the EIA component. Among the six outputs of the project, thewater environment management component covers standardization of environmentalinspection (Output 1), water quality survey (Output 2), development of databases of pollutionsources and river water quality (Output 3), and interpretation of information for water pollutioncontrol measures (Output 4).
For specific contents and the schedule of each output, please visit the following pages.
Output 1 – Inspection
Output 2 – Water Quality Survey
Output 3 – Database Development
Output 4 – Information Interpretation
Target Areas of Water Environment Management Component
Activities of the water environment management component of the project are beingimplemented in three cities in Myanmar, namely Yangon, Mandalay and Nay Pyi Taw.
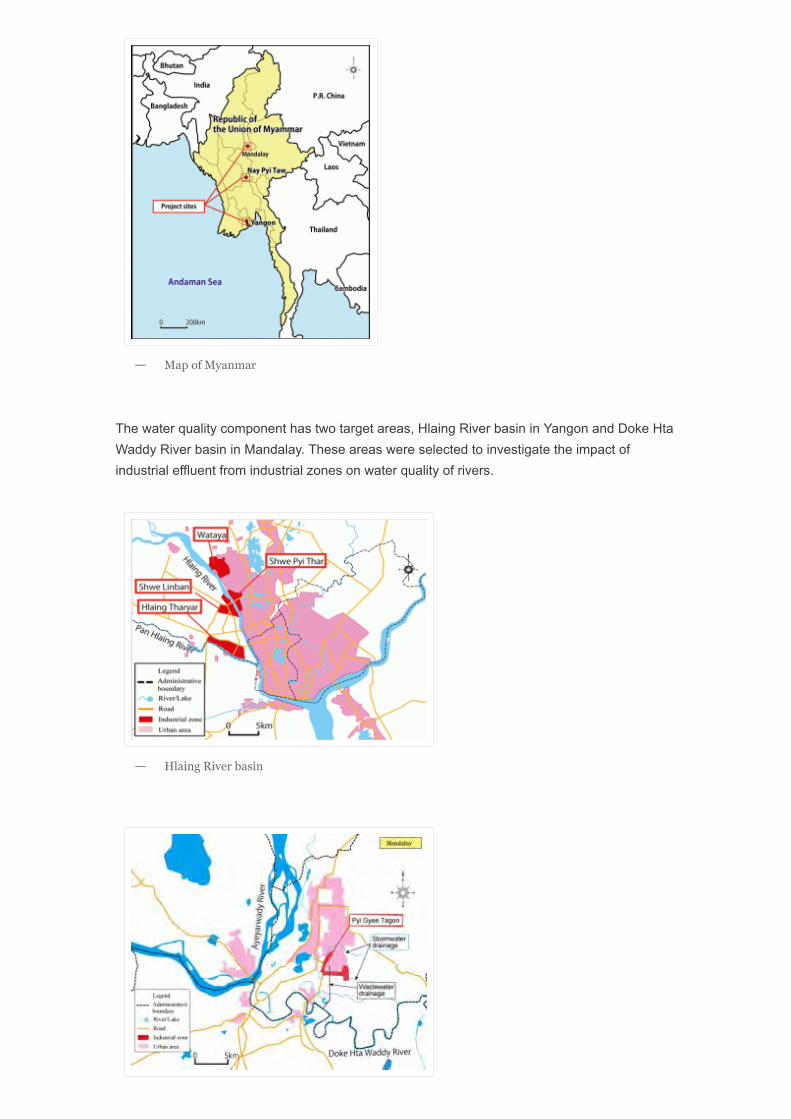
The water quality component has two target areas, Hlaing River basin in Yangon and Doke HtaWaddy River basin in Mandalay. These areas were selected to investigate the impact ofindustrial effluent from industrial zones on water quality of rivers.
Map of Myanmar—
Hlaing River basin—

Doke Hta Waddy River basin—
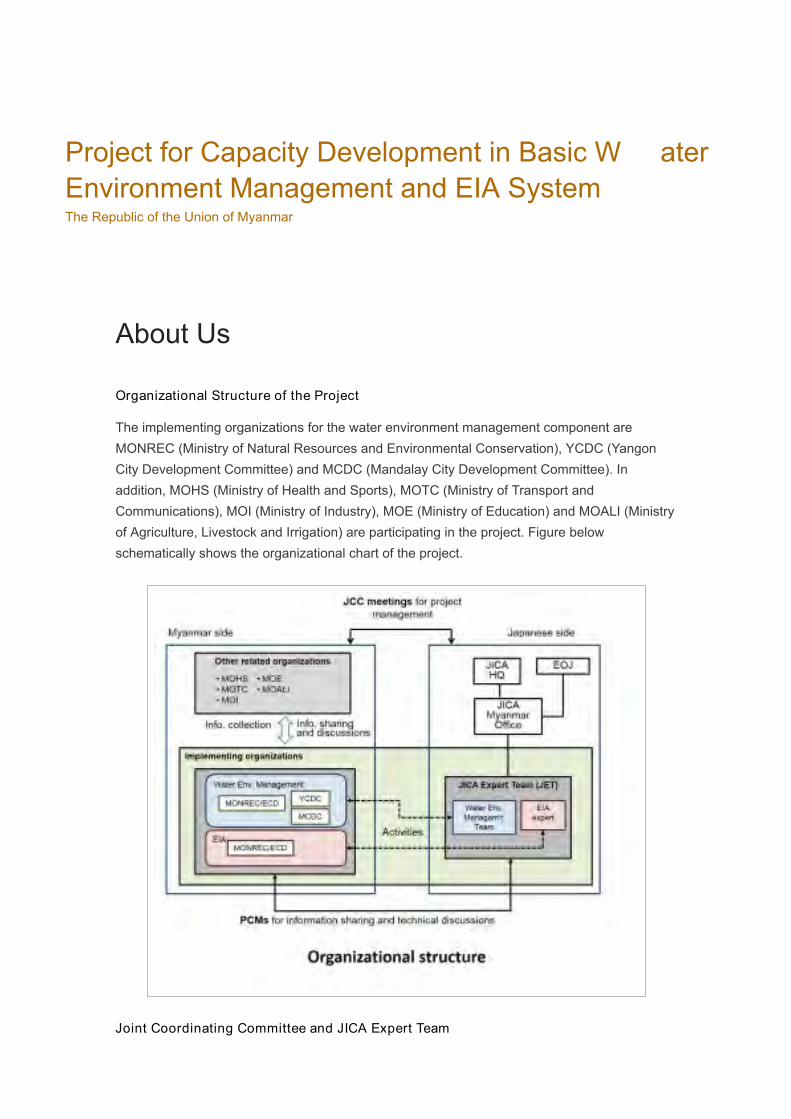
About Us
Organizational Structure of the Project
The implementing organizations for the water environment management component areMONREC (Ministry of Natural Resources and Environmental Conservation), YCDC (YangonCity Development Committee) and MCDC (Mandalay City Development Committee). Inaddition, MOHS (Ministry of Health and Sports), MOTC (Ministry of Transport andCommunications), MOI (Ministry of Industry), MOE (Ministry of Education) and MOALI (Ministryof Agriculture, Livestock and Irrigation) are participating in the project. Figure belowschematically shows the organizational chart of the project.
Joint Coordinating Committee and JICA Expert Team
Project for Capacity Development in Basic W aterEnvironment Management and EIA SystemThe Republic of the Union of Myanmar

In order to manage the project, Joint Coordinating Committee (JCC) has been organized. Seethe following link about the tasks and members of the JCC.
Joint Coordinating Committee
To support relevant organizations implement the project activities, JICA has dispatched a teamof environmental expert, JICA Expert Team (JET). Although they are based in Japan, theyspend considerable time in Myanmar, and all project activities are being implemented jointly bythe counterpart personnel from implementing organizations and JET members.
JICA Expert Team