Embed Size (px)
Citation preview
Wayne J Sand and Gravel Mine Expansion Project
Final Environmental lmpact Report
December 2015
APPENDIX J
Tra n s po rtati o n/Ci rcu I ation
(Revised Traff¡c lmpact Analysis Report)
tlo. âgel
TIGI¡XIGII iTPlliI
RevSED TRAFFrc IMPACT ANALYSIS
Wnvrur J Snruo AND Gnnvel MINE
PnOIECT EruVIRONMENTAI IMPRCT
Rrponr
Preparedfor
Ventura County Resourcs Management Agency
Planning Division
800 South Victoria Avenue, L#1740
Ventura, CA 93009-1740
November 4,2015
T'RS
130 Robin HillRoad, Suite 100
Goleta, CA 93117
(80s)6e24600
Project Number: 60419284
Srcno¡r
Tnelr or Corurerurs
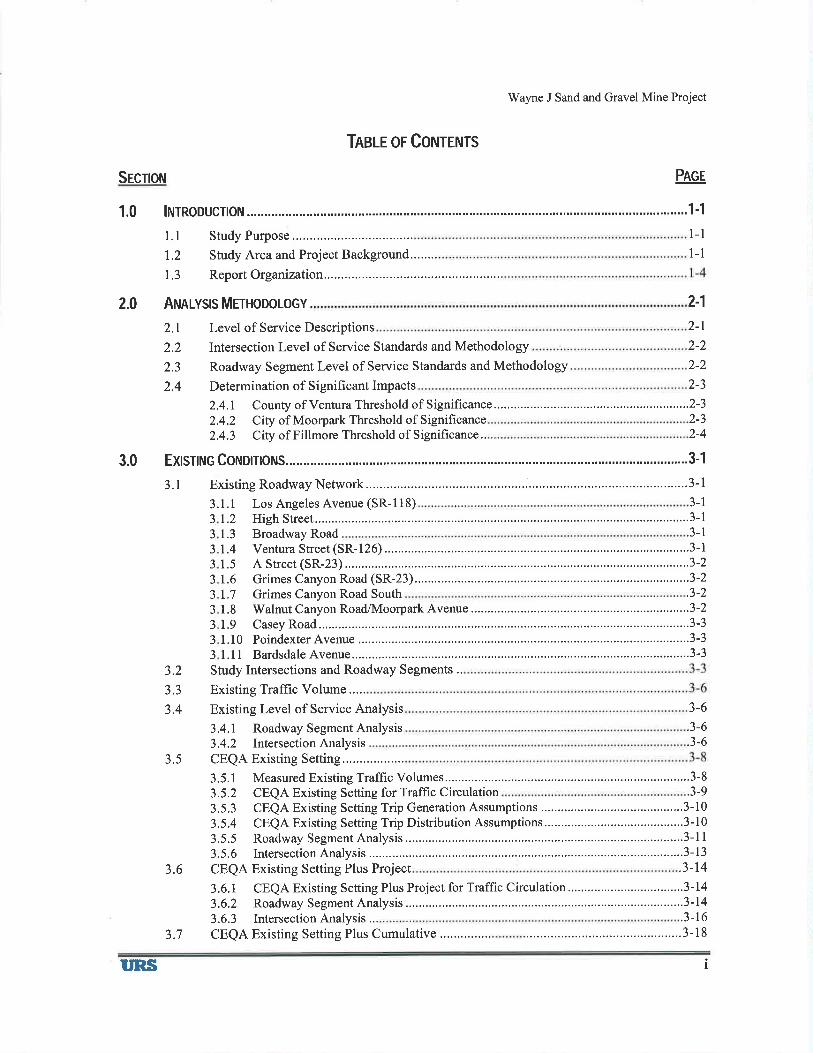
1.2 Study Area and Project Background........
1.3 ReportOrganization
Vy'ayne J Sand and Gravel Mine Project
Pncr
1-1
1-ll-1
2.0 A¡¡Rr-vss M¡rHoool-ocv
2.1 Level of Service Descriptions
2.2 Intersection Level of Service Standards and Methodology
2.3 Roadway Segment Level of Service Standards and Methodology
2.4 Determination of Significant Impacts
2.4.1 County of Ventura Threshold of Significance.................2.4.2 City of Moorpark Threshold of Significance2.4.3 City of Fillmore Threshold of Significance..
3.0 Exrsrrruc Cotuolnorus. ...............3-1
3.1 Existing Roadway Network...... .""'3-1
3.1.1 Los Angeles Avenue (SR-l18) 3-1
2-1
2-l2-2
2-2
2-3
2-32-32-4
1.2 High Street.. ..'...3-lJ
J
)J
J
J
J
J
J
J
1.3 Broadway Road .3- 1
1.7 Grimes Canyon Road South .3-2
1.8 Walnut Canyon Road/lvloorpark Avenue ........................3-2
1.9 Casey Road. ......3-31.10 Poindexter Avenue ,,..............3-3
1.11 Bardsdale Avenue........ ...'......3-3Study Intersections and Roadway Segments ..3.2
J.J
3.4
Existing Traffic Volume .....
Existing Level of Service Analysis
3.4.1 Roadway Segment Analysis3.4.2 IntersectionAnalysis
3.5 CEQAExisting Setting..................
3.5.1 Measured Existing Traffic Volumes....... ..'...'.............'.."3-83.5.2 CEQA Existing Setting for Traffic Circulation .3-93.5.3 CEQA Existing Setting Trip Generation Assumptions ............... .......3-10
3.5.4 CEQA Existing Setting Trip Distribution Assumptions............... '.....3-103.5.5 Roadway Segment Analysis .....................3-l I3.5.6 Intersection Analysis ...........3-13
3-6
.3-6
.3-6
3.6 CEQA Existing Setting Plus Project
3.6.1 CEQA Existing Setting Plus Project for Traffic Circulation...3.6.2 Roadway Segment Analysis3.6.3 Intersection Analysis ...
.3-r4,3-14.3-14.3-16
.........3- I 8
rrRs
3.7 CEQA Existing Setting Plus Cumulative ...............
t
3.7.1 CEQA Existing setting Plus cumulative for Traffic circulation
3.7.2 Roadway Segment AnalYsis
3.8 CEQA Existing Setting Plus Cumulative Plus Project
3,8.1 Roadway Segment Analysis """"""""""'3-22
4.0 REurEo PRo¡rcrs... """""""'4'1
5.0 Pnoposgo PRol¡cr DescRlpnoru """""""'5-1
5.2 Project Trip Generation and Distribution
5-l5-1
,5-4.5-55.2.2 Project TriP Distribution'
6.0 Exrsnrr¡c Pt-us Pno.¡¡cr TRAFFIc Coruororrls. """"""""6-1
6.1 Existing Plus Project Traffic Conditions """"""'6-16.1.1 Roadway Segment Analysis """""""""""'6-l
6.1.2 Intersection anâtysii...... """"""""'6-2
Yrnn (2025) Plus Cuuul-ATME TRAFFIc CoNDlrloNS ........'........ """"7'1
Wayne J Sand and Gravel Mine Project
5.2.1 Proposed Mining Projects Trip Generation '....".."""
3- l83-193-22
5.1 ProjectDescriPtion
7.0
8.0
7 .l Year (2025) Plus Cumulative Traffic Conditions."""''7.1.1 RoadwaY Segment AnalYsis
7.1.2 IntersectionAnalYsis7.2 Year (2025) Plus Cumulative Plus Project Conditions
7-r7-l7-47-5
7.2.1 Roadway Segment Analysis """""""""""'7-57.2,2 Interseciion Analysis """"""'7-67.2.3 Year (2}25)Mitigations """7-10
Frruor¡rcs AND REcoMMENDATIoNS """""""'8'1
8.1
8.2
8.3
Intersection Analysis Summary..'. """""""""""'8-lSegment Analysis Summary
Summary of Mitigation Measures """""""""""'8-38.3.1 Existing Plus Project Proposed Mitigation8.3.2 Year (2025) Plus Cumulative Plus Project Proposed Mitigations
8.4 Conclusion
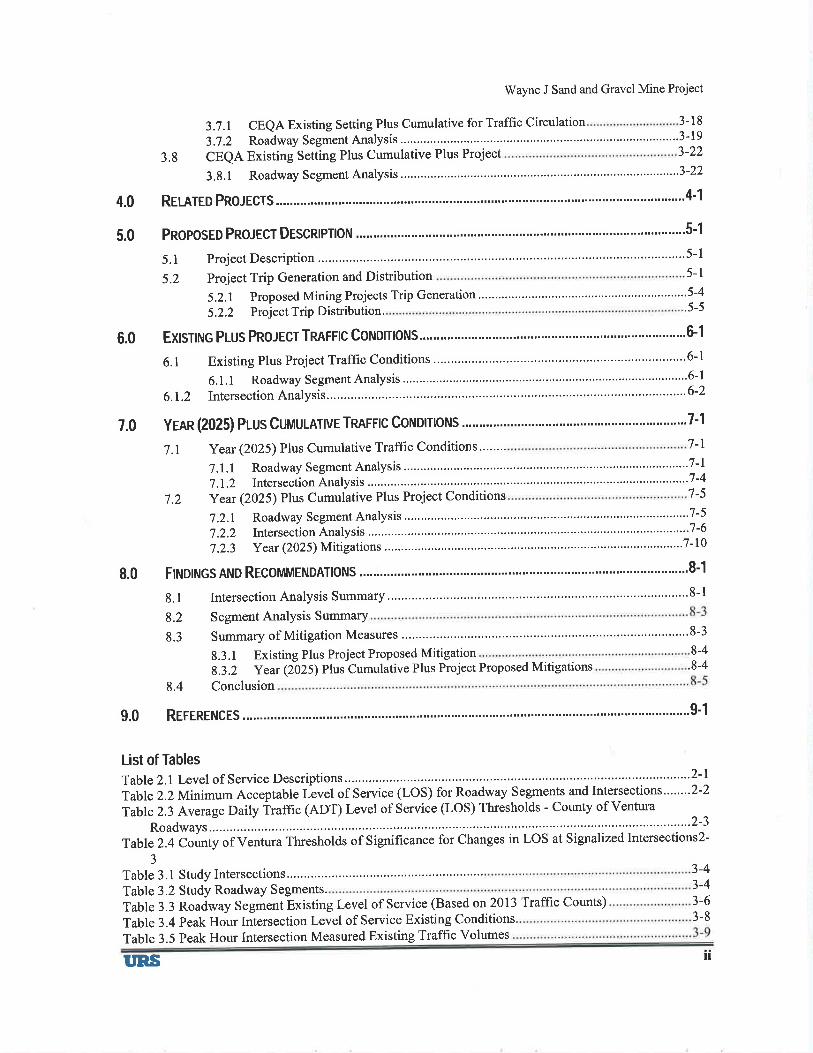
List of Tables
J
Table 3. 1 Study Intersections..........Table3.2 Study RoadwaY Segments.
Table 3.3 Roadway Segment Existing Level of Service (Based on 2013 Traffic Counts)
Table 3.4 Peak Hour Intersection Level of Service Existing Conditions.
.8-48-4
3-43-43-63-8
9.0 R¡r¡Rrruc¡s """"'9'1
Table2.l Level of Service Descriptions.....'..'..... """2-lTable 2.2 Minimum Acceptable Livel of Service (LOS) for Roadway Segments and Intersections'.......2-2
Table2.3 Average Daily iraffic (ADT) Level of Service (LOS) Thresholds - Counfy of Ventura
Table 2,4 County of Ventura Thresholds of Significance for Changes in LOS at Signalized Intersections2-
Table 3.5 Peak Hour Intersection Measured Existing Traff,rc Volumes
llIIRS
'Wayne J Sand and Gravel Mine Project
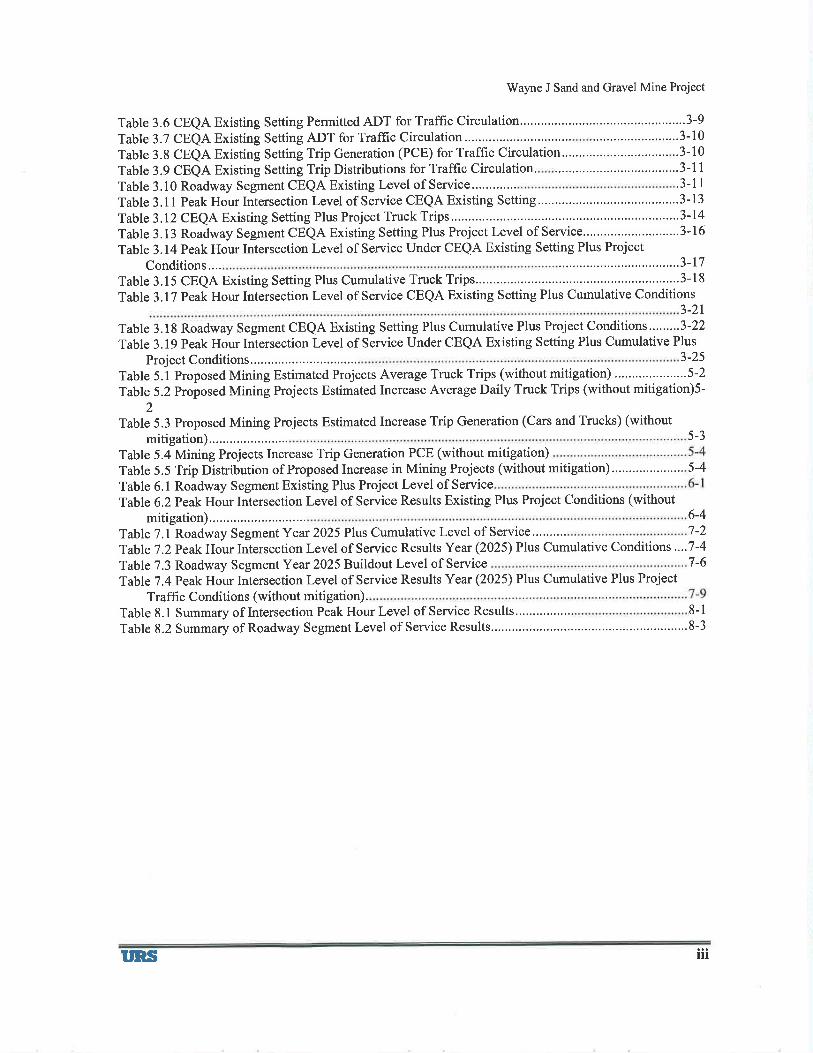
Table 3.6 CEQA Existing Setting Permitted ADT for Traffic Circulation.. .........................3-9
Table 3.7 CEQA Existing Setting ADT for Traffic CirculationTable 3.8 CEQA Existing Setting Trip Generation (PCE) for Traffic Circulation.. ..3-10
Table 3.9 CEQA Existing Setting Trip Distributions for Traffic circulation.Table 3.10 Roadway Segment CEQA Existing Level of Service............. .3-11
Table 3.11 Peak Hour Intersection Level of Service CEQA Existing Setting......... .......'.'.3-13
Table3.l2 CEQA Existing Setting Plus Project Truck Trips. --..3-14
Table 3.13 Roadway Segment CEQA Existing Setting Plus Project Level of Service............................3-16
Table 3.14 Peak Hour Intersection Level of Service Under CEQA Existing Setting Plus Project
Conditions....Table 3.15 CEQA Existing Setting Plus Cumulative Truck Trips........'... '....3-18Table 3.17 Peak Hour Intersection Level of Service CEQA Existing Setting Plus Cumulative Conditions
3-2r
Table 3.18 Roadway Segment CEQA Existing Setting Plus Cumulative Plus Project Conditions.........3-22
Table 3.19 Peak Hour Intersection Level of Service Under CEQA Existing Setting Plus Cumulative Plus
Project Conditions... 3-25
Table 5.1 Proposed Mining Estimated Projects Average Truck Trips (without mitigation) .....................5-2
Table 5.2 Proposed Mining Projects Estimated Increase Average Daily Truck Trips (without mitigation)5-
2Table 5.3 Proposed Mining Projects Estimated Increase Trip Generation (Cars and Trucks) (without
mitigation).. 5-3
Table 5.4 Mining Projects Increase Trip Generation PCE (without mitigation)Table 5.5 Trip Distribution of Proposed Increase in Mining Projects (without mitigation).. 5-4
Table 6.1 Roadway Segment Existing Plus Project Level of Service
Table 6.2 Peak Hour Intersection Level of Service Results Existing Plus Project Conditions (withoutmitigation).. 6-4
Table 7.1 Roadway Segment Year 2025 Plus Cumulative Level of Service.."..'... 7-2
Table7.2 Peak Hour Intersection Level of Service Results Year (2025) Plus Cumulative Conditions ....7-4
Table7.3 Roadway Segment Year 2025 Buildout Level of Service v-6
Table 7 .4 Peak Hour Intersection Level of Service Results Year (2025) Plus Cumulative Plus Project
Traffic Conditions (without mitigation).Table 8.1 Summary of Intersection Peak Hour Level of Service Results...."...,....... 8-1
Table 8.2 Summary of Roadway Segment Level of Service Results... ..........'.'8-3
TIRS nt
Wayne J Sand and Gravel Mine Project
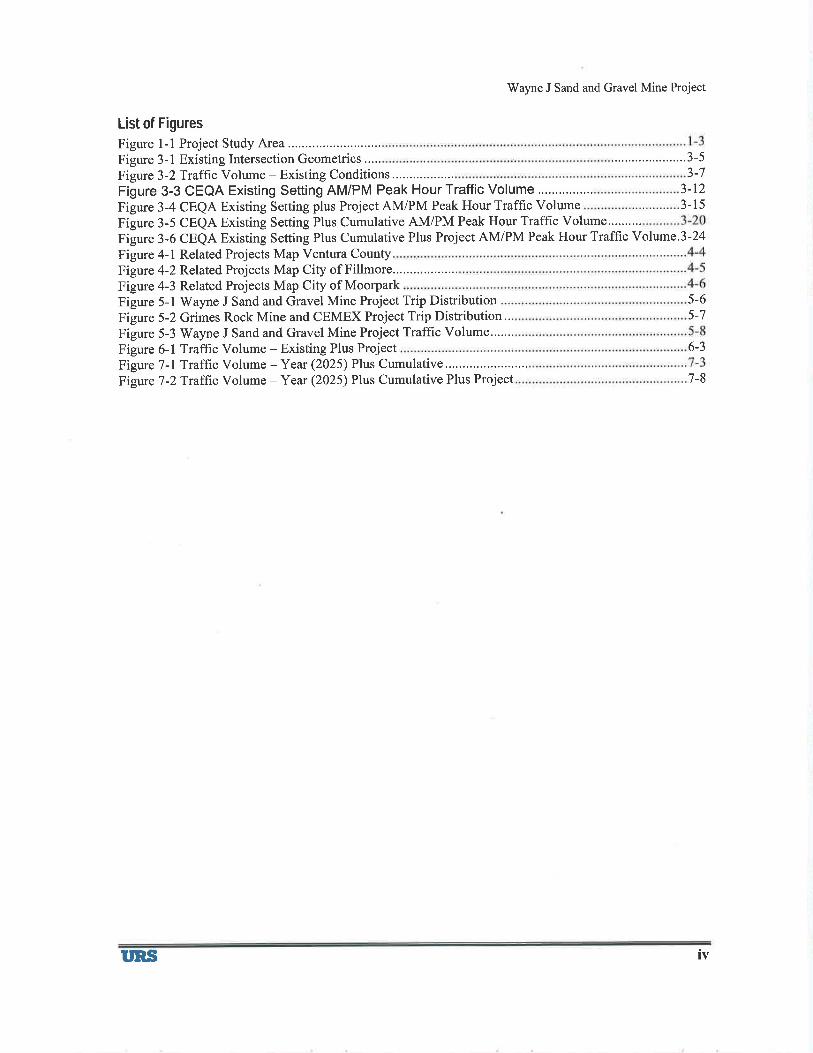
List of Figures
Figure l-l Project Study AreaFigure 3- I Existing Intersection Geometrics .....
Figure 3-2Traffic Volume - Existing Conditions 3-7
Figure 3-3 CEQA Existing Setting AM/PM Peak Hour Traffic Volume 3-r23-t5Figure 3-4 CEQA Existing Setting plus Project AM/PM Peak Hour Traffic Volume
Figure 3-5 CEQA Existing Setting Plus Cumulative AM/PM Peak Hour Traffic Volume..........Figure 3-6 CEQA Existing Setting Plus Cumulative Plus Project AM/PM Peak Hour Trafhc Volume.3-24Figure 4-1 Related Projects Map Ventura CountyFigure 4-2 Related Projects Map City of Fillmore..Figure 4-3 Related Projects Map City of MoorparkFigure 5-l Wayne J Sand and Gravel Mine Project Trip Distribution 5-6
......................3-5
Figure 5-2 Grimes Rock Mine and CEMEX Project Trip Distribution '..Figure 5-3 V/ayne J Sand and Gravel Mine Project Traffic Volume.'.."'Figure 6-1 Traffic Volume - Existing Plus ProjectFigure 7-LTraffic Volume-Year (2025) Plus Cumulative..........."'..'.......Figure 7 -2 Traffic Volume - Year (2025) Plus Cumulative Plus Project
5-7
6-3
7-8
üns tv
rüayne J Sand and Gravel Mine Project
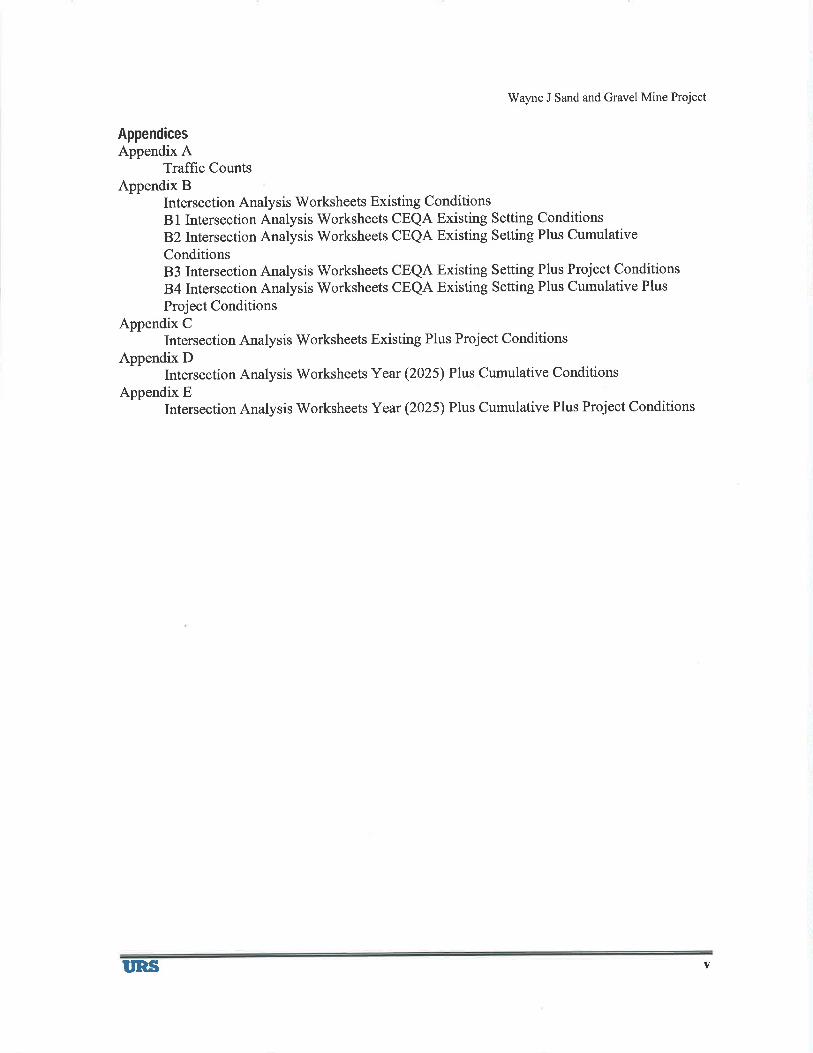
AppendicesAppendix A
Traffic CountsAppendix B
Intersection Analysis Worksheets Existing ConditionsBl Intersection Analysis Worksheets CEQA Existing Setting Conditions
B2 Intersection Analysis Worksheets CEQA Existing Setting Plus CumulativeConditionsB3 Intersection Analysis Worksheets CEQA Existing Setting Plus Project Conditions
B4 Intersection Analysis Worksheets CEQA Existing Setting Plus Cumulative Plus
Project ConditionsAppendix C
Intersection Analysis worksheets Existing Plus Project conditionsAppendix D
Intersection Analysis Vy'orksheets Year (2025) Plus Cumulative Conditions
Appendix EIntersection Analysis Worksheets Year (2025) Plus Cumulative Plus Project Conditions
T'RS v
'Wayne J Sand and Gravel Mine Project
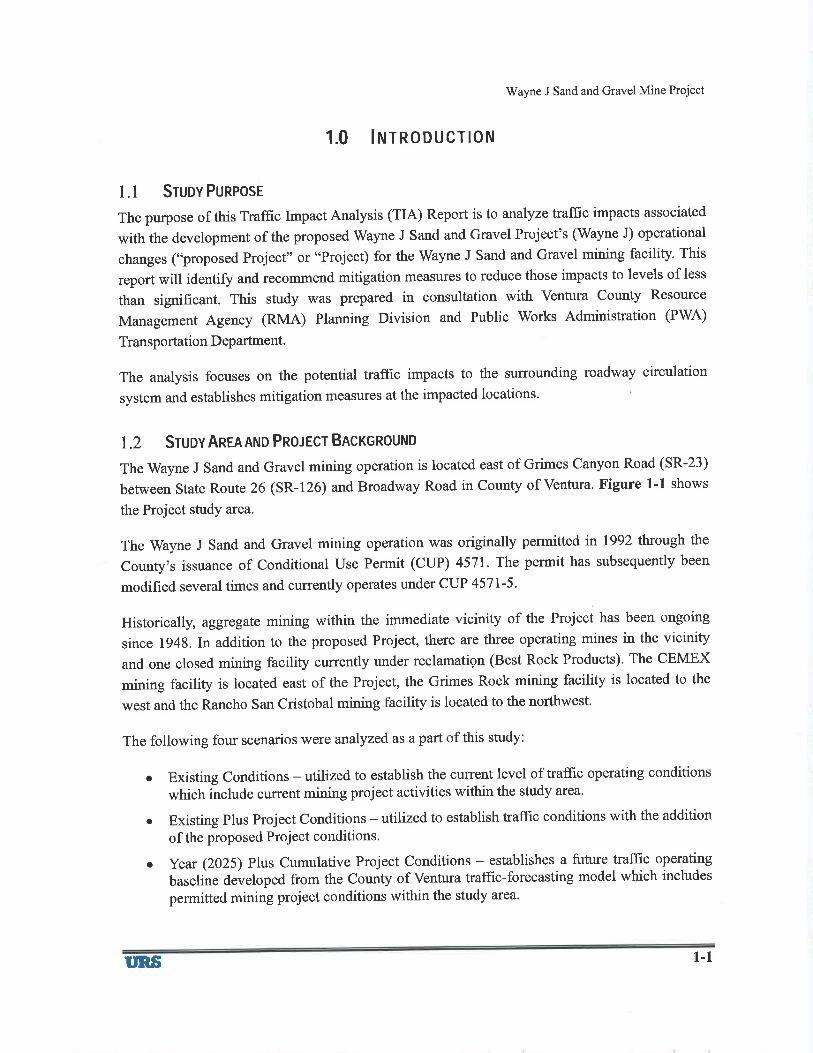
1.0 lrurnoDUcrloN
1.1 SruovPuRPosr
The purpose of this Traffrc Impact Analysis (TIA) Report is to analyze trafüc impacts associated
with the development of the proposed Wayne J Sand and Gravel Project's (Wayne J) operational
changes (..proposed Project" or "Project) for the Wayne J Sand and Gravel mining facility. This
report will identifu and recommend mitigation measures to reduce those impacts to levels of less
than signifrcant. This study was prepared in consultation with Ventura County Resource
Management Agency (RMA) Planning Division and Public 'Works Administration (PWA)
Transportation DePartment.
The analysis focuses on the potential traffic impacts to the surounding roadway circulation
system and establishes mitigation measures at the impacted locations.
1.2 SruovAneAAND PRolecr BRcrcRour'1o
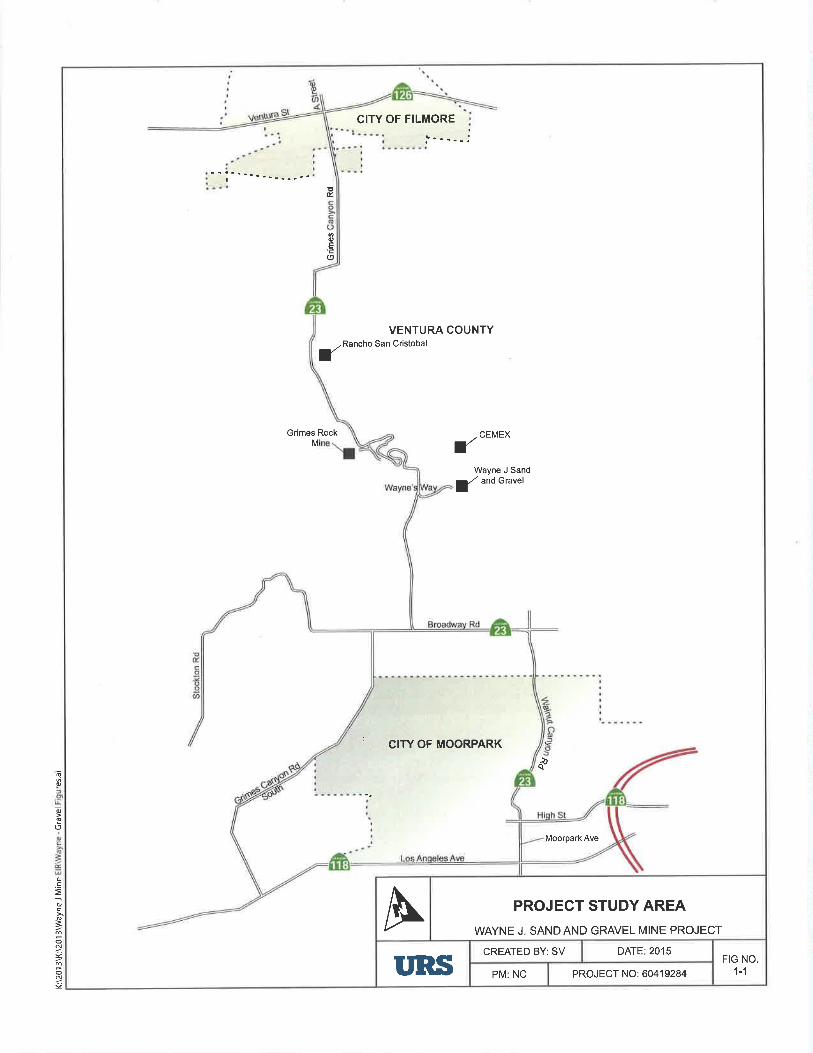
The Wayne J Sand and Gravel mining operation is located east of Grimes Canyon Road (SR-23)
between State Route 26 (SR-126) and Broadway Road in County of Ventura. Figure 1-1 shows
the Project study area.
The Wayne J Sand and Gravel mining operation was originally permitted ín 1992 through the
County,s issuance of Conditional Use Permit (CUP) 4571. The permit has subsequently been
modified several times and currently operates under cuP 4571-5.
Historically, aggregate mining within the immediate vicinity of the Project has been ongoing
since 1948. In addition to the proposed Project, there are three operating mines in the vicinþ
and one closed mining facility currently under reclamatign (Best Rock Products)' The CEMEX
mining facility is located east of the Project, the Grimes Rock mining facility is located to the
west and the Rancho San Cristobal mining facility is located to the northwest.
The following four scenarios were analyzed as a part of this study:
o Existing Conditions - utilized to establish the current level of trafüc operating conditions
which include current mining project activities within the study area.
o Existing Plus Project Conditions - utilized to establish traffrc conditions with the addition
of the proposed Project conditions.
¡ year (2025) Plus Cumulative Project Conditions - establishes a future traffic operating
baseline developed from the County of Ventura traffrc-forecasting model which includes
permitted mining project conditions within the study area'
T'RS 1-1
o
Wayne J Sand and Gravel Mine Project
Year (2025) Plus Cumulative Plus Project Conditions - represents future baseline trafficconditions with the addition of the proposed cumulative project trip generation associated
with Grimes Rock, CEMEX and Rancho San Cristobal plus the proposed Project.
IM t-2
o
õ(t
a.ç
o
B
oN
N
Moorpark Ave
' crrY oF MooRPARK
A PROJECT STUDY AREA
WAYNE J. SANDAND GRAVEL MINE PROJECT
DATE:2015CREATED BY: SV
1-1FIG NO.I'RS PM: NC PROJECT NO: 60419284
CITY OF FILMORE
,\-'---i
ÞÉ.
oE(9
/RanchofVENTURA COUNTY
San Cristobal
Grimes Rock / CEMEX
fWayne J Sand
a/ andGravel
M
+
Vy'ayne J Sand and Gravel Mine Project
The traffrc analyses prepared for this study were performed in accordance with approved
assumptions and consultation with the Ventura County RMA Planning Division and PWA
Transportation DePartment.
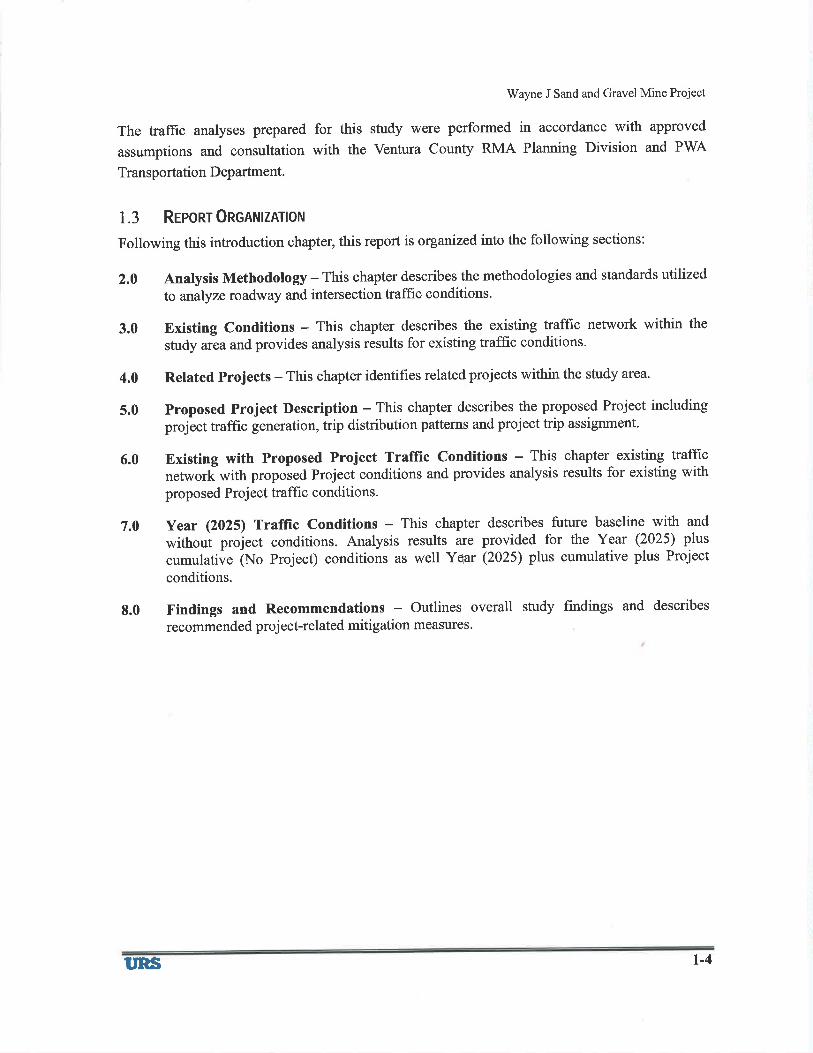
1.3 RrponrORcRttlzRnoru
Following this introduction chapter, this report is organized into the following sections:
2.0 Analysis Methodology - This chapter describes the methodologies and standards utilized
to analyze roadway and intersection traffic conditions.
3.0 Existing Conditions - This chapter describes the existing traffic network within the
study area and provides analysis results for existing traffic conditions.
4.0 Related Projects - This chapter identifies related projects within the study area.
S.0 proposed Project Description - This chapter describes the proposed Project including
project traffic generation, trip distribution patterns and project trip assignment.
6.0 Existing with Proposed Project Traffic Conditions - This chapter existing traffic
network with propoied Project conditions and provides analysis results for existing with
proposed Proj ect traffic conditions'
7.0 Year Q025) Traffic Conditions - This chapter describes future baseline with and
without project conditions. Analysis results are provided for the Year (2025) plus
cumulative (No f-.¡."t) conditions as well Ye:ar (2025) plus cumulative plus Project
conditions.
8.0 Findings and Recommendations - Outlines overall study findings and describes
recommended project-related mitigation measuros.
tRs l-4
Vy'ayne J Sand and Gravel Mine Project
2,0 ATNLYSISMTrHODOLOGY
The traffrc analyses prepared for this study were performed in accordance with discussions and
consultation with the Ventura County RMA Planning Division and PWA Transportation
Department. Detailed information on intersection analysis methodologies, standards, and
thresholds are discussed in the following sections.
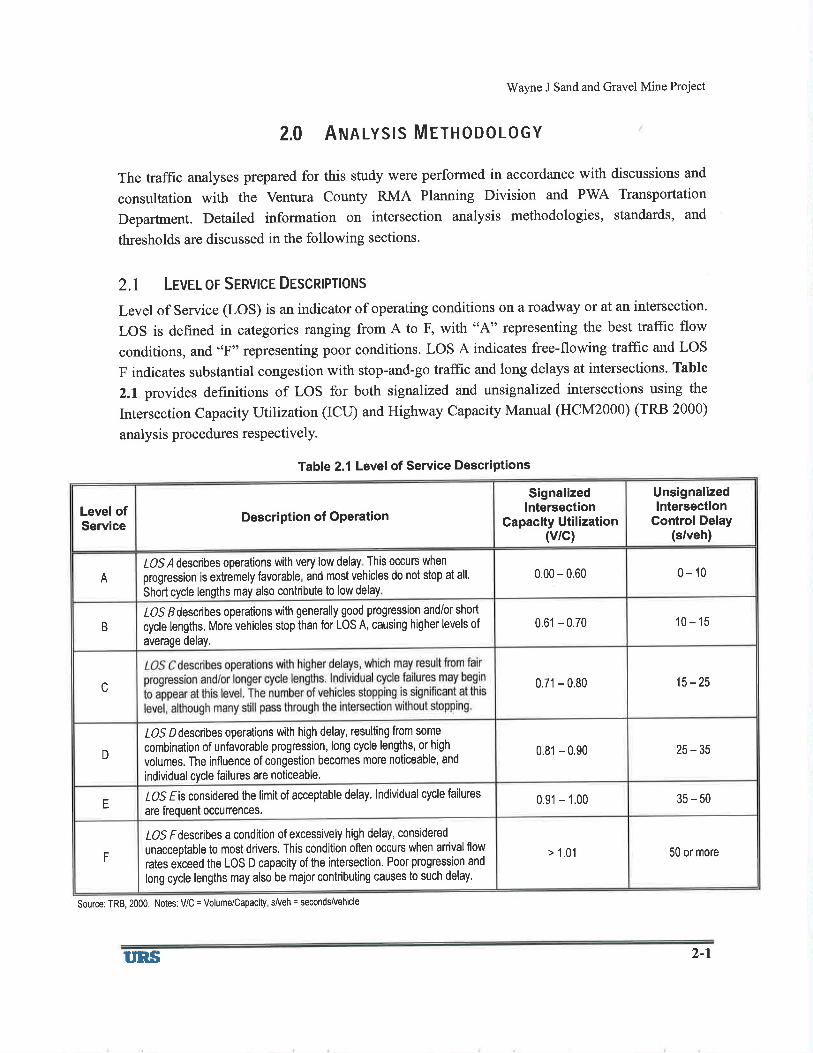
2.1 Levrl oF SERVIcE DescRlPnorus
Level of Service (LOS) is an indicator of operating conditions on a roadway or at an intersection.
LOS is defined in categories ranging from A to F, with "4" representing the best traffic flow
conditions, and "F" representing poor conditions. LOS A indicates free-flowing traffrc and LOS
F indicates substantial congestion with stop-and-go traffrc and long delays at intersections. Table
2.1 provides definitions of LOS for both signalized and unsignalized intersections using the
Intersection Capacity Utilization (ICU) and Highway Capacity Manual (HCM2000) (TRB 2000)
analysis procedures respectively.
Table 2.1 Level of Service Descriptions
Source: TRB,2000. Notes: V/C = Volume/Capacity, sfueh = secondsfuehicle
Unsignalizedlntersection
GontrolDelay(s/veh)
Signalizedlntersection
Capacity Utilization(v/c)
Level ofService
Description of Operation
0-100.00 - 0.60A
LOS A describes operations with very low delay This occurs when
progression ts exkemely favorable and most vehicles do not stop at all.
Short cycle lengths may also contribute to low delay
0.61 - 0,70 10-15lOS Edescribes operations with generally good progression and/or short
cycle lengths, More vehicles stop than for LOS A, causing higher levels of
average delay.B
15 -250.71 - 0.80c
25-350.81 - 0.90D
IOS D describes operations with high delay, resulting from some
combination of unfavorable progression, long cycle lengths, or high
volumes. The influence of congestion becomes more noticeable, and
individual cycle failures are noticeable.
35-500.91 - 1.00tOS Fis considered the limit of acceptable delay. lndividual cycle failures
are frequent occufrences.E
50 or more> 1.01F
LOS Fdescribes a condition of excessively high delay, considered
unacceptable to most drivers. This condition often occurs when arrival flow
rates exceed the LOS D capacity of the intersection. Poor progression and
long cycle lengths may also be major contributing causes to such delay.
uns 2-l
Wayne J Sand and Gravel Mine Project
2.2 lrureRs¡CnON LEVEL oF SERVIcE SrRruoRnos AND METHoDoLOGY
A computenzed, analysis of intersection operations was performed utilizing the TRAFFIX 7,6
analysis software, which uses the ICU, HCM2000 methodologies. The LOS criteria used for this
technique are listed in Table 2.1.
2.3 RoRownv Srcrurrur Lrvel oF SERVIcE StRruoRRos AND METHoDoLoGY
Roadway segment analysis was based on volume-to-capacity (V/C) calculations using County of
Ventura thoroughfares and conventional State highway capacities. County thoroughfares and
conventional State highways in the unincorporated area are classified as Class I, II, and III
roadways. Class I roadways are rural two-lane or multi-lane roads with essentially level terrain,
where the road section has been improved to meet current road standard criteria. Class II
roadways are rural two-lane roads, with essentially level and slightly rolling terrain, where the
road section does not meet current road standard criteria. Class III roadways are rural two-lane
roads, with mountainous terrain or sharply curving alignment, where the road section does not
meet current road standard criteria.
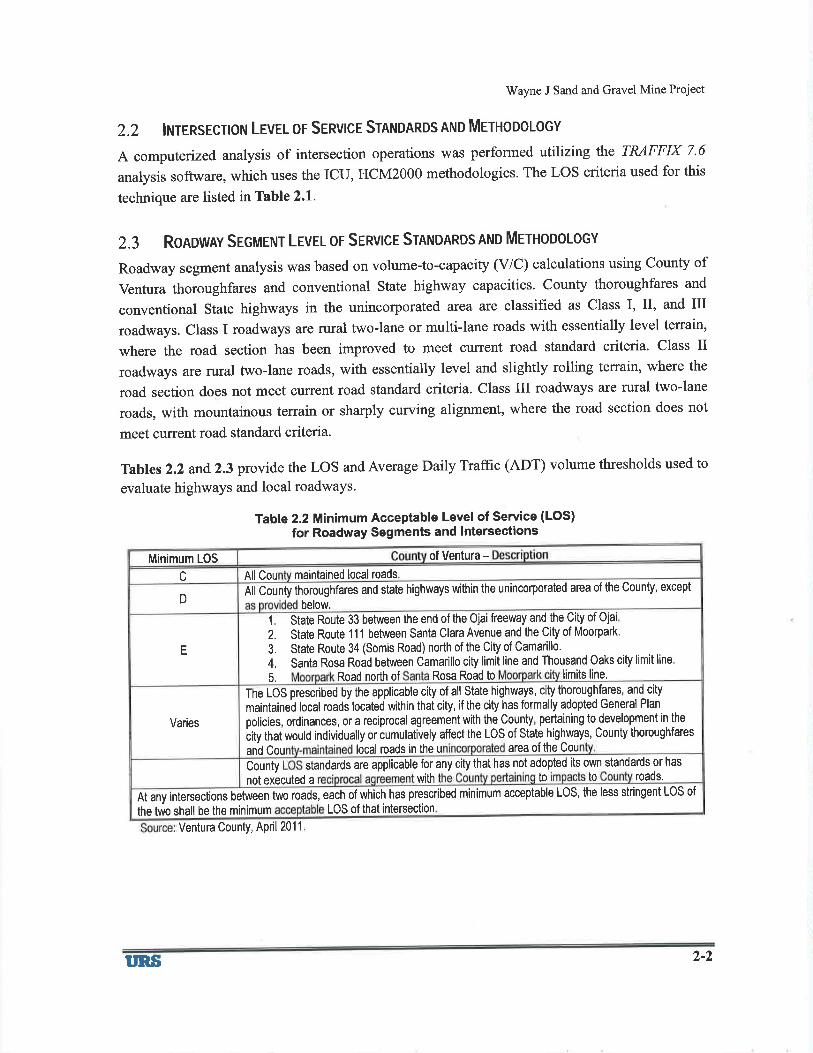
Tables 2.2 and2.3 provide the LOS and Average Daily Traffrc (ADT) volume thresholds used to
evaluate highways and local roadways.
Table 2.2 Minimum Acceptable Level of Service (LOS)for Roadway Segments and Intersections
Ventura Coun$, April 2011
of Ventura -Minimum LOS
maintained local roadsAllCoucAll County thoroughfares and state highways within the unincoçorated area of the County, except
below.D
1.
2.
3.
4.
5.
State Route 111 between Santa Clara Avenue and the City of Moorpark.
State Route 34 (Somis Road) north of the City of Camarillo.
Santa Rosa Road between Camarillo city limit line and Thousand Oaks city limit line.
of the Ojai freeway and the City of OjaiState Route 33 between the end
Road north of Rosa Road to limits line.
E
andStateallthe icable of thoroughfares, cityLOSThe highways, cityby appl cityprescribedPlanGeneralif has formthatwithin thentainedmat roadslocal located c¡ty ally adoptedcity
thetntothewith developmenta0r pertainingCountyordinances, agreementreciprocalpolicies,hStatetheaffect of thoroughfaresLOS Countyighways,0rwouldthat cumulativelyindividuallycity
Couofarea theutheroads tnlocaland Cou
Varies
ownits ardsstand has0rfor that nothas adoptedare any citystandards applicableCountyroads.totowithexecutednot a
less ofLOSmrntmum thehaswhich stringentLOS,two of acceptableeachAt between roads, prescribedintersectionsanyintersectionthatLOS ofallsh thebe mrntmumtwothe
ttRs 2-2
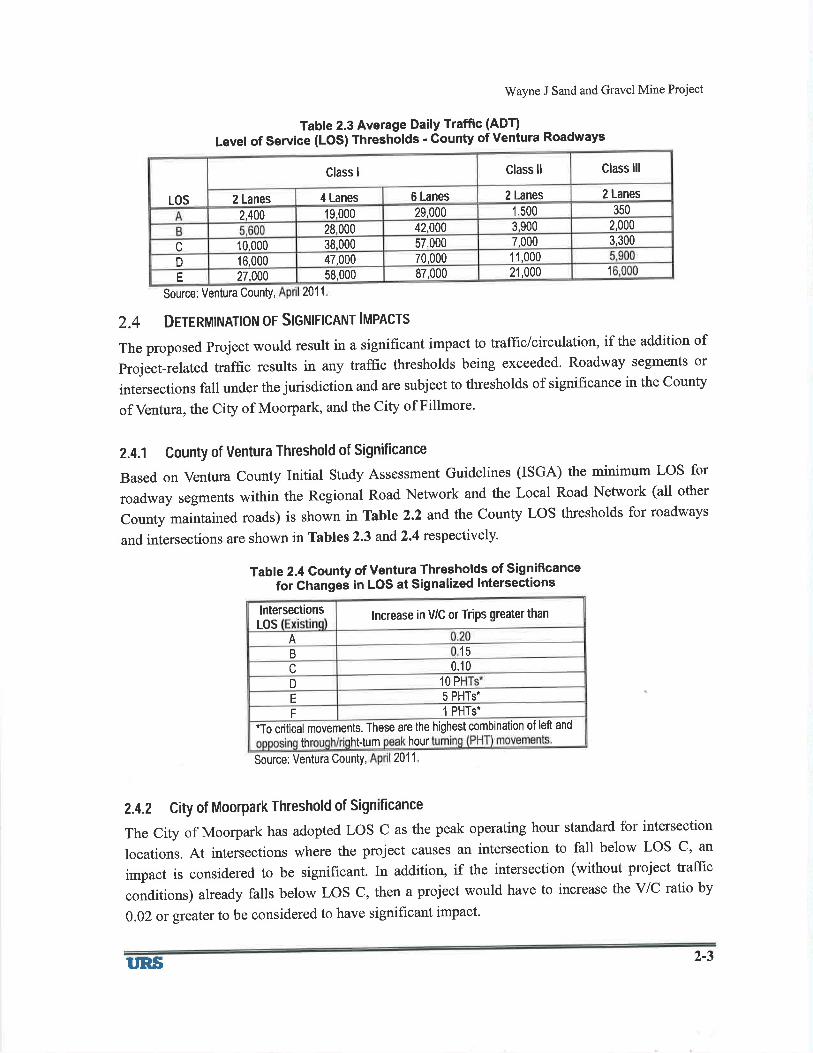
Class lllClass llClass I
2 Lanes2 Lanes6 Lanes4 LanesLOS 2 Lanes35029,000 1,50019,0002,400
2,00042,000 3,90028,0003,3007,00038,000 57,00010,000c
11,00070,00047,00016,000DI21,00087,00058,00027,000E
Wayne J Sand and Gravel Mine Project
Table 2.3 Average Daily Traffic (ADT)
Level of Service (Los) Thresholds - Gounty of ventura Roadways
Source: Ventura County, 2011
2.4 DrtRullrlRtloN oF SlcrulrrcRrur lupncrs
The proposed project would result in a significant impact to 1l.,:afficlcirculation, if the addition of
project-related traffrc results in any traffrc thresholds being exceeded. Roadway segments or
intersections fall under the jurisdiction and are subject to thresholds of significance in the County
of Ventura, the City of Moorpark, and the City of Fillmore'
2.4.1 County of Ventura Threshold of Significance
Based on Ventura County Initial Study Assessment Guidelines (ISGA) the minimum LOS for
roadway segments within the Regional Road Network and the Local Road Network (all other
County maintained roads) is shown in Table 2.2 and the County LOS thresholds for roadways
and intersections are shown in Tables 2.3 and 2.4 respectively.
Table 2.4 Gounty of Ventura Thresholds of Significancefor Ghanges in LOS at Signalized lntersections
Source: Ventura CountY, 2011
2.4.2 City of Moorpark Threshold of Significance
The Crty of Moorpark has adopted LOS C as the peak operating hour standard for intersection
locations. At intersections where the project causes an intersection to fall below LOS C, an
impact is considered to be significant. In addition, if the intersection (without project traffic
conditions) already falls below Los c, then a project would have to increase the v/c ratio by
0.02 or greater to be considered to have significant impact'
lncrease in V/C or Trips greater thanlntersectionsLOS
A15B
0.10c10PD
5 PHTs*E
1 PHTs-F*To critical movements. These are the highest combination of left and
httum hourth
ttRs 2-3
Wayne J Sand and Gravel Mine Project
The City of Moorpark Traffrc Impact Study Guidelines also requires the use of more
conservative stþulated values for intersection capacity. An intersection at Moorpark can be
evaluated up to two levels of service poorer than in unincorporated Ventura County, where
regional values for approach capacity are based upon measurements throughout Ventura County.
2.4.3 City of Fillmore Threshold of Significance
The City of Fillmore has adopted LOS C as the peak operating hour standard for intersection
locations on city streets and LOS D within both the Downtown Specifrc Plan area and on SR-
126. Consistent with the previous traffrc studies, the County of Ventura ISGA were assumed in
lieu of City of Fillmore project significant impact threshold guidelines.
IIRS 2-4
Wayne J Sand and Gravel Mine Project
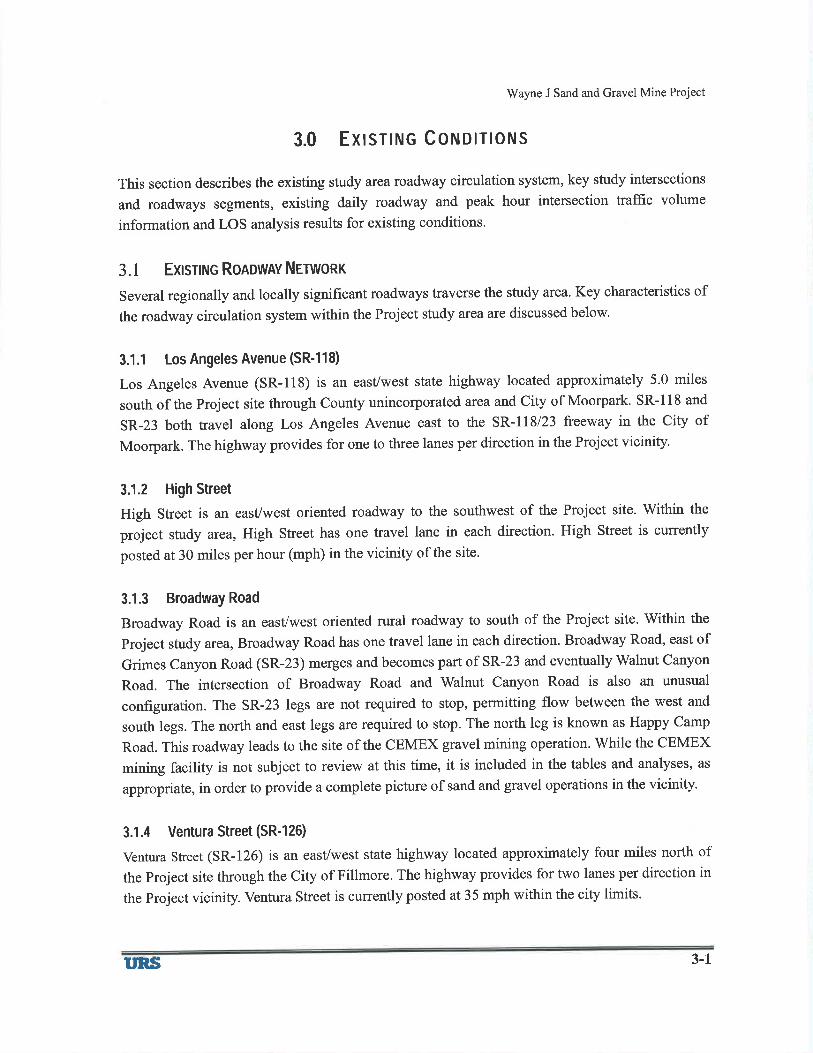
3.0 ExlsnNG CoNDlrloNs
This section describes the existing study area roadway circulation system, key study intersections
and roadways segments, existing daily roadway and peak hour intersection traffrc volume
information and LOS analysis results for existing conditions.
3.1 Extsnruc RonownY NrrwoRx
Several regionally and locally significant roadways traverse the study area. Key characteristics of
the roadway circulation system within the Project study area are discussed below.
3.1 .1 Los Angeles Avenue (SR-11 8)
Los Angeles Avenue (SR-118) is an easVwest state highway located approximately 5.0 miles
south of the Project site through County unincorporated area and City of Moorpark. SR-l18 and
SR-23 both travel along Los Angeles Avenue east to the SR-118123 freeway in the City of
Moorpark. The highway provides for one to three lanes per direction in the Project vicinity.
3.1.2 High Street
High Street is an easlwest oriented roadway to the southwest of the Project site. Within the
project study area, High Street has one travel lane in each direction. High Street is currently
posted at 30 miles per hour (mph) in the vicinity of the site.
3.1.3 Broadway Road
Broadway Road is an easlwest oriented rural roadway to south of the Project site. Within the
project study area, Broadway Road has one travel lane in each direction. Broadway Road, east of
Grimes Canyon Road (SR-23) merges and becomes part of SR-23 and eventually Walnut Canyon
Road. The intersection of Broadway Road and Walnut Canyon Road is also an unusual
configuration. The SR-23 legs are not required to stop, permitting flow between the west and
south legs. The north and east legs are required to stop. The north leg is known as Happy Camp
Road. This roadway leads to the site of the CEMEX gravel mining operation. While the CEMEX
mining facility is not subject to review at this time, it is included in the tables and analyses, as
appropriate, in order to provide a complete picture of sand and gravel operations in the vicinity.
3.1.4 Ventura Street (SR-126)
Ventura Street (SR-126) is an easVwest state highway located approximately four miles north of
the project site through the City of Fillmore. The highway provides for two lanes per direction in
the Project vicinity. Ventura Street is currently posted at 35 mph within the city limits.
I'RS 3-1
Wayne J Sand and Gravel Mine Project
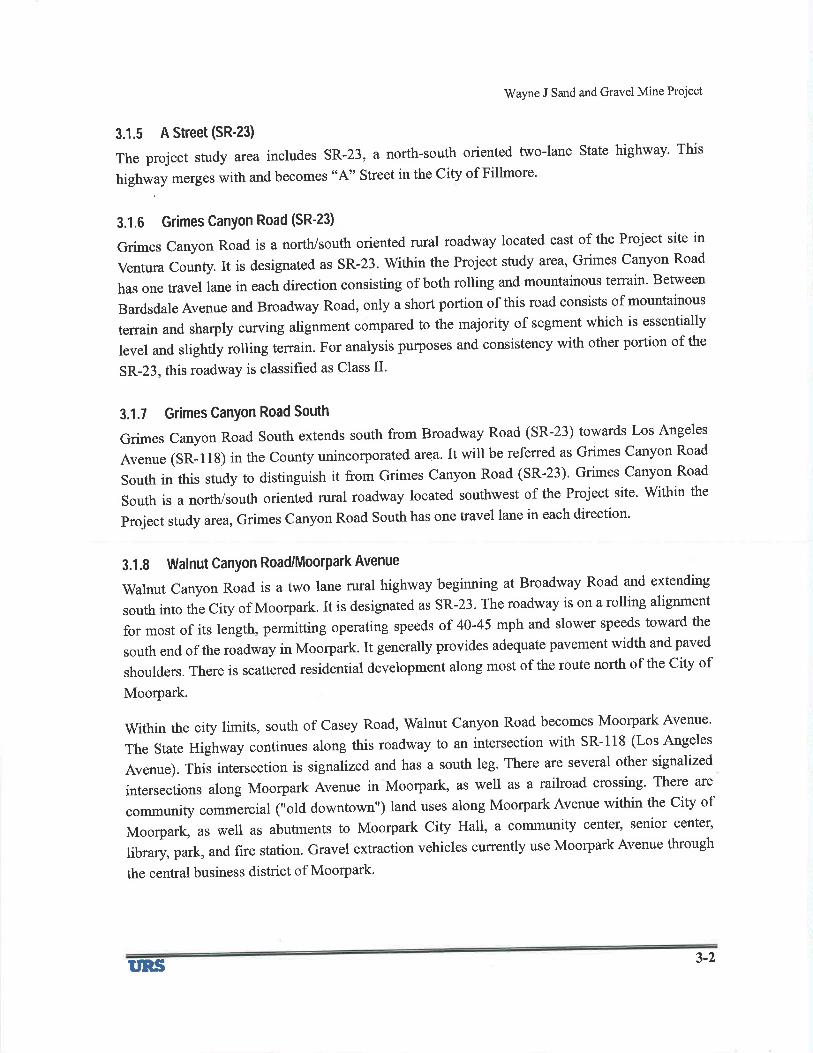
3.1,5 A Street (SR-23)
The project study area includes sR-23, a north-south oriented two-lane State highway' This
hiehwlv merges with and becomes "A" Street in the cþ of Fillmore'
3.1.6 Grimes CanYon Road (SR-23)
Grimes canyon Road is a north/south oriented rural roadway located east of the Project site in
ventura county. It is designated as sR-23. Within the Project study area, Grimes canyon Road
has one travel lane in each direction consisting of both rolling and mountainous terrain' Between
Bardsdale Avenue and Broadway Road, only a short portion of this road consists of mountainous
terrain and sharply curving alignment compared to the majority of segment which is essentially
level and slightly rolling terrain. For analysis purposes and consistency with other portion of the
SR-23, this roadway is classified as Class II'
3.1.7 Grimes CanYon Road South
Grimes canyon Road south extends south from Broadway Road (sR-23) towards Los Angeles
Avenue (sR-l18) in the county unincorporated arqa. It will be referred as Grimes canyon Road
South in this study to distinguish it from Grimes canyon Road (sR-23)' Grimes canyon Road
south is a north/south oriented rural roadway located southwest of the Project site' within the
Project study area, Grimes Canyon Road South has one travel lane in each direction'
3.1.8 Walnut Canyon Road/Moorpark Avenue
walnut canyon Road is a two lane rural highway beginning at Broadway Road and extending
south into the city of Moorpark. It is designated as sR-23. The roadway is on a rolling alignment
for most of its length, permitting operating speeds of 40-45 mph and slower speeds toward the
south end of the roadway in Moorpark. It generally provides adequate pavement width and paved
shoulders. There is scattered residential development along most of the route north of the City of
Moorpark.
within the city limits, south of casey Road, walnut canyon Road becomes Moorpark Avenue'
The State Highway continues along this roadway to an intersection with sR-118 (Los Angeles
Avenue). This intersection is signalized and has a south leg. There are several other signalized
intersections along Moorpark Avenue in Moorpark, as well as a railroad crossing' There are
community commercial ("old downtown") land uses along Moorpark Avenue within the city of
Moorpark, as well as abutments to Moorpark City Hall, a community center, senior center'
library park, and fire station. Gravel extraction vehicles currently use Moorpark Avenue through
the central business district of Moorpark'
rrns 3-2
Wayne J Sand and Gravel Mine Project
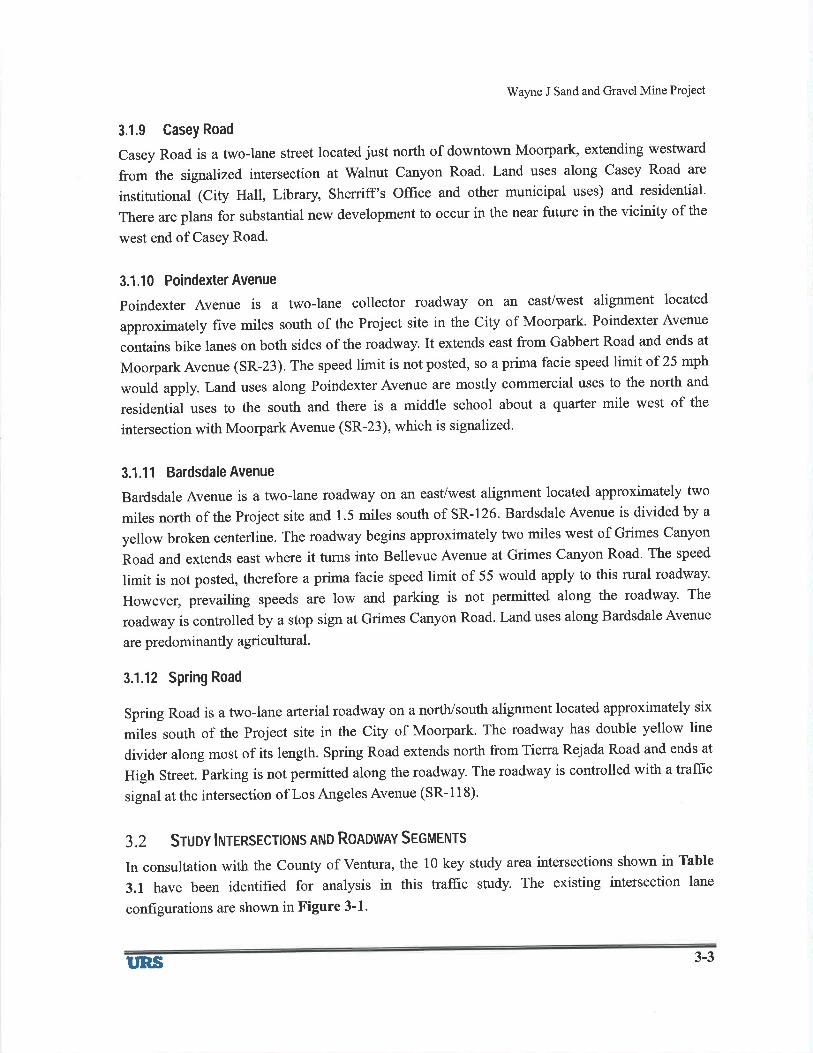
3.1.9 Casey Road
Casey Road is a two-lane street located just north of downtown Moorpark, extending westward
from the signalized intersection at Walnut Canyon Road. Land uses along Casey Road are
institutional (City Hall, Library Sherriff's Office and other municipal uses) and residential.
There are plans for substantial new development to occur in the near future in the vicinity of the
west end of Casey Road.
3.1.10 PoindexterAvenue
Poindexter Avenue is a two-lane collector roadway on an easVwest alignment located
approximately five miles south of the Project site in the City of Moorpark. Poindexter Avenue
contains bike lanes on both sides of the roadway. It extends east from Gabbert Road and ends at
Moorpark Avenue (SR-23). The speed limit is not posted, so a prima facie speed limit of 25 mph
would apply. Land uses along Poindexter Avenue are mostly coûrmercial uses to the north and
residential uses to the south and there is a middle school about a quarter mile west of the
intersection with MoorparkAvenue (SR-23), which is signalized'
3.1.11 Bardsdale Avenue
Bardsdale Avenue is a two-lane roadway on an east/west alignment located approximately two
miles north of the project site and 1.5 miles south of SR-126. Bardsdale Avenue is divided by a
yellow broken centerline. The roadway begins approximately two miles west of Grimes Canyon
Road and extends east where it turns into Bellevue Avenue at Grimes Canyon Road. The speed
limit is not posted, therefore a prima facie speed limit of 55 would apply to this rural roadway.
However, prevailing speeds are low and parking is not permitted along the roadway. The
roadway is controlled by a stop sign at Grimes Canyon Road. Land uses along Bardsdale Avenue
are predominantly agricultural.
3.1.12 Spring Road
Spring Road is a two-lane arterialroadway on a north/south alignment located approximately six
miles south of the Project site in the City of Moorpark. The roadway has double yellow line
divider along most of its length. Spring Road extends north from Tierra Rejada Road and ends at
High Street. parking is not permitted along the roadway. The roadway is controlled with atrafftc
signal at the intersection of Los Angeles Avenue (SR- 1 1 8)'
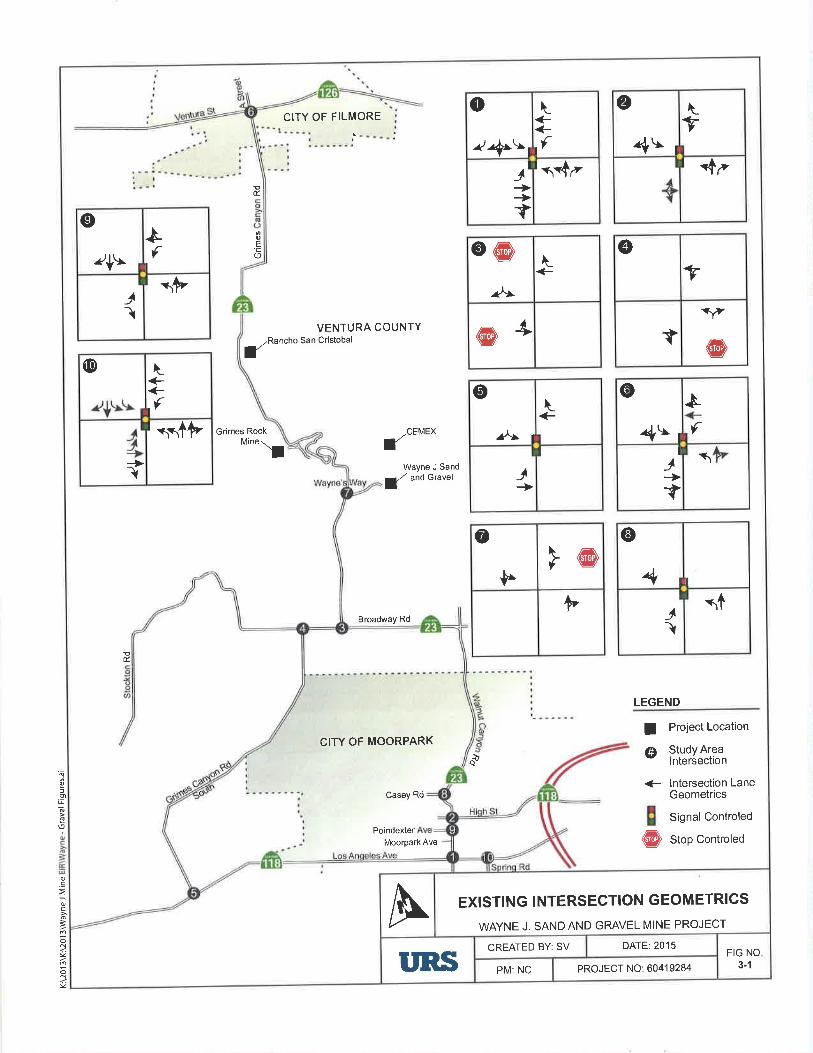
3.2 Sruov lrutRsrcnoNs AND Ronownv Securrurs
In consultation with the County of Ventura, the 10 key study area intersections shown in Table
3.1 have been identified for analysis in this traffrc study. The existing intersection lane
configurations are shown in Figure 3-1.
rms 3-3
Wayne J Sand and Gravel Mine Project
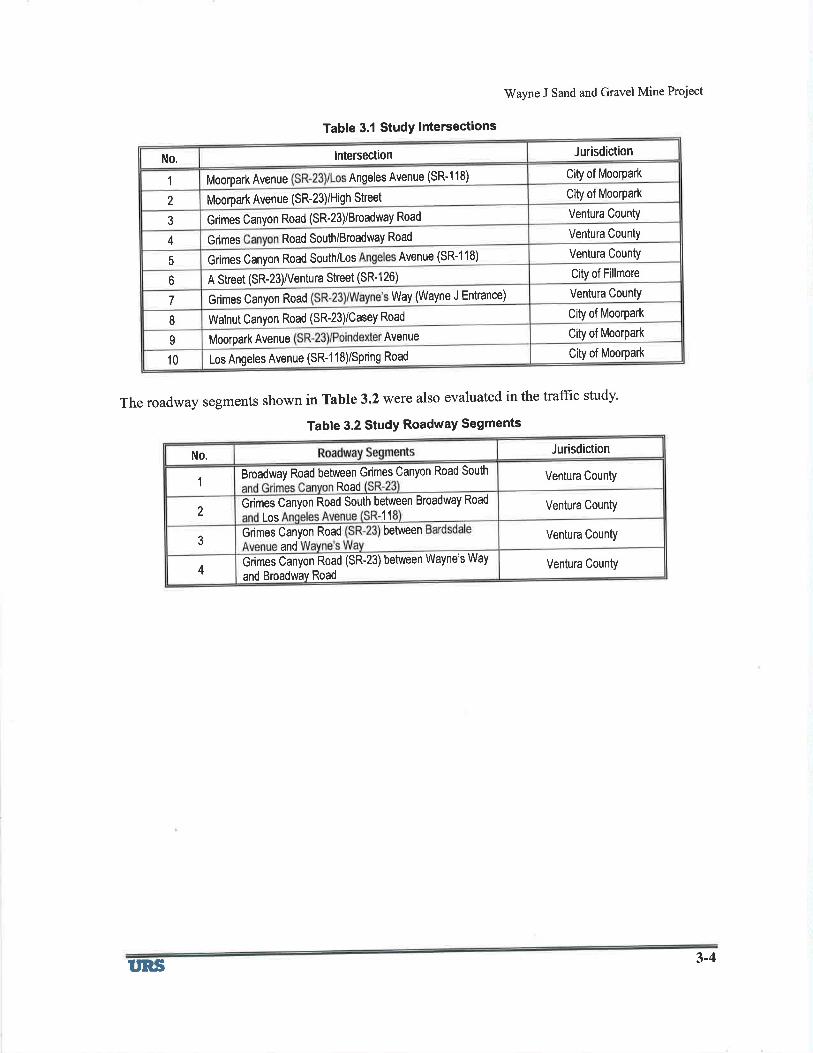
Table 3.1 StudY lntersections
The roadway segments shown in Table 3.2 were also evaluated in the traffrc study'
Table 3.2 StudY RoadwaY Segments
JurisdictionlntersectionNo.
City of MoorparkAngeles Avenue (SR-1 18)Moorpark Avenue1
City of MooçarkMoorpark Avenue (SR-23)/High Street2
Ventura County3 Grimes Canyon Road (SR-23)/BroadwaY Road
Ventura CountYRoad South/BroadwaY RoadGrimes4Ventura CountyAvenue (SR-118)Grimes Canyon Road South/Los5
City of FillmoreA Street (SR-23)/Ventura Street (SR-126)b
Ventura CountYWay (Wayne J Entrance)Grimes Canyon Road7City of MoorparkI Walnut Canyon Road (SR-23)/CaseY Road
City of MoorparkMoorpark Avenue Avenueo
City of MoorparkLos Angeles Avenue (SR-1 18)/SPring Road10
JurisdictionNo.
Ventura CountyRoad
Road SouthGrimes CanyonbetweenRoadBroadway1
Ventura CountyRoad South between BroadwaY Road
11LosGrimes Canyon
2
Ventura CountybetweenGrimes Canyon Road
and3
Ventura CountYand Broadway Road
between Wayne's WaYGrimes Canyon Road (sR-23)4
rtRs 3-4
=oi!õ(9
.g
=oÉ
È
o..1g
oN
CITY OF MOORPARK
Casey Rd
Moorpark AvePoindexter
CITY OF FILMORE
oÉ.
oE,co
\_<_
o@)
z^\
@4+
IVENTURA COUNTY
Rancho San Cristobal
Grimes Rock CEMEX(Mine
\Wayne J Sand
a/ andGravel
¡@Ø
ÞÞ
Broadway Rd
Þú.
LEGEND
d
I Project Location
@ i.\:il#,îå{- lntersection Lane
Geometrics
Signal Controled
@ stop Controled
\_+<_
tf?aÞ!l
o
rr$¿IJ++I
\_<?
V.{\ r
Ø
I ¡ -1¿
èf
I
0,/+\
1ÞJì
@<?
V
n¿
@I
@ \_++tfrslÞ
l>ì
\_+1ar
o
J+
èf
o
4!rI
J-+I\
I
@
4Jì
+
EXISTING INTERSECTION GEOMETRICS
WAYNE J. SAND AND GRAVEL MINE PROJECTADATE:2015CREATED BY: SV
FIG NO3-1PROJECT NO:60419284PM: NCI'RSI
Wayne J Sand and Gravel Mine Project
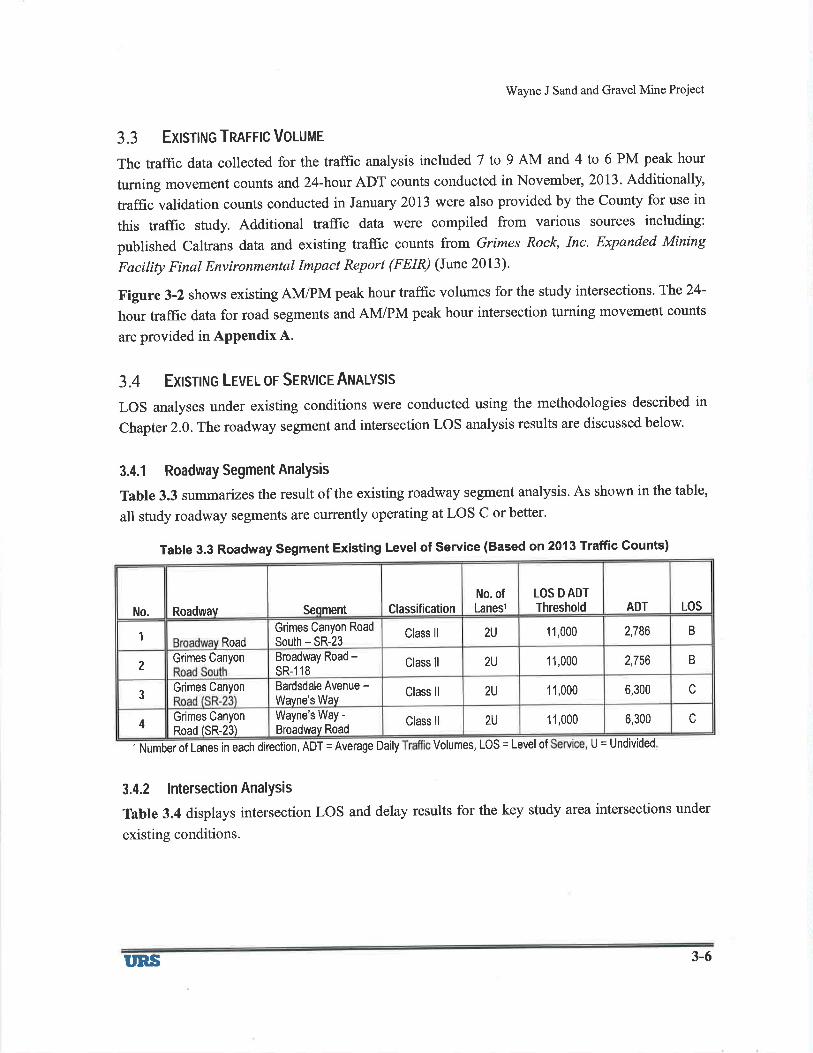
3.3 Exlsrtruc Tnnrrlc Vo¡-utue
The traffic data collected for the traffic analysis included 7 to 9 AM and 4 to 6 PM peak hour
turning movement counts and 24-hour ADT counts conducted in November,2013. Additionally,
traffic validation counts conducted in January 2013 were also provided by the County for use in
this traffic study. Additional trafüc data were compiled from various sources including:
published Caltrans data and existing trafüc counts from Grimes Rock, Inc. Expanded Mìning
Facitity Final Environmentøl Impact Report (FEIR) (June 2013)'
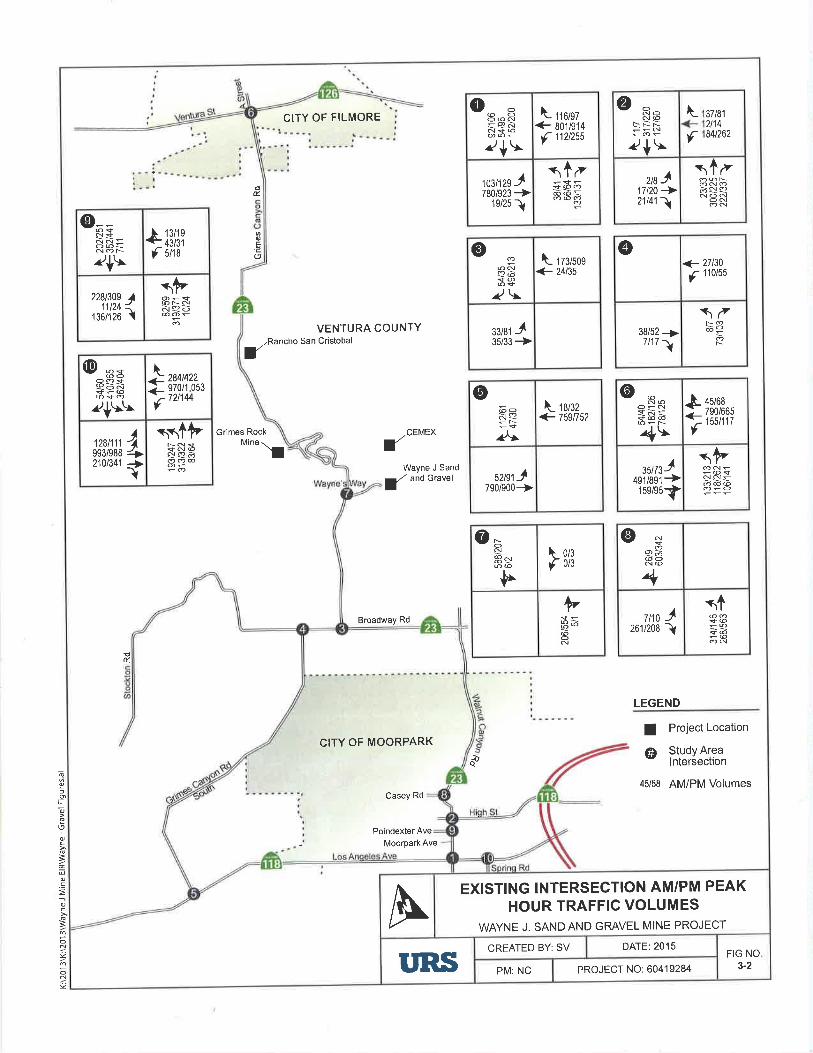
Figure 3-2 shows existing AM/PM peak hour traffic volumes for the study intersections. The24-
hour trafüc data for road segments and AN4/PM peak hour intersection turning movement counts
are provided in Appendix A.
3.4 Exlsnruc Lrvgl oF SERVIcE AruRlvsls
LOS analyses under existing conditions were conducted using the methodologies described in
Chapter 2.0. The roadway segment and intersection LOS analysis results are discussed below.
3.4.1 Roadway Segment AnalYsis
Table 3.3 summarizes the result of the existing roadway segment analysis. As shown in the table,
all study roadway segments are currently operating at LOS C or better.
Table 3.3 Roadway Segment Existing Level of Service (Based on 2013 Traffic Gounts)
t Number of Lanes in each direction, ADT = Average Daily Volumes, LOS = Levelof U = Undivided
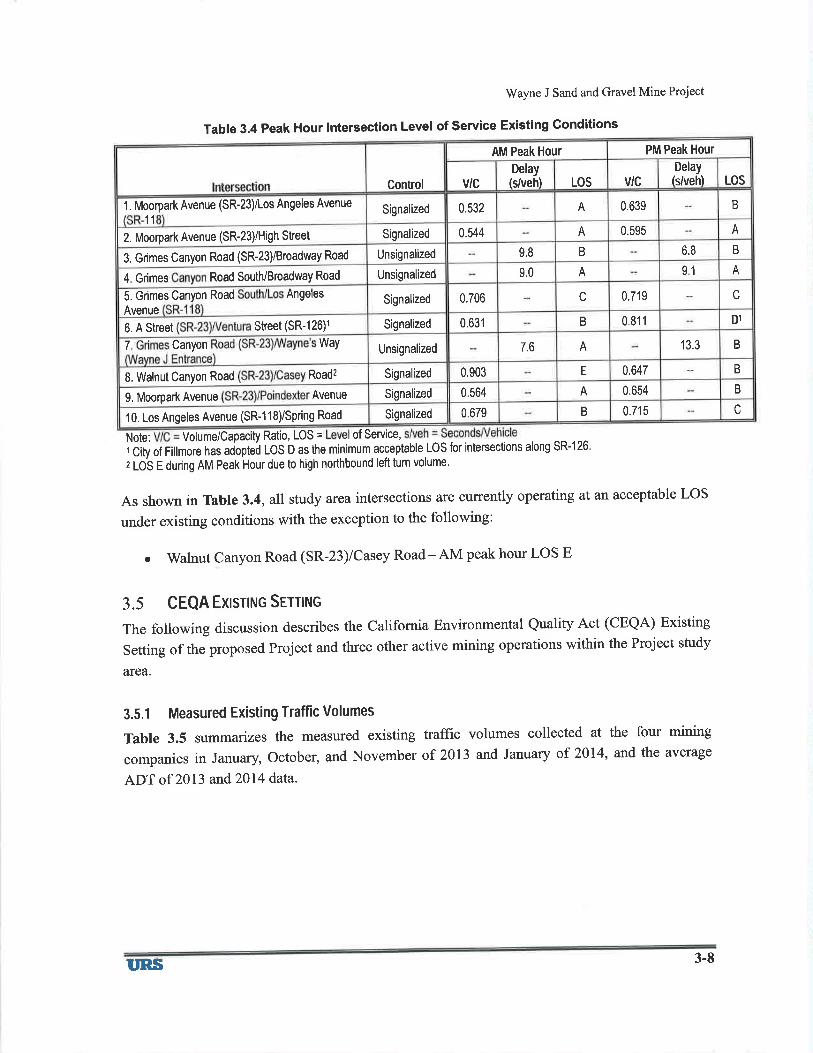
3.4.2 lntersection AnalYsis
Table 3.4 displays intersection LOS and delay results for the key study area intersections under
existing conditions.
LOSLOS D ADTThreshold ADTClassification
No. ofLaneslSeqmentNo. Roadwav
2,786 B2U 11,000Class llGrimes Canyon Road
South - SR-231Road
2,756 B2U 11,000Class llBroadway Road -sR-1182
Grimes Canyon
6,300 c2U 11,000Class llBardsdale Avenue -Wavne's Way3
Grimes Canyon
6,300 c2U 11,000Class llWayne's Way -
Broadway Road4Grimes Canyon
Road (SR-23)
tns 3-6
'õ
I.9õ
c
.=
IoN4
oN
CITY OF MOORPARK
Casey Rd
Poindexter Ave
Moorpark Ave
CITY OF FILMORE
Et
oE
IVENTURA COUNTY
Rancho San Cristobal
Grimes Rock -CEMEX(lvline
\Wayne J Sand
a/ andGravel
Broadway Rd
Þt
LEGEND
I Project Location
ð @ Study Arealntersection
45/68 AM/PM Volumes
f ttolsz+ Bo1/914
f 112t255
oo8"qE5Y'N
.1+ \10sn2s J
780/923 +1e/25ì
¡1¿
\_
f37t812t1484t262
ø\=2
oNON@NT
+s,s1¿òsaNONON
2ßJ17t20-+21l41 ì
o-nc:NoN
2
5Ë=ots
+\r
èi3iå?f stts
*Þ@NNñe2ò@Or_
228t309 A11t24<
r¡oltzo I
o@N
/\
\- rzsrsog<- 24t35
$MJ35/33 +
<- 27130
f 110t55
@
38/52 9>7/171
\¿òP
òr
284t422970/1,053721144
\_++f
@-*@ó
!?òñ8+3z/+\r\
128t111993/9882101341
4-1-++I
\+Þ+N@s!aò
o@oñ!?
/^r\- rsr¡z+ 755n52
szr-^790/900->
oNOôl_N
=ñ=/+\ fiiflir\Þs!S =
,uorJ+gr¡agt+15e/e5l
f, ol¡Ion
Ø roN
3so@
ÞÞuìòòoN
@ N
aõ@oN@
4+
s@
ON261t208
7 t10 Jì
A EXISTING INTERSECTION AM/PM PEAKHOUR TRAFFIC VOLUMES
WAYNE J. SAND AND GRAVEL MINE PROJECT
DATE:2015CREATED BY: SVFIG NO
3-2PM: NC PROJECT NO: 60419284T'RS
Vy'ayne J Sand and Gravel Mine Project
Table 3.4 Peak Hour Intersection Level of Service Existing Gonditions
Note: Volume/CapacitY Ratio, LOS = of Service,
I City of Fillmore has adoPted LOS D as the minimum acceptable LOS for intersections along SR-12b.
2 LOS E during AM Peak Hour due to high northbound left tum volume.
As shown in Table 3.4, all study area intersections are currently operating at an acceptable LOS
under existing conditions with the exception to the following:
¡ walnut canyon Road (sR-23)/Casey Road-AM peak hour Los E
3.5 CEQA Exlsnruc Srrnruc
The following discussion describes the California Environmental Quality Act (CEQA) Existing
Setting of the proposed Project and three other active mining operations within the Project study
afea.
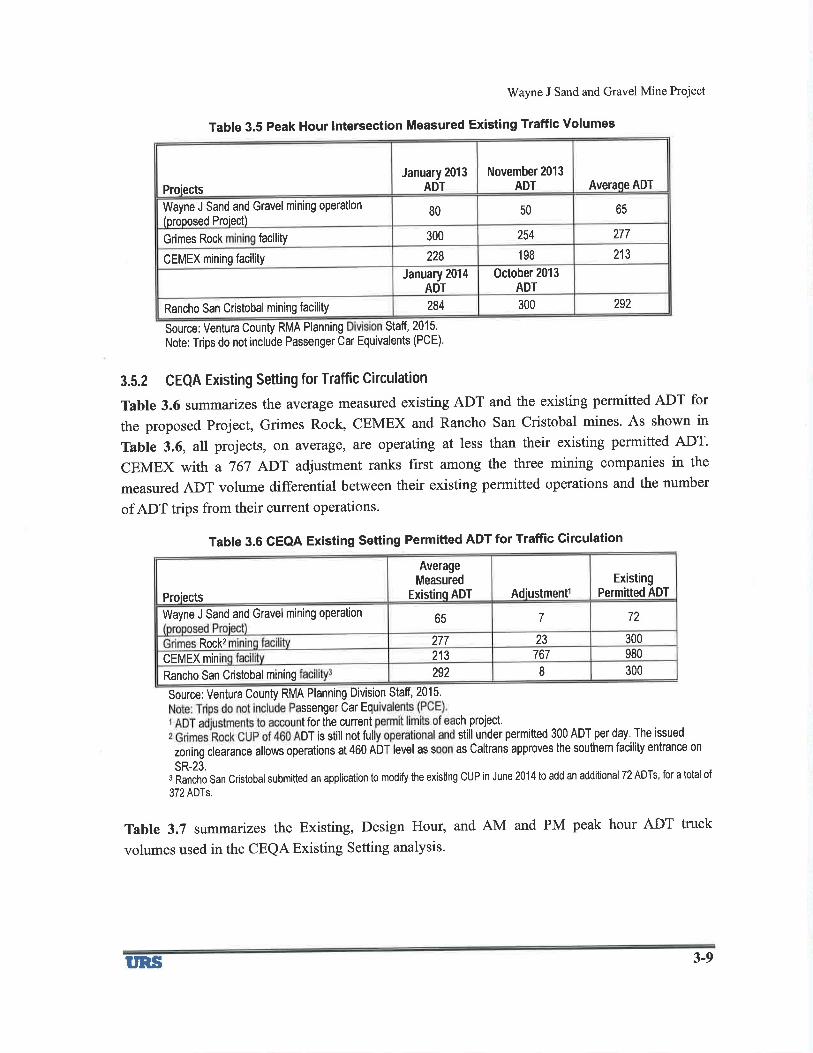
3.5.1 Measured Existing Traffic Volumes
Table 3.5 summarizes the measured existing traffrc volumes collected at the four mining
companies in January, October, and November of 2013 and January of 2014, and the average
ADT of 2013 and20l4 data.
PM Peak HourAM Peak Hour
LOSDelay(s/veh)LOS v/cv/c
Delay(s/veh)Control
B0.639A0.532Signalized1. Moorpark Avenue (SR-23)/Los Angeles Avenue
11A0.595A0.544Signalized2. Moorpark Avenue (SR-23)/High StreetB6.89.8 BUnsignalized3, Grimes Canyon Road (SR-23)/BroadwaY Road
9.1 AA9.0UnsignalizedRoad South/BroadwaY Road4. Grimes
cc 0.7190.706SignalizedAngeles5. Grimes Canyon Road
AvenueD1B 0.8110.631SignalizedStreet (SR-126)16. A Street
B13.3A7.6Unsignalizedway7 Canyon
B0.647E0.903SignalizedL Walnut Canyon Road Roadz
B0.654A0.564Signalized9. Moorpark Avenue Avenue
c0.715B0.679Signalized10. Los Angeles Avenue (SR-1 18)/SPring Road
ttRs 3-8
Wayne J Sand and Gravel Mine Project
Table 3.5 Peak Hour lntersection Measured Existing Traffic volumes
Source: Ventura County RMA Planning Staff,2015.
Note: Trips do not include Passenger Car Equivalents (PcE).
3.5.2 CEQA Existing Setting for Traffic Circulation
Table 3.6 summarizes the average measured existing ADT and the existing permitted ADT for
the proposed Project, Grimes Rock, CEMEX and Rancho San Cristobal mines. As shown in
Table 3.6, all projects, on average, are operating at less than their existing permitted ADT.
CEMEX with a 767 ADT adjustment ranks first among the three mining companies in the
measured ADT volume differential between their existing permitted operations and the number
of ADT trips from their current operations.
Table 3.6 CEG¡4 Existing Setting Permitted ADT for Traffic Circulation
Source: Ventura County RMA Planning Division Staff, 2015.
ssenger Car Eq
t for the cunent ch Project.DT is still not ful still under permitted 300 ADT per day, The issued
zoning clearance allows operations at 460 ADT level as s as Caltrans approves the southem facility entrance on
sR-23.3 Rancho San Cristobal submitted an application to modify the existing CUP in June 2014 to add an additional 72 ADTs, for a total of
372 ADTs.
Table 3.7 summarizes the Existing, Design Hour, and AM and PM peak hour ADT truck
volumes used in the CEQA Existing Setting analysis.
Averaqe ADTNovember 2013
ADTJanuary 2013
ADTProiects
6580 50Wayne J Sand and Gravel mining operation(oroposed Proiect)
277300 254Grimes Rock facility
213228 198CEMEX mining facilitY
october 2013
ADTJanuary 2014
ADT
300 292284Rancho San Cristobal mining facility
ExistingPermitted ADTAdiustmentr
AverageMeasured
Existinq ADTProiects
72765Wayne J Sand and Gravel mining operation
23 300277Rockz980767213CEMEX min300I292Rancho San Cristobal mining
I'RS 3-9
'Wayne J Sand and Gravel Mine Project
Table 3.7 CEQA Existing Setting ADT for Traffic Circulation
Ventura County Planning Division 15
Note: Trips do not include Passenger Car Equivalents (PcE).
ADT = Average Daily Tripsì órsign Hori = arrumeä to be ADT divided by 6 typical hours each day (e.g. wayne J sand and Gravel 72 Permitted ADT
divided by 6 equals 12 Design hour)'z Derived írom the design houi, the Afu peak hour inbound volume is assumed to be slightly higher than outbound volume with a
60/40 percent split of inbound and outbound traffic'
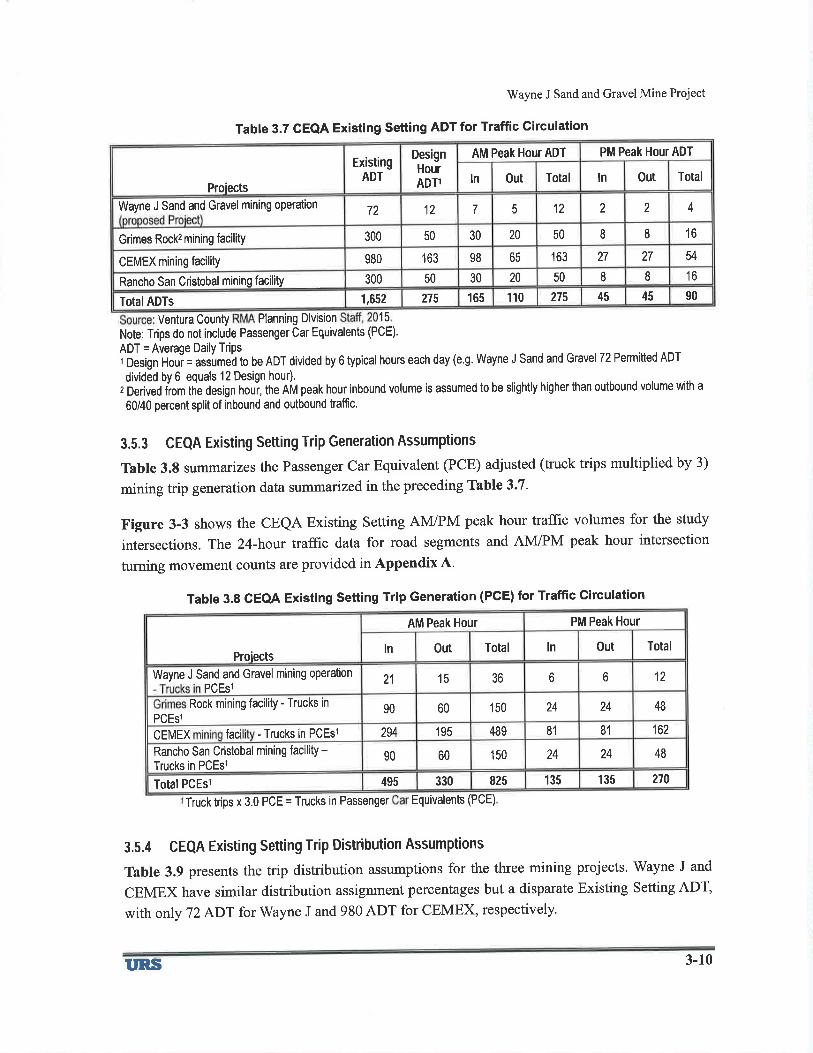
3.5.3 CEQA Existing Setting Trip Generation Assumptions
Table 3.8 summarizes the Passenger Car Equivalent (PCE) adjusted (truck trips multiplied by 3)
mining trip generation data summarized in the preceding Table 3.7.
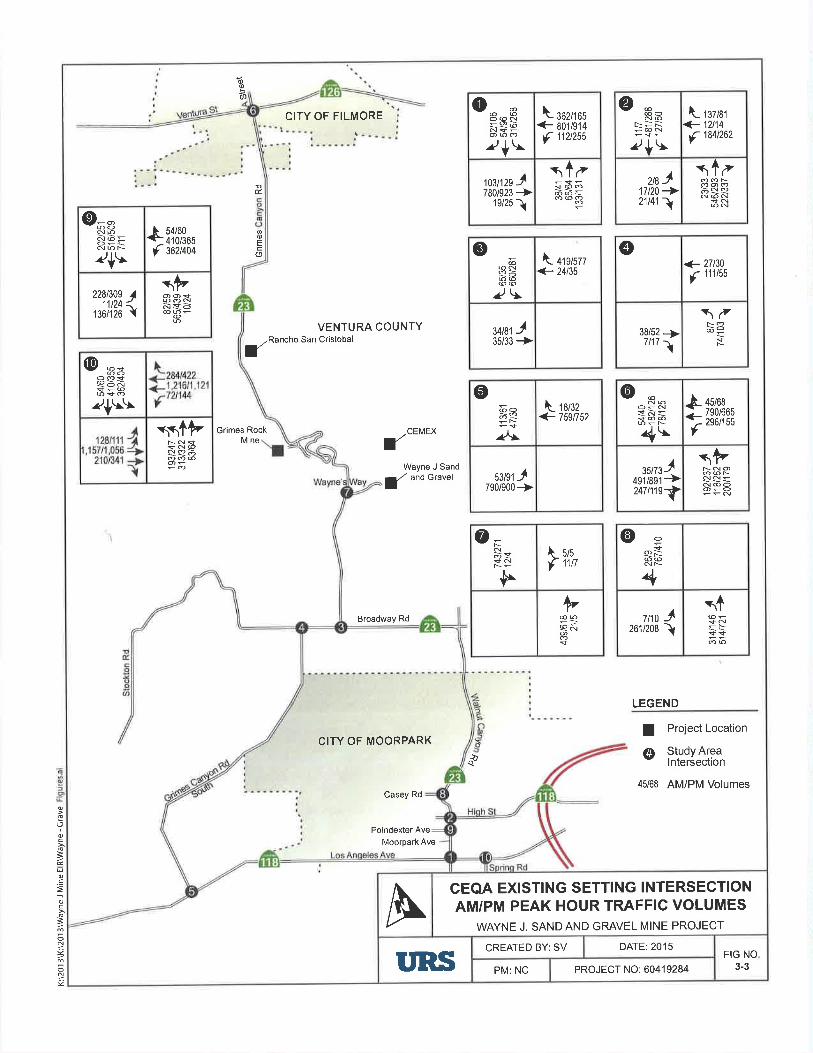
Figure 3-3 shows the CEQA Existing Setting AI\{/PM peak hour trafüc volumes for the study
intersections. The 24-:hour traffrc data for road segments and AM/PM peak hour intersection
tuming movement counts are provided in Appendix A.
Table 3.8 CEQA Existing Setting Trip Generation (PGE) for Traffic Circulation
Truck trips x 3.0 PCE = Trucks in Passenger Equivalents (PCE)
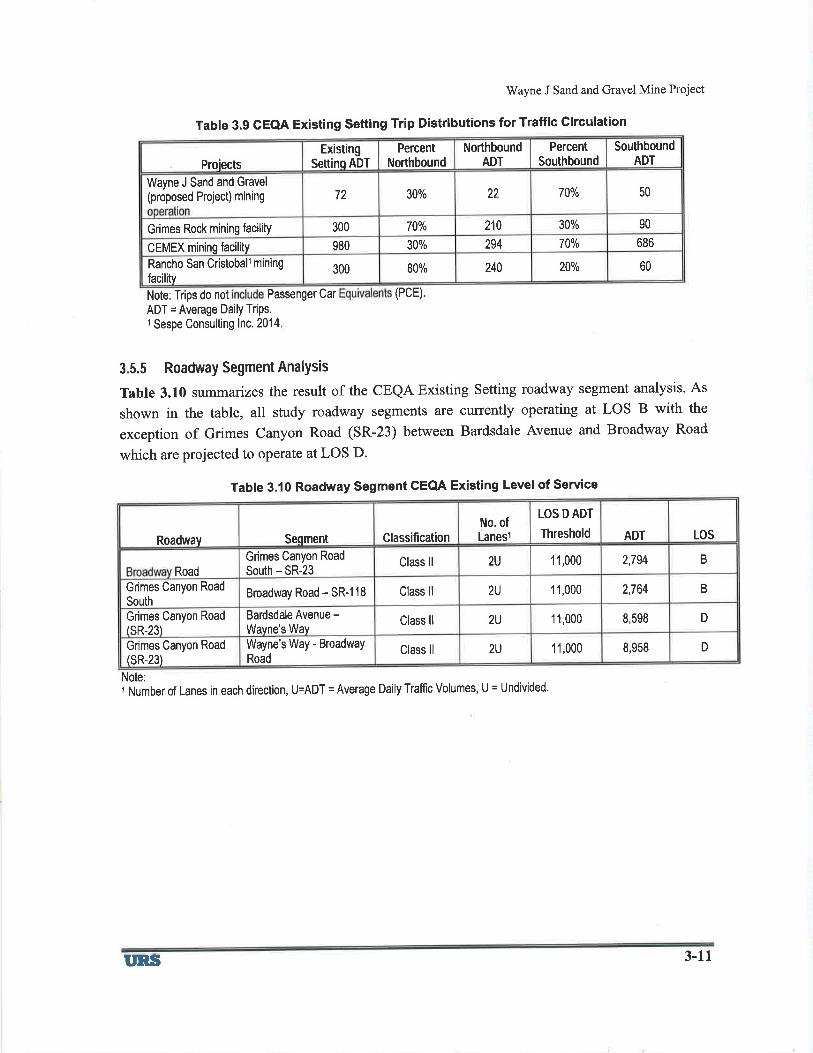
3.5.4 CEQA Existing Setting Trip Distribution Assumptions
Table 3.9 presents the trip distribution assumptions for the three mining projects. Wayne J and
CEMEX have similar distribution assignment percentages but a disparate Existing Setting ADIwith only 72 ADT for Wayne J and 980 ADT for CEMEX, respectively.
PM Peak Hour ADTAM Peak Hour ADT
ln Out Totalln 0ut TotalExisting
ADT
DesignHourADTlProiects
412 2 212 7 572Wayne J Sand and Gravel mining operation
I 1630 20 50 I300 50Grimes Rock2 mining facilitY
54163 27 2798 65980 163CEMEX mining facility
1650 I 850 30 20300Rancho San Cristobal mining facility
45 90165 110 275 451,ô52 275TOTAI ADTS
PM Peak HourAM Peak Hour
Out TotalTotal lnln 0utProiects
6 1215 36 621Wayne J Sand and Gravel mining operation
PCEst
24 48150 2490 60Rock mining facility - Trucks in
PCEst81 162195 489 81294- Trucks in PCEstfaciCEMEX
24 48150 2490 60mining facility -Rancho San Cristobal
Trucks in PCEst270135 135330 825495Total PCEsl
T'RS 3-10
PercentSouthbound
SouthboundADT
NorthboundADT
ExistingSEttiNO ADT
PercentNorthboundProiects
700/o 502272 30%Wayne J Sand and Gravel
(proposed Project) mining
30% 9070o/o 210300Grimes Rock mining facilitY
70To 68630% 294980CEMEX mining facility
20Yo 6080% 240300Rancho San Cristobalt mining
facilitv
Wayne J Sand and Gravel Mine Project
Table 3.9 CEQA Existing Setting Trip Distributions for Traffic Circulation
Note: Trips do not Passenger Car (PcE).
ADT = Average Daily Trips.t Sespe Consulting lnc. 2014
3.5,5 Roadway Segment AnalYsis
Table 3.10 summanzes the result of the CEQA Existing Setting roadway segment analysis. As
shown in the table, all study roadway segments are curently operating at LOS B with the
exception of Grimes Canyon Road (SR-23) between Bardsdale Avenue and Broadway Road
which are projected to operate at LOS D.
Table3.l0RoadwaySegmentGEQAExistingLeve|ofService
Note:r Number of Lanes in each direction, U=ADT = Average Daily Traffic Volumes, U = Undivided.
LOS
LOS D ADT
Threshold ADTClassificationNo, ofLaneslSeqmentRoadway
2,794 B11,000Class ll 2UGrimes Canyon Road
South - SR-23Road
2,764 B2U 11,000Class llBroadway Road - SR-1 18Grimes Canyon Road
South
8,598 D2U 11,000Class llBardsdale Avenue -Wavne's Wav
Grimes Canyon Road(sR-23)
8,958 D2U 11,000Class llWayne's Way - BroadwaY
RoadGrimes Canyon Road
lsR-23)
uns 3-11
õ
\,
a
ìe
=c
=oN
o
CITY OF MOORPARK
Casey Rd
Poindexter Ave
Moorpark Ave
-g
(t)
CITY OF FILMORE
EÉ.
oE'Ë(,
VENTURA COUNTYTRanchof
San Cristobal
Grimes Rock
( CEMEXMine
Wayne J Sand
a/ andGravel
Broadway Rd
LEGEND
d
I Project Location
@ Study Areatnterseclton
45/68 AM/PM Volumes
o @@N@
\\
@o@=Qon-¿+
f ¡ozltos+ Boi/914
f 112t255
s1¿@@io@o
tozhzs J780/923 -+
1e/25ì
ø*@ON@Þ=ñ
?+\l\- r¡zlsr
+ 12t14
f 184t262
2ßJ17120+21141 ì
r1¿oooòe!aN@N
@N
o-6NNoN
?+\'
oo
Nèf
54/60410/365362t404
228t309 411t24 <
r¡o¡zo I1Þoo<ñ{ò@Ðr_
@6
o@6Naòa@
@@2\r\- +rslszz
<- 24t35
uNJ35/33+
@+ 27130
ç 111t55
n¿òP
F38/52 -¡>7/171
@-=@o€òñ?+\\\
e!e?òoo@
\+Þf rsl¡z+ 759n52
o@oòQ
^rA
$MJ790/900+
è<-f
45/68790/665296¡ 55
o @NNO-N
=ñ=4\l,u,rtJ
491/891+247111e1
\ÞFNOo@FN@OO\_O
Ø NN
È
Þñ
lr sls
lrn
Þ@g)!año
@=ËË
47 t10
261t208Jì
$
A CEQA EXISTING SETTING INTERSECTIONAM/PM PEAK HOUR TRAFFIC VOLUMES
WAYNE J. SAND AND GRAVEL MINE PROJECT
CREATED BY: SV DATE: 2015FIG NO
3-3PROJECT NO: 60419284T'Rf; PM: NC
Wayne J Sand and Gravel Mine Project
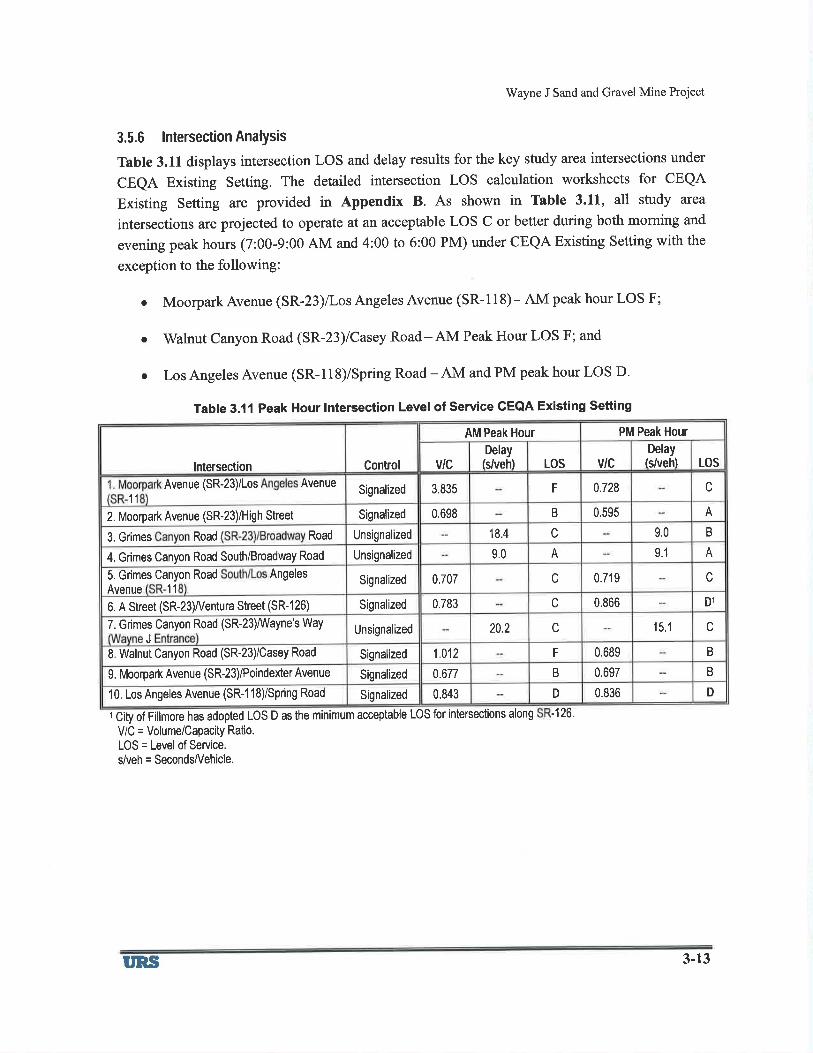
3.5.6 lntersectionAnalYsis
Table 3.11 displays intersection LOS and delay results for the key study area intersections under
CEQA Existing Setting. The detailed intersection LOS calculation worksheets for CEQA
Existing Setting are provided in Appendix B. As shown in Table 3.11, all study area
intersections are projected to operate at an acceptable LOS C or better during both morning and
evening peak hours (7:00-9:00 AM and 4:00 to 6:00 PM) under CEQA Existing Setting with the
exception to the following:
Moorpark Avenue (sR-23)/Los Angeles Avenue (SR-l18) - AM peak hour LOS F;
Walnut Canyon Road (SR-23)/Casey Road-AM Peak Hour LOS F; and
Los Angeles Avenue (SR- 1 1 8)/Spring Road - AM and PM peak hour Los D.
Table 3.11 Peak Hour lntersection Level of Service CEQA Existing Setting
r CityV/C
of Fillmore has adopted LOS D as the minimum
= Volume/Capacity Ratio.
acceptable LOS for intersections along -126.
LOS = Level of Service.
s/veh = Seconds/Vehicle.
a
a
a
PM Peak HourAM Peak Hour
LOS v/cDelay(s/veh) LOSv/c
Delay(s/veh)Controllntersection
cF 0.728Signalized 3.835Avenue (SR-23)/Los
11
Avenue
AB 0.595Signalized 0.6982. Moorpark Avenue (SR-23)/High Street
9.0 B18.4 cUnsignalized3. Grimes RoadRoad
9.1 A9.0 AUnsignalized4. Grimes Canyon Road South/Broadway Road
c0,707 c 0.719SignalizedAngeles
Avenue 11
5. Grimes Canyon Road
0.866 D10.783 cSignalized6. A Street (SR-23)/Ventura Street (SR-126)
15.1 c20.2 cUnsignalizedJ
7. Grimes Canyon Road (SR-23)Mayne's Way
0.689 B1,012 FSignalized8. Walnut Canyon Road (SR-23)/Casey Road
BB 0.6970.677Signalized9. Moorpark Avenue (SR-23)/Poindexter Avenue
DD 0.8360.843Signalized1 0. Los Angeles Avenue (SR-1 18)/Spring Road
T'RS 3-13
Wayne J Sand and Gravel Mine Project
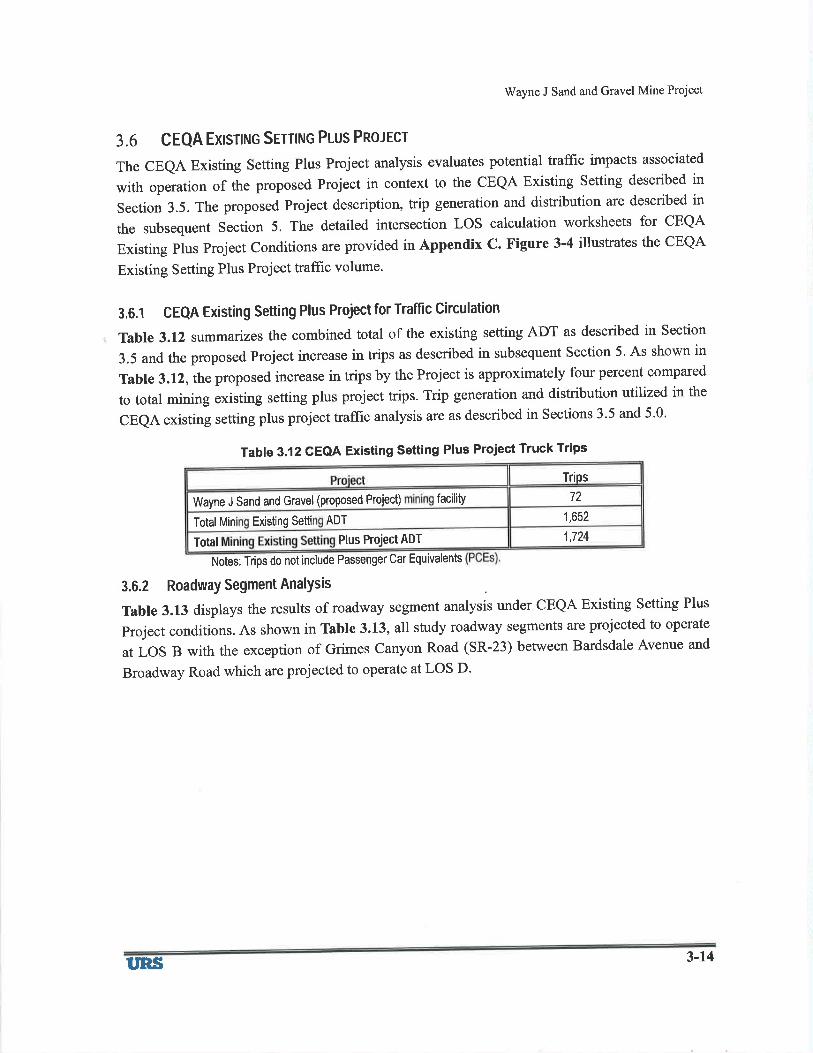
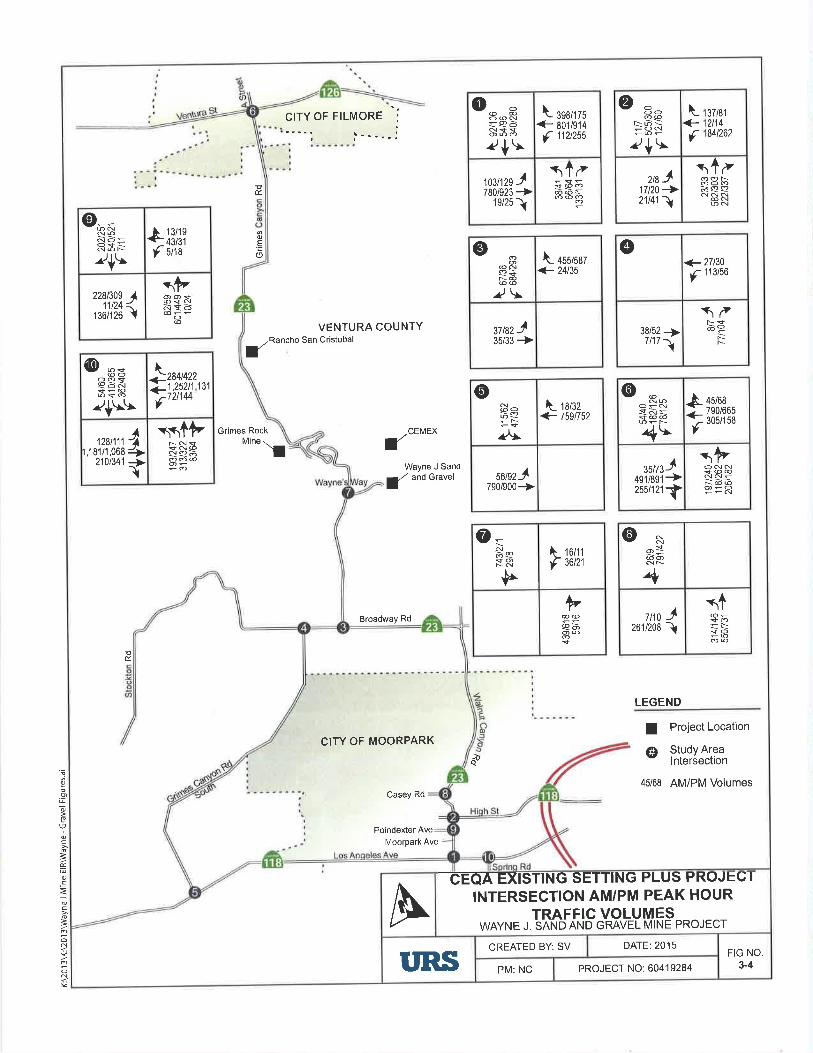
3.6 CEQA Exlsrl¡¡c Sernruc Plus Pno-lrcr
The CEeA Existing Setting Plus Project analysis evaluates potential traffrc impacts associated
with operation of the proposed Project in context to the CEQA Existing Setting described in
Section 3.5. The proposed Project description, trip generation and distribution are described in
the subsequent Section 5. The detailed intersection LOS calculation worksheets for CEQA
Existing plus project Conditions are provided in Appendix C. Figure 3-4 illustrates the CEQA
Existing Setting Plus Project traffrc volume.
3.6.1 cEQA Existing setting Plus Project for Traffic circulation
Table 3.12 summanzesthe combinedtotal of the existing settingADT as described in Section
3.5 and the proposed Project increase in trþs as described in subsequent Section 5. As shown in
Table 3.12, theproposed increase in trþs by the Project is approximately four percent compared
to total mining existing setting plus project trips. Trip generation and distribution utilized in the
CEeA existing setting plus project traffic analysis are as described in Sections 3'5 and 5'0'
Table3.l2GEQAExistingsettingPlusProjectTruckTrips
Notes: Trips do not incl ude Passenger Car Equivalents
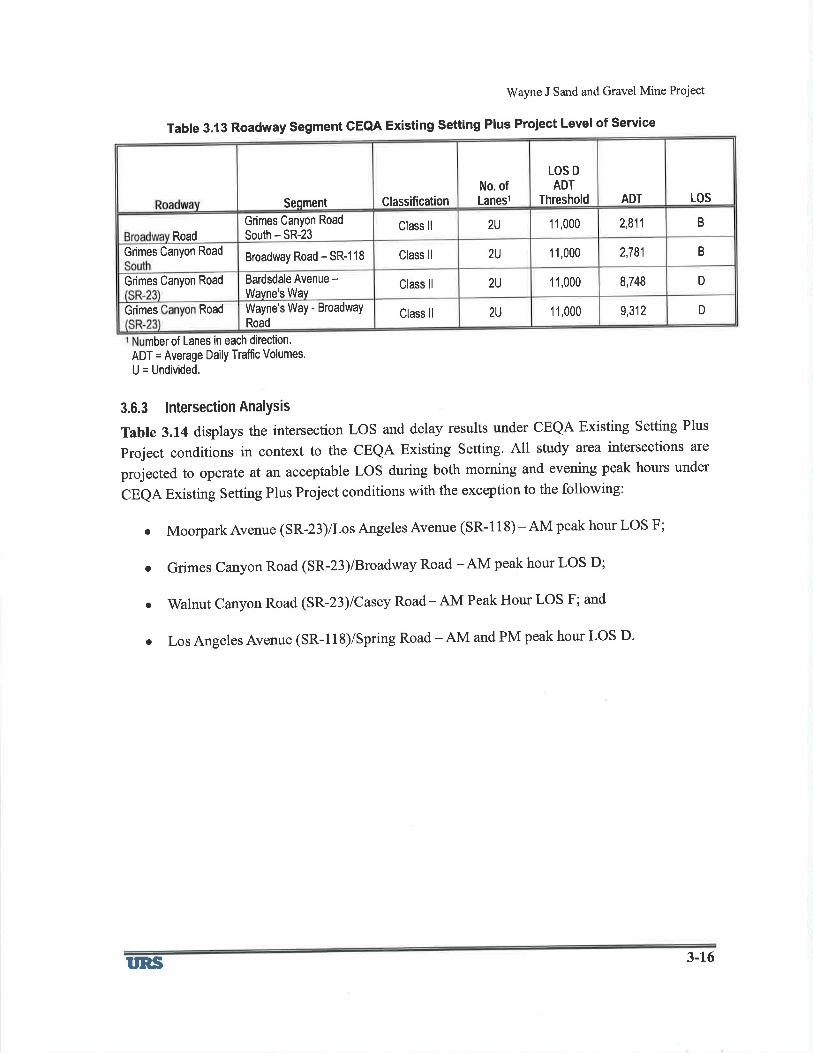
3.6.2 RoadwaY Segment AnalYsis
Table 3.13 displays the results of roadway segment analysis under CEQA Existing Setting Plus
Project conditions. As shown in Table 3.13, all study roadway segments are projected to operate
at LOS B with the exception of Grimes Canyon Road (SR-23) between Bardsdale Avenue and
Broadway Road which are projected to operate at LOS D'
Trips
72facilityWayne J Sand and Gravel (proposed Project)
1,652Existing SettiTotal Min ADT
1,724Plus Project ADTTotal
rns 3-14
',c
,9o
I
=Éú,E
c
=oN4
o4
CITY OF MOORPARK
Casey Rd
Poindexter Ave
lVoorpark Ave
CITY OF FILMORE i--'-: i-----i
Éú
oE'Ë(9
(VENTURA COUNTY
Rancho San Cristobal
Grimes Rock -CEMEX(Mine tlWayne J Sand
a/ andGravel
Broadway Rd
oÉ.
LEGEND
d
I Project Location
Ér¡ Studv Arear¡t lnteréection
45/ô8 AM/PM Volumes
f ¡ss/1zs<- 801/914
f 112t255
oo@ @
e€so602+\'
1o3n2s J780/923 ->
1s/25ì
s1¿ó@i
ø- oo-aleL\bN-oN?+\'
37 t812t1484t262
\_<_f
s1¿ò ae?NNN@N@N
zßJ17t20->21141 I
èf
13/1943t315/18
0-e!NoN
N
È=@È
2+\'sÞoosñsò
o@
2281309 A11t24 <
r¡e¡zo I
\- +ssÆez+ 24t35
oo
@NQ+.-NÓ@@
?\
yßzJ35/33 +
@+27130f 113t56
\zè9
ñr38/52 -ì>7/171
284t4221,252t1721144
\_++f
131
@-=@o!9òñ
2+\\\I
-4-++I128t111
1 ,181/1 ,0682101341
r.,$Þc!aòO-
\-<_
18t32759852
oN
ñ!?
/Al
saßzJ790/900+
fiime;
o @N6
sñ=
4\,ut zJ
¿glest+2ss/12i1
\ÞONN<@@
Or_o
Þ16t1136t21
o ñNòe9FN
ÞÞ
@@
!9òo6
o NN
Q>@oNN
4tro J
261/208 ì
$@r_
=\+o
A--CEQA
EXISTING SETTING PLUS PROJEGTINTERSECTION AM/PM PEAK HOUR
TRAFFIC VOLUMESWAYNE J. SAND AND GRAVEL MINE PROJECT
DATE:2015CREATED BY: SV
3-4FIG NO.
PROJECT NO: 60419284PM: NCI'RS
Wayne J Sand and Gravel Mine Project
Table 3.13 Roadway Segment CEQA Existing Setting Plus Proiect Level of Service
mber of Lanes in each direction.
ADT = Average Daily Traffic Volumes.
U = Undivided.
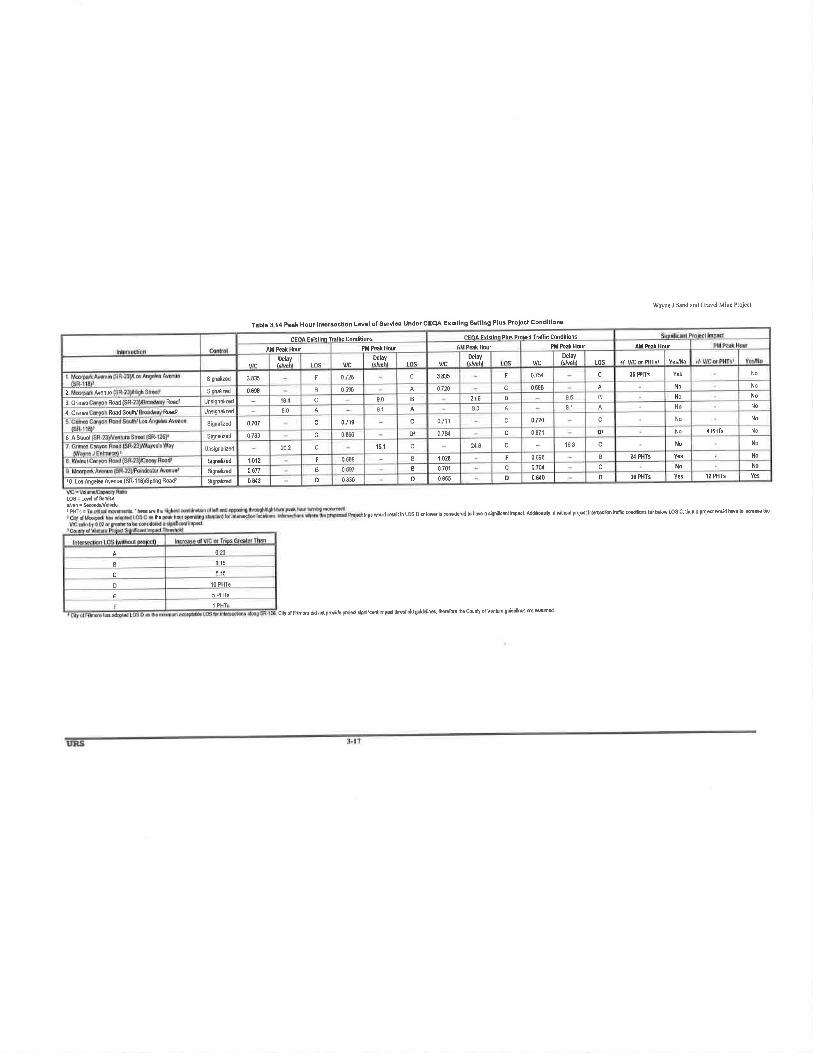
3.6.3 lntersectionAnalYsis
Tabte 3.14 displays the intersection LOS and delay results under CEQA Existing Setting Plus
project conditions in context to the CEQA Existing Setting. All study area intersections are
projected to operate at an acceptable Los during both morning and evening peak hours under
CEeA Existing Setting Plus Project conditions with the exception to the following:
. Moorpark Avenue (SR-23)/Los Angeles Avenue (SR- 1 I 8) - AM peak hour LOS F;
o Grimes canyon Road (sR-23)/Broadway Road - AM peak hour LoS D;
¡ walnut canyon Road (SR-23)lcasey Road-AM Peak Hour LOS F; and
o Los Angeles Avenue (sR- 1 1 8)/Spring Road - AM and PM peak hour Los D.
LOSADTNo. ofLanesl
LOS D
ADTThresholdClassificationSeqment
B11,000 2,8112UClass llGrimes Canyon Road
South - SR-23Road
B11,000 2,7812UClass llBroadway Road - SR-1 18Grimes Canyon Road
D11,000 8,7482UClass llBardsdale Avenue -Wavne's Way
Grimes Canyon Road
D11,000 9,3122UClass llWayne's Way - BroadwaY
Road
RoadGrimes
I'RS 3-16
nFôÂFrldin.plusPrôþdTnfficCondl¡onscEoA Er¡slim Trålfc Condit¡ons
AM Peak Hour Pll Peåk HourPM PdkHourAl¡ Peak Hour&lay hlay
LOSDelay
tos vt?,&lây
tos v/cNo07s c 36 PfiTsc 3 835 FF 0728Signatzsd 3 815
No Noc 05950720B 0 595Siqndizôd 0 6982
No NoD 95 B90 B 216184 cUnsi{nd¡zod3 Griß Ræd¡R€dNo No9191 90s0t,ns¡qnålzedRed Sdh/4 GriE Ræd
Noc No0711 c 0720c 0719 cSigm[zsd 0 707
No 4 PHfs No0 871 DrD¡ 07s cc 0 866Siqnd¡zed 07836 AShINoc No248 c 163151 c202 cUns¡gnalizêdNoB 24 PHfs0 6960683 B 1 028
1 012 FSisâlizôdNoc Noc 07s0 697 B 0 7010 677 ISigndiz€d
D 36 PHfs 12 PHTSD 0&00 836 D 0 0550 813 DSignalzed10 Lc Angd€ Avsu€ (SR.ll8)ßpnng RGd?
waFe J snd dd CnvelMinc Projst
Tablo 3 l4 Pæk Hour lnt€Éectlon L€v€l ot sorulce under cEclA Exl3tlng &frlng Plu' Prol€ct condltlons
tdp6 md Ìdil in t6 D dtffiis cdd lo hdê ad{nitu.ntimFt fidilddly,fl*hod prcþl htubn Èft cnfions fd MtOs c tun aproixtmü h〠lohæ úo
OlyolFdm@ #ndPu&Pmiælígnituñt¡mPdSr6hdd gütu kfdêh'Cdn! olVô¡tußgtrdiffi mdmd
rPfls
0m015B
010c
10 PHTSD
5 PHTgE
Wayne J Sand and Gravel Mine Project
According to the significance criteria, the following locations may result in significant
cumulative impacts under CEQA Existing Setting Plus Project conditions:
. MoorparkAvenue (sR-23y Los Angeles Avenue (sR-118)-AM impact;
o Walnut Canyon Road (SR-23)/Casey Road -AM impact; and
r Los Angeles Avenue (sR- I 1 8)/Spring Road - AM and PM impacts.
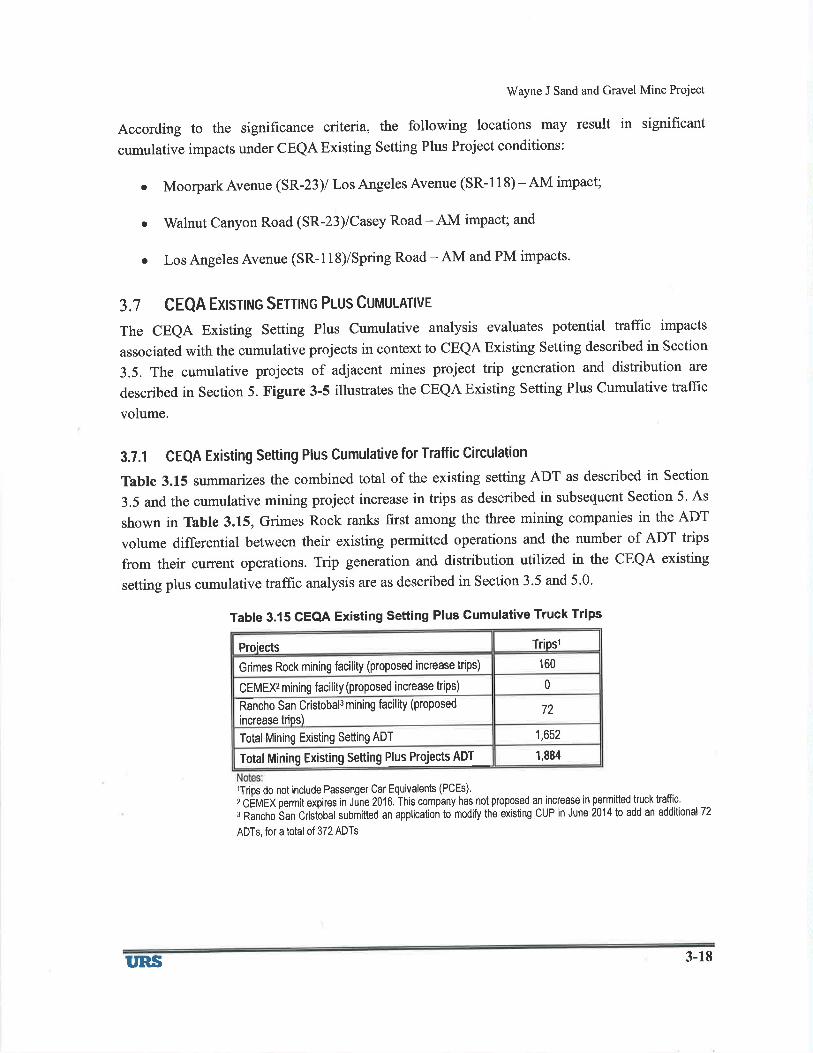
3.7 CEQA Exlsrlruc Serrlruc Plus CuruuLATlvE
The CEeA Existing Setting Plus Cumulative analysis evaluates potential traffrc impacts
associated with the cumulative projects in context to CEQA Existing Setting described in Section
3.5. The cumulative projects of adjacent mines project trip generation and distribution are
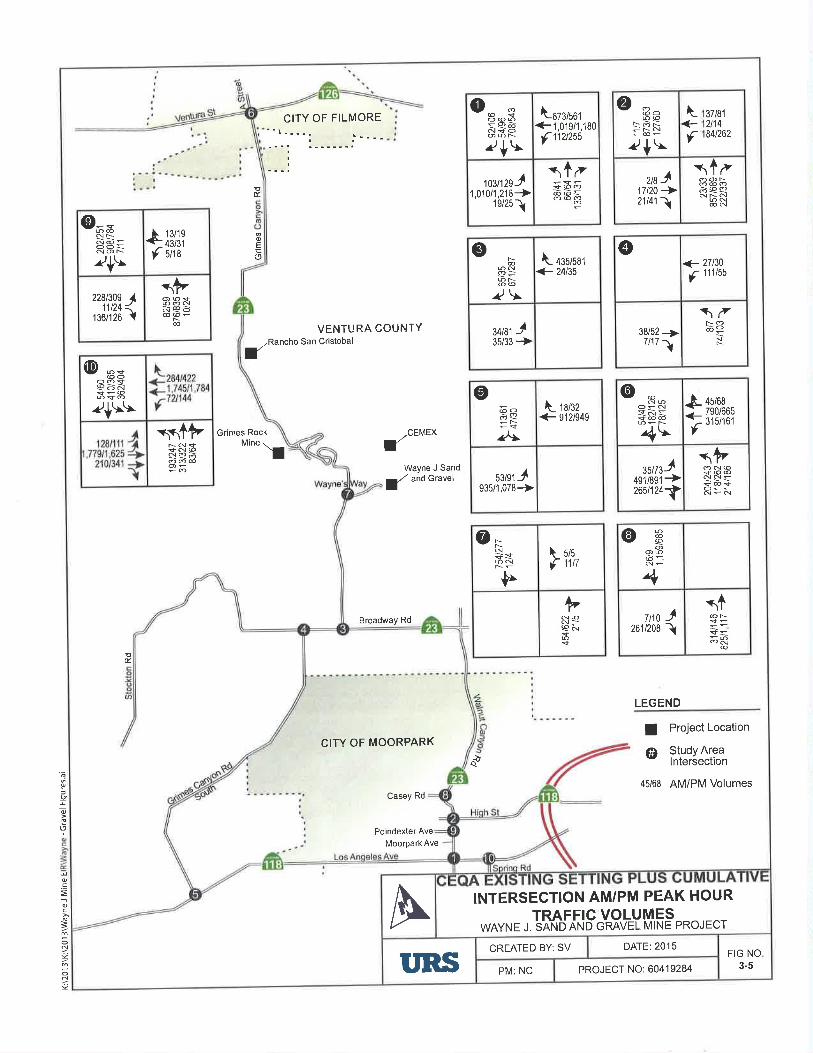
described in Section 5. Figure 3-5 illustrates the CEQA Existing Setting Plus Cumulative trafÏic
volume.
3.7.1 CEQA Existing setting Plus cumulative for Traffic circulation
Table 3.15 summaizes the combined total of the existing settingADT as described in Section
3.5 and the cumulative mining project increase in trþs as described in subsequent Section 5. As
shown in Table 3.15, Grimes Rock ranks first among the three mining companies in the ADT
volume differential between their existing permitted operations and the number of ADT trþs
from their current operations. Trip generation and distribution utilized in the CEQA existing
setting plus cumulative trafüc analysis are as described in Section 3.5 and 5'0'
Table 3.15 CEQA Existing setting Plus cumulative Truck Trips
lTrips do not include Passenger Car Equivalents (PCEs).
z CÉtr¡gX perm¡t expires in Jùne 2016. This company has not proposed an increase in permitted truck traffic'
3 Rancho'San Cristobal submitted an application to modify the existing CUP in June 2014 to add an additional 72
ADTs, for a total of 372 ADTs
TriDslProiects
160Grimes Rock mining facility (proposed increase trips)
0CEMEXzmining facility (proposed increase trips)
72Rancho San Cristobals mining facility (proposed
increase trios)
1,652Total Mining Existing Setting ADT
1,884Total M¡ning Existing Setting Plus Projects ADT
T'RS 3-18
Wayne J Sand and Gravel Mine Project
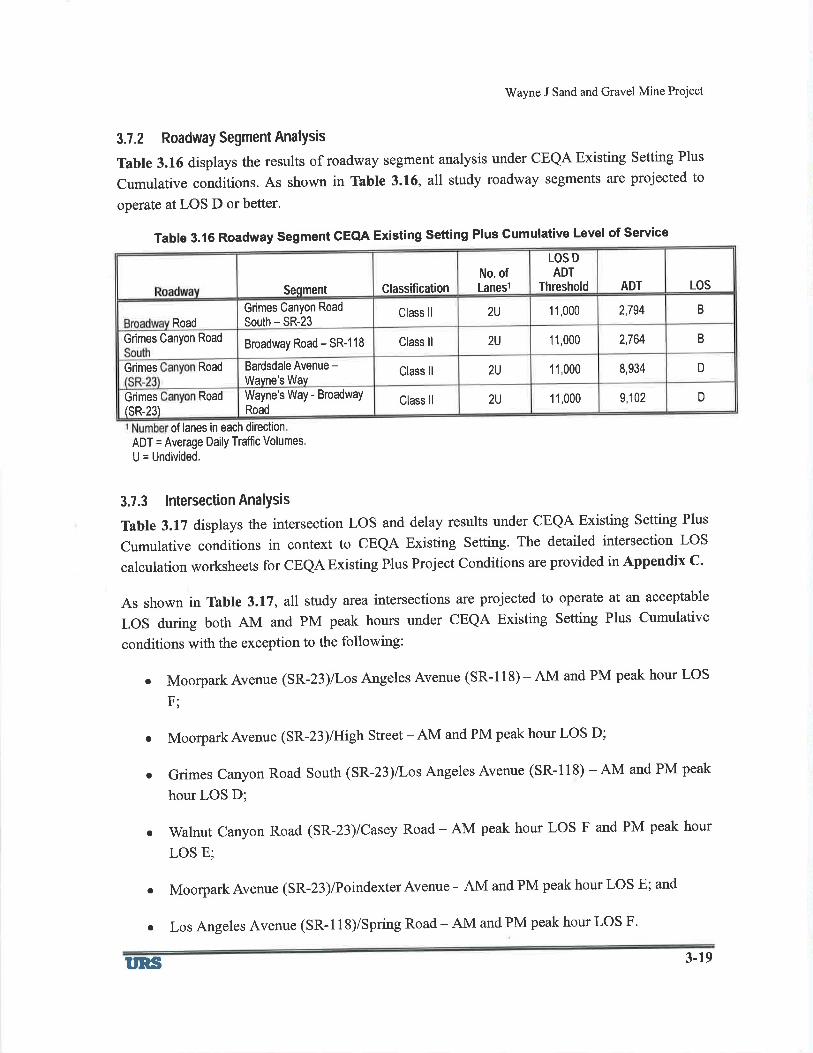
3.7.2 Roadway Segment AnalYsis
Table 3.16 displays the results of roadway segment analysis under CEQA Existing Setting Plus
Cumulative conditions. As shown in Table 3.16, all study roadway segments are projected to
operate at LOS D or better.
Table 3.16 Roadway Segment CECIA Existing Setting Plus Gumulative Level of Service
of lanes in each direction
ADT = Average Daily Traffìc Volumes.
U = Undivided.
3.7.3 IntersectionAnalYsis
Table 3.17 displays the intersection LOS and delay results under CEQA Existing Setting Plus
Cumulative conditions in context to CEQA Existing Setting. The detailed intersection LoS
calculation worksheets for CEQA Existing Plus Project Conditions are provided in Appendix C.
As shown in Table 3.17, al] study area intersections are projected to operate at an acceptable
LOS during both AM and pM peak hours under CEQA Existing Setting Plus Cumulative
conditions with the exception to the following:
o Moorpark Avenue (SR-23)/Los Angeles Avenue (SR-118) - AM and PM peak hour LOS
F;
o MoorparkAvenue (sR-23)/High Street -AM and PM peak hour Los D;
. Grimes Canyon Road South (SR-23)/Los Angeles Avenue (SR-l18) - AM and PM peak
hour LOS D;
¡ Walnut Canyon Road (SR-23)/Casey Road - AM peak hour LOS F and PM peak hour
LOS E;
. MoorparkAvenue (SR-23)/PoindexterAvenue -AM and PM peak hour LOS E; and
¡ Los Angeles Avenue (SR-ll8)/Spring Road - AM and PM peak hour Los F.
ADT LOS
LOS DADT
ThresholdClassificationNo. ofLaneslSeqment
B2,7942U 11,000Class llGrimes Canyon Road
South - SR-23Road
B11,000 2,7642UClass llBroadway Road - SR-1 1 8Grimes Canyon Road
D11,000 8,9342UClass llBardsdale Avenue -Wavne's Wav
RoadGrimes
D11,000 9,1 022UClass llWayne's Way - BroadwaY
Road
RoadGrimestsR-23)
I'RS 3-19
oõu
o.E
c
IoN4
N
CITY OF MOORPARK
Casey Rd
Poindexter Ave
Moorpark Ave
CITY OF FILMORE
t___-
EÉ
oÊ.,Ëo
TRanchofVENTURA COUNTY
San Cristobal
Grimes Rock /cEMEXfMine trWayne J Sand
a/ andGravel
Broadway Rd
!É.
LEGEND
à
I Pro.¡ect Location
@ i.\:îI#,e,"x
45/68 AM/PM Volumes
fozalsot+1,019f ,1Bo
f 112t255
oo8-3=qòN<O
^r1+ \103t12sJ
1,010/1,218-+1e/25ì
¡1¿
\_<-f
37ß12t1484t262
ØN
2
@o6@orrN
+\s1¿
ooNo@óò!e aNNNON
@N
usJ17t20-+21l41 ì
èf
13/1943/315/1 I
o-sNN
@Þa=ON
?+\'n+'ooNñ€òæ@r_
N6
228t309 411t24 <
r¡olrzo I
\- ¿sslsst<- 24135
o r@6Nhr@@?\
uMJ35/33 -+
<- 27t30
ç 111t55
@
38/52 +7/171
\¿ò=ì
N
(E -o@o9as
?+!\\
+N@s!aò\+Þ
\_+ 18t3291 2/949
oooò!?
¡^\
SIMJ935/1,078 ->
o @N@
O-Ngñ=<@@
4\è<-f
45/68790/ô65315i161
\ÞóN@
ìòì,u,rtJ
+gtlast+265/124ì>
f,sølrn
o FrNìsÞ
ÞN@N>9ñt
o @€oo@òl_-
4+@r
=-s=õR
@
tno J261i208 ì
INTERSECTION AM/PM PEAK HOURTRAFFIC VOLUMES
WAYNE ¡. SNÑD AND GRAVEL MINE PROJECTADATE:2015CREATED BY: SV
FIG NO3-5PROJECT NO:60419284PM: NCI'RS

LOS =
cily ol F{mæ E dab Los D æ ho
waFe J Strd ild Cravel Mine Prcjæt
Tablo3lTPskHoUrlnteÉctlonLovelof$illceCEQAExlstlngsåfrlngPlU¡cUmulatlvocondltlons
tuj*tcåffi fl in@ton b titHil L6 cisøsM b hw.6!ûdtuntimFt ln ffion,llbinb*bn infrhoulpr*rtffio cqftoß M' '*Hil
LoS c, hM 6 p(*xl
dongsRlæ Cilyo,FihmddmtPti&Prcittdgdi€ilhPæltr6hddgÙiddrc' ffiE üêCounty of Vñ6gffiiE hæud
sitrn¡ncant Cumúlalive lmodcFoa Er¡srino Plus Cmuhl¡ve fEfl¡c Condil¡onsaFôÀ Fr¡.r¡mThftuCodnlmsPM Peek Hour Ail Pêâk HourAM Peek HourPM Peåk HouiAM Pe¡kHour
Dlay+l V/C or PHTsr
fÞl.ytos v/c
Delayrúehì
lÞlâyLOSv/c
0ffi 5,86?F 6 595 F0728 c 3 900signalzôd 3 035 F
D 0.194 Yes 0.2260892 D 0821B 059ssionål¡zod 0 6902 sbd¡NoB No192 c 92c 90 Bt,ßionalizd 1843 Griß R€dNoNo90 91
UnsioÉl¡zod s040,112D 0 831 D 0.096c 0 0030707 c 0 719signalzêd5Gfu
0 025 No 0010 Noc 0876 o¡D. 08080 783 c 08ffis¡gnalizôd6 ASÞtNo153 c Noc 207 c202 c 151Unsignâlizd
r,248E 0,261B 1 273 0937F 0ffgSiqnål¡zd 1 012n,z2z YesE 02¡4B 0 911 E 0 s19B 0 697S¡qnalzêd 0 6770.170 YesF ol820 1 025 I 0140 0 836s¡0aliz6d 0&310 L6 Ang€ls Avsus (SR-11ô),Spdng R6d?
r-rôr.di^¡ I ôQtûilh'd nrnôil lmrd.ê ñfv/c nr Tr¡os GreålerThn
0m
015
010
D
1 PHTg
3-21
Wa1.ne J Sand and Gravel Mine Project
According to the significant impact criteria, the following intersections may result in significant
cumulative impacts under CEQA Existing setting plus cumulative conditions:
. Moorpark Avenue (sR-23)/Los Angeles Avenue (sR- I 1 8) - AM and PM impacts;
oMoorparkAvenue(SR.23)/HighStreet_AMandPMimpacts;
o Grimes Canyon Road South/Los Angeles Avenue (SR-l18) - AM and PM impacts;
o walnut canyon Road (sR-23)/casey Road -AM and PM impacts;
. Moorpark Avenue (sR-23)Æoindexter Avenue - AM and PM impacts; and
o Los Angeles Avenue (sR- 1 1 8)/Spring Road - AM and PM impacts.
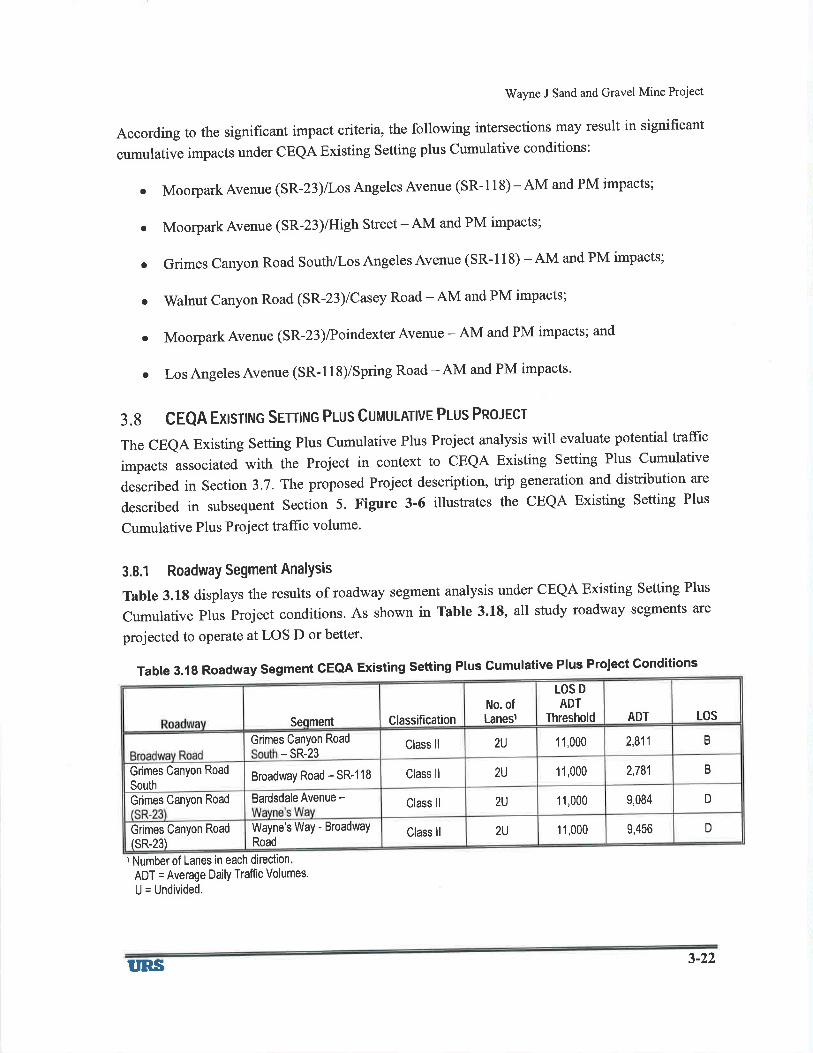
3.g CEQA Exlsnruc Sernruc Plus cUruuLATlvE Plus Pnorecr
The CEeA Existing Setting Plus Cumulative Plus Project analysis will evaluate potential trafüc
impacts associated with the Project in context to GEQA Existing setting Plus Cumulative
described in section 3.7. The proposed Project description, trip generation and distribution are
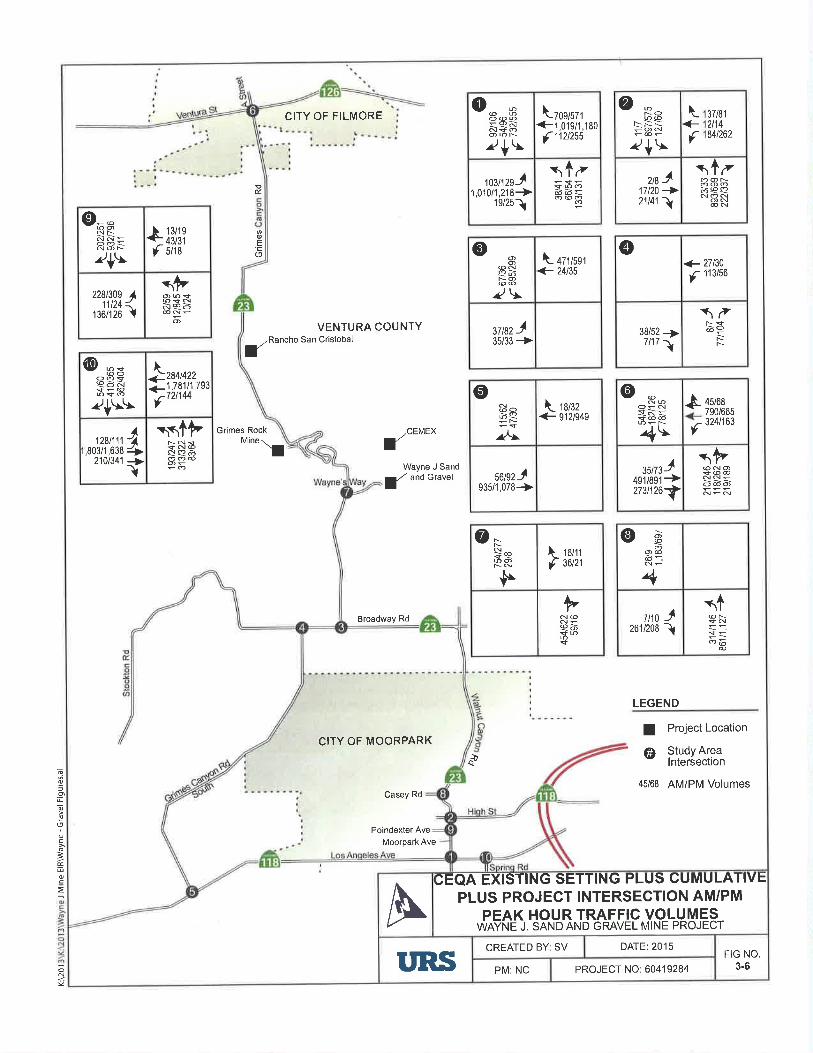
described in subsequent Section 5. Figure 3-6 illustrates the CEQA Existing Setting Plus
Cumulative Plus Project trafüc volume'
3.8.1 RoadwaY Segment AnalYsis
Table 3.18 displays the results of roadway segment analysis under CEQA Existing Setting Plus
Cumulative plus project conditions. As shown in Tabte 3.18, all study roadway segments are
projected to operate at LOS D or better'
Table 3.1g Roadway Segment CEQA Existing Setting Plus Gumulative Plus Project Gonditions
t Number of Lanes in each direction
ADT = Average Daily Traffìc Volumes.
U = Undivided.
LOSADTNo. ofLanesl
LOS D
ADTThresholdClassificationSeqment
B11,000 2,8112UClass llGrimes Canyon Road
- sR-23
2,781 B11,0002UClass llBroadway Road - SR-1 18Grimes Canyon Road
South
9,084 D11,0002UClass llBardsdale Avenue -Grimes Canyon Road
9,456 D11,0002UClass llWayne's Way - BroadwaY
RoadGrimes Canyon Road
tsR-23)
ttRs 3-22
Wayne J Sand and Gravel Mine Project
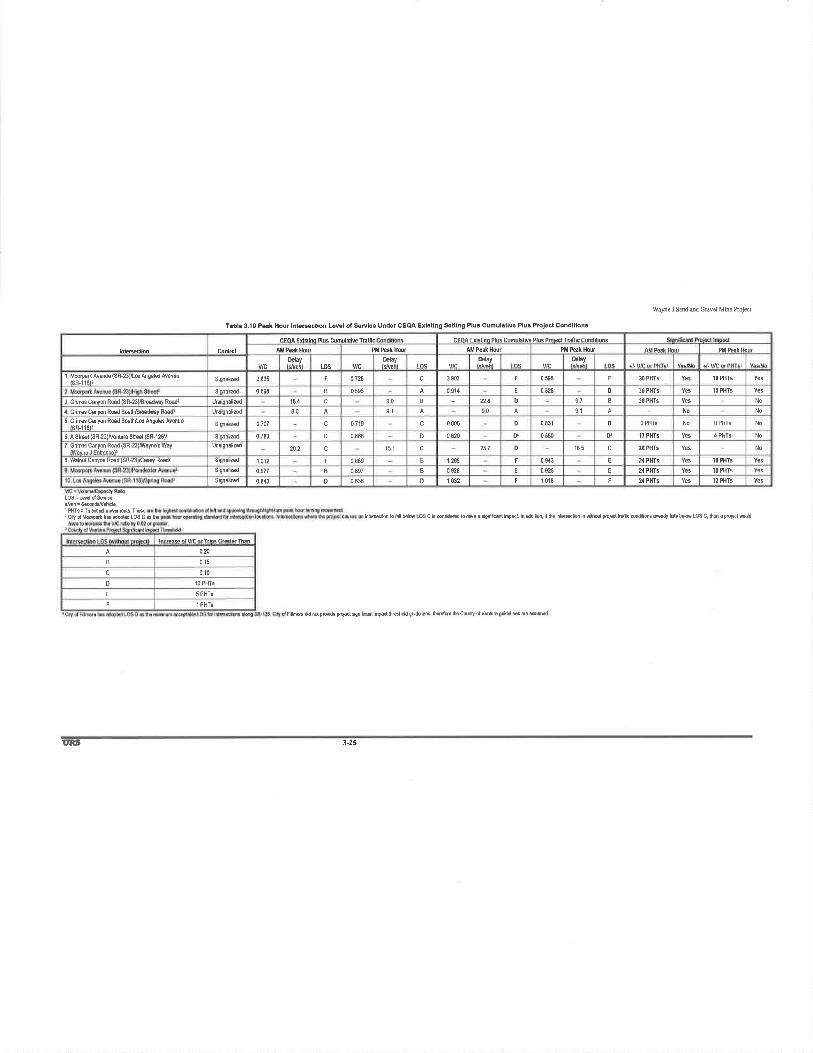
3.8.2 lntersection AnalYsis
Table 3.19 displays the intersection LOS and delay results under CEQA Existing Setting Plus
Cumulative plus project conditions in context to CEQA Existing Setting Plus Cumulative
conditions. The detailed intersection LOS calculation worksheets for CEQA Existing Plus
Project Conditions are provided in Appendix C'
As shown in Table 3.19, all study area intersections are projected to operate at an acceptable
LOS during both morning and evening peak hours under CEQA Existing Setting Plus
cumulative Plus Project conditions with the exception to the following:
o Moorpark Avenue (SR-23)/Los Angeles Avenue (SR- 1 1 S) - AM and PM peak hour LOS
F;
Moorpark Avenue (sR-23)/High street - AM and PM peak hour Los E and Los D
respectively;
Grimes Canyon RoaÜBroadway Road -AM peak hour LOS D;
Grimes canyon Road south /sR-llS -AM and PM peak hour Los D;
Grimes Canyon Road (SR-23)/Wayne's Way -AM peak hour LOS D;
Walnut Canyon Road (SR-23)/Casey Road- AM and PM peak Hour LOS F and LOS E
respectively;
Moorpark Avenue (sR-23)/Poindexter Avenue - AM and PM peak hour Los E; ,
Los Angeles Avenue (SR-ll8)/Spring Road - AM and PM peak hour Los F.
o
o
a
a
a
a
a
I'RS 3-23
q
Joõ\,
g
.=
=
o
CITY OF MOORPARK
Casey Rd
Moorpark Ave
Poindexter Ave
CITY OF FILMORE
oÉ.
oE'tr(9
VENTURA COUNTY,Rânchoa San Cristobal
Grimes Rock -CEMEXIMine
\Wayne J Sand
a/ andGravel
Broadway Rd
LEGEND
d
I Project Location
@ Study Areatnterseclton
45/68 AM/PM Volumes
fzoslszt+1f1
,01 9/1 ,1 8012t255
oo@ @o@Ð
obts?*!s1¿*(òóæ@\
P
1o3t12sJ1,010/1,218+
1e/25ì
Ø\I
þNO@@NTON
+\\_
<-f
37 t812t1484t262
r1¿o@NòqaNONON
@N
aa -^17t20->21141 ì
o-sNN
@oÈ.-
È=ON
?+çè13i1?f sha
*âto<Nñ€ò
o
228t309 411t24 <
rgo/1zo I
\- +zlsst<- 24t35
o ao@Neòro@@2\
ttßzJ35/33+
+ 27130
f: 113t56
@
38/52 +7/171
\¿òP
ÈF
(E -=@o€òñÉ=3?+\\\
,793
284t4221,7811172t144
\_++fl.ì1Þ
<N6e!{?òot_
A-1-++i
128t111
,803/1,638210t341
f ro¡¡z+ 912/949
o(ôôòQ
/*l
søßz-^935f,078-+
o @N@
O!_N{n.-=+@@
4\làf
45i68790/665324t163
nÞ@NO+@@òòò
35173491 /891273t126
J+IØ N
Natr@oN
Þ
fI 16t1136t21
ÞN@c?òs'
@Þo@ò-_
4tro -l
261/208 ì
+@r
=--oõ
@
AE-QA EXISTING SETTING PLUS CUMULATIVE
PLUS PROJECT INTERSECTION AM/PMPEAK HOUR TRAFFIC VOLUMES
WAYNE J. SAND AND GRAVEL MINE PROJECT
CREATED BY: SV DATE:2015FIG NO.
3-6PROJECT NO:60419284I'RS; PM: NC
I Pfrs : To dcd mffiñ Tk
WaFcJ bd ild Gravel Mine Projæt
Trbl€3.10PskHourlnt.¡ectlonL€velofSodlceUnd€rCEcùÀExlltlngsllngPlusCumulâtlv€Plu.ProlectCondltlon¡
intubn lo blbdm tOS C is ø&d to k6 Ê *Ftont¡mpl ln ddiüon, ilh inffiM h *bdFoþl [fro.dftons *!dy HsM LOS C, h6n E pn**l dd
Fllm tr dpüido FixtdgniÍcùlimflbGhdd!ùdns, kdm hCountr olVonùEgtriË tâ ß0md
, Citf ol lbtd ß dAH LOg C c hê
aFôÀ Fv¡d¡M þfre a,'dilr!tu.lDfll. CFôÂ Fr¡<rirn ÞÍ¡s Crñùlåt¡vÞ plß prôkt lrrtrr Cnndniônr
PM Pêâk Hour AM PeãkHdr PM Peâk HourconùûllÞlay oeláy
v/cDelåy
tos v/cIÞky
Yes 1O PHTSI hFft Av€nú€(SR-æjtr6 Ang*Aven!3Signalizd 3 035 I 0128 c 3S3 F 6 â95 F s PHTS
E 0 828 D 36 PHIS 1O PHTSsiq#d 0 698 B 0595 0 914
D 97 B 36 PHTS No3 Gdm Cânyon R@d ISR-23ì/BMóhV R€dl ußi@d¡z€d 104 c 90 B
90 91 No No4 Gim Cilyon Ræd Souûßßdwåy Rd Um¡qnalìzd 90 91
sig¡a{zd 0 707 c 0719 c 0806 D 0 031 D 0 PHT3 No O PHl! No5 GdN Cayon R€d SouhtrGAng€bAvdu6tsR-118F
Nô6 A slÉl ISR-23ìffsbß Sbt ISR-126Y Si0atz€d 0 783 c 0 866 D 0 820 D 0 ô00 v 17 PHls Yes 4 PHlt
151 c 257 D 165 c 26 PHTS No/ unm uanyon Kædlün-zJ,ftqnsr way unstgnazæ 202 c
0689 B I 289 F 0 943 E 21 PHTS 10 PHTSð Wahulcanyn RGd(SR-z3Jrcry Ræd¿ srgnslzd 1 012 F
B 0 697 B 0 926 E 0 92ô E 24 PHTS Yes 1(l PHTSurgnalzd 0 677
D 0 836 D 1 032 F 1 018 24 PHTS Yes 12 PHTS$rgnalEd 0&3
0æ
B 015
c 0't0
o 10 PHT8
E 5 PHTS
F I PHT8
uns 3-25
Wayne J Sand and Gravel Mine Project
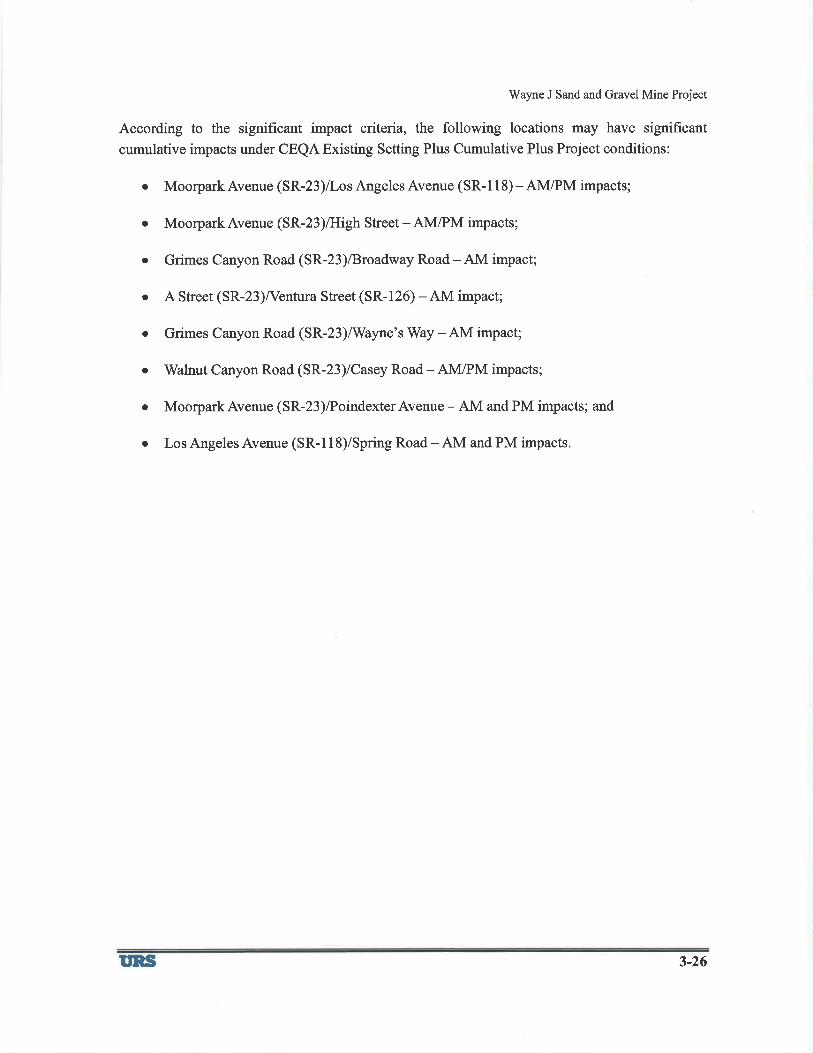
According to the significant impact criteria, the following locations may have significant
cumulative impacts under CEQA Existing Setting Plus Cumulative Plus Project conditions:
Moorpark Avenue (SR-23)/Los Angeles Avenue (SR- 1 I 8) - AM/PM impacts;
Moorpark Avenue (SR-23)/High Street - AM/PM impacts;
Grimes Canyon Road (SR-23)/Broadway Road-AM impact;
A Street (SR-23)A/entura Street (SR-126) -AM impact;
Grimes Canyon Road (SR-23)/Wayne's Way -AM impact;
Walnut Canyon Road (SR-23)/Casey Road-AM/PM impacts;
MoorparkAvenue (SR-23)/PoindexterAvenue -AM and PM impacts; and
Los Angeles Avenue (SR- 1 1 8)/Spring Road - AM and PM impacts.
a
a
a
a
a
o
a
a
uns 3-26
Wayne J Sand and Gravel Mine Project
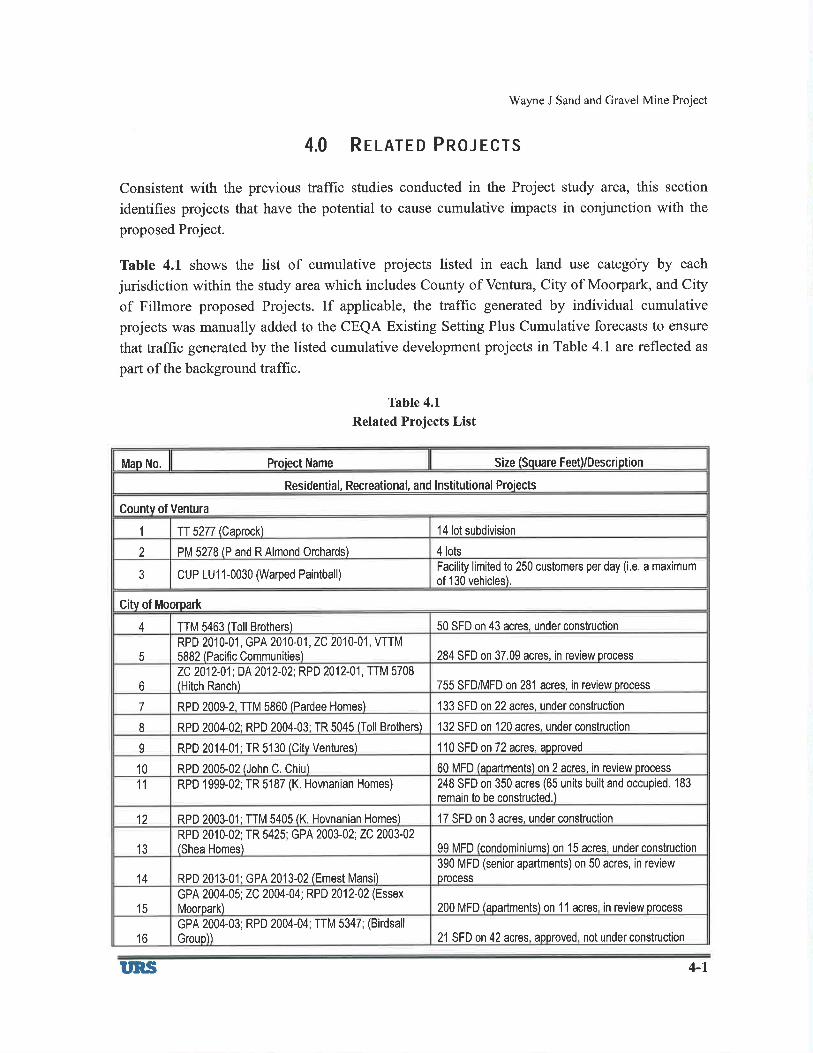
4.0 R¡IRTED PROJECTS
Consistent with the previous traff,rc studies conducted in the Project study area, this section
identifies projects that have the potential to cause cumulative impacts in conjunction with the
proposed Project.
Table 4.1 shows the list of cumulative projects listed in each land use categoþ by each
jurisdiction within the study area which includes County of Ventura, City of Moorpark, and City
of Fillmore proposed Projects. If applicable, the trafftc generated by individual cumulative
projects was manually added to the CEQA Existing Setting Plus Cumulative forecasts to ensure
that traffic generated by the listed cumulative development projects in Table 4.1 are reflected as
part of the background traffic.
Table 4.1
Related Projects List
Size (Souare Feet)/Descri otionMao No. Proiect Name
Residential, Recreational, and lnstitutional Proiects
Countv of Ventura
14 lot subdivisionI 1ï 5277 (Caorock)
4 lots2 PM 5278 (P and R Almond Orchards)
Facility limited to 250 customers per day (i.e. a maximum
of 130 vehicles).3 CUP LU11-0030 (Warped Paintball)
Citv of Moorpark
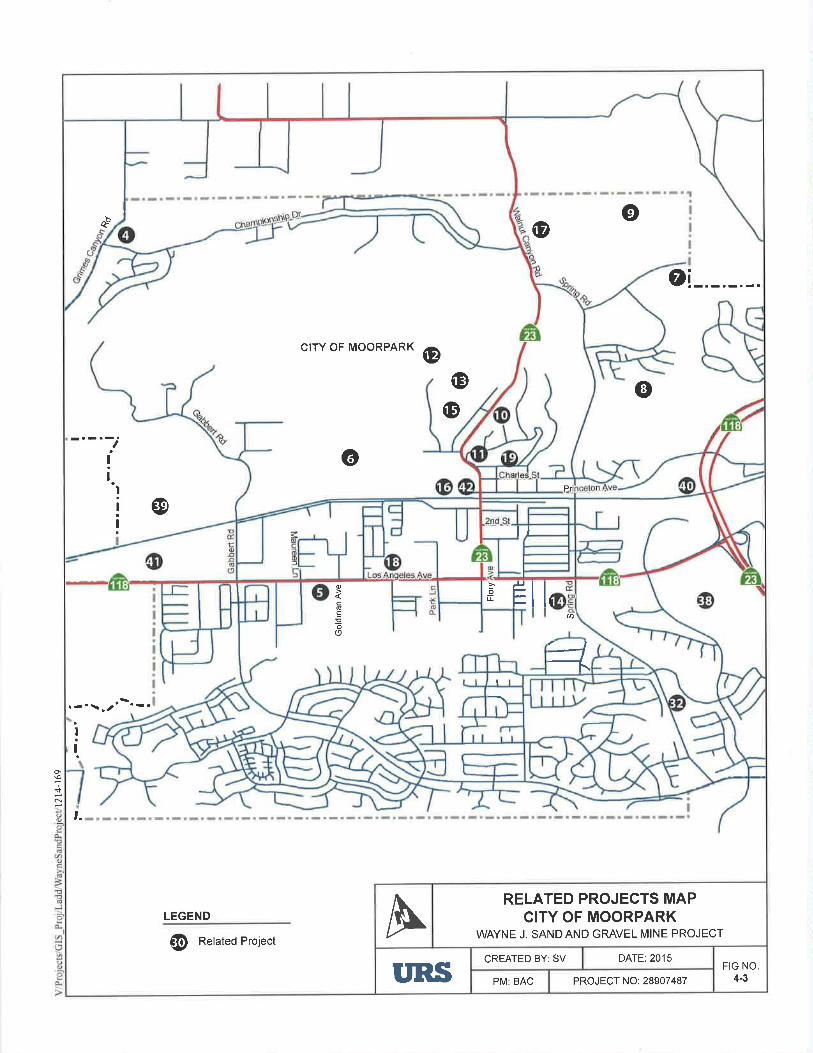
50 SFD on 43 acres. under construction4 TTM 5463 (Toll Brothers)
5
RpD 2010-01, GPA 2010-01, ZC 2010-01, VTTM
5882 lPacific Communities) 284 SFD on 37.09 acres, in review process
755 SFD/MFD on 281 acres, in review processo
2C2012-01;DA2012-02; RPD 2012-01, TTM 5708(Hitch Ranch)
1 33 SFD on 22 acres, under construction7 RPD 2009-2, TTM 5860 (Pardee Homes)
1 32 SFD on 1 20 acres. under construction8 RPD 2004-02: RPD 2004-03: TR 5045 (Toll Brothers)
1 1 0 SFD on 72 acres. aoorovedI RPD 2014-01: TR 5130 lOitv Ventures)
RPD 2005-02 (John C. Chiu) 60 MFD (aoartments) on 2 acres, in review process10
248 SFD on 350 acres (65 units built and occupied. 183
remain to be constructed.)11 RPD 1999-02; TR 5187 (K. Hovnanian Homes)
1 7 SFD on 3 acres, under construction12 RPD 2003-01: TTM 5405 (K, Hovnanian Homes)
99 MFD lcondominiums) on'15 acres, underconstruction13
RPD 2010-02; TR 5425; GPA 2003-02; ZC 2003-02(Shea Homes)
RPD 2013-01: GPA 2013-02lEmest Mansi)
390 MFD (senior apartments)on 50 acres, in reviewprocess14
200 MFD (aoartments) on 11 acres, in review orocess15
GPA 2004-05; ZC 2004-04; RPD 2012-02 (Essex
Mooroark)
21 SFD on 42 acres. aooroved, not under construction16
GPA 2004-03; RPD 2004-04; TTM 5347; (Birdsall
Grouo))
üns 4-l
Wayne J Sand and Gravel Mine Project
Map No. Proiect Name Size (Square Feet)/Description
17
RPD 2014-02; GPA 2014-01; ZC 2014-01, (Grand
Moorpark) 66 MFD lcondominiums) on 4 acres. in review Drocess
18 Area Housinq Authoritv of Countv of Ventura24 MFR (affordable units) on 1,2 acres, approved notunder construction
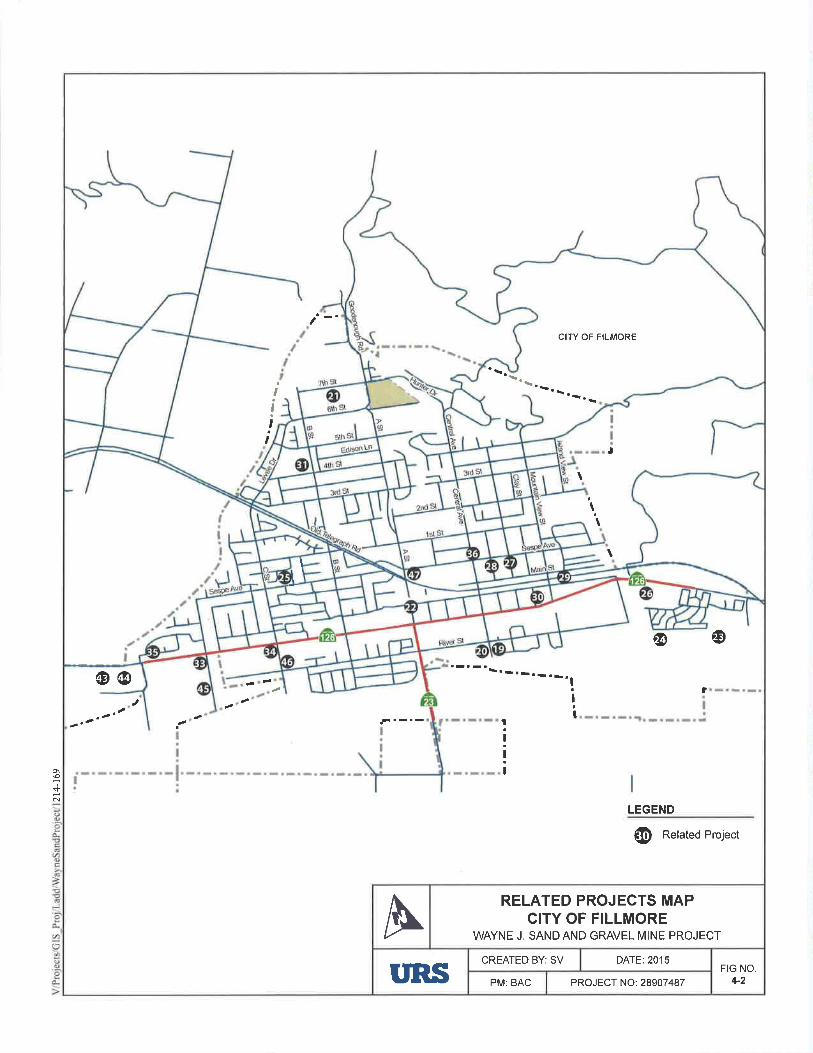
Citv of Fillmore
19 TTR 4435 72 unit proiect (45 SFD remain to be conskucted)
20 DP 01-16; TTR 5353 (Mod, #2) 1 1O SFD
21 DP 03-01: TTR 5422; GPA 03-01: ZC 03-01 146 units
22 DP 03-04: TTR 5429 6 units subdivision
23 DP 03-09: TTR 5474: DP 14-05: DP 14-0x 126 units (6 units remaininq)
24 TTR 5496 166 SFD
25 TTR 5509; DP 05-03 10 units
26 DP 04-16: TTR 5520 (Mod. #1) 460 units
27 TTR 5922 22 MFD units
28 TTR 5923 18 MFD units
29 DP 05-09; TPM 05-04; SPA 05-01 18 MFD units; 3 medical offices
30 DP 11-05 3 units
31 DP 14-04 2 units
Commercial (Retail and Office) Proiect
Citv of Moorpark
32 CPD 2012-02 (Kim Clement Center)21,644sq. ft. church on2.78 acres, approved, not underconstruction
City of Fillmore
33 DP14-048 8,340 SF retail buildino
34 DP 07-03 (Mod. #4) 29,300 SF retail buildins
35 DP 07-08; CUP 07-10 6,640 auto seruice and retail buildinq
36 DP 02-08 lMod. #2) 21 unit office buildinq with 3,850 commercial space
lndustrial Projects
Ventura Countv
37 cuP 4874-2 (PL 12-0159) Grimes Rock, lnc. permit modification to continue andexpand operations (inauqurated)
37A cuP 4913 Rancho San Cristobal, permit modification to continueand expand operations
Citv of Mooroark
38 IPD 2000-01 Mod. 1 (Patriot Commerce Center)
350,000 sq. ft. office/industrialbuildings, only 124,070 sq.
ft. of office park building area and 142,998 sq. ft. of homeimprovement store building area remaining to be
developed on the total site of 20 acres, Bldgs. D-J
Complete, Revised Bldqs. B-C ln Review Process
39 TR 5609 (A-B Prooerties) 17lots on 36 acres
I'RS 4-2
Wayne J Sand and Gravel Mine Project
Sources: County of Ventura 2014 and City of Moorpark Â
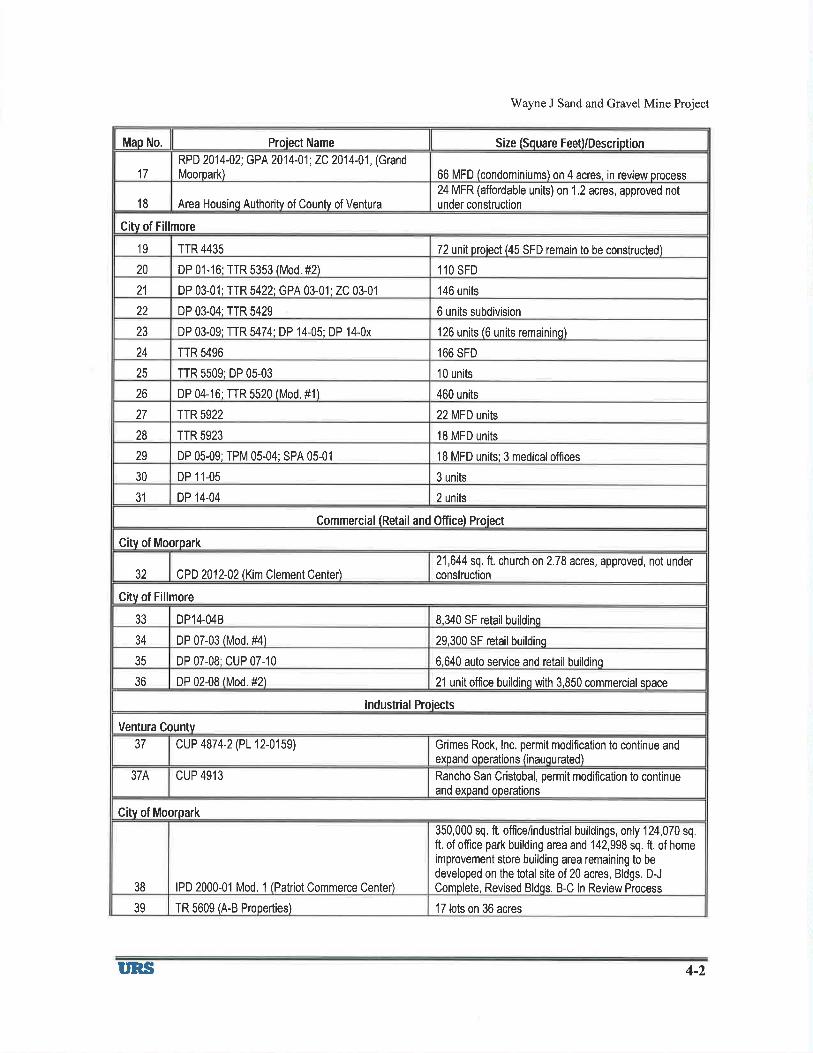
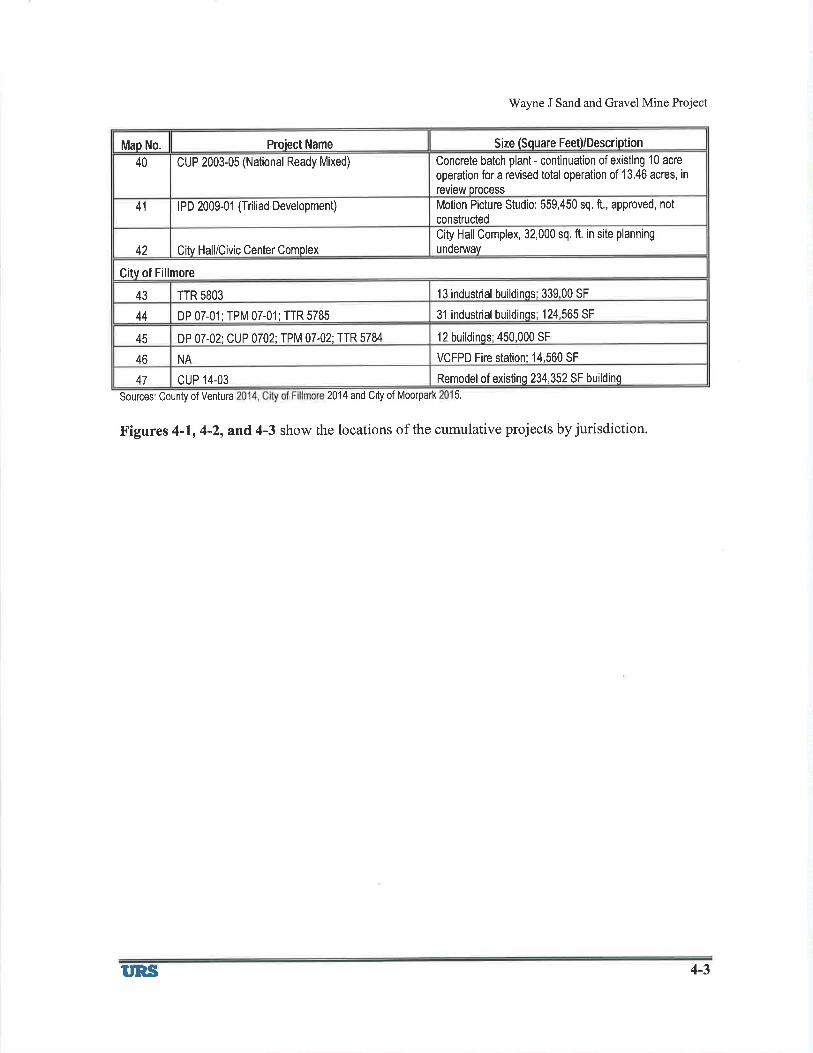
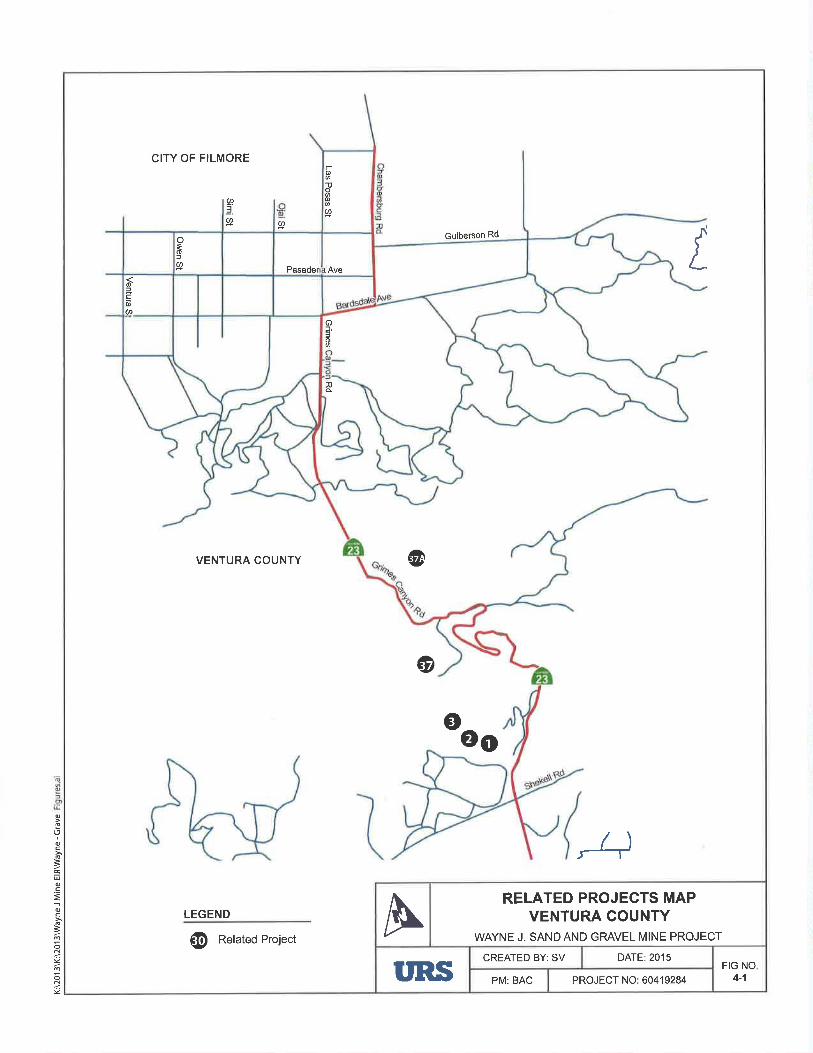
Figures 4-1,4-2, and 4-3 show the locations of the cumulative projects by jurisdiction.
Size (Square Feet)/DescriptionMao No. Proiect Name
Concrete batch plant - continuation of existing 10 acre
operation for a revised total operation of 13.46 acres, in
review process
40 CUP 2003-05 (National Ready Mixed)
Motion Picture Studio: 559,450 sq. ft., approved, not
constructed41 IPD 2009-01 (Triliad Development)
City Hall Complex, 32,000 sq. ft. in site planning
undenruav42 Citv Hall/Civic Center Comolex
Citv of Fillmore
13 industrial buildinos: 339.00 SF43 TTR 5803
31 industrial buildinqs; 124,565 SF44 DP 07-01: TPM 07-01; TTR 5785
12 buildinos: 450.000 SF45 DP 07-02; CUP 0702; TPM 07-02; TTR 5784
VCFPD Fire station: 14.560 SF46 NA
Remodel of existinq 234,352 SF buildinq47 cuP 14-03
uns 4-3
o
(J
oÉ
I=o.=
=oc
Iog
oN4
A RELATED PROJECTS MAPVENTURA COUNTY
WAYNE J. SAND AND GRAVEL MINE PROJECT
CREATED BY: SV DATE:2015FIG NO
4-',lT'RS PM: BAC PROJECT NO: 60419284
-oî,oo
Ø
oão=Ø
Pâsader r Ave
6fcõØ
oL3o
CITY OF FILMORE
al.Ø Ø
Guiberson Rd I
uo
VENTURA COUNTY @
Ø
oO6
,4LEGEND
@ Related Project
ôI
N
CITY OF FILMORE
.\.\.1.1
I
II,I
¿
\
\
T
I
I
A RELATED PROJECTS MAPCITY OF FILLMORE
WAYNE J. SANDAND GRAVEL MINE PROJECT
CREATED BY: SV DATE: 2015
PM: BAC PROJECT NO: 28907487
FIG NO.4-2I'RS
rÐ rÐ
(Ð@!II
I
¿I
!I
I
LEGEND
@ Related Project
ô€
N
qò oa
o
Þr
lf
''- ''i
CITY OF MOORPARK@
@
o
@
@
I
I
II
I
F Ëll,
= t\I
o
ÉGEIo(t
ct)
A RELATED PROJECTS MAPCITY OF MOORPARK
WAYNE J. SANDAND GRAVEL MINE PROJECT
CREATED BY: SV DATE:2015
PROJECT NO: 28907487
FIG NO,4-3T'RS PM: BAC
I
I
t.
LEGEND
@ Related Project
Wayne J Sand and Gravel Mine Project
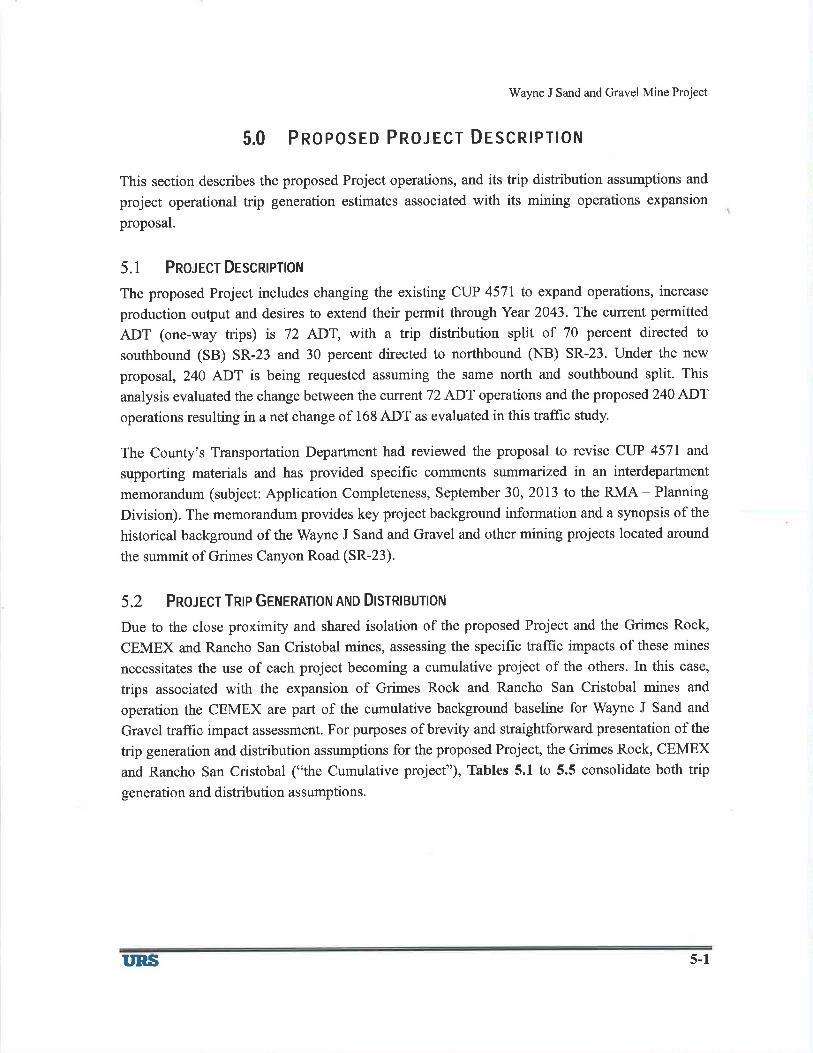
5.0 PnOPOSED PROJECT DESCRIPTION
This section describes the proposed Project operations, and its trip distribution assumptions and
project operational trip generation estimates associated with its mining operations expansion
proposal.
5.1 PnolrcrDrscRlpnolrl
The proposed Project includes changing the existing CUP 457I to expand operations, increase
production output and desires to extend their permit through Year 2043. The current permitted
ADT (one-way trips) is 72 ADT, with a trip distribution split of 70 percent directed to
southbound (SB) SR-23 and 30 percent directed to northbound (NB) SR-23. Under the new
proposal, 240 ADT is being requested assuming the same north and southbound split. This
analysis evaluated the change between the current 72 ADT operations and the proposed 240 ADT
operations resulting in a net change of 168 ADT as evaluated in this traffrc study.
The County's Transportation Department had reviewed the proposal to revise CW 457I and
supporting materials and has provided specific comments summarized in an interdepartment
memorandum (subject: Application Completeness, September 30, 2013 to the RMA - Planning
Division). The memorandum provides key project background information and a synopsis of the
historical background of the Wayne J Sand and Gravel and other mining projects located around
the summit of Grimes Canyon Road (SR-23).
5.2 PnorEcr Trup GerurnATtoN AND DlsrrusurloN
Due to the close proximity and shared isolation of the proposed Project and the Grimes Rock,
CEMEX and Rancho San Cristobal mines, assessing the specific traffrc impacts of these mines
necessitates the use of each project becoming a cumulative project of the others. In this case,
trips associated with the expansion of Grimes Rock and Rancho San Cristobal mines and
operation the CEMEX are part of the cumulative background baseline for Wayne J Sand and
Gravel trafftc impact assessment. For purposes of brevity and straightforward presentation of the
trip generation and distribution assumptions for the proposed Project, the Grimes Rock, CEMEX
and Rancho San Cristobal ("the Cumulative project"), Tables 5.1 to 5.5 consolidate both trþgeneration and distribution assumptions.
T'RS 5-1
Wayne J Sand and Gravel Mine Project
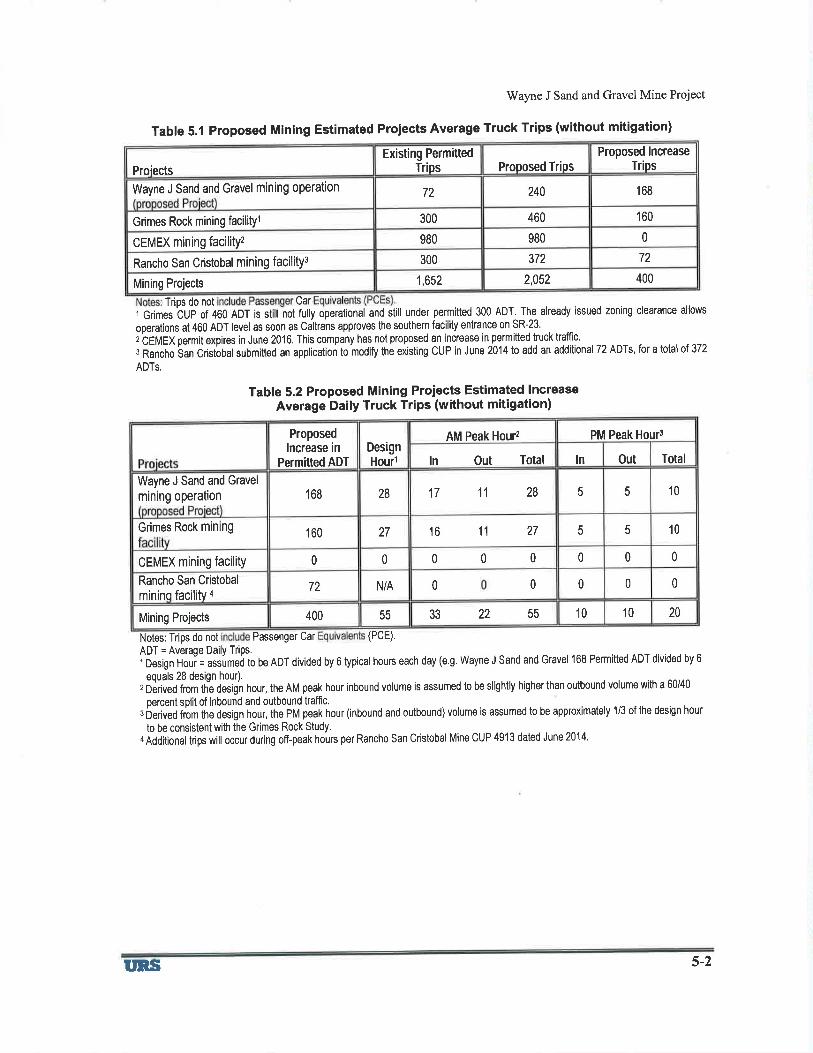
Table 5.1 proposed Mining Estimated Projects Average Truck Trips (without mitigation)
Trips do not CarI Grimes CUP of 460 ADT is still not fully operational and still under
operations at 460 ADT level as soon as Caltrans approves the southern2 CEMEX permit expires in June 2016. This company has not proposed
3 Rancho San Cristobal submitted an application to modify the existing
ADTs.
permitted 300 ADT, The already issued zoning clearance allows
facility entrance on SR-23.
an increase in permitted truck traffic.
CUP in June 2014 to add an additional 72 ADTs, for a total of 372
Table 5.2 Proposed Mining Projects Estimated lncreaseAverage Daily Truck Trips (without mitigation)
Notes: Trips do not Passenger Car (PcE).
ADT = Average Daily Trips.róesisn Hòui= assúmeà to be ADT divided by 6 typical hours each day (e.g. wayne J sand and Gravel 168 Permitted ADT divided by 6
equals 28 design houQ.2 Dèrived from thä design hour, the AM peak hour inbound volume is assumed to be slightly higher than outbound volume with a 60/40
percent split of inbound and outbound traffic.3 Derived from the design hour, the pM peak hour (inbound and outbound) volume is assumed to be approximately 1/3 of the design hour
to be consistent with the Grimes Rock Study.a Additional trips will occur during off-peak hours per Rancho San Cristobal Mine CUP 4913 dated June 2014'
Proposed lncreaseTriosProoosed Trips
Existing Perm¡ttedTripsProiects
16824072Wayne J Sand and Gravel mining operation
160460300Grimes Rock mining facilitYt
0980980CEMEX mining facilitYz
372 72300Rancho San Cristobal mining facilityt
2,052 4001,652Mining Projects
PM Peak HourlAM Peak Hourz
ln Out Totalln Out Total
Proposedlncrease in
Permitted ADT
DesignHourl
105 517 11 28168 28Wayne J Sand and Gravel
mining operation
5 5 1016 11 2727160Grimes Rock mining
0 000 0000CEMEX mining facilitY
0 00N/A 0072Rancho San Cristobal
mininq facilitv ¿
10 201055 33 22 55400Mining Projects
I'RS 5-2
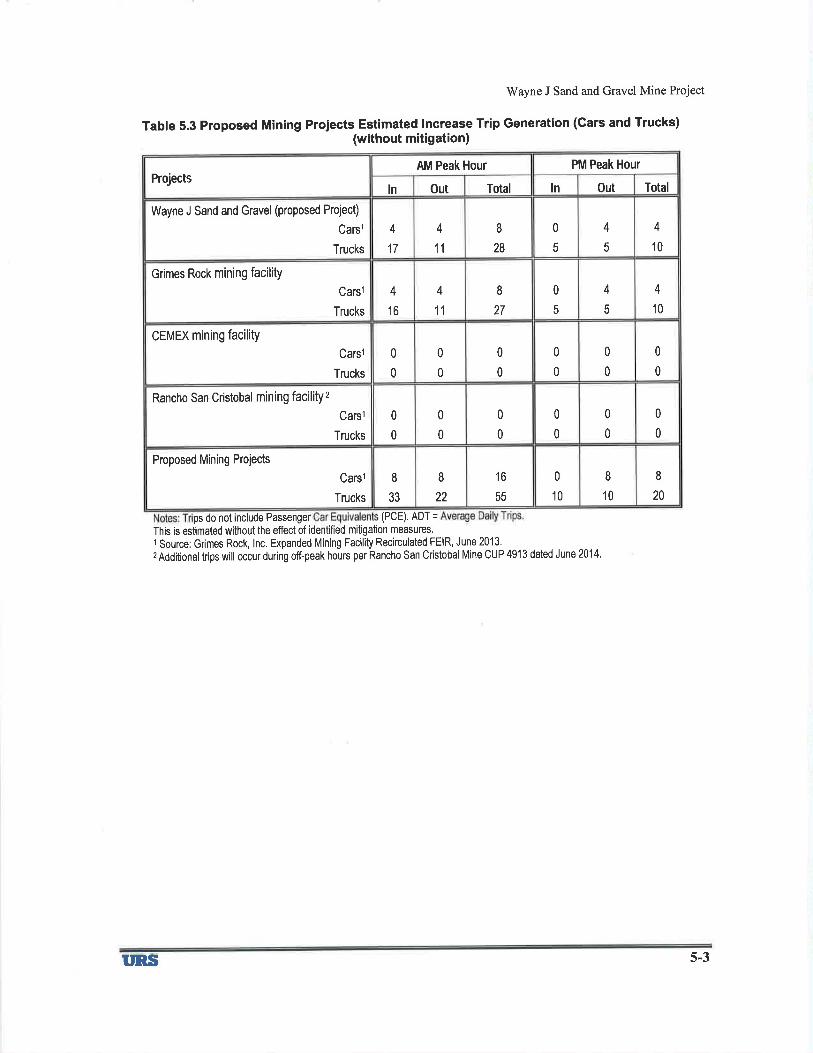
Wayne J Sand and Gravel Mine Project
Table 5.3 Proposed Mining Projects Estimated lncrease Trip Generation (Cars and Trucks)(without mitigation)
ps do not include Passenger (PCE). ADT =
This is estimated without the effect of identified mitigation measures.I Source: Grimes Rock, lnc. Expanded Mining Facility Recirculated FEIR' June 2013.2 Additional trips will occur during off-peak hours per Rancho San Cristobal Mine CUP 4913 dated June 2014.
PM Peak HourAM Peak Hour
0ut Totalln Out Total lnProjects
0
5
4
5
4
10
4
17
4
11
I28
Wayne J Sand and Gravel (proposed Project)
Carsl
Trucks
4
10
I27
0
5
4
5
4
1 6
4
11
Grimes Rock mining facilitY
Carsl
Trucks
0
0
0
0
0
0
0
0
0
0
0
0
CEMEX mining facility
Carsl
Trucks
0
0
0
0
0
0
0
0
0
0
0
0
Rancho San Cristobal mining facilityz
Carsl
Trucks
16
55
0
10
I10
8
20
8
33
8
22
Proposed Mining Projects
Carsl
Trucks
T'RS 5-3
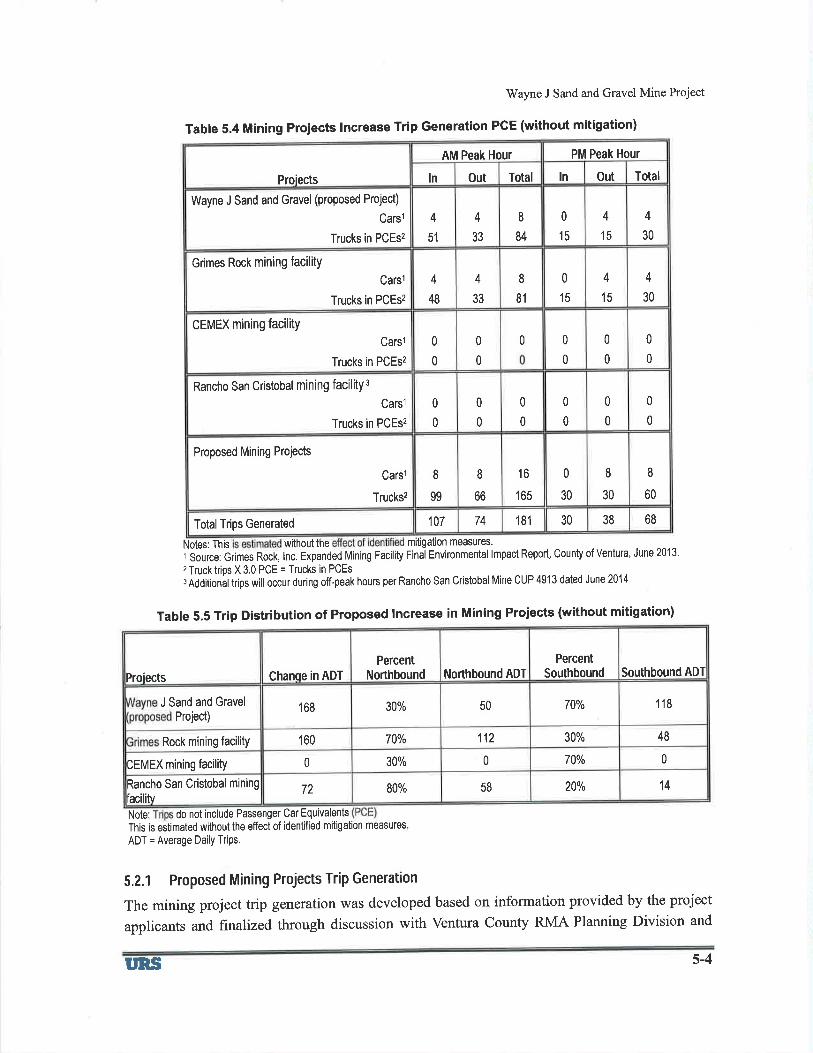
Notes: This without the
2 Truck trips X 3.0 PCE = Trucks in PCEs¡ Additional trips will occur during off-peak hours per Rancho San Cristobal Mine CUP 491 3 dated June 201 4
Table 5.5 Trip Distribution of Proposed lncrease in Mining Projects (without mitigation)
Note: do not include Passenger Gar Equivalents
This is estimated without the effect of identified mitigation measures
ADT = Average Daily Trips.
5.2.1 Proposed Mining Projects Trip Generation
The mining project trþ generation was developed based on information provided by the project
applicants and finalized through discussion with Ventura County RMA Planning Division and
Wayne J Sand and Gravel Mine Project
Table 5.4 Mining Projects Increase Trip Generation PGE (without mitigation)
1 Source: Grimes Rock, lnc. Expanded Mining Facility
mitigation measures.
Final Environmental lmpact Report, County of Ventura, June 201 3.
PM Peak HourAM Peak Hour
Out TotalOut Total lnlnProiects
0
15
4
15
4
30
4
51
4
33
I84
Wayne J Sand and Gravel (proposed Project)
Carsl
Trucks in PCEsz
4
15
4
30
4
33
I81
0
15
4
48
Grimes Rock mining facilitY
Carsl
Trucks in PCEs2
0
0
0 0
0
0
0
0
0
0
0
CEMEX mining facility
Carst
Trucks in PCEsz
0
0
0
0
0
0
0
0
0
0
0
0
Rancho San Cristobal mining facility I
Carsl
Trucks in PCEsz
8
60
16
165
0
30
I30
8
99
I66
Proposed Mining Projects
Carsl
Trucksz
68181 30 38107 74Total Trips Generated
PercentSouthbound Southbound ADïNorthbound ADT
PercentNorthboundChanqe in ADTPro¡ects
7jYo 1185030%168J Sand and Gravel
Project)
4830%112160 7IYoRock mining facility
700/o 0030%00EMEX mining facility
1420Yo5872 80%Rancho San Cristobal mining
lacilitv
trRs 5-4
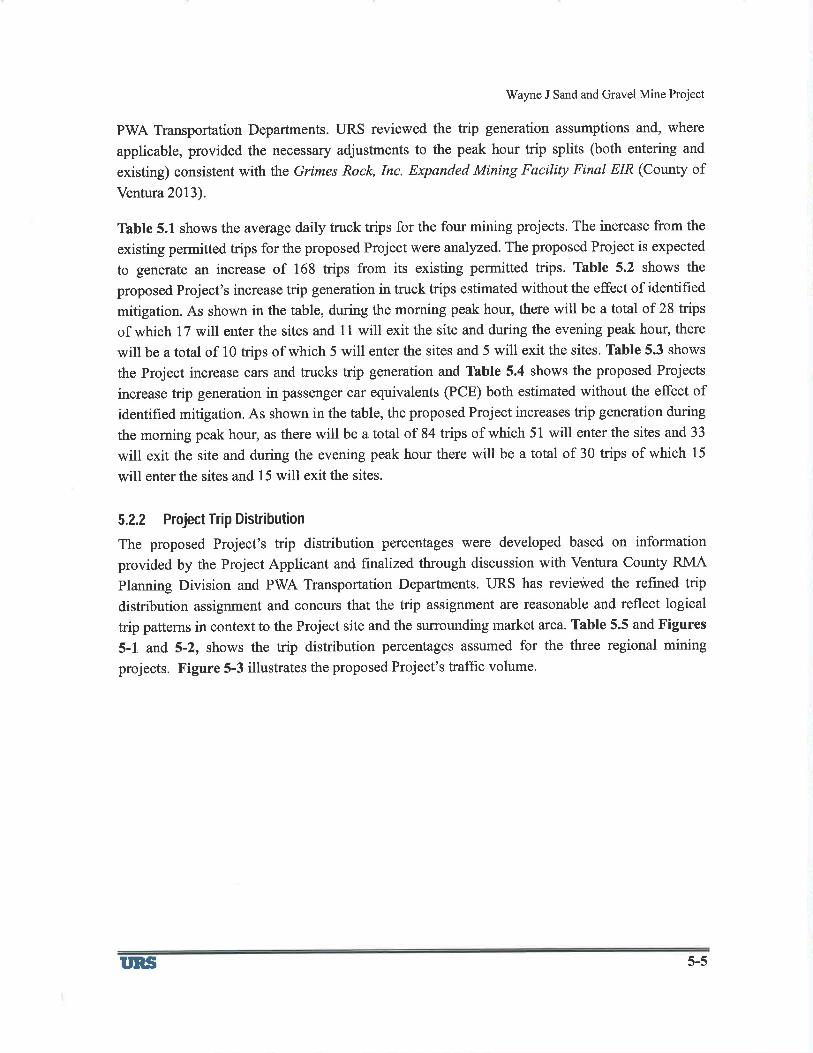
Wayne J Sand and Gravel Mine Project
PWA Transportation Departments. URS reviewed the trip generation assumptions and, where
applicable, provided the necessary adjustments to the peak hour trip splits (both entering and
existing) consistent with the Grimes Rock, Inc. Expanded Mining Facility Final EIR (County ofVentura 2013).
Table 5.1 shows the average daily truck trþs for the four mining projects. The increase from the
existing permitted trips for the proposed Project were analyzed. The proposed Project is expected
to generate an increase of 168 trips from its existing permitted trþs. Table 5.2 shows the
proposed Project's increase trip generation in truck trips estimated without the effect of identified
mitigation. As shown in the table, during the morning peak hour, there will be a total of 28 trips
of which 17 will enter the sites and 11 will exit the site and during the evening peak hour, there
will be a total of 10 trips of which 5 will enter the sites and 5 will exit the sites. Table 5.3 shows
the Project increase cars and trucks trip generation and Table 5.4 shows the proposed Projects
increase trþ generation in passenger car equivalents (PCE) both estimated without the effect of
identified mitigation. As shown in the table, the proposed Project increases trip generation during
the morning peak hour, as there will be a total of 84 trips of which 51 will enter the sites and 33
will exit the site and during the evening peak hour there will be a total of 30 trips of which 15
will enter the sites and 15 will exit the sites.
5.2.2 Project Trip Distribution
The proposed Project's trip distribution percentages were developed based on information
provided by the Project Applicant and finalized through discussion with Ventura County RMA
Planning Division and PWA Transportation Departments. URS has reviewed the refined trip
distribution assignment and concurs that the trip assignment are reasonable and reflect logical
trip patterns in context to the Project site and the surrounding market area. Table 5.5 and Figures
5-1 and 5-2, shows the trip distribution percentages assumed for the three regional mining
projects. Figure 5-3 illustrates the proposed Project's traffic volume.
I'RS 5-3
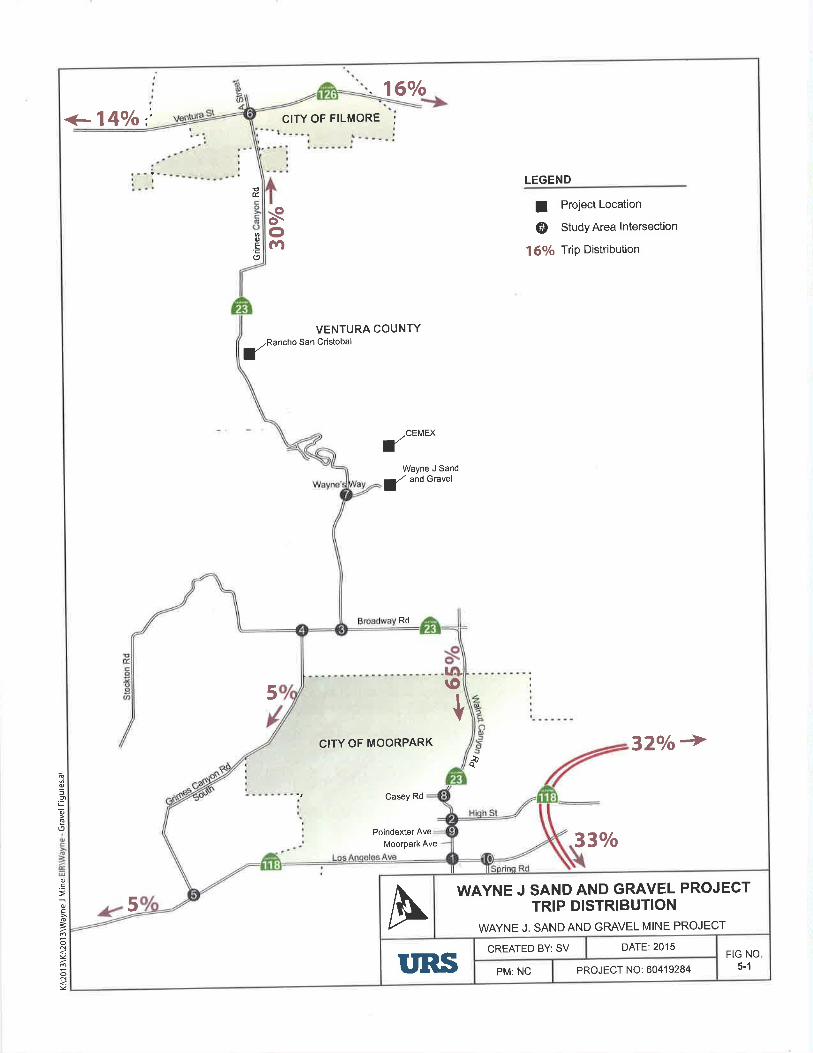
CITY OF MOORPARK
Casey Rd
\o
+
Moorpark AvePoindexter Ave
1 6o/o
<- 1 4o/o ,i CITY OF FILMORE ;
LEGENDEÉ.
oe(9
sofn
t Project Location
@ Study Area lntersection
1 6o¡o T riO Distribution
.RanchofVENTURA COUNTY
San Cristobal
/CEMEXfWayne J Sand
a/ andGravel
Rd
5
32o/o+*
33o/o
5WAYNE J SAND AND GRAVEL PROJECT
TRIP DISTRIBUTION
WAYNE J. SAND AND GRAVEL MINE PROJECTADATE:2015CREATED BY: SV
5-1FIG NO
PROJECT NO:60419284PM: NCI'RS
).9õ\,
.E
=ac
=o
od
E
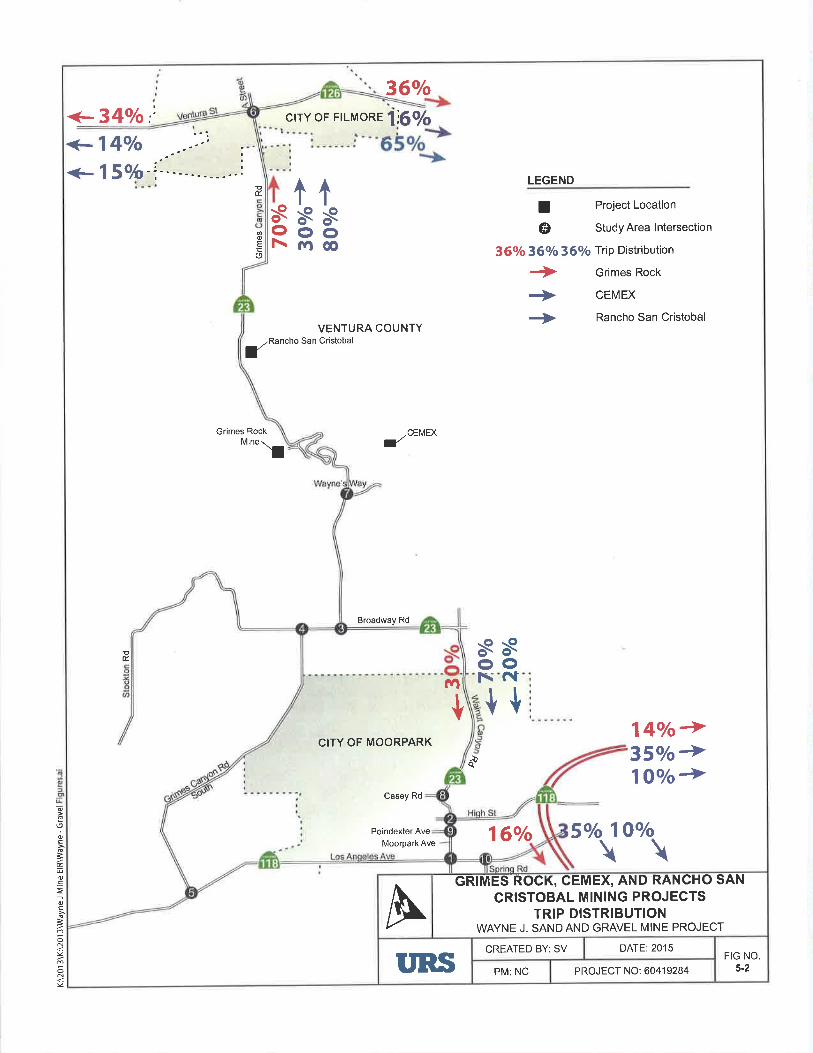
õ
oc
=É@.ç
o
=oN
E
o
160/o
CITY OF MOORPARK
Casey Rd
fn
{
Moorpark AvePo¡ndexter Ave
360/o
+34o/o,i crrY oF FTLMoRE 1i6o/o
11ssoofnæ
LEGENDoÉ.
oE'-(,
sol\
I Project Location
@ Study Area lntersection
3 60/o 3 60/o 3 6o/o T rip D i stri b ution
+ Grimes Rock
+ CEMEX
+ Rancho San CristobalVENTURA COUNTY
,RanchofSan Cristobal
Grimes Rock-CEMEX
-'Mine tl
Broadway Rd
oÉ. so so
r\t
Ih-
+
d
14o/o+35o/où1Oo/o+
5o/o 1oo/o
\\
A___GRIilI=S
ROCK, CEMEX, AND RANCHO SANCRISTOBAL MINING PROJECTS
TRIP DISTRIBUTIONWAYNE J. SAND AND GRAVEL MINE PROJECT
DATE:2015CREATED BY: SVFIG NO.
5-2PM: NC PROJECT NO:60419284T'RS
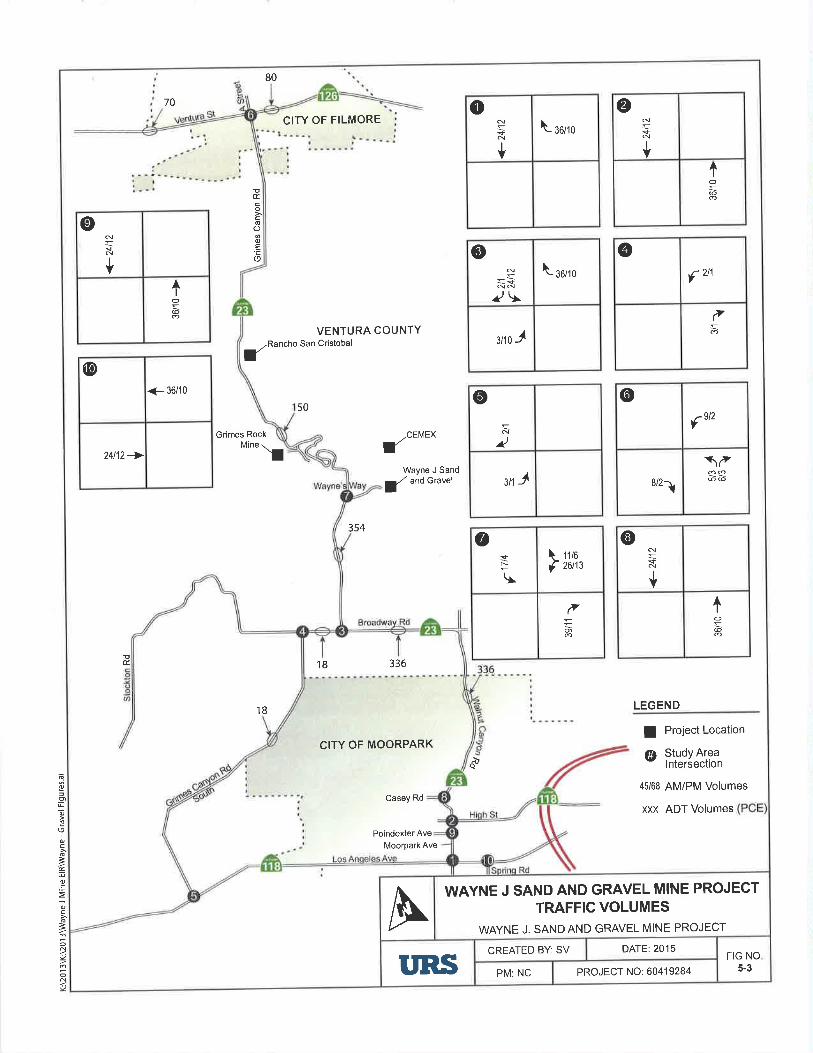
q
=,9î\9
ocñBca
=c
=oN4
oN
18
CITY OF MOORPARK
Casey Rd
Poindexter Ave
Moorpark Ave
336
80
70
CITY OF FILMORE
EÉ.Éoco(-)
oE'-(,
f 2t1
@
,I
VENTURA COUNTY,RanchoJ San Cristobal
<- 36/10
@
24112-+
50o
N
2
a1J
@
f 9t2
f\ttts?e@@8/21
Grimes Rock -CEI\¡EX(Mine
\Wayne J Sand
a/ and Gravel
354
oÉ.
18 LEGEND
d
I Project Location
@ ,'.iåÎlåli"x
45/ôB AM/PM Volumes
XXX ADT VOIUMCS
f ¡orro
oN
N
+
øN
=
+Io
0N
N
+
1o
oN
=ìNN?!f ,u,,0
3AO J
f, rr¡o
I zørrc
Øsr\
aò
@N
N
+A
I
o@
A WAYNE J SAND AND GRAVEL MINE PROJECTTRAFFIC VOLUMES
WAYNE J. SAND AND GRAVEL MINE PROJECT
DATE:2015CREATED BY: SVFIG NO
5-3PROJECT NO:60419284PM: NCT'RS
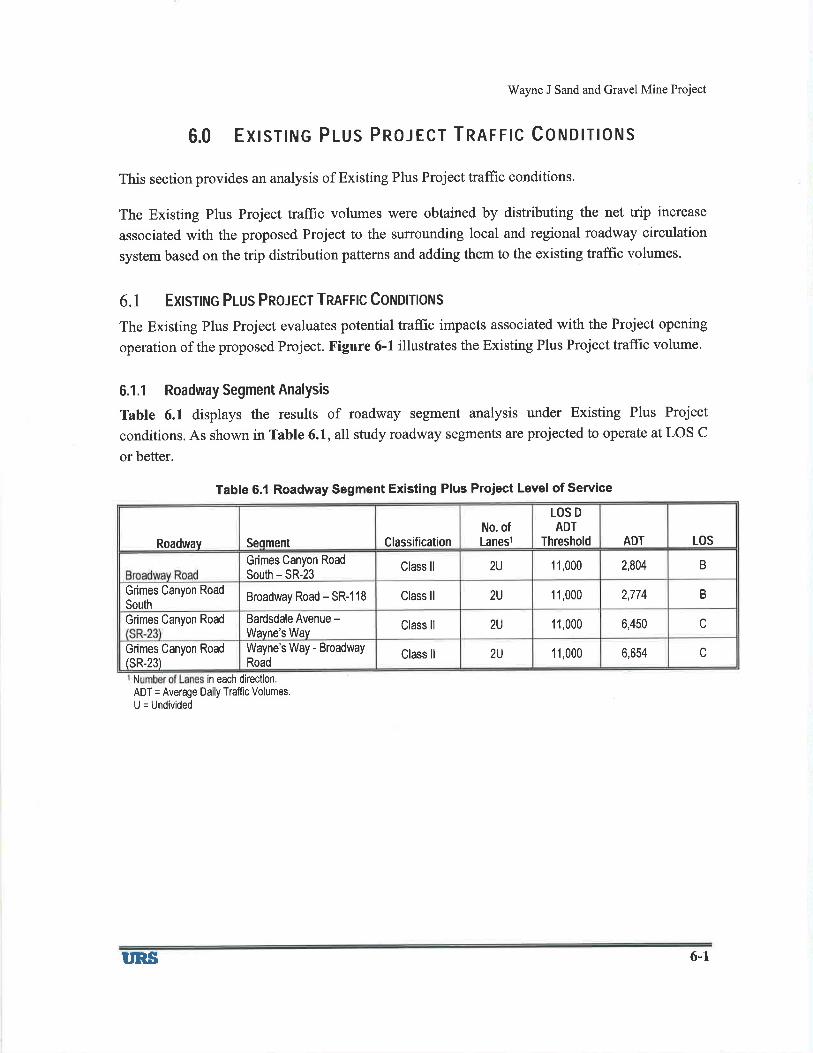
Wayne J Sand and Gravel Mine Project
6.0 ExISTING PLUS PROJECT TRAFFIC CONDITIONS
This section provides an analysis of Existing Plus Project traffrc conditions.
The Existing Plus Project traffic volumes were obtained by distributing the net trþ increase
associated with the proposed Project to the surrounding local and regional roadway circulation
system based on the trip distribution patterns and adding them to the existing traffic volumes.
6.1 Exrsnruc Plus PnotrcT TRAFFIc Coruorlorus
The Existing Plus Project evaluates potential trafüc impacts associated with the Project opening
operation of the proposed Project. Figure 6-1 illustrates the Existing Plus Project traffic volume.
6.1.1 Roadway Segment Analysis
Table 6.1 displays the results of roadway segment analysis under Existing Plus Project
conditions. As shown in Table 6.1, all study roadway segments are projected to operate at LOS C
or better.
Table 6.1 Roadway Segment Existing Plus Project Level of Service
N in each direction.
ADT = Average Daily Traffic Volumes.
U = Undivided
No. ofLanesl
LOS D
ADTThreshold ADT LOSSeoment ClassificationRoadwav
B2U 11,000 2,804Grimes Canyon Road
South - SR-23Class ll
BClass ll 2U 11,000 2,774Broadway Road - SR-1 18Grimes Canyon Road
South
6,450 cClass ll 2U 11,000Bardsdale Avenue -Wavne's Wav
Grimes Canyon Road
6,654 cClass ll 2U 11,000Wayne's Way - Broadway
RoadGrimes Canyon Road(sR-23)
I'RS 6-l
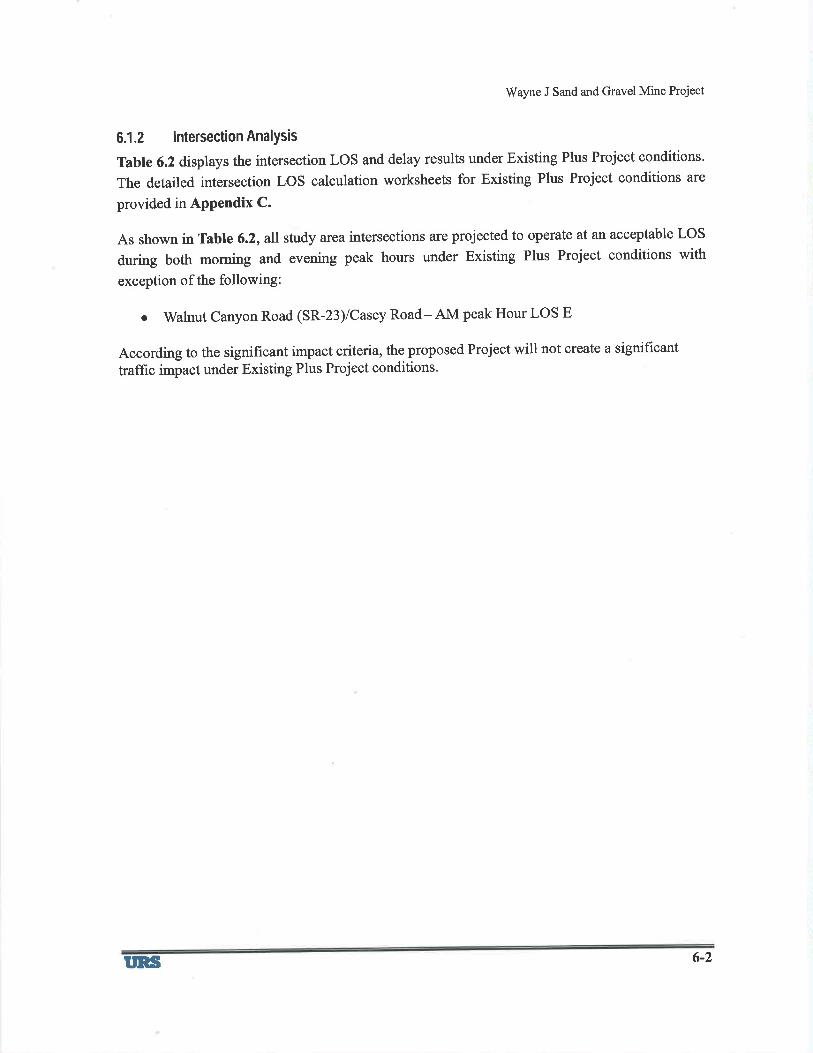
Wayne J Sand and Gravel Mine Project
6.1.2 lntersectionAnalYsis
Table 6.2 displays the intersection LOS and delay results under Existing Plus Project conditions'
The detailed intersection LOS calculation worksheets for Existing Plus Project conditions are
provided in Appendix C.
As shown in Table 6.2, allstudy area intersections are projected to operate at an acceptable LOS
during both morning and evening peak hours under Existing Plus Project conditions with
exception of the following:
o walnut canyon Road (sR-23)/Casey Road-AM peak Hour LOS E
According to the signifrcant impact criteria, the proposed Project will not create a significant
traffic impact under Existing Plus Project conditions.
uns 6-2
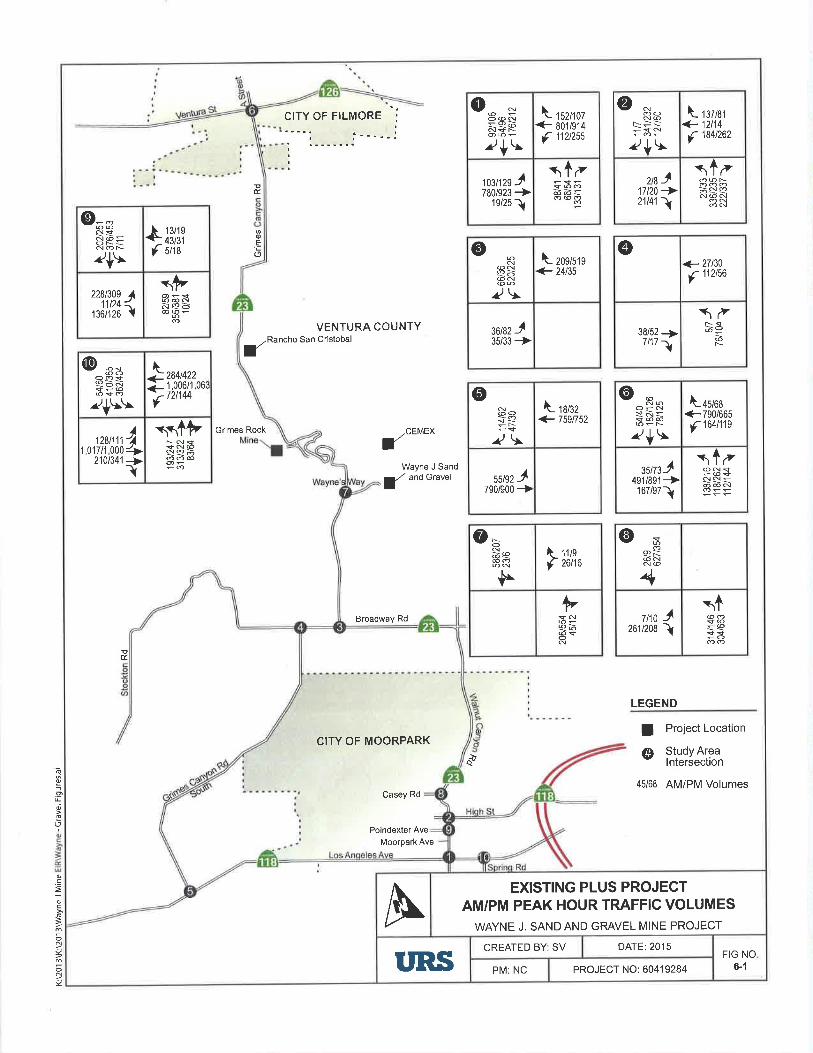
=.9õ(,
,.=c
=oN4
o4
CITY OF MOORPARK
Casey Rd
Poindexter Ave
Moorpark Ave
CITY OF FILMORE ;
"--: ..--_-_j
ÞÉ.
oE'E(,
VENTURA COUNTY,Ranchof San Cristobal
Grimes Rock -CEMEX(Wayne J Sand
a/ andGravel
Broadway Rd
Eú
LEGEND
d
I Project Location
a Studv AreaIt lnteréection
45/ô8 AM/PM Volumes
o N
N@ts
\
@o@
=Qo6
^¿+
f rszltoz<- 801/914
f 1121255
¡1¿:
tosrzs J7ï0ts23+
1e/25ì
ø^ óoN@Þ=È
?+\\- rszl¿r
<- 12t14
l: 184t262
s1¿òs! aN@N
ON
zßJ17t20-+21141 ì
èi3il?V shï
0-ÐaNo?+\
sfo=
228t309 A11t24 <
r¡o¡zo {nî'@@NÑQò@@-6
f zoslsrs+ 24135
oN
@Naò@@?\
$ßzJ35/33 +
@<- 27130
ç 112156
3B/52 -¡>7/171
\¿F+òP
òF
,06i28414221,006/172t144
\_++f
@-o@o
!9òñÉ58z1+!!
I-1-->
=>I
1281111
1,017/1,000210t341
+N6aaòoo@
ñ1Þ\- rsr¡z+ 759t752
oSS¿/!
ssßz -^790/900 -)
\-+sros+- 790/665
f 164t11e
@@N@
O-N{ñ=a=Ë?+\$nsJ
491/891 -+167/e7ì
r1¿@NSS¡q!=@@N
o NoNò!P@o@N
+^
f, rusI zarø
Þ!aò@voN
@Ë3ÈN@
47110
261t208Jì
+
A EXISTING PLUS PROJECTAM/PM PEAK HOUR TRAFFIC VOLUMES
WAYNE J. SAND AND GRAVEL MINE PROJECT
CREATED BY: SV DATE: 20'15FIG NO
6-lPROJECT NO:60419284T'RS PM: NC
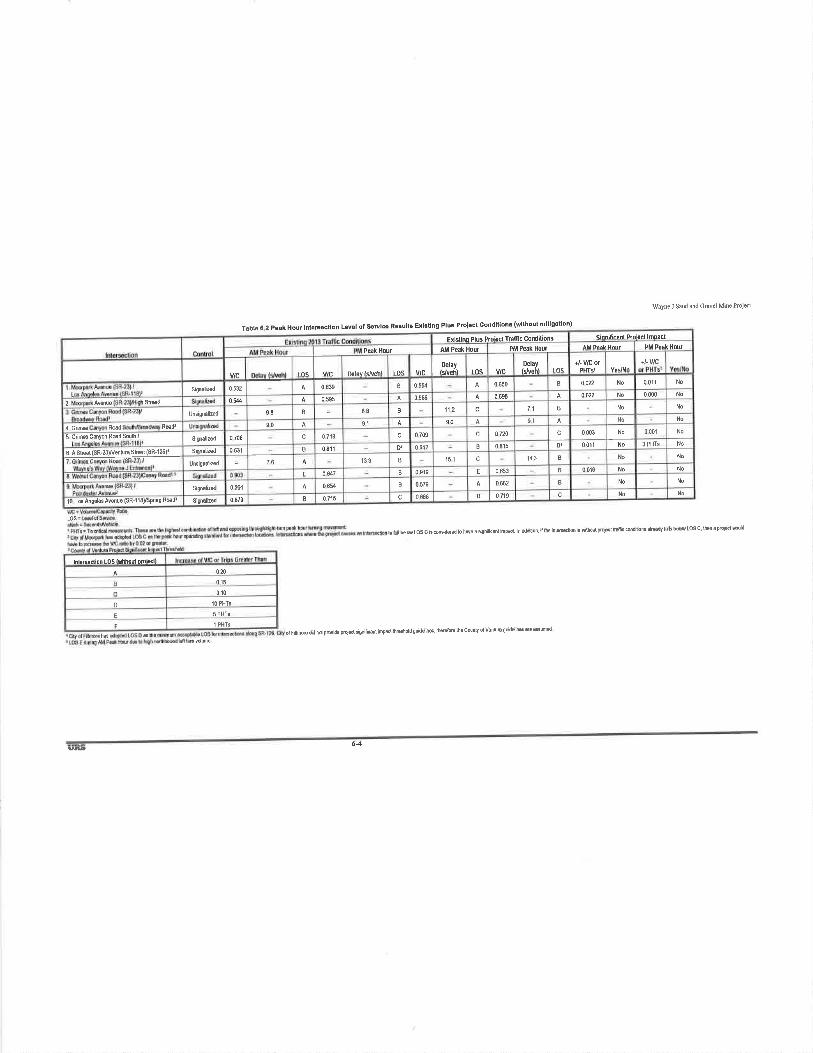
LOS
WaFe J Sad md Gravel MineProjæl
Îåblo 6 2 peåk Hoúf lnt€Mctlon Levol of soÍl@ R6.ult¡ Exlltlng Plu! Prolect condltions (wlfhout mltlgatlon)
loldlMilLGci!coffibhd66*¡dfu.nl¡mpeLl¡ddùon'lfuinMoninñodPþiEtfficddibnsdÈd'tdbwLosc'hsPßi*tFdd
olFlmñ ff ndDdido pÞieldgniklÛWtbrshddgúdinæ' Mm h6 Countv olVênÙBg#¡Ë to *umd
sirn¡n.ånl koiecl lmoâctFr¡sr¡m Plus Pro¡ecl Tralf c Cond¡t¡onsPM Peek HouPM Peek HoúAl, Peak HourPeak Hour
+,- v/ctos
+/- V/C orPHTSI Yes/Notos vic
tþlayldvehltos v/c
tÞlaYldvêhltôq v/c Mlev ls/vehl
Nôoo22 No 0 0110 650 B0590 639 Isiselized 0 532No0022 No 0 0000 5950ffiô0 59s0gstd¡2
No No71 B112 c68 IBUnsigndizd 98No No919091904Gfu Ræd Rmd
0 001
3 PHfs
No
No
c
D¡
0 003
0011
No
No
c nf20c 0 709c 07tg0 706Sign¡lized5 GriffiCtryon Rdd Souh/
B 0 ô15D¡ 0 6420 8110 631siqnåljzsd6. A SÞt (SR'23)NdtoE Sü*l (SR-l2ô)¡No No143 B151 c133 B
I
Un.ignaliz€dNo0016 No0 653 I0 919 E0ü7 BE
NoB No0 662B 0 5790 6540 561Siseliz€dNoc NoB 0 719c 0 686B 0 7150 679Sisål¡zedl0 L€ Angd€ Avsue (SR-118)isPring Rdd¡
rnrêrqEdìon LOS lwiüoú Dmie{ll
020
015
010
10 PHTgD
5 PHT9
1 PHT3F
6-4UÞ
Wayne J Sand and Gravel Mine Project
7.0 Yrnn (2025) PLUS CUMULATIvE TRAFFIc Cor'lDlTloNS
This section provides an analysis of Year (2025) Plus Cumulative Traffrc conditions both with
and without the proposed Project. Although the proposed Project is anticipated for Year 2043,
there will be no additional significant impacts for Year 2025 to Year 2043 due to no new peak
hour trips generated as well as imposition of the mitigation measures identified in Section 4'1.5
of the Grirnes Rock, Inc. Expanded Mining Facility Final EIR fJune 2013)'
year (2025) plus Cumulative Trafüc Conditions were obtained from the County of Ventura
traffrc-forecasting model. It is assumed that the proposed Project will operate at their existing
permitted level and no improvements will take place within Project study area'
The traffrc analysis conducted includes the following scenarios:
o Year (2025) Plus Cumulative Traffrc conditions (No Project)
o year (2025) plus Cumulative Trafüc Conditions Plus trþs from Wayne J Sand and
Gravel Mine Project (With proposed Project)
7 .1 Yrnn (2025) Plus CuruuunvE TRAFFIc Cotrlorlorus
The year (2025) plus Cumulative conditions were used as the baseline to evaluate potential
traffic impacts without the operation of the proposed Project. Figure 7-1 shows the Year (2025)
Plus Cumulative trafüc volume projections'
7.1.1 RoadwaY Segment AnalYsis
Table 7.1 displays the results of the roadway segment analysis under Yeat (2025) Plus
Cumulative Trafüc Conditions'
As shown in Table i.l, all study roadway segments are projected to operate at LOS D or better
with the exception of sR-23 from Bardsdale Avenue to Wayne's way.
T'RS 7-l
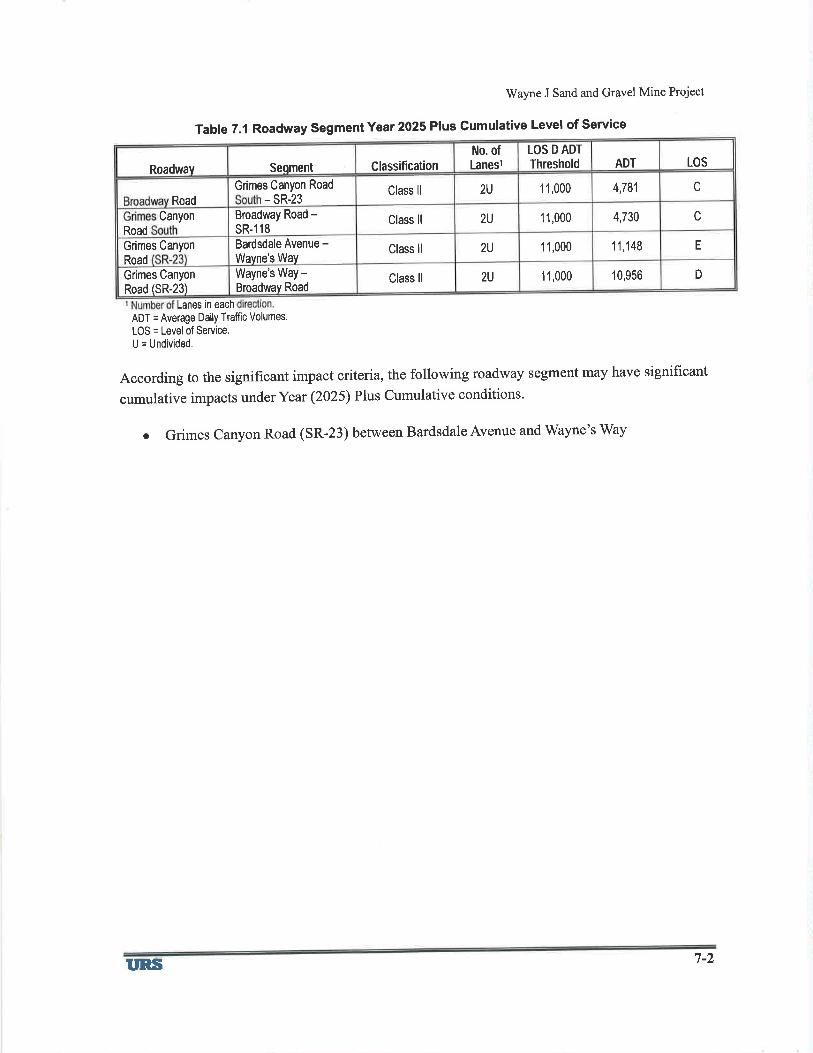
Wayne J Sand and Gravel Mine Project
Table 7.1 Roadway Segment Yea¡ 2025 Plus Cumulative Level of Service
Lanes in each
ADT = Average Daily Traffìc Volumes.
LOS = Level of Service.
U = Undivided,
According to the signifrcant impact criteria, the following roadway segment may have significant
cumulative impacts underYear (2025) Plus Cumulative conditions.
o Grimes canyon Road (SR-23) between Bardsdale Avenue and wayne's way
ADT LOSLOS D ADT
ThresholdNo. ofLaneslClassificationSeqmentRoadway
c4,7812U 11,000Class llGrimes Canyon Road
- sR-23Road
c4,7302U 11,000Class llBroadway Road -sR-118
Canyon
Road
E11,1482U 11,000Class llBardsdale Avenue -Wavne's Way
Grimes Canyon
Road
D10,9562U 11,000Class llWayne's Way -Broadway Road
Grimes Canyon
Road (SR-23)
uns 7-2
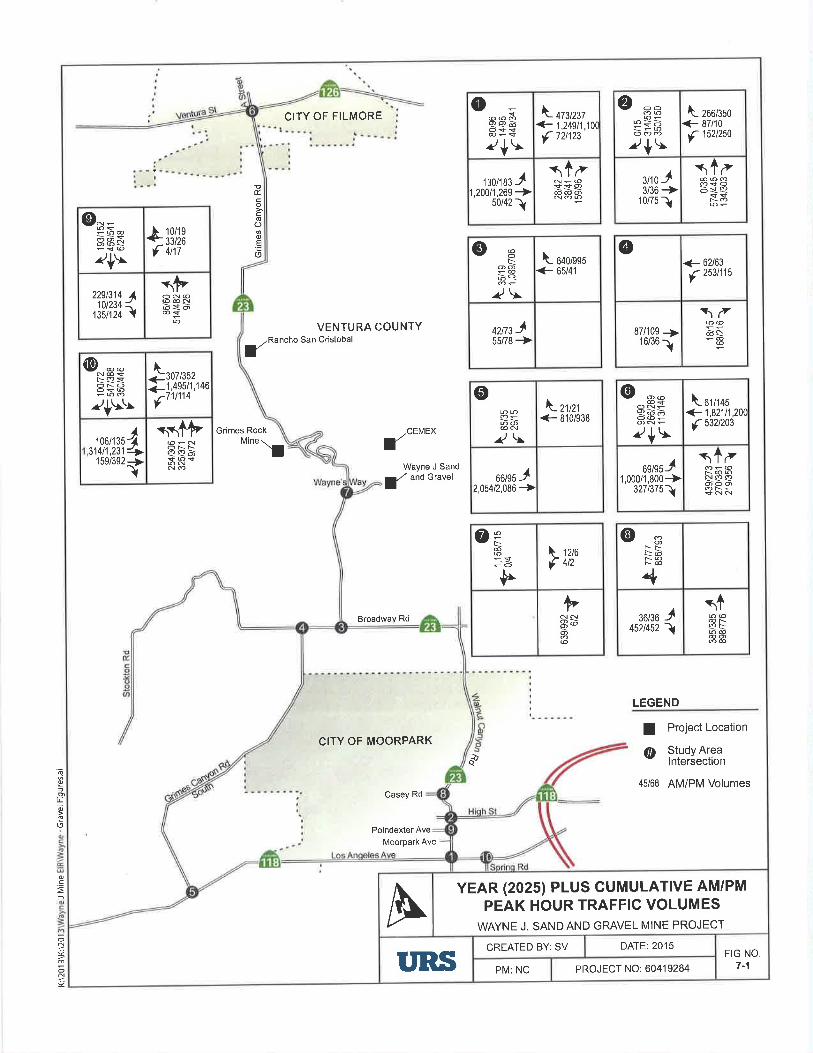
'õ
lo
õ(,
o2
o
.g
CITY OF MOORPARK
Casey Rd
Poindexter Ave
Moorpark Ave
CITY OF FILMORE
õÉ.
ocoooE'Ë(9
VENTURA COUNTY/Ranchof
San Cristobal
Grimes Rock .CEMEXfMine
\Wayne J Sand
a/ andGravel
Broadway Rd
LEGEND
d
I Project Location
F,t Studv AreaIt lnteréection
45/68 AM/PM Volumes
\_<-f
473t2371,249t1,72t123
10(
oa@
\
@@qaos@-
¿+r1¿
Nt_@s{e@@o--g1 30/'183
1,200/1,26950142
J+ì
\- zool¡so<- 87t10tî 1521250
Q' --6ìòooo2+\
3t10 J3/36+
10/75ì
r1¿@@óo<oòsa
è13í13f +ttt
o-=
?+\E-Èñ
sÞoN@@óNòsò
Ð
2291314 410t234 <
r¡sltz+ I
\- o+olsss+.65/41
OB\ooìì o-
2\
4anJ55/78 +
<- ô2163
f 253h15
@
\¿6@òa
@
87/109 9>16/36 1
@@
!P{ro@
NNoo
?+\\jä,äi,-
\+Þ@-NONtsa9ò6NNÓ
4106t135-A
31411,n1J+','159/392+
I
\ zlzr<- 810/938
o@os?sÐo@N?\
aaßs J2,054/2,086 ->
61t145I ,821t1,204532t203
\_+f
oo@@+aòòON-
.1+\r
øsßsJ1,000f ,800+
3271375ì
s1¿N@@
òòõ$NN
f, rz¡o
| +tz
ØC:-=Þ
ÞNNEòõ@
o a¡-\t@rÐts@
4\1
@@@tsÐ@@o
36/36452t452
Jì
A YEAR (20251PLUS CUMULATIVE AM/PMPEAK HOUR TRAFFIC VOLUMES
WAYNE J. SAND AND GRAVEL MINE PROJECT
DATE: 2015CREATED BY: SVFIG NO.
7-1PROJECT NO: 60419284PM: NCT'Rfi
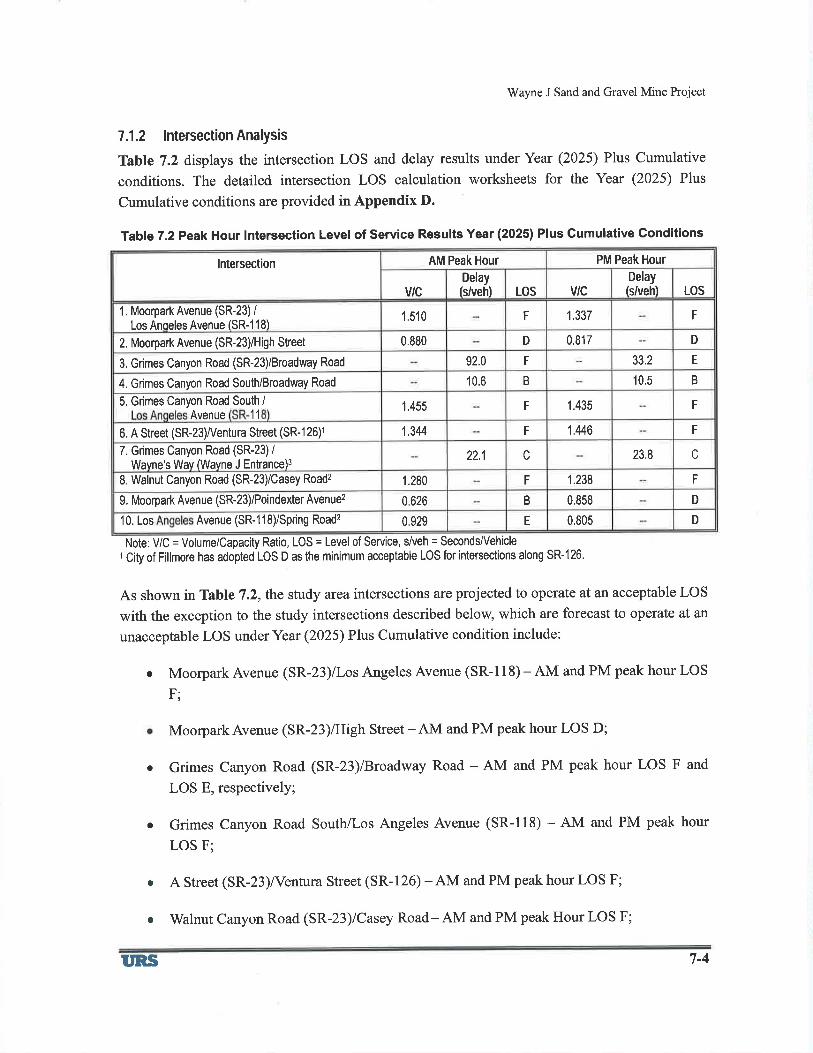
rüayne J Sand and Gravel Mine Project
7.1.2 lntersectionAnalysis
Table 7.2 displays the intersection LOS and delay results under Year (2025) Plus Cumulative
conditions. The detailed intersection LOS calculation worksheets for the Yeat (2025) Plus
Cumulative conditions are provided in,A'ppendix D.
1able7.2 Peak Hour lntersection Level of Service Results Year (2025) Plus Cumulative Gonditions
Note: V/C = Volume/Capacity Ratio, LOS = Level of Service, s/veh =1 City of Fillmore has adopted LOS D as the minimum acceptable LOS
Seconds/Vehiclefor intersections along SR-126.
As shown in Table 7.2,the study area intersections are projected to operate at an acceptable LOS
with the exception to the study intersections described below, which are forecast to operate at an
unacceptable LOS underYear (2025) Plus Cumulative condition include:
Moorpark Avenue (SR-23)/Los Angeles Avenue (SR-l18) - AM and PM peak hour LOS
F;
a
a
a
MoorparkAvenue (SR-23)/High Street -AM and PM peak hour LOS D;
Grimes Canyon Road (SR-23)/Broadway Road - AM and PM peak hour LOS F and
LOS E, respectively;
Grimes Canyon Road South/Los Angeles Avenue (SR-118) - AM and PM peak hour
LOS F;
A Street (SR-23)/Ventura Street (SR-126) -AM and PM peak hour LOS F;
Walnut Canyon Road (SR-23)/Casey Road-AM and PM peak Hour LOS F;
a
a
PM Peak HourAM Peak Hour
LOS v/cDelay(s/veh) LOSv/c
Delay(s/veh)
lntersection
FF 1.3371 .5101. Moorpark Avenue (SR-23) /Los Anqeles Avenue (SR-1 1 8)
D0.880 D 0.8172. Moorpark Avenue (SR-23)/High Street
33.2 E92.0 F3. Grimes Canyon Road (SR-23)/Broadway Road
10.5 B10.6 B4. Grimes Canyon Road South/Broadway Road
1.435 F1.455 F5. Grimes Canyon Road South /Avenue 11
F 1.446 F1.3446. A Street (SR-23)/Ventura Street (SR-126)1
c 23.8 c22.17. Grimes Canyon Road (SR-23)/
Wavne's Wav (Wavne J Entrance)3
F 1.238 F1.2808. Walnut Canyon Road (SR-23)/Casey Road2
DB 0.8580.6269. Moorpark Avenue (SR-23)/Poindexter Avenue2
DE 0.8050.92910. Los Avenue (SR-1 18)/Spring Road2
T'RS 7-4
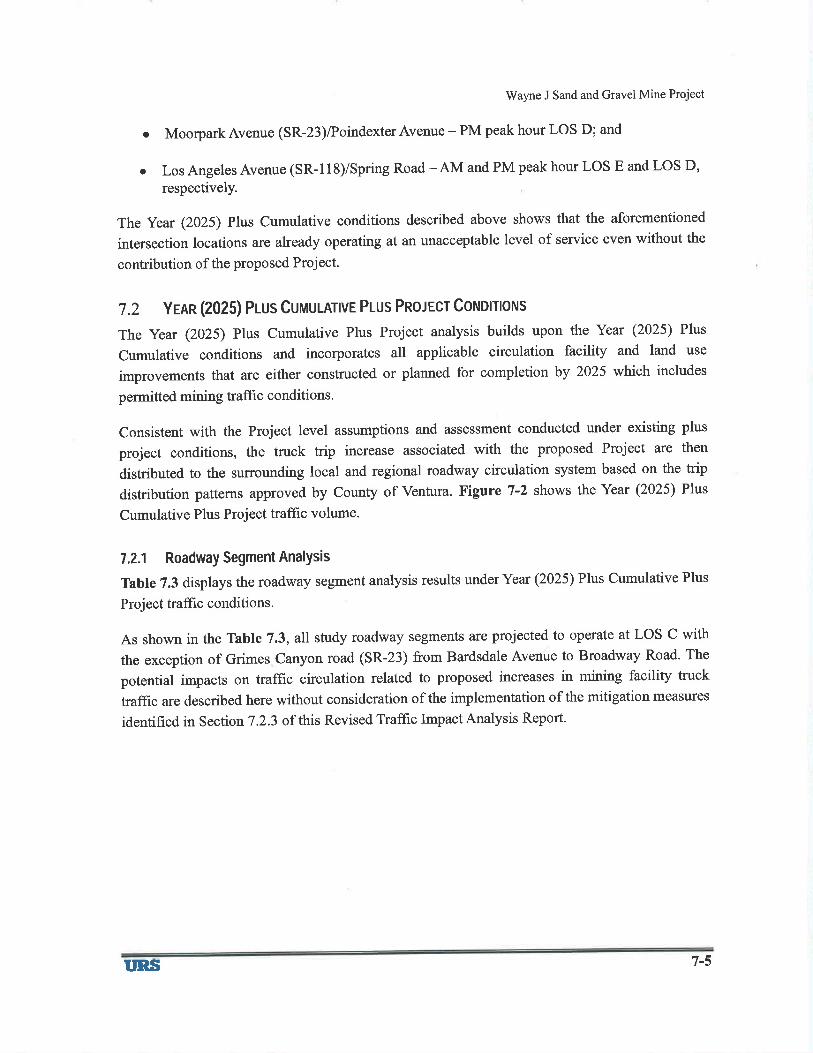
Wayne J Sand and Gravel Mine Project
o MoorparkAvenue (SR-23)iPoindexterAvenue - PM peak hour Los D; and
o Los Angeles Avenue (SR-118)/Spring Road - AM and PM peak hour LOS E and LOS D,
respectively.
The year (2025) Plus Cumulative conditions described above shows that the aforementioned
intersection locations are already operating at an unacceptable level of service even without the
contribution of the proposed Project.
7.2 Yenn (2025) Pr-us CuuuunvE PLUS Pno¡Ecr Coruomorus
The year (2025) Plus Cumulative Plus Project analysis builds upon the Year (2025) Plus
Cumulative conditions and incorporates all applicable circulation facility and land use
improvements that are either constructed or planned for completion by 2025 whicr' includes
permitted mining traffrc conditions.
Consistent with the project level assumptions and assessment conducted under existing plus
project conditions, the truck trip increase associated with the proposed Project are then
distributed to the surrounding local and regional roadway circulation system based on the trip
distribution patterns approved by County of Ventura. Figure 7-2 shows the Year (2025) Plus
Cumulative Plus Project traffrc volume.
7.2.1 Roadway Segment AnalYsis
Table 7.3 displays the roadway segment analysis results under Year (2025) Plus Cumulative Plus
Project trafüc conditions.
As shown in the Table 7.3, all study roadway segments are projected to operate at LOS C with
the exception of Grimes Canyon road (SR-23) from Bardsdale Avenue to Broadway Road. The
potential impacts on traffic circulation related to proposed increases in mining facility truck
traffic are described here without consideration of the implementation of the mitigation measures
identified in Section 7.2.3 of this Revised Traffrc Impact Analysis Report.
I'RS 7-5
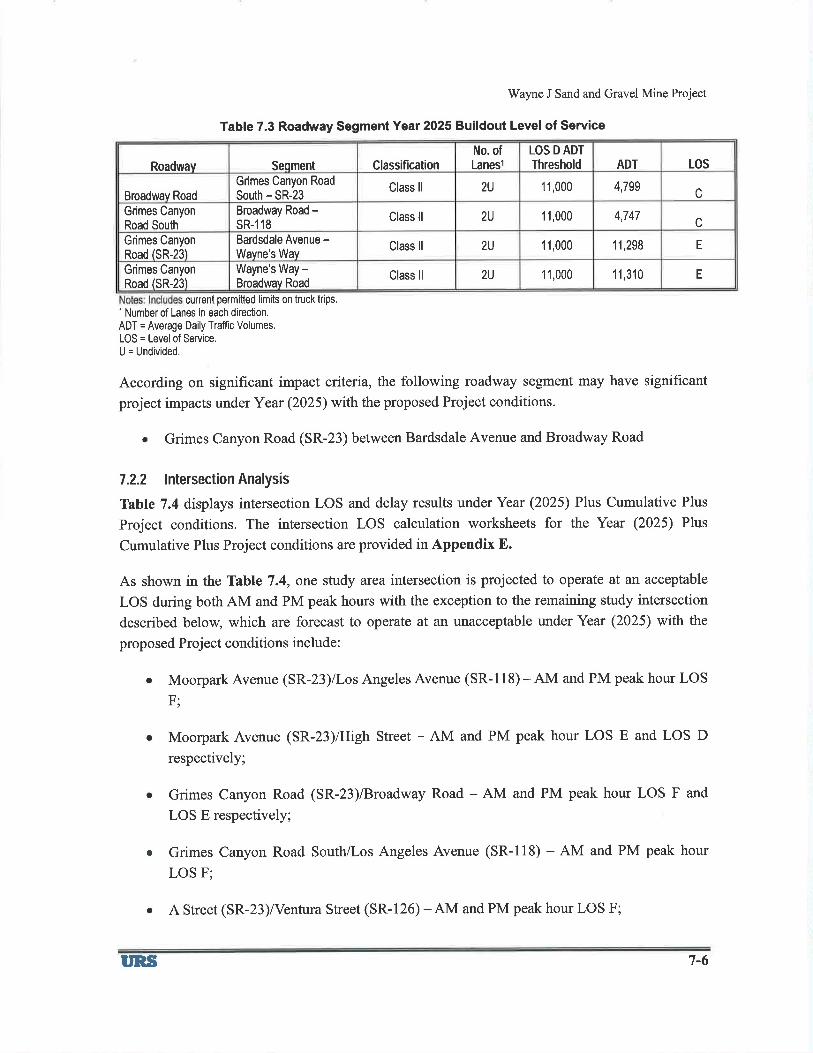
No. ofLanesl
LOS D ADT
Threshold ADT LOSSeqment ClassificationRoadway
2U 11,000 4,799 cGrimes Canyon Road
South - SR-23Class ll
Broadway Road
2U 1 1,000 4,747 cGrimes CanyonRoad South
Broadway Road -sR-1 18
Class ll
2U 1 1,000 11,298 EGrimes CanyonRoad ISR-231
Bardsdale Avenue -Wavne's Wav
Class ll
Class ll 2U 11,000 1 1 ,310 EGrimes CanyonRoad (SR-231
Wayne's Way -Broadwav Road
Wayne J Sand and Gravel Mine Project
Table 7.3 Roadway Segment Year 2025 Buildout Level of Service
cunent permitted limits on truck trips,1 Number of Lanes in each direction.
ADT = Average Daily Traffic Volumes.
LOS = Level of Service.
U = Undivided,
According on significant impact criteria, the following roadway segment may have significant
project impacts under Year (2025) with the proposed Project conditions.
. Grimes Canyon Road (SR-23) between Bardsdale Avenue and Broadway Road
7.2.2 lntersectionAnalysis
Table 7.4 displays intersection LOS and delay results under Year (2025) Plus Cumulative Plus
Project conditions. The intersection LOS calculation worksheets for the Year (2025) Plus
Cumulative Plus Project conditions are provided in Appendix E.
As shown in the Table 7.4, one study area intersection is projected to operate at an acceptable
LOS during both AM and PM peak hours with the exception to the remaining study intersection
described below, which are forecast to operate at an unacceptable under Year (2025) with the
proposed Project conditions include:
Moorpark Avenue (SR-23)/Los Angeles Avenue (SR- I 1 8) - AM and PM peak hour LOS
F;
Moorpark Avenue (SR-23yHigh Street - AM and PM peak hour LOS E and LOS D
respectively;
Grimes Canyon Road (SR-23)/Broadway Road - AM and PM peak hour LOS F and
LOS E respectively;
Grimes Canyon Road South/Los Angeles Avenue (SR-118) - AM and PM peak hour
LOS F;
a
a
o
a
a
uas
A Street (SR-23)/Ventura Street (SR-126) -AM and PM peak hour LOS F;
7-6
a
a
a
a
Wayne J Sand and Gravel Mine Project
Grimes Canyon Road (SR-23)/Wayne's Way -AM and PM Peak hour LOS E;
Walnut Canyon Road (SR-23)/Casey Road-AM and PM peak Hour LOS F;
MoorparkAvenue (SR-23)/PoindexterAvenue - PM peak hour LOS D; and
Los Angeles Avenue (SR-118)/Spring Road - AM and PM peak hour LOS E and LOS D,
respectively.
una 7-7
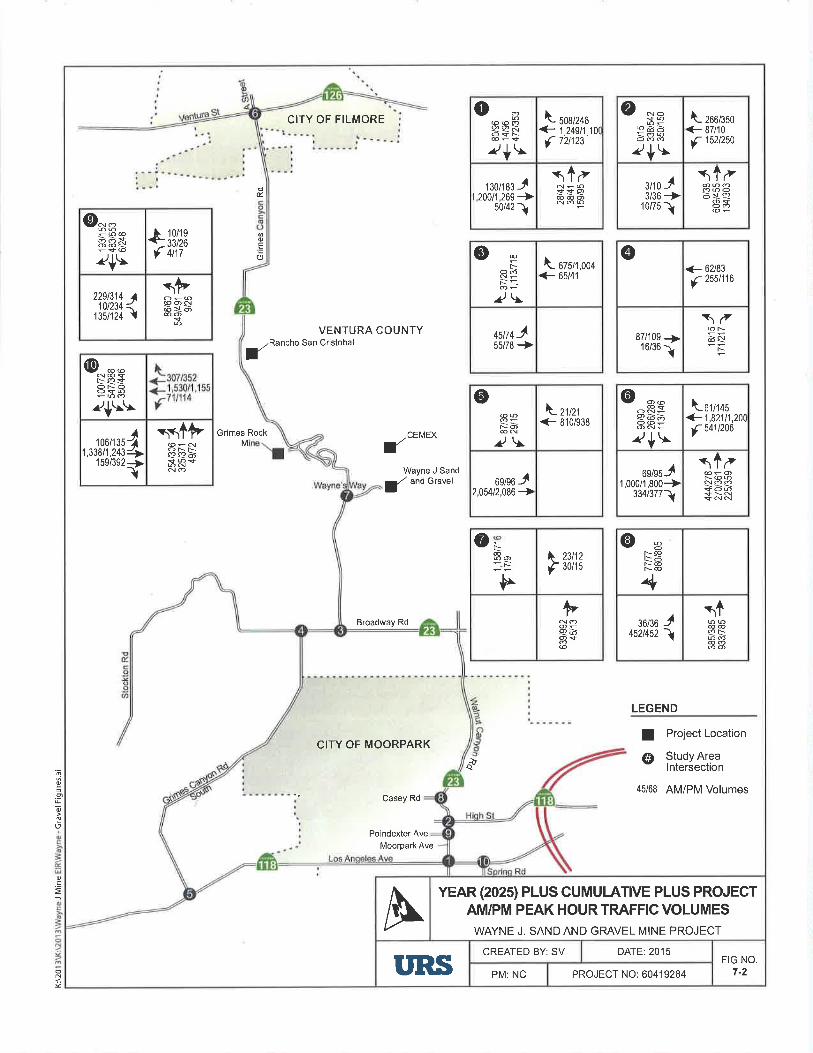
1o
r(9
.=
=
oN
CITY OF MOORPARK
Casey Rd
Poindexter Ave
Moorpark Ave
CITY OF FILMORE
ËÉ.
oE'Ë(, @
+ 62/83
f 255t116
87/109 9>16/361
\¿6ròs!
rVENTURA COUNTY
/RanchofSan Cristobal
Grimes Rock /3EMEXfM
Wayne J Sand
a/ andGravel
Broadway Rd
LEGEND
d
I Project Location
@ Study Arealntersectlon
45/68 AM/PM Volumes
oo oeeñosN
^l1'|'\r
0(
508/2461,249t1,172t123
\_<_f
130t1$J1,200/1,269 -+
50/42ì
r1¿@@o^-P
Ø NOcQ=@ooh
+\\
bo/
\- zool¡so<- 87/10
f 152t250
r1¿@@oó@oòsa
oó
3ho J3/36 +0/75ì
o**-O@ÈÈñri( è33'13
t 4t17
2251314 A10t234 <
135/124 {
*ÞOl_@@oNòsòæo
oPÞ
N._È-_
?!t ozsrr,oo¿+ 6s/41
45n4 J55/78 -+
@NNoa
z/+!\
@@
ra
I-+Ì
1 06/1 351,338t1,243
1 59/392
nnlÞ@-NÕNNe?aõ6NNO
o@oNO@N?\
l- zr¡zr<- 810/938
oslso -rl2,054t2,086 -+
oo@aòõô@-ONÌ_?*\
\-olr+s+1,821t1,20(
f 541t206
J+ì
69/95'1,000/1,800
334t377
s1¿N@@s! aa$oosÈNSNN
Ø@QO:_-È
Þ
> 23h2
¡f sorts
Þqò@
@*HFÈ
436/36
4521452
Jì
+@b@@
@oóo
A YEAR (20251PLUS CUMU|-ATTVE PLUS PROJECTAM/PM PEAK HOUR TRAFFIC VOLUMES
WAYNE J. SAND AND GRAVEL MINE PROJECT
DATE:2015CREATED BY: SV
I'RS PM: NC PROJECT NO: 60419284
FIG NO.7-2
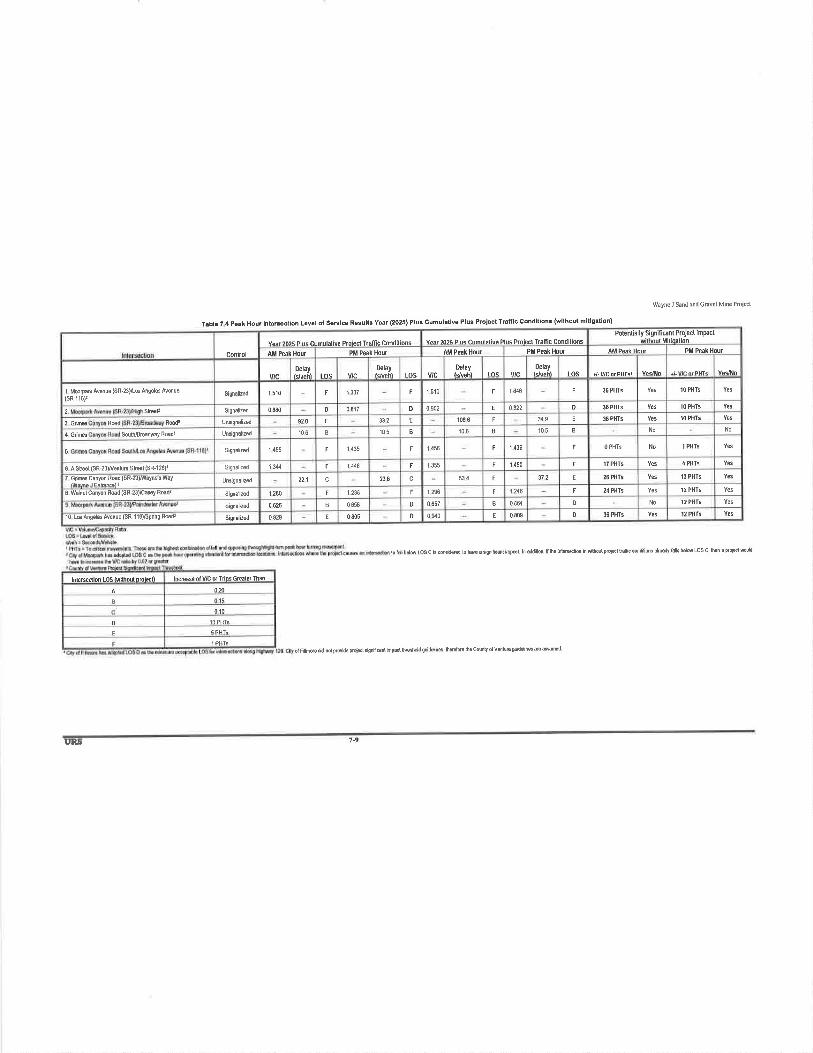
Potent¡ally S¡gnìfi ønt ProFct lmpactwithoúl Mili@t¡onvÞ¡r m2s phrs cilmúlãl¡vê Plus Pro¡ætTrañ¡c Conditimsve,.r02q phr.criñxlâl¡vc PrôiedfrafncConditions
AM Pêâk Hntrr PM PeaK HoUTAl¡l Peak Hour PM Peak HourÂM Pcãk Hour PM PæT HoUControl
tnsIÞlay
tos +lViC nÌPHTSlDelay
tos ulcDelay
ls,¡vehìV'CfÞlay
10 PHT51 640 F 36 PHT5F 1 510 FSignalizd 1 510 F 1 3371 M@paÁ Avenue (SR-231træ Ang6¡€€ Avenue
(sR-118)'
YesD 36PHTS Yes 1O PHTSD 0902 E 08220 880 D 0817SignalizsdSh*82g9 E 36 PHTS 10 PHfs332 E 108 6 F920 FUmigndized3Gfu Ræd
No105 B No105 B 106 B106 BUnrignabzsdSouhß@dFy Ræd¡4 cíffi
F 0PHTg No 1 PHT5F 1 456 F 1 4361 455 F 1 435S¡gnal¡zsd5
1 PHTS Yes1 4s0 F 'It PHTSF 1&6 FSìgnålizd 1W6 A Sht(sR-23)NdtuE SÞl (sR-126)¡
372 E 26 PHls 13 PHTSc 534 E221 c 238I GdM Cånyon R€d{sR-zJ)flayn€s wåY Unlignålizd
21 PHTS 12 PHT5I 236 1 216 FF I 238 Fsisâlized 1 2808 Wahut Cånyon R€d (SR-23)¡Cry Rdd¡
0 864 D No l2 PHfsD 0657 B0 626 B 0 858s¡gnal¡zd
D 36 PHTS t2 PHlsD 090 E 0 80sE 0 805Signdiz€d 0 92910 Lc Ang* Avdue (sR-118)ßpnng Rd
WaFcJ $nd ild Crav€l M¡ne Prcjæt
Tâbt. 7 4 poâk Hour tnt6ecilon Lov6t of Sedtcê Results Y€ar (2025) Plus Cumulatlvo Plus Projoct Traflc Condltlon3 (wllhout hltlgåtion)
lofdlHiltoscÈ@Mdlok6åJgniñmthFLhffin'lh€intæfunin*hod4þl'ffic@nfions*dyd'MLosc'hn6F4ftÐtr
olF{mds& noLødidê prcþLsistr€ilimPættlxdd guidffi hdüo h€ øunv dVdluE güdh* m E$ñd
ln.Þã.. ôlV/C d fdDs Grê¡ler Th.nlnrorsd¡on LOS (wft on oro¡.sl)
¡n
010
o
1 PHTS
1-9Uþ
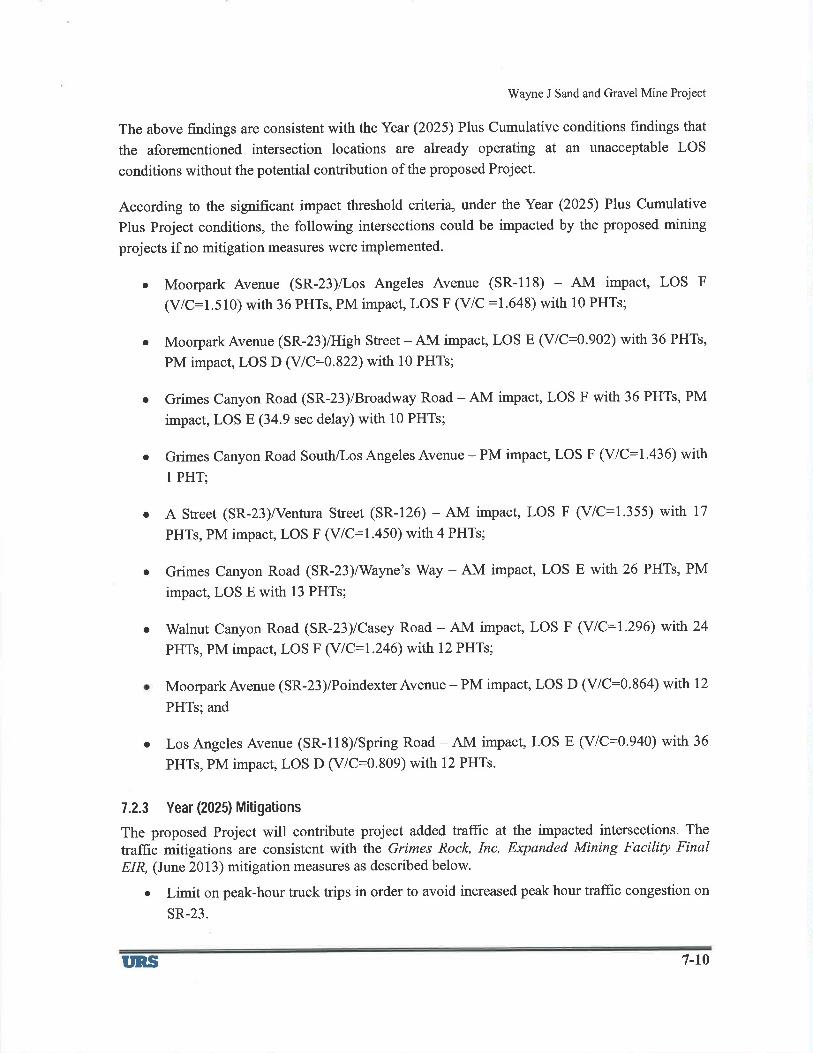
Wayne J Sand and Gravel Mine Project
The above findings are consistent with the Year (2025) Plus Cumulative conditions findings that
the aforementioned intersection locations are already operating at an unacceptable LOS
conditions without the potential contribution of the proposed Project.
According to the significant impact threshold criteria, under the Year (2025) Plus Cumulative
Plus Project conditions, the following intersections could be impacted by the proposed mining
projects if no mitigation measures were implemented.
¡ Moorpark Avenue (SR-23)/Los Angeles Avenue (SR-118) - AM impact, LOS F
(V/C:1.510) with 36 PHTs, PM impact, LOS F (VlC:L648) with 10 PHTs;
MoorparkAvenue (SR-23)/High Street -AM impact, LOS E (YlC:0.902) with 36 PHTs,
PM impact, LOS D (V/C:0.822) with l0 PHTs;
Grimes Canyon Road (SR-23)/Broadway Road - AM impact, LOS F with 36 PHTs, PM
impact, LOS E (34.9 sec delay) with 10 PHTs;
Grimes Canyon Road South/Los Angeles Avenue - PM impact, LOS F (V/C:l.436) with
1 PHT;
A Street (SR-23)A/entura Street (SR-126) - AM impact, LOS F (V/C:1.355) with 17
PHTs, PM impact, LOS F (V/C:l.450) with 4 PHTs;
Grimes Canyon Road (SR-23)/Wayne's Way - AM impact, LOS E with 26 PHTs, PM
impact, LOS E with 13 PHTs;
Walnut Canyon Road (SR-23)/Casey Road - AM impact, LOS F (V1C:I.296) with 24
PHTs, PM impact, LOS F (Y1C:I.246) with 12 PHTs;
MoorparkAvenue (SR-23)/PoindexterAvenue - PM impact, LOS D (V/C:0.864) with 12
PHTs; and
Los Angeles Avenue (SR-118)/Spring Road - AM impact, LOS E (V/C:0.940) with 36
PHTs, PM impact, LOS D (V/C:0.809) with 12 PHTs.
7.2.3 Year (2025) M¡t¡gat¡ons
The proposed Project will contribute project added traffic at the impacted intersections. The
traffrc mitigations are consistent with the Grimes Rock, Inc. Expanded Mining Facility FinalE1R, (June 2013) mitigation measures as described below.
o Limit on peak-hour truck trips in order to avoid increased peak hour trafüc congestion on
sR-23.
a
a
o
a
a
a
o
I'RS 7-t0
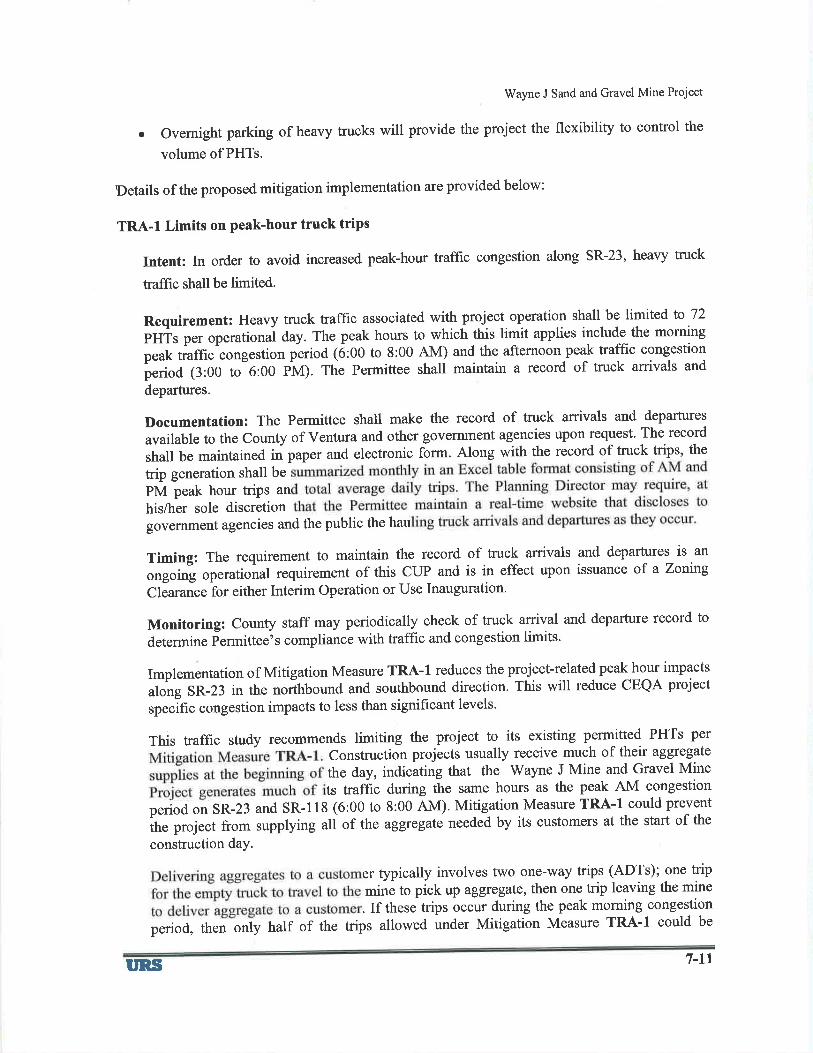
Wayne J Sand and Gravel Mine Project
. Ovemight parking of heavy trucks will provide the project the flexibility to control the
volume of PHTs'
Ðetails of the proposed mitigation implementation are provided below:
TRA-I Limits on peak-hour truck trips
Intent: In order to avoid increased peak-hour traffic congestion along SR-23, heavy truck
traffic shall be limited.
Requirement: Heavy tnrck traffic associated with project operation shall be limited to 72
pHTs per operationi auy. The peak hours to which this limit applies includg the morning
peak traffic congestion penod (6:00 to 8:00 AM) and the afternoon peak traffic congestion
period (3:00 to 6:00 pM). The Permittee shall maintain a record of truck arrivals and
departures.
Documentation: The permittee shall make the record of truck arrivals and departures
available to the County of Ventura and other government agencies upon request. The record
shall be maintained in paper and electronic form. Along with the record of truck trips' the
trip generation shall be
PM peak hour trþs an
his/her sole discretiongovernment agencies and the public the hau
Timing: The requirement to maintain the record of truck arrivals and departures is an
orrgoirr! operational requirement of this CLIP and is in effect upon issuance of a Zonrng
Clãarance -for
either Interim Operation or Use Inauguration.
Monitoring: County staff may periodically check of truck arrival and departure record to
determine Permittee's compliance with traffic and congestion limits'
Implementation of Mitigation Measure TRA-I reduces the project-related peak hour impacts
aloìg SR-23 in the noñhbound and southbound direction. This will reduce CEQA project
.p""ifr. congestion impacts to less than significant levels.
This traffic study recommends limiting the project to its existing permitted PHTs per
construction projects usually receive much of their aggregate
the day, indicating that the wayne J Mine and Gravel Mine
ts traffic during the same hours as the peak AM congestion
period on SR-23 and SR-l18 (6:00 to 8:00 AM). Mitigation Measure TRA-I could prevent
îhe project from supplying ali of the aggregate needed by its customers at the start of the
construction daY.
î'ffi"iÏiîïi:ä:ä;ï;îi"iiå!å1,ff1';;ïï:period, then onry harr or rh" t ip,Il"lî"ï'"iîffi"îrtffil:ffi:::llïîî:t'iîi:iÎ:
rrRs 7-lt
Wayne J Sand and Gravel Mine Project
outgoing product trþs. The other half would be empty trucks travelling to the mine to pick
"p ãgg.égàte. However, if trucks were already at the site in the morning then fewer empty
truckïwõuld have to travel to the site, and more of the PHTs would be outgoing product
trþs. Allowing trucks to park overnight at the mine could significantly increase the ability ofthå project to strip out pròduct during the peak congestion period compared to the volume itcould ship out if trucks have to first travel to the site.
frRs 7-12
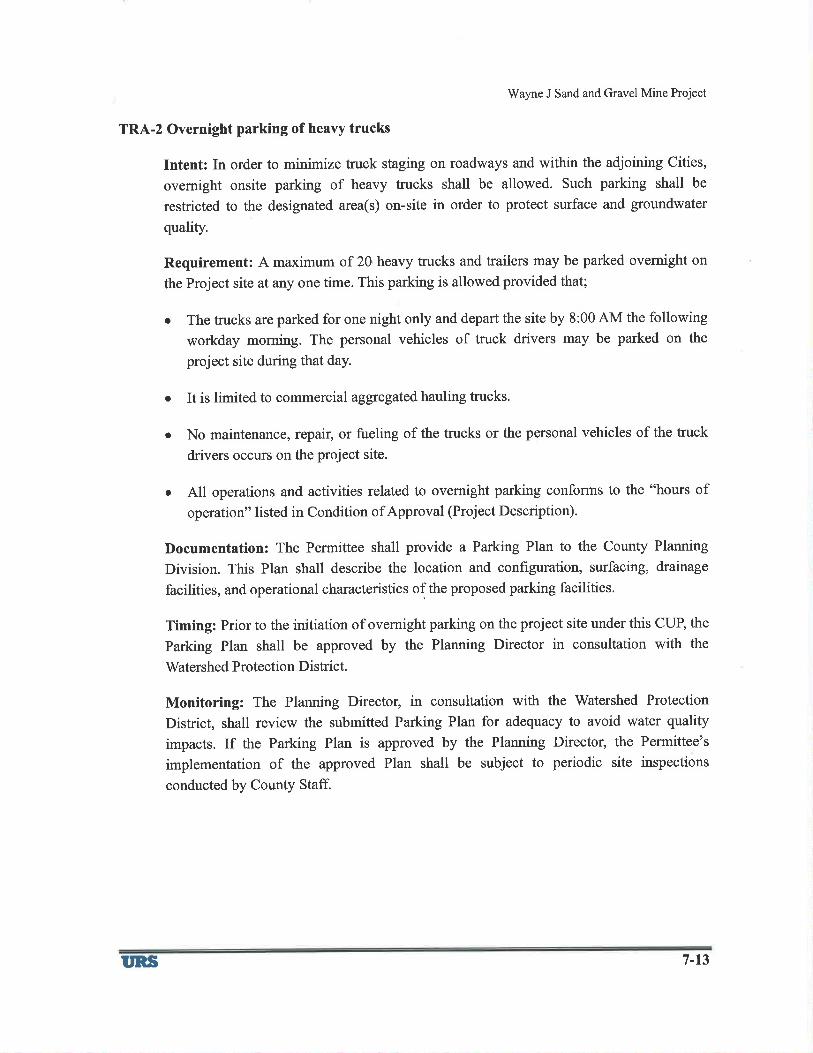
Wayne J Sand and Gravel Mine Project
TRA-2 Overnight parking of heavy trucks
Intent: In order to minimize truck staging on roadways and within the adjoining Cities,
ovemight onsite parking of heavy trucks shall be allowed. Such parking shall be
restricted to the designated area(s) on-site in order to protect surface and groundwater
quality.
Requirement: A maximum of 20 heavy trucks and trailers may be parked overnight on
the Project site at any one time. This parking is allowed provided that;
The trucks are parked for one night only and depart the site by 8:00 AM the following
workday moming. The personal vehicles of truck drivers may be parked on the
project site during that day.
a
a
a
It is limited to commercíal aggregated hauling trucks.
No maintenance,repair, or fueling of the trucks or the personal vehicles of the truck
drivers occurs on the project site.
All operations and activities related to overnight parking conforms to the "hours ofoperation" listed in Condition ofApproval (Project Description).
I)ocumentation: The Permittee shall provide a Parking Plan to the County Planning
Division. This Plan shall describe the location and configuration, surfacing, drainage
facilities, and operational characteristics ofthe proposed parking facilities.
Timing: Prior to the initiation of ovemight parking on the project site under this CUP, the
Parking Plan shall be approved by the Planning Director in consultation with the
Watershed Protection District.
Monitoring: The Planning Director, in consultation with the Watershed Protection
District, shall review the submitted Parking Plan for adequacy to avoid water quality
impacts. If the Parking Plan is approved by the Planning Director, the Permittee's
implementation of the approved Plan shall be subject to periodic site inspections
conducted by County Staff.
a
I'RS 7-13
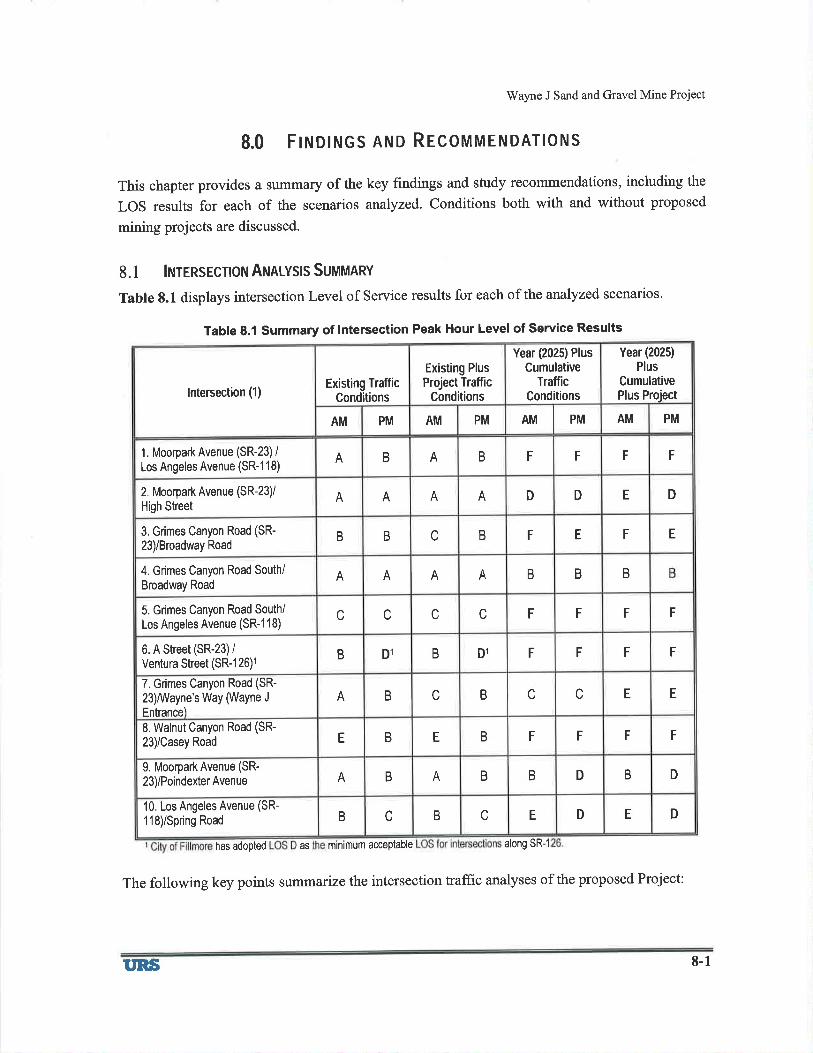
Wayne J Sand and Gravel Mine Project
8.0 F¡ruOINGS AND RECOMMENDATIONS
This chapter provides a summary of the key frndings and study recommendations, including the
LOS results for each of the scenarios analyzed. Conditions both with and without proposed
mining projects are discussed.
8.1 lrurrRsrcloN ANALYSIS SuuunnY
Table 8.1. displays intersection Level of Service results for each of the analyzed scenarios'
Table 8.1 Summary of lntersection Peak Hour Level of Service Results
has adopted AS minimum acceptable along SR-1
The following key points summarize the intersection traffrc analyses of the proposed Project:
Year (2025) PlusCumulative
TrafficConditions
Year (2025)
PlusCumulativePlus Project
Existing PlusProject Traffic
ConditionsExisting Traffic
Conditions
PM AM PMAM PM AMAM PM
lntersect¡on (1)
F FB F FA B A1. Moorpark Avenue (SR-23) /Los Angeles Avenue (SR-1 1 8)
D E DA A DA A2. Moorpark Avenue (SR-23Y
High Street
E F Ec B FB B3, Grimes Canyon Road (SR-
23)/Broadway Road
B B BA A AA4. Grimes Canyon Road South/
Broadway Road
Fc F F Fc cc5. Grimes Canyon Road South/
Los Angeles Avenue (SR-1 1 8)
F FD1 F FB D1 B6. A Street (SR-23)/
Ventura Street (SR-1 26)t
c c E EB c BA7. Grimes Canyon Road (SR-
23)Mayne's Way (Wayne J
Entrance)
FB F F FB EE8. Walnut Canyon Road (SR-
23)/Casey Road
B DB B DA B A9. Moorpark Avenue (SR-
23)iPoindexter Avenue
E Dc E DB c B10. Los Angeles Avenue (SR-
I 18)/Spring Road
rns 8-1
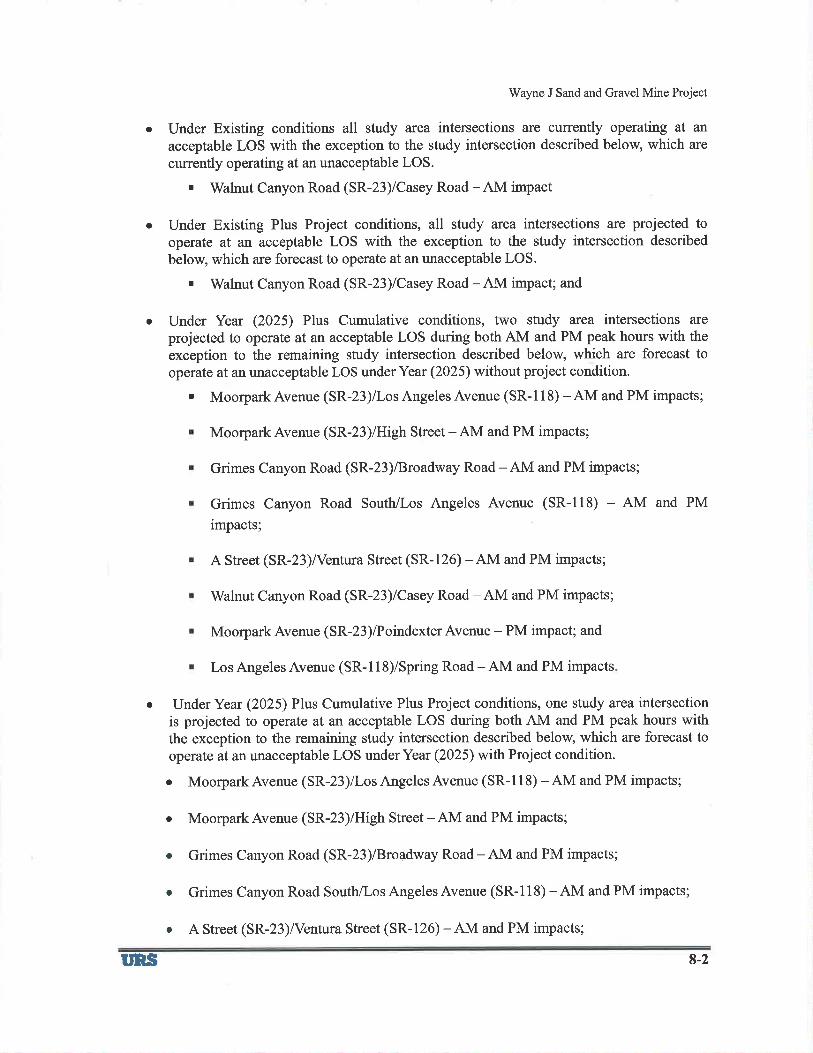
o
a
o
Vy'ayne J Sand and Gravel Mine Project
Under Existing conditions all study area intersections are culrently operating at an
acceptable LOS with the exception to the study intersection described below, which are
currently operating at an unacceptable LOS.
¡ Walnut Canyon Road (SR-23)/Casey Road-AM impact
Under Existing Plus Project conditions, all study area intersections are projected tooperate at an acceptable LOS with the exception to the study intersection described
below, which are forecast to operate at an unacceptable LOS.
¡ Walnut Canyon Road (SR-23)/Casey Road -AM impact; and
Under Year (2025) Plus Cumulative conditions, two study area intersections are
projected to operate at an acceptable LOS during both AM and PM peak hours with the
exception to the remaining study intersection described below, which are forecast tooperate at an unacceptable LOS underYear (2025) without project condition.
. Moorpark Avenue (SR-23)/Los Angeles Avenue (SR- 1 I 8) - AM and PM impacts;
MoorparkAvenue (SR-23)/High Street -AM and PM impacts;
Grimes Canyon Road (SR-23)/Broadway Road-AM and PM impacts;
Grimes Canyon Road South/Los Angeles Avenue (SR-118) - AM and PM
impacts;
A Street (SR-23)A/entura Street (SR-126) -AM and PM impacts;
Walnut Canyon Road (SR-23)/Casey Road -AM and PM impacts;
Moorpark Avenue (SR-2 3 )/P o indexter Avenue - PM impact; and
Los Angeles Avenue (SR-118)/Spring Road -AM and PM impacts
Under Year (2025) Plus Cumulative Plus Project conditions, one study area intersectionis projected to operate at an acceptable LOS during both AM and PM peak hours withthe exception to the remaining study intersection described below, which are forecast tooperate at an unacceptable LOS underYear (2025) with Project condition.
o Moorpark Avenue (SR-23)/Los Angeles Avenue (SR- 1 1 8) - AM and PM impacts;
Moorpark Avenue (SR-23)/High Street - AM and PM impacts;
Grimes Canyon Road (SR-23)/Broadway Road -AM and PM impacts;
Grimes Canyon Road South/Los Angeles Avenue (SR-l18) - AM and PM impacts;
A Street (SR-23)/Ventura Street (SR-126) -AM and PM impacts;
a
a
a
a
a
rtns 8-2
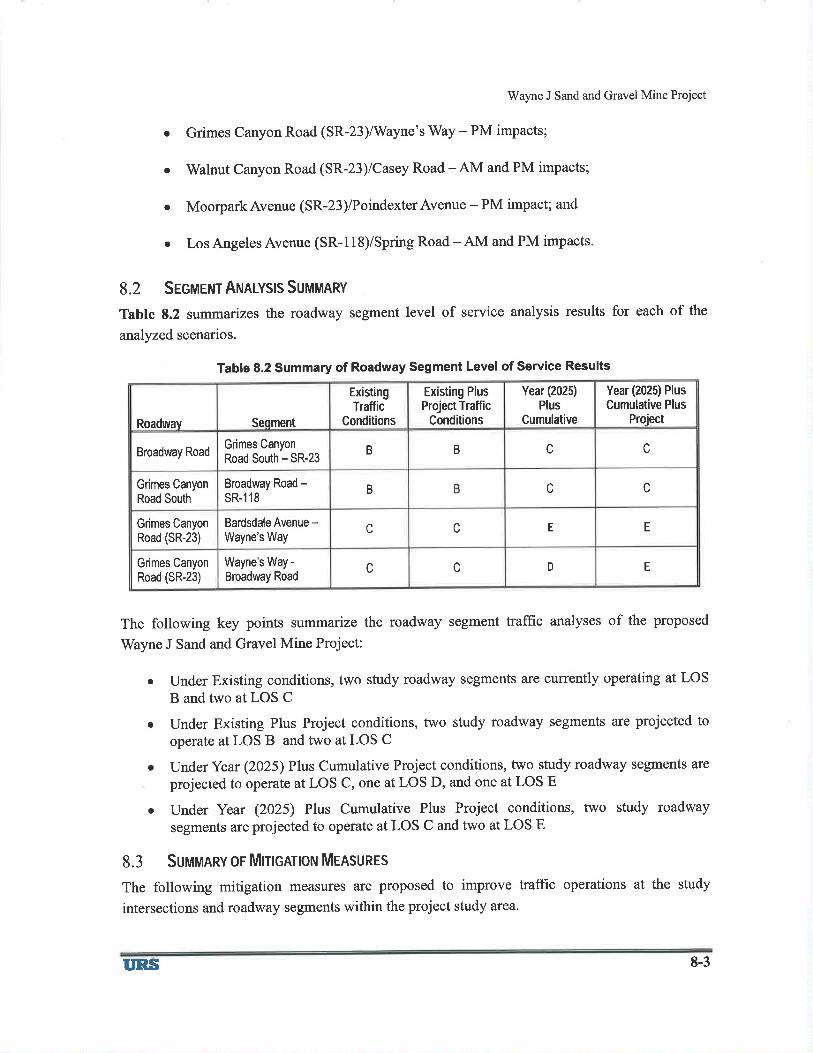
Wayne J Sand and Gravel Mine Project
o Grimes Canyon Road (SR-23)/IVayne's Way - PM impacts;
¡ Walnut Canyon Road (SR-23)/Casey Road -AM and PM impacts;
o MoorparkAvenue (SR-23)ÆoindexterAvenue - PM impact; and
¡ Los Angeles Avenue (SR-118)/Spring Road - AM and PM impacts'
8.2 Securrur AruRI-vsls Sult¡lt¡nRv
Table 8.2 summarizes the roadway segment level of service analysis results for each of the
analyzed scenarios.
Table 8.2 Summary of Roadway Segment Level of Service Results
Year (2025) PlusCumulative Plus
Proiect
Existing PlusProject Traffic
Conditions
Year (2025)
PlusCumulativeSeoment
ExistingTraffic
ConditionsRoadwav
cB cGrimes CanyonRoad South - SR-23
BBroadway Road
c cBBroadway Road -sR-118
Grimes CanyonRoad South
E Ec cGrimes CanyonRoad (SR-23)
Bardsdale Avenue -Wayne's Way
c D EcGrimes CanyonRoad (SR-23)
Wayne's Way -
Broadway Road
The following key points summarize the roadway segment traffic analyses of the proposed
Wayne J Sand and Gravel Mine Project:
o Under Existing conditions, two study roadway segments are currently operating at LOS
B and two at LOS C
Under Existing Plus Project conditions, two study roadway segments are projected to
operate at LOS B and two at LOS C
Under Year (2025) Plus Cumulative Project conditions, two study roadway segments are
projected to operate at LOS C, one at LOS D, and one at LOS E
Under Year (2025) Plus Cumulative Plus Project conditions, two study roadway
segments are projected to operate at LOS C and two at LOS E
8.3 Suuunnv oF MmcATloN MEASURES
The following mitigation measures are proposed to improve trafüc operations at the study
intersections and roadway segments within the project study area.
a
a
a
T'RS 8-3
Wayne J Sand and Gravel Mine Project
8.3.1 Existing Plus Project Proposed Mitigation
Under Existing Plus Project conditions all study roadway segments and intersection are forecast
to operate at acceptable levels of service (LOS). According to the significant threshold criteria
presented in Chapter 2.0, there are no study roadway segments or intersections that would be
impacted associated with Existing Plus Project conditions. Based on the aforementioned traffic
analysis findings, no traffic mitigations are proposed under Existing Plus Project conditions.
9.3.2 Year (2025) Plus Cumulative Plus Project Proposed Mitigations
Under Year (2025) Plus Cumulative Plus Project conditions, the one study intersection is
forecast to operate at acceptable levels of service (LOS), however, nine of the 10 study
intersections and two of the four study roadway segments were found to be significantly
impacted according to the significant threshold criteria presented in Chapter 2.0. This Project
will result in a significant and unmitigated traffic impact to the roadway segment of Grimes
Canyon Road (SR-23) between Bardsdale Avenue and Broadway Road. For the intersections,
the following mitigation measures are recommended under long term (Year 2025) conditions:
2025 Roadwav Sesment Mitisations
According to the frndings from the Year (2025) Plus Cumulative Plus Project conditions
analysis, two of the four study roadway segments will be signifrcantly impacted. This will result
in a significant and unmitigated traffic impact to the roadway segment of Grimes Canyon Road
(SR-23) between Bardsdale Avenue and Broadway Road.
2025 Intersection Mitieations
According to the findings from the Year (2025) Plus Cumulative Plus Project conditions
analysis, nine of the 10 study intersections were found to be significantly impacted' The
following proposed mitigation measures are consistent with the previous mitigation
recommendations presented under the Grimes Canyon Quarries Trffic Study, prepared by Katz,
Okitsu & Associates (October 2007).
TRA-I Limits on Peak-Ilour Truck Trips
To avoid increased peak-hour traffic congestion along SR-23, heavy truck traffic shall be
limited during the morning (6 to 8 AM) and evening (3 to 6 PM) peak hours.
The peak hour trip restrictions will eliminate intersection traffic impacts along SR-23 and
SR-118, specifically the following impacted study intersections:
o Intersection #1 - Moorpark Avenue (SR-23)/Los Angeles Avenue (SR-l18);
¡ Intersection#2 - Moorpark Avenue (SR-23)/High Street;
I'RS 8-4
Wayne J Sand and Gravel Mine Project
¡ Intersection #3 - Grimes canyon Road (sR-23)/Broadway Road;
o Intersection #5 - Grimes Canyon Road South/Los Angeles Avenue (SR-118);
o Intersection #6 - A Street (SR-23)/Ventura Street (SR-126);
olntersection#7-GrimesCanyonRoad(SR-23)/Wayne,sWay;
o Intersection #8 - walnut canyon Road (sR-23)/Casey Road;
¡ Intersection #9 - Moorpark Avenue (SR-23)Æoindexter Avenue; and
o Intersection #10 - Los Angeles Avenue (SR-ll8)/Spring Road.
TRA-2 Overnight Parking of Heavy Trucks
In order to prevent truck staging on roadways and within the adjoining Cities, overnight
onsite parking of heavy trucks shall be restricted to the designated area(s) on-site. In
order to protect impacts to surface and groundwater quality, overnight parking of heavy
trucks shall be limited. Overnight onsite parking of heavy trucks shall be limited to
twenty (trucks) only. This condition is already included within the proposed new permit
application provided by the Applicant/Permittee'
8.4 Cor'¡cl-uslot'l
The operation of the proposed Project along with background traffic growth and related
cumulative project will collectively contribute to impacts to the surrounding roadway network in
the long term (year 212s).Implementation of the proposed mitigation measure TRA-I will help
improve traffic operating conditions thereby mitigating these traffic impacts to levels of
insignificance. Additionally, implementation of TRA-2 will prevent impacts associated with
truck parking to surface and groundwater'
ttRs 8-5
Wayne J Sand and Gravel Mine Project
9.0 R¡r¡RENCES
Califomia Department of Transportation (Caltrans). 2015. Trffic Census Program. [Online]
[C ited: August I 4, 20 I 5 .] http : I I tr affic -counts. dot. ca. gov/
Grimes Rock, Inc. 2013. Grimes Rock Mining Facility Modified Conditionql Use Permit 4874-2. (PLl2-
0159), submitted to the County of Ventura, October.
Katz, Okitsu & Associates. 2007. Trffic Studyþr the Grimes Canyon Quarries in the County of Ventura.
August 2007.
Moorpark, City of. 1992. General Plan.May.
2015. Agency Correspondence, City of Moorpark, Dave Bobart, Community development
Director.
Sespe Consulting, Inc.2014. Rancho San Cristobal Mine Conditional Use Permit 4913 Minor
Modification Application submitted to the County of Ventura. June'
Transportation Research Board (TRB). 2000. Highway Capacity Mqnual (HCM2000). s.I: National
Academy of Sciences, December.
Ventura, County of. 2013. Grimes Rock, Inc. Expanded Mining Facility Final Environmental Impact
Report, County of Ventura, June 2013
2015 . Agency Correspondence, County of Ventura RMA Planning Division.
2014. Agency Correspondence, Covnty of Ventura RMA Planning Division'
2011. Initial Study Assessment Guidelines,County of Ventura, April.
2009. Wayne J Sand and Gravel CUP Modification 4571-6 Final Environmental Impøct Report,
June.
2009a. CEMEX Consolidated Conditions of Approval CUP 4633 (CEMEX),May.
Rancho San Cristobal Mine CUP 4913
TIRS 9-l
Apprrrrorx A
TnnrrIC COUNTS
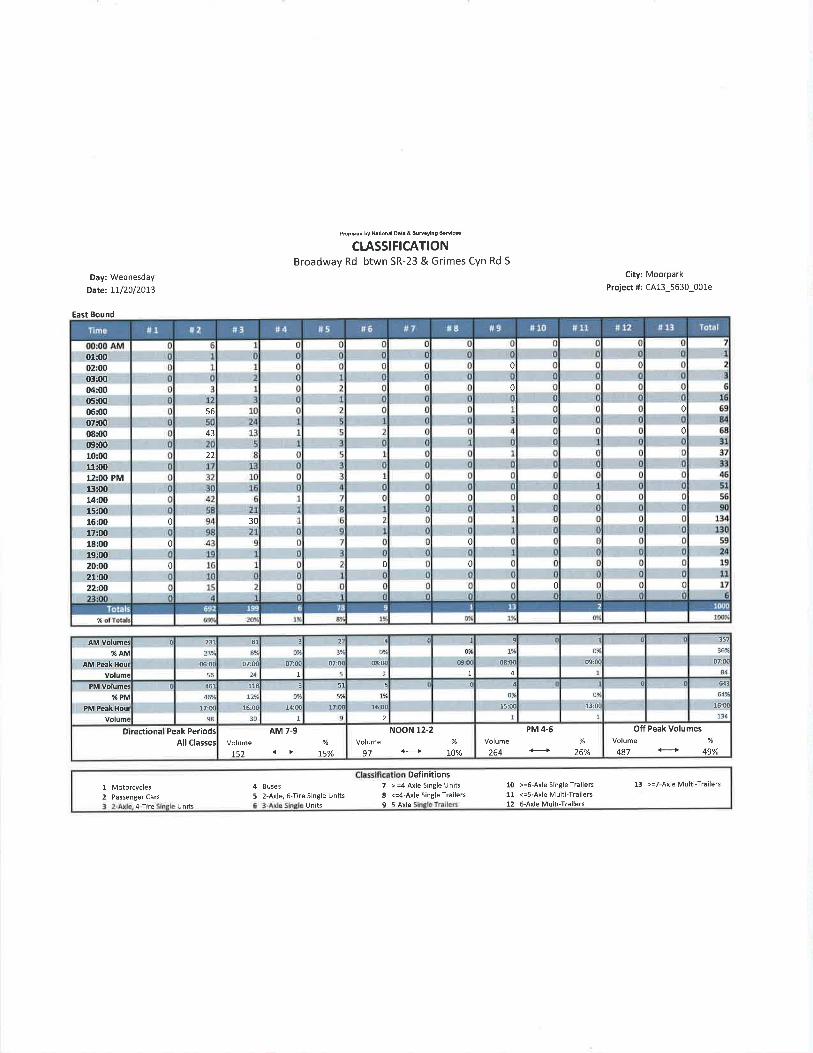
PrepNd by N¡üon6lDåhA SuMfns $dco.
crÁsslFlcATloNBroadway Rd btwn SR-23 & Grimes Cyn Rd 5
Day: Wednesday
Ddtet [L/20/2OL3
C¡ty: Moorpark
Project fl : cA13_5630_001e
Eest Bound
Definitions1 Motorcycles2 Passenger cars
4 Buses
5 2-Axle, 6-Tire Single Units
7 > =4 Axle Single Units
I <=4-Axle s¡ngle Trailers
10 >=6-Axle Single Trailers
11 <=5-Axle Multi-Trailers12 6-Axle Mulìi-Trãilers
13 >=7 Axle Multi-Trailers
4-Tire U nits u nits 9 5 Axle
0
0
0
0
0
0
0
0
01:üt02:0003:ül04:0005:ül06:0007:0008:00ül:ü)10:0011:ül12:00 PM13:0014:00l5:00l6:0017:ü)18:(x)19:0020:0021:0022t00
0
0
0
56
43
22
30
%
lo1
09:0(
1
0 357
36%
07:00
a4
4
oy<
08:tr2
Io%
09tr1
9
08:m
4
c 231
237.
06:0(
56
8la't
07:0(
24
3
úÁ
O7:00
1
2)
3't
07:0(
5
AM Volume%AN
AM Peak Hou¡
Volum(
o7
13:ü
1
( ot3
64%
16:0C
134
51
s%
1t o0
:lvt
16 0t
2
4
o%
15:00
1
PM Volume%PN
PM PeakHour
Volum(
( 461
46V
17:0(
98
11f
r21
16:0(
30
3
o%
14:m
1
PM 4.6Volume %
264 € 26%
Off Peak Vo umes
Volume %
487 <+ 49%
AM 7.9Volume %
1\) € 75%
Volume %
97 € r0%
NOON 12-2D rectlona Peak Per¡odsAll classes
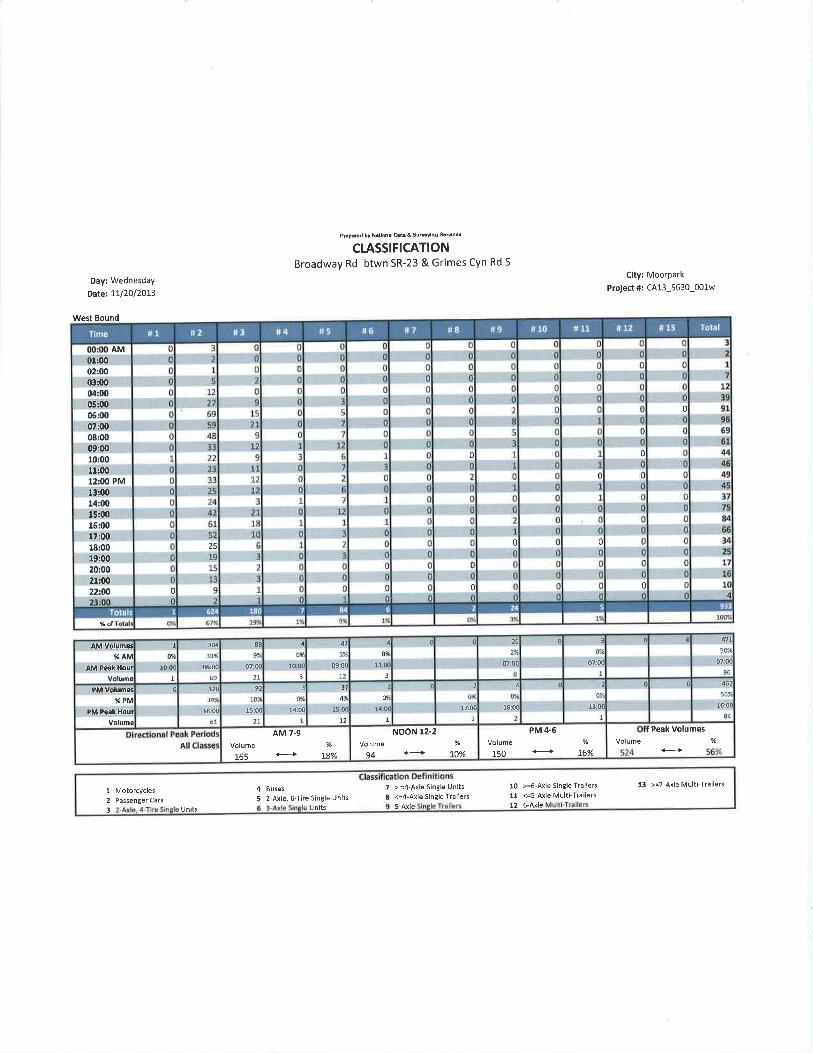
PFÞ.red bY kuond Oábt gum9ns &d'e'
clÁsslFlcATloNBroadway Rd btwn SR-23 & Grimes Cyn Rd S
Day: Wednesday
Ddtet 7l/20/2013
West Bound
City: Moorpark
Project #: CA13_5630-00lw
U
0
0
0 0
0
0
25
0l:(Xl02:0O
03:(x)04:0005:0006:0007r0008:00Gl:ü)10:00ll:0012:00 PM13!0014:0015:0016:0017:0018:0019:0O
20:0021:ül22tOO
AM
0
%ol
0 471
s0v.
07:o[
96
C 3
o%
07:00
1
0 20
2%
07:00
41
s%
09:0C
72
4
o./.
11 0(
3
8t
9%
07:O(
21
4
D%
10 0(
3
AM Volum6%AM
AM Peak Hour
volume
j
o"t
10tr1
304
33%
06:00
690 6)
50't
16:0(
a4
0 2
o%
13:0(
1
t 2
o%
12:00
2
4
o%
16:0C
2
3l4%
15 0(
12
o7
14ü1
320
34%
16:0{
61
92
10%
15:00
21
0't
14:ü1
PM volumë%PM
PM Peak Hour
Volumc
0
Peak Vo umesPM 4.6Volume %
150 t6%Volûme %
94 € r0%
NOON 12-2AM 7-9
Volume %
165 .+ 78%A
13 >=7 Axle Multi-Trailers
lJ nits 5-AxleUnits3
10 >=6-Axle s¡ngle Trailers
11 <=5-Axle Multi-Trãilers12 6-Axle
7 > =4-Axle single units
8 <=4-Axle s¡ngle Trailers4 Buses
5 2-Axle,6-T¡re Single Units1 Motorcycles2 Passenger cars
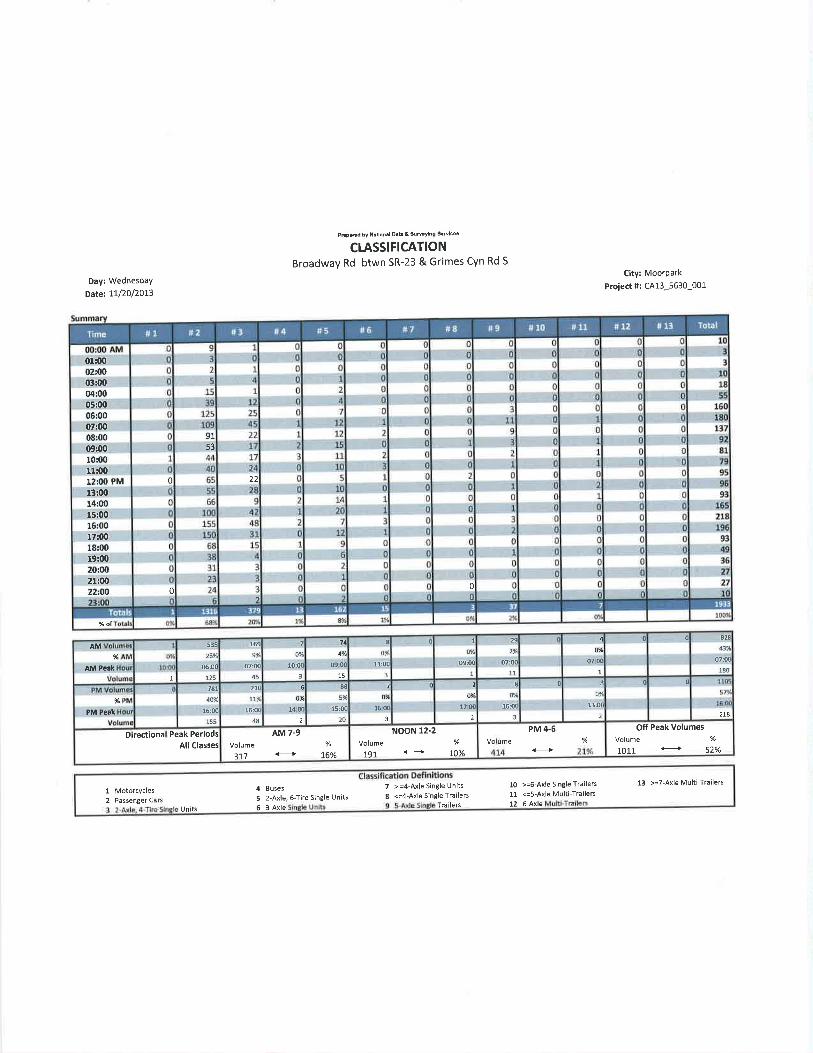
PFpæd bY N.üon.l D.b A SuMfng Sdco'
CI-ASSIFICAT¡ONBroadway Rd btwn SR-23 & Grimes Cyn Rd S
Day: Wednesday
Da|€t rL/2O/2013
C¡ty: lvloorpark
Pro¡ect #: CA13-5630-001
0
9153
22
01:(x¡02:0003:00(M:00
05:0006:0007:(X,08:00ül:ül10:0011:0012:00 PM13:ü)14:0015:0016:0017:ü)18:0019:ü)20:0021:0022:00
0
0
%of
( 0 828
43%
07:0(
180
4
0%
07 0{
1
1
o%
09:00
1
29
2%
07:0ú
11
Io%
11:00
3
1
o11
10:(X
3
74
4"1
09 0(
15
535
2A%
06:0C
125
169
9%
07:00
45I
AM
AM PeaK
%
218
0 (0
ofl
13:0(
2
2
o%
12 0C
2
Io.l.
16:0(
3
7
o%
16tr3
6
o%
14 00
2
88
5%
15:00
20
781
40%
16:00
155
21C
t7%
16:0(
4aPM Peak
%
Off Peak Vo umes
Volume %
1oL1 e 52%
PM 4.6
Volume %
191 € L0%
NOON 12-2AM 7-9
Volume %
117 æ L6%
D rect¡ona Peak PeriodsAll Classes
13 >=7-Axle lvlulti Trailers
LJ n ¡tsTrailers 12 6 Axle
7 > =4-Axle s¡ngle Units
8 <=4-Axle Single Trailers
10 >=6-Axle Single Tra¡lers
11 <=s-Axle Mult¡-Trailers4 Euses
5 2-Axle,6'T¡re s¡ngle Units
6 3 Axle
1 Motorcvcles2 Passenger cars
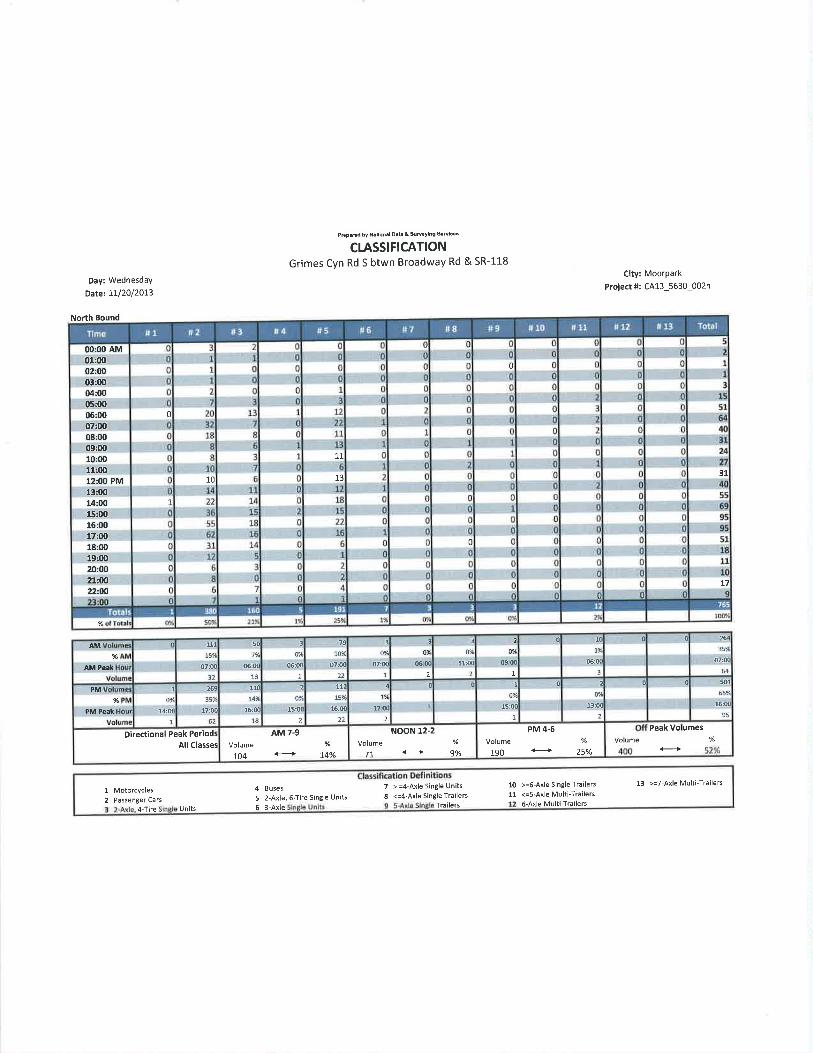
PÞPnd bYN.Uon.l Dáb $My|ns 9dc"
clÁsslFlcATloNGrimes Cyn Rd S btwn Broadway Rd & SR-118
Day: WednesdaY
Date:71120/2OL3
North Bound
City: Moorpark
Pro¡ect s: CA13_5630-002n
3l
L7
0
U
11
13
0
10
00:00 AM01:0002:0003:0004:0005r(x)06:0007:0008:0009:0010:0011:0012:fi) PM13:0014:0015:0016:0017:0018:fi)19¡0020:0021:ül22tO0
%
264
3501
07:fi
64
1(
191
05i0(
3
03
o%
11:o0
2
olt
09 0(
1
03
o4
07:(X
1
oyl
60(2
3
o%
06:00
1
79
10%
07:00
22
111
15
07ifr
32
50
1%,
06:fr
AM
AM Peak
%
0 501
6s%
16:0{
95
2
0%
13:00
2
(c 1
o%
15ioC
1
4
1%
t2u2
02
oot
15:0(
2
Ll275%
16:(X
22
toq
14:0(
1
269
3s%
17:00
62
11(
r4v.
15:0(
18
PM
PM Pcak
%
Peak Vo umes%
PM 4-6
Volume %
190 € 25%
NOON 12-2
9./.Volume
71
AM 7-9
Volume %
104 € 74%
Direct¡ona Peak PeriodsAll Classes
13 >=7-Axle Multi-Trailers
Units6-Axle MultÈTrãilers
4-f¡re Trailers
10 >=6-Axle single Tra¡lers
11 <=5-Axle Multi-Trailers4 Buses
5 2-Axle,6-T¡re Single IJnits
6 3-Axle
1 Motorcvcles2 Passenger Cars
7 > =4-Axle single Un¡ts
8 <=4-Axle s¡ngle Trailers
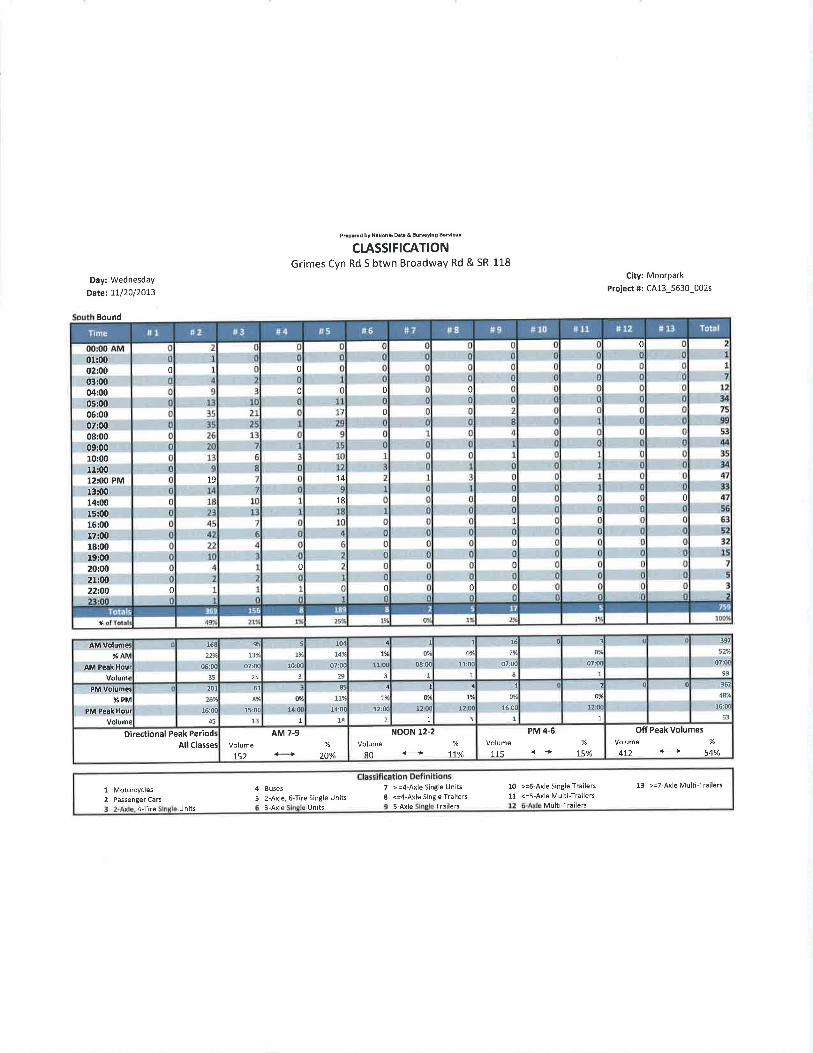
Pmpæd bY N¿üond O.b & guMfns $dco.
clÁsslFlcATloNGrimes Cyn Rd S btwn Broadway Rd & SR-118
Day: Wednesday
Datet tL/20/2Ot3
C¡ty: Moorpark
Project #: CA13_5630_002s
Bound
1 Motorcycles2 Passenger Cars
4 Buses 7 > =4-Axle s¡ngle Units
I <=4-Axle Single Trailers
10 >=6-Axle 5¡ngle Trailers
11 <=5-Axle Multi-Tra¡lers
13 >=7-Axle Mult¡ Trðilers
5 2-Axle,6-Tire single Un¡tsMulti Trailers4-T¡re u nits 3-Axle un¡ts S-Axle Treilers
0
0
0
0
n
0
0
74
18
0
0
0
01:(xl02:0003:0004:0005:0006:0007:m08:0009:(X)
10:0011:0012:q) PM13r0O
14:0015:(x,16:0017:(X)
18:0019:O{l
20:0021:fi!22t00
0
0
19
%
3
o%
or:0C
1
( 397
52%
07:m
99
loy,
11:0C
1
16
2%
07:O0
8
5
I%
10:0(
3
104
t4%
07:00
29
79
11 0(
3
1
o%
08:O0
1
168
22%
06:00
35
9:
ßa07:O(
25
AM Volume%AN
AM Pêâk llour
volum(2
o%
12 0(
1
( 0 362
48./<
16:0(
63
1
o%
12m
1
1it
12 0(
3
to%
16:0C
1
o"1
14U1
85
I7V.
14:0C
18
1A
l2:(X
2
201
26%
16:00
45
61
8%
15:00
13
PM Volums%PM
PM Peak Hour
VolumePM 4-6
Vôlume %
'115 € I5%
Off Peak Vo umes
Volume %
4r2 € 54%
NOON 12-2
Volume
80€ tI%
AM 7.9
Volume %
t52 € 20%
Oirectona PeakPeriodsAl Classes
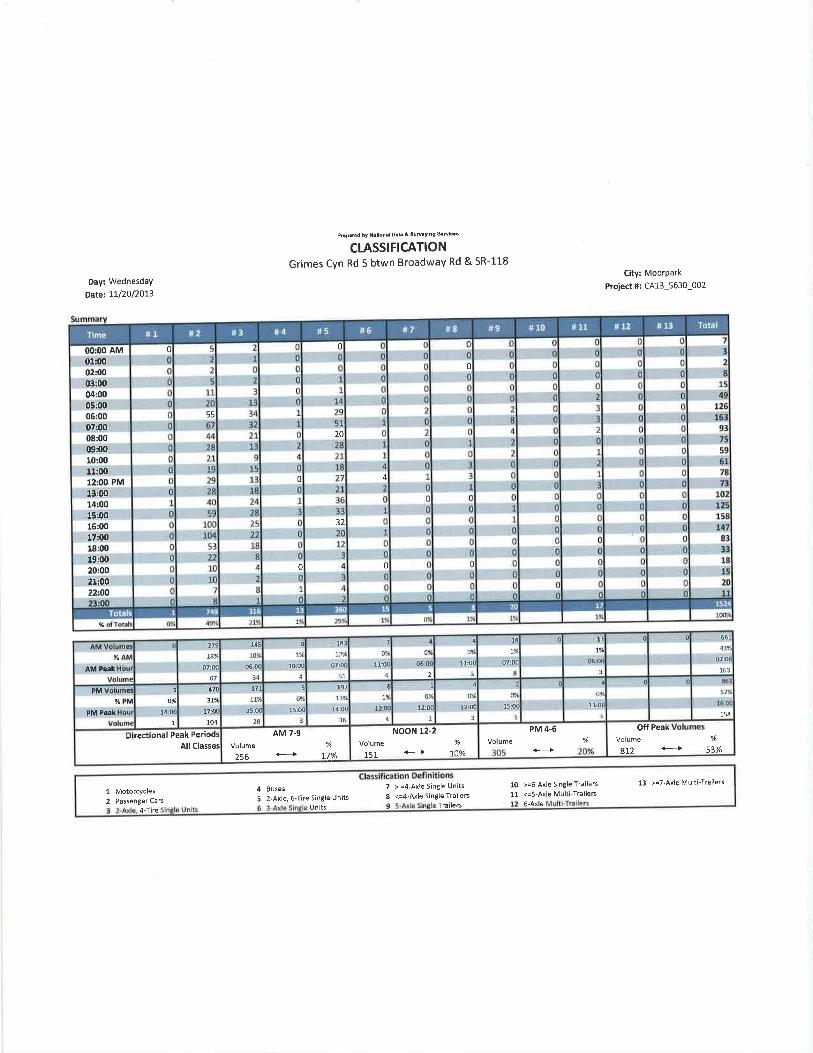
PFPmd hY NåUond Dib Sümf ng $dc"
cl-AsslFlcATloNGrimes Cyn Rd S btwn Broadway Rd & SR-11-8
Day: WednesdaY
DãÉt rL/2012073
City: MoorPark
Pro¡ect S: CA13_5630-002
0
4
0
0
0
0
20
32
0
55
00:00 AM01:0002:0003:0004:0005:0006:0007:0008:00ü):ü)10:0011:0O
12:00 PM13:0014:0015:ü¡16:0017:0018:0019:ü¡20:0021:0022t0O
%
661
437.
07:ü163
0 I1:
701
06 0(
3
4
oy<
11:o(
18
7%
07:O0
4
001
Gü2
18:
72"Á
07:(X
51
7
o%
11:O!
4
145
10q
06:0(
34
8
7%
10:m
4
279
18%
07:00
67
%
AM Peak
158
0 4
o%
13:0(
3
4
o%
12:O0
3
2
o%
15:0(
1
t701
12 0(
1
o%
L2iOC
1
197
13%
14:0{
36
l7t|t%
15:m
28
5
o%
15:0(
3
1
o%
14 00
1
474
31"1
17:0(
104
PM Peak
PM
%
€ 53%
Off Peak
arz
PM 4.6NOON 12-2
Volume %
151 I0%
AM 7.9
Volume %
256 € \7%
D rect ona Peak PeriodsAll Classes
13 >=7-Axle Multi-Trailers
5 2-Axle,6-T¡re Single Un¡ts
Units
4 Buses
6-Axle9 Trãilers4-Tire
10 >=6 Axle single Tra¡lers
11 <=5-Axle MultÈTrailers7 > =4-Axle S¡ngle Un¡ts
8 <=4-Axle single Trailers1 Motorcycles2 Pêssenger Cars
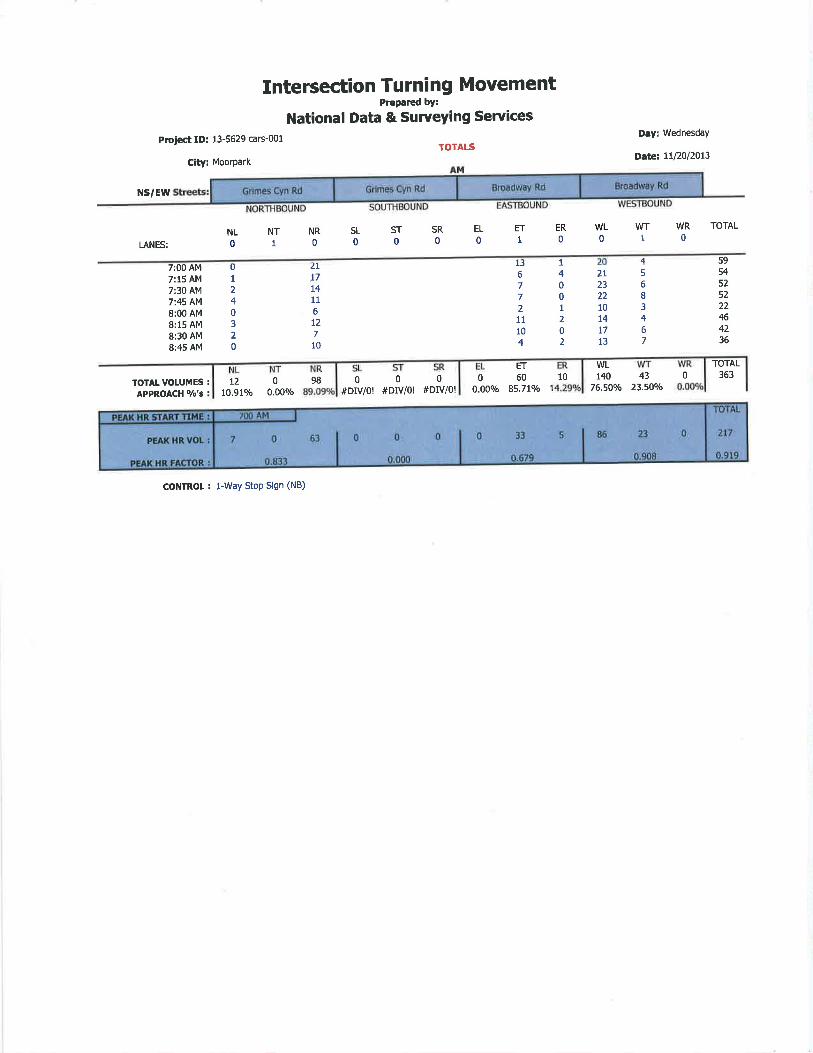
Intersection Turning MovementPrcPared bY:
National Data & SurueYing Seruices
Pruf:ct ID: 13-5629 cars-001
c¡ty: Moorpark
TOTALS
Day: wednesday
Dater 11/20/2013
NS/Ew
LANES:
EL
0SR0
ST0
SL
0NR0
NT1
Nt0
ET1
WR0
WT1
WL0
ER
0
TOTAL
13677211104
ZL
.t7L4116t2710
1
4001
2
02
456I3467
597:00 AM
7:15 AM
7:30 AM7:45 AM
8:00 AM8:15 AM
8:30 AM
8:45 AM
TOTALVOLUMES I
APPR.OACH o/o's :120
10.91olo 0.00o/o
000#Drv/o! #DIV/o! #DIV/o!
ET
0600.000/o 85.71olo 1 76.5o0/o 23'50o/o
01
240320
2l232210t4t713
54525222464236
36343WL14010
TOTAL
098
CONTROL : l-WaY StoP Sign (NB)
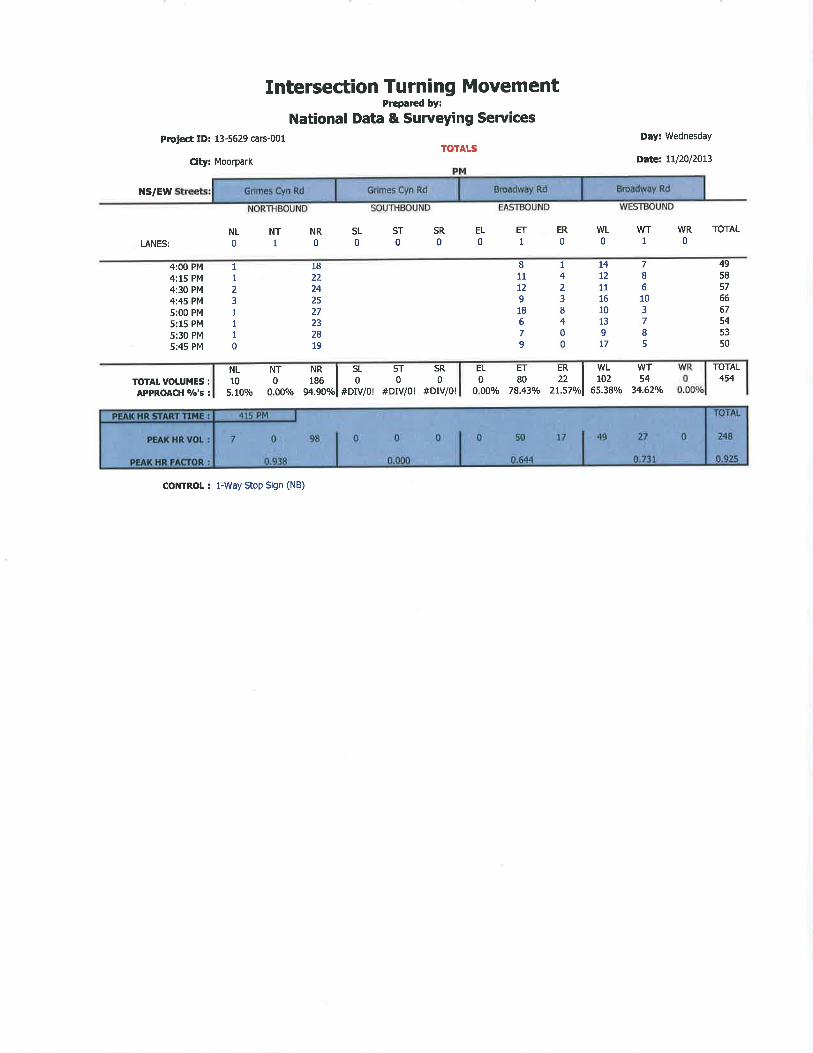
Intersection Turning MovementPrePared bY:
National Data & Surueying Se¡vicesProJect ID: 13-5629 cars-001
City: Moorpark
TOTALSDay: Wednesday
Date: U/20/2013
NS/EW
LANES:
EL
0SR0
ST0
SL
0NTI
NL0
NR0
ETI
WR0
VW1
WL0
ER
0
TOTAL
4958576667545350
7I61037
85
t4t2111610139t7
I423I400
811t2918679
1822242527232819
1
1
231
1
1
0
4:00 PM
4:15 PM
4:30 PM
4:45 PM
5:00 PM
5:15 PM
5:30 PM
5:45 PM
NL10
5.100/o
454ET80
EL
0NT0
NRI186 |
9a.9ovol
SL ST SR ERI22 1
zt.stonl
WL WTt02 54
65.380/o 34.620/o
TOTAL
TOTAL VOLUMES :APPROACH o/o's : 0 00o/o
000#Drv/o! #Drv/o! #DIV/o! 78.43o/o0 00o/o
CONTROL : l-Way StoP Sign (NB)
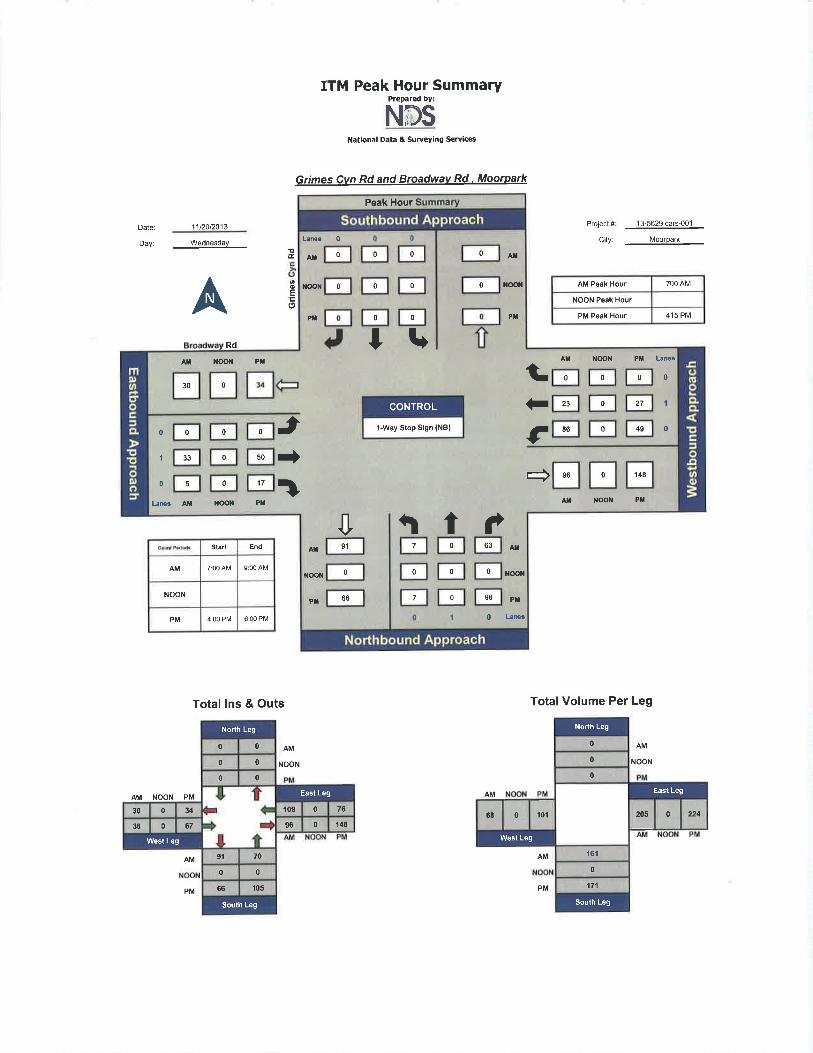
ITM Peak Hour SummaryPrepared by:
NESNat¡onal Dâta & Suryeying Sery¡c6
Grimes Cvn Rd and Broadwav Rd . Moorpark
Date: 11t2012013
Dayr Wednesdav
Rd
EndStart
AM 7:00 AM g:00 AM
NOON
PM 4:m PÀ, 6:00 PM
Total lns & Outs
oE
(9A!d
NOON
Project#: 13-5629cils-001
C¡ty: __Moorpa!_
700 Al\ilAM Peak Hour
NOON Peak Hour
PM Peak Hour 415 PM
Total Volume Per Leg
NOON
AMAM
AM NOON PM
AM
AM
AM
Peak Hour
0 0 0 0
0 0 0 0
0 0
30
33 50
17
23
86
96
27
49
148
9't
66
63
90
0 0 00
1-way Stop Sign (NB)
CONTROL 0
0 0 0 0
0
05 0
7 0
0 0 0
7 0
CFçt
-a
Pf
l¡ma
^il
N@NNOOt¡
PTPT
+0
0
AT
Ata
TbAX NOON PT
ATI NOON PTrì1?NOON
Låmc 0
Ar{
NOON
Pil
Atl ìIOON Pll Lamg
0
I
0
L¡rer Am IOON P]{
0
1
0
0 0
00
0 0
109 0 7630 0 u96 0 14838 0 67
9t 70
0 0
66 105
West Leg
South Leg
East Leg
North Leg
0
0
0
205 0 22468 0 l0l
161
0
171
North Leg
West Leg
East Leg
Soulh LegPM PM
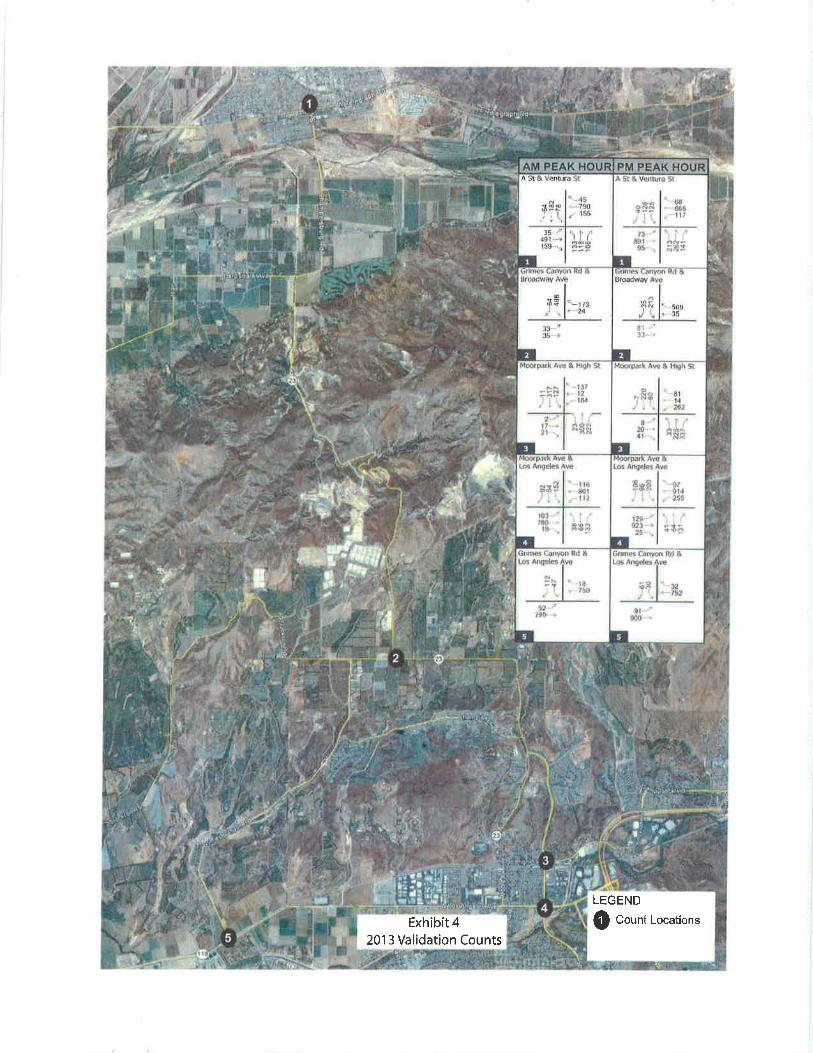
Exhibít 42013 Validation Counts
@ Count Locations
LEGEND
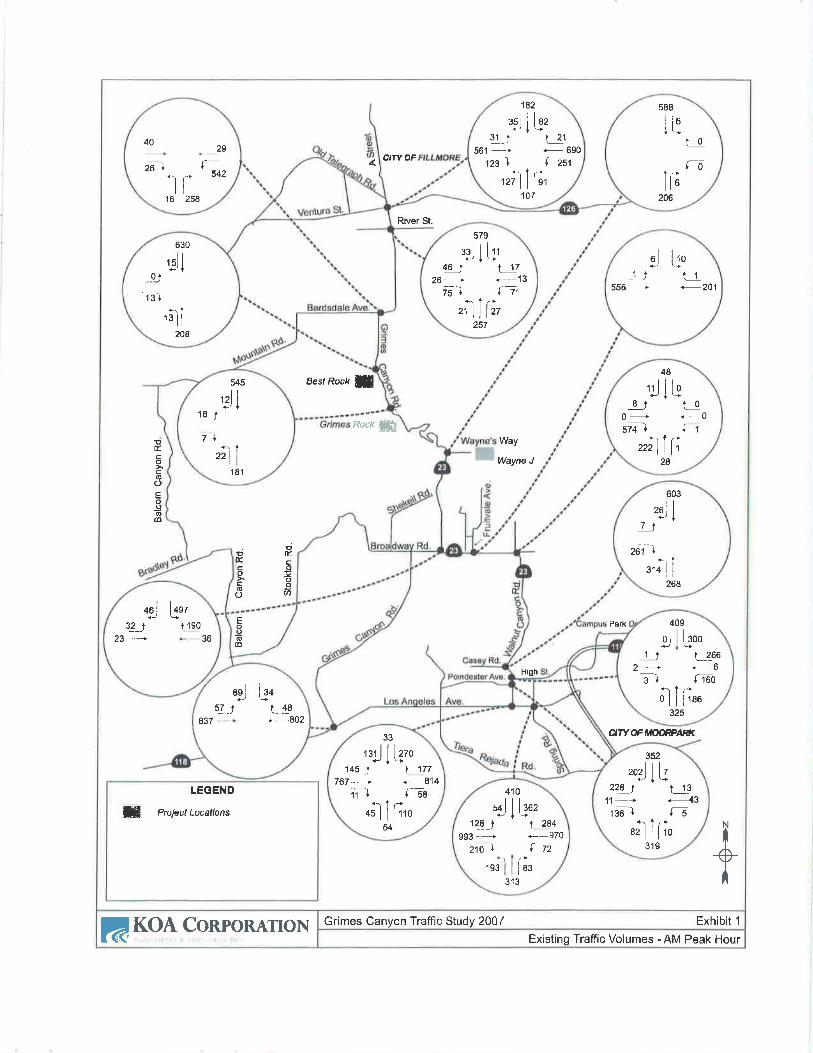
I ctfv oF
Eú.
oco()Eooo
(D
way
Wayne J
Pârk
High
ctTY(Etþ(ÆAf,,<
LEGEND
tå Project LocationsN
I+I
rsr I I lzzo
767 -- --11 ¡
33
1E_i
54
+s | | rrro
I 177
- 8'14
f- 5s
3-1 t561
1rã-ì
esl i iez
i27 | lttsl
182
107
L?1
- 690
t zst
6
t0
,o
s88liil
206It;
+ I
40
26
2S
542'ì I'
16 258
,l J Ll,
z lilzt
579
257
46J26'-ttl
tJ----13lit
el l.i''a-1*201-1 J
556 -
rsll
'3li
630
208
0r
lTr
EesfRock fi
River St.
rrlilo
222li11
48
28
_9_i0+siq-+
L0*_0j116J
7+22 I
1
545
'AI
8l
,Ðl
er+li
603
268
]J
zal \
Rock ft
¿tCo¡ooØ
ltÉ,coÉ6o
Eo.!¿oæ
4.6)
36
þzr 19032_ J
23 '-*
oli¡186
409
ol
325
1'¡2-'
ì_-r
L_?ô6. _6fioo
I eoo
.gj i e+
5!) t_ {8- ,802837
,orl I l,
ezllIro
352
31S
22LJ11 -taã'I
r 13
+43í5
410
ri I lsoz
12_9)
993 - -'zro I
193 Íå,313
I 284.-- 970
f-tz
Exhibit 1Grimes Canyon Traffic Study 2007KOA ConponnrroNã Existing Traffic Volumes - AM Peak Hour
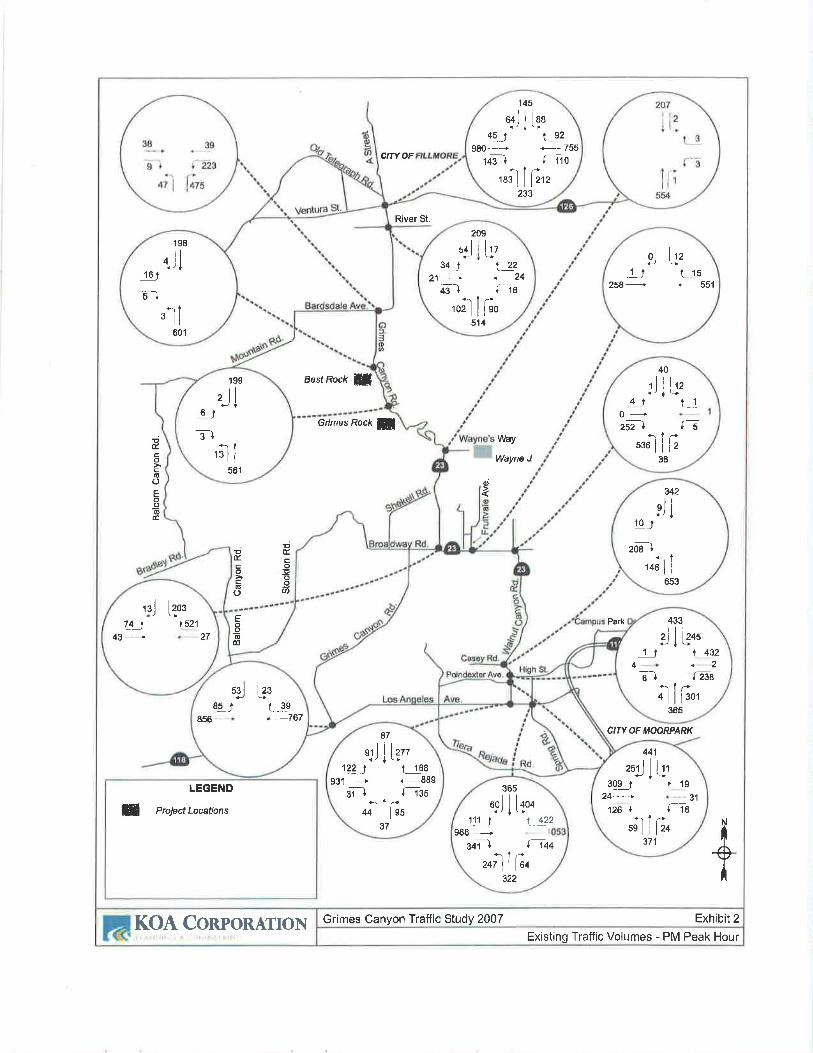
srl I lzzzr'¡t'tl88l-ßs
++lllss
87
.--889
3f
122,J931
-gr-¡
q)980 --'
143 'ì
orj t i aa
,uJl lli,,
145
233
te2.-- 75s
lro
rozlllso
209
llutl f
l_?2*-2421
{ts
514
3lJ
43+
ei l1z1t
258+t15.-551
198
II
3 ll601
1þ)
tl
River St.
saoljlz38
tlt,le1_ :1
40
rE!)
zsz)
,ll199
6J-il
Irlïs61
ei i
''1rn6li
u2
653
10J
eoi ì
EeslRock ffi
Gnmas Rock fil
EÉ.coooø,
EÉ.co
E(J
Eooõ6
j E,t 521
13
27
7lJ43 -----
433
z,l lzo"
ãì læ,a'rtr'4ll1301
1)4
365
t 432.2
J r99-
-767856
85
rd t,zt
zsrlIl¡119
l7a
441
31
371
ælljzr
3qs t24-- -
126 +
365
uoi I looo
zulllae322
t 144
111J L_4?2
LEGEND
n ProJectLocatlons
CITY OF
dtÉoEooEol:o(f)
way
Wayne J
o
Park
CITY OF MOORPARK
N
i+A
Exhibit 2Grimes Canyon Traffic Study 2007KOA COnpOnATIONExisting Traffic Volumes - PM Peak Hour
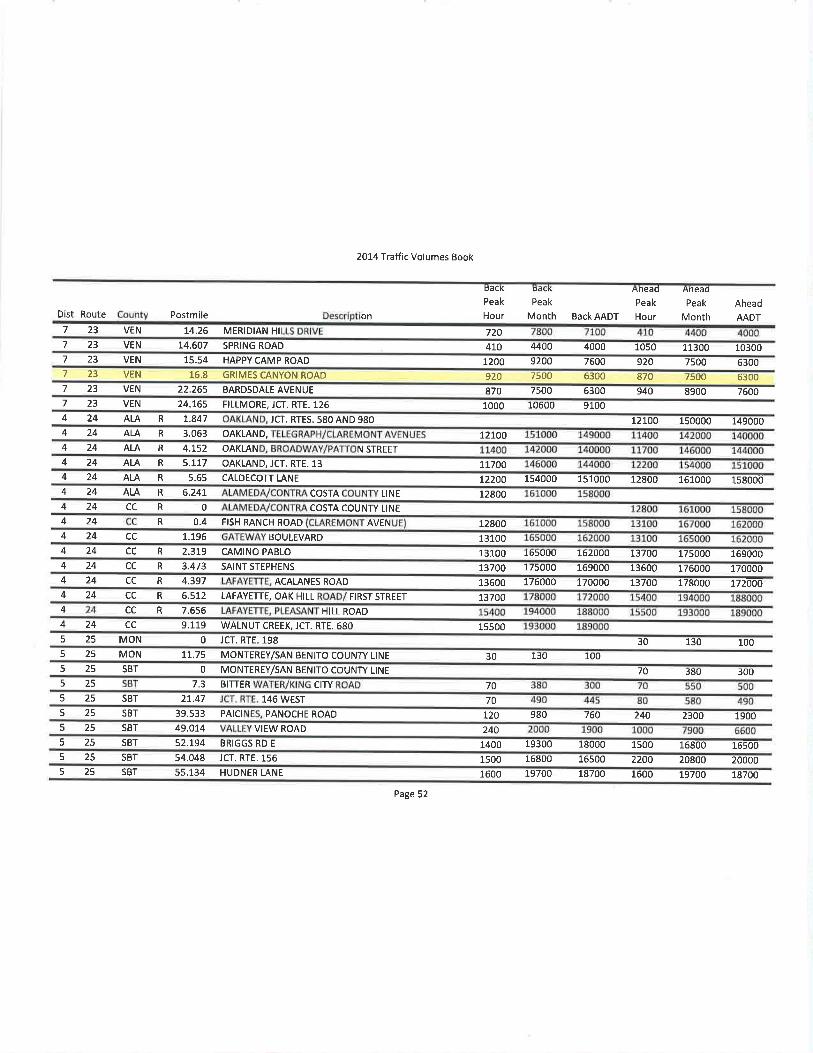
2014 Traffic Volumes Book
tsacK
Peak
Hour
Þd cK
Peak
Month BackAADT
Aneao
Peak
Hour
Aneao
Peak
MonthAhead
AADTRouteDst
7 23 VEN
Postmile
14,26 MERIDIAN HI
on
7207 23 VEN T4.607 SPRING ROAD 4to 4400 4000 1050 11300 103007 23 VEN 15,54 HAPPY CAMP ROAD 1200 9200 7600 920 7500 63007 23 VEN 16.8 GRIMES CANYON ROAD 920 T,OO 6300 870 7500 63007 23 VEN 22,265 BARDSDALEAVENUE 870 7500 6300 940 8900 76007 23 VEN 24.165 FILLMORE, JCT. RTE. 126 1000 10600 91004 24 At-A R I.A47 JCT. RTES, 580 AND 980 12100 150000 1490004 24 ALA R 3.063 OAKLAND,
4 24 ALA R 4.152 OAKLAN
4 24 ALA R 5.117 OAKLAND, JCT. RTE. 13
N STREET
L2TOO
7r7004 24 ALA R 5.65 CALDECOTT I.ANE t22O0 154000 151000 12800 161000 158000
12800
L2800
4 24 At-A R 6.241 COSTA LINE
COSTA COUNTY LINE
AVEN
R24
24
24
4
4
4
cc
cc 1.196 BOULEVARD
R 0.4 FISH RANCH ROAD
0
131004 24 CC R 2.319 CAMTNO PABLO 13100 lb5uuu 162000 1.3700 175000 1690004 24 CC R 3.473 SAINT STEPHENS 13700 17s000 169000 13600 176000 1700004 24 CC R 4.397 ACALANES ROAD
4 24 CC R 6.512 LAFAYETTE, OAK HILL FIRST STREET
cc R 7.6s6 HILL ROAD
cc 9.119 WALNUT CREEK, JCT. RTE. 680
13600 776000 t70000 t3700 178000 172000
13700
1550024
4
4
5 25 MON O JCT. RTE.198 30 130 1005 2s MON T7.75 MONTEREY/SAN BENITO COUNTY LINE 30 lJU 1005 25 SBT O MONTEREY/SAN BENITO COUNTY LINE 70 3E0 3005
5 25 SBT
7,3 BITTER
21.47 146 WEST
70
70
25 CITY
5 25 SBT 39.533 PAtCt PANOCHE ROAD L20 980
240
760 240 2300 19005 25 SBT 49.Or4 VIEW ROAD
5 25 SBT 52.194 BRIGGS RD E 1400 19300 18000 1500 16800 16500255 SBT 54.048 lCT. RTE. 156 1500 16800 16500 2200 20800 20000
5 25 SBT 55.134 HUDNER LANE 1600 19700 18700 1600 1970-18700-
Page 52
Apprruorx B
lrur¡RSEcnoru ANALysls WoRKSHEETS
Exlsrtruc CoNDtnoNS
AM sun Aug 30, 2015 12:40:57 Page 1-1
Vilayne J. Sand and Gravef Mine Project Traffic StudyExisting
Morning Peak Hour
Scenario
command:Vol-ume:Geometry:Impact Fee:Trip Generation:Trip DistributionPaths:Routes:Configuration:
Scenario ReportAM
AM
AM
Exi st ingDefault Impact FeeAM
AM
Default PathsDefault RoutesExi sting
Traffix 7.6.0115 (c) 2003 Dowling Assoc. Licensed to URS CORP., SANTA ANA, CA
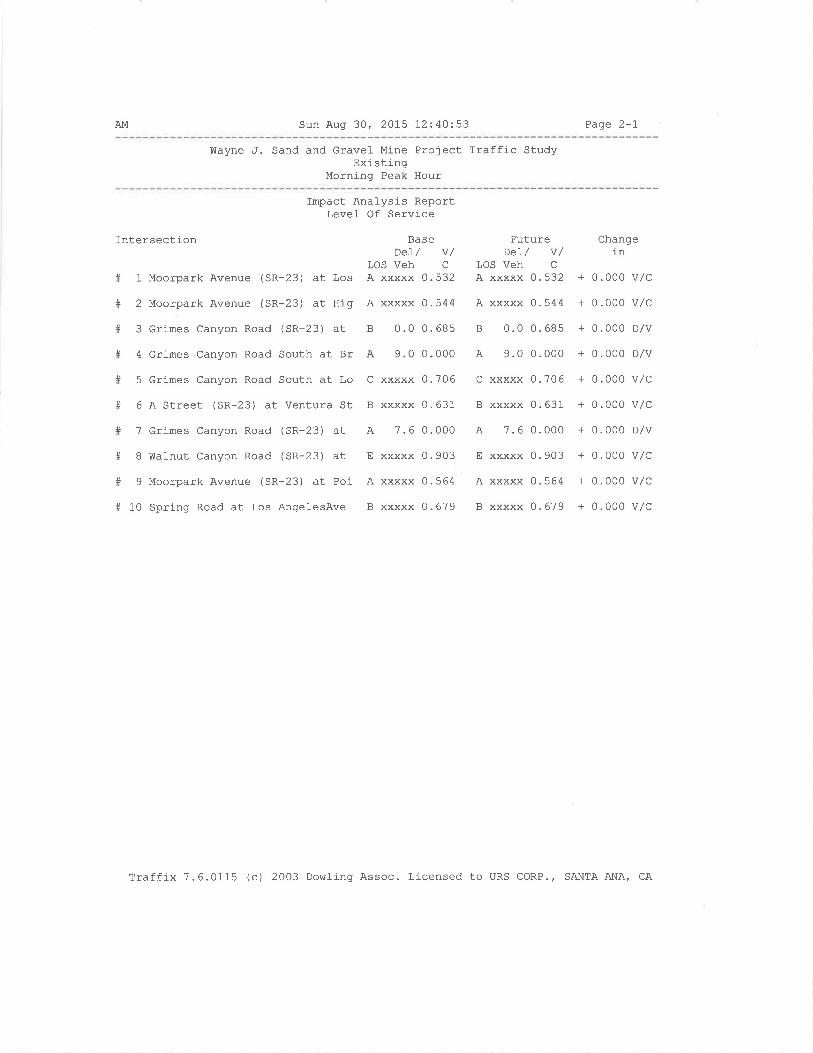
AM Sun Aug 30, 2075 12:40:53 Page 2-I
wayne J. Sand and Gravel- Mine Project Traffic StudyExisting
Morning Peak Hour
Impact Analysis ReportLevel Of Service
Intersection BaseDeI/ v/
Los Veh C
# 1 Moorpark Avenue (SR-23) at Los A xxxxx 0.532
# 2 Moorpark Avenue (SR-23) at Hig A xxxxx 0.544
# 3 Grimes canyon Road (SR-23) at B 0.0 0.685
# 4 Grirnes Canyon Road South at Br A 9.0 0.000
# 5 Grimes Canyon Road South at Lo C xxxxx 0.706
# 6 A Street (SR-23) at Ventura St B xxxxx 0.631
# 7 Grimes Canyon Road (SR-23) at A 7.6 0.000
+ 8 hlal-nut Canyon Road (SR-23) at E xxxxx 0.903
# 9 Moorpark Avenue (SR-23) at Poi A xxxxx 0.564
# 10 Spring Road at Los Angel-esAve B xxxxx 0.679
FutureoeI,/ v /
LOS Veh C
A xxxxx 0.532
A xxxxx 0.544
B 0.0 0. 685
A 9.0 0.000
C xxxxx 0.706
B xxxxx 0.631
A 7.6 0.000
E xxxxx 0.903
A xxxxx 0.564
B xxxxx 0.679
Changean
+ 0.000 v,/c
+ 0.000 V/c
+ 0.000 D/v
+ 0.000 D,/v
+ 0.000 V/c
+ 0.000 v,/c
+ 0.000 D/v
+ 0.000 v/c
+ 0.000 V/c
+ 0.000 V/c
Traffix 7.6.0115 (c) 2003 Dowling Assoc. Licensed to URS CORP., SANTA ANA, CA
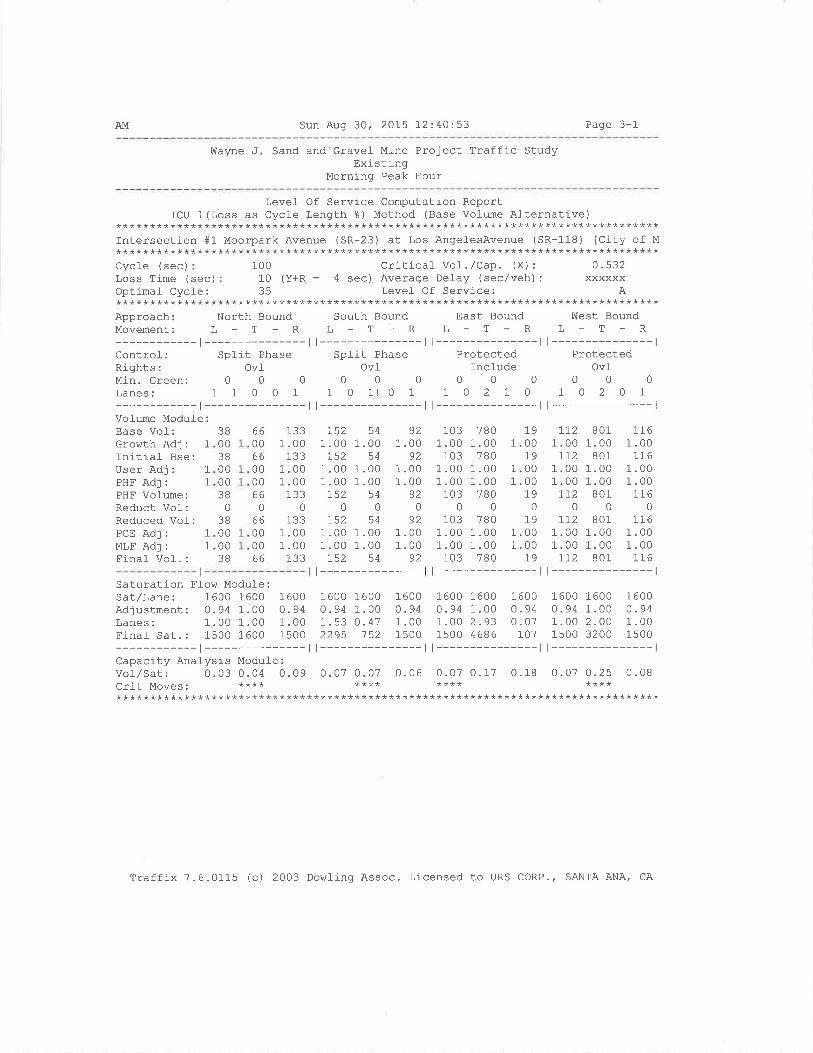
AM Sun Aug 30, 2OL5 1,2:40:53 Page 3-1
Wayne ,J. Sand and Gravel Mine Project Traffic StudyExisting
Morning Peak Hour
Level Of Service Computation ReportICU 1(Loss as Cycle Length å) Method (Base Vofume Afternative)
********************************************************************************Intersection #1 Moorpark Avenue (SR-23) at Los Angel-esAvenue (SR-118) [City of M********************************************************************************CycÌe (sec): 100 Critical- Vol./Cap. (X): 0.532Loss Time (sec) : 10 (Y+R : 4 sec) Average Delay (sec/veh) : xxxxxxOptlnal Cycte: 35 Levef Of Service: A********************************************************************************Approach: North Bound South Bound East Bound West BoundMovement] L - T - R L - T - R L - T - R L _ T - R
-r---------ll---------ll---------ll---------------lControl-: Split Phase Split Phase Protected ProtectedRights: Ovf Ovl- Incfude OvlMin.Green: 0 0 0 0 0 0 0 0 0 0 0 0
Lanes: 1 1 0 0 1 1 0 1! 0 1 1 O 2 1 0 1 0 2 0 1
-t---------ll---------ll---------ll---------------lVolume Module:Base Vol:Growth Adj: 1
Initíal Bse:User Adj: 1
PHF Adj: 1
PHF Volume:Reduct Vol:Reduced Vof:PcE Adj: 1
MLF Adj: 1
Final- Vol. :
660066000066
0
66000066
1331 .00
1331.001.00
1330
1331.001 .00
133
]_52 54 921 .00 1.00 1 .00r52 54 92
1 .00 1.00 1 .001 .00 1.00 1 .00752 54 92
000r52 54 92
1 .00 1.00 1.001 .00 1 .00 1 .00r52 54 92
t---------------
3B003B000038
038000038
103 780 191.00 1.00 1.00103 780 79
1.00 1.00 1.001.00 1.00 1.00103 780 79
000103 780 19
1.00 1.00 1.001.00 1.00 1.00103 780 L9
t--------------l
TI2 801 IL61 .00 1.00 1 .00TI2 801 IL6
1 .00 1.00 1.001 .00 1.00 1.00Lr2 801 116
000TI2 BO1 tI6
1 .00 1.00 1.001 .00 1.00 1.00Lr2 801 116
t---------------lSaturation Ffov¡ Modufe:Sat/Lane: 1600 1600 1600Adjustment: 0.94 1.00 0.94Lanes: 1.00 1.00 1.00Finaf Sat.: 1500 1600 1500
-t---------Capacity Analysis Module:vol/Sat: 0.03 0.04 0.09 0.07 0.07 0.06 0.07 0. 17 0. 18 0.07 0.25 0.08Cfit MOVeS i *++ * **** **** ************************************************************************************
1600 16000.94 1.001.53 0.472295 152
1 6000. 941.001500
1 6000.941 .001500
00 160000 0.9493 0.0786 L07
1600 16000.94 1.001 .00 2 .001s00 3200
1 6000.941.001500
I61.2.46
Traffix 7.6.0115 (c) 2003 DowÌing Assoc. Licensed to URS CORP., SANTA ANA' CA
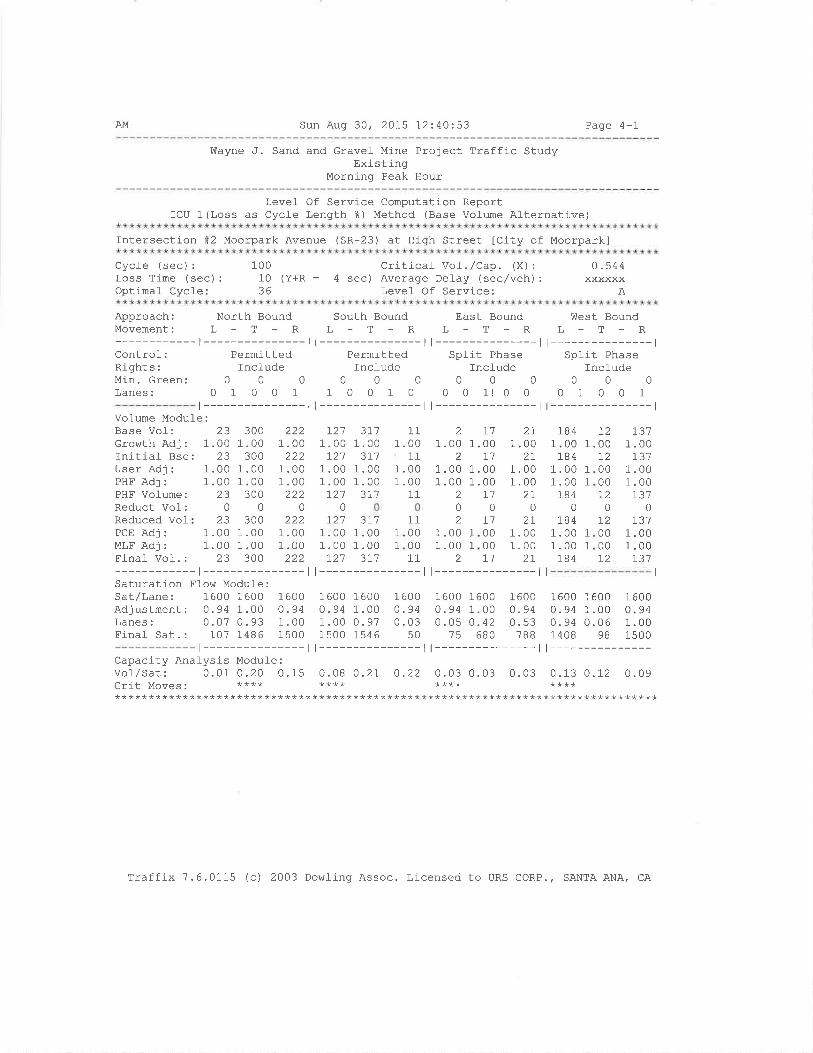
AM Sun Aug 30, 2015 !2:40:.53 Page 4-1
Wayne J. Sand and Gravel- Mine Project Traffic StudyExisting
Morning Peak Hour
Level Of Service Computatlon ReportICU 1 (Loss as Cycle Length å) Method (Base Volume Al-ternative)
Intersection #2 Moorpark Avenue (SR-23) at High Street ICity of Moorpark]
Cycle (sec):Loss Time (sec) :
Optimal Cycle:
10010 (Y+R :36
Critical- Vol . ,/Cap . (X ) :
4 sec) Average Del-ay (sec,/veh) :
Level Of Service:
0.544xxxxxx
A
Approach: North BoundMovement: L - T - R
-t---------------lControl: PermittedRights: IncfudeMin.Green: 0 0 0Lanes: 0 1 0 0 1
South Bound East BoundL-T-RL-T_R
| --------------- | I --------------- |
Permitted Split PhaseIncfude Include
0000001 0 0 1 0 0 0 1! 0 0
| --------------- | I --------------- |t---------------l
West BoundL-T-R
t---------------lSplit Phase
Incfude000
01001t---------------l
Vol-ume Module:Base Vol: 23 300Growth Adj : 1.00 1 .00Initiaf Bse: 23 300User Adj : 1.00 1 .00PHF Adj : 1.00 1 .00PHF Volume:Reduct Vol:Reduced VolPCE AdJ:MLF AdJ:FinaÌ Vol.:
-t---------------lSaturation Flow Modufe:Sat/Lane: 1600 1600 1600Adjustment: 0.94 1.00 O.94Lanes: 0.07 0.93 1.00Final- Sat. : 107 1486 1500
111 .00
111 .001 .00
11
2 r'71.00 1.00
2r11.00 1.001.00 1.00
21.
1.0027
1.001 .00
184 721 .00 1 .00r84 72
T1 2I00
I1 2T00 1.0000 1.001,1 21
1.00 1
1.00 1
r84
184 72 I31tt
1 600ôq¿
1.001 500
3000
3001 .001 .00
300
2221 .00
2221 .001 .00
2220
2221.001.00
222
r21 3r11.00 1.00721 3r7
1 .00 1.001 .00 1.0072'7 3r't
r311 .00
r311 .001.00r31
0072'7
1.001.00
)?0
)?1 .001 .00
ZJ
3r'71.00 1
1.00 1
11000011
0184
1.001.00
2
02
1.00 1
1.00 1
2
000072
0t20000
r311.001.00
r2'7 3r'7
1
1
1600 16000.94 1.000. 94 0.061408 98
| --------------- | I --------------- |
1600 1600 16000.94 1.00 0.941 .00 0. 97 0.031500 1546 50t---------------l
000042
680 7BB
1 6000.940.05
aÊ
I61.0.
1 6000.940.53
t---------------l | --------------- | I --------------- |
Capacity Anal-ysis Modufe:Vol/Sat: 0.01 0.20 0. 15 0.08 0.21 0.22 0.03 0.03 0.03 0.13 0.12 0.09crit Moves: **** **** **** ************************************************************************************
Traffix 7.6.0115 (c) 2003 Dowling Assoc. Licensed to URS CORP., SANTA ANA, CA
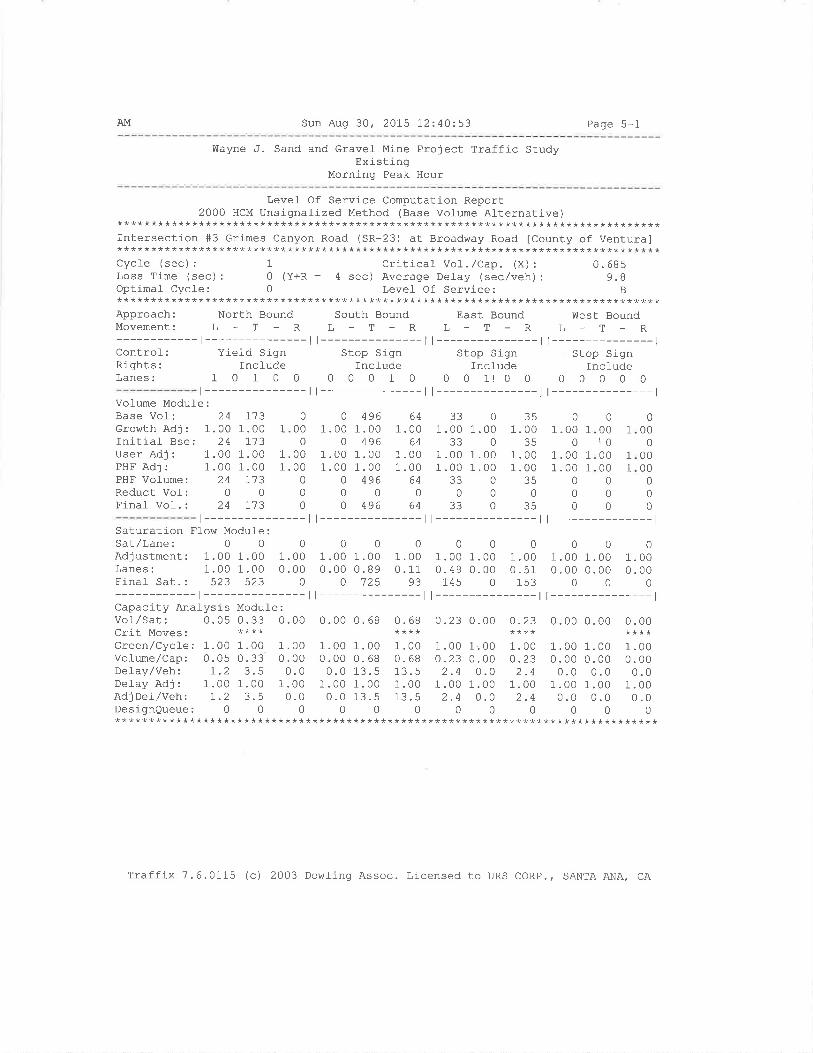
AM Sun Aug 30, 2015 12:40:53 Page 5-1
Iliayne J. Sand and Gravel Mine Project Traffic StudyExistang
Morning Peak Hour
Levef Of Service Computation Report2000 HCM Unsignalized Method (Base Volume Al_ternative)********************************************************************************
Intersection #3 Grimes Canyon Road (SR-23) at Broadway Road Icounty of Ventura]********************************************************************************Cycle (sec) : 1 Critical Vol .,/Cap. (X) : 0.685Loss Time (sec): 0 (Y+R : 4 sec) Average Delay (sec/veh): 9.8Optimaf CycJ-e: 0 Level- Of Service: B********************************************************************************Approach: North Bound South Bound East Bound West BoundMovement: L - T - R L - T _ R L - T - R L - T - R
-t--------- ll--------- |--------- |---------------lControl-: Yield Sign Stop Sign Stop Sign Stop SignRights: Include Include Include IncludeLanes: 1 0 1 0 0 0 0 0 1 0 0 0 1! 0 0 0 0 0 0 0
t --------------- | --------------- | --------------- l t --------------- l
Vol-ume Moduf e:Base Vol: 24 713Growth Adj : 1.00 1.00Initial- Bse: 24 713User Adj: 1.00 1.00PHF Adj : 1 .00 1.00PHF Vofume: 24 7'73Reduct Vol-: 0 0Final Vol. : 24 I13
0
1 .000
1 .001.00
0
00
0 4961.00 1.00
o 4961.00 1.001.00 1.00
0 49600o 496
641.00
641 .001 .00
640
64
3301.00 1.00
3301 .00 1.001 .00 1 .00
33000
330
351.00
?tr
1.001.00
350
35
01.00 1
01.00 1
1.00 1
0
00
0
00r00000
0
00
1
1
1
000
00000
0
00
t --------------- | --------------- | --------------- | --------------- l
Saturatlon Fl-ow Modufe:Sat/Lane: 0 0 0 0 0 0 0 0 0 0 O 0Ad¡ustment: 1.00 1.00 1 .00 1 .00 1 .00 1 .00 1 .00 1.00 1.00 1 .00 1.00 1.00Lanes: 1.00 1.00 0.00 0.00 0.89 0.11 0.49 0.00 0.51 0.00 0.00 0.00Final Sat. : 523 523 0 0 125 93 745 0 153 0 0 0
-t--------- |--------- |--------- |---------------lCapacity Analysis Module :
Vol,/Sat: 0.05 0.33 0.00 0.00 0. 68 0. 68 0.23 0.00 0.23 0.00 0. O0 0.00crit Moves. **** **** **** ****Green/Cycle: 1.00 1.00 1.00 1.00 1.00 1.00 1.00 1.00 1.00 1.00 1.00 1.OOvolume/Cap: 0.05 0.33 0.00 0.00 0.68 0.68 0.23 0.00 0.23 0.00 0.00 O.OODelay/Veh: 1.2 3.5 0.0 0.0 13.5 13.5 2.4 0.0 2.4 0.0 0.0 O.ODelayAdj: 1.001.00 1.00 1.001.00 1.00 1.001.00 1.00 1.001.00 1.00AdjDeJ-/veh: 1.2 3.5 0.0 0.0 13.5 13.5 2.4 0.0 2.4 0.0 0.0 0.0DesignQueue: 0 0 0 0 0 0 0 0 0 0 0 0********************************************************************************
Traffix 7.6.0115 (c) 2003 Dowling Assoc. Licensed to URS CORP., SANTA ANA, CA
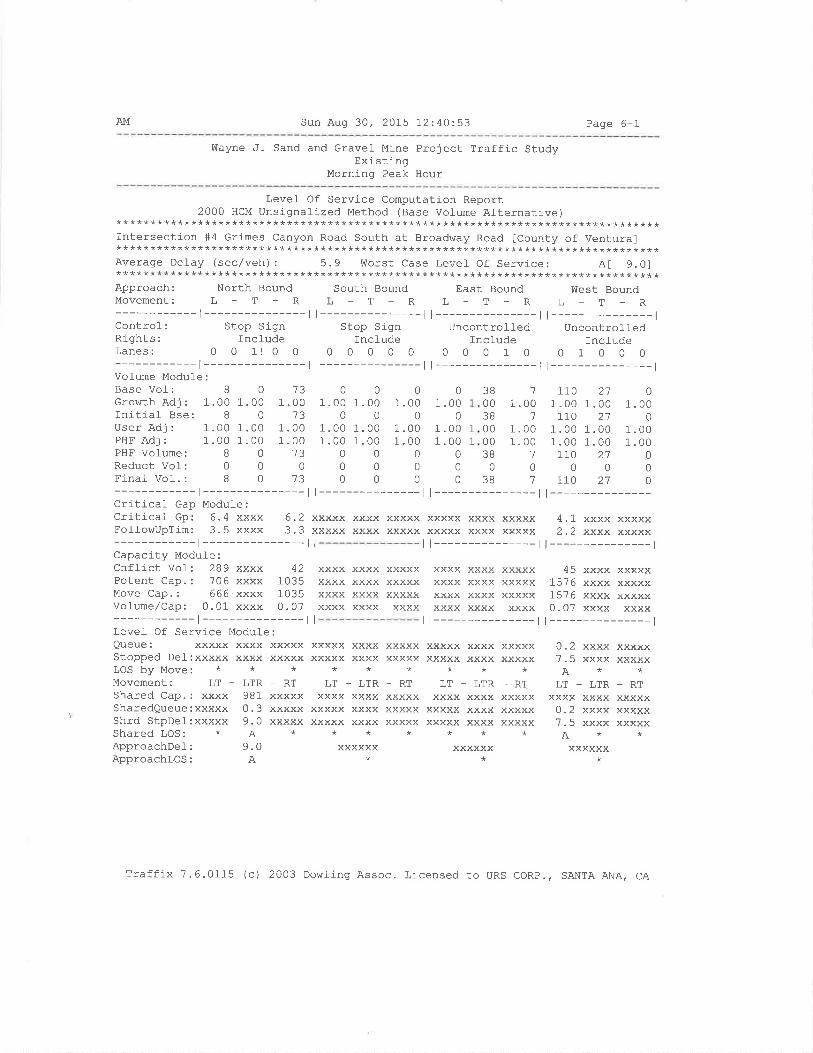
AM Sun Aug 30, 2015 72:4O:53 Page 6-1
Wayne ,f. Sand and Gravel_ Mine Project Traffic StudyExist ing
Morning Peak Hour
Leve1 Of Service Computation Report2000 HCM Unsignalized Method (Base Volume Alternative)********************************************************************************
Intersection #4 Grimes Canyon Road South at Broadway Road ICounty of Ventura]********************************************************************************Average Del-ay (sec/veh): 5.9 úlorst Case Levet Of Service: A[ 9.0]********************************************************************************Approach: North Bound South Bound East Bound West BoundMovement: L - T - R L - T - R L - T - R L - T - R
-t--------- |--------- |--------- |---------------lControl: Stop Sign Stop Sign Uncontrofled Uncontrol_l-edRights: Include Include Include IncfudeLanes: 0 0 11 0 0 0 0 0 0 0 0 0 0 1 0 0 1 0 0 0
-t--------- |--------- |--------- |---------------lVofume Module:Base Vol-: B 0 73 0 0 0Growth Adj : 1.00 1 .00 1 .00 1 .00 1.00 1 .00fnitiaf Bse:User Adj:PHF Adj:PHF Vo1ume:Reduct Vof:Final- Vol. :
-t--------- |--------- |--------- |---------------lCriti-caf Gap Module:critical Gp: 6.4 xxxx 6.2 xxxxx xxxx xxxxx xxxxx xxxx xxxxx 4.1 xxxx xxxxxFofl-ohlupTim: 3.5 xxxx 3.3 xxxxx xxxx xxxxx xxxxx xxxx xxxxx 2.2 xxxx xxxxx
- t --------------- |Capacity Module:Cnffict Vol: 289 xxxx 42Potent Cap.: 706 xxxx 1035Move Cap.: 666 xxxx 1035Volume/Cap: 0.01 xxxx 0.07
- t --------------- |Levef Of Service Modufe:
801.00 1.001.00 1.00
800080
1.001.00
130
13
00.00 1.00.00 1 .00
000000
01 .00
01.001 .00
00
0
38003B0000?a
038
110 211.00 1.001 .00 1.00110 2'7
00110 27
01.001.00
0
00
71102101.00 1 .00 1.00 1.00
01.00 1
1.00 1
0
00
1
1
1.1.
'7
0000
1
01
XYYY YYYYY
xxxx xxxxxxxxx xxxxxXXXX XXXX
xxxxxxxxxxxxxxxx
xxxx xxxx xxxxxxxxx xxxx xxxxxxxxx xxxx xxxxxxxxx xxxx xxxx
45 xxxx xxxxx1576 xxxx xxxxx1576 xxxx xxxxx0.07 xxxx xxxx
\
Queue: xxxxx xxxxStopped Del:xxxxx xxxxLOS by Move: * *Movement: LT - LTRShared Cap.: xxxx 981SharedQueue: xxxxx 0 .3Shrd StpDef:xxxxx 9.0Shared LOS: * AApproachDel : 9.0ApproachlOS: A
xxxxxxxxxx
_RTxxxxxxxxxxxxxxx
xxxxx xxxxxxxxx xxxx**
LT _ LTRxxxx lYvv
xxxxx xxxxxxxxx xxxx**
xxxxxx*
XXXXXxxxxx
-RTxxxxxXXXXXXXXXX
xxxxx xxxxXXXXX XXXX**
LT - LTRxxxx xxxx
xxxxx xxxxxxxxx xxxx**
IYYV9Y*
xxxxxXXXXX
-RTvYvvv
YYYYY
xxxxx
0.2 xxxx7.5 xxxxA*
LT - LTRxxxx xxxx0.2 xxxx7 .5 xxxxA*
XYYYYT
xxxxxxxxxx
_RTXXXXXxxxxx
Traffix 7.6.0115 (c) 2003 DowJ-ing Assoc. Licensed to URS coRp., SANTA ANA, cA
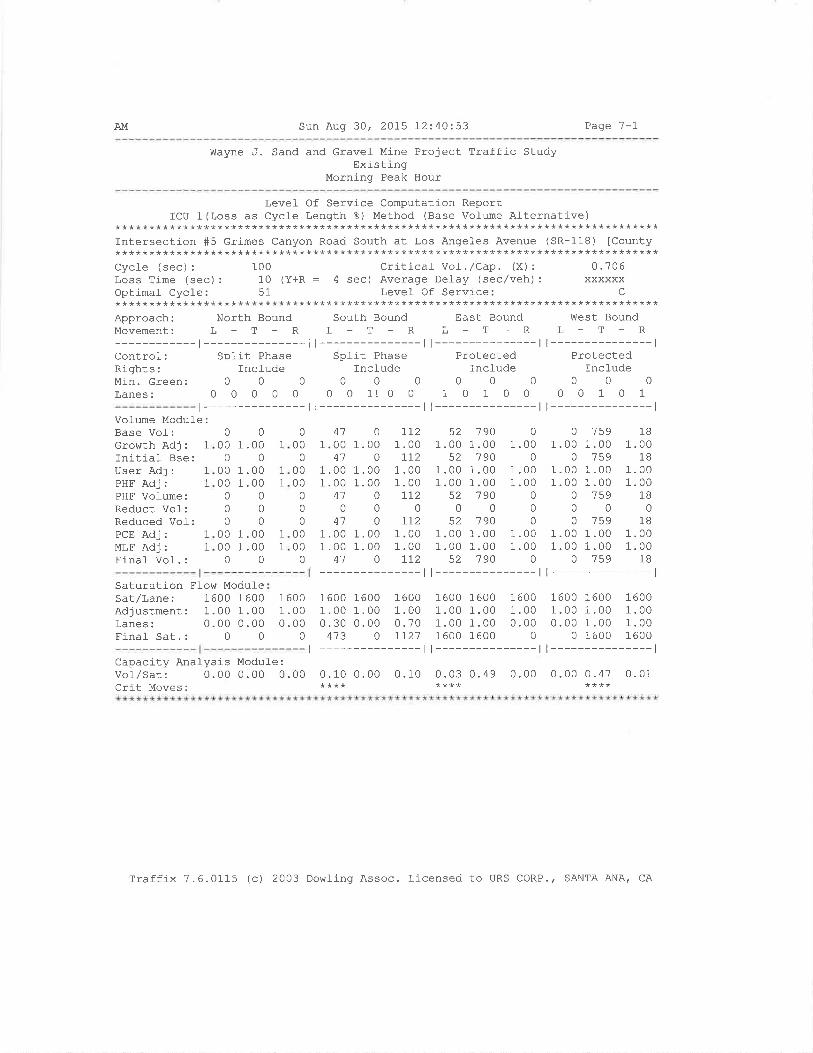
AM Sun Aug 30, 2015 72:40:.53 Page 7-1
Wayne J. Sand and Gravel Mine Project Traffic StudyExistr-ng
Morning Peak Hour
Level Of Service Cornputation ReportfCU 1 (Loss as Cycfe Length 8) Method (Base VoÌume Alternative)
********************************************************************************Intersection #5 crimes Canyon Road South at Los Angel-es Avenue (SR-118) [County********************************************************************************Cycl-e (sec): 100 Critical Vol./Cap. (X): 0.706Loss Time (sec) : 10 (Y+R : 4 sec) Average Delay (sec/veh) : xxxxxxOptimal Cycle: 51 Level Of Service: C********************************************************************************Approach: North Bound South Bound East Bound West BoundMovement: L - T - R L - T - R L - T - R L - T - R
-t--------- |--------- l l--------- l l---------------lControl-: Split Phase Sp1it Phase Protected ProtectedRights: Tncfude Incl-ude fnclude Incl-udeMin.creen: 0 0 0 0 0 0 0 0 0 0 0 0Lanes: 0 0 0 0 0 0 0 1! 0 0 1 0 1 0 0 0 0 1 0 1
r --------------- | --------------- l l --------------- l l --------------- l
Vofl.me Modul-e:Base Vol-:Growth Adj: 1
Initiaf Bse:User Adj: 1
PHF Adj: 1
PHF Vofume:Reduct Vol:Reduced Vof:PCE Adj: 1
MLF Adj: 1
Final Vol. :
000
00000
000
0000
0
0
1 .000
1.001.00
0
0
0
1.001.00
0
1
0
000
0000
0
0
0
0000
0
4'7 0 rL2 52 190 0 0 159 181.00 1.00 1 .00 1.00 1.00 1.00 1.00 1.00 1.00
41 0 1r2 52 790 0 0 159 181.00 1.00 1 .00 1.00 1.00 1.00 1.00 1.00 1.001.00 1.00 1.00 1.00 1.00 1.00 1 .00 1.00 1.00
41 0 7r2 52 '790 0 0 759 18000000000
41 0 7r2 52 190 0 0 159 181 .00 1 .00 1 .00 1.00 1.00 1.00 1 .00 1.00 1.001 .00 1.00 1 .00 1 .00 1.00 1.00 1.00 1.00 1.00
41 0 rr2 52 190 0 0 159 18
| --------------- | I --------------- | t--------------- |
1 .000 .701-1-21
1
1
1
1
Saturation Flow ModufeSat/Lane: 1600 1600Adjustment: 1.00 1.00Lanes: 0.00 0.00Final Sat.: 0 0
1 6001 .000 .00
0
1600 16001.00 1.000.30 0.00413 0
1 6001.001.001 600
1 6001.001 .001 600
00 160000 1.0000 1.000 1600
1 6001.001.001 600
1 600 T61.0.
161.0.
000000
0
Capacity AnalysisVol,/Sat: 0.00Crit Moves:
Modul-e:0.00 0.00 0.10 0.00 0.10 0.03 0.49 0.00 0.00 0.47**** **** ****
0.01
Traffix 7.6.0115 (c) 2003 Dowling Assoc. Licensed to URS CORP., SANTA ANA, CA
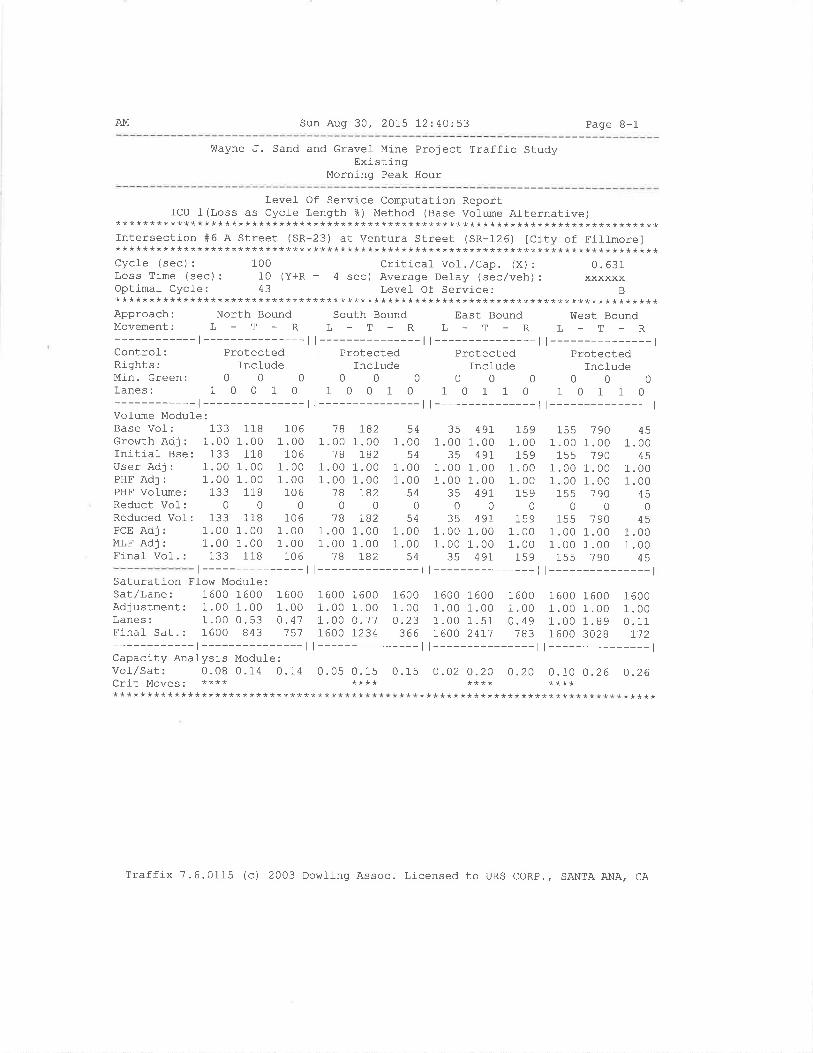
AM Sun Aug 30, 2075 12:40:53 Page B-1
Wayne J. Sand and Gravel Mj-ne Project Traffic StudyExisting
Morning Peak Hour
Level- Of Service Computation ReportICU 1(Loss as Cycl_e Length ?) Method (Base VoJ-ume Afternative)********************************************************************************
Intersection #6 e Street (SR-23) at Ventura Street (SR-126) tCity of Fillmorel********************************************************************************Cycle (sec) : 100 Critical Vo1. /Cap. (X) : 0.631Loss Time (sec) : 10 (Y+R : 4 sec) Average Delay (sec/veh) : xxxxxxOptimaÌ Cycle: 43 Levef Of Service: B********************************************************************************Approach: North Bound South Bound East Bound ülest BoundMovement: L - T - R L - T - R L - T - R L - T - R
-t--------- |--------- |--------- |---------------lControl-: Protected Protected protected protectedRights: Inc.l-ude Include Incfude IncludeMin.creen: 0 0 0 0 0 0 0 0 0 0 0 O
Lanes: 1 0 0 1 0 1 0 0 1 0 1 0 1 1 0 1 0 1 1 0-t--------- |--------- |--------- |---------------l
Volume Modufe:Base Vol: 133 118 106 18 782 54 35 49I 159 155 i9O 45Growth Adj : 1.00 1 .00 1 .00 1.00 1.00 1.00 1 .00 1.00 1.00 1.00 1.00 1. OOInitial- Bse: 133 118 106 18 IB2 54 35 49I 159 155 i9O 45user Adj : 1.00 1.00 1.00 1 .00 1.00 1 .00 1 .00 1 .00 1.00 1 .00 1. OO 1. O0PHF Adj : 1.00 1.00 1.00 1 .00 1.00 1.00 1.00 1.00 1.00 1.00 1.00 1. OOPHF Vol-ume: 133 118 106 18 782 54 35 497 159 155 i90 45Reduct Vol: 0 0 0 0 0 0 0 0 0 0 O O
Reduced Vol-: 133 118 106 1B I82 54 35 49I 159 155 i9O 45PcE Adj : 1.00 1.00 1.00 1 .00 1 .00 1.00 1 .00 1.00 1.00 1 .00 1.00 1. OOMLF Adj : 1.00 1 .00 1 .00 1.00 1.00 1.00 1.00 1.00 1.00 1.00 1.00 1. OOFinaf Vol.: 133 118 106 18 782 54 35 49I 159 155 19O 45
t --------------- | --------------- | --------------- | --------------- l
Saturation Flow Modul-e:sat/Lane: 1600 1600 1600 1600 1600 1600 1600 1600 1600 1600 1600 1600Adjustment: 1.00 1 .00 1 .00 1.00 1 .00 1.00 1.00 1.00 1. 00 1 .00 1.00 1. OOLanes: 1.00 0.53 0.41 1.00 0.77 O.23 1.00 1.51 0.49 1.00 1.89 0.11Finaf Sat.: 1600 843 151 7600 7234 366 7600 2411 783 1600 3028 I'72
-t--------- |--------- |--------- |---------------lCapacity Analysis Module :
Vof /Sat: 0.08 0.14 0.14 0.05 0. 15 0.15 O.02 0.20 O .20 O .1-O O .26 O.26crit Moves. **** **** **** ************************************************************************************
Traffix 7.6.0115 (c) 2003 Dowling Assoc. Licensed to URS coRp., SANTA ANA, cA
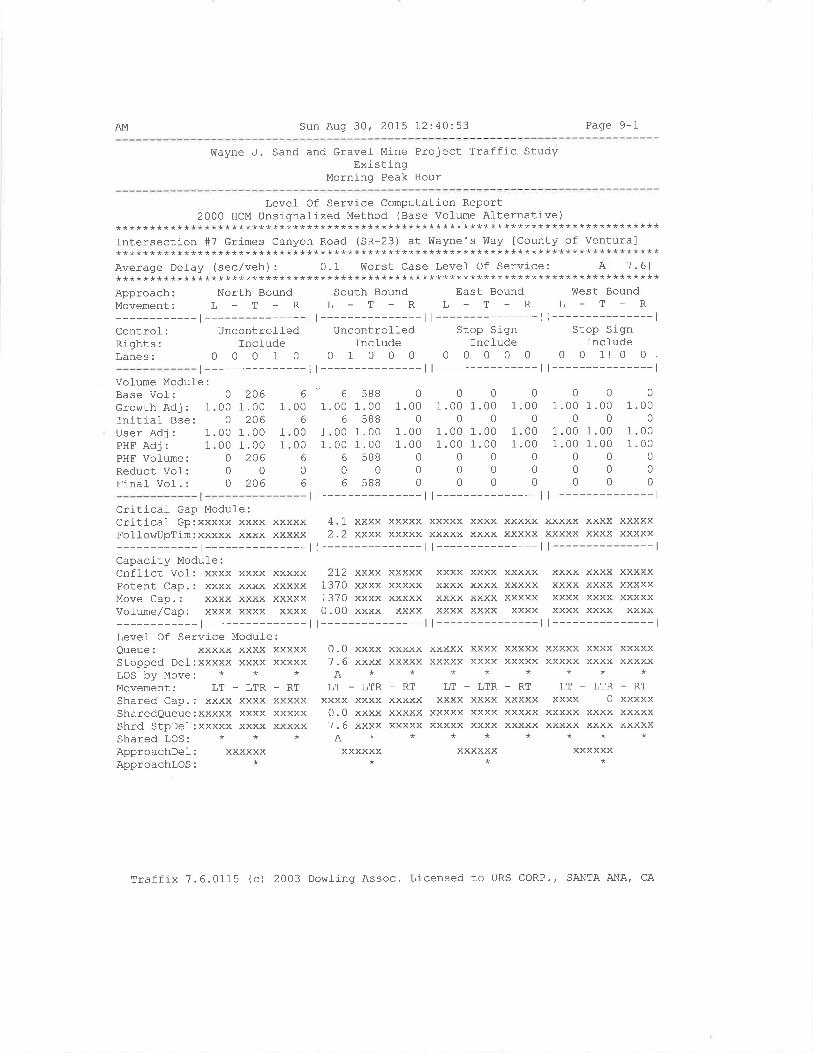
AM Sun Aug 30, 2OI5 12:40:53 Page 9-1
Wayne J. Sand and Gravel- Mine Project Traffic StudyExisting
Morning Peak Hour
Level Of Service Computation Report2000 HCM Unsignalized Method (Base Vol-ume Al-ternative)
********************************************************************************Intersection #7 Grimes Canyon Road (SR-23) at Wayne's Way [County of Ventura]********************************************************************************Average Delay (sec/veh): 0.1 Worst Case Levef Of Service: A[ 1 -61********************************************************************************Approach: North Bound South Bound East Bound West BoundMovement: L - T - R L - T - R L - T - R L - T - R
-r---------ll---------ll---------ll---------------lControl: Uncontroffed Uncontrol-l-ed Stop Sign Stop SignRights: Incfude Incl-ude Include IncludeLanes: 0 0 0 1 0 0 1 0 0 0 0 0 0 0 0 0 0 1! 0 0
t --------------- | --------------- l l --------------- l l --------------- l
Vol-ume Modul-e:Base Vol: 0 206Growth Adj : 1.00 1 .00Initial- Bse: O 206User Adj : 1.00 1.00PHF Adj : 1.00 1.00PHF VoÌume: 0 206Reduct Vof: 0 0Final Vol-.: 0 206
Criticaf Gap Modufe:Critical Gp:xxxxx xxxx xxxxxFol-l-owupTim: xxxxx xxxx xxxxx
-l---------------lCapacity Modufe:Cnfl-i-ct Vof : xxxx xxxx xxxxxPotent Cap.: xxxx xxxx xxxxxMove Cap.: xxxx xxxx xxxxxVolume/Cap: xxxx xxxx xxxx
-t---------------lLevef Of Service Module:Queue: xxxxx xxxx xxxxxStopped Del-:xxxxx xxxx xxxxxLOS by Move: * * *Movement: LT - LTR - RT
Shared Cap.: xxxx xxxxSharedQueue:xxxxx xxxxShrd StpDel:xxxxx xxxxShared LOS: * *ApproachDel: xxxxxxApproachlOS: *
'-'658800000001 .00 1.00 1.00 1 .00 1.00 1.00 1 .00 1 .00 1.00
658800000001.00 1 .00 1.00 1 .00 1. 00 1.00 1 .00 1.00 1.001.00 1.00 1.00 1 .00 1.00 1.00 1 .00 1.00 1.00
658800000000000000006s880000000
|--------- ll--------- ll---------------l
4.1 xxxx xxxxx xxxxx xxxx xxxxx xxxxx xxxx xxxxx2.2 xxxx xxxxx xxxxx xxxx xxxxx xxxxx xxxx xxxxx
t--------------- | | --------------- | I --------------- |
2I2 xxxx xxxxx xxxx xxxx xxxxx xxxx xxxx xxxxx1370 xxxx xxxxx xxxx xxxx xxxxx xxxx xxxx xxxxx1370 xxxx xxxxx xxxx xxxx xxxxx xxxx xxxx xxxxx0.00 xxxx xxxx xxxx xxxx xxxx xxxx xxxx xxxx
| --------------- | I --------------- | I --------------- |
61 .00
6
1 .001 .00
6
06
0.01.6A
LT
XXXXXXXX
- LTR
xxxxxxxxxx
_RT
xxxxx xxxxxxxxx xxxx**
LT _ LTR
xxxxxxxxxx
-RT
xxxxx xxxx xxxxxxxxxx xxxx xxxxx***
LT_LTR-RTxxxxxXXXXXXXXXX
XXXXXXXXXXXXXXX
xxxx xxxx xxxxx xxxx xxxx xxxxx xxxx 0
0.0 xxxx xxxxx xxxxx xxxx xxxxx xxxxx xxxx7.6 xxxx xxxxx xxxxx xxxx xxxxx xxxxx xxxxA*******xxxxxx xxxxxx xxxxxx***
Traffix 7.6.0115 (c) 2003 Dowling Assoc. Licensed to URS CORP.' SANTA ANA, CA
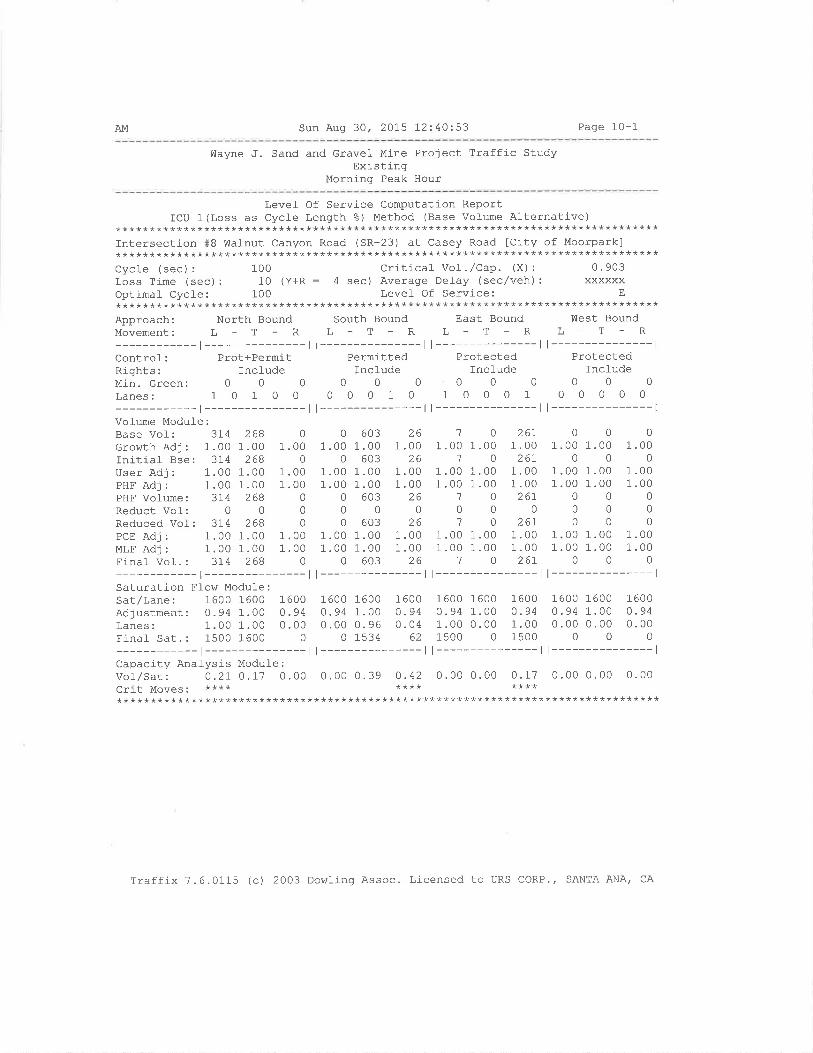
AM Sun Aug 30, 2015 12:40:53 Page 10-1
þlayne ,f. Sand and Gravel Mine Project Traffic StudyExisting
Morninq Peak Hour
Level Of Service Computation ReportICU 1(Loss as Cycle Length å) Method (Base VolÌjme Alternative)
********************************************************************************Intersection #8 Wafnut Canyon Road (SR-23) at Casey Road ICity of Moorpark]********************************************************************************cycl-e (sec) : 100 critical Vol . ,/cap. (X) : 0 . 903Loss Time (sec) : 10 (Y+R : 4 sec) Average Defay (sec/veh) : xxxxxxOptinal Cycle: 100 Level- Of Service: E********************************************************************************Approach: North Bound South Bound East Bound West BoundMovement: L - T - R L - T - R L - T - R L - T - R
-t---------ll---------ll---------ll---------------lControf: Prot+Permit Permitted Protected ProtectedRights: Incl-ude Include Incfude IncludeMin.Green: 0 0 0 0 0 0 0 0 0 0 0 0
Lanes: 1 0 1 0 0 0 0 0 1 0 1 0 0 0 1 0 0 0 0 0
-l---------ll---------ll---------ll---------------lVol-ume Module:Base VoI: 3L4 268 0 0 603 26 '7 0 261 0 0 0
GrowthAdj: 1.001.00 1.00 1.001.00 1.00 1'001.00 1.00 1.001.00 1.00Initiaf Bse: 314 268 0 0 603 26 '7 0 26L 0 0 0
User Adj : !.00 1.00 1 .00 1.00 1.00 1 .00 1 .00 1.00 1.00 1 .00 1.00 1.00PHF Adj : 1.00 1.00 1 .00 1.00 1.00 1.00 1 .00 1.00 1.00 1 .00 1 .00 1.00PHF Volume: 374 268 0 0 603 26 '7 O 267 0 0 0
Reduct Vol-: 0 0 0 0 0 0 0 0 0 0 0 0
Reduced Vol-: 374 268 0 0 603 26 1 0 267 0 0 0
PcEAdj: 1.001.00 1.00 1.001.00 1.00 1.001.00 1.00 1.001.00 1.00MLFAdj: 1.00 1.00 1.00 1.00 1.00 1.00 1.00 1.00 1.00 1.00 1.00 1.00Final VoÌ.: 314 268 0 0 603 26 1 0 261 0 0 0
-r---------ll---------ll---------ll---------------lSaturation Ffow Modul-e:Sat/Lane: 1600 1600Adjustment: 0.94 1.00Lanes: 1.00 1.00Final Sat.: 1500 1600
-t---------ll---------ll---------ll---------------lCapacity Analysis Module :
VoÌ/Sat: O.2I 0.I1 0.00 0.00 0.39 O.42 0.00 0.00 O.L1 0.00 0.00 0.00Cfit MOVeS. **** **** ************************************************************************************
1 600nq¿0.00
0
1600 16000.94 1.000.00 0. 96
ô 1q?¿
1 6000.940.04
62
1 6000.941 .001 500
00 160000 0.9400 1.000 1500
L61.0.
I60.n
00 1600 160094 1.00 0.9400 0.00 0.00000
Traffix 7.6.0115 (c) 2003 Dowling Assoc. Licensed to URS CORP., SANTA ANA, CA
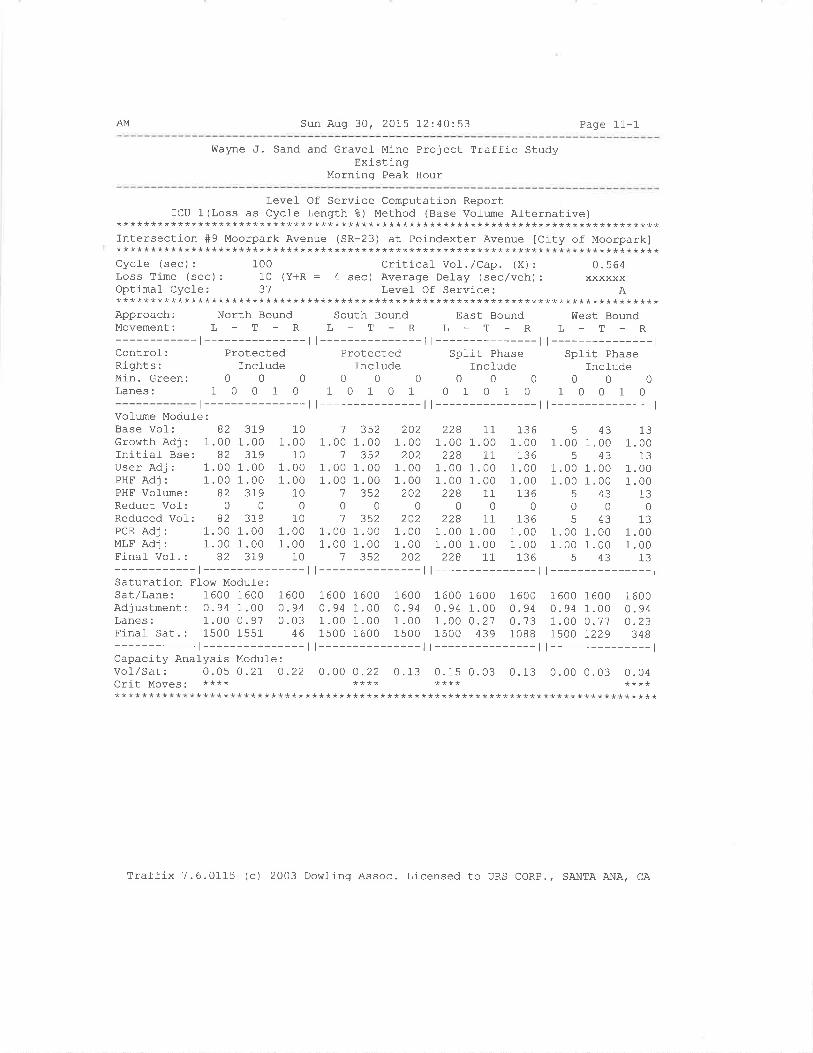
AM Sun Aug 30, 2015 12:40:53 Page 11-1
Wayne J. Sand and Gravel- MlneExisting
Morning Peak
Project Traffic Study
Hour
Level Of Service Computation ReportICU 1 (Loss as Cycle Length 8) Method (Base Vol-ume Atternative)********************************************************************************
Intersection #9 Moorpark Avenue (SR-23) at Poindexter Avenue ICity of Moorpark]********************************************************************************Cycle (sec): 100 Critical Vol./Cap. (X): 0.564Loss Time (sec): 10 (Y+R : 4 sec) Average Delay (sec/veh): xxxxxxOptimal Cycle: 31 Level Of Service: A********************************************************************************Approach: North Bound South Bound East Bound hlest BoundMovement: L - T - R L _ T - R L _ T - R L _ T - R
-j---------------lControl: ProtectedRights: fncfudeMin.Green: 0 0 0Lanes: 1 0 0 1 0
Vofume Modufe:Base Vol: 82 319 10Growth Adj : 1.00 1.00 1.00Initial- Bse: 82 319 10User Adj : 1.00 1 .00 1.00PHF Adj: 1.00 1.00 1.00PHF Vol-ume: 82 319 1-0
Reduct Vol-: 0 0 0Reduced Vof: 82 319 10PCE Adj : 1.00 1 .00 1.00MLF Adj : 1.00 1 .00 1 .00Final- Vol-. : 82 319 10
-t---------------lSaturation Flow Modufe:Sat/Lane: 1600 1600 1600Adjustment: 0.94 1.00 0.94Lanes: 1.00 0.97 0.03Finaf Sat.: 1500 1551 46
-t---------------lCapacity Anafysis Modul-e :
t---------------lProtected
Include000
10101
1600 1600 16000.94 1.00 0.941 .00 1.00 1 .001500 1600 1500
l---------------l
l---------------lSpfit Phase
Include000
01010
1600 1600 16000.94 1.00 0.94r.00 0.21 0.731500 439 1088
l---------------l
l---------------lSplit Phase
Include000
10010l---------------l| --------------- | r--------------- | t--------------- |
1 352 2021.00 1.00 1.00
'7 352 2021 .00 1.00 1 .001 .00 1.00 1 .00
1 352 2020001 352 202
1.00 1.00 1.001 .00 1.00 1 .00
1 352 202t---------------l
228 11 1361 .00 1.00 1.00228 11 136
1 .00 1.00 1.001 .00 1.00 1 .00228 11 736
000228 11 136
1 .00 1.00 1.001 .00 1. 00 1.00228 11 136
l---------------r
51 .00
1.001.00
5
05
1.001.00
5
431.00
431. 001.00
430
431. 001.00
43
131.00
131.001 .00
130
131.001.00
13l---------------l1600 1600 16000. 94 1.00 0. 941.00 0.77 0.231500 1229 348
l---------------l
Vol,/Sat: 0.05 0.21 O .22 0.O0 0 .22 0. 13 0.15 0.03 0. 13 0.00 0.03 O. 04crit Moves. **** **** **** ************************************************************************************
Traffix 7.6.0115 (c) 2003 Dowllng Assoc. Licensed to URS CORP., SANTA ANA, CA
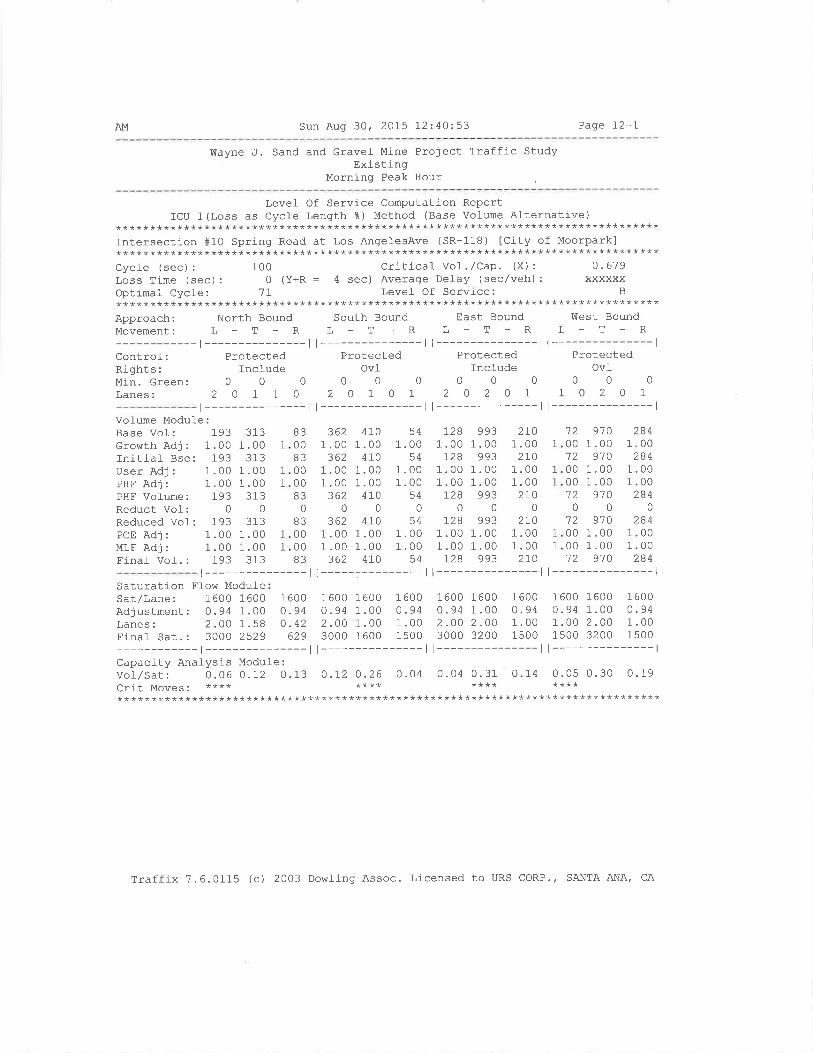
AM Sun Aug 30, 2015 12:40:53 Page 12-1
vilayne J. Sand and Gravel- Mine Project Traffic StudyExisting
Morning Peak Hour
Level Of Service Computation ReportIcU 1 (Loss as cycfe Length t) Method (Base Vol-ume Afternative)
********************************************************************************Intersection #10 Spring Road at Los AngelesAve (SR-118) [City of Moorpark]********************************************************************************Cycle (sec): 100 Critical Vol./Cap. (X): 0-619Loss Time (sec): 0 (Y+R = 4 sec) Average Delay (sec/veh): xxxxxxOptimal Cycle: '7I Levef Of Service: B********************************************************************************Approach: North Bound South Bound East Bound l¡lest BoundMovement: L - T _ R L - T - R L - T - R L - T - R
-l---------ll---------ll---------ll---------------lControl: Protected Protected Protected ProtectedRights: Include Ovl Incl-ude Ovl-
Min.Green: O 0 0 0 0 0 0 0 0 0 0 0
Lanes: 2 0 1 1 0 2 0 1 0 1 2 O 2 0 1 1 O 2 0 1
r---------------ll---------------ll---------------ll---------------lVofume Modul-e:Base Vol-: 193Growth Adj : 1.00Initial- Bse: 193User Adj : 1.00PHF Adj : 1.00PHF Vofume: 193Reduct Vol: 0
Reduced Vol: 193PcE Adj : 1.00MLF Adj : 1.00Final- Vof. : 193
Saturation Flow ModuleSat/Lane: 1600 1600Adjustment: 0.94 1.00Lanes: 2.00 1.58Finaf Sat. : 3000 2529
3131 .00
3131 .001 .00
3130
3131 .001 .00
313
8300830000B3
0B30000B3
3621 .00
?6)1 .001 .00
3620
3621 .001 .00
362
4101.00
4101.001.00
4100
4101 .001 .00
410
541 .00
541 .001 .00
540
541 .001 .00
54
7281.00
1281.001 .00
12B0
r281 .001.00r28
9931.00
9931.001.00
9930
9931.001. 00
993
2101.00
2101.001.00
2700
2701 .001.002r0
00
000012
012000012
9'7 0
1 .00910
1.001.00
9100
9701 .001.00
910
2841.00
2841.001.00
2840
2841.001.00
284
1
1
1,
1
1
1
1
1
1
1
t--------------- l l----- --------- l l---------------l l---------------l1 600nq¿
^I)629
1 600o.942.003000
00 160000 0.9400 1.0000 1500
1600 16000.94 1.002.OO 2.003000 3200
16000 .941.001500
1 6000.941 .001 500
1 6001.002.003200
1 6000.941.001500
761.1.1,6
-r---------ll---------ll---------ll---------------lCapacity Analysis Module:vol,/Sat: 0 .06 0 .I2 0.13 0 .I2 O.26 0.04 0.04 0. 31 0.14 0.05 0.30 0. 19
crit Moves. **** **** **** ************************************************************************************
Traffix 7.6.0115 (c) 2003 Dowlj-ng Assoc. Licensed to URS CORP., SANTA ANA, CA
PM Sun Aug 30, 2015 12:42:08 Page 1-1
Wayne J. Sand and Gravel Mine Project Traffic StudyExistrng
Evening Peak Hour
Scenario
Command:Volume:Geometry:Impact Fee:Trip Generation:Trip Distribution:Paths:Routes:Configuration:
Scenarlo ReportPM
PM
PM
ExistingDefaul-t fmpact FeePM
PM
Defauft PathsDefault RoutesExi st ing
Traffix 7.6.0115 (c) 2003 Dowling Assoc. Licensed to URS CORP., SANTA ANA' CA
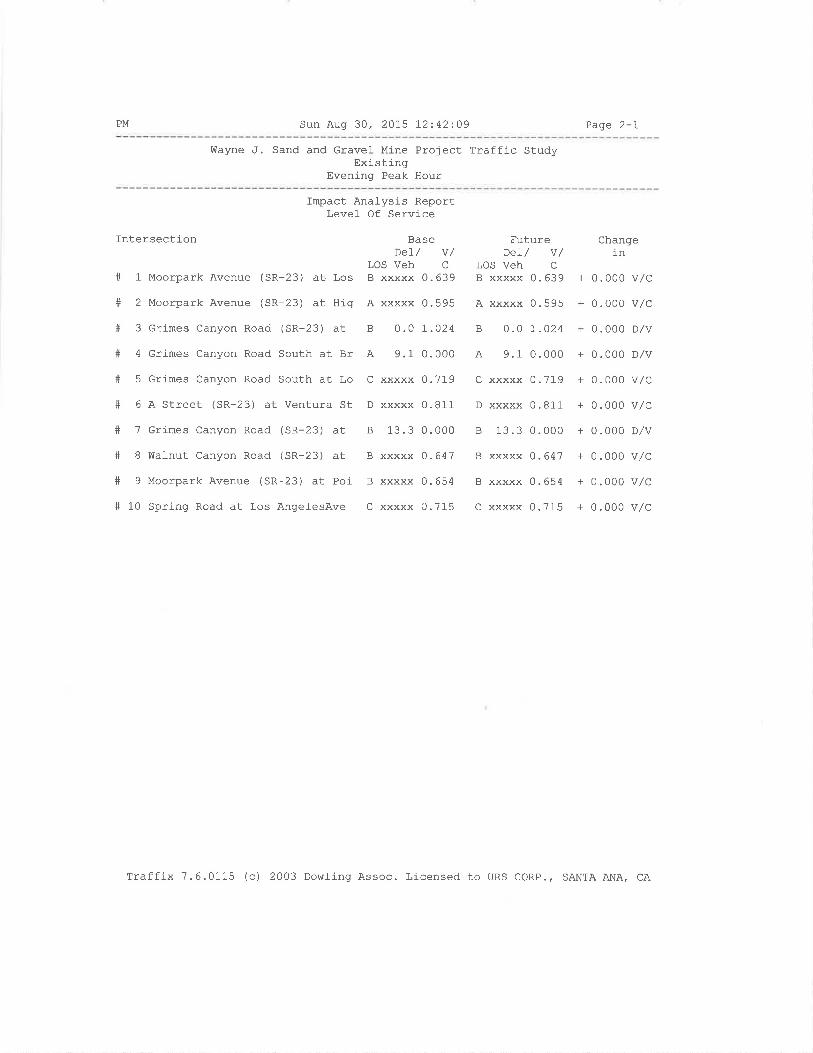
PM Sun Auq 30, 2015 12:42:09 Page 2-1
Wayne J. Sand and Gravel Mlne Project Traffic StudyExisting
Evening Peak Hour
Intersection
Moorpark Avenue (SR-23) at Los
Moorpark Avenue (SR-23) at Hig
Grimes Canyon Road (SR-23) at
Grimes Canyon Road South at Br
Grimes Canyon Road South at Lo
A Street (SR-23) at Ventura St
Grimes Canyon Road (SR-23) at
Walnut Canyon Road (SR-23) at
Moorpark Avenue (SR-23) at Poi
Spring Road at Los Angel-esAve
Impact Analysis ReportLevel- Of Service
BaseDeI/ v/
LOS Veh C
B xxxxx 0.639
A xxxxx 0.595
B 0. 0 7.024
A 9.1 0.000
C xxxxx 0.719
D xxxxx 0.811
B 13 .3 0.000
B xxxxx 0.647
B xxxxx 0.654
C xxxxx 0.715
#1fr¿
#3+4#5#6#7#8#e# 10
Futureoel-/ V/
LOS Veh C
B xxxxx 0.639
A xxxxx 0.595
B 0. o I.o24
A 9.1 0.000
C xxxxx 0.719
D xxxxx 0.811
B 13.3 0.000
B xxxxx 0.647
B xxxxx 0.654
C xxxxx 0.715
Changein
+ 0.000 v,/c
+ 0.000 v,/c
+ 0.000 D/v
+ 0.000 D/V
+ 0.000 v,/c
+ 0.000 v,/c
+ 0.000 D,/V
+ 0 .000 v,/c
+ 0.000 v,/c
+ 0.000 v,/c
Traffix 7.6.0115 (c) 2003 Dowling Assoc. Licensed to URS CORP., SANTA ANA, CA
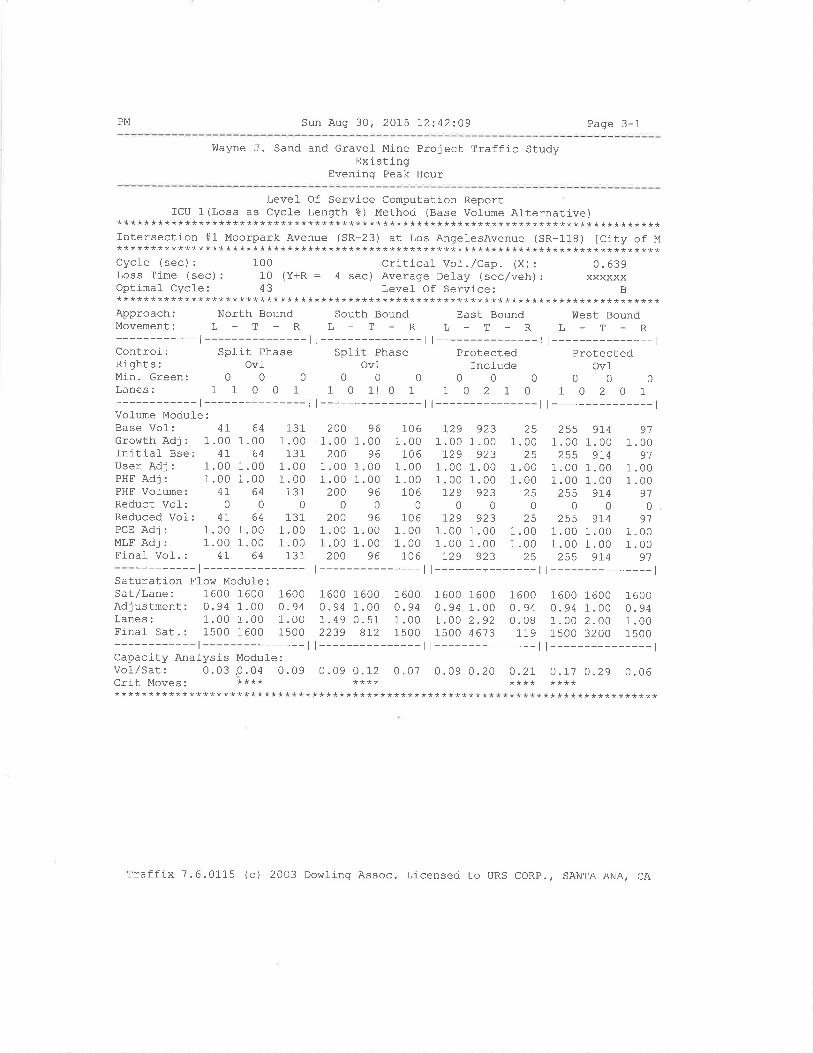
PM Sun Aug 30, 2015 t2:42:09 Page 3-1
!ùayne J. Sand and Gravel Mine Project Traffic StudyExisting
Evening Peak Hour
Level Of Service Computation ReportICU 1 (Loss as Cycl-e Length 8) Method (Base Volume Afternative)********************************************************************************
Intersection #1 Moorpark Avenue (SR-23) at Los AngelesAvenue (SR-118) tCity of M********************************************************************************Cycle (sec) : 100 Critical Vol-.,/Cap. (X) : 0.639Loss Time (sec) : 10 (Y+R : 4 sec) Average Delay (sec/veh) : xxxxxxOptimal- Cycle: 43 Level- Of Service: B********************************************************************************Approach: North Bound South Bound East Bound !ùest BoundMovement: L - T _ R L _ T - R L - T _ R L - T - R
-t--------- l t--------- |--------- |---------------lControl-: SpJ-it Phase Split Phase protected protectedRights: Ovl- Ovl Incl-ude OvfMin.Green: 0 0 0 0 0 0 0 0 0 O O O
Lanes: 1 1 0 0 1 1 0 1! 0 1 1 0 2 1 0 1 0 2 0 1
-t--------- |--------- |--------- |---------------lVol-ume Module:Base Vol: 41 64 131 2O0 96 106 729 923 25 255 9I4 91GrowthAdj: 1.00 1.00 1.00 1.00 1.00 1.00 1.00 1.00 1.00 1.00 1.00 1.00Initial- Bse: 4L 64 131 2O0 96 106 I29 923 25 2SS 914 91user Adj : 1 .00 1.00 1.00 1 .00 1.00 1.00 1 .00 1.00 1.00 1 . O0 1.00 1. OOPHF Adj : 1.00 1.00 1 .00 1 .00 1.00 1 .00 1 .00 1.00 1.00 1 .00 1.00 1. OOPHF Volume: 47 64 131 20O 96 106 I29 923 25 255 9I4 9iReduct Vol-: 0 0 0 0 0 0 0 0 0 O O O
Reduced Vol: 47 64 131 200 96 106 I29 923 25 255 9I4 9iPcE Adj : 1.00 1.00 1 .00 1 .00 1.00 1 .00 1.00 1.00 1.00 1 . O0 1. OO 1. OOMLFAdj: 1.001.00 1.00 1.001.00 1.00 1.001.00 1.00 1.001.00 1.OOFinal Vol-. : 41 64 131 200 96 106 I29 923 25 255 9I4 91
-l---------ll---------ll---------ll---------------lSaturation Elow Modufe:Sat/Lane: 1600 1600 1600 1600 1600 1600 160o 16oo 1600 1600 16oo 16ooAdjustment: 0.94 1.00 0 .94 0 . 94 1.00 O .94 0. 94 1.00 O.94 0. 94 1. OO O. 94Lanes: 1.00 1 .00 1 .00 1.49 0.51 1.00 7.OO 2.92 0. 08 1 .00 2.00 1 .00Final sat.: 1500 1600 1500 2239 B].2 1500 1500 4673 119 15oo 3200 1500
-t--------- |--------- |--------- |---------------lCapacity Analysis Module:vol/Sat: 0.03.0.04 0.09 O.O90.72 0.07 0.090.20 O.2I O.7':.0.29 0.06crit Moves. **** **** **** ************************************************************************************
Traffix 7.6.0115 (c) 2003 Dowling Assoc. Licensed to URS coRp., SANTA ANA, cA
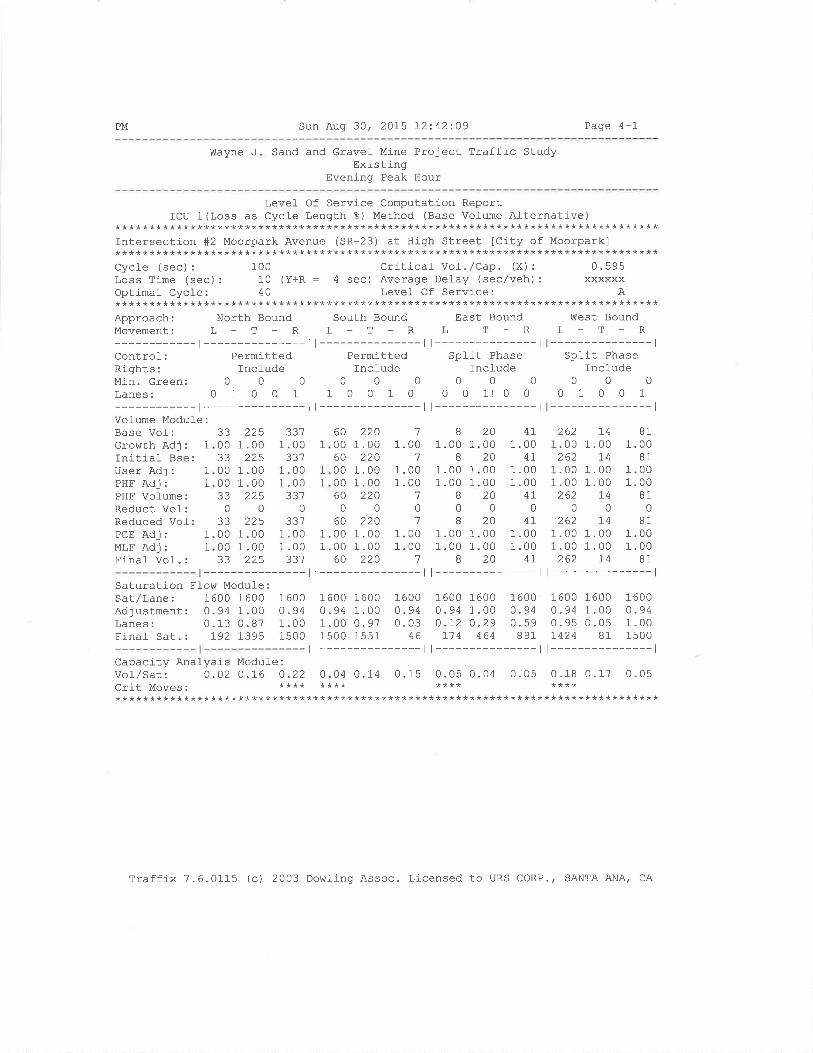
PM Sun Aug 30, 2015 12:42:09 Page 4-1
Wayne J Sand and Gravel MineExisting
Project Traffic Study
Evening Peak Hour
Level- Of Service Computation ReportICU 1 (Loss as Cycle Length ?) Method (Base VoÌume Alternative)
********************************************************************************Intersection #2 Moorpark Avenue (SR-23) at High Street ICity of Moorpark]********************************************************************************Cycl-e (sec) : 100 Criticaf Vot.,/Cap. (X) : 0.595Loss Tíme (sec): 10 (Y+R : 4 sec) Average Delay (sec/veh): xxxxxxOptimal Cycle: 40 Level Of Service: A********************************************************************************Approach: North Bound South Bound East Bound West BoundMovement: L - T - R L - T - R L - T - R L - T - R
-r--------- l l--------- r--------- l l---------------lcontrol: Permitted Permitted Split Phase SpJ-it PhaseRights: Incfude Incfude Incl-ude IncludeMin.creen: 0 0 0 0 0 0 0 0 0 0 0 0Lanes: 0 1 0 0 1 1 0 0 1 0 0 0 1! 0 0 0 1 0 0 1
-t---------ll---------ll---------ll---------------lVofume Modu.Ie:Base Vol:Growth Adj: 1
Initial Bse:User Adj: 1
PHF Adj: 1
PHF Volume:Reduct Vol:Reduced Vol:PCE Adj: 1
MLF Adj: 1
Finaf Vol.:
2?
0033000033
022
000033
2251 .00
22s1 .001 .00
2250
2251 .001 .00tt\
21a
1 .00
1.001.00
3370
??f
1 .001 .00
33?
600060000060
060000060
2201 .00
2201 .001.00
2200
220I .001 .00
220
1
1 .001
1 .001 .00
7
01
1.001.00
1
B
1.00I
1.001.00
o
0
8
1.001.00
I
262.00262.00.00262
0262.00.00262
I41 .00
t41 .001 .00
740
741 .001 .00
I4
B11.00
B11 .001.00
810
811 .001 .00
81
1
200020000020
020000020
4I1.001
1
1
1
1
1
1
1.001.00
470
1.001 .00
47
4I
471
1
t --------------- | --------------- l l --------------- l l --------------- l
Saturation Fl-ow ModuleSat/Lane: 1600 1600Adjustment: 0.94 1.00Lanes: 0.13 0.87Final Sat. : 792 7395
1 600o.941 .001 500
1 6000.940.03
46
1 600o.941 .001500
1600 16000.94 1.001 .00 0. 971500 1551
1600 16000.94 1.000 .72 0.29
r1 4 464
1600 16000.94 1 .000.95 0.051424 81
1 6000 .940.59
891
Capacity Analysis Modul-e :
Vol-/Sat: 0 .O2 O .76 0 .22 0.04 0.14 0.15 0.05 0.04 0.05 0.18 0.17 0.05Cfit MOVeS. **** **** **** ************************************************************************************
Traffix 7.6.0115 (c) 2003 DowÌing Assoc. Licensed to URS CORP., SANTA ANA, CA
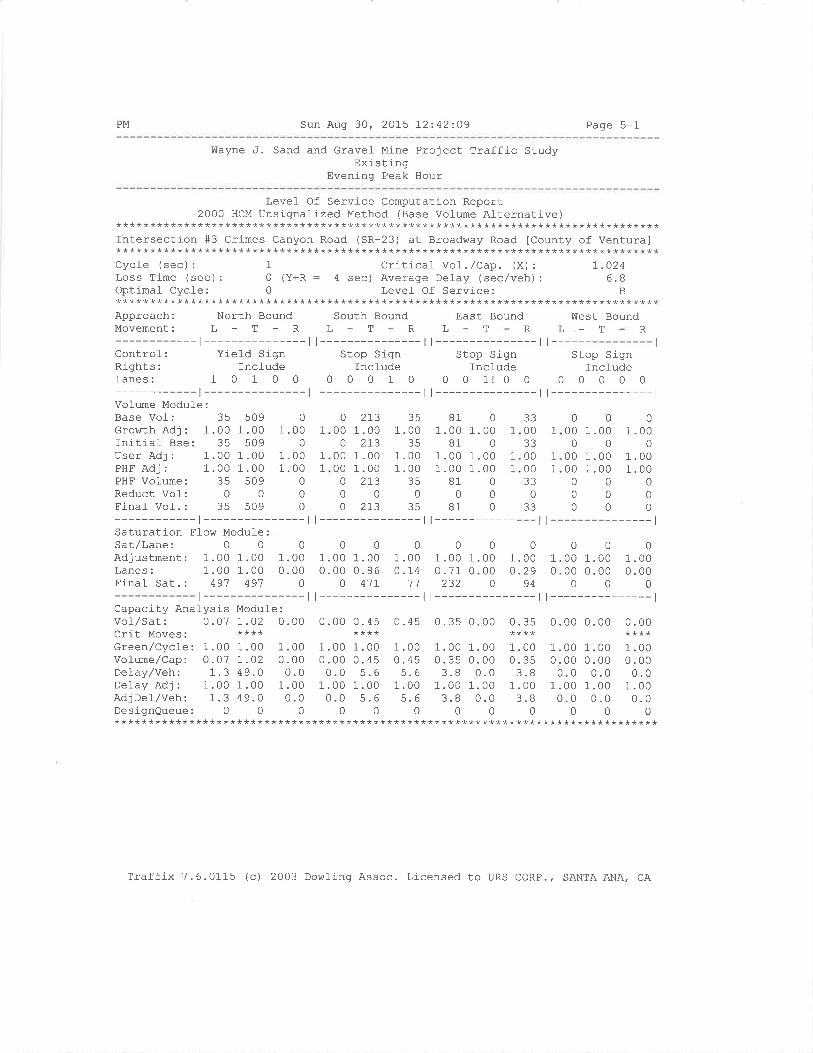
PM Sun Aug 30, 2015 72:42:09 Page 5-1
Wayne J. Sand and Gravef Mine Project Traffic StudyExisting
Evening Peak Hour
Level Of Service Computation Report2000 HCM Unsignalized Method (Base Volurne Alternative)********************************************************************************
Intersection #3 Grimes Canyon Road (SR-23) at Broadway Road [County of Ventura]********************************************************************************Cycle (sec): 1 Critícal Vol./Cap. (X): 7.024Loss Time (sec): 0 (Y+R : 4 sec) Average Delay (sec/veh): 6.8Optimal- Cycle: 0 Level- Of Service: B********************************************************************************Approach: North BoundMovement: L - T - R
-t---------------lControl: Yield SignRights: IncludeLanes: 1 0 1 0 0
-t---------------lVolume Module:Base Vol: 35 509 0Growth Adj : 1.00 1 .00 1 .00Initial Bse: 35 509 0User Adj : 1 .00 1 .00 1.00PHF Adj : 1 .00 1 .00 1.00PHF Vol-ume: 35 509 0Reduct Vol: 0 0 0Final- VoI.: 35 509 0
LSouth Bound East Bound Í{est Bound
R
l---------------lStop Sign
Incfude00000
l---------------l
T RL-T RL-T| --------------- | I --------------- |
Stop Sign Stop SignIncl-ude Include
0 0 0 1 0 0 0 1! 0 0
| --------------- | | --------------- ¡
1
1
1
1
I1
1
1
1_
0 2r300 1.00o 273
00 1.0000 1 .00o 2r300o 2L3
?R
1 .00?q
1 .001 .00
)c
035
81 01.00 1.00
81 01.00 1.001.00 1.00
81 000
81 0
0000 1.0000
00 1.0000 1.00000000
01 .00
01.001.00
00
0
?2
0033000033
0
-t--------- |--------- |--------- |---------------lSaturation Ffow Module:Sat,/l,ane: 0 0 0 0 0 0 0 0 0 0 0 0Adjustment: 1.00 1.00 1.00 1.00 1.00 1.00 1.00 1.00 1.00 1.00 1.00 1.00Lanes : 1.00 1.00 0.00 0.00 0. B6 0 .14 0.71 0.00 0 .29 0 .00 0.00 0.00Final- Sat. : 491 491 0 0 41I 11 232 0 94 0 0 0
t --------------- | --------------- | --------------- | --------------- l
Capacity Analysj-s Module:Vol/Sat: 0 .01 7 .O2 0.00 0.00 0. 45 0.45 0 .35 0. 00 0.35 0.00 0.00 0.00crit Moves: **** **** **** ****Green/Cycfe: 1 .00 1 .00 1.00 1.00 1.00 1 .00 1.00 1.00 1.00 1 .00 1.00 1.00Volume/Cap: 0.01 7.02 0.00 0.00 0.45 0.45 0.35 0.00 0.35 0.00 0.00 0.00Delay/veh: 1.3 49.0 0.0 0.0 5.6 5.6 3.8 0.0 3.8 0.0 0.0 0.0Delay Adj : 1.00 1 .00 1 .00 1 .00 1.00 1 .00 1 .00 1.00 1.00 1.00 1.00 1.00AdjDel,/veh: 1.3 49.0 0.0 0.0 5.6 5.6 3.8 0.0 3.8 0.0 0.0 0.0DesignQueue: 0 0 0 0 0 0 0 0 0 0 0 0********************************************************************************
Traffj-x 7.6.0115 (c) 2003 DowJ-ing Assoc. Licensed to URS CORP., SANTA ANA, CA
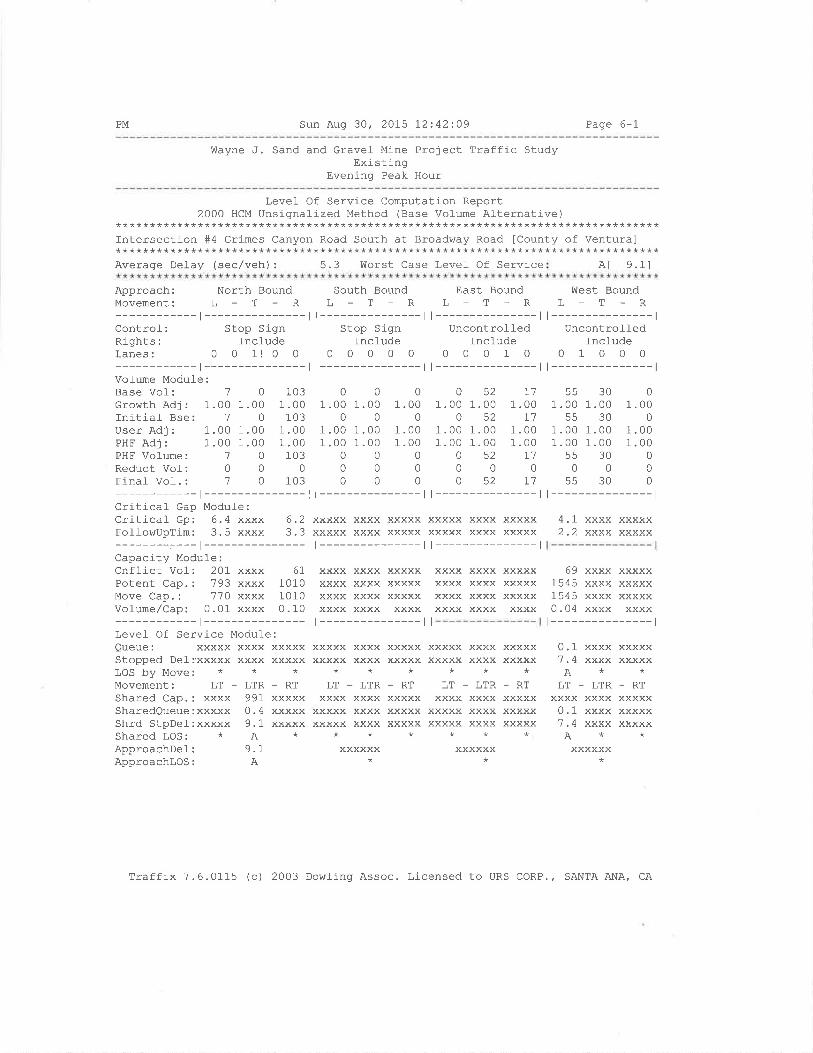
PM Sun Aug 30, 201,5 L2:42:09 Page 6-1
Wayne J. Sand and Gravel Mine Project Traffic StudyExisting
Evening Peak Hour
Level- Of Service Computation Report2000 HCM Unsignal-ized Method (Base Volume Alternative)
fntersection #4 Grimes Canyon Road South at Broadvlay Road ICounty of Ventura]********************************************************************************
********************************************************************************Average Del-ay (sec/veh) : 5.3 Worst Case Level- Of Service At 9.11
Approach: North Bound South Bound East BoundMovement: L - T - R L - T - R L - T - R
-t--------- |--------- |---------------lControl: Stop Sign Stop Sign UncontrolledRights: Include Include IncÌudeLanes: 0 0 11 0 0 0 0 0 0 0 0 0 0 1 0
-r--------- |--------- |---------------lVolume Module:Base Vol: 'l 0 103 0 0 0 0 52 I'7crourth Adj : 1.00 1 .00 1 .00 1.00 1.00 1 .00 1.00 1. 00 1.00InitialBse: 1 0 103 0 0 0 0 52 11User Adj : 1.00 1 .00 1.00 1.00 1.00 1 .00 1 .00 1. 00 1.00PHF Adj : 1.00 1 .00 1 .00 1 .00 1.00 1 .00 1 .00 1.00 1.00PHFVoI-ume: 1 0 103 0 0 0 0 52 l1Reduct Vol: 0 0 0 0 0 0 0 0 0
Final Vof .: '7 O 103 0 0 0 0 52 11-t--------- |--------- |---------------rCriticaf Gap Module:Critical Gp: 6.4 xxxx 6.2 xxxxx xxxx xxxxx xxxxx xxxx xxxxxFollowUpTim: 3.5 xxxx 3.3 xxxxx xxxx xxxxx xxxxx xxxx xxxxx--------:---l---------ll---------ll---------------lCapacity Module:Cnflict Vo1: 201 xxxx 6L xxxx xxxx xxxxx xxxx xxxx xxxxxPotent Cap.: 793 xxxx 1010 xxxx xxxx xxxxx xxxx xxxx xxxxxMove Cap.: 770 xxxx 1010 xxxx xxxx xxxxx xxxx xxxx xxxxxVolume/Cap: 0.01 xxxx 0.10 xxxx xxxx xxxx xxxx xxxx xxxx
!ìlest BoundL_T-R
l---------------lUncontroffed
Include01000
t---------------lss300
1.00 1.00 1.005s300
1.00 1.00 1.001.00 1.00 1.00
55300000
55300t---------------l
4.7)) xxxx xxxxxxxxx xxxxx
69 xxxx xxxxx1545 xxxx xxxxx1545 xxxx xxxxx0.04 xxxx xxxx
l---------------l
Queue: xxxxx xxxxStopped Del-:xxxxx xxxxLOS by Move: * *Movement: LT - LTRShared Cap.: xxxx 997SharedQueue : xxxxx 0. 4
Shrd StpDeÌ:xxxxx 9.1Shared LOS: * AApproachDef: 9.IApproachlos: A
xxxxx xxxxx xxxxxxxxx xxxxx xxxx***-RT LT-LTRXXXXX XXXX XXXXxxxxx xxxxx xxxxxxxxx xxxxx xxxx***
vvY?vq*
xxxxxXXXXX
-RTxxxxxxxxxxxxxxx
xxxxx xxxxxxxxx xxxx**
LT - LTRYvtt vvYY
xxxxx xxxxXXXXX XXXX**
xxxxxx*
xxxxxxxx
- LTRvvvt
xxxx
xxxxxx
xxxxxXXXXX
-RTxxxxxXXXXXYYYYY
XXXXX
-RTXXXXXXXXXXxxxxx
ALT
0.11.4
0.11¿.
?9!V
A
Traffix 7.6.0115 (c) 2003 Dowling Assoc. Licensed to URS CORP., SANTA ANA, CA
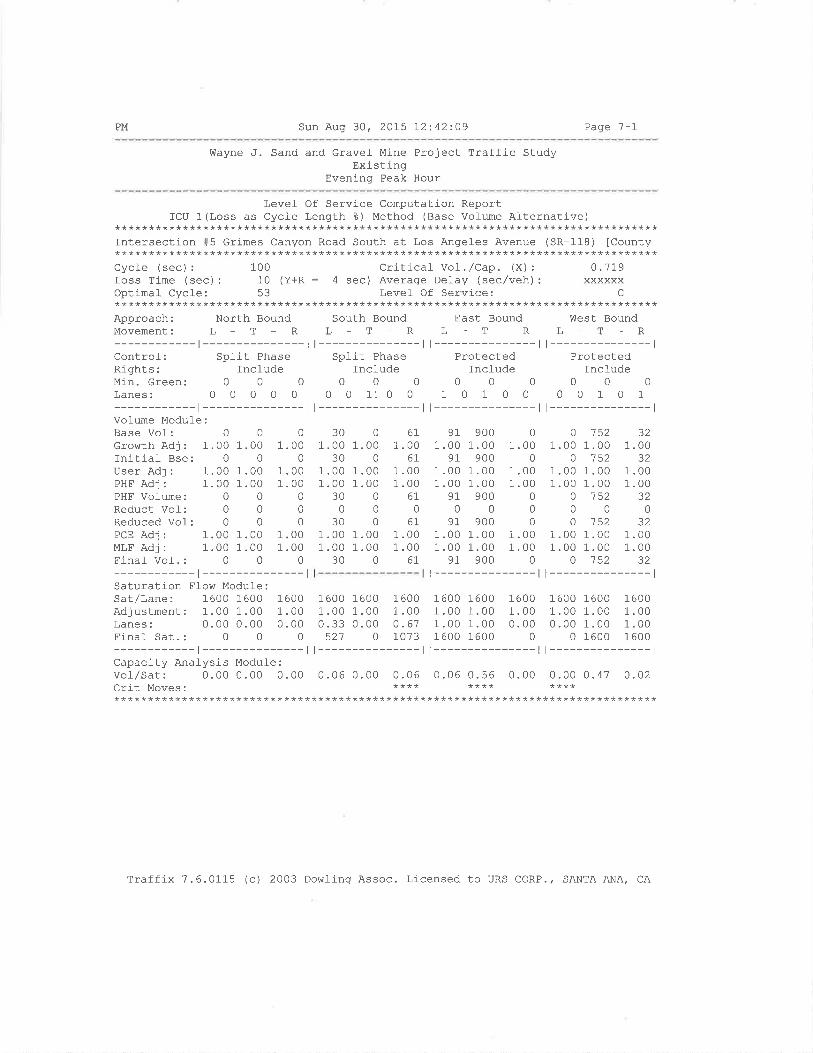
PM Sun Auq 30, 2015 72:42209 Page 7-1
Wayne J. Sand and Gravel- Mine Project Traffic StudyExistrng
Evening Peak Hour
Level Of Service Computation ReportICU 1 (Loss as Cycle Length å) Method (Base Volume Alternative)********************************************************************************
Intersection #5 Grimes Canyon Road South at Los Angefes Avenue (SR-118) lcounty********************************************************************************Cycle (sec): 100 Critical Vo]./Cap. (X): 0.179Loss Time (sec) : 10 (Y+R = 4 sec) Average Delay (sec/veh) : xxxxxxOptimal- Cycle: 53 Level- Of Servj-ce: C******++************************************************************************Approach: North BoundMovement: L - T - R
-t---------------lControl: Split PhaseRights: IncludeMin.Green: 0 0 0Lanes: 0 0 0 0 0
-t---------------lVol-ume Moduf e:Base Vol: 0 0 0
Growth Adj : 1 .00 1 .00 1.00Initial- Bse: 0 0 0
User Adj : 1.00 1.00 1.00PHF Adj : 1.00 1.00 1.00PHF Vofume: 0 0 0Reduct Vof: 0 0 0Reduced Vof: 0 0 0PcE Adj : 1.00 1.00 1 .00MLF Adj : 1.00 1 .00 1 .00Finaf Vof.: 0 0 0
-t---------------lSaturation Flow Module:sat/Lane: 1600 1600 1600Adjustment: 1.00 1.00 1.00Lanes: 0.00 0.00 0.00Final Sat.: 0 0 0
-t---------------lCapacity Analysis Modul-e :
Vol/Sat: 0.00 0 .00 0.00Crit Moves:
South BoundL-T_R
t---------------lSplit Phase
Include000
0 0 1! 0 0
t---------------l
300611 .00 1.00 1 .00
30061I .00 1 .00 1 .001.00 1.00 1.00
30061000
300611 .00 1.00 1 .001 .00 1.00 1 .00
30061
91 900 01 .00 1.00 1.00
91 900 01 .00 1. 00 1.001 .00 1.00 1.00
91 900 0
00091 900 0
1 .00 1.00 1.001.00 1.00 1. 00
91 900 0
t---------------l
0 152 321 .00 1.00 1.00
0 752 321.00 1.00 1.001.00 1.00 1.00
0 152 32000o 152 32
1.00 1.00 1.001.00 1.00 1.00
o 152 32t---------------l
East BoundL-T_R
t---------------lProtected
Include000
10100t---------------l
West BoundL_T-R
l---------------lProtected
Include000
00101t---------------l
1600 1600 16001 .00 1.00 1.000.33 0.00 0.61521 0 1073
t---------------l
1600 1600 16001.00 1.00 1.001.00 1.00 0.001600 1600 0
l---------------l
1600 1600 16001 .00 1.00 1 .000.00 1.00 1.00
0 1600 1600t---------------l
0 .06 0.00 0.06 0.06 0.56 0.00 0.00 0. 47 0.02**** **** ************************************************************************************
Traffix 7.6.0115 (c) 2003 Dowfing Assoc. Licensed to URS CORP., SANTA ANA, CA
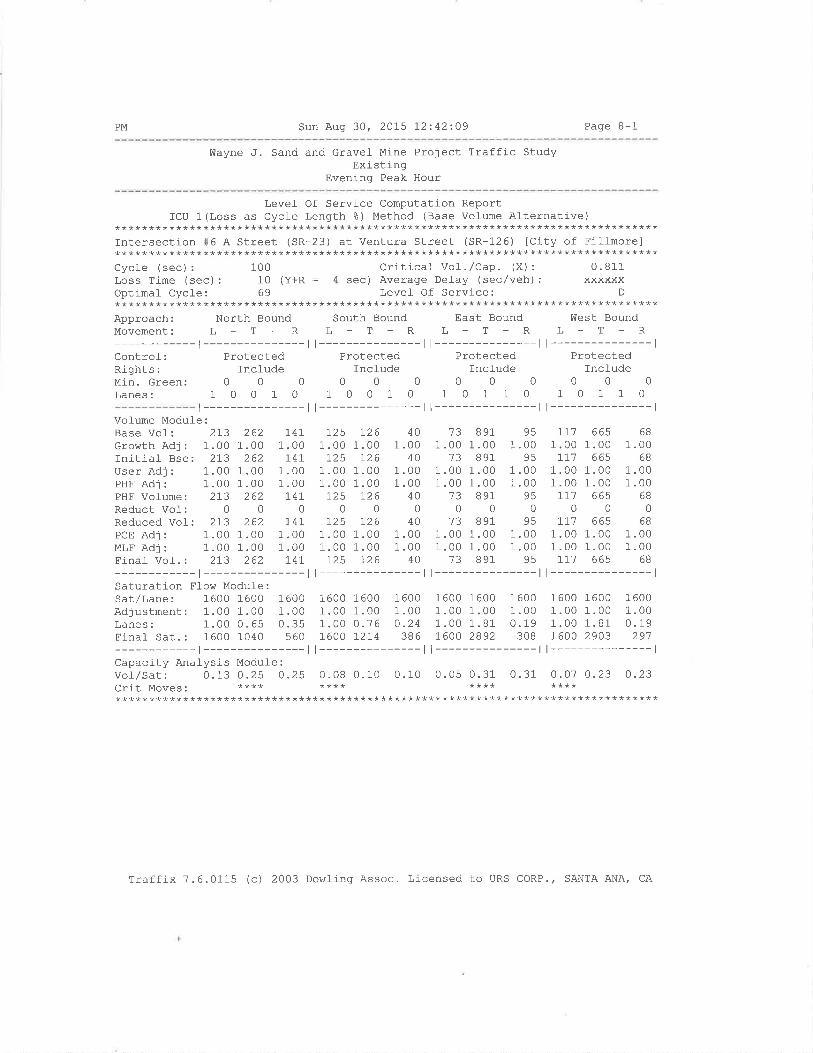
PM Sun Aug 30, 2015 12:42:09 Page 8-1
tdayne J. sand and Gravel- Mine Project Traffic StudyExisting
Evening Peak Hour
Level- Of Service Computation ReportICU 1(Loss as Cycle Length 8) Method (Base Volume Alternative)
********************************************************************************Intersection #6 A Street (SR-23) at Ventura Street (SR-126) [City of Fiffmore]********************************************************************************Cycle (sec): 100 Critical Vo]./Cap. (X): 0.811Loss Time (sec) : 10 (Y+R : 4 sec) Average Delay (sec/veh) : xxxxxxOptimal Cycle: 69 Level Of Service: D********************************************************************************Approach: North Bound South Bound East Bound Í{est BoundMovement: L - T - R L - T - R L - T - R T, - T - R
-t---------ll---------ll---------ll---------------lControl: Protected Protected Protected ProtectedRiqhts: Include Include Include IncludeMin.creen: 0 0 0 0 0 0 0 0 0 0 0 0
Lanes: 1 0 0 1 0 1 0 0 1 0 1 0 1 1 0 1 0 1 1 0
t --------------- | --------------- l l --------------- l l --------------- l
Vol-ume Module:Base Vof: 21-3 262 747 I25 t26 40 13 891 95 77'l 665 68
GrowthAdj: 1.001.00 1.00 1.001.00 1.00 1.001.00 1.00 1.001.00 1.00Initial Bse: 2t3 262 I4I I25 726 40 13 891 95 II'7 665 68
User Adj : l-.00 1 .00 1 .00 1 .00 1.00 1.00 1 .00 1.00 1.00 1 .00 1.00 1.00PHFAdj: 1.001.00 1.00 1.001.00 1.00 1.001.00 1.00 1.001.00 1.00PHF VoÌume: 273 262 74I 725 726 40 13 891 95 IIl 665 68Reduct Vof: 0 0 0 0 0 0 0 0 0 0 0 0
Reduced Vol-: 2I3 262 I4]- 725 126 40 13 891 95 IIl 665 68
PCEAdj: 1.001.00 1.00 1.001.00 1.00 1.001.00 1.00 1.001.00 1.00MLFAdj: 1.00 1.00 1.00 1.00 1.00 1.00 1.00 1.00 1.00 1.00 1.00 1.00Finaf Vol-.: 273 262 I41- 725 726 40 13 891 95 IIl 665 68
-r--------- t--------- l l--------- l l---------------lSaturation Fl-ow Module:Sat/Lane: 1600 1600 1600 1600 1600 1600 1600 1600 1600 1600 l-600 1600Adjustment: 1.00 1 .00 1 .00 1.00 1 .00 1 .00 1 .00 1.00 1.00 1.00 1.00 1.00Lanes: 1.00 0. 65 0.35 1.00 0.76 0 .24 1 .00 1. 81 0. 19 1.00 1. 81 0.19Final- Sat.: 1600 1040 560 1600 I2I4 386 7600 2892 308 1600 2903 29'7
-t---------ll---------ll---------ll---------------lCapacity Analysis Modufe :
Vof/Sat: 0 .I3 0 .25 0 .25 0 .08 0.10 0.10 0.05 0. 31 0.31 0.07 0.23 O.23crit Moves. **** **** **** ************************************************************************************
Traffix 7.6.0115 (c) 2003 Dowling Assoc. Licensed to URS CORP., SANTA ANA, CA
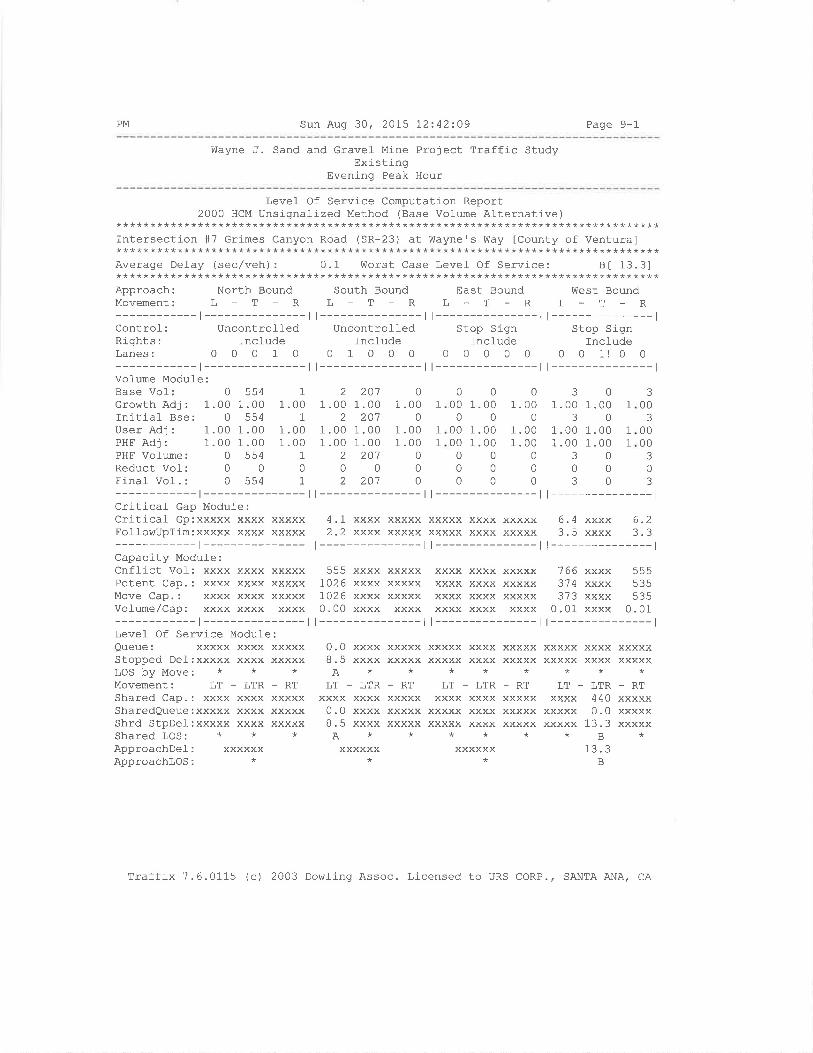
PM Sun Aug 30, 2015 L2:42:09 Page 9-1
Wayne J. Sand and Gravel Mine Project Traffic StudyExisting
Evening Peak Hour
Levef Of Service Computation Report2000 HCM Unsignalized Method (Base Volume Al-ternative)********************************************************************************
Intersection #7 Grimes Canyon Road (SR-23) at Wayners Way lcounty of Ventura]********************************************************************************Average DeJ-ay (sec/veh): 0.1 Worst Case Level Of Service: Bt 13.31********************************************************************************Approach: North BoundMovement: L - T - R
-l---------------lControÌ: UncontrolledRights: IncludeLanes: 0 0 0 1 0
-t---------------lVolume Module:Base Vol: 0 554 1
Growth Adj: 1.00 1.00 1.00Initial Bse: 0 554 1
User Adj : 1.00 1.00 1 .00PHF Adj : 1.00 1.00 1.00PHF Vol-ume: 0 554 1
Reduct Vol-: 0 0 0Final Vof. : 0 554 1
South BoundL_T_R
t---------------lUncontrolled
Include01000
t---------------l22010
1 .00 1 .00 1 .002 20'7 0
1 .00 1.00 1 .001 .00 1.00 1 .00
2201000022010
East BoundL-T-R
l---------------lStop Sign
Incfude00000
t---------------l
West BoundL-T-R
t---------------lStop Sign
Include0 0 1! 0 0
t---------------l
1
1
1
1
1
1
0000 1.0000
00 1.0000 1.00000000
01.00
01.001.00
0
00
31.00
3
1 .001 .00
303
01.00
01 .001 .00
000
3
003
0000
303
-t--------- |--------- ll--------- |---------------lCriticaf Gap Module:Critical Gp:xxxxx xxxx xxxxx 4.1 xxxx xxxxx xxxxx xxxx xxxxx 6.4 xxxx 6.2FollowUpTim:xxxxx xxxx xxxxx 2.2 xxxx xxxxx xxxxx xxxx xxxxx 3.5 xxxx 3.3
-r--------- |--------- t--------- |---------------lCapacity Module:Cnflict Vof: xxxx xxxx xxxxx 555 xxxx xxxxx xxxx xxxx xxxxx '766 xxxx 555Potent Cap.: xxxx xxxx xxxxx 1026 xxxx xxxxx xxxx xxxx xxxxx 374 xxxx 535Move Cap.: xxxx xxxx xxxxx 1026 xxxx xxxxx xxxx xxxx xxxxx 373 xxxx 535Volume/Cap: xxxx xxxx xxxx 0.00 xxxx xxxx xxxx xxxx xxxx 0.01 xxxx 0.01
-t--------- r--------- |--------- |---------------lLevel Of Service Module:Queue: xxxxx xxxx xxxxx 0.0 xxxx xxxxx xxxxx xxxx xxxxx xxxxx xxxx xxxxxStopped Del:xxxxx xxxx xxxxx 8.5 xxxx xxxxx xxxxx xxxx xxxxx xxxxx xxxx xxxxxLOS by Move: * * * A * * * * * * * *Movement: LT - LTR - RT LT - LTR - RT LT - LTR _ RT LT - LTR - RTShared Cap.: xxxx xxxx xxxxx xxxx xxxx xxxxx xxxx xxxx xxxxx xxxx 440 xxxxxSharedQueue:xxxxx xxxx xxxxx 0.0 xxxx xxxxx xxxxx xxxx xxxxx xxxxx 0.0 xxxxxShrd StpDel:xxxxx xxxx xxxxx 8.5 xxxx xxxxx xxxxx xxxx xxxxx xxxxx 13.3 xxxxxshared Los: * * * A * * * * * * B *ApproachDel: xxxxxx xxxxxx xxxxxx 13.3Approachlos: * * * B
Traffix 7.6.0115 (c) 2003 DowÌing Assoc. Licensed to URS CORP., SANTA ANA, CA

PM Sun Aug 30, 2015 12:42:09 Page 10-1
Wayne ,f. Sand and Gravef Mine Project Traffic StudyExisting
Evening Peak Hour
Level Of Service Computation ReportfCU 1(Loss as Cycle Length å) Method (Base Vol-ume Alternative)
Intersection #8 Walnut Canyon Road (SR-23) at Casey Road [City of Moorpark]********************************************************************************Cycle (sec): 100 Critical Vol./Cap. (X): 0.641Loss Time (sec): 10 (Y+R : 4 sec) Averaqe Delay (sec/veh): xxxxxxOptimal Cycle: 86 Level Of Service: B********************************************************************************Approach: North Bound South Bound East Bound West BoundMovement: L - T - R L - T - R L - T - R L - T - R
-t---------------lControl: Prot+PermitRights: IncfudeMin.Green: 0 0 0
Lanes: 1 0 1 0 0
-t---------------lVolume Modufe:Base Vol: 74 6 653 0crowth Adj : 1.00 1 .00 1 .00InitiaÌ Bse: 146 653 0User Adj : 1.00 1 .00 1 .00PHF Adj : l- .00 1 .00 1 .00PHF Volume: 14 6 653 0Reduct VoÌ: 0 0 0Reduced Vol-: 146 653 0
PcE Adj : 1.00 1 .00 1 .00MLF Adj : 1.00 1.00 1.00Final- VoI.: L46 653 0
Saturation Flow Modufe:Sat/Lane: 1600 1600 1600Adjustment: 0.94 1.00 0.94Lanes: 1.00 1.00 0.00Finaf Sat.: 1500 1600 0
-t---------------lCapacity Analysis Modul-e :
Vol,/Sat: 0.10 0.41 0.00
t---------------lPerrnittedInclude
00000010
l---------------l
1600 1600 16000.94 1.00 0.940.00 0.97 0.03
0 1559 38t---------------l
l---------------lProtected
Include000
10001t---------------l
t---------------lProtected
Include000
00000t---------------l
1 600o.940.00
0
034291 .00 1.00 1 .00
034291 .00 1.00 1 .001 .00 1.00 1.00
0342900003429
1 .00 1.00 1.001.00 1.00 1.00
o3429t---------------l
2081 .00
2081.001.00
2080
208
0001.00 1.00 1.00
0001.00 1.00 1.001.00 1.00 1.00
000000000
1 .00 1.00 1.001 .00 1.00 1 .00
000t---------------l
1001.00 1.00
10 01.00 1.001.00 1.00
100
00
0101 .00 1.00 1.001 .00 1 .00 1.00
10 0 208t---------------l1600 1600 16000.94 1 .00 0. 941 .00 0.00 1.001500 0 1500t---------------t
009400
0
I60.0.
000000
0
I61.0.
o-oo o-22 0.23 0.01 0.00 0.14 0.00 0.00 0.00Cfit MOVeS: **** ************************************************************************************
Traffix 7.6.0115 (c) 2003 Dowfing Assoc. Licensed to URS CORP., SANTA ANA, CA
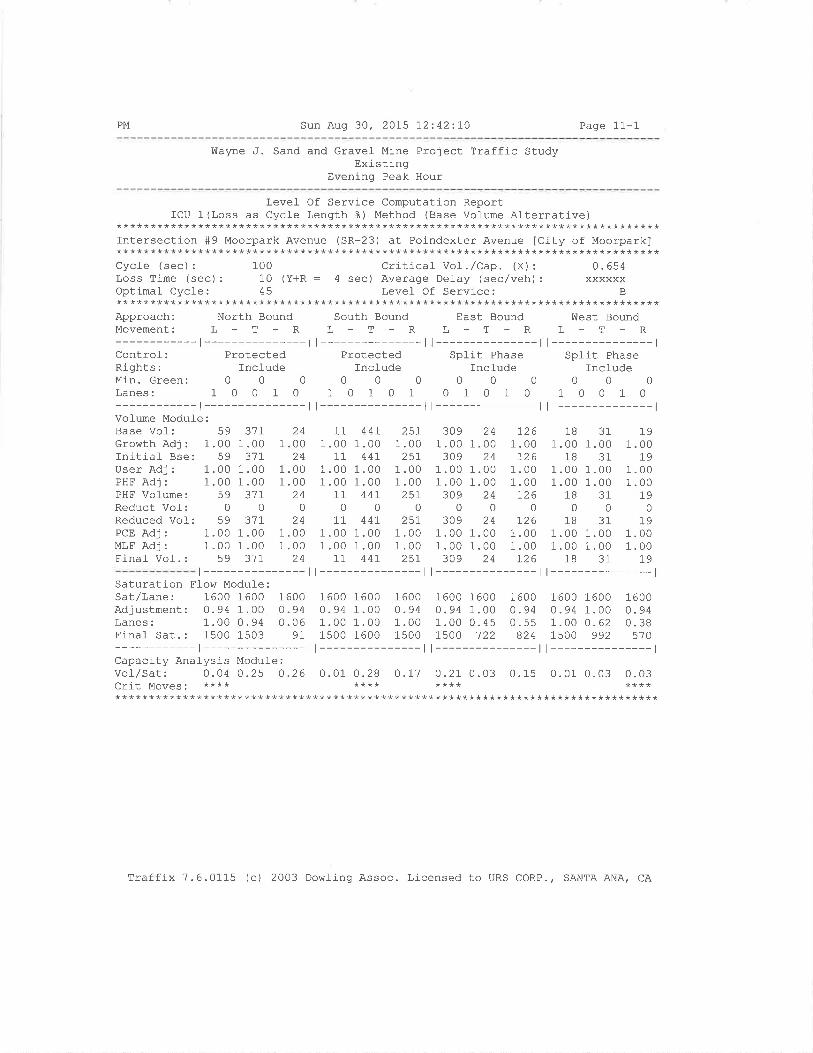
PM Sun Aug 30, 2015 72:42:10 Page 11-1
Wayne J. Sand and Gravef MineExlsting
Evening Peak
Project Traffic Study
Hour
Level- Of Service Computation ReportfCU 1 (Loss as Cycl-e Length 8) Method (Base Volume Afternative)********************************************************************************
Intersection #9 Moorpark Avenue (SR-23) at Poindexter Avenue [City of Moorpark]********************************************************************************Cycle (sec): 100 Criticaf Vol./Cap. (X): 0.654Loss Time (sec): 10 (Y+R : 4 sec) Average Delay (sec/veh): xxxxxxOptimal CycÌe: 45 Level Of Service: B********************************************************************************Approach: North BoundMovement: L - T - R
-l---------------lControÌ: ProtectedRights: IncludeMin.Green: 0 0 0Lanes: 1 0 0 1 0
-t---------------lVolume Module:Base Vol: 59 31I 24Gro\4rthAdj: 1.00 1.00 1.00Tnítiaf Bse: 59 3'77 2'4
User Adj : 1 .00 1 .00 1.00PHF Adj : 1.00 1 .00 1.00PHF Volume: 59 3'lI 24Reduct Vol: 0 0 0Reduced Vol: 59 31I 24PcE Adj : 1.00 1 .00 1 .00MLF Adj : 1.00 1 .00 1 .00Final- Vof. : 59 31I 24
South BoundL-T-R
t---------------lProtected
Include000
1010rt---------------t
East BoundL-T-R
l---------------lSplit Phase
Incl-ude000
01010l---------------l
Í,¡est BoundL-T-R
t---------------lSplit Phase
Incfude000
10010t---------------l
11 447 25]_ 309 24 126 18 31 191 .00 1.00 1.00 1.00 1.00 1.00 1.00 1.00 1.00
11 44t 25I 309 24 126 18 31 191.00 1.00 1.00 1 .00 1 .00 1.00 1.00 1 .00 1.001.00 1.00 1 .00 1 .00 1 .00 1.00 1.00 1.00 1.00
11 447 25I 309 24 126 18 31 19000000000
11 44I 25I 309 24 126 18 31 191 .00 1.00 1 .00 1.00 1.00 1.00 1 .00 1.00 1.001 .00 1.00 1 .00 1.00 1.00 1.00 1 .00 1.00 1.00
11 44I 25L 309 24 726 18 31 L9t--------------- | t--------------- | t--------------- |
Saturation Flor^¡ Module :
Sat/Lane: 1600 1600 1600 1600 1600 1600 1600 1600 1600 1600 1600 1600Adjustment: 0. 94 1 .00 0.94 0. 94 1.00 0.94 0.94 1.00 0. 94 0.94 1.00 0. 94Lanes: 1.00 0.94 0.06 1.00 1.00 1.00 1.00 0.45 0.55 1.00 O.62 0.38Finaf Sat.: 1500 1503 91 1500 1600 1500 1500 122 824 1500 992 570
-r--------- |--------- ll--------- t---------------lCapacity Analysis Module :
vol/Sat: 0 .04 O .25 0 .26 0.01 0.28 0. 17 0.21 0.03 0. 15 0.01 0.03 0.03crit Moves. **** **** **** ************************************************************************************
t---------------l
Traffix 1.6.OI1,5 (c) 2003 Dohrfing Assoc. Licensed to URS CORP./ SANTA ANA, CA
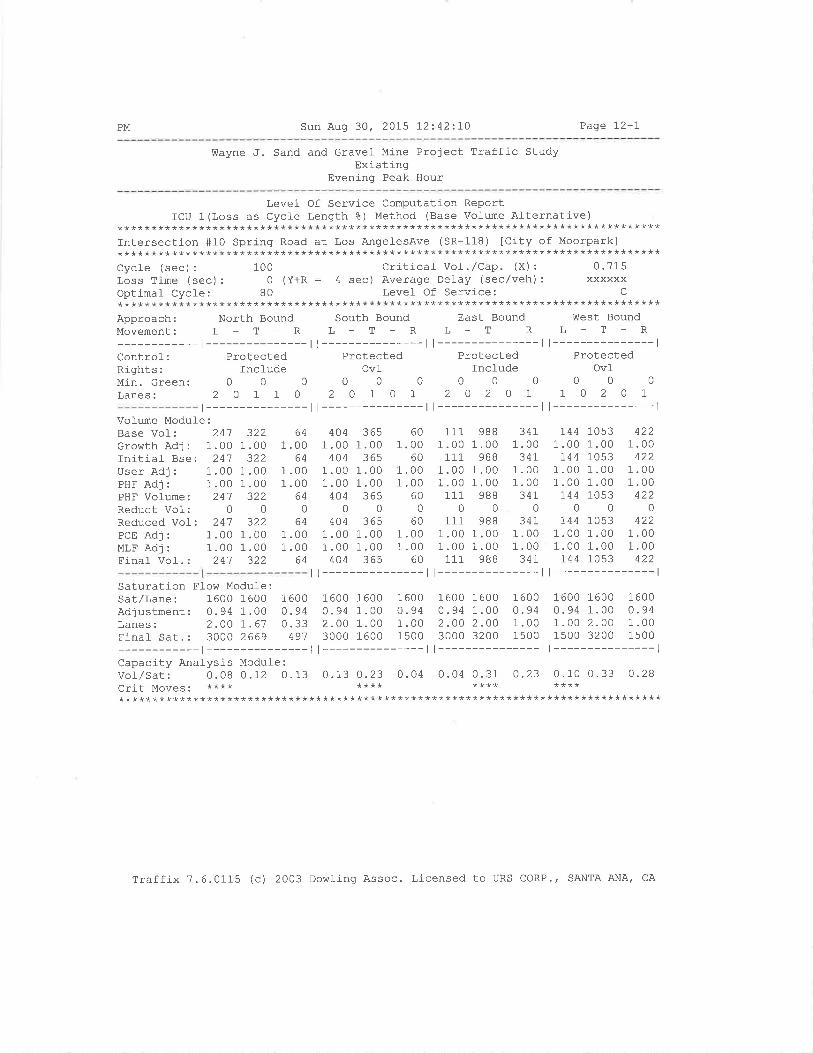
PM Sun Aug 30, 2015 12:42:10 Paqe 72-I
Wayne J. Sand and Gravel Mine Project Traffic StudyExisting
Evening Peak Hour
Level Of Service Computation ReportIcU L (Loss as cycle Length å) Method (Base VoÌume Afternative)
**+*****************************************************************************Intersection #10 Spring Road at Los Angel-esAve (SR-118) [City of Moorpark]********************************************************************************Cycle (sec) : 100 Critical Vol-.,/Cap. (X) : 0.715Loss Time (sec): 0 (Y+R : 4 sec) Average Delay (sec/veh): xxxxxxOptimal Cycle: 80 Level Of Service: C********************************************************************************Approach: North Bound South Bound East Bound West BoundMovement: L - T _ R L - T - R L - T _ R L - T - R
-r---------ll---------ll---------ll---------------lControf: Protected Protected Protected ProtectedRights: lnclude Ovt Include OvlMin.creen: O 0 0 0 0 0 0 0 0 0 0 0
Lanes: 2 0 1 1 0 2 0 1 0 1 2 0 2 O 1 1 O 2 0 1
r---------------ll---------------ll---------------ll---------------lVolume Module:Base Vol-'. 24'lGrowth Adj : 1.00Initial- Bse: 241User Adj : 1.00PHF Adj : 1.00PHF Vofume: 241Reduct Vol: 0Reduced Vol: 241PCE Adj : 1.00MLF Adj : 1.00Finaf Vol. : 241
3221 .00
3221 .001 .00
?))0
3221.001 .00
322
641 .00
641 .001 .00
640
641 .001 .00
64
404 365 60 111 9BB 341 144 1053 4221.00 1.00 1.00 1.00 1 .00 1.00 1 .00 1.00 1.00404 365 60 111 9BB 341 144 1053 422
1.00 1.00 1 .00 1.00 1 .00 1.00 1 .00 1.00 1.001.00 1.00 1 .00 1 .00 1 .00 1.00 1 .00 1.00 1.00404 365 60 111 988 341 144 1053 422
000000000404 365 60 111 988 34r 144 1053 422
1 .00 1.00 1.00 1 .00 1.00 1.00 1.00 1 .00 1.001 .00 1.00 1.00 1 .00 1.00 1 .00 1.00 1.00 1.00404 365 60 111 988 341 144 1053 422
|--------- lr--------- ll---------------lSaturation Fl-ow ModuÌe :
sat/Lane: 1600 1600 1600 1600 1600 1600 1600 1600 1600 1600 1600 1600Adjustment: 0. 94 1 .00 0.94 0. 94 1.00 0.94 0. 94 1 .00 0. 94 0. 94 1.00 0. 94Lanes: 2.0O 7.61 0.33 2.00 1.00 1.00 2.OO 2.OO 1.00 1.00 2.00 1.00Final Sar.: 3000 2669 491 3000 1600 1500 3000 3200 1500 1500 3200 1500
-l---------ll---------ll---------ll---------------lCapacity Analysis Module:vol,/Sat: 0.08 0.12 0. 13 0.13 0.23 0.04 0.04 0.31 0.23 0 . 10 0.33 0.28crit Moves. **** **** **** ************************************************************************************
Traffix 7.6.0115 (c) 2003 Dowling Assoc. Licensed to URS CORP.' SANTA ANA' CA
CEQA Existing Setting AM Sun Aug 30, 2015 12:46:46 Page 1-1
Wayne J. Sand and Gravel Mine Project Traffic StudyCEQA Existing Setting
Morning Peak Hour
Scenario
Command:Vol-ume:Geometry:Impact Fee:Trip Generation:Trip DistributionPaths:Routes:Configuration:
Scenario RePortCEQA Existing Setting AM
AM
AMExistingDefault Impact FeeAMAMDefault PathsDefaul-t RoutesAM Existing
Traffix 7.6.0115 (c) 2003 DowÌing Assoc. Licensed to URS CORP.' SANTA ANA' CA
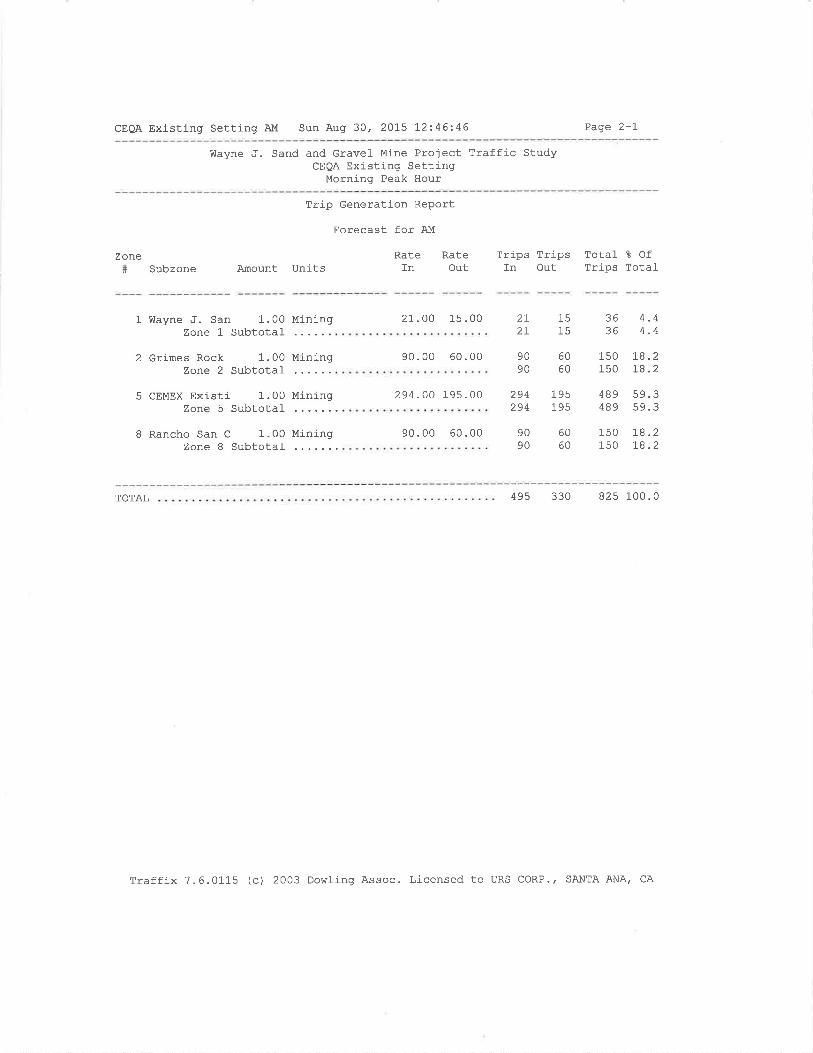
CEOA Existing Setting AM Sun Aug 30, 20]-5 12246:46 Paqe 2-I
Wayne J. Sand and Gravel Mine Proiect Traffic StudyCEoA Existing Setting
Morning Peak Hour
Zone# Subzone
Trip Generation Report
Forecast for AM
Rate RateAmount Units In Out
Trips TripsIn Out
Total å OfTrips Total-
1- Wayne 'J. San 1.00 MiningZone 1 Subtotal
2 Grirnes Rock 1-.00 Miningzone 2 Subtotal
5 CEMEX Existi 1.00 Miningzone 5 Subtotal
I Rancho San C 1.00 MiningZone 8 Subtotal
2r.oo 15.00
90.00 60.00
294.OO 195.00 294294
90.00 60.00
2I21,
IE
IE3636
90 6090 60
150150
tB.2L8.2
19s19s
489489
59.359.3
4.44.4
90 6090 60
150150
r8.2TB.2
TOTAL 495 330 825 100.0
Traffix 7.6.01-15 (c) 2003 Dowling Assoc. Licensed to URS CORP.' SANTA ANA' CA
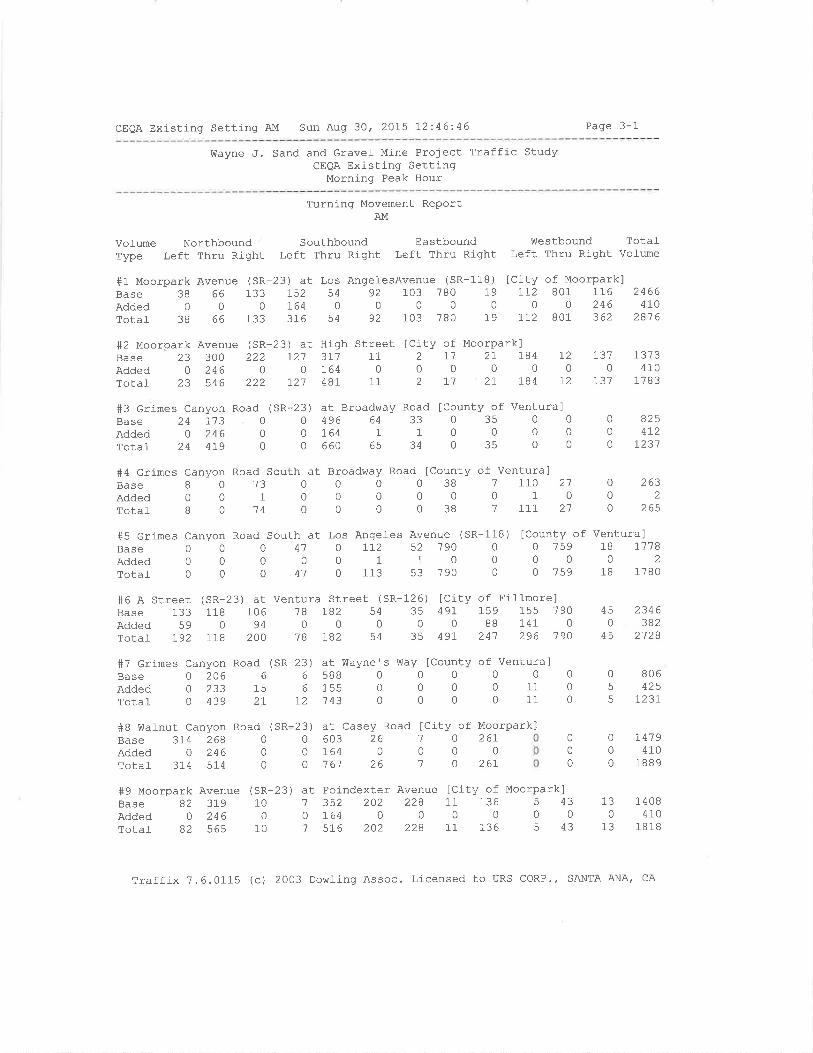
CEQA Existing Setting AM Sun Aug 30' 2015 L2:46:46 Page 3-1
Wayne J. Sand and Gravel Mine Project Traffic StudyCEQA Existlng Setting
Morning Peak Hour
Turnj-ng Movement ReportAM
Volume Northbound Southbound Eastbound Vilestbound TotalType Left Thru Right Left Thru Right Left Thru Right Left Thru Right Volume
#1 Moorpark Avenue (SR-23) at Los AngefesAvenue (SR-118) [City of Moorpark]Base 38 66 133 I52 54 92 103 780 19 712 801 116Added0001640000000246Totaf 38 66 133 316 54 92 103 780 79 II2 801 362
#2 Moorpark Avenue (SR-23) at High Street lCity of Moorpark]Base 23 300 222 I21 311 11AddedO246007640Total 23 546 222 I21 481 11
2
02
r'70
11
24664ro
281 6
27 184 L2000
27 184 72
r310
137
137 3410
1783
#3 crimes Canyon Road (
Base 24 I73 0
Added O 246 0Total 24 4]-9 0
3) at Broadway Road lcounty of Ventura]0496643303500oL641100000660653403500
210
8254L2
1.231
2632
265
ICounty of Ventura]0 759 18 r'71800020 759 18 1780
SR-20
00
000
#4 Grimes Canyon Road South at Broadway Road [County of Ventura]Base80130000387110Added0010000001rotaf 8 0 14 0 0 0 0 38 'l 7I]-
#5 Grimes Canyon Road South at Los Angefes Avenue (SR-118)Base O 0 0 41 O L12 52 '79O 0
AddedO00001100rotaf O 0 0 41 0 113 53 '79O 0
#6 A Street (SR-23) at Ventura Street (SR-126) lCity of FilÌmorelBase 133 118 106 18 I82 54 35 49L 159 155 '79O
Added59O9400000881'470rotaf 792 118 2QO 18 I82 54 35 497 241 296 79O
#7 Grimes Canyon Road (SR-23) at Wayne's Vrlay fCounty of Ventura]Base020666588000000Added02331561550000110rotal O 439 2L 12 143 0 0 0 0 11 0
23) at Casey Road0 603 26o7640o '761 26
[City of Moorpark]267
026r
450
45
2346382
2128
806425
1237
I4'7 9410
1889
SR
05
5
0
00
0
0
0
0
0
0
1
0'7
#8 lrlafnut Canyon Road (
Base 314 268 0Added O 246 0
Total 3I4 514 0
#9 Moorpark AvenueBase 82 319Added 0 246Totaf 82 565
(SR-23) at Poindexter Avenue lcity of Moorpark]10 '7 352 202 228 11 136 5 4300164000000
10 '7 5].6 202 228 11 136 5 430
1a 14 08410
181813
Traffix ?.6.0115 (c) 2003 Dowling Assoc. Licensed to URS CORP., SANTA ANA' CA
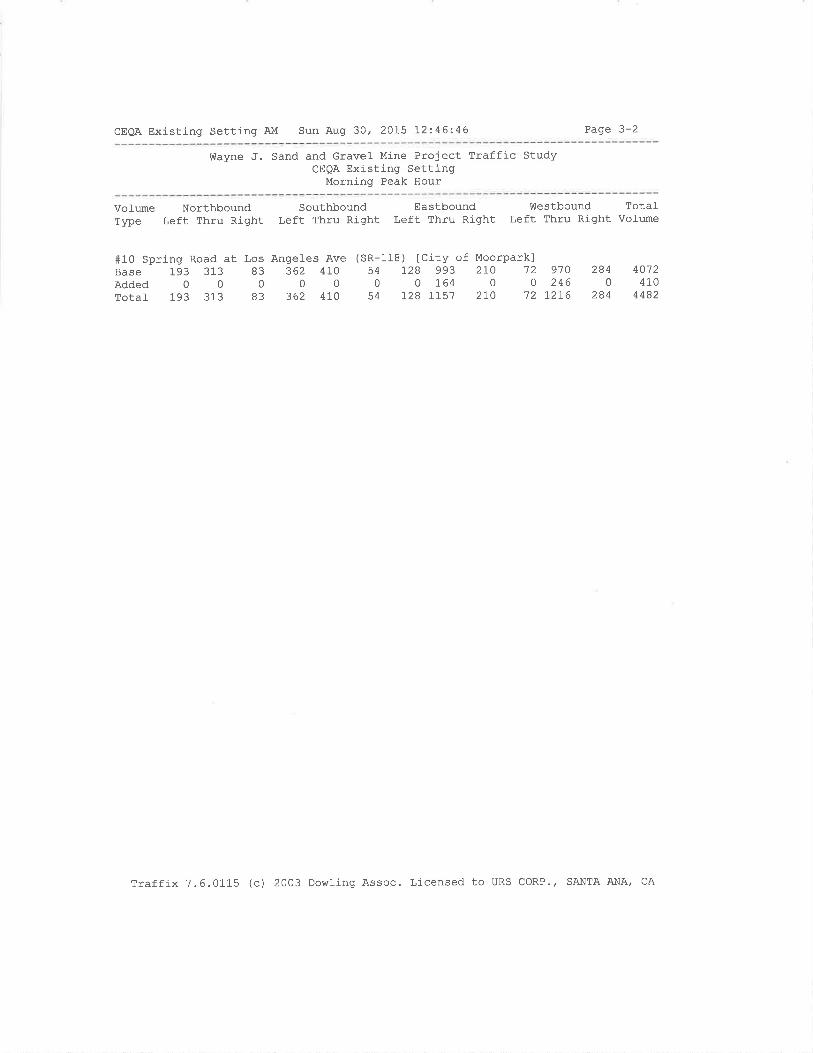
CEOA Existing Setting AM Sun Aug 30' 2015 t2246:46 Page 3-2
Wayne ,f. Sand and Gravel Mine Project Traffic StudyCEQA Existing Setting
Morning Peak Hour
Vol-ume NorthboundType Left Thru Right
SouthboundLeft Thru Right
EastboundLeft Thru Right
Westbound Totall,eft Thru Right Vo1ume
#10 Spring Road at Los Angeles AveBase 193 3l-3 83 362 410Added00000Totaf 193 313 83 362 410
(SR-118) [City of Moorpark]54 728 993 2rO 12 970001.6400246
54 r2B L15'7 2tA '72 121,6
2840
284
4012410
4482
Traffix ?.6.0115 (c) 2003 Dowling Assoc. Licensed to URS coRP., SANTA ANA, CA

CEQA Existing Setting AM Sun Aug 30, 2015 L2:46:48 Page 6-1
hlayne ,f. Sand and Gravel Mine Project Traffic StudyCEQA Existing Setting
Morning Peak Hour
Impact Analysis ReportLevel- Of Service
Intersection BaseoeI/ v/
LOS Veh C# 1 Moorpark Avenue (SR-23) at Los A xxxxx 0.532
# 2 Moorpark Avenue (SR-23) at Hig A xxxxx 0.544
# 3 Grimes Canyon Road (SR-23) at B 0.0 0.685
# 4 Grimes Canyon Road South at Br A 9.0 0.000
# 5 Grimes Canyon Road South at Lo C xxxxx 0.?06
# 6 A Street (SR-23) at Ventura St B xxxxx 0.631
# 7 crimes Canyon Road (SR-23) at A ?.6 0.000
# I Wafnut Canyon Road (SR-23) at E xxxxx 0.903
# 9 Moorpark Avenue (SR-23) at Poi A xxxxx 0.564
# 10 Spring Road at Los Angel-es Ave C xxxxx 0.779
FutureDeI/ v/
LOS Veh C
F xxxxx 3.835
B xxxxx 0.698
c 0.0 0.879
A 9.0 0.000
C xxxxx 0.707
C xxxxx 0.783
c 20.2 0.000
F xxxxx 1.012
B xxxxx 0.67?
D xxxxx 0.843
Changein
+ 3.303 v,/c
+ o.754 v/c
+ 0.000 D,/V
+ 0 .004 D,/V
+ 0.001 v/c
+ 0.153 v,/c
+1,2.520 D/v
+ 0.109 v,/c
+ 0.113 v,/c
+ 0.064 V/C
Traffix 7.6.0115 (c) 2003 DowJ-ing Assoc. Licensed to URS CORP., SANTA ANA, CA

CEQA Existing Setting AM Sun Aug 30, 2015 12:46:48 Page 7-1
!ùayne J. Sand and Gravel Mine Project Traffic StudyCEQA Existing Setting
Morning Peak Hour
LeveI Of Service Computation ReportICU 1(Loss as Cycle Length ?) Method (Future Vol-ume Alternative)
********************************************************************************Intersection #1 Moorpark Avenue (SR-23) at Los AngelesAvenue (SR-118) [City of M
********************************************************************************Cycle (sec) : 100 Critical- Vol .,/Cap. (X) : 3.835Loss Time (sec): 10 (Y+R : 4 sec) Average Delay (sec/veh): xxxxxxOptimal Cycle: 100 Level Of Service: F********************************************************************************Approach: North Bound South Bound East Bound West BoundMovement: L - T - R L - T - R L _ T - R L - T - R
-r---------ll---------ll---------ll---------------lControl: Split Phase Split Phase Protected ProtectedRights: Ovl Ovl Incl-ude OvfMin.Green: O 0 0 0 0 0 0 0 0 0 0 0
Lanes: 1 1 0 0 1 1 0 1! 0 1 1 O 2 1 0 1 0 2 0 1
t---------------ll---------------ll---------------ll---------------lVol-ume Moduf e:Base Vol:crohrth Adj: 1
Initial Bse:Added Vol-:PasserByvol-:Initial Fut:User Adj: 1
PHF Adj: 1
PHF Vol-ume:Reduct VoI:Reduced Vol:
66 133 L52 541.00 1 .00 1 .00 1.00
66 133 752 54007640
103 7801 .00 1.00
191.00
19
054
1.00
00
79
380038
0
0Jõ
00003B
0
3800003B
1 .00 1.0054
0
541.00 1.00 1.00 1.001.00 1.00 1.00 1.00
66 133 316 54
1600 16000.94 1.001. 99 0.012985 16
921 .00
9200
921 .001 .00
920
921 .001 .00
92
78000
7801 .001.00
7800
8011 .00
8010
0801
1161.00
116246
0362
1 .00 1 .00 1.00 1 .001.00 1.00 1.00 1 .00
1
IT2.00712
00
r1,20
3161 .00
133
3160
316
0
10300
1031.001.00
1030
103
11
1
66000066
0
1
.00
.00133
0
1 .00 1.00 1.00 1 .1.00 1.00 1.00 1.103 780 19 1
12 80100
L2 BO1
00 1.0000 1.00t2 801
3620
3621.001.00
362
PCE Adj:MLF AdJ:Final Vol-. :
Saturation Flow ModufeSat/Lane: 1600 1600Adjustment: 0.94 1.00Lanes: 1.00 1.00Finaf Sat.: 1500 1600
66 133
19 1
019 1780
1
1
1 6000.941.001500
1 6000. 940. 07
107
1600 16000.94 1 .001 .00 2 .001500 3200
1 6000.941.001500
1 6000.941.001500
1600 16000.94 1.001 .00 2. 931500 4686
-l---------ll---------ll---------ll---------------lCapacity Anafysis Module :
Vof/Sat: O. 03 0.04 0.09 0.11 3.38 0.06 0.07 0. 17 0.18 0.07 0.25 0 .24crit Moves. **** **** **** ************************************************************************************
Traffix 7.6.0115 (c) 2003 Dowling Assoc. Licensed to URS CORP., SANTA ANA, CA
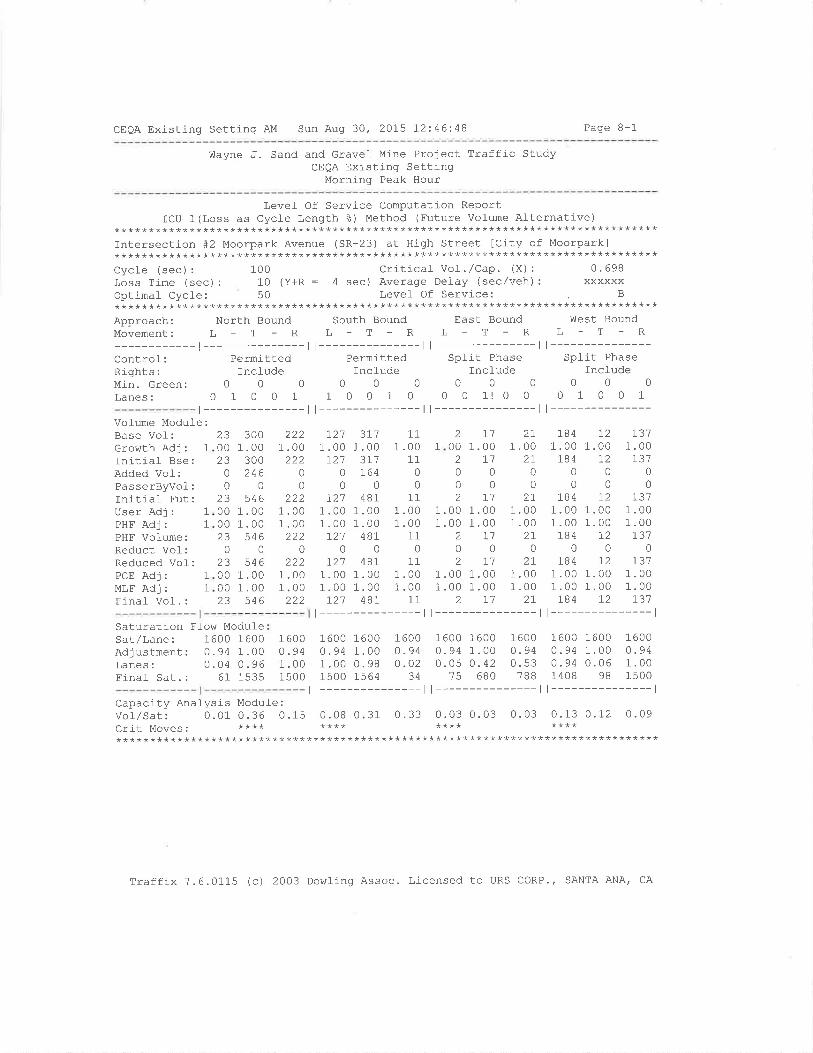
CEQA Existing Setting AM Sun Aug 30, 2015 12:46:48 Page B-1
Wayne J. Sand and Gravel- Mine Project Traffic StudyCEQA Existlng Setting
Morning Peak Hour
Level Of Service Computation ReportICU 1(Loss as Cycle Length %) Method (Future Vofume Alternative)
********************************************************************************Intersection #2 Moorpark Avenue (SR-23) at High Street lCity of Moorparkl********************************************************************************Cycl-e (sec): 100 Critical Vol./Cap. (X): 0.698Loss Time (sec) : 10 (Y+R = 4 sec) Average Defay (sec/veh) : xxxxxxOptimal CycJ-e: 50 Levef Of Service: B********************************************************************************Approach: North Bound South Bound East Bound West BoundMovement: L _ T - R L - T - R L _ T - R L - T - R
-l---------ll---------ll---------ll---------------lControf: Permitted Permitted Split Phase Split PhaseRlghts: Incl-ude Incfude IncÌude IncfudeMin.creen: 0 0 0 0 0 0 0 0 0 0 0 0
Lanes: 0 1 0 0 1 I 0 0 1 0 0 0 1! 0 0 0 1 0 0 1
t---------------ll---------------ll---------------ll---------------lVo.lume Module:Base Vol:Growth Adj: L
Initiaf Bse:Added Vol:PasserByvoÌ:Initial Fut:User Adj: 1
PHF Adj: 1
PHF Volume:Reduct Vol:Reduced Vof:PCE Adj: 1
MLF Adj: 1
Final Vol. :
1
1.00 1.00 1.001.00 1.00 1.00
2I12I0002T12I
1.00 1.00 1 .001.00 1.00 1.00
2r127t---------------l1600 16000.94 1.000 .05 0.42
'75 680
1 6000. 940. 53
7BB
r1 21-
1.00 1.00r1 270000
230023
0
0z50000a)
0z30000ZJ
3001 .00
300246
0
5461 .001.00
5460
5461 .001 .00
546
1 .00222
0
0
1 .001.00
2220
2221 .001 .00
222
r21 3L1 111 .00 1.00 1 .00r21 31'7 11
o7640000
721 48r 111 .00 1.00 1 .001 .00 1.00 1 .00t21 481 11
000r21 481 11
1.00 1.00 1.001.00 1.00 1.00r2't 4 81 11
t---------------l
184 12 r311.00 1.00 1.00184 12 731
000000
r84 72 7311 .00 1.00 1 .001.00 1.00 1.00184 L2 r31
000184 12 r37
1.00 1.00 1.001.00 1.00 1.00184 72 r31
t---------------l
2
002
0
0
2 21.1"'7
Saturation Ffow ModuleSat/Lane: 1600 1600Adjustment: 0.94 1.00Lanes: 0.04 0.96Final- Sat.: 61 1535
1 600nq¿1 .001 500
1 600o.94o.02
34
1600 16000. 94 1.000. 94 0.061408 98
1 600o .941 .001 500
1600 16000.94 1.001 .00 0. 981500 1564
Capacity Analysis Modul-e :
Vol/Sat: 0.01 0.36 0 .15 0.08 0.31 0 .33 0.03 0.03 0. 03 0. 13 0. 12 0.09Cfit MOVeS ' **** **** **** ************************************************************************************
Traffix 7.6.0115 (c) 2003 DowÌing Assoc. Licensed to URS CORP., SANTA ANA, CA
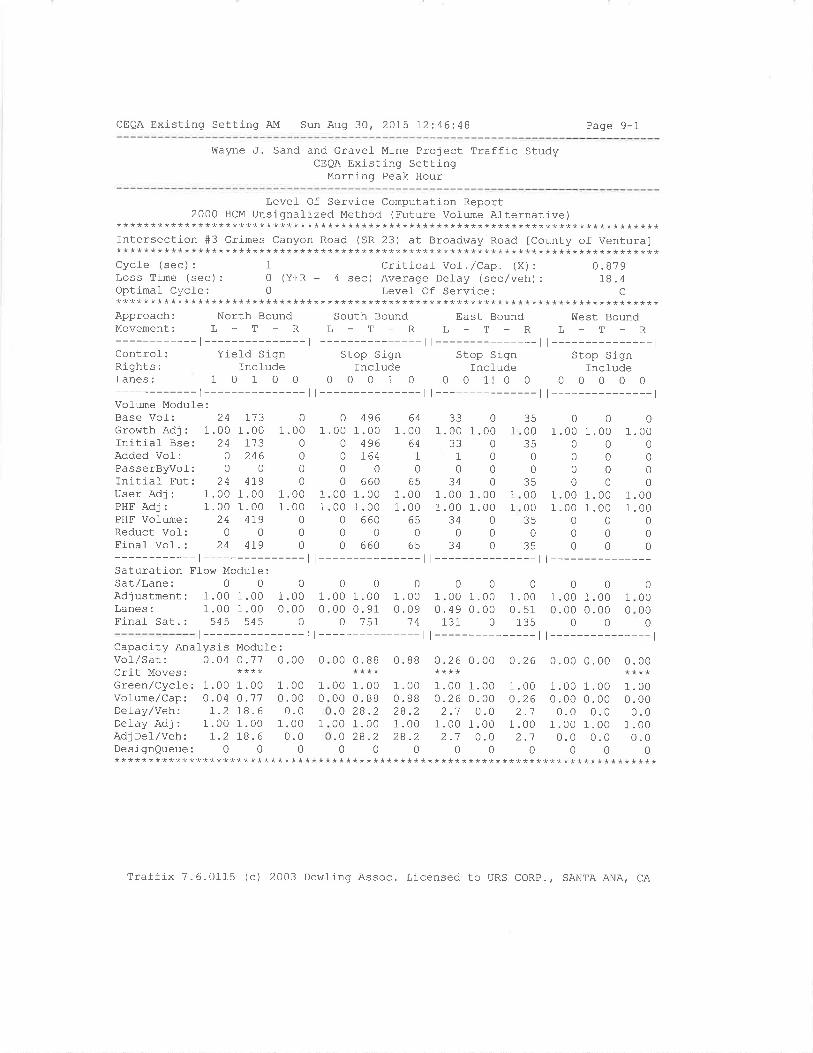
CEQA Existing Setting AM Sun Aug 30, 2OI5 12:46:48 Page 9-1
Wayne J. Sand and Gravel Mlne Project Traffic StudyCEQA Existing Settinq
Morning Peak Hour
Level Of Service Computation Report2000 HCM Unsignalized Method (Future Vofume Afternative)********************************************************************************
Intersection #3 Grimes Canyon Road (SR-23) at Broadway Road lcounty of Ventura]********************************************************************************Cycle (sec): 1 Criticaf Vol./Cap. (X): 0.879Loss Time (sec): 0 (Y+R : 4 sec) Average Delay (sec/veh): 18.4Optinal Cycle: 0 Level Of Service: C********************************************************************************Approach: North Bound South Bound East Bound V{est BoundMovement: L - T - R L - T - R L - T - R L - T - R
-t--------- |--------- |--------- |---------------lControl: Yield Sign Stop Sign Stop Sign Stop SignRights: Include Include Include IncfudeLanes: 1 0 1 0 0 0 0 0 1 0 0 0 1! 0 0 0 0 0 0 0
-t--------- |--------- |--------- |---------------lVofume Modufe:Base Vol z 24Growth Adj : 1.00Initiaf Bse: 24Added Vol: 0PasserByvof: 0Initial Fut: 24User Adj : 1.00PHF Adj : 1.00PHF Volume i 24Reduct Vol: 0Final Vol. : 24
I131 .00
173246
0
4r91.001 .00
4r90
4r9
01 .00
000
01 .001 .00
000
01 .00
0
0
00
1.001.00
0
00
4961.00
496764
0660
1.001.00
6600
660
641.00
641
065
1 .001.00
650
65
3301.00 1.00
3301000
3401.00 1.001 .00 1.00
34000
340
1.001.00
000
00
0
01 .001.00
0
00
1
01.00
0000
0I .00
00
0
01 .001 .00
0
0
0
3500?q
00
350000
0atr
01.00
1
1
Saturation Ffow Module:Sat/Lane: 0 0Adjustment: 1.00 1.00Lanes: 1.00 1.00Final- Sat. : 545 545
Capacity AnaÌysisVollsat: 0.04Crit Moves:Green/Cycl-e: 1 . 00Volume/Cap: 0 .04Delay/Veh: I.2Defay Adj: 1.00Adj Del/Veh : 1.2DesignQueue: 0
0000000001.00 1.00 1.00 1.00 1.00 1.00 1.00 1.00 1.000.00 0.00 0. 91 0.09 0.49 0.00 0. 51 0.00 0.00
0 0 157 14 131 0 135 0 0
1
0
0
0000
0l --------------- | --------------- | --------------- | --------------- l
Module:o .'71 0 .00
1 .00 1 .00o .11 0. 0018 . 6 0.01.00 1.0018.6 0.0
00
0.88
1.000.8828.21.0028 .2
0
O. BB
1.000.8828.21 .0028.2
0
0.26 0.00
1.00 1.000.26 0.002.1 0.0
1.00 1.002-1 0.0
00
0.26
1 .000.26
)1
1.002.1
0
0.00
1.000.000.0
1 .000.0
0
0.00
1.000. 000.0
1 .000.0
0
0. 00
1.000.000.0
1.000.0
0
0
1
0
1
00
0000.000.0
0********************************************************************************
Traffix 7.6.0115 (c) 2003 Dowling Assoc. Licensed to URS CORP., SANTA ANA/ CA
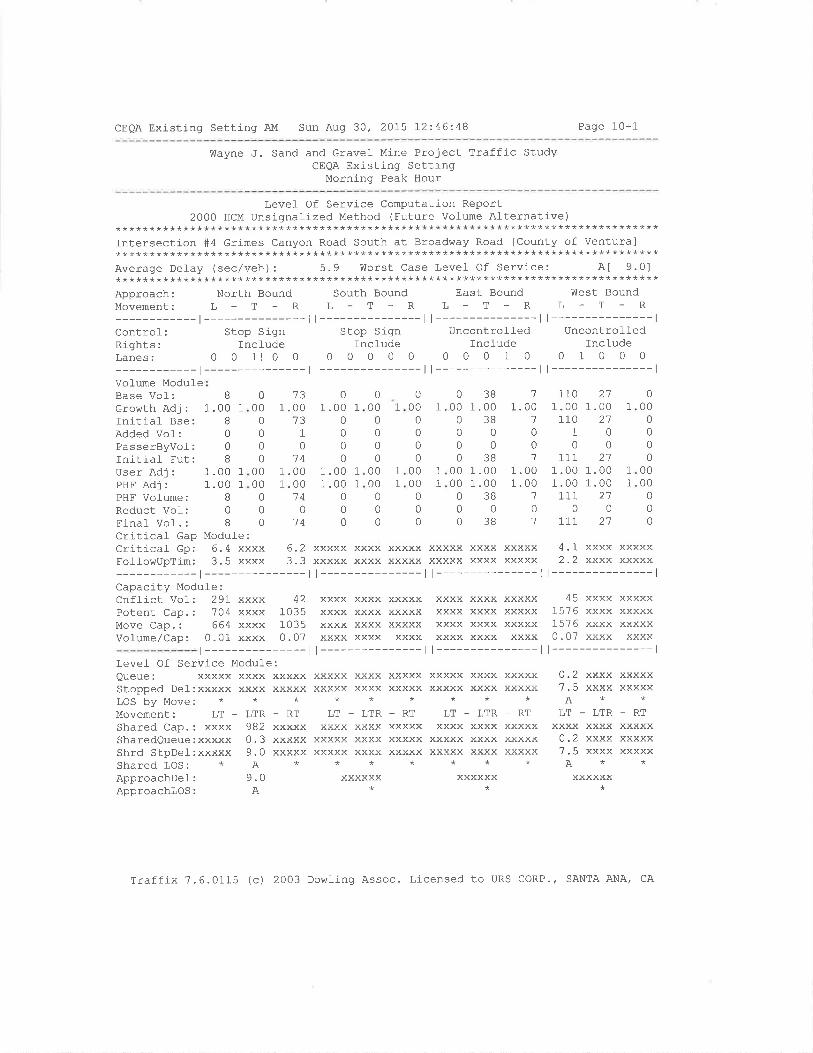
CEQA Existing Setting AM Sun Aug 30, 2015 12:46:48 Page 10-1
Wayne J. Sand and Gravel Mine Proiect Traffic StudyCEQA Existing Setting
Morning Peak Hour
Levef Of Service Computation Report2000 HCM UnsignaÌized Method (Euture Volume Al-ternative)
********************************************************************************Intersection #4 Grimes Canyon Road South at Broadway Road ICounty of Ventura]********************************************************************************Average Defay (sec/veh): 5.9 Worst Case Level Of Service: A[ 9.0]********************************************************************************Approach: North Bound South Bound East Bound West BoundMovement: L - T - R L - T - R L - T - R L - T - R
-r---------ll---------ll---------ll---------------lControl: Stop Sign Stop Sign Uncontroll-ed UncontrolledRights: Include Include Incl-ude Incl-udeLanes: 0 0 1! 0 0 0 0 0 0 0 0 0 0 1 0 0 1 0 0 0
-t---------ll---------ll---------ll---------------lVol-ume ModuleBase Vof:Growth Adj:Initial Bse:Added Vol:PasserByvof:Initial- Fut:User Adj:PHF AdJ:PHF Volume:Reduct VoI:Einal- Vol. :
1
Criticaf Gap ModuÌe:Critical Gp: 6. 4 xxxxFol-lohrupTim: 3.5 xxxx
1.00 1
1.00 1
B
0
B
1 .001.00
1
0
1
13.00
1
0
14.00.0014
014
6.222
01 .00
0
0
0
01 .001 .00
000
03800 1.000380000038
00 1.0000 1.0003800038
110 211.00 1.00110 21
1000
111 211 .00 1.001.00 1.00111 2'7
00111 27
000
0000
0000
000
B
1.00 1
I008
1
1
000
0000
0000
0
00
1
1
0
000
0
00
0000
0
00
1
1
1
1
1 1 1
1
1.001
001
1
0
000000
0000
000
1
1
-t---------------lCapacity Module:Cnfl-ict Vol: 29L xxxx 42Potent Cap.: 704 xxxx 1035Move Cap.: 664 xxxx 1035Volume/Cap: 0.01 xxxx 0.07
Level Of SerVice Modul-e:Queue: xxxxx xxxx xxxxxStopped Del-:xxxxx xxxx xxxxxLOS by Move: * * *Movement: LT - LTR - RTShared Cap.: xxxx 982 xxxxxSharedQueue:xxxxx 0.3 xxxxxShrd StpDel: xxxxx 9.0 xxxxxShared LOS: * A *ApproachDel: 9.0Approachlos: A
xxxxx xxxx xxxxx xxxxx xxxx xxxxxxxxxx xxxx xxxxx xxxxx xxxx xxxxx| --------------- | I --------------- |
xxxx xxxx xxxxx xxxx xxxx xxxxxxxxx xxxx xxxxx xxxx xxxx xxxxxxxxx xxxx xxxxx xxxx xxxx xxxxxxxxx xxxx xxxx xxxx xxxx xxxx
4.1t)
xxxx xxxxxxxxx xxxxx
t---------------l
| --------------- | l--------------- | l--------------- |
45 xxxx xxxxx1576 xxxx xxxxx1576 xxxx xxxxx0.07 xxxx xxxx
t---------------l
xxxxx xxxxxxxxx xxxx**
LT - LTRxxxx xxxx
xxxxx xxxxXXXXX XXXX**
YYqYYY*
rY!YY
XXXXX
_RTXXXXXXXXXXxxxxx
xxxxx xxxxxxxxx xxxx**
LT - LTRYY?V qYY!
xxxxx xxxxxxxxx xxxx**
xxxxxx*
xxxxxxxxxx
_RTxxxxxxxxxxxxxxx
XXXXXxxxxx
_RTXXXXXxxxxxxxxxx
A!l -
o.2?R
0.2AE
XXXXXXXX
LTRxxxxxxxxxxxx
YYYY
Axxxxxx
Traffix 7.6.0115 (c) 2003 Dowling Assoc. Licensed to URS CORP./ SANTA ANA' CA

CEQA Existing Setting AM Sun Aug 30, 2015 12:46:48 Page 11-1
v,¡ayne J. Sand and Gravel- Mine Project Traffic StudyCEQA Existing Setting
Morning Peak Hour
Levef Of Service Computation ReportICU 1(Loss as Cycle Length g) Method (Future Volume Alternative)
Intersection +5 crimes Canyon Road South at Los Angeles Avenue (SR-118) [County
Cycl-e (sec) :
Loss Time (sec):Optinal Cycle:
10010 (Y+R :51
Critical Vol. /Cap. (X) :
4 sec) Average Delay (sec/veh)LeveI Of Service:
0.707xxxxxx
c
Approach: North BoundMovement: L - T - R
-t---------------lControl-: SpÌit PhaseRights: IncludeMin.Green: 0 0 0Lanes: 0 0 0 0 0
-l---------------lVol-ume Modul-eBase Vol:Growth Adj:Initial- Bse:Added Vof:PasserByvoI:Initiaf Fut:User Adj:PHF Adj:PHF Vofume:Reduct Vof:Reduced Vof:PCE Adj:MLF Adj:Finaf Vol. :
Saturation Flow ModufeSat/Lane: 1600 1600Adjustment: 1
Lanes: 0Final- Sat. :
Capacity AnaÌysis Modufe :
Vof/Sat: 0.00 0.00 0.00Crit Moves:
South Bound East BoundL-T-RL-T-R
I --------------- | | --------------- |
Split Phase Protectedfncfude Include
0000000 0 1! 0 0 1 0 1 0 0
| --------------- | I --------------- |
v,lest BoundL-T-R
l---------------lProtected
Include000
00101t---------------l
000
0000
0000
000
0000
0
0
1.00 1
0
0
0
01.00 1
1.00 1
000
1.00 1
1.00 1
0
000
0000
0000
000
0000
0
000
.01.001.00
0
0
0
410041
0
041000041
041
o rr2 52 1901.00 1.00 1 .00 1.00 1
1 .00 1.00 1
?qÔ
1.00159
0
0?(o
1.001.00159
0
159
1B1 .00
1B00
181.001.00
180
18
0
000
0
00
00
EÔ
1
053
1 .00tra
053
1 .001 .00
tra
1 6001.001 .001 600
0
000
0
00
0000
0
0
0
111
113
113
1
11
1
1
1
7721
0
1900
0? o^
1.001.00
1130
1.00 1.00'790 0
00'790 0
1
1
1 .00 1.00 1.001 .00 1.00 1.00
41 0 113
1 .00 1.00 1 .00 1.00 1.001.00 1.00 1.00 1.00 1.001900015918
0000
0
1
00000
0
761.0.
1 6001.000. 00
000000
0 410 0 113 0
600 1600.00 1.00.00 1.00
0 1600
1 6001.001.001 600
1 6001 .00o.29
1 6001 .001 .001 600
1 6001.000.00
0
1 6001.000.71
1
1
0
0.10 0.00 0. 10 0.03 0. 49 0.00 0.00 0.47 0.01**** **** ****
Traffix 7.6.0115 (c) 2003 DowÌing Assoc. Licensed to URS coRP./ SANTA ANA, cA
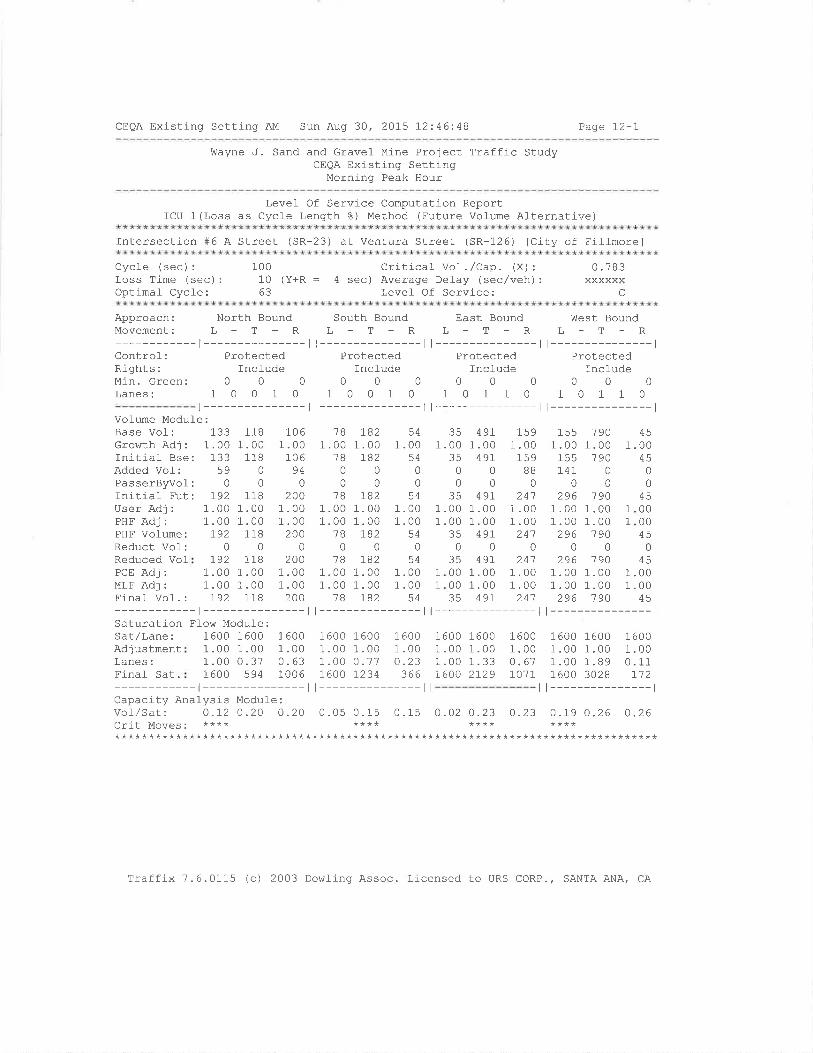
CEQA Existing Setting AM Sun Aug 30, 2015 12:46:48 Page I2-1
!ùayne J. Sand and Gravel Mine Project Traffic StudyCEQA Existing Setting
Morning Peak Hour
Level Of Service Computation ReportICU 1 (Loss as Cycle Length t) Method (Future Vofume Alternative)
Intersection #6 A Street (SR-23) at Ventura Street (SR-126) [City of Fil]-morel
Cycle (sec):Loss Time (sec):Optimal CycÌe:
10010 (Y+R =63
Critical- vol . ,/Cap. (X) :
4 sec) Average Del-ay (sec/veh) :
Levef Of Service:
0.783xxxxxx
C
Approach: North BoundMovement: L - T - R
-t---------------lControf: ProtectedRights: IncludeMin.Green: 0 0 0Lanes: 1 0 0 1 0
South BoundL-T-R
t---------------lProtected
Incfude000
10010t---------------l
East BoundL-T_R
l---------------lProtected
IncÌude000
10110l---------------l
West BoundL-T-R
t---------------tProtected
Include000
10110t---------------tt---------------l
Vol-ume Module:Base Vol: 133 118Growth Adj : 1.00 1.00Initial Bse: 133 118Added Vof: 59 0PasserByvof: 0 0Initiaf Fut: 792 118User Adj:PHF Adj:PHF Vofume:Reduct Vof:Reduced VofPCE Adj:MLF Adj:Einal Vof. : 792 118 2OO
-t---------------lSaturation Flow Module:Sat/Lane: 1600 1600 1600
1061 .00
10694
0200
1.001.00
2000
2001 .001 .00
r821.00
IB20
0LB2
1.001.00
7820
7821.001.00r82
541 .00
540
0
541.001.00
540
541.001.00
54
35 4971 .00 1 .00
35 49r0000
35 49r1.00 1.001.00 1.00
35 49t
1591.00
15988
0
2411.001.00
241
451 .00
4500
181.00
180
01B
1 .001 .00
1B0
-78
1.001.00
1B
155 7 901.00 1.00155 190
190
74r0
296
1.00 1
1.00 1
296
0
0
1.00 1
1 .00 1
r92
.00
.00118
0
118.00.00
1
1
.00 1.00 1
.00 1.00 1
296 19000
45000045
00r92
1.001.00
1.001.001600
4971.001 .00
0
35000035
0024'1
1 .001 .00
1600 2129 1071tt
296 190 451
1
I1
.00 I .00
.00 1.00190 45497 241
l--------------- | I --------------- I I --------------- |
AdjustmentLanes:Final Sat.
.00 1 .00
.31 0.63s94 1006
1600 1600 16001 .00 1.00 1 .001.00 0.77 0.237600 1234 366
t---------------l
1
0
1600 1600 16001.00 1.00 1.001.00 1.33 0.61
1600 1600 16001 .00 1 .00 1.001.00 1.89 0.111600 3028 r12
l---------------l-t---------------lCapacity Analysis Module:Vol/Sat: 0.12 O.2O O.2O 0.05 0.15 0.15 0.02 0.23 0.23 0.79 0.26 0.26crit Moves. **** **** **** ************************************************************************************
Traffix 7.6.0115 (c) 2003 Dowling Assoc. Licensed to URS CORP., SANTA ANA| CA
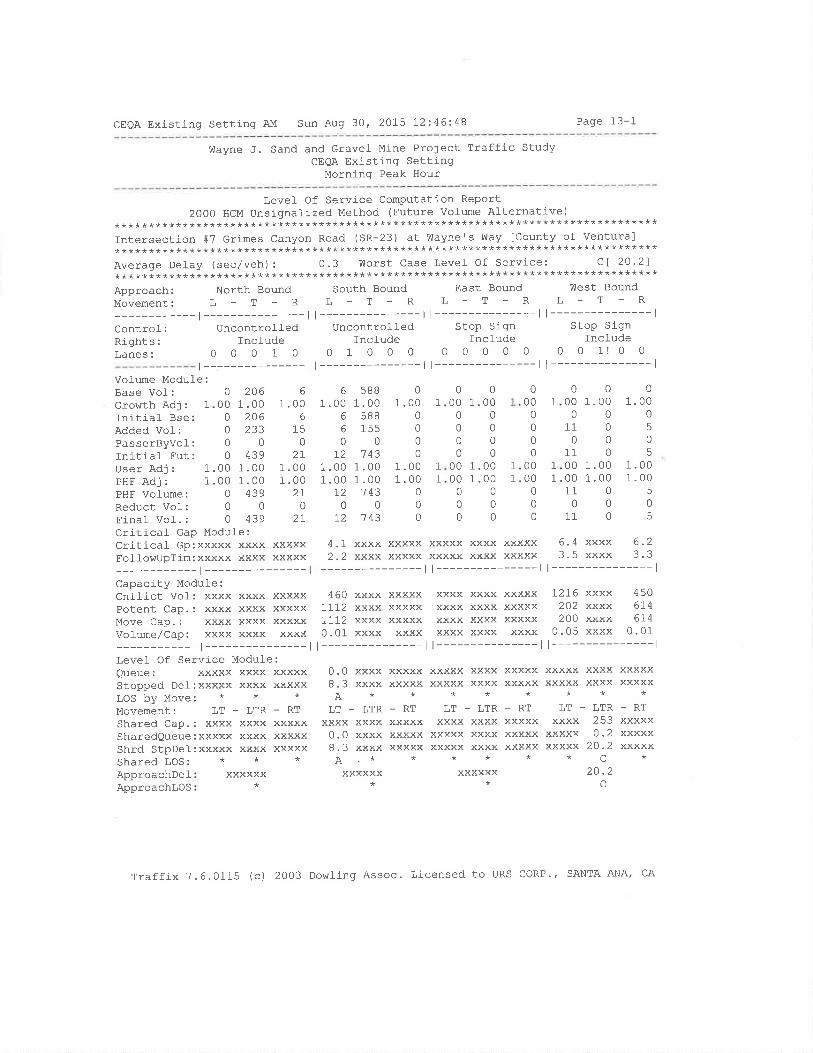
CEQA Existing Setting AM Sun Aug 30, 2015 72:.46:48 Page 13-1
!,layne J. Sand and Gravel Mine Project Traffic StudyCEQA Existing Setting
Morning Peak Hour
Levef Of Service Computation Report2000 HCM Unsignalized Method (Future Volume Alternative)
********************************************************************************Intersection #7 Grimes canyon Road (sR-23) at wayne's way lCounty of ventura]********************************************************************************Average Delay (sec/veh): 0.3 ülorst Case Levef Of Service: Cl 20.21********************************************************************************Approach: North Bound south Bound East Bound west Bound
Movement: L - T - R L - T - R L - T - R L - T - R
-l---------ll---------ll---------ll---------------lcontrol: Uncontrolfed uncontrofled stop siqn stop signRights: Include IncÌude Include Incl-udeLanes: O O O 1 O O 1 0 0 0 0 0 0 0 0 0 0 1! 0 0
t-- ------------ l l--------------- l l---------------l l---------------lVol-ume Module:Base Vof:Growth Adj: 1
Initiaf Bse:Added Vof:PasserByvol-:Initial Fut:User Adj: 1
PHF Adj: 1
PHF Vofume:Reduct Vof:Final VoI.:Critical- Gap Module:Critical- Gp:xxxxx xxxx xxxxxFolfowupTim:xxxxx xxxx xxxxx
-l---------------lCapacity Modufe:Cnflict Vol: xxxx xxxx xxxxxPotent Cap.: xxxx xxxx xxxxxMove Cap.: xxxx xxxx xxxxxVolume/Cap: xxxx xxxx xxxx
-l---------------lLevel- Of Service Modul-e:Queue: xxxxx xxxx xxxxxStopped Del:xxxxx xxxx xxxxxLOS by Move: * * *Movement: LT - LTR - RT
Shared Cap.: xxxx xxxx xxxxxSharedQueue:xxxxx xxxx xxxxxShrd StpDeJ-:xxxxx xxxx xxxxxShared LOS: * * *ApproachDel-ApproachLOS
000
0
.00
.0000
0
zuo1 .00
206zJ3
0/?o
1 .001.00
4390
439
6
1 .006
150
2I1 .001 .00
2I0
2I
6 5881 .00 1 .00
6 5886 15500
t2 1431 .00 1.001.00 1.00
1.2 14300
72 143
0
1 .000
00
0
1 .001 .00
0
00
000 1.
011
01100 1.00 1-.
110
11
000
000
0
00 1 1
000
00
0
0
0000
0
0
0
1
01.00
05
0
5
1.001.00
5
0
000
00
00
0000
0
00
1
1
1
1
1
1
0
000
1 .001 .00
0
00
0000
0000
000
4.1 xxxx xxxxx xxxxx xxxx xxxxx 6.4 xxxx 6-22.2 xxxx xxxxx xxxxx xxxx xxxxx 3.5 xxxx 3.3
| --------------- | I --------------- | l--------------- |
460 xxxx xxxxx xxxx xxxx xxxxx L2I6 xxxx 4501112 xxxx xxxxx xxxx xxxx xxxxx 202 xxxx 6741112 xxxx xxxxx xxxx xxxx xxxxx 200 xxxx 6740.01 xxxx xxxx xxxx xxxx xxxx 0.05 xxxx 0.01
| --------------- | I --------------- | l--------------- |
0.0 xxxx xxxxx xxxxx xxxx xxxxx xxxxx xxxx xxxxx8.3 xxxx xxxxx xxxxx xxxx xxxxx xxxxx xxxx xxxxxA********
LT - LTR - RT LT - LTR _ RT LT - LTR - RT
xxxx xxxx xxxxx xxxx xxxx xxxxx xxxx 253 xxxxx0.0 xxxx xxxxx xxxxx xxxx xxxxx xxxxx 0.2 xxxxx8.3 xxxx xxxxx xxxxx xxxx xxxxx xxxxx 20 -2 xxxxx^******c*
VYYYYY xxxxxx xxxxxx 20.2C
Traffix ?.6.0115 (c) 2003 Dowling Assoc. Licensed to URS CORP'' SANTA ANA' CA

CEQA Existing Setting AM Sun Aug 30, 2015 72246"48 Page 14-1
Wayne J. Sand and Gravel Mine Project Traffic StudyCEQA Existing Setting
Morning Peak Hour
Level- Of Service Computation ReportICU 1 (Loss as cycle Length 8) Method (Euture volume Alternative)
********************************************************************************Intersection #B Walnut Canyon Road (SR-23) at Casey Road lCity of Moorpark]********************************************************************************cycle (sec): 100 criticaf Vol'/Cap' (x): I'0I2Lãss Time (sec) : 10 (y+R : 4 sec) Average Delay (sec/veh) : xxxxxxOptimal Cycle: 100 Levef Of Service¡ E
********************************************************************************Approach:NorthBoundSouthBoundEastBoundWestBoundMovemENt: L - T - R L _ T - R L - T - R L - T - R
-l---------------l l--------- ll--------- I l---------------lControf: Prot+Permit Permitted Protected ProtectedRights: Incfude Tnclude Incl-ude IncludeMin.creen: 0 0 O O O O O 0 0 0 0 0
Lanes: 1 O 1 O 0 0 O O 1 0 1 O O 0 1 0 0 0 0 0
-l---------ll---------ll---------ll---------------lVolume Module:Base Vol:. 3I4Growth Adj : 1.00Initiaf Bse: 3L4Added Vol: 0
PasserByvol: 0
Initiaf Fut: 3I4User Adj : 1.00PHF Adj : 1.00PHF Vofume: 314Reduct Vof: 0
Reduced VoÌ: 314PcE Adj : 1.00MLF Adj : 1.00Final- VoI. : 3I4
00
2681 .00
268246
0
5141 .001 .00
5140
5141 .001 .00
514
0 60300 1.000 6030 ]_64000 161
00 1.0000 1.000 '761
000 '761
00 1.0000 1.00o '761
26r1.00
0
1 .000000
1 .001 .00
000
1 .001 .00
0
261 .00
260
026
1 .001 .00
260
261 .001 .00
zt)
1
1
1
1
1
'701 .00 1.00
70000010
.00000
26r
0
1.0000
00
1.001 .00
0
00
001.00 1.00
00000000
1.00 1.001.00 1.00
1.00 1
1.00 1
1
01
000000
1 .00 1.001.00 1.00
001.00 1.001 .00 1.00
10
00
2611.001.0026r
026r
1.001.0026r
1.001 .00
0
t---------------llSaturation Ffow Module:Sat/Lane: 1600 1600Adjustment: 0.94 1.00Lanes: 1.00 1.00Einal Sat.: 1500 1600
-t-----------Capacj-ty Anal-Ysis ModuleVol,/Sat: 0.2I O.32Crit Moves ' ****************************
1 6000.940 .00
0
1 6000.940.00
0
1. 00nÔ?1548
1600 16000.94 1.001.00 0.001500 0
1 6000.941.001 500
1 6000.940 .00
0
1 6000.940 .03
49
1 600 I61.0.
009400
0
't6ñ
0.
000000
0
----| ----l l ----l l---------------l
o. oo 0.00 o.50 0.53 0. oo 0. o0 0 ' 17 0.00 0.00 0.00**** ****
********************************************************
Traffix ?.6.0115 (c) 2OO3 Dowling Assoc. Licensed to URS CORP'r SANTA ANA' CA
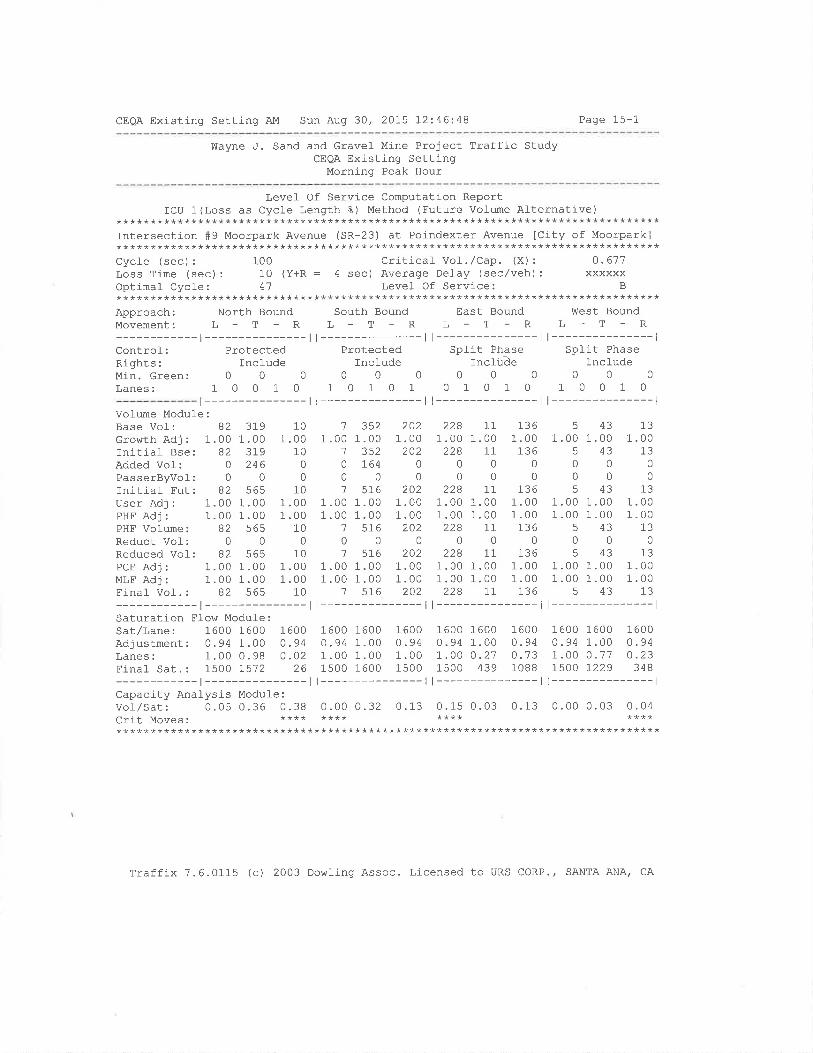
CEQA Existing Settinq AM Sun Aug 30, 2075 12:46:48 Page 15-1
Wayne J. Sand and Gravel Mine Project Traffic StudyCEQA Existing Setting
Mornj-ng Peak Hour
Levef Of Service Computation ReportICU 1(Loss as Cycle Length 8) Method (Future VoÌume Alternative)
********************************************************************************Intersection #9 Moorpark Avenue (SR-23) at Poindexter Avenue [City of Moorpark]********************************************************************************Cycl-e (sec) : 100 Critical- Vol . /Cap. (X) : 0.611Loss Time (sec) : 10 (Y+R = 4 sec) Average Defay (sec/veh) : xxxxxxOptimal Cycle: 4'7 Level- Of Service: B********************************************************************************Approach: North Bound South Bound East Bound West BoundMovement: L - T - R L - T - R L - T - R L - T - R
-t---------ll---------ll---------ll---------------lcontrof: Protected Protected Split Phase Split PhaseRights: Include Include Inctuàe IncludeMin,creen: 0 0 0 0 0 0 0 0 0 0 0 0
Lanes: 1 0 0 1 0 1 0 1 0 1 0 1 0 1 0 1 0 0 1 0
l---------------t t---------------l l---------------l l---------------lVofume Modufe:Base Vol-: 82 319 10 1 352 2O2 228 11 136 5 43 13GrowthAdj: 1.00 1.00 1.00 1.00 1.00 1.00 1.00 1.00 1.00 1.00 1.00 1.00Initiaf Bse: 82 319 10 1 352 2O2 228 11 136 5 43 13AddedVol: O 246 0 0 764 0 0 0 0 0 0 0
PasserByVol: 0 0 0 0 0 0 0 0 0 0 0 0
Initial Fut: 82 565 10 1 576 202 228 11 136 5 43 13User Adj : 1.00 1.00 1.00 1 .00 1.00 1.00 1 .00 1.00 1.00 1 .00 1.00 1.00PHF Adj : 1.00 1.00 1 .00 1 .00 1.00 1 .00 1 .00 1.00 1.00 1 .00 1.00 1.00PHF Volume: 82 565 10 '1 516 202 228 11 136 5 43 13Reduct Vof: 0 0 0 0 0 0 0 0 0 0 0 0
Reduced Vof: 82 565 10 '7 5L6 202 228 11 136 5 43 13PCE Adj : 1.00 1.00 1.00 1 .00 1.00 1.00 1 .00 1.00 1.00 1 .00 1.00 1.00MLFAdj: 1.001.00 1.00 1.001.00 1.00 1.001.00 1.00 1.001.00 1'00Final Vof.: 82 565 10 'l 516 202 228 11 136 5 43 13
-t---------ll---------ll---------ll---------------lSaturation FIow Module:Sat/Lane: 1600 1600 1600 1600 1600 1600 1600 1600 1600 1600 1600 1600Adjustment: 0.94 1.00 0.94 0.94 1.00 0.94 0.94 1.00 0.94 0.94 1.00 O.94Lanes: 1.00 0. 98 0.02 1.00 1 .00 1 .00 L00 O.21 0.73 1.00 0.77 O .23Final- Sat.: 1500 1572 26 1500 1600 1500 1500 439 1088 I5OO 1229 348
-t---------ll---------ll---------ll---------------lCapacity Analysis Module :
Vof/Sat: 0.05 0.36 0.38 0 .00 0.32 0.13 0.15 0.03 0. 13 0.00 0.03 0.04Cfit MOVeS. **** **** **** +***********************************************************************************
Traffix 7.6.0115 (c) 2003 Dowling Assoc. Lícensed to URS CORP.' SANTA ANA' CA
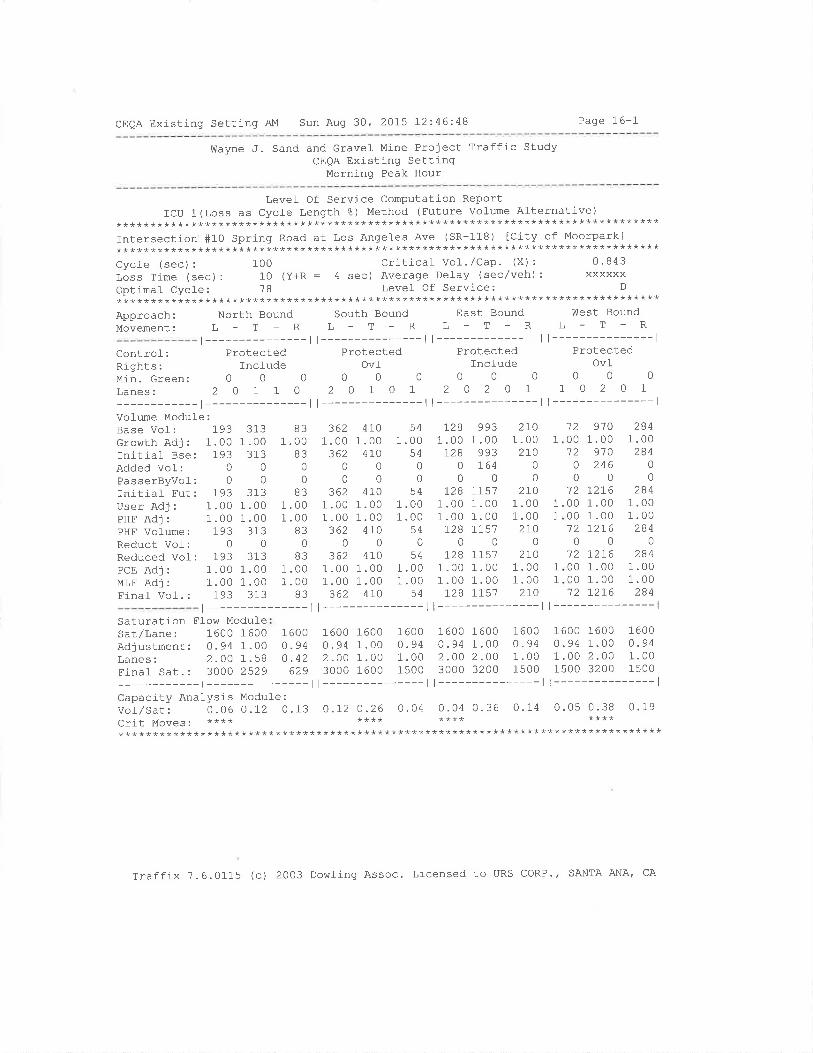
CEQA Existing Setting AM Sun Aug 30' 2015 12:46:48 Page 16-1
Í{ayne J. Sand and Gravel- Mine Project Traffic StudyCEoA Existing Settinq
Morning Peak Hour
Level Of Service Computation ReportICU 1(Loss as Cycle Length 3) Method (Future vol-ume Al-ternative)
********************************************************************************Intersection #10 Spring Road at Los Angel-es Ave (SR-118) lcity of Moorpark]********************************************************************************Cycfe (sec) : 100 Criticat VoJ- ' /Cap. (X) : 0 ' 843
Loss Time (sec): 10 (Y+R : 4 sec) Average Delay (sec/veh): xxxxxxOptimal Cycle: 'r-8 Lewef of Service: D
********************************************************************************Approach: North Bound south Bound East Bound vÍest BoundMovement: L - T - R L - T - R L - T - R L - T - R
t---------------ll---------------ll---------------ll---------------lControl: ProtectedRights: IncfudeMin.Green: 0 0 0
Lanes: 2 O 1 1 0
-l---------------lVofume Module:Base Vol: 193 313 83Growth Adj: 1.00 1.00 1.00Initial Bse: 193 313 83AddedVol-: 0 0 0
PasserByvof: 0 0 0
Initial- Fut: 193 313 83User Adj : 1.00 1 .00 1 .00PHF Adj : 1.00 1 .00 1.00PHF Volume: 193 313 83Reduct Vof: 0 0 0
Reduced VoI: 193 313 83PcE Adj: 1.00 1.00 1.00MLF Adj : 1.00 1 .00 1 .00Final Vol. : 193 313 83
ProtectedOvf
00020101
t---------------l
ProtectedInclude
00020201
t---------------l
ProtectedOvl
00010201
t---------------l362
1 .00362
0
0
3621 .001 .00
3620
3621 .001 .00
362
4101.00
4100
0410
1.001.00
4100
4101.001 .00
410
541 .00
540
0
^I1 .001 .00
540
r- ¿,
1 .001.00
qA
7281 .00
12800
12B1 .001 .00
I2B0
L2B1 .001 .00
I2B
9931.00
993764
011571.001.00TI51
0
11571.001.001157
2701.002r0
00
2ro1.001.002ro
0270
1.001.002ro
120012
00
120000'72
0120000'72
9'701.00
910246
0t2r61.001.0012I6
0
121_6
1.001.0012r6
2841 .00
2840
0
2841 .001.00
2840
2841 .001.00
284
1
1
1
1
1
r---------------ll---------------ll---------------ll---------------lSaturation Flow ModuleSat/Lane: 1600 1600Adjustment: 0.94 1.00Lanes: 2.00 1.58Fi-naf Sat. : 3000 2529
1 6000.94o .42
629
1 6000.942.OO3000
00 160000 0.9400 1 .0000 1500
1 600o.941 .0015 00
1600 16000.94 1.001 .00 2.001s00 3200
1 6000.941.001500
I61.1.1-6
1600 16000.94 1.002 .00 2.003000 3200
-l---------ll---------ll---------ll---------------lCapacity AnaÌysis Module:vor/sat: o .06 0 .I2 0.13 0 .72 0 .26 0.04 0 .04 0. 36 0. 14 0.05 0.38 0.19crit Moves ' **** **** **** ************************************************************************************
Traffix 7.6.0115 (c) 2OO3 Dowling Assoc. Licensed to URS CORP.' SANTA ANA, CA
::3i-:il::1::-::::tï-:T---::l-1n--10-'--',-?!?-:?:'-^-':-1:--------L--------::::-1-1---V,layne J. Sand and Gravef Mine Project Traffic Study
CEQA Existing SettingEvenj-ng Peak Hour
Scenarío:
Command:Volume:Geometry:Impact Fee:Trip Generation:Trip DistributionPaths :
Routes:Configuration:
Scenario RePortCEQA Existing Setting PM
PM
PM
ExistingDefault Impact FeePM
PM
Default PathsDefault RoutesPM Existing
Traffix 7.6.0115 (c) 2O03 Dowling Assoc. Licensed to URS coRP., SANTA ANA, CA
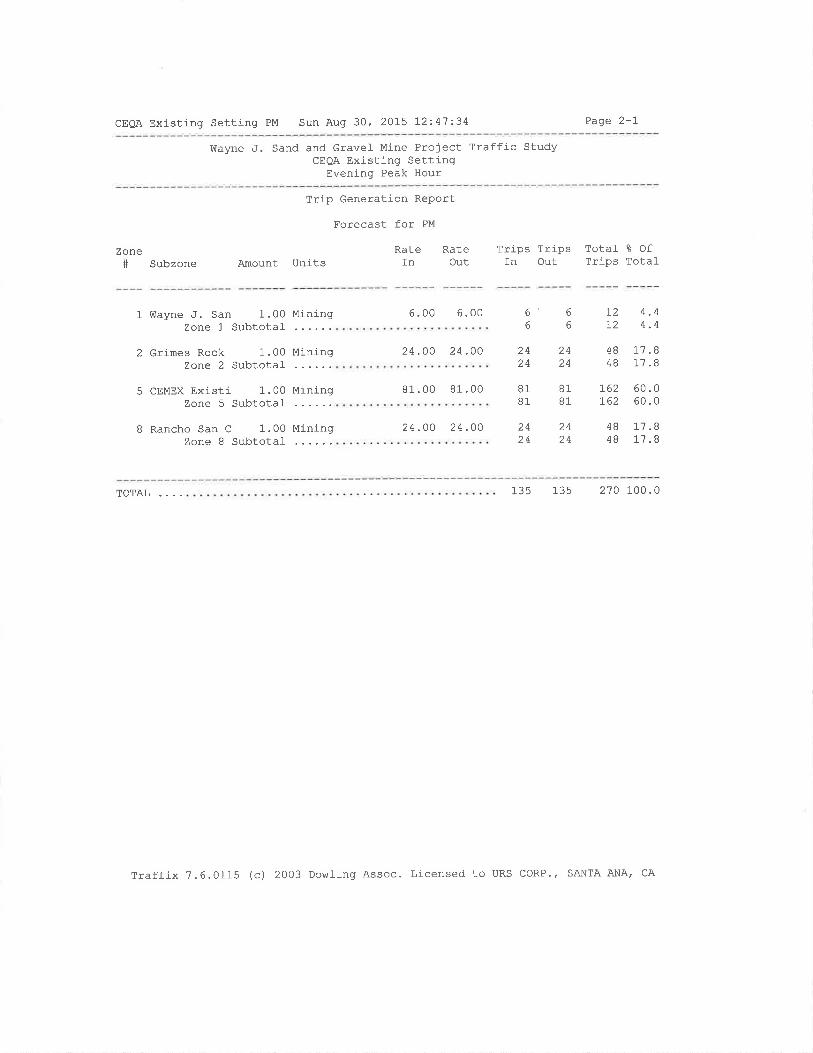
CEOA Existing Setting PM Sun Aug 30' 2015 12:4'7:34 Page 2-I
vilayne J. Sand and Gravel Mine Project Traffic StudyCEQA Existing Setting
Evening Peak Hour
Zone# Subzone
Trip Generation Report
Forecast for PM
Rate RateArnount Units In Out
Trips Trips Totaf å OfTrips TotalIn Out
1 Wayne ,f . San 1.00 MiningZone 1 Subtotal
2 Grimes Rock 1.00 MiningZone 2 Subtotal-
5 CEMEX Existi 1.00 MiningZone 5 Subtotal
B Rancho San C 1.00 MiningZone I Subtotal
6' 6
66T2t2
4.44.4
2424
24zq
4848
I7 .BI1 .B
81B1
B1B1
2424
24z4
4B
4B17.817 .8
6.00 6.00
24.OO 24.00
81.00 81.00
24.OO 24.00
162 60.0162 60.0
TOTAL .... 135 135 270 1,00.0
Traffix 7.6.0115 (c) 2003 Dowlíng Assoc. Licensed to URS coRP.' SANTA ANA, CA
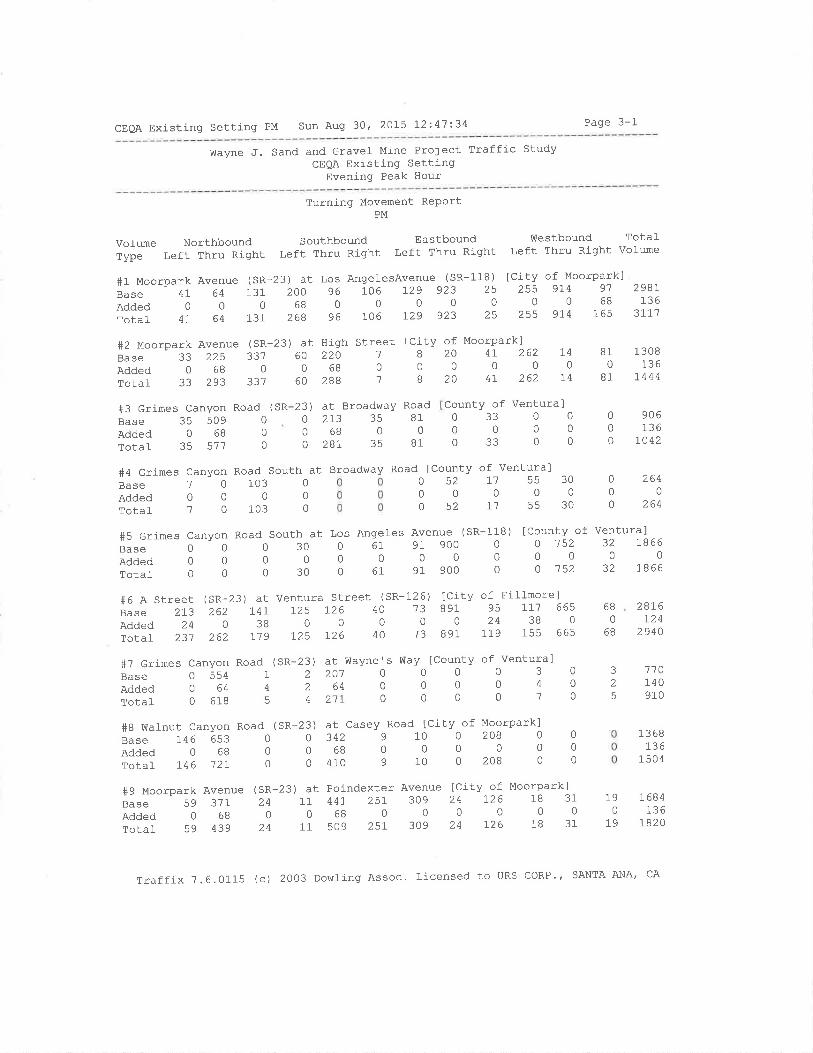
CEQA Existing Setting PM Sun Aug 30, 2075 12:41:34 Page 3-1
Wayne,f. Sand and Gravel Mine Project Traffic StudyCEOA Existing Setting
Evening Peak Hour
Vofume NorthboundType Left Thru Right
#1 Moorpark Avenue (SR-23) a
Base 41' 64 131 20O
Added00068Total 41 64 131 268
#3 Grimes Canyon Road (
Base 35 509 0
Added 0 68 0
TotaÌ 35 571 0
Turning Movement RePortPM
Southbound Eastbound Westbound TotalLeft Thru Rj-ght Left Thru Right Left Thru Right Volume
tLo9
9
s AngelesAvenue (SR-l-18) tCity of Moorparkl6 106 r29 923 25 255 974 91
0000000686 106 r29 923 25 255 9r4 165
298r136
3rt]
906136
to42
#2 Moorpark Avenue (SR-23) at High StreetBase 33 225 331 60 220 1
AddedO6800680rotal 33 293 33? 60 288 '1
lCity of Moorparkl
23ir at BroadwaY Road0 2r3 35 81068000 28r 35 81
h at Los Angeles Avenue (
30 0 61 9t 90000000
30 0 61 91 900
SR
200
20
41 262 t4000
41 262 14
810
81
1 308136
14 44
8
0
B
CountSR v of Ventural3300000
3300
Road South at Broad\^ray Road [county of Ventura]
000
00
0
000
00
0
#5 Grimes CanYon Road SoutBase000Added 0 0 0
Totaf 0 0 0
#7 Grimes Canyon Road (SR
Base 0 554 IAdded O 64 4
Total 0 618 5
#8 V{alnut CanYon Road (
Base 746 653 0
Added 0 68 0
Total 146 12I 0
#4 Grlmes CanyonBase 7 0
Added 0 0
Totaf 7 0
#9 Moorpark AvenueBase 59 3'7IAdded 0 68Totaf 59 439
o52r1553000000o52115530
zôq0
264
1030
103
(sR-23)24
024
2876124
2940
118) [County of Ventura]o 0 152 32 1866000000 0 152 32 1866
#6 A Street (SR-23) at Ventura Street (SR-126) [City of Fi]-l-morelBaSe2:.3262I4I725L2640138919511.7665Added240380000O24380rotal 23'1 262 I19 1-'25 126 40 13 891 119 155 665
680
6B
SR
2
2
3
25
0
0
0
3)2
2
4
3)0
0
0
at Wayne's V^lay [County of Ventura]20'.-00003064000040
211000070at Casey Road [CitY of Moorpark]342910020806800000
41091002080
at Poindexter Avenue ICity of Moorpark]11 44I 251 309 24 126 18 31
06800000011 509 25r 309 24 126 18 31
110140910
13 68136
1504
190
19
I684136
TB2O
Traffix 7.6.0115 (c) 2003 Dowling Assoc. Licensed to URS coRP., SANTA ANA' CA

CEOA Existinq Setting PM Sun Auq 30, 201-5 I2z4'7"34 Page 3-2
wayne J. Sand and Gravel Mine Project Traffic StudyCEQA Existíng Setting
Evening Peak Hour
Vollnne NorthboundType l,eft Thru Right
SouthboundLeft Thru Right
EastboundLeft Thru Right
V,Testbound TotalLeft Thru Right Volume
#10 Spring Road at Los Angeles AveBase 24'7 322 64 404 365Added00000Total 247 322 64 404 365
(SR-118) [City of Moorpark]60 111 988 341 144 105300680068
60 l-11 l-056 34L ]-44 Lr2r
4220
4ZZ
452L136
4657
Traffix ?.6.0115 (c) 2003 Dowling Assoc. Licensed to URS CORP'f SANTA ANA' CA

CEQA Existing Setting PM Sun Aug 30' 2015 I2z4'l:36 Page 6-1
Wayne J. Sand and Gravel Mine Project Traffic StudyCEQA Existing Settíng
Evening Peak Hour
Intersection
Moorpark Avenue (SR-23) at Los
Moorpark Avenue (SR-23) at Hig
crimes Canyon Road (SR-23) at
Grimes Canyon Road South at Br
GrÍmes Canyon Road South at Lo
A Street (SR-23) at Ventura St
Grimes Canyon Road (SR-23) at
Wal-nut Canyon Road (SR-23) at
Moorpark Avenue (SR-23) at Poi
Spring Road at Los Angel-es Ave
#1+2#3#4#5+6#1#B#9#10
Impact Analysis ReportLevel- of Service
BaSenet/ v/
LOS Veh C
B xxxxx 0.639
A xxxxx 0.595
B 0. o r.024
A 9.1 0.000
C xxxxx 0.719
D xxxxx 0.811
B 13.3 0.000
B xxxxx 0.647
B xxxxx 0.654
D xxxxx 0.815
FutureDe]-/ v/
LOS Veh C
C xxxxx 0.?28
A xxxxx 0.595
B 0.0 1.159
A 9.1 0.000
C xxxxx 0.719
D xxxxx 0.866
c 15.1 0.000
B xxxxx 0.689
B xxxxx 0.697
D xxxxx 0.836
Changein
+ 0.089 v,/c
+ 0.000 v,/c
+ 0.000 D/v
+ 0.000 D/v
+ 0.000 V/C
+ 0.055 v,/c
+ I.846 D/V
+ o.042 v/c
+ 0.042 v/c
+ 0.027 v/c
Traffix 7.6.0115 (c) 2003 Dowting Assoc. Licensed to uRs coRP.' SANTA ANA' CA

CEQA Existíng Setting PM Sun Aug 30' 2015 I2z4'7:36 Page 7-1
Wayne J. Sand and Gravel Mine Project Traffic StudyCEQA Existíng Settinq
Evening Peak Hour
Level Of Service Computation ReportICU 1(Loss as Cycfe Length %) Method (FutuIe volume Alternative)
********************************************************************************Intersection#lMoorparkAvenue(SR-23)atLoSAnqeIeSAvenue(SR-118)[cityofM********************************************************************************Cycle (sec): 100 Critical Vof'/Cap' (X): 0'128Loss Time (sec) : 10 (Y+R : 4 sec) Average Delay (sec/veh) : xxxxxxOptimal CycJ-e: 54 Level Of Service; C
********************************************************************************Approach:NorthBoundSouthBoundEastBoundWestBoundMovement: L - T - R L - T - R L - T - R L - T - R
-l---------ll---------ll---------ll---------------lcontrof: split Phase split Phase Protected ProtectedRights:Min. GreenLanes:
Volume Module:Base Vol: 4Icrohrth Adj : 1.00Initial Bse: 4IAdded Vol: 0
PasserByvol: 0
Initial Fut: 4IUser Adj : 1.00PHF Adj : 1.00PHF Vol-ume: 4IReduct Vof: 0
Reduced Vol: 4LPCE Adj : 1.00MLF Adj : 1.00Final Vof. : 4I
2001 .00
20068
0268
1 .001 .00
2680
2681 .001 .00
268
1600 16000.94 1.00r .1r 0.292566 463
Ovf OvI Include OvIOOOOOOOOOOOO
1 1 O O 1 1 0 1l o 1 1 0 2 1 0 1 0 2 0 1
t---------------ll---------------ll---------------ll---------------l
641 .00
640
0
641 .001.00
640
641 .001 .00
64
1311 .00
13100
1311 .001 .00
1310
1311 .001.00
131
961 .00
960
096
1.001 .00
960
961.001.00
96
1061.00
10600
1061 .001.00
1060
1061 .001 .00
106
1291 .00
12900
1291 .001 .00
1290
1291 .001 .00
729
9231 .00
9230
0923
1.001 .00
9230
9231.001.00
923
251.00
00
z51.001 .00
z50
z31.001.00
25
4trtr
1 .00?qq
00
2551 .001 .00
1trÃ
0
2551 .001.00
255
9r41.00
9740
0974
1.001.00
9740
9r41 .001.009r4
9'l1 .00
916B
0165
1 .001.00
1650
1651 .001 .00
165
Saturation Flor¡/ ModufeSat/Lane: 1600 1600Adjustment: 0.94 1.00Lanes: 1.00 1.00Final Sat.: 1500 1600
1 6000.941 .001 500
1 600ôo¿1.001500
1 600ôq¿
1 .001 500
00 160000 0. 9492 0.0813 II9
1 6000.941.001500
761.2.46
1600 16000.94 1.001.00 2.001500 3200
-l---.-----ll---------ll---------ll---------------lCapacity Anatysj-s Module :
vor/sat: 0.03 o.04 0.09 o.10 0.21 0.07 0.09 0.20 0-2I O.I'7 0.29 0-11Cfit MO\,¡eS: **** **** **** ************************************************************************************
Traffix 7.6.0115 (c) 2OO3 Dowling Assoc. Licensed to URS coRP.' SANTA ANA' CA
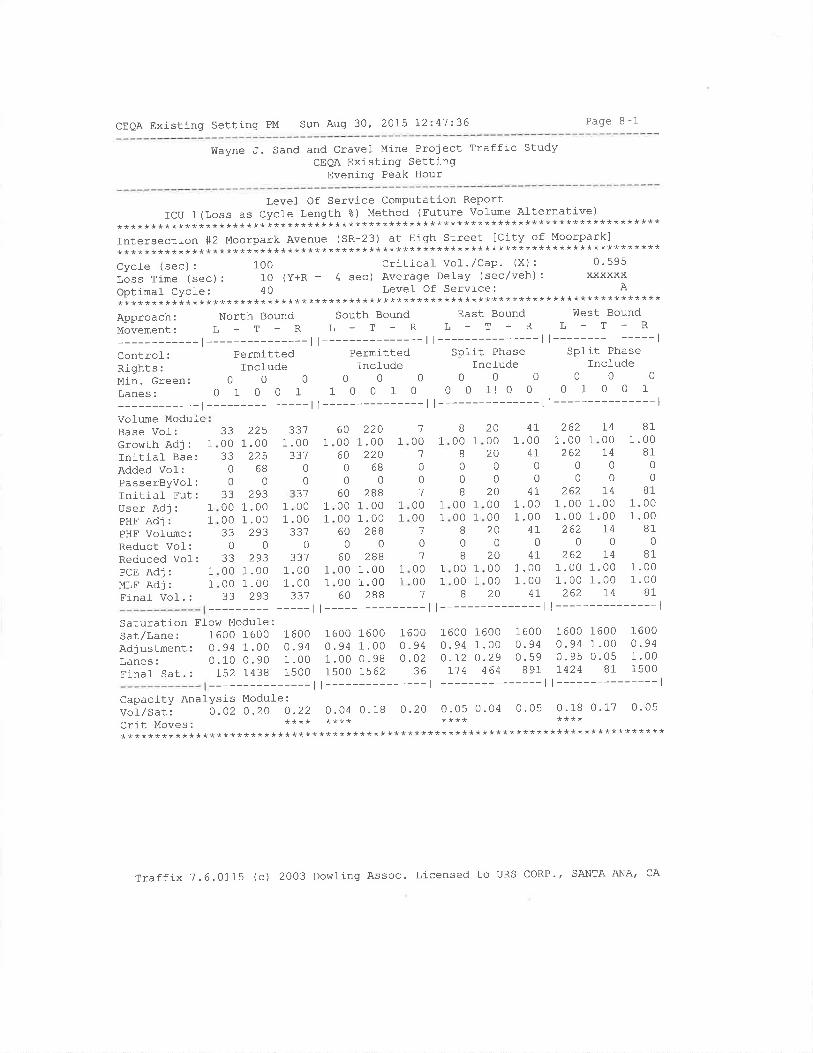
CEQA Existing Setting PM Sun Aug 30' 2015 1'2"4'l:36 Page B-1
Wayne J. Sand and Gravel- Mine Project Traffic StudyCEQA Existing Sêtting
Evening Peak Hour
Levef Of Service Computation ReportICU 1(Loss as Cycle Length 8) Method (Future volume Alternative)
********************************************************************************Intersection #2 Moorpark Avenue (SR-23) at High Street ICity of Moorpark]********************************************************************************Cycle(sec):l00criticalVol-"/Cap'(x):0'595lãss Tine (sec) : 10 (y+R : 4 sec) Average Delay (sec/veh) : xxxxxxOptimal- Cycle: 40 Level Of Service; A********************************************************************************Approach: North Bound South Bound East Bound West Bound
MovemeNt: L - T - R L - T - R L - T - R L - T - R
-l---------ll---------ll---------ll---------------lControl:PermittedPermittedSplitPhaseSplitPhaseRights: Include Include Include IncludeItin.Green: O O 0 0 O O 0 0 0 0 0 0
Lanes: O 1 0 O 1 1 0 O 1 O 0 0 11 0 0 0 1 0 0 1
-l---------ll---------ll---------ll---------------lVolume ModuleBase Vol-:Growth Adj:InitiaÌ Bse:Added Vol:PasserByvol-:Initial- Eut:User Adj:PHF AdJ:PHF Volume:Reduct Vol:Reduced VoI:PCE AdJ:MLF AdJ:¡ rnâ.1- vof . :
Saturation Fl-Sat/Lane:Adjustment:Lanes:Final Sat. :
----ll----ll----ll---------------low Modul-e:1600 1600 1600 1600 1600 1600 1600 1600 1600 1600 1600 1600
0.94 1 . O0 o.g4 0. 94 1. OO O .94 0.94 1.00 0 '94 0.94 1.00 0 ' 94
o. t-o o.90 1 .00 1 . O0 O. 98 o.O2 O .r2 0.29 0.59 0. 9s 0.05 1' 00
152 1438 15OO 1500 1562 36 r14 464 891 7424 81 1500
----ll----ll----ll---------------lysis Module:o.oz o.zo 0.22 0.04 0.18 O.2o 0.05 0.04 0.05 0.18 0.17 0'05
**** **** **** ****Capacity AnalVof/Sat:crit Moves:
2251 .00
22568
0tq?
2201.00 t
22068
0288
1.00 1
1.00 1
2880
20 4r00 1.0020 4r0000
20 4r00 1.0000 1.0020 4700
20 4700 1.0000 1.0020 4r
1,4
0074
00
740000I4
0
I40000I4
B11.00
8100
811.001.00
810
811.001.00
81
1
33002?
00
33000033
0
33000033
3371.00 1
331
1
1
1
1
1
1
1
1
'l00
1
0
01
0000
1
01
0000
1
1
1
1
1
288
600060
0
0
60000060
0
60000060
1 1
8
00B
00B
0000I0I
0000
8
2621 .00
26200
2621 .001.00
2620
2621 .001.00
zbz
1
1
1
1
1
1
1
1.00 1
1.00 1
0
0aa
0000
1
1
,o?0
2931 .001 .00
293
3370
3371.00 1
1.00 1
331
1.001 .00
288
********************************************************************************
Traffix 1.6.O1-I5 (c) 2003 Dowling Assoc. Licensed to URS CORP.' SANTA ANA| CA
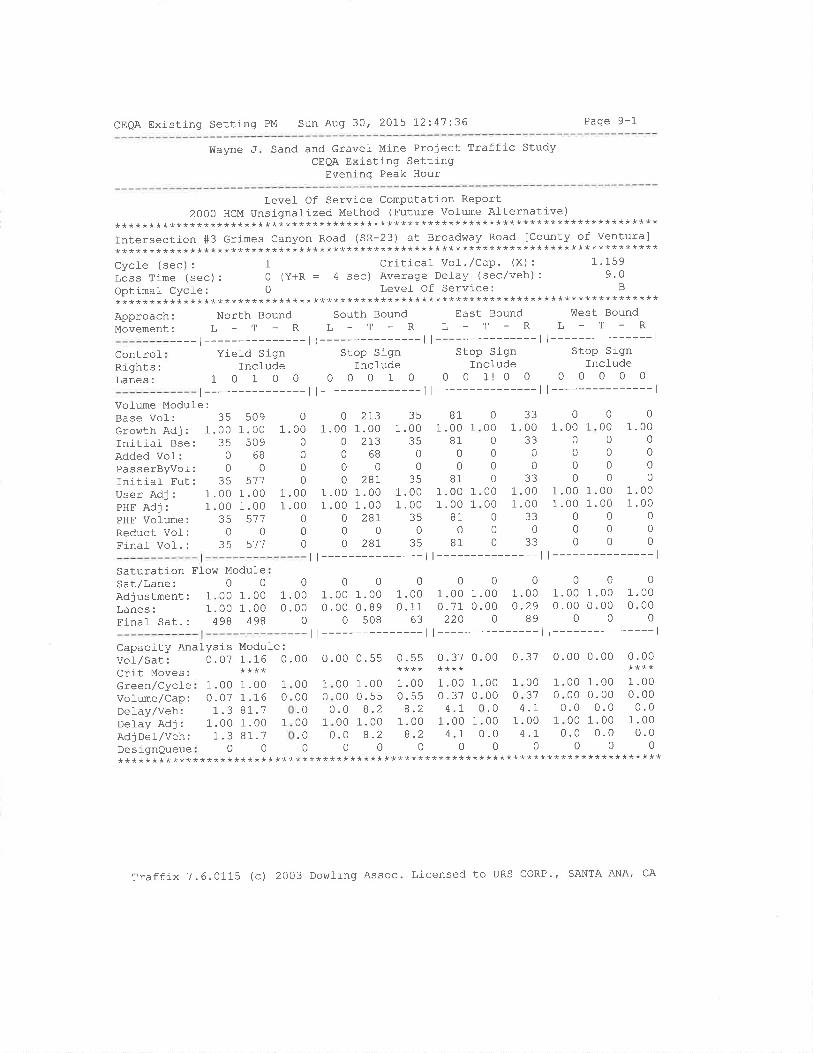
CEQA Existing Setting PM Sun Aug 30, 2015 72:.47:36 Page 9-1
Wayne J. Sand and Gravel Mine Project Traffic StudyCEQA Existing Setting
Evening Peak Hour
Levet Of Service Computation Report20OO HCM Unsignalized Method (Future Vol-ume Alternative)
********************************************************************************Intersection #3 Grimes Canyon Road (SR-23) at Broadway Road fCounty of Ventura]********************************************************************************Cycle (sec): 1 Critical VoI./Cap' (X): 1'159lòss Time (sec): O (Y+R : 4 sec) Average Delay (sec/veh): 9'0Optimal CycÌe: 0 Level Of Service: B
********************************************************************************Approach: North Bound south Bound East Bound west Bound
Movement: L - T - R L - T - R L - T - R L - T - R
----r------ll---------ll---------ll---------------lYield Sign Stop Sign Stop Sign Stop Sign
Include Incfude Include Incfude1 O 1 O O 0 o 0 1 0 0 0 11 0 0 0 0 0 0 0
ControlRights:Lanes:
Vol-ume Module:Base Vol-: 35Growth Adj : 1.00Initial- Bse: 35Added Vof: 0PasserByvol: 0Initiaf Fut: 35User Adj : 1.00PHE Adj : 1.00PHF Volume: 35Reduct VoÌ: 0Final- Vol. : 35
t---------------ll---------------ll---------------ll---------------l509
1.00Ãno
6B
0511
1 .001 .00
51'70
51'7
01 .00
0
0
00
1 .001 .00
000
0 2r31 .00 1.00
0 273068000 287
1.00 1.001.00 1.00
O 2BI000 287
351 .00
?q
0
035
1 .001.00
350
35
811 .00
B10
0B1
1 .001.00
810
81
03300 1.000330000033
00 1.0000 1.0003300033
01 .00
0
000
1.001.00
00
0
01.00
0
000
1.001.00
000
11
0
000
00
0
1
1
1 .001.00
0
00
Saturation Floh, ModufeSat/Lane: 0 0
Adjustment: 1.00 1.00Lanes: 1.00 1.00Final Sat. : 498 498
0001.00 1.00 1.000.00 0. B9 0.11
0 508 63
| --------------- l
0001.00 1.00 1.000.71 0.00 0.29220 0 89
| ---------- ----- |
0001.00 1.00 1.000.00 0.00 0.00
000l---------------l
01 .000.00
0
Capacity Anal-ysis Module :
Vot/Sat: 0.07 1 .16 0.00 0.00 0.55 0.55Crit Moves:Green/CycleVolume/Cap:DeIay/Veh:Delay Adj:Adj De I /Veh :
DesignQueue
.00
.011.3.001aa.J
0
1 .001.1681.?1 .008r.'7
0
00 1.0000 0.55.0 8.200 1.00.0 8.200
1 .000.55
ó.¿1.008.2
0
1.00 1
0.37 0
^11.00 1
4.r0
0.00 0.00****
1.00 1.000.00 0.000.0 0.0
1.00 1.000.0 0.0
00***********
0
1
04
1
0
10
1
0
1
1
0
1
1
0
0000.000.0
0
1
0.37 0.00 0.37 0.00
1
******************
0000.000
0031.100.1
0
0000.000
40 0.00
0.00
***************************************************
Traffix 7.6.0115 (c) 2OO3 Dowling Assoc. Licensed to URS CORP., SANTA ANA, CA
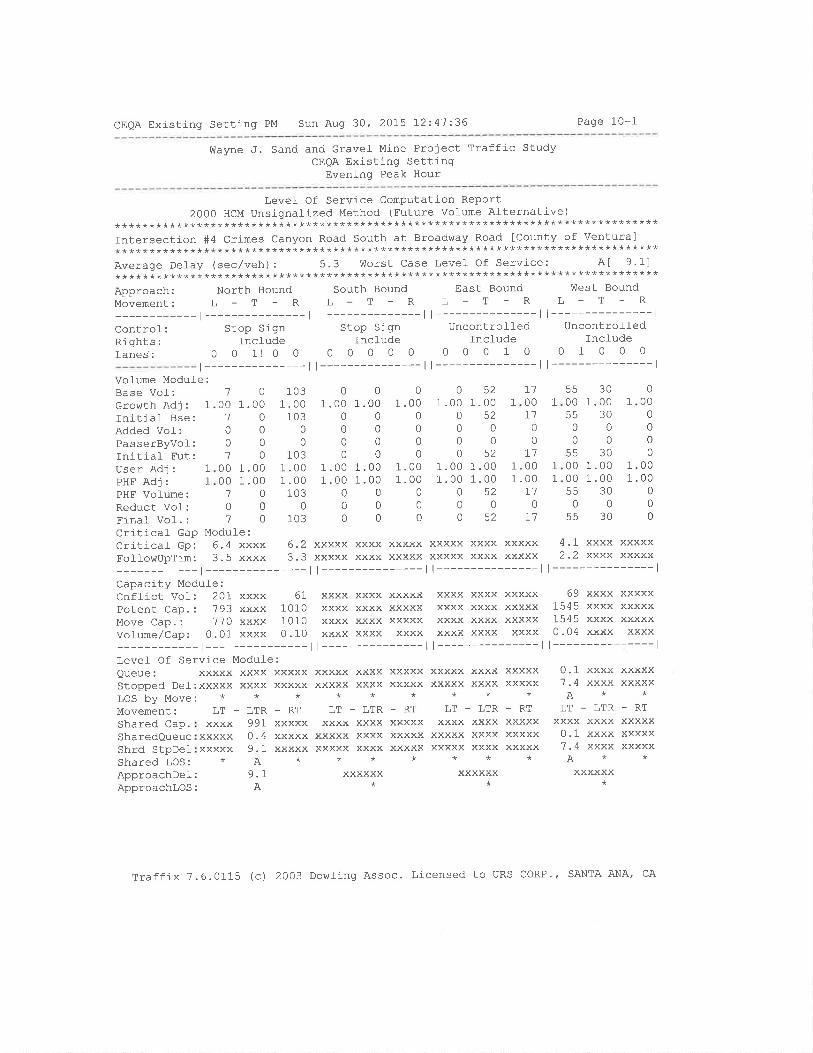
CEOA Existing Setting PM Sun Aug 30, 2015 12:4'7:36 Page 10-1
Wayne J. Sand and Gravel Mine Project Traffic StudyCEQA Existing Setting
Evening Peak Hour
Level Of Service Computation Report2000 HCM Unsignal-ized Method (Future Volume Alternative)
********************************************************************************Intersectj-on #4 crimes Canyon Road South at Broadway Road ICounty of Ventura]********************************************************************************Average Defay (sec/veh): 5.3 Worst Case Levet of service: A[ 9.1]********************************************************************************Approach: North Bound sOuth Bound East Bound !Ùest Bound
Movement: L - T - R L - T - R L - T - R L - T - R
-r---------ll---------ll---------ll---------------lcontrol: stop sign stop sÍgn uncontrolfed uncontroffedRights: Incfude Include Include IncfudeLanes: O O 1! O 0 0 O O O 0 0 0 0 1 0 0 1 0 0 0
t---------------ll---------------ll---------------ll---------------lVofume Modul-e:Base Vof:crowth Adj: 1
Initial Bse:Added Vol-:PasserByvof:Initial Fut:User Adj: 1
PHF Adj: 1
PHF VoIUME:Reduct Vol:Final Vof. :
0
1 .000
000
1 .001 .00
00
0
1000 1.00100000'70
00 1.0000 1 .00'700010
103.00103
0
0
103.00.00103
0103
0
1.000
0
0
01.001.00
0
00
0
1 .00000
0
1 .001 .00
0
0
0
o520000052
1 .00 1.001.00 1.00
05200052
1.00 1
1.00 1
L]0
L1
I100 1
7'l00
30.0030
00
30.00.0030
0
30
0
000
1.001.00
00
0
LT - LTRxxxx xxxx
xxxxx xxxxxxxxx xxxx**
xxxxxx*
o521 .00 1.00 1
LT - LTRxxxx xxxx
xxxxx xxxxxxxxx xxxx**
XXXXXX*
5500trÊ
0
0(tr
000055
0
55
1
0
001
1
1
-RTxxxxxxxxxx!vY!v
1
xxxxxxxx
- LTRxxxxxxxxXXXX
XXXXXxxxxx
-RTXXXXXxxxxxVYVYV
1-1
1
t
Critical Gap Module:Critical Gp: 6.4 xxxx 6.2 xxxxx xxxx xxxxx xxxxx xxxx xxxxx 4.1 xxxx xxxxxFollowUpTim: 3.5 xxxx 3.3 xxxxx xxxx xxxxx xxxxx xxxx xxxxx 2.2 xxxx xxxxx
-l---------ll---------ll---------ll---------------lCapacity Module:Cnffict Vol-: 201 xxxx 61 xxxx Xxxx xxxxx xxxx xxxx xxxxx 69 xxxx xxxxxpotent Cap.: ?93 xxxx 1O1O xxxx xxxx xxxxx xxxx xxxx xxxxx 1545 xxxx xxxxxMove Cap.: 770 xxxx 1O1O xxxx xxxx xxxxx xxxx xxxx xxxxx 1545 xxxx xxxxxvolume/cap: 0.01 xxxx 0.10 xxxx xxxx xxxx xxxx xxxx xxxx 0.04 xxxx xxxx
-l---------ll---------ll---------ll---------------lLevet Of Service Module:Queue: xxxxx xxxx xxxxx xxxxxStopped Def:xxxxx xxxx xxxxx xxxxxLOS by Move: * * * *
xxxx xxxxx xxxxx xxxx xxxxxxxxx xxxxx xxxxx xxxx xxxxx*****
Movement: LT - LTR - RT -RTxxxxxxxxxxxxxxx
0.11I
ALTxxx0.11¿.
A
xShared Cap.SharedQueueShrd StpDeÌShared LOS: * A *ApproachDel: 9.IApproachlos: A
xxxxxxxxxxxxxx
xxxxxXXXXXxxxxx
99rAAo1
xxxxxx
Traffix 7.6.0115 (c) 2003 Dowling Assoc. Licensed to URS CORP', SANTA ANA' cA

CEOA Existing Setting PM Sun Aug 30, 2OI5 12:41'-36 Page 11-1
Wayne J. Sand and Gravef Mine Proiect lraffic StudyCEQA Existing Settì-ng
Evening Peak Hour
Level Of Service Computation ReportICU 1(Loss as CycJ-e Length 8) Method (Future volume Alternative)
********************************************************************************Intersection #5 Grimes Canyon Road South at Los Angeles Avenue (SR-118) [County********************************************************************************cycle (sec): 1OO critical- vo1./Cap. (X): 0'?19Loss Time (sec) : 10 (Y+R = 4 sec) Average Delay (sec/veh) : xxxxxxoptimal Cycle: 53 Level- of Service: C
********************************************************************************Approach: North Bound sOuth Bound East Bound west BoundMovement: L _ T - R L - T - R L - T _ R L - T _ R
-l---------ll---------ll---------ll---------------lcontrol: split Phase split Phase Protected ProtectedRights: Include Include Include IncludeMin.creen: 0 O O 0 0 0 0 0 0 0 0 0
Lanes: O O O O O 0 0 1! 0 0 1 0 1 0 0 0 0 1 0 1
r---------------ll---------------ll---------------ll---------------lVol-ume Moduf e:Base Vol: 0 0 0
Growth Adj : 1.00 1 .00 1 .00Tnitiaf Bse: 0 0 0
AddedVol-: 0 0 0
PasserByvol: 0 0 0
InitiaÌ Fut: 0 0 0
User Adj : 1.00 1 .00 1.00PHF Adj : 1.00 1.00 1.00PHF Vol-ume: 0 0 0
Reduct Vol: 0 0 0
Reduced Vol: 0 0 0
PCE Adj : 1.00 1 .00 1.00MLE Adj : 1.00 1.00 1.00Final- Vol .: 0 0 0
-t---------
91 9000000
91 900
1 6001.000 .00
0
1 6001.000 .611073
1600 16001.00 1.001.00 1 .001600 1600
00 1600 160000 1.00 1.0000 0.00 1.000 0 1600
1 6001 .001.001 600
301.00 1
300
030
1.00 1
1.00 1
300
301.00 1
1.00 1
30t------
000
0
.00
.000
0
0.00.00
0
6100
611 .001 .00
6I0
671 .001 .00
67
1.00 1.00 1.001 .00 1.00 1.00
91 900 0000
91 900 0
1 .00 1.00 1.001 .00 1.00 1.00
91 900 0
| --------------- l
0 152 321 .00 1.00 1.00
o 152 320000000 '1 52 32
1 .00 1.00 1.001 .00 1 .00 1.00
0 '752 320000 '752 32
1.00 1.00 l_.001 .00 1.00 1.00
0 '752 32t---------------l
0
0061 91 900
1.00 1 .00 1.00 1
000
0000
Saturation Flow Module:Sat/Lane: 1600 1600Adjustment: 1.00 1.00Lanes: 0.00 0.00Final Sat.: 0 0
1600 16001.00 1.000.33 0.00521 0
761.U.
-l---------ll---------ll---------ll---------------lCapacity Anal-ysis Modufe:vot/sat: 0. o0 o. oo o . oo o. o6 0.00 0.06 0.06 0.56 0.00 0.00 0. 47 0 -02crit Moves ' **** **** ************************************************************************************
Traffix 7.6.0115 (c) 2003 Dowling Assoc. Licensed to URS CORP., SANTA ANA' CA
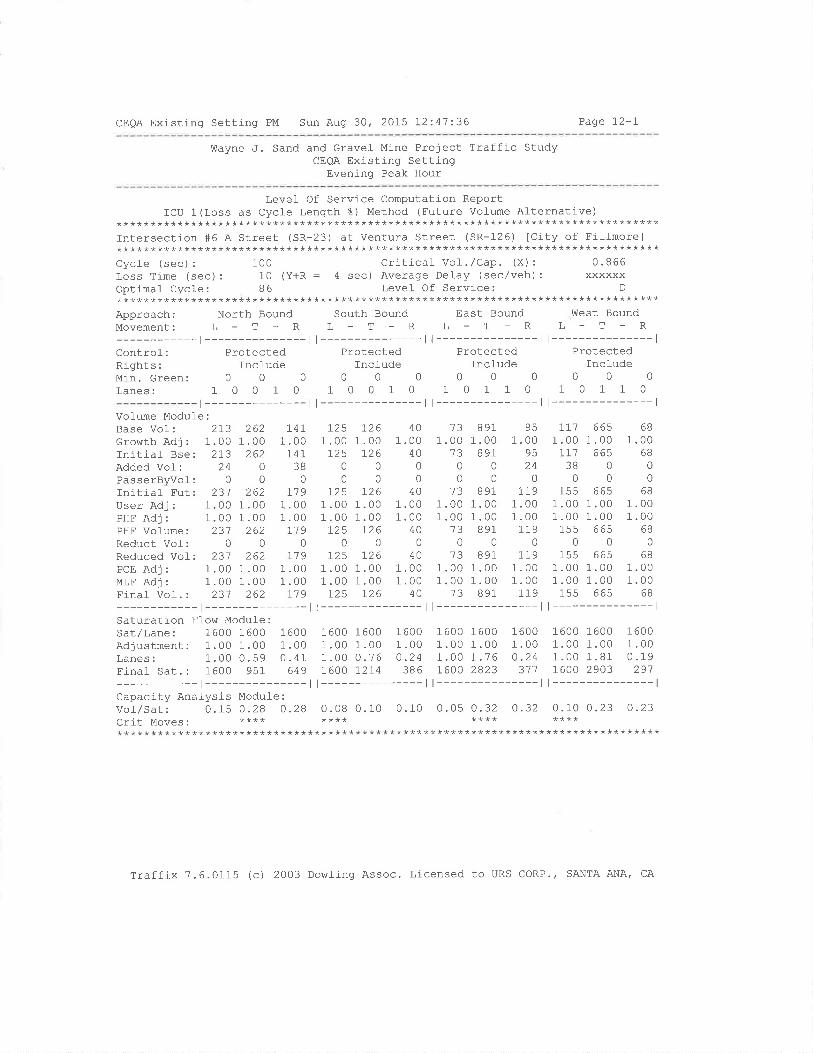
CEQA Existing Setting PM Sun Aug 30, 2015 12:4'7:36 Page 12-1
V,¡ayne J. Sand and Gravel- Mine Project Traffic StudyCEQA Existing Setting
Evening Peak Hour
Level Of Service Computation ReportICU 1 (Loss as Cycle Length %) Method (Future Volume Afternative)
********************************************************************************Intersection #6 A Street (SR-23) at Ventura Street (SR-126) [City of Fj-Ilmore]********************************************************************************Cycle (sec): 100 Critical vol./Cap. (x): 0.866Loss Time (sec): 10 (Y+R : 4 sec) Average Del-ay (sec/veh): xxxxxxOptimal Cycle: 86 Level Of Service: D
********************************************************************************Approach: North Bound South Bound East Bound West BoundMovement: L - T - R L _ T - R L - T _ R L - T - R
-l---------ll---------ll---------ll---------------lControf: Protected Protected Protected ProtectedRights: IncÌude Include Incfude IncludeMin.creen: 0 0 0 0 0 0 0 0 0 0 0 0
Lanes: 1 0 0 1 0 1 0 0 1 0 1 0 1 1 0 1 0 1 1 0
t---------------ll---------------ll---------------ll---------------lVolume Modufe:Base Vol:. 2I3 262 74I 725 L26 40 13 891 95 I71 665 68
GrowthAdj: 1.001.00 1.00 1.001.00 1.00 1'001'00 1.00 1.001.00 1.00Ini-tial Bse: 2I3 262 141 I25 126 40 13 891 95 7I1 665 68Added Vof: 24 0 38 0 0 0 0 0 24 38 0 0
PasserByvol: 0 0 0 0 0 0 0 0 0 0 0 0
Tnitial Fut: 231 262 I19 I25 126 40 13 891 II9 155 665 68
UserAdj: 1.001.00 1.00 1.001.00 1.00 1.001.00 1.00 1.001.00 1.00PHF Adj : 1.00 1 .00 1 .00 1 .00 1.00 1.00 1 .00 1.00 1.00 1 .00 1.00 1.00PHF Volume: 23'7 262 I19 I25 726 40 13 891 L79 155 665 68
Reduct Vof: 0 0 0 0 0 0 0 0 0 0 0 0
Reduced Vol: 231 262 I19 I25 726 40 13 891 119 155 665 68PCEAdj: 1.001.00 1.00 1.001.00 1'00 1.001.00 1.00 1.001.00 1.00MLFAdj: 1.00 1.00 1.00 1.00 1.00 1'00 1.00 1.00 1.00 1.00 1.00 1.00Finaf Vof.: 231 262 I19 725 126 40 13 891 119 155 665 68
-t---------ll---------ll---------ll---------------lSaturation Ffow Module:Sat/Lane: 1600 1600 1600 1600 1600 1600 1600 1600 1600 1600 1600 1600Adjustment: 1.00 1 .00 1 .00 1 .00 1.00 1.00 1 .00 1.00 1.00 1 .00 1.00 1.00Lanes: 1.00 0.59 0.41 1.00 0.76 0.24 1.00 1.76 0.24 1.00 1.81 0.19Final- Sat.: 1600 951 649 1600 I2I4 386 1600 2823 311 1600 2903 291
-t---------ll---------ll---------ll---------------lCapacity Analysis Module:Vof/Sat: 0.15 0.28 0.28 0.08 0.10 0.10 0.05 0.32 O.32 0.10 0.23 O-23crit Moves. **** **** **** ************************************************************************************
Traffj-x 7.6.0115 (c) 2003 Dowling Assoc. Licensed to URS CORP.' SANTA ANA, CA

CEQA Existing Setting PM Sun Aug 30, 2015 72:'41"36 Page 13-1
vilayne J. Sand and Gravel Mine Project Traffic StudyCEQA Existíng Setting
Evening Peak Hour
Level Of Service Computation Report20OoHcMUnsígnalizedMethod(FutureVolumeAlternative)
********************************************************************************Intersection #7 Grimes Canyon Road (SR-23) at Wayne's Way [County of Ventura]********************************************************************************Average Delay (sec/veh): o.2 worst case Level- of service: ct 15'11********************************************************************************Approach: North Bound South Bound Eas' Bound West Bound
MoveMENt: L - T - R L - T - R L - T - R L - T - R
-r---------ll---------ll------ll---------------lControl: Uncontroll-ed Uncontrolfed Stop Sign Stop SignRights: Incfude Include Include Incl-udeLaÃes: 0 0 0 1 O O 1 O 0 O O 0 0 0 0 0 0 1! 0 0
-l---------ll---------ll---------ll---------------lVolume ModufeBase Vof:Growth Adi:Initiaf Bse:Added VoI:PasserByvof:Initial Fut:User Adj:PHF AdJ:PHF VOIUME:Reduct Vol:Finaf Vof. :
Critical- Gap Module:Critical GP:xxxxx xxxxFol-l-owupTim : xxxxx xxxx
- | -------'-
2011.00 1
20764
0
1.001 .00
0
00
1.00 1.001 .00 1.00
4 211004 21r
1 .00 1.00 1
1.00 1 .00 1
000000
1.00 1
1.00 1
0
00
5541.00
q(¿
640
6181 .001.00
6180
618
3
1 .0034
01
1 .001.00
1
01
1
0
000000
1
1
00
2't I
2
1.002
2
04
0
000
00
0
0000
000
01.00 1
000
0
000
0
00
0
3
003
2
05
0000
50
L
1
1
0
1.0000
00
000
00
00
0000
0
00
1.01.0
xxxxxxxxxx
XXXXxxxx
1
4
05
005
0
6.4atr
4-r)) xxxx xxxxx xxxxx xxxx xxxxxxxxx xxxxx xxxxx xxxx xxxxx
6
32
3
Capacity Module:Cnffict Vol: xxxx xxxx xxxxxPotent CaP.: xxxx xxxx xxxxxMove Cap,: xxxx xxxx xxxxxvofume/Cap: xxxx xxxx xxxx
-l---------------llLevel Of Service Module:Queue: xxxxx xxxx xxxxxStopped Del:xxxxx xxxx xxxxxLOS by Move: * * *
MovemENt: LT - LTR _ RT
Shared CaP.: xxxx xxxx xxxxxSharedQueue:xxxxx xxxx xxxxxShrd StpDel:xxxxx xxxx xxxxxShared LOS: * * *
623 xxxx xxxxx968 xxxx xxxxx968 xxxx xxxxx
0.00 xxxx xxxx
LT _ LTRxxxx xxxx0.0 xxxx8 .7 xxxxA*xxxxxx
*
xxxx xxxx xxxxxxxxx xxxx xxxxxxxxx xxxx xxxxxxxxx xxxx xxxx
| --------------- l
899 xxxx 6273!2 xxxx 49I311 xxxx 49I
0.02 xxxx 0.01t---------------l
0.08.1A
xxxx xxxxx xxxxx xxxx xxxxx xxxxx xxxx xxxxxxxxx xxxxx xxxxx xxxx xxxxx xxxxx xxxx xxxxx
********-RT LT_LTRxxxxx xxxx xxxxxxxxx xxxxx xxxxxxxxx xxxxx xxxx***
xxxxxx*
-RT LT-LTRxxxxx xxxx 361xxxxx xxxxx 0.1xxxxx xxxxx 15.1**c
15.1(-
-RTxxxxxxxxxxxxxxx
ApproachDelApproachLOS
W9YY!Y
Traffix 7.6.0115 (c) 2003 Dowling Assoc. Licensed to URS CORP', SANTA ANA' cA
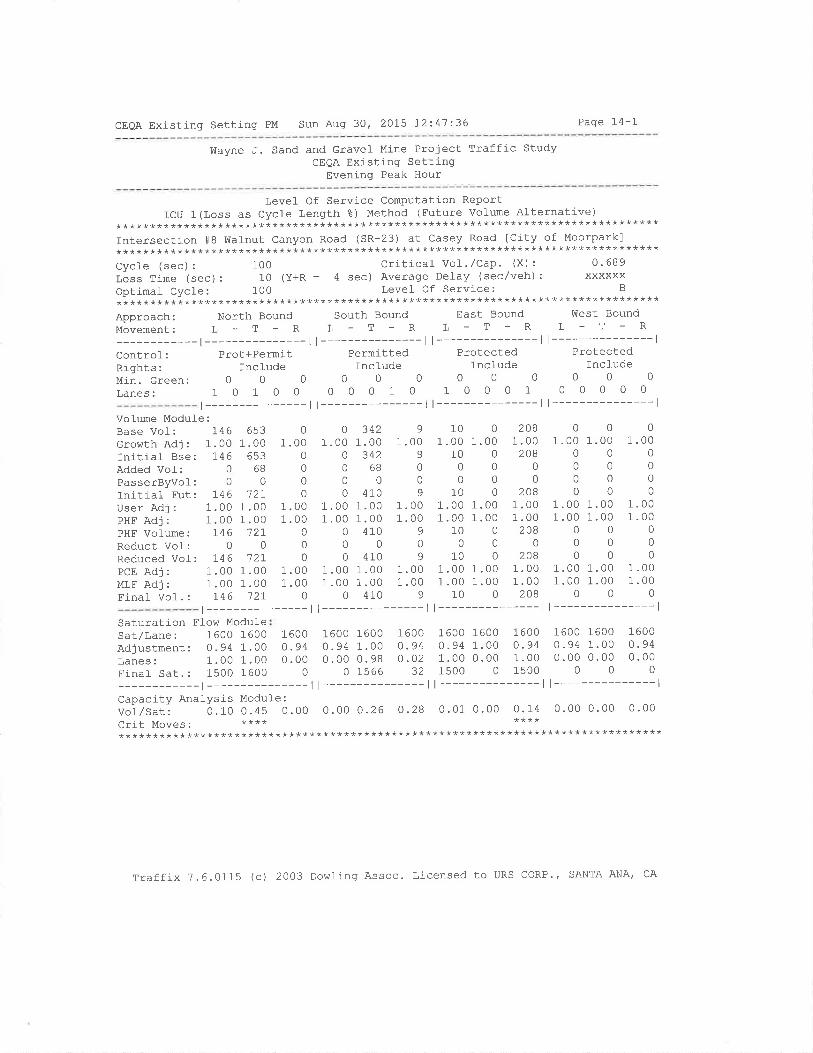
CEOA Existing Setting PM Sun Aug 30' 2015 12:4'1236 Page 14-1
!ûayne J. Sand and Gravel Mine Project Traffic StudyCEQA Existing Setting
Evening Peak Hour
Level- Of Service Computation ReportICU 1 (Loss as Cycle Length %) Method (Future volume Al-ternative)
********************************************************************************Intersection #8 Walnut Canyon Road (SR-23) at Casey Road [City of Moorpark]********************************************************************************Cycle (sec) : 100 Criticaf Vol-. /cap' (x) : 0 ' 689
Loss Time (sec) : 10 (Y+R : 4 sec) Average Delay (sec/veh) : xxxxxxOptimal- CycJ-e: 1OO Level Of Service; B
********************************************************************************Approach: North Bound south Bound East Bound west Bound
Movement: L - T - R L - T - R L - T - R L - T - R
-l---------ll---------ll---------ll---------------lcontrol-: Prot+Permit Permitted Protected ProtectedRights i Include IncÌude Include Incl-udeMin.creen: 0 O 0 O 0 0 0 0 0 0 0 0
Lanes: 1 O 1 O O 0 O 0 1 0 1 0 0 0 1 0 0 0 0 0
t---------------ll---------------ll---------------ll---------------lVol-ume Module:Base Vol: L46Growth Adj : 1.00Initial Bse: 146Added Vol: 0
PasserByvol: 0
Initial Fut: 146User Adj : 1.00PHF Adj : 1.00PHF Vol-ume: 146Reduct Vol: 0
Reduced Vof: 146PCE Adj : 1.00MLF Adj : 1.00Final- Vol.: 146
6s31 .00
65368
0'72r
1 .001.00
'72r0
'72r1 .001.00
't2L
01.00 1
0
000
1.00 L
1.00 1
000
1.00 1
1.00 1
0
3421.00
34268
0410
1.001.00
4100
4101.001 .00
410
9
1 .009
00
9
1.001.00
9
0
9
1 .001 .00
9
2081.00
20800
2081.001.00
2080
2081.001.00
208
1.00 1.001.00 1.00
000000
1.00 1.001.00 1.00
00
01.00
0
000
1. 001.00
00
0
1.001.00
0
1001.00 1.00
1000000
10 01 .00 1.001 .00 1.00
10000
1001 .00 1.001 .00 1.00
100
0
.0000
0
0.00.00
0
00
.00
.000
0
1.00 1
00
0
0
000
0
0
00
000000
0
161.0.
r---------------ll---------------ll---------------ll---------------lSaturation Flow ModuleSat/Lane: 1600 1600Adjustment: 0.94 1.00Lanes: 1.00 1.00Finaf Sat.: 1500 1600
1 6000.940.00
0
1 600o .941.001500
1 600o.940 .00
0
1 6000 .940 .00
0
1 6001.000. 987566
760.0.
00 1600 160094 0.94 1.0002 1.00 0.0032 1500 0
760.0.
009400
0
-l---------ll---------ll---------ll---------------lCapacity AnaÌysis Module :
vor/sat: o.10 0.45 O.0o o.0o 0.26 0.28 0.01 0.00 0.14 0.00 0.00 0.00Crit MOVqS. **** ************************************************************************************
Traffix 7.6.0115 (c) 2003 Dowting Assoc. Licensed to URS coRP., SANTA ANA, CA
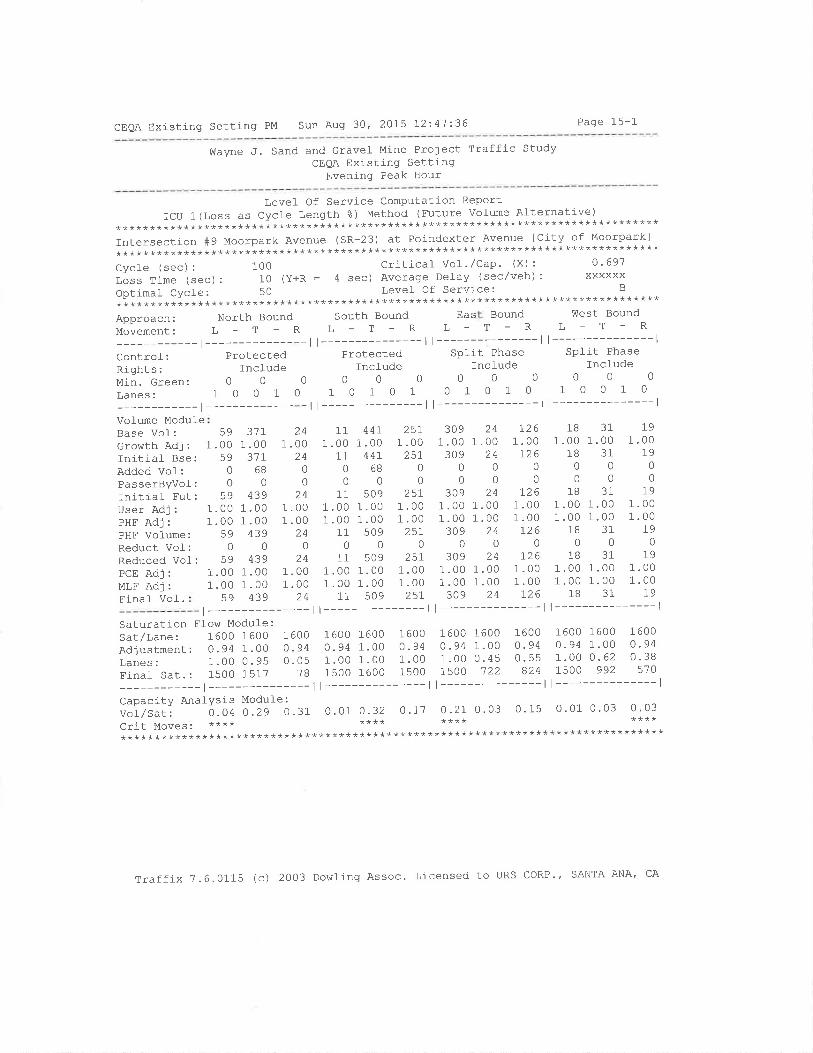
CEQA Exlsting Setting PM Sun Aug 30, 2015 I2z4'7:'36 Page 15-1
!ùayne ,J. Sand and Gravel Mine Project Traffic StudyCEQA Existing Setting
Evening Peak Hour
Level Of Service Computation ReportICU 1(Loss as cycfe Length %) Method (Future vol-ume Alternatj-ve)
********************************************************************************Intersection #9 Moorpark Avenue (SR-23) at Poindexter Avenue lCity of Moorpark]********************************************************************************Cycte (sec): 100 critical Vot'/Cap' (x): 0'691lãss Time (sec) : 10 (y+R : 4 sec) Average Delay (sec/veh) : xxxxxxOptimal Cycle: 50 Level Of Service¡ B
********************************************************************************Approach: North Bound South Bound Eas Bound West Bound
Movement: L - T - R L - T - R L - T - R L - T - R
-l--------- I l--------- I l--------- I l--------------- I
Control: Protected Protected Split Phase Split Phase
Rights: fncfude Incfude Include IncludeMin.Green: O O O O O 0 O O 0 0 0 0
Lanes: 1 O O 1 O 1 O 1 O 1 O I 0 1 0 1 0 0 1 0
-l---------ll---------ll---------ll---------------lVolume ModuleBase Vol:Gro\4rth Adj :
Initial Bse:Added Vol:PasserByvol:Initial Fut:User Adj:PHF AdJ:PHF Volume:Reduct Vol:Reduced Vof:PCE AdJ:MLF AdJ:Final Vol.
591 .00
(q
0
0Éo
1.001 .00
qo
0qo
1.001 .00
59
3'7r1 .0031r
680
4391 .001 .00
4390
4391 .001 .00
439
111 .00
1100
111 .001.00
110
111 .001 .00
11
241 .00
2400
241 .001.00
240
241 .001.00
24
7261.00
1260
0
1261.001 .00t26
0
1261.001 .00
126
311 .00
3100
311 .001.00
310
311 .001.00
a1
1.001.00
190
191.001.00
I9----l
241 .00
240
024
1 .001 .00
240
241 .00I .00
24
44r1.00
44r6B
0
5091.001.00
5090
5091.001.00
509
25r1 .0025r
00
25L1.001 .00
2570
25L1.001 .00
257
3091.00
30900
3091.001 .00
3090
3091 .001.00
309
1B1 .00
1B00
181 .001.00
180
181 .001.00
18
191.00
I90
0
19
| --------------- | I --------------- | I --------------- | I -----------Saturation Flow Modufe:sat/Lane: 160O 1600 1600 160O 1600 160O 1600 1600 1600 1600 1600 1600
Adjustment: 0.94 1 . OO O. 94 0.94 1.00 o. 94 O. 94 1.00 0 - 94 0. 94 1.00 o '94laÁes: 1.OO 0.95 O.05 1.OO 1.00 1.OO 1.OO 0.45 0.55 1.00 0.62 0.38
Finaf sar.: 1500 1517 18 1500 1600 1500 1500 122 824 1500 992 s70
-l---------ll---------ll---------ll---------------lCapacity AnafYSis Modufe:vor/s.t, o.o4 o .2g 0.31 O. 01 0.32 O .17 O .21 0. 03 0.15 0.01 0.03 0.03
crit Moves. **** **** **** ************************************************************************************
Traffix 7.6.0115 (c) 2OO3 Dowling Assoc. Licensed to URS coRP., SANTA ANA, CA
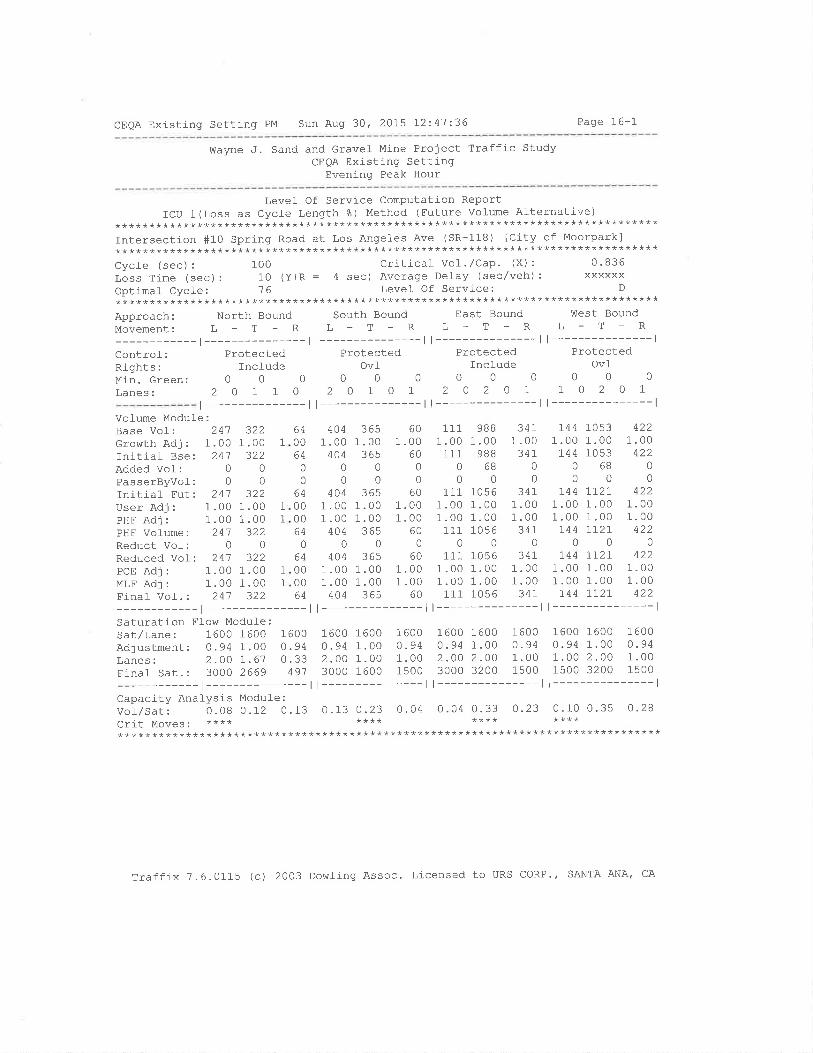
CEQA Existing Setting PM Sun Aug 30' 2015 !2:41:36 Paqe 16-1
Wayne J. Sand and Gravel Mine Project Traffic StudyCEQA Existing Setting
Evening Peak Hour
Levef Of Service Computation ReportICU 1(Loss as CycJ_e Length %) Method (Future voÌume Alternative)
********************************************************************************Intersection #10 spring Road at Los Angeles Ave (SR-118) [City of Moorpark]********************************************************************************Cycl-e (sec) : 100 Critical Vo].,/Cap. (X) : 0 ' 836
Loss Time (sec): 10 (Y+R = 4 sec) Average Delay (sec/veh): xxxxxxOptimaÌ Cycle: '76 Level- Of Service: D
********************************************************************************Approach: North Bound south Bound East Bound west BoundMovement: L - T - R L - T - R L - T - R L - T _ R
-l---------ll---------ll---------ll---------------lcontrof: Protected Protected Protected ProtectedRights: Include Ovl- lnclude OvlMin.Green: O 0 0 O 0 0 0 0 0 0 0 0
Lanes: 2 O 1 1 O 2 O I 0 I 2 0 2 0 1 1 O 2 0 1
r---------------ll---------------ll---------------ll---------------lVolume Module:Base Vol : 24'7crowth Adj : 1.00Initial Bse: 241Added Vol: 0PasserByvof: 0Initial Fut: 241User Adj : 1.00PHF Adj : 1.00PHF Volume i 24'7
Reduct Vof: 0Reduced Vof : 24'7PCE Adj : 1.00MLF Adj : 1.00Final Vol. : 241
-l---------ll---------ll---------ll---------------lSaturation Flow Modufe:sar/Lane: 16OO 1600 1600 160O 1600 1600 1600 1600 1600 1600 1600 1600
Adjustment: 0. 94 1.00 o .94 0.94 1 .00 0.94 0 . 94 1.00 o .94 0. 94 1.00 o.94Lanes: 2.OO I.61 0.33 2. O0 1.00 1.00 2.00 2.00 1.00 1.00 2.00 1.00Finar sar.: 3OOO 2669 491 3OOO 1600 1500 3000 3200 1500 1500 3200 1500
-l---------ll---------ll---------ll---------------lCapacity Analysis Module:vor,zsat: 0 .08 o .I2 0.13 0 .13 0.23 0.04 0.04 0. 33 0 .23 0 . 10 0.35 O.28
crit Moves. **** **** **** ************************************************************************************
?)?1.00 1
JZZ00
3221.00 1
1.00 I322
0
3221.00 1
1.00 1
J¿¿
64 40400 1.0064 4040000
64 40400 1.0000 1 .0064 40400
64 40400 1.0000 1 .0064 404
3651.00
3650
0365
1.001.00
3650
3651.001.00
365
601.00
600
0
601 .001 .00
600
601 .001 .00
60
1111 .00
1110
0
1111 .001 .00
1110
1111 .001.00
111
9BB1.00
9BB6B
010561.001.001056
0
10561.001.001056
341-1 .0034r
00
3471 .001.0034r
034t
1.001.0034r
r441 .00r44
0
0
I441 .001 .00r44
0
]-441 .001.00
744
10531.001053
680
7T2I1 .001.00II2I
0IT271 .001.00II2I
4221.00
42200
1.001.00
4220
4221.001.00
422
Traffix 7.6.0115 (c) 2OO3 Dowling Assoc. Licensed to URS CORP.f SANTA ANA' CA
CEQA Existing Setting AM Sun Aug 30, 2015 13:00:37 Page 1-1
Wayne J . Sand and Gravef Mine Project Traffic StudyCEQA Existing Setting Plus Cumufative
Morning Peak Hour
Scenario:
Command:Vol-ume:Geometry:Impact Fee:Trip Generation:Trip DistributionPaths:Routes:Configuration:
Scenario RePortCEQA Existing Setting AM
AM
AMExistingDefault Impact FeeAMAMDefaul-t PathsDefault RoutesAM Existing
Traffix 7.6.0115 (c) 2O03 Dowling Assoc. Licensed to URS CORP', SANTA ANA, CA
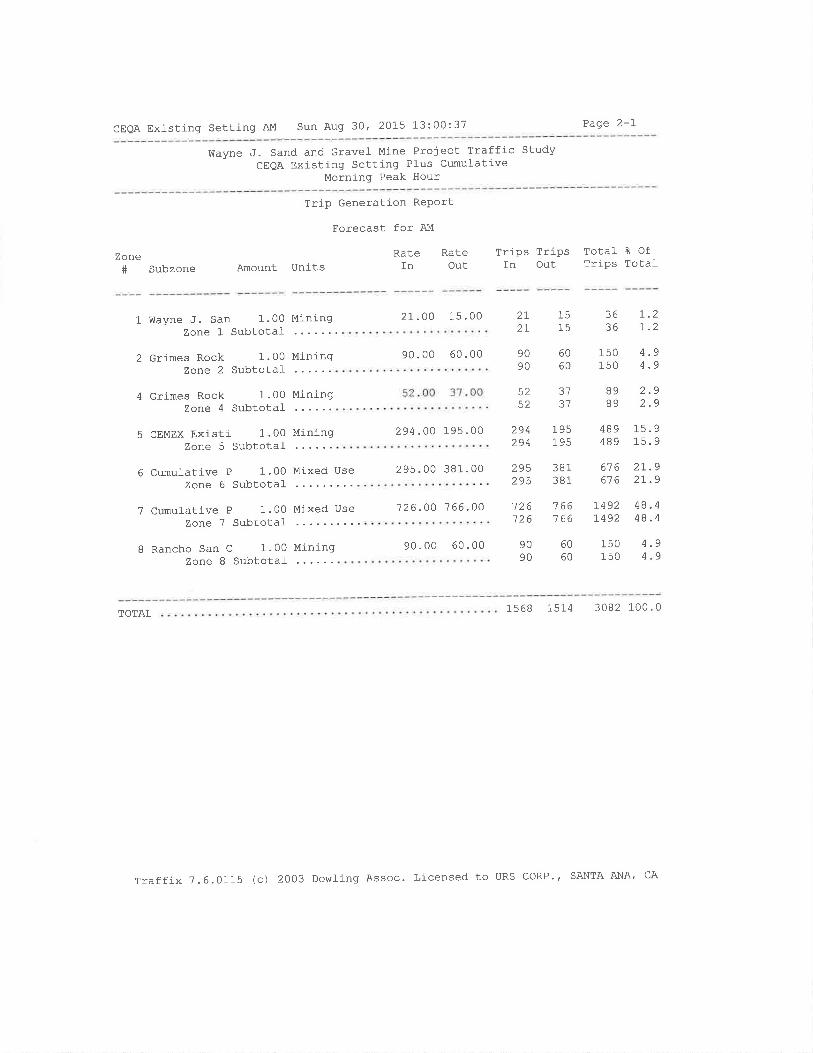
CEQA Existing Setting AM Sun Aug 30, 20L5 13:00:37 Page 2-1
Wayne J. Sand and Gravel Mine Project Traffic StudyCEQA Existing Setting Pl-us Cumul-ative
Morning Peak Hour
Zone# Subzone
TriP Generation RePort
Eorecast for AM
Rate RateAmount Units In Out
Trips TripsIn Out
Total B OfTrips Totaf
1 Wayne J. San 1.00 MiningZone 1 Subtotaf
2 Grimes Rock 1.00 Miningzone 2 Subtotal-
4 Grimes Rock 1.00 Miningzorre 4 Subtotal
5 CEMEX Existi 1.00 MiningZone 5 SubtotaÌ
6 Cumul-ative P 1.00 Mixed UseZone 6 Subtotal-
7 Cumulative P 1.00 Mixed UseZone J Subtotal
I Rancho San C 1.00 MiningZone 8 Subtotal
2L.OO 15.00
90.00 60.00
294.00 195.00
295.00 381.00
126.00 7 66.00
90.00 60.00
2I2l
1515
3636
9090
6060
150150
52 313t
B989
294294
195195
381381
61 661 6
21 .92r.9
tzo126
'7 66766
4B .448 .4
4.94.9
)qcÔ
7.21-2
4.94.9
489 15.9489 15.9
295295
r492t492
9090
6060
150150
TOTAL 1568 1514 3082 100.0
traffix 7.6.0115 (c) 2003 Dowling Assoc' Licensed to URS CORP'' SANTA ANA' CA
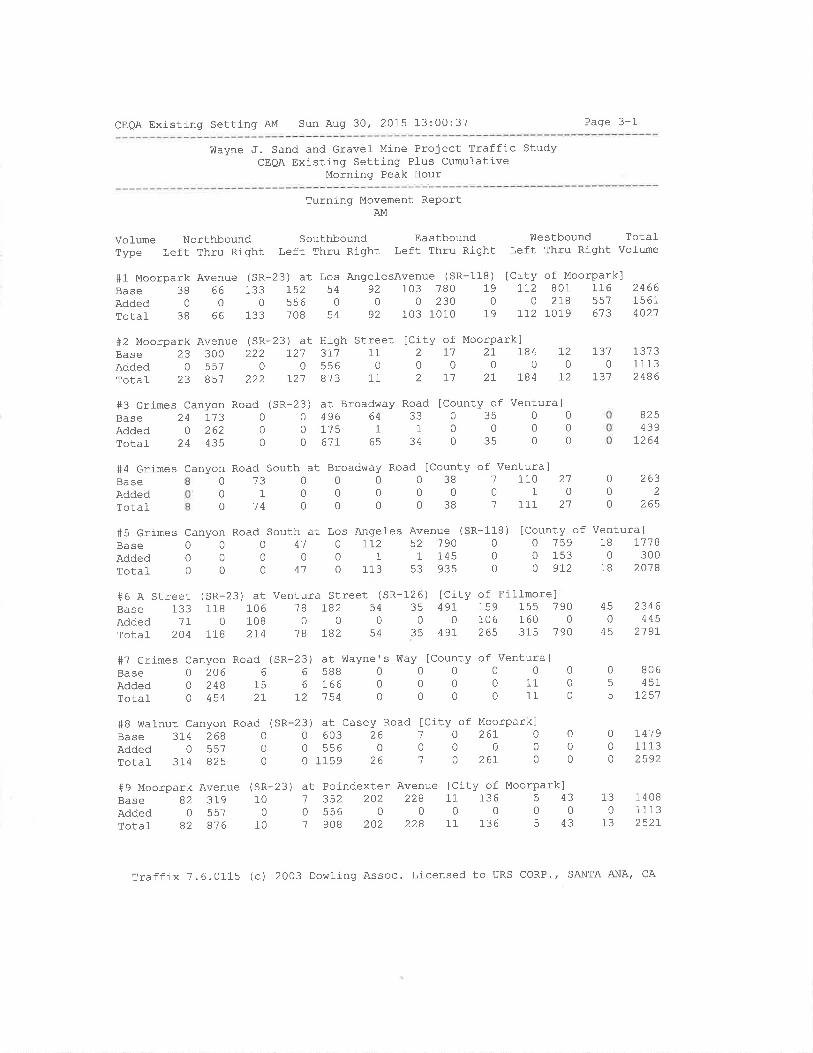
CEQA Existing Setting Al4 Sun Aug 30' 2015 13:00:37 Page 3-1
Wayne J. Sand and Gravel Mine Project Traffic StudyCEQA Existing Setting Plus Cumulative
Morning Peak Hour
Turning Movement ReportAM
Vol-ume Nolthbound Southbound Eastbound Westbound TotalType Left Thru Right Left Thru Right Left Thru Right Left Thru Right Vofume
#1 Moorpark Avenue (SR-23) at Los Anqel-esAvenue (sR-118) [City of Moorpark]Base 38 66 133 I52 54 92 103 780 19 1L2 801 ]-76Added000556000230002I8557rotal- 38 66 133 708 54 92 103 1010 79 II2 IOI9 673
246615 614021
#2 Moorpark Avenue (SR-23) at High Street [City of Moorpark]Base 23 300 222 I21 3I'l 11 2 11 2L 184 t2Added055700556000000rotal 23 85? 222 I21 8?3 11 2 71 27 184 72
L310
t37
130
13
137311132486
#3 Grimes Canyon Road (
Base 24 I'7 3 0
Added 0 262 0
Totaf 24 435 0
23\ aL Broadv/ay Road lCounty of Ventura]0496643303s00017511000006'71653403500
R_J
825439
t264
#4 Grimes Canyon Road South at Broadv/ay Road lCounty of Ventura]BaseAddedTotaf
0
0
0
131
14
000
1
01
000
0
00
0
00
0
00
Jö
038
1101
1110
2'7
2632
265
806451
t251
I41911_13
2592
14081 113252r
#5 Grimes Canyon Road SoutBase000Added 0 0 0
Total 0 0 0
(sR-23)
at Los Angefes Avenue (
0 rL2 52 '7 900 1 1 1450 113 s3 93s
118) [County of Ventura]0 0 759 18 71180015303000 0 9r2 18 2018
h4't
047
R-
#6 A StreetBase 133Added ]LTotal 2O4
#7 crimes Canyon Road (SR-23)Base020666Added 0 248 15 6
Total 0 454 21' 12
#B Walnut Canyon Road (
Base 314 268 0
Added 0 557 0
Total- 314 825 0
#9 Moorpark AvenueBase 82 319Added 0 557Totaf 82 816
at Ventura Street (SR-126) [City of Fi]-Imorel106 '78 rB2 54 35 49r 159 155 790108000001061600274 't8 182 54 35 491- 265 315 190
at Wayne's ülay [County of Ventura]5880000001660000110154 0 0 0 0 11 0
1180
118
450
45
2346445
21 97
SR
05
5
000
000
23) at Casey Road lCity of Moorpark]060326'7026100 ss6 0 0 0 0 0
01159 26 'l O 267 0
(SR-23) at Poindexter Avenue ICity of Moorpark]10 1 352 202 228 11 136 5 43
0055600000010 1 908 202 228 11 136 5 43
Traffix 7.6.0115 (c) 2003 Dowling Assoc. Licensed to URS CORP., SANTA ANA, CA

CEQA Existing Setting AM Sun Aug 30, 2015 13:00:37 Paqe 3-2
I/{ayne ,J. Sand and Gravel- Mine Project Traffic StudycEoA Exísting Setting Plus Cumulative
Morning Peak Hour
Volume NorthboundType Left Thru Right
Southbound EastboundLeft Thru Right Left Thru Right
!ìlestbound Total-l,eft Thru Right VoJ-ume
#10 Sprinq Road at ],os Angeles AveBase 193 313 83 362 410Added00000TotaL 193 313 83 362 410
) tCity of Moorparkl728 993 2tO 72 970
o18600715t2B L119 270 72 L145
118a R-54
054
2840
284
407215 615 633
Traffi-x 7.6.0115 (c) 2003 Dowling Assoc. Licensed to URS CORP., SANTA ANA, CA

CEQA Existing Setting AM Sun Aug 30' 2015 13:00:39 Page 6-1-
Wayne J. Sand and Gravel- Mine Project Traffic StudyCEOA Existing Setting PIus CumuÌatj-ve
Morning Peak Hour
Intersection
Moorpark Avenue (SR-23) at Los
Moorpark Avenue (SR-23) at Hig
Grj-mes Canyon Road (SR-23) at
Grimes Canyon Road South at Br
Grimes Canyon Road South at Lo
A Street (SR-23) at Ventura St
Grimes Canyon Road (SR-23) at
üIal-nut canyon Road (SR-23) at
Moorpark Avenue (SR-23) at Poi
Spring Road at Los Angeles Ave
#1#2#3#4#s+6+1#8#9# 10
Impact Analysis ReportLevef Of Service
Baseoel/ v/
LOS Veh C
A xxxxx 0.532
A xxxxx 0.544
B 0.0 0.685
A 9.0 0.000
C xxxxx 0.706
B xxxxx 0.631
A 7.6 0.000
E xxxxx 0.903
A xxxxx 0.564
C xxxxx 0.779
Futureoel/ v/
LOS Veh C
F xxxxx 3.903
D xxxxx 0.892
c 0.0 0.892
A 9.0 0.000
D xxxxx 0.803
D xxxxx 0.808
c 20.7 0.000
F xxxxx 1.273
E xxxxx 0.911
F xxxxx 1.025
Changein
+ 3.3'7I v/c
+ 0.348 V/C
+ 0.000 D/v
+ 0.004 D/V
+ 0.091 v/c
+ o.t11 v/c
+13.081 D,/V
+ 0.37I v/C
+ 0.341 v/c
+ 0.246 v/c
Traffix 7.6.0115 (c) 2OO3 Dowling Assoc. Licensed to URS CORP., SANTA ANA' cA
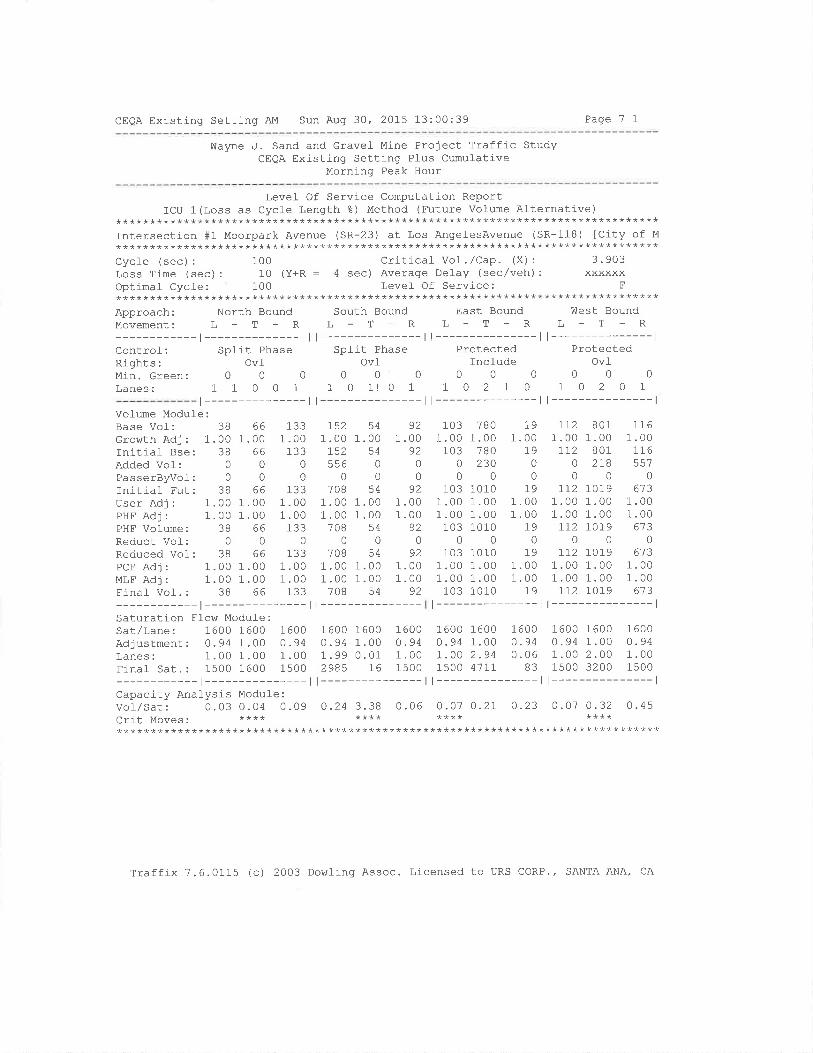
CEQA Existing Setting AM Sun Aug 30, 2015 13:00:39 Page 7-1
ü¡ayne J. Sand and Gravel Mine Project Traffic StudyCEQA Existinq Setting Plus Cumulative
Morning Peak Hour
Level Of Service Computation ReportICU 1 (Loss as Cycle Length %) Method (Future Volume Alternatj-ve)
********************************************************************************Intersection #1 Moorpark Avenue (SR-23) at Los AngelesAvenue (SR-118) [City of M
********************************************************************************Cycle (sec): 100 Critical- Vol./Cap. (X): 3.903Loss Time (sec): 10 (Y+R = 4 sec) Average Delay (sec/veh): xxxxxxOptimal CycJ-e: 100 Levef Of Service: F********************************************************************************Approach: North Bound South Bound East Bound West BoundMovement: L - T - R L - T _ R L - T _ R L - T _ R
-t---------ll---------ll---------ll---------------lControl: Sptit Phase Spl-it Phase Protected ProtectedRights: Ovl Ovl Include OvlMin.Green: O 0 0 0 0 0 0 0 0 0 0 0
Lanes: 1 1 0 0 1 1 0 1! 0 1 1 O 2 1 0 1 0 2 0 1
r---------------ll---------------ll---------------ll---------------lVolume Module:Base Vol: 38 66 133Growth Adj : 1.00 I .00 1 .00Ini-tiaf Bse: 38 66 133AddedVol: 0 0 0PasserByvoÌ: 0 0 0Initial Fut: 38 66 133User Adj: 1.00 1.00 1.00PHFAdj: 1.00 1.00 1.00PHF Volume: 38 66 133Reduct Vol: 0 0 0
Reduced Vol: 38 66 133PCE Adj: 1.00 1.00 1.00MLF Adj: 1.00 1.00 1.00Final Vol-. : 38 66 133
-t---------------l
r52 54 921 .00 1.00 1 .00r52 54 9255600
000708 54 92
1 .00 1 .00 1 .001.00 1.00 1.00708 54 92
000708 54 92
1 .00 1.00 1 .001 .00 1.00 1 .00708 54 92
t---------------
103 780 191.00 1.00 1.00103 780 19
o2300000
103 1010 191 .00 1.00 1.001 .00 1.00 1.00103 1010 79
000103 1010 79
1.00 1.00 1.001.00 1.00 1.00103 1010 19
t---------------l
772 801 1161.00 1.00 1.00772 801 rL6
0 2r8 557000
rr2 7019 6131 .00 1 .00 1 .001 .00 1.00 1 .00rr2 Lor9 6't3
000rr2 1,01,9 613
1 .00 1.00 1.001 .00 1.00 1.00772 ror9 613
t---------------lSaturation Ffow Modufe:sat/Lane: 1600 1600 1600 1600 1600 1600 1600 1600Adjustment: 0.94 1.00 O.94 0.94 1.00 0.94 0.94 1.00Lanes: 1.00 1 .00 1.00 1. 99 0.01 1 .00 I.00 2.94
1 6000. 940.06
1600 1600 16000. 94 1 .00 0.941 .00 2 .00 1 .00
Finaf sar.: 1500 1600 1500 2985 76 1500 1500 4711 83 1500 3200 1500-t---------ll---------ll---------ll---------------l
Capacity Anal-ysis Modufe :
Vot/Sat: 0.03 0.04 0.09 O.24 3.38 0.06 0.01 O.2I 0.23 O.O1 O-32 0.45crit Moves: **** **** **** ************************************************************************************
Traffix 7.6.0115 (c) 2003 Dowling Assoc. Licensed to URS CORP., SANTA ANA| CA
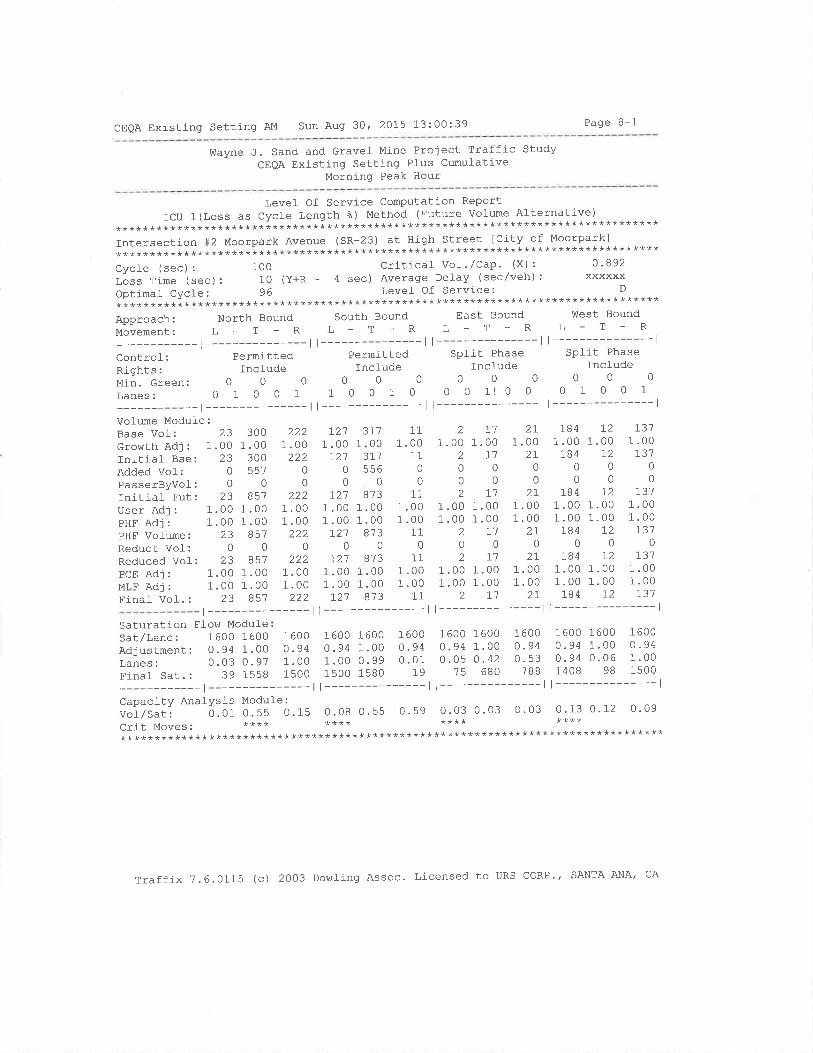
CEQA Existing Setting AM Sun Aug 30, 2015 13:00:39 Page B-1
Wayne J. Sand and Gravef Mine Project Traffic StudyCEQA Existing Setting Plus Cumulative
Morning Peak Hour
Level Of Service Computation ReportICU 1(Loss as cycle Length %) Method (Future volume Afternative)
********************************************************************************Intersection #2 Moorpark Avenue (SR-23) at High Street ICity of Moorpark]********************************************************************************Cyc1e(sec):lO0Criticafvol'/cap'(x):0'892lóss time (sec): 10 (y+R = 4 sec) Average Delay (sec/veh): xxxxxxOptimal- Cycle: 96 Level Of Service; D
********************************************************************************Approach: North Bound South Bound Eas Bound litrest Bound
Movement: L - T - R l, - T - R L - T - R L - T - R
-l---------ll---------ll---------ll---------------lControl: Permitted Permltted Spfit Phase Split Phase
Rights: IncÌude Incfude Incfude fncludeMin.Green: 0 O 0 O O O O 0 0 0 0 0
Lanes: O I 0 O 1 1 O 0 1 O O O 11 0 0 0 1 0 0 1
-l---------ll---------ll---------ll---------------lVolume Module:BASC VOf i ¿Jcrov'rth Adj : 1.00fnitiaf Bse: 23Added Vof: 0
PasserByvol: 0
Initial- Fut: 23User Adj : 1.00PHF Adj : 1.00PHF Vol-ume: 23Reduct Vol-: 0
Reduced Vol-: 23PcE Adj : 1.00MLF Adj : 1.00Finaf Vol. : 23
1 .00 1 .001 .00 1.00
211
3001.00
300cq?
0857
1 .001 .00
8570
8571 .001 .00
857
111.00
110
011
1.001 .00
110
111 .001.00
11
2
002
1.00 1
1.00 1
2
0
2
1,3't1 .00
1 )-
00
1 .001.00
7310
r311 .001.00
1-31
2221 .00
00
1 .001 .00
2220
2221 .001 .00
222
1271 .00
7210
0721
1 .001 .00
r210
r211 .001 .00
r21
3111 .00
371556
0
8731 .001.00
8730
8131 .001.00
873
l1.00
T100
7'7
.00
.00I1
0
271.00
2T00
2I1.001 .00
2t0
2I1.001 .00
2I
1841 .00
1840
0184
1 .001 .00
1840
1841 .001 .00
184
I21.00
720
072
1.001.00
I20
I21.001.00
72
2
1.00 1
137
T1
| --------------- | l--------------- | l--------------- | --------------- l
Saturation FÌohr Modul-eSat/Lane: 1600 1600Adjustment: 0.94 1.00Lanes: 0.03 0.97Finaf Sat.: 39 1558
1 6000.941.001 500
1 600o.940.53
788
1 6000.940.941408
0000069B
1 6000.941.001500
1600 16000.94 1.001 .00 0.991500 1580
00 160094 1.0005 0 .427s 680
1 6000. 940 .01
19
t60.0.
761.0.
-l---------ll---------ll---------Capacity Analysis Module:voi/s.tl 0.01 o. s5 0.15 o. oB 0.55 0.59 0 ' 03 0 ' 03 0 ' 03
Cfit MOVeS. **** **** ******************************************************************
| --------------- l
0.13 0. 12 0.09
******************
Traffix ?.6.0115 (c) 2OO3 DowÌing Assoc' Licensed to URS CORP'' SANTA ANA' CA

CEQA Existing Setting AM Sun Aug 30, 2015 13:00:39 Page 9-1
Wayne J. Sand and Gravel- Mine Project Traffic StudyCEQA Existing Setting Pl-us Cumul-ative
Morning Peak Hour
Level Of Service Computation Report2O0O HCM Unsigna]-ized Method (Future Volume Afternative)
********************************************************************************Intersection #3 Grimes Canyon Road (SR-23) at Broadway Road [County of Ventura]********************************************************************************Cycfe (sec):Loss Time (sec)Optimal- Cycle:***************Approach:Movement: L
Volume Module:_tsase vol ? ¿4Growth Adj : 1.00Initial Bse: 24Added VoÌ: 0
PasserByvol: 0
-[n-Itra.L IUE: ¿4
User Adj : 1.00PHF Adj: 1.00PHF Volume: 24Reduct Vol: 0Final Vol.: 24
Sat/Lane:AdjustmentLanes:Finaf Sat.
1 Critical Vol- . /CaP. (X) : O -892: O (Y+R : 4 sec) Average Delay (sec/veh): 79-2
O Levef Of Service: C
*****************************************************************North Bound South Bound East Bound West Bound
_T_RL_T_RL-T-RL_T-R-l---------ll---------ll---------ll---------------l
Control: Yield Sign Stop Sign Stop Sign Stop SignRights: Include Include Incfude IncfudeLanes: 1 O 1 O O O O 0 1 0 0 0 1! 0 0 0 0 0 0 0
t---------------ll---------------ll---------------ll---------------lr13
I .00713262
0435
1 .001.00
4350
435
0
0
00
1.001.00
000
0 4961.00 1.00
0 4960 17500o 617
1.00 1.001.00 1.00
o 61r00o 617
331.00 1
??
1
0
00 1.00 L
00 1.00 1
34000
340
35.00
2q
0
0
35.00.0035
035
1.00 1
1.00 1
0
00
I0
00640064
1
0
65000065
0
65
1
000
0
000
0
1.00 1
00
00
0
0000
0
000
0
0
0
00000
0
00
00
0000.000
1
0
00000
00000
00
0
1
00000000 1.00 1.00 1.00 1.00 1.0000 0. 91 0.09 0.49 0.00 0. 51o ']-52 13 131 0 134
341
11
1
1
1
001.00 1 .001 .00 I .00546 546
0000 1.0000 0.0000
1
01
01
01
0
00000
0
Capacity Analysis Modufe:vol-/Sat : O. 04 O. BO O. OO O ' 00 0.89 0.89 0.26 0.00 0.26 0.00 0
1 .000. B020 .61 .0020 .6
0
1 .000 .000.0
1.000.0
0
1.000. B929.'71.00)a 1
0
1.000. B91A 1
1.00aa 1
0
1 .000 .000.0
1.000.0
0
0. 00
1.000.000.0
1 .000.0
0
Crit Moves:Green/Cycfe:1.00Volume/Cap: 0.04Delay/Veh: 7.2Delay Adj : 1.00AdjDeI/Vehz 1.2DesignQueue: 0
1 .000 .000.0
1 .000.0
0
1.00 1.000.26 0.002.1 0 .0
1.00 1.002.'t 0.0
00
1.000.26
)1
1.002.1
0 0
1
0
0
0.01
Traffix 7.6.0115 (c) 2003 DowJ-ing Assoc. Licensed to URS CORP./ SANTA ANA| CA
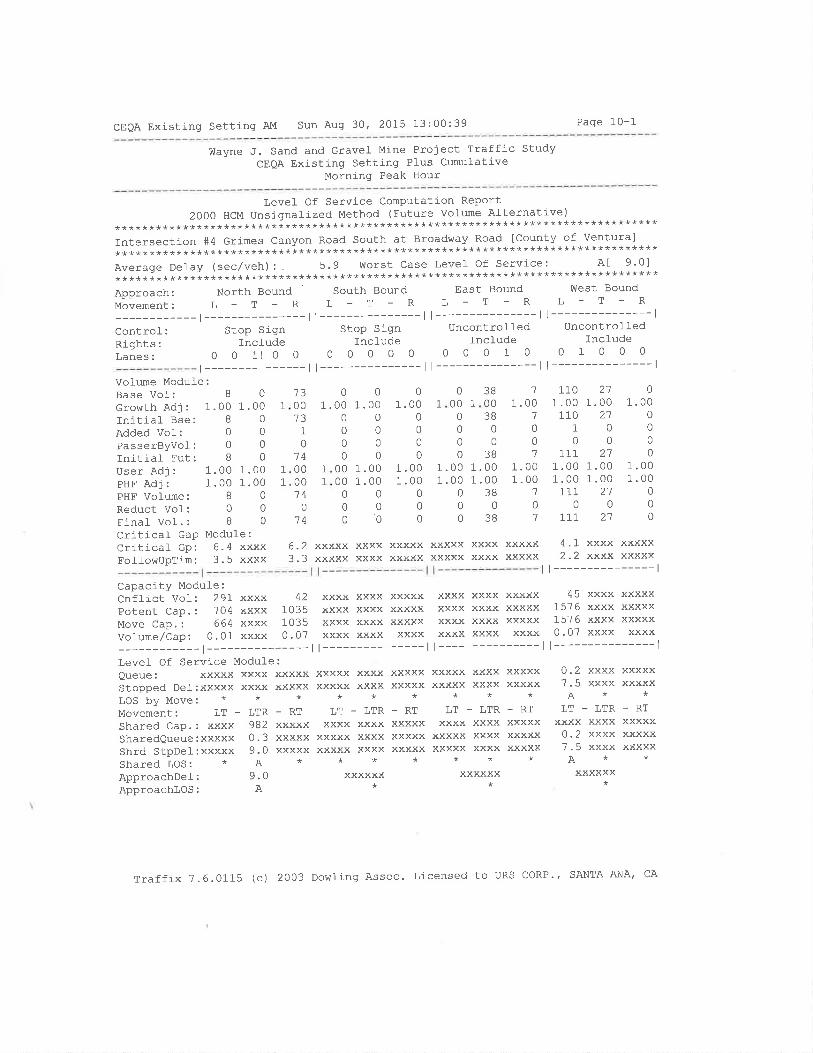
CEQA Existing Setting AM Sun Aug 30, 2015 13:00:39 Page 10-1
Wayne J. Sand and Gravel- Mine Proiect Traffic StudyCEOA Existing Setting PIus Cumulative
Morning Peak Hour
2************Intersection************Average Defa************Approach:Movement:
Control-:Rights:Lanes:
Vofume Modul-e:Base Vol-: B 0
Growth Adi : 1.00 1.00Initial- Bse: I 0
Added Vol: 0 0
PasserByvof: 0 0
Initiaf Fut: 8 0
User Adj : 1.00 1 .00PHE Adj : 1.00 1.00PHF Volume: B 0
Reduct VoI: 0 0
Final- Vol-.: B 0
Critical- Gap Module:Critical Gp: 6.4 xxxxFollowUpTim: 3.5 xxxx
1.00 1.00 1.00 1.001.00 1.00 1.00 1.00
000380000'00038
Level- Of Service Computation Report000 HCM Unsignafized Method (Future Volume Al-ternative)********************************************************************#4 Grimes Canyon Road south at Broadway Road lcounty of ventura]
********************************************************************y (sec/veh) : . 5.9 vìlorst Case Level Of Service: A[ 9'0]********************************************************************
North Bound South Bound East Bound West Bound
L-T-RL-T-RL-T-RL-T-Rt---------------ll---------------ll---------------ll---------------l
Stop Sj-gn Stop Sign Uncontrolled Uncontrol-ÌedInclude Incl-ude Incl-ude Include
0 o 1! o o o o 0 o 0 0 0 0 1 0 0 1 0 0 0
t---------------ll---------------ll---------------ll---------------l
1 001?
1
0'74
0000'74
0'74
1
1.00'7
0
0'7
1.001 .00
1
01
110 211.00 1.00110 27
1000
111 211.00 1.001 .00 1.00111 21
00111 21
01 .00
000
0
001.00 1.00
00000000
00000
L
01.00
000
01 .001.00
00
0
380038
00
38
000
000
0
t
1
1
1
1
00
4.1 xxxx xxxxx2.2 xxxx xxxxx
| --------------- l
Capacity Module:Cnllict VoI: 291 xxxx 42 xxxx xxxx xxxxx xxxx xxxx xxxxx 45 xxxx xxxxxpotent cap.: ?04 xxxx 1035 xxxx xxxx xxxxx xxxx xxxx xxxxx 1576 xxxx xxxxxuove cap.: 664 xxxx 1035 xxxx xxxx xxxxx Xxxx xxxx xxxxx 1576 xxxx xxxxxVolume/ðap: 0.01 xxxx O.O7 xxxx xxxx xxxx xxxx xxxx xxxx 0.07 xxxx xxxx
-l---------ll---------ll---------ll---------------lLevel Of Servíce Module:Queue: xxxxx xxxx xxxxxStopped Def:xxxxx xxxx xxxxxLOS by Move: * * *
MovemeNt: LT - LTR - RT
Shared Cap.: xxxx 982 xxxxxSharedQueue:xxxxx 0.3 xxxxxShrd StpDel:xxxxx 9.0 xxxxxShared LOS: * A *
ApproachDel: 9.0Approachlos: A
6.2 xxxxx xxxx xxxxx xxxxx xxxx xxxxx3.3 xxxxx xxxx xxxxx xxxxx xxxx xxxxx
xxxxx xxxxxxxxx xxxx**
LT - LTRxxxx xxxx
XXXXX XXXXxxxxx xxxx**
xxxxxx*
XXXXXxxxxx
-RTxxxxxXXXXXxxxxx
xxxxx xxxxxxxxx xxxx**
!a - !fÁ
xxxx xxxxxxxxx xxxxxxxxx xxxx**
VVYVY!*
xxxxxxxxxx
-RTxxxxxxxxxxxxxxx
VYYY
xxxx
LTRxxxxxxxxxxxx
xxxxxx
XXXXXxxxxx
-RTxxxxxxxxxxxxxxx
0.2'E
A
u.z
LTxxxx
A
Traffix 7.6.0115 (c) 2003 Dowling Assoc. Licensed to URS CORP'/ SANTA ANA/ CA
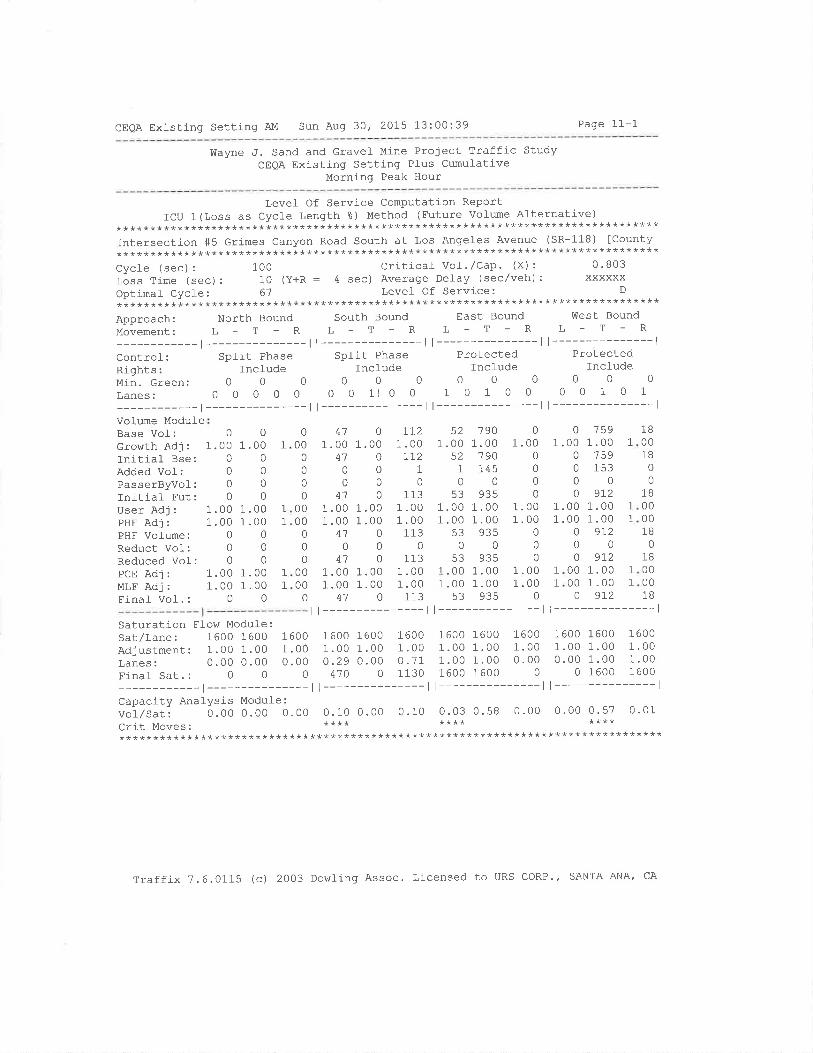
CEQA Existing Setting AM Sun Aug 30, 2OL5 13:00:39 Page 1-1-1
Wayne ,J. Sand and Gravel- Mine Proiect Traffic StudyCEQA Existing Setting Pl-us Cumulative
Morning Peak Hour
Level Of Service Computation ReportICU 1(Loss as Cycle Length %) Method (Future Volume Alternative)
********************************************************************************Tntersection #5 Grimes Canyon Road South at Los Angeles Avenue (SR-118) [County********************************************************************************Cycle (sec): 100 Critical Vol./Cap. (X): 0'803lãss Time (sec) : 10 (y+R : 4 sec) Average DeÌay (sec/veh) : xxxxxxOptimaÌ Cycle: 6'r. Level Of Service¡ D
********************************************************************************Approach: North Bound south Bound East Bound !üest Bound
MoveMENt: L - T - R L - T - R L - T - R L - T - R
-l---------ll---------ll---------ll---------------lcontrol_: split Phase split Phase Protected ProtectedRights: Incfude Incfude Incfude IncfudeMin.creen: O O 0 O 0 0 0 0 0 0 0 0
Lanes: O 0 0 O 0 0 O 11 0 0 1 0 1 0 0 0 0 1 0 1
-l---------ll---------ll---------ll---------------lVol-ume ModuleBase VoI:Growth Adj:Initial- Bse:Added Vol:PasserByvol-:Initial Fut:User Adj:PHF Adj r
PHF Vofume:Reduct Vol:Reduced Vol-:PCE Adj:MLF AdJ:Einaf Vol-. :
411 .00
410
04'7
1.001.00
4'7
0
01.00
000
0
1 .001.00
0
0
01.001.00
0
L121.00LI2
1
0
1131 .001 .00
1130
1131 .001.00
113
tÔ
1.00
1
0
531 .001 .00
530
531 .001.00
53
'7 901.00
790145
0935
1 .001.00
9350
9351 .001.00
935
01.00
0
000
1.001 .00
00
0
1.001.00
0
1591.00
'7 59153
0
9121.001.00
9L20
9121.00
001.00 1 .00
00000000
1.00 1 .001.00 1.00
000000
1.00 1.001.00 1.00
00
1
000
0
0
00
0000
000
0000
0
01 .00
0
0
00
1 .001 .00
0
0
0
T
1B0018
00
18000018
0
1B00001B
1
11
1
471
I1
1
1 .001 .00
47
00 1
100 1.00o 9r2
Saturation Flow Module:Sat/Lane: 16OO 1600 1600 1600 160O 1600 1600 1600 1600 1600 1600 1600
Adjustmenr: 1. OO 1 .00 1.00 1. OO 1.00 1 .00 1.00 1.00 1.00 1 .00 1.00 1.00Lanes: o. oo o.0o 0. oo 0.29 o.0o 0.71 1.00 1.00 0.00 0.00 1.00 1.00Final sat.: 0 o o 470 o 1130 1600 1600 0 0 1600 1600
-l---------ll---------ll---------ll---------------lCapacity Analysì-s Module :
vor/sut r o.0o o.0o o. o0 o.10 0. oo 0.10 0.03 0.58 0.00 0.00 0. 57 0.01Cfít MOVeS. **** **** ************************************************************************************
Traffix ?.6.0115 (c) 2003 Dowlì-ng Assoc. Licensed to URS CORP" SANTA ANA, CA

CEQA Existing Setting AM Sun Aug 30' 2015 13:00:39 Page 12-1
Wayne J. Sand and Gravel- Mine Project Traffic StudyCEQA Existing Setting Pfus Cumul-ative
Morning Peak Hour
Level- Of Service Computation ReportICU 1(Loss as Cycle Length g) Method (Future Vol-ume Afternative)
********************************************************************************Intersection #6 A Street (SR-23) at Ventura Street (SR-126) [City of Filfmore]********************************************************************************Cycle (sec) : 100 Critical VoJ-. /Cap. (X) : 0.808Loss Time (sec): 10 (Y+R : 4 sec) Average Del-ay (sec/veh): xxxxxxOptimal Cycle: 69 Leve1 Of Service: D
********************************************************************************Approach: North Bound South Bound East Bound West BoundMovement: L - T - R L - T - R L - T - R L - T - R
-t---------ll---------ll---------ll---------------lControl-: Protected Protected Protected ProtectedRights: Incl-ude fnclude Include IncludeMin.Green: O 0 0 0 0 0 0 0 0 0 0 0
Lanes: I O 0 1 0 1 0 0 1 0 1 0 1 1 0 1 0 1 1 0
r---------------ll---------------ll---------------ll---------------lVofume Module:Base Vol-: 133Growth Adj : 1.00Initial Bse: 133Added VoÌ: 7tPasserByvol: 0Initial- Fut: 204User Adj : 1.00PHF Adj : 1.00PHF Vofume: 204Reduct Vol: 0Reduced Vol: 2O4PcE Adj : 1.00MLF Adj : 1.00Finaf Vol.: 204
155 790 451 .00 1.00 1.00155 190 45160 0 0
000315 7 90 45
1 .00 1.00 1.001 .00 1.00 1.00315 190 45
000315 790 45
1 .00 1.00 1.001.00 1.00 1.00315 190 45
t---------------l
1181 .00
1180
0118
1 .001 .00
1180
1181 .001.00
118
1061 .00
106108
0274
1 .001 .00
2140
2141 .001.00
274
1B r82 541 .00 1 .00 1 .00
18 r82 54000000
18 IB2 541 .00 1.00 1 .001 .00 1.00 1 .00
'78 rB2 54000'78 rB2 54
1 .00 1.00 1.001 .00 1.00 1 .00
78 782 54
| --------------- l
35 497 1591.00 1 .00 1.00
35 49r 15900106000
3s 497 2651 .00 1.00 1.001.00 1.00 1.00
3s 49r 265000
35 497 2651 .00 1.00 1.001 .00 1.00 1.00
35 49r 265t---------------
Saturation Flow Modufe:sar/Lane: 1600 1600 1600 1600 1600 1600 1600 1600 1600 1600 1600 1600Adjustmenr: 1.00 1.00 1.00 1 .00 1.00 1.00 1 .00 1.00 1.00 1 .00 1.00 1.00Lanes: 1.00 0.36 0.64 1.00 0.77 0.23 1.00 1.30 0.70 1.00 1.89 0.11Finat sat.: 1600 569 1031 7600 7234 366 1600 2078 1722 1600 3028 7'72
-l---------ll---------ll---------ll---------------lCapacity Analysis Modul-e :
vol/Sat: O.L3 O.2I 0.2I 0.05 0.15 0.15 O.02 0.24 0.24 O-2O O'26 0.26crit Moves ' **** **** **** ************************************************************************************
Traffix 7.6.0115 (c) 2003 Dowling Assoc. Licensed to URS coRP., SANTA ANA, CA

CEQA Existing Setting AM Sun Aug 30, 2015 13:00:39 Page 13-1
V{ayne J . Sand and Gravel Mine Prolect TraffÍc StudyCEOA Existing Setting Plus Cumul-ative
Morníng Peak Hour
Level- Of Service Computation Report2000HcMUnsignalizedMethod(FutureVolumeAlternative)
********************************************************************************Intersection #7 Grimes Canyon Road (SR-23) at Wayne's lrlay fCounty of Ventura]********************************************************************************Averaqe Delay (sec/veh): 0.3 worst case J,evel of Servj-ce: cl 20'11********************************************************************************Approach: North Bound South Bound East Bound !^lest Bound
MovEMENt: L - T _ R L - T - R L - T - R L - T - R
-r---------ll---------ll---------ll---------------lControl: Uncontrolted Uncontrol-fed Stop Sign Stop SignRights: Include Incfude Include IncludeLanes: 0 0 0 1 0 O 1 O O O 0 O O 0 0 0 0 11 0 0
-l---------ll---------ll---------ll---------------lVofume Module:Base VoI:cror^tth Adj:Initial Bse:Added Vof:PasserByvoI:Initial Fut:User Adj : 1.00 1.00 1 .00PHF Adj : 1.00 1 .00 1.00PHF Vol-ume: 0 454 2IReduct VoI: 0 0 0
Einal Vol. : 0 454 21'
Critical GaP Module:Critical GP:xxxxx xxxx xxxxxFollowUpTim:xxxxx xxxx xxxxx
-t---------------lCapacity Module:Cnflict Vol: xxxx xxxx xxxxxPotent Cap.: xxxx xxxx xxxxxMove Cap.: xxxx xxxx xxxxxVolume/CaP: xxxx xxxx xxxx
-l---------------lLevel Of Service Modufe:Queue: xxxxx xxxx xxxxxStopped De.I:xxxxx xxxx xxxxxLOS by Move: * * *
MoVeMCNt: LT - LTR - RT
Shared Cap.: xxxx xxxx xxxxxSharedQueue:xxxxx xxxx xxxxxShrd StpDel:xxxxx xxxx xxxxxShared LOS: * * *
ApproachDel: xxxxxxApproachlos: *
1.00 1
1.00 1
00
0
xxxxxxxxYVYY
xxxx
xxxx xxxxxxxxx xxxxxxxxx xxxxxxxxx xxxx
t---------------l
01 .00
0
000
206 6
1.00 1.00 1
206 6
248 1500
454 2r
6
.006
6
0
t2.00.00L2
072
5881.00
5BB]-66
0154
1.001.00754
0754
0
1.000
5
0
1.001.00
5
0
01.00
000
01 .001 .00
0
00
1
0
0000
0
0
000
00
0
0
0000
0
00
1
0
1 .000000
00000
1
0000 1.0000
11 000
11 0
00 1.0000 1.0011 000
1l_ 0
1
11
1
00 11
4.1 xxxx xxxxx xxxxx xxxx xxxxx2.2 xxxx xxxxx xxxxx xxxx xxxxx
| --------------- | I --------------- |
6.4 xxxxxxxx
63
2
3
475 xxxx xxxxx1098 xxxx xxxxx1098 xxxx xxxxx0.01 xxxx xxxxr---------------ll
xxxx xxxxx xxxxx xxxx xxxxxxxxx xxxxx xxxxx xxxx xxxxx*****
-LTR-RT LT_LTR-RT
1243 xxxx 464195 xxxx 602193 xxxx 602
0.06 xxxx 0.01l---------------l
xxxxx xxxx xxxxxxxxxx xxxx xxxxx***
LT-LTR-RT
0.08.3
ALT
xxxx xxxx xxxxx xxxx xxxx xxxxx xxxx 245 xxxxxO.O xxxx xxxxx xxxxx xxxx xxxxx xxxxx 0'2 xxxxx8.3 xxxx xxxxx xxxxx xxxx xxxxx xxxxx 20.7 xxxxxA******c*xxxxxx xxxxxx 20.'7
**C
Traffix ?.6.0115 (c) 2OO3 Dowlj-ng Assoc. Licensed to URS CORP'' SANTA ANA' CA
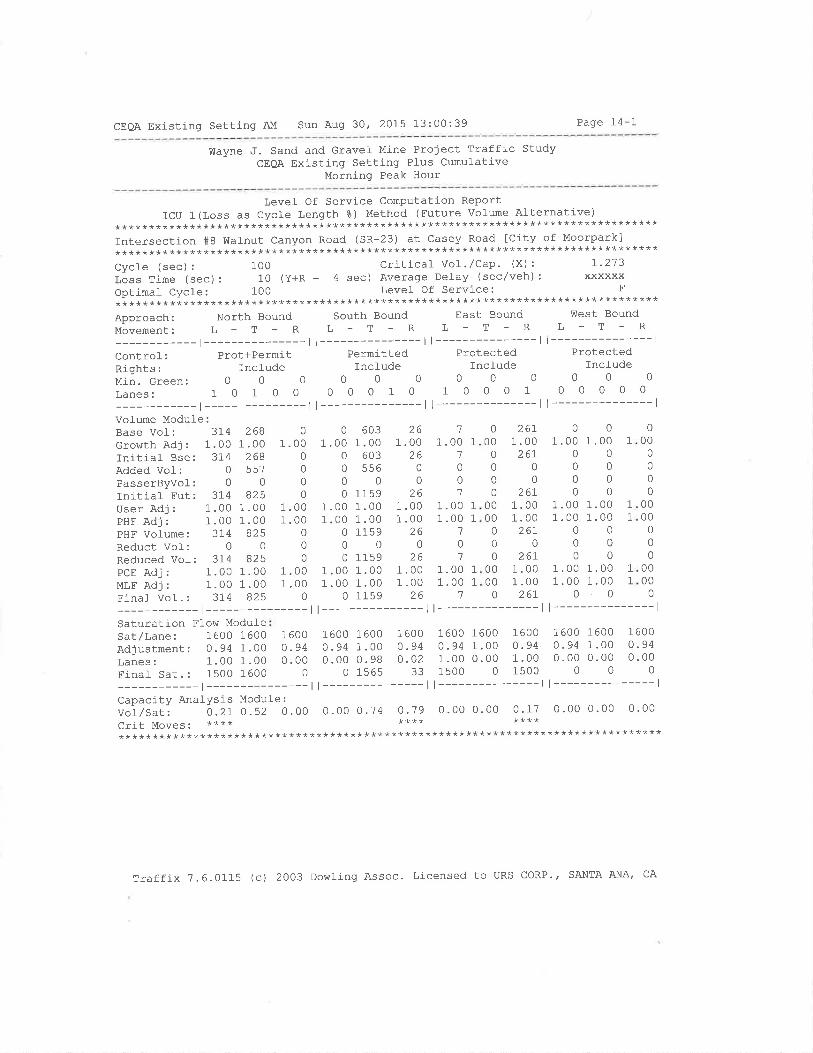
CEQA Existlng Setting AM Sun Aug 30, 2015 13:00:39 Page 14-1
Wayne J. Sand and Gravel Mine Project Traffic StudyCEQA Existing Setting Plus Cumulative
Morninq Peak Hour
Level Of Service Computation ReportICU 1(Loss as Cycle Length t) Method (Future volume Alternative)
********************************************************************************Intersection #8 Wafnut Canyon Road (SR-23) at Casey Road [City of Moorpark]********************************************************************************Cycle(sec):l-O0criticalVol'/Cap'(x):I'213Lãss time (sec) : 10 (y+R : 4 sec) Average Delay (sec/veh) : xxxxxxOptimal Cycle: 100 Level Of Service; F
********************************************************************************Approach: North Bound South Bound East Bound West Bound
MoveMENt: L - T - R L - T - R L - T - R L - T - R
-l---------ll---------ll---------ll---------------lControl-: Prot+Permit Permitted Protected ProtectedRights:fncfudelncl-udelncfudelncfudeMín.creen: 0 O O O O O 0 0 0 0 0 0
Lanes: 1 0 1 O O O 0 O 1 0 1 0 0 0 1 0 0 0 0 0
-l---------ll---------ll---------ll---------------lVol-ume Module:Base Vol: 314 268Growth Adl: 1.00 1.00Initial- Bse: 374 268Added Vol: 0 557PasserByvol: 0 0
Initiaf Fut: 3I4 825User Adj : 1.00 1.00PHF Adj : 1.00 1.00PHF Volume: 314 825Reduct Vol-: 0 0
Reduced Vof: 374 825PCE Adj : 1.00 1.00MLF Adj: 1.00 1.00Final Vol. : 31'4 825
001.00 1.00
00000000
1 .00 1.001.00 1.00
1
1.00 1
1
0
07
1.00 1
1.00 1
7
0'7
0
1.0000
00
1 .001 .00
000
1.001 .00
0
0
1 .0000
00
1.001.00
000
1 .001 .00
0
000
0
000
0000
0
0
00000
0
000000
1.00 1.001 .00 1.00
00
6031.00
6035s6
0115 9
1.001 .00115 9
0115 9
1.001.00115 9
¿61 .00
260
026
1 .001 .00
260
261 .001 .00
26
26r1.00
26L0
0zôr
1.001.00zor
026r
1 .001.0026r
1
000
0
0
00
0000
00
0
0000
0
11
1.00 1
1.00 1
1
00 160094 1.0000 0.980 1565
00 1600 160094 0. 94 1.0002 1.00 0.0033 1s00 0
1 6000. 941 .001500
00 160094 1.0000 0.0000
1 6000. 940.00
0
t_
1
Saturation Elow ModufeSat/Lane: 1600 1600Adjustment: 0.94 1.00Lanes: 1.00 1.00Finaf Sat.: 1500 1600
-l---------ll---------ll---------ll---------------lCapacity AnalYsis Module:voi/sat: O.2I O.S2 0.00 O.OO 0.74 O.19 0.00 0.00 0.17 0.00 0.00 0-00Crit MOVeS. **** **** ************************************************************************************
760.0.
160.U.
T60.0.
L60.0.
009400
0
Traffix 7.6.0115 (c) 2003 Dowling Assoc- Licensed to URS CORP', SANTA ANA, CA

CEQA Existing Setting AM Sun Auq 30t 2OI5 13:00:39 Page 15-1
Wayne J . Sand and Gravel Mine Project Traffic StudyCEQA Existing Setting Ptus Cumu]ative
Morning Peak Hour
Level Of Service Computation ReportICU 1(Loss as cycle Length 3) Method (Future Volume Alternative)
*****************************************************t**************************
Intersection#gMoorparkAvenue(SR-23)atPoindexterAvenue[cityofMoorpark]******************************************************************************Cycfe (sec) : 1OO Critical Vof'/Cap' (X): 0'911lãss Time (sec): 10 (y+R : 4 sec) Average Delay (sec/veh): xxxxxxOptimaf Cycle: 1OO Levef Of Service¡ E
**************************l****************************************************
Approach: North Bound South Bound East Bound West Bound
Movement: L - T - R L - T - R L - T - R L - T - R
-l---------ll---------ll------ll---------------lControl: Protected Protected Split Phase Split Phase
Rights: Incfude Include Include IncludeMin.Green: O 0 O O 0 O O 0 0 0 0 0
Lanes: 1 0 O 1 O 1 0 1 O 1 O 1 0 1 0 1 0 0 1 0
-l---------ll---------ll---------ll---------------l5 43 13
1.00 1.00 1.005 43 130000005 43 13
1 .00 1.00 1.001 .00 1.00 1.00
5 43 130005 43 13
1.00 1.00 1.001 .00 1.00 1.00
5 43 13
lt---------------l
Volume Module:Base Vol: 82Growth Adj: 1.00Initial Bse: 82Added Vof: 0
PasserByvol: 0
InitiaÌ Fut: 82User Adj : 1.00PHF Adj: 1'00PHF Volume: 82Reduct Vol: 0
Reduced Vol: 82PCE Adj : 1.00MLF Adj : 1.00Einal Vol. : 82
3191 .00
319557
081 6
1 .001 .00
81 6
0876
1 .001 .00
B'7 6
101 .00
1000
101 .001.00
100
101 .001.00
10
1
1
00-t
001
0000
1
01
3521.00
a tra
5560
9081.001.00
9080
9081.001 .00
908
2021 .00
2020
0202
1 .001.00
2020
2021 .001.00
202
2281.00
zzo0
0
2281.001 .00
2280
2281.001 .00
228
111.00
1100
111.001 .00
110
111 .001.00
11
1361.00
1360
0136
1.001 .00
1360
1361 .001 .00
136
1
1
Saturation Ffo\^r ModuleSat/Lane: 1600 1600Adjustment: 0.94 1.00Lanes: 1.00 0.99Finaf Sat.: 1500 1582
| --------------- | l--------------- | | ---------------
1 .001.00
1
1 6000.940 .01
I1
1600 16000.94 1.001 .00 1.001s00 1600
1 6000.941.001500
16000. 940.731088
1600 16000.94 1.007.OO 0.211500 439
1600 1600 16000.94 1.00 0.941.00 0.77 0.231500 1229 348
| --------------- l
Capacity AnalYsis Module:voi/sutt 0.05 0.55 0.59 o.o0 0.57 0.13 0'15 0'03 0.13 0.00 0.03 0.04
**************************************************************************Crit Moves
**********
Traffix 7.6.0115 (c) 2003 Dowling Assoc. Licensed to URS coRP.f SANTA ANA/ CA
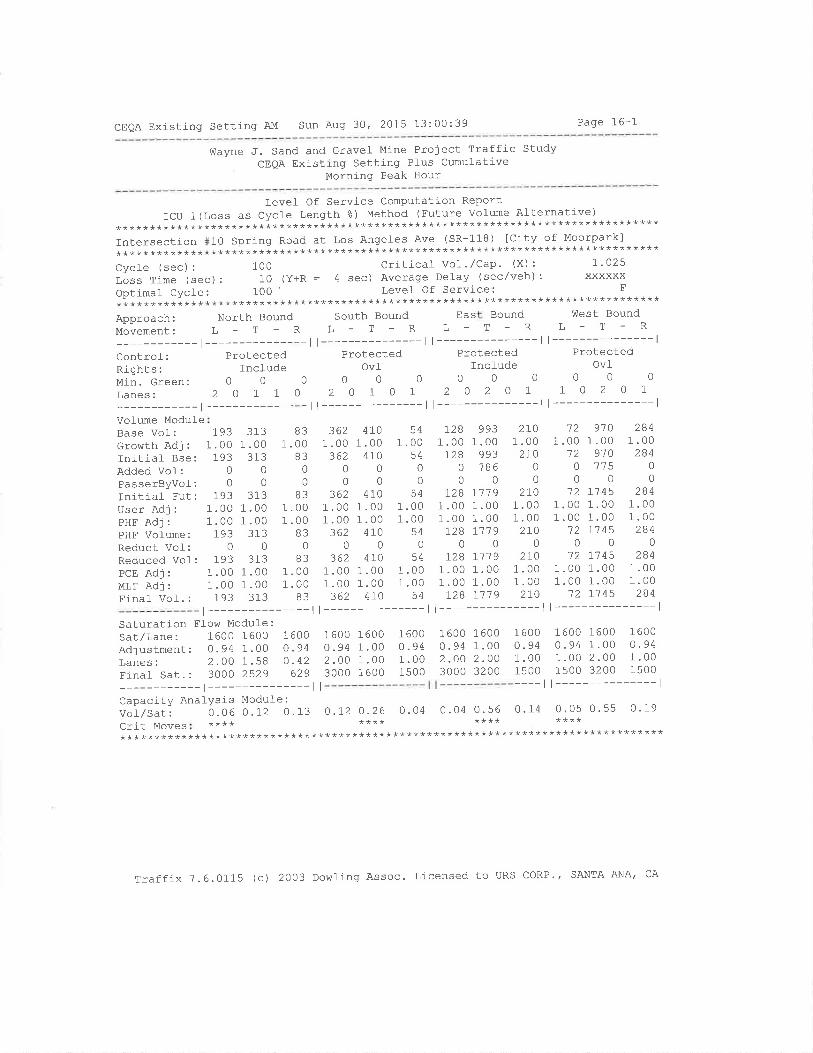
CEQA Existing Setting AM Sun Aug 30' 2015 13:00:39 Page 16-1
9{ayne J. Sand and Gravel Mine Project Traffic StudyCEQA Existing Settinq Pfus Cumul-ative
Mornlng Peak Hour
Level Of Service Computation ReportICU 1(Loss as cycfe Lenqth %) Method (Future volume Alternative)
********************************************************************************Intersection #10 Spring Road at Los Angefes Ave (SR-118) [City of Moorpark]********************************************************************************Cycle (sec) : 1OO Criticat Vol ' ,/Cap ' (X) : I 'O25Lãss Time (sec) : 10 (y+R : 4 sec) Averaqe Delay (sec/veh) : xxxxxxOptimal Cycle: 100 Levef Of Service¡ F
********************************************************************************Approach: North Bound South Bound Eas Bound V{est Bound
MovemENt: L - T - R L - T _ R L - T - R L - T - R
-l---------ll---------ll---------ll---------------lControl: Protected Protected Protected ProtectedRights: Include Ovt Incfude OvlMin.creen: O O O O O O O 0 0 0 0 0
Lanes: 2 O 1 1 O 2 O 1 0 1 2 0 2 O 1 1 0 2 0 1
-t--------- | l--------- I l--------- I l--------------- I
Volume ModufeBase Vof:Growth Adj:Initial Bse:Added Vol:PasserByvof:Initial Fut:User Adj:PHF AdJ:PHF Volume:Reduct Vof:Reduced Vof:PCE AdJ:MLE AdJ:Finaf Vol.:
3131.00
31300
3131 .001.00
3130
3131 .001 .00
313
541.00
q¿
00
541 .001.00
540
54
r281.00t28
0
0
I2B1.001 .00
I2B0
T2B
9931 .00
993186
0
r'Ì191 .001.00I11 9
0r11 9
2701.002r0
0
0
2ro1.001 .002r0
0
270
121.00
120
0
721.001 .00
120
12
9101.00
9'7 01'7 5
0
r'7 451 .001.00r'7 45
01-'7 45
2841.00
2840
0
2841.001.00
2840
2841 .001.00
284
1931 .00
10?
00
1931.001 .00
1930
1931.001.00
193
831 .00
B300
B31 .001 .00
B30
B31 .001 .00
83
3621 .00
3620
0
3621.001 .00
3620
3621.001 .00
362
4101.00
41000
4101 .001.00
4100
4101 .001.004ro
1. OO 1.00 1.00 1.00 1 .00 1.001 . OO 1 .00 1 .00 1 .00 1 .00 1.00
54 r2B 1119 270 12 7145
t---------------ll---------------ll---------------ll---------------lSaturation Ffol^l Module:Sat/Lane: 1600 1600 1600Adjustment: 0.94 1.00 O.94Lanes: 2.00 1.58 O -42Final Sat. : 3000 2529 629
-l---------------llCapacity AnaÌYSis Modufe :
Vol/Sat: 0 .06 O .I2 0.13CTit Moves**********
1600 16000.94 1.002 .00 1.003000 1600
1 6000.941 .001500
1 6001 .002.003200
1600 1600 1600 16000.94 0.94 1.00 0.941 .00 1 .00 2 .00 1.001500 1500 3200 1500---- I I --------------- |
1 600aì q¿
2 .003 000
o .r2 0.26 0. 04 O . 04 0. 56 0. 14 0 .05 0. 55 0.19**** **** ****
**********************************************************************
Traffix 7.6.0115 (c) 2OO3 DowÌing Assoc. Licensed to URS coRP.r SANTA ANA' CA

CEQA Existing Settíng PM Sun Aug 30' 2015 13:01:28 Page 1-1
Vlayne J. Sand and Gravel- Mine Project Traffic StudyCEQA Existing Setting Plus Cumulative
Evening Peak Hour
Scenario
Cornmand:Vo.lume:Geometry:Impact Fee:Trip Generation:Trip DistributionPaths :
Routes:Configuration:
Scenarj-o RePortCEQA Existing Setting PM
PM
PM
ExistíngDefault Impact FeePM
PM
Default PathsDefault RoutesPM Existing
Traffix 7.6.0115 (c) 2003 DowÌing Assoc. Licensed to URS CORP'' SANTA ANA, CA
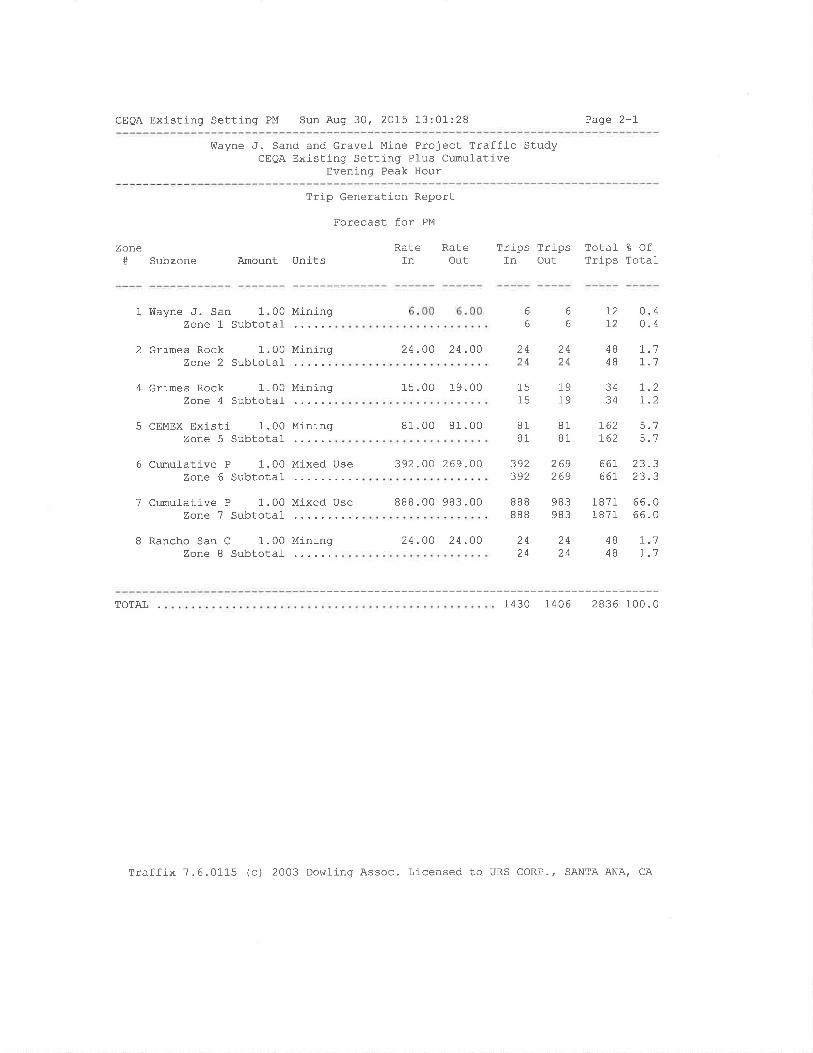
CEQA Existing Setting PM Sun Aug 30, 2015 L3:01:28 Paqe 2-I
V{ayne ,J. Sand and Gravel Mine Project Traffic StudyCEQA Existing Setting Plus Cumulative
Evening Peak Hour
Zone# Subzone Amount Units
Trip Generation Report
Forecast for PM
RateIn
Trips Trips Total- I OfRateOut In Out Trips Total
1lfayne,J. San 1.00 MiningZone 1 Subtotaf
2 Grimes Rock 1.00 MiningZone 2 Subtotal
4 crimes Rock 1.00 Miningzone 4 Subtotaf
5 CEMEX Existi 1.00 MiningZone 5 Subtotal
6 Cumul-ative P 1.00 Mixed UseZone 6 Subtotal
7 Cumul-ative P 1.00 Mixed UseZone '7 Subtotal-
B Rancho San C 1.00 MiningZone 8 Subtotal-
2424
2424
484B
1515
L979
3434
8181
8181
762762
392392
269269
66r661,
23.3aa a
BBB
BBB
983983
tglttglt
66.066.0
2424
2424
4B4B
6
6
6
6
(\ ¿.
0.4
r.1r.1
7.27.2
E'
q?
7.7I.1
T272
24.00 24 .00
15.00 19.00
81.00 81 .00
392.OO 269.OO
888.00 983.00
24.00 24 .O0
TOTAL 1430 1406 2836 100.0
Traffix 7.6.0115 (c) 2003 Dowling Assoc. Licensed to URS CORP., SANTA ANA' CA
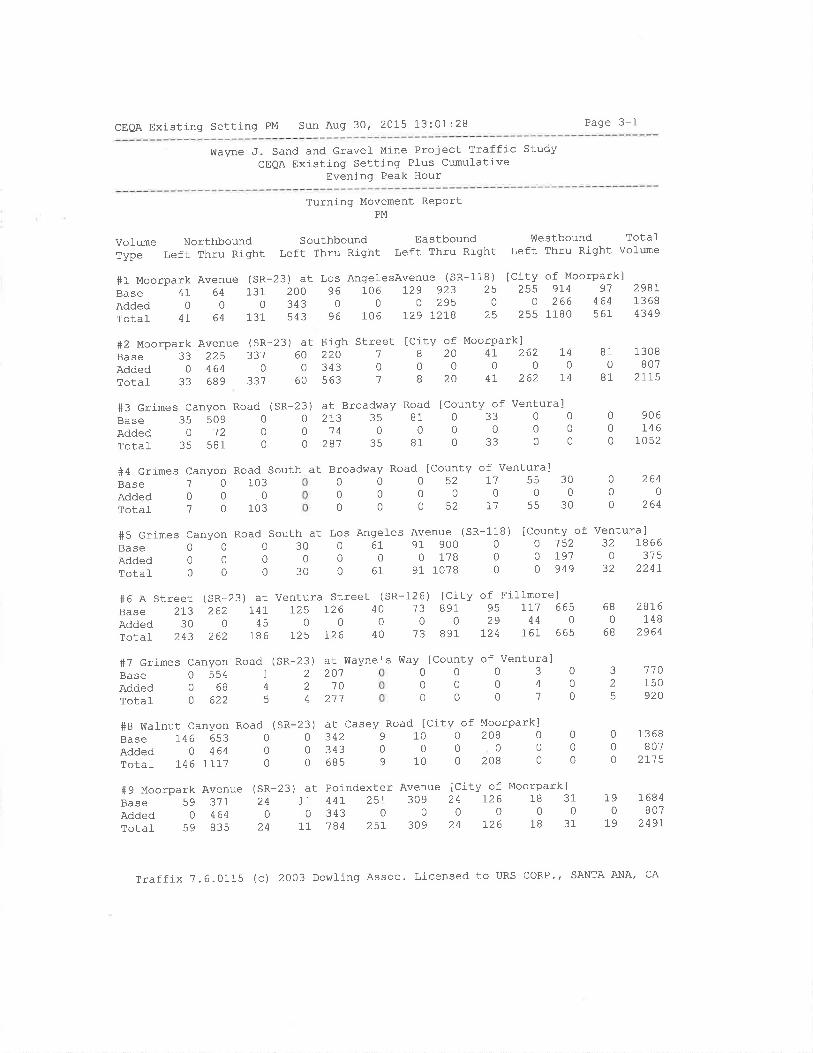
CEQA Exj-sting Setting PM Sun Aug 30, 2015 l-3:01:28 Page 3-1
Wayne J . Sand and GraveÌ Mine Project Traffic StudyCEQA Existing Setting PIus Cumul-ative
Evening Peak Hour
Turning Movement ReportPM
Volume Northbound Southbound Eastbound Westbound TotalType Left Thru Right Left Thru Right Left Thru Right Left ThIu Right vofume
#1 Moorpark Avenue (SR-23) at Los AngelesAvenue (SR-118) lcity of Moorpark]Base 47 64 131 2OO 96 106 729 923 25 255 9I4 97
Added00034300029500266464Total4:-6413154396106I29I2:-8252551180561
298t13 684349
1308807
2II5
S2 Moorpark Avenue (SR-23) at HighBase 33 225 337 60 22O
AddedO46400343rotal 33 689 33']- 60 563
Street [City of Moorparkl41 26200
47 262
at !ùayne's lrlay [County of Ventura]000300040007
lCity of MoorParkl10020800000
1002080
I08
1
0'7
200
¿U
t40
I4
B10
81
#3 Gri¡nes CanYon Road (
Base 35 509 0
Added 0 12 0
Total- 35 58 1 0
#4 Grimes Canyon Road South at Broadway Road
BaSeAddedTotal
#5 Grimes Canyon Road South at LosBaSeAddedTotal
23) at Broadway Road lCounty of Ventura]02733s8103300o 14 o 0 0 0 0 0
o 2B'7 3s 81 0 33 0 0
[County of Ventura]o5211553000000052115530
2640
264
Angeles Avenue (SR-118) [County of Ventura]67 9L 9OO 0 0 152 32 18660 o rlï 0 0 1'9'l 0 375
6L 91 1078 0 0 949 32 2247
SR-0
00
000
00
0
32
00
0
3)2
2
4
000
00
0
906I46
7052
'7
01
0
00
0
00
0
0
0
0
0
0
0 1030 ,00 103
240
24
000
300
30
#6 A Street (sR-23) at Ventura street (sR-126) [City of Fi]-fmorelBaSe2I326274LI25:-2640138919571..166568added3004500000294400Total- 243 262 186 L25 1'26 40 13 891 I24 161 665 68
28r6148
2964
'7'10
150920
13 68807
2L1 5
#7 Grimes Canyon RoadBase 0 554 1
Added 0 68 4
TôtaI O 622 5
#8 Walnut Canyon Road (
Base 146 653 0
Added 0 464 0
Total 146 I]-I'7 0
(sR-23)
23) al Casey Road034290343006859
( sR-2
SR
201IU
211
#9 Moorpark AvenueBase 59 3'lIAdded 0 464Total- 59 835
at Poindexter Avenue lCity of Moorpark]11 44r 25r 309 24 126 18 31
034300000011 184 25I 309 24 126 l-B 31
190
19
7684807
249r
Traffix 7.6.0115 (c) 2003 Dowling Assoc. Licensed to URS CORP', SANTA ANA' CA

CEoA Existing setting PM Sun Aug 30, 2015 13:01:28 Page 3-2
Wayne J. Sand and Gravel Mine Project Traffic StudyCEQA Existing Setting Pl-us Cumufative
Evening Peak Hour
Volume NorthboundType Left Thru Right
Southbound EastboundLeft Thiru Right Left Thru Right
Westbound TotalLeft Thru Right Volume
*10 Spring Road at Los Angel-es Ave (SR-Base 241 322 64 404 365 60Added000000Total 24'7 322 64 404 365 60
) tCity of Moorparkl111 9BB 341 144 1053
063700131777 7625 34r r44 t1B4
118422
0
422
452r13 6B
5BB 9
Traffix 7.6.0115 (c) 2003 Dowling Assoc. Licensed to URS CORP., SANTA ANA, CA

CEQA Existing Setting AM Sun Aug 30, 2015 12:56:55 Page 1-1
Wayne J. Sand and Gravef Mine Project Traffic StudyCEQA Existing Setting PIus Project
Morning Peak Hour
Scenari-o:
conmand:Vofume:Geometry:fmpact Fee:Trip Generation:Trip Distribution
Routes:Configuration:
Scenario RePortCEQA Existing Setting AM
AMAMExistingDefauft Impact FeeAM
AMDefault PathsDefault RoutesAM Existing
Traffix ?.6.0115 (c) 2OO3 Dowling Assoc. Licensed to URS CORP', SANTA ANA, CA
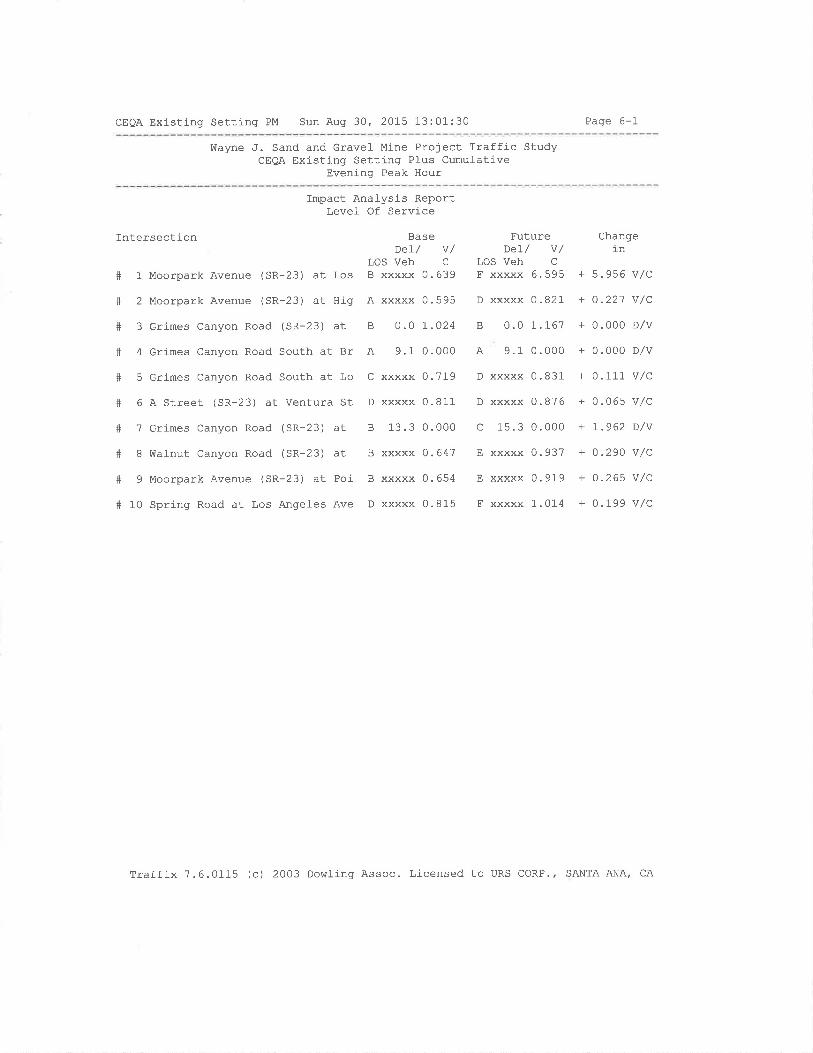
CEQA Existlng Setting PM Sun Aug 30, 2015 13:01:30 Page 6-1
V,tayne ,J. Sand and Gravel- Mine Project Traffic StudyCEQA Existing Setting Plus Cumufative
Evening Peak Hour
Impact Analysis ReportLevel Of Service
Intersection BaseDeI/ v/
LOS Veh C
# 1 Moorpark Avenue (SR-23) at Los B xxxxx 0.639
# 2 Moorpark Avenue (SR-23) at Hig A xxxxx 0.595
# 3 crimes Canyon Road (SR-23) at B 0.O L.024
# 4 Grimes Canyon Road South at Br A 9.1 0.000
# 5 Grimes Canyon Road South at Lo C xxxxx 0.719
# 6 A Street (SR-23) at Ventura St D xxxxx 0.811
# 7 crimes Canyon Road (SR-23) at B 13.3 0.000
# B walnut Canyon Road (SR-23) at B xxxxx 0.647
# 9 Moorpark Avenue (sR-23) at Poi B xxxxx 0.654
# 10 Spring Road at Los Angeles Ave D xxxxx 0.815
FutureDeI/ v/
LOS Veh C
F xxxxx 6.595
D xxxxx 0.821
B 0.o t.1,61
A 9.1 0.000
D xxxxx 0.831
D xxxxx 0.876
c 15.3 0.000
E xxxxx 0.937
E xxxxx 0.919
F xxxxx 1.014
Changean
+ 5.956 V/C
+ o.221 v/c
+ 0.000 D/v
+ 0.000 D,/v
+ 0.111 V,/C
+ 0.065 v/c
+ 7.962 D/v
+ 0.290 v/c
+ 0.265 V/C
+ o.I99 v/c
Traffix 7.6.0115 (c) 2003 Dowling Assoc. Licensed to URS CORP., SANTA ANA, CA
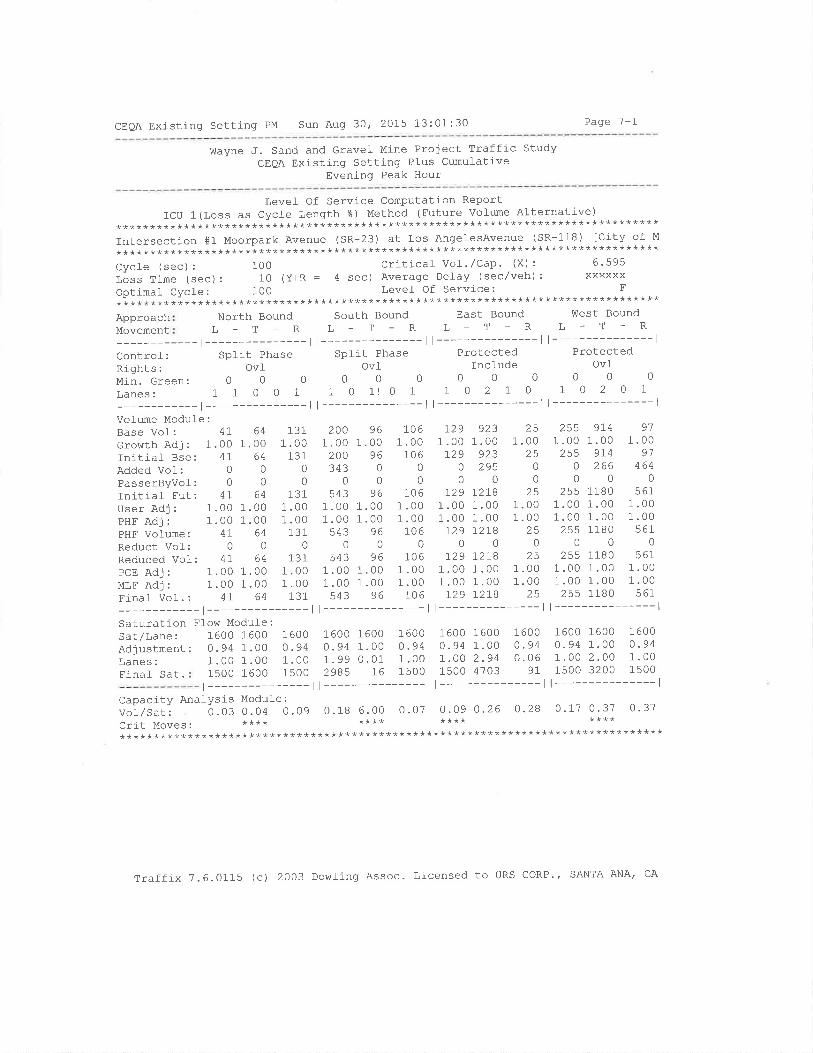
CEQA Existing Setting PM Sun Aug 30, 2015 13:01:30 Page 7-l
Wayne J. Sand and Gravel Mine Project Traffic StudyCEQA Existj-ng Setting Pl-us Cumulative
Evening Peak Hour
Level Of Service Computation ReportICU 1(Loss as Cycfe Length %) Method (Future volume Al-ternative)
********************************************************************************IntersectionslMoorparkAvenue(SR-23)atLoSAngeIeSAvenue(SR-118)[CityofM********************************************************************************Cycle (sec): 100 critical Vot'/Cap' (X): 6'595Loss Time (sec): 10 (Y+R : 4 sec) Average Delay (sec/veh): xxxxxxOptimal Cycle: 1OO Level Of Servlce; F
********************************************************************************ApproachMovement
Lanes:Final Sat.
North BoundL-T_R
South Bound East Bound West BoundL-T-RL_T_RL-T-R
-l---------ll---------ll---------ll---------------lcontrol: Split Phase spfit Phase Protected ProtectedRights: OvI OvÌ Include OvfPlin. Green: O O 0 O O O 0 0 0 0 0 0
Lanes: 1 1 O O 1 1 O 1l O 1 1 O 2 1 0 1 0 2 0 1
-l---------ll---------ll---------ll---------------lVolume Module:Base Vol: 41 64 131 2OO 96 106 729 923 25 255 974 91
crobrthAdj: 1.001.00 1.00 1.oo1.oo 1.oo 1.001.00 1.00 1.001.00 1.00rnirial Bse: 41 64 131 2oO 96 106 I29 923 25 255 9I4 91
AddedVol-: O O O 343 O O 0 295 0 0 266 464
PasserByvol: 0 O O O 0 O 0 0 0 0 0 0
rnitial Fut: 41 64 131 543 96 106 I29 I21'B 25 255 1180 561
USer Adj : 1.00 1. OO 1 . OO 1. OO 1. OO 1. OO 1.00 1.00 1.00 1 .00 1 .00 1.00pHFAdj: 1.001.00 1.00 1.001.00 1.00 1.001.00 1.00 1.001.00 1.00pHF Volume: 47 64 131 543 96 106 729 I2I8 25 255 1180 561
Reductvol: O O O O O 0 0 0 0 0 0 0
Reduced vol: 41 64 131 543 96 106 I29 :-278 25 255 1180 561pcE Adj: 1.00 1.oo 1.00 1.oo 1.oo 1.00 1.00 1.00 1.00 1.00 1.00 1.00MLFAdj: 1.001.00 1.oo 1.001.00 1.00 1.001.00 1.00 1.001.00 1.00Fi-nal vof.: 41 64 131 543 96 106 I29 I2I8 25 255 1180 561
-l---------ll---------ll---------ll---------------lSaturation Ffow Module:Sat/Lane: 1600 1600Adjustment: 0.94 1.00
1 .00 I .001500 1600
1600 16000.94 1.001.99 0.012985 16
1 6000.941 .001 500
1 6000.941 .001 500
1600 16000.94 1.00r.00 2.941500 4703
1 600o .940.06
91
1600 16000.94 1.001.00 2.001s00 3200
1 600o.941.001 500
r---------------ll---------------ll---------------ll---------------lCapacity Anafysis Module:vor/sat: o. 03 o. 04 o. 09 0.18 6.00 0.07 0 .09 0.26 0 -28 0.17 0. 37 0 - 37
Cfit MOVeS: **** **** **** ****
********************************************************************************
Traffix 7.6.0115 (c) 2OO3 Dowting Assoc. Licensed to URS coRP.' SANTA ANA' CA

CEQA Existing Setting PM Sun Auq 30, 20L5 13:01:30 Paqe B-1
Wayne J. Sand and Gravel Mine Project Traffic StudyCEQA Existing Setting Plus Cumulative
Evening Peak Hour
Level Of Service Computation ReportICU 1(Loss as cycle Length ?) Method (Future volume Afternative)
********************************************************************************Intersection S2 Moorpark Avenue (SR-23) at High Street [City of Moorpark]********************************************************************************Cycle (sec) : 1OO Critical vol'/Cap' (x) : 0'821lãss Time (sec) : 10 (y+R : 4 sec) Average DeÌay (sec/veh) : xxxxxxOptimal Cycle: 12 Level Of Servj-ce; D
********************************************************************************Approach: North Bound South Bound East Bound V'lest Bound
MovemENt: L - T - R L - T - R L - T - R L _ T - R
-l---------ll---------ll---------ll---------------lControf: Permitted Permitted Spfit Phase Split Phase
Rj-ghts: Include Include Include IncludeMin.creen: O 0 0 O O O 0 0 0 0 0 0
Lanes: O I O O 1 1 O O 1 O O O 11 0 0 0 1 0 0 l-
-l---------ll---------ll---------ll---------------lVolume Module:Base Vol:Growth Adj: 1
Initiaf Bse:Added Vol:PasserByvol:Initial Fut:User Adj: 1
PHF Adj: 1
PHF Volume:Reduct Vof:Reduced Vol:PCE Adj: 1
MLF Adj: 1
Final- VoI.:
330033
0
033000033
033000033
2251 .00
225464
0
6891 .001 .00
6890
6891 .001 .00
689
3371 .00
33100
3371 .001 .00
33'70
33'71 .001 .00
337
bU
1.0060
00
601.001 .00
600
601 .001 .00
60
2201.00
220343
0s63
1. 001 .00
s630
s631.001.00
s63
7
1 .001
00
1
1 .001 .00
1
01
1.001 .00
'7
-----l
B204I1.00 1.00 1.00
B204I0000008204L
1 .00 1.00 1 .001 .00 1.00 1.00
8204r0008204]'
1 .00 1.00 1.001.00 1.00 1.00
8204rt---------------l
262 14 811 .00 1.00 1.00262 14 81
000000
262 14 811 .00 1.00 1.001.00 1.00 1.00262 14 81-
000262 14 81
1 .00 1.00 1.001.00 1.00 1.00262 74 81
t---------------l| --------------- | I ----------Saturation Flow Modulesat,/Lane: 1600 1600Adjustment: 0.94 1.00Lanes: 0.05 0.95Final Sat. : 69 \52'7
1600 1600 1600 1600 1600 1600 16000.94 1. OO O .94 0.94 1.00 0. 94 0 .941.OO 0.99 0.01 0.r2 0.29 0.s9 0.9515OO 1580 18 11 4 464 891 1424
|--------- ll--------- ll----
1 6000.941 .001 500
1 6001 .000.05
B1
0.17
1 600o.941.001 500
-----l
0.0sCapacity AnalYsis Module:voi/satt o.oz o.¿s o.22 0.04 0.36 o.38 0'05 0'04 0'05 0'18crit Moves: **** **** **** ************************************************************************
Traffix 7.6.0115 (c) 2003 Dowling Assoc' Licensed to URS CORP'' SANTA ANA' CA

CEQA Existing Setting PM Sun Aug 30, 2015 13:01:30 Page 9-1
Wayne ,J. Sand and Gravel Mine Project Traffic StudyCEQA Existing Setting Plus Cumulative
Evening Peak Hour
Levef Of Service Computation Report2000 HCM Unsignalized Method (Future Vo]ume Alternative)
********************************************************************************Intersection #3 Grimes Canyon Road (SR-23) at Broadvtay Road lcounty of Ventura]********************************************************************************Cycfe (sec): 1 Critical- Vol./Cap. (X): I'161Loss Time (sec): O (Y+R = 4 sec) Average Defay (sec/veh): 9'2Optimal- Cycle: 0 Level Of Service: B
* * * * * ** * * * * * * * * * * * * * * * * * * * * * * * * * * * * * * * * * * * * * * ** * * * * * ** * * * * * * * * * * * * * * * * * * * * * * * * * *
Approach: North Bound south Bound East Bound !Ùest BoundMovement: L - T - R L - T - R L - T - R L - T - R
-l---------ll---------ll---------ll---------------lControl: Yield Sign Stop Sign Stop Sign Stop SignRj-ghts: Incl-ude IncÌude Incl-ude Incl-udeLanes: 1 O 1 0 0 O 0 0 1 0 0 0 1! 0 0 0 0 0 0 0
t---------------ll---------------ll---------------ll---------------lVofume Modul-e:Base Vol: 35Grot^tth Adj : 1.00Initial Bse: 35Added Vol-: 0PasserByvol: 0
Initial Fut: 35User Adj : 1.00PHF Adj : 1.00PHF Volume: 35Reduct Vof: 0Final Vo.l .: 35
Saturati-on FIo\^t Modul-e :
Sat/Lane: 0 0
Adjustment: 1.00 1.00 1
Lanes: 1.00 1.00 0
Final Sat. : 498 498
5091 .00
509t¿0
5811 .001 .00
5810
581
01 .00
0000
1 .001 .00
000
01 .00
000
0
1 .001 .00
00
0
ZIJ1.00
213't4
0
2811.001.00
2810
281
351 .00
00
1t
1 .001.00
350
35
81 0
1 .00 1.0081 00000
81 0
1 .00 1.001 .00 1.00
81 000
81 0
22
1 .002?
0
0
331.001 .00
??
033
1.00 1.001.00 1.00
000000
0.37 0.00
1.00 1.000.37 0.00
4 .r 0.01.00 1.004.r 0.0
00*************
0.00 0.00****
1.00 1 .000.00 0.000.0 0.0
1.00 1.000.0 0.0
00***********
t-
0
00000
0
0000
00
0
11
000
0
0
00
0
000
000
1
1
0.00.00
0
0000000001 .00 1 .00 1 .00 1.00 1.00 1.00 1 .00 1.00 1.00o .00 0.89 0.11 0.71 0.00 0.29 0.00 0.00 0.00
0511622r9089000|--------- ll--------- ll---------------l
Capacity Analysis Module:vol-/Sat: 0.O1 7-L] 0.00 0.00 0.56 0.56 0.37 0.00Cfit MOVeS. **** ****Green/Cycl-e: 1.00 1 .00 1 .00 1 .00 1.00 1 .00 1 .00 1.00Vol-ume/Cap: O.07 1.17 0.00 0.00 0.56 0.56 0.37 0.00Deray/veh: 1.3 84 .2 0.0 0.0 I .5 I .5 4 .! 0.0DelayAdj: 1.00 1.00 1.00 1.00 1.00 1-00 1.00 1.00AdjDel/Veh: !.3 84.2 0.0 0.0 8.5 8.5 4.I 0.0DesignQueue: O 0 0 0 0 0 0 0********************************************************
Traffix 7.6.0115 (c) 2003 Dowling Assoc. Licensed to URS CORP., SANTA ANA, CA

CEQA Existing Setting PM Sun Aug 30, 2015 13:01:30 Page 10-1
üIayne J. Sand and GraveÌ Mine Project Traffic StudyCEOA Existj-ng Setting Pl-us crmul-ative
Evenj-nq Peak Hour
Level Of Service Computation Report2o0oHcMUnsiq¡nalj-zedMethod(FutureVofumeAlternative)
********************************************************************************Intersection #4 Grimes Canyon Road South at Broadway Road ICounty of Ventura]********************************************************************************Average Delay (sec/veh): 5.3 WoISt case Level- of service: A[ 9'1]********************************************************************************Approach: North Bound South Bound East Bound West Bound
MovEMCNt: L - T - R L - T _ R L - T - R L - T - R
-l---------ll---------ll------ll---------------lControl: Stop Sign Stop Sign Uncontrofled UncontrofledRiqhts; IncÌude Incfude Include IncfudeLanes: O 0 1l O 0 O 0 O O O 0 O 0 1 0 0 1 0 0 0
-l---------ll---------ll------ll---------------lVofume Module:Base Vol : '1 0
Growth Adj : 1.00 1.00Initial Bse: 'l 0
Added Vof: 0 0
PasserByvol: 0 0
Initial- Fut: 1 0
User Adj : 1.00 1 .00PHF Adj : 1.00 1.00PHF Vofume: 'l 0
Reduct Vol: 0 0
Final Vo].: 7 0
Critical GaP Module:Critical GP: 6.4 xxxxFoIf ohtupTim: 3.5 xxxx
-t---------
Queue: xxxxx xxxxStopped Def:xxxxx xxxxLOS by Move: * *
MoVeMCNt: LT - LTRShared Cap.: xxxx 99ISharedQueue:xxxxx 0.4Shrd StpDel:xxxxx 9 -IShared LOS: * AApproachDel: 9 -tApproachlos: A
1031 .00
1030
0103
1 .001.00
1030
103
01.00 1
000
01.00 1
1.00 1
0
00
10
0000
00
00000
0
000
0
0
00000
0
00
1
05200 1.000520000^
Ea
00 1.0000 1.00u 5¿00052
55 301 .00 1.00
55 300000
55 301.00 1.001 .00 1.00
55 3000
55 30
t11 .00
L]00
771.001 .00
I10
I1
1
0
00000
00000
0
00
00 11
I1
1
1
0.1'7 -4
6.2 xxxxx xxxx xxxxx xxxxx xxxx xxxxx3.3 xxxxx xxxx xxxxx xxxxx xxxx xxxxx ^1)) xxxx xxxxx
vvvv YYY!!
Capacity Module:Cnflict Vol: 201 xxxx 6I xxxx xxxx xxxxxPotent Cap.: 793 xxxx 1010 xxxx xxxx xxxxxMove Cap.: 770 xxxx 1010 xxxx xxxx xxxxxVolume/Cap: 0.01 xxxx 0.10 xxxx xxxx xxxx
-l--------- | l---------------l i
Level Of Service Modufe:
xxxx xxxx xxxxxxxxx xxxx xxxxxxxxx xxxx xxxxxxxxx xxxx xxxx
69 xxxx xxxxx1545 xxxx xxxxx1545 xxxx xxxxx0.04 xxxx xxxx
I
xxxxxxxxxx
-RTxxxxxxxxxxxxxxx
xxxxx xxxxxxxxx xxxx**
LT - LTRxxxx xxxx
xxxxx xxxxxxxxx xxxx**
xxxxxx*
xxxxx xxxxxxxxx xxxx**
LT _ LTRxxxx xxxx
xxxxx xxxxxxxxx xxxx**
xxxxxx*
A
xxxx xxxxxxxxx xxxxx**
-LTR_RTLTxxxx xxxx xxxxx0.1 xxxx xxxxx7.4 xxxx xxxxxA**xxxxxx
*
xxxxxxxxxx
_RTxxxxxxxxxxxxxxx
xxxxxxxxxx
-RTxxxxxxxxxxxxxxx
Traffix ?.6.0115 (c) 2OO3 Dowfing Assoc' Licensed to URS CORP'' SANTA ANA' CA

CEOA Existing Setting PM Sun Aug 30, 2015 13:01:30 Paqe 11-1
Vilayne .f . Sand and Gravel Mine Project Traffic StudyCEQA Existing Setting Pfus Cumulative
Evenj-ng Peak Hour
Level Of Service Computation ReportICU 1 (Loss as Cycle Length E) Method (Future volume Altelnative)
********************************************************************************Intersection #5 Grimes Canyon Road South at Los Angeles Avenue (SR-118) [County********************************************************************************Cycle (sec): 1OO Critical Vol-./Cap' (X): 0'831Loss Time (sec) : 10 (Y+R : 4 sec) Average Defay (sec/veh) : xxxxxxOptimal- Cycle: 't4 Levet Of Service: D
********************************************************************************Approach: North Bound south Bound East Bound !{est Bound
Movement: L - T - R L - T - R L - T - R L - T - R
-l---------ll---------ll---------ll---------------lcontrol: Split Phase spfit Phase Protected ProtectedRights: Incl-ude Incfude Incl-ude Includetlin. Green: O O O O O 0 0 0 0 0 0 0
Lanes: 0 0 O O O O O 1! 0 0 1 0 1 0 0 0 0 1 0 1
t---------------ll---------------ll---------------ll---------------lVol-ume Module:Base Vol-:Growth Adj: 1
Initial- Bse:Added Vof:PasserByvolInitial FutUser Adj:PHF AdJ:PHF Vofume:Reduct Vol:Reduced Vol-PCE Adj:MLF AdJ:FinaÌ Vof. :
1.00 1.00 1
1.00 1.00 1
00
1
0
000000
000
0
0
00
0000
000
1
000
00
00
0000
000
0000
0
1
300030
0
0
30000030
030000030
0
1 .000
0
0
01.001.00
9T1.00
9I00
971 .001 .00
910
911 .001.00
9I
9001.00 1.
900178
010781.00 1.1.00 1.107 B
010781.00 1.1.00 1.107 B
0
1 .0000
0
01 .001 .00
0
00
1 .001.00
0
1.00152797
0
9491.001.00
9490
9491.001. 00
949
321.00
3200
321.001.00
320
3Z1.001.00
aa
61,
1 .006I
00
6I1.001 .00
610
6I1 .001 .00
6I
000
0000
0000
0
0
00000
0
1.00 1
1.00 1
00
0
1
1
1
1
1
1
0
00
1.001.00
0
Saturation Ffow Modufe:Sat/Lane: 1600 1600Adjustment: 1.00 1.00Lanes: 0.00 0.00Final Sat.: 0 0
1 6001 .000 .00
0
1 6001 .000 .61107 3
1600 16001 .00 1.001 .00 1.001600 1600
1 6001 .000 .00
0
1600 16001 .00 1.000.00 1.00
0 1600
1 6001 .001 .001 600
1600 16001 .00 1.000.33 0.00521 0
Capacity Analysis Module :
vot/sat: o.0o 0.00 o. oo o . 06 o.0o 0.06 0.06 0. 67 0.00 0.00 0.59 0 -o2
Crit Moves: **** **** +***********************************************************************************
Traffix ?.6.0115 (c) 2003 Dowling Assoc. Llcensed to URS CORP', SANTA ANA' CA
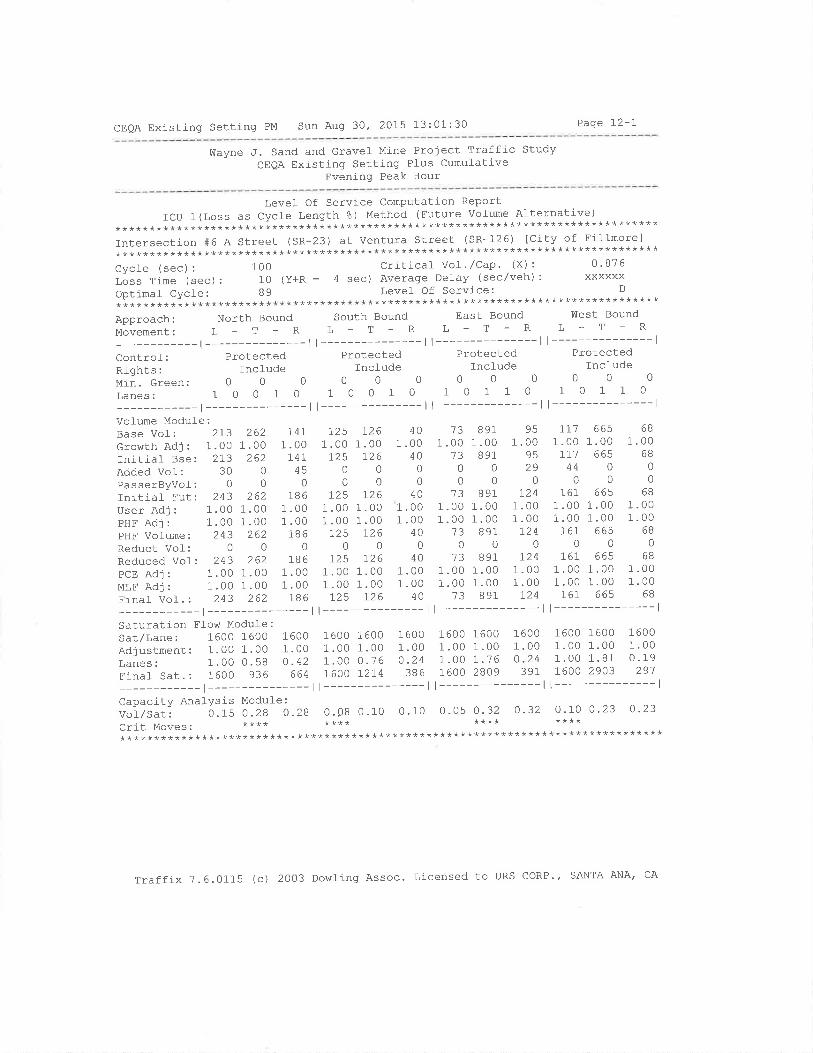
CEQA Existing Setting PM Sun Auq 30, 2015 13:01:30 Page I2-I
Wayne J. Sand and Gravel Mine Project Traffic StudyCEQA Existing Setting Plus Cumufative
Evening Peak Hour
Level Of Service Computation ReportICU 1(Loss as Cycle Length ?) Method (Future vol-ume Alternative)
********************************************************************************Intersection #6 e Street (SR-23) at Ventura Street (SR-126) [city of Fillmore]********************************************************************************Cycle (sec): 100 Critical Vol'/Cap' (x): 0'876LoSSTime(sec):10(Y+R:4sec)AverageDelay(sec/veh):XxxxxxOptimal Cycle: 89 Level Of Service; D
********************************************************+***********************Approach: North Bound South Bound East Bound West Bound
MoveMENt: L - T _ R L _ T - R L _ T - R L - T _ R
-l---------ll---------ll---------ll---------------lControf: Protected Protected Protected ProtectedRights: Incfude Include Include fncludetqin. Green: 0 O 0 O 0 O O 0 0 0 0 0
Lanes: 1 O O 1 O 1 O O 1 0 1 O 1 1 0 1 0 1 1 0
-l---------ll---------ll---------ll---------------lVolume Modufe:BaSeVoI:2I3262].4I125726401389195II166568GrowrhAdj: 1.001.00 1.00 1.001.00 1.00 1.001.00 1.00 1.001.00 1'00Initi-al Bse: 2I3 262 L411 725 126 40 13 891 95 7I1 665 68
Added Vol: 30 O 45 O O O O O 29 s4 0 0
PasserByVol: O O 0 0 O 0 O 0 0 0 0 0
rnitial Fur: 243 262 186 725 726 40 't3 891 1-24 161 665 68
UserAdj:1.001.001.001.001.001.001.001.001.001.001'001.00PHFAdj:1.001.001.001.001.001.001.001.001.001.001.001.00pHF Volume: 243 262 186 I25 126 40 13 891 1-24 161 665 68
Reduct Vol: O O 0 O O O 0 0 0 0 0 0
Reduced vof: 243 262 186 725 126 40 13 891 I24 761 665 68
PcEAdj:1.001.001.001.001.001.001.001.001.001.001.001.00MLFAdj:1.001.001.001.001.001.001.001.001.001.001.001.00Finaf vol. : 243 262 186 725 126 40 13 891 1-24 761 665 68
-l---------ll---------ll---------ll---------------lSaturation Ffow Modufe:sar/Lane: 16OO 160O 160O 16OO 1600 16OO 1600 1600 1600 1600 1600 1600
Adjustment: 1.00 1.00 1.00 1.00 1.00 1.oo 1.00 1.00 1.00 1.00 1.00 1'00Lanes: 1.00 O.58 o.42 1.00 O'76 0.24 1'00 1.76 0.24 1.00 1.81 0.19
Finat sat.: 1600 936 664 7600 L2I4 386 1600 2809 391 1600 2903 291
-l---------ll---------ll---------ll---------------lCapacity AnaIYsis Module:vo1,/sat: 0.15 0.28 O.2B 0.08 o.10 o.10 O.05 0.32 0.32 0'10 0'23 O'23
crit Moves: **** **** **** ************************************************************************************
Traffix 7.6.0115 (c) 2OO3 Dowling Assoc. Licensed to URS coRP.' SANTA ANA' CA

CEQA Existing Setting PM Sun Aug 30, 2015 13:01:30 Page 13-1
Wayne .f. Sand and Gravel Mine Project Traffic StudyCEQA Existing Setting Pfus Cumulative
Evening Peak Hour
Level- Of Service Computation Report20OO HCM Unsiqnalized Method (Euture VoÌume Alternative)
********************************************************************************Intersection #7 Grimes Canyon Road (SR-23) at Wayne's V{ay [County of Ventura]********************************************************************************Average Delay (sec/veh): 0.2 worst case Level Of Service: ct 15.31********************************************************************************Approach: North Bound south Bound East Bound !üest BoundMovement: L - T - R L - T - R L - T - R L - T - R
-l---------ll---------ll---------ll---------------lControl: Uncontrolled Uncontrolfed Stop Sign Stop SignRights: Include Incfude Include IncludeLanes: O O O 1 O O 1 0 0 0 0 0 0 0 0 0 0 11 0 0
t---------------ll---------------ll---------------ll---------------lVolume Module:Base Vol: 0Growth Adj : 1.00Initial Bse: 0Added Vol-: 0
PasserByvol: 0
Initial- Fut: 0
User Adj : 1.00PHF Adj : 1.00PHF Vofume: 0
Reduct Vol: 0
Final- Vof .: 0
EC A
1 .00554
680
1.001 .00
4
04
2011.00
20110
0
21'71.001.00
2-71
0
2'71
01 .00
0
000
1 .001 .00
000
001.00 1.00
00000000
1 .00 1.001 .00 1.00
000000
0
000
1.001.00
000
3
2
05
1. 001.00
50
2
1 .002
2
04
1
1.001
4
0tr
1.001 .00
5
0
5
1
000
0
000
0000
000
1 1
3
0034
01
0000
1
01
1
1
000
a
1.00
6221 .001 .00
622
1
1
0
622Critj-cal Gap Module:Critical Gp:xxxxx xxxxFof lor¡rupTim: xxxxx xxxx
-t---------Capacity Module:Cnfl-ict Vol-: xxxx xxxx xxxxxPotent Cap.: xxxx xxxx xxxxxMove Cap.: xxxx xxxx xxxxxVolume/Cap: xxxx xxxx xxxx
-l---------------lLevel Of Service Modufe:Queue: xxxxx xxxx xxxxxStopped Del:xxxxx xxxx xxxxxLOS by Move: * + *Movement: LT - LTR - RT
Shared Cap.: xxxx xxxx xxxxxSharedQueue:xxxxx xxxx xxxxxShrd StpDel-:xxxxx xxxx xxxxxShared LOS: * * *ApproachDel: xxxxxxApproachlOS: *
627 xxxx xxxxx965 xxxx xxxxx965 xxxx xxxxx
0.00 xxxx xxxxt---------------l
xxxx xxxx xxxxxxxxx xxxx xxxxxxxxx xxxx xxxxxxxxx xxxx xxxxt---------------l
2
3
910 xxxx 625308 xxxx 489307 xxxx 489
0.02 xxxx 0.01t---------------l
xxxxxxxxxx
4.r)2
xxxx xxxxx xxxxx xxxx xxxxxxxxx xxxxx xxxxx xxxx xxxxx
xxxxxxxx
6.42tr
6
-t
0,0 xxxx xxxxx xxxxx xxxx xxxxx xxxxx xxxx xxxxx8.7 xxxx xxxxx xxxxx xxxx xxxxx xxxxx xxxx xxxxxA********
LTxxxx
A
0.08.7
LTRXXXXxxxxxxxx
xxxxxx
-RT LT-LTRxxxxx xxxx xxxxxxxxx xxxxx xxxxxxxxx xxxxx xxxx***
xxxxxx*
_RT LT-LTRxxxxx xxxx 363xxxxx xxxxx 0.1xxxxx xxxxx 15.3**c
15.3c
-RTxxxxxXXXXXxxxxx
Traffix ?.6.0115 (c) 2003 Dowling Assoc. Licensed to URS CORP., SANTA ANA/ CA
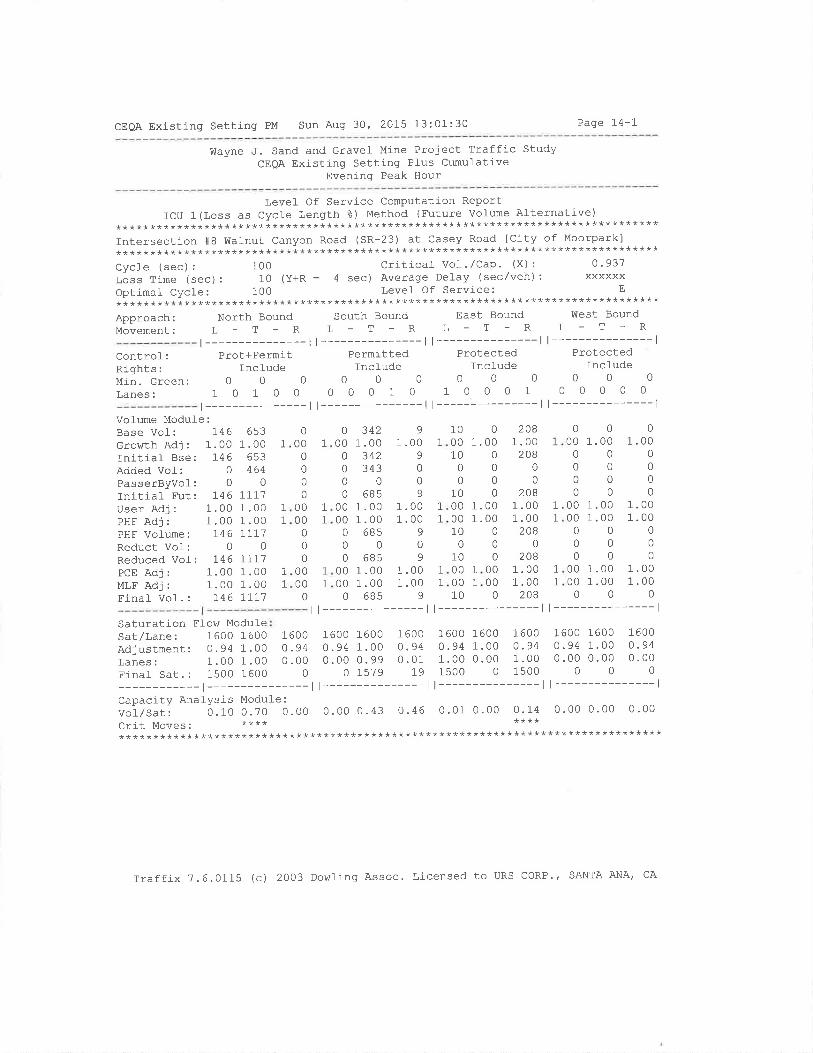
CEQA Existing Setting PM Sun Aug 30' 2015 13:01:30 Page 14-1
V{ayne J. Sand and Gravel Mine Project Traffic StudyCEQA Existing Setting PÌus Cumulative
Evening Peak Hour
Level- Of Service Computatj-on ReportICU 1 (Loss as Cycle Length %) Method (Future vofume Alternative)
********************************************************************************Intersection #8 Walnut Canyon Road (SR-23) at Casey Road lCity of Moorpark]********************************************************************************Cycf e (sec) : 1OO Criticaf Vof .,/Cap' (X) : 0 ' 937
Loss Time (sec) : 10 (Y+R : 4 sec) Average Delay (sec/veh) : xxxxxxOptimal CycJ-e: 1OO Levef Of Service: E
********************************************************************************Approach: North Bound south Bound East Bound !\lest Bound
Movement: L - T - R L - T - R L - T - R L - T - R
Control: Prot+Permit Permitted Protected ProtectedRights: Incl-ude Include Incl-ude IncludeMin.Green: 0 0 0 0 0 0 0 0 0 0 0 0
Lanes: 1 0 1 O O O O 0 1 0 1 0 0 0 1 0 0 0 0 0
t---------------ll---------------ll---------------ll---------------l
t---------------ll---------------ll---------------ll---------------lVolume Modufe:Base VoÌ:. 146Growth Adj : 1.00Initial Bse: ]_46Added Vol-: 0
PasserByvol: 0
Initial Fut: 746User Adj : 1.00PHF Adj : 1.00PHF VoÌume: 146Reduct Vol: 0
Reduced Vol: 146PCE Adj : 1.00MLF Adj : 1.00Final Vof. : 746
6s31.00 1
6s3464
0IIIl1.00 1
1.00 1
7II10
L7r11.00 1
1.00 1
1 117
000
000
0
0000
0
00
0000
0
0 34200 1.00o 3420 343000 685
00 1.0000 1.000 6Bs000 6Bs
00 1.0000 1.000 685
1.00 1
1.00 1
9
09
1.00 1
1.00 1
9
100010
0
010000010
010000010
2081.00
20800
2081 .001.00
2080
2081.00
0000 1.0000000000
00 1.0000 1.00000000
00 1.0000 1.0000
01.00
0
0
00
1.001 .00
00
0
1 .001 .00
0
1
1
1
9
1 .009
0
09
1
01.00
0
00
0
1.001 .00
0
0
0
1
1
1
11
1
00 1
100 1.000 208
Saturation FIow ModuÌesat/Lane: 1600 1600Adjustment: 0.94 1.00Lanes: 1.00 1.00Finaf Sat.: 1500 1600
1 6000.940 .01
19
1600 16000.94 1.001 .00 0.001500 0
1 6000.941.001500
1 6000.940.00
0
00 160000 0. 9400 0.0000
1 600o.940 .00
0
1600 16000.94 1.000.00 0. 99
0 1579
L61.0.
-l---------ll---------ll---------ll---------------lCapacity Analysis Module :
vol-/sut' o.10 0.70 o.oo o.oo 0.43 0.46 0.01 0.00 0.14 0.00 0-00 0-00Crj_t MOVeS. **** ************************************************************************************
Traffix 7.6.0115 (c) 2003 Dowling Assoc. Licensed to URS CORP'/ SANTA ANA, CA
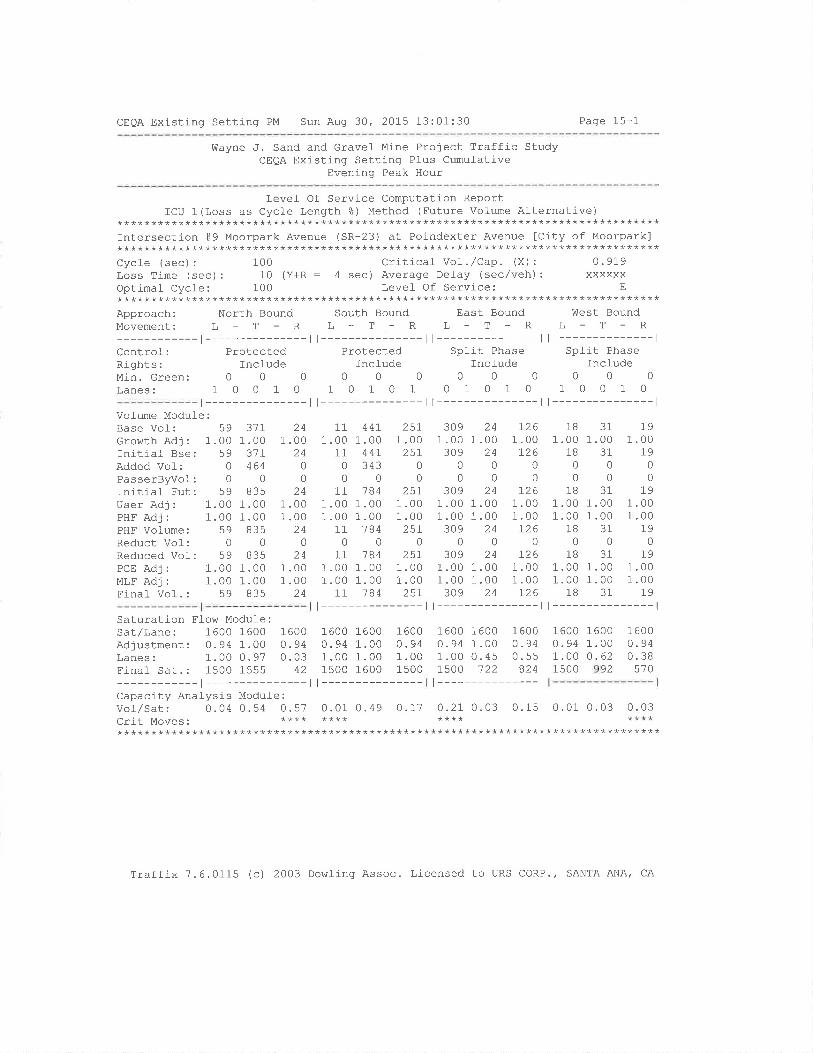
CEQA Exlsting Settlng PM Sun Aug 30, 2OI5 13:01:30 Page 15-1
Wayne J. Sand and Gravef Mine Project Traffic StudyCEQA Existing Setting Plus Cumul-ative
Evening Peak Hour
Level Of Service Computation ReportICU 1(Loss as Cycle Length %) Method (Future Volume Alternative)
********************************************************************************Intersection #9 Moorpark Avenue (SR-23) at Poindexter Avenue [City of Moorpark]********************************************************************************Cycle (sec) : 100 Critical Vol .,/Cap. (X) : 0.919Loss Time (sec) : 10 (Y+R = 4 sec) Average DeÌay (sec/veh) : xxxxxxOptinal- Cycle: 100 Level Of Service: E
********************************************************************************Approach: North Bound South Bound East Bound West BoundMovement: L - T - R L - T - R L - T - R L - T - R
-t--------- r--------- l l--------- l l---------------lControl: Protected Protected Spfit Phase Split PhaseRights: Incfude Incfude Include IncfudeMi-n. Green: 0 0 0 0 0 0 0 0 0 0 0 0
Lanes: 1 0 0 1 0 1 0 1 0 1 0 1 0 1 0 1 0 0 1 0
t---------------ll---------------ll---------------ll---------------lVolume Modul-e:Base Vof: 59Growth Adj : 1.00Initial Bse: 59Added Vol: 0
PasserByvoÌ: 0
Initial Fut: 59User Adj : 1.00PHF Adj : 1.00PHF Vol-ume: 59Reduct Vof: 0
Reduced Vof: 59PCE Adj : 1.00MLF Adj : 1.00Final- VoI. : 59
31r1.0031r464
0
8351 .001 .00
B3s0
B3s1 .001 .00
83s
241 .00
2400
241 .00I .00
240
241 .001 .00
24
11 44r 25r1 .00 1.00 1.00
11 44r 25L0 343 0000
11 184 25r1 .00 1.00 1 .001 .00 1 .00 1 .00
11 184 25r000
11 184 25r1 .00 1 .00 1.001.00 1.00 1.00
11 184 25rl---------------l
309 24 7261.00 1.00 1.00309 24 726
000000
309 24 1261 .00 1.00 1.001 .00 1.00 1.00309 24 126
000309 24 726
1.00 1.00 1 .001.00 1.00 1.00309 24 L26
t---------------l
18 31 L91.00 1.00 1 .00
18 31 19000000
18 31 191.00 1.00 1.001.00 1.00 1.00
18 31 19000
18 31 191.00 1.00 1.001 .00 1. 00 1.00
18 31 19t---------------l
Saturation Flow Modufe:Sat/Lane: 1600 1600 1600Adjustment: 0.94 1.00 O.94Lanes: 1.00 0.97 0.03Final Sat.: 1500 1555 42
-t---------------lCapacity Analysis Modufe :
1600 1600 16000.94 1.00 0.941 .00 1.00 1 .001500 1600 1500t---------------
1600 1600 16000.94 1.00 0.941 .00 0.45 0.551500 122 824t---------------l
1 6000.941.00150 0
00 160000 0.9462 0.3892 570
761.0.
Vol/Sat: 0.04 0.54 0.57 0.01 0.49 O.L1 0.21 0.03 0.15 0.01 0'03 0.03crit Moves. **** **** **** ************************************************************************************
Traffix 7.6.0115 (c) 2003 Dowling Assoc. Licensed to URS CORP., SANTA ANA/ CA

CEOA Existing Setting PM Sun Aug 30, 2015 13:01:30 Page 16-1
Wayne J. Sand and Gravel- Mine Project Traffíc StudyCEQA Existing Setting PIus Cumulative
Evenj-ng Peak Hour
Level Of Service Computation ReportICU 1(Loss as Cycle Length 8) Method (Future vol-ume Al-ternative)
********************************************************************************Intersection #10 spring Road at Los Angefes Ave (sR-118) [City of Moorpark]********************************************************************************Cycte (sec) : 100 criticat Vol-. /cap. (X) : 1 ' 014
Loss Time (sec) : 10 (Y+R : 4 sec) Average Delay (sec/veh) : xxxxxxOptimal Cycle: 100 Level Of Service: E
********************************************************************************Approach: North Bound south Bound East Bound west BoundMovement: L _ T _ R L - T - R L - T - R L - T - R
-l---------ll---------ll---------ll---------------lcontrol: Protected Protected Protected ProtectedRights: Include Ovl Include OvIMin.creen: 0 O O O 0 0 0 0 0 0 0 0
Lanes: 2 O 1 1 O 2 O 1 0 1 2 0 2 0 1 1 O 2 0 1
r---------------ll---------------ll---------------ll---------------lVol-ume Moduf e:Base Vof : 24'lGrowth Adj : 1.00Initial Bse: 24'7Added Vol-: 0PasserByvol: 0_Ln-It1al. ! Ut' : z4 tUser Adj : 1.00PHF Adj : 1.00PHF Vol-ume: 24'7Reduct Vol: 0
Reduced Vol: 241PCE Adj : 1.00MLF Adj : 1.00Final Vol. : 241
Saturation Ffow Module:Sat/Lane: 1600 1600Adjustment: 0.94 1.00Lanes: 2.0O I.61Final Sat. : 3000 2669
3221.00
J¿¿
00
3221 .001.00
0322
1 .001.00
64.00
6400
64.00.00
640
64.00.00
64
4041 .00
40400
4041 .001 .00
4040
4041 .001 .00
404
3651.00
36500
3651.001 .00
3650
3651 .001.00
365
601 .00
6000
601 .001 .00
600
601 .001 .00
60
1111 .00
1110
0111
1 .001.00
1110
1111.001 .00
111
9BB1.00
988637
0
r6251.001.00r625
0
r6251.001 .00r625
3471 .0034r
00
3411.001.0034r
0341
1.001.0034r
1441 .00
]-440
0744
1 .001 .00r44
0744
1 .001 .00r44
10531 .00105313r
0I1B41.001.00L78 4
0
I1B41.001.00T1 84
4221 .00
42200
4221 .001 .00
4220
4221 .001.00
422
1
1
1
1
L
r---------------ll---------------ll---------------ll---------------l1 600o.940 .33
491
1 6001.001.001 600
1 6000.941.001 500
1 6000 .941.001500
1600 16000.94 1.001 .00 2 .001500 3200
1 6000. 941.001 500
1 6000.942.O03000
1600 16000 .94 1.002.OO 2.003000 3200
-l---------ll---------ll---------ll---------------lCapacity Analysid' Modute :
vof/sat: 0. 08 o .12 0.13 O .13 0.23 0.04 0.04 0.51 0 .23 0.10 0. 56 0.28crit Moves. **** **** **** ************************************************************************************
Traffix 1.6.O\75 (c) 2OO3 Dowling Assoc. Lj-censed to URS CORP., SANTA ANA, CA
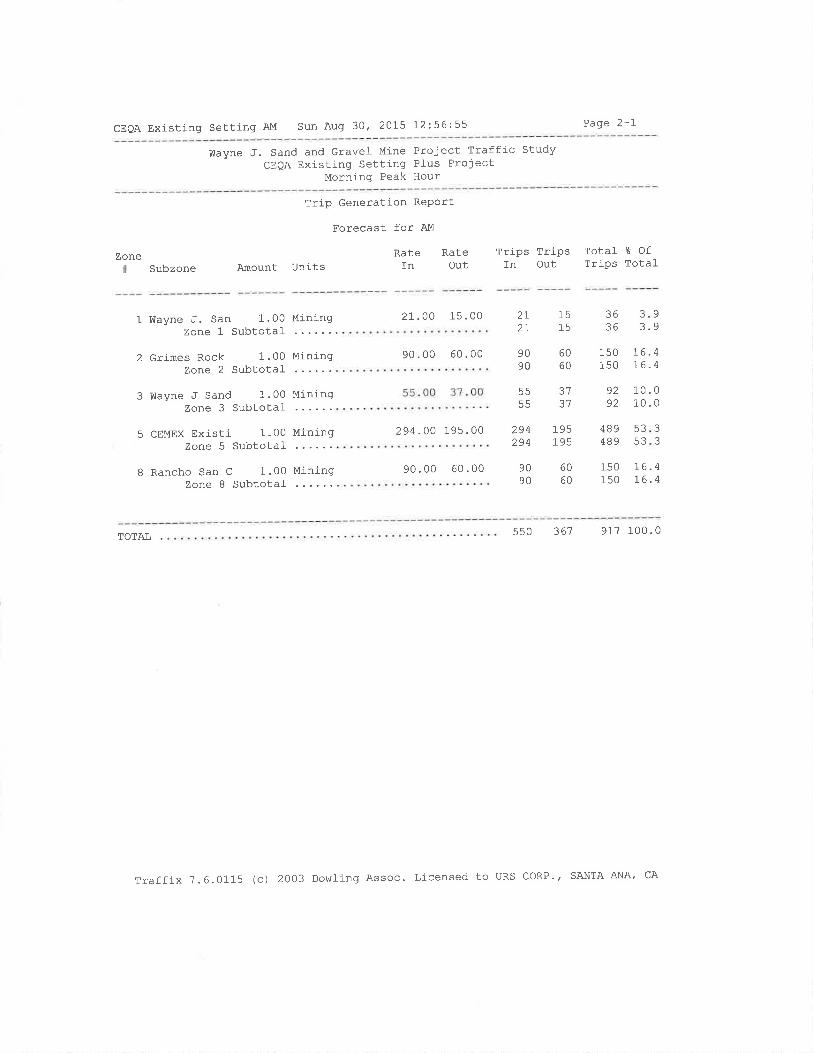
CEQA Existing Setting Alt Sun Aug 30, 2015 12:56:55 Paqe 2-t
Wayne ,J. Sand and Gravel Mine Project Traffj-c StudyCEQA Existing Setting PIus Project
Morning Peak Hour
Zone# Subzone
Trip Generation Report
Forecast for AM
Rate RateAmount units fn out
Trips TripsIn Out
Total E OfTrips Total-
1 Wayne J. San 1.00 Miningzone L Subtotal
2 Grimes Rock 1.00 Miningzone 2 Subtotal-
3 Vilayne J Sand 1 .00 Mj-ningZone 3 Subtotal
5 CEMEX Existi 1.00 MiningZone 5 Subtotal
B Rancho San C 1.00 MiningZone I Subtotal-
21.00 15.00
90.00 60.00 90
294.00 195.00 294294
90.00 60.00
2T2L
Itr
153636
906060
150150
5555
3'7
31
195195
489489
9090
6060
150150
16.416 .4
92 10.092 10.0
3.920
t6 .476.4
53R2
33
550 367 917 100.0TOTAL
Traffix 7.6.0115 (c) 2003 Dowling Assoc. Licensed to URS coRP.' SANTA ANA' CA
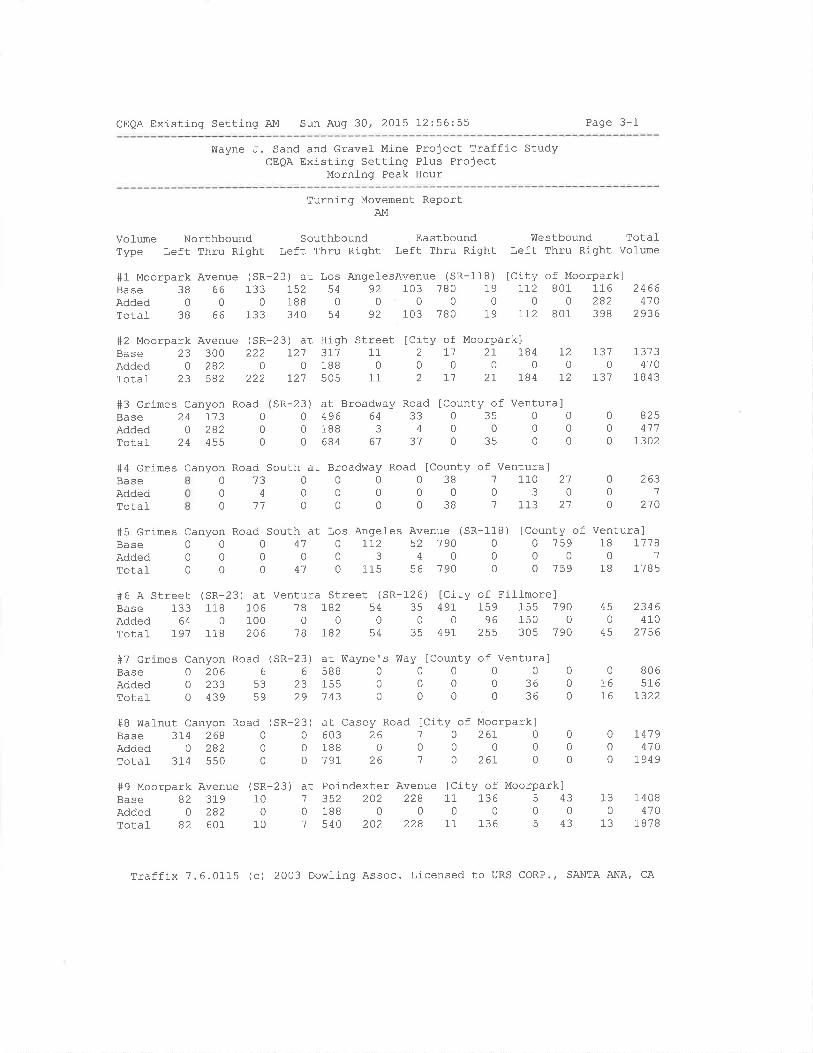
CEQA Existing Setting AM Sun Aug 30, 2015 12:56:55 Page 3-1
Wayne ,J. Sand and Gravel Mine Project Traffic StudyCEoA Existing Setting Pfus Project
Morning Peak Hour
Turning Movement ReportAM
Vol-ume Northbound Southbound EastboundType Left Thru Right Left Thru Right Left Thru Right
S1 Moorpark Avenue (SR-23) at Los AngelesAvenue (SR-118)Base 38 66 133 752 54 92 103 780 19Added00018800000rotal 38 66 133 340 54 92 103 780 19
Westbound TotafLeft Thru Right Volume
lCity of Moorparklrr2 801 116
00282rr2 801 398
2466410
2936
#2 Moorpark Avenue (SR-23) at High Street ICity of Moorpark]BaseAddedTotaI
BaseAddedTotal
23 300 222 I21 371 110282001880
23 582 222 r2'7 505 11
2I0
2L
184 1200
184 12
r310
r31
r313410
1843
8254'71
r302
3B0
JÒ
110 2130
113 2'7
2
02
t10
7'7
#3 Grimes Canyon RoadBase 24 I13 0Added O 282 0Total 24 455 0
at Broadway Road ICounty of Ventura]496643303s00188340000684613103500
000
0
0
0
'7
07
00
0
0
0
0
000
0
0
0
000
sR-23 )
000
#4 Grimes Canyon Road South at Broadway Road lcounty of Ventura]13
4
11
000
2631
210
806516
1322
#5 Grimes Canyon Road South at Los Angeles Avenue (SR-118) [County of Ventura]BaSeAddedTotal
#7 Grimes Canyon Road (SR-23)Base020666Added O 233 53 23Total 0 439 59 29
#B walnut Canyon RoadBase 3I4 268 0
Added 0 282 0
Total 3L4 550 0
#9 Moorpark AvenueBase 82 319Added 0 282Total- 82 601
0
0
0
0
0
0
0
00
0
0
0
470
4'1
TI23
115
52 190 0 0 159 18 r11B4000001
56 190 0 0 159 18 1785
#6 A Street (SR-23) at Ventura Street (SR-126) [City of FiÌ]-morelBase 133 118 106 -18 LB2 54 35 49I 159 155 7 90Added64010000000961500rotaÌ 791 118 206 18 782 54 35 49I 255 305 19O
450
45
2346410
2'156
0I6I6
L419410
7949
130
1a
14084'70
1878
at ülayne's Way lcounty of Ventura]588 0 0 0 0 0
155000036143 0 0 0 0 36
0
0
0
000
3) at Casey Road [City of Moorpark]0603261026100188000000 791 26 '7 0 261, 0
(SR-23) at Poindexter Avenue [City of Moorpark]10 1 352 202 228 11 136 5 430 0 188 0 0 0 0 0 0
10 1 540 202 228 11 136 5 43
( sR-2
Traffix 7.6.0115 (c) 2003 Dowlinq Assoc. Licensed to URS CORP., SANTA ANA, CA
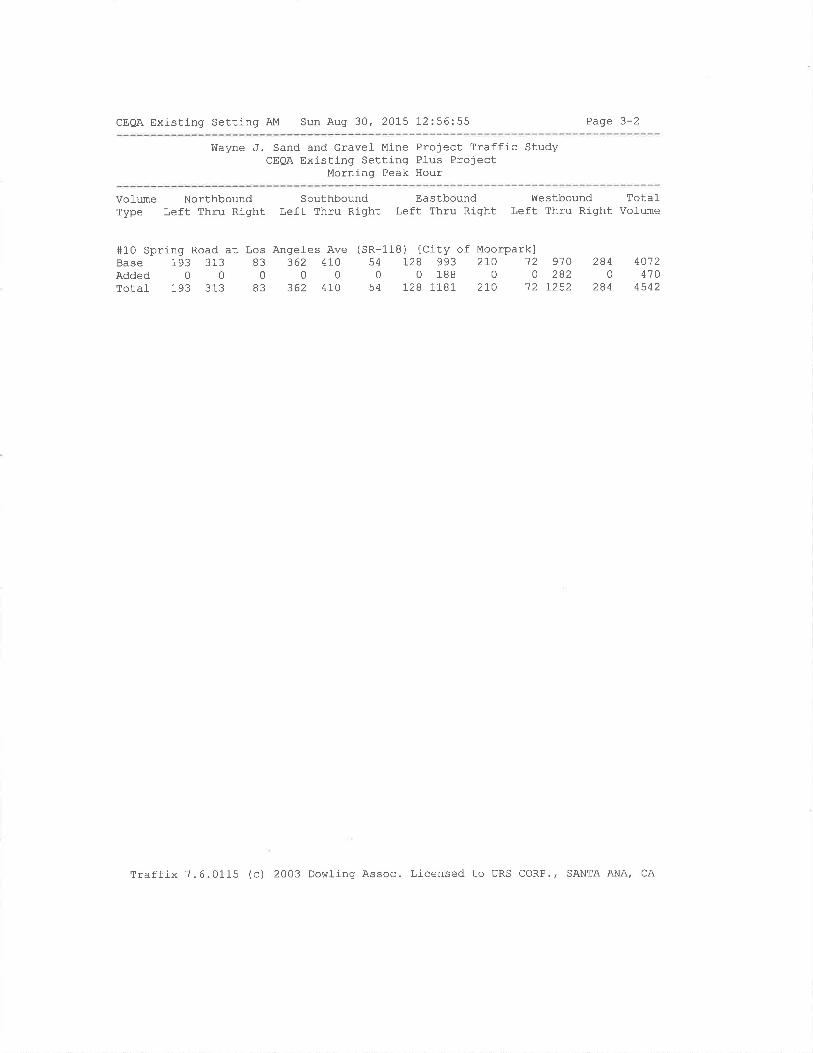
CEOA Existing Setting AM Sun Aug 30, 2015 l-2:56:55 Page 3-2
Wayne 'J. Sand and Gravel Mine Project Traffic StudyCEQA Existing Setting Plus Project
Morning Peak Hour
Vol-ume Northbound SouthboundType Left Thru Riqht Left Thru Right
EastboundLeft Thru Right
Westbound TotafLeft Thru Right Volume
#10 Spring Road at l,os Angeles AveBase 193 313 83 362 410Added00000rotal 1 93 313 83 362 4 10
(SR-118) tCity of Moorparkl54 L28 993 2rO 12 9100018800282
54 128 1181 2r0 12 7252
2840
284
40'72410
4542
Traffix 7.6.0115 (c) 2003 Dowling Assoc. Licensed to URS CORP.' SANTA ANA, CA

CEQA Existing Setting AM Sun Aug 30, 2015 12:56:.51 Page 6-1
lfayne J. Sand and Grave1 Mine Project Traffic StudyCEQA Existing Setting PJ-us Project
Morning Peak Hour
Impact Analysis ReportLevel- Of Servíce
Intersection Baseoel/ v/
LOS Veh C
ff 1 Moorpark Avenue (SR-23) at Los A xxxxx 0.532
# 2 Moorpark Avenue (SR-23) at Hig A xxxxx 0.544
# 3 Grimes Canyon Road (SR-23) at B 0.0 0.685
# 4 Grimes Canyon Road South at Br A 9.0 0.000
# 5 Grimes Canyon Road South at Lo C xxxxx 0.706
# 6 A Street (SR-23) at Ventura St B xxxxx 0.631
# 7 crimes Canyon Road (SR-23) at A 7.6 0.000
# B V,Ialnut Canyon Road (SR-23) at E xxxxx 0.903
# 9 t'ioorpark Avenue (SR-23) at Poi A xxxxx 0.564
# 10 Spring Road at Los Angel-es Ave C xxxxx 0.779
Futureoel/ v/
LOS Veh C
F xxxxx 3.835
C xxxxx 0.720
D 0.0 0.926
A 9.0 0.000
C xxxxx 0.711
C xxxxx 0.794
c 24.8 0.000
F xxxxx 1.028
C xxxxx 0.701
D xxxxx 0.855
Changein
+ 3.303 v,/C
+ 0.776 v/C
+ 0.000 D,/v
+ 0.013 D/v
+ 0.004 v/c
+ o.164 V/C
+I1 .L62 D/V
+ 0.725 v/c
+ 0.137 v,/C
+ 0.076 v/c
Traffix 7.6.0115 (c) 2003 Dowling Assoc. Licensed to URS CoRP., SANTA ANA, cA
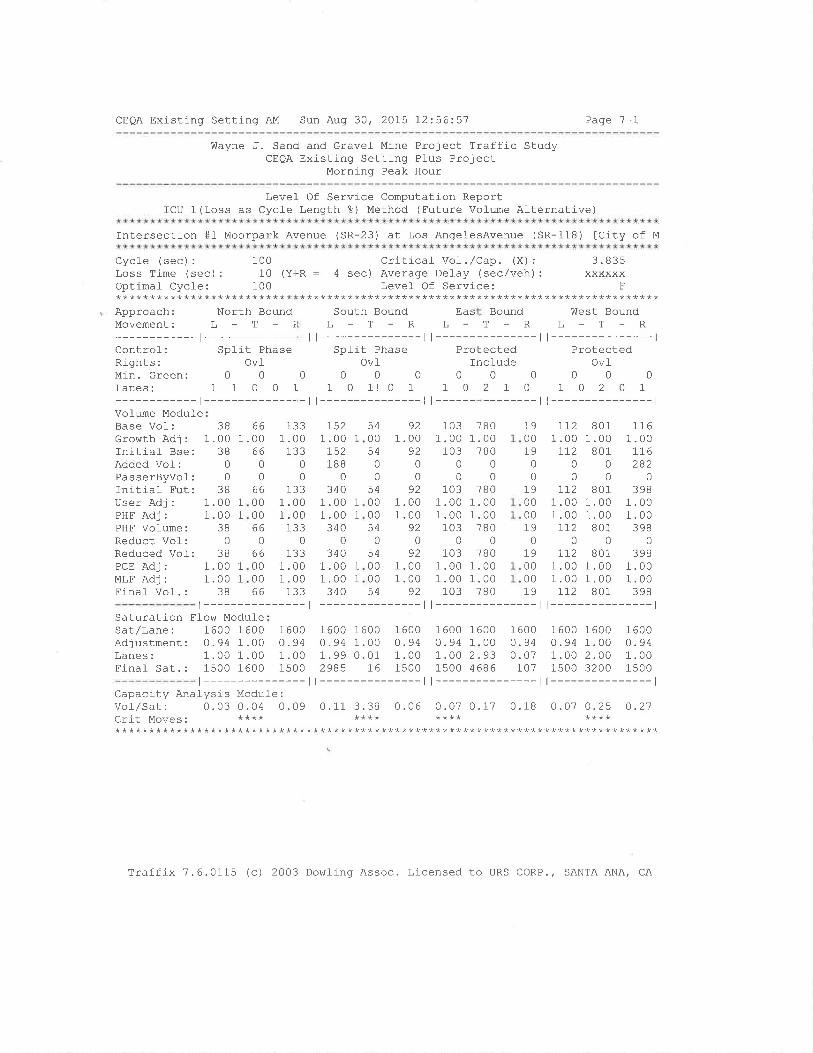
CEQA Existing Setting Al4 Sun Aug 30, 2075 L2:56:5'1 Page 7-1
Wayne J. Sand and Gravef Mine Project Traffic StudyCEQA Existing Setting PIus Project
Morning Peak Hour
Level Of Service Computation ReportICU 1(Loss as Cycl-e Length %) Method (Future Volume Alternative)
Intersectj-on #1 Moorpark Avenue (SR-23) at Los AngelesAvenue (SR-118) [City of M
CycÌe (sec) :
Loss Time (sec):Optimaf Cycle:
10010 (Y+R =
100
Critical- VoJ- . ,/Cap. (X) :
4 sec) Average Delay (sec/veh) :
Level Of Service:
3.835XXXXXX
F** *** *** ** * * * *** *** *** * ** * * ** * ** * *** **** * *** * ** ** * ** * *** *** * * * * * *** **** ** * ** * **Approach: North Bound South Bound Eas Bound West BoundMovement: L - T - t L - T - R L - T - R L - T - R
-r--------- r--------- |--------- |---------------lControl: Split Phase Split Phase Protected ProtectedRights: Ovf Ovl- Include OvfMin.Green: 0 0 0 0 0 0 0 0 0 0 0 0Lanes: 1 1 0 0 1 1 0 1! 0 1 1 0 2 1 0 1 0 2 0 1
-t--------- ll--------- l l------ l l---------------lVofume ModuleBase Vol-:Growth Adj:Initial Bse:Added Vof:PasserByvof:Initial Fut:User Adj:PHF Adj:PHF VoÌume:Reduct Vol:Reduced Vol:PCE Adj:MLE Adj:Final Vol. :
1031.00
1030
0103
1 .001 .00
1030
1031 .001 .00
103
00
381.00 1
1.00 1
380
381.00 1
1.00 1
38
38 66 1331.00 1.00 1.00 1
38 66 133
1 600ô o¿
1 .001500
1 6000 .947 .992985
0000
66 13300 1.00 1
00 1.00 1
66 13300
66 13300 1.00 1
00 1.00 1
66 133
I Éô
.00r52188
0340.00.00340
0340.00.00340
540054
0
0
54000054
0
54000054
921 .00
9200
921 .001 .00
920
921 .001 .00
92
7801.00
78000
7801.001.00
7800
7801.001.00
780
190019
0
019000019
019000019
II21 .00
71200
7r21 .001.00
IT20
7121.001.00II2
8011.00
8010
0
8011.001.00
8010
8011.001.00
801
1161.00
116zÕz
0
3981.001.00
3980
3981 .001 .00
398
1
1
1
1
1
t --------------- | --------------- l l --------------- r --------------- l
Saturation Flow ModuleSat/Lane: 1600 1600Adjustment: 0.94 1.00Lanes: 1.00 1.00Finaf Sat.: 1500 1600
00 0.9493 0.07
1600 1600 1
0.94 0.94 1
1 .00 r.oo 2
1 6001.000. 01
I6 1500 1500 4686 107
600 1600 1600 16000.94 1.001.00 2.001500 3200
1 6000 .941.001 500
t --------------- | --------------- | --------------- | --------------- l
Capacity Analysis Module:vof/Sat : 0.03 0 .04 0.09 0 . 11 3.38 0.06 0.07 0. 17 0. 18 O .01 0.25 O.21crit Moves: **** **** **** ***+********************************************************************************
Traffix 7.6.0115 (c) 2003 Dowling Assoc. Licensed to URS CORP., SANTA ANA, CA
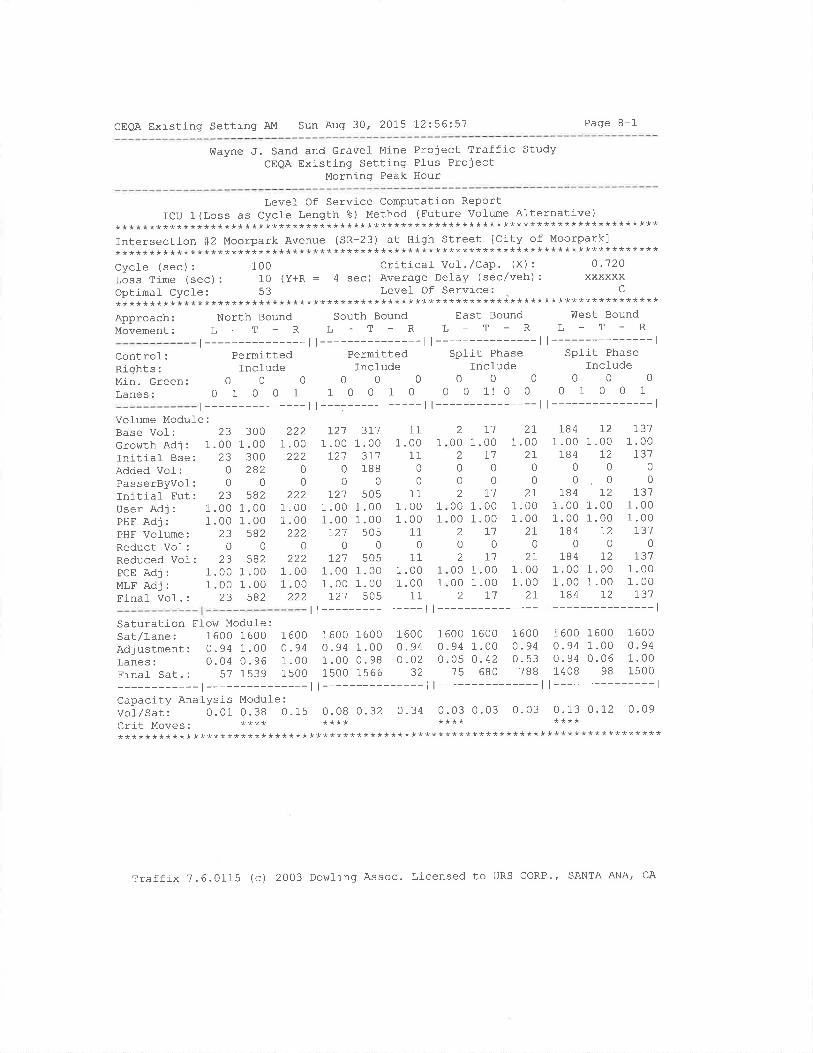
CEQA Existing Setting AM Sun Aug 30, 2015 1'2:56:51 Page B-1
Wayne J. Sand and Gravel Mine Project Traffic StudyCEQA Existing Setting Plus Project
Morning Peak Hour
Level Of Service Computation ReportICU 1(Loss as Cycle Length å) Method (Future vofume Alternative)
********************************************************************************Intersection #2 Moorpark Avenue (SR-23) at High Street ICity of Moorpark]********************************************************************************Cycle (sec) : 1OO Critical Vol. /Cap. (X) : 0 '72OLoss Time (sec): 10 (Y+R : 4 sec) Average Delay (sec/veh): xxxxxxOptlmal- Cycle: 53 Level Of Service: C
********************************************************************************Approach: North Bound south Bound East Bound west BoundMovement: L - T - R L - T - R L - T - R L - T - R
Control: Permitted Permitted Split Phase Split Phase
Rights: fnclude Include Incfude IncludeMin.Green: O O O O O 0 0 0 0 0 0 0
Lanes: O 1 O O 1 1 O O 1 0 0 0 1! 0 0 0 1 0 0 1
t---------------ll---------------ll---------------ll---------------l
t---------------ll---.-----------ll---------------ll---------------lVolume Module:Base Vol: 23Gro\^,th Adj : 1.00Initlal Bse: 23Added Vol-: 0
PasserByvol: 0Initial- Fut: 23User Adj : 1.00PHF Adj : 1.00PHF Volume: 23Reduct Vo1: 0
Reduced Vol: 23PCE Adj : 1.00MLF Adj : 1.00Final- Vof .: 23
3001.00
300282
0
5821 .001 .00
5820
5821 .001 .00
582
2221.00
22200
2221 .001 .00
2220
2221 .001 .00
222
1211 .00
t2'700
r211 .001 .00
r210
t211 .001.00
r21
3I11 .00
3r'7188
0505
1.001.00
5050
5051.001.00
E^t
111 .00
110
0
111 .001 .00
110
111 .001 .00
11
2
002002
0000
2
02
0000
2
I11 .00
I100
r'71 .001.00
r'70
7'7
1.001.00
I7
2L
1.0027
00
2T1.001.00
2I0
2I1 .001.00
21-
1841 .00
1840
0184
1 .001.00
1840
tB41.001.00
184
721.00
T200
I21.001.00
I20
721.001 .00
1,2
1,311.00r31
0
0r37
1.001 .00r31
01 aa
1 .001.00r31
1
1
1
1
1
Saturation Ffow Module:sat/Lane: 1600 1600 1600 1600 1600 1600 1600 1600 1600 1600 1600 1600
Adjustmenr: 0.94 1 .00 O .94 0. 94 I .00 O.94 0.94 1 .00 0. 94 0.94 1.00 o -94Lanes: o. 04 0. 96 1 . OO 1 . O0 O. 98 0 .O2 0.05 0. 42 0.53 0. 94 0.06 1.00Finaf sar.: 57 1539 1500 1500 1566 32 '15 680 7BB 1408 98 1500
-l---------ll---------ll---------ll---------------lCapacity Analysis Module :
vor/sat: O. 01 0.38 0.15 0. 08 0.32 0.34 0.03 0.03 0.03 0.13 0.12 0.09crit Moves ' **** **** **** ************************************************************************************
Traffix 7.6.0115 (c) 2003 Dowling Assoc. Licensed to URS CORP', SANTA ANA, CA

CEQA Existing Setting AM Sun Aug 30' 2015 12256:.5'l Page 9-1
Wayne J. Sand and Gravel- Mine Project Traffic StudyCEQA Existing Setting Plus Project
Morning Peak Hour
Level- of Service computation Report20OO HCM Unsignalized Method (Future Volume Alternative)
********************************************************************************Intersection #3 Grimes Canyon Road (SR-23) at Broadway Road lcounty of Ventura]********************************************************************************Cycl-e(sec):lCritica1VoI',/Cap'(x):0'926Loss Time (sec): o (Y+R = 4 sec) Average Detay (sec/veh): 2I.6Optimal Cycle: 0 Levef Of Service; D
********************************************************************************Approach: North Bound south Bound East Bound üIest Bound
Movement: L - T - R L - T - R L - T - R L - T - R
-l---------ll---------ll---------ll---------------lControl: YieJ-d Sign Stop Sign Stop Sign Stop SignRights:IncludelncfudelncludelncfudeLanes: 1 O 1 O O O 0 O 1 0 0 0 1! 0 0 0 0 0 0 0
-l---------ll---------ll---------ll---------------lVolume Modufe:Base VoI: 24 l-13Grov'rthAdj: 1.00 1.00Initial Bse: 24 t'13Added Vol: O 282PasserByvol: 0 0
Initial Fut: 24 455User Adj : 1 .00 1.00PHF Adj : 1.00 1 .00PHF Volume: 24 455Reduct Vol: 0 0
Einat Vof. : 24 455
1.00 1
1.00 1
00
0
0
1 .000 .00
0
0
1 .000.09
12
001.00 1.000.51 0.00131 0
0
1.000.00
0
01 .00
0000
1
01.00
0
000
1.001. 00
000
0
0000
0
00000
000
1
496.00496188
0684.00.00684
0
684
641 .00
643
06'7
1.001 .00
610
61
3301.00 1.00
3304000
3I U
1.00 1.001.00 1.00
31 000
370
35000 1.00 1.3500000
35000 1.00 1.00 1 .00 1.35000
350
0
00000
0
0000
0
00
1
11
1
0000.000.0
0
1
Saturation Flow ModuleSat/Lane: 0 0
Adjustment: 1.00 1.00Lanes: 1.00 1.00Final Sat . : 54 1 54 1
001.00 1.000.00 0. 91
o 739
0001.00 1 .00 1.000.49 0.00 0.0072900
-l---------ll---------ll---------ll---------------lCapacity Analysis Module :
vot,/sat: o.04 0.84 O.OO 0.00 0.93 0.93 0.27 0.00 o.21 0.00 0.00 0.00Crit Moves: ****Green/Cycl-e:1.00 1.00 1.00 1.00 1.Vol-ume/Cap: 0.04 0.84 0.00 0.00 0.Defay/veh: 7.2 24.4 0.0 0.0 33
Detay Adj : 1.00 1.00 1 .00 1.00 1 .
AdjDel/Veh: 1.2 24'4 0.0 0.0 33DesignQueue: 0 0 0 0*************************************
00 1.002'7 0.00.8 0.000 1.00.8 0.000
1.00o.2'7
aa
1.00aa
0
1 .000 .000.0
1 .000.0
0
1.000.000.0
0093.100.'70
1.n
33
0093.'t00.10
1
0
1
1
0
1.2?
1 00n
0002
****************************************
Traffix 7.6.0115 (c) 2003 Dowling Assoc. Licensed to URS CORP', SANTA ANA, CA

CEQA Existing Setting AM Sun Aug 30' 2015 t2:56:.51 Page 10-1
Wayne J . Sand and Gravel Mine Project Traffic StudyCEQA Exj-sting Setting Plus Project
Morning Peak Hour
2************Intersection************Average Dela************Approach:
Y:r:i:::-___Control:Rights:Lanes:
Volume ModufeBase Vof:Growth Adj:Initial Bse:Added Vol-:PasserByvol:Initlal Fut:User Adj:PHF AdJ:PHF Volume:Reduct Vol:Einal VoI. :
Critical Gap Module:Critical Gp: 6.4 xxxx 6-2 xxxxx xxxx xxxxxEolfowupTim: 3.5 xxxx 3.3 xxxxx xxxx xxxxx
LeveI Of Service Computation ReportOO0 HCM Unsignalized Method (Future Vofume Alternative)********************************************************************#4 Grimes canyon Road south at Broadway Road [county of ventula]
********************************************************************y (sec/veh): 6.0 Worst Case Levef Of Service: A[ 9'0]********************************************************************
North Bound South Bound East Bound V'¡est Bound
L-T_RL-T-RL-T-RL-T-Rt---------------ll---------------ll---------------ll---------------l
Stop Sign Stop Sign Uncontrolled Uncontrofl-edIncfude Include fncÌude Include
0 0 1l o o 0 o o o o 0 0 0 1 0 0 1 0 0 0
t---------------ll---------------ll---------------ll---------------l0
00000
00000
00
0
1
1 .00'7
00't
I1.00 1.
I0
0B
1.00 1
1.00 1
I0B
1.00 1 .00 1.00 1.1.00 1.00 1.00 1.
? L13 210001 II3 21
0 7300 1.000 730400o '71
00 1.0000 1 .00o1100o11
001.00 1.00
00000000
1.00 1.001.00 1.00
000000
01 .00
0000
1 .001.00
00
0
0381.00 1.00
0 380000038
1.00 1.001 .00 1.00
03800038
110 211.00 1.00 1
110 2'7
3000
113 21
xxxxx xxxx xxxxx 4.1 xxxx xxxxxxxxxx xxxx xxxxx 2.2 xxxx xxxxx|--------- ll---------------l
45 xxxx xxxxx1576 xxxx xxxxx1576 xxxx xxxxx0.07 xxxx xxxxt---------------l
0.2 xxxx xxxxx7 .5 xxxx xxxxxA**
LT-LTR_RTxxxx xxxx xxxxx0.2 xxxx xxxxx7.5 xxxx xxxxxA**xxxxxx
*
Capacity Module:cnflict vol_: 295 xxxx 42 xxxx xxxx xxxxx Xxxx xxxx xxxxxpotent cap.: 701 xxxx 1035 xxxx xxxx xxxxx xxxx xxxx xxxxxMove Cap.: 660 xxxx 1035 xxxx xxxx xxxxx xxxx xxxx xxxxxVolume/Cap: 0.01 xxxx 0.07 xxxx xxxx xxxx xxxx xxxx xxxx
-l---------ll---------ll---------------lLeveI Of Service Modufe:Oueue: xxxxx xxxx xxxxx xxxxx xxxx xxxxx xxxxx xxxx xxxxxStopped Del:xxxxx xxxx xxxxx xxxxx xxxx xxxxx xxxxx xxxx xxxxxLOS tY Move: * * * * * * * * *
MoveMENt: LT - LTR - RT LT - LTR _ RT LT - LTR - RT
Shared Cap.: xxxx 982 xxxxx xxxx xxxx xxxxx xxxx xxxx xxxxxSharedQueue:xxxxx 0.3 xxxxx xxxxx xxxx xxxxx xxxxx xxxx xxxxxShrd StpDef:xxxxx 9.0 xxxxx xxxxx xxxx xxxxx xxxxx xxxx xxxxxShared LOS: * A * * * * * * *
ApproachDel: 9.0 xxxxxx xxxxxxaþþroachr,os: A * *
Traffix 7.6.0115 (c) 2003 Dowling Assoc. Licensed to URS CORP', SANTA ANA' CA
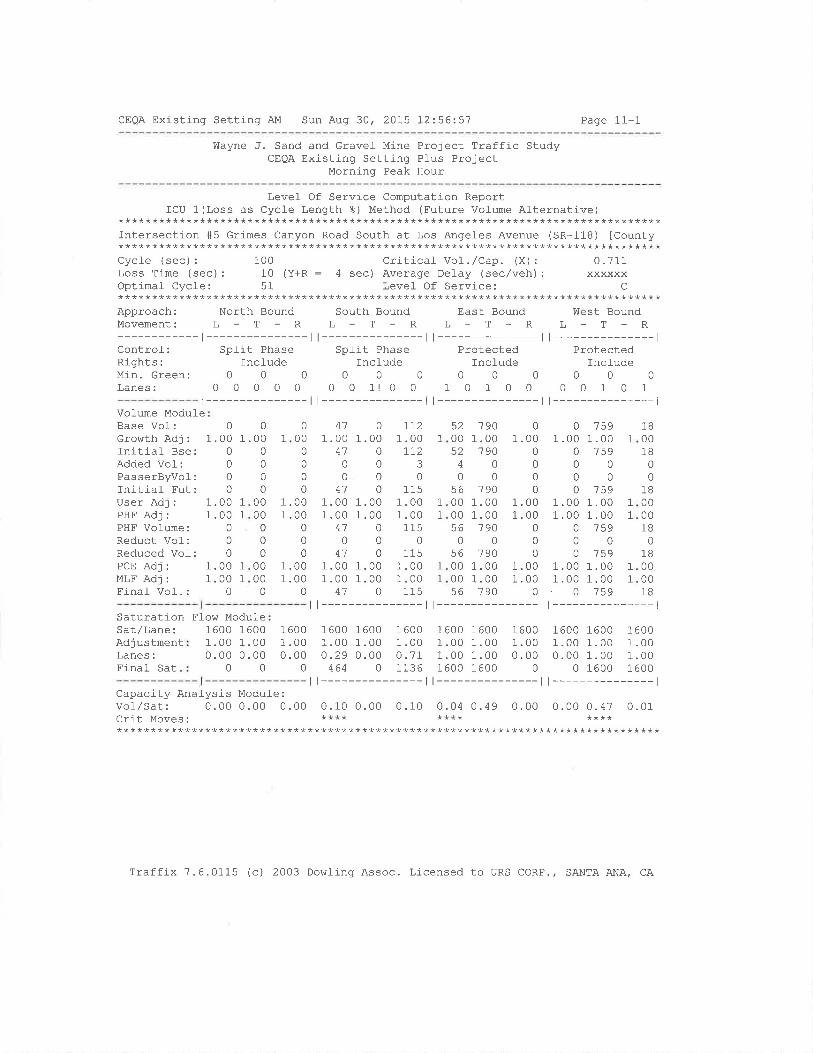
CEQA Existing Setting AM Sun Aug 30, 2015 12:56:51 Page 11-1
V{ayne J. Sand and Gravef Mine Project Traffic StudyCEQA Existing Setting Plus Project
Morning Peak Hour
Level Of Service Computation ReportICU 1 (Loss as Cycle Length t) Method (Future Vofume Alternative)********************************************************************************
Intersection #5 Grimes Canyon Road South at Los Angefes Avenue (SR-118) lCounty********************************************************************************Cycl-e (sec): 100 Critical Vol./Cap. (X): 0.711Loss Time (sec) : 10 (Y+R : 4 sec) Average Oelay (sec/veh) : xxxxxxOptimal Cycle: 51 Level- Of Service: C********************************************************************************Approach: North Bound South Bound East Bound West BoundMovement: L - T - R L - T - R L _ T - R L - T - R
-t--------- |--------- |--------- t---------------lControl-: Split Phase Spl-it Phase Protected ProtectedRights: Incl-ude Incl-ude Include Incl-udeMin.Green: 0 0 0 0 0 0 0 0 0 0 0 0Lanes: 0 0 0 0 0 0 0 1! 0 0 1 0 1 0 0 0 0 1 0 1
l --------------- | --------------- | --------------- | --------------- l
Vol-ume ModuleBase VoI:Growth Adj:Initlal- Bse:Added Vol-:PasserByvof:fnitiaf Fut:User Adj:PHF Adj:PHF Vofume:Reduct Vof:Reduced Vof:PCE Adj:MLF Adj:Final Vol.:
0
1.00 1
0000
1.00 1
1.00 1
0
0
01.00 1
1.00 1
0
0
0
0
00000
000
0000
0
0
0
0
0.00.00
00
0
.00
.000
411.00
4100
411 .001 .00
410
411.001.00
41
0
1 .000000
1 .001.00
0
0
01.001.00
0
II21.00 1
II23
0115
1.00 I1.00 1
1150
1151.00 1
1.00 1l1E
1901.00
'7 9000
1901.001.00190
0
190
1.00 1.00 1.00 1
1.00 1 .00 1 .00 1
0 0 1590000 0 759
1591.00159
0
0? qq
0.00 1
0
00
\20052
4
056000056
0
56000056
01 .00
0000
01.00
0
000
1
180018
00
1B
00001B
0
1B00001B
1
1
1
1
1
1
.00 1.00 1.00 1.00 1
. 00 1.00 1 .00 1.00 1
190 0 0 759
Saturation Flow ModuleSat/Lane:AdjustmentLanes:Final- Sat.
1 6001 .000.00
0
1 6001 .000 .00
0
1 6001 .000.29
464
00 1 60000 1 .0000 0.710 1136
1600 16001 .00 1.001 .00 1.001600 1600
1 6001.000.00
0
1600 16001 .00 1.000.00 1.00
0 1600
1 6001.001. 001 600
000000
0
T61.0.
161.0.
Capacity AnaÌysis Module:vol/Sat: 0.00 0.00 0.00 0.10 0.00 0.10 0.04 0.49 0.00 0.00 0.47 0.01crit Moves. **** **** ************************************************************************************
Traffix 7.6.0115 (c) 2003 Dowling Assoc. Licensed to URS CORP., SANTA ANA, CA
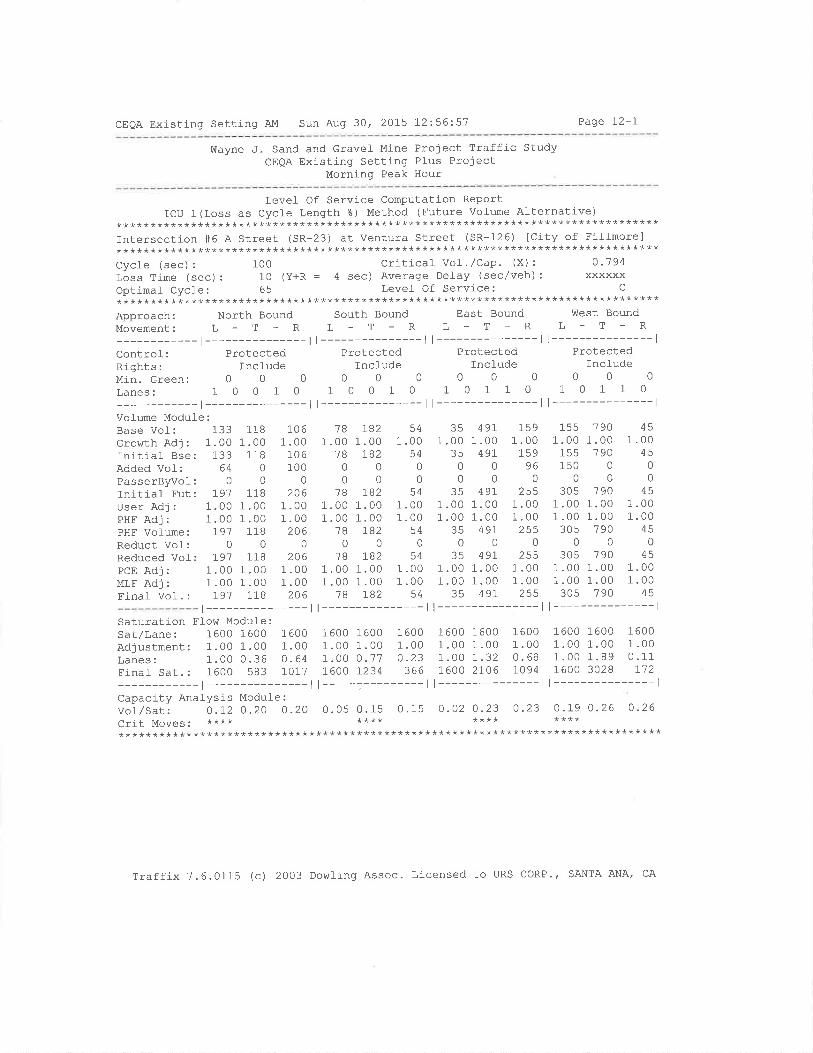
CEQA Existj-ng Setting AM Sun Aug 30, 2015 12:'56:5'7 Page 12-1
Wayne J. Sand and Gravel Mine Project Traffic StudyCEQA Existing Setting Pl-us Project
Morninq Peak Hour
Levet Of Service Computation ReportICU 1(Loss as Cycle Length 8) Method (Future vol-ume Alternative)
********************************************************************************Intersection #6 A Street (SR-23) at Ventura Street (SR-126) [City of Fiflmore]********************************************************************************Cycf e (sec) : 100 Criticaf Vol . /Cap. (X) : 0.'794Loss Time (sec): 10 (Y+R = 4 sec) Average Delay (sec/veh): xxxxxxOptimal Cycle: 65 Levef Of Service: C
********************************************************************************Approach: North Bound south Bound East Bound west BoundMovement: L - T - R L - T - R L - I - R L - T - R
-l---------ll---------ll---------ll---------------lcontrol-: Protected Protected Protected ProtectedRights: Include Incl-ude Include IncludeMin.creen: 0 O 0 O 0 0 0 0 0 0 0 0
Lanes: 1 0 0 1 O 1 O 0 1 0 1 0 1 1 0 1 0 1 1 0
-l---------ll---------ll---------ll---------------lVofume Module:Base Vol-: 133Growth Adj : 1.00Initial- Bse: 133Added Vol: 64PasserByvol-: 0
Initiaf Fut: 791User Adj: 1.00PHF Adj : 1.00PHF Vofume: I9'7Reduct Vof: 0Reduced Vol: I91PCE Adj: 1.00MLF Adj : 1.00Finaf Vol. : I91
1181 .00
11800
1181 .001 .00
1180
1181 .001 .00
118
1061 .00
106100
0206
1 .001 .00
2060
2061 .001 .00
206
1B1 .00
1B0
018
1 .001.00
780
781 .001.00
'78
1821.00r82
0
0
7821.001.00
IB20
IB21.001.00
IB2
541.00
5400
541.001 .00
540
541 .001 .00
54
35.0035
00
35.00.00
035
.00
.00
4971.00
49r00
4971.001.00
49r0
49r1.001.00
49L
1591 .00
15996
0ôEtr
1 .001 .00
art
0ôEE
1.001 .00
aEt
1551 .00
155150
0
3051 .001 .00
30s0
30s1 .001 .00
30s
190r .00190
00
'190
1.001.00
'7 900
'7 901.001.00190
451 .00
4500
451 .001 .00
450
451 .001 .00
45
1
1
1
1
1
t---------------ll---------------ll---------------ll---------------lSaturation Flow Module:Sat/Lane: 1600 1600 1600 1600 1600 1600 1600 1600 1600 1600 1600 1600
Adjustment: 1.00 1 . oo 1. oo 1. o0 1 .00 1.00 1 .00 1.00 1.00 1 .00 1.00 1.00Lanes: 1.OO 0.36 0.64 1.00 0.77 0.23 1.00 1.32 0.68 1.00 1.89 0.11Final Sar.: 1600 583 1017 1600 1234 366 1600 2106 1094 1600 3028 I12
-l---------ll-----.---ll---------ll---------------lCapacity AnaÌysis Module :
vot/Sar: o .I2 O .20 o.2O O. 05 O. 15 0 .15 0.o2 0.23 0 .23 0 .I9 0.26 0 -26crit Moves. **** **** **** ************************************************************************************
Traffix 7.6.0115 (c) 2OO3 Dowling Assoc. Licensed to URS CORP., SANTA ANA' CA
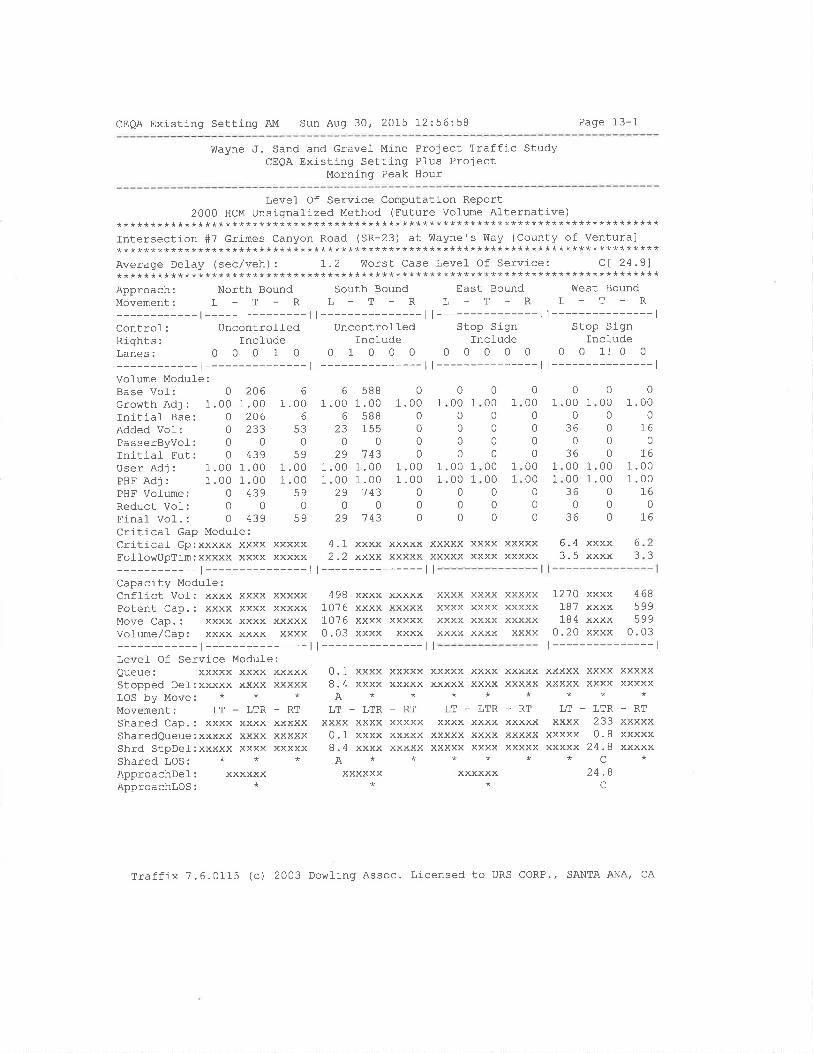
CEOA Existing Setting AM Sun Aug 30, 2015 12:56"58 Page 13-1
lrlayne J. Sand and GraveÌ Mine Project Traffic StudyCEQA Existing Setting Plus Project
Morning Peak Hour
Level Of Service Computation Report2000 HCM Unsignalized Method (Future Volume Alternative)
********************************************************************************Intersection #? Grímes Canyon Road (SR-23) at Wayne's !Ùay [County of Ventura]********************************************************************************Average Del-ay (sec/veh): I.2 Worst Case Level- of Service: cl 24.8)********************************************************************************Approach: North Bound South Bound East Bound West BoundMovement: L - T - R L - T - R L - T - R L - T - R
-l---------ll---------ll---------ll---------------lControf: Uncontrol-Ied Uncontrolled Stop Sign Stop SignRights: Incl-ude Include IncÌude IncludeLanes: 0 0 0 1 0 0 1 0 0 0 0 0 0 0 0 0 0 11 0 0
-r---------ll---------ll---------ll---------------lVolume Modufe:Base Vol-: 0 206 6
Growth Adj: 1.00 1.00 1.00Initial Bse: 0 206 6
Added Vol: 0 233 53PasserByvol: 0 0 0Initial Fut: 0 439 59User Adj : 1.00 1.00 1 .00PHF Adj : 1.00 1.00 1.00PHF Vofume: 0 439 59Reduct Vof: 0 0 0Final Vol-. : 0 439 59Critical Gap Module:Critical Gp:xxxxx xxxx xxxxxFollowUpTim:xxxxx xxxx xxxxx
-t---------------lCapacity Modu1e:Cnflict Vof: xxxx xxxx xxxxxPotent Cap.: xxxx xxxx xxxxxMove Cap.: xxxx xxxx xxxxxVolume/Cap: xxxx xxxx xxxx
-l---------------lLevel- Of Service Modul-e:Queue: xxxxx xxxx xxxxxStopped Del:xxxxx xxxx xxxxxLOS by Move: * * *Movement: LT - LTR - RT
Shared Cap.: xxxx xxxx xxxxxSharedQueue:xxxxx xxxx xxxxxShrd StpDel:xxxxx xxxx xxxxxShared LOS: * * *ApproachDel: xxxxxxApproachlOS: *
6 5BB1.00 1.00
6 58823 15500
29 '7 431 .00 1.001.00 1.00
29 14300
29 143
1.00 1.00 1
1.00 1.00 1
000000
0
0
0
0
0000
000
01.00 1
036
0
00 1.0000 1.0036 0
0036 0
01 .00
016
0I6
1.001.00
L60
16
01.00
0000
11
000 1
00
0
0
000
0
000000
0000
0
0
0
0
000
0
0036
1
I1
1
4.I)t
xxxx xxxxx xxxxx xxxx xxxxxxxxx xxxxx xxxxx xxxx xxxxx
6.4 XXXXXXXX
63
r---------------ll498 xxxx xxxxx
1076 xxxx xxxxx1076 xxxx xxxxx0 .03 xxxx xxxx
t --------------- |
xxxx xxxxxxxxx xxxxxxxxx xxxxxxxxx xxxx
.J
1270 xxxx 468187 xxxx 599184 xxxx 599
0.20 xxxx 0.03| --------------- l
YYY!
xxxxYYYY
XXXX
0.18.4
xxxx xxxxx xxxxx xxxx xxxxx xxxxx xxxx xxxxxxxxx xxxxx xxxxx xxxx xxxxx xxxxx xxxx xxxxx********A
LT - LTRxxxx xxxx0.1 xxxx8.4 xxxxA*
xxxxxx
LT - LTRYIYY YYYY
xxxxx xxxxxxxxx xxxx**
xxxxxx*
-RT LT_LTRxxxxx xxxx 233xxxxx xxxxx 0.8xxxxx xxxxx 24.8**c
24.8c
_RTxxxxxxxxxxxxxxx
-RTxxxxxxxxxxxxxxx
Traffix 7.6.0L15 (c) 2003 Dowling Assoc. Licensed to URS CORP., SANTA ANA, CA

CEQA Existing Setting AM Sun Aug 30, 2015 12:56:58 Page 14-1
Wayne J. Sand and Gravel- Mine Project Traffic StudyCEQA Exísting Setting PIus Project
Morning Peak Hour
Levef Of Service Computation ReportICU 1 (Loss as cycl-e Length %) Method (Future vol-ume Alternative)
********************************************************************************Intersection #B Wafnut Canyon Road (SR-23) at Casey Road [City of Moorpark]********************************************************************************Cycte (sec): 1OO Critical Vol'/Cap' (X): 1"028
lãss Time (sec): 10 (y+R : 4 sec) Average Delay (sec/veh): xxxxxxOptimal Cycle: 100 ' Level Of Service: E
********************************************************************************Approach: North Bound South Bound East Bound V{est Bound
MoveMENt: L - T - R L - T - R L - T - R L - T - R
-l---------ll---------ll-----ll---------------lControf: Prot+Permit Permitted Protected ProtectedRights: Include fnclude Incl-ude Incl-ude
Min.creen: O 0 0 O O O 0 0 0 0 0 0
Lanes: 1 O 1 0 0 O O 0 1 0 1 O O 0 1 0 0 0 0 0
-l---------ll---------ll-----ll---------Vol-ume Module:Base Vof: 3I4Growth Adj : 1.00Initial Bse: 3LqAdded Vol-: 0
PasserByvol: 0
Initi-al Fut: 3]-4User Adi : 1.00PHF Adj : 1.00PHF Volume z 3L4Reduct Vol: 0
Reduced VoI: 3L4PCE Adj : 1.00MLF Adj : 1.00Final Vof. : 314
0
1.00 1
0
00
01.00 1
1.00 1
00
01.00 1
1.00 1
0
261 .00
2600
zo1 .001.00
260
2681 .00
268282
0
s501 .001.00
5500
5501 .001 .00
5s0
6031 .00
6031BB
0
19r1 .001.0019r
0
19r
261_
1.00267
0
026r
1.001.0026r
026r
1.001.0026r
0
1 .000
000
1 .001 .00
00
01 .001 .00
0
100010
00 1.0000 1.0010
000
000
00000
0
00
01.00
0
00
0
0
00
1.001.00
0
01 .00
00
0
0
0
00
1.001.00
0
701 .00 1.00
'70000070
1.00 1.001 .00 1.00
1.001.00
1 .001.00
26.00 1.00.00 1.00
0 791
1.001 .00
26
1600 16000 . 94 1.000.00 0. 97
0 1549
1
1
Saturation Flow Modul-e:Sat/Lane: 1600 1600Adjustment: 0.94 1.00Lanes: 1.00 1.00Final Sat.: 1500 1600
-t---------------llCapacity AnalYsis Module :
Vol/Sat: 0 '2L 0.34 0.00Crit Moves ' **********************************
1600 1600 1600 1600 1600 16000.94 1.00 0.94 0. 94 1.00 0. 94
1 .00 0.00 1.00 0.00 0.00 0.00150001500000
----ll----ll---------------lo . o0 0.51 0.54 o.0o 0.00 0 -r1 0.00 0.00 0.00
**** ******************************************************
1 6000.940 .03
4B
009400
0
I60.0.
Traffix 7.6.0115 (c) 2003 DowÌing Assoc. Licensed to URS CORP'' SANTA ANA' CA
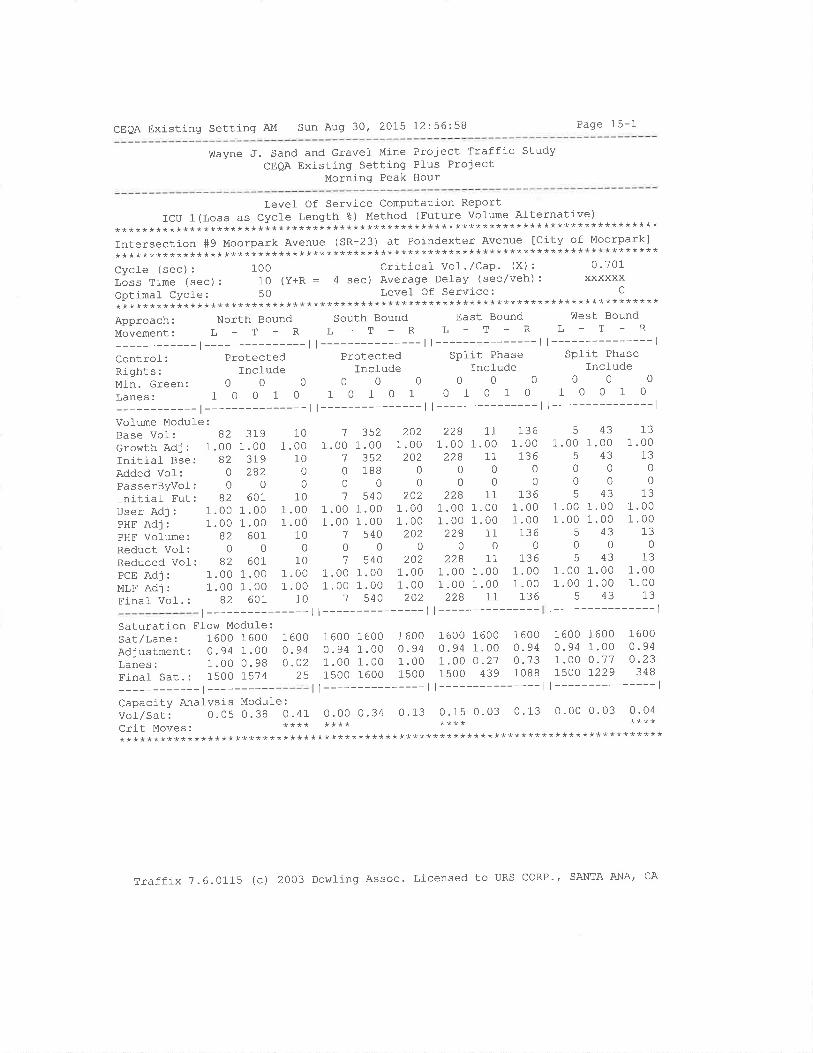
CEQA Existing Setting AM Sun Aug 30, 2015 12:56:58 Page 15-1
Wayne J. Sand and Gravel Mine Project Traffic StudyCEQA Existing Setting PIus Project
Morning Peak Hour
Levet Of Service Computation ReportICU 1(Loss as Cycfe Length 8) Method (Future volume Al-ternative)
********************************************************************************Intersection #9 Moorpark Avenue (SR-23) at Poindexter Avenue [City of Moorpark]********************************************************************************Cycle (sec): 100 critical Vo1'/Cap' (x): 0'701lóss Time (sec): 10 (Y+R : 4 sec) Average Detay (sec/veh): xxxxxxOptimal- CycJ-e: 50 Levef Of Servj-ce; C
********************************************************************************Approach: North Bound South Bound East Bound West Bound
Movement: L - T - R L - T - R L - T - R L - T - R
-l---------ll---------ll------ll---------------lControl: Protected Protected Split Phase SpÌit Phase
Rights:IncludeInc].udelncludelncfudeuiÀ.creen: 0 0 O O 0 0 O 0 0 0 0 0
Lanes: 1 O 0 1 O 1 O 1 0 1 0 1 0 1 0 1 0 0 1 0
-l---------ll---------ll---------ll---------------lVofume Module:Base VoI: 82cror^rth Adj : 1.00Initiaf Bse: 82Added Vof: 0
PasserByvol: 0
Initial I'ut: B2
User Adj : 1.00PHF Adj : 1.00PHF Volumel. 82Reduct Vol: 0
Reduced Vol-: B2
PCE Adj : 1.00MLF Adj : 1.00Einal Vol.: 82
101 .00
1000
101 .001.00
100
101 .001.00
10
3521 .00
352188
0540
1.001.00
5400
540
2021 .00
20200
2021 .001.00
2020
2021 .00 1.00 1.001 .00 1.00 1 .00
't 540 202t---------------l
228 11 1361 .00 1.00 1.00228 11 136
000000
228 11 1361 .00 1.00 1 .001.00 1 .00 1.00228 11 136
000228 11 136
1 .00 1.00 1.001.00 1 .00 1.00228 11 136
t---------------
5 43 131 .00 1.00 1.00
543130000005 43 13
1 .00 1.00 1.001.00 1.00 1 .00
5 43 130005 43 13
1 .00 1.00 1.001.00 1.00 1.00
5 43 13
t---------------l
3191 .00
319¿ó¿
0601
1 .001.00
6010
6011 .001 .00
601
1 .001.00
7
0
1
1
00'7
007
1
t---------------lSaturation Flow Module:Sat/Lane: 1600 1600Adjustment: 0.94 1.00Lanes: 1.00 0.98Finaf Sat.: 1500 1574
-t----------
1 6000.940.02
1600 16oo 1600 1600 1600 1600 1600 1600 1600o. 94 1. O0 0.94 0.94 1.00 0. 94 0.94 1.00 0. 94
1.00 1.OO 1.00 r.oo o.21 0.73 1.00 0-77 0.231500 1600 1500 1500 439 1088 7500 1229 348
----ll----ll---------------l25
llCapacity AnaÌysis Module :
voi/s.t r O. 05 0.38 0.41 O . OO 0.34 0.13 O .15 0.03 0.13 0.00 0.03 0.04
Cfit MOVeS. **** **** **** ****
********************************************************************************
Traffix 7.6.0115 (c) 2003 Dowling Assoc. Licensed to URS CORP', SANTA ANA' CA
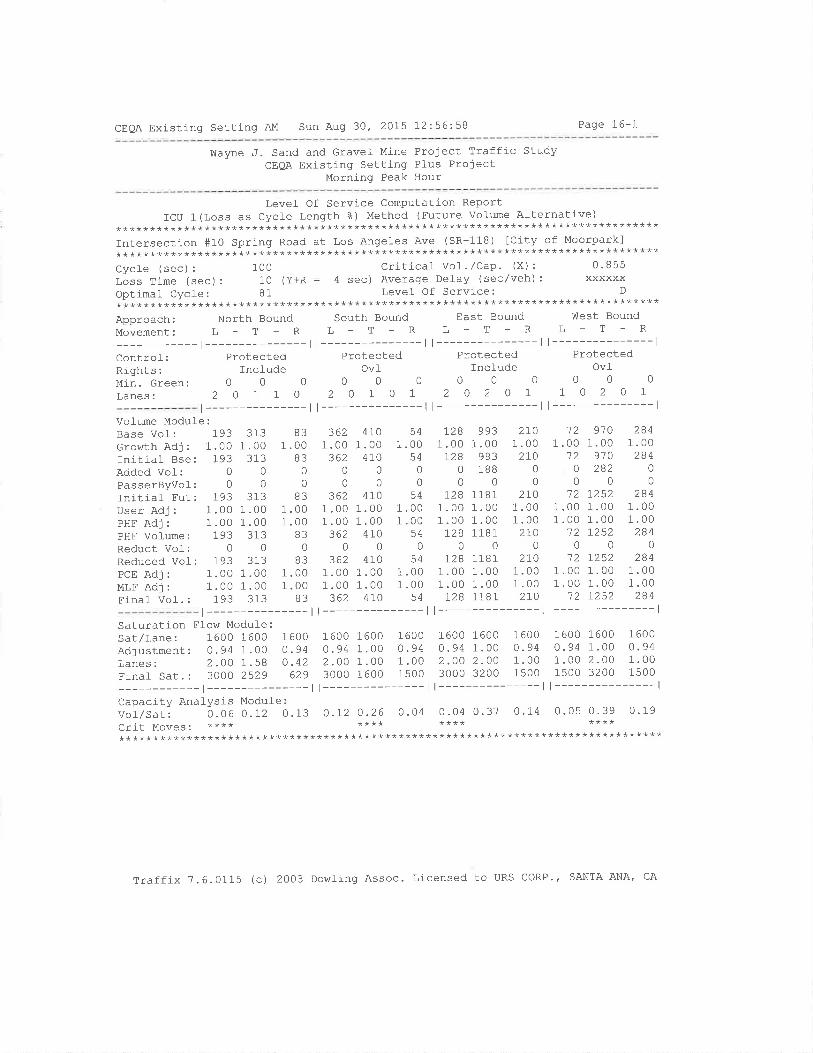
CEQA Existing Setting AM Sun Aug 30, 2015 12:56:58 Page 16-1
Wayne J. Sand and Gravel Mine Project Traffic StudyCEQA Existing Setting Plus Project
Morning Peak Hour
Level Of Service Computation ReportICU 1(Loss as Cycle Length %) Method (Future volume Alternative)
********************************************************************************Intersection #10 Spring Road at Los Angeles Ave (SR-118) tCity of Moorparkl********************************************************************************Cycfe (sec): 1OO Criticaf Vol./Cap' (X): 0'855Loss Time (sec): 10 (Y+R : 4 sec) Average Detay (sec/veh): xxxxxxOptimal Cycle: 81 Level- Of Service: D
********************************************************************************Approach: North Bound south Bound East Bound west Bound
Movement: L - T - R L - T - R L - T - R L - T - R
-l---------ll---------ll---------ll---------------lcontrol: Protected Protected Plotected ProtectedRights: Include Ovl Include OvfMin.creen: O 0 O O O 0 0 0 0 0 0 0
Lanes: 2 O 1 1 O 2 O 1 O 1 2 0 2 0 1 1 0 2 0 1
r---------------ll---------------ll---------------ll---------------lVolume Module:Base Vol: 193crohrth Adjr 1.00Initíal Bse: 193Added Vol: 0
PasserByvof: 0
fnltiaf Fut: 193User Adj : 1.00PHF Adj : 1.00PHF VoÌume: 193Reduct Vof: 0
Reduced Vol: 193PCE Adj : 1.00MLF Adj : 1.00Final Vof. : 193
3131 .00
31300
3131 .001 .00
a1)
0313
1 .001.00
313
B31 .00
B300
831.001 .00
830
831 .001 .00
83
3621 .00
3620
0
3621 .001.00
3620
3621.001 .00
362
4101.00
4100
0
4101.001 .00
4100
4101.001.00
410
541.00
540
0
^L1.001 .00
540
541 .001 .00
54
7281 .00r28
00
r281.001 .00
T2B0
7281 .001 .00
].28
9931 .00
993188
0
118 1
1.001.00118 1
011811.001 .001181
2701.00
2700
0
2LO1 .001.00
2LO0
2ro1.001.00
2L0
121 .00
120
012
1 .001 .00
120
121 .001 .00
'12
9101.00
9'70282
012521.001.001252
072521.001.007252
2841.00284
00
2841.001 .00
2840
2841 .001.00
284
t---------------ll---------------ll---------------ll---------------lSaturation Flow Module:sar/Lane: 160O 1600 1600 1600 16OO 1600 1600 1600 1600 1600 1600 1600
Adjustment: 0.94 1. O0 O.94 0.94 1.00 0.94 0.94 1.00 o.94 0.94 1.00 o -94Lanes: 2.00 1.58 O.42 2.OO 1.OO 1.00 2.oo 2.00 1.00 1.00 2.00 1.00Final sar.: 30oo 2529 629 3OOO 1600 1500 3000 3200 1500 1500 3200 1s00
-l---------ll---------ll---------ll---------------lCapacity AnaÌysis Module:vor/sat: o-06o.I2 0.13 o.I2O.26 O.04 0.040.37 0.14 0.050'39 0.19crit Moves ' **** **** **** ************************************************************************************
Traffix 7.6.0115 (c) 2O03 Dowling Assoc. Licensed to URS CORP.' SANTA ANA, CA
CEQA Existing Setting PM Sun Aug 30, 2075 12:58:11 Page 1-1-
Wayne J. Sand and Gravel Mine Project Traffic StudyCEQA Existing Setting PÌus Project
Evening Peak Hour
Scenario
Command:Vofume:Geometry:Impact Fee lTrip Generation:Trip DistributionPaths:Routes:Configuration:
Scenario RePortCEQA Existing Setting PM
PMPM
Exist ingDefault Impact FeePM
PM
Defaul-t PathsDefauft RoutesPM Existing
Traffix 7.6.0115 (c) 2OO3 Dowting Assoc. Licensed to URS CORP., SANTA ANA' CA
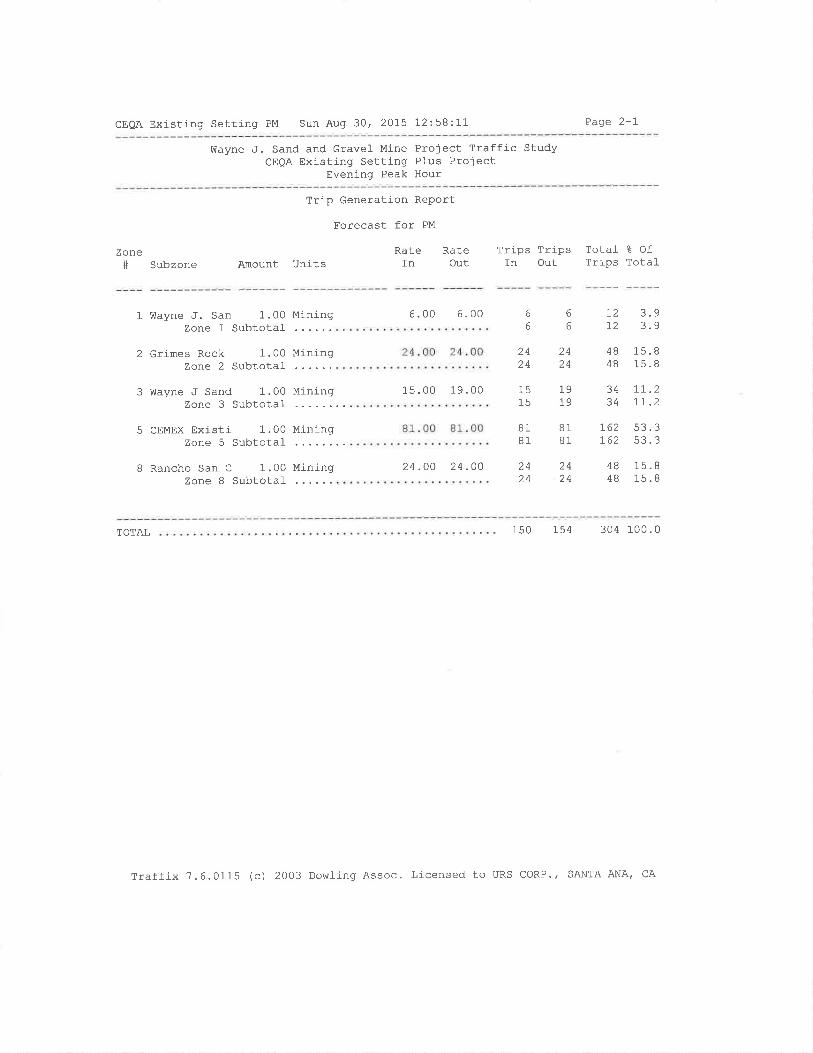
CEOA Existing Setting PM Sun Aug 30, 2015 1-2:58:11 Page 2-1
Wayne ,f. Sand and Grave1 Mine Project Traffic StudyCEQA Existing Setting Plus Project
Evening Peak Hour
Zone# Subzone
Trip Generation RePort
Forecast for PM
Rate RateAmount Units In Out
Trips Trips Total ? OfTrips Total-In Out
1 !{ayne J. San 1.00 MiningZone 1 Subtotal
2 Grimes Rock 1.00 MiningZone 2 SubtotaÌ
3 Wayne ,f Sand 1 .00 MiningZone 3 Subtotal
5 CEMEX Existi 1.00 MiningZone 5 Subtotal
B Rancho San c 1.00 MiningZone 8 Subtotal-
24 .OO 24.00 24
2424
2424
4848
15.815.8
1515
19t9
3434
LL.2Lr.2
8181
818t
]-62762
242424
4848
15. B
15. B
6.00 6.00 6666
1,2
I220?o
15.00 19.00
R? ?
53 .3
TOTAL 150 154 304 100.0
Traffix 7.6.0115 (c) 2003 Dowling Assoc. Licensed to URS CORP.' SANTA ANA/ CA
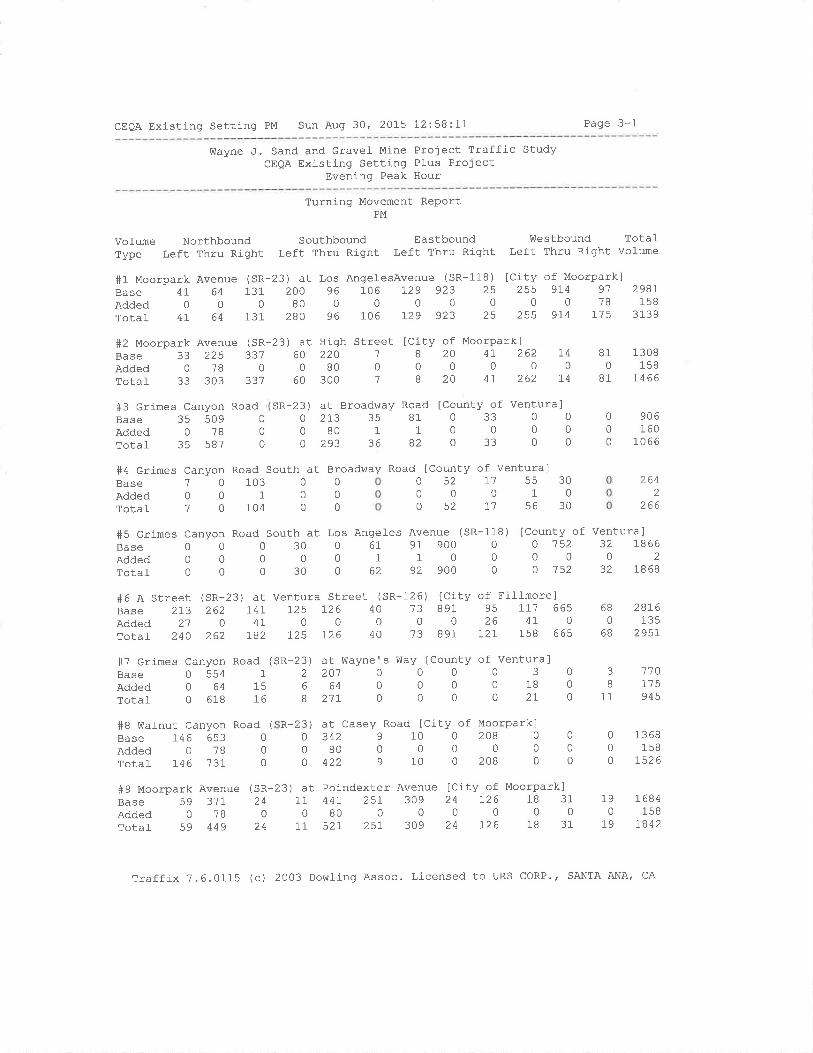
CEOA Existing Setting PM Sun Aug 30, 2015 12:58:11 Page 3-1
lilayne J. Sand and Gravel Mine Project Traffic StudyCEQA Existing Setting Plus Project
Evening Peak Hour
Turning Movement ReportPM
Vol-ume Northbound Southbound EastboundType Left Thru Right Left Thru Right Left Thru Right
#1 Moorpark Avenue (SR-23) at Los AngelesAvenue (SR-118)Base 41 64 131 20O 96 106 t29 923 25AddedO0O8000000rotal- 41 64 131 28O 96 106 I29 923 25
ülestbound TotalLeft Thru Right VoÌume
lCity of Moorparkl255 9r4 91 298r
0018158255 9r4 115 3139
#2 Moorpark Avenue (SR-23) at HighBase 33 225 331 60 220Added07800B0rotal 33 303 33'7 60 300
#3 Grimes Canyon RoadBase 35 509Added 0 ?BTotal 35 587
Street [City of Moorpark]?820412621400000018204126214
at Broadway Road ICounty of Ventura]27335810330080 1 1 0 0 0 0
293368203300
sR-23 )
0
0
0
810
81
1 308158
t466
906160
1066
110175945
#4 Grimes Canyon Road South at Broadway Road lCounty of Ventura]
000
0
0
0
-118 )
00
0
BaseAddedTotal
'7
07
0
0
0
00
0
00
0
1031
104
052r7553000010052715630
2642
266
lcounty of Ventura]o 152 32 18660002o 152 32 1868
28r6135
2957
#5 Grimes Canyon Road South at Los Angeles Avenue (
Base0003006191'900AddedO0000110rotal-0003006292900
SR
#6 A Street (SR-23) at Ventura Street (SR-126) [City of Fillmore]Base 2I3 262 I4I 725 126 40 '73 891 95 II1 665
Added2104100000264L0rotaf 240 262 182 I25 126 40 '13 891 I2l 158 665
6B
068
3
8
11
#7 crimes Canyon Road (SR-2Base 0 554 1
Added 0 64 15Total 0 618 76
#B VilaÌnut Canyon Road (
Base 146 653 0
Added 0 78 0
Totaf L46 '737 0
ât Wayne's lÍay [County of Ventura]20100003064 0 0 0 0 18 0
2170000210
at Casey Road [CitY of MoorPark]342910020808000000
42291002080
0
0
0
0
00
3)2
6
I
3)000
2R-13 68
158r526
S9 Moorpark Avenue (SR-23) at Poindexter Avenue [City of Moorpark]Base 59 311 24 11 441 25]- 309 24 126 18 31
AddedO7800B0000000rotaf 59 449 24 11 52I 25t 309 24 126 18 31
190
79
T684158
1,842
Traffix 7.6.0115 (c) 2003 Dowling Assoc. Licensed to URS CORP., SANTA ANA| CA
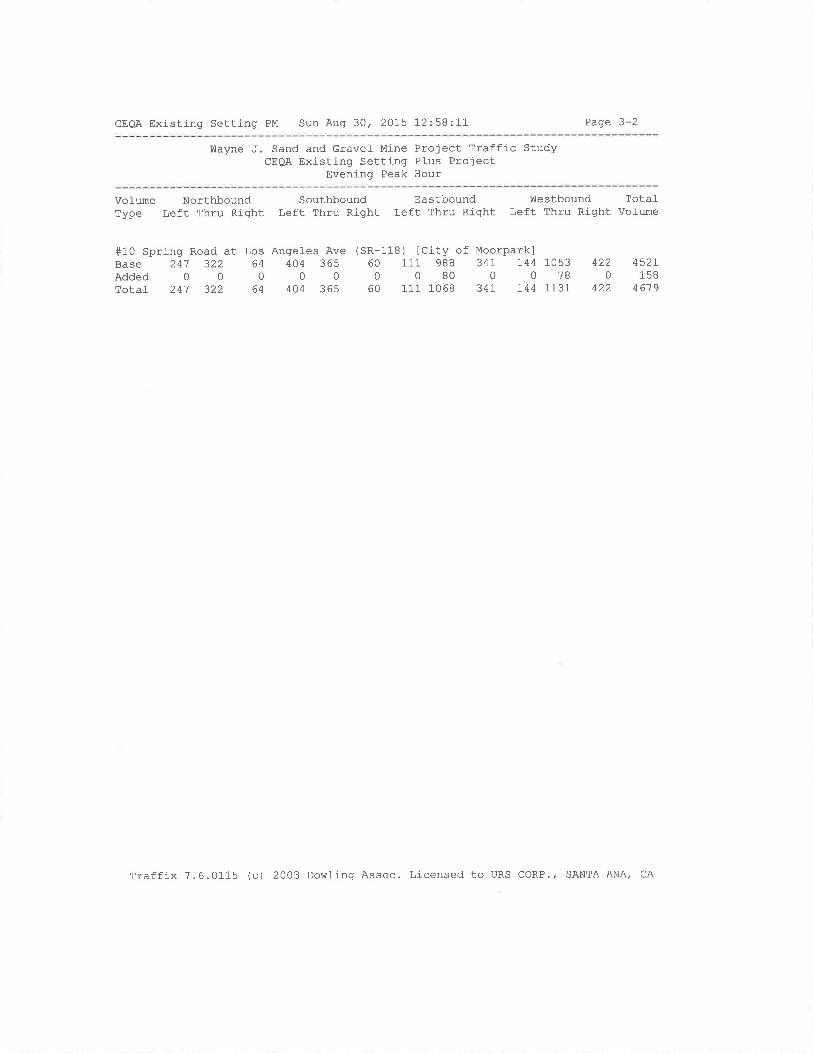
CEQA Existing Setting PM Sun Aug 30, 2015 l-2:58:11 Page 3-2
wayne .1. Sand and Gravel- Mine Proiect Traffic StudyCEQA Existing Setting Pl-us Project
Evening Peak Hour
Vollme Northbound SouthboundType Left Thru Right Left Thru Right
EastboundLeft Thru Right
Westbound TotalLeft Thru Right VoÌume
#10 Spring Road at Los Angeles Ave (SR-Base 247 322 64 404 365 60Added000000rotal 241 322 64 404 365 60
) tCity of Moorparkl111 9BB 34r 144 1053
0800018111 1-068 34L r44 1137
1184ZZ
0
422
452r1sB
461 9
Traffix 7.6.0115 (c) 2003 Dowling Assoc. Licensed to URS CoRP., SANTA ANA' CA

CEQA Existíng Setting PM Sun Aug 30, 2OI5 12:58:13 Page 6-1
lfayne J Sand and Gravel Mine Project Traffic StudyCEOA Existing Setting Plus Project
Evening Peak Hour
Intersection
#1+2#3#4+5#6#1+B#9#10
Moorpark Avenue (SR-23) at Los
Moorpark Avenue (SR-23) at Hig
Grimes canyon Road (SR-23) at
Grimes Canyon Road South at Br
Grimes Canyon Road South at Lo
A Street (SR-23) at Ventura St
Grimes Canyon Road (SR-23) at
Wal-nut Canyon Road (SR-23) at
Moorpark Avenue (SR-23) at Poi
Spring Road at Los Angeles Ave
Impact AnalYSls ReportLevel Of Service
Baseoel/ v/
LOS Veh C
B xxxxx 0.639
A xxxxx 0.595
B 0. o 7.o24
A 9.1 0.000
C xxxxx 0.719
D xxxxx 0.811
B 13.3 0.000
B xxxxx 0.647
B xxxxx 0.654
D xxxxx 0.815
FutureoeL/ v/
LOS Veh C
C xxxxx 0.754
A xxxxx 0.595
B 0.0 1 .181
A 9.1 0.000
C xxxxx 0.720
D xxxxx 0.871
c t6 .3 0. 000
B xxxxx 0.696
C xxxxx 0.704
D xxxxx 0.840
Changein
+ 0.115 V/C
+ 0.000 v/c
+ 0.000 D/V
+ 0.005 D/v
+ 0 .001 v,/c
+ 0 .059 v,/c
+ 3.045 D,/V
+ 0.049 V/C
+ 0.050 v/c
+ 0.025 v/c
Traffix 7.6.0115 (c) 2003 Dowling Assoc. Licensed to URS coRP., SANTA ANA, CA
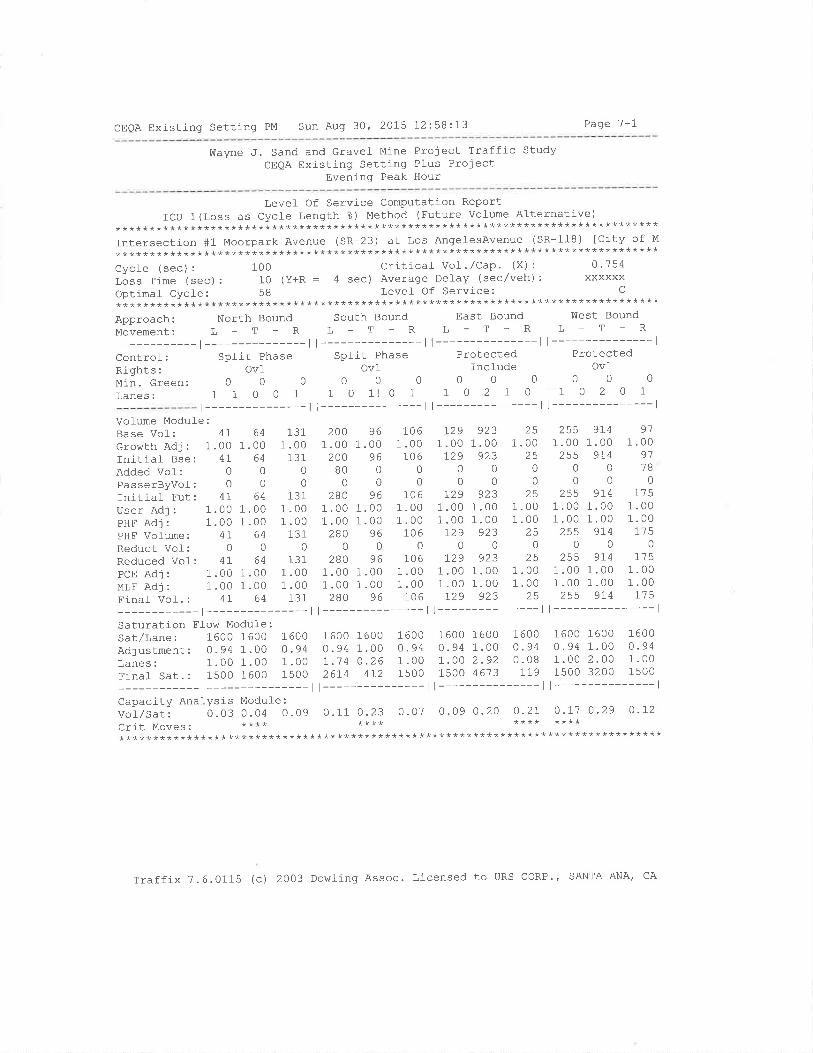
CEQA Existing Setting PM Sun Aug 30, 2015 12:58:13 Page 7-l
!ûayne J. Sand and Gravel- Mine Project Traffic StudyCEQA Existing Setting Plus Project
Evening Peak Hour
Level of Service computation ReportICU 1(Loss as Cycl-e Length %) Method (Future vol-ume Alternative)
********************************************************************************Intersection #1 Moorpark Avenue (SR-23) at Los AngeÌesAvenue (SR-118) [City of M
********************************************************************************Cycle (sec): 100 Critical Vol'/Cap' (x): 0'754Loss Time (sec) : 10 (Y+R : 4 sec) Average Delay (sec/veh) : xxxxxxOptimal Cycle: 58 Levef Of Service: C
********************************************************************************Approach: North Bound south Bound East Bound west Bound
Movement: L - T - R L - T - R L - T - R L - T - R
-l---------ll---------ll---------ll---------------lcontrof: split Phase split Phase Protected ProtectedRights: Ovl- Ovt Include OvIMin.Green: 0 O O O O 0 0 0 0 0 0 0
Lanes: 1 1 O O 1 1 0 1l O 1 1 0 2 1 0 1 0 2 O 1
t---------------ll---------------ll---------------ll---------------lVolume Modufe:Base Vol: 41 64 131 200 96 106 I29 923 25 255 974 91
GrowrhAdj: 1.oo1.oo 1.oo 1.001.00 1.OO 1.001.00 1.00 1.001.00 1.00rnirial Bse: 4L 64 131 200 96 106 ]_29 923 25 255 9I4 9'l
AddedVol: O O O 80 O 0 0 0 0 0 0 78
PasserByvol: O O O O 0 O 0 0 0 0 0 0
rnitiaf Fut: 4L 64 131 2BO 96 106 I29 923 25 255 974 175
userAdj: 1.001.00 1.00 1.oo1.oo 1.00 1.001.00 1.00 1.001.00 1.00pHFAdj: 1.001.00 1.OO 1.001.00 1.OO 1.001.00 1.00 1.001.00 1.00pHF Vofume z 4L 64 131 2BO 96 106 729 923 25 255 9I4 175
Reduct Vof: O O 0 0 O 0 0 0 0 0 0 0
Reduced vol: 41 64 131 2BO 96 106 I29 923 25 255 974 175pcEAdj: 1.001.00 1.OO 1.001.00 1.OO 1.001.00 1.00 1.001.00 1.00MLFAdJ: 1.OO1.OO 1.OO 1.001.00 1.00 1.001.00 1.00 1.001.00 1.00Fi_nal Vot.: 41 64 131 2BO 96 106 I29 923 25 255 9I4 175
-t---------ll---------ll---------ll---------------lSaturation Flow Module:Sat/Lane: 160O 160O 1600 160O 16OO 1600 1600 1600 1600 1600 1600 1600
Adjusrmenr: 0.94 1.00 0.94 0.94 1.00 0.94 0.94 1.00 O.94 0.94 1.00 o-94Lanes: 1.OO 1.OO 1.OO I.14 0.26 1.00 I.00 2.92 0.08 1.00 2.00 1-00Final Sat.: 15OO 1600 15OO 2614 4:.2 15OO 1500 4673 7I9 1500 3200 1s00
-l---------ll---------ll---------ll---------------lCapacity Analysis Module :
vor/sat: 0.03 o.04 o.09 0.11 0.23 O.07 0.09 0.20 0-2I 0.I1 0.29 0-I2crit Moves. **** **** **** ************************************************************+***********************
Traffix 7.6.0115 (c) 2OO3 Dowling Assoc. Licensed to URS CORP.' SANTA ANA| CA
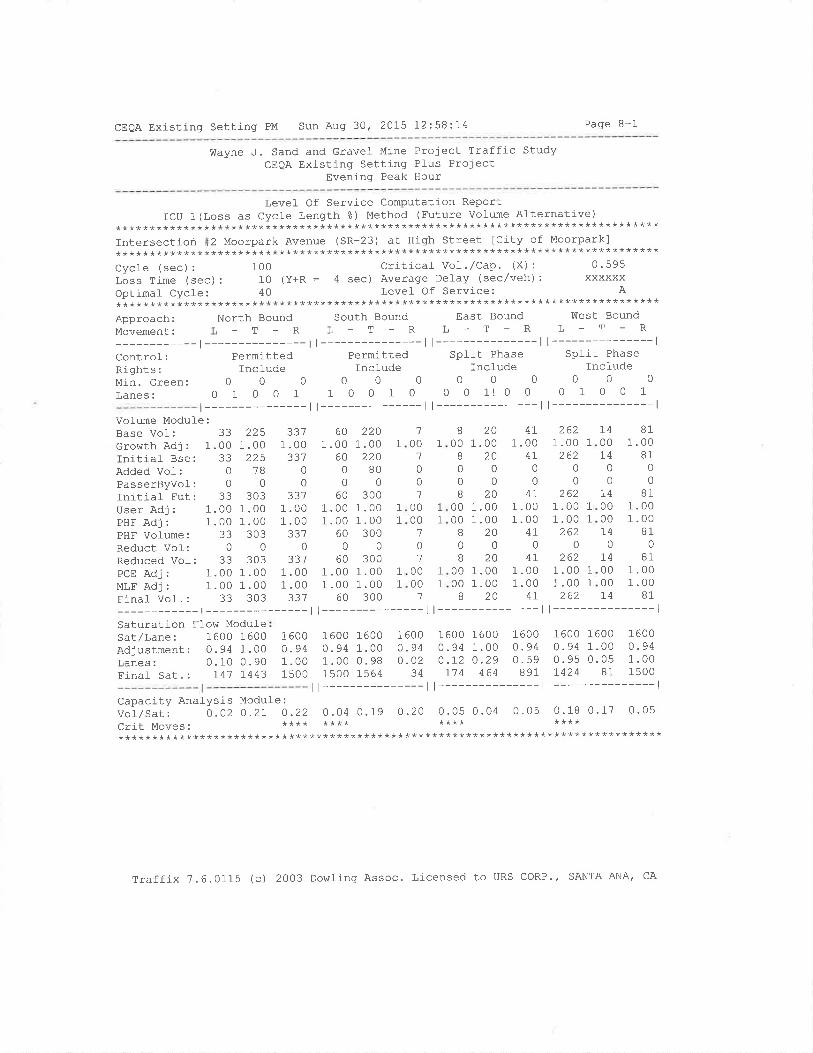
CEQA Existing Setting PM Sun Aug 30, 2015 I2:58:L4 Page B-1
Wayne ,f. Sand and Gravel Mine Project Traffic StudyCEQA Existing Setting Pfus Project
Evening Peak Hour
Level Of Service Computation ReportICU 1 (Loss as CycJ-e Length å) Method (Future volume Alternative)
********************************************************************************Intersection #2 Moorpark Avenue (SR-23) at High Street ICity of Moolpark]********************************************************************************Cycle (sec) : 100 Critical- VoI .,/Cap, (X) : 0'595Lõss Tirne (sec) : 10 (y+R : 4 sec) Average Defay (sec/veh) : xxxxxxOptimal Cycle: 40 Level- Of Service: A********************************************************************************Approach: North Bound south Bound East Bound west BoundMOVEMENT: L - T - R L - T - R L - T _ R L - T - R
-l---------ll---------ll---------ll---------------lcontrol: Permitted Permitted split Phase spfit Phase
Rights: Incl-ude Incl-ude Include Includeuin.creen: 0 O O 0 0 0 0 0 0 0 0 0
Lanes: O 1 0 O 1 1 0 0 1 0 0 0 1! 0 0 0 1 0 0 1
t---------------l l---------------l l---------------l l---------------lVolume Module:Base Vol-: 33Growth Adj : 1.00Initial Bse: 33Added Vol: 0
PasserByvoÌ: 0
Initiaf Fut: 33User Adj : 1.00PHF Adj : 1.00PHF Volume: 33Reduct VoÌ: 0
Reduced Vof: 33PCE Adj : 1.00MLF Adj : 1.00Final- Vol. : 33
2251 .00
22518
0303
1 .001 .00
3030
3031 .001.00
303
???1 .00
3370
0331
1 .001 .00
033 I
1 .001 .00
331
601 .00
6000
601.001 .00
600
601 .001 .00
60
2201.00
22080
0300
1.001 .00
3000
3001.001 .00
300
82000 1.008200000820
00 1.0000 1.0082000820
00 1.0000 1.00820
4t1.00
4T0
047
1 .001.00
4I0
4I1.001.00
4I
2621 .00
2620
0262
1 .001 .00
2620
2621.001.00
¿oz
7400T4
00
I40000I4
0
74000074
B11.00
810
0
811.001 .00
810
811 .001 .00
81
1
1
1
1
1
'7
001
0
01
0000
1
01
0000
1
1
1
1
1
1 1
1
1
1
1
Saturation Flow ModufeSat/Lane: 1600 1600Adjustment: 0.94 1.00Lanes: 0.10 0.90
1 6000.941 .00
1600 16000.94 1.001.00 0.98
1 6000.940.02
1600 1600 1600 1600 1600 16000.94 1.00 0. 94 0.94 1.00 0.940.r2 0.29 0.59 0.95 0.05 1.00
Finaf Sat.: 741 7443 1500 1500 1564 34 I'r.4 464 891 1424 81 1500
Capacity Analysis Modufe:vor/sat: o.o2 0.2I O.22 0.04 0.19 0.20 0.05 0.04 0.05 0.18 0.17 0.05Crit MOVeS. **** **** **** ************************************************************************************
Traffix 7.6.0115 (c) 2003 Dowling Assoc. Licensed to URS CORP., SANTA ANA' CA
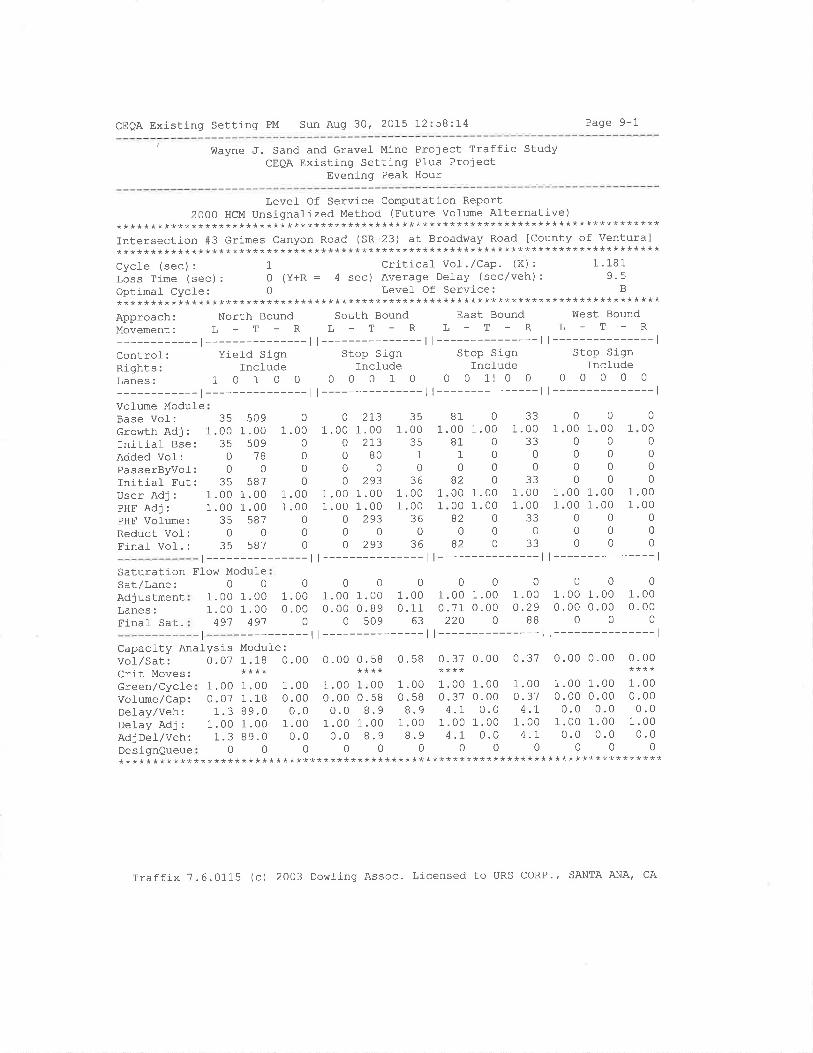
CEQA Existing Setting PM Sun Aug 30, 2015 12:58:14 Page 9-1
Wayne ,J. Sand and Gravel Mine Project Traffic StudyCEQA Existing Setting Plus Project
Evening Peak Hour
Level- Of Service Computation Report2OOO HCM Unsignalized Method (Future Vofume Alternative)
********************************************************************************Intersection #3 Grimes Canyon Road (SR-23) at Broadway Road ICounty of Ventura]********************************************************************************Cycle (sec): 1 Critical VoI./Cap. (X): 1'181lòss time (sec): 0 (Y+R : 4 sec) Average De]ay (sec/veh): 9'5Optimal Cycte: 0 Level Of Service: B
********************************************************************************Approach: North Bound south Bound East Bound west BoundMovement: L - T - R l, - T - R L - T - R L - T - R
-l---------ll---------ll---------ll---------------lControl: Yield Sign Stop Sign Stop Sign Stop SignRights: Incl-ude Include Incl-ude Incl-udeLanes: 1 O 1 0 0 O 0 0 1 0 0 0 1! 0 0 0 0 0 0 0
-l---------ll---------ll---------ll---------------lVolume ModuleBase Vol-:Growth Adj:Initial Bse:Added Vol:PasserByvol-:Initial Fut:User Adj:PHF AdJ:PHF Volume:Reduct Vol:Einaf Vol. :
s091.00 1
509ftJ
0587
1.00 1
1.00 1
5870
587
213.00273
BO
0293
351 .00
?q1
036
1.00 1
3300
0
000
1.001.00
000
0000
1.001.00
000
01.00 1
81 01.00 1.00
000
0
0
00
0000
0
00
11
000
0
0035
1 .002tr
00
351 .001 .00
350
35
1 .000 .07
1a
1 .001.3
0
0.00
0000
.00
.00000
1.000 .000.0
1 .000.0
0
1.00 1.00 1.00 1
1 .00 1.00 1 .00 1
o 293 360000 293 36
811
0ó¿0000B2
082
0000
0000
1.001.00
000
L
1
1 .00 1.000.00 0.00
1.00 1
0.00
8.9 8.900
331.001.00
??
022
l---------------ll---------------ll---------------ll---------------lSaturation Flow Modul-eSat/Lane:AdjustmentLanes:Finaf Sat. 49'7
0
1.00 1
1.00 1
00000000000. o0 1.00 1 .00 1.00 1.00 1.00 1.00 1.00 1 .00 1.00 1.00. oo 0.00 0.00 0.89 0.11 0.71 0.00 0.29 0.00 0.00 0.0049100s0963220088000
.18 o.0o 0.00 0. s8 0 .58 0.37 0.00 0.37 0.00 0.00 0.00*** **** **** ****
I
Capacity Anal-ysisVol/Sat: 0.07Crit Moves:Green/Cyc1eVolume/Cap:Delay/Veh:Delay Adj:Ad j Del,/Veh:DesignQueue
1
1
1
B
1
I
.00
.189.0.00qô
0
1.00 1
0.00 00.0
1.00 1
0.00
00 1.0.
B
00 1.00 1.0058 0.37 0.00.9 4.L 0.0
1.000.374.r
1.00.00.
000
RO
8.9.00
0.00.01.00 1.00 1.00 1.00
4 .r 0.0 4.L000
.00 1.000.0 0.0
00********************** **********************************************************
Trafflx 7.6.0115 (c) 2003 Dowling Assoc. Licensed to URS coRP., SANTA ANA, CA
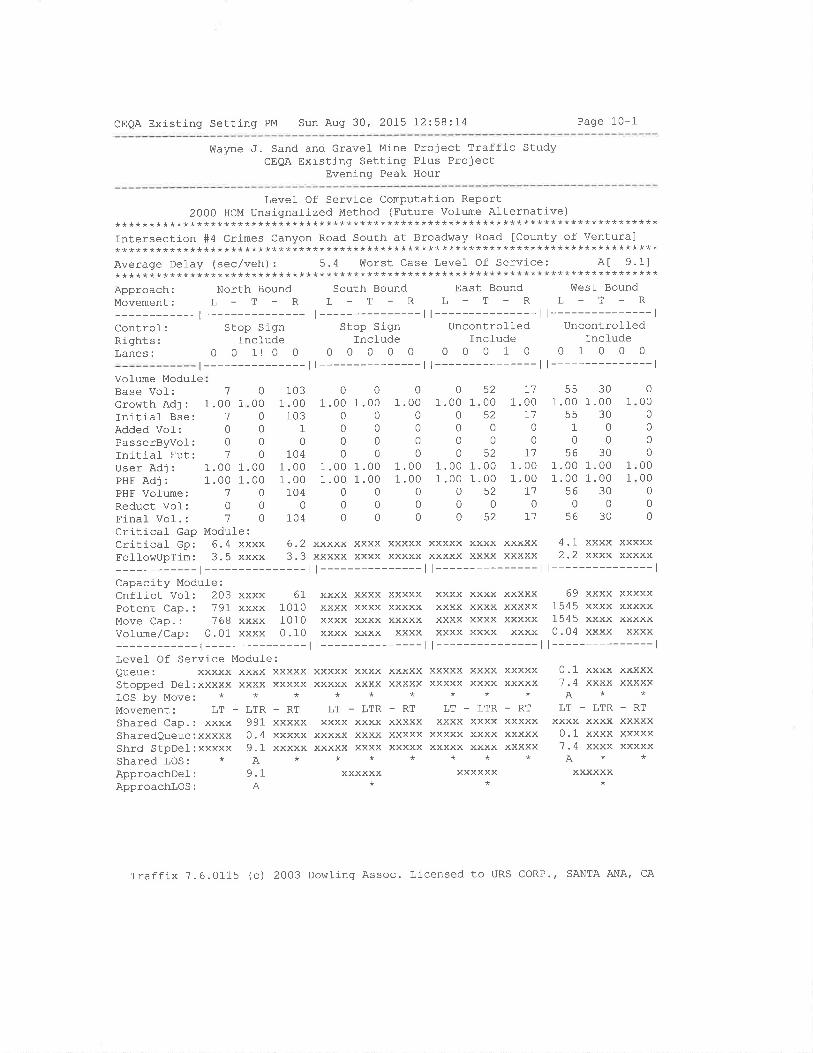
CEOA Existing Setting PM Sun Aug 30' 2OI5 12:58:.L4 Page 1-0-1
Wayne J. Sand and Gravel Mine Project Traffic StudyCEQA Existing Setting Plus Project
Evening Peak Hour
Levef Of Service Computation Report2000 HCM Unsignalized Method (Future Vol-ume ALternative)
********************************************************************************Intersection #4 Grimes Canyon Road South at Broadway Road ICounty of Ventura]********************************************************************************Average Delay (sec/veh): 5.4 Worst Case Level Of Service: A[ 9'1]********************************************************************************Approach: North Bound South Bound East Bound West BoundMovement: L - T - R L - T - R L - T - R L - I - R
-l---------ll---------ll---------ll---------------lcontrol: Stop Sign Stop sign uncontrol-led uncontrolledRights: fnclude Incl-ude Include IncfudeLanes: O O 1l O O 0 0 0 0 0 0 0 0 1 0 0 1 0 0 0
t---------------ll---------------ll---------------ll---------------lVol-ume ModuleBase Vol:Growth Adj:Initial Bse:Added Vol-:PasserByvol:Initial- Fut:User Adj : 1.00 1 .00PHF Adj : 1.00 1 .00PHF Vofume: '7 0Reduct Vol: 0 0Final- Vol. : '7 0Critical Gap Module:Critical Gp: 6.4 xxxxEoll-oh/UpTim: 3. 5 xxxx
6.2 xxxxx xxxx xxxxx xxxxx xxxx xxxxx3.3 xxxxx xxxx xxxxx xxxxx xxxx xxxxx
0
1.00 1
0000
01 .00
00
0
01 .001 .00
00
0
000
0000
7
1.00 1
1
001
1031 .00
1031
0104
1 .001 .00
1040
104
001 .00 1.00
00000000
1 .00 1.001 .00 1.00
000000
520052
00
51.
I11 .00
770
0L1
1.001.00
I10
L]
55 301 .00 1.00
55 301000
s6 301.00 1.001.00 1.00
56 3000
56 30
1
000
0
000
0000
0
0
0
1.00 1.001 .00 1 .00
o5200o52
1
1
A1 xxxx xxxxxXXXX XXXXX
-l---------ll---------ll---------ll---------------lCapacity Module:Cnfl-ict VoÌ: 203 xxxx 6I xxxx xxxx xxxxx xxxx xxxx xxxxx 69 xxxx xxxxxpotent Cap.: 791 xxxx 1010 xxxx xxxx xxxxx xxxx xxxx xxxxx 1545 xxxx xxxxxMove Cap.: ?68 xxxx 1010 xxxx xxxx xxxxx xxxx xxxx xxxxx 1545 xxxx xxxxxVotume/Cap: O.01 xxxx 0.10 xxxx xxxx xxxx xxxx xxxx xxxx 0.04 xxxx xxxx
-l---------ll---------ll---------ll---------------lLevel Of Service Modul-e:eueue: xxxxx xxxx xxxxx xxxxx xxxx xxxxx xxxxx xxxx xxxxx 0.1 xxxx xxxxxStopped Del:xxxxx xxxx xxxxx xxxxx xxxx xxxxx xxxxx xxxx xxxxx 7.4 xxxx xxxxxLOS by Move: * * * * * * * * * A * *
Movement: LT - LTR - RT LT - LTR - RT LT - LTR - RT LT - LTR - RT
Shared Cap.: xxxx 991 xxxxx xxxx xxxx xxxxx xxxx xxxx xxxxx xxxx xxxx xxxxxSharedeueue:xxxxx 0.4 xxxxx xxxxx xxxx xxxxx xxxxx xxxx xxxxx 0.1 xxxx xxxxxShrd StpDet:xxxxx 9.1 xxxxx xxxxx xxxx xxxxx xxxxx xxxx xxxxx 7.4 xxxx xxxxxShared LOS: * A * * * * * * * A * *
ApproachDel: 9 -L xxxxxx xxxxxx xxxxxxApproachlos: A * * *
Traffix 7.6.0115 (c) 2003 Dowling Assoc. Licensed to URS CORP., SANTA ANA' CA
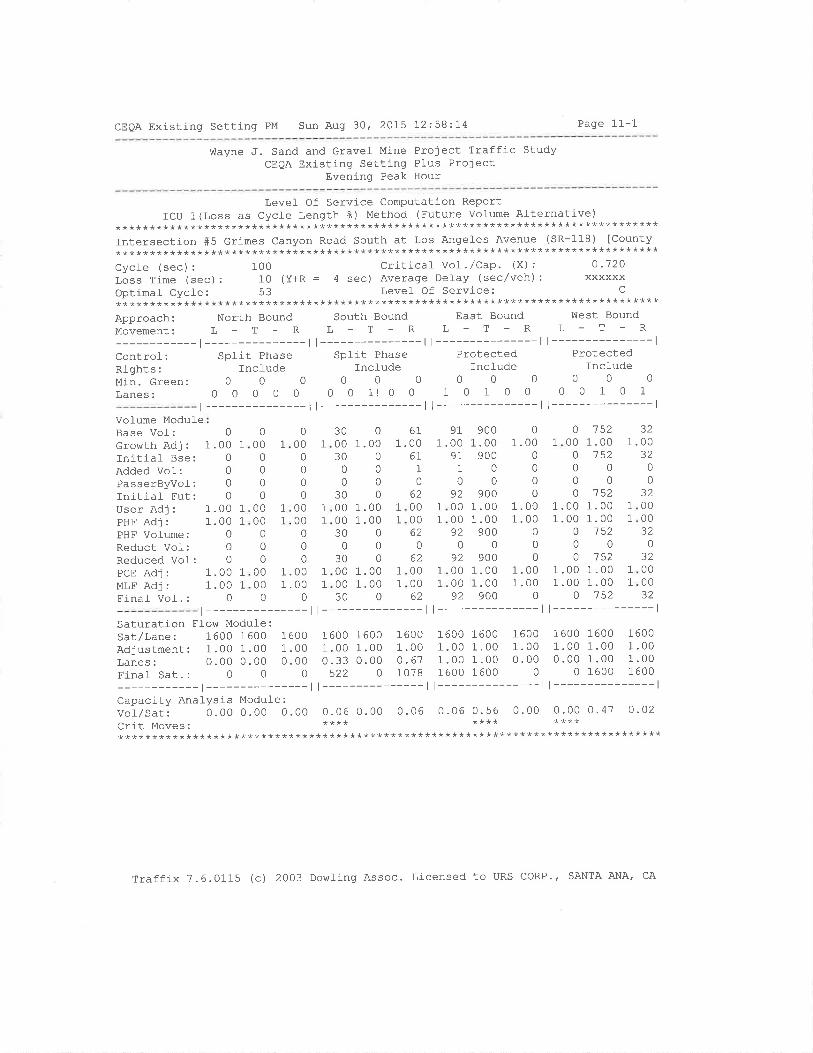
CEQA Existing Setting PM Sun Aug 30, 2015 12:58:14 Page 11-1
lfayne J. Sand and Grave1 Mine Project Traffic StudyCEQA Existing Setting PIus Project
Evening Peak Hour
Level Of Service Computation ReportICU 1(Loss as Cycfe Length 8) Method (Future volume Al-ternative)
********************************************************************************Intersection #5 Grimes canyon Road south at Los AngeÌes Avenue (sR-118) lcounty********************************************************************************Cycte (sec): 100 Critical Vol./Cap. (X): 0'120Loss Time (sec): 10 (Y+R : 4 sec) Average Delay (sec/veh): xxxxxxOptimal Cycle: 53 Levef of Service: C
********************************************************************************Approach: North Bound south Bound East Bound west BoundMovement: L - T - R L - T - R L - T - R L - T - R
-l---------ll---------ll---------ll---------------lcontrol: Split Phase sptit Phase Protected ProtectedRights: Incfude fncl-ude Include IncludeMin.Green: 0 O O 0 0 0 0 0 0 0 0 0
Lanes: O 0 0 O 0 0 O 11 0 0 1 0 1 0 0 0 0 1 0 1
r---------------ll---------------ll---------------ll---------------lVolume ModuleBase Vol:Growth Adj:Initial Bse:Added Vol-:PasserByvol:Initial Fut:User Adj:PHF AdJ:PHF Volume:Reduct Vof:Reduced Vol:PCE AdJ:MLF AdJ:Final Vof. :
SaturationSat/Lane:Adjustment:Lanes:Finaf Sat. :
000
1.00 1
1.00 1
0
01.00 1
0000
1.00 1
1.00 1
000
1.00 1
1.00 1
0
90000
9001.001.00
9000
900
01 .00
0
000
1 .001 .00
000
0 15200000 152
1 .00 1.00 1
1 .00 1.00 1
o 152000 152
000
00
00
0000
0
00
0000
0
1
000
0
0
00
00
1
30000 1.003000000
30000 1.0000 1.0030000
30000 1.0000 1.00300
6t 91 9001 .00 1 .00 1 .00
0 '752 3200 1.00 1.001
1
1 001
1
1
1
1
1
6T1
0
62000062
0oz000062
9I1
092000092
0
92000092
00
JZ000032
0320000-)z
1
1600 1600 1600 1600 16001 .00 1.00 1 .00 1 .00 1 .000.33 0.00 0.61 1.00 1.00
.00 1.00 1 .00 1.00
.00 1.00 1.00 1.00900 0 0 152
1
11
1
1
1
t---------------ll---------------ll---------------ll---------------lFfow Modufe:
1600 16001.00 1 .000.00 0.00
1.001 .001 600
1 6001 .001 .001 600
000000
0
761.0.
000000
0
I61.0.
1 6001 .000 .00
1 600
o 0 0 522 0 1078 1600 1600-l---------ll---------ll---------ll---------------l
Capacity Analysis Module :
vor,/sat: o.0o o.oo 0.00 0.06 0.00 0.06 0.06 0.56 0.00 0.00 0.47 o-o2Crit MOVeS: **** **** ************************************************************************************
Traffix 7.6.0115 (c) 2OO3 Dowting Assoc. Licensed to URS CORP.f SANTA ANA, CA
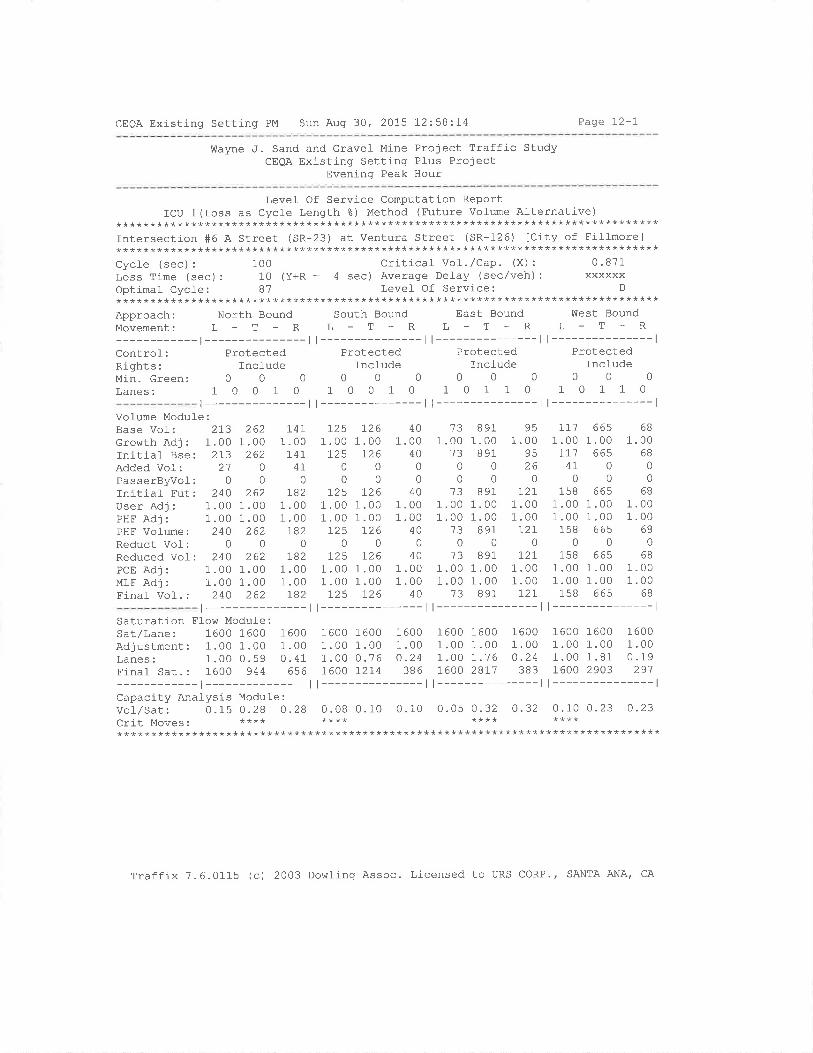
CEQA Existing Setting PM Sun Aug 30, 2015 12:58:74 Paqe I2-I
!ùayne ,J. Sand and Gravel Mine Project Traffic StudyCEQA Existing Setting Pfus Project
Evening Peak Hour
Level- Of Service Computation ReportICU 1(Loss as Cycle Length %) Method (Future Volume Afternative)
********************************************************************************Intersection #6 A Street (SR-23) at Ventura Street (SR-126) [City of Fillmore]********************************************************************************Cycl-e (sec): 100 Critical Vol./Cap. (X): 0.871Loss Time (sec): 10 (Y+R : 4 sec) Average Detay (sec/veh): xxxxxxOptimat CycJ-e: B1 Level Of Service: D
********************************************************************************Approach: North Bound South Bound East Bound hlest BoundMovement: L - T - R L - T - R L - T - R L - T - R
-t---------ll---------ll---------ll---------------lControf: Protected Protected Protected ProtectedRights: Incl-ude Include Include IncludeMi-n. creen: 0 0 0 0 0 0 0 0 0 0 0 0
Lanes: 1 0 0 1 0 1 0 0 1 0 1 0 1 1 0 1 0 1 1 0
r---------------ll---------------ll---------------ll---------------lVolume Modufe:Base Vol-: 2L3Growth Adj: 1.00Initiaf Bse: 2I3Added Vof: 21PasserByvol: 0
Initial Fut: 240User Adj : 1.00PHF Adj : 1.00PHF Volume: 240Reduct Vol: 0Reduced Vof: 240PcE Adj : 1.00MLF Adj : 1.00Finaf Vof. : 24O
2621.00
2620
0
2621 .001 .00
2620
2621 .001.00
262
1,471.00
74741
0r82
1 .001 .00r82
0782
1.001.00r82
1251.00
1250
0r25
1 .001 .00
l-250
1251.001.00
125
7261 .00
72600
1261.001.00
7260
L261.001.00
126
401.00
400
040
1 .001 .00
400
401 .001 .00
40
/J
1 .0013
00
131.001 .00
130
131 .001.00
13
8911.00
89100
8911.001.00
8910
8911.001.00
891
951 .00
9526
0
12t1.001.0072r
0r2t
1.001 .00L2r
IIl1 .00
1L147
0158
1.001 .00
1580
1581 .001 .00
158
66s1 .00
66500
6651.001.00
6650
6651.001.00
665
681.00
6B
0
0oõ
1.001 .00
6B
068
1.001.00
6B
r---------------ll---------------ll---------------ll---------------lSaturation Flow Modufe:sat/Lane: 160O 1600 1600 1600 1600 1600 1600 1600 1600 1600 1600 1600Adjustment: 1.00 1.00 1.00 1.00 1.00 1.00 1.00 1.00 1.00 1.00 1'00 1.00Lanes: 1.00 0.59 O.41 1.00 0.76 O.24 1.00 1.76 0.24 1.00 1.81 0.19Finaf sat.: 1600 944 656 L600 1274 386 7600 2811 383 ]-600 2903 291
-t---------ll---------ll---------ll---------------lCapacì-ty Analysis Modul-e :
vol/Sat: 0.15 0.28 0 .28 0.08 0. 10 0. 10 0.05 0.32 O.32 0 .10 0.23 0 '23crit Moves. **** **** **** ************************************************************************************
Traffix 7.6.0115 (c) 2003 Dowling Assoc. Licensed to URS coRP., SANTA ANA, CA

CEQA Existing Setting PM Sun Aug 30' 2015 12:58:.74 Page 13-1
V{ayne J. Sand and Gravef Mlne Project Traffic StudyCEQA Existing Setting Pl-us Project
Evening Peak Hour
Level- Of Service Computation Report2000 HCM Unsignalized Method (Future Vo1ume Alternative)
********************************************************************************Intersection #? Grimes canyon Road (sR-23) at v{rayne's way [county of ventura]********************************************************************************Average Delay (sec/veh): 0.6 worst case Level of service: ct 16.31********************************************************************************Approach: North Bound south Bound East Bound west Bound
Movement: L - T - R L - T - R L - T - R L - T - R
-l--------- I l-------:- I l--------- I l---------------lcontrol: uncontrolled Uncontroll-ed stop sign stop signRights:Lanes:
VoÌume Modufe:Base Vol-: 0 554Growth Adj : 1.00 1 .00Tnltial- Bse: 0 554Added Vol: O 64PasserByvol-: 0 0
Initial Fut: 0 618User Adj : 1.00 1 .00PHF Adj : 1.00 1.00PHF Volume: 0 618Reduct Vol-: 0 0
Einal Vol-.: 0 618Critical Gap Module:Critical GP:xxxxx xxxxFoIf owupTim: xxxxx xxxx
1
1 .001
150
761 .001 .00
760
76
XXXXXxxxxx
Capacity Module:Cnflict Vol: xxxx xxxx xxxxxPotent Cap.: xxxx xxxx xxxxxMove Cap.: xxxx xxxx xxxxxVolume/Cap: xxxx xxxx xxxx
-l---------------llLevel- Of Serv.ice Module:Queue: xxxxx xxxx xxxxxStopped DeÌ:xxxxx xxxx xxxxxLOS by Move: * * *MovemeNt: LT - LTR - RT
Shared Cap.: xxxx xxxx xxxxxSharedQueue:xxxxx xxxx xxxxxShrd StpDel:xxxxx xxxx xxxxxShared LOS: * * *ApproachDel: xxxxxxApproachlos: *
1.001.00
8
0
B
1 .001 .00
0
00
000011
0
11
2011.00 1
20'764
0
27r1.00 1
1.00 1
21r0
21r
0
1.0000
00
1.001.00
00
0
3
1 .00 1.aJ
180
271.00 1.1.00 1.
2I0
2L
Incfude Include Include Incfudeo 0 o 1 0 o 1 0 0 o 0 0 0 0 0 0 0 1! 0 0
t---------------ll---------------ll---------------ll---------------l0
0000
00
0000
00
0
2
1 .002
6
08
1
0
000
0
0
0
0000
00
0
0
00000
0
1
0
0000
00
0000
00
0
3
1.003
B
011
1
11
1
xxxx4 .1.)t
xxxx xxxxx xxxxx xxxx xxxxxxxxx xxxxx xxxxx xxxx xxxxx
6.4?q
6.2xxxx
t---------------l634 xxxx xxxxx959 xxxx xxxxx959 xxxx xxxxx
0.01 xxxx xxxx
xxxx xxxx xxxxx 913 xxxx 626xxxx xxxx xxxxx 306 xxxx 488xxxx xxxx xxxxx 304 xxxx 488xxxx xxxx xxxx 0.07 xxxx O.02
lt--------- ll---------------l
0.õ.A
0 xxxx8 xxxx
LT - LTRxxxx xxxx0.0 xxxx8. B xxxxA*xxxxxx
xxxxxxxxxx
-RTXXXXXxxxxxxxxxx
xxxxx xxxxxxxxx xxxx**
LT - LTRxxxx xxxx
xxxxx xxxxxxxxx xxxx**
XXXXXX*
XXXXXxxxxx
_RTxxxxxxxxxxXXXXX
xxxxx xxxxxxxxx xxxx**
LT - LTRxxxx 349
xxxxx 0.3xxxxx 16.3*c
16.3C
YYYYY
9YYYX
-RTxxxxxxxxxxxxxxx
Traffix 7.6.0115 (c) 2003 Dowling Assoc. Licensed to URS CORP'' SANTA ANA' CA
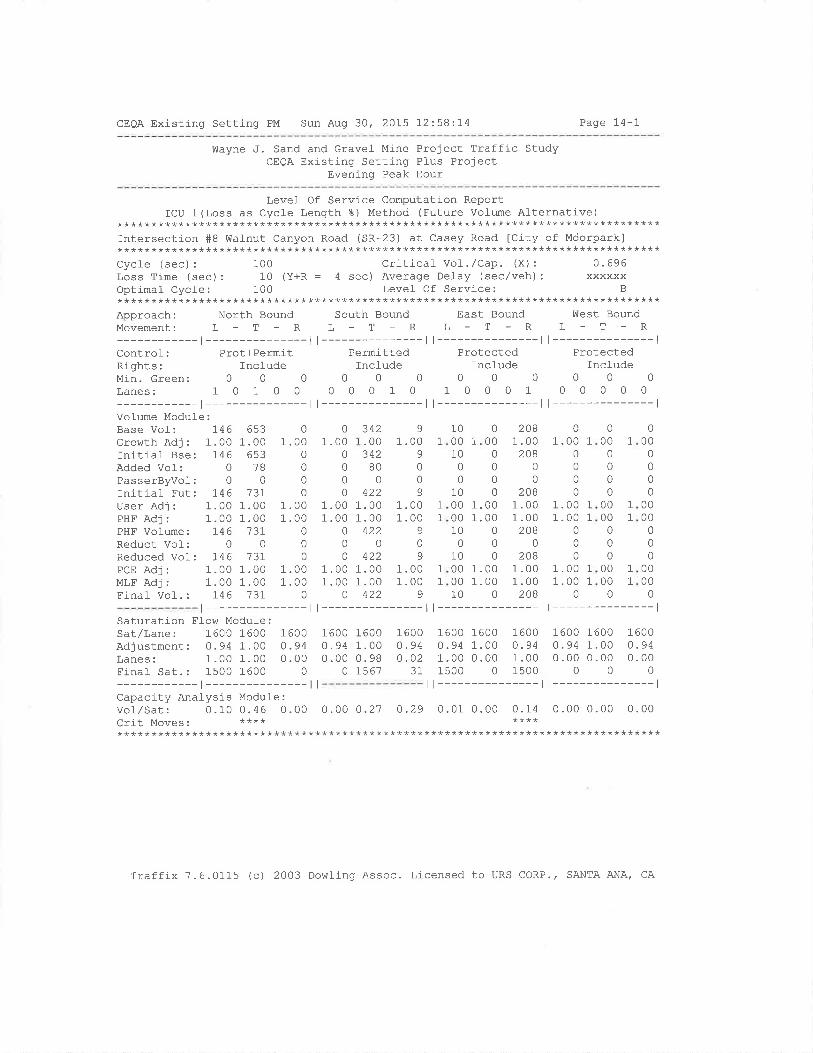
CEQA Existing Setting PM Sun Aug 30, 2015 72:58:14 Page 14-1
Wayne J. Sand and Gravel Mine Project Traffic StudyCEQA Existing Setting Plus Project
Evening Peak Hour
Levef of Service Computation ReportICU 1(Loss as Cycfe Length %) Method (Future Volume AJ-ternative)
********************************************************************************lntersection #8 Wafnut Canyon Road (SR-23) at Casey Road [City of Mciorpark]********************************************************************************Cycle (sec): 100 Critical- Vol./Cap. (X): 0.696Loss Time (sec) : 10 (Y+R : 4 sec) Average Delay (sec/veh) : xxxxxxOptimal Cycte: 100 Level- Of Service: B********************************************************************************Approach: North Bound South Bound East Bound West BoundMovement: L - T - R L - T - R L - I - R L - T - R
-t---------ll---------ll---------ll---------------lControl: Prot+Permit Permitted Protected ProtectedRights: Include Include Include Incl-udeMin.Green: 0 0 0 0 0 0 0 0 0 0 0 0
Lanes: 1 0 1 0 0 0 0 0 1 0 1 0 0 0 1 0 0 0 0 0
-t--------- |--------- l l--------- l l---------------lVol-ume Module:Base Vof:. 146Growth Adj: 1.00Initiaf Bse: 146Added Vol: 0PasserByVol: 0Initial Fut: 146User Adj : 1.00PHF Adj: 1.00PHF Volume: 146Reduct Vol: 0Reduced Vof: 146PCE Adj : 1.00MLF Adj : 1.00Final Vol. : 146
1 .001 .00
0
0
01.00 1.001.00 1.00
o 208
1 600o.941 .001500
00 160000 0.9400 1.000 1500
009400
0
6s31 .00
6531B
073r
1 .001 .0073r
0737
1 .001 .00
7 31-
01 .00
0000
1 .001 .00
000
1 .001 .00
0
0000
1.00 1
1.00 1
00
01.00 1
1.00 1
0
342.00342
800
422.00.00422
0
422.00.004Z¿
9
1 .009
009
1 .001 .00
9
09
1 .001 .00
9
2081.00
2080
0
2081 .001 .00
2080
208
0
0
0
0
1.00 1
1.00 1
0
0
0
1.00 1
1.00 1
0
01 .00
01.00 1
1
1
1
1
1
1
1
1
I60.0.
I61.0.
1600 1
0.94 1
0.00 0
1
100010
0
010000010
010000010
000
00
0
0
1
0
000
000
0000
000
0000
0
1
0
000
0
0
0
0000
0
0
0
0000
0
r --------------- | --------------- l l --------------- l l --------------- l
Saturation Ffow Modul-e:Sat/Lane: 1600 1600 1600Adjustment: 0.94 1-.00 0.94Lanes: 1 .00 1.00 0.00Final Sat.: 1500 1600 0
-t---------------lCapacity AnaÌysis Module :
Vof/Sat:Crit Moves:
600 1600.00 0.94.98 O.O2
0 1567 31tl
1600 16000.94 1.000.00 0.00
00| --------------- | I --------------- |
0.10 0.46 0.00 0.00 0.21 0.29 0.01 0.00 0.14**** ****
0.00 0.00 0.00
********************************************************************************
Traffix 7.6.0115 (c) 2003 Dowling Assoc. Licensed to URS CORP.' SANTA ANA, CA
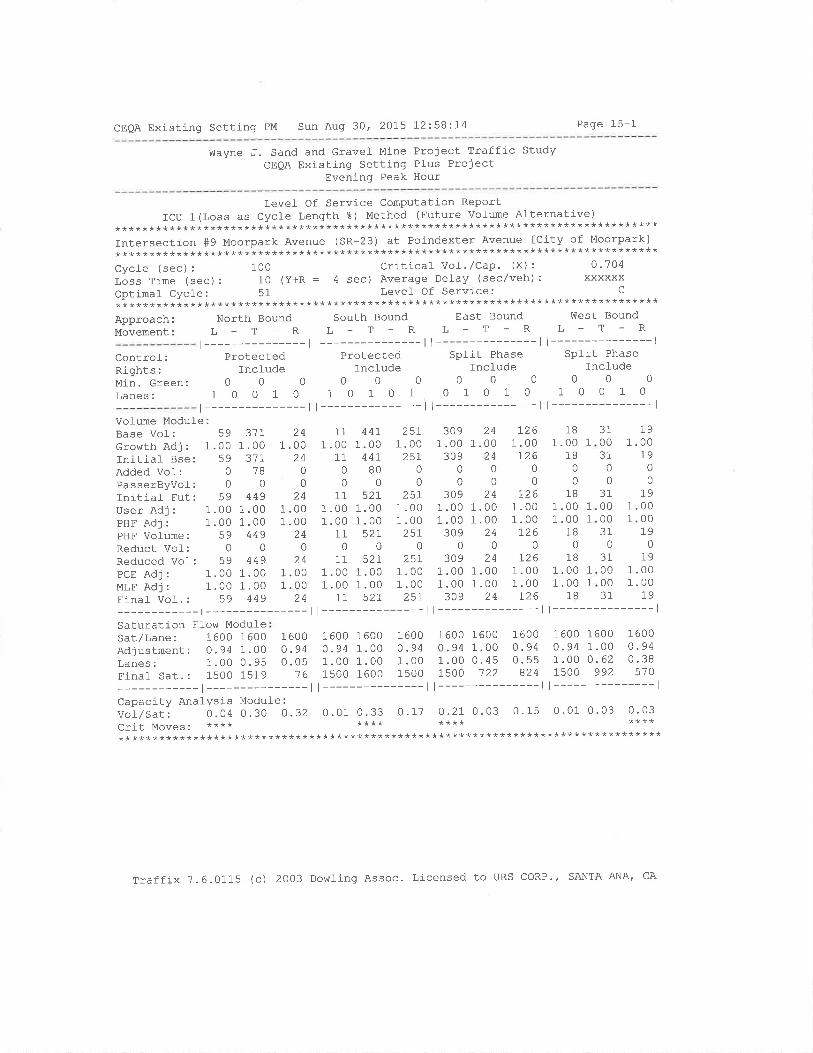
CEOA Existing Setting PM Sun Aug 30, 2015 t2:5BzI4 Page 15-1
Wayne J. Sand and Gravel Mine Project Traffj-c StudyCEQA Existing Setting Pl-us Project
Evening Peak Hour
Level Of Service Computation ReportICU 1(Loss as Cycle Length %) Method (Future vofume Afternative)
********************************************************************************Intersection #9 Moorpark Avenue (SR-23) at Poindexter Avenue [City of Moorpark]*+******************************************************************************Cycte (sec): 1OO Criticaf Vol./Cap' (X): 0'704lòss tine (sec) : 10 (y+R : 4 sec) Average Delay (sec/veh) : xxxxxxOptj-mal Cycle: 51 Level- Of Service: C
********************************************************************************North Bound South Bound East Bound vÍtrest Bound
L-T_RL-T-RL-T-RL-T-Rr---------------ll---------------ll---------------ll---------------l
Controf: Protected Protected Spfit Phase Split Phase
Rights:IncfudelncludelncÌudelncludeMin.creen: 0 O O 0 O 0 0 0 0 0 0 0
Lanes: 1 O 0 1 0 1 0 1 0 1 0 1 0 1 0 1 0 0 1 0
Approach:Movement:
Vofume Modul-e:Base Vof: 59Growth Adj : 1.00Initiaf Bse: 59Added VoI: 0PasserByvol-: 0Initiaf Fut: 59User Adj : 1.00PHF Adj : 1.00PHE Volume: 59Reduct Vol-: 0
Reduced Vof: 59PcE Adj : 1.00MLF Adj : 1.00Final Vol-.: 59
Saturation Fl-ow ModuleSat/Lane: 1600 1600Adjustment: 0.94 1.00Lanes: 1.00 0.95
r---------------ll---------------ll---------------ll---------------l31r
1 .0031r
1B0
4491 .001.00
4490
4491.001 .00
449
241.00
2400
241 .001 .00
240
241 .001.00
24
111 .00
110
0
111 .001.00
110
111 .001 .00
11
4471.00
44r80
0
52r1 .001.0052r
052r
1.001.00
527
3091 .00
3090
0309
1 .001 .00
3090
3091 .001 .00
309
241.00
2400
241.001 .00
240
241.001.00
24
1261.00
1260
0L26
1 .001.00r26
0
t261.001 .00
L26
181 .00
180
01B
1 .001 .00
1B0
1B
1 .001 .00
1B
31 1900 1.0031 190000
31 1900 1.0000 1.0031 1900
31 1900 I .0000 1.0031 19
25r1.0025r
00
25I1 .001 .0025r
025r
1.001 .0025r
T
1
1
1
1
1 600o.940 .05
1600 160o 1600 1600 1600 1600 1600 1600 16000.94 1. OO 0.94 0.94 1.00 0.94 0.94 1.00 0 -941 . OO 1.00 1 . oo 1 .00 0.45 0.55 1 .00 0. 62 0.38
FinaÌ sar.: 15OO 1519 16 1500 1600 1500 1500 '722 824 1500 992 s70
-l---------ll---------ll---------ll---------------lCapacity Analysis Module :
vo1/sut, O. 04 O .30 O .32 0. 01 O. 33 O .I1 0 .21 0.03 0. 1s 0 .01 0.03 0.03crit Moves. **** **** **** ************************************************************************************
Traffix 7.6.0115 (c) 2003 DowJ-ing Assoc. Licensed to URS CORP', SANTA ANA' CA

CEQA Existing Setting PM Sun Aug 30, 2075 12258:74 Page 16-1
V,¡ayne J. Sand and Gravef Mine Project Traffic StudyCEQA Existinq Setting Plus Project
Evening Peak Hour
LeveÌ of Service computation ReportICU 1(Loss as Cycle Length U ) Method (Future Vol-ume Al-ternative)
Intersection #10 Spring Road at Los Angeles Ave (SR-118) tcity of Moorparkl
********************************************************************************
Cycle (sec):Loss Time (sec):Optimal- CycÌe:
Approach: North BoundMovement: L - T - R
-t---------Control: ProtectedRights: IncfudeMin.Green: 0 0 0Lanes: 2 O 1 1 0
- | ---------Vofume Module:Base VoÌ : 24'7 322 64Growth Adj: 1.00 1.00 1.00Initial Bse: 241 322 64AddedVol: 0 0 0
PasserByvol-: 0 0 0Initial Fut: 241 322 64User Adj : 1.00 1 .00 1.00PHF Adj : 1.00 1 .00 1.00PHF Volume: 24'7 322 64Reduct Vol-: 0 0 0
Reduced VoI: 24'7 322 64PCE Adj : 1 .00 1 .00 1.00MLF Adj : 1 .00 1 .00 1.00Final Vof. : 241 322 64
Saturation Flor,r Modul-e:Sat/Lane: 1600 1600 1600
100 Criticaf Vol. /Cap. (X) :
10 (Y+R : 4 sec) Average Delay (sec/veh)11 Level Of Service:
South BoundL-T-
East Bound
0.840xxxxxx
D
West BoundRL_T RL T R
t---------------lProtected
Ovf000
10201t---------------l
I t--------- ll---------------lProtected Protected
Ovl Include000000
2010120201Ir--------- |---------------l
404 365 601.00 1.00 1.00404 365 60
000000
404 365 601 .00 1.00 1 .001 .00 1.00 1 .00404 365 60
000404 365 60
1.00 1.00 1.001 .00 1.00 1 .00404 365 60
t---------------l
111 9BB 3411 .00 1.00 1.00111 9BB 34r
0 80 0000
111 1068 34r1 .00 1.00 1.001.00 1.00 1.00111 1068 347
000111 1068 347
1.00 1.00 1.001.00 1.00 1.00111 1068 34L
t---------------
144 1053 4221.00 1.00 1.00144 1053 422
0 78 0
000744 r73r 422
1 .00 1.00 1 . 001 .00 1 .00 1.00144 1131 422
000144 1131 422
1 .00 1.00 1.001.00 1.00 1.00144 1131 422
t---------------t
Adjustment: 0.94Lanes: 2.00Final Sat. : 3000
1600 1600 1600 1600 1600 1600 1600 1600 16000.94 1.00 0.94 0.94 1.00 0.94 0.94 1.00 0.942 .00 1.00 1 .00 2.00 2.00 1 .00 1.00 2 .00 1 .003000 1600 1500 3000 3200 1500 1500 3200 1500
| --------------- | | --------------- | I --------------- |-t---------------lCapacity Analysis ModuÌe:Vof/Sat: 0.08 0.12 0.13
1.00 0r.61 02669
.94
.3349'7
0. 13 0.23 0.04 0.04 0.33 0.23 0 . 10 0.35 0 .28crit Moves. **** **** **** ************************************************************************************
Traffix 7.6.0115 (c) 2003 Dowlinq Assoc. Licensed to URS CORP.f SANTA ANA, CA
CEQA Existing Setting AM Sun Aug 30' 2015 13:03:55 Page 1-1
!úayne J. Sand and Gravel Mine Project Trafflc StudyCEQA Existing Setting Pfus Cumulative Plus Project
Morning Peak Hour
Scenario
Command:Volume:Geometry:Impact Fee:Trip Generation:Trip Distribution:Paths:Routes:Configuration:
Scenarío ReportCEQA Existinq Setting AM
AMAMExj-stingDefauft Impact FeeAMAMDefault PathsDefaul-t RoutesAM Existing
Traffix 7.6.0115 (c) 2003 Dowling Assoc. Licensed to URS CORP.' SANTA ANA' CA
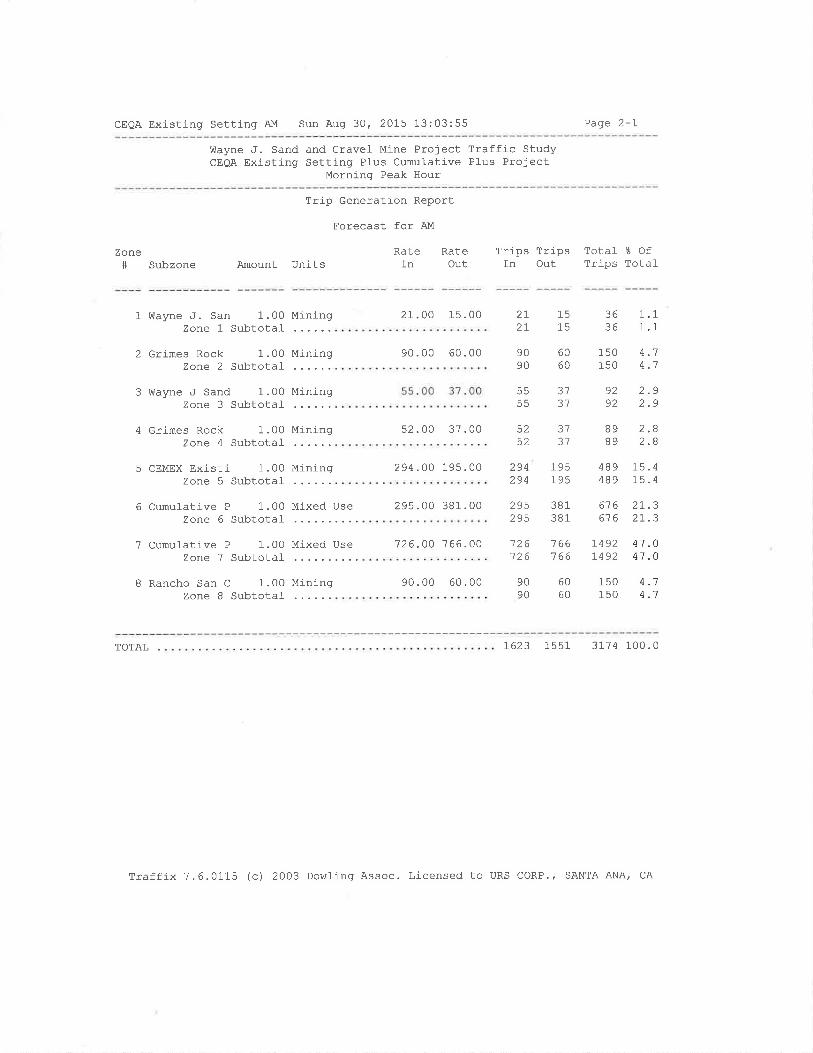
CEQA Existing Setting AM Sun Aug 30, 2015 13:03:55 Page 2-L
Wayne J. Sand and Gravel Mine Project Traffic StudyCEoA Existing Setting Plus Crmulative Plus Project
Morning Peak Hour
Zone# Subzone Amount Units
Trip Generation Report
Eorecast for AM
Rateln
RateOut
Trips Trips Total 3 OfTrips Total-In Out
1 Wayne J. San 1.00 MiningZone 1 Subtotal
2 Grimes Rock 1.00 MiningZone 2 Subtotal
3 Wayne J Sand 1.00 MiningZone 3 Subtotal
4 Grimes Rock 1.00 MininqZone 4 Subtotal
5 CEMEX Existi 1.00 MiningZone 5 Subtotal
6 Cumulative P 1.00 Mixed UseZone 6 Subtotal
7 Cumulative P 1.00 Mixed Usezone '7 Subtotal
B Rancho San C 1.00 MiningZone B Subtotal-
90.00 60.00
52.00 37 .00 Êa
294.00 195.00 294294
295.00 381 .00 295295
126.00 7 66 .O0
90.00 60.00
2r.oo 15.00 272T
1515
3636
9090
6060
150150
55EE
3'73'1
F'
31-7 I
oo
89
195195
489489
15.41( ¿
381381
61 661 6
2r.321 .3
126126
'7 66'7 66
r492r492
41 .041 .0
90 6090 60
150150
¿. '1
4.1
1.11.1
4.14-1
2.92-9
2.82.8
9292
TOTAL t623 1551 3174 100.0
Traffix 7.6.0115 (c) 2003 Dowling Assoc. Licensed to URS CORP.' SANTA ANA, CA
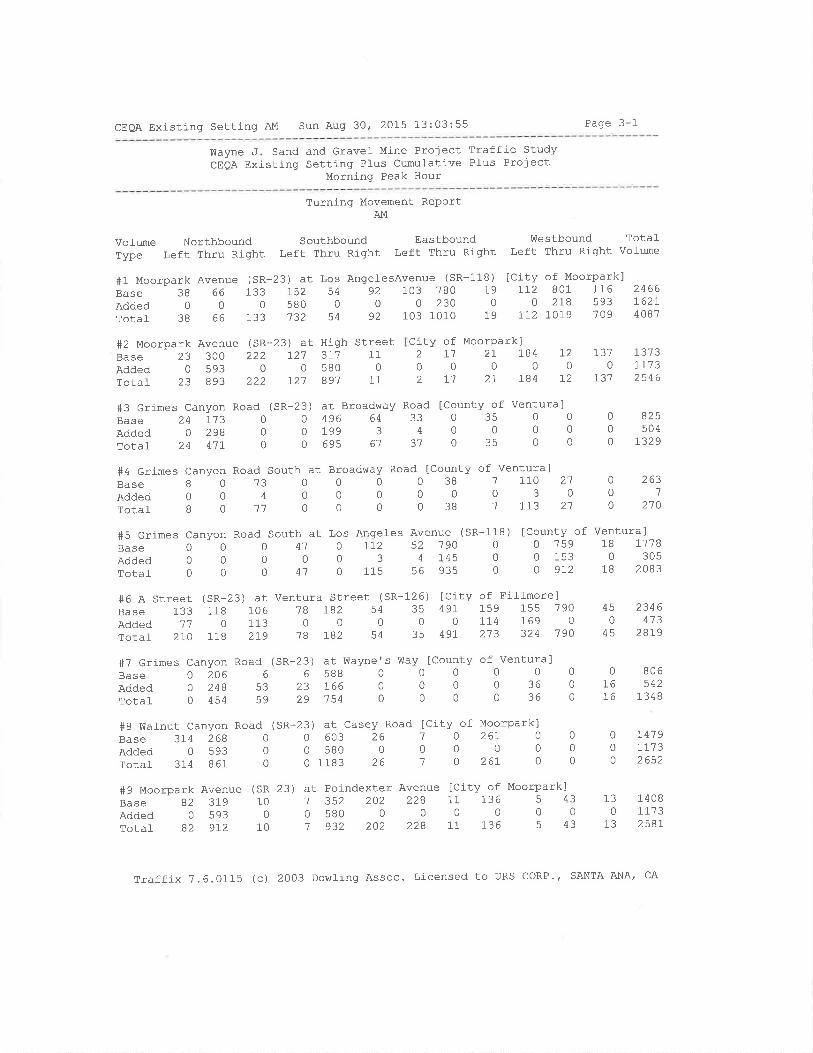
CEQA Existing Setting AM Sun Aug 30, 20L5 13:03:55 Page 3-1
Wayne J. Sand and Gravel Mine Project Traffic StudyCEQA Existing Setting Plus Cumufative Plus Project
Morning Peak Hour
Turning Movement RePortAM
Volume Northbound SouthboundType Left Thru Right Left Thru Right
Sl- Moorpark Avenue (sR-23) at Los AngeÌesAvenue (SR-118) [city of Moorpark]Base 38 66 133 752 54 92 103 ?80 79 L72 801 116
Added00058000023000278593Totaf386613373254921031010191.I2I0I9.709
Eastbound Westbound TotafLeft Thru Right Left Thru Right Volume
2466762r4081
#2 MoorparkBase 23Added 0Total 23
B
08
Avenue300593893
(SR-23) at High Street222 727 37'7 11
005800222 721 891 11
Moorparkl2L 184 12000
21 184 12
City ofI1
07'7
2
02
r310
r3'7
1373II732546
825504
L329
#3 Grimes Canyon RoadBase 24 173 0
Added O 298 0
Total 24 4'lI 0
#4 Grimes Canyon Road South at Broadway Road
BaseAddedTotal
3) at BroadI^ray Road lCounty of Ventura]0496643303s000 199 3 4 0 0 0 0
0695613103500
ICounty of Ventura]0 38 7 110 2'7
000300 38 '7 173 2'7
263'7
2'70
) [County of Ventura]0 759 18 r'7'780 153 0 3050 972 18 2083
( sR-200
0
0
00
0
0
0
00
0
000
0
00
1a
4
#5 Grimes Canyon Road South at Los Angeles Avenue (SR
BaSeAddedTotal-
o4100o41
1L2 5234
115 56
190145935
0
00
00
0
00
0
-23)000
- 1180
00
#6 A Street (SR-23) at Ventura Street (SR-126)Base 133 118 106 7B I82 54 35
Added 1'r. O 113 0 0 0 0
Totaf 27O 118 2I9 18 IB2 54 35
#7 Grirnes Canyon RoadBase O 206 6
Added 0 248 53Total- 0 454 59
#8 Watnut Canyon RoadBase 3I4 268 0
Added 0 593 0
rotal 374 861 0
#9 Moorpark Avenue (SR-23)Base 82 319 10Added 0 593 0
Total 82 9I2 10
lCity of Eillmorel49r 159 155 190
0 114 169 0
49r 2'13 324 '7 90
(SR-23) at Wayne's Way [County of Ventura]6588000000
23t6600003602s '754 0 0 0 0 36 0
at Casey Road [CitY of MoorPark]6032670261058000000
1183 26 1 0 267 0
at Poindexter Avenue ICity of Moorpark]1 352 202 228 11 136 5 43
os8oo00000'7 932 202 228 11 136 5 43
450
45
01,6
t6
806542
1348
1t10
77732652
130
13
1408TI132581
2346413
28t9
(SR000
000
Trafflx 7.6.0115 (c) 2003 Dowling Assoc. Licensed to URS CORP', SANTA ANA, cA

CEQA Existing Setting AM Sun Aug 30, 2015 13:03:55 Page 3-2
Wayne J. Sand and Gravel Mine Project Traffic StudyCEQA Existing Setting Pl-us Cumulative PIus Project
Morning Peak Hour
Vol-ume NorthboundType Left Thru Right
SouthboundLeft Thru Right
EastboundLeft Thru Right
Westbound Total-Left Thru Right Volume
#10 Spring Road at Los Angeles AveBase l-93 313 83 362 410Added00000Total 193 313 83 362 410
(SR-l-18) tCity of Moorparkl54 728 993 2I0 ',72 9'700 0 Bl_0 0 0 811
54 128 1803 2rA 12 1181
2840
284
Traffix 1.6.0775 (c) 2003 Dowling Assoc. Licensed to URS CORP., SANTA ANA, CA
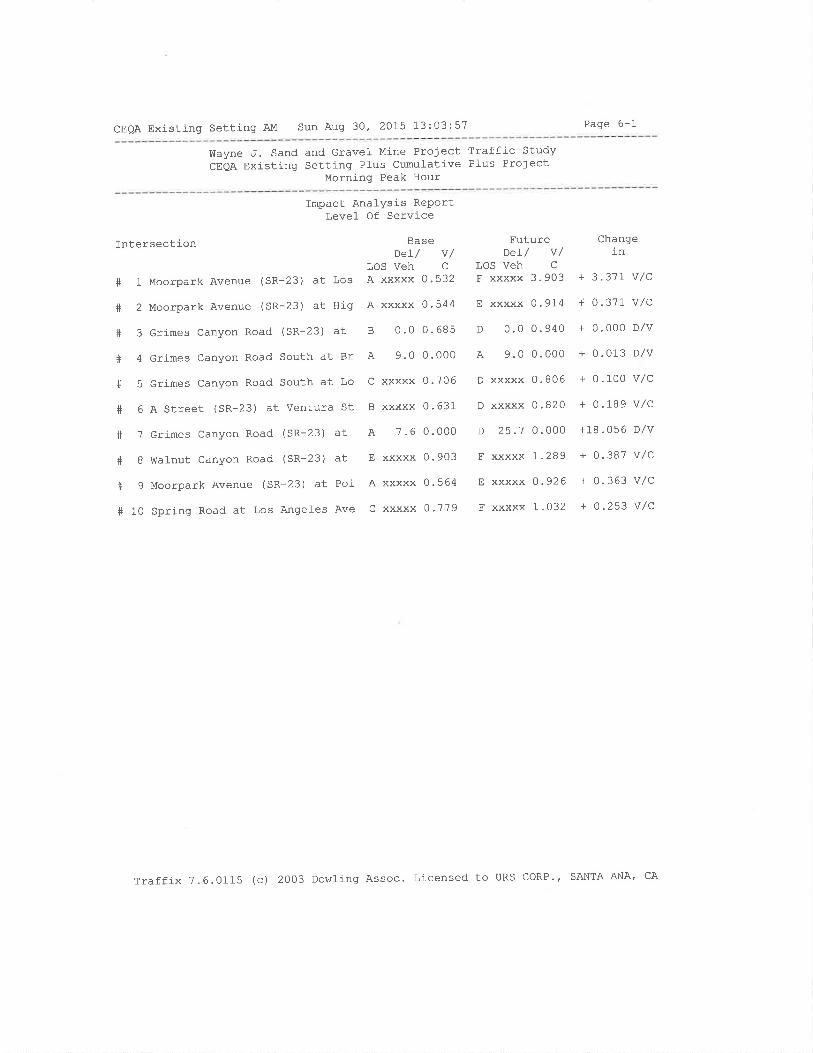
CEOA Existing Setting AM Sun Aug 30, 2015 13:03:57 Page 6-1
Wayne J, Sand and Gravel- Mine Project Traffic StudyCEQA Existing Setting Pl-us CumuÌative Plus Project
Morning Peak Hour
Intersection
#L#2#3+4#s+6+1#8+9#10
Moorpark Avenue (SR-23) at Los
Moorpark Avenue (SR-23) at Hig
Grimes canyon Road (SR-23) at
Grimes Canyon Road South at Br
Grimes Canyon Road South at Lo
A Street (SR-23) at Ventura St
crimes Canyon Road (SR-23) at
ülalnut Canyon Road (SR-23) at
Moorpark Avenue (SR-23) at Poi
Sprinq Road at Los Angefes Ave
Impact Analysis ReportLevel- Of Service
BaSeDeI/ v/
LOS Veh cA xxxxx 0.532
A xxxxx 0.544
B 0.0 0.685
A 9.0 0.000
C xxxxx 0.706
B xxxxx 0.631
A 7.6 0.000
E xxxxx 0.903
A xxxxx 0.564
C xxxxx 0.779
FutureDeI/ v/
LOS Veh C
F xxxxx 3.903
E xxxxx 0.914
D 0.0 0.940
A 9.0 0.000
D xxxxx 0.806
D xxxxx 0.820
D 25.7 0.000
F xxxxx 1.289
E xxxxx 0.926
F xxxxx 1.032
Changein
+ 3.317 v/c
+ 0.37r v/c
+ 0.000 D/v
+ 0.013 D/V
+ 0.100 V/C
+ 0.189 V/C
+18 .056 D/V
+ 0.387 v/C
+ 0.363 v,/C
+ o.253 V/C
Traffix 7.6.0115 (c) 2003 Dowling Assoc. Licensed to URS coRP., SANTA ANA' CA
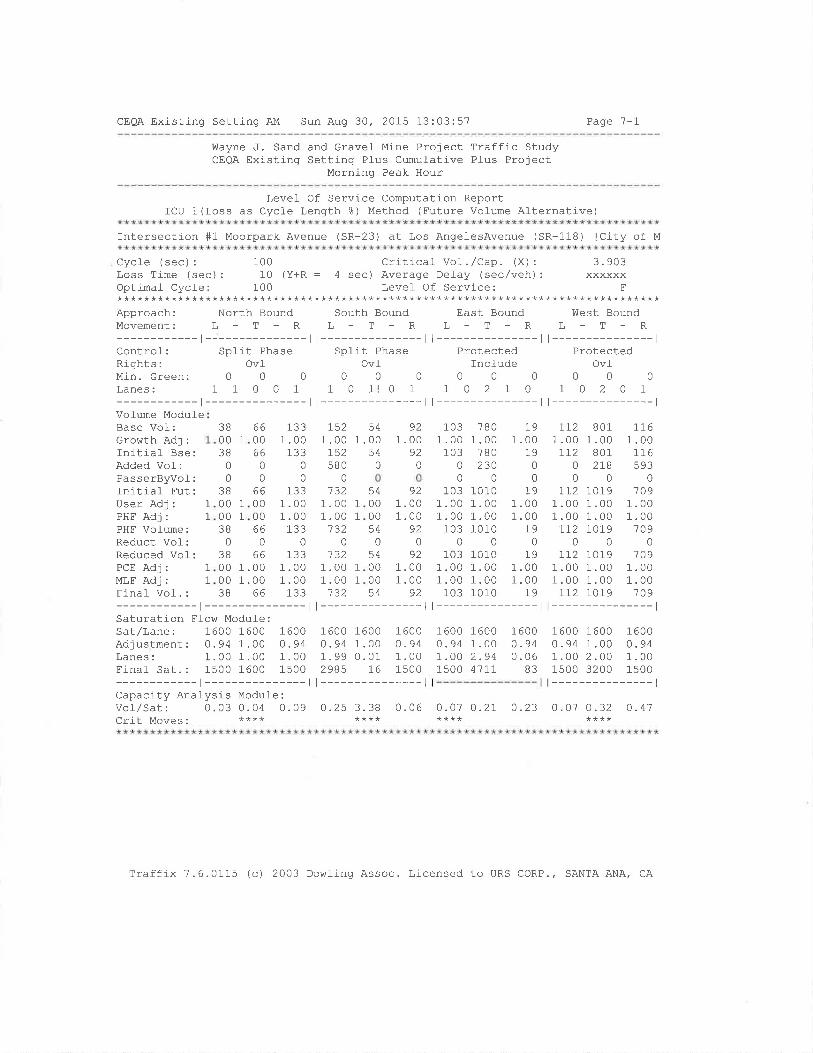
CEQA Existing Setting AM Sun Aug 30, 2015 13:03:57 Page 7-1
Wayne J. Sand and Gravel Mine Project Traffic StudyCEQA Existing Setting Plus Cumulative Plus Project
Morning Peak Hour
LeveÌ Of Service Computation ReportICU 1(Loss as Cycle Length ?) Method (Future Vofume Alternative)
Intersection #1 Moorpark Avenue (SR-23) at Los AngelesAvenue (SR-118) [City of M
Cycle (sec) : 100 Criticaf Vo1. /Cap. (X) : 3.903Loss Time (sec) : 10 (Y+R : 4 sec) Average Del-ay (sec/veh) : xxxxxxoptimal Cycle: 100 Level Of Service: F********************************************************************************Approach: North Bound South Bound East Bound V{est BoundMovement: L - T - R L - T - R L - T - R L - T - R
-t--------- |--------- l l--------- l l---------------lControf: Split Phase Split Phase Protected ProtectedRights: Ovl Ovl Include OvlMin.Green: 0 0 0 0 0 0 0 0 0 0 0 0
Lanes: 1 1 0 0 I I 0 1! 0 1 I 0 2 1 0 1 0 2 O 1
-t--------- |--------- |--------- |---------------lVoÌume ModuleBase Vol:Growth Adj:Initiaf Bse:Added Vof:PasserByvof:Initiaf Fut:User Adj:PHF Adj:PHF Volume:Reduct Vol:Reduced Vof:PCE Adj: 1
MLF Adj: 1
Final Vol. :
-t---------------lSaturation Flow Modul-e:Sat/Lane: 1600 1600 1600Adjustment: 0.94 1.00 0.94Lanes: 1.00 1.00 1.00Final- Sat.: 1500 1600 1500
-t---------------l
r52 54 921 .00 1. 00 1 .00r52 54 9258000
1600 1600 16000.94 1.00 0.941 .99 0.01 1 .002985 L6 1500t---------------l
l---------------l
3B003B
0
0
3800003B
038000038
1
660066
0
0
1331 .00
r3300
66 13300 1.0000 1 .0066 13300
66 133
921 .001 .00
920
921 .001 .00
92
103 780 191.00 1.00 1.00103 780 19
02300000
103 1010 191.00 1.00 1.001.00 1.00 1.00103 1010 19
000103 1010 19
1 .00 1 .00 1 .001 .00 1 .00 1.00103 1010 19
l---------------l
T72 801 1161.00 1.00 1.007L2 801 116
o 2I8 593000
rr2 7019 1091.00 1.00 1.001 .00 1 .00 1.00Ll-2 7019 109
000II2 IOI9 1O9
1 .00 1.00 1.001 .00 1.00 1.007r2 7019 109
t---------------l
1
1
1
1
1
1
0
1321.001.00
1320
1 .001 .00
54000054
054000054
1 .00 1 .001 .00 1 .00
66 133
1
1
1600 16000.94 1.001ñn.)OA1500 4711
T60.0.
00940683
1600 1600 16000.94 1.00 0.941.00 2.00 1.001500 3200 1500
l---------------lCapacity AnafyVof/Sat: 0
Crit Moves:
sis Module:.03 0.04 0.09 0.25 3.38 0.06 0.01 0.2r 0.23 0.O1 0.32 0.41**** **** ****
Traffix 7.6.0115 (c) 2003 Dowling Assoc. Licensed to URS CORP., SANTA ANA, CA
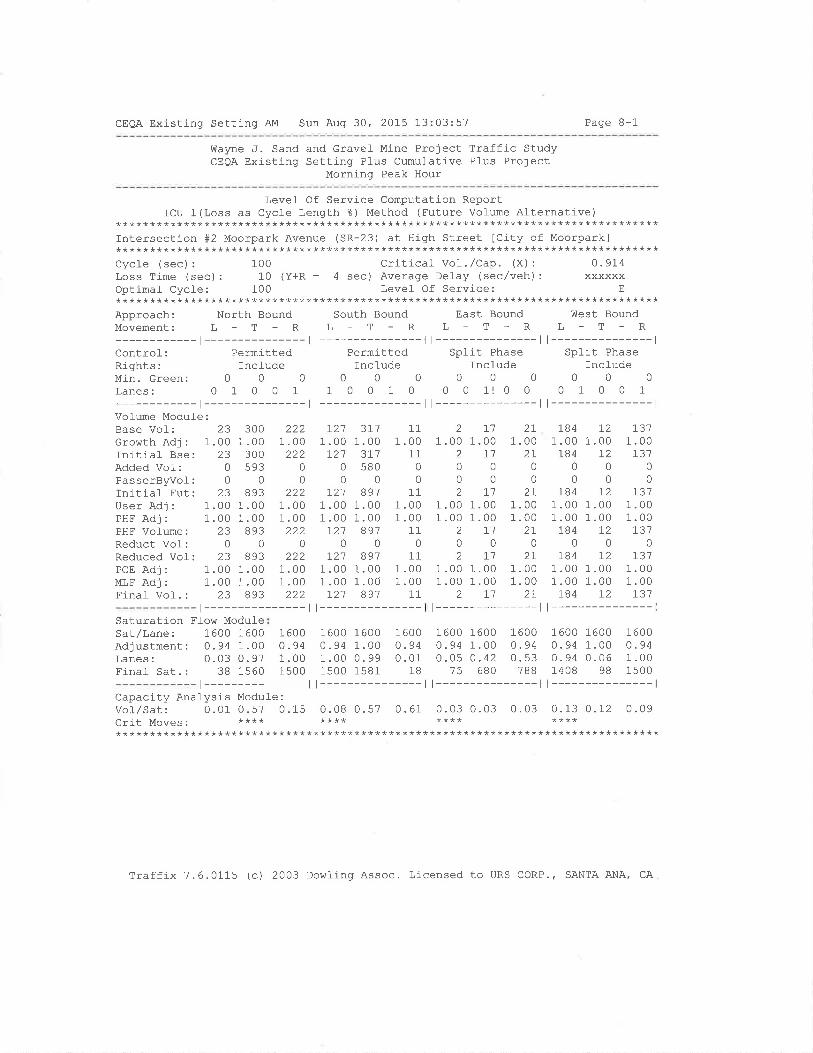
CEQA Existing Setting AM Sun Aug 30t 2015 13:03:57 Page B-1
Wayne J. Sand and Gravel Mine Project Traffic StudyCEQA Existing Setting Plus Cumulative Plus Project
Morning Peak Hour
Level Of Service Computation ReportICU 1(Loss as Cyc]e Length ?) Method (Future Volume Alternative)
********************************************************************************Intersection #2 Moorpark Avenue (SR-23) at High Street ICity of Moorpark]********************************************************************************Cycle (sec) : 100 Critical Vo1 .,/Cap. (X) : 0.914Loss Time (sec) : 10 (Y+R = 4 sec) Average Delay (sec/veh) : xxxxxxOptimal Cycle: 100 Level Of Service: E********************************************************************************Approach: North Bound South Bound East Bound West BoundMovement: L _ T - R L _ T - R L _ T - R L - T - R
-r--------- t--------- l l--------- l l---------------lControl: Permitted Permj-tted Split Phase Split PhaseRights: Incl-ude Incl-ude Include IncfudeMin.Green: 0 0 0 0 0 0 0 0 0 0 0 0
Lanes: 0 1 0 0 1 1 0 0 1 0 0 0 1! 0 0 0 1 0 0 1
-t---------------lVolume Module:Base Vof: 23 300 222crowth Adj : 1.00 1.00 1 .00Initial- Bse: 23 300 222Added VoI: 0 593 0PasserByvof: 0 0 0Initiaf Fut: 23 893 222User Adj : 1.00 1 .00 1 .00PHF Adj : 1.00 1.00 1 .00PHF Vofume: 23 893 222Reduct Vof: 0 0 0Reduced Vol: 23 893 222PCE Adj : 1.00 1 .00 1 .00MLF Adj : 1.00 1 .00 1 .00Finaf Vo1. : 23 893 222
t--------------- | t---------------l l--------------- |
t---------------l
72't 3r1 111 .00 1.00 1 .0072't 3r1 11
0s800000
r21 891 111 .00 1.00 1.001.00 1.00 1.00r21 891 11
000721 891 11
1.00 1.00 1.001 .00 1 .00 1 .00r21 891 11
t---------------
2r7271.00 1.00 1.00
2 L'7 270000002712I
1.00 1.00 1.001.00 1.00 1.00
2712r0002I12I
1 .00 1 .00 1.001 .00 1 .00 1.00
2112rt---------------l
784 12 r311.00 1.00 1.00184 t2 r31
000000
18 4 72 r3'71 .00 1.00 1.001 .00 1.00 1.00184 72 737
000784 12 737
1 .00 1.00 1.001 .00 1.00 1.00184 72 731
t---------------lSaturation Flow Modulesat/Lane: 1600 1600Adjustment: 0.94 1.00Lanes: 0.03 0.97Finaf Sat.: 38 1560
1600 1600 1600 1600 1600 1600 1600 1600 16000 .94 1.00 0 .94 0.94 1.00 0. 94 0. 94 1.00 0. 941 .00 0. 99 0.01 0.05 0.42 0.53 0. 94 0.06 1 .001500 1581 18 75 680 788 1408 98 1500
| --------------- | l--------------- | I --------------- |
Capacity Analysis Module:VoI/Sat: 0.01 0.57 0.15 0.08 0.57 0. 61 0.03 0.03 0.03 0.13 0. 12 0.09crit Moves: **** **** **** ********+***************************************************************************
1 6000.941 .001 500
l---------------l
Traffix 7.6.0115 (c) 2003 Dowling Assoc. Licensed to URS CORP., SANTA ANA, CA
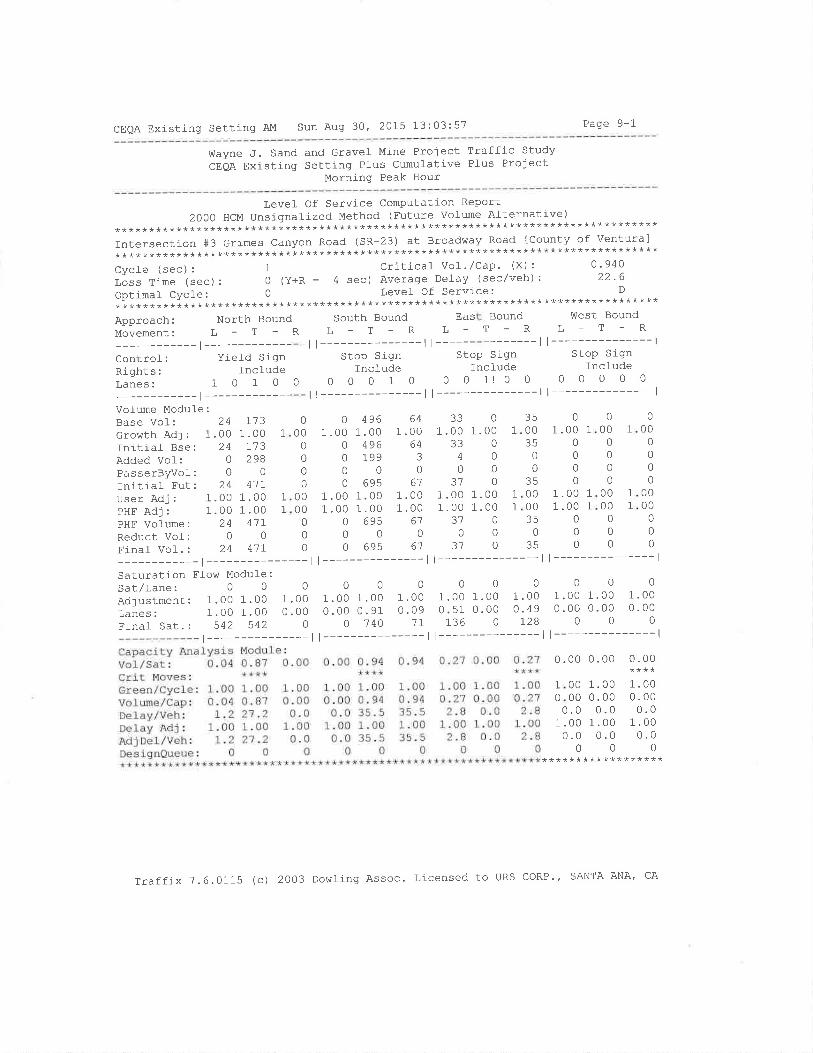
CEQA Existing Setting AM Sun Aug 30, 2015 13:03:57 Page 9-1
üIayne ,f . Sand and Gravel Mine ProjectCEQA Existing Setting Pl-us Cumulative
Morning Peak Hour
Traffic StudyPlus Project
Level Of Service Computation Report20OOHCMUnsigna.IizedMethod(FutureVolumeAfternative)
********************************************************************************Intersection #3 Grimes Canyon Road (SR-23) at Broadway Road lCounty of Ventura]********************************************************************************Cycfe (sec): 1 Criticat Vol'/Cap' (X): 0'940LoSsTime(sec):O(Y+R:4sec)AverageDelay(sec/veh):22'6Optimal Cycle: O Level Of Servicel D
********************************************************************************Approach: North Bound South Bound Eas Bound filest Bound
Movement: L - T - R L - T - R L - T - R L - T - R
-l---------ll---------ll------ll---------------lcontrol: Yield sign Stop sign stop sign stop signRights: Include Include Include IncfudelaÃes: 1 O 1 O 0 0 0 0 1 0 O 0 1! 0 0 0 0 0 0 0
-l---------ll---------ll---------ll---------------lVolume Modul-e:Base Vol- : 24crot¡rth Adj : 1.00Initial Bse: 24Added Vol: 0
PasserByvof: 0
-Ln.rt'.rar lut: z¿t
User Adj : 1.00PHF Adj : 1.00PHF Volume: 24Reduct Vol: 0
Finat VoI.: 24
7731 .00
713298
0
4171 .001.00
4110
41r
331 .00
334
0
JI
1 .001.00
310
31
350035
0
035000035
035
0
1.00 1
0
000
1.00 1
1.00 1
00
0
-t---------------lSaturation Elow Modufe:Sat/Lane: 0 0 0
Adjustment: 1.00 1.00 1.00Lanes: 1 .00 1.00 0.00Final sat. : 542 542 0
0 496 641 .00 1.00 1 .00
o 496 64019930000 695 61
1 .00 1.00 1.001.00 1.00 1 .00
0 695 6'l0000 695 6'7
t---------------l000
1 .00 1 .00 1 .000.00 0. 91 0.09
o 140 1r
t---------------000
1 .00 1.00 1.000.51 0.00 0.49136 0 r28
| --------------- l
1
000
01 .00
00
00
0
000
0
0
0
1
0000
0
0
000
000
0000
000
1
1
1
0000
0000
000
1
1
1.00 1
1.00 1
0
00
00
| --------------- I I --------------- | | ---------------
0001 .00 1 .00 1 .000.00 0.00 0.00
000t --------------- l
0.00 0.00 0.00****
1
0
00 1.0000 0.00.0 0.000 1.00
1.000 .000.0
1 .00:1
0.0 0.0 0.0000******************
Traffix ?.6.0115 (c) 2OO3 DowÌing Assoc. Licensed to URS coRP.' SANTA ANA, CA
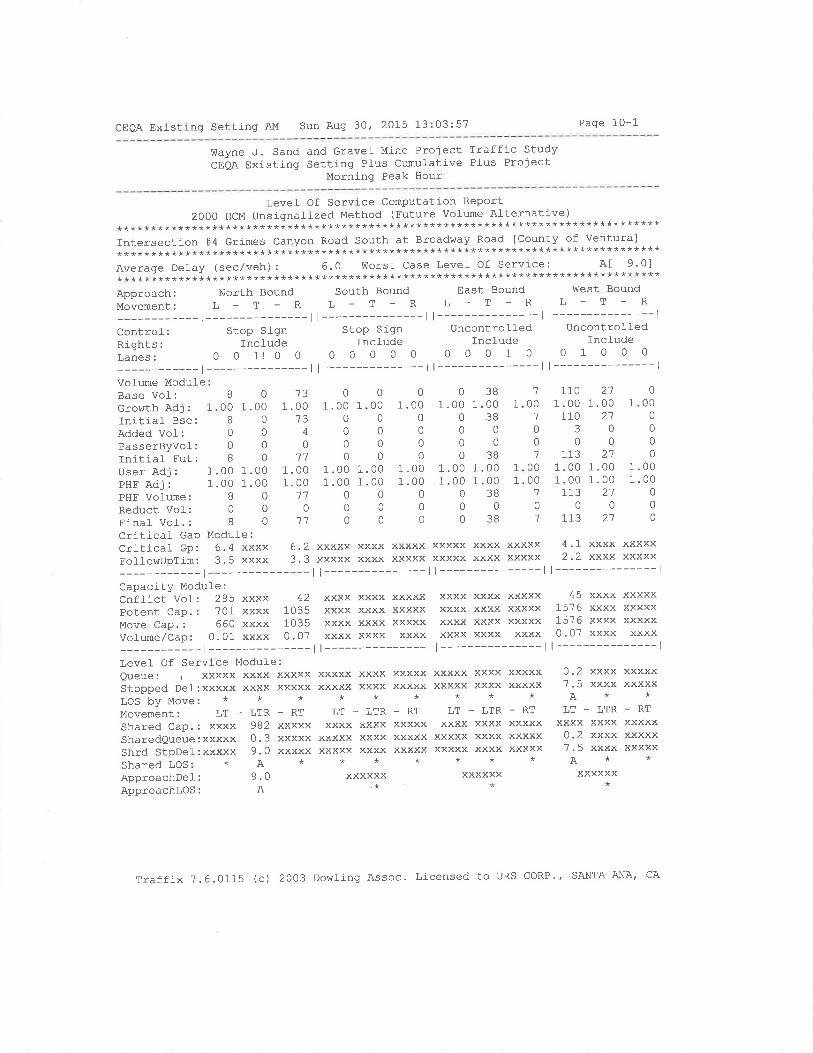
CEOA Existing Setting AM Sun Aug 30, 2075 13:03:57 Page 10-1
wayne ,f. Sand and Gravel Mine ProjectCEQA Existing Setting Ptus Cumulative
Morning Peak Hour
Traffic StudyPÌus Project
Level- Of Service Computation Report2O00HcMUnsignalizedMethod(FutureVolumeAlternative)
********************************************************************************Intersection #4 Grimes canyon Road south at Broadway Road Icounty of Ventura]********************************************************************************Average Delay (sec/veh): 6.0 Worst Case Level of service: A[ 9.0]********************************************************************************Approach: North Bound south Bound East Bound viest Bound
MoveMENt: L - T - R L - T - R L - T - R L - T - R
-l---------ll---------ll---------ll---------------lcontrol-: stop sign stop sign uncontroll-ed uncontrol-fedRights:IncludeInc]-udelncludelncludel,anes: 0 O 1l O O 0 O O O 0 0 0 0 1 0 0 1 0 0 0
-l---------ll---------ll---------ll---------------lVofume Module:Base VoI: B 0
Growth Adj : 1.00 1 .00fnitial- Bse: I 0
Added Vol: 0 0
PasserByvol: 0 0
Initiaf Eut: 8 0
User Adj : 1.00 1 .00PHF Adj : 1.00 1 .00PHF Volume: B 0
Reduct Vof: 0 0
Finaf Vof.: B 0
Critical- Gap Module:Crit j-cal Gp: 6.4 xxxxFoll-olrupTim: 3.5 xxxx
aa
1 .00aa
4
0
1 .001 .00
't'7
0'77
6.22?
01.00
000
01 .001.00
00
0
1
1.00 1.001.00 1.00
000000
1 .001 .00
00
0
20
1.00 1
380
0
381.00 1
1.00 1
JÕ
0
3B
110 2'7
.00 1.00110 21
3000
113 21.00 1.00.00 1.00113 21
00113 2'l
01 .00
0
00
0
1.001. 00
0
00
0
1.0000
00
0
1 .0000
00
000
0
00
0
'7
00 1't
00
1
00 1
00 1'7
0'7
xxxxx xxxx xxxxx xxxxx xxxx xxxxxxxxxx xxxx xxxxx xxxxx xxxx xxxxx
4.I2.2
xxxx xxxxxxxxx xxxxx
-ì---------ll---------ll---------Capacity Module:Cnffict Vof: 295 xxxx 42 xxxx xxxx xxxxx xxxx xxxx xxxxxPotent Cap.: 701 xxxx 1035 xxxx xxxx xxxxx xxxx xxxx xxxxxMoveCap.:660xxxx1035xxxxxxxxxxxxxxxxxxxxxxxxxxVofume/Cap: 0.01 xxxx 0.07 xxxx xxxx xxxx xxxx xxxx xxxx
-l---------ll---------ll---------Level Of Service Modul-e:Queue: / xxxxx xxxx xxxxx xxxxx xxxx xxxxx xxxxx xxxx xxxxxStopped Del:xxxxx xxxx xxxxx xxxxx xxxx xxxxx xxxxx xxxx xxxxxLOS bY Move: * * * * * * * * *
Movement: LT - LTR - RT LT - LTR - RT LT - LTR - RT
Shared Cap.: xxxx 982 xxxxx xxxx xxxx xxxxx xxxx xxxx xxxxxSharedQueue:xxxxx 0.3 xxxxx xxxxx xxxx xxxxx xxxxx xxxx xxxxxShrd StpDel:xxxxx 9.0 xxxxx xxxxx xxxx xxxxx xxxxx xxxx xxxxxShared LOS: * A * * * * * * *
ApproachDel: 9.0 xxxxxx xxxxxxAþproachlos: A * *
| --------------- l
45 xxxx xxxxxl-576 xxxx xxxxx1576 xxxx xxxxx0.07 xxxx xxxx
| --------------- l
0.2 xxxx7 .5 xxxxA*
LT - LTRxxxx xxxx0.2 xxxx7 .5 xxxxA*xxxxxx
xxxxxxxxxx
-RTxxxxxxxxxxxxxxx
Traffix 7.6.0115 (c) 2OO3 Dowling Assoc. Licensed to URS coRP., SANTA ANA, CA
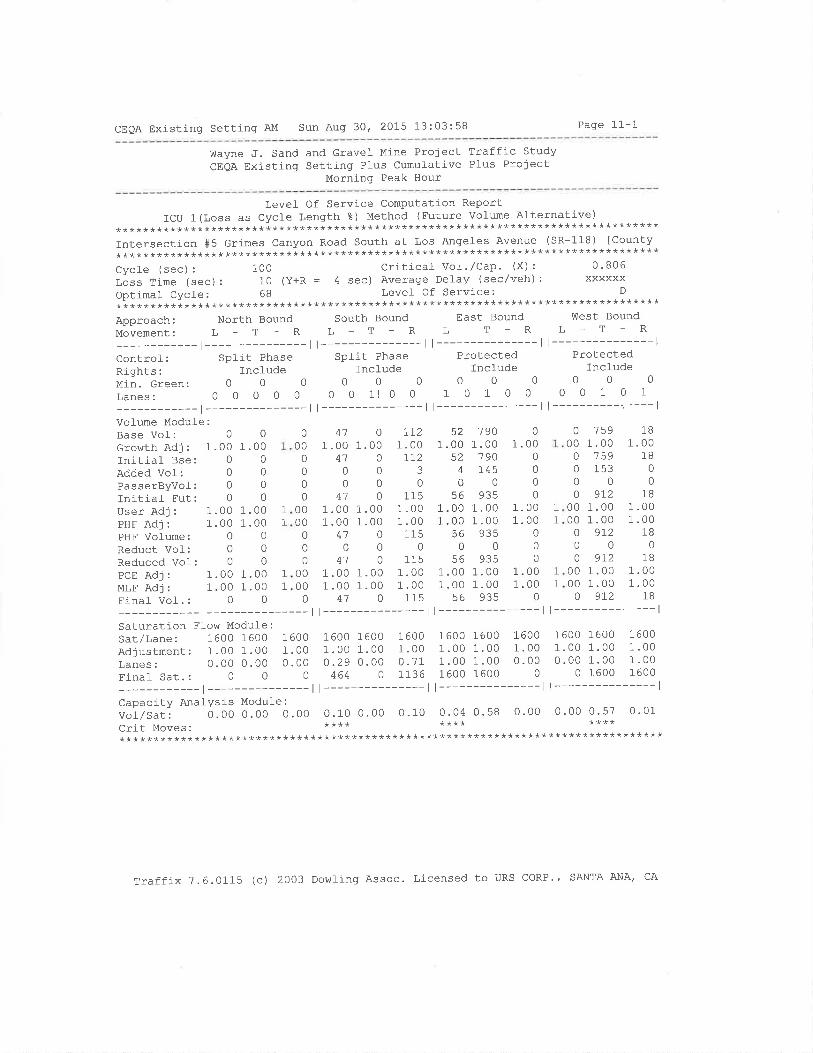
CEQA Existing Setting AM Sun Aug 30, 20L5 13:03:58 Page 11-1
Wayne J. Sand and Gravel Mine Project Traffic StudyCEQA Existj-ng Setting Plus Cumulative Pl-us Project
Morning Peak Hour
Level- Of Service Computation ReportICU 1(Loss as Cycle Length 8) Method (Future vol]-rme Alternative)
********************************************************************************Intersection #5 Grimes Canyon Road South at Los Angeles Avenue (SR-118) [County********************************************************************************Cycle (sec): 1OO Critical Vol'/Cap' (X): 0'806lãss tj_me (sec) : 10 (y+R = 4 sec) Average Defay (sec/veh) : xxxxxxOptimal Cycle: 68 Levef Of Service; D
***************************************************************************+****Approach:NorthBoundSouthBoundEastBoundwestBoundMovemeNt: L - T - R L - T - R L _ T _ R L - T _ R
-l---------ll---------ll---------ll---------------lcontrol: Split Phase split Phase Plotected ProtectedRights: Include Incl-ude Incfude Incfudel¿in. creen: O O O O 0 O 0 0 0 0 0 0
Lanes: O 0 0 O O O O 11 0 O 1 0 1 0 0 0 0 1 0 1
-l--------- I l--------- I l--------- I l----------'---- |
VoÌume Modul-e:Base Vol-:Growth Adj:Initial- Bse:Added Vol:PasserByvol:Initiaf Fut:User Adj:PHF AdJ:PHF Volume:Reduct Vol-:Reduced Vol:PCE AdJ:MLF AdJ:Final Vol-. :
001.00 1.00
00000000
1.00 1.001.00 1 .00
411.00 1
4100
000000
1.00 1 .00 1
1.00 1.00 1
00
1.00 1
1.00 1
410
411.00 1
1.00 1
41
r721 .00
IT23
011EaaJ
1.001 .00
1150
115
521.00
ta
4
056
1 .001.00
560
1B1 .00
1B00
181.001.00
180
1
1L
1
41
0
000000
0000
000
0000
0
0.00
000
0.00.00
000
.00
.000
1901.00190145
0
9351 .001 .00
9350
9351.001. 00
935
1.
1.1.
1.1.
0
0000
0
00000
00
0
0000
0
0 75900 1.000 7590 15300o 972
00 1.0000 1 .00o 9r200o 972
00 1.0000 1.000 9r2
1600 1600 16001 .00 1.00 1 .000.00 1.00 1 .00
0 1600 1600---------------l
0.00 0.57 0.01****
****************
18561.00 1 .001.00 1.00115 56
1 .001.00
18
1
L
Saturation Flow Module:Sat/Lane: 1600 1600 1600 1600 1600 1600 1600 1600Adjustment: 1.O0 1.00 1.OO 1.00 1.00 1.00 1'00 1'00l,anes: O.O0 O.0O 0.OO 0.29 0.00 0.71 1'00 1'00Fi-na1 Sat.: O O O 464 0 1136 1600 1600
-l---------ll---------ll---------Capacity Analysis Module:vo1/sat: 0. oo o. oo 0.00 0.10 0.00 0.10 0.04 0. 58
Crit Moves' **** ************************************************************
761.0.
000000
0
------ |0. 00
Traffix ?.6.0115 (c) 2003 Dowling Assoc. Licensed to URS CORP'' SANTA ANA, CA
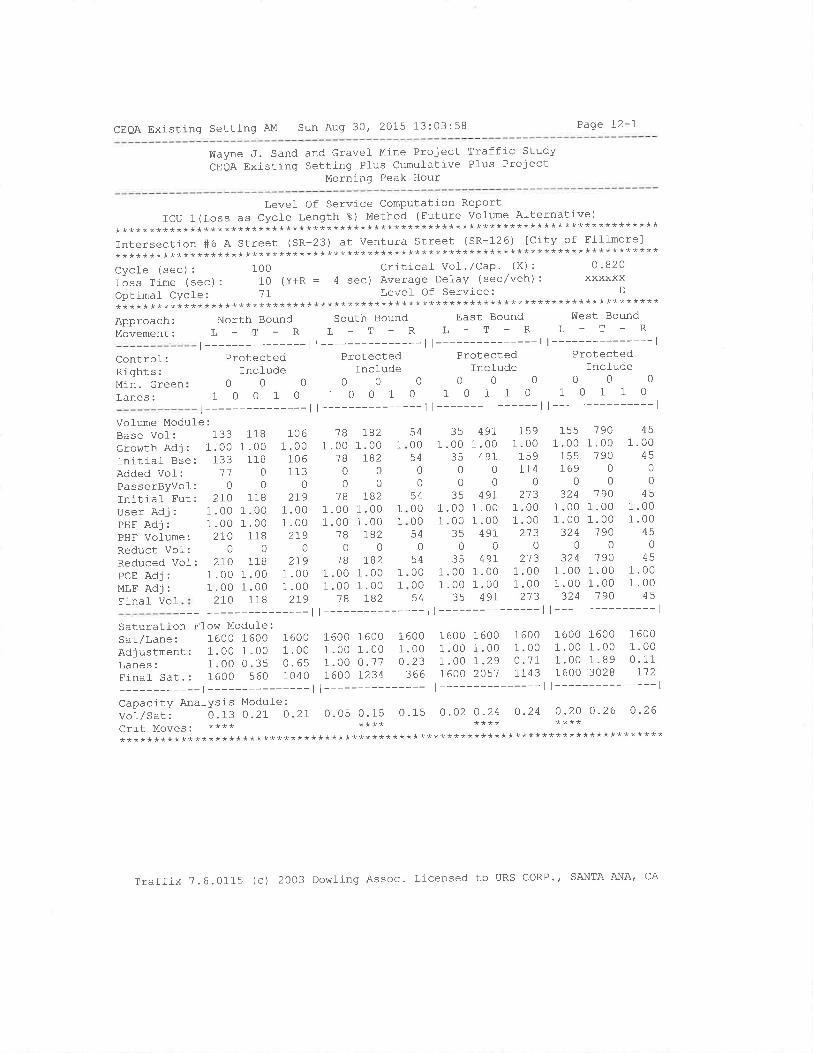
CEQA Existing Setting ÀM Sun Aug 30f 2015 13:03:58 Page 12-1
Wayne J. Sand and Gravel Mine Project Traffic StudyCEQA Existing Setting Plus Cumulative Plus Project
Morning Peak Hour
Level Of Service Computation ReportICU 1(Loss as CycÌe Length %) Method (Future volume Alternative)
********************************************************************************Intersectlon #6 A Street (SR-23) at Ventura Street (SR-126) [City of Fillmore]********************************************************************************Cycle (sec) : 1OO Critical- vol'/Cap' (x) : 0'820lãss Time (sec) : 10 (y+R : 4 sec) Average Delay (sec/veh) : xxxxxxOptimal- Cycle: 'lI Level Of Service; D
********************************************************************************Approach:Movement:
Control:Rights:Min. GreenLanes:
Vofume Module:Base Vol:Growth Adj: L
Initial Bse:Added Vof:PasserByvol:Initial- Fut:user Adl: -L
PHF Adj: 1
PHF Volume:Reduct Vol:Reduced Vol-:PCE AdJ:MLF AdJ:Final Vof
North Bound South BoundL_T-RL-T_R
| --------------- | I --------------- |
Protected ProtectedTnclude Include
0000001001010010
I --------------- | I --------------- I
East Bound West BoundL-T-RL-T-R
| --------------- | I --------------- |
Protected ProtectedInclude Include
0000001011010110
| --------------- | I --------------- |
133.00133
110
2ro.00.00270
0
1061 .00
106113
0
2l_91 .001 .00
2190
2r91 .001 .002r9
1.00 1.00 1
1.00 1.00 1
78 r8200
78 r821 .00 1.00 1
1.00 1.00 1
78 r82
351.00
3500
2tr
1.001 .00
350
1.00 1
1.00 1
3240
3241.00 1
1.00 1
324
451 .00
450
045
1.001 .00
450
45
324
35
540054
00
54000054
0
54000054
18218
210
1181.00
11800
1181 .001.00
1180
1181 .001 .00
118
18 I821.00 1.00 1
18 1820000
1551.00 1
155769
0
49L1.00
4970
0
49r1.001.00
4910
49r1.001.00
491
1591 .00
159LI4
0
2131.001.00
2'130
2131.001.00
2't3
190.00190
00
190.00.00190
0'7 90.00.00190
1.001 .00
21-O
1 .001.00
35
1.001 .00
45
Saturation Flow Module:sat/Lane: 16OO 1600 1600 1600 16OO 16OO 16OO 1600 1600 1600 1600 1600
Adjustment: 1.00 1.oo 1.oo 1.OO 1.OO 1.00 1.OO 1.00 1-00 1.00 1.00 1'00l,anes: 1. O0 O .35 O. 65 1. oo 0.77 O .23 I .OO I.29 0.71 1 .00 1. 89 0 ' 11
Finaf sat.: 1600 560 1040 1600 1234 366 1600 2057 1-143 1600 3028 1-'t2
-l---------ll---------ll---------ll---------------lCapacity AnaÌYsis Module :
voi/s.tr 0.13 0.21 O.27 0.05 0.15 0.15 O.O2 0.24 0.24 0.2O 0.26 0.26
crit Moves. **** **** **** ************************************************************************************
Traffix 7.6.0115 (c) 2003 Dowling Assoc. Licensed to URS coRP.f SANTA ANA, CA
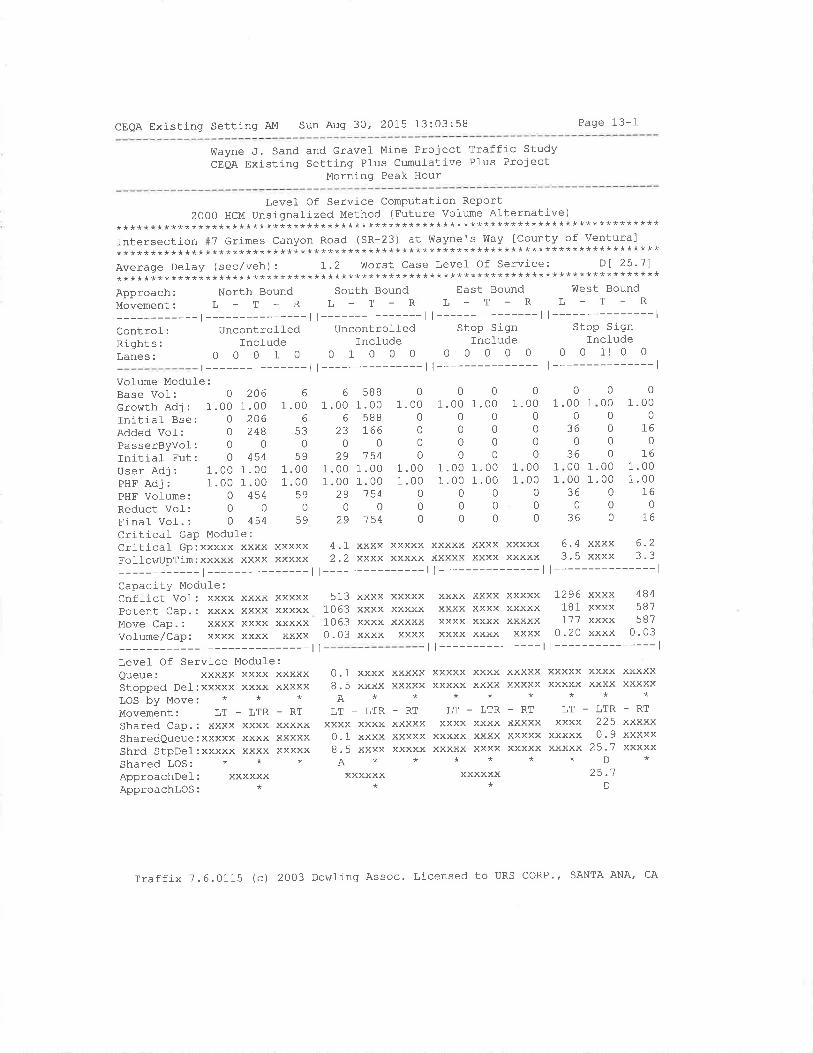
CEQA Existj-ng Setting AM Sun Aug 30, 2015 13:03:58 Page 13-1
v{ayne J. SandCEQA Existing
and GraveI Mine Project Traffic StudySetting Plus Cumufative Plus Project
Morning Peak Hour
Volume Module:Base VoI: 0 206Growth Adj : 1.00 1 .00Initial Bse: O 206Added Vof: O 248PasserByvol: 0 0
Initial Fut: 0 454User Adj : 1.00 1.00PHF Adj : 1.00 1 .00PHF Vofume: 0 454Reduct Vol-: 0 0
Final- Vol-.: 0 454
2************Intersection************Average Del-a************Approach:
T:::i:l:-___Control:Rights:Lanes:
Queue: xxxxx xxxxStopped Del:xxxxx xxxxLOS by Move: * *Movement: LT - LTRShared Cap.: xxxx xxxxSharedQueue:xxxxx xxxxShrd StpDef:xxxxx xxxxShared LOS: * *
ApproachDel: xxxxxxApproachlOs: *
01.00 1
0
360
00 1.00 1
00 1.00 1
36 000
36 0
Level- Of Service Computation ReportOO0 HCM Unsignal-ized Method (Future Volume Al-ternative)********************************************************************#7 Grirnes Canyon Road (SR-23) at Wayne's Way [County of Ventura]
********************************************************************y (sec/veh) : L.2 Worst case Level of Service: Dl 25'11********************************************************************
North Bound South Bound East Bound West Bound
L-T-RL-T-RL-T-RL-T-Rt---------------ll---------------ll---------------ll---------------l
Uncontrolled Uncontrol-Ied Stop Sign Stop SignIncfude Incfude Incl-ude Include
0 0 o 1 o o 1 0 o 0 o 0 0 0 0 0 0 1! 0 0
t---------------ll---------------ll---------------ll---------------l
6
1 .006
530
591 .001 .00
qo
0
59
6
1 .006
t?0
291.001 .00
290
29
5BB1.00
5881.66
0'7 54
1.001.00
1540
'7 54
01 .00
000
01 .001 .00
000
001 .00 1.00
00000000
1.00 1.001.00 1.00
000000
0.00
0
T60
L6.00.00I6
016
01.00
000
0
00000
36
1
0
0000
0
01
1
00 I1
Critical Gap Module:critical Gp:xxxxx xxxx xxxxx 4.1 xxxx xxxxx xxxxx xxxx xxxxx 6.4 XXxx 6-2
FollowUpTim:xxxxx xxxx xxxxx 2.2 xxxx xxxxx xxxxx xxxx xxxxx 3.5 xxxx 3'3-l---------ll---------ll---------ll---------------l
Capacity Module:Cnflict Vol: xxxx xxxx xxxxx 513 xxxx xxxxx xxxx XXxx xxxxx 1296 xxxx 484
Potent Cap.: xxxx xxxx xxxxxMove Cap.: xxxx xxxx xxxxxVol-ume/Cap: xxxx xxxx xxxx
-l---------------llLeveI Of Service Modufe:
1063 xxxx xxxxx1063 xxxx xxxxx0.03 xxxx xxxx
xxxx xxxx xxxxx 181 xxxx 587xxxx xxxx xxxxx 177 xxxx 587xxxx xxxx xxxx 0.20 xxxx 0.03
r t--------- I l---------------lxxxxxxxxxx
-RTxxxxxxxxxxxxxxx
0.1 xxxx8.5 xxxxA*
LT _ LTRXXXX XXXX0.1 xxxx8.5 xxxxA*xxxxxx
xxxxxxxxxx
- Kaxxxxxxxxxxxxxxx
xxxxx xxxxxxxxx xxxx**
LT - LTRxxxx xxxx
xxxxx xxxxxxxxx xxxx**
xxxxxx*
YYYYY
VV?YY
-RTxxxxxXXXXXxxxxx
xxxxx xxxxXXXXX XXXX**
LT - LTRxxxx 225
xxxxx 0.9xxxxx 25.7
*DaÊ azJ. I
D
xxxxxxxxxx
-RTxxxxxxxxxxxxxxx
Traffix 7.6.0115 (c) 2OO3 Dowting Assoc. Licensed to URS CORP" SANTA ANA, cA
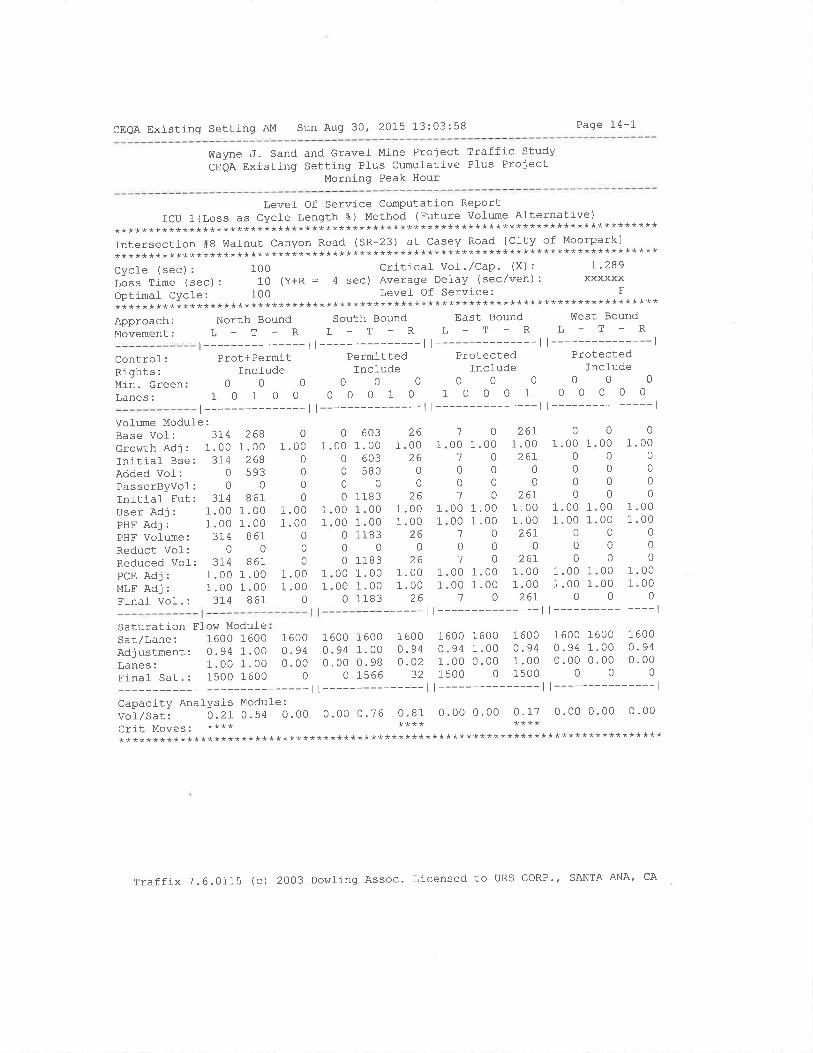
CEQA Existing Setting AM Sun Aug 30, 2015 13:03:58 Page 14-1
Wayne J. Sand and Gravel Mine ProjectCEQA Existing Setting PIus Cumulative
Morning Peak Hour
Traffic StudyPlus Project
Level- Of Service Computation ReportICU 1(Loss as Cycle Length 8) Method (Euture volume Alternative)
********************************************************************************Intersection #B wafnut canyon Road (sR-23) at Casey Road [city of Moorpark]********************************************************************************Cycle (sec) : 100 Critical Vol- ' ,/Cap ' (X) : I '289Lóss Time (sec) : 10 (y+R : 4 sec) Average Delay (sec/veh) : xxxxxxOptimal Cycle: 1OO Level Of Service¡ F
********************************************************************************Approach:Movement:
North BoundL-T-R
t---------------lProt+Permit
Incfude000
10100t---------------l
Controf:Rights:Min. GreenLanes:
Vol-ume Module:Base Vol : 31'4Growth Adj : 1.00lnitiaf Bse: 3I4Added Vol: 0
PasserByvol: 0
Initial Fut: 374User Adj : 1.00PHF Adj : 1.00PHF Volume: 3L4Reduct VoI: 0
Reduced Vof: 3I4PCE Adj : 1.00MLF Adj : 1.00Final VoI. : 3I4
Saturation FIow ModuleSat/Lane: 1600 1600Adjustment: 0.94 1.00Lanes: 1.00 1.00Einaf Sat.: 1500 1600
-l---------ll---------Capacity Analysis Modufe :
Vof/Sat: O.27 0.54 0.00 0.00 0.76Crit Moves' *******************************************
South Bound East BoundL-T-RL-T-R
| --------------- I I --------------- |
Permitted ProtectedInclude Incfude
0000000001010001
| --------------- | I --------------- |
V{est BoundL-T-R
t---------------lProtected
Include000
00000l---------------l
2681.00
268593
0861
1 .001.00
8610
8611 .001.00
861
1 .001 .00
00
0
1 .001 .00
0
0 60300 1.000 6030 580000 1183
00 1.0000 1.000 1183000 1183
00 1.0000 1.000 1183
261 .00
2600
261 .001.00
260
261 .001.00
zô
01 .00
0000
1.001 .00
0
1.00 1
0
000
1.00 1
1.00 1
01 .00
000
0
1
1
001
00't
0000
't
01
0000
'7
1
1
1
11
1
1
zbr1 .0026r
00
26r1.001 .0026r
026r
1. 001 .0026r
000
000
0
0000
0
00
0000
0
0
1.000
0
00
1.001.00
0
00
0000
0
009400
0
1
10
00
1 .001 .00
0
000
1.001.00
0
1
I1
1
1600 1
0.94 0
0.00 00
1600 16000.94 1.001.00 0.001500 0
1 6000.941 .001 500
1 6000.940.00
0
I60.n
600 1600.94 1.00.00 0. 98
0 1566
1 600o.94o.02
32
761.0.
000000
0
ll--------- ll---------------lo.81 0. oo 0.00 0.L] 0.00 0.00 0.00**** ****
*****************************************
Traffix 7.6.0115 (c) 2003 Dowling Assoc. Licensed to URS CORP', SANTA ANA' CA
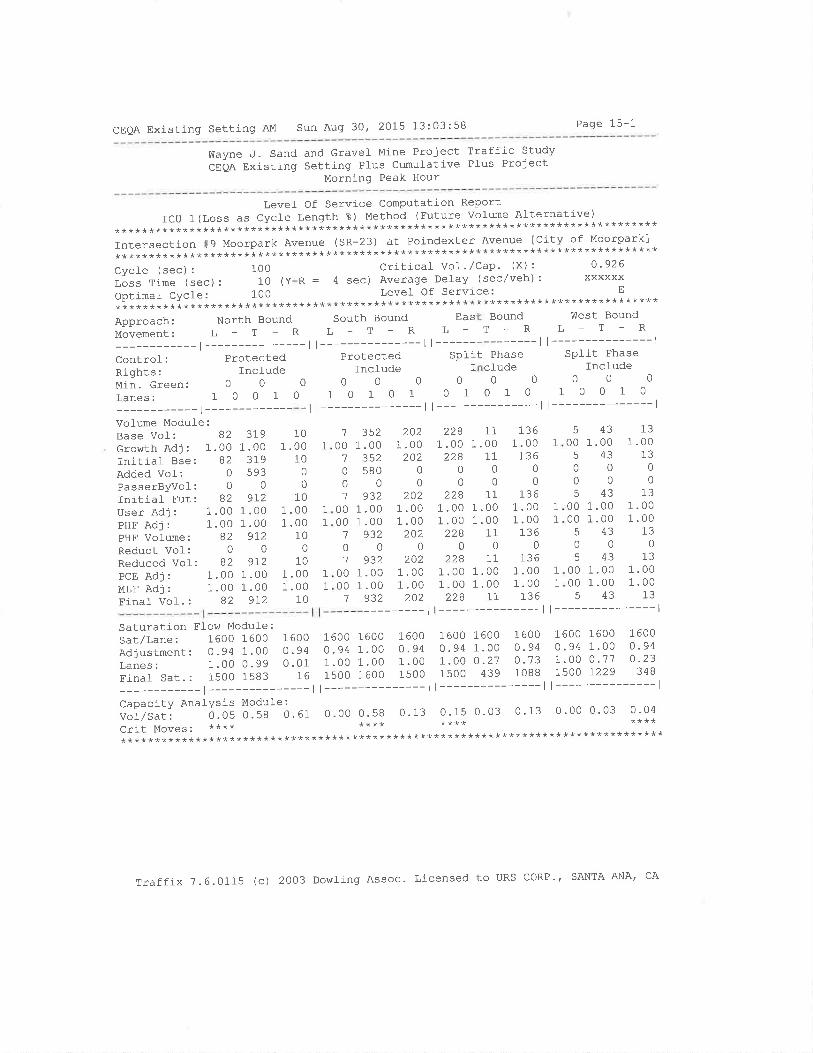
CEQA Existing Setting AM Sun Aug 30' 2015 13:03:58 Page 15-1
Wayne ,J. Sand and GraveÌ Mine ProjectCEQA Existíng Setting PIus Cumr'lÌative
Morning Peak Hour
Level- Of Service Computation ReportIcUl(LosSasCycleLengtht)Method(FutureVofumeA]-ternative)
********************************************************************************Intersection #9 Moorpark Avenue (SR-23) at Poindexter Avenue lCity of Moorpark]* * * * * * * * * * * * * * * * * x * *l * * * * * * * * * * * * * * * * * * * * * * * * * * * * * * * * * * * * * * * * * * * * * * * * * * * * * * * * * * *
Cycle (sec) : 100 Critical Vol ' /Cap' (x) : 0 '926LosSTime(sec):10(Y+R:4sec)AverageDelay(sec/veh):xxXxXXOptimat Cycle: 1OO Level Of Service: E
********************************************************************************Approachr North Bound South Bound Eas- Bound !Ùest Bound
MoveMENt: L - T _ R L - T - R L - T - R L _ T - R
-l---------ll---------ll------ll---------------lControl: Protected Protected Split Phase Split Phase
Rights; Incfude Include I clude IncludeMin.Green: O 0 O O 0 0 O O 0 0 0 0
Lanes: 1 O 0 1 O 1 0 1 O 1 0 1 O 1 0 1 0 0 1 0
-l---------ll---------ll---------ll---------------l
Traffic StudyPIus Project
Volume Module:Base Vol I 82Growth Adj : 1.00Initial Bse: 82Added VoI: 0
PasserByvol: 0
lnitial Fut: 82User Adj: 1.00PHF Adj : 1.00PHI' Volume z 82Reduct Vol: 0
Reduced Vol-: B2
PcE Adj : 1.00MLF Adj : 1.00Flnal- Vol.: 82
3191 .00
319593
0
9121.001 .00
9120
9121 .001.00
91,2
2021.00
2020
0202
1 .001 .00
2020
2021 .001 .00
202
2281 .00
22800
2281 .001 .00
zzó0
2281 .001 .00
228
111.00
1100
111 .001.00
110
111.001 .00
11
1361.00
13600
1361.001 .00
1360
1361 .001.00
136
5
005
0
05
0000
q
0
0000
q
431.00
4300
431 .001.00
430
431.001 .00
43
131.00
,LJ
0
0
t_3
1.001 .00
130
131.001.00
13
l_0
1.00 1
100
010
1.00 1
1.00 1
100
101.00 1
1.00 1
10
't 35200 1.00't 3520 580001 932
00 1.0000 1.001 932001 932
00 1.0000 1.001 932
1
1
1
1
1
Saturation Flow Module:Sat/Lane: 1600 1600 1600Adjustment: 0.94 1.00 0.94Lanes: 1.00 0.99 0.01Final Sat.: 1500 1583 76
-t---------Capacity AnalYsis Module :
Vof/Sat: 0.05 0.58 0. 61
Crit Moves' ********************************
1600 16000.94 1.001 .00 0.777500 1229
|--------- ll--------- ll---------------l
0. oo o. sB 0.13 0.15 o. 03 0.13 0 .00 0.03 0.04**** **** ++**
****************************************************
1600 16000.94 1.001 .00 1.001s00 1600
0.941 .001500
1600 16000.94 1.00r .00 0.2'l1500 439
1 6000.940.731088
1 600o .94U. ZJ
348
1 600
Traffix ?.6.0115 (c) 2OO3 Dowling Assoc. Licensed to URS coRP., SANTA ANA, CA
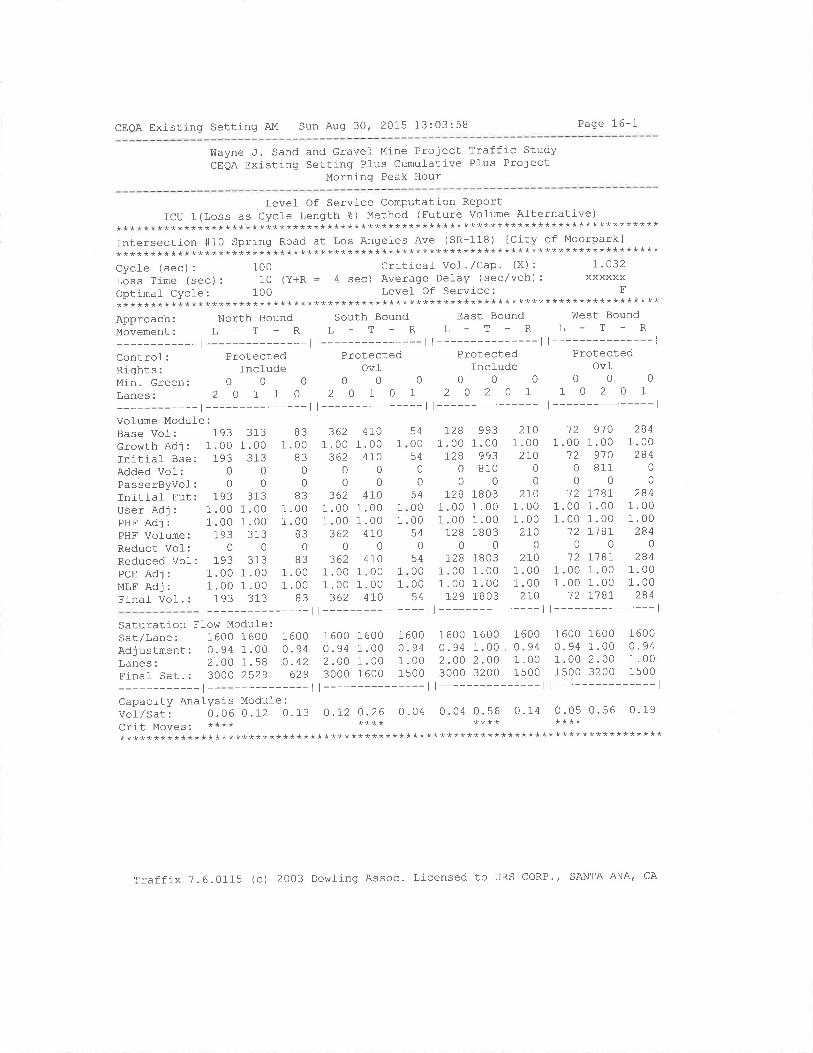
CEQA Existing Setting AM Sun Auq 30, 2015 13:03:58 Page 16-1
Wayne J. Sand and Gravel Mine Project Traffic StudyCEQA Existing Setting Pfus Cumul-ative Pfus Project
Morning Peak Hour
Level Of Service Computation ReportICU 1 (Loss as Cycle Lenqth %) Method (Future vofume Alternative)
********************************************************************************Intersection #10 Spring Road at Los Angeles Ave (SR-118) tcity of Moorparkl********************************************************+***********************Cycle (sec): 100 Criticaf Vol'/Cap' (X): I'O32Loss Time (sec) : 10 (Y+R = 4 sec) Average DeJ-ay (sec/veh) : xxxxxxOptimat Cycle: 100 Level- Of Service; E
********************************************************************************Approach: North Bound south Bound East Bound west Bound
MoveMCNt: L _ T _ R L - T - R L - T - R L - T - R
-l---------ll---------ll---------ll---------------lControl: Protected Protected Protected ProtectedRights: Incfude Ovl- Include Ovl-
Min.creen: O O O 0 0 O 0 0 0 0 0 0
Lanes: 2 O 1 1 O 2 0 1 0 1 2 O 2 0 1 1 O 2 0 1
-l---------ll---------ll---------ll---------------lVolume Module:Base Vof: 193Growth Adj : 1.00Initial Bse: 193Added Vol: 0PasserByvol: 0Initial Fut: 193User Adj: 1.00PHE Adj : 1.00PHF Vofume: 193Reduct VoÌ: 0Reduced Vol: 193PCE Adj : 1.00MLF Adj : 1.00Final Vol.: 193
3131.00
31300
3131.001 .00
3130
3131 .001.00
313
B31.00
B30
0
B31 .001 .00
B30
B31 .001.00
B3
4101 .00
4L000
4101.001.00
4100
4101 .001.00
410
540054
0
054000054
0
54000054
r281.00
r2800
I2B1 .001.00
L2B0
I2B1.001.00
I2B
9931.00
993810
018031.001.001803
0
18 031.001.0018 03
2101.002ro
00
2r01 .001.002r0
0
2r01.001.002r0
12.0012
0
0
12.00.0012
0
12.00.0012
9101.00
9'l o811
0
1? 811.001 .0017 81
017 811.001.00I18I
2841.00
28400
2841.001.00
2840
2841 .001.00
284
3621 .00
36200
3621 .001 .00
3620
5ÕZ
1 .001.00
362
1
1
1
1
1
1
1
1
1
1
t---------------ll---------------ll---------------ll---------------lSaturation Flow Module:sar/Lane: 160O 16OO 16OO 1600 1600 1600 1600 1600 1600 1600 1600 1600
Adjustment: 0.94 1 . OO 0.94 0.94 1.00 o. 94 0. 94 1.00 . 0. 94 0.94 1 .00 O -94
l,anes: 2.00 1.58 0.42 2.OO l.oo 1.oo 2.oo 2.00 1.00 1.00 2.00 1.00Finat sat.: 3OOO 2529 629 3OOO 1600 1500 3000 3200 1500 1500 3200 1s00
-l---------ll---------ll---------ll---------------lCapacity Anafysis Modufe:vor/sat: 0. 06 0.12 0.13 0 .12 0.26 0. 04 0.04 0. 56 0. 14 0.05 0.56 0 - 19
Crit Moves' **** **** **** ************************************************************************************
Traffix ?.6.0115 (c) 2OO3 Dowling Assoc. Licensed to URS CORP', SANTA ANA' CA
CEOA Existing Setting PM Sun Aug 30, 2015 13:04:39 Page 1-1
tr{ayne J. Sand and Gravel Mine Proiect Traffic StudyCEQA Existing Setting Plus Cumulatj-ve Plus Project
Evening Peak Hour
Scenario
Conìnand:Vol-ume:Geometry:Impact Fee:Trip Generation:Trip Distribution:Paths:Routes:Configuration:
Scenario RePortCEQA Existing Setting PM
PM
PM
ExistingDefault Impact EeePM
PM
Default PathsDefault RoutesPM Existinq
Traffix 7.6.0115 (c) 2OO3 Dowling Assoc. Licensed to URS CORP., SANTA ANA, CA
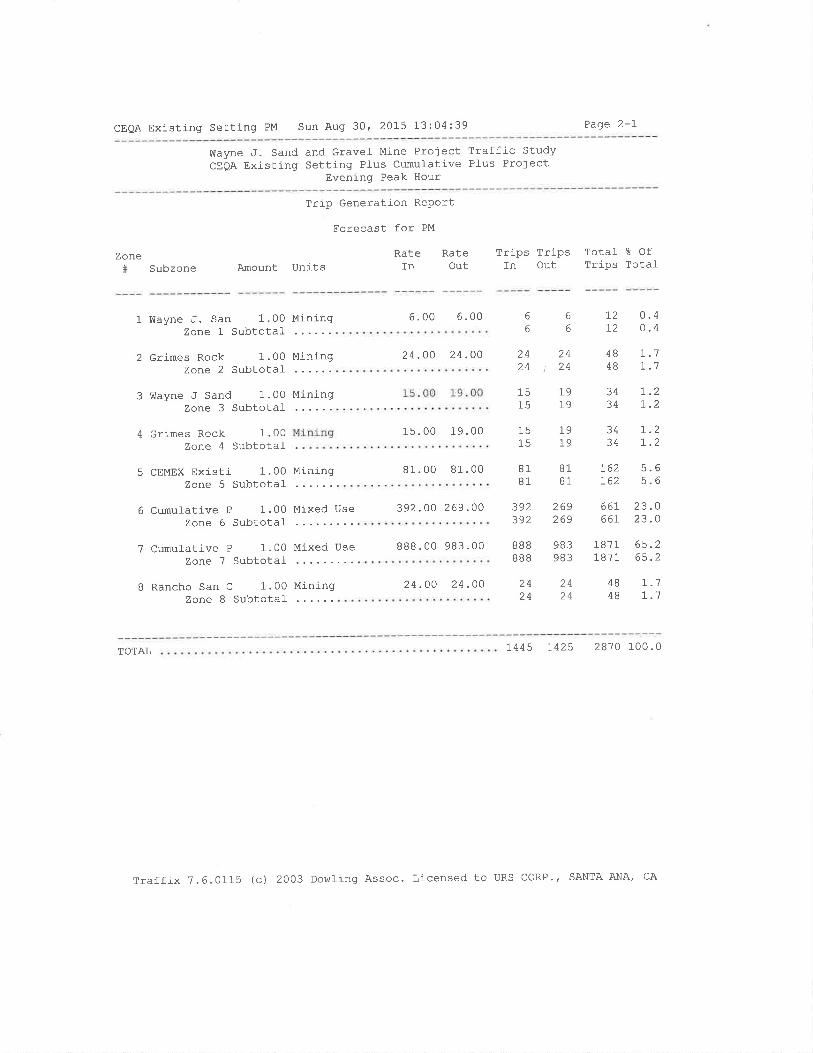
CEQA Existing Setting PM Sun Aug 30, 2015 13:04:39 Page 2-L
VìIayne .f. Sand and Gravel Mine Project Traffic StudyCEQA Existj-ng Setting Plus Cumulative Plus Project
Evening Peak Hour
Zone# Subzone
Trip Generatlon Report
Forecast for PM
Rate RateArnount Units In Out
Trips Trips Total % OfTrips TotafIn Out
1 Wayne J. San 1.00 Miningzone 1 Subtotal
2 Grimes Rock 1.00 MiningZone 2 Subtotaf
3 !Íayne J Sand 1.00 MiningZone 3 Subtotaf
4 Grimes Rock 1.00Zone 4 Subtotal-
5 CEMEX Existi 1.00 Miningzone 5 Subtotaf
6 Cumufative P 1.00 Mixed UseZone 6 Subtotaf
7 Cumufative P 1.00 Mixed Usezo^e 7 Subtotal
B Rancho San C 1.00 MiningZone 8 Subtotal
24.OO 24.00 24 2424
484824
24.OO 24.OO
1s.00 19.00
392.00 269.00
888.00 983.00
81.00 81 .00 81
I2T2
4B48
1515
191-9
3434
1515
19l_9
B181
L62t62
6.00 6.00 6666
ñA
o.4
I.1L.'1
24 2424t24
r.2r.z
5.65.6
L.'7I.'1
7.2r.2
3434
B1
392392
BB8BB8
269269
983983
23.023.O
66t66r
1871 65.21871 65.2
TOTAL 1445 1425 2870 100.0
Traffix 7.6.0115 (c) 2003 Dowling Assoc. Licensed to URS coRP., SANTA ANA, CA
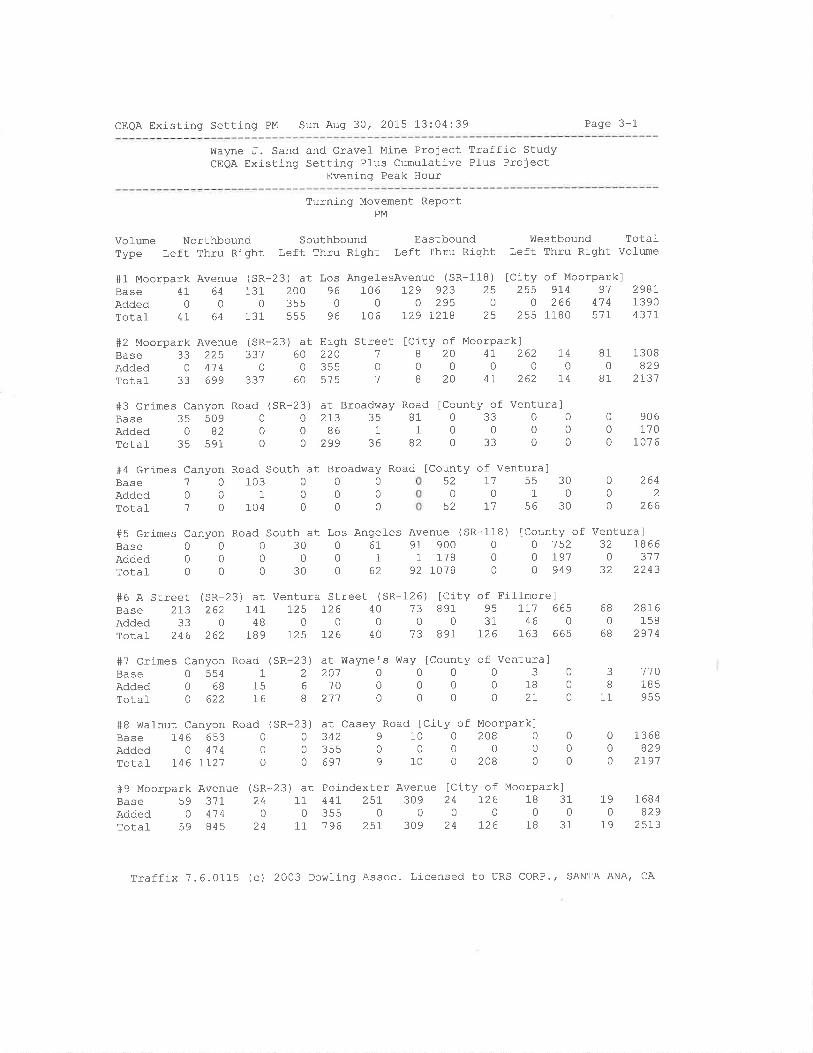
CEQA Existing Setting PM Sun Aug 30, 2015 13:04:39 Page 3-1
Wayne ,J. Sand and Gravel Mine Project Traffic StudyCEQA Existing Setting Plus Cumulative Pl-us Project
Evenì-ng Peak Hour
Turning Movement ReportPM
Vofume Northbound Southbound EastboundType Left Thru Right Left Thru Right Left Thru Right
#1 Moorpark Avenue (SR-23) at Los AnqelesAvenue (SR-118)Base 41 64 131 20O 96 106 I29 923 25Added0003550002950Totaf 41 64 131 555 96 106 I29 7278 25
Westbound Total-Left Thru Right Vo]ume
[City of Moorpark]255 914 91 29Br
0 266 41 4 13902s5 1180 571 431r
#2 Moorpark Avenue (SR-23) at High Street [City of Moorpark]Base 33 225 337 60 22O
Added 0 414 0 0 355Total- 33 699 331 60 575
#3 Grimes Canyon Road (
Base 35 509 0
Added 0 82 0Total 35 591 0
¿U
020
470
47
810
81
1
01
B
0I
262 1400
262 74
1308829
2r37
2642
266
2BI6158
29'7 4
110185955
13 68829
2791
1684829
2s73
R-a 23) at Broadhray Road lcounty of Ventura]0213358103300 86 1 1 0 0 0
029936820330
52 7'7 55 300010
52 7'7 56 30
0
00
0
0
0
0
00
000
0
00
000
7
0'7
680
6B
000
906170
L01 6
#4 Grimes Canyon Road South at Broadv¡ay Road lCounty of Ventura]BaseAddedTotaf
#6 A StreetBase 273Added 33Total 246
1031
104
#5 Grimes Canyon Road South at Los Angel-es Avenue (
Base0003006191900Added0000011178rotal 0 0 0 30 0 62 92IO1B
SR - 118000
) lCounty of Ventura]0 152 32 18660 1,91 0 31'70 949 32 2243
(SR-23) at Ventura Street (SR-126)262 r41- r25 726 40 '73
0 48 0 0 0 0
262 189 r25 126 40 13
ICity of Filfmore]891 95 tIl 665
0 31 46 0891 726 163 665
#7 Grimes Canyon Road (
Base 0 554 1
Added 0 68 15Total 0 622 76
#B Walnut Canyon Road (
Base 146 653 0
Added 0 414 0
Total 146 II21 0
#9 Moorpark AvenueBase 59 31LAdded 0 414Total- 59 845
at Wayne's Way lcounty of Ventura]201000030100000180
2'7'70000210
at Casey Road [City of Moorpark]342910020803550000069191002080
(SR-23) at Poindexter Avenue ICity of Moorpark]24 11 44r 25r 309 24 126 18 310035s000000
24 11 196 25r 309 24 126 18 31
000
000
3)2
6
B
3)0
0
0
2
2
SR
SR
J
B
11
190
79
Traffix 7.6.0115 (c) 2003 Dowling Assoc. Licensed to URS coRP., SANTA ANA/ CA
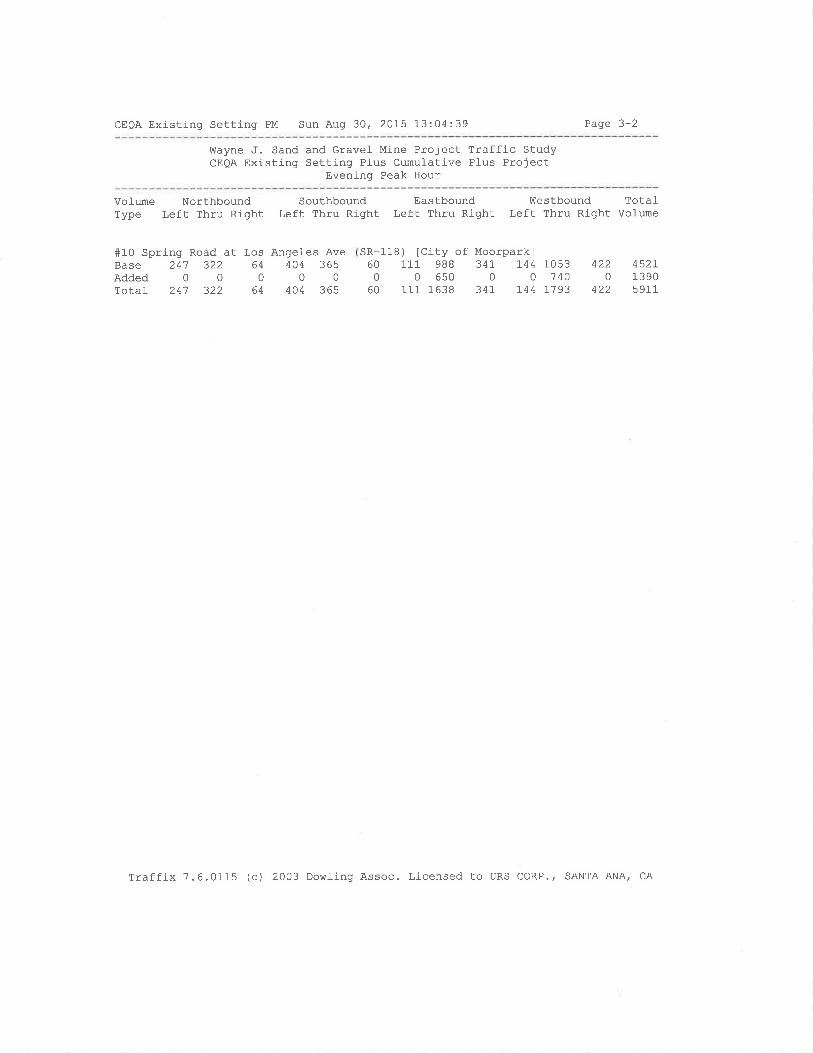
CEQA Existing Setting PM Sun Aug 30, 2015 13:04:39 Page 3-2
Wayne J. Sand and Gravel Mine Project Traffic StudyCEQA Existing Setting Pl-us Cumulative Pfus Project
Evening Peak Hour
VolumeType
NorthboundLeft Thru Right
SouthboundLeft Thru Right
Eastbound !ùestbound TotalLeft Thru Right Left Thru Right Volume
#10 Spring Road at Los Angeles AveBase 241 322 64 404 365Added00000Totaf 247 322 64 404 365
SR-118) [City of Moorpark]60 111 988 341 144 10530 0 650 0 0 '740
60 111 1638 341 r44 7793
4220
422
452r13 905 911
Traffj-x 7.6.0115 (c) 2003 Dowling Assoc. Licensed to URS CORP., SANTA ANA/ CA
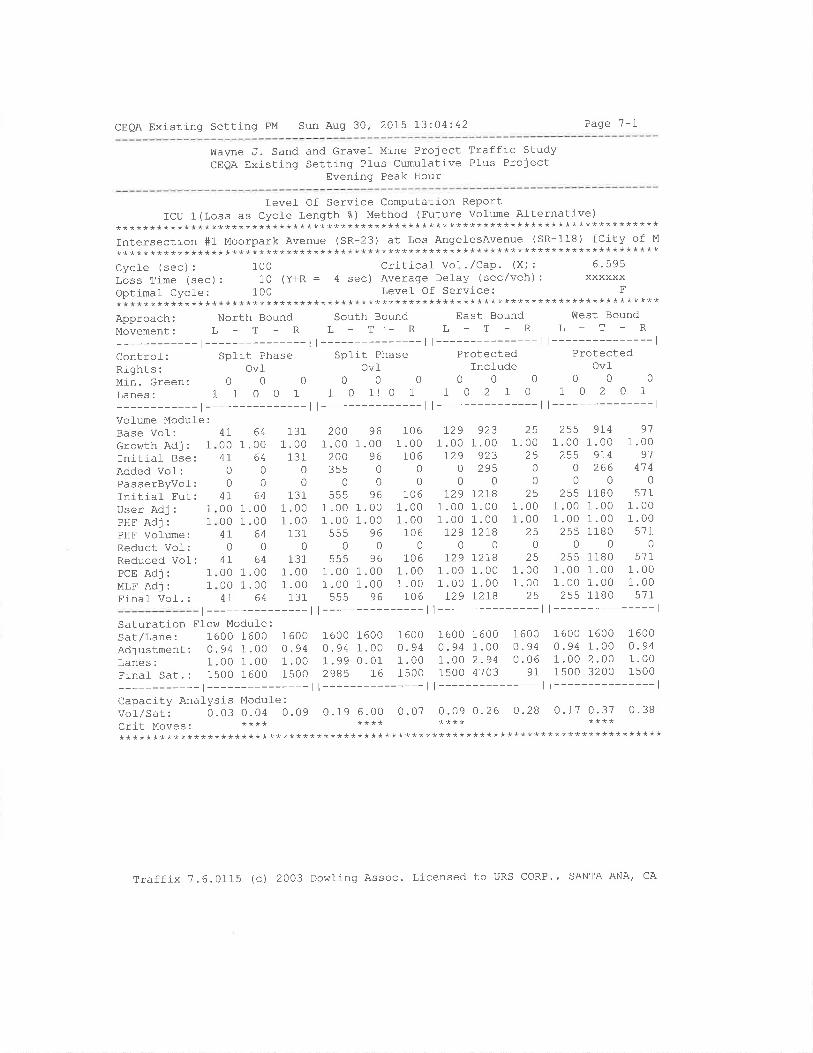
CEQA Existing Setting PM Sun Aug 30, 2015 13204l.42 Page 7-1
Wayne ,1. Sand and Gravel Mine Project Traffic StudyCEQA Existing Settinq Plus Cumulative Plus Project
Evening Peak Hour
Levef Of Service Computation Reportfcu 1(Loss as CycJ-e Length %) Method (Futule vofume Alternative)
********************************************************************************Intersection s1 Moorpark Avenue (sR-23) at Los AngelesAvenue (SR-118) [City of M
********************************************************************************Cycle (sec): 1OO Critical Vol./Cap' (X): 6'595lãss Time (sec): 10 (Y+R : 4 sec) Average Delay (sec/veh): xxxxxxOptimaÌ Cycle: 1OO Level Of Service: F
********************************************************************************Approach: North Bound south Bound East Bound !Ùest Bound
MovemêNt: L - T - R L - T ,- R L - T - R L _ T - R
-r---------ll---------ll---------ll---------------lcontrof: sptit Phase split Phase Protected ProtectedRiqhts: OvÌ Ovl- Include OvfMin.creen: O 0 O O O 0 0 0 0 0 0 0
Lanes: 1 1 O O 1 1 O 1! 0 1 1 0 2 1 0 1 0 2 O I-l---------ll---------ll---------ll---------------l
Volume Module:Base Vol-:Growth Adj: 1
Initial- Bse:Added Vol:PasserByvol-:Initiaf Fut:User Adj: 1
PHF Adj: 1
PHF VoIUMC:Reduct Vol:Reduced Vol:PCE Adj: 1
MLF Adj: 1
Final Vof. :
4I004L
00
4I00004I
0
4l00004I
641 .00
640
0
641 .001 .00
640
641 .001.00
64
1311.00
13100
1311.001 .00
1310
1311 .001 .00
131
200I .00
200355
0
5551 .001 .00
ttrtr
0555
1 .001.00
trtrE
961.00
960
096
1.001.00
960
961.001.00
96
1061.00
10600
1061.001 .00
1060
1061 .001.00
106
7291.00r29
00
7291 .001 .00
1290
1291 .001 .00
729
9231.00
923295
012r81.001.007218
0
12781.001 .0012I8
251.00
250
0z3
1 .001 .00
250
251.001.00
25
2551 .00
25500
2551 .001 .00
,cq0
2551 .001.00
255
9r41.00
914266
0118 01 .001.00t1B0
0118 01.001.00118 0
911.00
9141 4
0
51I1 .001 .00
5710
5711.001.00
571
t---------------ll---------------ll---------------ll---------------lSaturation Flo\^, Module:sar/Lane: 1600 16OO 1600 160O 1600 1600 1600 1600 1600 1600 1600 1600
Adjustment: 0.94 1.OO 0.94 0.94 1.OO 0.94 0.94 1.00 0.94 0.94 1.00 0.94Lanes: 1.OO 1.00 1.00 1.99 O.01 1.00 I.00 2.94 0.06 1.00 2.00 1.00Finat sat.: 1500 1600 15OO 2985 16 1500 1500 4703 91 1500 3200 1500
-l---------ll---------ll---------ll---------------lCapacity Anal-ysis Module :
vol,zsat: O. 03 0. 04 O. 09 0.19 6. OO 0.07 0 .O9 O.26 O .28 0.17 0.37 0.38crit Moves. **** **** **** ************************************************************************************
Traffix 7.6.0115 (c) 2003 Dowling Assoc. Licensed to URS CORP.' SANTA ANA, CA

CEQA Existing Setting PM Sun Aug 30' 2015 13:04"42 Page 6-1
Wayne .1. Sand and Gravel- Mine Project Traffic StudyCEQA Existing Setting PIus Cumufative PIus Project
Evening Peak Hour
Intersection
Moorpark Avenue (SR-23) at Los
Moorpark Avenue (SR-23) at Hig
Grimes Canyon Road (SR-23) at
Grimes Canyon Road South at Br
Grimes Canyon Road South at Lo
A Street (SR-23) at Ventura St
Grimes Canyon Road (SR-23) at
Wafnut Canyon Road (SR-23) at
Moorpark Avenue (SR-23) at Poi
Spring Road at Los Angeles Ave
#1#2#3+4#5#6#1#B#9+10
Impact AnaJ-ysis ReportLevel Of Service
BaSeoel./ v/
LOS Veh C
B xxxxx 0.639
A xxxxx 0.595
B 0. o 1,.024
A 9.1 0.000
C xxxxx 0.719
D xxxxx 0.811
B 13.3 0.000
B xxxxx 0.647
B xxxxx 0.654
D xxxxx 0.815
FutureneL/ v/
LOS Veh C
F xxxxx 6.595
D xxxxx 0.828
B 0.0 1. 189
A 9.1 0.000
D xxxxx 0.831
D xxxxx 0.880
c 16.5 0.000
E xxxxx 0.943
E xxxxx 0.926
F xxxxx 1.018
Changean
+ 5.956 V/C
+ 0.233 v/C
+ 0.000 D/v
+ 0.005 D/v
+ 0.712 v/C
+ 0.068 v/c
+ 3.197 D/V
+ 0.296 v/c
+ 0.2'72 v/c
+ 0.203 v/C
Traffix 7.6.0115 (c) 2003 Dowling Assoc. Licensed to URS CORP., SANTA ANA, CA
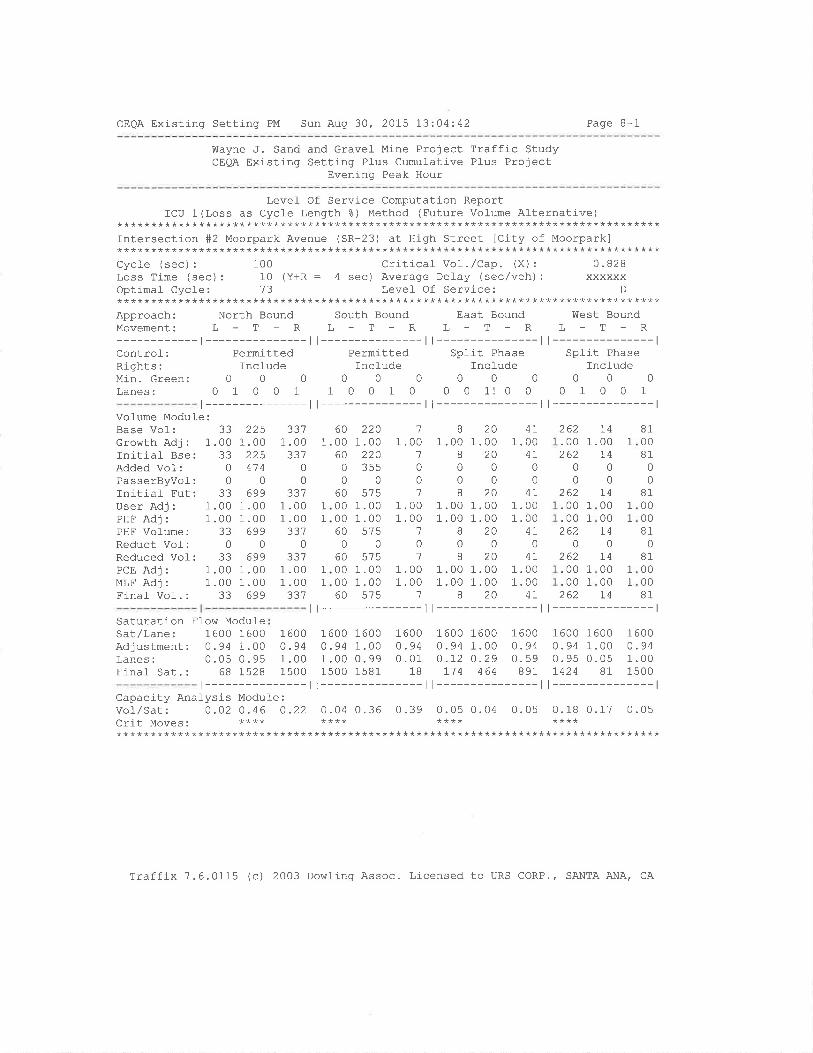
CEQA Exj-sting Setting PM Sun Aug 30, 2015 13:04:42 Page B-1
Wayne ,J. Sand and Gravel- Mine Project Traffic StudyCEQA Existing Setting PIus Cumulative Pfus Project
Evening Peak Hour
Levef Of Service Computation ReportICU 1(Loss as Cycfe Length ?) Method (Future Vol-ume Alternative)
* * * * * * * * * * * * * * * * * * * * * * * * * * * * * * * * * * * * * * * * * * * * * * * * * * * * * * * * * * * * * * * * * * * * * * ** * * * * * * * *Intersection #2 Moorpark Avenue (SR-23) at High Street ICity of Moorpark]********************************************************************************Cycle (sec) : 100 Criticaf Vol. /Cap. (X) : 0.828Loss Time (sec) : 10 (Y+R : 4 sec) Average Defay (sec/veh) : xxxxxxOptimal Cycle: 13 Level Of Service: D********************************************************************************Approach: North Bound South Bound East Bound West BoundMovement: L - T - R L - T - R L - T - R L - T - R
-t---------------lControf: PermittedRíghts: IncfudeMin.Green: 0 0 0Lanes: 0 1 0 0 I
Vofume Modul-e:Base Vof: 33Growth Adj: 1.00Initial Bse: 33Added Vol-: 0PasserByvol-: 0
Initial Fut: 33User Adj : 1.00PHF Adj : 1.00PHF Volume: 33Reduct Vof: 0
Reduced Vof: 33PcE Adj : 1.00MLF Adj : 1.00Final- Vof .: 33
Saturation Flow ModufeSat/Lane: 1600 1600Adjustment: 0.94 1.00Lanes: 0.05 0.95Final Sat. : 68 l52B
t---------------lPermittedlnclude
00010010
t---------------lSplit Phase
Include000
0 0 1! 0 0
t---------------lSplit Phase
Include000
01001t---------------l| --------------- | I --------------- | I --------------- |
2251 .00
)tq474
0699
1 .001 .00
6990
6991 .001 .00
699
3371 .00
JJI00))-
1 .001 .00
???0
3311.001 .00
337
tU0060
0
0
60000060
0
60000060
2201.00
220355
0
5751.001.00
ElE
0
5751.001.00
EfE
1
1 .00'7
001
1 .001 .00
1
01
1 .001 .00
1
1 .001 .00
I08
1 .001 .00
I
201.00
2000
201.001.00
200
ZU
1.001.00
20
471.00
4I00
4I1.001.00
4I0
4I1.001.00
41-
262.00 1
2620
0
262.00 1
.00 1
2620
262.00 1
.00 1
262
00 1
00 1
T40
T400 1
00 1T4
810081
00
B10000B1
0
B1000081
1
1
1
1
1
B
1 .00B
008
I4.00 1
t400
14
1 6000.941 .001 500
1 600o.940.01
1B
1 6000. 940. 59
891
1 6000.941 .0015 00
1600 16000.94 1.001.00 0. 991500 1581
1600 16000.94 1.000 .72 0.29
71 4 464
1600 16000. 94 1.000. 95 0.051424 81
t --------------- | --------------- | --------------- l l --------------- l
Capacity Analysis Module :
vol/Sat: 0.02 0.46 0.22 0.04 0.36 0.39 0.05 0.04 0.05 0.18 0.17 0.05crit Moves: **** **** **** ************************************************************************************
Traffíx 7.6.0115 (c) 2003 Dowling Assoc. Licensed to URS CORP./ SANTA ANA, CA
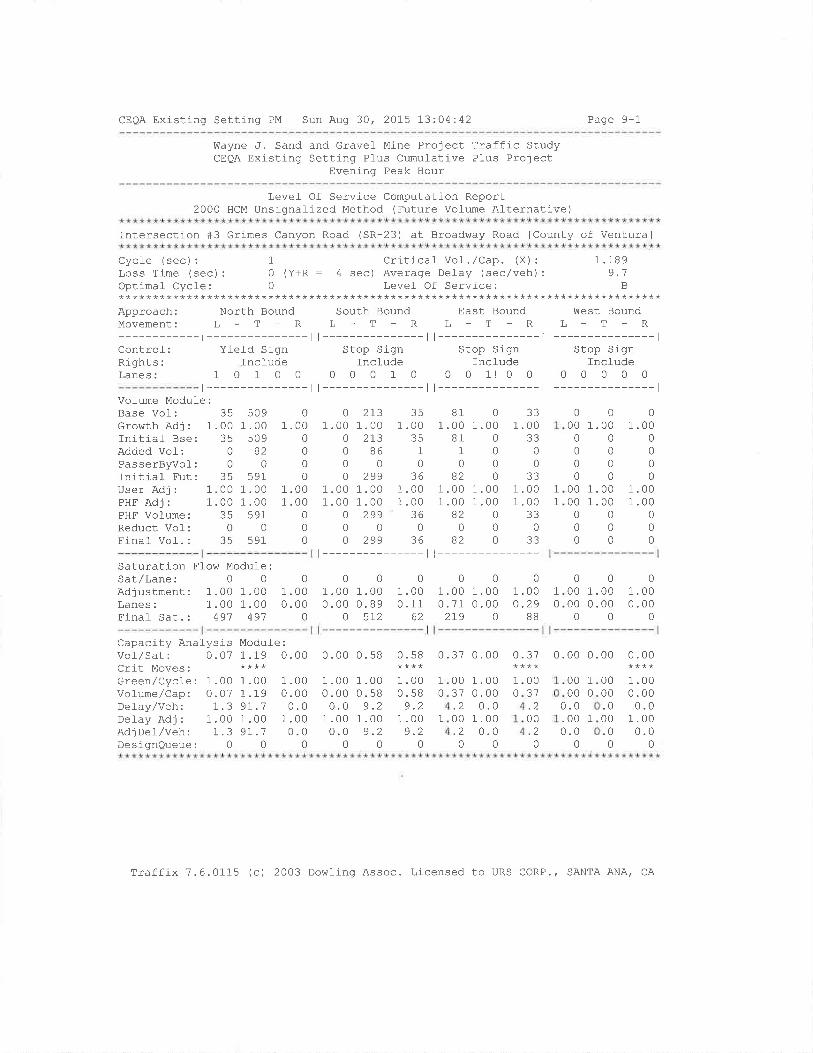
CEQA Existing Setting PM Sun Aug 30, 2015 13:04:42 Page 9-1
Wayne ,J. Sand and Gravel Mine Project Traffic StudyCEQA Existing Setting Pfus Cumulative Pl-us Project
Evening Peak Hour
Level Of Service Computation Report2000 HCM Unsignalized Method (Future Vofume Afternative)
Intersection +3 crimes Canyon Road (SR-23) at Broadway Road [County of Ventura]
Cycte (sec) : 1 Critlcaf Vof .,/Cap. (X) : 1.189Loss Time (sec): 0 (Y+R : 4 sec) Average Delay (sec/veh): 9.1Optimal Cycle: 0 Levef Of Service: B********************************************************************************Approach: North Bound South Bound East Bound West BoundMovement: L - T - R L - T - R L - T - R L - T - R
-t---------------lControl: Yield SignRights: IncludeLanes: 1 0 1 0 0
| --------------- | I --------------- r
Stop Sign Stop SignIncl-ude Include
0 0 0 1 0 0 0 1t 0 0
| --------------- | I --------------- |
0 .00
l---------------l
t---------------lStop Sign
Incfude00000
t---------------lVofume Module:Base Vol: 35Growth Adj: 1.00Initiaf Bse: 35Added Vol: 0
PasserByvoÌ: 0
Initial- Fut: 35User Adj : 1.00PHF Adj : 1.00PHF Vol-ume: 35Reduct Vof: 0Final Vof. : 35
5091 .00
s09B2
0591
1.001 .00
5910
591
01 .00
0000
1 .001 .00
00
0
0 2r3 351 .00 1.00 I .00
o 273 350 86 1
000o 299 36
1 .00 1. 00 1 .001 .00 1. 00 1 .00
o 299 36000o 299 36
t---------------l
810331 .00 1.00 1.00
81 0 33100000
820331 .00 1.00 1 .001 .00 1.00 1 .00
82033000
82033t---------------l
1.001.00
0
0
0
0
0
0
01.001.00
0
0
0
0
0000
00
0000
00
0
1
1
0
1.000
0
0
0
01.00
Saturation Flow Module:Sat/Lane: 0 0 0 0 0 0 0 0 0
Adjustment: 1 .00 1 .00 1 .00 1 .00 1.00 1 .00 I .00 1.00 1.00 1
Lanes : 1 .00 1 .00 0.00 0.00 0. 89 0.11 0.71 0.00 O.29 0
Finaf Sat. : 491 491 0 0 5I2 62 2I9 0 88
00000 1 .00 1.0000 0.00 0.00000
Capacity AnalysisVo],/Sat: 0.07Crit Moves:Green/Cycle: 1.00Vofume/Cap: 0.07Delay/Veh: 1.3Delay Adj : 1.00AdjDel/Veh: 1.3DesiqnQueue: 0
Module:1.19 0.00
1.00 1.001.19 0.009r.1 0.01 .00 1.009r.1 0. 0
00
0. sB
1 .000.589.2
I .00a)
0
0.58
1 .000.58
q)
1.00ot
0
00 1.0037 0.00.2 0.000 1.00.2 0.000
0031.200.2
0
0000.000.00
0.00
1 .000.000.0
1.000.0
0
0.37 0. 00 0.37 0.00 0.00
1 .000 .000.0
1 .000.0
0
1
0
0
0
1
01
0
1
0000.000.0
0
1
Traffix 7.6.0115 (c) 2003 Dowlinq Assoc. Llcensed to URS CORP., SANTA ANA, CA
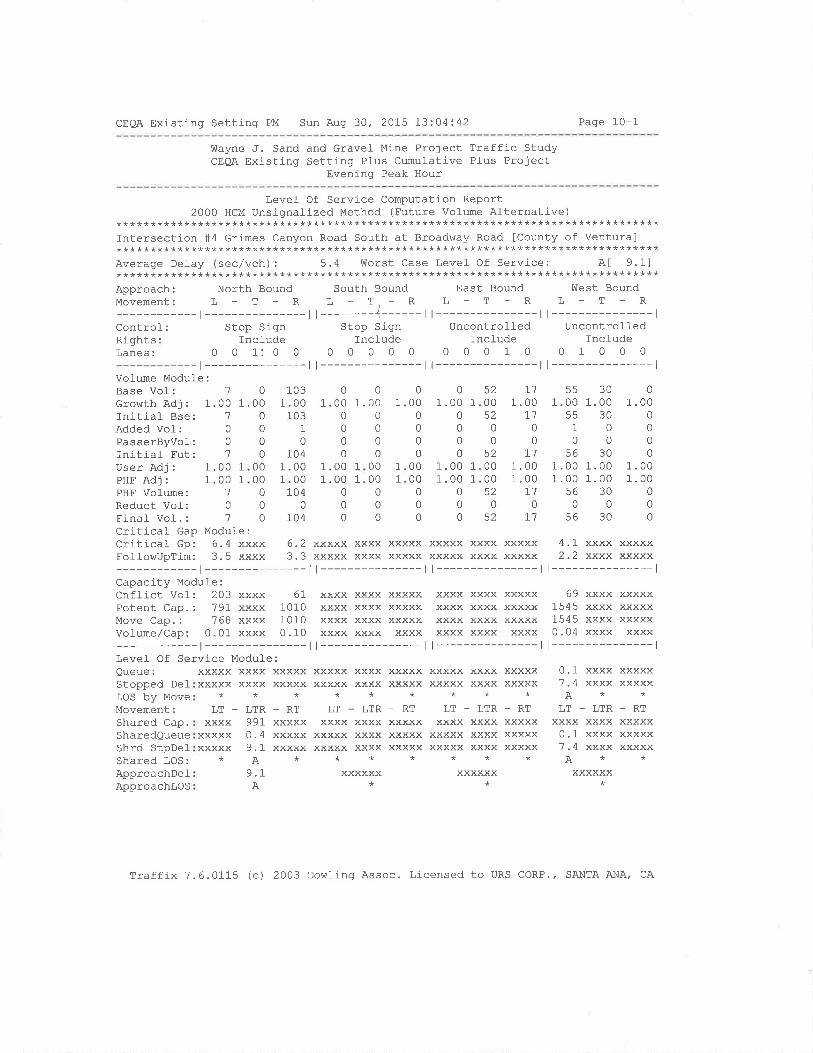
CEQA Existinq Setting PM Sun Aug 30, 2015 13:04:42 Page 10-1
Wayne J. Sand and Gravel- Mine Project Traffic StudyCEoA Existing Setting Pfus Cumulative Plus Project
Evening Peak Hour
Level Of Servíce Computation Report2000 HCM Unsignalized Method (Future Volume Afternative)
********************************************************************************Intersection #4 Grimes Canyon Road South at Broadway Road fCounty of Ventura]********************************************************************************Average Delay (sec/veh): 5.4 Worst Case Level- Of Service: A[ 9.1]********************************************************************************Approach: North Bound South Bound East Bound ü¡est BoundMovement: L - T - R L - T. - R L - T - R L - T - R
-r--------- r r--------J I l--------- I l---------------lControl: Stop Sign Stop Sign Uncontrol-l-ed UncontrolledRights: Incl-ude Include Incl-ude IncludeLanes: 0 0 1! 0 0 0 0 0 0 0 0 0 0 1 0 0 1 0 0 0
t --------------- | --------------- l l --------------- l l --------------- l
Vol-ume Module:Base Vof:Growth Adj:Initial Bse:Added Vol:PasserByvol:Initial Fut:User Adj:PHF AdJ:PHF Vol-ume:Reduct Vol-:Finaf Vof. :
Critical Gap Module:Critical- Gp: 6.4 xxxx 6.2 xxxxx xxxx xxxxxFollowUpTim: 3.5 xxxx 3.3 xxxxx xxxx xxxxx
-t---------ll---------Capacj-ty Module:Cnflict Vof: 203 xxxx 67 xxxx xxxx xxxxxPotent Cap.: 791 xxxx 1010 xxxx xxxx xxxxxMove Cap.: 768 xxxx 1010 xxxx xxxx xxxxxVoJ-ume/Cap: 0.01 xxxx 0.10 xxxx xxxx xxxx
1.00 1
1.00 1
1
0
1
00 1
00 1
000
103.00103
1
0104.00.00104
0104
1.00 1
1.00 1
000
0
0
0
00000
000
0
000
.00 1
.00 1
000
52 r100 1_.0052 L]0000
52 7100 1.0000 1.0052 r100
55 301.00 1.00
55 301000
56 301.00 1.001.00 1.00
s6 3000
s6 30
01.00
0
0
0
0
1.001.00
000
101.00 1.00'to
000070
11
0
00 1
0
000
0
000
000000
0000
0
0
0
01.00 1
xxxxx xxxxxxxxx xxxx**
LT - LTRxxxx 99I
xxxxx 0.4xxxxx 9.I
*A9.1A
1
xxxxxYYYYY
-RTVVYYY
YIYYX
xxxxx
xxxxx xxxxxxxxx xxxx**
LT - LTRxxxx xxxx
xxxxx xxxxxxxxx xxxx**
v!vvx!*
xxxxxxxxxx
_RTxxxxxXXXXXxxxxx
xxxxx xxxxxxxxx xxxx**
LT - LTRxxxx xxxx
xxxxx xxxxxxxxx xxxx**
xxxxxx*
0.1 xxxx7.4 xxxxA*
!1 - LIK
xxxx xxxx0.1 xxxx7 .4 xxxxA*xxxxxx
xxxxxxxxxx
-RT
xxxxxxxxxx
1
1
1
1
xxxxx xxxx xxxxxxxxxx xxxx xxxxx| --------------- l
4.1 xxxx xxxxx2.2 xxxx xxxxx
t---------------l
69 xxxx xxxxx1545 xxxx xxxxx1545 xxxx xxxxx0.04 xxxx xxxx
xxxx xxxx xxxxxxxxx xxxx xxxxxxxxx xxxx xxxxxxxxx xxxx xxxx
Queue:Stopped DelLOS by MoveMovement:Shared Cap.SharedQueueShrd StpDel-Shared LOS:ApproachDel-ApproachLOS
XXXXXXXXXX
-RTxxxxxxxxxxXXXXX
Traffix 7.6.0115 (c) 2003 Dowling Assoc. Licensed to URS CORP., SANTA ANA' CA
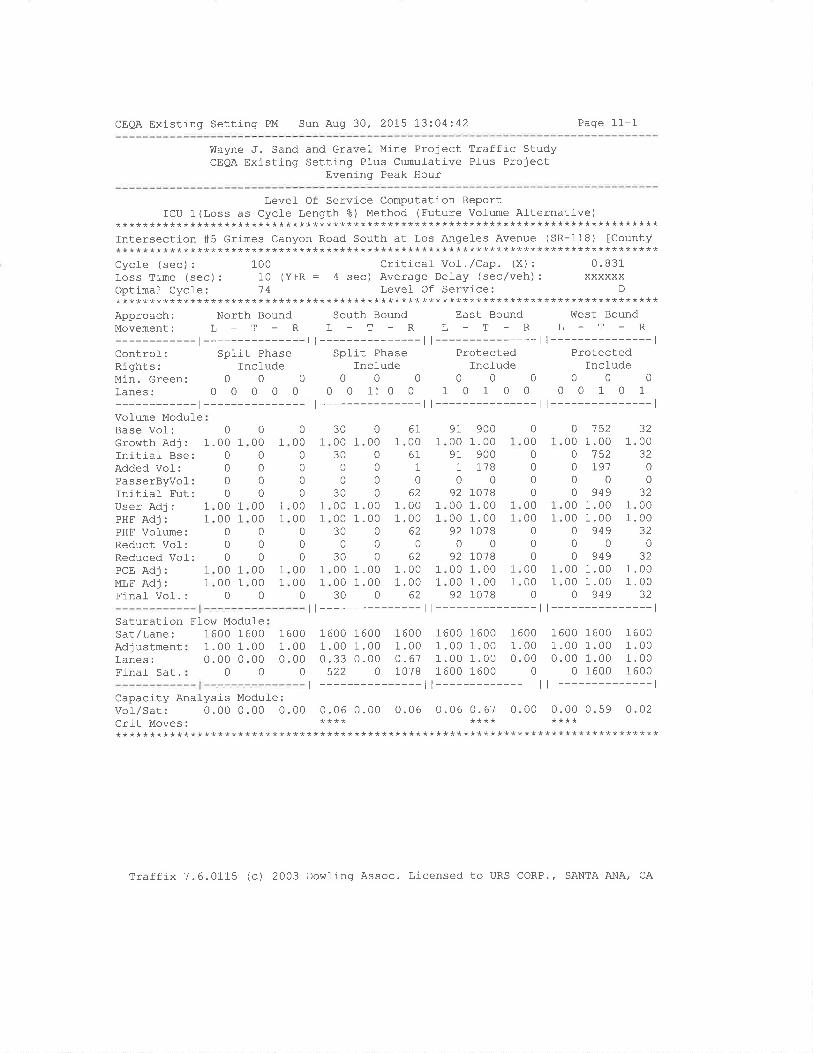
CEQA Existing Setting PM Sun Aug 30, 2015 13:04:42 Page 11-1
üIayne J. Sand and Gravel- Mine Project Traffic StudyCEQA Existing Setting PIus Cumulative Pl-us Project
Evening Peak Hour
Level- Of Service Computation ReportICU 1(Loss as Cycle Length t) Method (Future Vol-ume Al-ternative)
********************************************************************************Intersection #5 crimes Canyon Road South at Los Angeles Avenue (SR-118) [County********************************************************************************Cycle (sec) : 100 Critical- VoJ-. /Cap. (X) : 0.831Loss Time (sec) : 10 (Y+R : 4 sec) Average Del-ay (sec/veh) : xxxxxxOptimal Cycle: '14 Level- Of Service: D
********************************************************************************Approach: North Bound South Bound East Bound West BoundMovement: L _ T - R L - T - R L - T - R L - T - R
-r---------ll---------ll---------ll---------------lControl-: Split Phase SpÌit Phase Protected ProtectedRights: Incl-ude Include Incfude Incl-udeMin.Green: 0 0 0 0 0 0 0 0 0 0 0 0
Lanes: 0 0 0 0 0 0 0 1! 0 0 1 0 1 0 0 0 0 1 0 1
-t---------ll---------ll---------ll---------------lVolume Modul-eBase Vol:Gror¡/th Adj:Initial Bse:Added Vol-:PasserByvol-:Initial Fut:User Adj:PHF AdJ:PHF Volume:Reduct Vof:Reduced Vof:PCE Adj:MLF AdJ:Final- Vol. :
01.00 1
0000
00 1
00 1
000
00 1
00 1
0
1.001.00
0
00
1.001.00
0
6I1 .00
611
062
1 .001 .00
620
621.001 .00
62
9I0091
1
092000092
092000092
9001.00
9001,18
010781.001.001078
010781 .001 .001078
000
000
0
0000
0
0
0
0000
0
0 75200 1 .00o 152o r91000 949
00 1.0000 1.000 949000 949
00 1.0000 1.000 949
321.00
3200
JZ1.001.00
320
321 .001.00
32
000
0000
0000
0
0
0
0000
0
000
00
0
0
1
761.0.
000000
0
1
0
000
0
0
0
0000
000
0000
0
1
300030
0
0
30000030
0
30000030
1
1
1
1
1
1
1
1
1
1
1
1
1
1
1
1
1
1
1
1
1
1
1
1
1
SaturationSat/Lane:AdjustmentLanes:FinaL Sat.
Flow Module1 6001.000. 00
0
1 6001 .000 .00
0
1 6001 .000.33
522
00 160000 1.0000 0.610 1078
1600 16001.00 1.001.00 1.001600 1600
1 6001.000. 00
0
1600 16001 .00 1.000.00 1.00
0 1600
1 6001 .001 .001 600
761.0.
Capacity Analysis Modul-e :
vol/Sat: 0.00 0.00 0.00 0.06 0.00 0.06 0.06 0. 67 0.00 0.00 0.59 O.02crit Moves. **** **** ************************************************************************************
Traffix 7.6.0115 (c) 2003 Dowling Assoc. Licensed to URS CORP., SANTA ANA, CA
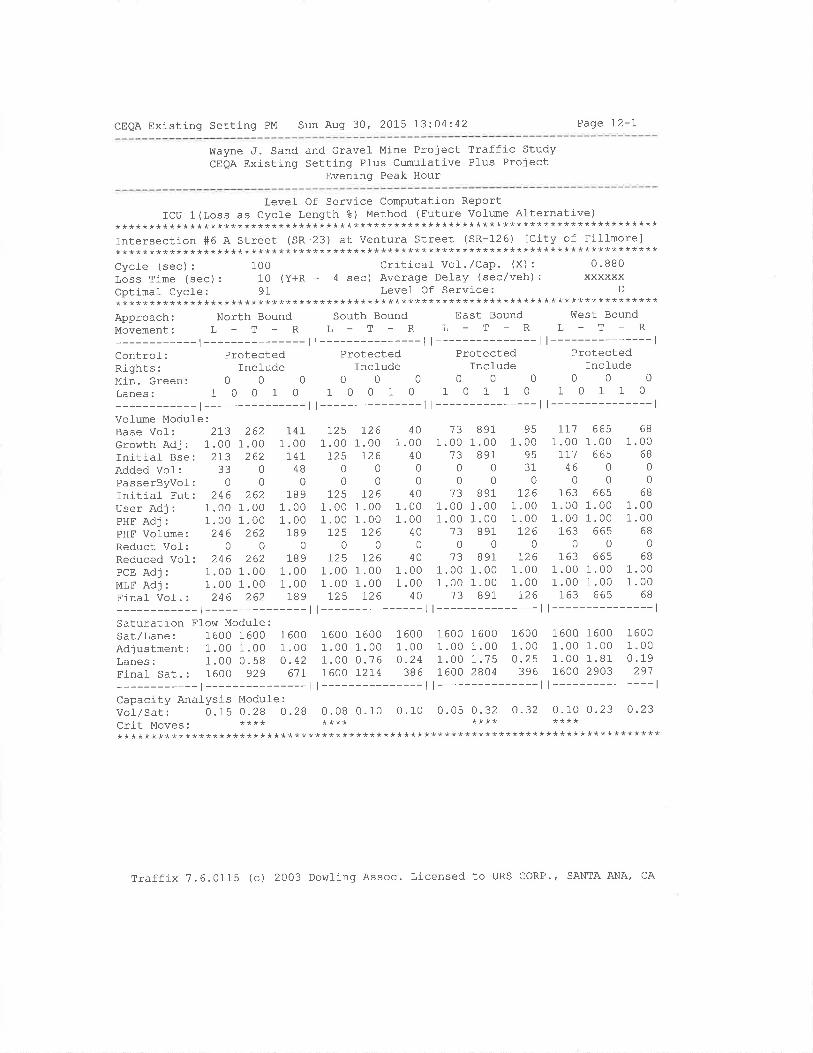
CEQA Existing Setting PM Sun Aug 30, 2015 73:04:42 Paqe I2-1
Vilayne J. Sand and Gravel- Mine Project Traffic StudyCEQA Exlsting Setting Plus Cumufative Plus Project
Evening Peak Hour
Level Of Service Computation ReportICU 1(Loss as Cycle Length 8) Method (Future volume Alternative)
********************************************************************************Intersection +6 A Street (SR-23) at Ventura Street (SR-126) [City of Fil]-morel********************************************************************************Cycle (sec) : 100 Criticaf Vol-.,/Cap. (X) : 0.880Loss Time (sec) : 10 (Y+R : 4 sec) Average Del-ay (sec/veh) : xxxxxxOptinal Cycle: 91' Level Of Service: D
********************************************************************************Approach: North Bound south Bound East Bound west BoundMovement: L - T - R L - T _ R L - T _ R L - T _ R
-t---------ll---------ll---------ll---------------lcontrof: Protected Protected Protected ProtectedRights: Include Incfude Include IncludeMin.Green: O O O 0 0 0 0 0 0 0 0 0
Lanes: 1 0 O 1 0 1 O 0 1 0 1 0 1 1 0 1 0 1 1 0
-l---------ll---------ll---------ll---------------lVolume Module:Base Vol- : 273 262 14I I25 126 40 '73 891 95 I7'7 665 68
Growrh Adj : 1 .00 1.00 1 . oo 1.00 1.00 1 .00 1 .00 1.00 1.00 1.00 1.00 1.00Initiaf Bse: 2I3 262 I4I I25 126 40 'r.3 891 95 IIl 665 68
AddedVol: 33 O 48 O 0 0 0 0 31 46 0 0
PasserByvol: O O 0 0 0 0 0 0 0 0 0 0
rnitial Fut: 246 262 189 t25 726 40 13 891 126 163 665 68
user Adj : 1.00 1 .00 1 .00 1.00 1.00 1 .00 1 .00 1.00 1.00 1 .00 1.00 1.00pHF Adj : 1. o0 1.00 1 .00 1 . oo 1.00 1.00 1 .00 1.00 1.00 1.00 1.00 1.00pHF Vofume; 246 262 189 I25 126 40 13 891 126 163 665 68
Reduct Vol-: O O O 0 0 0 0 0 0 0 0 0
Reduced vol-: 246 262 189 725 126 40 13 891 t26 163 665 68pcE Adj : 1.00 1 .00 1 .00 1.00 1.00 1 .00 1 .00 1.00 1.00 1 .00 1.00 1.00MLF Adj : 1.00 1 .00 1 .00 1 .00 1.00 1.00 1 .00 1.00 1.00 1 .00 1.00 1.00Final- Vol. : 246 262 189 I25 L26 40 13 891 126 163 665 68
-l---------ll---------ll---------ll---------------lSaturation Ffow Module:sar,/Lane: 1600 1600 1600 1600 1600 1600 1600 1600 1600 1600 1600 1600Adjustrnent: 1.00 1.00 1.00 1.OO 1.00 1.00 1.00 1.00 1.00 1.00 1.00 1.00Lanes: 1.00 O.58 0.42 1.OO 0.76 0.24 1.00 1.75 0.25 1.00 1.81 0.19Flnal Sat.: 1600 929 61I L600 7214 386 1600 2804 396 1600 2903 291
-l---------ll---------ll---------ll---------------lcapacity Analysis Module :
vol,/Sat: 0.15 0.28 O .28 0.08 0. 10 0.10 0.05 0.32 O.32 0.10 0.23 O.23crit Moves: **** **** **** ************************************************************************************
Traffix 7.6.0115 (c) 2003 DowÌing Assoc. Licensed to URS coRP.' SANTA ANA, CA
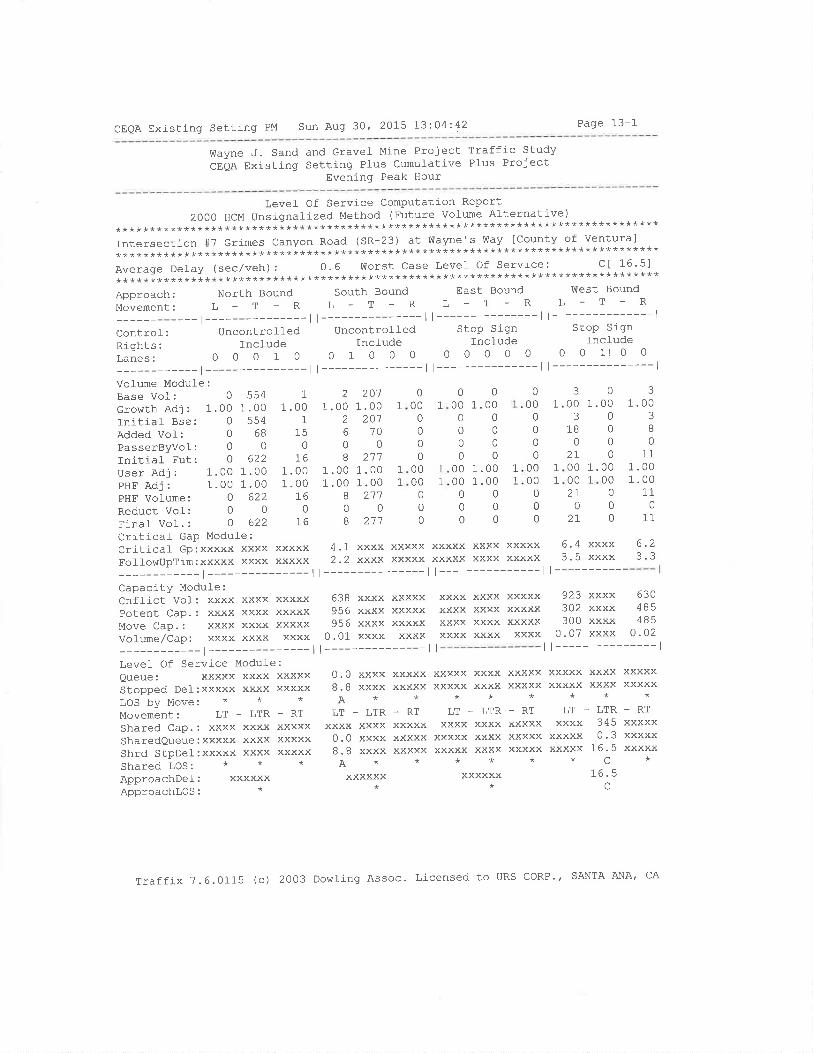
CEQA Existing Setting PM Sun Aug 30, 2015 L3:O4:42 Page 13-1
Wayne J. Sand and Gravel Mine ProjectCEQA Existing Setting Plus Cumufative
Evening Peak Hour
Traffic StudyPIus Project
Level- Of Service Computation Report2oOOHcMUnsignalizedMethod(FutuleVolumeAlternative)
********************************************************************************Intersection#TGrimesCanyonRoad(SR-23)atVrtayne's!ÙaylCountyofVentura]********************************************************************************Average DeJ-ay (sec/veh): 0.6 worst case Level Of Service: ct 16'51********************************************************************************Approach: North Bound South Bound East Bound l¡trest Bound
Movement: L - T - R L - T - R L - T - R L - T - R
-l---------ll---------ll---------ll---------------lControl: Uncontrofled Uncontrofled Stop Sign Stop Sign
Rights: Incl-ude lnclude Incfude IncfudeLanes: O 0 0 1 O O 1 O O O O 0 0 0 0 0 0 1! 0 0
-l---------ll---------ll---------ll---------------lVofume Module:Base Vol:Growth Adj:Initial Bse:Added Vof:PasserByvoÌ:Inltial- Fut:User Adj:PHF AdJ:PHF Volume:Reduct VoÌ:Finaf Vol.:Criticaf GaP Module:Crltical Gp:xxxxx xxxx xxxxx 4.1 xxxx xxxxx xxxxx xxxx xxxxx 6'4 xxxx
FoÌlowUpTim:xxxxx xxxx xxxxx 2.2 xxxx xxxxx xxxxx xxxx xxxxx 3'5 xxxx-l---------ll---------ll---------ll----------
Capacity Modufe:Cnffict Vol: xxxx xxxx xxxxx 638 xxxx xxxxxPotent Cap.: xxxx xxxx xxxxx 956 xxxx xxxxxMove Cap.: xxxx xxxx xxxxx 956 xxxx xxxxxVofrme/Cap: xxxx xxxx xxxx 0.01 xxxx xxxx
-l--------- I l---------------l I
Level- Of Service Modul-e:Queue: xxxxx xxxx xxxxxStopped Del:xxxxx xxxx xxxxxLOS by Move: * * *
Movement: LT - LTR - RT
Shared CaP.: xxxx xxxx xxxxxSharedQueue:xxxxx xxxx xxxxxShrd StpDel:xxxxx xxxx xxxxxShared LOS: * * *
ApproachDel: xxxxxxApproachlos: *
1 .001 .00
000
5541 .00
5546B
0622
1 .001 .00
o¿¿0
622
1
1 .001
150
T61 .001.00
I60
I6
.00 1.00 1
.00 1.00 1
B 21100I 211
20'11.00 1
20770
0
27100 1.00 1
00 1.00 1
000000
3
00 1
3
1B0
2I00 1
00 1
2I0
27
111.001 .00
110
11
000
0000
0000
0
00
2
1.002
6
0
I
01.00
00
0
0
000
0
00
0
01 .00
0
000
1 T
000
000
0
0000
0
31.00
3I0
0
.0000
00
.0000
0
00
1
11
1
00 1
1
6.2??
xxxx xxxx xxxxxxxxx xxxx xxxxxxxxx xxxx xxxxxxxxx xxxx xxxx
923 xxxx 630302 xxxx 485300 xxxx 485
0.07 xxxx O.O2| --------------- l
0.08.8A
LT
xxxxxxxx
- LTRxxxx xxxx0.0 xxxx8.8 xxxxA*xxxxxx
*
xxxxxxxxxx
-RTxxxxxxxxxxXXXXX
xxxxx xxxxxxxxx xxxx**
LT - LTRxxxx xxxx
xxxxx xxxxxxxxx xxxx**
xxxxxx*
XXXXXXXXXX
-RTxxxxx
xxxxx
xxxxx xxxxxxxxx xxxx**
LT - LTR
XXXXXxxxxx
-RT345 xxxxx0,3 xxxxx
16.5 xxxxxc*
16.5c
xxxxxxxxxxxxxx
Traffix ?.6.0115 (c) 2003 Dowling Assoc' Licensed to URS CORP'' SANTA ANA. CA
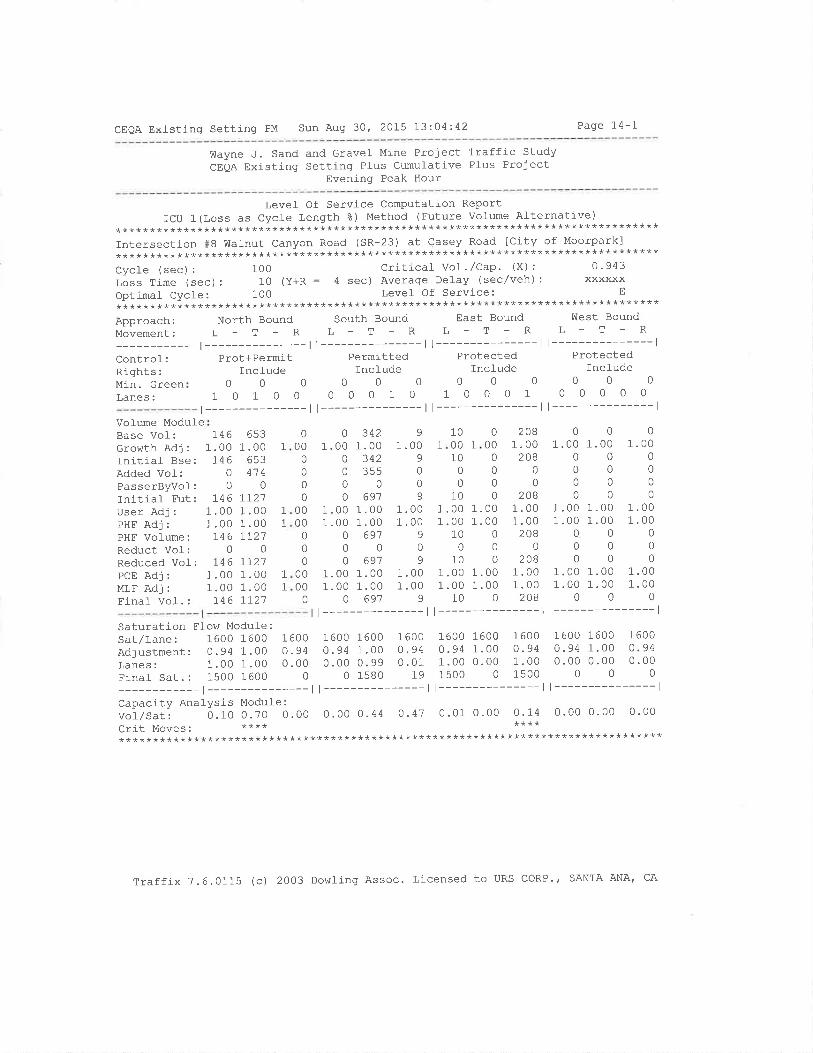
CEQA Existing Setting PM Sun Aug 30, 2015 13:.04:42 Page 14-1-
!ùayne J. Sand and GraveÌ Mine ProjectCEQA Existing Setting PIus Cumufative
Evening Peak Hour
Traffic StudyPlus Project
Levef Of Service Computation ReportICU 1(Loss as Cycl-e Length 8) Method (Future voflme Al-ternative)
********************************************************************************Intersection#sWalnutcanyonRoad(SR-23)atcaseyRoadlcityofMoorpark]********************************************************************************Cycle (sec): 1OO Critical- Vol'/Cap' (X): 0'943Loss Time (sec): 10 (Y+R : 4 sec) Average Delay (sec/veh): xxxxxxOptírnal Cycle: 100 Levef Of Service: E
********************************************************************************Approach: North Bound south Bound East Bound v1]est Bound
Movement: L - T - R L - T - R L - T - R L - T - R
-l---------ll---------ll---------ll---------------lControl: Prot+Permít Permitted Protected ProtectedRights:Min. GreenLanes:
Volume ModuleBase Vol:crowth Adi:Initlal Bse:Added Vol-:PasserByvol:Initial Fut:User Adj:PHF AdJ:PHF Volume:Reduct VoI:Reduced Vo1:PCE AdJ:MLF AdJ:Flnal Vof. :
Incl-ude Include Include Incfudeoooo0o000000
10100000101000100000t---------------ll---------------ll---------------ll---------------l
I461 .00I46
00
7461 .001.00
7460
746
6531.00 1
6534'7 4
01r211.00 1
1.00 1
1-r21
3421.00
342?EÉ
0
69'7
1000 1
100
010
2081.00
2080
0208
1.001.00
2080
2081.001. 00
208
01 .00
000
0
1.001.00
0
00
1 .001.00
0
01.00
0
00
0
1.001.00
0
00
1 .001.00
0
0
1 .000
0
00
1.001 .00
00
0
000
0
0
00
0000
00
0
0000
0
9
1 .009
0
0
9
1
000
0
0
00
0
1 .000
00
0
1 .001 .00
0
0
0
1 .001 .00
0
110
000021
1.00 1.00 1 .00 1.001.00 1.00 1.00 1.0069'7 9 10 0
000069'7 9 10 0
1 .00 1.00 1 .00 1.00 1.001.00 1.00 1.00 1.00 1.00
06979100
1.00 1.1.00 1.746 77
1
1
Saturation Ffow Modul-e:Sat/Lane: 1600 1600 1600 1600 1600 1600 1600 1600 1600
Adjustment: 0.94 1. O0 O '94 0.94 1.00 O.94 0.94 1 ' 00 O '94Lanes: 1.OO 1.00 O.O0 O-00 0.99 0.01 1.00 0'00 1'00
1 600o .940 .00
1600 16001.00 0. 940.00 0.00
Final sat.: 1500 1600 O O 1580 19 1500 0 1500 0 0 0
-l---------ll---------ll---------ll---------------lCapacity Analysis Modufe :
vor/sut, 0.10 o.70 o.0o o.oo 0.44 0.41 0.01 0.00 0.14 0.00 0.00 0-00CIit MOveS. **** ************************************************************************************
Traffix 7.6.0115 (c) 2003 Dowling Assoc. Licensed to URS CORP., SANTA ANA, CA
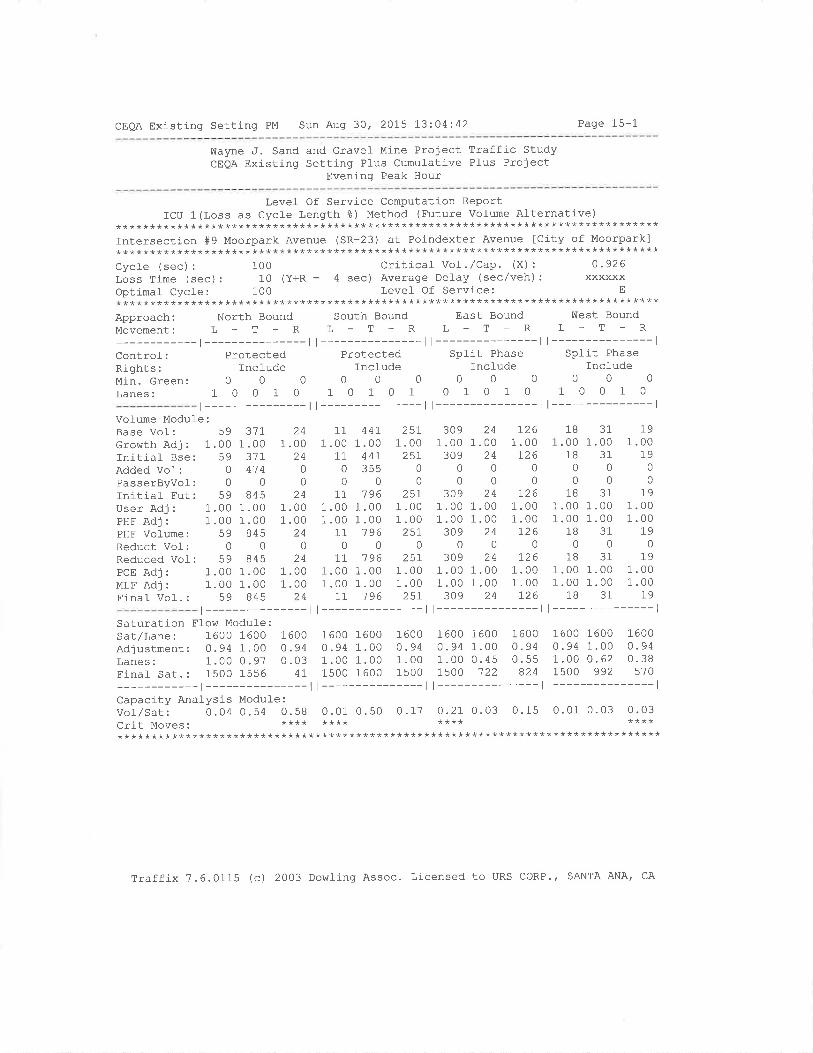
CEOA Existing Setting PM Sun Aug 30, 2015 13:04:42 Page 15-1
frlayne J. Sand and Gravel Mine Project Traffic StudyCEQA Existing Setting Pfus Cumufative Plus Project
Evening Peak Hour
Levet Of Service Conputation ReportICU 1 (Loss as Cycle Length g) Method (Future Vol-ume Alternative)
********************************************************************************Intersection #9 Moorpark Avenue (SR-23) at Poindexter Avenue [City of Moorpark]********************************************************************************Cycle (sec) : 100 Critical Vol . /Cap. (X) : 0 '926Loss Time (sec) : 10 (Y+R : 4 sec) Average Del-ay (sec/veh) : xxxxxxOptimat Cycle: 100 Level Of Service: E
********************************************************************************Approach: North Bound south Bound East Bound west BoundMovement: L - T - R L - T - R L - T - R L - T - R
-l---------ll---------ll---------ll---------------lcontrol_: Protected Protected spJ-it Phase split PhaseRíghts: Include Include Include IncfudeMin.creen: O O O 0 0 0 0 0 0 0 0 0
Lanes: 1 O 0 1 O 1 0 1 0 1 0 1 0 1 0 1 0 0 1 0
t---------------ll---------------ll---------------ll---------------lVolume Module:Base Vol-: 59Growth Adj : 1.00Initial- Bse: 59Added Vol: 0PasserByvol: 0
-Lnrtra-L ¡ut: 5yUser Adj : 1.00PHF Adj : 1.00PHF Vol-ume: 59Reduct Vol: 0Reduced Vof: 59PCE Adj : 1.00MLF Adj : 1.00Final- Vol.: 59
31L1.00
31741 4
0845
1 .001.00
8450
8451 .001 .00
845
241 .00
2400
241 .001 .00
240
241 .001 .00
24
11.0011
00
11.00.0011
011
.00
.0011
44r1.00
44t3s5
0196
1 .001.00
1960
7961 .001.00
196
25r1 .0025r
0
0
25r1 .001 .0025r
0
2571 .001 .002sr
3091 .00
30900
3091.001 .00
3090
3091 .001.00
309
241.00
2400
241 .001.00
240
241 .001 .00
24
7261 .00
L260
0126
1 .001 .00t26
0
1,261.001 .00
126
1B.00
1800
18.00.0018
0
18.00.0018
311.00
3100
311.001.00
310
311.001.00
31
I91 .00
I90
019
1.001 .00
790
191.001.00
1-9
11
1
11
1
1
11
1
t---------------ll---------------ll---------------ll---------------lSaturation Ff o\.¡ Moduf e:Sat/Lane: 1600 1600 1600 1600 1600 1600 1600 1600 1600 1600 1600 1600Adjustment: 0.94 1 .00 0.94 0.94 1 .00 0 .94 0 . 94 1 .00 o.94 0.94 1.00 0. 94
l,anes: 1. OO 0.97 0. 03 1 .00 1.00 1 .00 1 .00 0.45 0.55 1.00 0. 62 0.38Finaf sar.: 1500 1556 41 1500 1600 1500 1500 'Ì22 824 1500 992 570
-l---------ll---------ll---------ll---------------lCapacity Analysis ModuÌe:vor/sar: 0. 04 0.54 0.58 0.01 0. 50 0 .17 0.21 0.03 0. 15 0.01 0.03 0.03crit Moves. **** **** **** ************************************************************************************
Traffix ?.6.0115 (c) 2003 Dowling Assoc. Licensed to URS CORP.' SANTA ANA, CA
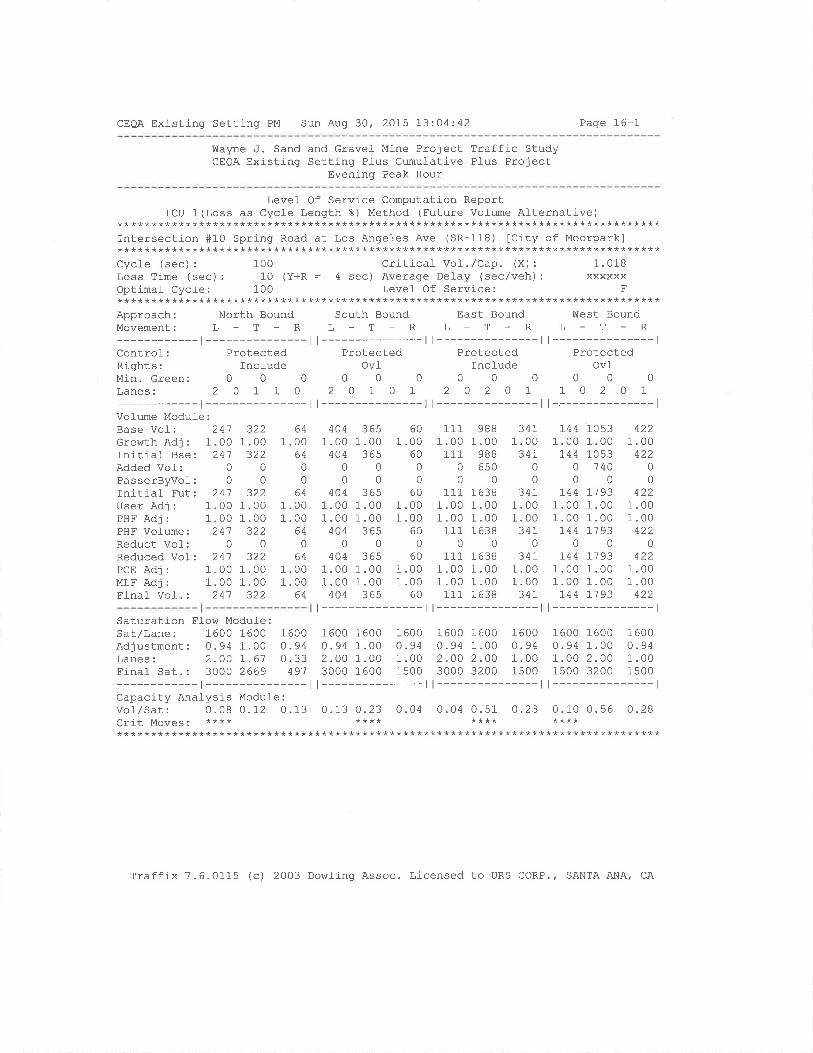
CEQA Exlsting Setting PM Sun Aug 30, 2015 L3:04:42 Page 16-1
Wayne ,J. Sand and Gravel Mine Project Traffic StudyCEQA Existing Settinq PÌus Cumulative PÌus Project
Evening Peak Hour
Level Of Service Computation ReportICU 1(Loss as Cycle Length %) Method (Future Volume Alternative)
********************************************************************************Intersection #10 Spring Road at Los Angeles Ave (SR-118) [City of Moorpark]********************************************************************************Cycle (sec): 100 Criticaf Vol-./Cap. (x): 1.018Loss Time (sec): 10 (Y+R : 4 sec) Average Delay (sec/veh): xxxxxxOptimal Cycle: 100 Level- Of Servj-ce: F********************************************************************************Approach: North BoundMovement: L - T - R
-t---------------lControf: ProtectedRights: IncludeMin.Green: 0 0 0Lanes: 2 O 1 1 0
-l---------------lVofume Modufe:Base Vof i 24'7 322 64Growth Adj: 1.00 1.00 1.00Initiaf Bse: 241 322 64AddedVol: 0 0 0PasserByvol-: 0 0 0f nitial- Fut: 24'7 322 64UserAdj: 1.001.00 1.00PHFAdj: 1.001.00 1.00PHF Vol-ume: 24'7 322 64Reduct Vol-: 0 0 0Reduced VoÌ: 24'7 322 64PcE Adj: 1.00 1.00 1.00MLF Adj : 1 .00 1.00 1 .00Final Vol-. : 24'7 322 64
South BoundL-T_R
t---------------lProtected
Ovl000
20101t---------------l
East BoundL_T-R
t---------------lProtected
Include000
20201t---------------l
West BoundL-T-R
t---------------tProtected
Ovf000
10201l-=-------------l
404 365 601 .00 1.00 1.00404 365 60
000000
404 365 601 .00 1.00 1.001 .00 1.00 1.00404 365 60
000404 365 60
1 .00 1.00 1.001.00 1.00 1.00404 365 60
t---------------l
111 988 34r1.00 1.00 1.00111 988 341
06500000
111 1638 3411.00 1.00 1.001.00 1.00 1.00111 1638 341
000111 1638 34I
1.00 1.00 1.001.00 1.00 1.00111 1638 341
t---------------
144 1053 4221 .00 1.00 1.00144 1053 422
0 140 0000
r44 7193 4221 .00 1.00 1.001 .00 1.00 1.00744 7193 422
000r44 7193 422
1 .00 1.00 1.001 .00 1.00 1.00t44 7193 422
l---------------lSaturation Ffokr ModuÌe:Sat/Lane: 1600 1600 1600 1600 1600 1600 1600 1600 1600 1600 1600 1600Adjustment: 0. 94 1 .00 O.94 0.94 1 .00 0. 94 0.94 1.00 0.94 0.94 1.00 0. 94Lanes: 2.OO L61 0.33 2.00 1.00 1.00 2.00 2.00 1.00 1.00 2.00 1.00Finaf Sat.: 3OOO 2669 49'7 3000 1600 1500 3000 3200 1500 1500 3200 1500
-r--------- |--------- l l--------- l l---------------lCapacity Analysis Module:vol/Sat: 0.08 0.12 0.13 0.13 0.23 0.04 0.04 0.51 0 .23 0.10 0.56 O.28crit Moves ' **** **** **** ************************************************************************************
Traffix 7.6.0115 (c) 2003 Dowling Assoc. Licensed to URS CORP., SANTA ANA, CA
App¡ruorx C
ITTTRSEcTIoT ANALYSIS WoRKSHEETS
Exrsrrruc Plus PRoJEcr CoNDrroNS

AM-WP Sun Aug 30, 2015 12:43:70 Page 1-1
wayne ,J. Sand and Gravel Mine Project Traffic StudyExisting Pfus Project
Morning Peak Hour
Scenario:
Corunand:Vol-ume:Geometry:Impact Fee:Trip Generation:Trip DistributionPaths:Routes:Configuration:
Scenario RePortAM-WP
AM-WPAM
ExistingDefault Impact FeeAMAMDefault PathsDef aul-t- RoutesExisting
Traffix ?.6.0115 (c) 2003 Doh¡ting Assoc. Licensed to URS coRP., SANTA ANA| CA

AM-ViIP Sun Aug 30, 2015 L2:43:IO Page 2-t
Wayne J. Sand and Gravel Mine Project Traffic StudyExisting Plus Project
Morning Peak Hour
Zone# Subzone
Trip Generation Report
Forecast for AM
Rate RateAmount Units In Out
Trips TripsIn Out
Total t OfTrips Total
1 Wayne J. San 1.00 Miningzone 1 Subtotal
55.00 37 .00 EE
55373'7
TOTAL 55 31 92 l_00.0
Traffix 7.6.0115 (c) 2003 Dovtl-ing Assoc. Licensed to URS CORP.' SANTA ANA, CA
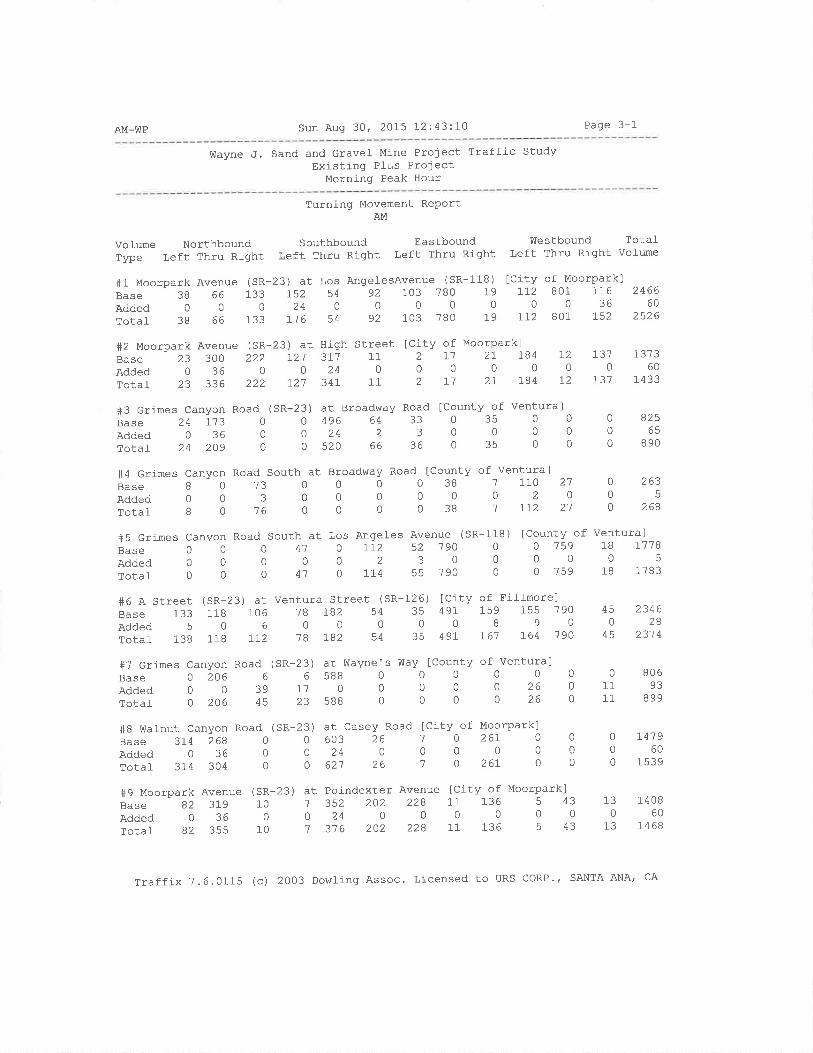
AM-lilP Sun Aug 30, 20L5 t2:43:I0 Page 3-1
!\layne J. Sand and Gravel- Mine Project Traffic StudyExisting Plus Project
Morning Peak Hour
Turning Movement ReportAM
vol-ume Northbound Southbound Eastbound westbound TotalType Left Thru Right Left Thru Right Left Thru Right Left Thru Right volune
#1 Moorpark Avenue (sR-23) at Los AngelesAvenue (SR-118) tCity of MoorparklBase3866133I52549210378019|1.2801116Added0OO24OO0000036Tota]-3866133116549210378019I|2801I52
246660
2526
#2 Moorpark Avenue (SR-23) at High StreetBase 23 300 222 721 371 11
AddedO3600240Total- 23 336 222 I21 341 11
[City of Moorpark]2 r1 21 18400002 r1 27 184
23) at Broadhray Road lCounty of Ventura]0496643303500o242300000520663603500
lcounty of Ventural38 7 110 2'7
002038 '7 rr2 21
720
t2
7310
r31
1 37360
1433
#3 Grimes CanYon Road (
Base 24 773 0
Added 0 36 0
Totat 24 2O9 0
#4 Grimes Canyon Road South at Broadway Road
BaSeAddedTotal
SR0
00
00
0
00
0
0
00
0
00
000
00
0
82565
890
+6 A streetBase 133Added 5
Total- 138
(sR-23)118
0
118
13a
'76
(sR-23)10
010
B
0B
263
268
#5 Grimes Canyon Road South at Los Angel-es Avenue (SR-118)
BaSEAddedTotal
0
0
0
0
0
0
0
00
0
00
0
0
0
410
41
7122
71-4
52 19030
55 190
[County of Ventura]0 759 18 r11B00050 759 18 1783
at Ventura Street (SR-126) lCity of Fi]-lmorel106 ?B rB2 54 35 49r 159 155 190
600000890112 18 tB2 54 35 49r 161 764 '790
450
45
23462B
231 4
#7 Grimes CanyonBase 0 206Added 0 0
Totaf 0 206
#8 Walnut Canyon Road (
Base 3I4 268 0
Added 0 36 0
rotal 314 304 0
Road (SR-23) at Vrtayne's !üay lCounty of Ventura]6 6 588 0 0 0 0 0 0
39r1000002604s235880000260
3) at Casey Road [CitY of Moorpark]060326702670o2400000062126702670
01111
80693
899
r41960
1 539
130
13
14 0B60
14 6B
SR-2000
0
00
#9 Moorpark AvenueBase 82 319Added 0 36Total 82 355
at Poindexter Avenue ICity of Moorpark]1 352 202 228 11 136 5 43
o24000000't 3'76 202 228 11 136 5 43
Traffix 7.6.0115 (c) 2OO3 Dowling Assoc. Licensed to URS CORP', SANTA ANA' CA
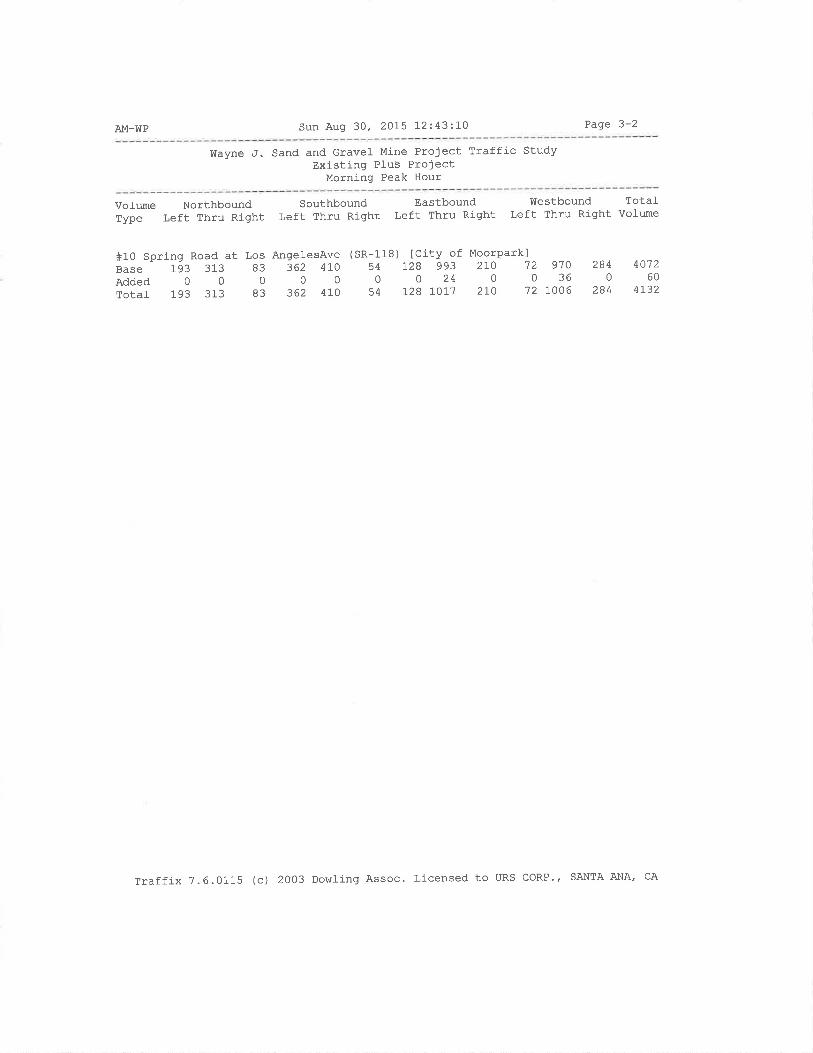
AM-WP Sun Aug 30' 2015 1-2t43:10 Page 3-2
Wayne J. Sand and Gravel Mine Project Traffic StudyExisting Plus Project
Morning Peak Hour
Volwne NorthboundType Left Thru Right
SouthboundLeft Thru Right
EastboundLeft Thru Right
flestbound Total-Left Thru Right Volume
#10 Spring Road at f,os AngelesAveBase 193 313 83 362 410Added00000rotal 193 313 83 362 410
[City of Moorpark]728 993 2L0 12 9'ÌO
o240036728 LOLT 2L0 72 1006
(sR-118)54
n
54
284n
284
407260
4L32
Traffíx 7.6.0115 (c) 2003 Dowling Assoc. Licensed to URS CORP', SANTA ANA' cA
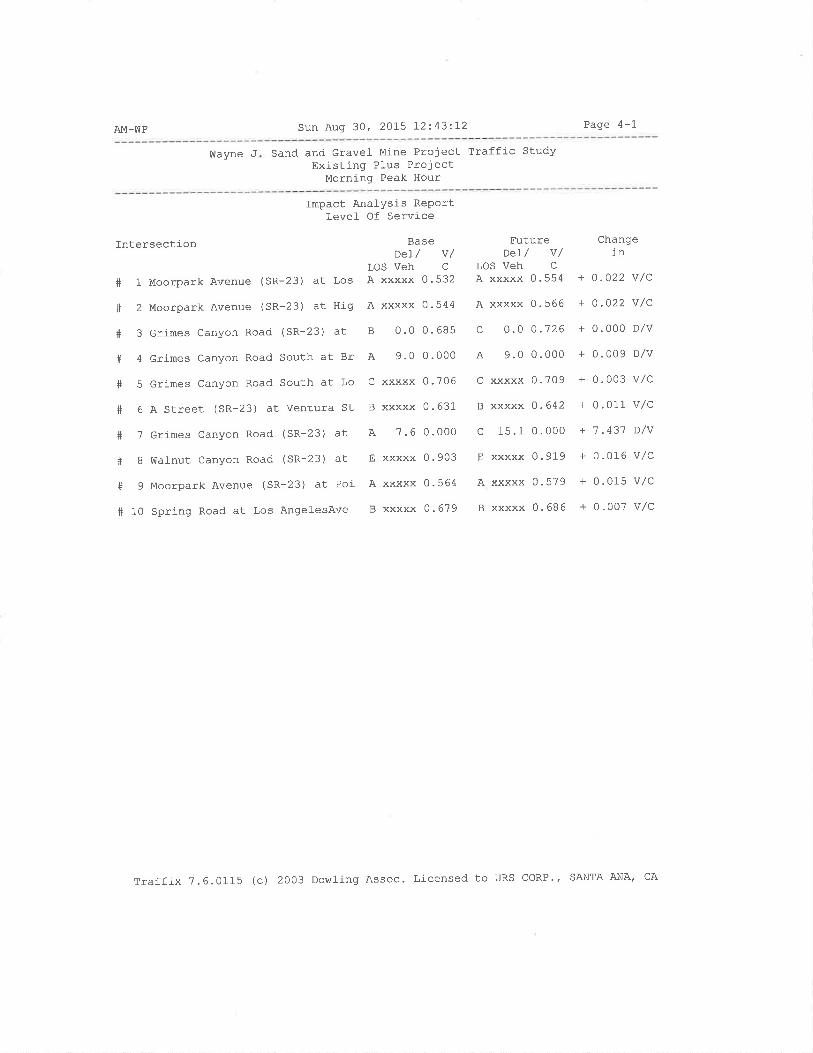
AM-WP Sun Aug 30' 2015 12:43.:1'2 Page 4-1
!ùayne J Sand and Gravel- Mine Project Traffic StudyExisting Plus Project
Morning Peak Hour
Intersecti-on
#1+2#3#4#s#6+1#8#9+10
Moorpark Avenue (SR-23) at Los
Moorpark Avenue (SR-23) at Hig
crimes Canyon Road (SR-23) at
Grimes Canyon Road South at Br
Grimes Canyon Road South at Lo
A Street (SR-23) at Ventura St
crimes Canyon Road (SR-23) at
Wafnut Canyon Road (SR-23) at
Moorpark Avenue (SR-23) at Poi
Spring Road at Los Angel-esAve
Impact Anal-ysis ReportLeveI Of Service
BaseDeI/ v/
LOS Veh C
A xxxxx 0.532
A xxxxx 0.544
B 0.0 0. 685
A 9.0 0.000
C xxxxx 0.706
B xxxxx 0.631
A 7.6 0.000
E xxxxx 0.903
A xxxxx 0.564
B xxxxx 0.679
FutureDeI/ v/
LOS VEh C
A xxxxx 0.554
A xxxxx 0.566
c 0.0 0.126
A 9.0 0.000
C xxxxx 0.709
B xxxxx 0.642
c 15.1 0.000
E xxxxx 0.919
A xxxxx 0.579
B xxxxx 0.686
Changein
+ o.022 v/c
+ 0.022 v/c
+ 0.000 D/V
+ 0.009 D/v
+ 0.003 v/c
+ 0.011- v,/c
+ '7 .431 D/v
+ 0.016 v/c
+ 0.015 v,/c
+ 0.007 v/c
Traffix 7.6.0115 (c) 2OO3 Dowling Assoc. Licensed to URS CORP" SANTA ANA' CA

AM-üIP Sun Aug 30, 2015 l2:43:t2 Page 5-1
Vùayne J. Sand and Gravel- Mine Project Traffic StudyExisting Plus Project
Morning Peak Hour
Level- Of Service Computation ReportICU 1 (Loss as Cycle Lenqth 8) Method (Future Vol-ume Alternative)
********************************************************************************Intersection #1 Moorpark Avenue (SR-23) at Los Angel-esAvenue (SR-l-18) [City of M
********************************************************************************Cycle (sec) : 100 Critical- Vof .,/Cap. (X) : 0.554Loss Time (sec) : 10 (Y+R : 4 sec) Average DeÌay (sec/veh) : xxxxxxOptimaf Cycle: 3']. Level Of Service: A********************************************************************************Approach: North Bound South Bound East Bound !Ùest BoundMovement: L - T - R L - T - R L - T - R L - T - R
-t---------ll---------ll---------ll---------------lControl: Split Phase Split Phase Protected ProtectedRights: Ovf Ovf Include Ovl-
Min.creen: 0 0 0 0 0 0 0 0 0 0 0 0
Lanes: 1 1 0 0 1 1 0 1! 0 1 1 O 2 1 0 1 0 2 0 1
t---------------ll---------------ll---------------ll---------------lVolume Module:Base Vol: 38Growth Adj : 1.00lnitial Bse: 38Added VoI: 0
PasserByvol: 0Initial Eut: 38User Adj : 1,00PHF Adj : 1.00PHF Volume: 38Reduct Vof: 0
Reduced Vol: 38PCE Adj : 1.00MLF Adj : 1.00Final Vof.: 38
661 .00
6600
661.001.00
660
661 .001 .00
oo
1331 .00
13300
1331 .001 .00
1330
1331 .001 .00
133
r521.00r52
240
7'7 6
1 .001.00
7760
r'7 61 .001 .00
r'7 6
92 10300 1.0092 1030000
92 10300 1 .0000 1 .0092 10300
92 10300 1.0000 1.0092 103
7801.00
78000
7801.001.00
7800
7801.001 .00
780
191.00
190
019
1.001 .00
190
791.001.00
19
1r21 .00
77200
II21 .001 .00r72
0
I121 .001 .00LI2
8011.00
8010
0
8011.001.00
8010
8011.001.00
801
1,L61.00
11636
01 \'.)
1.001.00r52
01 Êa
1.001.00
L52
1
540054
0
054000054
0
54000054
1
1
1
1
1
1
11
1
r---------------lr---------------ll---------------ll---------------lSaturation Flow Modufe:sar/Lane: 1600 1600 1600 1600 1600 1600 1600 1600 1600 1600 1600 1600Adjustment: O. 94 1.00 0. 94 0. 94 1 .00 0.94 0. 94 1.00 0.94 0. 94 1.00 O -94Lanes: 1. OO 1. OO 1 .00 1 . 64 0.36 1 .00 1 .00 2. 93 0.07 1.00 2.00 1.00Final- sar. : 1500 1600 1500 2460 5'76 1500 1500 4686 107 1500 3200 1500
-t---------ll---------ll---------ll---------------lCapacity Analysis Modul-e :
Vol-/Sat: 0.03 0.04 0.09 0.07 0.09 0.06 0.07 0.17 0. 18 O -07 O.25 0. 10
Cfit MOVeS ' **** **** **** ************************************************************************************
Traffix 7.6.0115 (c) 2003 DowJ_ing Assoc. Licensed to uRs coRP., SANTA ANA, CA
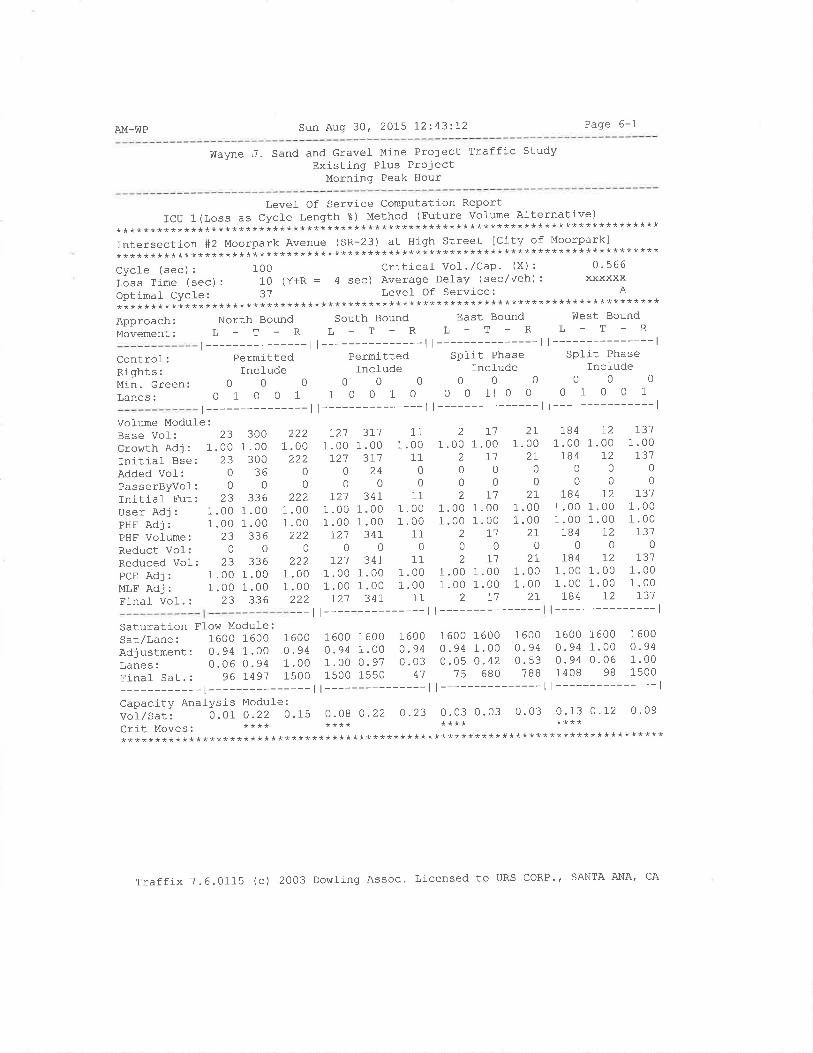
Sun Aug 30, 2OL5 I2:43:L2 Page 6-1AM-WP
Wayne J. Sand and Gravel Mine Project Traffic StudyExisting PLus Project
Morning Peak Hour
Levef Of Service Computation ReportICU 1(Loss as Cycl-e Length %) Method (Future vollrme Al-ternative)
********************************************************************************Intersection #2 Moorpark Avenue (sR-23) at High Street Icity of Moorpark]********************************************************************************Cycle (sec): 1OO Critical- VoI'/Cap' (X): 0'566Lóss Time (sec): 10 (y+R = 4 sec) Average Delay (sec/veh): xxxxxxOptimal Cyc1e: 31 Level Of Service; A
********************************************************************************Approach:Movement:
Control:Rights:Min. GreenLanes:
Vohme Moduf e:Base VoI: 23Growth Adj : 1.00Tnitial Bse: 23Added Vol-: 0
PasserByvof: 0
Initial Fut: 23User Adj: 1.00PHF Adj : 1.00PHF Volume:. 23Reduct Vof: 0
Reduced Vol: 23PCE Adj : 1.00MLF Adj : 1.00Final- Vol-. : 23
North Bound South Bound East BoundL-T-RL-T_RL-T-R
l--------------- | l---------------l l--------------- |
Permitted Permitted SPI-it PhaseInclude Incfude IncÌude
oooo00000o 1 O O 1 1 0 0 1 0 0 0 11 0 0
| --------------- | I --------------- I I --------------- ì
West BoundL-T-R
t---------------lSplit Phase
Include000
01001t---------------l
3001.00 t
30036
0336
1.00 1
1.00 1
3360
1.001 .00
336
222.00222
00
222.00.00222
0
222.00.00
---l
72'1 371 11 2 r'7 2r1 . OO 1.00 1.00 1.00 1 .00 1.00I2'7 3r1 11 2 r1 27
o240000000000
721 34I 11 2 Ll 2L1 . OO 1.00 1 .00 1.00 1.00 1.001 . OO 1.00 1 .00 1 .00 1.00 1.00r21 341 11 2 l1 2r
000000721 34r 11 2 r1 2r
1 . OO 1.00 1 .00 1 .00 1 .00 1.001. OO 1 . O0 1.00 1 .00 1.00 1 ' 00721 341 11 2 r1 2r
| --------------- | I ---------------
184 72 r311.00 1.00 1.00184 t2 137
000000
184 72 1371.00 1.00 1.001 .00 1.00 1.00184 12 r31
000184 12 r31
1.00 1.00 1.001 .00 1.00 1 .00184 72 r31
t---------------l
3361
1
Saturation Flow Module:sar/Lane: 1600 1600 1600 160O 1600 1600 1600 1600 1600 1600 1600 1600
Adjustment: 0.94 1.00 O.g4 0.94 1.OO 0.94 0.94 1.00 o-94 0.94 1.00 o'94laáes: 0.06 0.94 1 . O0 1 .00 o. 9? 0. 03 o .05 0. 42 0.53 0.94 0.06 1.00
Final sat.: 96 1491 1500 15oO 1550 4'7 'r-5 680 788 1408 98 1s00
-l---------ll---------ll---------ll---------------lCapacity AnalYsis Module :
voi/s.t, o.or 0.22 0.15 0.08 0.22 0.23 O.03 0.03 0.03 0.13 0.12 0.09
crit Moves. **** **** **** *******************************************************************************+****
Traffix 7.6.0115 (c) 2O03 DowJ-ing Assoc. Licensed to URS CORP'' SANTA ANA' cA
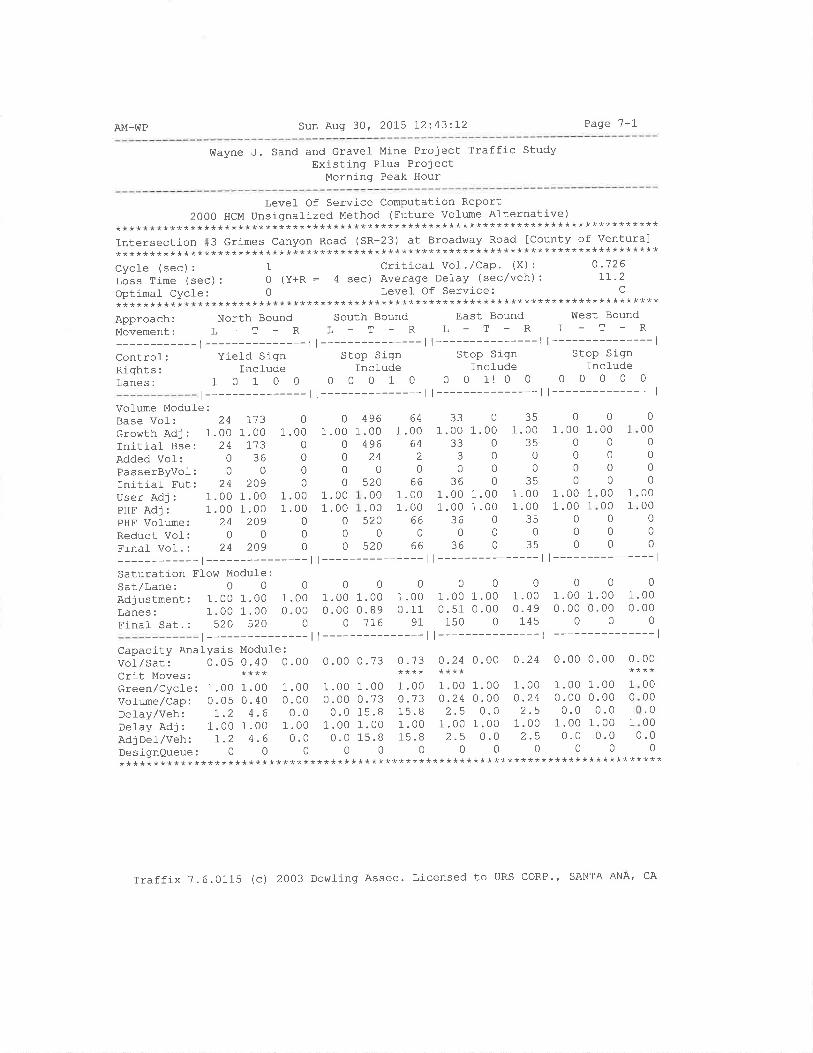
AM-ü7P Sun Aug 30, 2015 12:43:I2 Page 7-1
Vlayne J. Sand and Gravel Mine Project Traffic StudyExisting Pl-us Project
Morning Peak Hour
Level- Of Service Computation Report2000 HCM Unsignalízed Method (Future Volume Alternative)
********************************************************************************Intersection #3 Grimes Canyon Road (SR-23) at Broadway Road [County of Ventura]********************************************************************************Cycle (sec): 1 Criticaf Vof./Cap' (x): 0'126lõss Time (sec): O (Y+R : 4 sec) Average Delay (sec/veh): II'2Optimal Cycle: O Level- Of Service: C
********************************************************************************Approach:NorthBoundSouthBorrndEaStBoundWestBoundMovement: L - T - R L - T - R L - T - R L - T - R
-l---------ll---------ll---------ll---------------lControf: Yield Sign Stop Sign Stop Slgn Stop Sj-gn
Riqhts:Includelncludelncludelncl-udeLanes: 1 O 1 0 0 O O O 1 O 0 0 1! 0 0 0 0 0 0 0
t---------------ll---------------ll---------------ll---------------lVolume Module:Base Vof z 24Growth Adj : 1.00Initial- Bse: 24Added Vol: 0
Passerljyvo-L: u
Initiat Fut: 24User Adj : 1.00PHF Adj : 1.00PHF Vofume:. 24Reduct Vol-: 0Final- Vol.: 24
7131 .00r13
360
209T.UU1 .00
2090
209
01 .00
0
000
1.001 .00
0
0
0
01 .00
0
0
00
1.001 .00
000
496.00496
240
520.00.00520
0520
641 .00
642
066
1 .001 .00
660
66
??1 .00
333
0
361 .001.00
360
36
1.00 1
1.00 I000
35.0035
00
2tr
.00
.002R
035
0
00
0
1.00 1
1.00 1
0
0
0
000
0
0
00
0000
00
0
1
0
1.0000
00
1
01.00 1 1
000
0
000
0000
000
1
1
sat/Lane:Adjustment:Lanes:Final Sat. :
001.00 1.001 .00 1 .00520 520
001.00 1.000.00 0.00
00
000000001 . OO 1 .00 1.00 1.00 1 .00 1.00 1.00 1 .00o.0o o. oo 0.89 0 . 11 0.51 0.00 0.49 0 .00
00116911s001450t--------------- | l--------------- | l--------------- | l--------------- |
Capacity Anal-ysis Modufe :
vot/sut, 0.05 o.40 o.oo o.oo 0.73 0.?3 0.24 0.00 0.24 0.00 0.00Cfit MOVeS. **** **** ****
Green/Cycle: 1. OO 1.00 1 .00 1 .00 1. oo 1.00 1 .00 1.00 1.00 1.00 1.00votume,/cap: 0.05 0.40 o.oo o.oo 0.73 0.?3 0.24 0.oo o.24 0.00 0.00oeray,/ven: I.2 4.6 0.0 0.0 15.8 15.8 2'5 0'0 2'5 0'0 0'0oeraye¿j:1.001.001.001.001.001.001.001.001.001.001.00AdjDãr/váh: 1.2 4.6 o.o 0.0 15.8 15.8 2-5 0.0 2'5 0'0 0'0DeÁigngueue: O 0 O O 0 0 0 0 0 0 0
********************************************************+****************
0. 00
1
1
0
0000.000
0.00
Traffix 7.6.0115 (c) 2O03 Dowling Assoc. Licensed to URS CORP'' SANTA ANA/ CA
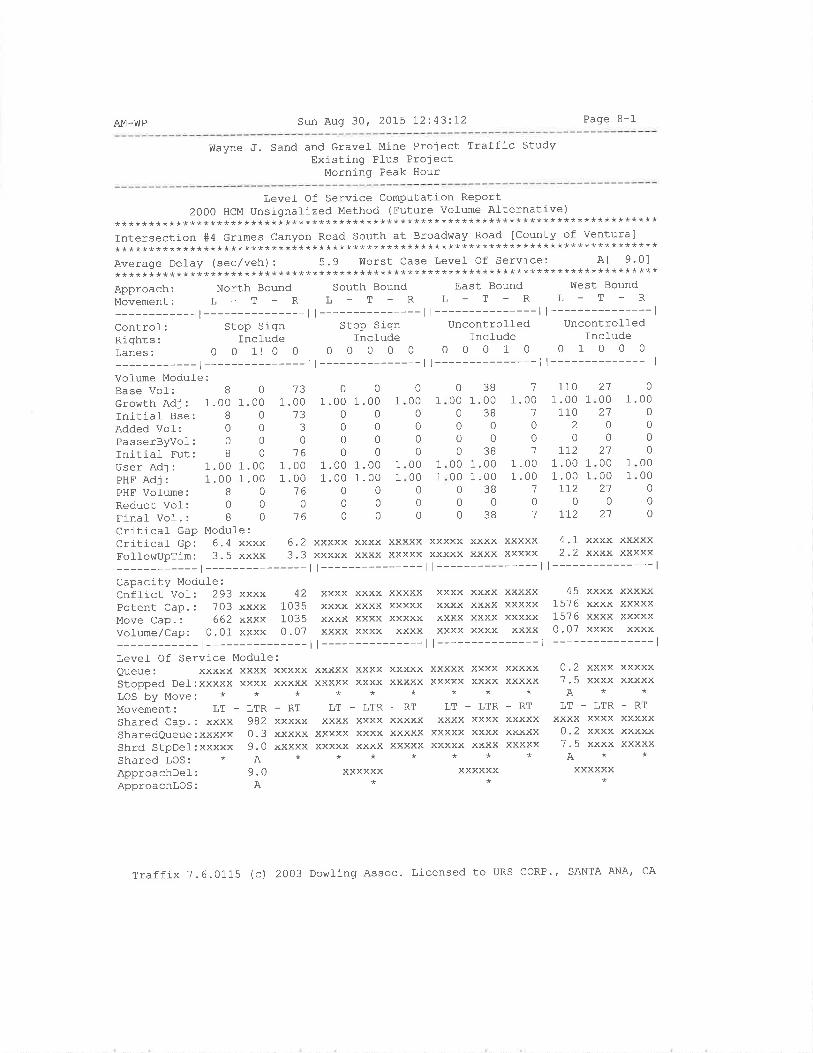
AM_WP Sun Aug 30, 2015 I2:43:L2 Page 8-1
Wayne ,J. Sand and Grave1 Mine Project Traffic StudyExisting Plus Project
Morning Peak Hour
Level of Service Computation Report2000 HCM Unsignalized Method (Future Volume Alternative)
***************************************************************************+****Intersection #4 Grimes Canyon Road South at Broadh¡ay Road ICounty of Ventura]********************************************************************************Average Delay (sec/veh) : 5.9 lilorst Case Level Of Service: A[ 9.0]********************************************************************************Approach: North Bound south Bound East Bound west Bound
Movement: L - T - R L - T - R L - T - R L - T - R
-l---------ll---------ll---------ll---------------lcontrof: stop sign Stop sign uncontrolled uncontrolledRights:Includelncludelncfudelncludel,anes: O O 1l O O 0 0 O 0 0 0 0 0 1 0 0 1 0 0 0
-l---------ll---------ll---------ll---------------lVolume Modul-e:Base Vof: B
Growth Adj : 1.00 1.Initial Bse: IAdded Vol: 0PasserByvol: 0
Initiaf Fut: 8
User Adj : 1.00 1.PHFAdj: 1.00 1.PHF VolumE: B
Reduct Vol: 0
Finaf Vof. : B
Critical Gap Module:Criticaf Gp: 6.4 xxxx 6.2 xxxxx xxxx xxxxx xxxxx xxxx xxxxx 4.1 xxxx xxxxxFolfohtupTim: 3.5 xxxx 3.3 xxxxx xxxx xxxxx xxxxx xxxx xxxxx 2'2 xxxx xxxxx
-l---------ll---------ll---------ll---------------lCapacity Module:Cnftict Vol-: 293 xxxx 42 xxxx xxxx xxxxx xxxx xxxx xxxxx 45 xxxx xxxxx
aa
1 .00
30
161 .001 .00
160
16
001.00 1.00
00000000
1 .00 1 .001.00 1.00
000000
03800 1.000 3800000 38
00 1.0000 1.0003800038
1.001_.00
1
0
1
1101.00 1
1102
0
t721.00 1
1.00 1
I120
772
21000021
02'7
0
00000
0
0000
0
0
0
0010
00000
0
0000
0
00
1
1
1.001
007
27
1576 xxxx xxxxx1576 xxxx xxxxx0.07 xxxx xxxxt---------------l
0.2 xxxx xxxxx7.5 xxxx xxxxxA**
LT-LTR-RTxxxx xxxx xxxxx0.2 xxxx xxxxx7.5 xxxx xxxxxA**
xxxxxx*
01.00
00
0
0
000
00
210
0
1
111
1
1
00
Potent Cap.: 703 xxxx 1035 xxxx xxxx xxxxx xxxx xxxx xxxxxMove Cap.: 662 xxxx 1035 xxxx xxxx xxxxx xxxx xxxx xxxxxVolume/Cap: 0,01 xxxx 0.07 xxxx xxxx xxxx xxxx xxxx xxxx
-l---------ll---------ll---------------lLevef Of Service Modul-e:Queue: xxxxx xxxx xxxxx xxxxx xxxx xxxxx xxxxx xxxx xxxxxStopped De.l-:xxxxx xxxx xxxxx xxxxx xxxx xxxxx xxxxx xxxx xxxxxLOS ÈY Move: * * * * * * * * *
Movement: LT - LTR - RT LT - LTR - RT LT - LTR - RT
Shared Cap.: xxxx 982 xxxxx xxxx xxxx xxxxx xxxx xxxx xxxxxSharedQueue:xxxxx 0.3 xxxxx xxxxx xxxx xxxxx xxxxx xxxx xxxxxshrd stpDef:xxxxx 9.0 xxxxx xxxxx xxxx xxxxx xxxxx xxxx xxxxxShared LOS: * A * * * * * * *
ApproachDef: 9.0 xxxxxx xxxxxxApproachlos: A * *
Traffix ?.6.0115 (c) 2OO3 Dowlj-ng Assoc. Licensed to URS coRP., SANTA ANA, CA
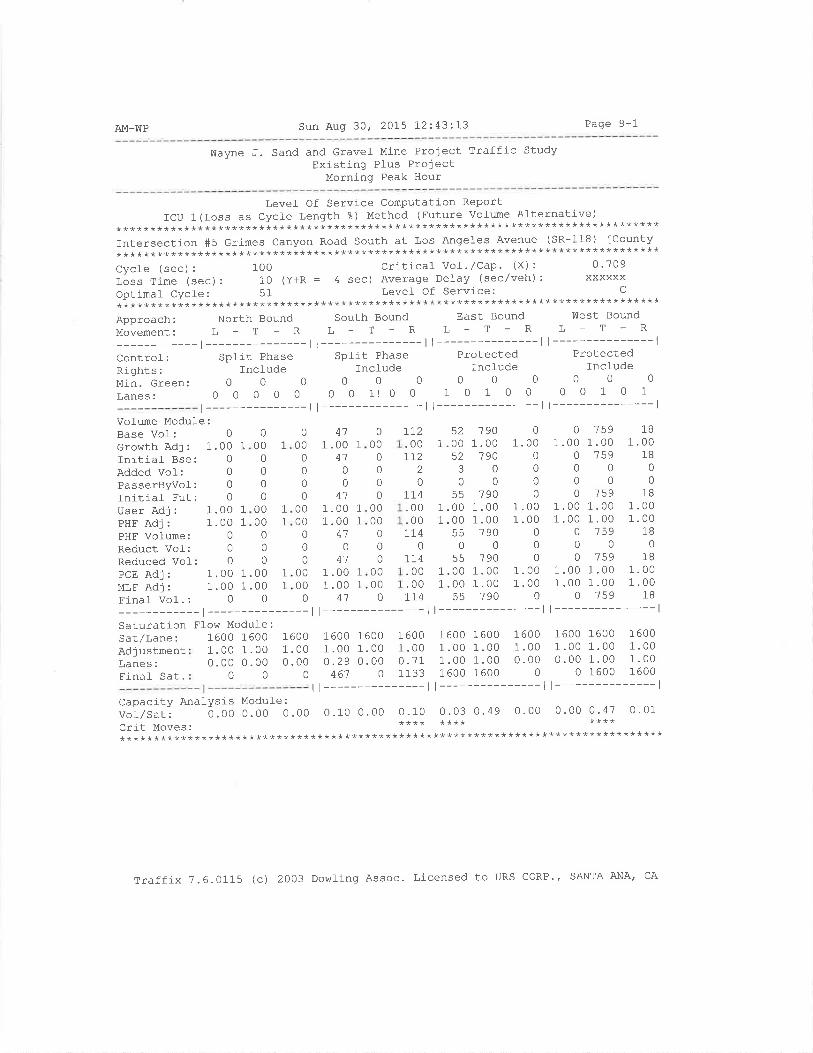
AM-V1tP Sun Augt 30, 2015 1'2:43:73 Page 9-1
v[ayne J. Sand and Grave]- Mine Project Traffic StudyExistj-nq Plus Project
Morning Peak Hour
ICU 1************Intersection************Cycle (sec) r
Loss Time (sOptimal Cycl************Approach:Movement:
Controf:Rights:Min. Green:Lanes:
Vofume Module:Base Vol:Growth Adi:Initiaf Bse:Added Vol-:PasserByvof:Initial Fut:User Adj:PHF AdJ:PHE Volume:Reduct Vol:Reduced Vol:PCE AdJ:MLF AdJ:Finaf Vof. :
Sat/Lane:AdjustmentLanes:Final- Sat.
1.00 1
1.00 1
0
0
01.00 1.00 1
1.00 1 .00 L
00
00 160000 1.0000 0.0000
Levef Of Service Computation Report(Loss as Cycle Length ?) Method (Future Volì.me Alternative)********************************************************************#5 Grimes canyon Road south at Los Angel-es Avenue (sR-118) lCounty
********************************************************************1OO Critical Vol./CaP. (X): 0'709
ec) : 10 (Y+R : 4 sec) Average DeJ-ay (sec/veh) : xxxxxxe: 51 Level Of Service; C
********************************************************************North Bound South Bound East Bound !Ùest Bound
L-T-RL_T-RL-T-RL_T-Rt---------------ll---------------ll---------------ll---------------l
Sptit Phase Split Phase Protected ProtectedfncÌude Include Include Incfude
000000000000o o o 0 o 0 o 11 0 o 1 0 1 0 0 0 0 1 0 1
r---------------ll---------------ll---------------ll---------------l
000
0
000
0000
000
01.00 1
0000
1
0
0000
0
00000
0
00
0000
0
111
41.0041
0
04't
.00
.0041
0
41.00.0041
TI2.00rL2
2
07]-4.00.0011,4
0tI4.00.00II4
521 .00
523
0trtr
1 .001 .00
EÊ
0EÈ
1 .001 .00
01.00
0
000
1.001.00
0
.000
0
00
.00
.000
0
0
.00
.000
1591.00
? RÕ
00
1591.001 .00
1590
1591 .001.00
'7 59
1B1.00
1B0
018
1.001.00
180
1B1.001 .00
18
0
00000
0
0000
0
00
0000
0
'7 901.00
19000
1901 .001.00
1900
1901.001.00
190
1
11
1
1
1,
1
1
7
11
1
1
1
0
0
01.001.00
0
I61.0.
1 6001 .000 .00
0
1600 16001 .00 1.000.29 0.0046'7 0
1600 16001 .00 1.001 .00 1.001600 1600
1 6001.000. 00
0
00 160000 1.0000 1.000 1600
1 6001.001.001 600
1 6001.000.711133
I61.0.
Capacity Anafysis Modufe:vor/sut, 0. oo o.0o o. oo 0.10 o. o0 o.10 0.03 0. 49 0.00 0.00 0.47 0.01Crit Moves: **** **** ************************************************************************************
Traffix 7.6.0115 (c) 2003 Dowling Assoc. Licensed to URS CORP', SANTA ANA' cA
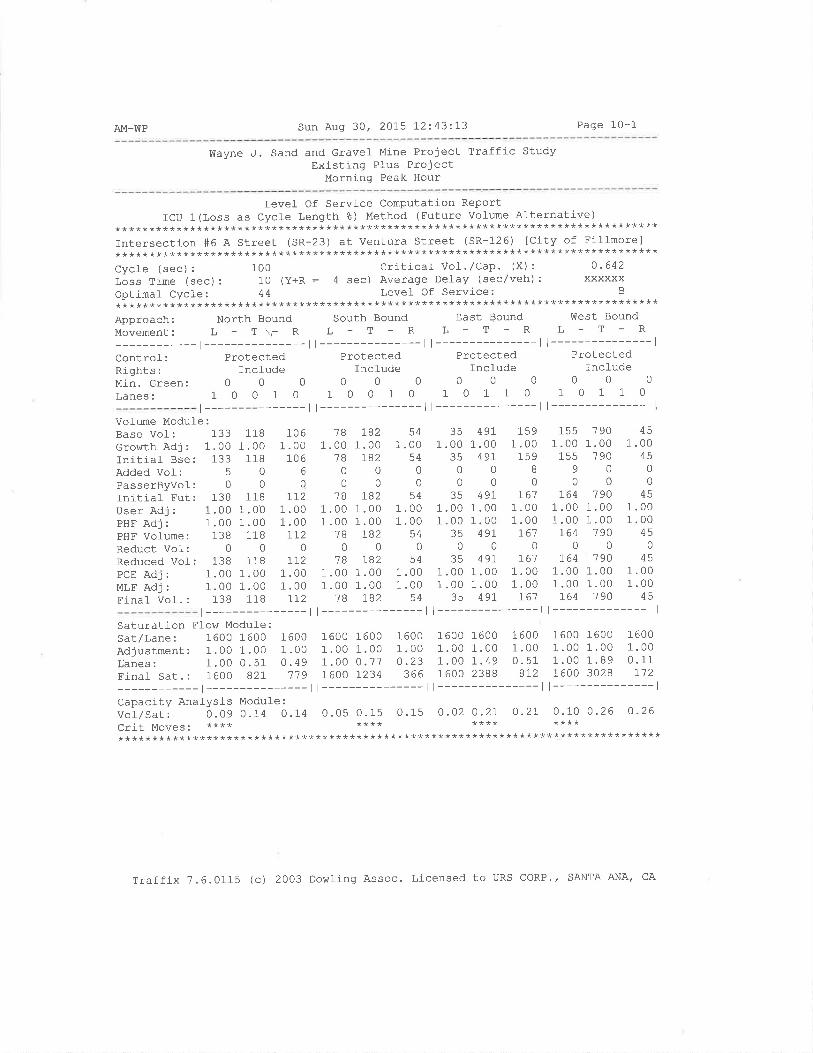
AM-WP Sun Aug 30, 2075 I2:43:I3 Page 10-1
Wayne J. Sand and Gravef Mine Project Traffic StudyExisting Plus Proiect
Morning Peak Hour
Level Of Service Computation Reportfcu 1(Loss as Cycfe Length t) Method (Future vol-ume Alternative)
********************************************************************************Intersection #6 A Street (SR-23) at Ventura Street (SR-126) [City of Fillmore]********************************************************************************Cycle (sec) : 100 critical- Vol .,/Cap. (X) : O '642Loss Time (sec) : 10 (Y+R : 4 sec) Average Delay (sec/veh) : xxxxxxOptimaf Cycle: 44 Level- Of Service; B
* * * * * * * * * ** * * ** * * * * * * * * * * * * * * * * * * * * * * * * * * * * * * * * * * * * * * * * * * * * * * * * * * * * * * * * * * * * * * * * *
Approach: North Bound south Bound East Bound west Bound
l4ovement: L - T \,- R L - T - R L - T - R L - T - R
-l---------ll---------ll---------ll---------------lcontrol_: Protected Protected Protected ProtectedRights: Include Include Include Incl-udetqin. creen: 0 O O O 0 0 0 0 0 0 0 0
Lanes: 1 O O 1 O 1 O 0 1 0 1 0 1 1 0 1 0 1 1 0
l---------------ll---------------ll---------------ll---------------lVol-ume Module:Base Vol: 133Growth Adj : 1.00Initial- Bse: 133Added VoI: 5
PasserByvol: 0Initial Fut: 138User Adj : 1.00PHF Adj : 1.00PHF Vofume: 138Reduct Vol: 0Reduced Vol-: 138PcE Adj : 1.00MLF Adj : 1.00Finaf Vol.: 138
1181 .00
11800
1181 .001 .00
1180
1181 .001 .00
118
1061 .00
1066
0
LL21 .001 .00r72
0
II21 .001.001r2
781 .00
'78
00
1B1 .001 .00
7B0
7B1 .001.00
7B
I821.00
78200
IB21.001 .00
tB20
IB21 .001 .00
IB2
541 .00
5400
541 .001 .00
540
541 .001 .00
54
351 .00
350
02R
1 .001 .00
0
351 .001.00
35
49t1.00
49700
49r1 .001.00
49r0
49r1.001.00
49r
1591.00
159I0
r611.001.00
r610
r611.001.00
r61
1551 .00
1tE
9
0764
1 .001.00
7640
7641 .001 .00
764
'7 901 .00
'7 900
0190
1 .001.00
7900
1901.001.00190
451.00
4500
451.001.00
450
451.001 .00
45
t---------------ll---------------ll---------------ll---------------lSaturation Flow Modufe:sar/Lane: 1600 1600 1600 1600 1600 1600 1600 1600 1600 1600 1600 1600
Adjustment: 1 .00 1.00 1 . oo 1. oo 1. oo 1.00 1 .00 1 .00 1.00 1 .00 1.00 1.00Lanes: 1.00 0.51 0.49 1.00 0.77 0.23 1.00 1.49 0.51 1.00 1.89 0.11Finat sar.: 1600 82I 7'19 7600 1234 366 1600 2388 BI2 1600 3028 1-'72
-l---------ll---------ll---------ll---------------lCapacity Analysis Module :
vo1/sut, O.09 0.14 0.14 0.05 0.15 0.15 o.02 0.2I 0.2I 0.10 0.26 o-26crit Moves. **** **** **** ************************************************************************************
Traffix 7.6.0115 (c) 2003 Dowting Assoc. Licensed to URS CORP., SANTA ANA, CA
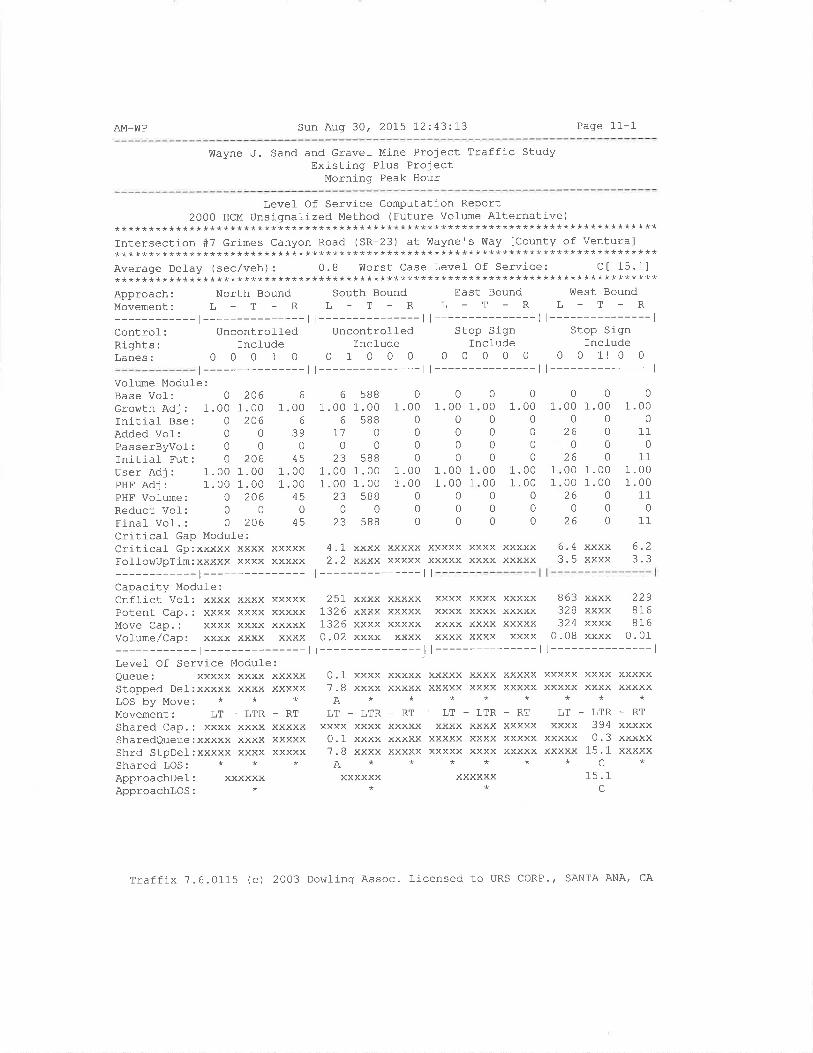
AM-WP Sun Aug 30, 2015 I2:43:L3 Page 11-1
Wayne J. Sand and Gravel Mine Project Traffic StudyExisting Plus Project
Morning Peak Hour
Level Of Service Computation Report2000 HCM Unsignalized Method (Future VolLme Alternative)
********************************************************************************Tntersection #7 Grimes Canyon Road (SR-23) at Wayne's Way lCounty of Ventura]* * ** * * * * * * * * * * * * * * * * * * * * * * * * * * * * * * * * * * * * * * * * * * * * * * * * * * * * * * * * * * * * * * * * * * * * * * * * * * * *
Average DeJ-ay (sec/veh): 0.8 Worst Case LeveÌ Of Service: Ct 15.11********************************************************************************Approach: North Bound South Bound East Bound v{est BoundMovement: L _ T - R L - T _ R L - T - R L - T - R
-l---------ll---------ll---------ll---------------lControf: Uncontroffed Uncontroffed Stop Sign Stop SignRights: Incfude Inctude Include IncludeLanes: 0 0 0 1 0 0 1 0 0 0 0 0 0 0 0 0 0 1! 0 0
t---------------ll---------------ll---------------ll---------------lVolume Module:Base Vol: 0 206 6
Growth Adj : 1 .00 1.00 1.00Initial Bse: 0 206 6
AddedVol: 0 0 39PasserByvol: 0 0 0
Initial Fut: O 206 45User Adj : 1.00 1.00 1.00PHF Adj : 1.00 1 .00 1 .00PHF Vol-ume: 0 206 45Reduct Vof: 0 0 0Final Vof. : 0 206 45Critical Gap Module:CriticaÌ Gp:xxxxx xxxx xxxxxFollohrupTím: xxxxx xxxx xxxxx
Cnfl-ict Vol: xxxx xxxx xxxxxPotent Cap.: xxxx xxxx xxxxxMove Cap.: xxxx xxxx xxxxxVolume/Cap: xxxx xxxx xxxx
-l---------------lLevel Of Service Module:Queue: xxxxx xxxx xxxxxStopped Def:xxxxx xxxx xxxxxLOS by Move: * * *Movement: LT - LTR - RT
Shared Cap.: xxxx xxxx xxxxxSharedQueue:xxxxx xxxx xxxxxShrd StpDel:xxxxx xxxx xxxxxShared LOS: * * *ApproachDel: xxxxxxApproachlOS: *
6
1 .006
I10
231.001 .00
230
ZJ
5881.00
5BB0
0
5881.001.00
5880
588
01 .00
00
0
0
1 .001 .00
000
01.00 1
000
0
1.00 1
1.00 1
000
1.00 1
1.00 1
000
.00
.0011
011
6.2
0000 1.0000
26000
26000 1.0000 1.0026000
260
xxxx xxxxx xxxxx xxxx xxxxxxxxx xxxxx xxxxx xxxx xxxxx
vvvYXXXX
000
0000
0000
000
01 .00
00
0
0
1
0
1.000
110
111
1
^I3.54.r2-2
251 xxxx xxxxx xxxx xxxx xxxxx 863 xxxx 2291326 xxxx xxxxx xxxx xxxx xxxxx 328 xxxx 8161326 xxxx xxxxx xxxx xxxx xxxxx 324 xxxx 8160.02 xxxx xxxx xxxx xxxx xxxx 0.08 xxxx 0.01
| --------------- ) | --------------- | I --------------- |
0.1 xxxx xxxxx xxxxx xxxx xxxxx xxxxx xxxx xxxxx?. B xxxx xxxxx xxxxx xxxx xxxxx xxxxx xxxx xxxxxA********
LT - LTRxxxx xxxx0.1 xxxx7 .8 xxxxA*xxxxxx
*
LT - LTRxxxx xxxx
xxxxx xxxxxxxxx xxxx**
xxxxxx*
-RTVVYYY
XXXXXXXXXX
LTxxxx
YVvvq
xxxxx
_RTxxxxxxxxxxXXXXX
_RTxxxxxxxxxxXXXXX
- LlK
3940.3
1E If J. f
c15.1
C
Traffix 7.6.0115 (c) 2003 Dowling Assoc. Licensed to URS coRP., SANTA ANA, CA
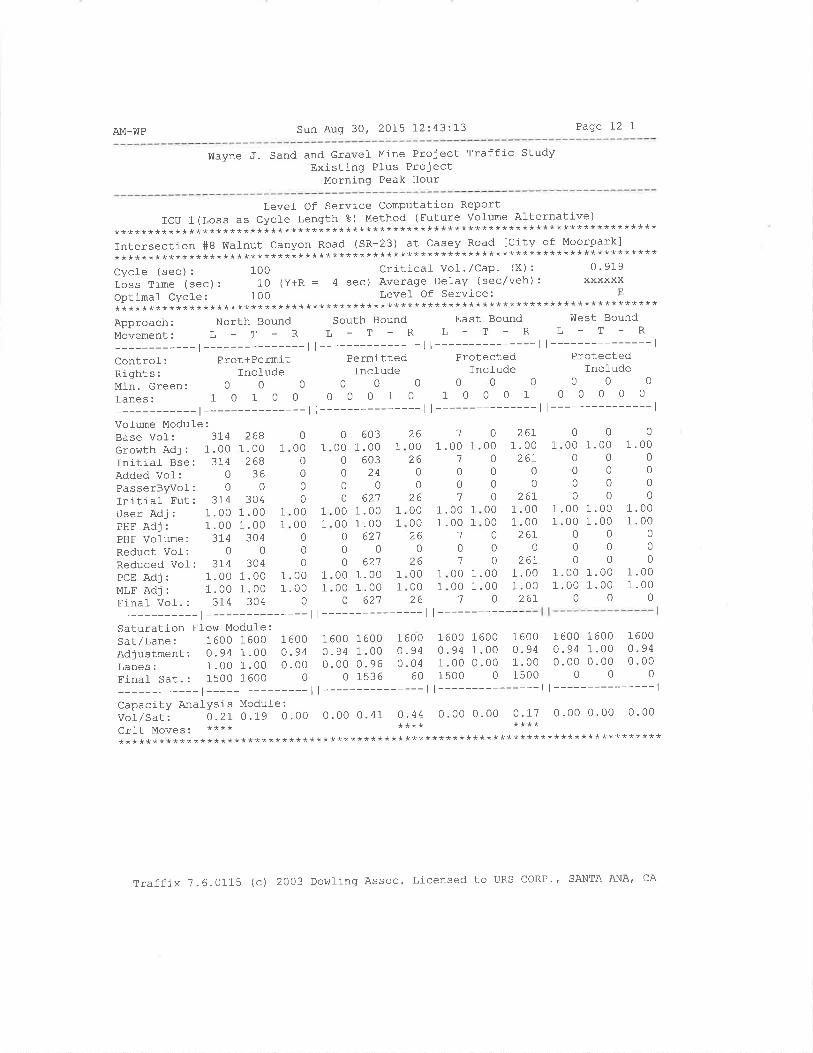
AM-ü]P Sun Aug 3Ot 20L5 12:43"13 Page 72-I
lrlayne J. Sand and Gravel Mine Project Traffic StudyExisting PIus Project
Morning Peak Hour
Level Of Service Computation ReportICU 1(Loss as CycJ-e Length g) Method (Future Vofume Alternative)
********************************************************************************Intersection #8 V,latnut Canyon Road (SR-23) at Casey Road [City of Moorpark]********************************************************************************Cycle(sec):l00CriticafVol-"/Cap'(X):0'919Loss Time (sec) : 10 (Y+R : 4 sec) Average Delay (sec/veh) : xxxxxxOptimaf Cycle: 1OO Level Of Service3 E
********************************************************************************Approach:NorthBoundSouthBoundEastBoundV'lestBoundMovemENt: L - T - R L - T - R L - T - R L - T - R
-l---------ll---------ll---------ll---------------lControl: Prot+Permit Permitted Protected ProtectedRj-ghts: Incl-ude Incfude Include IncfudeMin.creen: O O O O 0 O 0 0 0 0 0 0
Lanes: 1 O 1 O O 0 O 0 1 O 1 0 0 0 1 0 0 0 0 0
-l---------ll---------ll---------ll---------------lVolume Module:Base Vol- z 31-4
Growth Adi: 1.00Ini-tial- Bse: 314Added Vol: 0
PasserByvol-: 0
fnitiaf Fut: 314User Adj : 1.00PHF Adj : 1.00PHF Volume: 314Reduct Vol-: 0
Reduced Vof: 314PcE Adj : 1.00 1 .00MLF Adj : 1.00 1.00Final Vol-. : 3L4 304
Saturation Fl-ow Module:Sat/Lane: 1600 1600Adjustment: 0.94 1.00Lanes: 1.00 1.00Finat Sat.: 1500 1600
00 1
00 1
26
100010
00 1.0000 1.0070
1 600o.940.04
60
1600 16000.94 1.001 .00 0.001500 0
1 6000.941.001 500
00 160094 1.0000 0.0000
1 6000.940. 00
0
2681.00 1
268Jtl
0304
1.00 1
1.00 1
3040
304
260026
00
¿ô000026
0
1
1.00 1
1
0
01
1.00 1
1.00 1
26L1.0026r
00
26r1.001.00
2670
26r1.001.0026r
0
1.0000
00
1.001.00
00
0I .001.00
0
0
1 .000
0
00
1.001 .00
0
0
01.001.00
0
000
000
00000
000
00
L
0 60300 1.00 1
0 603o24000 62'7
00 1.00 1
00 1.00 1
0 627000 62'7
00 1.00 1
00 1.00 1
0 621
00 160094 1.0000 0.960 1s36
000
0
00
0
01 .00
0
00
01 .001.00
000
1 .001 .00
0
1
1
0000
261 1
11 .000
760.0.
009400
0
I60.0.
L60.0.
-l---------ll---------ll-----------Capacity AnalYsis Modufe :
vor/sat: O.2L 0.1'g O.OO 0.00 0.41 0'44 0'00 0'00Crit MOVeS. **** **************************************************************
---- I I --------------- |
0.17 0 .00 0.00 0.00
**********************
Traffix 7.6.0115 (c) 2O03 Dowling Assoc. Licensed to URS coRP./ SANTA ANA' CA

AM-WP Sun Aug 30, 2015 12:43:I3 Page 13-1
htayne J. Sand and Gravel Mine Project Traffic StudyExisting Pfus Project
Morning Peak Hour
Level Of Service Computation ReportICU 1 (Loss as Cycfe Length 8) Method (Future volume Alternative)
********************************************************************************Intersection #9 Moorpark Avenue (SR-23) at Poindexter Avenue lcity of Moorpark]********************************************************************************Cycle (sec) : 100 Critical Vol .,/Cap' (X) : 0 ' 579
Loss Time (sec): 10 (Y+R : 4 sec) Average Defay (sec/veh): xxxxxxOptinal CycJ-e: 38 Level Of Service; A********************************************************************************Approach: North Bound South Bound East Bound vüest Bound
MovemENt: L - T - R L - T _ R L _ T - R L - T - R
-l---------ll---------ll---------ll---------------lControl-: Protected Pïotected Split Phase Split Phase
Rights: Incfude Include Incfude IncludeMin.creen: O O O O O O 0 0 0 0 0 0
Lanes: 10010101010101010010t---------------ll---------------ll---------------ll---------------l
Vol-ume Module:Base VoÌ:. 82Growth Adj : 1.00Initial Bse: 82Added Vol: 0PasserByvol-: 0
Initiaf Fut: 82User Adj: 1.00PHF Adj : 1.00PHF Volume: 82Reduct Vol: 0
Reduced Vol-: 82PcE Adj : 1.00MLF Adj : 1.00Final Vol. : 82
3191 .00
31936
0
3551 .001 .00
.Etr
0
3551 .001 .00
355
101.00 1
100
0
101.00 1
1.00 1
100
101.00 r1.00 1
10
1 35200 1.001 352o24007 376
00 1.0000 1.007 3'7600't 31 6
00 1.0000 1.001 3'76
2021.00
20200
2021 .001 .00
2020
2021 .001 .00
202
2281 .00
2280
0a)a
1.001 .00
2280
2281 .001 .00
228
111 .00
1100
111.001.00
110
111.001 .00
11
1361 .00
1360
0136
1.001.00
1360
1361.001.00
136
5
1.005
0
0
1.001 .00
50
1 .001 .00
5
431.00
4300
431.001.00
430
431.001 .00
43
I130013
00
130000IJ
013000013
1
1
1
1
-l---------ll---------ll---------ll---------------lSaturation FIow Modufe:Sar/Lane: 1600 1600 1600 1600 1600 1600 1600 1600 1600 1600 1600 1600
Adjusrment: 0.94 1. OO 0.94 0.94 1.00 o.94 0.94 1.00 o.94 0.94 1.00 o -94LaÀes: 1.OO 0.9? O.03 1.OO 1.OO 1.00 I.00 O.21 0.73 1.00 0.77 O.23
Final sat.: 1500 1556 41 1500 1600 1500 1500 439 10BB 7500 7229 348
-r---------ll---------ll---------ll---------------lcapacity Anafysis Module :
vor/sut, o. 05 0.23 0.24 o. OO 0.24 0.13 0.15 0.03 0. 13 0.00 0.03 0.04crit Moves. **** **** **** ************************************************************************************
Traffix 7.6.0115 (c) 2003 Dowling Assoc. Licensed to URS CORP" SANTA ANA' cA

AM-ü1P Sun Aug 30, 2015 12:43:.73 Page 14-1
Wayne J. Sand and Gravel- Mine Project Traffic StudyExisting Plus Project
Morning Peak Hour
Level Of Service Computation ReportICU 1(Loss as Cycle Length ?) Method (Future Vofume Afternative)
********************************************************************************Intersection #10 Spring Road at Los AngefesAve (SR-118) tCity of Moorparkl********************************************************************************Cycte (sec) : 100 Critical Vol .,/Cap. (X) : 0.686Loss Time (sec): 0 (Y+R = 4 sec) Average Delay (sec,/veh): xxxxxxOptinal Cycle: 13 Level- Of Service: B********************************************************************************Approach: North Bound South Bound East Bound West BoundMovement: L - T - R L - T _ R L - T _ R L - T _ R
-t---------ll---------ll---------ll---------------lControl: Protected Protected Protected ProtectedRights: fncl-ude Ovl Include Ovl-Min.Green: 0 0 0 0 0 0 0 0 0 0 0 0
Lanes: 2 O 1 1 O 2 0 1 0 1 2 O 2 O 1 1 0 2 0 1
t---------------ll---------------ll---------------ll---------------lVolume Modufe:Base VoI: 193Growth Adj : 1.00Initial Bse: 193Added Vol: 0
PasserByVol: 0
Initial Fut: 193User Adj : 1.00PHF Adj : 1.00PHF Volume: 193Reduct VoI: 0
Reduced Vol-: 193PCE Adj : 1.00MLF Adl : 1.00Flnal- VoL: 193
3131 .00
31300
3131.001.00
3130
3131 .001 .00
313
8300B3
00
83000083
083000083
3621.00
3620
0
3621.001 .00
3620
3621 .001 .00
362
4101.00
4100
0410
1 .001 .00
4100
4101.001.00
410
541 .00
5400
541 .001 .00
540
541 .001 .00
\¿.
T2B1 .00
7280
0728
1.001.00r28
01ao
1 .001 .00r28
9931.00
99324
0
10171.001.001017
010171.001.001017
2ro1.00
27000
2r01.001.002r0
02r0
1.001.002ro
120012
0
0'72
000012
0
000012
9101.00
91036
010061 .001 .00100 6
010061 .001 .00100 6
2841.00
28400
2841 .001 .00
2840
2841.001.00
284
1
1
1
1
1
t---------------ll---------------ll---------------ll---------------lSaturation Flow Modufe:Sat/Lane: 1600 1600 1600 1600 1600 1600 1600 1600 1600 1600 1600 1600Adjustment: 0. 94 1 .00 0. 94 0 .94 1 .00 O .94 0 . 94 1.00 O.94 0. 94 1.00 0. 94
Lanes: 2.00 1.58 0.42 2.00 1.00 1.00 2.00 2.0O 1.00 1.00 2.00 1.00Finaf sar.: 3000 2529 629 3000 1600 1500 3000 3200 1500 1500 3200 1500
-r---------ll---------ll-'-------ll---------------lCapacity Analysis Module :
vol/Sat: O .06 O .72 0.13 0 .72 0.26 0 .04 0.04 0.32 0. 14 0.05 0.31 0.19crit Moves. **** **** **** ************************************************************************************
Traffix 7.6.0115 (c) 2003 Dowling Assoc. Lj-censed to URS CORP., SANTA ANA' CA
PM-WP Sun Aug 30, 2015 12:44:3'7 Page 1-1
Wayne J. Sand and Gravel Mine Project Traffic StudyExisting Plus Project
Evening Peak Hour
Scenario:
Comrnand:Vol-ume:Geometry:Impact Fee:Trip Generation:Trip DistributionPaths:Routes:Configuration:
Scenario ReportPM_WP
PM-hlPPM
Exi stingDefault Impact FeePM
PM
Default PathsDefaul-t RoutesExi sting
Traffix 7.6.0115 (c) 2OO3 Dowling Assoc. Licensed to URS CORP.f SANTA ANA, CA

PM-!ÙP Sun Aug 30, 2015 12:44:31 Paqe 2-I
Wayne J. Sand and Gravel Mine Project Traffic StudyExisting Plus Project
Evening Peak Hour
Zone# Subzone Anount Units
Trip Generation Report
Forecast for PM
RateIn
RateOut
Trips Trips Total Z OfTrips TotalIn Out
1 üIayne J. San 1.00 MiningZone 1 Subtotal
1515
19I9
34 100.034 100.0
15.00 19.00
TOTAL 15 19 34 100.0
D
Traffix 7.6.0115 (c) 2003 Dowling Assoc. Licensed to URS CORP., SANTA ANA, CA
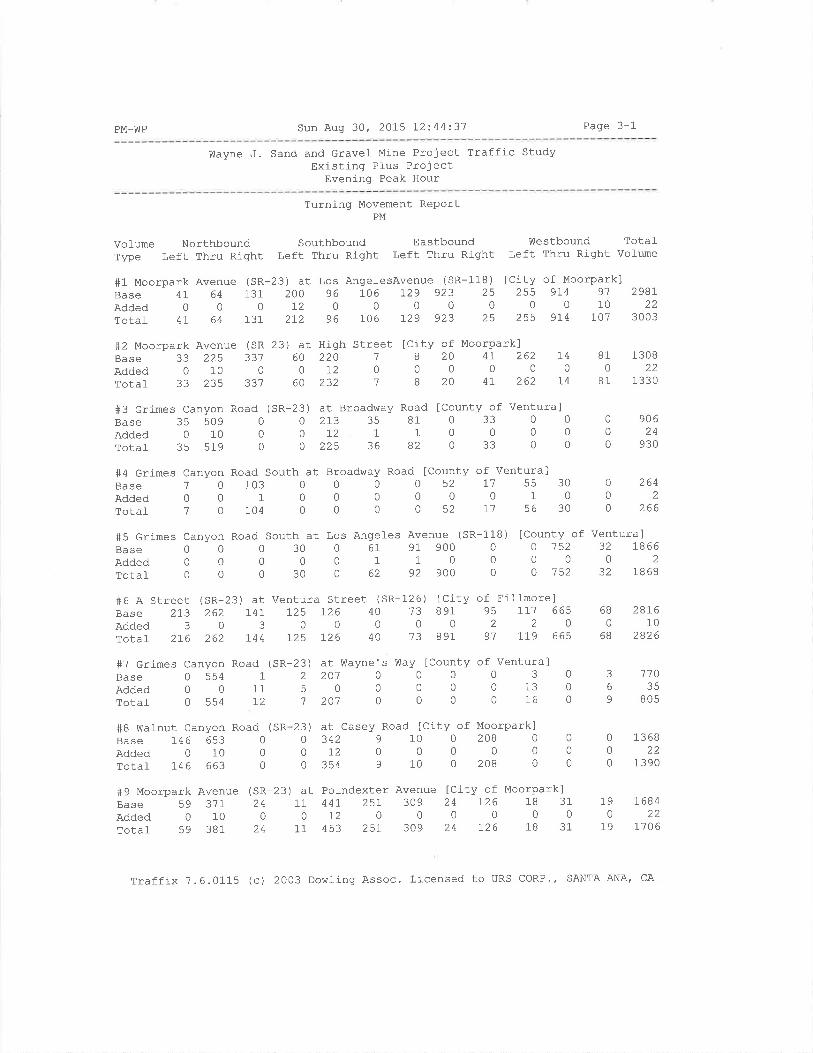
PM-WP Sun Aug 30, 2015 12:,44'.31 Page 3-1
Wayne J. Sand and Gravel Mine Project Traffic StudyExisting Plus Project
Evening Peak Hour
Turninq Movement ReportPM
Volume Northbound Southbound EastboundType Left Thru Right left Thru Right Left Thru Right
S1 Moorpark Avenue (SR-23) at Los Angel-esAvenue (SR-118)Base 41 64 131 200 96 106 I29 923 25Added0OO7200000rotal- 47 64 131 272 96 106 I29 923 25
htestbound Total-Left Thru Right Volume
ICity of Moorpark]255 91,4 91
0010255 9r4 101
298r22
3 003
#2 Moorpark Avenue (SR-23) at HighBase 33 225 337 60 22OAdded0100072Totaf 33 235 33'7 60 232
#3 GrimesBaSeAddedTotal
#6 R streetBase 2I3Added 3
Totaf 216
#7 Grimes Canyon RoadBase 0 554 1
Added 0 0 11Total- 0 554 12
#8 Walnut Canyon Road (
Base 146 653 0
Added 0 10 0
Totaf 146 663 0
#9 Moorpark AvenueBase 59 317Added 0 10Total 59 381
Street [City of Moorpark]'7 I 20 41 262 7400000018204126214
C
350
35
anyon Road509 0100
519 0
( sR-2 3) at Broadvray Road [County of Ventura]02733581033000r2 1100000225368203300
810
81
6B
068
130822
1330
90624
930
#4 Grimes Canyon Road South at Broadway Road [County of Ventura]Base70103000052 I'75530Added00100000010rota]1O104000052I15630
0
00
0
00
3
6
9
0
0
0
00
0
2642
z6t)
#5 Grimes Canyon Road South at Los Angeles Avenue (SR-118) lCounty of Ventura]Base 0 O O 30 0 61 91 900 0 0 152 32 1866AddedO0O0O11000002rotaÌ O O 0 30 O 62 92 900 0 0 152 32 1868
(SR-23) at Ventura Street (SR-126) [City of Filfmore]262 r4r 725 1,26 4 0 '7 3 B 91 95 rrl 665
0300000220262 r44 L25 126 40 13 891 91 \r9 665
3) at Wayne's !üay fCounty of Ventura]2201000030500000130'7201 0000160
( sR-2
SR
28r610
2826
11035
805
13 6822
1390
23) at Casey Road [City of Moorpark]034291002080or200000035491002080
(SR-23) at Poindexter Avenue ICity of Moorpark]24 11 44r 25r 309 24 126 18 31
00r200000024 11 453 257 309 24 126 18 31
190
I9
]-68422
1706
Traffix 7.6.0115 (c) 2OO3 DowJ-ing Assoc. Licensed to URS CORP., SANTA ANA' CA
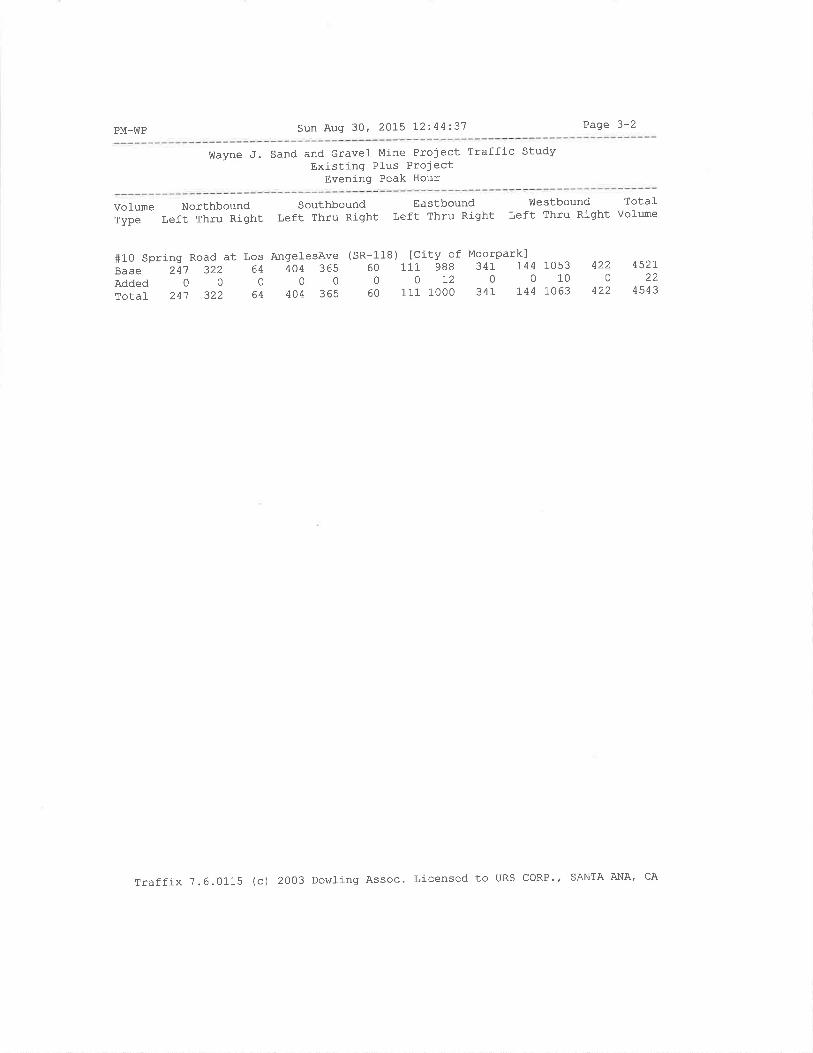
PM-!ÙP Sun Aug 30' 2015 L2:4423'7 Paqe 3-2
Wayne J. Sand and Gravel Mine Project Traffic StudyExisting Plus Project
Evening Peak Hour
Volume NorthboundType Left Thru Right
SouthboundLeft Thru Right
EastboundLeft Thru Right
Westbound Total-Left Thru Right Volume
#10 Spring Road at Los AngelesAveBase 24'7 322 64 4O4 365Added00000Total 247 322 64 404 365
(SR-118) tCitY of MoorParkl60 111 988 341 144 105300L20010
60 111 1000 347 r44 1'063
4220
422
4521-¿¿
4543
Traffix 7.6.0115 (c) 2003 Dowfing Assoc. Licensed to URS CORP'' SANTA ANA' cA

PM-!ÙP Sun Aug 30, 2015 12:44:39 Page 4-1
Wayne J. Sand and Gravel- Mj-ne Project Traffic StudyExisting PÌus Project
Evenj-ng Peak Hour
Intersection
Moorpark Avenue (SR-23) at Los
Moorpark Avenue (SR-23) at Hig
Grimes Canyon Road (SR-23) at
Grimes Canyon Road South at Br
Grimes Canyon Road South at Lo
A Street (SR-23) at Ventura St
Grimes Canyon Road (SR-23) at
hlal-nut Canyon Road (SR-23) at
Moorpark Avenue (SR-23) at Poi
Spring Road at Los AngefesAve
#1+2#3#4#s#6+'t#8#e#10
Impact Analysis ReportLevef Of Service
BaSeDeI/ v/
LOS Veh C
B xxxxx 0.639
A xxxxx 0.595
B 0. 0 7.024
A 9.1 0.000
C xxxxx 0.719
D xxxxx 0.811
B 13.3 0.000
B xxxxx 0.647
B xxxxx 0.654
C xxxxx 0.715
Futureoel/ v/
LOS Veh C
B xxxxx 0.650
A xxxxx 0.595
B 0.0 1.046
A 9.1 0.000
C xxxxx 0.720
D xxxxx 0.815
B 14.3 0.000
B xxxxx 0.653
B xxxxx 0.662
C xxxxx 0.719
Changetn
+ 0.011 v,/c
+ 0.000 v,/c
+ 0.000 D/v
+ 0.005 D/v
+ 0.001 v,/c
+ 0.004 v/c
+ 1.034 D/V
+ 0.006 v/c
+ 0.008 v,/c
+ 0.004 v,/c
Traffix ?.6.0115 (c) 2003 Dowling Assoc. Licensed to URS CORP., SANTA ANA' CA
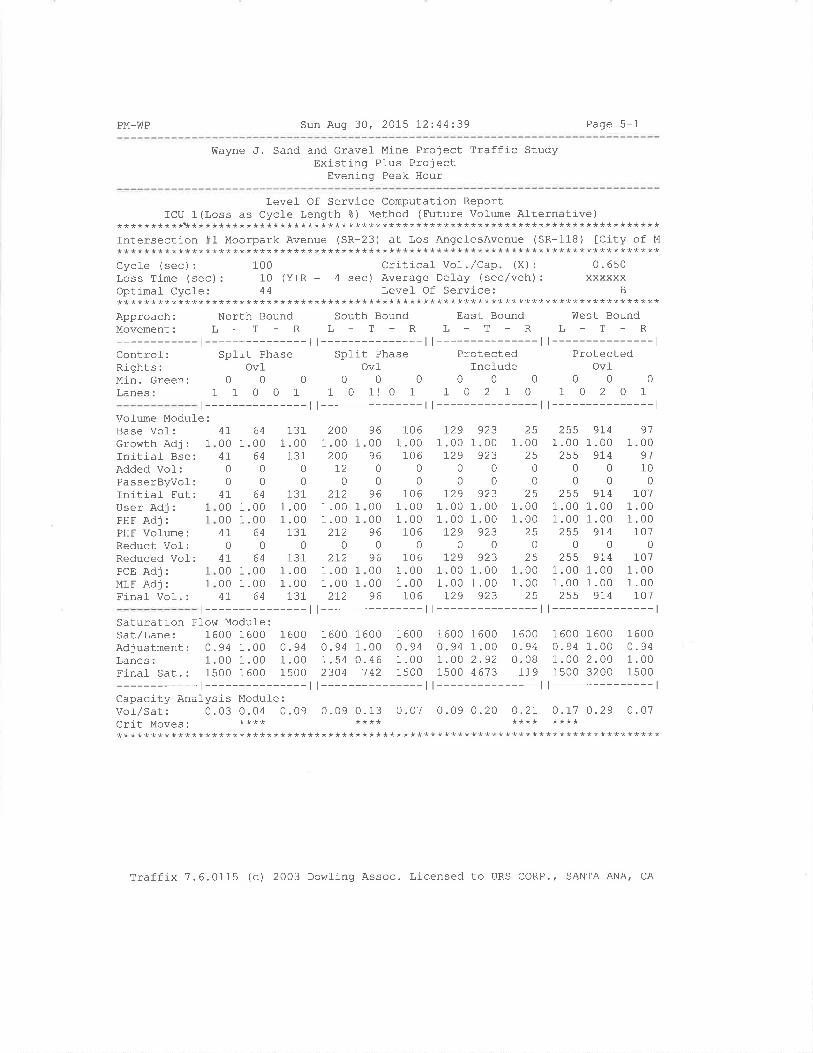
PM-WP Sun Aug 30, 2015 12:44:39 Page 5-l
V{ayne .f. Sand and Gravel Mine Project Traffic StudyExisting Plus Project
Evening Peak Hour
Level Of Service Computation ReportICU 1(Loss as Cycle Length 8) Method (Future Volume Alternative)
**********!**********************************************************************
Intersection #1 Moorpark Avenue (SR-23) at Los AngefesAvenue (SR-118) [City of M********************************************************************************Cycle (sec) : 100 Critical Vo1 .,/Cap. (X) : 0.650Loss Time (sec) : 10 (Y+R : 4 sec) Average Delay (sec/veh) : xxxxxxOptimal Cycle: 44 Level Of Service: B********************************************************************************Approach: North BoundMovement: L - T - R
-t---------------lControl-: Split PhaseRights: OvIMi-n. Green: 0 0 0
Lanes: 1 1 0 0 1
South BoundL_T-R
t---------------lSplit Phase
OvI000
1 0 1! 0 1
t---------------l
East BoundL_T-R
t---------------lProtected
Incfude000
102r0t---------------l
üIest BoundL-T-R
t---------------lProtected
Ovf000
10201t---------------lt---------------l
Vofume Modul-e:Base Vol:Growth Adj: 1
Initiaf Bse:Added Vol-:PasserByvof:Initial Fut:User Adj: 1
PHF Adj: 1
PHF Vofume:Reduct Vol:Reduced Vol:PcE Adj: 1
MLF Adj: 1
Fi-naf Vol. :
1.00 1
1.00 1
| --------------- | I --------------- |
4T004T
0
0
4I00004L
0
4T000047
641 .00
6400
641 .001 .00
640
641 .001 .00
64
200.00200
T20
2L2.00.002L2
0ZI¿.00.00212
960096
0
0
96000096
0
96000096
1061 .00
10600
1061 .001.00
1060
1061 .001 .00
106
r29 923 251 .00 1.00 1.00r29 923 25
000000
729 923 251.00 1.00 1.001.00 1.00 1.00r29 923 25
0001,29 923 25
1.00 1.00 1.001.00 1.00 1.00r29 923 25
t---------------l
255 9r4 911.00 1.00 1.00255 974 91
0010000
255 974 rol1 .00 1.00 1.001 .00 1.00 1 .00255 9L4 107
000255 9r4 701
1 .00 1.00 1.001 .00 1.00 1 .00255 9r4 rjl
t---------------l
1311.00
1310
0
1
1
1
1
1
1
1
1
131
1310
1311.001.00
131
Saturation Fl-ow Module:Sat/Lane: 1600 1600 1600 1600 1600 1600 1600 1600 1600 1600 1600 1600Adjustment: 0.94 1 .00 O .94 0.94 1.00 0 .94 0.94 1 .00 O .94 0. 94 1 .00 0. 94Lanes: 1.00 1.00 1.00 7.54 O.46 1.00 I.OO 2.92 0.08 1.00 2.00 1.00Final Sat.: 1500 1600 1500 2304 142 1500 1500 4673 119 1500 3200 1500
-t---------ll---------ll---------ll---------------lCapacity Analysis Modufe :
Vol-/Sat: 0.03 0.04 0.09 0.09 0. 13 0.07 0.09 0.20 0 .27 0.I'7 O.29 0.07crit Moves: **** **** **** ************************************************************************************
Traffix 7.6.0115 (c) 2003 Dowling Assoc. Licensed to URS CORP.' SANTA ANA' CA
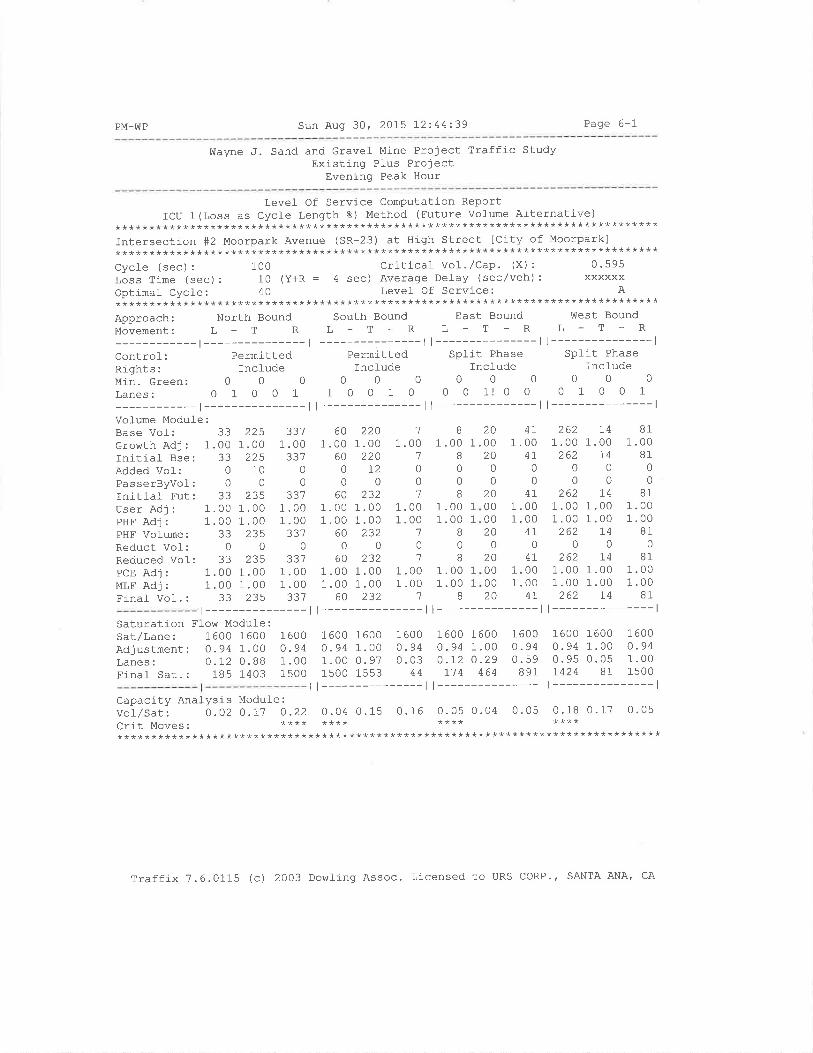
PM-WP Sun Aug 30, 2OL5 72:44:39 Page 6-1
lrlayne J. Sand and Gravel- Míne Project Traffic StudyExisting PIus Project
Evening Peak Hour
Level Of Service Computation ReportICU 1(Loss as Cycfe Length ?) Method (Future vofume Alternative)
********************************************************************************Intersection #2 Moorpark Avenue (SR-23) at High Street ICity of Moorpark]********************************************************************************Cycle (sec): 100 Critical Vol./Cap. (X): 0'595Loss Time (sec): 10 (Y+R : 4 sec) Average Del-ay (sec/veh): xxxxxxOptimat CycJ-e: 40 Levef Of Service: A********************************************************************************Approach: North Bound south Bound East Bound v{est BoundMOVEMENT: L _ T _ R L - T - R L - T - R L - T _ R
-l---------ll--------ll---------ll---------------lcontrol_: Permitted Permitted split Phase split PhaseRights: Include Incfude Include IncfudeMin.creen: 0 0 0 O 0 0 0 0 0 0 0 0
Lanes: O 1 0 0 1 1 O 0 1 0 0 0 1! 0 0 0 1 0 0 1
-l---------ll---------ll---------ll---------------lVolume Module:Base Vol-: 33Growth Adj : 1.00Initial Bse: 33Added Vol: 0PasserByvol: 0Initiaf Fut: 33User Adj : 1.00PHF Adj : 1.00PHF Volume: 33Reduct Vol: 0Reduced Vol: 33PCE Adj : 1.00MLF Adj: 1.00Finaf VoÌ. : 33
2251 .00
22510
0
2351.001 .00
2350
1 .001 .00
235
J3 t
1 .0033'7
0
0aa-
1 .001 .00
3310
???1.001 .00
601 .00
6000
601.001 .00
600
601.001 .00
60
2201 .00
220I2
0232
1.001.00
¿J¿0
2321 .001.00
232
1
1 .001
00'7
1 .001 .00
'7
0'7
1 .001 .00
1
8
1 .008
0
0
B
1 .001 .00
B
0
B
1 .001 .00
B
000020
020000020
4L
1.0047
0
04I
1.001 .00
4L
0
4I1. 001 .00
4t
2621.00
¿6200
2621.001.00
zóz0
2621.001.00
zoz
741 .00
740
0I4
1 .001.00
I40
I41 .001.00
I4
B11.00
B100
B11.001.00
810
811.001 .00
81
201 .00
2000
201
1
1
1
t---------------ll---------------ll---------------ll---------------lSaturation Flow Modufe:Sat/Lane: 1600 1600 1600Adjustment: 0.94 1.00 O.94Lanes: 0. 12 0. BB 1 .00Final Sat.: 185 1403 1500
1 6000.940.03
44
1600 16000.94 1.000.95 0.051424 81
1 600o .941.001500
1600 16000.94 1.001 .00 0. 971500 1553
1600 16000.94 1.000 .72 0.29
r1 4 464
1 6000.940.59
891
Capacj-ty Anafysis Module:vol,/sar: 0 .o2 o.I1 o .22 0. 04 0. 15 0.16 0.05 0.04 0.05 0.18 0.17 0.05crit Moves. **** **** **** ************************************************************************************
Traffix 7.6.0115 (c) 2O03 Dowling Assoc. Licensed to URS CORP., SANTA ANA' CA

PM-WP Sun Aug 30, 2015 12:44:39 Page 7-1
Wayne J. Sand and Gravel Mine Project Traffic StudyExisting Plus Proiect
Evening Peak Hour
Level Of Service Computation Report2000 HCM Unsignalized Method (Future Volume Alternative)
********************************************************************************Intersection #3 Grimes Canyon Road (SR-23) at Broadway Road [County of Ventura]********************************************************************************Cycte (sec) : 1 Critical Vol. /Cap. (X) : 1.046Loss Time (sec): 0 (Y+R : 4 sec) Average Delay (sec/veh): 1-1Optimal- Cycle: 0 Level Of Service: B
********************************************************************************Approach: North Bound South Bound East Bound !Ùest BoundMovement: L - T - R L - T - R L - T - R L - T - R
-r---------ll---------ll---------ll---------------lControl: Yield Sign Stop Sign Stop Sign Stop SignRights: Include Incl-ude Include IncfudeLanes: 1 O 1 0 0 0 0 0 1 0 0 0 11 0 0 0 0 0 0 0
-l---------ll---------ll---------ll---------------lVolume Module:Base Vof: 35Growth Adj : 1.00Initial Bse: 35Added Vol: 0PasserByvol-: 0Initiaf Fut: 35User Adj : 1.00PHF Adj : 1.00PHF Volume: 35Reduct Vof: 0
Final Vol.: 35-l--------- I l---------------l
Saturation Flow Modul-e:Sat/Lane: 0 0 0 0 0 0
Adjustment: 1.00 1.00 1.00 1.00 1.00 1.00Lanes: 1.00 1 .00 0.00 0.00 0. B6 0.14Final- Sat. : 496 496 0 0 415 16
-l--------- ll---------------lCapacity Anafysis Module:Vol/Sat: 0.07 1.05 0.00 0.00 0.47 0 .4-7
CIit MOVeS. **** '****
| --------------- | I --------------- |
0000001.00 1.00 1.00 1 .00 1 .00 1.000.71 0.00 0.29 0.00 0.00 0.0023r093000
| --------------- | I --------------- |
0.3s 0.00 0.3s 0.00 0.00 0.00**** ****1.00 1.00 1.00 1.00 1.00 1.000 .3s 0.00 0.35 0.00 0.00 0.003.9 0.0 3.9 0.0 0.0 0.0
1 .00 1 .00 1.00 1 .00 1.00 1.003.9 0.0 3.9 0.0 0.0 0.0
000000
5091 .00
s0910
0519
1.001 .00
5190
519
1.00 1
1.00 1
000
0000
00
0
1.00 1
213I2
0¿25
1.00 1
1.00 1
00 1
351
0
000036
036
1.00 1
1.00 1
000
.0033
00
33.00.00
22
033
0
00
0
1.00 1
1.00 1
000
00 1.0007 1.05.3 53.300 1 .00.3 s3.300
1 .000.000.0
1 .000.0
0
1 .00 1.000.00 0.47
0 .0 6.01.00 1.000.0 6.0
00
1 .000 .41
6.01.00
6.00
01 .00
0000
000
0
0
0
0
1
0
1.000000
810081
1
0
B20000B2
0B2
1
01.00 1
0
000
0
0
00000
00
0
1
000
0
0
00
0000
000
361
11
L
2250
225
Green/Cycl-eVolume/Cap:Delay/veh:Delay Adj:Adj De1/Veh:DesignQueue
1
0
1
1
********************************************************************************
Traffix 7.6.0115 (c) 2003 Dowling Assoc. Licensed to uRs coRP., SANTA ANA, CA
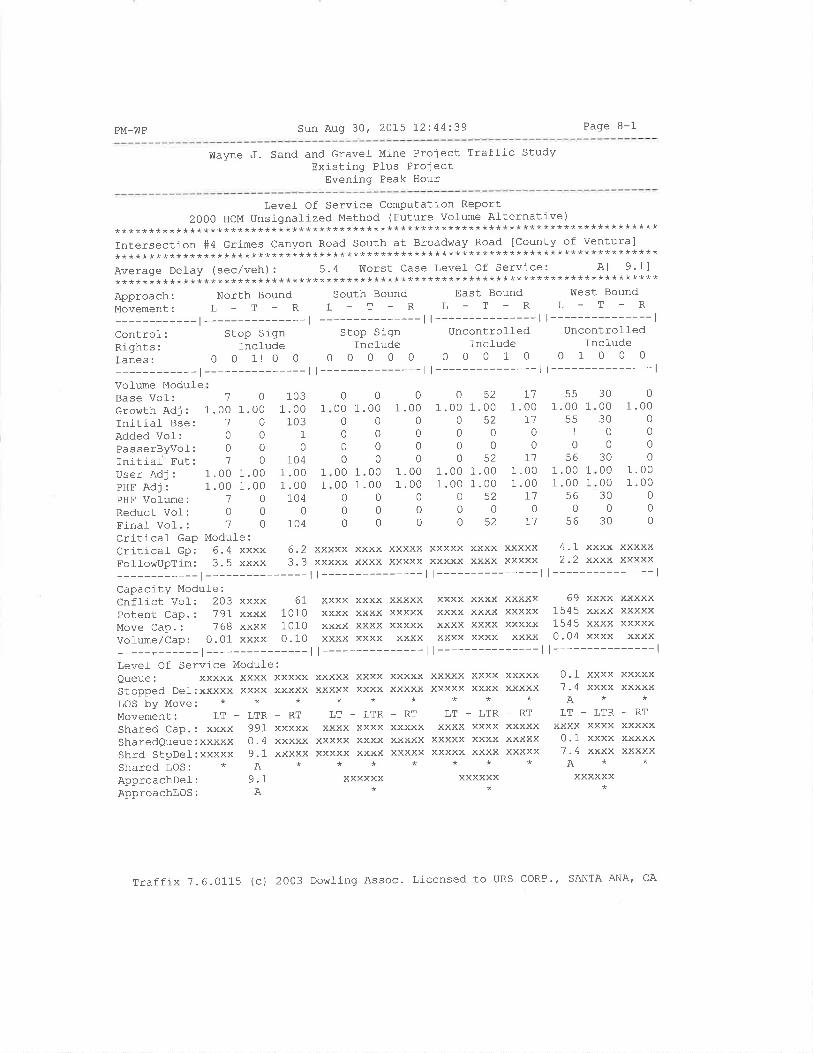
PM-WP Sun Aug 30' 2015 12:44:39 Page 8-1
Wayne J. Sand and Gravel Mine Project Traffic StudyExisting Pl-us Project
Evenj-ng Peak Hour
LeveI Of Service Cornputation Report2OO0 HCM UnsignaJ-ized Method (Future Vol-ume Alternative)
********************************************************************************Intersection #4 Grimes canyon Road south at Broad\"ray Road Icounty of ventura]********************************************************************************Average Delay (sec/veh): 5.4 üIorst Case Level Of Service: A[ 9.1]********************************************************************************Approach:NorthBoundSouthBoundEastBoundvÍestBoundMovemENt: L - T - R L - T - R L - T - R L - T - R
-l---------ll---------ll---------ll---------------lcontrol: Stop sign stop sign uncontrofled uncontrofledRights:Incl-udelncludelncludelncludeLanes: 0 O 11 0 O 0 0 O O 0 0 0 0 1 0 0 1 0 0 0
-l---------ll---------ll---------ll---------------lVolume ModuleBase Vol:Growth Adj:Initlal Bse:Added Vol:PasserByvol-:Initial Fut:User Adj:PHF AdJ:PHF Vo1ume:Reduct Vof:Finaf Vol. :
Critícal Gap Module:Critical Gp: 6.4 xxxx
103.00103
1
0
104.00.00104
0104
6.2
0000 1.0000000000
00 1.0000 1.00000000
01 .00
0
00
0
1 .001 .00
0
00
o521 .00 1.00
0s20000052
1 .00 1 .001 .00 1.00
o5200o52
T11.00
I100
771.001.00
I10
I1
TE
1.00 1
551
056
1.00 1
1.00 1
560
56
30000 1.003000000
30000 1.0000 1.0030000
300
101.00 1.00
10000070
1.00 1.001.00 1 .00
100010
1
1
1
I
1
1
Fol-f ourupTim: 3.5 xxxx 3.3-l---------------l
Capacity Module:Cnflict Vof: 203 xxxx 67Potent Cap.: 791 xxxx 1010Move Cap.: 768 xxxx 1010VoÌume/Cap: 0.01 xxxx 0.10
-l---------------lLevel- Of Service Modul-e:Queue: xxxxx xxxx xxxxxStopped Def:xxxxx xxxx xxxxxLOS by Move: * * *MoVeMCNt: LT - LTR - RT
Shared Cap.: xxxx 991 xxxxxSharedQueue: xxxxx 0. 4 xxxxxShrd StpDel:xxxxx 9.1 xxxxxShared LOS: * A *
ApproachDel: 9.1ApproachlOS: A
xxxxx xxxx xxxxx xxxxx xxxx xxxxxxxxxx xxxx xxxxx xxxxx xxxx xxxxx| --------------- | I --------------- |
xxxx xxxx xxxxx xxxx xxxx xxxxxxxxx xxxx xxxxx xxxx xxxx xxxxxxxxx xxxx xxxxx xxxx xxxx xxxxxxxxx xxxx xxxx xxxx xxxx xxxx
| --------------- | I --------------- |
4 .1 xxxx xxxxx2.2 xxxx xxxxx
l---------------l69 xxxx xxxxx
1545 xxxx xxxxx1545 xxxx xxxxx0.04 xxxx xxxxl---------------l
XXXXX XXXXxxxxx xxxx**
LT - LTRxxxx xxxx
xxxxx xxxxxxxxx xxxx**
xxxxxx*
xxxxx xxxxxxxxx xxxx**
LT _ LTRxxxx xxxx
xxxxx xxxxxxxxx xxxx**
xxxxxx*
xxxxxxxx
_ LTRxxxx xxxx xxxxx0.1 xxxx xxxxx7.4 xxxx xxxxxA**xxxxxx
*
XXXXXxxxxx
-RTVVYYT
xxxxxxxxxx
xxxxxVVYYV
- Ka
xxxxxXXXXXxxxxx
xxxxxxxxxx
- Kt
0.1'7 .4
ALT
Traffix 7.6.0115 (c) 2003 Dowling Assoc. Licensed to URS CORP./ SANTA ANA, CA

PM_WP Sun Aug 30, 2075 12:44:39 Page 9-1
I¡layne J. Sand and Gravel- Mine Project Trafflc StudyExistj-ng Plus Project
Evening Peak Hour
Level of Service computation ReportICU 1(Loss as Cycfe Length %) Method (Future Volume Alternative)
********************************************************************************Intersection #5 Grimes Canyon Road South at Los Angel-es Avenue (SR-118) [County********************************************************************************Cycle (sec): 100 Criticaf Vol'/cap' (X): O'12O
lãss 1.ime (sec) : 10 (y+R : 4 sec) Average DeJ-ay (sec/veh) : xxxxxxOptimal Cycle: 53 Level- Of Service¡ C
********************************************************************************Approach:NorthBoundSouthBoundEastBoundü¡estBoundMovemENt: L _ T - R L _ T - R L - T _ R L _ T - R
-t---------ll---------ll---------ll---------------lcontrol-: split Phase split Phase Protected ProtectedRights:IncludeTncludelncfudelncludeMin.creen: O O 0 O 0 0 0 0 0 0 0 0
Lanes: 0 0 0 O O 0 O 1l O O 1 0 1 0 0 0 0 1 0 1
-l---------ll---------ll---------ll---------------lVol-ume Modul-eBase VoI:Growth Adj:Initiaf Bse:Added Vol:PasserByvol-:Initial Fut:User Adj:PHF AdJ:PHF Volume:Reduct Vol-:Reduced Vof:PCE AdJ:MLE AdJ:Finaf Vol-. :
01.00 1
0000
00
00000
0
000
0
000
0
00
1.00
1
000
000
00000
000
0000
0
1
30000 1.003000000
30000 1.0000 1.0030000
30000 1.0000 1.00300
1
6L006I
1
0o¿000062
0
62000062
9I1.00
9t1
0
921 .001.00
920
921 .001.00
92
0
1.0000
0
01.001.00
00
0
1 .001.00
0
0
000
0
00
0000
00
00000
0
321.00
00
?)1.001 .00
?20
1.001.00
32
9001 .00
90000
9001.001 .00
9000
9001.001 .00
900
1521.00
00
1.001.00
1Èa
01q)
1.001 .00
'752
1
1
1
1
1
1.00 1 .00 1
1.00 1 .00 1
1
1
1
t
1
11
1
1
t1
1
1000
Saturation FIow Modu.IeSat/Lane: 1600 1600Adjustment: 1.00 1.00Lanes: 0.00 0.00Final Sat.: 0 0
-l---------ll---------ll---------ll---------------lCapaclty AnalYsis Modufe :
vor/sat, o. oo o.0o o. oo o. o6 o. oo 0. 06 0.06 0.56 0.00 0.00 0.47 0 -o2
Crit Moves. **** **** ************************************************************************************
1 6001 .000 .00
0
1 6001 .000.33
5ZZ
00 160000 1 .0000 0.610 1078
1600 16001 .00 1.001.00 1.001600 1600
1 6001.000. 00
0
1600 16001.00 1.000.00 1.00
0 1600
1 6001.001.001 600
I61.0.
Traffix 7.6.0115 (c) 2003 Dowling Assoc. Licensed to uRs coRP./ SANTA ANA' CA
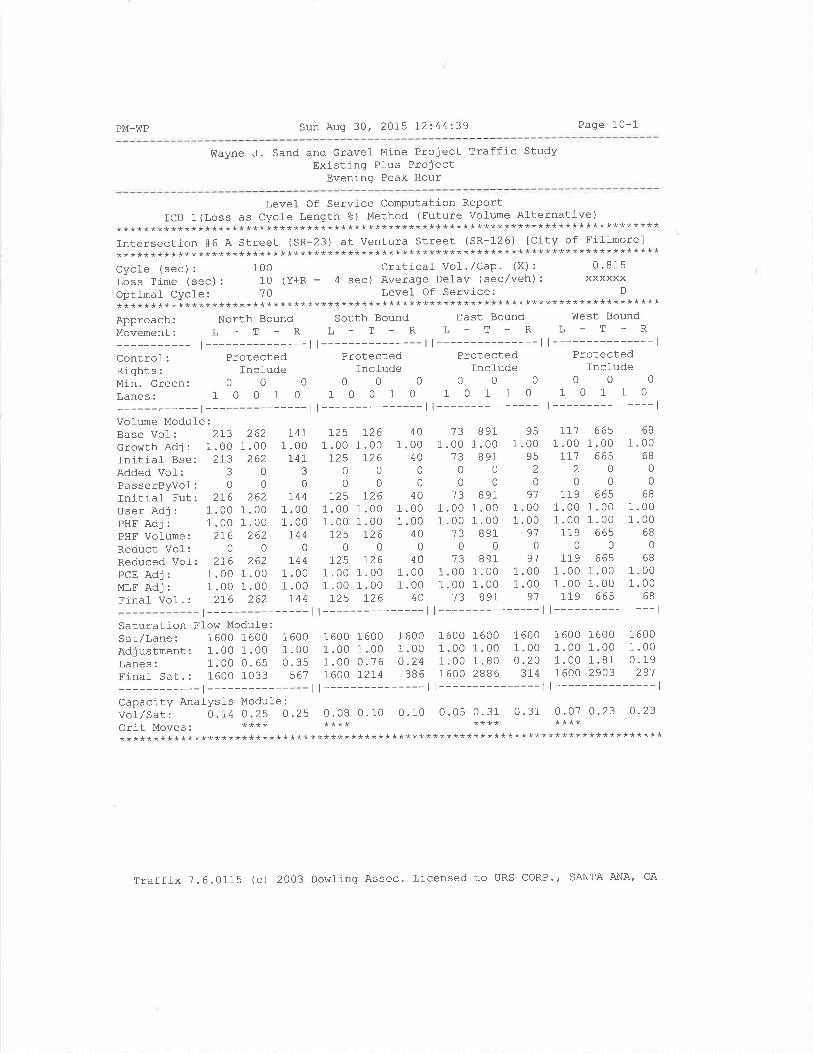
PM-WP Sun Aug 30, 2075 t2:44:39 Page 1-0-1
Wayne J. Sand and Gravel Mine Project Traffic StudyExisting Plus Project
Evening Peak Hour
Level- Of Service Computation ReportICU l_(Loss as cycte Length å) Method (Future vol-ume Alternative)
********************************************************************************Intersection #6 A Street (SR-23) at Ventura Street (SR-126) [City of Fillmore]********************************************************************************Cycle (sec): 1OO Criticaf VoI./Cap' (X): 0'815Loss Time (sec) : 10 (Y+R : 4 sec) Average Delay (sec/veh) : xxxxxxOptimal Cycle: 10 Level- Of Service: D
********************************************************************************Approach: North Bound south Bound East Bound west Bound
Movement: L - T - R L - T - R L - T - R L - T - R
-l---------ll---------ll---------ll---------------lControf: Protected Protected Protected ProtectedRights:IncÌudelncl-udelncludelncludeMi-n, Green: O 0 O O 0 0 0 0 0 0 0 0
Lanes: 1 0 O 1 O 1 O O 1 0 1 0 1 1 0 1 0 1 1 0
-r---------ll---------ll---------ll---------------lVolume Modul-e:Base Vol:. 213Grohrth Adj : 1.00Initiaf Bse: 273Added Vol-: 3
PasserByvol: 0
Initial Fut: 216User Adj : 1.00PHF Adj : 1.00PHF Volume:. 216Reduct Vol: 0
Reduced Vol: 21'6PCE Adj : 1.00MLF Adj: 1.00Final VoI.: 216
2621 .00
2620
0
2621.001 .00
2620
2621 .001 .00
zb¿
r471.00I4I
3
0r44
1 .001 .00r44
0144
1 .001 .00
1-4 4
1251 .00
7250
0
1251 .001.00
0725
1.001 .00\25
1261.00
1260
0126
1.001.00
1260
1261 .001 .00
126
401 .00
400
0
401.001.00
400
401 .001 .00
40
't31 .00
130
013
1 .001 .00
130
131.001 .00
aa
8911.00
8910
0
8911.001 .00
8910
8911.001.00
891
q6
.00oÃ
2
0o?
.00
.0091
0
91.00.0091
7111.00
r71
0119
1 .001 .00
1190
1191 .001 .00
119
6651.00
6650
066s
1.001.00
6650
6651.001.00
665
6B
1.006B
00
681 .001 .00
680
681.001.00
68
1
1
1
1
1
t---------------ll---------------ll---------------ll---------------lSaturation Ffow Modul-e :
sar/Lane: 1600 1600 1600 1600 1600 1600 1600 1600 1600 1600 1600 1600
Adjustmenr: 1.00 1.00 1.00 1.00 1.oo 1.oo 1.00 1.00 1.00 1.00 1.00 1-00Lanes: 1.00 0.65 0.35 1.OO 0.?6 0.24 1.00 1.80 0.20 1.00 1.81 0.19Finaf sat.: 1600 1033 561 7600 I2I4 386 1600 2886 314 1600 2903 291
-l---------ll---------ll---------ll---------------lCapacity Analysis ModuÌe :
vot/sat: 0.74 0.25 0.25 0.oB o.10 0.10 0.05 0.31 0.31 0.o1 0.23 0-23crit Moves. **** **** **** ************************************************************************************
Traffix 7.6.0115 (c) 2003 Dowling Assoc. Licensed to URS CORP', SANTA ANA' CA
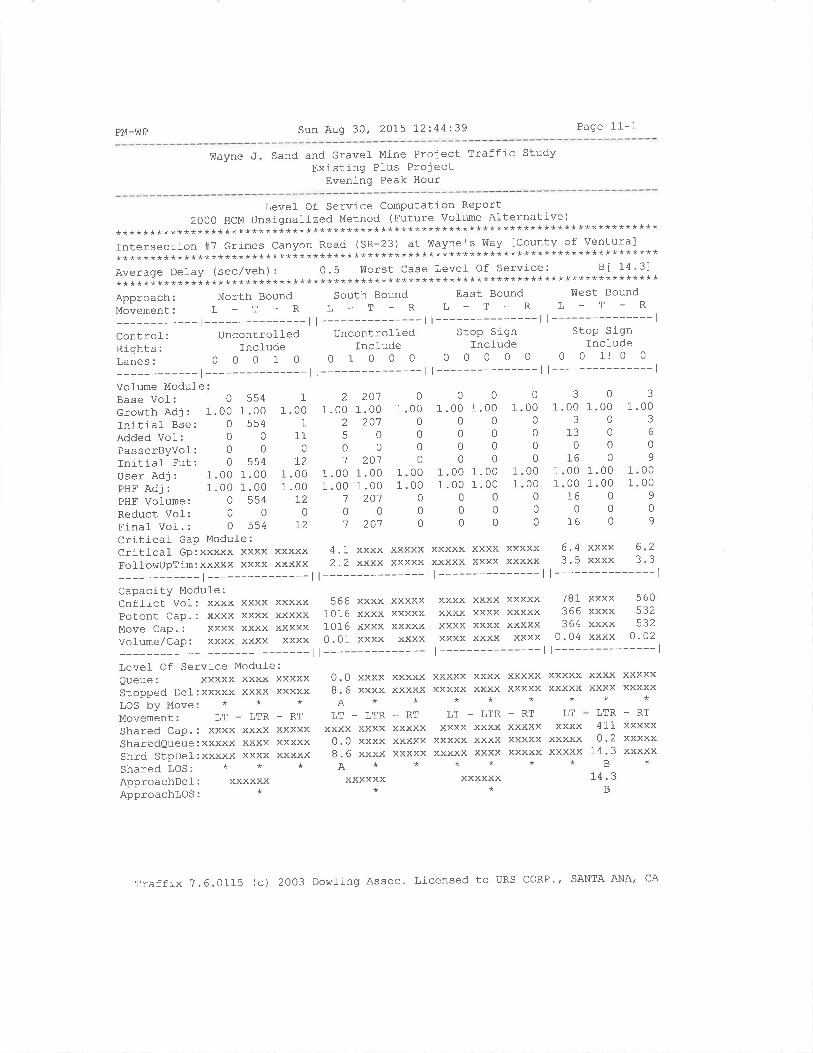
PM-IiIP Sun Aug 30, 2015 72 44:39 Page 11-1
Wayne J Sand and GraveÌ Mine Project Traffic StudyExisting Pl-us Project
Evening Peak Hour
Levef Of Service Computation Report20OOHcMUnsignalizedMethod(FutureVolumeA]-ternative)
********************************************************************************Intersection#TGrimescanyonRoad(SR-23)ath]ayne'SI¡IaylCountyofVentura]********************************************************************************Average Delay (sec/veh): 0.5 worst case Levef of service: Bt 14'31********************************************************************************Approach: North Bound South Bound East Bound West Bound
MovemENt: L - T - R L _ T - R L - T - R L - T - R
-l---------ll---------ll---------ll---------------lControl: Uncontrolled Uncontrolled Stop Sign Stop Sign
Rights: fncfude lnclude Include IncÌudeLanes: O O 0 1 O O 1 O O 0 O 0 0 0 0 0 0 1! 0 0
-l---------ll---------ll---------ll---------------lVolume ModuleBase VoI:Growth Adj:Initial Bse:Added Vol:PasserByvol:Initial Fut:User Adi:PHE AdJ:PHF Volume:Reduct Vol:Finaf Vol. : 0 554 12
Critical Gap Module:Critical- GP:xxxxx xxxx xxxxxFolJ-owUpTim:xxxxx xxxx xxxxx
-t---------
5541 .00
5540
0554
1.001 .00
1
1.00 1
I11
0
I21.00 1
1.00 r72
0
3
1.00 1
3
130
2
.002
01
.00
01 .00
00
00
1
0
00000
0
0000
00
0
0
0000
00
3
1.003
6
0
9
009
09
20'71.00 1
20100
2011.00 1
1.00 1
20'70
20'1
LTRxxxxvqxxxxxx
xxxxxx
00000 1 .00 1.00000000000000
00 1 .00 1.0000 1.00 1.00000000000
00 1.00 r00 1.00 1
16 000
16 0
I61
1
7
1
001.001 .00
0 55400
001
01
6.4aÉ
¿. 1
2.2
0B
0.08.6
xxxx xxxxx xxxxx xxxx xxxxxxxxx xxxxx xxxxx xxxx xxxxx xxxx
6
3
2
3
566 xxxx xxxxx xxxx xxxx xxxxx 781 xxxx 560
1016 xxxx xxxxx xxxx xxxx xxxxx 366 xxxx 532
1016 xxxx xxxxx xxxx xxxx xxxxx 364 xxxx 532
0.01 xxxx xxxx xxxx xxxx xxxx 0.04 xxxx O'02
| --------------- | I --------------- | | --------------- |
0 xxxx xxxxx xxxxx xxxx xxxxx xxxxx xxxx xxxxx6 xxxx xxxxx xxxxx xxxx xxxxx xxxxx xxxx xxxxx
********
Capacity Modufe:Cnflict Vol: xxxx xxxx xxxxxPotent CaP,: xxxx xxxx xxxxxMove Cap.: xxxx xxxx xxxxxVofume/Cap: xxxx xxxx xxxx
-t---------------lLevel- Of Service Module:Queue: xxxxx xxxx xxxxxStopped Def:xxxxx xxxx xxxxxLOS by Move: * * *
Movement: LT - LTR - RT
Shared CaP.: xxxx xxxx xxxxxSharedQueue:xxxxx xxxx xxxxxShrd StpDel:xxxxx xxxx xxxxxShared LOS: * * *
ApproachDel: xxxxxxApproachlOS: +
-RT LT-LTRxxxxx xxxx xxxxxxxxx xxxxx xxxxxxxxx xxxxx xxxx***
xxxxxx*
LI _
xxxx
A
A
_RT LTxxxxx xxxxxxxxx xxxxxxxxxx xxxxx**
LTR4II0.2
1¿ ?
B14 .3
B
-RTxxxxxxxxxxXXXXX
Traffix ?.6.0115 (c) 2003 DowÌing Assoc' Licensed to URS CORP'' SANTA ANA' CA

PM-WP Sun Aug 30, 2015 !2:44:39 Page I2-I
Wayne J. Sand and Gravel Mine Project Traffic StudyExisting PIus Project
Evening Peak Hour
LeveÌ Of Service Computation ReportICU 1 (Loss as Cycle Length å) Method (Future Vofume Afternative)
********************************************************************************Intersection #B Walnut Canyon Road (SR-23) at Casey Road [City of Moorpark]********************************************************************************Cycle (sec) : 100 critj-caf Vol-. /Cap' (X) : 0' 653
Loss Tj_me (sec) : 10 (Y+R : 4 sec) Average Del-ay (sec/veh) : xxxxxxOptimaf Cycle: 9I Levef Of Service: B
*********************************************************+**********************Approach: North Bound south Bound East Bound west Bound
MovemeNt: L - T - R L - T - R L - T - R L - T - R
-l---------ll---------ll---------ll---------------lcontrol-: Prot+Permit Permitted Protected ProtectedRights: IncÌude Incl-ude Incl-ude Includel¿in. Green: 0 O 0 0 0 0 0 0 0 0 0 0
Lanes: 1 0 1 0 O O 0 0 1 0 1 0 0 0 1 0 0 0 0 0
t---------------ll---------------ll---------------ll---------------lVolume Module:Base Vol:. 146Growth Adj : 1.00Initial Bse: 746Addeo vol: u
PasserByvol: 0
Initial- Fut: 146User Adj : 1.00PHF Adj : 1.00PHF Volume: 146Reduct VoI: 0
Reduced Vol-: 146PCE Adj: 1.00MLF Adj : 1.00Final- Vol.: 146
6531.00 1
65310
0663
1.00 1
1.00 1
6630
6631.00 1
1.00 1
663
0000 1.0000000000
00 1 .0000 1 .00000000
00 1 .0000 1 .0000
3421.00 1
342I2
0354
1.00 1
1.00 1
3540
3541.00 1
1.00 1
354
1001.00 1.00
10 0
0000
1001.00 1.001 .00 1.00
208 01.00 1.00 1.208 0
0000
208 0
1.00 1 .00 1.1.00 1 .00 1.208 0
00208 0
1.00 1 .00 1.1.00 1 .00 1.
9
009
00
9
0000
9
0
9
0000
9
000
0000
0000
00
00000
0
1
000
0
0
00
0000
000
0000
0
1
1
Saturation Floh¡ Modufe:Sat/Lane: 1600 1600Adjustment: 0.94 1.00Lanes: 1.00 1.00Fina1 Sat.: 1500 1600
100
101 .001.00
1 6000.940. 00
0
00 160094 1.0000 0. 980 1560
1 6000.940.02
31
1 6000.941.0015 00
000
1.001.00
I60.0.
I60.(J.
1
1
1002080
1600 16000.94 1.001 .00 0.001s00 0
00 160094 1.0000 0.0000
1 600nq¿0.00
0
-l---------ll---------ll---------ll---------------lCapacity Anafysis Modufe :
vot/sat: 0.10 0.41 0. oo 0.00 0.23 0 .24 0.01 0.00 0. 14 0.00 0.00 0.00Crit MOVSS. **** ************************************************************************************
Traffix 7.6.0115 (c) 2003 Dowlíng Assoc. Licensed to URS CORP., SANTA ANA, CA
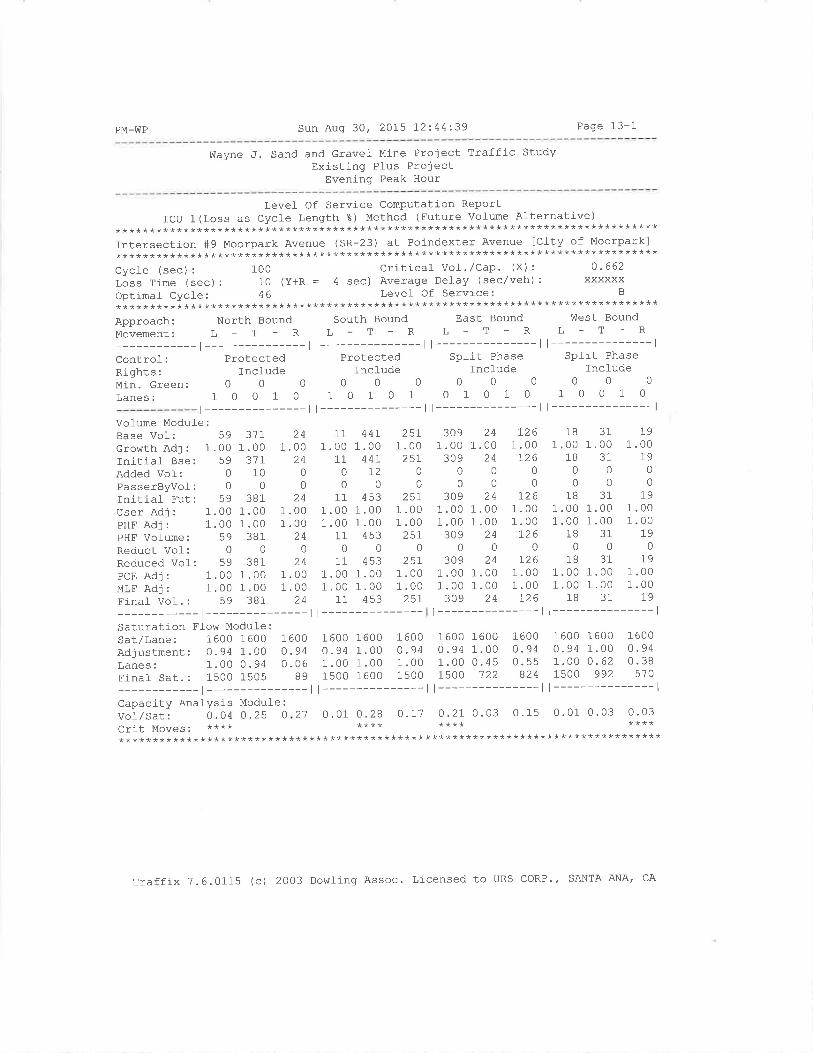
PM-WP Sun Aug 30, 20l-5 12:44:39 Page 13-1
üfayne J. Sand and Gravel Mine Project Traffic StudyExisting Plus Project
Evening Peak Hour
Levef Of Service Computation ReportICU l-(Loss as cycle Length %) Method (Future vofume Alternative)
********************************************************************************Intersection #9 Moorpark Avenue (SR-23) at Poindexter Avenue lcity of Moorpark]* * * * * * * * * * * * * * * * * * * * * * * * * * * * * * * * * * * * * * * * * * * * * * * * * * * * * * * * * * * * * * * * * * * * * * * * * * * * * * * *
Cyc1e (sec) : 100 Crit j-caf Vol .,/Cap' (X) : 0 '662Loss Time (sec): 10 (Y+R = 4 sec) Average Del-ay (sec/veh): xxxxxxOptimal Cycle: 46 Levet Of Service: B
********************************************************************************Approach: North Bound south Bound East Bound west Bound
Movementr L - T - R L - T - R L - T - R L - T - R
-l---------ll---------ll---------ll---------------lcontrol: Protected Protected Split Phase split Phase
Rights:IncludelncludelncludelncludeMin.Green: 0 0 O 0 O 0 0 0 0 0 0 0
Lanes: 1 O O 1 O 1 O 1 O 1 0 1 0 1 0 1 0 0 1 0
r---------------ll---------------ll---------------ll---------------lVolume Modufe:Base Vol: 59 317 24
croh¡thAdj: 1.00 1.00 1.00Initial Bse: 59 31I 24Added Vol-: 0 10 0
PasserByvof: 0 0 0
Initial Eut: 59 381 24User Adj : 1.00 1.00 1 .00PHF Adj : 1.00 1 .00 1 .00PHE Vofume: 59 381 24Reduct Vol: 0 0 0
Reduced Vof: 59 381 24PcE Adj : 1.00 1.00 1.00MLFAdj: 1.00 1.00 1.00Finaf Vot.: 59 381 24
-l---------------lSaturation Flow Module:Sat/Lane: 1600 1600 1600Adjustment: 0.94 1.00 0.94Lanes: 1.00 0 . 94 0.06Fina] Sat.: 1500 1505 89
309 24 1261 .00 1.00 1 .00309 24 126
000000
309 24 1261 .00 1 .00 1.001 .00 1 .00 1.00309 24 126
000309 24 126
1 .00 1.00 1.001.00 1.00 1.00309 24 126
l---------------l
18 31 191.00 1.00 1.00
18 31 79000000
18 31 191 .00 1.00 1.001.00 1.00 1.00
18 31 19000
18 31 791.00 1.00 1.001.00 1.00 1.00
18 31 19
t---------------l
11 44r 25L1.00 1.00 1.00
11 44r 251o720000
11 453 2571 .00 1.00 1 .001 .00 1.00 1 .00
11 453 25r000
11 453 25r1.00 1.00 1.001 .00 1 .00 1 .00
11 453 25Lt---------------1600 16000.94 1.001.00 1.001500 1600
1 6000.941 .001 500
1 6001 .000 .62
992
1600 16000.94 1.001.00 0.451500 122
1 6000.940. 55
824
1 6000.941 .001500
1 600o.940. 38
570
Capacity Analysis Module:Vof/Sat: 0 .O4 0.25 0
Crit Moves ' ****21 O . 01 0.28 O .7'l 0 .21 0.03 0. 15 0.01 0.03 0.03
**** **** ************************************************************************************
Traffix 7.6.0115 (c) 2003 Dowling Assoc. Licensed to URS coRP', SANTA ANA, CA

PM-WP Sun Auq 30, 2015 L2:44:39 Page 14-1
V{ayne J. Sand and Gravef Mine Proiect Traffic StudyExisting Pfus Project
Eveni-ng Peak Hour
Level Of Service Computation ReportICU 1(Loss as Cycle Length %) Method (Future Volume Al-ternative)
********************************************************************************Intersection #10 Spring Road at Los AngelesAve (SR-118) tCity of Moorparkl********************************************************************************Cycle (sec): 100 criticat vo1./Cap. (x): 0-179Loss Time (sec) : 0 (Y+R = 4 sec) Average Defay (sec/veh) : xxxxxxOptimal- Cycle: 81 Levef Of Service: C
********************************************************************************Approach: North Bound South Bound East Bound West BoundMovement: L - T - R L - T - R L - T - R L - T - R
-t---------ll---------ll---------ll---------------lControf: Protected Protected Protected ProtectedRights: Incfude Ovl fnclude Ovl-Min.creen: O 0 0 0 0 0 0 0 0 0 0 0
Lanes: 2 O 1 1 O 2 0 1 0 1 2 0 2 0 1 1 0 2 0 1
t --------------- | --------------- l l --------------- l l --------------- l
Vol-ume Module:Base Vol | 241 322 64Growth Adj : 1.00 1 .00 1 .00Initial Bse: 247 322 64Added Vol-: 0 0 0PasserByvof: 0 0 0Initial Fut: 241 322 64User Adj : 1 .00 1.00 1 .00PHF Adj: 1.00 1.00 1.00PHF Vol-ume: 24'7 322 64Reduct VoI: 0 0 0
Reduced Vof: 241 322 64PcE Adj : 1.00 1 .00 1 .00MLF Adj : 1.00 1 .00 1 .00Final Vol. : 241 322 64
-l---------------lSaturation Flow Modufe:Sat/Lane: 1600 1600 1600AdjustmentLanes:Final Sat.
404 365 601 .00 1.00 1 .00404 36s 60
000000
404 365 601 .00 1 . 00 1.001.00 1.00 1.00404 365 60
000404 365 60
1 .00 1.00 1 .001 .00 1.00 1 .00404 365 60
t---------------l1600 1600 r600
111 988 34L1.00 1.00 1.00111 988 347
oL20000
111 1000 34r1.00 1.00 1.001.00 1.00 1.00111 1000 34r
000111 1000 341
1 .00 1.00 1.001 .00 1.00 1.00111 1000 341
t---------------l1600 1600 1600
144 1053 4221.00 1.00 1.00144 1053 422
0100000
144 1063 4221 .00 1.00 1 .001 .00 1.00 1 .00r44 l-063 422
000r44 1063 422
1.00 1.00 1.001.00 1.00 1.00!44 7063 422
t---------------l1600 1600 1600
0 .942 -00300 0
1 .00 0 . 94 0. 94 1 .00 0 .94 0. 94 1 .00 0. 94 0.94 1.00 0 -947.61 0.33 2.00 1.00 1.00 2.oo 2.oo 1.00 1.00 2.00 1.002669 491 3000 1600 1500 3000 3200 1500 1500 3200 1500
-r---------ll---------ll---------ll---------------lCapacity Analysis Module :
vof/Sat: 0.08 0.12 0.13 0.13 0.23 0.04 0.04 0.31 0.23 0.10 0.33 0 .28crit Moves. **** **** **** ************************************************************************************
Traffix 7.6.0115 (c) 2003 Dowling Assoc. Licensed to URS CORP.f SANTA ANA, CA
Apprruorx D
ITTTRSEcTIoT ANALYSIS WORKSHEETS
YrnR (2025) Plus CUMULATTvT CoNDrroNS
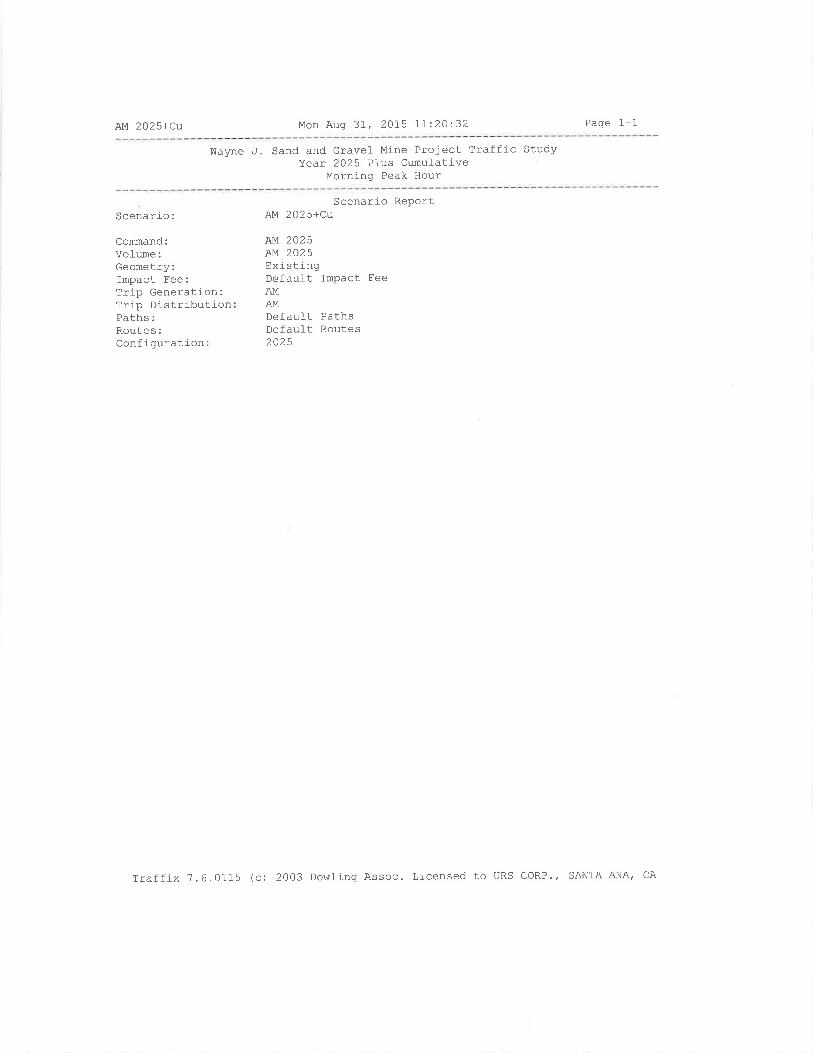
AM 2025+Cu Mon Aug 37t 2075 II:2O232 Page 1-l
Wayne J. Sand and Gravel Mine Project Traffic StudyYear 2025 Plus Cumulative
Morning Peak Hour
Scenario:
Cornmand:Vofume:Geometry:Impact Fee:Trip Generation:Trip DistributionPaths:Routes:Configuration:
Scenario ReportAI4 2025+Cu
ÞM 2025AM 2025Exi stingDefault Impact FeeAMAMDefault PathsDefault Routes2025
Traffix 1.6.OII5 (c) 2OO3 Dowling Assoc. Lícensed to URS coRP., SANTA ANA, CA
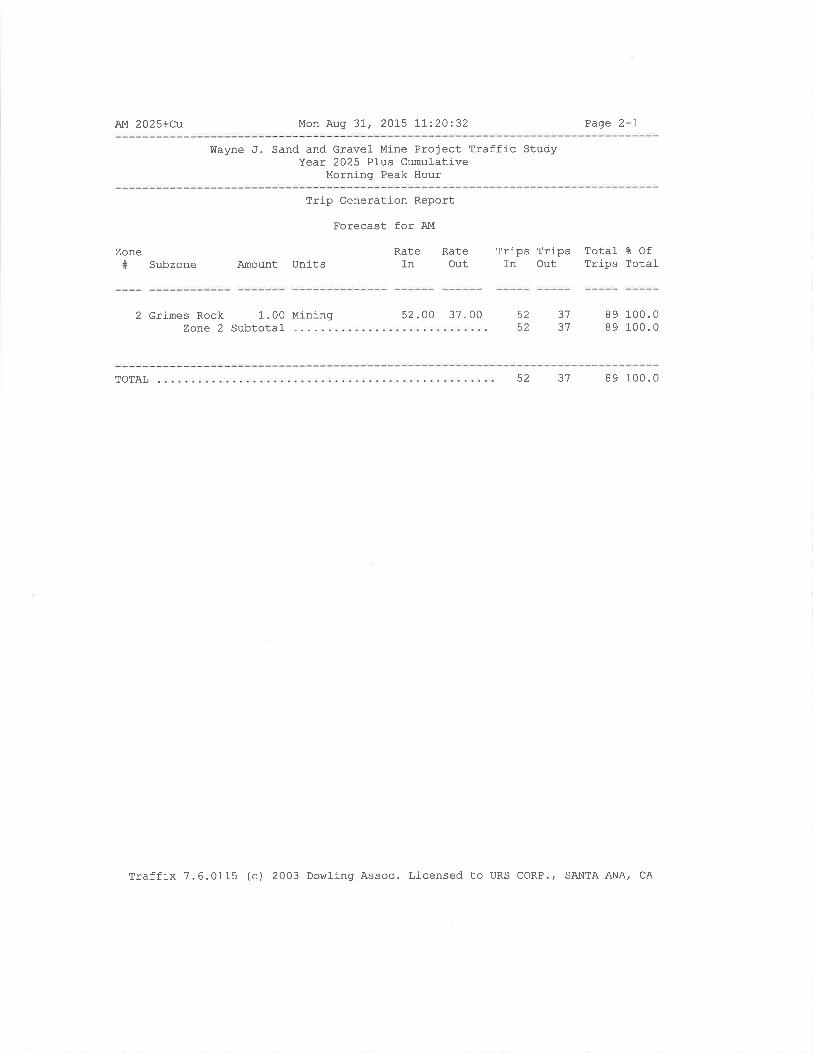
AM 202S+Cu Mon Aug 3L, 201-5 II:20:32 Page 2-I
Wayne ,f. Sand and Gravel Mine Project Traffic StudyYear 2025 Plus Cumulative
Morning Peak Hour
Zone# Subzone
Trip Generation Report
Forecast for AM
RateAmount Units In
RateOut
Trips Trips Total- I OfTrips TotalIn Out
2 Grimes Rock 1.00 MiningZone 2 Subtotal-
52.00 37.00 c,2
52373'7
89 100.089 1_00.0
TOTAL 52 31 89 100.0
Traffix 7.6.0115 (c) 2003 Dowling Assoc. Licensed to URS coRP., SANTA ANA, CA
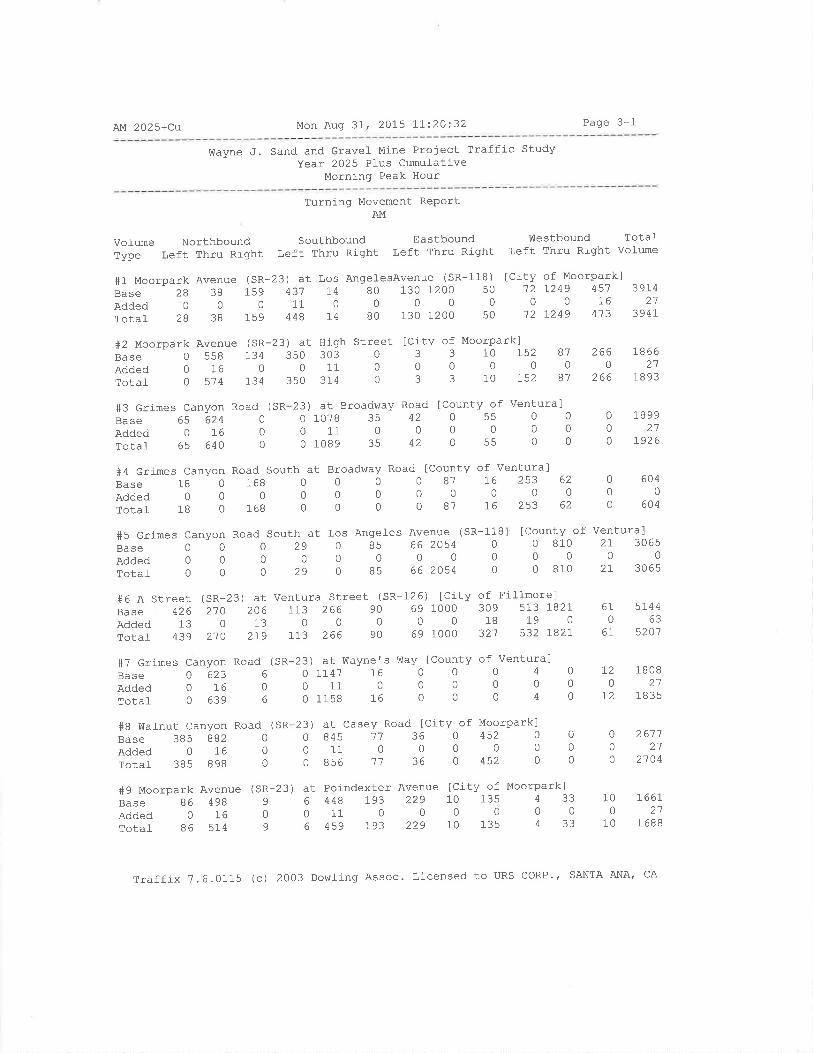
AM 2025+Cu Mon Aug 31, 2015 17:.20:32 Page 3-1
Wayne ,J. Sand and Gravel Mine Project Traffic StudyYear 2025 Plus Cumulative
Morning Peak Hour
Turning Movement ReportAM
Vol-ume NorthboundType Left Thru Right
#1 Moorpark Avenue (SR-Base 28 38 159Added 0 0 0
Total- 28 38 15 9
Base 0 558 134 350Added01600lotal 0 51 4 134 350
#3 Grimes Canyon Road (
Base 65 624 0
Added 0 16 0
Totaf 65 640 0
SouthboundLeft Thru Right
EastboundLeft Thru Right
V{estbound TotalLeft Thru Right Vol-ume
#2 Moorpark Avenue (SR-23) at High Street lCity of Moorpark]
23) at Los AngeÌesAvenue (SR-118)43'r. 74 80 130 1200 50
11 O 0 0 0 0
448 14 B0 130 1200 50
lCity of Moorparkl12 ]-249 4510 0 16
'12 1249 413
3 91421
3941
B70
B'l
2660
26t)
186621
1a02
1899
r926
6040
604
lcounty of Ventural0 810 21 306500000 810 2t 3065
514463
520'7
180821
1835
30311
314
10 r5200
10 r52
303
00
0
303
SR 23\ at Broadhray Road [County of Ventura]01078 35 42 0 55 0
o 11 0 0 0 0 0
o1oB9 35 42 0 55 0
County of Ventural81 16 253 620000
81 L6 253 62
#4 Grimes Canyon Road South at Broadway Road I
BaSEAddedTotal
000
000
000
0
00
0
00
0
0
0
0
0
0
00
0
#5 Grimes Canyon Road South at Los Angeles AvenueBase O 0 O 29 0 85 662054AddedO0OO0000Total- 0 O O 29 0 85 662054
#6 A Street (SR-23) at Ventura Street (SR-126) [City of Fi]-fmorelBase4262.7o206113266906910003095L3782IAdded13013OOO0018t90Totaf43921o2I91132669069100032.75321821
#7 Grimes Canyon Road (
Base 0 623 6
Added 0 16 0
Total 0 639 6
at Wayne's l¡tray [County of Ventura]
1B0
18
1680
168
(SR9
09
II4'711
115 8
760
16
(sR-1180
00
sR-2 3 )00
0
6T0
61
720
1-2
000
4
04
0
00
00
0
0
0
0
#B Wafnut Canyon Road (
Base 385 882 0
Added 0 16 0
Totat 385 898 0
3) at casey Road lcity of MoorPark]o 845 1'7 36 0 452 0
o 11 0 0 0 0 0
o 856 '11 36 0 452 0
at Poindexter Avenue ICity of Moorpark]6 448 193 229 10 135 4 33
0 11 O 0 0 0 0 0
6 459 193 229 10 135 4 33
ò R- 200
0
00
0
261121
21 04
#9 Moorpark AvenueBase 86 498Added 0 16Total 86 514
100
10
I66I21
1688
Trafflx 7.6.0115 (c) 2003 Dowting Assoc. Licensed to URS CORP', SANTA ANA' CA
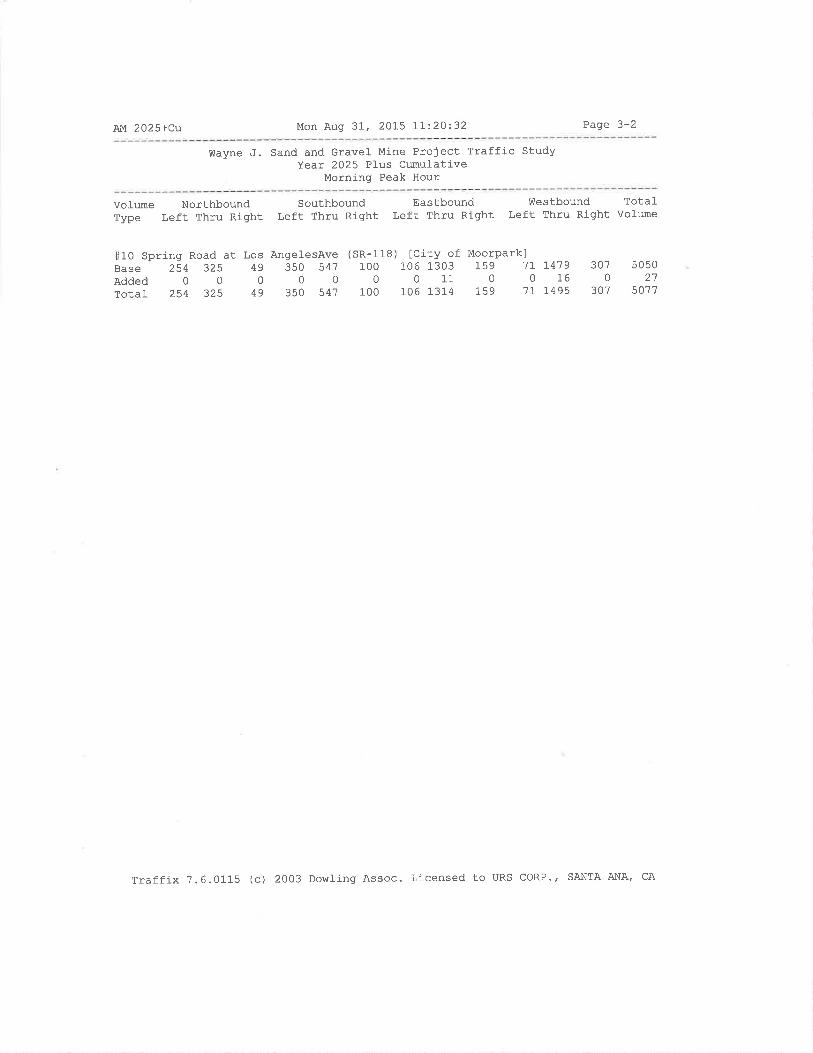
AM 2025+cu Mon Auq 3I, 2OtS Itz2O:32 Page 3-2
Wayne ,J. Sand and Gravel Mine Project Traffic StudyYeat 2025 Plus Crmulative
Morning Peak Hour
Vofume NorthboundType Left Thru Right
SouthboundLeft Thru Right
EastboundLeft Thru Right
vÍestbound Total-Left Thru Right Volume
#10 Spring Road at Los AngelesAveBase 254 325 49 350 547Added00000Totat 254 325 49 350 54'7
lCity of Moorpark]106 1303 1s9 1r 1479
0 11 0 0 16106 1314 159 'tr 1495
(sR-118)100
0100
307ñ
307
50502'7
5071
Traffix ?.6.0115 (c) 2003 Dowling Assoc. Licensed to URS coRP.' SANTA ANA, CA

AM 2025+Cu Mon Aug 31,, 2OL5 17:20132 Page 4-1
Wayne J. Sand and Gravel- Mine Prolect Traffic StudyYear 2025 Pl-us Cumul-ative
Morning Peak Hour
lntersection
Moorpark Avenue (SR-23) at Los
Moorpark Avenue (SR-23) at Hig
crimes Canyon Road (SR-23) at
Grimes Canyon Road south at Br
Grimes Canyon Road South at Lo
A Street (SR-23) at Ventura St
Grimes canyon Road (SR-23) at
Walnut Canyon Road (SR-23) at
Moorpark Avenue (SR-23) at Poi
Spring Road at Los AngelesAve
#1#2#3+4#5+6+1#8+9#10
Tmpact Analysis ReportLevel Of Service
BaseDeL/ v/
LOS Veh C
F xxxxx 1.510
O xxxxx 0.870
F 0.0 1.306
B 10. 6 0.000
F xxxxx 1.455
F xxxxx 1.318
c 2r.5 0.000
F xxxxx 1.273
B xxxxx 0.619
E xxxxx 0.924
FutureDel/ v/
LOS Veh C
F xxxxx 1.510
D xxxxx 0.880
F 0.0 1.319
B 10.6 0.000
E xxxxx 1.455
F xxxxx 1.344
c 22.1 0.000
F xxxxx 1.280
B xxxxx 0.626
E xxxxx 0.929
Changeln
+ 0.000 v,/c
+ 0.010 v/c
+ 0.000 D/v
+ 0.000 D,/v
+ 0.000 v/c
+ 0.026 v/c
+ 0.582 D/V
+ 0.007 v,/c
+ 0.007 v/c
+ 0.005 v/c
Traffix ?.6.0115 (c) 2003 Dowling Assoc. Licensed to URS coRP., SANTA ANA, CA

AM 2025+Cu Mon Aug 3I, 2015 I1:2O:32 Page 5-1
üIayne ,f. Sand and Gravel Mine Project Traffic StudyYear 2025 Plus Cumulative
Morninq Peak Hour
Levef Of Service Computation ReportICU 1(Loss as Cycle Length ?) Method (Euture volume Afternative)
********************************************************************************Intersection #1 Moorpark Avenue (sR-23) at Los Angel-esAvenue (sR-118) [City of M
********************************************************************************Cycle (sec) : 100 Criticaf VoJ-. /Cap' (x) : 1 ' 510
Lãss Time (sec) : 10 (y+R : 4 sec) Average Delay (sec/veh) : xxxxxxOptinaf Cycle: 1OO Levef Of Service: F
********************************************************************************Approach: North Bound south Bound East Bound west Bound
Movement: L - T - R L - T - R L - T - R L - T - R
-l---------ll---------ll---------ll---------------lcontrol-: split Phase splít Phase Protected ProtectedRights: Ovl Ovl- Incl-ude OvfuiÀ.creen: 0 O 0 O O 0 0 0 0 0 0 0
Lanes: 1 1 O O 1 1 0 1! 0 1 1 O 2 1 0 1 0 2 0 1
-l---------ll---------ll---------ll---------------lvol-ume Module:Base Vol- : 28Growth Adj: 1.00In-It1AJ- IJSe: ZóAdded Vol: 0PasserByvol: 0Initial Fut: 28User Adj : 1.00PHF Adj : 1.00PHF Volume:' 28Reduct Vol: 0
Reduced Vol-: 28PCE Adj : 1.00MLF Adj : 1.00Finaf Vol. : 28
-t-----
381.00
3800
3B1.001 .00
3B0
3B1 .001 .00
3B
1591 .00
1590
0
1591 .001 .00
1590
1591 .001 .00
159
4311.00
43111
0
4481 .001 .00
4480
4481 .001.00
448
741.00
L40
0I4
1 .001.00
I40
741.001.00
74
80.0080
0
0BO
.00
.00BO
0
BO
.00
.0080
1301 .00
13000
1301 .001 .00
1300
1301 .001.00
130
72001 .001200
0
012001.001.001200
0
12001.001 .00t200
501.00
5000
501.001 .00
500
501 .001.00
50
aa
1 .0072
0
0
121 .001.00
120
121 .001 .00
12491 .00]-249
00
12491.001.007249
0
12491 .001 .001249
4511.00
45116
0413
1.001.00
4'730
4'731 .001 .00
473
1
1
T
1
1
Saturation Flot¡, Modufe:Sar/Lane: 1600 1600 1600 1600 1600 1600 1600 1600 1600 1600 1600 1600
Adjustment: 0. 94 1. OO 0.94 0.94 1. OO O .94 0.94 1.00 o.94 0.94 1.00 0 - 94
Lanes: 1. OO 1. OO 1.00 1 . 99 O. 01 1 . O0 1 .00 2.88 0.I2 1 .00 2.00 1.00Final Sat.: 1500 1600 15OO 2985 76 1500 1500 4608 180 1500 3200 1500
-l---------ll---------ll---------ll---------------lCapacity Analysis Modufe :
vor/sat: o.o2 o.o2 0.11 0.15 O.BB 0.05 0.09 0.26 0.28 0.05 0.39 0-32CIit MOVeS. **** **** **** ************************************************************************************
Traffix 7.6.0115 (c) 2003 Dowting Assoc. Licensed to URS CORP'' SANTA ANA, CA

AM 2025+cu Mon Aug 3I, 2015 II:20:32 Page 6-1
!ìlayne J. Sand and Gravel Mine Project Traffic StudyYeat 2025 Ptus Cumulative
Morning Peak Hour
Level Of Service Computation ReportICU 1(Loss as Cycle Length t) Method (Future Volume Alternative)
********************************************************************************Tntersection #2 Moorpark Avenue (SR-23) at High Street ICity of Moorpark]********************************************************************************Cycle (sec): 100 Critical Vol./Cap' (X): 0'BB0lõss Tirne (sec) : 10 (y+R = 4 sec) Average Delay (sec/veh) : xxxxxxOptimal Cycle: gI Level Of Service; D
********************************************************************************Approach:Movement:
North Bound South Bound East Bound vilest BoundL-T-RL-T-RL_T-RL-T-R
t---------------ll---------------ll---------------ll---------------lControf: Permitted Permitted Split Phase Split Phase
Riqhts:IncludeIncl-udelncludelncfudeMin.creen: O O O O O O 0 0 0 0 0 0
Lanes: 0 1 O 0 1 1 0 0 1 0 0 0 1! 0 0 0 1 0 0 1
t---------------ll---------------ll---------------ll---------------lVofume Module:Base Vol: 0
Growth Adj : 1.00Initial Bse: 0Added Vof: 0
PasserByvol: 0lnrt1al tu!: u
User Adj : 1.00PHE Adj : 1.00PHF Volume: 0
Reduct Vof: 0Reduced Vo1: 0
PcE Adj : l-.00MLF Adj : 1.00Final Vof. : 0
5581 .00
55876
0
5'l 4
1 .001 .00
5740
5'7 4
1 .001 .00
5'7 4
t341 .00
13400
1341 .001 .00
1340
7341 .001 .00
134
3031.00
30311
0314
1.001.003!4
0
3141 .001.00
3L4
01 .00
0
000
1 .001 .00
000
1.001 .00
0
101.00
1000
101.001.00
100
101.001 .00
10
r521 .00
1520
0t52
1.001 .00
7520
r521 .001.00r52
811.00
8100
B11.001.00
B10
B'1
1.001.00
B'7
zbt)1.00
2660
'0266
1.001.00
2660
2661.001.00
zóo
3501.00
35000
3501 .001 .00
3500
3501.001 .00
350
1
1
1,
1
1
3300 1.0033000033
00 1.0000 1.003300
00 1.0000 1.00
??
Saturation Flow ModuleSat/Lane: 1600 1600Adjustment: 0.94 1.00Lanes: 0.00 1.00Final- Sat.: 0 1600
1 600o.941 .001 500
1600 16000. 94 1.001 .00 1.001500 1600
1 600nq¿o .62
938
I60.0.
00 1600 160094 0.94 1.0000 0.19 0.190 2Br 300
1600 16000.94 1.000.64 0.36954 582
1 6000 -941.001 500
Capacity Analysis Module:vor/sut ' o. oo 0.36 0.09 0 .23 0.20 O.0o 0.01 0.01 0.01 0.16 0.15 0 - 18
clit MO\,leS: **** **** **** ****
* * * * * * * * * * * * * * * * * ** * * * * * * * * * * * * * * * * * * * * * * * * * * * * * * * * * * * * * * * * * * * * * * * * * * * * * * * * * * * * *
Traffix 7.6.0115 (c) 2003 Dowling Assoc. Licensed to URS CORP" SANTA ANA' cA
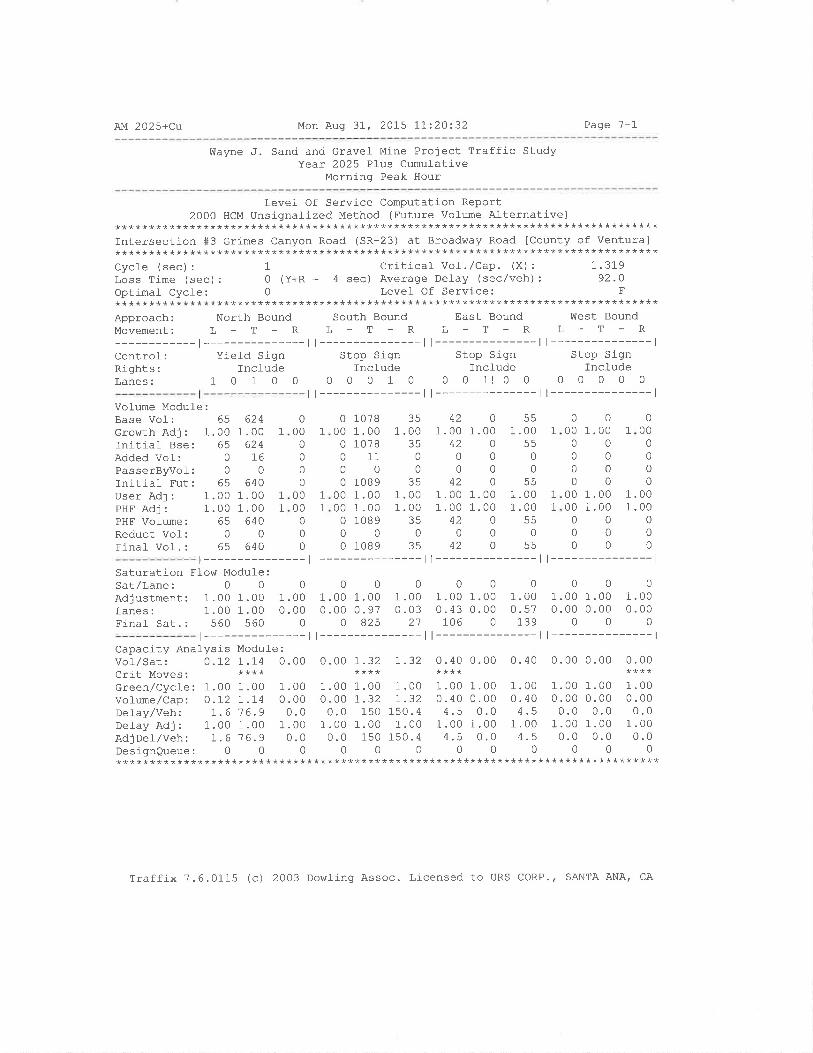
AM 2025+Cu Mon Aug 31, 2015 17'.2O:32 Page 7-1
!ùayne J. Sand and Gravel Mine Project Traffic StudyYear 2025 Plus Cumul-ative
Morning Peak Hour
Level- Of Service Computation Report2000 HCM Unsignal-ized Method (Future Vofume Alternative)
********************************************************************************Intersection #3 crimes Canyon Road (SR-23) at Broadway Road [County of Ventura]********************************************************************************Cycle (sec) : 1 Crj-tical vo1 . /Cap. (X) : 1.319Loss Time (sec): 0 (Y+R : 4 sec) Average Delay (sec/veh): 92.0Optimat CycÌe: 0 Level Of Service: E********************************************************************************Approach: North Bound South Bound East Bound ülest BoundMovement: L - T - R L - T - R L - T - R L - T - R
-r---------ll---------ll---------ll---------------lControl: YieJ-d Sign Stop Sign Stop Sign Stop SignRights: Include Include Incfude Incl-udeLanes: 1 0 1 0 0 0 0 0 1 0 0 0 1! 0 0 0 0 0 0 0
Vol-ume Module:Base Vol: 65Growth Adj : 1.00lnitial Bse: 65Added Vol-: 0
PasserByvol: 0
Initial- Fut: 65User Adj : 1.00PHF Adj : 1.00PHE Volume: 65Reduct Vol: 0
Final- Vof .: 65
Saturation Flow Module:Sat/Lane: 0 0
Adjustment: 1.00 1.00Lanes: 1.00 1.00Finaf Sat. : 560 560
6241 .00
624T6
0640
1.001 .00
6400
640
0 107800 1.000 10780 11000 1089
00 1.0000 1.000 1089000 1089
351 .00
350
0
351.001.00
350
35
4201.00 1.00
4200000
4201.00 1.001 .00 1.00
42000
420
551.00
00
EE
1 .001.00
550
trtr
1
01.00
0000
000
00
0
0
0000
000
1
0
0000
0
0
0000
000
1
1
1
1
1
0
000
0
00
1
11
001.00 1.000.00 0.97
0 825
1.001 .00
000
1.001 .00
000
0
1.000.00
0
t --------------- t --------------- l l --------------- l l --------------- l
01 .000.00
0
0000001 .00 1.00 1 .00 1 .00 1 .00 1 .000 .03 0 . 43 0.00 0.57 0.00 0.00
21 106 0 139 0 0
t---------------ll---------------ll---------------ll---------------lCapacity AnaÌysis Modufe :
Vol,/Sat: O .I2 ]-74 0.00 0.00 1.32 7 .32 0.40 0.00 0.40 0.00 0.00 0.00crit Moves: **** **** **** ****Green/Cycle: 1.00 1.00 1.00 1.00 1.00 1.00 1.00 1'00 1.00 1.00 1.00 1.00Volume/Cap: O.1,2 L.I4 0.00 0.00 1.32 I.32 0.40 0.00 0.40 0.00 0.00 0.00Delay/Veh: I.6 16.9 0.0 0.0 150 150.4 4.5 0.0 4.5 0.0 0.0 0.0DelayAdj: 1.001.00 1.00 1.001.00 1.00 1.001.00 1.00 1.001.00 1.00AdjDel/veh: 1.6'76.9 0.0 0.0 150 150.4 4.5 0.0 4.5 0.0 0.0 0.0DesignQueue: 0 0 0 0 0 0 0 0 0 0 0 0********************************************************************************
Traffix 7.6.0115 (c) 2003 Dowling Assoc. Licensed to URS CORP.' SANTA ANA, CA
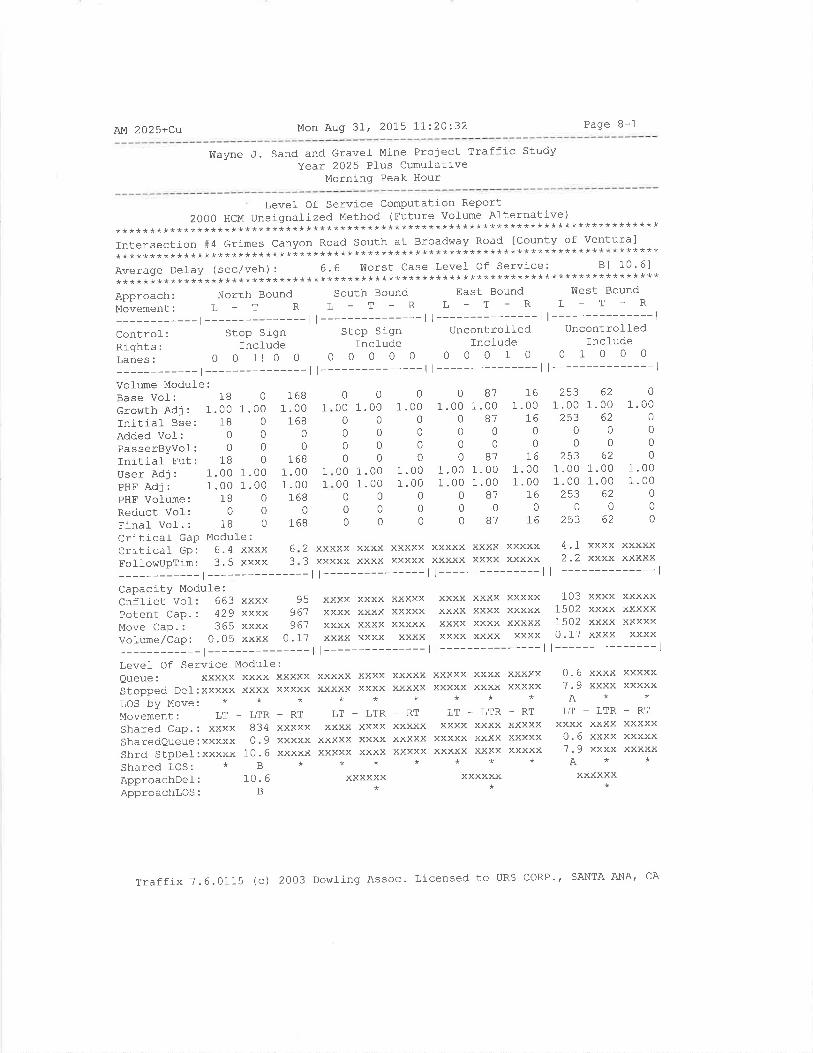
AM 2025+Cu Mon Aug 3L, 2015 71220:32 Page B-1
Wayne J. Sand and Gravel- Mine Project Traffj-c Studylear 2025 Plus Cumulative
Morning Peak Hour
Level Of Service Computation Report2000HCMUnsignalizedMethod(FutureVolumeAlternative)
********************************************************************************Intersection #4 Grimes Canyon Road South at Broadr¡'ay Road ICounty of Ventura]********************************************************************************Average Detay (sec/veh): 6.6 Worst case Level Of Service: Bt 10'61********************************************************************************Approach: North Bound South Bound East Bound West Bound
Movementt L - T - R L - T - R L - T - R L - T - R
-l---------ll---------ll---------ll---------------lControl: Stop Sign Stop Sign Uncontrolled UncontrolledRights: Incfude Include Include IncfudeLanes: 0 0 1l O O 0 0 O O O O O 0 1 0 0 1 0 0 0
-l---------ll---------ll---------ll---------------lVolume Module:BASE VOJ-: II'croürth Adj : 1.00Initial- Bse: 18Added Vof: 0
PasserByvof: 0
Initiaf Fut: 18User Adj : 1.00PHF Adj : 1.00PHF Volume: 18Reduct Vo1: 0
Final Vof. : 18Critical- GaP Module:Critlcal- GP: 6.4 xxxx 6
0000 1.0000000000
00 1.0000 1.00000000
01.00
00
00
1 .001 .00
0
00
0871.00 1.00
0 870000087
1 .00 1.001 .00 1.00
0 87000 87
761.00
I60
0I6
1.001.00
L60
76
01.00
0
00
01.001.00
00
0
0
1.000
000
1 .001 .00
000
1681.00 1
16800
1681.00 L
1.00 1
1680
168
FolÌowUpTim: 3.5 xxxx-t----------
Capacity Module:Cnflict Vol: 663 xxxx 95
Potent CaP.: 429 xxxx 961Move Cap.: 365 xxxx 961Volume/Cap: 0.05 xxxx 0.17
-l---------Levef Of Service Module:Queue: xxxxx xxxx xxxxxStopped Del:xxxxx xxxx xxxxxLOS by Move: * * *
Movement: LT - LTR - RT
Shared Cap.: xxxx 834 xxxxxSharedQueue:xxxxx 0.9 xxxxxShrd StpDel-:xxxxx 10.6 xxxxxShared LOS: * B *
ApproachDel: 10.6Approachlos: B
2 xxxxx xxxx xxxxx xxxxx xxxx xxxxx3 xxxxx xxxx xxxxx xxxxx xxxx xxxxxaJ
----- | l--------------- | l---------------l l---------------l
4.r2.2
xxxx xxxxxxxxx xxxxx
za3 0z1.00 1.00253 62
0000
253 621 .00 1.001 .00 1.00253 62
00253 62
0. 6 xxxx7.9 xxxxA*
LT _ LTRxxxx xxxx
0. 6 xxxx7.9 xxxxA*xxxxxx
*
xxxx xxxx xxxxxxxxx xxxx xxxxxxxxx xxxx xxxxxxxxx xxxx xxxx
xxxx xxxx xxxxxxxxx xxxx xxxxxxxxx xxxx xxxxxxxxx xxxx xxxx
103!50275020.17
xxxx xxxxxxxxx xxxxxxxxx xxxxxxxxx xxxx
xxxxx xxxxXXXXX XXXX**
LT - LTRxxxx xxxx
xxxxx xxxxxxxxx xxxx**
xxxxxx*
XXXXXXXXXX
_RTxxxxxXXXXXXXXXX
xxxxx xxxxxxxxx xxxx**
LT - LTRxxxx xxxx
XXXXX XXXXxxxxx xxxx**
xxxxxx*
xxxxxxxxxx
-RTxxxxxXXXXXxxxxx
xxxxxxxxxx
-RTxxxxxxxxxxxxxxx
Traffix 7.6.0115 (c) 2003 Dowling Assoc. Licensed to URS CORP'' SANTA ANA' CA
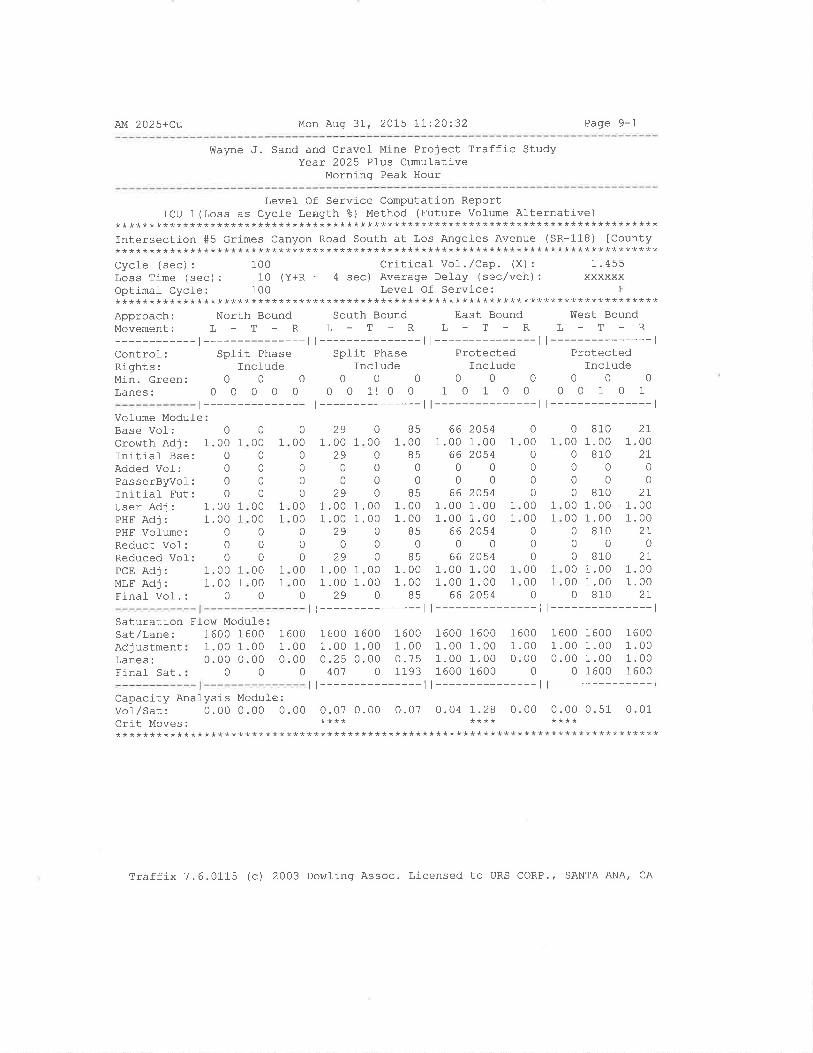
AM 2025+Cu Mon Aug 37, 2015 7I:20:32 Page 9-1
Wayne J. Sand and Gravel Mine Project Traffic StudyYear 2025 Plus Cumul-ative
Morning Peak Hour
Level- Of Service Computation ReportICU 1 (Loss as Cycle Length %) Method (Future Vol-ume Afternative)
********************************************************************************Intersection #5 crimes Canyon Road South at Los Angeles Avenue (SR-118) [County********************************************************************************Cycle (sec) : 100 Criticaf vol .,/Cap. (x) : 1.455Loss Time (sec) : 10 (Y+R : 4 sec) Average Delay (sec/veh) : xxxxxxOptímal Cycle: 100 Level- Of Service: E
********************************************************************************Approach: North Bound South Bound East Bound West BoundMovement: L - T - R L - T - R L - T - R L - T - R
-r---------ll---------ll---------ll---------------lControl: Split Phase Split Phase Protected ProtectedRights: Include Include Include IncludeMin.creen: 0 0 0 0 0 0 0 0 0 0 0 0
Lanes: 0 0 0 0 0 0 0 1! 0 0 1 0 1 0 0 0 0 1 0 1
t --------------- | --------------- l l --------------- l l --------------- l
Vol-ume Module:Base Vol: 0Growth Adj : 1.00Initial Bse: 0Added Vol: 0PasserByvol: 0Initial- Fut: 0User Adj : 1.00PHF Adj : 1.00PHF Vol-ume: 0Reduct Vol: 0Reduced Vol: 0PCE Adj : 1.00MLF Adj : 1.00Final- Vof .: 0
291.00 1
290
0
1 .001 .00
290
1.001.00
0
0
0
1
0
000
0
0
0
0000
000
0000
0
1
0
000
00
0
0000
000
0000
0
1 .00 1.00 1.00 1 .00 1.001 .00 1.00 1.00 1 .00 1.00
29 0 85 66 2054
851.00
850
0
B51 .001 .00
B50
B5
661.00
6600
661 .001 .00
660
66
20541.00 1
205400
20541.00 1
1.00 1
20540
2054
0 81000 1.000 81000000 810
00 1.0000 1.000 810000 810
00 1.0000 1.000 810
2I1 .00
2I0
0
2T1.001.00
2T0
2I1.001 .00
2t
000
0000
000
00
0
0
0000
0
00
0000
0
1
1
1
1
11
1
1
1
11
1
1
1
1
I61.0.
29
29
Saturation Ffow ModuleSat/Lane:AdjustmentLanes:Final Sat.
1 6001 .000.00
0
00 1 60000 1.0000 0.0000
1 6001.00o.25
401
00 1 60000 1 .0000 0.750 1193
1600 16001.00 1.001 .00 1.001600 1600
1 6001.000. 00
0
1600 16001.00 1.000.00 1.00
0 1600
1 6001 .001 .001 600
I61.0.
Capacity Analysis Module :
vof/Sat: 0.00 0 .00 0 .00 0.07 0.00 0.07 0.O4 I .28 0 ' 00 0 .00 0.51 0.01crit Moves. **** **** ************************************************************************************
Traffíx 7.6.0115 (c) 2003 DowJ-ing Assoc. Licensed to URS CORP.' SANTA ANA, CA
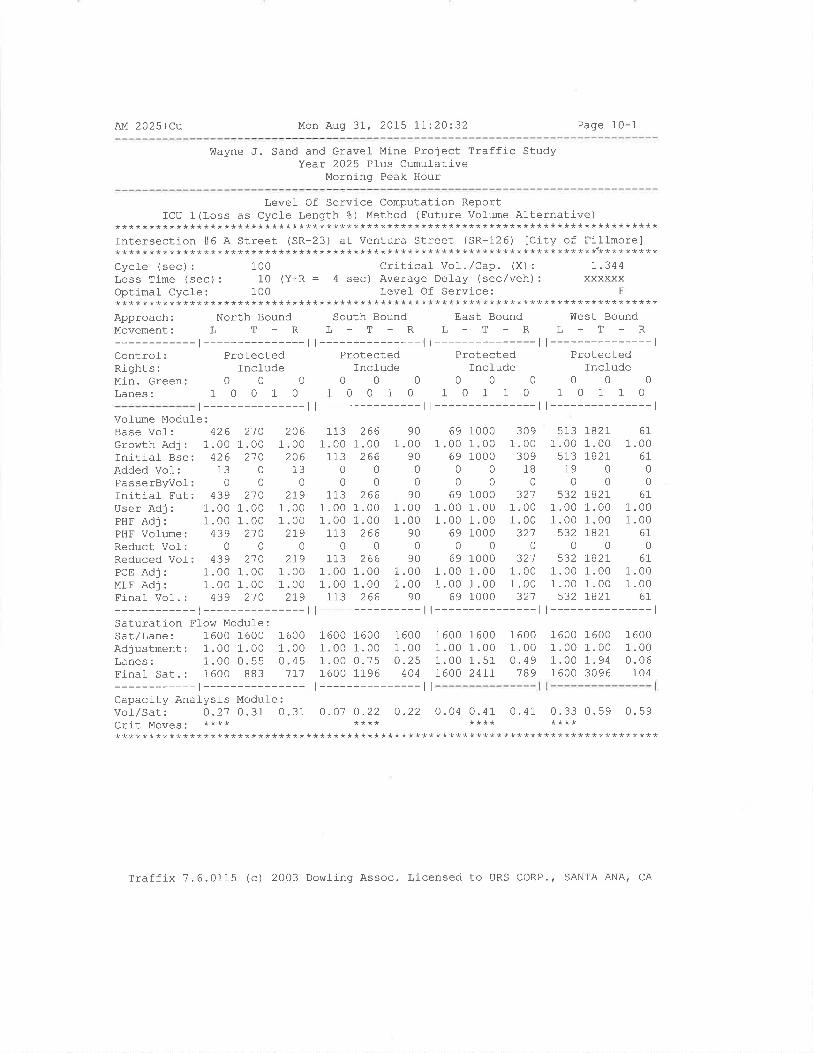
AM 2025+cu Mon Aug 31-, 2075 II:2O:32 Page 10-1
Wayne ,J. Sand and Gravel- Mine Project Traffic StudyYear 2025 Pl-us Cumulative
Morning Peak Hour
Level Of Service Computatj-on ReportICU 1(Loss as Cycfe Length %) Method (Future Volume Afternative)
********************************************************************************Intersection #6 A Street (SR-23) at Ventura Street (SR-126) [City of Fi]-l-rnorel***********************************************************************'*********Cycle (sec) : 100 Critical Vol .,/Cap. (X) : 7.344Loss Time (sec) : 10 (Y+R : 4 sec) Average Defay (sec/veh) : xxxxxxOptimal Cycle: 100 Level Of Servj-ce: F********************************************************************************Approach: North Bound South Bound East Bound West BoundMovementi L - T - R L - T - R L - T - R L - I - R
-t--------- |--------- l l--------- l l---------------lControf: Protected Protected Protected ProtectedRights: Incl-ude Incfude Include IncludeMin.creen: 0 0 0 0 0 0 0 0 0 0 0 0
Lanes: 1 0 0 1 0 1 0 0 1 0 1 0 1 1 0 1 0 1 1 0
t --------------- | --------------- | --------------- l l --------------- l
Vofume Module:Base Vol: 426 21O 206cro$/th Adj: 1.00 1.00 1.00Initial- Bse: 426 21O 206Added Vol: 13 0 13PasserByvof: 0 0 0
Initiaf Fut: 439 21O 2I9User Adj: 1.00 1.00 1.00PHFAdj: 1.001.00 1.00PHF Vofume: 439 210 219Reduct Vol: 0 0 0
Reduced Vof: 439 210 2L9PCE Adj: 1.00 1.00 1.00MLFAdj: 1.001.00 1.00Finaf Vol. : 439 210 2L9
-t---------------lSaturation Flow Module:Sat/Lane: 1600 1600 1600Adjustment: 1.00 1.00 1.00Lanes: 1.00 0.55 0.45Finaf Sat.: 1600 883 17'7
113 266 901.00 1.00 1.00113 266 90
000000
113 266 901 .00 1.00 1 .001 .00 1 .00 1.00113 266 90
000113 266 90
1 .00 1.00 1 .001 .00 1.00 1 .00113 266 90
t---------------1600 1600 16001 .00 1.00 1 .001 .00 0.75 0 .251600 1196 404
69 1000 3091.00 1.00 1.00
69 1000 3090 0 18000
69 1000 3211.00 1.00 1.001.00 1.00 1.00
69 1000 321000
69 1000 32't1.00 1.00 1.001.00 1.00 1.00
69 1000 32'7
t---------------l1600 1600 16001 .00 1.00 1.001 .00 1.51 0.491600 2471 189
513 7827 611 .00 1 .00 1.00513 1821 617900000
532 7821 6r1 .00 1 .00 1.001 .00 1 .00 1.00532 r82r 6r
000532 r82r 6r
1.00 1.00 1.001.00 1.00 1.00532 L827 6r
t---------------l1600 1600 16001.00 1.00 1.001.00 1.94 0.061600 3096 104
-t--------- I l---------------l I
Capacity Analysis Module :
Vof/Sat: 0.21 0.37 0.31 O.01 O.22 O.22 0.04 0.41 0.41 0.33 0.59 0.59crit Moves. **** **** **** ************************************************************************************
Traffix 7.6.0115 (c) 2003 Dowling Assoc. Licensed to URS CORP., SANTA ANA, CA
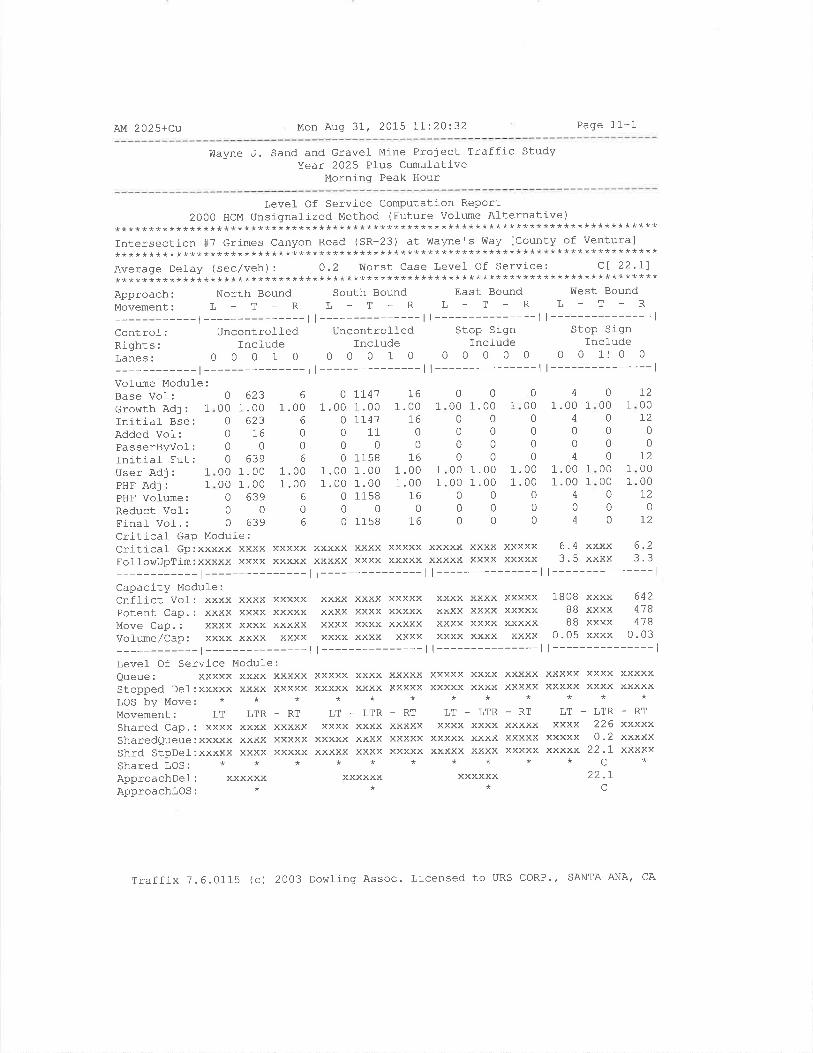
AM 2025+Cu Mon Aug 3I , 201'5 II:20:32 Page 11-1
Wayne J. Sand and Gravel- Mine Project Traffic StudyYear 2025 Pfus Cumulative
Morning Peak Hour
Level Of Service Computation Report20OO HCM Unsignal-ized Method (Future VoÌume Alternative)
********************************************************************************Intersection#TGrimesCanyonRoad(SR_23)atWayne'sWay[CountyofVentura]********************************************************************************Averaqe Detay (sec/veh): 0.2 worst case Level Of Service: cl 22.7)********************************************************************************Approach: North Bound south Bound East Bound west BoundMovement: L - T - R L - T - R L - T - R L - T - R
-l---------ll---------ll---------ll---------------lControf: Uncontrolled Uncontrolled Stop Sign Stop SignRights: Include Include Include IncludeLanes: O O O 1 O 0 O O 1 0 0 0 0 0 0 0 0 1! 0 0
-l---------ll---------ll---------ll---------------lVofume ModuÌe:Base VoI:Growth Adj: 1
Initial Bse:Added Vol:PasserByvol:Initiaf Fut:User Adj: 1
PHF Adj: 1
PHF VoÌume:Reduct Vol:Finaf Vof. :
Criticaf Gap Module:Criticaf Gp:xxxxx xxxx xxxxx xxxxx xxxx xxxxx xxxxx xxxx xxxxxFo1lo\^rupTim:xxxxx xxxx xxxxx xxxxx XXXX XXXXX XXXXX XXXX XXXXX
-l---------ll---------ll---------Capacity Module:Cnffict Vol-: xxxx xxxx xxxxx xxxx xxxx xxxxx xxxx xxxx xxxxxPotent Cap.: xxxx xxxx xxxxx xxxx xxxx xxxxx xxxx xxxx xxxxxMove Cap.: xxxx xxxx xxxxx xxxx xxxx xxxxx xxxx xxxx xxxxxVofume/Cap: xxxx xxxx xxxx xxxx xxxx xxxx xxxx xxxx xxxx
-l---------ll---------ll---------Levef Of Service Module:Queue: xxxxx xxxx xxxxx xxxxx xxxx xxxxx xxxxx xxxx xxxxxStopped Del:xxxxx xxxx xxxxx xxxxx xxxx xxxxx xxxxx xxxx xxxxxLOS bY Move: * * * * * * * * *
Movement: LT - LTR - RT LT - LTR - RT LT - LTR - RT
Shared Cap.: xxxx xxxx xxxxx xxxx xxxx xxxxx xxxx xxxx xxxxxSharedQueue:xxxxx xxxx xxxxx xxxxx xxxx xxxxx xxxxx xxxx xxxxxShrd StpDef:xxxxx xxxx xxxxx xxxxx xxxx xxxxx xxxxx xxxx xxxxxshared Los: * * * * * * * * *
ApproachDel: xxxxxx xxxxxx xxxxxxApproachlos: * * *
0000
00
0
6231 .00
62376
0639
1.001.00
6390
639
6
1 .006
006
1 .001 .00
6
06
0
1 .000
0
00
1 .001 .00
000
71411.00IT41
110
115 8
1.001 .00115 8
0
115 8
161 .00
7600
161 .001 .00
L60
16
000
0
1 .001 .00
0
00
04000004
1.00 1.00 1
1.00 1 .00 1
o400o4
0
0000
00
0000
000
0
000000
1
4
1.00 1
1
111
6.42(
000
0
0
00
0000
0
00
0
1.00 1
000 1
720072
00
I20000I2
0t2
| ----1808
8888
0 .05| ----xxxxxxxxxx
LTxxxx
xxxxxXXXXX
xxxx 6.2xxxx 3.3
-----------l
xxxx 642xxxx 418xxxx 418xxxx 0.03
-----------l
xxxx xxxxxxxxx xxxxx**
-LTR-RT226 xxxxx0.2 xxxxx
22.I xxxxxc*
zz. rc
Traffj_x 7.6.0115 (c) 2003 DowÌing Assoc. Licensed to URS coRP., SANTA ANA, CA
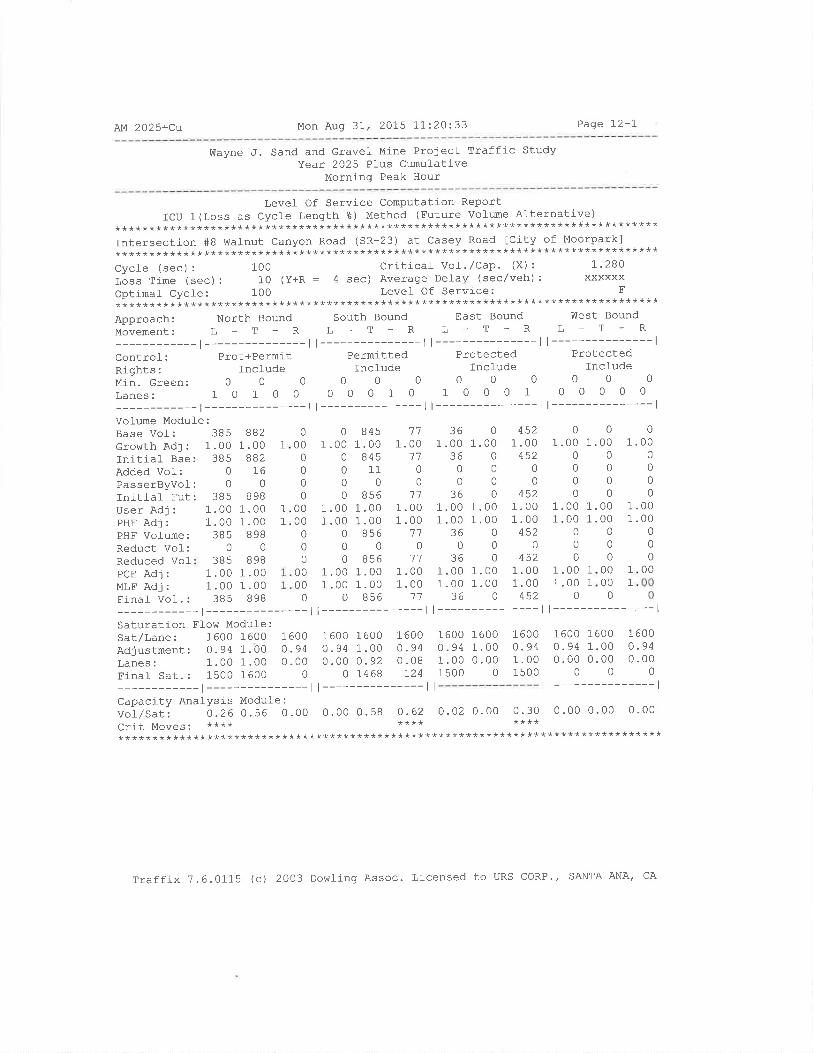
AM 202S+Cu Mon Aug 37, 2075 11:20:33 Page 72-I
Wayne J. Sand and Gravel- Mine Project Traffic StudyYear 2025 PÌus Crmufative
Morning Peak Hour
Level Of Service Computation ReportICU 1(Loss as Cycle Length 8) Method (Future voÌume Alternative)
* * * * * * * * * * * * * * * * * * * * * * * * * * * * * * * * * * * * * * * * * * * * * * * * * * * * * * * * * * * * * * * * * * * * * * * * * * * * * * * *
Intersection #B Walnut Canyon Road (SR-23) at Casey Road ICity of Moorpark]********************************************************************************Cycle (sec): 1OO Critical- Vol./Cap' (X): I'280Lãss time (sec): 10 (y+R : 4 sec) Average Delay (sec/veh): xxxxxxOptimaf Cycte: 100 Level Of Service; F
********************************************************************************Approach: North Bound south Bound East Bound Íilest Bound
MovemENt: T, - T - R L - T - R L - T - R L _ T - R
-l---------ll---------ll---------ll---------------lcontrol-: Prot+Permit Permitted Protected ProtectedRights:Includefncludelncludelncfudel¿in. creen: 0 O O O O 0 0 0 0 0 0 0
Lanes: 1 O 1 O O O 0 0 1 O 1 0 0 0 1 0 0 0 0 0
-l---------ll---------ll---------ll---------------lVoÌume Module:Base Vol-: 385 882Growth Adj : 1.00 1 .00 1
Initial- Bse: 385 882Added VoI: O 16PasserByvol: 0 0
Initial Fut: 385 898User Adj : 1.00 1 .00 1
PHF Adj: 1.00 1.00 1
PHF Volume:Reduct Vol-:Reduced Vol-PCE Adj:MLF AdJ:Final Vof. :
0
000
0
00
00
009400
0
1
0.00
0
000
.00
.000
0
0.00.00
0
8451 .00
84511
0Bs6
1.001.00
8560
8561 .001.00
856
111.00
1'7
00
1 .001.00
'71
0
361.00
3600
361 .001 .00
360
0
1.0000
00
1.001.00
000
4521 .00
45200
4521.001.00
4520
452
01.00 1.
0
000
1 .00 1.1.00 1.
0
0
0
000
0
00
0
0000
0
00
0000
0
01 .00
0
000
1.001.00
0
0
0
001,
1
385 89800
385 8981.00 1.001.00 1 .00385 898
000
00 1
00 1
0
36711.00 1.00 1.00 1.00 1.001 .00 1 .00 1.00 1.00 1.00
113604520
1600 16000.94 1.001 .00 0.001500 0
1
11
1
00
Sat/Lane:Adjustment:Lanes:Final Sat. :
00 160094 1.0000 0.920 1468
1600 16000. 94 1 .001.00 1 .001500 1600
1 600o.940 .08
124
1 600o .941.001500
1600 16000.94 1.000.00 0.00
00
1 6000.940. 00
0
760.0.
760.0.
| --------------- l
Capacity Analysis Module :
vor/sat: o.26 0.56 0.oo o.oo 0.58 0.62 0.02 0.00 0.30 0.00 0.00 0-00CIit MOVeS. **** **** ************************************************************************************
Traffix 7.6.0115 (c) 2OO3 Dowlj-ng Assoc. Licensed to URS CORP', SANTA ANA' CA
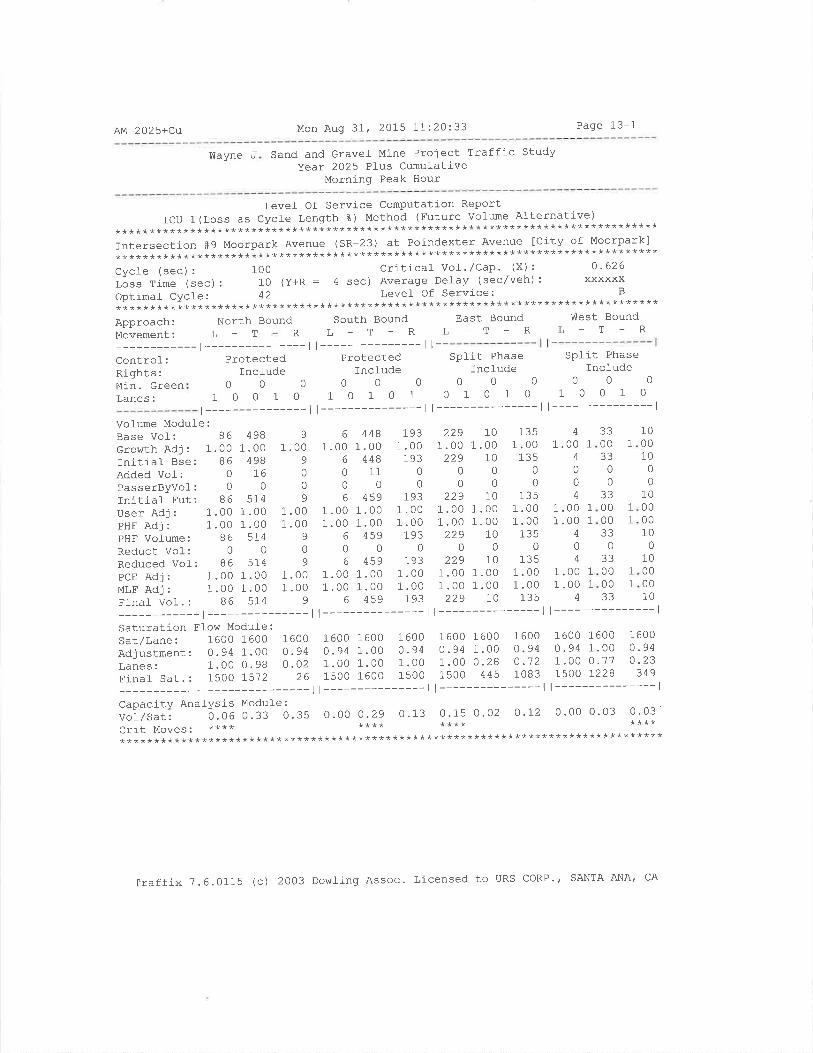
AM 2025+Cu Mon Aug 3It 2OI5 11:20:33 Page 13-1
Wayne J Sand and GraveÌ Mine Project Traffic StudyYear 2025 Pl-us Cumulative
Morning Peak Hour
LeveI Of Service Computation ReportICU 1(Loss as cycle Length g) Method (Future Volume Afternative)
********************************************************************************Intersection +9 Moorpark Avenue (SR-23) at Poindexter Avenue [Cíty of Moorpark]********************************************************************************Cycle (sec): 1OO criticaf Vot'/Cap' (x): 0'626lãss 1ime (sec) : 10 (y+R = 4 sec) Average Delay (sec/veh) : xxxxxxOptimal Cycle: 42 Level- Of Service; B
********************************************************************************
L-IApproach:Movement:
Control-:Rights:Min. GreenLanes:
North Bound South Boundr-T-Þ
ProtectedInclude
00010101
t---------------l
East BoundTT-Þ
ViTest BoundL_T-R
ProtectedInclude
00010010
l---------------l
R
.00 1.00
.00 1 .0096
--- | ----600 1600.94 0.94.02 1 .0026 1500
--- | ----.35 0.00
*********
Split PhaseInclude
00001010
t---------------ll-
Split PhaseInclude
00010010--------------l
Volume Module:Base Vol-: 86 498cro¡¡/th Adj : 1.00 1.00Initial- Bse: 86 498Added Vol: 0 16PasserByvol: 0 0
Initiaf Fut: 86 5L4User Adj: 1.00 1.00PHF Adj : 1.00 1.00PHF Volume: 86 514Reduct VoÌ: 0 0
Reduced Vof: 86 514
6
1 .006
00
6
1 .001.00
6
0
6
100010
00
10000010
0
10000010
PcE Adj : 1.00 1 .00 1
MLF Adj : 1.00 1.00 1
Final Vol. : 86 514-t------------
Saturation FIow Modufe:Sat/Lane: 1600 1600 1
Adjustment: 0.94 1.00 0
Lanes: 1.00 0 . 98 0
Finaf Sat.: 1500 1572
Capacity AnalYsis Module :
Vot/Sat: 0.06 0.33 0
Crit Moves' ****+************************
4
1.00 1
4
0
04
1.00 1
1.00 1
4
04
9
1.009
009
1 .001 .00
9
0
9
4481.00
44811
0/ (o
1 .001.00
4590
4591.001.00
459
1931.00
1930
0193
1.001 .00
1930
1931 .001 .00
193
2291.00
2290
0229
1 .001 .00
2290
2291 .001.00
229
101 .00
1000
101.001.00
100
101 .001.00
10
1351 .00
1350
0135
1.001.00
1350
1351.001.00
135
1.00 1
1.00 1
4
330033
00
??
000033
0
33000033
1
1
1
1
1
I l--------- I l---------------l
1600 1600 1600 1600 1600 1600 1600 16001 . OO 0.94 O. 94 1 .00 0. 94 0.94 1.00 0.941. OO 1 . OO 1 . O0 0.28 0.12 1 .00 0.77 0 -231600 15oo 1500 445 1083 7500 r22B 349
ll--------- I l---------------l
o.2g o .13 O. 15 O. 02 0.72 0.00 0.03 0.03 '
**** **** **************************************************
Traffix 7.6.0115 (c) 2OO3 Dowling Assoc. Licensed to URS coRP., SANTA ANA/ CA

AM 2025+Cu Mon Auq 31, 2015 11:20:33 Page 14-1
Wayne J. Sand and Gravel- Mine Project Traffic StudyYeat 2025 Plus Cumul-ative
Morning Peak Hour
Level Of Service Computation ReportICU 1(Loss as Cycle Length E) Method (Future vol-r$e Al-ternative)
********************************************************************************Intersection #10 spring Road at Los AngefesAve (sR-118) [City of Moorpark]********************************************************************************Cycle (sec): 100 critical vol-./cap' (x): 0'929Loss Time (sec) : O (Y+R : 4 sec) Average Del-ay (sec/veh) : xxxxxxOptimal Cycle: 100 Level Of Service: E
********************************************************************************Approach: North Bound South Bound East Bound vilest BoundMOVCMENT: L - T - R L _ T - R L - T - R L - T - R
-l---------ll---------ll---------ll---------------lcontrol_: Protected Protected Protected ProtectedRights: lnclude Ovf Include Ovl-
Mín.creen: 0 O O O 0 0 0 0 0 0 0 0
Lanes: 2 O 1 1 O 2 0 1 0 1 2 0 2 0 1 1 O 2 0 1
-l---------ll---------ll---------ll---------------lVofume Module:Base VoI 254 325Growth Adj:Inítial- BseAdded Vo1:PasserByvol-fnitiaf FutUser Adj:PHF AdJ:PHF Volume:Reduct Vol-:Reduced Vol-PCE Adj:MLF AdJ:Final Vof. :
1.00 1 .00254 325
0000
254 3251.00 1 .001.00 1 .00254 325
350 541 1001.00 1.00 1.00350 54'l 100
r4'7 9 3071.00 1.00r479 307
325 49 350 547 100
1061 .00
10600
1061 .001 .00
106
13031.001303
110
1.001.001314
0
1591.00 1
15900
1591.00 1
1.00 1
1590
159
T60
95000095
0
0
0
3071.001.00
3070
491 .00
490
1t0017
00
'77
000077
0'7t0000'7r
00
3501 .001.00
3500
491 .001 .00
49
0000
547 100 13141.00 1 .001.00 l_.00
I41.1.I4
14 95 3071.00 1.001.00 1.00
1.00 1
1.00 1
54'7 100000
2541.00 1 .00 1 .00 1 .00 1.00 1 .001.00 1 .00 1.00 1.00 1.00 1.00
0 0
1 600o.940.26
L3r41.001.00
0
1061 .001 .00
254 325 49 350 541 100 106 1314 159
t---------------ll---------------ll---------------ll---------------l1495 307
1600 1600 1600 1600 1-600 16000. 94 1.00 0.94 0. 94 1.00 0. 942.00 2.00 1.00 1.00 2.00 1.00
Saturation FIoh¡ Modul_eSat/Lane: 1600 1600Adjustment: 0.94 1.00Lanes: 2.0O 'l'.'7 4
1600 16000.94 1.002 .00 1.00
1 6000.941 .00
Final Sat.: 3OOO 2781 393 3000 1600 1500 3000 3200 1500 1500 3200 1500
-r---------ll---------ll---------ll---------------lCapacity Analysis Modul-e :
vol/sat: 0. oB 0.12 o .I2 O . 12 0.34 0.07 0.04 0. 41 0. 11 0.05 0.47 0 .20crit Moves. **** **** **** ************************************************************************************
Traffix 7.6.0115 (c) 2003 Dowling Assoc. Lícensed to URS CORP.' SANTA ANA' CA

PM 2025+Cu Mon Aug 3I, 2015 IL:22t12 Page 1-1
Wayne J. Sand and Gravef Mine Project Trafflc StudyYear 2025 Plus Cumulalive
Evening Peak Hour
Scenario ReportScenario
Conmand:Volì.]me:Geometry:Impact Fee:Trip Generation:Trip DistributionPaths :
Routes:Configuration:
PM 2025+Cu
PM 2025PM 2025ExistingDefauft Impact FeePM
PM
Defauft PathsDefault Routes2025
Traffix 7.6.0115 (c) 2003 Dowling Assoc. Licensed to URS CORP., SANTA ANA' CA
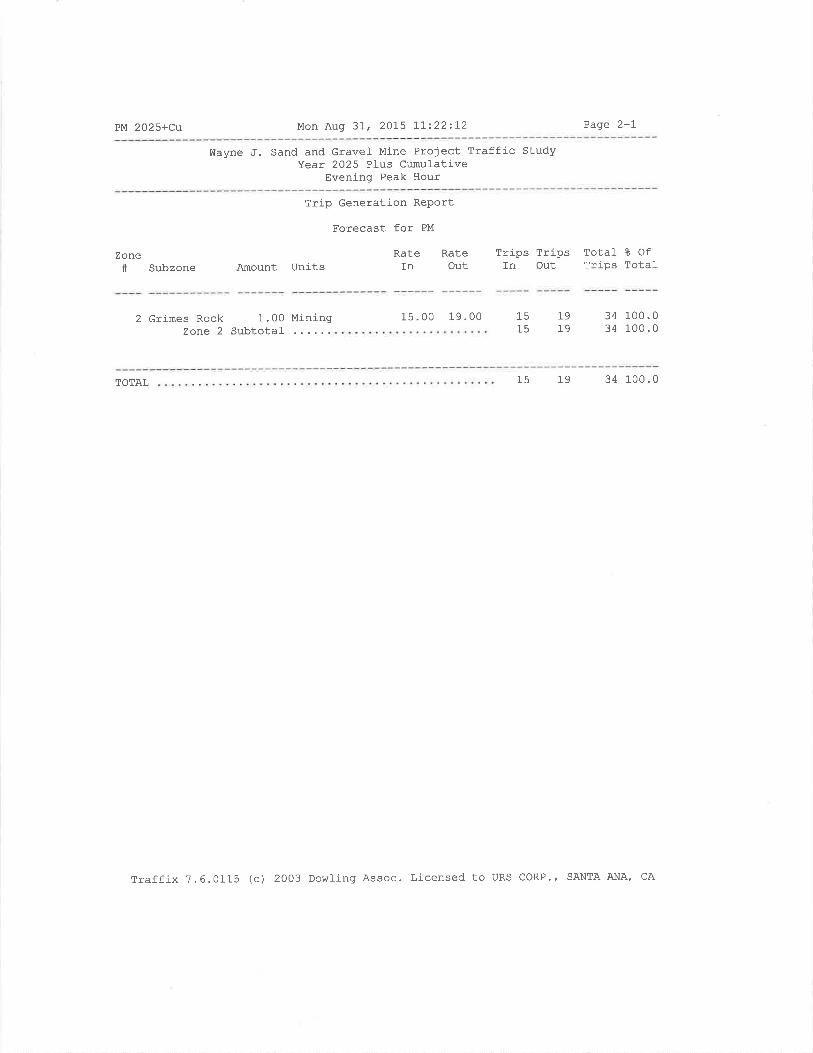
PM 202s+cu Mon Auqt 3r., 20L5 1t222:I2 Page 2-7
Wayne J. Sand and. Gravel Mine Project Traffic StudyYear 2025 Plus Cumulative
Evening Peak Hour
Zone# Subzone
Trip Generation RePort
Forecast for PM
Rate RateAmount Units In Out
Trips TripsIn Out
Total t OfTrips Tota1
2 Grimes Rock 1.00 MiningZone 2 Subtotal
15.00 19.00 1515
1919
34 100.034 100.0
TOTAL 15 19 34 100.0
Traffix 7.6.0115 (c) 2003 Dowling Assoc. Licensed to URS CORP.' SANTA ANA' CA
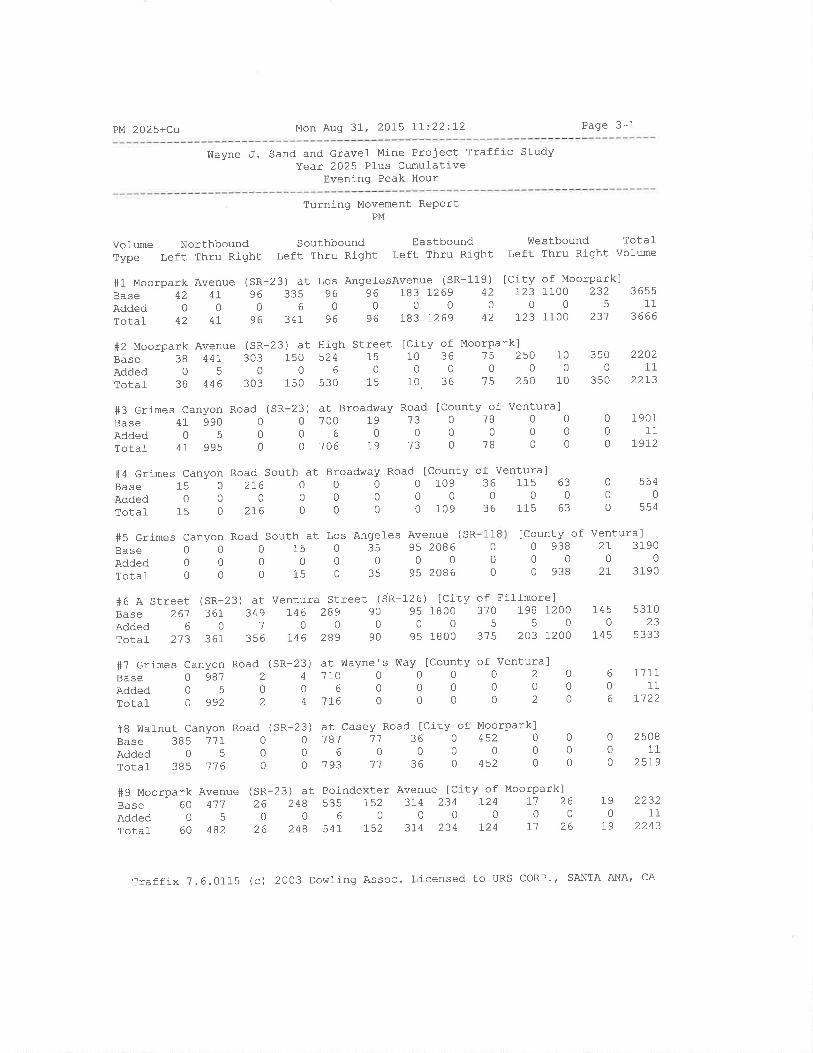
PM 2025+Cu Mon Aug 3I, 2015 77:22:12 Page 3-1
!ûayne J. Sand and Gravel Mine Project Traffic StudyYear 2025 Plus Cumufative
Evening Peak Hour
Turning Movement ReportPM
Volume Northbound SouthboundType Left Thru Ríght Left Thru Right
EastboundLeft Thru Right
òK
V{estbound TotalLeft Thru Right Volume
#1 Moorpark Avenue (SR-23) at Los Angel-esAvenue (SR-1-18)
Base 42 4t 96 335 96 96 IB3 1269 42
AddedOO0600000rotal 42 41' 96 34I 96 96 I83 7269 42
#2 Moorpark Avenue (SR-23) at High Street lCity of Moorpark]Base 38 44]. 303 150 524 15 10 36 't5 250 10
Added05006000000Total 38 446 303 150 530 15 10 36 75 25o 10
[City or23 t
0
r23 7
f Moorparkl100 232
05100 231
3 65511
3666
#3 Grimes Canyon Road (
Base 47 990 0
Added 0 5 0
Totaf 41 995 0
#4 crimes Canyon Road South at Broadway Road I
BaSeAddedTotal
SR 23) at Broadway Road lcounty of Ventura]o 7oo 19 13 0 78 0 0
060000000 706 19 13 0 78 0 0
3500
350
1450
145
790
19
220211
22r3
1 90111
7912
(q¿
0
554
531 0
5333
150
15
2t60
216
0
00
00
0
0
00
00
0
00
0
00
0
0
0
0
6
0
6
000
0
00
County of Ventural109 36 11s
000109 36 115
630
63
#5 Grj-mes Canyon Road South at Los8ase000150Added00000Totaf000150
#7 Grimes Canyon RoadBase 0 987 2
Added 0 5 0
Totat O 992 2
#B vilafnut Canyon Road (
Base 385 11I 0
Added 0 5 0
Totat 385 'l'l 6 0
#9 Moorpark AvenueBase 60 4'71
Added 0 5
Totaf 60 482
at Wayne's Way lcounty of Ventura]710 0 0 0 0 2 0
6000000716 0 0 0 0 2 0
3) at casey Road [City of MoorPark]o 181 '7't 36 0 452 0
0600000o 793 '11 36 0 452 0
(SR-23) at Poindexter Avenue ICity of Moorpark]26 248 535 752 3r4 234 r24 r'7 26
00600000026 248 541 r52 3I4 234 !24 l1 26
Angeles Avenue (
3s 9s 2086000
35 95 2086
[County of Ventura]0 938 21 319000000 938 21 3190
180
00
1
#6 A Street (SR-23) at Ventura Street (SR-126) [City of Fíllrnore]Base 261 361 349 146 289 90 95 1800 370 198 1200
Added6O1OO000550rotaf 213 361 356 146 289 90 95 1800 375 203 1200
(sR-23)4
0
4
I1 II11
L122
SR- 22 508
112s79
223211
2243
Traffix 7.6.0115 (c) 2OO3 Dowling Assoc. Lícensed to URS CORP', SANTA ANA' cA
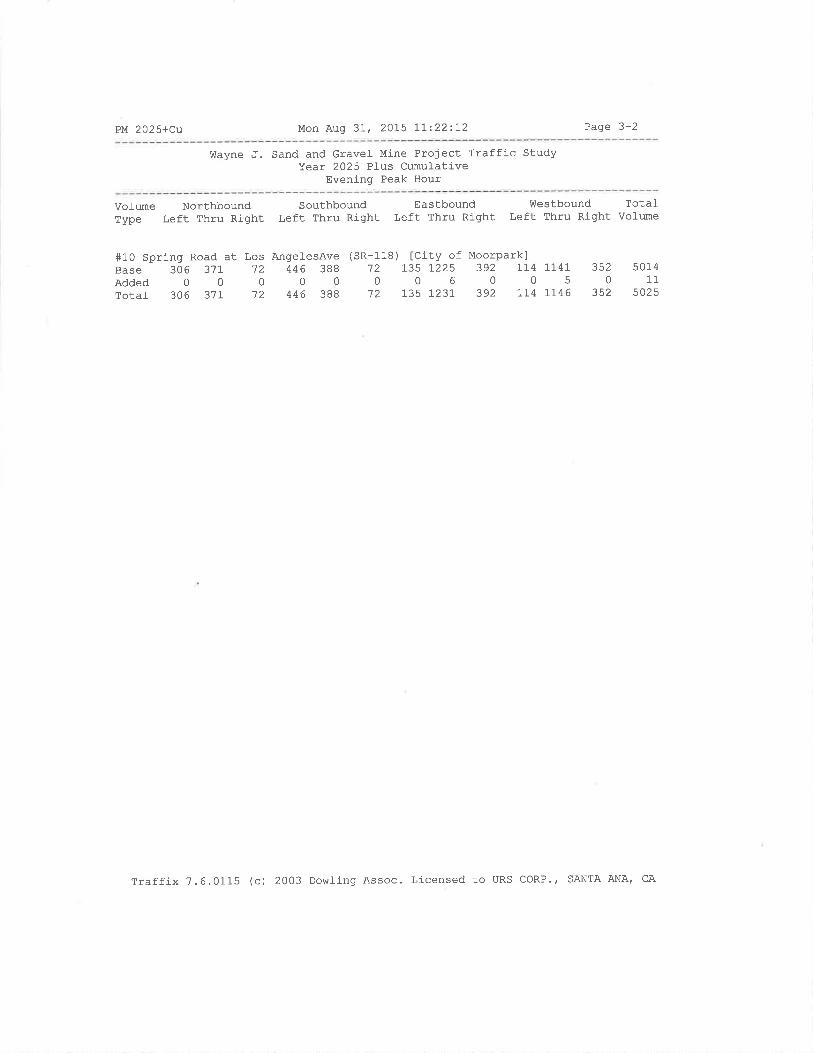
PM 2025+Cu Mon Auq 31-, 2015 Lt:22:I2 Page 3-2
Wayne J. Sand and Gravel Mine Project Traffic StudyYear 2025 PIus Cumulative
Evening Peak Hour
Vol-ume NorthboundType Left Thru Right
SouthboundLeft Thru Right
EastboundLeft Thru Right
Westbound TotalLeft Thru Right Vol-wne
#10 SpriBaseAddedTotal-
ng Road at Los Angel-esAve306 3'7r '72 446 388
00000306 371 72 446 388
(SR-1]-B) lcity of Moorpark]72 r35 1-225 392 rr4 ]-747006005
12 135 1231 392 7r4 1146
3520
352
5 01411
502 5
Traffix 7.6.0115 (c) 2003 Dowling Assoc. Licensed to URS coRP., SANTA ANA, CA
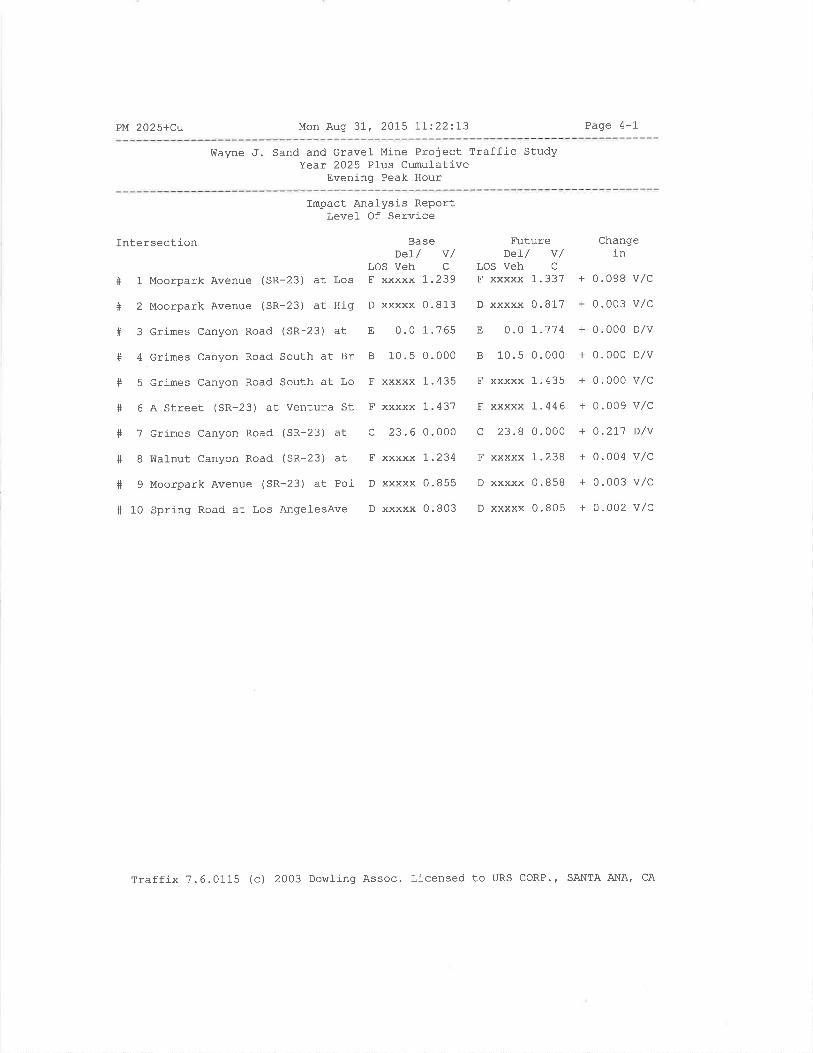
PM 2025+Cu Mon Aug 31 , 2075 1'Il.22:I3 Page 4-1
Wayne .f. Sand and Gravel Mine Project Traffic StudyYear 2025 Plus Cumulative
Evening Peak Hour
Intersection
Moorpark Avenue (SR-23) at Los
Moorpark Avenue (SR-23) at Hig
Grimes Canyon Road (SR-23) at
Grimes Canyon Road South at Br
crimes Canyon Road South at Lo
A Street (SR-23) at Ventura St
Grimes Canyon Road (SR-23) at
V{al-nut Canyon Road (SR-23) at
Moorpark Avenue (sR-23) at Poi
Spring Road at Los Angel-esAve
#l-+2#3#4#s#6*l
#8#e#10
fmpact Analysis ReportLevel Of Service
BaseDeI/ v/
LOS Veh C
F xxxxx l-.239
D xxxxx 0.813
E 0.0 1.765
B 10.5 0.000
F xxxxx 1.435
F xxxxx 1.437
c 23.6 0.000
F xxxxx I.234
D xxxxx 0.855
D xxxxx 0.803
Futureoel- / v/
LOS Veh C
F xxxxx 1.337
D xxxxx 0.817
E 0. o 1.114
B 10.5 0.000
F xxxxx 1.435
F xxxxx l- . 44 6
c 23. B 0. 000
F xxxxx 1,238
D xxxxx 0.858
D xxxxx 0.805
Changein
+ 0.098 v,/c
+ 0.003 v/c
+ 0.000 D,/v
+ 0.000 D,/V
+ 0.000 V/c
+ 0.009 v/c
+ 0.2L1 D/v
+ 0.004 v/C
+ 0.003 v/c
+ 0.002 v/c
Traffix 7.6.0115 (c) 2003 Dowling Assoc. Licensed to URS CORP.' SANTA ANA, CA
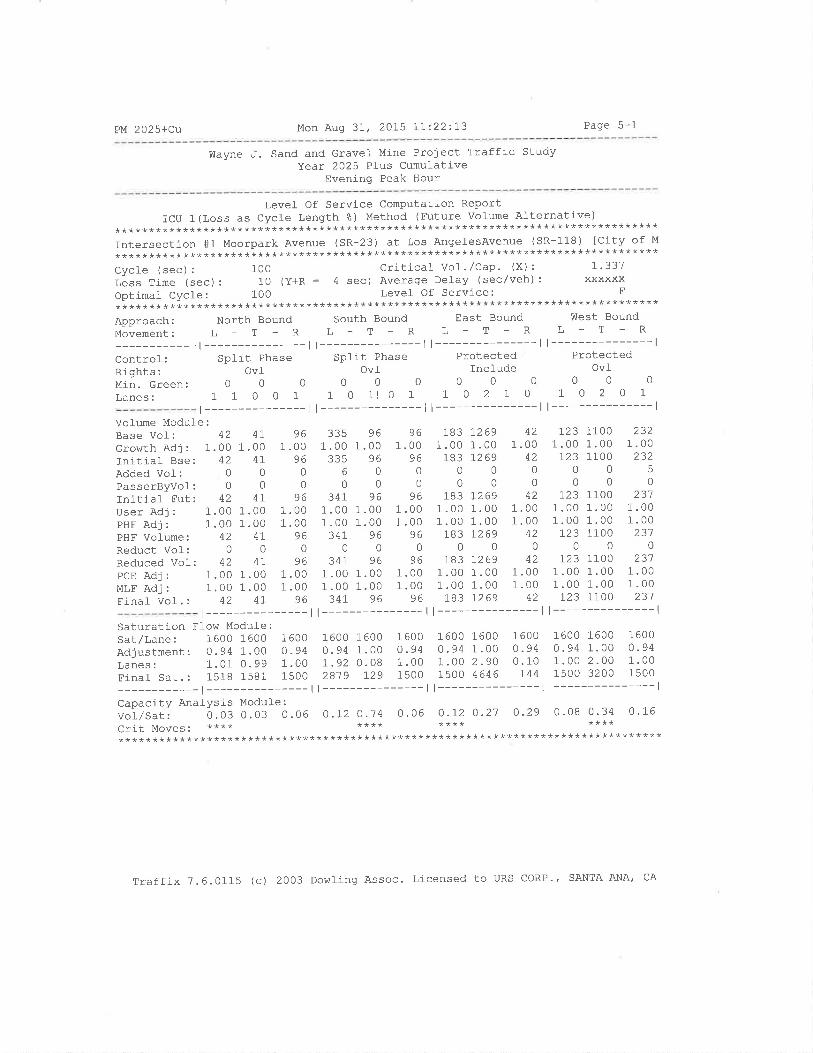
PM 2025+cu Mon Aug 3I, 2OI5 LI:22:I3 Page 5-1
Í1¡ayne J. Sand and Gravel Mine Project Traffic StudyYear 2025 Pl-us Cumulative
Evening Peak Hour
TCU 1************Intersection************cycle (sec):Loss Time (sOptimal Cycl************Approach:
Y:r:i:::-___Control:Rights:Min. Green:Lanes:
Vofume Module:Base Vol: 42Growth Adj : 1.00Initiat Bse: 42Added Vol r 0
PasserByVol: 0
Initial Fut: 42User Adj : 1.00PHF Adj : 1.00PHF Volume: 42Reduct Vof: 0
Reduced Vol: 42PCE Adj : 1.00MLF Adj : 1.00FinaÌ Vof. : 42
Level- Of Service Computation Report(Loss as Cycle Length 8) Method (Future Vol-ume Al-ternative)********************************************************************#1 Moorpark Avenue (sR-23) at Los AngefesAvenue (sR-118) [Cíty of M
********************************************************************1OO Criticaf Vol./CaP. (X): 1'337
ec) : 10 (Y+R = 4 sec) Averaqe Delay (sec/veh) : xxxxxxe: 100 Level Of Service; F
********************************************************************North Bound South Bound East Bound West Bound
L_Î-RL-T_RL-T-RL-T-Rt---------------ll---------------ll---------------ll---------------l
Split Phase Spfit Phase Protected ProtectedOvl Ovf Include OvI
0000000000001 1 0 o 1 1 O 1l o 1 1 0 2 1 0 1 0 2 0 1
r---------------ll---------------ll---------------ll---------------l47
1 .004T
00
4I1 .001 .00
4t0
41,
1 .001 .00
41-
961 .00
960
096
1.001 .00
960
961 .001 .00
96
3351 .00
3356
0347
1.001 .00
3470
34r1 .001.0034r
961.00
9600
961.001 .00
960
961.001.00
96
961.00
9600
961 .001 .00
960
961 .001 .00
96
1831 .00
1830
0183
1 .001.00
1830
1831 .001 .00
183
72691.00t269
0
0
1,2691.001.00t269
072691.001.001269
421 .00
420
042
1.001 .00
420
421.001.00
42
r231 .00
72300
r231.001 .00r23
0
1231 .001.00
123
110 01.001100
0
01 1001.001.001100
0110 01.001 .00110 0
1.00232
5
0
2311 .001.00
2310
2311.001.00
231
t---------------ll---------------ll---------------ll---------------lSaturation Ffow Module:sat/Lane: 1600 1600 1600 1600 1600 1600 1600 1600 1600 1600 1600 1600
Adjustment: o.94 1.00 o.94 0.94 1.OO O.94 0.94 1.00 o-94 0.94 1.00 0-94
LaÀes: 1.01 0.99 1.00 1.92 0.08 1.00 1.00 2.90 0.10 1.00 2.00 1-00Final Sar.: 1518 1581 15OO 2819 729 15OO 1500 4646 744 1500 3200 1s00
-l---------ll---------ll---------ll---------------lCapacity Anal-Ysis Modufe:voi/sutr 0.030.03 0.06 o.t2o.'1 4 0.06 0.I20.21 o.29 0.080.34 0.16crit Moves. **** **** **** ************************************************************************************
Traffix 7.6.0115 (c) 2O03 Dowling Assoc. Licensed to URS coRP.' SANTA ANA' CA
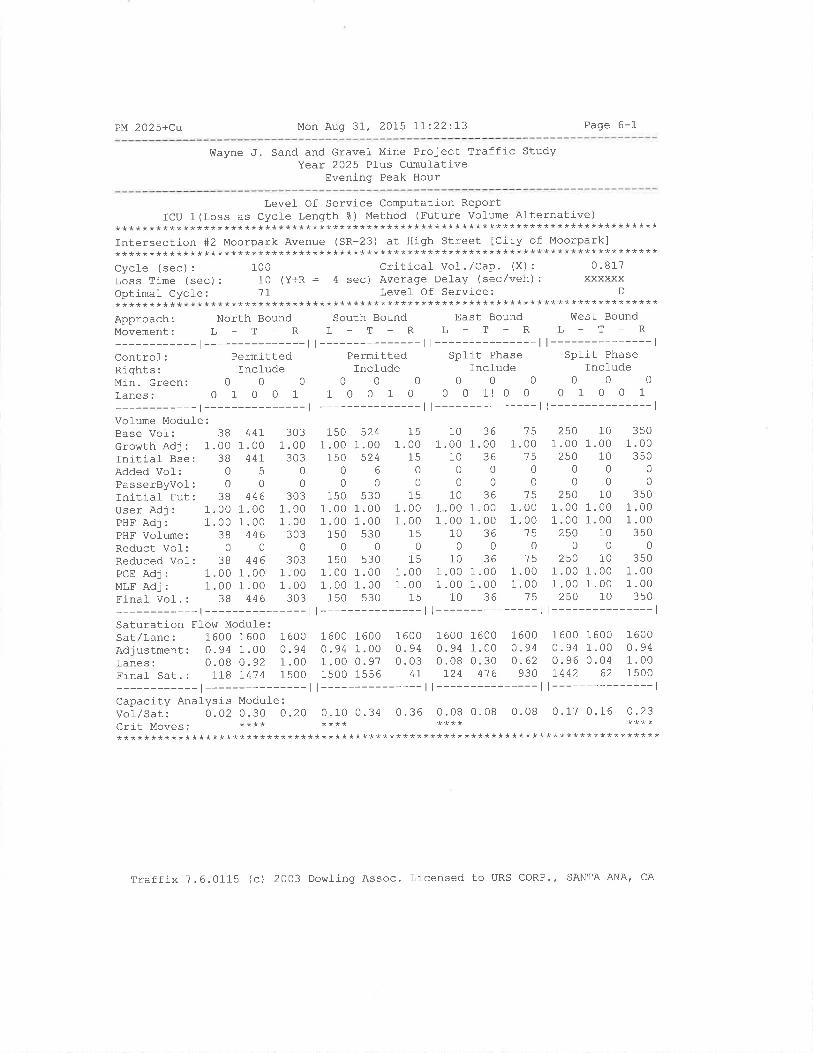
PM 2025+Cu Mon Aug 37, 2075 II:22:13 Page 6-1
frlayne J. Sand and Gravel Mine Project Traffic StudyYear 2025 PIus cimulative
Evening Peak Hour
Level Of Service Computation ReportICU 1 (Loss as Cycfe Length %) Method (Future Vol-ume Alternative)
********************************************************************************rntersection #2 Moorpark Avenue (sR-23) at High Street Icity of Moorpark]********************************************************************************Cycle (sec): 100 Critical Vol-./cap. (X): 0.817Loss Time (sec): 10 (Y+R : 4 sec) Average Delay (sec/veh): xxxxxxOptimal CycÌe: '7I Level Of Service: D
********************************************************************************Approach: North Bound south Bound East Bound west BoundMovement: L - T _ R L - T - R L - T - R L - T _ R
-l---------ll---------ll---------ll---------------lcontrof: Permitted Permitted spÌit Phase split PhaseRights: Include Include Include IncludeMin.Green: 0 0 O 0 0 0 0 0 0 0 0 0
Lanes: O 1 O O 1 1 0 0 1 0 0 0 1! 0 0 0 1 0 0 1
-l---------ll---------ll---------ll---------------lVolume Module:Base Vol: 38 447 303 150 524 15 10 36 '15 25O 10 350
GrowrhAdj: 1.oo 1.oo 1.00 1.00 1.00 1.00 1.00 1.00 1.00 1.00 1.00 1.00Initiaf Bse: 38 44I 303 150 524 15 10 36 15 250 10 350
AddedVol: O 5 O 0 6 0 0 0 0 0 0 0
PasserByvol: 0 0 O 0 0 0 0 0 0 0 0 0
Initial Fut: 38 446 303 150 530 15 10 36 '75 250 10 350
user Adj : 1. oo 1 .00 1 .00 1.00 1.00 1.00 1 .00 1.00 1.00 1 .00 1.00 1.00pHF Adj : 1.00 1 .00 1 .00 1 .00 1.00 1 .00 1.00 1.00 1.00 1 .00 1.00 1.00PHF Volume: 38 446 303 150 530 15 10 36 15 250 10 350
Reduct Vol-: O O O 0 0 0 0 0 0 0 0 0
Reduced VoI: 38 446 303 150 530 15 10 36 15 250 10 350
PcEAdj: 1.001.O0 1.00 1.00I.00 1.00 1.001.00 1.00 1.001.00 1'00MLFAdj: 1.OO 1.00 1.00 1'00 1.00 1.00 1.00 1.00 1.00 1.00 1.00 1'00Final vol-.: 38 446 303 150 530 15 10 36 15 250 10 350
-l---------ll---------ll---------ll---------------lSaturati-on Flow Module:Sat/Lane: 1600 1600 1600 1600 1600 1600 1600 1600 1600 1600 1600 1600Adjusrmenr: 0.94 1 .00 O .94 0.94 1.00 0. 94 0.94 1.00 O .94 0 . 94 1.00 0 .94Lanes: 0.08 0.92 1.00 1.00 0.97 0.03 0.08 0'30 0.62 0.96 0.04 1.00Fínar sar.: II8 L414 15OO 1500 1556 4I L24 476 930 1442 62 1500
-r---------ll---------ll---------ll---------------lCapacity Anafysis Module :
vor/sar: o. 02 o .30 o .20 0.10 0.34 0.36 0.08 0.08 0.08 0 .17 0. 16 0.23crit Moves. **** **** **** ************************************************************************************
Traffix 7.6.0115 (c) 2003 Dowling Assoc. Licensed to URS CORP.f SANTA ANA, CA
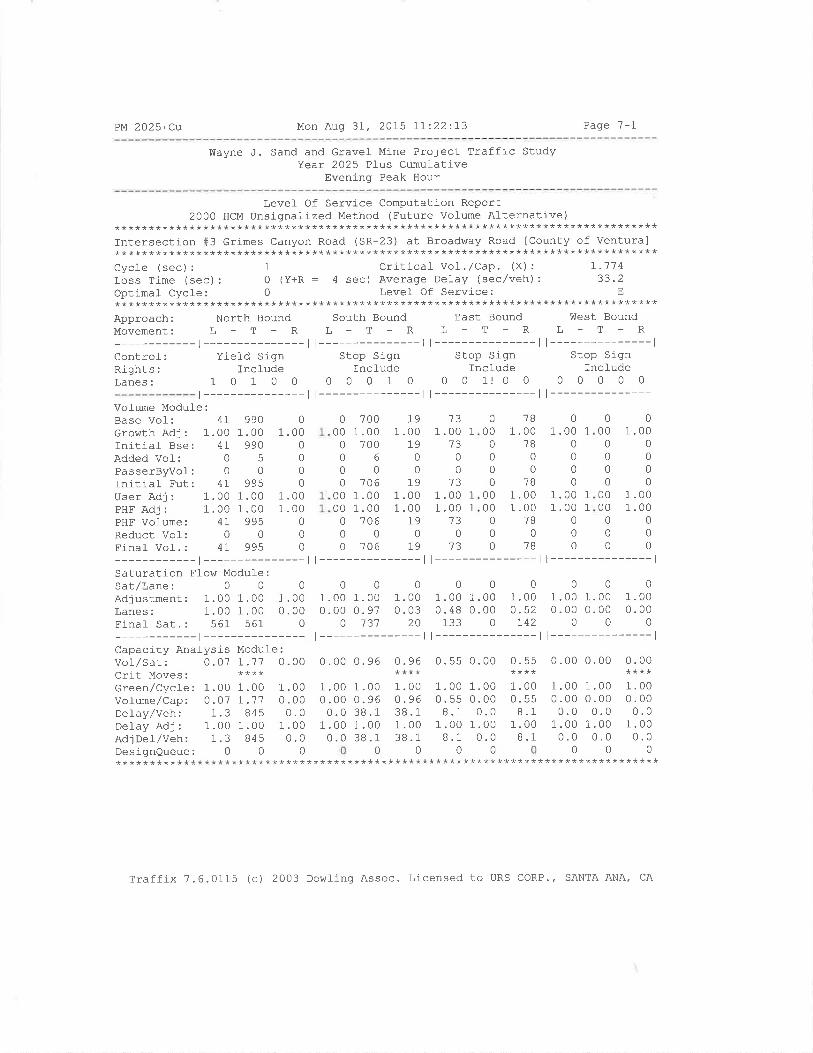
PM 2025+cu Mon Aug 3L, 2075 IL:22:I3 Page 7-1
Wayne J. Sand and Gravel Mine Project Traffic StudyYear 2025 Pfus Cumulative
Evenlng Peak Hour
T,evel Of Service Cornputation Report2000 HCM Unsignalized Method (Future Volume Alternative)
********************************************************************************Intersection #3 Grimes Canyon Road (SR-23) at Broadway Road [County of Ventura]********************************************************************************Cycle (sec) : 1 Critical Vol .,/Cap. (X) : 7.1'74Loss Time (sec): 0 (Y+R : 4 sec) Averaqe Del-ay (sec/veh): 33.2Optj-mal Cycle: 0 Level Of Service: E
********************************************************************************Approach: North Bound South Bound East Bound West BoundMovement: L - T - R L - T - R L - T - R L - T - R
-l---------ll---------ll---------ll---------------lControl-: Yield Sign Stop Sign Stop Sign Stop SignRights: Incfude Incl-ude Include IncÌudeLanes: 1 0 1 0 0 0 0 0 1 0 0 0 11 0 0 0 0 0 0 0
r --------------- | --------------- l l --------------- l l --------------- l
Vol-ume Module:Base Vol: 47Growth Adj : 1.00Initial Bse: 4LAdded Vol-: 0
PasserByvol: 0
Initial- Fut: 4IUser Adj : 1.00PHF Adj : 1.00PHF Vofume: 4tReduct Vof: 0Einaf Vof. : 4t
-l--------- ll---------------lSaturatíon Flow Module:Sat/Lane: 0 0 0 0 0 0
Adjustment: 1.00 1.00 1 .00 1 .00 1.00 1.00Lanes: 1.00 1 .00 0.00 0.00 0. 97 0 .03Finaf Sat. : 561 561 0 0 13'7 20
-r--------- I l---------------lCapacity AnaÌysis Module :
Vo1,/Sat: 0 .O1 7.11 0.00 0 .00 0. 96 0.96Crit Moves: **** ****Green/Cycfe:Volume,/Cap:Delay/Veh:DeJ-ay Adj:Adj DeÌ/Veh:DesignQueue:
0 70000 1.000 70006000 706
00 1.0000 1.000 706000 706
191 .00
1900
191 .001.00
190
L9
731 .00
a1
0
073
1.001 .00
130
1a
0000 1.0000000000
00 1.0000 1.00000000
9901.00
9905
0
9951 .001 .00
9950
995
01 .00
0
0
00
1 .001 .00
000
1.00 1.00 1.o .01 r.'77 0 .
1.3 845 0
1.00 1.00 1.1.3 845 0
00
781.00
1800
1 .001 .00
1B0
7B
1.00 1
1.00 1
0
00
1
1
1
00
0
000000
0000
0
0
0
1B
01.00 1
0
0
0
0
0000.000.00
1 .00 1.000.00 0. 96
1 .00 1.000.0 38 .1
0.0 38.1
1.000.9638.11 .0038.1
0
t---------------l000
1 .00 1 .00 1 .000.48 0.00 0.52133 0 r42
t---------------l0.55 0.00 0.55
****1.00 1.00 1.000.55 0.00 0.558.1 0.0 8.1
1 .00 1.00 1.008.1 0.0 8.1
l---------------l000
1.00 1.00 1.000.00 0.00 0.00
000t---------------l0.00 0.00 0.00
****1.00 1.00 1 .000.00 0.00 0.000.0 0.0 0.0
1.00 1.00 1. 000.0 0.0 0.0
0000********************************************************************************
Traffix 7.6.0115 (c) 2003 Dowlinq Assoc. Licensed to URS CORP., SANTA ANA| CA
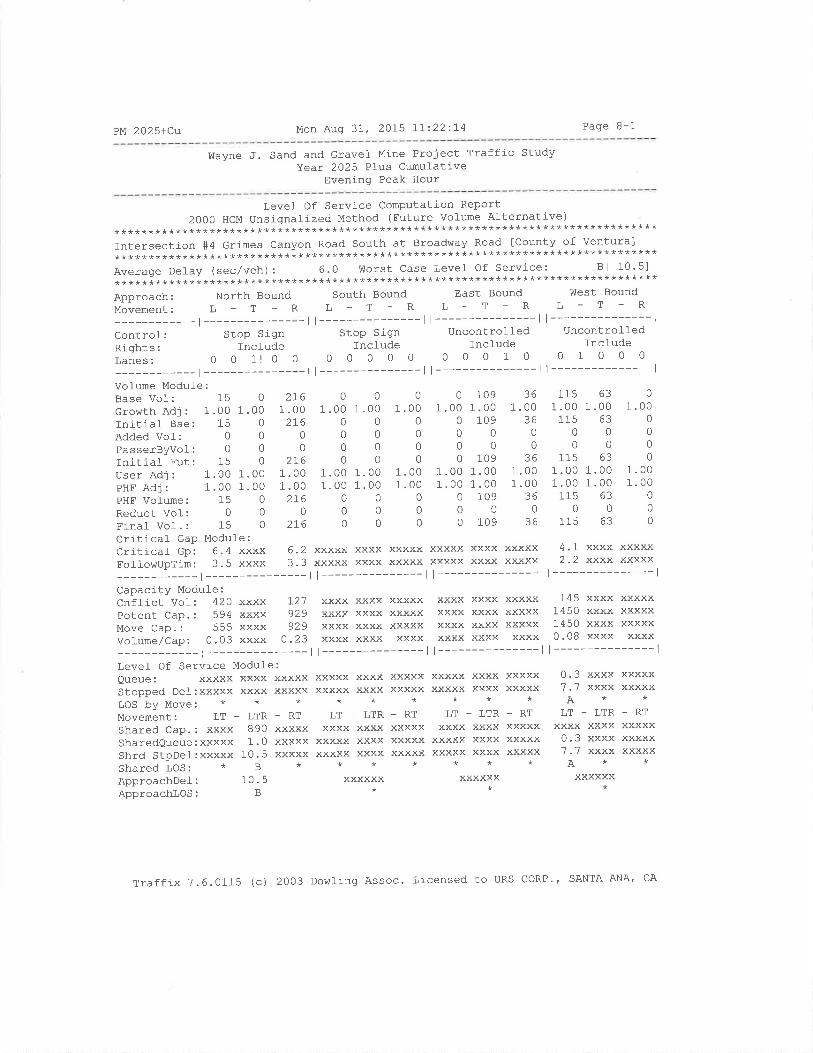
PM 2025+cu Mon Aug 3I, 2015 II:22:I4 Page B-1
Wayne J. Sand and Gravel Mine Project Traffic StudyYear 2O25 Pfus Cumulative
Evening Peak Hour
LeveÌ Of Service Computation Report20oOHcMUnsignalizedMethod(FutureVo]-umeAlternative)
********************************************************************************Intersection #4 Grimes Canyon Road South at Broadway Road ICounty of Ventura]********************************************************************************Average Detay (sec/veh): 6.0 !Ùorst case Level of service: Bt 10'51********************************************************************************Approach: North Bound South Bound East Bound West Bound
Movement: L - T - R L - T - R L - T - R L - T - R
-l---------ll---------ll---------ll---------------lcontrol: Stop sign stop sign uncontrolled UncontroÌfedRights: Incfude Include Include Incl-udelaÀes: O 0 11 0 O O O O O 0 0 0 0 1 0 0 1 0 0 0
-l---------ll---------ll---------ll---------------lVofume Modufe:Base Vol: 15 O 216crowth Adj : 1.00 1 .00 1 .00Initiaf Bse: 15 O 276Added Vof: 0 0 0
PasserByvol: 0 0 0
Initial- Fut: 15 0 216User Adj: 1.00 1.00 1.00PHF Adj : 1.00 1.00 1.00PHF Volume: 15 O 216Reduct Vol: 0 0 0
Final Vol. : 15 O 216Critical Gap Module:
001 .00 1.00
00000000
1 .00 1.001.00 1 .00
000000
0 1091 .00 1.00
0 10900000 109
1 .00 1.001.00 1.00
0 109000 109
361 .00
360
036
1.001 .00
360
36
115 631.00 1.00115 63
0000
115 631.00 1.001.00 1.00115 63
00115 63
1.001 .00
000
1.001.00
00
0
0
1.0000
00
0
1 .000000
Critical Gp: 6.4 xxxx 6.2 xxxxx xxxx xxxxx xxxxx xxxx xxxxxFotlowUpTim: 3.5 xxxx 3'3 xxxxx xxxx xxxxx xxxxx xxxx xxxxx
-l---------ll---------ll---------Capacity Module:Cnflict Vot: 42O xxxx 12'l xxxx xxxx xxxxx xxxx xxxx xxxxxPotent Cap.: 594 xxxx 929 xxxx xxxx xxxxx xxxx xxxx xxxxxl4ove Cap.: 555 xxxx 929 xxxx xxxx xxxxx xxxx xxxx xxxxxVolume/Cap: 0.03 xxxx 0.23 xxxx xxxx xxxx xxxx xxxx xxxx
-l---------ll---------ll---------------lLevef Of Service Modufe:Queue: xxxxx xxxx xxxxx xxxxx xxxx xxxxx xxxxx xxxx xxxxxStopped Del-:xxxxx xxxx xxxxx xxxxx xxxx xxxxx xxxxx xxxx xxxxxLOS tY Move: * * * * * * * * *
Movement: LT - LTR - RT LT - LTR - RT LT - LTR - RT
Shared Cap.: xxxx 890 xxxxx xxxx xxxx xxxxx xxxx xxxx xxxxxSharedQueue:xxxxx 1.0 xxxxx xxxxx xxxx xxxxx xxxxx xxxx xxxxxShrd StpDel:xxxxx 10.5 xxxxx xxxxx xxxx xxxxx xxxxx xxxx xxxxxShared LOS: * B * * * * * * *
ApproachDel: 10.5 xxxxxx xxxxxxApproachlos: B * *
4.1 xxxx xxxxx2.2 xxxx xxxxx
| --------------- l
145 xxxx xxxxx1450 xxxx xxxxx1450 xxxx xxxxx0.08 xxxx xxxx
t---------------l
0.3 xxxx xxxxx7 .7 xxxx xxxxxA**
LT-LTR-RTxxxx xxxx xxxxx0.3 xxxx xxxxx7.7 xxxx xxxxxA**
VVYVYV*
Traffix 7.6.0115 (c) 2003 Dowling Assoc. Licensed to URS CORP'' SANTA ANA' CA
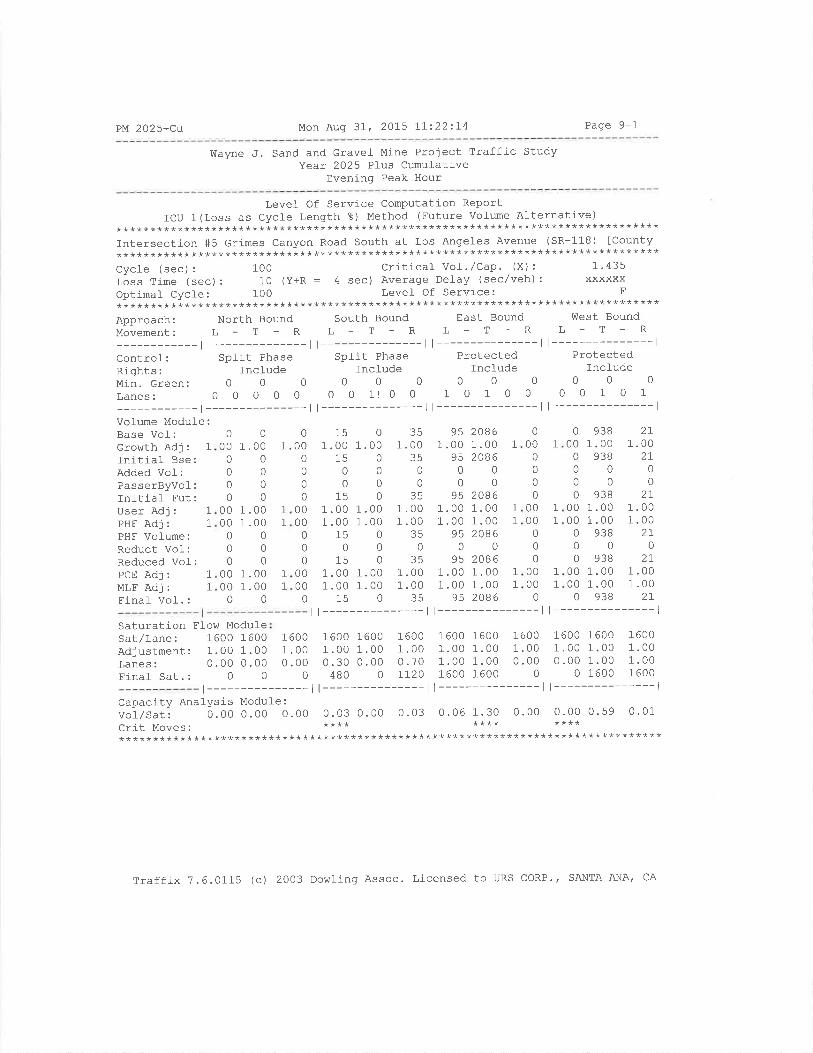
PM 2025+Cu Mon Aug 31, 2015 1L:22:I4 Page 9-1
Wayne J. Sand and Gravel Mlne Project lraffic StudyYear 2025 Plus Cumul-ative
Evening Peak Hour
Level Of Service Computation ReportICU 1 (Loss as Cycle Length %) Method (Future vol-ume Alternative)
********************************************************************************Intersection #5 crimes Canyon Road South at Los Angeles Avenue (SR-118) lCounty********************************************************************************Cycle (sec) : 100 Critical Vol. /Cap. (X) : 1 ' 435
l,oss Time (sec) : 10 (Y+R : 4 sec) Average Delay (sec/veh) : xxxxxxOptinal Cycle: 100 Level Of Service: F
********************************************************************************Approach: North Bound south Bound East Bound west Bound
Movement: L - T - R L - T - R L - T - R L - T - R
-t--------- I l--------- I l--------- I l--------------- |
controf: split Phase Split Phase Protected ProtectedRights: Incl-ude IncÌude Incfude IncludeMin.creen: O O 0 0 0 0 0 0 0 0 0 0
Lanes: O O 0 O O O O 11 0 0 1 0 1 0 0 0 0 1 0 1
-l---------ll---------ll---------ll---------------lVofume Module:Base Vol:Growth Adj: 1
Initial Bse:Added Vol:PasserByvol-:fnitiaf Fut:User Adj: 1
PHF Adj: 1
PHF Volume:Reduct VoÌ:Reduced VoI:PCE Adj z IMLF Adj: 1
Final Vol-. :
151 .00
1500
151 .001.00
150
01.00 1
0
0
00
1.00 1
1.00 1
35.00
2E
0
0ãtr
.00
.00?q
0
35.00.0035
951.00
9500
951.001.00
950
ÔR
1 .001 .00
20861.00 1
208600
0 93800 1.000 93800000 938
00 1.0000 1.000 938000 938
00 1.0000 1.000 938
271 .00
2I0
027
1.001.00
2I0
2I1.001.00
2I
0000 1.0000000000
00 1 .0000 1 .00000000
00 1 .0000 1 .0000
1
000
00
0
00000
0
00
0000
0
0
000
00
00000
0
0
00000
0
1
1
1
1
11
1
20861.001 .002086
1 .001 .00
IEfJ
020861 .001 .002086
15
0
00
1.001.00
0
1
1
1
1
1
1
I1
Saturation Elow ModufeSat/Lane: 1600 1600Adjustment: 1.00 1.00Lanes: 0.00 0.00Einal Sat.: 0 0
1 6001.000 .00
0
1600 16001 .00 1 .000.30 0.00480 0
1600 16001.00 1.001.00 1.001600 1600
1 6001 .000.00
0
1600 16001 .00 1.000.00 1.00
0 1600
1 6001.001 .001 600
1 6001 .000.70II2O
t---------------ll---------------ll---------------ll---------------lCapacity Anafysis Modufe :
vo1/sut r 0. OO O. OO 0. O0 0.03 0.00 0.03 0 .06 1.30 0.00 0.00 0.59 0.01crit Moves ' **** **** ************************************************************************************
Traffix 7.6.0115 (c) 2003 Dowling Assoc. Llcensed to URS CORP.' SANTA ANA, CA

PM 2025+Cu Mon Auq 31, 2015 LI:22:I4 Page 10-1
V,iayne J. Sand and Gravel Mine Project Traffic StudyYear 2025 Plus Cumulative
Evening Peak Hour
Level Of Service Computation ReportICU 1(Loss as Cycle Length %) Method (Future Vofume Alternative)
********************************************************************************rntersection #6 A Street (SR-23) at Ventura Street (SR-126) [City of Fillmore]********************************************************************************Cycle (sec): 100 Critical Vol./Cap. (X): 7.446Loss Time (sec) : 10 (Y+R : 4 sec) Averaqe Delay (sec/veh) : xxxxxxOptimaf Cycte: 100 Level Of Service: F********************************************************************************Approach: North Bound South Bound East Bound Ílest BoundMovement: L - T - R L - T - R L - T - R L - T - R
-t--------- |--------- l l--------- l l---------------lControl: Protected Protected Protected ProtectedRights: Include Include Incfude IncfudeMin.Green: 0 0 0 0 0 0 0 0 0 0 0 0
Lanes: 1 0 0 1 0 1 0 0 1 0 1 0 1 1 0 1 0 1 1 0
t --------------- | --------------- l l --------------- l l --------------- l
Vofume Module:Base Vol : 26'7Growth Adj : 1.00Initial Bse: 261Added Vol: 6
PasserByvof: 0Initiaf Fut: 213User Adj : 1.00PHF Adj : 1.00PHF Vofume z 2'73Reduct Vol: 0Reduced Vol: 213PCE Adj : 1.00MLF Adj : 1.00Finaf Vol. : 213
3611 .0036r
00
3611 .001 .00
3610
3611 .001 .00
361
3491 .00
3491
0356
1 .001 .00
3560
3561 .001 .00
356
146 289 901 .00 1 .00 1 .00146 2e9 90
000000
146 289 901.00 1.00 1.001.00 1.00 1.00146 289 90
000146 289 90
1 .00 1. 00 1 .001 .00 1 .00 1 .00146 289 90
t---------------
95 1800 3701.00 1.00 1.00
95 1800 370005000
95 1800 3751 .00 1.00 1 .001 .00 1.00 1 .00
95 1800 375000
95 1800 3751.00 1.00 1.001.00 1.00 1.00
95 1800 375t---------------
198 1200 r451.00 1.00 1.00198 1200 145
500000
203 1200 1451 .00 1.00 1.001 .00 1.00 1.00203 1200 745
000203 ].200 145
1 .00 1.00 1 .001 .00 1.00 1 .00203 l_200 1.45
t---------------lt---------------lSaturation FIow Module:Sat/Lane: 1600 1600 1600 1600 1600 1600 1600 1600 1600 1600 1600 1600Adjustment: 1 .00 1 .00 1 .00 1 .00 I .00 1.00 1 .00 1.00 1.00 1.00 1.00 1.00Lanes: 1.00 0.50 0.50 1.00 0.76 0.24 1.00 1.66 0.34 1.00 1.78 O.22Einal- Sat.: 1600 806 '194 1600 1220 380 7600 2648 552 1600 2855 345
-t---------ll---------ll---------ll---------------lCapacity Analysis Module :
Vol/Sat: 0.I1 0.45 0.45 O.09 0.24 O.24 0.06 0.68 0.68 O.I3 O.42 0.42crit Moves. **** **** **** ************************************************************************************
Traffix 7.6.0115 (c) 2003 Dowling Assoc. Licensed to URS CORP., SANTA ANA, CA
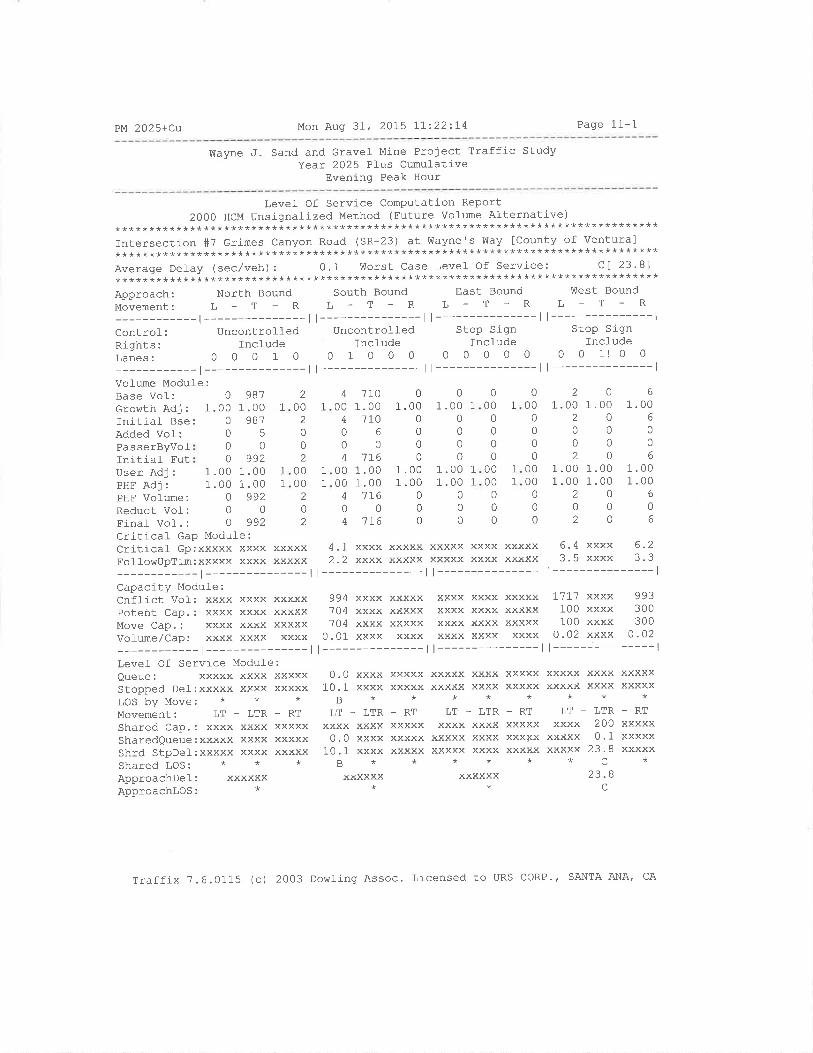
PM 2025+cu Mon Aug 31' 2015 7I:22:t4 Page 11-1
üIayne J. Sand and Gravel Mine Project Traffic StudyYear 2025 Plus Cumul-ative
Evenj-ng Peak Hour
Level Of Service Computation Report2000 HCM Unsignalized Method (Future Volume Alternative)
********************************************************************************Intersection #7 Grimes Canyon Road (SR-23) at Wayne's Vilay [County of Ventura]********************************************************************************Average Del-ay (sec/veh): 0.1 worst case Level Of Service: cl 23'Bl********************************************************************************Approach: North Bound south Bound East Bound !Ùest Bound
Movement: L - T - R L - T - R L - T - R L - T - R
-r---------ll---------ll---------ll---------------lControl-: Uncontrolfed Uncontrol-l-ed Stop Sign Stop SignRlghts:IncfudelncludelncfudelncfudeLaÀes: O O 0 1 O O 1 O O 0 0 0 0 0 0 0 0 1! 0 0
-l---------ll---------ll---------ll---------------lVo]ume Module:Base Vol-: 0 981Growth Adj : 1.00 1 .00 1
lnitial- Bse: 0 987Added Vol:PasserByvol-Initiaf FutUser Adj:PHF AdJ:PHF Volume:Reduct VoI:Finaf Vol. :
Critical- Gap Module:CritiCal Gp:Xxxxx xxxx xxxxx 4.1 xxxx xxxxx xxxxx xxxx xxxxx 6.4 xxxx 6'2FolJ-owUpTim:xxxxx xxxx xxxxx 2.2 xxxx xxxxx xxxxx xxxx xxxxx 3.5 xxxx 3'3
-l---------ll---------ll---------ll---------------lCapacity Modufe:Cnffict Vol: xxxx xxxx xxxxx 994 xxxx xxxxx xxxx xxxx xxxxx I'lI'l xxxx 993
Potent Cap.: xxxx xxxx xxxxx 704 xxxx xxxxx xxxx xxxx xxxxx 100 xxxx 300
Move Cap.: xxxx xxxx xxxxx ?04 xxxx xxxxx xxxx xxxx xxxxx 100 xxxx 300
VoÌume/Cap: xxxx xxxx xxxx O.01 xxxx xxxx xxxx xxxx xxxx 0.02 xxxx O'02
-l---------ll---------ll---------ll---------------lLeveÌ Of Service Modufe:oueue: xxxxx xxxx xxxxx 0.0 xxxx xxxxx xxxxx xxxx xxxxx xxxxx xxxx xxxxxstopped Del:xxxxx xxxx xxxxx 10.1 xxxx xxxxx xxxxx xxxx xxxxx xxxxx xxxx xxxxxLOS tY Move: * * * B * * * * * * * *
Movement:LT-LTR_RTLT-LTR-RTLT-LTR_RTLT_LTR-RTshared cap,: xxxx xxxx xxxxx xxxx xxxx xxxxx xxxx xxxx xxxxx xxxx 200 xxxxxSharedQUeUe: Xxxxx xxxx XxxXX O. O xXXx xxxxx XXXXX xxXX Xxxl<x xxxxx 0.1 XxxxxShrd StpDel:xxxxx xxxx xxxxx 10.1 xxxx xxxxx xxxxx xxxx xxxxx xxxxx 23.8 xxxxxshared Los: * * * B * * * * * * c *
ApproachDel: xxxxxx xxxxxx xxxxxx 23 '8ApþroachlOs: * * * C
0500^ ôô,
1.00 1 .001.00 1.00
0 99200o 992
4 1I000 1.004 1I006004 7l-6
00 1.0000 1.004 1]-6004 116
01 .00
0
000
1 .001 .00
0
0
0
1.00 1
1.00 1
0
00
2000 1.0020000020
00 1.0000 1.00200020
6
1.006
0
0
6
1 .001.00
6
06
11
2
002
002
0000
2
0
2
1
1
1
000
0000
0000
0
0
0
0
0000
00
0000
000
01.00 1
000
0
1
1
1
1.
1.1.
Traffix 7.6.0115 (c) 2003 Dowling Assoc. Licensed to URS CORP., SANTA ANA, CA
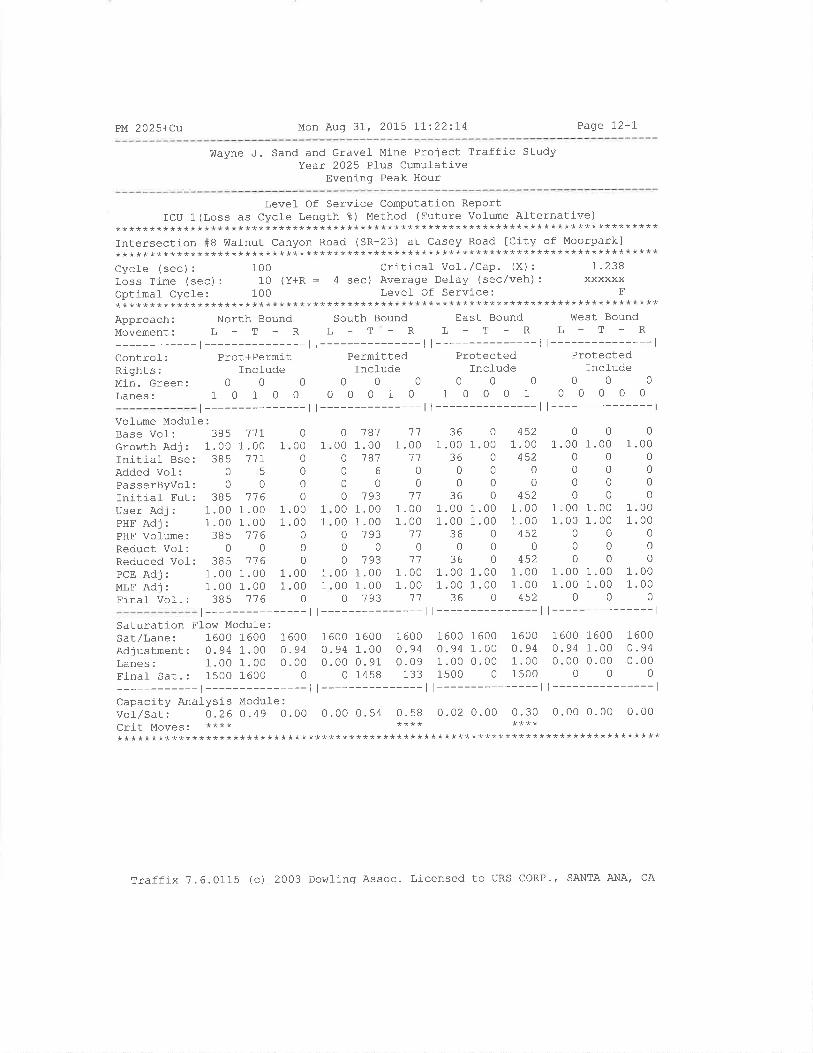
PM 2025+cu Mon Aug 3L, 2015 I!:22:I4 Page 12-1
Wayne .I. Sand and Gravel Mine Project Traffic StudyYear 2025 Plus Cumulative
Evening Peak Hour
LeveÌ Of Service Computation ReportICU 1 (Loss as Cycle Length 8) Method (Future Volume Al-ternative)
********************************************************************************Intersection #B Wal-nut Canyon Road (SR-23) at Casey Road [Clty of Moorpark]********************************************************************************Cycl-e (sec) : 100 Crítical- Vol . /Cap. (X) : I .238Loss Time (sec) : 10 (Y+R : 4 sec) Average Delay (sec/veh) : xxxxxxOptimal Cycle: 100 Level Of Service: F********************************************************************************Approach: North Bound south Bound East Bound hlest BoundMovement: L - T - R L - T - R L _ T - R L _ T - R
-r---------ll---------ll---------ll---------------lcontrol: Prot+Permit Permitted Protected ProtectedRights: Include Incfude Incfude Incl-udeMln.Green: O 0 O 0 0 0 0 0 0 0 0 0
Lanes: 1 0 1 0 0 0 0 0 1 0 1 0 0 0 1 0 0 0 0 0
r---------------ll---------------ll---------------ll---------------lVo1ume Module:Base Vof: 385Growth Adj : 1.00Initial Bse: 385Added Vol-: 0
PasserByvoÌ: 0Initial Fut: 385User Adj : 1.00PHF Adj : 1.00PHF VoÌume: 385Reduct Vof: 0
Reduced Vol: 385PcE Adj : 1.00MLF Adj : 1.00Final Vol. : 385
7'tr1 .00
'7'7rq
0716
1.001.00
I 16
0116
1 .001.00
116
1.00 1
1.00 L
000
1.00 1
1.00 1
0
0 '781
00 1.000 18106000 793
00 1.0000 1.000 793000 793
00 1.0000 1.000 793
'71
1.0011
00
111.001.00
110
111.001 .00
11
361 .00 1.
3600
361 .00 1.1 .00 1.
JO
036
1 .00 1.1 .00 1.
36
o 45200 1.000 45200000 452
00 1.0000 1.000 452000 452
00 1.0000 1.00o 452
001.00 1.00
00000000
1 .00 1.001.00 1.00
000000
1 .00 1.001.00 1.00
00
01.00
0000
1.001.00
0
00
1 .001.00
0
1
0
000
000
1
t---------------ll---------------ll---------------ll---------------lSaturation Fl-ow Modufe:sat/Lane: 1600 1600 1600 1600 1600 1600 1600 1600 1600 1600 1600 1600Adjustmenr: 0.94 1.00 o.94 0.94 1.00 0.94 0.94 1.00 o.94 0.94 1.00 o-94Lanes: 1.00 1. OO O. OO 0. O0 0. 91 0.09 1 .00 0.00 1.00 0.00 0.00 0.00Finaf sar.: 1500 1600 O 0 1458 133 1500 0 1500 0 0 0
-l---------ll---------ll---------ll---------------lCapacity Analysis Modul-e :
vor/sar: 0.26 0.49 O.0O 0.00 0.54 0.58 0.02 0.00 0.30 0.00 0.00 0.00Crit MOVeS ' **** **** ************************************************************************************
Traffix 7.6.0115 (c) 2003 Dowling Assoc. Licensed to URS CORP.' SANTA ANA, CA
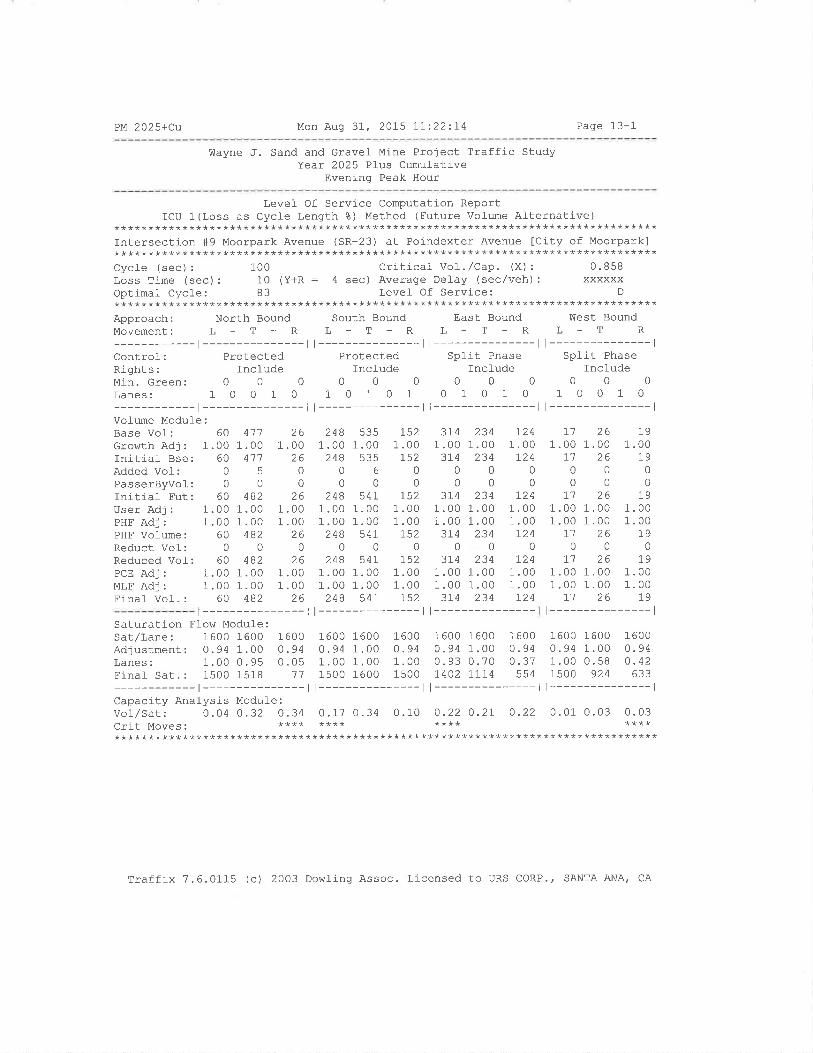
PM 2025+Cu Mon Aug 3I , 201,5 II:22:74 Page 13-1
Wayne J. Sand and Gravel Mine Project Traffic StudyYear 2025 Plus Cumulative
Evening Peak Hour
Level Of Service Computation ReportICU 1(Loss as Cycle Length 8) Method (Future Vofume Alternative)
********************************************************************************Intersection #9 Moorpark Avenue (SR-23) at Poindexter Avenue lCj-ty of Moorpark]********************************************************************************Cycl-e (sec) : 100 CriticaÌ VoI .,/Cap. (X) : 0.858Loss Time (sec): 10 (Y+R : 4 sec) Average Delay (sec/veh): xxxxxxOptinal CycJ-e: 83 Levef Of Service: D
********************************************************************************Approach: North Bound South Bound East Bound Vllest BoundMovement: L - T - R L - T - R L - T - R L - T - R
-t---------------lControf: ProtectedRights: IncludeMin.Green: 0 0 0Lanes: 1 0 0 1 0
-t---------------lVofume Module:Base Vof: 60 417 26Growth Adj : 1.00 1.00 1 .00Initiaf Bse: 60 411 26Added Vol: 0 5 0PasserByVoJ-: 0 0 0Initial Fut: 60 482 26User Adj: 1.00 1.00 1.00PHF Adj : 1.00 1.00 1 .00PHF Vofume: 60 482 26Reduct Vol-: 0 0 0
Reduced Vol-: 60 482 26PCE Adj : 1.00 1.00 1.00MLF Adj : 1.00 1.00 1.00Einaf Vof.: 60 482 26
t---------------lProtected
Incl-ude000
10101t---------------l
t---------------lSplit Phase
Include000
01010t---------------l
t---------------lSplit Phase
Include000
10010t---------------l
l---------------l
248 535 r52 374 234 r241.00 1.00 1 .00 1 .00 1.00 1 .00248 535 r52 3r4 234 124
060000000000
248 541 r52 374 234 r241 .00 1.00 1 .00 1.00 1. 00 1.001 .00 1.00 1 .00 1.00 L . 00 1.00248 541 r52 3r4 234 r24
000000248 541 r52 3L4 234 724
1 .00 1.00 1.00 1 .00 1.00 1.001 .00 1.00 1.00 1 .00 1.00 1.00248 541 752 3r4 234 724
| --------------- | I ---------------
71 26 191 .00 1.00 1.00
7'7 26 19000000
77 26 191 .00 1.00 1 . 001.00 1.00 1.00
71 26 19000
r1 26 191.00 1.00 1.001.00 1.00 1.00
L] 26 19t---------------l
Saturation Flow Module:Sat/Lane: 1600 1600 1600 1600 1600 1600 1600 1600 1600 1600 1600 1600Adjustment: 0. 94 1 .00 0 .94 0 . 94 1 .00 0. 94 0.94 1.00 O '94 0.94 1.00 0.94Lanes: 1.00 0.95 0.05 1 .00 1 .00 1 .00 0. 93 0.70 0.37 1 .00 0.58 O.42Finaf Sat.: 1500 1518 11 1500 1600 1500 I4O2 7LI4 554 1500 924 633
-r---------ll---------ll---------ll---------------lCapacity Anal-ysis Modul-e :
vollSat: 0.04 O.32 0.34 0.17 0.34 0.10 O.22 0'2I 0.22 0.01 0.03 0.03CIit MOVeS: **** **** **** ************************************************************************************
Traffix 7.6.0115 (c) 2003 Dowling Assoc. Licensed to URS CORP., SANTA ANA, CA

PM 2025+Cu Mon Aug 3It 2OI5 lL:22:14 Page 14-1
Wayne J. Sand and Gravel Mine Project Traffic StudyYear 2025 Plus Cumulative
Evening Peak Hour
Levef Of Servlce Computation ReportICU 1(Loss as Cycfe Length %) Method (Future Vofune Alternative)
* * * * * * * * * * * * * * * * * * * * * * * * * * * * * * * * * * * * * * * * * * * * * ** * * * * * * * * * * * * * * * * * * * * * * * * * * * * * * * * *
Intersection #10 Spring Road at Los AngefesAve (SR-118) tCity of Moorparkl********************************************************************************Cycle (sec): 100 Criticaf Vot./Cap. (X): 0'805lòss time (sec) : O (y+R = 4 sec) Average Delay (sec/veh) : xxxxxxOptimal Cycle: 100 Level Of Service; D
********************************************************************************Approach: North Bound south Bound East Bound west Bound
Movement: L - T - R L - T - R L - T - R L - T - R
-l---------ll---------ll---------ll---------------lcontrol: Protected Protected Protected ProtectedRights: Include Ov1 Incfude Ovl-
Min.creen: O O 0 O O 0 0 0 0 0 0 0
Lanes: 2 O 1 1 O 2 O 1 0 1 2 O 2 O 1 1 O 2 0 1
-l---------ll---------ll---------ll---------------lVofume Modul-e:Base Vof: 306 31I '12 446 388 12 I35 7225 392 ILA l-I4I 352
GrowrhAdj: 1.001.00 1.00 1.001.00 1.00 1.001.00 1.00 1.001.00 1.00rniriat Bse: 306 311 12 446 3BB 't2 I35 1225 392 I]-4 7741 352
Addedvol: O 0 O O 0 0 0 6 0 0 5 0
PasserByvof: O O 0 O O 0 0 0 0 0 0 0
rnitial Fur: 306 317 12 446 388 '72 135 1231 392 ]-l4 7146 352
userAdj: 1.001.00 1.oo 1.001.00 1.00 1.001.00 1.00 1.001.00 1.00pHF Adj : 1. O0 1.00 1 . o0 1 .00 1.00 1 .00 1 .00 1.00 1.00 1.00 1.00 1.00pHF Volume: 306 31:I 12 446 388 '72 135 1231 392 1'74 1146 352
Reduct Vof: O O 0 O O 0 0 0 0 0 0 0
Reduced vol: 306 371 12 446 388 '72 135 1231 392 114 1746 352pcEAdj: 1.001.00 1.oo 1.001.00 1.00 1.001.00 1.00 1.001.00 1.00MLFAdj: 1.OO1.OO 1.00 1.OO1.OO 1.00 1.001.00 1.00 1.001.00 1.00Finaf vof.: 306 371 72 446 388 12 135 1231 392 7I4 1146 352
t---------------ll---------------ll---------------ll---------------lSaturation Flow Modufe:Sat/Lane: 16OO 16OO 1600 160O 16OO 1600 1600 1600 1600 1600 1600 1600
Adjusrment: 0.94 1 . OO O .94 0.94 1. OO O .94 0. 94 1.00 o.94 0.94 1.00 0 - 94
Lanes: 2.OO 7.61 0.33 2.00 1.00 1.00 2.00 2.oo 1.00 1.00 2.00 1.00Final- sar.: 3OO0 2680 4BB 3OOO 1600 1500 3000 3200 1500 1500 3200 1500
-l---------ll---------ll---------ll---------------lCapacity Analysis Module :
vot_/sat: 0.10 0.14 0 .15 o .I5 0 .24 0.05 0.05 0.38 o.26 0 .08 0.36 0.23crit Moves. **** **** **** *********************************************************************************l**
Traffix 7.6.0115 (c) 2003 Dowting es5oc. Licensed to URS CORP', SANTA ANA' CA
AppEruorx E
lrurERS Eclott ANALysls WoRKSH E ETS
Yrnn (2025) Plus CUMULAT¡v¡ Plus PRoJEcr CoNDtloNS
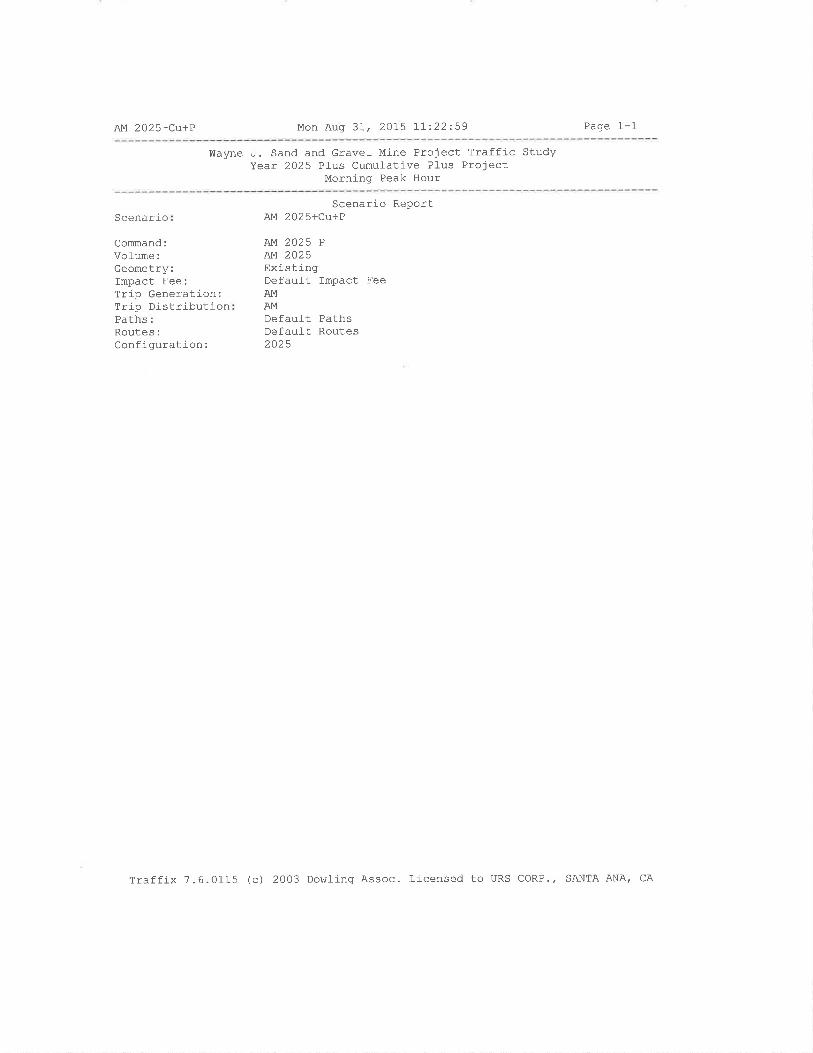
AM 2025+Cu+P Mon Aug 37t 2OI5 LI:22:59 Page 1-1
Wayne J. Sand and Gravel Mine Project Traffic StudyYear 2025 Pfus Cumufative Pl-us Project
Morning Peak Hour
Scenario
Command:Volume:Geometry:Impact Fee:Trip Generation:Trip DistributionPaths:Routes:Configuration:
Scenario ReportAM 202s+Cu+P
AM 2025 P
Ar4 2025ExistingDefauft Impact FeeAM
AMDefault PathsDefault Routes2025
Traffix 7.6.0115 (c) 2003 Dowling Assoc. Licensed to URS CORP., SANTA ANA, CA
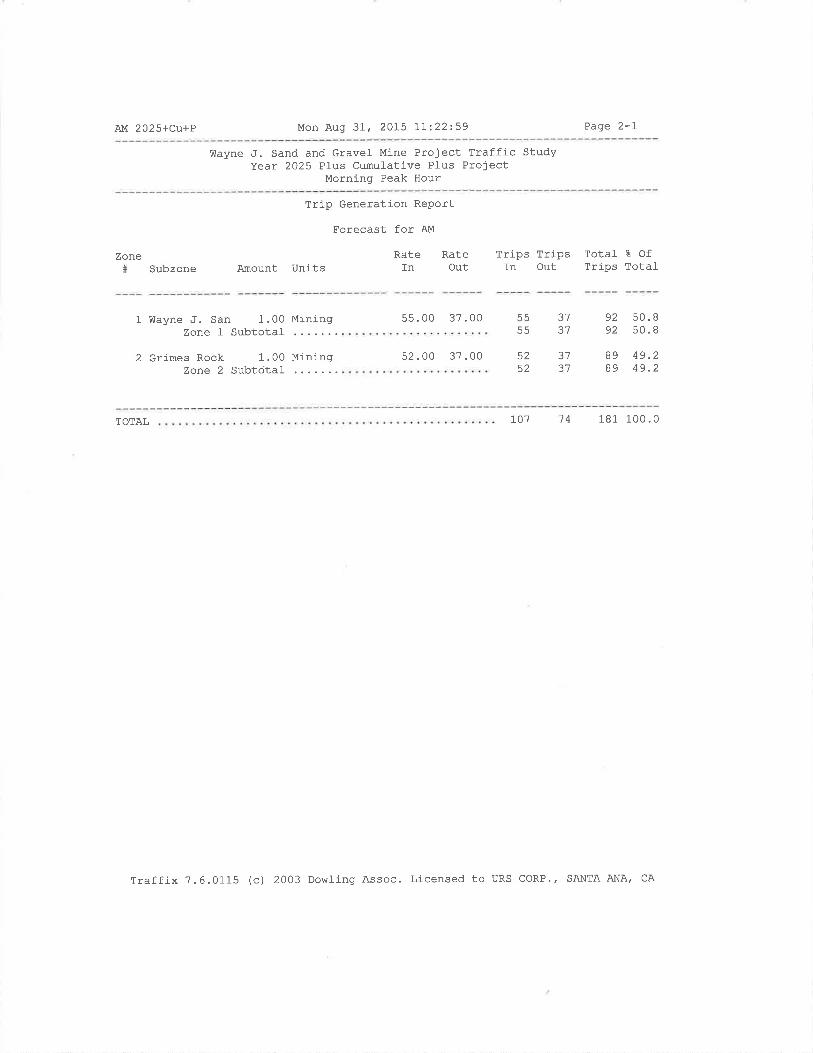
AM 2025+cu+P Mon Aug 3I, 20L5 ]-1':22:59 Page 2-7
Wayne ,J. Sand and Gravel Mine Project Traffic StudyYear 2025 Plus Cumulative Pfus Project
Morning Peak Hour
Zone# Subzone
Trip Generation Report
Forecast for AM
Rate RateAmount Units In out
Trips Trlps Total- E OfTrips Tota1In Out
1 vùayne J. san 1.00 MiningZone 1 Subtotal
2 Grimes Rock 1.00 MiningZone 2 Subtotal-
55.00 37 .0055
3137
52 .00 37 .00 52 3'7
52 3'7
92 50. B
92 50.8
B9B9
49.249.2
TOTAL 107 74 181 100.0
Traffix 7.6.0115 (c) 2003 Dowling Assoc. Licensed to URS CORP., SANTA ANA' CA
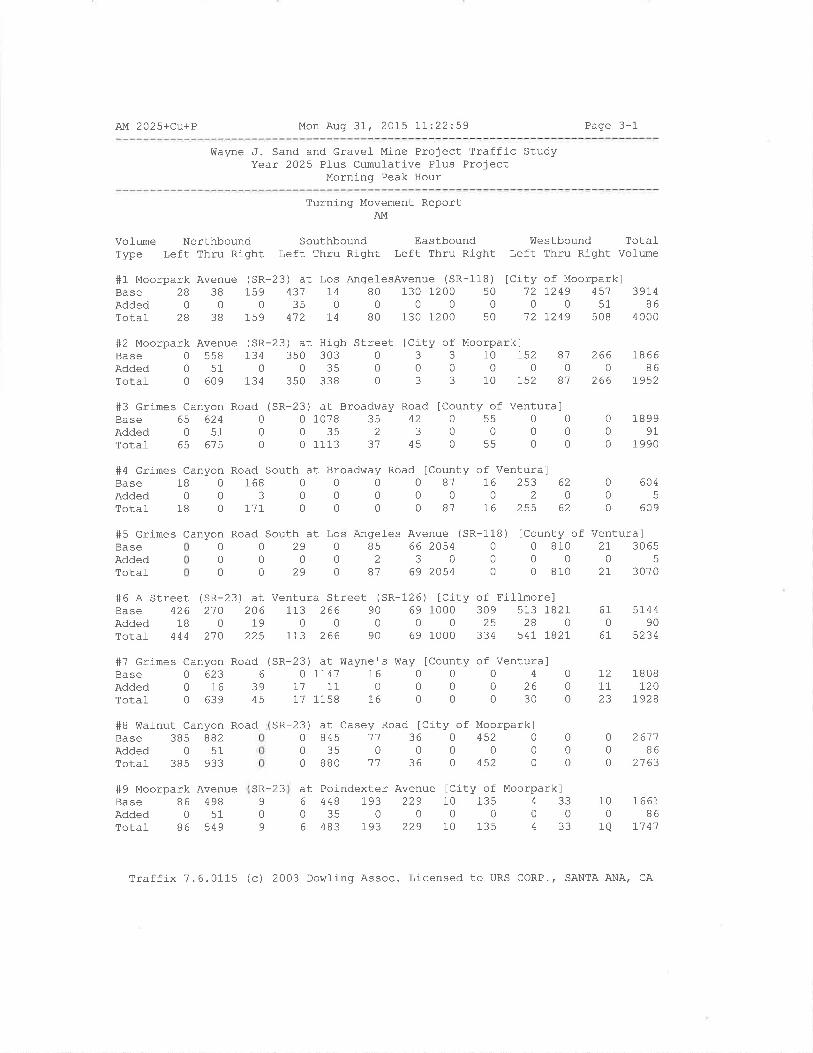
AM 2025+cu+P Mon Aug 3I, 20L5 77:22:59 Page 3-1
Wayne J. Sand and Gravel Mine Project Traffic StudyYear 2025 Pl-us CumuÌative Plus Project
Morning Peak Hour
Turning Movement ReportAM
#1 Moorpark Avenue (SR-23) at Los AngelesAvenue (SR-118) [CiBase 2B 38 159 431 14 80 130 1200 50Added0003500000Total 28 38 159 472 14 B0 130 1200 50
VolLme Northbound SouthboundType Left Thru Right Left Thru Right
#2 Moorpark Avenue (SR-23) at High Street [CiBase 0 558 134 350 303 0 34dded051003500Total- 0 609 I34 350 338 0 3
#3 Grimes Canyon Road (
Base 65 624 0Added 0 51 0TotaÌ 65 615 0
EastboundLeft Thru Right
lfestbound TotalLeft Thru Right Volume
Moorparkl49 451 39140 s1 86
49 508 4000
ty of72 12
0
12 12
ty of3
0
3
Moorparkl10 r5200
10 r52
8'7
087
2660
266
186686
1952
18999T
1990
SR-23) at Broad\^ray Road lCounty of Ventural01078 35 42 0 55 0 003s23000001113 3'7 45 0 55 0 0
#4 Grj-mes canyon Road South at Broadway Road lcounty of Ventura]Base 18 0 168 0 0 0 0 B'l 76 253 62Added00300000020Total- 18 0 171 0 0 0 0 B'7 16 255 62
#5 Grimes Canyon Road South at Los Angel-es Avenue
0
00
0
0
0
290
29
85 66 205430
69 2054
(sR-118)0
00
6045
609
lcounty of Ventura]0 810 21, 306500050 810 21 3070
BaseAddedTotal-
2
#6 A Street (SR-23) at Ventura Street (SR-126) [City of Fillmore]Base 426 21O 206 113 266 90 69 1000 309 513 1821Added180190000025280rotaf 444 210 225 113 266 90 69 1000 334 547 IB27
#7 Grimes Canyon Road (SR-23) at Wayne's Way lcounty of Ventura]Base 0 623 6 07741 16 0 0 0 4 0
Added 0 16 39 I'7 11 0 0 0 0 26 0
rotal- 0 639 45 17 1158 L6 0 0 0 30 0
0
0
0
000
000
4
04
a6
06
sR-23 )
000
81
670
61
574490
5234
18 08r20
I928
2611B6
21 63
I21123
#8 V,lal-nut Canyon RoadBase 385 882Added 0 51Total 385 933
#9 Moorpark AvenueBase 86 498Added 0 51Tota1 86 549
at Casey Road [City of Moorpark]845 '71 36 0 452 0
35 0 0 0 0 0
BB0 '71 36 0 452 0
t Poindexter Avenue lCity of Moorpark]448 193 229 10 1353s0000
483 193 229 10 135
0
0
0
000
SR-2 390
9
330
100
1Q
r66786
11 41
Traffix 7.6.0115 (c) 2003 Dowllng Assoc. Licensed to URS CORP.' SANTA ANA' CA
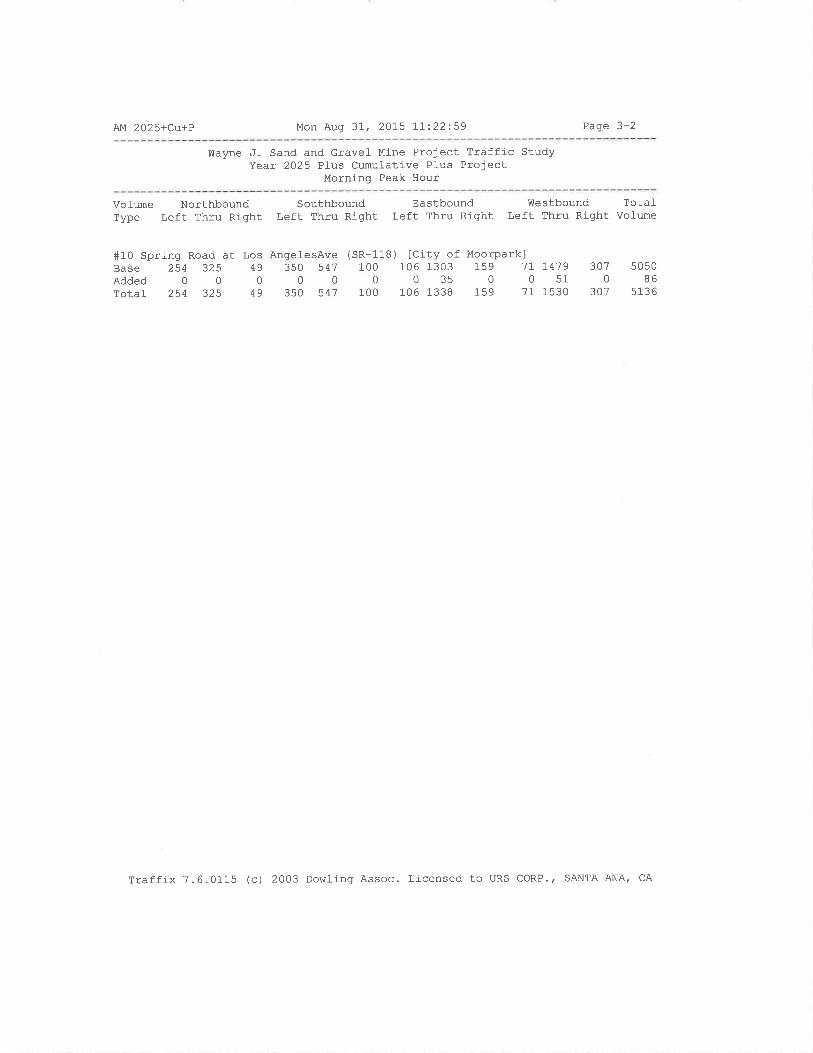
AM 2025+cu+P Mon Auql 3L, 2015 ]-1':.22:59 Paqe 3-2
Wayne J. Sand and Gravel Mine Project Traffic Study'Íear 2025 Pl-us Cumulative Plus Project
Morning Peak Hour
Vol-ume NorthboundType Left Thru Right
SouthboundLeft Thru Right
EastboundLeft Thru Right
Westbound TotalLeft Thru Right Volume
#10 Spring Road at Los AngefesAve (SR-l-l-B) [City of Moorpark]Base 254 325 49 350 54'7 100 106 1303 159 1I t4'79Added0000000350051rotal 254 325 49 350 54'l 100 106 1338 159 71 1530
3070
307B6
513 6
Traffix 7.6.0115 (c) 2003 Dowl-ing Assoc. Licensed to URS CORP.' SANTA ANA' CA

AM 2025+Cu+P Mon Aug 31-, 2075 l-1:23:00 Page 4-1-
Wayne J. Sand and Gravel Mine Project Traffic StudyYear 2025 PIus Cumul-ative Plus Project
Morning Peak Hour
Impact AnalYsis Reportl,evel Of Service
Intersectio¡ BaseDeI,/ v /
LOS Veh C
S 1 Moorpark Avenue (SR-23) at Los F xxxxx 1.510
# 2 Moorpark Avenue (SR-23) at Hig D xxxxx 0'870
# 3 crimes canyon Road (SR-23) at F 0.0 1'306
+ 4 Grines Canyon Road South at Br B 10.6 0.000
# 5 Grlmes Canyon Road South at Lo F xxxxx 1.455
# 6 A Street (SR-23) at Ventura St F xxxxx l-.318
# 7 Grimes Canyon Road (SR-23) at C 2L.5 0.000
# I f{al-nut canyon Road (SR-23) at F xxxxx 1.273
# 9 Moorpark Avenue (SR-23) at Poi B xxxxx 0.619
# 10 Spring Road at Los Angel-esAve E xxxxx 0.924
FutureDeL/ v/
LOS Veh C
F xxxxx 1.510
E xxxxx 0. 902
F 0.0 1.366
B 10.6 0.000
F xxxxx 1.456
F xxxxx 1.355
E 53.4 0.000
F xxxxx 1.296
B xxxxx 0.657
E xxxxx 0.940
Changein
+ 0.000 V,/c
+ 0.032 v/C
+ 0.000 D/v
+ O.02I D/v
+ 0.001- V/C
+ 0.037 v/c
+31.898 D/V
+ 0.023 vlC
+ 0.039 v/c
+ 0.016 V/C
Traffix ?,6.0115 (c) 2003 Dowling Assoc. Licensed to URS CORP', SANTA ANA, cA
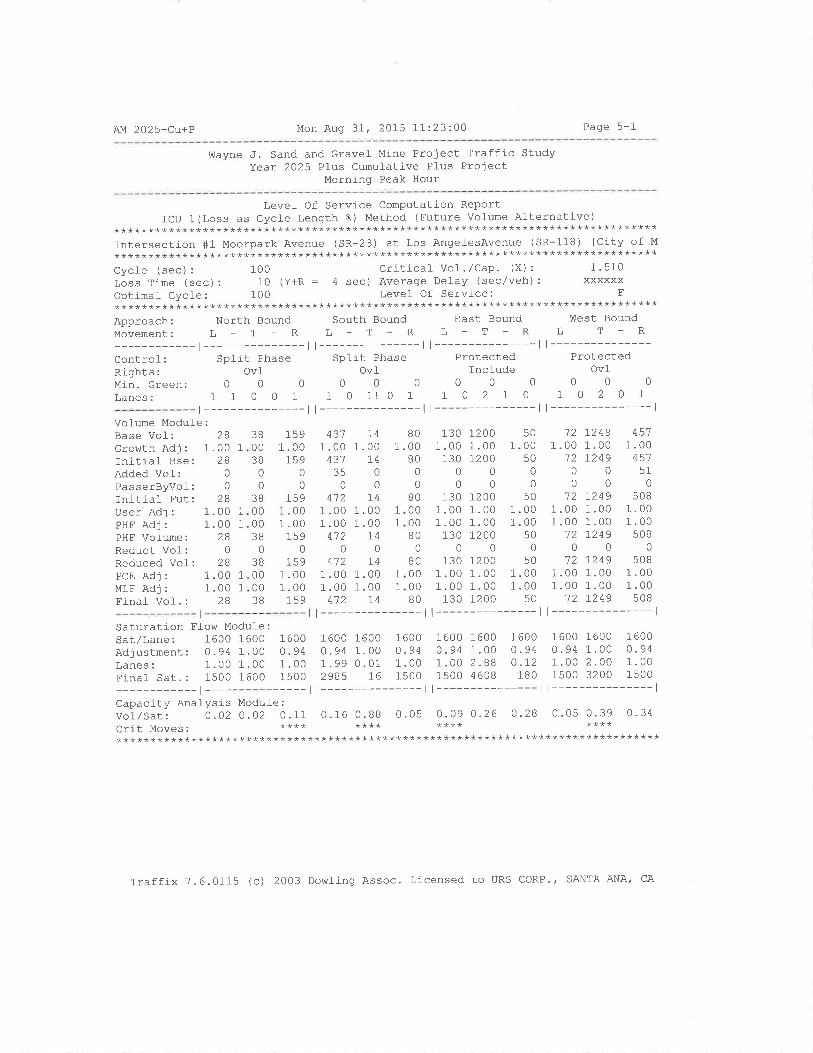
AM 2025+Cu+P Mon Aug 3I, 2OI5 11:23:00 Page 5-1
VÍayne J. Sand and Grave.I Mine Project Traffic StudyYear 2025 PÌus Cumulative Plus Project
Morning Peak Hour
Levet Of Service Computation ReportICU 1 (Loss as CycJ_e Length %) Method (Future Volume Afternative)
********************************************************************************Intersection #1 Moorpark Avenue (sR-23) at Los AngelesAvenue (SR-118) [City of M
********************************************************************************Cycte (sec) : 100 Critical Vo]. /Cap. (X) : 1 ' 510
Loss Time (sec) : 10 (Y+R : 4 sec) Average Defay (sec/veh) : xxxxxxOptimal Cycle: 100 Level Of Service: F********************************************************************************Approach: North Bound South Bound East Bound !Ùest BoundMovement: L - T _ R L - T - R L _ T - R L _ T _ R
-l---------ll---------ll---------ll---------------lcontrol: Split Phase spllt Phase Protected ProtectedRights: Ovl Ovl Include OvlMin.creen: O O 0 0 O 0 0 0 0 0 0 0
Lanes: 1 1 O O 1 1 0 11 0 1 1 O 2 1 0 1 0 2 O 1
r---------------ll---------------ll---------------ll---------------lVofume Module:Base Vol: ¿óGrot^Ith Adj : 1.00 1
Initial Bse: 28Added Vol-: 0
PasserByvor: u
Initial Fut: 28User Adj : 1.00 1
PHF Adj : I .00 1
PHF Vol-ume:. 28Reduct Vof: 0
Reduced Vol: 28PCE Adj : 1.00 1
MLF Adj: 1.00 lFinal Vol. : 28
38 15900 1 .0038 1590000
38 1s900 1.0000 1.0038 1s900
38 1s900 1.0000 1.0038 159
43'7
1 .00431
?q
0
4121 .001 .00
4120
4121 .001 .00
412
741.00
I400
741.001 .00
I40
0000
80 13000 1.0000 1 .0080 13000
80 13000 1 .00
0
012001.00 1
1.00 I7200
012001.00 1
121 .00
1200
121 .001 .00
120
121 .001 .00
12
12491.00L249
00
12491.001.001249
0L2491.001.001249
4511 .00
45151
0
5081.001.00
s0B0
s0B1 .001.00
s0B
B0 130 12001 .00 1 .00 1.00 1
B0 130 1200
500050
00
50000050
0
5000
1
1
I41.001 .00
I4
1
1 00 1 .00 1.00 1.0080 130 1200 50
Saturation Elow Modufe:sar/Lane: 1600 1600 1600 1600 1600 1600 1600 1600 1600 1600 1600 1600Adjustmenr: 0.94 1. OO 0.94 0.94 1.00 0.94 0.94 1.00 0.94 0.94 1.00 O.94Lanes: 1.OO 1.OO 1.OO 1.99 0.01 1.00 1.00 2.88 0.L2 1.00 2.00 1.00Finaf sat.: 1500 1600 15OO 2985 16 1500 1500 4608 180 1500 3200 1500
-l---------ll---------ll---------ll---------------lCapacity Anafysis Module:Vot/sar: o .o2 0 .02 0.11 0.16 0. 88 0.05 0.09 0.26 0 .28 0.05 0.39 0.34crit Moves: **** **** **** ************************************************************************************
Traffix 7.6.0115 (c) 2003 Dowling Assoc. Licensed to URS CORP./ SANTA ANA, CA
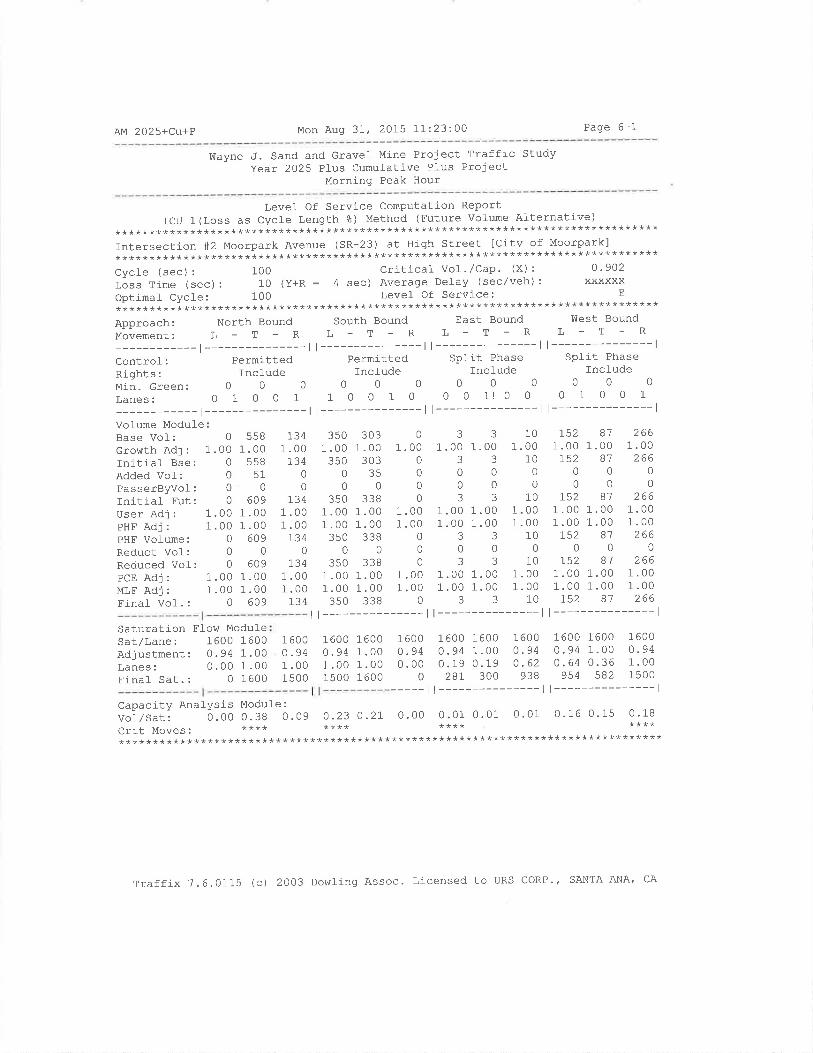
AM 2025+Cu+P Mon Aug 3I, 2015 11:23:00 Page 6-1
Wayne J. Sand and Gravel Mine Project Traffic StudyYear 2025 Pl-us Cumul-ative Pl-us Project
Morning Peak Hour
Level Of Service Computation ReportICU 1(Loss as Cycle Length å) Method (Future volume Alternative)
********************************************************************************Intersection S2 Moorpark Avenue (SR-23) at High Street ICity of Moorpark]***************************************************************************+****Cycle (sec): 100 Critical Vol'/Cap' (x): 0'902lãss Time (sec) : 10 (Y+R : 4 sec) Average Delay (sec/veh) : xxxxxxOptimal Cycle: 100 Level Of Service; E
********************************************************************************Approach: North Bound South Bound East Bound West Bound
Movement: L - T - R L - T - R L - T - R L - T - R
-l---------ll---------ll---------ll---------------lControl: Permitted Permitted Split Phase Split Phase
Rights:Incfudelncfudelncludelnc].udeuiÀ.creen: 0 O O O 0 0 0 0 0 0 0 0
Lanes: O 1 O O 1 1 O O 1 O 0 0 1! 0 0 0 1 0 0 1
-l---------ll---------ll---------ll---------------lVolume ModuleBase Vol-:crot¡tth Adj:Initial Bse:Added Vof:PasserByvol:Tnitial Fut:User Adj:PHF AdJ:PHF Vol-ume:Reduct Vol:Reduced VoI:PCE AdJ:MLF Adj:Final VoI. :
Saturation Ffo¡ir ModuleSat/Lane: 1600 1600Adjustment: 0.94 1.00Lanes: 0.00 1.00Finaf Sat.: 0 1600
01.00
0
000
1 .001.00
0
0
01.001.00
0
5581 .00
55851
0
6091 .001.00
6090
6091 .001 .00
609
]-341 .00
13400
7341 .001 .00
7340
1341 .001 .00
134
350 303 0 3
1.00 1.00 1.00 1.00350 303 0 3
035000000
350 338 0 3
1.00 1 .00 1.00 1.001.00 1.00 1.00 1.00350 338 0 3
0000350 338 0 3
1 .00 1.00 1 .00 1 .001.00 1 .00 1.00 1 .003s0 338 0 3
|--------- l l----
3 10 r52 87 2661 .00 1.00 1 .00 1.00 1.00
3 10 r52 81 26600000000003 10 r52 87 266
1.00 1.00 1.00 1.00 1.001 .00 1.00 1 .00 1.00 1.00
3 10 r52 81 266000003 10 L52 81 266
1 .00 1 .00 1 .00 1.00 1 .001.00 1.00 1 .00 1 .00 1.00
3 10 t52 87 266ll---------------l
1600 1600 1600 1600 16001.00 0.94 0.94 1.00 0.940.19 0.62 0.64 0.36 1.00300 938 954 582 1500
| --------------- l
0.01 0.01 0. 16 0.15 0.18****
*****************************
1 600o.941 .001 500
1600 16000.94 1.001 .00 1 .001500 1600
00 160094 0.9400 0.190 28r
160.0.
Capacity Analysis Module :
Vof/Sat: 0.00 0.38 0.09 0.23 O-2ICrit Moves ' **** ********************************************
----- | ----0.00 0 .01
***************
Traffix 7.6.0115 (c) 2003 DowÌing Assoc. Licensed to URS CORP', SANTA ANA, CA
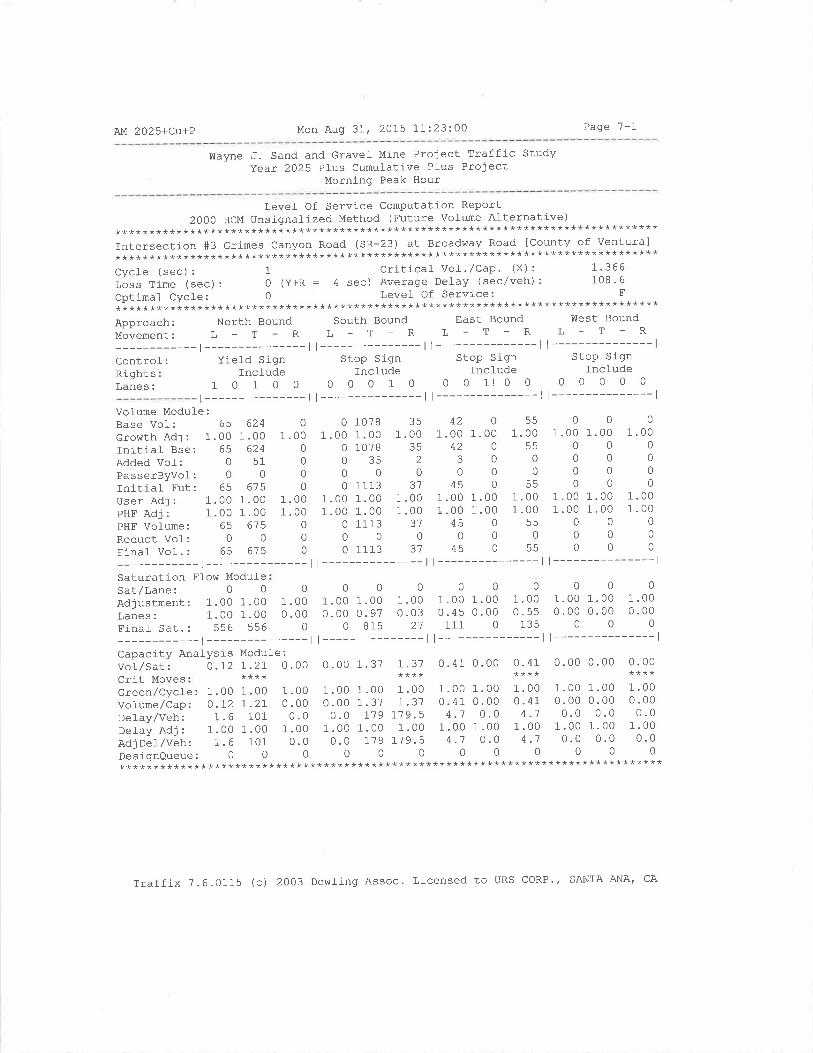
AM 2025+Cu+P Mon Aug 3It 2015 11:23:00 Page 7-1
Wayne J. Sand and Gravel Mine Project Traffic StudyYear 2025 Plus Cumul-ative Plus Project
Morning Peak Hour
Leve1 Of Service Computation Report20OOHcMUnSignalizedMethod(FutureVofumeAlternative)
********************************************************************************Intersection #3 Grimes Canyon Road (SR-23) at Broadway Road ICounty of Ventura]********************************************************************************ôr¡nlo lqcoì: 1 Critical- Vol-'/Cap' (X) : 1'366vYvfv \uvv, i
lãss Time (sec): 0 (Y+R: 4 sec) Average Detay (sec/veh): 108'6Optimal CycÌe: O Level Of Service; F
********************************************************************************Approach:NorthBoundSouthBoundEastBoundWestBoundMovement: L - T - R L - T - R L - T - R L - T - R
-l---------ll---------ll---------ll---------------lControÌ: Yíeld Sign Stop Sign Stop Sign Stop SignRi ght sLanes:
Volume Module:Base Vol: 65croürth Adj : 1.00fnitial- Bse: 65Added Vof: 0
PasserByvol: 0
Initial- Fut: 65User Adj : 1.00PHF Adj : 1.00PHF Volume: 65Reduct Vol: 0
Final VoI. : 65
Saturation Flow ModufeSat/Lane: 0 0
Adjustment: 1.00 1.00l,anes: 1.00 1.00Final Sat. : 556 556
0000001. OO 1.00 1.00 1.00 1.00 1.000. o0 o. 97 0.03 0.45 0.00 0. 55
o 815 2't 111 0 135
0001 .00 1.00 1.00
000000000000
1.00 1.00 1.001 .00 1.00 1.00
000000000
| --------------- l
0001.00 1.00 1 .000 .00 0.00 0.00
000| --------------- l
0.00 0.00 0.00****
1.00 1.00 1.000.00 0.00 0.000.0 0.0 0.0
1 .00 1.00 1.000.0 0.0 0.0
000******************
Include Incfude Include Include1 0 1 O 0 o o o 1 o o 0 1! 0 0 0 0 0 0 0
t---------------ll---------------ll---------------ll---------------l624
1 .00624
510
61 51 .001 .00
6150
61 5
01 .00
0
000
1 .001 .00
0
00
10781.001078
350
11 131.001.0011 13
0
11 13
)E
1 .00?q
2
0
1 .001 .00
310
31
420551 .00 1.00 1.00
42055300000
45 0 551 .00 1.00 1 .001 .00 1.00 1.00
45 0 55000
45 0 55
| ---------
01 .00
0000
1 001 .00
000
0
1 .000 .00
0
-l---------ll---------ll---------Capacity AnaÌysis Modufe :
vol-/sutt O.I2 I.2I O'OO 0.00 1.37 I'3'7 0'41 0'00 0'41****
1.00 1.000.00 0.41
0 .0 4.11.00 1.000.0 4.'7
00***********
Crit MovesGreen/Cycle:1.00 1.00 1.00 1.00 1.00 1.Vofume/Cap: O.I2 I.27 0.00 0.00 1.37 1.Detay/Veh: L.6 101 0.0 0.0 1-19 1'1 9
Detay Adj : 1.00 1 .00 1 .00 1 .00 1.00 1.AdjDel,/Veh: 1.6 101 0.0 0.0 719 I1 9
DesignQueue: 0 0 0 0 0
*******************************************
00 1 .0031 0.41.5 4.100 1 .00
EA1
00********
Traffix 7.6.0115 (c) 2003 DowÌing Assoc. Licensed to URS coRP., SANTA ANA' CA

AM 2025+Cu+P Mon Aug 3I, 20L5 11:23:00 Page B-1
Wayne J. Sand and Gravel Mine Project Traffic StudyYear 2025 Pl-us Cumulatj-ve Pl-us Project
Morning Peak Hour
Level- of Service Computation Report2O0O HCM UnsignaÌized Method (Future Volurne Al-ternative)
********************************************************************************Intersection #4 Grimes Canyon Road South at Broadl¿/ay Road ICounty of Ventura]********************************************************************************Average Defay (sec/veh): 6.6 Worst Case Level Of Service: Bt 10.61********************************************************************************Approach: North Bound south Bound East Bound west BoundMOVCMENT: L - T - R L _ T - R L _ T - R L - T - R
-l---------ll---------ll---------ll---------------lcontrol_: stop sign stop sign uncontrolled uncontroÌledRights: Include Include Incfude fncludel,anes: O O 1! 0 O O O 0 0 0 0 0 0 1 0 0 1 0 0 0
-l---------ll---------ll---------ll---------------lVolume Module:Base Vof: 18Growth Adj : 1.00 1.lnitial Bse: 18Added Vof: 0
PasserByvof: 0
-Lnrtra-L .Eut: .l-õ
User Adj : 1.00 1.PHF Adj: 1.00 1.PHF Volume: 18Reduct Vol: 0
Final Vol. : 18Critical Gap Module:Critlcal GpFoll-owupTim
6.4 xxxx 6.2 xxxxx xxxx xxxxx xxxxx xxxx xxxxx 4.1 xxxx xxxxx3.5 xxxx 3.3 xxxxx xxxx xxxxx xxxxx xxxx xxxxx 2.2 xxxx xxxxx
t---------------ll---------------ll---------------ll---------------lCapacity Module:Cnflict Vot: 667 xxxx 95 xxxx xxxx xxxxx xxxx xxxx xxxxx 103 xxxx xxxxxpotent Cap.: 42'7 xxxx 961 xxxx xxxx xxxxx xxxx xxxx xxxxx 1502 xxxx xxxxxMove Cap.: 362 xxxx 96't xxxx xxxx xxxxx xxxx xxxx xxxxx 1502 xxxx xxxxxVolume/Cap: 0.05 xxxx 0.18 xxxx xxxx xxxx xxxx xxxx xxxx 0.17 xxxx xxxx
-l---------ll---------ll---------ll---------------lLevel Of Service Module:eueue: xxxxx xxxx xxxxx xxxxx xxxx xxxxx xxxxx xxxx xxxxx t 0.6 ""*x xx*""Stopped Del-:xxxxx xxxx xxxxx xxxxx xxxx xxxxx xxxxx xxxx xxxxx 7.9 xxxx xxxxxLOS ty Move: * * * * * * * * * A * *
MovemeNt:LT_LTR-RTLT_LTR-RTLT_LTR-RTLT-LÎR_RTShared Cap.: XXXX 834 xxXXX xXXx xXXx xXXXX xXXX xxXX xxxxx Xxxx XXXX XxxxxSharedeueue:xxxxx 0.9 xxxxx xxxxx xxxx xxxxx xxxxx xxxx xxxxx 0.6 xxxx xxxxxShrd StpDel:xxxxx 10.6 xxxxx xxxxx xxxx xxxxx xxxxx xxxx xxxxx 7.9 xxxx xxxxxShared LOS: * B * * * * * * * A * *
ApproachDel: 10. 6 xxxxxx xxxxxx xxxxxxApproachlos: B * * *
1681 .00
16830
t7r1 .001 .00IlI
0
r17
0000
1.00 1
1.00 1
00
0
0000 1.0000000000
00 1 .0000 1.00000000
0871 .00 1.00
08700000 87
1 .00 1.001.00 1.00
087000 87
761.00
T600
I61.001 .00
760
T6
253 621.00 1.00253 62
2000
255 621.00 1.001 .00 1.00255 62
002s5 62
0
00000
0
0000
00
0
01.00 1 1
0
0000
0
00000
0
00
1
1
Traffix 7.6.0115 (c) 2003 DowÌing Assoc. Licensed to URS CORP., SANTA ANA' cA
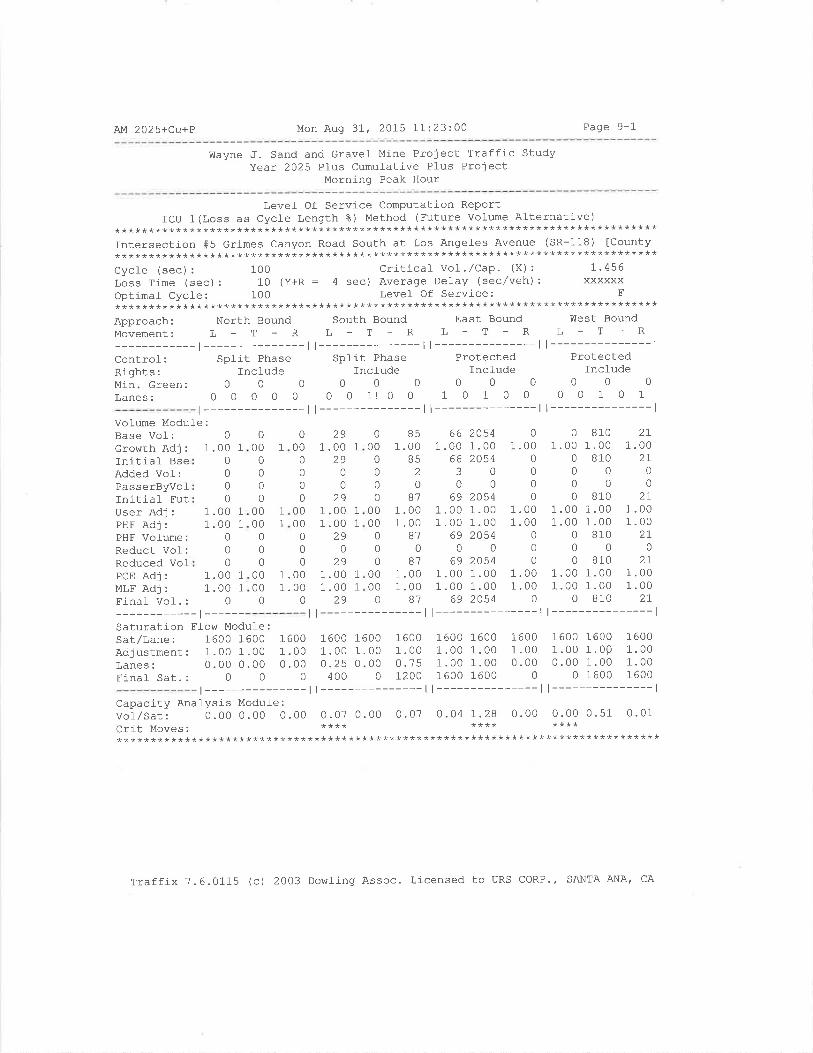
AM 2025+Cu+P Mon Aug 3It 2015 11:23:00 Page 9-1
Wayne J. Sand and Gravel Mine Project Traffic StudyYear 2025 Plus Cumul-ative Plus Project
Morning Peak Hour
Level- Of Service Computation ReportICU 1 (Loss as Cycle Length ?) Method (Future vol-ume Alternative)
********************************************************************************fntersection #5 Grimes Canyon Road South at Los Angel-es Avenue (SR-f18) [County********************************************************************************Cycle (sec) : 1OO Critical VoI. /cap. (X) : 1.456Loss Time (sec): 10 (Y+R = 4 sec) Average Defay (sec/veh): xxxxxxOptirnal Cycle: 100 Level Of Service: F********************************************************************************Approach: North Bound south Bound East Bound west BoundMovement: L - T - R L _ T _ R L - T - R L - T - R
-r---------ll---------ll---------ll---------------lcontrol: spÌit Phase split Phase Protected ProtectedRights: Include Incfude Include IncludeMin.creen: 0 O O 0 0 0 0 0 0 0 0 0
Lanes: O O O O O O 0 1! 0 0 1 0 1 0 0 0 0 1 0 1
t---------------ll---------------ll---------------ll---------------lVolume ModuÌe:Base VoI:Growth Adj:Initial BseAdded Vol:PasserByvoflnítial FutUser Adj:PHF AdJ:PHF Volume:Reduct Vol:Reduced VolPcE Adj : 1.00 1
MLF Adj : 1.00 1
Final VoI.: 0
-t------Saturation Fl-o\^/ Module :
Sat/Lane: 1600 1600Adjustment: 1.00 1.00Lanes: 0.00 0.00Final Sat.: 0 0
1.00 1
1.00 1
00
0
0
0
0
1 .001.00
0
1.00 1
1.00 1
290
291.00 1
1.00 1
29
01.00 1
00
0
0
000
00
0
0
0000
00
0
0000
0
1
000
0
0
0
000
291.00 1
2900
0 8500 1.000 Bs02000 87
00 1.0000 1.000 8700087
00 1.0000 1.000 87
661 .00
663
069
1 .001 .00
690
691 .001 .00
69
20541.002054
00
20541.001.002054
020541.001.002054
0
1.00000
0
1.001.00
0
1.000
00
0
1.001.00
00
0
1.001 .00
0
8101.00
81000
8101 .001 .00
8100
8101.001 .00
810
2I1 .00
2L
0
027
1 .001.00
2T0
2I1.001.00
2I
291
1 000
0
0
1.001 .00
0
000000
0
1 6001.000 .00
0
1600 16001.00 1.000.25 0.00400 0
1 6001 .000 .75L200
1600 16001 .00 1.001.00 1.001600 1600
00 160000 1.0p00 1.000 1600
1 6001.001.001 600
761.0.
L61.0.
t---------------ll---------------ll---------------ll---------------lCapacity Analysis Module :
Vol/Sat: o.0o o. oo o.0o o. 07 0.00 0.07 0.04 1.28 0.00 0.00 0.51 0.01CIit MOVeS: **** **** ************************************************************************************
Traffix 7.6.0115 (c) 2003 DowÌing Assoc. Licensed to URS coRP., SANTA ANA, CA
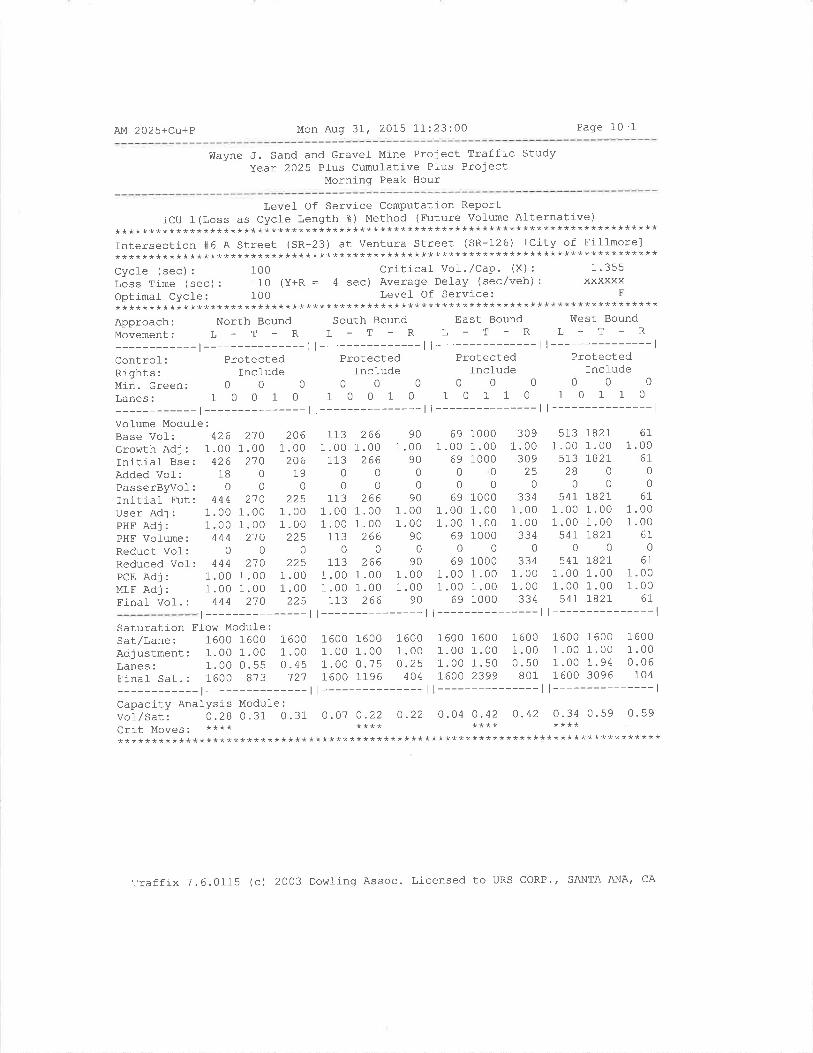
AM 2025+Cu+P Mon Aug 3I, 2075 11:23:00 Page 10-1
lfayne J. Sand and Gravel Mine Project Traffic StudyYear 2025 Pl-us Cumufative Pl-us Project
Morning Peak Hour
Level Of Service Computatj-on ReportICU 1(Loss as Cycle Length 3) Method (Future vol-ume Alternative)
********************************************************************************Intersection #6 A Street (SR-23) at Ventura Street (SR-126) [City of Fillnore]********************************************************************************Cycle (sec) : 100 Critical Vol. /Cap. (X) : 1 ' 355
Loss Time (sec): 10 (Y+R : 4 sec) Average Delay (sec/veh): xxxxxxOptimaÌ Cycle: 1OO , Level Of Service; F
********************************************************************************Approach: North Bound south Bound East Bound lilest Bound
Movement: L - T - R L - T - R L - T - R L - T - R
-l---------ll---------ll---------ll---------------lcontrol-: Protected Protected Protected ProtectedRights: fnclude Incl-ude Include IncludeMin.creen: O O O O O 0 0 0 0 0 0 0
Lanes: 1 O 0 1 O 1 O O 1 0 1 0 1 1 0 1 0 1 1 0
-l---------ll---------ll---------ll---------------lVoÌume Modufe:Base Vol- : 426Growth Adj : 1.00-Ln.It.Ia_L bse: 4zoAdded Vol: 18PasserByvol: 0Initial Fut: 444User Adj : 1.00PHF Adj : 1.00PHF Vol-ume z 444Reduct Vol: 0
Reduced Vol: 444PCE Adj : 1.00MLF Adj : 1.00Final Vol. : 444
2101 .00
21000
2'7 0
1 .001.00
2100
2101.001 .00
210
2061.00
20679
0
2251 .001 .00
2250
2251 .001.00
zza
1131 .00
11300
1131 .001 .00
1130
1131.001 .00
113
2661.00
26600
2661 .001 .00
2660
2661 .001.00
266
901.00
900
0
901 .001 .00
900
901.001.00
90
691 .00
6900
691 .001 .00
690
691 .001 .00
69
10 001.001000
00
10001.001.001000
010001 .001.001000
3091.00
309
0
3341 .001.00
3340
3341.001.00
334
5131.00
5132B
0
5411 .001 .00
5410
5411 .001.00
541
782r1.00I82I
00
1-82!1.001.00IB2I
0
LB271.001.00IB2I
6I1. 00
6L0
06t
1.001 .00
610
6t1 .001.00
67
r---------------ll---------------ll---------------ll---------------lSaturation Flow Module:sat/Lane: 1600 1600 16OO 160O 1600 1600 1600 1600 1600 1600 1600 1600
Adjustment: 1.00 1.00 1.oo 1.oo 1.oo 1.00 1.00 1.00 1.00 1.00 1.00 1.00l,anes: 1. O0 0.55 0.45 1.00 0.75 0 .25 1 .00 1.50 0.50 1 .00 1.94 0.06Final Sat.: 1600 873 121 1600 1196 404 7600 2399 801 1600 3096 104
-l---------ll---------ll---------ll---------------lCapacity Anal-ysis Modul-e :
vorlsat: 0.28 0.31 0.31 0.01 0.22 0.22 0.04 0.42 0.42 0.34 0.59 0.s9crit Moves. **** **** **** ************************************************************************************
Traffix 7.6.0115 (c) 2O03 Dowling Assoc. Licensed to uRs coRP.' SANTA ANA, CA
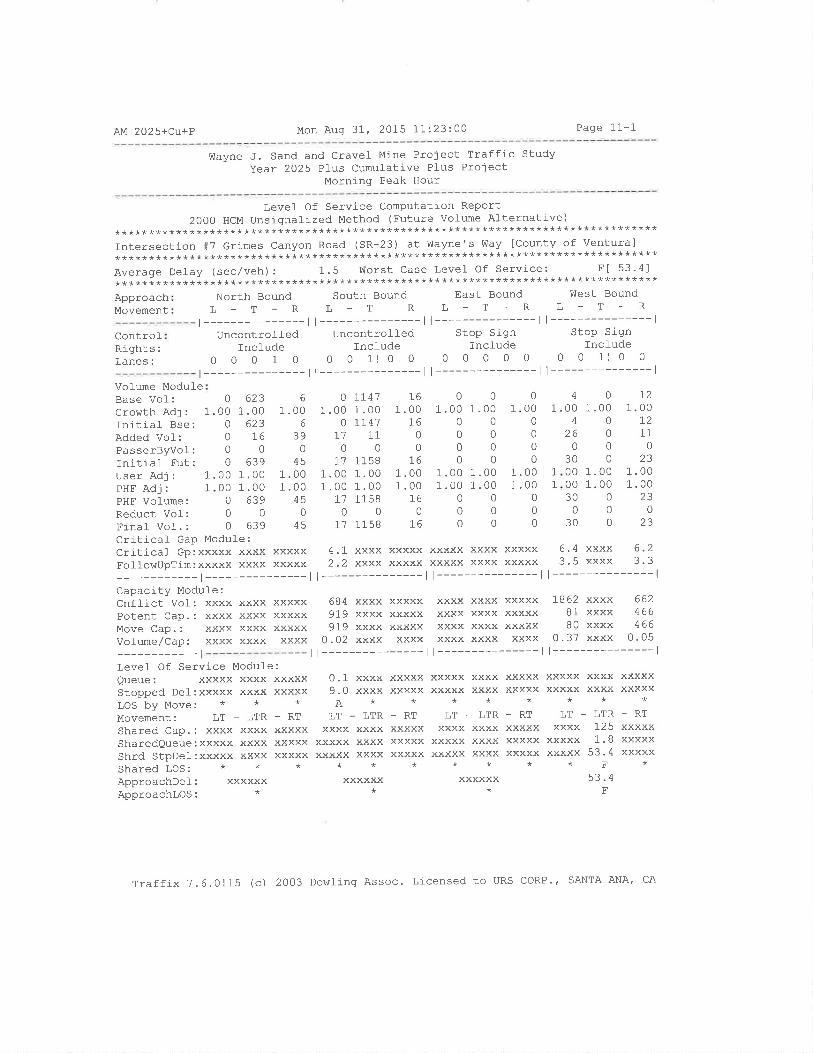
AM 2025+Cu+P Mon Aug 3Lt 2OI5 11:23:00 Page 11-1
V{ayne J. Sand and GraveÌ Mine Project Traffic StudyYear 2025 Plus Cumulative Pl-us Project
Morning Peak Hour
Levet Of Service Computation Report2000 HCM Unsignalízed Method (Future Vofume Alternative)
********************************************************************************Intersection#TGrimescanyonRoad(SR-23)atWayne'sWay[CountyofVentura]********************************************************************************Average Delay (sec/veh): 1.5 WoIst Case Level- of service: Ft 53.41********************************************************************************ApproachMovement
North Bound South BoundL-T-RL-T_R
| --------------- | I --------------- |
Uncontrolled UncontrolledInclude Incfude
0 0 0 1 0 0 0 11 0 0
| --------------- | I --------------- |
East Bound !Ùest BoundL-T-RL-T_R
| --------------- | I --------------- |
Stop Sign StoP SignIncfude Incfude
0 0 0 0 0 0 0 1! 0 0
| --------------- | I --------------- |
ControfRights:Lanes:
Volume ModuleBase Vof:Growth Adj:Initial Bse:Added Vol-:PasserByvol:Initial Fut:User Adj:PHF AdJ:PHF Vofume:Reduct Vol:Final VoÌ. :
Criticaf Gap Modufe:Critical Gp:xxxxx xxxx xxxxxFollowUpTim:xxxxx xxxx xxxxx
-l---------------lCapacity Module:Cnflict Vol: xxxx xxxx xxxxxPotent Cap.:Move Cap.:volume/Cap:------------lLevel Of Service Modul-e:Queue: xxxxx xxxx xxxxxStopped Del:xxxxx xxxx xxxxxLOS by Move: * * *
Movement: LT - LTR - RT
xxxx xxxx xxxxxxxxx xxxx xxxxxxxxx xxxx xxxx
919 xxxx xxxxx919 xxxx xxxxx
0.02 xxxx xxxx| --------------- l
xxxx xxxx xxxxxxxxx xxxx xxxxxxxxx xxxx xxxxt---------------l
6. 4 xxxx 6.23.5 xxxx 3.3
t---------------l1862 xxxx 662
81 xxxx 466B0 xxxx 466
0.37 xxxx 0.05t---------------l
0
1.000
00
01.00
00000
1
'L
1
623.00623
160
639.00.00639
0
639
6
1 .006
390
Ltr,
1 .001.00
450
45
0
1 .000
110
I11 .001 .00
7'7
077
7L411.00TI41
110
115I1 .001 .00115 8
0115 8
I61.00
I600
761 .001 .00
I60
I6
001.00 1.00
00000000
1.00 1.001 .00 1 .00
000000
4000 1.0040
26000
30000 1.0000 1.0030000
300
721.00
I211
023
1 .001.00
023
110
0000
00
1
1.00 1
1.00 1
00
0
4.1 xxxx xxxxx xxxxx xxxx xxxxx2.2 xxxx xxxxx xxxxx xxxx xxxxx
| --------------- | I --------------- |
684 xxxx xxxxx xxxx xxxx xxxxx
0.19.0A
LT
xxxx xxxxx xxxxx xxxx xxxxx xxxxx xxxx xxxxxxxxx xxxxx xxxxx xxxx xxxxx xxxxx xxxx xxxxx
********
Shared Cap.: xxxx xxxx xxxxx xxxx xxxxSharedQueue:xxxxx xxxx xxxxx xxxxx xxxxShrd StpDel-:xxxxx xxxx xxxxx xxxxx xxxxShared LOS: * + * * *
ApproachDef: xxxxxx xxxxxxApproachlOs: * *
- LTR -RTXXXXXxxxxxxxxxx
LT - LTRxxxx xxxx
xxxxx xxxxxxxxx xxxx**
xxxxxx*
-RT LT-LTRxxxxx xxxx I25xxxxx xxxxx 1 .8xxxxx xxxxx 53.4
**Fq?¿
F
-RTXXXXXxxxxxXXXXX
Traffix 7.6.0115 (c) 2O03 Dowling Assoc. Licensed to URS coRP.f SANTA ANA' CA
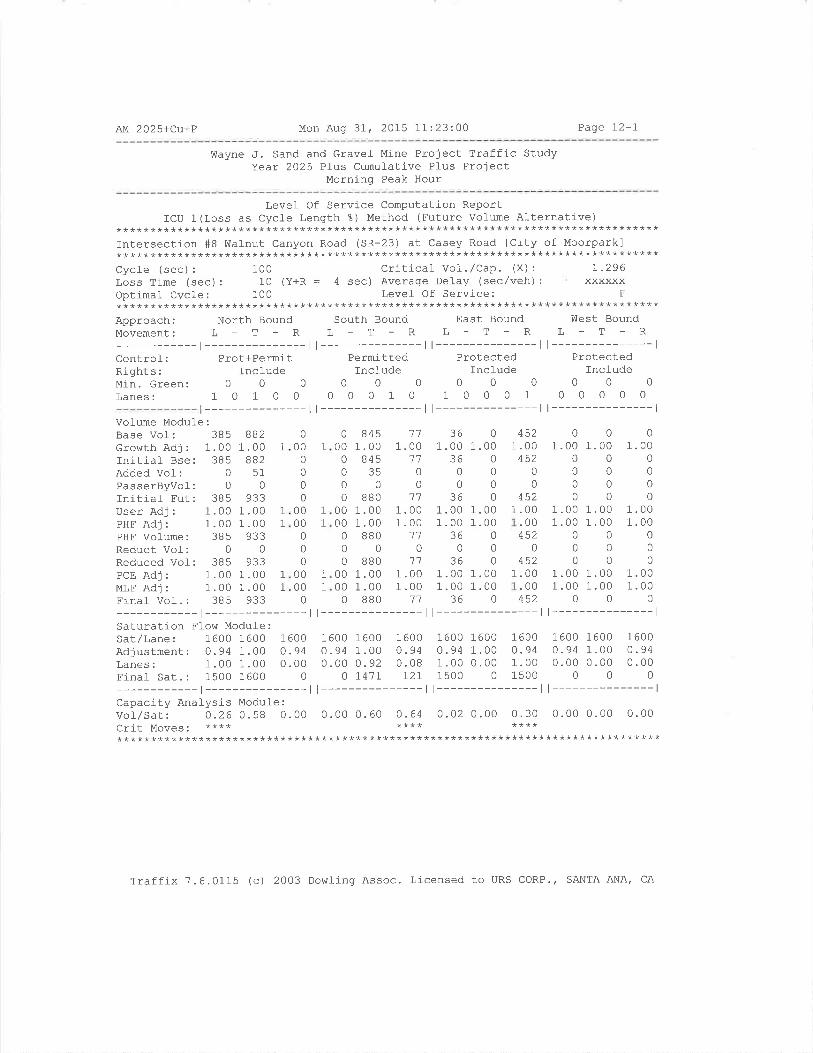
AM 2025+Cu+P Mon Aug 3I, 2015 11:23:00 Page 72-I
!ûayne ,J. Sand and Gravel Mine Project Trafflc StudyYear 2025 Plus Cumulative Pfus Project
Mornlng Peak Hour
Level Of Servj-ce Computation ReportICU 1 (Loss as Cycle Lenqth %) Method (Future Volume Al-ternative)
********************************************************************************Intersection #B V{afnut Canyon Road (SR-23) at Casey Road ICity of Moorpark]********************************************************************************CycÌe (sec): 100 critícaf vol./Cap. (x): I-296Loss Tj-me (sec) : 10 (Y+R = 4 sec) Average Delay (sec/veh) : xxxxxxOptimat Cycle: 100 Level Of Service: F********************************************************************************Approach: North Bound South Bound East Bound West BoundMovement: L - T - R L - T - R L - T - R L - T - R
-t---------ll---------ll---------ll---------------lControl: Prot+Permit Permitted Protected ProtectedRights: Incfude Incfude Include IncludeMin.creen: O 0 0 0 0 0 0 0 0 0 0 0
Lanes: 1 0 1 0 0 0 0 0 1 0 1 0 0 0 1 0 0 0 0 0
t---------------ll---------------ll---------------ll---------------lVolume Module:Base Vol: 385Growth Adj : 1.00Initial Bse: 385Added Vol: 0PasserByvol-: 0Initial- Fut: 385User Adj : 1.00PHF Adj : 1.00PHF Vol-ume: 385Reduct Vof: 0Reduced VoI: 385PCE Adj : 1.00MLF Adj : 1.00Final Vof. : 385
8821 .00
88251
0
9331 .001.00
9330
9331.001 .00
933
0 84500 1.000 845035000 880
00 1.0000 1.000 880000 880
00 1.0000 1.00O BBO
1'7
1 .00'77
00
111.001.00
110
111 .001 .00
17
361 .00
3600
361 .001.00
360
361 .001 .00
36
0
1.000
000
1.001.00
00
01.001 .00
0
452.00452
0
0452.00.00452
0
452.00.00452
01 .00
000
01 .001 .00
0
0
0I .001 .00
0
0
0
00
1.001.00
00
0
1.001.00
0
01.001
0
000000
0000
0
0
0
0000
0
1
01.00
0000
1.001.00
0
0
0
1.001.00
0
1
1
1
1
1
1
11
1
11
-l---------ll---------ll---------ll---------------lSaturation Flow Modufe:Sat/Lane: 1600 1600 1600 1600 1600 1600 1600 1600 1600 1600 1600 1600Adjustment: 0.94 1 .00 0.94 0.94 1 .00 0 '94 0. 94 1 ' 00 0. 94 0.94 1.00 0.94Lanes: 1.00 1 .00 0.00 0.00 0. 92 0.08 1 .00 0 ' 00 1.00 0.00 0.00 0.00Final Sat.: 1500 1600 0 O L41I I27 1500 0 1500 0 0 0
-l---------ll---------ll---------ll---------------lCapacity Analysis Module :
vol/Sat: O .26 0 .58 0.00 0.00 0. 60 0 .64 0.02 0.00 0.30 0.00 0.00 0.00Crit MOv.eS. **** **** ************************************************************************************
Traffix 7.6.0115 (c) 2003 DowJ-ing Assoc. Licensed to URS CORP., SANTA ANA, CA
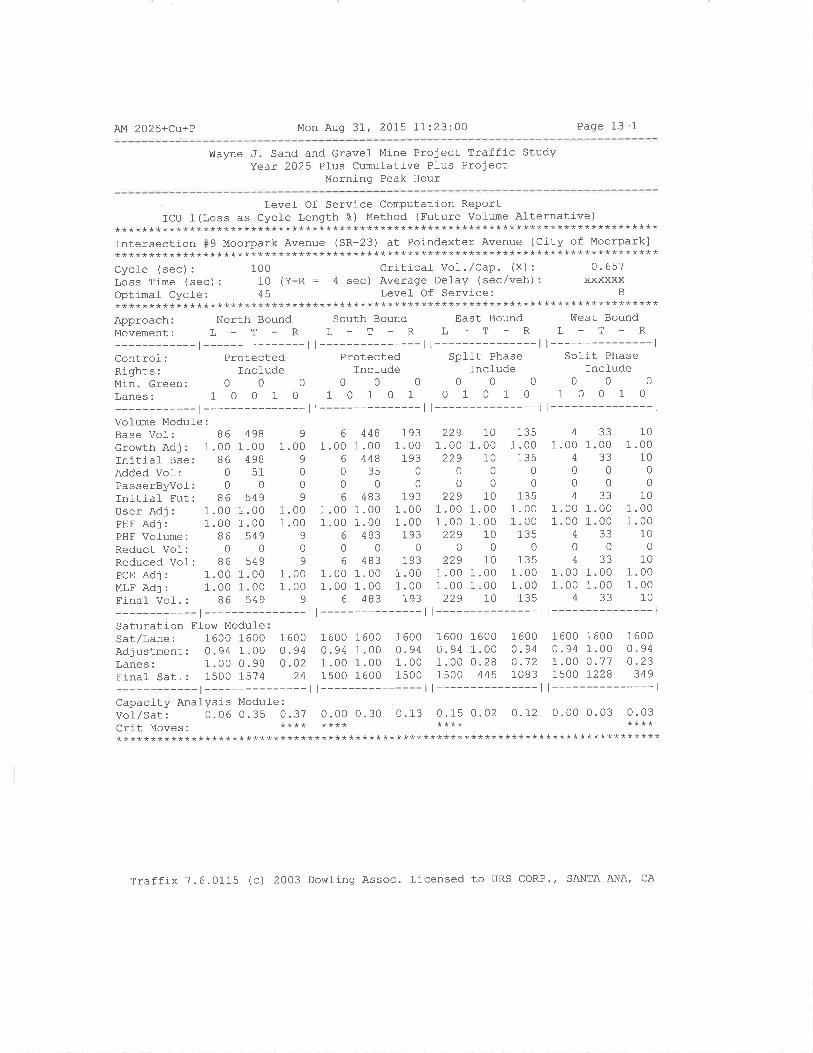
AM 2025+Cu+P Mon Aug 31, 2015 11:23:00 Page 13-1
Wayne J. Sand and Gravel Mì-ne Project Traffic StudyYear 2025 Plus Cumulative Pl-us Proiect
Morning Peak Hour
rcu 1 (Loss ." .llï!'"3:n:;ïiï":;äå"ÌË:i::"*;:iil. A,.rernarive)********************************************************************************Intersection #9 Moorpark Avenue (SR-23) at Poindexter Avenue lCity of Moorpark]********************************************************************************Cycle (sec) : 1OO Criticaf VoI. /Cap. (X) : 0.657Loss Time (sec) : 10 (Y+R : 4 sec) Average De1ay (sec/veh) : xxxxxxOptimal Cycle: 45 Level- Of Service: B
********************************************************************************Approach: North Bound south Bound East Bound vìlest BoundMovement: L - T - R L - T - R L - T - R L - T - R
-r---------ll---------ll---------ll---------------lcontrol: Protected Protected Split Phase split PhaseRights: Incl-ude Include Include IncÌudeMin.creen: O O O 0 0 0 0 0 0 0 0 0
Lanes: 1 O 0 1 O 1 0 1 0 1 0 1 0 1 0 1 0 0 1 0
-t---------ll---------ll---------ll---------------lVolume Module:Base Vof: 86Growth Adj : 1.00Initial Bse: 86Added Vof: 0PasserByvol: 0Tnitial Eut: 86User Adj : 1.00PHF Adj : 1.00PHF Volume: 86Reduct Vol-: 0Reduced Vof: 86PCEAdj: 1.001.00 1.00 1.001'00 1.00 1.001.00 1-00 1.00MLFAdj: 1.00 1.00 1.00 1.00 1.00 1.00 1.00 1.00 1-00 1.00Final Vol-. : 86 549 9 6 483 193 229 10 135 4
4981.00
49851
0549
1 .001.00
5490
R/ O
9
1 .009
00
9
1 .001 .00
9
0
9
6 4481.00 1 .00
6 448035006 483
1.00 1 .001.00 1.00
6 483006 483
1931 .00
1930
0
1931 .001 .00
1930
193
229 101 .00 1 .00229 10
0000
229 101 .00 1.001 .00 1 .00229 10
00229 10
1351.00
13500
1351.001.00
12tr
0135
4
004
1.00 1
1.00 1
4
04
33 1000 1.0033 100000
33 1000 1.0000 1.0033 1000
33 1000 1.0000 1 .0033 10
4
1.00 1
1
1
Saturation Fl-ow ModufeSat/Lane: 1600 1600Adjustment: 0.94 1.00Lanes: 1.00 0.98
1 6000.940.02
160O 1600 1600 1600 1600 1600 1600 1600 16000.94 1 .00 0.94 0.94 1.00 0 .94 0 . 94 1.00 0 .941.00 1.00 1.00 1.00 0.28 0.'72 1.00 0.77 0.23
Final sar.: 1500 15?4 24 1500 1600 1500 1500 445 1083 1500 1228 349
-l---------ll---------ll---------ll---------------lCapacity Analysis Modul-e :
Vof/sar: o. o6 0.35 0.37 0.00 0. 30 0.13 0.15 0.02 0 .12 0.00 0.03 0.03crit Moves. **** **** **** ************************************************************************************
Traffix 7.6.0115 (c) 2003 Dowling Assoc. Licensed to URS coRP./ SANTA ANA, CA
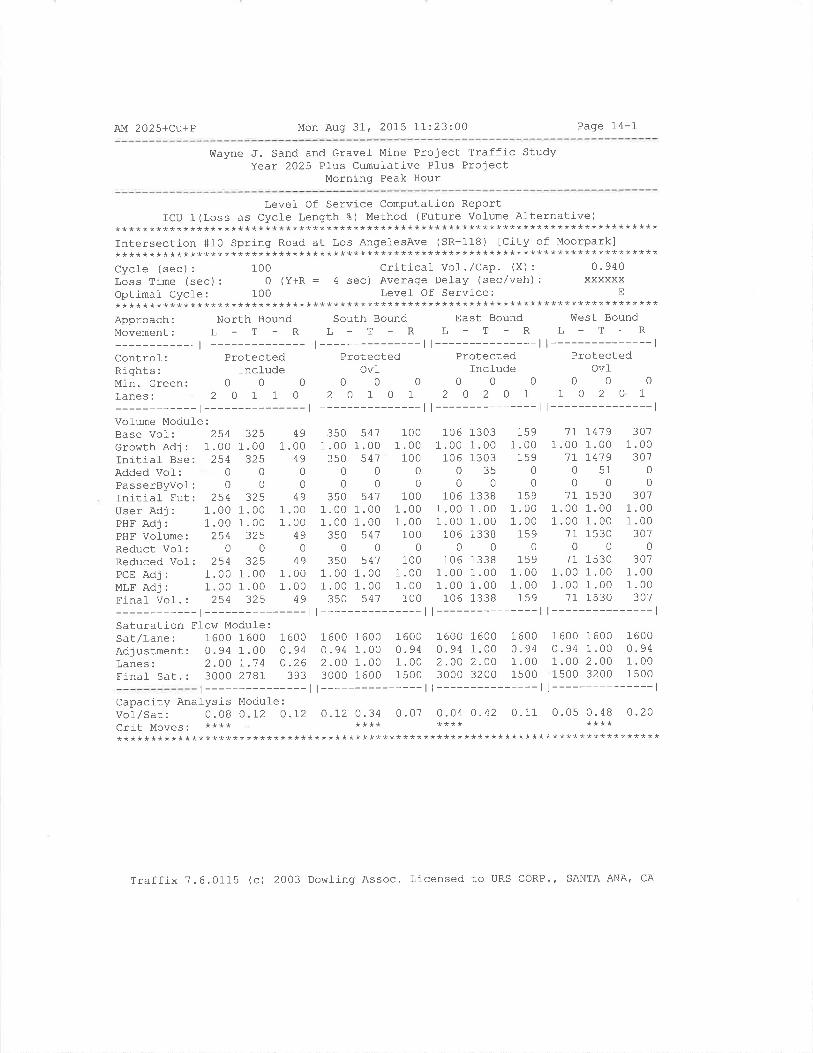
AM 202s+Cu+P Mon Aug 3I, 2015 11:23:00 Page 14-1
Wayne J. Sand and Gravel Mine Prolect Traffic StudyYear 2025 Plus Cumulative Plus Project
Morning Peak Hour
Level Of Service Computation ReportICU 1 (Loss as Cycle Length 8) Method (Future Vol-ume AÌternative)
********************************************************************************Intersection #10 spring Road at Los AngelesAve (sR-118) tcity of Moorparkl********************************************************************************Cycle (sec): 1OO criticaf Vo1./cap. (X): 0'940Loss Time (sec): 0 (Y+R : 4 sec) Average Delay (sec/veh): xxxxxxOptimal Cycle: 100 Level Of Service: E
********************************************************************************Approach: North Bound South Bound East Bound West BoundMovement: L - T - R L - T - R L - T - R L - T - R
-r---------ll---------ll---------ll---------------lControÌ: Protected Protected Protected ProtectedRights: Include Ovt Include OvfMin.creen: 0 O O 0 0 0 0 0 0 0 0 0
Lanes: 2 O 1 1 O 2 0 1 0 1 2 O 2 0 1 1 0 2 0 1
-l---------ll---------ll---------ll---------------lVol-ume Modul-e:Base Vol:. 254 325 49 350 541 100 106 1303 159 1I \419 307GrowthAdj: 1.001.00 1.00 1.001.00 1.00 1.001.00 1.00 1.001.00 1.00Initial Bse: 254 325 49 350 541 100 106 1303 159 1I ]-419 301
AddedVol-: O O 0 0 0 0 0 35 0 0 51 0
PasserByvof: 0 O 0 0 0 0 0 0 0 0 0 0
rnitial_ Fut: 254 325 49 350 541 100 106 1338 159 71 1530 301
UserAdj: 1.001.00 1.OO 1'001.00 1.00 1.001.00 1.00 1'001.00 1'00PHFAdj: 1.00 1.OO 1.OO 1.00 1.00 1.00 1.00 1.00 1.00 1.00 1.00 1-00pHF Votume: 254 325 49 350 541 100 106 1338 159 71 1530 307Reduct Vo1: O 0 O 0 0 0 0 0 0 0 0 0
Reduced vol: 254 325 49 350 541 100 106 1338 159 71 1530 307PCEAdj: 1.001.00 1.00 1.001.00 1.00 1.001.00 1.00 1.001.00 1.00MLFAdj: 1.001.00 1.OO 1.001.00 1.00 1.001.00 1.00 1'001.00 1.00Final_ vof.: 254 325 49 350 541 100 106 1338 159 71 1530 307
-l---------ll---------ll---------ll---------------lSaturation Ffow Modufe:Sat/Lane: 1600 1600 1600 1600 1600 1600 1600 1600 1600 1600 1600 1600Adjustment: 0. 94 1 .00 o .94 0. 94 1.00 0 .94 0 . 94 1.00 O.94 0.94 1 .00 0. 94
Lanes: 2.OO I.'r-4 0.26 2.00 1.00 1.00 2'00 2.OO 1.00 1.00 2'00 1.00Final Sat.: 3OOO 2781 393 3000 1600 1500 3000 3200 1500 1500 3200 1500
l---------------ll---------------ll---------------ll---------------lCapacity AnaÌysls Modufe :
vol/Sat: O.OB 0.12 0.12 0.72 O.34 0.07 0.04 0.42 0.11 0.05 0.48 O-2O
crit Moves. **** **** **** ************************************************************************************
Traffix 7.6.0115 (c) 2003 Dowling Assoc. Licensed to URS CORP., SANTA ANA' CA
PM 202s+Cu+P Mon Aug 3I, 201_5 lI:23:.45 Page 1-1
Wayne J. Sand and Gravel Mine Project Traffic StudyYear 2025 Pfus Cumulative PÌus Project
Evening Peak Hour
Scenario ReportScenario
Command:Volurne:Geometry:Impact Fee:Trip Generation:Trip Distribution:Paths:Routes:Configuration:
PM 202s+Cu+P
PM 2025 P
PNl 2025Exist ingDefault Impact FeePM
PM
Defauft PathsDefauft Routes2025
Traffix 7.6.0115 (c) 2003 Dowfing Assoc. Licensed to URS CORP., SANTA ANA, CA
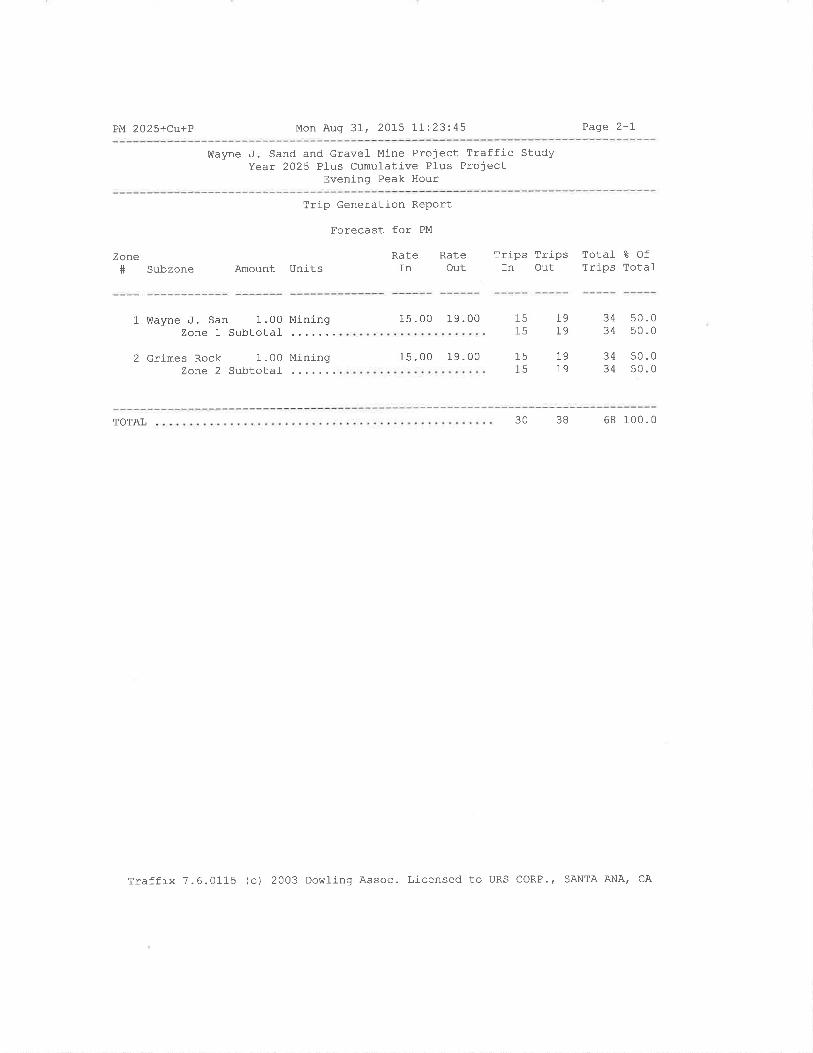
PM 2025+Cu+P Mon Aug 31, 2015 71:23:45 Page 2-7
V{ayne J. Sand and Gravel- Mine Project Traffic StudyYear 2025 Plus Cumulative Plus Project
Evening Peak Hour
Zone# subzone
Trip Generation Report
Forecast for PM
Rate RateAmount Units In Out
Trips Trips Total- I OfTrips TotafIn Out
1 Wayne .f . San 1.00 MiningZone ! Subtotal-
2 Grirnes Rock 1.00 MiningZone 2 Subtotaf
15.00 19.00
15.00 1-9.00
1515
19I9
1515
4
4
a
3s0.0s0.0
791-9
3434
s0 .0s0.0
TOTAL 30 38 68 100.0
Traffix 7.6.01-15 (c) 2003 DowJ_ing Assoc. Licensed to URS coRP., SANTA ANA, CA
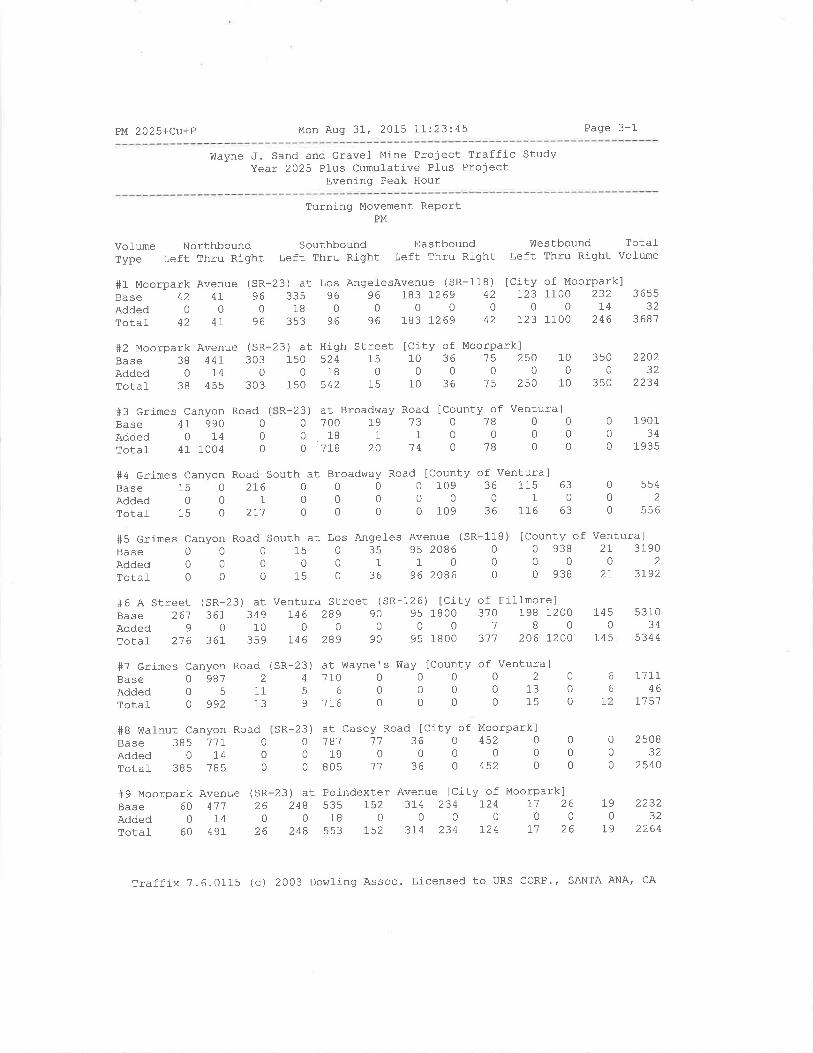
PM 202s+Cu+P Mon Aug 37, 2075 17l.23:45 Page 3-1
Wayne J. Sand and Gravel Mine Project Traffic StudyYear 2025 Plus Cumulative Plus Project
Evening Peak Hour
Turning Movement ReportPM
Southbound Eastbound Westbound TotalLeft Thru Right Left Thru Right Left Thru Right VoÌume
#1 Moorpark Avenue (sR-23) at Los AngelesAvenue (SR-118) [City of Moorpark]Base 42 41 96 335 96 96 I83 1269 42 123 1100 232
AddedOOO18000000014rotal 42 41 96 353 96 96 I83 7269 42 123 1100 246
VoÌume NorthboundType Left Thru Right
#3 Grimes Canyon Road (
Base 47 990 0
Added 0 14 0
Total 41 1004 0
#7 Grimes Canyon RoadBase 0 987 2
Added 0 5 11Total 0 992 13
#8 Wafnut Canyon RoadBase 385 11]- 0
Added 0 L4 0rotal 385 785 0
23) at Broadbray Road lCounty of Ventura]0700191307800o 18 1 1 0 0 0 0
0 ?18 20 '1 4 0 78 0 0
3 6555Z
3681
#2 Moorpark Avenue (SR-23) at High Street ICity of Moorpark]Base 38 441- 303 150 524 15 10 36 15 25O
AddedO14OO1800000rotal 38 455 303 150 542 15 10 36 't5 250
100
10
3500
350
1450
145
190134
1 935
5 31034
5344
2202aa
2234
71II46
L]5'7
2508JZ
2540
223232
2264
R-
#4 Grimes Canyon Road South at Broadway Road lCounty of Ventura]Base 15 O 216 O 0 0 0 109 36 115 63
Added0O1O0000010rotal- 15 O 2I1 0 O 0 0 109 36 116 63
0
0
0
00
0
1B0
0
0
1
5542
556
lCounty of Ventural0 938 21 319000020 938 21 3192
#5 Grimes Canyon Road South at Los Angel-es Avenue (
Base O 0 0 15 0 35 952086AddedOO000110Total- O O 0 15 0 36 962086
SR
#6 A Street (sR-23) at ventura Street (sR-126) [City of Filfnore]Base 261 361 349 146 289 90 95 1800 370 198 1200Added901000000780rotaf 216 361 359 746 289 90 95 1800 311 206 1200
!fay( sR-2 t^
000
3)4
59
at Wayne
at Casey Road'7 81 11180
8 05 1'7
lCounty of Ventural000200 0 0 13 0
0 0 0 15 0
City of Moorparklo4520000o4520
sR-23 )
00
0
7106
176
6
6
72
190
19
t36
036
00
0
0
00
#9 Moorpark AvenueBase 60 411Added 0 14Total 60 49I
(SR-23) at Poindexter Avenue [City of Moorpark]26 248 535 L52 374 234 r24 r1 260 o 18 0 0 0 0 0 0
26 248 553 752 3r4 234 r24 r1 26
Traffix 7.6.0115 (c) 2O03 Dowling Assoc. Licensed to URS coRP., SANTA ANA, CA
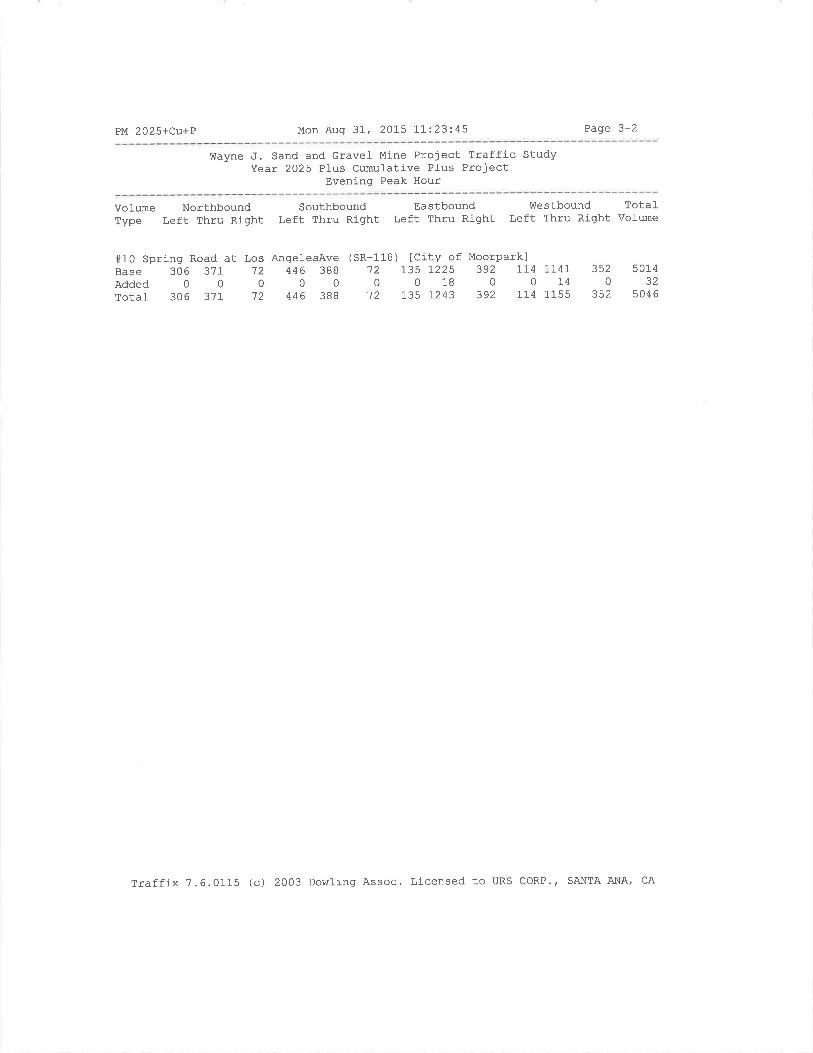
PM 2025+Cu+P Mon Aug 37, 20LS II:23:45 Page 3-2
wayne J, Sand and Gravel Mine Project Traffic StudyYear 2025 Plus Cumulative Pl-us Project
Evening Peak Hour
VoLume NorthboundType l,eft Thru Right
SouthboundLeft Thru Right
EastboundLeft Thru Right
Westbound Total-Left Thru Right Volume
#10 aprang30
30
Road at Los Angel-esAve (SR-118) [City of Moorpark]6 37r 12 446 388 '72 135 1225 392 rr4 t1'4r00000001800r46 3'71 '12 446 3BB 12 r35 7243 392 114 1155
BaseAddedTotal-
3s20
352
5 014
504 6
Traffix 7.6.0115 (c) 2003 Dowling Assoc. Licensed to URS CORP.' SANTA ANA, CA

PM 2025+Cu+P Mon Auq 3I' 20L5 II:23:4'7 Page 4-1
Wayne J. Sand and Gravel Mine Project Traffic StudyYear 2025 Plus Cumul-ative Pl-us Project
Evening Peak Hour
Intersection
Moorpark Avenue (SR-23) at Los
Moorpark Avenue (SR-23) at Hig
crimes Canyon Road (SR-23) at
Grimes Canyon Road South at Br
Grimes Canyon Road South at Lo
A Street (SR-23) at Ventura St
crimes Canyon Road (SR-23) at
lrlalnut canyon Road (SR-23) at
Moorpark Avenue (SR-23) at Poi
Spring Road at Los Angel-esAve
#1#2#3#4#5#6#1#B#e+10
Impact Analysis ReportLevef Of Service
BaSeoel-/ v/
LOS Veh C
F xxxxx 1.239
D xxxxx 0.813
E 0.0 1.765
B 10 .5 0.000
F xxxxx 1.435
F xxxxx l-. 4 37
c 23.6 0.000
F xxxxx 1.234
D xxxxx 0.855
D xxxxx 0.803
Eutureoel- / v/
LOS Veh C
F xxxxx 1.648
D xxxxx 0.822
E 0.o r.193
B 10.5 0.000
F xxxxx 1.436
F xxxxx L.450
E 37.2 0.000
E xxxxx I.246
D xxxxx 0.864
D xxxxx 0.809
Changean
+ 0.410 v,/c
+ 0.009 v,/c
+ 0.000 D/v
+ 0.009 D/V
+ 0.001 v/c
+ 0.013 v,/c
+I3 .66'7 D/V
+ 0.0I2 v/c
+ 0.009 v,/c
+ 0.006 v/c
Traffix ?.6.0115 (c) 2003 Dobtl-ing Assoc. Licensed to URS CORP., SANTA ANA, CA
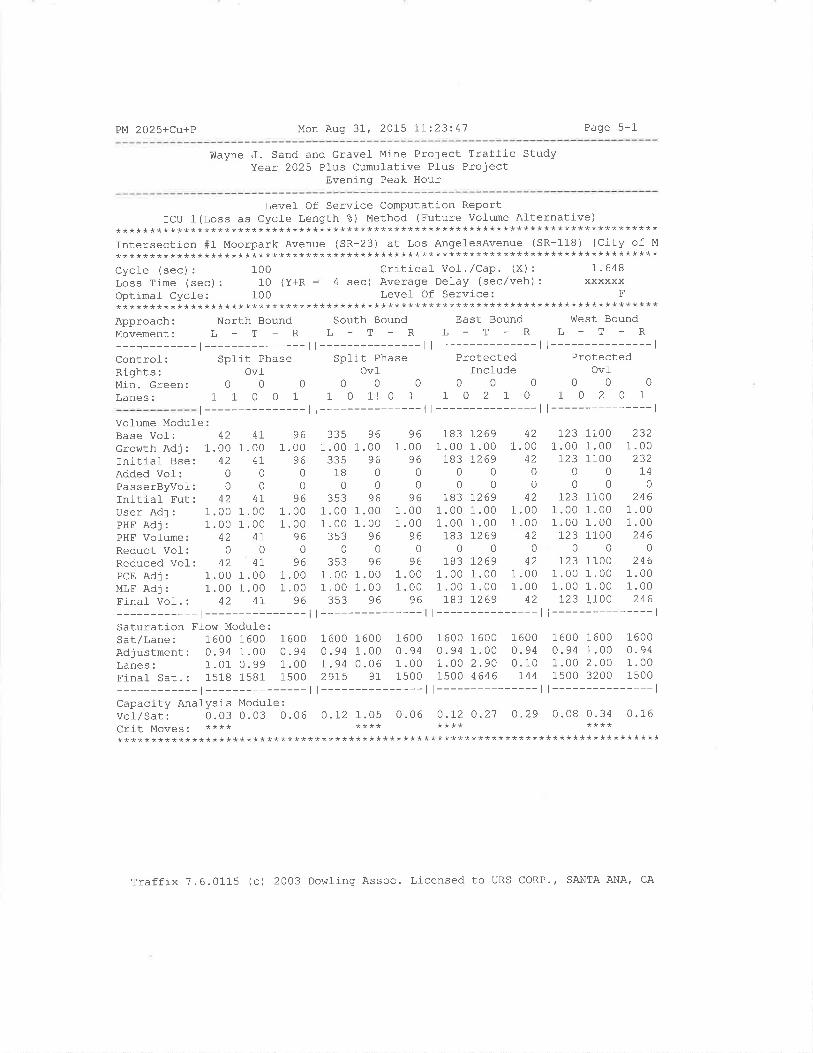
PM 2025+Cu+P Mon Aug 31 , 20L5 1'I:23:41 Page 5-1
Wayne J. Sand and Gravel Mine Project Traffic StudyYear 2025 Pl-us Cumufative Pl-us Project
Evening Peak Hour
Level Of Service Computation ReportICU 1(Loss as Cycle Length ?) Method (Future Volume Afternative)
********************************************************************************Intersection #1 Moorpark Avenue (SR-23) at Los AngelesAvenue (SR-118) [City of M
********************************************************************************Cycle (sec): 100 Critical Vol./Cap. (X): I.648Loss Time (sec): 10 (Y+R = 4 sec) Average Del-ay (sec/veh): xxxxxxOptimal Cycle: 100 Levef Of Service: F********************************************************************************Approach: North Bound South Bound East Bound hlest BoundMovement: L _ T _ R L - T _ R L - T - R L - T - R
-l---------ll---------ll---------ll---------------lControl: Split Phase Spl-it Phase Protected ProtectedRights: Ovl Ovl fnclude OvlMin.Green: O O 0 0 0 0 0 0 0 0 0 0
Lanes: 1 1 O O 1 1 0 1! 0 1 1 0 2 1 0 I 0 2 0 1
t---------------ll---------------ll---------------ll---------------lVofume Module:Base Vol: 42 41 96 335 96 96 I83 7269 42 123 1100 232GrowthAdj: 1.001.00 1.O0 1.001.00 1.00 1.001.00 1.00 1.001.00 1-00InitlaÌ Bse: 42 4L 96 335 96 96 I83 !269 42 123 1100 232AddedVol: 0 0 0 18 0 0 0 0 0 0 0 14
PasserByvol: 0 O 0 0 0 0 0 0 0 0 0 0
rniriat Eut: 42 41 96 353 96 96 183 7269 42 123 1100 246
UserAdj: 1.001.00 1.00 1.001.00 1.00 1.001.00 1-00 1.001.00 1-00PHFAdj: 1.001.00 1.00 1.001.00 1.00 1.001.00 1.00 1.001.00 1-00PHF Volume: 42 41 96 353 96 96 IB3 1269 42 123 1100 246Reduct Vol-: 0 0 0 0 0 0 0 0 0 0 0 0
Reduced Vol_: 42 41 96 353 96 96 IB3 7269 42 723 1700 246PCEAdj: 1.001.00 1.00 1.001.00 1.00 1.001.00 1.00 1.001'00 1.00MLFAdj: 1.OO 1.00 1.00 1.00 1.00 1.00 1'00 1.00 1.00 1.00 1.00 1.00Finat Vol-.: 42 41 96 353 96 96 IB3 7269 42 123 1.100 246
-l---------ll---------ll---------ll---------------lSaturati-on Flow Module:sar/Lane: 1600 160O 1600 1600 1600 1600 1600 1600 1600 1600 1600 1600Adjustment: O. 94 1 . O0 0.94 0. 94 1.00 O .94 0. 94 1.00 0. 94 0. 94 1.00 0 ' 94
Lanes: 1.01 0.99 1.00 1.94 0.06 1.00 1.00 2'90 0.10 1.00 2.00 1'00Final_ sat.: 1518 1581 1500 2915 91 1500 1500 4646 I44 1500 3200 1500
-t---------ll---------ll---------ll---------------lCapacity Analysis Module:Vol/Sat: 0. 03 O. 03 0.06 0.12 1.05 0.06 O .I2 0.2'7 O '29 0.08 0.34 0.16crit Moves. **** **** **** ************************************************************************************
Traffix 7.6.0115 (c) 2003 Dowling Assoc. Llcensed to URS CORP., SANTA ANA, CA
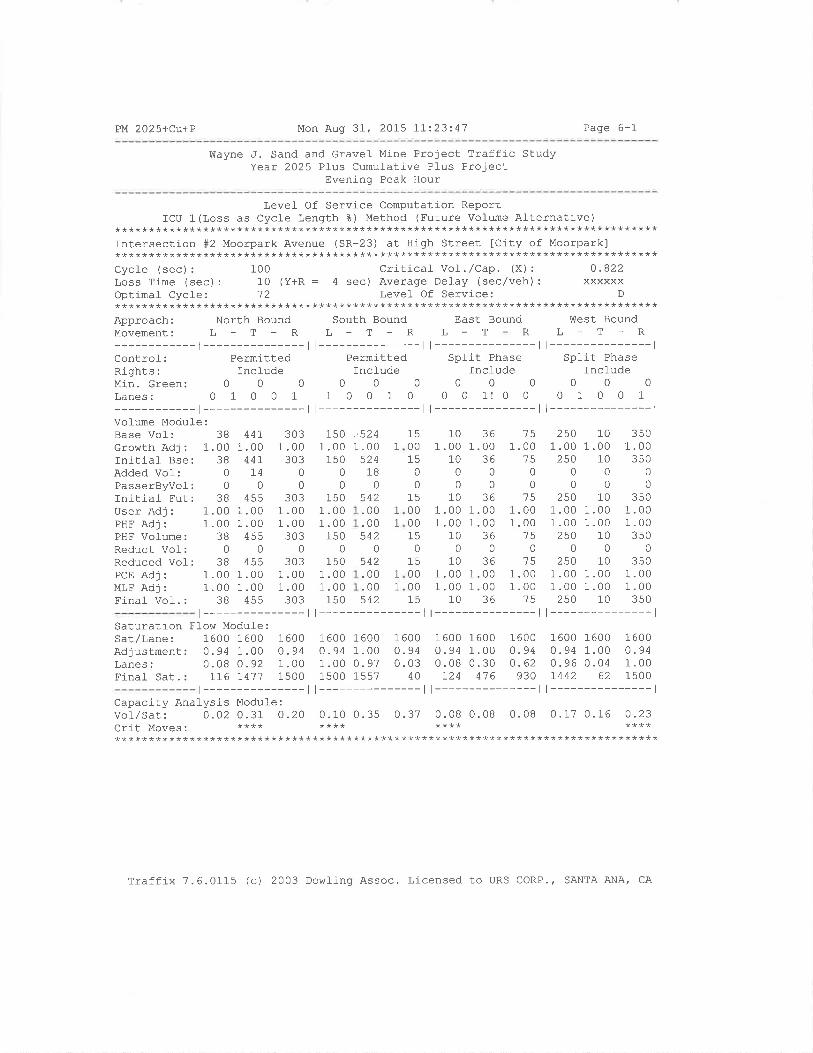
PM 2025+Cu+P Mon Aug 3I, 2015 IL:23:41 Page 6-1
Wayne J. Sand and cravel- Mine Project Traffic StudyYear 2025 PÌus Cumul-ative Plus Project
Evening Peak Hour
Level Of Service Computation ReportICU 1(Loss as Cycle Length %) Method (Future Vohme Afternative)
********************************************************************************Intersection #2 Moorpark Avenue (SR-23) at High Street ICity of Moorpark]********************************************************************************Cycl-e (sec) : 100 Critical- Vol . /Cap. (X) : 0.822Loss Time (sec) : 10 (Y+R : 4 sec) Average Delay (sec/veh) : xxxxxxOptimal Cycle: '72 Level- Of Service: D********************************************************************************Approach: North BoundMovement: L - T - R
-t---------------lControf: PermittedRights: IncludeMi-n.creen:000Lanes: 0 1 0 0 1
-l---------------lVolume Modul-e:Base Vol-: 38 441 303Growth Adj: 1.00 1.00 1.00Initiaf Bse: 38 447 303Added Vol: 0 14 0PasserByVol: 0 0 0Initial Fut: 38 455 303User Adj : 1.00 1.00 1 .00PHF Adj : 1.00 1.00 1 .00PHF Volume: 38 455 303Reduct Vol: 0 0 0Reduced Vol: 38 455 303PcE Adj : 1.00 1.00 1 .00MLF Adj : 1.00 1.00 1 .00Final Vol. : 38 455 303
Saturation Fl-ow Module:Sat/Lane: 1600 1600Adjustment: 0.94 1.00Lanes: 0.08 0.92Final- Sat. : 116 1471
South BoundL-T-R
t---------------lPermittedInclude
00010010
t---------------l
East BoundR
t---------------lSpllt Phase
lncfude000
0 0 1! 0 0
t---------------l
1600 1600 16000.94 1.00 0.940.08 0.30 0.62r24 416 930
t---------------l
ülest BoundL-T-R
t---------------lSplit Phase
IncÌude000
01007t---------------l
1600 1600 16000.94 1.00 0. 940.96 0.04 1.001,442 62 1500t---------------l
L-T
| --------------- | r --------------- I
1501 .00
1500
0
1501.001.00
1500
1501.001.00
150
.00
.00542
0
542.00.00542
10 36 151 .00 1.00 1.00
10 36 't5000000
10 36 '75
1.00 1.00 1.001.00 1.00 1.00
10 36 75000
10 36 151 .00 1.00 1.001.00 1.00 1.00
10 36 15t---------------l
250 10 3501.00 1.00 1 .00250 10 350
000000
250 10 3501.00 1.00 1.001.00 1.00 1.00250 10 350
000250 10 350
1 .00 1 .00 1.001 .00 1 .00 1.00250 10 3s0
t---------------l
,5241 .00
52418
0
1
150015
00
1E
000015
015000015
5421
1
1
1
t---------------l
1600 1600 16000.94 1 .00 0.941 .00 0. 97 0.031500 1557 40t---------------l
1 6000.941.001 500
Capacity Analysis Module:Vol/Sat: 0.02 0.31 O.20Crit Moves' ****
0.10 0.35 0.37 0.08 0.08 0.08 0.17 0.16 0.23**** **** ************************************************************************************
Traffj-x 7.6.0115 (c) 2003 Dowling Assoc. Licensed to URS CORP., SANTA ANA, cA

PM 2025+cu+P Mon Aug 3I , 20!5 7I:23:4'7 Page 7-1
Wayne J. Sand and Gravef Mine Project Traffic StudyYear 2025 PIus Cumufative Plus Project
Evening Peak Hour
Level Of Service Computation Report2000 HCM Unsignalized Method (Future Voflrme Alternative)
********************************************************************************Intersection #3 Grirnes Canyon Road (SR-23) at Broadway Road [County of Ventura]********************************************************************************Cycl-e (sec) : 1 Crj-tical Vol . /Cap. (X) : I.'793Loss Time (sec): 0 (Y+R : 4 sec) Average Del-ay (sec/veh): 34-9Optimal Cycle: 0 Levef Of Service: E
********************************************************************************
Movement:-t---------ll---------ll---------ll---------------l
Controf: Yield Sign Stop Sign Stop Sign Stop SiqnRights: Incl-ude Include Incfude IncludeLanes: 1 O 1 0 0 0 0 0 1 0 0 0 1! 0 0 0 0 0 0 0
-l---------ll---------ll---------ll---------------lVolume Modul-e:Base Vol z 4LGrowth Adj : 1.00Initial Bse: 4lAdded Vof: 0
PasserByvol: 0Initiaf Fut: 4IUser Adj : 1.00PHF Adj: 1.00PHF Vofume: 4IReduct Vof: 0
Final VoÌ. : 47
9901 .00
990I4
0
10041.001.001004
01004
700.00700
180
718.00.00718
0lIB
t91 .00
791
020
1 .001 .00
200
20
'73 0 ?81 .00 1.00 1.00
13078100000
14 0 781.00 1.00 1.001.00 1.00 1.00
'1 4 0 78000
14 0 78
t---------------l
0000 1.0000000000
00 1.0000 1.00000000
1.00 1 .00 1
1.00 1.00 1
000000
1.00 1
1.00 1
0
0
0
Approach:
Green/CycleVoJ-ume/Cap:DeJ-ay/Veh:Dej-ay Adj:Adj Del/Veh:DesignQueue
North BoundL-T-R
South BoundL-T-R
East BoundL-T-R
0001.00 1.00 1.000. 49 0.00 0.51r34 0 141
t---------------l
üIest BoundL-T_R
0001.00 1 .00 1.000.00 0.00 0.00
000t---------------l
0
1 .000
000
000
000
0
1 7
0
1.00 1
0000
-l--------- I l---------------lSaturation Flow Module:Sat/Lane: 0 0 0 0 0 0
Adjustmenr: 1.00 1.00 1.00 1.00 1.00 1.00Lanes : 1 .00 1.00 0.00 0.00 0 ' 97 0.03Finaf Sat. : 560 560 0 0 136 20
-l--------- ll---------------lCapacity Analysis ModuÌe :
vol/Sat: 0.01 I.19 0.00 0.00 0.98 0.98Crit MO1,.eS. **** ****
1.00 1 .000 .0'7 r .191.3 909
1 .00 1 .001.3 909
00
1 .000 .000.0
1.000.0
0
^ Et
1.000. 558.2
1.00
0.00 0.00
1 .00 1.000.00 0.000.0 0.0
1.00 1.00
0. 00
1 .000.000.0
1.00
t---------------l
.00
.000.0
1
0
1
1.0.401.
009B
.B00
1.0.401.
0098
a
00
0.55 0.00
1.00 1.000.55 0.00
B .2 0.01.00 1.0000
0.0 40. B 40. B B .2 0.0 B .2 0.0 0.0 0.0000000000
********************************************************************************
Traffix 7.6.0115 (c) 2003 Dowling Assoc. Licensed to URS CORP., SANTA ANA, CA
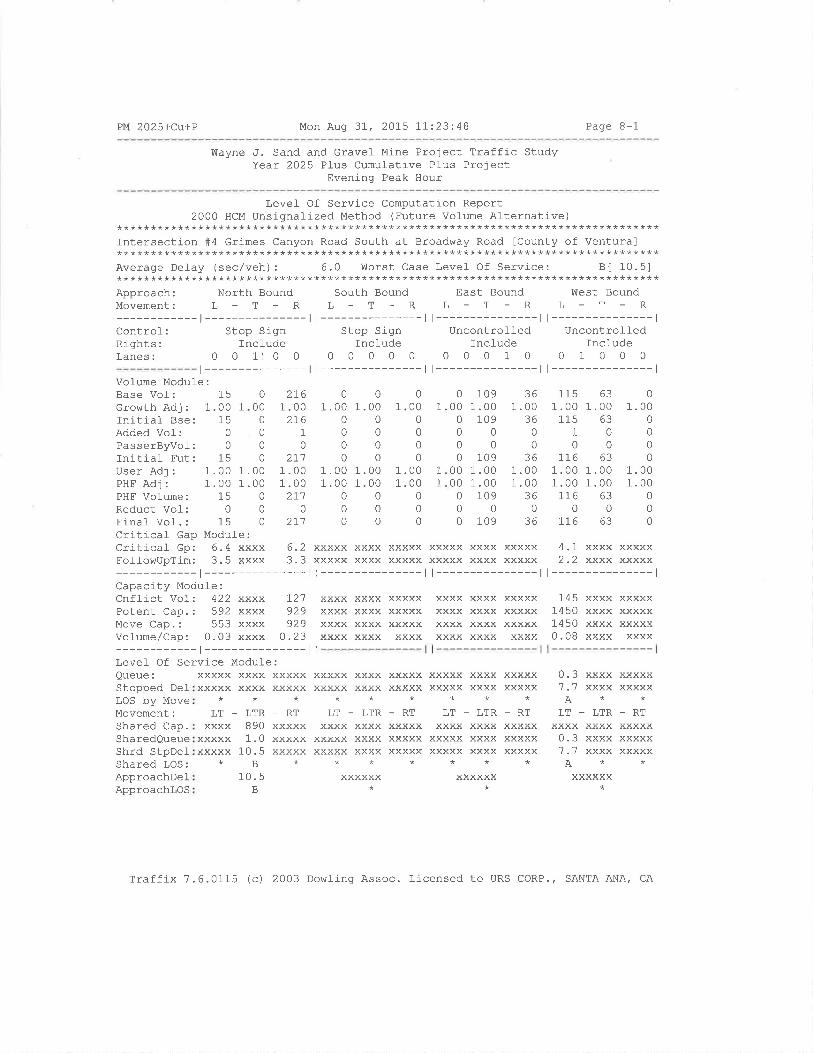
PM 2025+Cu+P Mon Aug 3It 20L5 t7:23:48 Page 8-1
V{ayne J. Sand and Gravel Mine Project Traffic StudyYear 2025 Pl-us Cumufative Plus Project
Evening Peak Hour
Level Of Service Computation Report2000 HCM Unsignalized Method (Euture Volume Afternative)
********************************************************************************Intersection #4 Grimes Canyon Road South at Broadway Road ICounty of Ventura]********************************************************************************Average Delay (sec/veh): 6.0 Worst Case Level- Of Service: Bt 10.51********************************************************************************Approach: North Bound South Bound East Bound West BoundMovement: L - T - R L - T - R L - T - R L - T - R
-t--------- |--------- l l--------- l l---------------lControl: Stop Sign Stop Sign UncontroÌÌed Uncontrol-fedRights: Include Include Tncl-ude ÌncludeLanes: 0 0 1! 0 0 0 0 0 0 0 0 0 0 1 0 0 1 0 0 0
t --------------- | --------------- | --------------- l l --------------- l
Vofume Module:Base Vol: 15Growth Adj : 1.00 1
Initial Bse: 15Added Vol: 0
PasserByvol: 0Initial Fut: 15
2761 .00
2161
0
2r11 .001 .00
2710
277
00.00 1.00 1
00000000
0 10900 1.000 10900000 109
00 1.0000 1.000 109000 109
Jb1.00
360
0
361.001.00
360
36
115 631.00 1.00115 63
1000
116 631 .00 1.001 .00 1.00116 63
00116 63
01.00
0000
1.001.00
000
User Adj : 1.00 1.00PHFAdj: 1.00 1.00PHF Vofume: 15 0
Reduct Vo1: 0 0
Final Vol.: 15 0
Critical Gap Module:Critical Gp: 6.4 xxxx 6.2 xxxxx xxxx xxxxx xxxxx xxxx xxxxxFoÌlowUpTim: 3.5 xxxx 3.3 xxxxx xxxx xxxxx xxxxx xxxx xxxxx
-t---------ll---------ll---------------lCapacity Module:Cnffict Vol: 422 xxxx I2'7 xxxx xxxx xxxxx xxxx xxxx xxxxxPotent Cap.: 592 xxxx 929 xxxx xxxx xxxxx xxxx xxxx xxxxxMove Cap.: 553 xxxx 929 xxxx xxxx xxxxx xxxx xxxx xxxxxVofume/Cap: 0.03 xxxx O.23 xxxx xxxx xxxx xxxx xxxx xxxx
-r---------------tlLevel- Of Service Module:
000
0
0
0
0
0
1.00 1
0000
1.00 1.001 .00 1.00
000000
1.00 L
1.00 7
0
0
0
4.1 xxxx xxxxx2 .2 xxxx xxxxx
t---------------l145 xxxx xxxxx
1450 xxxx xxxxx1450 xxxx xxxxx0.08 xxxx xxxx
Queue:Stopped DefLOS by MoveMovement:Shared Cap.SharedQueueShrd StpDelShared LOS:ApproachDel-ApproachLOS
xxxxx xxxxXXXXX XXXX**
LT - LTRxxxx 890
xxxxx 1.0xxxxx 10.5
*B10.5
B
xxxxx xxxxxxxxx xxxx**
LT - LTRxxxx xxxx
xxxxx xxxxYYYI! YYYI**
XXXXXX*
XXXXX XXXXYIYYY YYYY**
LT _ LTRxxxx xxxx
xxxxx xxxxxxxxx xxxx**
xxxxxx*
0.3 xxxx7 .7 xxxxA*
LT - LTRxxxx xxxx0.3 xxxx7 .7 xxxxA*
XXXXXX
xxxxxxxxxx
_RTxxxxxxxxxxxxxxx
XXXXXxxxxx
-RTxxxxxXXXXXxxxxx
XXXXXxxxxx
_RTxxxxxXXXXXXXXXX
XXXXXxxxxx
-RTXXXXX
XXXXX
Traffíx 7.6.0115 (c) 2003 DowJ-ing Assoc. Licensed to URS CORP./ SANTA ANA, CA

PM 2025+Cu+P Mon Aug 3I' 201.5 71t23:48 Page 9-1
Wayne J. Sand and Gravel Mine Project Traffic StudyYear 2025 PIus Cumulative Pfus Project
Evening Peak Hour
Level Of Service Computation ReportICU 1(Loss as Cycfe Length 8) Method (Future volume Afternative)
********************************************************************************Intersectj-on #5 Grimes Canyon Road South at Los Angeles Avenue (SR-118) [County********************************************************************************Cycle (sec): 100 critical- Vol./Cap. (X): l'436Loss Time (sec) : 10 (Y+R : 4 sec) Average Delay (sec/veh) : xxxxxxOptimal- Cyc]e: 100 Level Of Service: F********************************************************************************Approach: North Bound south Bound East Bound üIest BoundMOVEMENT: L - T _ R L - T - R L - T - R L - T _ R
-l---------ll---------ll---------ll---------------lcontrol: Split Phase split Phase Protected ProtectedRights: Include Incl-ude Incfude IncludeMin.Green: O O 0 O 0 0 0 0 0 0 0 0
Lanes: O 0 O 0 O O O 1! 0 0 1 0 1 0 0 0 0 1 0 1
-l---------ll---------ll---------ll---------------lVol-ume Moduf e:Base Vol: 0Growth Adj : 1.00Initial Bse: 0
Added Vol: 0
PasserByvof: 0
-Lnrt ral .E ut : U
User Adj : 1.00PHE Adj : 1.00
0
000
1.00 1
1.00 1
000
1.00 1
1.00 1
0
.0035
1
036
.00
.0036
036
.00
.0036
951.00
OR
1
096
1 .001.00
960
961.001.00
96
20861.002086
00
20861.001.002086
020861.001.002086
0
1.000
000
1.001.00
000
1.001.00
0
0
1.000
0
00
1.001.00
000
1 .001 .00
0
9381 .00
9380
0938
1. 001.00
9380
o?a
1.001.00
938
2I1.00
21,
00
2I1.001 .00
270
271.001 .00
27
I 1 1
000
00
00
0000
0
0
0
0000
0
000
0
0
0
00000
00
00000
0
1500
00
15000015
015000015
0
1.00
761.0.
1
L
1
11
1
1
PHF Vofume:Reduct Vol:Reduced Vol-:PCE Adj:MLF AdJ:Finaf Vol.:
0
00
1.00 1
1.00 1
0
1
1
1
1
Saturation Flot^t ModuleSat/Lane: 1600 1600Adjustment: 1.00 1.00Lanes: 0.00 0.00Final Sat.: 0 0
1 6001 .000 .00
0
1 6001 .00o.29
417
00 160000 1 .0000 0.710 tr29
1600 16001 .00 1.001 .00 1 .001600 1600
16001.000. 00
0
1600 16001 .00 1.000.00 1.00
0 1600
1 6001.001 .001 600
Capacity Anafysis Modul-e :
vol/Sat: 0. oo o . o0 o. oo 0. 03 0.00 0.03 0.06 1 . 30 0.00 0.00 0. 59 0.01crit Moves. **** **** ************************************************************************************
Traffix 7.6.0115 (c) 2003 Dowling Assoc. Licensed to URS coRP., SANTA ANA' CA
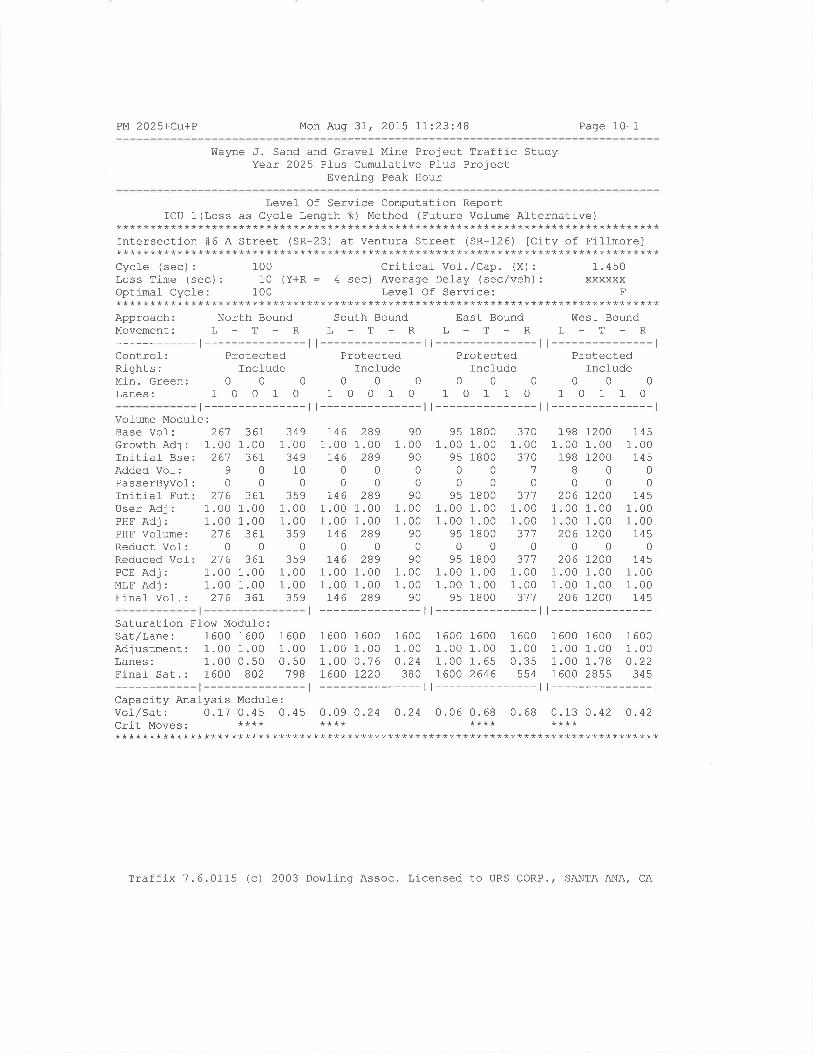
PM 2025+Cu+P Mon Aug 37, 2015 77:23:48 Page 10-1
Wayne J. Sand and Gravel- Mine Project Traffic StudyYear 2025 Pfus Cumul-ative Pl-us Project
Evening Peak Hour
Level Of Service Computation ReportTCU 1 (Loss as Cycle Length å) Method (Future Volume Afternative)
********************************************************************************Intersection #6 A Street (SR-23) at Ventura Street (SR-126) [City of Fillmore]********************************************************************************Cycte (sec) : 100 Criticaf Vol-.,/Cap. (X) : 1.450Loss Time (sec) : 10 (Y+R = 4 sec) Average Delay (sec/veh) : xxxxxxOptimal Cycle: 100 Levef Of Service: F********************************************************************************Approach: North Bound South Bound East Bound Íitrest BoundMovement: L - T - R
-t---------------lControf: ProtectedRights: IncludeMin.Green: 0 0 0
Lanes: 1 0 0 1 0
L-T-RL-T-R| --------------- | I --------------- |
Protected ProtectedIncfude Incfude
0000001001010110
| --------------- | I --------------- |t---------------l
L-T-Rt---------------l
ProtectedInclude
00010110
t---------------lVolume Modufe:Base Vol : 26'7Growth Adj : 1.00Initial Bse: 261Added Vof: 9
PasserByVol: 0
Initial Fut: 216User Adj : 1.00PHF Adj : 1.00PHF VoÌume : 2'l 6
Reduct Vol: 0Reduced Vof: 21 6PCE Adj : 1.00MLF Adj : 1.00Einal Vol-. : 21 6
146 289 901 .00 1.00 1 .00 1
146 289 90000000
3611.00
3610
0
3611 .001 .00
3610
36r1 .001 .00
361
3491 .00
34910
0359
1 .001.00
3s90
3s91 .001 .00
3s9
r461.00 1
1.00 1
r460
r461.00 1
1.00 1
746
.00
.00289
0289.00.00,oo
901.00 1
1.00 1
900
901.00 1
1.00 1
90
95 180000 1.009s 18000000
95 180000 1.0000 1.0095 180000
95 180000 1.0000 1.0095 1800
3101.00
3701
0317
1.001.00
3'710
3771.001.00
311
198 1200 1451.00 1.00 1.00198 1200 145
800000
206 7200 1451.00 1.00 1.001.00 1.00 1.00206 7200 145
000206 7200 145
1 .00 1.00 1.001 .00 1.00 1 .00206 1200 145
l---------------l
289
Saturation Fl-ow Module:Sat/Lane: 1600 1600 1600 1600 1600 1600 1600 1600 1600 1600 1600 1600Adjustment: 1.00 1.00 1.00 1.00 1.00 1.00 1.00 1.00 1.00 1.00 1.00 1.00Lanes: 1.00 0.50 0.50 1.00 0.76 O.24 1.00 1.65 0.35 1.00 1.78 O.22Finaf Sat.: 1600 8O2 198 1600 1220 380 7600 2646 554 1600 2855 345
-t--------- |--------- l l--------- l r---------------lCapacity Analysis Module:vol,/Sat: 0.17 0.45 0.45 0.09 0.24 0.24 0.06 0.68 0.68 0.I3 0.42 0.42crit Moves: **** **** **** ************************************************************************************
Traffix 7.6.0115 (c) 2003 Dohrling Assoc. Licensed to URS CORP., SANTA ANA, CA
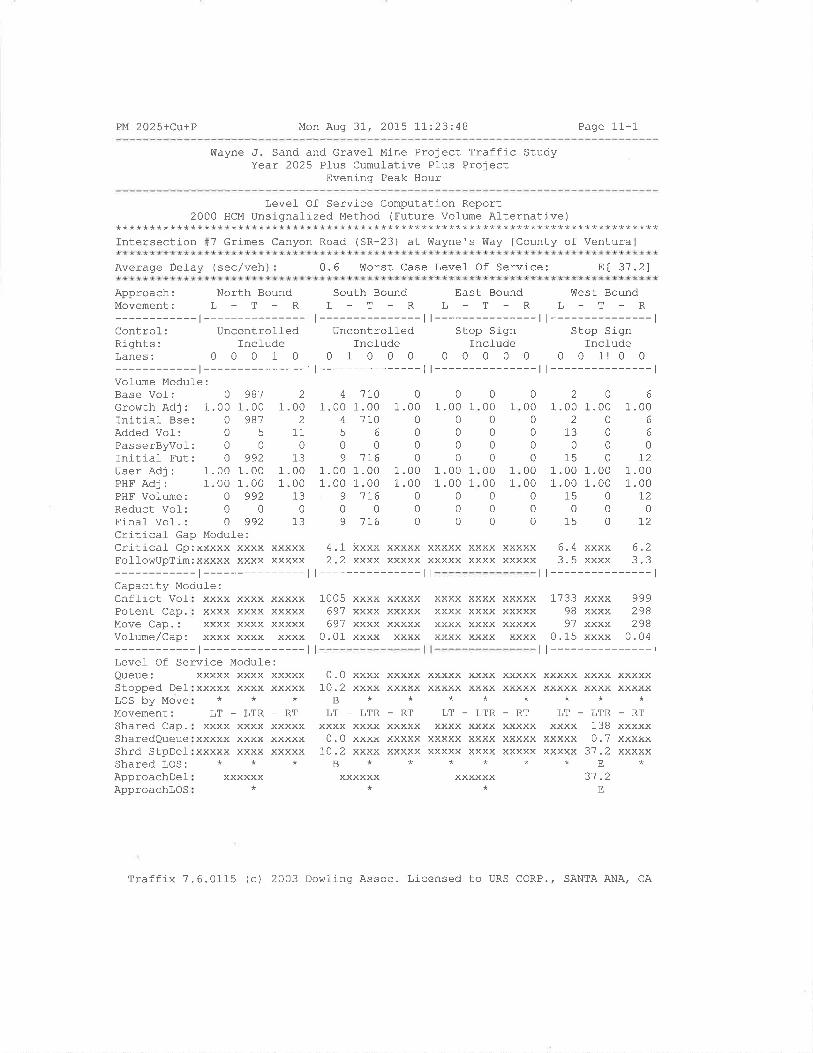
PM 2025+Cu+P Mon Aug 3I, 2075 II:23:48 Page 11-1
Wayne J. Sand and Gravel- Mine Project Traffic StudyYear 2025 Plus Cumulative Pfus Project
Evening Peak Hour
********************************************************************************Level Of Service Computation Report
2000 HCM Unsignalized Method (Future Volume Al-ternative)
Intersection #7 Grimes Canyon Road (SR-23) at Wayne's ülay [County of Ventura]
Average Detay (sec/veh) 0.6 $¡orst Case Level Of Service: EI 3'7 .21
Approach: North BoundMovement: L - T - R
-t---------------lControl-: UncontrolledRights: IncfudeLanes: 0 0 0 1 0
-t---------------lVolume Module:Base Vol: 0
Growth Adj : 1.00Initial Bse: 0Added Vof: 0PasserByVol: 0Initial Fut: 0User Adj : 1.00PHF Adj : 1.00PHF Volume: 0Reduct Vof: 0Final Vol. : 0
Cnfl-íct VolPotent Cap.Move Cap.:VoJ-ume/Cap:
- t --------------- |Levef Of Service Module:
South BoundL-T-R
t---------------lUncontrol-led
fnclude01000
t---------------l
East BoundL-T-R
t---------------lStop Sign
Incfude00000
t---------------l
V17est BoundL-T-R
t---------------lStop Slgn
Incfude0 0 1! 0 0
t---------------l
1733 xxxx98 xxxx97 xxxx
0.15 xxxx
9871.00
98'l5
0
992
2
1 .002
110
13
'tro 0 0
1.00 1.00 1.00 1
lro 0 0
600000
176 0 0
02000 1 .00 1.000200 13 00000 15 0
00 1 .00 1.0000 1 .00 1.000 15 00000150
6
1.006
6
0I2
1.001.00
720
L2
4
1 .004
509
0
000
0
0
0
0000
0
00
7
1
1
1 .00 1 .00 1.00 1.00 1.00 1 .00 1
1 .00 1 .00 1.00 1.00 1.00 1 .00 1
99213911600000000
99213971600Critical Gap ModuJ-e:Critical Gp:xxxxx xxxx xxxxx 4.1 kxxx xxxxx xxxxx xxxx xxxxx 6.4 xxxx 6.2Follor^rupTim:xxxxx xxxx xxxxx 2.2 xxxx xxxxx xxxxx xxxx xxxxx 3.5 xxxx 3.3
| --------------- l
xxxx xxxx xxxxxxxxx xxxx xxxxxxxxx xxxx xxxxxxxxx xxxx xxxx
XXXX
xxxxXXXX
xxxx xxxxxvSvv Y99t9
xxxx xxxxxXXXX XXXX
999298298
0.04
1005 xxxx xxxxx697 xxxx xxxxx697 xxxx xxxxx
0.01 xxxx xxxx| --------------- l
Queue:Stopped DelLOS by MoveMovement:Shared Cap.SharedQueueShrd StpDefShared LOS:ApproachDelApproachLOS
xxxxx xxxxXXXXX XXXX**
LT - LTRVYYY YYYY
xxxxx xxxxxxxxx xxxx**
xxxxxx*
0.0 xxxx10.2 xxxx
B*LT _ LTR
xxxx xxxx0.0 xxxx
10.2 xxxxB*xxxxxx
XXXXX XXXXXXXXX XXXX**
LT - LTRxxxx xxxx
YYI!Y YY?Y
XXXXX XXXX**xxxxxx
*
xxxxx xxxxxxxxx xxxx**
!l - LaK
xxxx 138xxxxx 0.1xxxxx 37.2
*Ea1 a
E
xxxxxXXXXX
_RTxxxxxxxxxxxxxxx
xxxxxxxxxx
- Áa
XXXXXxxxxxxxxxx
xxxxxXXXXX
- Kttt9vY
t9Y9!
xxxxx
XXXXXxxxxx
-RTXXXXXYVVTV
xxxxx
Traffix 7.6.0115 (c) 2003 Dowling Assoc. Licensed to URS CORP,, SANTA ANA, CA
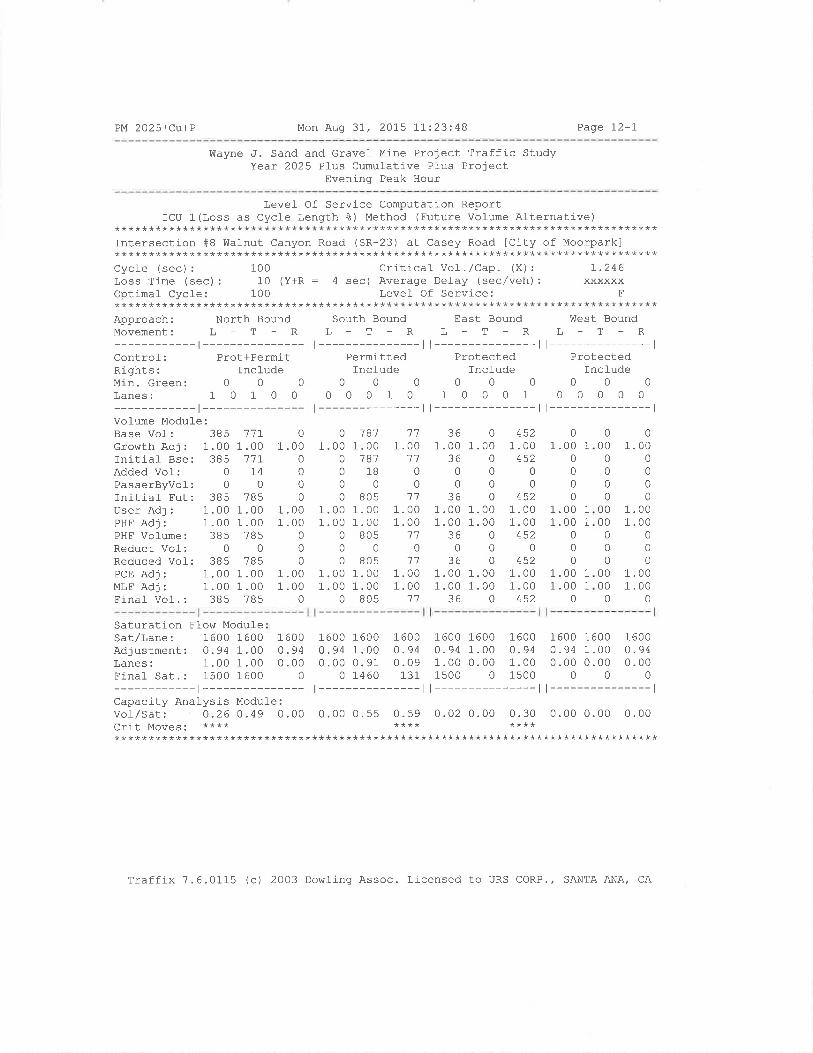
PM 2025+Cu+P Mon Aug 3I, 2OI5 7L:23:48 Page I2-I
ülayne ,J. Sand and Gravel Mine Project Traffic StudyYear 2025 Plus Cumufative Plus Project
Evening Peak Hour
Level Of Service Computation ReportICU 1(Loss as Cycle Length å) Method (Future Volume Alternative)
********************************************************************************Intersection #B úlafnut Canyon Road (SR-23) at Casey Road ICity of Moorpark]********************************************************************************Cycle (sec): 100 Critical- Vol./Cap. (X): I.246l,oss Time (sec) : 10 (Y+R : 4 sec) Average Del-ay (sec/veh) : xxxxxxOptimal Cycle: l-00 Level Of Service: F********************************************************************************Approach: North Bound South Bound East Bound V^¡est BoundMovement: L - T - R L - T - R L - T - R L - T - R
-r--------- |--------- l l--------- l l---------------lControf: Prot+Permit Permitted Protected ProtectedRights: Incl-ude Include lncfude IncludeMln.Green: 0 0 0 0 0 0 0 0 0 0 0 0
Lanes: 1 0 1 0 0 0 0 0 1 0 1 0 0 0 1 0 0 0 0 0
-t--------- |--------- l l--------- l l---------------lVolume Modul-e:Base Vof: 385Growth Adj : 1.00Initiaf Bse: 385Added Vof: 0
PasserByvof: 0
Initiaf Fut: 385User Adj : 1.00PHF Adj : 1.00PHF Volume: 385Reduct Vol: 0Reduced Vol: 385PCE Adj : 1.00MLF Adj : 1.00Final Vol. : 385
Saturation FIoI¿, ModuleSat/Lane: 1600 1600Adjustment: 0.94 1.00Lanes: 1.00 1.00Final Sat.: 1500 1600
7771.0011r
1.4
0785
1 .001 .00
7850
7851 .001 .00
785
01 .00
0000
1 .001 .00
0
00
1 .001 .00
0
0
1.000
0
0
01.001.00
0
0
0
18'71.00
78118
0
8051.001.00
8050
805
111 .00
1100
111.001 .00
110
11
361 .00
3600
361 .001 .00
360
36
4521.00
4520
0452
1.001.00
4520
452
0000
1.00 1
1.00 1
000
1.00 1
1.00 1
0
1.001.00
0
0
0
1.001.00
0
01 .00
0000
01.00 1
000
0
00
00000
00
0
0000
0
01.00
0
0
00
1 6000 .940.00
0
1.001.00
000
1 6000.940.00
0
1.00 1.00 1 .00 1 .00 1.00 1.001.00 1.00 1 .00 1 .00 1 .00 1.00
0 805 '71 36 0 452
1600 16000.94 1.001 .00 0.001s00 0
1 6000.940 .00
0
00 1 60000 0.9491 0.0960 131
1 6000. 941.001s00
1 6000.940 .00
0
I61.0.1-4
000000
0
I61.0.
-t--------- |--------- l l--------- l l---------------lCapacity Analysis ModuÌe :
Vof/Sat: O.26 O.49 0.00 0.00 0.55 0.59 0.02 0.00 0.30 0.00 0.00 0.00crit Moves. **** **** ************************************************************************************
Traffix 7.6.0115 (c) 2003 DowJ-ing Assoc. Licensed to URS CORP., SANTA ANA, CA
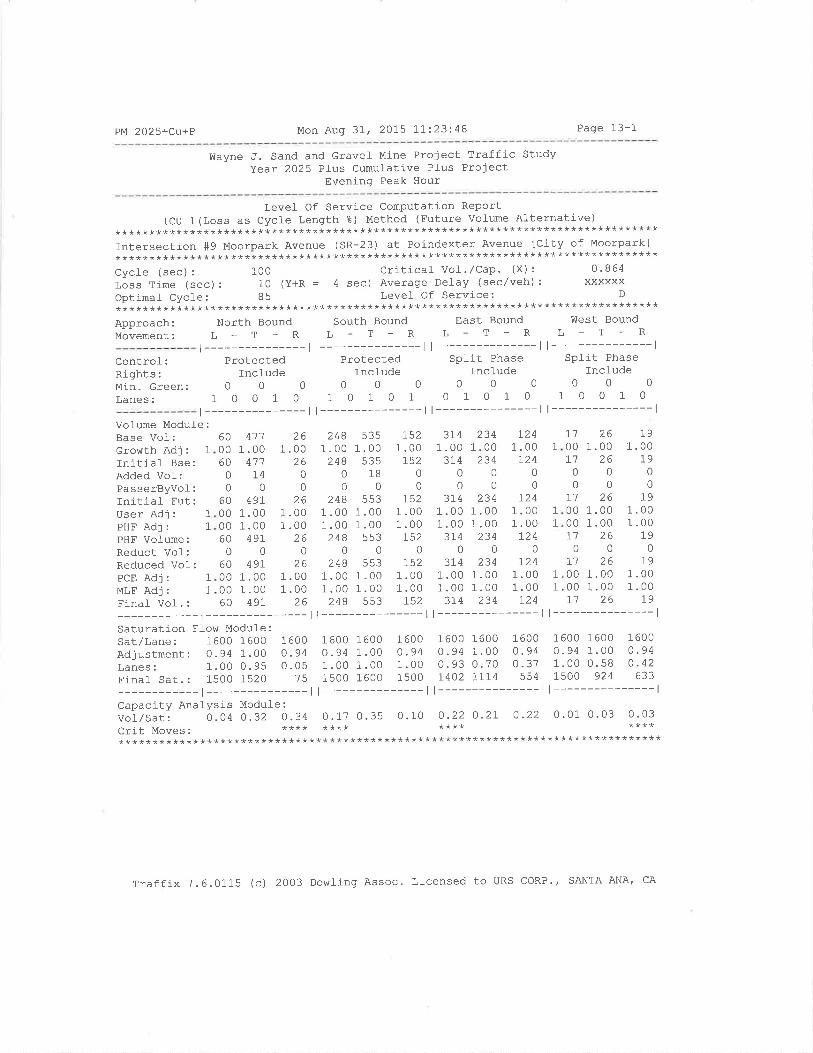
PM 202s+Cu+P Mon Aug 37, 2075 7I:23:48 Page 13-1
Wayne J. Sand and Gravef Mine Project Traffic StudyYear 2025 Pl-us Cumulative PIus Project
Evening Peak Hour
Level Of Service Cornputation ReportICU 1(Loss as Cycle Length ?) Method (Future voÌume Alternative)
********************************************************************************Intersection +9 Moorpark Avenue (SR-23) at Poindexter Avenue lCity of Moorpark]********************************************************************************CycJ-e (sec) : 100 Criticaf vol. /Cap. (x) : 0 ' 864
Loss Time (sec) : 10 (Y+R = 4 sec) Average DeJ-ay (sec/veh) : xxxxxxOptimal Cycle: 85 Level- Of Service: D
* * * * * * * * * * * * * * * * * * * * * * * * * * * * * * * * * * * * * * * * * * * * * * * * * * * * * * * * * * * * * * * * * * * * * * * * * * * * * * * *
Approach: North Bound south Bound East Bound west Bound
Movement: L - T - R L - T - R L - T - R L - T - R
Control: Protected Protected Split Phase Sp1it Phase
Rights:IncludelncludelncludeTncfudeMin.Green: O 0 0 O O 0 0 0 0 0 0 0
Lanes: 1 O 0 1 O 1 0 1 O 1 0 1 0 1 0 1 0 0 1 0
t---------------ll---------------ll---------------ll---------------l
r---------------ll---------------ll---------------ll---------------lVolume Modul-e:Base Vol:Gror¡rth Adj: 1
Initial Bse:Added Vol:PasserByvol:Initiaf Fut:User Adj: 1
PHF Adj: 1
PHF Vofume:Reduct Vof:Reduced Vo1:PCE Adj: 1
MLF Adj: 1
Final Vof. :
60 41100 1.0060 4110 1400
60 49r00 1 .0000 1.0060 49r00
60 49r00 1.0000 1 .0060 49r
261.00
zb00
261 .001 .00
260
261 .001 .00
26
2481.00
24800
2481 .001 .00
2480
2481.001 .00
248
s351 .00
53518
0553
1.001 .00
5530
5531 .001.00
553
7521.00
75200
L521 .001 .00r52
0r52
1.001 .00r52
3741 .00
37400
3141 .001 .00
3]_40
31,41 .001 .00
374
2341.00
2340
0
2341 .001.00
2340
2341.001.00
234
1241.00
7240
0124
1.001 .00
1240
\241 .001.00
124
L100r'l
0
0I10000I1
0
I1000071
261 .00
Zt)00
261.001 .00
260
261.001 .00
26
10
1.0019
00
I91 .001 .00
190
791 .001.00
19
1
1
1
1
1
Saturation Ffow Module:Sat/Lane: 1600 1600Adjustment: 0.94 1.00Lanes: 1.00 0.95
1 6000.940 .05
1600 16oo 1600 1600 1600 1600 1600 1600 16000.94 1 .00 0 .94 0.94 1.00 0 .94 0. 94 1.00 0 -941.OO 1.00 1.OO 0.93 0.70 0.37 1.00 0.58 0-42
FinaÌ sar.: 15oO 1520 75 15OO 1600 1500 1402 1714 554 1500 924 633
-l---------ll---------ll---------ll---------------lCapacity Analysis Module :
vor/sut' o.04 0.32 0.34 O.1? O.35 0.10 0.22 0.2L 0.22 0.01 0.03 0-03crit Moves ' **** **** **** ************************************************************************************
Traffix ?.6.011-5 (c) 2003 Dowllng Assoc. Licensed to URS CORP'' SANTA ANA, cA
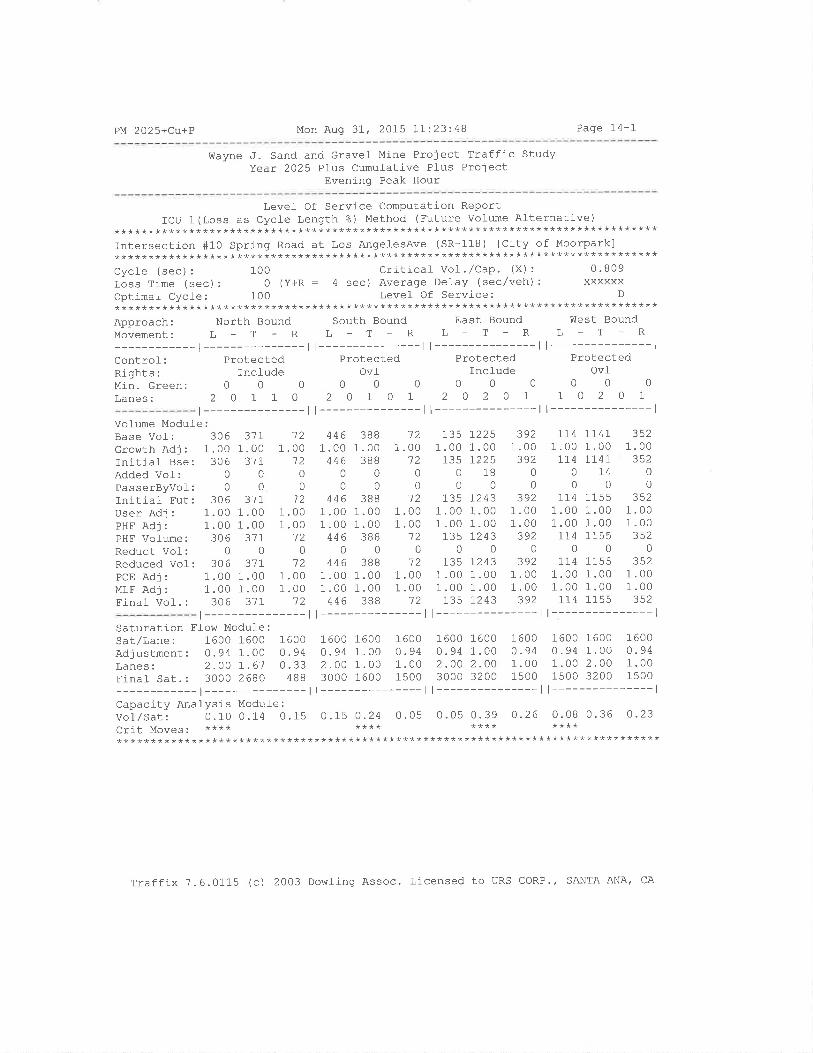
PM 202s+Cu+P Mon Auq 3I, 2015 1I:23:48 Page 14-1
Wayne J. Sand and Gravel Mine Project Traffic StudyYear 2025 Plus CumuÌative Pl-us Project
Eveninq Peak Hour
Level- Of Service Computation ReportICU 1(Loss as Cycle Length %) Method (Future volume Alternative)
********************************************************************************fntersection #10 Spring Road at Los Angel-esAve (SR-118) tCity of Moorparkl********************************************************************************Cycl-e (sec): 1OO Criticat Vol./Cap. (X): 0.809Loss Time (sec): 0 (Y+R : 4 sec) Average Delay (sec/veh): xxxxxxOptimal Cycle: 100 Level Of Service: D
********************************************************************************Approach: North Bound south Bound East Bound v{est BoundMovement: L - T - R L _ T _ R L - T _ R L _ T - R
-r---------ll---------ll---------ll---------------lcontrol: Protected Protected Protected ProtectedRights: Include Ovf Incfude OvfMin.creen: 0 O O 0 0 0 0 0 0 0 0 0
Lanes: 2 O 1 1 O 2 0 1 0 1 2 0 2 O 1 I 0 2 0 1
t---------------ll---------------ll---------------ll---------------lVolume Modul-e:Base Vol: 306 317GrowthAdj: 1.001.00 1.Initiaf Bse: 306 37IAdded Vof: 0 0
PasserByvol: 0 0
Initial Fut: 306 371User Adj : 1.00 1 .00 1 .
PHF Adj : 1 .00 1.00 1 .
PHF Volume: 306 31IReduct Vol: 0 0Reduced Vol: 306 371pcEAdj: 1.001.00 1.oo 1.001.00 1.00 1.001.00 1.00 1.001.00 1.00MLFAdj: 1.001.00 1.00 1.001.00 1.00 1.001.00 1.00 1.001.00 1'00Final Vol.: 306 31I 12 446 388 12 735 1243 392 114 1155 352
't2 446 38800 1.00 1.0012 446 388000000
'72 446 3BB00 1 .00 1.0000 1.00 1.0012 446 3BB000'72 446 3BB
121 .00
120
012
1 .001 .00
120
12
1351 .00
1350
0
1351 .001 .00
1350
135
12251.001225
1B0
12431.001.007243
0
t243
3921.00
39200
3921.001 .00
3920
392
7741.00
1140
0II4
1.001.00II4
0174
114 1
1.00LT4I
740
115 51.001.00115 5
0115 5
3521.00
35200
3521.001.00
3520
352
t---------------ll---------------ll---------------ll---------------lSaturatíon Floh/ Modul-e :
sar/Lane: 1600 1600 1600 1600 1600 1600 1600 1600 1600 1600 1600 1600Adjustment: o.94 1.OO O.94 O.94 1.00 0.94 0.94 1.00 0.94 0.94 I.00 o-94Lanes: 2.OO I.6'7 0.33 2'00 1.00 1.00 2-00 2'O0 1.00 1.00 2.00 1.00Final_ sar.: 3OOO 2680 4BB 3000 1600 1500 3000 3200 1500 1500 3200 1500
-l---------ll---------ll---------ll---------------lCapacity Anafysis Module:Vol_/sar: 0.10 0.14 0.15 0.I5 0.24 0.05 0.05 0.39 0.26 0.08 0.36 0.23crit Moves. **** **** **** ************************************************************************************
Traffix 7.6.0115 (c) 2003 Dowling Assoc. Licensed to URS CORP./ SANTA ANA, CA


