Embed Size (px)
Citation preview

Pergamon Geochimica et Cosmochimica Acta, Vol. 59. No. 6. pp. 1101 -I I 12, 1995
Copyright 0 1995 Elsevier Science Ltd Printed in the USA. All rights reserved
0016-7037/95 $9.50 + 00
0016-7037( 95)00027-5
Analysis of proton binding by a peat humic acid using a simple electrostatic model
C. J. MILNE, ’ * D. G. KINNIBURGH, ’ J. C. M. DE WIT,*+ W. H. VAN RIEMSDIJK,* and L. K. KOOPAL*
‘British Geological Survey, Wallingford, Oxon OX10 8BB, UK ‘Wageningen Agricultural University, Dreijenplein, 6703 HB Wageningen. The Netherlands
(Received December 13, 1993; accepted in revised firm December 12, 1994 )
Abstract-Detailed potentiometric titration data were collected for a purified peat humic acid (PPHA) over a range of pH (pH 3.5- 10.5) and KN03 background electrolyte concentrations (0.001-0.3 M). The data were analyzed following the master curve approach which includes both an electrostatic double layer model and a model for the intrinsic heterogeneity of the PPHA. Spherical and cylindrical double layer models gave equally good fits to the data.
A salt dependence observed around pH 5 could not be completely removed by taking into account the electrostatic interactions. Hysteresis was observed to a much greater extent in the first titration cycle compared with the second cycle. This suggested that some slow and only partly reversible aggregation was occurring possibly as a result of the aggregation created during the purification of the humic acid. Titration curves for fully redispersed samples fitted the master curve approach (surface charge vs. surface pH) reasonably well but still displayed an ionic strength dependence at a pH of less than 5 which could not be accounted for using the simple electrostatic model.
Heterogeneity analysis of the master curve showed that the affinity distribution had two peaks centred at log K{’ - 4andlog Kc- 8 to 9. The total number of weak acid sites titrated between pH 3.5 and 10.5 was approximately 3.5 eq kg-’ but the total number of sites estimated from the isotherm analysis was 5.3-5.8 eq kg -I. Double T&h and double Langmuir-Freundlich isotherms fitted the data almost equally well but the implied distribution of sites between the more acidic ‘ ‘carboxylic” sites and the weakly acidic “phenolic” sites varied with the isotherm chosen. An important source of uncertainty in the analysis was in estimating the charge on the humic acid at its initial pH of about pH 3.
INTRODUCTION
Binding of cations by natural organic matter, including humic acids, can play an important role in the control of metal spe- ciation and mobility in aqueous and soil environments (Buf- fle, 1988; Sposito, 1986). Improving and extending our knowledge of the complexation behaviour of humic sub- stances is, therefore, the subject of considerable interest.
Humic acids (HA) are polydisperse mixtures of organic polyelectrolytes possessing a variety of different types of functional groups which act as binding sites for cations. As a consequence of the complex heterogeneous nature of the hu- mic material each specific type of site can, in principle, have its own unique intrinsic chemical affinity for proton or metal binding. Humic ligands are, therefore, often best characterized by a distribution of affinity constants (Buffle, 1988).
Metal ion binding is also strongly pH dependent due in part to the competition between metal ions and protons for the available binding sites and in part to the effect of pH on the electric charge of the humic acid molecule. As the pH in- creases, dissociation of acidic functional groups cause the hu- mic acid molecule to become increasingly negatively charged, creating an electric field which, in turn, attracts the positively charged protons and metal ions.
This combination of chemical heterogeneity and electro- static effects means that a completely rigorous description of ion binding in complex electrolytes is probably impractical.
* Author to whom correspondence should be addressed. + Present address: TAUW Infra Consult bv, Handelskade 1 I, Post-
bus 479, 7400 AL Deventer, The Netherlands.
Therefore, in order to obtain a better understanding of the binding behaviour of protons and metals it is necessary to develop models in which various simplifications are made. Early models, which did not include electrostatics, developed discrete site and continuous distribution heterogeneity models to describe cation binding (Perdue and Lytle, 1983; Dzombak et al., 1986). Inevitably these models are limited by their ex- clusion of electrostatic influences; they allow useful descrip- tions of cation binding under a given set of pH and ionic strength conditions but cannot be extrapolated to different conditions (Bartschat et al., 1992). More recently, attention has focused on developing more fundamental physicochem- ical models by explicitly including descriptions of the elec- trostatic effects (Goldberg, 1992). Several such models have now been applied to ion-binding to humic materials. For ex- ample, Marinsky and Ephraim (1986) and Cabaniss and Mo- rel ( 1989) discuss the assumption of an equilibrium Donnan phase model, Bartschat et al. ( 1992) develop an oligoelectro- lyte model by applying the nonlinear Poisson-Boltzmann equation to an impenetrable, spherical fulvic acid particle, while Tipping and Hurley ( 1992) and Tipping ( 1993) use an empirical electrostatic description, with an emphasis on de- veloping a model with practical applicability and compatibil- ity with existing geochemical computer code. Here we ex- plore the use of the master curve approach of de Wit et al. ( 1990). The application of this approach to humic substances has been discussed earlier (de Wit et al., 1991, 1993a,b).
A limitation of much of the earlier data is the limited pH range over which proton binding was determined. In this pa- per we characterize proton binding by a purified peat HA (PPHA) using potentiometric titration curves measured at
1101

1102 C. J. Milne et al.
several concentrations of background electrolyte and covering the pH range 3.5-10.5. A simple electrostatic double layer model is then used to remove the ionic strength dependence by converting bulk solution H+ concentrations to surface H’ concentrations. In principle, if the model is correct then all of the data should merge into a single master curve which re- flects the effect of the surface concentration of protons on the HA charge.
The master curve can then be analyzed in terms of chemical heterogeneity independent of any electrostatic effects. The in- trinsic affinity distribution can be obtained from the master curve using approximation methods such as the LOGA or CA (Condensation Approximation) methods (Nederlof et al., 1990, 1992). An empirical isotherm equation which has an affinity distribution similar to the experimental one can then be selected for describing the binding data. For example, if the affinity distribution is characterized by a number of nar- row peaks, then isotherm equations for a discrete heteroge- neous surface (e.g., a series of Langmuir isotherms) would seem most appropriate. Alternatively, if the affinity distribu- tion is smooth and broad, a description based on isotherm equations for a heterogeneous surface (e.g., Langmuir- Freundlich, Generalized Freundlich or T&h equation) is pre- ferred. All three of these equations can be extended to incor- porate competitive multicomponent adsorption (van Riems- dijk et al., 1987; van Riemsdijk and Koopal, 1992).
THEORY
Electrostatic Interactions
According to the Boltzmann distribution law the concen- tration of ion i (mol m-3) at a given position in an electric field, ci (x), is given by
q(x) = co,, exp( -riipX)), (1)
where c,,~ (mol mm3) is the bulk concentration of i, Z, is the charge of ion i (including sign), I,!J(x) (V) is the electric po- tential at position x, T (K) is the temperature, F (C mall’) is Faraday’s constant, and R (J mol-’ K-‘) is the gas constant.
Following Bqn. 1, the concentration of protons in solution at the location of the proton binding sites can be defined as
(2)
where & is the electric potential of the humic particle at the binding sites and [H+] is the concentration of protons in the bulk solution. The exponential term is often called the Boltz- mamr factor.
An important part of the master curve procedure for humics is the use of a double layer model to account for the electro- static interactions. Such double layer models provide the re- lation between the measured surface negative charge, Q, due to proton dissociation and the surface potential, I,$, and in- volve some knowledge or assumptions about the particle ge- ometry (e.g., Overbeek, 1952; Tanford, 1961). Analyses of a large number of experimental datasets (de Wit et al., 1993a,b) have shown that spherical and cylindrical double layer models describe the electrostatic interactions for humic acids almost
equally well. Planar models, which have simpler electrostatic effects, are not appropriate for the relatively small humic acid molecules. In this procedure the humic acid molecules are considered to be impermeable and are characterized by an average radius r (end effects are neglected for the cylindrical model). The radius determines the curvature of the surface and is the single parameter which has to be specified for the calculation of (cls. The effects of polydispersity, conforma- tional changes, and the permeability of the molecules are ne- glected.
Determination of the Affinity Distribution
The shape of the master curve should be directly related to the chemical heterogeneity (de Wit et al., 1990) since, in prin- ciple, electrostatic effects have been removed. Several nu- merical methods are available for deriving the affinity distri- bution from the master curve, of which the so called CA method, combined with a smoothing technique which reduces the number of spurious peaks appearing in the affinity distri- bution, is generally the most appropriate for analyzing exper- imental data (Nederlof et al., 1992). With the CA method, the distribution function FCA is related to the first derivative of the master curve
-dQ FcA(~% GI) = d log H,,
where log KK' is the intrinsic affinity constant of the proton- ation reaction for a given group. The term intrinsic is used to refer to the equilibrium constants at zero surface charge (Goldberg, 1992). In the present context it indicates that es- timated surface concentrations have been used to derive the log K values rather than bulk solution concentrations.
Isotherm Equations
The affinity distribution defines the chemical heterogeneity of the humic acid sample. In order to describe the proton binding in a mathematically succinct way, a binding equation capable of fitting data for heterogeneous surfaces is required. Several relatively simple isotherm equations are available. A well known and often used expression consists of a series of Langmuir equations; this series is ideally suited to cases where there are a few discrete types of sites:
Q = Qmax C .A( 1 - @j.“)> (4) ,=I
where n is the number of classes of sites, A is the fraction of all groups that are of type j, and 0j.H is the degree of proton- ation of groups of class j, given by the Langmuir isotherm
K”’ H lj,,, = JJ. s
1 + K"' H /.H s
The ( 1 - ti,,,) term reflects the fact that the negative surface charge decreases with increasing protonation, i.e., that the charge is proportional to the degree of dissociation of the hu- mic particles. Pax&s and Wedborg (1985) used a six-site model for proton binding by fulvic and humic acids, involving twelve adjustable parameters. Since there is a tendency for the

Proton binding by humic acid 1103
Table I. Metal and trace element content of the PPHA (dry weight) quoting 30 uncertainty limits.
mg kg-’ 30 mg kg-’ 30
Ne 113 IO B 1.0 1.7 K 1167 23
Ca 304 4
Mg 18.3 0.3
P 206 I Si 60.2 0.04
Ba 15.9 0.1
Fe 26.3 I .6
Zn 18.8 0.3
Al 37.2 1.3 CU 7.5 0.2
Cd 5.1 2.3
Pb 2.0 1.2
Cl ~23 20
NO, <IO 4
Li 0.7 1.1
Sr I .4 0.03
Be <O.Ol 0.01
SC 0.02 0.05
Y 0.04 0.04
Mn 1.3 0.04
co 0.3 0.1
V 0.1 0.07
La 0.2 0.18
Zr 0.3 0.12
Cr 3.0 0.6
Ni 2.8 0.2
MO 1.2 0.1
adjustable parameters to be highly correlated and to have cor- respondingly large standard errors, it is probably better to fix the log K’s at regular intervals and then fit only the A.
Instead of the multi-site Langmuir isotherm (Eqn. 4), other isotherm equations for continuous heterogeneous ligands can be used. Three well known analytical equations for hetero- geneous ligands (Kinniburgh et al., 1983) are the Langmuir- Freundlich (LF) equation, the Generalized Freundlich (GF) equation, and the T&h equation. These isotherm equations, written in terms of the dissociation of HA, and their associated affinity distribution functions are given in Appendix 1. The distribution function underlying the LF equation is symmet- rical and pseudo-Gaussian. The distribution function for the GF isotherm is exponential and has a pronounced high affinity tail whereas that for the Toth isotherm has a large low affinity tail implying a relatively large number of low affinity sites, i.e., these low affinity sites are the sites that bind protons rather weakly which in turn means that they will tend to be dissociated at low pH.
These distributions have at most a single peak and so to describe more complex distributions two or more of them could be combined. In principle this could be any combination of the different types of binding equations, for example, a Langmuir-Freundlich isotherm combined with a T&h iso- therm but, for simplicity only combinations of isotherms of the same type are considered here.
EXPERIMENTAL
Extraction and Purification of the Peat Humic Acid
The peat HA was prepared from a commercial Irish horticultural peat following the standard IHSS procedure for the extraction of hu- mic acid (Thurman and Malcolm, 198 I), as modified by Reid et al. ( 1990). This involved repeated extraction with KOH/HCl to sepa- rate the HA from humin and FA and the use of HF to remove silicate impurities. An extra extraction by EDTA was added at the end in order to reduce the Fe content. Finally the HA in its H-form was extensively dialysed in Visking dialysis tubing (molecular weight cut-off 12OOt-14000) to remove free acid. The complete dialysis lasted six months. It was evident from the pale brown colour of the dialysate that some of the HA had passed through the dialysis membrane.
The final suspension of purified peat HA (PPHA) was divided between a number of bottles and stored in a refrigerator at 5°C. This
suspension had a pH of 3.2, an HA content of 5.28 mglml suspension, and an ash content of 0.2%. The elemental composition of the HA determined on a freeze-dried subsample was C 52.07%, H 5.07%, N 2.37%. S 0.57%. and 0 39.93%. The PPHA has a lower C content than that for an Irish peat HA studied by Malcolm and MacCarthy (1986) (C 60.70%, H 5.22%, N 1.29%, S 0.90%, and 0 32.59%) but it is within the range normally found for HA’s, The residue from ashing was dissolved in 1% nitric acid and analyzed by ICP-OES to determine its metal and trace element content (Table 1). Finally, Cl _ and NOT were determined by standard calorimetry.
Solid-state 13C nmr analysis revealed the six major peaks charac- teristic of a peat humic acid (Malcolm, 1989) with fairly typical relative intensities (Fig. 1). This confirmed that the PPHA contained a range of both aliphatic and aromatic structures. The E.,/E6 ratio, i.e., the ratio of spectral absorbance at 465 nm to that at 665 nm, was 6.5 in 0.05 M aqueous sodium bicarbonate solution, following the procedure of Chen et al. (1977). This is a relatively high value, generally more characteristic of a fulvic acid than a humic acid. Chen et al. ( 1977) also showed that the Ed/E6 ratio is negatively correlated with humic molecular or particle size, which suggests that our PPHA has a fairly low molecular weight compared with other humic acids.
The molecular weight distribution was determined by equilibrium UV-scanning ultracentrifugation using a Beckmann L8-70 ultracen- trifuge by the method of Reid et al. ( 1990). This showed the PPHA to be polydisperse with a weight average molecular weight of ap- proximately 23000 in 1 M NaCI. However, Reid et al. ( 1990) found that the measured value for humic acids is strongly salt dependent; for example, the weight average molecular weight of a peat HA var- ied between 7550 (0.1 M NaCI) and 16730 ( 1 M NaCl). Therefore, this figure has to be treated with caution. In addition. some of the sample failed to redistribute because it was highly aggregated and some aggregation persisted even in the redistributed material. This suggests that the centrifugation measurements actually represent the weights of the aggregates and hence substantially overestimate the molecular weight of the PPHA.
Potentiometric Titrations and pH Stat Experiments
Experiments were carried out using a fully automated titration sys- tem which is described elsewhere (Kinniburgh et al., 1995). The thermostatted reaction vessel was maintained at a slight overprcssure ( - 1 cm H,O) of nitrogen in order to exclude atmospheric carbon dioxide. The pH was monitored with duplicate pH electrodes (Russell pH Ltd) and a single calomel reference electrode connected to the reaction vessel via an electrolyte bridge. Since titrations typically took 16-24 hr to complete, the electrolyte in the bridge (0.1 M KNO,) was continuously renewed (one complete exchange per hour) by a peristaltic pump to prevent build-up of salt leaking from the calomel reference electrode.
c-o groups. e.g catiilohydmte
250 200 150 100 50 0 PPM
FIG. 1. “C nmr spectrum of the purified peat humic acid (PPHA). The six major peaks are highlighted.

1104 C. J. Milne et al.
8
PH
6
Initial Ionic strength
/
I
- O.WlM
/ * 0.003M
, . 0.006M
L-J
/
. 0.01 M
5/ . 0.06M
;/ 0 O.lM . 0.3 M
I I I 0 I 2 3 4 5
Volume of titrant (ml]
FIG. 2. Base titration curves of the undispersed PPHA at seven concentrations of KN03 background electrolyte: 0.001 M, 0.003 M, 0.006 M, 0.01 M, 0.06 M, 0.1 M, and 0.3 M. Each titration took approximately 16 hr. The ionic strengths varied slightly throughout the titration and so the values given are nominal.
Reagents used in these experiments were of Analar grade (Merck Ltd). Phosphate and phthalate buffer solutions for pH calibration were prepared from dry reagents according to NBS standard recipes. Acid titrant (0.1 M HNO,) was prepared from commercial volumet- ric standards but the analogous base solutions were found to be prone to carbonate contamination. In order to try to minimize this problem base titrant ( - 0.1 M KOH) was prepared by diluting a near-saturated concentrate into freshly boiled water. The concentrate was first cen- trifuged to remove any potassium carbonate which had precipitated. The final solution was stored in a desiccator fitted with a Carbosorb filter and was standardized against the acid using the Gran procedure. The background and bridge electrolyte solutions were prepared from Analar grade KN09.
Proton titration experiments used 20 mL of PPHA suspension di- luted to give 25 mL of the required ionic strength of background electrolyte. This gave a final concentration of approximately 4 g HA L-‘, which is 4-20 times higher than many of the earlier expcri- ments. After each addition of titrant, the rate of drift of each electrode was simultaneously measured over a 2 mm interval following an initial delay of 20 s to allow adequate mixing of the t&rant. The readings were accepted when the rate of linear drift for both elec-
0.8
0.7
0.6
8 * 0.5
s a 0.4
g 0.3 $
0.2
0.1
0.0 0.
pH 1C
-I I 0.05 0.10 0.15 0.20 0.25 0.30 0.35
ionic strength (MI
FIG. 3. Change in charge of the undispersed PPHA, AQ, as a func- tion of the final concentration of KN03 at pH 4,5,6,8, and 10. These curves were determined using a pH stat.
trodes was less than that specified by the electrode read criteria, here set to 0.05 mV min-’ (approximately 0.001 pH min-‘) for each electrode. A maximum time of 20 min was set for acquiring readings for each data point and if an acceptable reading had not been achieved by then, the titration proceeded regardless. Data points were recorded at approximately 0.05 pH intervals up to about pH 11 giving ap- proximately 160 points per titration. Less rigorous stability criteria (up to 0.2 mV mm’) were specified for some experiments when it was desired to carry out a more rapid titration.
A series of salt titrations was also carried out in which the pH of a sample of PPHA was maintained at a constant pH whilst the back- ground ionic strength was increased with KNO, The volume of base required to bring the sample back to the prescribed pH after each addition of electrolyte was recorded. These titrations enabled the change in charge on the PPHA at different ionic strengths to be mea- sured accurately. After each addition of electrolyte, base was slowly added and the stat pH maintained within 2 0.2 mV (? 0.004 pH units) of its desired value for a minimum of 5 min. The sizes of the electrolyte doses were chosen to obtain approximately evenly spaced data along the titration curve, i.e., the doses gradually became larger as the experiment progressed since the rate of proton release from the PPHA declines as the electrolyte concentration increases.
DATA ANALYSIS
The pH values recorded by the duplicate pH electrodes were averaged. They usually agreed to within +O.Ol pH or better. We rejected data when the drift in either of the pH buffers measured before and after an experiment was greater than 2 0.03 pH, which was unusual. Figure 2 presents the raw experimental data for titrations at seven concentrations of KN03 background electrolyte. The ionic strengths, I, quoted are the initial values before the addition of any titrant. Since approximately 0.1 M titrants were used for all experiments the variation in ionic strength is minimal for the 0.1 M ex- periment and most pronounced for those experiments which initially have the lowest ionic strength (0.001 M). In the sub- sequent data analysis the ionic strength was calculated ex- plicitly for every data point, taking into account both back- ground electrolyte ions and free H + and OH ~.
The pH stat experiments measured the consumption of base (KOH) required to maintain a constant pH (pH 4,5,6,8, and
Proton binding by humic acid 1105
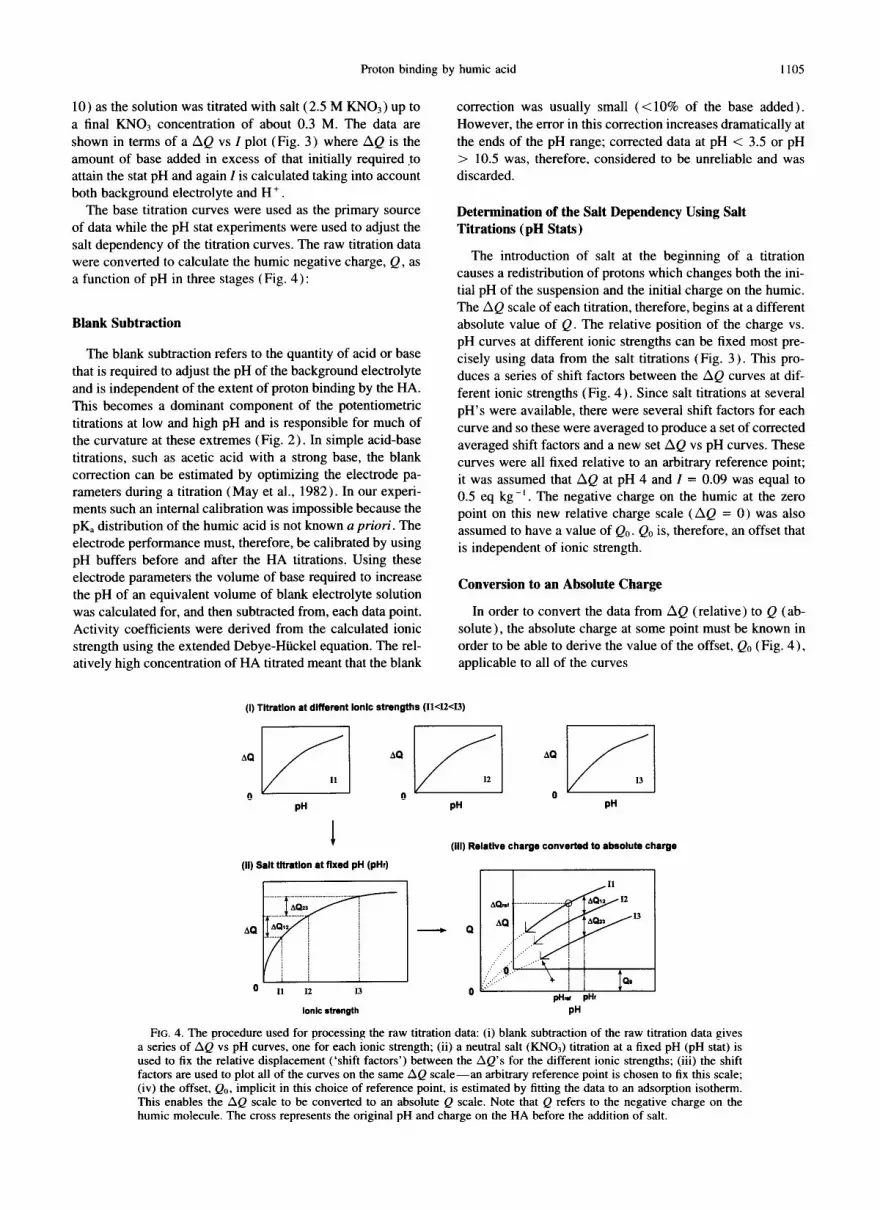
10) as the solution was titrated with salt (2.5 M KNOX) up to a final KN03 concentration of about 0.3 M. The data are shown in terms of a AQ vs I plot (Fig. 3) where AQ is the amount of base added in excess of that initially required to attain the stat pH and again I is calculated taking into account both background electrolyte and H + .
The base titration curves were used as the primary source of data while the pH stat experiments were used to adjust the salt dependency of the titration curves. The raw titration data were converted to calculate the humic negative charge, Q, as a function of pH in three stages (Fig. 4):
Blank Subtraction
The blank subtraction refers to the quantity of acid or base that is required to adjust the pH of the background electrolyte and is independent of the extent of proton binding by the HA. This becomes a dominant component of the potentiometric titrations at low and high pH and is responsible for much of the curvature at these extremes (Fig. 2). In simple acid-base titrations, such as acetic acid with a strong base, the blank correction can be estimated by optimizing the electrode pa- rameters during a titration (May et al., 1982). In our experi- ments such an internal calibration was impossible because the pK, distribution of the humic acid is not known a priori. The electrode performance must, therefore, be calibrated by using pH buffers before and after the HA titrations. Using these electrode parameters the volume of base required to increase the pH of an equivalent volume of blank electrolyte solution was calculated for, and then subtracted from, each data point. Activity coefficients were derived from the calculated ionic strength using the extended Debye-Htickel equation. The rel- atively high concentration of HA titrated meant that the blank
correction was usually small (<lo% of the base added). However, the error in this correction increases dramatically at the ends of the pH range; corrected data at pH < 3.5 or pH > 10.5 was, therefore, considered to be unreliable and was discarded.
Determination of the Salt Dependency Using Salt Titrations (pH Stats)
The introduction of salt at the beginning of a titration causes a redistribution of protons which changes both the ini- tial pH of the suspension and the initial charge on the humic. The AQ scale of each titration, therefore, begins at a different absolute value of Q. The relative position of the charge vs. pH curves at different ionic strengths can be fixed most pre- cisely using data from the salt titrations (Fig. 3 ). This pro- duces a series of shift factors between the AQ curves at dif- ferent ionic strengths (Fig. 4). Since salt titrations at several pH’s were available, there were several shift factors for each curve and so these were averaged to produce a set of corrected averaged shift factors and a new set AQ vs pH curves. These curves were all fixed relative to an arbitrary reference point; it was assumed that AQ at pH 4 and I = 0.09 was equal to 0.5 eq kg -I. The negative charge on the humic at the zero point on this new relative charge scale (AQ = 0) was also assumed to have a value of Q,,. Q0 is, therefore, an offset that is independent of ionic strength.
Conversion to an Absolute Charge
In order to convert the data from AQ (relative) to Q (ab- solute), the absolute charge at some point must be known in order to be able to derive the value of the offset, Q0 (Fig. 4). applicable to all of the curves
(I) Tltratlon at different lonlc strengths (Il<I2<13)
PH PH
I (ill) Relathre charge conveti to absolute charge
(II) Salt titration at fixed pH (pHt)
lank strength
PH~ PHI PH
FIG. 4. The procedure used for processing the raw titration data: (i) blank subtraction of the raw titration data gives a series of AQ vs pH curves, one for each ionic strength; (ii) a neutral salt (KNOr) titration at a fixed pH (pH stat) is used to fix the relative displacement (‘shift factors’) between the AQ’s for the different ionic strengths; (iii) the shift factors are used to plot all of the curves on the same AQ scale-an arbitrary reference point is chosen to fix this scale; (iv) the offset, Q,,, implicit in this choice of reference point. is estimated by fitting the data to an adsorption isotherm. This enables the AQ scale to be converted to an absolute Q scale. Note that Q refers to the negative charge on the humic molecule. The cross represents the original pH and charge on the HA before the addition of salt.

1106 C. J. Milne et al
15
z 10
E E 5
‘F; 6 0
i= 20 I =‘O.l’M 2
g ? 15
10
5
2 3 4 5 6 7 8 9 10 11 12
PH
FIG. 5. Time needed after addition of an increment of base to achieve a rate of pH drift of less than 0.05 mV mini’ (0.001 pH mini’) for titrations of (undispersed) PPHA at two concentrations of KNO, background electrolyte (a) 0.001 M and (b) 0.1 M. The min- imum time was controlled by the time taken to monitor the drift (2 min) and the maximum time waited was set to 20 min.
Q(pH, I) = Q0 + AQ(pH, I) =f(isotherm equation). (6)
It was not possible to determine a point of zero charge for the PPHA with any accuracy (if it exists, it is less than pH 3 where analytical errors introduce relatively large errors in the charge determination). Therefore, the value of Q0 in Eqn. 6 is best determined indirectly by fitting the AQ data to a model isotherm in the same way that the total number of binding sites is usually determined by fitting.
RESULTS AND DISCUSSION
Although the shapes of the titration curves (Fig. 2) are
broadly similar, an ionic strength dependence can be seen,
with the titrations at higher I requiring larger volumes of added base to reach a given pH. The trend is consistent across the range of I used (0.001-0.3 M). Interestingly the salt de- pendence is most pronounced around pH 5 where the curves at lower I show a distinct inflection. The salt titrations (Fig. 3) show this salt dependency very clearly. The dependency of AQ on I increases with increasing pH up to pH 5, but then decreases at about pH 6. These data provide an independent confirmation of the relatively large salt effect seen at pH 5 in the titration curves (Fig. 2).
The pronounced inflections and apparent strong salt de- pendency of the titration curves at pH 5 have also been ob- served by Barak and Chen ( 1992) for other humic acid sam- ples. In Fig. 5 the time between successive doses is plotted as a function of pH for two representative titrations (0.001 M and 0.1 M). Since the time between doses was determined by the time taken to achieve a certain minimum rate of pH drift it gives an approximate indication of the kinetics of the de- protonation reaction. There is considerable noise in the plot but it can clearly be seen that around pH 4-5 the equilibration
time is significantly longer than at other pH values. Further- more, the effect is greatest at low salt levels. This suggested that the inflections were due not to a true electrostatic effect, but to a kinetic or dispersion effect possibly including changes in the aggregation or conformation of the humics. For ex- ample, it is possible that at low pH the PPHA is in the form of aggregates or micelles which disperse into smaller mole- cules as the negative charge increases. The effect is more pro- nounced at a low ionic strength where the screening of elec- trostatic interactions is less.
Reversibility of the Titration Curves
In order to investigate further the changes producing the relatively large ionic strength effects seen at pH 5 the revers- ibility of the titration curves was measured over the pH range 3-7. A sample of PPHA was titrated from pH 3 to pH 7 then back to pH 3, back up to pH 7 then back to pH 3 making four consecutive titrations in all. The background electrolyte was initially 0.003 M KN03. The total time for the four titrations was 30 hr.
The results, after correction for the solution blank, show that there was considerable hysteresis in the first cycle but that this was much reduced in the second cycle (Fig. 6). A second experiment, following the same cycle of titration pro- cedures, but using PPHA suspension which was ten times more dilute ( -0.4 g HA L -‘) showed a very similar degree of hysteresis (Fig. 6). Significantly, however, the smaller charge required to titrate the more dilute HA meant that the correction for titration of the background electrolyte became the dominant influence much earlier in the experiment (higher pH under acid conditions and lower pH under basic condi- tions) . The uncertainty in the correction was such that data at pH < 4 (or pH > 10) was considered to be too unreliable and was discarded. The wider usable pH range therefore rep-
I I
7 0
6
I a 5
4 _ 4 g HA I-’
0 0.4 g HA If 3
I 0.5 1.0 1.5 2.0 2.5
net charge titrated (eq kg-‘)
FIG. 6. Titration curves showing the hysteresis seen in repeated base-acid titration cycles at two concentrations of PPHA which differ by an order of magnitude. The density of data for the experiment at 0.4 g HA L-’ (0) was three times greater than shown but is reduced for clarity. The single arrow marks the first leg of the (base) titrations (i), before the PPHA has been completely dispersed, the double arrow marks the return acid titration (ii). The third (base titration) cycles overly track (ii).

Proton binding by humic acid 1107
resents one advantage of using more concentrated HA sus- pensions for titration experiments.
From these hysteresis experiments it appears that there is a rapid disaggregation or unfolding of the HA molecule on the first upward leg (increasing pH, increasing negative charge) but that the reverse aggregation or condensation reaction go- ing from high pH to low pH is so slow that it does not occur to a great extent during the course of the experiments. The effect is independent of HA concentration over the range stud- ied. These results are somewhat similar to those of Pax&s and Wedborg ( 1985 ) who found hysteresis in the first up- down titration cycle of a FA but found that the hysteresis decreased in subsequent cycles. It is possible that this hyster- esis is an experimental artefact arising from the method of preparation of the HA since the final steps in the isolation and purification procedure involve H + -saturation and centrifuga- tion which causes some aggregates to form. We found that it was difficult to completely redisperse these aggregates by purely physical means. For example, sonification did not help.
The method of storage of the prepared HA also appears to be significant. Titration through complete hysteresis cycles of a sample which had been stored freeze-dried rather than as a refrigerated suspension did not show the hysteresis behaviour. The freeze-dried material readily dissolved in neutral electro- lyte forming a solution/suspension of similar pH to the stored aqueous material. Both the base and reverse acid titration curves were similar to the curves produced by the reverse titration on the stored suspension. Therefore, for this humic acid, freeze-drying appears to be a good way of preserving the sample.
The effect of the rate of titration on the hysteresis seen in the first base-acid cycle was investigated by varying the elec- trode drift criteria used during the titrations: the four criteria used were 0.05 mV mini’ (normal), 0.1, 0.2, and 0.5 mV min-’ , corresponding to rates of titrations of approximately 0.001, 0.002, 0.0034, and 0.01 pH min-’ . Each titration was started with a fresh sample of PPHA and the total time taken for a complete base-acid cycle varied from 18 hr to 4.3 hr. The upward pH leg (base addition) of the titration was always slower than the downward leg (acid addition). The rate of titration had little overall effect on the titration curves and the extent of the hysteresis remained similar even for the most rapid titration. This confirms that the disaggregation or con- formational changes that take place on the upward titration leg are rapid and must take place in minutes rather than hours, a conclusion that is consistent with the time-to-equilibrium data presented in Fig. 5.
The kinetics of the reverse process are extremely slow. A sample of PPHA was titrated to pH 7 to disperse it, then ti- trated back to pH 4 where the hysteresis effect is largest and then the drift in pH of the PPHA suspension was monitored for seven days. A steady monotonic pH drift upwards was observed, suggesting a tendency for the sample to close the hysteresis loop by returning to its stored, undispersed equilib- rium condition. However, the process was far from com- pleted; the pH drifted by only 0.15 pH units over the seven days whereas complete closure of the loop would have re- quired a drift of 0.7 pH units. It appears, therefore, that the initial state of aggregation in our PPHA could not be easily induced by lowering the pH which adds weight to the sug-
gestion that it resulted, in part at least, from the final centrif- ugation stage of the isolation and purification procedure.
Ionic Strength Dependence
In order to obtain proton binding data which were not strongly influenced by the hysteresis and dispersion effects, the titrations were repeated following a modified procedure in which the sample was initially fully dispersed at high pH. First the PPHA suspension was titrated to pH 10 and held there for 15 minutes to ensure effective dispersion, after which the sample was titrated slowly with acid back to its initial pH (which was recorded by the titrator) and then titrated with base once more. If desired, the second hysteresis loop could be completed by a further acid titration. Each leg of the pro- cedure provided a titration curve for analysis.
The set of data collected from these experiments did not show the inflections previously observed at pH 5; the titration curves for the different ionic strengths remain nearly parallel throughout the pH range (Fig. 7). pH stat experiments at low pH, which would measure the ionic strength dependence di- rectly, are difficult to accomplish using redispersed HA be- cause the redispersion procedure itself prevents very low ionic strengths from being achieved. Therefore, when calculating the salt shifts of the titration curves more weight has been placed on the high pH stat data where the PPHA can be as- sumed to be fully redispersed. It is unlikely that this causes serious errors because the curves are so parallel.
We considered carefully whether the parallel nature of our titration curves is an artefact or reflects a real phenomenon: electrostatic models imply an increasing divergence of the titration curves with increasing pH as the negative charge on the HA increases. However, other published titration data (e.g., Marinsky et al., 1982; Bartschat et al., 1992; Machesky, 1993 ) tend to support our finding of near parallel titration curves with a relatively large ionic strength-dependence at low pH. Furthermore, the size of the dependence at low pH
4.0
3.5 .'
3.0 -
- 2.5 - c .I? o- u
2.0 -
(3 ..-. 4 1.5- 0.33 M --- 0.09M - 0.08 M
1.0 - - - 0.014M - - 0.008 M
0.5 - - - 0.001 M
3 4 5 6 7 a 9 IO 11
PH
FIG. 7. Change in charge, AQ, as a function of pH for the redis- persed PPHA at six ionic strengths after correction for differences in the initial charge (i.e., after step (iii) in Fig. 4). Dashed curves are used for clarity-the data density is similar to that in Fig. 2. The ionic strengths varied slightly throughout the titration and so the val- ues given are nominal.

1108 C. J. Milne et al
is comparable between several of the literature datasets. For 1979; Young et al., 1981) that this method can overestimate example, the offset between titration curves for ionic strengths the carboxyl content by not allowing for the dissociation of 0.1 M and 0.001 M at pH 4 is consistently 0.4-0.6 mol kg-’ phenolic-type sites that occur below pH 9.8. The difficulty HA (e.g., Bar&chat et al., 1992; Tipping et al., 1988) com- can be addressed by modifying the method slightly to remove pared with our own results of -0.45 mol kg-‘. Ephraim et the positive interference from the phenolic groups (Holtzclaw al. ( 1989) also observed a similar pH-independent salt-de- and Sposito, 1979). More recently, Machesky (1993) used a pendence for an aquatic fulvic acid. This combination of ev- simple form of integration of the titration buffer capacity idence from different studies suggests that our results are real function to estimate the carboxylic acid equivalence point and and points to a limitation in the ability of the electrostatic hence estimate the titratable carboxylic (and phenolic) groups model to describe the behaviour of humic acids at low pH. from the integrated areas under the buffer capacity function.
The Master Curve
The data for the titration of fully redispersed PPHA were analyzed by the master curve procedure in which the electro- static parameter (r) and the isotherm parameters (Q,,, K$) were initially fitted simultaneously. However, it was found that r and Q0 were highly correlated and the fit proved to be rather insensitive to the values chosen. This often led to even- tual convergence at physically unreasonable values of r and Q0 as the strict convergence criterion used meant that large adjustments of parameters in the latter stages of the optimi- zation were probably not significant. Therefore, it was nec- essary to try to determine either r or Q0 independently.
Analysis of our own titration data shows approximately 3.5 eq kg-’ of titratable charge between pH 3.5 and pH 10.5 (Fig. 7). Applying the approach of Machesky ( 1993) suggests a total carboxyl group concentration for our PPHA of 2.6 + 0.2 eq kg’, a total phenolic site concentration of 1.5 5 0.2 eq kg -I, and a total titratable charge of 4.2 ? 0.2 eq kg-‘. This is clearly a greater total titratable charge than observed be- tween pH 3.5-10.5, but not by the 50% margin suggested by Machesky ( 1993 ) for the widely studied Suwanee River FA. The discrepancy may arise in part because an acid soluble fulvic acid might be expected to have more groups with lower pK, than a humic acid.
Using the master curve procedure to analyze a range of published HA titration data, de Wit et al. (1993a) estimated median particle radii of 0.85 nm for the spherical model and 0.32 nm for the cylindrical model. This is within the range of measurements of Barak and Chen (1992) who give radii for cylindrical humic acid particles of between 0.24 and 1.1 nm. Barak and Chen (1992) preferred the cylindrical model and hence did not give results for spheres. A radius of 0.85 nm for spheres corresponds to a molecular weight of 1550 (as- suming a density of 1000 kg mm3). Using the molecular weight estimated by ultracentrifugation (M.W. 23000), which is likely to be an overestimate due to the aggregation of the PPHA, gives an upper bound for the radius of 2.1 nm. The optimal radius for the cylindrical model is consistently a factor of two smaller than that for the spherical model since for a given radius the tighter curvature of a sphere produces a stronger electrostatic effect. These values, therefore, provide a guide to the range of radii which can be considered to be physically realistic when fitting our data.
It should be noted that in this paper we have not attempted a detailed functional group characterization of the humic acid used and so the terms carboxylic and phenolic are used only to distinguish between the sites belonging to the two major distributions that have been identified. A limitation of the dis- tribution function analysis is that it is difficult to resolve the overlap between the distributions of carboxylic and phenolic groups and, in the case of the Machesky approach, the anal- ysis is based on the assumption that the functional group dis- tributions are symmetrical.
Using the combination Gran plot technique of Takamatsu and Yoshida ( 1978) the total titratable charge of the PPHA between pH 1.6 and pH 12.1 was estimated to be 3.94 eq kg -‘. However, the remaining curvature at the extremities of the Gran plots meant that it was difficult to estimate accurately the amount of free acid and base present. The curvature sug- gests that some of the titratable groups of the HA dissociate at very low pH (pH < 1.6), and could not be distinguished by the linearization procedure. The estimated charge, there- fore, represents a minimum.
The initial charge and total titratable charge of humics have proven difficult to measure experimentally. Tipping et al. ( 1988) measured the total acidity of a H’-saturated humic by titration with base to pH 11.5, while Ephraim et al. ( 1989), Takamatsu and Yoshida ( 1978), and Barak and Chen ( 1992) have used a modified Gran plot. Each approach has its limi- tations, the underlying problem is that many humics contain a significant number of functional groups which are either very strongly acidic (pK, < 3 ) or very weakly acidic (pK, > 11). These groups are difficult to quantify accurately by titration since the blank subtraction at these extreme pH’s is relatively large and therefore particularly sensitive to small errors in pH (or emf) measurement.
A charge balance calculation should give the initial charge of the PPHA without the need for any titration or without incurring any blank correction errors. The negative charge on the humic acid must be balanced by the net positive charge carried by the excess protons and any other ions in solution. The analysis given in Table 1 leads to a net charge excluding that of the proton of 0.06 eq kg -’ (assuming the S and P are structural). The stock PPHA suspension (5.28 g L-‘) had a pH of 3.2 and so the protons in solution represent a further 0.13 eq kg-’ of negative humic charge. This suggests an ini- tial negative charge on the HA of about 0.2 eq kg-‘. However, this charge increases in magnitude with the addition of KN03 prior to titration and so again represents only a minimum.
Several authors have attempted to measure only the car- boxy1 content of HAS. The widely used Ca-acetate method (Schnitzer and Gupta, 1965) is equivalent to a normal titration to pH 9.8 but it has been shown (Holtzclaw and Sposito,
Acceptable master curve fits across most of the pH range could be produced by using either spherical or cylindrical electrostatic double layer models. By constraining r and Q0 to physically realistic values the optimum fits were achieved when Q0 = 0.8 -+ 0.2 eq kg-‘, with rSph = 1.3 + 0.1 nm for

Proton binding by humic acid 1109
? 3.0
P O- 2.5
r Ionic strength - .O.zNM
.0.09 M ----0.05M - - 0.014 M - .O.CCBM -0.001 M
0.0 ’ I
2 3 4 5 6 7 8 9 10
- tog Hs
FIG. 8. Charge, Q, as a function of surface pH (log I?&) for the same six ionic strengths as shown in Fig. 7. Log H, was estimated using a cylindrical double layer model. The plot represents the best fit that can be obtained to a master curve; here rcYl = 0.6 nm, Q0 = 0.8 eq kg-‘. The ionic strengths varied slightly throughout the titration and so the values given are nominal.
the spherical model and rcyl = 0.6 ? 0.1 nm for the cylindrical model (Fig. 8). There was no significant difference between the goodness of fit for the two model geometries. The affinity distributions from the cylindrical model are discussed below.
Although the fitted value of Q0 = 0.8 eq kg-’ should be approximately equal to the charge on the humic at pH 3 and I = 0.1, it is larger than the initial charge anticipated from the Gran plot analysis and from the analysis of the charge balance of the PPHA suspension. It is, however, consistent with the analysis of literature data of de Wit et al. ( 1993a) where the master curve analysis indicated a charge of the order of 1 eq kg-’ below pH 3 for most of the datasets considered. This may be a consequence of the strong electrolyte dependence at low pH; even the best fits of the present data were not able to fully account for the electrolyte dependence of the titration curves around pH 4.
Affinity Distribution and Isotherm Analysis
The affinity distributions obtained by applying the CA method to the Q( log H,) data for the cylindrical model ( rcyl = 0.6 nm, Q,, = 0.8 eq kg-‘) are given in Fig. 9. The distri-
butions so derived from the different ionic strengths agree well, as they should if the master curve procedure is success- ful. They are characterized by a bimodal distribution with a peak centred at log KF - 4, and a second peak at log Kk - 8 to 9. The peaks are attributed to carboxylic sites and phenolic sites, respectively. The form of the distribution was insensitive to small changes in the master curve within the uncertainty ranges indicated and the spherical and cylindrical models resulted in almost identical affinity distributions.
As the distribution suggests that there are two groups of sites, the Q vs. log H, data of the master curve have been fitted to isotherm equations consisting of the sum of two Langmuir- Freundlich equations, two Generalized Freundlich equations and two Toth equations (Fig. 10). This was carried out using a nonlinear least-squares fitting procedure (Kinniburgh,
1.2
Ionic strength
0 0.001 M
* 0.008 M
0 0.014 M
. 0.08 M
. 0.09M
* 0.33 M
04 -
0.3 -
02 -
Ol-
00 2 3 4 5 6 7 a 9
log KH’“’
FIG. 9. Affinity distributions calculated from the first derivative of the Q vs. log H, plots for the redispersed PPHA which are shown in Fig. 8. The ionic strengths varied slightly throughout the titration and so the values given are nominal.
1993 ). Each isotherm had six adjustable parameters, three each for the two component equations: Kri, the location of the equation on the log KH axis, m, the width of the distribution function and Q,,,=. the maximum possible charge on the PPHA molecule. Unlike conventional isotherm analysis, the independent variable was the surface proton concentration rather than the bulk solution proton concentration.
Careful fitting of the double isotherm equations enabled good fits to the data to be achieved. Predictably, the fits were less good at very low pH where the master curve does not fully describe the data, and at very high pH where the maxi- mum of the second (phenolic) distribution is close to the end of the data range and the peak is consequently less well de- fined.
The best fits (Table 2) have associated affinity distributions (Fig. 10) which match the experimentally derived distribution (Fig. 9) quite well. The T&h fit is slightly better than the LF, which is in turn better than the GF. However, these isotherms
o Langmuir-Freundlich . T6rn o Generalized Freundlich
FIG. 10. Affinity distributions derived from the best fitting iso- therms of the double Langmuir-Freundlich. double Generalized Freundlich, and double T&h isotherms for the redispersed PPHA.

1110 C. J. Milne et al.
Table 2. Fitted parameters (and their standard errors) for the double Langmuir-Freundlich, double T6th and double Generalized Freundlich isotherms fitted to the master curve using a cylindrical electrostatic model with ~0.6 nm and Q,=O.S eq kg.‘. R2 is the coefficient of determination; RMSE is the residual root mean square error.
I - R2
RMSE
log &In’
ml
Q,,, (eq kg") log &21.’
mz
Q,,,, (eq kg-')
Langmuir- Freundlich
0.00356
0.0558
3.69kO.07
0.48f0.02
3.og+o.17
8.3BzO.56
0.45+0.15
2.19*0.88
TClth
0.00350
0.0553
4.49kO.28
0.45+0.06
2.46tO.58
I I .22+4.54
0.24+0.17
3.1912.47
Generalized Freundlich
0.00409
0.0598
2.28f0.03
0.13HkOl
4.46?rO.l5
7.93fl.05
0.26+1.18
1.3lk3.65
show different asymptotic behaviour which may be important under different conditions, especially at low surface cover- ages, and when considering metal ion binding. The Q (log Hs) binding curve resulting from the double T&b equation is shown in Fig. 11, together with the experimental master curve. Use of the double LF equation results in a very similar and good description of the data. The total number of sites, Q maxl + Qmaxl, for the three isotherms was estimated as 5.27, 5.65, and 5.77 eq kg-’ based on the double LF, Toth and GF isotherms, respectively, of which 3.5 eq kg-’ (61-66%) are titrated in the pH range 3.5- 10.5. The LF isotherm suggests that there are more carboxylic-type sites whereas the Toth isotherm suggests more phenolic-type sites. This points to a difficulty in this type of analysis: it is not possible to resolve unambiguously the sites into two sets without knowing the underlying distributions, and these are not known a priori.
CONCLUSIONS
Detailed potentiometric titration data were obtained for a purified peat humic acid (PPHA) over a wide range of pH ( pH 3 - 11) and KN03 background electrolyte concentrations (0.001-0.3 M). These titrations were carried out using a high concentration of HA, namely about 4 g L-’ , and generally took about 16 hr to complete. The data were analyzed in terms of a simple model which considered both the electrostatic in- teractions between charged surface groups and the intrinsic heterogeneity of the PPHA. The PPHA was assumed to con- sist of identical solid, impermeable spherical particles.
Relatively strong salt dependence was found around pH 5 and could not be completely removed by taking into account the electrostatic interactions. pH stat experiments in which the PPHA was titrated with KNO, confirmed this relatively strong salt dependence at pH 5. When the PPHA was titrated through two base-acid cycles (pH 3-7), a large degree of hysteresis was found in the first but not the second titration cycle. This suggested that the initial state of aggregation of the PPHA was not reproducible and probably reflected the aggregation induced by the final centrifugation step carried out during the preparation of the PPHA. Preliminary titration of the PPHA samples to pH 10 before measuring the titration curves com- pletely dispersed the sample and removed the anomaly around
pH 5. PPHA which had been freeze-dried also behaved as a fully dispersed sample.
Titration curves for fully redispersed PPHA fitted the mas- ter curve approach (surface charge vs. surface pH) reasonably well over a wide pH range (pH 5- 10) although the simple electrostatic approach adopted does not completely account for the observed electrolyte dependence of the H+ titration curves at low pH (3-5). The size of the initial charge of the PPHA at the beginning of a titration has an important influ- ence on the goodness of fit of the master curve but estimating this initial charge accurately poses problems. Similar prob- lems arise in estimating the number of very weakly acidic sites, i.e., those dissociating above pH 10.5. Our data showed that the change in charge between pH 3.5 and 10.5 was about 3.5 eq kg-’ and that this represents an estimated 61-66% of the total number of sites potentially available for titration.
The difficulty in estimating the surface charge at low pH in part reflects the lack of fit resulting from the simplified view of the electrical double layer adopted. Indeed, it is perhaps doubtful if any such electrostatic model could fully account for the electrolyte dependence since the H+ binding curves at different salt concentrations are essentially parallel over a such a broad pH range (pH 3.5- 10). Also, from a practical point of view, since the solution of the Poisson-Boltzmann equation for the spherical double layer is necessarily carried out by numerical integration, it is computationally rather slow.
Both spherical and cylindrical double layer models were used in the master curve analysis. Heterogeneity analysis of the master curve showed that the affinity distribution had two peaks, one centred around log Kg = 4 characteristic of car- boxylic groups and the other centred around log K’$’ = 8-9 characteristic of phenolic groups. The log KE' value for the phenolic groups is somewhat lower than expected since the log K,‘s for phenolic groups in simple organic molecules is generally above 9.
Proton binding can be described by combining two simple isotherm equations, essentially one describing each peak.
5.0
4.5
4.0 t
3.5 -
- 7 3.0 -
B 0 - s 2.5
2 2.0 -
1.5 - ?
/
0 Maatarcutve 1.0 --Double T&h isotherm
0.5
0.0 1 I 2 3 4 5 6 7 9 9 10
- log H,
FIG. 11. Comparison of the master curve isotherm (derived from application of the electrostatic model to the experimental data, with- out isotherm analysis) with the best-fitting double T&h isotherm sub- sequently fitted to the master curve. A cylindrical double layer model has been used to convert bulk solution H+ concentrations to surface concentrations, H,.

Proton binding by humic acid 1111
Both the double T&h and the double Langmuir-Freundlich equations gave good fits to the data. They did not differ greatly in their estimates of the total number of sites but the distribution between the first (carboxylic) and second (phe- nolic) distributions differed significantly.
An advantage of the use of a simple electrostatic model such as the one presented here is that once the surface poten- tial has been calculated, the effect of pH and background elec- trolyte concentration on metal binding can in principle be cal- culated. Also the log K values derived after the electrostatic correction should reflect the intrinsic properties of the PPHA although the low value for the log Ke for the phenolic peak raises doubts about this. At high pH values the intrinsic log K values are about 1 log K unit lower than the conditional log K values.
Acknowledgments-We would like to thank P. M. Reid and M. N. Jones (University of Manchester) for the molecular weight deter- mination, D. C. Apperley (University of Durham) for the “C mm analysis and E. Tipping for helpful discussion. We are also grateful to S. Cabaniss and G. Redden for thoughtful and constructive re- views. The work described in this paper was partially funded by the European Community Environmental Research Programme on Soil Quality under contract number EV4V-OlOO-NL(GDF). DGK and CJM contribute to this paper with the permission of the Director of the British Geological Survey (NERC ).
Editorial handling: G. Sposito
REFERENCES
Barak P. and Chen Y. ( 1992) Equivalent radii of humic macromol- ecules from acid-base titration. Soil Sci. 154, 184- 195.
Bartschat B. M., Cabaniss S. E., and Morel F. M. M. (1992) Oli- goelectrolyte model for cation binding by humic substances. En- viron. Sci. Technol. 26, 284-294.
Buffle J. ( 1988) Complexation in Aquatic Systems: an Analytical Approach. Horwood.
Cabaniss S. E. and Morel F. M. M. ( 1989) Comment on “A unified physicochemical description of the protonation and metal ion com- plexation equilibria of natural organic acids (humic and fulvic ac- ids).” Environ. Sci. Tech. 23, 746-748.
Chen Y., Senesi N., and Schnitzer M. (1977) Information provided on humic substances by E,/E, ratios. Soil Sci. Sot. Amer. J. 41, 352-358.
de Wit J. C. M., van Riemsdijk W. H., Nederlof M. M., Kinniburgh D. G., and Koopal L. K. ( 1990) Analysis of ion binding on humic substances and the determination of intrinsic affinity distributions. Anal. Chim. Acta 232, 189-207.
de Wit J. C. M., Nederlof M. M., van Riemsdijk W. H., and Koopal L. K. ( 1991) Determination of H+ and metal ion affinity distri- butions for humic substances. Wafer Air Soil Poll. 57-58, 339- 349.
de Wit J. C. M., Van Riemsdijk W. H., and Koopal L. K. (1993a) Proton binding to humic substances, 1. Electrostatic effects. En- viron. Sci. Technol., 27,2005-2014.
de Wit J. C. M., van Riemsdijk W. H., and Koopal L. K. (1993b) Proton binding to humic substances. 2. Chemical heterogeneity and adsorption models. Environ. Sci. Technol. 27, 2015-2022.
Dzombak D. A., Fish W., and Morel F. M. M. ( 1986) Metal-humate interactions. 1. Discrete ligand and continuous distribution models. Environ. Sci. Technol. 20,669-675.
Ephraim J. H., Boren H., Pettersson C., Arsenie I., and Allard B. (1989) A novel description of the acid-base properties of an aquatic fulvic acid. Environ. Sci. Tech. 23, 356-362.
Goldberg S. ( 1992) Use of surface complexation models in soil chemical systems. Adv. Agron. 47, 233-329.
Holtzclaw K. M. and Sposito G. ( 1979) Analytical properties of the soluble. metal-complexing fractions in sludge-soil mixtures: IV.
Determination of carboxyl groups in fulvic acid. Soil Sci. Sot. Amer. J. 43,318-323.
Kinniburgh D. G. ( 1993) FIT: User guide. B. G. S. Technical Report. WD/93/23,40 pp.
Kinniburgh D. G., Barker J. A., and Whitfield M. J. ( 1983) A com- parison of some simple adsorption isotherms for describing diva- lent cation adsorption by ferrihydrite. J. Colloid Interface Sci. 95, 370-384.
Kinniburgh D. G., Milne C. J., and Venema P. (1995) Design and construction of a PC-based automatic titrator. Soil Sri. Sot. Amer. J. 59,417-422.
Machesky M. L. ( 1993) Calorimetric acid-base titrations of aquatic and peat-derived fulvic and humic acids, Environ. Sci. Tech. 27, 1182-1189.
Malcolm R. L. ( 1989) Applications of solid-state ‘% NMR spec- troscopy to geochemical studies of humic substances. In Humic Substances. II. In Search of Structure (ed. M. H. B. Hayes et al.), pp. 339-372. Wiley.
Malcolm R. L. and MacCarthy P. ( 1986). Limitations in the use of commercial humic acids in water and soil research. Environ. Sci. Tech. 20,904-911.
Marinsky J. A. and Ephraim J. H. ( 1986) A unified physicochemical description of the protonation and metal ion complexation equilib- ria of natural organic acids (humic and fulvic acids). 1. Analysis of the influence of polyelectrolyte properties on protonation equi- libria in ionic media: Fundamental concepts. Environ. Sci. Tech. 1986,349-354.
Marinsky J. A., Gupta S.. and Schindler P. ( 1982) The interaction of Cu( II) ion with humic-acid. J. Colloid Znterface Sci. 89,401- 411.
May P. P., Williams D. R.. Linder P. W., and Torrington R. G. ( 1982) The use of glass electrodes for the determination of formation con- stants. 1. A definitive method for calibration. Talanfa 29, 249- 256.
Nederlof M. M., van Riemsdijk W. H., and Koopai L. K. (1990) Determination of adsorption affinity distributions: A general framework for methods related to local isotherm approximations. J. Colloid Inte$ace Sci. 135,410-426.
Nederlof, M. M.. van Riemsdijk W. H., and Koopal L. K. ( 1992) Comparison of semi-analytical methods to analyze complexation with heterogeneous ligands. Environ. Sci. Tech. 26, 763-771.
Overbeek J. Th. G. ( 1952) Electrochemistry of the double layer. In Colloid Science, Vol. I. (ed. H. R. Kruyt) pp 115- 193. Elsevier.
Pax&us N. and Wedborg M. ( 1985) Acid-base properties of aquatic fulvic acid. Anal. Chim. Acta 169, 87-98.
Perdue E. M. and Lytle C. R. ( 1983) Distribution model for binding of protons and metal ions by humic substances. Environ. Sci. Tech- nol. 17, 654-660.
Reid P. M., Wilkinson A. E., Tipping E., and Jones M. N. (1990) Determination of molecular weights of humic substances by ana- lytical (UV scanning) ultracentrifugation. Geochim. Cosmochim. Acta 54, 131-138.
Schnitzer M. and Gupta U. C. ( 1965) Determination of acidity in soil organic matter. Soil Sci. Sot. Amer. Proc. 29, 274-277.
Sposito G. ( 1986) Sorption of trace metals by humic materials in soils and natural waters. CRC Crit. Rev. Environ. Ctrl. 16, 193- 229.
Takamatsu T. and Yoshida T. ( 1978) Determination of stability con- stants of metal-humic acid complexes by potentiometric titration and ion-selective electrodes. Soil Sci. 125, 377-386.
Tanford C. ( 196 1) Physical Chemistry of Macromolecules. Wiley. Thurman E. M. and Malcolm R. L. ( 1981) Preparative isolation of
aquatic humic substances. Environ. Sci. Tech. 15, 463-466. Tipping E. ( 1993) Modelling the competition between alkaline earth
cations and trace metal species for binding by humic substances. Environ. Sci. Tech. 27, 520-529.
Tipping E. and Hurley M. A. ( 1992) A unifying model of cation binding by humic substances. Geochim. Cosmochim. Acta 56, 3627-3641.
Tipping E., Backes C. A., and Hurley M. A. ( 1988) The complexa- tion of protons, aluminium and calcium by aquatic humic sub- stances: A model incorporating binding-site heterogeneity and ma- croionic effects, Water Res. 22, 597-611.

1112 C. J. Mime et al
van Riemsdijk W. H. and Koopal L. K. ( 1992) Ion binding by natural heterogeneous colloids. In Environmental Particles (ed. J. Buffle and H. P. van Leeuwen), pp. 455-495. Lewis Pub.
van Riemsdijk W. H., de Wit J. C. M., Koopal L. K., and Bolt G. H. ( 1987) Metal ion adsorption on heterogeneous surfaces: Ad- sorption models. J. Colloid Znterface Sci. 116, 5 1 l-522.
Young S. D., Bathe B. W., Welch D., and Anderson H. A. ( 1981) Analysis of the potentiometric titration of natural and synthetic polycarboxylates. J. Soil Sci. 32, 579-592.
APPENDIX 1
Affinity Distributions for the Langmuir-Freundlich, Generalized Freundlich, and T6th Isotherms
If a Langmuir local isotherm is assumed, then the affinity distri- bution is derived by applying the inverse Stieltjes transform to the original isotherm equation. The total adsorption, Q, is given by in- tegrating the nonnormalized affinity distribution, F( KH) across the range of affinity constants, Ku. In practice, it is most useful to express this distribution in terms of log KH rather than KH. Hence if the local isotherm is given by
then:
Q = j- m
F(log &)&(Kddlog KH. -m
C-42)
The three isotherms and their associated affinity distributions (Kin- niburgh et al., 1983), written in terms of deprotonation, are given by:
Langmuir-Freundlich
Q = Qmar 1 _ (kHHs)m
(
Q max
1 + (&?s)” = 1 + (z,,Hs)-’ (A3)
FLF( Jog Ku )
= Qm.. 1 - (
In 10 sin (sm)
n(&IK;; + 2 cos (nm) + Ei;;K$“) C.44)
Generalized Freundlich
Q=Qma.(l -(i&r) (A5)
F&Jog &) = Qm,, 1 - (
RH In 10 sin (7rm)
H(K” - if”)” ) when KH > 6
=0 when K,s&,‘,, (A6)
T&h
(A7) Q = Q,,,,, 1 - (
“I,HS ) [I + (KHHs)“]“” ’
Fw(log KH)
= Qmax 1 _ t%f?
c . (tg + 2&K;; cos (?rm) + K;m)-“2m
X sin 1
L ( -tan-’
K; sin (am)
??z + Kz cos (nm) )I) (A8)
In
The modal value of this distribution is not located at E” but is dis- placed towards the lower affinity end of the distribution. The position of the mode is given approximately by KH + log m/m.
When m = 1 all three isotherms reduce to the Langmuir equation for which the distribution is a Dirac delta function.