Embed Size (px)
Citation preview
ANALYSING THE BIOPHYSICAL PERFORMANCE OF ARGENTINA USING THE MFA
METHODOLOGY (1970-2009)
Pedro L. Perez Manrique, Julien Brun, Ana Citlalic Gonzalez-Martinez, Mariana Walter and Joan
Martinez-Alier
Summary
This paper studies the biophysical features of Argentinean economy using the approach of social
metabolism. A Material Flow Analysis (MFA) of this economy was conducted for the period 1970-
2009. We conclude that Argentina follows a resource-intensive and export-oriented development
model with a persistent physical trade deficit. We also find that the terms of trade have declined
during the studied period. Results are systematically compared with a similar study conducted for
Spain. By comparing different metabolic profiles with divergent levels of development and similar
levels of population we discuss the differences between developing and developed countries
regarding material use.
Keywords: Material flow accounting, extractive economies, societal metabolism, Argentina.
Address Correspondence to:
Pedro Luis Perez
ICTA, Universitat Autonoma de Barcelona
Edificio Cn. Campus de la UAB
08193 Bellaterra. Barcelona
2
Introduction
World economy growth and trade liberalization in Latin American countries have generated
an explosion of commodity flows between this region and the rest of the world in the last thirty
years. Argentina, as one of the major South American economies has importantly increased its
participation in international based on a growing mining industry and a stronger agricultural sector.
In 2008, it was the 4th gold and 5th copper producer in Latin America (USBM 2011), 3rd producer
of soybeans and 5th producer of maize of the world (FAOSTAT 2010). Such economic
performances rest on physical conditions and have direct impacts on the environment that might
alter present and future conditions for social reproduction.
By using the approach of societal metabolism (Ayres and Simonis, 1994; Fischer-Kowalski,
1998), the biophysical pattern of economies can be quantified. In this sense, the objective of this
paper is to presents the biophysical profile of Argentinean economy between 1970 and 2009 by
means of the use of the Material Flow Analysis (MFA) methodology. By doing so, we intend to
observe the material impact of economic growth policies based on the intensification of natural
resource extraction.
This paper is structured in five sections. Section 2 presents the foundations of social
metabolism and MFA methodology as well as the practical issues dealt with in the application of
this methodology. Section 3 presents a summary of the economic history of Argentina in the past
four decades analyzing the economic cycles and crises affecting the country as well as structural
aspects. Sections 4 analyze main MFA flows such as Domestic Extraction (DE), physical Imports
(M) and Exports (X) and derived indicators. Results are systematically compared with a similar
study carried out for the case of Spain. By comparing metabolic profiles of economies with
divergent economic development paths and similar levels of population, differences regarding
material use between developing and developed countries can be observed.
The question of integration of Latin American countries in the global economy and their
difficulties to reach economic development has been an important concern for decades; addressed
notably by sociologists and economists belonging to the “theory of dependency” approach. The
latter points out a polarization process of the world economy between “centers” and “peripheries”.
In this context, Section 4 also addresses the physical dimension of Argentina’s integration into
global economy by means of trade. In addition, comparison with Spain is performed in order to
observe differences in terms of external trade integration strategies and trends; and identifying the
consequences of specialization patterns in Argentina’s external trade.
3
Theory, Methods & Sources.
Social Metabolism.
This biophysical analysis of Argentina's economy rests on the framework of Social
Metabolism, an approach useful to analyse the physical base of socioeconomic systems; which has
been developed in the fields of Ecological Economics and Industrial Ecology since the 1990s. This
notion of Social Metabolism refers to the overall material and energetic interchanges between a
society and its environment in order to sustain itself, to reproduce or to grow (Fischer-Kowalski,
1998).
According to this approach, the economic process is supported by flows of materials and
energy provided by the environment, which are processed by the economy and then returned to the
environment as material wastes (Goodland, 1990).
MFA as a Physical Accounting Methodology.
Economy-wide Material Flow Analysis (Economy-wide MFA) is defined as “a consistent
compilation of the overall material inputs into national economies, the material accumulation within
the economic system and the material outputs to other economies or to the environment”
(EUROSTAT 2001 p.17), providing a picture in physical terms of an economic system.
Focusing on the input side by taking into account all materials that enter into the national
economy ―excepting water and air― this article allows to reveal information about the physical
dimension of foreign trade and can determine the amount of all inputs transferred from the
environment to the economy. The basic flows measured in this analysis are:
The physical indicator used are Domestic extraction (DE), Direct material input (DMI),
Domestic material consumption (DMC) and Physical trade balance (PTB).
DE comprises harvested or extracted material for domestic use, DMI accounts for the total
input entering into the economic activities. It is obtained by summing up domestic extraction plus
imports. DMC sums up all materials directly used in the economic system until released to the
environment. It is calculated by subtracting exports to direct material input. This indicator is the
closest equivalent to GDP and can be considered as its physical equivalent. PTB, net physical flow
through the national borders. It is obtained by subtracting exports from imports (M-X). Contrary to
the monetary trade balance (X-M), PTB takes into account the fact that money and goods move in
opposite directions in economies.
4
Trade flows are classified in direct or indirect (hidden) flows. Direct flows account for the
material physically transferred during the dealing, hidden flows account for all the material
requirement necessary to produce the traded good, and virtually transferred. Indirect and unused
flows are not included in this analysis, despite their relevance¹. The main materials categories taken
into account are mentioned in Table 1.
Being widely applied to OCDE countries², Economy-wide Material Flow Analysis started to
be applied to so called southern countries, and in particular to Latin American countries such as
Chile, Peru, Mexico, Ecuador, Colombia and Brazil (Giljum, 2004; Russi et. al. 2008; Gonzalez-
Martinez and Schandl, 2008; Vallejo, 2010; Vallejo et. al. 2011; Eisenmenger et. al. 2007). These
analyses helped to define the metabolic pattern of economies at the periphery of the global economy
and to understand the socio-ecological consequences of their trade patterns.
Among Latin America, Argentina has remained as one country whose material throughput
has not been studied yet over a long period (1970-2009), despite various specificities, which make
this economy a case of interest. Argentina is the third largest Latin American economy (after Brazil
and Mexico), having a long history of exploitation of natural resources. In addition, this country
experienced several crises and structural changes during the past forty years, which have had effects
on the biophysical structure of this economy. Nowadays, despite the international economic
turmoil, it is one of the few countries performing an outstanding economic growth.
For comparison purposes, biophysical data on Spain, obtained in Gonzalez-Martinez et al.
(forthcoming) is presented along the document. The choice of Spain is motivated by at least two
reasons. Firstly, in the past these two countries shared quite the same level of wealth. For instance
in 1970 per capita GDP in Argentina was 11.7% higher than per capita GDP in Spain. Nevertheless,
since then both followed very different paths of development leading Spain to grow faster whereas
Argentina remained far below. In 2009, per capita GDP of Spain was three times higher than per
capita GDP in Argentina, although at present Argentina GDP is growing fast while Spain stagnates
(after the end of the building boom and a spectacular decline in cement consumption). Secondly,
their strategies of integration into the world economy have diverged. Spain is the typical European
country net importer of natural resources whereas Argentina is a large net exporter. Besides, their
population is similar. In 1970, Spanish population was 33.8 million while Argentinean population
were 24.0 million inhabitants. By 2009, Spain had 46.0 million habitants whereas Argentina had
40.1 million people (INDEC 2011, INE 2011).
5
Data Sources
In this work we applied the standard approach of Economy-wide MFA as defined by
EUROSTAT (2001), focusing in the Argentinean economy between 1970 and 2009; a relevant
period in which the country experienced major political and economic events. Table 1 summarizes
the different sources used in this analysis, subdivided into categories of relevance for our case
study. Times series were compiled following a preference for data from national sources, using
international databases only when local ones were not available.
Table 1: Domestic extraction categories and sources
Material
categorie
s
Subcategories Sources and data
Domestic
extraction
categories
Biomass Food, fodder, timber
and other biomass
Most of the data comes from FAO databases (2011), contrasted
with MAGyP's data (2011). Fodder category includes an
estimation of grazing apparent demand by livestock.
Minerals Metallic ores,
industrial minerals,
construction
minerals
All data comes from SMRA (1993, 2011). For the case of metals,
primary ore production was calculated with the help of data from
the industry and the USBM (2011). Sand and gravel extraction for
construction was estimated using cement production statistics of
USBM (2011).
Fossil
fuels
Oil, coal, natural gas,
other fossil fuels
All data comes from SMRA (1993, 2011), SERA (2000, 2011)
completed by IEA database (2010a).
Physical
Trade
Imports
and
Exports
Data was compiled from UNSD (2011).
Source: author's elaboration, adapted from Gonzalez-Martinez (2008)
Argentina’s Economic Overview
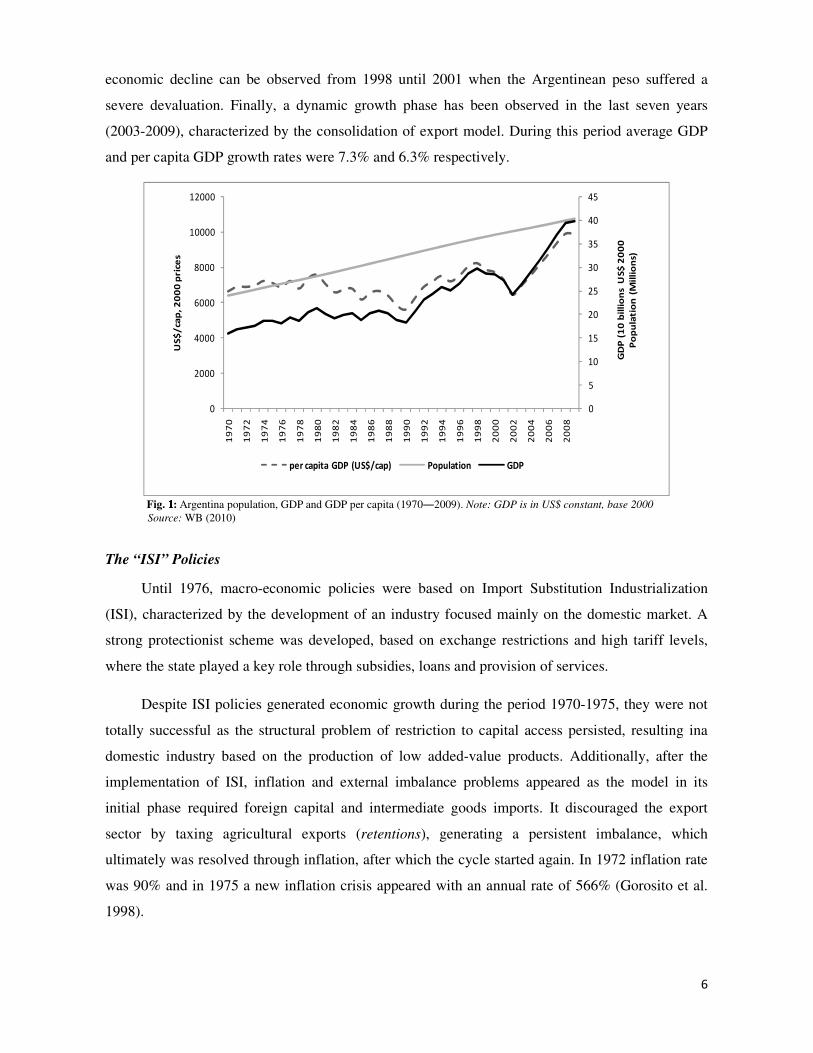
Considering GDP evolution in Argentina, four different stages can be observed the behavior
during the period of study (figure 1). A turbulent period between 1970-1990 marked by political
instability and lack of continuity of growth policies [ISI Policies (1970-1975), neoliberal policies
(1976-1982)], democratic transition and hyperinflation (1983-1990)). This climate of political
instability generated continuous fluctuations of GDP and per capita GDP, annual average growth
rates was 0.82% and -0.7% respectively. A second stage of economic growth covering the period
1991-1998 mainly driven by convertibility policies that favored the opening to foreign markets and
promoting the development of industrial, agriculture and mining sectors. During this period;
average GDP and per capita GDP growth rates were 6.3% and 5% respectively. A third phase of
6
economic decline can be observed from 1998 until 2001 when the Argentinean peso suffered a
severe devaluation. Finally, a dynamic growth phase has been observed in the last seven years
(2003-2009), characterized by the consolidation of export model. During this period average GDP
and per capita GDP growth rates were 7.3% and 6.3% respectively.
0
5
10
15
20
25
30
35
40
45
0
2000
4000
6000
8000
10000
12000
19
70
19
72
19
74
19
76
19
78
19
80
19
82
19
84
19
86
19
88
19
90
19
92
19
94
19
96
19
98
20
00
20
02
20
04
20
06
20
08
US
$/
cap
, 2
00
0 p
rice
s
per capita GDP (US$/cap) Population GDP
GD
P (
10
bil
lio
ns
US$
20
00
Po
pu
lati
on
(M
illi
on
s)
Fig. 1111: Argentina population, GDP and GDP per capita (1970―2009). Note: GDP is in US$ constant, base 2000
Source: WB (2010)
The “ISI” Policies
Until 1976, macro-economic policies were based on Import Substitution Industrialization
(ISI), characterized by the development of an industry focused mainly on the domestic market. A
strong protectionist scheme was developed, based on exchange restrictions and high tariff levels,
where the state played a key role through subsidies, loans and provision of services.
Despite ISI policies generated economic growth during the period 1970-1975, they were not
totally successful as the structural problem of restriction to capital access persisted, resulting ina
domestic industry based on the production of low added-value products. Additionally, after the
implementation of ISI, inflation and external imbalance problems appeared as the model in its
initial phase required foreign capital and intermediate goods imports. It discouraged the export
sector by taxing agricultural exports (retentions), generating a persistent imbalance, which
ultimately was resolved through inflation, after which the cycle started again. In 1972 inflation rate
was 90% and in 1975 a new inflation crisis appeared with an annual rate of 566% (Gorosito et al.
1998).
7
The Neoliberal Policies
In March of 1976, armed forces took power, implementing neoliberal economic policies,
already put in practice by force in Chile and Uruguay, considered at that time successful cases. The
main economic measures implemented were abolishment of ISI policies, commercial opening,
deregulation of the economy and reduction of state’s size. Treber (1987) and Ramos (1986)
underline that, despite the fact that neoliberal economic policies put in practice from 1976 to 1983
reduced inflation and boosted exports, were unsuccessful regarding growth. As shown in Figure 1,
average GDP growth rate was 0.5 %.
The democratic transition
The military government collapsed in 1982 after the Malvinas War against United Kingdom.
Raúl Alfonsín won free elections in 1983, representing democratic transition. His intention was the
stabilization of the economy where the import re-substitution emerged again as an alternative after
the failure of the economic openness experience (ECLAC 1984). However, economic crisis
reappeared in 1989 when inflation reached its peak in July of 1989 (197% monthly rate), generating
economic chaos and the new collapse of the closed-economy approach.
The arrival of Menem's presidency in May 1989 and the Convertibility Law took effect on
April 1, 1991 showing that curiously, a Peronist government became neoliberal.
The Age of Convertibility.
The "Convertibility Plan" implied a change in the relative prices of the economy. In this
context, monetary policy was reduced to a currency board mechanism, where the central bank was
unable to print money above the limits determined by the level of dollar reserves (because of the
peso-dollar fixed parity), subordinating the economy to monetary policy of the U.S. Federal
Reserve. (Giletta, 2005).The strong peso allowed the payment of the dollarized liabilities of the
economy where the agricultural sector, heavily indebted, could restore its profitability, overcoming
a period characterized by low international prices (Peretti, 1998).
In this context, structural change took place, recreating advantages in natural resource
endowments, and driving some innovative activities, especially in the public and private service
sector. Thus, trends in specialization of the Argentinean production system prevailing in the 90s
were based mainly on the use of "old" (e.g., agriculture3) and 'new' natural advantages (oil, gas and
derivatives and large metal mining), the use of markets such as public service sector and the
development of consumer-oriented high-income services (property, commercial, financial,
8
education and health) (Heymann, 2006). The key word was “re-primarization”, that is, emphasis on
the extractive industries mainly biomass extraction.
In general, the economy had favorable conditions in the external markets through increases
in international prices of exported goods. The supply of exportable goods was expanded due to a
significant boost in grain production (between 1997 and1998 harvest rose 70%). Exports measured
in money terms increased more than twice between 1993 and 1998 (Heymann, 2006). Moreover, in
1996 Argentina approved the use of genetically modified soybeans and the expansion of the
agricultural frontier towards the north of Argentina.
The Financial Crisis.
In 2001 a financial crisis and shortage of foreign currency known as the “corralito” started
up and the economy turned from recession to depression (JEC 2003).
This scenario resulted in devaluation of the national currency in December 2001 caused
among other things by the asphyxia of the external financing mechanism of the convertible peso
(total external debt rose from US$ 61,337 million in 1991 to 145,583 million dollars in 2003).
Similarly, temporal international prices falling of major export products, appreciation of the dollar
against other currencies and the strong devaluation of the Brazilian currency, principal trading
partner, generated this outcome, characterized also by social unrest and high unemployment rate
(Giletta, 2005).
As shown in Figure 1, GDP at constant prices declined over 8% per year between 1998 and
2001 mainly by domestic demand contraction of -12% average. Contribution of exports to
aggregate growth in this period was low (4% of GDP) and imports fell nearly 24% (Bugna and
Porta, 2007).
2003-2009, a New Growth Regime
In the context of domestic demand contraction, sectors that initially recovered were those
able to increase their exports. The international sustained demand and higher prices for primary
commodities favored such development (Giletta, 2005).
The exchange rate policy based on devaluation of national currency boosted the agricultural
sector. Soybean crops increased during this period, due to technology and production efficiency
achieved in the previous decade (Wainer, 2005).
9
In this new scenario, Argentina's economy has experienced rapid growth in recent years.
Average annual rate between 2003 and 2008 was 8.4%. Despite, the economy grew 0.9% in 2009,
affected by the international economic crisis (INDEC 2011); it regained growth in 2010, favoring
prospects for re-election of Cristina Fernández who, like her late husband President Kirschner, has
been riding the commodity boom.
Material Flow Patterns of the Argentinean Economy
Notions of ‘metabolic profiles’ (Schandl and Schulz, 2000) of the economy and ‘socio-
ecological transitions’ (Fischer-Kowalski and Haberl, 2007; Krausmann et al., 2007) are built and
analyzed on the base of three material flow indicators: Direct Material Input (DMI), Domestic
Material Consumption (DMC) and Physical Trade Balance (PTB). In addition, terms of trade (TOT)
describe the position of the country in trade relations with the rest of the world. Biophysical scales
and dematerialization trends are compared through material intensities related to income and
population figures.
Metabolic profiles are defined by patterns and levels of material use. This term can be useful
to analyze “socio-ecological transitions” which understand the social change process as a qualitative
transition which transforms the agrarian socio-ecological regime into an industrial regime thereby
establishing a distinct and fundamentally new pattern of society–nature interaction and material and
energy use (Fischer-Kowalski and Haberl, 1997, 2007; de Vries and Goudsblom, 2002). Metabolic
profiles, demographic features, patterns of land use, socioeconomic organization, infrastructure, and
technologies are fundamental facts in socio-ecological transitions (Schandl et al., 2009).
Extraction of Materials in Argentina.
With a territory of 3,761,274 km2, Argentina is the second largest country in South America,
seven times larger than Spain. Due to its fertile soils and favorable climate, the “Pampas” region has
become one of the most agro productive regions in the world, gaining the nickname of “barn of the
world” (Pengue, 2001).
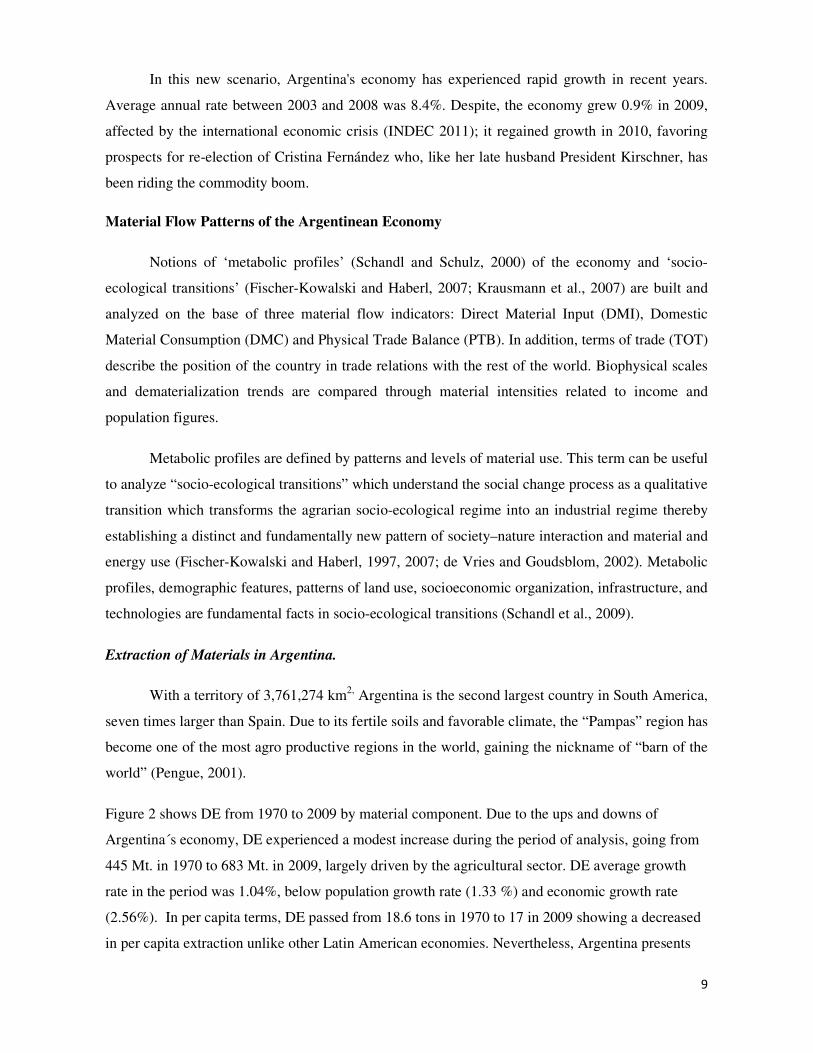
Figure 2 shows DE from 1970 to 2009 by material component. Due to the ups and downs of
Argentina´s economy, DE experienced a modest increase during the period of analysis, going from
445 Mt. in 1970 to 683 Mt. in 2009, largely driven by the agricultural sector. DE average growth
rate in the period was 1.04%, below population growth rate (1.33 %) and economic growth rate
(2.56%). In per capita terms, DE passed from 18.6 tons in 1970 to 17 in 2009 showing a decreased
in per capita extraction unlike other Latin American economies. Nevertheless, Argentina presents
10
higher values of per capita DE than other economies in the region: 8.3 tons/cap average from 1970
to 2007 for Colombia (Vallejo et al. 2011), 7.4 tons/cap average in the same period for Ecuador
(Vallejo, 2010). Even Spain ―an economy based on ¨heavy¨ building minerals― presented a per
capita DE of 12 tons/cap in average for the period 1980-2009 (Gonzalez-Martinez. et al.
forthcoming).
0
100
200
300
400
500
600
700
800
19
70
19
72
19
74
19
76
19
78
19
80
19
82
19
84
19
86
19
88
19
90
19
92
19
94
19
96
19
98
20
00
20
02
20
04
20
06
20
08
Mil
lion
to
nn
es Biomass
Construction minerals
Industrial Minerals
Metal ores
Fossil Fuels
Fig. 2: Domestic extraction of Argentina (1970-2009) Source: own estimations
Biomass DE represents the most predominant activity (72% of DE share), composed of
fodder and grazing, other biomass from fishing and agricultural crops. As for the latter, soybeans
has been the most predominant flow: it represented 17% of all agricultural crops in weight
between1970-2009 and 21% of all agricultural crops between 1996-2009, being the main export
product.
Biomass from primary crops increased consistently from 50 Mt. in 1970, to 137 Mt. in 2009.
According to Pengue (2001), permanent crops for exports have displaced crops for domestic
consumption. This is the case of soybeans whose production passed from 26,000 tons in 1970, to
30.9 Mt. in 2009. This growth was driven on the one hand by high international prices of this
commodity from the 1990s onwards (because of increased demand) and on the other hand, by
higher mechanization of agricultural sector and the introduction of transgenic soybeans and
chemical weeding with glyphosate (Teubal, 2006).
This rise in agricultural production requires clearing the land and forest, as well as the
displacement of many indigenous and rural communities because of the expansion of agricultural
frontier. Harvested area of this soybeans passed from 38,000 Ha in 1970 to 18 million Ha in 2009,
being more than half of the total area used for grain production (MAGyP 2011); evidencing
11
problems like detriment of food security, increasing use of agrochemicals, water, air and soil
pollution; and health impacts on the surrounding populations (Binimelis et al. 2009). Material
Flows from deforestation have not been subtracted in our accounts due to the lack of reliable annual
estimates.
Despite livestock units and land occupied for raising cattle showed only a moderate pattern
of growth, it was the most predominant biomass flow (74% of total biomass share). This is related
to the importance of the livestock industry in Argentina: 53.4 million cattle heads in average were
raised in the national territory during the period under study (FAO 2010).
DE ores and fossil fuels increased ―in weight― by a factor of 27 and 3 respectively
between 1970-2009. The DE intensification of those categories since mid 1990s was driven
primarily by external demand ―particularly for ores― and high international prices. In addition,
mining was eased by the 1993 Foreign Investment law, under which licenses were released for oil
and gas mining.
DE ores passed from 9.6 Mt. in 1997 to 34.4 in 1998, driven by the opening in 1997 of
mining projects such as “Bajo la Alumbrera”, “Cerro de la Vanguardia” y “Salar de Hombre
Muerto”. As a result, exports value increased from 150 million dollars in 1990 to 1,200 million in
1999 (Prado, 2005).
Extraction of fossil fuels rose importantly due to the approval of the 1993 foreign
investment law mentioned above, mainly in natural gas exploitation (ECLAC 1997), which
increased by a factor of 6.31 during the period, showing annual growth rates of 9.9% in 1995 and
13.8% in 1996.
In Argentina, annual extraction of construction minerals represents 14% of total DE, unlike
Spain where this category represented 68% until the economic crisis of 2008-09. (Gonzalez-
Martinez, et. al. forthcoming). The sum of construction minerals and industrial minerals related to
construction activities in Argentina just increased by a factor of 1.39, between 1980 to 2009.
Correspondence of building materials extraction and economic growth cycles was found in
previous studies (Weisz et al. 2006; Behrens et al. 2007). In Argentina the deepest economic
downturns in 1989 and 2001 coincide with the lowest DE of construction minerals. Likewise,
economic recovery from 2002 onwards led to an increment in construction activities. However, in
contrast to Spain or other Latin-American countries such as Mexico, building materials have not
been and they are not the most important flow of this economy.
12
Material Input
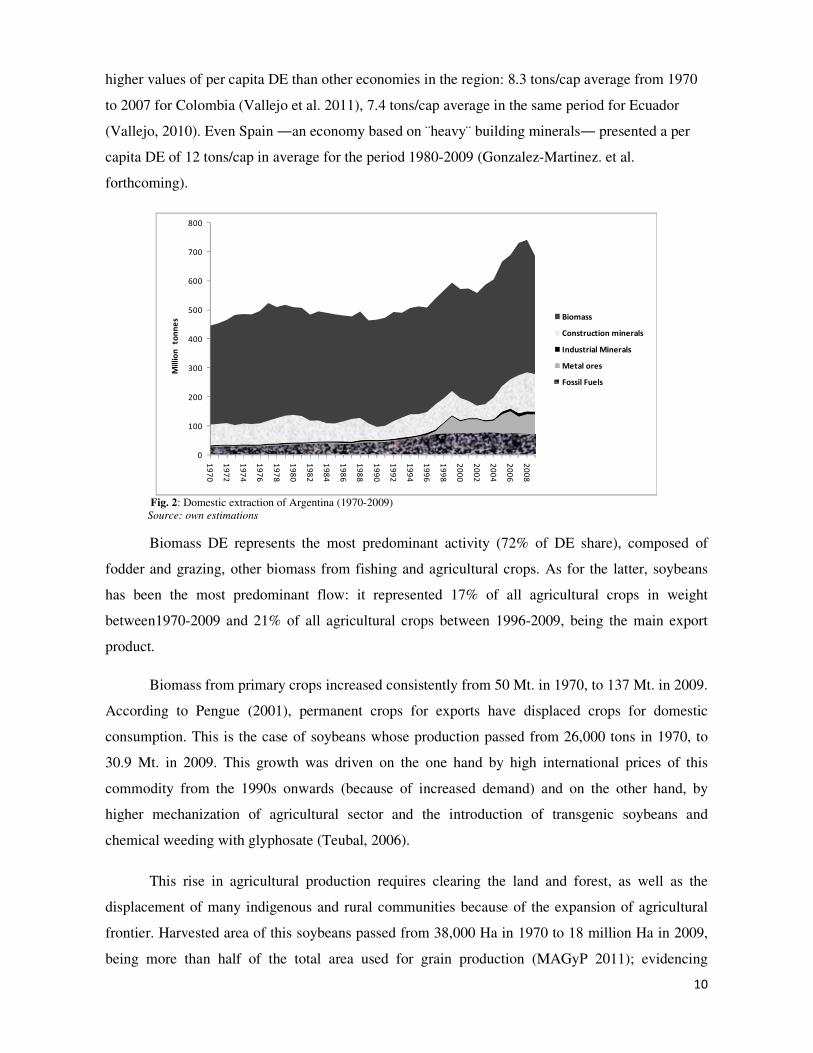
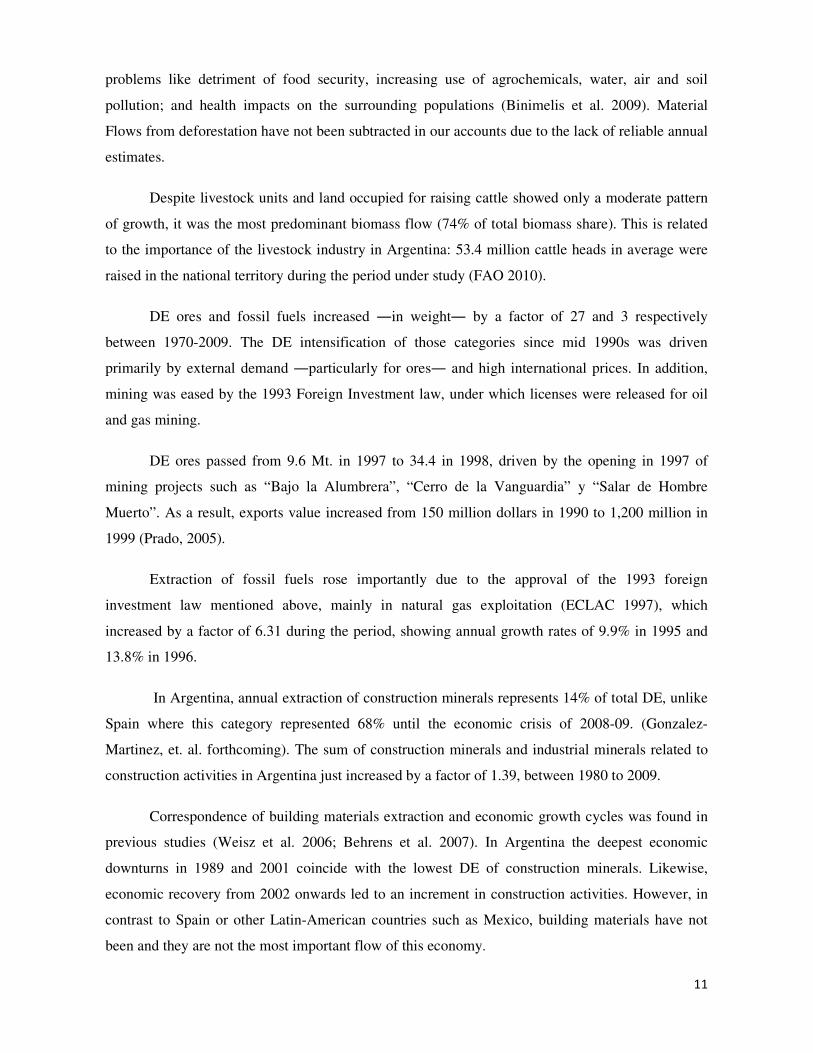
The evolution of per capita DMI of Argentina is depicted in Figure 3. Per capita DMI
remained constant in 19 tons from 1970 to 2009. Imports grew especially after 1990 because of the
commercial opening resulting from the fixed parity plan. DE of resources has been by far the main
source of material inputs, per capita imported materials represented only 2.3% of per capita DMI in
1970 and 3% in 2009. A completely opposite pattern regarding imports is presented by Spain,
where per capita imported materials accounted for 23% of the DMI in 1980, increasing to 31% in
2009 (Gonzalez-Martinez, et al. forthcoming).
1,12 1,28 1,32 2,01 1,74
14,24 13,2111,34 10,20 10,04
0,100,09
0,13 1,12 1,71
3,143,55
1,522,19
3,46
0,45 0,47
0,25
0,590,55
0,00
5,00
10,00
15,00
20,00
25,00
1970 1980 1990 2000 2009
Ton
s/ca
p
Imports
Other Minerals
Ores
Biomass
Fossil Fuels
Fig. 3. Argentina per capita DMI (tons/cap.) (1970-2009) Source: Author’s estimations
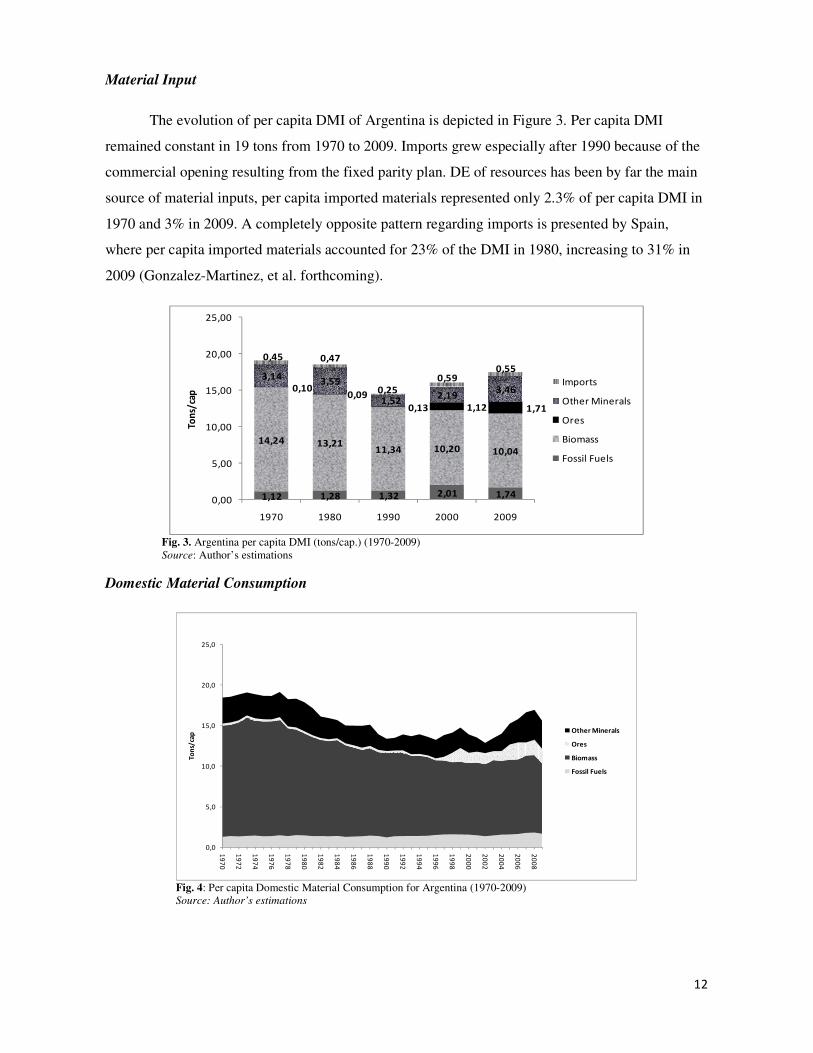
Domestic Material Consumption
0,0
5,0
10,0
15,0
20,0
25,0
19
70
19
72
19
74
19
76
19
78
19
80
19
82
19
84
19
86
19
88
19
90
19
92
19
94
19
96
19
98
20
00
20
02
20
04
20
06
20
08
To
ns/
cap Other Minerals
Ores
Biomass
Fossil Fuels
Fig. 4: Per capita Domestic Material Consumption for Argentina (1970-2009) Source: Author’s estimations
13
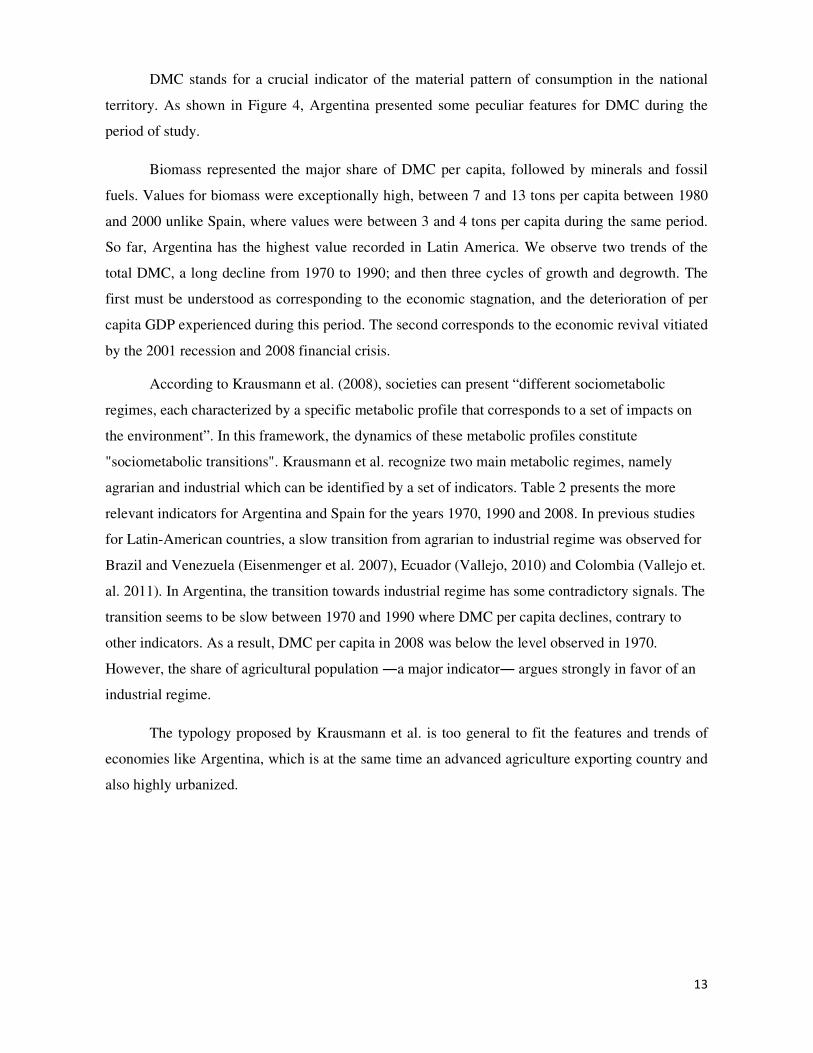
DMC stands for a crucial indicator of the material pattern of consumption in the national
territory. As shown in Figure 4, Argentina presented some peculiar features for DMC during the
period of study.
Biomass represented the major share of DMC per capita, followed by minerals and fossil
fuels. Values for biomass were exceptionally high, between 7 and 13 tons per capita between 1980
and 2000 unlike Spain, where values were between 3 and 4 tons per capita during the same period.
So far, Argentina has the highest value recorded in Latin America. We observe two trends of the
total DMC, a long decline from 1970 to 1990; and then three cycles of growth and degrowth. The
first must be understood as corresponding to the economic stagnation, and the deterioration of per
capita GDP experienced during this period. The second corresponds to the economic revival vitiated
by the 2001 recession and 2008 financial crisis.
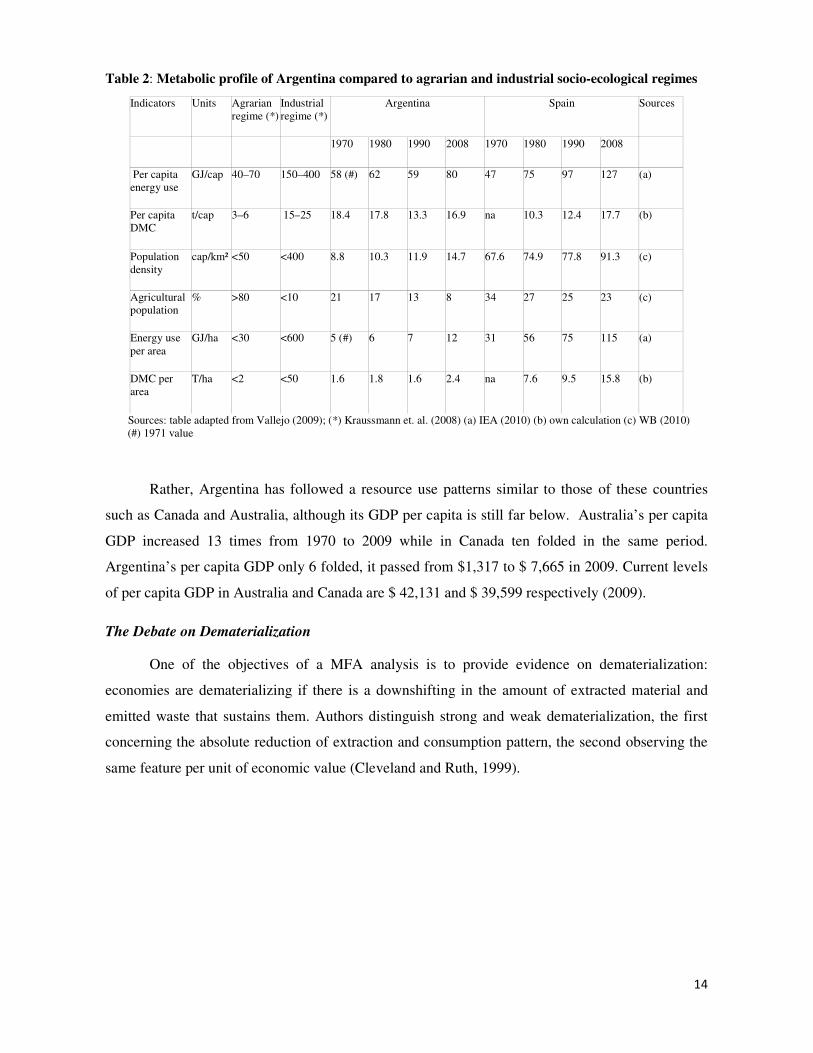
According to Krausmann et al. (2008), societies can present “different sociometabolic
regimes, each characterized by a specific metabolic profile that corresponds to a set of impacts on
the environment”. In this framework, the dynamics of these metabolic profiles constitute
"sociometabolic transitions". Krausmann et al. recognize two main metabolic regimes, namely
agrarian and industrial which can be identified by a set of indicators. Table 2 presents the more
relevant indicators for Argentina and Spain for the years 1970, 1990 and 2008. In previous studies
for Latin-American countries, a slow transition from agrarian to industrial regime was observed for
Brazil and Venezuela (Eisenmenger et al. 2007), Ecuador (Vallejo, 2010) and Colombia (Vallejo et.
al. 2011). In Argentina, the transition towards industrial regime has some contradictory signals. The
transition seems to be slow between 1970 and 1990 where DMC per capita declines, contrary to
other indicators. As a result, DMC per capita in 2008 was below the level observed in 1970.
However, the share of agricultural population ―a major indicator― argues strongly in favor of an
industrial regime.
The typology proposed by Krausmann et al. is too general to fit the features and trends of
economies like Argentina, which is at the same time an advanced agriculture exporting country and
also highly urbanized.
14
Table 2: Metabolic profile of Argentina compared to agrarian and industrial socio-ecological regimes
Indicators Units Agrarian regime (*)
Industrial regime (*)
Argentina Spain Sources
1970 1980 1990 2008 1970 1980 1990 2008
Per capita energy use
GJ/cap 40–70 150–400 58 (#) 62 59 80 47 75 97 127 (a)
Per capita DMC
t/cap 3–6 15–25 18.4 17.8 13.3 16.9 na 10.3 12.4 17.7 (b)
Population density
cap/km² <50 <400 8.8 10.3 11.9 14.7 67.6 74.9 77.8 91.3 (c)
Agricultural population
% >80 <10 21 17 13 8 34 27 25 23 (c)
Energy use per area
GJ/ha <30 <600 5 (#) 6 7 12 31 56 75 115 (a)
DMC per area
T/ha <2 <50 1.6 1.8 1.6 2.4 na 7.6 9.5 15.8 (b)
Sources: table adapted from Vallejo (2009); (*) Kraussmann et. al. (2008) (a) IEA (2010) (b) own calculation (c) WB (2010)
(#) 1971 value
Rather, Argentina has followed a resource use patterns similar to those of these countries
such as Canada and Australia, although its GDP per capita is still far below. Australia’s per capita
GDP increased 13 times from 1970 to 2009 while in Canada ten folded in the same period.
Argentina’s per capita GDP only 6 folded, it passed from $1,317 to $ 7,665 in 2009. Current levels
of per capita GDP in Australia and Canada are $ 42,131 and $ 39,599 respectively (2009).
The Debate on Dematerialization
One of the objectives of a MFA analysis is to provide evidence on dematerialization:
economies are dematerializing if there is a downshifting in the amount of extracted material and
emitted waste that sustains them. Authors distinguish strong and weak dematerialization, the first
concerning the absolute reduction of extraction and consumption pattern, the second observing the
same feature per unit of economic value (Cleveland and Ruth, 1999).
15
0
0,5
1
1,5
2
2,5
3
19
70
19
72
19
74
19
76
19
78
19
80
19
82
19
84
19
86
19
88
19
90
19
92
19
94
19
96
19
98
20
00
20
02
20
04
20
06
20
08
Ton
s/U
S$
DMC/GDP
DE/GDP
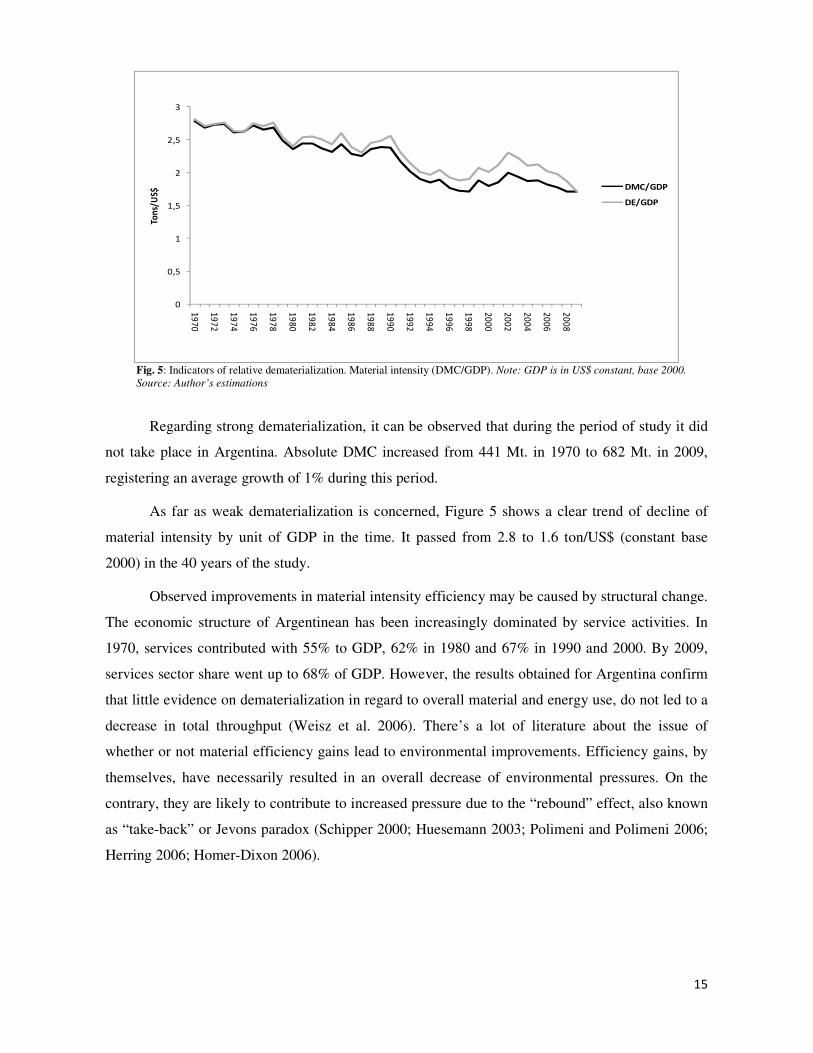
Fig. 5: Indicators of relative dematerialization. Material intensity (DMC/GDP). Note: GDP is in US$ constant, base 2000. Source: Author’s estimations
Regarding strong dematerialization, it can be observed that during the period of study it did
not take place in Argentina. Absolute DMC increased from 441 Mt. in 1970 to 682 Mt. in 2009,
registering an average growth of 1% during this period.
As far as weak dematerialization is concerned, Figure 5 shows a clear trend of decline of
material intensity by unit of GDP in the time. It passed from 2.8 to 1.6 ton/US$ (constant base
2000) in the 40 years of the study.
Observed improvements in material intensity efficiency may be caused by structural change.
The economic structure of Argentinean has been increasingly dominated by service activities. In
1970, services contributed with 55% to GDP, 62% in 1980 and 67% in 1990 and 2000. By 2009,
services sector share went up to 68% of GDP. However, the results obtained for Argentina confirm
that little evidence on dematerialization in regard to overall material and energy use, do not led to a
decrease in total throughput (Weisz et al. 2006). There’s a lot of literature about the issue of
whether or not material efficiency gains lead to environmental improvements. Efficiency gains, by
themselves, have necessarily resulted in an overall decrease of environmental pressures. On the
contrary, they are likely to contribute to increased pressure due to the “rebound” effect, also known
as “take-back” or Jevons paradox (Schipper 2000; Huesemann 2003; Polimeni and Polimeni 2006;
Herring 2006; Homer-Dixon 2006).
16
Physical Trade Pattern
0
10
20
30
40
50
60
70
80
0
20.000
40.000
60.000
80.000
100.000
120.000
19
70
19
72
19
74
19
76
19
78
19
80
19
82
19
84
19
86
19
88
19
90
19
92
19
94
19
96
19
98
20
00
20
02
20
04
20
06
20
08
Bill
ion
s U
S$
Imports (tons)
Exports (tons)
Imports (US$)
Exports (US$)
Mill
ion
to
nn
es
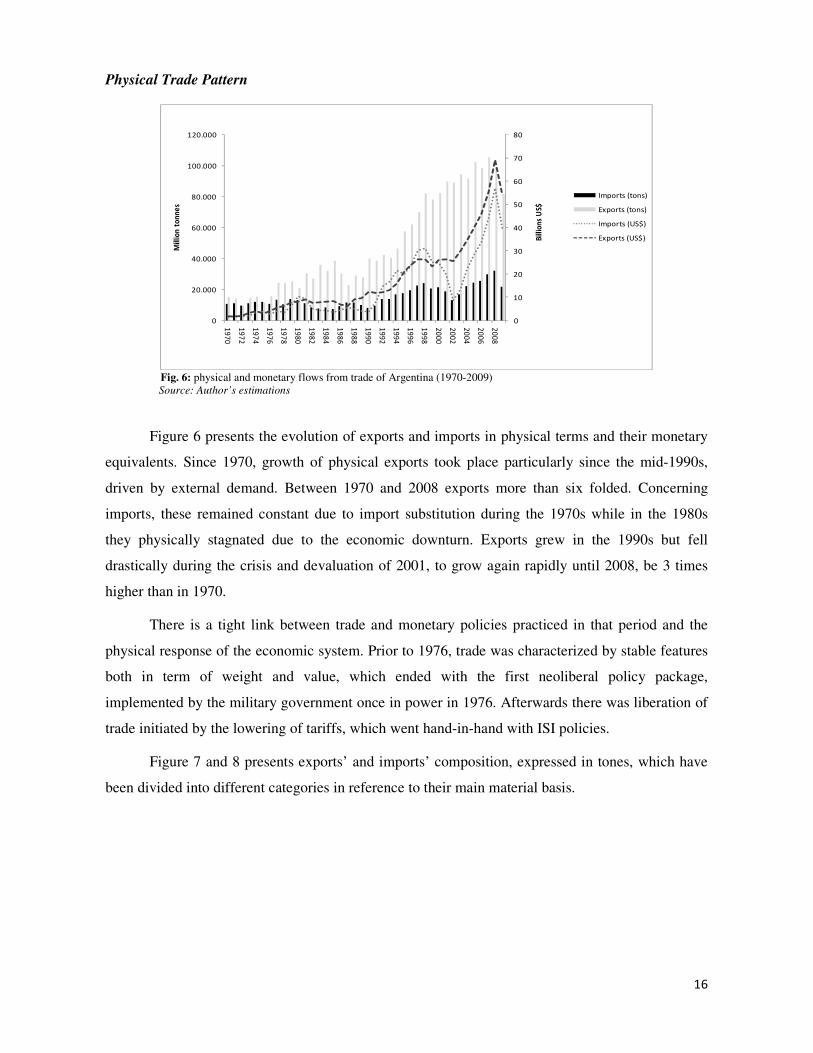
Fig. 6: physical and monetary flows from trade of Argentina (1970-2009) Source: Author’s estimations
Figure 6 presents the evolution of exports and imports in physical terms and their monetary
equivalents. Since 1970, growth of physical exports took place particularly since the mid-1990s,
driven by external demand. Between 1970 and 2008 exports more than six folded. Concerning
imports, these remained constant due to import substitution during the 1970s while in the 1980s
they physically stagnated due to the economic downturn. Exports grew in the 1990s but fell
drastically during the crisis and devaluation of 2001, to grow again rapidly until 2008, be 3 times
higher than in 1970.
There is a tight link between trade and monetary policies practiced in that period and the
physical response of the economic system. Prior to 1976, trade was characterized by stable features
both in term of weight and value, which ended with the first neoliberal policy package,
implemented by the military government once in power in 1976. Afterwards there was liberation of
trade initiated by the lowering of tariffs, which went hand-in-hand with ISI policies.
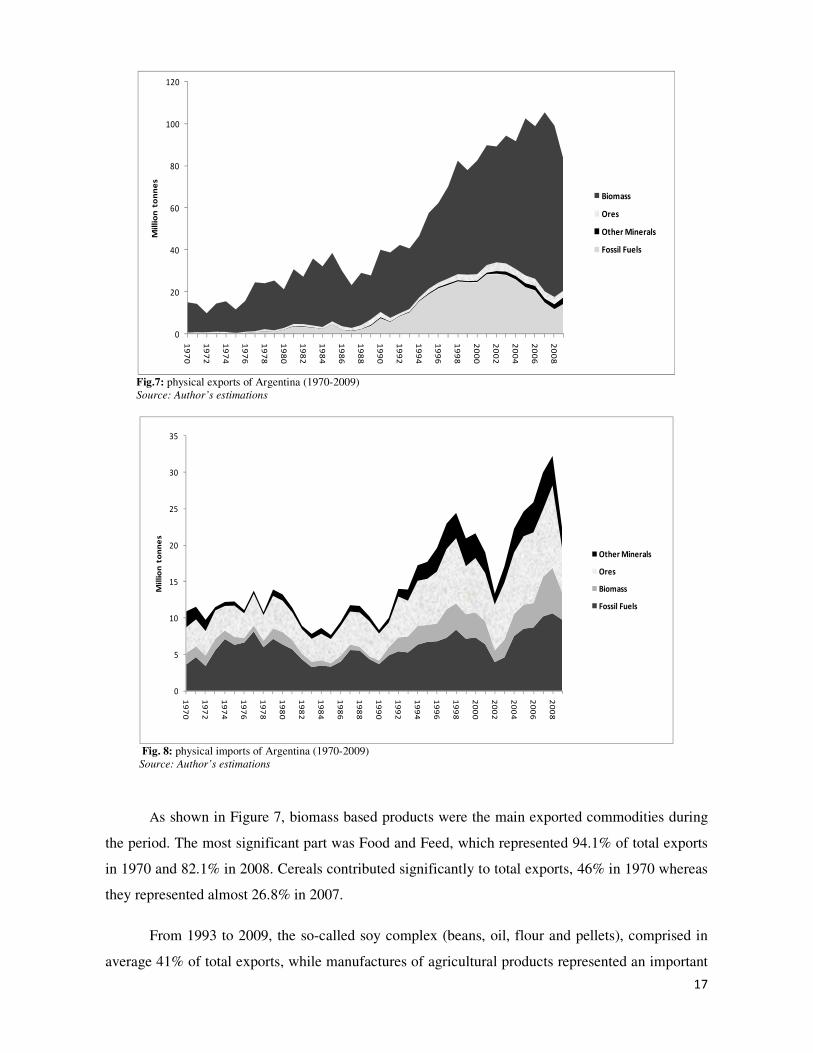
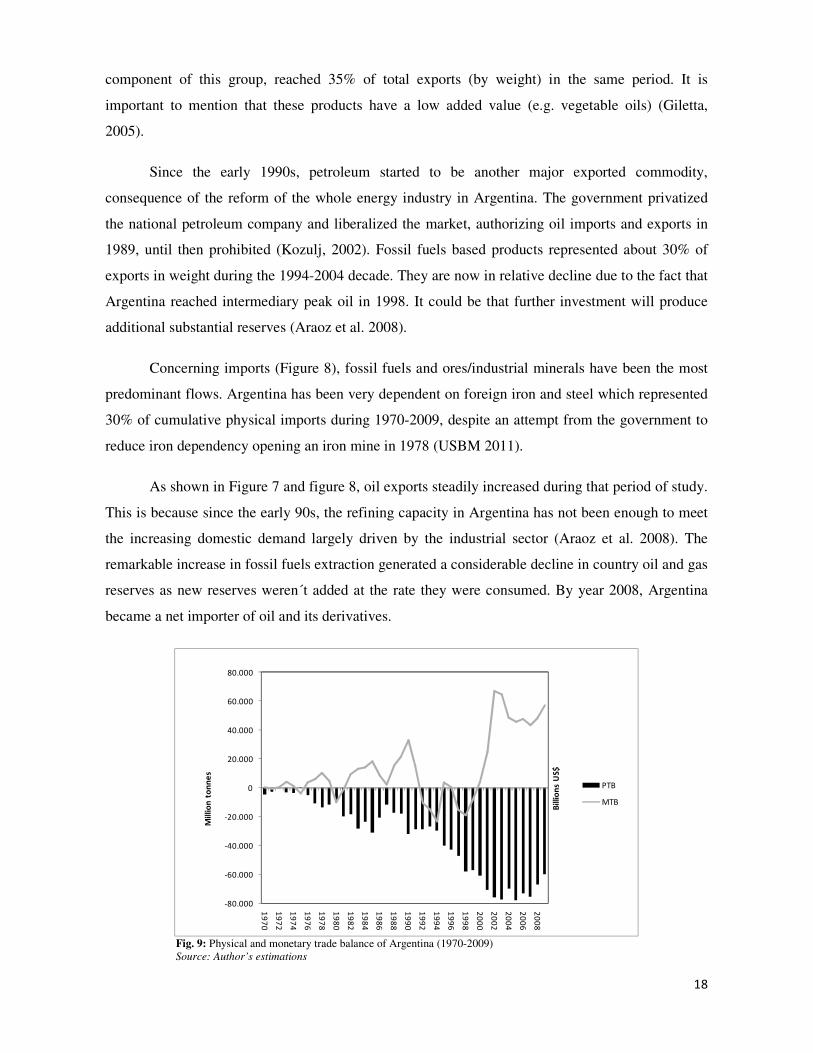
Figure 7 and 8 presents exports’ and imports’ composition, expressed in tones, which have
been divided into different categories in reference to their main material basis.
17
0
20
40
60
80
100
120
19
70
19
72
19
74
19
76
19
78
19
80
19
82
19
84
19
86
19
88
19
90
19
92
19
94
19
96
19
98
20
00
20
02
20
04
20
06
20
08
Mil
lio
n t
on
ne
s
Biomass
Ores
Other Minerals
Fossil Fuels
Fig.7: physical exports of Argentina (1970-2009) Source: Author’s estimations
0
5
10
15
20
25
30
35
19
70
19
72
19
74
19
76
19
78
19
80
19
82
19
84
19
86
19
88
19
90
19
92
19
94
19
96
19
98
20
00
20
02
20
04
20
06
20
08
Mil
lio
n t
on
ne
s
Other Minerals
Ores
Biomass
Fossil Fuels
Fig. 8: physical imports of Argentina (1970-2009) Source: Author’s estimations
As shown in Figure 7, biomass based products were the main exported commodities during
the period. The most significant part was Food and Feed, which represented 94.1% of total exports
in 1970 and 82.1% in 2008. Cereals contributed significantly to total exports, 46% in 1970 whereas
they represented almost 26.8% in 2007.
From 1993 to 2009, the so-called soy complex (beans, oil, flour and pellets), comprised in
average 41% of total exports, while manufactures of agricultural products represented an important
18
component of this group, reached 35% of total exports (by weight) in the same period. It is
important to mention that these products have a low added value (e.g. vegetable oils) (Giletta,
2005).
Since the early 1990s, petroleum started to be another major exported commodity,
consequence of the reform of the whole energy industry in Argentina. The government privatized
the national petroleum company and liberalized the market, authorizing oil imports and exports in
1989, until then prohibited (Kozulj, 2002). Fossil fuels based products represented about 30% of
exports in weight during the 1994-2004 decade. They are now in relative decline due to the fact that
Argentina reached intermediary peak oil in 1998. It could be that further investment will produce
additional substantial reserves (Araoz et al. 2008).
Concerning imports (Figure 8), fossil fuels and ores/industrial minerals have been the most
predominant flows. Argentina has been very dependent on foreign iron and steel which represented
30% of cumulative physical imports during 1970-2009, despite an attempt from the government to
reduce iron dependency opening an iron mine in 1978 (USBM 2011).
As shown in Figure 7 and figure 8, oil exports steadily increased during that period of study.
This is because since the early 90s, the refining capacity in Argentina has not been enough to meet
the increasing domestic demand largely driven by the industrial sector (Araoz et al. 2008). The
remarkable increase in fossil fuels extraction generated a considerable decline in country oil and gas
reserves as new reserves weren´t added at the rate they were consumed. By year 2008, Argentina
became a net importer of oil and its derivatives.
-80.000
-60.000
-40.000
-20.000
0
20.000
40.000
60.000
80.000
19
70
19
72
19
74
19
76
19
78
19
80
19
82
19
84
19
86
19
88
19
90
19
92
19
94
19
96
19
98
20
00
20
02
20
04
20
06
20
08
Bil
lion
s U
S$
PTB
MTB
Mil
lio
n t
on
ne
s
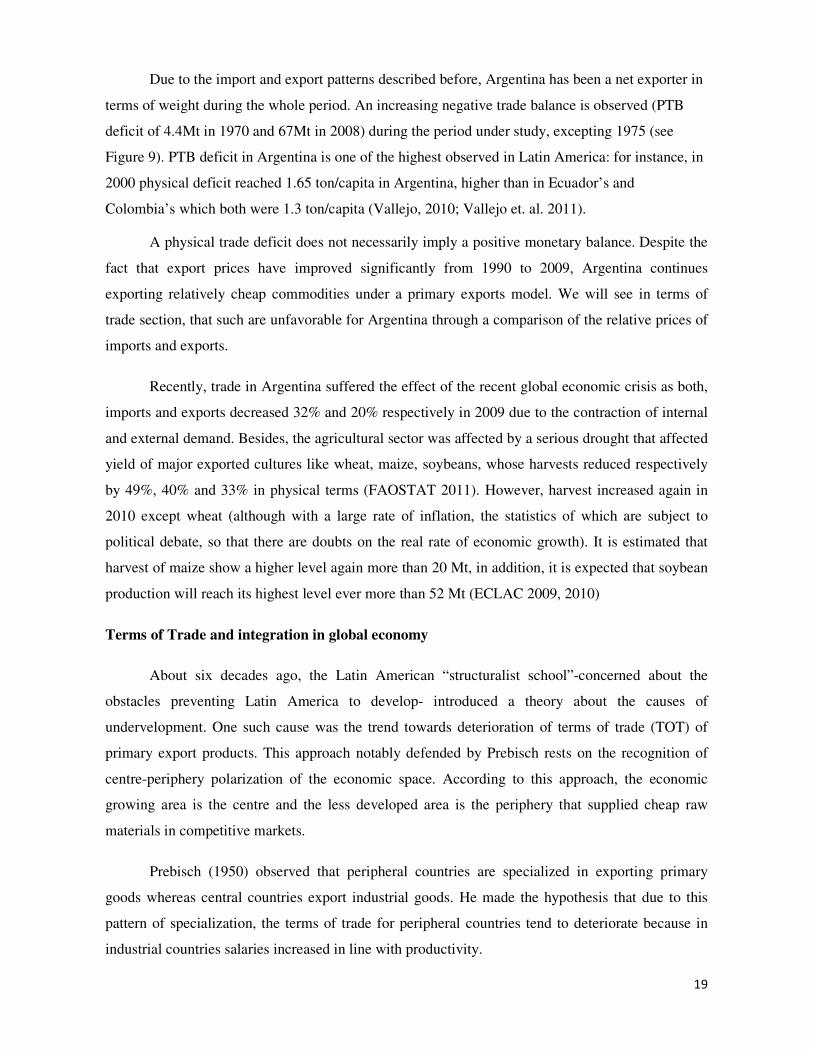
Fig. 9: Physical and monetary trade balance of Argentina (1970-2009) Source: Author’s estimations
19
Due to the import and export patterns described before, Argentina has been a net exporter in
terms of weight during the whole period. An increasing negative trade balance is observed (PTB
deficit of 4.4Mt in 1970 and 67Mt in 2008) during the period under study, excepting 1975 (see
Figure 9). PTB deficit in Argentina is one of the highest observed in Latin America: for instance, in
2000 physical deficit reached 1.65 ton/capita in Argentina, higher than in Ecuador’s and
Colombia’s which both were 1.3 ton/capita (Vallejo, 2010; Vallejo et. al. 2011).
A physical trade deficit does not necessarily imply a positive monetary balance. Despite the
fact that export prices have improved significantly from 1990 to 2009, Argentina continues
exporting relatively cheap commodities under a primary exports model. We will see in terms of
trade section, that such are unfavorable for Argentina through a comparison of the relative prices of
imports and exports.
Recently, trade in Argentina suffered the effect of the recent global economic crisis as both,
imports and exports decreased 32% and 20% respectively in 2009 due to the contraction of internal
and external demand. Besides, the agricultural sector was affected by a serious drought that affected
yield of major exported cultures like wheat, maize, soybeans, whose harvests reduced respectively
by 49%, 40% and 33% in physical terms (FAOSTAT 2011). However, harvest increased again in
2010 except wheat (although with a large rate of inflation, the statistics of which are subject to
political debate, so that there are doubts on the real rate of economic growth). It is estimated that
harvest of maize show a higher level again more than 20 Mt, in addition, it is expected that soybean
production will reach its highest level ever more than 52 Mt (ECLAC 2009, 2010)
Terms of Trade and integration in global economy
About six decades ago, the Latin American “structuralist school”-concerned about the
obstacles preventing Latin America to develop- introduced a theory about the causes of
undervelopment. One such cause was the trend towards deterioration of terms of trade (TOT) of
primary export products. This approach notably defended by Prebisch rests on the recognition of
centre-periphery polarization of the economic space. According to this approach, the economic
growing area is the centre and the less developed area is the periphery that supplied cheap raw
materials in competitive markets.
Prebisch (1950) observed that peripheral countries are specialized in exporting primary
goods whereas central countries export industrial goods. He made the hypothesis that due to this
pattern of specialization, the terms of trade for peripheral countries tend to deteriorate because in
industrial countries salaries increased in line with productivity.
20
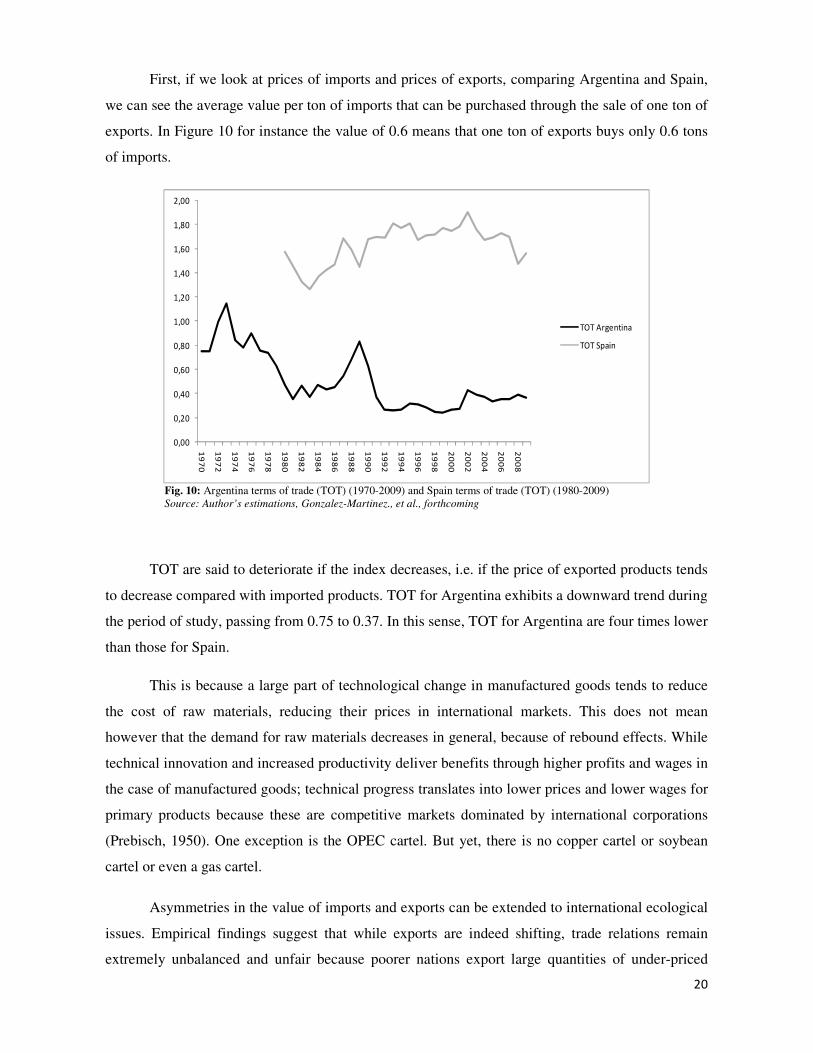
First, if we look at prices of imports and prices of exports, comparing Argentina and Spain,
we can see the average value per ton of imports that can be purchased through the sale of one ton of
exports. In Figure 10 for instance the value of 0.6 means that one ton of exports buys only 0.6 tons
of imports.
0,00
0,20
0,40
0,60
0,80
1,00
1,20
1,40
1,60
1,80
2,00
19
70
19
72
19
74
19
76
19
78
19
80
19
82
19
84
19
86
19
88
19
90
19
92
19
94
19
96
19
98
20
00
20
02
20
04
20
06
20
08
TOT Argentina
TOT Spain
Fig. 10: Argentina terms of trade (TOT) (1970-2009) and Spain terms of trade (TOT) (1980-2009) Source: Author’s estimations, Gonzalez-Martinez., et al., forthcoming
TOT are said to deteriorate if the index decreases, i.e. if the price of exported products tends
to decrease compared with imported products. TOT for Argentina exhibits a downward trend during
the period of study, passing from 0.75 to 0.37. In this sense, TOT for Argentina are four times lower
than those for Spain.
This is because a large part of technological change in manufactured goods tends to reduce
the cost of raw materials, reducing their prices in international markets. This does not mean
however that the demand for raw materials decreases in general, because of rebound effects. While
technical innovation and increased productivity deliver benefits through higher profits and wages in
the case of manufactured goods; technical progress translates into lower prices and lower wages for
primary products because these are competitive markets dominated by international corporations
(Prebisch, 1950). One exception is the OPEC cartel. But yet, there is no copper cartel or soybean
cartel or even a gas cartel.
Asymmetries in the value of imports and exports can be extended to international ecological
issues. Empirical findings suggest that while exports are indeed shifting, trade relations remain
extremely unbalanced and unfair because poorer nations export large quantities of under-priced
21
products whose value does not include the environmental ―and social― costs of their extraction,
processing, or shipping (Jorgenson, 2009; Rice, 2007).
In this sense, an ecologically unequal exchange (Hornborg, 1998, Giljum and Eisenmenger,
2004; Muradian and Martinez-Alier, 2001) can be observed in the intensification of natural resource
exploitation in order to acquire the same amounts of imported goods, while environmental liabilities
and social costs are not incorporated into the final prices of export goods (Roberts and Parks, 2009).
As Hornborg wrote in 1998, world metropolitan areas rely structurally on relatively cheap imports
of energy and materials which they dissipate or use in large quantities. In this context, the
international division between the center and the periphery relates to the physical trade in which
many Southern countries provide the material and energy for Northern countries to increase or
maintain their socioeconomic metabolism. The North today includes parts of China.
In this line of thought, Bunker (1985, 2007) suggested a structural asymmetry between
“extractive economies” in the periphery and “productive economies” in the core. Eisenmenger and
Giljum (2006) called“extractive economies” all those economies specialized in extracting resources
for exporting rather than for domestic use. In this sense, we note that Argentina, as a country
specialized in primary export products, behaves as an “extractive economy”.
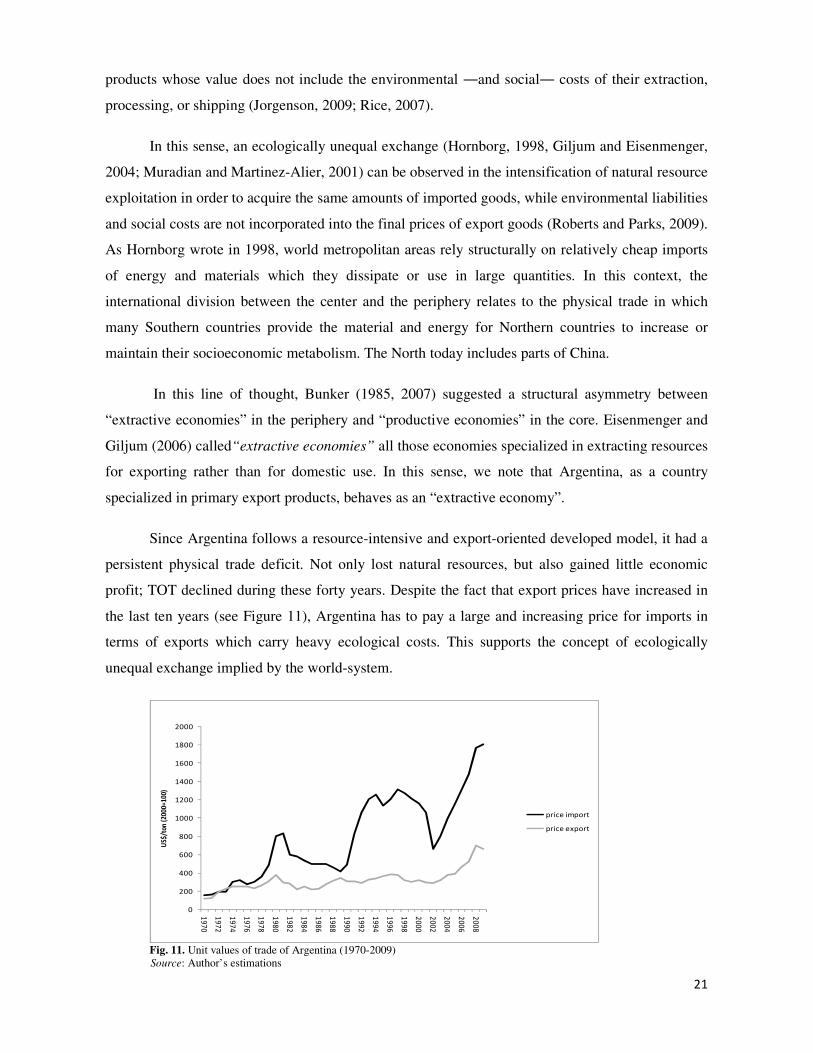
Since Argentina follows a resource-intensive and export-oriented developed model, it had a
persistent physical trade deficit. Not only lost natural resources, but also gained little economic
profit; TOT declined during these forty years. Despite the fact that export prices have increased in
the last ten years (see Figure 11), Argentina has to pay a large and increasing price for imports in
terms of exports which carry heavy ecological costs. This supports the concept of ecologically
unequal exchange implied by the world-system.
0
200
400
600
800
1000
1200
1400
1600
1800
2000
19
70
19
72
19
74
19
76
19
78
19
80
19
82
19
84
19
86
19
88
19
90
19
92
19
94
19
96
19
98
20
00
20
02
20
04
20
06
20
08
US$
/ton
(20
00=1
00)
price import
price export
Fig. 11. Unit values of trade of Argentina (1970-2009)
Source: Author’s estimations
22
Trends of unit values of trade of Argentina (US$ per ton of imported and exported materials)
are presented in Figure 11. Unit values of exported and imported products are expressed at constant
prices (base year 2000). During this period, import prices have been higher than export prices
reaching a factor of 2.73 in 2009 in Argentina while an opposite trend is the case of Spain where the
export prices are higher than import prices. Even the industrialization of agricultural exports, the
registered high commodity prices in the 2000s and the fact that Argentina is positioned as a net
exporter of fossil fuels since 1990 have not achieved a significantly reduction of this gap. Trade
policy in Argentina has not improved terms of trade for this country but it has intensified the use of
exhaustible resources and intensive agricultural activities, implying both important environmental
damages.
Conclusions
This study presents information about biophysical aspects of the Argentinean economy
using MFA methodology and comparing such results to those of another study on Spanish economy
(Gonzalez-Martinez., et. al. forthcoming). The quantity of materials domestically extracted and
consumed in Argentina has grown by 77% and 77.2% respectively during the forty years period of
study, due to growth of biomass and ores extraction.
Over the last four decades, external demand was the main driving force for the increasing
use of natural resources in Argentina. The growth of exports since 1970 was mainly based on
biomass products. From the late 1990s onwards this pattern changed as metals ores gained
importance. MFA indicators show the degree of commoditization of the Argentina’s foreign trade.
Mining projects only consider the production of concentrates and products without refining, so the
added value in the extraction of minerals is low. Additionally, despite the fact that manufactures of
agricultural origin have increased, the added value remains low in total Argentinean exports.
Therefore, the Argentinean economy presents the same pattern as other Latin American
economies. Its dependence on exports of bulk commodities in the monetary and physical trade
balance increased during the period analyzed, which places it as an “extractive economy”.
Additionally, it is an economy based on intensive agricultural activities that go hand-by-hand with
deforestation, loss of biodiversity, and intensive use of agrochemicals. Likewise, open cast mining
of coal or other minerals is also a source of hazardous wastes, which threaten human health and the
environment. In addition, deterioration of TOT was observed in the case of Argentina during the
period of study, evidence that seems to reinforce the ecological Prebisch’s thesis.
23
The typology proposed to analyze sociometabolic transitions (Krausmann et al.) is too
general to fit the features and trends of economies like Argentina. Whether Argentina has gone
through a transition from an agrarian regime to an industrial economy, as it was observed in other
empirical studies in Latin American economies, it is difficult to conclude. Argentina is
characterized by high levels of biomass production as if it was an agrarian society but it is highly
urbanized and with a relatively high level of energy consumption per capita. It current per capita
GDP of $ 7.665 (current US$ in 2009) (WB 2011) is one of the largest in Latin America but its
industrial economy is still based on low added value products.
Rather, we might conclude that Argentina presents a resource use pattern similar to those
countries with an abundance of natural resources, large territories and low population densities such
as Australia or Canada. Nevertheless, per capita income in Argentina is still far below these two
countries.
Finally, despite extraction and material consumption in Argentina increased, improvements
in material intensity efficiency were observed. This gains in material efficiency may have been the
result of an increasingly dominance of the service sector in the economy.
Acknowledgements
Financial support for this research was provided by the Institute for Environmental Sciences and
Technologies at the Autonomous University of Barcelona.
Notes
1. Despite the fact that indirect flows increase the accuracy of the analysis , their inclusion can generate arbitrariness
since they are calculated by multiplying direct flows by standards coefficients which do not take into account available
technology and the specific natural and economic conditions of each country.
2. See Bringezu et. al. 2003 for a review of the MFA application in developed economies.
3. Pampa's agricultural sector was transformed by means of introducing technological and organizational innovations,
encouraged by the new structure of relative prices. This fact summed up to the natural fertility of the land in
exploitation boosted yields and productivity.
24
References
Aráoz, I., G. Barbarán, and D. Maur. 2008. Análisis del Sector de Refinerías en Argentina con el
Modelo MESSAGE. [Refineries Sector Analysis in Argentina with the MESSAGE model].
Año XI, Boletín Energético No21. Comisión Nacional de Energía Atómica, Buenos Aires,
Argentina.
Ayres, R.U., Simonis, U.E.,1994. Industrial Metabolism. Restructuring for Sustainable
Development, Tokyo, UN University. Press.
Behrens, A., Giljum, S., Kovanda, K., Niza, S., 2007. The material basis of the global economy:
Worldwide patterns of natural resource extraction and their implications for sustainable
resource use policies. Ecological Economics, 64(2): 444–453.
Binimellis. R., Pengue. W., Monterroso, I., 2009. “Transgenic treadmill”: Responses to the
emergence and spread of glyphosate-resistant johnsongrass in Argentina. Geoforum, 40(4):
623-633.
Bunker, S. 1985. Underdeveloping the Amazon: Extraction, unequal exchange, and the failure of
the modern state. Chicago: University of Chicago Press.
Bunker, S. 2007. The poverty of resource extraction. In Rethinking environmental history: World-
system history and global environmental change, edited by A. Hornborg et al. Lanham, MD,
USA: Altamira Press.
Cleveland, C. J., Ruth M., 1998. Indicators of Dematerialization and the Materials Intensity of Use.
Journal of Industrial Ecology, 2(3): 15-50.
De Vries, B., Goudsblom, J., 2002. Mappae Mundi. Humans and their Habitats in a Long-Term
Socio-Ecological Perspective. Amsterdam University Press, Amsterdam.
Di Tella, G., Dornbusch, R. (Ed.), 1989. The political Economy of Argentina, 1946-1983.
Macmillan Press, Basingstoke.
ECLAC (Economic Commission for Latin America and the Caribbean), 1984. Notas sobre la
Evolución de la Economía Argentina en 1989. [Notes about the Evolution of Argentina
Economy in 1983]. Documento de trabajo N° 12.
ECLAC, 1990. Notas sobre la Evolución de la Economía Argentina en 1989. [Notes about the
Evolution of Argentina Economy in 1989]. Documento de trabajo N° 37.
ECLAC, 1997. Nota sobre la evolución de la economía argentina en 1996. [Notes about the
Evolution of Argentina Economy in 1996]. Documento de trabajo Nº 80.
ECLAC, 2009. Economic Survey of Latin America and the Caribbean 2009-2010, United Nations
Publication, Santiago.
25
ECLAC, 2010. Economic Survey of Latin America and the Caribbean 2009-2010, United Nations
Publication, Santiago.
Eisenmenger, N., Giljum, S., 2006. Evidence from Societal Metabolism Studies for Ecological
Unequal Trade, In: Hornborg, A., Crumle, C.L. (Eds.). The World System and the Earth
System. Global Socio-Environmental Change and Sustainability since the Neolithic. Left
Coast Press Inc., Walnut Creek, California. pp. 288-302.
Eisenmenger, N., Ramos-Martin, J., Schandl, H., 2007. Transition in a changed context: patterns of
development in a globalizing world, in: Fischer-Kowalski, M., Haberl, H. (Eds.),
Socioecological Transitions and Global Change: Trajectories of Social Metabolism and
Land Use. Edward Elgar, Cheltenham, pp. 179–222.
EUROSTAT (Statistical Office of the European Union). 2001. Economy-wide material flow
accounts and derived indicators: A methodological guide. Luxembourg: EUROSTAT.
FAO (Food and Agriculture Organization), 2010. FAOSTAT Database. Rome: FAO.
http://faostat.fao.org. Accessed March 15, 2011.
Fischer-Kowalski, M. 1998. Society’s metabolism: The intellectual history of material flow
analysis, Part I: 1860–1970. Journal of Industrial Ecology 2(1): 61–78.
Fischer-Kowalski, M., Haberl, H., 2007. Socioecological Transitions and Global Change:
Trajectories of Social Metabolism and Land Use. Edward Elgar, Cheltenham.
Fischer-Kowalski, M., Haberl, H., 1997. Tons, joules and money: modes of production and their
sustainability problems. Society and Natural Resources 10(1), 61–85.
Giletta, M.A., 2005. El escenario pos-devaluatorio: desempeño de la economía argentina y
dinámica del sector agropecuario. [The post-devaluation scenario: Argentina's economic
performance and agricultural sector dynamic]. Work presented during 36th yearly meeting
of the Asociación Argentina de Economía Agraria, at Universidad Nacional de Lomas de
Zamora, Buenos Aires, October 24, 25 y 26 de octubre de 2005.
http://www.inta.gov.ar/manfredi/info/documentos/economia/escedevalua.pdf. Accessed June
15, 2011.
Giljum, S. 2004. Trade, Materials Flows, and Economic Development in the South: The Example of
Chile. Journal of Industrial Ecology, 8(1-2): 241–261.
Giljum, S., Eisenmenger, N. 2004. North-South trade and the distribution of environmental goods
and burdens: A biophysical perspective. Journal of Environment and Development, 13(1):
73–100.
Gónzalez-Martínez. A.C., Brun, J., Pérez, P., Walter, M., Martínez-Alier, J. (forthcoming). A
bipohysical analysis of the economic crisis in Spain. González-Martínez, A.C., Cañellas
Boltà.
26
Gonzalez-Martinez. A. 2008. Social Metabolism and Patterns of Material Use: Mexico, South
America and Spain. PhD Thesis. Institut de Ciències i Tecnologia Ambientals (ICTA).
UAB. Barcelona.
Gonzalez, A. and H. Schandl. 2008. The biophysical perspective of a middle income economy:
Material flows in Mexico. Ecological Economics 68(1-2): 317–327.
Goodland. R., 1990. Book Reviews: Integration of Economy and Ecology, Ecological Economics,
2(1990), 343-359.
Gorosito, E., De Simone, P., Castro, L., Real, A., 1998. Introducción al estudio de la historia
económica argentina (desde 1930). [Introduction to the Study of Argentina's economic
history (since 1930)]. Ediciones de la Universidad, Buenos Aires
Herring, H. 2006. Energy efficiency-a critical view. Energy 31(1): 10–20.
Heymann, D. 2006. Buscando la tendencia: crisis macroeconómica y recuperación en la Argentina.
[Searching the trend: macroeconomic crisis and recovery in Argentina]. CEPAL. SERIE
Estudios y perspectivas. Oficina de la CEPAL en Buenos Aires. N° 31.
Homer-Dixon, T. 2006. The upside of down-catastrophe, creativity and the renewal of civilization.
Washington, DC: Island Press.
Hornborg, A., 1998. Towards an ecological theory of unequal exchange: Articulating world system
theory and ecological economics. Ecological Economics, 25(1): 127–136.
Huesemann, M. H. 2003. The limits of technological solutions to sustainable development. Clean
Technologies and Environmental Policy 5(1): 21–34.
IEA (International Energy Agency), 2010a. World energy statistics, IEA World Energy Statistics
and Balances (database).doi:10.1787/data-00510-en (Accessed on 23 juin 2011)
IEA, 2010b. World Indicators, IEA World Energy Statistics and Balances
(database).doi:10.1787/data-00514-en (Accessed on 23 June 2011)
INDEC (Instituto Nacional de Estadística y Censos), 2011. Indices de precios implícitos en la
oferta y demanda globales. Base 1993=100. doi: http://www.indec.mecon.ar/ (Accessed on
14 June 2011)
INDEC, 2011. Estimaciones y Proyecciones de Poblacion. Total del país. (1950-2015). doi:
http://www.indec.gov.ar/ (Accessed on 10 Apryl 2011)
INE (Instituto Nacional de Estadística), 2011. Cifras de Población y Censos Demográficos. doi:
http://www.ine.es/inebmenu/mnu_cifras pob.htm#5/ (Accessed on 11 Apryl 2011)
JEC (Joint Economic Committee), 2003. Office of the Chairman. ARGENTINA’S ECONOMIC
CRISIS: CAUSES AND CURES. Staff report, June 2003.
http://jec.senate.gov/republicans/public/?a=Files.Serve&File_id=5fbf2f91-6cdf-4e70-8ff2-
620ba901fc4c
27
Jorgenson, A.K., 2009. The Sociology of Unequal Exchange in Ecological Context: A Panel Study
of Lower-Income Countries, 1975–2000. Sociological Forum 24(1): 22–46.
Kozulj, R., 2002. Balance de la privatización de la industria petrolera en Argentina y su impacto
sobre las inversiones y la competencia en los mercados minoristas de combustibles.
[Balance of privatization of the oil industry in Argentina and its impact on investment and
competition in retail fuel markets]. United Nations Publication, Santiago.
Krausmann, F., H. Schandl and R. Sieferle. 2007. Socio-ecological regime transition in Austria and
the United Kingdom. Ecological Economics, 65(1): 187–201.
Krausmann, F., S. Gingrich, N. Eisenmenger, K.H. Erb, H. Haberl, and M. Fischer-Kowalski. 2009.
Growth in global materials use, GDP and population during the 20th century. Ecological
Economics 68(10):2696–2705.
Llach, J., 2007. El comercio exterior argentino en una perspectiva de largo plazo. [Argentina's
foreign trade in a long-term perspective]. Edited version of comments express by the author
during a roundtable in the seminar “Estructura y Desafíos del Comercio Exterior
Argentino”, organized by CEI (International Economy Center) and the ECLAC Economic
Commission for Latin America and the Caribbean), 29th of august of 2007. Available on
www.cei.gov.ar/seminarios. Accessed June 15, 2011.
MAGyP (Ministerio de Agricultura, Ganadería y Pesca de Argentina), 2011. Agricultural Integrated
Information System. http://www.siia.gov.ar/. Accessed March 15, 2011.
Muradian, R., Martinez-Alier, J., 2001. Trade and the environmental: from a ‘Southern’
perspective. Ecological Economics, 36(2): 281–297.
OECD, 2008. Measuring Material Flows and Resource Productivity, Vol. I and II. The OECD
Guide and The Accounting framework, OECD, Paris.
Pengue, W. 2001. The impact of soya expansion in Argentina. Seedling, Volume 18, Issue 3, June
2001, GRAIN Publications. http://www.grain.org/es/article/entries/292-the-impact-of-
soybean-expansion-in-argentina. Accessed March 15, 2011.
Perez-Rincon, M. 2006. Colombian international trade from a physical perspective: towards an
ecological “Prebisch thesis”. Ecological Economics, 59(4): 519–529.
Peretti, M. 1998. Competitividad del sector agropecuario Argentino en la década de los 90´s.
[Argentine agricultural sector competitiveness in the early 90's]. INTA EEA Márcos Juárez,
1998 y sus actualizaciones
Pimentel, D. 1980. Handbook of energy utilization in agriculture. CRC Press, Boca Raton.
Prado, O. 2005. Situación y perspectiva de la minería metálica en Argentina. [Situation and
perspectives of metal mining in Argentina]. CEPAL, Serie Recursos Naturales e
Infraestructura Nº 91. Santiago de Chile.
28
Prebisch, R. 1950. The economic development of Latin America and its principal problems.
ECLAC, New York.
Polimeni, J. M. and R. I. Polimeni. 2006. Jevons’ Paradox and the myth of technological
innovation. Ecological Complexity 3(4): 344–353.
Portantiero, J. C. 1989. Political and Economic Crises in Argentina. In: di Tella, G., Dornbusch, R.
(Ed), The political Economy of Argentina, 1946-1983. Macmillan Press, Basingstoke.
Ramos, J. 1986. Neoconservative economics in the southern cone of Latin America : 1973-1983.
The Johns Hopkins University Press, Baltimore.
Rice, J., 2007. Ecological Unequal Exchange: International Trade and Uneven Utilization of
Environmental Space in the World System. Social Forces, 85(3): 1369–92.
Roberts, J. T. and Parks, B. 2009. Ecologically Unequal Exchange, Ecological Debt, and Climate
Justice : The History and Implications of Three Related Ideas for a New Social Movement.
International Journal of Comparative Sociology 50(3-4): 385–409
Russi, D., A. Gonzalez, J.Silva-Macher, S. Giljum, J. Martinez-Alier, and MC. Vallejo. 2008.
Material flows in Latin America: A comparative analysis of Chile, Ecuador, Mexico, and
Peru, 1980–2000. Journal of Industrial Ecology 12(5–6): 704–720.
Schandl, H., Fischer-Kowalski, M., Grunbuhel, C. and Krausmann, F. 2009. Socio-metabolic
transitions in developing Asia. Technological Forecasting and Social Change 76 (2), 267–
281.
Schandl, H., Schulz, N., 2000. Using Material Flow Accounting to operationalise the concept of
Society's Metabolism. A preliminary MFA for the United Kingdom for the Period of 1937–
1997. ISER Working Paper 2000–3 University of Essex, Colchester.
Schipper, L. 2000. On the rebound: The interaction of energy efficiency, energy use and economic
activity. An introduction. Energy Policy 28(6/7): 351–353.
SERA (Secreteria de Energía de la Republica Argentina), 2011. Databases on hydrocarbons.
http://energia3.mecon.gov.ar/hidrocarburos/home_pet.php?idpagina=1608. Accessed March
15, 2011.
SERA, 2000. Anuario de combustibles, año 1999.
SMRA (Secreteria de Minería de la Republica Argentina), 1993. Estadistica Minera de la Republica
Argentina. Resumen 1970-1991. Buenos Aires, Secretería de Minería de la Nación.
SMRA, 2011. Internal document.
Teubal, M. 2006. Expansión del modelo sojero en la Argentina. De la producción de alimentos a los
commodities. Realidad Económica, 220(2006): 71-96.
29
Treber, S. 1987. La Economía argentina actual: 1970-1987 [Current Argentina's economy: 1970-
1987]. Second ed. Macchi, Buenos Aires.
Turner. K., Lenzenb. M., Wiedmannc. T., Barrettc. J., 2007. Examining the global environmental
impact of regional consumption activities—Part 1: A technical note on combining input–
output and ecological footprint analysis. Ecological Economics, 62(1): 37–44.
USBM (United States Bureau of Mines), 2011. Minerals Yearbook: Mineral industries of Latin
America and Canada, 1932–2009. Bureau of Mines, Reston.
Vallejo, M. C. 2010. Biophysical structure of the Ecuadorian economy, foreign trade, and policy
implications. Ecological Economics, 70(2): 159-169.
Vallejo, M. C., Pérez Rincón, M. A., Martinez-Alier, J., 2011. Metabolic Profile of the Colombian
Economy from 1970 to 2007. Journal of Industrial Ecology, 15(2): 245–267.
Wainer, A. El Estado debe fijar la estrategia [The State should set the strategy]. In: Le Monde
Diplomatique, año IV, número 71, mayo de 2005. pp,10
WB (World Bank), 2011. World Development Indicators. WB, Washington DC.
http://data.worldbank.org/data-catalog/world-development-indicators. Accessed March 15,
2010.
Weisz, H., F. Krausmann, C. Amann, N. Eisenmenger, KH. Erb, K. Hubacek, and M. Fischer-
Kowalski. 2006. The physical economy of the European Union: Cross-country comparison
and determinants of material consumption. Ecological Economics 58(4): 676–698.
About the Authors
Pedro L. Perez Manrique, Julien Brun, Mariana Walter and Joan Martinez-Alier are
members of the ICTA, Universitat Autonoma de Barcelona, Ana Citlalic Gonzalez-Martinez is a
PhD in Environmental Sciences at ICTA, Universitat Autonoma de Barcelona.


