Embed Size (px)
Citation preview
ASSOCIAÇÃO DE POLITÉCNICOS DO NORTE (APNOR)
INSTITUTO POLITÉCNICO DE BRAGANÇA
Analysing and Forecasting Tourism Demand in Vietnam with
Artificial Neural Networks
Nguyen Le Quyen
Final Dissertation submitted to Instituto Politécnico de Bragança
To obtain the Master Degree in Management, Specialisation in Business
Management
Supervisors:
Professora Doutora Paula Odete Fernandes
Professor Doutor João Paulo Teixeira
Bragança, January, 2022
ASSOCIAÇÃO DE POLITÉCNICOS DO NORTE (APNOR)
INSTITUTO POLITÉCNICO DE BRAGANÇA
Analysing and Forecasting Tourism Demand in Vietnam with
Artificial Neural Networks
Nguyen Le Quyen
Supervisors:
Professora Doutora Paula Odete Fernandes
Professor Doutor João Paulo Teixeira
Bragança, January, 2022
i
Abstract
Vietnam has experienced a tourism boom over the last decade with more than 18 million international
tourists in 2019, compared to 1.5 million twenty-five years ago. Tourist spending has translated into rising
employment and income for the tourism sector, making it the key driver to the socio-economic
development of the country. Facing the COVID-19 pandemic, Vietnam´s tourism has suffered extreme
economic losses. However, the number of international tourists is expected to reach the pre-pandemic
levels in the next few years after the COVID-19 pandemic subsides.
Forecasting tourism demand plays an essential role in predicting future economic development.
Accurate predictions of tourism volume would facilitate decision-makers and managers to optimize
resource allocation as well as to balance environmental and economic aspects. Various methods to
predict tourism demand have been introduced over the years. One of the most prominent approaches is
Artificial Neural Network (ANN) thanks to its capability to handle highly volatile and non-linear data. Given
the significance of tourism to the economy, a precise forecast of tourism demand would help to foresee
the potential economic growth of Vietnam.
First, the research aims to analyse Vietnam´s tourism sector with a special focus on international tourists.
Next, several ANN architectures are experimented with the datasets from 2008 to 2020, to predict the
monthly number of international tourists traveling to Vietnam including COVID-19 lockdown periods. The
results showed that with the correct selection of ANN architectures and data from the previous 12
months, the best ANN models can forecast the number of international tourists for next month with a
MAPE between 7.9% and 9.2%. As the method proves its forecasting accuracy, it would serve as a
valuable tool for Vietnam´s policymakers and firm managers to make better investment and strategic
decisions to promote tourism after the COVID-19 situation.
Keywords: Artificial Neural Networks, International Tourists, Tourism Forecasting, Tourism Demand,
Vietnam.

ii
Resumo
O Vietname conheceu um boom turístico na última década com mais de 18 milhões de turistas
internacionais em 2019, em comparação com 1,5 milhões há vinte e cinco anos. As despesas turísticas
traduziram-se num aumento do emprego e de receitas no sector do turismo, tornando-o no principal
motor do desenvolvimento socioeconómico do país. Perante a pandemia da COVID-19, o turismo no
Vietname sofreu perdas económicas extremas. Porém, espera-se que o número de turistas
internacionais, pós pandemia da COVID-19, atinja os níveis pré-pandémicos nos próximos anos.
A previsão da procura turística desempenha um papel essencial na previsão do desenvolvimento
económico futuro. Previsões precisas facilitariam os decisores e gestores a otimizar a afetação de
recursos, bem como o equilíbrio entre os aspetos ambientais e económicos. Vários métodos para prever
a procura turística têm sido introduzidos ao longo dos anos. Uma das abordagens mais proeminentes
assenta na metodologia das Redes Neuronais Artificiais (ANN) dada a sua capacidade de lidar com
dados voláteis e não lineares. Dada a importância do turismo para a economia, uma previsão precisa
da procura turística ajudaria a prever o crescimento económico potencial do Vietname.
Em primeiro lugar, a investigação tem por objetivo analisar o sector turístico do Vietname com especial
incidência nos turistas internacionais. Em seguida, várias arquiteturas de ANN são experimentadas com
um conjunto de dados de 2008 a 2020, para prever o número mensal de turistas internacionais que se
deslocam ao Vietname, incluindo os períodos de confinamento relacionados com a COVID-19. Os
resultados mostraram, com a correta seleção de arquiteturas ANN e dados dos 12 meses anteriores,
os melhores modelos ANN podem prever o número de turistas internacionais para o próximo mês com
uma MAPE entre 7,9% e 9,2%. Como o método evidenciou a sua precisão de previsão, o mesmo pode
servir como uma ferramenta valiosa para os decisores políticos e gestores de empresas do Vietname,
pois irá permitir fazer melhores investimentos e tomarem decisões estratégicas para promover o turismo
pós situação da COVID-19.
Palavras-chave: Redes Neuronais Artificiais, Turistas Internacionais, Previsão Turística, Procura
Turística, Vietname.
iii
Acknowledgements
First, I would like to express my deepest gratitude to my supervisors, Professora Doutora Paula Odete
Fernandes and Professor Doutor João Paulo Teixeira for their invaluable support and guidance. Without
their understanding, encouragement, and patience, I would not have been able to complete this project.
Further, I would like to express my appreciation for the financial supports from National Funds through
the Fundação para a Ciência e Tecnologia (FCT) under the projects UIDB/GES/04752/2020 and
UIDB/05757/2020 and the project “BIOMA – Bioeconomy integrated solutions for the mobilization of the
Agro-food market” (POCI-01-0247-FEDER-046112), by “BIOMA” Consortium, and financed by
European Regional Development Fund (FEDER).
Last but not least, my biggest thanks to my daughter, my mother, my sister, my friends Hang and
Emanuel, aunt Salete and uncle António, Inês, Mario, Luísa, Shangli and Umberto, Dzung, Linh and
others for their unconditional love and support throughout all the time.

iv
Abbreviations and Acronyms
ADLM Auto-Regressive Distributed Lag Model
AI Artificial Intelligence
AIDS Almost Ideal Demand System
ANN Artificial Neural Network
AR Autoregressive
ARFIMA Autoregressive Fractionally Integrated Moving Average
ARIMA Autoregressive Integrated Moving Average
ARIMA-GARCH Generalized Autoregressive Conditional Heteroskedastic
ARIMAX Extended version of the ARIMA model
ARMA Autoregressive Moving Average
AR-MIDAS Autoregressive Mixed-data Sampling
ASEAN The Association of Southeast Asian Nations
BGVAR Bayesian Estimation Techniques
BVAR Bayesian VAR Model
CI Cointegration Analysis
DL Distributed Lag Model
ECM Error Correction Model
Elliotsig Elliot symmetric sigmoid transfer function
Elman NN Elman Neural Network
ES Single Exponential Smoothing
GA Genetic Algorithm
GRNN Generalized Regression Neural Network
GSO General Statistics Office of Vietnam
HA Historical Average
IATA The International Air Transport Association
iDEA Vietnam E-commerce and Digital Economy Agency
Logsig Logarithmic sigmoid transfer function
v
MA Moving Average
MAE Mean Absolute Error
MAPE Mean Absolute Percentage Error
MIDAS Mixed-data Sampling
MLP Multilayer Perceptron
NAR Non-linear Autoregressive Neural Network
Purelin Linear transfer function
RBF Radial Basis Function Network
SARIMA Seasonal Autoregressive Integrated Moving Average
SOM Self-organizing Maps
STSM Structural Time-series Model
SVM Support Vector Machines
SVR Support Vector Regression
Tansig Tangent-hyperbolic transfer function
Trainbr Bayesian Regularization backpropagation algorithm
Traincgf Conjugate gradient backpropagation with Fletcher-Reeves updates
Trainlm Levenberg-Marquardt algorithm
Trainrp Resilient Backpropagation algorithm
TVP Time Varying Parameter
UNESCO The United Nations Educational, Scientific and Cultural Organization
UNWTO The United Nations World Tourism Organization
VAR Vector Autoregressive
VECM Vector Error Correction Model
VNAT Vietnam National Administration of Tourism
VP Static Varying Parameters
WEF World Economic Forum

vi
Table of Contents
List of Figures .......................................................................................................................................... vii
List of Tables .......................................................................................................................................... viii
Introduction ............................................................................................................................................... 1
1. Review of tourism modelling and forecasting studies .......................................................................... 3
1.1. Tourism demand forecasting ......................................................................................................... 3
1.2. Time series models ....................................................................................................................... 6
1.3. Econometric models ...................................................................................................................... 7
1.4. AI-based models ........................................................................................................................... 9
1.5. Judgmental methods ................................................................................................................... 11
1.6. Tourism modelling and forecasting using ANN methodology ..................................................... 12
1.7. ANN-based models proposed in the research ............................................................................ 16
2. Development of tourism sector in Vietnam ........................................................................................ 18
2.1. Tourism demand ......................................................................................................................... 19
2.1.1 International tourists .............................................................................................................. 20
2.1.2. Domestic tourists .................................................................................................................. 29
2.2. Tourism supply ............................................................................................................................ 31
2.2.1. Major tourist attractions ........................................................................................................ 31
2.2.2. Transport infrastructure ........................................................................................................ 32
2.2.3. Tourism enterprises and human resources .......................................................................... 33
2.2.4. Accommodations .................................................................................................................. 35
2.2.5. Other activities ...................................................................................................................... 37
2.3. SWOT analysis of the tourism sector .......................................................................................... 38
3. Research Methodology ...................................................................................................................... 41
3.1. Objectives of the study ................................................................................................................ 41
3.2. Data collection ............................................................................................................................. 41
3.3. Research methods and data analysis ......................................................................................... 41
3.3.1. Datasets ............................................................................................................................... 43
3.3.2. ANN Inputs ........................................................................................................................... 45
3.3.3. ANN architectures, training, and accuracy measures .......................................................... 45
4. Results and discussions ..................................................................................................................... 48
4.1. Results ......................................................................................................................................... 48
4.2. Discussions ................................................................................................................................. 51
Conclusions, limitations, and implications for future works .................................................................... 54
References ............................................................................................................................................. 57
vii
List of Figures
Figure 1. Structure of Artificial Neural Networks. ................................................................................... 13
Figure 2. Architectural graph of a MLP ANN with one hidden layer. ...................................................... 17
Figure 3. Tourism demand in Vietnam between 2000 and 2019. .......................................................... 19
Figure 4. Tourism revenues by groups of tourists (VND 1000 billion). .................................................. 20
Figure 5. International tourists to Southeast Asia in 2019. .................................................................... 20
Figure 6. Number of international tourist arrivals to Vietnam and annual change rate in arrivals
(1995-2020). ........................................................................................................................................... 21
Figure 7. Monthly number of international tourist arrivals in Vietnam and its trend (2008:01 to 2020:12).
................................................................................................................................................................ 23
Figure 8. International tourists to Vietnam by region in 2019. ................................................................ 24
Figure 9. International tourists to Vietnam by country in 2019. .............................................................. 24
Figure 10. Growth of international tourists from 5 Western European countries. .................................. 25
Figure 11. International tourists by mode of transport............................................................................ 25
Figure 12. Average overnight stays and spending of international tourists in 2019. ............................. 26
Figure 13. Length of stay and average spending by major markets in 2019. ........................................ 27
Figure 14. Average spending per day of international tourists (USD).................................................... 27
Figure 15. Spending purposes of international tourists (%). .................................................................. 28
Figure 16. Key destinations for international tourists in Vietnam in 2019. ............................................. 29
Figure 17. Domestic Tourists. ................................................................................................................ 30
Figure 18. Average expenditure per domestic tourist in 2019. .............................................................. 30
Figure 19. Growth of enterprises in the tourism sector. ......................................................................... 34
Figure 20. Licensed tour guides and Tour guides by languages in 2019. ............................................. 34
Figure 21. Accommodations and rooms. ............................................................................................... 36
Figure 22. Annual % change in the number of accommodation and rooms. ......................................... 36
Figure 23. Random test set strategy. ..................................................................................................... 44
Figure 24. Fixed test set strategy. .......................................................................................................... 44
Figure 25. Activations transfer functions. ............................................................................................... 46
Figure 26. M5 with all datasets (learning with strategy 1). ..................................................................... 49
Figure 27. M5 for the Random test set (learning with strategy 1). ......................................................... 49
Figure 28. M10 with all datasets (learning with strategy 1) .................................................................... 50
Figure 29. M10 with test set (learning with strategy 1). ......................................................................... 50
Figure 30. M10 with all datasets (learning with strategy 2). ................................................................... 51
Figure 31. M10 with test set (learning with strategy 2). ......................................................................... 51
Figure 32. Architectures of model M5 (above) and M10 (below). .......................................................... 52

viii
List of Tables
Table 1. Targets for the tourism sector toward 2030. ............................................................................ 18
Table 2. Summary of Parameters. ......................................................................................................... 43
Table 3. Comparison of the prediction model performance. .................................................................. 48
1
Introduction
Vietnam, a strip of land in the eastern part of Southeast Asia, is one of the most attractive destinations
for tourists all over the world. With over 3000 kilometers of coastline, pristine beaches including the best
bays in the world, 7 World Heritage Sites, dynamic growing cities, mountainous highlands, and diverse
culture and history, Vietnam has favourable conditions for tourism development.
Tourism is one of the fastest-growing sectors and the most important driving forces to the economic
development of Vietnam. The sector has seen dramatic growth, ranging from 10 to 25% during the last
10 years. For 2015-2018, the average growth rate was 25%, ranking as one of the highest growth rates
in tourism in the world (The World Bank, 2019). Vietnam has been highly successful at attracting tourists
and reaping the economic benefits from this booming tourism activity. In 2019, the country received 18
million international tourists, up 2.5 million compared to that of 2018 (Vietnam National Administration of
Tourism, 2019). Tourism revenues contributed from 4 to 10% to the national GDP (Vietnam National
Administration of Tourism, 2019).
The Vietnamese Government has prioritized tourism as the strategic driver of socio-economic
development by introducing a resolution to transform tourism into a leading business and make Vietnam
one of the most popular destinations in Southeast Asia. To achieve those ambitious goals, a long-term
strategy and action plan for the sector have been made for the period 2018 - 2030 (Government of
Vietnam, 2020). A VND30 trillion (US$1.32 billion) program was approved to improve transport
infrastructure at major tourist destinations in 2017 (Government of Vietnam, 2017). Further, the
government approved the establishment of a VND300 billion (US$12.9 million) tourism development
fund for promotional activities in 2018 (Government of Vietnam, 2018). In addition to funding activities,
the government has also relaxed immigration policies allowing tourists from 46 countries,
including China, Japan, South Korea, Russia, the US, the UK and so on to enter Vietnam for 30 days
with a single-entry electronic visa.
Forecasting tourism demand has gained much interest from researchers, managers, and policymakers
worldwide (Truong & Le, 2017). According to the UN World Tourism Organization (UNWTO), tourism
demand is defined as tourism consumption, tourism gross fixed capital formation and tourism collective
consumption (UNWTO, 2021). In forecasting studies, tourism demand is often measured in terms of
number of tourist arrivals, tourism expenditure or overnight stays of tourists. Facing an increasingly
complicated business environment, tourism needs to rely more on modelling and forecasting techniques
to predict demand and optimize the allocation of limited resources (Cortes-Jimenez & Blake, 2011;
Baggio & Sainaghi, 2016; Alamsyah & Friscintia, 2019). Accurate predictions are essential for tourist
attractions where the decision-makers and business managers try to take advantage of the sector

2
developments and/or to balance their local environmental and economic aspects (Athanasopoulos,
Song, & Sun, 2018; Zhang, Li, Muskat, & Law, 2021). For example, governments require precise
forecasting methods for informed decision-making on issues such as infrastructure development, and
accommodation site planning (Hassani, Silva, Antonakakis, Filis, & Gupta, 2017; Kourentzes &
Athanasopoulos, 2019). Organizations need the forecasts to make tactical decisions on tourism
promotional activities (Ongan & Gozgor, 2018), and tourism and hospitality practitioners need reliable
predictions for operational decisions such as staffing and scheduling (Song & Li, 2008; Fernandes &
Teixeira, 2008).
Given the significant role of tourism in socio-economic development, the thesis aims to analyse the
characteristics of the tourism sector in Vietnam with a special focus on international tourists – the key
target group of customers. Data is obtained from public sources for the period 1995-2020. Next, the
forecasting capability of Artificial Neural Network methodology is assessed with the datasets of
international tourists to Vietnam from 2008 to 2020. Several ANN architectures are experimented to
predict the monthly number of international tourists, considering lockdown periods due to the COVID-19
pandemic. It is expected that the best-performed ANN models in this research will serve as a valuable
tool for policymakers and managers in planning tourism activities.
The thesis is structured as follows. After the introduction, a literature review on tourism modelling and
forecasting studies is presented in Section 1. Section 2 explains in detail the development of Vietnam´s
tourism sector. Section 3 presents ANN methodology and models experimented within the research.
Section 4 discusses results generated from the previous part. Conclusions, limitations, and suggestions
for further research are presented in the final part.
3
1. Review of tourism modelling and forecasting studies
1.1. Tourism demand forecasting
According to the UN World Tourism Organization (UNWTO), tourism is defined as «a social, cultural
and economic phenomenon which entails the movement of people to countries or places outside
their usual environment for personal or business/professional purposes» (UNWTO, 2021). Tourism
has become one of the most dynamic, resilient, and fastest-growing economic sectors, contributing
to GDP, job creation and social and economic development along its value chain, and outpacing the
world economy every year over the last decade (UNWTO, 2020a). According to World Tourism
Barometer and Statistical Annex in January 2020 (UNWTO, 2020b), international tourists worldwide
grew 4% in 2019 to reach 1.5 billion. All regions enjoyed an increase in tourists. The Middle East
(+8%) led growth, followed by Asia and the Pacific (+5%). International tourists in Europe and Africa
(both +4%) increased in line with the world average, while the Americas saw growth of 2%.
Forecasting tourism demand is a challenging task for both decision-makers and researchers because
the seasonal and fragile nature of tourism (Witt & Witt, 1995) especially in the world of increasing
uncertainties. Advances in information technologies and better access to large amounts of data
provide more possibilities for generating highly accurate forecasting models. New themes and trends
in tourism and hotel demand forecasting are comprehensively reviewed by Goh and Law (2011), Wu
et al. (2017), Song et al. (2019), Ghalehkhondabi et al. (2019) and Zhang et al. (2020). The existing
literature on predicting tourism demand is extensive, ranging from different countries, various
statistical techniques, and a different set of data (Silva, Hassani, Heravi, & Huang, 2019). Most recent
studies often measured tourism demand in terms of the number of tourists (Gunter & Onder, 2015;
Apergis, Mervar, & Payne, 2017; Zhu, Lim, Xie, & Wu, 2018; Alamsyah & Friscintia, 2019; Höpken,
Eberle, Fuchs, & Lexhagen, 2021), tourism expenditure (Li, Wong, Song, & Witt, 2006; Cortes-
Jimenez & Blake, 2011; Ognjanov, Tang, & Turner, 2018), or overnight stays (Teixeira & Fernandes,
2012; Peng, Song, & Crouch, 2014; Teixeira & Fernandes, 2014; Baggio & Sainaghi, 2016;
Constantino, Fernandes, & Teixeira, 2016) as such data is better aggregated (Song, Qiu, & Park,
2019).
New methods have been continually developed to gain higher forecasting accuracy (Jiao, Li, & Chen,
2020). Van Doorn (1984) presented four main categories of the methodology include explorative
forecasting methods (time series analysis, historical analogy, causal methods, projective scenarios
and morphological analysis), speculative forecasting (individual expert opinion, brainstorming, panel
consensus and Delphi), normative/explicative forecasting (subjective probabilistic forecasting,
Bayesian statistics, pattern identification or prospective scenarios) and integrative methods (input-
output analysis, multimethod models and cross-impact analysis).
4
More recently, the studies on tourism demand forecasting can be categorized generally into
qualitative and quantitative approaches (Law, Li, Fong, & Han, 2019). Major groups of methods used
to forecast tourism demand include time series models, econometrics models, artificial intelligence
techniques and qualitative methods (Sun, Wei, Tsui, & Wang, 2019; Chen, Li, Wu, & Shen, 2019;
Fu, Hao, Li, & Hsu, 2019). Time series models, econometric approaches, and artificial intelligence
(AI) models are three main categories of quantitative forecasting methods (Peng, Song, & Crouch,
2014). The fourth category is judgmental methods, which can be used for both qualitative and
quantitative forecasting (Lin & Song, 2015; Wu, Song, & Shen, 2017). Time series models and
econometric models are most frequently used, and artificial intelligence models have started to gain
popularity in the past decade (Fernandes & Teixeira, 2008; Jiao & Chen, 2019) thanks to their
capability to deal with non-linear behaviour (Teixeira, Santos, & Fernandes, 2014). In general, time-
series and econometrics models rely on the stability of historical patterns and economic structure,
while artificial intelligence models are dependent on the quality and size of available training data
(Law, Li, Fong, & Han, 2019). Scholars have generally agreed that no single method can consistently
outperform other methods on all occasions (Li, Hu, & Li, 2020).
Extensive review papers captured tourism demand forecasting methods developed during certain
periods. Witt and Witt (1995) reviewed empirical research on tourism demand forecasting from the
1960s to the 1990s. The authors classified the research into two main groups: quantitative
forecasting (econometric models, spatial models, and time-series methods) and qualitative
forecasting (Delphi method). According to Witt and Witt (1995), when accuracy is measured in terms
of error magnitude, the no-change model and autoregression outperformed exponential smoothing,
trend curve analysis, Gompertz and econometrics. When measuring accuracy in terms of the
direction of change error, econometrics was possible to forecast the direction of change of tourism
demand with higher accuracy than the no-change model.
Li, Song, and Witt (2005) reviewed eighty-four post-1990 empirical studies of international tourism
demand modelling and forecasting using econometric approaches. Compared to the studies between
the 1960s and 1980s, more advanced econometric techniques, such as the Cointegration Analysis
model (CI) and Error Correction Model (ECM), Vector Autoregressive approach (VAR), Time-
Varying-Parameter (TVP), and Almost Ideal Demand Systems (AlDAS) models have been applied
to tourism demand studies in the 1990s and early 2000s. These methods contribute to improvements
in the understanding of international tourism demand. In particular, the CI/ECM approaches identify
the differences between the long-run and short-run demand elasticities, and the time-varying-
parameter model demonstrates the evolution of elasticities throughout time. A further review of 23
tourism demand forecasting studies suggested that there is no single model that outperforms the
others in all cases. The performance of alternative models was situation-specific, and many factors
may influence their forecasting accuracy. In general, the TVP model and the structural time-series
model (STSM) performed relatively well, especially for short-run forecasting. When advanced
econometric models compete with their univariate time-series counterparts or the conventional
benchmark no-change model, the econometric models were likely to outperform the others,
especially as far as annual data are concerned.
5
Goh and Law (2011) reviewed 155 research papers published between 1995 and 2009 on modelling
the estimation and forecasting of tourism demand. The models were classified into three main groups
according to the methods and techniques adopted—an econometric-based approach, time-series
techniques, and artificial intelligence (AI)-based methods. It appears that the more advanced
econometric (and time series analysis) methods such as cointegration, ECM, and TVP produce
better results in terms of forecasting accuracy. Moreover, the combined use of these advanced
methods seemed to have outperformed the fixed-parameter models. Among the 384 models
established in the 155 papers, 45% and 50% were correspondingly based on econometric and time
series techniques, whereas only 5% adopts AI-based techniques. Although AI-based methods were
found at almost all times to outperform their econometric counterparts, the forecasting performance
of these techniques cannot be generalized, as it remains largely unknown whether the techniques
can outperform advanced econometric techniques.
Song and Li (2008) reviewed 121 post-2000 empirical studies. The latest developments of
quantitative forecasting techniques are summarized in three categories: time-series models, the
econometric approach, and AI techniques. Although the studies showed that the newer and more
advanced forecasting techniques were likely to generate higher forecasting accuracy under certain
circumstances, no clear-cut evidence showed that any one model could consistently outperform
other models in the forecasting competition.
Peng, Song, and Crouch (2014) reviewed 65 studies published during the period 1980–2011, the
meta-regression analysis showed that the origins of tourists, destination, time period, modelling
method, data frequency, number of variables and their measures and sample size all significantly
influenced the accuracy of forecasting models. This study was the first attempt to pair forecasting
models with the data characteristics and the tourism forecasting context.
Wu, Song, and Shen (2017) reviewed studies published from 2007 to 2015 on tourism and hotel
demand modelling and forecasting. This review finds that the studies focused on hotel demand are
relatively less than those on tourism demand. It is also observed that more and more studies have
moved away from the aggregate tourism demand analysis, whereas disaggregate markets and niche
products have attracted increasing attention. Some studies have gone beyond neoclassical
economic theory to seek additional explanations of the dynamics of tourism and hotel demand, such
as environmental factors, tourist online behaviour and consumer confidence indicators, among
others. More sophisticated techniques such as nonlinear smooth transition regression, mixed-
frequency modelling technique and nonparametric singular spectrum analysis have also been
introduced to this research area. Several techniques such as Delphi (Lin & Song, 2015) or specific
econometric models (Li, Song, & Witt, 2005) or the literature on uncertainty in travel demand (Rasouli
& Timmermans, 2012) have also been examined.
Jiao and Chen (2019) reviewed 72 studies in tourism demand forecasting during the period from
2008 to 2017. Forecasting models were examined in three categories: econometric, time series and
AI models. Econometric and time series models are popular models as these two models are often
used as benchmarks for forecasting capability and comparison concerning new models. AI models

6
have been rapidly developed in the past decade and hybrid AI models have become a new trend.
Time series, econometric, AI and combination models continue to dominate tourism demand
forecasting, whereas some new trends have emerged from 2008 to 2017. Regarding the capability
of forecasting as a benchmarking, research shows that hybrid models often outperform individual
standard models. However, there is no single model that outperforms the others in every
circumstance, which is consistent with the conclusions in the literature review by Li, Song, and Witt
(2005). Most recently, Song, Qiu, and Park (2019) conducted an extensive review on a wide range
of forecasting methods applied over the period from the 1960s to 2018, from judgmental approaches
to various kinds of quantitative methods, including time series, econometric and AI-based models.
1.2. Time series models
A time series is an ordered sequence of values of a random variable, which is documented on
constant time intervals (Ghalehkhondabi, Ardjmand, Young, & Weckman, 2019). For example, the
number of tourists to Vietnam every day, month or year is time series. Based on successive values
that represent consecutive measurements taken at regularly spaced intervals (such as monthly,
quarterly, or annual measurements) (Song, Qiu, & Park, 2019), time series models try to recognize
the trends, establish historical patterns and use the patterns to predict the future value for the next
coming time series. Peng, Song, and Crouch (2014) divided time series models into basic and
advanced time series techniques.
According to Song, Qiu, and Park (2019), the most common types of time series models included
the Naïve, autoregressive (AR), single exponential smoothing (ES), moving average (MA) and
historical average (HA) models. Naïve 1 and Naïve 2 are undoubtedly the most easily adopted and
the most popular methods used in the tourism forecasting literature. Time series models have been
extensively employed in forecasting tourism demand thanks to their simple operation and practical
ability to establish historical patterns. Based on the conclusions from (Athanasopoulos, Hyndman,
Song, & Wu, 2011; Claveria, Monte, & Torra, 2015a), Naïve 1 model was able to provide forecasting
accuracy, particularly for short predicting horizons.
The main difference between the basic and advanced time series models is the ability of the
advanced method to capture trends and seasonality of the time series. The Autoregressive Moving
Average (ARMA) models are a type of stationary stochastic models that comprise two models of
autoregressive and moving average models to achieve greater flexibility in the fitting of actual time
series (Box, 2015). Based on the traditional ARMA models, various models have been developed
such as autoregressive integrated moving average (ARIMA) and seasonal ARIMA (SARIMA). ARIMA
models could be applied when the data is not stationary while SARIMA models could show better
forecasting accuracy in the case of univariate time series data with a seasonal component. ARIMA
models consider both current and lagged observations (AR components), both current and lagged
random shocks (MA components), the degrees of integration (I). SARIMA models consider both non-
seasonal and seasonal factors (S components). Among the models, ARIMA methods are more
popular thanks to their flexibility in modelling tourism demand (Lim & McAleer, 2002; Gounopoulos
& Petmezas, 2012). Several recent developments in time series techniques are based on ARIMA-
7
type models. Chu (2008) applied the autoregressive fractionally integrated moving average
(ARFIMA) approach to forecasting the tourism demand in Singapore. Chan, Lim, and McAleer (2005)
applied the generalized autoregressive conditional heteroskedastic (model ARIMA-GARCH) to
forecast international tourists in Singapore. Many other studies used the Autoregressive fractionally
integrated moving average (ARFIMA) as a benchmark for the time series model (Nowman & Van
Dellen, 2012; Apergis, Mervar, & Payne, 2017).
Various studies have acknowledged that seasonality is the core nature of tourism. As a result,
literature on forecasting tourism demand has considered seasonality as the key predictor in
modelling. Loganathan and Ibrahim (2010) used the Box-Jenkins SARIMA model to forecast the
number of international tourists to Malaysia. Nanthakumar (2012) applied the SARIMA method to
forecast the tourists from ASEAN countries to Malaysia. The study found that SARIMA did not out-
performance ARIMA in forecasting tourism demand. Bigovic (2012) used Box-Jenkins-based
SARIMA models to forecast the Montenegrin tourists. In a more recent study, the Box-Jenkins
ARIMA model was developed by Anvari, Tuna, Canci, and Turkay (2016) to predict the tourism
demand to Turkey. Gil-Alana (2010) used seasonal-AR to analyse international tourists in the Canary
Islands. The ARIMA-seasonal decomposition model was used to investigate Turkish inbound tourism
by Koc and Altinay (2007). Seasonal fractional-ARIMA was employed to estimate Spanish tourism
demand by Gil-Alana et al. (2004)
1.3. Econometric models
For the last decades, researchers have shown increasing interest in econometric forecasting
approaches that focused on searching the causal relationships between economic factors and
tourism demand in diverse practical circumstances (Song, Qiu, & Park, 2019). The most distinctive
difference between econometric methods and non-causal time series is the ability of econometric
models to use explanatory variables to predict tourism demand (Jiao & Chen, 2019). Econometric
models attempt to find a causal relationship between the output variable (tourism demand) and the
input variables (economic, social, demographic, etc.) (Ghalehkhondabi, Ardjmand, Young, &
Weckman, 2019). As such, the focus of economic models is to establish the cause-and-effect
between input and output variables. Then, define how significantly a variety of explanatory variables
influence future tourism demand and identify the most influential variables by removing uncorrelated
ones.
The most prevalent econometric methods include distributed lag (DL) models (Wan & Song, 2018),
the error correction models (Lee, 2011; Vanegas, 2013, Gunter & Onder, 2015), autoregressive
distributed lag models (Ayeh & Lin, 2011; Tukamushaba, Lin, & Bwire, 2013; Huang, Zhang, & Ding,
2017), vector autoregressive models (Gunter & Onder, 2016) and time-varying parameter models
(Song, Li, Witt, & Athanasopoulos, 2011).
DL models could include previous values of the influential factors to tourism demand. Guizzardi and
Mazzocchi (2010), Wan and Song (2018) used the DL models used as the benchmarks in assessing
and comparing forecasting capability. As a more advanced model, Auto-Regressive Distributed Lag
8
Model (ADLM) has gained more attention than DL. The model could not only evaluate the impact of
influential variables but also the effect of lagged demand factors. The ADLM and the ECM methods
show remarkable ability in assessing tourism demand. Thanks to its flexibility, the ADLM can be
integrated with other methods to improve its performance in tourism modelling and forecasting. For
instance, the time-varying parameter was found to work well with both the ADLM and the ECM for
describing structural variations (Li, Wong, Song, & Witt, 2006).
Based on those models, many researchers have presented improved and integrated approaches.
The TVP structural time-series model (TVP-STSM) was introduced by Song, Li, Witt, and
Athanasopoulos (2011). TVP and STSM were combined to take advantage of the ability of STSM to
capture seasonality, trends and cycles while TVP was used to identify coefficients of the explanatory
variables. Gunter and Onder (2016) have combined Bayesian estimation with VAR methods while
considering big data as explanatory variables. ECM models have been improved based on ADLM
methods. ECM examines the long-term relationship between tourism demand and its influential
variables as well as the short-term error correction process in deciding tourism demand. Both the
ADLM and ECM underline the magnitude of the causal relationships between influential factors and
tourism demand (Song, Qiu, & Park, 2019). Mixed-data sampling (MIDAS) is integrated with a
reduced form of ADLM for using mixed-frequency data to estimate tourists in the Caribbean
(Bangwayo-Skeete & Skeete, 2015). The term ‘AR-MIDAS’ means that the functional form of the
applied model is a partial adjustment model, or a reduced ADLM (Song, Qiu, & Park, 2019).
The ARIMAX is an extended version of the ARIMA model, aiming at distinguishing the dynamics of
tourism demand. X in the ARIMAX models signifies the exogenous variables. An autoregressive term
with exogenous variables method was implemented by Li, Goh, Hung, and Chen (2018) to explore
the impact of climate change on tourism. Tsui, Balli, Gilbey, and Gow (2014) found that the ARIMAX
model performed better in the long run than the SARIMA model in predicting air passengers to Hong
Kong. In a study of forecasting demand for hotels (Pan & Yang, 2017) concluded that the ARMAX
model showed better performance compared to the ARMA model in forecasting hotel occupancies.
To forecast the number of Japanese tourists to Korea, Park, Lee, and Song (2017) used the
SARIMAX model and the result showed that this model outperformed standard time series models,
such as the SARIMA or the Holt-Winters ES. Also, the ARIMAX-type models have been integrated
with static varying parameters (VP) and MIDAS and showed promising results in predicting tourism
demand (Pan & Yang, 2017).
The STSM considers the impact of seasonal factors as exogenous variables. Some applications of
the STSM in tourism demand modelling and forecasting can be the vector autoregressive model and
the vector error correction model (VECM). These extension models can capture the interdependency
of multiple time series. Within a VAR framework, all the explanatory variables are treated as
endogenous, with an assumption that all of the variables affect each other intertemporally (Guizzardi
& Stacchini, 2015; Ognjanov, Tang, & Turner, 2018).
Bayesian VAR (BVAR) model is an improved model of classical VAR in which informative restrictions
were included in the modelling process. Wong, Song, and Chon (2006) found that BVAR
9
considerably outperformed non-Bayesian models. The classical VAR model has been further
expanded into a global VAR (GVAR) framework by Pesaran, Schuermann, and Weiner (2004).
Based on the approach, Assaf, Li, Song, and Tsionas (2018) presented Bayesian estimation
techniques (BGVAR) to forecast international traveling demand in Southeast Asian countries.
Another rare type of method to forecast tourism demand is the panel data regression which
incorporates information on both the intertemporal movements and the cross-sectional heterogeneity
of the tourism demand data (Long, Liu, & Song, 2019). In many cases, econometric techniques
outperformed the classical VAR (Song & Li, 2008).
The most influential factors in forecasting tourism demand are tourist´s income level and relative
price (comparing tourism price in the destinations with such in the origins), substitute price
(comparing prices of tourism between rival destinations) (Ayeh & Lin, 2011; Gunter & Onder, 2015),
the exchange rate of origin and destinations (Li, Song, & Witt, 2005; Song & Li, 2008). Many other
variables such as financial crises (Song & Lin, 2010), terrorist attacks (Bonham, Edmonds, & Mak,
2006), economic crisis and swine flu (Page, Song, & Wu, 2012), climate change (Moore, 2010), and
political instability and terrorism (Saha & Yap, 2014) have also been considered in the length of
tourism forecasting literature.
1.4. AI-based models
The success of AI-based techniques which are widely applied in various scientific areas has
supported tourism researchers to use the techniques in forecasting tourism demand (Díaz & Sbert,
2011). AI models can capture nonlinear relationships and patterns among time series and exogenous
variables and AI’s potential to improve forecasting performance. Palmer, Montaño, and Sesé (2006)
suggested that time series and econometric models are limited in a way that the model must be
formally specified and a probability distribution for data must be assumed before implementation.
According to Hansen, McDonald, and Nelson (1999) AI-based techniques do not require a formally
specified model and data probability distribution, making it a more advantageous method compared
to time series and econometric models, especially in the case of non-normal and nonlinear data.
According to Goh and Law (2011) ANN-based models to forecast tourism demand can be
categorized into two groups: AI-based time series methods and AI-based casual methods. AI-based
models also can be classified into five main categories: artificial neural network (ANN), rough sets
approach (Pai, Hong, & Lin, 2005; Pa, Hong, Chang, & Chen, 2006), fuzzy time series (Tsaur & Kuo,
2011; Lee, Nor, & Sadaei, 2012; Huarng, Yu, Moutinho, & Wang, 2012), and grey theory (Sun, Sun,
Wang, Zhang, & Gao, 2016; Ma, 2021; Hu, 2021).
Rough set modelling is a good technique to handle vague data and identify relationships and patterns
in hybrid data, with both quantitative and qualitative information (Jiao & Chen 2019). Goh et al. (2008)
used a rough set approach to the long-haul United States´ and United Kingdom´s tourism demand
for Hong Kong by incorporating two non-economic variables, a leisure time index, and a climate index
into the traditional regression framework. The study found that the rough sets method with non-
economic variables outperforms the regression models with the same datasets. Tourism data are
10
believed to be affected by both qualitative and quantitative data and thus are suitable to use a rough
set approach for tourism forecasting. Another study on the rough set approach could be found in the
study of Celotto, Ellero, and Ferretti (2012)
Fuzzy models have fewer observations than other forecasting methods because the models do not
require the presumption of data distribution and model formulation. There are different types of fuzzy
system models applied in tourism demand forecasting. Chen, Ying, and Pan (2010) applied an
adaptive network-based fuzzy inference system on forecasting annual tourists to Taiwan and later
on (Hadavandi, Ghanbari, Shahanaghi, & Abbasian-Naghneh, 2011; Shahrabi, Hadavandi, & Asadi,
2013) developed a new hybrid intelligence model that incorporates genetic algorithm (GA) into the
fuzzy system. Genetic algorithm is another AI technique that has been used in forecasting tourism
demand, often combined with other AI models such as support vector regression (Chen & Wang,
2007; Cai, Lu, & Zhang, 2009; Chen, Liang, Hong, & Gu, 2015).
ANNs have been the most frequently used AI-based models (Fernandes & Teixeira, 2008; Teixeira
& Fernandes, 2012; Fernandes, Teixeira, Ferreira, & Azevedo, 2013; Constantino, Fernandes, &
Teixeira, 2016; Srisaeng & Baxter, 2017; Silva, Hassani, Heravi, & Huang, 2019). Various studies
compare the forecasting performance of ANN models to that of other methods, for example Law
(2000) presents a neural network model that incorporates the back-propagation learning process to
forecast the nonlinearly separable tourists. The results show that the ANN outperforms the multiple
regression models. Fernandes, Teixeira, Ferreira, and Azevedo (2008) examined the ANN models
as an alternative to the Box-Jenkins methodology in forecasting tourism demand in Portugal. The
results showed that the ANN models produced satisfactory statistical and adjustment qualities,
suggesting that it is suitable for modelling and forecasting the tourism demand. Among three different
ANN techniques for tourist demand forecasting, a multi-layer perceptron and a radial basis function
showed better predictive performance than the Elman network (Claveria, Monte, & Torra, 2015a).
Although the satisfying forecasting performance generated by AI models facilitates the development
of AI models, it is not common to construct entirely new models to forecast tourism demand. Instead,
hybrid models are frequently developed, aiming to take advantage of different aspects of the AI single
models involved and minimize the limitations on tourism demand forecasting, by combining the
modelling process systematically (Jiao & Chen, 2019).
Different AI models described above have their advantages and disadvantages. Hence, a simple
solution is to integrate different AI models aiming to combine their advantages and minimize their
limitations by generating hybrid models upon single AI models (Hadavandi, Ghanbari, Shahanaghi,
& Abbasian-Naghneh, 2011). After 2010, hybrid models become a new trend in tourism forecasting,
especially AI-based hybrid models (Pai, Hung, & Lin, 2014). AI-based models under different
classifications including SVR, ANN and GA are combined systematically to improve forecasting
accuracy (Hong, 2011; Abellana, Rivero, Aparente, & Rivero, 2021).
A combination of SVR methods with GA suggested a hybrid approach known as the GA-SVR. Pai,
Hong, Chang, and Chen (2006); Chen and Wang (2007) used the approach for tourism demand
modelling and forecasting. Chen, Liang, and Hong (2015) proposed a model of support vector
11
regression with an adaptive genetic algorithm and the seasonal mechanism. Next, a combination of
seasonal SVR with a new algorithm fruit fly optimization algorithm, based on the fly food-finding
process was introduced by Lijuan and Guohua (2016).
Fuzzy system models were also combined with other AI models to construct hybrid models as well.
Hadavandi et al. (2011) presented the hybrid model using a genetic algorithm for learning rule base
and tuning database of fuzzy system. The proposed model showed successful forecasting capability
for tourist demand to Taiwan from different source markets including Hong Kong, the US and
Germany. Shahrabi, Hadavandi, and Asadi (2013) developed a new modular genetic-fuzzy
forecasting system by combining genetic fuzzy expert systems and data pre-processing to forecast
monthly tourists to Japan.
Hybrid models are also combined with linear and nonlinear models, for example Purwanto, Sunardi,
Julfia, and Paramananda (2019) proposed a hybrid model combining ARIMA and linear trend model
to predict tourist arrivals in Indonesia. The results showed that the hybrid model produced better
prediction performance compared to ARIMA, linear trend and Holt-Winter triple exponential
smoothing models. Chen (2011) combined the linear and nonlinear statistical models to forecast real-
time series data sets of Taiwanese outbound tourism demand with possibly nonlinear characteristics.
The paper suggested that a combination of forecasting methods can show promising predictive
performance in the tourism context.
With the rapid expansion of the internet, people depend more on the Internet in the decision-making
process in various aspects of life including traveling. Therefore, big data has become an important
driver in the development of AI-based forecasting approaches. As a result, using online big data
becomes a new trend in predicting traveling decisions. The search engine data from sources such
as the Google Trends, Google Analytics and Baidu indices have shown the promising predictive
ability of tourism demand (Dergiades, Mavragani, & Pan, 2018; Sun, Wei, Tsui, & Wang, 2019;
Huarng & Yu, 2019; Feng, Li, Sun, & Li, 2019; Li, Hu, & Li, 2020; Li & Law, 2020; Höpken, Eberle,
Fuchs, & Lexhagen, 2021). However, many challenging questions remain such as interpretation of
the empirical results (Song & Liu, 2017), unavailable time series data for search volume index,
keyword threshold selection (Park, Lee, & Song, 2017) or over-parameterization (Gunter & Onder,
2016).
1.5. Judgmental methods
Lin and Song (2015) suggested that judgmental techniques in forecasting referred to the techniques
of ‘asking’ the experts, stakeholders, and the public, plus using judgment-aided methods for
developing scenarios. It is believed that the approach could provide a comprehensive and conclusive
description of future developments by using the accumulated experience and insights of experts or
public groups (Song, Qiu, & Park, 2019). Uysal and Crompton (1985) presented two most used
judgmental methods in forecasting tourism demand, i.e., Delphi techniques and scenario-building.
According to Vanhove (1980), the Delphi model is a well-established judgmental method for long-
term demand forecasting. This method aims to generate debate and build consensus rather than test
12
hypotheses, to map out a field rather than to test relationships within it (Kaynak & Macaulay, 1984).
Kaynak, Bloom and Leibold (1994) suggested that the technique was suitable to use when dealing
with uncertainty in the tourism context where our understanding of tourism demand and its
determinants is limited. According to Briedenhann and Butts (2006), the Delphi technique is a unique
method that could stimulate straightforward responses and indirect interactions between anonymous
experts, while concurrently exposing arguments. However, this approach has been criticized for its
biased interpretation because the collective judgment of experts often contains subjective opinions.
Several studies applied the Delphi method along with some quantitative forecasting models.
Tideswell, Mules, and Faulkner (2001) combined statistical techniques with expert opinions in a
quasi-Delphi process in developing the forecasts of tourism in South Australia. Lin and Song (2015)
confirmed that the incorporation of the Delphi methods and quantitative approaches could be very
valuable for achieving convergent validity. Song, Gao, and Lin (2013) suggested a forecasting model
for tourism demand with both quantitative and judgmental forecasting components. The study applied
scenario analysis and dynamic Delphi surveys by users and experts to adjust the predictions of
ADLM models.
The limitations of Delphi methods might be improved through discussions of experts who exchange
views on forecasting tourism development. The approach to scenario construction which has been
used in policy formulation and societal studies and climate change has been one of the key
components entrenched in the scenario studies (Song, Qiu, & Park, 2019). The study by Moutinho
and Witt (1995) proposed a non-Delphi consensus forecasting approach to analyse selected
scenarios through applying scientific and technological developments. The results showed that the
tourism experts expected scientific and technological developments would have major impacts on
tourism up to 2030. Yeoman et al. (2007) studied the long-term implications of increasing oil prices
on Scottish Tourism with 2 scenarios, i.e., energy inflation and carbon tax. The study proposed
economic assumptions for each scenario regarding variability in energy prices, value-added tax rate
and petroleum capacity in Scotland. Peeters and Dubois (2010) presented a set of 70 scenarios
using a linear growth (i.e., constant growth rates) model for tourist trips, tourist nights, and differential
growth of the transport volume for three transport modes (air, car, and others) to achieve the target
emission reduction.
1.6. Tourism modelling and forecasting using ANN methodology
AI-based models have been applied widely in forecasting tourism demand thanks to its capability to
explain non-linear data without a priori information about the associations between inputs and
outputs The artificial neural network (ANN) approach is the most frequently used AI-based method
because it shows strong flexibility in processing imperfect data and nonlinearity. These data-driven
and model-free approaches have played an important role in forecasting studies in the tourism
context.
The first neural networks were introduced in 1943 by neurophysiologist Warren McCulloch and
mathematician Walter Pitts. They used electrical circuits and a basic algorithm-based system to
13
model how neurons in the brain might work. With more advanced computers, in 1958, Frank
Rosenblatt, a psychologist at Cornell University, proposed the idea of a system with a simple input-
output relationship as known as Perceptron. Perceptron used a ground-breaking algorithm to handle
complicated tasks. Thanks to the advancements of computers and the availability of large data from
the 2000s, ANNs have gained the enormous interest of researchers worldwide.
ANN approach is a modelling technique imitating the human nervous system that allows learning by
example from representative data. The method is unique in a way that it can establish empirical
relationships between multi-inputs and multi-outputs, then extract subtle knowledge from
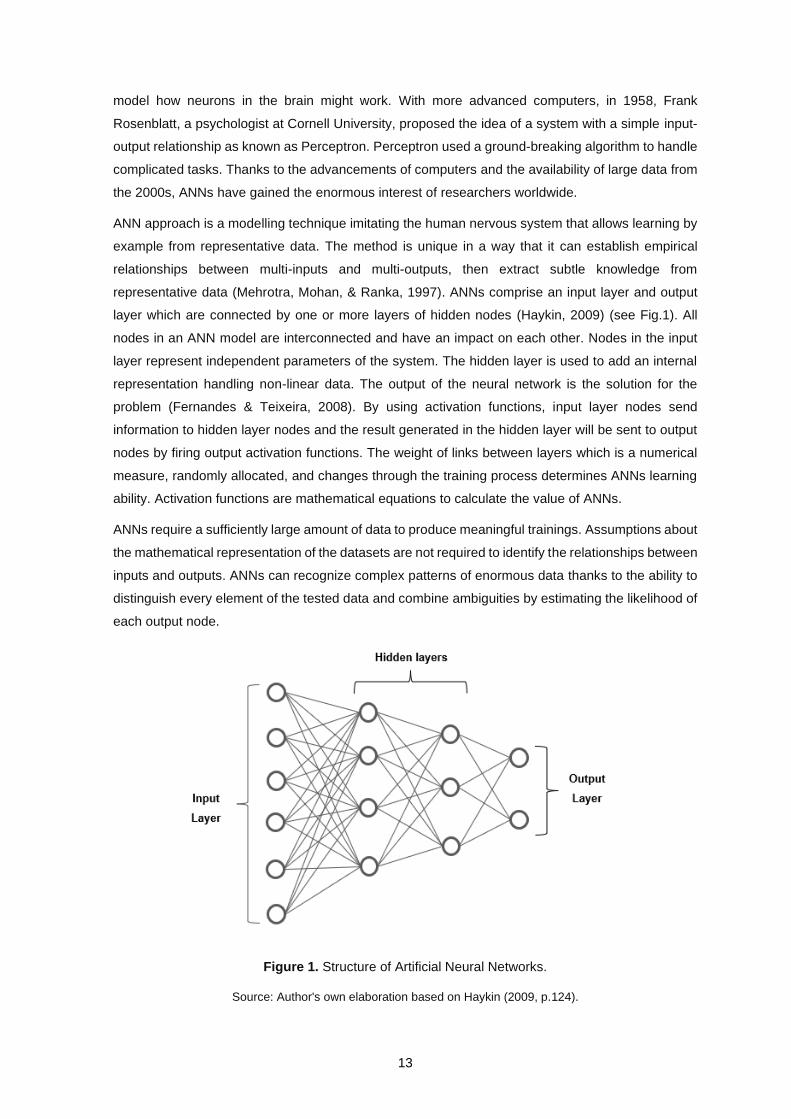
representative data (Mehrotra, Mohan, & Ranka, 1997). ANNs comprise an input layer and output
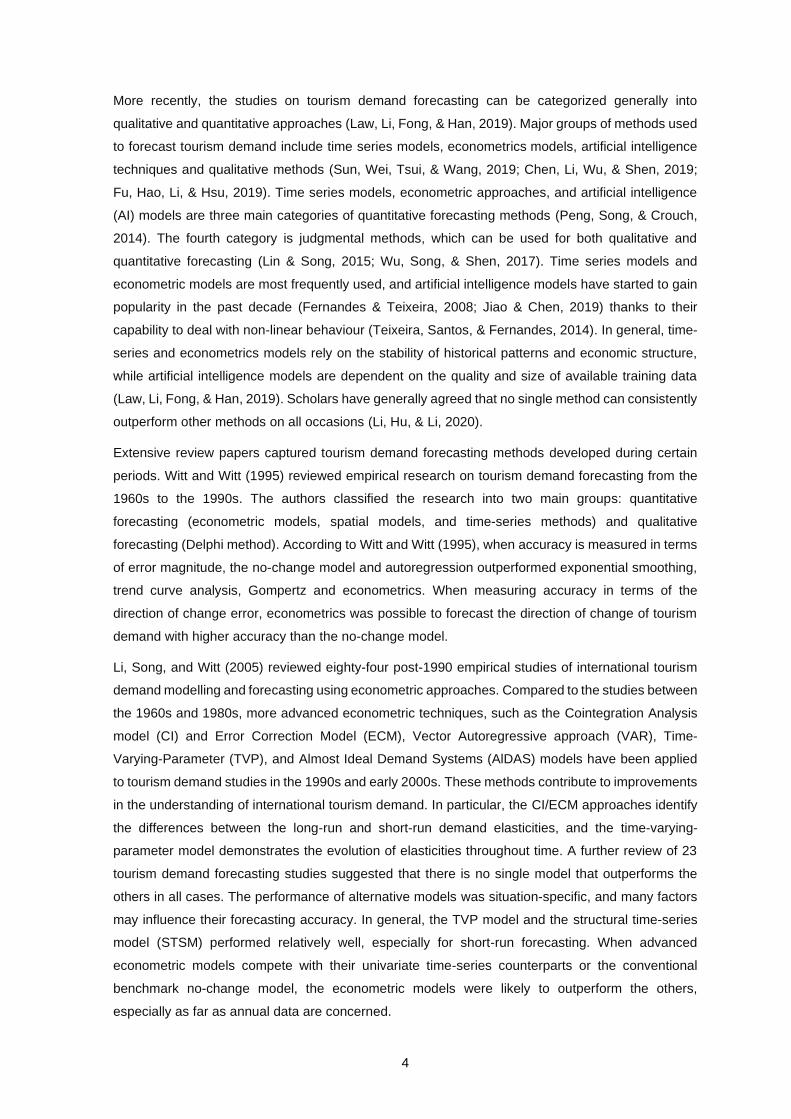
layer which are connected by one or more layers of hidden nodes (Haykin, 2009) (see Fig.1). All
nodes in an ANN model are interconnected and have an impact on each other. Nodes in the input
layer represent independent parameters of the system. The hidden layer is used to add an internal
representation handling non-linear data. The output of the neural network is the solution for the
problem (Fernandes & Teixeira, 2008). By using activation functions, input layer nodes send
information to hidden layer nodes and the result generated in the hidden layer will be sent to output
nodes by firing output activation functions. The weight of links between layers which is a numerical
measure, randomly allocated, and changes through the training process determines ANNs learning
ability. Activation functions are mathematical equations to calculate the value of ANNs.
ANNs require a sufficiently large amount of data to produce meaningful trainings. Assumptions about
the mathematical representation of the datasets are not required to identify the relationships between
inputs and outputs. ANNs can recognize complex patterns of enormous data thanks to the ability to
distinguish every element of the tested data and combine ambiguities by estimating the likelihood of
each output node.
Figure 1. Structure of Artificial Neural Networks.
Source: Author's own elaboration based on Haykin (2009, p.124).
14
According to Haykin (2009), ANNs have the following properties and capabilities:
• Nonlinearity: A neural network, made up of an interconnection of nonlinear neurons, is itself
nonlinear. The nonlinearity is of a special kind in the sense that it is distributed throughout the
network.
• Input-Output Mapping: the network learns from the examples by constructing an input-output
mapping for the problem at hand. A supervised learning involves modification of the synaptic
weights of a neural network by applying a set of labelled training examples, or task examples. Each
example consists of a unique input signal and a corresponding desired (target) response. The
network is presented with an example picked at random from the set, and the synaptic weights
(free parameters) of the network are modified to minimize the difference between the desired
response and the actual response of the network produced by the input signal following an
appropriate statistical criterion. The training of the network is repeated for many examples in the
set until the network reaches a steady state where there are no further significant changes in the
synaptic weights.
• Adaptive Learning: Neural networks have a built-in capability to adapt their synaptic weights to
changes in the surrounding environment. A neural network trained to operate in a specific
environment can be easily retrained to deal with minor changes in the operating environmental
conditions.
• Evidential Response: In the context of pattern classification, a neural network can be designed to
provide information not only about which particular pattern to select, but also about the confidence
in the decision made. This latter information may be used to reject ambiguous patterns, should they
arise, and thereby improve the classification performance of the network.
• Contextual Information: Knowledge is represented by the very structure and activation state of a
neural network. Every neuron in the network is potentially affected by the global activity of all other
neurons in the network. Consequently, contextual information is dealt with naturally by a neural
network.
• Fault Tolerance: A neural network, implemented in hardware form, has the potential to be inherently
fault tolerant, or capable of robust computation, in the sense that its performance degrades
gracefully under adverse operating conditions. For example, if a neuron or its connecting links are
damaged, recall of a stored pattern is impaired in quality.
In terms of connecting patterns of different layers, Claveria, Monte, and Torra (2015b) divided ANNs
into two architecture groups: feed-forward networks and feedback networks (or recurrent networks).
Feed-forward networks have one input layer and a single output layer in which input nodes send
information to output nodes in one direction. Feedback networks or interactive networks use their
memory to deal with a series of inputs with feedback connections from outer layers to lower layers
of nodes considering the data´s temporal structure. Unlike feed-forward networks, signals of
15
recurrent networks can go in both ways through hidden layers. The architectures are commonly
utilized to handle a sequence of events happening in a certain order. There are many recurrent
architectures: fully recurrent, simple recurrent, bidirectional recurrent, and Elman networks (a special
case of recurrent networks) and so on.
Relate to learning strategy, ANNs can also be categorized into two groups: supervised and
unsupervised learning networks. In supervised learning networks, weights are varied to estimate the
target outputs for each experimented pattern. Support vector machines (SVM) and Multilayer
perceptron (MLP) networks are among the most used supervised learning models. On contrary,
during the training under unsupervised learning, ANNs have no target outputs and depending on the
input values, the networks group similar weight values in a certain range. In other words, data
patterns are examined and organized according to their correlations. Based on 10 time series of
monthly tourist arrivals to Turkey between 2001 and 2011, Akın (2015) compared the forecasting
performances of SARIMA, SVR and Multilayer Perceptron (MLP) and confirmed that there is no
single best model for all the cases.
Self-organizing maps (SOM) of Kohonen are among the most popular non-supervised models
(Kohonen, 1982). According to Claveria, Monte, and Torra (2015b), ANN hybrid learning is a
combination of both learning methods in which some weights are determined by a supervised
process while the others are determined by unsupervised procedure. Radial basis function (RBF)
network, an example of the hybrid model, combines supervised and unsupervised learning strategy
with three layers such as input layer, the hidden layer including nodes computing a radial symmetric
activation function and output layer including nodes that linearly combine outputs from hidden layers.
Following are some common types of ANNs:
• Feedforward Neural Network – is one of the most basic forms of ANNs. Data in the network is sent
through the different input nodes until it reaches output nodes. The process is considered as front
propagating wave because data pass in one direction from the first layer to the output node. The
network determines the sum of values of inputs and their weights which are later sent to the output
layer. Applications of feed-forward networks can be found in the studies of Fernandes, Teixeira,
Ferreira, and Azevedo (2008), Teixeira and Fernandes (2012), Fernandes, Teixeira, Ferreira, and
Azevedo (2013), Teixeira, Santos, and Fernandes (2014), Teixeira and Fernandes (2015),
Constantino, Fernandes, and Teixeira (2016). Multilayer Perceptron (MLP) is the same as
Feedforward Neural Network which is made up of three or more layers. It is employed in the
classification of data that cannot be separated linearly. It is a form of a fully connected ANN. The
studies of Claveria, Monte, and Torra (2013), Cuhadar, Cogurcu, and Kukrer (2014) are among
numerous experiments using MLP to forecast tourist volume.
• Radial Basis Function Neural Network: considers the distance of any point from the centre. These
neural networks are composed of two layers. The characteristics are merged with the radial basis
function in the inner layer. The output of these characteristics is then used to calculate the identical
result in the following time step. Studies by Zhang and Li (2012), Cuhadar, Cogurcu, and Kukrer
16
(2014), Claveria, Monte, and Torra (2017) applied these networks to forecast tourism demand in
different contexts.
• Modular Neural Network: consists of independent networks which operate individually to get target
outputs. The task is divided into small components which are processed separately, increasing the
speed of the computational process for a large set of data (Happel & Murre, 1994).
Although ANNS have been shown the highly predictive capability for tourism data, ANNs are
questioned as a theoretical background for the approach is unidentified (Zhang, Patuwo, & Hu,
1998). The methods have black boxes due to the unknown assumptions under each input and output
node. The independent variables in forecasting the desired output values are difficult to extract within
the network, and the weight adjusting process is often insufficiently examined. Besides, in case of
rare distress events application of ANN is limited as the data is often insufficient to train the model.
ANN models are not able to combine judgmental approaches in the modelling process.
1.7. ANN-based models proposed in the research
The Artificial neural network (ANNs) model is one of the most frequently used AI-based models. A
neural network is a machine that is designed to model how the brain performs a particular task or
function of interest (Ghalehkhondabi, Ardjmand, Young, & Weckman, 2019). A neural network is
composed of a set of interconnected artificial neurons, or a group of processing units, which process
and transmit information through activation functions (Teixeira, Santos, & Fernandes, 2014). Various
studies show empirical evidence in favour of ANNs (Fernandes, Teixeira, Ferreira, & Azevedo, 2008;
Teixeira & Fernandes, 2015; Law, Li, Fong, & Han, 2019; Álvarez-Díaz, González-Gómez, & Otero-
Giráldez, 2019). Fernandes, Teixeira, Ferreira, and Azevedo (2013) used ANN to forecast tourism
demand in the North and Centre of Portugal. The study found that ANN was suitable for modelling
and predicting the reference data. Srisaeng and Baxter (2017) used ANN to predict passenger
demand for international airlines in Australia and the result showed that ANN using MLP architecture
provided highly predictive capability. Also, according to Alamsyah and Friscintia (2019), ANN was
able to accurately predict the monthly tourists in Indonesia. Álvarez-Díaz et al. (2019) found that a
non-linear autoregressive neural (NAR) network shows slightly better performance than SARIMA in
the case of forecasting international overnight stays and international tourists. While comparing
ARIMA models and ANNs in forecasting tourism demand in Sweden, Höpken, Eberle, Fuchs, and
Lexhagen (2021) confirmed that ANNs tend to outperform the ARIMA model when using a big data-
based approach.
The advantages of ANNs are (i) capability to map linear or nonlinear function without any assumption
imposed by the modelling process (Wu, Song & Shen, 2017); (ii) having been proved to have strong
practicality and flexibility for treating imperfect data, or handling almost any kind of nonlinearity (Song,
Qiu, & Park, 2019); (iii) the neural network methods can perform well for shorter records of tourism
demand under unstable tourism conditions (Kon & Turner, 2005).
Different ANN models have been applied to tourism and hotel forecasting practice, including multi-
layer perceptron (MLP), radial basis function (RBF), generalized regression neural network (GRNN)
17
and Elman neural network (Elman NN) in which MLP is the most widely used (Song, Qiu, & Park,
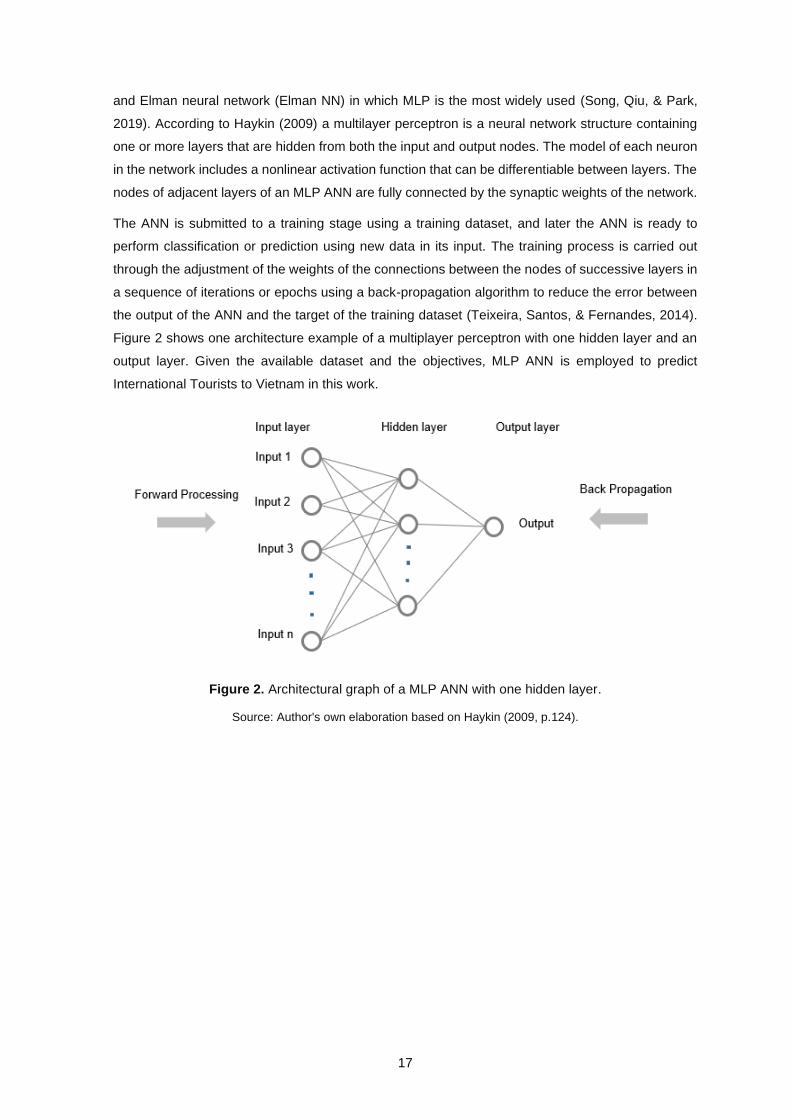
2019). According to Haykin (2009) a multilayer perceptron is a neural network structure containing
one or more layers that are hidden from both the input and output nodes. The model of each neuron
in the network includes a nonlinear activation function that can be differentiable between layers. The
nodes of adjacent layers of an MLP ANN are fully connected by the synaptic weights of the network.
The ANN is submitted to a training stage using a training dataset, and later the ANN is ready to
perform classification or prediction using new data in its input. The training process is carried out
through the adjustment of the weights of the connections between the nodes of successive layers in
a sequence of iterations or epochs using a back-propagation algorithm to reduce the error between
the output of the ANN and the target of the training dataset (Teixeira, Santos, & Fernandes, 2014).
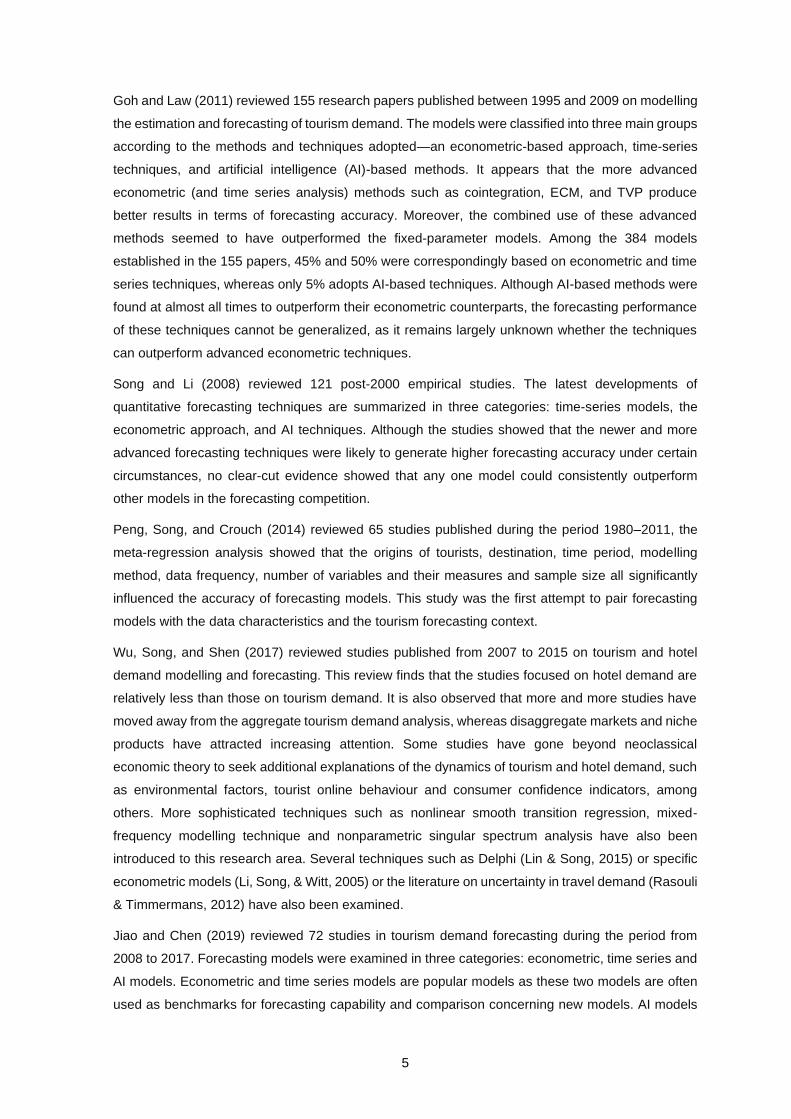
Figure 2 shows one architecture example of a multiplayer perceptron with one hidden layer and an
output layer. Given the available dataset and the objectives, MLP ANN is employed to predict
International Tourists to Vietnam in this work.
Figure 2. Architectural graph of a MLP ANN with one hidden layer.
Source: Author's own elaboration based on Haykin (2009, p.124).
18
2. Development of tourism sector in Vietnam
The tourism sector plays an important role in the economy thanks to its ability to create jobs, attract
foreign investments, contribute to tax revenues, foster economic growth, and spread prosperity. The
service sector seems to create more job opportunities for women and young people than others. As
a labour-intensive sector, the blossom of tourism provides significant prospects for small and medium
enterprises – key players of the economy – to flourish. The sector also creates linkages with various
sectors transportation, food and beverage, real estate. Therefore, it has strong multiplier effects on
the rest of the economy, generating jobs and income opportunities along its value chain (The World
Bank, 2019). Furthermore, one way to share prosperity between prosperous and underprivileged
areas is to facilitate tourism development to boost up local economies.
With beautiful landscape, pristine nature and diverse culture, Vietnam has been benefited from the
development of the tourism sector. According to the World Economic Forum’s (WEF) Travel and
Tourism Competitiveness Index in 2019, Vietnam ranks the 35th globally (out of 140 countries) and
the 3rd within the Southeast Asia region in terms of its natural and cultural resources and the 29th in
terms of cultural resources and business travel (World Economic Forum, 2019). Remarkably,
Vietnam has eight UNESCO World Heritage sites - the highest number compared to other countries
in Southeast Asia.
Considering this setting, the Government of Vietnam is prioritizing tourism as a strategic sector and
driver of socio-economic development. In January 2020, the Government approved a long-term
strategic plan for the development of the tourism sector until 2030 with specific goals for the next
period 2020-2025 and 2026-2030 (Government of Vietnam, 2020). Until 2025, the government
expects that Vietnam´s tourism sector will become one of the leading industries, making Vietnam
into the top 50 countries in terms of the Travel and Tourism Competitiveness Index.
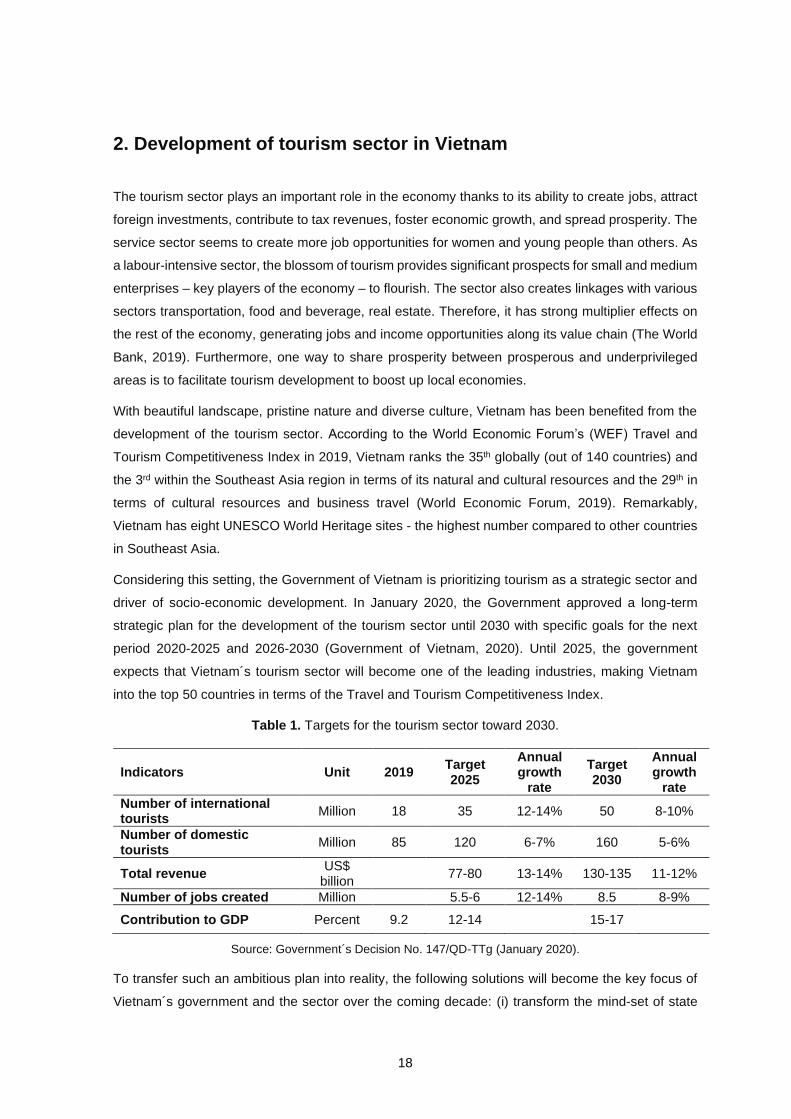
Table 1. Targets for the tourism sector toward 2030.
Indicators Unit 2019 Target 2025
Annual growth
rate
Target 2030
Annual growth
rate
Number of international tourists
Million 18 35 12-14% 50 8-10%
Number of domestic tourists
Million 85 120 6-7% 160 5-6%
Total revenue US$
billion 77-80 13-14% 130-135 11-12%
Number of jobs created Million 5.5-6 12-14% 8.5 8-9%
Contribution to GDP Percent 9.2 12-14 15-17
Source: Government´s Decision No. 147/QD-TTg (January 2020).
To transfer such an ambitious plan into reality, the following solutions will become the key focus of
Vietnam´s government and the sector over the coming decade: (i) transform the mind-set of state
19
management on tourism, (ii) improve and refine policies on tourism development, (iii) develop tourism
infrastructure, (iv) enhance tourism human resources, (v) diversify target groups of tourists, (vi)
develop tourism products, (vii) improve tourism promotion, (viii) apply new technologies, (ix)
strengthen state management of the tourism sector.
2.1. Tourism demand
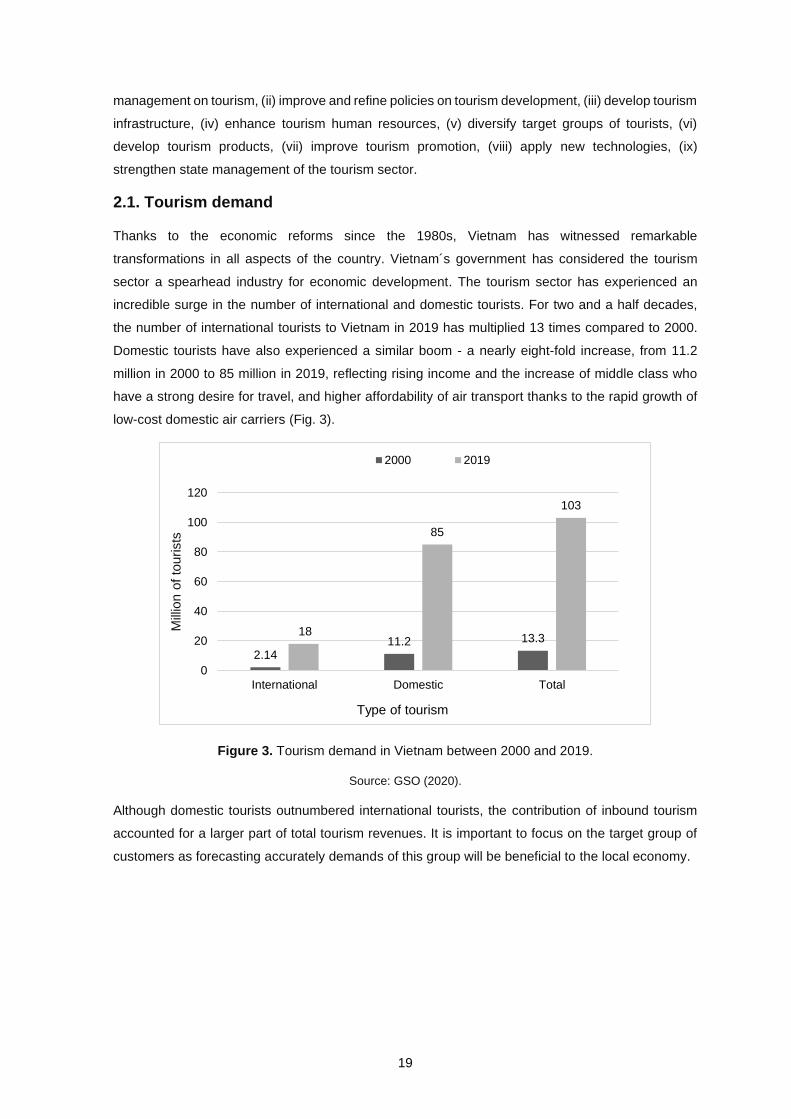
Thanks to the economic reforms since the 1980s, Vietnam has witnessed remarkable
transformations in all aspects of the country. Vietnam´s government has considered the tourism
sector a spearhead industry for economic development. The tourism sector has experienced an
incredible surge in the number of international and domestic tourists. For two and a half decades,
the number of international tourists to Vietnam in 2019 has multiplied 13 times compared to 2000.
Domestic tourists have also experienced a similar boom - a nearly eight-fold increase, from 11.2
million in 2000 to 85 million in 2019, reflecting rising income and the increase of middle class who
have a strong desire for travel, and higher affordability of air transport thanks to the rapid growth of
low-cost domestic air carriers (Fig. 3).
Figure 3. Tourism demand in Vietnam between 2000 and 2019.
Source: GSO (2020).
Although domestic tourists outnumbered international tourists, the contribution of inbound tourism
accounted for a larger part of total tourism revenues. It is important to focus on the target group of
customers as forecasting accurately demands of this group will be beneficial to the local economy.
2.1411.2 13.3
18
85
103
0
20
40
60
80
100
120
International Domestic Total
Mill
ion o
f to
urists
Type of tourism
2000 2019
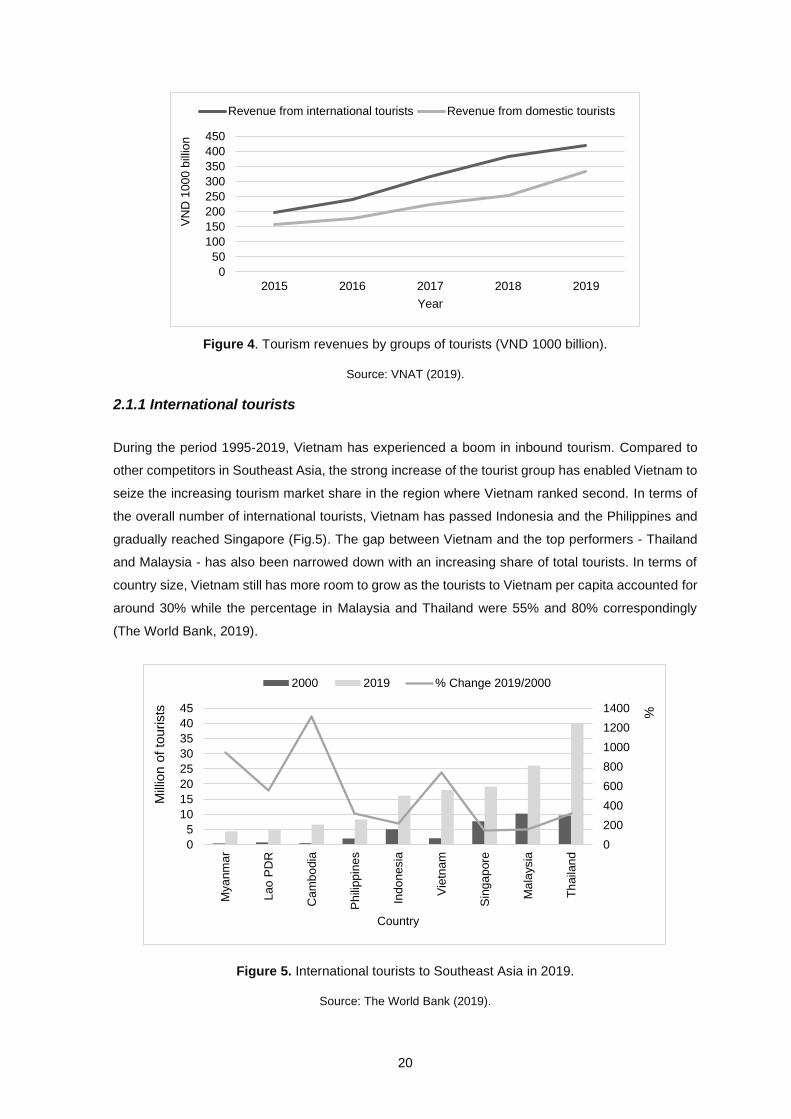
20
Figure 4. Tourism revenues by groups of tourists (VND 1000 billion).
Source: VNAT (2019).
2.1.1 International tourists
During the period 1995-2019, Vietnam has experienced a boom in inbound tourism. Compared to
other competitors in Southeast Asia, the strong increase of the tourist group has enabled Vietnam to
seize the increasing tourism market share in the region where Vietnam ranked second. In terms of
the overall number of international tourists, Vietnam has passed Indonesia and the Philippines and
gradually reached Singapore (Fig.5). The gap between Vietnam and the top performers - Thailand
and Malaysia - has also been narrowed down with an increasing share of total tourists. In terms of
country size, Vietnam still has more room to grow as the tourists to Vietnam per capita accounted for
around 30% while the percentage in Malaysia and Thailand were 55% and 80% correspondingly
(The World Bank, 2019).
Figure 5. International tourists to Southeast Asia in 2019.
Source: The World Bank (2019).
0
50
100
150
200
250
300
350
400
450
2015 2016 2017 2018 2019
VN
D 1
00
0 b
illio
n
Year
Revenue from international tourists Revenue from domestic tourists
0
200
400
600
800
1000
1200
1400
0
5
10
15
20
25
30
35
40
45
Mya
nm
ar
Lao
PD
R
Cam
bo
dia
Ph
ilipp
ines
Indo
nesia
Vie
tna
m
Sin
ga
pore
Ma
laysia
Th
aila
nd
%
Mill
ion o
f to
urists
Country
2000 2019 % Change 2019/2000
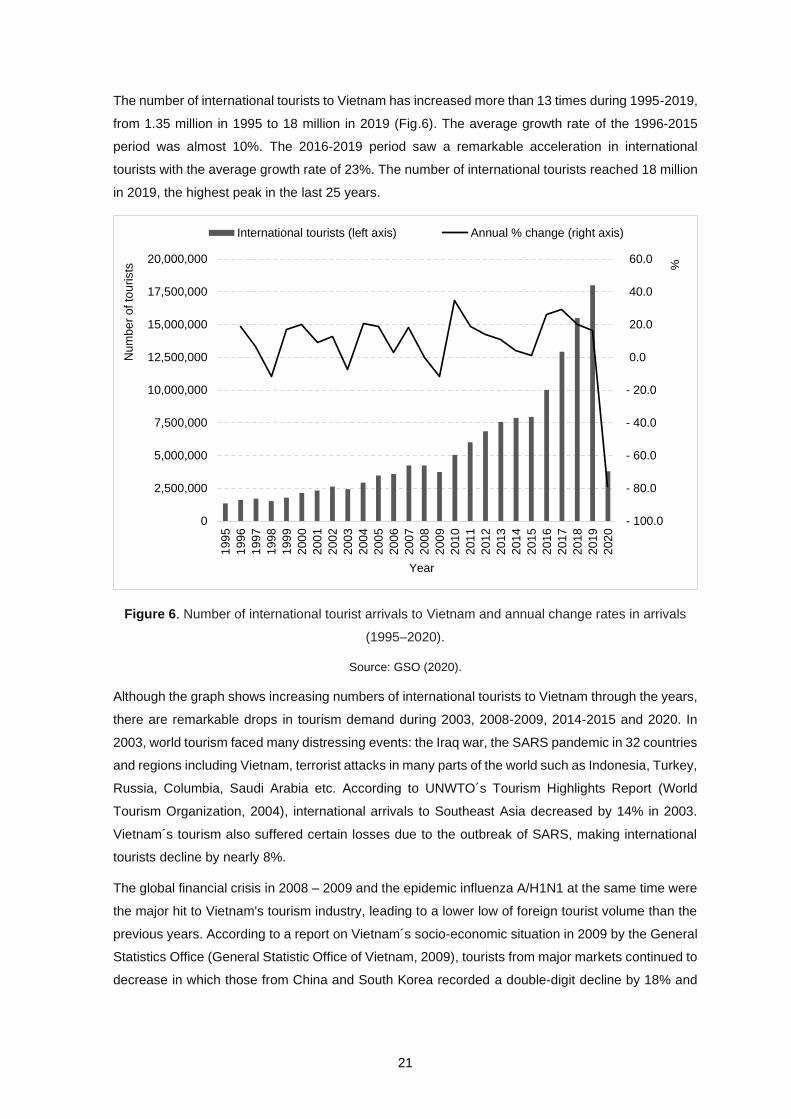
21
The number of international tourists to Vietnam has increased more than 13 times during 1995-2019,
from 1.35 million in 1995 to 18 million in 2019 (Fig.6). The average growth rate of the 1996-2015
period was almost 10%. The 2016-2019 period saw a remarkable acceleration in international
tourists with the average growth rate of 23%. The number of international tourists reached 18 million
in 2019, the highest peak in the last 25 years.
Figure 6. Number of international tourist arrivals to Vietnam and annual change rates in arrivals
(1995–2020).
Source: GSO (2020).
Although the graph shows increasing numbers of international tourists to Vietnam through the years,
there are remarkable drops in tourism demand during 2003, 2008-2009, 2014-2015 and 2020. In
2003, world tourism faced many distressing events: the Iraq war, the SARS pandemic in 32 countries
and regions including Vietnam, terrorist attacks in many parts of the world such as Indonesia, Turkey,
Russia, Columbia, Saudi Arabia etc. According to UNWTO´s Tourism Highlights Report (World
Tourism Organization, 2004), international arrivals to Southeast Asia decreased by 14% in 2003.
Vietnam´s tourism also suffered certain losses due to the outbreak of SARS, making international
tourists decline by nearly 8%.
The global financial crisis in 2008 – 2009 and the epidemic influenza A/H1N1 at the same time were
the major hit to Vietnam's tourism industry, leading to a lower low of foreign tourist volume than the
previous years. According to a report on Vietnam´s socio-economic situation in 2009 by the General
Statistics Office (General Statistic Office of Vietnam, 2009), tourists from major markets continued to
decrease in which those from China and South Korea recorded a double-digit decline by 18% and
- 100.0
- 80.0
- 60.0
- 40.0
- 20.0
0.0
20.0
40.0
60.0
0
2,500,000
5,000,000
7,500,000
10,000,000
12,500,000
15,000,000
17,500,000
20,000,000
199
5
199
6
199
7
199
8
199
9
200
0
200
1
200
2
200
3
200
4
200
5
200
6
200
7
200
8
200
9
201
0
201
1
201
2
201
3
201
4
201
5
201
6
201
7
201
8
201
9
202
0
%
Nu
mb
er
of to
uri
sts
Year
International tourists (left axis) Annual % change (right axis)
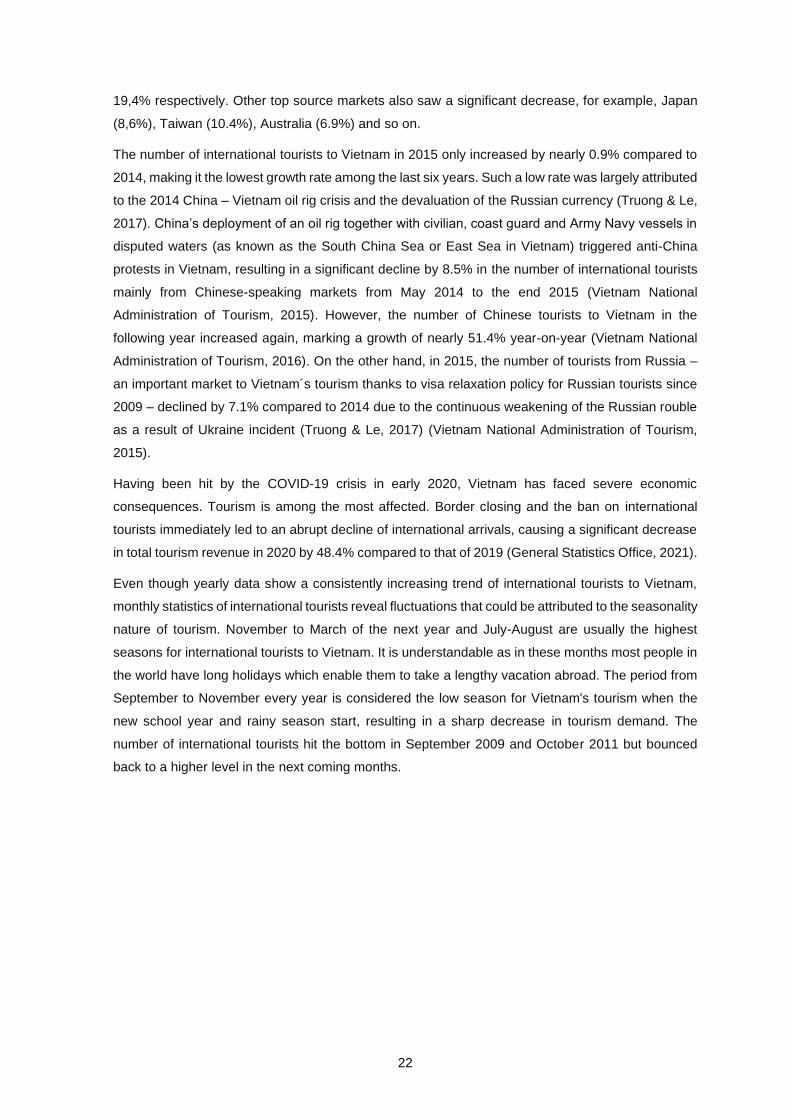
22
19,4% respectively. Other top source markets also saw a significant decrease, for example, Japan
(8,6%), Taiwan (10.4%), Australia (6.9%) and so on.
The number of international tourists to Vietnam in 2015 only increased by nearly 0.9% compared to
2014, making it the lowest growth rate among the last six years. Such a low rate was largely attributed
to the 2014 China – Vietnam oil rig crisis and the devaluation of the Russian currency (Truong & Le,
2017). China’s deployment of an oil rig together with civilian, coast guard and Army Navy vessels in
disputed waters (as known as the South China Sea or East Sea in Vietnam) triggered anti-China
protests in Vietnam, resulting in a significant decline by 8.5% in the number of international tourists
mainly from Chinese-speaking markets from May 2014 to the end 2015 (Vietnam National
Administration of Tourism, 2015). However, the number of Chinese tourists to Vietnam in the
following year increased again, marking a growth of nearly 51.4% year-on-year (Vietnam National
Administration of Tourism, 2016). On the other hand, in 2015, the number of tourists from Russia –
an important market to Vietnam´s tourism thanks to visa relaxation policy for Russian tourists since
2009 – declined by 7.1% compared to 2014 due to the continuous weakening of the Russian rouble
as a result of Ukraine incident (Truong & Le, 2017) (Vietnam National Administration of Tourism,
2015).
Having been hit by the COVID-19 crisis in early 2020, Vietnam has faced severe economic
consequences. Tourism is among the most affected. Border closing and the ban on international
tourists immediately led to an abrupt decline of international arrivals, causing a significant decrease
in total tourism revenue in 2020 by 48.4% compared to that of 2019 (General Statistics Office, 2021).
Even though yearly data show a consistently increasing trend of international tourists to Vietnam,
monthly statistics of international tourists reveal fluctuations that could be attributed to the seasonality
nature of tourism. November to March of the next year and July-August are usually the highest
seasons for international tourists to Vietnam. It is understandable as in these months most people in
the world have long holidays which enable them to take a lengthy vacation abroad. The period from
September to November every year is considered the low season for Vietnam's tourism when the
new school year and rainy season start, resulting in a sharp decrease in tourism demand. The
number of international tourists hit the bottom in September 2009 and October 2011 but bounced
back to a higher level in the next coming months.
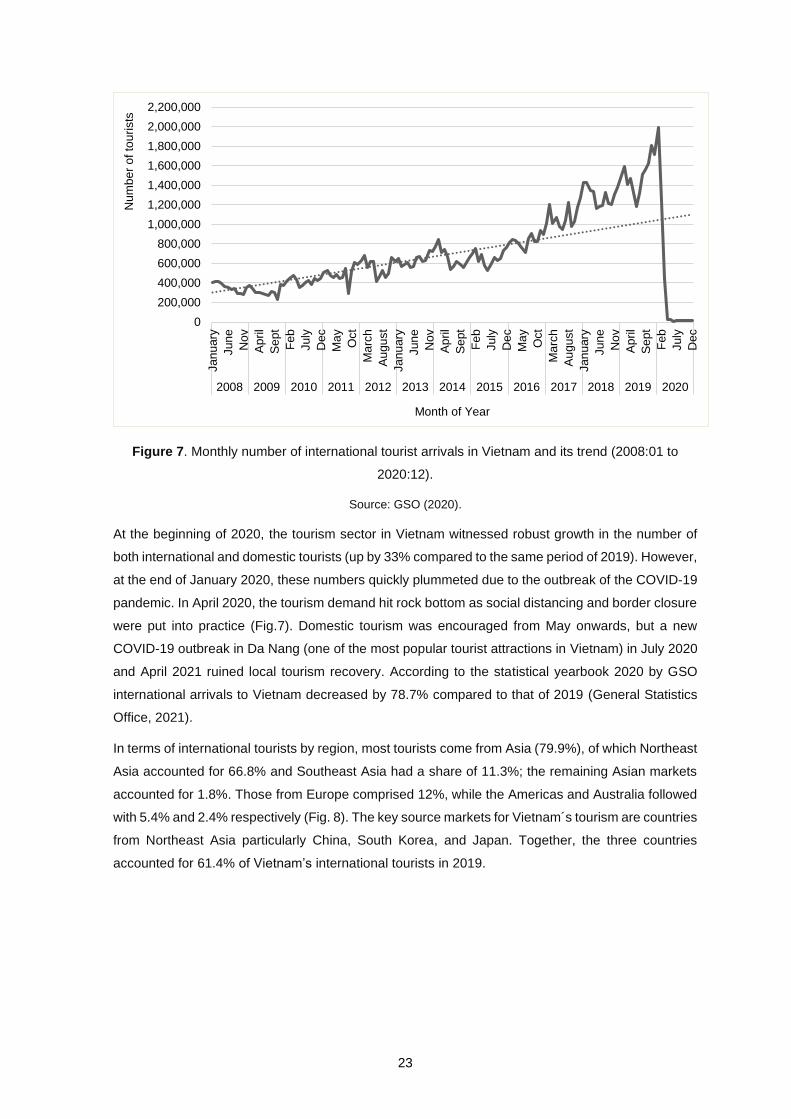
23
Figure 7. Monthly number of international tourist arrivals in Vietnam and its trend (2008:01 to
2020:12).
Source: GSO (2020).
At the beginning of 2020, the tourism sector in Vietnam witnessed robust growth in the number of
both international and domestic tourists (up by 33% compared to the same period of 2019). However,
at the end of January 2020, these numbers quickly plummeted due to the outbreak of the COVID-19
pandemic. In April 2020, the tourism demand hit rock bottom as social distancing and border closure
were put into practice (Fig.7). Domestic tourism was encouraged from May onwards, but a new
COVID-19 outbreak in Da Nang (one of the most popular tourist attractions in Vietnam) in July 2020
and April 2021 ruined local tourism recovery. According to the statistical yearbook 2020 by GSO
international arrivals to Vietnam decreased by 78.7% compared to that of 2019 (General Statistics
Office, 2021).
In terms of international tourists by region, most tourists come from Asia (79.9%), of which Northeast
Asia accounted for 66.8% and Southeast Asia had a share of 11.3%; the remaining Asian markets
accounted for 1.8%. Those from Europe comprised 12%, while the Americas and Australia followed
with 5.4% and 2.4% respectively (Fig. 8). The key source markets for Vietnam´s tourism are countries
from Northeast Asia particularly China, South Korea, and Japan. Together, the three countries
accounted for 61.4% of Vietnam’s international tourists in 2019.
0
200,000
400,000
600,000
800,000
1,000,000
1,200,000
1,400,000
1,600,000
1,800,000
2,000,000
2,200,000
Jan
uary
Jun
e
No
v
Ap
ril
Se
pt
Fe
b
July
De
c
Ma
y
Oct
Ma
rch
Au
gu
st
Jan
uary
Jun
e
No
v
Ap
ril
Se
pt
Fe
b
July
De
c
Ma
y
Oct
Ma
rch
Au
gu
st
Jan
uary
Jun
e
No
v
Ap
ril
Se
pt
Fe
b
July
De
c
2008 2009 2010 2011 2012 2013 2014 2015 2016 2017 2018 2019 2020
Nu
mb
er
of to
uri
sts
Month of Year
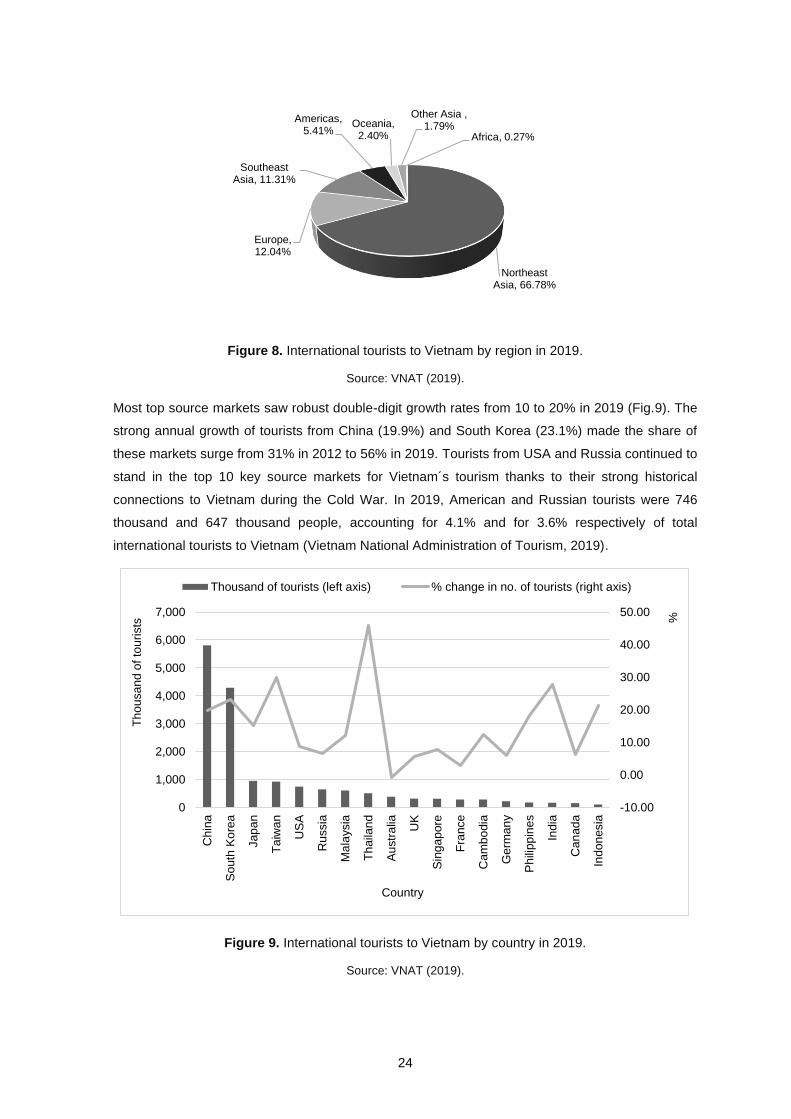
24
Figure 8. International tourists to Vietnam by region in 2019.
Source: VNAT (2019).
Most top source markets saw robust double-digit growth rates from 10 to 20% in 2019 (Fig.9). The
strong annual growth of tourists from China (19.9%) and South Korea (23.1%) made the share of
these markets surge from 31% in 2012 to 56% in 2019. Tourists from USA and Russia continued to
stand in the top 10 key source markets for Vietnam´s tourism thanks to their strong historical
connections to Vietnam during the Cold War. In 2019, American and Russian tourists were 746
thousand and 647 thousand people, accounting for 4.1% and for 3.6% respectively of total
international tourists to Vietnam (Vietnam National Administration of Tourism, 2019).
Figure 9. International tourists to Vietnam by country in 2019.
Source: VNAT (2019).
Northeast Asia, 66.78%
Europe, 12.04%
Southeast Asia, 11.31%
Americas, 5.41%
Oceania, 2.40%
Other Asia , 1.79%
Africa, 0.27%
-10.00
0.00
10.00
20.00
30.00
40.00
50.00
0
1,000
2,000
3,000
4,000
5,000
6,000
7,000
Ch
ina
So
uth
Ko
rea
Jap
an
Ta
iwan
US
A
Russia
Ma
laysia
Th
aila
nd
Au
str
alia UK
Sin
ga
pore
Fra
nce
Cam
bo
dia
Ge
rma
ny
Ph
ilipp
ines
India
Can
ad
a
Indo
nesia
%
Th
ou
sa
nd
of
tou
rists
Country
Thousand of tourists (left axis) % change in no. of tourists (right axis)
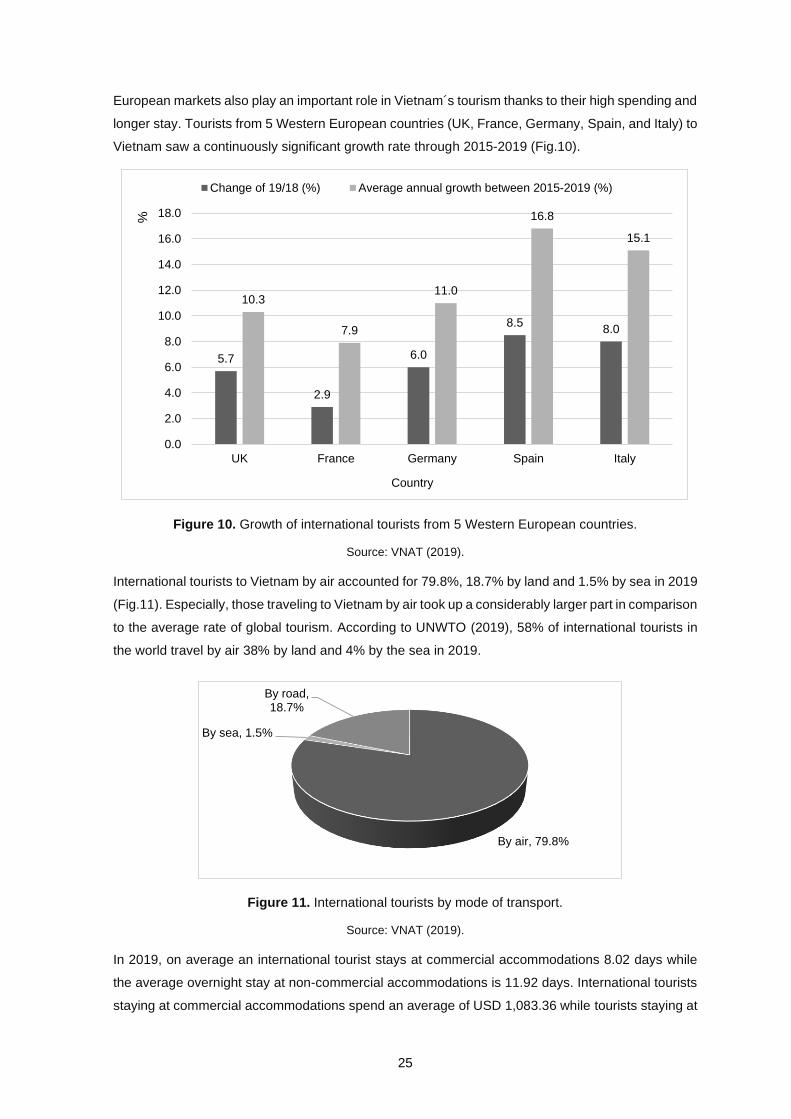
25
European markets also play an important role in Vietnam´s tourism thanks to their high spending and
longer stay. Tourists from 5 Western European countries (UK, France, Germany, Spain, and Italy) to
Vietnam saw a continuously significant growth rate through 2015-2019 (Fig.10).
Figure 10. Growth of international tourists from 5 Western European countries.
Source: VNAT (2019).
International tourists to Vietnam by air accounted for 79.8%, 18.7% by land and 1.5% by sea in 2019
(Fig.11). Especially, those traveling to Vietnam by air took up a considerably larger part in comparison
to the average rate of global tourism. According to UNWTO (2019), 58% of international tourists in
the world travel by air 38% by land and 4% by the sea in 2019.
Figure 11. International tourists by mode of transport.
Source: VNAT (2019).
In 2019, on average an international tourist stays at commercial accommodations 8.02 days while
the average overnight stay at non-commercial accommodations is 11.92 days. International tourists
staying at commercial accommodations spend an average of USD 1,083.36 while tourists staying at
5.7
2.9
6.0
8.58.0
10.3
7.9
11.0
16.8
15.1
0.0
2.0
4.0
6.0
8.0
10.0
12.0
14.0
16.0
18.0
UK France Germany Spain Italy
%
Country
Change of 19/18 (%) Average annual growth between 2015-2019 (%)
By air, 79.8%
By sea, 1.5%
By road, 18.7%
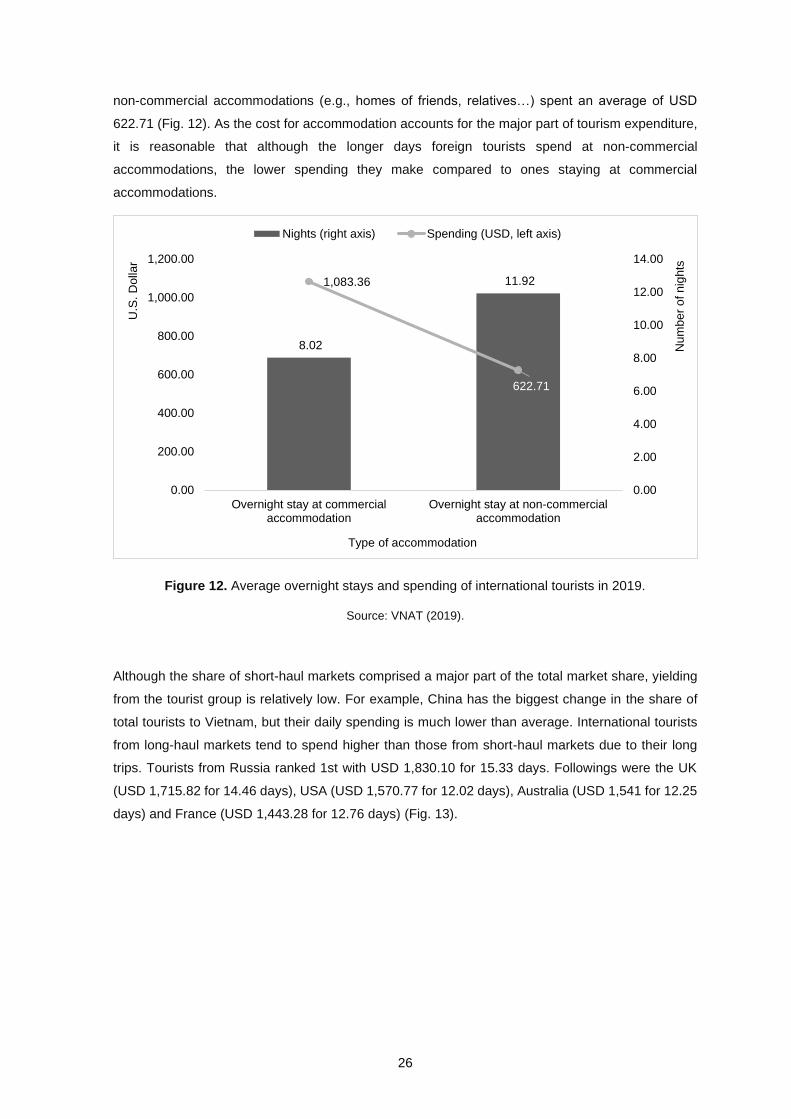
26
non-commercial accommodations (e.g., homes of friends, relatives…) spent an average of USD
622.71 (Fig. 12). As the cost for accommodation accounts for the major part of tourism expenditure,
it is reasonable that although the longer days foreign tourists spend at non-commercial
accommodations, the lower spending they make compared to ones staying at commercial
accommodations.
Figure 12. Average overnight stays and spending of international tourists in 2019.
Source: VNAT (2019).
Although the share of short-haul markets comprised a major part of the total market share, yielding
from the tourist group is relatively low. For example, China has the biggest change in the share of
total tourists to Vietnam, but their daily spending is much lower than average. International tourists
from long-haul markets tend to spend higher than those from short-haul markets due to their long
trips. Tourists from Russia ranked 1st with USD 1,830.10 for 15.33 days. Followings were the UK
(USD 1,715.82 for 14.46 days), USA (USD 1,570.77 for 12.02 days), Australia (USD 1,541 for 12.25
days) and France (USD 1,443.28 for 12.76 days) (Fig. 13).
8.02
11.92 1,083.36
622.71
0.00
2.00
4.00
6.00
8.00
10.00
12.00
14.00
0.00
200.00
400.00
600.00
800.00
1,000.00
1,200.00
Overnight stay at commercialaccommodation
Overnight stay at non-commercialaccommodation
Nu
mb
er
of n
igh
ts
U.S
. D
olla
r
Type of accommodation
Nights (right axis) Spending (USD, left axis)
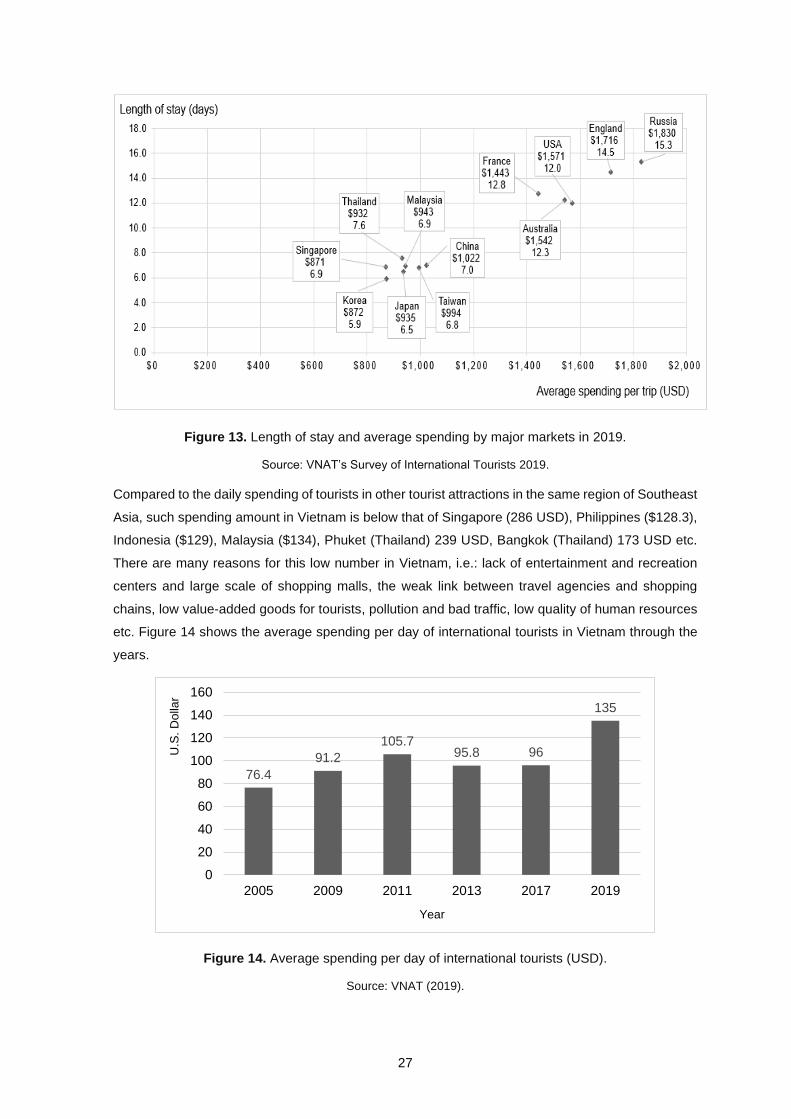
27
Figure 13. Length of stay and average spending by major markets in 2019.
Source: VNAT’s Survey of International Tourists 2019.
Compared to the daily spending of tourists in other tourist attractions in the same region of Southeast
Asia, such spending amount in Vietnam is below that of Singapore (286 USD), Philippines ($128.3),
Indonesia ($129), Malaysia ($134), Phuket (Thailand) 239 USD, Bangkok (Thailand) 173 USD etc.
There are many reasons for this low number in Vietnam, i.e.: lack of entertainment and recreation
centers and large scale of shopping malls, the weak link between travel agencies and shopping
chains, low value-added goods for tourists, pollution and bad traffic, low quality of human resources
etc. Figure 14 shows the average spending per day of international tourists in Vietnam through the
years.
Figure 14. Average spending per day of international tourists (USD).
Source: VNAT (2019).
76.4
91.2
105.795.8 96
135
0
20
40
60
80
100
120
140
160
2005 2009 2011 2013 2017 2019
U.S
. D
olla
r
Year
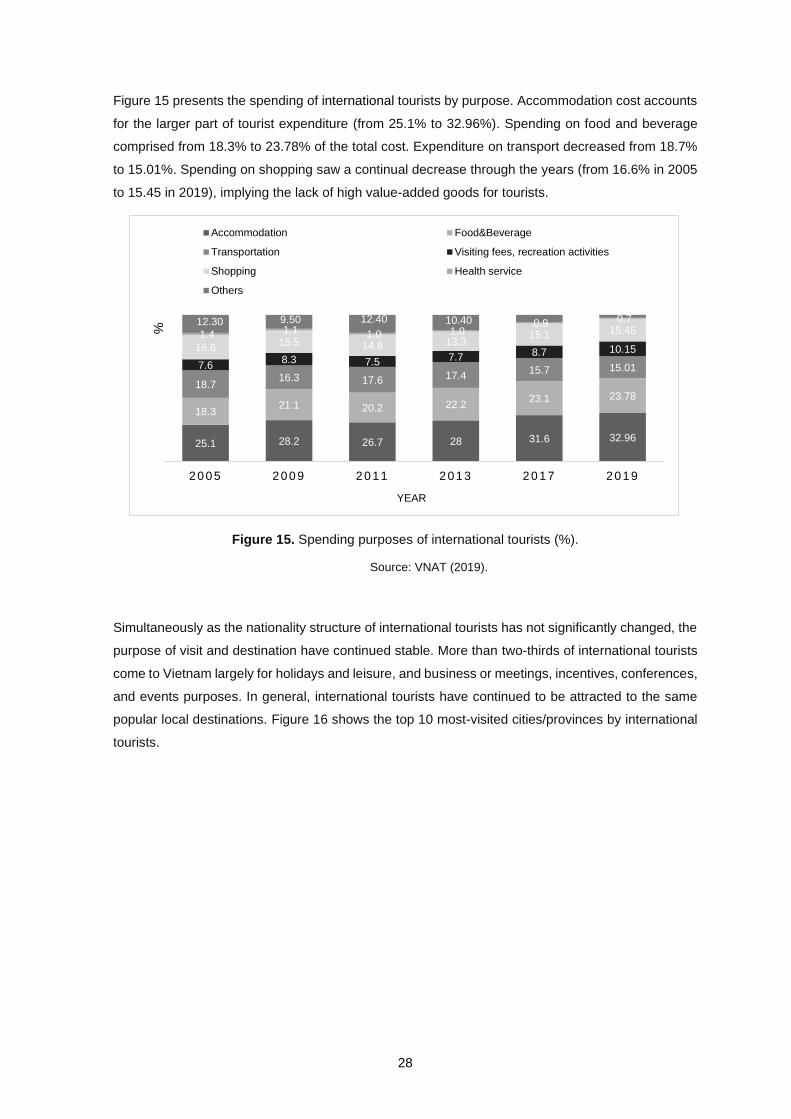
28
Figure 15 presents the spending of international tourists by purpose. Accommodation cost accounts
for the larger part of tourist expenditure (from 25.1% to 32.96%). Spending on food and beverage
comprised from 18.3% to 23.78% of the total cost. Expenditure on transport decreased from 18.7%
to 15.01%. Spending on shopping saw a continual decrease through the years (from 16.6% in 2005
to 15.45 in 2019), implying the lack of high value-added goods for tourists.
Figure 15. Spending purposes of international tourists (%).
Source: VNAT (2019).
Simultaneously as the nationality structure of international tourists has not significantly changed, the
purpose of visit and destination have continued stable. More than two-thirds of international tourists
come to Vietnam largely for holidays and leisure, and business or meetings, incentives, conferences,
and events purposes. In general, international tourists have continued to be attracted to the same
popular local destinations. Figure 16 shows the top 10 most-visited cities/provinces by international
tourists.
25.1 28.2 26.7 28 31.6 32.96
18.321.1 20.2 22.2
23.1 23.7818.7
16.3 17.6 17.415.7 15.017.6
8.3 7.5 7.7 8.7 10.1516.615.5 14.6 13.3
15.1 15.451.4 1.1 1.0 1.0 0.9 0.7 12.30 9.50 12.40 10.40
4.90 2.00
2005 2009 2011 2013 2 0 1 7 2019
%
YEAR
Accommodation Food&Beverage
Transportation Visiting fees, recreation activities
Shopping Health service
Others
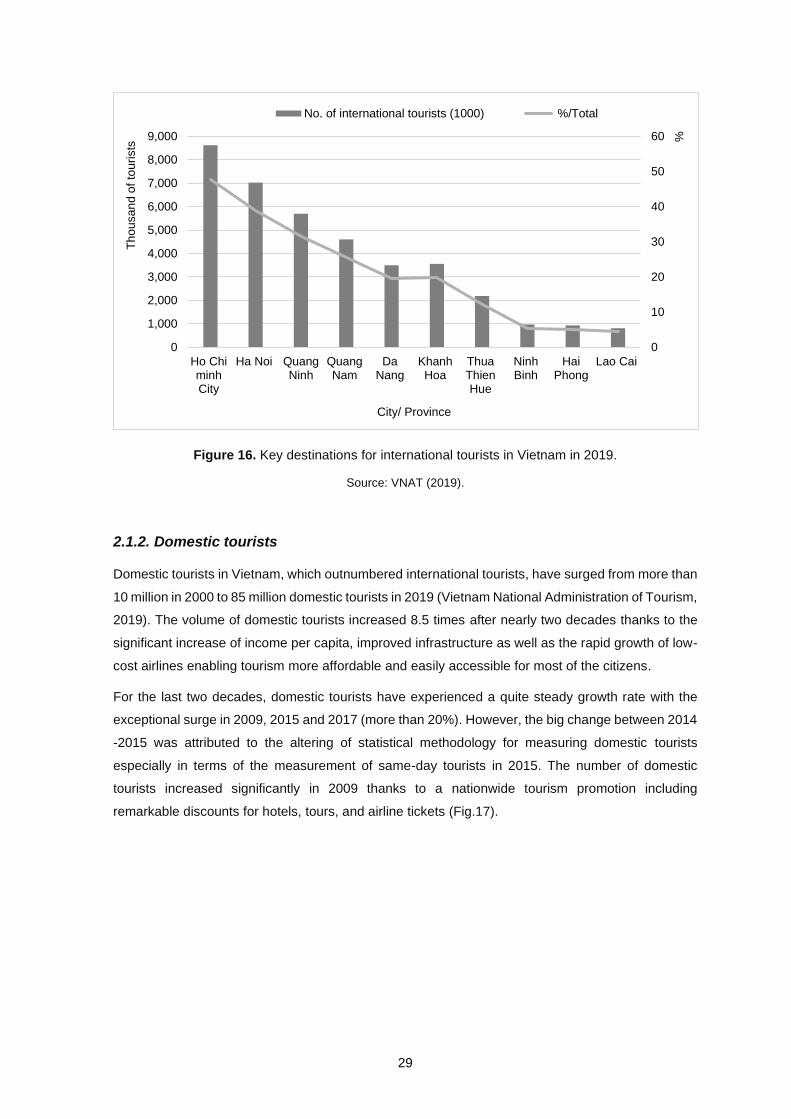
29
Figure 16. Key destinations for international tourists in Vietnam in 2019.
Source: VNAT (2019).
2.1.2. Domestic tourists
Domestic tourists in Vietnam, which outnumbered international tourists, have surged from more than
10 million in 2000 to 85 million domestic tourists in 2019 (Vietnam National Administration of Tourism,
2019). The volume of domestic tourists increased 8.5 times after nearly two decades thanks to the
significant increase of income per capita, improved infrastructure as well as the rapid growth of low-
cost airlines enabling tourism more affordable and easily accessible for most of the citizens.
For the last two decades, domestic tourists have experienced a quite steady growth rate with the
exceptional surge in 2009, 2015 and 2017 (more than 20%). However, the big change between 2014
-2015 was attributed to the altering of statistical methodology for measuring domestic tourists
especially in terms of the measurement of same-day tourists in 2015. The number of domestic
tourists increased significantly in 2009 thanks to a nationwide tourism promotion including
remarkable discounts for hotels, tours, and airline tickets (Fig.17).
0
10
20
30
40
50
60
0
1,000
2,000
3,000
4,000
5,000
6,000
7,000
8,000
9,000
Ho ChiminhCity
Ha Noi QuangNinh
QuangNam
DaNang
KhanhHoa
ThuaThienHue
NinhBinh
HaiPhong
Lao Cai
%
Th
ou
sa
nd
of
tou
rists
City/ Province
No. of international tourists (1000) %/Total
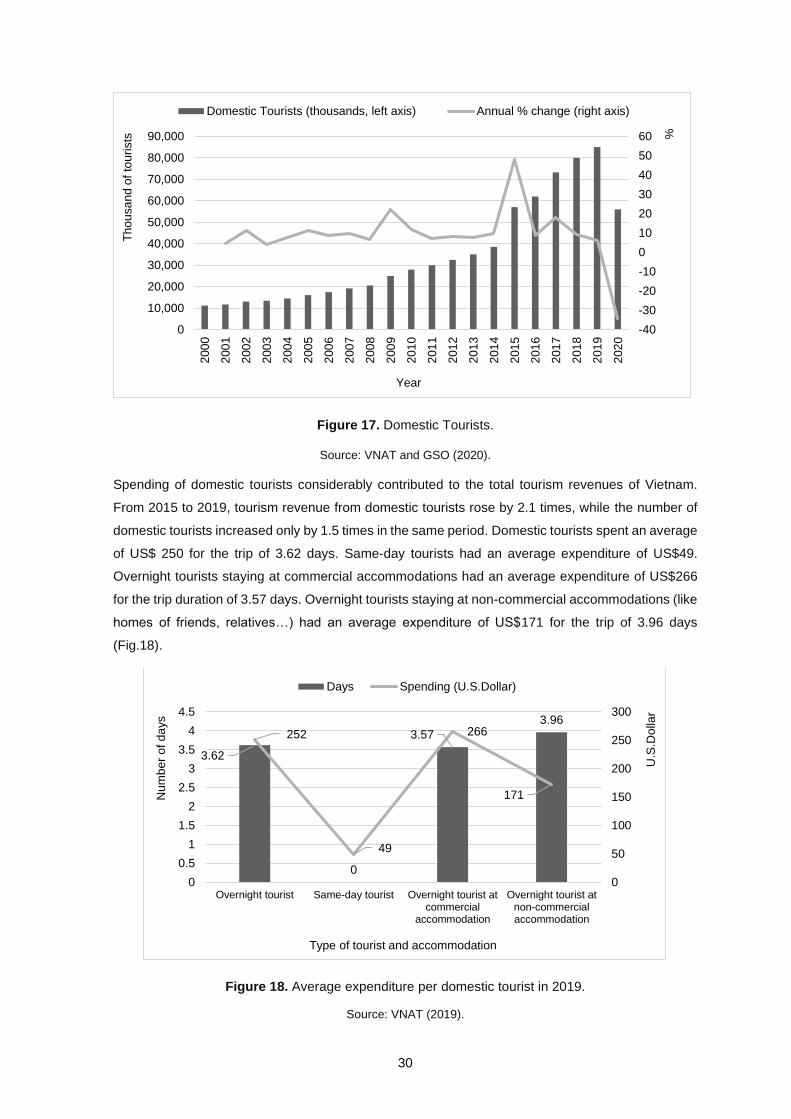
30
Figure 17. Domestic Tourists.
Source: VNAT and GSO (2020).
Spending of domestic tourists considerably contributed to the total tourism revenues of Vietnam.
From 2015 to 2019, tourism revenue from domestic tourists rose by 2.1 times, while the number of
domestic tourists increased only by 1.5 times in the same period. Domestic tourists spent an average
of US$ 250 for the trip of 3.62 days. Same-day tourists had an average expenditure of US$49.
Overnight tourists staying at commercial accommodations had an average expenditure of US$266
for the trip duration of 3.57 days. Overnight tourists staying at non-commercial accommodations (like
homes of friends, relatives…) had an average expenditure of US$171 for the trip of 3.96 days
(Fig.18).
Figure 18. Average expenditure per domestic tourist in 2019.
Source: VNAT (2019).
-40
-30
-20
-10
0
10
20
30
40
50
60
0
10,000
20,000
30,000
40,000
50,000
60,000
70,000
80,000
90,000
200
0
200
1
200
2
200
3
200
4
200
5
200
6
200
7
200
8
200
9
201
0
201
1
201
2
201
3
201
4
201
5
201
6
201
7
201
8
201
9
202
0
%
Th
ou
sa
nd
of
tou
rists
Year
Domestic Tourists (thousands, left axis) Annual % change (right axis)
3.62
0
3.57
3.96
252
49
266
171
0
50
100
150
200
250
300
0
0.5
1
1.5
2
2.5
3
3.5
4
4.5
Overnight tourist Same-day tourist Overnight tourist atcommercial
accommodation
Overnight tourist atnon-commercialaccommodation
U.S
.Do
llar
Num
be
r o
f d
ays
Type of tourist and accommodation
Days Spending (U.S.Dollar)

31
2.2. Tourism supply
The Vietnamese tourism sector has seen continuously robust growth over the period 2010-2019
thanks to increasing tourism demand, strong investments, healthy government support and rising
incomes in key developed and emerging source markets. The COVID-19 pandemic ruined tourism
growth as the industry has been suffering exceptionally new lows due to border closure, investment
constraints and a poor macroeconomic outlook. However, with rich history and culture together with
natural beauty, Vietnam is expected to relive its success story in the next few years once the virus is
under control and international flights are opened again. The expectation is based on strong
government supports such as enormous infrastructure spending, investment incentivizing, and
market potential. Most investors prudently keep a confident view for the tourism sector's recovery in
the medium-term.
2.2.1. Major tourist attractions
The potential of Vietnam's tourism is rooted in its diversity of tourist attractions from intact natural
reserves, mountains and beaches, historical legacies to bustling cities like Ho Chi Minh City and
Hanoi. The country possesses a mixture of UNESCO World Heritage sites, including Ha Long Bay,
Hội An Ancient Town, the Complex of Huế Monuments, Tràng An Scenic Landscape Complex, My
Son Sanctuary, and so on (Vietnam National Administration of Tourism, 2019). Vietnam also offers
tropical forests as well as white and sandy beaches and mountain retreats. Thanks to the strategic
location in Southeast Asia, Vietnam has enjoyed proximity to several key regional economies
including China, Korea, Japan, Singapore, Malaysia and so on. The diversity of tourist destinations
together with the country's long geography could mitigate the effects of seasonality, providing year-
round travel opportunities for tourists.
As the capital of Vietnam, Hanoi is home to cultural diversity and historical attractions, including the
Hanoi Old Quarter, Ho Chi Minh Mausoleum Complex, Ngoc Son Temple and the Water Puppet
Show at the Hoan Kiem Lake. The city is connected regionally and globally by Noi Bai International
Airport with numerous airlines providers such as Vietnam Airlines, AirAsia, Cathay Pacific, Hong
Kong Airlines, Thai Airways, Tiger Airways, and so on. Hanoi is highly accessible thanks to its
connections to major travel hubs, such as Hong Kong, Thailand, Singapore, and Qatar. Hanoi is also
connected via rail links along the eastern coast to the south of the country and north to China.
Tourists can find a variety of accommodation options in this city from high-end international brand
hotels, such as Hilton Opera, Movenpick, Intercontinental and Sofitel Legend Metropole which hosted
the Trump-Kim summit in late February 2019 to many budget guesthouses and backpacker-style
hostels (Fitch Solutions, 2020).
One of the most significant tourism destinations in Vietnam is Hạ Long Bay - the UNESCO World
Heritage site - in the north of the country. Hạ Long Bay can be reached via the airport in Hanoi or via
Cat Bi International Airport in Hai Phong Province. Tourists also can travel to the region by
international cruises. Although Hạ Long City is small, it can offer various types of accommodations
including international brands, such as Novotel and Wyndham.
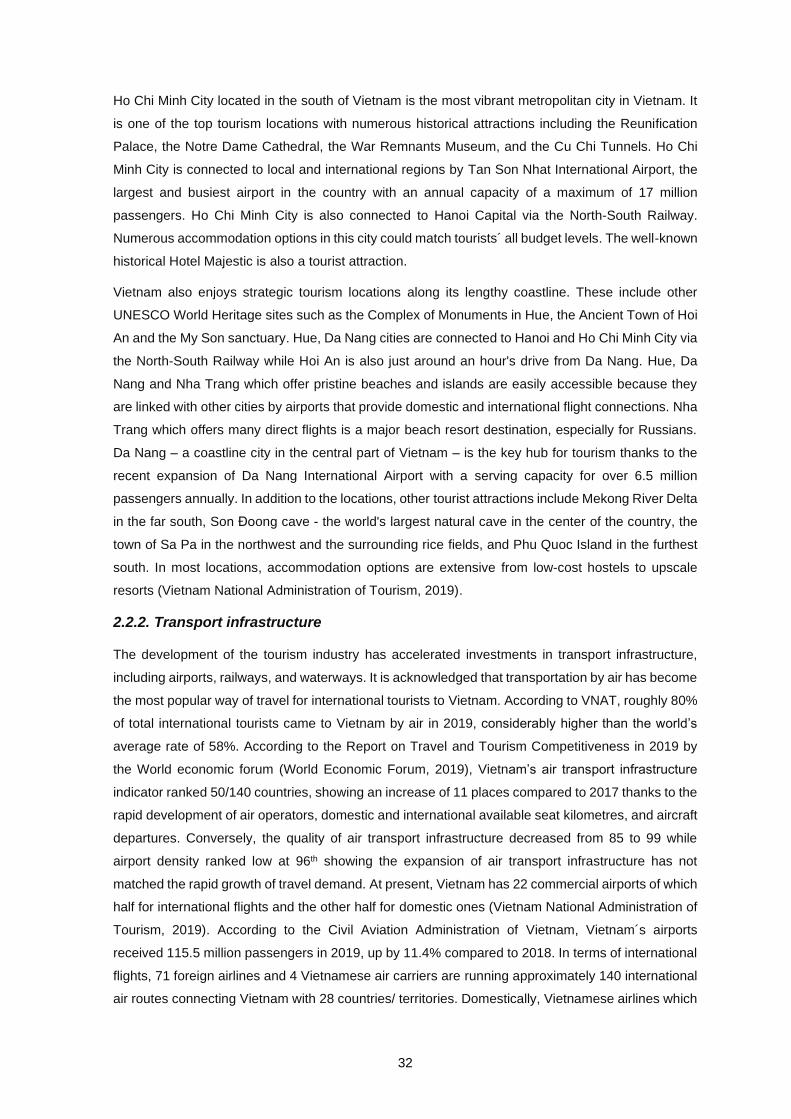
32
Ho Chi Minh City located in the south of Vietnam is the most vibrant metropolitan city in Vietnam. It
is one of the top tourism locations with numerous historical attractions including the Reunification
Palace, the Notre Dame Cathedral, the War Remnants Museum, and the Cu Chi Tunnels. Ho Chi
Minh City is connected to local and international regions by Tan Son Nhat International Airport, the
largest and busiest airport in the country with an annual capacity of a maximum of 17 million
passengers. Ho Chi Minh City is also connected to Hanoi Capital via the North-South Railway.
Numerous accommodation options in this city could match tourists´ all budget levels. The well-known
historical Hotel Majestic is also a tourist attraction.
Vietnam also enjoys strategic tourism locations along its lengthy coastline. These include other
UNESCO World Heritage sites such as the Complex of Monuments in Hue, the Ancient Town of Hoi
An and the My Son sanctuary. Hue, Da Nang cities are connected to Hanoi and Ho Chi Minh City via
the North-South Railway while Hoi An is also just around an hour's drive from Da Nang. Hue, Da
Nang and Nha Trang which offer pristine beaches and islands are easily accessible because they
are linked with other cities by airports that provide domestic and international flight connections. Nha
Trang which offers many direct flights is a major beach resort destination, especially for Russians.
Da Nang – a coastline city in the central part of Vietnam – is the key hub for tourism thanks to the
recent expansion of Da Nang International Airport with a serving capacity for over 6.5 million
passengers annually. In addition to the locations, other tourist attractions include Mekong River Delta
in the far south, Son Đoong cave - the world's largest natural cave in the center of the country, the
town of Sa Pa in the northwest and the surrounding rice fields, and Phu Quoc Island in the furthest
south. In most locations, accommodation options are extensive from low-cost hostels to upscale
resorts (Vietnam National Administration of Tourism, 2019).
2.2.2. Transport infrastructure
The development of the tourism industry has accelerated investments in transport infrastructure,
including airports, railways, and waterways. It is acknowledged that transportation by air has become
the most popular way of travel for international tourists to Vietnam. According to VNAT, roughly 80%
of total international tourists came to Vietnam by air in 2019, considerably higher than the world’s
average rate of 58%. According to the Report on Travel and Tourism Competitiveness in 2019 by
the World economic forum (World Economic Forum, 2019), Vietnam’s air transport infrastructure
indicator ranked 50/140 countries, showing an increase of 11 places compared to 2017 thanks to the
rapid development of air operators, domestic and international available seat kilometres, and aircraft
departures. Conversely, the quality of air transport infrastructure decreased from 85 to 99 while
airport density ranked low at 96th showing the expansion of air transport infrastructure has not
matched the rapid growth of travel demand. At present, Vietnam has 22 commercial airports of which
half for international flights and the other half for domestic ones (Vietnam National Administration of
Tourism, 2019). According to the Civil Aviation Administration of Vietnam, Vietnam´s airports
received 115.5 million passengers in 2019, up by 11.4% compared to 2018. In terms of international
flights, 71 foreign airlines and 4 Vietnamese air carriers are running approximately 140 international
air routes connecting Vietnam with 28 countries/ territories. Domestically, Vietnamese airlines which
33
account for nearly a half of the air transportation market share in Vietnam are providing more than
50 routes with over 55 million passengers in 2019. According to a forecast of IATA during 2019-2035,
Vietnam would be the 5th fastest-growing aviation market in the world in terms of additional
passengers per year (IATA, 2018).
Vietnamese Government considers air travel one of the key tools to promote tourism. Therefore, a
large amount of government investments has been put into building airports and expanding
underdeveloped ones. The Air transport capacity of Vietnam is expected to serve 150 million
passengers by 2035. The construction of a major airport project in Long Thanh Province started in
the second quarter of 2020 and is expected to open to serve 100 million passengers by 2025. The
largest airport in Vietnam – Tan Son Nhat International Airport - is also undergoing an expansion
project (Centre for Aviation, 2021). An additional terminal is planned to serve extra 50 million
passengers annually. Many other provinces are seeking investments for road construction to connect
with other regions.
The expansion plan of Noi Bai International Airport in Hanoi is also under assessment. The project
aims to receive 35 million passengers by 2030 and 50 million by 2050. Plans for the development of
several other airports across the country have also been studied or implemented. These include the
construction of Lao Cai International Airport in Sapa, Phu Cat Airport which opened its new terminal
in Bình Định Province in May 2018, Van Don International Airport near Ha Long Bay started its
operation in December 2018 with the capacity of up to 2.5 million passengers (Centre for Aviation,
2021).
2.2.3. Tourism enterprises and human resources
A favourable business environment and relaxed regulations on travel business have facilitated the
rapid increase of newly established travel enterprises. In 2019, there were more than 1,000
applications submitted to the Vietnam National Administration of Tourism (VNAT) regarding licensing
new establishments, business modification, renewal, and withdrawal of tour providers. Also in this
year, the total number of inbound and outbound operators reached 2.667, doubling the number of
2015 and increasing by 22.5% compared to that of 2018 (Vietnam National Administration of
Tourism, 2019) (Fig.19).

34
Figure 19. Growth of enterprises in the tourism sector.
Source: VNAT (2019).
Concerning the structure of tourism enterprises, limited companies accounted for 62.4%, joint-stock
companies follow 36.3%. VNAT is the key governmental body responsible for providing official
training, examinations, certification, and inspection of tourism services.
According to VNAT´s report in 2019, 27,683 licensed tour guides were joining the tourism market
including 17,825 international tour guides, 9,134 domestic ones and 724 on-site. The number
increased by 15% compared to that of 2018. 71.3% of tour guides have university and higher
education degrees, 18% with a college degree and 10.7% with others. Corresponding to the key
international source markets, most tour guides speak English (52.7%), Chinese (24.6%), and French
(7.8%) (Fig.20). VNAT has organized various training courses for tour guides in different provinces
across the countries. Less developed provinces have been supported further on tour operating and
improving guiding skills.
Figure 20. Licensed tour guides and Tour guides by languages in 2019.
Source: VNAT (2019).
1,564 1,600 1,752
2,178
2,667
9.5
2.3
9.5
24.3
22.5
0
5
10
15
20
25
30
0
500
1,000
1,500
2,000
2,500
3,000
2015 2016 2017 2018 2019
%
Nu
mb
er
of e
nte
rpri
se
s
Year
No. of travel enterprises Growth %
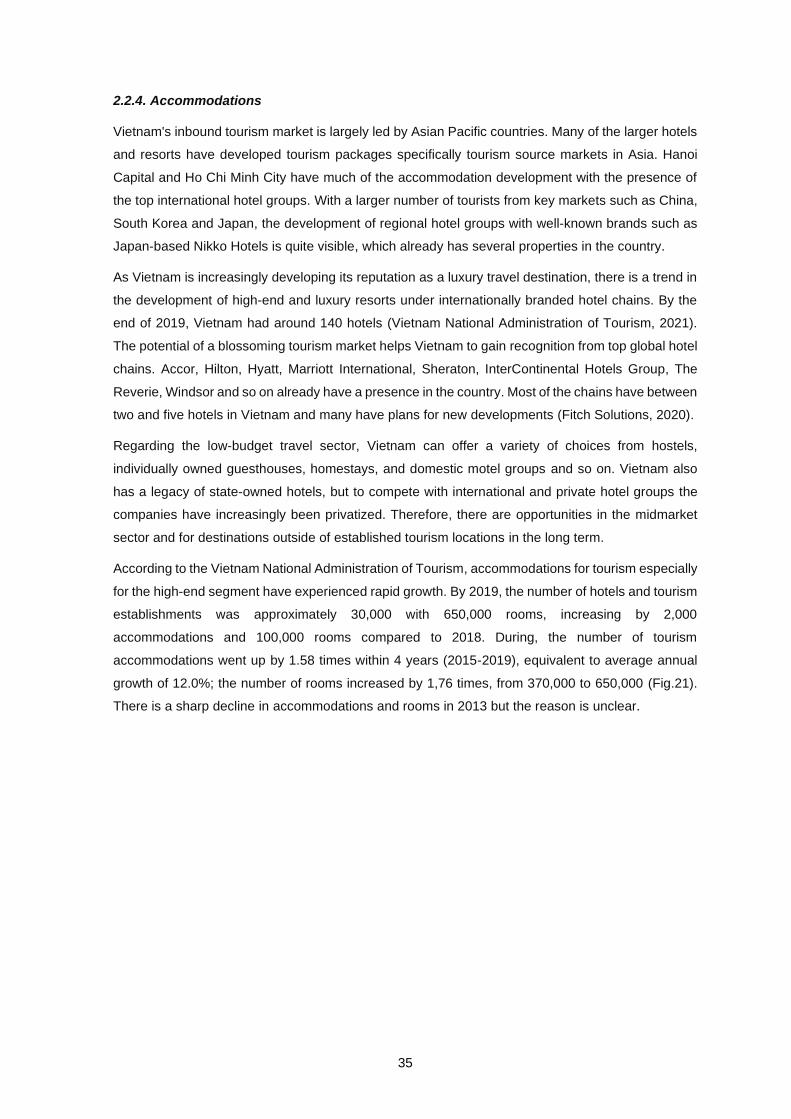
35
2.2.4. Accommodations
Vietnam's inbound tourism market is largely led by Asian Pacific countries. Many of the larger hotels
and resorts have developed tourism packages specifically tourism source markets in Asia. Hanoi
Capital and Ho Chi Minh City have much of the accommodation development with the presence of
the top international hotel groups. With a larger number of tourists from key markets such as China,
South Korea and Japan, the development of regional hotel groups with well-known brands such as
Japan-based Nikko Hotels is quite visible, which already has several properties in the country.
As Vietnam is increasingly developing its reputation as a luxury travel destination, there is a trend in
the development of high-end and luxury resorts under internationally branded hotel chains. By the
end of 2019, Vietnam had around 140 hotels (Vietnam National Administration of Tourism, 2021).
The potential of a blossoming tourism market helps Vietnam to gain recognition from top global hotel
chains. Accor, Hilton, Hyatt, Marriott International, Sheraton, InterContinental Hotels Group, The
Reverie, Windsor and so on already have a presence in the country. Most of the chains have between
two and five hotels in Vietnam and many have plans for new developments (Fitch Solutions, 2020).
Regarding the low-budget travel sector, Vietnam can offer a variety of choices from hostels,
individually owned guesthouses, homestays, and domestic motel groups and so on. Vietnam also
has a legacy of state-owned hotels, but to compete with international and private hotel groups the
companies have increasingly been privatized. Therefore, there are opportunities in the midmarket
sector and for destinations outside of established tourism locations in the long term.
According to the Vietnam National Administration of Tourism, accommodations for tourism especially
for the high-end segment have experienced rapid growth. By 2019, the number of hotels and tourism
establishments was approximately 30,000 with 650,000 rooms, increasing by 2,000
accommodations and 100,000 rooms compared to 2018. During, the number of tourism
accommodations went up by 1.58 times within 4 years (2015-2019), equivalent to average annual
growth of 12.0%; the number of rooms increased by 1,76 times, from 370,000 to 650,000 (Fig.21).
There is a sharp decline in accommodations and rooms in 2013 but the reason is unclear.
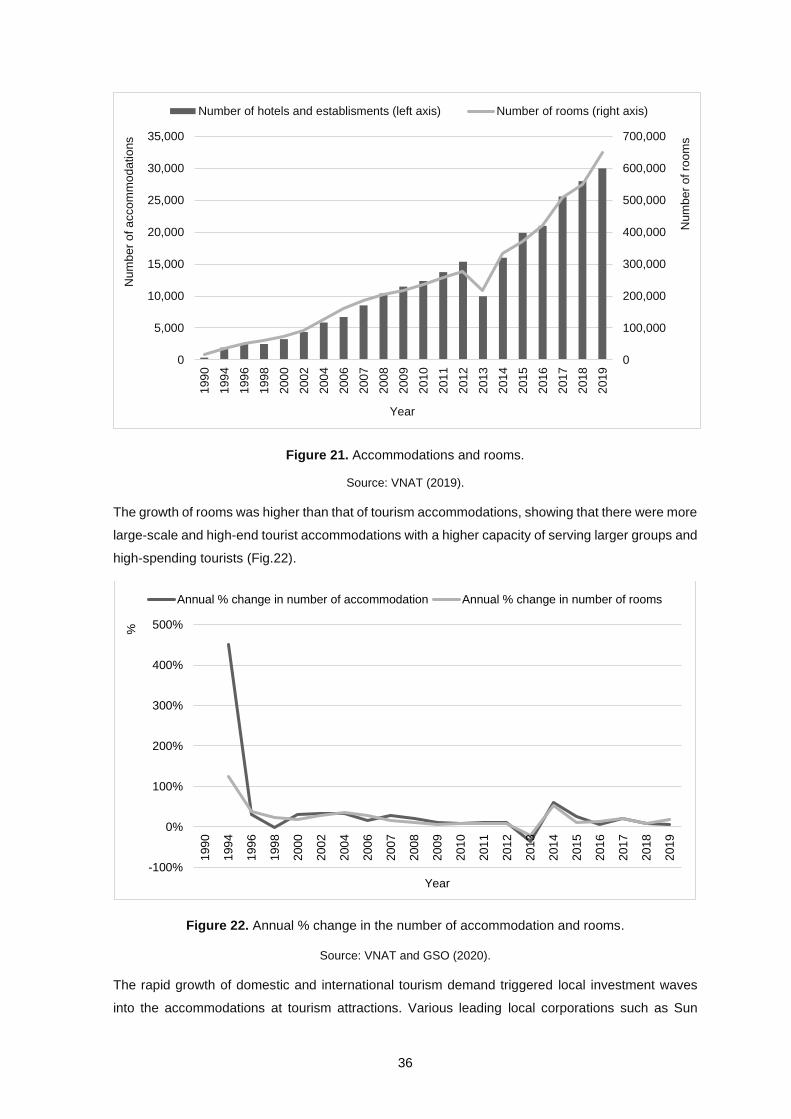
36
Figure 21. Accommodations and rooms.
Source: VNAT (2019).
The growth of rooms was higher than that of tourism accommodations, showing that there were more
large-scale and high-end tourist accommodations with a higher capacity of serving larger groups and
high-spending tourists (Fig.22).
Figure 22. Annual % change in the number of accommodation and rooms.
Source: VNAT and GSO (2020).
The rapid growth of domestic and international tourism demand triggered local investment waves
into the accommodations at tourism attractions. Various leading local corporations such as Sun
0
100,000
200,000
300,000
400,000
500,000
600,000
700,000
0
5,000
10,000
15,000
20,000
25,000
30,000
35,000
199
0
199
4
199
6
199
8
200
0
200
2
200
4
200
6
200
7
200
8
200
9
201
0
201
1
201
2
201
3
201
4
201
5
201
6
201
7
201
8
201
9
Nu
mb
er
of ro
om
s
Nu
mb
er
of a
cco
mm
od
atio
ns
Year
Number of hotels and establisments (left axis) Number of rooms (right axis)
-100%
0%
100%
200%
300%
400%
500%
199
0
199
4
199
6
199
8
200
0
200
2
200
4
200
6
200
7
200
8
200
9
201
0
201
1
201
2
201
3
201
4
201
5
201
6
201
7
201
8
201
9
%
Year
Annual % change in number of accommodation Annual % change in number of rooms

37
Group, Vingroup, FLC group and BIM group... have joined the market. In Khanh Hoa Province,
a tourism attraction located in the South-Central Coast of Vietnam with a coastline of 385 km
featuring numerous creek mouths, lagoons, river mouths, and hundreds of islands and so on), more
than 6,000 new rooms were launched in 2019. Da Nang City, one of the most important port cities in
Vietnam, offered 4,500 new rooms. In the Gulf of Thailand, Phu Quoc Island which is known for
white-sand beaches, mountains, dense tropical jungle, hiking trails and wildlife launched 3,000 new
rooms in the same year (Vietnam National Administration of Tourism, 2019).
There are 970 highly rated accommodations (from and above 3 stars) in 2019, representing an
increase of 10% compared to 2018. 3-star tourism establishments increase strongly in terms of
absolute number while luxury accommodation group has the highest percentage of change. Also in
the same year, there were more than 5,400 1–3-star tourist accommodations, with over 162,024
rooms. However, the number of qualified tourist accommodations was much higher approximately
16,300 tourist establishments and 237,000 rooms as registration for ranking is not mandatory.
According to a report by the Vietnam National Administration of Tourism in 2019, the average room
occupancy in 2019 was 52%, slightly lower than the previous year (54%) due to the larger increase
of supply compared to that of demand and the decrease of length of stay. Regions recording strong
growth of tourist accommodations like Da Nang, Khanh Hoa, Phu Quoc witnessed a decrease in
room occupancy, sometimes below 50%. Hanoi and Ho Chi Minh City recorded moderate growth of
room number and relatively high occupancy of over 60%. Provinces in the Central region had an
average room occupancy of over 50%. Northern provinces including Ha Nam, Hai Duong, Bac Ninh,
Nam Dinh, Phu Tho, Tuyen Quang recorded the rate of around 50%.
2.2.5. Other activities
The tourism sector has mobilized different sources from different stakeholders to promote tourism
activities. Target markets are short-haul destinations in Asia, especially Northeast Asia, Southeast
Asia, and India. Tourism promotion also focused on attracting high spending tourists from long-haul
destinations such as Europe, North America, Russia, Australia and so on.
The tourism sector has also taken advantage of the development of digital technology in its business.
Information and Communication Technology (ICT) applied is expected to add more value to tourism
products and services as well as to improve state management and enhance the tourist experience.
Vietnam has a plan to build a digital tourism database containing information regarding tour guides,
travel businesses, accommodations, and so on. The database will connect information from
businesses, local authorities to central management bodies to serve as a digital data platform for
tourism management and promotion activities. The country also has the plan to build and launch the
application “Vietnam Tour Guiding” to support tour guides, travel agencies and tourism management
authorities (Vietnam National Administration of Tourism, 2019). The application aims at connecting
tourists with tour guides and travel agencies during the travel itineraries; allowing evaluation and
rating of tour guides and travel agencies; providing useful information about tourism products and
services and facilitating e-payment. Designing a Dashboard of Vietnam tourism, upgrading Vietnam’s
38
tourism promotional website and pushing tourism promotional campaigns via VNAT’s social networks
are also among the key tasks to be done soon.
Furthermore, VNAT has the plan to collaborate with Vietnam E-Commerce and Digital economy
Agency - IDEA (Ministry of Industry and Trade) to integrate tourism into the “One National Card”
Program which allows tourists to use tourist services in Vietnam and make payments conveniently,
based on a shared database with different sectors. Also, to support smart tourism start-ups, VNAT
hosted the contest “Vietnam Smart Tourism Start-ups”. The competition lasted from March to June
2019, attracting various young innovative start-ups with creative ideas and advanced technologies.
Also in late 2019, a contest “Mekong Innovative Start-ups in Tourism” (MIST) was officially
announced (Vietnam National Administration of Tourism, 2019). Further VNAT has been organizing
communication activities and training programs on information technology for tourism state
management officials and tourism enterprises.
2.3. SWOT analysis of the tourism sector
Vietnam’s tourism has experienced stellar expansion over the past decade. Strong investments,
higher connectivity capacity between regions, improvement of air transport and accommodations
infrastructure are among the main reasons behind the robust growth. However, the outlook for the
next coming years has changed drastically due to the spread of the COVID-19 pandemic. Followings
are strengths and weaknesses as well as opportunities and challenges the sector has to face:
Strengths
• Vietnam has a favourable geographical location including a long coastline with many beautiful
landscapes, beaches, islands, wildlife parks and so on. A tropical climate is also an advantage
for tourism.
• Vietnam has a long history of over 4000 years with diverse cultural traditions, culinary elite,
oriental religious life and 54 ethnic communities. Each ethnic community has a unique culture and
cuisine, highlighting the unique identity of the ethnic group and region.
• Vietnam is a safe and stable country. The country has been highly appreciated for the success of
controlling the COVID-19 pandemic by implementing decisive, consistent, and effective
prevention solutions by the World Health Organization and the international community.
• Vietnam´s tourism has received greater attention and support from the Government and close
collaborations with other stakeholders such as local management, enterprises etc.
• Air connections between Vietnam and source markets have increasingly expanded. More
international and domestic airlines expressed interest in joining the country´s emerging air
transport market.
• The technical infrastructure for tourism has been upgraded. Many high-class hotels, resorts and
entertainment and recreation complexes have been put into operation by such big Vietnamese
business groups as Sun Group, Vingroup, FLC, BIM, BRG.
39
• In 2019, Vietnam´s tourism was honoured by reputable international organizations with global and
regional awards. Vietnam is emerging as an attractive and safe destination, while there are still
uncertainties in some other areas in the region and the world.
Weaknesses
• Adherence to tourism master plans in tourism destinations has often undermined tourism
development objectives and sustainability. In many cases, the requirements according to the
master plan have either not been properly followed or implemented. Some investments of this
kind caused threats to the business and environmental sustainability.
• Most of Vietnam’s tourism enterprises which are small and medium with limited resources have
been severely impacted by the COVID-19 pandemic, resulting in business suspension or closure.
This situation in return would negatively affect the competitiveness of the sector.
• According to the WEF competitiveness index, Vietnam´s tourism lagged other countries in
Southeast Asia in terms of tourist service infrastructure, health and hygiene, ground and port
infrastructure, environmental sustainability.
• The rapid increase in the number of tourists and the associated expansion in accommodations
have stimulated the risk of overwhelming transport and service infrastructure. Some airports,
especially Tan Son Nhat in Ho Chi Minh City, are facing overcapacity, resulting in a bottleneck
for air travel. Besides, Vietnam still lacks seaports for receiving tourist cruise ships.
• The workforce supply in tourism has not been able to keep up with the strongly growing demand
of the sector. There has been a shortage of tourism staff, especially high-quality human
resources. The scarcity could prevent the sector from improving service quality. It also costs
tourism enterprises more in terms of time and financial resources for re-training the staff to meet
the market requirements.
• Labour productivity of tourism is rather low compared to other sectors in the country and tourism
in competing countries, reflecting a visibly significant skill gap.
Opportunities
• Facing the COVID-19 pandemic, the Vietnamese tourism sector must re-structure towards higher
flexibility and sustainability through reinforcing management, enhancing the quality of human
resources, re-targeting source markets and promoting cooperation with various stakeholders.
• The highly opened economy could help Vietnam to attract more international resources. By
participating in economic exchange activities and investment relationships, the tourism sector has
the chance to attract foreign capital to improve the tourism infrastructure.
• The country has advantages thanks to its location in a fast-growing area of the Asia-Pacific region.
Southeast Asia is an attractive destination for global tourists. Rising interests on Southeast Asian
countries offers opportunities for Vietnam to exploit existing tourism resources.

40
• Vietnam is well-known for its social and political stability which makes the country a safer travel
destination compared to other unstable territories and tourism markets worldwide.
• The development of information technology on the Internet platform has created great
opportunities for developing countries including Vietnam to promote tourism activities with lower
costs.
Threats
• Due to COVID-19 outbreak, Vietnam has been enforcing border closure, travel restrictions,
cancelation of cultural festivals and entertainment activities, and shutdown of tourist attractions
from March 2020. The pandemic has seriously affected all the socio-economic activities of which
tourism and aviation are most heavily hit.
• The competition in tourism worldwide becomes fiercer. According to the World Economic Forum’s
(WEF), Tourism Competitiveness Index are the scores and ranks of countries according to a
variety of physical and institutional factors relevant to tourism. In terms of its overall score on this
index in 2019, Vietnam was ranked 63𝑟𝑑 globally, to the same degree as the average group of
regional competitors. But compared to the top regional performers such as Thailand, Singapore,
Malaysia, and Indonesia, the country is still behind.
• Climate change and unexpected weather variations like floods, tropical hurricanes, sea-water
levels rising etc. have posed big problems to Vietnam. These events have severely deteriorated
tourism infrastructure, especially in the Mekong River Delta.
• Rapid tourism growth threatens to intensify existing prominent environmental tensions and poor
sustainability practices. Natural and historical assets at the main tourist attractions are especially
at risk. For example, in Ha Long Bay (Quang Ninh province), tourist boats and floating fishing
villages in the Bay are the main reason for pollution and damage to marine wildlife (The World
Bank, 2019). Extreme tourism growth also jeopardizes the sustainability of major culture-based
tourist areas.
• The global economic uncertainties such as financial and economic crises come in a cycle. With
the higher level of globalization, Vietnam's tourism is vulnerable to such distressing events.
Besides, the dependence on specific regions is also a threat to the sector when international
tourists to Vietnam are mostly from China, South Korea, and Japan.
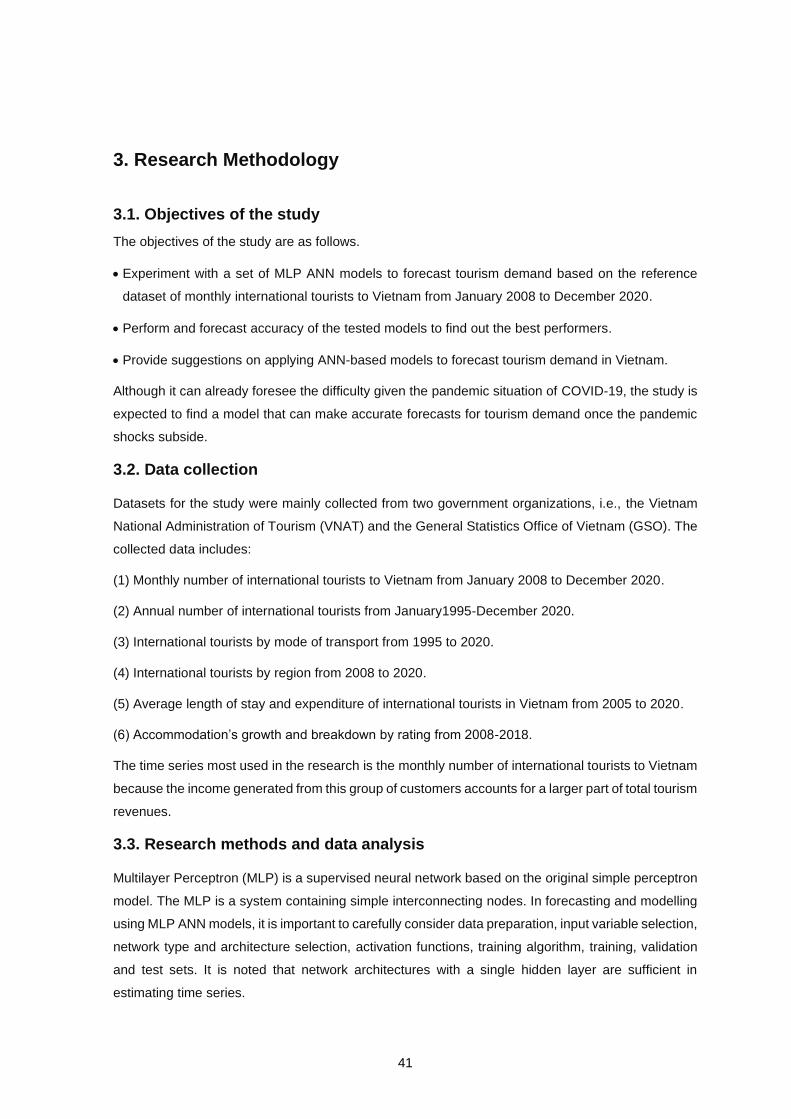
41
3. Research Methodology
3.1. Objectives of the study
The objectives of the study are as follows.
• Experiment with a set of MLP ANN models to forecast tourism demand based on the reference
dataset of monthly international tourists to Vietnam from January 2008 to December 2020.
• Perform and forecast accuracy of the tested models to find out the best performers.
• Provide suggestions on applying ANN-based models to forecast tourism demand in Vietnam.
Although it can already foresee the difficulty given the pandemic situation of COVID-19, the study is
expected to find a model that can make accurate forecasts for tourism demand once the pandemic
shocks subside.
3.2. Data collection
Datasets for the study were mainly collected from two government organizations, i.e., the Vietnam
National Administration of Tourism (VNAT) and the General Statistics Office of Vietnam (GSO). The
collected data includes:
(1) Monthly number of international tourists to Vietnam from January 2008 to December 2020.
(2) Annual number of international tourists from January1995-December 2020.
(3) International tourists by mode of transport from 1995 to 2020.
(4) International tourists by region from 2008 to 2020.
(5) Average length of stay and expenditure of international tourists in Vietnam from 2005 to 2020.
(6) Accommodation’s growth and breakdown by rating from 2008-2018.
The time series most used in the research is the monthly number of international tourists to Vietnam
because the income generated from this group of customers accounts for a larger part of total tourism
revenues.
3.3. Research methods and data analysis
Multilayer Perceptron (MLP) is a supervised neural network based on the original simple perceptron
model. The MLP is a system containing simple interconnecting nodes. In forecasting and modelling
using MLP ANN models, it is important to carefully consider data preparation, input variable selection,
network type and architecture selection, activation functions, training algorithm, training, validation
and test sets. It is noted that network architectures with a single hidden layer are sufficient in
estimating time series.

42
According to Teixeira and Fernandes (2015) the learning process requires the following stages:
1. Assign random numbers to the weights.
2. For every element in the training set, calculate output using the summation functions embedded
in the nodes.
3. Compare the computed output with observed values.
4. Adjust the weights and repeat steps (2) and (3) if the result from step (3) is not below a threshold
value; alternatively, this cycle can be stopped early by reaching a predefined number of
iterations, or the performance in a validation set does not improve.
In this study, the prediction equation for computing a forecasted 𝑌𝑖 using selected past
observations can be written as:
𝑌𝑖 = 𝑓2[(∑ 𝑊𝑗,𝑖 𝑓(∑ 𝑊𝑘,𝑗 𝑋𝑘 + 𝑏𝑗) +
𝑀
𝑘=1
𝑏𝑖)]
𝑁
𝑗=1
[1]
where:
𝑌𝑖: is the output vector of the MLP at the time i.
M: the number of inputs nodes.
N: the number of hidden nodes.
i: the 𝑖𝑡ℎ output node.
j: the 𝑗𝑡ℎ hidden node.
k: the 𝑘𝑡ℎ input node.
𝑋𝑘 value of the 𝑘𝑡ℎ input node.
f: the hidden layer activation function.
𝑓2: the output layer activation function.
𝑊𝑗,𝑖 with j = 1, 2,…. N are weights from the hidden nodes to output nodes.
𝑊𝑘,𝑗 with k = 1, 2,… M are weights from the input nodes to hidden nodes.
𝑏𝑗 and 𝑏𝑖 are the bias associated with the nodes in output and hidden layers, respectively.
Several ANN models with different architectures are compared. The models are different in the
combination of the inputs, hidden activation functions, training algorithm, output activation function
and the number of hidden nodes. Table 2 presents all parameters used in the study. Details are
discussed further in the next sections.
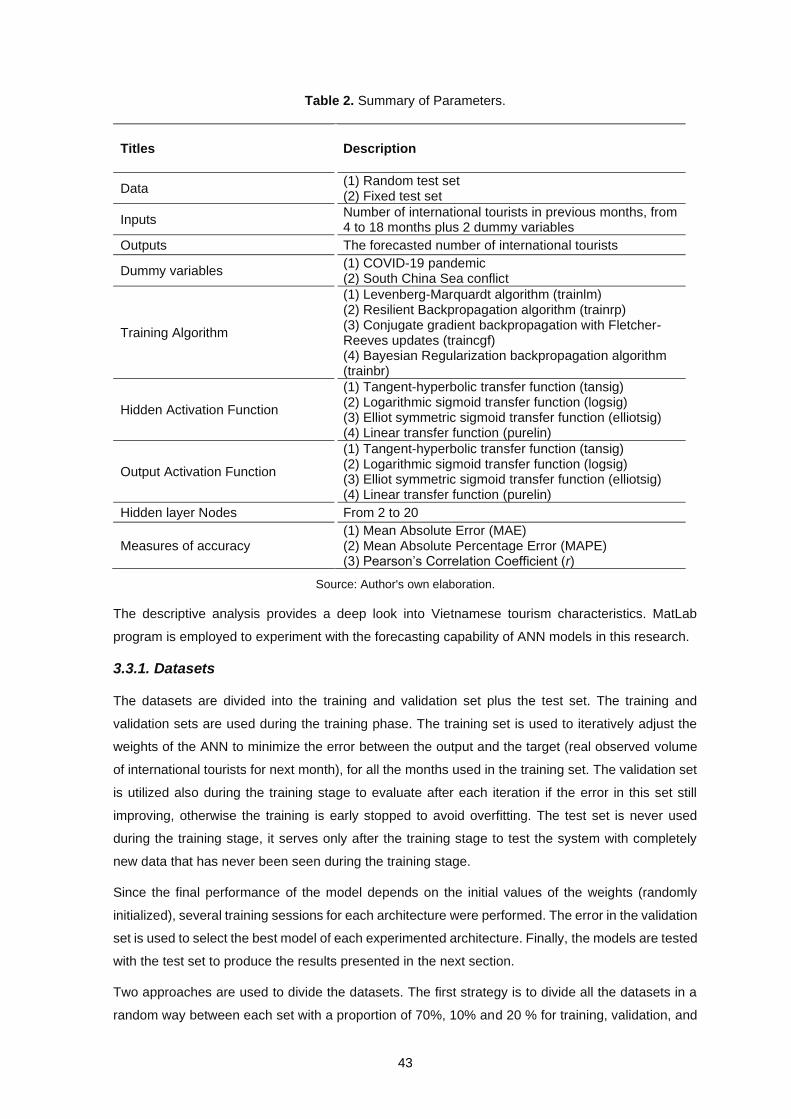
43
Table 2. Summary of Parameters.
Titles Description
Data (1) Random test set (2) Fixed test set
Inputs Number of international tourists in previous months, from 4 to 18 months plus 2 dummy variables
Outputs The forecasted number of international tourists
Dummy variables (1) COVID-19 pandemic (2) South China Sea conflict
Training Algorithm
(1) Levenberg-Marquardt algorithm (trainlm) (2) Resilient Backpropagation algorithm (trainrp) (3) Conjugate gradient backpropagation with Fletcher-Reeves updates (traincgf) (4) Bayesian Regularization backpropagation algorithm (trainbr)
Hidden Activation Function
(1) Tangent-hyperbolic transfer function (tansig) (2) Logarithmic sigmoid transfer function (logsig) (3) Elliot symmetric sigmoid transfer function (elliotsig) (4) Linear transfer function (purelin)
Output Activation Function
(1) Tangent-hyperbolic transfer function (tansig) (2) Logarithmic sigmoid transfer function (logsig) (3) Elliot symmetric sigmoid transfer function (elliotsig) (4) Linear transfer function (purelin)
Hidden layer Nodes From 2 to 20
Measures of accuracy (1) Mean Absolute Error (MAE) (2) Mean Absolute Percentage Error (MAPE) (3) Pearson’s Correlation Coefficient (r)
Source: Author's own elaboration.
The descriptive analysis provides a deep look into Vietnamese tourism characteristics. MatLab
program is employed to experiment with the forecasting capability of ANN models in this research.
3.3.1. Datasets
The datasets are divided into the training and validation set plus the test set. The training and
validation sets are used during the training phase. The training set is used to iteratively adjust the
weights of the ANN to minimize the error between the output and the target (real observed volume
of international tourists for next month), for all the months used in the training set. The validation set
is utilized also during the training stage to evaluate after each iteration if the error in this set still
improving, otherwise the training is early stopped to avoid overfitting. The test set is never used
during the training stage, it serves only after the training stage to test the system with completely
new data that has never been seen during the training stage.
Since the final performance of the model depends on the initial values of the weights (randomly
initialized), several training sessions for each architecture were performed. The error in the validation
set is used to select the best model of each experimented architecture. Finally, the models are tested
with the test set to produce the results presented in the next section.
Two approaches are used to divide the datasets. The first strategy is to divide all the datasets in a
random way between each set with a proportion of 70%, 10% and 20 % for training, validation, and
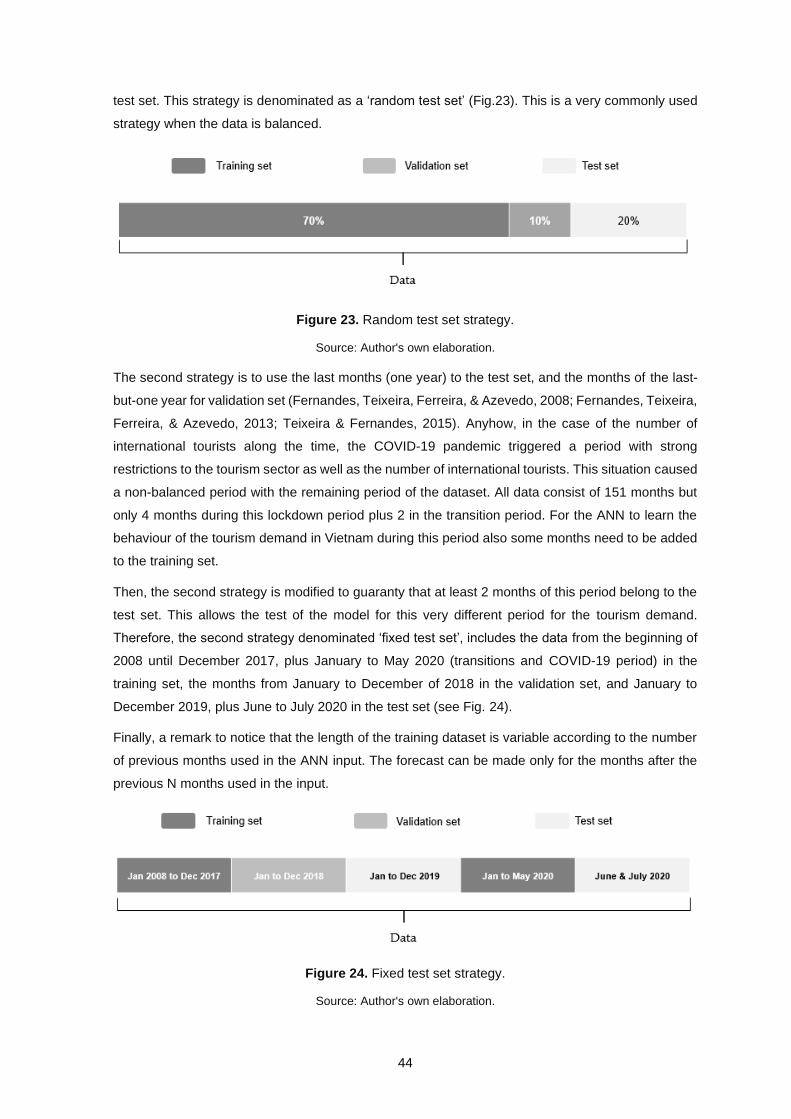
44
test set. This strategy is denominated as a ‘random test set’ (Fig.23). This is a very commonly used
strategy when the data is balanced.
Figure 23. Random test set strategy.
Source: Author's own elaboration.
The second strategy is to use the last months (one year) to the test set, and the months of the last-
but-one year for validation set (Fernandes, Teixeira, Ferreira, & Azevedo, 2008; Fernandes, Teixeira,
Ferreira, & Azevedo, 2013; Teixeira & Fernandes, 2015). Anyhow, in the case of the number of
international tourists along the time, the COVID-19 pandemic triggered a period with strong
restrictions to the tourism sector as well as the number of international tourists. This situation caused
a non-balanced period with the remaining period of the dataset. All data consist of 151 months but
only 4 months during this lockdown period plus 2 in the transition period. For the ANN to learn the
behaviour of the tourism demand in Vietnam during this period also some months need to be added
to the training set.
Then, the second strategy is modified to guaranty that at least 2 months of this period belong to the
test set. This allows the test of the model for this very different period for the tourism demand.
Therefore, the second strategy denominated ‘fixed test set’, includes the data from the beginning of
2008 until December 2017, plus January to May 2020 (transitions and COVID-19 period) in the
training set, the months from January to December of 2018 in the validation set, and January to
December 2019, plus June to July 2020 in the test set (see Fig. 24).
Finally, a remark to notice that the length of the training dataset is variable according to the number
of previous months used in the ANN input. The forecast can be made only for the months after the
previous N months used in the input.
Figure 24. Fixed test set strategy.
Source: Author's own elaboration.
45
For Multilayer Perceptron networks to be used for forecasting, the structure of the network must be
determined. The process of determining the network structure briefly includes the processes of
determining how many layers the network will consist of, how many processing elements will be in
each layer, and which transfer function these process elements will have. The learning process of
the MLP network was realized by presenting the training data to the network. The implementation of
the method was carried out with a MATLAB computer program.
3.3.2. ANN Inputs
Nodes in the input layer represent independent parameters of the system. The hidden layer is used
to add an internal representation handling non-linear data. The output of the neural network is the
solution for the problem The input of the ANN consists of the number of international tourists in
previous months. The number of months can be variable and according to previous studies, it
typically varies around 12 previous months (Fernandes, Teixeira, Ferreira, & Azevedo, 2008;
Fernandes, Teixeira, Ferreira, & Azevedo, 2013; Teixeira & Fernandes, 2015). In the work, a
variation between 4 and 18 months has been experimented with. The value of each month
corresponds to one input of the ANN.
Additionally, because the abrupt lockdown caused by the COVID-19 pandemic led to a sudden
plunge in the number of international tourists (Fig.6) after February 2020, a dummy variable is used
to code the pandemic period. This variable is 0 before the pandemic period and 1 during the
pandemic period. This variable requires one input in the ANN.
In order to model also the South China Sea conflict that caused a significant decrease in the
international number of tourists to Vietnam between May 2014 and December 2015 (Fig. 7), another
dummy variable is used. This variable is 0 outside the period and 1 in the period. Another input is
required for this variable. Considering the input variables, the number of input nodes in the ANN is
the number of previous months plus 2, for the dummy variables.
3.3.3. ANN architectures, training, and accuracy measures
The objective of the ANNs is to forecast the number of international tourists for next month as a way
to forecast the tourism demand in Vietnam. Several architectures of MLP ANN models are
experimented with using two different dataset organizations concerning the test set. The
experimented architectures vary in their input length, the number of nodes in the hidden layer,
activation functions in hidden and output layers, and training functions. The test set is organized in
two different ways: random test set and pre-defined test set.
The ANN architectures are based on a Multi-Layer Perceptron (MLP) with one hidden layer, similar
to the one presented in Fig. 2. The number of input nodes is variable to accommodate information
about previous months, the COVID-19 period and South China Sea conflict information.
The output has only one node with the value of the forecasted number of international tourists. The
number of nodes in the hidden layer varies between 2 and 20 in several experimental simulations.
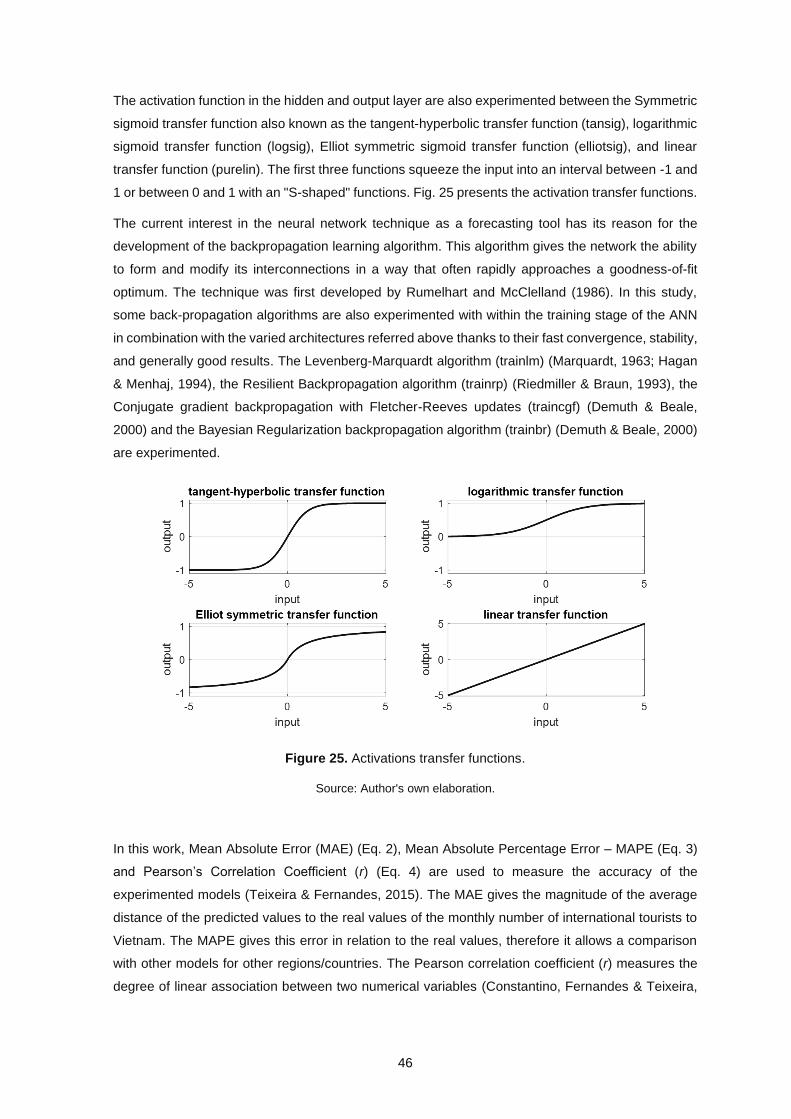
46
The activation function in the hidden and output layer are also experimented between the Symmetric
sigmoid transfer function also known as the tangent-hyperbolic transfer function (tansig), logarithmic
sigmoid transfer function (logsig), Elliot symmetric sigmoid transfer function (elliotsig), and linear
transfer function (purelin). The first three functions squeeze the input into an interval between -1 and
1 or between 0 and 1 with an "S-shaped" functions. Fig. 25 presents the activation transfer functions.
The current interest in the neural network technique as a forecasting tool has its reason for the
development of the backpropagation learning algorithm. This algorithm gives the network the ability
to form and modify its interconnections in a way that often rapidly approaches a goodness-of-fit
optimum. The technique was first developed by Rumelhart and McClelland (1986). In this study,
some back-propagation algorithms are also experimented with within the training stage of the ANN
in combination with the varied architectures referred above thanks to their fast convergence, stability,
and generally good results. The Levenberg-Marquardt algorithm (trainlm) (Marquardt, 1963; Hagan
& Menhaj, 1994), the Resilient Backpropagation algorithm (trainrp) (Riedmiller & Braun, 1993), the
Conjugate gradient backpropagation with Fletcher-Reeves updates (traincgf) (Demuth & Beale,
2000) and the Bayesian Regularization backpropagation algorithm (trainbr) (Demuth & Beale, 2000)
are experimented.
Figure 25. Activations transfer functions.
Source: Author's own elaboration.
In this work, Mean Absolute Error (MAE) (Eq. 2), Mean Absolute Percentage Error – MAPE (Eq. 3)
and Pearson’s Correlation Coefficient (r) (Eq. 4) are used to measure the accuracy of the
experimented models (Teixeira & Fernandes, 2015). The MAE gives the magnitude of the average
distance of the predicted values to the real values of the monthly number of international tourists to
Vietnam. The MAPE gives this error in relation to the real values, therefore it allows a comparison
with other models for other regions/countries. The Pearson correlation coefficient (r) measures the
degree of linear association between two numerical variables (Constantino, Fernandes & Teixeira,
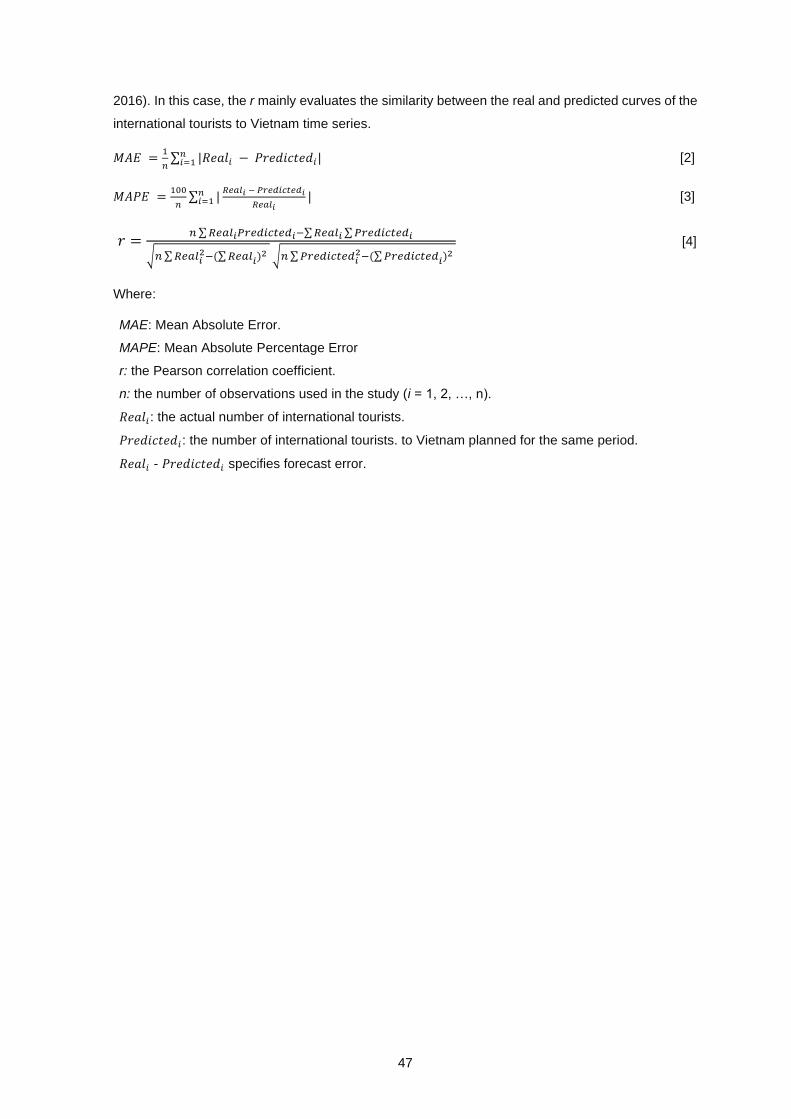
47
2016). In this case, the r mainly evaluates the similarity between the real and predicted curves of the
international tourists to Vietnam time series.
𝑀𝐴𝐸 =1
𝑛∑ |𝑅𝑒𝑎𝑙𝑖 − 𝑃𝑟𝑒𝑑𝑖𝑐𝑡𝑒𝑑𝑖|𝑛
𝑖=1 [2]
𝑀𝐴𝑃𝐸 =100
𝑛∑ |
𝑅𝑒𝑎𝑙𝑖 − 𝑃𝑟𝑒𝑑𝑖𝑐𝑡𝑒𝑑𝑖
𝑅𝑒𝑎𝑙𝑖|𝑛
𝑖=1 [3]
𝑟 =𝑛 ∑ 𝑅𝑒𝑎𝑙𝑖𝑃𝑟𝑒𝑑𝑖𝑐𝑡𝑒𝑑𝑖−∑ 𝑅𝑒𝑎𝑙𝑖 ∑ 𝑃𝑟𝑒𝑑𝑖𝑐𝑡𝑒𝑑𝑖
√𝑛 ∑ 𝑅𝑒𝑎𝑙𝑖2−(∑ 𝑅𝑒𝑎𝑙𝑖)2 √𝑛 ∑ 𝑃𝑟𝑒𝑑𝑖𝑐𝑡𝑒𝑑𝑖
2−(∑ 𝑃𝑟𝑒𝑑𝑖𝑐𝑡𝑒𝑑𝑖)2 [4]
Where:
MAE: Mean Absolute Error.
MAPE: Mean Absolute Percentage Error
r: the Pearson correlation coefficient.
n: the number of observations used in the study (i = 1, 2, …, n).
𝑅𝑒𝑎𝑙𝑖: the actual number of international tourists.
𝑃𝑟𝑒𝑑𝑖𝑐𝑡𝑒𝑑𝑖: the number of international tourists. to Vietnam planned for the same period.
𝑅𝑒𝑎𝑙𝑖 - 𝑃𝑟𝑒𝑑𝑖𝑐𝑡𝑒𝑑𝑖 specifies forecast error.
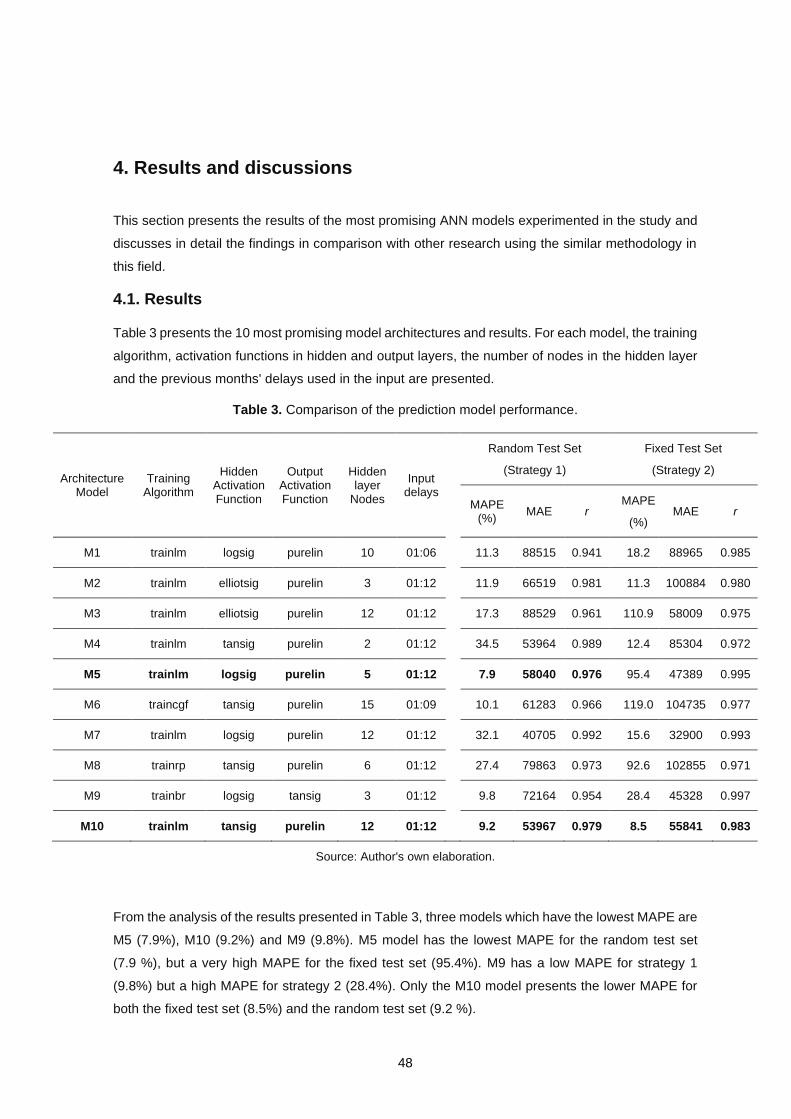
48
4. Results and discussions
This section presents the results of the most promising ANN models experimented in the study and
discusses in detail the findings in comparison with other research using the similar methodology in
this field.
4.1. Results
Table 3 presents the 10 most promising model architectures and results. For each model, the training
algorithm, activation functions in hidden and output layers, the number of nodes in the hidden layer
and the previous months' delays used in the input are presented.
Table 3. Comparison of the prediction model performance.
Architecture Model
Training Algorithm
Hidden Activation Function
Output Activation Function
Hidden layer
Nodes
Input delays
Random Test Set
(Strategy 1)
Fixed Test Set
(Strategy 2)
MAPE (%)
MAE r MAPE
(%) MAE r
M1 trainlm logsig purelin 10 01:06 11.3 88515 0.941 18.2 88965 0.985
M2 trainlm elliotsig purelin 3 01:12 11.9 66519 0.981 11.3 100884 0.980
M3 trainlm elliotsig purelin 12 01:12 17.3 88529 0.961 110.9 58009 0.975
M4 trainlm tansig purelin 2 01:12 34.5 53964 0.989 12.4 85304 0.972
M5 trainlm logsig purelin 5 01:12 7.9 58040 0.976 95.4 47389 0.995
M6 traincgf tansig purelin 15 01:09 10.1 61283 0.966 119.0 104735 0.977
M7 trainlm logsig purelin 12 01:12 32.1 40705 0.992 15.6 32900 0.993
M8 trainrp tansig purelin 6 01:12 27.4 79863 0.973 92.6 102855 0.971
M9 trainbr logsig tansig 3 01:12 9.8 72164 0.954 28.4 45328 0.997
M10 trainlm tansig purelin 12 01:12 9.2 53967 0.979 8.5 55841 0.983
Source: Author's own elaboration.
From the analysis of the results presented in Table 3, three models which have the lowest MAPE are
M5 (7.9%), M10 (9.2%) and M9 (9.8%). M5 model has the lowest MAPE for the random test set
(7.9 %), but a very high MAPE for the fixed test set (95.4%). M9 has a low MAPE for strategy 1
(9.8%) but a high MAPE for strategy 2 (28.4%). Only the M10 model presents the lower MAPE for
both the fixed test set (8.5%) and the random test set (9.2 %).
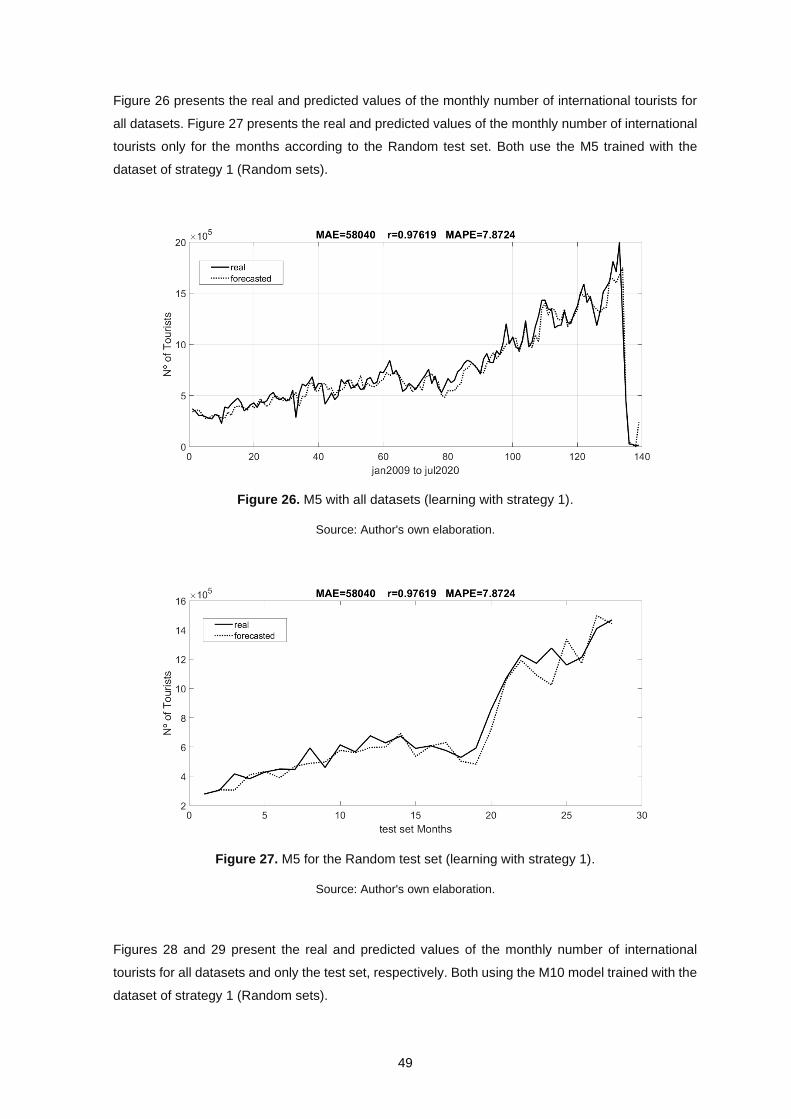
49
Figure 26 presents the real and predicted values of the monthly number of international tourists for
all datasets. Figure 27 presents the real and predicted values of the monthly number of international
tourists only for the months according to the Random test set. Both use the M5 trained with the
dataset of strategy 1 (Random sets).
Figure 26. M5 with all datasets (learning with strategy 1).
Source: Author's own elaboration.
Figure 27. M5 for the Random test set (learning with strategy 1).
Source: Author's own elaboration.
Figures 28 and 29 present the real and predicted values of the monthly number of international
tourists for all datasets and only the test set, respectively. Both using the M10 model trained with the
dataset of strategy 1 (Random sets).
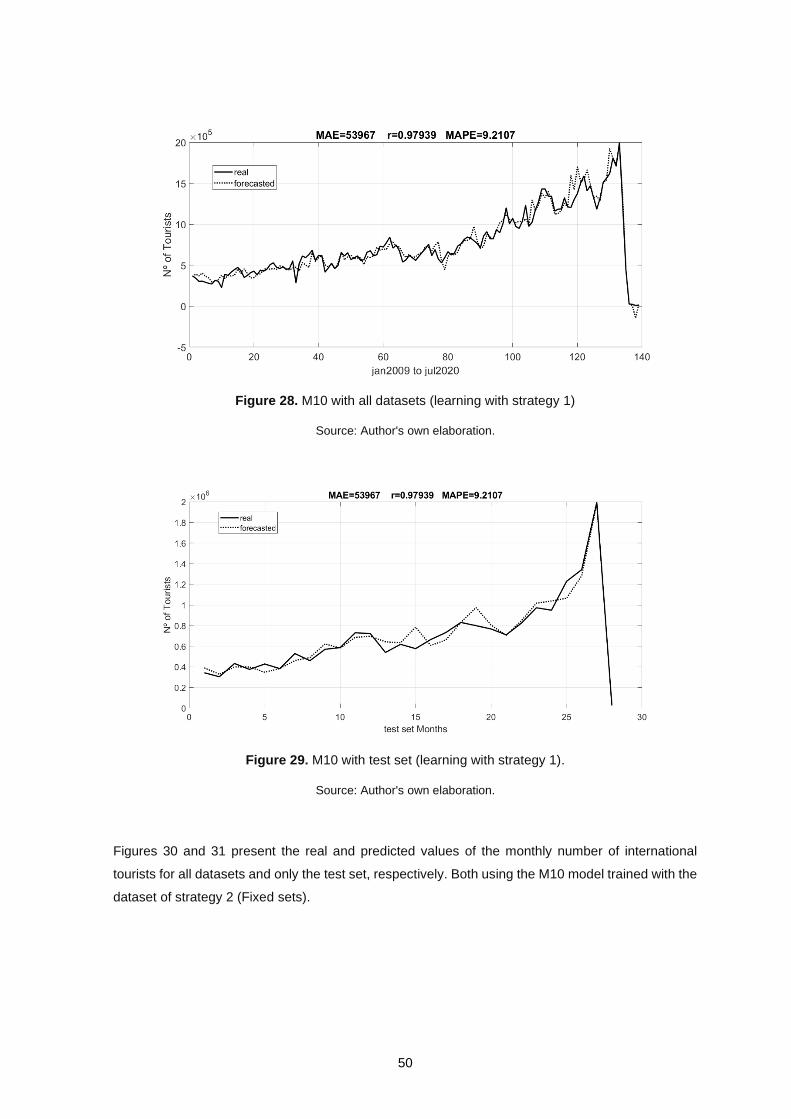
50
Figure 28. M10 with all datasets (learning with strategy 1)
Source: Author's own elaboration.
Figure 29. M10 with test set (learning with strategy 1).
Source: Author's own elaboration.
Figures 30 and 31 present the real and predicted values of the monthly number of international
tourists for all datasets and only the test set, respectively. Both using the M10 model trained with the
dataset of strategy 2 (Fixed sets).
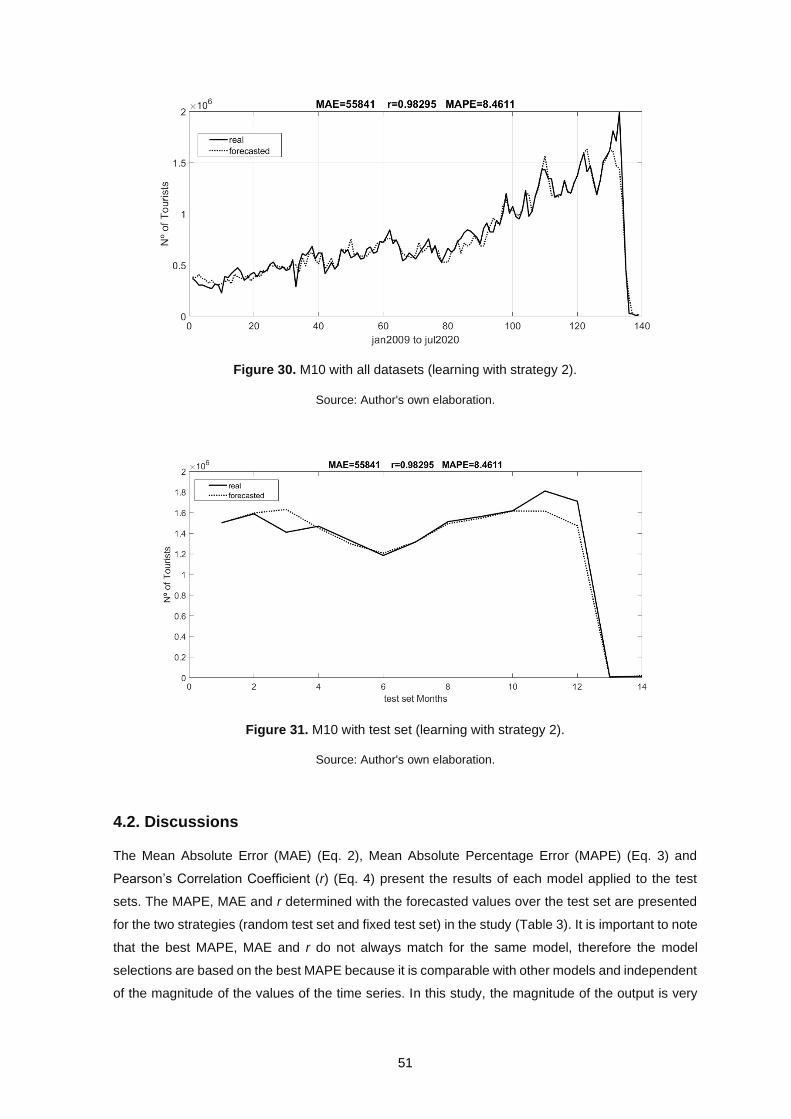
51
Figure 30. M10 with all datasets (learning with strategy 2).
Source: Author's own elaboration.
Figure 31. M10 with test set (learning with strategy 2).
Source: Author's own elaboration.
4.2. Discussions
The Mean Absolute Error (MAE) (Eq. 2), Mean Absolute Percentage Error (MAPE) (Eq. 3) and
Pearson’s Correlation Coefficient (r) (Eq. 4) present the results of each model applied to the test
sets. The MAPE, MAE and r determined with the forecasted values over the test set are presented
for the two strategies (random test set and fixed test set) in the study (Table 3). It is important to note
that the best MAPE, MAE and r do not always match for the same model, therefore the model
selections are based on the best MAPE because it is comparable with other models and independent
of the magnitude of the values of the time series. In this study, the magnitude of the output is very
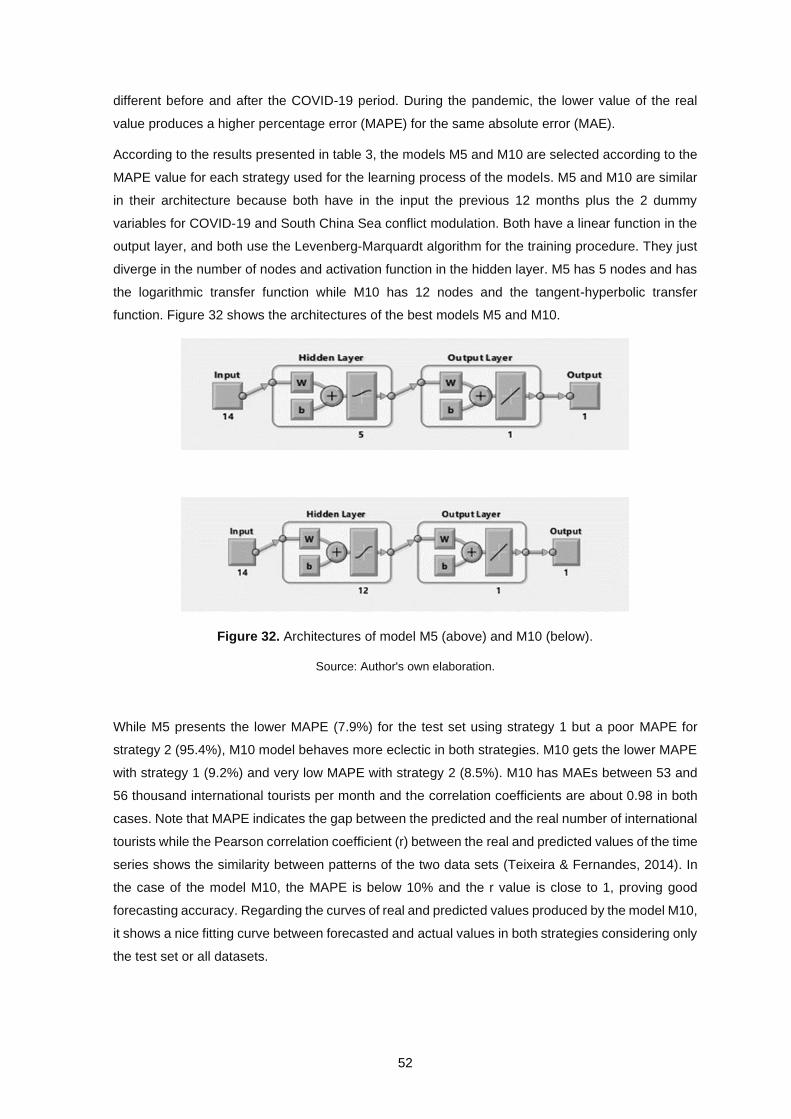
52
different before and after the COVID-19 period. During the pandemic, the lower value of the real
value produces a higher percentage error (MAPE) for the same absolute error (MAE).
According to the results presented in table 3, the models M5 and M10 are selected according to the
MAPE value for each strategy used for the learning process of the models. M5 and M10 are similar
in their architecture because both have in the input the previous 12 months plus the 2 dummy
variables for COVID-19 and South China Sea conflict modulation. Both have a linear function in the
output layer, and both use the Levenberg-Marquardt algorithm for the training procedure. They just
diverge in the number of nodes and activation function in the hidden layer. M5 has 5 nodes and has
the logarithmic transfer function while M10 has 12 nodes and the tangent-hyperbolic transfer
function. Figure 32 shows the architectures of the best models M5 and M10.
Figure 32. Architectures of model M5 (above) and M10 (below).
Source: Author's own elaboration.
While M5 presents the lower MAPE (7.9%) for the test set using strategy 1 but a poor MAPE for
strategy 2 (95.4%), M10 model behaves more eclectic in both strategies. M10 gets the lower MAPE
with strategy 1 (9.2%) and very low MAPE with strategy 2 (8.5%). M10 has MAEs between 53 and
56 thousand international tourists per month and the correlation coefficients are about 0.98 in both
cases. Note that MAPE indicates the gap between the predicted and the real number of international
tourists while the Pearson correlation coefficient (r) between the real and predicted values of the time
series shows the similarity between patterns of the two data sets (Teixeira & Fernandes, 2014). In
the case of the model M10, the MAPE is below 10% and the r value is close to 1, proving good
forecasting accuracy. Regarding the curves of real and predicted values produced by the model M10,
it shows a nice fitting curve between forecasted and actual values in both strategies considering only
the test set or all datasets.
53
The plots of the output presented from Figures 28 to 31 confirm the forecasting competence of the
MLP ANN model for the tourism time series in Vietnam. The result is consistent with the conclusions
of other studies using ANN to forecast tourism demand (Fernandes, Teixeira, Ferreira & Azevedo,
2008; Teixeira & Fernandes, 2012; Claveria, Monte & Torra, 2013; Teixeira & Fernandes, 2014;
Cuhadar, Cogurcu, & Kukrer 2014; Teixeira & Fernandes, 2015; Srisaeng & Baxter, 2017; Alamsyah
& Friscintia, 2019; Çuhadar, 2020; Höpken, Eberle, Fuchs, & Lexhagen, 2021).
It is interesting to see that the MAPE of the model M10 in this work is higher than that of other studies
using the same methodology. For example, Teixeira and Fernandes (2014) experimented several
ANN models to forecast tourism demand time series in Portugal including Tourism Revenue, Total
Overnights, Domestic Overnights and Foreign Overnights. The results showed that the MAPE values
achieved were rather low, i.e., MAPE of 4.7% for Revenue time series, 6.0% for Total Overnights,
4.7% for Domestic Overnights and only the MAPE for Foreign Overnights was above 10%. In a study
by Constantino, Fernandes and Teixeira (2015), the best model to predict the number of Overnight
Stays in Mozambique achieved the MAPE of 6.5%. Çuhadar (2020) applied MLP ANN to forecast a
monthly number of foreign tourist arrivals to Croatia. The experimented MLP ANN model showed the
best performance with the MAPE of 6.5%. According to Srisaeng and Baxter (2017), the best ANN
model used to predict Australia´s outbound airline passengers achieved the MAPE of 2.8%. This
result (higher MAPE) in the case of Vietnam can be explained by the fact that the test set includes
the COVID-19 data which is much more different than the remaining one and the target values for
this COVID-19 period are very low, resulting in a higher MAPE.
For both test set strategies in this work, the best model M10 achieves r of about 0.98 which is similar
to or even higher compared to that of other research. For example, r values of the best models in the
study of Teixeira and Fernandes (2014) varied from 0.91 to 0.98. Constantino, Fernandes, and
Teixeira (2015) found that the best model in their experiment achieved r = 0.696. It is worth noting
that r measures the similarity between the sequence of values in the test set. In the thesis, the
sequence includes the COVID-19 period with an extremely strong decrease that the model has been
able to follow. This sharp variation in the sequence of values that is followed by the predicted values
explains the higher r.
54
Conclusions, limitations, and implications for future works
Vietnam has been successful at promoting tourism in recent years and reaping the economic benefits
from this booming activity. Tourism plays an essential role in economic development as it provides
more job opportunities especially for women and young people as well as creates linkages with
various sectors. The growth of tourism accelerates the expansion of many other industries such as
transportation, food and beverage, real estate and so on.
Given the significant impact of the tourism sector on the economy, a precise forecasting model for
tourism demand would help to predict economic growth in Vietnam. Hence, it is important to find a
model with a highly predictive capability to forecast the tourism demand. In this study, several
forecasting ANN models are examined with a special focus on international tourists. The datasets of
monthly international tourists to Vietnam are collected from January 2008 to December 2020. The
period also includes time series data of pre-and post-COVID-19 pandemic into its analysis. The ANN
architectures are based on a Multi-Layer Perceptron (MLP) with one hidden layer.
The forecasted number of international tourists is the single output, while inputs contain the number
of international tourists in previous months varying between 4 to 18 months plus 2 for the dummy
variables, namely COVID-19 pandemic, and the South China Sea conflict. These two distress events
caused some sharp declines in the number of international tourists to Vietnam.
The datasets are divided according to two strategies: random test set and fixed test set. Concerning
the random test set, training, validation, and test set have a proportion of 70%, 10% and 20 % of all
datasets. It is important to note that as the experiment considers the effect of the COVID-19
pandemic. The second strategy is the fixed test set approach in which the test set contains data of
last months (one year) including at least 2 months of the lockdown period and the validation set
covers the months of the last-but-one year.
The number of nodes in the hidden layer varies between 2 and 20 in several experimental
simulations. The activation functions in the hidden and output layer include tangent-hyperbolic
transfer function, logarithmic sigmoid transfer function, Elliot symmetric sigmoid transfer function,
and linear transfer function. In the training stage, experimented back-propagation algorithms are the
Levenberg-Marquardt algorithm, the Resilient Backpropagation algorithm, the Conjugate gradient
backpropagation with Fletcher-Reeves updates and the Bayesian Regularization backpropagation
algorithm.
There are two selected models out of the 10 most promising ones, i.e., M5 and M10. M5 model
produces the lowest MAPE for the random test set (7.9 %) but very high MAPE for the fixed test set
(95.4%) while the M10 model shows very low MAPE in both learning strategies with MAPE=8.5%,
r=0.983 for the fixed test set and 9.2 % and 0.979 respectively for the random test set. Therefore,
the model M10 is the best performer in the study. The best architecture for the reference datasets is
achieved by using inputs of the previous 12 months plus 2 dummy variables, a linear function in the
55
output layer, the Levenberg-Marquardt algorithm for training procedure, 12 nodes and the tangent-
hyperbolic transfer function in the hidden layer.
The output plots presented from Figures 28 to 31 confirm the forecasting competence of the MLP
ANN model for the tourism time series in Vietnam. This result is consistent with various research
findings in different countries mentioned in the methodology section. Given the limited number of
studies on forecasting tourism demand in Vietnam using the ANN approach, the contribution of the
research is to fill this gap. In addition, the research provides policymakers and business managers
in Vietnam with a useful instrument for planning tourism activities. Having suffered extreme losses
due to the border closure for almost two years, the Vietnamese government and tourism businesses
need accurate prediction of future demand to make vital decisions regarding pricing strategies,
promotions, operations, and management, in order to gain full benefits out of their limited resources
while keeping the sector sustainable. The recovery of tourism is more likely to create favourable
effects on relevant sectors, which is expected to contribute significantly to the revival of the whole
economy.
It is important to note that the size of the training set is one of three key factors influencing the
generalization of the network (Haykin, 2008, p166). The intuition behind the learning process
(training) is that the more data is assigned to a training set, the better forecasting performance a
network can achieve until the learning rate slows down (Ahmad Alwosheel, 2018). Within this
research, however, the number of international tourists after the country opens its border is not
covered as Vietnam suspended the entry for international tourists from March 2020 until further
notice due to continuous waves of COVID-19 (Dung, 2021). Also, the data related to the COVID-19
pandemic lockdown used for the training set and test set is limited to only two months. Therefore,
the model can merely capture the past behaviour of tourists under normal circumstances and few
months of COVID-19 lockdown while it is more likely that the behaviour would change considerably
after the extreme period of COVID-19. New factors could have strong impacts on travel decisions,
namely the restrictions and precautions that tourists must take while travelling. The rules on
quarantining for 14 days; the limited choices of transports and accommodations; and the restricted
access to tourist attractions, restaurants, and entertainment activities probably discourage tourists to
visit the country.
According to the latest report from Worldometers, until 26 November 2021, the total number of
COVID-19 infected cases per 1 million people and total deaths per 1 million people in Vietnam are
rather low as the country ranks 149 and 133 respectively out of 221 reported countries and territories,
(Worldometer, 2021). In early October 2021, the government of Vietnam announced a plan to reopen
major tourist destinations to vaccinated tourists from countries with a low risk of COVID-19 from
December 2021. On 20 November 2021, Vietnam received the first international tourists to the
country’s largest Phu Quoc resort island after nearly two years of border closure (Reuters, 2021). A
full resumption is intended to take effect from July next year (KC, 2021). Besides, domestic tourism
demand has been accelerated to make up for the lost income from international tourists. It is
expected that tourism demand in Vietnam will increase again and reach the pre-pandemic level in
56
the next few years. Considering the post-pandemic outlook of tourism in Vietnam and the
requirement for newly updated observations for ANN models to achieve adequately accurate
predictions, an improvement in the ANN models in future research by using larger datasets on
inbound tourism is recommended, including new data to be collected during the COVID-19 lockdown
and recovery period. The improved model would facilitate all stakeholders in the sector to provide
forward realistic action plans in order to efficiently utilise their depleted budgets while fully capturing
the opportunity once Vietnam is entirely open for travel and tourism. Also, it is recommended to
extend the forecasting research by including both inbound and outbound tourism demand in Vietnam
given the increasing contributions of domestic tourists.
In addition, several studies confirmed the contributing impacts of other factors on forecasting tourism
demand such as gross domestic product, exchange rate, airfares, flights, tourism attractiveness and
so on in different contexts (Constantino, Fernandes, & Teixeira, 2015; Srisaeng & Baxter, 2017), but
they are not experimented in the case of Vietnam. Hence, explanatory variables such as the gross
domestic product of top source markets, the exchange rate between Vietnamese Dong and the
United States Dollar/Euro/Chinese Renminbi, direct flights from key tourist markets to Vietnam etc
would be added into the modelling stage to increase predicting accuracy of ANN models.
57
References
Abellana, D., Rivero, D., Aparente, M., and Rivero, A. (2021). Hybrid SVR-SARIMA model for tourism
forecasting using PROMETHEE II as a selection methodology: a Philippine scenario. Journal
of Tourism Futures, 7(1), 78-97.
Akın, M. (2015). A novel approach to model selection in tourism demand modeling. Tourism
Management, 48, 64–72
Ahmad Alwosheel, S. v. (2018). Is your dataset big enough? Sample size requirements when using
artificial neural networks for discrete choice analysis. Journal of Choice Modelling, 167-182.
doi:10.1016/j.jocm.2018.07.002
Alamsyah, A., and Friscintia, P. B. (2019). Artificial Neural Network for Indonesian Tourism
Forecasting. 2019 7th International Conference on Information and Communication
Technology (ICoICT), (pp. 1-7). Indonesia. doi:10.1109/ICoICT.2019.8835382
Álvarez-Díaz, M., González-Gómez, M., and Otero-Giráldez, M. S. (2019). Forecasting International
Tourism Demand Using a Non-Linear Autoregressive Neural Network and Genetic
Programming. Forecasting 2019, 1(1), 90-106. doi: https://doi.org/10.3390/forecast1010007
Anvari, S., Tuna, S., Canci, M., and Turkay, M. (2016). Automated Box–Jenkins forecasting tool with
an application for passenger demand in urban rail systems. Journal of Advanced
Transportation, 50(1), 25-49.
Apergis, N., Mervar, A., and Payne, J. E. (2017). Forecasting disaggregated tourist arrivals in
Croatia: Evidence from seasonal univariate time series models. Tourism Economics, 23(1),
78-98. doi:https://doi.org/10.5367%2Fte.2015.0499
Assaf, A. G., Li, G., Song, H., and Tsionas, M. G. (2018). Modeling and forecasting regional tourism
demand using the Bayesian global vector autoregressive (BGVAR) model. Journal of Travel
Research, 58(3), 383-397. doi:10.1177/0047287518759226
Athanasopoulos, G., Hyndman, R. J., Song, H., and Wu, D. C. (2011). The tourism forecasting
competition. International Journal of Forecasting, 27(3), 822–844.
Athanasopoulos, G., Song, H., and Sun, J. (2018). Bagging in Tourism Demand Modeling and
Forecasting. Journal of Travel Research, 57(1), 52-68. doi:10.1177/0047287516682871
Ayeh, J., and Lin, S. (2011). ‘Estimating tomorrow’s tourist arrivals’: forecasting the demand for
China’s tourism using the general-to-specific approach. Tourism and Hospitality Research,
11(3), 197–206.
58
Baggio, R., and Sainaghi, R. (2016). Mapping time series into networks as a tool to assess the
complex dynamics of tourism systems. Tourism Management, Elsevier, 54(C), 23-33.
doi:10.1016/j.tourman.2015.10.008
Bangwayo-Skeete, P. F., and Skeete, R. W. (2015). Can Google data improve the forecasting
performance of tourist arrivals? Mixed-data sampling approach. Tourism Management, 46,
454-464.
Bigovic´, M. (2012). Demand forecasting within Montenegrin tourism using Box-Jenkins methodology
for seasonal ARIMA models. Tourism and Hospitality Management, 18(1), 1-18.
Bonham, C., Edmonds, C., and Mak, J. (2006). The impact of 9/11 and other terrible global events
on tourism in the United States and Hawaii. Journal ofTravel Research, 45(1), 99-110.
Box, G. J. (2015). Time Series Analysis: Forecasting and Control. Hoboken, New Jersey: John Wiley
and Sons.
Briedenhann, J., and Butts, S. (2006). Application of the Delphi technique to rural tourism project
evaluation. Current Issues in Tourism, 9(2), 171-190.
Cai, Z.-j., Lu, S., and Zhang, X.-b. (2009). Tourism demand forecasting by support vector regression
and genetic algorithm. 2009 2nd IEEE International Conference on Computer Science and
Information Technology, (pp. 144-146). doi:10.1109/ICCSIT.200
CAPA - Centre for Aviation. (2021, May 10). Vietnam: airport infrastructure needs USD5billion
upgrade. Retrieved November 26, 2021, from Centre for Aviation:
https://centreforaviation.com/analysis/reports/vietnam-airport-infrastructure-needs-
usd5billion-upgrade-559324
Celotto, E., Ellero, A., and Ferretti, P. (2012). Short-medium Term Tourist Services Demand
Forecasting with Rough Set Theory. Procedia Economics and Finance, 3, 62-67.
doi:10.1016/S2212-5671(12)00121-9
Chan, F., Lim, C., and McAleer, M. (2005). Modelling multivariate international tourism demand and
volatility. Tourism Management, 26(3), 459-471.
doi:https://doi.org/10.1016/j.tourman.2004.02.013
Chen, J. L., Li, G., Wu, D. C., and Shen, S. (2019). Forecasting Seasonal Tourism Demand Using a
Multiseries Structural Time Series Method. Journal of Travel Research, 58 (1), 92–103.
Chen, K.-Y. (2011). Combining linear and nonlinear model in forecasting tourism demand. Expert
Systems with Applications, 38(8), 10368-10376.
Chen, K.-Y., and Wang, C.-H. (2007). Support Vector Regression with Genetic Algorithms in
Forecasting Tourism Demand. Tourism Management, 28, 215-226.
doi:10.1016/j.tourman.2005.12.018

59
Chen, M., Ying, L., and Pan, M. (2010). Forecasting tourist arrivals by using the adaptive network-
based fuzzy inference system. Expert Systems with Applications, 37(2), 1185–1191.
doi:10.1016/j.eswa. 2009.06.032
Chen, R., Liang, C., and Hong, W. (2015). Forecasting holiday daily tourist flow based on seasonal
support vector regression with adaptive genetic algorithm. Applied Soft Computing Journal,
26, 435-443. doi:10. 1016/j.asoc.2014.10.022
Chu, F. (2008). A fractionally integrated autoregressive moving average approach to forecasting
tourism. Tourism Management, 29(1), 79-88. doi:10.1016/j.tourman.2007.04.003
Claveria, O., Monte, E., and Torra, S. (2013). Tourism Demand Forecasting with Different Neural
Networks Models. SSRN Electronic Journal. doi:10.2139/ssrn.2507362
Claveria, O., Monte, E., and Torra, S. (2015a). Tourism Demand Forecasting with Neural Network
Models: Different Ways of Treating Information. International Journal of Tourism Research,
17, 492-500. doi:10.1002/jtr.2016
Claveria, O., Monte, E., and Torra, S. (2015b). A new forecasting approach for the hospitality
industry. International Journal of Contemporary Hospitality Management, 27(7), 1520-1538.
Claveria, O., Monte, E., and Torra, S. (2017). Data pre-processing for neural network-based
forecasting: Does it really matter? Technological and Economic Development of Economy, 23,
709-725. doi:10.3846/20294913.2015.1070772
Cortes-Jimenez, I., and Blake, A. (2011). Tourism Demand Modeling by Purpose of Visit and
Nationality. Journal of Travel Research, 50(4), 408-416. doi:10.1177/0047287510363615
Çuhadar, M. (2020). Modelling and Forecasting Inbound Tourism Demand to Croatia using Artificial
Neural Networks: A Comparative Study. Journal of Tourism and Services, 21(11).
Çuhadar, M., Cogurcu, I., and Kukrer, C. (2014). Modelling and forecasting cruise tourism demand
to Izmir by different artificial neural network architectures. International Journal of Business
and Social Research, 4(3), 12–28.
Demuth, H., and Beale, M. (2000). Neural Network Toolbox, for use with Matlab – User’s Guide,
version 4. the Math Works.
Dergiades, T., Mavragani, E., and Pan, B. (2018). Google Trends and tourists' arrivals: Emerging
biases and proposed corrections. Tourism Management, 66, 108-120.
Díaz, M., and Sbert, J. M. (2011). Forecasting daily air arrivals in Mallorca Island using nearest
neighbour methods. Tourism Economics. 17(1), 191-208.
Dung, T. (27 de 7 de 2021). Online Newspaper of the Government of Vietnam. (Vietnam Government
Portal) Obtido em 11 de 2021, de http://news.chinhphu.vn/Home/Viet-Nam-rejects-inaccurate-
information-about-entry-policy/20217/44816.vgp
Feng, Y., Li, G., Sun, X., and Li, J. (2019). Forecasting the number of inbound tourists with Google
Trends. Procedia Computer Science, 162, 628-633. doi:10.1016/j.procs.2019.12.032
60
Fernandes, P. O., and Teixeira, J. P. (2008). Applying the artificial neural network methodology to
tourism time series forecasting. 5th International Scientific Conference in ‘Business and
Management’. Vilnius, Lithuania. doi:ISBN 978-9955-28-267-9
Fernandes, P. O., Teixeira, J. P., Ferreira, J. J., and Azevedo, S. G. (2008). Modelling tourism
demand: a comparative study between artificial neural networks and the Box-Jenkins
methodology. Romanian Journal of Economic Forecasting, 9(3), 30-50.
Fernandes, P. O., Teixeira, J. P., Ferreira, J., and Azevedo, S. (2013). Training Neural Networks by
Resilient Backpropagation Algorithm for Tourism Forecasting. Management Intelligent
Systems Advances in Intelligent Systems and Computing, 220, pp. 41-49. Salamanca, Spain.
doi:10.1007/978-3-319-00569-0_6
Fitch Solutions. (2020). Vietnam Tourism Report Q4 2020. London: Fitch Solutions Group Ltd.
Fu, Y., Hao, J.-X., Li, X. (., and Hsu, C. H. (2019). Predictive Accuracy of Sentiment Analytics for
Tourism: A Meta- learning Perspective on Chinese Travel News. Journal of Travel Research,
58 (4), 666-79.
General Statistic Office of Vietnam. (2009). Vietnam´s socio-economic situation in 2009. Hanoi,
Vietnam.
General Statistics Office. (2021). Statistical Yearbook of Vietnam 2020. Hanoi: Statistical Publishing
House.
Ghalehkhondabi, I., Ardjmand, E., Young, W. A., and Weckman, G. R. (2019). A review of demand
forecasting models and methodological developments within tourism and passenger
transportation industry. Journal of Tourism Futures, 5(1), 75-93. doi:10.1108/JTF-10-2018-
0061
Gil-Alana, L. A. (2010). International tourists in the Canary Islands: Persistence, long memory,
seasonality and other implicit dynamics. Tourism Economics, 16(2), 287-302.
Gil-Alana, L. A., De Gracia, F. P., and Cuñado, J. (2004). Seasonal fractional integration in the
Spanish tourism quarterly time series. Journal of Travel Research, 42(4), 408-414.
Goh, C., and Law, R. (2011). The Methodological Progress of Tourism Demand Forecasting: A
Review of Related Literature. Journal of Travel and Tourism Marketing, 28(3), 296-317.
doi:DOI: 10.1080/10548408.2011.562856
Goh, C., Law, R., and Mok, H. M. (2008). Analyzing and forecasting tourism demand: A rough sets
approach. Journal of Travel Research, 46(3), 327-338.
Gounopoulos, D., and Petmezas, D. and. (2012). Forecasting tourist arrivals in Greece and the
impact of macroeconomic shocks from the countries of tourists’origin. Annals of Tourism
Research, 39(2), 641-666.
61
Government of Vietnam. (2017). Prime Minister's Decision No. 1861/QD-TTg: Approval of the target
program for tourism infrastructure development for 2016-2020. Hanoi: Government Office of
Vietnam.
Government of Vietnam. (2018). Prime Minister´s Decision No. 49/2018/QĐ-TTg: Estabilistment and
Approval of Organization Charter and Operation of Tourism Development Fund. Hanoi:
Government Office of Vietnam.
Government of Vietnam. (22 de 1 de 2020). Decision 147/QD-TTg. Approval of Tourism
Development Strategy of Vietnam towards 2030. Hanoi, Vietnam, Vietnam.
Guizzardi, A., and Mazzocchi, M. (2010). Tourism demand for Italy and the business cycle. Tourism
Management, 31(3), 367-377.
Guizzardi, A., and Stacchini, A. (2015). Real-time forecasting regional tourism with business
sentiment surveys. Tourism Management, 47, 213-223.
Gunter, U., and Onder, I. (2015). Forecasting international city tourism demand for Paris: accuracy
of uni- and multivariate models employing monthly data. Tourism Management, Pergamon,
46, 123-135.
Gunter, U., and Onder, I. (2016). Forecasting city arrivals with Google analytics. Annals of Tourism
Research, 61, 199-212. doi:10.1016/j.annals.2016.10.007
H.A.Constantino, P.O.Fernandes, and J.P.Teixeira. (2016). Tourism demand modelling and
forecasting with artificial neural network models: The Mozambique case study. Tékhne, 14(2),
113-124.
Hadavandi, E., Ghanbari, A., Shahanaghi, K., and Abbasian-Naghneh, S. (2011). Tourist arrival
forecasting by evolutionary fuzzy systems. Tourism Management, 32(5), 1196-1203.
doi:10.1016/j.tourman.2010.09.015
Hagan, M. T., and Menhaj, M. (1994). Training feedforward networks with the Marquardt algorithm.
IEEE Transactions on Neural Networks, 5(6), 989-993.
Hansen, J., McDonald, J., and Nelson, R. (1999). Time series prediction with genetic-algorithm
designed neural networks: an empirical comparison with modern statistical models.
Computational Intelligence, 15, 171–184. doi:10.1111/0824-7935.00090
Happel, B. L., and Murre, J. M. (1994). Design and evolution of modular neural network architectures.
Neural networks, 7(6-7), 985-1004.
Hassani, H., Silva, E., Antonakakis, N., Filis, G., and Gupta, R. (2017). Forecasting accuracy
evaluation of tourist arrivals. Annals of Tourism Research, 63, 112-127.
doi:10.1016/j.annals.2017.01.008
Haykin, S. (2009). Neural networks and learning machines (3rd ed.). Upper Saddle River, New
Jersey, USA: Pearson Education, Inc.
62
Hong, W.C.; Dong, Y., Chen,L.Y., and Wei, S.Y. (2011). SVR with hybrid chaotic genetic algorithms
for tourism demand forecasting. Applied Soft Computing, 2011(2), 1881-1890.
doi:10.1016/j.asoc.2010.06.003
Höpken, W., Eberle, T., Fuchs, M., and Lexhagen, M. (2021). Improving Tourist Arrival Prediction: A
Big Data and Artificial Neural Network Approach. Journal of Travel Research, 60(5), 998-1017.
Hu, Y.-C. (2021). Forecasting the demand for tourism using combinations of forecasts by neural
network-based interval grey prediction models. Asia Pacific Journal of Tourism Research,
26(12), 1350-1363. doi:10.1080/10941665.2021.1983623
Huang, X., Zhang, L., and Ding, Y. (2017). The Baidu index: uses in predicting tourism flows –A case
study of the forbidden city. Tourism Management Elsevier, 58(C), 301-306.
doi:10.1016/j.tourman.2016.03.015
Huarng, K. H., and Yu, T. H. (2019). Application of Google trends to forecast tourism demand. Journal
of Internet Technology, 20(4), 1273-1280. doi:10.3966/160792642019072004025
Huarng, K.-H., Yu, T., Moutinho, L., and Wang, Y.-C. (2012). Forecasting tourism demand by fuzzy
time series models. International Journal of Culture, 6. doi:10.1108/17506181211265095
International Air Transport Association (IATA). (2018). IATA Economics Report: the importance of
air transport to Vietnam. IATA.
Jiao, X., and Chen, J. (2019). Tourism forecasting: A review of methodological developments over
the last decade. Tourism Economics, 25(3), 469-492. doi:10.1177/1354816618812588
Jiao, X., Li, G., and Chen, J. L. (2020). Forecasting international tourism demand: a local
spatiotemporal model. Annals of Tourism Research, 83, 102937.
Kaynak, E., and Macaulay, J. A. (1984). The Delphi technique in the measurement of tourism market
potential: The case of Nova Scotia. Tourism Management, 5(2), 87-101.
Kaynak, E., Bloom, J., and Leibold, M. (1994). Using the Delphi Technique to Predict Future Tourism
Potential. Marketing Intelligence and Planning, 12, 18-29. doi:10.1108/02634509410065537
KC (22 de 10 de 2021). Communist Party of Vietnam Online Newspaper. (The central organ of the
Communist Party of Vietnam) Obtido em 2 de 11 de 2021, de https://dangcongsan.vn/kinh-
te/de-xuat-mo-lai-duong-bay-quoc-te-theo-4-giai-doan-594819.html
Koc, E., and Altinay, G. (2007). An analysis of seasonality in monthly per person tourist spending in
Turkish inbound tourism from a market segmentation perspective. Tourism Management,
28(2), 227-237.
Kohonen, T. (1982). Self-organized formation of topologically correct feature maps. Biological
Cybernetics, 43, 59-69.
Kon, S. C., and Turner, L. W. (2005). Neural network forecasting of tourism demand. Tourism
Economics, 11, 201-328.
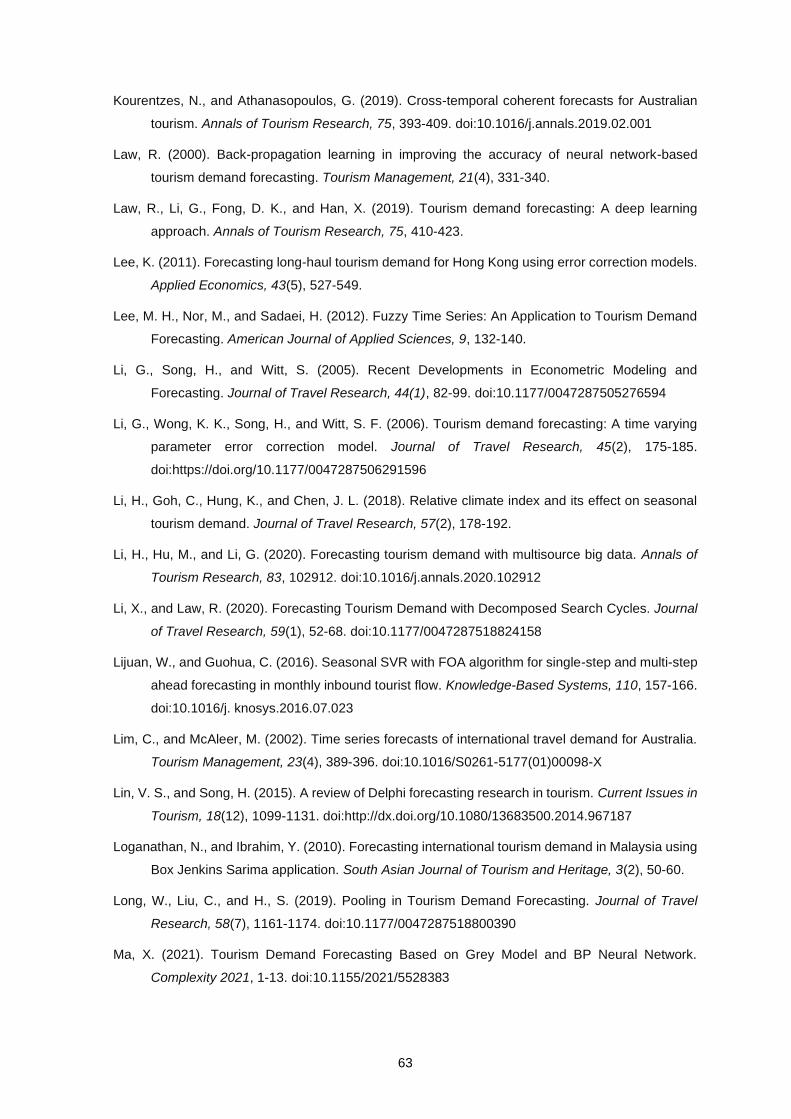
63
Kourentzes, N., and Athanasopoulos, G. (2019). Cross-temporal coherent forecasts for Australian
tourism. Annals of Tourism Research, 75, 393-409. doi:10.1016/j.annals.2019.02.001
Law, R. (2000). Back-propagation learning in improving the accuracy of neural network-based
tourism demand forecasting. Tourism Management, 21(4), 331-340.
Law, R., Li, G., Fong, D. K., and Han, X. (2019). Tourism demand forecasting: A deep learning
approach. Annals of Tourism Research, 75, 410-423.
Lee, K. (2011). Forecasting long-haul tourism demand for Hong Kong using error correction models.
Applied Economics, 43(5), 527-549.
Lee, M. H., Nor, M., and Sadaei, H. (2012). Fuzzy Time Series: An Application to Tourism Demand
Forecasting. American Journal of Applied Sciences, 9, 132-140.
Li, G., Song, H., and Witt, S. (2005). Recent Developments in Econometric Modeling and
Forecasting. Journal of Travel Research, 44(1), 82-99. doi:10.1177/0047287505276594
Li, G., Wong, K. K., Song, H., and Witt, S. F. (2006). Tourism demand forecasting: A time varying
parameter error correction model. Journal of Travel Research, 45(2), 175-185.
doi:https://doi.org/10.1177/0047287506291596
Li, H., Goh, C., Hung, K., and Chen, J. L. (2018). Relative climate index and its effect on seasonal
tourism demand. Journal of Travel Research, 57(2), 178-192.
Li, H., Hu, M., and Li, G. (2020). Forecasting tourism demand with multisource big data. Annals of
Tourism Research, 83, 102912. doi:10.1016/j.annals.2020.102912
Li, X., and Law, R. (2020). Forecasting Tourism Demand with Decomposed Search Cycles. Journal
of Travel Research, 59(1), 52-68. doi:10.1177/0047287518824158
Lijuan, W., and Guohua, C. (2016). Seasonal SVR with FOA algorithm for single-step and multi-step
ahead forecasting in monthly inbound tourist flow. Knowledge-Based Systems, 110, 157-166.
doi:10.1016/j. knosys.2016.07.023
Lim, C., and McAleer, M. (2002). Time series forecasts of international travel demand for Australia.
Tourism Management, 23(4), 389-396. doi:10.1016/S0261-5177(01)00098-X
Lin, V. S., and Song, H. (2015). A review of Delphi forecasting research in tourism. Current Issues in
Tourism, 18(12), 1099-1131. doi:http://dx.doi.org/10.1080/13683500.2014.967187
Loganathan, N., and Ibrahim, Y. (2010). Forecasting international tourism demand in Malaysia using
Box Jenkins Sarima application. South Asian Journal of Tourism and Heritage, 3(2), 50-60.
Long, W., Liu, C., and H., S. (2019). Pooling in Tourism Demand Forecasting. Journal of Travel
Research, 58(7), 1161-1174. doi:10.1177/0047287518800390
Ma, X. (2021). Tourism Demand Forecasting Based on Grey Model and BP Neural Network.
Complexity 2021, 1-13. doi:10.1155/2021/5528383
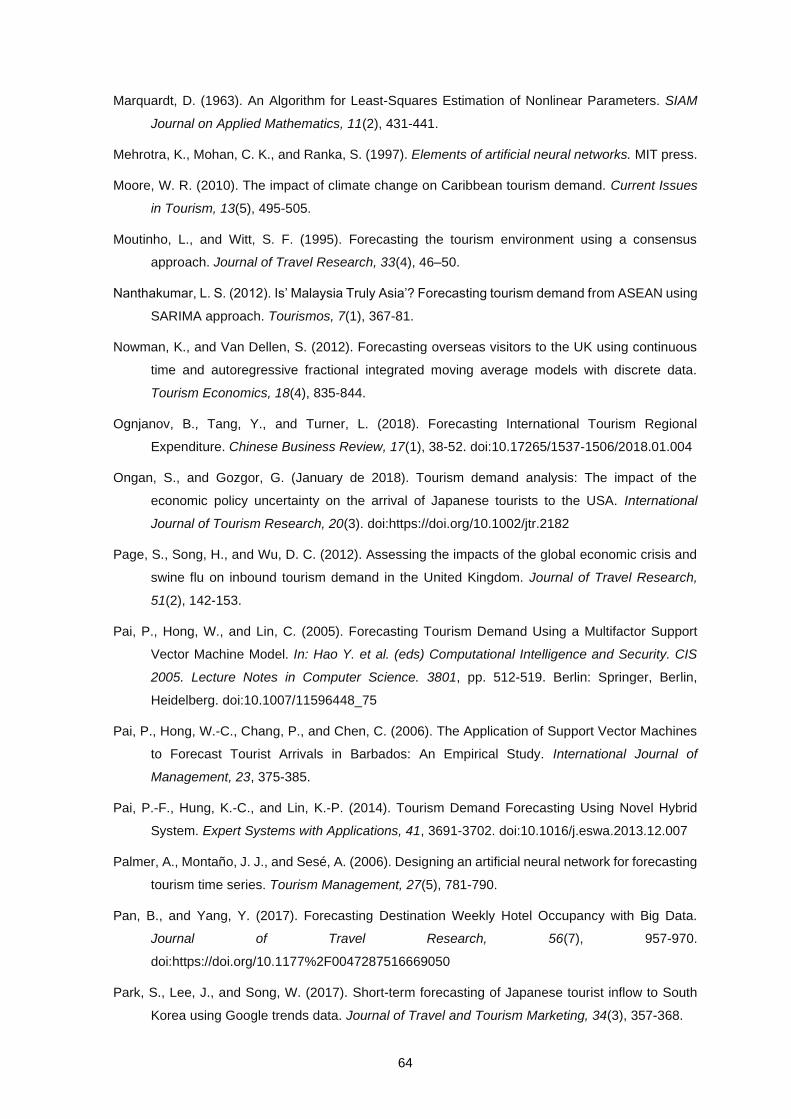
64
Marquardt, D. (1963). An Algorithm for Least-Squares Estimation of Nonlinear Parameters. SIAM
Journal on Applied Mathematics, 11(2), 431-441.
Mehrotra, K., Mohan, C. K., and Ranka, S. (1997). Elements of artificial neural networks. MIT press.
Moore, W. R. (2010). The impact of climate change on Caribbean tourism demand. Current Issues
in Tourism, 13(5), 495-505.
Moutinho, L., and Witt, S. F. (1995). Forecasting the tourism environment using a consensus
approach. Journal of Travel Research, 33(4), 46–50.
Nanthakumar, L. S. (2012). Is’ Malaysia Truly Asia’? Forecasting tourism demand from ASEAN using
SARIMA approach. Tourismos, 7(1), 367-81.
Nowman, K., and Van Dellen, S. (2012). Forecasting overseas visitors to the UK using continuous
time and autoregressive fractional integrated moving average models with discrete data.
Tourism Economics, 18(4), 835-844.
Ognjanov, B., Tang, Y., and Turner, L. (2018). Forecasting International Tourism Regional
Expenditure. Chinese Business Review, 17(1), 38-52. doi:10.17265/1537-1506/2018.01.004
Ongan, S., and Gozgor, G. (January de 2018). Tourism demand analysis: The impact of the
economic policy uncertainty on the arrival of Japanese tourists to the USA. International
Journal of Tourism Research, 20(3). doi:https://doi.org/10.1002/jtr.2182
Page, S., Song, H., and Wu, D. C. (2012). Assessing the impacts of the global economic crisis and
swine flu on inbound tourism demand in the United Kingdom. Journal of Travel Research,
51(2), 142-153.
Pai, P., Hong, W., and Lin, C. (2005). Forecasting Tourism Demand Using a Multifactor Support
Vector Machine Model. In: Hao Y. et al. (eds) Computational Intelligence and Security. CIS
2005. Lecture Notes in Computer Science. 3801, pp. 512-519. Berlin: Springer, Berlin,
Heidelberg. doi:10.1007/11596448_75
Pai, P., Hong, W.-C., Chang, P., and Chen, C. (2006). The Application of Support Vector Machines
to Forecast Tourist Arrivals in Barbados: An Empirical Study. International Journal of
Management, 23, 375-385.
Pai, P.-F., Hung, K.-C., and Lin, K.-P. (2014). Tourism Demand Forecasting Using Novel Hybrid
System. Expert Systems with Applications, 41, 3691-3702. doi:10.1016/j.eswa.2013.12.007
Palmer, A., Montaño, J. J., and Sesé, A. (2006). Designing an artificial neural network for forecasting
tourism time series. Tourism Management, 27(5), 781-790.
Pan, B., and Yang, Y. (2017). Forecasting Destination Weekly Hotel Occupancy with Big Data.
Journal of Travel Research, 56(7), 957-970.
doi:https://doi.org/10.1177%2F0047287516669050
Park, S., Lee, J., and Song, W. (2017). Short-term forecasting of Japanese tourist inflow to South
Korea using Google trends data. Journal of Travel and Tourism Marketing, 34(3), 357-368.
65
Peeters, P., and Dubois, G. (2010). Tourism travel under climate change mitigation constraints.
Journal of Transport Geography, 18(3), 447-457.
Peng, B., Song, H., and Crouch, G. I. (2014). A meta-analysis of international tourism demand
forecasting and implications for practice. Tourism Management, 45, 181-193.
doi:https://doi.org/10.1016/j.tourman.2014.04.005
Pesaran, M. H., Schuermann, T., and Weiner, S. M. (2004). Modeling regional interdependencies
using a global error-correcting macroeconometric model. Journal of Business and Economic
Statistics, 22(2), 129-162.
Purwanto, Sunardi, Julfia, F. T., and Paramananda, A. (2019). Hybrid model of ARIMA-linear trend
model for tourist arrivals prediction model in Surakarta City, Indonesia. AIP Conference
Proceedings, 2114. doi:10.1063/1.5112481
Rasouli, S., and Timmermans, H. (2012). Uncertainty in travel demand forecasting models: literature
review and research agenda. Transportation Letters, 4, 55-73.
Riedmiller, M., and Braun, H. (1993). A direct adaptive method for faster backpropagation learning:
The RPROP algorithm. Proceedings of the IEEE International Conference on Neural
Networks.
Saha, S., and Yap, G. (2014). The moderation effects of political instability and terrorism on tourism
development: A cross-country panel analysis. Journal of Travel Research, 53(4), 509-521.
Shahrabi, J., Hadavandi, E., and Asadi, S. (2013). Developing a hybrid intelligent model for
forecasting problems: case study of tourism demand time series. Knowledge-Based Systems,
43, 112-122. doi:10.1016/j. knosys.2013.01.014
Silva, E. S., Hassani, H., Heravi, S., and Huang, X. (2019). Forecasting tourism demand with
denoised neural networks. Annals of Tourism Research, 74, 134-154.
Singh. (2021). (Fundamentals of Neural Networks International Journal for Research in Applied
Science and Engineering Technology.
Song, H., and Li, G. (2008). Tourism demand modelling and forecasting—A review of recent
research. Tourism Management, 29, 203-220. doi:10.1016/j.tourman.2007.07.016
Song, H., and Lin, S. (2010). Impacts of the financial and economic crisis on tourism in Asia. Journal
of Travel Research, 49(1), 16-30.
Song, H., and Liu, H. (2017). Predicting Tourist Demand Using Big Data. In: Xiang Z., Fesenmaier
D. (eds) Analytics in Smart Tourism Design. Em T. o. Verge. Springer, Cham.
doi:10.1007/978-3-319-44263-1_2
Song, H., Gao, B. Z., and Lin, V. S. (2013). Combining statistical and judgmental forecasts via a web-
based tourism demand forecasting system. International Journal of Forecasting, 29(2),
295-310.
66
Song, H., Li, G., Witt, S., and Athanasopoulos, G. (2011). Forecasting tourist arrivals using time-
varying parameter structural time series models. International Journal of Forecasting, 27, 855-
869. doi:10.1016/j.ijforecast.2010.06.001
Song, H., Qiu, R. T., and Park, J. (2019). A review of research on tourism demand forecasting. Annals
of Tourism Research, 75, 338-362. doi:https://doi.org/10.1016/j.annals.2018.12.001
Srisaeng, P., and Baxter, G. (2017). Modelling Australia’s outbound passenger air travel demand
using an artificial neural network approach. International Journal for Traffic and Transport
Engineering, 7(4), 406-423. doi:http://dx.doi.org/10.7708/ijtte
Sun, S., Wei, Y., Tsui, K.-L., and Wang, S. (2019). Forecasting tourist arrivals with machine learning
and internet search index. Tourism Management, 70, 1-10.
doi:https://doi.org/10.1016/j.tourman.2018.07.010
Sun, X., Sun, W., Wang, J., Zhang, Y., and Gao, Y. (2016). Using a Grey–Markov model optimized
by Cuckoo search algorithm to forecast the annual foreign tourist arrivals to China. Tourism
Management, 52, 369–379.
Teixeira, J. P., and Fernandes, P. O. (2012). Tourism time series forecast- Different ANN
architectures with time index input. Procedia Technology, 5, 445-454.
Teixeira, J. P., and Fernandes, P. O. (2014). Tourism time series forecast with artificial neural
networks. Review of Applied Management Studies, 12, 26-36.
Teixeira, J. P., and Fernandes, P. O. (2015). Tourism Time Series Forecast. Em Improving
Organizational Effectiveness with Enterprise Information Systems (pp. 72-87). USA: Business
Science Reference (an imprint of IGI Global).
Teixeira, J. P., Santos, N., and Fernandes, P. O. (2014). A comparison of linear and non linear
models to forecast the tourism demand in the North of Portugal. Revista de Ciencias
Administrativas: Teoría y praxis, 10(2), 91-104. doi:ISSN 1405-924X
The World Bank. (2019). Taking stock: Recent Economic Development of Vietnam. Special focus:
Vietnam´s Tourism Developments. Hanoi, Vietnam: World Bank Group.
Tideswell, C., Mules, T., and Faulkner, B. (2001). An integrative approach to tourism forecasting: A
glance in the rearview mirror. Journal of Travel Research, 40(2), 162-171.
Truong, V., and Le, A. (2017). The evolution of tourism policy in Vietnam, 1960-2015. Em C. M. Hall,
The Routledge Handbook of Tourism in Asia (pp. 202-204). Routledge.
Tsaur, R. C., and Kuo, T. C. (2011). The adaptive fuzzy time series model with an application to
Taiwan’s tourism demand. Expert Systems with Applications, 38(8), 9164-9171.
Tsui, W. H., Balli, H. O., Gilbey, A., and Gow, H. (2014). Forecasting of Hong Kong airport's
passenger throughput. Tourism Management, 42, 62-76.
Tukamushaba, E., Lin, V., and Bwire, T. (2013). Modeling and forecasting inbound tourism demand
for long- haul markets of beijing. Journal of China Tourism Research, 9(4), 489-506.
67
UNWTO. (2004). Tourism Highlights. Madrid: World Tourism Organization.
UNWTO. (2020a). ALULA framework for inclusive community development through tourism.
UNWTO.
UNWTO. (2020b). World Tourism Barometer and Statistical Annex.
UNWTO. (2021). The World Tourism Organization (UNWTO). Retrieved November 26, 2021, from
https://www.unwto.org/glossary-tourism-terms
Uysal, M., and Crompton, J. L. (1985). An overview of approaches used to forecast tourism demand.
Journal of Travel Research, 23(4), 7-15.
Van Doorn, J. W. (1984). Tourism forecasting and the policymaker: Criteria of usefulness. Tourism
Management, 5(1), 24-39.
Vanegas, M. (2013). Co-integration and error correction estimation to forecast tourism in El Salvador.
Journal of Travel and Tourism Marketing, 30(6), 523-537.
Vanhove, N. (1980). Forecasting in tourism. The Tourist Review, 35(3), 2-7.
Vietnam National Administration of Tourism. (2015). Vietnam Tourism Annual Report 2015. Hanoi,
Vietnam.
Vietnam National Administration of Tourism. (2016). Vietnam Tourism Annual Report 2016. Hanoi,
Vietnam.
Vietnam National Administration of Tourism. (2019). Vietnam Tourism Annual Report 2019. Hanoi:
Labour Publishing House.
Wan, S., and Song, H. (2018). Forecasting turning points in tourism growth. Annals of Tourism
Research, 72, 156-167.
Witt, S. F. (1995). Forecasting tourism demand: A review of empirical research. International Journal
of Forecasting 11, 447-457.
Wong, K. K., Song, H., and Chon, K. S. (2006). Bayesian models for tourism demand forecasting.
Tourism Management, 27(5), 773-780.
World Bank. (2020). What will be the new normal for Vietnam: The economic impact of COVID-19.
Hanoi: World Bank.
World Economic Forum. (2019). Travel and Tourism Competitiveness Report and Index benchmarks:
Travel and Tourism at a Tipping Point. Geneva: World Economic Forum’s Platform for Shaping
the Future of Mobility.
Worldometer. (2021). Worldometers COVID-19 Corona Virus Pandemic. (Worldometer) Retrieved
from https://www.worldometers.info/coronavirus/
Wu, D. C., Song, H., and Shen, S. (2017). New developments in tourism and hotel demand modeling
and forecasting. International Journal of Contemporary Hospitality Management, 29(1),
507-529. doi:10.1108/IJCHM-05-2015-0249

68
Yeoman, I., Lennon, J. J., Blake, A., Galt, M., Greenwood, C., and McMahon-Beattie, U. (2007). Oil
depletion: What does this mean for Scottish tourism? Tourism Management, 28(5),
1354-1365.
Zhang, C., Wang, S., Sun, S., and Wei, Y. (July de 2020). Knowledge mapping of tourism demand
forecasting research. Tourism Management Perspectives, 35(January), 100715.
doi:https://doi.org/10.1016/j.tmp.2020.100715
Zhang, G., Patuwo, B. E., and Hu, M. Y. (1998). ). Forecasting with artificial neural networks: The
state of the art. International Journal of Forecasting, 14(1), 35-62.
Zhang, H., and Li, J. (2012). Prediction of Tourist Quantity Based on RBF Neural Network. Journal
of Computers, 7. doi:10.4304/jcp.7.4.965-970
Zhang, Y., Li, G., Muskat, B., and Law, R. (2021). Tourism Demand Forecasting: A Decomposed
Deep Learning Approach. Journal of Travel Research, 60(5), 981-997.
Zhu, L., Lim, C., Xie, W., and Wu, Y. (2018). Modelling tourist flow association for tourism demand
forecasting. Current Issues in Tourism, 21(8), 902-916.
doi:https://doi.org/10.1080/13683500.2016.1218827


