Embed Size (px)
Citation preview
An assessment of ecosystem services of Corbett Tiger Reserve,India
Ruchi Badola • Syed Ainul Hussain •
Bidyut Kumar Mishra • Bidyarani Konthoujam •
Sneha Thapliyal • Parag Madhukar Dhakate
� Springer Science+Business Media, LLC 2010
Abstract This paper examines the economic value of
selected ecosystem services of Corbett Tiger Reserve, India.
The direct cost was derived from secondary sources, and
indirect and opportunity costs through socioeconomic sur-
veys. For recreational value the individual approach to travel
cost method was used, and to assess carbon sequestration the
replacement cost method was used. The maintenance cost of
the reserve was estimated as US $2,153,174.3 year-1. The
indirect costs in terms of crop and livestock depredation by
wild animals ranged from US $2,408 to US $37,958 vil-
lage-1 over a period of 5 years. The dependence of local
communities was for fuel wood (US $7,346 day-1), fodder
(US $5,290 day-1), small timber, and other nontimber for-
est products. The recreational value of the reserve was
estimated as US $167,619 year-1. With the cost per visitor
being US $2.5, the consumers’ surplus was large, showing
the willingness of visitors to pay for wildlife recreation. The
forests of the reserve mitigate carbon worth US $63.6 mil-
lion, with an annual flow of US $65.0 ha-1 year-1. The
other benefits of the reserve include US $41 million through
generation of electricity since 1972. The analysis reveals
that, though the benefits outweigh costs, they need to be
accrued to local communities so as to balance the distribu-
tion of benefits and costs.
Keywords Ecosystem services � Protected areas �Corbett Tiger Reserve � Economic valuation �Local community � Costs and benefits
1 Introduction
The concept of ecosystem services provides a robust ratio-
nale for biodiversity conservation complementary to tradi-
tional arguments based on intrinsic value. In principle, it also
provides a mechanism for optimizing investments in biodi-
versity conservation and directing them to where they are
most useful (Kinzig et al. 2007). This requires the valuation
of ecosystem services, and in particular, the contribution that
biodiversity makes to that value. The establishment of pro-
tected areas (PAs) forms the cornerstone of the strategy for
biodiversity conservation; however, in economic and
development terms, it is difficult to justify the costs involved.
In most countries, development imperatives favor uses of
land, natural resources, and funds that yield immediate and
demonstrable financial returns. Given society’s increasing
demands for employment, income, and infrastructure,
development decisions tend to maximize short-term eco-
nomic gains. Prices generated for natural resources often do
not reflect the true social costs and benefits of resource use,
convey misleading information about resource scarcity, and
provide inadequate incentives for management, efficient use,
and conservation of natural resources (Panayotou 1993).
When PAs are undervalued, their conservation appears to be
less desirable in development terms. Because it is difficult to
demonstrate the high economic value of PAs or to make the
case for PAs as an option that economically benefits land,
resource, and investment, it is also difficult to argue for their
establishment, to ensure that they are managed sustainably,
or to defend them against conversion to other land uses.
R. Badola � S. A. Hussain (&) � B. K. Mishra � B. Konthoujam
Wildlife Institute of India, Post Box #18, Dehra Dun,
Uttarakhand 248 001, India
e-mail: [email protected]
S. Thapliyal
Indian Institute of Management, Bannerghatta Road, Bangalore,
Karnataka 560076, India
P. M. Dhakate
Corbett Tiger Reserve, Ramnagar, Uttarakhand 244715, India
123
Environmentalist
DOI 10.1007/s10669-010-9278-5
Protected areas generate significant economic, environ-
mental, and social benefits (Myers 1990; Dudley and
Stolton 2005). These benefits are realized at local, national,
and global levels. However, people living in and around
PAs, while deriving little benefits from conservation, pay
enormous costs in terms of lost access to their life-support
system, particularly in developing Third World countries
(Wells 1992; Brockington 2002). Three types of costs are
associated with PAs, viz. direct costs that include acqui-
sition costs, management costs, and transaction costs;
indirect costs associated with damage to economic activi-
ties arising from conservation, for example, damage to
crops, livestock, and human beings from wild animals
living in PAs adjacent to human settlements (Hoare 2000;
Naughton et al. 1999); and opportunity costs or benefits
forgone from the next best use of the resource: in case of
terrestrial PAs, the highest extractive value of that land
(Naidoo et al. 2006; Adams et al. 2010). Unless the costs of
conservation are assessed and it is clear who pays these
costs and what they get in return, conservation interven-
tions will not be effective. Compensation for impoverish-
ment caused by PAs requires knowledge as to who has
been affected and how it has influenced their lives.
Appreciation of the multiple benefits of conservation will
be incomplete without good understanding of the costs
involved. Hence, measures devised to conserve biodiver-
sity must provide economic incentives to increase net local
benefits from conservation and sustainable resource use,
along with good community engagement and education.
To ensure their sustainability and develop rational nat-
ural resource use policies, valuation of ecosystem services
provided by PAs has become an essential analytical tool.
Ecosystem services are the processes and conditions of
natural ecosystems that support human activity and sustain
human life (Daily 1997). The type, quality, and quantity of
services provided by an ecosystem are affected by resource
use decisions of individuals and communities (Jack et al.
2008). At the landscape level, conservation of biodiversity
and maintaining the sustained flow of ecosystem services
that it provides are now increasingly becoming the focus of
ecosystem-based natural resource management (Ehrlich
and Wilson 1991; Fisher et al. 2008). Some recent studies
have attributed the sustained flow of services to the health
of ecosystems resulting from improved conservation
(Naidoo and Ricketts 2006; Chan et al. 2006). Despite the
vital importance of ecosystem services, there has not been
much progress in incorporating these into conservation
planning, largely due to poor characterization of the flow of
services from conserved ecosystems such as PAs (Chan
et al. 2006). Inclusion of ecosystem services in conserva-
tion planning would provide opportunities for biodiversity
protection (Naidoo et al. 2006) as well as for advancing
human well-being. Valuation of ecosystem services can
help resource managers deal with the effects of market
failures, by putting a price on use and nonuse values, which
otherwise are generally hidden from traditional economic
accounting (Daily et al. 1997).
Cost–benefit analyses, where the economic costs and
benefits of conservation are estimated and incorporated
into decision-making, would help planners to make
informed decisions regarding allocation of resources to PA
conservation as well as to understand their distributional
impacts. They would also indicate the overall economic
efficiency of various competing uses of natural resources
and thereby help society to make informed choices about
trade-offs (Loomis 2000; Christe et al. 2006; Pearce 2001;
OECD 2001). This approach can also identify marginalized
stakeholders who threaten natural resources due to unsus-
tainable use and indicate ways of capturing the values
derived by beneficiaries, thereby guiding management
practices in terms of efficiency and distributional impacts
(Howarth and Farber 2002; Costanza 2001; Costanza and
Folke 1997).
India has a large number of PAs which correspond to
International Union for Conservation of Nature (IUCN)
categories II, IV, and VI. The first among these is Corbett
National Park. Established as India’s first national park on
August 8, 1936, it was named Hailey National Park after
Sir William Malcolm Hailey, then governor of Uttar
Pradesh State, who was instrumental in its creation. Fol-
lowing independence, its name was changed to Ramganga
National Park in 1954 and then in 1957 to its present name,
Corbett National Park, in memory of Jim Corbett, the
legendary hunter and naturalist. With the launching of
Project Tiger on April 1, 1973, the park was selected as
one of the nine tiger reserves. Since then it has been
known as Corbett Tiger Reserve (CTR), comprising
Corbett National Park (520.82 km2), Sonanadi Wildlife
Sanctuary (301.18 km2), and a buffer zone (466.32 km2).
The present paper (a) examines the costs associated with
the maintenance of CTR, India, (b) evaluates some con-
sumptive and nonconsumptive benefits derived from the
reserve, and (c) assesses the awareness and perceptions of
key stakeholders, i.e., local communities and tourists,
regarding the ecosystem services of CTR.
2 Study area
CTR is situated in the ecologically important Bhabar-Terai
Region, a strip of land skirting the southern part of the
Shivalik Mountains in northern India. It is located in the
Kumaon and Pauri-Garhwal Regions of Uttarakhand State
in the foothills of the Central Himalayas. The geographical
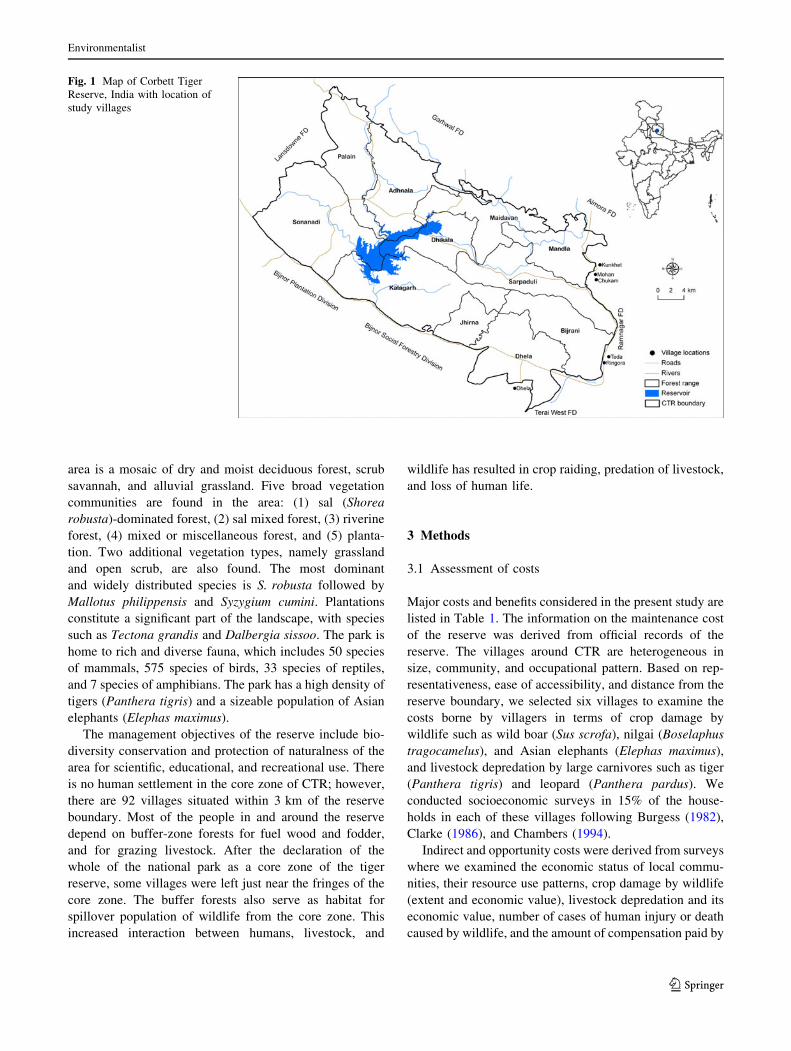
extent of the area is from 78�050E to 79�080E longitude and
29�250N to 29�480N latitude (Fig. 1). The vegetation of the
Environmentalist
123
area is a mosaic of dry and moist deciduous forest, scrub
savannah, and alluvial grassland. Five broad vegetation
communities are found in the area: (1) sal (Shorea
robusta)-dominated forest, (2) sal mixed forest, (3) riverine
forest, (4) mixed or miscellaneous forest, and (5) planta-
tion. Two additional vegetation types, namely grassland
and open scrub, are also found. The most dominant
and widely distributed species is S. robusta followed by
Mallotus philippensis and Syzygium cumini. Plantations
constitute a significant part of the landscape, with species
such as Tectona grandis and Dalbergia sissoo. The park is
home to rich and diverse fauna, which includes 50 species
of mammals, 575 species of birds, 33 species of reptiles,
and 7 species of amphibians. The park has a high density of
tigers (Panthera tigris) and a sizeable population of Asian
elephants (Elephas maximus).
The management objectives of the reserve include bio-
diversity conservation and protection of naturalness of the
area for scientific, educational, and recreational use. There
is no human settlement in the core zone of CTR; however,
there are 92 villages situated within 3 km of the reserve
boundary. Most of the people in and around the reserve
depend on buffer-zone forests for fuel wood and fodder,
and for grazing livestock. After the declaration of the
whole of the national park as a core zone of the tiger
reserve, some villages were left just near the fringes of the
core zone. The buffer forests also serve as habitat for
spillover population of wildlife from the core zone. This
increased interaction between humans, livestock, and
wildlife has resulted in crop raiding, predation of livestock,
and loss of human life.
3 Methods
3.1 Assessment of costs
Major costs and benefits considered in the present study are
listed in Table 1. The information on the maintenance cost
of the reserve was derived from official records of the
reserve. The villages around CTR are heterogeneous in
size, community, and occupational pattern. Based on rep-
resentativeness, ease of accessibility, and distance from the
reserve boundary, we selected six villages to examine the
costs borne by villagers in terms of crop damage by
wildlife such as wild boar (Sus scrofa), nilgai (Boselaphus
tragocamelus), and Asian elephants (Elephas maximus),
and livestock depredation by large carnivores such as tiger
(Panthera tigris) and leopard (Panthera pardus). We
conducted socioeconomic surveys in 15% of the house-
holds in each of these villages following Burgess (1982),
Clarke (1986), and Chambers (1994).
Indirect and opportunity costs were derived from surveys
where we examined the economic status of local commu-
nities, their resource use patterns, crop damage by wildlife
(extent and economic value), livestock depredation and its
economic value, number of cases of human injury or death
caused by wildlife, and the amount of compensation paid by
Fig. 1 Map of Corbett Tiger
Reserve, India with location of
study villages
Environmentalist
123
the government. Resource dependency of local people on
the forests for fire wood, fodder, and other nonwood forest
products (NWFP) was also examined to analyze the benefits
derived by people from the reserve. Information on price of
fuel wood and fodder was collected from the local market.
Calculations were done by considering 100 kg of fuel wood
at US $5.0 and 100 kg of fodder at US $2.5. Income from
and damage to agricultural produce was estimated by con-
sidering the market price of paddy and wheat. The gov-
ernment support price for wheat is US $14 per 100 kg and
for paddy US $11 per 100 kg. Loss of livestock was con-
verted into monetary terms by considering the current
market price of livestock and calculating the net loss. If any
compensation had been paid, this was accounted for while
calculating the net loss. The market price of different types
of livestock at different maturity levels varied, but for the
present study, the market price of a buffalo of local breed
was averaged at US $300, a cow at US $125, a subadult
buffalo at US $50, a calf at US $25, and a bull at US $62.
The compensation amount was US $62 for a buffalo,
US $30 for a cow, US $11 for a calf, and US $20 for a
subadult buffalo. Table 1 lists the major costs and benefits
of CTR considered in this study as well as the methods used.
3.2 Recreational benefits
The individual approach to travel cost method (TCM) was
opted to estimate the worth of CTR for recreational pur-
poses (Brown and Nawas 1973; Dobbs 1993; Sohrabi et al.
2009). TCM assumes that the value of the site or its recre-
ational services is reflected in how much people are willing
to pay to reach it. It is referred to as a ‘‘revealed preference’’
method, because it uses actual behavior and choices to infer
values. Thus, people’s preferences are revealed by their
choices. The basic premise of the travel cost method is that
the time and travel cost expenses that people incur to visit a
site represent the ‘‘price’’ of access to the site. Thus, peo-
ple’s willingness to pay to visit the site can be estimated
based on the number of trips that they make at different
travel costs (Hecht 1999). This is analogous to estimating
people’s willingness to pay for a marketed good based on
the quantity demanded at different prices.
Primary data on the place of origin of tourists, group
composition, educational level, income, reasons for visit,
and travel expenses were generated by randomly inter-
viewing 308 tourists at the three entrance gates of the
reserve. Secondary data on entrance fees, average distance
of CTR from major cities, and annual tourist visitation for
the year 2004–2005 were collected from the CTR office,
Ramnagar. The average cost of travel and average cost of
time spent on that travel by the visitors (Iamtrakul et al.
2005) were derived from these data sets. Using the total
cost of travel and number of visitors, a regression graph
was plotted. The equation of the regression curve was
analyzed to work out the consumer’s surplus (at different
hypothetical entrance fee values), which gave the eco-
nomic benefit of CTR to the visitors. The total cost of
travel was calculated for each tourist by adding the travel
cost and the monetary value of the time spent in travel to
get to CTR. The travel cost was the round-trip cost by the
mode of transportation used, while the cost of time spent
was estimated from the average wage per hour and the time
spent on the round trip. Summed together, these gave the
total cost of travel. This did not include the cost of stay at
CTR, the entrance fee, or the cost of taking a safari into the
park.
Visitors being interviewed for the travel cost calculation
were also asked to state the principle benefits of CTR from
their perspective. Similarly, 100 villagers from villages
surrounding the reserve were asked to state the prime
advantage of the reserve to them.
3.3 Carbon sequestration
To derive the carbon sequestration value of the forests
of the reserve we used the replacement cost approach
Table 1 Major costs and benefits considered in this study
Cost/benefit Description Method of study
Direct costs Budget outlays and maintenance costs;
costs of land acquisition
Review of records and other secondary information
Indirect costs Cost of crop damage, livestock depredation,
loss of life and property
Household survey and secondary information
Opportunity costs Foregone outputs from PAs in terms of forestry products
and/or alternative use of the area
Household survey and assessment of alternative
land use options
Direct use value Fuel wood, fodder grazing, and revenue generation Household survey
Recreation benefits Travel cost method
Indirect use value Carbon sequestration Replacement cost method
Watershed protection Review of records and other secondary information
Increased soil fertility Household survey and secondary information
Environmentalist
123
(Bann 1997). This method assigns a value to the environ-
mental service by estimating the cost of replacing the
environmental benefit with alternatives (Dixon and
Sherman 1990). It focuses on the costs of providing man-
made substitutes for ecosystem services and regards the
value of an ecosystem service as the price of the cheapest
alternative (Woodward and Wui 2001; Hussain and Badola
2008). Following Lal and Singh (2003), the total growing
stock of the forest was multiplied by an expansion ratio
(ER) to derive the total biomass, including branches, twigs,
and foliage. The ER is applied to account for nonstem
biomass which is not accounted for in volume estimation.
In this study the ER value was determined on the basis of
earlier studies in India, Nepal, and Myanmar (Cannell
1982; Singh and Negi 1997), being 1.16 for Shorea
robusta, 1.34 for Tectona grandis, 1.25 for conifers, 1.40
for broadleaved species, and 1.32 for hardwood mixed with
conifers. To convert the aboveground biomass into dry
matter, it was multiplied by a conversion ratio (CR), which
is a constant (0.5) for mixed forests (IPCC 1996). The CR
is defined as the ratio of aboveground oven-dry biomass of
entire tree to oven-dry biomass of inventoried volume or
growing stock (FAO 1997). This value was then divided by
the area of forests and discounted at 10% to obtain the
annual flow of carbon in CTR forests. This gave the worth
of additional aboveground carbon stored in the forests of
CTR on an annual basis, which was 3.84 million tons, after
deducting biomass extracted for fuel and fodder by local
communities (*2,000 ton).
The carbon content of live matter was calculated by
taking the carbon fraction in biomass as 0.5. The carbon
content was multiplied by 44/12 to obtain tons of CO2
stored. Monetary value was converted into annual flows by
discounting it at a market interest rate of 10% (IPCC 1996).
We used the average costs (US$ t-1) of CO2 mitigation
as per the existing market price of certified emission
reductions (CER) from registered projects in India, which
is the second largest market for Clean Development
Mechanism (CDM) projects. Prices for CERs from regis-
tered projects were quoted between €13–16 (US $17–21)
during 2008 (Tvinnereim et al. 2009).
3.4 Other indirect benefits
Data regarding the average yield of agricultural crops and
fertilizer used were collected from inhabitants of sur-
rounding villages. The total number of visitors in the last
5 years and the revenue generated were obtained from the
CTR Head Office at Ramnagar. The details about the
Kalagarh Dam on Ramganga River and the amount of
electricity generated were collected from the Irriga-
tion Department at Kalagarh. Data regarding direct benefits
and employment generated were taken from secondary
sources.
4 Results
4.1 Socioeconomic characteristics of the villages
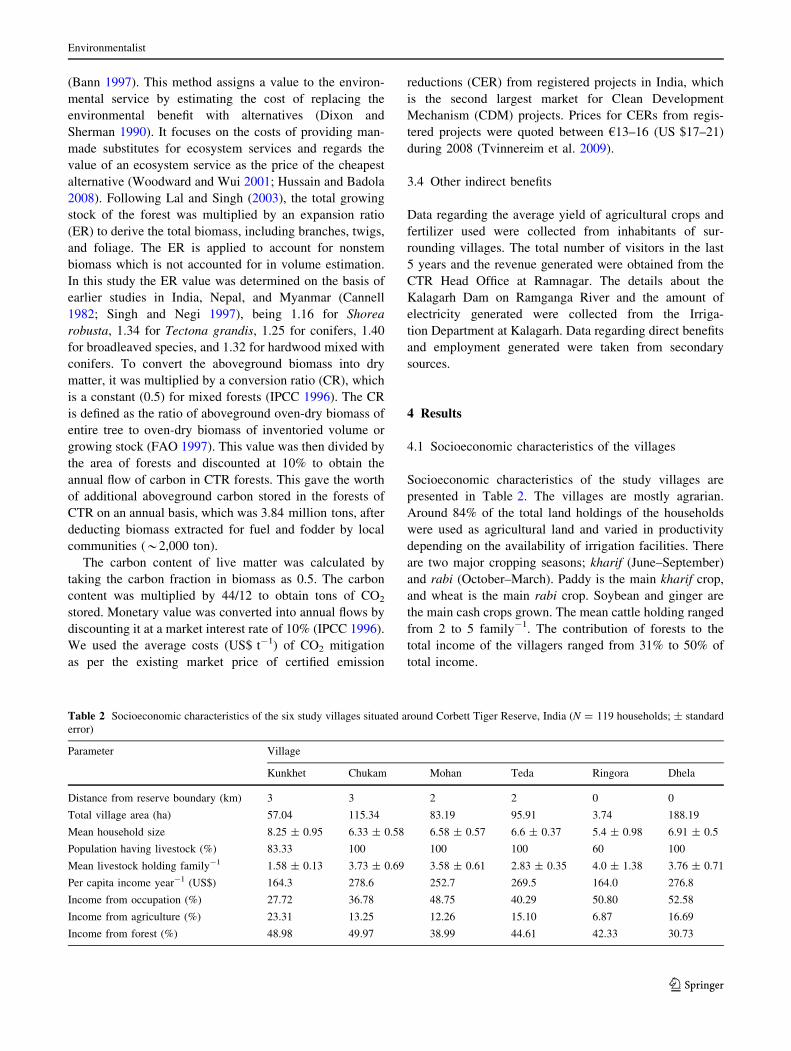
Socioeconomic characteristics of the study villages are
presented in Table 2. The villages are mostly agrarian.
Around 84% of the total land holdings of the households
were used as agricultural land and varied in productivity
depending on the availability of irrigation facilities. There
are two major cropping seasons; kharif (June–September)
and rabi (October–March). Paddy is the main kharif crop,
and wheat is the main rabi crop. Soybean and ginger are
the main cash crops grown. The mean cattle holding ranged
from 2 to 5 family-1. The contribution of forests to the
total income of the villagers ranged from 31% to 50% of
total income.
Table 2 Socioeconomic characteristics of the six study villages situated around Corbett Tiger Reserve, India (N = 119 households; ± standard
error)
Parameter Village
Kunkhet Chukam Mohan Teda Ringora Dhela
Distance from reserve boundary (km) 3 3 2 2 0 0
Total village area (ha) 57.04 115.34 83.19 95.91 3.74 188.19
Mean household size 8.25 ± 0.95 6.33 ± 0.58 6.58 ± 0.57 6.6 ± 0.37 5.4 ± 0.98 6.91 ± 0.5
Population having livestock (%) 83.33 100 100 100 60 100
Mean livestock holding family-1 1.58 ± 0.13 3.73 ± 0.69 3.58 ± 0.61 2.83 ± 0.35 4.0 ± 1.38 3.76 ± 0.71
Per capita income year-1 (US$) 164.3 278.6 252.7 269.5 164.0 276.8
Income from occupation (%) 27.72 36.78 48.75 40.29 50.80 52.58
Income from agriculture (%) 23.31 13.25 12.26 15.10 6.87 16.69
Income from forest (%) 48.98 49.97 38.99 44.61 42.33 30.73
Environmentalist
123
4.2 Direct and indirect costs
Between the years 2004–2005 and 2006–2007, the mean
maintenance cost of the reserve was US $2,153,174.3, of
which US $1,015,873 (47.2%) was spent on staff salaries
and US $1,137,301.3 (52.8%) on actual management of the
reserve (Table 3). Most of the funds came from the gov-
ernment, and the resources generated from the reserve were
deposited with the government. During 2000–2004, a total
of 1,003 cases of crop damage by wildlife were reported.
About 88% of all respondents said that their fields were
raided by wild animals. This covers an area of 110.9 ha of
crop land. The cases were largely crop damage by elephants
which stray into cultivated areas. The government com-
pensates at the prevailing market price of US $0.11 kg-1
for paddy and US $0.14 kg-1 for wheat. Crops damaged by
other wildlife went unreported, as there was no provision of
compensation for losses incurred due to these. The eco-
nomic loss ha-1 is the sum total of losses (kg ha-1) of
paddy and wheat damage, multiplied by their respective
market price (Table 4).
During 2000–2004, a total of 2,283 cases of cattle dep-
redation were recorded in the villages surrounding CTR.
The cattle kills were generally attributed to tigers in the
plains and leopards in the hills. Around 98% of the livestock
loss was attributed to tigers, while leopards accounted for
only 2.04%. About 41% of the respondents reported loss of
livestock in the last 5 years. From April 1999 to March
2004, 5 people were killed and 13 injured, mostly by tigers.
Net loss due to livestock depredation ranged from
US $603 to US $11,633 per village over a 5-year period
(Table 4). The indirect costs in terms of crop and livestock
depredation by wild animals ranged from US $2,408 to
US $37,958 village-1 over a 5-year period (Table 4).
4.3 Provision of biomass
Of all households surveyed in the six villages (N = 119),
97.6% were wholly or partially dependent on forest for fuel
wood. Of all households owning livestock (N = 113),
94.7% were wholly or partially dependent on forest for
fodder. In the study area, 63.9% of the population was
wholly or partially dependent on forest for small timber.
The cost of fuel wood derived from forest by these villages
was US $7,346 day-1. Around 50% of cattle were grazed
only in forest, while 34.2% were grazed both in forest and
on fallow land. Even if all cattle were not grazed in forest,
the majority of fodder requirement was met by forest.
Thus, fodder from the buffer zone of the reserve fed, by
either grazing or extraction, *10,580 cattle day-1. The
average fodder consumption per cattle was 20 kg day-1.
The cost of fodder derived from the forest came to
US $5,290 day-1. Bhabhar (Eulaliopsis binata), a seasonal
grass, was extracted in summer, with value added by local
people by making it into rope, supplementing their liveli-
hoods at the rate of US $12 per 100 kg.
4.4 Revenue generated from tourism
The total number of day visits to the reserve via all entry
gates during 2004–2005 was 110,000, generating revenue
Table 3 Maintenance cost
(US$) of Corbett Tiger Reserve,
India during 2004–2007
Year Maintenance cost Salaries Total
2006–2007 1,378,571 1,050,000 2,428,571
2005–2006 1,176,190 1,007,143 2,183,333
2004–2005 857,143 990,476 1,847,619
Mean ± standard error 1,137,301.3 ± 51,773.9 1,015,873 ± 17,728.8 2,153,174.3 ± 168,382.9
Table 4 Economic loss due to wildlife around Corbett Tiger Reserve, India during 2000–2004
Parameter Kunkhet Chukam Mohan Teda Ringora Dhela
Crop damage
Agricultural area (ha) 5.13 5.9 3.64 10.22 0.81 22.98
Losses ha-1 (US$) 1,776 1,737 1,477 15,265 833 1,146
Total loss (US$) 23,396 10,250 5,376 15,601 663 26,325
Livestock depredation
Total loss (US$) 1,143 976 2,310 1,417 1,476 13,238
Compensation paid (US$) 36 373 282 307 269 1,605
Net loss (US$) 1,107 603 2,028 1,110 1,745 11,633
Total loss due to crop and livestock depredation (US$) 24,503 10,853 7,404 16,711 2,408 37,958
Environmentalist
123
of US $432,541. The number of tourists increased from
132,000 in 2005–2006 to 144,000 in 2006–2007, with a
corresponding increase in revenue generated. Total revenue
generated from tourism in CTR from 2004 to 2007 was
US $1,458,732 (Table 5).
4.5 Recreational value
A total of 308 tourists were interviewed regarding their
cost of travel, distance traveled, time taken to reach the
destination, reason for travel, and number of visits in a
year. Table 6 presents a profile of the 308 tourists inter-
viewed. The number of visitors from different income
classes visiting CTR and their cost of travel was regressed
to obtain a demand curve. From the function obtained for
the demand curve y = 88,243 - 551.98x, we replaced the
value of the ticket fee with succeeding higher values to
obtain the consumer surplus. These values gave the final
demand curve, the area under which was about
US $167,619. This was the consumer surplus, which is the
difference between the price which one is willing to pay
and the price one actually pays. This was the economic
estimate of the recreational services of CTR. The average
number of visits per year during 2000–2005 was 77,612.
Hence, the average cost per visit was US $2.5.
4.6 Carbon sequestration
Table 7 summarizes the results of carbon stored as stand-
ing biomass in the forests of CTR. The minimum price
(US $17) of 2008 for CERs projects in India (Tvinnereim
et al. 2009) was taken to estimate the value of carbon
stored. This value was then divided by the area of forests
and discounted at 10% to obtain the annual flow of carbon.
This gave the amount of aboveground carbon stored in the
forests of CTR on an annual basis, which was 3.84 million
tons (Table 7). The total cost of CO2 mitigation by the
forests of the reserve was estimated as US $63.6 million,
with annual flow of US $65.0 ha-1 year-1.
Table 5 Direct benefits derived by Corbett Tiger Reserve, India from
tourism during 2004–2007
Year Number of tourists Revenue (US$)
2006–2007 144,000 564,286
2005–2006 132,000 461,905
2004–2005 110,000 432,541
Mean ± standard error 128,666.7 ± 9,955.5 486,244 ± 39,931.1
Table 6 Profile of the 308 tourists interviewed at Corbett Tiger Reserve, India (values in parentheses indicate number of tourists in that
category)
Tourist category
I II III IV V
Annual income (US$) \2,285 (1) 2,286–4,572 (49) 4,572–7,143 (80) 7,143–11,429 (101) [11,429 (77)
Distance traveled to reach
CTR (km)
\400 (136) 400–800 (20) 800–1,200 (72) 1,200–1,600 (4) 1,600–2,000 (76)
Reasons for visiting CTR Nature appreciation (90) Tiger attraction (49) Leisure (92) En route (45) Educational tour (32)
Cost of travel time
(US$/individual)
\25 (164) 25–50 (49) 50–75 (33) 75–100 (25) [100 (37)
Table 7 Estimation of carbon stored in the forests of Corbett Tiger Reserve, India
Forest type Area
(km2)
Growing
stock
(mt)
Expansion
ratio (ER)
Conversion
ratio (CR)
Aboveground
forest biomass
(mt)
Aboveground
forest biomass
density (t/ha)
Aboveground
crop biomass
density (t/ha)
Net change
in biomass
(mt)
CO2
stored
(mt)
Shorearobusta
544.92 2.565 1.16 0.720 2.142 39.309 10 1,597,106.028 2.928
Tropical dry
deciduous
forest
433.29 1.345 1.45 0.500 0.975 22.502 10 498,370.158 0.914
Total 978.21 3.842
Source: (a) Forest types and extent: Mathur and Tiwari (1979), (b) growing stock: Mathur and Tiwari (1979), (c) expansion and conversion ratio:
Cannell (1982), Singh and Negi (1997), Lal and Singh (2003)
mt million tons
Environmentalist
123
4.7 Catchment protection
The reserve has Ramganga, Sonanadi, Mandal, and Palain
Rivers flowing through it. The length of Ramganga River is
627 km. A major part of its watershed (8,676 km2) is in
northern hilly parts of the reserve. The Ramganga Dam
Project at Kalagarh has generated over 8,200 kilowatt of
electricity with total earnings of US $41 million and over
88810.7 million m3 of water for irrigation since 1974,
without any direct investment in catchment treatment or
significant siltation problems.
4.8 Fixing and cycling of nutrients
Forests facilitate breakdown of various nutrients and help
them leach to nearby agricultural fields. This is evident in
the fertility of the agricultural fields in areas surrounding
CTR. Several farm lands in villages inside the buffer are
rain fed, with no fertilizers used. Average crop yield here is
about 2,000 kg ha-1 as compared with the national average
of 2,300 kg ha-1 even though the amount of fertilizer used
is low (125 kg ha-1 crop-1) as compared with the national
average of 450 kg ha-1 crop-1.
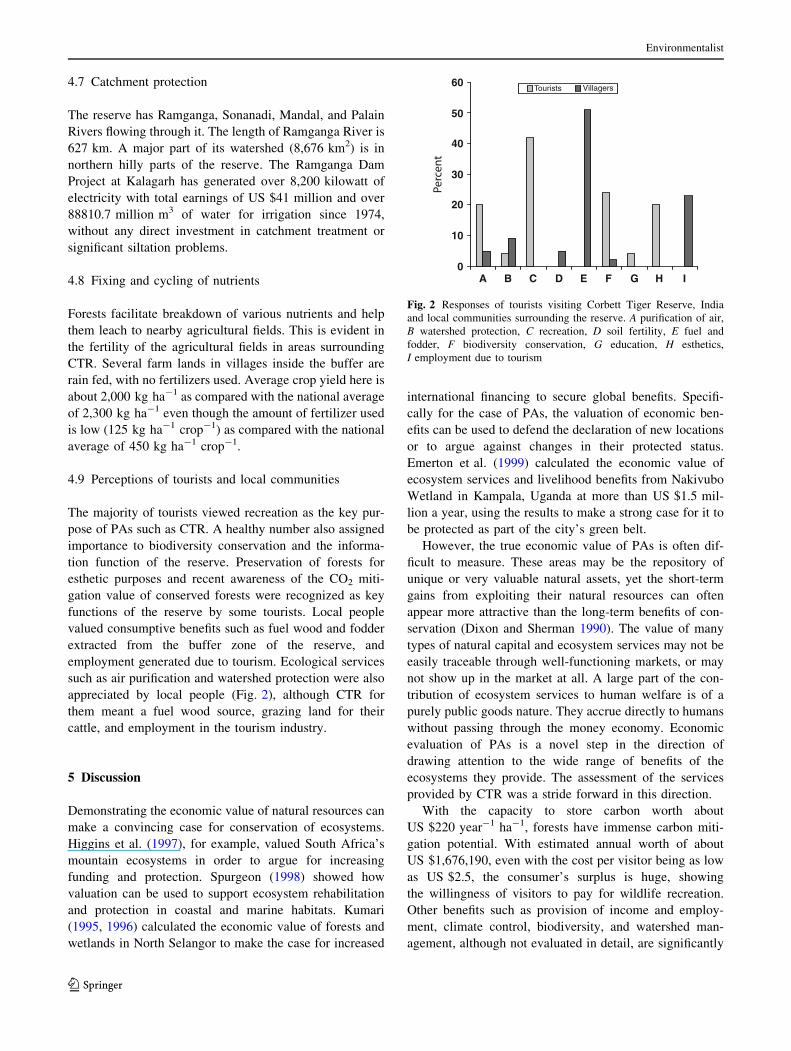
4.9 Perceptions of tourists and local communities
The majority of tourists viewed recreation as the key pur-
pose of PAs such as CTR. A healthy number also assigned
importance to biodiversity conservation and the informa-
tion function of the reserve. Preservation of forests for
esthetic purposes and recent awareness of the CO2 miti-
gation value of conserved forests were recognized as key
functions of the reserve by some tourists. Local people
valued consumptive benefits such as fuel wood and fodder
extracted from the buffer zone of the reserve, and
employment generated due to tourism. Ecological services
such as air purification and watershed protection were also
appreciated by local people (Fig. 2), although CTR for
them meant a fuel wood source, grazing land for their
cattle, and employment in the tourism industry.
5 Discussion
Demonstrating the economic value of natural resources can
make a convincing case for conservation of ecosystems.
Higgins et al. (1997), for example, valued South Africa’s
mountain ecosystems in order to argue for increasing
funding and protection. Spurgeon (1998) showed how
valuation can be used to support ecosystem rehabilitation
and protection in coastal and marine habitats. Kumari
(1995, 1996) calculated the economic value of forests and
wetlands in North Selangor to make the case for increased
international financing to secure global benefits. Specifi-
cally for the case of PAs, the valuation of economic ben-
efits can be used to defend the declaration of new locations
or to argue against changes in their protected status.
Emerton et al. (1999) calculated the economic value of
ecosystem services and livelihood benefits from Nakivubo
Wetland in Kampala, Uganda at more than US $1.5 mil-
lion a year, using the results to make a strong case for it to
be protected as part of the city’s green belt.
However, the true economic value of PAs is often dif-
ficult to measure. These areas may be the repository of
unique or very valuable natural assets, yet the short-term
gains from exploiting their natural resources can often
appear more attractive than the long-term benefits of con-
servation (Dixon and Sherman 1990). The value of many
types of natural capital and ecosystem services may not be
easily traceable through well-functioning markets, or may
not show up in the market at all. A large part of the con-
tribution of ecosystem services to human welfare is of a
purely public goods nature. They accrue directly to humans
without passing through the money economy. Economic
evaluation of PAs is a novel step in the direction of
drawing attention to the wide range of benefits of the
ecosystems they provide. The assessment of the services
provided by CTR was a stride forward in this direction.
With the capacity to store carbon worth about
US $220 year-1 ha-1, forests have immense carbon miti-
gation potential. With estimated annual worth of about
US $1,676,190, even with the cost per visitor being as low
as US $2.5, the consumer’s surplus is huge, showing
the willingness of visitors to pay for wildlife recreation.
Other benefits such as provision of income and employ-
ment, climate control, biodiversity, and watershed man-
agement, although not evaluated in detail, are significantly
0
10
20
30
40
50
60
A B C D E F G H I
Tourists Villagers
Fig. 2 Responses of tourists visiting Corbett Tiger Reserve, India
and local communities surrounding the reserve. A purification of air,
B watershed protection, C recreation, D soil fertility, E fuel and
fodder, F biodiversity conservation, G education, H esthetics,
I employment due to tourism
Environmentalist
123
important. At a time when PAs need to justify their des-
ignation and management, combining utilitarian needs with
wildlife management can provide an excellent argument
for protection and one that is likely to be increasingly
needed in the future (Dudley and Stolton 2005). This study
has also made an attempt to look at the cost–benefit dis-
tribution and the perception of key stakeholders, i.e.,
tourists and local people. It is clear that most of the costs of
CTR, i.e., indirect costs due to damage by wildlife as well
as opportunity costs in terms of lost access to their life-
support systems, are borne by local people, yet little direct
tangible benefits accrue to them. Use of forest resources by
local people is de facto and indiscriminate, and they have
no stake in conservation of the forests (Badola 1999).
Overuse of forests due to tenure insecurity as well as the
imbalance in cost–benefit distribution are major factors in
the lack of investment and interest in improving the pro-
ductivity of the system by local people (Badola and
Hussain 2003; Badola et al. 2000).
In order to apply valuation of ecosystem services to
support decision-making on ecosystem management, it is
necessary to explicitly consider the scales at which eco-
system services accrue to the different stakeholders, par-
ticularly in developing countries such as India, where a
large proportion of the population still remain dependent
on biomass resources for their livelihoods. Identification of
scales and stakeholders allows analysis of potential con-
flicts in environmental management, in particular between
local stakeholders and stakeholders at larger scales, par-
ticularly if services relevant at higher scales restrict use of
local production services. In the case of CTR, it may be
recreational, biodiversity, and watershed services that
restrict the use of forest by local stakeholders. Analysis of
the (opportunity) costs and benefits of ecosystem man-
agement for stakeholders at different scales also provides a
basis for determining the size of potential compensation
payments to local users (Hein et al. 2006).
Much needs to be researched upon to arrive at a value
closer to the actual worth of ecosystem services of CTR
and other PAs, which is currently the focus of our research.
When all factors are taken into account, most natural
ecosystems and PAs have a highly positive benefit-to-cost
ratio. It is therefore important to increase efforts to inves-
tigate the full economic value of PAs. Quantification of the
economic value of PAs can show whether goods and ser-
vices are currently underpriced and also can capture PA
benefits as cash values or monetary values as well as for
generating revenues. Prices and market measures can
provide an effective means of regulating the demand for
resources and incentives for sustainable management
(Brockington and Schmidt-Soltau 2004). Better informa-
tion on the economic value of PAs will most likely provide
an important incentive to allocate sufficient funds for their
continued conservation and to stimulate sustainable utili-
zation of the important functions of these areas (de Groot
1994). It would also provide adequate information to
resource managers and policy makers to adequately
address the issues of equity, efficiency, and sustainability
in biodiversity conservation.
Acknowledgments We would like to convey our gratitude to the
Director and Dean, Wildlife Institute of India for providing guidance
and support in executing this work. We gratefully acknowledge the
field support extended to us by Mr. Gyan Sarin, Director, Corbett
Foundation. We are grateful to Prof. Karin E. Limburg, Conference
Committee Coordinator, USEE Conference 2007 and President,
United States Society for Ecological Economics for her support and
encouragement and for finding funds for the participation of S.A.H. at
the USEE Conference. We thank two anonymous reviewers for their
comments and suggestions.
References
Adams VM, Pressey RL, Naidoo R (2010) Opportunity costs: who
really pays for conservation? Biol Conserv 143:439–448
Badola R (1999) People and protected areas in India. Unsalvya
199:12–15
Badola R, Hussain SA (2003) Conflict in paradise: women and
protected areas in the Indian Himalayas. Mt Res Dev 23(3):
238–239
Badola R, Bhardwaj AK, Mukherjee SK (2000) Integrating conser-
vation and development in protected area management—can we
do it? Indian For 126:1054–1067
Bann C (1997) The economic value of mangroves: a manual for
researchers. Economy and Environment Program for Southeast
Asia, Singapore
Brockington D (2002) Fortress conservation. The preservation of the
Mkomazi Game Reserve, Tanzania. James Currey, Oxford
Brockington D, Schmidt-Soltau K (2004) The social and environ-
mental impacts of wilderness and development. Oryx 38:
140–142
Brown WG, Nawas F (1973) Impact of aggregation on the estimation
of outdoor recreation demand functions. Am J Agric Econ
55:246–249
Burgess RG (1982) Field research: a source book and field manual.
George Allen and Unwin, London
Cannell MGR (1982) World forest biomass and primary production
data. Academic, London, pp 145–166
Chambers R (1994) Participatory rural appraisal (PRA): challenges,
potentials, and paradigm. World Dev 22:1437–1454
Chan KMA, Shaw MR, Cameron DR, Underwood EC, Daily GC
(2006) Conservation planning for ecosystem services. PLoS
Biology 4:2138–2152
Christe M, Hanley N, Warren J, Murphy K, Wright R, Hyde T (2006)
Valuing the diversity of biodiversity. Ecol Econ 58:304–317
Clarke R (1986) The handbook of ecological monitoring. Oxford
Science, Clarendon Press, Oxford
Costanza R (2001) Visions, values, valuation, and the need for an
ecological economics. Bioscience 51(6):459–468
Costanza R, Folke C (1997) Valuing ecosystem services with
efficiency, fairness and sustainability as goals. In: Daily GC
(ed) Nature’s services: societal dependence on natural ecosys-
tem. Island, Washington, DC
Daily GC (1997) Nature’s services: societal dependence on natural
ecosystem. Island, Washington, DC
Environmentalist
123
Daily GC, Alexander S, Ehrlich R, Goulder L, Lubchenco J, Matson
PA, Mooney HA, Postel S, Schneider SH, Tilman D, Woodwell
GM (1997) Ecosystem services: benefits supplied to human
societies by natural ecosystems. Issues Ecol 1(2):1–18
de Groot RS (1994) Functions and values of protected areas: a
comprehensive framework for assessing the benefits of protected
areas to human Society. In: Munasinghe M, McNeely J (eds)
Protected area economics and policy linking conservation and
sustainable development. The World Bank, Washigton, DC
Dixon JA, Sherman PB (1990) Economics of protected areas: a new
look at benefits and costs. Earthscan, London
Dobbs IM (1993) Individual travel cost method: estimation and
benefit assessment with a discrete and possibly grouped depen-
dent variable. Am J Agric Econ 75(1):84–94
Dudley N, Stolton S (2005) The role of forested protected areas in
supplying drinking water to the world’s biggest cities. In: Trzyna
T (ed) The urbane imperative. California Institute of Public
Affairs, Sacramento
Ehrlich PR, Wilson EO (1991) Biodiversity studies: science and
policy. Science 253(5021):758–762
Emerton L, Iyango L, Luwum P, Malinga A (1999) The economic
value of Nakivubo Urban wetland, Uganda. IUCN, The World
Conservation Union, Eastern Africa Regional Office, Nairobi
FAO (1997) Estimating biomass and biomass change of tropical
forests: a primer. FAO Forestry Paper No.134. Rome
Fisher B, Turner RK, Balmford A et al (2008) Integrating ecosystem
services and economic theory. Ecol Appl 18(8):2050–2067
Hecht JE (1999) The economic value of the environment: cases from
South Asia. IUCN, The World Conservation Union, Nepal
Country Office, Kathmandu
Hein L, van Koppen K, de Groot RS, van Ierland EC (2006) Spatial
scales, stakeholders and the valuation of ecosystem services.
Ecol Econ 57:209–228
Higgins SI, Turpie JK, Costanza R, Cowling RM, Le Maitre DC,
Marais C, Midgley GF (1997) An ecological economic simula-
tion model of mountain fynbos ecosystem: dynamics, valuation
and management. Ecol Econ 22(2):141–156
Hoare R (2000) African elephants and humans in conflict: the outlook
for co-existence. Oryx 34:134–138
Howarth RB, Farber S (2002) Accounting for the value of ecosystem
services. Ecol Econ 41:421–429
Hussain SA, Badola R (2008) Valuing mangrove ecosystem services:
linking nutrient retention function of mangrove forests to
enhanced agroecosystem production. Wetlands Ecol Manage
16:441–450
Iamtrakul P, Teknomo K, Hokao K (2005) Public park valuation
using travel cost method. Proc East Asia Soc Transp Stud
5:1249–1264
IPCC (1996) Revised guidelines for national greenhouse gas inven-
tories, reference manual, 5.1–5.53
Jack BK, Kousky C, Sims KRE (2008) Designing payments for
ecosystem services: lessons from previous experience with
incentive-based mechanisms. Proc Natl Acad Sci 105(28):
9465–9470
Kinzig A, Perrings C, Scholes B (2007) Ecosystem services and the
economics of biodiversity conservation. http://www.public.
asu.edu
Kumari K (1995) An environmental and economic assessment of
forest management option: a case study in Malaysia. Environ-
ment Department Papers No. 026. Environmental Economics
Series, World Bank, Washington, DC
Kumari K (1996) An application of the incremental cost framework to
biodiversity conservation: a wetland case study in Malaysia.
Working Paper GEC 95-15. Centre for Social and Economic
Research on the Global Environment, London
Lal AK, Singh PP (2003) Economic worth of carbon stored in above
ground biomass of India’s Forests. Indian For 129(7):874–880
Loomis JB (2000) Can environmental economic valuation techniques
aid ecological economics and wildlife conservation? Wildl Soc
Bull 28(1):52–60
Mathur RS, Tiwari RC (1979) Working plan for the West Kalagarh
Forest Division, Uttar Pradesh (1979–80 to 1988–89), Nainital
Working Plan Circle II, Uttar Pradesh, India
Myers N (1990) The biodiversity challenge: expanded hotspot
analysis. Environmentalist 10:243–256
Naidoo R, Ricketts TH (2006) Mapping the economic costs and
benefits of conservation. PLoS Biol 4(11):e360. doi:10.1371/
journal.pbio.0040360
Naidoo R, Balmford A, Ferraro PJ, Polasky S, Ricketts TH, Rouget M
(2006) Integrating economic costs into conservation planning.
Trends Ecol Evol 21(12):681–687
Naughton L, Rose R, Treves A (1999) The social dimensions of
human–elephant conflict in Africa: a literature review and two
case studies from Uganda and Cameroon. IUCN, Gland
OECD (2001) Valuation of biodiversity benefits: selected studies.
OECD, Paris
Panayotou T (1993) Green markets. ICEG, USA
Pearce D (2001) Valuing biological diversity: issues and overview.
In: OECD (ed) Valuation of biodiversity benefits. Selected
studies. OECD, Paris
Singh R, Negi JDS (1997) Biomass prediction and distribution of
organic matter in natural Cinnamomum camphora stand. Indian
For 123:1161–1170
Sohrabi SB, Yachkaschi A, Oladi D, Fard TS, Latifi H (2009) The
recreational valuation of a natural forest park using travel cost
method in Iran. Biogeosci For 2:85–92
Spurgeon JPG (1998) The socio-economic costs and benefits of
coastal habitat rehabilitation and creation. Mar Pollut Bull
37(8–12):373–382
Tvinnereim E, Roine K, Heimdal C (2009) Carbon 2009—emission
trading coming home. Point carbon. Oslo, pp 48
Wells MP (1992) Biodiversity conservation, affluence and poverty:
mismatched costs and efforts to remedy them. Ambio 21(3):
237–243
Woodward RT, Wui YS (2001) The economic value of wetland
services: a meta-analysis. Ecol Econ 37:257–270
Environmentalist
123