Embed Size (px)
Citation preview
Sethy‒Chauhan:Assessing habitat use by sun bears
- 215 -
APPLIED ECOLOGY AND ENVIRONMENTAL RESEARCH 14(1): 215-236. http://www.aloki.hu ● ISSN 1589 1623 (Print) ● ISSN 1785 0037 (Online)
DOI: http://dx.doi.org/10.15666/aeer/1401_215236
2016, ALÖKI Kft., Budapest, Hungary
ASSESSING HABITAT USE BY SUN BEARS IN NAMDAPHA
TIGER RESERVE, ARUNACHAL PRADESH, INDIA
SETHY, J.1*
‒ CHAUHAN, N. S.2
1P.G. Department of Zoology, North Orissa University,
Takatpur, Baripada, Mayurbhanj, Odisha
2Amity Institutes of Wildlife Sciences (AIWS), Amity University Campus, Sector-125,
Noida, 201 303, Gautam Buddha Nagar U.P. (India)
*Corresponding author:
e-mail: [email protected]
(Received 24th Mar 2015; accepted 6th Jan 2016)
Abstract. Malayan sun bear is one of the least known species, the population of which has dramatically
decreased. Their habitat loss was considered the main reason for the decline during the last decade, but
their habitat preferences are still not well known. The habitat use by sun bear was assessed based on
direct sightings and indirect evidences such as claw marks, scats, nests, dens, digging sign and foot prints
etc. in Namdapha Tiger Reserve. Six variables, namely elevation, slope, vegetation cover, distance to
water, human disturbance and terrain type were used to measure habitat conditions for the bear sign
locations sampled during the field surveys. The data on habitat use by sun bears collected from the 430
sample plots along the 43 transects showed maximum number of plots with bear signs in Tropical semi-
evergreen forest. Although sun bears showed some preference for Tropical semi-evergreen forest and
Tropical wet-evergreen forest habitat categories, but as such there was no preference or avoidance by
bears for rest of the habitat types. Among various habitat categories, the proportional availability of
Tropical semi-evergreen forest was found to be highest. In comparison to the availability of various
habitat types, the expected use of these habitat categories was found in proportion. The habitat use by sun
bear was assessed based on direct sightings and indirect evidences in Namdapha tiger reserve. Six
variables, namely elevation, slope, vegetation cover, distance to water, human disturbance & terrain type
were used to measure habitat conditions for the bear sign locations sampled during the field surveys. The
habitat use based on density of bear signs per hectare was highest in Tropical semi-evergreen forest
(0.271), followed by Tropical wet-evergreen forest (0.257), Semi-evergreen forest (0.195) Mix forest
(0.139), Temperate forest (0.112) & Bamboo forest (0.027). Habitat used by sun bear were calculated
using of fixed kernel method. Therefore its habitat composition resembled more that of the landscape, and
comparison between K95 and the study area revealed better habitat selection within the landscape (second
order selection). The proportions of two common habitat types (fields and spruce forests) differed
between the core areas used in the study. Comparison between the smallest core areas (K50) and (K99)
revealed best habitat preferences within the home range (third order habitat selection). Comparing the
distribution of individual location points in different habitats to the habitat composition of home ranges
did not reveal habitat preferences of sun bear.
Keywords: Ursus malayanus, human disturbance, terrain types, bear signs, habitat preference,
Namdapha
Introduction
Sun bear (Helarctos malayanus) remains the least known bear species in the world.
The sun bear is an Appendix I species of the Convention on International Trade in
Endangered Species of Wild Fauna and Flora (CITES) as a species in danger of
extinction which is or may be affected by international trade. The sun bear is among the
Schedule 1 animals in the Indian Wildlife Protection Act, 1972 and in IUCN 2009 Red
list of Threatened with extinction Species. The habitat utilization by bear species

Sethy‒Chauhan:Assessing habitat use by sun bears
- 216 -
APPLIED ECOLOGY AND ENVIRONMENTAL RESEARCH 14(1): 215-236. http://www.aloki.hu ● ISSN 1589 1623 (Print) ● ISSN 1785 0037 (Online)
DOI: http://dx.doi.org/10.15666/aeer/1401_215236
2016, ALÖKI Kft., Budapest, Hungary
showed varied patterns in different places. Sun bears rely mainly on tropical forest
habitat. Two ecologically distinct categories of tropical forest occur within its range,
distinguished by differences in climate, phenology, and floristic composition (IUCN
Red list, 2006).
Some observations have been reported of sun bear occurrence in secondary forests or
disturbed areas (Wong, 2002; Wong et al., 2004; Fredriksson, 2005), but the ages of
these forests, as well as the scale and frequency of use by these bears relative to their
overall populations, are important factors when analysing population-level patterns. Results concur with those of several other studies (Wilson and Wilson, 1975; Wilson
and Johns, 1982; Johns, 1983; Normua et al., 2003, 2004) that indicated sun bears
predominantly occur in primary forest. Wong et al. (2004) extrapolated across the sun
bear’s global range, concluding that the importance of primary forests for sun bear
survival is uncertain and that bears clearly occur in logged forests.
Sun bears also have been reported in mangrove forest, although their occurrence in
this forest type probably depends on proximity to other more favoured habitats. Sun
bears use selectively logged areas (Wong et al., 2004; Meijaard et al., 2005), and oil
palm plantations near forest edges (Nomura et al., 2004). However, there is no evidence
that sun bears can survive in deforested or agricultural areas in the absence of nearby
forest (Augeri, 2005). This can alter a bear’s movement dynamics through the landscape
and prohibit critical habitat use (Augeri, 2000a; Mattson et al., 1996; Boyce, 2000;
Augeri, 2002b). Sun bears are omnivores, and use habitats where they feed primarily on
termites, ants, beetle larvae, bee larvae and honey, and a large variety of fruit species,
especially figs (Ficus spp.), when available (Wong et al., 2002; Augeri, 2005;
Fredriksson et al., 2006a).
The dry lowland forests of Sumatra represent one of the most diverse yet threatened
habitats on earth. Harapan Rainforest (HRF) is an initiative, based in the southeast of
Sumatra that will conserve and restore the largest remaining tract of this habitat. The
site contains a population of Malayan Sun Bear, which is considered a high research
priority as it is the least known bear species in the world and is likely to play an
important role in seed dispersal and, hence, forest restoration at the site (Powell, 2011).
In India, the historic distribution of Malayan sun bears in the low land tropical forest
habitats of Manipur, Assam and Meghalaya (Higgins, 1932; Blanford, 1891; Pocock,
1941; Choudhry, 1989, 1992; Gee, 1967). Recently sun bears were reported to occur in
mainland South-East Asia as far west as Bangladesh and north-eastern India.
Occurrence of sun bear was reported in Manipur, Mizoram, Nagaland, Arunachal
Pradesh and Assam (Chuahan and Singh, 2005a, 2005b; Chauhan and Singh, 2006;
Chauhan and Lalthupuia, 2008; Chauhan and Sethy, 2011a, 2011b; Sethy and Chauhan,
2011, 2012a, 2012b, 2012c; Chauhan et al., 2012a, 2012b; Choudhury, 2011; Borah et
al., 2012; Karanth and Nicols, 2000).
Material and methods
Study area
The Eastern Himalayas and the hills of north-east India are recognized as a global
biodiversity hotspot. While north-east region occupies 8% of the country’s area, it
harbours 56% of its faunal diversity. Within this region, arguably the most biodiversity
rich state (the largest among the seven in north-east India, covering 83743 km2) is the
state of Arunachal Pradesh (26°28'-29°30'N and 91°30'-97°30'E).

Sethy‒Chauhan:Assessing habitat use by sun bears
- 217 -
APPLIED ECOLOGY AND ENVIRONMENTAL RESEARCH 14(1): 215-236. http://www.aloki.hu ● ISSN 1589 1623 (Print) ● ISSN 1785 0037 (Online)
DOI: http://dx.doi.org/10.15666/aeer/1401_215236
2016, ALÖKI Kft., Budapest, Hungary
Namdapha Tiger Reserve (Figure 1) is situated in the Changlang district of
Arunachal Pradesh and has common boundary with Kamlang wildlife sanctuary in the
north, Miao reserve forest (RF), Nampong RF, Diyun RF etc. in the west, forest areas of
Kachin Province of Myanmar in the south and unclassed state forest areas of
Gandhigram in the east. The total area of the reserve is 1985.25km2 (1807.82 km
2 core
and 177.43 km2 reserve forest area as buffer), delineated on the north south and south
east by the international boundary between Myanmar and Chaina.
Figure. 1. Map of study area of Namdapha Tiger Reserve, Arunachal Pradesh
To study the habitat use pattern of sun bear, the following methods have been used in
Namdapha Tiger Reserve.
Transect sampling
Monitoring of wildlife populations through sign records has been used in many
studies to determine population abundance and to quantify habitat use and availability
(Nams, 1989; Clevenger et al., 1997). Bear sign information was gathered along 43
transects with a length of 2 to 3 km each and 5m width. Placement of transects within
the study areas was stratified according to the area represented by each vegetation type
in the study area (Kendall et al., 1992). Given the poor accessibility within the study
area, starting locations for most transects were placed near the Gandhigram villages to
Namdapha and Dehing River or near the unpaved road that connects different village
with portions of the study area. Once we located the start of each transect, we followed
Sethy‒Chauhan:Assessing habitat use by sun bears
- 218 -
APPLIED ECOLOGY AND ENVIRONMENTAL RESEARCH 14(1): 215-236. http://www.aloki.hu ● ISSN 1589 1623 (Print) ● ISSN 1785 0037 (Online)
DOI: http://dx.doi.org/10.15666/aeer/1401_215236
2016, ALÖKI Kft., Budapest, Hungary
an upslope direction for those transects starting near the Namdapha and Dehing River
and a random direction for high-elevation transects.
Habitat variables
Habitat variables based on GIS technology are suitable tools to predict the presence
and relative use of bear habitat across large landscapes (Clark and van Manen, 1992),
particularly because such models are appropriate for generalist species (Donovan et al.,
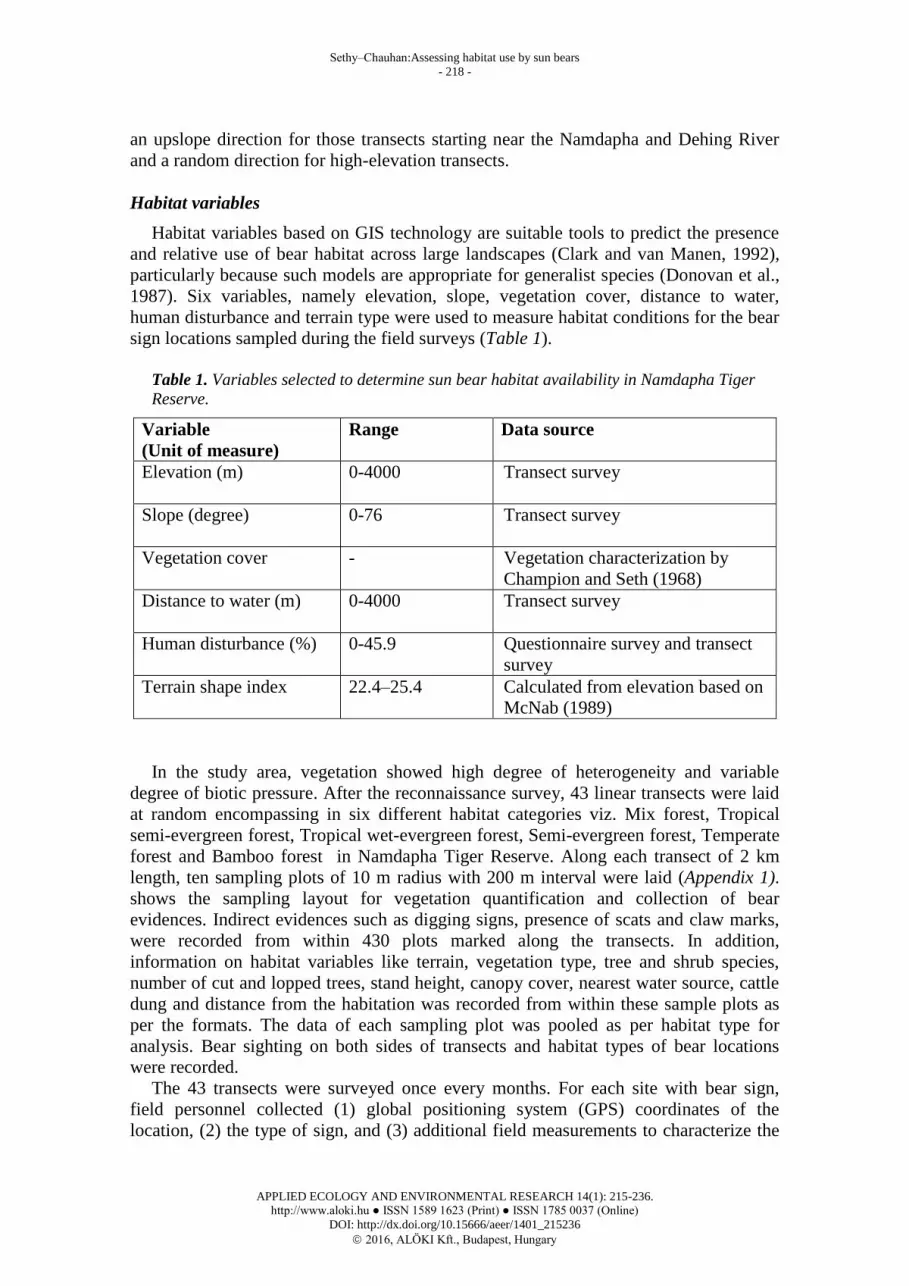
1987). Six variables, namely elevation, slope, vegetation cover, distance to water,
human disturbance and terrain type were used to measure habitat conditions for the bear
sign locations sampled during the field surveys (Table 1).
Table 1. Variables selected to determine sun bear habitat availability in Namdapha Tiger
Reserve.
Variable
(Unit of measure)
Range Data source
Elevation (m)
0-4000 Transect survey
Slope (degree)
0-76 Transect survey
Vegetation cover - Vegetation characterization by
Champion and Seth (1968)
Distance to water (m)
0-4000 Transect survey
Human disturbance (%) 0-45.9 Questionnaire survey and transect
survey
Terrain shape index 22.4–25.4 Calculated from elevation based on
McNab (1989)
In the study area, vegetation showed high degree of heterogeneity and variable
degree of biotic pressure. After the reconnaissance survey, 43 linear transects were laid
at random encompassing in six different habitat categories viz. Mix forest, Tropical
semi-evergreen forest, Tropical wet-evergreen forest, Semi-evergreen forest, Temperate
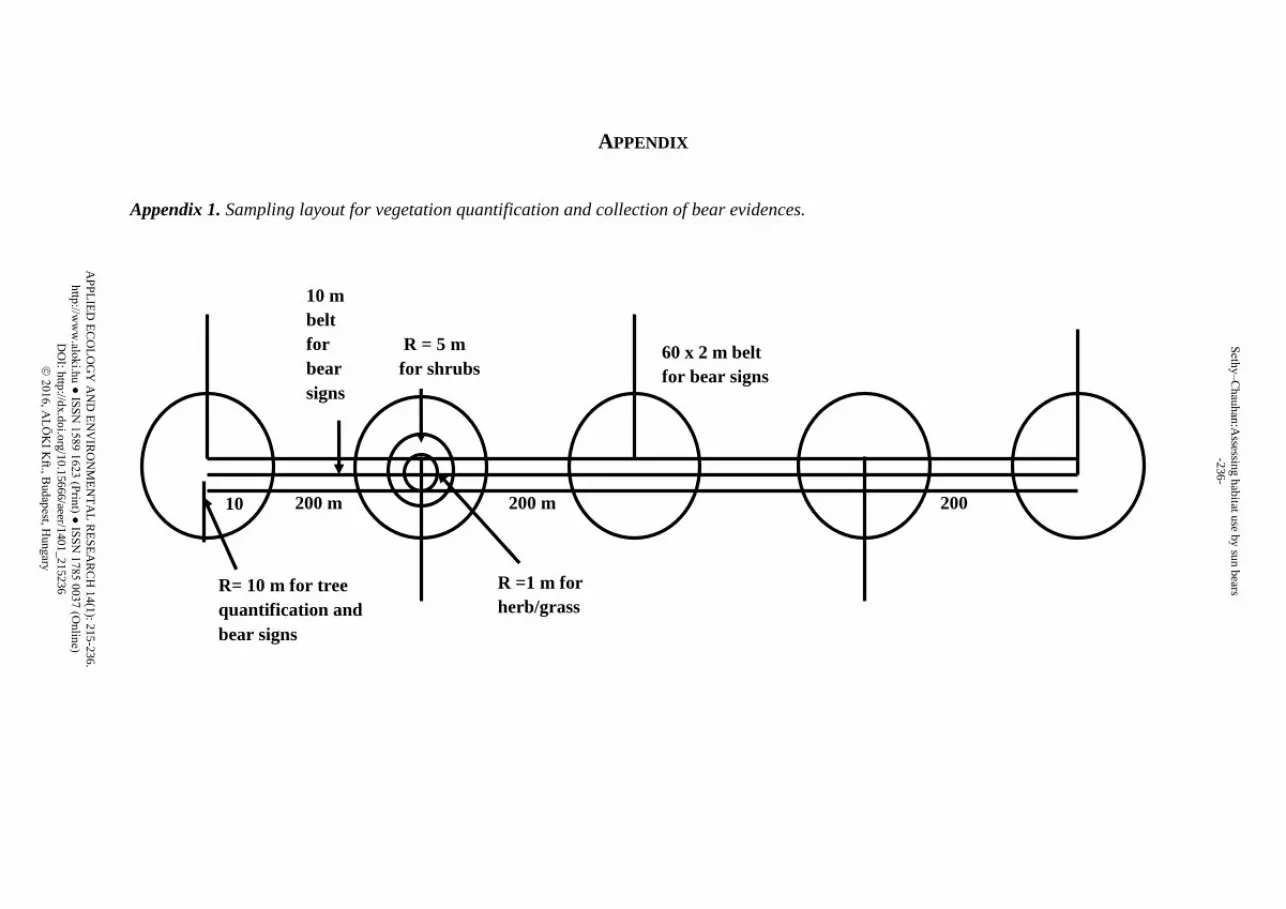
forest and Bamboo forest in Namdapha Tiger Reserve. Along each transect of 2 km
length, ten sampling plots of 10 m radius with 200 m interval were laid (Appendix 1).
shows the sampling layout for vegetation quantification and collection of bear
evidences. Indirect evidences such as digging signs, presence of scats and claw marks,
were recorded from within 430 plots marked along the transects. In addition,
information on habitat variables like terrain, vegetation type, tree and shrub species,
number of cut and lopped trees, stand height, canopy cover, nearest water source, cattle
dung and distance from the habitation was recorded from within these sample plots as
per the formats. The data of each sampling plot was pooled as per habitat type for
analysis. Bear sighting on both sides of transects and habitat types of bear locations
were recorded.
The 43 transects were surveyed once every months. For each site with bear sign,
field personnel collected (1) global positioning system (GPS) coordinates of the
location, (2) the type of sign, and (3) additional field measurements to characterize the
Sethy‒Chauhan:Assessing habitat use by sun bears
- 219 -
APPLIED ECOLOGY AND ENVIRONMENTAL RESEARCH 14(1): 215-236. http://www.aloki.hu ● ISSN 1589 1623 (Print) ● ISSN 1785 0037 (Online)
DOI: http://dx.doi.org/10.15666/aeer/1401_215236
2016, ALÖKI Kft., Budapest, Hungary
site. The GPS co-ordinates were used in combination with GIS to measure topographic,
ecological, and anthropogenic variables selected to assess bear habitat use within the
study area.
To generate a habitat map of the study area, 430 permanent vegetation plots were
marked along 43 transects at an interval of 200 m. Within each sampling plot, a 10 m
circular plot was laid to quantify tree density, 5 m circular plots for shrub density, and four
1 x 1 m quadrates for ground cover (herb, grass, bare ground, rock and litter) estimation.
Habitat parameters such as altitude, slope and aspect were also recorded by using GPS and
ocular estimation for each sampling plot. Aspect was measured on four point scale of North,
South, East and West using a compass. For the habitat characterization and community
classification, TWINSPAN analysis (Hill, 1979) was used.
To assess the habitat use by sun bear in Namdapha Tiger Reserve, availability and
utilization approach of Neu et al. (1974) was used. To know the difference between
the habitat variables in the plots where bear signs were present or absent, Kruskal-
Wallis non-parametric test was used (Zar, 1984). Multi-dimensional scaling,
regression analysis, and non-parametric analysis were performed in SPSS software
(Norussis, 1994).
Six habitat classes were used in the analyses: Tropical semi-evergreen forest,
Tropical wet-evergreen forest, Semi-evergreen forest, Mix forest, Temperate forest and
Bamboo forest. Habitat selection within the landscape (second order selection) was
studied by comparing the habitat composition in the total home ranges (MCP and K95)
with that in the whole study area. Habitat selection within the home ranges (third order
selection) was examined by comparing the habitat compositions of the core areas to
those in the total home ranges. Habitat use was calculated using the fixed kernel method
(Worthon 1989). The 95% kernel habitat uses (K95), calculated using the smoothing
parameter 1, and was one of the ‘total home ranges’. The core areas, i.e. areas used
more frequently than other parts of the home ranges, were estimated using the fixed
kernel method.
Results
The habitat use by sun bear was assessed based on direct sightings and indirect
evidences such as claw marks, scats, nests, dens, digging sign and foot prints etc. in
Namdapha Tiger Reserve, Arunachal Pradesh. The Namdapha Tiger Reserve
encompasses an area of 2200.25 km2, and has six distinct habitat types viz. Tropical
semi-evergreen forest, Tropical wet-evergreen forest, Semi-evergreen forest, Mix forest,
Temperate forest and Bamboo forest. In Exposed rock with slope grasses and Tropical
semi-evergreen forest and Tropical wet-evergreen forest, dominant tree species were
Ficus, Alglinium chinense, Spondias axillaris and Horsefieldia amygdalina.
Habitat use overview
By surveying a total of 43 transects covering six different habitats, 379 bear signs
were collected from 1500 trees. All these bear signs were recorded in Tropical semi-
evergreen forest, Tropical wet-evergreen forest, Semi-evergreen forest, Temperate
forest, Mix forest and Bamboo forest.
The highest percentage (46.4% with 29.33±7.19) of bear signs were recorded during
2009, followed by (30.9% with 14.33±3.75) during 2010 and (22.7% with 19.5±4.16)
during 2008 (Figure 2). During 2008, sun bear signs were highest in Tropical semi-

Sethy‒Chauhan:Assessing habitat use by sun bears
- 220 -
APPLIED ECOLOGY AND ENVIRONMENTAL RESEARCH 14(1): 215-236. http://www.aloki.hu ● ISSN 1589 1623 (Print) ● ISSN 1785 0037 (Online)
DOI: http://dx.doi.org/10.15666/aeer/1401_215236
2016, ALÖKI Kft., Budapest, Hungary
evergreen forest (6.9%) followed by Tropical wet-evergreen forest (6.1%), Semi-
evergreen forest (4.5%), Mix forest (2.9%), Temperate forest (1.3%) and Bamboo forest
(1.1%). In 2009, bear signs were highest recorded in Tropical wet-evergreen forest
(12.9%) followed by Tropical semi-evergreen forest (12.7%), Semi-evergreen forest
(8.7%), Mix forest (7.1%), Temperate forest (3.2%), and Bamboo forest (0.8%).
Whereas in 2010, sun bear signs were highest in Temperate forest (7.1%), followed by
Tropical wet-evergreen forest (6.9%), Tropical semi-evergreen forest (6.6%), Semi-
evergreen forest (5.8%), Mix forest (4.5%). There were no signs were found in Bamboo
forest in 2010 during the study periods.
Figure 2. Annual veriation of bear signs in different habitat in Namdapha Tiger Reserve.
During the study period, indirect evidences: nests, scats and digging signs were
recorded in different terrain as sun bears were feeding and resting in various terrain
types (Figure 3). The digging sings were highest in undulating terrain (37.5%),
followed by flat and gentle terrain (25.0% each) and steep slope (12.5%). Scat signs
were highest in undulating terrain (29.4%), followed by steep slope (25.9%), flat terrain
(24.7%) and gentle slope (20.0%). Similarly nests were highest in undulating terrain
(42.2%), followed by (26.7%) gentle slope, (17.8%) steep slope and (13.3%) flat terrain.
Use of disturbed and undisturbed habitats
Sun bear were found to use disturbed and undisturbed habitats to varying extent
along different elevations. There were three categories of elevations i.e. Lowland
ranged from 0 to 500 msl, Mid-elevation was 501 msl to 1500 msl and Temperate
was 1500 msl and above. The majority of bear signs (74.1%) were observed in
undisturbed forest regardless of sites (r2=0.8291, F=4.851, df=3, P<0.2713). In areas

Sethy‒Chauhan:Assessing habitat use by sun bears
- 221 -
APPLIED ECOLOGY AND ENVIRONMENTAL RESEARCH 14(1): 215-236. http://www.aloki.hu ● ISSN 1589 1623 (Print) ● ISSN 1785 0037 (Online)
DOI: http://dx.doi.org/10.15666/aeer/1401_215236
2016, ALÖKI Kft., Budapest, Hungary
with higher intensities and extents of disturbance, fewer bear signs (25.9%) were
observed (Figure 4).
Figure 3. Presence of signs in different terrain types in Namdapha Tiger Reserve.
Figure 4. Comparison of total observed signs in primary undisturbed forest versus disturbed
areas.

Sethy‒Chauhan:Assessing habitat use by sun bears
- 222 -
APPLIED ECOLOGY AND ENVIRONMENTAL RESEARCH 14(1): 215-236. http://www.aloki.hu ● ISSN 1589 1623 (Print) ● ISSN 1785 0037 (Online)
DOI: http://dx.doi.org/10.15666/aeer/1401_215236
2016, ALÖKI Kft., Budapest, Hungary
Analysis of fixed kernel
The total habitat used in the study areas were calculated through fixed kernel;
minimum 95% fixed kernel habitat use (K95) differed in size. Therefore its habitat
composition resembled more that of the landscape, and comparison between K95 and
the study area revealed better habitat selection within the landscape. The proportions of
two common habitat types (fields and spruce forests) differed between the cores area
used in the study. Comparison between the smallest core area (K50) revealed best
habitat preferences within the habitat (third order habitat selection). Comparing the
distribution of individual location points in different habitats to the habitat composition
of home ranges did not reveal habitat preferences of sun bear.
The Fixed Kernel showed that, which was more than suitable for habitat use in the
three different Fixed Kernel analyses. The estimated habitat use (99%, 95% and 50%
Fixed Kernel) of all was given in (Figure 5). The core activity (50% Fixed Kernel) area
of sun bear habitat as determined, followed by 95% Fixed Kernel and less activity in
(99% Fixed Kernel).
Figure 5. Fixed Kernel (99%, 95% and 50%) based habitats of sun bear in Namdapha Tiger
Reserve.
Habitat availability vs. Utilization
In Namdapha Tiger Reserve, the data on habitat use by sun bears collected from the
430 sample plots along the transects showed maximum number of plots in Tropical
semi-evergreen forest (n=120), followed by Tropical wet-evergreen forest (n=110),
Semi-evergreen forest (n=70) Mix forest (n=50) and there were 40 plots in each of
Temperate and Bamboo forest (Table 2). The Tropical semi-evergreen forest near water

Sethy‒Chauhan:Assessing habitat use by sun bears
- 223 -
APPLIED ECOLOGY AND ENVIRONMENTAL RESEARCH 14(1): 215-236. http://www.aloki.hu ● ISSN 1589 1623 (Print) ● ISSN 1785 0037 (Online)
DOI: http://dx.doi.org/10.15666/aeer/1401_215236
2016, ALÖKI Kft., Budapest, Hungary
bodies, river and streams and Tropical wet-evergreen forest were characterized by the
presence of Actinodaphre obovata species. The habitat category: Mix forest
characterized by Spondias axillaris and Ardisia spp. and Exposed rocks with slope
grasses and Tropical wet-evergreen characterized by Horsefieldia amygdalina and
Calamus species were found to have 5 plots in each. So among various habitat
categories, the proportional availability of Tropical semi-evergreen forest was found to
be highest (0.279), followed by Tropical wet-evergreen forest (0.256), Semi-evergreen
forest (0.163), Mix forest (0.116) and the proportional availability was 0.093 in each of
Temperate forest and Bamboo forest. In comparison to the availability of various habitat
types, the expected use of these habitat categories was found in proportion.
The habitat use based on density of bear signs per hectare was highest in Tropical
semi-evergreen forest (0.271), followed by Tropical wet-evergreen forest(0.257), Semi-
evergreen forest (0.195) Mix forest (0.139), Temperate forest (0.112) and Bamboo
forest (0.027) (Table 2). The use of Tropical semi-evergreen forest Tropical wet-
evergreen forest habitats was high, and the expected use was highest. So the habitat use
by sun bears was also found to be in proportion to the availability and the expected use
of these habitat categories.
The Kruskal-Wallis test comparison showed that there was no significant difference
between the expected utilization of each habitat category and the use of these habitat
categories within the study area (2=15.709, df=5, p=0.0077). The null hypothesis was
therefore accepted, implying that observed bear evidences were distributed
proportionally to the occurrence of habitat categories. The availability and the
utilization patterns of different habitat types by sun bear used the Tropical-wet
evergreen habitat more than its availability.
Use of terrain types
Based on sign surveys and presence of scats and nests, various terrain types viz. flat,
undulating, gentle slope and steep slope were found to be differentially used by sun
bears in the study area (Table 3). The use of flat terrain by sun bear was maximum
(52.8%), followed by steep slope (32.4%), gentle slope (8.4%) and flat terrain (6.1%) in
different forest types. Sun bears were found to use flat terrain maximum in Bamboo
forest (18.1%), followed by Temperate forest (15.9%), Tropical semi-evergreen forest
(5.1%), Semi-evergreen forest (4.2%), Tropical wet-evergreen (4.1%) and Mix forest
(3.6%) with mean value of 3.83±0.79. Sun bears were found to use undulating terrain
maximum in Mix forest (63.6%), followed by Tropical semi-evergreen forest (59.6%),
Tropical wet-evergreen forest (55.1%), Semi-evergreen forest (45.8%), Temperate
forest (36.4%) and Bamboo forest (27.3%) with mean value of 33.33±8.77. Whereas
they were found to use gentle slope maximum in Bamboo forest (18.1%), followed by
Mix forest (12.7%), Semi-evergreen forest (9.7%), Tropical wet-evergreen forest
(9.2%), Temperate forest (6.8%) and Tropical semi-evergreen forest was (5.1%) with
mean value of 5.50±1.08. The steep slope terrain was used maximum in Temperate
forest (40.9%) by sun bear, followed by Semi-evergreen forest (40.3%), Bamboo forest
(36.5%), Tropical wet-evergreen forest (31.6%), Tropical semi-evergreen forest
(30.2%) and Mix forest was (20.1%) with mean value of 20.5±4.62.
The data on proportional availability and utilization of various terrain types: flat,
undulating, gentle slope and steep slope has been compared with the expected use of
these terrains by sun bears (Table 4). The proportional availability of undulating terrain
was found to be the highest (0.437), followed by gentle slope (0.288), steep slope

Sethy‒Chauhan:Assessing habitat use by sun bears
- 224 -
APPLIED ECOLOGY AND ENVIRONMENTAL RESEARCH 14(1): 215-236. http://www.aloki.hu ● ISSN 1589 1623 (Print) ● ISSN 1785 0037 (Online)
DOI: http://dx.doi.org/10.15666/aeer/1401_215236
2016, ALÖKI Kft., Budapest, Hungary
(0.167) and flat terrain (0.107). The expected use of these terrain types was found to be
directly proportional to the availability of these terrains. The expected use of undulating
terrain was found to be highest (0.450), followed by gentle slope terrain (0.323), steep
slope terrain (0.138) and flat terrain (0.089).
Following hypothesis was tested using the Chi square test: sun bear used each type of
terrain category in exact proportion to its occurrence within the study area (null
hypothesis). The observed utilization of each terrain category was compared with
expected utilization of terrain. Goodness fit of comparison showed that the expected
utilization of each terrain category was not significantly different (2=2.202, df=3,
p=0.531) from the observed utilization. The null hypothesis was therefore accepted,
implying that the observed utilization of each terrain category was in proportion to its
occurrence. There was neither any preference nor avoidance by bears for any type of
terrain. Bear used certain category of terrains for specific purpose.
Analysis for variance among the variables (Kruskal-Wallis test)
Two hypotheses were assessed; first was that all the habitat variables viz. number of
trees, lopped trees, fell trees, number of shrubs, number of herbs, cattle dung, distance
from habitation, distance from water and distance from road were evenly distributed in
the used and unused areas of sun bears i.e. null hypothesis (H0), and second was that all
the habitat variables were not evenly distributed in the areas where bear signs were
present and absent i.e. Alternative hypothesis (HA).
The Chi-square values clearly showed that when habitat variables within the sampled
plots were correlated with the bear presence as a fixed variable, then the number of
shrubs (109.146), distance from human habitation (413.590), distance from road
(413.408) distance from water sources (416.081), and cattle dung (90.938) had highly
significant correlation with bear presence. This has proved that these variables were not
the same in areas where bear signs were present or absent. This rejects the null
hypothesis (H0) and accepts the Alternative hypothesis (HA). Whereas, for the number
of trees (84.103), lopped trees (162.367), fell trees (21.140), number of herbs (140.754)
and distance from road (413.408), Chi-square values were not significant. This showed
that these habitat variables were almost the same in the areas where bear signs were
present or absent (Table 5). Therefore null hypothesis was not rejected.

Table 2. Habitat availability vs. habitat use by sun bear in Namdapha Tiger Reserve (Based on the Bonferroni confidence intervals)
Habitat type No. of plots in the
transect (n=430)
Relative index Utility
(n=339)
Relative Index
(p)
Lower
confidence
limit
Upper
confidence
limit
Utilization
Mix forest
50 0.116 47 0.139 0.089 0.188 **
Tropical wet-evergreen
forest
110 0.256 87 0.257 0.194 0.319 **
Tropical semi-evergreen
forest
120 0.279 92 0.271 0.208 0.335 **
Semi-evergreen forest
70 0.163 66 0.195 0.138 0.251 **
Temperate forest
40 0.093 38 0.112 0.067 0.157 **
Bamboo forest
40 0.093 9 0.027 0.004 0.050 **
** Calculated according to Neu et al. (1974). The asterisk denotes the habitat use in proportion to its availability.
Seth
y‒
Ch
auh
an:A
ssessing
hab
itat use b
y su
n b
ears
-225
-
AP
PL
IED
EC
OL
OG
Y A
ND
EN
VIR
ON
ME
NT
AL
RE
SE
AR
CH
14
(1): 2
15
-23
6.
http
://ww
w.alo
ki.h
u ●
ISS
N 1
589
1623
(Prin
t) ● IS
SN
1785
0037
(Onlin
e)
DO
I: http
://dx.d
oi.o
rg/1
0.1
566
6/aeer/1
401
_21
523
6
2
01
6, A
LÖ
KI K
ft., Bud
apest, H
ung
ary

Table 3. Use of terrain in different habitats by sun bear based on indirect signs in Namdapha Tiger Reserve during 2008-2010.
Habitat type No. of plots
in the transect
No. of signs (%) Total no. of
bear signs Flat terrain Undulating
terrain
Gentle slope
terrain
Steep slope
terrain
Mix forest 50 2 (3.6) 35 (63.6) 7 (12.7) 11 (20.1) 55
Tropical wet-evergreen forest 110 4 (4.1) 54 (55.1) 9 (9.2) 31 (31.6) 98
Tropical semi-evergreen forest 120 5 (5.1) 59 (59.6) 5 (5.1) 30 (30.2) 99
Semi-evergreen forest 70 3 (4.2) 33 (45.8) 7 (9.7) 29 (40.3) 72
Temperate forest 40 7 (15.9) 16 (36.4) 3 (6.8) 18 (40.9) 44
Bamboo forest 40 2 (18.1) 3 (27.3) 2 (18.1) 4 (36.5) 11
Seth
y‒
Ch
auh
an:A
ssessing
hab
itat use b
y su
n b
ears
-226
-
AP
PL
IED
EC
OL
OG
Y A
ND
EN
VIR
ON
ME
NT
AL
RE
SE
AR
CH
14
(1): 2
15
-23
6.
http
://ww
w.alo
ki.h
u ●
ISS
N 1
589
1623
(Prin
t) ● IS
SN
1785
0037
(Onlin
e)
DO
I: http
://dx.d
oi.o
rg/1
0.1
566
6/aeer/1
401
_21
523
6
2
01
6, A
LÖ
KI K
ft., Bud
apest, H
ung
ary

Table 4. Proportional availability and expected use of terrain by sun bear in Namdapha Tiger Reserve. (Based on the Bonferroni confidence interval).
** Asterisk denotes the use of terrain in proportion to availability, and ++ Plus sign denotes the use of terrain more than availability.
Terrain type Availability of
terrain (n)
Relative index Utility of
terrain (n)
Relative index
(p)
Lower
confidence
limit
Upper
confidence
limit
Utilization of
terrain
Flat 46 0.107 24 0.089 0.043 0.135 **
Undulating 188 0.437 121 0.450 0.370 0.530 **
Gentle slope 124 0.288 87 0.323 0.248 0.399 ++
Steep slope 72 0.167 37 0.138 0.082 0.193 ++
Seth
y‒
Ch
auh
an:A
ssessing
hab
itat use b
y su
n b
ears
-227
-
AP
PL
IED
EC
OL
OG
Y A
ND
EN
VIR
ON
ME
NT
AL
RE
SE
AR
CH
14
(1): 2
15
-23
6.
http
://ww
w.alo
ki.h
u ●
ISS
N 1
589
1623
(Prin
t) ● IS
SN
1785
0037
(Onlin
e)
DO
I: http
://dx.d
oi.o
rg/1
0.1
566
6/aeer/1
401
_21
523
6
2
01
6, A
LÖ
KI K
ft., Bud
apest, H
ung
ary

Table 5. Analysis of variance using Kruskal-Wallis non-parametric test for habitat use by sun bear.
Habitat
variable
No. of
trees
No. of
shrubs
No. of
herbs
No. of
tree
felled
No. of
tree
lopped
Cattle
dung
Distance
from
habitation
Distance
from
road
Nearest
water
source
Herb
cover
Shrub
cover
Chi-sq. 84.103 109.146 140.754 21.140 162.367 90.938 413.590 413.408 416.081 135.193 107.351
df 5 5 5 5 5 5 5 5 5 5 5
Asymp.
sig.
.000 .000 .000 .001 .000 .000 .000 .000 .000 .000 .000
Seth
y‒
Ch
auh
an:A
ssessing
hab
itat use b
y su
n b
ears
-228
-
AP
PL
IED
EC
OL
OG
Y A
ND
EN
VIR
ON
ME
NT
AL
RE
SE
AR
CH
14
(1): 2
15
-23
6.
http
://ww
w.alo
ki.h
u ●
ISS
N 1
589
1623
(Prin
t) ● IS
SN
1785
0037
(Onlin
e)
DO
I: http
://dx.d
oi.o
rg/1
0.1
566
6/aeer/1
401
_21
523
6
2
01
6, A
LÖ
KI K
ft., Bud
apest, H
ung
ary
Sethy‒Chauhan:Assessing habitat use by sun bears
- 229 -
APPLIED ECOLOGY AND ENVIRONMENTAL RESEARCH 14(1): 215-236. http://www.aloki.hu ● ISSN 1589 1623 (Print) ● ISSN 1785 0037 (Online)
DOI: http://dx.doi.org/10.15666/aeer/1401_215236
2016, ALÖKI Kft., Budapest, Hungary
Discussion
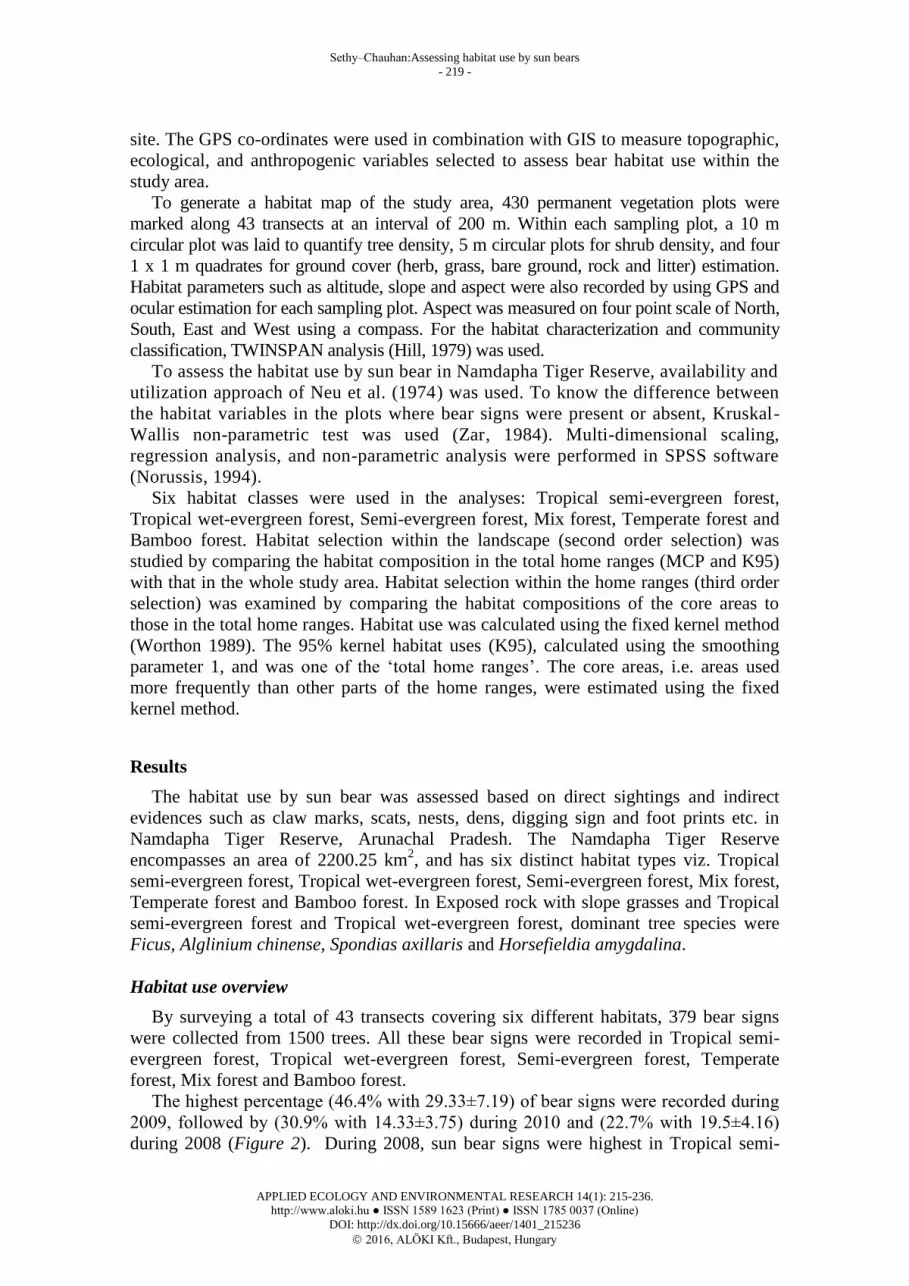
In Namdapha Tiger Reserve, six distinct habitat types, namely, Tropical semi-
evergreen forest, Tropical wet-evergreen forest, Semi-evergreen forest, Mix forest,
Temperate forest and Bamboo forest (Figure 6). Sun bears have been found to use all
these habitat categories. Due to increasing human population, expansion of agricultural
land, continuous encroachment on forest land, livestock grazing and biotic pressure, sun
bear population seems to be adversely impacted in this Reserve, and so it is threatened.
These factors together might have also adversely impacted the habitats and their use in
the study area.
Figure 6. Map of habitat use by sun bear in different forest types in Namdapha Tiger Reserve.
The habitat use by sun bear was assessed based on direct sightings and indirect
evidences such as claw marks, scats, nests, dens, digging sign and foot prints etc. in
Namdapha Tiger Reserve. Results from the present study showed that the significant
majority of sun bear activity in undisturbed areas was predominantly in older
heterogeneous forests that retained some primary forest traits and had substantial
time to regenerate and evolve through older succession stages that provide mature
forest structure.
By surveying a total of 43 transects covering six different habitats, 379 bear signs
were collected from 1500 trees. All these bear signs were recorded in Tropical semi-
evergreen forest, Tropical wet-evergreen forest, Semi-evergreen forest, Temperate
forest, Mix forest and Bamboo forest.

Sethy‒Chauhan:Assessing habitat use by sun bears
- 230 -
APPLIED ECOLOGY AND ENVIRONMENTAL RESEARCH 14(1): 215-236. http://www.aloki.hu ● ISSN 1589 1623 (Print) ● ISSN 1785 0037 (Online)
DOI: http://dx.doi.org/10.15666/aeer/1401_215236
2016, ALÖKI Kft., Budapest, Hungary
Sun bear were found to use disturbed and undisturbed habitats to varying extent
along different elevations. There were three categories of elevations i.e. Lowland ranged
from 0 to 500 msl, Mid-elevation was 501 msl to 1500 msl and Temperate was 1500
msl and above.
The total habitat used in the study areas were calculated through fixed kernel;
minimum 95% fixed kernel habitat use (K95) differed in size. Therefore its habitat
composition resembled more that of the landscape, and comparison between K95 and
the study area revealed better habitat selection within the landscape. The proportions of
two common habitat types (fields and spruce forests) differed between the cores area
used in the study. Comparison between the smallest core area (K50) revealed best
habitat preferences within the habitat (third order habitat selection). Comparing the
distribution of individual location points in different habitats to the habitat composition
of home ranges did not reveal habitat preferences of sun bear.
The Fixed Kernel showed that, which was more than suitable for habitat use in the
three different Fixed Kernel analyses. The estimated habitat use (99%, 95% and 50%
Fixed Kernel). The core activity (50% Fixed Kernel) area of sun bear habitat as
determined, followed by 95% Fixed Kernel and less activity in (99% Fixed Kernel).
Habitat use by sun bears data were collected from the 430 sample plots along the 43
transects showed maximum number of plots in Tropical semi-evergreen forest, followed
by Tropical wet-evergreen forest, Semi-evergreen forest, Mix forest and there were 40
plots in each of Temperate and Bamboo forest. The Tropical semi-evergreen forest near
water bodies, river and streams and Tropical wet-evergreen forest were characterized by
the presence of Actinodaphre obovata species. The habitat category: Mix forest
characterized by Spondias axillaris and Ardisia spp. and Exposed rocks with slope
grasses and Tropical wet-evergreen characterized by Horsefieldia amygdalina and
Calamus species were found to have 5 plots in each. So among various habitat
categories, the proportional availability of Tropical semi-evergreen forest was found to
be highest, followed by Tropical wet-evergreen forest, Semi-evergreen forest, Mix
forest and the proportional availability in each of Temperate forest and Bamboo forest.
In comparison to the availability of various habitat types, the expected use of these
habitat categories was found in proportion.
The habitat use based on density of bear signs per hectare was highest in Tropical
semi-evergreen forest, followed by Tropical wet-evergreen forest, Semi-evergreen
forest, Mix forest, Temperate forest and Bamboo forest. The use of Tropical semi-
evergreen forest Tropical wet-evergreen forest habitats was high, and the expected use
was highest. So the habitat use by sun bears was also found to be in proportion to the
availability and the expected use of these habitat categories.
The Kruskal-Wallis test comparison showed that there was no significant difference
between the expected utilization of each habitat category and the use of these habitat
categories within the study area. The null hypothesis was therefore accepted, implying
that observed bear evidences were distributed proportionally to the occurrence of habitat
categories. The availability and the utilization patterns of different habitat types by sun
bear used the Tropical-wet evergreen habitat more than its availability.
Based on sign surveys and presence of scats and nests, various terrain types viz. flat,
undulating, gentle slope and steep slope were found to be differentially used by sun
bears in the study area. The use of flat terrain by sun bear was maximum, followed by
steep slope, gentle slope and flat terrain in different forest types. Sun bears were found
to use flat terrain maximum in Bamboo forest, followed by Temperate forest, Tropical

Sethy‒Chauhan:Assessing habitat use by sun bears
- 231 -
APPLIED ECOLOGY AND ENVIRONMENTAL RESEARCH 14(1): 215-236. http://www.aloki.hu ● ISSN 1589 1623 (Print) ● ISSN 1785 0037 (Online)
DOI: http://dx.doi.org/10.15666/aeer/1401_215236
2016, ALÖKI Kft., Budapest, Hungary
semi-evergreen forest, Semi-evergreen forest, Tropical wet-evergreen and Mix forest.
Sun bears were found to use undulating terrain maximum in Mix forest (63.6%),
followed by Tropical semi-evergreen forest, Tropical wet-evergreen forest, Semi-
evergreen forest, Temperate forest and Bamboo forest. Whereas they were found to use
gentle slope maximum in Bamboo forest, followed by Mix forest, Semi-evergreen
forest, Tropical wet-evergreen forest, Temperate forest and Tropical semi-evergreen
forest. The steep slope terrain was used maximum in Temperate forest by sun bear,
followed by Semi-evergreen forest, Bamboo forest, Tropical wet-evergreen forest,
Tropical semi-evergreen forest and Mix forest.
The data on proportional availability and utilization of various terrain types: flat,
undulating, gentle slope and steep slope has been compared with the expected use of
these terrains by sun bears. The proportional availability of undulating terrain was found
to be the highest, followed by gentle slope, steep slope and flat terrain. The expected use
of these terrain types was found to be directly proportional to the availability of these
terrains. The expected use of undulating terrain was found to be highest, followed by
gentle slope terrain, steep slope terrain and flat terrain.
Following hypothesis was tested using the Chi square test: sun bear used each type of
terrain category in exact proportion to its occurrence within the study area (null
hypothesis). The observed utilization of each terrain category was compared with
expected utilization of terrain. Goodness fit of comparison showed that the expected
utilization of each terrain category was not significantly different from the observed
utilization. The null hypothesis was therefore accepted, implying that the observed
utilization of each terrain category was in proportion to its occurrence. There was
neither any preference nor avoidance by bears for any type of terrain. Bear used certain
category of terrains for specific purpose.
Two hypotheses were assessed; first was that all the habitat variables viz. number of
trees, lopped trees, fell trees, number of shrubs, number of herbs, cattle dung, distance
from habitation, distance from water and distance from road were evenly distributed in
the used and unused areas of sun bears i.e. null hypothesis (H0), and second was that all
the habitat variables were not evenly distributed in the areas where bear signs were
present and absent i.e. Alternative hypothesis (HA).
The Chi-square values clearly showed that when habitat variables within the sampled
plots were correlated with the bear presence as a fixed variable., then the number of
shrubs (109.146), distance from human habitation (413.590), distance from road
(413.408) distance from water sources (416.081), and cattle dung (90.938) had highly
significant correlation with bear presence. This has proved that these variables were not
the same in areas where bear signs were present or absent. This rejects the null
hypothesis (H0) and accepts the Alternative hypothesis (HA). Whereas, for the number
of trees (84.103), lopped trees (162.367), fell trees (21.140), number of herbs (140.754)
and distance from road (413.408), Chi-square values were not significant. This showed
that these habitat variables were almost the same in the areas where bear signs were
present or absent. Although sun bears showed some preference for Tropical semi-evergreen forest
and Tropical wet-evergreen forest habitat categories, but as such there was no
preference or avoidance by bears for rest of the habitats in Namdapha Tiger Reserve.
Since maximum bear signs were from Tropical wet-evergreen forest located far
away from the Gandhigram village, perhaps bears did spent much time in this habitat
for feeding on fruits and other food items. More bear signs in these habitats might be
Sethy‒Chauhan:Assessing habitat use by sun bears
- 232 -
APPLIED ECOLOGY AND ENVIRONMENTAL RESEARCH 14(1): 215-236. http://www.aloki.hu ● ISSN 1589 1623 (Print) ● ISSN 1785 0037 (Online)
DOI: http://dx.doi.org/10.15666/aeer/1401_215236
2016, ALÖKI Kft., Budapest, Hungary
due to intensive use of these habitats by bears and more availability of preferred
food items and shelter to bears. Several studies documented habitat use and
movement patterns of sun bears (Wong, 2002; Augeri, 2005). Sun bears in South
East Asia ranged widely during the season.
It is important to consider the frequencies of individual bears among different habitat
types relative to forest age and the overall population. Some observations have been
reported of sun bear occurrence in secondary forests or disturbed areas (Wong, 2002;
Wong et al., 2004; Fredriksson, 2005), but the ages of these forests, as well as the scale
and frequency of use by these bears relative to their overall populations, are important
factors when analysing population-level patterns. Six variables, namely elevation, slope,
vegetation cover, distance to water, human disturbance and terrain type were used to
measure habitat conditions for the bear sign locations sampled during the field surveys.
Ultimately, compression can create insular effects, possibly increase stress levels in
individual bears, and exert notable pressure on the population. Reduced food density,
availability or access can influence bear health, movements, mating, recruitment, and
population dynamics (Craighead et al., 1995; Powell et al., 1997; Wasser et al., 2004)
and can increase physiological stresses on the bears (Cattet et al., 2003; Owen et al.,
2004; Wasser et al., 2004).
Augeri (2005) compared natural patterns of Malayan sun bear habitat selection,
ecology and landscape use with the effects of disturbance. In Namdapha Tiger Reserve,
flat, undulating, gentle slope and steep slope terrains were found to be differentially
used by sun bears based on sign surveys and presence of scats and nests, in the study
area. In Namdapha Tiger Reserve, the differential use of terrains in various habitat types
could be related to factors like availability food, resting, seeking shelter, escape cover
and biotic disturbance. In northern Sumatra and in East Kalimantan, Borneo, another
study on the habitat use by sun bear indicated that differences in family age, seasons,
and years contribute to differences in overall habitat use patterns (Augeri, 2005).
Sun bear were found to use disturbed and undisturbed habitats to varying extent
along different elevations in Namdapha Tiger Reserve. Sun bears preferred forested
habitats and the phenomenon may explain the tight home range patterns of sun bears in
small forest reserves such as Sungai Wain Protection Forest, East Kalimantan (Meijaard
et al., 2005), where the bears have also been observed in edge areas and local gardens
(Fredriksson, 2005). In the current study, sun bears avoided the use of or movement
through such disturbed areas, but in smaller patches, forage and habitat losses could
force bears into marginal edge habitats and human-cultivated areas for food. This can
alter a bear’s movement dynamics through the landscape and prohibit critical habitat use
(Augeri, 1994, 2000; Mattson et al., 1996; Merrill et al., 1999; Boyce, 2000).
Acknowledgements. The authors are thankful to Director, Wildlife Institute of India for his support and
encouragement in conducting the study. We thankfully acknowledge the help of the forest department,
Arunachal Pradesh. We also thankful to all field officers for their help and useful discussions on this
study matter.

Sethy‒Chauhan:Assessing habitat use by sun bears
- 233 -
APPLIED ECOLOGY AND ENVIRONMENTAL RESEARCH 14(1): 215-236. http://www.aloki.hu ● ISSN 1589 1623 (Print) ● ISSN 1785 0037 (Online)
DOI: http://dx.doi.org/10.15666/aeer/1401_215236
2016, ALÖKI Kft., Budapest, Hungary
REFERENCES
[1] Augeri, D.M. (1994): Assessment of Trans Canada Highway Perturbation on Black Bear
Population, Guild and Community Structures in Banff National Park. Technical Report
and Proposal for Parks Canada.
[2] Augeri, D.M. (2000): Malayan Sun Bear (Helarctos malayanus) Landscape Use: A
Preliminary Analysis. Ursid Research Centre Report No. 2. Institute of the Rockies,
Missoula, MT.
[3] Augeri, D.M. (2005): On the Bio-geographic ecology of the Malayan sun bear. A
dissertation submitted to the University of Cambridge in partial fulfilment of the
conditions of application for the degree of Doctor of Philosophy. Pp 1-349.
[4] Blanford, W.T. (1891): Fauna of British India, including Ceylon and Burma. Mammalia,
part 2:251-617. ‒ Taylor and Francis, London, UK.
[5] Borah, J., Firoz, M., Lalthunapuia,V., Kakati, K. (2012): Recent camera-trap records of 3
bear species in Northeast India: Distribution and conservation status. 21st International
conference on Bear Research and Management, New Delhi.26-30 November.
[6] Boyce, M.S. (2000): Metapopulation Analysis for the Bitterroot Population. In: Grizzly
Bear Recovery in the Bitterroot Ecosystem. Final Environmental Impact Statement,
Appendix 21 C.U.S. Fish and Wildlife Service.
[7] Cattet, M.R.L., Christison, K., Caullkett, N.A., Stenhouse, G.B. (2003): Physiologic
Responses of Grizzly Bears to Different Methods of Capture. ‒ J. Wildlife Diseases,
39:649-654.
[8] Chauhan, N.P.S., Jagdish Singh, R.K. (2005a): Human-Malayan sun bear conflicts in
Manipur State, India. Proc. 16th International Conference on Bear Research and
Management’, Riva Del Garda, Trentino, Italy.
[9] Chauhan, N.P.S., Jagdish Singh, R.K. (2005b): Is Malayan sun bear population
recovering in India: Status and distribution? Proc. 16th International Conference on Bear
Research and Management’, Riva Del Garda, Trentino, Italy.
[10] Chauhan, N.P.S. (2006): The Status of Malayan sun bears in India. Understanding bears
to secure their future, Japan bear network.Pp20-25.
[11] Chauhan, N.P.S., Lalthunpuia. (2009): Status and distribution of Malayan sun bear
(Helarctos malayanus) in North-Eastern states, India. Indian Forester, 134 (10): 1339-
1348.
[12] Chauhan, N.P.S., Sethy, J. (2011a): Human-Malayan sun bear conflicts in Manipur State,
India. Indian forester. 137:722-731.
[13] Chauhan, N.P.S., Sethy, J. (2011b): Status and distribution of sun Malayan sun bear in
North-Eastern region of India. A Report ‒ Wildlife Institute of India, Dehradun.
[14] Chauhan, N.P.S., Sethy, J., Mondal, K., Kumar, A. (2012): Bear Conservation Action
Plan Manipur. National Bear Conservation and Welfare Action Plan. Pp.209-220.
[15] Chauhan, N.P.S., Sethy,J., Mondal, K., Latha, T. (2012): Bear Conservation Action Plan
Nagaland. National Bear Conservation and Welfare Action Plan. Pp.245-252.
[16] Choudhury, A.U. (1989): The primates of Assam: their distribution, habitat and status.
Ph.D. thesis, Gauhati University, Guwahati, India. 300pp.
[17] Choudhury, A.U. (1992): Wildlife in Manipur - A preliminary survey. ‒ Tiger paper 19
(1): 20-28.
[18] Clark, J.D., Van Manen, F.T. (1992): Geographic information systems and black bear
habitat analyses. Eastern Workshop on Black Bear Research and Management, 11:137-
153.
[19] Clevenger, A.P., Purroy, F.J., Campos, M.A. (1997): Habitat assessment of a relict brown
bear (Ursus arctos) population in northern Spain. ‒ Biological Conservation 80:17-22.

Sethy‒Chauhan:Assessing habitat use by sun bears
- 234 -
APPLIED ECOLOGY AND ENVIRONMENTAL RESEARCH 14(1): 215-236. http://www.aloki.hu ● ISSN 1589 1623 (Print) ● ISSN 1785 0037 (Online)
DOI: http://dx.doi.org/10.15666/aeer/1401_215236
2016, ALÖKI Kft., Budapest, Hungary
[20] Craighead, J.J., Sumner, J.S., Mitchell, J.A. (1995): The Grizzly Bears of Yellowstone.
Their Ecology in the Yellowstone Ecosystem, 1959-1992. Island Press, Washington, D.C.
535 pp.
[21] Donovan, M., Rabe, D., Olson, C. (1987): Use of geographic information systems to
develop habitat suitability models. ‒ Wildlife Society Bulletin 15:574-579.
[22] Fredriksson, G. (2005): Human-Sun Bear Conflicts in East Kalimantan, Indonesian
Borneo. ‒ Ursus 16:130-137.
[23] Higgins, J.C. (1932): The Malaya bear. ‒ J. Bombay Nat. Hist. Soc. 35: 673-674.
[24] Hill, M.O. (1979). Twinspan. A Fortran programme for arranging multivariate data in an
ordered two-way classification of the individual and attribution, Cornell University, New
York.
[25] IUCN. (2006): The IUCN Species Survival Commission-2006 IUCN Red List of
Threatened Species.
[26] Johns, A.D. (1983): Ecological Effects of Selective Logging in a West Malayan Rain
Forest, Ph.D. Dissertation. University of Cambridge, Cambridge, UK.
[27] Karanth, K.U., Nichols, J.D. (2000). Camera Trapping Big Cats: Some Questions That
Should Be Asked Frequently. Wildlife Conservation Society and U.S. Geological Survey.
Unpublished notes.
[28] Kendall, K.C., Metzger, L.H., Patterson, D.A., Steele, B.M.(1992): Power of Sign
Surveys to Monitor Population Trends. ‒ Ecol. Appl., 2:422-430.
[29] Mattson, D.J. (1999): Changes in Mortality of Yellowstone’s Grizzly Bears. ‒ Ursus
10:129-138.
[30] Mattson, D.J., Herrero, S., Wright, R.G., Pease, C.M. (1996): Designing and Managing
Protected Areas For Grizzly Bears: How Much Is Enough? Pages 133-164, in: R.G.
Wright (ed.) National Parks and Protected Areas: Their Role in Environmental Protection.
Blackwell Science, Cambridge, MA. 496 pp.
[31] Meijaard, E., Sheil, D., Nasi, R., Augeri, D., Rosenbaum, B., Iskandar, D., Setyawati,
T., Lammertink, J., Rachmatika, M.I., Wong, A., Soehartono, A., Stanley, S., O'Brien, T.
(2005): Life after logging: Reconciling wildlife conservation and production forestry in
Indonesian Borneo. Center for International Forestry Research, Bogor, Indonesia. 345 pp.
[32] Merrill, T., Mattson, D.J., Wright, R.G.,Quigley, H.B. (1999): Defining Landscapes
Suitable for Restoration of Grizzly Bears, Ursus arctos, in Idaho. ‒ Biological
Conservation 87:231-248.
[33] Nams, V.O. (1989): Effects of radiotelemetry error on sample size and bias when testing
for habitat selection. ‒ Canadian Journal of Zoology, 67: 1631-1636.
[34] Neu, C.W., Byers, C.R., Peek, J.M. (1974): A technique for analysis of utilization
availability data. ‒ Journal of Wildlife Management 38: 541-545.
[35] Normua, F., Higashi, S., Ambu, L., Mohamad, M. (2004): Notes on Oil Palm Plantation
Use and Seasonal Spatial Relationships of Sun Bears in Sabah, Malaysia. ‒ Ursus 15
(2):227-231.
[36] Normua, F., Higashi, S., Ambu, L., Mohamad, M. (2003): Oil Palm Plantation Usage and
Mating Systems of Sun Bears. ‒ Unpubl. manuscript. 24 pp.
[37] Norussis, M.J. (1994): SPSS/PC + statistical data analysis: SPSS Inc., Headquarters, S.
Wacker Drive, Chicago, Illinois.
[38] Owen, M.A., Swaisgood, R.R., Czekala, N.M., Steinman, K., Lindburg, D.G. (2004):
Monitoring Stress in Captive Giant Pandas (Ailuropoda melanoleuca): Behavioral and
Hormonal Responses to Ambient Noise. ‒ Zoo Biology 23:147-164.
[39] P hillips, M.K. (1987): Behavior and habitat use of grizzly bears in Northeastern Alaska.
International Conference on Bear Research and Management 7:159-167.
[40] Powell, R.A., Zimmerman, J.W., Seaman, D.E., (1997): Ecology and Behaviour of North
American Black Bears: Home Ranges, Habitat, and Social Organization. ‒ Chapman &
Hall, London. 203 pp.

Sethy‒Chauhan:Assessing habitat use by sun bears
- 235 -
APPLIED ECOLOGY AND ENVIRONMENTAL RESEARCH 14(1): 215-236. http://www.aloki.hu ● ISSN 1589 1623 (Print) ● ISSN 1785 0037 (Online)
DOI: http://dx.doi.org/10.15666/aeer/1401_215236
2016, ALÖKI Kft., Budapest, Hungary
[41] Sethy, J., Chauhan, N.P.S. (2011): Use and trade of bear body parts: Impact and
conservation in Arunachal Pradesh state, India. ‒ International Journal of Bio-resource
and Stress Management 2(4):409-415.
[42] Sethy, J., Chauhan, N.P.S. (2012a): Human-Malayan sun bear conflict in North-East
India, 21st International conference on Bear Research and Management, New Delhi.26-
30 November.
[43] Sethy, J., Chauhan, N.P.S. (2012b): Use and trade of bear body parts: impact and
conservation in Arunachal Pradesh. 21st International conference on Bear Research and
Management, New Delhi.26-30 November.
[44] Sethy, J., Chauhan, N.P.S. (2012c): Conservation status of Sun bear (Helarctos
malayanus) in Nagaland State, North-East India. ‒ Asian Journal of Conservation Biology
1(2):103-109.
[45] Wasser, S.K., Davenport, B., Ramage, E.R., Hunt, K.E., Parker, M., Clarke, C.,
Stenhouse, G. (2004): Scat Detection Dogs in Wildlife Research and Management:
Application to Grizzly and Black Bears in the Yellow head Ecosystem, Alberta, Canada.
‒ Canadian Journal of Zoology 82:475-492.
[46] Wilson, C.C., Wilson, W.L. (1975): The Influence of Selective Logging on Primates and
Other Animals in East Kalimantan. ‒ Fol. Primatol 23:245-274.
[47] Wilson, W.L., Johns, A.D. (1982): Diversity and abundance of selected animal species in
undisturbed forest, selectively logged forest and plantations in East Kalimantan,
Indonesia. ‒ Biological Conservation 24: 205-218.
[48] Wong, S.T. (2002): The Ecology of Malayan Sun Bear (Helarctos malayanus) in the
Lowland Tropical Forest of Borneo. M.S. Thesis, University of Montana. 153 pp.
[49] Wong, S.T., Servheen, C., Ambu, L. (2002): Food habits of Malayan sun bears in
Lowland tropical forest of Borneo. ‒ Ursus 13:127-136.
[50] Wong, S.T., Servheen, C.W., Ambu, L. (2004): Home range, Movement and Activity
Patterns and Bedding Sites of Malayan Sun Bear Helarctos malayanus in the Rainforest
of Borneo. ‒ Biological Conservation 119:169-181.
[51] Worthon B.J. (1989): Kernel methods for estimating the utilisation distribution in home
range studies. ‒ Ecology 70:164–168.
[51] Zar, J.H. (1984): Non Parametric Anova. Biostastical analysis. IInd edition ‒ Prentice-
Hall, Inc. Englewood cliffis, New Jersey. Pp. 176.
APPENDIX
Appendix 1. Sampling layout for vegetation quantification and collection of bear evidences.
10
m 10 m
200 m 200
m
200 m
60 x 2 m belt
for bear signs
10 m
belt
for
bear
signs
R = 5 m
for shrubs
R =1 m for
herb/grass
R= 10 m for tree
quantification and
bear signs
AP
PL
IED
EC
OL
OG
Y A
ND
EN
VIR
ON
ME
NT
AL
RE
SE
AR
CH
14
(1): 2
15
-23
6.
http
://ww
w.alo
ki.h
u ●
ISS
N 1
589
1623
(Prin
t) ● IS
SN
1785
0037
(Onlin
e)
DO
I: http
://dx.d
oi.o
rg/1
0.1
566
6/aeer/1
401
_21
523
6
2
01
6, A
LÖ
KI K
ft., Bud
apest, H
ung
ary
Seth
y‒
Ch
auh
an:A
ssessing
hab
itat use b
y su
n b
ears
-236
-