Embed Size (px)
Citation preview
ORIGINAL ARTICLE
Leaf litter decomposition of dominant tree species of NamdaphaNational Park, Arunachal Pradesh, northeast India
Atiqur Rahman Barbhuiya Æ Ayyanadar Arunachalam ÆPrabhat Chandra Nath Æ Mohammed Latif Khan ÆKusum Arunachalam
Received: 20 October 2006 / Accepted: 5 June 2007 / Published online: 12 December 2007
� The Japanese Forest Society and Springer 2007
Abstract Rates of weight loss and nutrient (N and P)
release patterns were studied in the leaf litter of the dom-
inant tree species (Ailanthus grandis, Altingia excelsa,
Castanopsis indica, Duabanga sonneriatioides, Dysoxylum
binectariferum, Mesua ferrea, Shorea assamica, Taluma
hodgsonii, Terminalia myriocarpa and Vatica lancefolia)
of a tropical wet evergreen forest of northeast India.
Nitrogen and phosphorus mineralization rate and decay
pattern varied significantly from species to species. In
general, the decay pattern, characterized by using a com-
posite polynomial regression equation, exhibited three
distinct phases of decay during litter decomposition—an
initial slow decay phase (0.063% weight loss day-1), fol-
lowed by a rapid decay phase (0.494% weight loss day-1)
and a final slow decay phase (0.136% weight loss day-1).
The initial chemical composition of the litter affected
decomposition rates and patterns. Species like D. sonner-
iatoides, D. binectariferum, and T. hodgsonii with higher N
and P content, lower carbon and lignin content, and lower
C:N ratio and lignin:N ratio exhibited relatively faster
decomposition rates than the other species, for example M.
ferrea, C. indica and A. grandis. A slow decay rate was
recorded for species such as M. ferrea, C. indica, and A.
grandis. The initial N and P content of litter showed sig-
nificant positive correlations with decay rates. Carbon and
lignin content, lignin:N, and C:N showed significant neg-
ative correlations with decay rates. Soil total N and P, and
rainfall, soil temperature, and soil moisture had positive
correlations with decay rates. The rapid decomposition
rates observed in comparison with other different forest
litter decay rates confirm that tropical wet evergreen forest
species are characterized by faster decomposition rates,
indicating a faster rate of organic matter turnover and rapid
nutrient cycling.
Keywords Decay rate � Lignin � Litter decomposition �Nitrogen � Phosphorus � Tropical wet evergreen forest
Introduction
The term ‘‘decomposition’’ is defined as the process of
biological disintegration of dead organic materials whereby
mineralization of complex organic compounds into simple
inorganic forms takes place. This loss of nutrients from
decomposing litter is a key process governing the avail-
ability of nutrients in ecosystems (Moore et al. 2006). The
release of nutrients from forest litter through natural
decomposition processes is recognised as an important part
of the plant biomass that is made available for further plant
growth (Maclean and Wein 1978). The importance of litter
decomposition to nutrient cycling and ecosystem function
has long been known, and a huge number of studies has
been undertaken (Gillon et al. 1999; Moore et al. 2006),
many in response to regional or species-specific concerns.
Attempts to predict the effects of climate change have
recently prompted studies of litter from wider ranges of
plant types (Perez-Harguindeguy et al. 2000).
The effect of litter quality is obvious from the different
decay rates of various tissue types, but identifying the
A. R. Barbhuiya � A. Arunachalam � P. Chandra Nath �M. Latif Khan � K. Arunachalam
Department of Forestry, North Eastern Regional
Institute of Science and Technology,
Nirjuli 791109, Arunachal Pradesh, India
A. R. Barbhuiya (&)
Department of Forestry, Mizoram University,
Aizawl 796009, Mizoram, India
e-mail: [email protected]
123
J For Res (2008) 13:25–34
DOI 10.1007/s10310-007-0044-6
particular litter characteristics that are consistently and
closely related to decomposability has proven surprisingly
difficult. Across a broad range of litter type C:N ratio
seems to be the best predictor of decay rate (Perez-Har-
guindeguy et al. 2000), while the lignin content or lignin:N
ratio is better correlated with decay rates (Loranger et al.
2002). Long-term studies have indicated that the factors
that best correlate with rates of early decay are often not
the same as those that relate to long-term decay (Joffre
et al. 2001; Yang and Janssen 2002). Berg and Staaf (1980)
and Sangha et al. (2006) suggested that early decomposi-
tion is regulated by nutrient concentrations (especially N
and P) whereas the late-stage decay is regulated by lignin
concentration. Different species have different nutrient
release patterns, which are related to quality, season, and
environmental factors (Abiven et al. 2005; Arunachalam
et al. 2003).
Namdapha National Park has a variety of tree species, but
there is too little information on the relative rates of decay of
foliar litter of these species and litter chemical parameters
useful for predicting their decay rates. Thus, in this study we
have quantified the decomposition rates and nutrient min-
eralization patterns of the dominant tropical tree species
Ailanthus grandis, Altingia excelsa, Castonopsis indica,
Dysoxylum binectariferum, Duabanga sonneriatioides,
Mesua ferrea, Taluma hodgsonii, Terminalia myriocarpa,
Shorea assamica, and Vatica lancefolia of Namdapha
National Park, Arunachal Pradesh, India, to understand their
role in the organic matter and nutrient turnover that has a
bearing on the overall productivity of the ecosystem.
Study site
The study was conducted in a tropical wet evergreen forest
([200 years old approximately) in the Namdapha National
Park (27�2303000 N to 27�3904000 N latitude to 96�150200 E
to 96�5803300 E longitude) in the Changlang district of
Arunachal Pradesh, northeast India. The total park area is
1,985 km2 over an elevation range of 250–4,571 m asl,
of which 177 km2 is buffer zone. The region experiences
four seasons—winter (mid-November to February), spring
(March to April), monsoon (May to September), and a brief
autumn (October to mid-November). The major perennial
rivers flowing through Namdapha National Park include
the Noa-Dihing, Deban, Namdapha, and Burma Nala. In
addition to these, innumerable seasonal rainfed streams and
streamlets also drain the park. The annual rainfall ranged
from 2,000 to 4,300 mm between 1994 and 2004.
An experimental plot of 100 m 9 100 m was estab-
lished inside the Namdapha National Park (27�26015.800–27�26019.700 N latitude to 96�28012.300–96�28010.400 E lon-
gitude). The vegetation in the plot was dominated by mixed
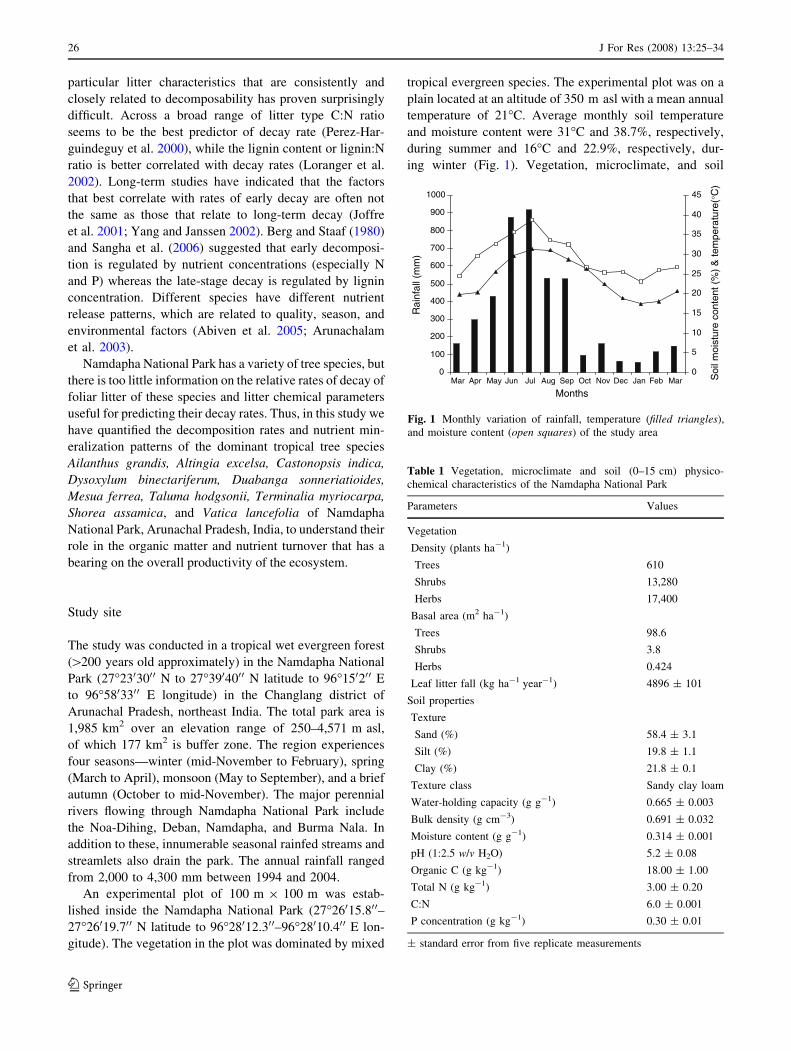
tropical evergreen species. The experimental plot was on a
plain located at an altitude of 350 m asl with a mean annual
temperature of 21�C. Average monthly soil temperature
and moisture content were 31�C and 38.7%, respectively,
during summer and 16�C and 22.9%, respectively, dur-
ing winter (Fig. 1). Vegetation, microclimate, and soil
0
100
200
300
400
500
600
700
800
900
1000
Mar Apr May Jun Jul Aug Sep Oct Nov Dec Jan Feb Mar
Months
Rai
nfal
l (m
m)
0
5
10
15
20
25
30
35
40
45
Soi
l moi
stur
e co
nten
t (%
) &
tem
pera
ture
(°C
)
Fig. 1 Monthly variation of rainfall, temperature (filled triangles),
and moisture content (open squares) of the study area
Table 1 Vegetation, microclimate and soil (0–15 cm) physico-
chemical characteristics of the Namdapha National Park
Parameters Values
Vegetation
Density (plants ha-1)
Trees 610
Shrubs 13,280
Herbs 17,400
Basal area (m2 ha-1)
Trees 98.6
Shrubs 3.8
Herbs 0.424
Leaf litter fall (kg ha-1 year-1) 4896 ± 101
Soil properties
Texture
Sand (%) 58.4 ± 3.1
Silt (%) 19.8 ± 1.1
Clay (%) 21.8 ± 0.1
Texture class Sandy clay loam
Water-holding capacity (g g-1) 0.665 ± 0.003
Bulk density (g cm-3) 0.691 ± 0.032
Moisture content (g g-1) 0.314 ± 0.001
pH (1:2.5 w/v H2O) 5.2 ± 0.08
Organic C (g kg-1) 18.00 ± 1.00
Total N (g kg-1) 3.00 ± 0.20
C:N 6.0 ± 0.001
P concentration (g kg-1) 0.30 ± 0.01
± standard error from five replicate measurements
26 J For Res (2008) 13:25–34
123
characteristics have been summarized in Table 1. Tree
density and basal area were 610 trees ha-1 and 98.6 m2 ha-1,
respectively, in the selected plot. The ten dominant tree
species in the experimental plot are listed in in Table 2. Soil
was sandy clay loam, acidic (pH = 5.2), and the C:N ratio
was 6 (Table 1).
Methodology
Leaf litter chemistry
Freshly fallen leaves of the ten dominant tree species, viz.,
Ai. grandis, A. excelsa, C. indica, D. binectariferum,
D. sonneriatoides, M. ferrea, T. hodgsonii, T. myriocarpa,
S. assamica, and V. lancefolia, were collected during the
peak litter fall period (March). The litter samples were air
dried in the laboratory and sub-samples were kept at 80�C
for 48 h to determine the dry mass. The oven-dried mate-
rials were powdered in a Wiley mill to pass through 1 mm
pore size stainless-steel mesh and analysed for their
chemical composition. The ash content was determined by
igniting 1 g ground litter sample at 550�C for 6 h in a
muffle furnace and a total of 50% of the ash-free mass was
calculated as the carbon (C) content (Allen et al. 1974). Soil
organic carbon (SOC) was determined by the complete
oxidation method (Nelson and Sommers 1975). Nitrogen
(N) was estimated by use of a semi-micro Kjeldahl proce-
dure entailing acid digestion, distillation, and titration, in
accordance with Anderson and Ingram (1993). Total
phosphorus (P) was determined by triacid digestion, fol-
lowed by colorimetric reaction with ammonium and
stannous chloride (molybdenum blue method; Jackson
1958). Lignin, cellulose, and hemicellulose content were
determined gravimetrically according to Allen et al. (1974).
Litter decomposition
Decomposition of leaf litter of dominant tree species
was studied in the forest stand using a nylon bag
(15 cm 9 15 cm) technique (Gilbert and Bocock 1960).
The mesh size was 2 mm, small enough to prevent major
losses of litter samples yet large enough to permit aerobic
microbial activity and free entry of small soil organisms.
Air-dried material (5 g) was placed in each bag, which was
then stitched with nylon thread. For each species 80 bags
were prepared and randomly dispersed on the experimental
forest floor in the month of March 2003. After 30, 60, 90,
Table 2 List of tree species for decomposition study of Namdapha
National Park
Name of the species Family Growth
characteristics
Ailanthus grandis Prain. Simarubaceae Medium
Altingia excelsa Noron. Hamamelidaceae Slow
Castanopsis indica(Roxb.) Miq.
Fabaceae Slow
Duabanga sonneratioidesBuch.
Sonneratiaceae Fast
Dysoxylum binectariferumHk.f ex Bed
Meliaceae Medium
Mesua ferrea L. Clusaceae Slow
Shorea assamica Dyer. Dipterocarpaceae Slow
Talauma hodgsoniiHk. F. & Thom.
Magnoliaceae Slow
Terminalia myriocarpaMuell.
Combretaceae Fast
Vatica lancefolia(Roxb.) Blume.
Dipterocarpaceae Slow
Table 3 Initial chemical composition of leaf litter of the dominant tree species of the Namdapha National Park
Species C (mg g-1) N (mg g-1) P (mg g-1) Lignin (mg g-1) C:N L:N Cellulose
(mg g-1)
Hemicellulose
(mg g-1)
A. grandis 363.3 ± 26.8 10.6 ± 0.2 0.502 ± 0.011 170.3 ± 23.7 34.3 ± 1.3 16.1 ± 1.0 234.8 ± 36.8 61.6 ± 0.8
A. excelsa 341.5 ± 2.5 14.9 ± 0.6 0.513 ± 0.031 248.0 ± 8.8 23.1 ± 2.6 16.8 ± 2.0 320.2 ± 30.1 55.7 ± 4.6
C. indica 285.0 ± 9.7 6.9 ± 0.3 0.713 ± 0.017 180.0 ± 10.0 41.9 ± 3.2 26.5 ± 2.5 28.6 ± 2.1 70.3 ± 5.0
D. binectariferum 302.7 ± 19.3 18.7 ± 3.1 0.645 ± 0.001 157.9 ± 11.6 21.0 ± 1.1 8.4 ± 0.7 395.8 ± 36.1 49.5 ± 8.5
D. sonneriatoides 303.3 ± 51.0 20.5 ± 2.0 0.914 ± 0.024 137.6 ± 13.8 18.8 ± 1.6 6.7 ± 1.0 384.0 ± 29.7 60.2 ± 5.7
M. ferrea 281.7 ± 12.2 5.7 ± 0.8 0.456 ± 0.006 248.5 ± 26.4 49.4 ± 4.5 43.6 ± 2.6 219.0 ± 14.7 78.6 ± 6.3
T. hodgsonii 315.1 ± 21.3 13.2 ± 1.0 0.856 ± 0.001 210.6 ± 31.4 23.9 ± 2.9 16.0 ± 1.2 265.6 ± 45.3 40.8 ± 3.0
T. myriocarpa 301.6 ± 20.0 15.3 ± 3.3 0.474 ± 0.021 187.5 ± 17.6 19.7 ± 2.1 12.3 ± 1.0 241.4 ± 37.0 63.8 ± 7.0
S. assamica 315.0 ± 11.7 10.7 ± 4.5 0.617 ± 0.003 234.0 ± 18.8 29.4 ± 2.5 21.9 ± 1.3 275.1 ± 26.3 60.0 ± 1.9
V. lancefolia 340.1 ± 26.6 13.6 ± 2.3 0.543 ± 0.020 223.4 ± 21.4 25.0 ± 1.1 16.4 ± 2.9 225.6 ± 33.0 95.6 ± 9.3
± standard error from five replicate measurements
L:N, lignin:nitrogen ratio
J For Res (2008) 13:25–34 27
123
120, 150, 180, 210, 240, 270, 300, 330, 360, and 390 days
five-litter bags for each species were brought to the labo-
ratory, carefully avoiding loss of materials from the bags.
The litter bags were washed in a bucket full of tap water,
by swirling briefly, and carefully decanted through a 2-mm
mesh size sieve to remove extraneous matter. The litter was
then dried at 80�C for 48 h and weighed. The samples were
powdered and used for analysis of N and P concentrations.
The annual decay constant (k) was calculated by fol-
lowing the negative exponential decay model (Olson
1963): k = -ln (X/X0)/t, where, X0 is the initial dry weight,
X is the dry weight remaining at the end of the investiga-
tion, and t is the time period. The time required for 50%
(t50) and 99% (t99) weight loss was calculated as t50 =
0.693/k and t99 = 5/k (Olson 1963).
The effects on the rate of decomposition of the litter of
climatic variables, initial litter chemistry, and a few soil
characteristics were assessed by using a simple linear
regression function, Y = a + bx (Zar 1974). ANOVA was
used to test for differences among different species,
A. grandis
0
20
40
60
80
100
120 M. ferrea
A. excelsa
0
20
40
60
80
100
120T. hodgsoni
C. indica
0
20
40
60
80
100
120T. myriocarpa
D. binacterifeum
0
20
40
60
80
100
120S. assamica
D. sonneratoides
0
20
40
60
80
100
120
30 60 90 120 150 180 210 240 270 300 330 360 390 30 60 90 120 150 180 210 240 270 300 330 360 390
V. lancefolia
Dry
mat
ter
rem
aini
ng (
% o
f th
e in
itial
)
Y=98.56+0.33X-2.43X2-0.15X3
r=0.997, P<0.001 Y=99.16+3.15X-2.31X2+0.12X3
r=0.989, P<0.001
Y=95.90+4.61X-4.05X2+0.27X3
r=0.998, P<0.001Y=106.32-10.44X-2.24X2+0.24X3
r=0.991, P<0.001
Y=107.98-6.05X-1.05X2+0.07X3
r=0.991, P<0.001 Y=103.84-9.28X-0.98X2+0.09X3
r=0.993, P<0.001
Y=96.95-1.33X-2.99X2+0.22X3
r=0.999, P<0.001 Y=95.11+0.66X-3.12X2+0.21X3
r=0.994, P<0.001
Y=82.67+3.60X-5.33X2+0.45X3
r=0.996, P<0.001Y=103.21-4.65X-1.65X2+0.11X3
r=0.991, P<0.001
AutumnSummerSpring Winter AutumnSummerSpring Winter
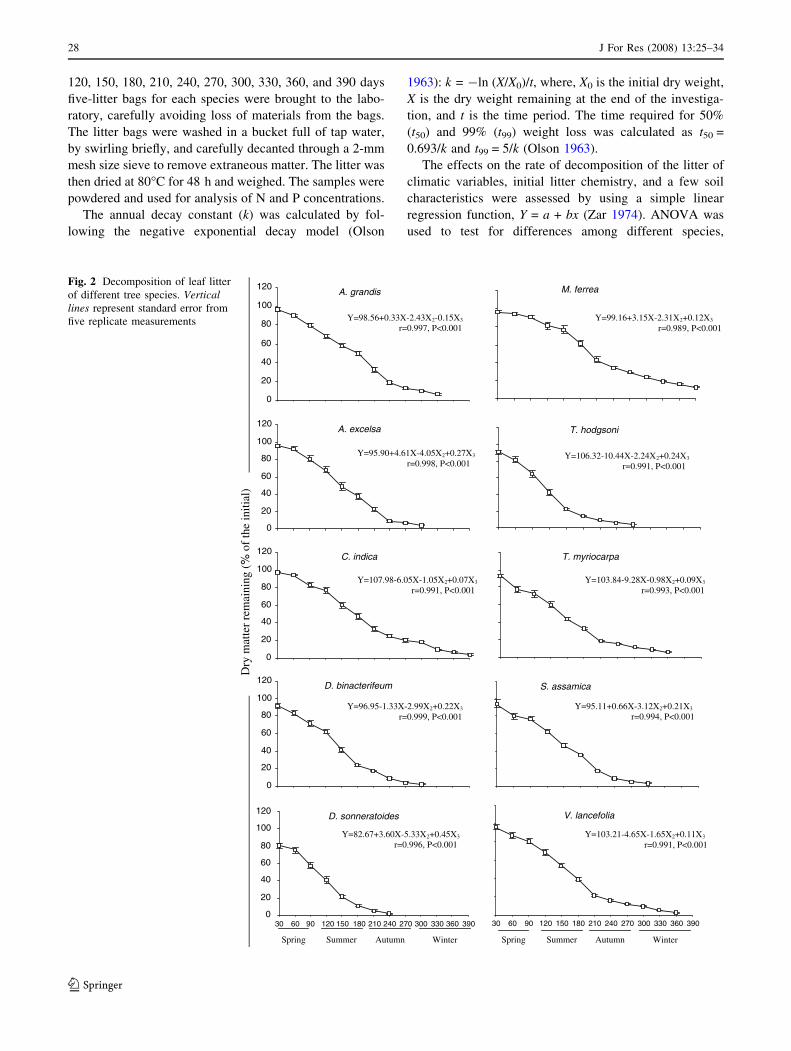
Fig. 2 Decomposition of leaf litter
of different tree species. Verticallines represent standard error from
five replicate measurements
28 J For Res (2008) 13:25–34
123
different litter components, and, during sampling, dates of
decomposition. A composite polynomial regression model
Y = a + bX1 + cX2 + dX3…, was constructed using dummy
factors as the indicator variables to distinguish different
phases of decomposition (Arunachalam et al. 1998). By
using this equation an expected decay curve was fitted to
the litter mass data obtained at different times in the
decomposition study. In this equation, Y is the mass
remaining, a is the Y intercept (constant), b is the rate of
change in Y with respect to time, and c and d are shifts
parameters for adjustment of the Y intercept in Phase-II and
Phase-III, respectively. The shift parameters were the
dummy factors, equivalent to zero if decay was slow or 1 if
decay was fast.
Results
Nitrogen concentration in the leaf litter of the 10 dominant
tree species varied from a minimum of 5.8 mg g-1 for M.
ferrea to a maximum of 20.5 mg g-1 for D. sonneriatoides
(Table 3). Phosphorus concentration varied between
0.456 mg g-1 for M. ferrea to 0.914 mg g-1 for D.
sonneriatoides. Lignin, cellulose, and hemicellulose
concentrations varied significantly (P \ 0.05) among the
species. Lignin and C:N ratio were the greatest for M.
ferrea and minimum for D. sonneriatoides (Table 3).
Besides M. ferrea (49.4), A. grandis, C. indica, and S.
assamica had relatively high C:N ratios whereas for the
other species the C:N ratio was \25. Cellulose concen-
tration was highest for D. binectariferum (396 mg g-1) and
lowest for M. ferrea (219 mg g-1). Hemicellulose ranged
between 40.7 mg g-1 for T. hodgsonii to 95.6 mg g-1 for
V. lancefolia. The corresponding lignin:N ratio ranged
from 6.7 (D. sonneriatoides) to 43.6 (M. ferrea) (Table 3).
Species differences in litter decay rates were evident
from decomposition values expressed as mean percentage
remaining dry weight for the different sampling times
(Fig. 2). The time required for complete disappearance of
the original biomass of different tree leaf litter ranged from
240 to 390 days. In this study, the decomposition occurred
in three phases. The polynomial regression equations
describing decay rates over time were highly significant
(P \ 0.001) for all the species. In all, the first phase lasted
for 30 to 90 days and was characterised by a slow rate of
decay (0.063% weight loss day-1). This was followed by a
period of rapid weight loss (0.494% weight loss day-1) for
up to 210 days. In the third phase (i.e., 210–390 days),
decay continued more-or-less at a constant rate (0.136%
weight loss day-1).
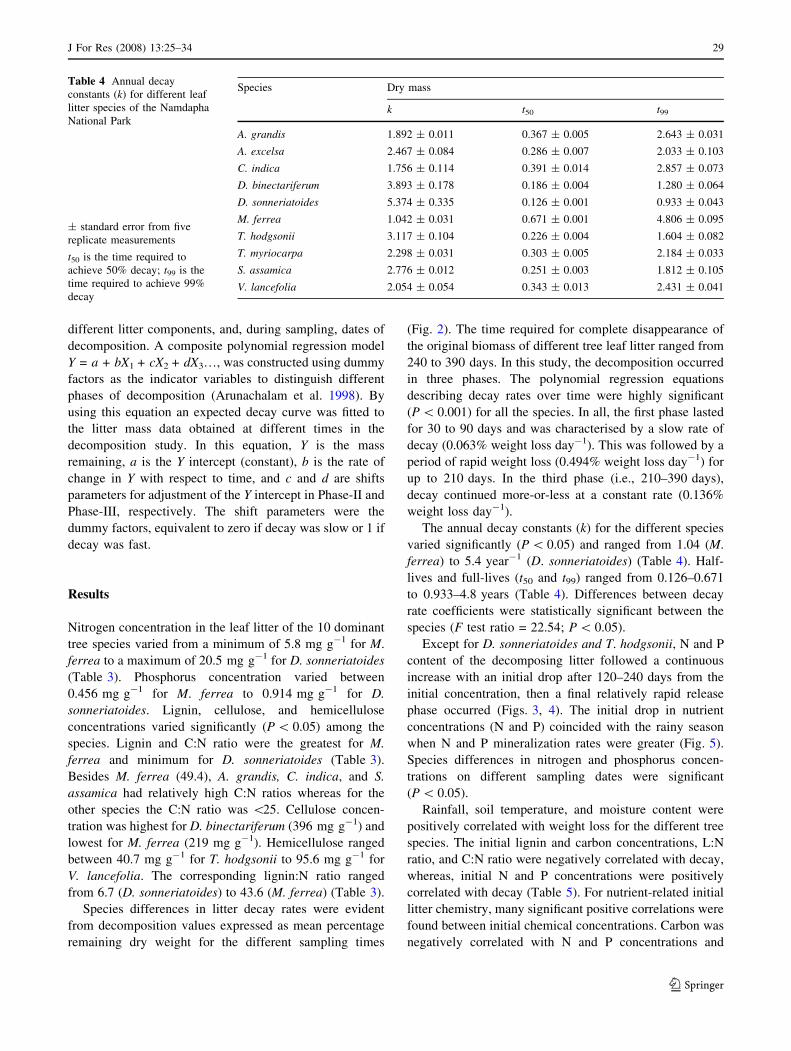
The annual decay constants (k) for the different species
varied significantly (P \ 0.05) and ranged from 1.04 (M.
ferrea) to 5.4 year-1 (D. sonneriatoides) (Table 4). Half-
lives and full-lives (t50 and t99) ranged from 0.126–0.671
to 0.933–4.8 years (Table 4). Differences between decay
rate coefficients were statistically significant between the
species (F test ratio = 22.54; P \ 0.05).
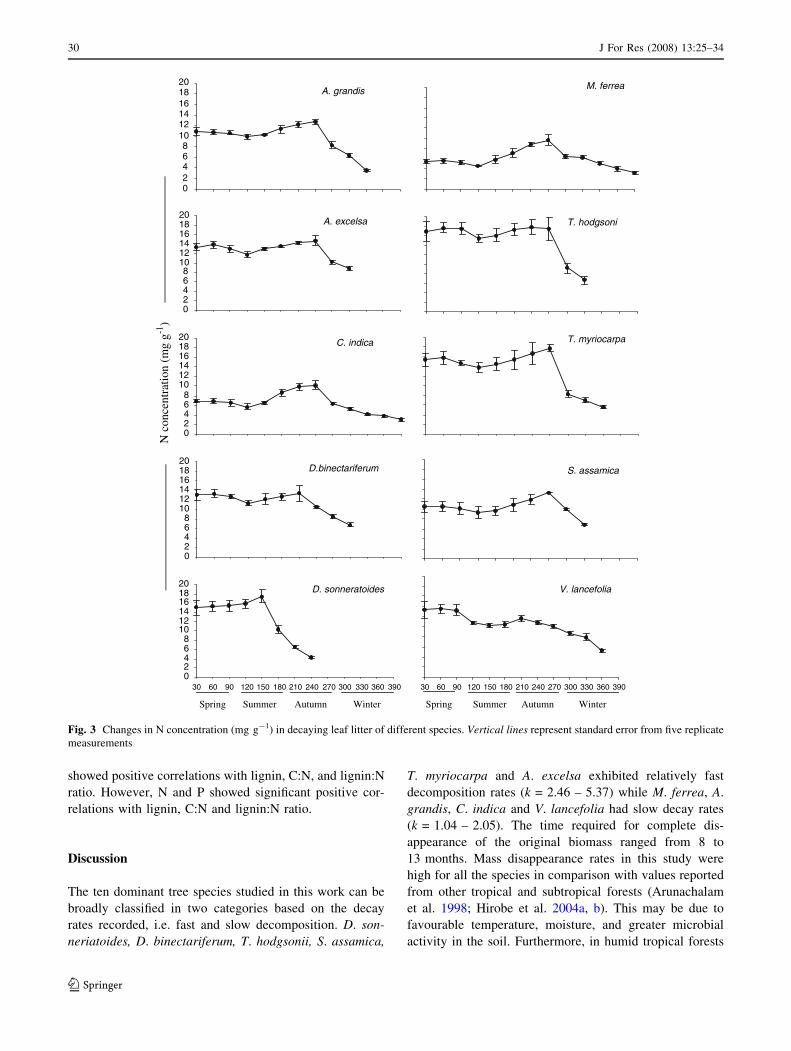
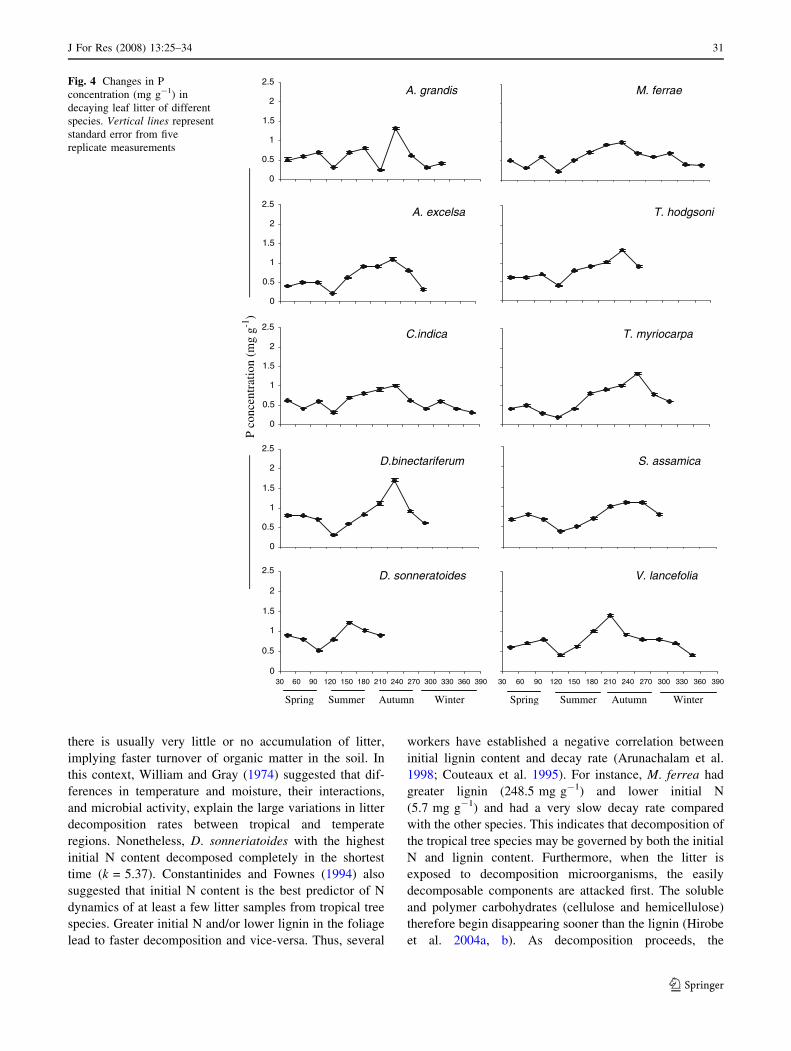
Except for D. sonneriatoides and T. hodgsonii, N and P
content of the decomposing litter followed a continuous
increase with an initial drop after 120–240 days from the
initial concentration, then a final relatively rapid release
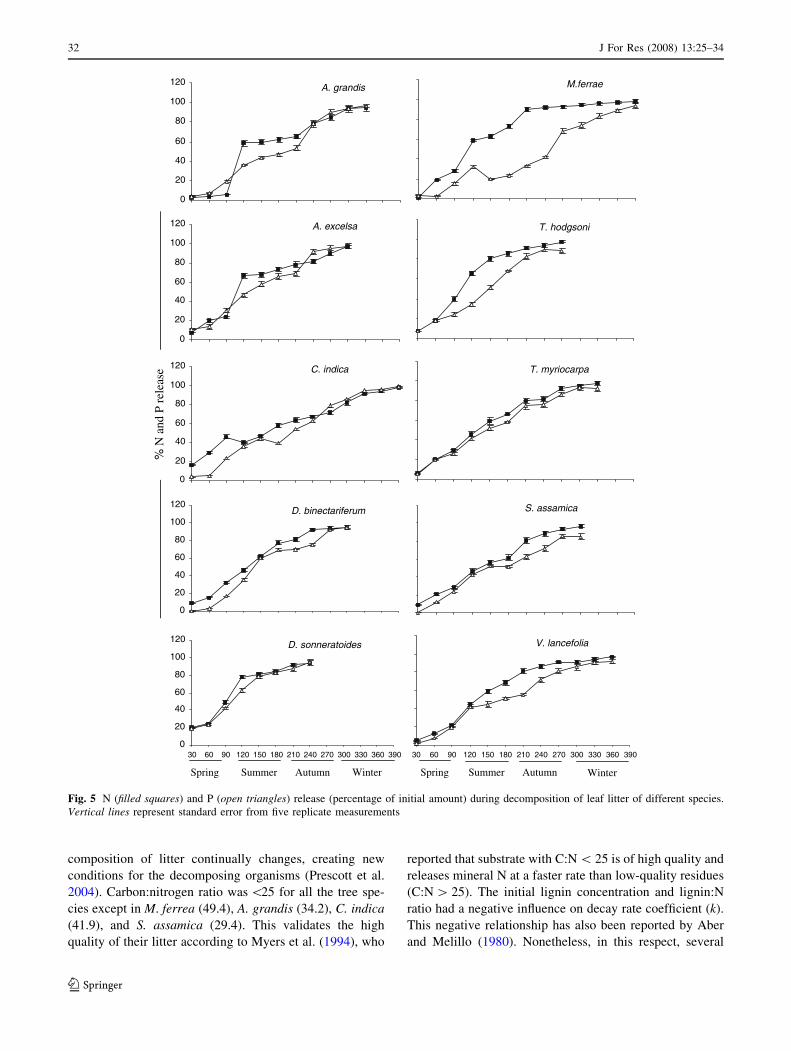
phase occurred (Figs. 3, 4). The initial drop in nutrient
concentrations (N and P) coincided with the rainy season
when N and P mineralization rates were greater (Fig. 5).
Species differences in nitrogen and phosphorus concen-
trations on different sampling dates were significant
(P \ 0.05).
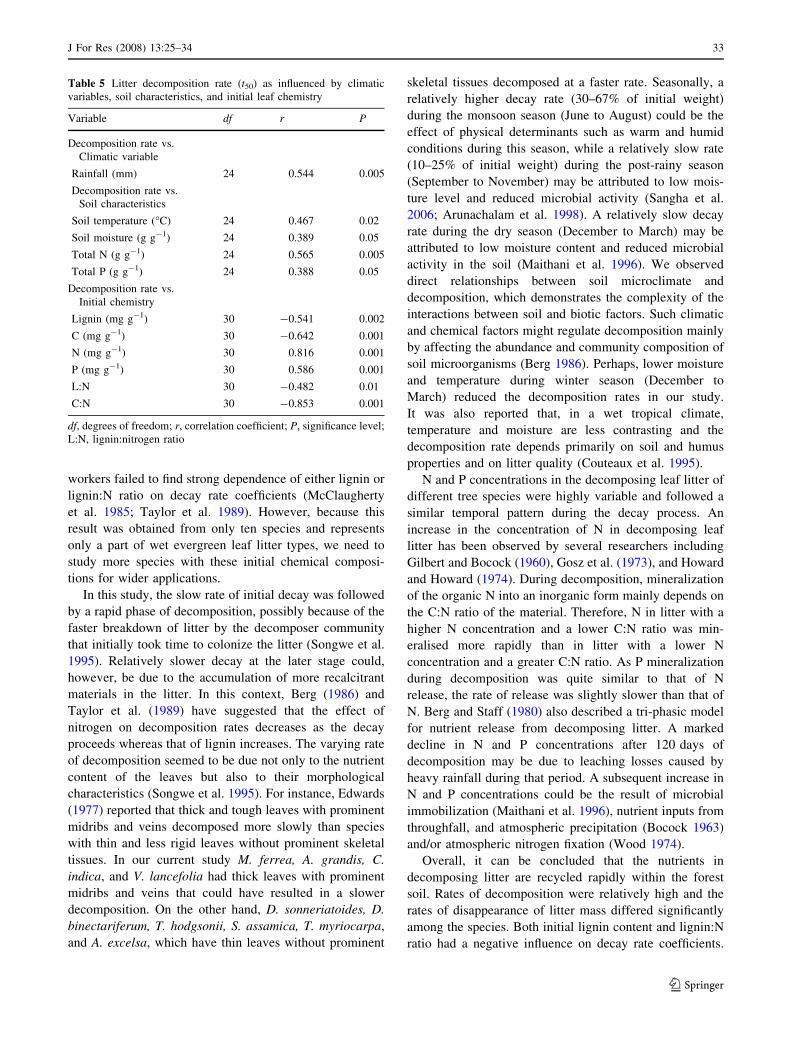
Rainfall, soil temperature, and moisture content were
positively correlated with weight loss for the different tree
species. The initial lignin and carbon concentrations, L:N
ratio, and C:N ratio were negatively correlated with decay,
whereas, initial N and P concentrations were positively
correlated with decay (Table 5). For nutrient-related initial
litter chemistry, many significant positive correlations were
found between initial chemical concentrations. Carbon was
negatively correlated with N and P concentrations and
Table 4 Annual decay
constants (k) for different leaf
litter species of the Namdapha
National Park
± standard error from five
replicate measurements
t50 is the time required to
achieve 50% decay; t99 is the
time required to achieve 99%
decay
Species Dry mass
k t50 t99
A. grandis 1.892 ± 0.011 0.367 ± 0.005 2.643 ± 0.031
A. excelsa 2.467 ± 0.084 0.286 ± 0.007 2.033 ± 0.103
C. indica 1.756 ± 0.114 0.391 ± 0.014 2.857 ± 0.073
D. binectariferum 3.893 ± 0.178 0.186 ± 0.004 1.280 ± 0.064
D. sonneriatoides 5.374 ± 0.335 0.126 ± 0.001 0.933 ± 0.043
M. ferrea 1.042 ± 0.031 0.671 ± 0.001 4.806 ± 0.095
T. hodgsonii 3.117 ± 0.104 0.226 ± 0.004 1.604 ± 0.082
T. myriocarpa 2.298 ± 0.031 0.303 ± 0.005 2.184 ± 0.033
S. assamica 2.776 ± 0.012 0.251 ± 0.003 1.812 ± 0.105
V. lancefolia 2.054 ± 0.054 0.343 ± 0.013 2.431 ± 0.041
J For Res (2008) 13:25–34 29
123
showed positive correlations with lignin, C:N, and lignin:N
ratio. However, N and P showed significant positive cor-
relations with lignin, C:N and lignin:N ratio.
Discussion
The ten dominant tree species studied in this work can be
broadly classified in two categories based on the decay
rates recorded, i.e. fast and slow decomposition. D. son-
neriatoides, D. binectariferum, T. hodgsonii, S. assamica,
T. myriocarpa and A. excelsa exhibited relatively fast
decomposition rates (k = 2.46 – 5.37) while M. ferrea, A.
grandis, C. indica and V. lancefolia had slow decay rates
(k = 1.04 – 2.05). The time required for complete dis-
appearance of the original biomass ranged from 8 to
13 months. Mass disappearance rates in this study were
high for all the species in comparison with values reported
from other tropical and subtropical forests (Arunachalam
et al. 1998; Hirobe et al. 2004a, b). This may be due to
favourable temperature, moisture, and greater microbial
activity in the soil. Furthermore, in humid tropical forests
A. grandis
02468
101214161820 M. ferrea
A. excelsa
02468
101214161820
T. hodgsoni
C. indica
02468
101214161820 T. myriocarpa
D.binectariferum
02468
101214161820
S. assamica
D. sonneratoides
02468
101214161820
30 60 90 120 150 180 210 240 270 300 330 360 390 30 60 90 120 150 180 210 240 270 300 330 360 390
V. lancefolia
N c
once
ntra
tion
(mg
g-1)
AutumnSummer Spring Winter AutumnSummerSpring Winter
Fig. 3 Changes in N concentration (mg g-1) in decaying leaf litter of different species. Vertical lines represent standard error from five replicate
measurements
30 J For Res (2008) 13:25–34
123
there is usually very little or no accumulation of litter,
implying faster turnover of organic matter in the soil. In
this context, William and Gray (1974) suggested that dif-
ferences in temperature and moisture, their interactions,
and microbial activity, explain the large variations in litter
decomposition rates between tropical and temperate
regions. Nonetheless, D. sonneriatoides with the highest
initial N content decomposed completely in the shortest
time (k = 5.37). Constantinides and Fownes (1994) also
suggested that initial N content is the best predictor of N
dynamics of at least a few litter samples from tropical tree
species. Greater initial N and/or lower lignin in the foliage
lead to faster decomposition and vice-versa. Thus, several
workers have established a negative correlation between
initial lignin content and decay rate (Arunachalam et al.
1998; Couteaux et al. 1995). For instance, M. ferrea had
greater lignin (248.5 mg g-1) and lower initial N
(5.7 mg g-1) and had a very slow decay rate compared
with the other species. This indicates that decomposition of
the tropical tree species may be governed by both the initial
N and lignin content. Furthermore, when the litter is
exposed to decomposition microorganisms, the easily
decomposable components are attacked first. The soluble
and polymer carbohydrates (cellulose and hemicellulose)
therefore begin disappearing sooner than the lignin (Hirobe
et al. 2004a, b). As decomposition proceeds, the
A. grandis
0
0.5
1
1.5
2
2.5M. ferrae
A. excelsa
0
0.5
1
1.5
2
2.5T. hodgsoni
C.indica
0
0.5
1
1.5
2
2.5T. myriocarpa
D.binectariferum
0
0.5
1
2
2.5
S. assamica
D. sonneratoides
0
0.5
1
1.5
2
2.5
30 60 90 120 150 180 210 240 270 300 330 360 390 30 60 90 120 150 180 210 240 270 300 330 360 390
V. lancefolia
P c
once
ntra
tion
(m
g g-1
)
AutumnSummerSpring WinterAutumnSummer Spring Winter
1.5
Fig. 4 Changes in P
concentration (mg g-1) in
decaying leaf litter of different
species. Vertical lines represent
standard error from five
replicate measurements
J For Res (2008) 13:25–34 31
123
composition of litter continually changes, creating new
conditions for the decomposing organisms (Prescott et al.
2004). Carbon:nitrogen ratio was \25 for all the tree spe-
cies except in M. ferrea (49.4), A. grandis (34.2), C. indica
(41.9), and S. assamica (29.4). This validates the high
quality of their litter according to Myers et al. (1994), who
reported that substrate with C:N \ 25 is of high quality and
releases mineral N at a faster rate than low-quality residues
(C:N [ 25). The initial lignin concentration and lignin:N
ratio had a negative influence on decay rate coefficient (k).
This negative relationship has also been reported by Aber
and Melillo (1980). Nonetheless, in this respect, several
Winter Winter
A. grandis
0
20
40
60
80
100
120 M.ferrae
A. excelsa
0
20
40
60
80
100
120 T. hodgsoni
C. indica
0
20
40
60
80
100
120 T. myriocarpa
D. binectariferum
0
20
40
60
80
100
120 S. assamica
D. sonneratoides
0
20
40
60
80
100
120
30 60 90 120 150 180 210 240 270 300 330 360 390 30 60 90 120 150 180 210 240 270 300 330 360 390
V. lancefolia
% N
and
P r
elea
se
AutumnSummerSpring AutumnSummerSpring
Fig. 5 N (filled squares) and P (open triangles) release (percentage of initial amount) during decomposition of leaf litter of different species.
Vertical lines represent standard error from five replicate measurements
32 J For Res (2008) 13:25–34
123
workers failed to find strong dependence of either lignin or
lignin:N ratio on decay rate coefficients (McClaugherty
et al. 1985; Taylor et al. 1989). However, because this
result was obtained from only ten species and represents
only a part of wet evergreen leaf litter types, we need to
study more species with these initial chemical composi-
tions for wider applications.
In this study, the slow rate of initial decay was followed
by a rapid phase of decomposition, possibly because of the
faster breakdown of litter by the decomposer community
that initially took time to colonize the litter (Songwe et al.
1995). Relatively slower decay at the later stage could,
however, be due to the accumulation of more recalcitrant
materials in the litter. In this context, Berg (1986) and
Taylor et al. (1989) have suggested that the effect of
nitrogen on decomposition rates decreases as the decay
proceeds whereas that of lignin increases. The varying rate
of decomposition seemed to be due not only to the nutrient
content of the leaves but also to their morphological
characteristics (Songwe et al. 1995). For instance, Edwards
(1977) reported that thick and tough leaves with prominent
midribs and veins decomposed more slowly than species
with thin and less rigid leaves without prominent skeletal
tissues. In our current study M. ferrea, A. grandis, C.
indica, and V. lancefolia had thick leaves with prominent
midribs and veins that could have resulted in a slower
decomposition. On the other hand, D. sonneriatoides, D.
binectariferum, T. hodgsonii, S. assamica, T. myriocarpa,
and A. excelsa, which have thin leaves without prominent
skeletal tissues decomposed at a faster rate. Seasonally, a
relatively higher decay rate (30–67% of initial weight)
during the monsoon season (June to August) could be the
effect of physical determinants such as warm and humid
conditions during this season, while a relatively slow rate
(10–25% of initial weight) during the post-rainy season
(September to November) may be attributed to low mois-
ture level and reduced microbial activity (Sangha et al.
2006; Arunachalam et al. 1998). A relatively slow decay
rate during the dry season (December to March) may be
attributed to low moisture content and reduced microbial
activity in the soil (Maithani et al. 1996). We observed
direct relationships between soil microclimate and
decomposition, which demonstrates the complexity of the
interactions between soil and biotic factors. Such climatic
and chemical factors might regulate decomposition mainly
by affecting the abundance and community composition of
soil microorganisms (Berg 1986). Perhaps, lower moisture
and temperature during winter season (December to
March) reduced the decomposition rates in our study.
It was also reported that, in a wet tropical climate,
temperature and moisture are less contrasting and the
decomposition rate depends primarily on soil and humus
properties and on litter quality (Couteaux et al. 1995).
N and P concentrations in the decomposing leaf litter of
different tree species were highly variable and followed a
similar temporal pattern during the decay process. An
increase in the concentration of N in decomposing leaf
litter has been observed by several researchers including
Gilbert and Bocock (1960), Gosz et al. (1973), and Howard
and Howard (1974). During decomposition, mineralization
of the organic N into an inorganic form mainly depends on
the C:N ratio of the material. Therefore, N in litter with a
higher N concentration and a lower C:N ratio was min-
eralised more rapidly than in litter with a lower N
concentration and a greater C:N ratio. As P mineralization
during decomposition was quite similar to that of N
release, the rate of release was slightly slower than that of
N. Berg and Staff (1980) also described a tri-phasic model
for nutrient release from decomposing litter. A marked
decline in N and P concentrations after 120 days of
decomposition may be due to leaching losses caused by
heavy rainfall during that period. A subsequent increase in
N and P concentrations could be the result of microbial
immobilization (Maithani et al. 1996), nutrient inputs from
throughfall, and atmospheric precipitation (Bocock 1963)
and/or atmospheric nitrogen fixation (Wood 1974).
Overall, it can be concluded that the nutrients in
decomposing litter are recycled rapidly within the forest
soil. Rates of decomposition were relatively high and the
rates of disappearance of litter mass differed significantly
among the species. Both initial lignin content and lignin:N
ratio had a negative influence on decay rate coefficients.
Table 5 Litter decomposition rate (t50) as influenced by climatic
variables, soil characteristics, and initial leaf chemistry
Variable df r P
Decomposition rate vs.
Climatic variable
Rainfall (mm) 24 0.544 0.005
Decomposition rate vs.
Soil characteristics
Soil temperature (�C) 24 0.467 0.02
Soil moisture (g g-1) 24 0.389 0.05
Total N (g g-1) 24 0.565 0.005
Total P (g g-1) 24 0.388 0.05
Decomposition rate vs.
Initial chemistry
Lignin (mg g-1) 30 -0.541 0.002
C (mg g-1) 30 -0.642 0.001
N (mg g-1) 30 0.816 0.001
P (mg g-1) 30 0.586 0.001
L:N 30 -0.482 0.01
C:N 30 -0.853 0.001
df, degrees of freedom; r, correlation coefficient; P, significance level;
L:N, lignin:nitrogen ratio
J For Res (2008) 13:25–34 33
123
Thus it is clear that initial lignin and nutrient concentrations
(N and P) play an important role in determining the rate of
litter decomposition in the tropical wet evergreen ecosys-
tem, and hence nutrient cycling in the forest ecosystem.
Acknowledgments The authors thank the Ministry of Environment
and Forests, Government of India, for financial assistance. Special
thanks are due to K. Haridasan for his ungrudging help in identifi-
cation of plant species and to the Principal Chief Conservator of
Forests, Arunachal Pradesh, for permitting us to work in the Namd-
apha National Park. Field and laboratory assistance by Shri J. Saikia
and Shri M. Ingti is thankfully acknowledged. We thank the three
anonymous reviewers for their valuable comments.
References
Aber JD, Melillo JM (1980) Litter decomposition: measuring relative
contribution of organic matter and nitrogen to forest soils. Can J
Bot 58:416–421
Abiven S, Recous S, Reyes V, Oliver R (2005) Mineralisation of C
and N from root, stem and leaf residues in soil and role of their
biochemical quality. Biol Fert Soils 42:119–128
Allen SE, Grimshaw HM, Parkinson JA, Quarmby C (1974) Chemical
analysis in ecological materials. Blackwell, Oxford
Anderson JM, Ingram JSI (1993) Tropical soil biology and fertility—
a handbook of methods, 2nd edn. C.A.B International,
Wallingford
Arunachalam A, Maithani K, Pandey HN, Tripathi RS (1998) Leaf
litter decomposition and nutrient mineralization patterns in
regrowing stands of a humid subtropical forest after tree cutting.
For Ecol Manage 109:151–161
Arunachalam K, Singh ND, Arunachalam A (2003) Decomposition of
leguminous crop residues in jhum cultivation system in northeast
India. J Plant Nutr Soil Sci 166:731–736
Berg B (1986) Nutrient release from litter and humus in coniferous
forest soils: a mini review. Scand J For Res 1:359–369
Berg B, Staff H (1980) Decomposition rate and chemical changes in
Scot pine needle litter. 2. Influence of chemical composition.
Ecol Bull 32:363–372
Bocock KL (1963) Changes in the amount of nitrogen in decompos-
ing leaf litter of sessile oak (Quercus petraca). J Ecol 51:555–
566
Constantinides M, Fownes JH (1994) Nitrogen mineralization of leaf
and litter of tropical plants: relationship to nitrogen, lignin and
soluble poly-phenol concentrations. Soil Biol Biochem 26:49–55
Couteaux MM, Bottner P, Berg B (1995) Litter decomposition,
climate and litter quality. Trends Ecol Evol 10:63–66
Edwards JP (1977) Studies of mineral cycling of montane rain forest
in New Guinea. II. The production and disappearance of litter.
J Ecol 65:971–992
Gilbert O, Bocock KL (1960) Changes in the leaf litter when placed
on the surface of soils with contrasting humus types. II. Changes
in the nitrogen content of oak and ash litter. J Soil Sci 11:10–19
Gillon D, Joffre R, Ibrahima A (1999) Can litter decomposability be
predicted by near infrared reflectance spectroscopy? Ecology
80:175–186
Gosz JR, Likens GE, Bormann FH (1973) Nutrient release from
decomposing leaf and branch litter in the Hubbard Brook Forest,
New Hampshire. Ecol Monogr 43:173–191
Hirobe M, Sabang J, Bhatta BK, Takeda H (2004a) Leaf-litter
decomposition of 15 tree species in a lowland tropical rain forest
in Sarawak: decomposition rates and initial litter chemistry. J For
Res 9:341–346
Hirobe M, Sabang J, Bhatta BK, Takeda H (2004b) Leaf-litter
decomposition of 15 tree species in a lowland tropical rain forest
in Sarawak: dynamics of carbon, nutrients, and organic constit-
uents. J For Res 9:347–354
Howard PJ, Howard DM (1974) Microbial decomposition of tree and
shrub litter. I. Weight loss and chemical composition of
decomposing litter. Oikos 25:341–352
Jackson ML (1958) Soil chemical analysis. Prentice Hall, Englewood
Cliffs
Joffre R, Agren GI, Gillon D, Bosatta E (2001) Organic matter quality
in ecological studies: theory meets experiment. Oikos 93:451–458
Loranger G, Ponge JF, Imbert D, Lavelle P (2002) Leaf decompo-
sition in two semi-evergreen tropical forests: influence of litter
quality. Biol Fert Soils 35:247–252
Maclean DA, Wein RW (1978) Weight loss and nutrient changes in
decomposing litter and forest floor material in New Brunswick
forest stands. Can J Bot 56:2730–2749
Maithani K, Tripathi RS, Arunachalam A, Pandey HN (1996)
Seasonal dynamics of microbial biomass C, N and P during
regrowth of a disturbed subtropical humid forest in northeast
India. Appl Soil Ecol 4:31–37
McClaugherty CA, Pastor J, Aber JD, Melillo JM (1985) Forest litter
decomposition in relation to soil nitrogen dynamics and litter
quality. Ecology 66:266–275
Moore TR, Trofymow JA, Prescott CE, Fyles J, Titus BD (2006)
Patterns of carbon, nitrogen and phosphorus dynamics in decom-
posing foliar litter in Canadian forests. Ecosystems 9:46–62
Myers RJK, Palm CA, Cuevas E, Gunatilleke IUN, Brossard M
(1994) The synchronization of nutrient mineralization and plant
nutrient demand. In: Woomer PL, Swift MJ (eds) The biological
management of tropical soils fertility. A Wiley-Sayce Publica-
tion, Chichester, pp 81–116
Nelson DW, Sommers LE (1975) A rapid and accurate method for
estimating organic carbon in soil. Proc Indian Acad Sci 84:456–
462
Olson JA (1963) Energy storage and the balance of producers and
decomposer in ecological system. Ecology 44:322–331
Perez-Harguindegy N, Diaz S, Cornelissen JHC, Vendramini F, Cabido
M, Castellanos A (2000) Chemistry and toughness predict leaf
litter decomposition rates over a wide spectrum of functional types
and taxa in central Argentina. Plant Soil 218:21–30
Prescott CE, Vesterdal L, Preston CM, Simard SW (2004) Influence
of initial chemistry on decomposition of foliar litter on
contrasting forest types in British Columbia. Can J For Res
34:1714–1729
Sangha KK, Jalota RK, Midmore DJ (2006) Litter production,
decomposition and nutrient release in cleared and uncleared
pasture systems of central Queensland, Australia. J Trop Ecol
22:177–189
Songwe NC, Okali DUU, Fasehun FE (1995) Litter decomposition
and nutrient release in a tropical rainforest, Southern Bakundu
Forest Reserve, Cameroon. J Trop Ecol 1:333–350
Taylor BR, Parkinson D, Parson WJF (1989) Nitrogen and lignin
content as predictors of litter decay rates: a microcosm test.
Ecology 70:97–104
William ST, Gray TRG (1974) Decomposition of litter on the soil
surface. In: Dickinson CH, Pugh GJ (eds) Biology of plant litter
decomposition. Academic Press, London, pp 611–632
Wood TG (1974) Field investigation under decomposition of leaves
of Eucalyptus delegatensis in relation to environmental factors.
Pedobiology 14:343–371
Yang HS, Janssen BH (2002) Relationships between substrate initial
reactivity and residues aging speed in carbon mineralization.
Plant Soil 239:215–224
Zar JH (1974) Biostatistical analysis, 2nd edn. Prentice Hall,
Englewood Cliffs
34 J For Res (2008) 13:25–34
123


