Embed Size (px)
Citation preview
CHAPTER ONE
1.1 Introduction
At the beginning of the twenty first century no
environmental issue is of such truly global
magnitude as the issue of climate change. Tune
to one of the news in a radio or TV and one of
the recurring topical subjects you will hear
about is climate change. Is our climate
changing? Is the question many asked. Many
scientists have concluded that the temperature
of our planet is rising significantly because of
the human activities. However, some other
scientists argue that the warming of the last
few years is part of a natural global cycle.
Climate change has been so pervasive that people
have developed psychological unrest as a result
of its consequences. In March 2010, there was a
weather forecast on the sudden reappearance of
what looks like harmattan occasioned by the
sandy storms from the Sahara desert. Acid rain
1
was predicted as a possible outcome. People of
Kano and even Nigerians were warmed not to allow
the acid rain to touch their body because it
could lead to body cancer, panic, natural
insecurity, speculations, rumours and
uncertainty characterized the entire period,
(See The Nation, 2010).
The major challenges facing humanity currently
are associated with the negative effects of
climate change, particularly in Sub – Saharan
Africa. Climate change is adversely affecting
practically all economic sectors, (Kadzomira,
2010). Africa is to have a future associated
with scarce water, declining agricultural yield,
desert encroachment and damaged coastal
infrastructure, (Kadzomira, 2010). The prognosis
on the negative effects of climate change for
Kano urban area is also very grim.
There are now scientific and physical proofs
that the climate of the world is changing,
2
(Adejoke et al., 2010), because by taking a good
look at the Kano urban area, evidence such as
drying of water recourses, increase in ambient
temperature, unpredictability, and erratic
climatic changing of seasons are already
prevailing. Thus, the effects of climate change
are even already taking its tools on the country
Nigeria in particular and Africa continent in
general, (Adejoke et al., 2010). It has become a
threat to all sectors of the nation’s socio –
economic development including the natural
ecosystem and security of life and property.
The West – African region has experienced a
marked declined in rainfall since 1968 – 1972
period ranging from 15% to 30% depending on the
area (Madiodio, 2005). The region’s major river
(Niger, Senegal and Volta) experienced
concomitant decrease in average discharge of 40%
to 60%, (Madiodio, 2005). He also cited that if
the trends in climate change contexts that took
3
place over the last three decades continue to
prevail, West Africa will experience decrease in
freshwater availability. Compared to previous
decades it is observed that since the early
1970s, the mean annual rainfall has decreased by
10% in the West Tropical Zone to more than 30%
in the Sahelian zone while the average discharge
of the regions major river systems dropped by
40% to 60%. This sharp decrease in water
availability has been combined with greater
uncertainty in the spatial and temporal
distribution of rainfall and temperature
(Oyebinde et al., 2002: Niasse et al., 2009).
In addition, Meteorological record shows cycles
of increasing and decreasing rainfall just since
the early 20th century, (IPCC, 2007). For
example, the Sahelian drought was preceded far
above average rainfall and was followed by
several years of average rainfall. Record also
suggests an overall downward trend in average
4

rainfall since 1990 where scientists have
suggested that the clearing of vegetation and
global warming may account for this apparent
trend. They argue that the removal of vegetation
causes higher surface temperature increase
evaporation and reduced rainfall. It is in view
of all this arguments that this research is
conceived.
1.2 Research Problem
Climate changes have been stated by many
environmental scientists to be one of the
fundamental environmental world problems
limiting man in this present age. Thus, “is the
climate of Kano urban area changing? Is the
problem set forth by this research, which will
be probed by analyzing past rainfall and
temperatures records of the study area.
1.3 Aims and Objectives
Based on the research problem stated above, the
study has the following aims and objectives;
5
a. To discuss the concept of climate change using
the climate data (Temperature and Rainfall),
b. To compare the past and present records of
rainfall and temperature of Kano Urban Area in
order to establish that climate change is a
reality,
c. To also compare the microclimate of the two
primary study areas (Tarauni and Ungogo
stations),
d. To describe various effects of climate change
in Kano Urban Area and
e. To project the possible consequences of
climate change in the area under study.
1.4 Significance of the Study
Climate is as important to the earth as father
of a man is as important to his origin. Hence,
understanding our climatic behaviour is of great
significance. The study anticipated to benefit
all facet of human endeavour. Specifically, as
it tends to broaden people’s view on the
consequences, effects and future projections
held by climate change.
6
The recommendations proposed in the research
should be taken seriously by all relevant
governmental parastatals responsible to manage
our environment, on the necessary steps towards
making people to be aware and get ready to
climate change as it stipulates the necessary
steps to mitigate its effects.
1.5 Research Hypotheses
The hypotheses to be tested by this research work are
stated as;
i. The rainfall of Kano urban area has
drastically decreased in its quantity and
duration.
ii. The temperature of Kano urban area has
doubled.
1.6 Scope and Limitation
This research work limits its scope to
temperature and rainfall data because there is
limited time to study other important element
like humidity, water balance, sunshine etc.
7
while climatic evidence were the main factors,
other factors cannot be covered or touched
because of the limitations in space. The project
might be too bulky and the data to be generated
may be too much for the research to analyse
given such a time of few months to graduate.
1.7 Research Methodology
The methodology involves various means that
where employed in carrying out the research
work, thus, the various methods used in
gathering data for this study were discussed
under this section and the methods include the
data type (both primary and secondary sources),
the study area and the methods of data analysis
and presentation.
1.7.1 Data Types
The data types adopted for this research work
are the primary and secondary sources of data.
Under this primary data, observation of the
subject matter was the main source which
8
involves the climatic element (i.e. temperature
and rainfall) for thirty one years past records
of the study area. On the other hand, the
secondary data includes textbooks, internet
publications, newspapers, journals, articles
etc.
1.7.2 Sample Area
In order to meet up with accurate result of the
topic at hand, a manageable unit of the study
area in respect of their geographical locations
were sampled out, and they include;
Northern most part of the sample area; Aminu
Kano International Airport at Ungogo Local
Government Area of Kano State.
South eastern position: Institute of
Agricultural Research, Ahmadu Bello
University, Shika Zaria at Tarauni Local
Government Area of Kano State.
9

1.7.3 Methods of Data Analysis and Presentation
Descriptive statistics was employed, out of
which a line graph was chosen to present the
datas. Since the study involves a longitudinal
measurement of records, a line graph was chosen
because it is idle for such a task, in the sense
that the presentation will not be redundant as
single line graph will correct such redundancy.
The data gathered will be plotted in a simple
line graph to detect whether there is increase
or decrease in the two variables (rainfall and
temperature). Hence follows are analysis of the
results. After each analysis, the result
obtained should be able to judge the argument
raise earlier that is the hypothesis.
1.8 Definition of Some Key Terms
Some words are defined below as used in this study,
10
1. Change; to alter the content or form of; to
cause something to have a completely different
form.
2. Climate; the weather of an area over a long
period of time; It is the weather conditions
most prevailing in a place for at least 35 or 40
years.
3. Climate Change; it is a change in the statistical
distribution of weather over a period of time
that range from decades to million of years.
4.Global Warming; it is the increase in the average
temperature of earth’s near surface air and
oceans since the mid 20th century and its
projected continuation.
5. Temperature; the specific degree of hot or
coldness of a body or an environment; the
specific degree of heat or coldness as measured
by a thermometer or other standard scale like
Fahrenheit or Celsius. In this research, it is
11
being used in relation to the temperatures of
air only.
6. Precipitation; the falling to earth of any form of
water (rain, snow, hail, sleet or mist); the
quality of water falling to earth at a specific
place within a specified period of time.
7.Microclimate; the climate of a small, specific or
partial area as contrasted to that of a large
area, for example the microclimate of a given
city.
8.Weather; the state of the atmosphere at a
particular place and time as characterized by
sunshine, moisture, temperature, precipitation
and other climatic variables.
9. Effects; Results produced by a cause; ability to
bring about a result
10. Kano Urban Area; this is the area surrounding
the main Kano area/business district which
include the eight Local Government Areas i.e.
Municipal, Gwale, Dala, Nasarawa, Ungogo,
Kumbotso, Fagge and Tarauni.
12

13
CHAPTER TWO
THE GEOGRAPHY OF THE STUDY AREA
2.1 Introduction
This chapter intends to explore the geographical
information of the area under study. This will
includes aspect like: the location and position,
geology, climate (temperature, rain and
humidity), relief, vegetation, soil, economy and
environmental management.
2.2 Location and Position of the Study Area
The study area is situated almost at the centre
of Kano state, comprising of the following local
government areas of Gwale, Dala, Tarauni,
Nassarawa, Hotoro, Munincipal, Ungogo and Fagge.
The Kano region covers an area extending between
latitude 120 03`N and 120 04`N; longitude 320
00`E and 340 00`E.
2.3 Geology
There are three major rock formations in the
study area namely: the basement complex rocks
14
comprising of crystalline igneous and
metamorphic rocks dating back to the Precambrian
ages, younger rocks were intruded later in the
Jurassic epoch, the youngest formation is the
Chad sediment deposited from the quaternary
including recent deposits, Olafin (1987).
The study area is almost at the centre of Kano
state which is underlain by crystalline rock of
basement complex. To the eastern margins the
cretaceous sediments overlap the crystalline
rocks. In most areas, the solid rocks are
covered by several meters of weathered materials
or sandy drifts. In the Dala and Gwauron Dutse
hill (in the city) are some two inselberg
witnessed standing above 100 feet (ASL), Olafin
(1987).
2.4 Relief
Kano urban area is part of the very popular
plain in Hausaland, identified by a geographer
called Falconer. The rock structure and relief
15
are very closely related, (Abdullahi 2007).
However, the relief is greatly influenced by the
geology of the area fort example, igneous
structures are always higher in elevation when
compared to sedimentary structures that are
lower in elevation respectively, (Abdullahi
2007).
All together, the Kano urban area has a very low
relative relief of less than 30km, the landscape
is fairly a flat one and the two major hills
Dala and Gwauron Dutse suffers from
pediplanation as it is the most important
process in the creation of plains. This is
complemented by sedimentation of wind rift
materials where the wind blown materials where
dropped to cover the then existing land form.
Around Federal College of Education, Kano the
relief is about 430m ASL, and in all together
the Kano region lies between 600 – 400m ASL,
(Abdullahi, 2007).
16

2.5 Climate
According to W. Koppen classification, the study
area has a tropical wet and dry type of climate.
The area being situated on the semi arid
environment experienced long periods of dry
season that is seven to eight months (from
middle October to May) and short period of
raining seasons that is four to five months
(June to September), while the Harmattan seasons
is experienced between November to February.
The study area is associated with very hot
scorching sunshine which leads to high
evaporation processes. Also the mean annual
temperature and total rainfall are about 260C and
884.4mm respectively, Olafin, (1987). And the
climate is determined by the movement of two air
masses, a moist rather cool southerly air mass
known as the south – westerly and a hot and dry
air mass called the north easterly. The moist
south air forms wedges under the lighter dry air
17
and the region where the two air masses meet is
primarily an area of profound moisture gradient.
The humidity is called the Intertropical
Discontinuity (ITD). From 210C in the coolest
months, December and January when the
northeasterly wind is at the height blowing
vehemently unchecked from the Sahara, its cool,
very dry and dusty, also to 310C hottest months
April to May, hence the climatic conditions of
the study area is strongly influenced by
rainfall and temperature.
2.5.1 Rainfall
The first rain commences early in May and is
concentrated from June to September. August is
the hottest month, an average rainfall of 12``
is recorded in Kano metropolis. Rainfall is a
very critical element in the region because of
its deficiency during dry season. In a normal
year, the mean annual rainfall in the
Metropolitan Kano is about 800mm, Olafin (1984).
18
Great temporal variation occurring in the amount
of rainfall received any where in the Kano
region. No two consecutive years record the same
amount, and averages calculated for two periods
are never the same.
2.5.2 Temperature
The latitudinal position of Kano region itself
and its interior locations away from the sea
determine its climate which is hot and dry for
most of the year. Maximum dry temperature of
about 380C is common and minimum temperature is
about 100C. Plant growth is there possible
throughout the year as far as the is concerned,
but the rainfall which is often unreliable
constitutes a serious problem.
2.5.3 Humidity
Humidity refers to the amount of water vapour
presences in the atmosphere (air), the humidity
in Kano metropolis is very low because the area
is located at Sudan Savannah which is
19
characterized by high temperature or about 330C
so that the amount of sunshine has an effect on
the relative humidity of the area.
The dryness condition of the region is as a
result of distance of the region from the sea,
keeps the humidity of the area low about 30% but
this increase to about 40% - 75% during wet
season.
2.6 Vegetation
The study area region lies in the Sudan Savannah
zone, but its vegetation has been completely
modified as a result of several centuries of
human occupation, featuring bush burning for
cultivation, as well as cattle grazing, city
expansion etc. In closely settled area around
Kano natural bush vegetation is almost
completely absent, but several trees have been
planted for shade and fruits. Such cultivation
of trees includes Acacia, Albido, Tamarind,
Indica, and Buterosperman parkii. A considerably
20
growth of natural vegetation, occurs in areas
which are remote from human settlement or which
are marginal or uncultivatable but even in such
areas grazing and bush burning are not restrict.
2.7 Soil
The nature of the soil is weathered rock and
sandy drift constitute the two main soil forming
parent materials, but difference in soil types
depends on the catena arrangement. On the
interflows and upper slopes of undulating
districts the soils are of red brown to orange
colour and consist of sandy clay loam overlying
literate ironstone. These soils are cultivated
even in areas where the ironstone is only a few
inches beneath the surface. In the Fadamas or
seasonally flooded valley floors, heavier grey
alluvial soils with a heights clay contents
occur.
Accelerated soil erosion by wind and running
water has laid certain tracks in the densely
21
settled areas, such as the Kano Urban areas.
Wind erosion is particular serious towards the
end of the dry season, when the storms preceding
the onset of the rains blow off much of the
soil.
2.8 Economy
Kano has long been the economic centre of
Northern Nigeria, and a centre for the
production and export of groundnut. Kano houses
the Bayero University and a rail way station
with trains to Lagos routed through Kaduna,
while Mallam Aminu Kano International Airport
lies nearby. Because Kano is north of the rail
junction to Kaduna it has equal access to the
seaport at Lagos and Port Harcourt. Formerly
walled, most of the gates to the old city
survive. The old city houses the vast Kurmi
market, known for its crafts while old dye pits
22
still in use – lie nearby. Also in the old city
are the Emir palace, the great mosque and the
Gidan Makama museum housed in 15 century
building that is a National Monument,
(Britannica Encyclopaedia, 2007). As of
November 2007, there are plans to establish an
information technology park in the city, (NCKP
ITP, 2007). The city is supplied with water by
the nearby Challawa Gorge Dam which is also
being considered as a source of hydro power,
(Abdu Salihu, 2009).
3.9 Population
According to the 1991 Nigerian Population
Census, Kano which is the second largest state
in the country consists of 21,858,725 males.
2773,316 females making a total of 562,040
people, out of which 1,364, 300 people are
living within the metropolitan Kano.
23
CHAPTER THREE
LITERATURE REVIEW
3.1 Historical Evolution of Climate Change
The history of the scientific discovery of
climate change began in the early 19th century
when natural changes in Paleoclimate were first
suspected and the natural greenhouse
effect first identified, (Wikipedia, 2010). In
the late 19th century, scientists first argued
that human emissions of greenhouse gases could
change the climate, but the calculations were
disputed. In the 1950s and 1960s, scientists
increasingly thought that human activity could
change the climate on a timescale of decades,
but were unsure whether the net impact would be
to warm or cool the climate. During the 1970s,
scientific opinion increasingly favoured the
warming viewpoint. In the 1980s the consensus
position formed that human activity was in the
24
process of warming the climate, leading to the
beginning of the modern period of global
warming science summarized by
the Intergovernmental Panel on Climate Change,
(Wikipedia, 2010).
3.1.1 Paleoclimate Change and the Natural Greenhouse
Effect, Early and Mid 1800s
Prior to the 18th century, scientists had not
suspected that prehistoric climates were
different from the modern period. By the late
18th century, geologists found evidence of a
succession of geological ages with changes in
climate. There were various competing theories
about these changes, and James Hutton, whose
ideas of cyclic change over huge periods of time
were later dubbed uniformitarianism, was among
those who found signs of past glacial activity
in places too warm for glaciers in modern times
(Young Davis, 1995).
25
Although he wasn't a scientist, in 1815 Jean-
Pierre Perraudin described for the first time
how glaciers might be responsible for the giant
boulders seen in alpine valleys. As he hiked in
the Val de Bagnes, he noticed giant granite
rocks that were scattered around the narrow
valley. He knew that it would take an
exceptional force to move such large rocks. He
also noticed how glaciers left stripes on the
land, and concluded that it was the ice that had
carried the boulders down into the valleys,
(Holli Riebeek, 2005).
His idea was initially met with disbelief. Jean
de Charpentier wrote, "I found his hypothesis so
extraordinary and even so extravagant that I
considered it as not worth examining or even
considering." (Imbrie, et al., 1979) Despite
Charpentier rejecting his theory, Perraudin
eventually convinced Ignaz Venetz that it might
be worth studying. Venetz convinced Charpentier,
26
who in turn convinced the influential
scientist Louis Agassiz that the glacial theory
had merit, (Holli Riebeek, 2005).
Agassiz developed a theory of what he termed
"Ice Age" — when glaciers covered Europe and
much of North America. In 1837 Agassiz was the
first to scientifically propose that the Earth
had been subject to a past ice age, (Evans,
2008). William Buckland had led attempts in
Britain to adapt the geological theory
of catastrophism to account for erratic boulders
and other "diluvium" as relics of the Biblical
flood. This was strongly opposed by Charles
Lyell's version of Hutton's uniformitarianism,
and was gradually abandoned by Buckland and
other catastrophist geologists. A field trip to
the Alps with Agassiz in October 1838 convinced
Buckland that features in Britain had been
caused by glaciation, and both he and Lyell
strongly supported the ice age theory which
27
became widely accepted by the 1870s. (Young
Davis, 1995)
In the same general period that scientists first
suspected climate change and ice ages, Joseph
Fourier, in 1824, found that Earth's atmosphere
kept the planet warmer than would be the case in
a vacuum, and he made the first calculations of
the warming effect. Fourier recognized that the
atmosphere transmitted visible light waves
efficiently to the earth's surface. The earth
then absorbed visible light and emitted infrared
radiation in response, but the atmosphere did
not transmit infrared efficiently, which
therefore increased surface temperatures. He
also suspected that human activities could
influence climate, although he focused primarily
on land use changes. In a 1827 paper Fourier
stated, "The establishment and progress of human
societies, the action of natural forces, can
notably change, and in vast regions, the state
28
of the surface, the distribution of water and
the great movements of the air. Such effects are
able to make to vary, in the course of many
centuries, the average degree of heat; because
the analytic expressions contain coefficients
relating to the state of the surface and which
greatly influence the temperature" (William
Connolley, 2008)
3.1.2 The First Calculations of Human-Induced Climate
Change, Late 1800s
By the late 1890s, American scientist Samuel
Pierpoint Langley had attempted to determine the
surface temperature of the moon by measuring
infrared radiation leaving the moon and reaching
the earth, (David Archer, 2009) The angle of the
moon in the sky when a scientist took a
measurement determined how much CO2 and water
vapour the moon's radiation had to pass through
to reach the earth's surface, resulting in
weaker measurements when the moon was low in the
29

sky. This result was unsurprising given that
scientists had known about the greenhouse effect
for decades.
Meanwhile, Swedish scientist Arvid Högbom had
been attempting to quantify natural sources of
emissions of carbon dioxide (CO2) for purposes of
understanding the global carbon cycle. Högbom
decided to compare the natural sources with
estimated carbon production from industrial
sources in the 1890s, (Spencer Weart, 2003).
Another Swedish scientist, Svante Arrhenius,
integrated Högbom and Langley's work. He
realized that Högbom's calculation of human
influence on carbon would eventually lead to a
doubling of atmospheric carbon dioxide, and used
Langley's observations of increased infrared
absorption where moon rays pass through
atmosphere at a low angle, encountering more CO2,
to estimate an atmospheric warming effect from a
30
future doubling of CO2. He also realized the
effect would also reduce snow and ice cover on
earth, making the planet darker and warmer.
Adding in this effect gave a total calculated
warming of 5-6 degrees Celsius. However, because
of the relatively low rate of CO2 production in
1896, Arrhenius thought the warming would take
thousands of years and might even be beneficial
to humanity, (Spencer Weart, 2003).
3.1.3 Concern and Increasing Urgency, 1950s and 1960s
Better spectrography in the 1950s showed that
CO2 and water vapour absorption lines did not
overlap completely. Climatologists also realized
that little water vapour was present in the
upper atmosphere. Both developments showed that
the CO2 greenhouse effect would not be
overwhelmed by water vapour, (Spencer Weart,
2003).
31
Scientists began using computers to develop more
sophisticated versions of Arrhenius' equations,
and carbon-14 isotope analysis showed that
CO2 released from fossil fuels were not
immediately absorbed by the ocean. Better
understanding of ocean chemistry led to a
realization that the ocean surface layer had
limited ability to absorb carbon dioxide. By the
late 1950s, more scientists were arguing that
carbon dioxide emissions could be a problem,
with some projecting in 1959 that CO2 would rise
25% by the year 2000, with potentially "radical"
effects on climate, (Spencer Weart, 2003).
By the 1960s, aerosol pollution ("smog") had
become a serious local problem in many cities,
and some scientists began to consider whether
the cooling effect of particulate pollution
could affect global temperatures. Scientists
were unsure whether the cooling effect of
particulate pollution or warming effect of
32
greenhouse gas emissions would predominate, but
regardless, began to suspect the net effect
could be disruptive to climate in the matter of
decades. In his 1968 book The Population
Bomb, Paul R. Ehrlich wrote "the greenhouse
effect is being enhanced now by the greatly
increased level of carbon dioxide... this is
being countered by low-level clouds generated by
contrails, dust, and other contaminants... At
the moment we cannot predict what the overall
climatic results will be of our using the
atmosphere as a garbage dump," (Paul Ehrlich,
1968).
3.1.4 Controversy and Disinterest, Early 1900s to Mid
1900s
Arrhenius' calculations were disputed and
subsumed into a larger debate over whether
atmospheric changes had caused the ice ages.
Experimental attempts to measure infrared
absorption in the laboratory showed little
33
differences resulted from increasing CO2 levels,
and also found significant overlap between
absorption by CO2 and absorption by water vapor,
all of which suggested that increasing carbon
dioxide emissions would have little climatic
effect. These early experiments were later found
to be insufficiently accurate, given the
instrumentation of the time. Many scientists
also thought that oceans would quickly absorb
any excess carbon dioxide, (Spencer Weart,
2003).
While a few early 20th-Century scientists
supported Arrhenius' work, including E. O.
Hulburt and Guy Stewart Callendar, most
scientific opinion disputed or ignored it
through the early 1950s, (Spencer Weart, 2003).
3.1.5 Scientists Increasingly Predicting Warming,1970s
Scientists in the 1970s started to shift from
the uncertain leanings in the 1960s to
34

increasingly a prediction of future warming. A
survey of the scientific literature from 1965 to
1979 found 7 articles predicting cooling and 44
predicting warming, with the warming articles
also being cited much more often in subsequent
scientific literature, (Peterson et al., 2008).
Several scientific panels from this time period
concluded that more research was needed to
determine whether warming or cooling was likely,
indicating that the trend in the scientific
literature had not yet become a consensus,
(Connolley et al., 2008). On the other hand, the
1979 World Climate Conference of the World
Meteorological Organization concluded "it
appears plausible that an increased amount of
carbon dioxide in the atmosphere can contribute
to a gradual warming of the lower atmosphere,
especially at higher latitudes....It is possible
that some effects on a regional and global scale
may be detectable before the end of this century
35
and become significant before the middle of the
next century," (WMO, 2009)
The mainstream news media at the time did not
reflect scientific opinion. In
1975, Newsweek magazine published a story that
warned of "ominous signs that the Earth's
weather patterns have begun to change," and
reported "a drop of half a degree [Fahrenheit]
in average ground temperatures in the Northern
Hemisphere between 1945 and 1968,"(Peter Gwynne,
1975). The article continued by stating that
evidence of global cooling was so strong that
meteorologists were having "a hard time keeping
up with it," (Peter Gwynne, 1975). On October
23, 2006, Newsweek issued an update stating that
it had been "spectacularly wrong about the near-
term future" (Jerry Adler, 2006).
3.1.6 Climate Change Scientific Consensus Developed,
1980-1988
36
By the early 1980s, the slight cooling trend
from 1945-1975 had stopped, (James Hansen,
2009). Aerosol pollution had decreased in many
areas due to environmental legislation and
changes in fuel use, and it became clear that
the cooling effect from aerosols was not going
to increase substantially while carbon dioxide
levels were progressively increasing, (James
Hansen, 2009).
In 1985 a joint UNEP/WMO/ICSU Conference on the
"Assessment of the Role of Carbon Dioxide and
Other Greenhouse Gases in Climate Variations and
Associated Impacts" assessed the role of carbon
dioxide and aerosols in the atmosphere, and
concluded that greenhouse gases "are expected"
to cause significant warming in the next century
and that some warming is inevitable, (WMO,
2009) In June 1988, James E. Hansen made one of
the first assessments that human-caused warming
37
had already measurably affected global climate,
(James Hansen, 2009).
3.1.7 Modern Period: 1988 to Present
Both the UNEP and WMO had followed up on the
1985 Conference with additional meetings. In
1988 the WMO established the Intergovernmental
Panel on Climate Change with the support of the
UNEP. The IPCC continues its work through the
present day, and issues a series of Assessment
Reports and supplemental reports that describe
the state of scientific understanding at the
time each report is prepared. Scientific
developments during this period are discussed in
the articles for each Assessment Report,
(Intergovernmental Panel on Climate Change,
2008).
3.2 Physical Evidence for Climatic Change
Petit et al., (1999) are of the opinion that
evidence of climatic changes are taken from a
38
variety of sources that can be used to reconstruct
climates, and they include;
1) Historical and Archaeological Evidence: Climate
change in the recent past may be detected by
corresponding changes in settlement and
agriculture pattern. Archaeological evidence,
oral history and historical documents can offer
insights into past changes in the climate.
2) Vegetation: A change in the type, distribution
and coverage of vegetation may occur given a
change in the climate; this much is obvious. In
any given scenario, a wild change in climate may
result in increased precipitation and warmth,
resulting in improved plant growth and the
sequestration of airborne carbon dioxide.
Larger, faster or more radical changes however,
may well result in vegetation stress, rapid
plant loss and desertification in certain
circumstances, (Bachelet et al., 2004).
39
3) Sea Level Changes: Global sea level change for
much of the last century has generally been
estimated using tide gauge measurements collated
over long periods of time to give a long time
average. More recently, altimeter measurement
(an altitude – measuring device such as
specially calibrated barometer) – in combination
with accurately determined satellite orbits –
have provided an improved measurement of global
sea level change, (University of Colorado at
Boulder, 2009, retrieved).
4) Changes in Temperature: According to N.O.A.A
(2008) state of the climate report and the
N.A.S.A (2008) surface temperature analysis;
a. Since the mid 1970s, the average surface
temperature has warmed about 1oF,
b. The earth’s surface is currently warming at
a rate of about 2.9oF per century,
40
c. The eight warmest years on records (since
1880) have all occurred only after 2001,
with the warmest year being 2005,
In addition from (IPCC, 2007);
a. The warming trend is seen in both daily
maximum and minimum temperature with minimum
temperature increasing at a faster rate than
maximum temperature,
b. Land areas have tended to warm faster than
oceans areas and the winter months have
warmed far than summer months,
c. Widespread reductions in the number of days
below freezing occurred during the later
half of the 20th century in the United
States as well as most land areas of the
northern hemisphere and areas of the south
hemisphere,
d. Average temperatures in the Artic have
increased at almost twice the global rate in
the past 100 years.
41
5) Changes in Rainfall: According to the IPCC, an
increase in the average global temperature is
likely to lead to changes in precipitation and
atmospheric moisture because of changes in
atmospheric circulation and increase in
evaporation and water vapour. Further more, IPCC
2007 Climatic Models suggests;
a. An increase in global average annual
precipitation during 21st century, although
changes in precipitation will vary from
region to region,
b. An increase in intensity of precipitation
events, particularly in tropical and high
latitude regions that experience overall
increase in precipitation,
c. Annual average precipitation increase over
most of northern Europe, the Artic, Canada,
the North-eastern United States, Tropical
and Eastern Africa, the Northern Pacific and
42
Antarctica, as well as Northern Asia and the
Tibetan Plateau in winter,
d. Annual average precipitation decrease in
most of the Mediterranean, Northern Africa,
Northern Sahara, Central America, the
American Southeast, the Southern Andes as
well as South-eastern Australia during
winter,
e. And reduced rainfall over continental
interiors during summer due to increase in
evaporation.
3.3 Causes of Climate Change
Gribbin (1978) is of the opinion that several
theories, covering varying timescales, have been
advanced to try to explain climatic changes. At
present there is no unanimous consensus of
opinion as to its causes; climatic change may be
explained by one of these theories, several in
combination, or by a theory yet to be
43
propounded. Thus, the suggested theories
include;
1) Variations in Solar Energy: Although it was
initially believed that solar energy output did
not vary over time, increasing evidences
suggests that sunspot activity, which occur in
cycles may significantly affect out climatic –
times of high annual temperatures on earth
appear to correspond to period of maximum
sunspot activity.
2) Astronomical Relationships Between the Sun and
the Earth: There is increasing evidence
supporting Milankovitch’s cycles of change in
the earth’s orbit, tilt and wobble. This world
accounts for changes in the amount of solar
radiation reaching the earth’s surface.
3) Changes in Oceanic Circulation: Changes in
oceanic circulation affect the exchange of heat
between the oceans and the atmosphere. This can
44
have both long term effects on world climate
(where currents at the onset of the quaternary
ice age flowed in opposite direction to those at
the end of the ice age) and short term effects.
4) Composition of the Atmosphere: Gases in the
atmosphere can be increased and altered
following volcanic eruptions. At present,
increasing concern is being expressed at the
build up of carbon dioxide gas in the atmosphere
and the resultant greenhouse effect together
with the use of aerosol which are blamed for the
depletion of ozone in the upper atmosphere.
5) Human Influence: Anthropogenic factors are human
activities that change the climate. In some
cases the chain of causality of human influence
on the climate is direct and unambiguous (for
example, the effects of irrigation on local
humidity), whilst in other instance it is less
clear. Various hypotheses for human induced
climate change have been argued for many years.
45
Presently, the scientific consensus on climate
change is that human activity is very likely the
cause for the rapid increase in global average
temperature over the past several decades,
(IPCC, 2007).
Consequently, the debate has largely shifted
onto ways to reduce further human impact and to
find ways to adapt to change that has already
occurred, (IPCC, 2007). Of most concern in these
anthropogenic factors is the increase in Carbon
dioxide levels due to emission from fossils fuel
combustion, followed by aerosols (particulate
matter in the atmosphere) and cement
manufacture. Other factors, including land use,
ozone depletion, and deforestation are also of
concern in the roles they play both separately
and in conjunction with other factors in
affecting climate, microclimate and measures of
climate variables, (Steinfield, et al., 2006).
3.4 Climate Change and the Economy
46
Socio economic scenarios are used by analysts to
make projection of future Green House Gas
emissions and to assess future vulnerability to
climate change (Charter et al., 2005), producing
scenarios required estimates of future
population level, economic activity, the
structure of governance, social values and
patterns of technical change. Economic and
energy modelling can be used to analyze and
quantify the effects of such drives.
The Emission Scenarios
Global future scenarios can be thought of
stories of possible future consequence. They
allow the description of factors that are
difficult to quantify, such as government,
social structures and institutions. Marita et al.,
(2001) assessed the literature on global future
47
scenarios. They found considerably variety among
scenarios, ranging from variety of sustainable
development to the collapse of social, economic
and environmental systems. In the majority of
studies, the following relationships were found;
- Rising Green House Gases: This was
associated with scenarios having growth,
post industrial economy with
globalization mostly with low government
intervention and generally high levels of
competition. Income equality declined
within nations, but there were no clear
patterns in social equity or internal
income equity.
- Falling Green House Gases: In some of
these scenarios Gross Domestic Product
rose. Other scenarios showed economic
activity limited at an ecologically
sustainable level scenarios with falling
emission had a high level of government
48
interventions in the economy. The
majority of scenarios showed increase
social equity and income equality within
and among nations.
No strong patterns were found in the
relationship between economic activity and GHGs
emissions. Economic growth was found to be
compatible with increasing or decreasing growth
of GHG emissions. In the latter case, emissions
growth is mediated by increased energy
sufficient and efficiency, shifts to non –
fossil energy source and or shift to a post
industrial service base economy.
Thus, the concept of carbon credit came into
existence as a result of increasing awareness of
the need for controlling emission. The IPCC has
observed that; Policies that provide a real or
implicit price of carbon could create incentives
for producers and consumer to significantly
49

invest in low GHG products, technologies and
processes. Such policies could include economic
instruments, government funding and regulations.
A carbon credits is a generic term meaning that
a value has been assigned to a reduction of
offset of greenhouse gas emissions. Carbon
credit and markets are key components of
national and international attempts to mitigate
the growth in concentrations of Green House
Gases. One carbon credit is equal to one ton of
carbon dioxide or in some markets, carbon
dioxide equivalent gases. Carbon trading is an
application of an emission trading approach.
Green House Gases emissions are capable to cap
and then markets are used to allocate the
emissions among the group of regulated sources.
The goal is to allow market mechanisms to drive
industrial and commercial processes in the
directions of low emissions or less carbon
50
intensive approaches than those used when there
is no cost to emitting carbon dioxide and other
GHGs into the atmosphere. Since GHGs mitigation
projects generate credits, this approach can be
used to finance carbon reduction schemes between
trading partners and around the world, (IPCC,
2007).
3.5 Climate Change and Politics
Climate change is a defining issue in this
contemporary life. Since the industrial
revolution, heavy reliance on carbon – based
sources for energy in industry and society has
contributed to substantial changes in the
climate, indicated by increase in temperature
and sea level rise. This particular period of
time has been referred to as the “Anthropocene
Era”, or the “Age of Hydrocarbon Human”
(Anthony, 2008).
In the last three decades, concerns regarding
human contributions to climate change have moved
51
from obscure scientific inquiries to the force
of science politics, policy and practices at
many levels. From local adaptation strategies to
international treaty negotiation, “The Politics
of Climate Change” is a pervasive, vital and
contested as it has ever been, (Anthony 2008).
On the cusp of a new commitment to international
cooperation to rein in green house gas emissions
(to be decided at UN climate change conference
in Copenhagen, Denmark in December, 2009) world
leader say ‘Climate Change is one of the most
serious threat facing humanity’. Are they right?
If they are, who is going to do what about it?
Who will benefit and who will pay?
The open democracy which invites everyone to
take part in one of the hottest debates of out
time, which took place in the Danish Capital,
Copenhagen’s, many environmentalist whipped up
the rhetorical tempo in the months before the
conference by using such phrase as the “Last
52
Chance to save the earth” and the most important
meeting in the history of mankind”, (BBC
Official Website, 2009).
At present, public discussion of climate change
tends to be partial and disparate. Loosely
connected debates hinges on the evidence that
climate change is occurring and estimates of its
potential impacts; the prospects for agreeing an
international framework for an economic response
to, for instance, carbon trading surrounding the
potential for technological innovation that
could solve the problem and scenarios building
that tends to emphasize the necessity for
dramatic lifestyle change. But the debate is too
limited in scope and too compartmentalize. To
truly come to terms with the increasing urgent
need for mitigation and adaptation requires a
broad, policy perspective because the impact of
climate change challenges every corner of the
21st century states.
53
Anthony (2008) continued that, although an
international agreements is a vital aspect of an
effective global response to climate change, we
cannot rely exclusively on international
consensus as an impetus for action. No amount of
discussion at the international level will be of
any consequences if the countries mainly
responsible for causing climate change do not
make effective and radical responses to it. So
it is at the national level in the developed
countries that progress first has to be made.
And it is through decisive national leadership
at this level that a global solution can
eventually be induced.
The Copenhagen’s Climate Change Outcomes
Marc (2009), as reported in his website, the COP
15 Copenhagen Conference took place between
December 7th and December 19th 2009 and officials
and ministers from 192 countries attended the
conference over 20,000 people attended in total,
54
and there were also thousands of climate change
protectors outside the summit. The conference was
a total failure as political leaders scratched
together a last minute compromise that did not
include any binding agreements. Avoiding total
disarray, leaders agreed to continue working
towards the targets set at the start of the
conferences. UN Secretary General Banki-moon
called it a beginning. Politicians such as
American President Barrack Obama, also hopped the
outcomes was a step in the right direction. The
document that emerged from the climate change
conference is the “Copenhagen Accord”. This
Copenhagen Accord contains twelve’s points as set
out in the United Nation’s Framework Convention on
Climate Change Report (unfccc.int, 2009). The main
points contained in the documents are;
ii. The signees recognize findings that proclaim
climate change to be one of the greatest
challenges faced in our time.
55
iii. They agree to work towards keeping the rise in
global temperatures to below two degree
Celsius.
iv. Large industrialized countries must provide
plans for cutting carbon emissions by January
30th 2010.
v. They must prevent deforestation.
vi. Developing countries should be provided with
incentive to use clean energy.
Climate Change Targets will now be sanitized; the
UKs Department for Energy and Climate Change
(decc.gov.uk, 2009) reported that some of
Copenhagen outcomes that results from the UN
Climate Change Summit Countries were;
i. Countries will now be held to account for what
they are actually achieving with mandatory
reporting every two years for developing
countries.
ii. To aid developing countries, $ 30 billion of
immediate short term funding from developed
56
countries will be provided over the next three
years to kick short emission reduction
measures.
However, Marc concluded that these measures are
not enough for many climate change activists, and
they still consider Copenhagen to have been a
failed opportunity that could cost the plant and
its inhabitants dearly.
3.6 Effects of Climate Change: African Perspective
In the latest report of the Intergovernmental
Panel on Climate Change, the chapter on Africa
asserts that in the last few years many
connections between climate variability and
climate change have been discovered. But,
notwithstanding these discoveries is still in
urgent need for research in order to better
understand the complex interrelationship between
climate change and Africa’s land use systems,
57
food security, health and biodiversity etc,
(Boko et al., 2007).
3.6.1 Rise in Temperature and Rainfall
The level of information on the consequences of
climate change in Africa has however clearly
improved in the last couple of years. The latest
IPPC report confirms the continuation of the
trend which have been visible on the continent
for some now: using temperature as well as
depending area increased or decrease rainfall,
(Boko et al., 2007).
Based on a scenario of average emissions, as
presented in the IPCC report of 2007, a rise in
global average surface temperature of three to
four degree Celsius (3 – 4oC) compared to the
last two decades, 1980 and 1990, is expected by
the period 2080 to 2090. However, these averages
do not shed light on regional differences. The
rise in temperature in Africa will probably show
regional and seasonal variations. In North
58

Africa, in particular summer are expected to be
hotter; the winter temperature in contrast will
be lower, (Boko et al., 2007).
In Sahelian zone one most reckon with a
potential rise in temperature of 3.6oC (German
Advisory Council on Global Change, WBGU, 2008),
rain fall projections are comparatively
speaking, less consistent. The average emission
scenario presumes that rainfall along the
Mediterranean coast and north of the Sahara will
decrease by one fifth by the period 2080 - 2090,
(Boko, 2007: 443). Declining rainfall and a
rising rate of evaporation die to high
temperature will probably further aggravate
water scarcity in the Northern Africa Summer.
For the regions of Southern Africa which lies in
the subtropical belt, the projections indicate a
clear reduction in rainfall in the winter
months, (WBGU, 2008: 147). Here the
precipitation figures could decrease by up to
59
40% during the southern winter, (Boko, 2007:
443). This is arguably the regional projection
with the most dramatic consequences. The
situation in Tropical and East Africa different,
here a seven percent (7%) increase in rainfall
is anticipated, (Boko, 2007: 443). Furthermore,
the rainfall distribution is highly variable in
East Africa. Records show that rainfall has
increased in the last century. However,
projections up to 2050 indicate difference in
parts of equatorial east Africa rainfall will
increase in winter while in summer it will
decrease. In the whole it is to be expected that
the intensity and frequency of rainfall will
change. High temperature and less rainfall in
the dry months will affect the course of the
river. The Pagari and Ruvu rivers in Tanzania
will presumably carry six to nine percent and
one – tenth, respectively loss water. One of the
freshwater sources the Kilimanjaro glacier has
60
melted away to a large extent already and is
expected to completely disappear by 2015/2020,
(W.W.F, 2006: 4).
3.6.2 Agriculture and Water Scarcity
It is clear evidence that African farmers have
become used to adjusting to the invariable,
unpredictable changes in weather, according to
IPCC report (Boko et al., 2007). Climate change
will cost African farmers more effort in terms
of survival strategies than everything demanded
from them so far. Thus, a considerably drop in
agricultural yield is expected on the entire
continent; arid and semi – arid areas are
expected to expand by 5 – 8% by 2080. This
corresponds to a loss of approximately 6000
million hectares of agricultural productive
land, (WBGU, 2008: 148).
Africa agriculture is moreover a highly
sensitive sector with records to the climate,
because rain fed agriculture is prevalent here.
61

Climate change according to IPCC projections
will shorten the cultivation phases, and thus
more land will drop out of production due to
water scarcity. If land use is constantly
restricted as a result of climate change (still
in seasons, water scarcity due to steady drop in
rainfall), this will have negative implication
on employment and production in the agrarian
sector and directly on the lives of a great part
of the African rural population. Approximately
70% of the population lives from agriculture,
and 40% of all Africans exports are derived from
agriculture. The IPCC estimates that the decline
in production could reach more than 50% in some
countries by 2020 and that the income from
agricultural production could drop by up to 90%
by 2100, small scale farmers will be most
affected. The food security in the entire
continent will be impaired and this may led to
increase dependency on food import.
62
Also the rise in the sea level predicted for
agriculture in Africa and human settlement and
even agricultural lands as well as freshwater
reservoirs, a rise of mainly 50cm in the level
of the Mediterranean Sea could release saltwater
nine kilometres into the coastal aquifers of the
Nile Delta. Egypt’s utility and shrinking water
supply is 90% dependent on the Nile (WBGU,
2008). Moreover, a sea level increase of 1m
could mean a loss of 4,500km of arable land for
coastal areas where at least, one hundred
thousand people will have to resettled, (UNDP,
2007: 100).
3.6.3 Poverty and Health
The most recent UNDP report on human development
establishes clearly the connection between
climate change and poverty. The consequences of
climate change perpetuate and aggravate already
existing injustices. This is particularly true
of Africa, where two mutually reinforcing
63
factors poverty and factual climate change for
examples in the form of drought collide. Africa
states are without exception, the taillight of
the human development index, (UNDP, 2007).
While farmers can fall back on insurance in case
of crop failure due to drought, people in Africa
have to develop other strategies. They will
probably reduce consumption, reduce food intake
and withdraw their children from school in order
to compensate for the change. The interplay
between environment and development will
inevitably end in crisis. As a consequences of
climate change, it is assumed that diseases such
as malaria and rift valley fever will spread.
Even though it is assumed that malaria pathogens
or their carriers will not survive climate
change in some regions, other areas will become
malaria zones. Even today, malaria is spreading
into the hitherto malaria – free highland of
Ethiopia, Kenya, Rwanda and Burundi. It is even
64

likely that malaria will spread into the
highlands of Somalia and Angola by the end of
the century. By and large it is anticipated that
malaria cases will increase by 5 – 7 % by 2100,
(Boko, 2007; WWF, 2006)
3.6.4 Violent Conflicts
Numerous studies indicate that there is a
connection between climate change on the one
hand and security and violent conflicts on the
other (Smith, 2007; WBGU, 2006; Campbell, 2007;
Boko, 2007: 443). Dan Smith of International
Alert have pointed out that climate change could
promote violent conflicts. With increased
scarcity of usable land and water resources,
impoverishment will continue. This is
particularly predicted for North Africa.
Conflicts around scarce resources (water) and
migration (for example as a result of drought)
could become more frequent and could intensify
due to climate change. With regards to already
65
smouldering conflicts, the repercussion from
climate change alongside others. Factors could
have an escalating effect. However, the
contribution of this factor in comparison to
other factors is difficult to measure.
3.6.5 Biodiversity Loss
The African continent still posses a unique
biodiversity one-fifth of all known mammals;
birds and plants species living in their
habitats, but it is threatened by climate
change, (WWF, 2006:9). Local deforestation,
slash and burn agriculture, the conversion of
pristine habitats into agricultural areas,
pollution and over fishing of coastal water are
further exacerbating the situation. The warming
of the oceans and the rise in the sea level will
affect the protective function and the
biodiversity of the mangrove forests and coral
reefs, the spawning ground for fish and an
essential protective mechanism of the coast, a
66
factor not to be underestimated for tourism will
be lost. The projection regarding the loss of
mammals, particularly along the migratory routes
of large herds of wild mammals and (migratory
birds) are especially alarming. For southern
African it is estimated that the interplay
between land use and climate change
(particularly desertification) will have serious
effects on the survival chances of larger
mammals. In the Kruger National Park (South
Africa), it is feared that at least two thirds
of the species will be lost, (WWF, 2006:9).
3.7 Future Projection of Climate Change
Green House Gas concentration in the atmosphere
will increase during the next century unless
green house gas emissions decreases
substantially from present level, (IPCC, 2007).
Increased green house gas concentrations are
likely to raise earth’s average temperature,
67

influence precipitations and some storm patterns
as well as raise sea level, (IPCC, 2007).
The magnitude of these changes, however is
uncertain, the amount and speed of future
climate change will ultimately depend on;
Weather green house gases and aerosol
concentrations increase, stay the same or
decrease.
How strongly features of climate (e.g.
temperature, precipitation etc) respond to
changes in greenhouse gas and aerosols
concentration.
How must the climate varies as a result of
natural influences (e.g. from volcanic
activity and changes in the sun’s intensity)
and its internal variability (referring to
the random changes in the circulation of the
atmosphere and ocean).
68
A good example of future changes in
precipitation projected by a general circulation
model is the ‘Climate Model’.
Climate Model, virtually all published estimates
of how the climate could change in the future
are produced by computer models of earth’s
climate system, these model are known as General
Circulation Models (GCM). According to IPCC,
2007;
“Confidence in models comes from thephysical basis and their skill inrepresenting observed climate and pastclimate changes. Models have prove tobe extremely important tools forstimulating and understanding climateand there is considerable confidenceof future climate change, modelscontinue to have significantlimitations, such as theirrepresentation of clouds which lead touncertainties in the magnitude andtiming, as well as regional details ofpredicted climate change. Neverthelessover several decades, models developedhave consistently provided a robustand unambiguous picture of significantclimate warming in response toincreasing greenhouse gases”.
69
It is important to recognize that projections of
climate change in specific areas are not
forecasts comparable to tomorrow’s weather
forecast. Rather they are hypothetical examples
of how the climate might change and usually
contain a range of possibilities as opposed to
one specific high likelihood outcomes.
3.8 Control Measures So Far Taken
Intergovernmental Panel on Climate Change (IPCC)
was established in November, 1988, jointly by the
United Nation Environmental Programmes (UNEP) and
the World Meteorological Organization (WMO) as a
forum in which government representatives
deliberate on the scientific aspect of issues
related to global warming. More than one thousand
scientists are enlisted from around the world, to
consolidate, evaluate and report to the world the
latest scientific findings most especially on
climate change.
Treaty on Framework Convention on Climate Change:
70
Advances in IPCC studies about global warming
have highlighted the importance for the
international problems for international
community, (IPCC, 2007). As a result,
intergovernmental negotiating committee for
framework convention on climate change (IPCC) was
established within the United Nations in December
1990; only 1 year and 4months later, in April
1992, the treaty on framework convention on
climate change was adopted exceptional speed for
an international treaty of this nature. They
treaty was signed by 55 countries at the “Earth
Summit (United Nations Conference on the
Environment and Development)” held in Rio de
Janeiro in June 1992. Against the back ground of
mounting international interest in the
environmental issue, the treaty was ratified by
the 50th country in December 1993, fulfilling the
conditions for its taking effects. The treaty
71
went into effects in March 1994. The principle
objectives of the treaty is to stabilize the
atmospheric concentration of greenhouse gases to
such an extent as not to artificially influence
the climate, requiring industrial advanced
countries in particular to reduce their carbon
dioxide emissions back to their 1990 levels by
the end of the 1990s, (IPCC, 2007).
Kyoto Conference of Treaty for Framework Conference on
Climate Change
In compliances with this convention, countries
that are parties to the United Nation Framework
Convention on Climate Change convene to discuss
concrete measures to control global warming.
At the first session (COP 1), held in March in
Berlin, the Berlin mandate was adopted,
stipulating the adaptation of COP 3 of concrete
objectives policies and measures after the year
2000. From December 1 to 10, 1997 COP 3 was held
in Kyoto, there the Kyoto Protocol was adopted,
72
which demands 39 developed countries including
Japan, the United States and EU countries, reduces
the total emission of six greenhouse gases,
including carbon dioxide and methane (in carbon
dioxides equivalent) by 5% of the 1990 level
between 2008 and 2012, (IPCC, 2007).
COP 4 was held in November 1998, in Buenos Aires,
Argentina, where rules where formulated to
advances realization of the reduction objectives
set in the Kyoto protocol. These went into effects
after 90 days of their ratification by at least 55
countries, provided that the carbon dioxide
emission value of developed countries in 1990
(these rules where expected to take effect from,
2000), (IPCC, 2007).
o Kyoto Protocol Outline Target Year: 2008 – 2012
o Object Gases: CO2, CH4, N2O, HFCs, PFC2 SF6
o Reduction Objectives: Reduction by all
concerned developed countries of the total
emission value of CO2, N2O, CH4, HFCs, PFCs, SF6
73
in carbon dioxide equivalent, by at least 50%
of the 1990 emission level (or the 1995 level
for CFCs).
o Main Countries Specific Reduction Percentages
Japan – 6%
USA – 7%
EU – 8%
(www.IPCC.org/climatechnagecontrolreport
2007)
o Remarks:
- Carbon dioxide absorbing sources, such as
tree planting and forests creation or
losses are taken into account in
measuring reduction changes.
74
- Emission limits may be negotiated among
developed countries.
- A reduction amount exceeding the amount
designated for a given target period may
be carried forward to the following
target period.
- Reduction may be promoted through
projects conducted jointly by developed
countries and by developed and developing
countries.
(www.IPCC.org/climatechnagecontrolreport2007)
75
CHAPTER FOUR
DATA ANALYSIS, PRESENTATION AND DISCUSSION OF FINDINGS
4.1 Introduction
This aspect of the study presents and analyse
the data gathered. The analysis will be done
immediately after the presentation of the
results and discussion of the findings follows.
The nature of the presentation and why a
particular statistical descriptive method was
used for the presentation where stated on the
methodology in chapter one.
4.2 Data Presentation and Analysis
The data gathered from the two meteorological
stations (i.e. IAR and MAKIA) in the two local
government area under study are presented in a
tabular form with relevant columns and rows all
indicating each element to be used in the study
and their equivalent years. The figure that
76

follows the table are the elements to be studied
in a more reasonable and readable manner for
better discussion of the findings that comes
forth.
Thus, they are as follows;
77
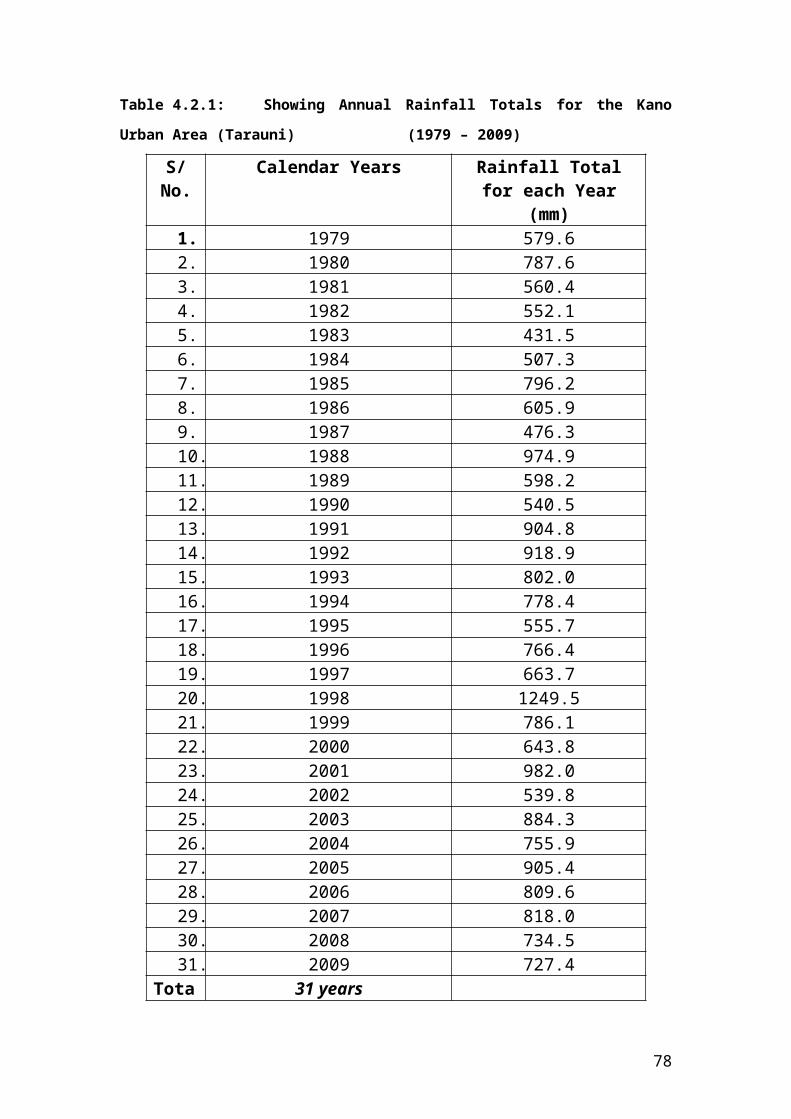
Table 4.2.1: Showing Annual Rainfall Totals for the Kano
Urban Area (Tarauni) (1979 – 2009)
S/No.
Calendar Years Rainfall Totalfor each Year
(mm)1. 1979 579.62. 1980 787.63. 1981 560.44. 1982 552.15. 1983 431.56. 1984 507.37. 1985 796.28. 1986 605.99. 1987 476.310. 1988 974.911. 1989 598.212. 1990 540.513. 1991 904.814. 1992 918.915. 1993 802.016. 1994 778.417. 1995 555.718. 1996 766.419. 1997 663.720. 1998 1249.521. 1999 786.122. 2000 643.823. 2001 982.024. 2002 539.825. 2003 884.326. 2004 755.927. 2005 905.428. 2006 809.629. 2007 818.030. 2008 734.531. 2009 727.4
Tota 31 years
78
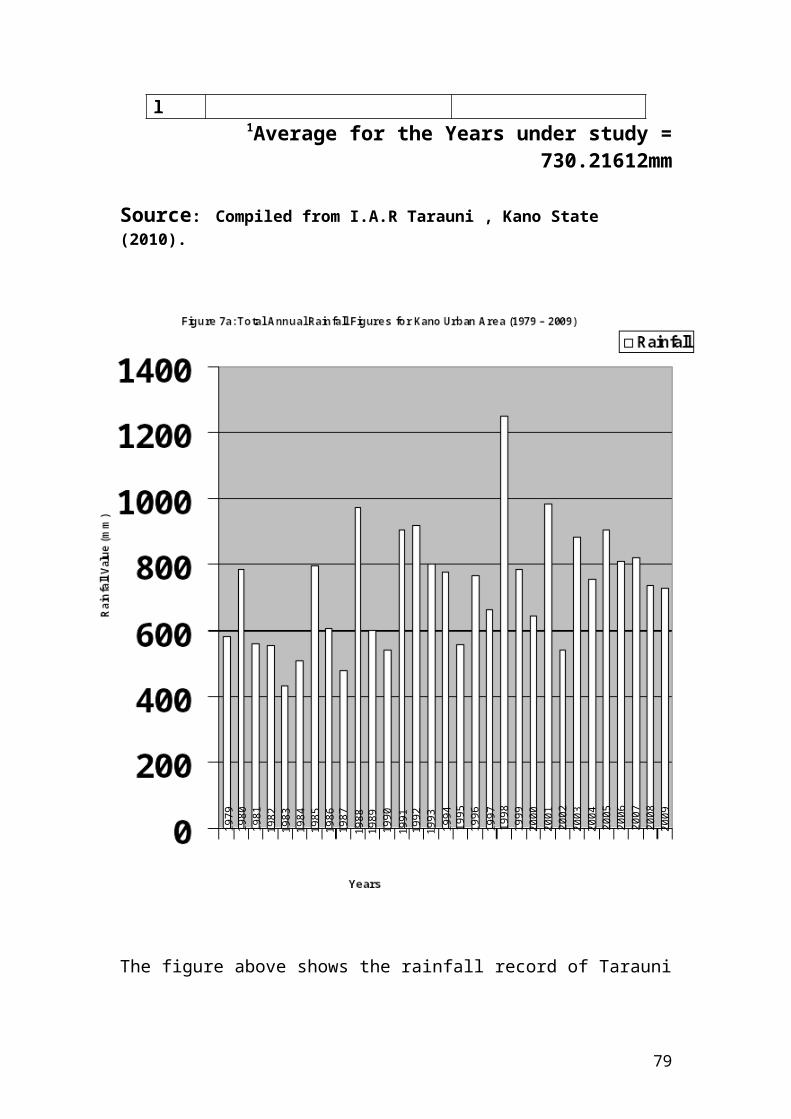
l 1Average for the Years under study =
730.21612mm
Source: Compiled from I.A.R Tarauni , Kano State (2010).
The figure above shows the rainfall record of Tarauni
1979
1980
1981
1982
1983
1984
1985
1986
1987
1988
1989
1990
1991
1992
1993
1994
1995
1996
1997
1998
1999
2000
2001
2002
2003
2004
2005
2006
2007
2008
2009
79

Local Government Area of the Kano State from (1979 –
2009). It can be seen clearly that for most of the
years, the rainfall rarely reaches 1500mm and the
records for each individual year varies significantly
from each other. The lowest year of 1983 records the
least rainfall of 431.5mm for that year and the
highest recorded value being the year 1998, having
1249.5mm. A total mean of 730.216mm was derived from
the 31years under study.
80
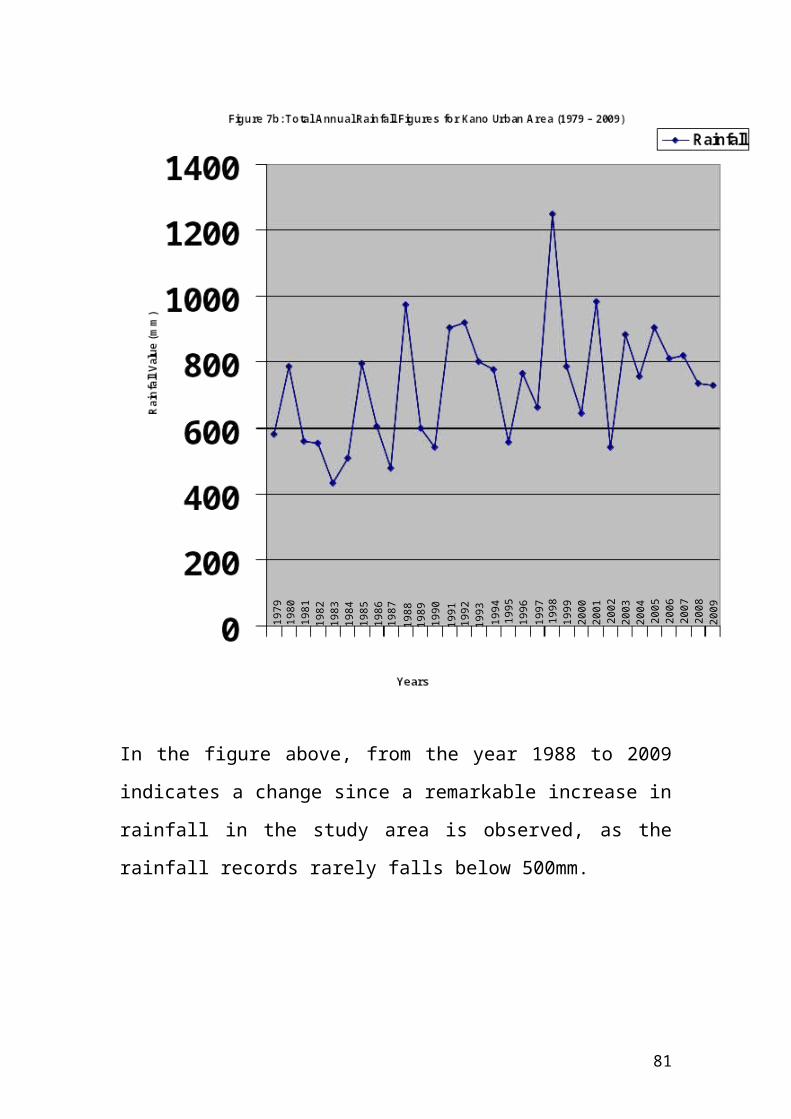
In the figure above, from the year 1988 to 2009
indicates a change since a remarkable increase in
rainfall in the study area is observed, as the
rainfall records rarely falls below 500mm.
1979
1980
1981
1982
1983
1984
1985
1986
1987
1988
1989
1990
1991
1992
1993
1994
1995
1996
1997
1998
1999
2000
2001
2002
2003
2004
2005
2006
2007
2008
2009
81

Table 4.2.2 Showing the Mean of Maximum
Temperature Record for Kano Urban Area
(Tarauni) (1979 – 2009)S/No.
Calendar Years Mean Per Annum(oC)
1 1979 33.252 1980 30.503 1981 30.754 1982 32.755 1983 32.456 1984 31.757 1985 32.258 1986 33.339 1987 33.58
10 1988 31.7511 1989 32.0012 1990 33.8313 1991 33.0014 1992 32.4215 1993 33.0816 1994 32.6717 1995 32.5818 1996 34.0819 1997 32.9220 1998 32.7521 1999 33.5022 2000 33.0823 2001 33.2524 2002 33.8325 2003 34.5026 2004 34.7527 2005 34.7528 2006 34.0029 2007 34.8330 2008 34.0031 2009 36.08Total
31 years
82
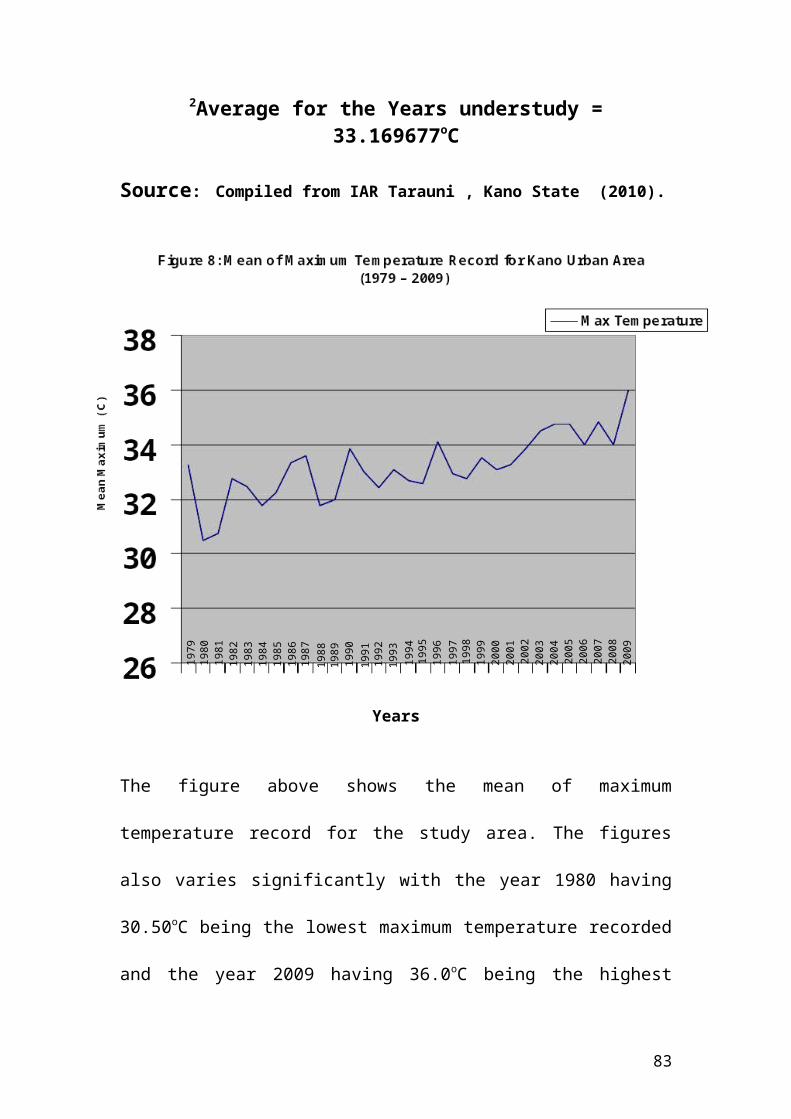
2Average for the Years understudy =33.169677oC
Source: Compiled from IAR Tarauni , Kano State (2010).
Years
The figure above shows the mean of maximum
temperature record for the study area. The figures
also varies significantly with the year 1980 having
30.50oC being the lowest maximum temperature recorded
and the year 2009 having 36.0oC being the highest
1979
1980
1981
1982
1983
1984
1985
1986
1987
1988
1989
1990
1991
1992
1993
1994
1995
1996
1997
1998
1999
2000
2001
2002
2003
2004
2005
2006
2007
2008
2009
83
maximum temperature recorded. And a total mean of
33oC for the 31years under study was derived.
Hence, the value of 36oC indicates a change in
maximum temperature of the area since 1999 maximum
temperature were seen above 32oC and from the year
2000 temperature has been rising in the area.
84
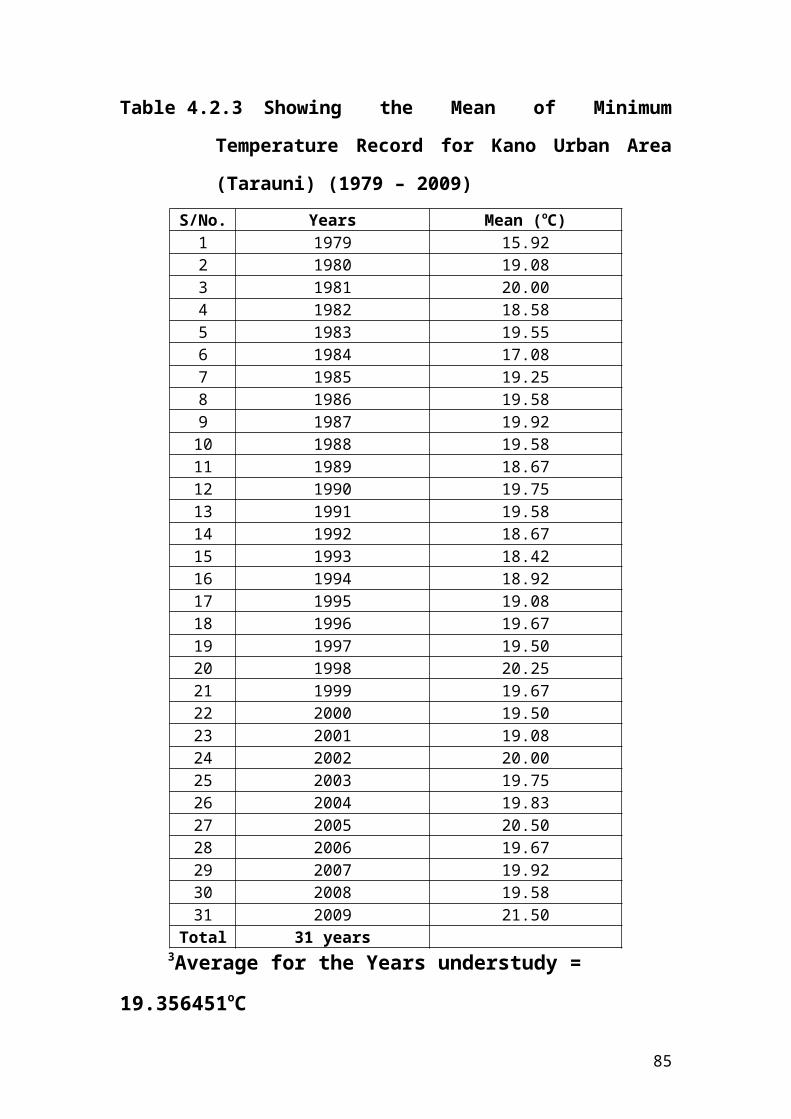
Table 4.2.3 Showing the Mean of Minimum
Temperature Record for Kano Urban Area
(Tarauni) (1979 – 2009)S/No. Years Mean (oC)
1 1979 15.922 1980 19.083 1981 20.004 1982 18.585 1983 19.556 1984 17.087 1985 19.258 1986 19.589 1987 19.9210 1988 19.5811 1989 18.6712 1990 19.7513 1991 19.5814 1992 18.6715 1993 18.4216 1994 18.9217 1995 19.0818 1996 19.6719 1997 19.5020 1998 20.2521 1999 19.6722 2000 19.5023 2001 19.0824 2002 20.0025 2003 19.7526 2004 19.8327 2005 20.5028 2006 19.6729 2007 19.9230 2008 19.5831 2009 21.50
Total 31 years 3Average for the Years understudy =
19.356451oC
85

Source: Compiled from IAR Tarauni , Kano State (2010).
The figure above shows the mean of minimum
temperature record for the study area. It is also
clear that the record for each individual’s years
varies significantly for the 31 years under study.
The lowest record as seen is the year 1979 with
1979
1980
1981
1982
1983
1984
1985
1986
1987
1988
1989
1990
1991
1992
1993
1994
1995
1996
1997
1998
1999
2000
2001
2002
2003
2004
2005
2006
2007
2008
2009
86
15.92oC and the highest record being 2009 with
21.50oC. A total mean for the whole years understudy
(i.e. 31years) was calculated to be 19oC.
From the year 1989 the minimum temperature has been
increasing as the value rarely fall below 19oC
indicating a change in the minimum temperature of the
study area.
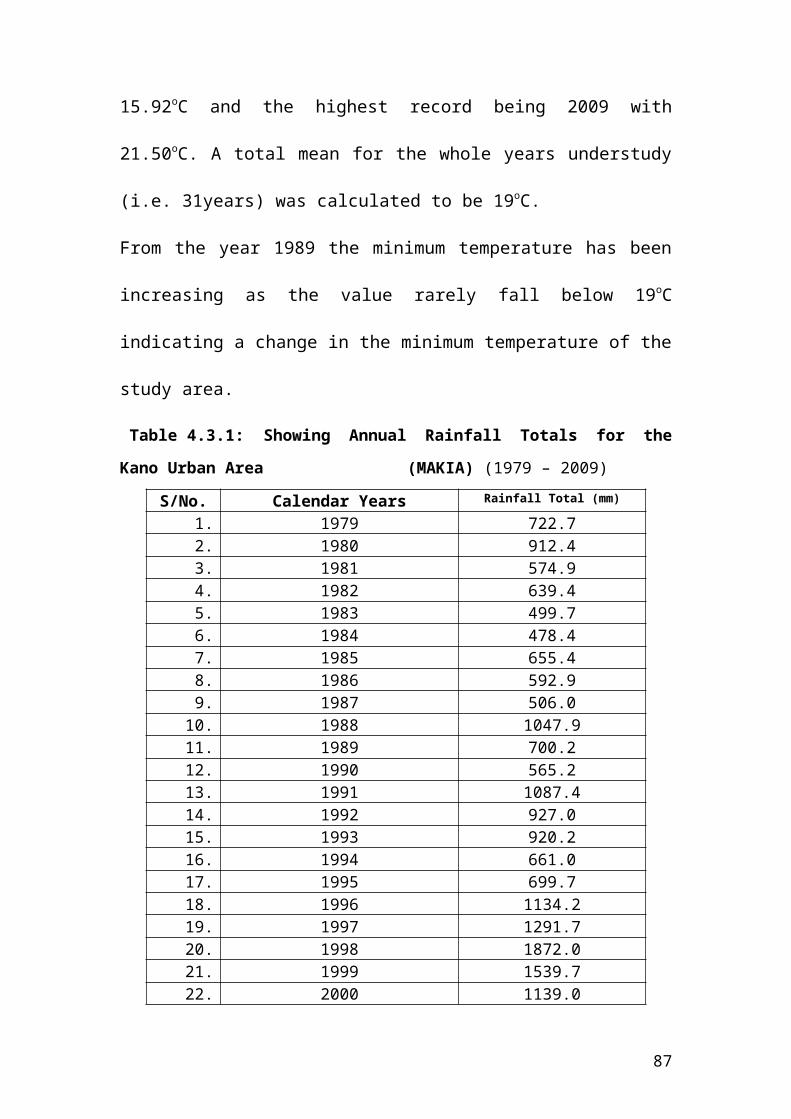
Table 4.3.1: Showing Annual Rainfall Totals for the
Kano Urban Area (MAKIA) (1979 – 2009)
S/No. Calendar Years Rainfall Total (mm)
1. 1979 722.72. 1980 912.43. 1981 574.94. 1982 639.45. 1983 499.76. 1984 478.47. 1985 655.48. 1986 592.99. 1987 506.010. 1988 1047.911. 1989 700.212. 1990 565.213. 1991 1087.414. 1992 927.015. 1993 920.216. 1994 661.017. 1995 699.718. 1996 1134.219. 1997 1291.720. 1998 1872.021. 1999 1539.722. 2000 1139.0
87
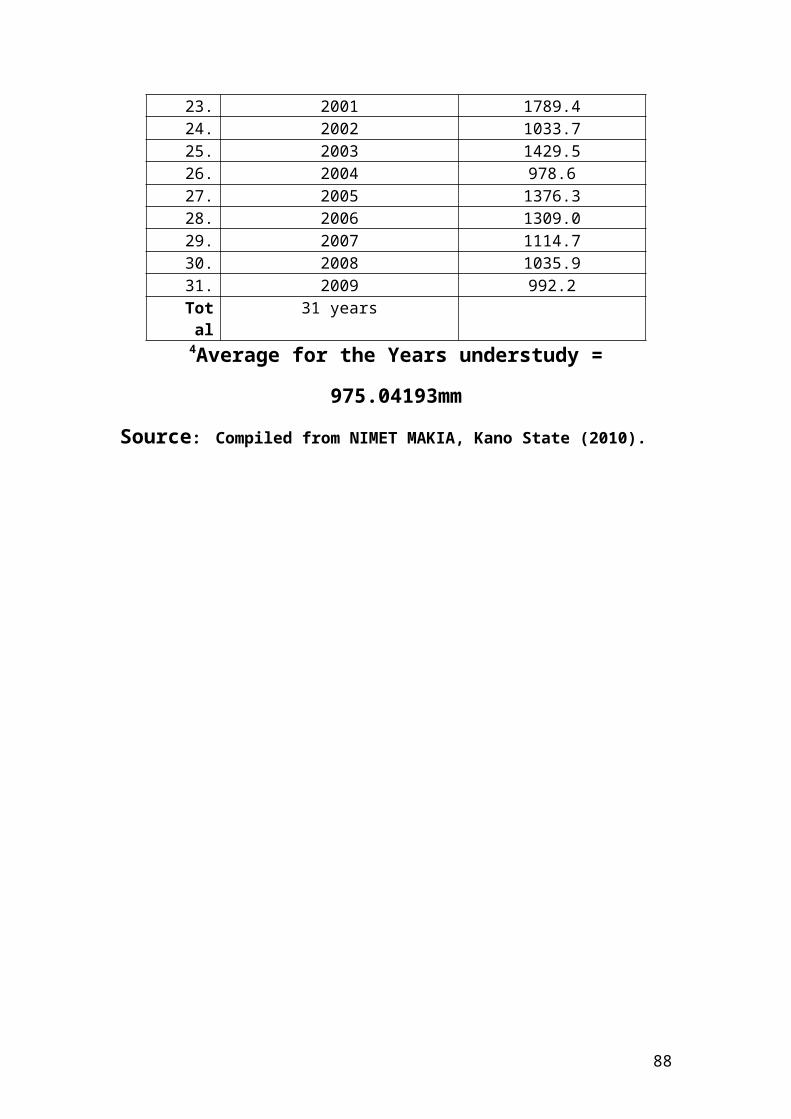
23. 2001 1789.424. 2002 1033.725. 2003 1429.526. 2004 978.627. 2005 1376.328. 2006 1309.029. 2007 1114.730. 2008 1035.931. 2009 992.2Total
31 years
4Average for the Years understudy =
975.04193mm
Source: Compiled from NIMET MAKIA, Kano State (2010).
88
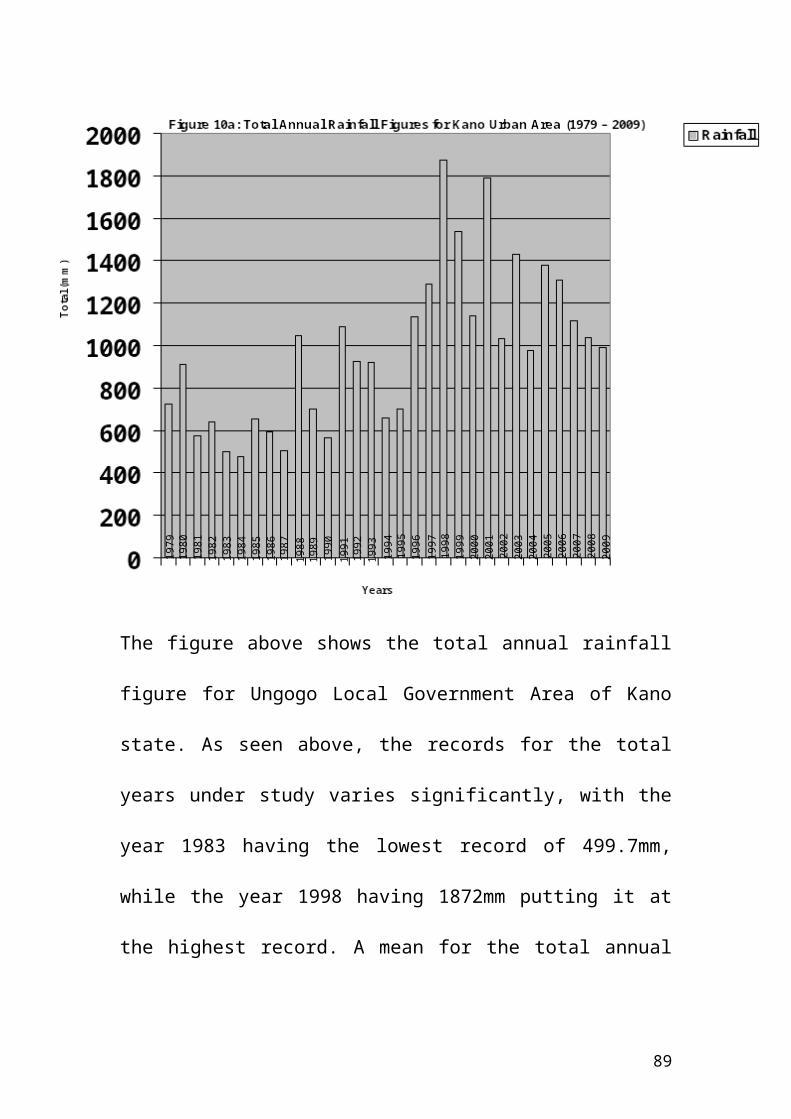
The figure above shows the total annual rainfall
figure for Ungogo Local Government Area of Kano
state. As seen above, the records for the total
years under study varies significantly, with the
year 1983 having the lowest record of 499.7mm,
while the year 1998 having 1872mm putting it at
the highest record. A mean for the total annual
1979
1980
1981
1982
1983
1984
1985
1986
1987
1988
1989
1990
1991
1992
1993
1994
1995
1996
1997
1998
1999
2000
2001
2002
2003
2004
2005
2006
2007
2008
2009
89
records of rainfall for the whole 31 years was
calculated to be 975.04mm.
90
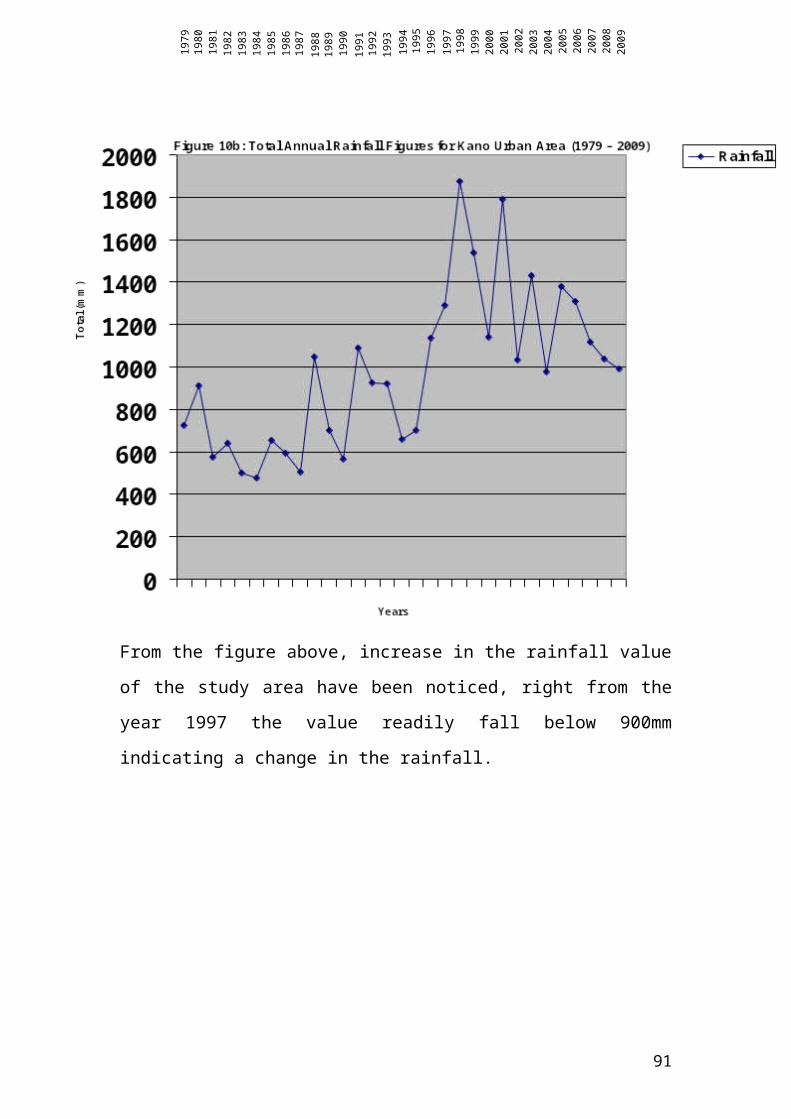
From the figure above, increase in the rainfall value
of the study area have been noticed, right from the
year 1997 the value readily fall below 900mm
indicating a change in the rainfall.
1979
1980
1981
1982
1983
1984
1985
1986
1987
1988
1989
1990
1991
1992
1993
1994
1995
1996
1997
1998
1999
2000
2001
2002
2003
2004
2005
2006
2007
2008
2009
91
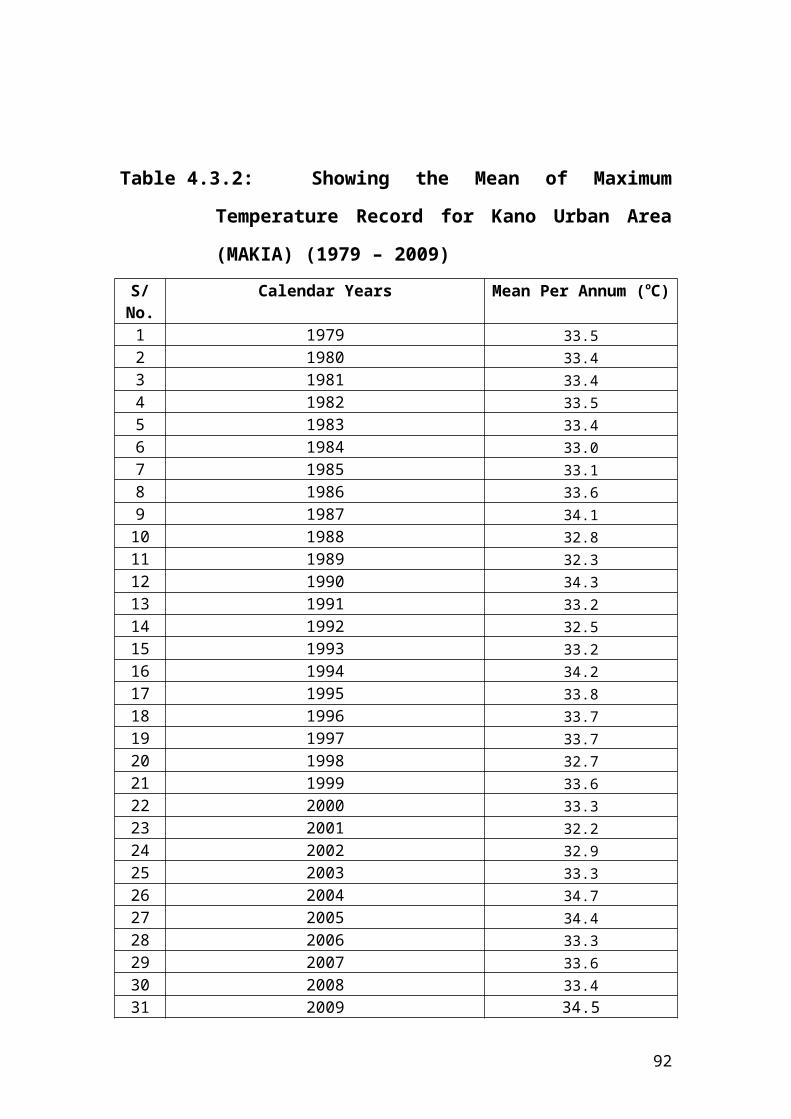
Table 4.3.2: Showing the Mean of Maximum
Temperature Record for Kano Urban Area
(MAKIA) (1979 – 2009)S/No.
Calendar Years Mean Per Annum (oC)
1 1979 33.52 1980 33.43 1981 33.44 1982 33.55 1983 33.46 1984 33.07 1985 33.18 1986 33.69 1987 34.110 1988 32.811 1989 32.312 1990 34.313 1991 33.214 1992 32.515 1993 33.216 1994 34.217 1995 33.818 1996 33.719 1997 33.720 1998 32.721 1999 33.622 2000 33.323 2001 32.224 2002 32.925 2003 33.326 2004 34.727 2005 34.428 2006 33.329 2007 33.630 2008 33.431 2009 34.5
92
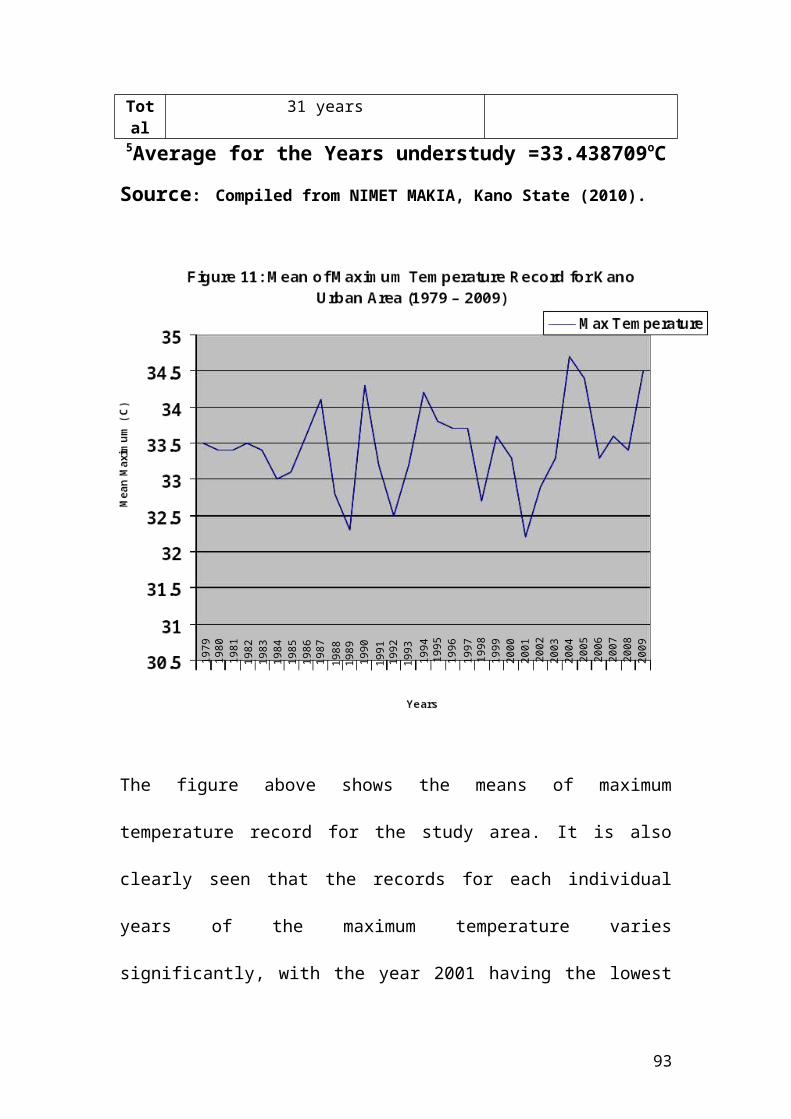
Total
31 years
5Average for the Years understudy =33.438709oC
Source: Compiled from NIMET MAKIA, Kano State (2010).
The figure above shows the means of maximum
temperature record for the study area. It is also
clearly seen that the records for each individual
years of the maximum temperature varies
significantly, with the year 2001 having the lowest
1979
1980
1981
1982
1983
1984
1985
1986
1987
1988
1989
1990
1991
1992
1993
1994
1995
1996
1997
1998
1999
2000
2001
2002
2003
2004
2005
2006
2007
2008
2009
93
record of 32.2oC while the year 2004 having the
highest record of 34.7oC. A total mean for the years
of the study area’s maximum temperature was
calculated to be 33.4oC.
From the year 2003, the value of maximum temperature
rarely falls below 33.4oC indicating a change in it
as it keeps on increasing.
94
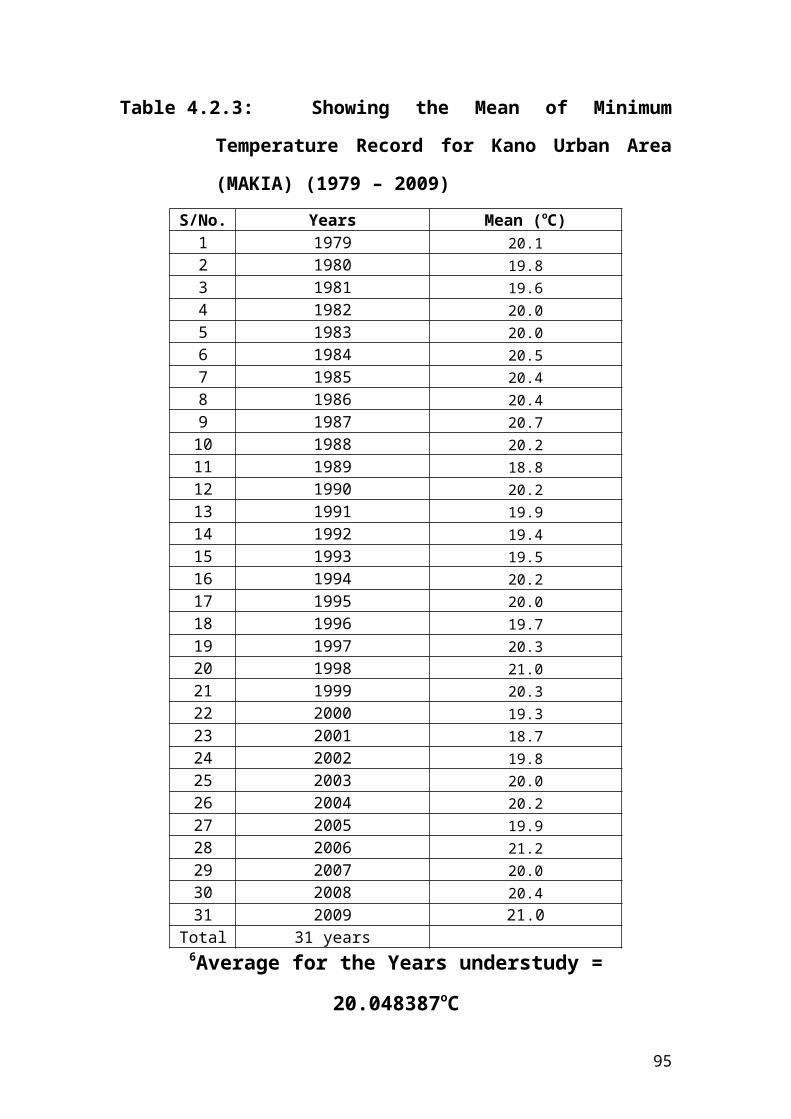
Table 4.2.3: Showing the Mean of Minimum
Temperature Record for Kano Urban Area
(MAKIA) (1979 – 2009)S/No. Years Mean (oC)
1 1979 20.12 1980 19.83 1981 19.64 1982 20.05 1983 20.06 1984 20.57 1985 20.48 1986 20.49 1987 20.710 1988 20.211 1989 18.812 1990 20.213 1991 19.914 1992 19.415 1993 19.516 1994 20.217 1995 20.018 1996 19.719 1997 20.320 1998 21.021 1999 20.322 2000 19.323 2001 18.724 2002 19.825 2003 20.026 2004 20.227 2005 19.928 2006 21.229 2007 20.030 2008 20.431 2009 21.0
Total 31 years6Average for the Years understudy =
20.048387oC
95
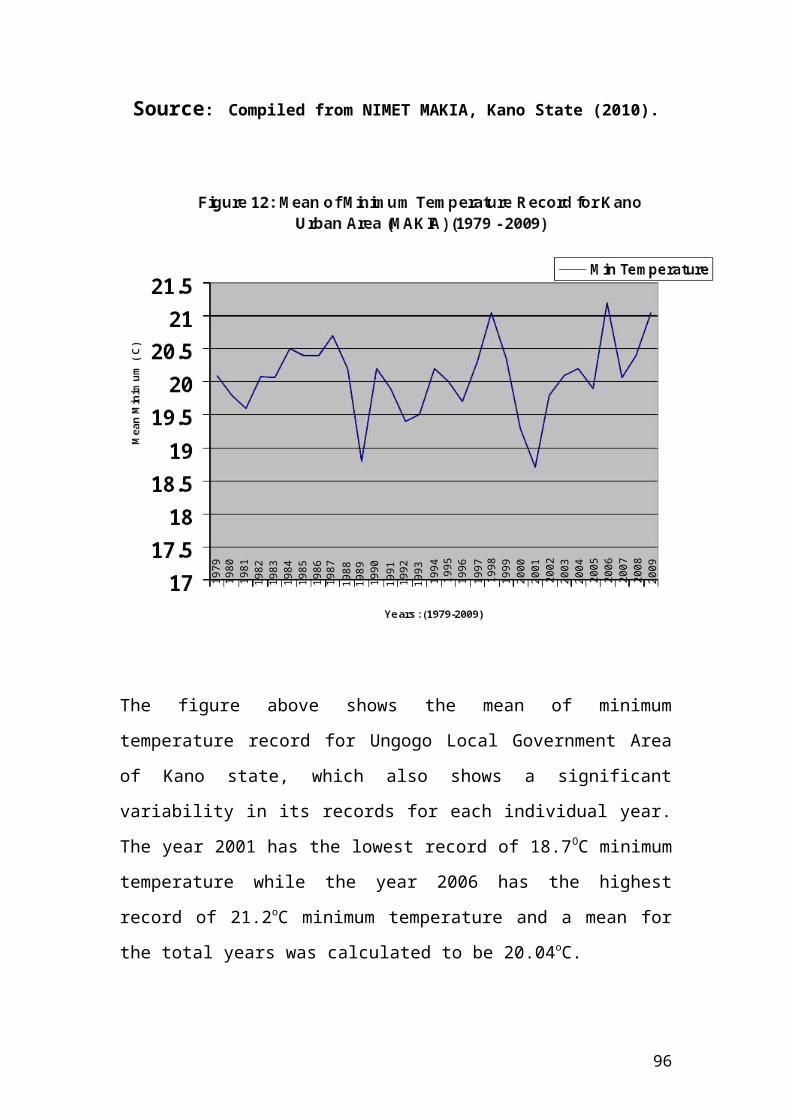
Source: Compiled from NIMET MAKIA, Kano State (2010).
The figure above shows the mean of minimum
temperature record for Ungogo Local Government Area
of Kano state, which also shows a significant
variability in its records for each individual year.
The year 2001 has the lowest record of 18.7OC minimum
temperature while the year 2006 has the highest
record of 21.2oC minimum temperature and a mean for
the total years was calculated to be 20.04oC.
1979
1980
1981
1982
1983
1984
1985
1986
1987
1988
1989
1990
1991
1992
1993
1994
1995
1996
1997
1998
1999
2000
2001
2002
2003
2004
2005
2006
2007
2008
2009
96

From the figure above, the records have been unevenly
fluctuating throughout the period of study. But known
the less, the nature of the figure also shows a
reasonable increase as the year 2001 marked the
period of low minimum temperature record for the
study area and to date it have been increasing,
indicating a change .
97
4.3 Discussion of Findings
The nature, pattern and characteristics of
rainfall, temperature and other elements of the
climate in this region are tropical continental
north wet and dry with some places that are in
it fringes experiencing the Sahel climate. For
most part of the year it is hot, with most
months of the year particularly before the rainy
seasons, have temperatures as high as 30oC, and
the climatic type experiences harmattan from
December to February and temperature are then
lower. The rainfall rarely exceeds 1500mm as its
peak.
The analysis of each elements presented above
indicates that there is a reasonable changes of
pattern and distribution of climatic elements
experience in the two local government area
under study, the nature of rainfall in figure 7
for the first decade is generally lower compared
to the second and third decades, which
98

experiences a very much rainfall, as it even
records the year (i.e. 1998) with the highest
peak of rainfall that is >1000mm. Hence, the
climatic change effect in times of rainfall
indicates an increasing rainfall to the region.
Figure 10, also follows the same pattern, with
its first decades recording lower rainfall when
related to the second and third decades
respectively. The second decade rainfall records
seems to increase while the third decade
generally experiences a much more rainfall, with
the year (1998) being the peak of more than
1500mm. Hence, the climatic change effect in
times of rainfall also indicates an increasing
rainfall.
The temperature for both areas under study
follows the same pattern as the maximum and
minimum temperature increases from first decade
to third decade. The third decade with year
(2009) in figure 8 records the highest maximum
99
temperature of (33oC) for the region and the year
(2009) in figure 9 records the highest minimum
temperature of (19oC) for the same region
respectively.
Figure 11 which is the maximum temperature
records for that region also indicates an
increase from the first to third decade, with
the year (2004) under the third decade recording
the highest maximum temperature of (34.7oC) and
the year (2007) of figure 12 indicating the year
with the highest record of minimum temperature
of (21.2oC) for the region. Thus, the climatic
change effect in times of temperature is also
that of increasing temperature.
Therefore, a vivid comparison of both regions
indicates clearly that the Ungogo Local government
Area experiences a higher rainfall than the Tarauni
Local Government, as shown below;
The Average for the
Rainfall Records of
The Average for the
Rainfall Records of
100
Ungogo for 31 years Tarauni for 31 years975.04mm 730.21mm
In all, this justify the hypothesis stating that
the rainfall of Kano Urban Area has drastically
decrease in its quantity and duration void,
while affirming the hypothesis stating that the
temperature of Kano Urban Area has double,
correct.
CHAPTER FIVE
SUMMARY, RECOMMENDATION AND CONCLUSION
5.1 Summary
The topic “An Appraisal of the Rainfall and
Temperature Variables as Evidences of Climate
Change in Kano Area” was carried out on a due
research procedure to include, chapter one which
further entails introduction, research problem,
aims and objectives, significant of the study,
research hypothesis, scope and limitation,
research methodology, and definition of key
101
terms. Chapter two is the geography of the study
area and it looks into location and position,
geology, relief, climate, vegetation, soil,
economy and population of the study area.
Chapter three is the literature review. Chapter
four presents the data and their analysis, while
chapter five summaries, stipulate some
recommendations and conclude the topic.
5.2 Recommendations
If existing or not, environmental agencies
should setup committees that would go round in
order to inspect if the discharge rate of
international standard for emission of gases are
met and if where necessary should encourage
recycling of materials and products by this
industries and other emission dischargers.
Mitigation measures such as aforestation, good
environmental practises, pollution reduction,
102
should be encouraged by government to its
populace.
Adaptive mechanism should be adopted in places
where climate change is adversely affecting, to
limit some of its effects.
People should be enlightened on the effects held
by climate change in various communication media
in order to avoid the discharge of unfriendly
gases/materials into the atmosphere.
And finally, government should make available,
research institutes for student utility.
5.3 Conclusion
The following conclusions are drawn from this study;
i) The climate change effect to rainfall in Kano
Urban Area does not decreases but rather
increases.
ii) The climate change effect to temperature in
Kano urban area is that of increment.
103
iii) The study area experiences an uneven
distribution of rainfall but follows the same
patterns of change which is increasing from
the last three decades to present time.
iv) And finally, the Ungogo Local Government
Area experience more rainfall and temperature
than the Tarauni Local Government Area of Kano
metropolitan.
104
REFERENCES
Abdu Salihu (2009), “Hydropower Development at Tiga and
Challawa Gorge Dams, Kano state, Nigeria”. International
Network on Small Hydro Power (In-SHP). Retrieved 2009
– 10 – 02
Abdullahi, Ahmed S., (2007), Local Geography of Kano,
Unpublished Lecture Notes, at Federal College of
Education, Kano.
Adejoke O.F., (2010), “Climate Change and Gross Border Crime
in Nigeria”. Being a paper Presented at the 250th
Anniversary Conference, Organized for the Royal
Norwegian Society of Science and letters on Climate
Change and Security in Trondhiem, Norway, 21 – 24:
June, 2010.
Anthony Giddens (2008), The Politics of Climate Change;
National Response on the Challenges of Global Warming. Policy
Network Paper, Third Floor 11, Tufton Street London,
SW1P3QB, United Kingdom.
Bachelet, D., Neilson, J.M., Lenihan, R.J., Drapek
(2001), “Climate Change Effects on Vegetation Distribution and
Carbon Budget in United States”, (PDF) Ecosystem 4: 164 –
185. doi:10.1007/s10021-001-002-7
105
Boko, M., Niarg, I., Nogel C., Githeko, A., Medany,
M., Osman – Elasha B., Fabo, R., Yanda, P., (2007),
African in Parry, M.I., Caniani, O.F., Palutikof, J.,
Vandoe Linden, P.J., Hason C.E., (ed), Climate Change
2007: Impacts, Adaptation Report of the Intergovernmental panel on
Climate Change. Cambridge (UK) 433 – 467
Connolley W M.,(2009), "The 1975 US National Academy
of Sciences/National Research Council Report".
Retrieved 28 June 2009.
David Archer (2009). The Long Thaw: How Humans Are
Changing the Next 100,000 Years of Earth's Climate. Princeton
University Press. p. 19. ISBN 9780691136547.
decc.gov.uk, (2009)
Declaration of the World Climate Conference: World
Meteorological Organization. Retrieved 28 June 2009.
Evans E.P. (1887): The Authorship of the Glacial Theory,
North American review. / Volume 145, Issue 368, July
1887. Accessed on February 25, 2008.
German Advisory Council on Global Change, WBGU
(2008), Wet in Wandel, Sickner heitsriski
Klimawandel, Berlin/Heideberg/New York.
106
Gribben J. (1978), The Climate Threat. Collins Fontana
Publication, USA
Holli Riebeek (28 June 2005). "Paleoclimatology".
NASA. Retrieved 01 July 2009.
Imbrie, J. and K. P. Imbrie, 1979: Ice Ages, Enslow
Publishers: Hillside, New Jersey.
IPCC (2007) Climate Change 2007: The Physical Science Basis
(Summary for Policy).
IPCC (2007), “16th Years of Scientific Assessment in
Support of the Climate Convention”. 2004. Retrieved
28 June 2008.
IPCC (2007), Emission Trading, Cap and Share, Personal
Carbon Trading, UNFCCC
IPCC (2007), The Physical Science Basis
http:ipc.wg1.ucar.edu
Jerry Adler (23 October 2006). "Climate Change:
Prediction Perils". Newsweek.
John Tyndall (1872) "Contributions to molecular
physics in the domain of radiant heat" DjVu
107
Kadzamira Z.D (2009), “Mainstreaming Climate Change into
Agricultural Education: Challenges and Perspectives”. Working
Paper Forward Speech. Published by the World
Agroforestry Center, Namibia, Kenya.
Kano’. Encyclopaedia Britannica. Chicago:
Encyclopaedia Britannica, Inc., 2007
Madiodio Niasse (2005), Climate – Induced Water Conflict Risks
in West African: Recognizing Copying with Increasing Climate Impact on
Shared Watercourse. An International Workshop, Holmen
Fjord Hotel, Asker, Near Oslo. Organized by Center
for the Study of Civil War, International peace
Research Institute Oslo (PRIO).
Nigeria City of Kano Plans IT Park (NCKP ITP)’.
Panapress (Afriquenligne). 2007-11-04.
Olofin E.A (1987), Some Aspect of the Physicals Geography of
Kano Region and Related Human Responses. Debris Standard
Printers, 734 Zaria Road, Gyadi – Gyadi, Kano,
Nigeria.
Oyebande, (2002); Niasse (2004), Equity Dimensions of Dam
– Based Water Resources Development, Winners and Losers. In
Steffen, Will; Jager, J: Carlson D.J Bradshaw, C.,
108
Challenges of a Changing Earth. Springer. Berlin London
Chap 6, Pp. 39 – 43.
Paul R. Ehrlich (1968). The Population Bomb. p. 52.
Peter Gwynne (1975). "The Cooling World" (PDF).
Peterson, T.C., W.M. Connolley, and J. Fleck (2008).
"The Myth of the 1970s Global Cooling Scientific
Consensus". Bull. Amer. Meteor. Soc.89: 1325–
1337. doi:10.1175/2008BAMS2370.1.
Petit R.A., Humberto Ruiloba M., Bressani R., Barnola
I., Basile, M., Bender J., Chappellaz, M., Davis
(1999), “Climate and Atmospheric History of Past 420,000 Years
from the Yostok Ice Core, Antarctica”, Nature 399(1): 429 –
439. doi: 10.10238/20859. PMID 20859.
ttp//:www.nature.com/nature/journal/v399/n6735/full/3
99429aO.html Retrieved (2008 – 01 – 22)
Saka, A., (2008), Global Warming and the Impacts of Climate
Change on Vulnerable Communities and Sectors of Economic Growth.
Paper Presented at the 2nd ANAFE International
Symposium on “Mainstreaming Climate Change into
Agriculture and Natural Resources Management
Education: Tools Experience and Challenges” Held at
109
Capital Hotel Lilongwe Malawi from the 28th July to
1st August, 2008.
Science and the Challenges Ahead. Report of the National Science
Board.
Smith, Darr/Vivekananda, Janani (2007), A Climate of
Conflict. The Links Between Climate Change, Peace and War.
International Alert, London.
Spencer Weart (2003). "Other Greenhouse Gases". The
Discovery of Global Warming.
Spencer Weart (2003). "The Carbon Dioxide Greenhouse
Effect". The Discovery of Global Warming.
Spencer Weart (2003). "The Discovery of Global
Warming". American Institute of Physics.
Statement of Dr. James Hansen, Director, NASA Goddard
Institute for Space Studies". The Guardian (London).
Retrieved 28 June 2009.
Steinfeld, H.P., Gerber, T., Wassenar, V., Castel, M.
Rosales, C. de Haan, (2006), Livestock’s Long Shadow.
ttp://www.fao.org/docrep/010/a0e/a070/e/a071e00.HTM(
retrieved, 2010)
110
Stern N. (2006), The Economics of Climate Change: A Review
Available
at http://www.hmtreasury.gov.uk/independent=review ec
onomics_climate_chnages/stern_review_report.ctm
Accessed on 18.09.08
Stern, Nicholas 92006), The Economic Climate Change. The
Stern Review, Cambridge/ New York.
unfcc.int, (2009)
United Nations Development Programme (UNDP) (2007),
Human Development Report 2007/08, Fighting Climate Change;
Human Solidarity in a Divided World, New York.
www.wikipedia.com/historyofclimatechange/
2010retrieved
William Connolley. "Translation by W M Connolley of:
Fourier 1827: MEMOIRE sur les temperatures du globe
terrestre et des espaces planetaires". Retrieved 18
July 2009.
World Meteorological Organisation (WMO)
(1986). "Report of the International Conference on
the assessment of the role of carbon dioxide and of
other greenhouse gases in climate variations and
111
associated impacts". Villach, Austria. Retrieved 28
June 2009.
World Wide Fund for Nature (W.W.F) (2006), Climate
Change Impacts on East Africa. Review of Scientific
Literature, ww.muf.org.uk/filelibraty/prffle-
africaclimatechnage-report-pdf(27.02.2008)
Young, Davis A. (1995). The biblical Flood: a case study of the
Church's response to extrabiblical evidence. Grand Rapids, Mich:
Eerdmans. ISBN 0-8028-0719-4. Retrieved 2008-09-16.
112
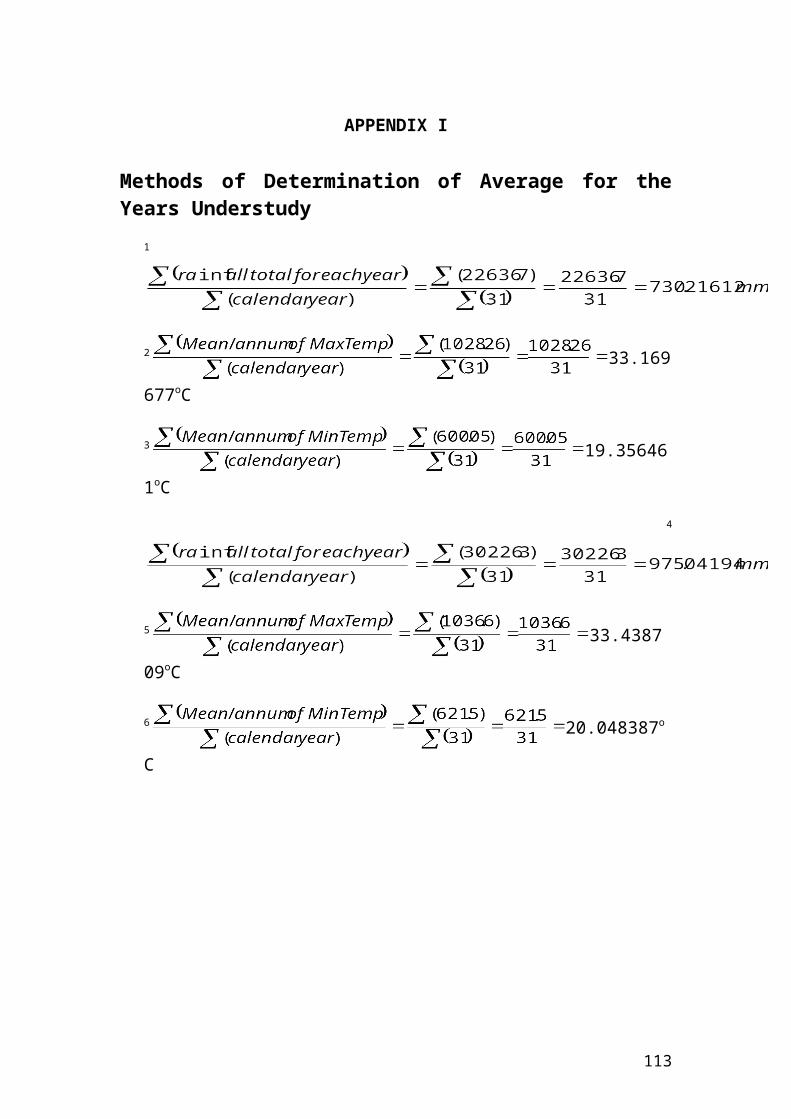
APPENDIX I
Methods of Determination of Average for theYears Understudy
1
2 33.169
677oC
3 19.35646
1oC
4
5 33.4387
09oC
6 20.048387o
C
113