Embed Size (px)
Citation preview

Assist.Anurak ThongsukhowongAssist.Anurak Thongsukhowong
Faculty of Management ScienceFaculty of Management ScienceKhon Kean UniversityKhon Kean UniversityTel.Tel. 043043--202401202401 Ext.Ext. 164164Tel. Tel. 043043 202401 202401 Ext. Ext. 164164
Fax. Fax. 043043--202402202402EE--mail:mail: [email protected]@kku.ac.thEE mail: mail: [email protected]@kku.ac.th
Website: http://home.kku.ac.th/anutonWebsite: http://home.kku.ac.th/anuton
1
Energy project appraisal and management
2
Financial AnalysisFinancial AnalysisCommon Size AnalysisCommon Size Analysis
Trend Percentage Analysisg y
Ratio Analysis
Method of Evaluating Capital Investment
3
Common Size Analysis
Common Size Analysis
เปนการลดตวเลขของแตล รายการทปรากฏในงบ เปนการลดตวเลขของแตละรายการทปรากฏในงบแสดงฐานะการเงนและงบกาไรขาดทนใหเปนอตรารอยละของสนทรพยรวม หนสนและทนรวม หรอตอยอดขายสทธ เพอเนนใหเหนถงการเปลยนแปลงในสวนผสมหรอสทธ เพอเนนใหเหนถงการเปลยนแปลงในสวนผสมหรอโครงสรางงบการเงน ซงจะชวยใหเหนถงการเปลยนแปลงในโครงสรางของงบการเงนไดเปนอยางด
4

Common Size Analysis
บรษท ตวอยาง จากดงบแสดงฐานะการเงนเปรยบเทยบและการยอสวนตามแนวดง
ณ วนท 31 ธนวาคม 2550 - 2555
สนทรพย
รายการ 31 ธนวาคม (พนบาท) 31 ธนวาคม (%)2550 2551 2552 2553 2554 25552550 2551 2552 2553 2554 2555
สนทรพยหมนเวยน เงนสด เงนลงทนชวคราว
6.1 2.6 4.3 4.0 4.7 5.262.1 28.2 58.6 59.0 74.2 83.4
3 4 9 7 2 9 2 7 2 5 2 833 7 105 1 39 6 39 8 39 5 44 9 เงนลงทนชวคราว ลกหนการคา (สทธ) สนคา
3.4 9.7 2.9 2.7 2.5 2.833.7 105.1 39.6 39.8 39.5 44.9
25.7 42.1 14.9 15.6 17.1 18.2263.1 261.1 203.3 230.3 269.9 291.9
17.8 18.2 16.1 16.4 17.0 15.8182.4 197.2 219.6 219.6 268.3 253.4
ป
สนทรพยหมนเวยนอน ๆรวมสนทรพยหมนเวยน
2.5 5.6 3.7 3.5 3.3 2.225.6 60.7 50.5 51.6 52.1 35.2
55.5 60.2 41.9 42.2 44.6 44.2566.9 652.3 571.6 622.6 704.0 708.8 ทดน อาคาร และอปกรณ สนทรพยอน ๆ
รวมสนทรพย
42.4 39.4 50.0 46.8 45.3 44.9433.5 426.9 682.2 690.4 715.1 720.1
2.1 0.4 8.1 11.0 10.1 10.921.6 4.3 110.5 162.3 159.4 174.8
100 0 100 0 100 0 100 0 100 0 100 01 022 0 1 083 5 1 364 3 1 475 3 1 578 5 1 603 7
5
รวมสนทรพย 100.0 100.0 100.0 100.0 100.0 100.01,022.0 1,083.5 1,364.3 1,475.3 1,578.5 1,603.7
Common Size Analysis
หนสนและสวนของผถอหนรายการ 31 ธนวาคม (พนบาท) 31 ธนวาคม (%)
2550 2551 2552 2553 2554 25552550 2551 2552 2553 2554 2555หนสนและสวนของผถอหนหนสนหมนเวยนเจาหนการคา
18.0 17.3 13.3 11.7 9.6 10.0184.4 187.5 181.4 172.6 151.5 160.4ตวเงนจายหนสนหมนเวยนอนรวมหนสนหมนเวยน
5.2 5.2 7.7 6.0 3.9 2.752.7 56.3 105.1 88.5 61.6 43.3
2.6 6.8 1.4 1.7 2.2 1.826.3 73.7 19.1 25.1 34.7 28.8
25.8 29.3 22.4 19.4 15.7 14.5263.4 317.5 305.6 286.2 247.8 232.5
หนสนระยะยาวรวมหนสนหมนเวยน
รวมหนสน
25.8 29.3 22.4 19.4 15.7 14.5263.4 317.5 305.6 286.2 247.8 232.5
14.7 15.0 19.5 16.3 14.5 12.5150.0 162.5 266.0 240.5 228.9 200.5
40.5 44.3 41.9 35.7 30.2 27.0413.4 480.0 571.6 526.7 475.7 433.0 สวนของผถอหนหนสามญ (100 บาท)สวนเกนมลคาหนสามญ
39.1 39.2 38.5 42.0 39.3 38.7400.0 425.0 525.0 620.0 620.0 620.0
5 9 6 5 8 8 10 8 10 1 10 060 0 70 0 120 0 160 0 160 0 160 0สวนเกนมลคาหนสามญกาไรสะสมรวมสวนของผถอหน
5.9 6.5 8.8 10.8 10.1 10.060.0 70.0 120.0 160.0 160.0 160.014.5 10.0 10.8 11.5 20.4 24.3148.6 108.5 147.7 168.6 321.8 390.7
59.5 55.7 58.1 64.3 69.8 73.0608.6 603.5 792.7 948.6 1,101.8 1,170.7
6รวมหนสนและสวนของผถอหน
100.0 100.0 100.0 100.0 100.0 100.01,022.0 1,083.5 1,364.3 1,475.3 1,578.5 1,603.7
พนบาท1 600
Common Size Analysis
1 200
1,400
1,600
800
1,000
1,200
%800
600
%100
Year
200
400
0
75
2550 2551 2552 2553 2554 2555Year0
สนทรพยหมนเวยน
50
สนทรพยหมนเวยน
ทดน อาคาร และอปกรณ
สนทรพยอน
25
72550 2551 2552 2553 2554 2555Year0
พนบาท1 600
Common Size Analysis
1 200
1,400
1,600
800
1,000
1,200
%800
600
%100
Year
200
400
0
75
Year0
หนสนหมนเวยน
502550 2551 2552 2553 2554 2555
หนสนหมนเวยน
หนสนระยะยาว
สวนของผถอหน
25
8
Year0
2550 2551 2552 2553 2554 2555

Trend Percentage Analysis
Trend Percentage Analysis เปนการวเคราะหทศทางความเปนไปไดของรายการตาง ๆ ท เปนการวเคราะหทศทางความเปนไปไดของรายการตาง ๆ ทปรากฏในงบการเงน ซงตองอาศยงบการเงนของชวงเวลาหลาย
ป ป ป โ ๆ ปตอเนองกน เพอนามาสรปเปนขอคดเหนวาแนวโนมทางการเงนและการดาเนนงานเปนทนาพอใจหรอไมวเคราะหแนวโนมจากขอมลเดม
เปนการศกษาแนวโนมจากขอมลทใหมาโดยตรง เชน เปน
วเคราะหอตรารอยละของแนวโนม
เปนการศกษาแนวโนมจากขอมลทใหมาโดยตรง เชน เปนจานวนเงน (บาท) นาหนก (กโลกรม) เปนตน
วเคราะหอตรารอยละของแนวโนมเปนการศกษาแนวโนมโดยปรบขอมลเปนรอยละกอนการ
9
เปรยบเทยบ
วเคราะหแนวโนมจากขอมลเดมTrend Percentage Analysisวเคราะหแนวโนมจากขอมลเดม
Net Sales 813 854 860 1,201 1,341 1,4922550 2551 2552 2553 2554 2555
Change of Net Sales, , ,
41 6 341 140 151
1 500
Bahts
1,400
1,500
1,200
800
1,000
2550 2551 2552 2553 2554 2555Year0
10
2550 2551 2552 2553 2554 2555
วเคราะหอตรารอยละของแนวโนมTrend Percentage Analysisวเคราะหอตรารอยละของแนวโนม
อตรารอยละของปฐานเคลอนท (Progressive year horizontal trend analysis)horizontal trend analysis)เปนการคานวณอตรารอยละของการเพมหรอลดของรายการนน ๆ ใ ในแตละชวงเวลาทผานมา
gtXt Xt-1
X= (100)-
Xt-1
g2546X2546 X2545
X= (100) = 5%854 813
813(100)- -
=X2545
g2547X2547 X2546= (100) = 1%
813
- =860 854 (100)-g2547
X2546= (100) = 1%= 854
(100)
11
Trend Percentage Analysis
Net Sales 813Increase Rate (%)
854 860 1,201 1,341 1,4925 1 40 12 11
2550 2551 2552 2553 2554 2555
40
%
30
20
10
Year2551 2552 2553 2554 2555
12

วเคราะหอตรารอยละของแนวโนมTrend Percentage Analysisวเคราะหอตรารอยละของแนวโนม
อตรารอยละของปฐาน (Simple base year horizontal trend analysis)horizontal trend analysis)
XgtXtXb
= (100)
g X2546 (100) 105%854 (100)g2546X2546X2545
= (100) = 105%854813
(100) =
g X2547 (100) 106%860 (100)g2547X2547X2545
= (100) = 106%860813
(100) =
13
Trend Percentage Analysis
Net Sales 813Base year Rate (%)
854 860 1,201 1,341 1,492105 106 148 165 184100
2550 2551 2552 2553 2554 2555
%
Base year Rate (%) 105 106 148 165 184100
175
125
150
100
Year02550 2551 2552 2553 2554 2555
14
นาความสมพนธของงบการเงนมาเทยบRatio Analysis
Liquidity Rations
Ratio Analysis นาความสมพนธของงบการเงนมาเทยบสดสวน และอธบายผล
Current RatiosLiquidity RationsQuick/Acid test RatiosInventory Turnover RatioDays Sales Outstanding (DSO)Asset Management Ratios Days Sales Outstanding (DSO)Fixed Assets Turnover RatioTotal Assets Turnover Ratio
Debt Management RatiosTotal Debt to Total AssetsTimes Interest Earned (TIE)EBITDA Coverage Ratio
Profitability Ratios
EBITDA Coverage RatioProfit Margin on SalesBasic Earning Power (BEP)Return on Total Assets (ROA)Return on Total Assets (ROA)Return on Common Equity (ROE)
Price Earnings Ratios (P/E Ratio)15
Market Value Ratios Price Earnings Ratios (P/E Ratio)Price/Cash Flow RatioMarket/Book Ratio (M/B Ratio)
Liquidity Ratios Debt Management Ratios
Ratio Analysisq yCurrent Ratios
Current AssetsCurrent Liabilities
gTotal Debt to Total Assets
Total DebtTotal Assets
Quick/Acid test RatiosCurrent Assets - Inventories
Current Liabilities
Times Interest Earned (TIE)Earnings Before Interest and Taxes
Interest ChargeEBITDA Coverage Ratio
Asset Management RatiosInventory Turnover Ratio
Sales
EBITDA Coverage RatioEBITDA + Lease payments
Interest + Loan repayments + Lease paymentsP fit bilit R ti
Days Sales Outstanding (DSO)Inventories
Account Receivables
Profitability RatiosProfit Margin on SalesNet income available to Common Stockholder
SalesAverage sales per dayFixed Assets Turnover Ratio
Sales
Basic Earning Power (BEP)Sales
EBITTotal Assets
R t T t l A t (ROA)Total Assets Turnover RatioNet Fixed Assets
SalesT t l A t
Return on Total Assets (ROA)
Return on Common Equity (ROE)
Net IncomeTotal Assets
16
Total Assets Return on Common Equity (ROE)Net income Available to Common Stockholder
Common equity

Market Value Ratios
Ratio AnalysisMarket Value Ratios
Price Earnings Ratios (P/E Ratio)Price per share
Earning per sharePrice/Cash Flow RatioEarning per share
Price per shareC fCash flow per shareMarket/Book Ratio (M/B Ratio)Market price per share Common equityMarket price per share
Book value per shareCommon equity
Share outstanding
17
Ratio AnalysisABC Co.,Ltd.
2011 2010
,Income Statement
For the year Ending December 31, 2010-2011 Unit: millions of Bahts
Net sales 3,000.0 2,850.0Operating costs excluding depreciation and amortizationEarnings before interests. Taxes. Depreciation, and amortization (EBITDA)DepreciationAmortization
, ,2,616.2 2,497.0
383.8 353.0100.0 90.0
0.0 0.0Depreciation and amortizationEarnings before interest and taxes (EBIT, or operating income)Less InterestEarning before taxes (EBT)
100.0 90.0283.8 263.088.0 60.0
195.8 203.0Earning before taxes (EBT)Less Taxes (40%)Net income before preferred dividendsLess Preferred dividendsNet income
195.8 203.078.3 81.0
117.5 122.04.0 4.0
113.5 117.8Net incomeCommon dividendsAddition to retained earningsPer-share data:
Common stock price
113.5 117.857.5 53.056.0 64.8
23.00 26.00Common stock priceEarnings per share (EPS)Dividends per share (DPS)Book value per share (BVPS)Cash flow per share (CFPS)
23.00 26.002.27 2.361.15 1.06
17.92 16.804.27 4.16
18
Cash flow per share (CFPS) 4.27 4.16
**Loan repayments 20.0
Ratio Analysis
Earnings per share (EPS)Net income
= Common shares outstanding113 500 000
Dividends per share (DPS) =Dividends paid to common stockholders
113,500,00050,000,000
= 2.27
Dividends per share (DPS) = Common shares outstanding57,500,00050,000,000
= 1.15
Book value per share (BVPS) =Total common equity
Common shares outstanding896,000,00050 000 000
= 17.92
Cash flow per share (CFPS) =Net income + Depreciation + Amortization
Common shares outstanding
50,000,000
213,500,00050,000,000
= 4.27
19
Ratio AnalysisABC Co.,Ltd.,
Statement of Retained EarningsFor the year Ending December 31, 2011
Balance of retained earnings, 12/31/05 710.0 Add N t i 2006 113 5Add: Net income, 2006 113.5Less: Dividends paid (57.5)
Balance of retained earnings, 12/31/06 766.0
Assets 2011 2010 Liabilities and Equity 2011 2010
ABC Co.,Ltd.Balance Sheet
December 31, 2010-2011 Unit: millions of Bahts
Cash and marketable securities
Assets 2011 2010 Liabilities and Equity 2011 2010
Accounts receivableInventories
Accounts payableNotes payableAccruals
10 80375 315615 415
3060110 60140 130
Total current assetsNet plant and equipment
AccrualsTotal current liabilities
Long-term bondsTotal Debt
615 4151,000 8101,000 870
140 130310 220754 580
1,064 800Total DebtPreferred stock (400,000 shares)Common stock (50,000,000 shares)
Retained earnings
1,064 80040 40
130 130766 710
20Total common equityTotal liabilities and equityTotal assets 2,000 1,680
896 8402,000 1,680

Ratio AnalysisLiquidity Ratios Calculation Ratio Industry Ave.Liquidity Ratios
Current RatiosQuick/Acid test Ratios
Asset Management Ratios
1,000/310385/310
=3.2x=1.2x
4.2x2.1x
Inventory Turnover RatioDays Sales Outstanding (DSO)Fixed Assets Turnover Ratio
g3,000/615375/8.3333,000/1,000
=4.9x=45days=3.0x
9.0x36days
3.0xTotal Assets Turnover Ratio
Debt Management RatiosTotal Debt to Total Assets
3,000/2,000
1,604/2,000
=1.5x
=53.2%
1.8x
40.0%Times Interest Earned (TIE)EBITDA Coverage Ratio
Profitability Ratios
283.8/88411.8/136
=3.2x=3.0x
6.0x4.3x
o tab ty at osProfit Margin on SalesBasic Earning Power (BEP)Return on Total Assets (ROA)
113.5/3,000283.8/2,000113.5/2,000
=3.8%=14.2%=5.7%
5.0%17.2%
9.0%Return on Total Assets (ROA) 113.5/2,000 5.7% 9.0%
Market Value RatiosPrice Earnings Ration (P/E Ratio) 23.0/2.27 =10.1x 12.5x
Return on Common Equity (ROE) 113.5/896 =12.7% 15.0%
21
Price Earnings Ration (P/E Ratio)Price/Cash Flow RatioMarket/Book Ratio (M/B Ratio)
23.0/2.2723.0/4.2723.0/17.92
10.1x=5.4x=1.3x
12.5x6.8x
17x
Ratio Analysis
Du Pont ChartReturn on Equity 12.7%
Return on Assets 5.7% Asset/Equity 2.23Multiplied by
Profit Margin 3.8% Total Assets Turn over 1.5Multiplied by
Sales Net incomeDividend Sales Total AssetsDividend3,000 113.5into
Net incomeSubtractedTotal Costs
3,000 2,000into
Current Add Fixed Assets113.5from2,886.5
Other Operating Interest plus Preferred
Assets 1,000to1,000
Cash and Accounts Inventory Costs 2,616.2 Dividends 92
Depreciation 100 Taxes 78.3
Marketable Securities 10
Receivable 375
615
22
Method of Evaluating Capital Investment
Method of Evaluating Capital Investment
Average rate of return methodCash payback methodCash payback methodNet preset value methodInternal rate of return method
Cash payback method
Average rate ofreturn method
46%
71% Source : Robert A. Howell, J D B St h R
Internal rate of return method
Net present value method
p y
64%
69%
James D. Brown, Stephen R. Soucy, and Allen H. Seed, Management Accounting in the New/Manufacturing Environment, National Association of Accountants and Computer Aided Manufacturing I t ti l M t l N
230 10 20 30 40 50 60 70 80 90 100Percentage of Respondents Using the Method
International, Montvale, New Jersey, 1987.
Method of Evaluating Capital InvestmentAverage Rate of Return MethodThe average rate of return, sometimes called the accounting rate of return, is a measure of the average income as a per cent of the
Average Rate of Return Method
average investment in fixed assets. The average rate of return is determined by using the following equation:
Estimated average annual incomeAverage rate of return =
Estimated average annual income
Average investment
To illustrate, assume that management is considering the purchase of a machine at a cost of $500,000. The machine is expected to have a useful life of 4 years, with no residual value, p y , ,and to yield total income of $200,000.
Average rate of return = $200,000/4 = 20%Average rate of return = ,($500,000+$0)/2
= 20%
24
Method of Evaluating Capital InvestmentWhen several capital investment proposals are considered theWhen several capital investment proposals are considered, the proposals can be ranked by their average rates of return. The higher the average rate of return, the more desirable the proposal.
ExampleProposal A Proposal B
Estimated average annual incomeAverage investment
$ 30,000 $ 36,000$120,000 $180,000
Average rate of return:
$30,000/$120,000$36 000/$180 000
25%20%$36,000/$180,000 20%
25
Method of Evaluating Capital InvestmentCash Payback MethodThe expected period of time that will pass between the date of an investment and the complete recovery in cash (or equivalent) of the
Cash Payback Method
amount invested is the cash payback period. To simplify the analysis, the revenues and expenses other than depreciation related to operating fixed assets are assumed to be all in the form p gof cash. The excess of the cash flowing in from revenue over the cash flowing out for expenses is termed net cash flow. The time required for the net cash flow to equal the initial outlay for the fixedrequired for the net cash flow to equal the initial outlay for the fixed asset is the payback period.
To illustrate, assume that the proposed investment in a fixed asset with an 8 year life is $200,000. The annual cash revenues from the investment are $50,000, and the annual cash expenses are $10,000. Thus, the annual net cash flow is expected to be $40,000 ($50,000-us, t e a ua et cas o s e pected to be $ 0,000 ($50,000$10,000).
$200,000$40 000 = 5 year cash payback period
26
$40,000
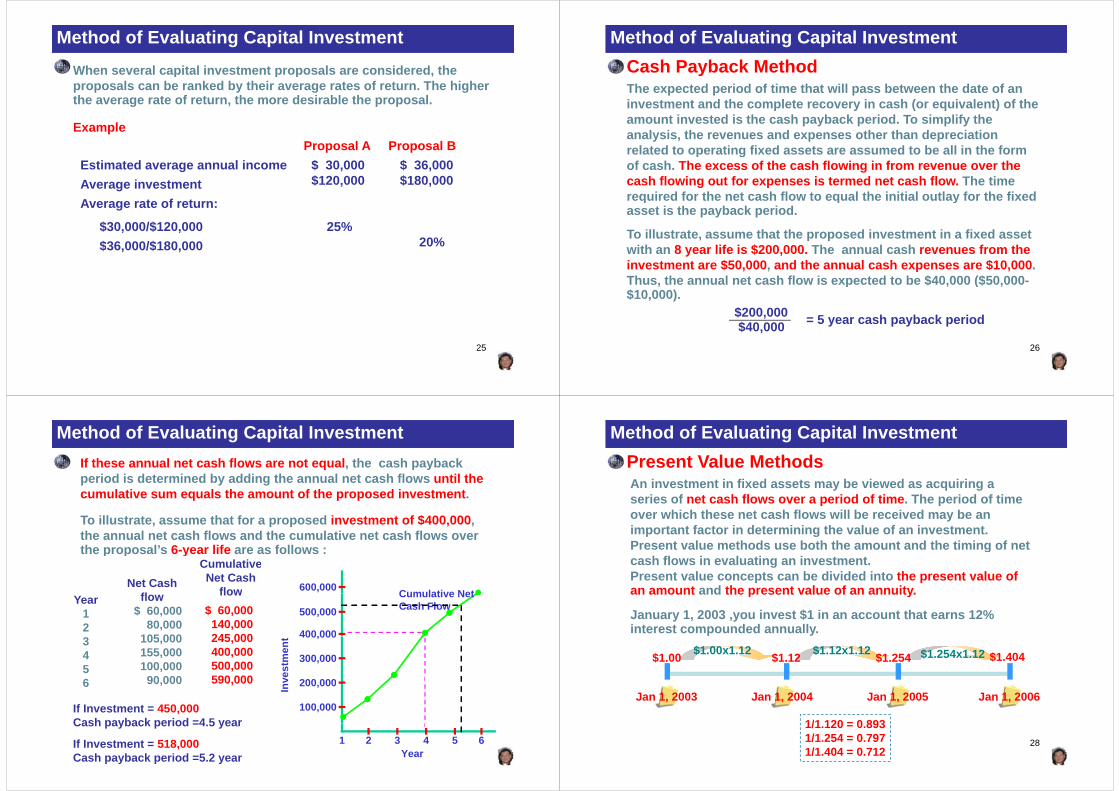
Method of Evaluating Capital InvestmentIf these annual net cash flows are not equal the cash paybackIf these annual net cash flows are not equal, the cash payback period is determined by adding the annual net cash flows until the cumulative sum equals the amount of the proposed investment.
To illustrate, assume that for a proposed investment of $400,000, the annual net cash flows and the cumulative net cash flows over the proposal’s 6-year life are as follows :the proposal s 6-year life are as follows :
Net Cash fl
Cumulative Net Cash
flow 600,000 Cumulative NetYear12
flow$ 60,000
80,000105 000
flow$ 60,000140,000245 000 400,000
500,000
Cumulative Net Cash Flow
3456
105,000155,000100,000
90 000
245,000400,000500,000590 000 ve
stm
ent
200 000
300,000
400,000
6 90,000 590,000
If Investment = 450,000Cash payback period =4 5 year
100,000
Inv 200,000
27
Cash payback period =4.5 year
If Investment = 518,000Cash payback period =5.2 year
1 2 3 4 5 6Year
Method of Evaluating Capital InvestmentPresent Value MethodsPresent Value MethodsAn investment in fixed assets may be viewed as acquiring a series of net cash flows over a period of time. The period of time over which these net cash flows will be received may be an important factor in determining the value of an investment. Present value methods use both the amount and the timing of net gcash flows in evaluating an investment. Present value concepts can be divided into the present value of an amount and the present value of an annuity.an amount and the present value of an annuity.
January 1, 2003 ,you invest $1 in an account that earns 12% interest compounded annually.
$1.00x1.12 $1.12x1.12 $1.254x1.12$1.00 $1.12 $1.254 $1.404
Jan 1, 2003 Jan 1, 2004 Jan 1, 2005 Jan 1, 2006
1/1 120 = 0 89328
1/1.120 = 0.8931/1.254 = 0.7971/1.404 = 0.712

Method of Evaluating Capital InvestmentPresent Value of $1 at Compound InterestPresent Value of $1 at Compound Interest
Year 6% 10% 12% 15% 20%
1 0.943 0.909 0.893 0.870 0.833Example2 0.890 0.826 0.797 0.756 0.694
3 0.840 0.751 0.712 0.658 0.5794 0.792 0.683 0.636 0.572 0.4825 0.747 0.621 0.567 0.497 0.4026 0 705 0 564 0 507 0 432 0 335
January 1, 2003 ,Present value of a $100 annuity for five periods at 12%
Example
6 0.705 0.564 0.507 0.432 0.3357 0.665 0.513 0.452 0.376 0.2798 0.627 0.467 0.404 0.327 0.2339 0.592 0.424 0.361 0.284 0.19410 0.558 0.386 0.322 0.247 0.162
could be determined by using the present value factors.
Jan 1, 2003 Dec 1, 2003 Dec 1, 2004 Dec 1, 2005 Dec 1, 2006 Dec 1, 2007
Present value of amount $100$100 $100 $100 $100
$89.30 $100x0.893$100 0 797
$79.70$71.20$63.60
$100x0.712
$100x0.636
$100x0.797
29
$63 60$56.70
$360.50
$100x0.567
$100x3.605
Method of Evaluating Capital Investment
Present Value of $1 at Compound Interest
Year 6% 10% 12% 15% 20% Present Value of an Annuity of$1 at Compound Interest
1 0.943 0.909 0.893 0.870 0.8332 0.890 0.826 0.797 0.756 0.6943 0 840 0 751 0 712 0 658 0 579
Year 6% 10% 12% 15% 20%
1 0.943 0.909 0.893 0.870 0.8333 0.840 0.751 0.712 0.658 0.5794 0.792 0.683 0.636 0.572 0.4825 0.747 0.621 0.567 0.497 0.4026 0.705 0.564 0.507 0.432 0.335
2 1.833 1.736 1.690 1.626 1.5283 2.673 2.487 2.402 2.283 2.1064 3.465 3.170 3.037 2.855 2.5895 4.212 3.791 3.605 3.353 2.991
7 0.665 0.513 0.452 0.376 0.2798 0.627 0.467 0.404 0.327 0.2339 0.592 0.424 0.361 0.284 0.19410 0.558 0.386 0.322 0.247 0.162
6 4.917 4.355 4.111 3.785 3.3267 5.582 4.868 4.564 4.160 3.6058 6.210 5.335 4.968 4.487 3.8379 6 802 5 756 5 328 4 772 4 0319 6.802 5.756 5.328 4.772 4.03110 7.360 6.145 5.650 5.019 4.192
30
Method of Evaluating Capital InvestmentNet Present Value MethodsThe net present value method analyzes capital investment proposals by comparing the initial cash investment with the present value of
Net Present Value Methods
by comparing the initial cash investment with the present value of the net cash flows. It is sometimes called the discounted cash flow method. The interest rate (return) used in net present value analysis is set by management This rate is often based upon such factors asis set by management. This rate is often based upon such factors as the nature of the business, the purpose of the investment, the cost of securing funds for the investment, and the minimum desired rate of return If the net present value of the cash flows expected from areturn. If the net present value of the cash flows expected from a proposed investment equals or exceeds the amount of the initial investment, the proposal is desirable.Jan 1, 2003, assume a proposal to acquire $200,000 of equipmentwith an expected useful life of 5 years (no residual value) and minimum desired rate of 10%Net cash flows for the years Dec 31, 2003 $70,000
Dec 31, 2004 $60,000Dec 31 2005 $50 000
31
Dec 31, 2005 $50,000Dec 31, 2006 $40,000Dec 31, 2007 $40,000
Method of Evaluating Capital Investment
Jan 1, 2003Dec 1, 2003 Dec 1, 2004 Dec 1, 2005Dec 1, 2006 Dec 1, 2007
$$ $ $ $$
$$4949 560560
$40,000$70,000 $60,000 $50,000 $40,000$$6363,,630630 $70,000x0.909
$60,000x0.826
$200,000
$$4949,,560560$$3737,,550550$$2727 320320
$50,000x0.751$40,000x0.683
$60,000 0 8 6
$$2727,,320320$$2424,,840840
$$202202,,900900
$40,000x0.621
$$202202,,900900Net present value
Present value index = Total present value of net cash flowAmount to be invested
$$22,,900900
Amount to be invested
= $202,900$200,000
= 1.0145
32
$200,000

Method of Evaluating Capital InvestmentIf a business is considering three alternative proposals and hasIf a business is considering three alternative proposals and has determined their net present values, the present value index for each proposal is as follows:
Proposal A Proposal BTotal present value of net cash flowAmount to be invested
$107,000 $86,400$100 000 $80 000
Proposal C$93,600$90 000Amount to be invested $100,000 $80,000 $90,000
Net present value $ 7,000 $ 6,400 $ 3,600
1 07 1 08 1 04Present value index 1.07(107,000/100,000)
1.08(86,400/80,000)
1.04(93,600/90,000)
33
Method of Evaluating Capital InvestmentInternal Rate of Return MethodThe internal rate of return method uses present value concepts to compute the rate of return from the net cash flows expected from
Internal Rate of Return Method
capital investment proposals. This method is sometimes called the time-adjusted rate of return method. It is similar to the net present value method, in that it focuses on the present value of the net , pcash flows. However, the internal rate of return method starts with the net cash flows and, in a sense, works backwards to determine the rate of return expected from the proposalthe rate of return expected from the proposal
Assume that management is evaluating a proposal to acquire equipment costing $33,530. The equipment is expected to provide q p g q p p pannual net cash flows of $10,000 per year for five years. If we assume a rate of return of 12%, we can calculate the present value of the net cash flows, using the present value of an annuity tablethe net cash flows, using the present value of an annuity table
Annual net cash flow (at the end of each of five years)$10,000Present value of an annuity of $1 at 12% for 5 year 3.605P t l f l t h fl $36 050
34
Present value of annual net cash flows $36,050Less amount to be invested $33,530Net present Value $ 2,520
Method of Evaluating Capital Investment$36 050 present value of the cash inflows based on a 12% rate of$36,050 present value of the cash inflows, based on a 12% rate of return, is greater than the $33,530 to be invested. Therefore, the internal rate of return must be greater than 12%. Through trial-and-error procedures the rate of return that equates the $33 530 cost oferror procedures, the rate of return that equates the $33,530 cost of the investment with the present value of the net cash flows is determined to be 15%, as shown below.
Jan 1, 2003 Dec 1, 2003 Dec 1, 2004 Dec 1, 2005 Dec 1, 2006 Dec 1, 2007
$33,530
$10,000$10,000 $10,000 $10,000 $10,000$33,530
10 000x3 353 (15% 5 year)Net present value0
10,000x3.353 (15%, 5 year)
35
Method of Evaluating Capital InvestmentExample : To illustrate assume that management is considering aExample : To illustrate, assume that management is considering a proposal to acquire equipment costing $97,360. The equipment is expected to provide equal annual net cash flows of $20,000 for seven yearsseven years.
Present value factor for an annuity of $1 =Amount to be invested
Equal annual net cash flowsq
=$97,360$20,000
= 4.868
Present Value of an Annuity of$1 at Compound Interest
Year 6% 10% 12% 15% 20%
1 0.943 0.909 0.893 0.870 0.8332 1.833 1.736 1.690 1.626 1.5283 2.673 2.487 2.402 2.283 2.1064 3 465 3 170 3 037 2 855 2 5894 3.465 3.170 3.037 2.855 2.5895 4.212 3.791 3.605 3.353 2.9916 4.917 4.355 4.111 3.785 3.3267 5.582 4.868 4.564 4.160 3.605
36
7 5.582 4.868 4.564 4.160 3.6058 6.210 5.335 4.968 4.487 3.8379 6.802 5.756 5.328 4.772 4.03110 7.360 6.145 5.650 5.019 4.192

Method of Evaluating Capital Investmentassume that management is considering a proposal to acquireassume that management is considering a proposal to acquire equipment costing $97,360. The equipment is expected to provide equal annual net cash flows of $21,000 for seven years.
Present value factor for an annuity of $1 =Amount to be invested
Equal annual net cash flows$97,360 = 4 636=$21,000
4.636Present Value of an Annuity of$1 at Compound Interest
Year 6% 10% 12% 15% 20%
1 0.943 0.909 0.893 0.870 0.8332 1.833 1.736 1.690 1.626 1.5283 2 673 2 487 2 402 2 283 2 106 10%+ 12%-10% x(4 868-4 636)[ ]3 2.673 2.487 2.402 2.283 2.1064 3.465 3.170 3.037 2.855 2.5895 4.212 3.791 3.605 3.353 2.9916 4.917 4.355 4.111 3.785 3.326
10%+ (4.868-4.564)x(4.868-4.636)[ ]
10%+ 10%+ ((2/0.304) X0.232)[ ]6 4.917 4.355 4.111 3.785 3.3267 5.582 4.868 4.564 4.160 3.6058 6.210 5.335 4.968 4.487 3.8379 6.802 5.756 5.328 4.772 4.03110 7.360 6.145 5.650 5.019 4.192
11.523%
[ ]
37
10 7.360 6.145 5.650 5.019 4.192
Method of Evaluating Capital InvestmentUnequal Proposal LivesThe alternative proposals may have unequal lives. To illustrate, assume that alternative investments. A truck and computers, are
Unequal Proposal Lives
being compared. The truck has a useful life of 8 years, and the computer network has a useful life of 5 years. Each proposal requires an initial investment of $100,000, and the company q $ , , p ydesires a rate of return of 10%.
T k 8 lifAssuming truck is to be sold at
Truck 8-year life
Compare
gthe end of 5 year $40,000
Computer network 5-year life
Compare
38
Method of Evaluating Capital InvestmentThe expected cash flows and net present value of each alternative shows:The expected cash flows and net present value of each alternative shows:
TruckPresent Value Net Cash Present Value of
Of $1 at 10% Flow Net Cash FlowYear
ComputerPresent Value Net Cash Present Value of
Of $1 at 10% Flow Net Cash FlowYearOf $1 at 10% Flow Net Cash Flow1 0.909 $ 30,000 $ 27,2702 0.826 30,000 24,7803 0.751 25,000 18,7754 0.683 20,000 13,6605 0 621 15 000 9 315
Of $1 at 10% Flow Net Cash Flow1 0.909 $ 30,000 $ 27,2702 0.826 30,000 24,7803 0.751 30,000 22,5304 0.683 30,000 20,490
5 0.621 15,000 9,3156 0.564 15,000 8,4607 0.513 10,000 5,1308 0.467 10,000 4,670Total $ 155,000 $112,060
5 0.621 35,000 21,735Total $ 155,000 $116,805Amount to be invested 100,000Net present value $ 16,805
Amount to be invested 100,000Net present value $ 12,000
Truck-Revised t o 5 year lifePresent Value Net Cash Present Value of
Of $1 at 10% Flow Net Cash FlowYear
1 0.909 $ 30,000 $ 27,2702 0.826 30,000 24,7803 0.751 25,000 18,775, ,4 0.683 20,000 13,6605 0.621 15,000 9,315
Total $ 160 000 $118 640
5(Residual value)0.621 40,000 24,840
Truck NPV >Computers NPV
39
Total $ 160,000 $118,640Amount to be invested 100,000Net present value $ 18,640
Method of Evaluating Capital InvestmentLease versus Capital InvestmentLeasing fixed assets has become common in many industries. Leasing allows a business to use fixed assets without spending
Lease versus Capital Investment
large amounts of cash to purchase them. In addition, management may believe that a fixed asset has a high risk of becoming obsolete. This risk may be reduced by leasing rather than y y gpurchasing the asset. Also, the Internal Revenue Code allows the lesser (the owner of the asset) to pass tax deductions on to the lessee (the party leasing the asset) These provisions of the taxlessee (the party leasing the asset). These provisions of the tax law have made leasing assets more attractive.
UncertaintyAll capital investment analyses rely on factors that are uncertain. The long-term nature of capital investments suggests that some
Uncertainty
The long term nature of capital investments suggests that some estimates are likely to involve uncertainty. Error in one or more of the estimates could lead to incorrect decisions.
40

Method of Evaluating Capital InvestmentChange in Price LevelsIn performing investment analysis, management must be concerned about changes in price levels. Price levels may
Change in Price Levels
change due to inflation, which occurs when general price levels are rising. Price levels may also change for foreign investments as the y g gresult of currency exchange rates. Currency exchange rates are the rates at which currency in another country can be exchanged.
Q lit ti C id tiSome benefits of capital investments are qualitative in nature and
t b il ti t d i d ll t If t d
Qualitative Considerations
cannot be easily estimated in dollar terms. If management does not consider these qualitative considerations, the quantitative analyses may suggest rejecting a worthy investment.
Funding for capital projects may be obtained from issuing bonds or stock or from operating cash. Capital rationing is the process by which management allocates these funds among competing capital
41
which management allocates these funds among competing capital investment proposals. In this process, management often uses a combination of the methods described in this chapter.
NoAlternative Capital
Investment Proposals
Minimum CashPayback and Average Rate of
Return Standards Met?
RejectedProposals
Decision
Yes
Proposals forFurther Analysis
No
Net PresentValue and Internal Rate
of Return StandardsRejectedProposals
YesMet?
Proposals forF th A l i
p
Further Analysis
Yes NoDo Qualitative
Considerations Change theDo Qualitative
Considerations Change the RejectedRejected
AcceptedProposals
Decision? Decision? ProposalsProposals
U f d d P l
Ranking ofProposals
42Funded
Proposals
Unfunded ProposalsReconsider If Funds
Subsequently BecomeAvailable
NoYes Capital Funds Available?
Question??Question??
43
Modifying Accounting data forStatement of Cash flows
Modifying Accounting data for Managerial decisions
Operating Assets and Operating Capital
Balance SheetAssets LiabilitiesAssetsOperate Operating Assets
Working Capital
LiabilitiesCharge InterestDo not charge Interest
Nonoperating AssetsFixed Assets Equities
44

Statement of Cash flows
Net Operating Working Capital (NOWC)= All current asset – All current liabilities the do not charge interest
ABC Co.,Ltd. =(Cash & marketable securities + AR + Inventories) – (AP + Accruals)Y 2006
g
Year 2006=(10 + 375 + 615) – (60 + 140)=800Year 2005=(80 + 315 + 415) – (30 + 130)=650650
Total Operating Capital=Net Operating Working Capital + Net Fixed AssetsYear 2006Year 2006=800 + 1,000=1,800Y 2005
45
Year 2005=650 +870=1,520
Statement of Cash flows
Net Operating Profit After Taxes (NOPAT)
กาไรทกจการควรไดรบจากการดาเนนงานโดยไมรวมกาไรทกจการควรไดรบจากการดาเนนงานโดยไมรวมคาจายในการจดหาเงนทน และสนทรพยทางการเงนทไมเกยวของกบการดาเนนงานตามปกต
Net Operating Profit After Taxes (NOPAT)E i b f i t t d t (1 T t )= Earning before interest and taxes x (1 – Tax rate)
ABC Co.,Ltd.Y 2006Year 2006=283.8(1 – 0.40) = 170.3Year 2005=263(1-0.40) = 157.8
46
Statement of Cash flows
Free Cash Flow (FCF)กระแสเงนสดทพรอมจะนาไปจายใหผลงทนได หลงจากทกนเงนไวเพอลงทน และกนไวเปนเงนทนหมนเวยน
Free Cash Flow (FCF)= Operating Cash Flow – Gross investment in Operating Capital
Operating Cash Flow = NOPAT + Depreciation= 283.8(1-0.40) + 100= 270.30
Gross investment in Operating Capital= Net investment + Depreciation= Net investment + Depreciation= (1,800 – 1,520) + 100= 380
47
380Free Cash Flow = 270 – 380
= -109.70
Measuring Cash FlowsStatement of Cash flows
Measuring Cash Flows
Operating freecash flows
Financing freecash flows=
Free Cash Flows:An Operating Perspective
Free Cash Flows:A Financing Perspective=
48

Tona Co Ltd
Statement of Cash flowsTona Co.,Ltd.
Income StatementDecember 31, 2006
ยอดขาย 11,508Unit: millions of Bahts
ยอดขายตนทนสนคาขายกาไรขนตนคาใชจายในการบรหารและการตลาด
11,5086,5374,971
1 832คาใชจายในการบรหารและการตลาดคาเสอมราคา คาใชจายในการดาเนนงานรวม
ไ
1,832 345
2,177กาไรจากการดาเนนงานดอกเบยจายกาไรกอนภาษ
2,794387
2,407ภาษจายกาไรกอนเงนปนผลหนบรมสทธเงนปนผลหนบรมสทธ
,765
1,64225เงนปนผลหนบรมสทธ
กาไรสทธกาไรสทธสวนของผถอหนสามญ
ป
251,6171,617
49เงนปนผลหนสามญการเปลยนแปลงในกาไรสะสม
688929
Tona Co.,Ltd.
Statement of Cash flows,
Balance SheetDecember 31, 2005-2006
2006 2005 การเปลยนแปลงสนทรพย 2006 2005 การเปลยนแปลงเงนสดลกหนสนคาคงเหลอ
สนทรพย33249570
34148471
9(11)
1สนคาคงเหลอคาใชจายจายลวงหนารวมสนทรพยหมนเวยน
70208
1,10519 134
71247
1,14320 088
13938
954สนทรพยถาวรคาเสอมราคาสนทรพยถาวรรวมสนทรพยถาวร
19,134(4,782)14,352
20,088(5,127)14,961
954(345)
609การลงทนสนทรพยอนรวมสนทรพยอน
7791,152
17 388
7021,436
18 242
(77)284854รวมสนทรพยอน 17,388 18,242 854
50
Tona Co.,Ltd.
Statement of Cash flows,
Balance SheetDecember 31, 2005-2006
2006 2005 การเปลยนแปลงหนสนและสวนของผถอหน
หนสนตวเงนระยะสนเจาหนการคา
693638
1,629651
93613เจาหนการคา
ภาษคางจายคาใชจายคางจายรวมหนสนหมนเวยน
63823
7822 136
65153
6522 985
1330
(130)849รวมหนสนหมนเวยน
หนสนระยะยาวรวมหนสน
2,1366,5338,669
2,9856,3259,310
849(208)
641สวนของผถอหนหนบรมสทธหนสามญ (มลคาและสวนเกน)
165583
80708
(85)125หนสามญ (มลคาแล สวนเกน)
กาไรสะสมการซอหนกลบคนสวนของผถอหนสามญ
58310,998(3,027)
8 554
70811,927(3,783)
8 852
125929
(756)298
51
สวนของผถอหนสามญรวมสวนของผถอหนสามญรวมหนสนและสวนของผถอหนสามญ
8,5548,719
17,388
8,8528,932
18,242
298213854
F C h Fl A O ti P ti
Statement of Cash flows
Free Cash Flows: An Operating Perspective
Step 1: Income statement Accrual Basis Cash BasispEBIT+ Depreciation
EBITDA= EBITDA- Tax (Cash)= Cash flows after Operatingp g
Step 2: Compute investing in net current assetsChange in Current assets
Ch i i t t b i t li biliti- Change in non-interest-bearing current liabilitiesStep 3: Compute investing in Fixed assets and Others assets
52

F C h Fl A O ti P ti
Statement of Cash flows
Free Cash Flows: An Operating Perspective
Step 1: Income statement Accrual Basis Cash Basisp
กาไรจากการดาเนนงาน (EBIT)คาเสอมราคา
2,794345
กาไรกอนดอกเบย ภาษ คาเสอมราคาและรายการตดบญช (EBITDA)ภาษจายหก การเปลยนแปลงในภาษคางจาย
3,139765 30
ภาษจายทเปนเงนสดกระแสเงนหลงภาษจากการดาเนนงาน
7352,404
53
F C h Fl A O ti P ti
Statement of Cash flows
Free Cash Flows: An Operating Perspective
Step 2: Compute investing in net current assetsp p gการเปลยนแปลงในสนทรพยหมนเวยน: การเปลยนแปลงในเงนสด
การเปลยนแปลงในลกหน9
(11) การเปลยนแปลงในลกหน การเปลยนแปลงในสนคาคงเหลอ การเปลยนแปลงในคาใชจายจายลวงหนา
(11) 1
39 การเปลยนแปลงในสนทรพยหมนเวยนการเปลยนแปลงในหนสนหมนเวยน:
การเปลยนแปลงในเจาหน
38
13 การเปลยนแปลงในเจาหน การเปลยนแปลงในคาใชจายคางจาย การเปลยนแปลงในหนสนหมนเวยนทไมตองชาระดอกเบย
13 (130)
(117)การเปลยนแปลงในเงนทนหมนเวยนสทธจาการดาเนนงาน(สนทรพยหมนเวยน – หนสนหมนเวยนทไมตองชาระดอกเบย)
155
54
F C h Fl A O ti P ti
Statement of Cash flows
Free Cash Flows: An Operating Perspective
Step 3: Compute investing in Fixed assets and Others assetsp p gการเปลยนแปลงในสนทรพยระยะยาว การลงทนในสนทรพยถาวร
การเปลยนแปลงในการลงทน954 (77) การเปลยนแปลงในการลงทน
การเปลยนแปลงในสนทรพยอน เงนสดสทธทใชในการลงทน
(77) 284
1,161กระแสเงนสดจากการดาเนนงาน(2,404-155-1,161)
1,088
55
F C h Fl A Fi i P ti
Statement of Cash flows
Free Cash Flows: A Financing Perspective
Step 1: Compute the real interestStep 1: Compute the real interestInterest paid – Accrued Interest (change)
Step 2: Compute the change of liabilitiesStep 2: Compute the change of liabilitiesStep 3: Compute Dividend paidStep 4: Compute the change of stocksStep 4: Compute the change of stocks
56

Statement of Cash flows
2006 2005MVAPrice per shareNumber of shares (millions)Market value of equity
23.0 26.050.0 50.0
1 150 0 1 300 0Market value of equityBook value of equity
1,150.0 1,300.0896.0 840.0
MVA = Market value – Book value 254.0 460.0MVA Market value Book value 254.0 460.0EVAEBIT 283.8 263.0Tax rate(%)NOPAT = EBIT(1-Tax rate)Total investor Supplied operating capital
40 40170.3 157.8
1 800 0 1 520 0Total investor – Supplied operating capital 1,800.0 1,520.0After tax cost of capital(%) 10.0 10.3Dollar cost of capital(%) 180 156.6
57
p (%)EVA = NOPAT – Capital cost (9.7) (1.2)
Market Value Added (MVA) andStatement of Cash flows
Market Value Added (MVA) and Economic Value Added (EVA)
MVAมลคาเพมทางการตลาด ซงเกดจากผลตางระหวางมลคาทางการตลาดของเจาของกจการกบเงนทนทมาจากเจาของ
MVA = Market value of equity – Equity capital supply by investors= (Shares outstanding x Stock price) – Total Common equity
EVA
มลคาเพมทางเศรษฐศาสตร เปนการวดประสทธภาพการจดการซงกอใหเกดการเพมมลคาของผถอหนในปใ ป ไ ใดปหนงทกาหนดไว
EVA = NOPAT – After tax cost of capital used to support operationsEBIT (1 T t ) (O ti C it l) (Aft t t
58
= EBIT – (1 – Taxes rate) – (Operating Capital) – (After tax percentage cost of capital)
F C h Fl A Fi i P ti
Statement of Cash flows
Free Cash Flows: A Financing Perspective
ดอกเบยจายใหแกเจาหน 387ดอกเบยจายใหแกเจาหนหก การเปลยนแปลงในดอกเบยคางจายดอกเบยจายใหแกเจาหน
387 0
387ดอกเบยจายใหแกเจาหนบวก หนสนระยะยาวลดลงหก หนสนระยะสนเพมขน
387208
(936)หก หนสนร ย สนเพมขนบวก เงนปนผลหนบรมสทธบวก เงนปนผลหนสามญ
(936)25
688บวก เงนปนผลหนสามญบวก การลดลงในหนบรมสทธบวก การลดลงในหนสามญ
68885
631ว รล ลงใน นส มญกระแสเงนสดจายใหแกผถอหน
631,088
59