Embed Size (px)
Citation preview
Overseas Road Note 5A guide to road project appraisal

Published 2005ISBN: 0-9543339-6-9
Subsector : TransportTheme: T2Project Title: Overseas Road Note 5: A guide to road project appraisal
Project Reference: R8132
This document is an output from a project funded by the UK Department for International Development (DFID) for the benefit of developing countries. The views expressed in it are not necessarily those of DFID.

The Department for InternationalDevelopment (DFID) is the UKGovernment department responsible forpromoting sustainable development andreducing poverty. The central focus of theGovernment’s policy, based on the 1997and 2000 White Papers on InternationalDevelopment, is a commitment to theinternationally agreed MillenniumDevelopment Goals, to be achieved by2015. These seek to:
■ Eradicate extreme poverty and hunger ■ Achieve universal primary education ■ Promote gender equality and empower
women ■ Reduce child mortality ■ Improve maternal health ■ Combat HIV/AIDS, malaria and other
diseases ■ Ensure environmental sustainability ■ Develop a global partnership for
development
DFID’s assistance is concentrated in thepoorest countries of sub-Saharan Africaand Asia, but also contributes to povertyreduction and sustainable development inmiddle-income countries, including thosein Latin America and Eastern Europe.
DFID works in partnership withgovernments committed to theMillennium Development Goals, with civilsociety, the private sector and theresearch community. It also works withmultilateral institutions, including theWorld Bank, United Nations agencies,and the European Commission.
DFID has Headquarters in London andEast Kilbride, offices in many developingcountries, and staff based in BritishEmbassies and High Commissionsaround the world.
1
The Department for International Development: a brief mission statement
DFID, 1 Palace Street, London SW1E 5HEDFID, Abercrombie House, EagleshamRoad, East Kilbride, Glasgow G75 8EATel: +44 (0) 20 7023 0000Fax: +44 (0) 20 7023 0019
Public Enquiry Point: 0845 300 4100(from outside the UK: +44 1355 84 3132)DFID website: www.dfid.gov.ukEmail: [email protected]
ORN5 was originally published in 1988by the then Overseas Unit of theTransport and Road Research Laboratoryon behalf of the Overseas DevelopmentAdministration. The editor for that editionwas Dr R Robinson. This revised editionhas been produced by the InternationalTeam of the Transport ResearchLaboratory (TRL) on behalf of theDepartment for InternationalDevelopment (DFID). The editors for thistask have been Dr J Rolt, Mr. P Fouracreand Dr A Davis. Others involved in thedrafting of the document were: Dr JCook, Dr A Daly, Mr C Fry, Dr G Jacobs,
Mr C Baguley and Mr S Done. Thedrafting has also benefited from theadvice of a review committee that hasincluded Dr R Robinson, Mr C Ellis, Dr IHeggie and Mr D Stiedl. Both DrRobinson and Mr Ellis undertook detailedreviews of the final drafts. But as in anydocument of this type that has receivedmany helpful contributions, the editorsacknowledge their full responsibility forthe final document.
First published 1988Revised edition 2005
2
Acknowledgements
Overseas Road Notes are preparedprincipally for road and transportorganisations in developing countries. A limited number of copies are availableto other organisations and to individualswith an interest in road management,and may be obtained from:
TRL LimitedCrowthorne House, Nine Mile Ride,Wokingham, Berkshire, RG40 3GAUnited Kingdomwww.trl.co.uk
Limited extracts from the text may bereproduced provided the source isacknowledged. For more extensivereproduction, please contact TRL usingthe postal or website address above.
Overseas Road Notes
Good road infrastructure is a key ingredientfor national development; it supportsefficient industrial and agricultural activity aswell as national and international trade. Forcommunities and individuals, a roadnetwork opens up opportunities foraccessing employment, markets, educationand health facilities, as well as contributingto social inclusion and security. Though notspecifically mentioned, it is clear that roadinvestment has an important role to play inthe achievement of the MillenniumDevelopment Goals.
Expenditure on new development andrehabilitation of roads is likely to be a majorcomponent of national budgeting, and itbehoves both governments and donors tometiculously plan these works in order toavoid unnecessary and inefficient use ofresources. This argument points to theneed for a formalised planning process thatdemonstrates the logic and justification forspecific road development decisions. Suchan approach is also vital to demonstrateboth transparency and accountability in thedecision-making process of road selectionand development.
ORN5, ‘A guide to road project appraisal’,was first published in 1988 in order toprovide guidance on carrying out feasibilitystudies for road projects in developing
countries. Judging from its continuing highdemand, it has proved a popular andimportant addition to the armoury oftransport planners throughout thedeveloping world. But over time it hasinevitably ‘aged’. Today, the investmentdecision-making process (across allinfrastructure) puts far more emphasis onenvironmental, social and poverty issues;there have also been developments intechnologies and analytical techniques, aswell as our understanding of how roadsand bridges perform under given traffic andenvironmental conditions.
In updating the original ORN, thisdocument addresses these shifts anddevelopments, and presents a substantiallyrevised text. The revision also presentsmore contextual material to give policy-makers and advisors a clear overview ofthe process of road appraisal, and whatshould be expected of a planning team.The importance of setting a feasibility studywithin the context of an overall transportstrategy is strongly canvassed through theadvocacy of adopting a project cycleprocess. The other major change concernsthe removal of the worked examples; it wasfelt that these can be found in othersources, most notably text-books andtutorial materials for using appraisalsoftware.
This new ORN5 remains true to its originalprinciples of presenting a process forappraisal, rather than the detailed technicalknowledge required to make the appraisal.(Other volumes in the ORN series providemuch of this required technical information.)The structure of the new volume is alsosimilar to its predecessor, although therehas been some re-organisation andamalgamation of chapters toaccommodate the new materials on socialand environmental issues.
It is hoped that in its new guise, ORN5 willcontinue to provide the guidance thattransport planners in developing countrieshave relied upon in its erstwhile edition.
Peter O’Neill
Central Research TeamDepartment for International Development
3
Foreword

4
5
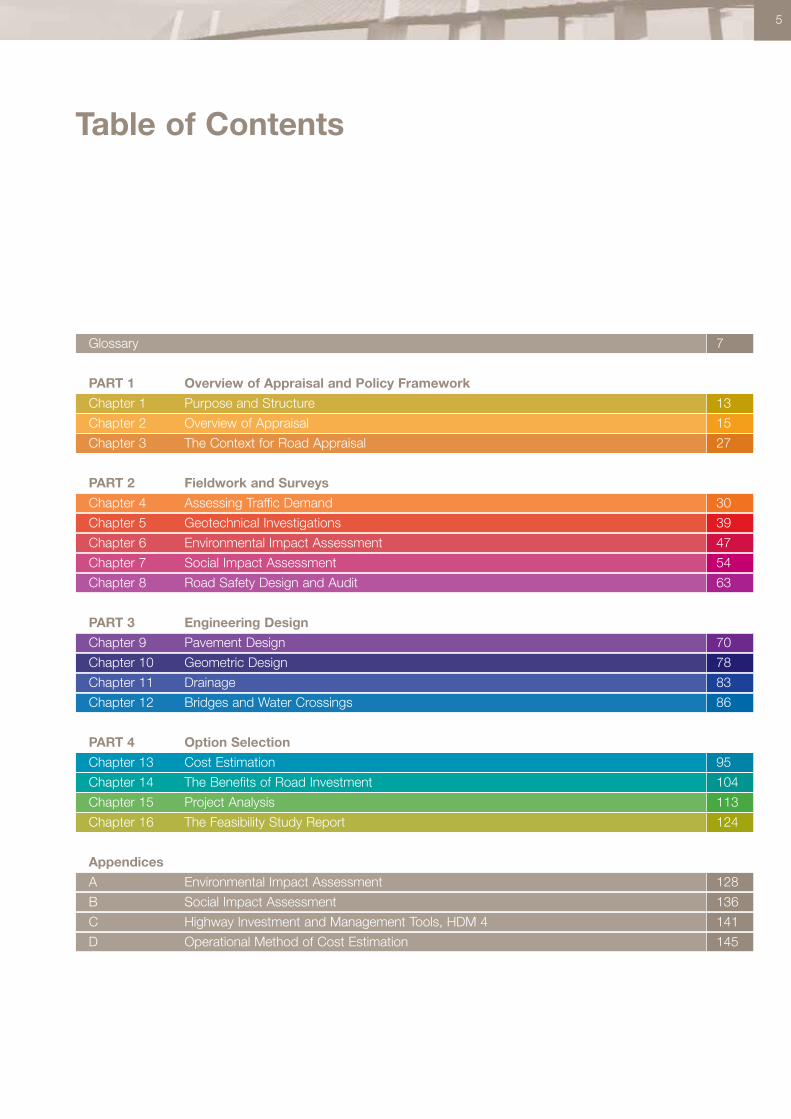
Table of Contents
Glossary
PART 1 Overview of Appraisal and Policy Framework
Chapter 1 Purpose and Structure
Chapter 2 Overview of Appraisal
Chapter 3 The Context for Road Appraisal
PART 2 Fieldwork and Surveys
Chapter 4 Assessing Traffic Demand
Chapter 5 Geotechnical Investigations
Chapter 6 Environmental Impact Assessment
Chapter 7 Social Impact Assessment
Chapter 8 Road Safety Design and Audit
PART 3 Engineering Design
Chapter 9 Pavement Design
Chapter 10 Geometric Design
Chapter 11 Drainage
Chapter 12 Bridges and Water Crossings
PART 4 Option Selection
Chapter 13 Cost Estimation
Chapter 14 The Benefits of Road Investment
Chapter 15 Project Analysis
Chapter 16 The Feasibility Study Report
Appendices
A Environmental Impact Assessment
B Social Impact Assessment
C Highway Investment and Management Tools, HDM 4
D Operational Method of Cost Estimation
7
13
15
27
30
39
47
54
63
70
78
83
86
95
104
113
124
129
128
136
141
145
6 List of Acronyms
List of Acronyms
AADT Annual Average Daily TrafficAC Asphaltic ConcreteAHP Analytical Hierarchy ProcessARI Accounting Rate of InterestCBA Cost Benefit Analysis DBM Dense Bitumen MacadamDFID Department for International
DevelopmentDGD Detailed Geotechnical DesignEF Equivalent FactorEIA Environmental Impact
AssessmentEIS Environmental Impact StatementEMP Environmental Management PlanESA Equivalent Standard AxleFED Final Engineering DesignFYRR First Year Rate of ReturnGA Geotechnical AssessmentGDP Gross Domestic ProductGDR Geotechnical Difficulty RatingGI Ground InvestigationGNP Gross National ProductGR Geotechnical ReviewHC Human CapitalHDM Highway Development and
Management System
HRA Hot Rolled AsphaltIRR Internal Rate of ReturnMCA Multi-Criteria Analysis NGO Non-Government OrganisationNPV Net Present ValueORN Overseas Road NotePCE Passenger Car EquivalentPCSE Passenger Car Space EquivalentPCU Passenger Car UnitPED Preliminary Engineering DesignPGR Preliminary Geotechnical ReviewPVC Present Values of CostRED Road Economics Decision ModelRP Revealed PreferenceSEA Strategic Environmental
AssessmentSIA Social Impact AssessmentSP Stated PreferencegTKP global Transport Knowledge
PartnershipTOR Terms of ReferenceVEC Valued Ecosystem ComponentsVOC Vehicle Operating CostWTP Willingness to Pay
Access roads These cater for within-district travel by linkingaccess zones to roads of a higher functional class.
Accessibility The ease of reaching desired destinations.
Activity Any work or intervention that is carried out on theroad network, including works to undertake road maintenance,new construction, improvements, and the like.
Administration The operation and maintaining existingsystems and procedures, originating elsewhere, as effectivelyand efficiently as possible.
Agency agreement A ‘framework’ agreement that setsdown the general principles of the relationship between a clientand a supplier of services, but leave the supplier withconsiderable discretion about the detailed operationalrequirements; known as a ‘contract plan’ in Francophonecountries.
Alignment The vertical and the horizontal alignments are theterms used to describe the geometric features of the road inthe vertical plane (i.e. as seen from the side) and the horizontalplane (as seen from above).
Appraisal Process of justifying and reaching a decision toinvest resources in the road being appraised
Arterial roads Main roads connecting national andinternational centres.
Asset The physical infrastructure being managed.
Asset management A term applied to the management ofassets using life cycle cost techniques, and often involving theassignment of a monetary value to the asset and all activitiesand operations undertaken in relation to the asset.
Audit A physical check, usually on a sample basis, that workhas been carried out, where specified, to pre-defined standardsor procedures, and that costs and other resources have beenaccounted for properly.
Availability (of travel and transport) Capable of being used,or within the reach of travellers; requires both the existence oftransport infrastructure and services that are in a condition orstate that enables them to be used.
Axle load survey Roadside survey undertaken to estimatethe numbers of ‘equivalent standard axles’ currently using aroad.
Budget head A category under which a budget is brokendown for the purposes of its allocation.
Business plan A document describing the contribution toachieving corporate objectives of each of the divisions within anorganization and setting out the annual objectives, tasks andprogrammes.
Camber The centre of the road is made higher than theedges to promote lateral run-off of water
Capital budget The government budget normally used tofund major projects.
Carriageway That part of the road used by traffic.
Chainage Distance measured along the road from a defineddatum.
Client The body commissioning works or services.
Collector roads These roads link traffic to and from ruralareas, either direct to adjacent urban centres, or to the arterialroad network.
Committed works Works for which a budget has beenapproved.
Condition index A parameter that combines individualdefect measurements to reflect a generic indication ofdefectiveness.
Condition-responsive treatment Works that are carried outin response to defects exceeding a defined threshold.
Construction ‘Development works’.
Contract An agreement between two willing parties toperform some action, where there has been an ‘offer’, an‘acceptance’ and a ‘consideration’ (usually money).
Contractor The supplier of works or services under acontract.
7
Glossary
Contractual claim A request made by a contractor foradditional payment or an extension of time necessary toundertake works that are unforeseen or not specified in thecontract.
Core road network That part of the road network, normallyof a strategic nature, that will always be maintained even whenavailable resources are extremely limited.
Corporate plan A document describing the business of anorganization and setting out its mission and medium termobjectives, and strategy for meeting these.
Cost estimation Procedure used for estimating the costs ofa road scheme. The three basic techniques are the global rate,unit rate and operational methods.
Cost-effective The ratio of ‘effectiveness’ to ‘cost’, whereeffectiveness is a measure of the future value or worth resultingfrom a decision that is taken, and cost is the present-day costof implementing that decision.
Cost-benefit analysis A formal comparison of costs andbenefits to determine whether or not an investment isworthwhile.
Cost-plus contract Works contract where the contractor ispaid for monies actually spent plus a mark-up for overheadsand profit.
Customer The beneficiary of a service being provided. Themain customers for a road administration are the road users,who include: owners and operators of commercial vehicles andbuses; representatives of industry, commerce and agriculture,who have a vested interest in an efficient road network tosupport their business operations; and the travelling publicusing the road network.
Cuts and Cuttings Sections where material has beenremoved to lower the elevation of the road.
Cyclic works Routine maintenance works carried out eachyear whose frequency depends on environment and not traffic.
Data Facts (quantities, values, names, etc) from which otherinformation may be inferred.
Defect Deteriorated from new condition.
Designated road A road that is a legal entity under a RoadsAct or similar legislation (the terms ‘adopted’, ‘declared’,‘gazetted’, ‘proclaimed’ are used in some countries).
Development works Works which extend the capacity ofthe network by widening, realignment or constructing a newsection.
Direct labour ‘In-house works implementation’.
Emergency works Works carried out on the network toreopen a cut or blocked road.
Environmental impact assessment (EIA) The process ofassessing the environmental factors that will influence roadplanning and design. Often a legal requirement, with formalreporting, full disclosure and open to public scrutiny.
Equipment-based works Works that are undertaken mainlywith the assistance of mechanical equipment.
Equivalence factor (EF) The pavement damaging effect ofan axle in relation to the damage created by a standard axle.
Equivalent standard axle (load) All axle loads (measured inan axle load survey) are converted to an equivalent number ofstandard axles (ESA) and pavement design is usually basedupon the total cumulative ESAs that the pavement will have tocarry over its design life.
Evaluation Strictly the assessment of whether a completedproject met the appraisal expectations. But often usedsynonymously with appraisal.
Gazetteer A list of designated links or sections that definesthe road network
Global cost The ‘broadest brush’ category of cost-estimating technique which relies on libraries of achieved costsof similar works related to the overall size or capacity of theasset being considered.
Feasibility The final and most detailed stage of roadappraisal before commitment to final design and procurement.
Feature A fundamental component of the road, such as thecarriageway, shoulder, footway, etc.
Fills Material that has been moved from one place to anotherto build up the elevation of the road
Final engineering design (FED) The final stage of designwhen the drawings and bills of quantities are produced for usein the procurement and implementation process.
Force account ‘In-house works implementation’.
Framework document A document describing ministerialpolicy requirements for an organization and in terms of itsoverall aims.
Functional specification A specification that is defined interms of the end-result to be achieved.
Geotechnical investigations The surveys, analysis andreporting of the geological features that will critically affect roadplanning and design (e.g. nature of the terrain, soil properties,location and suitability of building materials, hydrology, etc.)
8 Glossary
Goal-orientated project planning (GOPP) A projectdevelopment process that works backwards from a problemstatement by identifying the causes of problems, then breaksthese down into smaller and smaller components, and thenidentifies solutions to each of the small components, buildingthese back up again in such a way to find a solution to theproblem; sometimes called ‘problem tree analysis’ or ‘ZOPP’.
Heavy vehicle A vehicle with an unladen mass in excess of3,500kg.
In-house works implementation Works undertaken by aunit of the client’s own organization.
Information Data that has been transformed to bemeaningful through processing and dissemination.
Information quality level (IQL) Criteria developed by theWorld Bank for grouping data in terms of their level of detail andother attributes to assist in specifying data collection that iscost-effective when used in conjunction with road managementsystems.
Institutional appraisal An investigation of an organizationthat identifies its strengths and weaknesses, success inmeeting defined aims, and the constraints under which itoperates.
Intermediate means of transport (IMT) Motorized vehicleswith less than four wheels; unconventional motorized vehicles;and non-motorized vehicles, including bicycles, wheel barrows,hand and animal-drawn carts, and the like.
Intervention level The threshold above or below whichaction must be taken to ensure that standards are met, oftenexpressed in terms of defined thresholds of road condition,response time, or performance.
Inventory The physical attributes of the road or other assetbeing managed.
Labour-based works Works that are undertaken mainly bymanual labour with the assistance only of tools and small itemsof mechanical equipment.
Lengthworker An individual responsible for carrying outmaintenance works on a defined length of road.
Level of service A subjective measure of user requirements
Life cycle (costs) All of the costs associated with aninvestment from the present time to the future.
Link A length of road where traffic volumes are reasonablyuniform.
Lump sum contract Works contract where the contractor ispaid a pre-agreed fixed sum for all works carried out.
Maintenance The group of works that enables a road tocontinue to provide an acceptable level of service.Maintenance reduces road deterioration, lowers road usercosts, and keeps the road open on a continuous basis.
Management The planned and organized use of resourcesto achieve particular goals or objectives
Management cycle A series of well-defined steps whichtake the management process through the decision makingtasks. Typical steps would be i) define aims; ii) assess needs;iii) determine options; iv) choose actions; v) implement activities;vi) monitor and audit. The process typically completes thecycle once in each periodic cycle of the particular managementfunction.
Management functions Areas where road managementdecisions are made, normally sub-divided into (strategic)planning, programming, preparation, and operationsmanagement.
Management system A set of procedures to assist withmanagement.
Marker post A fixed item at the roadside to indicate location.
Mission (statement) This outlines, in broad terms, thenature of the operation being managed by the organizationresponsible for the road network.
Mobility The ability of individuals to move about.
Monitoring Reviewing past activities to learn fromexperience to enable better objectives to be set in the future.
Moving observer count Method of determining traffic flowwhilst driving along a length of road.
Multi-criteria analysis (MCA) A method for comparing theworth of alternative options on the basis of their ‘performance’against a set of pre-determined criteria.
Multi-year programme A schedule of road works plannedto take place in discrete years into the future.
Network A particular grouping of roads for managementpurposes; examples are the national road network; trunk roadnetwork; paved road network, etc.
Network management The process of managing a roadnetwork, including the activities of ‘strategic planning’,‘programming’, ‘preparation’ and ‘operations management.
Network referencing The process of breaking the roadnetwork down into successively smaller links, segments andsections, each of which can be defined uniquely for roadmanagement purposes.
Network screening Preliminary determination of which roadsections are likely to need treatment.
9
Node The start and end point of a road section.
Objective A specific and measurable goal or target to beachieved by a body within the short to medium term (tactical) orlong term (strategic) time scale.
Operation(s) The on-going activities of an organization,decisions on the management of which are made on a near-term basis, typically daily or weekly, including the scheduling ofwork to be carried out, monitoring in terms of labour,equipment and materials, the recording of work completed, andthe use of this information for monitoring and control.
Operational cost A fundamental cost-estimating techniquethat compiles the total cost of the work from consideration ofthe constituent operations or activities revealed by the methodstatement and programme, and from the accumulated demandfor resources.
Overlay works The addition of material on top of apavement for the purpose of increasing its structural strength.
Path Narrow cleared way for pedestrian traffic and, in somecases, bicycles and motorcycles.
Performance bond An unconditional bank guarantee, infavour of the client, that a contractor will meet all contractualrequirements.
Performance indicator A sub-set of objectives,performance against which is published for public scrutiny.
Performance standard This specifies the resourcerequirements for each activity to be carried out, and builds up aconsistent description of the activity based on a preferred andspecified method of working, and resources of equipment,labour and materials to perform the activity in accordance withthe preferred method.
Periodic works Works carried out on the network plannedat discrete intervals in time of several years.
Plan A systematic and formalized process for directing andcontrolling future operations in such a manner that policyobjectives are achieved.
Planning (strategic) This involves an analysis of the roadsystem as a whole, typically requiring the preparation of longterm, or strategic, estimates of expenditure for roaddevelopment and conservation under various budgetary andeconomic scenarios; predictions may be made of expenditureunder selected budget heads, and forecasts of road conditions,in terms of key indicators, under a variety of funding levels.
Policy The statement or series of statements which definethe basic rules and requirements which can guide all decisionsand actions that need to be taken.
Policy document A document containing a writtenstatement of policy; a ‘statement of intent’.
Policy instrument The means of putting policy in place.
Policy framework A hierarchical set of statements thatdefine policy relevant to different bodies or levels ofadministration; typically consisting of mission statement,objectives and standards that define in detail the aims of anorganization and how it proposes to achieve these.
Preliminary engineering design (PED) Engineeringdrawings done to a limited level of detail, which may beprepared as an output from a feasibility study.
Preparation The near-term planning stage where roadschemes and projects are packaged for implementation. Atthis stage, designs are refined and prepared in more detail; billsof quantities and detailed costings are made; together withwork instructions and contracts; detailed specifications andcostings are likely to be drawn up.
Pre-feasibilty An intermediate stage in road planning, whena number of transport solutions are appraised in relation to aspecified problem. It will be clear at the end of this stagewhether a road solution is likely to be worthwhile, and hencefurther investigated with a feasibility study.
Preventive works Periodic works on the network designedto prevent the rapid escalation of deterioration.
Prioritization The process of allocating scarce resourcesbetween the competing ‘claims’ of different road projects.
Priority index A parameter whose numerical value indicateswhere in a list of priorities particular actions lie.
Procedure A documented series of steps for carrying out aparticular activity or task.
Procedural specification A specification that is defined interms of the method to be followed.
Programming The preparation, under budget constraints, ofmulti-year works and expenditure programmes in which thosesections of the network likely to require treatment, and newconstruction possibilities, are identified and selected; a tacticalplanning exercise.
Project A set of activities with a defined start and finish, andwhich consume resources in moving from start to finish.
Project cycle A defined sequence of steps to be followed inexecuting a project.
Quality control Checking completed works to ensure thatspecifications have been met.
Quality management An approach to management thatencompasses all activities of the overall management function,and that determines the overall direction and intentions of anorganization are designed in such a way that ensures thatexpressed customer requirements are met first time, every time.
10 Glossary
Quality management system The organizational structure,procedures, processes and resources needed to implement apolicy of quality management.
Rating A score assigned to indicate condition or priority.
Reactive works Routine maintenance activities that arecarried out each year whose extent depends on a combinationof traffic and environmental effects.
Reconstruction Works requiring the replacement of some ofthe existing infrastructure asset; eg pavement reconstructionrequiring removal and replacement of road surfacing material.
Recurrent budget The budget head often used to fund on-going activities and maintenance works.
Rehabilitation Works that are needed to restore a road to amaintainable condition.
Renewal Works to restore a road to a similar condition towhen it was new.
Resurfacing works The addition of material on top of apavement for the purpose of reducing roughness or surfacedistress.
Road administration The body responsible for managingthe road network.
Road agency A body carrying out work under an agencyagreement. A road administration (terminology used in WorldBank documents) [note that these definitions are in conflict]
Road authority A road administration that is authorizedthrough legislation to be the manager of the road networkA parastatal body that manages the road network (terminologyused in World Bank documents)[note that these definitions are in conflict]
Road class/hierarchy A grouping of road sectionsaccording to pre-defined rules, often based on issues ofownership, function, funding source, etc.
Road management The process of maintaining andimproving the existing road network to enable its continued useby traffic efficiently and safely, normally in a manner that iseffective, and environmentally sensitive; a process that isattempting to optimize the overall performance of the roadnetwork over time.
Roads board A committee set up to administer or to adviseon the administration and management of a road network.
Roads register A ‘gazetteer’.
Roughness Longitudinal unevenness of the road surface thatimpacts on the suspension of vehicles.
Routine works Works carried out on the network that areneeded each year.
Rural roads Access roads, arterial and collector roads inrural areas.
Rural transport infrastructure Tracks, trails, paths androads in rural areas.
Safety audit A formal, systematic procedure for assessingthe safety of a road scheme, and for recommending remedialmeasures to address identified hazards.
Schedule A short to medium term plan for carrying outactivities.
Scheduled treatment Works that are carried out at pre-defined intervals of time.
Scheme Term which is loosely used synonymously with aroad option or a road project.
Screening The general process of sifting alternative solutionsin order to derive a preferred option to meet a specific transportproblem. Similar to appraisal, but conveys a wider scope ofsolutions, and a coarser approach to selection of a few optionsthat may then be appraised.
Sector A sub-division of government administration; e.g.transport sector; road sub-sector.
Section A length of road that is reasonably uniform in termsof its physical characteristics.
Segment A length of road that is reasonably uniform in termsof geometry.
Sensitivity analysis The assessment of a decision tochanges in assumptions about key variables (demand levels,project costs, etc.)
Serviceability ‘Level of service’.
Social benefits Benefits resulting from an investment thatimprove that quality of life of the population, or parts of thepopulation, but which may not be quantifiable in economic ormonetary terms.
Social impact assessment (SIA) The process of assessingthe social implications of a road development, and hence forsuggesting remedial measures that may be required to addressspecific social issues of concern.
Special works Works whose frequency cannot bedetermined with any certainty in advance, such as emergencyworks.
Specification A detailed description of the attributes of theoutput from an activity, or of the steps by which that activity iscarried out.
Specificity The feature of an organization that enables it toidentify and focus on specific objectives, without being side-tracked to unproductive tasks.
11

Spoil Unwanted material that needs to be disposed of safely
Stakeholder Someone with a vested interest in theperformance of the road administration, including the roadusers, industry, agriculture and commerce, who are its‘customers’, plus the road administration itself and the roadengineering industry.
Standard A detailed operational target to be achieved by anindividual unit in an organization to enable policy to beimplemented; a requirement, sometimes legally enforceable,that a road administration is obliged to meet as part of its roadmanagement activity.
Standard axle load A standard axle load is 8.16 metrictonnes
Strategic Pertaining to actions designed to achieve, in thelonger term, a wide-ranging mission.
Strategy A plan for implementing policy.
Structural Number A measure of the overall strength of theroad. It is essentially a weighted thickness
Subgrade The soil on which the road is built
Sustainability The pursuit of development that meets theneeds of the present without compromizing the ability of futuregenerations to meet their needs.
System Entities forming a complex whole that are groupedtogether in a structured way to enable for a particular purpose;examples are:A ‘computer system’, which is a collection of software andhardware designed to carry out a particular functionA ‘management system’ which is a set of procedures designedto assist the management process (which may also include acomputer system)
Tactical Pertaining to actions designed to achieve definedobjectives in the short to medium term.
Target price contract Works contract where the contractoris paid a fixed price plus an incentive payment for meeting pre-defined targets.
Task A sub-division of an activity.
Tender A formal written offer to carry out works, or to supplygoods, material or services.
Terms of reference (TOR) The ‘brief’ prepared by a clientwhich instructs appointed consultants/contractors in theirexpected activities and outputs. The TOR for a feasibility studyshould be drafted as part of the associated pre-feasibility work.
Tracks Single lane, cleared and improved seasonal roadsthat connect to higher class roads; used mainly by non-motorized traffic and pedestrian travellers, but traversable atcertain times by light four-wheel drive vehicles, pick-up trucks,animal-drawn carts and pack animals; sometimes known ascommunity roads.
Trails Narrow tracks suitable only for two-wheel vehicles,pedestrians and pack animals.
Training levels A formalized way of classifying skills andneeds of individuals that assists in identifying training needs.
Transport The movement of passengers and freight fromone place to another.
Travel Making journeys; moving around.
Treatment Works to correct defects.
Treatment length Contiguous lengths of road requiringcommon treatments.
Treatment option One of a number of treatments that canbe applied to correct the same defects.
Undesignated road A road that has not been designated asa legal entity under a Roads Act or similar legislation.
Unit rate A cost-estimating technique based on thetraditional bill of quantity approach to pricing engineering work,typically relating to aggregate quantities of work to be carriedout, measured in accordance with an appropriate method ofmeasurement.
Upgrading Works to increase the standard of a road; egpavement strengthening, road widening.
Utility Public service infrastructure; eg telecommunications,electricity, water.
Vision (statement) A broad indication of the generaldirection in which policy should develop over time.
Visual inspection An inspection based on the use of simplemeasurements, or on subjective judgement.
Work package A collection of works that are carried outunder one contract or work instruction.
Works All construction and maintenance activities that arecarried out on the road network, normally sub-divided intoroutine maintenance, periodic maintenance, special works,rehabilitation, and development.
Work order/instruction Written authorization to carry outcertain works.
12 Glossary

PART 1
Overview of Appraisal and Policy Framework
13
This Note gives guidance on carrying out feasibility studies for ‘capital’ roadprojects (rehabilitation and development)in developing and transition countries. In scope it deals with all types of road(trunk, urban and rural) that canaccommodate motorized vehicles. It is intended for use by administrators,economists, transport planners andengineers in road and transportministries, their organizations and localgovernment who are responsible forpreparing or appraising projectsubmissions.
The approach includes consideration of many aspects that support greatersustainability, for example, setting theappraisal within the context of an overalltransport strategy and greater emphasison social, environmental and policyissues.
The Note is structured in four parts:
Part 1. An introduction to road appraisaland the feasibility process that indicatesthe scope of work involved, howindividual tasks relate to one another andthe outputs that should be expectedfrom a study. This provides a basicoutline that will be of value to theadministrators, policy-advisors anddecision-takers who may not beconcerned with the detailed workings ofa feasibility study, but need to be alertedto its key components.
Part 2. This part of the guide covers themain fieldwork and surveys undertakenas part of the feasibility process. Thesesurveys provide the key information usedby both the design and the appraisalteams. They inform on the basic issueslike demand (for the road improvement),the nature of the terrain, possiblealignments, quality and availability of
materials, and the environmental andsocial issues that will need to beaddressed.
Part 3. This part presents the main tasksundertaken by the engineering designteam in the feasibility process. Thesetasks may be undertaken largely asdesk-based exercises, though clearly thedesign team will need to be familiar withthe terrain and alignment opportunities.
Part 4. This part addresses the processby which a preferred engineering optionis selected and recommended, based ona comparison of the costs and benefitsof alternatives.
In Parts 2 - 4 the individual analyticalcomponents of a feasibility study arepresented in sufficient detail to give thetechnical reader knowledge of whatinformation needs to be collected, how it is analyzed and used, and how itcomplements the overall feasibilityprocess. It is not intended that thechapters contain sufficient technicalknowledge for the inexperienced readerto carry out an appraisal on their ownand to carry out the engineering designsto the accuracy that is appropriate. Thefocus is on process, with the readerbeing referred to other texts for moredetailed technical explanations.
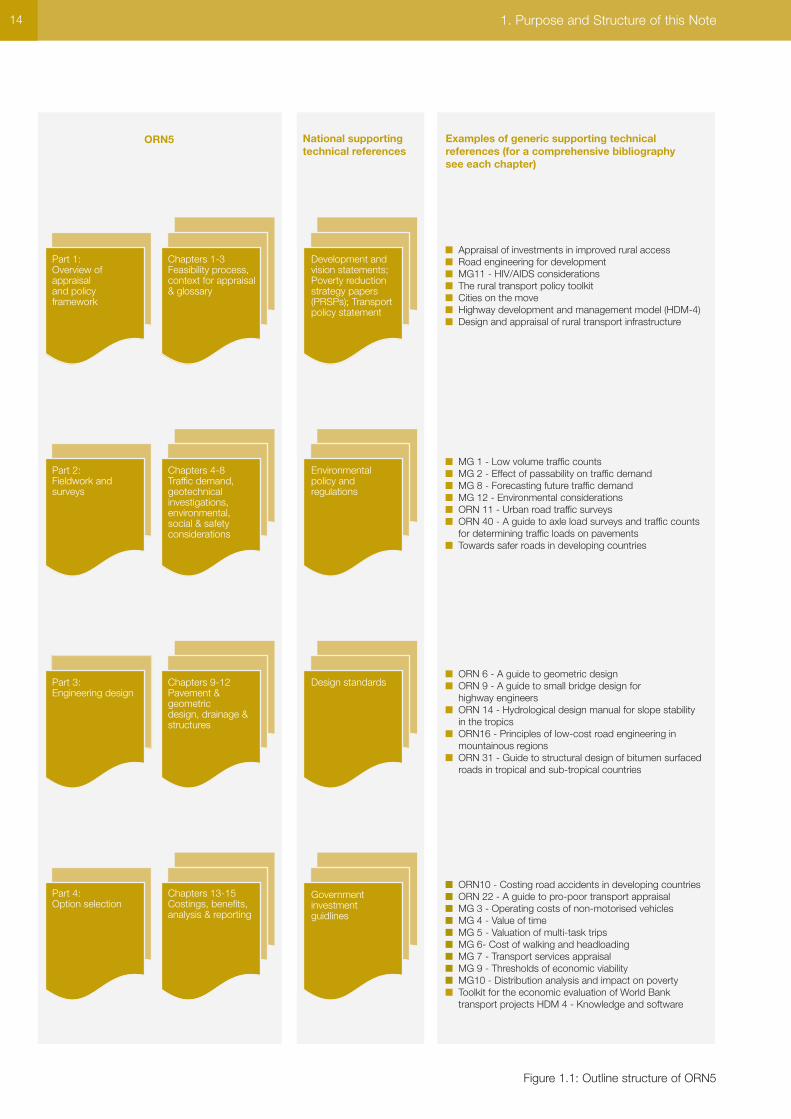
Figure 1.1 illustrates the structure ofOverseas Road Note 5 (ORN5) and alsohow it relates to external documents of amore technical nature. The list of keytechnical documents is not exhaustive,but represents a range of documentsthat are relatively easily available throughTRL, the World Bank and/or the globalTransport Knowledge Partnership (gTKP).A bibliography listing more detailedsources of information is also provided atthe end of each chapter.
The glossary gives a summarydescription for many of the terms used in this document. For clarity, a few keyterms used throughout the document are repeated here. A road appraisal is the process of justifying and reaching adecision to invest resources in the roadbeing appraised; it is project-oriented. It involves a sifting process for choosingbetween options (for solving a transportproblem) and screening out less-deserving options. Through this processof screening, a preferred choice iseventually recommended (or all optionsmay be rejected as inadequate).Appraisal also helps to prioritize theallocation of limited funds betweendifferent projects, an importantrequirement for the programming of roadinvestment. Appraisal usually involvesseveral distinct stages, of which thefeasibility stage is the last and mostdetailed prior to final road design. Assuch, it should be expected to incur highexpenditure. Evaluation of a road projectoccurs after the road has been built, andaddresses the question whether theinvestment was beneficial.
1. Purpose and Structure of this Note
Part 1:Overview of appraisal and policy framework
Part 2: Fieldwork and surveys
Part 3: Engineering design
Part 4: Option selection
Chapters 1-3Feasibility process, context for appraisal & glossary
Chapters 4-8Traffic demand, geotechnical investigations, environmental, social & safety considerations
Chapters 13-15Costings, benefits, analysis & reporting
Development and vision statements; Poverty reduction strategy papers (PRSPs); Transport policy statement
Chapters 9-12Pavement & geometric design, drainage & structures
Environmental policy and regulations
Government investment guidlines
Design standards
National supportingtechnical references
ORN5 Examples of generic supporting technical references (for a comprehensive bibliography see each chapter)
■ Appraisal of investments in improved rural access■ Road engineering for development■ MG11 - HIV/AIDS considerations■ The rural transport policy toolkit■ Cities on the move■ Highway development and management model (HDM-4)■ Design and appraisal of rural transport infrastructure
■ MG 1 - Low volume traffic counts■ MG 2 - Effect of passability on traffic demand■ MG 8 - Forecasting future traffic demand■ MG 12 - Environmental considerations■ ORN 11 - Urban road traffic surveys■ ORN 40 - A guide to axle load surveys and traffic counts for determining traffic loads on pavements■ Towards safer roads in developing countries
■ ORN 6 - A guide to geometric design■ ORN 9 - A guide to small bridge design for highway engineers■ ORN 14 - Hydrological design manual for slope stability in the tropics■ ORN16 - Principles of low-cost road engineering in mountainous regions■ ORN 31 - Guide to structural design of bitumen surfaced roads in tropical and sub-tropical countries
■ ORN10 - Costing road accidents in developing countries■ ORN 22 - A guide to pro-poor transport appraisal■ MG 3 - Operating costs of non-motorised vehicles■ MG 4 - Value of time■ MG 5 - Valuation of multi-task trips■ MG 6- Cost of walking and headloading■ MG 7 - Transport services appraisal■ MG 9 - Thresholds of economic viability■ MG10 - Distribution analysis and impact on poverty■ Toolkit for the economic evaluation of World Bank transport projects HDM 4 - Knowledge and software
Figure 1.1: Outline structure of ORN5
1. Purpose and Structure of this Note14
15
2.1 THE PROJECT CYCLE
2.1.1 Components of the projectcycle
Projects are planned and carried outfollowing a sequence of activities, oftenknown as the ‘project cycle’. There aremany ways of defining the steps in thissequence but, in this Note, the followingterminology is used:
■ Problem identification ■ Pre-feasibility■ Feasibility■ Design ■ Procurement and negotiation ■ Implementation ■ Operation ■ Monitoring and evaluation.
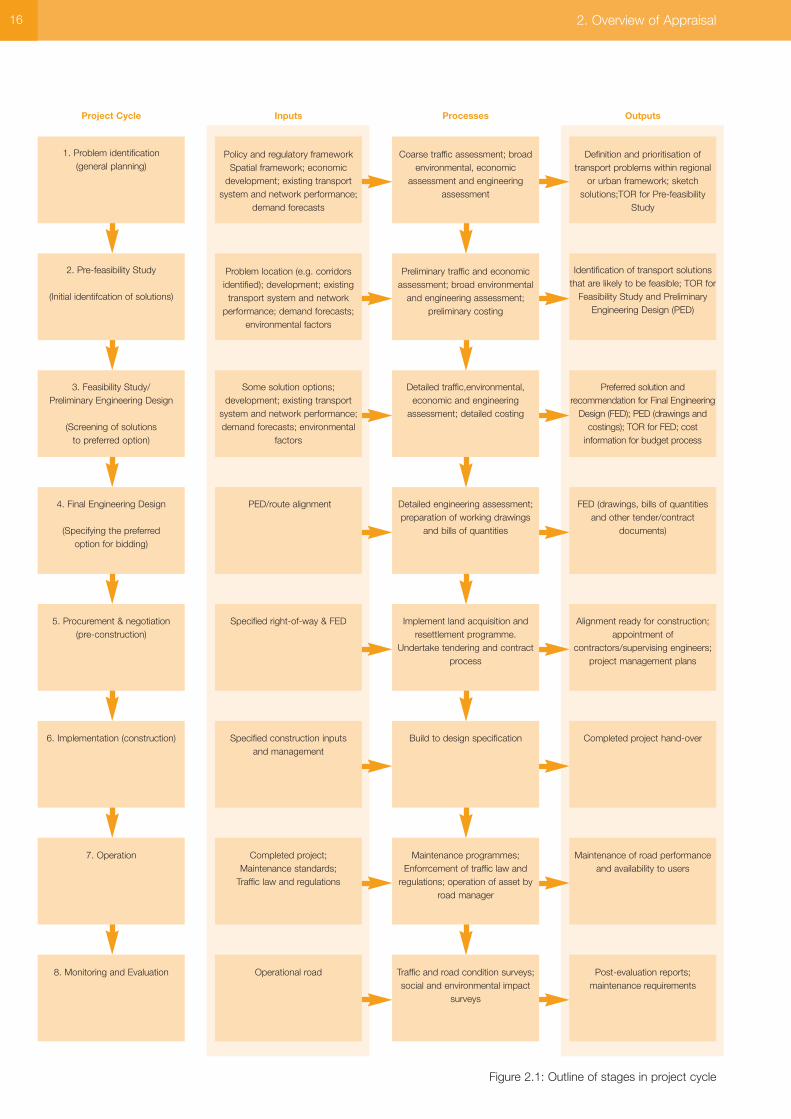
The first three steps (1-3) make up theplanning phases of the project cycle,though evaluation (step 8) may also beconsidered integral to the planningprocess by providing feedback on thewisdom and processes of past decisions.Figure 2.1 provides an outline of thestages of the project cycle.
The planning phases of the cycle involvea gradual process of screening andrefining alternative options (for resolvingan earlier identified problem). In thisprocess there are clear decision points (at the end of each stage) when potentialprojects are either rejected or takenforward for further and more detailedanalysis. Dubious projects should berejected at an early planning stage (andbefore feasibility) as they gain a‘momentum of their own’, and hencebecome increasingly difficult to stop at the later stages in the cycle when minorchanges of detail are often all that arepossible.
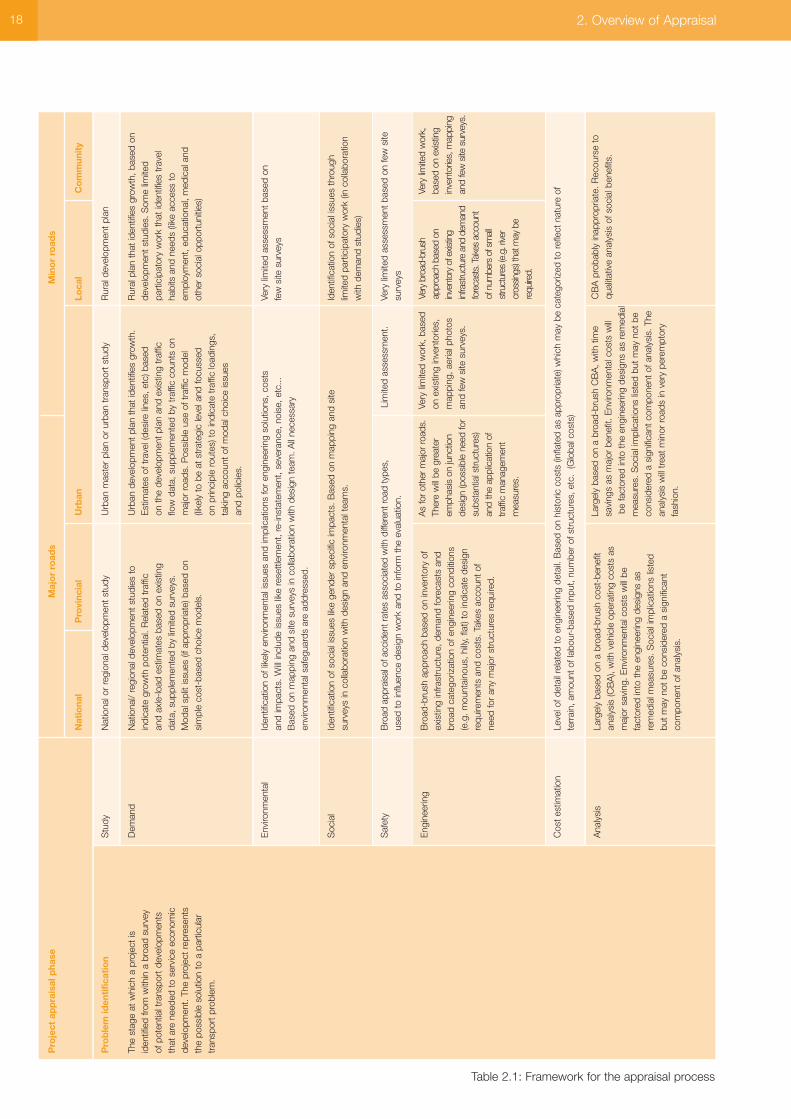
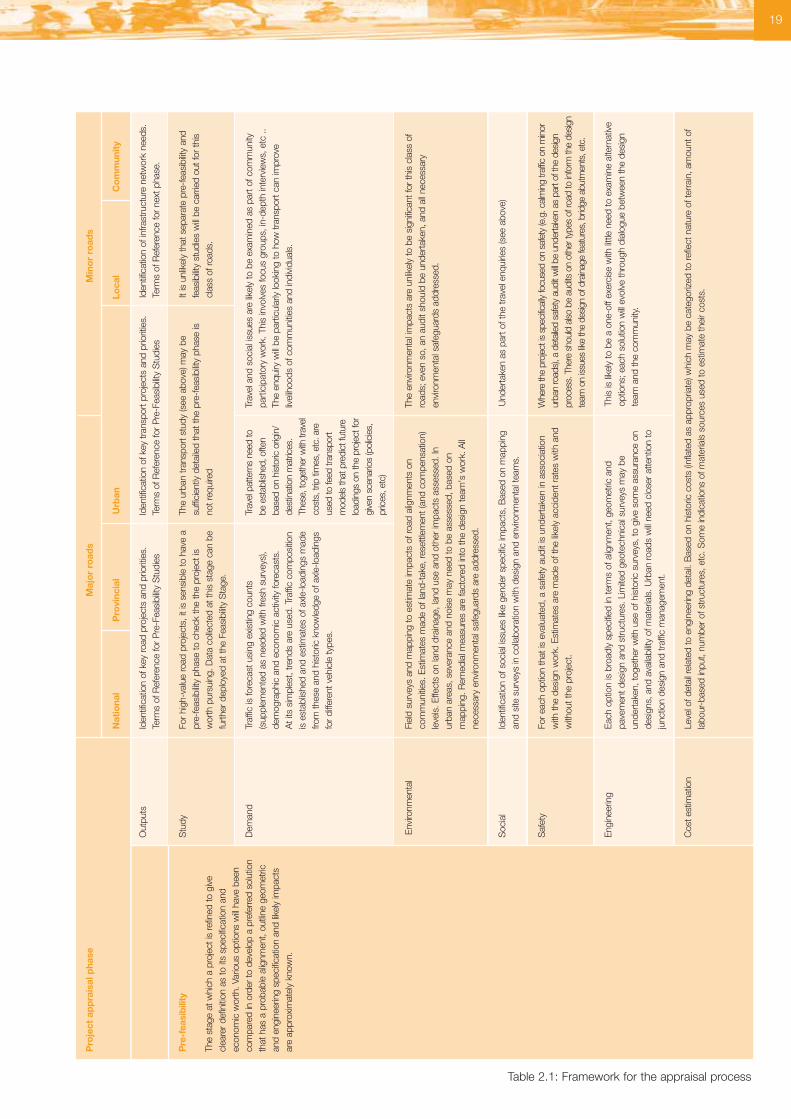
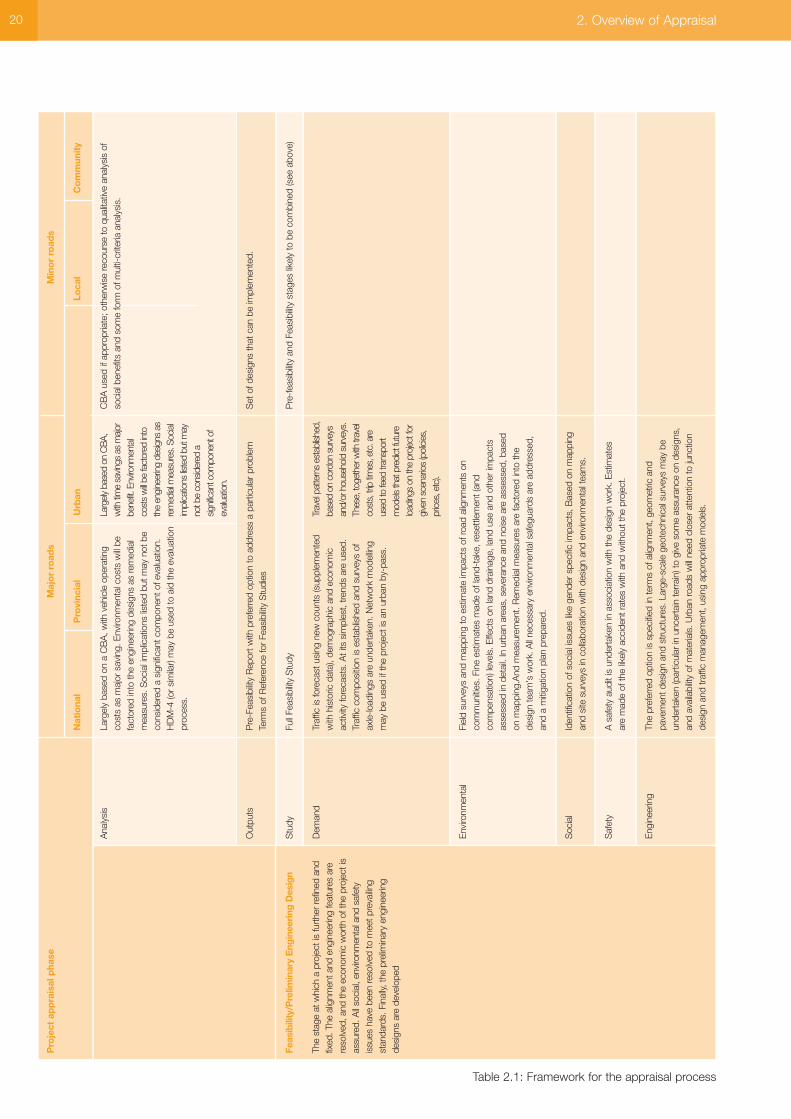
Within each of the planning phases(project identification, pre-feasibility andfeasibility), the same basic process ofanalysis is adopted. Differences occurlargely in the level of detail applied.Sometimes phases are merged, with pre-feasibility becoming an extension of theproject identification, or a first step in thefeasibility stage. Table 2.1 sets out aframework for the appraisal process asapplied to different types of road.
2.1.2 Problem identification
The first stage of the cycle is to findpotential projects. General planningidentifies key transport constraints andsketches solutions at a global or macrolevel, and should prioritize these as to theneed and urgency for resolution. Theplanning process takes into accountgovernment policies and programmes (in all relevant sectors) which impact ontransport development. The need forgeneral road development is thereforeexamined in a very wide socio-economicand policy-orientated context.
The framework for general planning couldbe cross-sectoral in nature or it could alsobe focused specifically on transportissues. In all cases, however, the scope is ‘macro’ in nature, taking in a completeregion or city. Examples of such spatial(or structure) plans and transportationstudies include:
■ A national or regional developmentstudy (e.g. regional spatial plans)
■ An urban development study (ormaster plan)
■ A national or regional transport study(sometimes known as a multi-modal or inter-modal transport study)
■ An urban land-use/transportation study■ An integrated rural accessibility plan■ A road safety strategic plan
2.1.3 Pre-feasibility
At the start of the pre-feasibility stagethere is a clearly defined transportproblem (identified in general planning),but no strong evidence that this problemcould be solved by road improvement, or any other transport solution (e.g.improvements to transport services) in an environmentally or economicallyacceptable manner. By the end of thepre-feasibility stage, there will be clearevidence whether or not a roadimprovement project is worthwhile. If it is, the pre-feasibility will normally identifywhat type of project would be suitable,checks that the project is not prematureand provides the information needed tocommission a feasibility study. Typically,this phase might identify ‘corridors’ thatrequire a new road.
An affirmative pre-feasibility study will alsotrigger the inclusion of a ‘line-item’ in thelong-term road preparation budget (of theministry or its highway agency). It givesadvance warning that monies will need tobe budgeted for the future implementationof this particular project.
The pre-feasibility study may indicate thatthe proposed road improvement projectwould not be effective in solving theproblem, or should be reconsidered later,perhaps when there is more traffic). Inthat case the process should beterminated or shelved without incurringthe high cost of a feasibility study.
2.1.4 Feasibility
The feasibility study finds the mostsuitable road improvement project forsolving or helping to solve an identifiedtransport problem. At the start of thestudy there is a clearly defined problemwith an expectation that the problem can
2. Overview of Appraisal
16 2. Overview of Appraisal
Project Cycle
1. Problem identification(general planning)
2. Pre-feasibility Study
(Initial identifcation of solutions)
3. Feasibility Study/ Preliminary Engineering Design
(Screening of solutions to preferred option)
4. Final Engineering Design
(Specifying the preferred option for bidding)
5. Procurement & negotiation(pre-construction)
6. Implementation (construction)
7. Operation
8. Monitoring and Evaluation
Inputs
Policy and regulatory frameworkSpatial framework; economic
development; existing transportsystem and network performance;
demand forecasts
Problem location (e.g. corridorsidentified); development; existingtransport system and network
performance; demand forecasts;environmental factors
Some solution options;development; existing transport
system and network performance;demand forecasts; environmental
factors
PED/route alignment
Specified right-of-way & FED
Specified construction inputsand management
Completed project;Maintenance standards;
Traffic law and regulations
Operational road
Processes
Coarse traffic assessment; broadenvironmental, economic
assessment and engineeringassessment
Preliminary traffic and economicassessment; broad environmental
and engineering assessment;preliminary costing
Detailed traffic,environmental,economic and engineering
assessment; detailed costing
Detailed engineering assessment;preparation of working drawings
and bills of quantities
Implement land acquisition andresettlement programme.
Undertake tendering and contractprocess
Build to design specification
Maintenance programmes;Enforrcement of traffic law and
regulations; operation of asset byroad manager
Traffic and road condition surveys;social and environmental impact
surveys
Outputs
Definition and prioritisation oftransport problems within regional
or urban framework; sketchsolutions;TOR for Pre-feasibility
Study
Identification of transport solutionsthat are likely to be feasible; TOR for
Feasibility Study and PreliminaryEngineering Design (PED)
Preferred solution andrecommendation for Final Engineering
Design (FED); PED (drawings andcostings); TOR for FED; cost
information for budget process
FED (drawings, bills of quantitiesand other tender/contract
documents)
Alignment ready for construction;appointment of
contractors/supervising engineers;project management plans
Completed project hand-over
Maintenance of road performanceand availability to users
Post-evaluation reports;maintenance requirements
Figure 2.1: Outline of stages in project cycle
be solved by some form of roadimprovement, in a manner that isenvironmentally, socially and economicallyacceptable. This expectation is backedup by the evidence needed to justify theconsiderable cost of carrying out afeasibility study (identified in a pre-feasibility study).
By the end of the study there should be a clear recommendation for a specificroad improvement project. The study will provide evidence that this particularproject should be carried out and that this project provides the most suitablesolution to the problem, taking intoaccount its operational benefits and itsenvironmental and economic implications.It will also provide a detailed descriptionand a preliminary engineering design(PED) and associated drawings of theproposed project to enable costs to bedetermined at a level of detail to enablefunding decisions to be made.
The feasibility study will also provide aninput to the road preparation budgetprocess, giving greater detail (than earlierphases) of costs that will be incurred andproject timings.
17
18 2. Overview of Appraisal
Pro
ject
ap
pra
isal
pha
seM
ajo
r ro
ads
Min
or
road
s
Nat
iona
lP
rovi
ncia
lU
rban
Loca
lC
om
mun
ity
Pro
ble
m id
enti
ficat
ion
Stu
dyN
atio
nal o
r re
gion
al d
evel
opm
ent s
tudy
Urb
an m
aste
r pl
an o
r ur
ban
tran
spor
t stu
dyR
ural
dev
elop
men
t pla
n
The
stag
e at
whi
ch a
pro
ject
isD
eman
dN
atio
nal/
regi
onal
dev
elop
men
t stu
dies
toU
rban
dev
elop
men
t pla
n th
at id
entif
ies
grow
th.
Rur
al p
lan
that
iden
tifie
s gr
owth
, bas
ed o
nid
entif
ied
from
with
in a
bro
ad s
urve
y in
dica
te g
row
th p
oten
tial.
Rel
ated
traf
ficEs
timat
es o
f tra
vel (
desi
re li
nes,
etc
) bas
edde
velo
pmen
t stu
dies
. Som
e lim
ited
of p
oten
tial t
rans
port
dev
elop
men
ts
and
axle
-load
est
imat
es b
ased
on
exis
ting
on th
e de
velo
pmen
t pla
n an
d ex
istin
g tr
affic
part
icip
ator
y w
ork
that
iden
tifie
s tr
avel
th
at a
re n
eede
d to
ser
vice
eco
nom
ic
data
, sup
plem
ente
d by
lim
ited
surv
eys.
flow
dat
a, s
uppl
emen
ted
by tr
affic
cou
nts
onha
bits
and
nee
ds (l
ike
acce
ss to
deve
lopm
ent.
The
proj
ect r
epre
sent
s M
odal
spl
it is
sues
(if a
ppro
pria
te) b
ased
on
maj
or r
oads
. Pos
sibl
e us
e of
traf
fic m
odel
empl
oym
ent,
educ
atio
nal,
med
ical
and
th
e po
ssib
le s
olut
ion
to a
par
ticul
ar
sim
ple
cost
-bas
ed c
hoic
e m
odel
s.(li
kely
to b
e at
str
ateg
ic le
vel a
nd fo
cuss
edot
her
soci
al o
ppor
tuni
ties)
tran
spor
t pro
blem
.on
prin
cipl
e ro
utes
) to
indi
cate
traf
fic lo
adin
gs,
taki
ng a
ccou
nt o
f mod
al c
hoic
e is
sues
and
polic
ies.
Envi
ronm
enta
lId
entif
icat
ion
of li
kely
env
ironm
enta
l iss
ues
and
impl
icat
ions
for
engi
neer
ing
solu
tions
, cos
ts
Very
lim
ited
asse
ssm
ent b
ased
on
and
impa
cts.
Will
incl
ude
issu
es li
ke r
eset
tlem
ent,
re-in
stat
emen
t, se
vera
nce,
noi
se, e
tc...
fe
w s
ite s
urve
ysB
ased
on
map
ping
and
site
sur
veys
in c
olla
bora
tion
with
des
ign
team
. All
nece
ssar
y en
viro
nmen
tal s
afeg
uard
s ar
e ad
dres
sed.
Soc
ial
Iden
tific
atio
n of
soc
ial i
ssue
s lik
e ge
nder
spe
cific
impa
cts.
Bas
ed o
n m
appi
ng a
nd s
ite
Iden
tific
atio
n of
soc
ial i
ssue
s th
roug
hsu
rvey
s in
col
labo
ratio
n w
ith d
esig
n an
d en
viro
nmen
tal t
eam
s.
limite
d pa
rtic
ipat
ory
wor
k (in
col
labo
ratio
n w
ith d
eman
d st
udie
s)
Saf
ety
Bro
ad a
ppra
isal
of a
ccid
ent r
ates
ass
ocia
ted
with
diff
eren
t roa
d ty
pes,
Lim
ited
asse
ssm
ent.
Very
lim
ited
asse
ssm
ent b
ased
on
few
site
used
to in
fluen
ce d
esig
n w
ork
and
to in
form
the
eval
uatio
n.su
rvey
s
Engi
neer
ing
Bro
ad-b
rush
app
roac
h ba
sed
on in
vent
ory
ofex
istin
g in
frast
ruct
ure,
dem
and
fore
cast
s an
d br
oad
cate
goriz
atio
n of
eng
inee
ring
cond
ition
s (e
.g. m
ount
aino
us, h
illy, f
lat)
to in
dica
te d
esig
nre
quire
men
ts a
nd c
osts
. Tak
es a
ccou
nt o
f ne
ed fo
r an
y m
ajor
str
uctu
res
requ
ired.
Cos
t est
imat
ion
Leve
l of d
etai
l rel
ated
to e
ngin
eerin
g de
tail.
Bas
ed o
n hi
stor
ic c
osts
(inf
late
d as
app
ropr
iate
) whi
ch m
ay b
e ca
tego
rized
to r
efle
ct n
atur
e of
te
rrai
n, a
mou
nt o
f lab
our-
base
d in
put,
num
ber
of s
truc
ture
s, e
tc.
(Glo
bal c
osts
)
Ana
lysi
sLa
rgel
y ba
sed
on a
bro
ad-b
rush
cos
t-be
nefit
an
alys
is (C
BA
), w
ith v
ehic
le o
pera
ting
cost
s as
m
ajor
sav
ing.
Env
ironm
enta
l cos
ts w
ill be
fa
ctor
ed in
to th
e en
gine
erin
g de
sign
s as
re
med
ial m
easu
res.
Soc
ial i
mpl
icat
ions
list
ed
but m
ay n
ot b
e co
nsid
ered
a s
igni
fican
t co
mpo
nent
of a
naly
sis.
As
for o
ther
maj
or ro
ads.
Ther
e w
ill be
gre
ater
emph
asis
on
junc
tion
desi
gn (p
ossi
ble
need
for
subs
tant
ial s
truct
ures
)an
d th
e ap
plic
atio
n of
traffi
c m
anag
emen
tm
easu
res.
Very
lim
ited
wor
k, b
ased
on e
xist
ing
inve
ntor
ies,
map
ping
, aer
ial p
hoto
san
d fe
w s
ite s
urve
ys.
Very
bro
ad-b
rush
ap
proa
ch b
ased
on
inve
ntor
y of
exis
ting
infra
stru
ctur
e an
d de
man
dfo
reca
sts.
Tak
es a
ccou
nt
of n
umbe
rs o
f sm
all
stru
ctur
es (e
.g. r
iver
cros
sings
) tha
t may
be
requ
ired.
Very
lim
ited
wor
k,ba
sed
on e
xist
ing
inve
ntor
ies,
map
ping
and
few
site
sur
veys
.
Larg
ely
base
d on
a b
road
-bru
sh C
BA
, with
tim
esa
ving
s as
maj
or b
enef
it. E
nviro
nmen
tal c
osts
will
be fa
ctor
ed in
to th
e en
gine
erin
g de
sign
s as
rem
edia
lm
easu
res.
Soc
ial i
mpl
icat
ions
list
ed b
ut m
ay n
ot b
eco
nsid
ered
a s
igni
fican
t com
pone
nt o
f ana
lysi
s. T
hean
alys
is w
ill tre
at m
inor
roa
ds in
ver
y pe
rem
ptor
yfa
shio
n.
CB
A p
roba
bly
inap
prop
riate
. Rec
ours
e to
qual
itativ
e an
alys
is o
f soc
ial b
enef
its.
Table 2.1: Framework for the appraisal process
19
Pro
ject
ap
pra
isal
pha
seM
ajo
r ro
ads
Min
or
road
s
Nat
iona
lP
rovi
ncia
lU
rban
Loca
lC
om
mun
ity
For e
ach
optio
n th
at is
eva
luat
ed, a
saf
ety
audi
t is
unde
rtake
n in
ass
ocia
tion
with
the
desi
gn w
ork.
Est
imat
es a
re m
ade
of th
e lik
ely
acci
dent
rate
s w
ith a
ndw
ithou
t the
pro
ject
.
Whe
re th
e pr
ojec
t is
spec
ifical
ly fo
cuse
d on
saf
ety
(e.g
. cal
min
g tra
ffic o
n m
inor
urba
n ro
ads)
, a d
etai
led
safe
ty a
udit
will
be u
nder
take
n as
par
t of t
he d
esig
npr
oces
s. T
here
sho
uld
also
be
audi
ts o
n ot
her t
ypes
of r
oad
to in
form
the
desig
nte
am o
n iss
ues
like
the
desig
n of
dra
inag
e fe
atur
es, b
ridge
abu
tmen
ts, e
tc.
Engi
neer
ing
Each
opt
ion
is b
road
ly s
peci
fied
in te
rms
of a
lignm
ent,
geom
etric
and
pave
men
t des
ign
and
stru
ctur
es. L
imite
d ge
otec
hnic
al s
urve
ys m
ay b
eun
derta
ken,
toge
ther
with
use
of h
isto
ric s
urve
ys, t
o gi
ve s
ome
assu
ranc
e on
desi
gns,
and
ava
ilabi
lity
of m
ater
ials
. Urb
an ro
ads
will
need
clo
ser a
ttent
ion
toju
nctio
n de
sign
and
traf
fic m
anag
emen
t.
Leve
l of d
etai
l rel
ated
to e
ngin
eerin
g de
tail.
Bas
ed o
n hi
stor
ic c
osts
(inf
late
d as
app
ropr
iate
) whi
ch m
ay b
e ca
tego
rized
to re
flect
nat
ure
of te
rrai
n, a
mou
nt o
fla
bour
-bas
ed in
put,
num
ber o
f stru
ctur
es, e
tc. S
ome
indi
catio
ns o
f mat
eria
ls s
ourc
es u
sed
to e
stim
ate
thei
r cos
ts.
This
is li
kely
to b
e a
one-
off e
xerc
ise
with
littl
e ne
ed to
exa
min
e al
tern
ativ
eop
tions
; eac
h so
lutio
n w
ill ev
olve
thro
ugh
dial
ogue
bet
wee
n th
e de
sign
team
and
the
com
mun
ity.
Cos
t est
imat
ion
Saf
ety
Und
erta
ken
as p
art o
f the
trav
el e
nqui
ries
(see
abo
ve)
Iden
tific
atio
n of
soc
ial i
ssue
s lik
e ge
nder
spe
cific
impa
cts,
Bas
ed o
n m
appi
ngan
d si
te s
urve
ys in
col
labo
ratio
n w
ith d
esig
n an
d en
viro
nmen
tal t
eam
s.S
ocia
l
The
envi
ronm
enta
l im
pact
s ar
e un
likel
y to
be
sign
ifican
t for
this
cla
ss o
fro
ads;
eve
n so
, an
audi
t sho
uld
be u
nder
take
n, a
nd a
ll ne
cess
ary
envi
ronm
enta
l saf
egua
rds
addr
esse
d.
Fiel
d su
rvey
s an
d m
appi
ng to
est
imat
e im
pact
s of
road
alig
nmen
ts o
nco
mm
uniti
es. E
stim
ates
mad
e of
land
-tak
e, re
settl
emen
t (an
d co
mpe
nsat
ion)
leve
ls. E
ffect
s on
land
dra
inag
e, la
nd u
se a
nd o
ther
impa
cts
asse
ssed
. In
urba
n ar
eas,
sev
eran
ce a
nd n
oise
may
nee
d to
be
asse
ssed
, bas
ed o
nm
appi
ng. R
emed
ial m
easu
res
are
fact
ored
into
the
desi
gn te
am's
wor
k. A
llne
cess
ary
envi
ronm
enta
l saf
egua
rds
are
addr
esse
d.
Envi
ronm
enta
l
Trav
el a
nd s
ocia
l iss
ues
are
likel
y to
be
exam
ined
as
part
of c
omm
unity
parti
cipa
tory
wor
k. T
his
invo
lves
focu
s gr
oups
, in-
dept
h in
terv
iew
s, e
tc ..
Th
e en
quiry
will
be p
artic
ular
ly lo
okin
g to
how
tran
spor
t can
impr
ove
livel
ihoo
ds o
f com
mun
ities
and
indi
vidu
als.
Trav
el p
atte
rns
need
to
be e
stab
lishe
d, o
ften
base
d on
his
toric
orig
in/
dest
inat
ion
mat
rices
.Th
ese,
toge
ther
with
trav
elco
sts,
trip
tim
es, e
tc. a
reus
ed to
feed
tran
spor
tm
odel
s th
at p
redi
ct fu
ture
load
ings
on
the
proj
ect f
orgi
ven
scen
ario
s (p
olic
ies,
pric
es, e
tc)
Traf
fic is
fore
cast
usi
ng e
xist
ing
coun
ts(s
uppl
emen
ted
as n
eede
d w
ith fr
esh
surv
eys)
,de
mog
raph
ic a
nd e
cono
mic
act
ivity
fore
cast
s.
At i
ts s
impl
est,
trend
s ar
e us
ed. T
raffi
c co
mpo
sitio
nis
est
ablis
hed
and
estim
ates
of a
xle-
load
ings
mad
efro
m th
ese
and
hist
oric
kno
wle
dge
of a
xle-
load
ings
for d
iffer
ent v
ehic
le ty
pes.
Dem
and
It is
unl
ikel
y th
at s
epar
ate
pre-
feas
ibilit
y an
dfe
asib
ility
stud
ies
will
be c
arrie
d ou
t for
this
cl
ass
of ro
ads.
The
urba
n tra
nspo
rt st
udy
(see
abo
ve) m
ay b
esu
ffici
ently
det
aile
d th
at th
e pr
e-fe
asib
ility
phas
e is
not r
equi
red
For h
igh-
valu
e ro
ad p
roje
cts,
it is
sen
sibl
e to
hav
e a
pre-
feas
ibilit
y ph
ase
to c
heck
the
the
proj
ect i
sw
orth
pur
suin
g. D
ata
colle
cted
at t
his
stag
e ca
n be
furth
er d
eplo
yed
at th
e Fe
asib
ility
Sta
ge.
Stu
dy
Iden
tific
atio
n of
infra
stru
ctur
e ne
twor
k ne
eds.
Term
s of
Ref
eren
ce fo
r nex
t pha
se.
Iden
tific
atio
n of
key
tran
spor
t pro
ject
s an
d pr
iorit
ies.
Term
s of
Ref
eren
ce fo
r Pre
-Fea
sibi
lity
Stu
dies
Iden
tific
atio
n of
key
road
pro
ject
s an
d pr
iorit
ies.
Term
s of
Ref
eren
ce fo
r Pre
-Fea
sibi
lity
Stu
dies
Out
puts
Pre
-fea
sibi
lity
The
stag
e at
whi
ch a
pro
ject
is re
fined
to g
ive
clea
rer d
efin
ition
as
to it
s sp
ecific
atio
n an
dec
onom
ic w
orth
. Var
ious
opt
ions
will
have
bee
nco
mpa
red
in o
rder
to d
evel
op a
pre
ferre
d so
lutio
nth
at h
as a
pro
babl
e al
ignm
ent,
outli
ne g
eom
etric
and
engi
neer
ing
spec
ificat
ion
and
likel
y im
pact
sar
e ap
prox
imat
ely
know
n.
Table 2.1: Framework for the appraisal process
20 2. Overview of Appraisal
Pro
ject
ap
pra
isal
pha
seM
ajo
r ro
ads
Min
or
road
s
Nat
iona
lP
rovi
ncia
lU
rban
Loca
lC
om
mun
ity
Saf
ety
A s
afet
y au
dit i
s un
derta
ken
in a
ssoc
iatio
n w
ith th
e de
sign
wor
k. E
stim
ates
are
mad
e of
the
likel
y ac
cide
nt ra
tes
with
and
with
out t
he p
roje
ct.
Engi
neer
ing
The
pref
erre
d op
tion
is s
peci
fied
in te
rms
of a
lignm
ent,
geom
etric
and
pave
men
t des
ign
and
stru
ctur
es. L
arge
-sca
le g
eote
chni
cal s
urve
ys m
ay b
eun
derta
ken
(par
ticul
ar in
unc
erta
in te
rrai
n) to
giv
e so
me
assu
ranc
e on
des
igns
,an
d av
aila
bilit
y of
mat
eria
ls. U
rban
road
s w
ill ne
ed c
lose
r atte
ntio
n to
junc
tion
desi
gn a
nd tr
affic
man
agem
ent,
usin
g ap
prop
riate
mod
els.
Iden
tific
atio
n of
soc
ial i
ssue
s lik
e ge
nder
spe
cific
impa
cts,
Bas
ed o
n m
appi
ngan
d si
te s
urve
ys in
col
labo
ratio
n w
ith d
esig
n an
d en
viro
nmen
tal t
eam
s.S
ocia
l
Fiel
d su
rvey
s an
d m
appi
ng to
est
imat
e im
pact
s of
road
alig
nmen
ts o
nco
mm
uniti
es. F
ine
estim
ates
mad
e of
land
-tak
e, re
settl
emen
t (an
dco
mpe
nsat
ion)
leve
ls. E
ffect
s on
land
dra
inag
e, la
nd u
se a
nd o
ther
impa
cts
asse
ssed
in d
etai
l. In
urb
an a
reas
, sev
eran
ce a
nd n
oise
are
ass
esse
d, b
ased
on m
appi
ng.A
nd m
easu
rem
ent.
Rem
edia
l mea
sure
s ar
e fa
ctor
ed in
to th
ede
sign
team
's w
ork.
All
nece
ssar
y en
viro
nmen
tal s
afeg
uard
s ar
e ad
dres
sed,
and
a m
itiga
tion
plan
pre
pare
d.
Envi
ronm
enta
l
Trav
el p
atte
rns
esta
blish
ed,
base
d on
cor
don
surv
eys
and/
or h
ouse
hold
sur
veys
.Th
ese,
toge
ther
with
trav
elco
sts,
trip
tim
es, e
tc. a
reus
ed to
feed
tran
spor
tm
odel
s th
at p
redi
ct fu
ture
load
ings
on
the
proj
ect f
orgi
ven
scen
ario
s (p
olic
ies,
pric
es, e
tc).
Traf
fic is
fore
cast
usi
ng n
ew c
ount
s (s
uppl
emen
ted
with
his
toric
dat
a), d
emog
raph
ic a
nd e
cono
mic
activ
ity fo
reca
sts.
At i
ts s
impl
est,
trend
s ar
e us
ed.
Traf
fic c
ompo
sitio
n is
est
ablis
hed
and
surv
eys
ofax
le-lo
adin
gs a
re u
nder
take
n. N
etw
ork
mod
ellin
gm
ay b
e us
ed if
the
proj
ect i
s an
urb
an b
y-pa
ss.
Dem
and
Pre
-fea
sibi
lity
and
Feas
ibilit
y st
ages
like
ly to
be
com
bine
d (s
ee a
bove
)Fu
ll Fe
asib
ility
Stu
dyS
tudy
Feas
ibili
ty/P
relim
inar
y E
ngin
eeri
ng D
esig
n
The
stag
e at
whi
ch a
pro
ject
is fu
rther
refin
ed a
ndfix
ed. T
he a
lignm
ent a
nd e
ngin
eerin
g fe
atur
es a
rere
solv
ed, a
nd th
e ec
onom
ic w
orth
of t
he p
roje
ct is
assu
red.
All
soci
al, e
nviro
nmen
tal a
nd s
afet
yis
sues
hav
e be
en re
solv
ed to
mee
t pre
vailin
gst
anda
rds.
Fin
ally,
the
prel
imin
ary
engi
neer
ing
desi
gns
are
deve
lope
d
Set
of d
esig
ns th
at c
an b
e im
plem
ente
d.
Pre
-Fea
sibi
lity
Rep
ort w
ith p
refe
rred
optio
n to
add
ress
a p
artic
ular
pro
blem
Term
s of
Ref
eren
ce fo
r Fea
sibi
lity
Stu
dies
CB
A u
sed
if ap
prop
riate
; oth
erw
ise
reco
urse
to q
ualit
ativ
e an
alys
is o
fso
cial
ben
efits
and
som
e fo
rm o
f mul
ti-cr
iteria
ana
lysi
s.La
rgel
y ba
sed
on C
BA,
w
ith ti
me
savin
gs a
s m
ajor
bene
fit. E
nviro
nmen
tal
cost
s w
ill be
fact
ored
into
th
e en
gine
erin
g de
signs
as
rem
edia
l mea
sure
s. S
ocia
lim
plic
atio
ns lis
ted
but m
ay
not b
e co
nsid
ered
asig
nific
ant c
ompo
nent
of
eval
uatio
n.
Larg
ely
base
d on
a C
BA
, with
veh
icle
ope
ratin
gco
sts
as m
ajor
sav
ing.
Env
ironm
enta
l cos
ts w
ill be
fact
ored
into
the
engi
neer
ing
desi
gns
as re
med
ial
mea
sure
s. S
ocia
l im
plic
atio
ns li
sted
but
may
not
be
cons
ider
ed a
sig
nific
ant c
ompo
nent
of e
valu
atio
n.H
DM
-4 (o
r sim
ilar)
may
be
used
to a
id th
e ev
alua
tion
proc
ess.
Ana
lysi
s
Out
puts
Table 2.1: Framework for the appraisal process

21
Pro
ject
ap
pra
isal
pha
seM
ajo
r ro
ads
Min
or
road
s
Nat
iona
lP
rovi
ncia
lU
rban
Loca
lC
om
mun
ity
Feas
ibilit
y R
epor
t with
Pre
limin
ary
Engi
neer
ing
Des
igns
Te
rms
of R
efer
ence
for F
inal
Des
ign
and
supe
rvis
ion.
Out
puts
Larg
ely
base
d on
CB
A,
with
tim
e sa
ving
s as
maj
orbe
nefit
. Env
ironm
enta
lco
sts
will
be fa
ctor
ed in
toth
e en
gine
erin
g de
sign
s as
rem
edia
l mea
sure
s. S
ocia
lim
plic
atio
ns li
sted
but
may
not b
e co
nsid
ered
asi
gnific
ant c
ompo
nent
of
eval
uatio
n. R
isk
anal
ysis
deve
lope
d an
d re
cord
ed.
Larg
ely
base
d on
a C
BA
, with
veh
icle
ope
ratin
gco
sts
as m
ajor
sav
ing.
Env
ironm
enta
l cos
ts w
ill be
fact
ored
into
the
engi
neer
ing
desi
gns
as re
med
ial
mea
sure
s. S
ocia
l im
plic
atio
ns li
sted
but
may
not
be
cons
ider
ed a
sig
nific
ant c
ompo
nent
of e
valu
atio
n.H
DM
4 (o
r sim
ilar)
likel
y to
be
used
to a
id th
eev
alua
tion
proc
ess.
Ris
k an
alys
is d
evel
oped
and
reco
rded
.
Leve
l of d
etai
l rel
ated
to e
ngin
eerin
g de
tail.
Bas
ed o
n hi
stor
ic c
osts
(inf
late
d as
appr
opria
te) b
ut h
ighl
y ge
ared
to re
flect
nat
ure
of te
rrai
n, m
ater
ials
requ
irem
ent
(and
sou
rces
) am
ount
of l
abou
r-ba
sed
inpu
t, nu
mbe
r of s
truct
ures
, etc
. (U
nit
rate
s us
ed).
Cos
t est
imat
ion
Ana
lysi
s
Table 2.1: Framework for the appraisal process
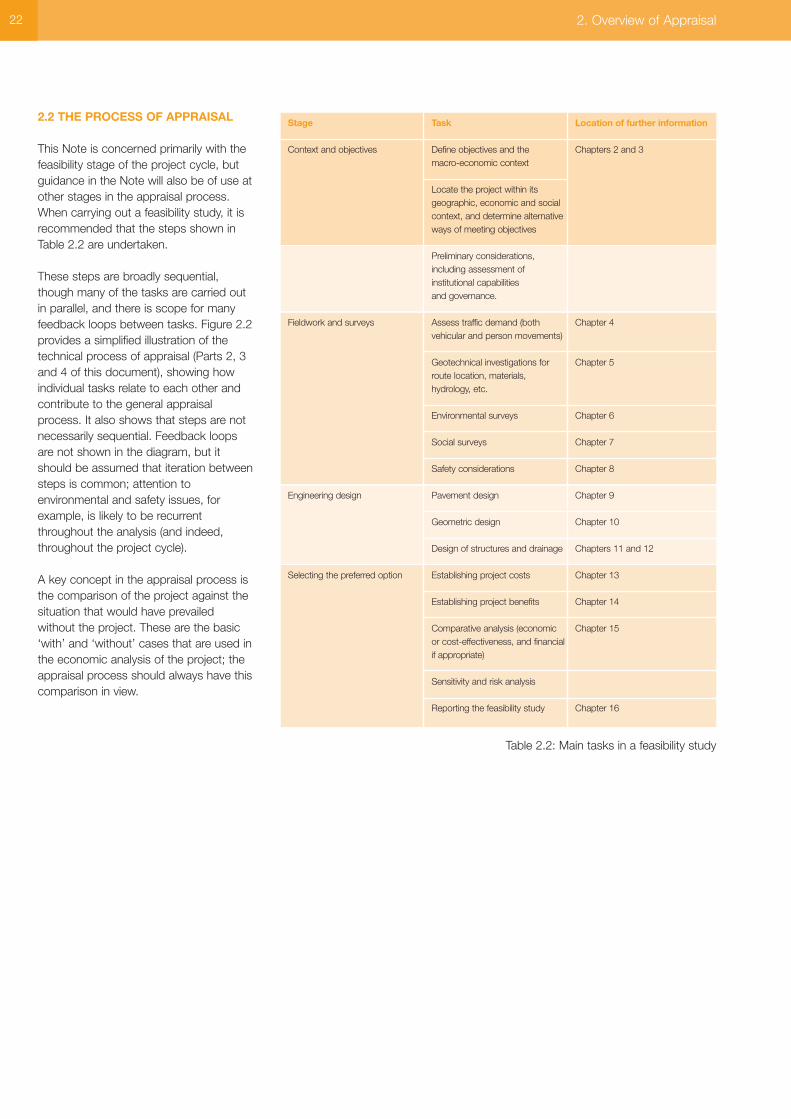
22 2. Overview of Appraisal
2.2 THE PROCESS OF APPRAISAL
This Note is concerned primarily with thefeasibility stage of the project cycle, butguidance in the Note will also be of use atother stages in the appraisal process.When carrying out a feasibility study, it isrecommended that the steps shown inTable 2.2 are undertaken.
These steps are broadly sequential,though many of the tasks are carried outin parallel, and there is scope for manyfeedback loops between tasks. Figure 2.2provides a simplified illustration of thetechnical process of appraisal (Parts 2, 3and 4 of this document), showing howindividual tasks relate to each other andcontribute to the general appraisalprocess. It also shows that steps are notnecessarily sequential. Feedback loopsare not shown in the diagram, but itshould be assumed that iteration betweensteps is common; attention toenvironmental and safety issues, forexample, is likely to be recurrentthroughout the analysis (and indeed,throughout the project cycle).
A key concept in the appraisal process isthe comparison of the project against thesituation that would have prevailedwithout the project. These are the basic‘with’ and ‘without’ cases that are used inthe economic analysis of the project; theappraisal process should always have thiscomparison in view.
Stage Task Location of further information
Context and objectives Define objectives and the Chapters 2 and 3macro-economic context
Locate the project within its geographic, economic and social context, and determine alternative ways of meeting objectives
Preliminary considerations, including assessment of institutional capabilities and governance.
Fieldwork and surveys Assess traffic demand (both Chapter 4vehicular and person movements)
Geotechnical investigations for Chapter 5route location, materials, hydrology, etc.
Environmental surveys Chapter 6
Social surveys Chapter 7
Safety considerations Chapter 8
Engineering design Pavement design Chapter 9
Geometric design Chapter 10
Design of structures and drainage Chapters 11 and 12
Selecting the preferred option Establishing project costs Chapter 13
Establishing project benefits Chapter 14
Comparative analysis (economic Chapter 15or cost-effectiveness, and financial if appropriate)
Sensitivity and risk analysis
Reporting the feasibility study Chapter 16
Table 2.2: Main tasks in a feasibility study
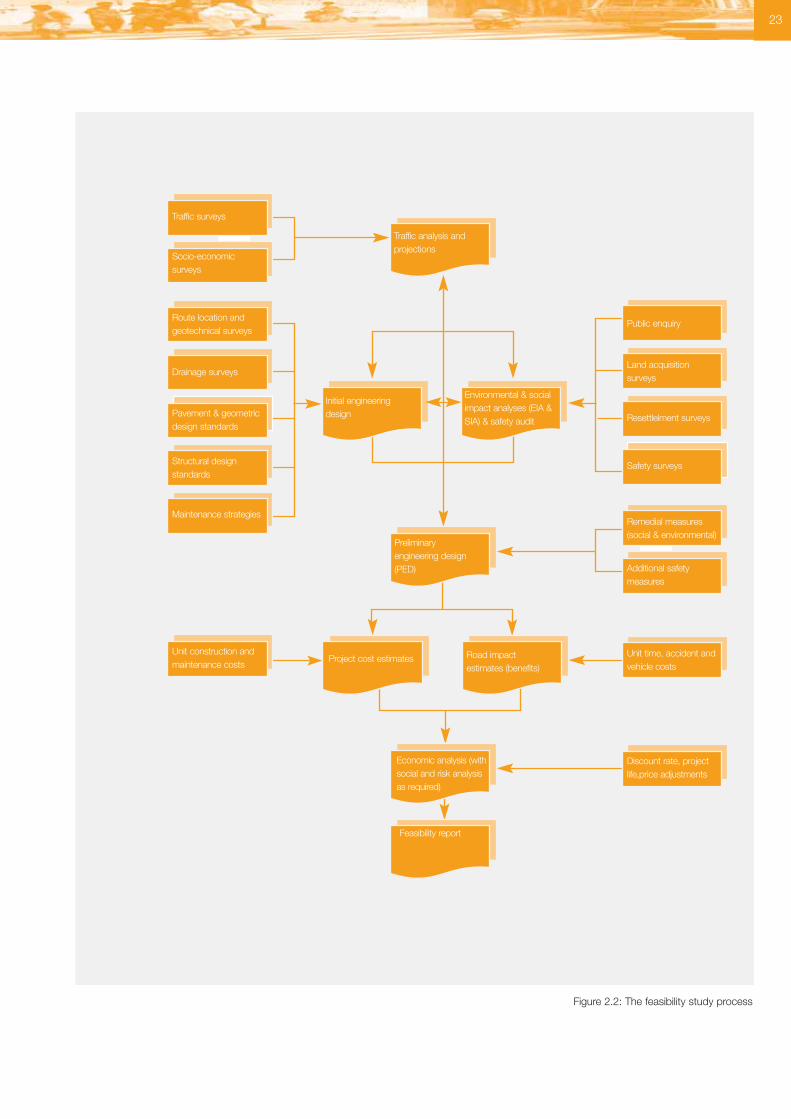
23
Traffic surveys
Socio-economic surveys
Route location andgeotechnical surveys
Drainage surveys
Pavement & geometricdesign standards
Structural designstandards
Maintenance strategies
Unit construction andmaintenance costs
Traffic analysis andprojections
Initial engineeringdesign
Environmental & socialimpact analyses (EIA &SIA) & safety audit
Preliminaryengineering design(PED)
Project cost estimates Road impactestimates (benefits)
Economic analysis (withsocial and risk analysisas required)
Feasibility report
Public enquiry
Land acquisitionsurveys
Resettlelment surveys
Safety surveys
Remedial measures(social & environmental)
Additional safetymeasures
Unit time, accident andvehicle costs
Discount rate, projectlife,price adjustments
Figure 2.2: The feasibility study process
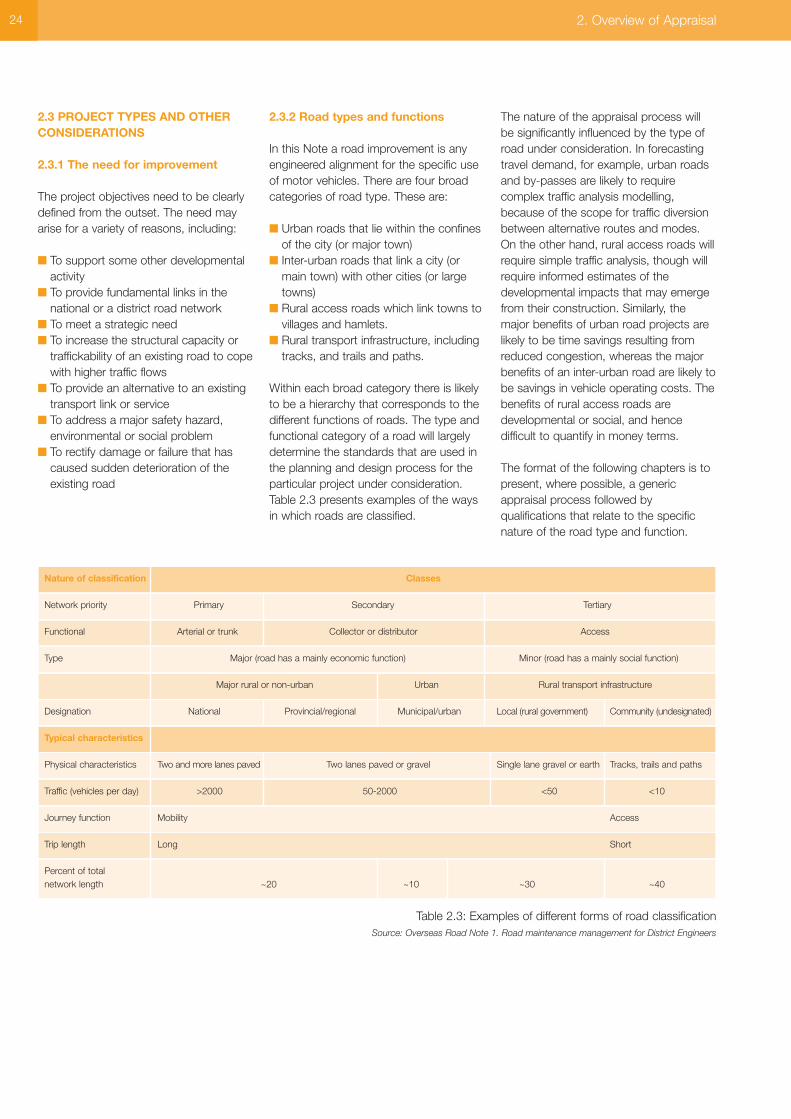
24 2. Overview of Appraisal
Nature of classification Classes
Network priority Primary Secondary Tertiary
Functional Arterial or trunk Collector or distributor Access
Type Major (road has a mainly economic function) Minor (road has a mainly social function)
Major rural or non-urban Urban Rural transport infrastructure
Designation National Provincial/regional Municipal/urban Local (rural government) Community (undesignated)
Typical characteristics
Physical characteristics Two and more lanes paved Two lanes paved or gravel Single lane gravel or earth Tracks, trails and paths
Traffic (vehicles per day) >2000 50-2000 <50 <10
Journey function Mobility Access
Trip length Long Short
Percent of total network length ~20 ~10 ~30 ~40
Table 2.3: Examples of different forms of road classificationSource: Overseas Road Note 1. Road maintenance management for District Engineers
2.3 PROJECT TYPES AND OTHERCONSIDERATIONS
2.3.1 The need for improvement
The project objectives need to be clearlydefined from the outset. The need mayarise for a variety of reasons, including:
■ To support some other developmentalactivity
■ To provide fundamental links in thenational or a district road network
■ To meet a strategic need■ To increase the structural capacity or
traffickability of an existing road to copewith higher traffic flows
■ To provide an alternative to an existingtransport link or service
■ To address a major safety hazard,environmental or social problem
■ To rectify damage or failure that hascaused sudden deterioration of theexisting road
2.3.2 Road types and functions
In this Note a road improvement is anyengineered alignment for the specific useof motor vehicles. There are four broadcategories of road type. These are:
■ Urban roads that lie within the confinesof the city (or major town)
■ Inter-urban roads that link a city (ormain town) with other cities (or largetowns)
■ Rural access roads which link towns tovillages and hamlets.
■ Rural transport infrastructure, includingtracks, and trails and paths.
Within each broad category there is likelyto be a hierarchy that corresponds to thedifferent functions of roads. The type andfunctional category of a road will largelydetermine the standards that are used inthe planning and design process for theparticular project under consideration.Table 2.3 presents examples of the waysin which roads are classified.
The nature of the appraisal process willbe significantly influenced by the type ofroad under consideration. In forecastingtravel demand, for example, urban roadsand by-passes are likely to requirecomplex traffic analysis modelling,because of the scope for traffic diversionbetween alternative routes and modes.On the other hand, rural access roads willrequire simple traffic analysis, though willrequire informed estimates of thedevelopmental impacts that may emergefrom their construction. Similarly, themajor benefits of urban road projects arelikely to be time savings resulting fromreduced congestion, whereas the majorbenefits of an inter-urban road are likely tobe savings in vehicle operating costs. Thebenefits of rural access roads aredevelopmental or social, and hencedifficult to quantify in money terms.
The format of the following chapters is topresent, where possible, a genericappraisal process followed byqualifications that relate to the specificnature of the road type and function.
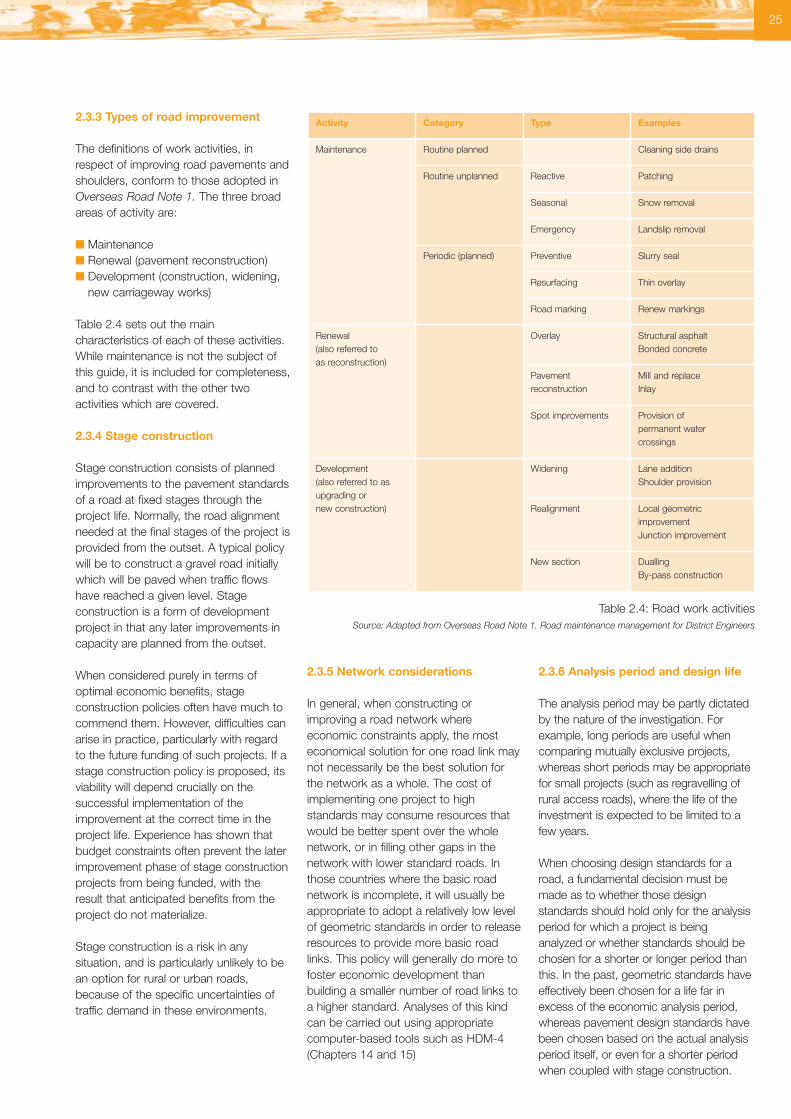
2.3.3 Types of road improvement
The definitions of work activities, inrespect of improving road pavements andshoulders, conform to those adopted inOverseas Road Note 1. The three broadareas of activity are:
■ Maintenance ■ Renewal (pavement reconstruction)■ Development (construction, widening,
new carriageway works)
Table 2.4 sets out the maincharacteristics of each of these activities.While maintenance is not the subject ofthis guide, it is included for completeness,and to contrast with the other twoactivities which are covered.
2.3.4 Stage construction
Stage construction consists of plannedimprovements to the pavement standardsof a road at fixed stages through theproject life. Normally, the road alignmentneeded at the final stages of the project isprovided from the outset. A typical policywill be to construct a gravel road initiallywhich will be paved when traffic flowshave reached a given level. Stageconstruction is a form of developmentproject in that any later improvements incapacity are planned from the outset.
When considered purely in terms ofoptimal economic benefits, stageconstruction policies often have much tocommend them. However, difficulties canarise in practice, particularly with regardto the future funding of such projects. If astage construction policy is proposed, itsviability will depend crucially on thesuccessful implementation of theimprovement at the correct time in theproject life. Experience has shown thatbudget constraints often prevent the laterimprovement phase of stage constructionprojects from being funded, with theresult that anticipated benefits from theproject do not materialize.
Stage construction is a risk in anysituation, and is particularly unlikely to bean option for rural or urban roads,because of the specific uncertainties oftraffic demand in these environments.
2.3.5 Network considerations
In general, when constructing orimproving a road network whereeconomic constraints apply, the mosteconomical solution for one road link maynot necessarily be the best solution forthe network as a whole. The cost ofimplementing one project to highstandards may consume resources thatwould be better spent over the wholenetwork, or in filling other gaps in thenetwork with lower standard roads. Inthose countries where the basic roadnetwork is incomplete, it will usually beappropriate to adopt a relatively low levelof geometric standards in order to releaseresources to provide more basic roadlinks. This policy will generally do more tofoster economic development thanbuilding a smaller number of road links toa higher standard. Analyses of this kindcan be carried out using appropriatecomputer-based tools such as HDM-4(Chapters 14 and 15)
2.3.6 Analysis period and design life
The analysis period may be partly dictatedby the nature of the investigation. Forexample, long periods are useful whencomparing mutually exclusive projects,whereas short periods may be appropriatefor small projects (such as regravelling ofrural access roads), where the life of theinvestment is expected to be limited to afew years.
When choosing design standards for aroad, a fundamental decision must bemade as to whether those designstandards should hold only for the analysisperiod for which a project is beinganalyzed or whether standards should bechosen for a shorter or longer period thanthis. In the past, geometric standards haveeffectively been chosen for a life far inexcess of the economic analysis period,whereas pavement design standards havebeen chosen based on the actual analysisperiod itself, or even for a shorter periodwhen coupled with stage construction.
25
Activity Category Type Examples
Maintenance Routine planned Cleaning side drains
Routine unplanned Reactive Patching
Seasonal Snow removal
Emergency Landslip removal
Periodic (planned) Preventive Slurry seal
Resurfacing Thin overlay
Road marking Renew markings
Renewal Overlay Structural asphalt(also referred to Bonded concreteas reconstruction)
Pavement Mill and replacereconstruction Inlay
Spot improvements Provision of permanent water crossings
Development Widening Lane addition(also referred to as Shoulder provisionupgrading or new construction) Realignment Local geometric
improvementJunction improvement
New section DuallingBy-pass construction
Table 2.4: Road work activitiesSource: Adapted from Overseas Road Note 1. Road maintenance management for District Engineers
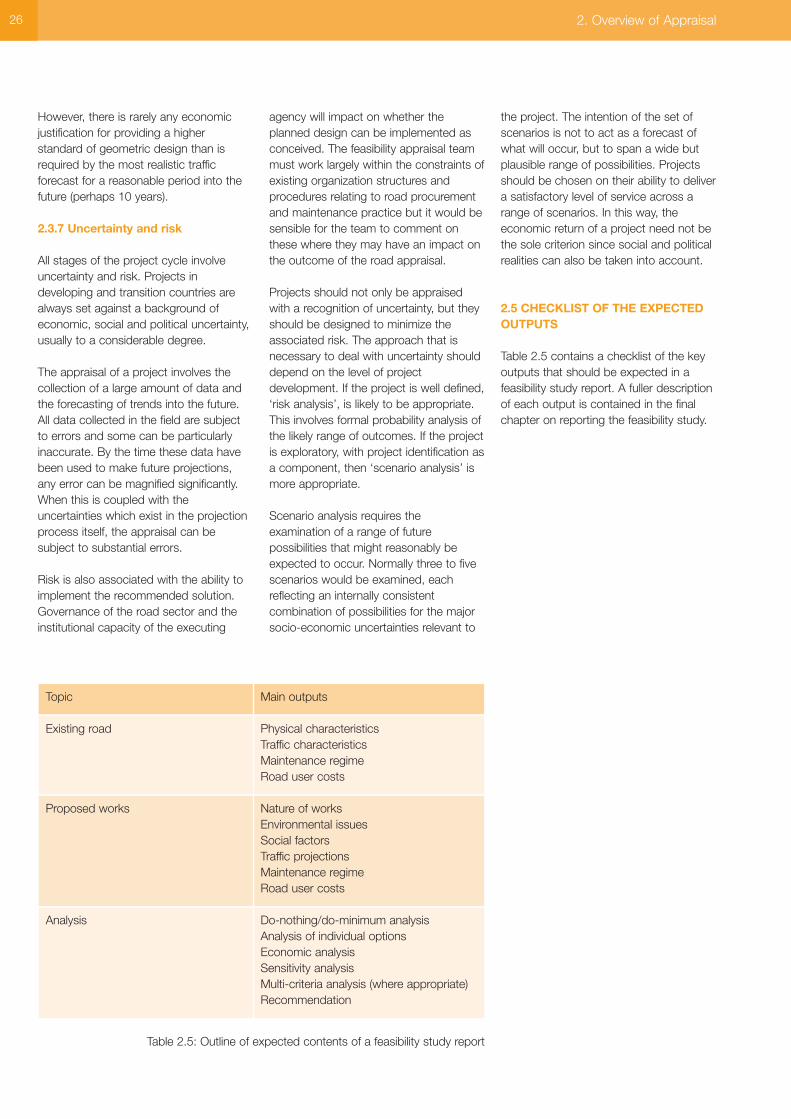
However, there is rarely any economicjustification for providing a higherstandard of geometric design than isrequired by the most realistic trafficforecast for a reasonable period into thefuture (perhaps 10 years).
2.3.7 Uncertainty and risk
All stages of the project cycle involveuncertainty and risk. Projects indeveloping and transition countries arealways set against a background ofeconomic, social and political uncertainty,usually to a considerable degree.
The appraisal of a project involves thecollection of a large amount of data andthe forecasting of trends into the future.All data collected in the field are subjectto errors and some can be particularlyinaccurate. By the time these data havebeen used to make future projections,any error can be magnified significantly.When this is coupled with theuncertainties which exist in the projectionprocess itself, the appraisal can besubject to substantial errors.
Risk is also associated with the ability toimplement the recommended solution.Governance of the road sector and theinstitutional capacity of the executing
agency will impact on whether theplanned design can be implemented asconceived. The feasibility appraisal teammust work largely within the constraints ofexisting organization structures andprocedures relating to road procurementand maintenance practice but it would besensible for the team to comment onthese where they may have an impact onthe outcome of the road appraisal.
Projects should not only be appraisedwith a recognition of uncertainty, but theyshould be designed to minimize theassociated risk. The approach that isnecessary to deal with uncertainty shoulddepend on the level of projectdevelopment. If the project is well defined,‘risk analysis’, is likely to be appropriate.This involves formal probability analysis ofthe likely range of outcomes. If the projectis exploratory, with project identification asa component, then ‘scenario analysis’ ismore appropriate.
Scenario analysis requires theexamination of a range of futurepossibilities that might reasonably beexpected to occur. Normally three to fivescenarios would be examined, eachreflecting an internally consistentcombination of possibilities for the majorsocio-economic uncertainties relevant to
the project. The intention of the set ofscenarios is not to act as a forecast ofwhat will occur, but to span a wide butplausible range of possibilities. Projectsshould be chosen on their ability to delivera satisfactory level of service across arange of scenarios. In this way, theeconomic return of a project need not bethe sole criterion since social and politicalrealities can also be taken into account.
2.5 CHECKLIST OF THE EXPECTEDOUTPUTS
Table 2.5 contains a checklist of the keyoutputs that should be expected in afeasibility study report. A fuller descriptionof each output is contained in the finalchapter on reporting the feasibility study.
Table 2.5: Outline of expected contents of a feasibility study report
Topic Main outputs
Existing road Physical characteristicsTraffic characteristicsMaintenance regimeRoad user costs
Proposed works Nature of worksEnvironmental issuesSocial factorsTraffic projectionsMaintenance regimeRoad user costs
Analysis Do-nothing/do-minimum analysisAnalysis of individual optionsEconomic analysisSensitivity analysisMulti-criteria analysis (where appropriate)Recommendation
2. Overview of Appraisal26
27
3.1 OVERVIEWThere is strong emphasis in this Note that aroad project should not be conducted inisolation. It should have its origins within abroad transport policy framework, and bepart of a programmed approach toinvestment in road infrastructure operation,maintenance, renewal and development.Justification and prioritization of a roadproject should be based upon its relativecontribution to achieving overall transportgoals. The Note does not attempt topresent the detailed process that should beadopted to comply with such a policy andprogrammed approach to road investment.However, in recognition of the criticalimportance of this concept, this chapterincludes a brief discussion of transportpolicy, road planning and the evolvinginstitutional framework within which roadsare being developed.
3.2 POLICY AND REGULATORYFRAMEWORK
Ideally, transport planning is undertakenwithin the framework of a transport policyand the surrounding regulatoryenvironment. Transport policy indicates thedirection of development of the transportsector expected by government. It is basedon a number of factors including:
■ Expectations of national and regionaldevelopment (the economy, society andthe environment) and the role thattransport must play in achieving these
■ Strategic needs and expectations of thetransport sector (in respect, say, ofnational security strategy)
■ The roles of both the public and privatesectors
■ The existing characteristics of thetransport sector, and where comparative
advantage may lie■ Constraints and opportunities for
developing the transport sector.
Over-riding all of this is likely to be theincreasing emphasis on the goals forachieving national poverty reduction andeconomic growth, and the role thattransport can play in meeting these goals.
Thus a clearly defined policy provides theguiding principles for development of thetransport sector, indicating the broadexpectations and directions of growth. Thisis the starting point for the investmentprioritization process, providing the sign-posts for focusing effort. The policy willindicate, for example, the relativeexpectations of sub-sectors (like rail androad), the focus of attention within a sub-sector (e.g. the relative importance of ruraland inter-urban roads) and the relativeimportance of motor vehicles versus nonmotorized transport modes. The policyshould also have a lot to say about efficiencymeasures (making the most of existingresources), about the expected level ofpublic and private involvement, and aboutsocial, environmental and traffic safetyissues.
Depending on the nature of governmentintervention, the policy may be prescriptivein the way it allocates resources, or it mayrely on the creation of the right investmentand operating environment throughappropriate sector financial and regulatoryincentives and controls. In either event, theregulatory framework for the transportsector should be seen as an intimate partof transport policy since it will stronglyinfluence the basis for decision making at alllevels of planning.
3.3 A ROAD POLICY DOCUMENT
Policies determine the course of action asto how future decisions are to be made andare clearly distinct from plans. A road policyframework provides a framework of advicefor policy makers, planners, engineers andtechnicians working at different levels withingovernment and the road administration. Itis suggested that the policy frameworkshould be set out in a policy document andshould comprise:
i) A mission statement. This sets out thebroad goals of how the road network is tobe managed. It is necessarily brief andshould broadly cover the overall planningfunction and objectives of the organization.It is usually of most concern to senior policymakers and senior management within aroad administration.
ii) Objectives. In order to translate thebroad goals into meaningful instructions it isnecessary to set specific objectives foreach area of the mission statement. Theobjectives need to be measurable, relevant,specific and achievable. Specific objectivesare deemed to be of most relevance to theprogramming function of roadmanagement. Their application is of mostconcern to professional engineers andmiddle level management.
iii) Standards and intervention levels.These specify detailed targets or theprecise instructions as to when anintervention is to be made. The applicationof standards and interventions is of mostconcern to junior professional andtechnicians in the preparation andoperations function of road management.
The existence of a written policy frameworkdoes not, of course, guarantee that the
3. The Context for Road Appraisal
objectives are consistent or logically followfrom the mission statement; neither does itguarantee that the standards and inter-ventions that are applied logically followfrom the specified objectives.
3.4 GOVERNANCE OF ROADPROGRAMMES AND PROJECTS
3.4.1 Institutional framework
A key aspect of policy development is theinstitutional framework that develops,‘owns’ and ‘drives’ policy forward, anddelivers the expected outcomes. In verybroad terms this framework should cover awide range of interests from top-to-bottomof the transport sector, including: ministerialinterests; government agencies anddepartments; transport parastatals; privatetransport operators; representatives ofindustry, commerce and agriculture;construction companies; transport usersand the public at large. In developing thepolicy, attention should be given to howeffectively these institutions work, and howthey can be re-shaped and strengthened inorder to achieve the policy goals.
An organizational model that many countiesare trying to emulate involves the functionalseparation of higher level planning andadministration from maintenance operations,with the latter being fulfilled through com-petitive bidding by contractors. Thus rolescan be split into the following categories:
■ The owner which is typically a ministry,department or local authority with overallresponsibility for the network
■ The administrator which is typically aroads authority or agency responsible forimplementing policy
■ The manager who is responsible forspecifying activities, letting contracts, andsupervising and monitoring work. In mostinstances this is done by the roadsauthority but in some countries thisactivity may be contracted out toconsultants
■ The contractor who is responsible fordirectly undertaking the physical work onthe network.
Although there are examples to thecontrary, the balance of evidence points tosubstantial savings if road maintenance isundertaken via competitive contract ratherthan being carried out ‘in-house’ by forceaccount.
3.4.2 Decentralization
There is currently a trend towardsdelegation of central decision making(relating to the rural road network) either tolocal authorities or through deconcentrationof central authority to the regional or localoffice of the road ministry or department.The justification for these changes hasbeen to provide greater transparency,accountability, responsiveness, probity,efficiency, equity and opportunities for massparticipation. Decentralization is seen as away to simplify complex bureaucraticprocedures, increase sensitivity to localconditions and needs, help nationalgovernment ministries reach a wide rangeof groups in decision making and helpincrease political stability through allowingcitizens to have more control over publicprogrammes at the local level. However,although rural roads may be technically lesscomplex than main roads, theirmanagement and procurement problemsare just as complex and planning problemsare very far from being simple.
3.4.3 Road Fund Boards
The increasing trend towards transparencyand value for money in the prioritization ofpublic and donor funds is stronglyinfluencing the way in which the transportsector is being organized. In the roadssector in particular, some governmentshave created a road fund which isindependent of the general governmentrevenue system (and hence exclusivelyused for roads expenditure), and isadministered by Road Fund Boards. Aboard may have the task of prioritizing roadexpenditure, based on guiding principlesset out in their regulations of establishment.Transparency is further enhanced by theseparation of ministerial responsibilities forpolicy and legislation, with executivepowers (for road works programming,design and implementation) being devolvedto semi-autonomous road administrations.These bodies are established as legalentities with a commercial approach tomanagement, and may operate under anagency agreement, independently ofgovernment and civil service structures.
3.4.4 Private initiatives
Some countries rely to some extent onprivate sector finance for road investment.The usual model is where governmentgrants a concession to a private sector
entity to provide and operate a designatedpiece of road infrastructure for a specifiedperiod of time. The private entity becomesthe temporary ‘owner’ of the road and it isreimbursed either through tolls, shadowtolls (in which a toll is paid by thegovernment or other road owner to theroad operator based on traffic counts onthe road and an agreed rate pervehicle/type), or a combination of both.Private sector ownership complicates theappraisal process since the private entityseeks a return on investment at marketprices, reflected by the levels of traffic usingthe road, while the government seeks toensure that the project remains viable interms of normal cost benefit analysismeasures i.e. to ensure that normalinvestment criteria for a public good areupheld (this essentially distinguishes afinancial from an economic analysis).
3.4.5 Scope for corruption
Road investment and maintenance is avery big business in any country, not leastin developing and transition countries.There is a clear need for governments andtheir road agents to properly account forthe huge sums of public finance (fromwhatever source, be it tax revenues ordonor grants and loans) being processed,and to address the possibilities for fraudand corruption. Many of the institutionalmeasures discussed above are helping tocreate the right framework for addressingcorruption.
The opportunities for corruption occur at allstages in the project cycle, but will evidentlybe more ‘rewarding’ at the implementationstages when large contracts are being putin place. Independent auditing andcompetitive bidding procedures, which arerequirements of donor-fundedprocurement, are an attempt to limit thescope for corruption.
At the feasibility stage of projectdevelopment, the scope for corruption maybe fairly limited; even so, the risk analysis ofa feasibility study should include within itsscope a commentary on the risksassociated with any deviation fromimplementation of the project as specified.Deviation from the design (due say tocorrupt procurement practices) could wellhave a significant impact on the roadperformance.
28 3. The Context for Road Appraisal
3.5 PRIORITIZING ROADEXPENDITURES
3.5.1 Value-for-money
The process of prioritizing investment intransport projects is all about seekingvalue-for-money, i.e. how should limitedresources best be deployed to meet thegoals of the transport sector (and ultimatelypoverty reduction goals). At a general levelof planning, the issue may concern whetherto invest, say, in rail or road; at the moredetailed level of planning (e.g. feasibility) theemphasis may be on choosing the bestroute or design option for the selectedproject.
Cost-benefit analysis (CBA) is the methodof choice for establishing both value-for-money and priorities at all levels of planningenquiry. CBA establishes both the absoluteand relative worth of an individual projectwhich must then be compared with all theother projects that might potentially beincluded in the road administration’s annualprogramme of works. This raises the issueof how many projects the roadadministration can afford to implement,given the availability of funds from thegovernment budget (or Road Fund), donorfunds and other grants and loans. In thiscontext, value-for-money means choosingthe right projects and implementing them atthe right time.
CBA has its limitations, however, as theremay be many unquantifiable (in moneyterms) impacts (benefits and costs) oftransport investment which cannot bedirectly included in the analysis. Many ruralroad infrastructure projects, for example,are difficult to justify using a standard CBAapproach because of the difficulty ofmeasuring all the benefits (e.g. the value acommunity places on access to basicpublic services). Thus, for example, theutility of CBA is limited in isolated areaswhere agricultural productivity, populationdensity and traffic volume (preconditions foruse of CBA) are low. Furthermore, thedistribution of costs and benefits is findingincreasing importance in decision-makingwith the current emphasis on povertyreduction.
Value-for-money must therefore be seen in the wider context of social andenvironmental impacts, as well as budgetconstraints and economic efficiency andgain.
3.5.2 Maintenance and capitalexpenditure
Maintenance and renewal of the existinginfrastructure are vital activities for anyhighway administration, and should takepriority over all new capital works otherthan in exceptional circumstances. Newinvestment not only competes withmaintenance for scarce revenues, but alsoincreases the burden on futuremaintenance requirements. The trade-offbetween maintenance and investmentshould ideally be explored through a long-term cash-flow programme which shows,on an annual basis, what resources areavailable, how much is required formaintenance and the balance left over fornew investment. While this Note stronglyendorses this approach, it does not containguidance on the procedures formaintenance programming andprioritization, these are described inOverseas Road Note 1.
Maintenance is the group of works thatenables a road to continue to provide anacceptable level of service. In doing this,maintenance reduces the rate ofdeterioration of the road, it lowers the costof operating vehicles on the road byproviding a safe, smooth running surface,and it keeps the road open on acontinuous basis by preventing it frombecoming impassable. It is a relatively lowcost activity and specifically excludes thosedevelopment works designed to increasethe strength or improve the alignment ofthe road, i.e. capital expenditure.
However, maintenance does have a placein the appraisal of a capital roads project:the costs of maintaining the new road overits lifetime must be factored into the CBA.Furthermore, these must be weighedagainst the maintenance costs that wouldhave been incurred without theconstruction of the new road.
3.5.3 Allocating funds betweencompeting choices
Budget allocations for rehabilitation andmaintenance need to be disbursedamongst different levels of the roadnetwork, between rural and urban roadsand also among different districts. Althougha rational funds allocation procedure isessential, the process is often very opaqueand prone to ‘political’ interference. Theprocedures may be based on bidding and
negotiation between national and localauthorities and road organizations or theymay be based on formulae which accountfor characteristics such as road length,area, population and income per head.
Maintenance management systems nowexist that can prioritize maintenanceexpenditure based on road conditionsurveys and the application of economicCBA to the problem. They includeoptimization of multiple options and full life-cycle analysis of both road administrationand user costs. The approaches canmaximize the net present value (a measureof economic worth used in CBA - seeChapter 15) of a maintenance programmesubject to a budget constraint. Thisprovides a rational economic basis for theallocation of maintenance funds and isperhaps most useful in helping to decidewhen the larger scale interventions, such asresealing or overlays, should take place.However, these models cannotsatisfactorily allocate maintenanceresources for the lowest volume roads(which the models do not address) whenvehicle accessibility becomes a majorproblem or when funding is extremelylimited and routine maintenance isthreatened.
Computer programming techniques havebeen developed to determine an optimalinvestment and maintenance programme.The objective of the computer programmight be to, say, maximize the long run netpresent value of the road investmentprogramme subject to a set of budgetconstraints.
DETAILED SOURCES OF INFORMATION
Gwilliam, K and Ajay Kumar (2002). Road FundsRevisited. TWU-47. World Bank, Washington,DC.
Malmberg Calvo, C (1998). Options formanaging and financing rural transportinfrastructure. Technical paper 411. World Bank,Washington, DC.
Heggie, I G and P Vickers (1998). Commercialmanagement and financing of roads. (Chapters3, 7, and 8 plus Annexes). Technical Paper 409.World Bank, Washington, DC.
Heggie, I G (2003). Commercializingmanagement and financing of roads indeveloping and transition countries. TransportReviews, Vol. 23, No. 2, 139-160.
29

PART 2
Fieldwork and Surveys
4.1 PURPOSE AND PROCESS
Traffic assessment is the process ofestimating future traffic loadings on theroad or network under review. Trafficforecasts are needed for two keyreasons:
■ As an input to the geometric,pavement and bridge design process
■ As an input to the environmental,economic and social impact analyses.
For the purposes of geometric designand the evaluation of economic benefits,the volume and composition of currentand future traffic needs to be known. Forthe structural design of paved roads, onlythe number and axle loading of theheavier vehicles need be considered aslighter vehicles contribute so little topavement damage.
For the purpose of the economicanalysis, it is also necessary to separatetraffic into the following three categories:
■ Normal traffic which is what wouldpass along the existing road beingconsidered by the project if noinvestment took place
■ Diverted or reassigned traffic which istraffic that changes from another route(or mode) to the project road, but stilltravels between the same origin anddestination
■ Generated or developmental trafficwhich is the additional traffic whichoccurs in response to the provision orimprovement of a road.
The basic traffic assessment process willgenerally include some or all of thefollowing phases:
■ Data review ■ Development of a forecasting
approach■ Data surveys ■ Application of the forecasting approach
4.2 DATA REVIEW AND SURVEYS
4.2.1 Data needs and surveys
Table 4.1 outlines the main datarequirements and survey types.Fundamental to all enquiries is a baselinetraffic count. Most road design,particularly where heavy goods vehiclesare an important component of trafficdemand, will also require an estimate ofaxle loadings.
30 4. Assessing Traffic Demand
4. Assessing Traffic Demand
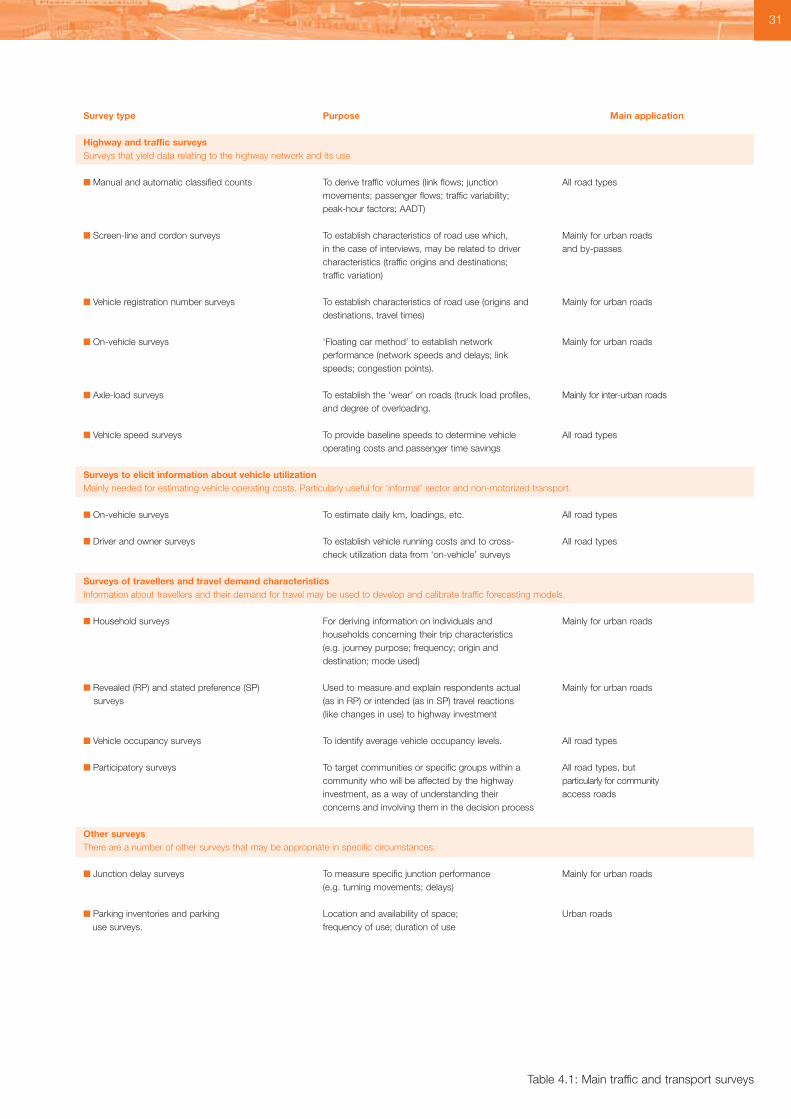
31
Survey type Purpose Main application
Highway and traffic surveysSurveys that yield data relating to the highway network and its use
■ Manual and automatic classified counts To derive traffic volumes (link flows; junction All road typesmovements; passenger flows; traffic variability; peak-hour factors; AADT)
■ Screen-line and cordon surveys To establish characteristics of road use which, Mainly for urban roadsin the case of interviews, may be related to driver and by-passescharacteristics (traffic origins and destinations; traffic variation)
■ Vehicle registration number surveys To establish characteristics of road use (origins and Mainly for urban roadsdestinations, travel times)
■ On-vehicle surveys ‘Floating car method’ to establish network Mainly for urban roadsperformance (network speeds and delays; link speeds; congestion points).
■ Axle-load surveys To establish the ‘wear’ on roads (truck load profiles, Mainly for inter-urban roadsand degree of overloading.
■ Vehicle speed surveys To provide baseline speeds to determine vehicle All road typesoperating costs and passenger time savings
Surveys to elicit information about vehicle utilization Mainly needed for estimating vehicle operating costs. Particularly useful for ‘informal’ sector and non-motorized transport.
■ On-vehicle surveys To estimate daily km, loadings, etc. All road types
■ Driver and owner surveys To establish vehicle running costs and to cross- All road typescheck utilization data from ‘on-vehicle’ surveys
Surveys of travellers and travel demand characteristicsInformation about travellers and their demand for travel may be used to develop and calibrate traffic forecasting models.
■ Household surveys For deriving information on individuals and Mainly for urban roadshouseholds concerning their trip characteristics (e.g. journey purpose; frequency; origin and destination; mode used)
■ Revealed (RP) and stated preference (SP) Used to measure and explain respondents actual Mainly for urban roadssurveys (as in RP) or intended (as in SP) travel reactions
(like changes in use) to highway investment
■ Vehicle occupancy surveys To identify average vehicle occupancy levels. All road types
■ Participatory surveys To target communities or specific groups within a All road types, but community who will be affected by the highway particularly for communityinvestment, as a way of understanding their access roadsconcerns and involving them in the decision process
Other surveysThere are a number of other surveys that may be appropriate in specific circumstances.
■ Junction delay surveys To measure specific junction performance Mainly for urban roads(e.g. turning movements; delays)
■ Parking inventories and parking Location and availability of space; Urban roadsuse surveys. frequency of use; duration of use
Table 4.1: Main traffic and transport surveys

4.2.2 Traffic counts
The basis for forecasting traffic demandand axle loadings are current trafficcounts and classifications for the existingroad. Many highways administrationscollect this information routinely (insupport of maintenance planning, forexample) for their main trunk network.Appropriate information is less likely to beavailable for urban and rural roads.
The estimate used should be the annualaverage daily traffic (AADT) currentlyusing the route. This is the total annualtraffic in both directions divided by 365,typically obtained by recording actualtraffic flows over a specific shorter periodfrom which the AADT is estimated. Thetraffic count is either classified intovehicle categories, or agglomerated into‘equivalent units’ of traffic (see Box 4.1).
The classification of traffic is partlydependent on the nature of the enquiryand partly on survey resources whichmay limit the number of different vehicletypes that can be competently recorded.Rural roads, for example, are likely torequire a much greater emphasis oncapturing non-vehicular trafficmovements, whereas axle-load surveysare mainly concerned with the numbersand types of the heavier categories ofvehicle. Examples of traffic classificationare contained in Table 4.2. In practicemany of these categories will beamalgamated to suit the nature of thesurvey.
32 4. Assessing Traffic Demand
Box 4.1: Traffic equivalence units used to agglomerate traffic statistics
Passenger car unit (equivalent) The Passenger Car Unit or Equivalent (PCU or PCE) is an index of theimpedance effect of a vehicle on other vehicles, using the car as the basic unit(taking the value 1.0). This index is particularly useful in urban areas where theimpedance effects of larger, less ‘nimble’ vehicles may critically affect theperformance of a geometric design. PCU values are usually measured undermaximum flow conditions (saturated flow) and, as such, are largelyindependent of other factors like traffic flow and road width.
Passenger car space equivalent In non-saturated traffic (i.e. free flowing), the PCU value of a vehicle is likely tovary with speed. To account for this, the Passenger Car Space Equivalent(PCSE) provides an index which is similar in nature to the PCU, but ismeasured at a constant speed. Values for different vehicle types are used asan input in HDM-4. (Volume 7 of the HDM-4 series).
Equivalent traffic weighting The Equivalent Traffic Weighting is a variant of the PCU, used in rural areaswhere the pedestrian is taken as the base. (DFID Economists Guide).
Equivalence factorThe equivalence factor (EF) of an axle is its pavement damaging effect inrelation to a standard axle which has a load of 80 kN. The EF values for eachaxle are summed for each vehicle type, and an average vehicle equivalencefactor can be calculated for each vehicle type or group. This is then used withtraffic count data to produce the equivalent standard axle (ESA) loading on theroad. (see Chapter 9).
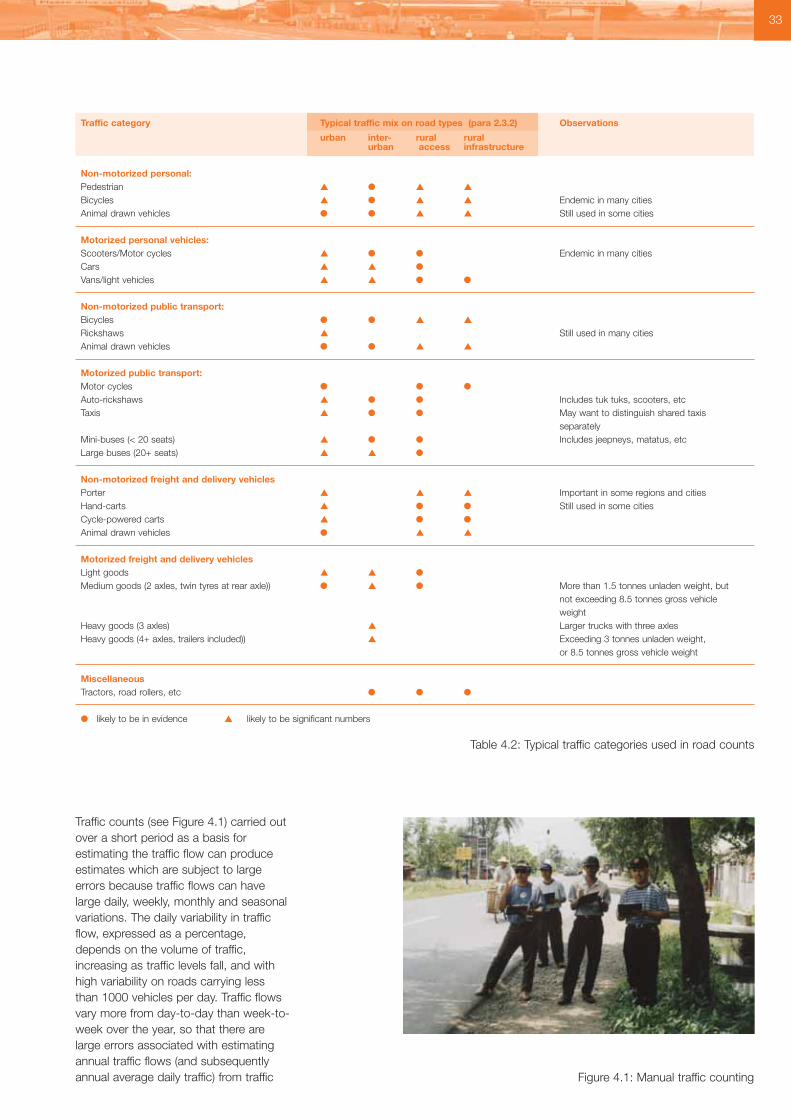
Traffic counts (see Figure 4.1) carried outover a short period as a basis forestimating the traffic flow can produceestimates which are subject to largeerrors because traffic flows can havelarge daily, weekly, monthly and seasonalvariations. The daily variability in trafficflow, expressed as a percentage,depends on the volume of traffic,increasing as traffic levels fall, and withhigh variability on roads carrying lessthan 1000 vehicles per day. Traffic flowsvary more from day-to-day than week-to-week over the year, so that there arelarge errors associated with estimatingannual traffic flows (and subsequentlyannual average daily traffic) from traffic
33
Traffic category Typical traffic mix on road types (para 2.3.2) Observations
urban inter- rural rural urban access infrastructure
Non-motorized personal:Pedestrian ▲ ● ▲ ▲
Bicycles ▲ ● ▲ ▲ Endemic in many citiesAnimal drawn vehicles ● ● ▲ ▲ Still used in some cities
Motorized personal vehicles:Scooters/Motor cycles ▲ ● ● Endemic in many citiesCars ▲ ▲ ●
Vans/light vehicles ▲ ▲ ● ●
Non-motorized public transport:Bicycles ● ● ▲ ▲
Rickshaws ▲ Still used in many citiesAnimal drawn vehicles ● ● ▲ ▲
Motorized public transport:Motor cycles ● ● ●
Auto-rickshaws ▲ ● ● Includes tuk tuks, scooters, etcTaxis ▲ ● ● May want to distinguish shared taxis
separatelyMini-buses (< 20 seats) ▲ ● ● Includes jeepneys, matatus, etcLarge buses (20+ seats) ▲ ▲ ●
Non-motorized freight and delivery vehiclesPorter ▲ ▲ ▲ Important in some regions and citiesHand-carts ▲ ● ● Still used in some citiesCycle-powered carts ▲ ● ●
Animal drawn vehicles ● ▲ ▲
Motorized freight and delivery vehiclesLight goods ▲ ▲ ●
Medium goods (2 axles, twin tyres at rear axle)) ● ▲ ● More than 1.5 tonnes unladen weight, but not exceeding 8.5 tonnes gross vehicle weight
Heavy goods (3 axles) ▲ Larger trucks with three axlesHeavy goods (4+ axles, trailers included)) ▲ Exceeding 3 tonnes unladen weight,
or 8.5 tonnes gross vehicle weight
MiscellaneousTractors, road rollers, etc ● ● ●
● likely to be in evidence ▲ likely to be significant numbers
Table 4.2: Typical traffic categories used in road counts
Figure 4.1: Manual traffic counting

counts of a few days duration, orexcluding the weekend. For the samereason, there is a rapid fall in the likelysize of error as the duration of countingperiod increases up to one week, butthere is a marked decrease in thereduction of error for counts of longerduration. Traffic flows also vary frommonth-to-month, so that a weekly trafficcount repeated at intervals during theyear provides a better base for estimatingthe annual volume of traffic than acontinuous traffic count of the samelength. Traffic also varies considerablythrough the day, but this is unlikely toaffect the estimate of AADT providingsufficient hours are covered by the dailycounts. Box 4.2 gives specific advice oncount durations.
Traffic counts and classifications havetraditionally been undertaken manuallybut there are a variety of traffic counterswhich are available for automating thetask for vehicular traffic. Modern countersalso have detectors that are capable ofautomatic classification of the count.
4.2.3 Axle load surveys
The aim of an axle load survey is toestimate the number of ‘equivalentstandard axles’ currently using theexisting road. To do this, a survey isundertaken to determine an averageequivalency factor for each vehicle type(see also section 9.3.3). Axle loadsurveys can be undertaken using fixed orportable weighbridges, as well as weigh-in-motion equipment.
4.2.4 Secondary sources ofinformation
Secondary sources provide usefulinformation that may be relevant to theforecasting process. These sources fallinto two main categories, namelytransport information and economicbackground.
Transport information covers material thatadds to the general picture of existinghighway use and trends. These materialssupport both the forecasting process and
the understanding of current problems.They include:
■ Vehicle registration statistics, whichindicate scale and trends, as well asdetail of fleet composition and specificgrowth trends in class of vehicle bylocation
■ Traffic volumes on key roads may becollected routinely; this sourceprovides a global view of traffic growth,and may also indicate seasonalfluctuations
■ Accident statistics, which might belocation specific, but are likely to bemore general in nature
■ Transport prices and trends, whichmay be used in forecasting models,particularly if mode choice is acomponent
■ Land-use activity mapping.
The economic background describes thegeneral development potential of thearea, and key economic indicators arelikely to be used as independentvariables in trip forecasting models. Inurban areas it may be possible todevelop zonal values of the economicindicators where household studies areavailable. The key indicators are:
■ Income, usually measured by grossnational product (GNP) per capita
■ Population, which will be based oncensus information
■ Vehicle ownership levels■ Employment levels.
4.3 TRAFFIC FORECASTING
4.3.1 Normal traffic
The commonest method of forecastingthe growth of normal traffic is toextrapolate time series data on trafficlevels and assume that growth will eitherremain constant in absolute terms (alinear extrapolation) or constant in relativeterms (a constant elasticity extrapolation)i.e. traffic growth will be a fixed numberof vehicles per year or a fixed percentageincrease. Data on fuel sales can often beused as a guide to country-wide growthin traffic levels although improvements infuel economy over time should be takeninto account. As a general rule, it is onlysafe to extrapolate forward for as manyyears as reliable traffic data exist from thepast, and for as many years forward that
34 4. Assessing Traffic Demand
Box 4.2: Advice on traffic count durations
In order to reduce the magnitude of errors, it is recommended that trafficcounts to establish AADT at a specific site conform to the followingpractice:
■ The counts are for seven consecutive days
■ The counts on some of the days are for a full 24 hours, with preferablyone 24-hour count on a weekday and one during a weekend. On theother days, 16-hour counts should be sufficient. These should begrossed up to 24 hour values in the same proportion as the 16 hour/24hours split on those days when full 24-hour counts have beenundertaken
■ Counts are avoided on roads at times when travel activity increases‘abnormally’ due to the payment of wages and salaries, or at harvesttime, public holidays, etc, or on any occasion when traffic is abnormallyhigh or low. ‘Abnormal’ in this context means less than 12 times in ayear.
■ If possible, the seven-day counts should be repeated several timesthroughout the year.
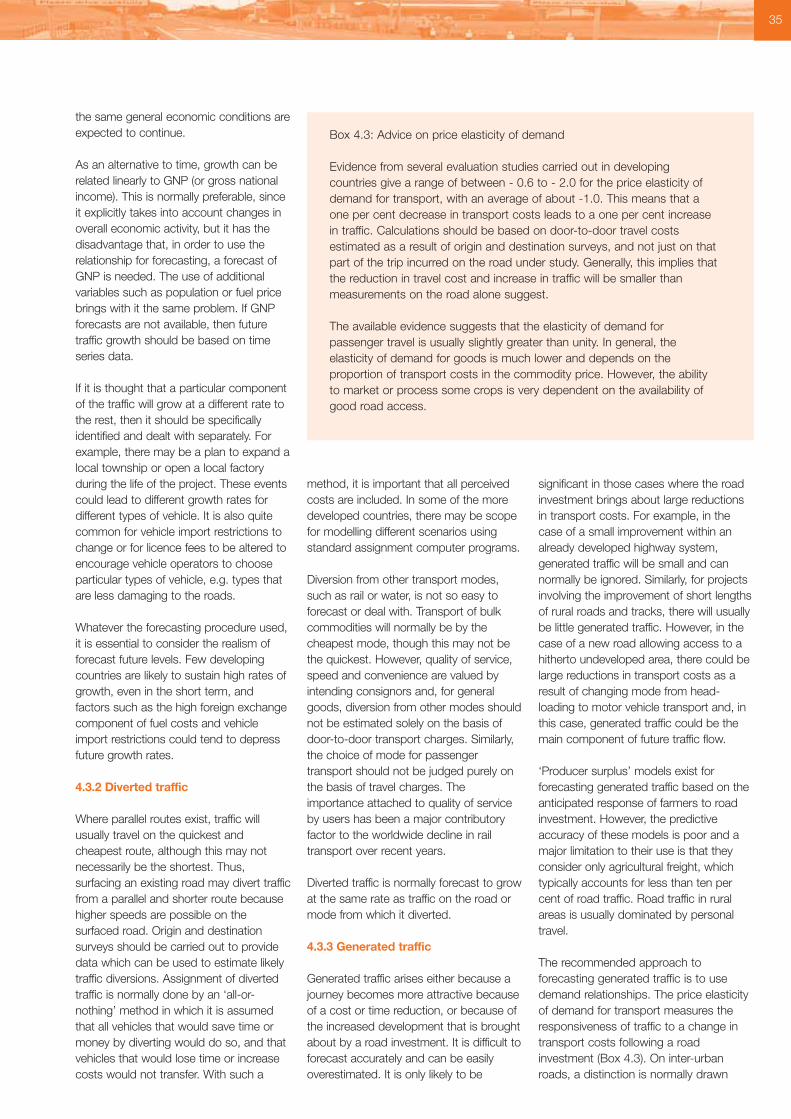
the same general economic conditions areexpected to continue.
As an alternative to time, growth can berelated linearly to GNP (or gross nationalincome). This is normally preferable, sinceit explicitly takes into account changes inoverall economic activity, but it has thedisadvantage that, in order to use therelationship for forecasting, a forecast ofGNP is needed. The use of additionalvariables such as population or fuel pricebrings with it the same problem. If GNPforecasts are not available, then futuretraffic growth should be based on timeseries data.
If it is thought that a particular componentof the traffic will grow at a different rate tothe rest, then it should be specificallyidentified and dealt with separately. Forexample, there may be a plan to expand alocal township or open a local factoryduring the life of the project. These eventscould lead to different growth rates fordifferent types of vehicle. It is also quitecommon for vehicle import restrictions tochange or for licence fees to be altered toencourage vehicle operators to chooseparticular types of vehicle, e.g. types thatare less damaging to the roads.
Whatever the forecasting procedure used,it is essential to consider the realism offorecast future levels. Few developingcountries are likely to sustain high rates ofgrowth, even in the short term, andfactors such as the high foreign exchangecomponent of fuel costs and vehicleimport restrictions could tend to depressfuture growth rates.
4.3.2 Diverted traffic
Where parallel routes exist, traffic willusually travel on the quickest andcheapest route, although this may notnecessarily be the shortest. Thus,surfacing an existing road may divert trafficfrom a parallel and shorter route becausehigher speeds are possible on thesurfaced road. Origin and destinationsurveys should be carried out to providedata which can be used to estimate likelytraffic diversions. Assignment of divertedtraffic is normally done by an ‘all-or-nothing’ method in which it is assumedthat all vehicles that would save time ormoney by diverting would do so, and thatvehicles that would lose time or increasecosts would not transfer. With such a
method, it is important that all perceivedcosts are included. In some of the moredeveloped countries, there may be scopefor modelling different scenarios usingstandard assignment computer programs.
Diversion from other transport modes,such as rail or water, is not so easy toforecast or deal with. Transport of bulkcommodities will normally be by thecheapest mode, though this may not bethe quickest. However, quality of service,speed and convenience are valued byintending consignors and, for generalgoods, diversion from other modes shouldnot be estimated solely on the basis ofdoor-to-door transport charges. Similarly,the choice of mode for passengertransport should not be judged purely onthe basis of travel charges. Theimportance attached to quality of serviceby users has been a major contributoryfactor to the worldwide decline in railtransport over recent years.
Diverted traffic is normally forecast to growat the same rate as traffic on the road ormode from which it diverted.
4.3.3 Generated traffic
Generated traffic arises either because ajourney becomes more attractive becauseof a cost or time reduction, or because ofthe increased development that is broughtabout by a road investment. It is difficult toforecast accurately and can be easilyoverestimated. It is only likely to be
significant in those cases where the roadinvestment brings about large reductionsin transport costs. For example, in thecase of a small improvement within analready developed highway system,generated traffic will be small and cannormally be ignored. Similarly, for projectsinvolving the improvement of short lengthsof rural roads and tracks, there will usuallybe little generated traffic. However, in thecase of a new road allowing access to ahitherto undeveloped area, there could belarge reductions in transport costs as aresult of changing mode from head-loading to motor vehicle transport and, inthis case, generated traffic could be themain component of future traffic flow.
‘Producer surplus’ models exist forforecasting generated traffic based on theanticipated response of farmers to roadinvestment. However, the predictiveaccuracy of these models is poor and amajor limitation to their use is that theyconsider only agricultural freight, whichtypically accounts for less than ten percent of road traffic. Road traffic in ruralareas is usually dominated by personaltravel.
The recommended approach toforecasting generated traffic is to usedemand relationships. The price elasticityof demand for transport measures theresponsiveness of traffic to a change intransport costs following a roadinvestment (Box 4.3). On inter-urbanroads, a distinction is normally drawn
35
Box 4.3: Advice on price elasticity of demand
Evidence from several evaluation studies carried out in developingcountries give a range of between - 0.6 to - 2.0 for the price elasticity ofdemand for transport, with an average of about -1.0. This means that aone per cent decrease in transport costs leads to a one per cent increasein traffic. Calculations should be based on door-to-door travel costsestimated as a result of origin and destination surveys, and not just on thatpart of the trip incurred on the road under study. Generally, this implies thatthe reduction in travel cost and increase in traffic will be smaller thanmeasurements on the road alone suggest.
The available evidence suggests that the elasticity of demand forpassenger travel is usually slightly greater than unity. In general, theelasticity of demand for goods is much lower and depends on theproportion of transport costs in the commodity price. However, the abilityto market or process some crops is very dependent on the availability ofgood road access.
between passenger and freight trafficand, on roads providing access to ruralareas, a further distinction is usually madebetween agricultural and non-agriculturalfreight traffic.
4.3.4 Outputs
Outputs from the traffic forecastingprocess will be tailored for the specificproject to meet the needs of the designteam and the appraisal processes. Foreach option under review (including thebase case), and for the project lifetime,the outputs from the forecasting processwill include:
■ Traffic volumes (by category of vehicle)and person movements on links
■ Travel times (by category of vehicle) onlinks
■ Where applicable, forecasts of divertedand generated traffic
■ Peak hour traffic volumes and AADT onlinks
■ Cumulative axle-loadings■ Turning movements at key
intersections.
4.4 UNCERTAINTY OF TRAFFICESTIMATES
Estimates of baseline traffic flows andtraffic growth rates will inevitably besubject to degrees of error. Errors in bothof these parameters will have a greatimpact on the estimated economic rate ofreturn of a road project. It is difficult toestimate baseline traffic flow to withinabout 20 percent and, typically, an errorthis size will give an error of a similarorder of magnitude in the economicworth. Errors in estimation of trafficgrowth will increase the uncertainty in theproject’s economic return even further.
Bearing in mind the large errors that canbe associated with both traffic countingand forecasting, it is vital thatconsiderable attention is paid to thequality and duration of the data collectionin this area. In addition, sensitivity testingshould always be carried out to determinethe effects of errors in traffic counts andforecasts on the final recommendations.Projects should normally be analyzedusing both ‘optimistic’ (high) and‘pessimistic’ (low) levels of future traffic inaddition to the scenario of the bestestimate.
4.5 SPECIAL CONSIDERATIONS FORURBAN ROADS
4.5.1 Introduction
Forecasting traffic on urban roads iscomplex because of the nature of theurban network and transport modes inuse. Here the estimation of future trafficvolumes has two basic elements:
■ Predicting travel demand (typicallypresented as a trip matrix) within thestudy area
■ Assignment of total trips to the roadnetwork and, in particular, to thescheme under review.
The process of forecasting travel demandhas as its output the level of trip-makingover the project life on the scheme ornetwork under review. The process caninvolve several steps, depending on thecomplexity of the problem:
■ Generation of trips■ Distribution of trips■ Modal choice.
Table 4.3 gives an overview of theforecasting process for urban roads.
4.5.2 Generation of trips
Travel prediction models are used toforecast how travel demand responds tochanges in the transport system. They arebased on mathematical relationships thatare derived using simple statisticaltechniques and relate observed trip-making to one or more independentvariables. The model should accuratelyreproduce observed trip-making, and cansubsequently be used to forecast flows inthe future using changed inputs reflectingassumptions about growth in theindependent variables. Thus, the growth inthe explanatory (independent) variablesmust be forecast in order to ‘drive’ theforecasting model. However, thesevariables are often the subject of detailednational planning, and may be either readilyavailable or relatively easy to generate.
4.5.3 Trip distribution
Trip distribution forecasts the patterns ofmovements between specific areas orzones given the demands for travel to andfrom these areas developed as part of thetrip distribution model. Matrix estimation
techniques are used to estimate theexisting trip pattern or matrix from countdata, developing the origin-destinationpatterns that are the most consistent withthe observed flows. These techniques canalso be used to update older observed orestimated matrices in the light of morerecent traffic counts. By using the readilyavailable data more extensively they canpermit a significant reduction in the datacollection exercise, by removing orreducing the need for roadside interviews.
4.5.4 Modal split
The upgrading of the road network maylead to changes in the modes whichtravellers use for their journey. This mayarise, particularly in the urban context,when travellers switch between publictransport and private transport, or betweenroad-based and other forms of publictransport.
In the absence of any policy measuresdesigned to influence mode choice,significant switches between modes areunlikely unless schemes are large, andthere are substantial volumes of travellersusing non-road based modes within thearea of influence of the scheme.
4.5.5 Assignment
Traffic assignment is the process in whichthe demand for travel between origins anddestinations determined by the tripdistribution model are assigned to specificlinks on the highway network.
Where a road project has little‘competition’ from other roads or transportmode, for example, in the case of a simpleon-line upgrading or bypass close to theexisting road, the assignment can bemanual. But where competition does exist,the issue of diverted traffic becomesimportant. A simple approach to thisproblem is the use of ‘diversion curves’.These estimate the amount of switchingbetween two competing roads, based oncomparative journey times and distancesfor the two options.
For very complex networks (essentially theurban context), models have beendeveloped which assign traffic to individuallinks in the network using criteria likegeneralized costs of travel or origin-destination trip times. These models havemechanisms that reflect the congestion
36 4. Assessing Traffic Demand
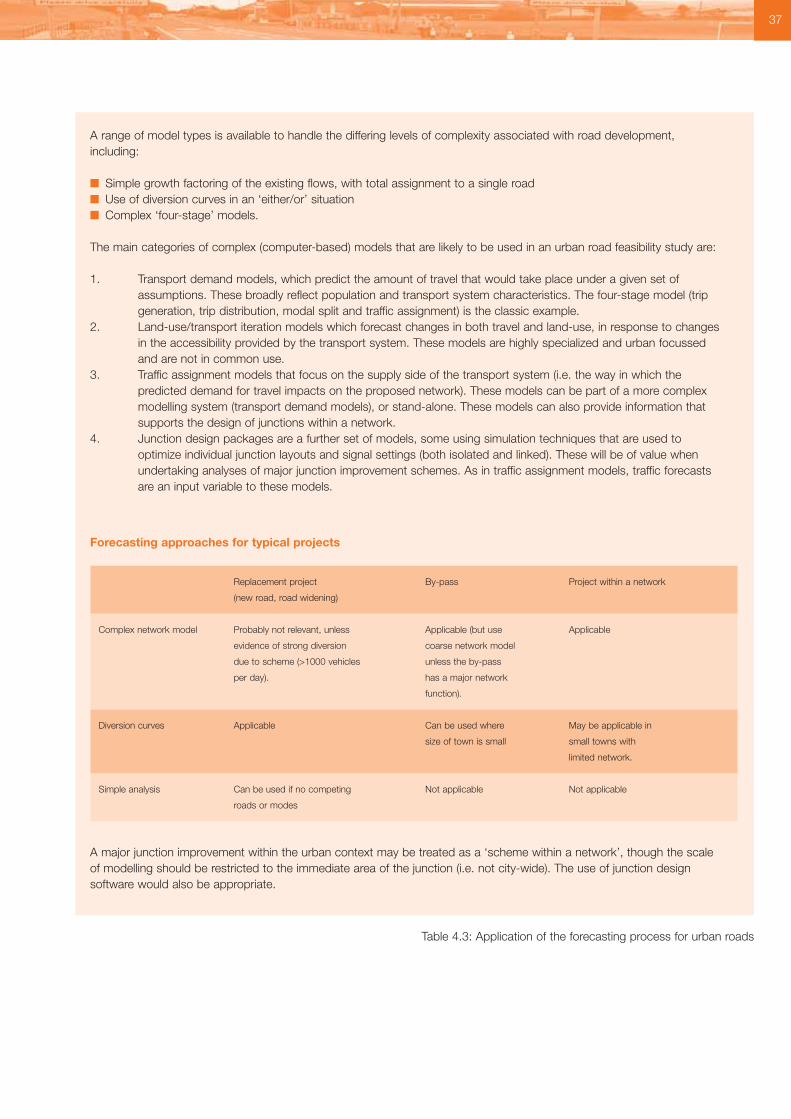
37
A range of model types is available to handle the differing levels of complexity associated with road development,including:
■ Simple growth factoring of the existing flows, with total assignment to a single road■ Use of diversion curves in an ‘either/or’ situation■ Complex ‘four-stage’ models.
The main categories of complex (computer-based) models that are likely to be used in an urban road feasibility study are:
1. Transport demand models, which predict the amount of travel that would take place under a given set ofassumptions. These broadly reflect population and transport system characteristics. The four-stage model (tripgeneration, trip distribution, modal split and traffic assignment) is the classic example.
2. Land-use/transport iteration models which forecast changes in both travel and land-use, in response to changesin the accessibility provided by the transport system. These models are highly specialized and urban focussedand are not in common use.
3. Traffic assignment models that focus on the supply side of the transport system (i.e. the way in which thepredicted demand for travel impacts on the proposed network). These models can be part of a more complexmodelling system (transport demand models), or stand-alone. These models can also provide information thatsupports the design of junctions within a network.
4. Junction design packages are a further set of models, some using simulation techniques that are used tooptimize individual junction layouts and signal settings (both isolated and linked). These will be of value whenundertaking analyses of major junction improvement schemes. As in traffic assignment models, traffic forecastsare an input variable to these models.
Forecasting approaches for typical projects
Replacement project By-pass Project within a network
(new road, road widening)
Complex network model Probably not relevant, unless Applicable (but use Applicable
evidence of strong diversion coarse network model
due to scheme (>1000 vehicles unless the by-pass
per day). has a major network
function).
Diversion curves Applicable Can be used where May be applicable in
size of town is small small towns with
limited network.
Simple analysis Can be used if no competing Not applicable Not applicable
roads or modes
A major junction improvement within the urban context may be treated as a ‘scheme within a network’, though the scaleof modelling should be restricted to the immediate area of the junction (i.e. not city-wide). The use of junction designsoftware would also be appropriate.
Table 4.3: Application of the forecasting process for urban roads

levels that accumulate on individual links asthe assignment proceeds.
4.5.6 Scale of analysis
The scale of forecasting analysis in afeasibility study is based on three mainfactors:
The nature of the area, the size andvariety of alternative choices (roads andother transport modes) and their marketsharesThe availability of data and resourcesThe forecasting approach adopted.
Urban road projects are likely to requiresome form of complex modelling, whileinter-urban and rural roads are likely tomerit a more simplified forecastingprocess. As a result, the urban process islikely to ‘consume’ larger amounts ofdata; as a minimum it requires:
■ A trip matrix ■ Classified traffic counts on links ■ Travel time speeds over the network ■ Zonal information relating to socio-
economic characteristics ■ Referenced road network and item
inventory.
Where these do not exist or are out-dated, new surveys must beimplemented to either furnish theinformation or to update the historicsources. Thus the estimation of theresources required to fulfil the forecastingprocess must be based on a goodunderstanding of the robustness ofexisting data sources.
4.6 SPECIAL CONSIDERATIONS FORRURAL ROADS
The volumes of traffic on rural transportinfrastructure are likely to be extremelylow and this has an impact on thereliability of limited duration traffic counts.The recommendations given in Box 4.2for traffic count durations may beapplicable in this situation though, forsome rural access roads, the levels oftraffic may be so small as to makecounting uneconomic. In this situation,estimating traffic levels should beundertaken as part of the social enquiry.
Low traffic volumes also make it hard todevelop an economic justification forimprovements to rural transportinfrastructure; there are insufficientbenefits (that can be valued in moneyterms) to off-set the costs involved. Themain source of benefit is likely to bedevelopmental (i.e. generated traffic), butthe estimation of these benefits is difficultto quantify in monetary terms.
The current trend in the appraisal of ruraltransport infrastructure is to estimate thenature of social benefits, and to combinethese benefits with any quantifiableeconomic gains through some form ofmulti-criteria analysis (see Chapter 15).This approach takes the emphasis offtraffic counting, and focuses more onsocial enquiry using participatorytechniques.
DETAILED SOURCES OF INFORMATION
Bennett, C R and I D Greenwood.Modelling road user and environmentaleffects in HDM 4. Volume 7 of the HDM4 series. PIARC, World RoadAssociation, Paris.
IT Transport (2001). Appraisal ofinvestments in improved rural access.DFID Economists Guide. IT Transport,Ardington, UK.
Transport Research Laboratory (1993).Urban road traffic surveys. OverseasRoad Note 11, TRL Ltd, Crowthorne,UK.
TRL (2004). A guide to axle load surveysand traffic counts for determining trafficloads on pavements. Overseas RoadNote 40, TRL Ltd, Crowthorne, UK.
38 4. Assessing Traffic Demand
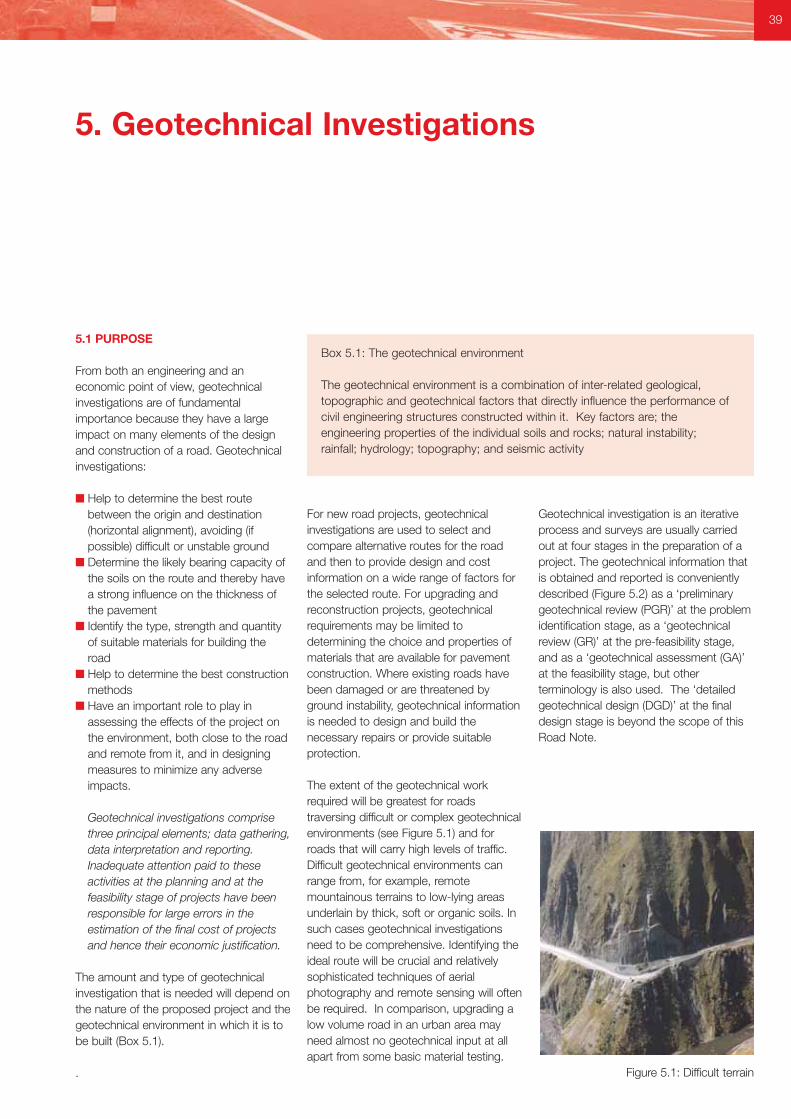
5.1 PURPOSE
From both an engineering and aneconomic point of view, geotechnicalinvestigations are of fundamentalimportance because they have a largeimpact on many elements of the designand construction of a road. Geotechnicalinvestigations:
■ Help to determine the best routebetween the origin and destination(horizontal alignment), avoiding (ifpossible) difficult or unstable ground
■ Determine the likely bearing capacity ofthe soils on the route and thereby havea strong influence on the thickness ofthe pavement
■ Identify the type, strength and quantityof suitable materials for building theroad
■ Help to determine the best constructionmethods
■ Have an important role to play inassessing the effects of the project onthe environment, both close to the roadand remote from it, and in designingmeasures to minimize any adverseimpacts.
Geotechnical investigations comprisethree principal elements; data gathering,data interpretation and reporting.Inadequate attention paid to theseactivities at the planning and at thefeasibility stage of projects have beenresponsible for large errors in theestimation of the final cost of projectsand hence their economic justification.
The amount and type of geotechnicalinvestigation that is needed will depend onthe nature of the proposed project and thegeotechnical environment in which it is tobe built (Box 5.1).
.
For new road projects, geotechnicalinvestigations are used to select andcompare alternative routes for the roadand then to provide design and costinformation on a wide range of factors forthe selected route. For upgrading andreconstruction projects, geotechnicalrequirements may be limited todetermining the choice and properties ofmaterials that are available for pavementconstruction. Where existing roads havebeen damaged or are threatened byground instability, geotechnical informationis needed to design and build thenecessary repairs or provide suitableprotection.
The extent of the geotechnical workrequired will be greatest for roadstraversing difficult or complex geotechnicalenvironments (see Figure 5.1) and forroads that will carry high levels of traffic.Difficult geotechnical environments canrange from, for example, remotemountainous terrains to low-lying areasunderlain by thick, soft or organic soils. Insuch cases geotechnical investigationsneed to be comprehensive. Identifying theideal route will be crucial and relativelysophisticated techniques of aerialphotography and remote sensing will oftenbe required. In comparison, upgrading alow volume road in an urban area mayneed almost no geotechnical input at allapart from some basic material testing.
Geotechnical investigation is an iterativeprocess and surveys are usually carriedout at four stages in the preparation of aproject. The geotechnical information thatis obtained and reported is convenientlydescribed (Figure 5.2) as a ‘preliminarygeotechnical review (PGR)’ at the problemidentification stage, as a ‘geotechnicalreview (GR)’ at the pre-feasibility stage,and as a ‘geotechnical assessment (GA)’at the feasibility stage, but otherterminology is also used. The ‘detailedgeotechnical design (DGD)’ at the finaldesign stage is beyond the scope of thisRoad Note.
Figure 5.1: Difficult terrain
39
5. Geotechnical Investigations
Box 5.1: The geotechnical environment
The geotechnical environment is a combination of inter-related geological,topographic and geotechnical factors that directly influence the performance ofcivil engineering structures constructed within it. Key factors are; theengineering properties of the individual soils and rocks; natural instability;rainfall; hydrology; topography; and seismic activity
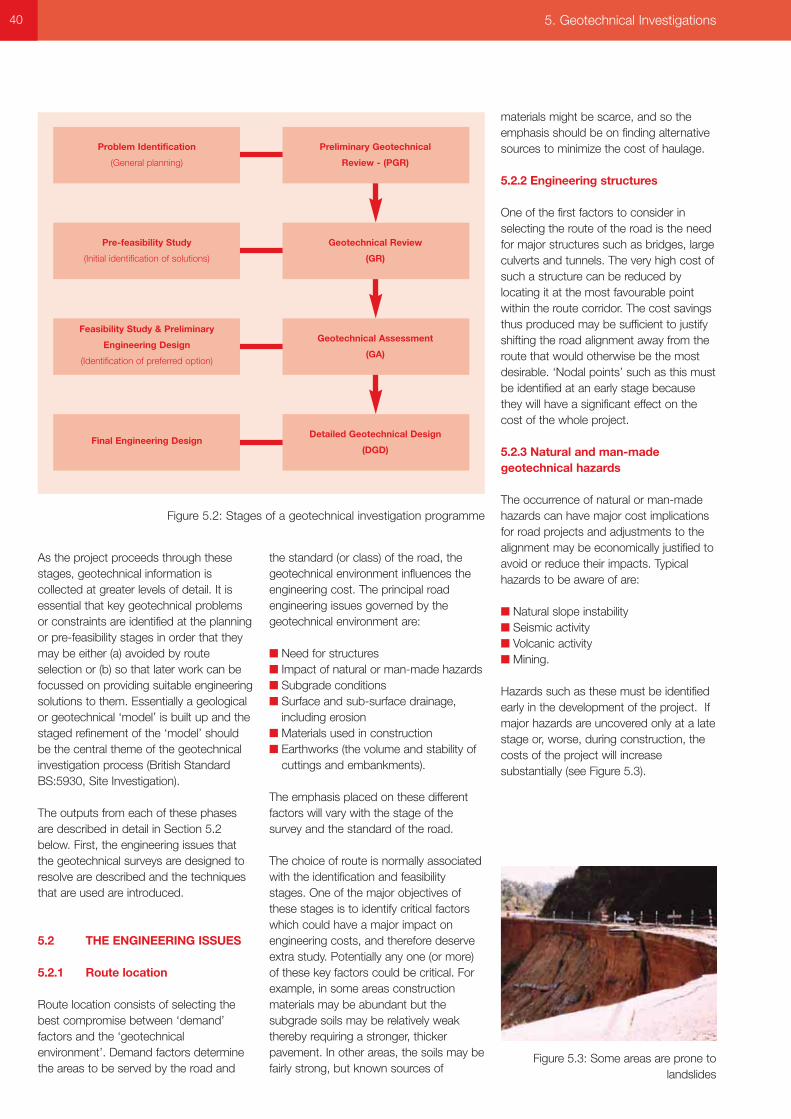
As the project proceeds through thesestages, geotechnical information iscollected at greater levels of detail. It isessential that key geotechnical problemsor constraints are identified at the planningor pre-feasibility stages in order that theymay be either (a) avoided by routeselection or (b) so that later work can befocussed on providing suitable engineeringsolutions to them. Essentially a geologicalor geotechnical ‘model’ is built up and thestaged refinement of the ‘model’ shouldbe the central theme of the geotechnicalinvestigation process (British StandardBS:5930, Site Investigation).
The outputs from each of these phasesare described in detail in Section 5.2below. First, the engineering issues thatthe geotechnical surveys are designed toresolve are described and the techniquesthat are used are introduced.
5.2 THE ENGINEERING ISSUES
5.2.1 Route location
Route location consists of selecting thebest compromise between ‘demand’factors and the ‘geotechnicalenvironment’. Demand factors determinethe areas to be served by the road and
the standard (or class) of the road, thegeotechnical environment influences theengineering cost. The principal roadengineering issues governed by thegeotechnical environment are:
■ Need for structures■ Impact of natural or man-made hazards■ Subgrade conditions■ Surface and sub-surface drainage,
including erosion■ Materials used in construction■ Earthworks (the volume and stability of
cuttings and embankments).
The emphasis placed on these differentfactors will vary with the stage of thesurvey and the standard of the road.
The choice of route is normally associatedwith the identification and feasibilitystages. One of the major objectives ofthese stages is to identify critical factorswhich could have a major impact onengineering costs, and therefore deserveextra study. Potentially any one (or more)of these key factors could be critical. Forexample, in some areas constructionmaterials may be abundant but thesubgrade soils may be relatively weakthereby requiring a stronger, thickerpavement. In other areas, the soils may befairly strong, but known sources of
materials might be scarce, and so theemphasis should be on finding alternativesources to minimize the cost of haulage.
5.2.2 Engineering structures
One of the first factors to consider inselecting the route of the road is the needfor major structures such as bridges, largeculverts and tunnels. The very high cost ofsuch a structure can be reduced bylocating it at the most favourable pointwithin the route corridor. The cost savingsthus produced may be sufficient to justifyshifting the road alignment away from theroute that would otherwise be the mostdesirable. ‘Nodal points’ such as this mustbe identified at an early stage becausethey will have a significant effect on thecost of the whole project.
5.2.3 Natural and man-madegeotechnical hazards
The occurrence of natural or man-madehazards can have major cost implicationsfor road projects and adjustments to thealignment may be economically justified toavoid or reduce their impacts. Typicalhazards to be aware of are:
■ Natural slope instability■ Seismic activity■ Volcanic activity■ Mining.
Hazards such as these must be identifiedearly in the development of the project. Ifmajor hazards are uncovered only at a latestage or, worse, during construction, thecosts of the project will increasesubstantially (see Figure 5.3).
Figure 5.3: Some areas are prone tolandslides
40 5. Geotechnical Investigations
Figure 5.2: Stages of a geotechnical investigation programme
Preliminary Geotechnical
Review - (PGR)
Geotechnical Review
(GR)
Geotechnical Assessment
(GA)
Detailed Geotechnical Design
(DGD)
Problem Identification
(General planning)
Pre-feasibility Study
(Initial identification of solutions)
Feasibility Study & Preliminary
Engineering Design
(Identification of preferred option)
Final Engineering Design
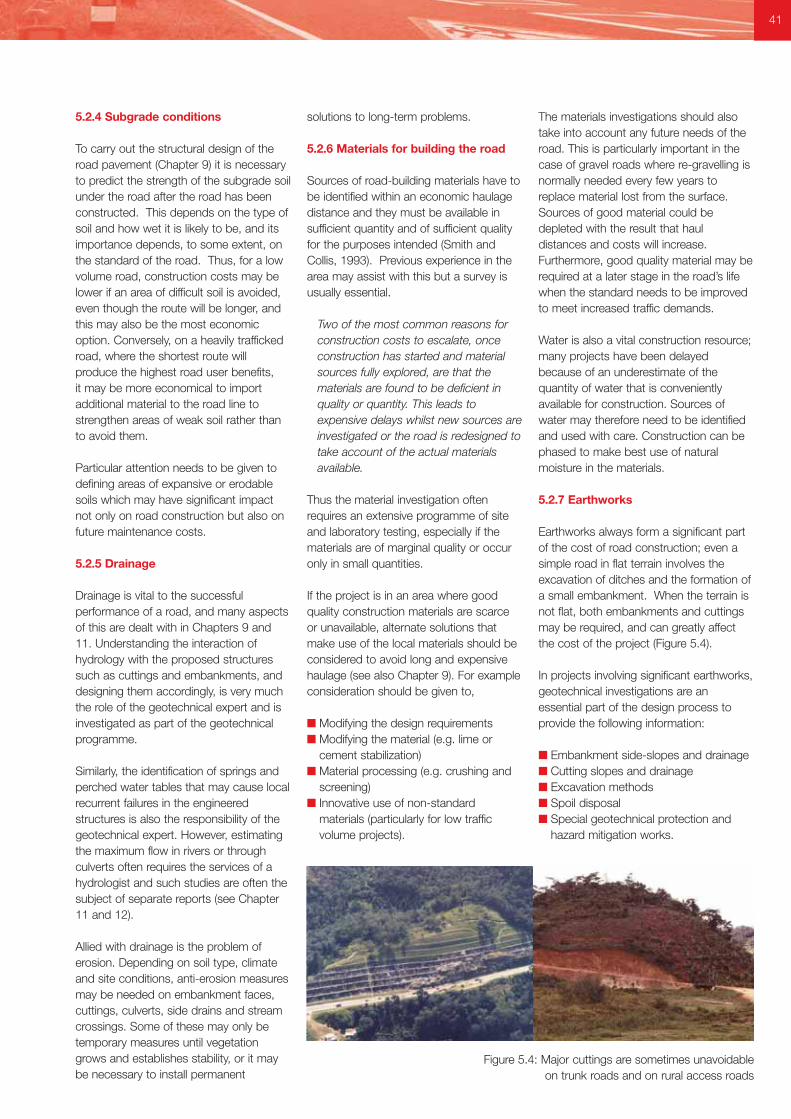
5.2.4 Subgrade conditions
To carry out the structural design of theroad pavement (Chapter 9) it is necessaryto predict the strength of the subgrade soilunder the road after the road has beenconstructed. This depends on the type ofsoil and how wet it is likely to be, and itsimportance depends, to some extent, onthe standard of the road. Thus, for a lowvolume road, construction costs may belower if an area of difficult soil is avoided,even though the route will be longer, andthis may also be the most economicoption. Conversely, on a heavily traffickedroad, where the shortest route willproduce the highest road user benefits, it may be more economical to importadditional material to the road line tostrengthen areas of weak soil rather thanto avoid them.
Particular attention needs to be given todefining areas of expansive or erodablesoils which may have significant impactnot only on road construction but also onfuture maintenance costs.
5.2.5 Drainage
Drainage is vital to the successfulperformance of a road, and many aspectsof this are dealt with in Chapters 9 and11. Understanding the interaction ofhydrology with the proposed structuressuch as cuttings and embankments, anddesigning them accordingly, is very muchthe role of the geotechnical expert and isinvestigated as part of the geotechnicalprogramme.
Similarly, the identification of springs andperched water tables that may cause localrecurrent failures in the engineeredstructures is also the responsibility of thegeotechnical expert. However, estimatingthe maximum flow in rivers or throughculverts often requires the services of ahydrologist and such studies are often thesubject of separate reports (see Chapter11 and 12).
Allied with drainage is the problem oferosion. Depending on soil type, climateand site conditions, anti-erosion measuresmay be needed on embankment faces,cuttings, culverts, side drains and streamcrossings. Some of these may only betemporary measures until vegetationgrows and establishes stability, or it maybe necessary to install permanent
solutions to long-term problems.
5.2.6 Materials for building the road
Sources of road-building materials have tobe identified within an economic haulagedistance and they must be available insufficient quantity and of sufficient qualityfor the purposes intended (Smith andCollis, 1993). Previous experience in thearea may assist with this but a survey isusually essential.
Two of the most common reasons forconstruction costs to escalate, onceconstruction has started and materialsources fully explored, are that thematerials are found to be deficient inquality or quantity. This leads toexpensive delays whilst new sources areinvestigated or the road is redesigned totake account of the actual materialsavailable.
Thus the material investigation oftenrequires an extensive programme of siteand laboratory testing, especially if thematerials are of marginal quality or occuronly in small quantities.
If the project is in an area where goodquality construction materials are scarceor unavailable, alternate solutions thatmake use of the local materials should beconsidered to avoid long and expensivehaulage (see also Chapter 9). For exampleconsideration should be given to,
■ Modifying the design requirements■ Modifying the material (e.g. lime or
cement stabilization)■ Material processing (e.g. crushing and
screening)■ Innovative use of non-standard
materials (particularly for low trafficvolume projects).
The materials investigations should alsotake into account any future needs of theroad. This is particularly important in thecase of gravel roads where re-gravelling isnormally needed every few years toreplace material lost from the surface.Sources of good material could bedepleted with the result that hauldistances and costs will increase.Furthermore, good quality material may berequired at a later stage in the road’s lifewhen the standard needs to be improvedto meet increased traffic demands.
Water is also a vital construction resource;many projects have been delayedbecause of an underestimate of thequantity of water that is convenientlyavailable for construction. Sources ofwater may therefore need to be identifiedand used with care. Construction can bephased to make best use of naturalmoisture in the materials.
5.2.7 Earthworks
Earthworks always form a significant partof the cost of road construction; even asimple road in flat terrain involves theexcavation of ditches and the formation ofa small embankment. When the terrain isnot flat, both embankments and cuttingsmay be required, and can greatly affectthe cost of the project (Figure 5.4).
In projects involving significant earthworks,geotechnical investigations are anessential part of the design process toprovide the following information:
■ Embankment side-slopes and drainage ■ Cutting slopes and drainage ■ Excavation methods■ Spoil disposal ■ Special geotechnical protection and
hazard mitigation works.
41
Figure 5.4: Major cuttings are sometimes unavoidable on trunk roads and on rural access roads
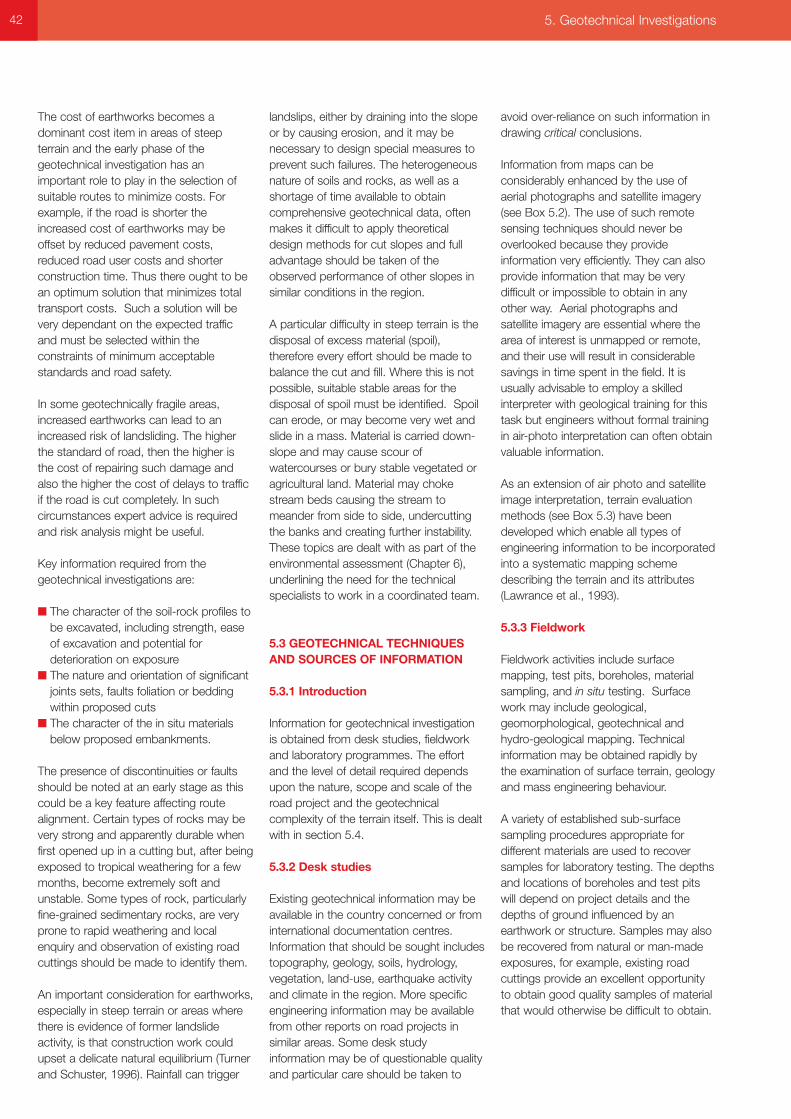
The cost of earthworks becomes adominant cost item in areas of steepterrain and the early phase of thegeotechnical investigation has animportant role to play in the selection ofsuitable routes to minimize costs. Forexample, if the road is shorter theincreased cost of earthworks may beoffset by reduced pavement costs,reduced road user costs and shorterconstruction time. Thus there ought to bean optimum solution that minimizes totaltransport costs. Such a solution will bevery dependant on the expected trafficand must be selected within theconstraints of minimum acceptablestandards and road safety.
In some geotechnically fragile areas,increased earthworks can lead to anincreased risk of landsliding. The higherthe standard of road, then the higher isthe cost of repairing such damage andalso the higher the cost of delays to trafficif the road is cut completely. In suchcircumstances expert advice is requiredand risk analysis might be useful.
Key information required from thegeotechnical investigations are:
■ The character of the soil-rock profiles tobe excavated, including strength, easeof excavation and potential fordeterioration on exposure
■ The nature and orientation of significantjoints sets, faults foliation or beddingwithin proposed cuts
■ The character of the in situ materialsbelow proposed embankments.
The presence of discontinuities or faultsshould be noted at an early stage as thiscould be a key feature affecting routealignment. Certain types of rocks may bevery strong and apparently durable whenfirst opened up in a cutting but, after beingexposed to tropical weathering for a fewmonths, become extremely soft andunstable. Some types of rock, particularlyfine-grained sedimentary rocks, are veryprone to rapid weathering and localenquiry and observation of existing roadcuttings should be made to identify them.
An important consideration for earthworks,especially in steep terrain or areas wherethere is evidence of former landslideactivity, is that construction work couldupset a delicate natural equilibrium (Turnerand Schuster, 1996). Rainfall can trigger
landslips, either by draining into the slopeor by causing erosion, and it may benecessary to design special measures toprevent such failures. The heterogeneousnature of soils and rocks, as well as ashortage of time available to obtaincomprehensive geotechnical data, oftenmakes it difficult to apply theoreticaldesign methods for cut slopes and fulladvantage should be taken of theobserved performance of other slopes insimilar conditions in the region.
A particular difficulty in steep terrain is thedisposal of excess material (spoil),therefore every effort should be made tobalance the cut and fill. Where this is notpossible, suitable stable areas for thedisposal of spoil must be identified. Spoilcan erode, or may become very wet andslide in a mass. Material is carried down-slope and may cause scour ofwatercourses or bury stable vegetated oragricultural land. Material may chokestream beds causing the stream tomeander from side to side, undercuttingthe banks and creating further instability.These topics are dealt with as part of theenvironmental assessment (Chapter 6),underlining the need for the technicalspecialists to work in a coordinated team.
5.3 GEOTECHNICAL TECHNIQUESAND SOURCES OF INFORMATION
5.3.1 Introduction
Information for geotechnical investigationis obtained from desk studies, fieldworkand laboratory programmes. The effortand the level of detail required dependsupon the nature, scope and scale of theroad project and the geotechnicalcomplexity of the terrain itself. This is dealtwith in section 5.4.
5.3.2 Desk studies
Existing geotechnical information may beavailable in the country concerned or frominternational documentation centres.Information that should be sought includestopography, geology, soils, hydrology,vegetation, land-use, earthquake activityand climate in the region. More specificengineering information may be availablefrom other reports on road projects insimilar areas. Some desk studyinformation may be of questionable qualityand particular care should be taken to
avoid over-reliance on such information indrawing critical conclusions.
Information from maps can beconsiderably enhanced by the use ofaerial photographs and satellite imagery(see Box 5.2). The use of such remotesensing techniques should never beoverlooked because they provideinformation very efficiently. They can alsoprovide information that may be verydifficult or impossible to obtain in anyother way. Aerial photographs andsatellite imagery are essential where thearea of interest is unmapped or remote,and their use will result in considerablesavings in time spent in the field. It isusually advisable to employ a skilledinterpreter with geological training for thistask but engineers without formal trainingin air-photo interpretation can often obtainvaluable information.
As an extension of air photo and satelliteimage interpretation, terrain evaluationmethods (see Box 5.3) have beendeveloped which enable all types ofengineering information to be incorporatedinto a systematic mapping schemedescribing the terrain and its attributes(Lawrance et al., 1993).
5.3.3 Fieldwork
Fieldwork activities include surfacemapping, test pits, boreholes, materialsampling, and in situ testing. Surfacework may include geological,geomorphological, geotechnical andhydro-geological mapping. Technicalinformation may be obtained rapidly bythe examination of surface terrain, geologyand mass engineering behaviour.
A variety of established sub-surfacesampling procedures appropriate fordifferent materials are used to recoversamples for laboratory testing. The depthsand locations of boreholes and test pitswill depend on project details and thedepths of ground influenced by anearthwork or structure. Samples may alsobe recovered from natural or man-madeexposures, for example, existing roadcuttings provide an excellent opportunityto obtain good quality samples of materialthat would otherwise be difficult to obtain.
42 5. Geotechnical Investigations
5.3.4 Laboratory testing programmes
Any laboratory testing programme shouldbe part of a rationally designedprogramme (see Boxes 5.4 and 5.5). Itshould be staged such that maximum usecan be made of early data to plan the bulkof the testing. It is also important that therelationships between in situ conditionsand laboratory conditions are consideredwhen designing and developing the testregime.
Early phases of the laboratory testprogramme will generally concentrate ongaining clues to unusual soil behaviour,e.g. swelling or collapse potential.Bearing in mind the difficulties of samplerecovery, statistical sample sizes and thecost of laboratory testing, most testingprogrammes will be based aroundrelatively simple classification tests thatcan be done quite quickly; moresophisticated tests will only be used ifabsolutely necessary. However, even atthe stage of final design, there is alwaysthe problem that natural materials showhigh variability in their properties andtherefore obtaining design parameters atthe ideal level of statistical reliability is verydifficult. As a result, considerableengineering judgement and skill is requiredand the services of an experiencedspecialist should always be used.
5.4 INFORMATION THAT SHOULD BEOBTAINED AT EACH STAGE OF THEGEOTECHNICAL INVESTIGATION
5.4.1 The scope and cost ofgeotechnical investigations
The scope, and hence the cost ofgeotechnical investigations, varies widelydepending upon the nature of the roadproject, its geotechnical environment andthe amount of risk that is acceptable tothe promoters or owners of the road. Atone end of the range, for example, on aflat alignment underlain by a strongsubgrade, the investigation may comprisea few trial pits that may take only a fewdays to complete. On the other hand, incomplex, steep topography underlain bycomplex soil-rock profiles, detailed designinvestigations could take many months.
The actual costs of geotechnical surveystherefore varies greatly depending on
43
Box 5.2: Aerial photographs and satellite imagery
Aerial photographs may be available (or may need to be commissioned) as partof the feasibility or pre-feasibility studies. They are generally flown at scalesranging from 1:20,000 to 1:60,000. Their chief advantage is in giving a highlydetailed view of the terrain. When studied with the aid of a stereoscope, theground surface is seen in full 3-dimensional relief. Even sub-surface features,such as tilted or folded rock strata or buried gravel deposits, can he identifiedfrom aerial photographs by the effect they have on surface features.
Satellite imagery is available for the whole world apart from persistently cloudyregions. The colour images depict terrain and drainage systems over relativelylarge areas (e.g. 185 x 185 km per image). They are commonly studied at scalesof 1:100,000 to 1:1,000,000 and are therefore most useful at desk study andproject identification (pre-feasibility) stages of investigation. By repeated coverageof the same area they also show changes in surface features. Changes in majorriver flow patterns, retreating coastlines, or deforestation can be observed in thisway and such information could prove vital.
Box 5.3: Terrain evaluation and classification
Terrain evaluation is a distillation of geomorphological, geological andgeotechnical mapping into a presentation that is easier for a road engineers tounderstand. Such mapping usually goes hand in hand with air photointerpretation.
Terrain or land system classification is a procedure by which the landscape isdivided up into components having fairly uniform characteristics. The premise isthat where the terrain possesses the same physical characteristics, it will alsohave uniform soil or rock features that affect engineering design. The concept ofuniformity also implies that a terrain unit has uniform potential for hazards ofparticular types to develop.
Box 5.4: Quality of laboratory testing
The quality of the testing programme depends upon the procedures in place toensure that tests are conducted properly using suitable equipment that ismechanically sound and calibrated correctly. The condition of test equipment andthe competence of the laboratory staff are therefore crucial. There needs to be arobust Quality Assurance (QA) procedure (overseen by a competent geotechnicalengineer) in place that will reject data that does not meet acceptable standards ofreliability Head, 1992).
Box 5.5: Tropically weathered soils
The behaviour of some tropically weathered material can be noticeably differentfrom the behaviour of temperate sedimentary soils. The approach to thelaboratory investigation of tropical materials in terms of the range of testsemployed, their detailed procedures and their interpretation should take this intoaccount (Fookes, 1997)
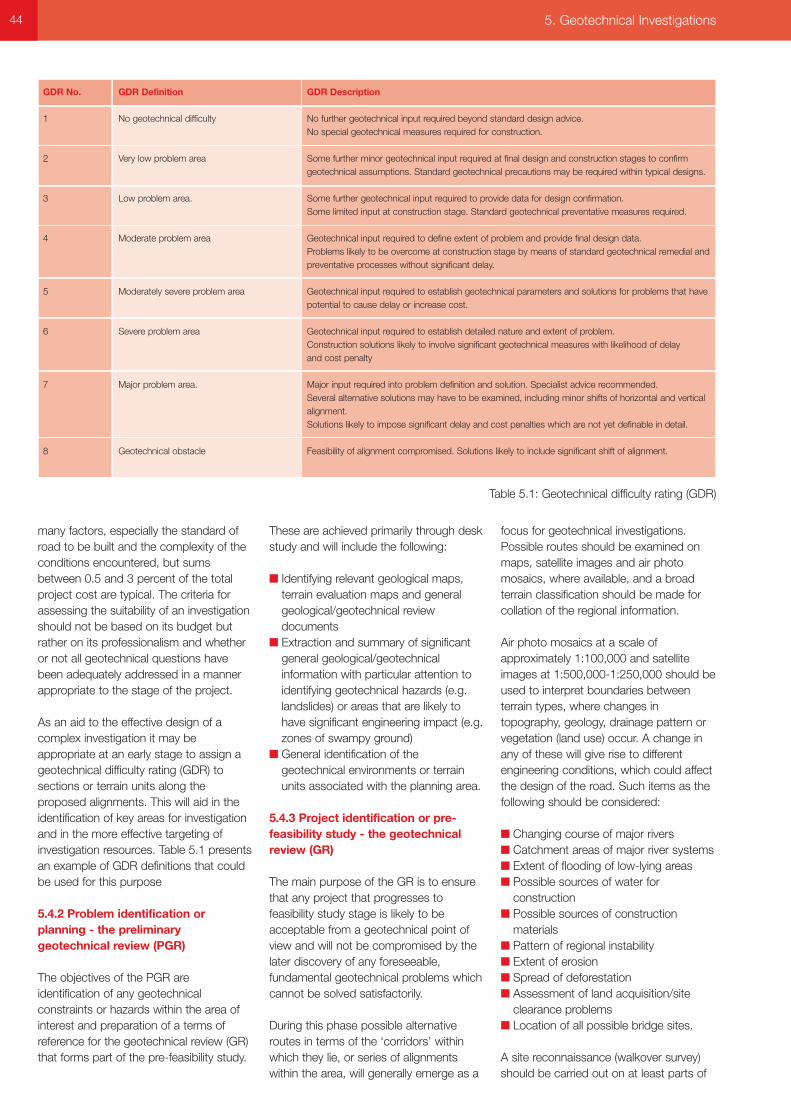
many factors, especially the standard ofroad to be built and the complexity of theconditions encountered, but sumsbetween 0.5 and 3 percent of the totalproject cost are typical. The criteria forassessing the suitability of an investigationshould not be based on its budget butrather on its professionalism and whetheror not all geotechnical questions havebeen adequately addressed in a mannerappropriate to the stage of the project.
As an aid to the effective design of acomplex investigation it may beappropriate at an early stage to assign ageotechnical difficulty rating (GDR) tosections or terrain units along theproposed alignments. This will aid in theidentification of key areas for investigationand in the more effective targeting ofinvestigation resources. Table 5.1 presentsan example of GDR definitions that couldbe used for this purpose
5.4.2 Problem identification orplanning - the preliminarygeotechnical review (PGR)
The objectives of the PGR areidentification of any geotechnicalconstraints or hazards within the area ofinterest and preparation of a terms ofreference for the geotechnical review (GR)that forms part of the pre-feasibility study.
These are achieved primarily through deskstudy and will include the following:
■ Identifying relevant geological maps,terrain evaluation maps and generalgeological/geotechnical reviewdocuments
■ Extraction and summary of significantgeneral geological/geotechnicalinformation with particular attention toidentifying geotechnical hazards (e.g.landslides) or areas that are likely tohave significant engineering impact (e.g.zones of swampy ground)
■ General identification of thegeotechnical environments or terrainunits associated with the planning area.
5.4.3 Project identification or pre-feasibility study - the geotechnicalreview (GR)
The main purpose of the GR is to ensurethat any project that progresses tofeasibility study stage is likely to beacceptable from a geotechnical point ofview and will not be compromised by thelater discovery of any foreseeable,fundamental geotechnical problems whichcannot be solved satisfactorily.
During this phase possible alternativeroutes in terms of the ‘corridors’ withinwhich they lie, or series of alignmentswithin the area, will generally emerge as a
focus for geotechnical investigations.Possible routes should be examined onmaps, satellite images and air photomosaics, where available, and a broadterrain classification should be made forcollation of the regional information.
Air photo mosaics at a scale ofapproximately 1:100,000 and satelliteimages at 1:500,000-1:250,000 should beused to interpret boundaries betweenterrain types, where changes intopography, geology, drainage pattern orvegetation (land use) occur. A change inany of these will give rise to differentengineering conditions, which could affectthe design of the road. Such items as thefollowing should be considered:
■ Changing course of major rivers■ Catchment areas of major river systems■ Extent of flooding of low-lying areas■ Possible sources of water for
construction■ Possible sources of construction
materials■ Pattern of regional instability■ Extent of erosion■ Spread of deforestation■ Assessment of land acquisition/site
clearance problems■ Location of all possible bridge sites.
A site reconnaissance (walkover survey)should be carried out on at least parts of
44 5. Geotechnical Investigations
GDR No. GDR Definition GDR Description
1 No geotechnical difficulty No further geotechnical input required beyond standard design advice. No special geotechnical measures required for construction.
2 Very low problem area Some further minor geotechnical input required at final design and construction stages to confirm geotechnical assumptions. Standard geotechnical precautions may be required within typical designs.
3 Low problem area. Some further geotechnical input required to provide data for design confirmation. Some limited input at construction stage. Standard geotechnical preventative measures required.
4 Moderate problem area Geotechnical input required to define extent of problem and provide final design data. Problems likely to be overcome at construction stage by means of standard geotechnical remedial and preventative processes without significant delay.
5 Moderately severe problem area Geotechnical input required to establish geotechnical parameters and solutions for problems that have potential to cause delay or increase cost.
6 Severe problem area Geotechnical input required to establish detailed nature and extent of problem. Construction solutions likely to involve significant geotechnical measures with likelihood of delay and cost penalty
7 Major problem area. Major input required into problem definition and solution. Specialist advice recommended. Several alternative solutions may have to be examined, including minor shifts of horizontal and vertical alignment. Solutions likely to impose significant delay and cost penalties which are not yet definable in detail.
8 Geotechnical obstacle Feasibility of alignment compromised. Solutions likely to include significant shift of alignment.
Table 5.1: Geotechnical difficulty rating (GDR)
the routes or corridors underconsideration to confirm and supplementinformation collected during the deskstudy. Such a reconnaissance is veryvaluable; it takes very little time and allowsa rapid geotechnical evaluation of theenvironment. It should produce:
■ A record of the key geological andgeotechnical features, with particularattention to signs of ground instabilityand other hazards identified from thedesk study
■ A record of any available hydro-geological and drainage information(e.g. groundwater seepages andstanding water levels)
■ A record of the geometry, nature andcondition of any existing man-madeearthworks in the area
■ Results of selected samples of exposedsoil and rock for field identification. Ifthere are limited opportunities for suchsampling then consideration must begiven to using hand augers or diggingshallow pits.
Finally and most importantly, thegeotechnical review should determine therequirements for the feasibility study.
5.4.4 Feasibility and preliminaryengineering design - the geotechnicalassessment (GA)
The objective of the GA is to assess indetail the impacts of the criticalgeotechnical issues that influence thedesign of a highway project, confirm thefeasibility of the project and identify thebest options to be taken through todetailed design. A number of key topicsform the core of this programme. Theseare,
■ A review and revision, if necessary, ofthe objectives and scope of the groundinvestigation (GI) works recommendedin the geotechnical review that wasconducted as part of the pre-feasibilitystudy.
■ Ground investigation works to the levelof detail required by the project.Essentially the road corridors areinvestigated to select the best route.This should be carried out mainly usingaerial photographs for all detailedinterpretations, ideally at a scale of1:20,000 - 1:60,000 (these can besupplemented by colour informationfrom satellite images). If more detailed
information is required, air photographymay need to be commissioned at ascale appropriate to the size of the taskand the complexity of the ground(approximately 1:10,000 - 1:30,000). Ifnecessary, a more detailed terrainclassification of the area should bemade. Further details of specific issuesare discussed below.
■ Analysis/interpretation of the dataproduced during the GI and updatedknowledge of the general geological,geotechnical and hydro-geologicalconditions along the proposedalignment(s) thereby defining thegeotechnical environment governing theproject and providing geotechnicalevaluations of the various corridor andalignment options.
■ Geotechnical input to the preliminaryengineering design (PED). This shouldinclude general earthworks design,outline structure foundation designs anddetails of construction materials andrelated costs.
■ A programme of any supplementary GIrequired to enable the final engineeringdesign to be completed.
The various detailed aspects of the GI areas follows:
StructuresPreliminary structure foundation designs interms of foundation types and detail oftypical designs should be developed inclose liaison with the structural engineer.The geotechnical assessment shouldprovide details of the relevant soil-rockprofiles and their geotechnicalcharacteristics. These should besufficiently detailed so that typicalfoundation widths, founding levels and,where appropriate, estimated pile lengths,may be developed in conjunction with thebridge engineer.
SubgradeThe GI should provide site-specific dataon the subgrade conditions along a finalalignment. Particular attention should bepaid to:
■ Identifying and defining the extent ofweak soils and severe problem areasfor pavement foundation. These include:swelling soils, collapsible soils, veryweak, soft or peaty soils
■ Identifying appropriate mitigationoptions.
Road-building materialsThe GI must identify and prove that thereare adequate and economically viablereserves of natural construction material.The materials required are:
■ Common embankment fill■ Capping layer (imported subgrade)■ Sub-base and road-base aggregate■ Road surfacing aggregate■ Aggregates for structural concrete■ Filter/drainage material■ Special requirements (e.g. rock-fill for
gabion baskets).
The location of construction materials,either borrow pits or quarries, should bedefined and material quality and variabilityclearly established. For large projectsinvolving the use of aggregate processingplant there may be a requirement toundertake quality assurance laboratorytests on trials of the processingprocedures.
For projects with bridge structuresrequiring high quality concrete aggregatethere may be a requirement to undertakespecialist laboratory work.
On large projects, with significant fill andaggregate requirements, mass-hauldiagrams should be drawn to augmentcost-benefit decisions with respect toutilizing any alternative materials.
If the project is in an area where goodquality construction materials are scarceor unavailable, consideration should begiven to developing appropriate solutionsto counter the shortfall, for example bymodifying the design requirements,modifying the material (eg, lime or cementstabilization) or by material processing(e.g. crushing and screening).
5.4.5 Timing
The fact that so many aspects of theoverall feasibility study depends on thegeotechnical information means that theearly initiation of the geotechnical work isusually vital. It is essential that thegeotechnical work is underway andfeeding back information during theengineering assessment process. The GImust be completed and the resultsanalyzed in time to contribute to thepreliminary engineering design. In projectswhere there are a number of options to beconsidered at feasibility stage, the design
45
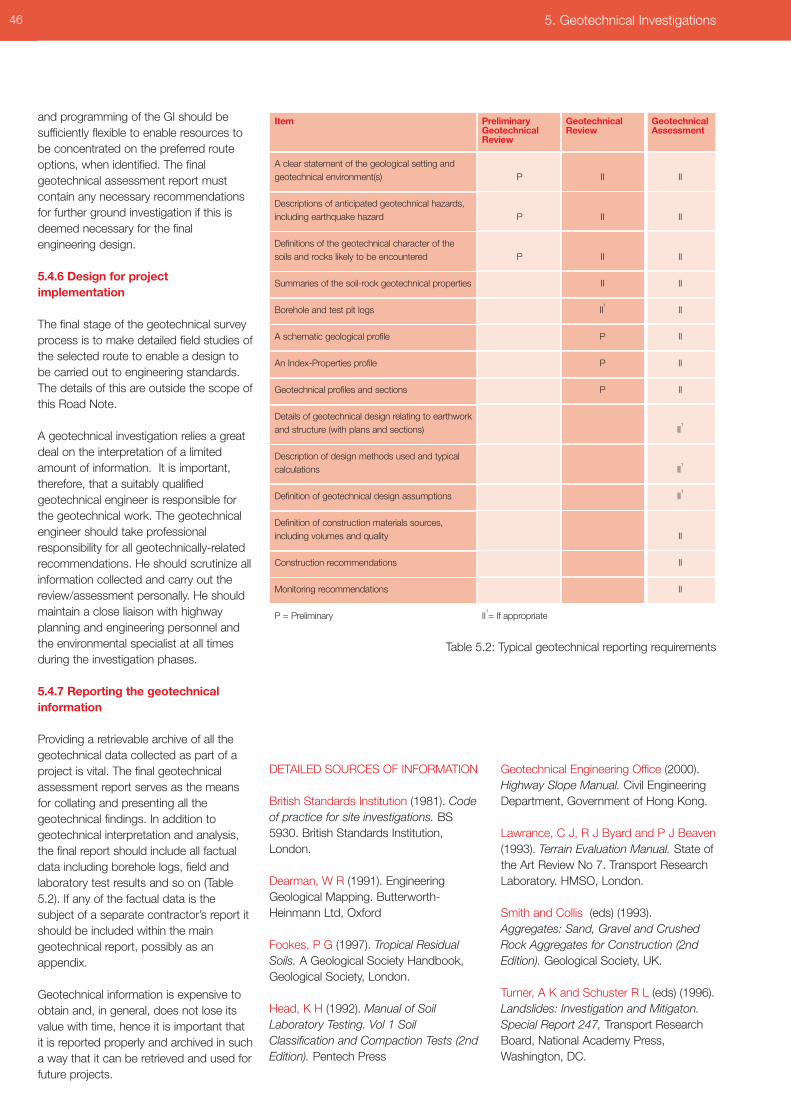
and programming of the GI should besufficiently flexible to enable resources tobe concentrated on the preferred routeoptions, when identified. The finalgeotechnical assessment report mustcontain any necessary recommendationsfor further ground investigation if this isdeemed necessary for the finalengineering design.
5.4.6 Design for projectimplementation
The final stage of the geotechnical surveyprocess is to make detailed field studies ofthe selected route to enable a design tobe carried out to engineering standards.The details of this are outside the scope ofthis Road Note.
A geotechnical investigation relies a greatdeal on the interpretation of a limitedamount of information. It is important,therefore, that a suitably qualifiedgeotechnical engineer is responsible forthe geotechnical work. The geotechnicalengineer should take professionalresponsibility for all geotechnically-relatedrecommendations. He should scrutinize allinformation collected and carry out thereview/assessment personally. He shouldmaintain a close liaison with highwayplanning and engineering personnel andthe environmental specialist at all timesduring the investigation phases.
5.4.7 Reporting the geotechnicalinformation
Providing a retrievable archive of all thegeotechnical data collected as part of aproject is vital. The final geotechnicalassessment report serves as the meansfor collating and presenting all thegeotechnical findings. In addition togeotechnical interpretation and analysis,the final report should include all factualdata including borehole logs, field andlaboratory test results and so on (Table5.2). If any of the factual data is thesubject of a separate contractor’s report itshould be included within the maingeotechnical report, possibly as anappendix.
Geotechnical information is expensive toobtain and, in general, does not lose itsvalue with time, hence it is important thatit is reported properly and archived in sucha way that it can be retrieved and used forfuture projects.
DETAILED SOURCES OF INFORMATION
British Standards Institution (1981). Codeof practice for site investigations. BS5930. British Standards Institution,London.
Dearman, W R (1991). EngineeringGeological Mapping. Butterworth-Heinmann Ltd, Oxford
Fookes, P G (1997). Tropical ResidualSoils. A Geological Society Handbook,Geological Society, London.
Head, K H (1992). Manual of SoilLaboratory Testing. Vol 1 SoilClassification and Compaction Tests (2ndEdition). Pentech Press
Geotechnical Engineering Office (2000).Highway Slope Manual. Civil EngineeringDepartment, Government of Hong Kong.
Lawrance, C J, R J Byard and P J Beaven(1993). Terrain Evaluation Manual. State ofthe Art Review No 7. Transport ResearchLaboratory. HMSO, London.
Smith and Collis (eds) (1993).Aggregates: Sand, Gravel and CrushedRock Aggregates for Construction (2ndEdition). Geological Society, UK.
Turner, A K and Schuster R L (eds) (1996).Landslides: Investigation and Mitigaton.Special Report 247, Transport ResearchBoard, National Academy Press,Washington, DC.
46 5. Geotechnical Investigations
Item Preliminary Geotechnical GeotechnicalGeotechnical Review AssessmentReview
A clear statement of the geological setting and geotechnical environment(s) P II II
Descriptions of anticipated geotechnical hazards, including earthquake hazard P II II
Definitions of the geotechnical character of the soils and rocks likely to be encountered P II II
Summaries of the soil-rock geotechnical properties II II
Borehole and test pit logs II1
II
A schematic geological profile P II
An Index-Properties profile P II
Geotechnical profiles and sections P II
Details of geotechnical design relating to earthwork and structure (with plans and sections) II
1
Description of design methods used and typical calculations II
1
Definition of geotechnical design assumptions II1
Definition of construction materials sources, including volumes and quality II
Construction recommendations II
Monitoring recommendations II
P = Preliminary II1= If appropriate
Table 5.2: Typical geotechnical reporting requirements
6.1 THE PURPOSE OFENVIRONMENTAL IMPACTASSESSMENT
Environmental impact assessment (EIA) isthe process for examining and reducingthe likely environmental impacts of aproject prior to its implementation. EIA isa legal requirement in many countries forcertain types of development project.EIA is commonly required for new roadsand road improvements because of therange of potential environmental impactsassociated with these projects (see Table6.1). This table is illustrative and it islikely that the impacts will differ fromproject to project.
Even when a full EIA is not required, suchas in the case of some smaller scale roadimprovement projects, an appropriatelevel of environmental analysis should beundertaken based on the likely effects ofthe project. Within this guidance EIA isreferred to as encompassing the formalprocess as well as similar environmentalanalyses.
In most contexts EIA addresses morethan just the natural or ecologicalenvironment. For example, most EIA’saddress aspects of the built environmentand many consider wider community andsocio-economic impacts. For thisreason, the EIA needs to be managed asan integrated component of the overallproject appraisal process. Chapter 7 ofthis document on the social impacts ofroad projects is particularly relevant tothose involved in the EIA.
This chapter provides general advice forEIA of road projects. It supplements and
should be read alongside more detailedEIA guidance listed at the end of thischapter and Appendix A providing topic-by-topic advice on the baseline data,likely impacts and mitigation measures.
6.2 OVERVIEW OF THEENVIRONMENTAL IMPACTASSESSMENT PROCESS
The basic EIA process involves a seriesof stages of examining and acting uponrelevant environmental information.Figure 6.1 shows how the EIA stagessupport the activities associated with thefeasibility work on a road project. Inpractice, the EIA process should beflexible rather than strictly linear, forexample re-examining someenvironmental baseline information in lightof discussions over possible mitigationmeasures.
EIA should be undertaken byappropriately qualified individuals workingas a multidisciplinary team. Where a widerange of environmental impacts areanticipated, the role of managing andcoordinating the environmental specialistswill also be of critical importance to thesuccess of the EIA and the overall projectappraisal.
47
6. Environmental Impact Assessment
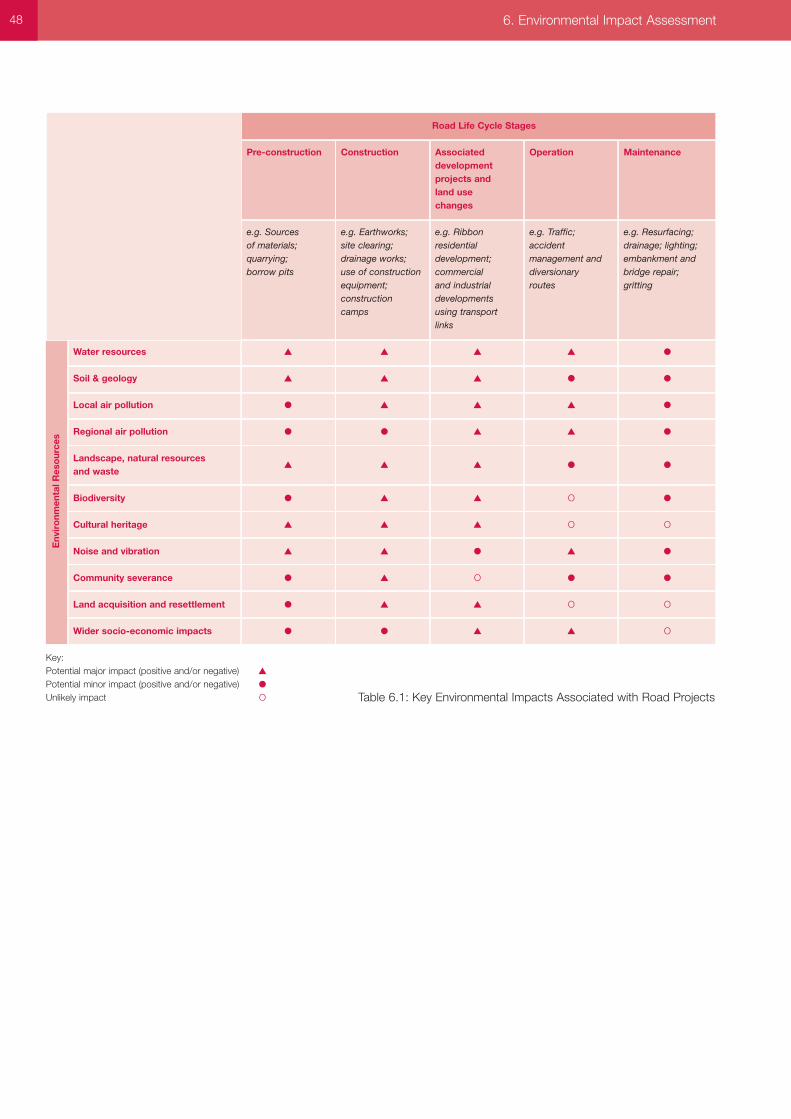
Env
iro
nmen
tal R
eso
urce
s
48 6. Environmental Impact Assessment
Table 6.1: Key Environmental Impacts Associated with Road Projects
Road Life Cycle Stages
Pre-construction Construction Associated Operation Maintenancedevelopment projects and land use changes
e.g. Sources e.g. Earthworks; e.g. Ribbon e.g. Traffic; e.g. Resurfacing; of materials; site clearing; residential accident drainage; lighting; quarrying; drainage works; development; management and embankment and borrow pits use of construction commercial diversionary bridge repair;
equipment; and industrial routes grittingconstruction developmentscamps using transport
links
Water resources ▲ ▲ ▲ ▲ ●
Soil & geology ▲ ▲ ▲ ● ●
Local air pollution ● ▲ ▲ ▲ ●
Regional air pollution ● ● ▲ ▲ ●
Landscape, natural resources and waste
▲ ▲ ▲ ● ●
Biodiversity ● ▲ ▲ O ●
Cultural heritage ▲ ▲ ▲ O O
Noise and vibration ▲ ▲ ● ▲ ●
Community severance ● ▲ O ● ●
Land acquisition and resettlement ● ▲ ▲ O O
Wider socio-economic impacts ● ● ▲ ▲ O
Key:Potential major impact (positive and/or negative) ▲
Potential minor impact (positive and/or negative) ●
Unlikely impact O
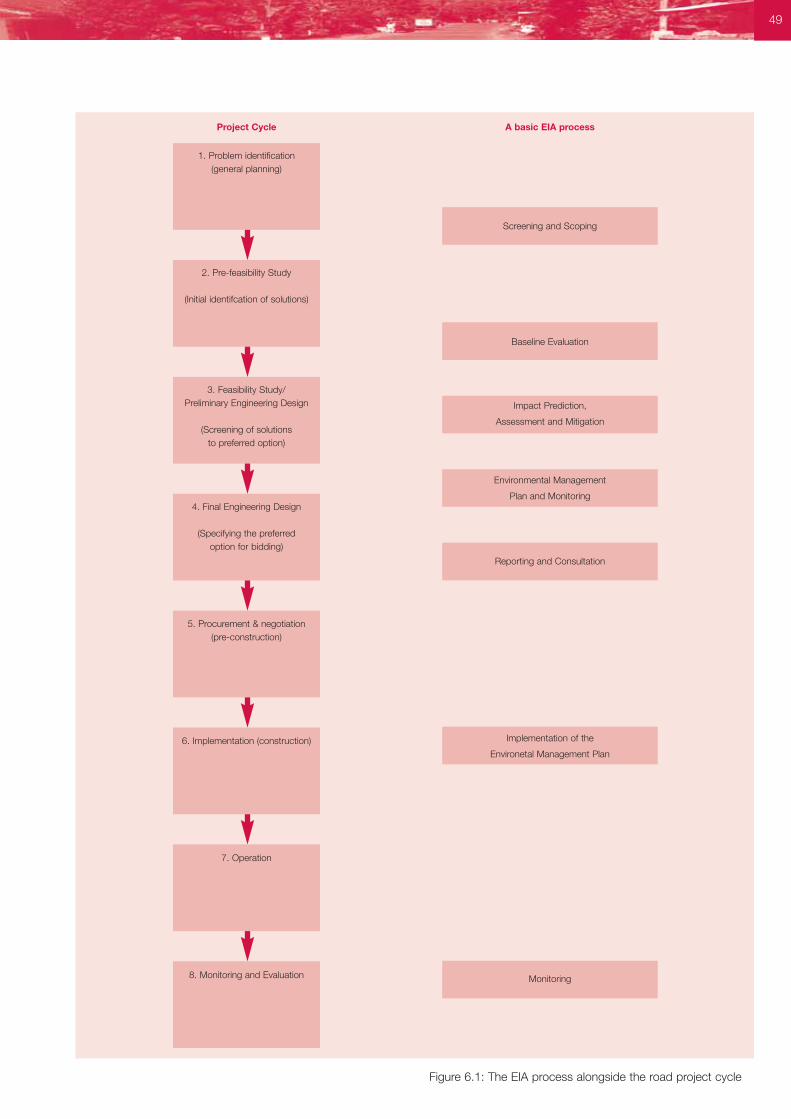
49
1. Problem identification(general planning)
2. Pre-feasibility Study
(Initial identifcation of solutions)
3. Feasibility Study/ Preliminary Engineering Design
(Screening of solutions to preferred option)
4. Final Engineering Design
(Specifying the preferred option for bidding)
5. Procurement & negotiation(pre-construction)
6. Implementation (construction)
7. Operation
8. Monitoring and Evaluation
Figure 6.1: The EIA process alongside the road project cycle
A basic EIA process
Screening and Scoping
Baseline Evaluation
Impact Prediction,
Assessment and Mitigation
Environmental Management
Plan and Monitoring
Reporting and Consultation
Implementation of the
Environetal Management Plan
Monitoring
Project Cycle
6.3 SCREENING & SCOPING
In conducting an EIA it is important toexamine relevant information from priorstudies. In some cases a StrategicEnvironmental Assessment (SEA) mayhave been undertaken. An SEA isdifferent from EIA because an SEAapplies to policies, strategies, plans andprogrammes rather than individualprojects. An SEA seeks to provide abroad environmental assessment of thestrategy for the transport network fromwhich individual projects can then bechosen.
Even where there has not been a formalstrategic plan, there may have been apreliminary environmental analysis duringa project identification phase. All suchpreliminary information should beobtained and reviewed as this will savetime and resources in conducting thenew EIA.
The first stage of environmentalassessment is screening to determinewhether a full EIA is needed. If not,some form of environmental analysis willusually be necessary and this should beproportional to the scale of the roadproject and its likely environmentalimpacts.
A full EIA must be undertaken in certaincircumstances including:
■ Where national/regional EIA regulationsapply
■ Where a project funding agencyrequires EIA.
The environmental screening decisionshould be made in consultation withrelevant parties such as theenvironmental regulatory body and anyfunding agencies. The screeningdecision should also be made availableto the public.
Environmental scoping is carried outalongside or soon after screening.Scoping involves identifying the mostimportant environmental issuesassociated with the project. Forexample, a new road involving land takein or near a national park is likely to giverise to ecological impacts. By contrastan urban road widening scheme mayhave particular impacts in terms of localair quality. Good scoping will lead to a
streamlined EIA and avoid the projectteam spending a lot of time onenvironmental issues which are relativelyinsignificant (see Box 6.1).
Scoping should involve:
■ Collaboration between environmentaltopic experts as relevant to the projectand its location
■ Consultation with relevant partiesincluding environmental regulatorybodies (e.g. the Ministry forEnvironment)
■ Developing a work plan for the EIA■ Proposing the assessment techniques
for particular EIA topics (e.g. a desktopassessment, modeling and/or sitesurveys)
■ Defining the criteria for determining thesignificance of the impacts
■ Identifying the timing andarrangements forconsultation/involvement in the EIA.
6.4 BASELINE EVALUATION
Following screening and scoping, thenext stage in the EIA process involvesformulating a complete view of theenvironment that may be affected by theproject. This is known as the evaluationof the environmental baseline andrequires collection of data on the main
‘environmental or community resources’(also known as valued ecosystemcomponents (VECs) in some contexts).The current environmental baselineconditions may be subject to changethrough natural events and trends, orhuman activities other than the proposedroad project. For this reason the likelyfuture state of the environment shouldalso be examined i.e. assuming that theroad project does not happen.Consideration of the future environmentalbaseline situation is particularly importantwhere the construction is not due to becompleted for a number of years.
Sources of environmental baseline datafor a road project may include (see alsoBox 6.2):
■ Topographic maps■ Vegetation maps■ Aerial photographs■ Scientific and technical reports■ Other environmental impact
assessment documents■ Technical, social, demographic and
economic information from local,regional, and national government
■ Professional and non-governmentalresearch organizations, anddevelopment agencies
■ Consultation with local residents andprofessionals.
50 6. Environmental Impact Assessment
Box 6.1: Screening and scoping: hints and tips
■ Provide an opportunity to involve other relevant parties in the screening andscoping decisions – it is better to debate the issues at this early stagerather than holding up the project later
■ The EIA team should not try to assess all of the environmental issues to thesame level of detail – the scoping process should be used to focus on themost important ones.
Box 6.2: Baseline evaluation: hints and tips
■ As part of project planning, ensure that the project team has identifiedadditional surveys where needed to supplement existing baselineenvironmental information. Note that some environmental surveys mayneed to be repeated and/or carried out at a particular time of the year
■ Consider whether the project team has selected appropriate ‘assessmentyears’ for developing the future environmental baseline. The assessmentyears will need to be chosen in consultation with the project engineeringdesign team. Typically these are the opening year of the road and a designyear, routinely defined as 10 years after road opening.
Where data do not exist for keyenvironmental community resources, newenvironmental surveys may need to beconducted.
Collection of environmental baseline datacan be a time consuming process. Theactivity should therefore be restricted tothose data sets that are most relevant tothe project i.e. the main environmental orcommunity resources that could besignificantly affected by the project.
Spatial scale is an importantconsideration in compiling theenvironmental baseline. For some topicsthe spatial area for which baseline dataare collected will coincide with thegeographic extent or ‘footprint’ of theroad project. However, the nature ofsome environmental and communityresources will require baseline data to becollected working to different spatialboundaries. For example, impacts ongroundwater resources may arise manykilometres from the source of pollution.
6.5 IMPACT PREDICTION,ASSESSMENT AND MITIGATION
Impact prediction and assessmentinvolve considering the baselineenvironment in the light of the expectedchanges associated with the project.The prediction and assessment shouldbe carried out early enough to provide aninput to the technical and economiccomparison of alternative options for theproject.
Impact prediction and assessmentshould be undertaken for all relevantenvironmental topics (see Box 6.3). It isalso important to consider theinterrelationships between them. Forexample, identifying when a community
may be affected by a number of negativeor positive environmental impacts. Forfurther information on the topics listed inBox 6.3, except those indicated as beingpart of the SIA process, the reader isreferred to the Appendix for topic bytopic environmental advice.
There are numerous techniques availablefor conducting the impact prediction andassessment such as predictive modeling,mapping/geographical informationsystems and forms of qualitative analysis.These techniques are summarized on atopic by topic basis in Appendix A.Appropriate techniques should be usedto characterize impacts against variousparameters:
■ Whether the impact is positive ornegative
■ Magnitude of the impact, inquantitative terms where possible (e.g.the scale of change resulting from theproject)
■ The timing in terms of the project lifecycle (see Table 6.1) as well as thecalendar month/season
■ Whether it is permanent or temporaryand the duration of its effects
■ Whether it is direct or indirect in nature■ Any regulatory considerations
associated with the impact■ The reversibility of the impact■ Whether the impact might be
cumulative in association with otherprojects (e.g. housing and commercialdevelopment near to the new roadalignment, with the projects collectivelycausing a major impact on a wetlandhabitat).
Once a potential impact has beencharacterized, consideration should begiven to its significance. Put simply,significance is a factor of the magnitudeand other characteristics of the expected
impact and the sensitivity of the receivingenvironment or community. Determiningsignificance is an important part of EIAand should be considered from theoutset of the process. Where nosignificant impact is anticipated, thisshould be stated and explained in theenvironmental impact statement (EIS).The consistent and robust determinationof significance can be assisted throughthe use of significance criteria which mayhave been developed for similar projectsor on a region/country-wide basis.
EIA is an active process and is intendedto help to improve the nature and designof the project. This is achieved throughconsidering how the impacts may beavoided, reduced or remedied alongsidethe process of prediction andassessment. Avoidance of the impact isthe preferred approach through selectingan alternative option or design.
Where an impact cannot be avoided,reducing or remedying the impact is thepreferable approach. This is known asmitigation. Mitigation may be achievedthrough:
■ Changes in the design, constructionpractices, maintenance, and operationof the project
■ Additional actions taken to protect thebiophysical and social environment, aswell as individuals who have beenimpacted adversely by the project.
Finally, where mitigation cannot beachieved, some form of compensationmay be considered, such as creation of anew area of equivalent wetland awayfrom the project itself. Compensation isnot always appropriate where anenvironmental feature is irreplaceable(e.g. an archaeological feature or uniquehabitat).
Mitigation and compensation measuresmust be realistic and achievable bearingin mind the issues such as capital cost,maintenance, land ownership andinstitutional responsibilities. The feasibilityof mitigation and compensationmeasures should therefore be carefullyconsidered and reported as part of theEIA and project appraisal processes.
Even with excellent baselineenvironmental data and a well-specifiedand designed project, EIA still involves
51
Box 6.3: The key topics for an EIA of a road project
■ Water resources■ Soil and geology ■ Local air pollution ■ Regional air pollution ■ Landscape, natural resources and waste■ Biodiversity
■ Cultural heritage ■ Noise and vibration■ Community severance*■ Land acquisition and
resettlement*■ Socio economic*
* primarily covered within a social impact assessment (SIA) whereone is undertaken
making predictions based on manyvariables. As with other aspects ofproject appraisal, there will be residualuncertainty associated with the impactpredictions and mitigation measures. Toprovide a credible assessment, all areasof uncertainty should be identified andcommunicated as part of the EIA.
Impact assessment and mitigation in EIAcan be supplemented by additionalsupporting analyses (see also Box 6.4).The need for such analyses may bedriven by project funding agencies orthrough contact with other stakeholders.Any such analyses will need to be closelyintegrated with the results of the EIA.They may include:
■ Socio-economic impact assessment(see Chapter 7)
■ Distributional analysis examining indetail which communities/socialgroups are affected by the variousimpacts identified in the EIA)
■ Sustainability tests, e.g. considerationof issues such as intergenerationalequity and the precautionary principle(which seeks to promote aprecautionary policy response wherepreliminary objective evaluationindicates that there are reasonablegrounds for concern that potentiallydangerous effects on theenvironment/communities may occur,even where there is a degree ofuncertainty)
■ Health impact assessment.
6.6 ENVIRONMENTAL MANAGEMENTPLAN AND MONITORING
Implementation of mitigation andmonitoring the impacts are often theweak links in EIA. A project environmentalmanagement plan (EMP) (also known asan environmental action plan, aconstruction management plan or anenvironmental protection plan) should beprepared as it is the main mechanism toachieve continuity between projectplanning/appraisal, detailed design,implementation/construction andoperation/maintenance (see Box 6.5).
An EMP should be drafted towards thecompletion of the impact assessment. Itshould be published as one chapter ofthe environmental impact statement andthen updated later at key points prior to
and during construction. Finally, ahandover EMP should be prepared asthe project enters the operation andmaintenance phase at which timeresponsibility is often handed over to adifferent department or organization.
The contents of an EMP shouldcomplement other project documentssuch as the design drawings showing thedesigns for the environmental mitigationmeasures. The main elements of anEMP are:
■ A list of all project-related activities andimpacts, organized by the constructionand operation/maintenance periods
■ A list of regulatory agencies involvedand their responsibilities
■ Details of specific mitigation/remedialmeasures and monitoring measuresassociated with:- The construction period activities and
impacts- The operation and maintenance
period activities and impacts■ A clear reporting schedule, including
discussion of what to submit, towhom, and when
■ Cost estimates and sources of fundingfor both one-time costs and recurringexpenses for EMP implementation.
Monitoring measures for the project may
take a variety of forms such as: ■ Compliance monitoring to enforce the
implementation of agreed mitigation■ Effects monitoring/evaluation to
consider the accuracy of the EIApredictions. This can provide a basisfor identifying further mitigationmeasures for the project and/orcapture issues of relevance to improvefuture projects.
6.7 REPORTING ANDCONSULTATION
A key reporting and consultation stagewill occur towards the end of thecompletion of the project appraisal andEIA to inform the decision whether toproceed with the project. However, it isalso beneficial to consult other parties atearlier stages of the process to improvethe assessment and avoid possibleexpensive changes to the design andmitigation at a later stage.
Typically, consultation is beneficial at thefollowing stages of EIA:■ At the scoping stage of the SEA to
identify sources of baselineenvironmental information andpotential significant impacts
■ During the impact assessment andmitigation
52 6. Environmental Impact Assessment
Box 6.4: Impact prediction, assessment and mitigation: hints and tips
■ The project team should consider and report on the less obviousenvironmental impacts as part of the assessment, even if they are laterruled out and found to be insignificant.
■ The project team will need to be creative in considering ways to avoid andreduce impacts through selecting alternatives and changing the projectdesign.
■ When proposing additional mitigation, the project team should examine thefeasibility and cost of implementing and maintaining the measures.
■ To bring credibility to the assessment, areas of uncertainty associated withthe predictions should be clearly identified.
Box 6.5: Environmental management plans and monitoring: hints and tips
■ The EMP is the most important output from the EIA – the project teamshould treat it as a live document through the construction phase
■ To save time and resources, the project team should try to make use ofenvironmental monitoring systems and data collected for other purposes(e.g. by environmental ministries or agencies).
■ When the environmental impactstatement (EIS) is published
■ During the design stage and as theproject enters the construction phaseand the EMP is updated.
During consultation, the followingstakeholders should be involved:
■ Government ministries■ Project designers■ Local officials■ Associations■ NGOs■ Community representatives■ Local residents.
It is important to highlight what isexpected of the consultees (i.e. what isbeing asked – questions within thedocuments can be useful triggers), andwho to contact when responding to theconsultation.
Public disclosure is an important aspectof all road projects. Internationally, one ofthe main drivers for improvingenvironmental reporting, consultation andpublic participation techniques in EIA isthe Aarhus Convention (2001). Theconvention provides for:
■ Access to environmental information -the right of everyone to receiveenvironmental information held bypublic authorities;
■ Public participation in environmentaldecision making - the right toparticipate from an early stage indecision making;
■ Access to justice - the right tochallenge in a court of law, publicdecisions that have been madewithout respecting the two otherrights.
The EIS is a key reporting output and itsformat and publication arrangementsshould be coordinated with other projectdocumentation. The required contents ofthe EIS may be specified in relevantlegislation and/or guidance. An EIS willtypically include the followingsubsections:
■ A non-technical summary■ Methods and issues including
identification of the environmentalassessment team, and introduction ofpolicy, legal and administrativeframework
■ A project description including theneed for the project and a summary ofany off-site works
■ Description of the environmentalbaseline
■ Discussion of alternative solutions anddesigns
■ Predicted environmental impacts (thismight also include identification ofmitigation measures)
■ Consultation (a complete record ofconsultation undertaken)
■ The environmental management planincluding monitoring provisions.
The EIS can also be useful for conveyingpositive aspects of project. If the projector secondary developments areenhancing any social or environmentalresources, it is a good opportunity togain public approval. Equally, thereporting process should be seen as achance to clear up misunderstandingsand identify conflict areas early on in theplanning process. This allows the detailedproject design to be modified (see Box6.6).
DETAILED SOURCES OF INFORMATION
Asian Development Bank (1997).Environmental impact assessment fordeveloping countries in Asia. AsianDevelopment Bank, Manila
DFID (2003). Environment guide.Department for InternationalDevelopment, London
EBRD (1996). Environmental procedures.European Bank for Reconstruction andDevelopment, London
EBRD (2003). Environmental policy.European Bank for Reconstruction andDevelopment, London
World Bank (1997). Roads and theenvironment handbook. Technical Paper376, World Bank, Washington, DC.
World Bank (1999). Environmentalassessment sourcebook. World Bank,Washington, DC.
53
Box 6.6: Reporting and consultation: hints and tips
■ Organized groups may be able to contribute specialist knowledge to theEIA process. However, it is often the local directly-affected community, whoalthough sometimes lacking in technical, financial and educationalresources, are the ones who may be able to make the most valuablecontributions during consultation
■ The EIS should not be overly ‘wordy’ or long. It should present thenecessary information clearly and concisely, in a format that can beunderstandable to the public. The use of maps and graphics, along withGIS, can be useful in helping readers visualize the project’s effects.
7.1 THE PURPOSE OF SOCIALIMPACT ASSESSMENT
Social impact assessment (SIA) is atechnique that can be used to examine thevarious positive and negative effects onsocial welfare of a transport intervention.SIA can be applied at both the projectappraisal phase, and in monitoring andevaluating implementation of theintervention. Its primary purpose in afeasibility study is to:
■ Identify and mitigate risk ■ Measure the social costs and benefits of
a road project.
SIA usually involves a high degree ofcommunity participation. Analytically itprovides an understanding of the socialcontext, institutions and coping strategiesthat affect social behaviour and policyimpacts. This includes:
■ The ways people cope with life throughtheir economy, social systems, andcultural values
■ The ways people use the naturalenvironment for subsistence, recreation,spiritual activities, cultural activities, etc
■ The ways people use the builtenvironment for shelter, makinglivelihoods, industry, worship, recreation,community associations, etc
■ The ways communities are organizedand held together by their social andcultural institutions and beliefs
■ Ways of life that communities value asexpressions of their identity
■ A group’s values and beliefs aboutappropriate ways to live, family andextra-family relationships, statusrelationships, means of expression, andother expressions of community.
■ The aesthetic and cultural character of a community or neighbourhood.
In identifying risk and social mitigationmeasures, SIA involves characterizingthese social attributes, forecasting howcommunities may be impacted by theplanned intervention, and hencedeveloping mitigation measures. Table 7.1indicates the range of potential socialimpacts associated with road projects.
The measurement of social costs andbenefits attributable to a road interventionare particularly important for justifyingdevelopment of rural transportinfrastructure. Because of the low trafficvolumes, the economic rate of return (seeChapter 15) on improvements to theseroads is typically insufficient to commitinvestment. Inclusion of social costs andbenefits in the analysis will support thecase for these roads and hence avoidmarginalization of poor rural communities.The application of social costs and benefitsto the appraisal of roads is discussedfurther in Chapter 15.
54 7. Social Impact Assessment
7. Social Impact Assessment
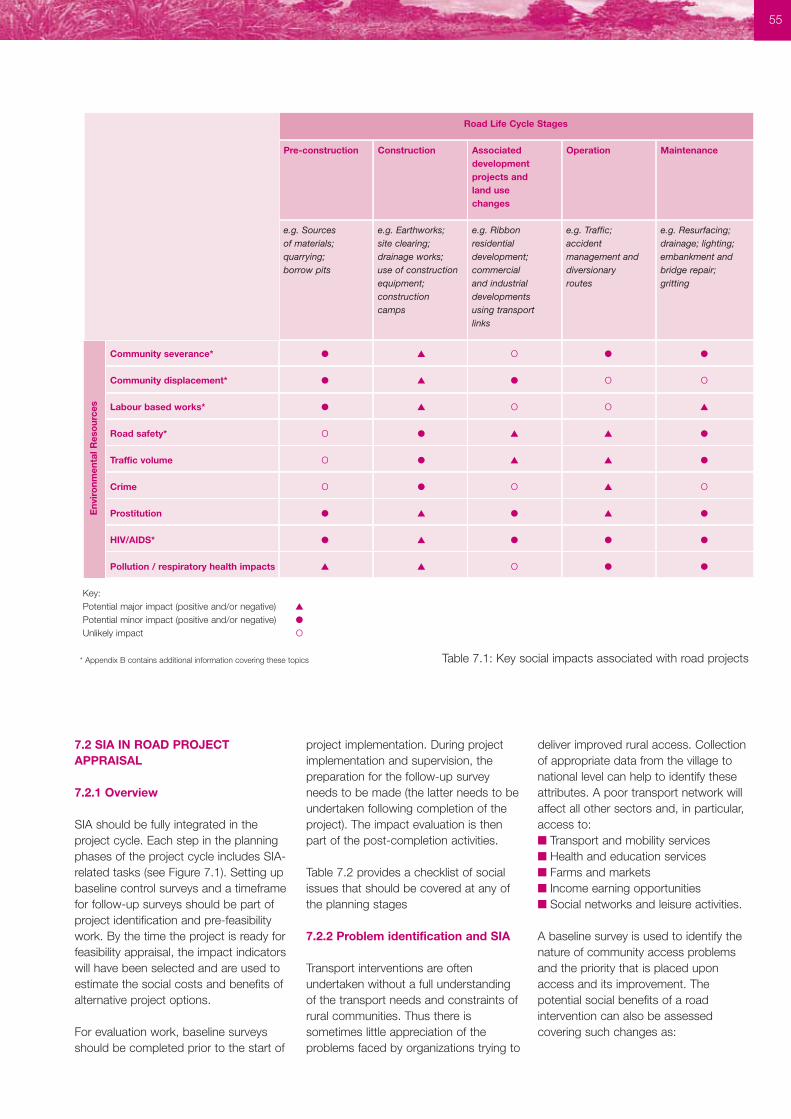
55
Env
iro
nmen
tal R
eso
urce
s
Table 7.1: Key social impacts associated with road projects
7.2 SIA IN ROAD PROJECTAPPRAISAL
7.2.1 Overview
SIA should be fully integrated in theproject cycle. Each step in the planningphases of the project cycle includes SIA-related tasks (see Figure 7.1). Setting upbaseline control surveys and a timeframefor follow-up surveys should be part ofproject identification and pre-feasibilitywork. By the time the project is ready forfeasibility appraisal, the impact indicatorswill have been selected and are used toestimate the social costs and benefits ofalternative project options.
For evaluation work, baseline surveysshould be completed prior to the start of
project implementation. During projectimplementation and supervision, thepreparation for the follow-up surveyneeds to be made (the latter needs to beundertaken following completion of theproject). The impact evaluation is thenpart of the post-completion activities.
Table 7.2 provides a checklist of socialissues that should be covered at any ofthe planning stages
7.2.2 Problem identification and SIA
Transport interventions are oftenundertaken without a full understandingof the transport needs and constraints ofrural communities. Thus there issometimes little appreciation of theproblems faced by organizations trying to
deliver improved rural access. Collectionof appropriate data from the village tonational level can help to identify theseattributes. A poor transport network willaffect all other sectors and, in particular,access to:■ Transport and mobility services■ Health and education services■ Farms and markets■ Income earning opportunities■ Social networks and leisure activities.
A baseline survey is used to identify thenature of community access problemsand the priority that is placed uponaccess and its improvement. Thepotential social benefits of a roadintervention can also be assessedcovering such changes as:
Road Life Cycle Stages
Pre-construction Construction Associated Operation Maintenancedevelopment projects and land use changes
e.g. Sources e.g. Earthworks; e.g. Ribbon e.g. Traffic; e.g. Resurfacing; of materials; site clearing; residential accident drainage; lighting; quarrying; drainage works; development; management and embankment and borrow pits use of construction commercial diversionary bridge repair;
equipment; and industrial routes grittingconstruction developmentscamps using transport
links
Community severance* ● ▲ O ● ●
Community displacement* ● ▲ ● O O
Labour based works* ● ▲ O O ▲
Road safety* O ● ▲ ▲ ●
Traffic volume O ● ▲ ▲ ●
Crime O ● O ▲ O
Prostitution ● ▲ ● ▲ ●
HIV/AIDS* ● ▲ ● ● ●
Pollution / respiratory health impacts ▲ ▲ O ● ●
Key:Potential major impact (positive and/or negative) ▲
Potential minor impact (positive and/or negative) ●
Unlikely impact O
* Appendix B contains additional information covering these topics

56 7. Social Impact Assessment
■ Improved social networks andenhanced social capital from peoplefinding it easier to maintain links withfamily members outside of theimmediate rural area. Such linksprovide for social interaction andaccess to help and resources in timesof need.
■ Enhanced community developmentmay arise from the community workingtogether to maintain or improve theirown transport conditions. Thisdepends upon how changes in
transport conditions are brought aboutand how they are maintained.
■ Increased confidence in an ability totravel to access services andopportunities.
■ Improved health and educationthrough easier access to services,particularly in areas such as maternalmortality and girls’ education.
■ Reduced vulnerability to unexpectedevents and shocks from crop failure,accidents and poor security. This isoften due to an increased ability to
access assistance and to secureincome from an alternative source.
■ Greater reliability of clinics and schoolsin securing secure staff for clinics andschools and easier to maintain theseservices because drugs can besupplied and school suppliesreplenished.
■ Reduced time burdens from engagingin mobility due to the improvedenvironmental impact of roads (e.g.less dust) and increased transportservice frequency.
Responsive to needs of people affected
Reaching poor and disadvantaged populations
Recognizing the roles and needs of women
Encouraging participation
Table 7.2: Checklist of social development objectives of road infrastructure projects
■ Have patterns of current road use, and forecast usage beenestablished? Are the needs of users reflected in project design? (e.g.need for the new road to accommodate motorized vehicles, oxcarts,drivers, cyclists and pedestrians)
■ Have other local concerns been taken into account e.g. for safety,especially for children, and for security?
■ Are there legal provisions in force to mitigate the cost of accidents ifthey occur (e.g. seat belt laws, insurance schemes, checks on theroad-worthiness of vehicles etc)? Are these laws consistently and fairlyapplied? If not, how will the project address this issue (e.g. throughpolicy dialogue at ministry level)?
■ Do farmers feel that levels of compensation proposed for land lost toroad widening is adequate?
■ Will the construction of the road be undertaken by local people,thereby bringing employment to the area (see Figure 7.2)?
■ If the project is financed as part of a ‘food for work’ campaign how willcontractors ensure labour opportunities go to the poorest?
■ Does the potential benefit from the road depend on other facilities alsobeing available e.g. transport, credit? Will/could the project facilitatetheir provision (e.g. through discussions with the Ministry of Transporton the need for a subsidized public bus service)?
■ For what purposes do women currently use the road? Will they be inany way disadvantaged by the new road (e.g. with regard to roadsafety, personal security, displacement etc)? Can/will the projectattempt to offset any negative effects?
■ If local labour is used to build the road will women labourers beemployed on equivalent terms and conditions as men?
■ How are local communities to be informed/consulted about the road?■ Will indigenous knowledge be used in project design? ■ Will local labour be used to maintain the road? Will local contractors be
asked to tender for maintenance and building work?■ Where the Public Works Department is the implementing agent: is the
department equipped to find out local needs and use local knowledgein project design? How can the project support the department toadopt a participative approach?
Adapted from DFID (1993)
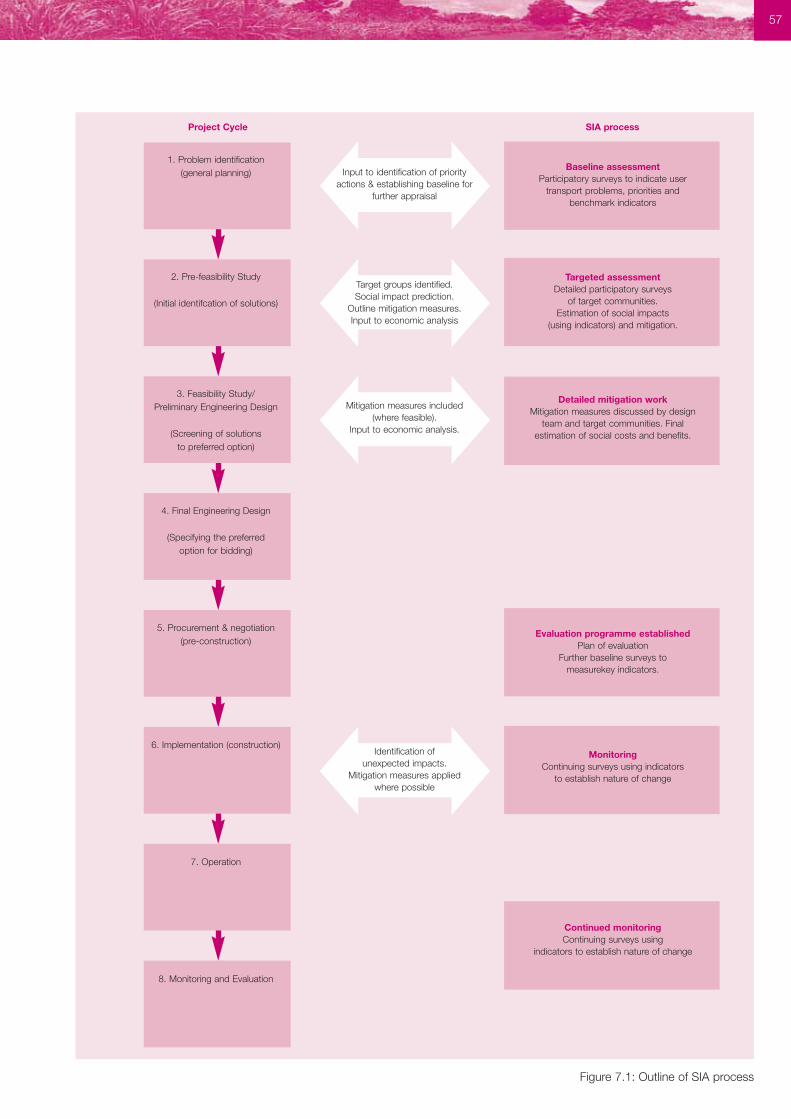
57
1. Problem identification(general planning)
2. Pre-feasibility Study
(Initial identifcation of solutions)
3. Feasibility Study/ Preliminary Engineering Design
(Screening of solutions to preferred option)
4. Final Engineering Design
(Specifying the preferred option for bidding)
5. Procurement & negotiation(pre-construction)
6. Implementation (construction)
7. Operation
8. Monitoring and Evaluation
Figure 7.1: Outline of SIA process
SIA process
Input to identification of priorityactions & establishing baseline for
further appraisal
Target groups identified.Social impact prediction.
Outline mitigation measures.Input to economic analysis
Mitigation measures included(where feasible).
Input to economic analysis.
Identification ofunexpected impacts.
Mitigation measures appliedwhere possible
Baseline assessmentParticipatory surveys to indicate user
transport problems, priorities andbenchmark indicators
Targeted assessmentDetailed participatory surveys
of target communities.Estimation of social impacts
(using indicators) and mitigation.
Detailed mitigation workMitigation measures discussed by design
team and target communities. Finalestimation of social costs and benefits.
Evaluation programme establishedPlan of evaluation
Further baseline surveys to measurekey indicators.
Monitoring Continuing surveys using indicators
to establish nature of change
Continued monitoring Continuing surveys using
indicators to establish nature of change
Project Cycle
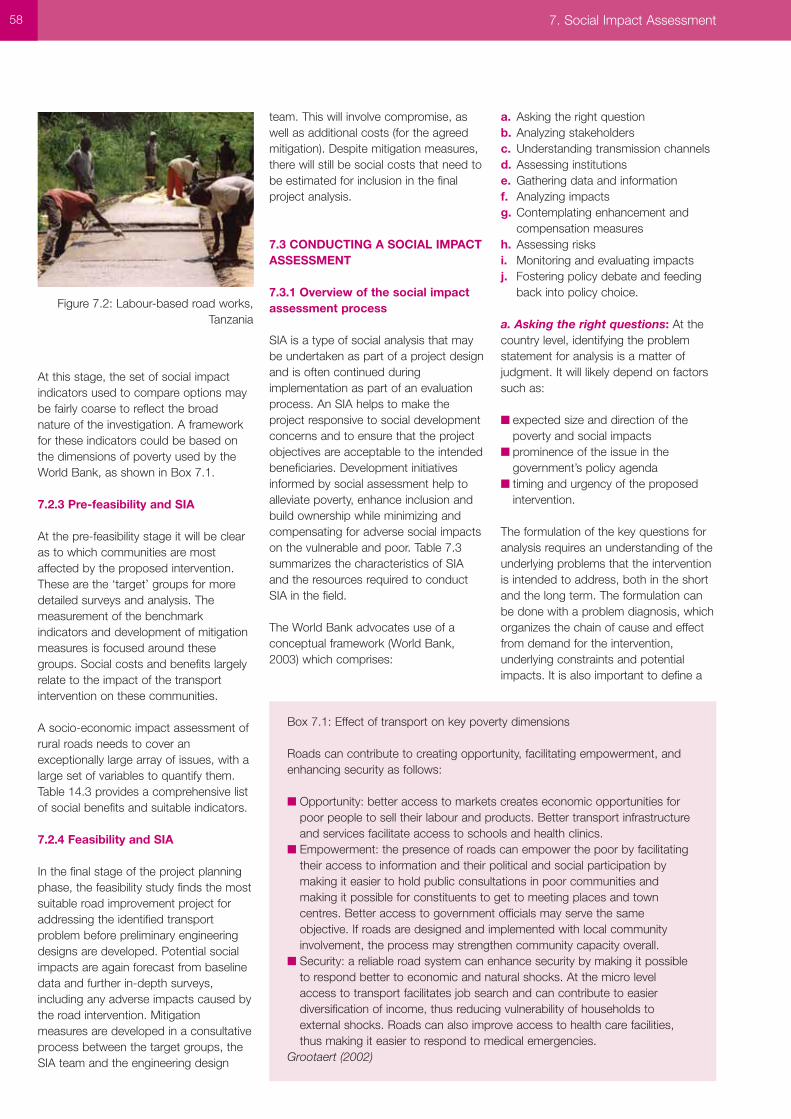
At this stage, the set of social impactindicators used to compare options maybe fairly coarse to reflect the broadnature of the investigation. A frameworkfor these indicators could be based onthe dimensions of poverty used by theWorld Bank, as shown in Box 7.1.
7.2.3 Pre-feasibility and SIA
At the pre-feasibility stage it will be clearas to which communities are mostaffected by the proposed intervention.These are the ‘target’ groups for moredetailed surveys and analysis. Themeasurement of the benchmarkindicators and development of mitigationmeasures is focused around thesegroups. Social costs and benefits largelyrelate to the impact of the transportintervention on these communities.
A socio-economic impact assessment ofrural roads needs to cover anexceptionally large array of issues, with alarge set of variables to quantify them.Table 14.3 provides a comprehensive listof social benefits and suitable indicators.
7.2.4 Feasibility and SIA
In the final stage of the project planningphase, the feasibility study finds the mostsuitable road improvement project foraddressing the identified transportproblem before preliminary engineeringdesigns are developed. Potential socialimpacts are again forecast from baselinedata and further in-depth surveys,including any adverse impacts caused bythe road intervention. Mitigationmeasures are developed in a consultativeprocess between the target groups, theSIA team and the engineering design
team. This will involve compromise, aswell as additional costs (for the agreedmitigation). Despite mitigation measures,there will still be social costs that need tobe estimated for inclusion in the finalproject analysis.
7.3 CONDUCTING A SOCIAL IMPACTASSESSMENT
7.3.1 Overview of the social impactassessment process
SIA is a type of social analysis that maybe undertaken as part of a project designand is often continued duringimplementation as part of an evaluationprocess. An SIA helps to make theproject responsive to social developmentconcerns and to ensure that the projectobjectives are acceptable to the intendedbeneficiaries. Development initiativesinformed by social assessment help toalleviate poverty, enhance inclusion andbuild ownership while minimizing andcompensating for adverse social impactson the vulnerable and poor. Table 7.3summarizes the characteristics of SIAand the resources required to conductSIA in the field.
The World Bank advocates use of aconceptual framework (World Bank,2003) which comprises:
a. Asking the right questionb. Analyzing stakeholdersc. Understanding transmission channelsd. Assessing institutionse. Gathering data and informationf. Analyzing impactsg. Contemplating enhancement and
compensation measuresh. Assessing risksi. Monitoring and evaluating impactsj. Fostering policy debate and feeding
back into policy choice.
a. Asking the right questions: At thecountry level, identifying the problemstatement for analysis is a matter ofjudgment. It will likely depend on factorssuch as:
■ expected size and direction of thepoverty and social impacts
■ prominence of the issue in thegovernment’s policy agenda
■ timing and urgency of the proposedintervention.
The formulation of the key questions foranalysis requires an understanding of theunderlying problems that the interventionis intended to address, both in the shortand the long term. The formulation canbe done with a problem diagnosis, whichorganizes the chain of cause and effectfrom demand for the intervention,underlying constraints and potentialimpacts. It is also important to define a
58 7. Social Impact Assessment
Figure 7.2: Labour-based road works,Tanzania
Box 7.1: Effect of transport on key poverty dimensions
Roads can contribute to creating opportunity, facilitating empowerment, andenhancing security as follows:
■ Opportunity: better access to markets creates economic opportunities forpoor people to sell their labour and products. Better transport infrastructureand services facilitate access to schools and health clinics.
■ Empowerment: the presence of roads can empower the poor by facilitatingtheir access to information and their political and social participation bymaking it easier to hold public consultations in poor communities andmaking it possible for constituents to get to meeting places and towncentres. Better access to government officials may serve the sameobjective. If roads are designed and implemented with local communityinvolvement, the process may strengthen community capacity overall.
■ Security: a reliable road system can enhance security by making it possibleto respond better to economic and natural shocks. At the micro levelaccess to transport facilitates job search and can contribute to easierdiversification of income, thus reducing vulnerability of households toexternal shocks. Roads can also improve access to health care facilities,thus making it easier to respond to medical emergencies.
Grootaert (2002)
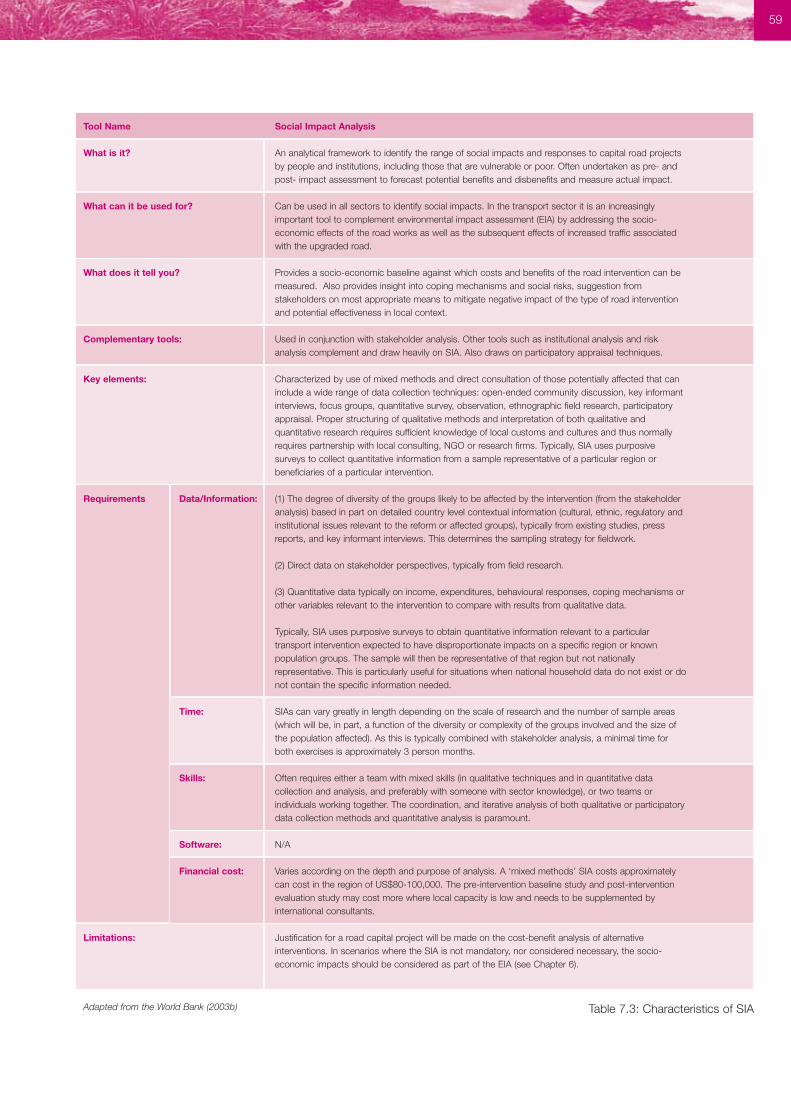
59
Table 7.3: Characteristics of SIA
Tool Name Social Impact Analysis
What is it? An analytical framework to identify the range of social impacts and responses to capital road projectsby people and institutions, including those that are vulnerable or poor. Often undertaken as pre- andpost- impact assessment to forecast potential benefits and disbenefits and measure actual impact.
What can it be used for? Can be used in all sectors to identify social impacts. In the transport sector it is an increasinglyimportant tool to complement environmental impact assessment (EIA) by addressing the socio-economic effects of the road works as well as the subsequent effects of increased traffic associatedwith the upgraded road.
What does it tell you? Provides a socio-economic baseline against which costs and benefits of the road intervention can bemeasured. Also provides insight into coping mechanisms and social risks, suggestion fromstakeholders on most appropriate means to mitigate negative impact of the type of road interventionand potential effectiveness in local context.
Complementary tools: Used in conjunction with stakeholder analysis. Other tools such as institutional analysis and riskanalysis complement and draw heavily on SIA. Also draws on participatory appraisal techniques.
Key elements: Characterized by use of mixed methods and direct consultation of those potentially affected that caninclude a wide range of data collection techniques: open-ended community discussion, key informantinterviews, focus groups, quantitative survey, observation, ethnographic field research, participatoryappraisal. Proper structuring of qualitative methods and interpretation of both qualitative andquantitative research requires sufficient knowledge of local customs and cultures and thus normallyrequires partnership with local consulting, NGO or research firms. Typically, SIA uses purposivesurveys to collect quantitative information from a sample representative of a particular region orbeneficiaries of a particular intervention.
Requirements Data/Information: (1) The degree of diversity of the groups likely to be affected by the intervention (from the stakeholderanalysis) based in part on detailed country level contextual information (cultural, ethnic, regulatory andinstitutional issues relevant to the reform or affected groups), typically from existing studies, pressreports, and key informant interviews. This determines the sampling strategy for fieldwork.
(2) Direct data on stakeholder perspectives, typically from field research.
(3) Quantitative data typically on income, expenditures, behavioural responses, coping mechanisms orother variables relevant to the intervention to compare with results from qualitative data.
Typically, SIA uses purposive surveys to obtain quantitative information relevant to a particulartransport intervention expected to have disproportionate impacts on a specific region or knownpopulation groups. The sample will then be representative of that region but not nationallyrepresentative. This is particularly useful for situations when national household data do not exist or donot contain the specific information needed.
Time: SIAs can vary greatly in length depending on the scale of research and the number of sample areas(which will be, in part, a function of the diversity or complexity of the groups involved and the size ofthe population affected). As this is typically combined with stakeholder analysis, a minimal time forboth exercises is approximately 3 person months.
Skills: Often requires either a team with mixed skills (in qualitative techniques and in quantitative datacollection and analysis, and preferably with someone with sector knowledge), or two teams orindividuals working together. The coordination, and iterative analysis of both qualitative or participatorydata collection methods and quantitative analysis is paramount.
Software: N/A
Financial cost: Varies according on the depth and purpose of analysis. A ‘mixed methods’ SIA costs approximatelycan cost in the region of US$80-100,000. The pre-intervention baseline study and post-interventionevaluation study may cost more where local capacity is low and needs to be supplemented byinternational consultants.
Limitations: Justification for a road capital project will be made on the cost-benefit analysis of alternativeinterventions. In scenarios where the SIA is not mandatory, nor considered necessary, the socio-economic impacts should be considered as part of the EIA (see Chapter 6).
Adapted from the World Bank (2003b)
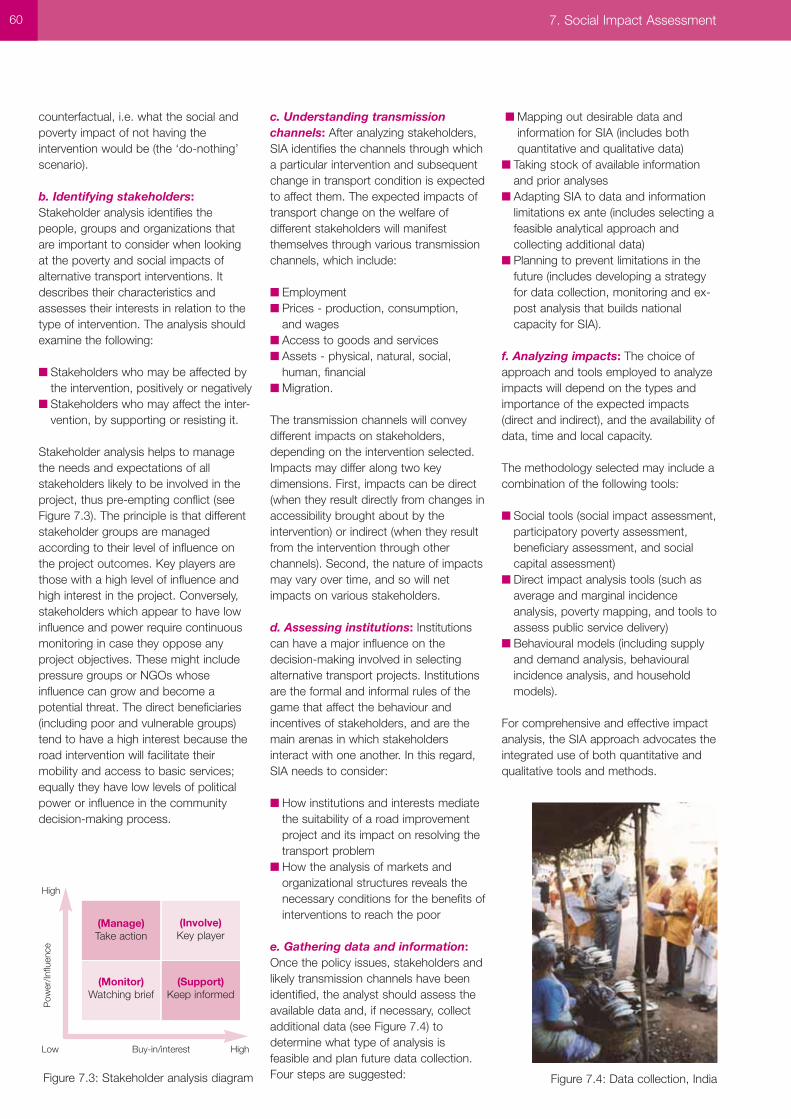
60 7. Social Impact Assessment
counterfactual, i.e. what the social andpoverty impact of not having theintervention would be (the ‘do-nothing’scenario).
b. Identifying stakeholders:Stakeholder analysis identifies thepeople, groups and organizations thatare important to consider when lookingat the poverty and social impacts ofalternative transport interventions. Itdescribes their characteristics andassesses their interests in relation to thetype of intervention. The analysis shouldexamine the following:
■ Stakeholders who may be affected bythe intervention, positively or negatively
■ Stakeholders who may affect the inter-vention, by supporting or resisting it.
Stakeholder analysis helps to managethe needs and expectations of allstakeholders likely to be involved in theproject, thus pre-empting conflict (seeFigure 7.3). The principle is that differentstakeholder groups are managedaccording to their level of influence onthe project outcomes. Key players arethose with a high level of influence andhigh interest in the project. Conversely,stakeholders which appear to have lowinfluence and power require continuousmonitoring in case they oppose anyproject objectives. These might includepressure groups or NGOs whoseinfluence can grow and become apotential threat. The direct beneficiaries(including poor and vulnerable groups)tend to have a high interest because theroad intervention will facilitate theirmobility and access to basic services;equally they have low levels of politicalpower or influence in the communitydecision-making process.
c. Understanding transmissionchannels: After analyzing stakeholders,SIA identifies the channels through whicha particular intervention and subsequentchange in transport condition is expectedto affect them. The expected impacts oftransport change on the welfare ofdifferent stakeholders will manifestthemselves through various transmissionchannels, which include:
■ Employment ■ Prices - production, consumption,
and wages ■ Access to goods and services ■ Assets - physical, natural, social,
human, financial ■ Migration.
The transmission channels will conveydifferent impacts on stakeholders,depending on the intervention selected.Impacts may differ along two keydimensions. First, impacts can be direct(when they result directly from changes inaccessibility brought about by theintervention) or indirect (when they resultfrom the intervention through otherchannels). Second, the nature of impactsmay vary over time, and so will netimpacts on various stakeholders.
d. Assessing institutions: Institutionscan have a major influence on thedecision-making involved in selectingalternative transport projects. Institutionsare the formal and informal rules of thegame that affect the behaviour andincentives of stakeholders, and are themain arenas in which stakeholdersinteract with one another. In this regard,SIA needs to consider:
■ How institutions and interests mediatethe suitability of a road improvementproject and its impact on resolving thetransport problem
■ How the analysis of markets andorganizational structures reveals thenecessary conditions for the benefits ofinterventions to reach the poor
e. Gathering data and information:Once the policy issues, stakeholders andlikely transmission channels have beenidentified, the analyst should assess theavailable data and, if necessary, collectadditional data (see Figure 7.4) todetermine what type of analysis isfeasible and plan future data collection.Four steps are suggested:
■ Mapping out desirable data andinformation for SIA (includes bothquantitative and qualitative data)
■ Taking stock of available informationand prior analyses
■ Adapting SIA to data and informationlimitations ex ante (includes selecting afeasible analytical approach andcollecting additional data)
■ Planning to prevent limitations in thefuture (includes developing a strategyfor data collection, monitoring and ex-post analysis that builds nationalcapacity for SIA).
f. Analyzing impacts: The choice ofapproach and tools employed to analyzeimpacts will depend on the types andimportance of the expected impacts(direct and indirect), and the availability ofdata, time and local capacity.
The methodology selected may include acombination of the following tools:
■ Social tools (social impact assessment,participatory poverty assessment,beneficiary assessment, and socialcapital assessment)
■ Direct impact analysis tools (such asaverage and marginal incidenceanalysis, poverty mapping, and tools toassess public service delivery)
■ Behavioural models (including supplyand demand analysis, behaviouralincidence analysis, and householdmodels).
For comprehensive and effective impactanalysis, the SIA approach advocates theintegrated use of both quantitative andqualitative tools and methods.
Figure 7.4: Data collection, IndiaFigure 7.3: Stakeholder analysis diagram
High
Low Buy-in/interest High
Pow
er/In
fluen
ce
(Monitor)Watching brief
(Involve)Key player
(Manage)Take action
(Support)Keep informed
61
g. Contemplating enhancement andcompensation measures: If the ex-ante analysis reveals adverse effects onthe living standards of the poor or othervulnerable groups, the following could beconsidered:
■ An alternative design that includesenhancement or mitigation measures,or a different sequencing of publicactions
■ Direct compensatory mechanisms thatcompensate on poverty, equity, orpolitical economy grounds (e.g. in theevent of land acquisition anddisplacement)
■ Delay or suspension of the project: if the benefits of the intervention arelower than the costs of mitigating orcompensating the poor.
h. Assessing risks: Risk assessmentaddresses the risk that some of theassumptions underlying the analysis maynot be realized. This provides furtherinsights into option choice and design. In addition, when combined with carefulmonitoring, risk analysis can helpanticipate and address major unintendedconsequences by adjusting the optiondesign during implementation.
There are four main types of risk in SIA:
■ Institutional risks: risks thatassumptions regarding institutionalarrangements and/or organizationalperformance were incorrect (forinstance, unexpected market failure,reform complexity exceedinginstitutional capacity, vested interests in the agency)
■ Political economy risks: risks thatgroups may block implementation orcapture benefits
■ Exogenous risks: risks of shocks suchas conflict, financial crisis, terms oftrade shocks, or natural disaster
■ Other country risks: risks of politicalinstability, conflict or social tensionspreventing implementation of the roadimprovement project.
i. Monitoring and evaluation:Monitoring and evaluation play animportant role in the analysis of povertyand social impacts of transportinterventions. Monitoring impactindicators (and the assumptionsunderlying the analysis) helps to signalunexpected developments during
implementation. Monitoring andevaluation are also central in thepromotion of accountability andownership. In order to enhance theirimpact, monitoring and evaluationsystems are best set up during the initialstages of the project. They should alsobe integrated with existing systems inorder to strengthen national capacity.
j. Fostering debate and feeding backinto choice: SIA is an integral element ofthe dialogue on the country’s povertyreduction strategy. Fostering and drawingupon public discussion of policy can beuseful at various points of the SIAprocess. At an early stage, the debatecan inform the choice of option for whichanalysis should be undertaken. Duringthe analysis, discussions can helpanalyze stakeholders, understandtransmission channels, and validatetechnical impact analysis. Policy debateamong stakeholders is also essential todevelop consensus, build ownership andto create leverage of social accountability,since it enhances the understanding ofthe potential poverty and social impactsof the project. Finally, it can also beuseful for monitoring and evaluationpurposes.
A sensible approach to SIA is bothcountry and context specific, dependentupon available data and capacity as wellas the road improvement project underscrutiny. The tools and techniques usedfor SIA are likely to vary greatly acrosscountries and interventions. However,regardless of the chosen methodology,there are some key components thatshould be addressed in this kind ofanalysis. Table 7.3 presents a summarymatrix that captures and integrates thesekey components. The matrix itself canserve as a useful tool during the SIAprocess.
7.3.2 Summary of Social ImpactAssessment Principles
The following principles should structureany SIA:
1. Involve the diverse public. Since SIA isall about determining and addressing theconcerns of the public, publicinvolvement is essential. Publicinvolvement should be an active andinteractive process, in which members of
the public are full participants in the SIAenterprise. It is essential that allpotentially affected segments of thepublic have opportunities to participate.One aspect of social assessmentinvolves determining who the affectedsegments of the public are, and how theyare organized. Public involvement mustreach out to groups that do not routinelyparticipate in government decisionmaking because of cultural, linguistic,and economic barriers.
2. Analyze impact equity. A basic part ofSIA is to analyze who wins and wholoses with each alternative considered. Itis especially important to analyze whetheran alternative may have high anddisproportionate adverse environmentalor health effects on a low-income orminority population. Impact equity mustbe considered in close and sympatheticconsultation with affected communities,neighbourhoods, and groups, especiallylow-income and vulnerable groups(elderly, young, infirm, poor). Analysisshould begin during scoping to ensurethat important issues are not left out.
3. Focus the assessment. This is amatter of scoping. Scoping during thefeasibility study should seek to ascertainwhat issues are really important toaffected communities and groups. Theanalysis should not focus only oneconomic issues or demographics.
4. Identify methods and assumptions.The SIA must report the assumptions onwhich it is based, and describe methodsemployed.
5. Define significance. An SIA shoulddiscuss how the significance of a socialvariable or an impact is represented. Inone case, emphasis may be given toimpacts on agricultural land use and lifestyle, while in another it may be given toimpacts on small family-ownedbusinesses in the vicinity of the project.There are obviously reasons for regardingone variable as more significant thananother in a given case; these reasonsneed to be made explicit. Similarly, thereasons for considering one kind ofimpact to be more significant thananother must be defined and weighted.
6. Provide feedback to projectstakeholders. An SIA should not besomething a consultant does in isolation,
62 7. Social Impact Assessment
producing a final deliverable withoutinvolvement of the client or the localpopulation. There should be participatorystakeholder consultation throughout theproject cycle and, in particular, at theproject’s inception when stakeholders‘buy-in’ is required. There should beactive feedback between the SIAcontractor, planners and communityleaders throughout the assessment andplanning processes. These processesshould be carefully co-ordinated so thatplanners can be informed of potentialproblems and opportunities before it istoo late to do anything about them.
7. Use SIA practitioners. Trained socialscientists, using appropriate professionalmethods, will provide the best results.Generally speaking, such practitionersinclude cultural anthropologists,sociologists, cultural geographers, and members of related professions.However, practitioners of other disciplines(e.g. economics, social history) may beeffective social impact analysts if theyhave the right interests and training.
8. Establish monitoring and mitigationprogrammes. An SIA should not onlyprovide an analysis of impacts, but alsothe basis for setting up programmes tomitigate social impacts and monitor howthese programmes work.
9. Identify data sources. As a matter ofgood practice, an SIA should identify thesources upon which the analysis isbased. In some cases, communitygroups may desire confidentiality andsuch desires should be accommodatedto the extent practicable and consistentwith law. If confidentiality cannot beguaranteed, informants should be toldand given the opportunity not to provideinformation, or to provide it in abridgedform.
In summary, the following should beconsidered when planning a socialimpact assessment as part of feasibilitystudies for capital road projects:
■ Identify the target beneficiaries andstakeholders – where has demand forthe intervention originated from?
■ Gather data and information to identifythe access issues affecting localpopulations and potential impacts ofinvestment alternatives
■ Assess the risks of undertakingalternative road projects on thecommunity (i.e. displacement of thepopulation, use of local labour duringconstruction, disbenefits of the roadintervention such as increased trafficspeed and risk of road traffic accidentsetc)
■ Conduct the social impact assessmentand measure the social benefits of theproposed intervention in conjunctionwith an environmental impactassessment and cost-benefit analysis.
7.3.3 Reporting and consultation
A detailed schedule of the socialassessment activities described in theterms of reference should be prepareddescribing the types of outputs the socialassessment plans to produce. Relevantcharts, graphs, statistical and qualitativeanalysis, along with raw data whereappropriate, can be provided in the SIAreport. In addition to the outputs of theSIA, a note on the social assessmentprocess itself can be included, statingany difficulties faced by the practitionersconducting the SIA and recommendingthe most appropriate disseminationstrategy for the findings. The analyticalreport format could be structured asfollows:
■ Background to the country area andcharacteristics of provinces, districtsand villages to be affected by eachinvestment alternative
■ Institutional framework and planning ofroads in the area under assessmentwith perceived (pre-intervention) andactual (post-intervention) impactsdescribed
■ Findings from the participatoryappraisal and questionnaire analysis
■ Recommendations for prioritizinginvestment alternative(s) based on theirrelative social impacts on localstakeholders and beneficiaries, andsupport for a specific roadimprovement project based on itssocial costs and benefits, and theimplications for poverty reductionobjectives.
DETAILED SOURCES OF INFORMATION
Chambers, R. (2003). Notes forparticipants in PRA-PLA familiarisationworkshops. Participation ResourceCentre. Institute for DevelopmentStudies, Brighton.
DFID (1993). Social developmenthandbook: a guide to social issues inODA projects and programmes.Overseas Development Administration,London.
DFID (2001). Sustainable livelihoodsguidance sheets. Department forInternational Development, London
Grootaert, C. (2002). Socio-economicimpact assessment of rural roads:methodology and questionnaires. WorldBank, Washington DC.
TRL (2004a). The rural transport policytoolkit. TRL Limited, Crowthorne, UK.
TRL (2004b). A guide to pro-poortransport appraisal. Overseas Road Note22, TRL Ltd, Crowthorne, UK.
World Bank (2003a). A user’s guide topoverty and social impact analysis. WorldBank, Washington DC.
World Bank (2003b). Social analysissourcebook: incorporating socialdimensions into bank-supported projects.World Bank, Washington DC.
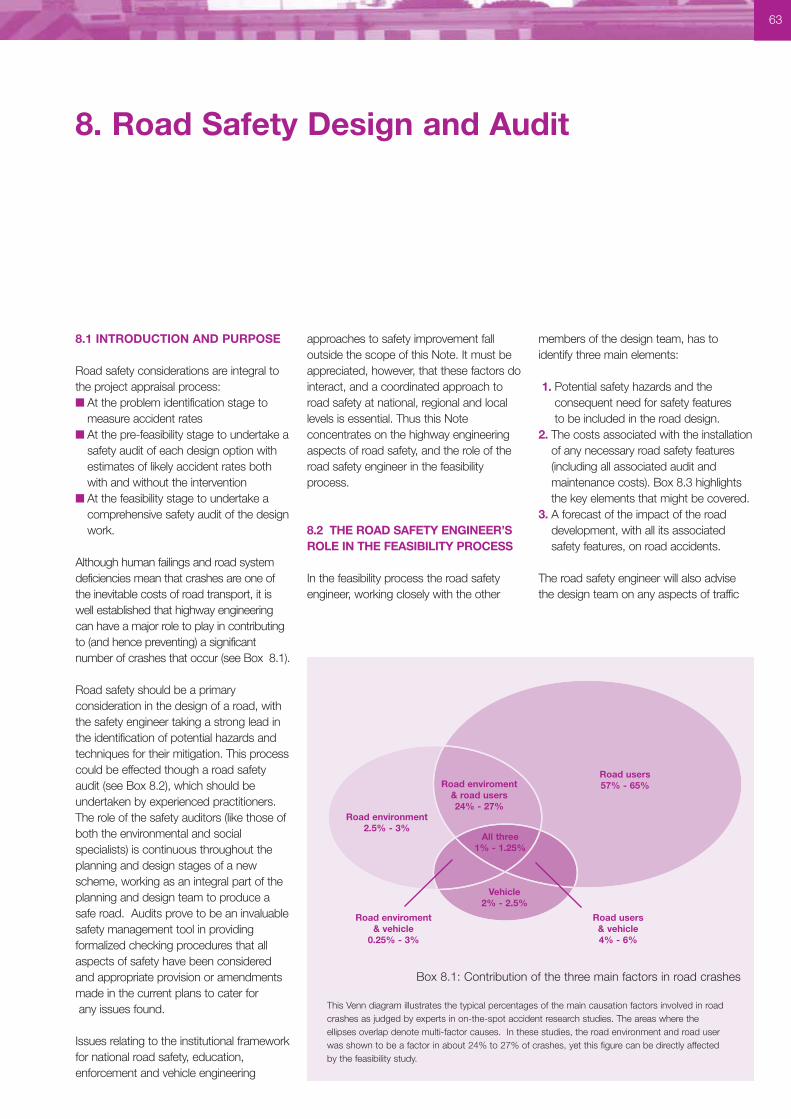
63
8.1 INTRODUCTION AND PURPOSE
Road safety considerations are integral tothe project appraisal process: ■ At the problem identification stage to
measure accident rates ■ At the pre-feasibility stage to undertake a
safety audit of each design option withestimates of likely accident rates bothwith and without the intervention
■ At the feasibility stage to undertake acomprehensive safety audit of the designwork.
Although human failings and road systemdeficiencies mean that crashes are one ofthe inevitable costs of road transport, it iswell established that highway engineeringcan have a major role to play in contributingto (and hence preventing) a significantnumber of crashes that occur (see Box 8.1).
Road safety should be a primaryconsideration in the design of a road, withthe safety engineer taking a strong lead inthe identification of potential hazards andtechniques for their mitigation. This processcould be effected though a road safetyaudit (see Box 8.2), which should beundertaken by experienced practitioners.The role of the safety auditors (like those ofboth the environmental and socialspecialists) is continuous throughout theplanning and design stages of a newscheme, working as an integral part of theplanning and design team to produce asafe road. Audits prove to be an invaluablesafety management tool in providingformalized checking procedures that allaspects of safety have been consideredand appropriate provision or amendmentsmade in the current plans to cater forany issues found.
Issues relating to the institutional frameworkfor national road safety, education,enforcement and vehicle engineering
approaches to safety improvement falloutside the scope of this Note. It must beappreciated, however, that these factors dointeract, and a coordinated approach toroad safety at national, regional and locallevels is essential. Thus this Noteconcentrates on the highway engineeringaspects of road safety, and the role of theroad safety engineer in the feasibilityprocess.
8.2 THE ROAD SAFETY ENGINEER’SROLE IN THE FEASIBILITY PROCESS
In the feasibility process the road safetyengineer, working closely with the other
members of the design team, has toidentify three main elements:
1. Potential safety hazards and theconsequent need for safety features to be included in the road design.
2. The costs associated with the installationof any necessary road safety features(including all associated audit andmaintenance costs). Box 8.3 highlightsthe key elements that might be covered.
3. A forecast of the impact of the roaddevelopment, with all its associatedsafety features, on road accidents.
The road safety engineer will also advisethe design team on any aspects of traffic
8. Road Safety Design and Audit
Box 8.1: Contribution of the three main factors in road crashes
This Venn diagram illustrates the typical percentages of the main causation factors involved in roadcrashes as judged by experts in on-the-spot accident research studies. The areas where theellipses overlap denote multi-factor causes. In these studies, the road environment and road userwas shown to be a factor in about 24% to 27% of crashes, yet this figure can be directly affectedby the feasibility study.
Road environment2.5% - 3%
Road users57% - 65%
Vehicle2% - 2.5%
Road users& vehicle4% - 6%
Road enviroment& vehicle
0.25% - 3%
Road enviroment& road users24% - 27%
All three1% - 1.25%

64 8. Road Safety Design and Audit
Box 8.2: Road Safety Audit
What is a Road Safety Audit?Road safety audit is a formal, systematic procedure forchecking the safety of new road schemes or schemes forthe improvement of existing roads. Specific aims are to
■ minimize the risk of accidents occurring on the schemeand to minimize their severity
■ minimize accidents on adjacent roads, ie. to avoidcreating accidents elsewhere on the network
■ recognize the importance of safety in highway design inmeeting the needs and perceptions of all road users
■ reduce the long-term cost of a scheme bearing in mindthat unsafe designs will be expensive to correct at alater stage
■ improve the awareness of safe design practices by allthose involved in the planning, design, construction andmaintenance of roads.
What should be audited?Schemes eligible for audit cover a wide range of differentclasses of road in both urban and rural areas, including:
■ Major highway schemes ■ Minor improvements ■ Traffic management schemes■ Maintenance works■ Safety improvement schemes
When to audit in the project cycle?
■ Appraisal (pre-feasibility, feasibility and preliminarydesign)
■ Final engineering design■ Implementation (pre-opening of the road or scheme)■ Monitoring (post-opening)
Who should audit?At the appraisal stages, a specialist who is independent ofthe design team is usually required to undertake the audit,working to a detailed brief provided by the ProjectManager/Design Engineer. He or she should have generalroads safety engineering experience and should havereceived recognised road safety engineering training aswell as safety audit training.
ChecklistsThe use of checklists can be a very valuable aid,particularly for those new to the audit process. Examples of these are given in some of the followinggeneral references on the subject:-IHT(1990), AustRoads (1994), TMS Consultancy (2001), HA (2003).
Capital cost. The additional costs of specific road safetyfeatures factored into the road design. If the implementation isexpected to span two or more financial years then the annualbreakdown of expenditure is also required. It should alsoinclude the cost of carrying out road safety audits at theappropriate stages of design and implementation.
Annual maintenance and operating costs. An estimate isalso required of the expected regular maintenance requireddue to the type of road safety feature installed; for example,simple kerb line alterations will probably not requiremaintenance, whereas roundabouts may do (particularly iftheir centre is landscaped) and traffic signals certainly incurregular maintenance costs.
Service life of scheme. For the economic appraisal,account should also be taken of how long the installation islikely to last; that is, before major rehabilitation or replacementis necessary.
Terminal salvage value. It is possible that some safetyfeatures or countermeasures may have a residual value if theyare removed, e.g. if a junction is temporarily signalized for a number of years until a by-pass is completed and, aftercompletion, lower subsequent traffic flows mean that thesignals can be removed. If the signal system could be usedelsewhere then the recovery of this cost should strictly betaken into account in the calculation; however, in most cases,any residual value is likely to be negligible.
Estimate of any disbenefits. Some accidentcountermeasures will inevitably produce secondary effects ontraffic movement, which could be considered as negativeeffects. For example, road closures necessitate driverschoosing alternative routes and speed reducing measuresmay incur penalties in terms of increases in journey time, fuelconsumption and emissions. The additional costs associatedwith these should strictly be calculated and deducted fromthe benefits due to the scheme.
Box 8.3: Road scheme safety elements for economic appraisal
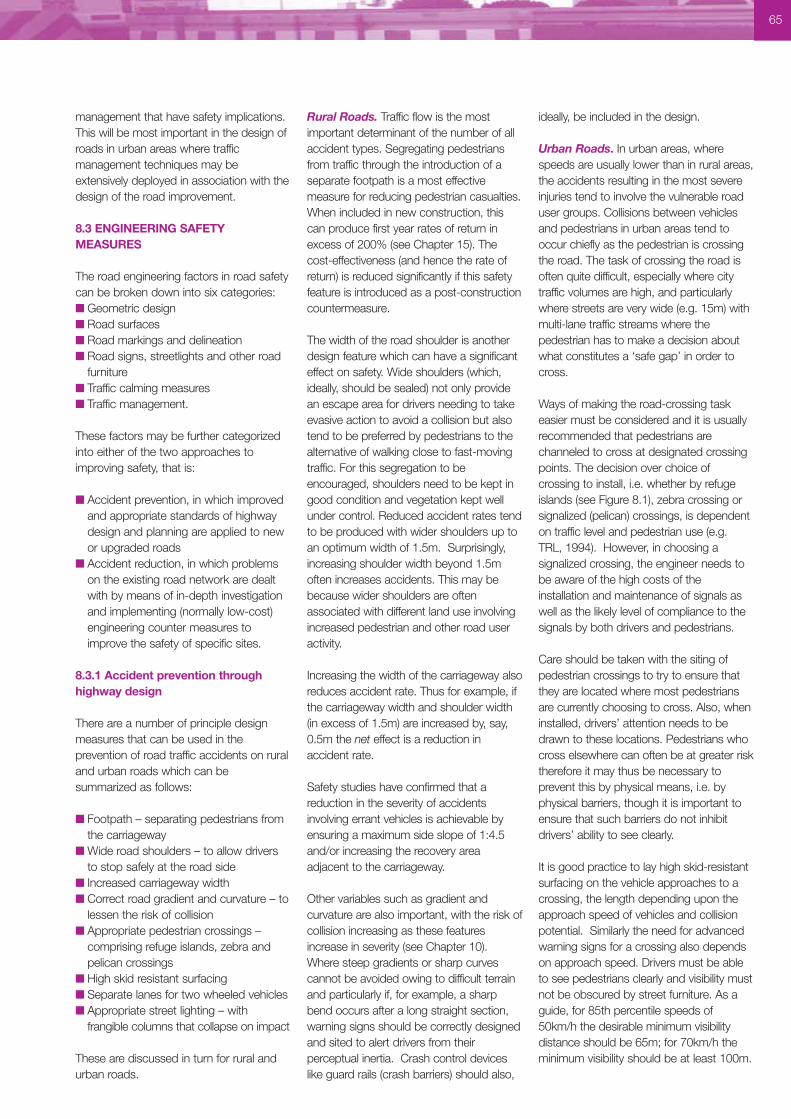
management that have safety implications.This will be most important in the design ofroads in urban areas where trafficmanagement techniques may beextensively deployed in association with thedesign of the road improvement.
8.3 ENGINEERING SAFETYMEASURES
The road engineering factors in road safetycan be broken down into six categories:■ Geometric design■ Road surfaces■ Road markings and delineation■ Road signs, streetlights and other road
furniture■ Traffic calming measures■ Traffic management.
These factors may be further categorizedinto either of the two approaches toimproving safety, that is:
■ Accident prevention, in which improvedand appropriate standards of highwaydesign and planning are applied to newor upgraded roads
■ Accident reduction, in which problemson the existing road network are dealtwith by means of in-depth investigationand implementing (normally low-cost)engineering counter measures toimprove the safety of specific sites.
8.3.1 Accident prevention throughhighway design
There are a number of principle designmeasures that can be used in theprevention of road traffic accidents on ruraland urban roads which can besummarized as follows:
■ Footpath – separating pedestrians fromthe carriageway
■ Wide road shoulders – to allow driversto stop safely at the road side
■ Increased carriageway width ■ Correct road gradient and curvature – to
lessen the risk of collision■ Appropriate pedestrian crossings –
comprising refuge islands, zebra andpelican crossings
■ High skid resistant surfacing■ Separate lanes for two wheeled vehicles■ Appropriate street lighting – with
frangible columns that collapse on impact
These are discussed in turn for rural andurban roads.
Rural Roads. Traffic flow is the mostimportant determinant of the number of allaccident types. Segregating pedestriansfrom traffic through the introduction of aseparate footpath is a most effectivemeasure for reducing pedestrian casualties.When included in new construction, thiscan produce first year rates of return inexcess of 200% (see Chapter 15). Thecost-effectiveness (and hence the rate ofreturn) is reduced significantly if this safetyfeature is introduced as a post-constructioncountermeasure.
The width of the road shoulder is anotherdesign feature which can have a significanteffect on safety. Wide shoulders (which,ideally, should be sealed) not only providean escape area for drivers needing to takeevasive action to avoid a collision but alsotend to be preferred by pedestrians to thealternative of walking close to fast-movingtraffic. For this segregation to beencouraged, shoulders need to be kept ingood condition and vegetation kept wellunder control. Reduced accident rates tendto be produced with wider shoulders up toan optimum width of 1.5m. Surprisingly,increasing shoulder width beyond 1.5moften increases accidents. This may bebecause wider shoulders are oftenassociated with different land use involvingincreased pedestrian and other road useractivity.
Increasing the width of the carriageway alsoreduces accident rate. Thus for example, ifthe carriageway width and shoulder width(in excess of 1.5m) are increased by, say,0.5m the net effect is a reduction inaccident rate.
Safety studies have confirmed that areduction in the severity of accidentsinvolving errant vehicles is achievable byensuring a maximum side slope of 1:4.5and/or increasing the recovery areaadjacent to the carriageway.
Other variables such as gradient andcurvature are also important, with the risk ofcollision increasing as these featuresincrease in severity (see Chapter 10).Where steep gradients or sharp curvescannot be avoided owing to difficult terrainand particularly if, for example, a sharpbend occurs after a long straight section,warning signs should be correctly designedand sited to alert drivers from theirperceptual inertia. Crash control deviceslike guard rails (crash barriers) should also,
ideally, be included in the design.
Urban Roads. In urban areas, wherespeeds are usually lower than in rural areas,the accidents resulting in the most severeinjuries tend to involve the vulnerable roaduser groups. Collisions between vehiclesand pedestrians in urban areas tend tooccur chiefly as the pedestrian is crossingthe road. The task of crossing the road isoften quite difficult, especially where citytraffic volumes are high, and particularlywhere streets are very wide (e.g. 15m) withmulti-lane traffic streams where thepedestrian has to make a decision aboutwhat constitutes a ‘safe gap’ in order tocross.
Ways of making the road-crossing taskeasier must be considered and it is usuallyrecommended that pedestrians arechanneled to cross at designated crossingpoints. The decision over choice ofcrossing to install, i.e. whether by refugeislands (see Figure 8.1), zebra crossing orsignalized (pelican) crossings, is dependenton traffic level and pedestrian use (e.g.TRL, 1994). However, in choosing asignalized crossing, the engineer needs tobe aware of the high costs of theinstallation and maintenance of signals aswell as the likely level of compliance to thesignals by both drivers and pedestrians.
Care should be taken with the siting ofpedestrian crossings to try to ensure thatthey are located where most pedestriansare currently choosing to cross. Also, wheninstalled, drivers’ attention needs to bedrawn to these locations. Pedestrians whocross elsewhere can often be at greater risktherefore it may thus be necessary toprevent this by physical means, i.e. byphysical barriers, though it is important toensure that such barriers do not inhibitdrivers’ ability to see clearly.
It is good practice to lay high skid-resistantsurfacing on the vehicle approaches to acrossing, the length depending upon theapproach speed of vehicles and collisionpotential. Similarly the need for advancedwarning signs for a crossing also dependson approach speed. Drivers must be ableto see pedestrians clearly and visibility mustnot be obscured by street furniture. As aguide, for 85th percentile speeds of50km/h the desirable minimum visibilitydistance should be 65m; for 70km/h theminimum visibility should be at least 100m.
65
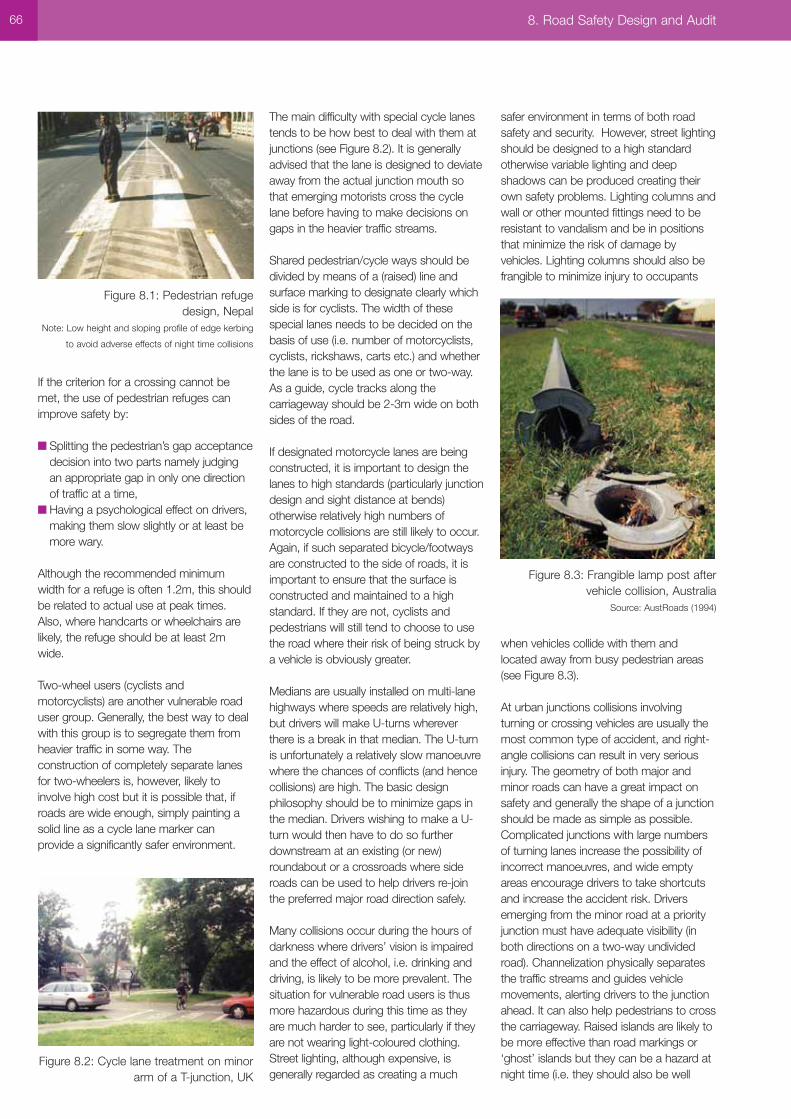
If the criterion for a crossing cannot bemet, the use of pedestrian refuges canimprove safety by:
■ Splitting the pedestrian’s gap acceptancedecision into two parts namely judgingan appropriate gap in only one directionof traffic at a time,
■ Having a psychological effect on drivers,making them slow slightly or at least bemore wary.
Although the recommended minimumwidth for a refuge is often 1.2m, this shouldbe related to actual use at peak times.Also, where handcarts or wheelchairs arelikely, the refuge should be at least 2mwide.
Two-wheel users (cyclists andmotorcyclists) are another vulnerable roaduser group. Generally, the best way to dealwith this group is to segregate them fromheavier traffic in some way. Theconstruction of completely separate lanesfor two-wheelers is, however, likely toinvolve high cost but it is possible that, ifroads are wide enough, simply painting asolid line as a cycle lane marker canprovide a significantly safer environment.
The main difficulty with special cycle lanestends to be how best to deal with them atjunctions (see Figure 8.2). It is generallyadvised that the lane is designed to deviateaway from the actual junction mouth sothat emerging motorists cross the cyclelane before having to make decisions ongaps in the heavier traffic streams.
Shared pedestrian/cycle ways should bedivided by means of a (raised) line andsurface marking to designate clearly whichside is for cyclists. The width of thesespecial lanes needs to be decided on thebasis of use (i.e. number of motorcyclists,cyclists, rickshaws, carts etc.) and whetherthe lane is to be used as one or two-way.As a guide, cycle tracks along thecarriageway should be 2-3m wide on bothsides of the road.
If designated motorcycle lanes are beingconstructed, it is important to design thelanes to high standards (particularly junctiondesign and sight distance at bends)otherwise relatively high numbers ofmotorcycle collisions are still likely to occur.Again, if such separated bicycle/footwaysare constructed to the side of roads, it isimportant to ensure that the surface isconstructed and maintained to a highstandard. If they are not, cyclists andpedestrians will still tend to choose to usethe road where their risk of being struck bya vehicle is obviously greater.
Medians are usually installed on multi-lanehighways where speeds are relatively high,but drivers will make U-turns whereverthere is a break in that median. The U-turnis unfortunately a relatively slow manoeuvrewhere the chances of conflicts (and hencecollisions) are high. The basic designphilosophy should be to minimize gaps inthe median. Drivers wishing to make a U-turn would then have to do so furtherdownstream at an existing (or new)roundabout or a crossroads where sideroads can be used to help drivers re-jointhe preferred major road direction safely.
Many collisions occur during the hours ofdarkness where drivers’ vision is impairedand the effect of alcohol, i.e. drinking anddriving, is likely to be more prevalent. Thesituation for vulnerable road users is thusmore hazardous during this time as theyare much harder to see, particularly if theyare not wearing light-coloured clothing.Street lighting, although expensive, isgenerally regarded as creating a much
safer environment in terms of both roadsafety and security. However, street lightingshould be designed to a high standardotherwise variable lighting and deepshadows can be produced creating theirown safety problems. Lighting columns andwall or other mounted fittings need to beresistant to vandalism and be in positionsthat minimize the risk of damage byvehicles. Lighting columns should also befrangible to minimize injury to occupants
when vehicles collide with them andlocated away from busy pedestrian areas(see Figure 8.3).
At urban junctions collisions involvingturning or crossing vehicles are usually themost common type of accident, and right-angle collisions can result in very seriousinjury. The geometry of both major andminor roads can have a great impact onsafety and generally the shape of a junctionshould be made as simple as possible.Complicated junctions with large numbersof turning lanes increase the possibility ofincorrect manoeuvres, and wide emptyareas encourage drivers to take shortcutsand increase the accident risk. Driversemerging from the minor road at a priorityjunction must have adequate visibility (inboth directions on a two-way undividedroad). Channelization physically separatesthe traffic streams and guides vehiclemovements, alerting drivers to the junctionahead. It can also help pedestrians to crossthe carriageway. Raised islands are likely tobe more effective than road markings or‘ghost’ islands but they can be a hazard atnight time (i.e. they should also be well
66 8. Road Safety Design and Audit
Figure 8.1: Pedestrian refugedesign, Nepal
Note: Low height and sloping profile of edge kerbing
to avoid adverse effects of night time collisions
Figure 8.2: Cycle lane treatment on minorarm of a T-junction, UK
Figure 8.3: Frangible lamp post aftervehicle collision, Australia
Source: AustRoads (1994)
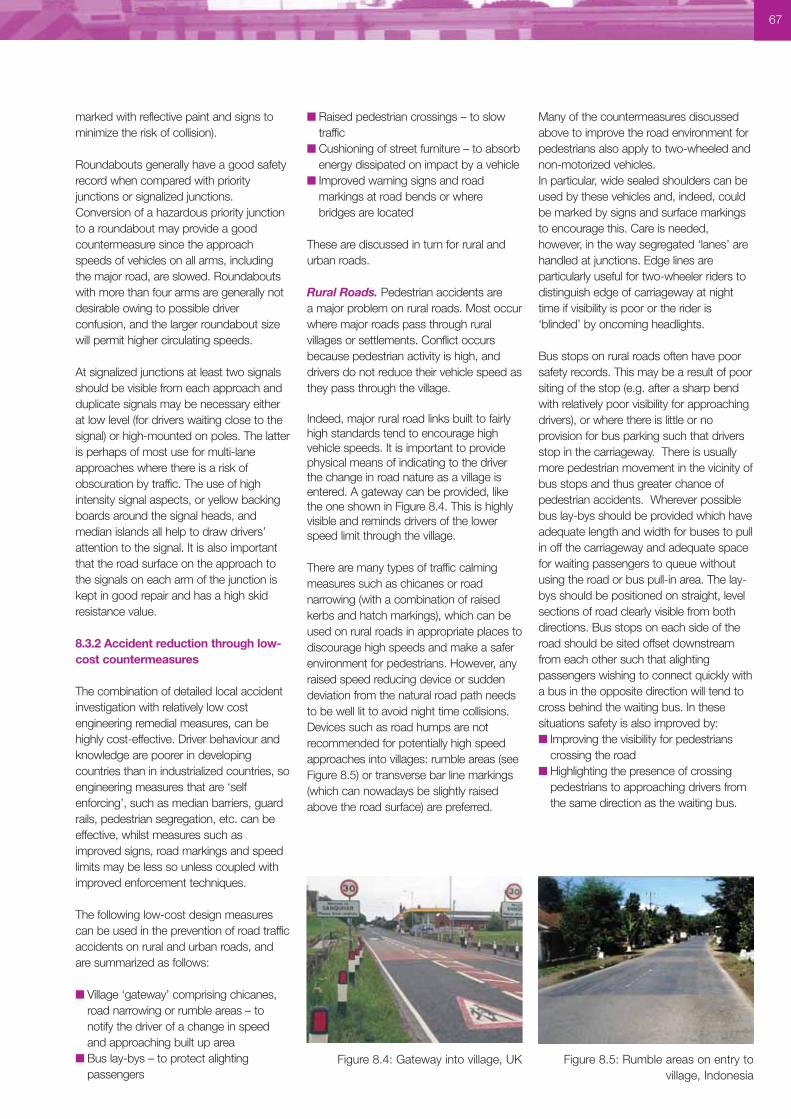
marked with reflective paint and signs tominimize the risk of collision).
Roundabouts generally have a good safetyrecord when compared with priorityjunctions or signalized junctions.Conversion of a hazardous priority junctionto a roundabout may provide a goodcountermeasure since the approachspeeds of vehicles on all arms, includingthe major road, are slowed. Roundaboutswith more than four arms are generally notdesirable owing to possible driverconfusion, and the larger roundabout sizewill permit higher circulating speeds.
At signalized junctions at least two signalsshould be visible from each approach andduplicate signals may be necessary eitherat low level (for drivers waiting close to thesignal) or high-mounted on poles. The latteris perhaps of most use for multi-laneapproaches where there is a risk ofobscuration by traffic. The use of highintensity signal aspects, or yellow backingboards around the signal heads, andmedian islands all help to draw drivers’attention to the signal. It is also importantthat the road surface on the approach tothe signals on each arm of the junction iskept in good repair and has a high skidresistance value.
8.3.2 Accident reduction through low-cost countermeasures
The combination of detailed local accidentinvestigation with relatively low costengineering remedial measures, can behighly cost-effective. Driver behaviour andknowledge are poorer in developingcountries than in industrialized countries, soengineering measures that are ‘selfenforcing’, such as median barriers, guardrails, pedestrian segregation, etc. can beeffective, whilst measures such asimproved signs, road markings and speedlimits may be less so unless coupled withimproved enforcement techniques.
The following low-cost design measurescan be used in the prevention of road trafficaccidents on rural and urban roads, andare summarized as follows:
■ Village ‘gateway’ comprising chicanes,road narrowing or rumble areas – tonotify the driver of a change in speedand approaching built up area
■ Bus lay-bys – to protect alightingpassengers
■ Raised pedestrian crossings – to slowtraffic
■ Cushioning of street furniture – to absorbenergy dissipated on impact by a vehicle
■ Improved warning signs and roadmarkings at road bends or wherebridges are located
These are discussed in turn for rural andurban roads.
Rural Roads. Pedestrian accidents are a major problem on rural roads. Most occurwhere major roads pass through ruralvillages or settlements. Conflict occursbecause pedestrian activity is high, anddrivers do not reduce their vehicle speed asthey pass through the village.
Indeed, major rural road links built to fairlyhigh standards tend to encourage highvehicle speeds. It is important to providephysical means of indicating to the driverthe change in road nature as a village isentered. A gateway can be provided, likethe one shown in Figure 8.4. This is highlyvisible and reminds drivers of the lowerspeed limit through the village.
There are many types of traffic calmingmeasures such as chicanes or roadnarrowing (with a combination of raisedkerbs and hatch markings), which can beused on rural roads in appropriate places todiscourage high speeds and make a saferenvironment for pedestrians. However, anyraised speed reducing device or suddendeviation from the natural road path needsto be well lit to avoid night time collisions.Devices such as road humps are notrecommended for potentially high speedapproaches into villages: rumble areas (seeFigure 8.5) or transverse bar line markings(which can nowadays be slightly raisedabove the road surface) are preferred.
Many of the countermeasures discussedabove to improve the road environment forpedestrians also apply to two-wheeled andnon-motorized vehicles. In particular, wide sealed shoulders can beused by these vehicles and, indeed, couldbe marked by signs and surface markingsto encourage this. Care is needed,however, in the way segregated ‘lanes’ arehandled at junctions. Edge lines areparticularly useful for two-wheeler riders todistinguish edge of carriageway at nighttime if visibility is poor or the rider is‘blinded’ by oncoming headlights.
Bus stops on rural roads often have poorsafety records. This may be a result of poorsiting of the stop (e.g. after a sharp bendwith relatively poor visibility for approachingdrivers), or where there is little or noprovision for bus parking such that driversstop in the carriageway. There is usuallymore pedestrian movement in the vicinity ofbus stops and thus greater chance ofpedestrian accidents. Wherever possiblebus lay-bys should be provided which haveadequate length and width for buses to pullin off the carriageway and adequate spacefor waiting passengers to queue withoutusing the road or bus pull-in area. The lay-bys should be positioned on straight, levelsections of road clearly visible from bothdirections. Bus stops on each side of theroad should be sited offset downstreamfrom each other such that alightingpassengers wishing to connect quickly witha bus in the opposite direction will tend tocross behind the waiting bus. In thesesituations safety is also improved by:■ Improving the visibility for pedestrians
crossing the road ■ Highlighting the presence of crossing
pedestrians to approaching drivers fromthe same direction as the waiting bus.
67
Figure 8.4: Gateway into village, UK Figure 8.5: Rumble areas on entry tovillage, Indonesia
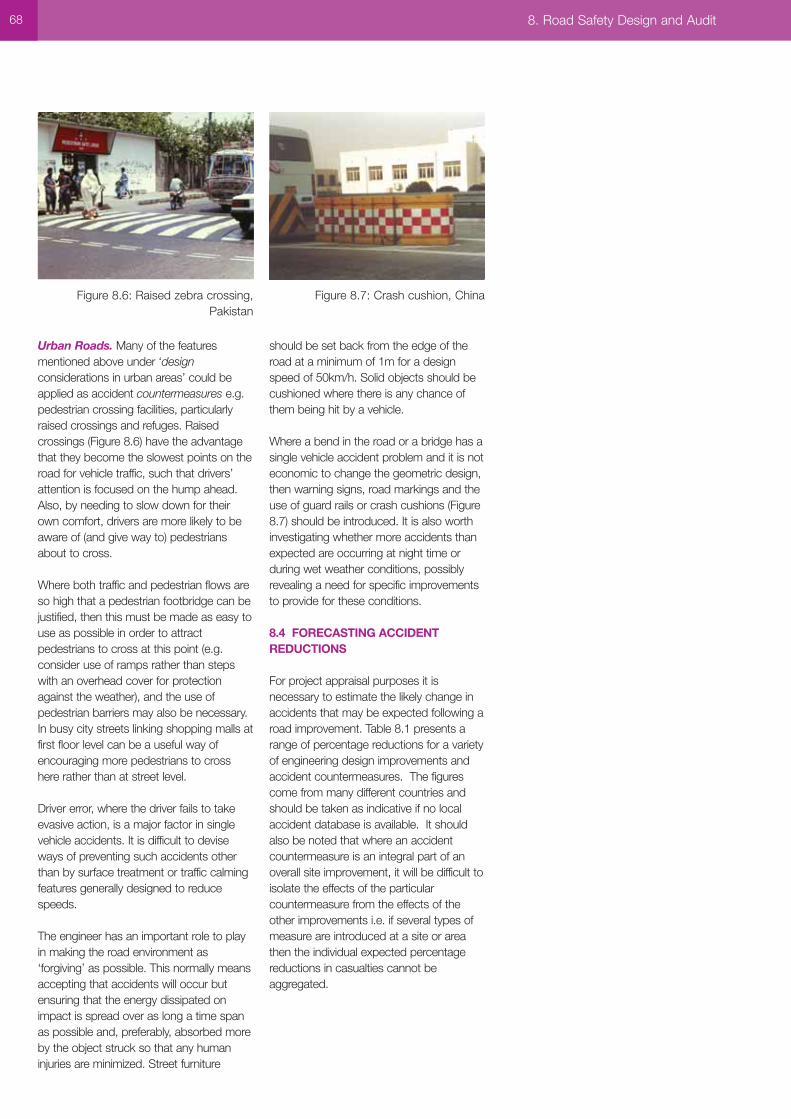
Urban Roads. Many of the featuresmentioned above under ‘designconsiderations in urban areas’ could beapplied as accident countermeasures e.g.pedestrian crossing facilities, particularlyraised crossings and refuges. Raisedcrossings (Figure 8.6) have the advantagethat they become the slowest points on theroad for vehicle traffic, such that drivers’attention is focused on the hump ahead.Also, by needing to slow down for theirown comfort, drivers are more likely to beaware of (and give way to) pedestriansabout to cross.
Where both traffic and pedestrian flows areso high that a pedestrian footbridge can bejustified, then this must be made as easy touse as possible in order to attractpedestrians to cross at this point (e.g.consider use of ramps rather than stepswith an overhead cover for protectionagainst the weather), and the use ofpedestrian barriers may also be necessary.In busy city streets linking shopping malls atfirst floor level can be a useful way ofencouraging more pedestrians to crosshere rather than at street level.
Driver error, where the driver fails to takeevasive action, is a major factor in singlevehicle accidents. It is difficult to deviseways of preventing such accidents otherthan by surface treatment or traffic calmingfeatures generally designed to reducespeeds.
The engineer has an important role to playin making the road environment as‘forgiving’ as possible. This normally meansaccepting that accidents will occur butensuring that the energy dissipated onimpact is spread over as long a time spanas possible and, preferably, absorbed moreby the object struck so that any humaninjuries are minimized. Street furniture
should be set back from the edge of theroad at a minimum of 1m for a designspeed of 50km/h. Solid objects should becushioned where there is any chance ofthem being hit by a vehicle.
Where a bend in the road or a bridge has asingle vehicle accident problem and it is noteconomic to change the geometric design,then warning signs, road markings and theuse of guard rails or crash cushions (Figure8.7) should be introduced. It is also worthinvestigating whether more accidents thanexpected are occurring at night time orduring wet weather conditions, possiblyrevealing a need for specific improvementsto provide for these conditions.
8.4 FORECASTING ACCIDENTREDUCTIONS
For project appraisal purposes it isnecessary to estimate the likely change inaccidents that may be expected following aroad improvement. Table 8.1 presents arange of percentage reductions for a varietyof engineering design improvements andaccident countermeasures. The figurescome from many different countries andshould be taken as indicative if no localaccident database is available. It shouldalso be noted that where an accidentcountermeasure is an integral part of anoverall site improvement, it will be difficult toisolate the effects of the particularcountermeasure from the effects of theother improvements i.e. if several types ofmeasure are introduced at a site or areathen the individual expected percentagereductions in casualties cannot beaggregated.
68 8. Road Safety Design and Audit
Figure 8.6: Raised zebra crossing,Pakistan
Figure 8.7: Crash cushion, China
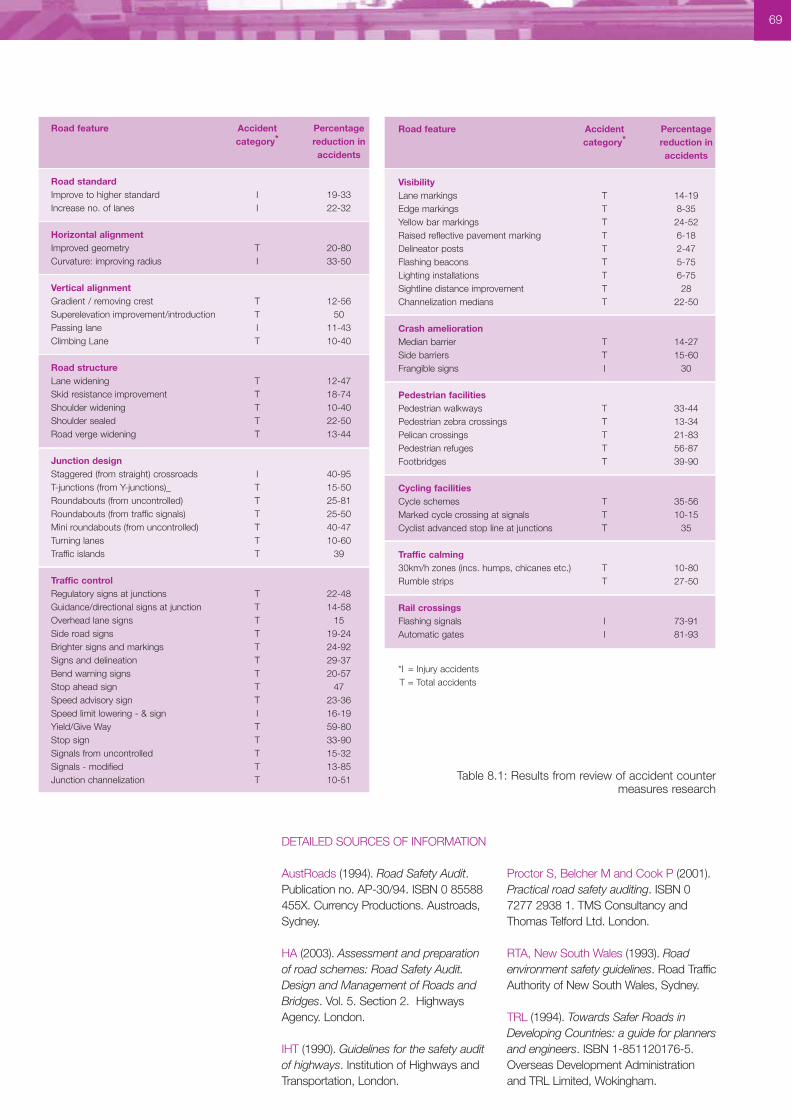
69
DETAILED SOURCES OF INFORMATION
AustRoads (1994). Road Safety Audit.Publication no. AP-30/94. ISBN 0 85588455X. Currency Productions. Austroads,Sydney.
HA (2003). Assessment and preparationof road schemes: Road Safety Audit.Design and Management of Roads andBridges. Vol. 5. Section 2. HighwaysAgency. London.
IHT (1990). Guidelines for the safety auditof highways. Institution of Highways andTransportation, London.
Proctor S, Belcher M and Cook P (2001).Practical road safety auditing. ISBN 07277 2938 1. TMS Consultancy andThomas Telford Ltd. London.
RTA, New South Wales (1993). Roadenvironment safety guidelines. Road TrafficAuthority of New South Wales, Sydney.
TRL (1994). Towards Safer Roads inDeveloping Countries: a guide for plannersand engineers. ISBN 1-851120176-5.Overseas Development Administrationand TRL Limited, Wokingham.
Table 8.1: Results from review of accident countermeasuresresearch
Road feature Accident Percentagecategory* reduction in
accidents
Road standardImprove to higher standard I 19-33Increase no. of lanes I 22-32
Horizontal alignmentImproved geometry T 20-80Curvature: improving radius I 33-50
Vertical alignmentGradient / removing crest T 12-56Superelevation improvement/introduction T 50Passing lane I 11-43Climbing Lane T 10-40
Road structureLane widening T 12-47Skid resistance improvement T 18-74Shoulder widening T 10-40Shoulder sealed T 22-50Road verge widening T 13-44
Junction designStaggered (from straight) crossroads I 40-95T-junctions (from Y-junctions)_ T 15-50Roundabouts (from uncontrolled) T 25-81Roundabouts (from traffic signals) T 25-50Mini roundabouts (from uncontrolled) T 40-47Turning lanes T 10-60Traffic islands T 39
Traffic controlRegulatory signs at junctions T 22-48Guidance/directional signs at junction T 14-58Overhead lane signs T 15Side road signs T 19-24Brighter signs and markings T 24-92Signs and delineation T 29-37Bend warning signs T 20-57Stop ahead sign T 47Speed advisory sign T 23-36Speed limit lowering - & sign I 16-19Yield/Give Way T 59-80Stop sign T 33-90Signals from uncontrolled T 15-32Signals - modified T 13-85Junction channelization T 10-51
Road feature Accident Percentagecategory* reduction in
accidents
VisibilityLane markings T 14-19Edge markings T 8-35Yellow bar markings T 24-52Raised reflective pavement marking T 6-18Delineator posts T 2-47Flashing beacons T 5-75Lighting installations T 6-75Sightline distance improvement T 28Channelization medians T 22-50
Crash ameliorationMedian barrier T 14-27Side barriers T 15-60Frangible signs I 30
Pedestrian facilitiesPedestrian walkways T 33-44Pedestrian zebra crossings T 13-34Pelican crossings T 21-83Pedestrian refuges T 56-87Footbridges T 39-90
Cycling facilitiesCycle schemes T 35-56Marked cycle crossing at signals T 10-15Cyclist advanced stop line at junctions T 35
Traffic calming30km/h zones (incs. humps, chicanes etc.) T 10-80Rumble strips T 27-50
Rail crossingsFlashing signals I 73-91Automatic gates I 81-93
*I = Injury accidents T = Total accidents
Table 8.1: Results from review of accident counter measures research

PART 3
Engineering Design
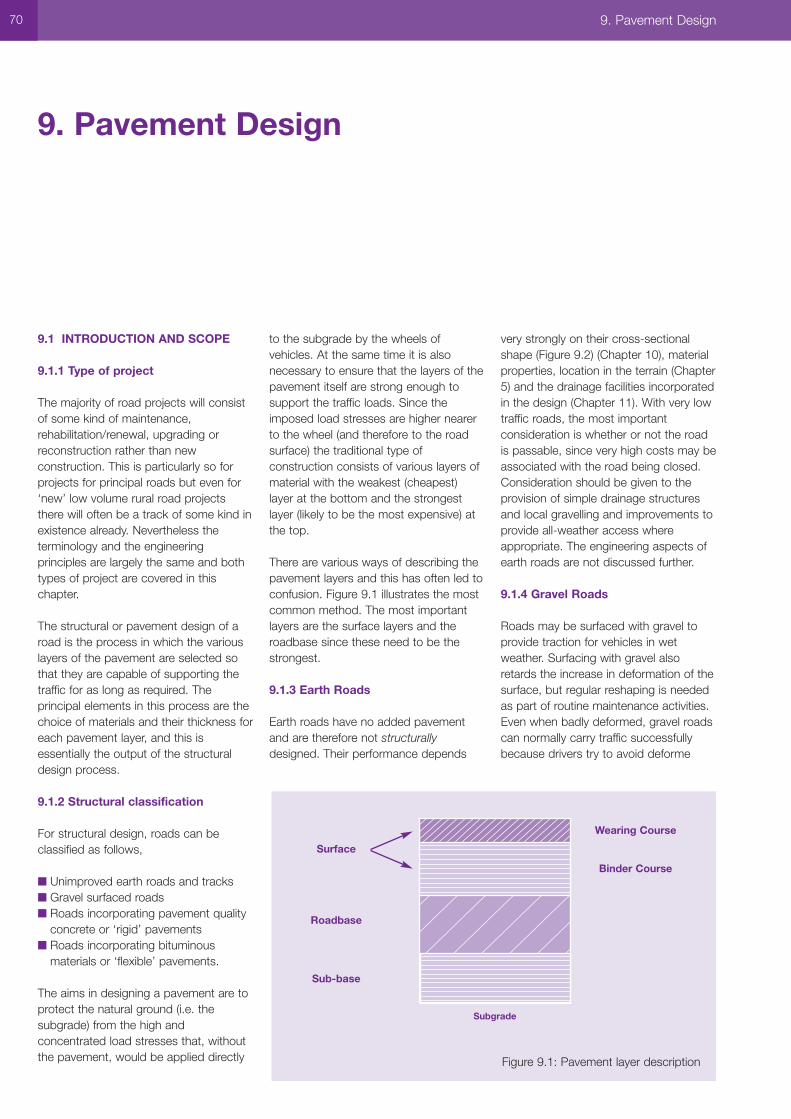
9.1 INTRODUCTION AND SCOPE
9.1.1 Type of project
The majority of road projects will consistof some kind of maintenance,rehabilitation/renewal, upgrading orreconstruction rather than newconstruction. This is particularly so forprojects for principal roads but even for‘new’ low volume rural road projectsthere will often be a track of some kind inexistence already. Nevertheless theterminology and the engineeringprinciples are largely the same and bothtypes of project are covered in thischapter.
The structural or pavement design of aroad is the process in which the variouslayers of the pavement are selected sothat they are capable of supporting thetraffic for as long as required. Theprincipal elements in this process are thechoice of materials and their thickness foreach pavement layer, and this isessentially the output of the structuraldesign process.
9.1.2 Structural classification
For structural design, roads can beclassified as follows,
■ Unimproved earth roads and tracks■ Gravel surfaced roads■ Roads incorporating pavement quality
concrete or ‘rigid’ pavements■ Roads incorporating bituminous
materials or ‘flexible’ pavements.
The aims in designing a pavement are toprotect the natural ground (i.e. thesubgrade) from the high andconcentrated load stresses that, withoutthe pavement, would be applied directly
to the subgrade by the wheels ofvehicles. At the same time it is alsonecessary to ensure that the layers of thepavement itself are strong enough tosupport the traffic loads. Since theimposed load stresses are higher nearerto the wheel (and therefore to the roadsurface) the traditional type ofconstruction consists of various layers ofmaterial with the weakest (cheapest)layer at the bottom and the strongestlayer (likely to be the most expensive) atthe top.
There are various ways of describing thepavement layers and this has often led toconfusion. Figure 9.1 illustrates the mostcommon method. The most importantlayers are the surface layers and theroadbase since these need to be thestrongest.
9.1.3 Earth Roads
Earth roads have no added pavementand are therefore not structurallydesigned. Their performance depends
very strongly on their cross-sectionalshape (Figure 9.2) (Chapter 10), materialproperties, location in the terrain (Chapter5) and the drainage facilities incorporatedin the design (Chapter 11). With very lowtraffic roads, the most importantconsideration is whether or not the roadis passable, since very high costs may beassociated with the road being closed.Consideration should be given to theprovision of simple drainage structuresand local gravelling and improvements toprovide all-weather access whereappropriate. The engineering aspects ofearth roads are not discussed further.
9.1.4 Gravel Roads
Roads may be surfaced with gravel toprovide traction for vehicles in wetweather. Surfacing with gravel alsoretards the increase in deformation of thesurface, but regular reshaping is neededas part of routine maintenance activities.Even when badly deformed, gravel roadscan normally carry traffic successfullybecause drivers try to avoid deforme
70 9. Pavement Design
9. Pavement Design
Subgrade
Wearing Course
Binder Course
Figure 9.1: Pavement layer description
Surface
Roadbase
Sub-base
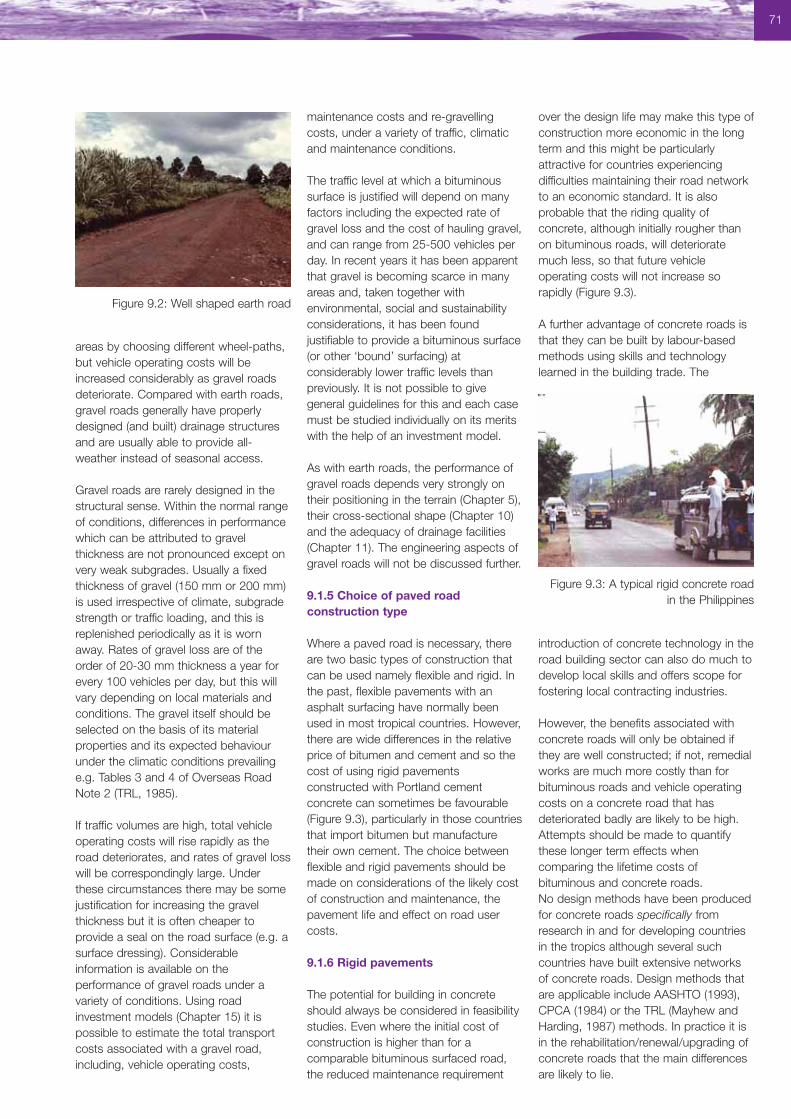
areas by choosing different wheel-paths,but vehicle operating costs will beincreased considerably as gravel roadsdeteriorate. Compared with earth roads,gravel roads generally have properlydesigned (and built) drainage structuresand are usually able to provide all-weather instead of seasonal access.
Gravel roads are rarely designed in thestructural sense. Within the normal rangeof conditions, differences in performancewhich can be attributed to gravelthickness are not pronounced except onvery weak subgrades. Usually a fixedthickness of gravel (150 mm or 200 mm)is used irrespective of climate, subgradestrength or traffic loading, and this isreplenished periodically as it is wornaway. Rates of gravel loss are of theorder of 20-30 mm thickness a year forevery 100 vehicles per day, but this willvary depending on local materials andconditions. The gravel itself should beselected on the basis of its materialproperties and its expected behaviourunder the climatic conditions prevailinge.g. Tables 3 and 4 of Overseas RoadNote 2 (TRL, 1985).
If traffic volumes are high, total vehicleoperating costs will rise rapidly as theroad deteriorates, and rates of gravel losswill be correspondingly large. Underthese circumstances there may be somejustification for increasing the gravelthickness but it is often cheaper toprovide a seal on the road surface (e.g. asurface dressing). Considerableinformation is available on theperformance of gravel roads under avariety of conditions. Using roadinvestment models (Chapter 15) it ispossible to estimate the total transportcosts associated with a gravel road,including, vehicle operating costs,
maintenance costs and re-gravellingcosts, under a variety of traffic, climaticand maintenance conditions.
The traffic level at which a bituminoussurface is justified will depend on manyfactors including the expected rate ofgravel loss and the cost of hauling gravel,and can range from 25-500 vehicles perday. In recent years it has been apparentthat gravel is becoming scarce in manyareas and, taken together withenvironmental, social and sustainabilityconsiderations, it has been foundjustifiable to provide a bituminous surface(or other ‘bound’ surfacing) atconsiderably lower traffic levels thanpreviously. It is not possible to givegeneral guidelines for this and each casemust be studied individually on its meritswith the help of an investment model.
As with earth roads, the performance ofgravel roads depends very strongly ontheir positioning in the terrain (Chapter 5),their cross-sectional shape (Chapter 10)and the adequacy of drainage facilities(Chapter 11). The engineering aspects ofgravel roads will not be discussed further.
9.1.5 Choice of paved roadconstruction type
Where a paved road is necessary, thereare two basic types of construction thatcan be used namely flexible and rigid. Inthe past, flexible pavements with anasphalt surfacing have normally beenused in most tropical countries. However,there are wide differences in the relativeprice of bitumen and cement and so thecost of using rigid pavementsconstructed with Portland cementconcrete can sometimes be favourable(Figure 9.3), particularly in those countriesthat import bitumen but manufacturetheir own cement. The choice betweenflexible and rigid pavements should bemade on considerations of the likely costof construction and maintenance, thepavement life and effect on road usercosts.
9.1.6 Rigid pavements
The potential for building in concreteshould always be considered in feasibilitystudies. Even where the initial cost ofconstruction is higher than for acomparable bituminous surfaced road,the reduced maintenance requirement
over the design life may make this type ofconstruction more economic in the longterm and this might be particularlyattractive for countries experiencingdifficulties maintaining their road networkto an economic standard. It is alsoprobable that the riding quality ofconcrete, although initially rougher thanon bituminous roads, will deterioratemuch less, so that future vehicleoperating costs will not increase sorapidly (Figure 9.3).
A further advantage of concrete roads isthat they can be built by labour-basedmethods using skills and technologylearned in the building trade. The
introduction of concrete technology in theroad building sector can also do much todevelop local skills and offers scope forfostering local contracting industries.
However, the benefits associated withconcrete roads will only be obtained ifthey are well constructed; if not, remedialworks are much more costly than forbituminous roads and vehicle operatingcosts on a concrete road that hasdeteriorated badly are likely to be high.Attempts should be made to quantifythese longer term effects whencomparing the lifetime costs ofbituminous and concrete roads. No design methods have been producedfor concrete roads specifically fromresearch in and for developing countriesin the tropics although several suchcountries have built extensive networksof concrete roads. Design methods thatare applicable include AASHTO (1993),CPCA (1984) or the TRL (Mayhew andHarding, 1987) methods. In practice it isin the rehabilitation/renewal/upgrading ofconcrete roads that the main differencesare likely to lie.
71
Figure 9.2: Well shaped earth road
Figure 9.3: A typical rigid concrete roadin the Philippines
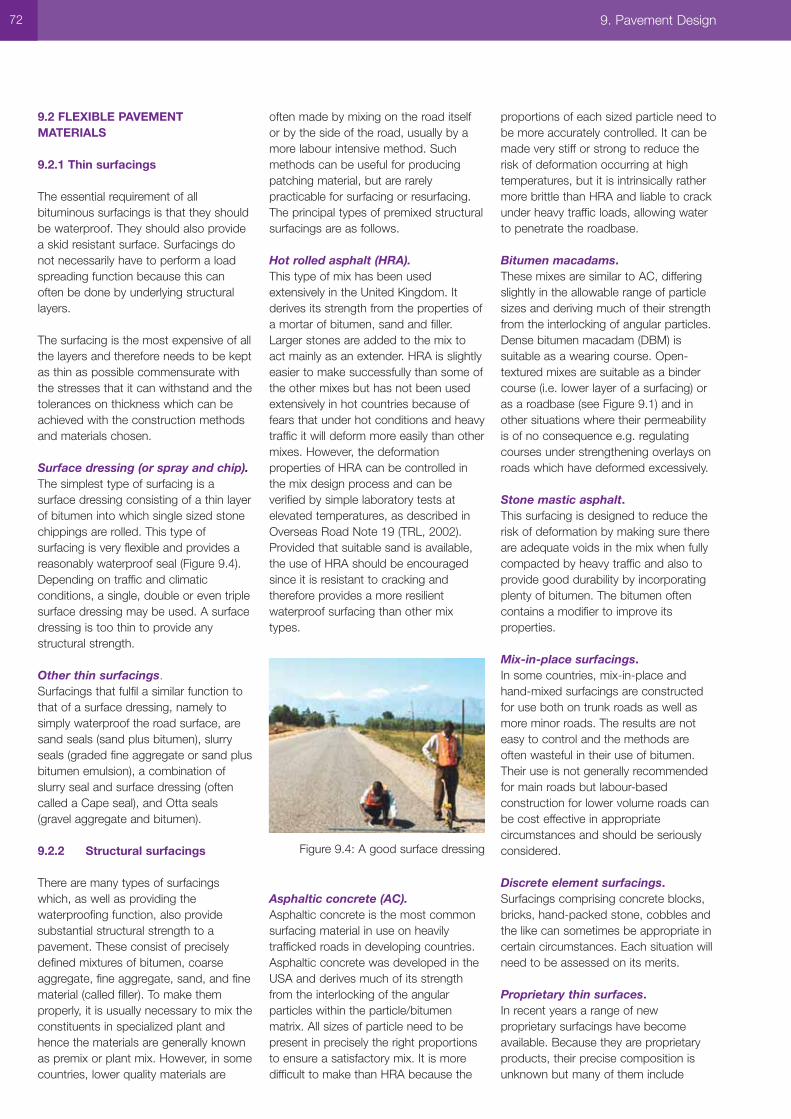
9.2 FLEXIBLE PAVEMENTMATERIALS
9.2.1 Thin surfacings
The essential requirement of allbituminous surfacings is that they shouldbe waterproof. They should also providea skid resistant surface. Surfacings donot necessarily have to perform a loadspreading function because this canoften be done by underlying structurallayers.
The surfacing is the most expensive of allthe layers and therefore needs to be keptas thin as possible commensurate withthe stresses that it can withstand and thetolerances on thickness which can beachieved with the construction methodsand materials chosen.
Surface dressing (or spray and chip).The simplest type of surfacing is asurface dressing consisting of a thin layerof bitumen into which single sized stonechippings are rolled. This type ofsurfacing is very flexible and provides areasonably waterproof seal (Figure 9.4).Depending on traffic and climaticconditions, a single, double or even triplesurface dressing may be used. A surfacedressing is too thin to provide anystructural strength.
Other thin surfacings. Surfacings that fulfil a similar function tothat of a surface dressing, namely tosimply waterproof the road surface, aresand seals (sand plus bitumen), slurryseals (graded fine aggregate or sand plusbitumen emulsion), a combination ofslurry seal and surface dressing (oftencalled a Cape seal), and Otta seals(gravel aggregate and bitumen).
9.2.2 Structural surfacings
There are many types of surfacingswhich, as well as providing thewaterproofing function, also providesubstantial structural strength to apavement. These consist of preciselydefined mixtures of bitumen, coarseaggregate, fine aggregate, sand, and finematerial (called filler). To make themproperly, it is usually necessary to mix theconstituents in specialized plant andhence the materials are generally knownas premix or plant mix. However, in somecountries, lower quality materials are
often made by mixing on the road itselfor by the side of the road, usually by amore labour intensive method. Suchmethods can be useful for producingpatching material, but are rarelypracticable for surfacing or resurfacing.The principal types of premixed structuralsurfacings are as follows.
Hot rolled asphalt (HRA).This type of mix has been usedextensively in the United Kingdom. Itderives its strength from the properties ofa mortar of bitumen, sand and filler.Larger stones are added to the mix toact mainly as an extender. HRA is slightlyeasier to make successfully than some ofthe other mixes but has not been usedextensively in hot countries because offears that under hot conditions and heavytraffic it will deform more easily than othermixes. However, the deformationproperties of HRA can be controlled inthe mix design process and can beverified by simple laboratory tests atelevated temperatures, as described inOverseas Road Note 19 (TRL, 2002).Provided that suitable sand is available,the use of HRA should be encouragedsince it is resistant to cracking andtherefore provides a more resilientwaterproof surfacing than other mixtypes.
Asphaltic concrete (AC).Asphaltic concrete is the most commonsurfacing material in use on heavilytrafficked roads in developing countries.Asphaltic concrete was developed in theUSA and derives much of its strengthfrom the interlocking of the angularparticles within the particle/bitumenmatrix. All sizes of particle need to bepresent in precisely the right proportionsto ensure a satisfactory mix. It is moredifficult to make than HRA because the
proportions of each sized particle need tobe more accurately controlled. It can bemade very stiff or strong to reduce therisk of deformation occurring at hightemperatures, but it is intrinsically rathermore brittle than HRA and liable to crackunder heavy traffic loads, allowing waterto penetrate the roadbase.
Bitumen macadams.These mixes are similar to AC, differingslightly in the allowable range of particlesizes and deriving much of their strengthfrom the interlocking of angular particles.Dense bitumen macadam (DBM) issuitable as a wearing course. Open-textured mixes are suitable as a bindercourse (i.e. lower layer of a surfacing) oras a roadbase (see Figure 9.1) and inother situations where their permeabilityis of no consequence e.g. regulatingcourses under strengthening overlays onroads which have deformed excessively.
Stone mastic asphalt. This surfacing is designed to reduce therisk of deformation by making sure thereare adequate voids in the mix when fullycompacted by heavy traffic and also toprovide good durability by incorporatingplenty of bitumen. The bitumen oftencontains a modifier to improve itsproperties.
Mix-in-place surfacings.In some countries, mix-in-place andhand-mixed surfacings are constructedfor use both on trunk roads as well asmore minor roads. The results are noteasy to control and the methods areoften wasteful in their use of bitumen.Their use is not generally recommendedfor main roads but labour-basedconstruction for lower volume roads canbe cost effective in appropriatecircumstances and should be seriouslyconsidered.
Discrete element surfacings. Surfacings comprising concrete blocks,bricks, hand-packed stone, cobbles andthe like can sometimes be appropriate incertain circumstances. Each situation willneed to be assessed on its merits.
Proprietary thin surfaces. In recent years a range of newproprietary surfacings have becomeavailable. Because they are proprietaryproducts, their precise composition isunknown but many of them include
72 9. Pavement Design
Figure 9.4: A good surface dressing
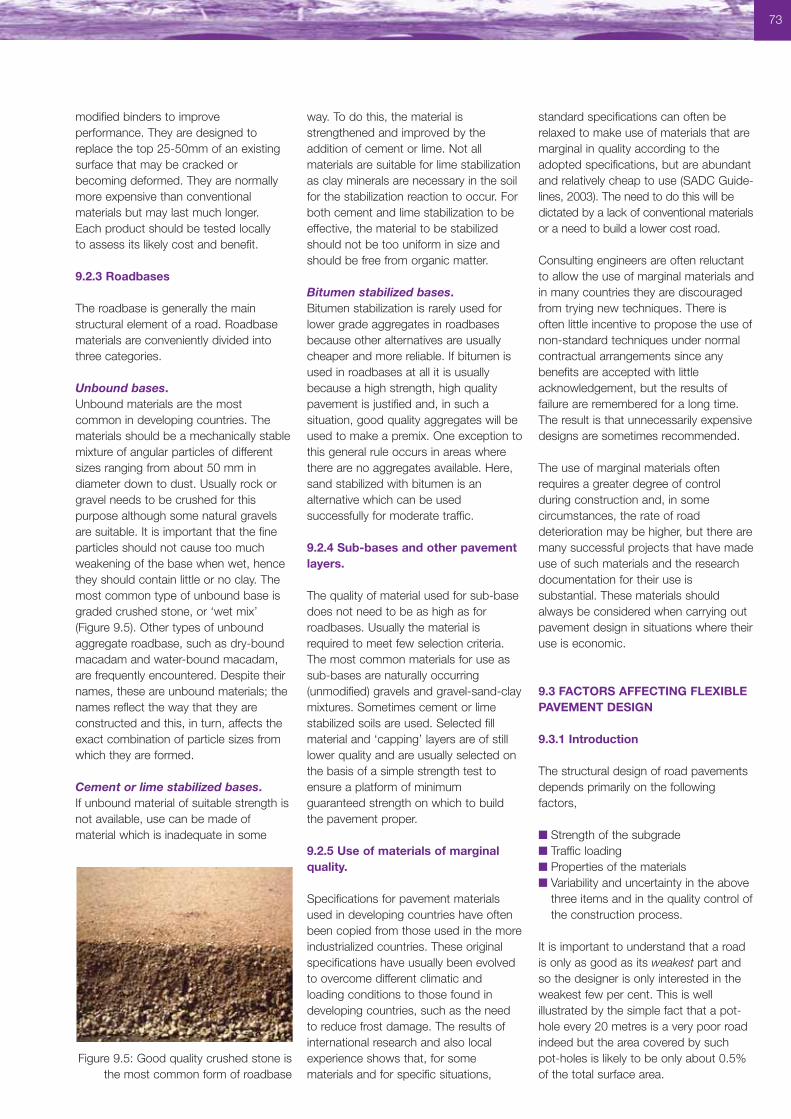
modified binders to improveperformance. They are designed toreplace the top 25-50mm of an existingsurface that may be cracked orbecoming deformed. They are normallymore expensive than conventionalmaterials but may last much longer. Each product should be tested locally to assess its likely cost and benefit.
9.2.3 Roadbases
The roadbase is generally the mainstructural element of a road. Roadbasematerials are conveniently divided intothree categories.
Unbound bases.Unbound materials are the mostcommon in developing countries. Thematerials should be a mechanically stablemixture of angular particles of differentsizes ranging from about 50 mm indiameter down to dust. Usually rock orgravel needs to be crushed for thispurpose although some natural gravelsare suitable. It is important that the fineparticles should not cause too muchweakening of the base when wet, hencethey should contain little or no clay. Themost common type of unbound base isgraded crushed stone, or ‘wet mix’(Figure 9.5). Other types of unboundaggregate roadbase, such as dry-boundmacadam and water-bound macadam,are frequently encountered. Despite theirnames, these are unbound materials; thenames reflect the way that they areconstructed and this, in turn, affects theexact combination of particle sizes fromwhich they are formed.
Cement or lime stabilized bases.If unbound material of suitable strength isnot available, use can be made ofmaterial which is inadequate in some
way. To do this, the material isstrengthened and improved by theaddition of cement or lime. Not allmaterials are suitable for lime stabilizationas clay minerals are necessary in the soilfor the stabilization reaction to occur. Forboth cement and lime stabilization to beeffective, the material to be stabilizedshould not be too uniform in size andshould be free from organic matter.
Bitumen stabilized bases.Bitumen stabilization is rarely used forlower grade aggregates in roadbasesbecause other alternatives are usuallycheaper and more reliable. If bitumen isused in roadbases at all it is usuallybecause a high strength, high qualitypavement is justified and, in such asituation, good quality aggregates will beused to make a premix. One exception tothis general rule occurs in areas wherethere are no aggregates available. Here,sand stabilized with bitumen is analternative which can be usedsuccessfully for moderate traffic.
9.2.4 Sub-bases and other pavementlayers.
The quality of material used for sub-basedoes not need to be as high as forroadbases. Usually the material isrequired to meet few selection criteria.The most common materials for use assub-bases are naturally occurring(unmodified) gravels and gravel-sand-claymixtures. Sometimes cement or limestabilized soils are used. Selected fillmaterial and ‘capping’ layers are of stilllower quality and are usually selected onthe basis of a simple strength test toensure a platform of minimumguaranteed strength on which to buildthe pavement proper.
9.2.5 Use of materials of marginalquality.
Specifications for pavement materialsused in developing countries have oftenbeen copied from those used in the moreindustrialized countries. These originalspecifications have usually been evolvedto overcome different climatic andloading conditions to those found indeveloping countries, such as the needto reduce frost damage. The results ofinternational research and also localexperience shows that, for somematerials and for specific situations,
standard specifications can often berelaxed to make use of materials that aremarginal in quality according to theadopted specifications, but are abundantand relatively cheap to use (SADC Guide-lines, 2003). The need to do this will bedictated by a lack of conventional materialsor a need to build a lower cost road.
Consulting engineers are often reluctantto allow the use of marginal materials andin many countries they are discouragedfrom trying new techniques. There isoften little incentive to propose the use ofnon-standard techniques under normalcontractual arrangements since anybenefits are accepted with littleacknowledgement, but the results offailure are remembered for a long time.The result is that unnecessarily expensivedesigns are sometimes recommended.
The use of marginal materials oftenrequires a greater degree of controlduring construction and, in somecircumstances, the rate of roaddeterioration may be higher, but there aremany successful projects that have madeuse of such materials and the researchdocumentation for their use issubstantial. These materials shouldalways be considered when carrying outpavement design in situations where theiruse is economic.
9.3 FACTORS AFFECTING FLEXIBLEPAVEMENT DESIGN
9.3.1 Introduction
The structural design of road pavementsdepends primarily on the followingfactors,
■ Strength of the subgrade■ Traffic loading■ Properties of the materials■ Variability and uncertainty in the above
three items and in the quality control ofthe construction process.
It is important to understand that a roadis only as good as its weakest part andso the designer is only interested in theweakest few per cent. This is wellillustrated by the simple fact that a pot-hole every 20 metres is a very poor roadindeed but the area covered by suchpot-holes is likely to be only about 0.5%of the total surface area.
73
Figure 9.5: Good quality crushed stone isthe most common form of roadbase
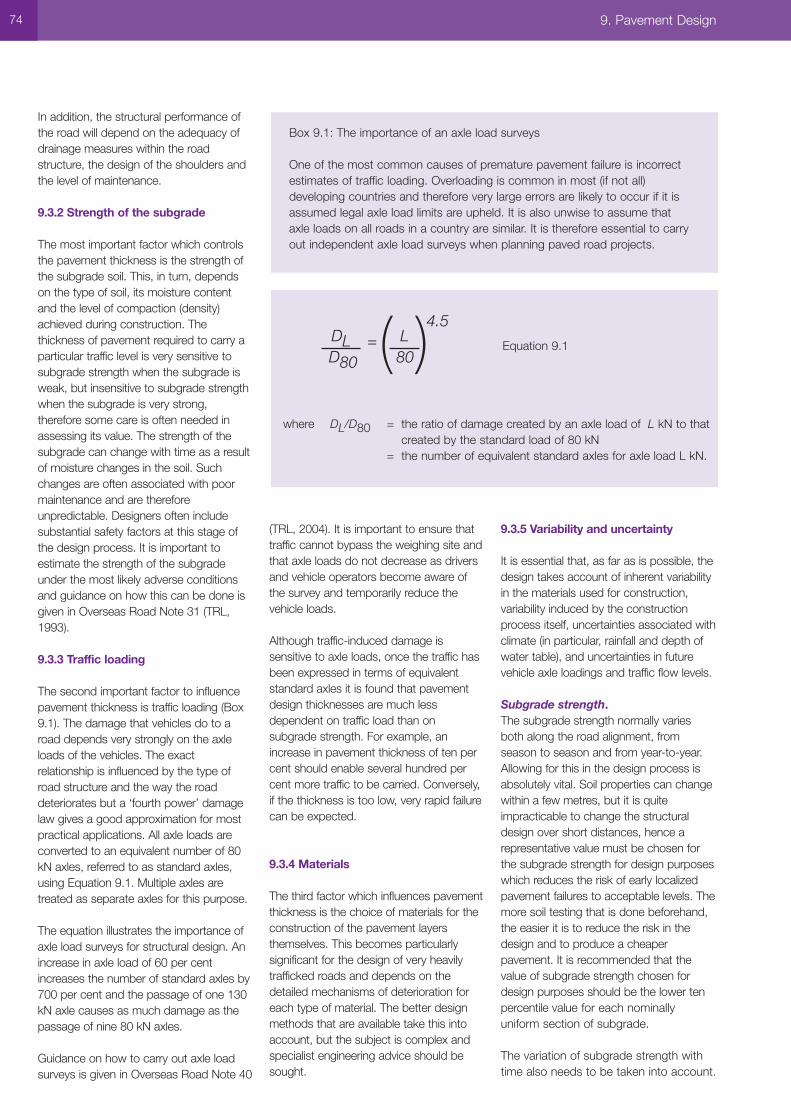
In addition, the structural performance ofthe road will depend on the adequacy ofdrainage measures within the roadstructure, the design of the shoulders andthe level of maintenance.
9.3.2 Strength of the subgrade
The most important factor which controlsthe pavement thickness is the strength ofthe subgrade soil. This, in turn, dependson the type of soil, its moisture contentand the level of compaction (density)achieved during construction. Thethickness of pavement required to carry aparticular traffic level is very sensitive tosubgrade strength when the subgrade isweak, but insensitive to subgrade strengthwhen the subgrade is very strong,therefore some care is often needed inassessing its value. The strength of thesubgrade can change with time as a resultof moisture changes in the soil. Suchchanges are often associated with poormaintenance and are thereforeunpredictable. Designers often includesubstantial safety factors at this stage ofthe design process. It is important toestimate the strength of the subgradeunder the most likely adverse conditionsand guidance on how this can be done isgiven in Overseas Road Note 31 (TRL,1993).
9.3.3 Traffic loading
The second important factor to influencepavement thickness is traffic loading (Box9.1). The damage that vehicles do to aroad depends very strongly on the axleloads of the vehicles. The exactrelationship is influenced by the type ofroad structure and the way the roaddeteriorates but a ‘fourth power’ damagelaw gives a good approximation for mostpractical applications. All axle loads areconverted to an equivalent number of 80kN axles, referred to as standard axles,using Equation 9.1. Multiple axles aretreated as separate axles for this purpose.
The equation illustrates the importance ofaxle load surveys for structural design. Anincrease in axle load of 60 per centincreases the number of standard axles by700 per cent and the passage of one 130kN axle causes as much damage as thepassage of nine 80 kN axles.
Guidance on how to carry out axle loadsurveys is given in Overseas Road Note 40
(TRL, 2004). It is important to ensure thattraffic cannot bypass the weighing site andthat axle loads do not decrease as driversand vehicle operators become aware ofthe survey and temporarily reduce thevehicle loads.
Although traffic-induced damage issensitive to axle loads, once the traffic hasbeen expressed in terms of equivalentstandard axles it is found that pavementdesign thicknesses are much lessdependent on traffic load than onsubgrade strength. For example, anincrease in pavement thickness of ten percent should enable several hundred percent more traffic to be carried. Conversely,if the thickness is too low, very rapid failurecan be expected.
9.3.4 Materials
The third factor which influences pavementthickness is the choice of materials for theconstruction of the pavement layersthemselves. This becomes particularlysignificant for the design of very heavilytrafficked roads and depends on thedetailed mechanisms of deterioration foreach type of material. The better designmethods that are available take this intoaccount, but the subject is complex andspecialist engineering advice should besought.
9.3.5 Variability and uncertainty
It is essential that, as far as is possible, thedesign takes account of inherent variabilityin the materials used for construction,variability induced by the constructionprocess itself, uncertainties associated withclimate (in particular, rainfall and depth ofwater table), and uncertainties in futurevehicle axle loadings and traffic flow levels.
Subgrade strength.The subgrade strength normally variesboth along the road alignment, fromseason to season and from year-to-year.Allowing for this in the design process isabsolutely vital. Soil properties can changewithin a few metres, but it is quiteimpracticable to change the structuraldesign over short distances, hence arepresentative value must be chosen forthe subgrade strength for design purposeswhich reduces the risk of early localizedpavement failures to acceptable levels. Themore soil testing that is done beforehand,the easier it is to reduce the risk in thedesign and to produce a cheaperpavement. It is recommended that thevalue of subgrade strength chosen fordesign purposes should be the lower tenpercentile value for each nominallyuniform section of subgrade.
The variation of subgrade strength withtime also needs to be taken into account.
74 9. Pavement Design
Box 9.1: The importance of an axle load surveys
One of the most common causes of premature pavement failure is incorrectestimates of traffic loading. Overloading is common in most (if not all)developing countries and therefore very large errors are likely to occur if it isassumed legal axle load limits are upheld. It is also unwise to assume thataxle loads on all roads in a country are similar. It is therefore essential to carryout independent axle load surveys when planning paved road projects.
DL =( L )D80 80
4.5
Equation 9.1
where DL/D80 = the ratio of damage created by an axle load of L kN to thatcreated by the standard load of 80 kN
= the number of equivalent standard axles for axle load L kN.
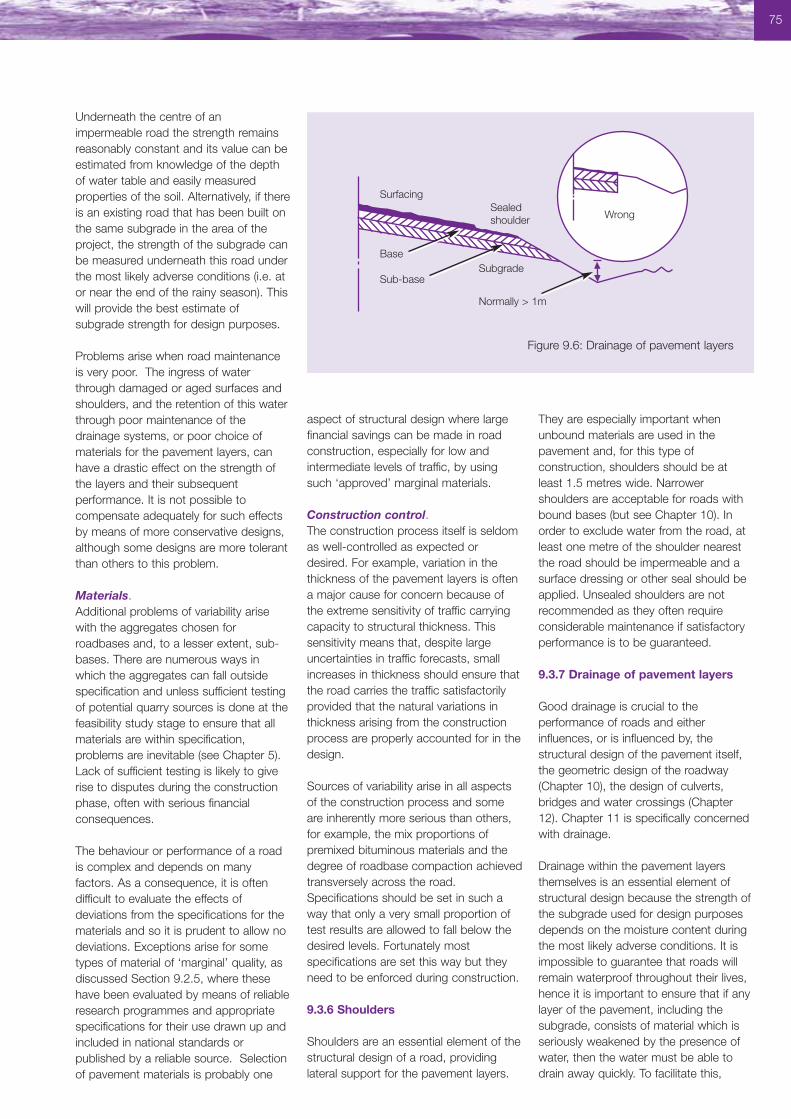
Underneath the centre of animpermeable road the strength remainsreasonably constant and its value can beestimated from knowledge of the depthof water table and easily measuredproperties of the soil. Alternatively, if thereis an existing road that has been built onthe same subgrade in the area of theproject, the strength of the subgrade canbe measured underneath this road underthe most likely adverse conditions (i.e. ator near the end of the rainy season). Thiswill provide the best estimate ofsubgrade strength for design purposes.
Problems arise when road maintenanceis very poor. The ingress of waterthrough damaged or aged surfaces andshoulders, and the retention of this waterthrough poor maintenance of thedrainage systems, or poor choice ofmaterials for the pavement layers, canhave a drastic effect on the strength ofthe layers and their subsequentperformance. It is not possible tocompensate adequately for such effectsby means of more conservative designs,although some designs are more tolerantthan others to this problem.
Materials. Additional problems of variability arisewith the aggregates chosen forroadbases and, to a lesser extent, sub-bases. There are numerous ways inwhich the aggregates can fall outsidespecification and unless sufficient testingof potential quarry sources is done at thefeasibility study stage to ensure that allmaterials are within specification,problems are inevitable (see Chapter 5).Lack of sufficient testing is likely to giverise to disputes during the constructionphase, often with serious financialconsequences.
The behaviour or performance of a roadis complex and depends on manyfactors. As a consequence, it is oftendifficult to evaluate the effects ofdeviations from the specifications for thematerials and so it is prudent to allow nodeviations. Exceptions arise for sometypes of material of ‘marginal’ quality, asdiscussed Section 9.2.5, where thesehave been evaluated by means of reliableresearch programmes and appropriatespecifications for their use drawn up andincluded in national standards orpublished by a reliable source. Selectionof pavement materials is probably one
aspect of structural design where largefinancial savings can be made in roadconstruction, especially for low andintermediate levels of traffic, by usingsuch ‘approved’ marginal materials.
Construction control. The construction process itself is seldomas well-controlled as expected ordesired. For example, variation in thethickness of the pavement layers is oftena major cause for concern because ofthe extreme sensitivity of traffic carryingcapacity to structural thickness. Thissensitivity means that, despite largeuncertainties in traffic forecasts, smallincreases in thickness should ensure thatthe road carries the traffic satisfactorilyprovided that the natural variations inthickness arising from the constructionprocess are properly accounted for in thedesign.
Sources of variability arise in all aspectsof the construction process and someare inherently more serious than others,for example, the mix proportions ofpremixed bituminous materials and thedegree of roadbase compaction achievedtransversely across the road.Specifications should be set in such away that only a very small proportion oftest results are allowed to fall below thedesired levels. Fortunately mostspecifications are set this way but theyneed to be enforced during construction.
9.3.6 Shoulders
Shoulders are an essential element of thestructural design of a road, providinglateral support for the pavement layers.
They are especially important whenunbound materials are used in thepavement and, for this type ofconstruction, shoulders should be atleast 1.5 metres wide. Narrowershoulders are acceptable for roads withbound bases (but see Chapter 10). Inorder to exclude water from the road, atleast one metre of the shoulder nearestthe road should be impermeable and asurface dressing or other seal should beapplied. Unsealed shoulders are notrecommended as they often requireconsiderable maintenance if satisfactoryperformance is to be guaranteed.
9.3.7 Drainage of pavement layers
Good drainage is crucial to theperformance of roads and eitherinfluences, or is influenced by, thestructural design of the pavement itself,the geometric design of the roadway(Chapter 10), the design of culverts,bridges and water crossings (Chapter12). Chapter 11 is specifically concernedwith drainage.
Drainage within the pavement layersthemselves is an essential element ofstructural design because the strength ofthe subgrade used for design purposesdepends on the moisture content duringthe most likely adverse conditions. It isimpossible to guarantee that roads willremain waterproof throughout their lives,hence it is important to ensure that if anylayer of the pavement, including thesubgrade, consists of material which isseriously weakened by the presence ofwater, then the water must be able todrain away quickly. To facilitate this,
75
Figure 9.6: Drainage of pavement layers
SurfacingSealedshoulder
Base
Sub-baseSubgrade
Normally > 1m
Wrong
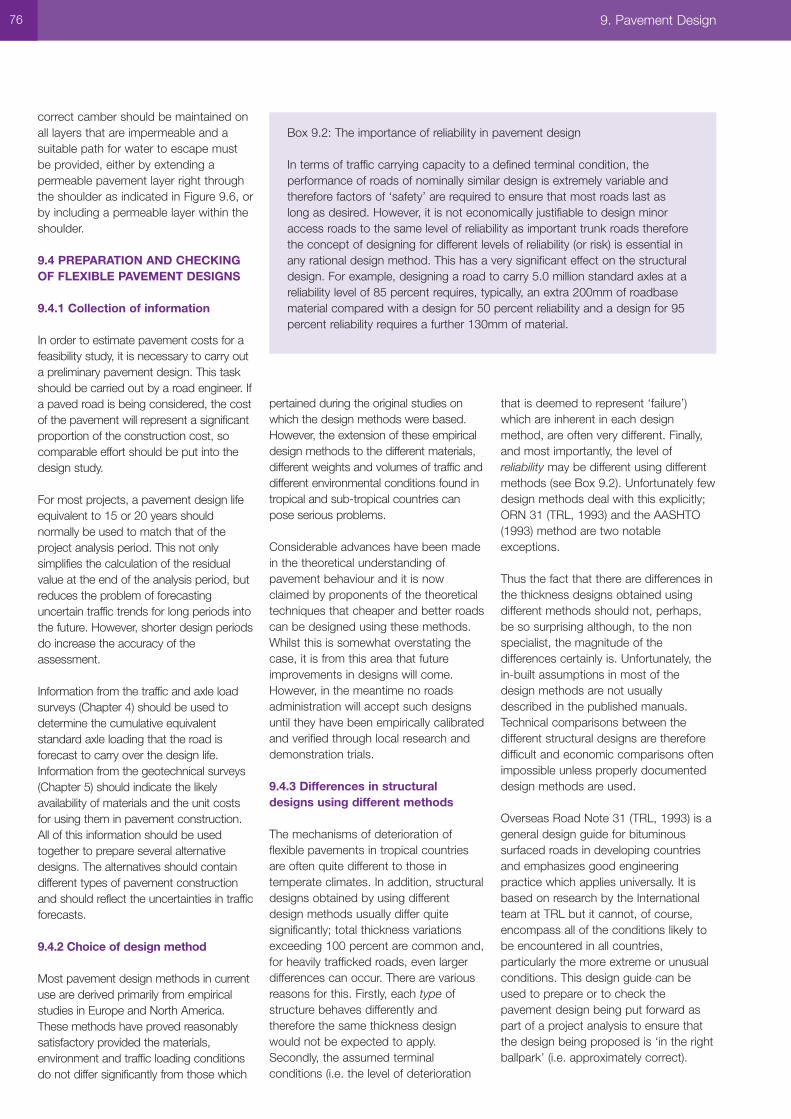
correct camber should be maintained onall layers that are impermeable and asuitable path for water to escape mustbe provided, either by extending apermeable pavement layer right throughthe shoulder as indicated in Figure 9.6, orby including a permeable layer within theshoulder.
9.4 PREPARATION AND CHECKINGOF FLEXIBLE PAVEMENT DESIGNS
9.4.1 Collection of information
In order to estimate pavement costs for afeasibility study, it is necessary to carry outa preliminary pavement design. This taskshould be carried out by a road engineer. Ifa paved road is being considered, the costof the pavement will represent a significantproportion of the construction cost, socomparable effort should be put into thedesign study.
For most projects, a pavement design lifeequivalent to 15 or 20 years shouldnormally be used to match that of theproject analysis period. This not onlysimplifies the calculation of the residualvalue at the end of the analysis period, butreduces the problem of forecastinguncertain traffic trends for long periods intothe future. However, shorter design periodsdo increase the accuracy of theassessment.
Information from the traffic and axle loadsurveys (Chapter 4) should be used todetermine the cumulative equivalentstandard axle loading that the road isforecast to carry over the design life.Information from the geotechnical surveys(Chapter 5) should indicate the likelyavailability of materials and the unit costsfor using them in pavement construction.All of this information should be usedtogether to prepare several alternativedesigns. The alternatives should containdifferent types of pavement constructionand should reflect the uncertainties in trafficforecasts.
9.4.2 Choice of design method
Most pavement design methods in currentuse are derived primarily from empiricalstudies in Europe and North America.These methods have proved reasonablysatisfactory provided the materials,environment and traffic loading conditionsdo not differ significantly from those which
pertained during the original studies onwhich the design methods were based.However, the extension of these empiricaldesign methods to the different materials,different weights and volumes of traffic anddifferent environmental conditions found intropical and sub-tropical countries canpose serious problems.
Considerable advances have been madein the theoretical understanding ofpavement behaviour and it is nowclaimed by proponents of the theoreticaltechniques that cheaper and better roadscan be designed using these methods.Whilst this is somewhat overstating thecase, it is from this area that futureimprovements in designs will come.However, in the meantime no roadsadministration will accept such designsuntil they have been empirically calibratedand verified through local research anddemonstration trials.
9.4.3 Differences in structuraldesigns using different methods
The mechanisms of deterioration offlexible pavements in tropical countriesare often quite different to those intemperate climates. In addition, structuraldesigns obtained by using differentdesign methods usually differ quitesignificantly; total thickness variationsexceeding 100 percent are common and,for heavily trafficked roads, even largerdifferences can occur. There are variousreasons for this. Firstly, each type ofstructure behaves differently andtherefore the same thickness designwould not be expected to apply.Secondly, the assumed terminalconditions (i.e. the level of deterioration
that is deemed to represent ‘failure’)which are inherent in each designmethod, are often very different. Finally,and most importantly, the level ofreliability may be different using differentmethods (see Box 9.2). Unfortunately fewdesign methods deal with this explicitly;ORN 31 (TRL, 1993) and the AASHTO(1993) method are two notableexceptions.
Thus the fact that there are differences inthe thickness designs obtained usingdifferent methods should not, perhaps,be so surprising although, to the nonspecialist, the magnitude of thedifferences certainly is. Unfortunately, thein-built assumptions in most of thedesign methods are not usuallydescribed in the published manuals.Technical comparisons between thedifferent structural designs are thereforedifficult and economic comparisons oftenimpossible unless properly documenteddesign methods are used.
Overseas Road Note 31 (TRL, 1993) is ageneral design guide for bituminoussurfaced roads in developing countriesand emphasizes good engineeringpractice which applies universally. It isbased on research by the Internationalteam at TRL but it cannot, of course,encompass all of the conditions likely tobe encountered in all countries,particularly the more extreme or unusualconditions. This design guide can beused to prepare or to check thepavement design being put forward aspart of a project analysis to ensure thatthe design being proposed is ‘in the rightballpark’ (i.e. approximately correct).
76 9. Pavement Design
Box 9.2: The importance of reliability in pavement design
In terms of traffic carrying capacity to a defined terminal condition, theperformance of roads of nominally similar design is extremely variable andtherefore factors of ‘safety’ are required to ensure that most roads last aslong as desired. However, it is not economically justifiable to design minoraccess roads to the same level of reliability as important trunk roads thereforethe concept of designing for different levels of reliability (or risk) is essential inany rational design method. This has a very significant effect on the structuraldesign. For example, designing a road to carry 5.0 million standard axles at areliability level of 85 percent requires, typically, an extra 200mm of roadbasematerial compared with a design for 50 percent reliability and a design for 95percent reliability requires a further 130mm of material.
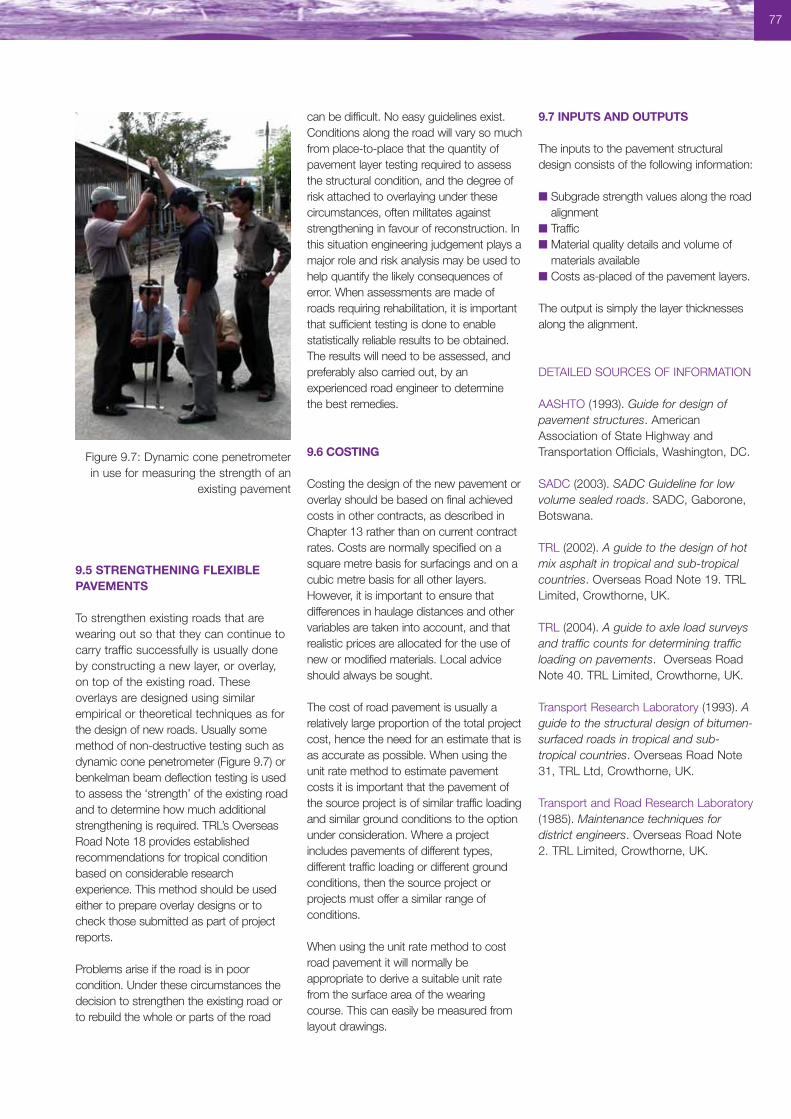
77
9.5 STRENGTHENING FLEXIBLEPAVEMENTS
To strengthen existing roads that arewearing out so that they can continue tocarry traffic successfully is usually doneby constructing a new layer, or overlay,on top of the existing road. Theseoverlays are designed using similarempirical or theoretical techniques as forthe design of new roads. Usually somemethod of non-destructive testing such asdynamic cone penetrometer (Figure 9.7) orbenkelman beam deflection testing is usedto assess the ‘strength’ of the existing roadand to determine how much additionalstrengthening is required. TRL’s OverseasRoad Note 18 provides establishedrecommendations for tropical conditionbased on considerable researchexperience. This method should be usedeither to prepare overlay designs or tocheck those submitted as part of projectreports.
Problems arise if the road is in poorcondition. Under these circumstances thedecision to strengthen the existing road orto rebuild the whole or parts of the road
can be difficult. No easy guidelines exist.Conditions along the road will vary so muchfrom place-to-place that the quantity ofpavement layer testing required to assessthe structural condition, and the degree ofrisk attached to overlaying under thesecircumstances, often militates againststrengthening in favour of reconstruction. Inthis situation engineering judgement plays amajor role and risk analysis may be used tohelp quantify the likely consequences oferror. When assessments are made ofroads requiring rehabilitation, it is importantthat sufficient testing is done to enablestatistically reliable results to be obtained.The results will need to be assessed, andpreferably also carried out, by anexperienced road engineer to determine the best remedies.
9.6 COSTING
Costing the design of the new pavement oroverlay should be based on final achievedcosts in other contracts, as described inChapter 13 rather than on current contractrates. Costs are normally specified on asquare metre basis for surfacings and on acubic metre basis for all other layers.However, it is important to ensure thatdifferences in haulage distances and othervariables are taken into account, and thatrealistic prices are allocated for the use ofnew or modified materials. Local adviceshould always be sought.
The cost of road pavement is usually arelatively large proportion of the total projectcost, hence the need for an estimate that isas accurate as possible. When using theunit rate method to estimate pavementcosts it is important that the pavement ofthe source project is of similar traffic loadingand similar ground conditions to the optionunder consideration. Where a projectincludes pavements of different types,different traffic loading or different groundconditions, then the source project orprojects must offer a similar range ofconditions.
When using the unit rate method to costroad pavement it will normally beappropriate to derive a suitable unit ratefrom the surface area of the wearingcourse. This can easily be measured fromlayout drawings.
9.7 INPUTS AND OUTPUTS
The inputs to the pavement structuraldesign consists of the following information:
■ Subgrade strength values along the roadalignment
■ Traffic■ Material quality details and volume of
materials available■ Costs as-placed of the pavement layers.
The output is simply the layer thicknessesalong the alignment.
DETAILED SOURCES OF INFORMATION
AASHTO (1993). Guide for design ofpavement structures. AmericanAssociation of State Highway andTransportation Officials, Washington, DC.
SADC (2003). SADC Guideline for lowvolume sealed roads. SADC, Gaborone,Botswana.
TRL (2002). A guide to the design of hotmix asphalt in tropical and sub-tropicalcountries. Overseas Road Note 19. TRLLimited, Crowthorne, UK.
TRL (2004). A guide to axle load surveysand traffic counts for determining trafficloading on pavements. Overseas RoadNote 40. TRL Limited, Crowthorne, UK.
Transport Research Laboratory (1993). Aguide to the structural design of bitumen-surfaced roads in tropical and sub-tropical countries. Overseas Road Note31, TRL Ltd, Crowthorne, UK.
Transport and Road Research Laboratory(1985). Maintenance techniques fordistrict engineers. Overseas Road Note2. TRL Limited, Crowthorne, UK.
Figure 9.7: Dynamic cone penetrometerin use for measuring the strength of an
existing pavement
78 10. Geometric Design
10. Geometric Design
10.1 PURPOSE OF GEOMETRICDESIGN
Geometric design is the process wherebythe layout of the road in the terrain isdesigned to meet the needs of the roaduser. The principal elements of thisprocess are the selection of suitablehorizontal and vertical alignments androad widths. The geometric designstandards provide the link between thecost of building the road and the costs tothe road users. Usually, but by no meansalways, the higher the geometricstandard, the higher the constructioncost and the lower the road user costs.The optimal design for a given traffic flowwill depend on terrain and othercharacteristics. Appropriate geometricdesign standards for use in developingcountries are given in Overseas RoadNote 6 (TRL, 1988).
One of the principal objectives of afeasibility study should be to makerecommendations about the geometricdesign standards for a project such thatthe optimum balance between roadconstruction cost and road user cost isobtained over the project analysis period(Box 10.1). It is vital that decisions arenot taken before this is carried out whichprejudice the choice of geometric designstandard. There are few developing countries thathave carried out basic research on trafficeconomics and safety in order to develop
their own geometric standards. Thereforestandards have been adapted from thoseused in industrialized countries. However,the needs of road users in theindustrialized countries are usually verydifferent from those in developingcountries. In developing countriespedestrians, animal-drawn carts,bicycles, auto-rickshaws, for example,are often an important component oftraffic mix, even on major highways. InEurope and North America, trafficcomposition is dominated by the motorcar, whilst, in developing countries, lorriesand buses often represent the largestproportion of the motorized traffic. As aresult, it may be necessary to adaptconventional geometric design standardsto meet the needs of all road users by,for example, widening the shoulders ofthe road to allow their use by slow-moving traffic.
10.2 ELEMENTS OF GEOMETRICDESIGN
10.2.1 Sight distance
Geometric design covers horizontal andvertical alignments, road width and sightlines. Sight distance is the distanceahead that can be seen by the driver.The sight distance needed for safestopping from travelling speed is the‘stopping sight distance’ and the sightdistance needed to see ahead for safe
overtaking is known as the ‘passing sightdistance’. Different aspects of sightdistance are used in the selection ofstandards for horizontal and verticalalignment.
10.2.2 Horizontal alignment
The key elements are the ‘minimumradius of curvature’, the ‘minimumstopping sight distance’ and the‘minimum passing sight distance’ (Figure10.1).
10.2.3 Vertical Alignment
The key elements are the ‘maximumgradient’, ‘length of maximum gradient’;‘minimum stopping sight distance’ or‘passing sight distance on summitcurves’, and ‘length of valley curves’(Figure 10.2)
10.2.4 Cross-section
The important factors are, ‘width ofcarriageway (running surface) and widthof shoulder’, ‘crossfall’, ‘camber and super-elevation’, ‘width of structure’, and‘width of road reserve’ (Figure 10.3).
10.3 RATIONAL BASIS FORGEOMETRIC DESIGN
When choosing geometric designstandards for a particular situation it isnecessary to consider the purpose forwhich the road is being provided. Forgeometric design purposes, it is mostconvenient to consider road projectsunder one of the following threecategories.
Box 10.1: Choice of design standards
In the past, insufficient attention has been given to the choice of designstandards with the result that roads have been built to standards well inexcess of those that are justified by the traffic levels over the life of theproject.
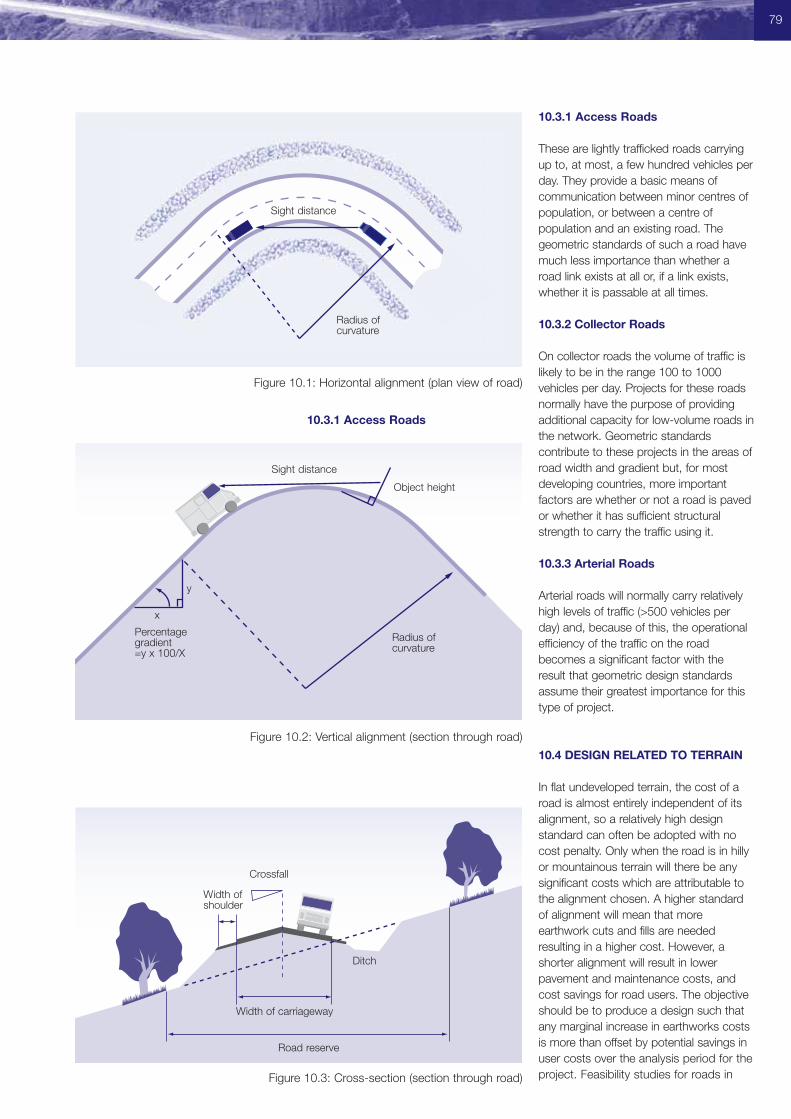
10.3.1 Access Roads
10.3.1 Access Roads
These are lightly trafficked roads carryingup to, at most, a few hundred vehicles perday. They provide a basic means ofcommunication between minor centres ofpopulation, or between a centre ofpopulation and an existing road. Thegeometric standards of such a road havemuch less importance than whether aroad link exists at all or, if a link exists,whether it is passable at all times.
10.3.2 Collector Roads
On collector roads the volume of traffic islikely to be in the range 100 to 1000vehicles per day. Projects for these roadsnormally have the purpose of providingadditional capacity for low-volume roads inthe network. Geometric standardscontribute to these projects in the areas ofroad width and gradient but, for mostdeveloping countries, more importantfactors are whether or not a road is pavedor whether it has sufficient structuralstrength to carry the traffic using it.
10.3.3 Arterial Roads
Arterial roads will normally carry relativelyhigh levels of traffic (>500 vehicles perday) and, because of this, the operationalefficiency of the traffic on the roadbecomes a significant factor with theresult that geometric design standardsassume their greatest importance for thistype of project.
10.4 DESIGN RELATED TO TERRAIN
In flat undeveloped terrain, the cost of aroad is almost entirely independent of itsalignment, so a relatively high designstandard can often be adopted with nocost penalty. Only when the road is in hillyor mountainous terrain will there be anysignificant costs which are attributable tothe alignment chosen. A higher standardof alignment will mean that moreearthwork cuts and fills are neededresulting in a higher cost. However, ashorter alignment will result in lowerpavement and maintenance costs, andcost savings for road users. The objectiveshould be to produce a design such thatany marginal increase in earthworks costsis more than offset by potential savings inuser costs over the analysis period for theproject. Feasibility studies for roads in
79
Figure 10.1: Horizontal alignment (plan view of road)
Figure 10.2: Vertical alignment (section through road)
Figure 10.3: Cross-section (section through road)
Sight distance
Radius ofcurvature
Percentagegradient=y x 100/X
Radius ofcurvature
Sight distance
Object height
Crossfall
Width ofshoulder
Ditch
Road reserve
Width of carriageway
y
x
80 10. Geometric Design
hilly terrain should always consideralternative alignments beforerecommendations are made.
Consistency of design standards overrelatively short lengths of route of say 5 to15 km will improve road safety byreducing sudden and unexpectedchanges in road standard. However,when the road passes through significantchanges in topographic type, it will usuallybe cost-effective to lower the alignmentstandards in the more rugged terrain.
The alignment should be chosen carefullyto provide good drainage and to minimizeearthworks. When locating roads inerosion-prone regions or areas whereinstability of slopes is a problem, carefulattention must be given to minimizing thedisturbance of the terrain caused by theroad (see Chapter 5). The location of theroad will also be affected by theavailability of road-making materials andthe distance that they have to be hauled.
10.5 HORIZONTAL ALIGNMENT
Suitable ranges of horizontal alignmentstandard are given in Table 10.1. Therewill normally be little difficulty in producingcost-effective designs with horizontalcurve radii well above the minimum valuesin the range. The absolute minimumvalues should only be required in severeterrain.
For access roads it is assumed that anynew roads will carry low traffic volumesand therefore should be built to minimumstandards. In steep ground, it is importantthat all of the vehicle types likely tooperate on a road can negotiate thecurves. The minimum radius should bechosen to be adequate for all likelyvehicles, including 4-wheel drive tipperlorries which tend to have very poorturning circles, but excluding large heavygoods vehicles. Where it is known thatthe road will only be required to carry, say,light 4-wheel drive vehicles, this figure canpossibly be reduced. However,consideration must be given to otherspecial users of the road, such as theRoads Department, to allow accessduring road maintenance. It is desirable toflatten the gradient at any tight corner.
For collector and arterial roads, projects
will often be for improvement rather thanfor new construction. In such cases, it isseldom economic to improve individualhorizontal curves. Proposals to do this toremove safety hazards may beconsidered, but should be looked at verycritically in terms of benefits and costs. Acompletely new alignment may bejustified where there is a physicalconstraint to widening the road, where ahigher speed road is economic, or wheresafety and congestion factors arise whenthe road passes through a settlement.
It is preferable that lengths of horizontalcurves should be close to the desirableminimum radius and as short as possible.This type of design provides themaximum length of road where sightdistances are not reduced and whereovertaking can be carried out. Previousdesign methods used longer curves toproduce ‘flowing alignments’ and moregentle bends. However, with suchdesigns, sight distances are restricted onthe longer curves and a shorter length ofalignment is available where overtaking issafe.
10.6 VERTICAL ALIGNMENT
The vertical alignment of a road has astrong influence upon the constructioncost, the operating cost of vehicles usingthe road, and the number of accidents.The vertical alignment should provideadequate sight distances over crests andshould not present any sudden hiddenchanges in alignment to the driver.Gradients need to be considered from thestandpoint of both length and steepness,and the speed at which heavy vehiclesenter the gradient. They should bechosen such that any marginal increase inconstruction cost is more than offset bythe savings in operating costs of theheavy vehicles ascending them over theproject analysis period.
For access roads, the cost of earthworksis often a substantial part of the cost oftotal construction, so it is best to considerthe maximum gradient that particulartypes of vehicle can climb safely ratherthan to adopt a gradient that can benegotiated by all kinds of vehicles. Thebasic determinant for maximum gradientis whether vehicles are to be 2-wheel-drive, 4-wheel-drive or animal drawn
trailers. The absolute maximum gradientsgiven in Table 10.1 should then apply.These gradients are extremely steep and,if possible, all gradients should be muchless severe than these. On access roadswith an earth surface, some soil typesmay give rise to slippery conditions in thewet and even moderate gradients can bevery difficult to negotiate. On hairpinbends, it is important to keep the gradienton the bend itself as flat as possible.
Collector road projects will often involveimprovement rather than newconstruction. If recommendations aremade to bypass a steep gradient, theproposal should compare the benefitsand costs of this course of action and thealternative of providing a climbing lane onthe existing alignment. This comparisonshould be looked at very critically. Steepgradients can bring problems ofpotentially dangerous downhill speeds forheavy vehicles and can also lead todifficulties in climbing hills for old or poorlymaintained vehicles such as often foundin developing countries. It may beeconomic to pave steep gradients on agravel road to reduce maintenanceproblems.
For arterial roads, the choice of verticalalignment for the road has a significanteffect on both the construction cost andthe road user cost. The maximumgradient should be chosen to minimizethe sum of these costs. Proposals shouldsupport recommendations for choice ofvertical alignment by comparing costswith alternative standard alignments.Road investment models should be usedfor carrying out such an analysis, andthese are described in Chapter 15.Minimum values for the radii of verticalcurves should be based on safety criteria;the standards in Table 10.1 are based onlimits of stopping sight distance which areappropriate. Where traffic flows will leadto congestion on steep gradients, therelative costs of building climbing lanesand flatter gradients should be evaluated.If climbing lanes are adopted, roadmarkings should be used to indicateclearly that two lanes are ‘up’ and one is‘down’.
The length of summit curves should be asclose to the minimum radius and as shortas possible to reduce the length of roadwhere minimum sight distance applies.
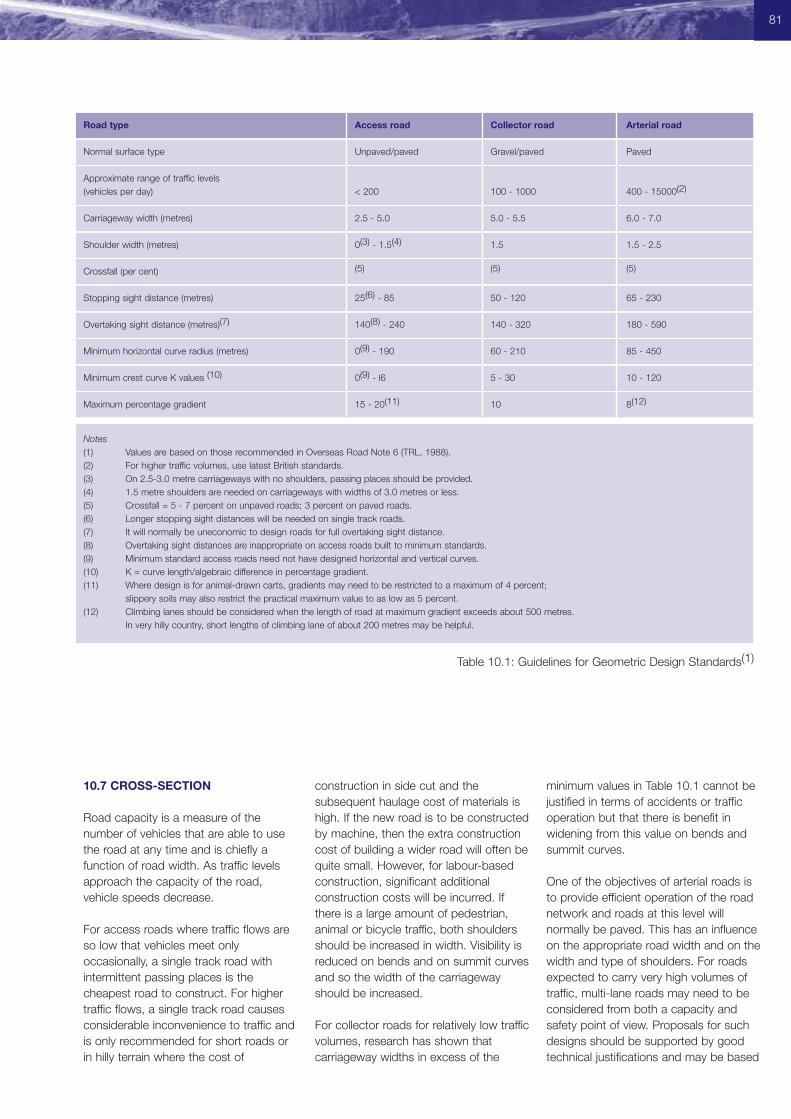
81
Table 10.1: Guidelines for Geometric Design Standards(1)
10.7 CROSS-SECTION
Road capacity is a measure of thenumber of vehicles that are able to usethe road at any time and is chiefly afunction of road width. As traffic levelsapproach the capacity of the road,vehicle speeds decrease.
For access roads where traffic flows areso low that vehicles meet onlyoccasionally, a single track road withintermittent passing places is thecheapest road to construct. For highertraffic flows, a single track road causesconsiderable inconvenience to traffic andis only recommended for short roads orin hilly terrain where the cost of
construction in side cut and thesubsequent haulage cost of materials ishigh. If the new road is to be constructedby machine, then the extra constructioncost of building a wider road will often bequite small. However, for labour-basedconstruction, significant additionalconstruction costs will be incurred. Ifthere is a large amount of pedestrian,animal or bicycle traffic, both shouldersshould be increased in width. Visibility isreduced on bends and on summit curvesand so the width of the carriagewayshould be increased.
For collector roads for relatively low trafficvolumes, research has shown thatcarriageway widths in excess of the
minimum values in Table 10.1 cannot bejustified in terms of accidents or trafficoperation but that there is benefit inwidening from this value on bends andsummit curves.
One of the objectives of arterial roads isto provide efficient operation of the roadnetwork and roads at this level willnormally be paved. This has an influenceon the appropriate road width and on thewidth and type of shoulders. For roadsexpected to carry very high volumes oftraffic, multi-lane roads may need to beconsidered from both a capacity andsafety point of view. Proposals for suchdesigns should be supported by goodtechnical justifications and may be based
Road type Access road Collector road Arterial road
Normal surface type Unpaved/paved Gravel/paved Paved
Approximate range of traffic levels(vehicles per day) < 200 100 - 1000 400 - 15000(2)
Carriageway width (metres) 2.5 - 5.0 5.0 - 5.5 6.0 - 7.0
Shoulder width (metres) 0(3) - 1.5(4) 1.5 1.5 - 2.5
Crossfall (per cent) (5) (5) (5)
Stopping sight distance (metres) 25(6) - 85 50 - 120 65 - 230
Overtaking sight distance (metres)(7) 140(8) - 240 140 - 320 180 - 590
Minimum horizontal curve radius (metres) 0(9) - 190 60 - 210 85 - 450
Minimum crest curve K values (10) 0(9) - l6 5 - 30 10 - 120
Maximum percentage gradient 15 - 20(11) 10 8(12)
Notes(1) Values are based on those recommended in Overseas Road Note 6 (TRL, 1988).(2) For higher traffic volumes, use latest British standards.(3) On 2.5-3.0 metre carriageways with no shoulders, passing places should be provided.(4) 1.5 metre shoulders are needed on carriageways with widths of 3.0 metres or less.(5) Crossfall = 5 - 7 percent on unpaved roads; 3 percent on paved roads.(6) Longer stopping sight distances will be needed on single track roads.(7) It will normally be uneconomic to design roads for full overtaking sight distance.(8) Overtaking sight distances are inappropriate on access roads built to minimum standards.(9) Minimum standard access roads need not have designed horizontal and vertical curves.(10) K = curve length/algebraic difference in percentage gradient.(11) Where design is for animal-drawn carts, gradients may need to be restricted to a maximum of 4 percent;
slippery soils may also restrict the practical maximum value to as low as 5 percent.(12) Climbing lanes should be considered when the length of road at maximum gradient exceeds about 500 metres.
In very hilly country, short lengths of climbing lane of about 200 metres may be helpful.
10. Geometric Design82
on best practice. Arterial roads shouldnormally carry centre line markings.
Shoulders should normally be at leastpartly sealed and should be differentiatedfrom the carriageway by the use ofdifferent coloured aggregate or edgemarkings. Where large amounts ofpedestrian, animal and bicycle transportare expected, shoulder widths should beincreased or it may be appropriate tosegregate this traffic entirely from thevehicular traffic.
Crossfall is needed on all roads in orderto assist the shedding of water into theside drains. Suitable values are given inTable 10.1.
10.8 ROAD RESERVE
For new road construction, mostcountries already have standards for theamount of land that will be bought oracquired for the road. Often this is muchwider than in industrialized countriessince the pressure on land space is notas great. The total width of the roadreserve may be from 10 metres to morethan 50 metres. Its purpose is to provideland for future road widening and toprovide the fill material for the roadconstruction. There are two problemswith having too wide a reserve. Firstly, itimplies a loss of land to agriculture orother use and, secondly, the roadauthority is sometimes obliged to cut thegrass in the road reserve. A third problemmay be that, if people graze their cattle inthe road reserve, then this can be atraffic hazard. On the whole, the roadreserve only needs to be sufficient for theroad, its drainage, services, for futurewidening to dual carriageway, and tocontrol erosion and unplanneddevelopment. A wider road reserve willimprove sight distance.
10.9 JUNCTION DESIGN
Conflicting vehicle movements atjunctions are a significant contribution toaccidents in many developing countries(Chapter 8). A small number of welldesigned junctions on a route ispreferable to a large number of lowstandard junctions. Simple cross-roadshave the worst accident record.Staggered cross-roads or two separated
T-junctions will reduce the accident rate.The use of roundabouts, traffic lights andchannelization may be appropriate toimprove vehicle flow and safety. Localwidening at T-junctions combined withpainted channelization (ghost islands) hasproved highly cost effective inindustrialized countries, as has the use oflow cost traffic engineering devices suchas yellow bar markings on the approachto junctions. Conflicts can be largelyeliminated by the expensive solution ofgrade separation, but it is not normallynecessary to design for free-flowconditions at intersections, and their usewill not be appropriate in most cases.
10.10 SIGNS AND ROAD MARKINGS
Warning signs should be used to informthe motorist that there is a change indesign standard on the road and toreduce approach speeds. On newprojects, signs will be needed where theproject joins on to the existing road orwhere standards have been changed onpassing into a different terrain type. Roadmarkings will be needed on summitcurves on paved roads where overtakingsight distance is not provided. Warningsigns should also be erected to inform ofother hazards such as road junctions.Mandatory signs indicate where action bythe driver is necessary which isenforceable by law, and direction signshelp to direct traffic along a route to adestination. If these three types of signsare used properly, they will form aninformation system which will reduceaccidents and minimize confusion anddelay.
Ideally, signs should be reflectorized, butordinary paint is better than nothing. Theuse of marker posts and chevron boardon bends is also strongly recommended,particularly for roads being designed atthe minimum standards beingrecommended here. As has beenmentioned earlier, the use of roadmarkings on the edge of roads, on thecentre line and on climbing lanes is alsorecommended. However, in manycountries, maintenance of road markingsand theft of road signs can be a problem.
10.11 COSTING EARTHWORKS
Standard engineering methods should be
used to prepare preliminary alignmentdesigns based on the range or geometricstandards recommended here. Computerprograms are available to assist with thisprocess from a variety of sources.
For feasibility study purposes, alignmentsdesigned on the basis of availablecontour maps are adequate to providethe level of detail required to make costestimates to an acceptable level ofaccuracy.
A significant proportion of the cost ofbuilding or realigning a road is the cost ofearthworks. This is made up principally ofthe cost of excavating cuttings, buildingembankments and hauling materialbetween the two. Additional material mayalso need to be brought in from pits, andany surplus or unsuitable material willneed to be dumped. Standardengineering methods should be used fordetermining earthworks quantities andcosts. Computer programs are availableto assist with these calculations.
Methods of costing based on those inChapter 13 should be used.
DETAILED SOURCES OF INFORMATION
Transport and Road Research Laboratory(1988). A guide to geometric design.Overseas Road Note 6. TRL Limited,Crowthorne, UK.
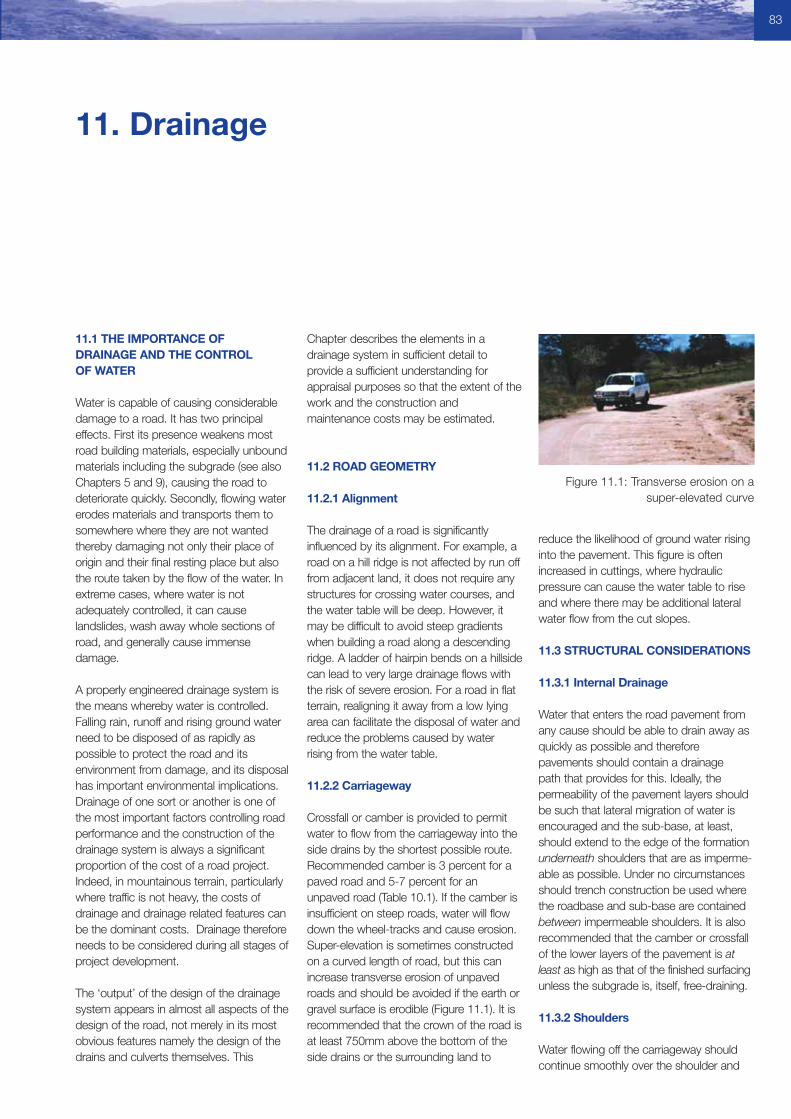
83
11.1 THE IMPORTANCE OF DRAINAGE AND THE CONTROLOF WATER
Water is capable of causing considerabledamage to a road. It has two principaleffects. First its presence weakens mostroad building materials, especially unboundmaterials including the subgrade (see alsoChapters 5 and 9), causing the road todeteriorate quickly. Secondly, flowing watererodes materials and transports them tosomewhere where they are not wantedthereby damaging not only their place oforigin and their final resting place but alsothe route taken by the flow of the water. Inextreme cases, where water is notadequately controlled, it can causelandslides, wash away whole sections ofroad, and generally cause immensedamage.
A properly engineered drainage system isthe means whereby water is controlled.Falling rain, runoff and rising ground waterneed to be disposed of as rapidly aspossible to protect the road and itsenvironment from damage, and its disposalhas important environmental implications.Drainage of one sort or another is one ofthe most important factors controlling roadperformance and the construction of thedrainage system is always a significantproportion of the cost of a road project.Indeed, in mountainous terrain, particularlywhere traffic is not heavy, the costs ofdrainage and drainage related features canbe the dominant costs. Drainage thereforeneeds to be considered during all stages ofproject development.
The ‘output’ of the design of the drainagesystem appears in almost all aspects of thedesign of the road, not merely in its mostobvious features namely the design of thedrains and culverts themselves. This
Chapter describes the elements in adrainage system in sufficient detail toprovide a sufficient understanding forappraisal purposes so that the extent of thework and the construction andmaintenance costs may be estimated.
11.2 ROAD GEOMETRY
11.2.1 Alignment
The drainage of a road is significantlyinfluenced by its alignment. For example, aroad on a hill ridge is not affected by run offfrom adjacent land, it does not require anystructures for crossing water courses, andthe water table will be deep. However, itmay be difficult to avoid steep gradientswhen building a road along a descendingridge. A ladder of hairpin bends on a hillsidecan lead to very large drainage flows withthe risk of severe erosion. For a road in flatterrain, realigning it away from a low lyingarea can facilitate the disposal of water andreduce the problems caused by waterrising from the water table.
11.2.2 Carriageway
Crossfall or camber is provided to permitwater to flow from the carriageway into theside drains by the shortest possible route.Recommended camber is 3 percent for apaved road and 5-7 percent for anunpaved road (Table 10.1). If the camber isinsufficient on steep roads, water will flowdown the wheel-tracks and cause erosion.Super-elevation is sometimes constructedon a curved length of road, but this canincrease transverse erosion of unpavedroads and should be avoided if the earth orgravel surface is erodible (Figure 11.1). It isrecommended that the crown of the road isat least 750mm above the bottom of theside drains or the surrounding land to
reduce the likelihood of ground water risinginto the pavement. This figure is oftenincreased in cuttings, where hydraulicpressure can cause the water table to riseand where there may be additional lateralwater flow from the cut slopes.
11.3 STRUCTURAL CONSIDERATIONS
11.3.1 Internal Drainage
Water that enters the road pavement fromany cause should be able to drain away asquickly as possible and thereforepavements should contain a drainage path that provides for this. Ideally, thepermeability of the pavement layers shouldbe such that lateral migration of water isencouraged and the sub-base, at least,should extend to the edge of the formationunderneath shoulders that are as imperme-able as possible. Under no circumstancesshould trench construction be used wherethe roadbase and sub-base are containedbetween impermeable shoulders. It is alsorecommended that the camber or crossfallof the lower layers of the pavement is atleast as high as that of the finished surfacingunless the subgrade is, itself, free-draining.
11.3.2 Shoulders
Water flowing off the carriageway shouldcontinue smoothly over the shoulder and
11. Drainage
Figure 11.1: Transverse erosion on asuper-elevated curve
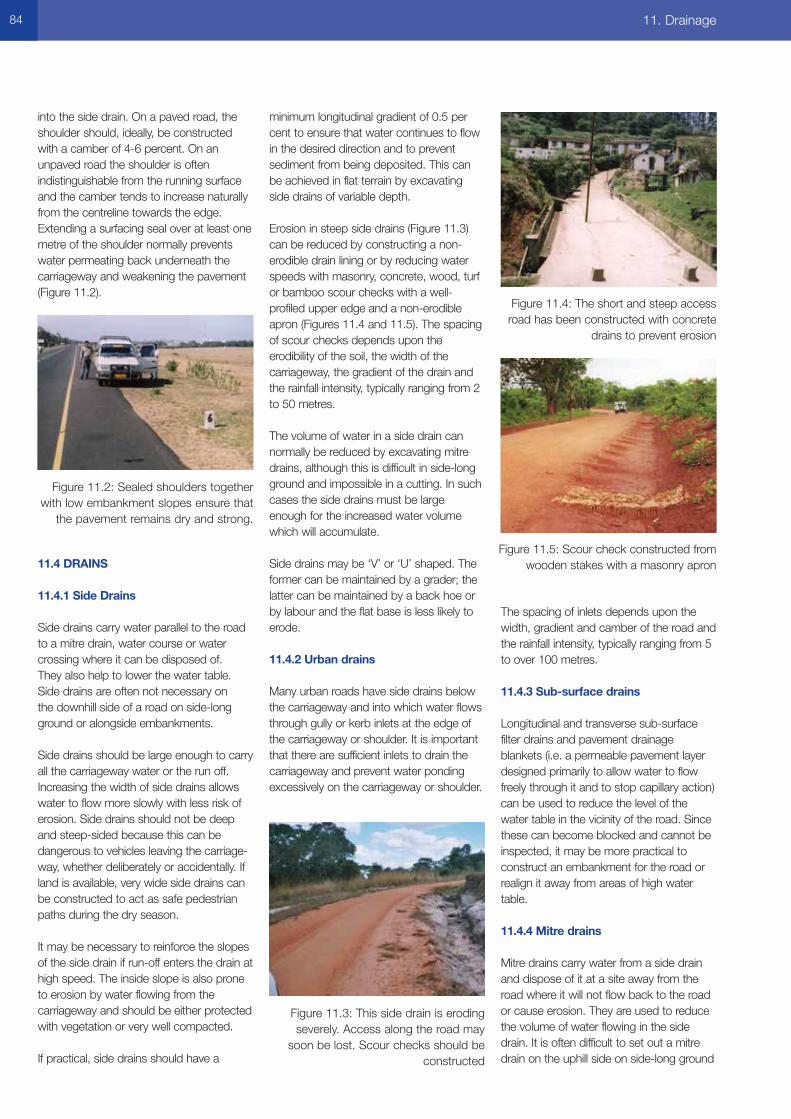
84 11. Drainage
into the side drain. On a paved road, theshoulder should, ideally, be constructedwith a camber of 4-6 percent. On anunpaved road the shoulder is oftenindistinguishable from the running surfaceand the camber tends to increase naturallyfrom the centreline towards the edge.Extending a surfacing seal over at least onemetre of the shoulder normally preventswater permeating back underneath thecarriageway and weakening the pavement(Figure 11.2).
11.4 DRAINS
11.4.1 Side Drains
Side drains carry water parallel to the roadto a mitre drain, water course or watercrossing where it can be disposed of. They also help to lower the water table.Side drains are often not necessary on the downhill side of a road on side-longground or alongside embankments.
Side drains should be large enough to carryall the carriageway water or the run off.Increasing the width of side drains allowswater to flow more slowly with less risk oferosion. Side drains should not be deepand steep-sided because this can bedangerous to vehicles leaving the carriage-way, whether deliberately or accidentally. Ifland is available, very wide side drains canbe constructed to act as safe pedestrianpaths during the dry season.
It may be necessary to reinforce the slopesof the side drain if run-off enters the drain athigh speed. The inside slope is also proneto erosion by water flowing from thecarriageway and should be either protectedwith vegetation or very well compacted.
If practical, side drains should have a
minimum longitudinal gradient of 0.5 percent to ensure that water continues to flowin the desired direction and to preventsediment from being deposited. This canbe achieved in flat terrain by excavatingside drains of variable depth.
Erosion in steep side drains (Figure 11.3)can be reduced by constructing a non-erodible drain lining or by reducing waterspeeds with masonry, concrete, wood, turfor bamboo scour checks with a well-profiled upper edge and a non-erodibleapron (Figures 11.4 and 11.5). The spacingof scour checks depends upon theerodibility of the soil, the width of thecarriageway, the gradient of the drain andthe rainfall intensity, typically ranging from 2to 50 metres.
The volume of water in a side drain cannormally be reduced by excavating mitredrains, although this is difficult in side-longground and impossible in a cutting. In suchcases the side drains must be largeenough for the increased water volumewhich will accumulate.
Side drains may be ‘V’ or ‘U’ shaped. Theformer can be maintained by a grader; thelatter can be maintained by a back hoe orby labour and the flat base is less likely toerode.
11.4.2 Urban drains
Many urban roads have side drains belowthe carriageway and into which water flowsthrough gully or kerb inlets at the edge ofthe carriageway or shoulder. It is importantthat there are sufficient inlets to drain thecarriageway and prevent water pondingexcessively on the carriageway or shoulder.
The spacing of inlets depends upon thewidth, gradient and camber of the road andthe rainfall intensity, typically ranging from 5to over 100 metres.
11.4.3 Sub-surface drains
Longitudinal and transverse sub-surfacefilter drains and pavement drainageblankets (i.e. a permeable pavement layerdesigned primarily to allow water to flowfreely through it and to stop capillary action)can be used to reduce the level of thewater table in the vicinity of the road. Sincethese can become blocked and cannot beinspected, it may be more practical toconstruct an embankment for the road orrealign it away from areas of high watertable.
11.4.4 Mitre drains
Mitre drains carry water from a side drainand dispose of it at a site away from theroad where it will not flow back to the roador cause erosion. They are used to reducethe volume of water flowing in the sidedrain. It is often difficult to set out a mitredrain on the uphill side on side-long ground
Figure 11.2: Sealed shoulders togetherwith low embankment slopes ensure that
the pavement remains dry and strong.
Figure 11.3: This side drain is erodingseverely. Access along the road may
soon be lost. Scour checks should beconstructed
Figure 11.4: The short and steep accessroad has been constructed with concrete
drains to prevent erosion
Figure 11.5: Scour check constructed fromwooden stakes with a masonry apron
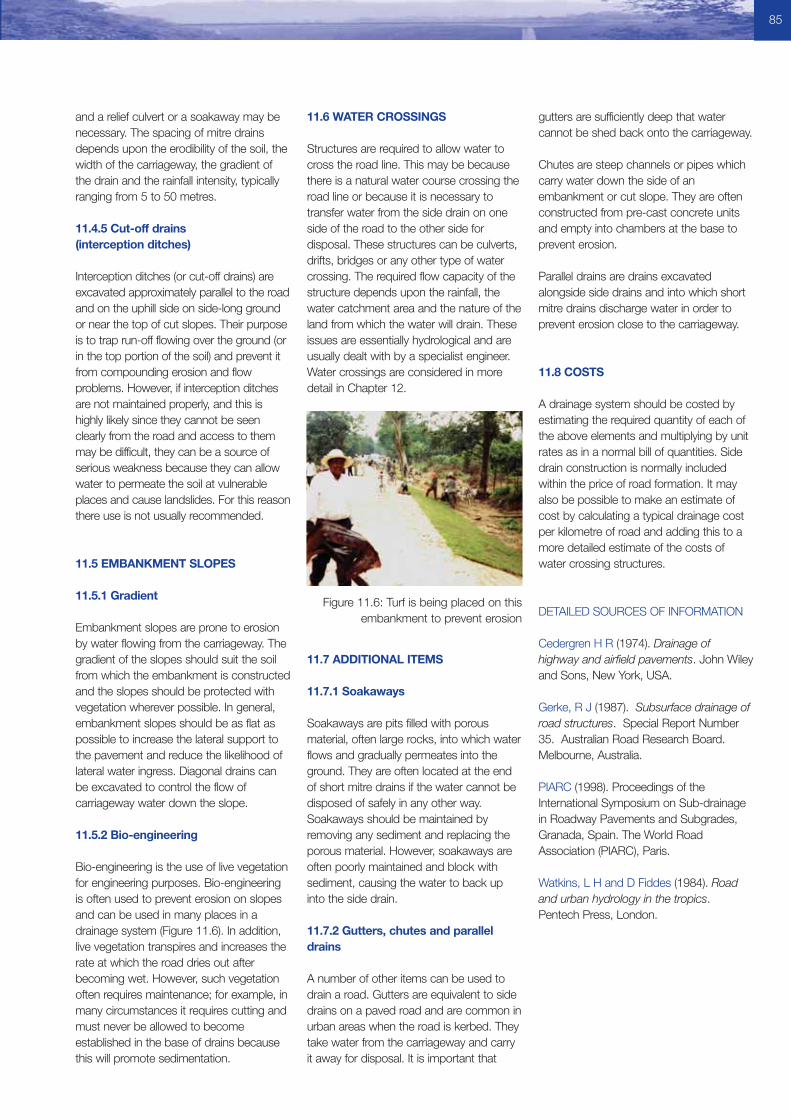
and a relief culvert or a soakaway may benecessary. The spacing of mitre drainsdepends upon the erodibility of the soil, thewidth of the carriageway, the gradient ofthe drain and the rainfall intensity, typicallyranging from 5 to 50 metres.
11.4.5 Cut-off drains (interception ditches)
Interception ditches (or cut-off drains) areexcavated approximately parallel to the roadand on the uphill side on side-long groundor near the top of cut slopes. Their purposeis to trap run-off flowing over the ground (orin the top portion of the soil) and prevent itfrom compounding erosion and flowproblems. However, if interception ditchesare not maintained properly, and this ishighly likely since they cannot be seenclearly from the road and access to themmay be difficult, they can be a source ofserious weakness because they can allowwater to permeate the soil at vulnerableplaces and cause landslides. For this reasonthere use is not usually recommended.
11.5 EMBANKMENT SLOPES
11.5.1 Gradient
Embankment slopes are prone to erosionby water flowing from the carriageway. Thegradient of the slopes should suit the soilfrom which the embankment is constructedand the slopes should be protected withvegetation wherever possible. In general,embankment slopes should be as flat aspossible to increase the lateral support tothe pavement and reduce the likelihood oflateral water ingress. Diagonal drains canbe excavated to control the flow ofcarriageway water down the slope.
11.5.2 Bio-engineering
Bio-engineering is the use of live vegetationfor engineering purposes. Bio-engineeringis often used to prevent erosion on slopesand can be used in many places in adrainage system (Figure 11.6). In addition,live vegetation transpires and increases therate at which the road dries out afterbecoming wet. However, such vegetationoften requires maintenance; for example, inmany circumstances it requires cutting andmust never be allowed to becomeestablished in the base of drains becausethis will promote sedimentation.
11.6 WATER CROSSINGS
Structures are required to allow water tocross the road line. This may be becausethere is a natural water course crossing theroad line or because it is necessary totransfer water from the side drain on oneside of the road to the other side fordisposal. These structures can be culverts,drifts, bridges or any other type of watercrossing. The required flow capacity of thestructure depends upon the rainfall, thewater catchment area and the nature of theland from which the water will drain. Theseissues are essentially hydrological and areusually dealt with by a specialist engineer.Water crossings are considered in moredetail in Chapter 12.
11.7 ADDITIONAL ITEMS
11.7.1 Soakaways
Soakaways are pits filled with porousmaterial, often large rocks, into which waterflows and gradually permeates into theground. They are often located at the endof short mitre drains if the water cannot bedisposed of safely in any other way.Soakaways should be maintained byremoving any sediment and replacing theporous material. However, soakaways areoften poorly maintained and block withsediment, causing the water to back upinto the side drain.
11.7.2 Gutters, chutes and paralleldrains
A number of other items can be used todrain a road. Gutters are equivalent to sidedrains on a paved road and are common inurban areas when the road is kerbed. Theytake water from the carriageway and carryit away for disposal. It is important that
gutters are sufficiently deep that watercannot be shed back onto the carriageway.
Chutes are steep channels or pipes whichcarry water down the side of anembankment or cut slope. They are oftenconstructed from pre-cast concrete unitsand empty into chambers at the base toprevent erosion.
Parallel drains are drains excavatedalongside side drains and into which shortmitre drains discharge water in order toprevent erosion close to the carriageway.
11.8 COSTS
A drainage system should be costed byestimating the required quantity of each ofthe above elements and multiplying by unitrates as in a normal bill of quantities. Sidedrain construction is normally includedwithin the price of road formation. It mayalso be possible to make an estimate ofcost by calculating a typical drainage costper kilometre of road and adding this to amore detailed estimate of the costs ofwater crossing structures.
DETAILED SOURCES OF INFORMATION
Cedergren H R (1974). Drainage ofhighway and airfield pavements. John Wileyand Sons, New York, USA.
Gerke, R J (1987). Subsurface drainage ofroad structures. Special Report Number35. Australian Road Research Board.Melbourne, Australia.
PIARC (1998). Proceedings of theInternational Symposium on Sub-drainagein Roadway Pavements and Subgrades,Granada, Spain. The World RoadAssociation (PIARC), Paris.
Watkins, L H and D Fiddes (1984). Roadand urban hydrology in the tropics.Pentech Press, London.
85
Figure 11.6: Turf is being placed on thisembankment to prevent erosion
12.1 INTRODUCTION
Bridges provide access over obstaclessuch as rivers, roads, railway lines,footpaths and ravines and are required formost road projects. The need for and thelocation of bridges may have a significantinfluence on general route selection as wellas on local geometry. They therefore requirecareful consideration at the project planningstage.
For projects that are concerned withimproving or up-grading existing routes, the structural engineering requirements forbridges and structures may be relativelyminor unless the existing structures lack thecapacity for the anticipated traffic andtherefore need strengthening, widening orrebuilding. On the other hand, for projectsconcerned with new roads, bridges andwater crossings can be an important andexpensive component, both in terms ofinitial cost and long-term maintenanceneeds, and can therefore represent asignificant fraction of the total investment.
The complexity of structures increasesrapidly as the size increases such that if alarge bridge (with a span greater thanabout 30m) is needed the costs of thebridge can form the major part of theproject and the bridge itself may become a project in its own right.
The engineering design of a bridge is aninherently complex process that requiresknowledge of structural engineering,geotechnical engineering and, for watercrossings, hydrology and hydraulics.However, the sizes of bridges that are mostfrequently required are such that relativelystraightforward basic designs can often beused for the superstructure, although thedesign of the foundations may varyconsiderably.
The treatment of bridges and structures forwater crossings at each stage of projectdevelopment depends on the type of roadproject and the number and size of thecrossings required. The level of detailshould be sufficient for decisions to bemade with confidence and with anaccuracy of the same order as othercomponents of the project. For example,for the majority of road projects it is notenvisaged that special geotechnical orhydrological information will be required atthe pre-feasibility stage. However, for majorbridge projects some preliminary design isrequired even at the planning stage toprovide sufficient information to enable thenormal project development process toprogress logically. For most projects,however, some familiarity with the detail ofbridge design is not required until thefeasibility stage. For typical road projects,this might be provided by a competenthighway engineer. Where major bridges arebeing considered, the services of anexperienced bridge design team arenecessary because of the significantlygreater level of expert knowledge that isneeded.
Rivers do not necessarily have to becrossed by a bridge. For low volume roadprojects it may be appropriate to considerthe use of low level crossings such as fordsand drifts. In order to choose the type ofstructure, consideration may need to begiven to the cost of delays to traffic if, forexample, a concrete drift is impassable at any time of the year or if a single-lanebridge is likely to become a trafficbottleneck in future. The choice of structure will therefore depend not only onengineering considerations but also on totaltransport costs in the same way as for theother elements of the road.
For major rivers, it may be economic toprovide a ferry service or improve an
existing service instead of providing a majorstructure. These alternative solutions areparticularly applicable where the riverchannel is constantly changing. Wheretraffic levels are low and the river is wideand slow-moving, they can be a cost-effective alternative. However, appraisalsshould take account of the delay to trafficintroduced by the use of ferries and boththeir capital and maintenance cost. Thevalue of time is discussed in Chapter 14.The information presented in this chapter isconcerned with bridges (and other watercrossings) but the same general principlesare required for most other highwaystructures such as retaining walls, gantries,etc. However, tunnels require specialistknowledge and are beyond the scope ofthis document.
The key factors that control the choice andthe design of a bridge, and therefore itscost, are the weight of traffic to be carried,the ground conditions of the site, and, forwater crossings, the likely flow of waterpassing across the line of the road.
12.2 STRUCTURE TYPES
12.2.1 Fords and drifts
The simplest river crossing is a ford andthis can provide a simple and economicalternative to a bridge in favourableconditions, i.e. where traffic volumes arelow and water depths are generally lessthan 150mm. Large stones with flat topscan be placed at the upstream anddownstream sides of the ford so thatpedestrians can use them as steppingstones rather than having to wade acrossthe river. Gravel or stones can be used toline the bottom of the ford to provide a firmfooting for vehicles. Fords would normallyonly be used for rivers that do not floodbecause this may cause the ford to be
86 12. Bridge and Water Crossings
12. Bridges and Water Crossings
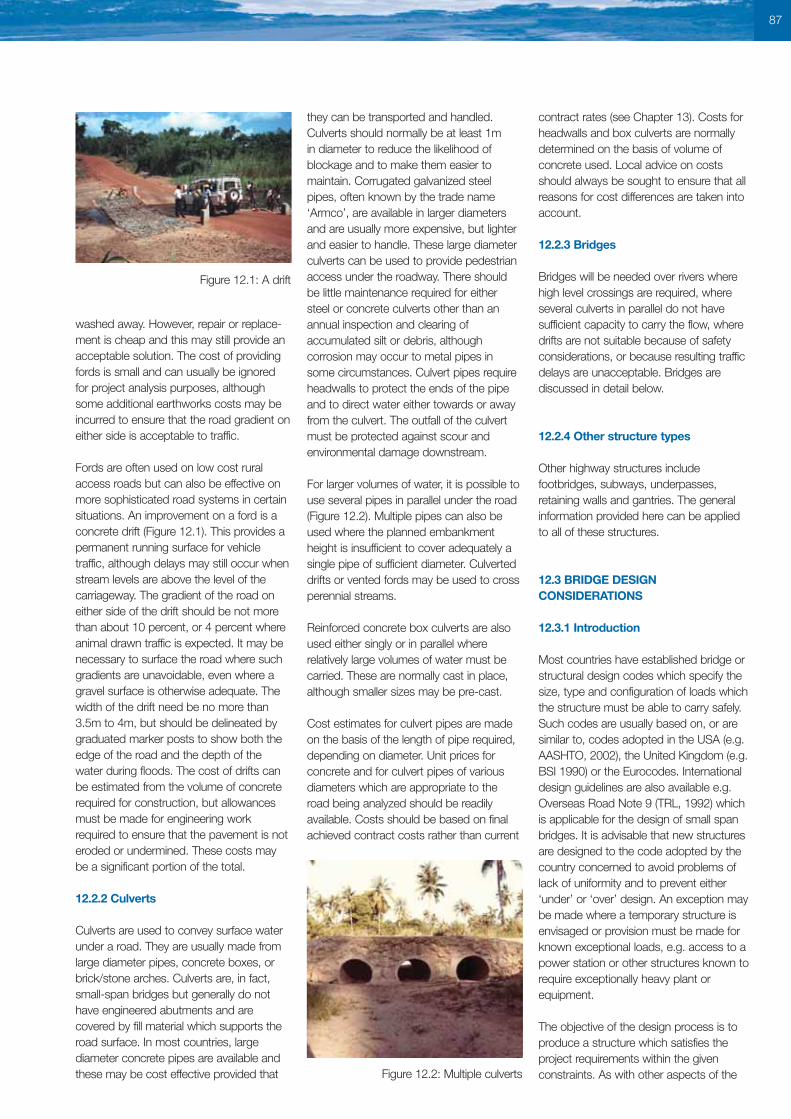
washed away. However, repair or replace-ment is cheap and this may still provide anacceptable solution. The cost of providingfords is small and can usually be ignoredfor project analysis purposes, althoughsome additional earthworks costs may beincurred to ensure that the road gradient oneither side is acceptable to traffic.
Fords are often used on low cost ruralaccess roads but can also be effective onmore sophisticated road systems in certainsituations. An improvement on a ford is aconcrete drift (Figure 12.1). This provides apermanent running surface for vehicletraffic, although delays may still occur whenstream levels are above the level of thecarriageway. The gradient of the road oneither side of the drift should be not morethan about 10 percent, or 4 percent whereanimal drawn traffic is expected. It may benecessary to surface the road where suchgradients are unavoidable, even where agravel surface is otherwise adequate. Thewidth of the drift need be no more than3.5m to 4m, but should be delineated bygraduated marker posts to show both theedge of the road and the depth of thewater during floods. The cost of drifts canbe estimated from the volume of concreterequired for construction, but allowancesmust be made for engineering workrequired to ensure that the pavement is noteroded or undermined. These costs maybe a significant portion of the total.
12.2.2 Culverts
Culverts are used to convey surface waterunder a road. They are usually made fromlarge diameter pipes, concrete boxes, orbrick/stone arches. Culverts are, in fact,small-span bridges but generally do nothave engineered abutments and arecovered by fill material which supports theroad surface. In most countries, largediameter concrete pipes are available andthese may be cost effective provided that
they can be transported and handled.Culverts should normally be at least 1m in diameter to reduce the likelihood ofblockage and to make them easier tomaintain. Corrugated galvanized steelpipes, often known by the trade name‘Armco’, are available in larger diametersand are usually more expensive, but lighterand easier to handle. These large diameterculverts can be used to provide pedestrianaccess under the roadway. There shouldbe little maintenance required for eithersteel or concrete culverts other than anannual inspection and clearing ofaccumulated silt or debris, althoughcorrosion may occur to metal pipes insome circumstances. Culvert pipes requireheadwalls to protect the ends of the pipeand to direct water either towards or awayfrom the culvert. The outfall of the culvertmust be protected against scour andenvironmental damage downstream.
For larger volumes of water, it is possible touse several pipes in parallel under the road(Figure 12.2). Multiple pipes can also beused where the planned embankmentheight is insufficient to cover adequately asingle pipe of sufficient diameter. Culverteddrifts or vented fords may be used to crossperennial streams.
Reinforced concrete box culverts are alsoused either singly or in parallel whererelatively large volumes of water must becarried. These are normally cast in place,although smaller sizes may be pre-cast.
Cost estimates for culvert pipes are madeon the basis of the length of pipe required,depending on diameter. Unit prices forconcrete and for culvert pipes of variousdiameters which are appropriate to theroad being analyzed should be readilyavailable. Costs should be based on finalachieved contract costs rather than current
contract rates (see Chapter 13). Costs forheadwalls and box culverts are normallydetermined on the basis of volume ofconcrete used. Local advice on costsshould always be sought to ensure that allreasons for cost differences are taken intoaccount.
12.2.3 Bridges
Bridges will be needed over rivers wherehigh level crossings are required, whereseveral culverts in parallel do not havesufficient capacity to carry the flow, wheredrifts are not suitable because of safetyconsiderations, or because resulting trafficdelays are unacceptable. Bridges arediscussed in detail below.
12.2.4 Other structure types
Other highway structures includefootbridges, subways, underpasses,retaining walls and gantries. The generalinformation provided here can be applied to all of these structures.
12.3 BRIDGE DESIGNCONSIDERATIONS
12.3.1 Introduction
Most countries have established bridge orstructural design codes which specify thesize, type and configuration of loads whichthe structure must be able to carry safely.Such codes are usually based on, or aresimilar to, codes adopted in the USA (e.g.AASHTO, 2002), the United Kingdom (e.g.BSI 1990) or the Eurocodes. Internationaldesign guidelines are also available e.g.Overseas Road Note 9 (TRL, 1992) whichis applicable for the design of small spanbridges. It is advisable that new structuresare designed to the code adopted by thecountry concerned to avoid problems oflack of uniformity and to prevent either‘under’ or ‘over’ design. An exception maybe made where a temporary structure isenvisaged or provision must be made forknown exceptional loads, e.g. access to apower station or other structures known torequire exceptionally heavy plant orequipment.
The objective of the design process is toproduce a structure which satisfies theproject requirements within the givenconstraints. As with other aspects of the
87
Figure 12.1: A drift
Figure 12.2: Multiple culverts
road design, the scale of the task dependscritically on the size of the engineeringstructures required. For most culverts, forexample, ‘off-the shelf’ solutions will beacceptable based on relatively little fieldinvestigation. However, for larger structuresthe process should begin with a definitionof the problem in terms of function,geometric layout and constraints and move towards a preferred solution afterconsidering different options. The processis necessarily iterative, often involvingadditional site investigations to obtain moredetail as the preferred solution is identifiedand more detailed design carried out.
Engineering assessment at the pre-feasibility stage should focus on the generaltechnical and economic feasibility ofproviding bridges or water crossings. At thefeasibility stage the objective is to select thestructural solutions for each water crossing.The following information is required toenable an effective engineering assessmentof different options to be carried out,
■ Location■ Site conditions (topography, geology,
hydrology)■ Geometry and alignment■ Environment■ Loading■ Aesthetics■ Costs
For many road projects it is likely thatapproximate locations, geometry andstructural form will be sufficient to enablethe solution to be evaluated and costsestimated. For major crossings, however, all of the above factors will need to beinvestigated to enable a proper assessmentof the project.
12.3.2 Location
The location of a bridge, culvert or retainingwall is governed by the general route of theroad and is often subordinate to thegeneral alignment and grade. In schemeswhere several alternative routes are beingconsidered, the general policy for theselection of a crossing site is to avoidhorizontal and vertical curvature as thesecan lead to serious problems in analysis,design and construction. Selection of abridge location should suit the particularobstacle being crossed and requires theconsideration of engineering and socialaspects as well as the appearance andcost of the structure. Locations should be
chosen to minimize the overall cost of theproject, including special investigations,initial design and construction, earthworks,and river training, if required. Futuremaintenance requirements should also betaken into consideration as these canrepresent a significant real cost to bridgeowners.
A large number of interacting and oftenconflicting factors need to be considered.These include the following,
■ Route and alignment of road.■ Access requirements and headroom
under the bridge (navigation, railwayrequirements, pedestrian access, localrequirements, etc).
■ River hydrology (high water level, riverdebris, flood plain, scour, etc).
■ General geography of site (faults,landslides, seismic activity, etc).
■ Geotechnical conditions.■ Environmental conditions (climate, marine
environment, pollution, etc).■ Availability of construction materials.■ Constraints on sub-structure.■ Time of construction.■ Access for construction.■ Aesthetics.■ Future maintenance and repair.
Thus a good bridge site should have thefollowing characteristics,
■ The bridge location should have suitablelocal geology with stable terrain.
■ The bridge should be as close aspossible to a direct alignment of the road
■ Road approaches should be straight formaximum visibility.
■ For economic construction, labour,materials and access should beavailable.
■ The bridge should cross the obstacle atright angles, i.e. no skew, and shouldhave a straight alignment to avoidcomplications in analysis.
■ The bridge location should be chosen tominimize the width of the crossing.
■ The soil around the bridge supportsshould have high bearing capacity tosupport the sub-structure, ideally withrock or other erosion resistant strata atfoundation level.
■ For economic foundations, the sub-structure should be located to avoidwork in water.
■ The river should be straight at the bridgelocation to minimize the risk of the riverchanging its geometry.
■ The banks of the river should be high toallow sufficient clearance over the riverfor both flood height and navigation. It isalso important to consider what the costof disruption or damage would be if theriver were to overtop the bridge.
■ Abutments and supports should beaway from the river water including floodplane to simplify construction, avoidscour and improve durability.
■ Where piers are required in the rivercourse, the disturbance to flow shouldbe minimized.
■ The river crossing should be locatedwhere the water flow is steady, with littleturbulence and cross currents, and wellaway from the confluence of rivertributaries.
■ Ideally no river training works should berequired to regulate the flow of the riveraround the bridge. The cost of providingriver training works is often high and,where there is evidence of the riverchanging its course, it may be preferableto reduce the design life and the cost,and accept the need to rebuild thebridge at a later date.
12.3.3 General site conditions
An assessment of the conditions at thebridge site is required before the bridge isdesigned in order to:
■ Determine the general suitability of thesite for the proposed works
■ Enable an adequate and economicdesign to be prepared
■ Plan the best method of construction■ Determine changes that may arise in the
environment as a result of the works■ Evaluate the relative suitability of
alternative sites.
Bridges are an expensive and vulnerablecomponent of road networks and shouldbe resistant to earthquakes, flood and otherenvironmental loads. Sufficient informationshould be obtained to ensure that thebridge environment is understood fully. This includes a topographical survey, ageotechnical survey (Chapter 5) and ahydrological survey. No reasonableestimate of cost can be made without this information.
Topographical surveyA topographical survey will be carried out as part of the feasibility study for mostroad schemes. This should highlight thelocations where bridges may be considered
88 12. Bridge and Water Crossings
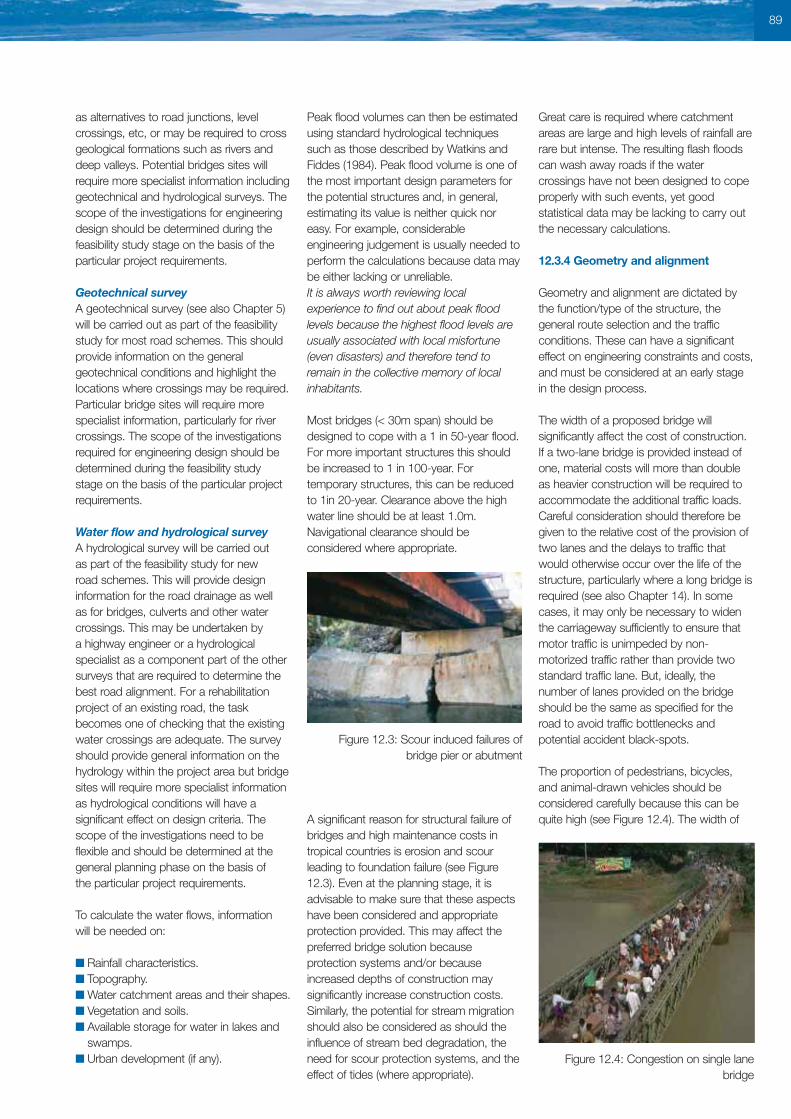
as alternatives to road junctions, levelcrossings, etc, or may be required to crossgeological formations such as rivers anddeep valleys. Potential bridges sites willrequire more specialist information includinggeotechnical and hydrological surveys. Thescope of the investigations for engineeringdesign should be determined during thefeasibility study stage on the basis of theparticular project requirements.
Geotechnical surveyA geotechnical survey (see also Chapter 5)will be carried out as part of the feasibilitystudy for most road schemes. This shouldprovide information on the generalgeotechnical conditions and highlight thelocations where crossings may be required.Particular bridge sites will require morespecialist information, particularly for rivercrossings. The scope of the investigationsrequired for engineering design should bedetermined during the feasibility studystage on the basis of the particular projectrequirements.
Water flow and hydrological surveyA hydrological survey will be carried out as part of the feasibility study for new road schemes. This will provide designinformation for the road drainage as well as for bridges, culverts and other watercrossings. This may be undertaken by a highway engineer or a hydrologicalspecialist as a component part of the othersurveys that are required to determine thebest road alignment. For a rehabilitationproject of an existing road, the taskbecomes one of checking that the existingwater crossings are adequate. The surveyshould provide general information on thehydrology within the project area but bridgesites will require more specialist informationas hydrological conditions will have asignificant effect on design criteria. Thescope of the investigations need to beflexible and should be determined at thegeneral planning phase on the basis of the particular project requirements.
To calculate the water flows, information will be needed on:
■ Rainfall characteristics.■ Topography.■ Water catchment areas and their shapes.■ Vegetation and soils.■ Available storage for water in lakes and
swamps.■ Urban development (if any).
Peak flood volumes can then be estimatedusing standard hydrological techniquessuch as those described by Watkins andFiddes (1984). Peak flood volume is one ofthe most important design parameters forthe potential structures and, in general,estimating its value is neither quick noreasy. For example, considerableengineering judgement is usually needed toperform the calculations because data maybe either lacking or unreliable. It is always worth reviewing localexperience to find out about peak floodlevels because the highest flood levels areusually associated with local misfortune(even disasters) and therefore tend toremain in the collective memory of localinhabitants.
Most bridges (< 30m span) should bedesigned to cope with a 1 in 50-year flood.For more important structures this shouldbe increased to 1 in 100-year. Fortemporary structures, this can be reducedto 1in 20-year. Clearance above the highwater line should be at least 1.0m.Navigational clearance should beconsidered where appropriate.
A significant reason for structural failure ofbridges and high maintenance costs intropical countries is erosion and scourleading to foundation failure (see Figure12.3). Even at the planning stage, it isadvisable to make sure that these aspectshave been considered and appropriateprotection provided. This may affect thepreferred bridge solution becauseprotection systems and/or becauseincreased depths of construction maysignificantly increase construction costs.Similarly, the potential for stream migrationshould also be considered as should theinfluence of stream bed degradation, theneed for scour protection systems, and theeffect of tides (where appropriate).
Great care is required where catchmentareas are large and high levels of rainfall arerare but intense. The resulting flash floodscan wash away roads if the watercrossings have not been designed to copeproperly with such events, yet goodstatistical data may be lacking to carry outthe necessary calculations.
12.3.4 Geometry and alignment
Geometry and alignment are dictated bythe function/type of the structure, thegeneral route selection and the trafficconditions. These can have a significanteffect on engineering constraints and costs,and must be considered at an early stagein the design process.
The width of a proposed bridge willsignificantly affect the cost of construction.If a two-lane bridge is provided instead ofone, material costs will more than doubleas heavier construction will be required toaccommodate the additional traffic loads.Careful consideration should therefore begiven to the relative cost of the provision oftwo lanes and the delays to traffic thatwould otherwise occur over the life of thestructure, particularly where a long bridge isrequired (see also Chapter 14). In somecases, it may only be necessary to widenthe carriageway sufficiently to ensure thatmotor traffic is unimpeded by non-motorized traffic rather than provide twostandard traffic lane. But, ideally, thenumber of lanes provided on the bridgeshould be the same as specified for theroad to avoid traffic bottlenecks andpotential accident black-spots.
The proportion of pedestrians, bicycles,and animal-drawn vehicles should beconsidered carefully because this can bequite high (see Figure 12.4). The width of
89
Figure 12.3: Scour induced failures ofbridge pier or abutment
Figure 12.4: Congestion on single lanebridge

90 12. Bridge and Water Crossings
the bridge itself should be sufficient to carrythe full width of the roadway includingauxiliary lanes, and/or pedestrian footways.A cheaper solution may be to provide lightfootways cantilevered out from the mainstructure.
12.3.5 Highway loading
Estimating traffic volumes and loadings isdiscussed in Chapter 4. The traffic loadingfor bridges is normally specified in theappropriate national design codes. Thecomposition and volume of traffic using theroad will be estimated as part of thefeasibility study (Chapter 4) and this will beused to ensure that the appropriate codesare used. These take into account theheaviest loading expected over the servicelife of the structure. In addition, abnormallyheavy loading can also be consideredwhere appropriate.
Non-traffic associated loads such as wind,earthquake and temperature will normallybe specified in the particular structuraldesign code being used.
Bridges tend to be expensive componentsof a road network, therefore specificconsideration should be given to the designloading from a strategic point of view. Theover-design of bridges in anticipation offuture developments may produce largeeconomic savings in future years.
12.3.6 Environment
The construction of a river crossing willaffect the environment around the bridgesite both upstream and downstream,particularly where a major bridge is beingconsidered. These effects should beconsidered as part of the environmentalimpact assessment for the road project(Chapter 6). The assessment shouldconsider the effect the bridge will have onthe river hydrology, the plant and animal life,and the living conditions of the localinhabitants.
12.3.7 Aesthetics
Aesthetic considerations are a veryimportant aspect of major bridge projectsand tend to be handled by specialist bridgedesigners. In many cases, architects andengineer have worked together to producea functional work of art which is structurally
sound and aesthetically pleasing. For mostbridges, however, this is not required.Nevertheless, aesthetics have a role to play and should not be neglected.
Features may also be incorporated into thebridge structure to improve its architecturalappearance or to adjust it so that it blendswell with the landscape and is in harmonywith the local environment. The added costis usually small since an intelligent use ofnormal quantities of materials should besufficient to meet aesthetic standards.However, costs sometimes increaseconsiderably with the demand for a special aesthetic effect. These include:
■ Close high abutments.■ Reduction in number of columns.■ Increase in span length.■ Decreased depth of superstructure.■ Curved soffit.■ Special architectural handrail.■ Extra length.■ Special layout of wing walls.■ Architectural concrete finishes.
While such features may be useful in somesituations they should be used with care.The ideal bridge structure is straight-forward, elegant and pleasing to the eye.Additional features added just for visualeffect can be detrimental. It is not possibleto be prescriptive in what is a verysubjective field and it is only through theirown experience, and by observing theresults of other designers, that engineerscan learn what makes a bridge attractive.
12.3.8 Economics
In order to carry out a proper economicappraisal, it will be necessary to havesufficient information to enable costs to bedetermined for the different options to asufficient degree of accuracy. However,detailed cost estimates will not normally bepossible or desirable for all options at thefeasibility stage. Methods of estimatingcosts are discussed in Chapter 13.
For major bridges, the cost will often be the main factor influencing the decision to proceed with construction and theselection of the type of bridge to be used.In this case a detailed comparison ofoptions will be required and costsdetermined more accurately.
12.4 TYPES OF BRIDGE
12.4.1 General
The main elements of a bridge are:
■ Deck■ Abutments, piers and foundations■ River training works■ Approaches.
Details such as joints, bearings, parapets,handrails, etc, are important but are notlikely to influence significantly the choice ofbridge type and therefore the costs.Maintenance costs may prove to besignificant and need to be considered foreach type of bridge.
Bridges are perceived in different ways byengineers and the public and this makes itdifficult to devise a classification system. Itis customary to use the followingcategories when describing bridge:
■ Function (road bridge, railway bridge, etc).■ Material of construction (reinforced
concrete bridge, steel bridge, etc).■ Form of superstructure (beam, beam
and slab bridge, cantilever, arch bridge,cable-stayed bridge, etc).
■ Length of span.■ Culvert: spans less than about 5m.■ Short-span bridge: span less than about
20m.■ Medium span: span between 20-100m.■ Long span: span greater than about
100m.
The following sections present a generaldescription of the more common forms ofbridge. This is not intended to be a conciseclassification and there is some overlapbetween the bridge types described.
12.4.2 Timber bridges
In many rural areas which are close toforests, the cheapest construction optionfor the superstructure of bridges may beparallel timber logs (Figure 12.5). Cuttingand squaring timber for such crossings isexpensive and not normally worthwhile.Ideally, timber should only be used wherethere is little or no problem with wood-boring insects and a naturally durablespecies should be selected, or else someform of chemical treatment, should beapplied. To be effective, timber preservation
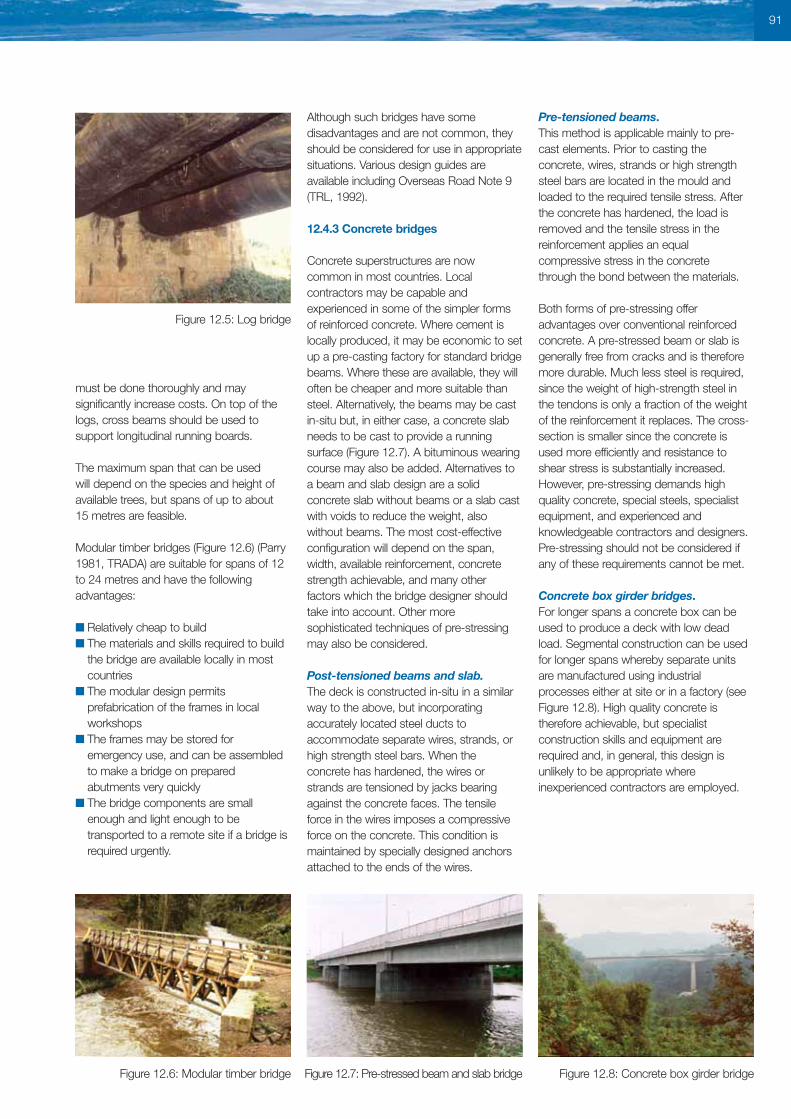
91
must be done thoroughly and maysignificantly increase costs. On top of thelogs, cross beams should be used tosupport longitudinal running boards.
The maximum span that can be used will depend on the species and height ofavailable trees, but spans of up to about 15 metres are feasible.
Modular timber bridges (Figure 12.6) (Parry1981, TRADA) are suitable for spans of 12to 24 metres and have the followingadvantages:
■ Relatively cheap to build■ The materials and skills required to build
the bridge are available locally in mostcountries
■ The modular design permitsprefabrication of the frames in localworkshops
■ The frames may be stored foremergency use, and can be assembledto make a bridge on preparedabutments very quickly
■ The bridge components are smallenough and light enough to betransported to a remote site if a bridge isrequired urgently.
Although such bridges have somedisadvantages and are not common, theyshould be considered for use in appropriatesituations. Various design guides areavailable including Overseas Road Note 9(TRL, 1992).
12.4.3 Concrete bridges
Concrete superstructures are nowcommon in most countries. Localcontractors may be capable andexperienced in some of the simpler formsof reinforced concrete. Where cement islocally produced, it may be economic to setup a pre-casting factory for standard bridgebeams. Where these are available, they willoften be cheaper and more suitable thansteel. Alternatively, the beams may be castin-situ but, in either case, a concrete slabneeds to be cast to provide a runningsurface (Figure 12.7). A bituminous wearingcourse may also be added. Alternatives toa beam and slab design are a solidconcrete slab without beams or a slab castwith voids to reduce the weight, alsowithout beams. The most cost-effectiveconfiguration will depend on the span,width, available reinforcement, concretestrength achievable, and many otherfactors which the bridge designer shouldtake into account. Other moresophisticated techniques of pre-stressingmay also be considered.
Post-tensioned beams and slab.The deck is constructed in-situ in a similarway to the above, but incorporatingaccurately located steel ducts toaccommodate separate wires, strands, orhigh strength steel bars. When theconcrete has hardened, the wires orstrands are tensioned by jacks bearingagainst the concrete faces. The tensileforce in the wires imposes a compressiveforce on the concrete. This condition is maintained by specially designed anchorsattached to the ends of the wires.
Pre-tensioned beams. This method is applicable mainly to pre-cast elements. Prior to casting theconcrete, wires, strands or high strengthsteel bars are located in the mould andloaded to the required tensile stress. Afterthe concrete has hardened, the load isremoved and the tensile stress in thereinforcement applies an equalcompressive stress in the concrete through the bond between the materials.
Both forms of pre-stressing offeradvantages over conventional reinforcedconcrete. A pre-stressed beam or slab isgenerally free from cracks and is thereforemore durable. Much less steel is required,since the weight of high-strength steel inthe tendons is only a fraction of the weightof the reinforcement it replaces. The cross-section is smaller since the concrete isused more efficiently and resistance toshear stress is substantially increased.However, pre-stressing demands highquality concrete, special steels, specialistequipment, and experienced andknowledgeable contractors and designers.Pre-stressing should not be considered ifany of these requirements cannot be met.
Concrete box girder bridges.For longer spans a concrete box can beused to produce a deck with low deadload. Segmental construction can be usedfor longer spans whereby separate unitsare manufactured using industrialprocesses either at site or in a factory (seeFigure 12.8). High quality concrete istherefore achievable, but specialistconstruction skills and equipment arerequired and, in general, this design isunlikely to be appropriate whereinexperienced contractors are employed.
Figure 12.5: Log bridge
Figure 12.7: Pre-stressed beam and slab bridgeFigure 12.6: Modular timber bridge Figure 12.8: Concrete box girder bridge
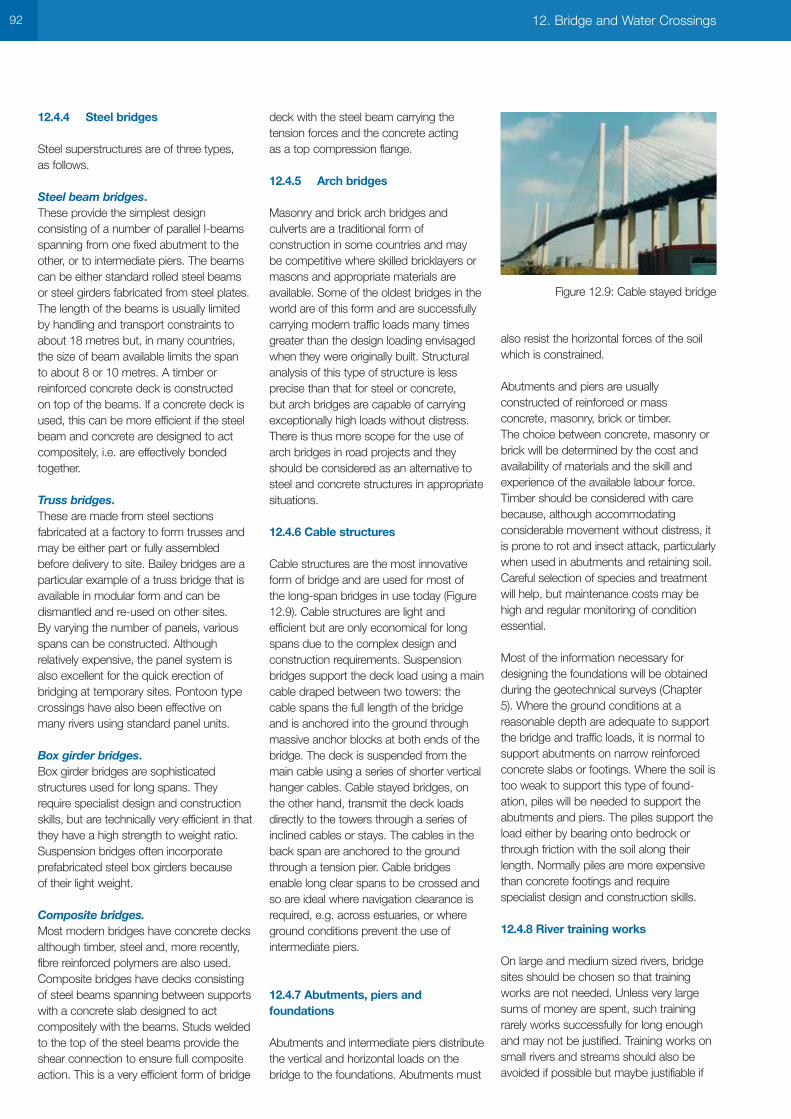
12.4.4 Steel bridges
Steel superstructures are of three types, as follows.
Steel beam bridges. These provide the simplest designconsisting of a number of parallel I-beamsspanning from one fixed abutment to theother, or to intermediate piers. The beamscan be either standard rolled steel beamsor steel girders fabricated from steel plates.The length of the beams is usually limitedby handling and transport constraints toabout 18 metres but, in many countries,the size of beam available limits the span to about 8 or 10 metres. A timber orreinforced concrete deck is constructed on top of the beams. If a concrete deck isused, this can be more efficient if the steelbeam and concrete are designed to actcompositely, i.e. are effectively bondedtogether.
Truss bridges. These are made from steel sectionsfabricated at a factory to form trusses andmay be either part or fully assembledbefore delivery to site. Bailey bridges are aparticular example of a truss bridge that isavailable in modular form and can bedismantled and re-used on other sites. By varying the number of panels, variousspans can be constructed. Althoughrelatively expensive, the panel system isalso excellent for the quick erection ofbridging at temporary sites. Pontoon typecrossings have also been effective on many rivers using standard panel units.
Box girder bridges.Box girder bridges are sophisticatedstructures used for long spans. Theyrequire specialist design and constructionskills, but are technically very efficient in thatthey have a high strength to weight ratio.Suspension bridges often incorporateprefabricated steel box girders because of their light weight.
Composite bridges.Most modern bridges have concrete decksalthough timber, steel and, more recently,fibre reinforced polymers are also used.Composite bridges have decks consistingof steel beams spanning between supportswith a concrete slab designed to actcompositely with the beams. Studs weldedto the top of the steel beams provide theshear connection to ensure full compositeaction. This is a very efficient form of bridge
deck with the steel beam carrying thetension forces and the concrete acting as a top compression flange.
12.4.5 Arch bridges
Masonry and brick arch bridges andculverts are a traditional form ofconstruction in some countries and may be competitive where skilled bricklayers ormasons and appropriate materials areavailable. Some of the oldest bridges in theworld are of this form and are successfullycarrying modern traffic loads many timesgreater than the design loading envisagedwhen they were originally built. Structuralanalysis of this type of structure is lessprecise than that for steel or concrete, but arch bridges are capable of carryingexceptionally high loads without distress.There is thus more scope for the use ofarch bridges in road projects and theyshould be considered as an alternative tosteel and concrete structures in appropriatesituations.
12.4.6 Cable structures
Cable structures are the most innovativeform of bridge and are used for most of the long-span bridges in use today (Figure12.9). Cable structures are light andefficient but are only economical for longspans due to the complex design andconstruction requirements. Suspensionbridges support the deck load using a maincable draped between two towers: thecable spans the full length of the bridgeand is anchored into the ground throughmassive anchor blocks at both ends of thebridge. The deck is suspended from themain cable using a series of shorter verticalhanger cables. Cable stayed bridges, onthe other hand, transmit the deck loadsdirectly to the towers through a series ofinclined cables or stays. The cables in theback span are anchored to the groundthrough a tension pier. Cable bridgesenable long clear spans to be crossed andso are ideal where navigation clearance isrequired, e.g. across estuaries, or whereground conditions prevent the use ofintermediate piers.
12.4.7 Abutments, piers andfoundations
Abutments and intermediate piers distributethe vertical and horizontal loads on thebridge to the foundations. Abutments must
also resist the horizontal forces of the soilwhich is constrained.
Abutments and piers are usuallyconstructed of reinforced or massconcrete, masonry, brick or timber. The choice between concrete, masonry orbrick will be determined by the cost andavailability of materials and the skill andexperience of the available labour force.Timber should be considered with carebecause, although accommodatingconsiderable movement without distress, itis prone to rot and insect attack, particularlywhen used in abutments and retaining soil.Careful selection of species and treatmentwill help, but maintenance costs may behigh and regular monitoring of conditionessential.
Most of the information necessary fordesigning the foundations will be obtainedduring the geotechnical surveys (Chapter5). Where the ground conditions at areasonable depth are adequate to supportthe bridge and traffic loads, it is normal tosupport abutments on narrow reinforcedconcrete slabs or footings. Where the soil istoo weak to support this type of found-ation, piles will be needed to support theabutments and piers. The piles support theload either by bearing onto bedrock orthrough friction with the soil along theirlength. Normally piles are more expensivethan concrete footings and requirespecialist design and construction skills.
12.4.8 River training works
On large and medium sized rivers, bridgesites should be chosen so that trainingworks are not needed. Unless very largesums of money are spent, such trainingrarely works successfully for long enoughand may not be justified. Training works onsmall rivers and streams should also beavoided if possible but maybe justifiable if
92 12. Bridge and Water Crossings
Figure 12.9: Cable stayed bridge
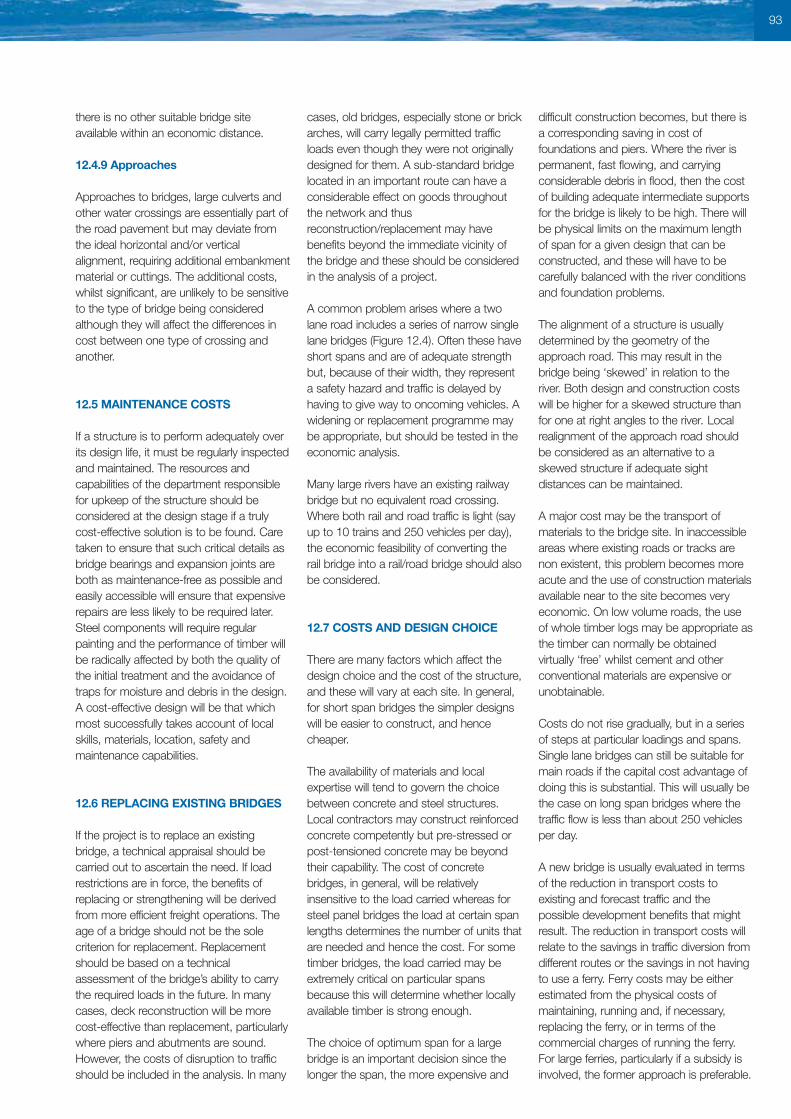
there is no other suitable bridge siteavailable within an economic distance.
12.4.9 Approaches
Approaches to bridges, large culverts andother water crossings are essentially part ofthe road pavement but may deviate fromthe ideal horizontal and/or verticalalignment, requiring additional embankmentmaterial or cuttings. The additional costs,whilst significant, are unlikely to be sensitiveto the type of bridge being consideredalthough they will affect the differences incost between one type of crossing andanother.
12.5 MAINTENANCE COSTS
If a structure is to perform adequately overits design life, it must be regularly inspectedand maintained. The resources andcapabilities of the department responsiblefor upkeep of the structure should beconsidered at the design stage if a trulycost-effective solution is to be found. Caretaken to ensure that such critical details asbridge bearings and expansion joints areboth as maintenance-free as possible andeasily accessible will ensure that expensiverepairs are less likely to be required later.Steel components will require regularpainting and the performance of timber willbe radically affected by both the quality ofthe initial treatment and the avoidance oftraps for moisture and debris in the design.A cost-effective design will be that whichmost successfully takes account of localskills, materials, location, safety andmaintenance capabilities.
12.6 REPLACING EXISTING BRIDGES
If the project is to replace an existingbridge, a technical appraisal should becarried out to ascertain the need. If loadrestrictions are in force, the benefits ofreplacing or strengthening will be derivedfrom more efficient freight operations. Theage of a bridge should not be the solecriterion for replacement. Replacementshould be based on a technicalassessment of the bridge’s ability to carrythe required loads in the future. In manycases, deck reconstruction will be morecost-effective than replacement, particularlywhere piers and abutments are sound.However, the costs of disruption to trafficshould be included in the analysis. In many
cases, old bridges, especially stone or brickarches, will carry legally permitted trafficloads even though they were not originallydesigned for them. A sub-standard bridgelocated in an important route can have aconsiderable effect on goods throughoutthe network and thusreconstruction/replacement may havebenefits beyond the immediate vicinity ofthe bridge and these should be consideredin the analysis of a project.
A common problem arises where a twolane road includes a series of narrow singlelane bridges (Figure 12.4). Often these haveshort spans and are of adequate strengthbut, because of their width, they representa safety hazard and traffic is delayed byhaving to give way to oncoming vehicles. Awidening or replacement programme maybe appropriate, but should be tested in theeconomic analysis.
Many large rivers have an existing railwaybridge but no equivalent road crossing.Where both rail and road traffic is light (sayup to 10 trains and 250 vehicles per day),the economic feasibility of converting therail bridge into a rail/road bridge should alsobe considered.
12.7 COSTS AND DESIGN CHOICE
There are many factors which affect thedesign choice and the cost of the structure,and these will vary at each site. In general,for short span bridges the simpler designswill be easier to construct, and hencecheaper.
The availability of materials and localexpertise will tend to govern the choicebetween concrete and steel structures.Local contractors may construct reinforcedconcrete competently but pre-stressed orpost-tensioned concrete may be beyondtheir capability. The cost of concretebridges, in general, will be relativelyinsensitive to the load carried whereas forsteel panel bridges the load at certain spanlengths determines the number of units thatare needed and hence the cost. For sometimber bridges, the load carried may beextremely critical on particular spansbecause this will determine whether locallyavailable timber is strong enough.
The choice of optimum span for a largebridge is an important decision since thelonger the span, the more expensive and
difficult construction becomes, but there isa corresponding saving in cost offoundations and piers. Where the river ispermanent, fast flowing, and carryingconsiderable debris in flood, then the costof building adequate intermediate supportsfor the bridge is likely to be high. There willbe physical limits on the maximum lengthof span for a given design that can beconstructed, and these will have to becarefully balanced with the river conditionsand foundation problems.
The alignment of a structure is usuallydetermined by the geometry of theapproach road. This may result in thebridge being ‘skewed’ in relation to theriver. Both design and construction costswill be higher for a skewed structure thanfor one at right angles to the river. Localrealignment of the approach road shouldbe considered as an alternative to askewed structure if adequate sightdistances can be maintained.
A major cost may be the transport ofmaterials to the bridge site. In inaccessibleareas where existing roads or tracks arenon existent, this problem becomes moreacute and the use of construction materialsavailable near to the site becomes veryeconomic. On low volume roads, the useof whole timber logs may be appropriate asthe timber can normally be obtainedvirtually ‘free’ whilst cement and otherconventional materials are expensive orunobtainable.
Costs do not rise gradually, but in a seriesof steps at particular loadings and spans.Single lane bridges can still be suitable formain roads if the capital cost advantage ofdoing this is substantial. This will usually bethe case on long span bridges where thetraffic flow is less than about 250 vehiclesper day.
A new bridge is usually evaluated in termsof the reduction in transport costs toexisting and forecast traffic and thepossible development benefits that mightresult. The reduction in transport costs willrelate to the savings in traffic diversion fromdifferent routes or the savings in not havingto use a ferry. Ferry costs may be eitherestimated from the physical costs ofmaintaining, running and, if necessary,replacing the ferry, or in terms of thecommercial charges of running the ferry.For large ferries, particularly if a subsidy isinvolved, the former approach is preferable.
93

For small ferries run competitively by privateenterprise the latter approach will usually besufficient. There are no reliable standardmethodologies for establishing thedevelopment benefits that may result froma new bridge. In general the developmentbenefits that are likely to arise will bedependent upon the combined effect of themagnitude of the change in transport costsand the development potential of the areathat has improved accessibility.
The costs to the economy of the totalfailure of a bridge are nearly alwaysextremely high. It is sometimes necessaryto quantify the benefits of a proposedinvestment from the reduced risk of bridgefailure or the temporary closure of thebridge. In these cases the benefits will becalculated in terms of the savings of trafficdiversion or use of a ferry. However in mostinstances the need for the bridge is not inquestion and any investment may beevaluated in terms of minimizing the totallong term engineering costs of keeping abridge in place (i.e. the lowest ‘agencycost’ solution) together with any trafficdisruption involved whilst work is inprogress. The benefits of bridge wideningare usually identified in terms of passengertime savings and reduced vehicle operatingcosts associated with the reduced trafficdelays forecast from the widened bridge.
DETAILED SOURCES OF INFORMATION
AASHTO (2002). Standard specificationsfor highway bridges. 17th edition. AmericanAssociation of State Highway andTransportation Officials, Washington, DC.
Bingham, J (1979). Low water crossings.Compendium 4, Transportation ResearchBoard, Washington, DC.
Bradley, J N (1972). Hydraulics of bridgewaterways. US Bureau of Public Roads,Washington, DC.
Eurocodes. BS EN 1995-1-1: 2004.Design of timber structures: common rulesand rules for buildings. Eurocode 5.
Eurocodes. BS EN 1995-1-1: 2004.Design of timber structures: bridges.Eurocode 5.
British Standards Institution (1990). Steel,concrete and composite bridges. Code ofpractice for design of concrete bridges. BS5400: Part 4: 1990, British StandardsInstitution, London.
Farraday and Charlton (1983). Hydraulicfactors in bridge design. HR, Wallingford,UK.
Highways Agency (2001). Loads forhighway bridges. Design manual for roadsand bridges. BD 37/01, Volume 1, Section3, Highways Agency, London.
Parry, J D (1981). The Kenyan low costmodular timber bridge. TRL LaboratoryReport LR970, TRL Limited, Crowthorne,UK.
TRADA. Prefabricated modular woodenbridges. Timber Research andDevelopment Association, UK.
Transport Research Laboratory (1992). Adesign manual for small bridges. OverseasRoad Note 9, TRL Limited, Crowthorne,UK.
Watkins and Fiddes (1984). Highway andurban hydrology in the tropics. PentechPress Limited, UK.
12. Bridge and Water Crossings94

PART 4
Option Selection
13.1 INTRODUCTION
The purpose of the final cost estimateshortly before a contract is awarded forconstruction is to provide the mostrealistic prediction possible of the totalcash expenditure and the cash flowrequirements that will be necessary tocomplete the project. This will reduce oreliminate the problems that inevitablyarise if the tendered contract bid pricesare considerably higher (or lower) thanexpected or the costs of the projectescalate during projection execution.However the level of accuracy required atthis late stage of project development ismuch higher than is needed, or can beobtained, at the earlier stages ofplanning, pre-feasibility and feasibility. It isthe purpose of this chapter to explainhow cost estimation is best done at eachstage of project development so that theexpectations of all interested parties arerealistic and can be satisfied, appropriateresources for the task can be assigned,and deficiencies can be identified andrectified.
It is important to remember that, as ageneral rule, costs are closely related tothe time that it takes to complete aproject and therefore anything thatincreases this will also increase costs.
13.2 COST COMPONENTS, DATAAND RESPONSIBILITIES
13.2.1 Cost components
Cost estimates for a road project need toinclude the costs of all factors necessaryto enable the works to be completed.Thus the estimate should include thecost of:
■ Engineering works included in the maincontract
■ Environmental mitigation works thatare not included in the main contract
■ Engineering works carried out byothers, for example utilities diversions
■ Supervision■ Land acquisition■ Resettlement■ Compensation■ Any surveys, investigations or other
special contracts■ Value added tax and other taxes■ An allowance for contingencies
Simple methods are required at the earlierstages of project development but, inorder to appreciate how a contractorobtains his bid price, it is worthwhilereviewing, from first principles, how thecost estimates for road works are built up.
Cost of the designed worksIt is necessary to determine all of theinputs required on site to complete thework. For each input, the required quantityand its unit cost must be established.Inputs may be small scale, such as hoursworked by a labourer (taking into accountlabour productivity figures), hours assistedby an item of plant (taking into accountexpected utilization and including fuel andother consumables) or the quantity ofcement used in a culvert (taking intoaccount wastage), or the inputs may belarge scale such as the length of aconstructed road or the number ofculverts of a given size. In all cases, thequantity of each input is multiplied by itsunit cost to give the total cost of thatinput. Although inputs such as concretingformwork and road detours are notpermanent, they are also costed andassigned to the relevant item.
Cost to the contractorThere are other activities on site whichhave costs which cannot be relateddirectly to a single input. These includesupervisors, administrators, sitetransport, safety measures, first aidprovision, training, insurances (public andsite accident), mobilization including anyimport duties for equipment, site campconstruction, gravel prospecting,production of drawings, maintenance ofcompleted road lengths until the finalhandover and so on. The quantity andthe cost of each need to be estimated.
Price charged to the client by thecontractorNext, there are costs which are added togive the likely figure which the client willpay to the contractor in order to obtainthe designed works. These include risk(for example, in case the contractorincurs costs due to delays caused bybad weather, unavailable labour or poorsub-contractor performance), profit, taxand financing charges such as intereston loans when buying equipment.
It is normal for the client to include acontingency in a cost estimate to allowfor error between the clients costestimate and the final cost charged bythe contractor (i.e. the contractors bidprice plus variation orders and claimsthroughout the construction period). Thecontingency at the pre-feasibility stagewill be higher than at the feasibility stageand this, in turn, will be more than at thefinal design stage because there aremore assumptions and unknowns in theearlier stages. However, care should betaken to avoid adding contingencies to allcomponents separately and inadvertentlyadding the same contingency more thanonce. In fact it is likely that some itemswill be underestimated and so the
95
13.Cost Estimation
magnitude of a sensible contingency ateach stage may not be as large as onemight first assume.
The total cost to the clientFinally, there are additional costs which theclient is likely to have to pay to other partiesin order to allow the contractor to constructthe designed works. These include thecosts of feasibility studies, surveys,investigations, design, supervision, landacquisition, tendering, procurement,construction of associated works by others,environmental mitigation not included in thecontract, resettlement and compensation,and final claims.
Long term costs to the clientMost cost estimates are carried out forcapital costs but any investment ininfrastructure requires investment in annualmaintenance and consideration of wholelife costs is recommended.
13.2.2 The role of the estimator
The key component of any cost estimate isthe engineering designs that are beingcosted and therefore the cost estimate canbe no more accurate than the designsthemselves (see Box 13.1). Cost estimationrequires very close liaison between theestimator, the other technical expertsinvolved in the project and the projectdesign organization, so the estimator willnormally be part of this organization. Theestimator must also communicate with theclient and the funding agency.
It is essential that the estimator is able toappreciate the conception of the projectand the intentions of the design, and caneasily investigate and clarify anyuncertainties with the designers as theyarise during the compilation of the estimate.Thus the estimator must have relevantexperience in the type of project envisagedand, wherever possible, in the costs andproductivities of construction work at thesite of the proposed project.
The estimator should be accountable forthe estimate and should be involved in thesubsequent monitoring of project costsagainst it. He (or she) should beresponsible for employing the estimatingtechnique most appropriate for the type ofproject and its stage of development. Inreaching this decision, the estimator shouldnote the strengths and weaknesses of thevarious estimating techniques employedand the sources of data.
It is highly desirable that the same estimatoris used on all the estimates required duringthe life of the project and is responsible forthe subsequent cost monitoring andcontrol. This clearly depends on thecontinuity achieved in the designorganization. When a new estimator has tobe appointed, for whatever reason, orwhen a check estimate is required from aseparate estimator, it is important to ensurean orderly transfer of all relevant informationso that the new estimator is able tobecome accountable for his estimate andthe subsequent cost control against it.
13.2.3 Data collection
It is also important that the estimator isdirectly involved in the collection of data.This should include visits to the projectlocation and any other appropriate sites.It should include a search for anysignificant risks, peculiarities andconstraints to which the project may besubject and any factors that might affectthe method of construction.
Project specific data are in two forms:
■ Current costs of basic inputs to thework
■ Productivity data relevant to the type ofwork, its location and the particularcircumstances surrounding it.
The estimator needs to collect currentcost data about a wide range of factorsincluding labour, plant, materials andadministration and financial matters.Section 13.7 summarizes all the sourcesof data.
13.3 METHODS OF ESTIMATINGCOSTS
There are three basic cost estimatingtechniques, summarized in Table 13.1.
13.4 THE UNIT RATE, SIMPLIFIEDUNIT RATE AND GLOBAL METHODS
13.4.1 Common Features
The global and the unit rate methods arebased on historical information fromprevious projects which, ideally, shouldbe located in ‘libraries’ or databases ofachieved costs. The information is usedto determine the total cost of a project,or the major elements of a project, interms of the overall cost for a unit ofconstruction. In the global method theunits chosen are very coarse (or global)and might, for example, be a cost perkilometre of single lane carriageway. The unit rate method uses a largernumber of smaller units. This allows thecost estimate to be more detailed andmore accurate. Thus the global and unitrate methods differ only in the size of the element used as the basis of the unit rate.
96 13. Cost Estimation
Box 13.1: Accuracy of cost estimation
At the final engineering design stage the level of detail needs to be sufficientfor the estimated cost to be within the required tolerances built into thefinancing. Thus the level of detail will increase through each stage of projectdevelopment to ensure that the level of accuracy is appropriate at each stageof the process.
At the feasibility stages it is not practicable to estimate the costs of individualprojects to a very high level of accuracy. However, good procedures at thesestages should be subject to random rather than systematic errors so thatwhen assessing a programme or portfolio of investments, such as a 5-yearplan for example, the total cost should be known rather more accurately.
There is no point in producing detailed cost estimates of components of theproject if there are major uncertainties that limit the achievable level ofaccuracy of the estimate as a whole. If these uncertainties cannot beresolved, the level of detail of the cost estimation needs to be adjustedaccordingly.
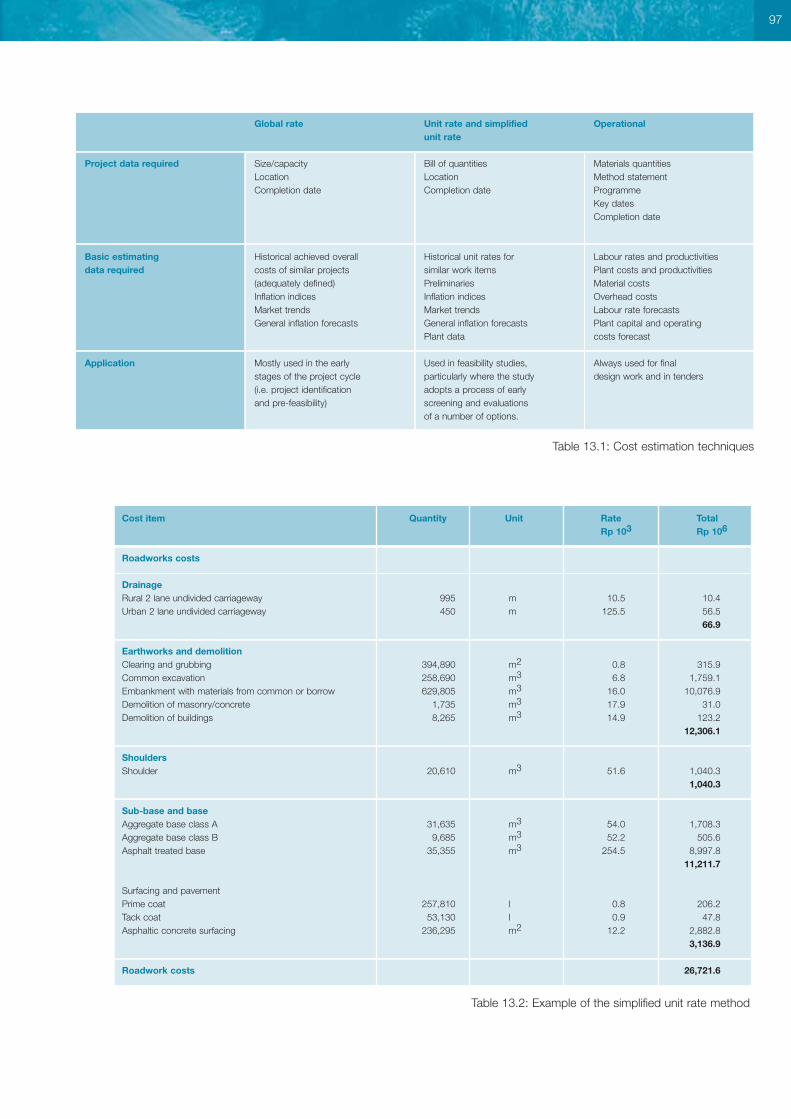
97
Global rate Unit rate and simplified Operationalunit rate
Project data required Size/capacity Bill of quantities Materials quantitiesLocation Location Method statementCompletion date Completion date Programme
Key datesCompletion date
Basic estimating Historical achieved overall Historical unit rates for Labour rates and productivitiesdata required costs of similar projects similar work items Plant costs and productivities
(adequately defined) Preliminaries Material costsInflation indices Inflation indices Overhead costsMarket trends Market trends Labour rate forecastsGeneral inflation forecasts General inflation forecasts Plant capital and operating
Plant data costs forecast
Application Mostly used in the early Used in feasibility studies, Always used for final stages of the project cycle particularly where the study design work and in tenders(i.e. project identification adopts a process of earlyand pre-feasibility) screening and evaluations
of a number of options.
Table 13.1: Cost estimation techniques
Cost item Quantity Unit Rate TotalRp 103 Rp 106
Roadworks costs
DrainageRural 2 lane undivided carriageway 995 m 10.5 10.4Urban 2 lane undivided carriageway 450 m 125.5 56.5
66.9
Earthworks and demolitionClearing and grubbing 394,890 m2 0.8 315.9Common excavation 258,690 m3 6.8 1,759.1Embankment with materials from common or borrow 629,805 m3 16.0 10,076.9Demolition of masonry/concrete 1,735 m3 17.9 31.0Demolition of buildings 8,265 m3 14.9 123.2
12,306.1
ShouldersShoulder 20,610 m3 51.6 1,040.3
1,040.3
Sub-base and baseAggregate base class A 31,635 m3 54.0 1,708.3Aggregate base class B 9,685 m3 52.2 505.6Asphalt treated base 35,355 m3 254.5 8,997.8
11,211.7
Surfacing and pavementPrime coat 257,810 l 0.8 206.2Tack coat 53,130 l 0.9 47.8Asphaltic concrete surfacing 236,295 m2 12.2 2,882.8
3,136.9
Roadwork costs 26,721.6
Table 13.2: Example of the simplified unit rate method
The unit rate method is based on the ‘bill ofquantities’ approach to pricing constructionwork. In its most detailed form, a bill will beavailable containing the quantities of thedifferent types of work measured inaccordance with an appropriate method ofmeasurement. The estimator selectshistorical rates or prices for each item in thebill using either information from recentsimilar contracts or published information(e.g. price books for civil engineering), or‘built-up’ rates from his own analysis of theoperations, plant and materials required forthe measured item.
When a detailed bill is not available orwhen less effort is required at the earlystages of project development, the unitrate method is normally simplified so thatthe items in the bill of quantities are verymuch less detailed than those used in biddocuments. The simplified bill of quantitiesmust be chosen carefully so that it isbased on items that can be measured orcalculated directly from availableinformation. Quantities will be required forthe main items of work and these will bepriced using ‘rolled-up’ rates which takeaccount of the associated minor items (anexample is shown in Table 13.2). Inextreme cases, the simplified unit rateestimates are essentially the same as theglobal estimates described below.
As an example of rolled-up items andrates, the pavement construction costcould consist of:
■ All of the items that normally appear atthe bidding stage in the section of thebill of quantities headed ‘pavement’rolled-up into a single item called‘pavement’
■ Alternatively, the costs of the variousitems that normally appear in the sectionof the bill headed ‘pavement’ may besplit into categories relating to maincarriageway, interchanges, side roads,and other items. The decision on how toroll up the various items should be madeto reflect the circumstances of theproject.
Rolled-up rates are produced by addingup the whole cost of all the items includedin the rolled-up item, and dividing that totalcost by the quantity of the individual itemthat is being used to represent the rolled-up item. For example, the rolled-up item‘pavement’ might represent the cost of thewearing course, binder course, roadbase,
sub-base, capping layer, kerbing,footways, and any other items that theestimator decides should be included inthat rolled-up rate. The measured itemmight be the surface area of the wearingcourse because this can be easilymeasured from the simplest of conceptualdesign drawings.
Clearly it is important that the projectsused as the source of information aresimilar to the proposed project in terms oftraffic loading, ground conditions and anyother features that might affect thepavement design. It is important that thetotal cost used to derive the rolled-up rateincludes any percentage additions that areapplied elsewhere in the original bill.
Since the estimate is compiled by thedirect application of historical prices anddoes not require an examination of theprogramme of work and method ofconstruction, it does not encourageconsideration of the particular peculiarities,requirements, constraints and risksaffecting the current project. Therefore, itdoes not provide an analysis of the actualcosts of work of the kind that would becarried out by a tendering contractor forany but the simplest of jobs. Thus, whenusing unit rates from previous projects,great care is needed to ensure thataccount is taken of the actual completioncosts of the project. The effective rates,taking account of subsequent claims, maybe much higher than the bid rates. Failureto allow for such increases will result inmajor under-estimation of costs.
The global method is the ‘broadest brush’approach and its approximate naturemeans that it is usually only suitable at theplanning and pre-feasibility stages ofproject development; it is not suitable forthe feasibility stage. However, if themethod is refined and made more detailed,for example, by separating roadwork costsand bridge costs, it begins to approachthe unit rate method which is the preferredchoice for estimating costs at the feasibilitystage.
13.4.2 Common problems
There are a number of potential problemswith unit rates that affect the accuracy ofthe cost estimate and which need to beborne in mind at all times during theprocess. Since global rates are essentially
rolled-up rates from more detailed unitrates (although they may never have beenbroken down in this way) the potentialproblems associated with detailed unitrates also apply to global rates.
Predicting the change in prices with time.These methods have the great advantagethat they are based on the actual costs ofcompleted projects rather than theirpredicted or tendered costs but, since thetechniques rely entirely on historical data,their main disadvantage is the difficulty ofpredicting how prices have changed sincethe earlier projects were completed. Thisdifficulty arises for the following reasons:
■ Historical data needs to be related to aspecific ‘base’ date that must bechosen with care. In the case ofconstruction work carried out over aperiod of time, it can be difficult tochoose a suitable date that reflectsaverage costs during the constructionperiod.
■ The only practical method for updatingcosts is to use some form of price indexto represent inflation. This can introducea degree of uncertainty, especially whenthere has been significant inflation.
■ Contract prices are also subject tosignificant fluctuations in response tomarket conditions. These affect not onlythe current project being appraised butwill also have affected the projects onwhich the cost data are to be based. The fluctuations cannot be accuratelyrepresented in price indices and will varywith the type of project, with the hostcountry and also with any countryproviding supplies or resources.
■ In general, the more recent the previousprojects, the more reliable the costestimations are likely to be.
Understanding which costs areactually included in the historic data.To use the historic information properly it isnecessary to understand fully what isincluded in each cost and what is not. Thismay be difficult unless good documentationis available or the database of informationhas been managed reliably. The followingcosts normally need to be included andcare is needed to ensure none are missing:
■ Engineering fees and expenses ofconsultants/contractors/client, includingdesign, construction supervision,procurement and commissioning
98 13. Cost Estimation

■ Final accounts of all contracts includingsettlements of claims and any otherpayments.
■ Land acquisition costs■ Transport costs of materials■ Financing costs■ Taxes.
If the costs have been itemized in sufficientdetail, as should be the case for the unitrate method, then this problem is muchless likely to arise.
Understanding what is included in theunit of measurement.This is similar to the previous problem ofcosts; it is also important to understandthe unit of measurement and to beconfident that all the historic data has beendealt with in the same way. For example:
■ Is the cost of a metre/kilometre of roadan overall average that includes pro ratacosts of bridges or have these beenestimated separately?
■ Does the cost of a square metre ofbridge deck area include pro rata costsof abutments?
Once again, this is less likely to be aproblem if the historic costs have beenitemized in sufficient detail.
Not comparing like-with-like.There are many factors that can have avery substantial influence on the costs of aroad, so it is important that costs areobtained from projects that are as similaras possible to the project being appraised.Many of these are engineering factors, butnot all. For example, large influencesinclude:
■ Differing levels of quality e.g. differentpavement thicknesses for different levelsof traffic
■ Different terrain and ground conditionse.g. flat plains compared withmountainous regions, weak swampyground compared with strong, dryground
■ Different logistics, depending on sitelocation
■ Prices of items taken out of totalcontract prices may be distorted by frontend loading by the contractor toimprove cash flow.
Statistical reliability (sample size)The issue of statistical reliability (or samplesize) is closely associated with the
inevitable problem of comparing like-with-like. Considerable non-specific project-to-project variability exists. To minimize itseffect and to ensure that the results arestatistically reliable the historical data needto be obtained from a sufficiently largesample of similar work in a similar locationand constructed in similar circumstances.It is often difficult to find such projects.Historical data from only one previousproject is unlikely to provide a satisfactorycost estimate but is often the only optionavailable.
13.4.3 Accuracy of the methods
The accuracy of the cost estimate relies onthe assumption that the unit rates for theproject being evaluated will be similar tothe historic unit rates obtained from the‘source’ projects. For the reasons outlinedabove, this is not always easy to justifyand, even when sufficient information isavailable to define the source projects ingreater detail, it is not easy to compensatefor the differences. Thus a scrutiny of allthe problems discussed above, especiallythe effects of inflation, must be madebefore any reliance can be placed on acollection of cost data. It also follows thatthe most reliable data are those maintainedby a specific organization where there isconfidence in the management of thatdata. The wider the source of the data, the greater is the risk of differences indefinition.
However, at certain stages in thedevelopment of projects, the unit rate orglobal methods are the only practicalmethod for estimating the costs.Fortunately, during the screening orevaluation stages, the errors likely to beintroduced will be applicable to all theoptions being screened or evaluated,therefore the choice between options islikely to remain valid despite the possibilityof systematic errors in costing. It is alsoworth noting that as long as care is takenin the choice of source data, the globaltechnique can be more reliable thanestimates derived from apparently moredetailed unit rates that have been obtainedfrom separate unrelated sources andapplied to rough estimates of the quantitiesinvolved.
The unit rate method (Box 13.2) is mostappropriate for repetitive work where theallocation of costs to specific operations isreasonably well defined and operational
risks are easily manageable. It is lessappropriate for civil engineering workswhere the method of construction isvariable and where the uncertainties ofground conditions are significant. It is alsolikely to be less than successful forengineering projects in locations where fewsimilar schemes have been completed inthe past. In these cases, success dependsmuch more on the experience of theestimator and his access to a well-understood data bank of relevant ‘rolled-up’ rates.
There is also a real danger that theprecision and detail of the individual ratescan generate a misplaced level ofconfidence in the figures. It must not beassumed that the previous work was ofthe same nature, carried out in identicalconditions and with the same duration (theduration of the work will have a significanteffect on the cost). Many constructioncosts are time related, as are the fees ofsupervisory staff, and all are affected byinflation.
Despite the difficulties, unit rate estimatingcan result in reliable estimates whenpractised by experienced estimators withgood, intuitive judgement and the ability toassess the realistic programme andcircumstances of the work.
At the engineering design stage it isimportant that the cost estimate is asaccurate as possible, hence it may benecessary to use a different estimatingmethod namely the operational method.This is essentially outside the scope of thisRoad Note but, for completeness, it isdescribed in Appendix D.
13.4 COST ESTIMATING STAGES ANDAPPROPRIATE METHODS
The stages of a project have beendescribed in Chapter 2. Table 13.3summarizes the type of information andthe most appropriate method ofestimation for each stage of thedevelopment of the project. In someprojects some of these stages may beomitted or may be indistinguishable fromadjacent stages, especially if the projectdoes not lend itself to different options (forexample, some straightforward roadstrengthening projects).
99
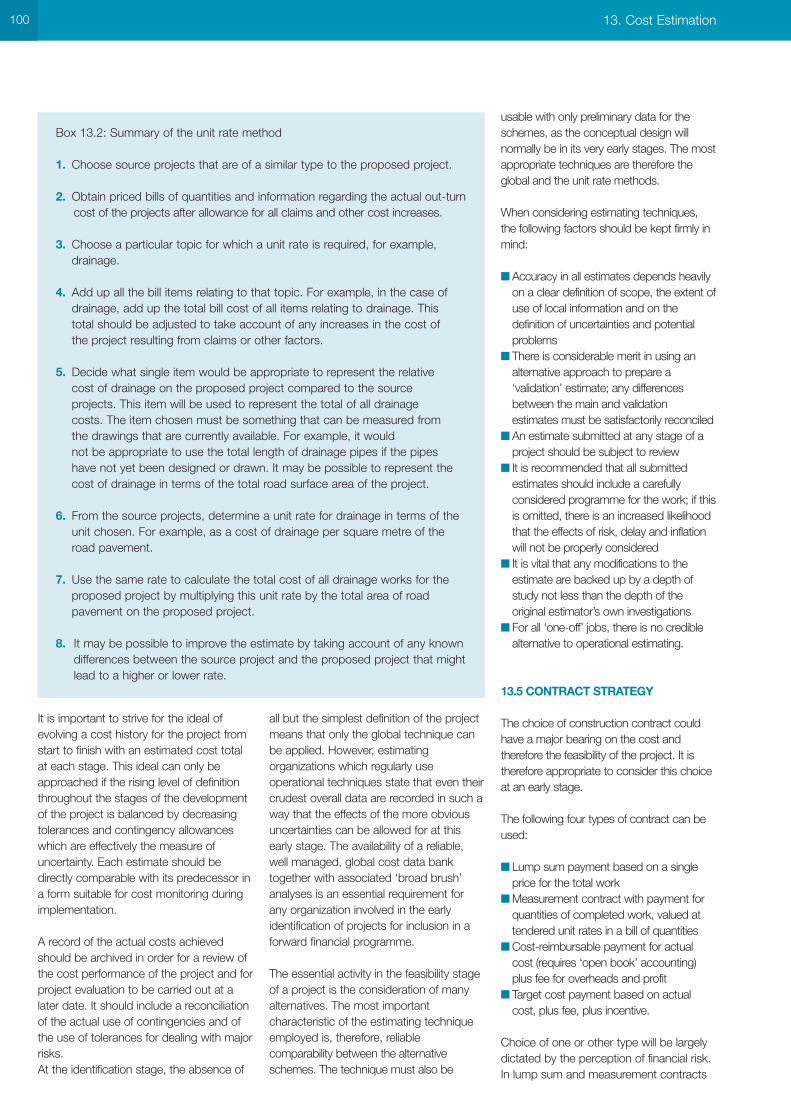
It is important to strive for the ideal ofevolving a cost history for the project fromstart to finish with an estimated cost totalat each stage. This ideal can only beapproached if the rising level of definitionthroughout the stages of the developmentof the project is balanced by decreasingtolerances and contingency allowanceswhich are effectively the measure ofuncertainty. Each estimate should bedirectly comparable with its predecessor ina form suitable for cost monitoring duringimplementation.
A record of the actual costs achievedshould be archived in order for a review ofthe cost performance of the project and forproject evaluation to be carried out at alater date. It should include a reconciliationof the actual use of contingencies and ofthe use of tolerances for dealing with majorrisks.At the identification stage, the absence of
all but the simplest definition of the projectmeans that only the global technique canbe applied. However, estimatingorganizations which regularly useoperational techniques state that even theircrudest overall data are recorded in such away that the effects of the more obviousuncertainties can be allowed for at thisearly stage. The availability of a reliable,well managed, global cost data banktogether with associated ‘broad brush’analyses is an essential requirement forany organization involved in the earlyidentification of projects for inclusion in aforward financial programme.
The essential activity in the feasibility stageof a project is the consideration of manyalternatives. The most importantcharacteristic of the estimating techniqueemployed is, therefore, reliablecomparability between the alternativeschemes. The technique must also be
usable with only preliminary data for theschemes, as the conceptual design willnormally be in its very early stages. The mostappropriate techniques are therefore theglobal and the unit rate methods.
When considering estimating techniques,the following factors should be kept firmly inmind:
■ Accuracy in all estimates depends heavilyon a clear definition of scope, the extent ofuse of local information and on thedefinition of uncertainties and potentialproblems
■ There is considerable merit in using analternative approach to prepare a‘validation’ estimate; any differencesbetween the main and validationestimates must be satisfactorily reconciled
■ An estimate submitted at any stage of aproject should be subject to review
■ It is recommended that all submittedestimates should include a carefullyconsidered programme for the work; if thisis omitted, there is an increased likelihoodthat the effects of risk, delay and inflationwill not be properly considered
■ It is vital that any modifications to theestimate are backed up by a depth ofstudy not less than the depth of theoriginal estimator’s own investigations
■ For all ‘one-off’ jobs, there is no crediblealternative to operational estimating.
13.5 CONTRACT STRATEGY
The choice of construction contract couldhave a major bearing on the cost andtherefore the feasibility of the project. It istherefore appropriate to consider this choiceat an early stage.
The following four types of contract can beused:
■ Lump sum payment based on a singleprice for the total work
■ Measurement contract with payment forquantities of completed work, valued attendered unit rates in a bill of quantities
■ Cost-reimbursable payment for actualcost (requires ‘open book’ accounting)plus fee for overheads and profit
■ Target cost payment based on actualcost, plus fee, plus incentive.
Choice of one or other type will be largelydictated by the perception of financial risk.In lump sum and measurement contracts
100 13. Cost Estimation
Box 13.2: Summary of the unit rate method
1. Choose source projects that are of a similar type to the proposed project.
2. Obtain priced bills of quantities and information regarding the actual out-turncost of the projects after allowance for all claims and other cost increases.
3. Choose a particular topic for which a unit rate is required, for example, drainage.
4. Add up all the bill items relating to that topic. For example, in the case of drainage, add up the total bill cost of all items relating to drainage. This total should be adjusted to take account of any increases in the cost of the project resulting from claims or other factors.
5. Decide what single item would be appropriate to represent the relative cost of drainage on the proposed project compared to the source projects. This item will be used to represent the total of all drainage costs. The item chosen must be something that can be measured from the drawings that are currently available. For example, it would not be appropriate to use the total length of drainage pipes if the pipes have not yet been designed or drawn. It may be possible to represent the cost of drainage in terms of the total road surface area of the project.
6. From the source projects, determine a unit rate for drainage in terms of the unit chosen. For example, as a cost of drainage per square metre of the road pavement.
7. Use the same rate to calculate the total cost of all drainage works for the proposed project by multiplying this unit rate by the total area of road pavement on the proposed project.
8. It may be possible to improve the estimate by taking account of any knowndifferences between the source project and the proposed project that mightlead to a higher or lower rate.
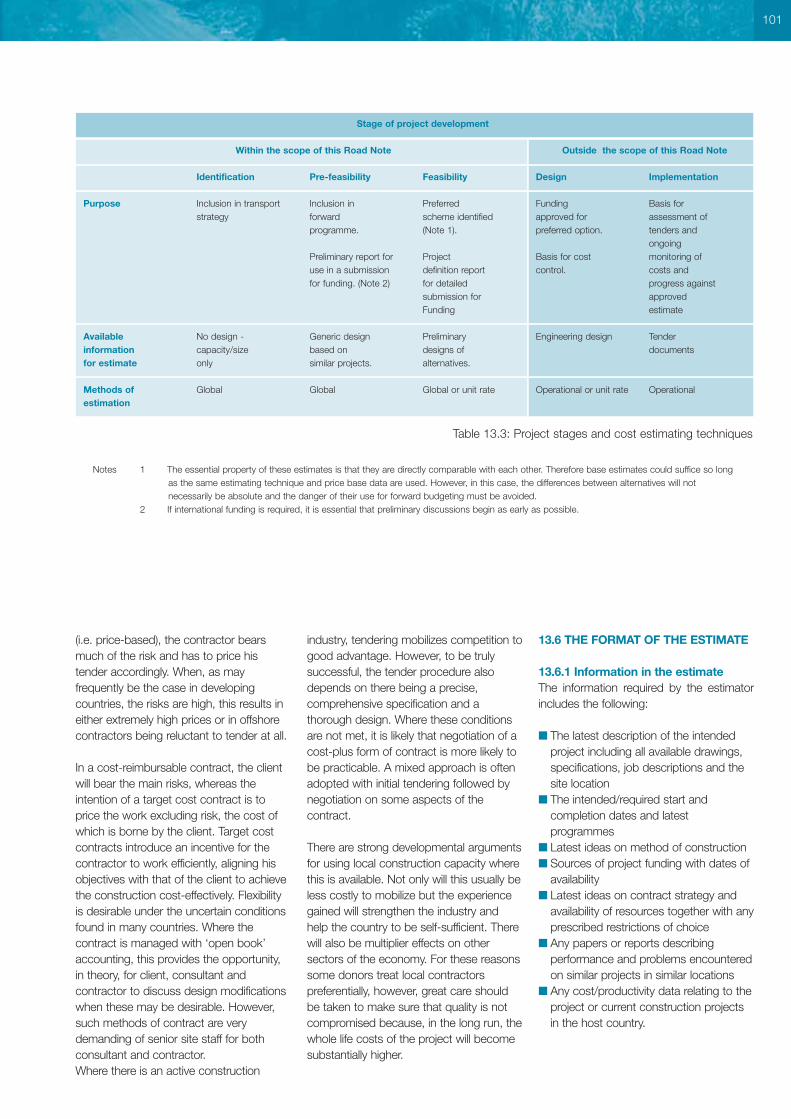
(i.e. price-based), the contractor bearsmuch of the risk and has to price histender accordingly. When, as mayfrequently be the case in developingcountries, the risks are high, this results ineither extremely high prices or in offshorecontractors being reluctant to tender at all.
In a cost-reimbursable contract, the clientwill bear the main risks, whereas theintention of a target cost contract is toprice the work excluding risk, the cost ofwhich is borne by the client. Target costcontracts introduce an incentive for thecontractor to work efficiently, aligning hisobjectives with that of the client to achievethe construction cost-effectively. Flexibilityis desirable under the uncertain conditionsfound in many countries. Where thecontract is managed with ‘open book’accounting, this provides the opportunity,in theory, for client, consultant andcontractor to discuss design modificationswhen these may be desirable. However,such methods of contract are verydemanding of senior site staff for bothconsultant and contractor.Where there is an active construction
industry, tendering mobilizes competition togood advantage. However, to be trulysuccessful, the tender procedure alsodepends on there being a precise,comprehensive specification and athorough design. Where these conditionsare not met, it is likely that negotiation of acost-plus form of contract is more likely tobe practicable. A mixed approach is oftenadopted with initial tendering followed bynegotiation on some aspects of thecontract.
There are strong developmental argumentsfor using local construction capacity wherethis is available. Not only will this usually beless costly to mobilize but the experiencegained will strengthen the industry andhelp the country to be self-sufficient. Therewill also be multiplier effects on othersectors of the economy. For these reasonssome donors treat local contractorspreferentially, however, great care shouldbe taken to make sure that quality is notcompromised because, in the long run, thewhole life costs of the project will becomesubstantially higher.
13.6 THE FORMAT OF THE ESTIMATE
13.6.1 Information in the estimateThe information required by the estimatorincludes the following:
■ The latest description of the intendedproject including all available drawings,specifications, job descriptions and thesite location
■ The intended/required start andcompletion dates and latestprogrammes
■ Latest ideas on method of construction■ Sources of project funding with dates of
availability■ Latest ideas on contract strategy and
availability of resources together with anyprescribed restrictions of choice
■ Any papers or reports describingperformance and problems encounteredon similar projects in similar locations
■ Any cost/productivity data relating to theproject or current construction projectsin the host country.
101
Stage of project development
Within the scope of this Road Note Outside the scope of this Road Note
Identification Pre-feasibility Feasibility Design Implementation
Purpose Inclusion in transport Inclusion in Preferred Funding Basis forstrategy forward scheme identified approved for assessment of
programme. (Note 1). preferred option. tenders andongoing
Preliminary report for Project Basis for cost monitoring ofuse in a submission definition report control. costs andfor funding. (Note 2) for detailed progress against
submission for approvedFunding estimate
Available No design - Generic design Preliminary Engineering design Tenderinformation capacity/size based on designs of documentsfor estimate only similar projects. alternatives.
Methods of Global Global Global or unit rate Operational or unit rate Operational estimation
Notes 1 The essential property of these estimates is that they are directly comparable with each other. Therefore base estimates could suffice so longas the same estimating technique and price base data are used. However, in this case, the differences between alternatives will notnecessarily be absolute and the danger of their use for forward budgeting must be avoided.
2 If international funding is required, it is essential that preliminary discussions begin as early as possible.
Table 13.3: Project stages and cost estimating techniques
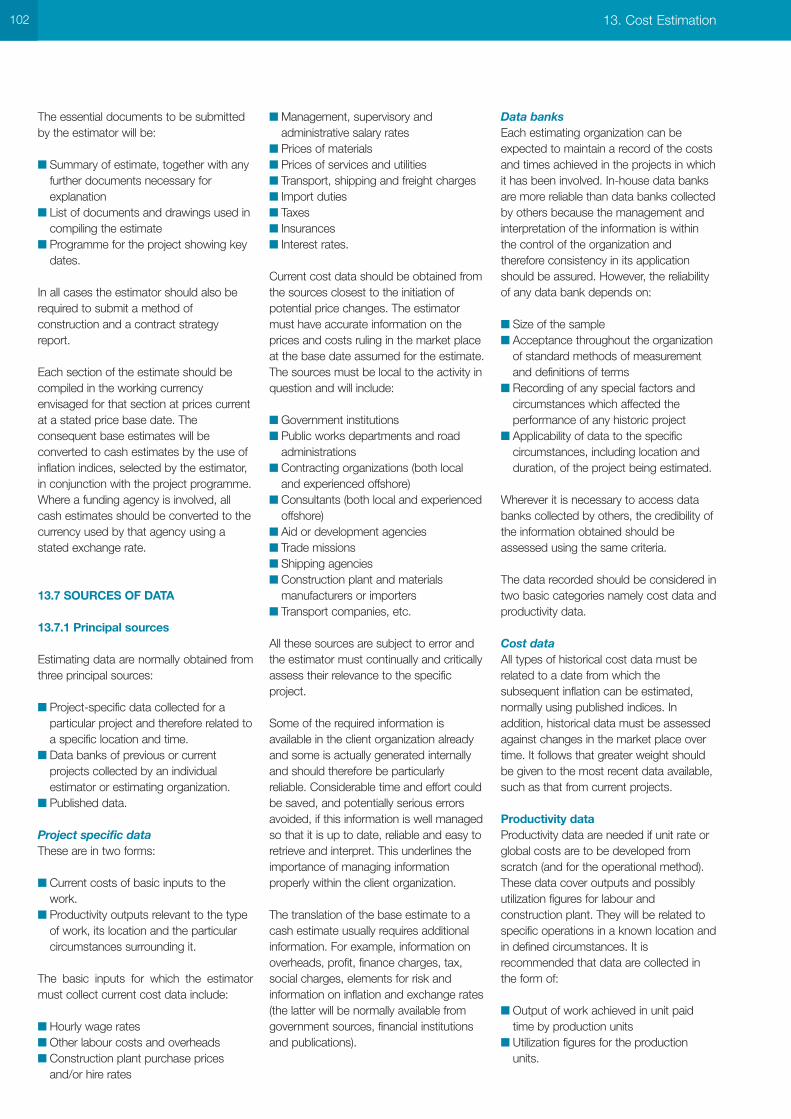
The essential documents to be submittedby the estimator will be:
■ Summary of estimate, together with anyfurther documents necessary forexplanation
■ List of documents and drawings used incompiling the estimate
■ Programme for the project showing keydates.
In all cases the estimator should also berequired to submit a method ofconstruction and a contract strategyreport.
Each section of the estimate should becompiled in the working currencyenvisaged for that section at prices currentat a stated price base date. Theconsequent base estimates will beconverted to cash estimates by the use ofinflation indices, selected by the estimator,in conjunction with the project programme.Where a funding agency is involved, allcash estimates should be converted to thecurrency used by that agency using astated exchange rate.
13.7 SOURCES OF DATA
13.7.1 Principal sources
Estimating data are normally obtained fromthree principal sources:
■ Project-specific data collected for aparticular project and therefore related toa specific location and time.
■ Data banks of previous or currentprojects collected by an individualestimator or estimating organization.
■ Published data.
Project specific dataThese are in two forms:
■ Current costs of basic inputs to thework.
■ Productivity outputs relevant to the typeof work, its location and the particularcircumstances surrounding it.
The basic inputs for which the estimatormust collect current cost data include:
■ Hourly wage rates■ Other labour costs and overheads■ Construction plant purchase prices
and/or hire rates
■ Management, supervisory andadministrative salary rates
■ Prices of materials■ Prices of services and utilities■ Transport, shipping and freight charges■ Import duties■ Taxes■ Insurances■ Interest rates.
Current cost data should be obtained fromthe sources closest to the initiation ofpotential price changes. The estimatormust have accurate information on theprices and costs ruling in the market placeat the base date assumed for the estimate.The sources must be local to the activity inquestion and will include:
■ Government institutions■ Public works departments and road
administrations■ Contracting organizations (both local
and experienced offshore)■ Consultants (both local and experienced
offshore)■ Aid or development agencies■ Trade missions■ Shipping agencies■ Construction plant and materials
manufacturers or importers■ Transport companies, etc.
All these sources are subject to error andthe estimator must continually and criticallyassess their relevance to the specificproject.
Some of the required information isavailable in the client organization alreadyand some is actually generated internallyand should therefore be particularlyreliable. Considerable time and effort couldbe saved, and potentially serious errorsavoided, if this information is well managedso that it is up to date, reliable and easy toretrieve and interpret. This underlines theimportance of managing informationproperly within the client organization.
The translation of the base estimate to acash estimate usually requires additionalinformation. For example, information onoverheads, profit, finance charges, tax,social charges, elements for risk andinformation on inflation and exchange rates(the latter will be normally available fromgovernment sources, financial institutionsand publications).
Data banksEach estimating organization can beexpected to maintain a record of the costsand times achieved in the projects in whichit has been involved. In-house data banksare more reliable than data banks collectedby others because the management andinterpretation of the information is withinthe control of the organization andtherefore consistency in its applicationshould be assured. However, the reliabilityof any data bank depends on:
■ Size of the sample■ Acceptance throughout the organization
of standard methods of measurementand definitions of terms
■ Recording of any special factors andcircumstances which affected theperformance of any historic project
■ Applicability of data to the specificcircumstances, including location andduration, of the project being estimated.
Wherever it is necessary to access databanks collected by others, the credibility ofthe information obtained should beassessed using the same criteria.
The data recorded should be considered intwo basic categories namely cost data andproductivity data.
Cost data All types of historical cost data must berelated to a date from which thesubsequent inflation can be estimated,normally using published indices. Inaddition, historical data must be assessedagainst changes in the market place overtime. It follows that greater weight shouldbe given to the most recent data available,such as that from current projects.
Productivity dataProductivity data are needed if unit rate orglobal costs are to be developed fromscratch (and for the operational method).These data cover outputs and possiblyutilization figures for labour andconstruction plant. They will be related tospecific operations in a known location andin defined circumstances. It isrecommended that data are collected inthe form of:
■ Output of work achieved in unit paidtime by production units
■ Utilization figures for the productionunits.
102 13. Cost Estimation

Such data can be collected at severallevels, examples of which are given belowin increasing order of detail:
a. A histogram of major resourcesavailable, coupled with the mainquantities of work achieved
b. Information of the form ‘x number ofmachines of y capacity were employedfor z weeks to remove V m3 of claymaterial’, together with utilization figuresfor the period
c. The output of work achieved on aspecific task by a labour gang or item ofequipment, together with overallutilization figures for the production unit.
As the level of detail increases, so does theimportance of clear definition andconsistent use of the terms used forproductivity measurement. In particular, thedistinction and relation between outputand utilization must be recognized.
It is recommended that levels (a) and (b)are the most appropriate for the initialcollection of productivity data. They are themost readily usable for client estimates,since they allow for downtime over asignificant period of time. As data arecollected from an increasing number ofprojects, it should become possible toreconcile differences between them. Thiswill be facilitated if a record is kept of themajor factors affecting output andutilization.
Such productivity data are unaffected byinflation and therefore can be appliedwherever similar circumstances for theworks are foreseen.
An example of a data source is ROadCosts Knowledge System (ROCKS), aWorld Bank initiative to provide aninternational knowledge system on roadwork unit cost for road preservation anddevelopment activities. It is an institutionalmemory (database) that collects historicaldata on road work costs per kilometre orper m2. The system is not fully functional atthe time of going to press, but could proveto be a useful future source of information.
Published dataWherever required data are not availablefrom in-house resources, or from specificresources related to the project, theestimator may have to resort to publisheddata. Such data must be used withcaution and thorough inquiry made into itsbasis and the circumstances of itsachievement. For instance, the unit ratesquoted for a common building activity inthe United Kingdom in a range ofestablished publications have been foundto vary by - 50% to + 150% from themean. Other studies have shown thatequipment outputs as low as 20 per centto 30 per cent of the manufacturer’spublished data might be expected,particularly in developing countries. Theestimator is responsible for judging thecredibility of any published data he maydecide to use.
DETAILED SOURCES OF INFORMATION
Davis Langdon (editor) (2004).Spon’s Civil Engineering andHighway Works Price Book (2005)19th Edition. Spon Press.
This annual publication containscurrent UK unit costs for a vast anddetailed range of civil engineeringactivities as well as a range of largescale approximate costs andsummary guidance on producing acost estimate.
John Williams (editor) (2005).Estimating for Building and CivilEngineering Works. 9th Edition,Butterworth Heinemann.
This publication contains detailedguidance on preparing a tenderestimate for building and civilengineering works.
103
14.1 PURPOSE
In order to analyze the economic worth ofa project, estimates need to be made, notonly of the costs associated with theproject, but also of the benefit streams thatare expected to occur as a result of theroad investment. Benefits normallyconsidered are:
■ Direct savings on the costs of operatingvehicles
■ Economies in road maintenance■ Time savings by travellers and freight■ Reduction in road accidents■ Other benefits not captured in the above
(like wider effects on the economicdevelopment of the region, and socialand environmental benefits).
It is useful to identify the benefits from roadinvestment as either primary or secondarybenefits. The primary benefits are thedirectly measurable ‘first round’ trafficrelated effects. Examples of primarybenefits include transport or accident costsavings. Secondary benefits arise at a laterstage and include changes in land valuesor the wider economic developmentgenerated from the investment. Secondarybenefits are very difficult to isolate andmeasure; in addition it would involvedouble counting to add primary andsecondary benefits together. For example,in theory, reduced transport costs willdirectly induce a rise in land values; to addchanges in land values to transport costsavings would involve double counting.
In general, the more competitive and lessdistorted an economy, then the more likelyit is that the primary traffic benefits willcover the full consequences of a roadinvestment. The arguments for introducingsecondary benefits into the analysis arestrongest in the following circumstances:
■ For remote new rural transportinfrastructure investment,
■ Where a relatively large change intransport costs are anticipated
■ Where there are unemployed resources ■ The local economy is perceived to be
uncompetitive and weak.
Social benefits (described later) are verymuch part of secondary benefits. Anyanalysis that includes social benefits has tobe wary of the possibility of double-counting and appropriate action should betaken to resolve the problem.
All types of benefits should be consideredfor all projects although, depending on thetype of project, different benefits willpredominate. The main benefits of differenttypes of road investment are listed in Table14.1.
14.2 VEHICLE OPERATING COSTSAVINGS
14.2.1 Factors affecting vehicleoperating costs
When a road improvement is undertaken,the owners and users of vehicles profitfrom reduced costs of transport. Higheraverage speeds can be maintained, andthe more even running, with fewer gearchanges and braking, may lead to savingsin fuel consumption. Tyres last longer onimproved road surfaces and there is lesswear and tear on the suspension andbody. These savings are perceived by roadusers in the form of lower expenditures.
Vehicle operating costs (VOC) depend onthe number and types of vehicles using theroad, the geometric design standards ofthe road, particularly the curvature,gradient and road width, the condition ofthe surface of the road, primarily its
uneveness or ‘roughness’, and driverbehaviour. Changes in any of theseparameters as a result of a project willresult in a change in vehicle operatingcosts.
The components of vehicle operating costwith their approximate respectivecontribution to the total are given in Table14.2.
Vehicle capital costs, driver and conductorlabour costs, passenger and freight valuesof time and overheads are sensitive to triptime. So savings in these items will arisefrom road improvements that increasespeed (e.g. a road widening) or reduce tripdistance (e.g. a new road link).
Fuel, tyre and oil consumption and vehiclemaintenance costs are all sensitive to tripdistance. In addition fuel is sensitive tovehicle speed. At slow speeds fuelconsumption (per km) is high, while it is ata minimum at speeds around 40 – 50km/h and rises gently as speeds increasebeyond this. Fuel consumption is alsohigher with stop-start movements thatoccur with urban road congestion. Tyreand maintenance costs are sensitive toroad roughness, the highest vehiclemaintenance costs correlating with theroughest roads.
14.2.2 Non-motorized transport
Non-motorized transport is still important inmany locations of the developing world.Headloading, bicycles, rickshaws andanimal powered transport are widely usedto transport both freight and passengers.Where the analysis calls for information onthese types, estimates of the costs ofoperating these various forms of transportcan be made from surveys of the providers(both the ‘drivers’ and the owners, asappropriate).
104 14. The Benefits of Road Investment
14. The Benefits of Road Investment
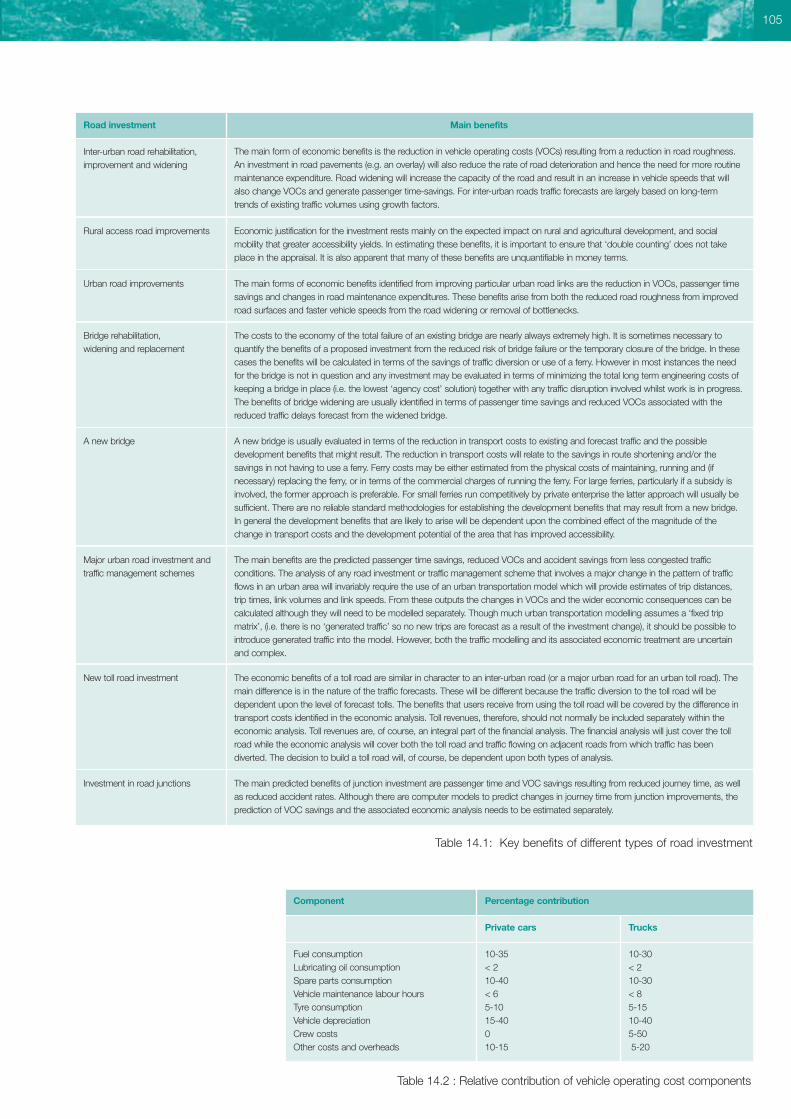
105
Road investment Main benefits
Inter-urban road rehabilitation, improvement and widening
Table 14.1: Key benefits of different types of road investment
The main form of economic benefits is the reduction in vehicle operating costs (VOCs) resulting from a reduction in road roughness.An investment in road pavements (e.g. an overlay) will also reduce the rate of road deterioration and hence the need for more routinemaintenance expenditure. Road widening will increase the capacity of the road and result in an increase in vehicle speeds that willalso change VOCs and generate passenger time-savings. For inter-urban roads traffic forecasts are largely based on long-termtrends of existing traffic volumes using growth factors.
Rural access road improvements Economic justification for the investment rests mainly on the expected impact on rural and agricultural development, and socialmobility that greater accessibility yields. In estimating these benefits, it is important to ensure that ‘double counting’ does not takeplace in the appraisal. It is also apparent that many of these benefits are unquantifiable in money terms.
Urban road improvements The main forms of economic benefits identified from improving particular urban road links are the reduction in VOCs, passenger timesavings and changes in road maintenance expenditures. These benefits arise from both the reduced road roughness from improvedroad surfaces and faster vehicle speeds from the road widening or removal of bottlenecks.
Bridge rehabilitation, widening and replacement
The costs to the economy of the total failure of an existing bridge are nearly always extremely high. It is sometimes necessary toquantify the benefits of a proposed investment from the reduced risk of bridge failure or the temporary closure of the bridge. In thesecases the benefits will be calculated in terms of the savings of traffic diversion or use of a ferry. However in most instances the needfor the bridge is not in question and any investment may be evaluated in terms of minimizing the total long term engineering costs ofkeeping a bridge in place (i.e. the lowest ‘agency cost’ solution) together with any traffic disruption involved whilst work is in progress.The benefits of bridge widening are usually identified in terms of passenger time savings and reduced VOCs associated with thereduced traffic delays forecast from the widened bridge.
A new bridge A new bridge is usually evaluated in terms of the reduction in transport costs to existing and forecast traffic and the possibledevelopment benefits that might result. The reduction in transport costs will relate to the savings in route shortening and/or thesavings in not having to use a ferry. Ferry costs may be either estimated from the physical costs of maintaining, running and (ifnecessary) replacing the ferry, or in terms of the commercial charges of running the ferry. For large ferries, particularly if a subsidy isinvolved, the former approach is preferable. For small ferries run competitively by private enterprise the latter approach will usually besufficient. There are no reliable standard methodologies for establishing the development benefits that may result from a new bridge.In general the development benefits that are likely to arise will be dependent upon the combined effect of the magnitude of thechange in transport costs and the development potential of the area that has improved accessibility.
Major urban road investment andtraffic management schemes
The main benefits are the predicted passenger time savings, reduced VOCs and accident savings from less congested trafficconditions. The analysis of any road investment or traffic management scheme that involves a major change in the pattern of trafficflows in an urban area will invariably require the use of an urban transportation model which will provide estimates of trip distances,trip times, link volumes and link speeds. From these outputs the changes in VOCs and the wider economic consequences can becalculated although they will need to be modelled separately. Though much urban transportation modelling assumes a ‘fixed tripmatrix’, (i.e. there is no ‘generated traffic’ so no new trips are forecast as a result of the investment change), it should be possible tointroduce generated traffic into the model. However, both the traffic modelling and its associated economic treatment are uncertainand complex.
New toll road investment The economic benefits of a toll road are similar in character to an inter-urban road (or a major urban road for an urban toll road). Themain difference is in the nature of the traffic forecasts. These will be different because the traffic diversion to the toll road will bedependent upon the level of forecast tolls. The benefits that users receive from using the toll road will be covered by the difference intransport costs identified in the economic analysis. Toll revenues, therefore, should not normally be included separately within theeconomic analysis. Toll revenues are, of course, an integral part of the financial analysis. The financial analysis will just cover the tollroad while the economic analysis will cover both the toll road and traffic flowing on adjacent roads from which traffic has beendiverted. The decision to build a toll road will, of course, be dependent upon both types of analysis.
Investment in road junctions The main predicted benefits of junction investment are passenger time and VOC savings resulting from reduced journey time, as wellas reduced accident rates. Although there are computer models to predict changes in journey time from junction improvements, theprediction of VOC savings and the associated economic analysis needs to be estimated separately.
Component Percentage contribution
Private cars Trucks
Fuel consumption 10-35 10-30Lubricating oil consumption < 2 < 2Spare parts consumption 10-40 10-30Vehicle maintenance labour hours < 6 < 8Tyre consumption 5-10 5-15Vehicle depreciation 15-40 10-40Crew costs 0 5-50Other costs and overheads 10-15 5-20
Table 14.2 : Relative contribution of vehicle operating cost components
14.2.3 Road investment models
Computer models are available forassisting in the calculation of vehicleoperating and maintenance costs under arange of conditions and hence estimatingcost savings as a result of road projects(see Box 14.1). Road planning modelssuch as HDM-4 use VOC relationships thatare based on research that has beencarried out in a number of countries. HDM-4 is an important source of information onhow VOCs change with road condition.However, because wide variations in VOCshave been found in different countries (forthe same input assumptions), it is veryimportant to calibrate the models to thelocal conditions. To use HDM-4 tocalculate VOCs the following vehicle inputdata are required:
■ Input prices (without tax and duties) ofnew vehicles, fuel, new and retreaded orremoulded tyres, oil, crew costs,passenger and freight values of time,maintenance labour costs and overheadcosts
■ Vehicle and load weights, vehicle andaxle configuration, number of wheels,fuel type, engine power
■ Vehicle utilization in terms of annualdistance travelled and hours worked perday
■ Average vehicle age.
For calibration data on typical maintenancecosts, tyre wear and fuel consumption are very useful. A mini guide to estimationof appropriate input data is given inAppendix C.
14.3 ROAD MAINTENANCE BENEFITS
14.3.1 Introduction
Many developing countries experiencedifficulties in carrying out adequatemaintenance. Savings in road maintenancecost are a potential benefit from manytypes of project and are particularlywelcome because they release scarceresources for maintenance of other roads.Maintenance savings can normally beobtained with the following types ofproject:
■ Paving a gravel road where traffic levelshave increased
■ Strengthening or reconstructing a roadwhich has deteriorated badly.
14.3.2 Paving gravel roads
In order to keep gravel roads in anacceptable and economic condition, theirsurface will normally need grading severaltimes a year and regravelling every fewyears. The frequency at which theseactivities are needed depends on the levelof traffic, the type of gravel material andthe climate. As traffic levels increase, thefrequency of the maintenance activityneeds to be increased and eventually thecost of maintenance is so high that itbecomes cheaper to provide a pavedroad.
The actual traffic level at which pavingbecomes economic should normally bedetermined using cost models such asthose described in Box 14.1. It is notpossible to give recommended traffic levelsbecause these values will depend on therelative costs of grading, regravelling andpaving which, in turn, will depend on localcircumstances. The higher the relative costof grading and regravelling, the lower willbe the traffic level at which pavingbecomes justified.
A further difficulty is that sources of goodroad building gravel are becoming scarcein many developing countries with theresult that haul distances and costs areincreasing. It may therefore be appropriatein appraisal studies to re-estimate the unitcost of regravelling during the life of theproject to take account of this. Aconsequence of this will be that, in somecases, it may be appropriate to pave aroad earlier and at a lower traffic level thanwas previously the case.
106 14. The Benefits of Road Investment
Box 14.1: Highway Cost Models
Highway cost models were initially developed to compute the total transportcosts of an individual road project over the ‘whole life’ of the road and weretherefore potentially very useful tools for the economic appraisal of road projects.For example, the first model in the Highway Design and Maintenance StandardsModel (HDM) series provided detailed modelling of (a) the engineering behaviourof roads (i.e. how they deteriorate), (b) how maintenance (both minor and major)affects this, (c) how the condition of the road affects the performance of thevehicles operating upon it and (d) the cost of operating those vehicles. Themodel then calculated the total whole life costs namely the cost of roadconstruction, road maintenance, vehicle operation, and travel time so that aneconomic evaluation of the engineering alternatives could be made. Subsequentversions of the model provided the facility to evaluate the optimum choice ofmaintenance, upgrading and construction investments for an entire road networkand became an important component of highway network managementsystems.
The successful use of HDM III over many years subsequently led to thedevelopment of a new and greatly expanded version, HDM 4. The HDM‘system’ was renamed the ‘Highway Development and Management System’ toreflect its greater scope and versatility. HDM-4 also considers non-motorizedtransport, social benefits, road accidents, unpaved roads, flexible and rigidpavements, vehicle emissions and more, thereby providing a powerful system forthe analysis and optimization of road maintenance and investment alternatives.It incorporates three main areas of applications namely project level analysis,network level investment programming under constrained budgets, and strategicplanning of long term network performance and expenditure needs. HDM 4effectively superseded HDM-III in 2000 and is the recommended software forevaluating highway investment options.
Simpler models requiring less input data but based on similar principles havealso been developed for specific purposes. For example, the World Bank’s RoadEconomics Decision Model (RED) is useful for appraising rural roads carrying lowlevels of traffic.
In arid areas, unpaved roads are oftenaffected by dust. Dust is a maintenanceproblem because it results in the loss ofmaterial from the road surface which hasto be replaced. It is a contributory factor toroad accidents because of the reduction invisibility and it also pollutes the atmosphereclose to the road and may reduce thevalue of crops. Hence, road safety,environmental and agricultural benefits mayarise as a result of paving gravel roads, butthese are difficult to quantify in aneconomic analysis.
Where economies in maintenance aremade as a result of paving gravel roads,vehicle operating cost savings will alsonormally be made. These two benefits arelinked closely together and roadinvestment models are therefore veryappropriate for carrying out the analysis.
14.3.3 Strengthening andreconstruction
A bitumen road with a rapidly deterioratingsurface needs increasing amounts ofmaintenance if it is to continue serving itsintended purpose. A bitumen road mayrequire the patching of pot-holes, repair oferoded edges, and the sealing andrepairing of cracked areas. Compared tothis, the overlaying or reconstruction of theroad can produce immediate savings byeliminating the need for continuous routinemaintenance, although future periodicmaintenance will still be needed. It is,however, important to strengthenpavements before they deteriorate to theextent that their structural integrity is lost.Road investment models, such as HDM-4,can be used to assess maintenancebenefits in these cases.
The cost of strengthening andreconstructing paved roads is considerablygreater than the annual cost of routine andperiodic maintenance, so it will be unusualfor projects of this nature to be justifiedsolely on the grounds of economies inmaintenance. Projects will normally bejustified principally on vehicle operatingcost savings and any maintenance savingswill increase the benefits and lead to ahigher rate of return.
14.3.4 Concrete roads
Where traffic levels are rising rapidly, andparticularly when large increases in goodsvehicles can be expected, the provision of
a concrete surfacing to an existing gravelroad may prove to be economicallyjustified. Similarly, concrete overlays toexisting bituminous surfacings are likely toreduce future maintenance costs.Experience of the construction of concretepavements is limited at present to very fewdeveloping countries and experience ofconcrete overlays is almost entirely limitedto Europe and North America. The use ofthese techniques should therefore betreated with caution (see Chapter 9).
14.3.5 Diverted traffic
If significant traffic diversion from otherroads is expected to take place as a resultof a new project, then the changingmaintenance needs on the road fromwhich the diversion took place should beconsidered in the assessment of benefits.Reduced maintenance needs on theexisting network will normally result in asmall benefit to the project, although thismay be offset by an increased cost ofmaintenance on the project itself.
14.3.6 Traffic delays duringmaintenance works
When large scale maintenance andrenewal works take place on heavilytrafficked roads, delays to traffic andincreased accidents are likely to occur. Forproject appraisal purposes, where futurestrengthening or stage construction isbeing planned, these additional costsshould ideally be taken into considerationas part of the appraisal. However, wherethese works are taking place in the lateryears of the project’s life, the effect ofadditional costs of delay and accidents onthe outcome of the project are likely to besmall in present value terms on all but themost heavily trafficked roads because ofthe effect of discounting (see Chapter 15).In these cases, lump sum estimatesshould be made of the additional costs forheavily trafficked roads; additional costscan be ignored on lightly trafficked roads.
However, where the project is for theupgrading of an existing paved road toprovide additional capacity or structuralstrength, the additional costs will occurearly in the projects life and are thereforemore likely to influence the choice or timingof the capital investment. The costs oftraffic delays will increase if projects aredelayed, because traffic levels will behigher. For very heavily trafficked roads, a
more rigorous estimate may beappropriate.
14.3.7 Determining maintenance costs
Maintenance costing systems that areimplemented in organizations are often notaccurate enough for determiningmaintenance cost savings. Typically,costing systems undervalue the costs ofowning and operating plant and equipmentby a significant amount by failing to includeinterest charges or even the replacementcost of the equipment. Costing systemsseldom include realistic overheads foremploying personnel and providingbuildings and other facilities. The result isthat real costs are commonly more than100 percent greater than those quoted byroads departments. The quality of fieldrecording of activities and expenditures isusually very poor with the result that theusefulness of the data collected is verydoubtful. Many costing systems in use onlyattempt to provide details of totalexpenditure for budgetary purposes and itis not possible to identify in detail theactivities on which expenditures havetaken place.
Against this background, it is difficult toobtain realistic unit costs which can beused to determine maintenance savings formany countries. However, in most cases,projects will not be justified solely on thegrounds of maintenance savings as thesewill be small in comparison with savings invehicle operating costs. Nevertheless,maintenance cost estimates are anecessary part of appraisal, includingcases where they are a negative benefit,and an attempt to collect good local costinformation must be made. Availablerecords in maintenance organizations mustbe examined to provide the basis of costestimates, but these should be reviewed inthe light of knowledge of how the recordsare obtained. In all cases, the sensitivity ofbenefits to large potential errors in the costestimates should be determined.
14.4 TIME SAVINGS
14.4.1 General considerations
Journey time savings can represent a largeproportion of a project’s benefits. Thebenefits of shorter journey times will accrueto the vehicle fleet, in that greater vehicleproductivity can be achieved, and to the
107
passengers and freight being carried. Ageneral discussion of some of theprinciples involved in the valuation of timesavings is given below, together with asuggested approach to their quantificationand incorporation in a feasibility study.
14.4.2 Vehicle fleet
Consider first vehicles which are usedexclusively for commercial purposes suchas buses and lorries. When travel time isreduced, the time saving can in principlebe used to make further journeys, andhence productivity per vehicle rises and thesize of fleet necessary to support thecurrent demand for transport can bereduced. This reduction in fleet size meansa reduction in those elements of the fleetoperating costs which are classed asstanding costs, notably crew wages,vehicle depreciation and interest on capital.By using appropriate values of vehicleutilization in the ‘with’ and ‘without’ projectcases, these cost savings will bedetermined directly.
It is often argued that, in practice, timesavings cannot be properly utilized and, asa result, will not lead to pro-rata reductionsin fleet size. The reasoning for this is thatcurrently most journeys are ‘quantized’ asround trips, such as a complete circuit of abus route, or a delivery made by roadwhere the lorry both starts and ends itsjourney at its base. If travel time on any ofthese journeys were saved, the chancesare that it would be insufficient to permitanother round trip during the sameworking day and, as completion of onlypart of the trip within a working day is notacceptable, the time saved could not beusefully employed. One of the problemswith this kind of argument is that, in someinstances, the time saving might just beadequate to allow another round trip and,in these cases, the benefits could be farmore than simply pro-rata. Overall, onehas to try and visualize a pattern of usewhich fairly represents the whole of thecurrent pattern. Unfortunately, it has toallow, for example, for the possibility, in thecase of buses, of extending the route,having additional stops, etc and, in thecase of lorries, of loading the night before,staying out overnight, etc. Additionally thedemand for transport is subject tofluctuations and long-terms trends, andtravel times themselves may also besubject to fluctuations and trends forreasons not associated with the project
under review. Clearly, providing a long-termrealistic and representative picture isoverwhelmingly difficult in all but the verysimplest of situations.
Looking at the problem from an overallpoint of view, because of the discretenature of most activities, the vehicle fleetcannot be productively employed for 100percent of the working day. If, after theproject is completed, vehicles on averageare working for the same proportion of theworking day as in the before situation, thisis equivalent to saying that time savingsare fully used. To assume that, in the longterm, time savings should not be costedas if the time were fully used is to implythat there is some special feature of thebefore situation which gives rise to anefficient use of time which will never bematched in the after situation.
It may well be that adaptation of currenttransport activity to take full benefit of thereduction in travel time brought about bythe project will not be immediate. However,it would be difficult to judge the true formof the lag between change and benefit onthe basis of detailed examination of theactivities of individual operators. On thewhole, unless other reliable information isavailable, it is safest to assume that all timebenefits are available at once.
The discussions above are lessappropriate for privately-owned cars. Thedemand for transport by a car owner is notshared between a number of vehicles butfalls just on his own vehicle. If his traveltime on a particular journey were to fall,this is unlikely to reduce directly thenumber of vehicles owned. It may wellencourage the car owner to make morejourneys, but the treatment of this isseparately dealt with in the discussion ontraffic generation benefits. Taxis should beconsidered in the same way as othercommercial vehicles
14.4.3 Vehicle occupants
Travel time savings for passengers inbuses and the occupants of private carsmay occur either during working or non-working time. Time savings during workinghours can be used for productivepurposes to increase the GNP. Non-working time savings do not increasenational production but, since there isevidence that people are prepared to payfor time savings that occur in non-working
time, such savings must be perceived asincreasing their welfare.
If working time is spent travelling, the valueof that travelling time is clearly equal to thewage rate plus those costs to theemployer which are directly associatedwith the costs of employment. In practice,the situation is not so straightforward.There are imperfections in the labourmarket, especially where minimum wagelegislation exists, where there are highrates of unemployment, or significant levelsof under employment. Despite theseproblems, it is usually assumed thatworking time savings should be equated tothe average wage rate plus overheadsassociated with employment, such aspensions, insurance, etc, shadow priced ifappropriate (see Chapter 15).
The value of non-working time is usuallybased on perceived-cost studies (Box14.2). Most of the research into perceivedcosts has taken place in the developedworld, but similar results have been foundin studies undertaken in developingcountries. The studies show that the valueput by individuals on journey time savingsaccruing outside working hours is between25-45 percent of their earnings and thathigher unit values of time saving should beascribed to higher income groups than tolower income groups. In practice this israrely done because it is consideredinequitable. In the United Kingdom, forexample, a flat rate equivalent to 43percent of the average hourly earnings isused in the evaluation of non-working timetravel savings for full time adult employees.This value is an average of bothcommuting and leisure time. Wheregovernments wish to adopt a policy thatmaximizes GDP rather than leisure timepreferences, a zero value should be usedfor leisure time whilst maintaining workingtime values. To use a percentage of theaverage wage may lead to anunderestimate of time costs in developingcountries because only the comparativelywealthy can afford to travel, even by bus,and certainly by car.
Other problems occur in the valuation ofpassenger time savings. The distinctionbetween working and non-working time isnot always clear cut, especially when manytrips are multi-purpose. Marginal values oftime may vary for the same individual,depending on the activities for which thetime saved is used. The value of time is
108 14. The Benefits of Road Investment
normally a function of factors other than atrade-off between time and cost, such ascomfort and convenience. For example,walking and waiting times may be valuedmore highly than travelling times.
As a general guide, the following approachshould be adopted:
■ Measure time savings separately forworking time and leisure time, as aminimum,
■ In the absence of better data, valueworking time at the average wage rate in the monetized economy, plusoverheads,
■ Value non-working time in the rangezero to 45 percent of working time,unless there are special reasons forattributing at a higher value. It wouldnormally be expected that values wouldbe at the lower end of this range.
14.4.4 Freight
The cost of delays in moving goodsconsists chiefly of costs due to interest onthe capital which the goods represent,costs due to damage or spoilage ofperishable goods, and ancillary costswhich arise as a consequence of journeytime, for example, where a piece ofequipment is immobilized while waiting fora spare part. The cost of interest on capitalis normally very small compared to theother elements of vehicle operating costs.Costs due to spoilage or damage may besignificant, but care must be taken toensure that a reduction in spoilage ordamage of perishable goods is dueprimarily to reductions in journey timerather than the provision of a smootherroad. If it is the latter, and this is moreusually the case, then the cost savingsshould still be credited to the project but,strictly, not be allocated as a time saving.
Studies of modal choice for goodstravelling by road and other modes havesuggested that, even for non-perishablegoods, consignors are usually willing topay far more than interest cost on thegoods to reduce travel time or to reduceuncertainty in time of delivery.
14.5 VALUING ACCIDENT SAVINGS
14.5.1 The need to value roadaccidents
Road improvements are likely to yield abenefit from reduced road accidents, andthis benefit should be captured in the roadappraisal. There is a cost associated withroad accidents which must be quantified.A reduction (or increase) in this cost thatresults from the road investment is the‘safety’ benefit (or disbenefit) ofundertaking the improvement. A detailedaccident cost study will often provideinformation on the costs of accidents inboth urban and rural environments and,possibly, for different regions of a country.Ideally such cost information should beavailable from the appropriate departmentof government. How these costs areestimated is discussed below.
14.5.2 Methods available to value roadaccidents.
The cost of road accidents depends tosome extent on the method of valuationthat has been used. There are two basicmethods namely the ‘gross output’ or‘human capital’ (HC) method and the‘willingness to pay’ (WTP) method. Themost appropriate of these is the willingnessto pay approach, but there are difficulties inobtaining reliable empirical estimates andso the gross output approach is preferred.In order to try to capture some of the‘humane’ considerations reflected in thewillingness to pay approach, gross outputvalues are often augmented by a furtherallowance for ‘pain, grief and suffering’ ofthose involved in road crashes.
14.5.3 Classification of accidents
In road safety studies accidents need to beclassified for costing purposes. Accidentsmay involve injury to a person i.e.‘personal-injury accidents’ or alternatively,may result only in damage to vehicles (andpossibly property), in which case they aretermed ‘damage-only accidents’. It is
109
Box 14.2: Methods for estimating the value of time
There are two main methods of estimating the value of time.
Revealed Preference (RP). This is based on observing choices where peoplecan choose between a slow but cheaper form of transport compared with amore expensive but faster form.
Stated Preference (SP). This is based on asking people to choose betweendifferent combinations of hypothetical choices.
Although the RP approach may be considered to be more reliable, in practicethe approach is constrained by the limited range of choices that are practicallyavailable. Because of its inherent flexibility the SP approach is now the principalmethod of valuing time.
Based on an RP analysis, for many countries non-working time has been valuedat about one third the wage rate. New research now tends to suggest thatpoorer people value their time at a higher rate, in relation to their incomes, thanthe richer sections of the population. Some studies have found, in consequence,that for inter-urban travel the value of time may even be valued higher than thewage rate. Because the value of time is dependent upon income levels theobserved value will vary for different classes of user (e.g. between bus and carusers).
Within an economic analysis, values of time are required to forecast how trafficvolumes will switch between different modes and routes (e.g. with theintroduction of a toll road). In this case different empirical values of time (e.g.between bus and car users or between different income groups) will improveforecasting accuracy. Values of time are also required in final valuation ofbenefits. In this case most countries have, for equity reasons, chosen not todifferentiate values of time between different regions and to use just one value ofnon-working time for all users.
standard practice for these accidents to befurther classified as being fatal, serious orslight. The typical definitions that defineaccident severity are:
■ A fatal accident is one in which one ormore persons are killed as a result of theaccident, provided death occurs within30 days
■ A serious accident is one in which thereare no deaths but one or more personsare seriously injured i.e. usually detainedin hospital as an ‘inpatient’
■ A slight accident is an accident in whichthere are no deaths or serious injuriesbut a person sustains an injury of aminor character such as a cut, sprain orbruise or receives outpatient treatment
■ A damage-only accident is one in whichno one is injured but damage to vehiclesand/or property is sustained.
Accident severity is defined by the mostserious casualty class of any of the victimsof the incident and road accidents arenormally costed by the class of theaccident. Thus the ‘cost of an accident’ isnot the same as the ‘cost of casualties’resulting from that accident.
14.5.4 Costs of accidents
The costs associated with a road accidentinclude:
■ Lost future output■ Property damage■ Medical■ Police and administration ■ Pain, grief and suffering.
Value of the loss of output. Roadaccidents lead to a loss of output in theyear in which the accident occurs and, inthe case of fatal and very seriousaccidents, in future years also. In thissituation costs in future years arediscounted to give present day values. Thevalue of lost output is obtained from thenational average wage rate before theremoval of taxes multiplied by the workingtime lost as a result of the accident.Certain assumptions have to be madeabout the working time lost as follows:
■ In the case of a fatal accident, thenumber of ‘person years lost’ isdetermined by obtaining the averageage of road accident fatalities andsubtracting this from the average age atwhich a person ceases to work
■ In the case of a serious accident, costsare determined from the averagenumber of days that the casualtyspends in hospital and then spendsrecovering at home
■ In the case of a slight accident, thecosts are determined from the (relativelysmall) number of days that the casualtyis not working due to attending adoctor’s surgery, a clinic or hospital (asan outpatient) to receive treatment, orbeing at home convalescing.
Cost of medical treatment. The medicalcosts resulting from road accidents arisefrom treatment in hospital (inpatient andoutpatient), treatment by generalpractitioners, and the use of ambulances.The average costs are worked out frominformation about the average of thefollowing quantities:
■ Length of stay in hospital■ Cost per day of hospital treatment■ Number of outpatients visits■ Cost per outpatient visit■ Costs incurred by general practitioners■ Costs incurred by the ambulance
service.
All these factors have to be taken intoaccount in the case of serious injuries.Outpatient and general practitionerstreatment can be ignored in the case offatalities and, by definition, inpatient costscannot arise in the case of slight injuries.
Information must be obtained on a ‘peraccident’ basis and average costs oftreatment for persons killed, seriously orslightly injured must be multiplied by theaverage number of persons injured in theequivalent categories of accident toprovide a cost of medical treatment peraccident.
Cost of damage to vehicles and otherproperty. There are three basic sourcesfor information on the cost of damage tovehicles namely, insurance companies,garages, and large fleet operators such asbus companies and freight operators. Acomprehensive accident cost study willmake use of these sources as appropriate.
In some parts of the world cars carrycomprehensive insurance (as opposed tothird party cover only) and, if the co-operation of insurance companies can beobtained, then making use of informationheld by them can be invaluable:
■ Background information such as age ofpersons injured, locality, severity ofaccident, degree of personal injury (ifany), number of casualties andnumbers of vehicles, etc
■ The payment for damage to the insuredvehicle and for damage to vehicles andother property belonging to third parties.
If statistics on cost of vehicular repair areunavailable from insurance companies thenan alternative approach is to collectinformation from garages, repair shopsand, additionally from bus companies andfreight operators.
In most countries damage-only accidentsdo not have to be reported to the policeand accurate statistics are therefore likelyto be unavailable. It may be possible toobtain an estimate from insurance recordswhich can indicate the number of vehiclesinvolved in damage accidents per vehicleinvolved in personal injury accidents.
Administrative and other costs. Othercosts that arise as a result of roadaccidents include those associated withthe administration of insurance, the policeand court proceedings. In addition, thecost of the delays caused to other vehiclesat the scene of the accident should beconsidered. None of these costs areparticularly easy to determine.Administrative costs are likely to be lowand it is probably not worth spendingmuch time and effort in producing detailedestimates.
Subjective or ‘human’ costs. Theprevious paragraphs dealt with the costs ofaccidents that directly or indirectly affectthe economy of a country. However, thereare other important issues to consider,such as suffering and bereavement, thatfall upon individuals. Although these aredifficult to express in monetary terms theirexistence is very real to the personsconcerned. Moreover they are costs whichthe community would usually be preparedto meet in order to avoid the miseryinvolved. If costs derived are to be used inthe economic assessments of roadimprovements, then it is important thatthey should reflect the value that thecommunity places on the saving of life andthe avoidance of suffering.
It is therefore necessary to estimate thevalue that the community places on theavoidance of loss of human life by adding
110 14. The Benefits of Road Investment
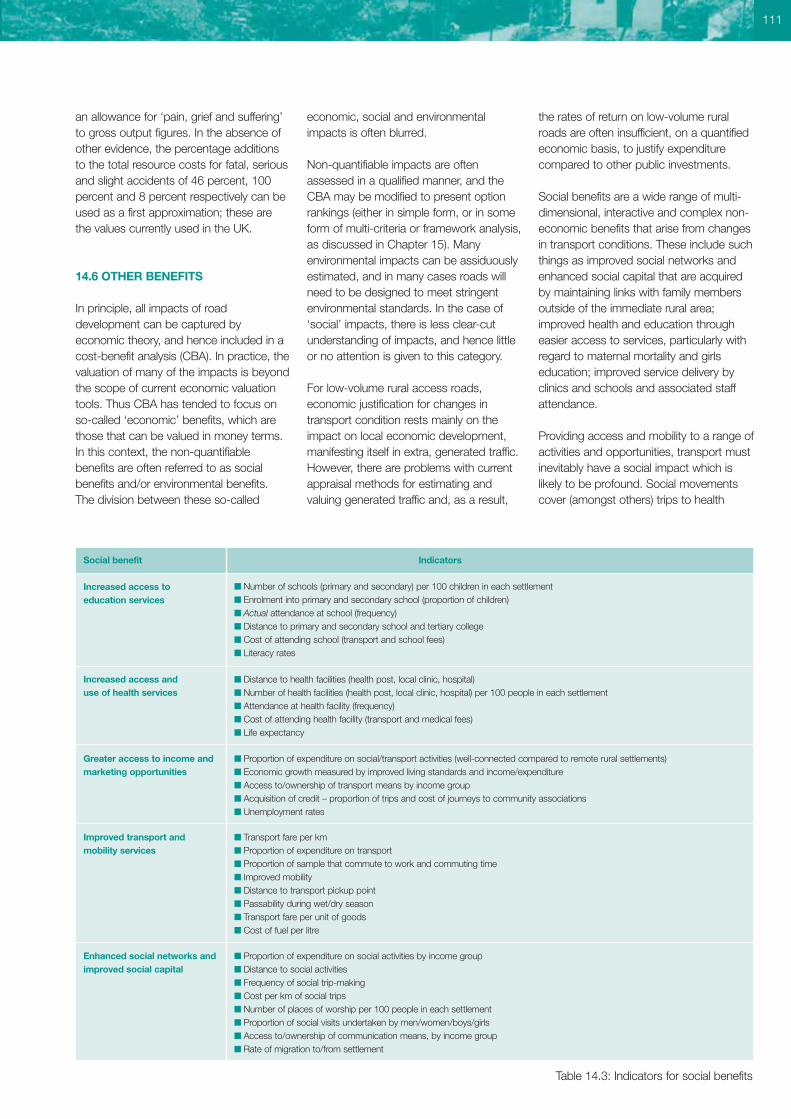
111
an allowance for ‘pain, grief and suffering’to gross output figures. In the absence ofother evidence, the percentage additionsto the total resource costs for fatal, seriousand slight accidents of 46 percent, 100percent and 8 percent respectively can beused as a first approximation; these arethe values currently used in the UK.
14.6 OTHER BENEFITS
In principle, all impacts of roaddevelopment can be captured byeconomic theory, and hence included in acost-benefit analysis (CBA). In practice, thevaluation of many of the impacts is beyondthe scope of current economic valuationtools. Thus CBA has tended to focus onso-called ‘economic’ benefits, which arethose that can be valued in money terms.In this context, the non-quantifiablebenefits are often referred to as socialbenefits and/or environmental benefits. The division between these so-called
economic, social and environmentalimpacts is often blurred.
Non-quantifiable impacts are oftenassessed in a qualified manner, and theCBA may be modified to present optionrankings (either in simple form, or in someform of multi-criteria or framework analysis,as discussed in Chapter 15). Manyenvironmental impacts can be assiduouslyestimated, and in many cases roads willneed to be designed to meet stringentenvironmental standards. In the case of‘social’ impacts, there is less clear-cutunderstanding of impacts, and hence littleor no attention is given to this category.
For low-volume rural access roads,economic justification for changes intransport condition rests mainly on theimpact on local economic development,manifesting itself in extra, generated traffic.However, there are problems with currentappraisal methods for estimating andvaluing generated traffic and, as a result,
the rates of return on low-volume ruralroads are often insufficient, on a quantifiedeconomic basis, to justify expenditurecompared to other public investments.
Social benefits are a wide range of multi-dimensional, interactive and complex non-economic benefits that arise from changesin transport conditions. These include suchthings as improved social networks andenhanced social capital that are acquiredby maintaining links with family membersoutside of the immediate rural area;improved health and education througheasier access to services, particularly withregard to maternal mortality and girlseducation; improved service delivery byclinics and schools and associated staffattendance.
Providing access and mobility to a range ofactivities and opportunities, transport mustinevitably have a social impact which islikely to be profound. Social movementscover (amongst others) trips to health
Social benefit Indicators
Increased access to education services
Table 14.3: Indicators for social benefits
■ Number of schools (primary and secondary) per 100 children in each settlement■ Enrolment into primary and secondary school (proportion of children)■ Actual attendance at school (frequency)■ Distance to primary and secondary school and tertiary college■ Cost of attending school (transport and school fees)■ Literacy rates
Increased access and use of health services
■ Distance to health facilities (health post, local clinic, hospital)■ Number of health facilities (health post, local clinic, hospital) per 100 people in each settlement■ Attendance at health facility (frequency)■ Cost of attending health facility (transport and medical fees)■ Life expectancy
Greater access to income andmarketing opportunities
■ Proportion of expenditure on social/transport activities (well-connected compared to remote rural settlements)■ Economic growth measured by improved living standards and income/expenditure■ Access to/ownership of transport means by income group ■ Acquisition of credit – proportion of trips and cost of journeys to community associations■ Unemployment rates
Improved transport and mobility services
■ Transport fare per km■ Proportion of expenditure on transport■ Proportion of sample that commute to work and commuting time ■ Improved mobility ■ Distance to transport pickup point■ Passability during wet/dry season■ Transport fare per unit of goods■ Cost of fuel per litre
Enhanced social networks andimproved social capital
■ Proportion of expenditure on social activities by income group■ Distance to social activities■ Frequency of social trip-making■ Cost per km of social trips■ Number of places of worship per 100 people in each settlement■ Proportion of social visits undertaken by men/women/boys/girls ■ Access to/ownership of communication means, by income group■ Rate of migration to/from settlement
centres, hospitals, schools, governmentoffices and to visit friends and relations.They are important because theystrengthen the social capital of theindividual and may help in personal orcommunity crisis.
Social benefits from changes in ruraltransport conditions can be seen as:
■ Improved social networks and enhancedsocial capital from people finding iteasier to maintain links with familymembers outside of the immediate ruralarea
■ Enhanced community development thatmay arise from the community workingtogether to maintain or improve theirown transport conditions
■ Increased confidence in an ability totravel to access services andopportunities.
■ Improved health and education througheasier access to services
■ Reduced vulnerability to unexpectedevents and shocks from crop failure,accidents and poor security
■ Greater reliability of clinics and schools insecuring staff and easier maintenance ofthese services because drugs can besupplied and school suppliesreplenished
■ Reduced time burdens from engaging intravel due to the improved environmentalimpact of roads (e.g. less dust) andincreased transport service frequency.
The social benefits of changes in transportconditions are best measured with the useof proxy indicators. These indicators arebased on participatory enquiry (part of thesocial impact analysis) which seeks toestimate a community perspective of howtransport influences their lives andlivelihoods. Examples are shown in Table 14.3.
In order to identify perceived and actualsocial benefits for individual cases, and toundertake consultation and sensitization of local communities for defining andassessing road appraisal options, it isadvised that a robust methodologicalapproach be adopted for measurement of social impact (see Chapter 7).
DETAILED SOURCES OF INFORMATION
IT Transport (2001). Appraisal ofinvestments in improved rural access.DFID Economists Guide. IT Transport,Ardington, UK.
ITS, University of Leeds (2003). Toolkit forthe economic evaluation of World Banktransport projects. Final Report. Institutefor Transport Studies, University of Leeds,Leeds, UK.
Jacobs G, A Aeron-Thomas and A Astrop(2000). Estimating global road fatalities.TRL Report 445. TRL Ltd., Crowthorne,UK
Transport Research Laboratory (1995).Costing road accidents in developingcountries. Overseas Road Note ORN10,Transport Research Laboratory,Crowthorne, UK.
TRL (2004). The rural transport policytoolkit. TRL Ltd., Crowthorne, UK.
TRL (2004). A guide to pro-poor transportappraisal. TRL Ltd., Crowthorne, UK.
14. The Benefits of Road Investment112
113
15.1 PURPOSE
Project analysis is usually on the basis of an economic assessment using theframework of cost-benefit analysis (CBA).Some project analyses may adopt a‘cost-effectiveness’ approach that willinvolve some form of ranking projects.Where private sources of funding arebeing invested in a road, a financialanalysis will also be required.
Through identifying, quantifying inmonetary terms, and comparing thecosts and benefits of each option theeconomic evaluation is able to provideguidance on the following:
■ Is the investment economicallyworthwhile? In other words, are thebenefits greater than the costs?
■ If there is a range of options (e.g.alternative road alignments orpavement designs), which option givesthe best economic returns?
■ Is the proposed project timing optimal?Or, would it be better to postpone theinvestment to a later date?
■ Should components of the project bephased in over a period of time?
■ Would it be better to combine theproject with other investments orcombine with other traffic managementmeasures?
■ How should risk affect the choice ofprojects?
■ If funds are limited and there are manyworthwhile investments, which shouldbe built first?
An economic analysis considers theproject from a national point of view. In aCBA the total costs and the total benefitsthat arise from a project are identifiedand measured, irrespective of who incurs
the costs or who benefits from the project. Within CBA it is usual to treateach unit (US$ say) of benefits as beingof equal value to each individual insociety irrespective of his or her incomelevel. No adjustments are made becauseof income distribution.
An economic analysis is different from afinancial analysis in a number ofimportant respects. A financial analysis isusually carried out from the perspectiveof a particular individual, company orgovernment department, while aneconomic analysis takes a wider, nationalperspective. A financial analysis usesconventional market prices while aneconomic analysis will use ‘economic’prices that only reflect the opportunitycost of using resources to the wholesociety, hence the taxation component ofmarket prices will be omitted (see below).
Whilst conventional CBA is commonlyused to prioritize main, secondary andurban roads, other methods are oftenemployed to prioritize low volume ruralaccess or feeder road investments.These procedures are often referred to as cost-effectiveness or multi-criteriaanalysis. Although there are manyformulations, the different procedures donot fit within a conventional economicframework. The procedures often includeindicators or measures of social as wellas economic demand, need or benefit.Compared with a conventional economicappraisal, less attention is given to theprecision of coverage of benefits (whichcan result in double counting).Sometimes the procedure will include amethod of incorporating consultation(either of local communities or officials) inthe selection and prioritization of roadinvestments.
15.2 ECONOMIC ANALYSIS
15.2.1 The impact of different formsof road investment
The expectation is that the immediateeconomic consequence of roadinvestment is to lower transport costs. As a result, economic activity will bechanged throughout the economy as thesaved resources are redeployed, asproducers adjust to their new cost andprice structure, and as consumers adjusttheir pattern of expenditure. The extent towhich the local economy near to the roadwill benefit from the investment will bedependent on its economic potential,such as unused land and labour, and onthe change in transport costs and prices.The effect on the economy is extremelycomplex and it is virtually impossible tomodel in detail.
For most road projects where vehicleaccess already exists, howeverrudimentary, the principal benefits fromthe project should be measured as roaduser cost savings as described inChapter 14. In these cases, a ‘consumersurplus’ approach to assessing benefitsshould be used as described below.
When evaluating generated trafficbenefits, it is useful to consider thecurrent traffic composition and the natureof the proposed investment. Studieshave shown that passenger traffic ismore sensitive than freight traffic tochanges in transport costs. Passengerfares are a direct component ofconsumers’ final demand whereas freightcosts represent only a small proportion ofthe final costs of both the product to theconsumer and the revenue to theproducer. Upgrading long lengths of
15. Project Analysis
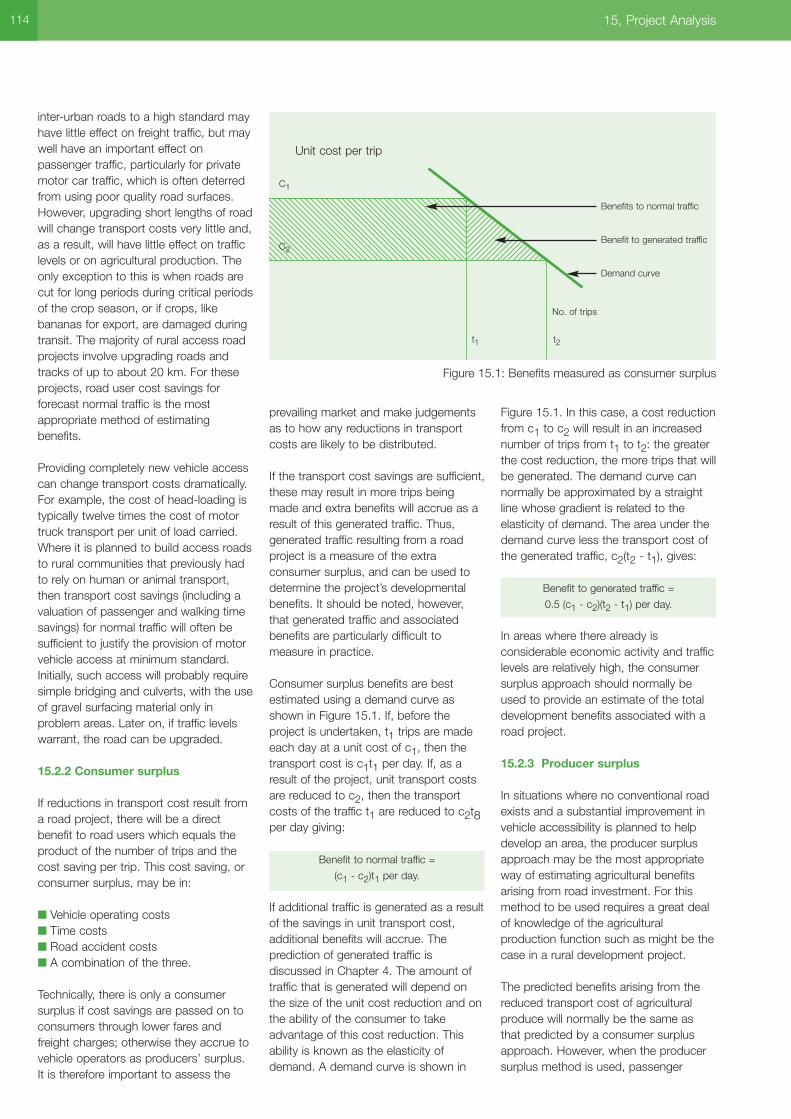
inter-urban roads to a high standard mayhave little effect on freight traffic, but maywell have an important effect onpassenger traffic, particularly for privatemotor car traffic, which is often deterredfrom using poor quality road surfaces.However, upgrading short lengths of roadwill change transport costs very little and,as a result, will have little effect on trafficlevels or on agricultural production. Theonly exception to this is when roads arecut for long periods during critical periodsof the crop season, or if crops, likebananas for export, are damaged duringtransit. The majority of rural access roadprojects involve upgrading roads andtracks of up to about 20 km. For theseprojects, road user cost savings forforecast normal traffic is the mostappropriate method of estimatingbenefits.
Providing completely new vehicle accesscan change transport costs dramatically.For example, the cost of head-loading istypically twelve times the cost of motortruck transport per unit of load carried.Where it is planned to build access roadsto rural communities that previously hadto rely on human or animal transport,then transport cost savings (including avaluation of passenger and walking timesavings) for normal traffic will often besufficient to justify the provision of motorvehicle access at minimum standard.Initially, such access will probably requiresimple bridging and culverts, with the useof gravel surfacing material only inproblem areas. Later on, if traffic levelswarrant, the road can be upgraded.
15.2.2 Consumer surplus
If reductions in transport cost result froma road project, there will be a directbenefit to road users which equals theproduct of the number of trips and thecost saving per trip. This cost saving, orconsumer surplus, may be in:
■ Vehicle operating costs ■ Time costs ■ Road accident costs ■ A combination of the three.
Technically, there is only a consumersurplus if cost savings are passed on toconsumers through lower fares andfreight charges; otherwise they accrue tovehicle operators as producers’ surplus.It is therefore important to assess the
prevailing market and make judgementsas to how any reductions in transportcosts are likely to be distributed.
If the transport cost savings are sufficient,these may result in more trips beingmade and extra benefits will accrue as aresult of this generated traffic. Thus,generated traffic resulting from a roadproject is a measure of the extraconsumer surplus, and can be used todetermine the project’s developmentalbenefits. It should be noted, however,that generated traffic and associatedbenefits are particularly difficult tomeasure in practice.
Consumer surplus benefits are bestestimated using a demand curve asshown in Figure 15.1. If, before theproject is undertaken, t1 trips are madeeach day at a unit cost of c1, then thetransport cost is c1t1 per day. If, as aresult of the project, unit transport costsare reduced to c2, then the transportcosts of the traffic t1 are reduced to c2t8per day giving:
Benefit to normal traffic =
(c1 - c2)t1 per day.
If additional traffic is generated as a resultof the savings in unit transport cost,additional benefits will accrue. Theprediction of generated traffic isdiscussed in Chapter 4. The amount oftraffic that is generated will depend onthe size of the unit cost reduction and onthe ability of the consumer to takeadvantage of this cost reduction. Thisability is known as the elasticity ofdemand. A demand curve is shown in
Figure 15.1. In this case, a cost reductionfrom c1 to c2 will result in an increasednumber of trips from t1 to t2: the greaterthe cost reduction, the more trips that willbe generated. The demand curve cannormally be approximated by a straightline whose gradient is related to theelasticity of demand. The area under thedemand curve less the transport cost ofthe generated traffic, c2(t2 - t1), gives:
Benefit to generated traffic =
0.5 (c1 - c2)(t2 - t1) per day.
In areas where there already isconsiderable economic activity and trafficlevels are relatively high, the consumersurplus approach should normally beused to provide an estimate of the totaldevelopment benefits associated with aroad project.
15.2.3 Producer surplus
In situations where no conventional roadexists and a substantial improvement invehicle accessibility is planned to helpdevelop an area, the producer surplusapproach may be the most appropriateway of estimating agricultural benefitsarising from road investment. For thismethod to be used requires a great dealof knowledge of the agriculturalproduction function such as might be thecase in a rural development project.
The predicted benefits arising from thereduced transport cost of agriculturalproduce will normally be the same asthat predicted by a consumer surplusapproach. However, when the producersurplus method is used, passenger
114 15, Project Analysis
Figure 15.1: Benefits measured as consumer surplus
Benefits to normal traffic
Benefit to generated traffic
Demand curve
No. of trips
Unit cost per trip
C1
C2
t1 t2
benefits and other non agricultural costsavings still need to be estimatedseparately.
The forecast increase in agriculturalproduction and the size of producerbenefits are predicted from:
■ The rise in farm-gate prices broughtabout by the decline in costs oftransporting produce to market
■ The decline in transport costs ofagricultural inputs.
The practical application of theagricultural production approach in thefield has been poor. The empiricaljustification for estimating changes inagricultural production has been weakand a failure to consider all the relevantcosts of production has often led to thebenefits being grossly over valued. Theapproach is not recommended unlessthere is a great deal of knowledge aboutagriculture and its likely supply responseto changes in input and output prices.
15.2.4 Cost-benefit analysis
PrinciplesThis section describes the standardtechniques used by economists for CBA.It is included for completeness for thebenefit of engineers, transport plannersand administrators who may not befamiliar with these techniques.
Each project is unique and is likely tohave features that prevent analysisfollowing an identical pattern, althoughthe same overall approach can usually befollowed. It is normal to determine thecosts and benefits which will be incurredover the analysis period if no investmentis made, and compare these with thecosts and benefits arising as a result ofmaking an investment. Costs should bedetermined as described in Chapter 13and benefits should be determined asdescribed in Chapter 14. These costsand benefits can then be compared asdescribed below to determine whetherthe investment is worthwhile and toidentify which is the best of thealternatives being considered.
The alternative in which no investmenttakes place is sometimes known as the‘baseline’ or ‘do nothing’ case. However,it is unusual for future investment in suchcases to be absolutely zero becausethere is normally an existing road which,in the future, will require someexpenditure on maintenance. If traffic onthe existing road is expected to growrapidly in the future, perhaps because ofsome complementary investment, thenrelatively large capital investments maybe needed just to prevent the road frombecoming impassable. In cases such asthis, the ‘do minimum’ alternative shouldbe considered as the most realisticbaseline case against which alternative
improvement projects should beevaluated. The choice of an appropriate‘do minimum’ case is an extremelydifficult decision and has a very largeinfluence on the size of economic returnobtained from a project. Considerableattention should therefore be given to itsselection.
Models are available that compute thenecessary CBA outputs based on theinput of appropriate engineering andtraffic data. The widely recognizedsoftware are HDM-4 (see Chapter 13) formajor roads and the Roads EconomicDecision Model (RED) for rural accessroads (see Box 15.1).
PricesIn order to carry out an economicanalysis, it is necessary to makeadjustments to costs and prices toensure that they are all measured in thesame units and that they represent realresource costs to the country as a whole.These adjustments are presented below.
Inflation. A first step is to remove theeffect of inflation to enable values to becompared on the same basis over time.Costs and prices are normally expressedin constant monetary terms, usually forthe first (base year) of analysis. In mostcases it can be assumed that futureinflation will affect both costs andbenefits equally, and hence its effect canbe ignored. However, there may beexceptions to this and, in these cases,different costs and prices will need to beassumed for different elements atdifferent times in the project analysisperiod.
Discounting. It is also necessary tofactor costs and benefits to take accountof the different economic values ofinvestments made (or benefit received) atdifferent times during the project’s life.When money is invested commercially,compound interest is normally paid onthe capital sum. The interest ratecomprises inflation, risk and the real costof postponing consumption. Thus,money used to invest in projects in theroads sub-sector could, in theory, beinvested elsewhere and earn a dividend.By using capital to invest in a project, thedividend is foregone and this should betaken into account in the analysis. To dothis, all future costs and benefits arediscounted (back to base year) to
115
Box 15.1: Economic analysis models
The Roads Economic Decision Model (RED) performs an economic analysisof road investments and maintenance alternatives and is customized to thecharacteristics of unpaved roads such as: a) high uncertainty in trafficforecasts, road condition, and future maintenance; b) periods during a yearwith disrupted passability; c) levels of service and corresponding road usercosts defined not only through roughness; d) high potential to influenceeconomic development; and e) beneficiaries other than motorized road users. RED is a consumer surplus model designed to help evaluate investments inlow volume roads. The model is implemented in a series of Excel workbooksthat: a) collect all user inputs; b) present the results in a user-friendly manner;c) estimate vehicle operating costs and speeds; d) perform an economiccomparison of investments and maintenance alternatives; and e) performsensitivity and stochastic risk analyses. The model computes benefitsaccruing to normal, generated and diverted traffic as a function of a reductionin vehicle operating and time costs. It also computes safety benefits. Modelusers can also add other benefits (or costs) to the analysis, such as thoserelated to non-motorized traffic, social service delivery and environmentalimpacts.Source: World Bank
convert them to present values of cost(PVC) using the formula:
PVC = ci /(1+(r/100))i
where ci = costs or benefits incurred in year i
r = discount rate expressed
as a percentage
i = year of analysis where,
for the base year, i = 0.
Since the inflation element is dealt withseparately and risk also needs separatetreatment, the discount rate used onhighway projects will differ from marketinterest rates.
The value of the discount rate used willclearly have a considerable influence onthe balance between the effect of capitalcosts, which are typically spent early inthe project life, and that of benefitsobtained in the future. Discountedbenefits may exceed costs at onediscount rate, but not at another. Thechoice of discount rate is thereforecrucial to the outcome of an appraisal inmany cases.
The discount rate normally used is thegovernment accounting rate of interest(ARI). The ARI is the opportunity cost ofcapital in the public sector, i.e. the rate ofreturn that can be expected on publicsector investments. The discount rate tobe used in an appraisal will normally beprovided to those carrying out theanalysis by the planning authorityresponsible for the project.
Economic prices. As stated earlier, ifinvestment in the project is to improvethe rate of economic growth through thereallocation of scarce resources, thetaxation component of all prices (i.e. of allcosts and benefits) should be deductedto give the economic price to be used inthe project analysis. This is becausethese charges do not reflect a demandon real resources but are a transfer ofspending power from those benefitingfrom the project to the government. Oneobvious example is the removal of fueltax when accessing the cost of fuel in theanalysis. Other transfer charges includesuch items as vehicle licence fees whichshould also be excluded.
Shadow Prices. Other distortions in theprice system may arise through quotas,subsidies and through imperfect
competition. Where market prices arefixed by institutional forces which causethem to be higher than would beexpected in a completely deregulatedmarket, resource costs will beexaggerated in the appraisal. Theconverse is also true. To overcome thisproblem, shadow pricing is used. Thus:
Economic price = market price - transfercharge + effect of other distortions
Some developing countries control thevalue of foreign exchange to keep it lowerin relation to domestic currency than isreally justified. The official exchange ratethen overvalues domestic currency;imported items appear too cheap anddomestic items too expensive. This meansthat it tends to encourage overinvestmentin imported capital items. This can beovercome by valuing all resources at theirborder prices. Imports are valued at theinternational price (inclusive of carriageinsurance and freight, c.i.f.) but excludingimport duty. Exports are valued free of anyexport duty (f.o.b.). This approach willtend to reallocate resources such that acountry will only import goods that cannotbe produced more cheaply at home,paying for them by exports which can beproduced comparatively cheaply.
Many developing countries have minimumwage laws or other regulations andinflexibilities which result in wages notcorrectly measuring ‘the opportunity costof labour’. Where significantunemployment exists, the real cost oflabour is much less than actual wagerates being paid. This means that wagesof construction workers or truck drivers,for example, may need to be modified toaccount for overvalued domestic currency.
On the other hand, it would also appearthat the real costs of skilled labour may begreater than the wages paid. The shadowprice for this is difficult to estimate andadvice should normally be sought from therelevant local ministry or commission. Forboth skilled and unskilled labour, shadowpricing should also be used whenassessing benefits. If labour-savingequipment is introduced as part of aproject, the real benefit is substantially lessif the replaced labour remains unemployedfor a significant period during theeconomic life of the equipment.
15.2.5 Alternative ways of comparingcosts and benefits
CBA is carried out to determine whetherthere is an adequate return on aparticular project in terms of benefitsfrom the capital investment. This can bedone using either the ‘net present value’or ‘internal rate of return’ decision rules(see below). When different projectoptions are available, these rules mayalso be used for helping to determinewhich investment option gives thehighest return of those considered. Inaddition, the ‘first year rate of return’ rulecan be used to assess whether theproject is timely and the NPV/cost ratiocan be used in order to rank schemes inorder of priority.
Net present value (NPV)This is simply the difference between thediscounted benefits and costs over theproject analysis period.A positive NPV indicates that the projectis economically justified at the given
discount rate; the higher the NPV, thegreater will be the benefits from theproject.
The NPV can only be calculated from apredetermined discount rate must be thesame for each project being compared.The NPV should only be quoted inconjunction with the discount rate thathas been used. The rate used shouldnormally be the government’s ownestimate of the minimum acceptable rateof return on public investment (seeearlier). One advantage of the NPVapproach is that the result is presentedas a sum of money (in whatever currencyhas been used in the analysis) and isthus ‘easy to understand’.
116 15, Project Analysis
n - 1 bi - ci
NPV = �___________
i= 0(1+(r / 100))i
where n = the project analysis period inyears
i = current year, with i=0 in thebase year
bi = the sum of all benefits in year ici = the sum of all costs in year ir = planning discount rate
expressed as a percentage.
NPV/cost ratioOne problem with the use of NPV is that,other things being equal, a large projectwill have a larger NPV than a lessexpensive one, and on this criterionwould always be chosen. This can causedifficulties when only two or threeprojects are being compared. However, if all projects that could be undertakenwith available public investment wereappraised and ranked according to thesize of the NPV/cost ratio, the bestchoice would be that giving the highestratio. In this event, several smallerprojects which in aggregate had a higherNPV would be chosen over a singlelarger project.
A large number of possible projects can beranked by the NPV/cost ratio and thosewith the highest ratios considered first.The NPV/cost ratio of the project justabove the point where money runs out isknown as the cut-off rate. The NPV/costratio can also be used when assessingalternative mutually exclusive schemes.Thus if these were, for example, twoalternative routes on which an improvedroad could be built or two alternativegeometric design options, the incrementalNPV/cost ratio can be used i.e.:
If the incremental NPV/cost ratio isgreater than the cut-off rate, then themore expensive scheme can be justified.
A range of NPV’s should always bequoted to reflect the range of scenariosand variables being investigated by thefeasibility study. It is also important toconsider the results of the financial, socialand environmental appraisals whendeciding which is the best project.
Internal rate of return (IRR)This is the discount rate at which thepresent value of costs and benefits areequal; in other words, the discount ratethat makes the NPV = 0. Calculation ofIRR is not as straightforward as NPV andis done by solving the following equationfor r:
Solutions are normally found graphicallyor by iteration. The IRR gives noindication of the size of the costs orbenefits of a project but acts as a guideto the profitability of the investment. Thehigher the IRR, the better is the project. Ifit is larger than the planning discountrate, then the project is economicallyjustified. Note that the IRR does notrequire the discount rate to be knownand is thus considered favourably byinternational lending agencies.
Project timing and first year rate ofreturn (FYRR)Cost-benefit analysis should also be usedto assist in determining the best time thata project should start. Even if the analysisshows that the project is worthwhile,there may still be a case for delaying thestart whilst traffic continues to grow toincrease the rate of return to a moreappropriate level. The best way ofdetermining this is to analyze the projectwith a range of investment timings to seewhich produces the highest NPV.However, for most road projects, wheretraffic continues to grow in the future, the(easier to calculate) first year rate ofreturn criterion can be used.
The FYRR is simply the sum of thebenefits in the first year that the project isopened to traffic, divided by the presentvalue of the capital cost, (bothdiscounted back to the same year) andexpressed as a percentage. Thus theFYRR is given by:
where j = first year of benefits, with j = 0 in the base year and
other notation as before.
If the FYRR is greater than the planningdiscount rate, then the project is timelyand should go ahead. If it is less than thediscount rate, but the NPV is positive, thestart of the project should be deferredand further rates of return should becalculated to define the optimum startingdate.
Recommended approachTable 15.1 summarizes the advantagesand disadvantages of the different criteria
that can be used in a cost benefitanalysis. In most cases the NPV and IRRwill give consistent results and willproduce the same ranking of alternativesaccording to their attractiveness.However, in a few cases, the use of IRRwill give a different ranking to thatrecommended by using NPV.
In general, where the government isusing a target or minimum cut-off rate ofreturn on capital, maximizing NPV shouldbe the criterion. As already mentioned,the IRR method is particularly usefulwhere discount rates are highly uncertain.Normally, both methods should beevaluated for a project and, in cases ofconflict, other factors will usually indicatewhich of the methods is mostappropriate in the particularcircumstances.
Some sponsoring agencies dictate whichmethod they require to be used.Nevertheless, results from the othermethods should still be presented toprovide a broader picture. The timing of aproject should always be tested byevaluating the FYRR and, if this suggeststhat the project is premature, a range ofinvestment timings should beinvestigated to determine whichproduces the highest NPV.
15.3 COST-EFFECTIVENESSANALYSIS
15.3.1 Principles
For many low-volume roads, the level oftraffic is often insufficient to justify anyimprovements using conventional CBA asthe analytical tool. That is to say, thebenefits that can be measured in monetaryterms are insufficient to outweigh the costsof the project. However, there may well beother benefits that cannot be measured inmonetary terms but which need to beconsidered in the appraisal process. Cost-effectiveness or multi-criteria analysis hasbeen developed in order to try to addressthis problem of combining both quantifiedand non-quantifiable benefits. All of thesetechniques involve some process ofranking of the options on the basis of theirperformance against a set of pre-determined criteria which may or may notinclude an economic component.
117
n - 1 bi - ci�___________
i= 0(1+(r / 100))i
= 0
NPV option 1 - NPV option 2___________________________COST option 1 - COST option 2
j - 1
FYRR = 100bj / �ci (r / 100)) j-i
i= 0
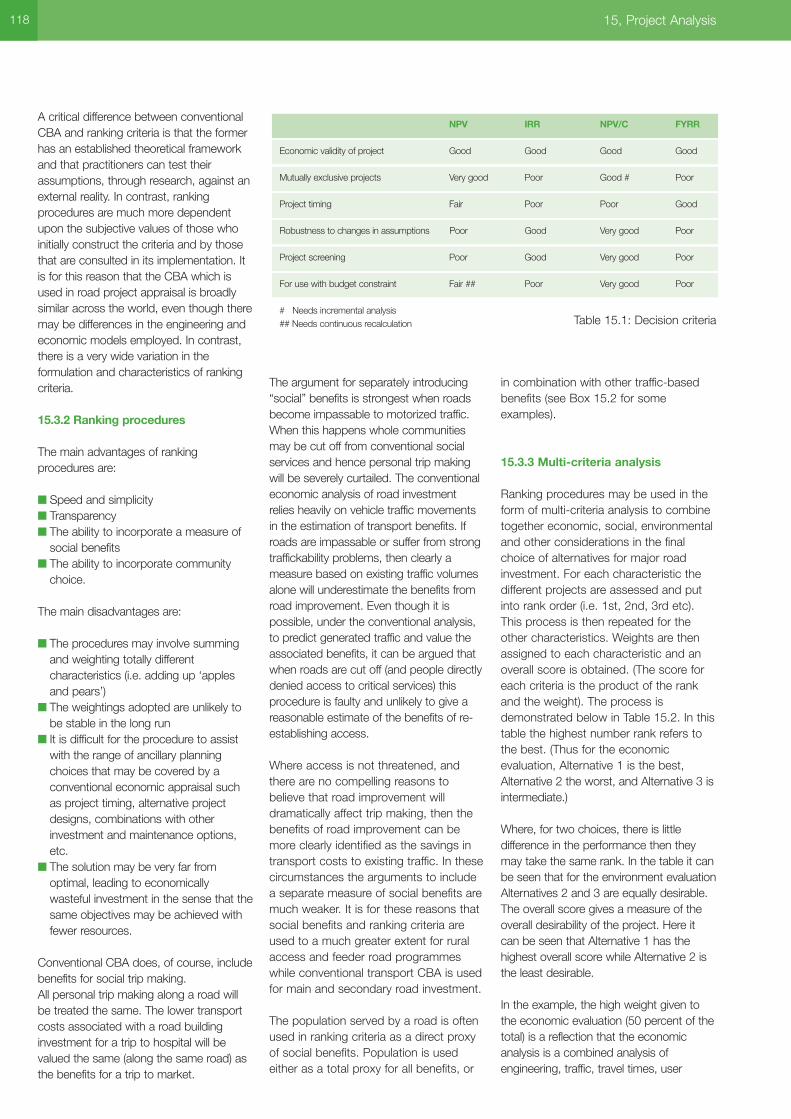
A critical difference between conventionalCBA and ranking criteria is that the formerhas an established theoretical frameworkand that practitioners can test theirassumptions, through research, against anexternal reality. In contrast, rankingprocedures are much more dependentupon the subjective values of those whoinitially construct the criteria and by thosethat are consulted in its implementation. Itis for this reason that the CBA which isused in road project appraisal is broadlysimilar across the world, even though theremay be differences in the engineering andeconomic models employed. In contrast,there is a very wide variation in theformulation and characteristics of rankingcriteria.
15.3.2 Ranking procedures
The main advantages of rankingprocedures are:
■ Speed and simplicity■ Transparency■ The ability to incorporate a measure of
social benefits■ The ability to incorporate community
choice.
The main disadvantages are:
■ The procedures may involve summingand weighting totally differentcharacteristics (i.e. adding up ‘applesand pears’)
■ The weightings adopted are unlikely tobe stable in the long run
■ It is difficult for the procedure to assistwith the range of ancillary planningchoices that may be covered by aconventional economic appraisal suchas project timing, alternative projectdesigns, combinations with otherinvestment and maintenance options,etc.
■ The solution may be very far fromoptimal, leading to economicallywasteful investment in the sense that thesame objectives may be achieved withfewer resources.
Conventional CBA does, of course, includebenefits for social trip making. All personal trip making along a road willbe treated the same. The lower transportcosts associated with a road buildinginvestment for a trip to hospital will bevalued the same (along the same road) asthe benefits for a trip to market.
The argument for separately introducing“social” benefits is strongest when roadsbecome impassable to motorized traffic.When this happens whole communitiesmay be cut off from conventional socialservices and hence personal trip makingwill be severely curtailed. The conventionaleconomic analysis of road investmentrelies heavily on vehicle traffic movementsin the estimation of transport benefits. Ifroads are impassable or suffer from strongtraffickability problems, then clearly ameasure based on existing traffic volumesalone will underestimate the benefits fromroad improvement. Even though it ispossible, under the conventional analysis,to predict generated traffic and value theassociated benefits, it can be argued thatwhen roads are cut off (and people directlydenied access to critical services) thisprocedure is faulty and unlikely to give areasonable estimate of the benefits of re-establishing access.
Where access is not threatened, andthere are no compelling reasons tobelieve that road improvement willdramatically affect trip making, then thebenefits of road improvement can bemore clearly identified as the savings intransport costs to existing traffic. In thesecircumstances the arguments to includea separate measure of social benefits aremuch weaker. It is for these reasons thatsocial benefits and ranking criteria areused to a much greater extent for ruralaccess and feeder road programmeswhile conventional transport CBA is usedfor main and secondary road investment.
The population served by a road is oftenused in ranking criteria as a direct proxyof social benefits. Population is usedeither as a total proxy for all benefits, or
in combination with other traffic-basedbenefits (see Box 15.2 for someexamples).
15.3.3 Multi-criteria analysis
Ranking procedures may be used in theform of multi-criteria analysis to combinetogether economic, social, environmentaland other considerations in the finalchoice of alternatives for major roadinvestment. For each characteristic thedifferent projects are assessed and putinto rank order (i.e. 1st, 2nd, 3rd etc).This process is then repeated for theother characteristics. Weights are thenassigned to each characteristic and anoverall score is obtained. (The score foreach criteria is the product of the rankand the weight). The process isdemonstrated below in Table 15.2. In thistable the highest number rank refers tothe best. (Thus for the economicevaluation, Alternative 1 is the best,Alternative 2 the worst, and Alternative 3 isintermediate.)
Where, for two choices, there is littledifference in the performance then theymay take the same rank. In the table it canbe seen that for the environment evaluationAlternatives 2 and 3 are equally desirable.The overall score gives a measure of theoverall desirability of the project. Here itcan be seen that Alternative 1 has thehighest overall score while Alternative 2 isthe least desirable.
In the example, the high weight given tothe economic evaluation (50 percent of thetotal) is a reflection that the economicanalysis is a combined analysis ofengineering, traffic, travel times, user
118 15, Project Analysis
NPV IRR NPV/C FYRR
Economic validity of project Good Good Good Good
Mutually exclusive projects Very good Poor Good # Poor
Project timing Fair Poor Poor Good
Robustness to changes in assumptions Poor Good Very good Poor
Project screening Poor Good Very good Poor
For use with budget constraint Fair ## Poor Very good Poor
# Needs incremental analysis## Needs continuous recalculation Table 15.1: Decision criteria
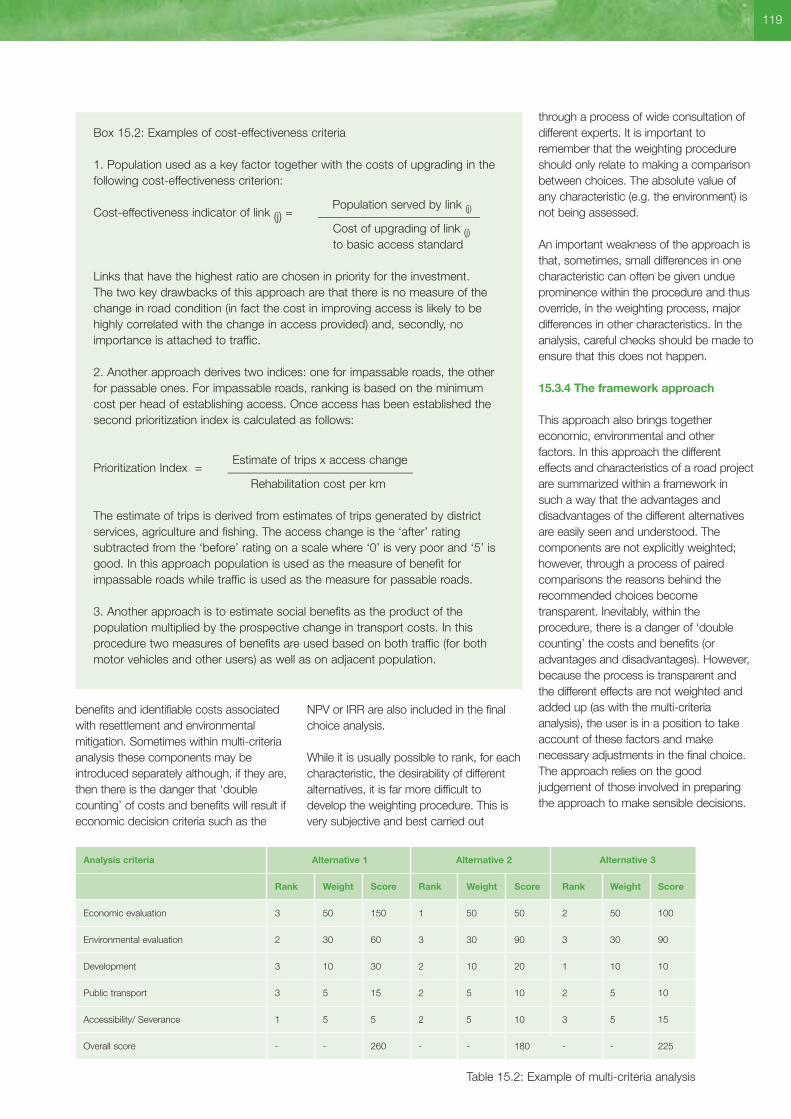
119
benefits and identifiable costs associatedwith resettlement and environmentalmitigation. Sometimes within multi-criteriaanalysis these components may beintroduced separately although, if they are,then there is the danger that ‘doublecounting’ of costs and benefits will result ifeconomic decision criteria such as the
NPV or IRR are also included in the finalchoice analysis.
While it is usually possible to rank, for eachcharacteristic, the desirability of differentalternatives, it is far more difficult todevelop the weighting procedure. This isvery subjective and best carried out
through a process of wide consultation ofdifferent experts. It is important toremember that the weighting procedureshould only relate to making a comparisonbetween choices. The absolute value ofany characteristic (e.g. the environment) isnot being assessed.
An important weakness of the approach isthat, sometimes, small differences in onecharacteristic can often be given undueprominence within the procedure and thusoverride, in the weighting process, majordifferences in other characteristics. In theanalysis, careful checks should be made toensure that this does not happen.
15.3.4 The framework approach
This approach also brings togethereconomic, environmental and otherfactors. In this approach the differenteffects and characteristics of a road projectare summarized within a framework insuch a way that the advantages anddisadvantages of the different alternativesare easily seen and understood. Thecomponents are not explicitly weighted;however, through a process of pairedcomparisons the reasons behind therecommended choices becometransparent. Inevitably, within theprocedure, there is a danger of ‘doublecounting’ the costs and benefits (oradvantages and disadvantages). However,because the process is transparent andthe different effects are not weighted andadded up (as with the multi-criteriaanalysis), the user is in a position to takeaccount of these factors and makenecessary adjustments in the final choice.The approach relies on the goodjudgement of those involved in preparingthe approach to make sensible decisions.
Box 15.2: Examples of cost-effectiveness criteria
1. Population used as a key factor together with the costs of upgrading in thefollowing cost-effectiveness criterion:
Population served by link (j)Cost-effectiveness indicator of link (j) = ___________________________Cost of upgrading of link (j)to basic access standard
Links that have the highest ratio are chosen in priority for the investment. The two key drawbacks of this approach are that there is no measure of thechange in road condition (in fact the cost in improving access is likely to behighly correlated with the change in access provided) and, secondly, noimportance is attached to traffic.
2. Another approach derives two indices: one for impassable roads, the otherfor passable ones. For impassable roads, ranking is based on the minimumcost per head of establishing access. Once access has been established thesecond prioritization index is calculated as follows:
Estimate of trips x access changePrioritization Index = _______________________________
Rehabilitation cost per km
The estimate of trips is derived from estimates of trips generated by districtservices, agriculture and fishing. The access change is the ‘after’ ratingsubtracted from the ‘before’ rating on a scale where ‘0’ is very poor and ‘5’ isgood. In this approach population is used as the measure of benefit forimpassable roads while traffic is used as the measure for passable roads.
3. Another approach is to estimate social benefits as the product of thepopulation multiplied by the prospective change in transport costs. In thisprocedure two measures of benefits are used based on both traffic (for bothmotor vehicles and other users) as well as on adjacent population.
Analysis criteria Alternative 1 Alternative 2 Alternative 3
Rank Weight Score Rank Weight Score Rank Weight Score
Economic evaluation 3 50 150 1 50 50 2 50 100
Environmental evaluation 2 30 60 3 30 90 3 30 90
Development 3 10 30 2 10 20 1 10 10
Public transport 3 5 15 2 5 10 2 5 10
Accessibility/ Severance 1 5 5 2 5 10 3 5 15
Overall score - - 260 - - 180 - - 225
Table 15.2: Example of multi-criteria analysis

The framework approach may besummarized as follows:
■ The key quantifiable and non-quantifiable effects and characteristics ofeach alternative option are summarizedwithin a table; particular attention isgiven to the critical differences betweenthe alternatives
■ Alternative pairs of ‘project cases’ arethen compared together. Throughcomparison of the key differences, onealternative of each pair is rejected
■ The pair-wise comparison is continueduntil one ‘project case’ remains. This isrecognized as the most desirableinvestment option. This alternative isthen finally compared with the ‘basecase’ or ‘do-minimum case’
■ A recommendation is then madewhether the project should go ahead ornot.
The factors that might be summarizedwithin a framework analysis are likely toinclude many key components of theeconomic and environmental evaluationsas well as results from participatoryexercises and any other ancillary studies.Examples of quantified components thatmay be included are:
■ VOC and time savings ■ Accident savings ■ Noise levels ■ The number of properties within a given
distance from the road■ The area of land acquisition covering
different land uses ■ People affected by resettlement ■ Environmental mitigation costs ■ Construction costs■ NPVs or IRRs ■ The percentage of people that prefer
each option.
Examples of non-quantifiable aspectsmight include statements on the following: ■ Visual intrusion and the way that local
amenities may be used and affected ■ The effects on public transport ■ The differential effects on future
development ■ The nature of the wider effects on the
natural environment ■ Severance and accessibility effects on
different communities.
Tools exist for undertaking multi-criteriaanalysis and one such is described inBox 15.3.
120 15, Project Analysis
Box 15.3: Including social benefits in the appraisal process
A social benefits software tool has been developed using the AnalyticalHierarchy Process (AHP) Method. This method systematically transforms theanalysis of competing objectives to a series of simple comparisons betweenthe constituent elements. In particular, the approach does not require anexplicit definition of trade-offs between the possible values of each attribute,and it allows users to understand the way in which outcomes are reachedand how the weightings influence the outcomes.
The social benefits software tool requires three major inputs: ■ A clear definition of mutually exclusive investment alternatives (for each
road section) to be compared■ The main goal, objectives, criteria and attributes under which the
alternatives are to be compared ■ A statement of preferences on the set of objectives.
A score is calculated for each alternative using the AHP. The scores can beconsidered as the utility index in terms of social benefits value that eachinvestment alternative could yield, and can therefore be used as an indicatorfor ranking or prioritization of projects. The ratio of the utility index to the costof implementing the investment alternative also provides a useful prioritizationindex.
The social benefits software is designed to be compatible with wellestablished road appraisal tools such as HDM-4. The investment alternativesanalyzed in the social benefits software can be exported to HDM-4. Thesecan then be analyzed together with the other investment alternatives definedin HDM-4 within the multi-criteria analysis framework incorporated in HDM-4.The scores (or utility indices) calculated in the social benefits software can beused in HDM-4 to combine social concerns with others (e.g. economic,environmental, energy efficiency, road safety, etc.). For project analysis atcommunity level, the utility indices will be used to rank and select projectalternatives. At national, regional or district level, the ratio of the utility index tothe cost of implementing each investment alternative can be used throughoptimization procedures as follows:
■ Programme analysis to prepare work programmes under specified budgetconstraints
■ Strategy analysis to allocate budget between road classes, administrativeunits, and work types
■ Research, for example to assess the impact of including/excluding socialconcerns on funding for low volume road.
Source: Overseas Road Note 22. A guide to pro-poor transport appraisal
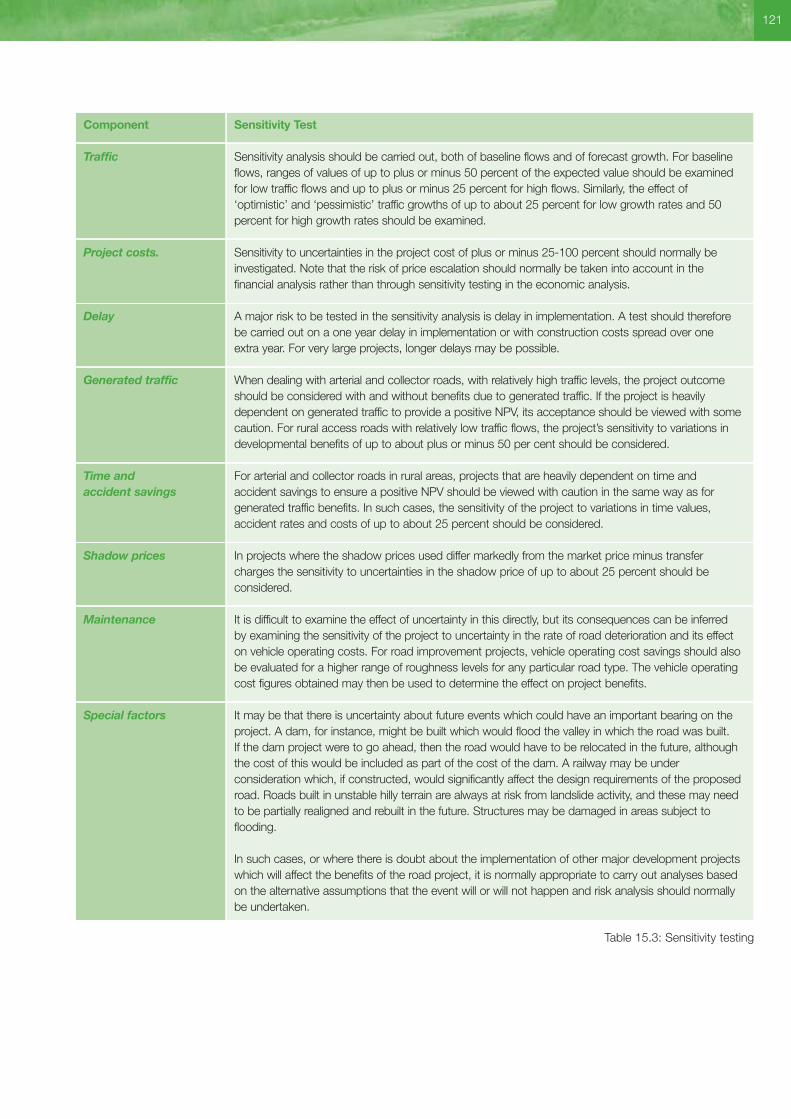
121
Component Sensitivity Test
Traffic Sensitivity analysis should be carried out, both of baseline flows and of forecast growth. For baselineflows, ranges of values of up to plus or minus 50 percent of the expected value should be examinedfor low traffic flows and up to plus or minus 25 percent for high flows. Similarly, the effect of‘optimistic’ and ‘pessimistic’ traffic growths of up to about 25 percent for low growth rates and 50percent for high growth rates should be examined.
Project costs. Sensitivity to uncertainties in the project cost of plus or minus 25-100 percent should normally beinvestigated. Note that the risk of price escalation should normally be taken into account in thefinancial analysis rather than through sensitivity testing in the economic analysis.
Delay A major risk to be tested in the sensitivity analysis is delay in implementation. A test should thereforebe carried out on a one year delay in implementation or with construction costs spread over oneextra year. For very large projects, longer delays may be possible.
Generated traffic When dealing with arterial and collector roads, with relatively high traffic levels, the project outcomeshould be considered with and without benefits due to generated traffic. If the project is heavilydependent on generated traffic to provide a positive NPV, its acceptance should be viewed with somecaution. For rural access roads with relatively low traffic flows, the project’s sensitivity to variations indevelopmental benefits of up to about plus or minus 50 per cent should be considered.
Time and For arterial and collector roads in rural areas, projects that are heavily dependent on time and accident savings accident savings to ensure a positive NPV should be viewed with caution in the same way as for
generated traffic benefits. In such cases, the sensitivity of the project to variations in time values,accident rates and costs of up to about 25 percent should be considered.
Shadow prices In projects where the shadow prices used differ markedly from the market price minus transfercharges the sensitivity to uncertainties in the shadow price of up to about 25 percent should beconsidered.
Maintenance It is difficult to examine the effect of uncertainty in this directly, but its consequences can be inferredby examining the sensitivity of the project to uncertainty in the rate of road deterioration and its effecton vehicle operating costs. For road improvement projects, vehicle operating cost savings should alsobe evaluated for a higher range of roughness levels for any particular road type. The vehicle operatingcost figures obtained may then be used to determine the effect on project benefits.
Special factors It may be that there is uncertainty about future events which could have an important bearing on theproject. A dam, for instance, might be built which would flood the valley in which the road was built. If the dam project were to go ahead, then the road would have to be relocated in the future, althoughthe cost of this would be included as part of the cost of the dam. A railway may be underconsideration which, if constructed, would significantly affect the design requirements of the proposedroad. Roads built in unstable hilly terrain are always at risk from landslide activity, and these may needto be partially realigned and rebuilt in the future. Structures may be damaged in areas subject toflooding.
In such cases, or where there is doubt about the implementation of other major development projectswhich will affect the benefits of the road project, it is normally appropriate to carry out analyses basedon the alternative assumptions that the event will or will not happen and risk analysis should normallybe undertaken.
Table 15.3: Sensitivity testing
15.4 ANALYSIS OF UNCERTAINTY
15.4.1 Scenario and risk analysis
The data and parameters used in theanalysis of a road project can be prone tosubstantial errors and it is important torecognize that these exist and to takesteps to minimize them. Because of this,the results of an appraisal are subject touncertainty and there will be a riskassociated with pursuing any course ofaction suggested by the appraisal.
It was recommended earlier that scenarioanalysis should be used for projects thatare not well defined or at the early stagesof the project cycle. In such cases, a rangeof options should be examined, coveringfuture possibilities that might reasonably beexpected to occur. For such scenarios,which will often be covering political,economic and social uncertainties, projectsshould be examined for their robustness inbeing able to deliver a satisfactory NPVover the range of options beingconsidered.
Where projects are well defined, riskanalysis is more appropriate and, in thesecases, the effect on the NPV ofcombinations of uncertainties in theproject’s most sensitive parameters shouldbe examined. Ideally, an approach basedon probabilities should be used and theremainder of this section describes howthis should be carried out.
15.4.2 Expected values
The basic calculation of net present valueshould incorporate the best estimates ofthe variables and parameters thatdetermine the cost and benefit streams.The estimates should be the ‘expectedvalues’ obtained, in principle by weightingeach possible value by the probability of itsoccurrence. Using expected valuesensures that the estimates are unbiased,providing that the formation of theprobability function of values is unbiased.In the absence of probability data, midpoints of the range of expected valuesshould be used. Biased estimates, such asconservative estimates of costs (on thehigh side) and of benefits (on the low side),should be avoided, since they distort thecomparison of alternative projects.
In view of the uncertainties present, it willusually be preferable to show the results of
a project analysis as a range of valuesreflecting major uncertainties, rather thanas a single figure, because this aids thechoice of the most robust project. It istherefore necessary to identify:
■ Those sensitive areas which have acritical importance on the success or failure of the project
■ Ways of improving the project by makingit less risky, more cost-effective, or both.
Sensitivity analysis is appropriate for initial identification of sensitive inputs orparameters, but risk analysis is alsorelevant where correlated sets of inputsneed to be identified, and to demonstrateclearly the range of possible outcomes fora project, even in the absence ofcorrelated inputs. Both are dealt withbelow.
15.4.3 Contingency
It is usual to include in the estimates ofcapital costs a separate allowance tocover contingencies. These are of twotypes.
■ Expected costs. Allowances should beincluded to cover costs which have notbeen separately identified, but whichexperience indicates must inevitablyoccur during the construction period. Alump sum contingency allowance totake account of all the constituent partsshould he used in such cases to cover avariety of items.
■ Tolerances. This form of contingencyallowance is an estimate, usually basedon past experience, of the probability ofunforeseen costs arising and of theirprobable magnitude. Tolerances reflectthe fact that costs may overrun due tophysical contingencies, such asunexpected poor ground conditions orlack of finance which prolongsconstruction time. The best estimate ofthe allowance should be regarded forappraisal purposes as part of the cost ofthe project, even though it may not haveto be spent.
Expected contingency allowances of up toabout 25 percent of the construction costare normal for road projects in developingcountries. It is not necessary to makeallowances in an economic appraisal tocover price increases due to inflationduring the construction period providingthat all prices are expressed in terms of
constant base year values as describedearlier. However, any such price increasewill affect the project’s cash flow and willneed to be estimated for budgetarypurposes in the financial analysis. Whenpreparing the project budget, it may alsobe necessary to consider separately theprices of imported items from thoseaffecting the cost of local labour andmaterials.
15.4.4 Sensitivity analysis
Sensitivity analysis is carried out by varyingthe magnitude of the more importantvariables, normally one at a time, whilstkeeping the values of the remainingvariables fixed. By looking at higher andlower figures than those expected, it ispossible to determine how sensitive thenet present value is to such changes. Thevariables that are chosen for testing are amatter of judgement but, for most roadschemes, those shown in Table 15.3should be considered as possiblecandidates.
Providing that investment models, such asHDM-4, are being used to assist with theproject appraisal, sensitivity analysis is easyand quick to do. Indeed, one of theprincipal advantages of such models isthat they enable this to be done at lowcost in terms of time. When investmentmodels are not available, a limited amountof sensitivity testing should still be done.The effect of uncertainty in traffic shouldalways be investigated even though themanual calculations needed may be timeconsuming. The effect of uncertainty inproject cost is easy to evaluate by handand should therefore normally bedetermined. It will assist in theinterpretation of the results if the NPV isevaluated separately for:
■ Benefits to normal traffic■ Benefits to generated traffic■ Time savings■ Accident savings.
15.4.5 Risk analysis
Sensitivity analysis should indicate which ofthe parameters examined are likely to havethe most significant effect on the feasibilityof the project because of inherentuncertainty, but does not show thecombined net effect of changes in allvariables or the likelihood of changesoccurring together. Where several
122 15, Project Analysis

123
parameters are identified whose estimatedaccuracy is critical to the successfuloutcome of the project, risk analysis maybe appropriate.
Risk analysis, in its simplest form, requiresspecifying the probability of an individualinput variable attaining a range of values.Using this, the probability distributions ofthe NPV and other output parameters canbe determined. Risk analysis provides abetter basis for judging the relative meritsof alternative projects, but it does nothingto diminish the risks. It is time consumingto carry out with projects that are ascomplex as roads, and such analysis musttherefore be reserved for a very fewvariables in highly critical cases. Somerisks identified by the sensitivity analysiscan be reduced by carrying out further fieldinvestigations and redesign which may ormay not be worthwhile depending on thecost of the investigation and the expectedreduction in the risk. Risk may alsosometimes be reduced by a more flexibleapproach to design and construction suchas is possible under cost-reimbursementor target price contracts.
However, for a small amount of effort, evenrough-and-ready forms of risk analysis arelikely to improve the quality of decisionmaking considerably.
DETAILED SOURCES OF INFORMATION
Lebo, J and D Schelling (2001). Designand appraisal of rural transportinfrastructure: Ensuring basic access forrural communities. World Bank,Washington, DC.
IT Transport (2001). Appraisal ofinvestments in improved rural access.DFID Economists Guide. IT Transport,Ardington, UK.
ITS (2003). Toolkit for the economicevaluation of World Bank transportprojects. Institute for Transport Studies,University of Leeds, Leeds, UK.
TRL (2004). The rural transport policytoolkit. TRL Ltd., Crowthorne, UK.
TRL (2004). A guide to pro-poor transportappraisal. Overseas Road Note 22, TRLLtd, Crowthorne, UK.
16. THE FEASIBILITY STUDY REPORT
16.1 PREPARATION
Decisions must be made at various stagesthroughout the project cycle. The earlydecisions on a project, however apparentlyinnocuous, can have a disproportionateeffect on the final shape of the scheme. At each stage, careful preparation andpresentation are necessary to reveal andjustify decisions taken or recommendationsmade. The feasibility study report marksthe end of the appraisal process andshould recommend whether the projectshould go ahead, and to what standards itshould be built. The report may wish torecommend alternative designs orapproaches to the project that wouldincrease the rate of return in those areaswhere the original project is not viable.
In addition to these decisions about thenature of the project, the way in which theproject is presented can be important forfuture projects of a similar kind, and for thefuture monitoring and evaluation of theproject. It can, for instance, throughsensitivity analysis, show the crucial factorswhich will make or break the project.These can give important signals to thoseconcerned with checking the progress andreviewing the results of the project in thefuture.
Once the need for a project has beenidentified, the extent of further investigationwill depend on a number ofconsiderations. The political, managerial,economic, technical and financial aspectsneed to be covered adequately in everycase, but depending on who the report isbeing written for, some aspects have to becovered in greater depth than others.
Where reports are prepared for aid donors,each will have different requirements.
Projects prepared for aid agenciesnormally dwell heavily on environmentaland socio-economic factors. The WorldBank, for instance, has a highly formal,elaborate and thorough process ofapproving projects through its executiveboard, necessitating extremely careful andcomprehensive preparation. Most bi-lateraldonors likewise impose well-defined andrigorous procedures for approving large aidprojects.
The team assigned to prepare the projectshould normally contain a range ofprofessionals such as engineers, transportplanners and economists. Sectorspecialists need to be added where thesize and complexity of the project require,for example, agronomists, engineeringgeologists, environmental specialists, roadsafety experts etc. Where, as is oftennecessary, members of the project teamare from an international consultant, thelocal government should participate as fullyas possible in the investigations. Thisnormally requires the allocation of localprofessional staff to the project team. Thefinance and planning ministries should bemade fully aware of progress andrecommendations, although the promotingministry should take responsibility for thedetailed professional work.
16.2 PRESENTATION
The particular approval procedure to beused affects the way in which the project ispresented. Some agencies insist onstandardized presentations with bulkysupporting documentation, while othersprefer shorter and more sharply focusedreports.
Whatever the nature of the approvingbody, it should be assumed that themajority of the people who have to take
the decision are non-specialists and arebusy. This argues for a clear and simpledocument with the accent on objectivityand brevity, and containing the moredetailed discussion of technical andspecialist aspects as annexes to the maindocument. It should contain a summaryand conclusions. A map of the projectlocation is usually essential, together withother visual aids like diagrams and barcharts. Where values are expressed inforeign currency, a conversion rate intolocal currency should be included.
In principle, the paper should be in a formthat can be made available to other partiesinvolved such as a foreign governmentproviding the loan or aid, the local authoritythat will have to implement the work, etc.To this end, the document could bedivided into two sections, one that can bedistributed and the other containinginformation and views meant for theapproval body only.
It is helpful if the submission clearly drawsout the effects of the project on differentparties who may be affected and on thewider economy of the country. Benefitsand costs should be shown individuallyand the appraisal methodology usedshould be indicated. Likewise, theeconomic discussion should includescenario analysis, or sensitivity and riskanalysis, in order to accentuate the mostimportant factors governing the success orfailure of the project. This analysis shouldbe consistent with government policies ofpricing, tariffs, procurement, incomespolicies, etc, where they are likely to haveinfluence on the outcome of the project.
A full checklist of what the feasibility reportshould contain is given in Table 16.1. Onepossible approach for presenting thefeasibility study report is to follow thegeneral order of topics as in this Note:
124 16. The Feasibility Study Report
16. The Feasibility Study Report
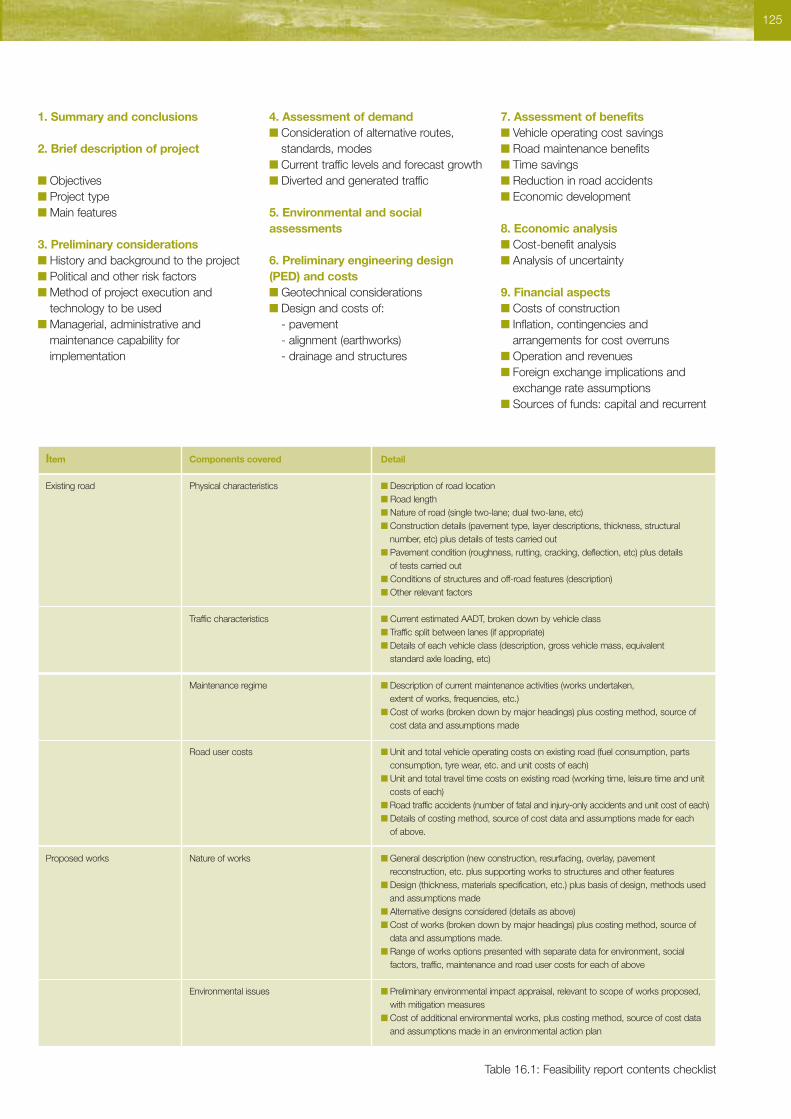
125
Item Components covered Detail
Existing road Physical characteristics ■ Description of road location■ Road length■ Nature of road (single two-lane; dual two-lane, etc)■ Construction details (pavement type, layer descriptions, thickness, structural
number, etc) plus details of tests carried out■ Pavement condition (roughness, rutting, cracking, deflection, etc) plus details
of tests carried out■ Conditions of structures and off-road features (description)■ Other relevant factors
Traffic characteristics ■ Current estimated AADT, broken down by vehicle class■ Traffic split between lanes (if appropriate)■ Details of each vehicle class (description, gross vehicle mass, equivalent
standard axle loading, etc)
Maintenance regime ■ Description of current maintenance activities (works undertaken, extent of works, frequencies, etc.)
■ Cost of works (broken down by major headings) plus costing method, source ofcost data and assumptions made
Road user costs ■ Unit and total vehicle operating costs on existing road (fuel consumption, partsconsumption, tyre wear, etc. and unit costs of each)
■ Unit and total travel time costs on existing road (working time, leisure time and unitcosts of each)
■ Road traffic accidents (number of fatal and injury-only accidents and unit cost of each)■ Details of costing method, source of cost data and assumptions made for each
of above.
Proposed works Nature of works ■ General description (new construction, resurfacing, overlay, pavementreconstruction, etc. plus supporting works to structures and other features
■ Design (thickness, materials specification, etc.) plus basis of design, methods usedand assumptions made
■ Alternative designs considered (details as above)■ Cost of works (broken down by major headings) plus costing method, source of
data and assumptions made.■ Range of works options presented with separate data for environment, social
factors, traffic, maintenance and road user costs for each of above
Environmental issues ■ Preliminary environmental impact appraisal, relevant to scope of works proposed,with mitigation measures
■ Cost of additional environmental works, plus costing method, source of cost dataand assumptions made in an environmental action plan
1. Summary and conclusions
2. Brief description of project
■ Objectives■ Project type■ Main features
3. Preliminary considerations■ History and background to the project ■ Political and other risk factors■ Method of project execution and
technology to be used■ Managerial, administrative and
maintenance capability forimplementation
4. Assessment of demand■ Consideration of alternative routes,
standards, modes■ Current traffic levels and forecast growth ■ Diverted and generated traffic
5. Environmental and socialassessments
6. Preliminary engineering design(PED) and costs■ Geotechnical considerations ■ Design and costs of:
- pavement- alignment (earthworks)- drainage and structures
7. Assessment of benefits■ Vehicle operating cost savings■ Road maintenance benefits■ Time savings■ Reduction in road accidents■ Economic development
8. Economic analysis■ Cost-benefit analysis ■ Analysis of uncertainty
9. Financial aspects■ Costs of construction ■ Inflation, contingencies and
arrangements for cost overruns■ Operation and revenues■ Foreign exchange implications and
exchange rate assumptions■ Sources of funds: capital and recurrent
Table 16.1: Feasibility report contents checklist
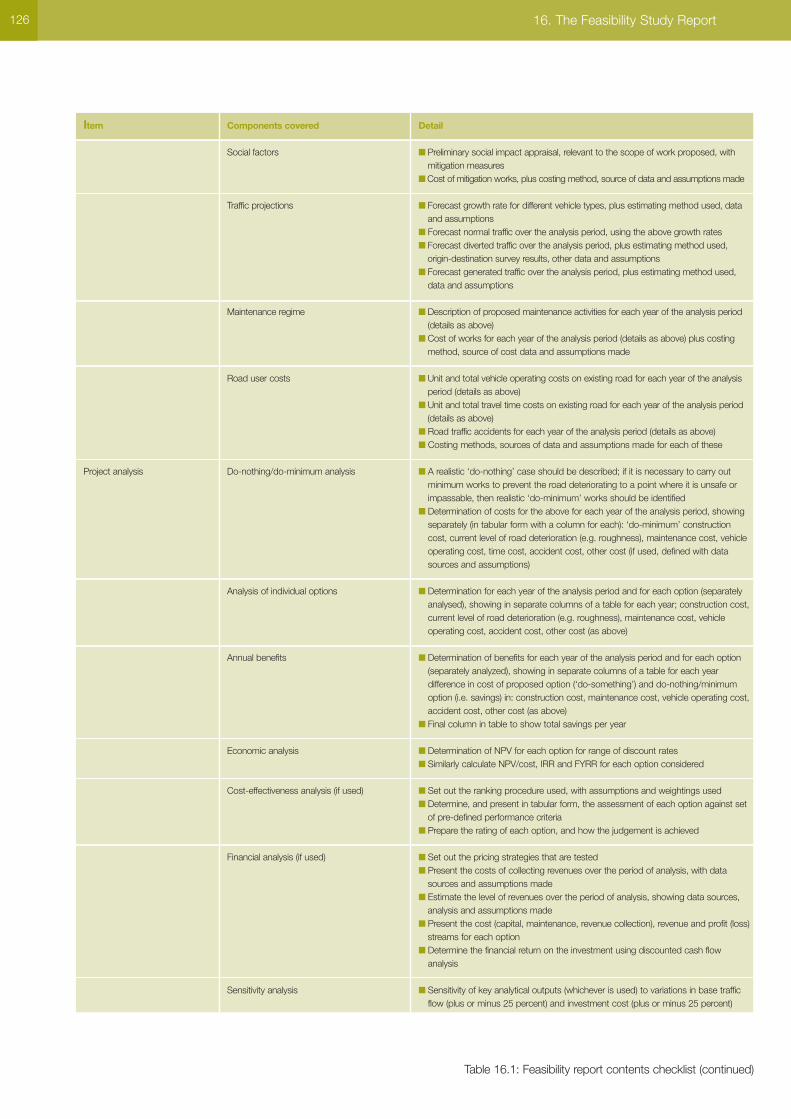
126 16. The Feasibility Study Report
Item Components covered Detail
Social factors ■ Preliminary social impact appraisal, relevant to the scope of work proposed, withmitigation measures
■ Cost of mitigation works, plus costing method, source of data and assumptions made
Traffic projections ■ Forecast growth rate for different vehicle types, plus estimating method used, dataand assumptions
■ Forecast normal traffic over the analysis period, using the above growth rates■ Forecast diverted traffic over the analysis period, plus estimating method used,
origin-destination survey results, other data and assumptions■ Forecast generated traffic over the analysis period, plus estimating method used,
data and assumptions
Maintenance regime ■ Description of proposed maintenance activities for each year of the analysis period(details as above)
■ Cost of works for each year of the analysis period (details as above) plus costingmethod, source of cost data and assumptions made
Road user costs ■ Unit and total vehicle operating costs on existing road for each year of the analysisperiod (details as above)
■ Unit and total travel time costs on existing road for each year of the analysis period(details as above)
■ Road traffic accidents for each year of the analysis period (details as above)■ Costing methods, sources of data and assumptions made for each of these
Project analysis Do-nothing/do-minimum analysis ■ A realistic ‘do-nothing’ case should be described; if it is necessary to carry outminimum works to prevent the road deteriorating to a point where it is unsafe orimpassable, then realistic ‘do-minimum’ works should be identified
■ Determination of costs for the above for each year of the analysis period, showingseparately (in tabular form with a column for each): ‘do-minimum’ construction cost, current level of road deterioration (e.g. roughness), maintenance cost, vehicleoperating cost, time cost, accident cost, other cost (if used, defined with datasources and assumptions)
Analysis of individual options ■ Determination for each year of the analysis period and for each option (separatelyanalysed), showing in separate columns of a table for each year; construction cost,current level of road deterioration (e.g. roughness), maintenance cost, vehicleoperating cost, accident cost, other cost (as above)
Annual benefits ■ Determination of benefits for each year of the analysis period and for each option(separately analyzed), showing in separate columns of a table for each yeardifference in cost of proposed option (‘do-something’) and do-nothing/minimumoption (i.e. savings) in: construction cost, maintenance cost, vehicle operating cost,accident cost, other cost (as above)
■ Final column in table to show total savings per year
Economic analysis ■ Determination of NPV for each option for range of discount rates■ Similarly calculate NPV/cost, IRR and FYRR for each option considered
Cost-effectiveness analysis (if used) ■ Set out the ranking procedure used, with assumptions and weightings used■ Determine, and present in tabular form, the assessment of each option against set
of pre-defined performance criteria■ Prepare the rating of each option, and how the judgement is achieved
Financial analysis (if used) ■ Set out the pricing strategies that are tested ■ Present the costs of collecting revenues over the period of analysis, with data
sources and assumptions made■ Estimate the level of revenues over the period of analysis, showing data sources,
analysis and assumptions made■ Present the cost (capital, maintenance, revenue collection), revenue and profit (loss)
streams for each option■ Determine the financial return on the investment using discounted cash flow
analysis
Sensitivity analysis ■ Sensitivity of key analytical outputs (whichever is used) to variations in base trafficflow (plus or minus 25 percent) and investment cost (plus or minus 25 percent)
Table 16.1: Feasibility report contents checklist (continued)

10. Implementation■ Responsibility for implementation■ Arrangements for construction■ Maintenance
11. Plans for monitoring andevaluation
12. Annexes(These must be keyed in to the main text,otherwise they may be ignored).
The conclusions in the project reportshould ensure that the following aspects ofthe project have been considered and arereflected in the final recommendations:
■ The options investigated have beenselected from the full range available
■ The results for each option arepresented as a range of values in termsof NPV, etc
■ The main assumptions and sensitivity ofthe result to them are clearly identified
■ The result may need to be interpreted,not in terms of profit, but as costsavings or benefits which are availablefor alternative use.
127

Appendices
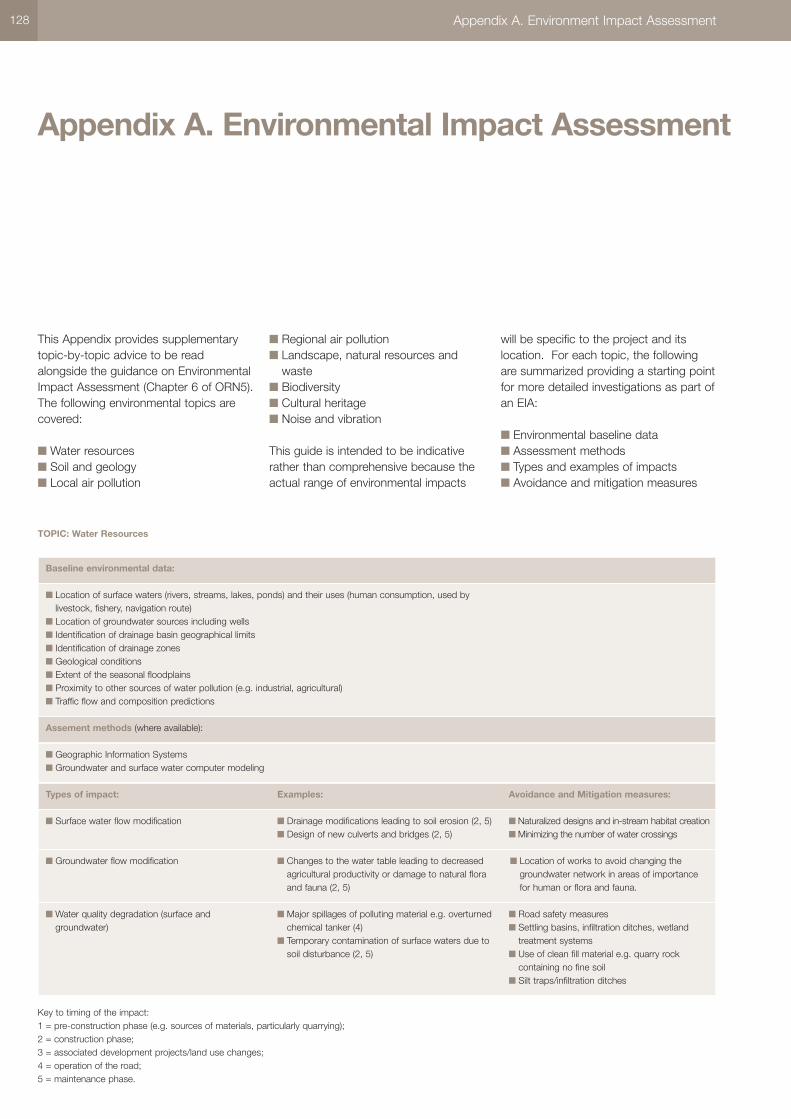
128 Appendix A. Environment Impact Assessment
Appendix A. Environmental Impact Assessment
This Appendix provides supplementarytopic-by-topic advice to be readalongside the guidance on EnvironmentalImpact Assessment (Chapter 6 of ORN5).The following environmental topics arecovered:
■ Water resources ■ Soil and geology ■ Local air pollution
■ Regional air pollution ■ Landscape, natural resources and
waste■ Biodiversity■ Cultural heritage ■ Noise and vibration
This guide is intended to be indicativerather than comprehensive because theactual range of environmental impacts
will be specific to the project and itslocation. For each topic, the followingare summarized providing a starting pointfor more detailed investigations as part ofan EIA:
■ Environmental baseline data■ Assessment methods ■ Types and examples of impacts■ Avoidance and mitigation measures
TOPIC: Water Resources
Baseline environmental data:
■ Location of surface waters (rivers, streams, lakes, ponds) and their uses (human consumption, used bylivestock, fishery, navigation route)
■ Location of groundwater sources including wells■ Identification of drainage basin geographical limits■ Identification of drainage zones■ Geological conditions■ Extent of the seasonal floodplains ■ Proximity to other sources of water pollution (e.g. industrial, agricultural)■ Traffic flow and composition predictions
Assement methods (where available):
■ Geographic Information Systems■ Groundwater and surface water computer modeling
Types of impact: Examples: Avoidance and Mitigation measures:
■ Surface water flow modification ■ Drainage modifications leading to soil erosion (2, 5)■ Design of new culverts and bridges (2, 5)
■ Naturalized designs and in-stream habitat creation■ Minimizing the number of water crossings
■ Groundwater flow modification ■ Changes to the water table leading to decreasedagricultural productivity or damage to natural floraand fauna (2, 5)
■ Location of works to avoid changing thegroundwater network in areas of importance for human or flora and fauna.
■ Water quality degradation (surface andgroundwater)
■ Major spillages of polluting material e.g. overturnedchemical tanker (4)
■ Temporary contamination of surface waters due tosoil disturbance (2, 5)
■ Road safety measures■ Settling basins, infiltration ditches, wetland
treatment systems ■ Use of clean fill material e.g. quarry rock
containing no fine soil■ Silt traps/infiltration ditches
Key to timing of the impact:1 = pre-construction phase (e.g. sources of materials, particularly quarrying); 2 = construction phase; 3 = associated development projects/land use changes; 4 = operation of the road; 5 = maintenance phase.
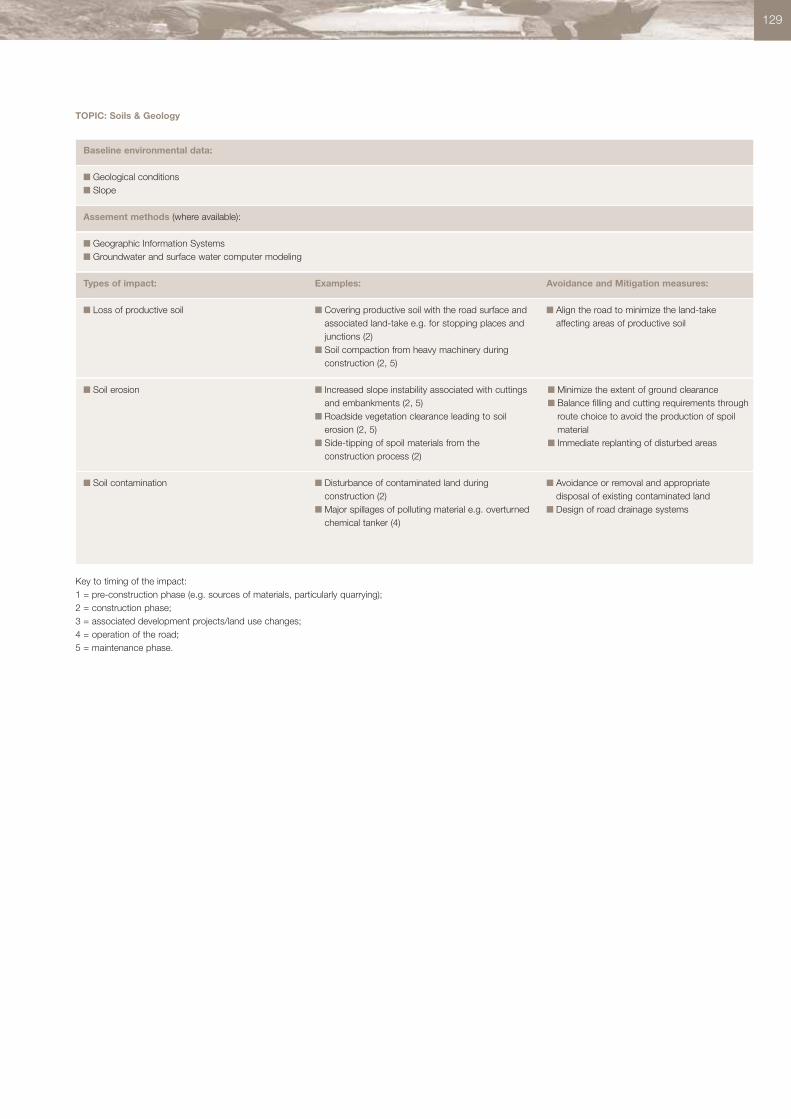
129
TOPIC: Soils & Geology
Baseline environmental data:
■ Geological conditions■ Slope
Assement methods (where available):
■ Geographic Information Systems■ Groundwater and surface water computer modeling
Types of impact: Examples: Avoidance and Mitigation measures:
■ Loss of productive soil ■ Covering productive soil with the road surface andassociated land-take e.g. for stopping places andjunctions (2)
■ Soil compaction from heavy machinery duringconstruction (2, 5)
■ Align the road to minimize the land-takeaffecting areas of productive soil
■ Soil erosion ■ Increased slope instability associated with cuttingsand embankments (2, 5)
■ Roadside vegetation clearance leading to soilerosion (2, 5)
■ Side-tipping of spoil materials from theconstruction process (2)
■ Minimize the extent of ground clearance■ Balance filling and cutting requirements through
route choice to avoid the production of spoilmaterial
■ Immediate replanting of disturbed areas
■ Soil contamination ■ Disturbance of contaminated land duringconstruction (2)
■ Major spillages of polluting material e.g. overturnedchemical tanker (4)
■ Avoidance or removal and appropriatedisposal of existing contaminated land
■ Design of road drainage systems
Key to timing of the impact:1 = pre-construction phase (e.g. sources of materials, particularly quarrying); 2 = construction phase; 3 = associated development projects/land use changes; 4 = operation of the road; 5 = maintenance phase.

130 Appendix A. Environment Impact Assessment
TOPIC: Regional Air Pollution
Baseline environmental data:
■ Density and distribution of general population who may be affected■ National/regional emission inventory by source category ■ Traffic movement: numbers, speed and vehicle fleet composition■ Fuel type and quality■ Prevailing wind direction, temperature and weather conditions■ Specific geographic issues: coastal, valley etc■ Trans-boundary pollution importation■ Topography■ Extent of unpaved roads
Assement methods (where available):
■ Emissions modeling/calculations based on emissions factors■ Dispersion modeling to derive changes in pollution concentrations■ Field measurement of existing air quality■ Geographic Information Systems
Types of impact: Examples: Avoidance and Mitigation measures:
■ Energy use, fuel consumption ■ Consumption of fossil fuels (2, 4) ■ Traffic management measures to reducecongestion
■ Avoiding steep grades and sharp curves whichwould promote deceleration and accelerationand increase emissions
■ Policy measures to improve fuel quality andmodernize the vehicle fleet
■ Policy measures to encourage modern publictransport, and increase occupancy of all roadtransport modes
■ Greenhouse gas emissions (primarily CO2) ■ Contribution to global climate change (2, 4)
■ Ozone (formed from the reaction of NOX andhydrocarbons with sunlight)
■ Potential health effects (2, 4)■ Crop damage (4)■ Visibility changes and impact on tourism (4)■ Damage to materials and fabrics (4)
Key to timing of the impact:1 = pre-construction phase (e.g. sources of materials, particularly quarrying); 2 = construction phase; 3 = associated development projects/land use changes; 4 = operation of the road; 5 = maintenance phase.
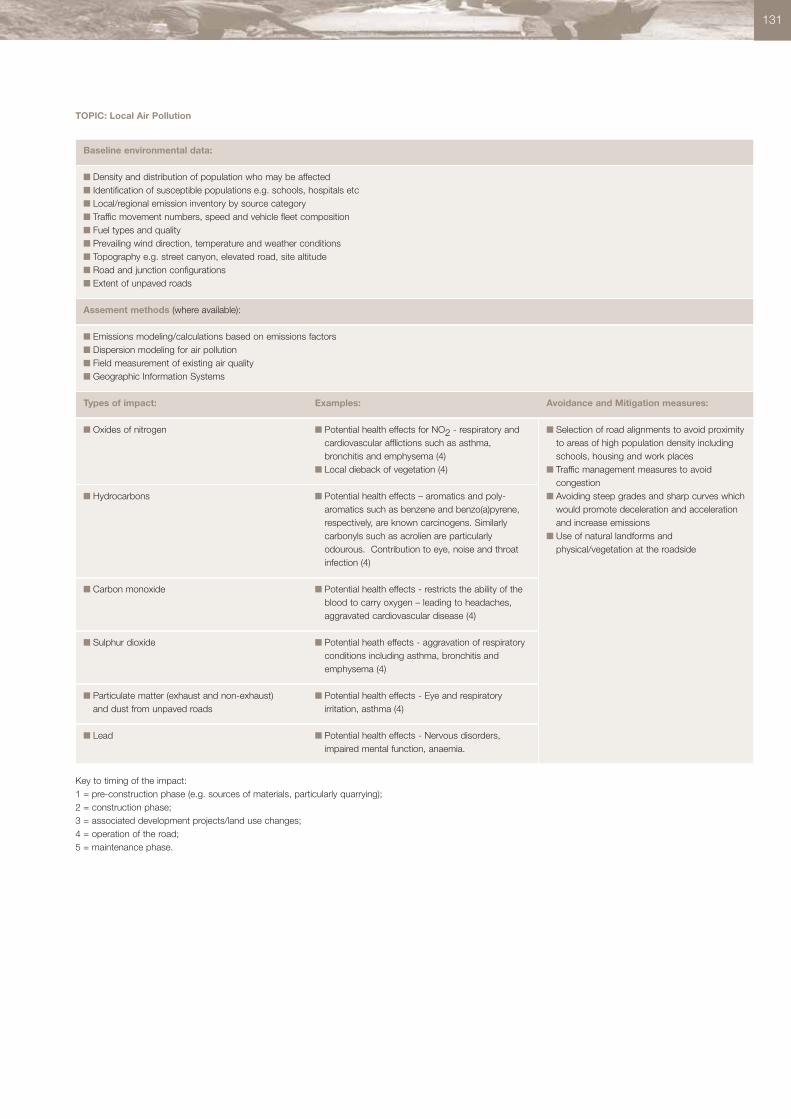
131
TOPIC: Local Air Pollution
Baseline environmental data:
■ Density and distribution of population who may be affected■ Identification of susceptible populations e.g. schools, hospitals etc ■ Local/regional emission inventory by source category ■ Traffic movement numbers, speed and vehicle fleet composition■ Fuel types and quality■ Prevailing wind direction, temperature and weather conditions■ Topography e.g. street canyon, elevated road, site altitude■ Road and junction configurations■ Extent of unpaved roads
Assement methods (where available):
■ Emissions modeling/calculations based on emissions factors■ Dispersion modeling for air pollution■ Field measurement of existing air quality■ Geographic Information Systems
Types of impact: Examples: Avoidance and Mitigation measures:
■ Oxides of nitrogen ■ Potential health effects for NO2 - respiratory andcardiovascular afflictions such as asthma,bronchitis and emphysema (4)
■ Local dieback of vegetation (4)
■ Selection of road alignments to avoid proximityto areas of high population density includingschools, housing and work places
■ Traffic management measures to avoidcongestion
■ Avoiding steep grades and sharp curves whichwould promote deceleration and accelerationand increase emissions
■ Use of natural landforms andphysical/vegetation at the roadside
■ Hydrocarbons ■ Potential health effects – aromatics and poly-aromatics such as benzene and benzo(a)pyrene,respectively, are known carcinogens. Similarlycarbonyls such as acrolien are particularlyodourous. Contribution to eye, noise and throatinfection (4)
■ Carbon monoxide ■ Potential health effects - restricts the ability of theblood to carry oxygen – leading to headaches,aggravated cardiovascular disease (4)
■ Sulphur dioxide ■ Potential heath effects - aggravation of respiratoryconditions including asthma, bronchitis andemphysema (4)
Key to timing of the impact:1 = pre-construction phase (e.g. sources of materials, particularly quarrying); 2 = construction phase; 3 = associated development projects/land use changes; 4 = operation of the road; 5 = maintenance phase.
■ Particulate matter (exhaust and non-exhaust)and dust from unpaved roads
■ Potential health effects - Eye and respiratoryirritation, asthma (4)
■ Lead ■ Potential health effects - Nervous disorders,impaired mental function, anaemia.
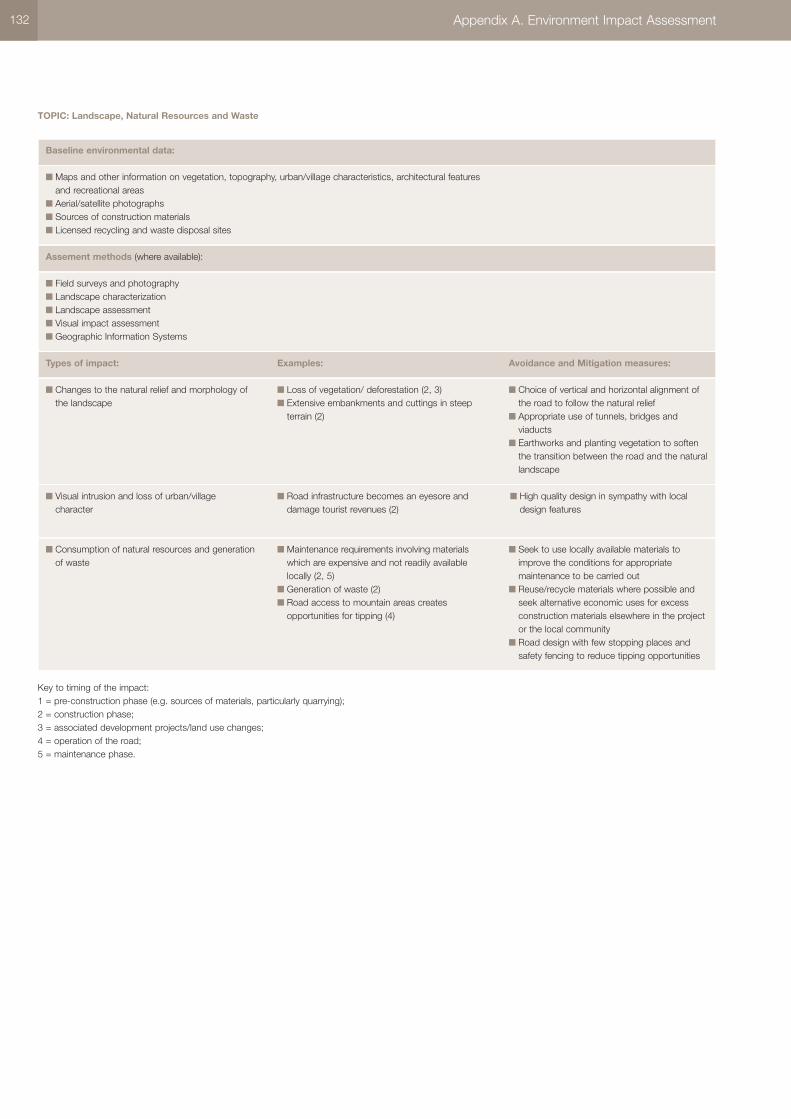
132 Appendix A. Environment Impact Assessment
TOPIC: Landscape, Natural Resources and Waste
Baseline environmental data:
■ Maps and other information on vegetation, topography, urban/village characteristics, architectural featuresand recreational areas
■ Aerial/satellite photographs ■ Sources of construction materials■ Licensed recycling and waste disposal sites
Assement methods (where available):
■ Field surveys and photography■ Landscape characterization ■ Landscape assessment ■ Visual impact assessment ■ Geographic Information Systems
Types of impact: Examples: Avoidance and Mitigation measures:
■ Changes to the natural relief and morphology ofthe landscape
■ Loss of vegetation/ deforestation (2, 3)■ Extensive embankments and cuttings in steep
terrain (2)
■ Choice of vertical and horizontal alignment ofthe road to follow the natural relief
■ Appropriate use of tunnels, bridges andviaducts
■ Earthworks and planting vegetation to softenthe transition between the road and the naturallandscape
■ Visual intrusion and loss of urban/villagecharacter
■ Road infrastructure becomes an eyesore anddamage tourist revenues (2)
■ High quality design in sympathy with localdesign features
■ Consumption of natural resources and generationof waste
■ Maintenance requirements involving materialswhich are expensive and not readily availablelocally (2, 5)
■ Generation of waste (2)■ Road access to mountain areas creates
opportunities for tipping (4)
■ Seek to use locally available materials toimprove the conditions for appropriatemaintenance to be carried out
■ Reuse/recycle materials where possible andseek alternative economic uses for excessconstruction materials elsewhere in the projector the local community
■ Road design with few stopping places andsafety fencing to reduce tipping opportunities
Key to timing of the impact:1 = pre-construction phase (e.g. sources of materials, particularly quarrying); 2 = construction phase; 3 = associated development projects/land use changes; 4 = operation of the road; 5 = maintenance phase.
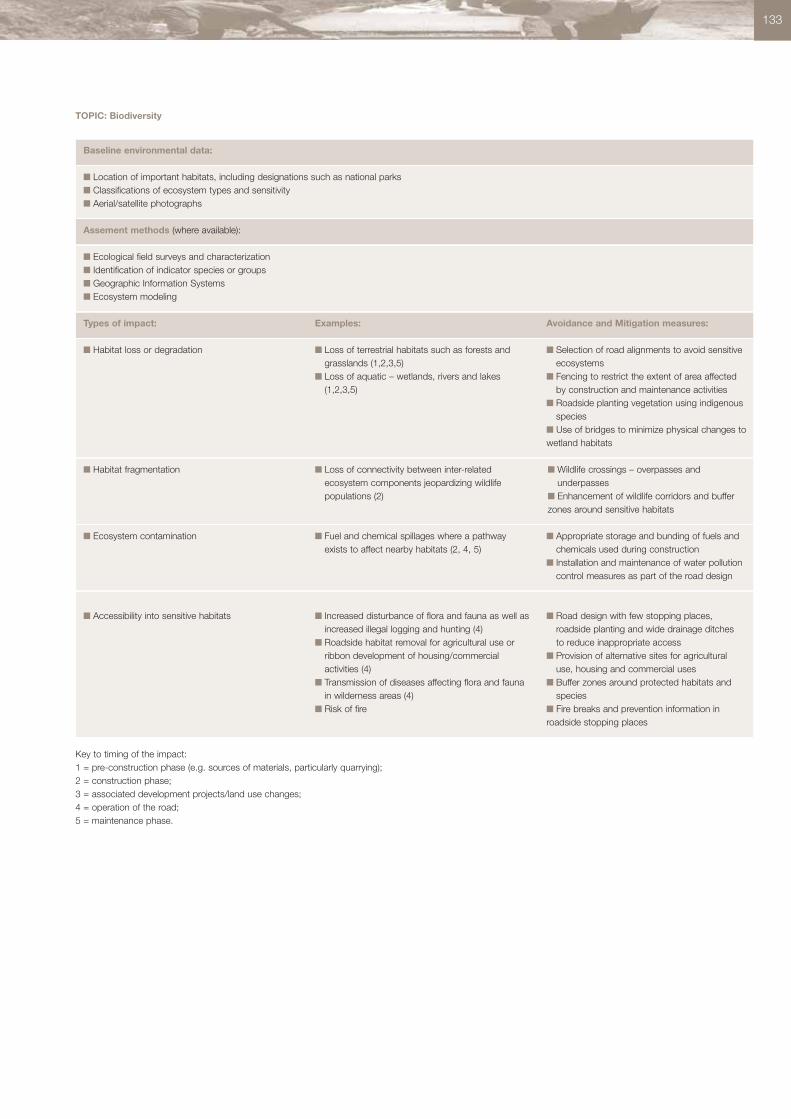
133
TOPIC: Biodiversity
Baseline environmental data:
■ Location of important habitats, including designations such as national parks■ Classifications of ecosystem types and sensitivity■ Aerial/satellite photographs
Assement methods (where available):
■ Ecological field surveys and characterization ■ Identification of indicator species or groups■ Geographic Information Systems■ Ecosystem modeling
Types of impact: Examples: Avoidance and Mitigation measures:
■ Habitat loss or degradation ■ Loss of terrestrial habitats such as forests andgrasslands (1,2,3,5)
■ Loss of aquatic – wetlands, rivers and lakes(1,2,3,5)
■ Selection of road alignments to avoid sensitiveecosystems
■ Fencing to restrict the extent of area affectedby construction and maintenance activities
■ Roadside planting vegetation using indigenousspecies
■ Use of bridges to minimize physical changes towetland habitats
■ Habitat fragmentation ■ Loss of connectivity between inter-relatedecosystem components jeopardizing wildlifepopulations (2)
■ Wildlife crossings – overpasses andunderpasses
■ Enhancement of wildlife corridors and bufferzones around sensitive habitats
■ Ecosystem contamination ■ Fuel and chemical spillages where a pathwayexists to affect nearby habitats (2, 4, 5)
■ Appropriate storage and bunding of fuels andchemicals used during construction
■ Installation and maintenance of water pollutioncontrol measures as part of the road design
Key to timing of the impact:1 = pre-construction phase (e.g. sources of materials, particularly quarrying); 2 = construction phase; 3 = associated development projects/land use changes; 4 = operation of the road; 5 = maintenance phase.
■ Accessibility into sensitive habitats ■ Increased disturbance of flora and fauna as well asincreased illegal logging and hunting (4)
■ Roadside habitat removal for agricultural use orribbon development of housing/commercialactivities (4)
■ Transmission of diseases affecting flora and faunain wilderness areas (4)
■ Risk of fire
■ Road design with few stopping places,roadside planting and wide drainage ditchesto reduce inappropriate access
■ Provision of alternative sites for agriculturaluse, housing and commercial uses
■ Buffer zones around protected habitats andspecies
■ Fire breaks and prevention information inroadside stopping places

TOPIC: Cultural Heritage
Baseline environmental data:
■ Location of historic settlements/buildings■ Results from nearby investigations and excavations■ Aerial/satellite photographs■ Secondary sources including site inventories, historic maps and bibliographic sources■ Details of tourist sites
Assement methods (where available):
■ Rapid field surveys ■ Archaeological investigations■ Local historical and anthropological research■ Geographic Information Systems
Types of impact: Examples: Avoidance and Mitigation measures:
■ Loss or damage to historic settlements/ buildingsand physical artefacts
Destruction of artefacts through ground clearanceand engineering works (1, 2, 4)
■ Selection of road alignment to avoid importantsites
■ Physical measures such as soil stabilizationand building restoration
■ Survey and removal of artefacts (e.g. to localmuseums) to preserve the historic record
■ Violation of traditionally exercised land rights Road access causes increased competition formineral resources, forestry and agricultural land(1, 2, 4)
■ Measures to protect and preserve thetraditional land rights such as long-termtenures
■ Appropriate development actions ascompensation such as access to educationand health case
■ Road design with few stopping places,roadside planting and wide drainage ditches toreduce inappropriate access
Key to timing of the impact:1 = pre-construction phase (e.g. sources of materials, particularly quarrying); 2 = construction phase; 3 = associated development projects/land use changes; 4 = operation of the road; 5 = maintenance phase.
Appendix A. Environment Impact Assessment134
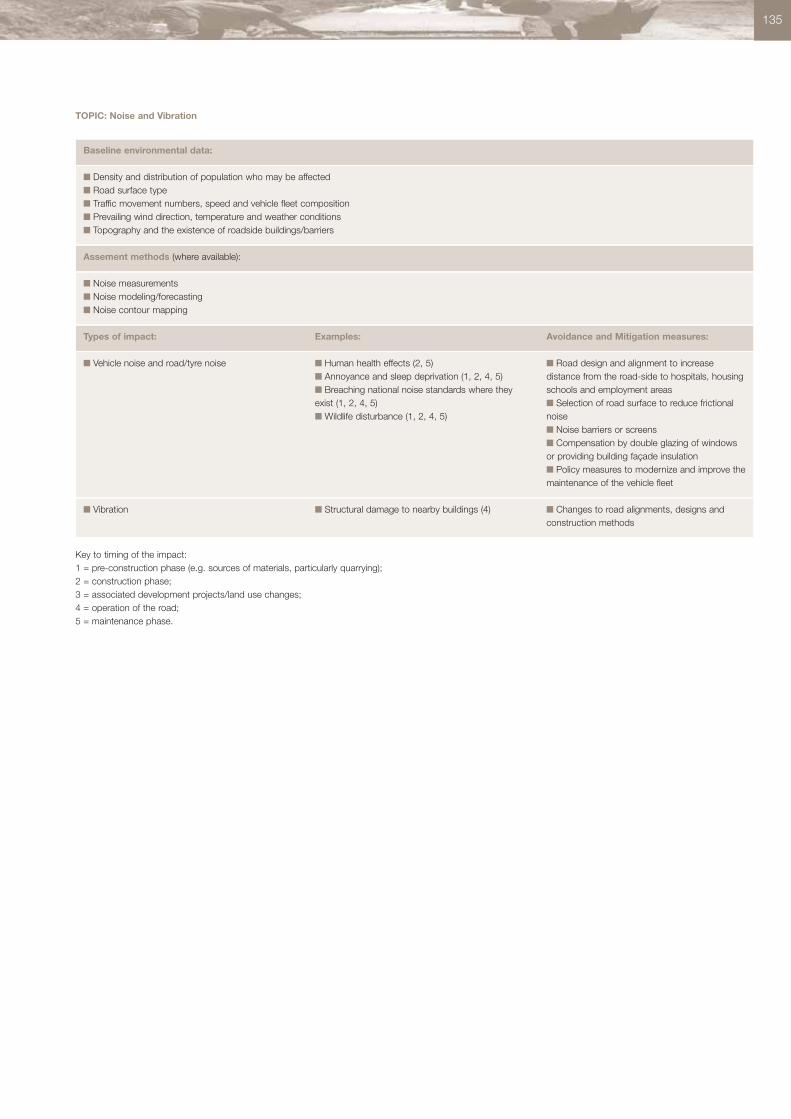
TOPIC: Noise and Vibration
Baseline environmental data:
■ Density and distribution of population who may be affected■ Road surface type■ Traffic movement numbers, speed and vehicle fleet composition■ Prevailing wind direction, temperature and weather conditions■ Topography and the existence of roadside buildings/barriers
Assement methods (where available):
■ Noise measurements■ Noise modeling/forecasting ■ Noise contour mapping
Types of impact: Examples: Avoidance and Mitigation measures:
■ Vehicle noise and road/tyre noise ■ Human health effects (2, 5)■ Annoyance and sleep deprivation (1, 2, 4, 5)■ Breaching national noise standards where theyexist (1, 2, 4, 5)■ Wildlife disturbance (1, 2, 4, 5)
■ Road design and alignment to increasedistance from the road-side to hospitals, housingschools and employment areas■ Selection of road surface to reduce frictionalnoise■ Noise barriers or screens■ Compensation by double glazing of windowsor providing building façade insulation■ Policy measures to modernize and improve themaintenance of the vehicle fleet
■ Vibration ■ Structural damage to nearby buildings (4) ■ Changes to road alignments, designs andconstruction methods
Key to timing of the impact:1 = pre-construction phase (e.g. sources of materials, particularly quarrying); 2 = construction phase; 3 = associated development projects/land use changes; 4 = operation of the road; 5 = maintenance phase.
135
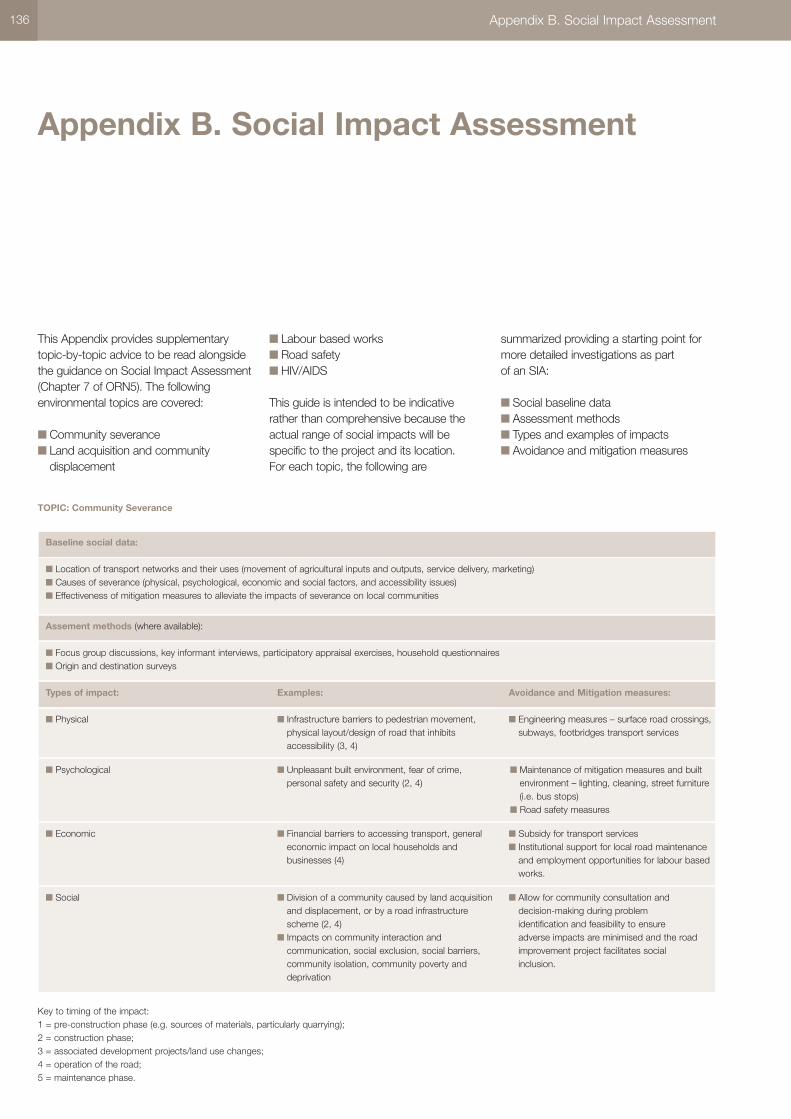
136 Appendix B. Social Impact Assessment
This Appendix provides supplementarytopic-by-topic advice to be read alongsidethe guidance on Social Impact Assessment(Chapter 7 of ORN5). The followingenvironmental topics are covered:
■ Community severance■ Land acquisition and community
displacement
■ Labour based works■ Road safety ■ HIV/AIDS
This guide is intended to be indicativerather than comprehensive because theactual range of social impacts will bespecific to the project and its location. For each topic, the following are
summarized providing a starting point formore detailed investigations as part of an SIA:
■ Social baseline data■ Assessment methods ■ Types and examples of impacts■ Avoidance and mitigation measures
Appendix B. Social Impact Assessment
TOPIC: Community Severance
Baseline social data:
■ Location of transport networks and their uses (movement of agricultural inputs and outputs, service delivery, marketing)■ Causes of severance (physical, psychological, economic and social factors, and accessibility issues)■ Effectiveness of mitigation measures to alleviate the impacts of severance on local communities
Assement methods (where available):
■ Focus group discussions, key informant interviews, participatory appraisal exercises, household questionnaires■ Origin and destination surveys
Types of impact: Examples: Avoidance and Mitigation measures:
■ Physical ■ Infrastructure barriers to pedestrian movement,physical layout/design of road that inhibitsaccessibility (3, 4)
■ Engineering measures – surface road crossings,subways, footbridges transport services
■ Psychological ■ Unpleasant built environment, fear of crime,personal safety and security (2, 4)
■ Maintenance of mitigation measures and builtenvironment – lighting, cleaning, street furniture(i.e. bus stops)
■ Road safety measures
■ Economic ■ Financial barriers to accessing transport, generaleconomic impact on local households andbusinesses (4)
■ Subsidy for transport services ■ Institutional support for local road maintenance
and employment opportunities for labour basedworks.
Key to timing of the impact:1 = pre-construction phase (e.g. sources of materials, particularly quarrying); 2 = construction phase; 3 = associated development projects/land use changes; 4 = operation of the road; 5 = maintenance phase.
■ Social ■ Division of a community caused by land acquisitionand displacement, or by a road infrastructurescheme (2, 4)
■ Impacts on community interaction andcommunication, social exclusion, social barriers,community isolation, community poverty anddeprivation
■ Allow for community consultation anddecision-making during problemidentification and feasibility to ensureadverse impacts are minimised and the roadimprovement project facilitates socialinclusion.
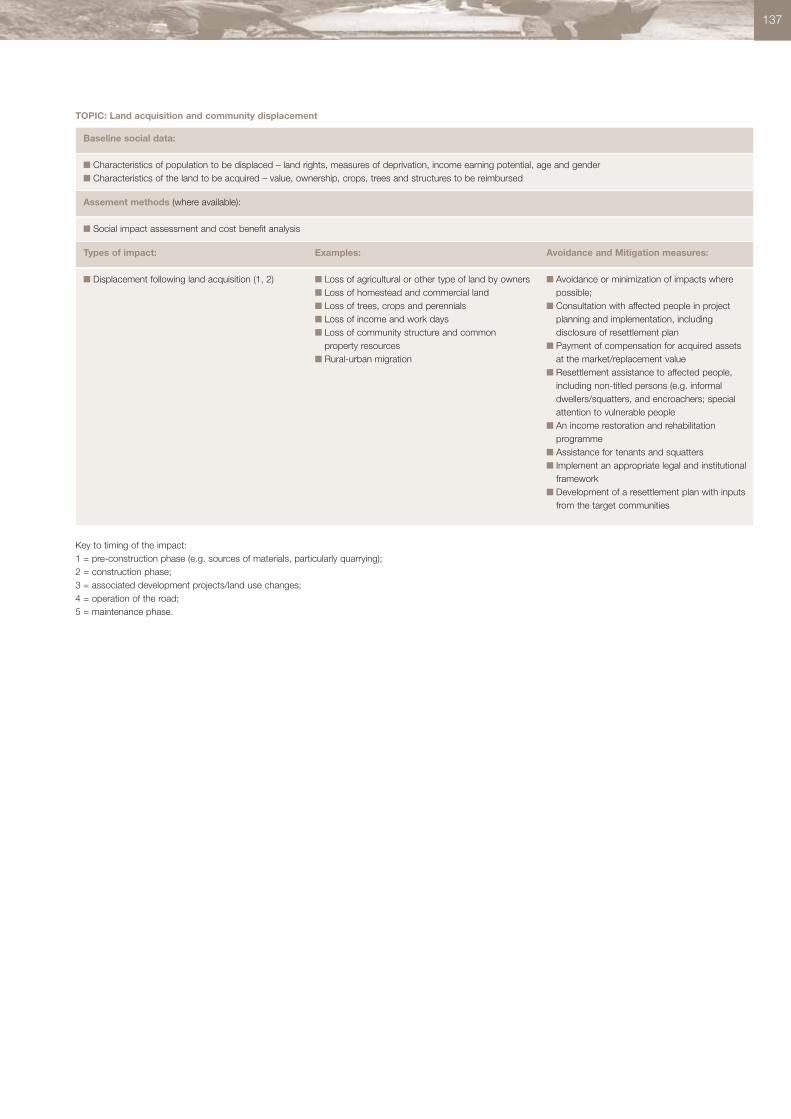
137
TOPIC: Land acquisition and community displacement
Baseline social data:
■ Characteristics of population to be displaced – land rights, measures of deprivation, income earning potential, age and gender■ Characteristics of the land to be acquired – value, ownership, crops, trees and structures to be reimbursed
Assement methods (where available):
■ Social impact assessment and cost benefit analysis
Types of impact: Examples: Avoidance and Mitigation measures:
■ Displacement following land acquisition (1, 2) ■ Loss of agricultural or other type of land by owners■ Loss of homestead and commercial land■ Loss of trees, crops and perennials■ Loss of income and work days■ Loss of community structure and common
property resources■ Rural-urban migration
■ Avoidance or minimization of impacts wherepossible;
■ Consultation with affected people in projectplanning and implementation, includingdisclosure of resettlement plan
■ Payment of compensation for acquired assetsat the market/replacement value
■ Resettlement assistance to affected people,including non-titled persons (e.g. informaldwellers/squatters, and encroachers; specialattention to vulnerable people
■ An income restoration and rehabilitationprogramme
■ Assistance for tenants and squatters■ Implement an appropriate legal and institutional
framework■ Development of a resettlement plan with inputs
from the target communities
Key to timing of the impact:1 = pre-construction phase (e.g. sources of materials, particularly quarrying); 2 = construction phase; 3 = associated development projects/land use changes; 4 = operation of the road; 5 = maintenance phase.
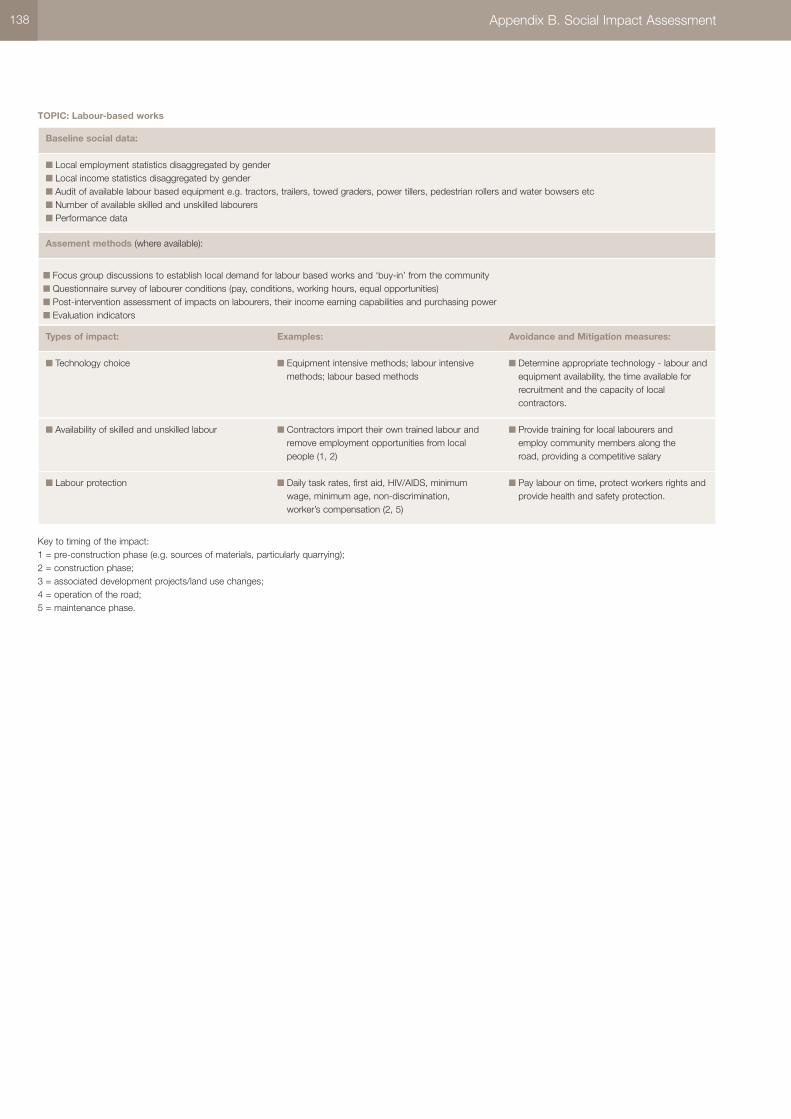
TOPIC: Labour-based works
Baseline social data:
■ Local employment statistics disaggregated by gender■ Local income statistics disaggregated by gender■ Audit of available labour based equipment e.g. tractors, trailers, towed graders, power tillers, pedestrian rollers and water bowsers etc■ Number of available skilled and unskilled labourers■ Performance data
Assement methods (where available):
■ Focus group discussions to establish local demand for labour based works and ‘buy-in’ from the community■ Questionnaire survey of labourer conditions (pay, conditions, working hours, equal opportunities)■ Post-intervention assessment of impacts on labourers, their income earning capabilities and purchasing power■ Evaluation indicators
Types of impact: Examples: Avoidance and Mitigation measures:
■ Technology choice ■ Equipment intensive methods; labour intensivemethods; labour based methods
■ Determine appropriate technology - labour andequipment availability, the time available forrecruitment and the capacity of localcontractors.
Key to timing of the impact:1 = pre-construction phase (e.g. sources of materials, particularly quarrying); 2 = construction phase; 3 = associated development projects/land use changes; 4 = operation of the road; 5 = maintenance phase.
■ Availability of skilled and unskilled labour ■ Contractors import their own trained labour andremove employment opportunities from localpeople (1, 2)
■ Provide training for local labourers andemploy community members along theroad, providing a competitive salary
■ Labour protection ■ Daily task rates, first aid, HIV/AIDS, minimumwage, minimum age, non-discrimination,worker’s compensation (2, 5)
■ Pay labour on time, protect workers rights andprovide health and safety protection.
Appendix B. Social Impact Assessment138
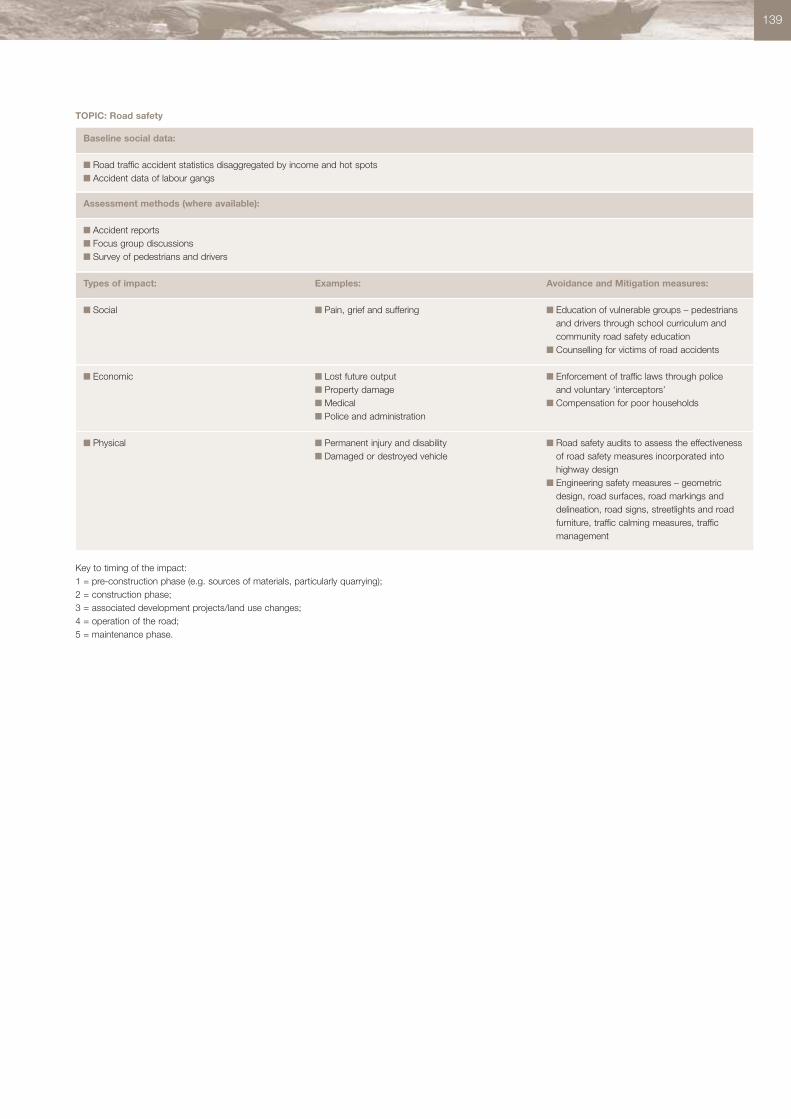
TOPIC: Road safety
Baseline social data:
■ Road traffic accident statistics disaggregated by income and hot spots■ Accident data of labour gangs
Assessment methods (where available):
■ Accident reports■ Focus group discussions■ Survey of pedestrians and drivers
Types of impact: Examples: Avoidance and Mitigation measures:
■ Social ■ Pain, grief and suffering ■ Education of vulnerable groups – pedestriansand drivers through school curriculum andcommunity road safety education
■ Counselling for victims of road accidents
Key to timing of the impact:1 = pre-construction phase (e.g. sources of materials, particularly quarrying); 2 = construction phase; 3 = associated development projects/land use changes; 4 = operation of the road; 5 = maintenance phase.
■ Economic ■ Lost future output■ Property damage■ Medical■ Police and administration
■ Enforcement of traffic laws through policeand voluntary ‘interceptors’
■ Compensation for poor households
■ Physical ■ Permanent injury and disability■ Damaged or destroyed vehicle
■ Road safety audits to assess the effectivenessof road safety measures incorporated intohighway design
■ Engineering safety measures – geometricdesign, road surfaces, road markings anddelineation, road signs, streetlights and roadfurniture, traffic calming measures, trafficmanagement
139

TOPIC: HIV/AIDS
Baseline social data:
■ Characteristics of labour used in labour based works■ Audit of commercial truck drivers and their health status
Assessment methods (where available):
■ Impact assessment of new transport routes■ Attitude survey of commercial sex workers and transport operators/drivers
Types of impact: Examples: Avoidance and Mitigation measures:
■ Transport activity ■ Transport corridors, stopping places and terminalpoints that demonstrate increased levels ofpromiscuous sexual contact especially withcommercial sex workers (4)
■ Awareness campaigns and free sexual healthadvice and condoms at truck stops and cross-border points
■ Educating and counselling truck drivers andsex workers about the cause and effects ofHIV/AIDS
■ Alternative sources of income
Key to timing of the impact:1 = pre-construction phase (e.g. sources of materials, particularly quarrying); 2 = construction phase; 3 = associated development projects/land use changes; 4 = operation of the road; 5 = maintenance phase.
■ Labour camps ■ Bringing together workers in temporary camps forinfrastructure construction and maintenanceactivities (2, 5)
■ The absence of normal social networks to regulatebehaviour encourages sexual activity betweennon-regular partners
■ Awareness programmes for labourers■ Training and promotion in contraception
use, distribution of condoms■ Employment of local labour at the site of
construction■ Migrant labourers encouraged to travel
with their family, or be encouraged to takeregular leave
■ Improved living conditions and contractconditions
Appendix B. Social Impact Assessment140
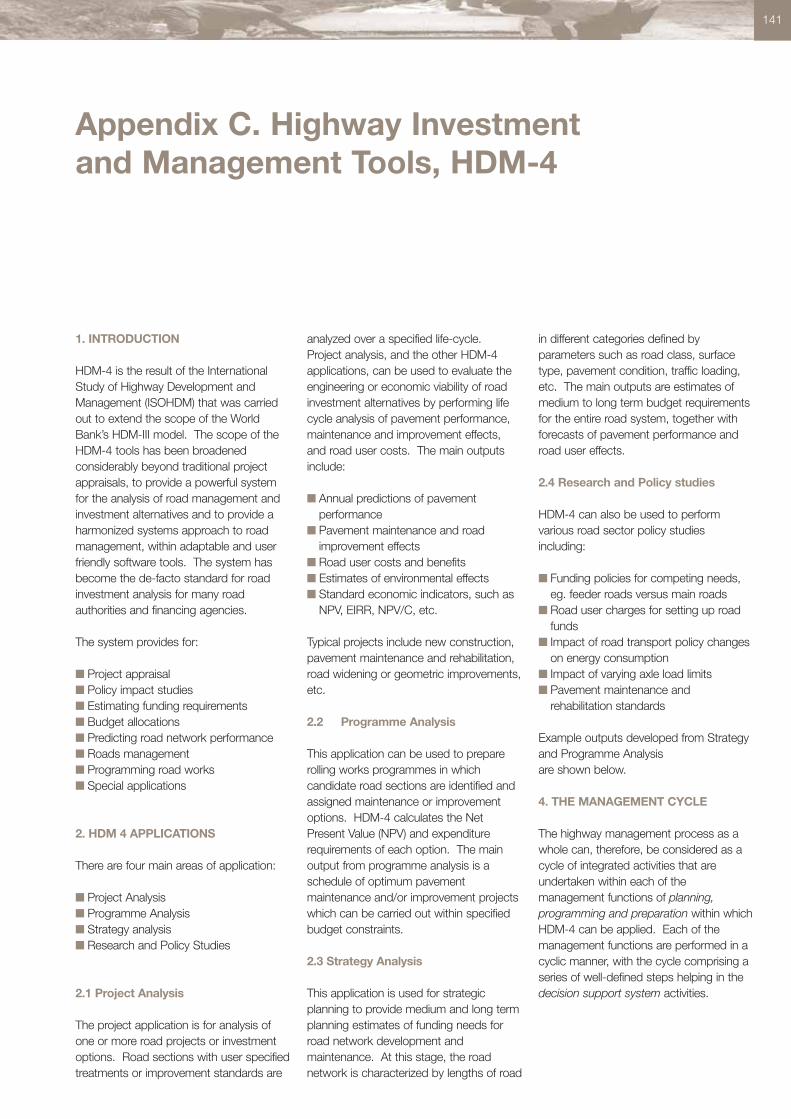
141
1. INTRODUCTION
HDM-4 is the result of the InternationalStudy of Highway Development andManagement (ISOHDM) that was carriedout to extend the scope of the WorldBank’s HDM-III model. The scope of theHDM-4 tools has been broadenedconsiderably beyond traditional projectappraisals, to provide a powerful systemfor the analysis of road management andinvestment alternatives and to provide aharmonized systems approach to roadmanagement, within adaptable and userfriendly software tools. The system hasbecome the de-facto standard for roadinvestment analysis for many roadauthorities and financing agencies.
The system provides for:
■ Project appraisal■ Policy impact studies■ Estimating funding requirements■ Budget allocations■ Predicting road network performance■ Roads management■ Programming road works■ Special applications
2. HDM 4 APPLICATIONS
There are four main areas of application:
■ Project Analysis■ Programme Analysis■ Strategy analysis■ Research and Policy Studies
2.1 Project Analysis
The project application is for analysis ofone or more road projects or investmentoptions. Road sections with user specifiedtreatments or improvement standards are
analyzed over a specified life-cycle.Project analysis, and the other HDM-4applications, can be used to evaluate theengineering or economic viability of roadinvestment alternatives by performing lifecycle analysis of pavement performance,maintenance and improvement effects,and road user costs. The main outputsinclude:
■ Annual predictions of pavementperformance
■ Pavement maintenance and roadimprovement effects
■ Road user costs and benefits■ Estimates of environmental effects■ Standard economic indicators, such as
NPV, EIRR, NPV/C, etc.
Typical projects include new construction,pavement maintenance and rehabilitation,road widening or geometric improvements,etc.
2.2 Programme Analysis
This application can be used to preparerolling works programmes in whichcandidate road sections are identified andassigned maintenance or improvementoptions. HDM-4 calculates the NetPresent Value (NPV) and expenditurerequirements of each option. The mainoutput from programme analysis is aschedule of optimum pavementmaintenance and/or improvement projectswhich can be carried out within specifiedbudget constraints.
2.3 Strategy Analysis
This application is used for strategicplanning to provide medium and long termplanning estimates of funding needs forroad network development andmaintenance. At this stage, the roadnetwork is characterized by lengths of road
in different categories defined byparameters such as road class, surfacetype, pavement condition, traffic loading,etc. The main outputs are estimates ofmedium to long term budget requirementsfor the entire road system, together withforecasts of pavement performance androad user effects.
2.4 Research and Policy studies
HDM-4 can also be used to performvarious road sector policy studiesincluding:
■ Funding policies for competing needs,eg. feeder roads versus main roads
■ Road user charges for setting up roadfunds
■ Impact of road transport policy changeson energy consumption
■ Impact of varying axle load limits■ Pavement maintenance and
rehabilitation standards
Example outputs developed from Strategyand Programme Analysis are shown below.
4. THE MANAGEMENT CYCLE
The highway management process as awhole can, therefore, be considered as acycle of integrated activities that areundertaken within each of themanagement functions of planning,programming and preparation within whichHDM-4 can be applied. Each of themanagement functions are performed in acyclic manner, with the cycle comprising aseries of well-defined steps helping in thedecision support system activities.
Appendix C. Highway Investment and Management Tools, HDM-4
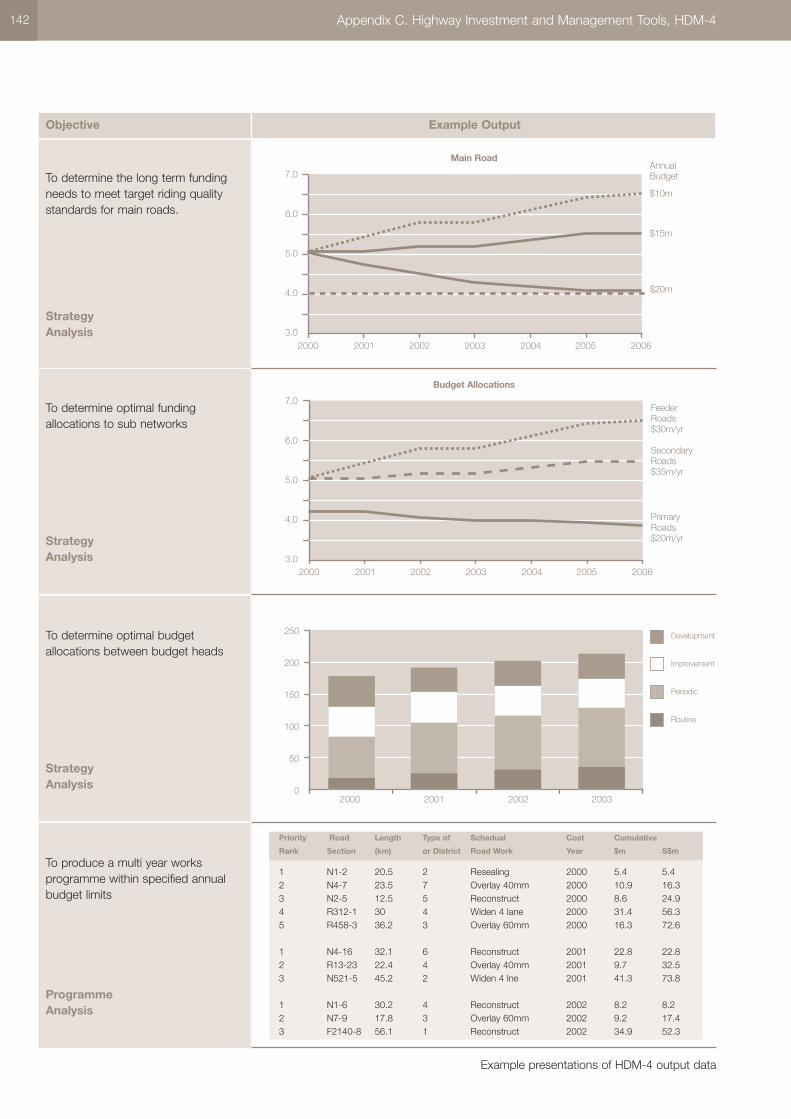
142 Appendix C. Highway Investment and Management Tools, HDM-4
Example presentations of HDM-4 output data
To determine the long term fundingneeds to meet target riding qualitystandards for main roads.
StrategyAnalysis
To determine optimal fundingallocations to sub networks
StrategyAnalysis
To determine optimal budgetallocations between budget heads
StrategyAnalysis
To produce a multi year worksprogramme within specified annualbudget limits
Programme Analysis
Objective Example Output
Main Road
Budget Allocations
AnnualBudget
$10m
$15m
$20m
FeederRoads$30m/yr
SecondaryRoads$35m/yr
PrimaryRoads$20m/yr
2000 2001 2002 2003 2004 2005 2006
2000 2001 2002 2003 2004 2005 2006
2000 2001 2002 2003
7.0
6.0
5.0
4.0
3.0
7.0
6.0
5.0
4.0
3.0
250
200
150
100
50
0
Development
Improvement
Periodic
Routine
Priority Road Length Type of Schedual Cost Cumulative
Rank Section (km) or District Road Work Year $m S$m
1 N1-2 20.5 2 Resealing 2000 5.4 5.42 N4-7 23.5 7 Overlay 40mm 2000 10.9 16.33 N2-5 12.5 5 Reconstruct 2000 8.6 24.94 R312-1 30 4 Widen 4 lane 2000 31.4 56.35 R458-3 36.2 3 Overlay 60mm 2000 16.3 72.6
1 N4-16 32.1 6 Reconstruct 2001 22.8 22.82 R13-23 22.4 4 Overlay 40mm 2001 9.7 32.53 N521-5 45.2 2 Widen 4 lne 2001 41.3 73.8
1 N1-6 30.2 4 Reconstruct 2002 8.2 8.22 N7-9 17.8 3 Overlay 60mm 2002 9.2 17.43 F2140-8 56.1 1 Reconstruct 2002 34.9 52.3
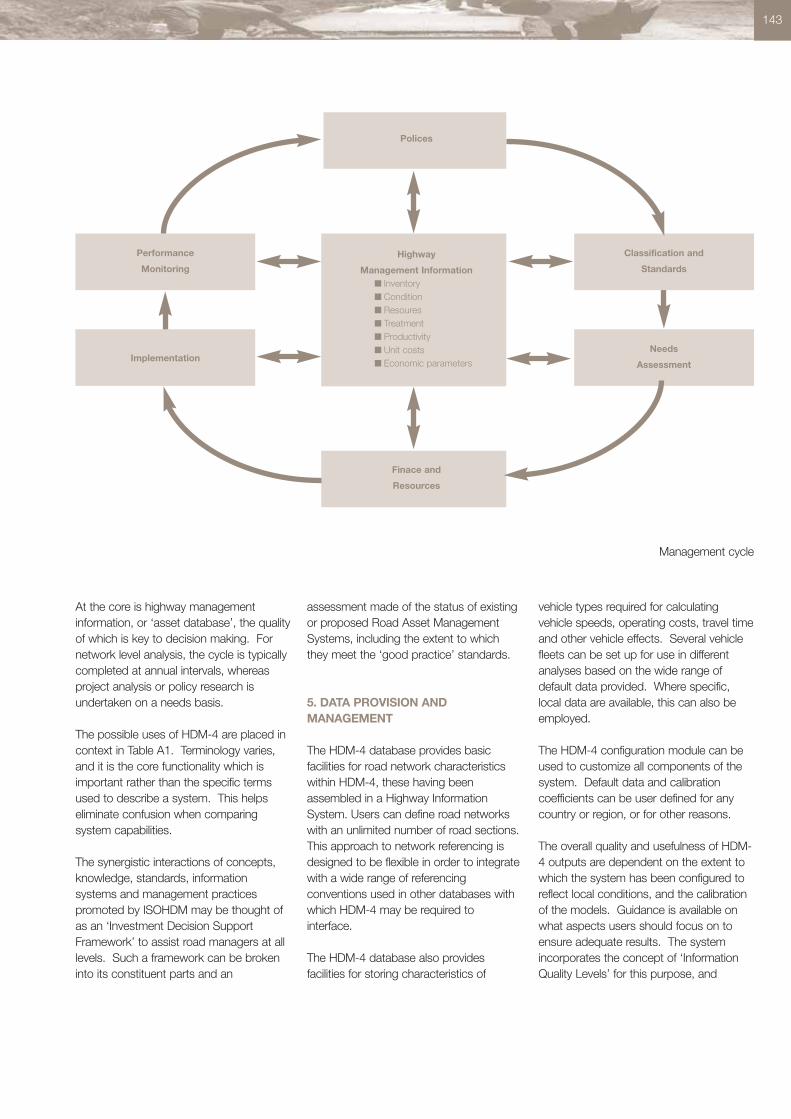
143
At the core is highway managementinformation, or ‘asset database’, the qualityof which is key to decision making. Fornetwork level analysis, the cycle is typicallycompleted at annual intervals, whereasproject analysis or policy research isundertaken on a needs basis.
The possible uses of HDM-4 are placed incontext in Table A1. Terminology varies,and it is the core functionality which isimportant rather than the specific termsused to describe a system. This helpseliminate confusion when comparingsystem capabilities.
The synergistic interactions of concepts,knowledge, standards, informationsystems and management practicespromoted by ISOHDM may be thought ofas an ‘Investment Decision SupportFramework’ to assist road managers at alllevels. Such a framework can be brokeninto its constituent parts and an
assessment made of the status of existingor proposed Road Asset ManagementSystems, including the extent to whichthey meet the ‘good practice’ standards.
5. DATA PROVISION ANDMANAGEMENT
The HDM-4 database provides basicfacilities for road network characteristicswithin HDM-4, these having beenassembled in a Highway InformationSystem. Users can define road networkswith an unlimited number of road sections.This approach to network referencing isdesigned to be flexible in order to integratewith a wide range of referencingconventions used in other databases withwhich HDM-4 may be required tointerface.
The HDM-4 database also providesfacilities for storing characteristics of
vehicle types required for calculatingvehicle speeds, operating costs, travel timeand other vehicle effects. Several vehiclefleets can be set up for use in differentanalyses based on the wide range ofdefault data provided. Where specific,local data are available, this can also beemployed.
The HDM-4 configuration module can beused to customize all components of thesystem. Default data and calibrationcoefficients can be user defined for anycountry or region, or for other reasons.
The overall quality and usefulness of HDM-4 outputs are dependent on the extent towhich the system has been configured toreflect local conditions, and the calibrationof the models. Guidance is available onwhat aspects users should focus on toensure adequate results. The systemincorporates the concept of ‘InformationQuality Levels’ for this purpose, and
Classification and
Standards
Needs
Assessment
Performance
Monitoring
Implementation
Polices
Highway
Management Information■ Inventory■ Condition■ Resoures■ Treatment■ Productivity■ Unit costs■ Economic parameters
Finace and
Resources
Management cycle
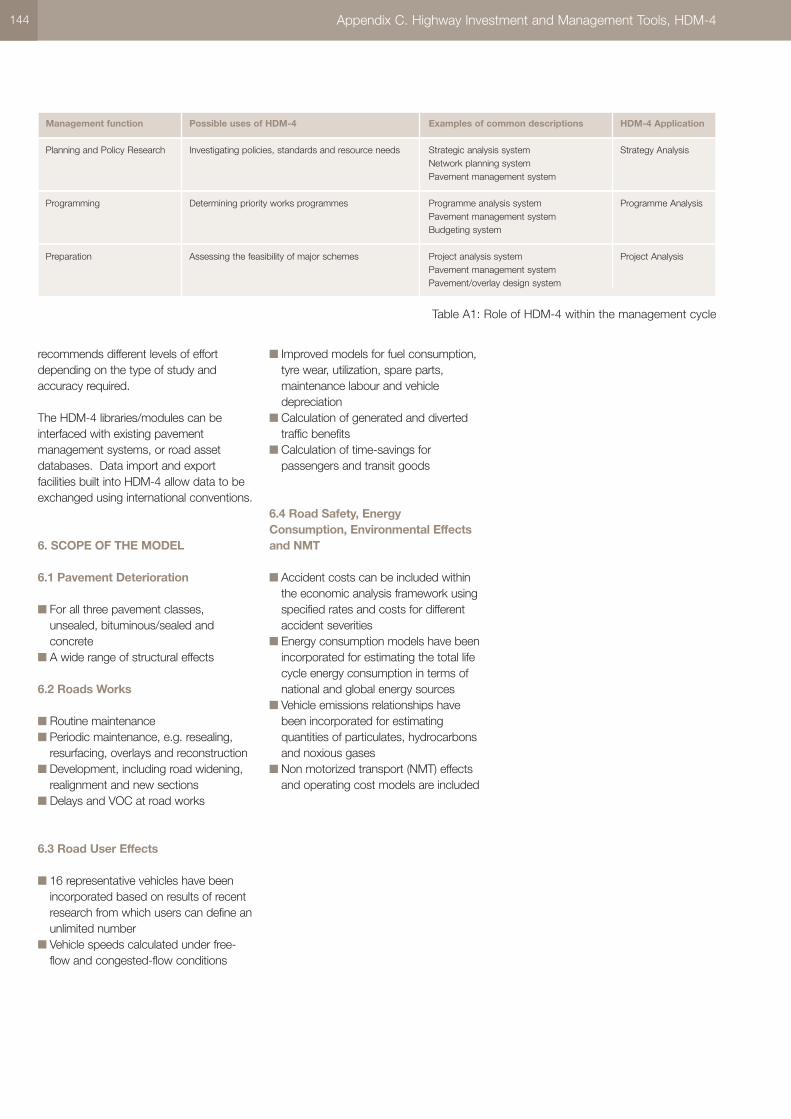
recommends different levels of effortdepending on the type of study andaccuracy required.
The HDM-4 libraries/modules can beinterfaced with existing pavementmanagement systems, or road assetdatabases. Data import and exportfacilities built into HDM-4 allow data to beexchanged using international conventions.
6. SCOPE OF THE MODEL
6.1 Pavement Deterioration
■ For all three pavement classes,unsealed, bituminous/sealed andconcrete
■ A wide range of structural effects
6.2 Roads Works
■ Routine maintenance■ Periodic maintenance, e.g. resealing,
resurfacing, overlays and reconstruction■ Development, including road widening,
realignment and new sections■ Delays and VOC at road works
6.3 Road User Effects
■ 16 representative vehicles have beenincorporated based on results of recentresearch from which users can define anunlimited number
■ Vehicle speeds calculated under free-flow and congested-flow conditions
■ Improved models for fuel consumption,tyre wear, utilization, spare parts,maintenance labour and vehicledepreciation
■ Calculation of generated and divertedtraffic benefits
■ Calculation of time-savings forpassengers and transit goods
6.4 Road Safety, Energy Consumption, Environmental Effects and NMT
■ Accident costs can be included withinthe economic analysis framework usingspecified rates and costs for differentaccident severities
■ Energy consumption models have beenincorporated for estimating the total lifecycle energy consumption in terms ofnational and global energy sources
■ Vehicle emissions relationships havebeen incorporated for estimatingquantities of particulates, hydrocarbonsand noxious gases
■ Non motorized transport (NMT) effectsand operating cost models are included
Management function Possible uses of HDM-4 Examples of common descriptions HDM-4 Application
Planning and Policy Research Investigating policies, standards and resource needs Strategic analysis system Strategy AnalysisNetwork planning systemPavement management system
Programming Determining priority works programmes Programme analysis system Programme AnalysisPavement management systemBudgeting system
Preparation Assessing the feasibility of major schemes Project analysis system Project AnalysisPavement management systemPavement/overlay design system
Table A1: Role of HDM-4 within the management cycle
Appendix C. Highway Investment and Management Tools, HDM-4144
145
This is generally considered to be the mostaccurate method of estimating projectcosts. It is a fundamental estimatingtechnique since the total cost of the workis compiled from consideration of theconstituent operations or activities revealedby the method statement and programme,and from the accumulated demand forresources. The advantages of working incurrent costs are obtained because labour,plant and materials are costed at currentrates.
The method requires the process ofconstruction to be broken down into itsmajor components (materials, equipment,labour, etc) and is therefore sensitive to theproductivities of plant and/or labour. Thismay be difficult to estimate in thecircumstances of the particular projectbeing evaluated. Also, a detailedprogramme of work is needed and this willnot be available until a relatively late stagein the project. The operational methodsuffers from the danger that allowance hasto be made for every item in theconstruction; it cannot be assumed thatsmaller items are included in the rates formajor elements. This greatly increases theamount of work and the possibility ofomitting a large number of minor itemsfrom the estimate creates a danger ofunderestimating the overall cost.
The most difficult data to obtain are theproductivities of labour and constructionplant in the geographical location of theproject and especially in the circumstancesof the specific activity under consideration.Claimed outputs of plant are obtainablefrom suppliers, but these need to bereviewed in the light of actual experiencebecause all plant stands idle at somestage and this down-time needs to betaken into account.
Labour productivities will vary from site tosite depending on management,organization, industrial relations, siteconditions, etc. and also from country tocountry. Productivity information is asignificant part of the ‘know how’ of acontractor and will naturally be jealouslyguarded. However, it is important to obtainreliable data for labour productivities fortwo reasons. Firstly, agencies who want toencourage the use of labour-basedmethods often assist new or inexperiencedcontractors by specifying realistic labourproductivities. Secondly, if productivitiesare known, it is possible to identifycontractors who may be exploiting theirlabourers. The preferred method is to use‘daily tasks’ thereby eliminating the need toconsider down-time for labour andconsiderably simplifying the estimate oftime and costs with the result thataccuracy and reliability are improved.
The operational technique is particularlyvaluable where there are significantuncertainties and risks. Because thetechnique exposes the basic sources ofcosts, the sensitivities of the estimate toalternative assumptions/methods can beinvestigated and the reasons for variationsin cost appreciated. It also provides adetailed current cost/time basis for theapplication of inflation forecasts and hencethe compilation of a project cash flow.
The operational technique provides thebest chance of identifying risks and delayas it involves the preparation of a methodof construction and a sequentialprogramme including an appreciation ofproductivities. Sensitivity analyses can becarried out to determine the mostvulnerable operations and appropriateallowances included. Action to reduce theeffect of risks should be taken wherepossible.
If there is sufficient information available,this method provides a verycomprehensive means of comparingoptions in financial terms. It is especiallysuitable if the options are similar inenvironmental and operational terms, sothat the cost becomes the most importantfactor in choosing between options.Sensitivity analysis can be used to assessthe effects of changing the various ratesand productivities for different options. Thismay help to determine which option carriesthe least risk.
The method is also suitable for estimatingthe cost of the detailed engineering design.At this stage of project development it isimportant to have the most accurateestimate of the cost. An assessment of riskis also valuable. The operational methodprovides both of these.
Appendix D. The Operational (resource cost) Method

A g
uid
e to
ro
ad p
roje
ct a
pp
rais
al
OR
N 5
ISBN 0-9543339-6-9