Embed Size (px)
Citation preview

Avai lable onl ine at www.sc iencedirect .com
journal homepage: www.elsevier .com/ locate / jva l
Strengthening Tuberculosis Control Overseas: Who Benefits?Hoa Thi Minh Nguyen, PhD1, Roslyn I. Hickson, PhD2,3, Tom Kompas, PhD1,*, Geoffry N. Mercer, PhD4,Kamalini M. Lokuge, PhD4Q11Crawford School of Public Policy, The Australian National University, Canberra, ACT, Australia; 2School of Mathematical andPhysical Sciences, University of Newcastle, Callaghan, New South Wales, Australia; 3IBM Research Australia, Melbourne, Victoria,Australia; 4National Centre for Epidemiology and Population Health, The Australian National University, Canberra, Australia
A B S T R A C T
Background: Although tuberculosis is a major cause of morbidity andmortality worldwide, available funding falls far short of that requiredfor effective control. Economic and spillover consequences of invest-ments in the treatment of tuberculosis are unclear, particularly whensteep gradients in the disease and response are linked by populationmovements, such as that between Papua New Guinea (PNG) and theAustralian cross-border region. Objective: To undertake an economicevaluation of Australian support for the expansion of basic DirectlyObserved Treatment, Short Course in the PNG border area of the SouthFly from the current level of 14% coverage. Methods: Both cost-utilityanalysis and cost-benefit analysis were applied to models that allowfor population movement across regions with different characteristicsof tuberculosis burden, transmission, and access to treatment. Cost-benefit data were drawn primarily from estimates published by theWorld Health Organization, and disease transmission data weredrawn from a previously published model. Results: Investing $16
million to increase basic Directly Observed Treatment, Short Coursecoverage in the South Fly generates a net present value of roughly $74million for Australia (discounted 2005 dollars). The cost per disability-adjusted life-year averted and quality-adjusted life-year saved for PNGis $7 and $4.6, respectively. Conclusions: Where regions with majordisparities in tuberculosis burden and health system resourcing areconnected through population movements, investments in tuber-culosis control are of mutual benefit, resulting in net health andeconomic gains on both sides of the border. These findings are likelyto inform the case for appropriate investment in tuberculosis controlglobally.Keywords: Australia, cost-benefit analysis, cost-utility analysis, DOTS,metapopulation model, PNG, tuberculosis control.
Copyright & 2014, International Society for Pharmacoeconomics andOutcomes Research (ISPOR). Published by Elsevier Inc.
Introduction
Tuberculosis (TB) remains a major health threat, being thesecond leading cause of death from an infectious disease world-wide. Two decades after the declaration of TB as a global healthemergency by the World Health Organization (WHO), in 1993, thefinancial resources needed in the fight against TB remain enor-mous [1]. Existing and inadequate funding levels are largelybecause most of the expenses incurred in the control of TB arefunded out of increasingly tight national budgets, while theprevalence of TB is skewed toward poor developing countrieswho can least afford it [1].
As a long-lived airborne communicable disease, TB takes itstoll not only on developing countries where prevalence is highbut also on developed countries, partly due to the mobility of thedisease. In developed countries, foreign-born immigrants andtravelers to areas with a high burden of TB account for anincreasing proportion of all new cases of TB [2–5]. That said,measures taken thus far to prevent TB in developed countries aretypically confined within given borders to the home country
[6–10]. Analysis suggests that strengthening TB programs incountries with a higher burden of TB, where most immigrantsand visitors come from, thus reducing the levels of transmissionfrom this source, may generate significant domestic gains fordeveloped countries [11]. Past modeling of such transmission andinterventions, however, has not accounted for the impact ofcitizens from developed countries traveling to high-incidencecountries. Therefore, there is a need to develop models thataccount for the impact of two-way population movements toquantify more accurately the benefits of measures to reduce TBincidence occurring from specific two-way travel between areaswith a high and low burden of TB.
We address this gap in the literature by evaluating theAustralian-funded control of TB in Papua New Guinea (PNG), itsclosest neighbor. It is worth noting that Australia has one of themost well-resourced health service systems and the lowestburden of TB in the world, while PNG is a poor developingcountry with many health system challenges, including a veryhigh burden of TB. Our economic evaluation draws on theperspectives of both the broader society and the health sector.
123456789
10111213141516171819202122232425262728293031323334353637383940414243444546474849505152535455565758596061626364656667
68697071727374757677787980818283848586878889909192939495
1098-3015$36.00 – see front matter Copyright & 2014, International Society for Pharmacoeconomics and Outcomes Research (ISPOR).Published by Elsevier Inc.http://dx.doi.org/10.1016/j.jval.2014.11.008
E-mail: [email protected].
* Address correspondence to: Tom Kompas, Crawford School of Public Policy, J.G. Crawford Building (132) Lennox Crossing, TheAustralian National University, Canberra, ACT 2601, Australia.
V A L U E I N H E A L T H ] ( 2 0 1 4 ) ] ] ] – ] ] ]

We focus only on the neighboring border areas of these twocountries, which covers the Torres Strait Islands (TSI) of Australiaand the South Fly district of PNG. Here, movements of peoplebetween the two communities for traditional activities arefrequent and largely unrestricted because of a special treatysigned between the two countries, facilitating cross-border move-ment for traditional purposes. For this reason, the area is aprincipal focus for concerns related to ongoing importation ofTB from PNG. We consider an Australian-funded expansion of abasic Directly Observed Treatment, Short Course (or basic DOTS)program in the South Fly, which covers detection and treatmentof patients with infectious (pulmonary) TB. This intervention isthe standard recommended by the WHO, including that forresource-poor areas such as the South Fly where TB prevalenceand incidence are high, while the prevailing TB programs andhealth services in place are particularly weak [12–14].
Methods
We undertook an economic evaluation of Australia’s support forthe control of TB in PNG based on an epidemiological model thatcaptures the patterns of disease transmission between the tworegions. Our evaluation draws on the perspective of both theheath sector and society. That is, we apply a cost-utility analysis(CUA) and a cost-benefit analysis (CBA)—the principal tools usedto guide resource allocation in the health sector and the wholeeconomy, respectively—in our evaluation. Being identical inmeasuring costs, these two approaches differ in the measure-ment of benefits. In particular, CUA measures health improve-ments due to an intervention by a combination of duration andthe quality of life saved while CBA measures them in monetaryterms. As such, CUA allows the comparison of one interventionagainst another in terms of the health gains it achieves whileCBA allows for the comparison of benefits aside from healthgains alone. Each has its own advantages, and by using both, weaddress the limitations in applying only one method.
Interventions and ComparatorThe interventions we assess in our article focus on the expansionof the basic DOTS program in PNG’s South Fly from the currentlevel of 14% coverage to various levels including 30%, 50%, 65%,80%, and 95% coverage. These interventions were simulated tolast for 20 years, starting from 2014. The duration of 20 years wasused because latent infections can last a lifetime, and changes inprevalence due to differences in control are likely to remain aftera long duration, such as 20 years. The health outcomes and costsgenerated by expanding the basic DOTS coverage were calculatedin relation to those generated by the comparator, which was tomaintain the current 14% coverage. Differences in costs andbenefits under the interventions and the comparator served asinputs to our economic evaluation.
We also explored the effect of a delay between detection andtreatment. Existing literature on other developing countriessuggests that 4 weeks is correct [15]. In the South Fly, however,a delay of 12 weeks seems more realistic because the commun-ities here are relatively isolated and health services are poor [16].Therefore, we present results with 1) a delay of 12 weeks, as arealistic case for the South Fly; 2) 4 weeks, using an estimate ofthe average delay in developing countries; and 3) 1 week, apossible ultimate goal for the South Fly. Changes in the delaybetween detection and treatment were considered in conjunctionwith changes in the expansion of the basic DOTS coveragebecause this alteration alone does not yield significant changesin health benefits due to the low coverage of the current basicDOTS program in the South Fly.
Finally, it is worth noting that we consider only the South Flyand the TSI instead of the whole of Australia and PNG in ourmodel because the frequent and relatively unscreened move-ments between the two countries occur between these twocommunities because of an existing treaty. This situation makesthe region unique and a focus therefore of special concern relatedto a possible spread of TB from PNG to Australia.
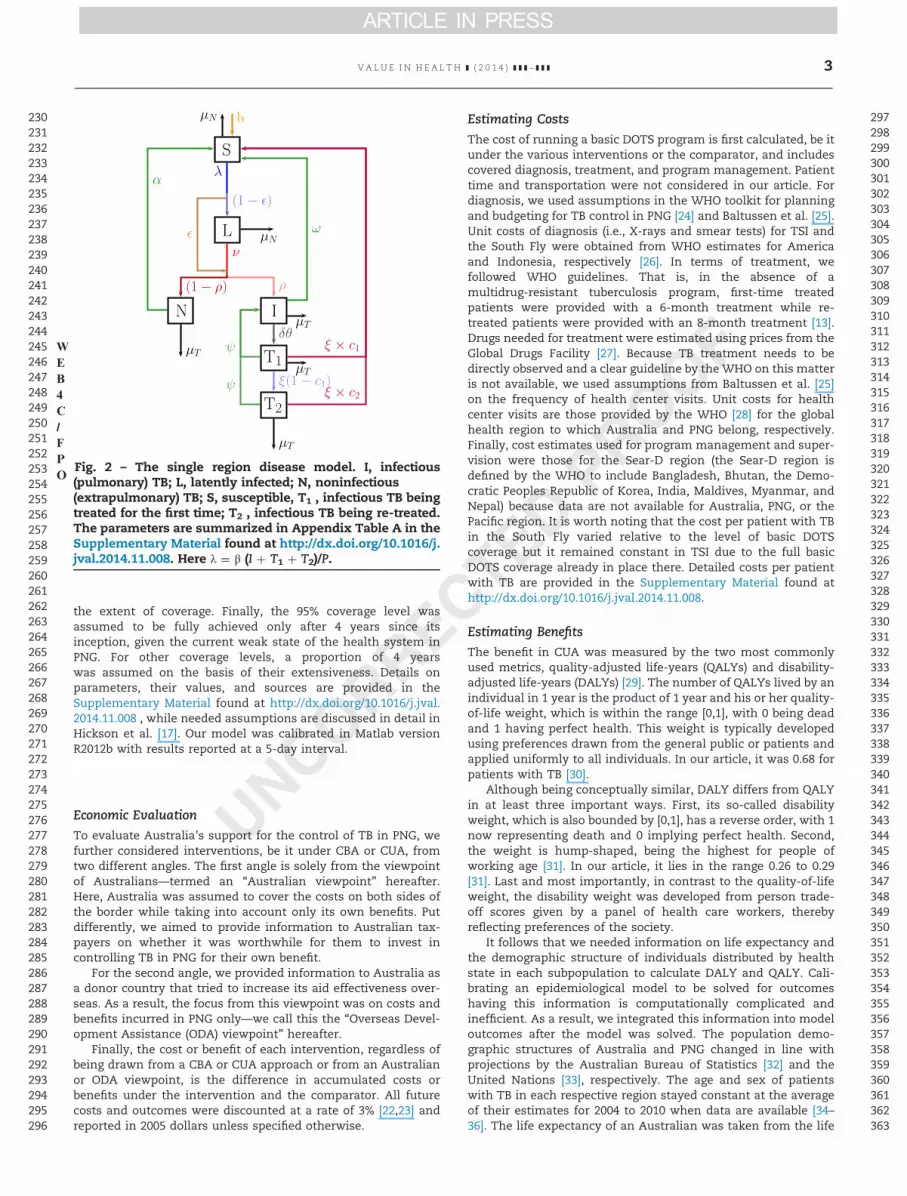
Epidemiological ModelOur epidemiological model was built using a combination ofmetapopulation and compartment modeling techniques, follow-ing Hickson et al. [17]. The former not only allows for eachcountry or subpopulation to have its own dynamics and attrib-utes but also for interaction (albeit limited) between thesesubpopulations [18–20]. This feature is particularly important toour analysis because there are major disparities in the burdenand transmission of TB, as well as access to treatment betweenthe two regions, which exist within the context of physical andcultural proximity, and with the established treaties for popula-tion movements in place. There are four subpopulations in themodel: 1) Australians in Australia—Pop (1,1); 2) Australians inPNG—Pop (2,1); 3) Papua New Guineans in PNG—Pop (2,2); and 4)Papua New Guineans in Australia—Pop (1,2) ( F1Fig. 1). A compart-ment technique was used to categorize people in each subpopu-lation by health state to distinguish uninfected from infectedpersons, latent infection from active infectious (pulmonary) andnoninfectious (extrapulmonary) TB, and those individuals beingtreated for the first time from those being re-treated after the firsttreatment failure ( F2Fig. 2).
Transition between health states, interaction of subpopula-tions due to travel as well as dynamics through time in the modelare captured by systems of nonlinear ordinary differential equa-tions provided in the Supplementary Material found at http://dx.doi.org/10.1016/j.jval.2014.11.008. The parameters and their val-ues used in the model reflect the current and historical situationin the two regions. For example, we started running the modelwith a single infectious case in PNG from the year 1800 until theepidemic stabilized, and the transmission rates were determinedso that the incidence, prevalence, death rate, and populationmatch the available data [17]. Based on this run, the initialconditions in terms of distributions of subpopulations acrossvarious health states were determined for intervention analysis.
Some assumptions were made when we experimented withthe interventions. First, we assumed that the rates of travelundertaken by Australians and Papua New Guinean people,estimated using two-way border crossings reported by theDepartment of Immigration and Citizenship [21], remained con-stant throughout the period of analysis. Second, we assumed thatthe detection rate, which determines the coverage of a basicDOTS program, increased following a logarithmic function tocapture the fact that detection is easiest to improve on when it isinitially low and becomes increasingly difficult to enhance with
96979899
100101102103104105106107108109110111112113114115116117118119120121122123124125126127128129130131132133134135136137138139140141142143144145146147148149150151152153154155156157158159160161162
163164165166167168169170171172173174175176177178179180181182183184185186187188189190191192193194195196197198199200201202203204205206207208209210211212213214215216217218219220221222223224225226227228229
Fig. 1 – Schematic of subpopulations in the metapopulation forSouth Fly and Torres Strait Islands. Note that homogeneousmixing occurs on each side of the border between Pop(1,1) andPop(1,2) and between Pop(2,1) and Pop(2,2).
WEB4C/FPO
V A L U E I N H E A L T H ] ( 2 0 1 4 ) ] ] ] – ] ] ]2
the extent of coverage. Finally, the 95% coverage level wasassumed to be fully achieved only after 4 years since itsinception, given the current weak state of the health system inPNG. For other coverage levels, a proportion of 4 yearswas assumed on the basis of their extensiveness. Details onparameters, their values, and sources are provided in theSupplementary Material found at http://dx.doi.org/10.1016/j.jval.2014.11.008 , while needed assumptions are discussed in detail inHickson et al. [17]. Our model was calibrated in Matlab versionR2012b with results reported at a 5-day interval.
Economic EvaluationTo evaluate Australia’s support for the control of TB in PNG, wefurther considered interventions, be it under CBA or CUA, fromtwo different angles. The first angle is solely from the viewpointof Australians—termed an “Australian viewpoint” hereafter.Here, Australia was assumed to cover the costs on both sides ofthe border while taking into account only its own benefits. Putdifferently, we aimed to provide information to Australian tax-payers on whether it was worthwhile for them to invest incontrolling TB in PNG for their own benefit.
For the second angle, we provided information to Australia asa donor country that tried to increase its aid effectiveness over-seas. As a result, the focus from this viewpoint was on costs andbenefits incurred in PNG only—we call this the “Overseas Devel-opment Assistance (ODA) viewpoint” hereafter.
Finally, the cost or benefit of each intervention, regardless ofbeing drawn from a CBA or CUA approach or from an Australianor ODA viewpoint, is the difference in accumulated costs orbenefits under the intervention and the comparator. All futurecosts and outcomes were discounted at a rate of 3% [22,23] andreported in 2005 dollars unless specified otherwise.
Estimating CostsThe cost of running a basic DOTS program is first calculated, be itunder the various interventions or the comparator, and includescovered diagnosis, treatment, and program management. Patienttime and transportation were not considered in our article. Fordiagnosis, we used assumptions in the WHO toolkit for planningand budgeting for TB control in PNG [24] and Baltussen et al. [25].Unit costs of diagnosis (i.e., X-rays and smear tests) for TSI andthe South Fly were obtained from WHO estimates for Americaand Indonesia, respectively [26]. In terms of treatment, wefollowed WHO guidelines. That is, in the absence of amultidrug-resistant tuberculosis program, first-time treatedpatients were provided with a 6-month treatment while re-treated patients were provided with an 8-month treatment [13].Drugs needed for treatment were estimated using prices from theGlobal Drugs Facility [27]. Because TB treatment needs to bedirectly observed and a clear guideline by the WHO on this matteris not available, we used assumptions from Baltussen et al. [25]on the frequency of health center visits. Unit costs for healthcenter visits are those provided by the WHO [28] for the globalhealth region to which Australia and PNG belong, respectively.Finally, cost estimates used for program management and super-vision were those for the Sear-D region (the Sear-D region isdefined by the WHO to include Bangladesh, Bhutan, the Demo-cratic Peoples Republic of Korea, India, Maldives, Myanmar, andNepal) because data are not available for Australia, PNG, or thePacific region. It is worth noting that the cost per patient with TBin the South Fly varied relative to the level of basic DOTScoverage but it remained constant in TSI due to the full basicDOTS coverage already in place there. Detailed costs per patientwith TB are provided in the Supplementary Material found athttp://dx.doi.org/10.1016/j.jval.2014.11.008.
Estimating BenefitsThe benefit in CUA was measured by the two most commonlyused metrics, quality-adjusted life-years (QALYs) and disability-adjusted life-years (DALYs) [29]. The number of QALYs lived by anindividual in 1 year is the product of 1 year and his or her quality-of-life weight, which is within the range [0,1], with 0 being deadand 1 having perfect health. This weight is typically developedusing preferences drawn from the general public or patients andapplied uniformly to all individuals. In our article, it was 0.68 forpatients with TB [30].
Although being conceptually similar, DALY differs from QALYin at least three important ways. First, its so-called disabilityweight, which is also bounded by [0,1], has a reverse order, with 1now representing death and 0 implying perfect health. Second,the weight is hump-shaped, being the highest for people ofworking age [31]. In our article, it lies in the range 0.26 to 0.29[31]. Last and most importantly, in contrast to the quality-of-lifeweight, the disability weight was developed from person trade-off scores given by a panel of health care workers, therebyreflecting preferences of the society.
It follows that we needed information on life expectancy andthe demographic structure of individuals distributed by healthstate in each subpopulation to calculate DALY and QALY. Cali-brating an epidemiological model to be solved for outcomeshaving this information is computationally complicated andinefficient. As a result, we integrated this information into modeloutcomes after the model was solved. The population demo-graphic structures of Australia and PNG changed in line withprojections by the Australian Bureau of Statistics [32] and theUnited Nations [33], respectively. The age and sex of patientswith TB in each respective region stayed constant at the averageof their estimates for 2004 to 2010 when data are available [34–36]. The life expectancy of an Australian was taken from the life
230231232233234235236237238239240241242243244245246247248249250251252253254255256257258259260261262263264265266267268269270271272273274275276277278279280281282283284285286287288289290291292293294295296
297298299300301302303304305306307308309310311312313314315316317318319320321322323324325326327328329330331332333334335336337338339340341342343344345346347348349350351352353354355356357358359360361362363
Fig. 2 – The single region disease model. I, infectious(pulmonary) TB; L, latently infected; N, noninfectious(extrapulmonary) TB; S, susceptible, T1 , infectious TB beingtreated for the first time; T2 , infectious TB being re-treated.The parameters are summarized in Appendix Table A in theSupplementary Material found at http://dx.doi.org/10.1016/j.jval.2014.11.008. Here λ ¼ β (I þ T1 þ T2)/P.
WEB4C/FPO
V A L U E I N H E A L T H ] ( 2 0 1 4 ) ] ] ] – ] ] ] 3

table 2008–2010 estimated by the Australian Bureau of Statistics[37], while that for a Papua New Guinean was taken from the lifetable 2011 by the WHO [38].
To assign money values to health outcomes in the CBA, weused a stated-preference method. This is the most widely usedmethod to measure underlying consumer demand and valuationfor nonmarket goods such as health benefits [29]. For example,respondents are asked to think about the contingency of anactual market for a health benefit, say a QALY, and then to revealthe maximum they would be willing to pay for it. This approachdominates the other two general methods including humancapital and revealed preference measures for two reasons. First,the human capital approach is often criticized for being incon-sistent with the theoretical foundation of CBA because it offers anarrow view of the utility consequences of an intervention toimpacts on labor productivityQ3 [39]. Also, the wage rates, whichreflect marginal labor productivity in the human capitalapproach, embed inherent inequities in the labor market suchas sex and race discrimination [29]. The latter, the revealedpreference approach, examines the relationship between partic-ular health risks associated with a hazardous job and the wagerates that individuals require to accept the job [40]. Although thisapproach is consistent with the standard welfare economicsframework and based on actual consumer choices, its estimationis very context and job specific [29].
The monetized benefit of each intervention in our article isthe area under the demand curve for QALY for the QALY gain dueto each intervention. Using a Riemann sum, this area can beapproximated as follows:
B¼ ∑N
i¼1WTPi # ΔQALY ð1Þ
where B is the present benefit of each intervention, WTPi is thewillingness to pay (WTP) for an additional QALY, and ∆QALY is asmall change in QALY gained. Although the “law of demand”would suggest a negative association between WTPi and QALY,evidence on this relationship so far is mixed: some found aninverse relationship, for example, Pinto-Prades et al. [41],whereas others suggested insensitivity of the WTP with respectto the size of the health outcome, for example, Olsen et al. [42].Acknowledging that the theory in consistently estimating WTPper QALY is yet to be standardized [41,43–45], our approach is toprovide the best possible analysis given the information availableto us now. That is, we used the recent estimate on Australians’WTP for an additional QALY by Shiroiwa et al. [46], which isconstant, in the absence of a reliable estimated form of WTPi as afunction of QALYi in Australia and elsewhere. Likewise, for PapuaNew Guineans, we used gross domestic product (GDP) per capitaas a proxy of their WTP per an additional QALY due to dataunavailability.Equation 1 is therefore simplified to
B ¼ WTP #∆QALY
where WTP is a constant WTP for an additional QALY and ∆QALYis the total change in the health outcome due to an intervention.Note that we cannot use DALY to measure health outcomes inmonetary terms because its disability weight reflects the society’s(not the consumer’s) preferences.
Evaluation CriteriaEvaluation criteria used for CUA are cost per QALY saved and costper DALY averted. For the former, the benchmark to decidewhether an intervention is cost-effective is the cost-effectiveness threshold by elected or appointed decision-making bodies [47]. Admittedly, none of the decision-makingbodies in Australia or elsewhere has specified or confirmed an
explicit threshold [44,48,49]. Nonetheless, there has been evi-dence that a threshold exists implicitly, being a range of costs perQALY with the probability of rejection increasing with the cost[50–52]. Furthermore, although this threshold reflects a societalperspective in making choices in resource allocation, one couldargue that individual perspectives would serve as the basis forformulating a consistent and transparent threshold [46,53,54]. Asa result, we used the range of AU$35,000 to AU$120,000 as athreshold for Australia suggested by Shiroiwa et al. [46], wherethe cost per QALY being below the lower bound or above theupper bound is likely associated with acceptance or rejection bydecision-making bodies, respectively. This range, especially thelower bound, is comparable to the range of AU$40,000 to AU$80,000 estimated by George et al. [52] who analyzed the deci-sions on new drugs made by the Pharmaceutical Benefits Advi-sory Committee in Australia from 1991 to 1996. It is also in linewith “conventional ranges” in the United Kingdom (£20,000–£30,000) [51] and the United States (US$50,000– US$100,000) [44].
For cost per DALY averted, we used GDP per capita as thebenchmark suggested by the WHO [55–57]. Accordingly, if the costper DALY is less than GDP per capita, the intervention isconsidered highly cost-effective. Finally, in CBA, the criterion isnet present value (NPV), which is the difference between thepresent values of all benefits and costs. An intervention isrecommended if it has a positive NPV. Furthermore, interven-tions are ranked on the basis of how high their NPVs are.
Results
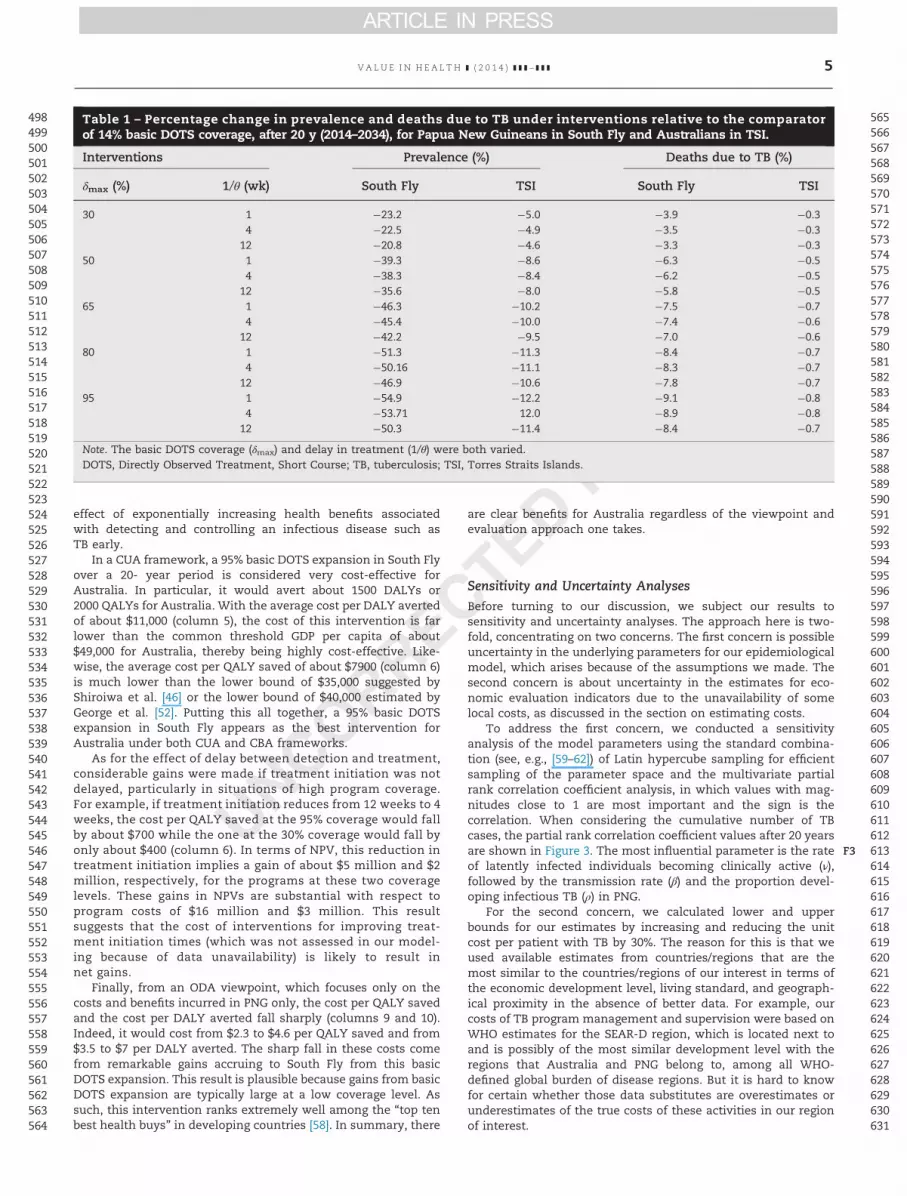
There are direct benefits for TSI from expanding basic DOTScoverage in South Fly as shown in the epidemiological modeloutcomes presented in T1Table 1. For example, an expansion ofbasic DOTS to 30% would result in 5% and 0.3% reductions in TBprevalence and TB-related deaths in TSI, respectively (columns 4and 6). From an ODA perspective, these reductions are moresubstantial, being 24% and 4% in South Fly (columns 3 and 5).Furthermore, for both regions, the more extensive the expansionis, the higher the accrued benefits are. Indeed, reductions in TBprevalence and deaths due to TB in both regions are more thandouble under a 95% coverage as compared with the one under a30% coverage. Although the changes in deaths due to TB in TSIare relatively small, they are significant in South Fly, rangingfrom 3% to 9%.
Results from economic evaluation ( T2Table 2) corroborate theones from the epidemiological model. Indeed, all NPVs arepositive (columns 3 and 7), suggesting that all interventions areworthwhile regardless of the expansion level or how long thedelay between detection and treatment would be. What ismore, the most striking result to emerge from Table 2 is thatthe intervention cost increases with the basic DOTS expansionlevel (columns 3 and 7) but at a much slower rate than does theNPV (columns 4 and 8). In other words, the health benefitincreases faster than the cost and this result is true regardlessof whether one considers the Australian viewpoint or the ODAviewpoint.
From an Australian viewpoint, a 95% basic DOTS expansion inSouth Fly would be the most preferred intervention based on aCBA principle of choosing the highest NPV (column 4). Indeed,with a $16 million intervention over a 20-year period, or about$800,000 per year, a 95% basic DOTS expansion in South Flywould generate about $74 million for Australia. There are twomain reasons why NPV is the highest under this intervention.The first reason is the high Australian WTP per QALY, which infact reflects how costly it would be to have TB in Australia. Thesecond reason is the economies-of-scale effect in expanding thebasic DOTS coverage in South Fly, and more importantly, the
364365366367368369370371372373374375376377378379380381382383384385386387388389390391392393394395396397398399400401402403404405406407408409410411412413414415416417418419420421422423424425426427428429430
431432433434435436437438439440441442443444445446447448449450451452453454455456457458459460461462463464465466467468469470471472473474475476477478479480481482483484485486487488489490491492493494495496497
V A L U E I N H E A L T H ] ( 2 0 1 4 ) ] ] ] – ] ] ]4
effect of exponentially increasing health benefits associatedwith detecting and controlling an infectious disease such asTB early.
In a CUA framework, a 95% basic DOTS expansion in South Flyover a 20- year period is considered very cost-effective forAustralia. In particular, it would avert about 1500 DALYs or2000 QALYs for Australia. With the average cost per DALY avertedof about $11,000 (column 5), the cost of this intervention is farlower than the common threshold GDP per capita of about$49,000 for Australia, thereby being highly cost-effective. Like-wise, the average cost per QALY saved of about $7900 (column 6)is much lower than the lower bound of $35,000 suggested byShiroiwa et al. [46] or the lower bound of $40,000 estimated byGeorge et al. [52]. Putting this all together, a 95% basic DOTSexpansion in South Fly appears as the best intervention forAustralia under both CUA and CBA frameworks.
As for the effect of delay between detection and treatment,considerable gains were made if treatment initiation was notdelayed, particularly in situations of high program coverage.For example, if treatment initiation reduces from 12 weeks to 4weeks, the cost per QALY saved at the 95% coverage would fallby about $700 while the one at the 30% coverage would fall byonly about $400 (column 6). In terms of NPV, this reduction intreatment initiation implies a gain of about $5 million and $2million, respectively, for the programs at these two coveragelevels. These gains in NPVs are substantial with respect toprogram costs of $16 million and $3 million. This resultsuggests that the cost of interventions for improving treat-ment initiation times (which was not assessed in our model-ing because of data unavailability) is likely to result innet gains.
Finally, from an ODA viewpoint, which focuses only on thecosts and benefits incurred in PNG only, the cost per QALY savedand the cost per DALY averted fall sharply (columns 9 and 10).Indeed, it would cost from $2.3 to $4.6 per QALY saved and from$3.5 to $7 per DALY averted. The sharp fall in these costs comefrom remarkable gains accruing to South Fly from this basicDOTS expansion. This result is plausible because gains from basicDOTS expansion are typically large at a low coverage level. Assuch, this intervention ranks extremely well among the “top tenbest health buys” in developing countries [58]. In summary, there
are clear benefits for Australia regardless of the viewpoint andevaluation approach one takes.
Sensitivity and Uncertainty AnalysesBefore turning to our discussion, we subject our results tosensitivity and uncertainty analyses. The approach here is two-fold, concentrating on two concerns. The first concern is possibleuncertainty in the underlying parameters for our epidemiologicalmodel, which arises because of the assumptions we made. Thesecond concern is about uncertainty in the estimates for eco-nomic evaluation indicators due to the unavailability of somelocal costs, as discussed in the section on estimating costs.
To address the first concern, we conducted a sensitivityanalysis of the model parameters using the standard combina-tion (see, e.g., [59–62]) of Latin hypercube sampling for efficientsampling of the parameter space and the multivariate partialrank correlation coefficient analysis, in which values with mag-nitudes close to 1 are most important and the sign is thecorrelation. When considering the cumulative number of TBcases, the partial rank correlation coefficient values after 20 yearsare shown in F3Figure 3. The most influential parameter is the rateof latently infected individuals becoming clinically active (ν),followed by the transmission rate (β) and the proportion devel-oping infectious TB (ρ) in PNG.
For the second concern, we calculated lower and upperbounds for our estimates by increasing and reducing the unitcost per patient with TB by 30%. The reason for this is that weused available estimates from countries/regions that are themost similar to the countries/regions of our interest in terms ofthe economic development level, living standard, and geograph-ical proximity in the absence of better data. For example, ourcosts of TB program management and supervision were based onWHO estimates for the SEAR-D region, which is located next toand is possibly of the most similar development level with theregions that Australia and PNG belong to, among all WHO-defined global burden of disease regions. But it is hard to knowfor certain whether those data substitutes are overestimates orunderestimates of the true costs of these activities in our regionof interest.
498499500501502503504505506507508509510511512513514515516517518519520521522523524525526527528529530531532533534535536537538539540541542543544545546547548549550551552553554555556557558559560561562563564
565566567568569570571572573574575576577578579580581582583584585586587588589590591592593594595596597598599600601602603604605606607608609610611612613614615616617618619620621622623624625626627628629630631
Table 1 – Percentage change in prevalence and deaths due to TB under interventions relative to the comparatorof 14% basic DOTS coverage, after 20 y (2014–2034), for Papua New Guineans in South Fly and Australians in TSI.
Interventions Prevalence (%) Deaths due to TB (%)
δmax (%) 1/θ (wk) South Fly TSI South Fly TSI
30 1 &23.2 &5.0 &3.9 &0.34 &22.5 &4.9 &3.5 &0.3
12 &20.8 &4.6 &3.3 &0.350 1 &39.3 &8.6 &6.3 &0.5
4 &38.3 &8.4 &6.2 &0.512 &35.6 &8.0 &5.8 &0.5
65 1 &46.3 &10.2 &7.5 &0.74 &45.4 &10.0 &7.4 &0.6
12 &42.2 &9.5 &7.0 &0.680 1 &51.3 &11.3 &8.4 &0.7
4 &50.16 &11.1 &8.3 &0.712 &46.9 &10.6 &7.8 &0.7
95 1 &54.9 &12.2 &9.1 &0.84 &53.71 12.0 &8.9 &0.8
12 &50.3 &11.4 &8.4 &0.7
Note. The basic DOTS coverage (δmax) and delay in treatment (1/θ) were both varied.DOTS, Directly Observed Treatment, Short Course; TB, tuberculosis; TSI, Torres Straits Islands.
V A L U E I N H E A L T H ] ( 2 0 1 4 ) ] ] ] – ] ] ] 5

632633634635636637638639640641642643644645646647648649650651652653654655656657658659660661662663664665666667668669670671672673674675676677678679680681682683684685686687688689690691692693694695696697698
699700701702703704705706707708709710711712713714715716717718719720721722723724725726727728729730731732733734735736737738739740741742743744745746747748749750751752753754755756757758759760761762763764765
Table 2 – Cost per DALY, QALY, and NPV (USD 2005) of interventions relative to the comparator of 14% basic DOTS coverage after 20 y (2014–2034) forPapua New Guineans in South Fly and Australians in TSI.
Interventions TSI South Fly
BasicDOTScoverage(%)
1/θ(wk)
Totaldiscountedcost (million)
NPV(million)
Cost perDALY
(thousand)
Cost perQALY
(thousand)
Totaldiscountedcost (million)
NPV (billion) Cost perDALY
Cost perQALY
30 1 3.22 (2.25–4.19) 32.76 (33.73–31.80) 5.56 (3.89–7.23) 3.89 (2.72–5.06) 3.23 (2.26–4.20) 3.14 (3.15–3.14) 3.41 (2.38–4.43) 2.24 (1.57–2.91)4 3.25 (2.27–4.22) 32.02 (32.99–31.04) 5.72 (4.01–7.44) 4 (2.80–5.20) 3.26 (2.28–4.24) 3.08 (3.09–3.08) 3.5 (2.45–4.55) 2.3 (1.61–3.00)12 3.33 (2.33–4.33) 29.77 (30.77–28.77) 6.25 (4.37–8.12) 4.37 (3.06–5.68) 3.34 (2.34–4.34) 2.91 (2.91–2.90) 3.81 (2.67– 4.95) 2.51 (1.76–3.26)
50 1 8.23 (5.76–10.69) 55.32 (57.78–52.85) 8.05 (5.64–10.47) 5.63 (3.94–7.31) 8.24 (5.77–10.72) 5.5 (5.51–5.50) 4.97 (3.48–6.46) 3.27 (2.29–4.25)4 8.31 (5.82–10.80) 54.06 (56.55–51.57) 8.29 (5.80–10.77) 5.79 (4.05–7.53) 8.33 (5.83–10.82) 5.41 (5.41–5.41) 5.11 (3.57–6.64) 3.36 (2.35–4.36)12 8.55 ( 5.99–11.12) 50.26 (52.83–47.70) 9.04 (6.32–11.75) 6.32 (4.42–8.21) 8.57 (6.00–11.14) 5.12 (5.12–5.11) 5.55 (3.88–7.21) 3.65 (2.55–4.74)
65 1 12.38 (8.67–16.10) 63.7 (67.41–59.98) 10.13 (7.09–13.17) 7.07 (4.95–9.19) 12.4 (8.68–16.12) 6.59 (6.59–6.58) 6.25 (4.37–8.12) 4.1 (2.87–5.34)4 12.51 (8.76–16.27) 62.24 (65.99–58.49) 10.42 (7.30–13.54) 7.27 (5.09–9.46) 12.54 (8.77–16.30) 6.48 (6.48–6.48) 6.42 (4.49–8.34) 4.22 (2.95–5.48)12 12.9 (9.03–16.77) 57.77 (61.64–53.90) 11.35 (7.94–14.75) 7.93 (5.55–10.31) 12.92 (9.04–16.79) 6.15 (6.15–6.14) 6.96 (4.87–9.05) 4.58 (3.21–5.95)
80 1 15.06 (10.54–19.57) 70.33 (74.85–65.82) 10.98 (7.68–14.27) 7.66 (5.36–9.96) 15.08 (10.56–19.60) 7.37 (7.37–7.36) 6.79 (4.75–8.83) 4.46 (3.12–5.80)4 15.23 (10.66–19.79 ) 68.73 (73.29–64.16) 11.29 (7.90–14.68) 7.88 (5.52–10.25) 15.25 (10.67–19.82) 7.25 (7.26–7.25) 6.98 (4.88–9.07) 4.58 (3.21–5.96)12 15.72 (11.01–20.44) 63.79 (68.50–59.07) 12.3(8.61–15.99) 8.59 (6.02–11.17) 15.75 (11.02–20.47) 6.9 (6.90–6.89) 7.57 (5.30–9.84) 4.98 (3.48–6.47)
95 1 16.33 (11.43–21.23) 76.08 (80.98–71.18) 11 (7.70–14.31) 7.68 (5.38–9.99) 16.35 (11.45–21.26) 7.95 (7.96–7.95) 6.83 (4.78–8.87) 4.48 (3.14–5.83)4 16.53 (11.57–21.48) 74.38 (79.33–69.42) 11.32 (7.92–14.72) 7.9 (5.53–10.27) 16.55 (11.59–21.52) 7.83 (7.84–7.83) 7.01 (4.91–9.12) 4.6 (3.22–5.99)12 17.1 (11.97–22.22) 69.12 (74.24–63.99) 12.34 (8.64–16.04) 8.62 (6.03–11.20) 17.12 (11.98–22.26) 7.46 (7.46–7.45) 7.61 (5.33–9.89) 5 (3.50– 6.50)
Note. The basic DOTS coverage (δmax) and delay in treatment (1/θ) were both varied. Numbers in parentheses were calculated when the cost per patient with TB increased or reduced by 30%.DALY, disability-adjusted life-year; NPV, net present value; QALY, quality-adjusted life-year; TSI, Torres Straits Islands.
VALUE
INH
EALTH
](2
014)]]]–]]]
6

Table 2, however, presents a high level of robustness in ourconclusions irrespective of what direction the true cost wouldgo. First, from an Australian viewpoint, a 95% basic DOTSexpansion in South Fly remains the most preferred interven-tion under the CBA framework for Australia, yielding a netbenefit in the range of $79 million to $69 millionQ4 (column 4).Likewise, under the CUA framework, this intervention is alsothe most cost-effective. For example, the average cost perDALY averted is in the order of $8,000 to $15,000 (column 5),being far lower than the threshold of $49,000 [55–57], while theaverage cost per QALY ranges from $5,500 to $10,000, beingmuch less than the lower bound of the suggested threshold of$35,000 [46], or the estimated threshold of $40,000 [52]. Second,from an ODA viewpoint, it still costs less than $10 per DALYaverted or less than $7 per QALY saved (columns 9 and 10) inPNG regardless of the level of coverage or what direction thecost goes. Therefore, the support for the control of TB in PNGstill fairs well under uncertainty, and results from our epide-miological model and economic evaluation are robust undersensitivity analysis.
Discussion
Since the early 1990s, DOTS has been promoted as an effectivetreatment for new smear- positive cases of TB [63]. Despite beingone of the Millennium Development Goals and later being rankedas one of the top 10 best health buys in developing countries [58],progress in DOTS implementation and expansion in developingcountries is still far from adequate. This slow progress is driven
mostly by a lack of required resources, with the financial costdisproportionately born by poor developing countries because oftheir high prevalence of TB. Our analysis demonstrates that thereare substantial domestic gains for Australia, a well-resourceddeveloped country, in strengthening TB control in PNG, its lower-resourced neighbor. Furthermore, from a donor point of view, thisassistance is very effective because it ranks extremely wellamong the top ten best health buys in developing countries,contributing to the achievement of Millennium DevelopmentGoals [58].
Our study has at least one limitation. We did not take intoaccount the impact of multidrug-resistant tuberculosis and HIV.There are two reasons for this. We focus on basic DOTS expan-sion because it is considered the “cornerstone” of the TB controlstrategy in any country [12]. This is especially true for a countrysuch as PNG where DOTS coverage is incredibly low whilesupporting services and resources are very inadequate. It is alsoclear that adding multidrug-resistant tuberculosis and HIV willrequire us to use a more elaborate stochastic spatial model,which, due to limited information about their prevalence, is bestleft as a topic for future research.
Our study has a number of strengths. First, to our knowledge,our model is the first that takes into account the impact of two-way population movements from a high-burden developingcountry to a low-burden developed country, with an economicanalysis showing that extending treatment in the high-burdenarea is mutually beneficial. Second, we use a spatial model tokeep track of TB spread between two countries due to travel,which was built to fit historical data and trends appropriately.Third, we apply both CUA and CBA to estimate cost per DALY
766767768769770771772773774775776777778779780781782783784785786787788789790791792793794795796797798799800801802803804805806807808809810811812813814815816817818819820821822823824825826827828829830831832
833834835836837838839840841842843844845846847848849850851852853854855856857858859860861862863864865866867868869870871872873874875876877878879880881882883884885886887888889890891892893894895896897898899
Fig. 3 – Sensitivity analysis, in which the parameters are defined in the Supplementary Material found at http://dx.doi.org/10.1016/j.jval.2014.11.008, with “South Fly” corresponding to (1,1) and “Torres Strait Islands” to (2,2). PNG, Papua New Guinea;TECC, XXXXQ16 ; TSI, Torres Strait Islands.
WEB4C/FPO
V A L U E I N H E A L T H ] ( 2 0 1 4 ) ] ] ] – ] ] ] 7

averted, cost per QALY saved, and the NPV of the basic DOTSintervention to represent perspectives from both the healthsector and the whole economy, as well for aid effectiveness.Although our results are not directly generalizable to othercountries because of differences in underlying epidemiologicaland economic characteristics, we suspect that studies applying asimilar model approach to countries with similar substantivedifferences in TB prevalence would likely generate comparableresults.
Overall, our study suggests that where countries with majordisparities in both TB burden and health system resourcingborder each other or are linked by population movements suchas migration, investments by well-resourced, low-burdencountries in TB control in high-burden, low-resourced neigh-bors are likely of mutual benefit, resulting in net gains on bothsides of the border as well as across the region as a whole. Thehigh relative cost of treatment in well-resourced settingsmeans that benefits exceed the costs of even a large-scaleexpansion of control programs in low-resourced areas. Basedon these models and the limited available data for the PNG–Australia border region, Australia would benefit from invest-ment in TB control in PNG, and the benefits are greater thegreater the investment. These models would be of relevance toother regions where such disparities and connections exist,and could be used in building the case for appropriate invest-ment in TB control globally.
Source of financial support: The Australian National Univer-sity and the University of Newcastle have provided funding in theform of salary for the authors. The funders had no role in studydesign, data collection and analysis, decision to publish, orpreparation of the manuscript.
Supplemental Material
Supplemental material accompanying this article can be found inthe online version as a hyperlink at http://dx.doi.org/10.1016/j.jval.2014.11.008 or, if a hard copy of article, at www.valueinhealthjournal.com/issues (select volume, issue, and article).
R E F E R E N C E S
[1] World Health Organization. Global Tuberculosis Report 2012. France:World Health Organization, 2012.
[2] Gaudette L, Ellis E. Tuberculosis in Canada: a focal disease requiringdistinct control strategies for different risk groups. Tuber Lung Dis1993;74:244–53.
[3] McKenna MT, McCray E, Onorato I. The epidemiology of tuberculosisamong foreign-born persons in the United States, 1986 to 1993. N Engl JMed 1995;332:1071–6.
[4] Cobelens FG, van Deutekom H, Draayer-Jansen IW, et al. Association oftuberQ17 culin sensitivity in Dutch adults with history of travel to areas ofwith a high incidence of tuberculosis. Clin Infect Dis 2001;33:300–4.
[5] Frothingham R, Stout JE, Hamilton CD. Current issues in globaltuberculosis control. Int J Infect Dis 2005;9:297–311.
[6] Binkin NJ, Zuber PL, Wells CD, et al. Overseas screening for tuberculosisin immigrants and refugees to the United States: current status. ClinInfect Dis 1996;23:1226–32.
[7] Horsfield N, Ormerod L. Suspected cases of pulmonary tuberculosisreferred from port of entry. BMJ 1986;292:765.
[8] Bonvin L, Zellweger J. Mass miniature X-ray screening for tuberculosisamong immigrants entering Switzerland. Tuber Lung Dis 1992;73:322–5.
[9] Thomas RE, Gushulak B. Screening and treatment of immigrants andrefugees to Canada for tuberculosis: implications of the experience ofCanada and other industrialized countries. Can J Infect Dis1995;6:246–55.
[10] Alvarez GG, Gushulak B, Rumman KA, et al. A comparativeexamination of tuberculosis immigration medical screening programsfrom selected countries with high immigration and low tuberculosisincidence rates. BMC Infect Dis 2011;11:3.
[11] Schwartzman K, Oxlade O, Barr RG, et al. Domestic returns frominvestment in the control of tuberculosis in other countries. N Engl JMed 2005;353:1008–20.
[12] World Health Organization. The Stop TB Strategy: Building On andEnhancing DOTS to Meet the TB-Related Millennium Development Q6Goals. World Health Organization, 2006.
[13] World Health Organization. Treatment of Tuberculosis Guidelines (4thed.). Geneva: World Health Organization, 2006.
[14] Lokuge K, Salee K, Konstantinos A. Tuberculosis control in the TorresStrait region: what’s needed and why? Report following a public forum.Development Policy Centre Discussion Paper No. 22. Available from:http://papers.ssrn.com/ sol3/papers.cfm?abstract_id=2126915.[Accessed November 27, 2013].
[15] Bassili A, Seita A, Baghdadi S, et al. Diagnostic and treatment delay intuberculosis in 7 countries of the Eastern Mediterranean region. InfectDis Clin Pract 2008;16:23–35.
[16] McBryde E. Evaluation of risks of tuberculosis in Western ProvincePapua New Guinea. Available from: http://www.ausaid.gov.au/countries/pacific/png/Documents/png-tb-evaluation-of-risk.pdf.[Accessed November 21, 2013].
[17] Hickson RI, Mercer GN, Lokuge K. A metapopulation model oftuberculosis transmission with a case study from high to low burdenareas. PLoS One 2012;7:e34411.
[18] Hanski I, Gilpin ME. Metapopulation Biology: Ecology, Genetics, andEvolution. San Diego: Elsevier Academic Press, 1997.
[19] Hanski I, Gaggiotti OE. Ecology, Genetics, and Evolution ofMetapopulations. San Diego: Elsevier Academic Press, 2004.
[20] Keeling MJ, Rohani P. Modeling Infectious Diseases in Humans andAnimals Q7. Princeton University Press, 2008.
[21] Department of Immigration and Citizenship. Inquiry into mattersrelating to the Torres Strait region, submissions received by thecommittee. Available from: http://www.aph.gov.au/senate/committee/fadt_ctte/torresstrait/submissions.htm. [Accessed September 5, 2010].
[22] Weinstein MC, Siegel JE, Gold MR, et al. Recommendations of thePanel on Cost-Effectiveness in Health and Medicine. JAMA1996;276:1253–8.
[23] Edejer TTT, Baltussen R, Adam T, et al. Making Choices in Health: WHOGuide to Cost-Effectiveness Q8Analysis. World Health Organization, 2003.
[24] World Health Organization. Planning and Budgeting for TB Control.Papua New Guinea, Western Pacific Region. Version 4 (November 2010),2010 Q9.
[25] Baltussen R, Floyd K, Dye C, et al. Cost effectiveness analysis ofstrategies for tuberculosis control in developing countries. BMJ2005;331:1364.
[26] World Health Organization. Diagnostics for Tuberculosis: Global Demandand Market Potential. Geneva: World Health Organization, 2006.
[27] Global Drug Facility. First-line drug calculation sheet. Available from:http://www.stoptb.org/gdf/monitoring/documents.asp. [Accessed May8, 2012].
[28] World Health Organization. Results of unit costs for patient services forthe 14 global burden of disease regions. Available from: http://www.who.int/choice/costs/unit_regions/en/. [Accessed May 23, 2014].
[29] Drummond MF, Sculpher MJ, Torrance GW, et al. Methods for theEconomic Ev Q18aluation of Health Care Programmes. Oxford UniversityPress, 2005.
[30] Tengs TO, Wallace A. One thousand health-related quality-of-lifeestimates. Med Care 2000;38:583–637.
[31] Murray CJ, Lopez AD. Global Comparative Assessments in the HealthSector: Disease Burden, Expenditures and Intervention Packages.Geneva: World Health Organization, 1994.
[32] Australian Bureau of Statistics. Population projections, Australia, 2006to 2101. Available from: Q11. [Assessed June 10, 2013].
[33] United Nations. World Population Prospects: The 2010 Revision. NewYork, NY: Population Division, Department of Economic and SocialAffairs, United Nations Q12. Available from: http://esa.un.org/unpd/wpp/index.htm. [Assessed May 27, 2013].
[34] World Health Organization. Global Tuberculosis Control: Report Q132010.World Health Organization, 2010.
[35] World Health Organization. Global Tuberculosis Control: Report 2007.World Health Organization, 2007.
[36] World Health Organization. Global Tuberculosis Control: Report 2004.World Health Organization, 2004.
[37] Australian Bureau of Statistics. Life tables, Australia, 2008-2010.Available from: Q14. [Assessed June 10, 2013].
[38] World Health Organization. World health statistics. Life tables, PapuaNew Guinea, 2011. Available from: http://apps.who.int/gho/data/node.main.687?lang=en. [Assessed June 10, 2013].
[39] Mishan EJ. Evaluation of life and limb: a theoretical approach. J Pol Econ1971;4:687–705.
900901902903904905906907908909910911912913914915916917918919920921922923924925926927928929930931932933934935936937938939940941942943944945946947948949950951952953954955956957958959960961962963964965966
967968969970971972973974975976977978979980981982983984985986987988989990991992993994995996997998999
1000100110021003100410051006100710081009101010111012101310141015101610171018101910201021102210231024102510261027102810291030103110321033
V A L U E I N H E A L T H ] ( 2 0 1 4 ) ] ] ] – ] ] ]8

[40] Marin A, Psacharopoulos G. The reward for risk in the labor market:evidence from the United Kingdom and a reconciliation with otherstudies. J Pol Econ 1982;90:827–53.
[41] Pinto-Prades JL, Loomes G, Brey R. Trying to estimate a monetary valuefor the QALY. J Health Econ 2009;28:553–62.
[42] Olsen JA, Donaldson C, Pereira J. The insensitivity of ‘willingness-to-pay’ to the size of the good: new evidence for health care. J EconPsychol 2004;25:445–60.
[43] Smith RD. Sensitivity to scale in contingent valuation: the importanceof the budget constraint. J Health Econ 2005;24:515–29.
[44] Gafni A, Birch S. Incremental cost-effectiveness ratios (ICERs): thesilence of the lambda. Soc Sci Med 2006;62:2091–100.
[45] Bobinac A, van Exel N, Rutten FF, Brouwer WB. Get more, pay more? Anelaborate test of construct validity of willingness to pay per QALYestimates obtained through contingent valuation. J Health Econ2012;31:158–68.
[46] Shiroiwa T, Sung YK, Fukuda T, et al. International survey onwillingness-to-pay (WTP) for one additional QALY gained: what is thethreshold of cost effectiveness? Health Econ 2010;19:422–37.
[47] Williams A, Sugden R. The Principles of Practical Cost-Benefit Analysis.New York: Oxford University Press, 1978.
[48] Eichler HG, Kong SX, Gerth WC, et al. Use of cost-effectiveness analysis inhealth-care resource allocation decision-making: how are cost-effectiveness thresholds expected to emerge? Value Health 2004;7:518–28.
[49] Henry DA, Hill SR, Harris A. Drug prices and value for money: theAustralian Pharmaceutical Benefits Scheme. JAMA 2005;294:2630–2.
[50] Devlin N, Parkin D. Does NICE have a cost-effectiveness threshold andwhat other factors influence its decisions? A binary choice analysis.Health Econ 2004;13:437–52.
[51] Rawlins MD, Culyer AJ. National Institute for Clinical Excellence and itsvalue judgments. BMJ 2004;329:224.
[52] George B, Harris A, Mitchell A. Cost-effectiveness analysis and theconsistency of decision making. Pharmacoeconomics 2001;19:1103–9.
[53] Bobinac A, Van Exel N, Rutten FF, Brouwer WB. Willingness to pay for aquality-adjusted life-year: the individual perspective. Value Health2010;13:1046–55.
[54] Towse A. Should NICE’s threshold range for cost per QALY be raised?Yes. BMJ 2009;338:268–9.
[55] Sachs J. Macroeconomics and Health: Investing in Health for EconomicDevelopment Q15. Report of the Commission on Macroeconomics andHealth. World Health Organization, 2001.
[56] Evans DB, Edejer TTT, Adam T, Lim SS. Achieving the millenniumdevelopment goals for health: methods to assess the costs and healtheffects. BMJ 2005;331:1137–40.
[57] World Health Organization. Cost effectiveness thresholds. Availablefrom: http://www.who.int/choice/costs/CER_thresholds/en/. [AccessedAugust 28, 2014].
[58] Measham AR, Alleyne G, Mills A, et al. Disease Control Priorities inDeveloping Countries. Washington, DC: World Bank and OxfordUniversity Press, 2006.
[59] Blower S, Dowlatabadi H. Sensitivity and uncertainty analysis ofcomplex models of disease transmission: an HIV model, as an example.Int Stat Rev 1994;62:229–43.
[60] Sanchez MA, Blower SM. Uncertainty and sensitivity analysis of thebasic reproductive rate: tuberculosis as an example. Am J Epidemiol1997;145:1127–37.
[61] Marino S, Hogue IB, Ray CJ, Kirschner DE. A methodology forperforming global uncertainty and sensitivity analysis in systemsbiology. J Theor Biol 2008;254:178–96.
[62] Thomas EG, Barrington HE, Lokuge KM, Mercer GN. Modellingthe spread of tuberculosis, including drug resistance and HIV: a casestudy in Papua New Guinea’s Western Province. ANZIAM J2010;52:26–45.
[63] Murray C, DeJonghe E, Chum H, et al. Cost effectiveness ofchemotherapy for pulmonary tuberculosis in three sub-SaharanAfrican countries. Lancet 1991;338:1305–8.
1034103510361037103810391040104110421043104410451046104710481049105010511052105310541055105610571058105910601061
106210631064106510661067106810691070107110721073107410751076107710781079108010811082108310841085108610871088
V A L U E I N H E A L T H ] ( 2 0 1 4 ) ] ] ] – ] ] ] 9


