Embed Size (px)
Citation preview
INVESTIGATE THE LONGER-TERM EFFECTS ON FARM BUSINESSES OF A bTB BREAKDOWN Project SE3120 Draft final report for Defra Draft: 17 October 2008 Contact: Martin Turner, Department of Geography, University of Exeter Laver Building, North Park Road, Exeter, EX4 4QE Tel: 01392 263833 Email: [email protected]
University of Exeter/ADAS UK Ltd
Longer-term effects of a bTB breakdown: draft report 17 October 2008
ii
University of Exeter/ADAS UK Ltd
Longer-term effects of a bTB breakdown: draft report 17 October 2008
iii
Acknowledgements and disclaimer
This research project was led by Martin Turner, University of Exeter and Mark
Temple, ADAS UK Ltd. The study was designed by a small team comprising Martin
Turner, Dr Keith Howe and Dr Emma Jeanes (University of Exeter), Mark Temple
and David Boothby (ADAS UK Ltd) and Paul Watts (Somerset Partnership NHS and
Social Care Trust). Martin Turner has acted as the principal author and editor of this
report, and carries the responsibility for any errors; but a number of people made
specific contributions to the report and particular acknowledgements are due to:
Dr Keith Howe, University of Exeter (Centre for Rural Policy Research): Literature
review (Chapter 2);
David Boothby, ADAS UK Ltd: management of the ADAS team for the farmers’
interview survey;
Dr Emma Jeanes, University of Exeter (Department of Management): Case studies of
GPs’ practices (part of Chapter 5);
Professor Richard Bennett and colleagues, University of Reading: Choice experiment
looking at farmers’ WTP for a bTB vaccine (Chapter 6 and Appendix E);
Lucy Wilson, ADAS UK Ltd (Environment Group): Analysis and reporting on the
GIS study of cattle populations (Appendix E);
Paul Watts, Somerset Partnership NHS and Social Care Trust: Consultant for the
GHQ-12 study.
Farm interviews were carried out by Nicola Buckingham, Dennis Chapple, Nerys
Davies, Susie Felix, Marc Jones, Fiona McVicar, Giles Martin, Andrew Sheppard and
Karen Wheeler.
Data management and analysis has been undertaken by Donald Barr, Theo Economou
and Kevin Mawdesley for the University of Exeter.
The authors acknowledge with thanks those farmers who contributed their time to
help in various stages of the research, and in some cases to more than one of the
following research activities: the stakeholders’ consultation, the face-to-face interview
survey, the postal survey and the choice experiment study; without their help,
willingly given, this research could not have been completed. In addition the
contributions made by (a) a wide range of stakeholders and (b) a number of GPs in
busy rural practices are also acknowledged with thanks, as also are the helpful
responses received from two insurance firms offering bTB cover. Particular thanks
are due to the following people and institutions for their invaluable help in significant
ways:
Birgit Austin and colleagues at the UK Data Archive
Andrew Woodend, Selina Matthews and colleagues, Defra’s Farm Economics Unit
Andy Mitchell and colleagues at the Veterinary Laboratories Agency
Phil Robertson and FBS Centre colleagues, Rural Business Research
Tony O’Regan and FBS team colleagues at Aberystwyth University
The views expressed in this report are those of the authors and are not necessarily
shared by other members of the University of Exeter or the University as a whole;
other members of ADAS UK Ltd or ADAS UK Ltd as a whole; other members of the
Somerset Partnership NHS and Social Care Trust or the Somerset Partnership as a
whole; other members of the University or Reading or the University as a whole; or
by Defra.

University of Exeter/ADAS UK Ltd
Longer-term effects of a bTB breakdown: draft report 17 October 2008
iv
University of Exeter/ADAS UK Ltd
Longer-term effects of a bTB breakdown: draft report 17 October 2008
v
Contents
Page
Acknowledgements iii List of tables vii List of figures ix List of farm case studies xi Glossary of abbreviations x Executive summary 1 1 Introduction 11
Background 11 The study brief 12 The study method 13 The research team 19
2 Review of the evidence from other research 20
Defining the longer term 20 Trends in cattle farming 21 Effects of stress in farming 24 Longer-term effects of a bTB breakdown 27 Badgers and bio-security 30 Conclusions 32
3 Factors which result in longer-term impacts 33
Introduction 33 Regional changes in cattle farming: the GIS study 33 Farm-level evidence for bTB as a driver of strategic change 36 Insuring against a bTB breakdown: practical issues 45 The human dimension: key findings 49 Discussion and conclusions 50
4 Estimated longer-term economic effects 55
Introduction 55 The stakeholders’ consultation: pointers to farm economic problems 60 The longer-term economic impacts from bTB: evidence from the FBS 62 Evidence from the farm interview survey 90
University of Exeter/ADAS UK Ltd
Longer-term effects of a bTB breakdown: draft report 17 October 2008
vi
Summary of responses from the postal survey 104 Conclusions 105
5 Understanding health and social effects 109
Introduction 109 The stakeholder consultation: pointers to farming stress 111 The postal survey: exploring the human impacts of a bTB breakdown 113 Interviews with General Practitioners: some case studies 131 The farmers’ view: results from the interview survey 138 Conclusions 144
6 Exploring farmers’ WTP for a bTB vaccine 146
Background 146 Study objectives and methodology 146 Study results 157 Discussion and conclusions 159
7 Discussion and conclusions 161
Review and reflection 161 Concluding summary 159
Bibliography 166
Appendices 171
A Stakeholder consultation: overall summary 172
B Farmers’ interview survey: summary results 177
C Desk study using FBA data: summary results 213
D Postal survey: the GHQ-12 questionnaire 221
E The GIS study of changes in cattle populations 224
F The choice experiment bTB cattle vaccine questionnaire 245
University of Exeter/ADAS UK Ltd
Longer-term effects of a bTB breakdown: draft report 17 October 2008
vii
List of tables
Page
3.1 The GIS study: summary of the effects of time and bTB on outcome variables for each area studied, and all areas 34
3.2 Attitude to farming, ‘bTB driver’ farms and ‘non-bTB driver’ farms
compared 37
3.3 Farmers and their communities, ‘bTB driver’ farms and all sample
farms compared 38
3.4 Farming values and objectives, ‘bTB driver’ farms and all sample
farms compared 39
3.5 Expectations on succession: ‘bTB driver’ farms and all sample
farms compared 40
3.6 The farm interview sample: ‘bTB driver’ and ‘non-bTB driver’ farms,
by farm type and bTB category 41
3.7 Interviewed dairy farms: ‘bTB driver’ and ‘non-bTB driver’ farms,
by bTB category 42
3.8 Interviewed beef farms: ‘bTB driver’ and ‘non-bTB driver’ farms,
by bTB category 43
3.9 Incidence of bTB insurance, initial and subsequent breakdowns 45
3.10 Farmers’ views of the role of bTB insurance in reducing business
risk at farm level 46
3.11 Interviewed farms: ‘bTB driver’ and ‘non-bTB driver’ farms, by
farm type and bTB category 52
3.12 Factors which result in longer term impacts from a bTB breakdown:
a summary of the research findings 53
4.1 The national incidence of bTB breakdowns: an initial analysis of
the VetNet database, July 2007 56
4.2 Adverse effects of a bTB breakdown on the financial vitality of farm businesses: summary of the stakeholders’ consultation findings 62
4.3 The FBS bTB sample: numbers of years in the survey over the
period 2002/03 to 2006/07 64
4.4 The FBS bTB sample, by farm type, 2002/03 to 2006/07 65
4.5 The FBS bTB sample, by period of movement restrictions 65
4.6 Sample sizes, FBS bTB dairy farms, 2002/03 to 2006/07 67
4.7 Sample sizes, FBS bTB suckler beef farms, 2002/03 to 2006/07 79
4.8 The role of bTB as a driver of past business change 90
4.9 Farmers’ identification of the main long-term effects of a
bTB breakdown 91
4.10 Self-declared net profit from farming: interviewed farms by
bTB category 92
University of Exeter/ADAS UK Ltd
Longer-term effects of a bTB breakdown: draft report 17 October 2008
viii
Page
4.11 Farmers’ attitudes to level of borrowing under present circumstances 93
4.12 Investment in recent bio-security improvements, by type of
improvement 94
4.13 Use of funds received for compensation/insurance 96
4.14 The farm-level impacts and financial importance of movement
restrictions 97
4.15 Wider implications of purchasing replacement breeding stock 100
4.16 Significant effects of a bTB breakdown on farm business
development plans 100
4.17 On-going problems: anticipated significant future impacts from
the past bTB breakdown 103
5.1 Adverse effects of a bTB breakdown on human health and well-being: summary of the stakeholders’ consultation findings 112
5.2 Postal survey using the GHQ-12: sample stratification 114
5.3 Illustrative example of alternative GHQ-12 scoring approaches 116
5.4 Postal survey response rate, by category of person 117
5.5 Total postal survey responses by bTB category and farm type 117
5.6 Postal survey response at farm level: farm type and bTB group 118
5.7 Detailed composition of postal survey respondents, by
responses per farm 120
5.8 Farms with two responses: analysis of responses by category 120
5.9 Farms with three responses: analysis of responses by category 121
5.10 Postal survey respondents: statistical analysis of cattle herds 122
5.11 Analysis of postal response: cattle herds by type and bTB category 123
5.12 Postal survey: years under movement restriction, mean and
median herd sizes compared 123
5.13 Periods of cattle movement restrictions by farm type 124
5.14 Years under movement restriction, by farm type 124
5.15 Percentage of respondents scoring a ‘high GHQ score’ by
category of bTB breakdown 125
5.16 ‘High GHQ scores’ by farm type and category of bTB breakdown 126
5.17 Proportions of GHQ ‘cases’ using the truncated sample of farms
with 20 or more head of cattle 128
5.18 Proportions of GHQ ‘cases’ for family members, by category of bTB breakdown 128
5.19 Proportions of GHQ ‘cases’ for farmers, by farm type and category
of bTB breakdown 129
5.20 Analysis using the Likert scale: proportions of GHQ ‘cases’ by
farm type and category of bTB breakdown 130
5.21 The non-economic impacts of a bTB breakdown: the farmers view 139
University of Exeter/ADAS UK Ltd
Longer-term effects of a bTB breakdown: draft report 17 October 2008
ix
Page
6.1 Example CE choice set showing attributes and their levels 150
6.2 Percentage of farmers scoring at each level of agreement to
the attitude statements presented to them and their mean score 153
6.3 Farmers’ perceptions of the risk of their herd testing positive to bTB
in any one year 154
6.4 Farmers’ perceptions of the likelihood of their herds testing bTB
positive within the next three years 154
6.5 Farmers’ perceptions as to the likelihood of a severe breakdown
within the next 5 years 155
6.6 Adoption of standard bTB bio-security practices by sample farmers 156
6.7 CE estimates of WTP for a bTB cattle vaccine 157
6.8 CV estimation of WTP for a bTB cattle vaccine 158
6.9 Farmer responses to attitudinal questions 159
University of Exeter/ADAS UK Ltd
Longer-term effects of a bTB breakdown: draft report 17 October 2008
x
List of figures
Page
1.1 Relationship between research activities (RA) and project objectives 14
3.1 The GIS study: rate of change in the mean numbers of cattle farms
per parish stratified by region and bTB incidence category 35
3.2 Interviewed dairy farms: ‘bTB driver’ and ‘non-bTB driver’ farms,
by bTB category 42
3.3 Interviewed beef farms: ‘bTB driver’ and ‘non-bTB driver’ farms,
by bTB category 44
4.1 Dairy farms income indicators: cash income and farm
family income, 2002/03 to 2006/07 69
4.2 Dairy farms income indicators: net farm income and
management and investment income, 2002/03 to 2006/07 70
4.3 Dairy farms financial indicators: farm output and off-farm
income, 2002/03 to 2006/07 72
4.4 Dairy farms investment indicators: buildings and net asset
purchases, 2002/03 to 2006/07 74
4.5 Dairy farms liability indicator: total loans, 2002/03 to 2006/07 75
4.6 Dairy farms technical indicators: milk production and farmer
and spouse AWUs, 2002/03 to 2006/07 76
4.7 Dairy farms technical indicators: farmed area and cattle
numbers, 2002/03 to 2006/07 77
4.8 Suckler beef farms income indicators: cash income and farm
family income, 2002/03 to 2006/07 81
4.9 Suckler beef farms income indicators: net farm income and
management and investment income, 2002/03 to 2006/07 82
4.10 Suckler beef farms financial indicators: farm output and
off-farm income, 2002/03 to 2006/07 84
4.11 Suckler beef farms investment indicators: buildings and net
asset purchases, 2002/03 to 2006/07 86
4.12 Suckler beef farms liability indicator: total loans, 2002/03 to
2006/07 87
4.13 Suckler beef farms technical indicator: farmer and spouse
AWUs, 2002/03 to 2006/07 88
4.14 Suckler beef farms technical indicators: farmed area and
cattle numbers, 2002/03 to 2006/07 89
5.1 Postal survey responses by category of respondent 119
University of Exeter/ADAS UK Ltd
Longer-term effects of a bTB breakdown: draft report 17 October 2008
xi
Page
5.2 Postal survey respondents: distribution by size and type of
cattle herd 122
5.3 Postal survey farms: movement restrictions by herd type 124
5.4 ‘High GHQ scores’: comparison between farm types, by
category of bTB breakdown 127
List of farm case studies
Page
Case Study A Dairying (economics/future plans) 44
Case Study B Suckler beef and beef rearing (economics/diversification) 58
Case Study C Beef rearing and deer (economics/knock-on
consequences) 59
Case Study D Dairying (economics/business plan) 98
Case Study E Dairying (economics/SPS effects) 101
Case Study F Suckler beef (economics/consequential losses) 102
Case Study G Dairying (economics/pedigree) 105
Case Study H Dairying (health/stress and social impacts) 140
University of Exeter/ADAS UK Ltd
Longer-term effects of a bTB breakdown: draft report 17 October 2008
xii
Glossary of abbreviations
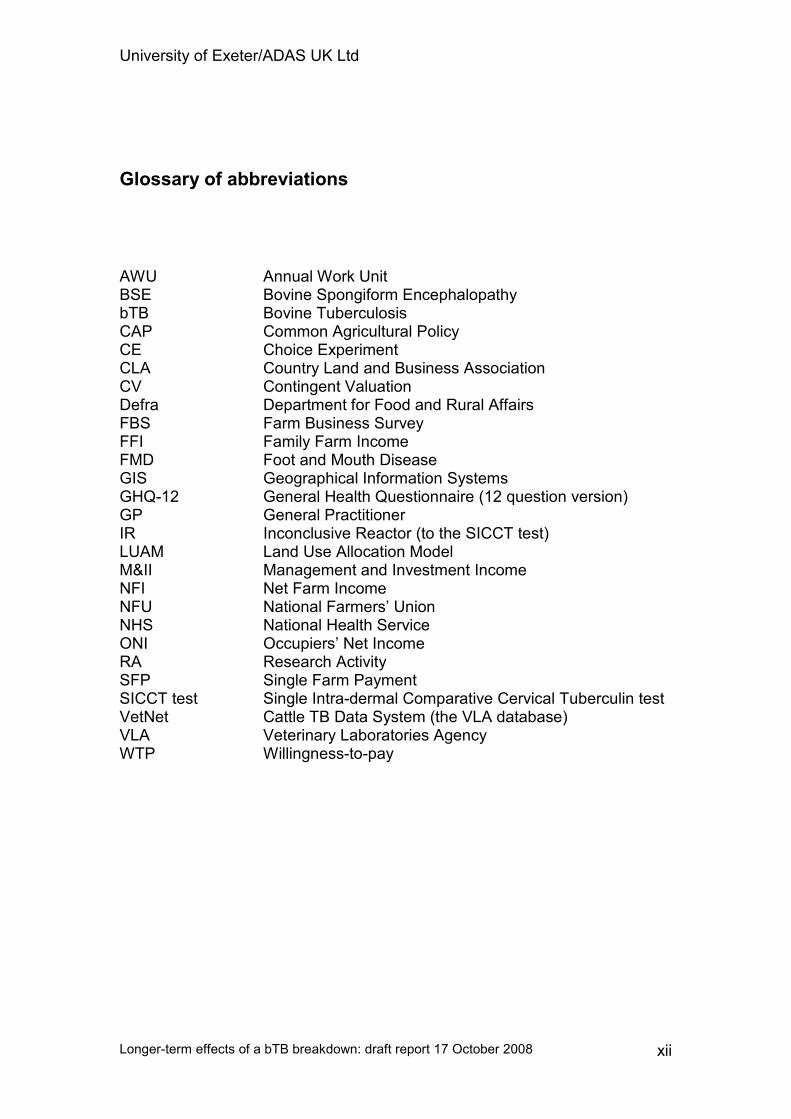
AWU Annual Work Unit BSE Bovine Spongiform Encephalopathy bTB Bovine Tuberculosis CAP Common Agricultural Policy CE Choice Experiment CLA Country Land and Business Association CV Contingent Valuation Defra Department for Food and Rural Affairs FBS Farm Business Survey FFI Family Farm Income FMD Foot and Mouth Disease GIS Geographical Information Systems GHQ-12 General Health Questionnaire (12 question version) GP General Practitioner IR Inconclusive Reactor (to the SICCT test) LUAM Land Use Allocation Model M&II Management and Investment Income NFI Net Farm Income NFU National Farmers’ Union NHS National Health Service ONI Occupiers’ Net Income RA Research Activity SFP Single Farm Payment SICCT test Single Intra-dermal Comparative Cervical Tuberculin test VetNet Cattle TB Data System (the VLA database) VLA Veterinary Laboratories Agency WTP Willingness-to-pay
University of Exeter/ADAS UK Ltd
Longer-term effects of a bTB breakdown: draft report 30 September 2008
1
EXECUTIVE SUMMARY
Research background and purpose
E1 Over the past decade the steadily rising incidence of bovine TB (bTB) has
resulted in recognised economic and social impacts on the agricultural industry.
Moreover, during this period the farming industry has gone through a period of
considerable economic and policy pressures for change. Bovine TB is acknowledged
as one of the most difficult animal health problems facing UK farmers and is a major
source of uncertainty, and hence higher costs, in cattle production. The research
programme used a variety of approaches, from empirical research to use of existing
databases, in investigating these issues.
E2 The overall aim of the study was to provide an evidence base on the longer-
term effects of a bTB breakdown on farm businesses, and so to inform policy
development in the future control of bTB. It focussed on two principal areas of
longer-term impacts: those exhibited in adverse social/human health effects, and
those economic effects within the farm business which extend over a period of many
months or years. The specific objectives of the project were:
(1) To make a summary review of the evidence from previous studies of the range
and incidence of longer-term effects of a bTB breakdown.
(2) To identify the main factors associated with a bTB breakdown which are
likely to result in long-term effects (for both farm business and people).
(3) To estimate the longer-term economic effects of a bTB breakdown in the
context of a range of ‘farm system and bTB breakdown’ scenarios.
(4) To provide a sound evidence base for a better understanding of the social and
human health effects of a bTB breakdown at farm-level.
(5) To explore cattle farmers' willingness to pay for a vaccine to avoid a bTB
breakdown, using a choice experiment approach.
University of Exeter/ADAS UK Ltd
Longer-term effects of a bTB breakdown: draft report 30 September 2008
2
Evidence from previous studies
E3 The main purpose of the literature review was to identify existing evidence on
the range and scope of potential longer-term effects of a bTB breakdown,
encompassing both economic/business related issues and also human health effects.
Overall, trends in cattle production, especially dairy farming, are not explained by
reference to conventional economic variables alone. Neither is it easy to identify and
quantify other factors affecting cattle farmers’ decisions, including their emotional
reactions to outbreaks of animal disease, that to date have mostly been excluded from
consideration.
E4 The stress effects of BSE and foot and mouth disease epidemics on farmers
and their families have been investigated, but bTB is largely neglected. Conceivably,
farmers’ perceptions of the consequences of animal disease are inextricably linked
with their attitudes towards authorities, and particularly government, who are seen
more as a source of problems than their solution. Conspicuous by its absence is any
substantive evidence in the literature of the financial implications of investment in
bio-security measures aimed at keeping cattle from contact with badgers. There is no
evidence of any significant long-term adjustments in farm resource use to improve
bio-security on cattle farms.
Factors which result in longer-term impacts
E5 In an analysis that focussed on the areas most severely affected by bTB, the
South West and West Midlands regions of England, and Wales, the GIS study of
regional trends in cattle farming identified some significant differences between bTB
parishes (parishes with a bTB incident or incidents) and other parishes. There was a
broad consistency in the findings across regions, with an established and consistent
trend away from dairying towards beef cattle over the decade to 2004.
E6 High bTB incidence parishes have more beef female cattle than other parishes.
There is strong evidence that it is the high bTB incidence which is itself driving the
rate of change. The rate of decrease in the number of cattle farms was greater in the
high bTB incidence parishes. In Wales high numbers of dairy cattle in a parish may
be associated with the high bTB incidence. A high bTB incidence appears to be a
University of Exeter/ADAS UK Ltd
Longer-term effects of a bTB breakdown: draft report 30 September 2008
3
significant influence on the trends over time (in cattle numbers, in the numbers of
cattle farms, in the relative balance between dairy and beef cattle).
E7 Following the identification of farms on which strategic decisions in farm
planning have been influenced by bTB, it was found that farmers on ‘bTB driver’
farms are consistently less optimistic about the future of farming, less likely to see
their own futures, and those of their family, in farming, and more negative in their
attitudes to their local and farming communities. They also differ from other farmers
on a wide range of farming values and objectives, are much more likely to have made
reductive adjustments to their businesses in recent years, and are much less likely to
expect a successor to take over the family farm in due course. Distinguishing
between cause and effect in these characteristics would require further specific
research.
E8 On dairy farms, the evidence is that the loss of a large number of animals is
most likely to be linked with an impact on farm decision-making. This is closely
followed in importance by spending a long period under movement restrictions. Even
on some lightly affected farms, bTB may be an influence of decision-making.
Lightly affected beef farms, in contrast, are rather more likely to take bTB into
account in their decision-making. As with dairy farms, ‘large number of cattle taken’
is ranked above ‘long period of restrictions’ in terms of decision-making impacts,
although both proportions are lower than for dairy farms.
E9 One important way of tackling business risk is the use of insurance to mitigate
the effects of a specific event, and bTB insurance has long been available to farmers.
Its availability, however, appears to be more limited than once was the case. It is
evident that the spread of bTB has already caused revisions both to the cost of bTB
insurance and the level of cover offered by insurers, an adverse economic effect as far
as farm businesses are concerned. While the firms consulted remain committed to
providing the best terms to their clients, and being as fair as possible in the
circumstances, the market reality is of rising claims. Further adjustments to
premiums and cover, driven by both claims experience and statistics on the incidence
of bTB, cannot be ruled out for the future.
University of Exeter/ADAS UK Ltd
Longer-term effects of a bTB breakdown: draft report 30 September 2008
4
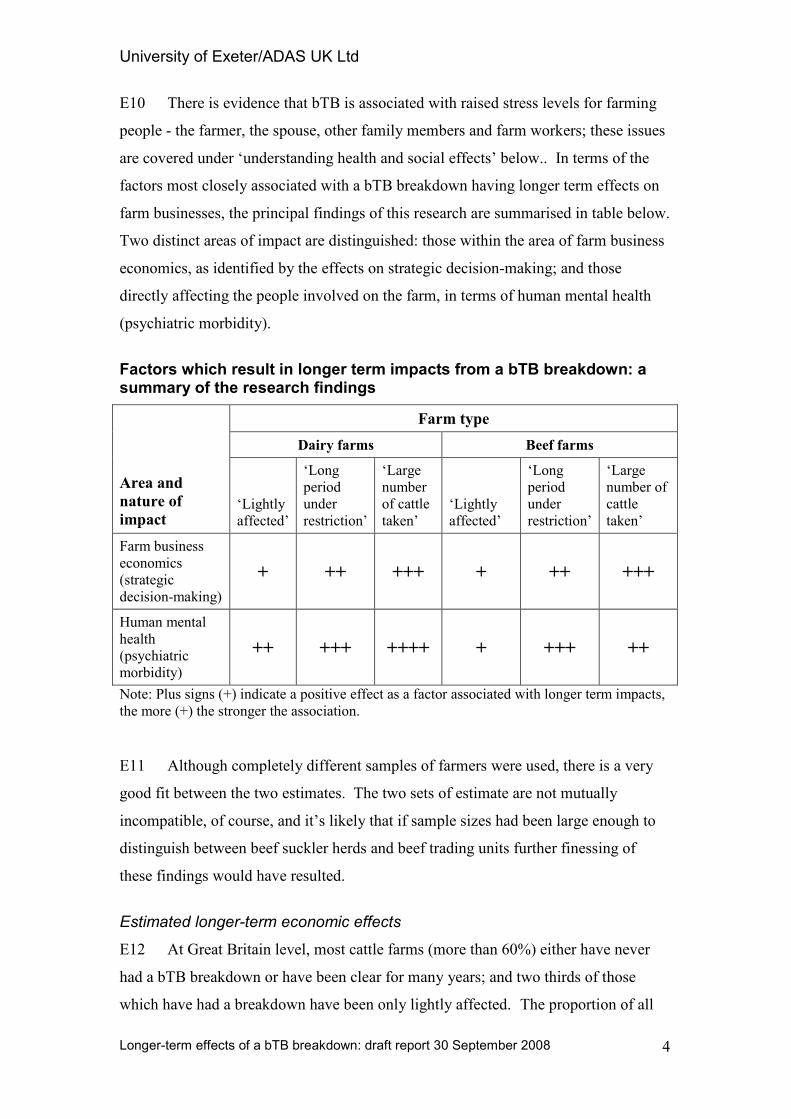
E10 There is evidence that bTB is associated with raised stress levels for farming
people - the farmer, the spouse, other family members and farm workers; these issues
are covered under ‘understanding health and social effects’ below.. In terms of the
factors most closely associated with a bTB breakdown having longer term effects on
farm businesses, the principal findings of this research are summarised in table below.
Two distinct areas of impact are distinguished: those within the area of farm business
economics, as identified by the effects on strategic decision-making; and those
directly affecting the people involved on the farm, in terms of human mental health
(psychiatric morbidity).
Factors which result in longer term impacts from a bTB breakdown: a summary of the research findings
Farm type
Dairy farms Beef farms
Area and
nature of
impact ‘Lightly
affected’
‘Long
period
under
restriction’
‘Large
number
of cattle
taken’
‘Lightly
affected’
‘Long
period
under
restriction’
‘Large
number of
cattle
taken’
Farm business
economics
(strategic
decision-making)
+ ++ +++ + ++ +++
Human mental
health
(psychiatric
morbidity)
++ +++ ++++ + +++ ++
Note: Plus signs (+) indicate a positive effect as a factor associated with longer term impacts,
the more (+) the stronger the association.
E11 Although completely different samples of farmers were used, there is a very
good fit between the two estimates. The two sets of estimate are not mutually
incompatible, of course, and it’s likely that if sample sizes had been large enough to
distinguish between beef suckler herds and beef trading units further finessing of
these findings would have resulted.
Estimated longer-term economic effects
E12 At Great Britain level, most cattle farms (more than 60%) either have never
had a bTB breakdown or have been clear for many years; and two thirds of those
which have had a breakdown have been only lightly affected. The proportion of all
University of Exeter/ADAS UK Ltd
Longer-term effects of a bTB breakdown: draft report 30 September 2008
5
bTB breakdowns resulting in more serious farm-level effects is small but not
insignificant: more than a quarter lose significant numbers of cattle and a further 4%
of cases are under livestock movement restrictions for a long period. The proportions
of farms with bTB breakdowns, both light and heavier, are substantially greater in the
‘bTB endemic’ areas. Most bTB breakdowns would not be expected to result in
longer-term effects on the farm business - identifiable longer-term economic effects
are likely to be seen on perhaps 10 – 15% of all affected farms.
E6 The stakeholder consultation identified reduced farm profitability, higher
costs, adverse impacts on calving patterns and inhibited business development. More
widely, loss of confidence and adverse effects on the environment were cited.
E13 Key findings from the FBS study of dairy farms are that differences in cash
flow and FFI between bTB farms and the control group increased over time, with
bTB-affected farms falling behind the others. In terms of NFI, however, the two bTB
groups had a broadly similar income position to the control group but for M&II the
trends are more volatile. Overall, in most years and for most income indicators, bTB
farms performed less well than the control group, although the differences are not
large in most years. The data suggest bTB farms generally have a higher level of off-
farm income.
E14 Starting from a similar level, average milk yield on bTB farms fell behind the
steady increase in yields seen in the control group, with a 6-8% gap by 2006/07. The
evidence is that farmers (and their spouses) work consistently longer hours on bTB
farms, supporting other findings that a bTB breakdown can cause considerable
additional work over a long period. Total cattle numbers increased markedly on ‘long
period of restriction’ bTB farms towards the end of the period; and these farms also
saw an increase in their farmed area.
E15 Key findings from the FBS study of suckler beef farms are that the control
group (all suckler beef farms) experienced a steady decline in profitability over the
five years from 2002/03. Farm incomes on bTB farms are more variable than for the
control sample; and incomes on ‘long period of restriction’ farms are lower than for
‘all bTB farms’. Incomes data are variable: for cash incomes a significantly lower
level of economic performance on the bTB-affected farms, but there is no consistent
pattern for NFI or M&II.
University of Exeter/ADAS UK Ltd
Longer-term effects of a bTB breakdown: draft report 30 September 2008
6
E16 Overall, farms with a bTB breakdown performed less well in most years,
those under movement restrictions being least profitable. The bTB farms exhibit
much greater annual variability in incomes. In most years investment in buildings
and net asset purchases was substantially lower on bTB farms than on the control
group of farms. The labour input of ‘farmer plus spouse’ was generally lower on bTB
farms than on others, throughout the five year period studied. With a smaller average
farm size, bTB-affected farms have a significantly higher stocking rate, consistent
with a general increase in cattle numbers while under movement restrictions.
E17 The farm interview survey involved 152 farms from across the bTB-endemic
areas of England and Wales. Its main findings are that strategic business decisions by
farmers typically take a range of factors into account, of which bTB may be one. Just
over a third of the surveyed farms listed bTB as a driver of a specific business
change, and in these cases it was dominantly listed as either the first (80%) or second
(16%) driver. Similarly, in terms of business threats, bTB was seen very much as one
threat among a number: it was the third most commonly listed main threat and was
ranked much the same for second and third level threats.
E18 Just over half of the sample farms had made improvements to bio-security
during the previous ten years; some of these had required very substantial investment,
particularly for fencing and physical improvements to feed storage and feeding areas.
Funds received as compensation for bTB losses, from government or insurer, were
almost all used within the farm business; in addition to replacing stock, a common
use was to reduce external borrowings.
E19 Movement restrictions give rise to significant adverse effects, but these vary
greatly. Being unable to sell cattle when planned generates many of the specific
impacts, especially extra feeding costs; also major disruption of the farming system is
common. Adverse financial impacts are widespread, especially higher interest charges. The
loss of breeding stock is identified as a particularly serious consequence of a bTB
breakdown; and if replacements are purchased these often result in other problems:
adverse effects on calving patterns, the introduction of ‘new’ diseases, a decrease in
herd equanimity, a general fall in yields or milk quality (dairy herds).
University of Exeter/ADAS UK Ltd
Longer-term effects of a bTB breakdown: draft report 30 September 2008
7
E20 Many farmers expected future consequences from the recorded bTB
breakdown(s). These included needing to replace breeding stock and a slowdown in
business growth and development, sometimes far beyond the initial breakdown.
Understanding health and social effects
E21 The research project aimed to provide a sound evidence base for a better
understanding of the social and human health effects of a bTB breakdown at farm
level. The postal survey involved 468 farms from across the bTB-endemic areas of
England and Wales, and its principal findings with respect to the implications of a
bTB breakdown for human health augment previous research on both (a) the short-
term effects of a bTB breakdown and (b) other studies of the effects of livestock
crises on the farming community.
E22 While a bTB breakdown is less dramatic than some other livestock disease
crises (such as FMD and BSE) by its nature the persistence and pervasiveness of the
control programme represents a clear source of on-farm stress, typically over an
extended period.
E23 The stakeholder consultation reflected perceptions of a range of human health
effects as a consequence of bTB, including physical, mental, emotional and social
changes. Many highlighted ‘uncertainty’ and ‘lack of control’ as powerful drivers of
human health problems.
E24 The GHQ-12 study provides objective evidence of the scale of the longer-term
effects of a bTB breakdown. In general terms, a much greater proportion of farmers
exhibit signs of psychiatric morbidity that the population as a whole. Overall, the
highest stress levels are seen on farms which have been under livestock movement
restrictions for a long period.
E25 However, on dairy farms, where people are generally more stressed than on
beef farms, the greatest stressor is the loss of a large number of cattle. There is
evidence that bTB is associated with raised stress levels for people other than the
farmer, particularly spouses; but the sample was too small for reliable results for farm
workers. For farmers, a bTB breakdown causes significant stress: this is highest for
dairy farmers, especially where they have lost a large number of cattle; while for both
University of Exeter/ADAS UK Ltd
Longer-term effects of a bTB breakdown: draft report 30 September 2008
8
trading beef and suckler beef farmers, a long period under restriction is the greater
stressor.
E26 The study of rural GPs identified that farmers typically present late with
symptoms and, for mental health issues in particular, GPs probably only see a small
proportion of cases. Several GPs pointed to the range of pressures affecting farmers,
particularly livestock farmers, of which bTB is only one; and the consequent
difficulty in direct attribution of cause and effect.
E27 The lack of control experienced as a result of a bTB breakdown was identified
as an important stressor; even so, bTB was thought to be a less serious problem than
the FMD epidemic of 2001. A range of moderating factors include age, farming
experience, farm ownership, diversification, the availability of support and the
significance of other crises.
E28 At interview, most farmers identified a range of adverse effects on their daily
lives as a result of a bTB breakdown, and often on those of their families and others.
Key effects relate to uncertainty, stress, time pressures and financial worries. Knock-
on effects on the local and farming communities do not appear in general to be very
significant.
Exploring farmers’ WTP for a bTB vaccine
E29 The results of the choice experiment survey show that cattle farmers have a
substantial WTP for a bTB cattle vaccine. Farmers primarily value the ability of a
vaccine to prevent a breakdown (or rather to reduce the probability of a breakdown).
However, they also recognise that a vaccine is unlikely to be 100% efficacious and so
they also value insurance backing that would pay compensation to farmers should
vaccinated cattle test bTB positive.
E30 Farmers appear to value the ability of a vaccine to reduce the severity of a
breakdown somewhat less, and their prime concern is to prevent a bTB breakdown in
the first place. This is not surprising, given that some of the most intrusive
consequences of bTB, such as movement restrictions, re-testing etc. are incurred
regardless of the severity (i.e. number of reactors) of a breakdown.
University of Exeter/ADAS UK Ltd
Longer-term effects of a bTB breakdown: draft report 30 September 2008
9
E31 Both the CE and CV instruments used were carefully developed and tested
prior to their application. The WTP estimated by the CE method seemed reasonable
and was backed up by appropriate reasoning given by respondents. The CV estimate
was of broadly the same order of magnitude as the CE estimate, despite the two
valuation methods being fundamentally different and the payment vehicle used also
being different, and with a different vaccine scenario presented to respondents. This
provides reassurance on the robustness of the WTP estimates.
E32 Many cattle farmers in the survey felt at high risk of their cattle having a bTB
breakdown. Indeed, their (subjective) perception of risk is likely to be somewhat
higher than the actual (objective) risk that they face. This perception of risk was
found to be positively correlated with their WTP. Despite this, farmers often did not
adopt all possible bio-security measures against bTB, although it is likely that not all
are equally relevant on every farm, or for every farming system. Many farmers felt
that there was little they could do to prevent their herds getting bTB.
E33 Overall, cattle farmers did not think that development of a cattle vaccine was,
by itself, the answer to the bTB problem but that a combined strategy was necessary
with a number of elements, including wildlife control.
Discussion and conclusions
E34 This research has focussed on the longer-term effects of a bTB breakdown and
has considerably extended the evidence base. There are two aspects of the research as
a whole that deserve final mention here: the identification of the key factors which are
associated with longer-term effects, and the exploration of farmers; WTP for a bTB
vaccine. The key factors were identified through studies of impact (a) within the
farm business and (b) on the people associated with the farm, while the WTP study
was essentially an independent RA.
E35 The key factors were identified through studies of impact (a) within the farm
business and (b) on the people associated with the farm. Although the two estimates
were derived independently, there is a good fit between them. Overall, the factor
most likely to result in longer-term impacts is the loss of a large number of cattle,
closely followed by the farm being under movement restrictions for a long period.
University of Exeter/ADAS UK Ltd
Longer-term effects of a bTB breakdown: draft report 30 September 2008
10
However, for beef farms as a whole the most stressful factor was being under
movement restrictions for a long period.
E36 The work undertaken by Reading University shows that cattle farmers have a
substantial WTP for a bTB cattle vaccine. Moreover, it finds that farmers primarily
value the ability of a vaccine to prevent a breakdown (or rather to reduce the
probability of a breakdown). However, farmers also recognise that a vaccine is
unlikely to be 100% efficacious and so they also value insurance backing that would
pay compensation to farmers should vaccinated cattle test bTB positive. Farmers
appear to value the ability of a vaccine to reduce the severity of a breakdown
somewhat less, and their prime concern is to prevent a bTB breakdown in the first
place. The broad comparability of the two WTP estimates, from the CE and CV
approaches respectively, provides some reassurance of their robustness.
E37 The issue of risk perceptions deserves further study, since farmers’
(subjective) perceptions of risk appear to be higher than the actual (objective) risk
that they face. Not only is this perception of risk positively correlated with their WTP
for a bTB vaccine, it seems possible that at least some of the observed structural
adjustment in cattle farming is being driven by inaccurate perceptions of risk by some
farmers. Importantly, cattle farmers did not think that the development of a cattle
vaccine was, by itself, the answer to the bTB problem; rather, its role was as part of a
combined strategy with a number of elements, including wildlife control.
University of Exeter/ADAS UK Ltd
Longer-term effects of a bTB breakdown: draft report 30 September 2008
11
1 INTRODUCTION
Background
Over the last decade or so the rising incidence of bovine TB (bTB) has resulted in
recognised economic and social impacts on the agricultural industry. The economic
impacts result from the nature of the disease, the government’s control measures
(restrictions on movement of cattle on and off the farm, repeat testing and compulsory
cleaning) and the impact of test ‘failures’ on the normal marketing of livestock and
product. The human impacts (on farmers, their families and farm staff) arise from the
loss of animals, significant changes to normal routines, financial worries and the
perceived increase in risk and uncertainty.
Moreover, the worsening of the disease situation - and hence the increasing economic
and social impacts - of bTB has coincided with a period of considerable economic
and policy pressures for the agricultural industry. Principal among these are (a) the
recent major changes in the CAP, (b) established long-term changes in the food chain
(many of which are detrimental to primary producers), (c) new requirements for
increasingly environmentally-friendly farming systems and (d) increased competitive
pressures from the enlargement of the EU and greater exposure to global markets.
These pressures, which arise directly or indirectly from significant long-term
adjustments in the food chain and in society’s expectations of farmers, have been
well-documented (Curry Commission, 2002) as have the appropriate policy responses
(Defra, 2002a).
Bovine TB is acknowledged as one of the most difficult animal health problems
facing UK farmers (ISG, 2007) and is a major source of uncertainty, and hence higher
costs, in cattle production. Uncertainty always increases costs as it forces decision-
makers to change how they allocate and manage existing resources, and to
supplement them with new or additional resources. Moreover, although farmers are
compensated for animals culled, statutorily government compensation cannot reflect
University of Exeter/ADAS UK Ltd
Longer-term effects of a bTB breakdown: draft report 30 September 2008
12
broader, long-term losses. Several studies have pointed to longer-term economic
impacts which have to be borne by the farm businesses affected (NAO Wales, 2003;
Sheppard and Turner, 2005; Bennett, 2004). These studies also identified important
social impacts on the farm family and farm staff, with personal pressures arising from
a number of sources including emotional responses to the loss of animals, concerns
about the welfare implications of retaining stock on the farm, greater business
uncertainty, the ‘hassle factor’ and frustration in the apparent lack of progress in
controlling the disease. A further factor of particular relevance here concerns the
changes recently made to the government’s compensation policy and the introduction
of pre-movement testing for cattle (Defra, 2006).
The study brief
The overall aim of the study was to provide an evidence base on the longer-term
effects of a bTB breakdown on farm businesses, and so to inform policy development
in the future control of bTB. As such, it was concerned with two principal areas of
longer-term impacts: those exhibited in adverse social/human health effects, and
those economic effects within the farm business which extend over a period of many
months or years, or even result in permanent changes (e.g. to farming system). The
research was pursued through a wide range of research activities. The research was
designed to provide additional knowledge of the farm-level implications of bTB
breakdowns through focussing on identifying those longer term effects which have
largely been ignored in previous studies. The specific objectives of the project were
agreed as follows:
1. To make a summary review of the evidence from previous studies of the range
and incidence of longer-term effects of a bTB breakdown, encompassing both
socio-economic and human medical studies to provide a clear analysis of the
major long-term problems so far identified.
2. Through primary research, to identify and, if possible, to rank the main factors
associated with a bTB breakdown which are likely to result in long-term
effects, on both the farm business and the people involved.
3. To provide broad estimates of the longer-term economic effects of a bTB
breakdown in the context of a range of ‘farm system and bTB breakdown’
scenarios.
University of Exeter/ADAS UK Ltd
Longer-term effects of a bTB breakdown: draft report 30 September 2008
13
4. To provide a sound evidence base for a better understanding of the social and
human health effects of a bTB breakdown at farm-level, including both the
range and typical incidence of such adverse impacts.
5. Through the use of a choice experiment approach, to explore cattle farmers'
willingness to pay for a vaccine to avoid a bTB breakdown, under a number of
vaccine characteristics/scenarios.
The study method
Approaches and research plan
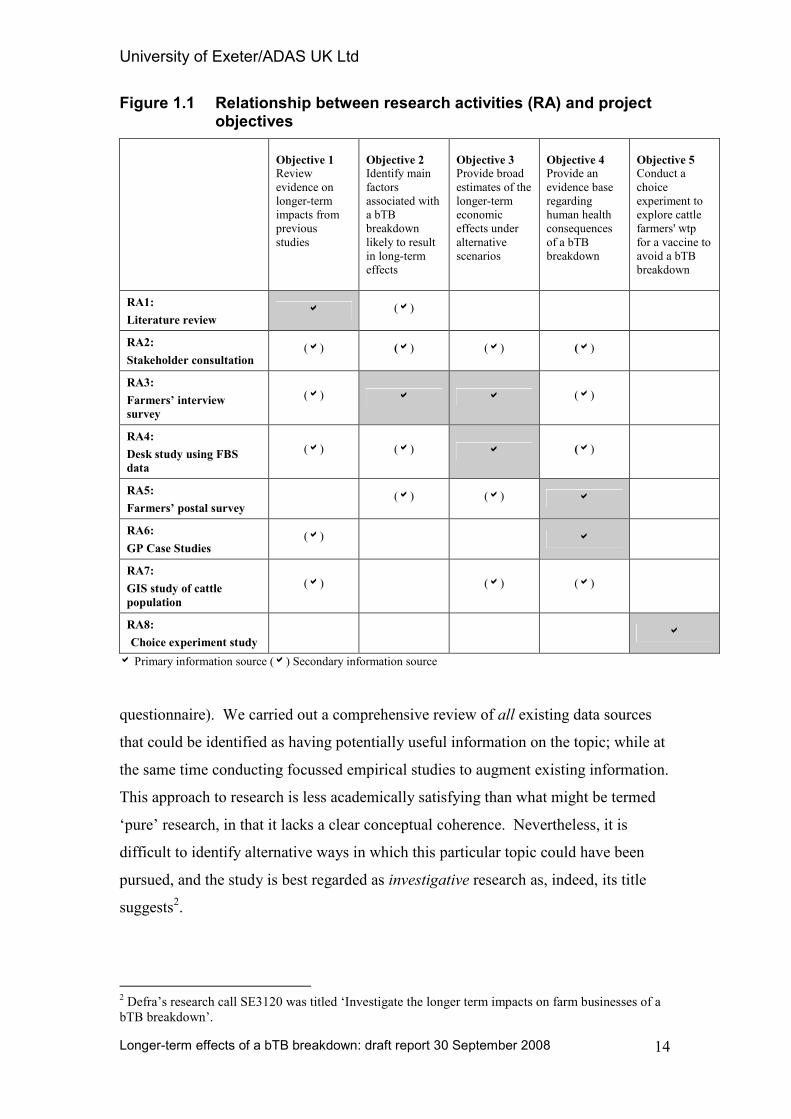
Our research plan was structured around the overall objectives above, and involving a
series of eight distinct ‘Research Activities’ (RAs). While the research plan does not
map research objective : research activity neatly, most of the RAs provide the
primary source of information for at least one objective and contribute to the
achievement of others (Figure 1.1). The study was supra-national rather than regional
in scope, covering the bTB-affected areas in both England and Wales, but with a
particular emphasis on the bTB-endemic areas1.
The nature of the study was such that identifying good quantitative information was
far from straightforward, and this was known from the outset. This is not only
because of the nature of the study topic (longer term economic effects may be so
significant as to effectively remove a potential respondent from the sampling frame,
for example) but also because the impacts may resist neat classification and preclude
the estimation of average or typical impacts. Not only do farm businesses often have
quite distinctive characteristics (and the study looked at a wide range of possible bTB
impacts within this population) but also, as expected, the human health impacts were
at least equally varied. Further, by definition, longer-term impacts emerge over a
period of time which may not in all instances sit easily within the framework and
timespan of a single research study.
Hence, our research approach relied on a number of distinct RAs to build as
comprehensive a set of information as possible, from as wide a range of sources as
possible. Moreover, it was structured to provide a foundation for possible future
research exploring the longer term impacts of bTB (e.g. through the use of a standard
1 Cornwall, Devon, Dorset, Somerset, Wiltshire, Gloucestershire, Worcestershire, Herefordshire,
Shropshire, Cheshire, Staffordshire, Derbyshire, Lancashire and Wales
University of Exeter/ADAS UK Ltd
Longer-term effects of a bTB breakdown: draft report 30 September 2008
14
Figure 1.1 Relationship between research activities (RA) and project objectives
Objective 1
Review
evidence on
longer-term
impacts from
previous
studies
Objective 2
Identify main
factors
associated with
a bTB
breakdown
likely to result
in long-term
effects
Objective 3
Provide broad
estimates of the
longer-term
economic
effects under
alternative
scenarios
Objective 4
Provide an
evidence base
regarding
human health
consequences
of a bTB
breakdown
Objective 5
Conduct a
choice
experiment to
explore cattle
farmers' wtp
for a vaccine to
avoid a bTB
breakdown
RA1:
Literature review a (a)
RA2:
Stakeholder consultation (a) (a) (a) (a)
RA3:
Farmers’ interview
survey
(a) a a (a)
RA4:
Desk study using FBS
data
(a) (a) a (a)
RA5:
Farmers’ postal survey (a) (a) a
RA6:
GP Case Studies (a) a
RA7:
GIS study of cattle
population
(a) (a) (a)
RA8:
Choice experiment study a
a Primary information source (a) Secondary information source
questionnaire). We carried out a comprehensive review of all existing data sources
that could be identified as having potentially useful information on the topic; while at
the same time conducting focussed empirical studies to augment existing information.
This approach to research is less academically satisfying than what might be termed
‘pure’ research, in that it lacks a clear conceptual coherence. Nevertheless, it is
difficult to identify alternative ways in which this particular topic could have been
pursued, and the study is best regarded as investigative research as, indeed, its title
suggests2.
2 Defra’s research call SE3120 was titled ‘Investigate the longer term impacts on farm businesses of a
bTB breakdown’.
University of Exeter/ADAS UK Ltd
Longer-term effects of a bTB breakdown: draft report 30 September 2008
15
One of the problems was limitations with the usefulness of most if not all of the
existing data sources. For example, we were aware that there are limitations with the
VetNet database as a research tool, but it was an invaluable resource nevertheless
because of the information on the timing and scale of bTB breakdowns. Similarly,
we were also aware that the scope of the Agricultural Census database, though
providing the possibility of a unique insight on spatial aspects of farm systems
development, imposed some limitations on what could be achieved; while the Farm
Business Survey (FBS) database, though also invaluable for this research, had its
limitations particularly in respect of completing a more comprehensive longitudinal
study.
Some aspects of the research programme were innovative: for the FBS-based desk
study, for example, the identification of a study sample, and the linking of data drawn
from the VetNet database with the FBS database, required close liaison with Defra’s
Farm Economics Unit, the UK Data Archive and Rural Business Research (the FBS
Consortium), to ensure the maintenance of confidentiality protocols. Similarly, the
longitudinal study of Agricultural Census data using GIS techniques, undertaken by
the ADAS team, required the development of new approaches. As part of our work
we believed it was important to ‘ground-truth’ the findings of the mental health
survey (RA5) and so we carried out a series of case studies based on GP practices
situated in, or close to, known bTB ‘hotspots’. The aim was to gather evidence on the
wider impacts of bTB breakdowns (on farm and rural dwellers’ social and mental
well-being) so as to provide an independent source against which the findings of RA5
can be assessed.
Research activities
In total eight separate RAs ranging from desk studies to specific empirical research
were carried out, the research extending over the period April 2007 through
September 2008. The RAs, with a brief outline of their focus in each case, are set out
below.
RA1 Literature review
The literature review focussed on two aspects of a bTB breakdown, the business-
related economic effects and the people-related social and medical effects; it had the
following aims:
University of Exeter/ADAS UK Ltd
Longer-term effects of a bTB breakdown: draft report 30 September 2008
16
(a) To produce a summary of range of the potential longer-term economic and
social/human health effects of bTB breakdowns, at least to the extent that these
have been identified by earlier work, in order to provide a context for the
findings of the present study.
(b) To review the existing literature on human stress in rural areas, specifically to
identify current evidence on the possible links, if any, between bTb breakdowns
and human stress and distress.
(c) To update Defra’s recent review with the findings of any other research
published before the start of the present study in 2007.
RA2 Stakeholder consultation
An extensive stakeholder consultation was conducted during the summer of 2007 in
order to identify, if possible, the full range of longer-term impacts arising from bTB
breakdowns and so inform later stages of the research. There were two components
to this research activity:
• a broad request to a wide range of bodies and institutions inviting written
submissions on the incidence, nature and impact of the longer-term adverse
impacts from bTB breakdowns, at the level of the affected farm business; and
• a limited number of personal interviews with key stakeholders which will
follow up on the written submissions and aim to collect evidence, probe claims
in more detail and inform later stages of the research.
A total of 40 stakeholders (71%) responded (of 56 initially mailed) and a full
summary of the findings is given in Appendix A.
RA3 Farmers’ interview survey
The types of longer-term impact identified by the first two research activities
informed the design of the farmers’ interview survey. In particular, considerable
attention was given to avoiding any (inadvertent) bias in the responses which, it might
be expected, could result in an over-emphasis on the economic significance of bTB as
a driver of business change. All farms sampled had experienced at least one bTB
herd breakdown. To minimise the bias inherent in asking farmers directly about the
longer term impacts of bTB on the farm business, the questionnaire was structured so
as to elicit information about changes that already had taken place, or were in train,
without making an explicit link between the changes and bTB. Instead, the role of
University of Exeter/ADAS UK Ltd
Longer-term effects of a bTB breakdown: draft report 30 September 2008
17
bTB in relation to strategic business planning on the farm was identified in the
context of a structured discussion about change, rather than in response to questions
about bTB as such. After the discussion had been completed, there was an
opportunity for verification. It is a testament to the design of the questionnaire and
the skill of the interviewers that very few ex post adjustments were made.
The VetNet database was used to select a stratified sample of farms in England (in the
main bTB-endemic areas) and Wales which have experienced a bTB breakdown, and
which reflect key characteristics of the target population. The sample structure was
based on a preliminary analysis of the VetNet data (see Table 4.1) and included a
range of enterprise types (dairy, beef sucklers, beef rearing) and a range of bTB
breakdown scenarios (single small, multiple small, single large, multiple large,
successive breakdowns, etc.) from the principal bTB areas of the West Country, the
Marches and Wales. A total of 152 farms completed the survey and the main results
are given in Appendix B.
RA4 Desk study using FBS information
A desk study primarily using data drawn from the annual FBS was undertaken, as
part of the research into the longer-term economic impacts of a bTB breakdown on
far, businesses. The principal problem in using the FBS database is it has inadequate
information regarding the incidence of bTB breakdowns, particularly prior to
2005/06; prior to 2002/03 there is no way of identifying farms which have had a bTB
breakdown. Having identified a target sample, Rural Business Research contacted
farmers to gain their written agreement to linking their FBS information with specific
data on the timing and scale of the breakdown from the VetNet database. The study
focussed on tracking the business development of several cohorts of ‘bTB
breakdown’ farms over about the five years since 2002/03, and comparing these with
a ‘non-bTB breakdown’ cohort of otherwise similar farms for the period. Key results
are given in Appendix C.
RA5 Farmer’ postal survey
This RA focussed on the impacts of a bTB breakdown on the social well-being and
mental health of the farm family and farm staff and used the established GHQ-12
questionnaire. It was administered through a postal survey to a sample of farmers
drawn from the VetNet database, which included the three categories of ‘bTB
University of Exeter/ADAS UK Ltd
Longer-term effects of a bTB breakdown: draft report 30 September 2008
18
breakdown’ farms identified for the farmers’ interview survey (‘lightly affected’,
large numbers of cattle lost’ and ‘long period of movement restrictions’) and a control
group (no bTB breakdown). The only way of approaching people other than the
farmer was through the farmer, and we enclosed three copies of the questionnaire and
separate reply-paid envelopes (for completion by the farmer, and two of the
following: their spouse, adult children and staff) and invited requests for more forms
as necessary. The study was conducted during March and April 2008 and responses
were received from 468 farms, 52% of the effective sample. The use of this
established questionnaire meant that the results could be compared with studies of the
general morbidity of the adult population, for which the questionnaire is regularly
used, and also with other studies of farmers which have used the same questionnaire.
The questionnaire is given in Appendix D, and the results are presented in Chapter 5.
RA6 GP case studies
Information from the GHQ-12 questionnaire (RA5) was augmented with a limited
broader review using six case studies of rural GP practices located in, or adjacent to,
established bTB ‘hotspots’. The primary aim of this RA was to ground-truth some of
the key findings and to identify possible wider, or more diffuse, effects at community
level. We used a semi-structured interview questionnaire which probe GPs’
experience of the implications of a bTB breakdown on the health of their patients,
including social well-being, physical and mental health, both in the immediate
aftermath of a bTB incident and into the longer term. This RA also explored the
nature of the support that is provided and considered any gaps in provision. This RA
was carried out in the autumn of 2007 and the findings are given in Chapter 5.
RA7 GIS study of cattle populations
This RA examined information from the Agricultural Census for evidence on the
nature and extent of the impact of bTB on cattle populations. One possible long term
cost of bTB and its control is that cattle farmers give up cattle production or switch to
less profitable cattle systems (for example, moving from dairying to beef). The
objective of this work was to examine the data on cattle populations and farm
holdings to see whether there is any connection between bTB ‘hotspots’ and relative
divergence in trend reductions in cattle populations over the longer term. The parish
testing interval was used as an indicator of bTB risk and this information was
University of Exeter/ADAS UK Ltd
Longer-term effects of a bTB breakdown: draft report 30 September 2008
19
integrated with data from the Agricultural Census database, to determine the
existence and strength of any correlations, within both regions and sub-regions,
between changes in cattle populations and the testing interval. Where data allowed,
an investigation into the number of cattle holdings was also carried out, determining
trends in farm types within affected areas. The full results are given in Appendix E.
RA8 Choice experiment
The final RA was based on a choice experiment questionnaire, designed with
appropriate choice sets to elicit cattle farmers' willingness to pay (WTP) to avoid a
bTB breakdown, with a bTb vaccine being the 'payment vehicle'. The choice
experiment was used to estimate the WTP for a vaccine depending upon a number of
vaccine characteristics including, for example, the efficacy of the vaccine, whether
subsequent breakdown losses (i.e. even with vaccination) are covered by an insurance
programme, etc. The choice experiment was administered to a sample of 287 cattle
farmers, with the sample split according to those that have suffered a bTB breakdown
and those that have not but are situated within bTB 'hotspot' areas. The questionnaire
used is given in Appendix F and the study methods and findings are the subject of
Chapter 6.
The research team
The research programme was undertaken by an inter-disciplinary team which
included, inter alia, expertise in animal health and welfare policy, economics, market
research, farm business economics, organisational behaviour, rural stress and mental
health. The research was led by Martin Turner, University of Exeter and Mark
Temple, ADAS UK Ltd. The study was designed by a small team comprising Martin
Turner, Dr Keith Howe and Dr Emma Jeanes (University of Exeter), Mark Temple
and David Boothby (ADAS UK Ltd) and Paul Watts (Somerset Partnership NHS and
Social Care Trust). Professor Richard Bennett and colleagues at the University of
Reading were responsible for RA8. Full details of the wide range of people who
worked on this research, or contribute in other ways, are given in the
Acknowledgements (page ii).
University of Exeter/ADAS UK Ltd
Longer-term effects of a bTB breakdown: draft report 30 September 2008
20
2 REVIEW OF THE EVIDENCE FROM OTHER RESEARCH
Defining the longer-term
A literature review to find out what is already known about the longer-term effects of
bTB on farm businesses needs ‘longer-term’ to be defined precisely. One approach is
to adopt an essentially arbitrary and pragmatic definition, such as any effects
discernible for at least one or more years after a herd breakdown. This is implicitly
the perspective taken by Sheppard and Turner (2005). Economic principles provide a
more rigorous foundation. In economic terms, the long term is strictly the period over
which all resources are considered variable. Thus a decision to start up, or quit, cattle
production is a long-term consideration. When changes are less extreme, as is more
usual, and some farm resources are unaffected while others are changed in kind or
quantity, those may be regarded as medium term. So, in the context of the present
study, longer term is defined as both long and medium term impacts of bTB
breakdown on farm resource use. It follows that a decision to quit milk or beef
production as a result of bTB, or investment in bio-security to protect cattle from
contact with badgers, or a change from buying-in herd replacements to home rearing,
are all examples of the type of longer-term adjustments with which the study is
concerned.
Yet there is a potential confounding factor that must be taken into account in the
interpretation of cause and effect. It is trends in cattle production completely
unrelated to bTB. For everyday commercial reasons, farmers constantly readjust their
resource use in response to changes in output and input prices, technology, and their
plans and expectations about the future. Changing relative prices affect farm profits.
So does technological change, by enhancing productivity and widening the
production choices available to farmers. How a farm business is organised also
reflects a farm family’s needs and aspirations, including how the business is prepared
for handing over to a successor. Thus the literature review begins with a look at
University of Exeter/ADAS UK Ltd
Longer-term effects of a bTB breakdown: draft report 30 September 2008
21
general trends in UK cattle farming. On that foundation, any contribution of bTB to
structural change can be assessed.
Trends in cattle farming
Bovine TB is mainly seen as a problem for milk producers, though also for beef
producers not least because of the complementary nature of milk and beef production.
There are very few recent publications about the economics of UK beef production,
and these pay little or no attention to the impacts of cattle disease (e.g. Williams et al.,
2005, Fogerty and Robbins, 2007). Substantive research into structural change in
milk production for recent years is mainly from Manchester University, while from
Nottingham University since 2005-06 the analysis of Farm Business Survey data
provides a detailed picture of the most recent changes in financial aspects.
Colman et al. (2002) estimated long-run cost functions for a representative sample of
UK dairy producers allowing future re-structuring of the industry to be simulated.
The model incorporates producers’ differential costs and milk prices under different
policy scenarios. Their general conclusion was that existing trends towards
increasing average herd size and fewer producers would continue. The authors noted
that of the 50,625 active UK milk producers in 1984, when milk quotas were
introduced, almost half had ceased production by 2001, an average decline of 1,375
producers each year. The rate of exit varied over the period, increasing between 1996
and 2001 when almost 1,700 farmers quit each year. The most recent published data
show that in June 2007 there remained 17,915 UK milk producers, a reduction of
almost 65% since 1984 (NDC, 1997; Dairy Council, 2001; DairyCo, 2008).
Yet despite evidence of such a radical decline in UK producer numbers, a
combination of increasing average herd size, smaller national herd, and sustained
increases in annual milk yield per cow has kept national output relatively stable
(except for year-to-year fluctuations) ever since the 1980s. However, a declining
trend in aggregate milk delivered to dairies began in 2004 (DairyCo, 2008, page 8).
Clearly, farm gate prices and the profits from milk production are key factors
underlying such changes. Detailed analyses for England are provided by Robertson
and Wilson (2007, 2008).
University of Exeter/ADAS UK Ltd
Longer-term effects of a bTB breakdown: draft report 30 September 2008
22
Survey data has revealed an optimistic outlook by many continuing milk producers.
Reporting on the declared intentions of a representative sample of 369 specialised
milk producers in England and Wales at the end of 2002/03, Colman et al. (2004,
page 61) note a more positive outlook than might have been expected in the light of
recent very poor returns from milk production and the rapid rate of exodus observed
in previous years. Some 86% of producers declared an intention to continue. This
finding was closely comparable with the results from a 1996/97 survey which
identified 87% of producers planning to expand or continue production, with only 4%
planning to quit and 3% to cut production (Farrar and Franks, 1998, Table 9.1). By
May-July 2007 only 219 of the original sample of 369 milk producers still provided
usable records for Colman (2008) to investigate further patterns of structural change
in UK milk production. Of these, yet again 85% expected to be in production in five
years’ time.
An intriguing aspect of these findings is that, in practice, many farmers have behaved
contrary to their stated intentions. Having excluded six of the original 369 farms
because no more recent information could be obtained, Colman and Zhuang (2005)
found that over 45 of the 363 remaining ceased dairy farming between April 2003 and
April 2005. As expected, the majority of these had a herd size of fewer than 70 cows
in 2002/03, and the lowest average margins. Less explicable were those 13 farms that
quit with herds ranging from over 100 to over 150 cows. Another 17% of continuing
milk producers either stated an intention to quit over the next five years or regarded
their futures as uncertain.
These outcomes are perplexing precisely because so many milk producers actually
did the opposite of what they said they intended to do. Also, it raised questions in the
authors’ minds about the reliability of their predictions about the future structure of
dairy farming in England and Wales based on the estimated long-run cost functions.
Predictions for 2007/08 and 2014/15 are given in Colman et al. (2005), where the
authors note that “ there are reasons for thinking that the model is persistently
retaining perhaps 2000 more herds than it should ...” (page 18). In particular “no
allowance can be made in the model for the personal factors affecting dairy farmers’
decisions about whether to stay in production, or of a whole range of unforeseeable
factors” (page 19).
University of Exeter/ADAS UK Ltd
Longer-term effects of a bTB breakdown: draft report 30 September 2008
23
Those farmers reported by Colman and Zhuang (2005) as having intended to continue
dairy farming but had quit by early 2005 were asked to give their main reasons for
doing so (page 18). Change in milk profitability, personal or family reasons, and
CAP policy changes as well as ‘other’ were categories cited. None of the questions
explicitly invited information about animal health issues, nor seems to have been
mentioned in reply. The fact that enterprises replacing dairy cows typically did not
involve giving up cattle production entirely may be taken as an indication that disease
was not considered important. This view is reinforced by evidence that the majority
of farms either expanded an existing beef enterprise or started a new one, while others
mostly expanded or established a new sheep enterprise. Substituting cattle by arable
production occurred in a negligible number of cases (Table 15, page 19).
In their study of the future of UK dairy farming, Colman and Harvey (2004) asked the
question, ‘How rational are farmers?’ Based on the same sample data to which
reference has been made, they concluded that the conventional economic assumption
of profit maximisation by farmers is often unrealistic. Importantly, that in itself
compromises “the ability of their businesses to withstand commercial and business
pressures. As and when these pressures become sufficiently strong, they will be
obliged to give up production.”(page 18).
Drawing together the various strands of evidence presented from the above limited
but authoritative sources, the following can be asserted. First, an ongoing decline in
the number of UK milk producers continues at a rate that exceeds predictions from
estimated economic models, and the intentions of milk producers revealed in
representative farm surveys. Second, quitting milk production mainly leads to an
expansion of other animal production, most frequently beef cattle, and less often
sheep production. Third, based on the same raw data it appears that many milk
producers do not behave rationally from an economic point of view. Fourth, either
these latter conclusions are incompatible, or some other exogenous factor (or factors)
is being overlooked. On the one hand, dairy farmers keep producing, maybe sub-
optimally, while aiming to continue or even expand, but then instead quit milk in
unexpected numbers for other animal production.
Such behaviour is not necessarily irrational. It might be evidence that dairy farmers
reach a critical point that triggers a shift out of milk production. But the cause might
University of Exeter/ADAS UK Ltd
Longer-term effects of a bTB breakdown: draft report 30 September 2008
24
not show up in conventional economic assumptions and the analysis of relationships
between prices, costs, technology and profits. Its origins might be non-economic,
rooted in other factors that influence how farmers behave. In the light of farmers’
experience of major disease epidemics in recent years, especially foot and mouth
disease (FMD), bovine spongiform encephalopathy (BSE), and also bTB, any
unrecorded factors merit investigation, including the stress arising from major disease
outbreaks.
Effects of stress on farmers
A striking feature of the literature on factors other than normal economic influences
affecting farmers and their families is the focus on stress. Also, if unsurprisingly,
BSE and FMD outbreaks feature prominently as causes of stress, with occasional
references to bTB. Historically, BSE and FMD were both major epidemics of
consequence throughout the UK. In contrast, bTB has had a more regional or local
focus in ‘hot spots’ of south west England and south Wales, although there is concern
to limit its spread far beyond. Irrespective of the specific disease, it is informative to
look at cattle disease as a problem in a generic sense with the potential to cause stress
in people.
A Policy Studies Institute report (PSI, 2005) is based on interviews with farm families
and workers about sources of stress, including the effects of animal disease. It reports
a number of interviewees diversifying their businesses away from conventional
agriculture as a direct response to a crisis, thus aiming to become less reliant on
farming as their main source of income. Both BSE in the mid-1990s and the FMD
outbreak of 2001 were frequently mentioned inducements. But opportunities for
diversification were tempered, for example, by the fact that the economic viability of
tourist enterprises already in place were also undermined by disruption of the rural
economy caused by FMD. The regional impacts were uneven, as might be expected.
In the areas worst affected by these diseases, whole communities were severely
affected. Market prices fell, and not just local markets but whole counties were
virtually closed down with major disruption of normal life.
Not least important is evidence of many interviewees being extremely critical of the
way both BSE and FMD crises were handled by the government. Lack of trust and
University of Exeter/ADAS UK Ltd
Longer-term effects of a bTB breakdown: draft report 30 September 2008
25
suspicion became hallmarks of farmers’ attitude towards Defra. This occurred in an
environment where, as is in the nature of the problem, a disease outbreak occurs
suddenly and unexpectedly. Unremarked in both this and other studies reviewed
below is that BSE initially involved an apparently new and completely unknown
pathogen. At least FMD is understood. Allowing for such differences in their
specific characteristics, both diseases create uncertainty for farmers. Either disease is
an occasional threat yet always lurking in the background, or an imminent threat once
an outbreak occurs. Uncertainty about a potentially catastrophic effect on a farm
business allied to lack of trust in authorities’ competence to help is a recipe for stress.
Obviously this can affect farmers and their families, but other farm workers are not
immune either.
Although the period covered by the research meant that PSI (2005) is particularly
concerned with BSE and FMD, it also mentions the impact of bTB at the time the
interviews took place. Such ‘stock crises’ were identified as a source of stress for the
whole of farms’ workforces, and in particular for farmers’ spouses, adult children
working on the farm, and farm workers. Often this was because their farm work
involved developing a close emotional bond with animals they had frequently raised
from birth. Premature death of an animal was seen by one farmer’s wife as
representing a kind of failure for farmers (page 48). Another farmer spoke of dairy
cattle as families going on for generations, and their loss as a result of disease
something irretrievable.
Such emotional damage inflicted on people quoted and most closely concerned with
animals include nervous breakdown, on-going anxiety at recollection of working with
the carcasses of dead animals, inability of a worker to face returning to his place of
work for several weeks after FMD, fear of job loss by a full-time employed farm
worker, and farmers’ anxiety about being able to provide a livelihood for the longer
term. Pertinent to the present study is that although BSE and FMD were described as
dramatic diseases, bTB “just drags on and on” with infected animals lacking any
obvious symptoms to alert farmers to the existence of their problem. All such effects
directly linked with disease outbreaks add to a perception that livestock farming is
anyway inherently stressful (page 80). The constant demands of tending animals,
busy and vulnerable times such as at lambing and calving, and the unpredictability of
University of Exeter/ADAS UK Ltd
Longer-term effects of a bTB breakdown: draft report 30 September 2008
26
the work all add to a perception that the demands of livestock farming are often non-
negotiable. There is less opportunity to reschedule the ordering of tasks in ways that
suited workers better.
Similar problems have been documented in other countries. A Canadian survey
(Walker and Walker, 1987) found that farmers scored higher than non-farmers on a
range of stress-related symptoms, including chronic tiredness, difficulty relaxing,
forgetfulness, loss of temper, problems concentrating, back pain and sleep disruption.
Mixed and dairy farmers scored higher on these symptoms than arable ones.
McGregor et al. (1995) identified a similar catalogue of problems in the UK. Their
survey of farmers attending agricultural shows similarly found that livestock farmers
suffered higher levels of stress than arable farmers, with dairy farmers having
particularly raised levels. With specific reference to FMD in the Netherlands, Van
Haaften et al. (2004) investigated its psychological impact on farmers. A perspective
not mentioned in comparable UK literature was that the Dutch authorities were seen
by farmers as denying the bonds between them and their animals, only looking at
animals as a means to production. Closer to UK conditions was that during the Dutch
FMD crisis farmers felt they had lost all autonomy. Thus farmers felt hopeless and
helpless during culling. To some extent this complements the finding by Peck et al.
(2002) and Peck (2005) that UK farmers affected by FMD scored higher than other
groups on psychiatric morbidity (73% as against 33% of farmers unaffected by
FMD). As a result, farmers were more likely to turn to their own communities and to
local vets than to any officials for support.
As regards the severity of stress, Watts (2002) shows apparently anomalous
behaviour, admittedly for a sample of 530 farmers in the single county of Somerset,
in that arable, not livestock, farmers exhibited the highest rate of psychiatric
morbidity. But also revealing was that foot and mouth disease was not cited as a
major issue for any of those farmers whose mental well-being was worst affected.
That was in marked contrast with those farmers who had no significant problems of
mental health. They did cite FMD as high on their scale of concerns. More important
for everyone, both worst and least affected, was having to put up with form filling,
regulations, and government bureaucracy. Though limited as a source of evidence,
this result does suggest that an explanation for dairy farmers’ apparently irrational
University of Exeter/ADAS UK Ltd
Longer-term effects of a bTB breakdown: draft report 30 September 2008
27
decisions from a narrow economic perspective might not be explained by the
damaging costs of animal disease outbreaks. Rather, it might be one source amongst
many others that creates feelings in farmers of being overburdened by the demands of
impersonal bureaucracy.
Yet this does not mean that the direct effects of animal disease on people are
unimportant. For example, again in relation to the 2001 epidemic, Deauville and
Jones (2001) surveyed various help providers (e.g. primary care and mental health
services, advice and support agencies) for farmers affected by FMD in Wales. They
found a broad consensus that the situation was having a health impact on those
affected. This was mainly on the mental health of individuals, but GPs emphasised
that consistent stress over a period of time would lead to physical health impacts.
One helpline noted that 50% of calls related to the foot and mouth situation were
showing symptoms of mental health impacts. The general consensus was that the
impacts on people’s mental health and well-being may be longer term, possibly over a
period of 1 to 2 years. There was also a perception that many farmers would leave
farming and then face stresses related to finding new employment and a new way of
life. For those who remain in farming there would be stress related to starting again.
The above review leaves no doubt about the deleterious effects of stress on cattle
farmers, their families and workers. Inevitably, given the catastrophic consequences
of both BSE and FMD for society far beyond farming itself, the literature emphasises
those diseases. There is very little mention of bTB. Nevertheless, to reiterate the
point made at the start of this section, it is animal disease in general that merits study.
It has adverse impacts on the economics of livestock production and on the decision
processes of livestock farmers subject to consequent stress. Each disease has its
particular technical characteristics, as a pathogen, for the severity and distribution of
its effects on people in farming and beyond, and for the strategies available for its
control. Thus information about any effects specifically associated with bTB will add
to current knowledge.
Longer term effects of a bTB breakdown
The longer-term effects of bTB on farm businesses are not well understood. Few
publications touch on the issue. A partial exception is Temple and Tuer (2000).
University of Exeter/ADAS UK Ltd
Longer-term effects of a bTB breakdown: draft report 30 September 2008
28
Their analysis of the financial costs of disruption because of bTB is the only source
found that analyses beef and dairy herds in detail. It considers the economic
consequences of making forced adjustments to a farming system, for example on the
demand for housing, labour and feed. Also analysed are the implications of forced
retention of cattle for their quality and hence market price. Aside from slaughtering,
for which compensation anyway is paid to offset a major source of direct cost, the
main costs of bTB control measures listed are from restrictions on movement of cattle
on and off the farm, repeat testing, and compulsory cleaning.
Superficially, the consequences of restrictions and measures for disease management
are short run. They might appear to endure on a farm only as long as bTB is present.
In practice, short-term adjustments can have longer-term effects. For example, the
authors quote typical replacement rates in beef suckler herds at about 17%. Based on
realistic assumptions about the timing of movement restrictions, buying in
replacements, and their age, for a beef flying herd selling suckler calves, their
calculations show that in a 50 cow herd a single bTB reactor could reduce calvings in
following years by 8.5. Thus short-term adjustments unintentionally can become
‘fixed’ in the sense that a farm’s configuration of resource use, once changed,
imposes a degree of inflexibility on what happens in the longer-term.
Bennett (2004) touches on longer-term issues as part of his study of the economic
impact of bTB and alternative control policies. Longer-term costs are seen as far
reaching. For example, valuable bloodlines can be lost. Diversification from milk
into beef and sheep production is also mentioned by farmers surveyed, as is stress as a
reason why a farmer’s wife gave up work, presumably on the farm. An implication
of this is that even if her work had been in some off-farm occupation, the loss of
money income might represent a significant loss to the farm household, not for
consumption purposes but as a source of finance for investment in the farm business.
A further dimension of Bennett’s work was his application of the Reading Land-Use
Allocation Model (LUAM), a linear programming model of agriculture in England
and Wales, to investigate the effect of veterinary testing costs and levies on dairy and
beef farms in bTB hotspot areas. The results showed little effect on milk production
in those areas, but some shift in beef production and increase in sheep production.
Such an approach is informative when new policies for bTB control are under
University of Exeter/ADAS UK Ltd
Longer-term effects of a bTB breakdown: draft report 30 September 2008
29
consideration, because the potential effects for longer term farm adjustments can be
simulated. Bennett notes that the relatively small impacts predicted reflect limited
viable alternatives to dairy and beef production in the areas studied.
Others of Bennett’s findings echo other sources. For example, one of Bennett’s
respondents increased his sheep enterprise and decreased his beef enterprise as a
result of bTB. Other farmers deliberately kept excess cattle numbers to a minimum.
No evidence was found supporting any negative effects on a tourist or property letting
enterprise. Two farmers specifically mentioned devaluation of the farm business,
because a history of bTB might reduce a farm’s market value and make it more
difficult to sell. Open-ended questions revealed that bTB could cause cash flow
problems and loss of control of the farm business. Also, under movement restrictions
farmers would be forced to keep store cattle, in effect having to create a new
enterprise. This last observation recalls outcomes of Temple and Tuer’s detailed
analysis.
Finally, Sheppard and Turner (2005) closely complement other authors’ findings.
But additionally, their survey of 61 farms showed that most farmers reported some
long-term effects bTB breakdowns, though the severity varied with individual
circumstances. Also, one-third of farmers affected said they had cancelled or
postponed planned investment in livestock, premises or equipment. Almost one-third
had been forced to cancel or postpone their expansion plans as a direct result of bTB.
One in six farms had diversified away from cattle breeding and production in order to
reduce the potential business risks of further bTB incidents. Importantly, the authors
concluded not only that they had evidence of widespread personal impacts on
farmers, their families and farm staff, but also that there appeared to be a general
reluctance to highlight this.
This finding is broadly consistent with Thomas et al. (2003), who found in the wake
of the BSE crisis for a representative cohort of 606 farmers, family members and
farm workers, that British farmers have a lower prevalence of psychiatric morbidity
than the British household population as a whole. But this seemed to be contradicted
by the relatively high male suicide rate amongst farmers (1% of all male suicides in
the age range 16-64). The authors attribute the apparent inconsistency to farmers’
fatalistic attitude towards their own life, plus their access to lethal methods.
University of Exeter/ADAS UK Ltd
Longer-term effects of a bTB breakdown: draft report 30 September 2008
30
Importantly, the authors stress the need for future studies to assess the characteristics
of farmers that might make them particularly susceptible to thoughts that life is not
worth living. Not admitting to the existence of a problem does not mean that a
problem does not exist. At the time of writing, the authors recommended
investigating the effect of extra stress likely to be experienced by British farmers as a
result of the then recent FMD outbreak. Reference has been made to relevant work as
part of this review. In view of the current growth of concern about bTB, a similar
comment could be made about that.
Badgers and bio-security
Investigations of badger ecology and the various ways by which badgers come into
contact with cattle can, in principle, yield information that helps farmers find ways to
modify their husbandry practices to protect cattle from bTB infection. For example,
Phillips et al. (2000, 2003) have reviewed ways in which husbandry changes, such as
changing from set-stocking to strip grazing, or avoiding feeding cattle in the field, or
off the ground, could be beneficial. As part of their own study of badger movements
around farm buildings, Ward et al. (2008) summarise other evidence pointing to the
wisdom of investing in bio-security. They quote Cheeseman and Mallinson (1981)
and Garnett et al. (2005) who consider that bTB prevalence might be higher than the
norm amongst badgers that visit farm yards, because their behaviour is influenced by
their infection. Remote surveillance of badger behaviour, the focus of the Ward
study, showed that when badgers excreted and scent-marked inside buildings it took
place mostly in feed stores. Therefore the presence of infectious badgers behaving in
this way suggests a serious threat to cattle who consume contaminated feed.
Defra publishes general guidelines for improving husbandry3, but Tolhurst et al.
(2008) is a rare example of research into the specific means by which badgers and
cattle can be kept apart, and the difficulties of so doing. Their focus is on the scope
for keeping badgers away from farm buildings by using an electric fence. On balance,
the evidence is that badger behaviour is changed when they are challenged by an
electric fence. But a problem for farmers is the sheer inconvenience of having to
create secure areas by such fences without the nuisance factor of impeded normal
3 http://www.defra.gov.uk/animalh/tb/publications/index.htm
University of Exeter/ADAS UK Ltd
Longer-term effects of a bTB breakdown: draft report 30 September 2008
31
access. The authors conclude that new designs for electric fences should be
considered to minimise such problems.
In a study of latrine distribution, Delahay et al. (2007) illustrate the sheer complexity
of badgers’ social behaviour, though with some cause for optimism that the natural
environment they inhabit can be conducive to limiting badger-to-cattle contact. For
example, there is evidence that woodlands or thick hedgerows are more attractive
locations for badger latrines that harbour a risk of cross-infection. Thus there appears
to be scope for managing cattle accordingly so as to limit the possibilities of contact
with contaminated locations on or adjoining pasture. As the authors conclude,
“Augmentation of hedges or double fencing of walls and hedges with
appropriate stock-proof (but badger-permeable) fencing may effectively exclude
cattle from associated latrines. However, such measures require financial
investment and maintenance. For example, vegetation in fenced-off areas needs
to be cut to avoid cattle grazing at their edges and to maximize continued use by
badgers. Management of high-risk areas and manipulating habitat composition
as suggested here, and altering grazing regimes may represent practical steps
that farmers can take to reduce cattle exposure to badger latrines. However,
until the potential disease control benefits of such measures can be
demonstrated experimentally, there may be little incentive in the farming
community to adopt them.” (Delahay et al., 2007, page 318)
Ward et al. (2006, 2008) concur that currently there is scant evidence on quantified
risks or the cost-benefit considerations to enable farmers to make properly informed
investment decisions. The majority of farmers who co-operated with the remote
surveillance study had not invested in bio-security, while Bennett and Cook (2005)
observed that even farmers who had experienced a herd breakdown did nothing by
way of new bio-security measures to protect their cattle in future. Ward et al. (2008)
speculate that such reluctance may be partly explained by inaccurate advice given
earlier by the Ministry of Agriculture, Fisheries and Food (1999). The recommended
minimum height for locating cattle troughs was too low to stop badgers getting
access. Thus farmers’ trust in the reliability of official information was undermined.
Also, most farmers in the Ward study were unaware of just how frequently badgers
visited their farms.
University of Exeter/ADAS UK Ltd
Longer-term effects of a bTB breakdown: draft report 30 September 2008
32
On the evidence of the above sources, currently there is a dearth of information on the
extent to which farmers can, or do, adapt their farming systems to minimize
potentially hazardous contact between badgers and cattle. A conclusion arising from
the information presented is that having a detailed knowledge of local conditions,
both as regards badger behaviour in the natural environment and the configuration of
farm buildings and related equipment, is essential to define the technical possibilities
for farmers to keep cattle satisfactorily isolated. In turn, the possibilities have
economic implications for farmers that need to be quantified. It is evident that the
issue of bio-security for bTB control merits closer analysis.
Conclusions
The main conclusions arising from the above are as follows:
• Overall, trends in cattle production, especially dairy farming, are not explained
by reference to conventional economic variables alone.
• Neither is it easy to identify and quantify other factors affecting cattle farmers’
decisions, including their emotional reactions to outbreaks of animal disease,
that to date have mostly been excluded from consideration.
• The stress effects of BSE and foot and mouth disease epidemics on farmers and
their families have been investigated, but bTB is largely neglected.
• Conceivably, farmers’ perceptions of the consequences of animal disease are
inextricably linked with their attitudes towards authorities, and particularly
government, who are seen more as a source of problems than their solution.
• Conspicuous by its absence is any substantive evidence in the literature of the
financial implications of investment in bio-security measures aimed at keeping
cattle from contact with badgers.
• There is no evidence of any significant long-term adjustments in farm resource
use to improve bio-security on cattle farms.
University of Exeter/ADAS UK Ltd
Longer-term effects of a bTB breakdown: draft report 30 September 2008
33
3 FACTORS WHICH RESULT IN LONGER-TERM IMPACTS
Introduction
Although the primary focus of this chapter is on the factors which are most likely to
result in longer-term impacts on farm businesses if a bTB breakdown occurs, it is
helpful to begin with some contextual analyses. One of the key findings of the
literature review (Chapter 2) is that, from the standpoint of conventional economic
research looking at the performance of the cattle industry, the overall trends in cattle
production, and particularly dairying, over recent years are not adequately explained
by reference to conventional economic variables alone. Under RA7 the research
programme used a range of information, principally drawn for the Agricultural
Census in conjunction with additional data from VetNet, in a statistical examination
of trends in cattle numbers in the bTB-endemic areas of England and Wales.
One possible longer term cost of bTB and its control is that cattle farmers give up
cattle production or switch to less profitable cattle systems (for example, moving
from dairying to beef). The objective of the work done for this part of the research
study was to examine the evidence relating to temporal changes in cattle populations
(as recorded by Defra’s June Census/survey) to see whether there is a connection
between bTB endemic areas and relative divergence in trend changes in cattle
populations over the longer term. This work aimed to examine the available data to
establish the existence, or otherwise of dissonance in cattle population trends for
‘bTB endemic’ areas and ‘bTB-free’ areas. The detailed methodology and results are
presented in Appendix E.
Regional changes in cattle farming: the GIS study
This section reviews the findings on regional changes in cattle numbers, and cattle
farming systems from RA7, the GIS study of changes in cattle populations. A
summary of the effects of (a) time (1995-2004) and (b) being in a high bTB incidence
parish compared to being in a parish with no bTB incidents during the study period is
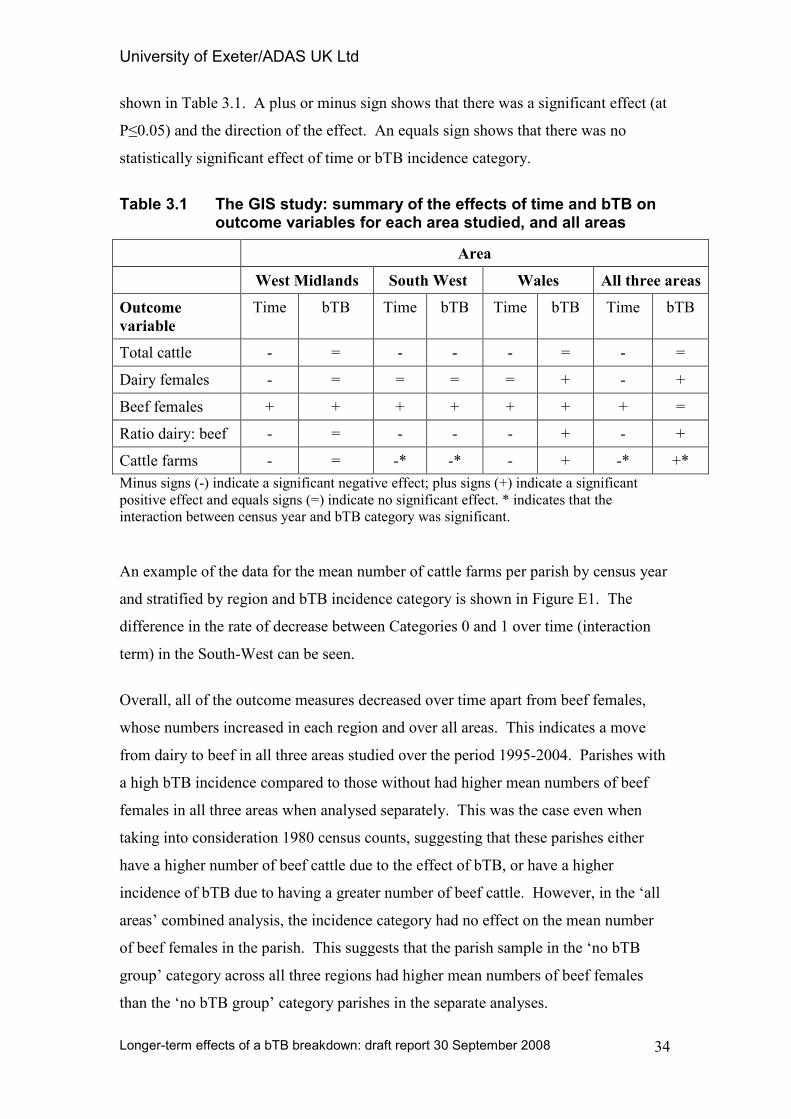
University of Exeter/ADAS UK Ltd
Longer-term effects of a bTB breakdown: draft report 30 September 2008
34
shown in Table 3.1. A plus or minus sign shows that there was a significant effect (at
P≤0.05) and the direction of the effect. An equals sign shows that there was no
statistically significant effect of time or bTB incidence category.
Table 3.1 The GIS study: summary of the effects of time and bTB on outcome variables for each area studied, and all areas
Area
West Midlands South West Wales All three areas
Outcome
variable
Time bTB Time bTB Time bTB Time bTB
Total cattle - = - - - = - =
Dairy females - = = = = + - +
Beef females + + + + + + + =
Ratio dairy: beef - = - - - + - +
Cattle farms - = -* -* - + -* +*
Minus signs (-) indicate a significant negative effect; plus signs (+) indicate a significant
positive effect and equals signs (=) indicate no significant effect. * indicates that the
interaction between census year and bTB category was significant.
An example of the data for the mean number of cattle farms per parish by census year
and stratified by region and bTB incidence category is shown in Figure E1. The
difference in the rate of decrease between Categories 0 and 1 over time (interaction
term) in the South-West can be seen.
Overall, all of the outcome measures decreased over time apart from beef females,
whose numbers increased in each region and over all areas. This indicates a move
from dairy to beef in all three areas studied over the period 1995-2004. Parishes with
a high bTB incidence compared to those without had higher mean numbers of beef
females in all three areas when analysed separately. This was the case even when
taking into consideration 1980 census counts, suggesting that these parishes either
have a higher number of beef cattle due to the effect of bTB, or have a higher
incidence of bTB due to having a greater number of beef cattle. However, in the ‘all
areas’ combined analysis, the incidence category had no effect on the mean number
of beef females in the parish. This suggests that the parish sample in the ‘no bTB
group’ category across all three regions had higher mean numbers of beef females
than the ‘no bTB group’ category parishes in the separate analyses.
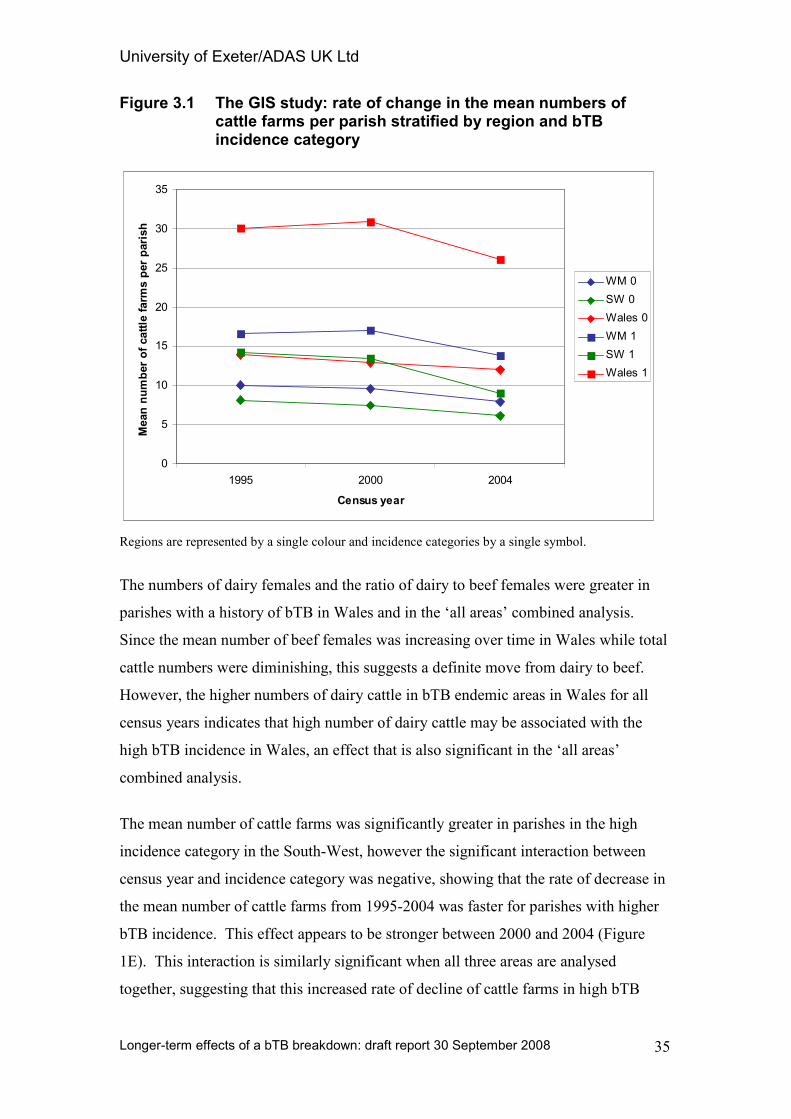
University of Exeter/ADAS UK Ltd
Longer-term effects of a bTB breakdown: draft report 30 September 2008
35
Figure 3.1 The GIS study: rate of change in the mean numbers of cattle farms per parish stratified by region and bTB incidence category
0
5
10
15
20
25
30
35
1995 2000 2004
Census year
Mean number of cattle farm
s per parish
WM 0
SW 0
Wales 0
WM 1
SW 1
Wales 1
Regions are represented by a single colour and incidence categories by a single symbol.
The numbers of dairy females and the ratio of dairy to beef females were greater in
parishes with a history of bTB in Wales and in the ‘all areas’ combined analysis.
Since the mean number of beef females was increasing over time in Wales while total
cattle numbers were diminishing, this suggests a definite move from dairy to beef.
However, the higher numbers of dairy cattle in bTB endemic areas in Wales for all
census years indicates that high number of dairy cattle may be associated with the
high bTB incidence in Wales, an effect that is also significant in the ‘all areas’
combined analysis.
The mean number of cattle farms was significantly greater in parishes in the high
incidence category in the South-West, however the significant interaction between
census year and incidence category was negative, showing that the rate of decrease in
the mean number of cattle farms from 1995-2004 was faster for parishes with higher
bTB incidence. This effect appears to be stronger between 2000 and 2004 (Figure
1E). This interaction is similarly significant when all three areas are analysed
together, suggesting that this increased rate of decline of cattle farms in high bTB
University of Exeter/ADAS UK Ltd
Longer-term effects of a bTB breakdown: draft report 30 September 2008
36
incidence parishes (i.e. using a cut-off of 6-7%) is an effect common to all hotspot
regions. This appears to provide objective evidence that bTB is having a long term
negative effect on the numbers of cattle farms in the UK.
In conclusion, where time has a significant effect when controlling for incidence
category, there is an overall increase or decrease in cattle or farm numbers over time,
which could be due to a variety of reasons. Where incidence category affiliation has
a significant effect when controlling for time, but the interaction is not significant, the
mean numbers of cattle and cattle farms are greater in one group of parishes
compared to the other. This is more likely to be a cause rather than an effect of high
bTB incidence or, conceivably, a correlate of a farming practice that is more
conducive to bTB, since there is no differential rate of change over time (i.e. with
increasing severity of bTB). Where the interaction term is significant, this represents
a differential time effect between parish groups, which suggests that it is the high
bTB incidence itself that is driving the rate of change.
Farm-level evidence for bTB as a driver of strategic business change
This spatial analysis has identified clear links between the level and incidence of bTB
and statistically significant changes in cattle farming, over and above the general
trends over the lest two or thee decades. In particular, this provides support for the
conclusion from the literature review, that analyses of economic variables alone have
not been able to fully explain the observed changes. The discussion turns now to
some of the findings of the farmer interview survey, RA3, regarding the role played
by a bTB breakdown4 as a driver of strategic change within their farm businesses.
The general approach used to identify farms where bTB has been a driver is
introduced in Chapter 1, and the results represent as objective an assessment of the
situation as was possible in a socio-economic survey of this nature. A summary of
the farms where bTB was identified as a driver of change is given in Chapter 4 (Table
4.8, see also the accompanying discussion) and more detailed results are given in
Appendix B. Drawing more widely on the results of the farmers’ interview survey,
responses to a series of questions looking at farmers’ outlook and attitudes were
4 This should be understood to include also the influence of successive bTB breakdowns, and also the
more subtle influence of perceptions of risk in bTB-endemic areas, and where localised ‘hotspots’ have
developed: all will have played a part in influencing farmers’ thinking and decision-making.
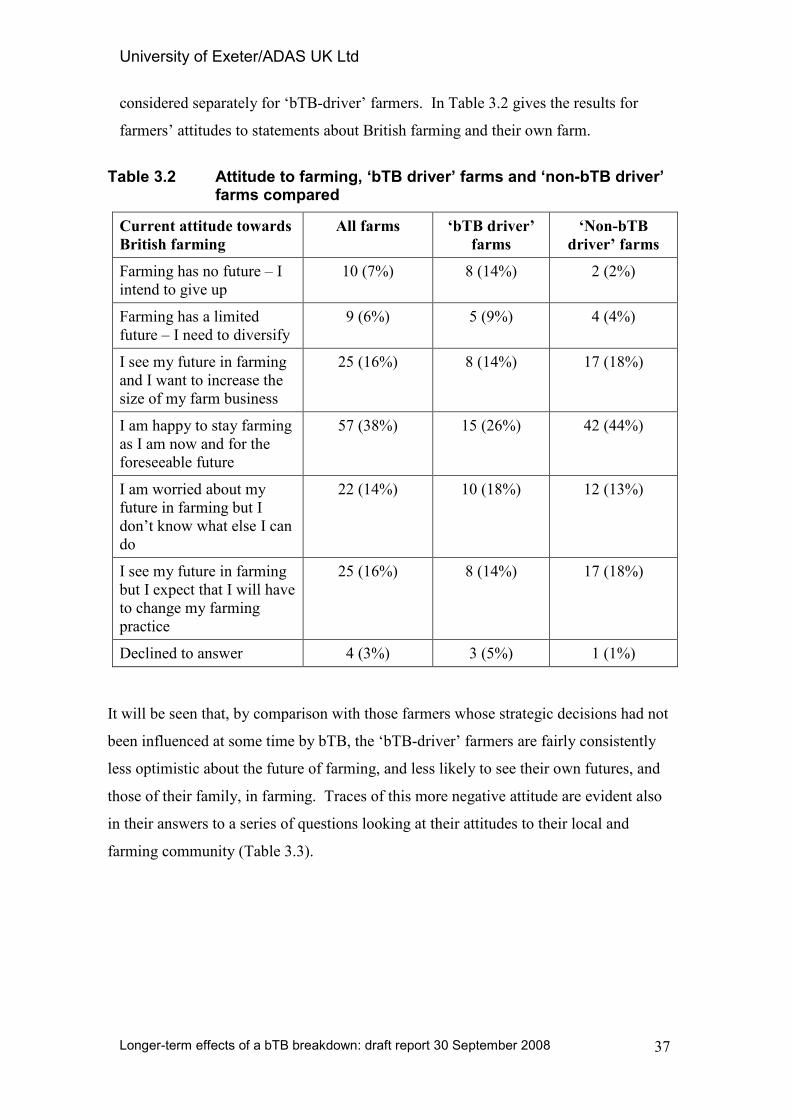
University of Exeter/ADAS UK Ltd
Longer-term effects of a bTB breakdown: draft report 30 September 2008
37
considered separately for ‘bTB-driver’ farmers. In Table 3.2 gives the results for
farmers’ attitudes to statements about British farming and their own farm.
Table 3.2 Attitude to farming, ‘bTB driver’ farms and ‘non-bTB driver’ farms compared
Current attitude towards
British farming
All farms ‘bTB driver’
farms
‘Non-bTB
driver’ farms
Farming has no future – I
intend to give up
10 (7%) 8 (14%) 2 (2%)
Farming has a limited
future – I need to diversify
9 (6%) 5 (9%) 4 (4%)
I see my future in farming
and I want to increase the
size of my farm business
25 (16%) 8 (14%) 17 (18%)
I am happy to stay farming
as I am now and for the
foreseeable future
57 (38%) 15 (26%) 42 (44%)
I am worried about my
future in farming but I
don’t know what else I can
do
22 (14%) 10 (18%) 12 (13%)
I see my future in farming
but I expect that I will have
to change my farming
practice
25 (16%) 8 (14%) 17 (18%)
Declined to answer 4 (3%) 3 (5%) 1 (1%)
It will be seen that, by comparison with those farmers whose strategic decisions had not
been influenced at some time by bTB, the ‘bTB-driver’ farmers are fairly consistently
less optimistic about the future of farming, and less likely to see their own futures, and
those of their family, in farming. Traces of this more negative attitude are evident also
in their answers to a series of questions looking at their attitudes to their local and
farming community (Table 3.3).
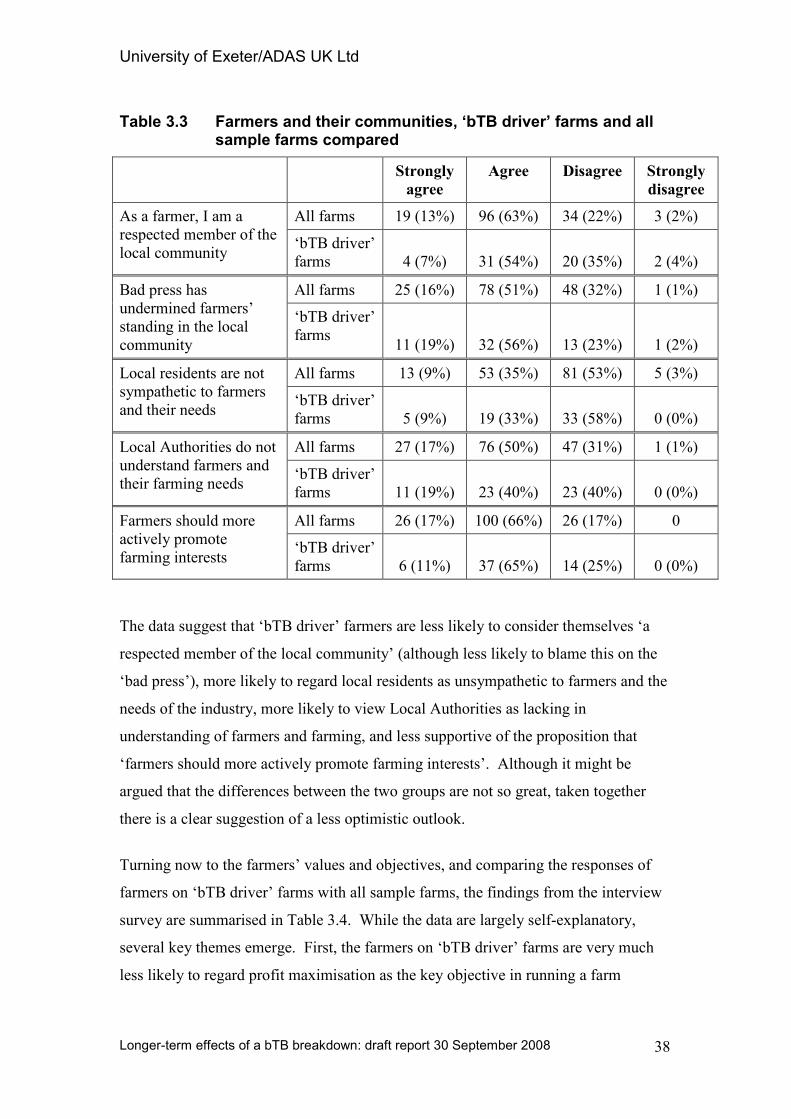
University of Exeter/ADAS UK Ltd
Longer-term effects of a bTB breakdown: draft report 30 September 2008
38
Table 3.3 Farmers and their communities, ‘bTB driver’ farms and all sample farms compared
Strongly
agree
Agree Disagree Strongly
disagree
All farms 19 (13%) 96 (63%) 34 (22%) 3 (2%) As a farmer, I am a
respected member of the
local community ‘bTB driver’
farms 4 (7%) 31 (54%) 20 (35%) 2 (4%)
All farms 25 (16%) 78 (51%) 48 (32%) 1 (1%) Bad press has
undermined farmers’
standing in the local
community
‘bTB driver’
farms 11 (19%) 32 (56%) 13 (23%) 1 (2%)
All farms 13 (9%) 53 (35%) 81 (53%) 5 (3%) Local residents are not
sympathetic to farmers
and their needs ‘bTB driver’
farms 5 (9%) 19 (33%) 33 (58%) 0 (0%)
All farms 27 (17%) 76 (50%) 47 (31%) 1 (1%) Local Authorities do not
understand farmers and
their farming needs ‘bTB driver’
farms 11 (19%) 23 (40%) 23 (40%) 0 (0%)
All farms 26 (17%) 100 (66%) 26 (17%) 0 Farmers should more
actively promote
farming interests ‘bTB driver’
farms 6 (11%) 37 (65%) 14 (25%) 0 (0%)
The data suggest that ‘bTB driver’ farmers are less likely to consider themselves ‘a
respected member of the local community’ (although less likely to blame this on the
‘bad press’), more likely to regard local residents as unsympathetic to farmers and the
needs of the industry, more likely to view Local Authorities as lacking in
understanding of farmers and farming, and less supportive of the proposition that
‘farmers should more actively promote farming interests’. Although it might be
argued that the differences between the two groups are not so great, taken together
there is a clear suggestion of a less optimistic outlook.
Turning now to the farmers’ values and objectives, and comparing the responses of
farmers on ‘bTB driver’ farms with all sample farms, the findings from the interview
survey are summarised in Table 3.4. While the data are largely self-explanatory,
several key themes emerge. First, the farmers on ‘bTB driver’ farms are very much
less likely to regard profit maximisation as the key objective in running a farm
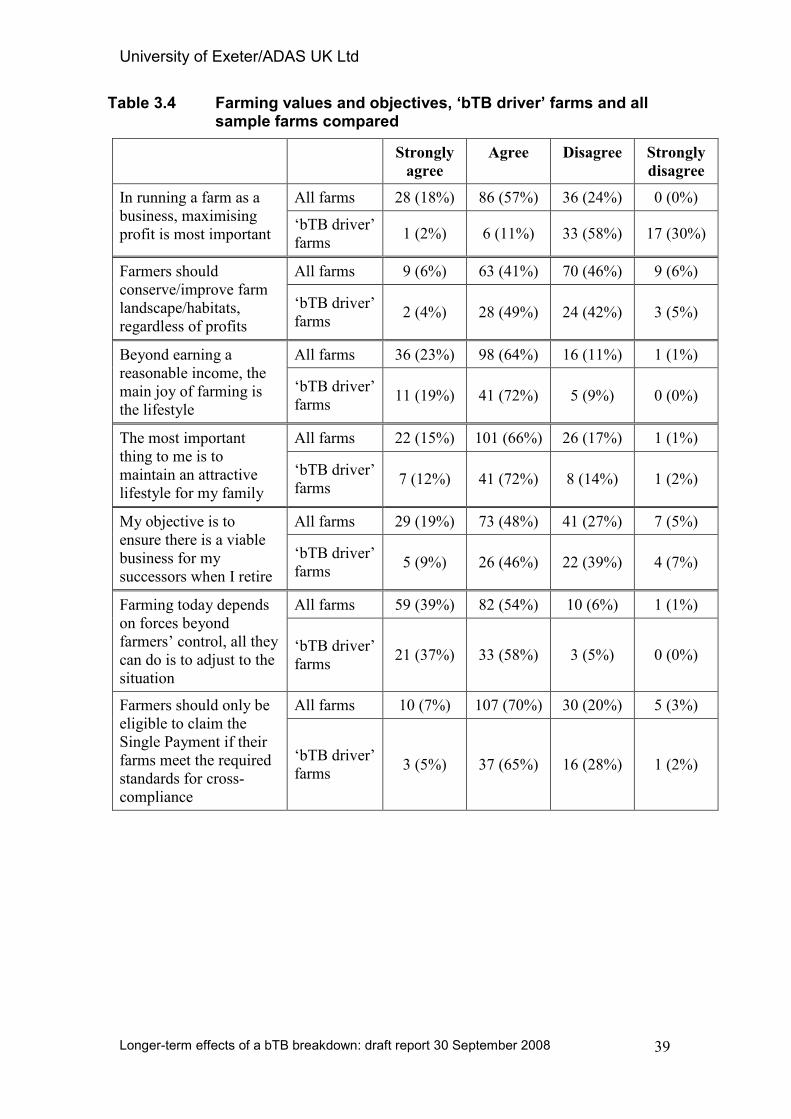
University of Exeter/ADAS UK Ltd
Longer-term effects of a bTB breakdown: draft report 30 September 2008
39
Table 3.4 Farming values and objectives, ‘bTB driver’ farms and all sample farms compared
Strongly
agree
Agree Disagree Strongly
disagree
All farms 28 (18%) 86 (57%) 36 (24%) 0 (0%) In running a farm as a
business, maximising
profit is most important ‘bTB driver’
farms 1 (2%) 6 (11%) 33 (58%) 17 (30%)
All farms 9 (6%) 63 (41%) 70 (46%) 9 (6%) Farmers should
conserve/improve farm
landscape/habitats,
regardless of profits
‘bTB driver’
farms 2 (4%) 28 (49%) 24 (42%) 3 (5%)
All farms 36 (23%) 98 (64%) 16 (11%) 1 (1%) Beyond earning a
reasonable income, the
main joy of farming is
the lifestyle
‘bTB driver’
farms 11 (19%) 41 (72%) 5 (9%) 0 (0%)
All farms 22 (15%) 101 (66%) 26 (17%) 1 (1%) The most important
thing to me is to
maintain an attractive
lifestyle for my family
‘bTB driver’
farms 7 (12%) 41 (72%) 8 (14%) 1 (2%)
All farms 29 (19%) 73 (48%) 41 (27%) 7 (5%) My objective is to
ensure there is a viable
business for my
successors when I retire
‘bTB driver’
farms 5 (9%) 26 (46%) 22 (39%) 4 (7%)
All farms 59 (39%) 82 (54%) 10 (6%) 1 (1%) Farming today depends
on forces beyond
farmers’ control, all they
can do is to adjust to the
situation
‘bTB driver’
farms 21 (37%) 33 (58%) 3 (5%) 0 (0%)
All farms 10 (7%) 107 (70%) 30 (20%) 5 (3%) Farmers should only be
eligible to claim the
Single Payment if their
farms meet the required
standards for cross-
compliance
‘bTB driver’
farms 3 (5%) 37 (65%) 16 (28%) 1 (2%)
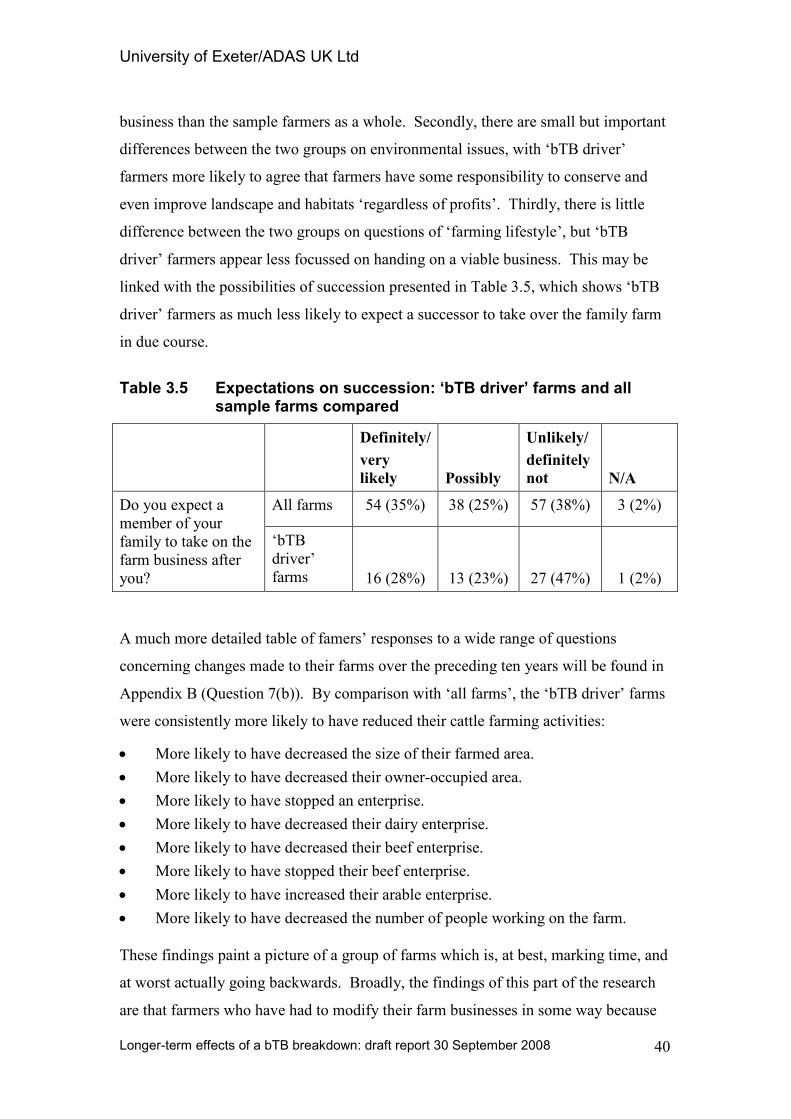
University of Exeter/ADAS UK Ltd
Longer-term effects of a bTB breakdown: draft report 30 September 2008
40
business than the sample farmers as a whole. Secondly, there are small but important
differences between the two groups on environmental issues, with ‘bTB driver’
farmers more likely to agree that farmers have some responsibility to conserve and
even improve landscape and habitats ‘regardless of profits’. Thirdly, there is little
difference between the two groups on questions of ‘farming lifestyle’, but ‘bTB
driver’ farmers appear less focussed on handing on a viable business. This may be
linked with the possibilities of succession presented in Table 3.5, which shows ‘bTB
driver’ farmers as much less likely to expect a successor to take over the family farm
in due course.
Table 3.5 Expectations on succession: ‘bTB driver’ farms and all sample farms compared
Definitely/
very
likely Possibly
Unlikely/
definitely
not N/A
All farms 54 (35%) 38 (25%) 57 (38%) 3 (2%) Do you expect a
member of your
family to take on the
farm business after
you?
‘bTB
driver’
farms 16 (28%) 13 (23%) 27 (47%) 1 (2%)
A much more detailed table of famers’ responses to a wide range of questions
concerning changes made to their farms over the preceding ten years will be found in
Appendix B (Question 7(b)). By comparison with ‘all farms’, the ‘bTB driver’ farms
were consistently more likely to have reduced their cattle farming activities:
• More likely to have decreased the size of their farmed area.
• More likely to have decreased their owner-occupied area.
• More likely to have stopped an enterprise.
• More likely to have decreased their dairy enterprise.
• More likely to have decreased their beef enterprise.
• More likely to have stopped their beef enterprise.
• More likely to have increased their arable enterprise.
• More likely to have decreased the number of people working on the farm.
These findings paint a picture of a group of farms which is, at best, marking time, and
at worst actually going backwards. Broadly, the findings of this part of the research
are that farmers who have had to modify their farm businesses in some way because
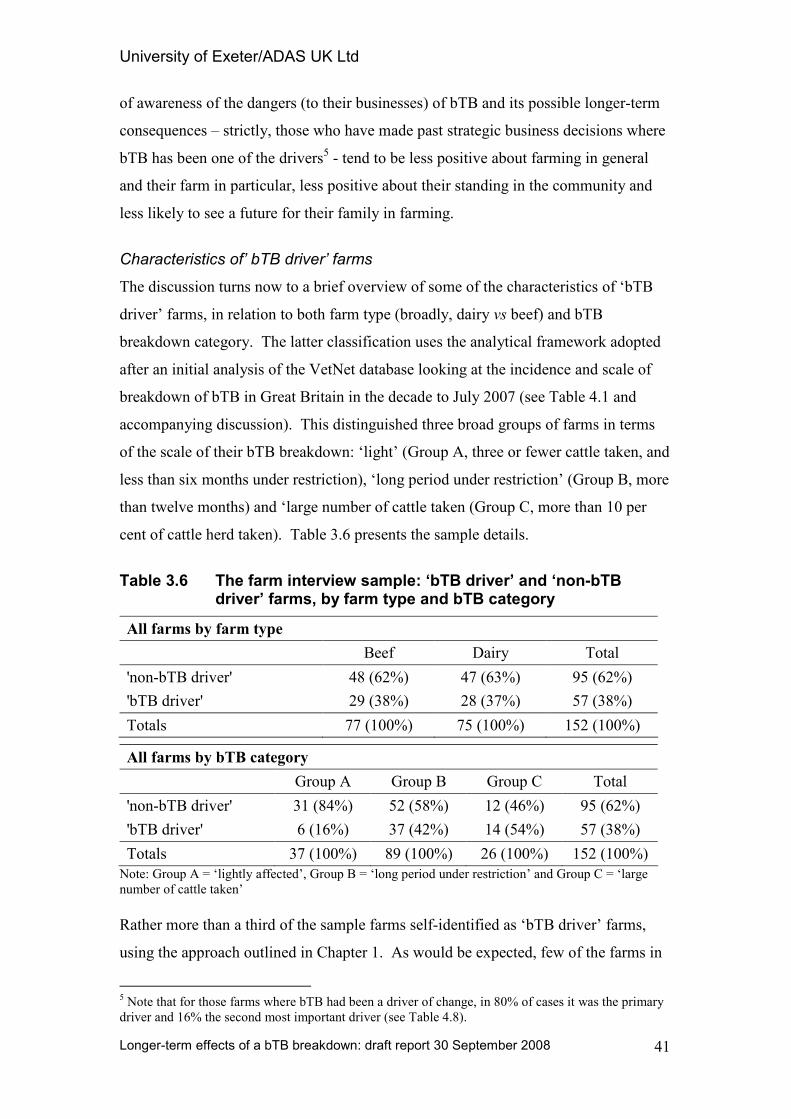
University of Exeter/ADAS UK Ltd
Longer-term effects of a bTB breakdown: draft report 30 September 2008
41
of awareness of the dangers (to their businesses) of bTB and its possible longer-term
consequences – strictly, those who have made past strategic business decisions where
bTB has been one of the drivers5 - tend to be less positive about farming in general
and their farm in particular, less positive about their standing in the community and
less likely to see a future for their family in farming.
Characteristics of’ bTB driver’ farms
The discussion turns now to a brief overview of some of the characteristics of ‘bTB
driver’ farms, in relation to both farm type (broadly, dairy vs beef) and bTB
breakdown category. The latter classification uses the analytical framework adopted
after an initial analysis of the VetNet database looking at the incidence and scale of
breakdown of bTB in Great Britain in the decade to July 2007 (see Table 4.1 and
accompanying discussion). This distinguished three broad groups of farms in terms
of the scale of their bTB breakdown: ‘light’ (Group A, three or fewer cattle taken, and
less than six months under restriction), ‘long period under restriction’ (Group B, more
than twelve months) and ‘large number of cattle taken (Group C, more than 10 per
cent of cattle herd taken). Table 3.6 presents the sample details.
Table 3.6 The farm interview sample: ‘bTB driver’ and ‘non-bTB driver’ farms, by farm type and bTB category
All farms by farm type
Beef Dairy Total
'non-bTB driver' 48 (62%) 47 (63%) 95 (62%)
'bTB driver' 29 (38%) 28 (37%) 57 (38%)
Totals 77 (100%) 75 (100%) 152 (100%)
All farms by bTB category
Group A Group B Group C Total
'non-bTB driver' 31 (84%) 52 (58%) 12 (46%) 95 (62%)
'bTB driver' 6 (16%) 37 (42%) 14 (54%) 57 (38%)
Totals 37 (100%) 89 (100%) 26 (100%) 152 (100%)
Note: Group A = ‘lightly affected’, Group B = ‘long period under restriction’ and Group C = ‘large
number of cattle taken’
Rather more than a third of the sample farms self-identified as ‘bTB driver’ farms,
using the approach outlined in Chapter 1. As would be expected, few of the farms in
5 Note that for those farms where bTB had been a driver of change, in 80% of cases it was the primary
driver and 16% the second most important driver (see Table 4.8).
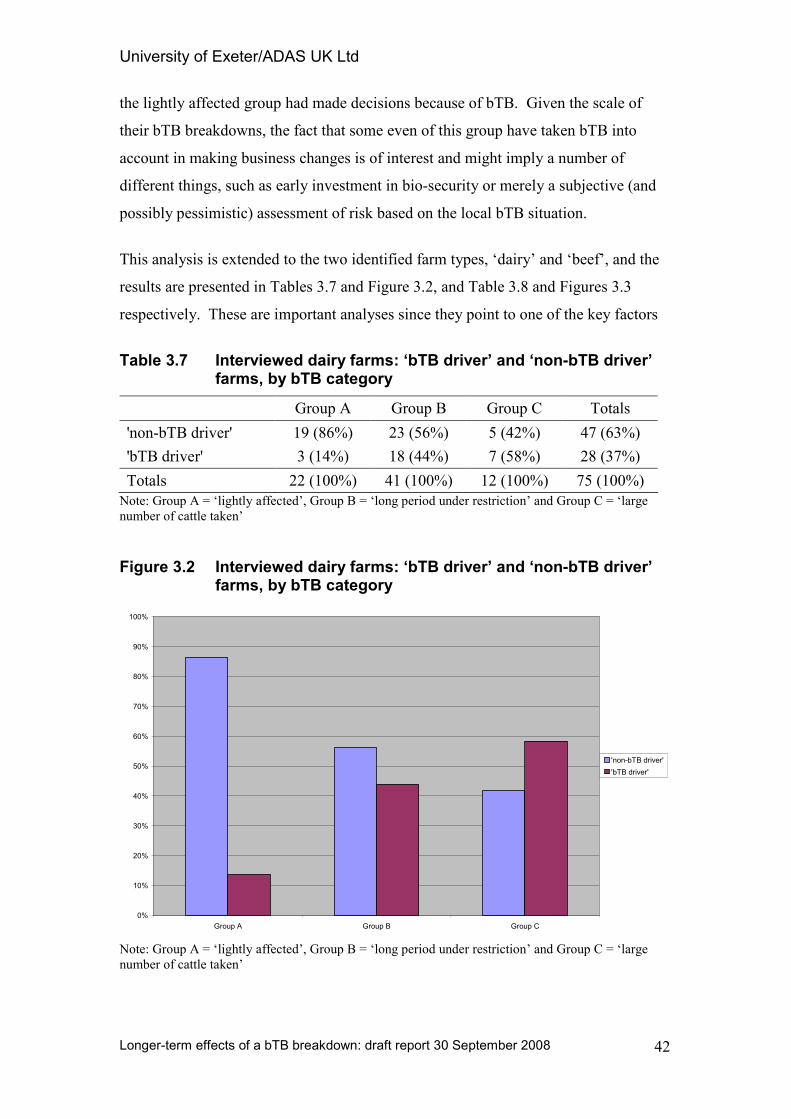
University of Exeter/ADAS UK Ltd
Longer-term effects of a bTB breakdown: draft report 30 September 2008
42
the lightly affected group had made decisions because of bTB. Given the scale of
their bTB breakdowns, the fact that some even of this group have taken bTB into
account in making business changes is of interest and might imply a number of
different things, such as early investment in bio-security or merely a subjective (and
possibly pessimistic) assessment of risk based on the local bTB situation.
This analysis is extended to the two identified farm types, ‘dairy’ and ‘beef’, and the
results are presented in Tables 3.7 and Figure 3.2, and Table 3.8 and Figures 3.3
respectively. These are important analyses since they point to one of the key factors
Table 3.7 Interviewed dairy farms: ‘bTB driver’ and ‘non-bTB driver’ farms, by bTB category
Group A Group B Group C Totals
'non-bTB driver' 19 (86%) 23 (56%) 5 (42%) 47 (63%)
'bTB driver' 3 (14%) 18 (44%) 7 (58%) 28 (37%)
Totals 22 (100%) 41 (100%) 12 (100%) 75 (100%)
Note: Group A = ‘lightly affected’, Group B = ‘long period under restriction’ and Group C = ‘large
number of cattle taken’
Figure 3.2 Interviewed dairy farms: ‘bTB driver’ and ‘non-bTB driver’ farms, by bTB category
0%
10%
20%
30%
40%
50%
60%
70%
80%
90%
100%
Group A Group B Group C
'non-bTB driver'
'bTB driver'
Note: Group A = ‘lightly affected’, Group B = ‘long period under restriction’ and Group C = ‘large
number of cattle taken’
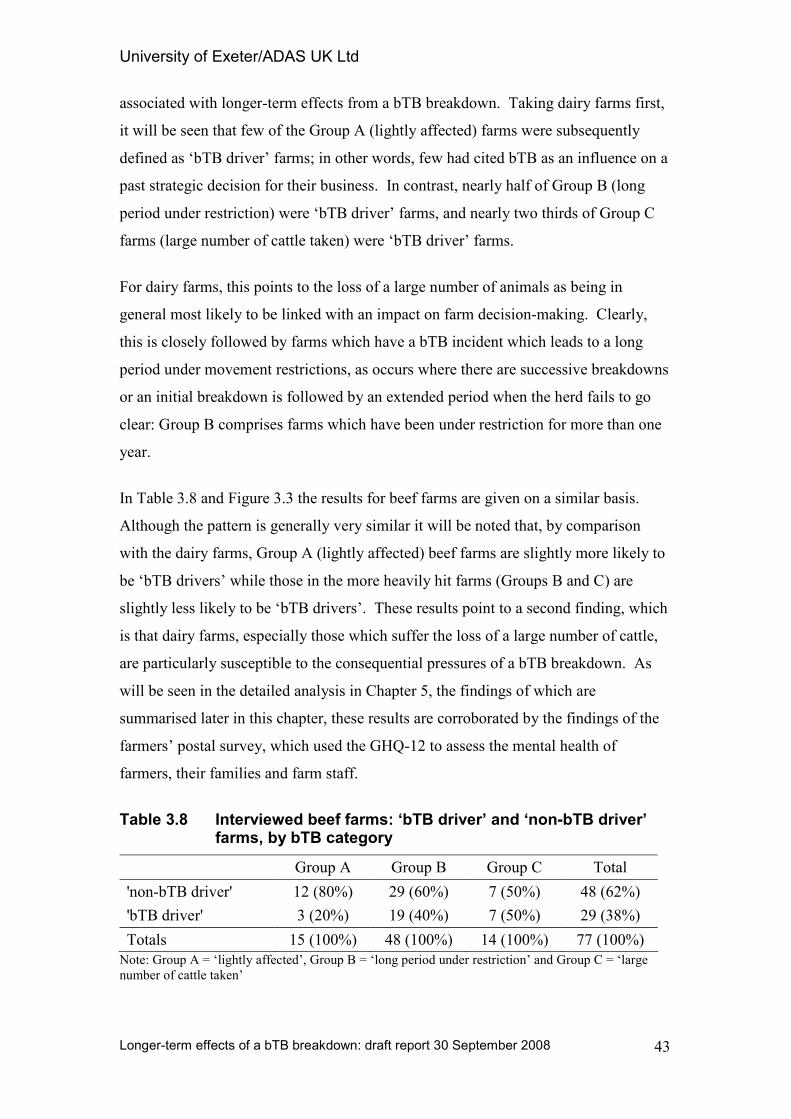
University of Exeter/ADAS UK Ltd
Longer-term effects of a bTB breakdown: draft report 30 September 2008
43
associated with longer-term effects from a bTB breakdown. Taking dairy farms first,
it will be seen that few of the Group A (lightly affected) farms were subsequently
defined as ‘bTB driver’ farms; in other words, few had cited bTB as an influence on a
past strategic decision for their business. In contrast, nearly half of Group B (long
period under restriction) were ‘bTB driver’ farms, and nearly two thirds of Group C
farms (large number of cattle taken) were ‘bTB driver’ farms.
For dairy farms, this points to the loss of a large number of animals as being in
general most likely to be linked with an impact on farm decision-making. Clearly,
this is closely followed by farms which have a bTB incident which leads to a long
period under movement restrictions, as occurs where there are successive breakdowns
or an initial breakdown is followed by an extended period when the herd fails to go
clear: Group B comprises farms which have been under restriction for more than one
year.
In Table 3.8 and Figure 3.3 the results for beef farms are given on a similar basis.
Although the pattern is generally very similar it will be noted that, by comparison
with the dairy farms, Group A (lightly affected) beef farms are slightly more likely to
be ‘bTB drivers’ while those in the more heavily hit farms (Groups B and C) are
slightly less likely to be ‘bTB drivers’. These results point to a second finding, which
is that dairy farms, especially those which suffer the loss of a large number of cattle,
are particularly susceptible to the consequential pressures of a bTB breakdown. As
will be seen in the detailed analysis in Chapter 5, the findings of which are
summarised later in this chapter, these results are corroborated by the findings of the
farmers’ postal survey, which used the GHQ-12 to assess the mental health of
farmers, their families and farm staff.
Table 3.8 Interviewed beef farms: ‘bTB driver’ and ‘non-bTB driver’ farms, by bTB category
Group A Group B Group C Total
'non-bTB driver' 12 (80%) 29 (60%) 7 (50%) 48 (62%)
'bTB driver' 3 (20%) 19 (40%) 7 (50%) 29 (38%)
Totals 15 (100%) 48 (100%) 14 (100%) 77 (100%)
Note: Group A = ‘lightly affected’, Group B = ‘long period under restriction’ and Group C = ‘large
number of cattle taken’
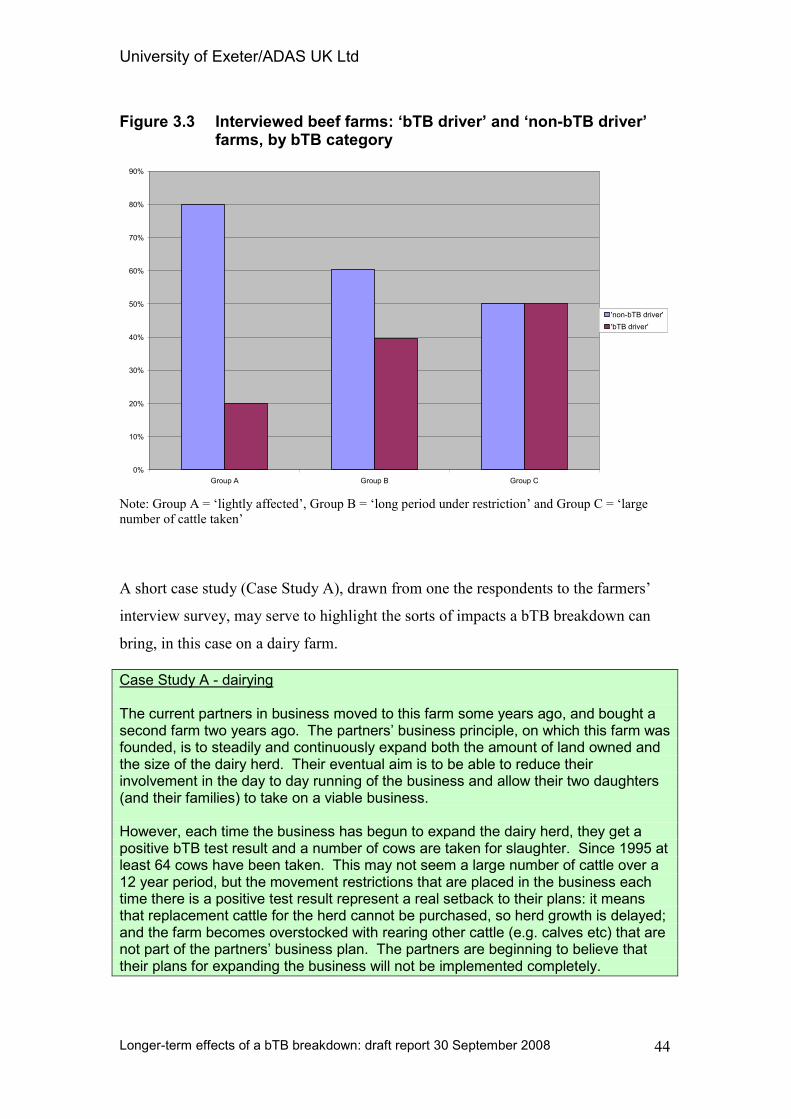
University of Exeter/ADAS UK Ltd
Longer-term effects of a bTB breakdown: draft report 30 September 2008
44
Figure 3.3 Interviewed beef farms: ‘bTB driver’ and ‘non-bTB driver’ farms, by bTB category
0%
10%
20%
30%
40%
50%
60%
70%
80%
90%
Group A Group B Group C
'non-bTB driver'
'bTB driver'
Note: Group A = ‘lightly affected’, Group B = ‘long period under restriction’ and Group C = ‘large
number of cattle taken’
A short case study (Case Study A), drawn from one the respondents to the farmers’
interview survey, may serve to highlight the sorts of impacts a bTB breakdown can
bring, in this case on a dairy farm.
Case Study A - dairying The current partners in business moved to this farm some years ago, and bought a second farm two years ago. The partners’ business principle, on which this farm was founded, is to steadily and continuously expand both the amount of land owned and the size of the dairy herd. Their eventual aim is to be able to reduce their involvement in the day to day running of the business and allow their two daughters (and their families) to take on a viable business. However, each time the business has begun to expand the dairy herd, they get a positive bTB test result and a number of cows are taken for slaughter. Since 1995 at least 64 cows have been taken. This may not seem a large number of cattle over a 12 year period, but the movement restrictions that are placed in the business each time there is a positive test result represent a real setback to their plans: it means that replacement cattle for the herd cannot be purchased, so herd growth is delayed; and the farm becomes overstocked with rearing other cattle (e.g. calves etc) that are not part of the partners’ business plan. The partners are beginning to believe that their plans for expanding the business will not be implemented completely.
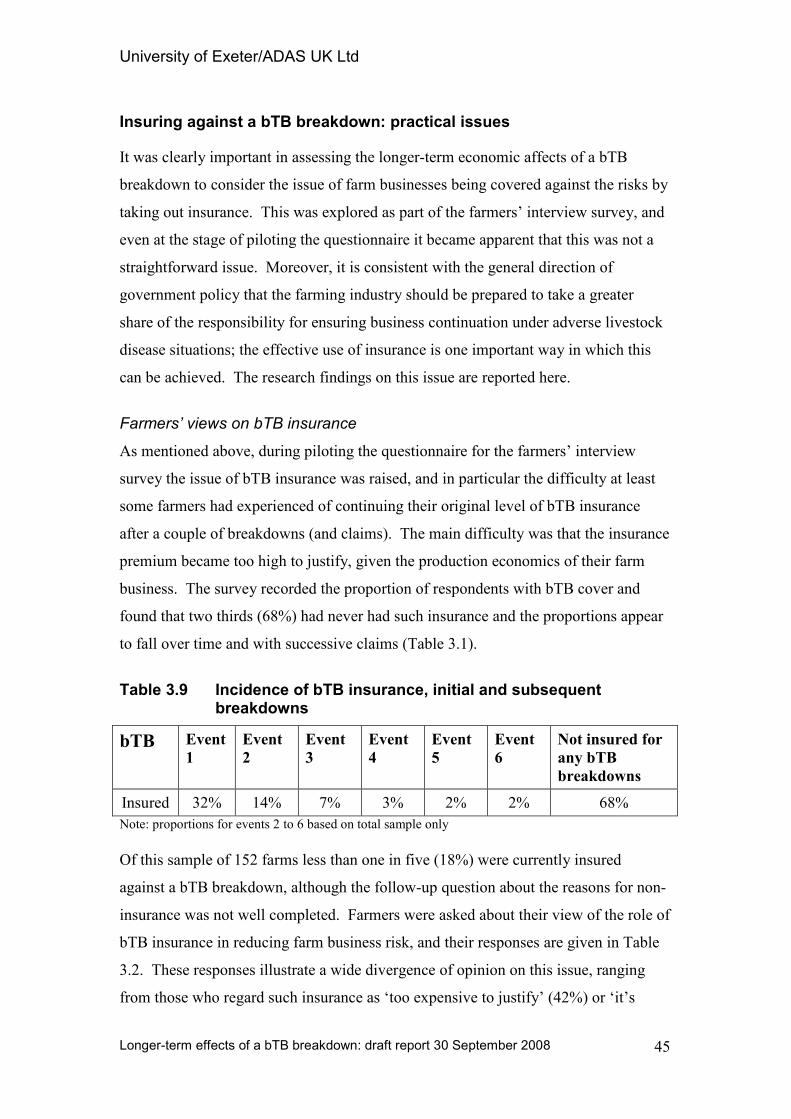
University of Exeter/ADAS UK Ltd
Longer-term effects of a bTB breakdown: draft report 30 September 2008
45
Insuring against a bTB breakdown: practical issues
It was clearly important in assessing the longer-term economic affects of a bTB
breakdown to consider the issue of farm businesses being covered against the risks by
taking out insurance. This was explored as part of the farmers’ interview survey, and
even at the stage of piloting the questionnaire it became apparent that this was not a
straightforward issue. Moreover, it is consistent with the general direction of
government policy that the farming industry should be prepared to take a greater
share of the responsibility for ensuring business continuation under adverse livestock
disease situations; the effective use of insurance is one important way in which this
can be achieved. The research findings on this issue are reported here.
Farmers’ views on bTB insurance
As mentioned above, during piloting the questionnaire for the farmers’ interview
survey the issue of bTB insurance was raised, and in particular the difficulty at least
some farmers had experienced of continuing their original level of bTB insurance
after a couple of breakdowns (and claims). The main difficulty was that the insurance
premium became too high to justify, given the production economics of their farm
business. The survey recorded the proportion of respondents with bTB cover and
found that two thirds (68%) had never had such insurance and the proportions appear
to fall over time and with successive claims (Table 3.1).
Table 3.9 Incidence of bTB insurance, initial and subsequent breakdowns
bTB Event
1
Event
2
Event
3
Event
4
Event
5
Event
6
Not insured for
any bTB
breakdowns
Insured 32% 14% 7% 3% 2% 2% 68%
Note: proportions for events 2 to 6 based on total sample only
Of this sample of 152 farms less than one in five (18%) were currently insured
against a bTB breakdown, although the follow-up question about the reasons for non-
insurance was not well completed. Farmers were asked about their view of the role of
bTB insurance in reducing farm business risk, and their responses are given in Table
3.2. These responses illustrate a wide divergence of opinion on this issue, ranging
from those who regard such insurance as ‘too expensive to justify’ (42%) or ‘it’s
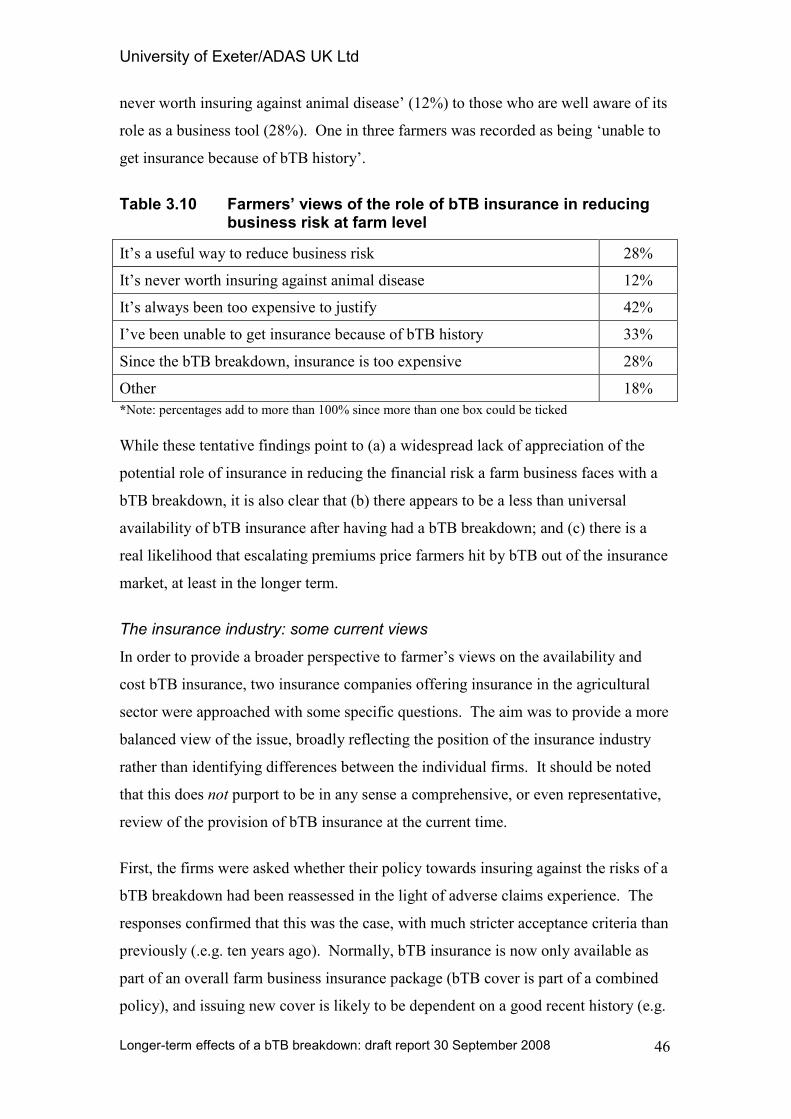
University of Exeter/ADAS UK Ltd
Longer-term effects of a bTB breakdown: draft report 30 September 2008
46
never worth insuring against animal disease’ (12%) to those who are well aware of its
role as a business tool (28%). One in three farmers was recorded as being ‘unable to
get insurance because of bTB history’.
Table 3.10 Farmers’ views of the role of bTB insurance in reducing business risk at farm level
It’s a useful way to reduce business risk 28%
It’s never worth insuring against animal disease 12%
It’s always been too expensive to justify 42%
I’ve been unable to get insurance because of bTB history 33%
Since the bTB breakdown, insurance is too expensive 28%
Other 18%
*Note: percentages add to more than 100% since more than one box could be ticked
While these tentative findings point to (a) a widespread lack of appreciation of the
potential role of insurance in reducing the financial risk a farm business faces with a
bTB breakdown, it is also clear that (b) there appears to be a less than universal
availability of bTB insurance after having had a bTB breakdown; and (c) there is a
real likelihood that escalating premiums price farmers hit by bTB out of the insurance
market, at least in the longer term.
The insurance industry: some current views
In order to provide a broader perspective to farmer’s views on the availability and
cost bTB insurance, two insurance companies offering insurance in the agricultural
sector were approached with some specific questions. The aim was to provide a more
balanced view of the issue, broadly reflecting the position of the insurance industry
rather than identifying differences between the individual firms. It should be noted
that this does not purport to be in any sense a comprehensive, or even representative,
review of the provision of bTB insurance at the current time.
First, the firms were asked whether their policy towards insuring against the risks of a
bTB breakdown had been reassessed in the light of adverse claims experience. The
responses confirmed that this was the case, with much stricter acceptance criteria than
previously (.e.g. ten years ago). Normally, bTB insurance is now only available as
part of an overall farm business insurance package (bTB cover is part of a combined
policy), and issuing new cover is likely to be dependent on a good recent history (e.g.
University of Exeter/ADAS UK Ltd
Longer-term effects of a bTB breakdown: draft report 30 September 2008
47
a clean loss history over the past three years or, in certain areas, the herd must have
recently had a clear routine test). Commonly, all bTB cases are reviewed every year
and if there is adverse claims experience there is a possibility of a loading being
applied. Specifically, it is clear that both firms still accept new business insuring
against bTB (e.g. from a potential new customer who wishes to have this cover, or
from an existing customer who hasn’t previously insured against bTB), provided that
the application falls within the strict acceptance criteria and with the premium subject
to any loading that may be appropriate.
Secondly, the two firms were asked about their approach to bTB insurance in the case
of farms which have not yet made a bTB claim. For example, does the premium vary
according to perceived risk based on location (e.g. comparing a farm in a known bTB
‘hotspot’ with a farm further away)? On this issue there appears to be a divergence in
approach. One firm currently rates according to (a) the parish testing interval and (b)
their own loss experience within a region. An example given was that a farm in an
annual testing parish in Cornwall would be charged more than someone in an annual
testing parish in Lancashire (see also comment below on monitoring the pattern of
bTB breakdowns). In the case of the other firm, it was stated that the premium does
not vary according to perceived risk; rather, the insurance risks are assessed in their
entirety. Both firms offer the same level of cover irrespective of area, although it was
pointed out that the premium charged may have an influence on the level of cover
chosen. One firm stated that the availability of cover may well differ from farm to
farm.
Thirdly, the situation in relation to farms which have made a bTB claim was
explored. Both firms were unequivocal on this: a bTB claim will not automatically
trigger a higher renewal premium; rather, any subsequent premium loading will be
based on the emergence of an adverse claims pattern. One firm indicated that in these
circumstances claim payments in comparison to premiums for an individual client are
taken into account, together with other factors such as the length of time the cover has
been in force, and the performance of the ‘combined’ policy as a whole. It is clear
that both firms do still provide bTB cover after a farmer has made a first claim,
although continued losses will increase the likelihood of the premium increasing.
With regard to the level of cover available, one firm stated that following a bTB claim
University of Exeter/ADAS UK Ltd
Longer-term effects of a bTB breakdown: draft report 30 September 2008
48
the level of cover now available is lower than it used to be. While the basic level of
cover will still be available, the higher level of cover (against the consequences of
movement restrictions, for example) previously offered will not – this has not been
available as a new cover for some years. Moreover, movement restriction cover will
not be renewed (for those who already have it) if the herd is not on routine testing
following the discovery of reactors.
Fourthly, it follows from the above that neither firm has reached the point where it
does not offer cover against a bTB breakdown, but the two firms were asked about
the broader issues involved. Although this hasn’t happened yet, both firms appeared
to accept that this was always a possibility. In such (hypothetical) circumstances, the
aggregate value (and the total number) of claims would be the major driver, but as
mentioned above the performance of the policy as a whole always has a strong
influence. It was clear that both companies make every effort to offer renewal terms
to their policyholders, while recognising that underwriting exigencies may result in a
premium judged unacceptably high by the policy-holder (‘it may sometimes become
a pound-swapping exercise’).
Both firms were asked whether they monitor the pattern of bTB breakdowns in
assessing risk and setting premium levels. While both firms are moving in this
direction, only one currently has this approach fully implemented, using increasingly
sophisticated statistics in assessing bTB insurance rates. This has resulted in
differential rates for different areas and regions, based on bTB breakdown patterns.
Meanwhile the other firm is implementing a new system which will accomplish this
in the near future, although it will take several years for consequences of this
approach to be fully evident. This change in approach from the use of national rates
governed solely by parish testing frequency was blamed on the spread of bTB-
endemic areas.
Finally, it is clear that both firms remain committed to offering the best terms
available to their clients, typically using regional, even local, knowledge in assessing
premiums, and being as fair as possible under the circumstances. Following a claim,
or an adverse claims pattern, changes in terms may include a combination of a loaded
premium and a cumulative excess (not providing cover for the first x reactors within
University of Exeter/ADAS UK Ltd
Longer-term effects of a bTB breakdown: draft report 30 September 2008
49
that period of insurance), an assessment made after taking all factors into account6.
One firm recognised that this approach may have provided a good reason for some
clients to stay with the firm (i.e. so as to maintain a level of bTB cover they would not
be able to obtain elsewhere while they are undergoing a breakdown).
In summary, this short consultation with two insurers appears to corroborate farmers’
responses about the cost and availability of bTB insurance. It is clear that the spread
of bTB has already caused revisions to the cost of bTB insurance and the level of
cover offered by insurers, an adverse economic effect as far as farm businesses are
concerned but one which appears to have been inevitable. Moreover, this short
consultation suggests that further adjustments to premiums and cover, driven by both
claims experience and statistics on the incidence of bTB, cannot be ruled out for the
future.
The human dimension: key findings
In pursuance of the agreed objectives, two of the RAs in this research programme
were specifically concerned with the human dimension of a bTB breakdown (RA5,
the farmers’ postal survey, and RA6, the GP Case Studies) while two others partially
addressed this issue (RA2, the stakeholder consultation, and RA3, the farmers’
interview survey). The detailed findings of these studies are presented and discussed
in full in Chapter 5, but in the present context it is useful to provide here a summary
of the key findings.
It was found that these studies augmented previous research on both (a) the short-
term effects of a bTB breakdown and (b) other studies of the effects of livestock
crises on the farming community. While a bTB breakdown is less dramatic than
some other livestock disease crises (such as FMD and BSE) by its nature the
persistence and pervasiveness of the control programme represents a clear source of
on-farm stress, typically over an extended period. The stakeholder consultation
reflected perceptions of a range of human health effects as a consequence of bTB,
including physical, mental, emotional and social changes. Many highlighted
‘uncertainty’ and ‘lack of control’ as powerful drivers of human health problems.
6 The cover typically offered is based on insuring a number of animals for a certain payment per
reactor or contact (e.g. 200 animals aged over 18 months @ £500 each).
University of Exeter/ADAS UK Ltd
Longer-term effects of a bTB breakdown: draft report 30 September 2008
50
The GHQ-12 study provides objective evidence of the scale of the longer-term effects
of a bTB breakdown. In general terms, a much greater proportion of farmers exhibit
signs of psychiatric morbidity that the population as a whole. Overall, the highest
stress levels are seen on farms which have been under livestock movement
restrictions for a long period. However, on dairy farms, where people are generally
more stressed than on beef farms, the greatest stressor is the loss of a large number of
cattle. There is evidence that bTB is associated with raised stress levels for people
other than the farmer, particularly spouses; but the sample was too small for reliable
results for farm workers. For farmers, a bTB breakdown causes significant stress:
this is highest for dairy farmers, especially where they have lost a large number of
cattle; while for both trading beef and suckler beef farmers, a long period under
restriction is the greater stressor.
The study of rural GPs identified that farmers typically present late with symptoms
and, for mental health issues in particular, GPs probably only see a small proportion
of cases. Several GPs pointed to the range of pressures affecting farmers, particularly
livestock farmers, of which bTB is only one; and the consequent difficulty in direct
attribution of cause and effect. The lack of control experienced as a result of a bTB
breakdown was identified as an important stressor; even so, bTB was thought to be a
less serious problem than the FMD epidemic of 2001. A range of moderating factors
include age, farming experience, farm ownership, diversification, the availability of
support and the significance of other crises.
At interview, most farmers identified adverse effects on their daily lives, and often on
those of their families and others. Key effects relate to uncertainty, stress, time
pressures and financial worries. Knock-on effects on the local and farming
communities do not appear in general to be very significant.
Discussion and conclusions
In this chapter some findings of the research programme not reported elsewhere have
been discussed in the context of understanding the influences associated with longer-
term impacts on farm businesses arising from a bTB breakdown (or breakdowns). In
addition, key findings from two of the RAs are reviewed in order to pull together the
University of Exeter/ADAS UK Ltd
Longer-term effects of a bTB breakdown: draft report 30 September 2008
51
main evidence on the factors most associated with longer-term effects as a result of a
bTB breakdown.
In an analysis that focussed on the areas most severely affected by bTB, the South
West and West Midlands regions of England, and Wales, the GIS study of regional
trends in cattle farming identified some significant differences between bTB parishes
(parishes with a bTB incident or incidents) and other parishes. Although there were
some variations, there was abroad consistency in the findings across regions:
• An established and consistent trend away from dairying towards beef cattle over
the decade to 2004.
• High bTB incidence parishes have more beef female cattle than other parishes.
• There is strong evidence that it is the high bTB incidence which is itself driving
the rate of change.
• The rate of decrease in the number of cattle farms was greater in the high bTB
incidence parishes.
• In Wales high numbers of dairy cattle in a parish may be associated with the
high bTB incidence.
• A high bTB incidence appears to be a significant influence on the trends over
time (in cattle numbers, in the numbers of cattle farms, in the relative balance
between dairy and beef cattle).
The identification of farms on which strategic decisions in farm planning have been
influenced by bTB, as one factor among others (though typically the main factor),
was designed to minimise the possibility of bias through ‘leading’ questions. Farmers
on ‘bTB driver’ farms are consistently less optimistic about the future of farming, and
less likely to see their own futures, and those of their family, in farming. They are
also more negative in their attitudes to their local and farming communities.
There are notable differences between farmers on ‘bTB driver’ farms and others on a
wide range of farming values and objectives. Moreover, they are much more likely to
have made reductive adjustments to their businesses in recent years. Finally, ‘bTB
driver’ farmers are much less likely to expect a successor to take over the family farm
in due course. Distinguishing between cause and effect in these characteristics would
require further specific research.
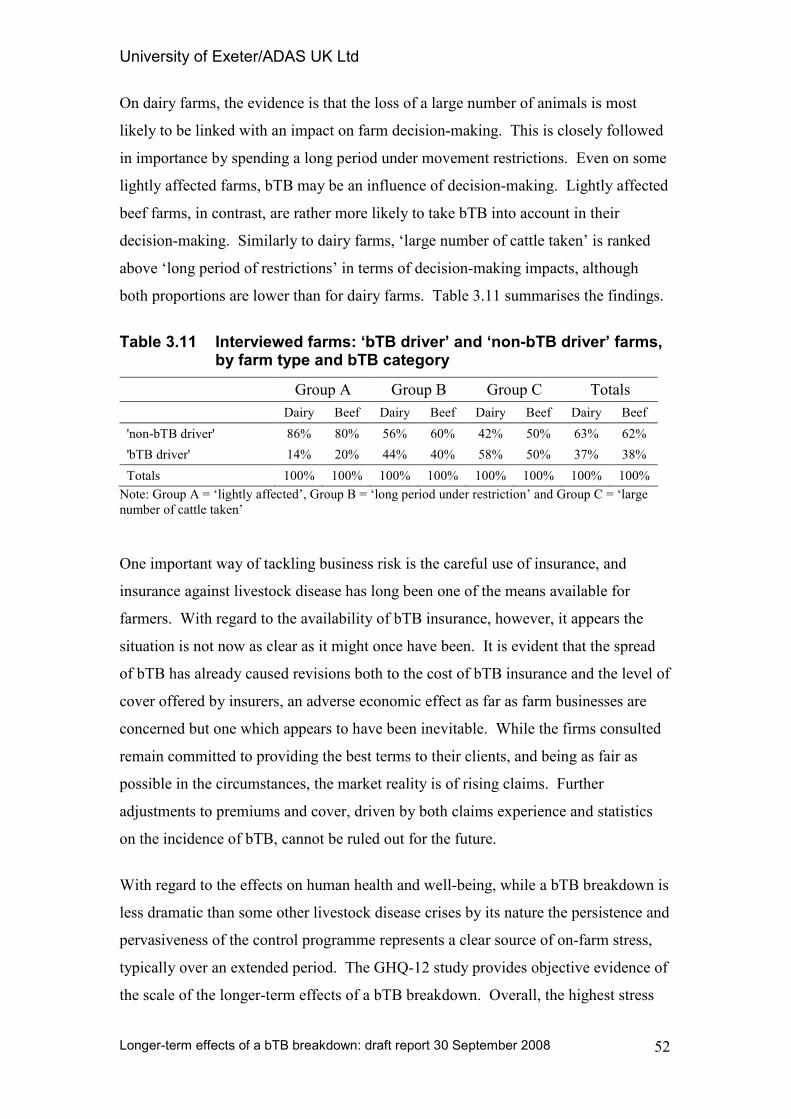
University of Exeter/ADAS UK Ltd
Longer-term effects of a bTB breakdown: draft report 30 September 2008
52
On dairy farms, the evidence is that the loss of a large number of animals is most
likely to be linked with an impact on farm decision-making. This is closely followed
in importance by spending a long period under movement restrictions. Even on some
lightly affected farms, bTB may be an influence of decision-making. Lightly affected
beef farms, in contrast, are rather more likely to take bTB into account in their
decision-making. Similarly to dairy farms, ‘large number of cattle taken’ is ranked
above ‘long period of restrictions’ in terms of decision-making impacts, although
both proportions are lower than for dairy farms. Table 3.11 summarises the findings.
Table 3.11 Interviewed farms: ‘bTB driver’ and ‘non-bTB driver’ farms, by farm type and bTB category
Group A Group B Group C Totals
Dairy Beef Dairy Beef Dairy Beef Dairy Beef
'non-bTB driver' 86% 80% 56% 60% 42% 50% 63% 62%
'bTB driver' 14% 20% 44% 40% 58% 50% 37% 38%
Totals 100% 100% 100% 100% 100% 100% 100% 100%
Note: Group A = ‘lightly affected’, Group B = ‘long period under restriction’ and Group C = ‘large
number of cattle taken’
One important way of tackling business risk is the careful use of insurance, and
insurance against livestock disease has long been one of the means available for
farmers. With regard to the availability of bTB insurance, however, it appears the
situation is not now as clear as it might once have been. It is evident that the spread
of bTB has already caused revisions both to the cost of bTB insurance and the level of
cover offered by insurers, an adverse economic effect as far as farm businesses are
concerned but one which appears to have been inevitable. While the firms consulted
remain committed to providing the best terms to their clients, and being as fair as
possible in the circumstances, the market reality is of rising claims. Further
adjustments to premiums and cover, driven by both claims experience and statistics
on the incidence of bTB, cannot be ruled out for the future.
With regard to the effects on human health and well-being, while a bTB breakdown is
less dramatic than some other livestock disease crises by its nature the persistence and
pervasiveness of the control programme represents a clear source of on-farm stress,
typically over an extended period. The GHQ-12 study provides objective evidence of
the scale of the longer-term effects of a bTB breakdown. Overall, the highest stress
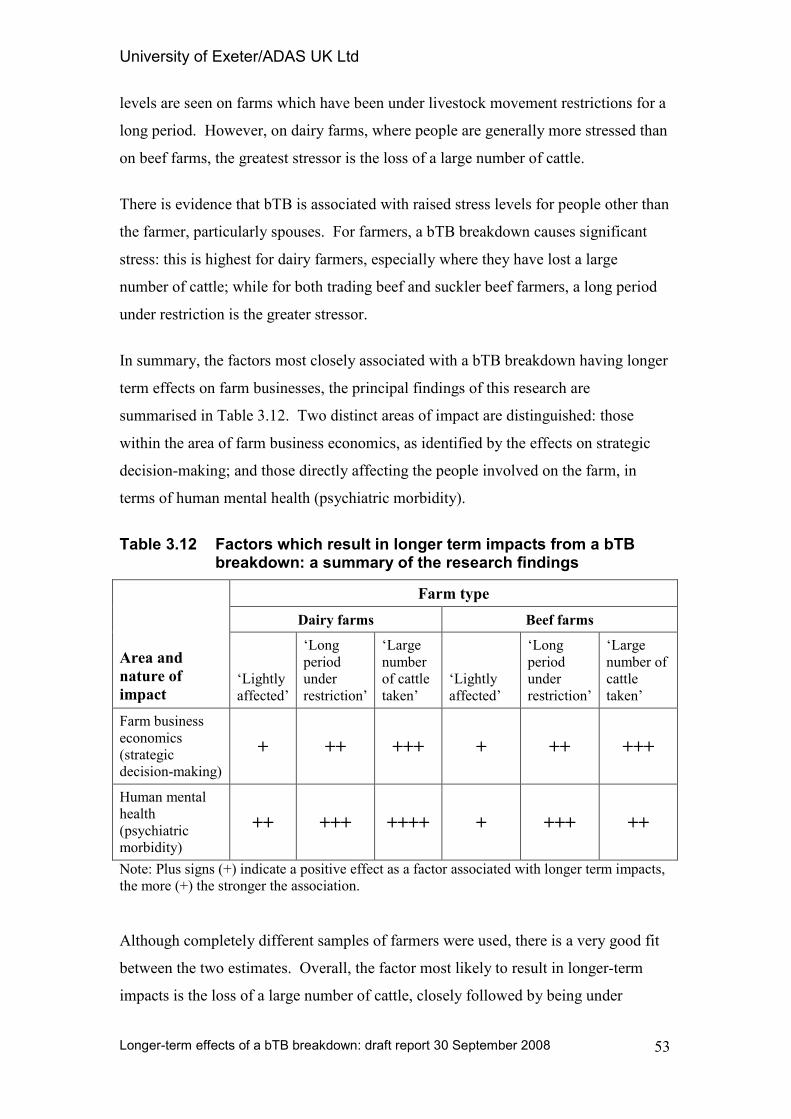
University of Exeter/ADAS UK Ltd
Longer-term effects of a bTB breakdown: draft report 30 September 2008
53
levels are seen on farms which have been under livestock movement restrictions for a
long period. However, on dairy farms, where people are generally more stressed than
on beef farms, the greatest stressor is the loss of a large number of cattle.
There is evidence that bTB is associated with raised stress levels for people other than
the farmer, particularly spouses. For farmers, a bTB breakdown causes significant
stress: this is highest for dairy farmers, especially where they have lost a large
number of cattle; while for both trading beef and suckler beef farmers, a long period
under restriction is the greater stressor.
In summary, the factors most closely associated with a bTB breakdown having longer
term effects on farm businesses, the principal findings of this research are
summarised in Table 3.12. Two distinct areas of impact are distinguished: those
within the area of farm business economics, as identified by the effects on strategic
decision-making; and those directly affecting the people involved on the farm, in
terms of human mental health (psychiatric morbidity).
Table 3.12 Factors which result in longer term impacts from a bTB breakdown: a summary of the research findings
Farm type
Dairy farms Beef farms
Area and
nature of
impact ‘Lightly
affected’
‘Long
period
under
restriction’
‘Large
number
of cattle
taken’
‘Lightly
affected’
‘Long
period
under
restriction’
‘Large
number of
cattle
taken’
Farm business
economics
(strategic
decision-making)
+ ++ +++ + ++ +++
Human mental
health
(psychiatric
morbidity)
++ +++ ++++ + +++ ++
Note: Plus signs (+) indicate a positive effect as a factor associated with longer term impacts,
the more (+) the stronger the association.
Although completely different samples of farmers were used, there is a very good fit
between the two estimates. Overall, the factor most likely to result in longer-term
impacts is the loss of a large number of cattle, closely followed by being under
University of Exeter/ADAS UK Ltd
Longer-term effects of a bTB breakdown: draft report 30 September 2008
54
movement restrictions for a long period; even a light brush with bTB has measurable
effects on farm decision-making on a significant minority of farms. However, for
beef farms as a whole the most stressful factor was being under movement
restrictions for a long period. The two sets of estimate are not mutually incompatible,
of course, and it’s likely that if sample sizes had been large enough to distinguish
between beef suckler herds and beef trading units further finessing of these findings
would have resulted.
University of Exeter/ADAS UK Ltd
Longer-term effects of a bTB breakdown: draft report 30 September 2008
55
4 ESTIMATED LONGER-TERM ECONOMIC EFFECTS
Introduction
As discussed in Chapter 1, it was recognised from the outset of this research project
that identifying good quantitative information on the longer-term economic effects on
a farm business of a bTB breakdown would be far from straightforward. The nature
of the research problem is that the on-farm pattern and incidence of bTB breakdowns
is extremely variable, and imposed on an industry which is in any case characterised
by almost infinitely variable systems, resources and performance. The definition of
‘longer-term’ for the purposes of this research is discussed in Chapter 2, and may be
simply stated as encompassing both long and medium term impacts of bTB
breakdown on farm resource use, for practical purposes being defined as effects
extending beyond one year.
Furthermore, although the identification and valuing of short-term (direct) effects is
relatively straightforward (see, for example, Bennett,2004; and Sheppard and Turner,
2005) by their very nature longer-term effects are likely to be more diffuse,
potentially even more variable and sometimes close to impossible to measure, even
when they are identified. Perhaps the principal reason for this problem is that, given
the existence of adverse economic effects over a period of years, most if not all
farmers could be expected to make adjustments to their businesses to mitigate these
effects, at least to the extent that this was possible. This implies that in some cases
the longer-tern effects may be little more than a farm business operating in a way
which, initially at least, was second-best: whether or not this is sub-optimal may be an
open question to be determined empirically.
It is important to appreciate that the pattern of bTB breakdowns is very varied, and
the broad findings of earlier studies in this respect (Bennett, op cit; Sheppard and
Turner, op cit) appear to be still relevant. An initial analysis of the national VetNet
database, undertaken by the VLA, is shown in Table 4.1.
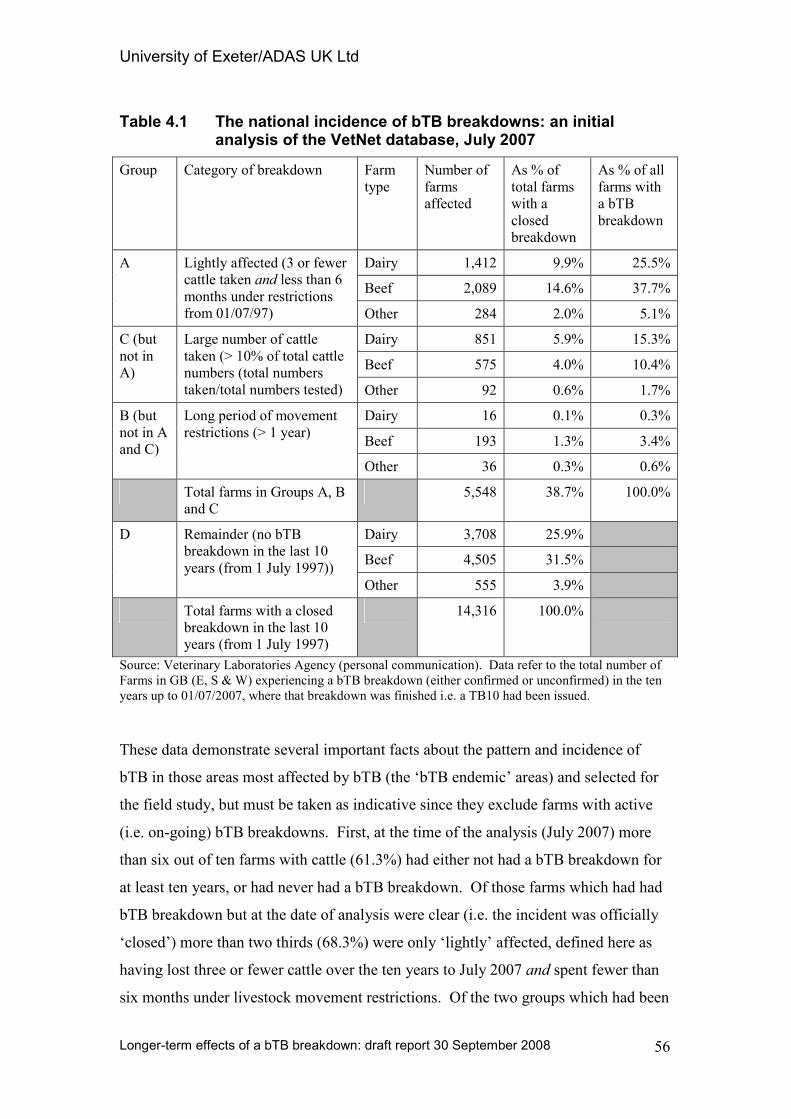
University of Exeter/ADAS UK Ltd
Longer-term effects of a bTB breakdown: draft report 30 September 2008
56
Table 4.1 The national incidence of bTB breakdowns: an initial analysis of the VetNet database, July 2007
Group Category of breakdown Farm
type
Number of
farms
affected
As % of
total farms
with a
closed
breakdown
As % of all
farms with
a bTB
breakdown
Dairy 1,412 9.9% 25.5%
Beef 2,089 14.6% 37.7%
A Lightly affected (3 or fewer
cattle taken and less than 6
months under restrictions
from 01/07/97) Other 284 2.0% 5.1%
Dairy 851 5.9% 15.3%
Beef 575 4.0% 10.4%
C (but
not in
A)
Large number of cattle
taken (> 10% of total cattle
numbers (total numbers
taken/total numbers tested) Other 92 0.6% 1.7%
Dairy 16 0.1% 0.3%
Beef 193 1.3% 3.4%
B (but
not in A
and C)
Long period of movement
restrictions (> 1 year)
Other 36 0.3% 0.6%
Total farms in Groups A, B
and C
5,548 38.7% 100.0%
Dairy 3,708 25.9%
Beef 4,505 31.5%
D Remainder (no bTB
breakdown in the last 10
years (from 1 July 1997))
Other 555 3.9%
Total farms with a closed
breakdown in the last 10
years (from 1 July 1997)
14,316 100.0%
Source: Veterinary Laboratories Agency (personal communication). Data refer to the total number of
Farms in GB (E, S & W) experiencing a bTB breakdown (either confirmed or unconfirmed) in the ten
years up to 01/07/2007, where that breakdown was finished i.e. a TB10 had been issued.
These data demonstrate several important facts about the pattern and incidence of
bTB in those areas most affected by bTB (the ‘bTB endemic’ areas) and selected for
the field study, but must be taken as indicative since they exclude farms with active
(i.e. on-going) bTB breakdowns. First, at the time of the analysis (July 2007) more
than six out of ten farms with cattle (61.3%) had either not had a bTB breakdown for
at least ten years, or had never had a bTB breakdown. Of those farms which had had
bTB breakdown but at the date of analysis were clear (i.e. the incident was officially
‘closed’) more than two thirds (68.3%) were only ‘lightly’ affected, defined here as
having lost three or fewer cattle over the ten years to July 2007 and spent fewer than
six months under livestock movement restrictions. Of the two groups which had been
University of Exeter/ADAS UK Ltd
Longer-term effects of a bTB breakdown: draft report 30 September 2008
57
more seriously affected (Groups B and C in Table 4.1), most had had a large number
of cattle taken (in total, over the period); only 4.3% of those farms which had had a
bTB breakdown cleared up had spent a long time under movement restrictions. It
should be noted that this latter figure in particular clearly understates the total
proportion of farms under long-term movement restrictions, because it excludes those
farms with on-going restrictions, but more comprehensive data are not available at
present.
These data (Table 4.1) identify several important characteristics of the scope and
pattern of bTB disease breakdowns, an appreciation of which is important in
developing an understanding of the current industry-level impacts of any longer-term
farm-level effects resulting from a bTB breakdown. Taking a Great Britain
perspective, the following conclusions can be drawn:
• Most cattle farms (more than 60%) either have never had a bTB breakdown or
have been clear for many years.
• Most of those farms which have had a bTB breakdown (more than 66%) have
been affected relatively lightly, losing less than three animals and being free of
movement restrictions after no more than six months.
• Small - but by no means insignificant - proportions of all bTB breakdowns
result in more serious farm-level effects: some 27% of cases lose significant
numbers of cattle (more than 10% of their herd) and a further 4% or so of cases
have to endure the imposition of livestock movement restrictions for an
extended period.
BUT
• The proportions of farms with bTB breakdowns, both light and heavier, will be
substantially greater in those counties and areas of England and Wales which
are subject to a much greater than average incidence of bTB (the ‘bTB
endemic’) areas.
By its very nature, a bTB breakdown would not be expected normally to result in
longer-term effects on the farm business concerned in the case of the Group A farms
identified above – those defined as ‘lightly affected’ in Table 4.1. Indeed, bearing in
mind the boundaries chosen for definition it would seem more than likely that even
some of the farms falling into Groups B and C (the two categories of more heavily
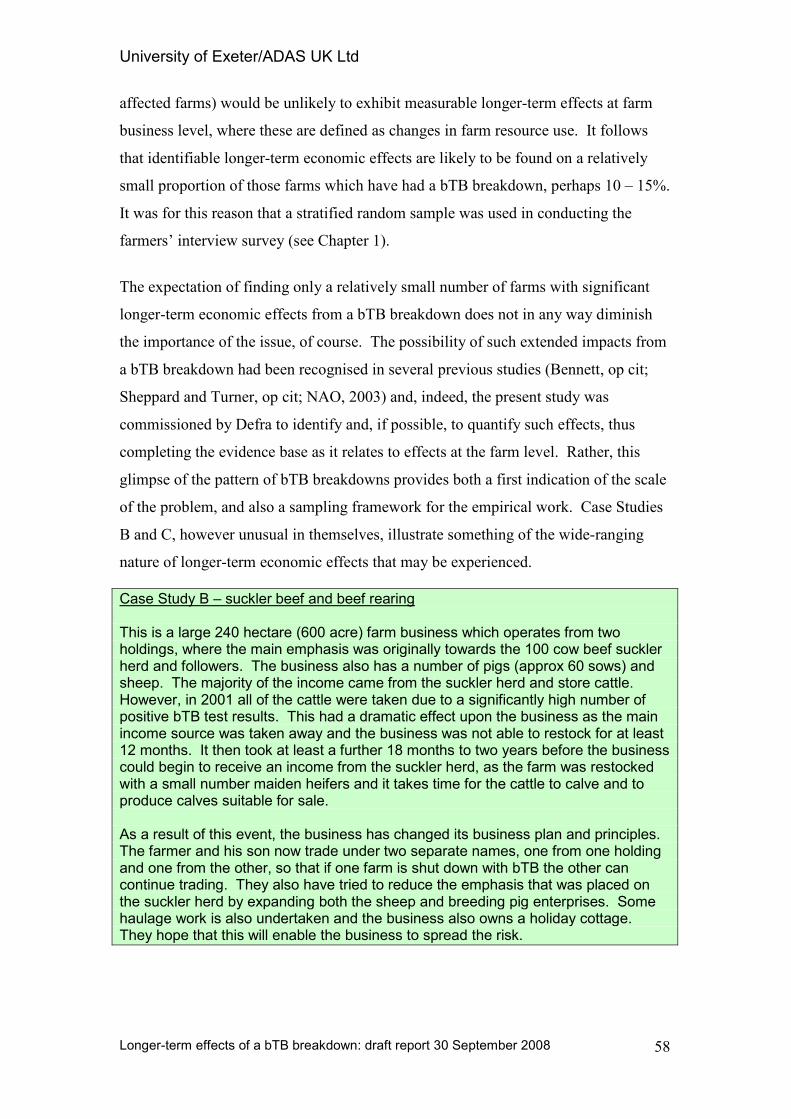
University of Exeter/ADAS UK Ltd
Longer-term effects of a bTB breakdown: draft report 30 September 2008
58
affected farms) would be unlikely to exhibit measurable longer-term effects at farm
business level, where these are defined as changes in farm resource use. It follows
that identifiable longer-term economic effects are likely to be found on a relatively
small proportion of those farms which have had a bTB breakdown, perhaps 10 – 15%.
It was for this reason that a stratified random sample was used in conducting the
farmers’ interview survey (see Chapter 1).
The expectation of finding only a relatively small number of farms with significant
longer-term economic effects from a bTB breakdown does not in any way diminish
the importance of the issue, of course. The possibility of such extended impacts from
a bTB breakdown had been recognised in several previous studies (Bennett, op cit;
Sheppard and Turner, op cit; NAO, 2003) and, indeed, the present study was
commissioned by Defra to identify and, if possible, to quantify such effects, thus
completing the evidence base as it relates to effects at the farm level. Rather, this
glimpse of the pattern of bTB breakdowns provides both a first indication of the scale
of the problem, and also a sampling framework for the empirical work. Case Studies
B and C, however unusual in themselves, illustrate something of the wide-ranging
nature of longer-term economic effects that may be experienced.
Case Study B – suckler beef and beef rearing This is a large 240 hectare (600 acre) farm business which operates from two holdings, where the main emphasis was originally towards the 100 cow beef suckler herd and followers. The business also has a number of pigs (approx 60 sows) and sheep. The majority of the income came from the suckler herd and store cattle. However, in 2001 all of the cattle were taken due to a significantly high number of positive bTB test results. This had a dramatic effect upon the business as the main income source was taken away and the business was not able to restock for at least 12 months. It then took at least a further 18 months to two years before the business could begin to receive an income from the suckler herd, as the farm was restocked with a small number maiden heifers and it takes time for the cattle to calve and to produce calves suitable for sale. As a result of this event, the business has changed its business plan and principles. The farmer and his son now trade under two separate names, one from one holding and one from the other, so that if one farm is shut down with bTB the other can continue trading. They also have tried to reduce the emphasis that was placed on the suckler herd by expanding both the sheep and breeding pig enterprises. Some haulage work is also undertaken and the business also owns a holiday cottage. They hope that this will enable the business to spread the risk.
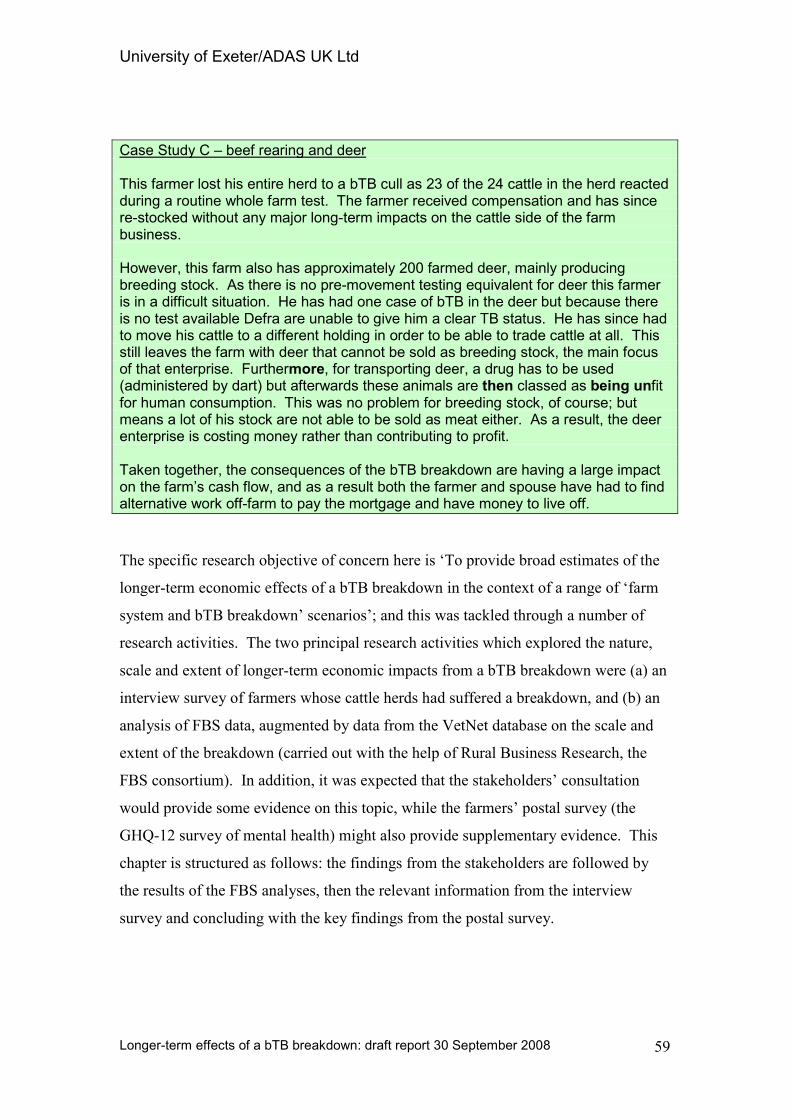
University of Exeter/ADAS UK Ltd
Longer-term effects of a bTB breakdown: draft report 30 September 2008
59
Case Study C – beef rearing and deer This farmer lost his entire herd to a bTB cull as 23 of the 24 cattle in the herd reacted during a routine whole farm test. The farmer received compensation and has since re-stocked without any major long-term impacts on the cattle side of the farm business. However, this farm also has approximately 200 farmed deer, mainly producing breeding stock. As there is no pre-movement testing equivalent for deer this farmer is in a difficult situation. He has had one case of bTB in the deer but because there is no test available Defra are unable to give him a clear TB status. He has since had to move his cattle to a different holding in order to be able to trade cattle at all. This still leaves the farm with deer that cannot be sold as breeding stock, the main focus of that enterprise. Furthermore, for transporting deer, a drug has to be used (administered by dart) but afterwards these animals are then classed as being unfit for human consumption. This was no problem for breeding stock, of course; but means a lot of his stock are not able to be sold as meat either. As a result, the deer enterprise is costing money rather than contributing to profit. Taken together, the consequences of the bTB breakdown are having a large impact on the farm’s cash flow, and as a result both the farmer and spouse have had to find alternative work off-farm to pay the mortgage and have money to live off.
The specific research objective of concern here is ‘To provide broad estimates of the
longer-term economic effects of a bTB breakdown in the context of a range of ‘farm
system and bTB breakdown’ scenarios’; and this was tackled through a number of
research activities. The two principal research activities which explored the nature,
scale and extent of longer-term economic impacts from a bTB breakdown were (a) an
interview survey of farmers whose cattle herds had suffered a breakdown, and (b) an
analysis of FBS data, augmented by data from the VetNet database on the scale and
extent of the breakdown (carried out with the help of Rural Business Research, the
FBS consortium). In addition, it was expected that the stakeholders’ consultation
would provide some evidence on this topic, while the farmers’ postal survey (the
GHQ-12 survey of mental health) might also provide supplementary evidence. This
chapter is structured as follows: the findings from the stakeholders are followed by
the results of the FBS analyses, then the relevant information from the interview
survey and concluding with the key findings from the postal survey.
University of Exeter/ADAS UK Ltd
Longer-term effects of a bTB breakdown: draft report 30 September 2008
60
The stakeholder consultation: pointers to farm economic problems
Stakeholders with a direct interest
The identification of adverse effects from a bTB breakdown commonly pointed to
farm incomes, reductions in capital value, the inhibition of business development and
the delaying, or abandonment, of plans for future business development.
The majority of respondents felt that there are often severe longer term financial
effects following a bTB breakdown, although the scale of these effects is dependent
on the duration and extent of any outbreak. While occasional breakdowns interrupt
trade in the short term, where animals are under restriction for a number of years this
has had longer term repercussions for many farm businesses. Farms may not be able
to trade stock effectively or, at least, respond in a normal manner to market
developments; for years, and are unable to sell cattle in the open market. Prolonged
movement restrictions lead to an adverse cash flow, due to increased feed
requirements and problems with cattle welfare. Following the loss of breeding cattle,
and herd replacements, there is often disruption of calving patterns long into the
future, which has a clear financial impact.
In some cases where replacement cattle have been bought in, this has lead to the
inadvertent introduction and promotion of other diseases (such as rotavirus and
pneumonia) and this is then associated with increased veterinary costs in the
treatment of these. In the longer term there is very often an unwillingness to invest in
the business due to uncertainty about the future, and it was reported that many
farmers in this situation feel expansion of the business is going to be difficult.
Pre-movement testing was considered by some respondents to be a burden over the
longer term, and as a bTB control policy it does not appear to be working. The extra
costs such as fencing were considered by some respondents to be another long term
capital cost, while others viewed this as more of a short term item. Some of those
who commented on this felt it was extremely naïve to think that fencing alone would
stop badgers entering.
A number of other adverse effects for the farm business were identified, although
many of these are less specifically of an economic nature. It was stated by some that,
University of Exeter/ADAS UK Ltd
Longer-term effects of a bTB breakdown: draft report 30 September 2008
61
in the longer term, more farmers may decide not to keep cattle, or some at least would
change to other farming methods; and that additional production and disease costs
may well make the sector unviable. If this happens, it was felt, it will have adverse
effects on the environment and some suckler beef systems, for example, have been
moved from upland and hill land due to declining economic returns. Some felt that
the gradual depopulation of cattle in Wales will result in a changing landscape and
this could damage tourism. An imbalance in ecosystems in the countryside due to the
reduction in the numbers of cattle will lead to reductions in wildlife such as ground
nesting birds, hedgehogs etc.
Some respondents pointed to changes in (some) farmers’ attitudes to wildlife; in
particular, it was felt, attitudes to badgers have changed and farmers have become
very wary of the presence of these animals on their farms.
There was almost unanimous anger from this group of respondents that Defra had
taken no action to control bTB in wildlife, coupled with frustration that it seemed the
authorities were prepared to protect sick wildlife rather than cattle. One consequence
of this, it was felt by some, is that farmers are losing respect for authority and have
less confidence in wider issues of farm and rural policy development.
Some stakeholders felt that the press attention given to the levels of compensation for
cattle slaughtered may cause some degree of public backlash against farmers in the
future. It was felt by some respondents that there is little account taken of the
consequential loss to farmers associated with bTB.
Stakeholders with an indirect interest
It was agreed by most respondents that the effects of bTB depend on the duration and
frequency of outbreaks and that it was also asserted that over time many businesses
do become unviable. It was thought by one stakeholder that in the long run beef
production will be reduced due to lack of control on bTB. It was noted that dairy
farmers are being forced to shoot Friesian bull calves at birth where there have been
long term breakdowns. Some stakeholders made a comparison of bTB policy
between the UK and elsewhere in Europe, where the objective was given as
eradication (of the disease).
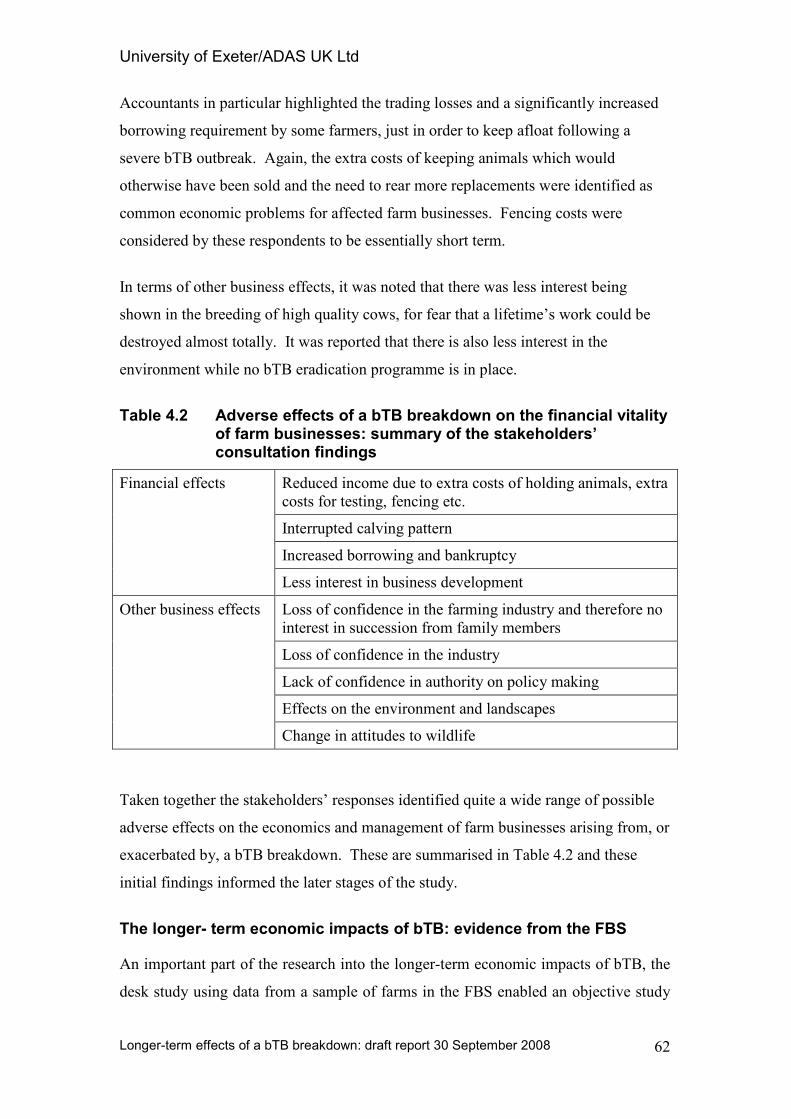
University of Exeter/ADAS UK Ltd
Longer-term effects of a bTB breakdown: draft report 30 September 2008
62
Accountants in particular highlighted the trading losses and a significantly increased
borrowing requirement by some farmers, just in order to keep afloat following a
severe bTB outbreak. Again, the extra costs of keeping animals which would
otherwise have been sold and the need to rear more replacements were identified as
common economic problems for affected farm businesses. Fencing costs were
considered by these respondents to be essentially short term.
In terms of other business effects, it was noted that there was less interest being
shown in the breeding of high quality cows, for fear that a lifetime’s work could be
destroyed almost totally. It was reported that there is also less interest in the
environment while no bTB eradication programme is in place.
Table 4.2 Adverse effects of a bTB breakdown on the financial vitality of farm businesses: summary of the stakeholders’ consultation findings
Reduced income due to extra costs of holding animals, extra
costs for testing, fencing etc.
Interrupted calving pattern
Increased borrowing and bankruptcy
Financial effects
Less interest in business development
Loss of confidence in the farming industry and therefore no
interest in succession from family members
Loss of confidence in the industry
Lack of confidence in authority on policy making
Effects on the environment and landscapes
Other business effects
Change in attitudes to wildlife
Taken together the stakeholders’ responses identified quite a wide range of possible
adverse effects on the economics and management of farm businesses arising from, or
exacerbated by, a bTB breakdown. These are summarised in Table 4.2 and these
initial findings informed the later stages of the study.
The longer- term economic impacts of bTB: evidence from the FBS
An important part of the research into the longer-term economic impacts of bTB, the
desk study using data from a sample of farms in the FBS enabled an objective study
University of Exeter/ADAS UK Ltd
Longer-term effects of a bTB breakdown: draft report 30 September 2008
63
of possible economic effects at the level of the whole farm to be carried using high
quality information already in existence.
The two principal problems in using the FBS database is that it has inadequate
information regarding the incidence of bTB breakdowns, particularly prior to
2005/06; and prior to 2002/03 any bTB compensation received was not separately
identified, so there is no record of which farms had suffered a disease breakdown.
The methodology used to make best use of the economic and management data
available from the FBS is discussed in Chapter 1; and it is sufficient here to state that,
working with Rural Business Research (the FBS consortium), it was possible to
identify a sample of 173 farm businesses whose business principals had given
permission to link their FBS records with those relating to their farms on the Vetnet
database. Of this total, it quickly became clear that some could not be used because
of differences in the sampling frames between the two databases7 and a final usable
sample of 149 farms was identified. These farms had completed at least one year in
the FBS between 2002/03 and 2006/07, and this data could be linked to their current
Vetnet record which thus provided valuable supplementary information on the timing
and scale of the bTB breakdown(s) experienced.
The aim of this research activity, therefore, was to look at the long term economic
impacts, if any, of bTB on farm businesses using the FBS as a source of economic
information on farm performance. This cohort of ‘bTB breakdown’ farms formed the
basis of comparisons with a ‘non-bTB breakdown’ cohort of otherwise similar farms
over the same period, 2002/03 to 2006/07. The main focus was on tracking the
development of these groups of businesses over time, but using wherever possible
sub-groups of the bTB cohort to identify whether any effects applied uniformly across
all farms, or whether there were differences according to farm type. The three farm
types examined were ‘dairy’, ‘suckler beef’ and ‘trading beef’. Lowland/upland
splits were not possible because of the resulting small sample sizes, but this was not
considered to seriously disadvantage the analysis in any case: it was judged that
differences between system were likely to be far greater than between area.
7 The FBS relates to the complete business, while Vetnet data relates to the holding; some businesses
comprise more than one holding.
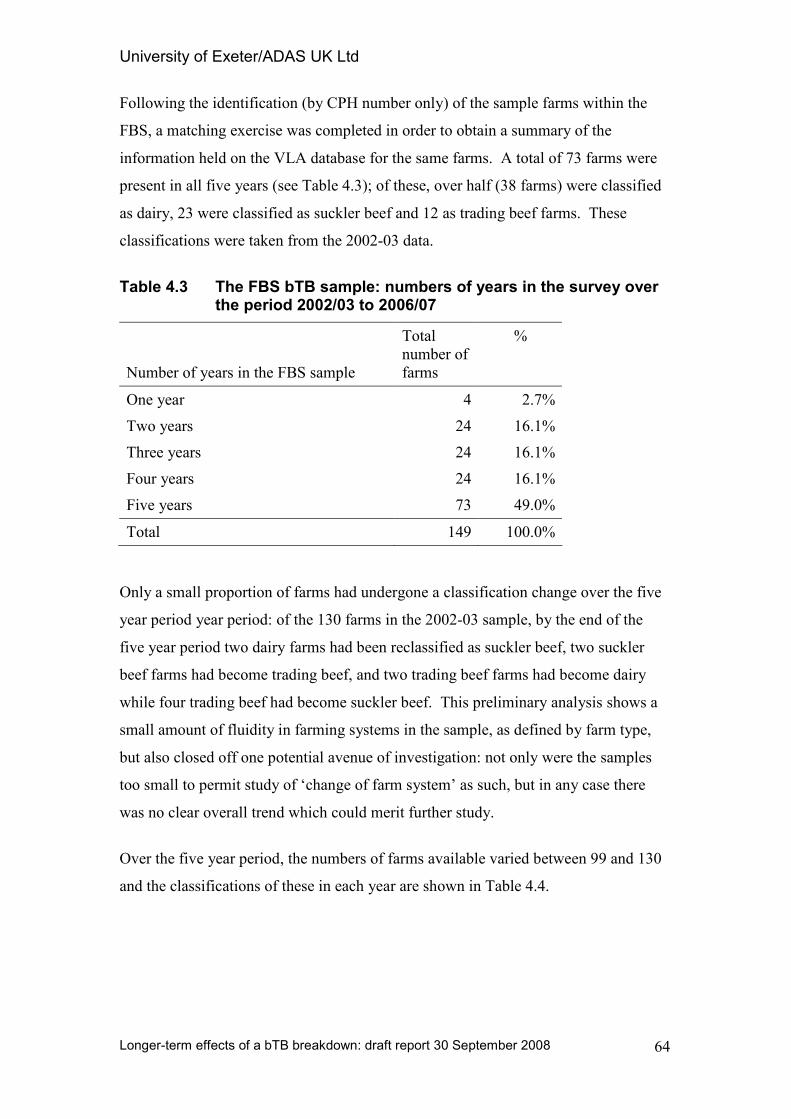
University of Exeter/ADAS UK Ltd
Longer-term effects of a bTB breakdown: draft report 30 September 2008
64
Following the identification (by CPH number only) of the sample farms within the
FBS, a matching exercise was completed in order to obtain a summary of the
information held on the VLA database for the same farms. A total of 73 farms were
present in all five years (see Table 4.3); of these, over half (38 farms) were classified
as dairy, 23 were classified as suckler beef and 12 as trading beef farms. These
classifications were taken from the 2002-03 data.
Table 4.3 The FBS bTB sample: numbers of years in the survey over the period 2002/03 to 2006/07
Number of years in the FBS sample
Total
number of
farms
%
One year 4 2.7%
Two years 24 16.1%
Three years 24 16.1%
Four years 24 16.1%
Five years 73 49.0%
Total 149 100.0%
Only a small proportion of farms had undergone a classification change over the five
year period year period: of the 130 farms in the 2002-03 sample, by the end of the
five year period two dairy farms had been reclassified as suckler beef, two suckler
beef farms had become trading beef, and two trading beef farms had become dairy
while four trading beef had become suckler beef. This preliminary analysis shows a
small amount of fluidity in farming systems in the sample, as defined by farm type,
but also closed off one potential avenue of investigation: not only were the samples
too small to permit study of ‘change of farm system’ as such, but in any case there
was no clear overall trend which could merit further study.
Over the five year period, the numbers of farms available varied between 99 and 130
and the classifications of these in each year are shown in Table 4.4.
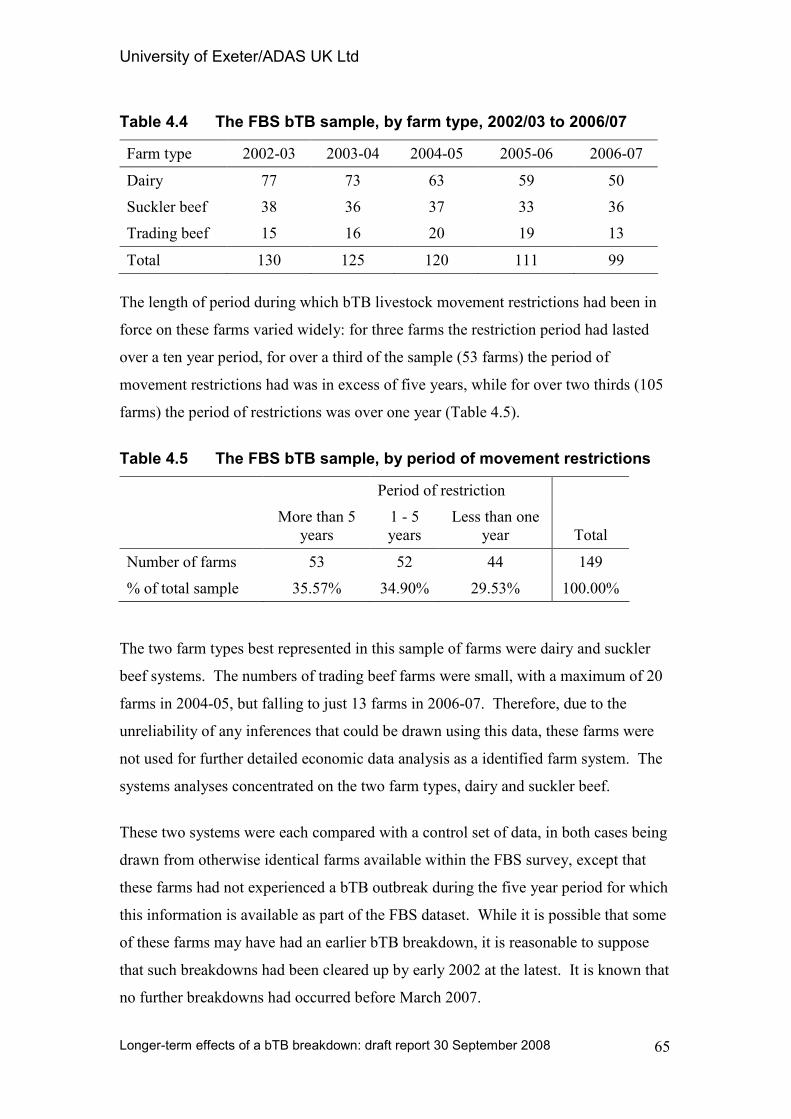
University of Exeter/ADAS UK Ltd
Longer-term effects of a bTB breakdown: draft report 30 September 2008
65
Table 4.4 The FBS bTB sample, by farm type, 2002/03 to 2006/07
Farm type 2002-03 2003-04 2004-05 2005-06 2006-07
Dairy 77 73 63 59 50
Suckler beef 38 36 37 33 36
Trading beef 15 16 20 19 13
Total 130 125 120 111 99
The length of period during which bTB livestock movement restrictions had been in
force on these farms varied widely: for three farms the restriction period had lasted
over a ten year period, for over a third of the sample (53 farms) the period of
movement restrictions had was in excess of five years, while for over two thirds (105
farms) the period of restrictions was over one year (Table 4.5).
Table 4.5 The FBS bTB sample, by period of movement restrictions
Period of restriction
More than 5
years
1 - 5
years
Less than one
year Total
Number of farms 53 52 44 149
% of total sample 35.57% 34.90% 29.53% 100.00%
The two farm types best represented in this sample of farms were dairy and suckler
beef systems. The numbers of trading beef farms were small, with a maximum of 20
farms in 2004-05, but falling to just 13 farms in 2006-07. Therefore, due to the
unreliability of any inferences that could be drawn using this data, these farms were
not used for further detailed economic data analysis as a identified farm system. The
systems analyses concentrated on the two farm types, dairy and suckler beef.
These two systems were each compared with a control set of data, in both cases being
drawn from otherwise identical farms available within the FBS survey, except that
these farms had not experienced a bTB outbreak during the five year period for which
this information is available as part of the FBS dataset. While it is possible that some
of these farms may have had an earlier bTB breakdown, it is reasonable to suppose
that such breakdowns had been cleared up by early 2002 at the latest. It is known that
no further breakdowns had occurred before March 2007.
University of Exeter/ADAS UK Ltd
Longer-term effects of a bTB breakdown: draft report 30 September 2008
66
A wide range of data was extracted from the FBS database for the sample farms for
each of five years under study; and these data have been categorised into four main
indicator areas: income, liabilities and assets, investment and technical performance.
All of the averages used in the data comparisons were calculated as weighted
averages using the allocated weights for England and Wales in the FBS survey. This
weighting removed some of the bias which might otherwise have resulted from small
sampling errors, making the resulting average more representative. In some of the
sub-samples, and for just some of the comparisons, it was found that a small number
of larger farms were exerting a disproportionate emphasis on the calculated means
(typically where an extreme record happened also to have a large weight), causing
skewness in the results. This effect was overcome by standardising the presentation
of the calculated results to the size of the dairy or suckler beef herd: for dairy farms
the data are presented on a ‘per 100 dairy cows’ basis whilst for suckler beef farms,
which tend to have smaller herds, the results are presented on a ‘per 50 beef cows’
basis.
The analysis of dairy farm results
Two different groupings of the dairy farms which had experienced a bTB breakdown
were used in the data analyses. The first group comprised those dairy farms which
were present in each of the five years, 2002-07, and these were defined as the
identical sample. It was felt that this selection gave a good comparator of progress
and change from one year to the next, using the same farms tracked over five years, in
order to look for patterns and trends, and there were a total of 38 farms in this sample.
The second group of dairy farms looked at in detail were those dairy farms which had
been under movement restrictions for a period of more than one year. The total
number of farms in this group varied from year to year, with a minimum of 41 farms
in 2006-07 and a maximum of 61 farms in 2002-03. Separate investigative analyses
were also carried out for those farms which had been under movement restrictions for
more than five years, in an attempt to explore even longer-term effects; however, the
sample sizes were rather small (ranging from 21 in 2006-07 to a maximum of 41 in
2002-03) and, as a consequence, the results were found to be more prone to small
sample influences, and these analyses have not been used further.
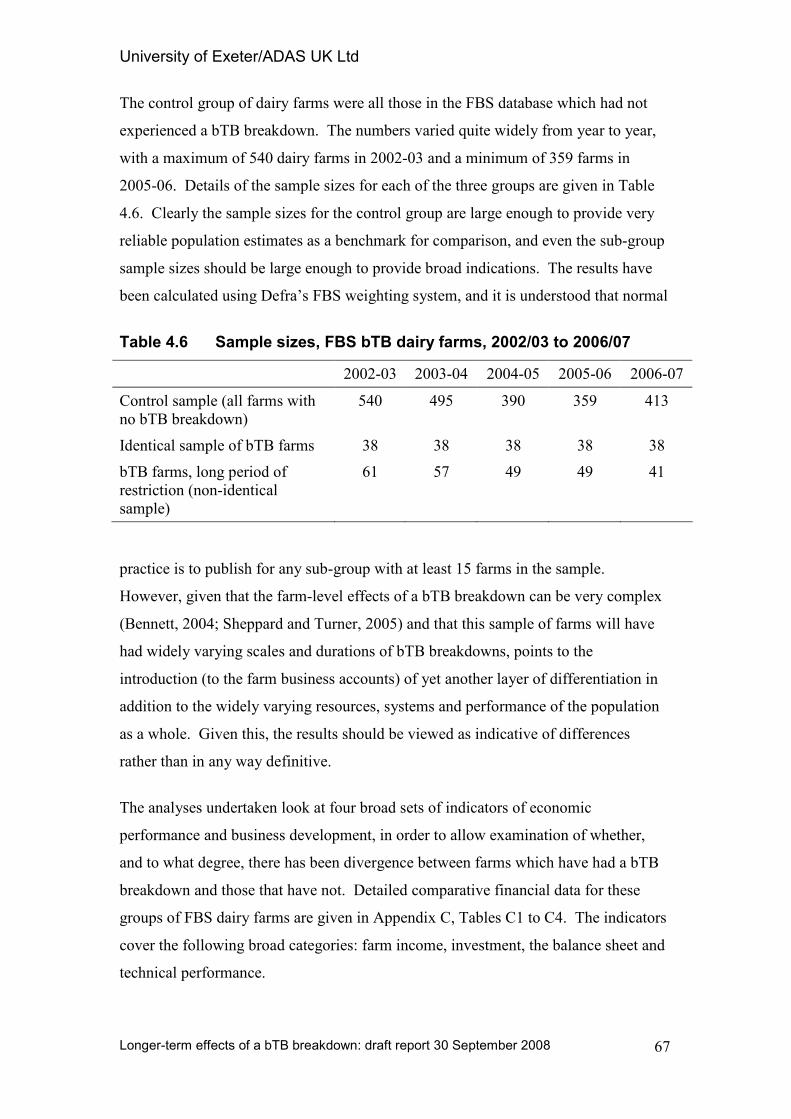
University of Exeter/ADAS UK Ltd
Longer-term effects of a bTB breakdown: draft report 30 September 2008
67
The control group of dairy farms were all those in the FBS database which had not
experienced a bTB breakdown. The numbers varied quite widely from year to year,
with a maximum of 540 dairy farms in 2002-03 and a minimum of 359 farms in
2005-06. Details of the sample sizes for each of the three groups are given in Table
4.6. Clearly the sample sizes for the control group are large enough to provide very
reliable population estimates as a benchmark for comparison, and even the sub-group
sample sizes should be large enough to provide broad indications. The results have
been calculated using Defra’s FBS weighting system, and it is understood that normal
Table 4.6 Sample sizes, FBS bTB dairy farms, 2002/03 to 2006/07
2002-03 2003-04 2004-05 2005-06 2006-07
Control sample (all farms with
no bTB breakdown)
540 495 390 359 413
Identical sample of bTB farms 38 38 38 38 38
bTB farms, long period of
restriction (non-identical
sample)
61 57 49 49 41
practice is to publish for any sub-group with at least 15 farms in the sample.
However, given that the farm-level effects of a bTB breakdown can be very complex
(Bennett, 2004; Sheppard and Turner, 2005) and that this sample of farms will have
had widely varying scales and durations of bTB breakdowns, points to the
introduction (to the farm business accounts) of yet another layer of differentiation in
addition to the widely varying resources, systems and performance of the population
as a whole. Given this, the results should be viewed as indicative of differences
rather than in any way definitive.
The analyses undertaken look at four broad sets of indicators of economic
performance and business development, in order to allow examination of whether,
and to what degree, there has been divergence between farms which have had a bTB
breakdown and those that have not. Detailed comparative financial data for these
groups of FBS dairy farms are given in Appendix C, Tables C1 to C4. The indicators
cover the following broad categories: farm income, investment, the balance sheet and
technical performance.
University of Exeter/ADAS UK Ltd
Longer-term effects of a bTB breakdown: draft report 30 September 2008
68
One further point needs brief discussion. It has been recognised that, for much of the
period under review here, the actual level of compensation received by farmers for
bTB cattle taken was often in excess of the market value – the statutory basis for
compensation – for a variety of reasons associated with the operation of the valuation
procedures (see, for example, NAO Wales, 2003). With effect from 1 February 2006
a new cattle compensation system was introduced in England which uses a ‘table
valuation’ approach and subsequently the Welsh Assembly has also taken steps to
tighten up compensation procedures. The new (typically lower) levels of
compensation in England would have influenced compensation revenues on English
FBS farms from 2006/07 onwards. These changes will have been made manifest in
the final year of the five years of FBS data being examined, and thus introduce a
(valid) source of distortion to the five year trend data.
More broadly, where compensation relates to the loss of breeding animals, this
amounts to a disposal of part of the farm’s productive assets, which are not
necessarily replaced within the same accounting year: if replacements are purchased,
these may take time to locate, but many farmers prefer, for sound animal health
reasons, to rear their own replacements. In all cases where replacement stock are not
purchased in the same accounting year as compensation is received, if the level of
compensation has been over-generous this will have the effect of over-stating both
output and incomes. Even where replacements are purchased within the year, the net
effect is likely to be at least a modest boost to income for essentially short-term
reasons. Since this study is concerned with longer-term effects, most income
indicators have been calculated both including and excluding bTB compensation in
order to better understand the farm-level effects. In practice, it might be expected that
the ‘true’ level of income lies somewhere between the two (i.e. indicators with and
without bTB compensation).
Figures 4.1 and 4.2 illustrate the results for four income indicators, Occupiers’ Net
Income (ONI), Farm Family Income (FFI), Net Farm Income (NFI) and Management
and Investment Income (M&II) for the period 2002/03 to 2006/07. Cash income and
ONI are based on the actual tenure and indebtedness of the farms, while NFI was
until recently Defra’s preferred lead indicator of farm income; M&II is the most
rigorous assessment of the economic performance of the industry. It has not been
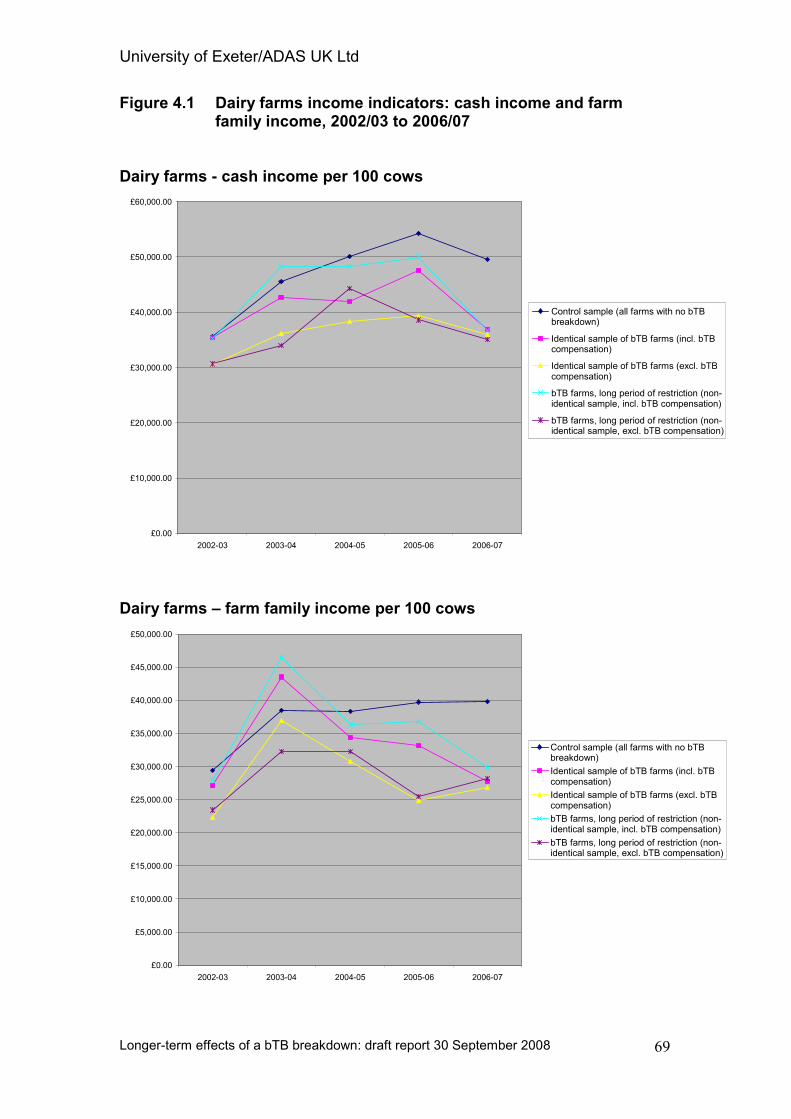
University of Exeter/ADAS UK Ltd
Longer-term effects of a bTB breakdown: draft report 30 September 2008
69
Figure 4.1 Dairy farms income indicators: cash income and farm family income, 2002/03 to 2006/07
Dairy farms - cash income per 100 cows
£0.00
£10,000.00
£20,000.00
£30,000.00
£40,000.00
£50,000.00
£60,000.00
2002-03 2003-04 2004-05 2005-06 2006-07
Control sample (all farms with no bTBbreakdown)
Identical sample of bTB farms (incl. bTBcompensation)
Identical sample of bTB farms (excl. bTBcompensation)
bTB farms, long period of restriction (non-identical sample, incl. bTB compensation)
bTB farms, long period of restriction (non-identical sample, excl. bTB compensation)
Dairy farms – farm family income per 100 cows
£0.00
£5,000.00
£10,000.00
£15,000.00
£20,000.00
£25,000.00
£30,000.00
£35,000.00
£40,000.00
£45,000.00
£50,000.00
2002-03 2003-04 2004-05 2005-06 2006-07
Control sample (all farms with no bTBbreakdown)
Identical sample of bTB farms (incl. bTBcompensation)
Identical sample of bTB farms (excl. bTBcompensation)
bTB farms, long period of restriction (non-identical sample, incl. bTB compensation)
bTB farms, long period of restriction (non-identical sample, excl. bTB compensation)
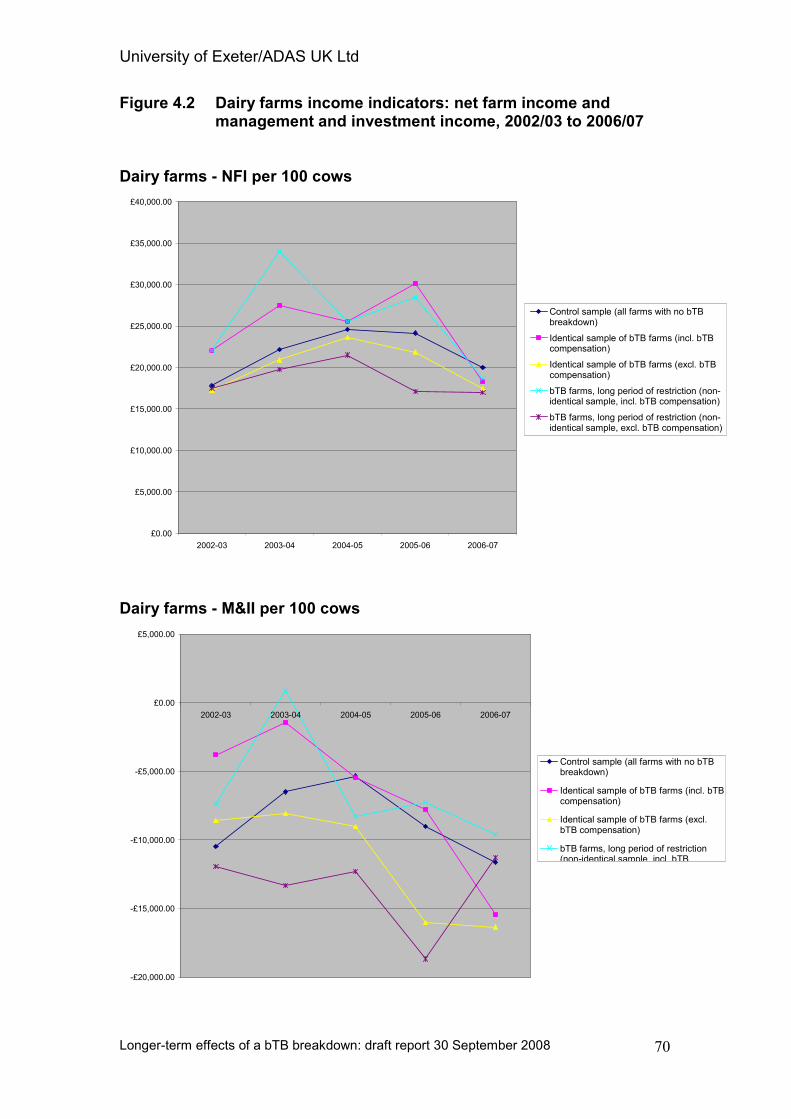
University of Exeter/ADAS UK Ltd
Longer-term effects of a bTB breakdown: draft report 30 September 2008
70
Figure 4.2 Dairy farms income indicators: net farm income and management and investment income, 2002/03 to 2006/07
Dairy farms - NFI per 100 cows
£0.00
£5,000.00
£10,000.00
£15,000.00
£20,000.00
£25,000.00
£30,000.00
£35,000.00
£40,000.00
2002-03 2003-04 2004-05 2005-06 2006-07
Control sample (all farms with no bTBbreakdown)
Identical sample of bTB farms (incl. bTBcompensation)
Identical sample of bTB farms (excl. bTBcompensation)
bTB farms, long period of restriction (non-identical sample, incl. bTB compensation)
bTB farms, long period of restriction (non-identical sample, excl. bTB compensation)
Dairy farms - M&II per 100 cows
-£20,000.00
-£15,000.00
-£10,000.00
-£5,000.00
£0.00
£5,000.00
2002-03 2003-04 2004-05 2005-06 2006-07
Control sample (all farms with no bTBbreakdown)
Identical sample of bTB farms (incl. bTBcompensation)
Identical sample of bTB farms (excl.bTB compensation)
bTB farms, long period of restriction(non-identical sample, incl. bTB
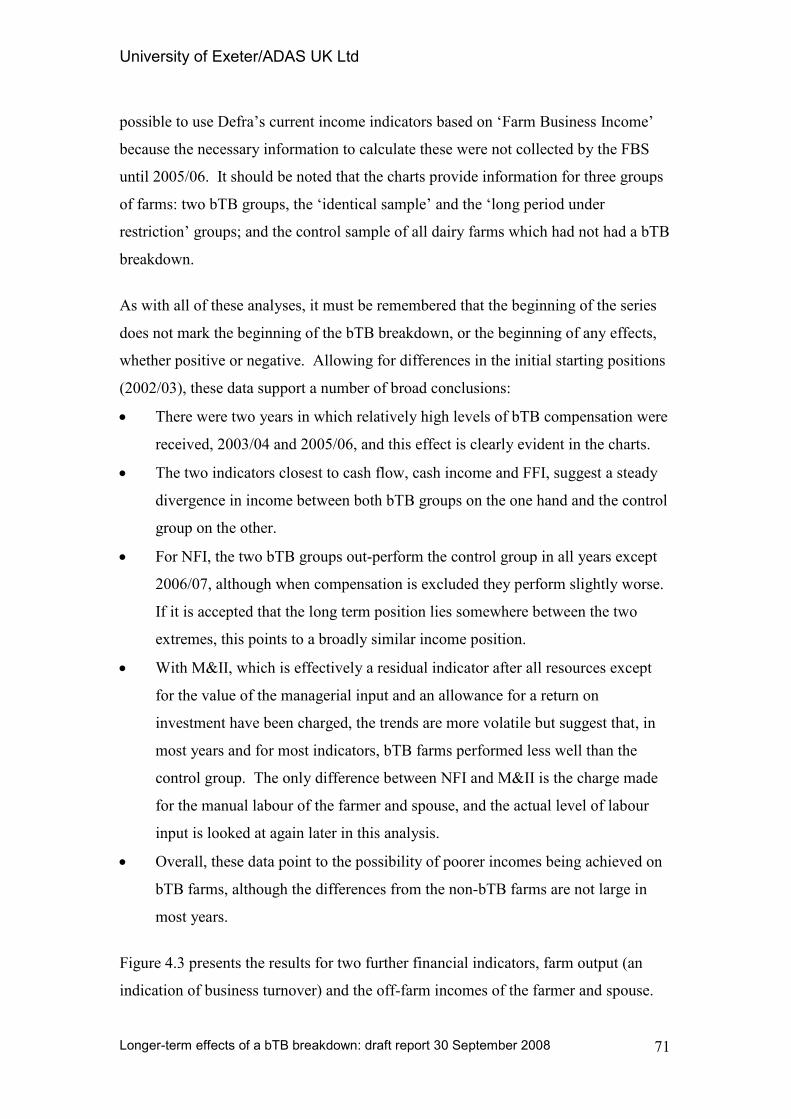
University of Exeter/ADAS UK Ltd
Longer-term effects of a bTB breakdown: draft report 30 September 2008
71
possible to use Defra’s current income indicators based on ‘Farm Business Income’
because the necessary information to calculate these were not collected by the FBS
until 2005/06. It should be noted that the charts provide information for three groups
of farms: two bTB groups, the ‘identical sample’ and the ‘long period under
restriction’ groups; and the control sample of all dairy farms which had not had a bTB
breakdown.
As with all of these analyses, it must be remembered that the beginning of the series
does not mark the beginning of the bTB breakdown, or the beginning of any effects,
whether positive or negative. Allowing for differences in the initial starting positions
(2002/03), these data support a number of broad conclusions:
• There were two years in which relatively high levels of bTB compensation were
received, 2003/04 and 2005/06, and this effect is clearly evident in the charts.
• The two indicators closest to cash flow, cash income and FFI, suggest a steady
divergence in income between both bTB groups on the one hand and the control
group on the other.
• For NFI, the two bTB groups out-perform the control group in all years except
2006/07, although when compensation is excluded they perform slightly worse.
If it is accepted that the long term position lies somewhere between the two
extremes, this points to a broadly similar income position.
• With M&II, which is effectively a residual indicator after all resources except
for the value of the managerial input and an allowance for a return on
investment have been charged, the trends are more volatile but suggest that, in
most years and for most indicators, bTB farms performed less well than the
control group. The only difference between NFI and M&II is the charge made
for the manual labour of the farmer and spouse, and the actual level of labour
input is looked at again later in this analysis.
• Overall, these data point to the possibility of poorer incomes being achieved on
bTB farms, although the differences from the non-bTB farms are not large in
most years.
Figure 4.3 presents the results for two further financial indicators, farm output (an
indication of business turnover) and the off-farm incomes of the farmer and spouse.
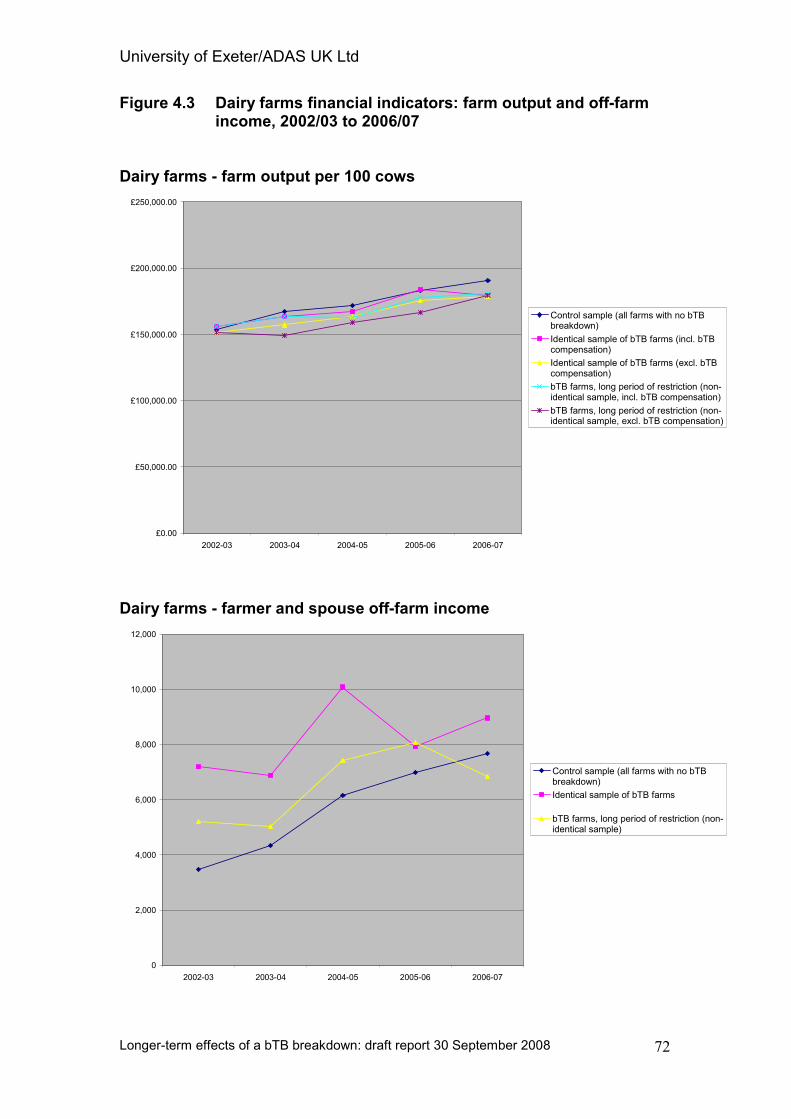
University of Exeter/ADAS UK Ltd
Longer-term effects of a bTB breakdown: draft report 30 September 2008
72
Figure 4.3 Dairy farms financial indicators: farm output and off-farm income, 2002/03 to 2006/07
Dairy farms - farm output per 100 cows
£0.00
£50,000.00
£100,000.00
£150,000.00
£200,000.00
£250,000.00
2002-03 2003-04 2004-05 2005-06 2006-07
Control sample (all farms with no bTBbreakdown)
Identical sample of bTB farms (incl. bTBcompensation)
Identical sample of bTB farms (excl. bTBcompensation)
bTB farms, long period of restriction (non-identical sample, incl. bTB compensation)
bTB farms, long period of restriction (non-identical sample, excl. bTB compensation)
Dairy farms - farmer and spouse off-farm income
0
2,000
4,000
6,000
8,000
10,000
12,000
2002-03 2003-04 2004-05 2005-06 2006-07
Control sample (all farms with no bTBbreakdown)
Identical sample of bTB farms
bTB farms, long period of restriction (non-identical sample)
University of Exeter/ADAS UK Ltd
Longer-term effects of a bTB breakdown: draft report 30 September 2008
73
With respect to farm output, and with a very similar starting position, the two bTB
groups have tracked the control group fairly closely, albeit with just a suggestion of a
slight gap opening up; the difference, however, is not great. Interestingly, off-farm
income appears to be rather higher on both of the bTB groups compared with the
control group, and this has been consistently so over the period except for the ‘long
period under restriction’ group in 2006/07 only. This appears to provide some
corroboration of information from other parts of the research that one response of the
farm family to a bTB breakdown is to increase, or take for the first time, off-farm
employment.
The focus turns now to the pattern of investment and Figure 4.4 presents two such
indicators of investment, for farm buildings and similar infra-structural improvements
and the broader net asset purchases. Capital investment in buildings is lower than the
control group in two of the five years, and higher in three years. There is a dramatic
peak in investment for the ’identical sample’ bTB group in 2003/04, and it could be
argued that the ‘long period under restriction’ bTB group broadly tracks the control
group.
Allowing for greater annual fluctuations in this indicator, although the data point to a
broadly comparable level of investment over the period there is some evidence of
bTB farms investing slightly more than their non-bTB counterparts. This may be
consistent with evidence from the farmers; interview survey on investment in bio-
security measures. A similar pattern is seen with net asset purchases with, again, a
broadly comparable level of investment between bTB and non-bTB farms.
Detailed analyses of aspects of the balance sheets – business assets and liabilities –
are given in Appendix C, Table C3, but these tend to be dominated by the value of
owner-occupied land and are not explored further here. However, Figure 4.5
illustrates the movement in total loans for the three groups of farms over the five year
period. The two bTB groups start with higher loans than the non-bTB control group
and, on average, maintain that position throughout, although there is some narrowing
of the gap in the final year.
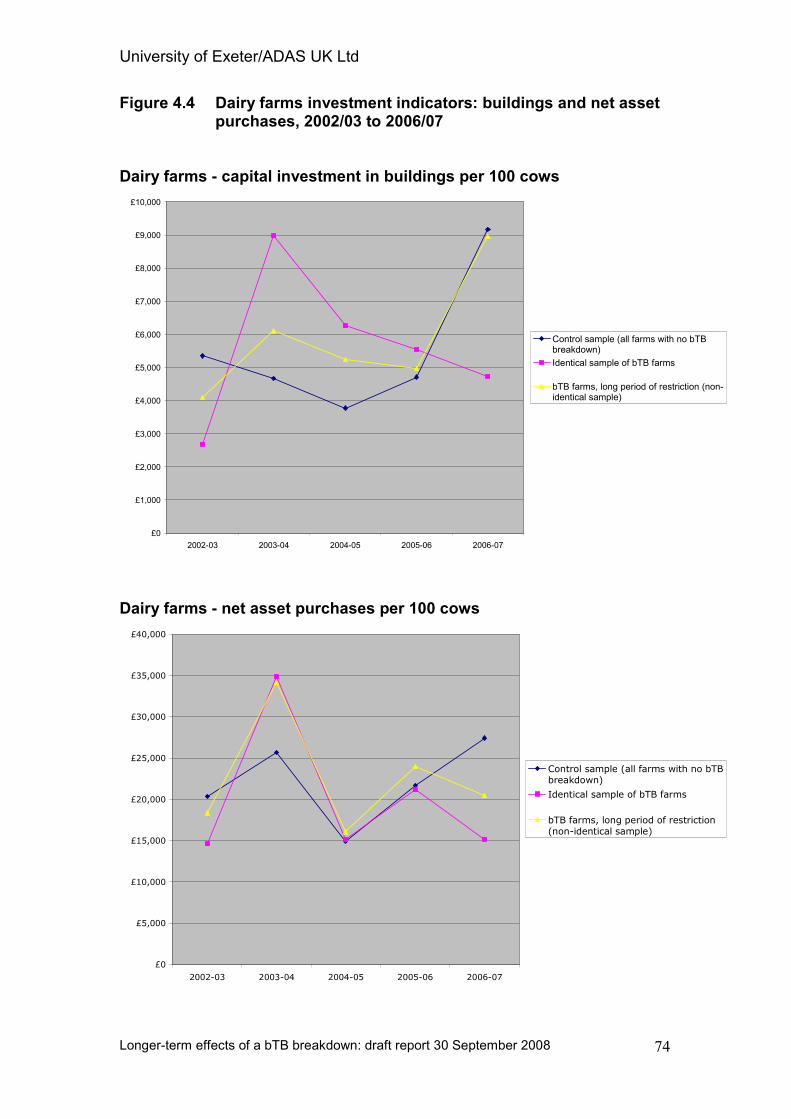
University of Exeter/ADAS UK Ltd
Longer-term effects of a bTB breakdown: draft report 30 September 2008
74
Figure 4.4 Dairy farms investment indicators: buildings and net asset purchases, 2002/03 to 2006/07
Dairy farms - capital investment in buildings per 100 cows
£0
£1,000
£2,000
£3,000
£4,000
£5,000
£6,000
£7,000
£8,000
£9,000
£10,000
2002-03 2003-04 2004-05 2005-06 2006-07
Control sample (all farms with no bTBbreakdown)
Identical sample of bTB farms
bTB farms, long period of restriction (non-identical sample)
Dairy farms - net asset purchases per 100 cows
£0
£5,000
£10,000
£15,000
£20,000
£25,000
£30,000
£35,000
£40,000
2002-03 2003-04 2004-05 2005-06 2006-07
Control sample (all farms with no bTBbreakdown)
Identical sample of bTB farms
bTB farms, long period of restriction(non-identical sample)
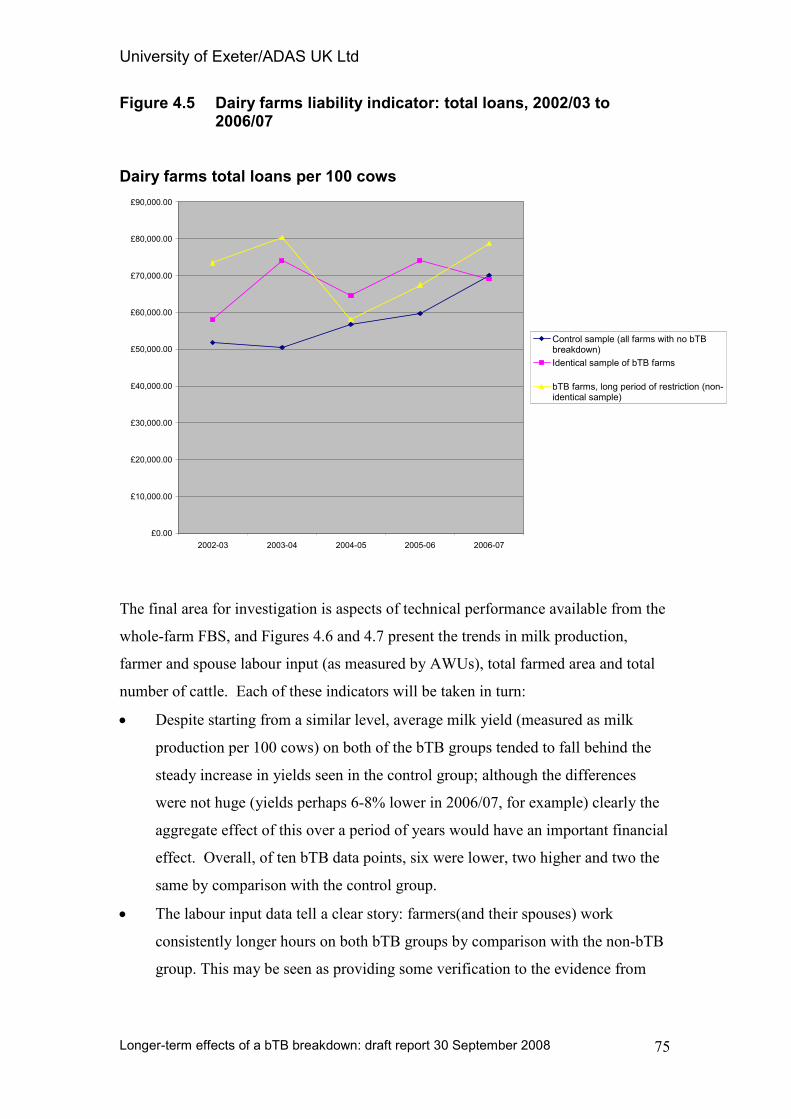
University of Exeter/ADAS UK Ltd
Longer-term effects of a bTB breakdown: draft report 30 September 2008
75
Figure 4.5 Dairy farms liability indicator: total loans, 2002/03 to 2006/07
Dairy farms total loans per 100 cows
£0.00
£10,000.00
£20,000.00
£30,000.00
£40,000.00
£50,000.00
£60,000.00
£70,000.00
£80,000.00
£90,000.00
2002-03 2003-04 2004-05 2005-06 2006-07
Control sample (all farms with no bTBbreakdown)
Identical sample of bTB farms
bTB farms, long period of restriction (non-identical sample)
The final area for investigation is aspects of technical performance available from the
whole-farm FBS, and Figures 4.6 and 4.7 present the trends in milk production,
farmer and spouse labour input (as measured by AWUs), total farmed area and total
number of cattle. Each of these indicators will be taken in turn:
• Despite starting from a similar level, average milk yield (measured as milk
production per 100 cows) on both of the bTB groups tended to fall behind the
steady increase in yields seen in the control group; although the differences
were not huge (yields perhaps 6-8% lower in 2006/07, for example) clearly the
aggregate effect of this over a period of years would have an important financial
effect. Overall, of ten bTB data points, six were lower, two higher and two the
same by comparison with the control group.
• The labour input data tell a clear story: farmers(and their spouses) work
consistently longer hours on both bTB groups by comparison with the non-bTB
group. This may be seen as providing some verification to the evidence from
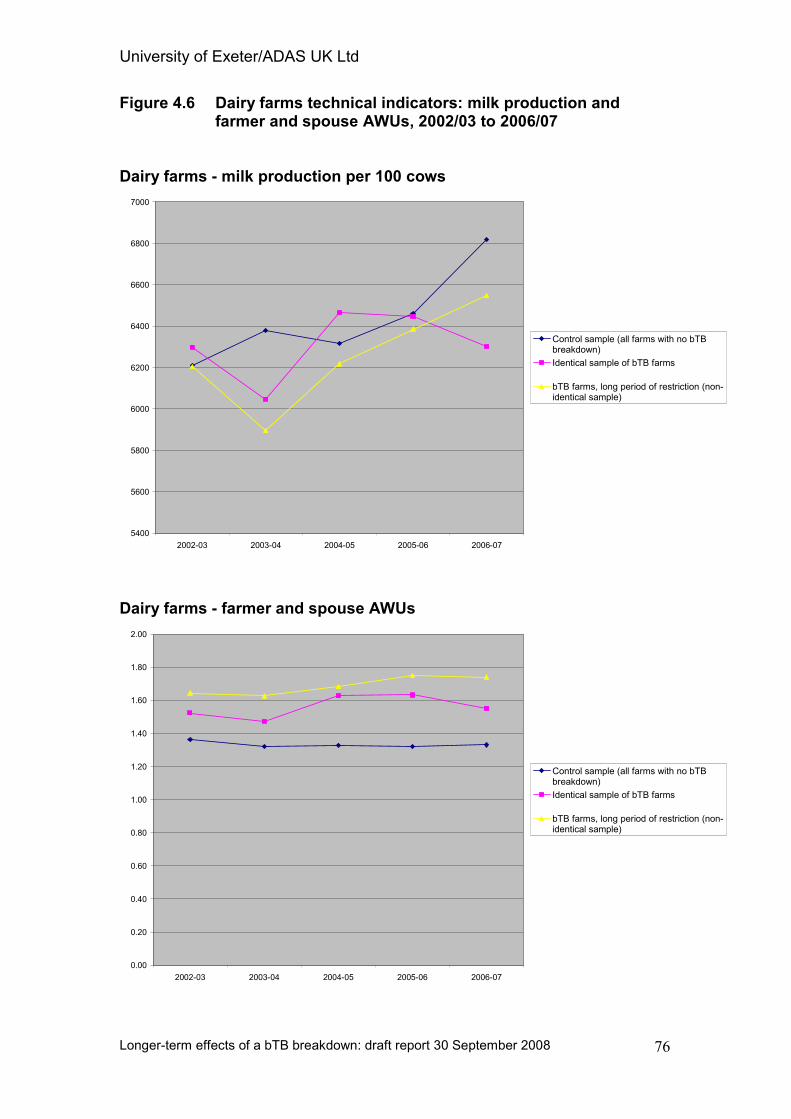
University of Exeter/ADAS UK Ltd
Longer-term effects of a bTB breakdown: draft report 30 September 2008
76
Figure 4.6 Dairy farms technical indicators: milk production and farmer and spouse AWUs, 2002/03 to 2006/07
Dairy farms - milk production per 100 cows
5400
5600
5800
6000
6200
6400
6600
6800
7000
2002-03 2003-04 2004-05 2005-06 2006-07
Control sample (all farms with no bTBbreakdown)
Identical sample of bTB farms
bTB farms, long period of restriction (non-identical sample)
Dairy farms - farmer and spouse AWUs
0.00
0.20
0.40
0.60
0.80
1.00
1.20
1.40
1.60
1.80
2.00
2002-03 2003-04 2004-05 2005-06 2006-07
Control sample (all farms with no bTBbreakdown)
Identical sample of bTB farms
bTB farms, long period of restriction (non-identical sample)
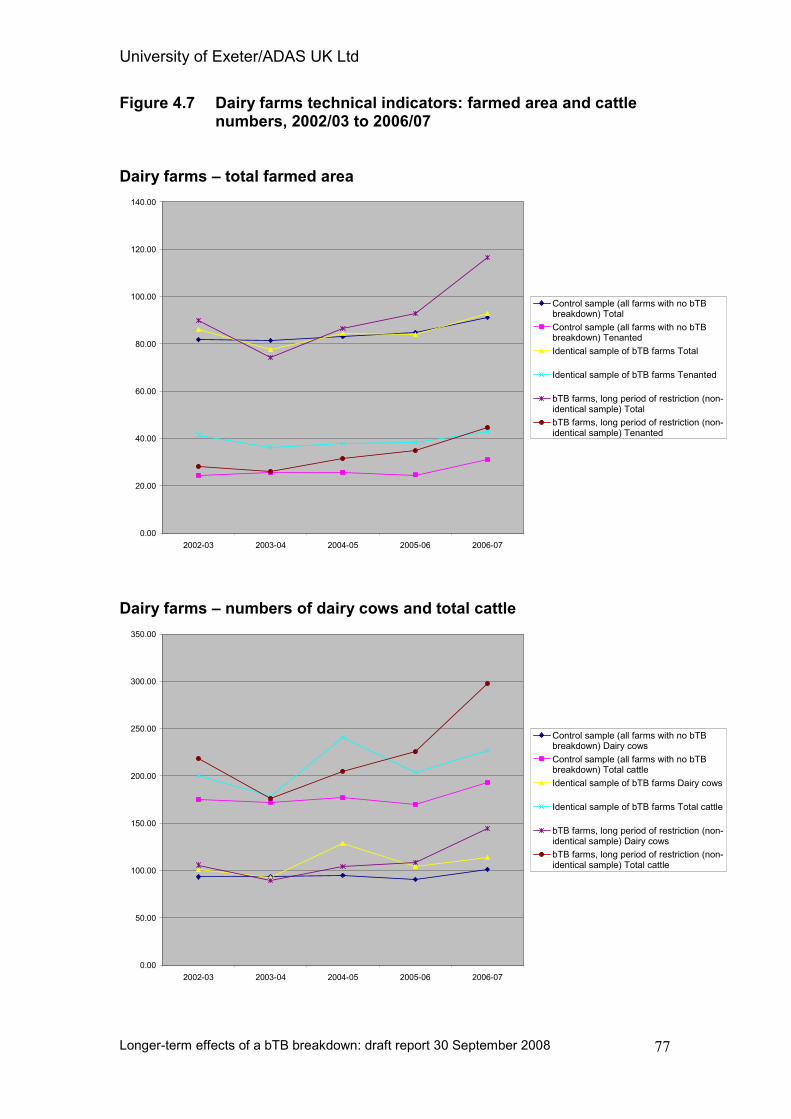
University of Exeter/ADAS UK Ltd
Longer-term effects of a bTB breakdown: draft report 30 September 2008
77
Figure 4.7 Dairy farms technical indicators: farmed area and cattle numbers, 2002/03 to 2006/07
Dairy farms – total farmed area
0.00
20.00
40.00
60.00
80.00
100.00
120.00
140.00
2002-03 2003-04 2004-05 2005-06 2006-07
Control sample (all farms with no bTBbreakdown) Total
Control sample (all farms with no bTBbreakdown) Tenanted
Identical sample of bTB farms Total
Identical sample of bTB farms Tenanted
bTB farms, long period of restriction (non-identical sample) Total
bTB farms, long period of restriction (non-identical sample) Tenanted
Dairy farms – numbers of dairy cows and total cattle
0.00
50.00
100.00
150.00
200.00
250.00
300.00
350.00
2002-03 2003-04 2004-05 2005-06 2006-07
Control sample (all farms with no bTBbreakdown) Dairy cows
Control sample (all farms with no bTBbreakdown) Total cattle
Identical sample of bTB farms Dairy cows
Identical sample of bTB farms Total cattle
bTB farms, long period of restriction (non-identical sample) Dairy cows
bTB farms, long period of restriction (non-identical sample) Total cattle
University of Exeter/ADAS UK Ltd
Longer-term effects of a bTB breakdown: draft report 30 September 2008
78
other parts of the study, and other studies, that a bTB breakdown can cause
extended periods of additional work.
• In terms of total farmed area, the data point to little difference between the
‘identical sample’ bTB group and the control group, whether it is all types of
tenure or simply tenanted farms that are considered, but there is some evidence
of the ‘long period under restriction’ bTB farms tending to increase their farmed
area towards the end of the five years period. This may well be linked with the
next indicator.
• Finally, total cattle numbers provide evidence of a more pronounced increase on
‘long period of restriction’ bTB farms towards the end of the period. Of course,
it is not possible to categorically state that this is a direct consequence of bTB
movement restrictions, or whether it marks a change of system; but since this
average change is seen for a group of 41 farms (Table 4.6) it seems most likely
to be a fairly direct consequence of bTB movement restrictions. It also goes
hand-in-hand with the observed increase in farmed area, of course.
This completes the analysis of the FBS dairy farm data, the broad conclusions are set
out at the end of this chapter. Briefly stated, however, there seems to be evidence of
some differentials in terms of income (bTB farms coming slightly lower than their
non-bTB peers; slightly higher investment; higher loans; a greater labour input by
farmer and spouse; lower milk yields; and more cattle being kept on a larger farmed
area.
The analysis of suckler beef farm results
The number of available FBS farms in this group was smaller than for the dairy group
and consequently, for farms which had experienced a bTB breakdown, it was not
possible to look at an identical set of farms over the five year period. Instead, a non-
identical sample was taken for each of the five years, containing a maximum of 37
farms and a minimum of 34 farms. As for the dairy farms, a sub-group comprising
farms experiencing movement restrictions for more than one year was also examined,
although the sample numbers here were very small, so the results are possibly subject
to small sample influences and should be considered as indicative only. Sample size
constraints have prevented the separate analysis of lowland and upland suckler beef
systems. Details of the sample sizes for each group are given in Table 4.7.
University of Exeter/ADAS UK Ltd
Longer-term effects of a bTB breakdown: draft report 30 September 2008
79
Table 4.7 Sample sizes, FBS bTB suckler beef farms, 2002/03 to 2006/07
2002-03 2003-04 2004-05 2005-06 2006-07
Control sample (all suckler beef
farms with no bTB breakdown)
575 545 512 485 544
All bTB suckler beef farms 37 36 37 34 37
bTB suckler beef farms, long
period of restriction (non-
identical samples)
22 21 18 16 18
The control group of suckler beef farms were all those in the FBS database which had
not experienced a bTB breakdown. The numbers varied quite widely from year to
year, with a maximum of 575 suckler beef farms in 2002-03 and a minimum of 485
farms in 2005-06. The sample sizes for the control group clearly are large enough to
provide very reliable population estimates as a benchmark for comparison, and the
sample size for the sub-group ‘all bTB suckler beef farms’ should be large enough to
provide reliable broad indications. The sample sizes for the sub-group ‘bTB suckler
beef farms, long period of restriction’ are very small, however, and the results should
be treated with care although, using Defra’s FBS weighting system, normal practice is
to publish for any sub-group with at least 15 farms in the sample.
However, the comments given earlier in respect of the dairy sample bear repetition
here. The farm-level effects of a bTB breakdown can be very complex (Bennett,
2004; Sheppard and Turner, 2005) and this sample of farms will have had widely
varying scales and durations of bTB breakdowns. Inevitably this results in the
introduction to the farm business accounts of yet another layer of differentiation in
addition to the widely varying resources, systems and performance of the population
as a whole. Accordingly, the results should be viewed as indicative of differences
rather than in any way definitive.
As for the dairy farms, the analyses undertaken look at four broad sets of indicators of
economic performance and business development, in order to allow examination of
whether, and to what degree, there has been divergence between farms which have
had a bTB breakdown and those that have not. Detailed comparative financial data
for these groups of FBS dairy farms are given in Appendix C, Tables C5 to C8. The
University of Exeter/ADAS UK Ltd
Longer-term effects of a bTB breakdown: draft report 30 September 2008
80
indicators cover the following broad categories: farm income, investment, the balance
sheet and technical performance. Results have been presented on a ‘per 50 cows’
basis.
The changed statutory basis for valuing livestock taken also deserves brief
restatement because of its impact on the trends presented here (see also the earlier
discussion in relation to the dairy group analyses). The new cattle compensation
system which was introduced in England on 1 February 2006 uses a ‘table valuation’
approach and has resulted in typically lower levels of compensation being paid; this is
evident in the 2006/07 FBS data, and will have influenced the identified trends.
As for the dairy farms, most income indicators are shown with and without the value
of bTB compensation, because, where compensation relates to the loss of breeding
animals, this amounts to a disposal of part of the farm’s productive assets. These are
not necessarily replaced within the same accounting year, either because of the time
lapse until suitable replacements can be purchased or because it is preferred to rear
home-bred replacements (e.g. for animal health reasons). Even where replacements
are purchased within the year, the net effect is likely to be at least a modest boost to
income for essentially short-term reasons. Since this study is concerned with longer-
term effects, most income indicators have been calculated both including and
excluding bTB compensation in order to better understand the farm-level effects. In
practice, it might be expected that the ‘true’ level of income lies somewhere between
the two (i.e. indicators with and without bTB compensation).
Figures 4.8 and 4.9 illustrate the results for four income indicators, Occupiers’ Net
Income (ONI), Farm Family Income (FFI), Net Farm Income (NFI) and Management
and Investment Income (M&II) for the period 2002/03 to 2006/07. Cash income and
ONI are based on the actual tenure and indebtedness of the farms, while NFI was
until recently Defra’s preferred lead indicator of farm income; M&II is the most
rigorous assessment of the economic performance of the industry. It has not been
possible to use Defra’s current income indicators based on ‘Farm Business Income’
because the necessary information to calculate these were not collected by the FBS
until 2005/06. The following charts, then, provide information for three groups of
farms: two bTB groups and the control sample of all suckler beef farms which had
not had a bTB breakdown.
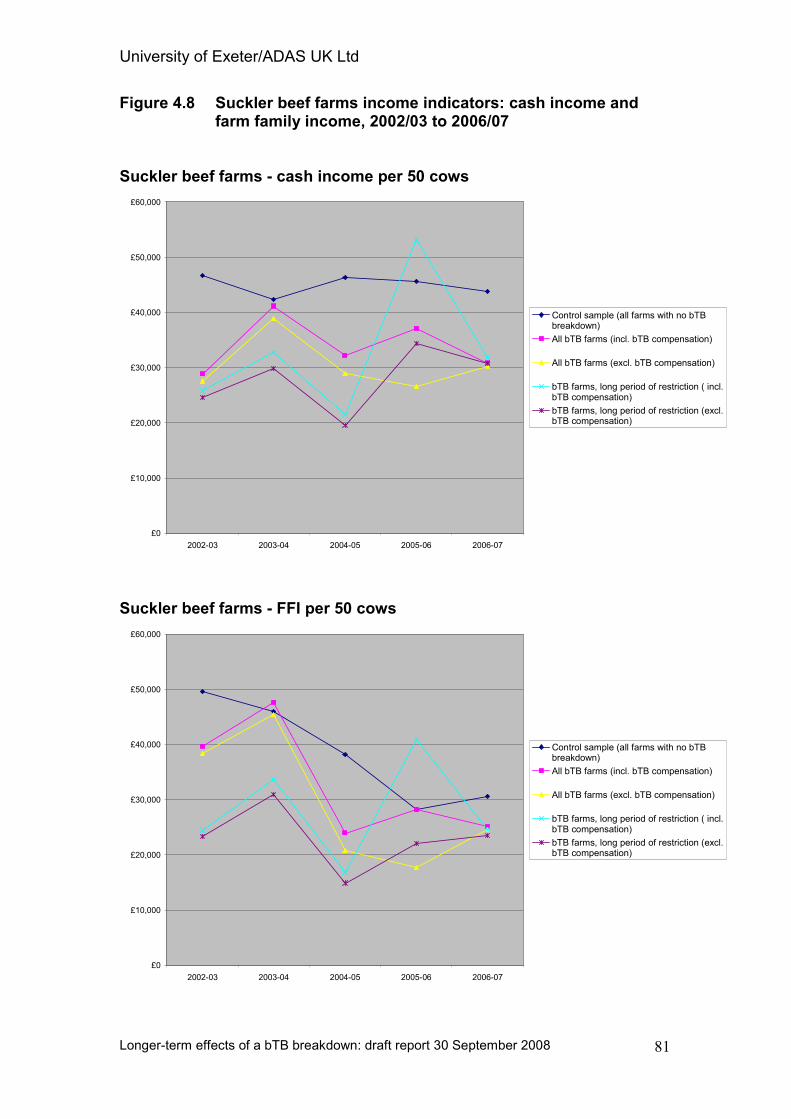
University of Exeter/ADAS UK Ltd
Longer-term effects of a bTB breakdown: draft report 30 September 2008
81
Figure 4.8 Suckler beef farms income indicators: cash income and farm family income, 2002/03 to 2006/07
Suckler beef farms - cash income per 50 cows
£0
£10,000
£20,000
£30,000
£40,000
£50,000
£60,000
2002-03 2003-04 2004-05 2005-06 2006-07
Control sample (all farms with no bTBbreakdown)
All bTB farms (incl. bTB compensation)
All bTB farms (excl. bTB compensation)
bTB farms, long period of restriction ( incl.bTB compensation)
bTB farms, long period of restriction (excl.bTB compensation)
Suckler beef farms - FFI per 50 cows
£0
£10,000
£20,000
£30,000
£40,000
£50,000
£60,000
2002-03 2003-04 2004-05 2005-06 2006-07
Control sample (all farms with no bTBbreakdown)
All bTB farms (incl. bTB compensation)
All bTB farms (excl. bTB compensation)
bTB farms, long period of restriction ( incl.bTB compensation)
bTB farms, long period of restriction (excl.bTB compensation)
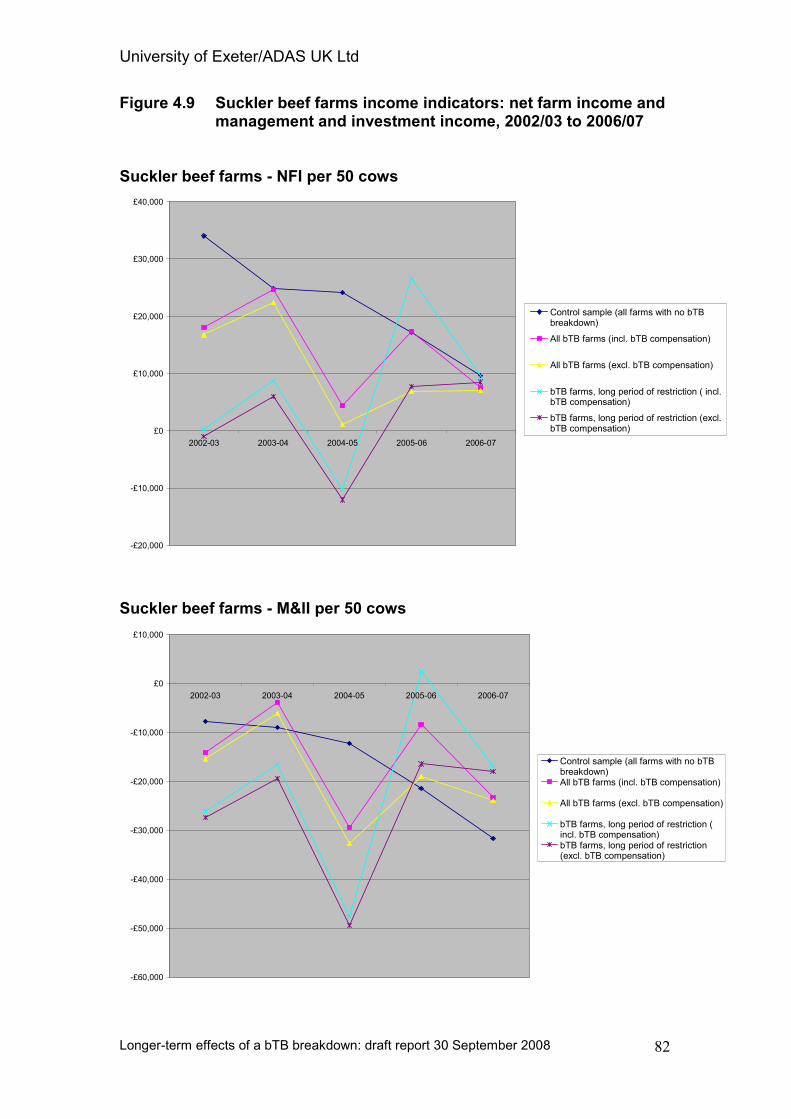
University of Exeter/ADAS UK Ltd
Longer-term effects of a bTB breakdown: draft report 30 September 2008
82
Figure 4.9 Suckler beef farms income indicators: net farm income and management and investment income, 2002/03 to 2006/07
Suckler beef farms - NFI per 50 cows
-£20,000
-£10,000
£0
£10,000
£20,000
£30,000
£40,000
2002-03 2003-04 2004-05 2005-06 2006-07
Control sample (all farms with no bTBbreakdown)
All bTB farms (incl. bTB compensation)
All bTB farms (excl. bTB compensation)
bTB farms, long period of restriction ( incl.bTB compensation)
bTB farms, long period of restriction (excl.bTB compensation)
Suckler beef farms - M&II per 50 cows
-£60,000
-£50,000
-£40,000
-£30,000
-£20,000
-£10,000
£0
£10,000
2002-03 2003-04 2004-05 2005-06 2006-07
Control sample (all farms with no bTBbreakdown)All bTB farms (incl. bTB compensation)
All bTB farms (excl. bTB compensation)
bTB farms, long period of restriction (incl. bTB compensation)bTB farms, long period of restriction(excl. bTB compensation)
University of Exeter/ADAS UK Ltd
Longer-term effects of a bTB breakdown: draft report 30 September 2008
83
It is important to appreciate that the beginning of the series, 2002/03, has been
determined not by when bTB first affected the sample farms, but because the
information available does not allow the identification of farms which had a bTB
breakdown before this date. The longer-term effects, therefore, whether positive or
negative, do not start in the first year of the series: some farms will have had a bTB
breakdown prior to this date, others will have been affected by bTB for the first time
some time in the five years studied. Allowing therefore for differences in the initial
starting positions, these data provide the following broad conclusions with regard to
the profitability of the businesses:
• Incomes on the two bTB groups of farms appear to have been rather more
variable than for the control sample as a whole; and there was only one year in
which a relatively high level of bTB compensation was received, 2004/05; and
incomes on ‘long period of restriction’ farms are fairly consistently lower than
for ‘all bTB farms’.
• With the possible exception of cash income, the control group (all suckler beef
farms) has experienced a steady decline in profitability, however this is
measured, over the five years from 2002/03.
• Taking first the two indicators closest to cash flow, cash income and FFI, almost
all data points over the five years lie below those for the control group, in some
years very substantially below, suggesting a significantly lower level of
economic performance on the bTB-affected farms.
• In respect of NFI, the results are more variable: by 2006/07there has been a
degree of convergence in the NFIs of the three groups although for much of the
five years the bTB groups performed less well.
• The situation for M&II is equally mixed, with no consistent picture emerging
regarding relative levels of income between the two bTB groups and the control
group. Since M&II is a residual measure, it is subject to cyclical swings and
this is evident for both of the bTB groups.
• Overall, against a general (system) trend toward lower incomes, farms with a
bTB breakdown have performed less well in most years, those under movement
restrictions being least profitable. Both of the two bTB groups have shown
much more variability in incomes, with considerable annual fluctuations, but
these swings have not been caused by high levels of compensation payments.
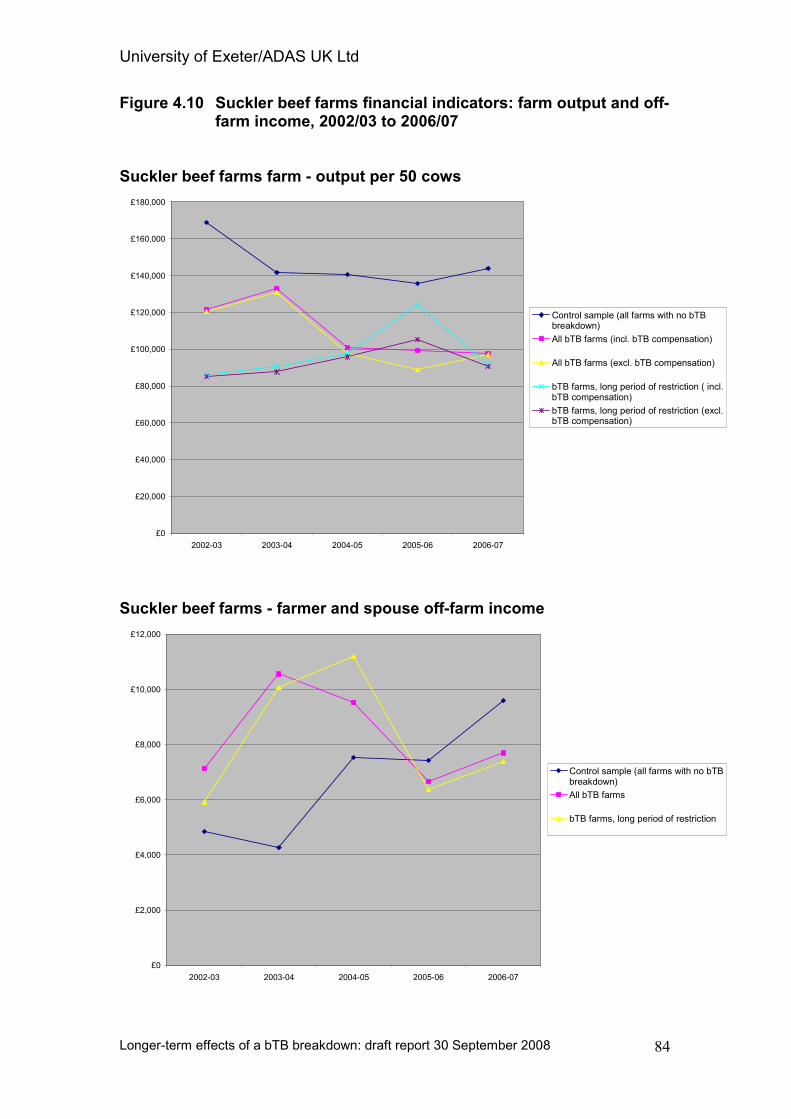
University of Exeter/ADAS UK Ltd
Longer-term effects of a bTB breakdown: draft report 30 September 2008
84
Figure 4.10 Suckler beef farms financial indicators: farm output and off-farm income, 2002/03 to 2006/07
Suckler beef farms farm - output per 50 cows
£0
£20,000
£40,000
£60,000
£80,000
£100,000
£120,000
£140,000
£160,000
£180,000
2002-03 2003-04 2004-05 2005-06 2006-07
Control sample (all farms with no bTBbreakdown)
All bTB farms (incl. bTB compensation)
All bTB farms (excl. bTB compensation)
bTB farms, long period of restriction ( incl.bTB compensation)
bTB farms, long period of restriction (excl.bTB compensation)
Suckler beef farms - farmer and spouse off-farm income
£0
£2,000
£4,000
£6,000
£8,000
£10,000
£12,000
2002-03 2003-04 2004-05 2005-06 2006-07
Control sample (all farms with no bTBbreakdown)
All bTB farms
bTB farms, long period of restriction
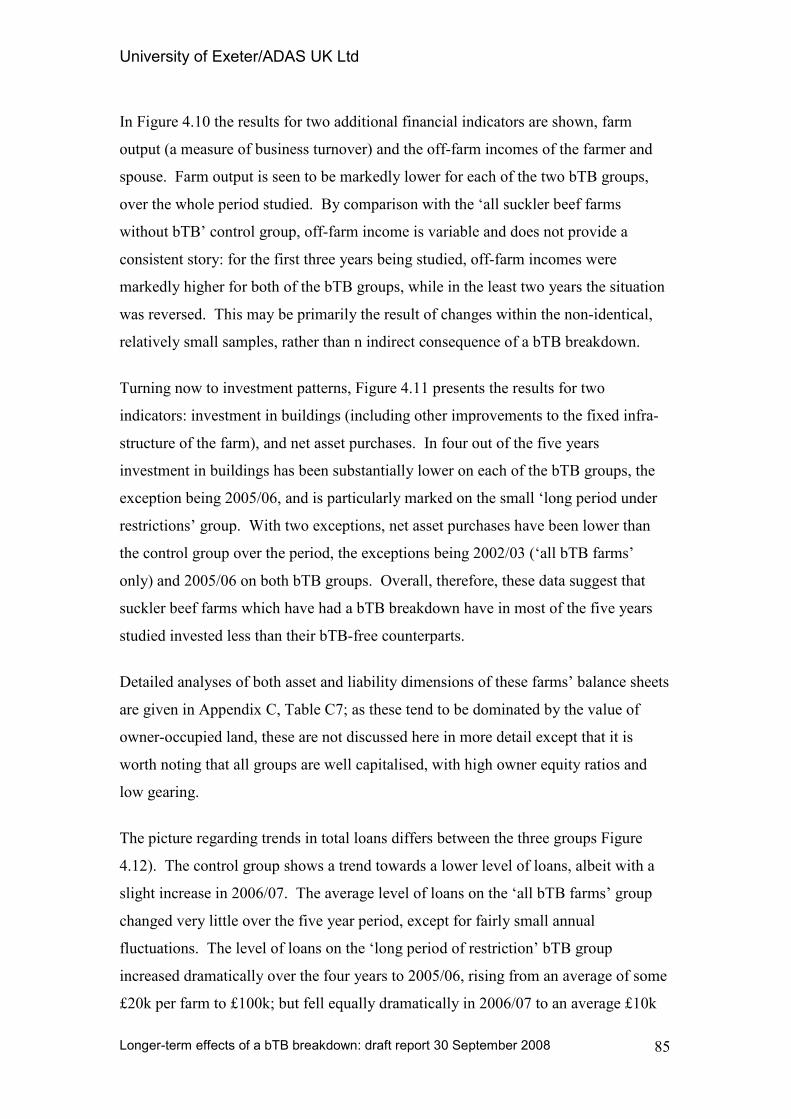
University of Exeter/ADAS UK Ltd
Longer-term effects of a bTB breakdown: draft report 30 September 2008
85
In Figure 4.10 the results for two additional financial indicators are shown, farm
output (a measure of business turnover) and the off-farm incomes of the farmer and
spouse. Farm output is seen to be markedly lower for each of the two bTB groups,
over the whole period studied. By comparison with the ‘all suckler beef farms
without bTB’ control group, off-farm income is variable and does not provide a
consistent story: for the first three years being studied, off-farm incomes were
markedly higher for both of the bTB groups, while in the least two years the situation
was reversed. This may be primarily the result of changes within the non-identical,
relatively small samples, rather than n indirect consequence of a bTB breakdown.
Turning now to investment patterns, Figure 4.11 presents the results for two
indicators: investment in buildings (including other improvements to the fixed infra-
structure of the farm), and net asset purchases. In four out of the five years
investment in buildings has been substantially lower on each of the bTB groups, the
exception being 2005/06, and is particularly marked on the small ‘long period under
restrictions’ group. With two exceptions, net asset purchases have been lower than
the control group over the period, the exceptions being 2002/03 (‘all bTB farms’
only) and 2005/06 on both bTB groups. Overall, therefore, these data suggest that
suckler beef farms which have had a bTB breakdown have in most of the five years
studied invested less than their bTB-free counterparts.
Detailed analyses of both asset and liability dimensions of these farms’ balance sheets
are given in Appendix C, Table C7; as these tend to be dominated by the value of
owner-occupied land, these are not discussed here in more detail except that it is
worth noting that all groups are well capitalised, with high owner equity ratios and
low gearing.
The picture regarding trends in total loans differs between the three groups Figure
4.12). The control group shows a trend towards a lower level of loans, albeit with a
slight increase in 2006/07. The average level of loans on the ‘all bTB farms’ group
changed very little over the five year period, except for fairly small annual
fluctuations. The level of loans on the ‘long period of restriction’ bTB group
increased dramatically over the four years to 2005/06, rising from an average of some
£20k per farm to £100k; but fell equally dramatically in 2006/07 to an average £10k
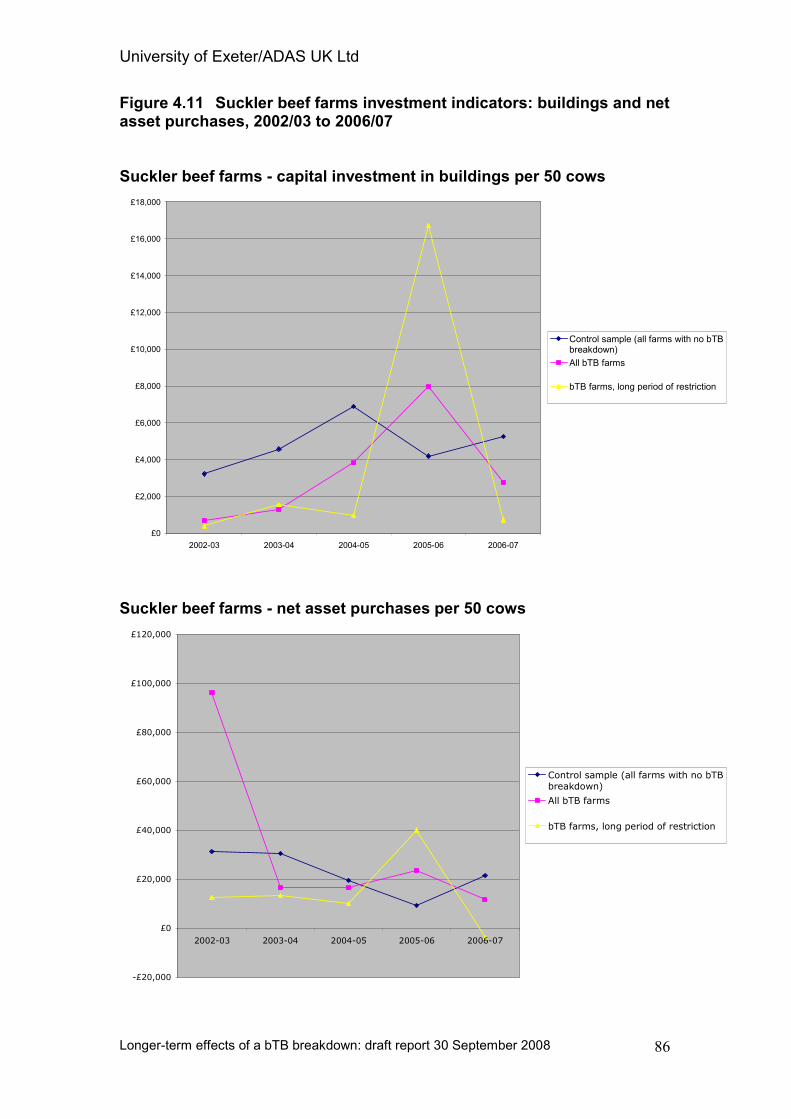
University of Exeter/ADAS UK Ltd
Longer-term effects of a bTB breakdown: draft report 30 September 2008
86
Figure 4.11 Suckler beef farms investment indicators: buildings and net asset purchases, 2002/03 to 2006/07 Suckler beef farms - capital investment in buildings per 50 cows
£0
£2,000
£4,000
£6,000
£8,000
£10,000
£12,000
£14,000
£16,000
£18,000
2002-03 2003-04 2004-05 2005-06 2006-07
Control sample (all farms with no bTBbreakdown)
All bTB farms
bTB farms, long period of restriction
Suckler beef farms - net asset purchases per 50 cows
-£20,000
£0
£20,000
£40,000
£60,000
£80,000
£100,000
£120,000
2002-03 2003-04 2004-05 2005-06 2006-07
Control sample (all farms with no bTBbreakdown)
All bTB farms
bTB farms, long period of restriction
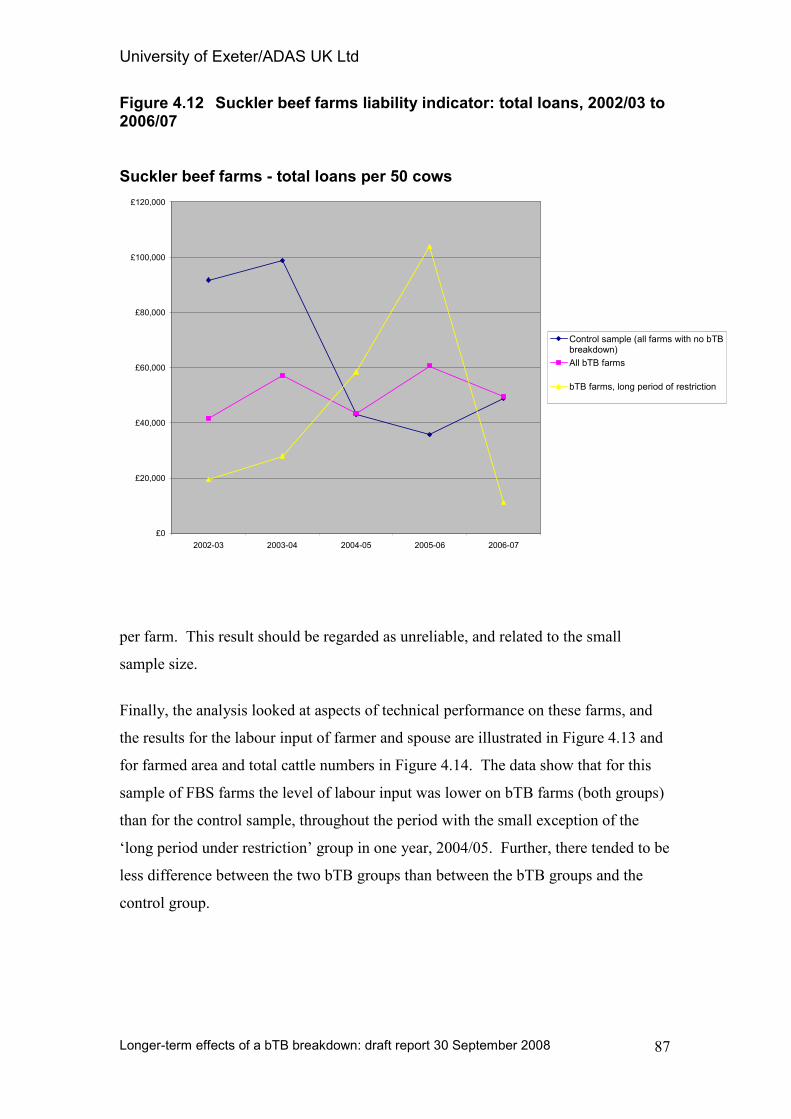
University of Exeter/ADAS UK Ltd
Longer-term effects of a bTB breakdown: draft report 30 September 2008
87
Figure 4.12 Suckler beef farms liability indicator: total loans, 2002/03 to 2006/07 Suckler beef farms - total loans per 50 cows
£0
£20,000
£40,000
£60,000
£80,000
£100,000
£120,000
2002-03 2003-04 2004-05 2005-06 2006-07
Control sample (all farms with no bTBbreakdown)
All bTB farms
bTB farms, long period of restriction
per farm. This result should be regarded as unreliable, and related to the small
sample size.
Finally, the analysis looked at aspects of technical performance on these farms, and
the results for the labour input of farmer and spouse are illustrated in Figure 4.13 and
for farmed area and total cattle numbers in Figure 4.14. The data show that for this
sample of FBS farms the level of labour input was lower on bTB farms (both groups)
than for the control sample, throughout the period with the small exception of the
‘long period under restriction’ group in one year, 2004/05. Further, there tended to be
less difference between the two bTB groups than between the bTB groups and the
control group.
University of Exeter/ADAS UK Ltd
Longer-term effects of a bTB breakdown: draft report 30 September 2008
88
Figure 4.13 Suckler beef farms technical indicator: farmer and spouse AWUs, 2002/03 to 2006/07
Suckler beef farms - farmer and spouse AWU
0.00
0.50
1.00
1.50
2.00
2.50
3.00
3.50
4.00
2002-03 2003-04 2004-05 2005-06 2006-07
Control sample (all farms with no bTBbreakdown)
All bTB farms
bTB farms, long period of restriction
In Figure 4.14 the results for (a) total farmed area and (b) total cattle numbers are
presented. The data clearly point to the bTB farms (both groups) being smaller than
their non-bTB peers, with a proportionately smaller tenanted land area. Meanwhile,
the average size of the control group has declined over the period but the sizes of both
of the bTB groups remained broadly constant. Another significant finding that
emerges from these analyses is that total cattle numbers on both bTB groups of farms
is higher than on the control group, with some evidence of a widening gap over the
five years; and the number of beef cows is also slightly higher. Bearing in mind the
smaller average farm size, this points to a significantly higher stocking rate on bTB-
affected farms. This would be consistent with general expectations that, while a farm
is under movement restrictions following a bTB breakdown, it is very difficult under
many farming systems to prevent cattle numbers increasing.
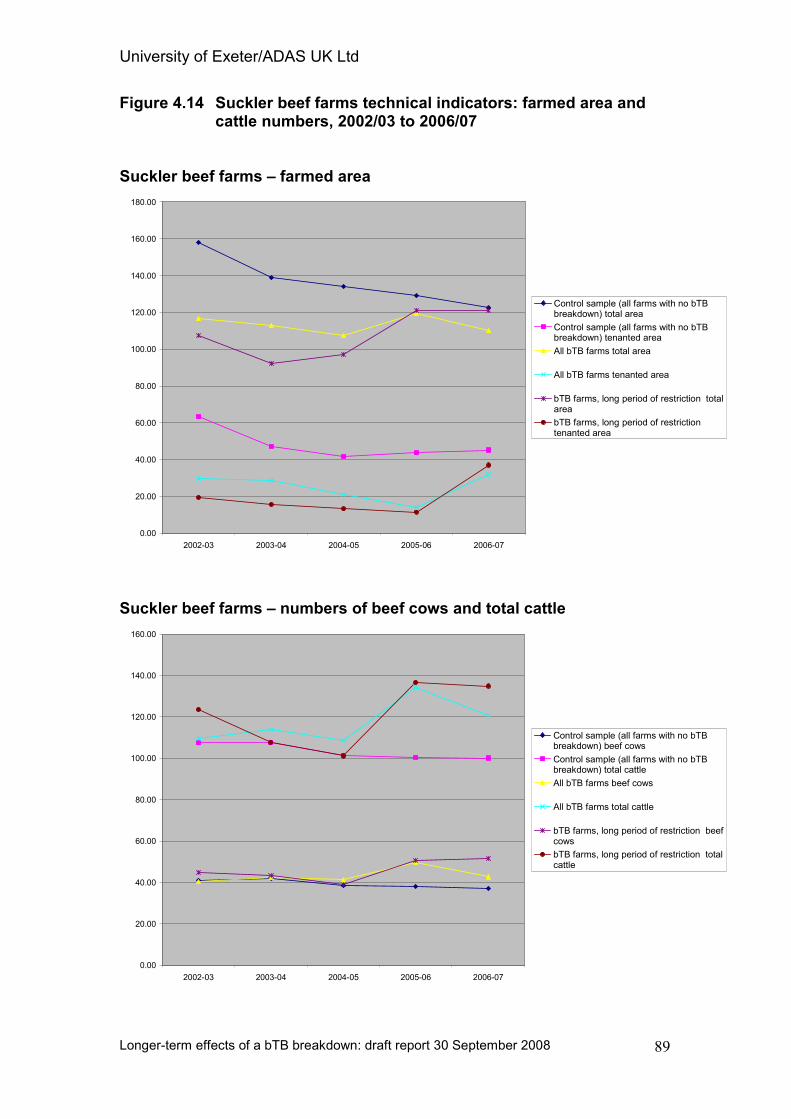
University of Exeter/ADAS UK Ltd
Longer-term effects of a bTB breakdown: draft report 30 September 2008
89
Figure 4.14 Suckler beef farms technical indicators: farmed area and cattle numbers, 2002/03 to 2006/07
Suckler beef farms – farmed area
0.00
20.00
40.00
60.00
80.00
100.00
120.00
140.00
160.00
180.00
2002-03 2003-04 2004-05 2005-06 2006-07
Control sample (all farms with no bTBbreakdown) total area
Control sample (all farms with no bTBbreakdown) tenanted area
All bTB farms total area
All bTB farms tenanted area
bTB farms, long period of restriction totalarea
bTB farms, long period of restriction tenanted area
Suckler beef farms – numbers of beef cows and total cattle
0.00
20.00
40.00
60.00
80.00
100.00
120.00
140.00
160.00
2002-03 2003-04 2004-05 2005-06 2006-07
Control sample (all farms with no bTBbreakdown) beef cows
Control sample (all farms with no bTBbreakdown) total cattle
All bTB farms beef cows
All bTB farms total cattle
bTB farms, long period of restriction beefcows
bTB farms, long period of restriction totalcattle
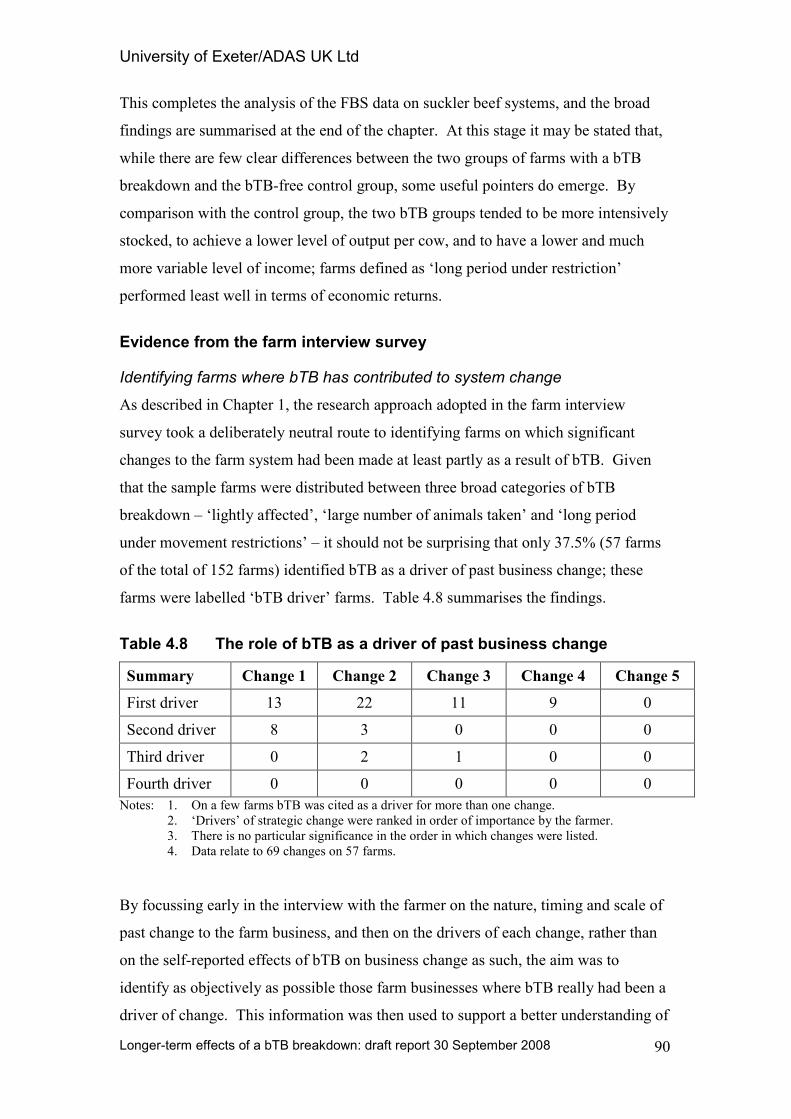
University of Exeter/ADAS UK Ltd
Longer-term effects of a bTB breakdown: draft report 30 September 2008
90
This completes the analysis of the FBS data on suckler beef systems, and the broad
findings are summarised at the end of the chapter. At this stage it may be stated that,
while there are few clear differences between the two groups of farms with a bTB
breakdown and the bTB-free control group, some useful pointers do emerge. By
comparison with the control group, the two bTB groups tended to be more intensively
stocked, to achieve a lower level of output per cow, and to have a lower and much
more variable level of income; farms defined as ‘long period under restriction’
performed least well in terms of economic returns.
Evidence from the farm interview survey
Identifying farms where bTB has contributed to system change
As described in Chapter 1, the research approach adopted in the farm interview
survey took a deliberately neutral route to identifying farms on which significant
changes to the farm system had been made at least partly as a result of bTB. Given
that the sample farms were distributed between three broad categories of bTB
breakdown – ‘lightly affected’, ‘large number of animals taken’ and ‘long period
under movement restrictions’ – it should not be surprising that only 37.5% (57 farms
of the total of 152 farms) identified bTB as a driver of past business change; these
farms were labelled ‘bTB driver’ farms. Table 4.8 summarises the findings.
Table 4.8 The role of bTB as a driver of past business change
Summary Change 1 Change 2 Change 3 Change 4 Change 5
First driver 13 22 11 9 0
Second driver 8 3 0 0 0
Third driver 0 2 1 0 0
Fourth driver 0 0 0 0 0
Notes: 1. On a few farms bTB was cited as a driver for more than one change.
2. ‘Drivers’ of strategic change were ranked in order of importance by the farmer.
3. There is no particular significance in the order in which changes were listed.
4. Data relate to 69 changes on 57 farms.
By focussing early in the interview with the farmer on the nature, timing and scale of
past change to the farm business, and then on the drivers of each change, rather than
on the self-reported effects of bTB on business change as such, the aim was to
identify as objectively as possible those farm businesses where bTB really had been a
driver of change. This information was then used to support a better understanding of
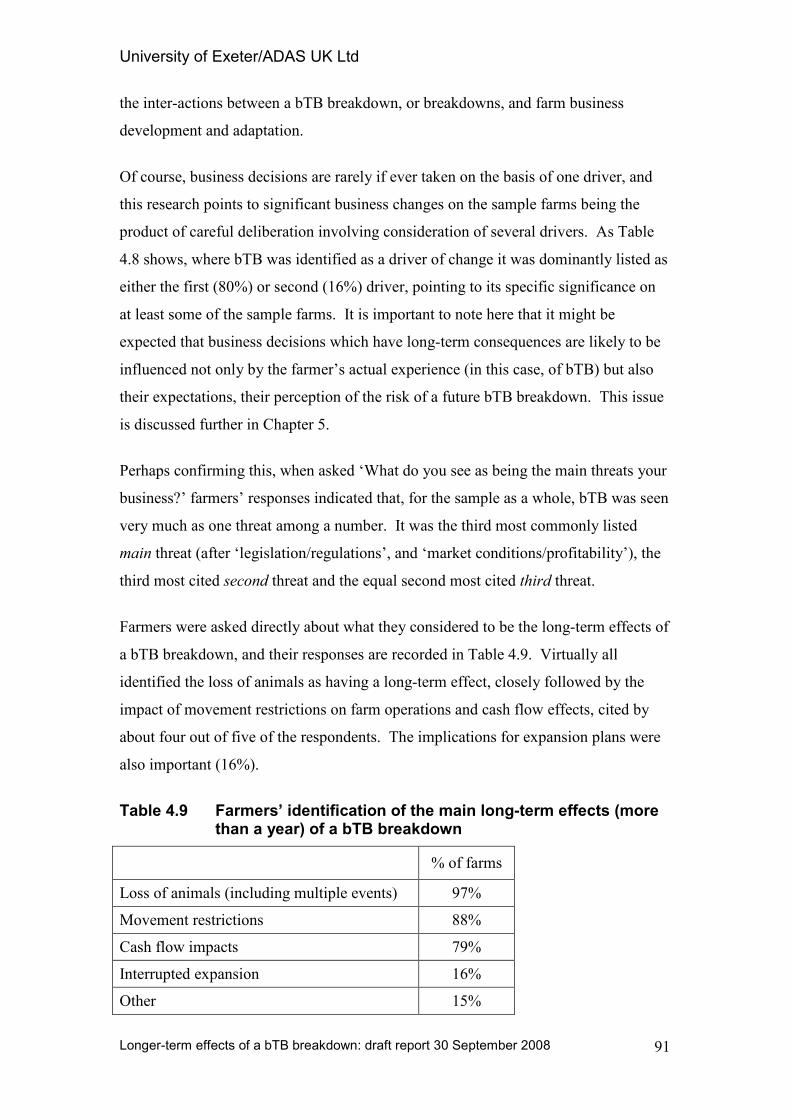
University of Exeter/ADAS UK Ltd
Longer-term effects of a bTB breakdown: draft report 30 September 2008
91
the inter-actions between a bTB breakdown, or breakdowns, and farm business
development and adaptation.
Of course, business decisions are rarely if ever taken on the basis of one driver, and
this research points to significant business changes on the sample farms being the
product of careful deliberation involving consideration of several drivers. As Table
4.8 shows, where bTB was identified as a driver of change it was dominantly listed as
either the first (80%) or second (16%) driver, pointing to its specific significance on
at least some of the sample farms. It is important to note here that it might be
expected that business decisions which have long-term consequences are likely to be
influenced not only by the farmer’s actual experience (in this case, of bTB) but also
their expectations, their perception of the risk of a future bTB breakdown. This issue
is discussed further in Chapter 5.
Perhaps confirming this, when asked ‘What do you see as being the main threats your
business?’ farmers’ responses indicated that, for the sample as a whole, bTB was seen
very much as one threat among a number. It was the third most commonly listed
main threat (after ‘legislation/regulations’, and ‘market conditions/profitability’), the
third most cited second threat and the equal second most cited third threat.
Farmers were asked directly about what they considered to be the long-term effects of
a bTB breakdown, and their responses are recorded in Table 4.9. Virtually all
identified the loss of animals as having a long-term effect, closely followed by the
impact of movement restrictions on farm operations and cash flow effects, cited by
about four out of five of the respondents. The implications for expansion plans were
also important (16%).
Table 4.9 Farmers’ identification of the main long-term effects (more than a year) of a bTB breakdown
% of farms
Loss of animals (including multiple events) 97%
Movement restrictions 88%
Cash flow impacts 79%
Interrupted expansion 16%
Other 15%
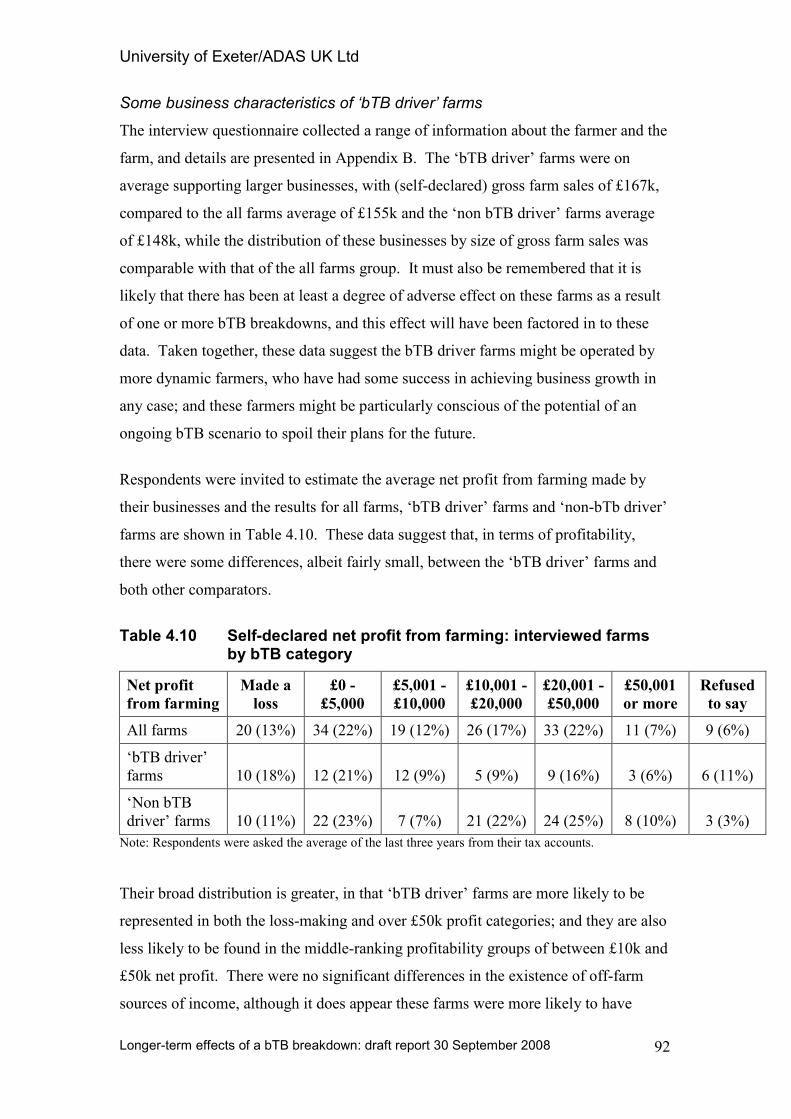
University of Exeter/ADAS UK Ltd
Longer-term effects of a bTB breakdown: draft report 30 September 2008
92
Some business characteristics of ‘bTB driver’ farms
The interview questionnaire collected a range of information about the farmer and the
farm, and details are presented in Appendix B. The ‘bTB driver’ farms were on
average supporting larger businesses, with (self-declared) gross farm sales of £167k,
compared to the all farms average of £155k and the ‘non bTB driver’ farms average
of £148k, while the distribution of these businesses by size of gross farm sales was
comparable with that of the all farms group. It must also be remembered that it is
likely that there has been at least a degree of adverse effect on these farms as a result
of one or more bTB breakdowns, and this effect will have been factored in to these
data. Taken together, these data suggest the bTB driver farms might be operated by
more dynamic farmers, who have had some success in achieving business growth in
any case; and these farmers might be particularly conscious of the potential of an
ongoing bTB scenario to spoil their plans for the future.
Respondents were invited to estimate the average net profit from farming made by
their businesses and the results for all farms, ‘bTB driver’ farms and ‘non-bTb driver’
farms are shown in Table 4.10. These data suggest that, in terms of profitability,
there were some differences, albeit fairly small, between the ‘bTB driver’ farms and
both other comparators.
Table 4.10 Self-declared net profit from farming: interviewed farms by bTB category
Net profit
from farming
Made a
loss
£0 -
£5,000
£5,001 -
£10,000
£10,001 -
£20,000
£20,001 -
£50,000
£50,001
or more
Refused
to say
All farms 20 (13%) 34 (22%) 19 (12%) 26 (17%) 33 (22%) 11 (7%) 9 (6%)
‘bTB driver’
farms 10 (18%) 12 (21%) 12 (9%) 5 (9%) 9 (16%) 3 (6%) 6 (11%)
‘Non bTB
driver’ farms 10 (11%) 22 (23%) 7 (7%) 21 (22%) 24 (25%) 8 (10%) 3 (3%)
Note: Respondents were asked the average of the last three years from their tax accounts.
Their broad distribution is greater, in that ‘bTB driver’ farms are more likely to be
represented in both the loss-making and over £50k profit categories; and they are also
less likely to be found in the middle-ranking profitability groups of between £10k and
£50k net profit. There were no significant differences in the existence of off-farm
sources of income, although it does appear these farms were more likely to have
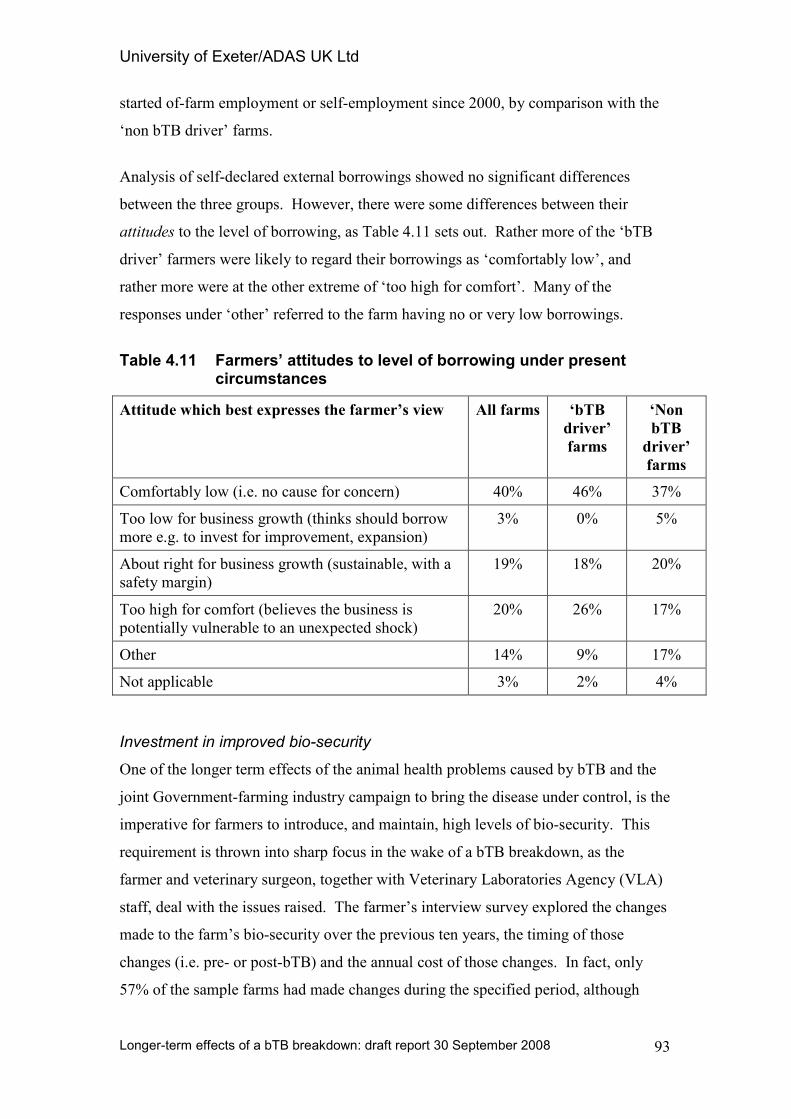
University of Exeter/ADAS UK Ltd
Longer-term effects of a bTB breakdown: draft report 30 September 2008
93
started of-farm employment or self-employment since 2000, by comparison with the
‘non bTB driver’ farms.
Analysis of self-declared external borrowings showed no significant differences
between the three groups. However, there were some differences between their
attitudes to the level of borrowing, as Table 4.11 sets out. Rather more of the ‘bTB
driver’ farmers were likely to regard their borrowings as ‘comfortably low’, and
rather more were at the other extreme of ‘too high for comfort’. Many of the
responses under ‘other’ referred to the farm having no or very low borrowings.
Table 4.11 Farmers’ attitudes to level of borrowing under present circumstances
Attitude which best expresses the farmer’s view All farms ‘bTB
driver’
farms
‘Non
bTB
driver’
farms
Comfortably low (i.e. no cause for concern) 40% 46% 37%
Too low for business growth (thinks should borrow
more e.g. to invest for improvement, expansion)
3% 0% 5%
About right for business growth (sustainable, with a
safety margin)
19% 18% 20%
Too high for comfort (believes the business is
potentially vulnerable to an unexpected shock)
20% 26% 17%
Other 14% 9% 17%
Not applicable 3% 2% 4%
Investment in improved bio-security
One of the longer term effects of the animal health problems caused by bTB and the
joint Government-farming industry campaign to bring the disease under control, is the
imperative for farmers to introduce, and maintain, high levels of bio-security. This
requirement is thrown into sharp focus in the wake of a bTB breakdown, as the
farmer and veterinary surgeon, together with Veterinary Laboratories Agency (VLA)
staff, deal with the issues raised. The farmer’s interview survey explored the changes
made to the farm’s bio-security over the previous ten years, the timing of those
changes (i.e. pre- or post-bTB) and the annual cost of those changes. In fact, only
57% of the sample farms had made changes during the specified period, although
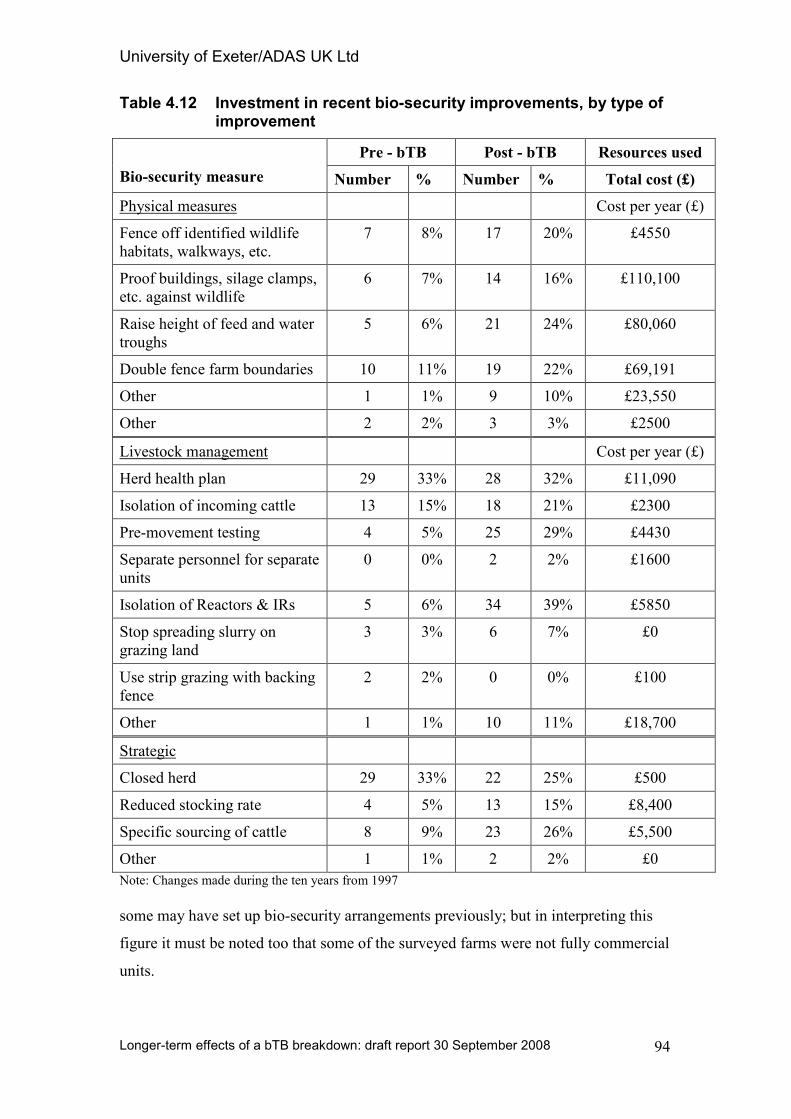
University of Exeter/ADAS UK Ltd
Longer-term effects of a bTB breakdown: draft report 30 September 2008
94
Table 4.12 Investment in recent bio-security improvements, by type of improvement
Pre - bTB Post - bTB Resources used
Bio-security measure Number % Number % Total cost (£)
Physical measures Cost per year (£)
Fence off identified wildlife
habitats, walkways, etc.
7 8% 17 20% £4550
Proof buildings, silage clamps,
etc. against wildlife
6 7% 14 16% £110,100
Raise height of feed and water
troughs
5 6% 21 24% £80,060
Double fence farm boundaries 10 11% 19 22% £69,191
Other 1 1% 9 10% £23,550
Other 2 2% 3 3% £2500
Livestock management Cost per year (£)
Herd health plan 29 33% 28 32% £11,090
Isolation of incoming cattle 13 15% 18 21% £2300
Pre-movement testing 4 5% 25 29% £4430
Separate personnel for separate
units
0 0% 2 2% £1600
Isolation of Reactors & IRs 5 6% 34 39% £5850
Stop spreading slurry on
grazing land
3 3% 6 7% £0
Use strip grazing with backing
fence
2 2% 0 0% £100
Other 1 1% 10 11% £18,700
Strategic
Closed herd 29 33% 22 25% £500
Reduced stocking rate 4 5% 13 15% £8,400
Specific sourcing of cattle 8 9% 23 26% £5,500
Other 1 1% 2 2% £0
Note: Changes made during the ten years from 1997
some may have set up bio-security arrangements previously; but in interpreting this
figure it must be noted too that some of the surveyed farms were not fully commercial
units.
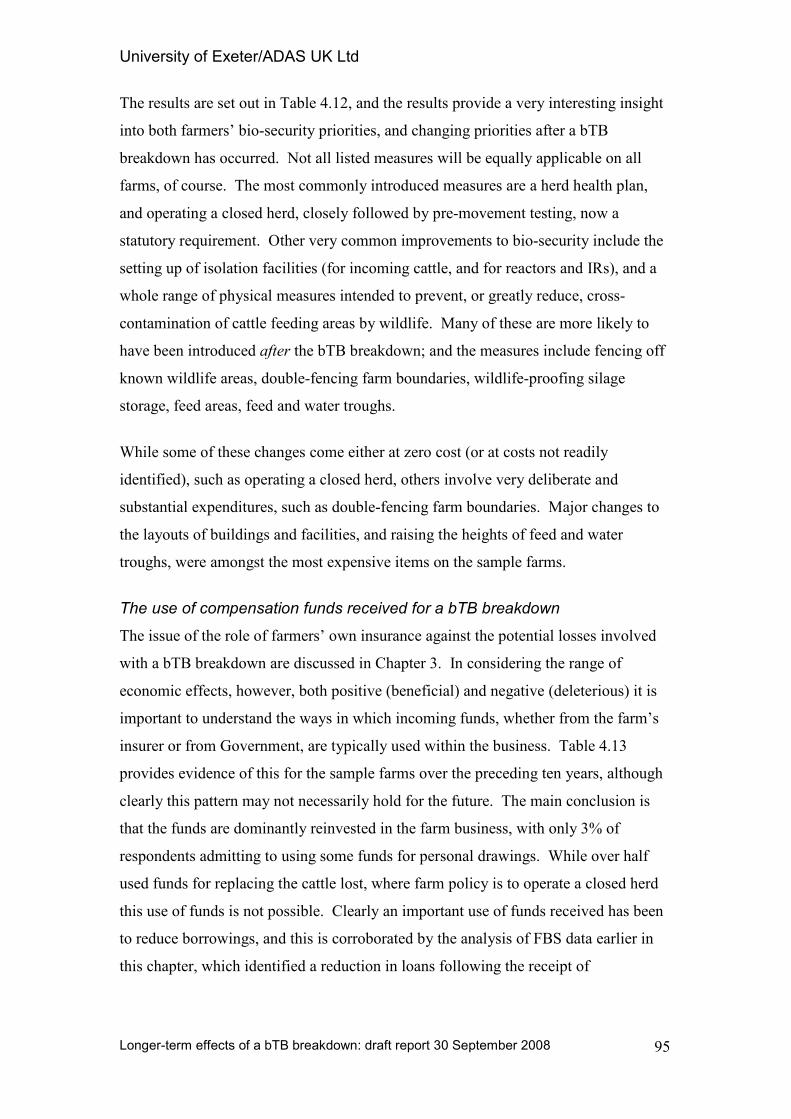
University of Exeter/ADAS UK Ltd
Longer-term effects of a bTB breakdown: draft report 30 September 2008
95
The results are set out in Table 4.12, and the results provide a very interesting insight
into both farmers’ bio-security priorities, and changing priorities after a bTB
breakdown has occurred. Not all listed measures will be equally applicable on all
farms, of course. The most commonly introduced measures are a herd health plan,
and operating a closed herd, closely followed by pre-movement testing, now a
statutory requirement. Other very common improvements to bio-security include the
setting up of isolation facilities (for incoming cattle, and for reactors and IRs), and a
whole range of physical measures intended to prevent, or greatly reduce, cross-
contamination of cattle feeding areas by wildlife. Many of these are more likely to
have been introduced after the bTB breakdown; and the measures include fencing off
known wildlife areas, double-fencing farm boundaries, wildlife-proofing silage
storage, feed areas, feed and water troughs.
While some of these changes come either at zero cost (or at costs not readily
identified), such as operating a closed herd, others involve very deliberate and
substantial expenditures, such as double-fencing farm boundaries. Major changes to
the layouts of buildings and facilities, and raising the heights of feed and water
troughs, were amongst the most expensive items on the sample farms.
The use of compensation funds received for a bTB breakdown
The issue of the role of farmers’ own insurance against the potential losses involved
with a bTB breakdown are discussed in Chapter 3. In considering the range of
economic effects, however, both positive (beneficial) and negative (deleterious) it is
important to understand the ways in which incoming funds, whether from the farm’s
insurer or from Government, are typically used within the business. Table 4.13
provides evidence of this for the sample farms over the preceding ten years, although
clearly this pattern may not necessarily hold for the future. The main conclusion is
that the funds are dominantly reinvested in the farm business, with only 3% of
respondents admitting to using some funds for personal drawings. While over half
used funds for replacing the cattle lost, where farm policy is to operate a closed herd
this use of funds is not possible. Clearly an important use of funds received has been
to reduce borrowings, and this is corroborated by the analysis of FBS data earlier in
this chapter, which identified a reduction in loans following the receipt of
University of Exeter/ADAS UK Ltd
Longer-term effects of a bTB breakdown: draft report 30 September 2008
96
Table 4.13 Use of funds received for compensation/insurance
Replacing livestock lost because of the bTB breakdown 53%
Reducing farm borrowings 20%
Investing in business assets (land, buildings, etc., machinery) 7%
Making other changes to the business 3%
Increased drawings from the business (e.g. holiday) 3%
Cumulative amounts not significant 8%
Other 26%
Note: more than one may apply for a given farm (‘all that apply’)
compensation. It is likely that this group of farms includes both those where
borrowings may have been seen to be too high prior to the bTB breakdown, and those
where an ex post assessment has suggested that the prudent level of borrowing has
been lowered because of perceptions of higher risks of a further breakdown.
Farmers’ perceptions of risk are considered in Chapter 6.
The farm-level impacts of livestock movement restrictions
The imposition of movement restrictions following the identification of a bTB reactor
has long been identified as having a potentially very significant effect on the
operation of a farm. These effects go far beyond the immediate implications for day-
to-day management, because they can seriously affect the farming system (see the
discussion of this issue in Chapter 2; and Temple and Tuer, 2001). The study
findings on this issue are summarised in Table 4.14, which shows both the proportion
of farms identifying the individual effect and the aggregate assessment of the
financial significance of the effect. These data need little elaboration but it is useful
to point to a number of important findings:
• First, it is clear that none of the identified impacts are felt across all, or nearly
all, farms; this in itself implies a considerable diversity of impacts at farm level.
• Most of the most widely experienced impacts are directly related to the feeding of the
cattle, and it seems fairly clear that this is a consequence of being unable to sell cattle
when planned.
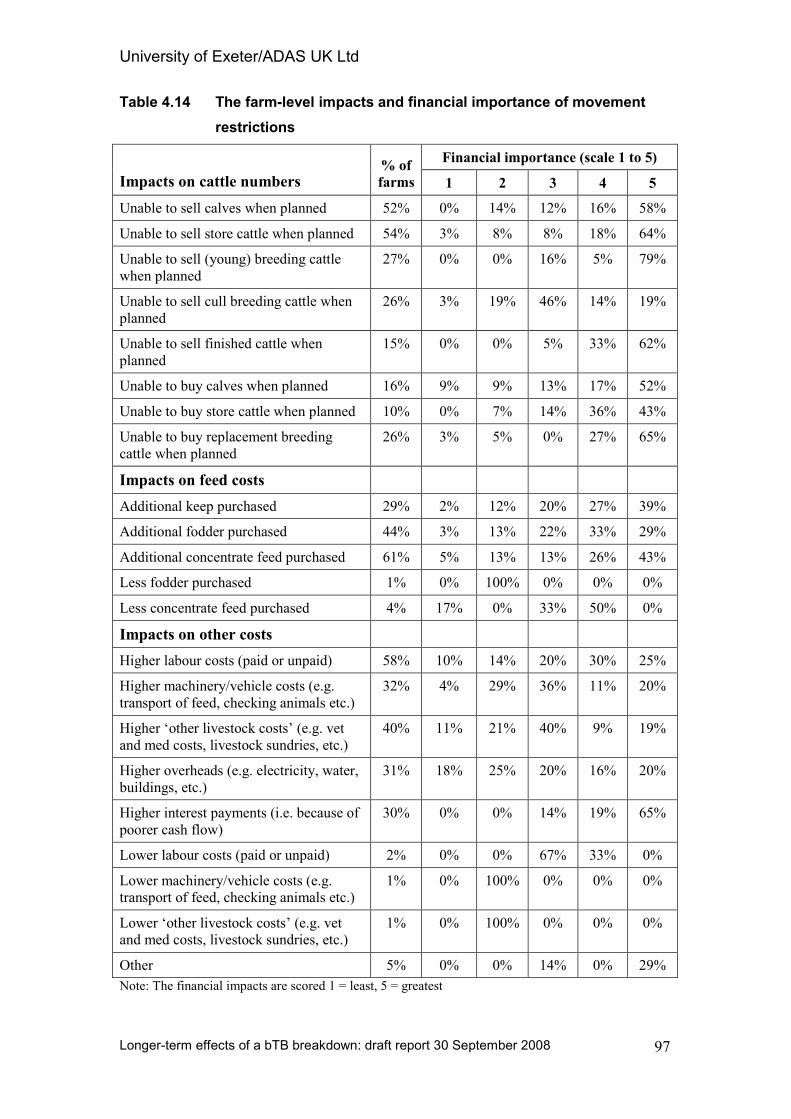
University of Exeter/ADAS UK Ltd
Longer-term effects of a bTB breakdown: draft report 30 September 2008
97
Table 4.14 The farm-level impacts and financial importance of movement
restrictions
Financial importance (scale 1 to 5)
Impacts on cattle numbers % of
farms 1 2 3 4 5
Unable to sell calves when planned 52% 0% 14% 12% 16% 58%
Unable to sell store cattle when planned 54% 3% 8% 8% 18% 64%
Unable to sell (young) breeding cattle
when planned
27% 0% 0% 16% 5% 79%
Unable to sell cull breeding cattle when
planned
26% 3% 19% 46% 14% 19%
Unable to sell finished cattle when
planned
15% 0% 0% 5% 33% 62%
Unable to buy calves when planned 16% 9% 9% 13% 17% 52%
Unable to buy store cattle when planned 10% 0% 7% 14% 36% 43%
Unable to buy replacement breeding
cattle when planned
26% 3% 5% 0% 27% 65%
Impacts on feed costs
Additional keep purchased 29% 2% 12% 20% 27% 39%
Additional fodder purchased 44% 3% 13% 22% 33% 29%
Additional concentrate feed purchased 61% 5% 13% 13% 26% 43%
Less fodder purchased 1% 0% 100% 0% 0% 0%
Less concentrate feed purchased 4% 17% 0% 33% 50% 0%
Impacts on other costs
Higher labour costs (paid or unpaid) 58% 10% 14% 20% 30% 25%
Higher machinery/vehicle costs (e.g.
transport of feed, checking animals etc.)
32% 4% 29% 36% 11% 20%
Higher ‘other livestock costs’ (e.g. vet
and med costs, livestock sundries, etc.)
40% 11% 21% 40% 9% 19%
Higher overheads (e.g. electricity, water,
buildings, etc.)
31% 18% 25% 20% 16% 20%
Higher interest payments (i.e. because of
poorer cash flow)
30% 0% 0% 14% 19% 65%
Lower labour costs (paid or unpaid) 2% 0% 0% 67% 33% 0%
Lower machinery/vehicle costs (e.g.
transport of feed, checking animals etc.)
1% 0% 100% 0% 0% 0%
Lower ‘other livestock costs’ (e.g. vet
and med costs, livestock sundries, etc.)
1% 0% 100% 0% 0% 0%
Other 5% 0% 0% 14% 0% 29%
Note: The financial impacts are scored 1 = least, 5 = greatest
University of Exeter/ADAS UK Ltd
Longer-term effects of a bTB breakdown: draft report 30 September 2008
98
• Significant proportions of respondents reported potentially serious effects on their
farming system, including both selling and purchasing cattle (irrespective of age,
depending on system)
• Adverse financial impacts are also generated by higher costs across a wide range of
resources: labour, vehicle and machinery, other livestock costs, overheads, and interest
payments.
• In terms of the ranking of these effects by their financial importance within the
business, the most widely cited for the heaviest impact (score = 5) are additional feed
costs of all categories for the additional animals
• A very high proportion of farmers’ rated higher interest charges as a ‘5’, probably an
almost inevitable result of the poorer cash flows resulting from disrupted selling (and
purchasing) patterns.
• The financial impacts of changes in the wide range of other costs were typically rated
rather lower, ‘3’ or ‘4’ being very common, although for a substantial minority of
farms changes in these costs can be very significant.
The effects of livestock movement restrictions, though clearly a vital tool in the
disease management strategy, can in some instances have far-reaching implications;
and this is particularly likely where the farm concerned is about to enter a period of
strategic change. Case Study D illustrates one such example.
Case Study D – dairying This dairy farm had not experienced a bTB breakdown until early 2007, when one cow went down with bTB. Even though it was only one cow, the experience has caused a lot of stress, additional costs, adversely affecting the farm’s income and has changed some of the farmers’ plans. At the time of the bTB breakdown, the farm was already going through a period of change with new plans for the business at a fairly advanced stage. The farmers had arranged to sell the dairy herd completely, and were planning to set up a new enterprise buying and rearing dairy young stock for sale as down-calving dairy replacements. Due to the farm being under bTB restrictions since the breakdown, they have not been able to start selling the young stock leaving the farmer with no income since January, the dairy herd having been sold. Consequently, the farmer himself has had to start relief milking to bring in an income. This was not part of their original plan.
This part of the study identifies the nature, incidence and perceived financial
importance of the full range of effects felt at farm level under cattle movement
restrictions. The emerging picture is one of very considerable disruption to the
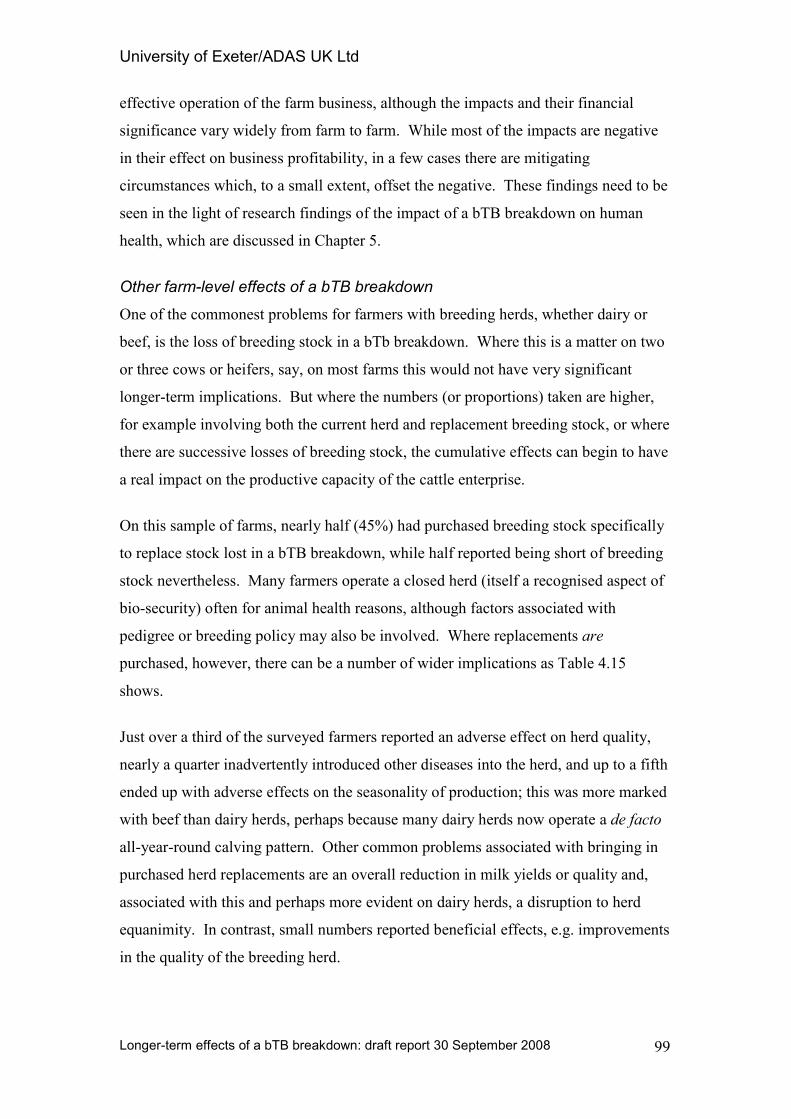
University of Exeter/ADAS UK Ltd
Longer-term effects of a bTB breakdown: draft report 30 September 2008
99
effective operation of the farm business, although the impacts and their financial
significance vary widely from farm to farm. While most of the impacts are negative
in their effect on business profitability, in a few cases there are mitigating
circumstances which, to a small extent, offset the negative. These findings need to be
seen in the light of research findings of the impact of a bTB breakdown on human
health, which are discussed in Chapter 5.
Other farm-level effects of a bTB breakdown
One of the commonest problems for farmers with breeding herds, whether dairy or
beef, is the loss of breeding stock in a bTb breakdown. Where this is a matter on two
or three cows or heifers, say, on most farms this would not have very significant
longer-term implications. But where the numbers (or proportions) taken are higher,
for example involving both the current herd and replacement breeding stock, or where
there are successive losses of breeding stock, the cumulative effects can begin to have
a real impact on the productive capacity of the cattle enterprise.
On this sample of farms, nearly half (45%) had purchased breeding stock specifically
to replace stock lost in a bTB breakdown, while half reported being short of breeding
stock nevertheless. Many farmers operate a closed herd (itself a recognised aspect of
bio-security) often for animal health reasons, although factors associated with
pedigree or breeding policy may also be involved. Where replacements are
purchased, however, there can be a number of wider implications as Table 4.15
shows.
Just over a third of the surveyed farmers reported an adverse effect on herd quality,
nearly a quarter inadvertently introduced other diseases into the herd, and up to a fifth
ended up with adverse effects on the seasonality of production; this was more marked
with beef than dairy herds, perhaps because many dairy herds now operate a de facto
all-year-round calving pattern. Other common problems associated with bringing in
purchased herd replacements are an overall reduction in milk yields or quality and,
associated with this and perhaps more evident on dairy herds, a disruption to herd
equanimity. In contrast, small numbers reported beneficial effects, e.g. improvements
in the quality of the breeding herd.
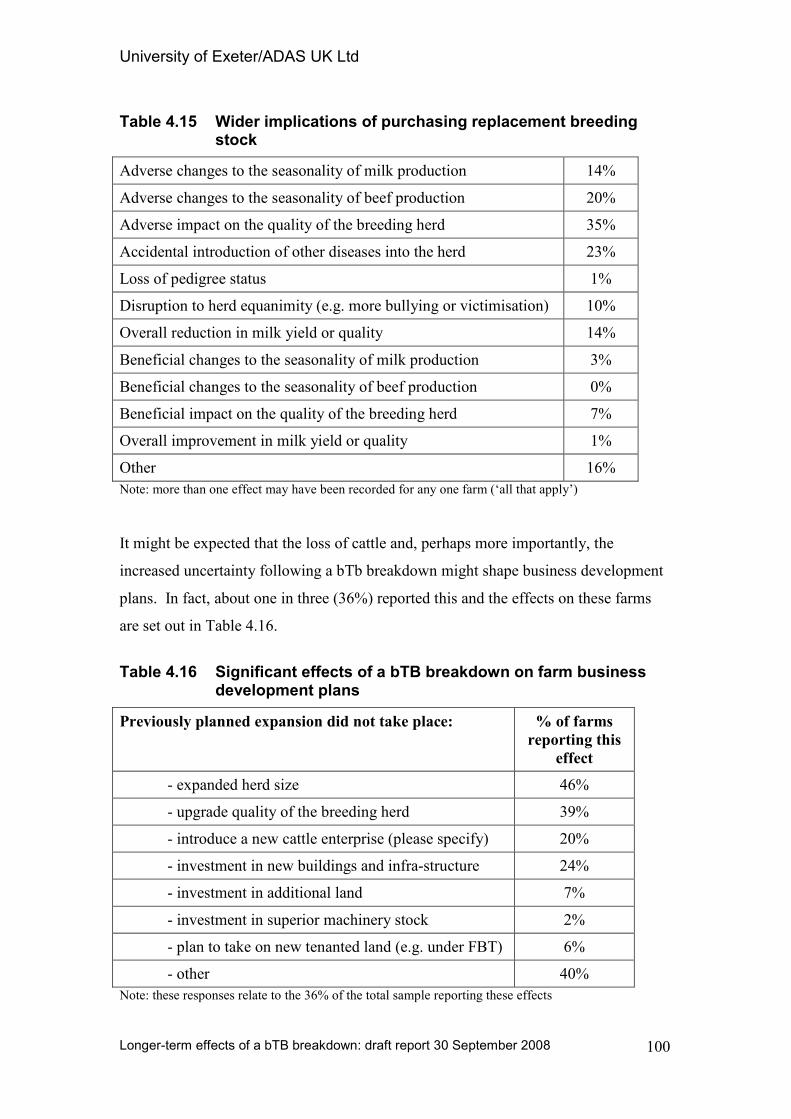
University of Exeter/ADAS UK Ltd
Longer-term effects of a bTB breakdown: draft report 30 September 2008
100
Table 4.15 Wider implications of purchasing replacement breeding stock
Adverse changes to the seasonality of milk production 14%
Adverse changes to the seasonality of beef production 20%
Adverse impact on the quality of the breeding herd 35%
Accidental introduction of other diseases into the herd 23%
Loss of pedigree status 1%
Disruption to herd equanimity (e.g. more bullying or victimisation) 10%
Overall reduction in milk yield or quality 14%
Beneficial changes to the seasonality of milk production 3%
Beneficial changes to the seasonality of beef production 0%
Beneficial impact on the quality of the breeding herd 7%
Overall improvement in milk yield or quality 1%
Other 16%
Note: more than one effect may have been recorded for any one farm (‘all that apply’)
It might be expected that the loss of cattle and, perhaps more importantly, the
increased uncertainty following a bTb breakdown might shape business development
plans. In fact, about one in three (36%) reported this and the effects on these farms
are set out in Table 4.16.
Table 4.16 Significant effects of a bTB breakdown on farm business development plans
Previously planned expansion did not take place: % of farms
reporting this
effect
- expanded herd size 46%
- upgrade quality of the breeding herd 39%
- introduce a new cattle enterprise (please specify) 20%
- investment in new buildings and infra-structure 24%
- investment in additional land 7%
- investment in superior machinery stock 2%
- plan to take on new tenanted land (e.g. under FBT) 6%
- other 40%
Note: these responses relate to the 36% of the total sample reporting these effects
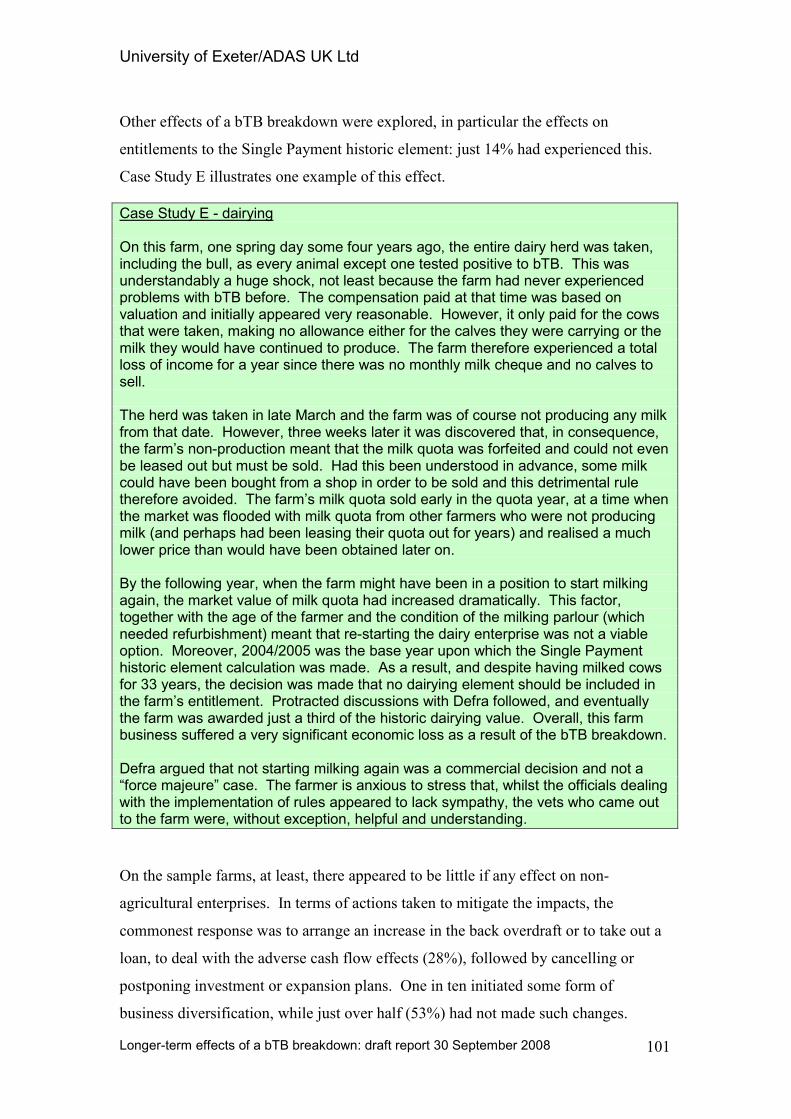
University of Exeter/ADAS UK Ltd
Longer-term effects of a bTB breakdown: draft report 30 September 2008
101
Other effects of a bTB breakdown were explored, in particular the effects on
entitlements to the Single Payment historic element: just 14% had experienced this.
Case Study E illustrates one example of this effect.
Case Study E - dairying On this farm, one spring day some four years ago, the entire dairy herd was taken, including the bull, as every animal except one tested positive to bTB. This was understandably a huge shock, not least because the farm had never experienced problems with bTB before. The compensation paid at that time was based on valuation and initially appeared very reasonable. However, it only paid for the cows that were taken, making no allowance either for the calves they were carrying or the milk they would have continued to produce. The farm therefore experienced a total loss of income for a year since there was no monthly milk cheque and no calves to sell. The herd was taken in late March and the farm was of course not producing any milk from that date. However, three weeks later it was discovered that, in consequence, the farm’s non-production meant that the milk quota was forfeited and could not even be leased out but must be sold. Had this been understood in advance, some milk could have been bought from a shop in order to be sold and this detrimental rule therefore avoided. The farm’s milk quota sold early in the quota year, at a time when the market was flooded with milk quota from other farmers who were not producing milk (and perhaps had been leasing their quota out for years) and realised a much lower price than would have been obtained later on. By the following year, when the farm might have been in a position to start milking again, the market value of milk quota had increased dramatically. This factor, together with the age of the farmer and the condition of the milking parlour (which needed refurbishment) meant that re-starting the dairy enterprise was not a viable option. Moreover, 2004/2005 was the base year upon which the Single Payment historic element calculation was made. As a result, and despite having milked cows for 33 years, the decision was made that no dairying element should be included in the farm’s entitlement. Protracted discussions with Defra followed, and eventually the farm was awarded just a third of the historic dairying value. Overall, this farm business suffered a very significant economic loss as a result of the bTB breakdown. Defra argued that not starting milking again was a commercial decision and not a “force majeure” case. The farmer is anxious to stress that, whilst the officials dealing with the implementation of rules appeared to lack sympathy, the vets who came out to the farm were, without exception, helpful and understanding.
On the sample farms, at least, there appeared to be little if any effect on non-
agricultural enterprises. In terms of actions taken to mitigate the impacts, the
commonest response was to arrange an increase in the back overdraft or to take out a
loan, to deal with the adverse cash flow effects (28%), followed by cancelling or
postponing investment or expansion plans. One in ten initiated some form of
business diversification, while just over half (53%) had not made such changes.
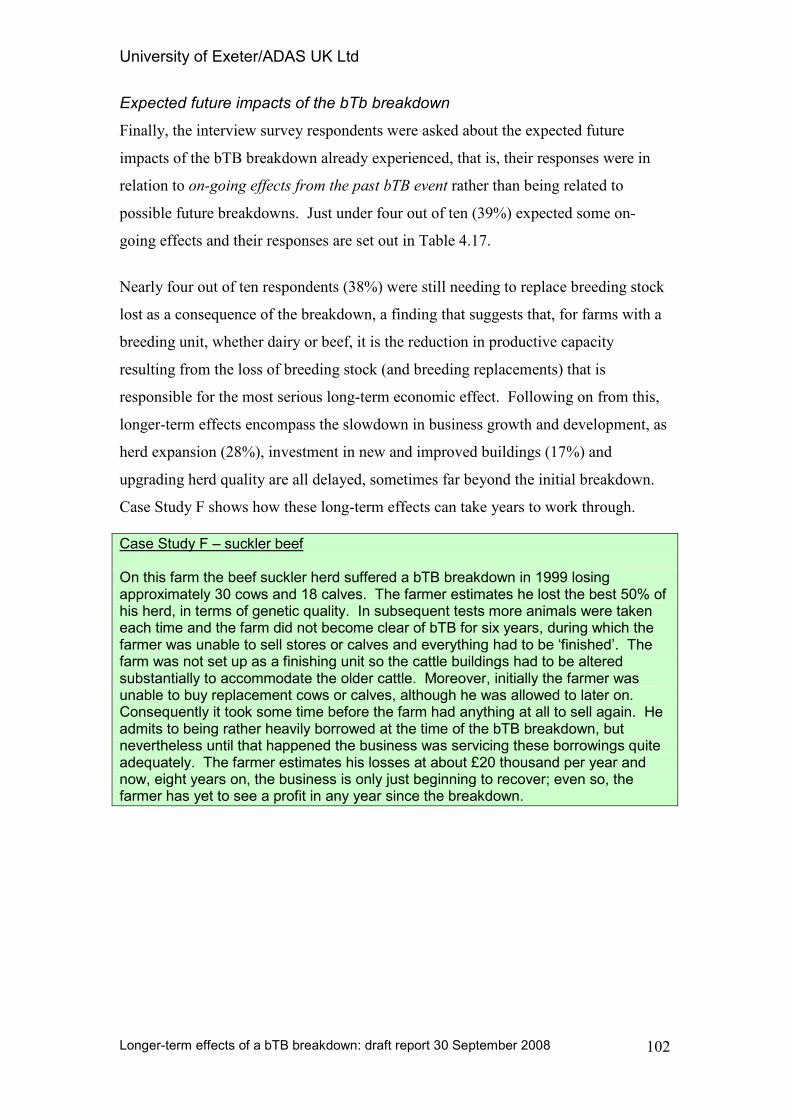
University of Exeter/ADAS UK Ltd
Longer-term effects of a bTB breakdown: draft report 30 September 2008
102
Expected future impacts of the bTb breakdown
Finally, the interview survey respondents were asked about the expected future
impacts of the bTB breakdown already experienced, that is, their responses were in
relation to on-going effects from the past bTB event rather than being related to
possible future breakdowns. Just under four out of ten (39%) expected some on-
going effects and their responses are set out in Table 4.17.
Nearly four out of ten respondents (38%) were still needing to replace breeding stock
lost as a consequence of the breakdown, a finding that suggests that, for farms with a
breeding unit, whether dairy or beef, it is the reduction in productive capacity
resulting from the loss of breeding stock (and breeding replacements) that is
responsible for the most serious long-term economic effect. Following on from this,
longer-term effects encompass the slowdown in business growth and development, as
herd expansion (28%), investment in new and improved buildings (17%) and
upgrading herd quality are all delayed, sometimes far beyond the initial breakdown.
Case Study F shows how these long-term effects can take years to work through.
Case Study F – suckler beef On this farm the beef suckler herd suffered a bTB breakdown in 1999 losing approximately 30 cows and 18 calves. The farmer estimates he lost the best 50% of his herd, in terms of genetic quality. In subsequent tests more animals were taken each time and the farm did not become clear of bTB for six years, during which the farmer was unable to sell stores or calves and everything had to be ‘finished’. The farm was not set up as a finishing unit so the cattle buildings had to be altered substantially to accommodate the older cattle. Moreover, initially the farmer was unable to buy replacement cows or calves, although he was allowed to later on. Consequently it took some time before the farm had anything at all to sell again. He admits to being rather heavily borrowed at the time of the bTB breakdown, but nevertheless until that happened the business was servicing these borrowings quite adequately. The farmer estimates his losses at about £20 thousand per year and now, eight years on, the business is only just beginning to recover; even so, the farmer has yet to see a profit in any year since the breakdown.
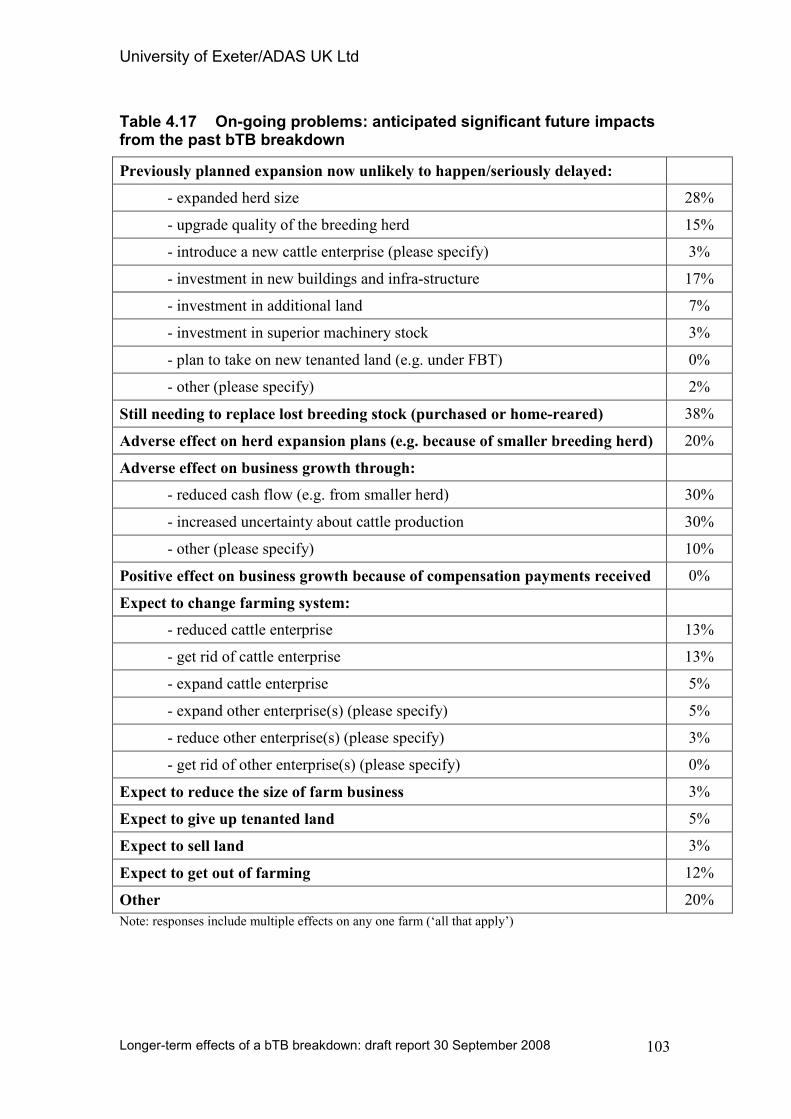
University of Exeter/ADAS UK Ltd
Longer-term effects of a bTB breakdown: draft report 30 September 2008
103
Table 4.17 On-going problems: anticipated significant future impacts from the past bTB breakdown
Previously planned expansion now unlikely to happen/seriously delayed:
- expanded herd size 28%
- upgrade quality of the breeding herd 15%
- introduce a new cattle enterprise (please specify) 3%
- investment in new buildings and infra-structure 17%
- investment in additional land 7%
- investment in superior machinery stock 3%
- plan to take on new tenanted land (e.g. under FBT) 0%
- other (please specify) 2%
Still needing to replace lost breeding stock (purchased or home-reared) 38%
Adverse effect on herd expansion plans (e.g. because of smaller breeding herd) 20%
Adverse effect on business growth through:
- reduced cash flow (e.g. from smaller herd) 30%
- increased uncertainty about cattle production 30%
- other (please specify) 10%
Positive effect on business growth because of compensation payments received 0%
Expect to change farming system:
- reduced cattle enterprise 13%
- get rid of cattle enterprise 13%
- expand cattle enterprise 5%
- expand other enterprise(s) (please specify) 5%
- reduce other enterprise(s) (please specify) 3%
- get rid of other enterprise(s) (please specify) 0%
Expect to reduce the size of farm business 3%
Expect to give up tenanted land 5%
Expect to sell land 3%
Expect to get out of farming 12%
Other 20%
Note: responses include multiple effects on any one farm (‘all that apply’)
University of Exeter/ADAS UK Ltd
Longer-term effects of a bTB breakdown: draft report 30 September 2008
104
These wider long-term effects include on-going adverse effects on cash flow (30%)
and, crucially, increased uncertainty about the reliability of cattle production (30%).
Expectations about the future were so dire for some that they were either going to
make radical changes to their farming system (13% ‘reduce scale of cattle enterprise’
and 13% ‘get rid of cattle enterprise’) or even get out of farming altogether (12%).
Looking to the future, ‘bTB driver’ farms were more likely than others in expecting
to cancel or postpone investment in livestock, premises or equipment.
Summary of responses from the postal survey
The postal survey utilising the GHQ-12 approach to assessing psychiatric morbidity
is reported in detail in Chapter 5, and the purpose here is simply to highlight the few
pointers to longer-term economic effects that emerge from that study. Three in
particular bear repetition here, because of the obvious linkage between the adverse
economic effects on the farm family’s livelihood and the levels of stress recorded for
the people concerned:
• Overall, the highest stress levels are seen on farms which have been under
livestock movement restrictions for a long period.
• However, on dairy farms, where people are generally more stressed than on
beef farms, the greatest stressor is the loss of a large number of cattle.
• For farmers, a bTB breakdown causes significant stress: this is highest for
dairy farmers, especially where they have lost a large number of cattle; while
for both trading beef and suckler beef farmers, a long period under restriction
is the greater stressor.
Taken together, the findings form these very different parts of the overall research
programme point to a clear linkage between the longer-term economic impacts of a
bTB breakdown on the operation and, ultimately, the performance of the farm
business on the one hand, and the implications of these problems for the people
whose livelihoods are affected – the farmers, their spouses and, to some degree, the
other people who work on the farm. These economic effects are not uniformly
experienced, since their impact on the individual farm depends on the farming
system, the scale and timing of the breakdown, and the stage of business development
at which that business is when the breakdown occurs. An example of the complexity
University of Exeter/ADAS UK Ltd
Longer-term effects of a bTB breakdown: draft report 30 September 2008
105
and persistence of the consequential effects over the longer term, following a bTB
breakdown, is provided by Case Study G.
Case Study G - dairying This farmer lost all his livestock to FMD in 2001 and re-stocked with dairy cows only. During the first whole farm bTB test in 2002 he had several reactors and this trend has continued over the past five years; and the farm has remained constantly closed during the whole of this period. His experience has been an average of eight milking cows being taken with every 60 day test and between 10-15 beef animals also reacting during a calendar year. At one test, 18 milking cows were taken. This has been having a dramatic and ongoing effect on the volume of milk sold, which in turn has had a knock-on effect on milk price. Most of the dairy cows taken have also been either heavily in-calf, newly calved or fresh milkers and so the economic effect has been at its maximum: the farm kept these cows through the calving season only to lose them before they were producing any milk. This farmer is allowed to purchase cattle to replace those lost to bTB in order to maintain his herd size When the compensation levels were based upon independent valuation this farmer believes he was receiving fair price for his pedigree stock. He has invested heavily in high yielding pedigree cows since 2002, with some cattle being worth tens of thousands of pounds. The compensation paid adequately covered the cost of replacement with similar quality animals. However, since the compensation grid was introduced in 2006, this farmer has suffered serious financial difficulties. With on average eight cows going every 60 days and only receiving in the region of £1200 for pedigree cattle he has been forced to pay the surplus himself to maintain his pedigree status and good bloodlines. This, in addition to losing up to 200 litres of milk per cow per day has had a serious effect on the farm’s cash flow and borrowings. In total over the past five years, this 160 cow dairy farm has lost in excess of 210 cattle, but only one has had visible lesions at post mortem. This fact only adds to the farmer’s anguish. Another major worry is the uncertain future of the farm’s pedigree breeding stock sales: if and when the farm becomes clean, will its bTB history make a resumption of sales impossible? Further, if the farmer decided he wanted to get out of farming, there is no route to do this apart from slowly reducing cow numbers as they are taken as reactors through not replacing them, and this would also represent a significant loss of income compared with a normal sale.
Conclusions
In terms of the economic effects of a bTB breakdown within a farm business, the
study gives rise to the following main conclusions:
• At Great Britain level, most cattle farms (more than 60%) either have never had
a bTB breakdown or have been clear for many years; and two thirds of those
which have had a breakdown have been only lightly affected.
University of Exeter/ADAS UK Ltd
Longer-term effects of a bTB breakdown: draft report 30 September 2008
106
• The proportion of all bTB breakdowns resulting in more serious farm-level
effects is small but not insignificant: more than a quarter lose significant
numbers of cattle and a further 4% of cases are under livestock movement
restrictions for a long period.
• The proportions of farms with bTB breakdowns, both light and heavier, are
substantially greater in the ‘bTB endemic’ areas.
• Most bTB breakdowns would not be expected to result in longer-term effects on
the farm business - identifiable longer-term economic effects are likely to be
seen on perhaps 10 – 15% of all affected farms.
• The stakeholder consultation identified reduced farm profitability, higher costs,
adverse impacts on calving patterns and inhibited business development. More
widely, loss of confidence and adverse effects on the environment were cited.
• Key findings from the FBS study of dairy farms are:
o Differences in cash flow and FFI between bTB farms and the control
group increased over time, with bTB-affected farms falling behind the
others.
o In terms of NFI, the two bTB groups had a broadly similar income
position to the control group but for M&II the trends are more volatile.
o Overall, in most years and for most income indicators, bTB farms
performed less well than the control group, although the differences
are not large in most years.
o The data suggest bTB farms generally have a higher level of off-farm
income.
o Starting from a similar level, average milk yield on bTB farms fell
behind the steady increase in yields seen in the control group, with a 6-
8% gap by 2006/07.
o The evidence is that farmers (and their spouses) work consistently
longer hours on bTB farms, supporting other findings that a bTB
breakdown can cause considerable additional work over a long period.
o Total cattle numbers increased markedly on ‘long period of restriction’
bTB farms towards the end of the period; and these farms also saw an
increase in their farmed area.
• Key findings from the FBS study of suckler beef farms are:
University of Exeter/ADAS UK Ltd
Longer-term effects of a bTB breakdown: draft report 30 September 2008
107
o The control group (all suckler beef farms) experienced a steady decline
in profitability over the five years from 2002/03.
o Farm incomes on bTB farms are more variable than for the control
sample; and incomes on ‘long period of restriction’ farms are lower
than for ‘all bTB farms’.
o Incomes data are variable: for cash incomes a significantly lower level
of economic performance on the bTB-affected farms, but there is no
consistent pattern for NFI or M&II.
o Overall, farms with a bTB breakdown performed less well in most
years, those under movement restrictions being least profitable. The
bTB farms exhibit much greater annual variability in incomes.
o In most years investment in buildings and net asset purchases was
substantially lower on bTB farms than on the control group of farms.
o The labour input of ‘farmer plus spouse’ was generally lower on bTB
farms than on others, throughout the five year period studied.
o With a smaller average farm size, bTB-affected farms have a
significantly higher stocking rate, consistent with a general increase in
cattle numbers while under movement restrictions.
• The farm interview survey established that strategic business decisions by
farmers typically take a range of factors into account, of which bTB may be
one. Just over a third of the surveyed farms listed bTB as a driver of a specific
business change, and in these cases it was dominantly listed as either the first
(80%) or second (16%) driver.
• Similarly, in terms of business threats, bTB was seen very much as one threat
among a number: it was the third most commonly listed main threat and was
ranked much the same for second and third level threats.
• The main farm interview survey findings are as follows:
o Just over half of the sample farms had made improvements to bio-
security during the previous ten years; some of these had required very
substantial investment, particularly for fencing and physical
improvements to feed storage and feeding areas.
o Funds received as compensation for bTB losses, from government or
insurer, were almost all used within the farm business; in addition to
replacing stock, a common use was to reduce external borrowings.
University of Exeter/ADAS UK Ltd
Longer-term effects of a bTB breakdown: draft report 30 September 2008
108
o Movement restrictions give rise to significant adverse effects, but these
vary greatly. Being unable to sell cattle when planned generates many
of the specific impacts, especially extra feeding costs; also major
disruption of the farming system is common. Adverse financial impacts
are widespread, especially higher interest charges.
o The loss of breeding stock appears a particularly serious consequence
of a bTB breakdown; and if replacements are purchased these often
result in other problems: adverse effects on calving patterns, the
introduction of ‘new’ diseases, a decrease in herd equanimity, a
general fall in yields or milk quality (dairy herds).
o Many farmers expected future consequences from the recorded bTB
breakdown(s). These included needing to replace breeding stock and a
slowdown in business growth and development, sometimes far beyond
the initial breakdown.
• Some of the postal survey findings are related to economic effects. The highest
stress levels are seen on farms which have been under livestock movement
restrictions for a long period; and people on dairy farms are generally more
stressed by a bTB breakdown than those on beef farms; the loss of a large
number of cattle, and being subject to movement restrictions for a long time, are
both notable stressors through their implications for business viability.
University of Exeter/ADAS UK Ltd
Longer-term effects of a bTB breakdown: draft report 30 September 2008
109
5 UNDERSTANDING HEALTH AND SOCIAL EFFECTS
Introduction
The background to this part of the study has been fairly extensively set out in
Chapters 1 and 2 and the purpose here is briefly to set our study, and findings, in its
wider context. Although specific evidence of the implications for human health of
the on-going problem of bTB in many livestock producing areas of the country is
sparse, from the outset it seemed possible that this might largely be because previous
bTB-specific studies had concentrated on short-term impacts (NAO, 2003; Bennett,
2004; Sheppard and Turner, 2005). Indeed, during the last couple of decades or so,
there has been a growing recognition, fuelled by a small but nonetheless significant
number of studies both in the UK and further afield, that have identified the multiple
problems associated with the farming industry as significant causes of stress, and
even suicide, in farmers and the farming workforce. In particular, over recent years
several studies have explored the linkages between farming and adverse impacts on
the mental health and equanimity of farmers, members of farm families and farm
workers (notably Parry, et al, 2005; see also Lobley, et al, 2004).
As the detailed review in Chapter 2 makes clear, much of the UK literature is
concerned with the human consequences of the 2001 FMD epidemic and the long-
running, and continuing, BSE epidemic. Of particular relevance to the present
research, these studies have established that crises with livestock can be amongst the
most stressful events farmers and the farm workforce have to deal with; and that in
this sense livestock farmers whose cattle herds suffer a bTB breakdown are subject to
greater exposure to stressors. Previous research has also shown that livestock crises
are likely to affect not only farmers, but their spouses, any adult children living at
home and farm workers as well.
A number of factors have been identified as driving this affect, including the tight
links human beings often develop when they raise and care for animals, sometimes
over a period of many years, when the untimely loss of such animals can be
University of Exeter/ADAS UK Ltd
Longer-term effects of a bTB breakdown: draft report 30 September 2008
110
profoundly disturbing. Parry et al (2005) conclude that livestock crises ‘provided the
most acute and visible causes of stress’; and further noted that these effects could be
exacerbated where the animals concerned formed part of long blood-lines, where the
animal represents the culmination of an extended breeding programme. It is
important to understand here that although this clearly applies to pedigree livestock,
such connections may also be manifest in the case of the breeders of non-pedigree
livestock: the affect arises because of personal involvement with the ‘family’ of the
livestock concerned, rather than because of the animal’s precise status on a pedigree
register. A finding of particular relevance to the present study was that although the
on-going bTB epidemic had received much less attention from the media (than FMD
and BSE) it nevertheless ‘encompassed a very real fear for many interviewees’: while
less dramatic, its steady attrition of the UK’s cattle population and its lack of
symptoms which made early diagnosis difficult is the cause of much distress (Parry,
et al, 2005).
Moreover, the bTB epidemic has continued apace through a period of considerable
economic and structural change for agriculture, the causes of which have been well-
documented (see, for example, Curry Commission, 2002). As this study’s review of
previous research has highlighted, there are many causes of stress for farmers; and
those associated with the consequences of a livestock disease epidemic, both direct
and indirect, represent further significant sources of stress on top of those common to
all farmers. Although there is very limited reference to bTB as a cause of farming
stress, it was clearly appropriate for this research to explore the issue properly.
The specific research objective was agreed as follows: ‘to provide a sound evidence
base for a better understanding of the social and human health effects of a bTB
breakdown at farm-level, including both the range and the typical incidence of such
adverse impacts’. This has been addressed in a number of ways. The farmers’
interview survey included a few questions which looked at aspects of whether, and in
what ways, the bTB breakdown had affected the daily lives of the farm family and
any farm staff. The possibility of a bTB breakdown causing stress was flagged by a
number of respondents to the stakeholders’ consultation, and this issue was
investigated through a postal survey using the established General Heath
Questionnaire (GHQ-12), mailed to a sample which included farmers whose
University of Exeter/ADAS UK Ltd
Longer-term effects of a bTB breakdown: draft report 30 September 2008
111
businesses had recorded a bTB breakdown and a control sample of otherwise similar
farmers whose businesses had not had a bTB breakdown. Finally, a number of case
studies of GP practices situated in several of the known bTB ‘hotspot’ areas explored
the issue of the effects of a bTB breakdown on physical and mental health of farm
families and farm workers.
The stakeholder consultation: pointers to farming stress
Stakeholders with a direct interest
The majority of respondents highlighted the increased stress farmers feel when
directly affected by a bTB breakdown. Even when one outbreak clears up there is
still the worry that it will reoccur. Many identified bTB as being the ‘unknown
quantity’ with the on-going potential to cause stress: cattle farmers simply do not
know when something may happen and, in any case, feel powerless to prevent it. In a
number of cases, it was reported, this has led to high blood pressure, nervous
breakdown, strokes and even suicide. In some cases it appears to have been a
contributory factor in marriage breakdown.
Several stakeholder respondents identified the increased pressure on family members
to help out (some with family living near who may not normally work on the farm)
which is sometimes associated with a bTB breakdown. A longer term effect, it was
felt, is that younger family members may be discouraged from going into farming,
although this may also be a consequence of what is seen as political inaction. Within
the rural community, some stakeholders identified the increased workloads involved
in looking after more animals (a common consequence of the imposition of
movement restrictions following a bTB breakdown) can lead to reluctance, or
inability, to support community events.
Furthermore, it was reported that relationships between farmers and their neighbours
can become tense, particularly if it is perceived that one neighbour is not doing
enough to prevent the spread of the infection. One farmer stated that he felt very
guilty that when his farm was found to be infected with bTB as all the neighbouring
farms had to be tested, with all that implies for those farmers and their families. Also,
where a farmer has neighbours who come from a more urban background, or where
neighbours are very concerned with badger conservation, this can lead to fraught
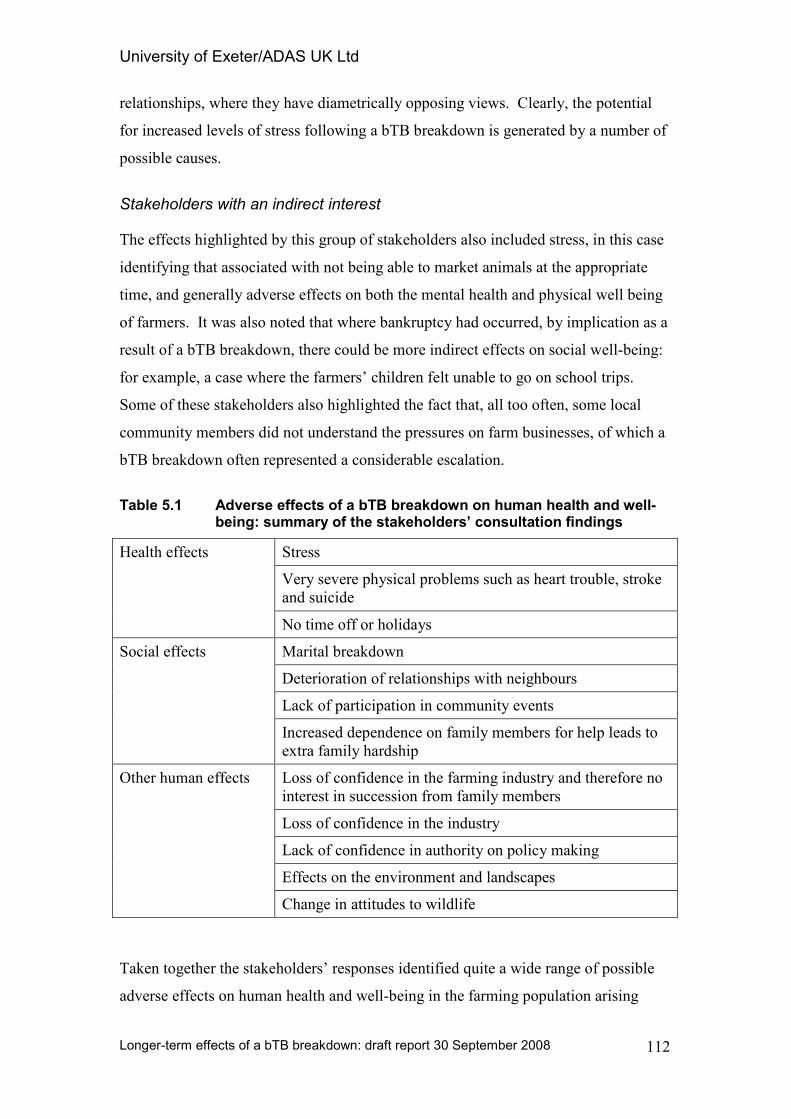
University of Exeter/ADAS UK Ltd
Longer-term effects of a bTB breakdown: draft report 30 September 2008
112
relationships, where they have diametrically opposing views. Clearly, the potential
for increased levels of stress following a bTB breakdown is generated by a number of
possible causes.
Stakeholders with an indirect interest
The effects highlighted by this group of stakeholders also included stress, in this case
identifying that associated with not being able to market animals at the appropriate
time, and generally adverse effects on both the mental health and physical well being
of farmers. It was also noted that where bankruptcy had occurred, by implication as a
result of a bTB breakdown, there could be more indirect effects on social well-being:
for example, a case where the farmers’ children felt unable to go on school trips.
Some of these stakeholders also highlighted the fact that, all too often, some local
community members did not understand the pressures on farm businesses, of which a
bTB breakdown often represented a considerable escalation.
Table 5.1 Adverse effects of a bTB breakdown on human health and well-being: summary of the stakeholders’ consultation findings
Stress
Very severe physical problems such as heart trouble, stroke
and suicide
Health effects
No time off or holidays
Marital breakdown
Deterioration of relationships with neighbours
Lack of participation in community events
Social effects
Increased dependence on family members for help leads to
extra family hardship
Loss of confidence in the farming industry and therefore no
interest in succession from family members
Loss of confidence in the industry
Lack of confidence in authority on policy making
Effects on the environment and landscapes
Other human effects
Change in attitudes to wildlife
Taken together the stakeholders’ responses identified quite a wide range of possible
adverse effects on human health and well-being in the farming population arising
University of Exeter/ADAS UK Ltd
Longer-term effects of a bTB breakdown: draft report 30 September 2008
113
from, or exacerbated by, a bTB breakdown. These are summarised in Table 5.1 and
these findings informed the later stages of the study.
The postal survey: exploring the human impacts of a bTB breakdown
Background to the GHQ-12 study
The principal empirical part of the study concerned with the impacts of a bTB
breakdown on the social well-being and mental health of the farm family and farm
staff utilised the nferNELSON GHQ-12 questionnaire, administered through a postal
survey to a sample of farmers drawn from the VetNet database. It is widely
recognised that the livestock farming communities are likely to come under
considerable stress as a result of a bTB outbreak, and this was one of the key findings
of the stakeholder consultation; this postal study aimed to investigate the
psychological impact of a bTB outbreak on farmers and their families. Our team
included a professional psychotherapist8 who has successfully used this questionnaire
in a study of farming stress (Watts et al, 2003) and in which the method of
questionnaire delivery was postal.
Because the farming community is already under stress from a number of factors, it
was decided to compare the measurement of stress on farmers and their families who
have experienced different severities of a bTB outbreak with a control group of
livestock farmers who have not experienced a bTB outbreak. Our target population
included farmers, their spouses, their adult children (over 18 years of age) living at
home, and their regular farm employees. However, only the farmer could be
identified from the VetNet database, and so three copies of the questionnaire were
enclosed (for completion by the farmer, and two of the following: their spouse, adult
children and staff) and the covering letter invited requests for more forms as
necessary.
The target population was farms/farmers which have experienced a bTB breakdown,
together with a small control group of non-bTB livestock farmers. It should be noted
that the use of this established questionnaire on social well-being and mental health
has the important benefit in that the results can be compared with the position for the
general morbidity of the adult population (for which the questionnaire is regularly
8 Consultant Nurse in Psychological Therapies, Somerset Partnership NHS and Social Care Trust
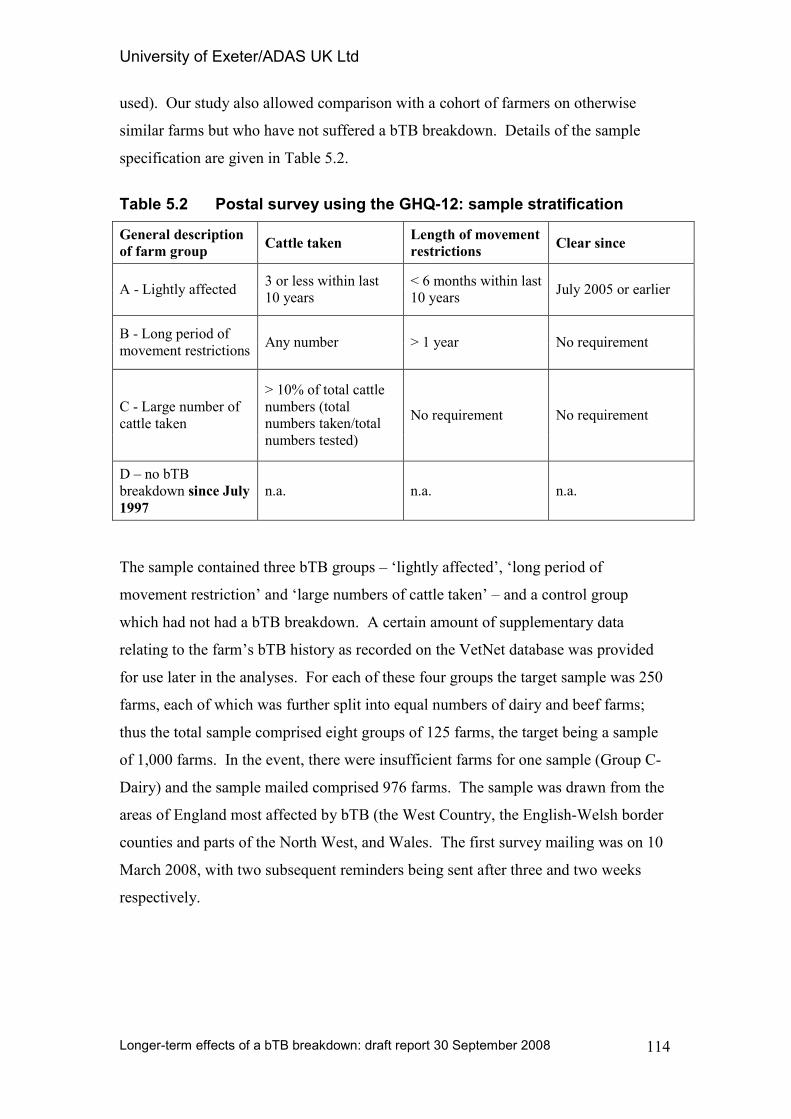
University of Exeter/ADAS UK Ltd
Longer-term effects of a bTB breakdown: draft report 30 September 2008
114
used). Our study also allowed comparison with a cohort of farmers on otherwise
similar farms but who have not suffered a bTB breakdown. Details of the sample
specification are given in Table 5.2.
Table 5.2 Postal survey using the GHQ-12: sample stratification
General description
of farm group Cattle taken
Length of movement
restrictions Clear since
A - Lightly affected 3 or less within last
10 years
< 6 months within last
10 years July 2005 or earlier
B - Long period of
movement restrictions Any number > 1 year No requirement
C - Large number of
cattle taken
> 10% of total cattle
numbers (total
numbers taken/total
numbers tested)
No requirement No requirement
D – no bTB
breakdown since July
1997
n.a. n.a. n.a.
The sample contained three bTB groups – ‘lightly affected’, ‘long period of
movement restriction’ and ‘large numbers of cattle taken’ – and a control group
which had not had a bTB breakdown. A certain amount of supplementary data
relating to the farm’s bTB history as recorded on the VetNet database was provided
for use later in the analyses. For each of these four groups the target sample was 250
farms, each of which was further split into equal numbers of dairy and beef farms;
thus the total sample comprised eight groups of 125 farms, the target being a sample
of 1,000 farms. In the event, there were insufficient farms for one sample (Group C-
Dairy) and the sample mailed comprised 976 farms. The sample was drawn from the
areas of England most affected by bTB (the West Country, the English-Welsh border
counties and parts of the North West, and Wales. The first survey mailing was on 10
March 2008, with two subsequent reminders being sent after three and two weeks
respectively.
University of Exeter/ADAS UK Ltd
Longer-term effects of a bTB breakdown: draft report 30 September 2008
115
Characteristics of the GHQ-12
The 12-item version of the General Health Questionnaire (GHQ-12) was selected as
the most appropriate tool for identifying psychiatric morbidity (Goldberg, 1972),
although longer versions exist. It was chosen because of its design as a self-
administered screening test aimed at detecting psychiatric disorders. It is designed to
be easy to administer, acceptable to respondents, fairly short and objective. The
questionnaire has been widely used in similar circumstances to identify differentials
across a varied population.
The questionnaire score gives an assessment of an individual’s position on an axis
from normality to undoubted illness and can be thought of as giving a probability
assessment of that individual being a psychiatric case having mental health problems.
Using the GHQ-12 to assess prevalence, a GHQ score of four or above is the usual
cut-off score for identifying a ‘case’, this level being taken as indicative of a
clinically significant mental health problem. The approach to scoring is discussed in
more detail in the following section.
The questionnaire focuses on breaks in normal function, rather than upon lifelong
traits. It consists of twelve questions concerning happiness, depression, anxiety, sleep
disturbance and ability to cope. The questionnaire concerns itself with two major
classes of phenomena: six of the items on the GHQ-12 deal with an inability to carry
out one’s normal ‘healthy’ functions (e.g. ‘playing a useful part in things’; ‘able to
enjoy day-to-day activities’), and the remaining six address the appearance of new
phenomena of a distressing nature (such as ‘losing sleep over worry’ or ‘thinking of
yourself as worthless’). The respondents are not asked how long he or she has
experienced each symptom and therefore the GHQ-12 should be understood to detect
essentially short term disorders.
One advantage of using the GHQ-12 is that it is widely used in national surveys and
in many other studies, so the results can be compared with those obtained elsewhere
from different populations. Of particular relevance here is that it has been used as a
measurement tool in studies measuring stress levels amongst the farming community
e.g. the impact of foot-and-mouth disease (Peck, et al, 2002; and Watts et al, 2002).
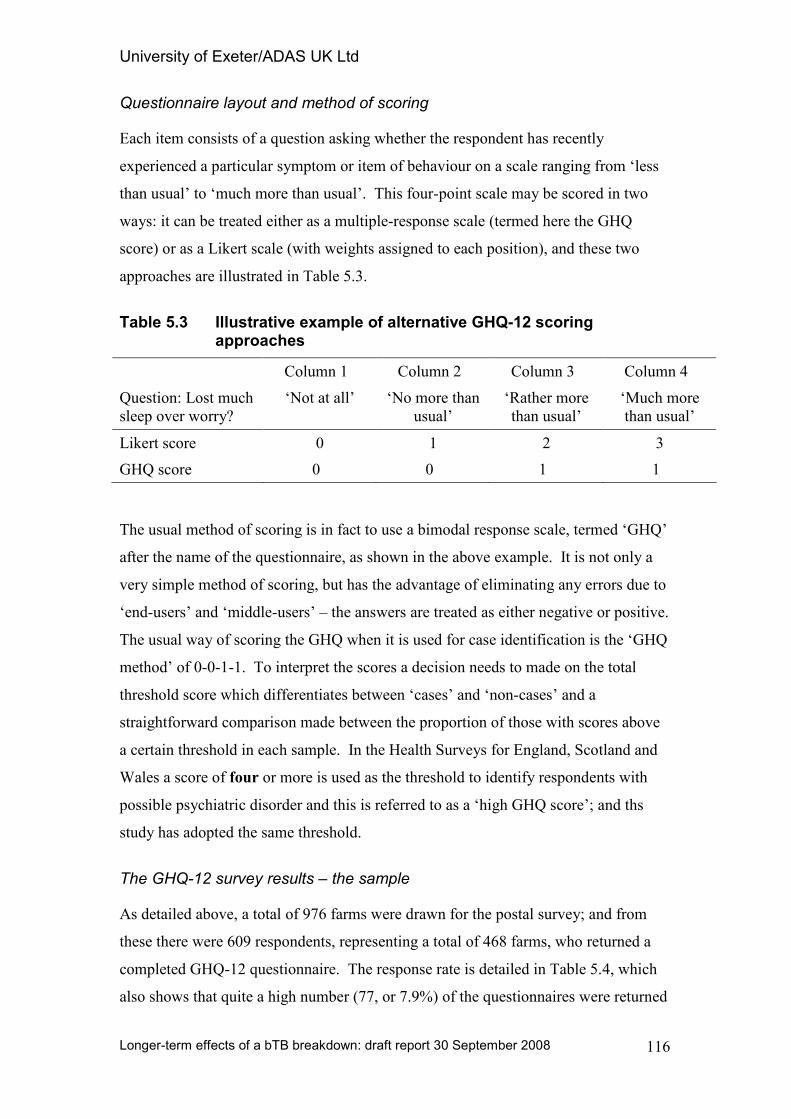
University of Exeter/ADAS UK Ltd
Longer-term effects of a bTB breakdown: draft report 30 September 2008
116
Questionnaire layout and method of scoring
Each item consists of a question asking whether the respondent has recently
experienced a particular symptom or item of behaviour on a scale ranging from ‘less
than usual’ to ‘much more than usual’. This four-point scale may be scored in two
ways: it can be treated either as a multiple-response scale (termed here the GHQ
score) or as a Likert scale (with weights assigned to each position), and these two
approaches are illustrated in Table 5.3.
Table 5.3 Illustrative example of alternative GHQ-12 scoring approaches
Column 1 Column 2 Column 3 Column 4
Question: Lost much
sleep over worry?
‘Not at all’ ‘No more than
usual’
‘Rather more
than usual’
‘Much more
than usual’
Likert score 0 1 2 3
GHQ score 0 0 1 1
The usual method of scoring is in fact to use a bimodal response scale, termed ‘GHQ’
after the name of the questionnaire, as shown in the above example. It is not only a
very simple method of scoring, but has the advantage of eliminating any errors due to
‘end-users’ and ‘middle-users’ – the answers are treated as either negative or positive.
The usual way of scoring the GHQ when it is used for case identification is the ‘GHQ
method’ of 0-0-1-1. To interpret the scores a decision needs to made on the total
threshold score which differentiates between ‘cases’ and ‘non-cases’ and a
straightforward comparison made between the proportion of those with scores above
a certain threshold in each sample. In the Health Surveys for England, Scotland and
Wales a score of four or more is used as the threshold to identify respondents with
possible psychiatric disorder and this is referred to as a ‘high GHQ score’; and ths
study has adopted the same threshold.
The GHQ-12 survey results – the sample
As detailed above, a total of 976 farms were drawn for the postal survey; and from
these there were 609 respondents, representing a total of 468 farms, who returned a
completed GHQ-12 questionnaire. The response rate is detailed in Table 5.4, which
also shows that quite a high number (77, or 7.9%) of the questionnaires were returned
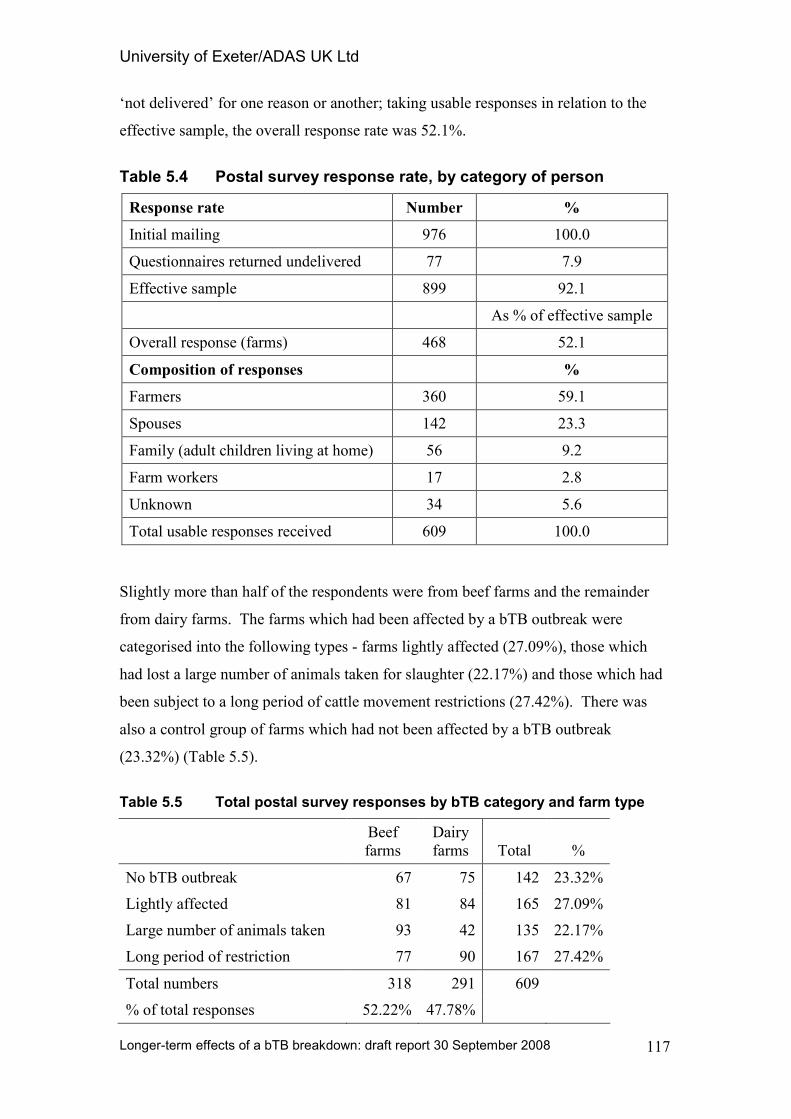
University of Exeter/ADAS UK Ltd
Longer-term effects of a bTB breakdown: draft report 30 September 2008
117
‘not delivered’ for one reason or another; taking usable responses in relation to the
effective sample, the overall response rate was 52.1%.
Table 5.4 Postal survey response rate, by category of person
Response rate Number %
Initial mailing 976 100.0
Questionnaires returned undelivered 77 7.9
Effective sample 899 92.1
As % of effective sample
Overall response (farms) 468 52.1
Composition of responses %
Farmers 360 59.1
Spouses 142 23.3
Family (adult children living at home) 56 9.2
Farm workers 17 2.8
Unknown 34 5.6
Total usable responses received 609 100.0
Slightly more than half of the respondents were from beef farms and the remainder
from dairy farms. The farms which had been affected by a bTB outbreak were
categorised into the following types - farms lightly affected (27.09%), those which
had lost a large number of animals taken for slaughter (22.17%) and those which had
been subject to a long period of cattle movement restrictions (27.42%). There was
also a control group of farms which had not been affected by a bTB outbreak
(23.32%) (Table 5.5).
Table 5.5 Total postal survey responses by bTB category and farm type
Beef
farms
Dairy
farms Total %
No bTB outbreak 67 75 142 23.32%
Lightly affected 81 84 165 27.09%
Large number of animals taken 93 42 135 22.17%
Long period of restriction 77 90 167 27.42%
Total numbers 318 291 609
% of total responses 52.22% 47.78%
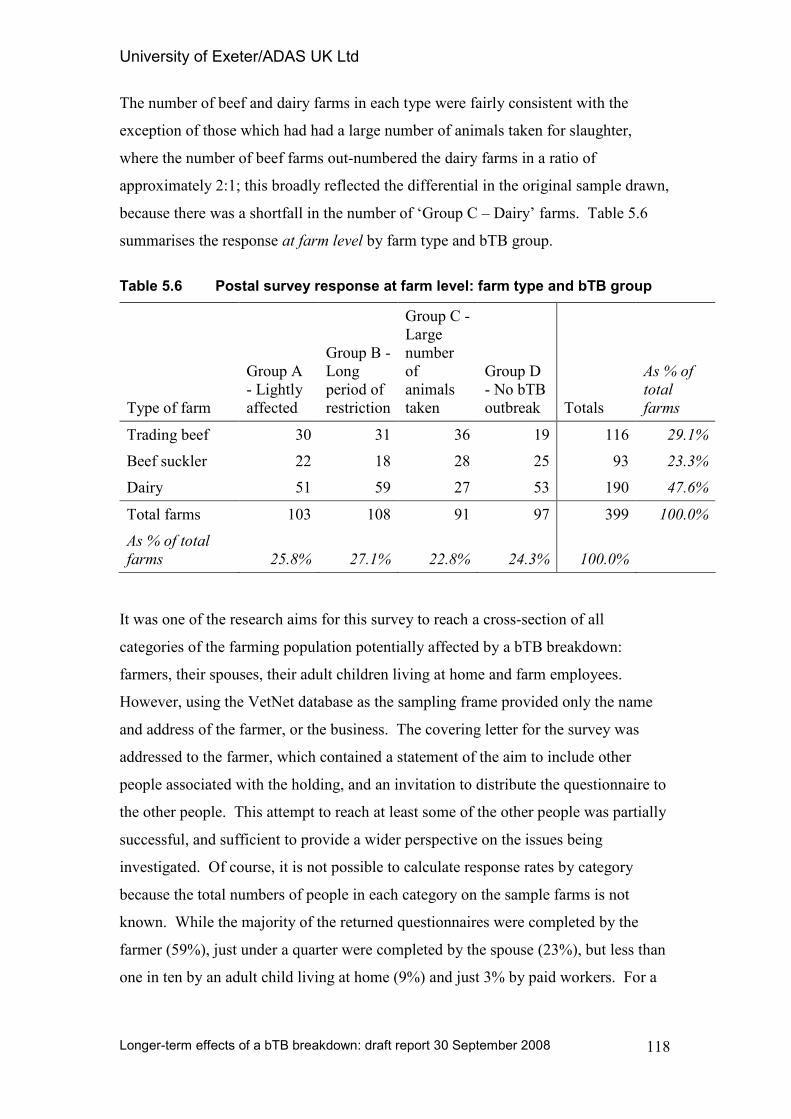
University of Exeter/ADAS UK Ltd
Longer-term effects of a bTB breakdown: draft report 30 September 2008
118
The number of beef and dairy farms in each type were fairly consistent with the
exception of those which had had a large number of animals taken for slaughter,
where the number of beef farms out-numbered the dairy farms in a ratio of
approximately 2:1; this broadly reflected the differential in the original sample drawn,
because there was a shortfall in the number of ‘Group C – Dairy’ farms. Table 5.6
summarises the response at farm level by farm type and bTB group.
Table 5.6 Postal survey response at farm level: farm type and bTB group
Type of farm
Group A
- Lightly
affected
Group B -
Long
period of
restriction
Group C -
Large
number
of
animals
taken
Group D
- No bTB
outbreak Totals
As % of
total
farms
Trading beef 30 31 36 19 116 29.1%
Beef suckler 22 18 28 25 93 23.3%
Dairy 51 59 27 53 190 47.6%
Total farms 103 108 91 97 399 100.0%
As % of total
farms 25.8% 27.1% 22.8% 24.3% 100.0%
It was one of the research aims for this survey to reach a cross-section of all
categories of the farming population potentially affected by a bTB breakdown:
farmers, their spouses, their adult children living at home and farm employees.
However, using the VetNet database as the sampling frame provided only the name
and address of the farmer, or the business. The covering letter for the survey was
addressed to the farmer, which contained a statement of the aim to include other
people associated with the holding, and an invitation to distribute the questionnaire to
the other people. This attempt to reach at least some of the other people was partially
successful, and sufficient to provide a wider perspective on the issues being
investigated. Of course, it is not possible to calculate response rates by category
because the total numbers of people in each category on the sample farms is not
known. While the majority of the returned questionnaires were completed by the
farmer (59%), just under a quarter were completed by the spouse (23%), but less than
one in ten by an adult child living at home (9%) and just 3% by paid workers. For a
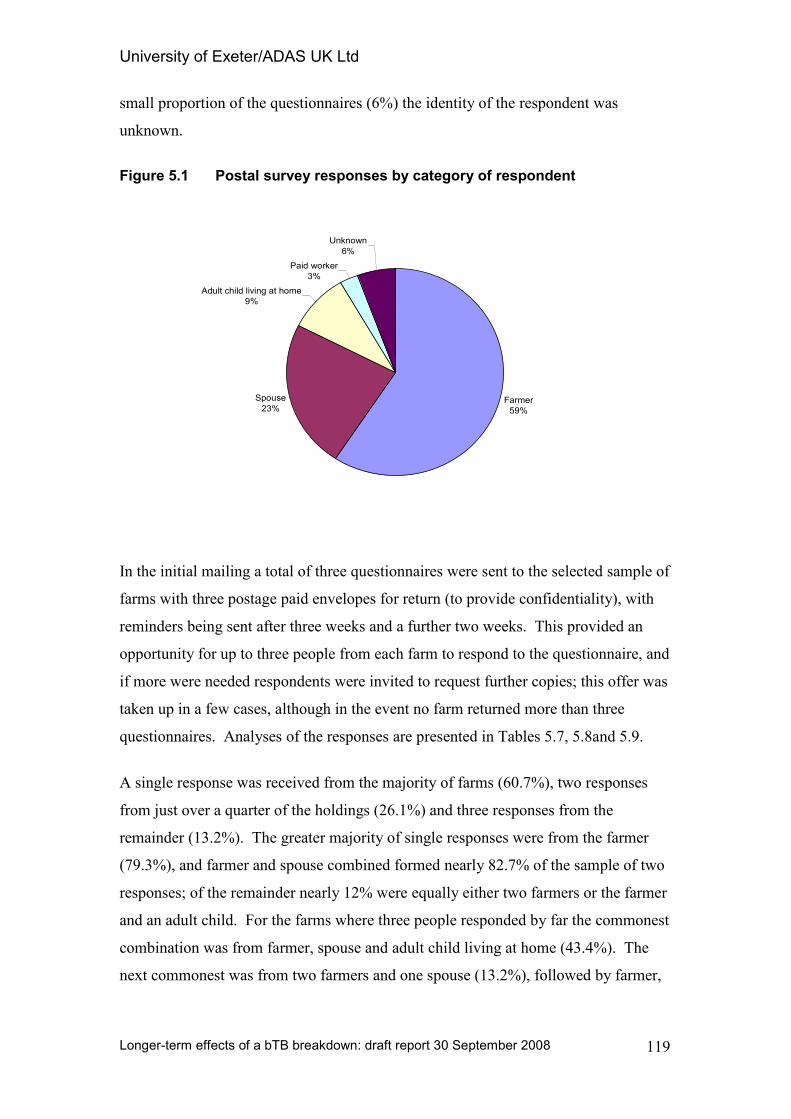
University of Exeter/ADAS UK Ltd
Longer-term effects of a bTB breakdown: draft report 30 September 2008
119
small proportion of the questionnaires (6%) the identity of the respondent was
unknown.
Figure 5.1 Postal survey responses by category of respondent
Farmer
59%
Spouse
23%
Adult child living at home
9%
Paid worker
3%
Unknown
6%
In the initial mailing a total of three questionnaires were sent to the selected sample of
farms with three postage paid envelopes for return (to provide confidentiality), with
reminders being sent after three weeks and a further two weeks. This provided an
opportunity for up to three people from each farm to respond to the questionnaire, and
if more were needed respondents were invited to request further copies; this offer was
taken up in a few cases, although in the event no farm returned more than three
questionnaires. Analyses of the responses are presented in Tables 5.7, 5.8and 5.9.
A single response was received from the majority of farms (60.7%), two responses
from just over a quarter of the holdings (26.1%) and three responses from the
remainder (13.2%). The greater majority of single responses were from the farmer
(79.3%), and farmer and spouse combined formed nearly 82.7% of the sample of two
responses; of the remainder nearly 12% were equally either two farmers or the farmer
and an adult child. For the farms where three people responded by far the commonest
combination was from farmer, spouse and adult child living at home (43.4%). The
next commonest was from two farmers and one spouse (13.2%), followed by farmer,
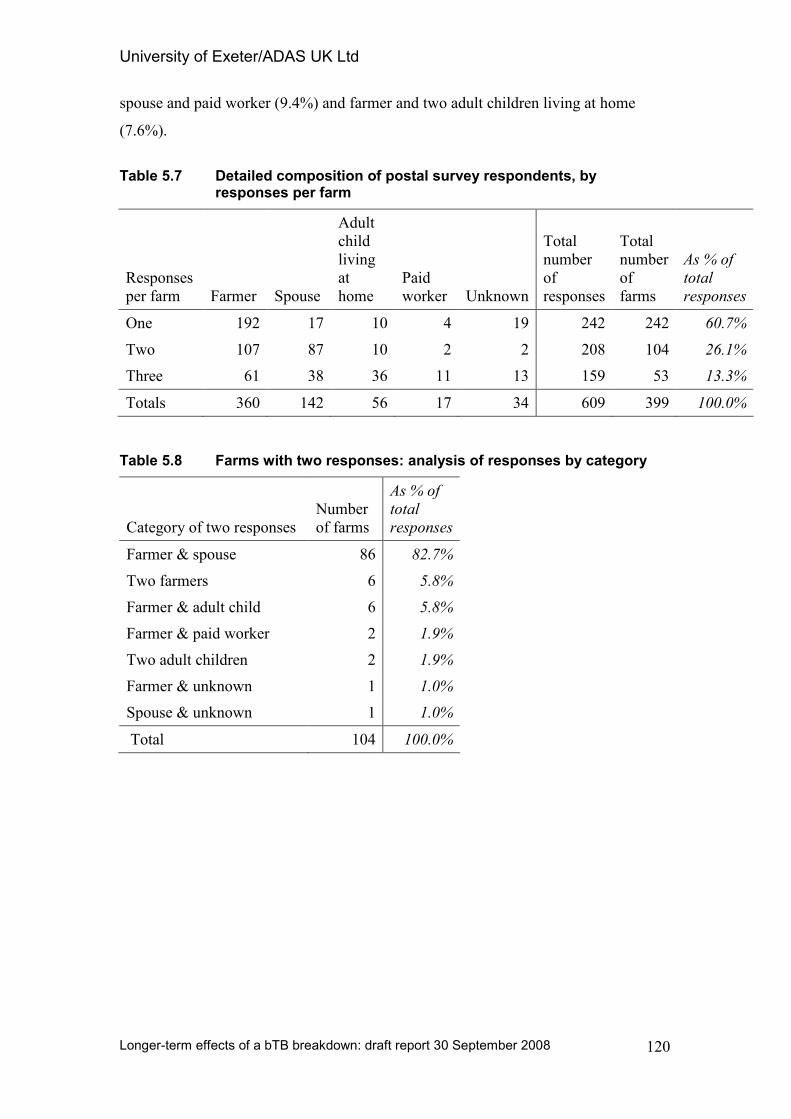
University of Exeter/ADAS UK Ltd
Longer-term effects of a bTB breakdown: draft report 30 September 2008
120
spouse and paid worker (9.4%) and farmer and two adult children living at home
(7.6%).
Table 5.7 Detailed composition of postal survey respondents, by responses per farm
Responses
per farm Farmer Spouse
Adult
child
living
at
home
Paid
worker Unknown
Total
number
of
responses
Total
number
of
farms
As % of
total
responses
One 192 17 10 4 19 242 242 60.7%
Two 107 87 10 2 2 208 104 26.1%
Three 61 38 36 11 13 159 53 13.3%
Totals 360 142 56 17 34 609 399 100.0%
Table 5.8 Farms with two responses: analysis of responses by category
Category of two responses
Number
of farms
As % of
total
responses
Farmer & spouse 86 82.7%
Two farmers 6 5.8%
Farmer & adult child 6 5.8%
Farmer & paid worker 2 1.9%
Two adult children 2 1.9%
Farmer & unknown 1 1.0%
Spouse & unknown 1 1.0%
Total 104 100.0%
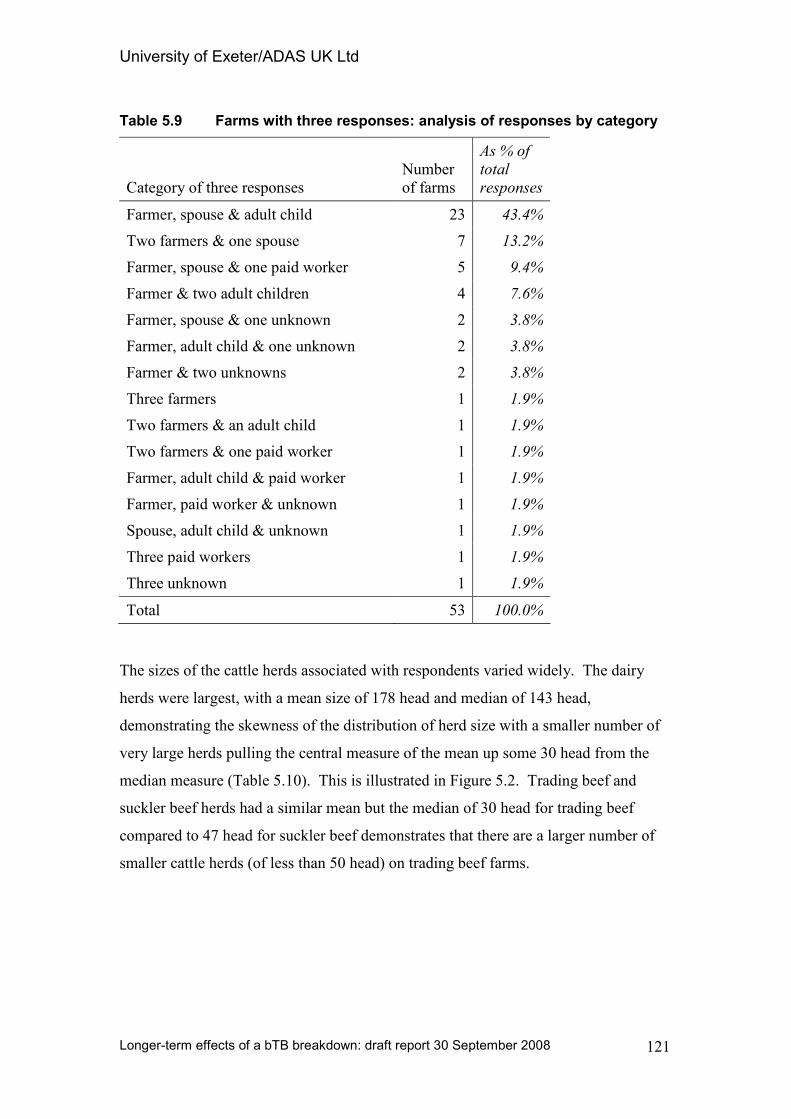
University of Exeter/ADAS UK Ltd
Longer-term effects of a bTB breakdown: draft report 30 September 2008
121
Table 5.9 Farms with three responses: analysis of responses by category
Category of three responses
Number
of farms
As % of
total
responses
Farmer, spouse & adult child 23 43.4%
Two farmers & one spouse 7 13.2%
Farmer, spouse & one paid worker 5 9.4%
Farmer & two adult children 4 7.6%
Farmer, spouse & one unknown 2 3.8%
Farmer, adult child & one unknown 2 3.8%
Farmer & two unknowns 2 3.8%
Three farmers 1 1.9%
Two farmers & an adult child 1 1.9%
Two farmers & one paid worker 1 1.9%
Farmer, adult child & paid worker 1 1.9%
Farmer, paid worker & unknown 1 1.9%
Spouse, adult child & unknown 1 1.9%
Three paid workers 1 1.9%
Three unknown 1 1.9%
Total 53 100.0%
The sizes of the cattle herds associated with respondents varied widely. The dairy
herds were largest, with a mean size of 178 head and median of 143 head,
demonstrating the skewness of the distribution of herd size with a smaller number of
very large herds pulling the central measure of the mean up some 30 head from the
median measure (Table 5.10). This is illustrated in Figure 5.2. Trading beef and
suckler beef herds had a similar mean but the median of 30 head for trading beef
compared to 47 head for suckler beef demonstrates that there are a larger number of
smaller cattle herds (of less than 50 head) on trading beef farms.
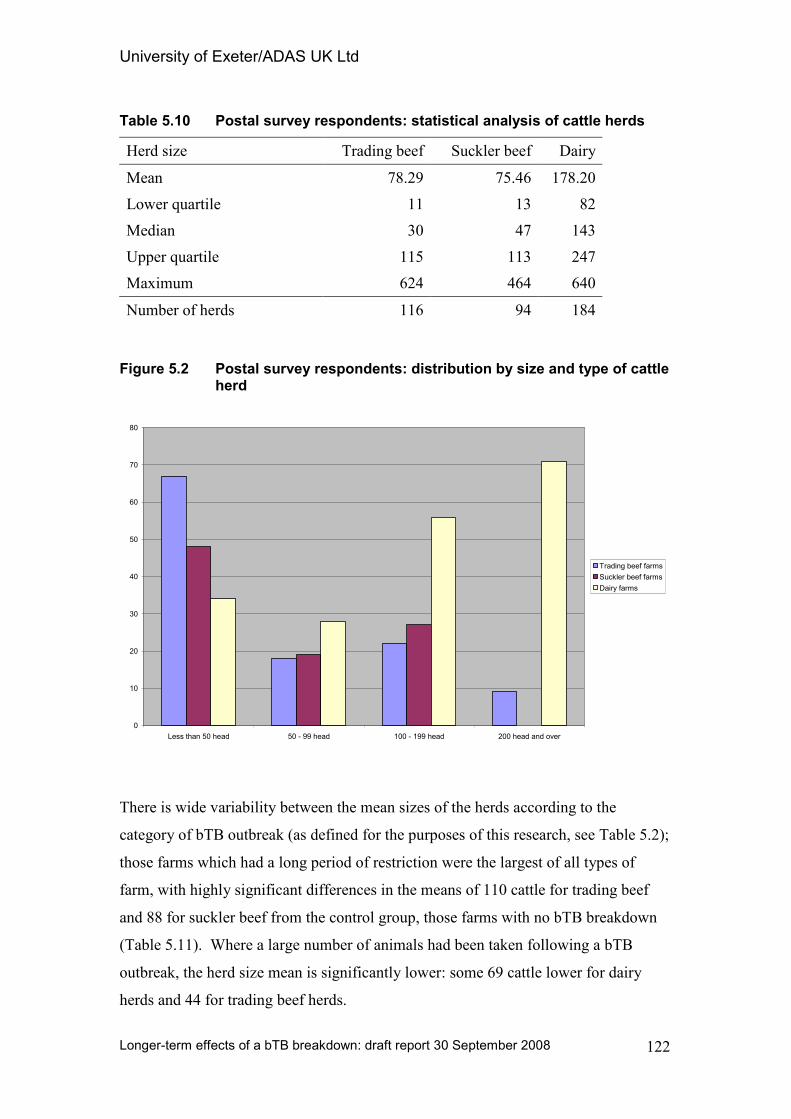
University of Exeter/ADAS UK Ltd
Longer-term effects of a bTB breakdown: draft report 30 September 2008
122
Table 5.10 Postal survey respondents: statistical analysis of cattle herds
Herd size Trading beef Suckler beef Dairy
Mean 78.29 75.46 178.20
Lower quartile 11 13 82
Median 30 47 143
Upper quartile 115 113 247
Maximum 624 464 640
Number of herds 116 94 184
Figure 5.2 Postal survey respondents: distribution by size and type of cattle herd
0
10
20
30
40
50
60
70
80
Less than 50 head 50 - 99 head 100 - 199 head 200 head and over
Trading beef farms
Suckler beef farms
Dairy farms
There is wide variability between the mean sizes of the herds according to the
category of bTB outbreak (as defined for the purposes of this research, see Table 5.2);
those farms which had a long period of restriction were the largest of all types of
farm, with highly significant differences in the means of 110 cattle for trading beef
and 88 for suckler beef from the control group, those farms with no bTB breakdown
(Table 5.11). Where a large number of animals had been taken following a bTB
outbreak, the herd size mean is significantly lower: some 69 cattle lower for dairy
herds and 44 for trading beef herds.
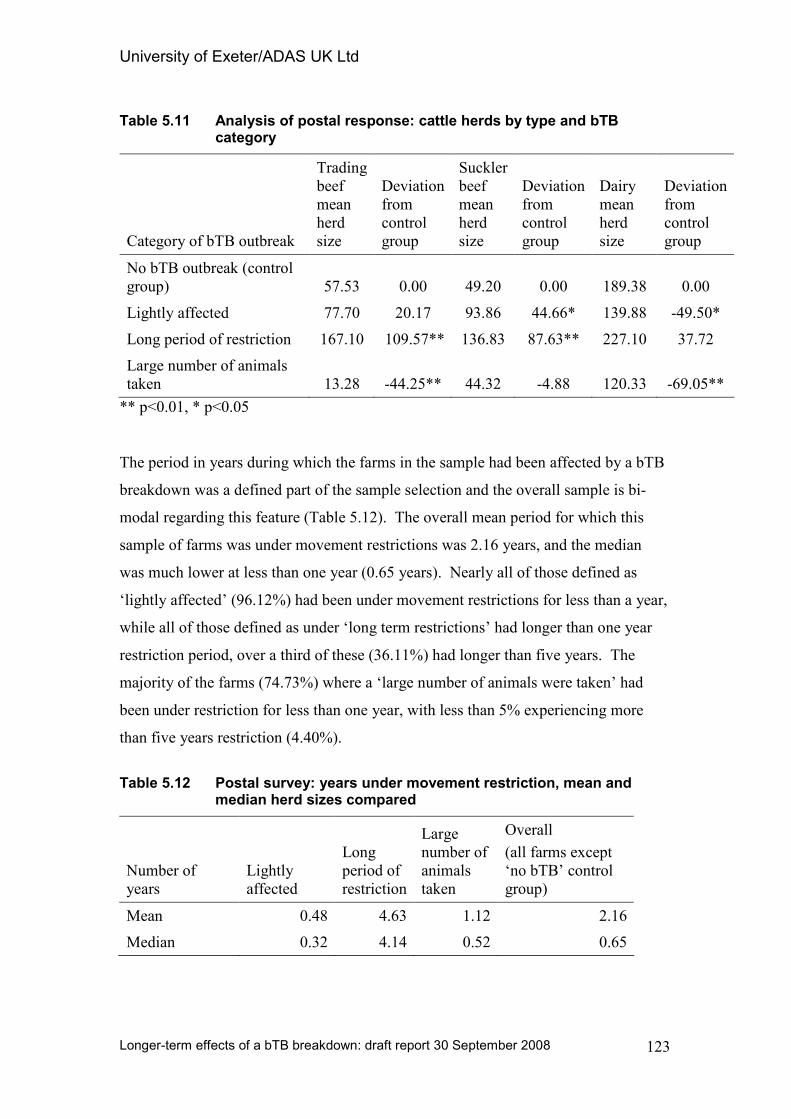
University of Exeter/ADAS UK Ltd
Longer-term effects of a bTB breakdown: draft report 30 September 2008
123
Table 5.11 Analysis of postal response: cattle herds by type and bTB category
Category of bTB outbreak
Trading
beef
mean
herd
size
Deviation
from
control
group
Suckler
beef
mean
herd
size
Deviation
from
control
group
Dairy
mean
herd
size
Deviation
from
control
group
No bTB outbreak (control
group) 57.53 0.00 49.20 0.00 189.38 0.00
Lightly affected 77.70 20.17 93.86 44.66* 139.88 -49.50*
Long period of restriction 167.10 109.57** 136.83 87.63** 227.10 37.72
Large number of animals
taken 13.28 -44.25** 44.32 -4.88 120.33 -69.05**
** p<0.01, * p<0.05
The period in years during which the farms in the sample had been affected by a bTB
breakdown was a defined part of the sample selection and the overall sample is bi-
modal regarding this feature (Table 5.12). The overall mean period for which this
sample of farms was under movement restrictions was 2.16 years, and the median
was much lower at less than one year (0.65 years). Nearly all of those defined as
‘lightly affected’ (96.12%) had been under movement restrictions for less than a year,
while all of those defined as under ‘long term restrictions’ had longer than one year
restriction period, over a third of these (36.11%) had longer than five years. The
majority of the farms (74.73%) where a ‘large number of animals were taken’ had
been under restriction for less than one year, with less than 5% experiencing more
than five years restriction (4.40%).
Table 5.12 Postal survey: years under movement restriction, mean and median herd sizes compared
Number of
years
Lightly
affected
Long
period of
restriction
Large
number of
animals
taken
Overall
(all farms except
‘no bTB’ control
group)
Mean 0.48 4.63 1.12 2.16
Median 0.32 4.14 0.52 0.65
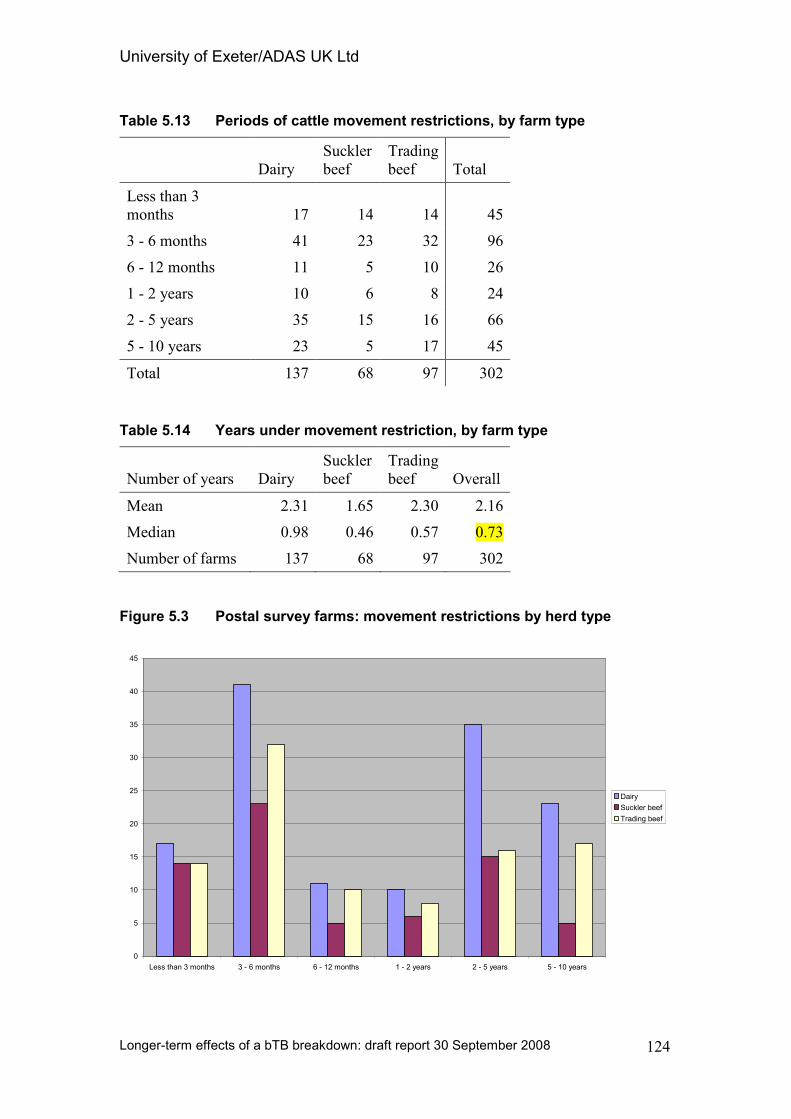
University of Exeter/ADAS UK Ltd
Longer-term effects of a bTB breakdown: draft report 30 September 2008
124
Table 5.13 Periods of cattle movement restrictions, by farm type
Dairy
Suckler
beef
Trading
beef Total
Less than 3
months 17 14 14 45
3 - 6 months 41 23 32 96
6 - 12 months 11 5 10 26
1 - 2 years 10 6 8 24
2 - 5 years 35 15 16 66
5 - 10 years 23 5 17 45
Total 137 68 97 302
Table 5.14 Years under movement restriction, by farm type
Number of years Dairy
Suckler
beef
Trading
beef Overall
Mean 2.31 1.65 2.30 2.16
Median 0.98 0.46 0.57 0.73
Number of farms 137 68 97 302
Figure 5.3 Postal survey farms: movement restrictions by herd type
0
5
10
15
20
25
30
35
40
45
Less than 3 months 3 - 6 months 6 - 12 months 1 - 2 years 2 - 5 years 5 - 10 years
Dairy
Suckler beef
Trading beef
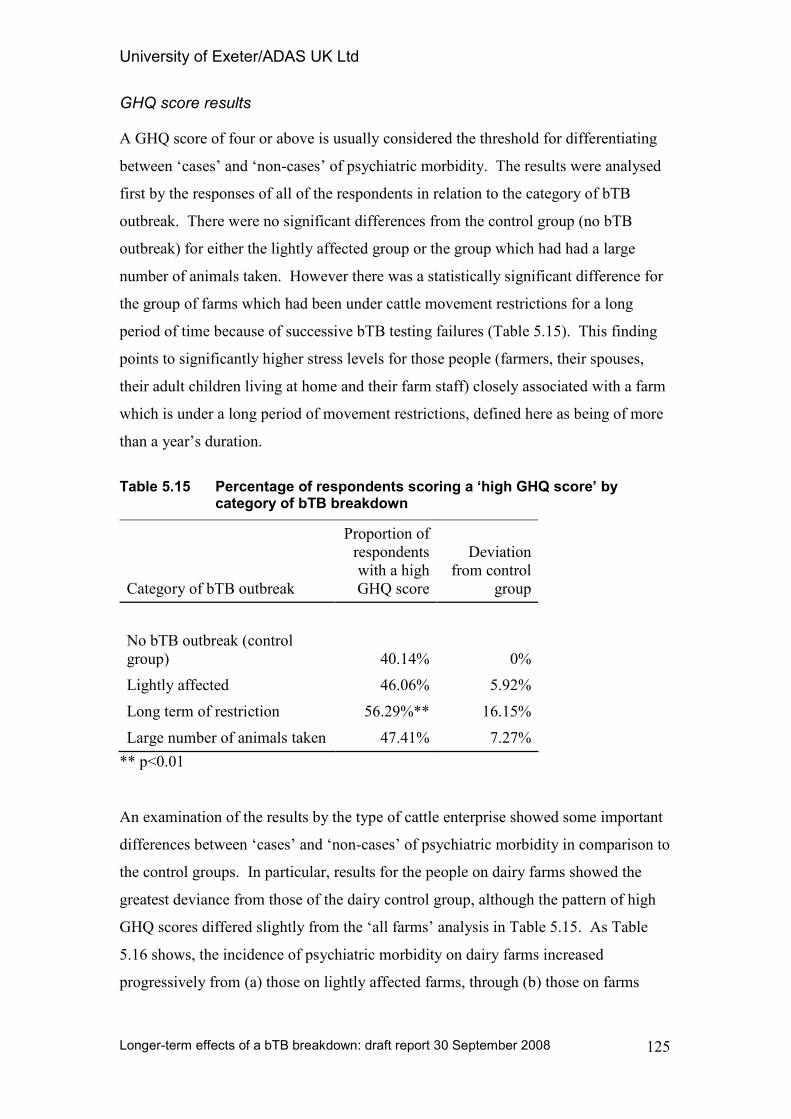
University of Exeter/ADAS UK Ltd
Longer-term effects of a bTB breakdown: draft report 30 September 2008
125
GHQ score results
A GHQ score of four or above is usually considered the threshold for differentiating
between ‘cases’ and ‘non-cases’ of psychiatric morbidity. The results were analysed
first by the responses of all of the respondents in relation to the category of bTB
outbreak. There were no significant differences from the control group (no bTB
outbreak) for either the lightly affected group or the group which had had a large
number of animals taken. However there was a statistically significant difference for
the group of farms which had been under cattle movement restrictions for a long
period of time because of successive bTB testing failures (Table 5.15). This finding
points to significantly higher stress levels for those people (farmers, their spouses,
their adult children living at home and their farm staff) closely associated with a farm
which is under a long period of movement restrictions, defined here as being of more
than a year’s duration.
Table 5.15 Percentage of respondents scoring a ‘high GHQ score’ by category of bTB breakdown
Category of bTB outbreak
Proportion of
respondents
with a high
GHQ score
Deviation
from control
group
No bTB outbreak (control
group) 40.14% 0%
Lightly affected 46.06% 5.92%
Long term of restriction 56.29%** 16.15%
Large number of animals taken 47.41% 7.27%
** p<0.01
An examination of the results by the type of cattle enterprise showed some important
differences between ‘cases’ and ‘non-cases’ of psychiatric morbidity in comparison to
the control groups. In particular, results for the people on dairy farms showed the
greatest deviance from those of the dairy control group, although the pattern of high
GHQ scores differed slightly from the ‘all farms’ analysis in Table 5.15. As Table
5.16 shows, the incidence of psychiatric morbidity on dairy farms increased
progressively from (a) those on lightly affected farms, through (b) those on farms
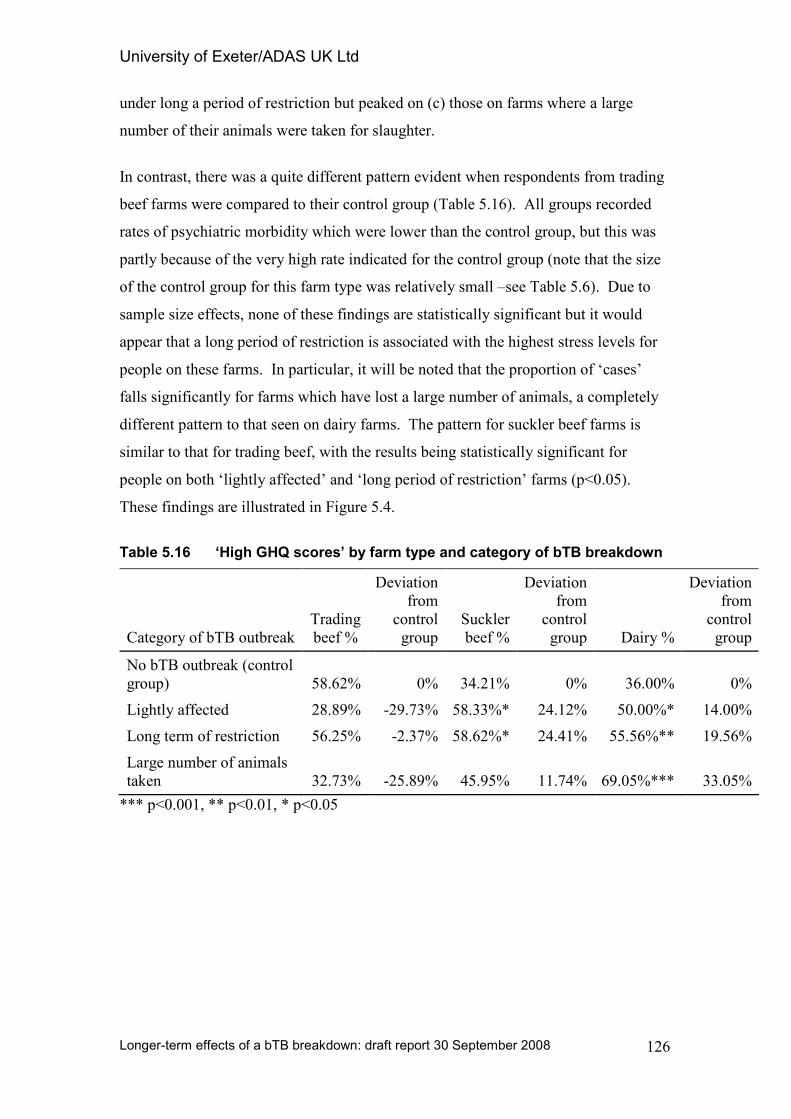
University of Exeter/ADAS UK Ltd
Longer-term effects of a bTB breakdown: draft report 30 September 2008
126
under long a period of restriction but peaked on (c) those on farms where a large
number of their animals were taken for slaughter.
In contrast, there was a quite different pattern evident when respondents from trading
beef farms were compared to their control group (Table 5.16). All groups recorded
rates of psychiatric morbidity which were lower than the control group, but this was
partly because of the very high rate indicated for the control group (note that the size
of the control group for this farm type was relatively small –see Table 5.6). Due to
sample size effects, none of these findings are statistically significant but it would
appear that a long period of restriction is associated with the highest stress levels for
people on these farms. In particular, it will be noted that the proportion of ‘cases’
falls significantly for farms which have lost a large number of animals, a completely
different pattern to that seen on dairy farms. The pattern for suckler beef farms is
similar to that for trading beef, with the results being statistically significant for
people on both ‘lightly affected’ and ‘long period of restriction’ farms (p<0.05).
These findings are illustrated in Figure 5.4.
Table 5.16 ‘High GHQ scores’ by farm type and category of bTB breakdown
Category of bTB outbreak
Trading
beef %
Deviation
from
control
group
Suckler
beef %
Deviation
from
control
group Dairy %
Deviation
from
control
group
No bTB outbreak (control
group) 58.62% 0% 34.21% 0% 36.00% 0%
Lightly affected 28.89% -29.73% 58.33%* 24.12% 50.00%* 14.00%
Long term of restriction 56.25% -2.37% 58.62%* 24.41% 55.56%** 19.56%
Large number of animals
taken 32.73% -25.89% 45.95% 11.74% 69.05%*** 33.05%
*** p<0.001, ** p<0.01, * p<0.05
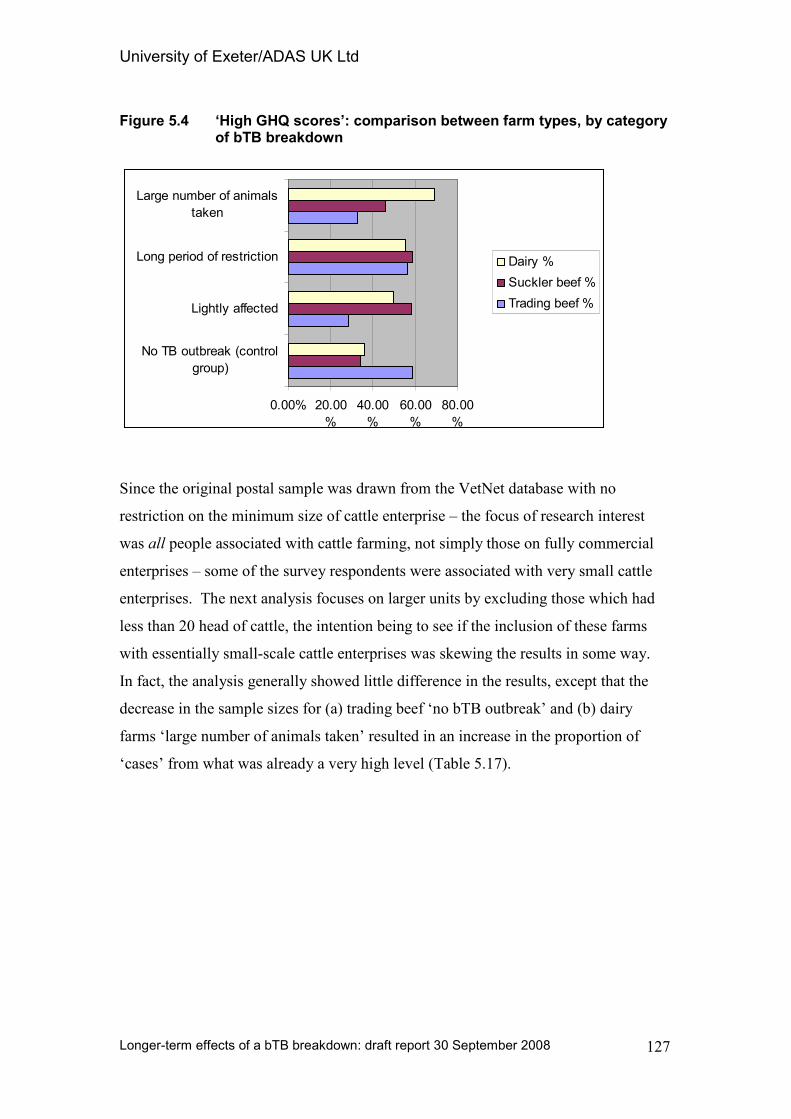
University of Exeter/ADAS UK Ltd
Longer-term effects of a bTB breakdown: draft report 30 September 2008
127
Figure 5.4 ‘High GHQ scores’: comparison between farm types, by category of bTB breakdown
0.00% 20.00
%
40.00
%
60.00
%
80.00
%
No TB outbreak (control
group)
Lightly affected
Long period of restriction
Large number of animals
taken
Dairy %
Suckler beef %
Trading beef %
Since the original postal sample was drawn from the VetNet database with no
restriction on the minimum size of cattle enterprise – the focus of research interest
was all people associated with cattle farming, not simply those on fully commercial
enterprises – some of the survey respondents were associated with very small cattle
enterprises. The next analysis focuses on larger units by excluding those which had
less than 20 head of cattle, the intention being to see if the inclusion of these farms
with essentially small-scale cattle enterprises was skewing the results in some way.
In fact, the analysis generally showed little difference in the results, except that the
decrease in the sample sizes for (a) trading beef ‘no bTB outbreak’ and (b) dairy
farms ‘large number of animals taken’ resulted in an increase in the proportion of
‘cases’ from what was already a very high level (Table 5.17).
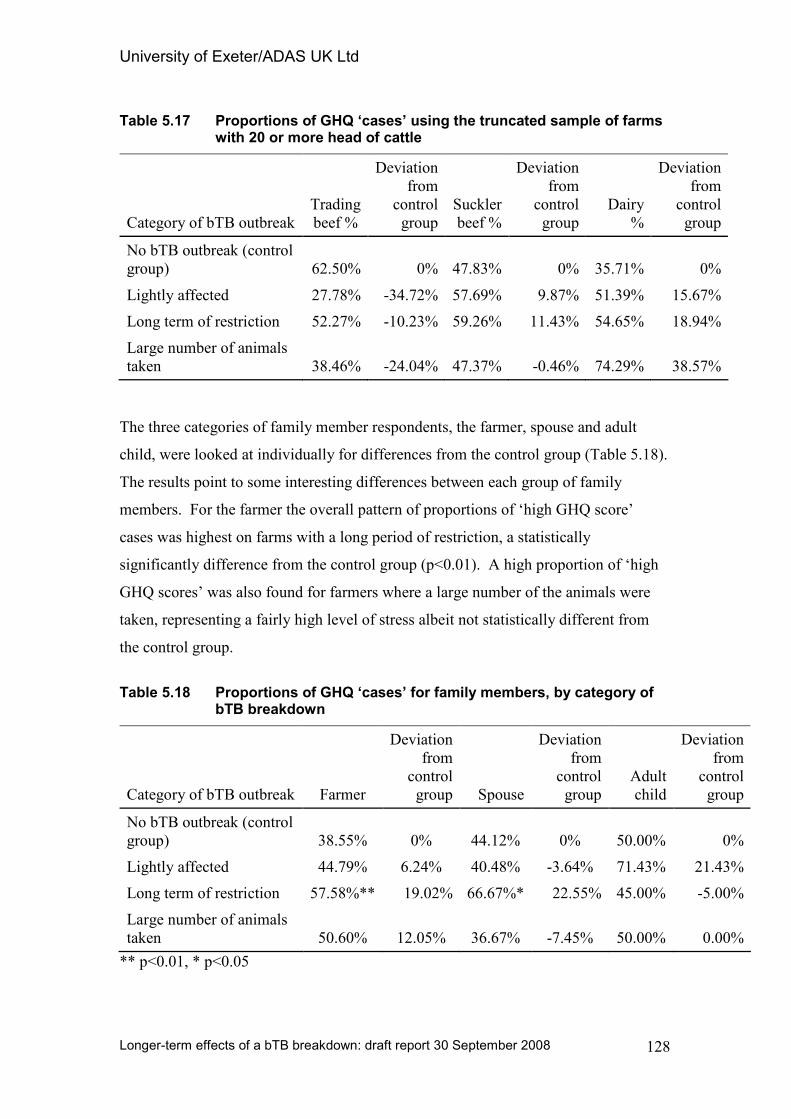
University of Exeter/ADAS UK Ltd
Longer-term effects of a bTB breakdown: draft report 30 September 2008
128
Table 5.17 Proportions of GHQ ‘cases’ using the truncated sample of farms with 20 or more head of cattle
Category of bTB outbreak
Trading
beef %
Deviation
from
control
group
Suckler
beef %
Deviation
from
control
group
Dairy
%
Deviation
from
control
group
No bTB outbreak (control
group) 62.50% 0% 47.83% 0% 35.71% 0%
Lightly affected 27.78% -34.72% 57.69% 9.87% 51.39% 15.67%
Long term of restriction 52.27% -10.23% 59.26% 11.43% 54.65% 18.94%
Large number of animals
taken 38.46% -24.04% 47.37% -0.46% 74.29% 38.57%
The three categories of family member respondents, the farmer, spouse and adult
child, were looked at individually for differences from the control group (Table 5.18).
The results point to some interesting differences between each group of family
members. For the farmer the overall pattern of proportions of ‘high GHQ score’
cases was highest on farms with a long period of restriction, a statistically
significantly difference from the control group (p<0.01). A high proportion of ‘high
GHQ scores’ was also found for farmers where a large number of the animals were
taken, representing a fairly high level of stress albeit not statistically different from
the control group.
Table 5.18 Proportions of GHQ ‘cases’ for family members, by category of bTB breakdown
Category of bTB outbreak Farmer
Deviation
from
control
group Spouse
Deviation
from
control
group
Adult
child
Deviation
from
control
group
No bTB outbreak (control
group) 38.55% 0% 44.12% 0% 50.00% 0%
Lightly affected 44.79% 6.24% 40.48% -3.64% 71.43% 21.43%
Long term of restriction 57.58%** 19.02% 66.67%* 22.55% 45.00% -5.00%
Large number of animals
taken 50.60% 12.05% 36.67% -7.45% 50.00% 0.00%
** p<0.01, * p<0.05
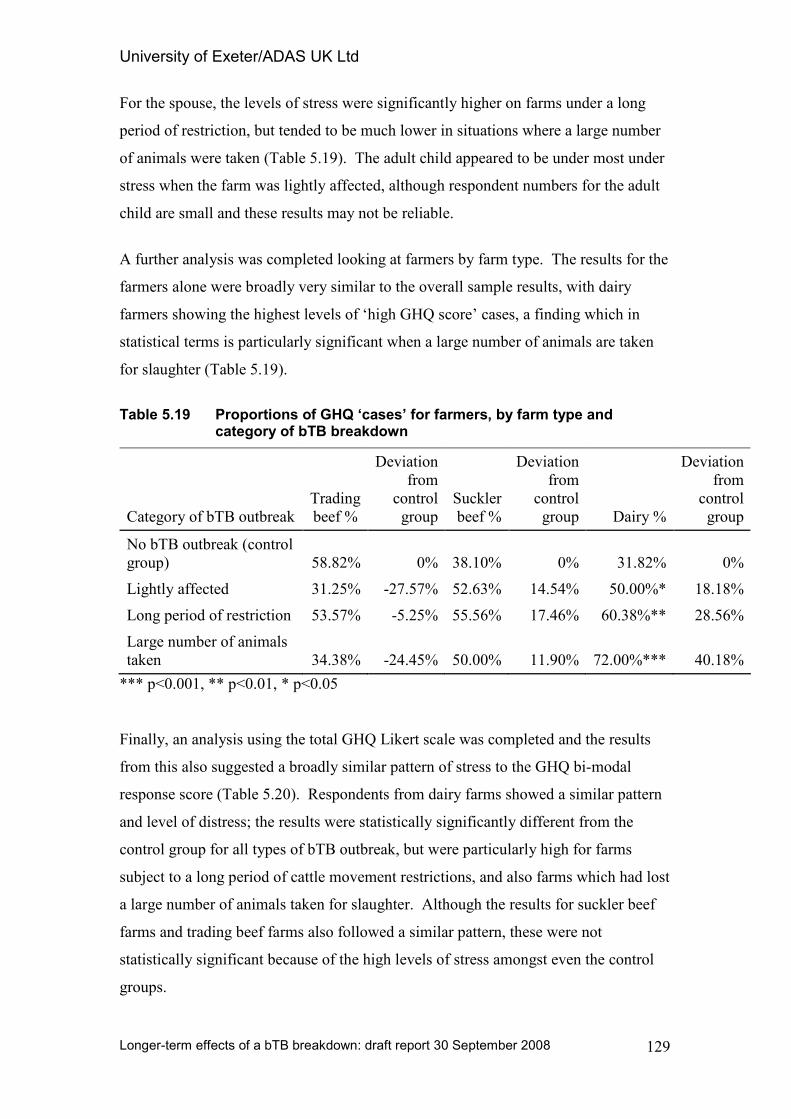
University of Exeter/ADAS UK Ltd
Longer-term effects of a bTB breakdown: draft report 30 September 2008
129
For the spouse, the levels of stress were significantly higher on farms under a long
period of restriction, but tended to be much lower in situations where a large number
of animals were taken (Table 5.19). The adult child appeared to be under most under
stress when the farm was lightly affected, although respondent numbers for the adult
child are small and these results may not be reliable.
A further analysis was completed looking at farmers by farm type. The results for the
farmers alone were broadly very similar to the overall sample results, with dairy
farmers showing the highest levels of ‘high GHQ score’ cases, a finding which in
statistical terms is particularly significant when a large number of animals are taken
for slaughter (Table 5.19).
Table 5.19 Proportions of GHQ ‘cases’ for farmers, by farm type and category of bTB breakdown
Category of bTB outbreak
Trading
beef %
Deviation
from
control
group
Suckler
beef %
Deviation
from
control
group Dairy %
Deviation
from
control
group
No bTB outbreak (control
group) 58.82% 0% 38.10% 0% 31.82% 0%
Lightly affected 31.25% -27.57% 52.63% 14.54% 50.00%* 18.18%
Long period of restriction 53.57% -5.25% 55.56% 17.46% 60.38%** 28.56%
Large number of animals
taken 34.38% -24.45% 50.00% 11.90% 72.00%*** 40.18%
*** p<0.001, ** p<0.01, * p<0.05
Finally, an analysis using the total GHQ Likert scale was completed and the results
from this also suggested a broadly similar pattern of stress to the GHQ bi-modal
response score (Table 5.20). Respondents from dairy farms showed a similar pattern
and level of distress; the results were statistically significantly different from the
control group for all types of bTB outbreak, but were particularly high for farms
subject to a long period of cattle movement restrictions, and also farms which had lost
a large number of animals taken for slaughter. Although the results for suckler beef
farms and trading beef farms also followed a similar pattern, these were not
statistically significant because of the high levels of stress amongst even the control
groups.
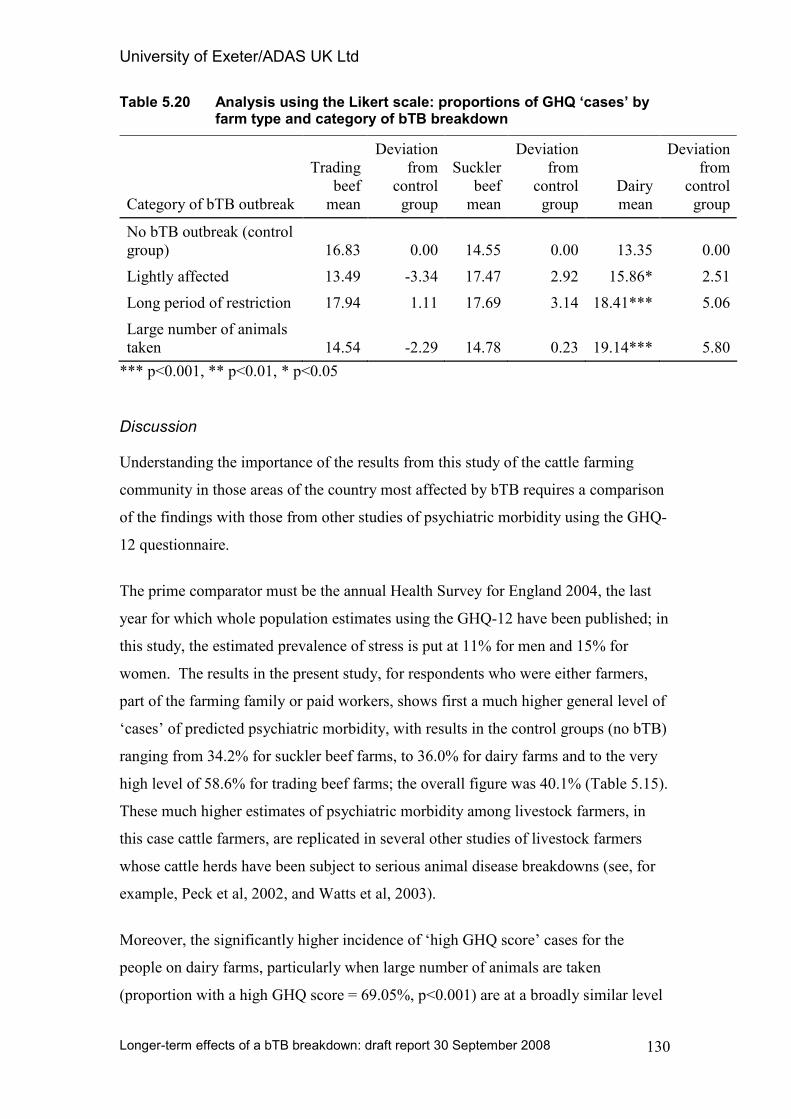
University of Exeter/ADAS UK Ltd
Longer-term effects of a bTB breakdown: draft report 30 September 2008
130
Table 5.20 Analysis using the Likert scale: proportions of GHQ ‘cases’ by farm type and category of bTB breakdown
Category of bTB outbreak
Trading
beef
mean
Deviation
from
control
group
Suckler
beef
mean
Deviation
from
control
group
Dairy
mean
Deviation
from
control
group
No bTB outbreak (control
group) 16.83 0.00 14.55 0.00 13.35 0.00
Lightly affected 13.49 -3.34 17.47 2.92 15.86* 2.51
Long period of restriction 17.94 1.11 17.69 3.14 18.41*** 5.06
Large number of animals
taken 14.54 -2.29 14.78 0.23 19.14*** 5.80
*** p<0.001, ** p<0.01, * p<0.05
Discussion
Understanding the importance of the results from this study of the cattle farming
community in those areas of the country most affected by bTB requires a comparison
of the findings with those from other studies of psychiatric morbidity using the GHQ-
12 questionnaire.
The prime comparator must be the annual Health Survey for England 2004, the last
year for which whole population estimates using the GHQ-12 have been published; in
this study, the estimated prevalence of stress is put at 11% for men and 15% for
women. The results in the present study, for respondents who were either farmers,
part of the farming family or paid workers, shows first a much higher general level of
‘cases’ of predicted psychiatric morbidity, with results in the control groups (no bTB)
ranging from 34.2% for suckler beef farms, to 36.0% for dairy farms and to the very
high level of 58.6% for trading beef farms; the overall figure was 40.1% (Table 5.15).
These much higher estimates of psychiatric morbidity among livestock farmers, in
this case cattle farmers, are replicated in several other studies of livestock farmers
whose cattle herds have been subject to serious animal disease breakdowns (see, for
example, Peck et al, 2002, and Watts et al, 2003).
Moreover, the significantly higher incidence of ‘high GHQ score’ cases for the
people on dairy farms, particularly when large number of animals are taken
(proportion with a high GHQ score = 69.05%, p<0.001) are at a broadly similar level
University of Exeter/ADAS UK Ltd
Longer-term effects of a bTB breakdown: draft report 30 September 2008
131
to the incidence measured following the foot-and-mouth outbreak in Cumbria in
2001, which was estimated at 73% of the farmers sampled (Peck et al, 2002). This
study also shows that the level of stress for beef farmers, on both suckler and trading
beef systems, is higher when their cattle herds are subject to a long period of
movement restriction (58.62% and 56.25% respectively) but, unlike dairy farmers,
tends to be relatively lower when they have lost a large number of cattle (45.9% and
32.7%). These findings are discussed in relation to farming systems and the other
study findings in Chapter 7.
Interviews with General Practitioners: some case studies
The health and social effects of bTB breakdowns are important indicators as to the
true cost of this event. In addition to exploring these issues with farmers, six general
practitioners (GPs), practising in hotspot areas, were interviewed for their experiences
of the effects of a breakdown. These case interviews serve to reinforce the data
obtained from the survey of farmers, but also provide an interesting insight into the
take-up of health and psychological support by farmers and how they compare to
their non-farming peers. The GPs were asked to consider both the short-term and
longer-term effects of a bTB breakdown on the health and well-being of their farming
patients. GPs are normally informed of cases of bTB as it indicates a possible need
for chest x-rays. No patients were identified even where case examples were given.
For the purposes of confidentiality the particular practices will not be identified,
however the interviews were conducted with GPs practicing in Devon (two),
Somerset (two) and Gloucestershire (two). The interviews were conducted by
telephone and face-to-face. Given the small nature of this survey, no attempt is made
to quantify these findings.
The general health of farmers
In general the health of farmers was said to be comparable to their non-farming peers.
There was no indication that farmers were less physically healthy than those working
in other professions in terms of measures such as blood pressure (with one exception),
strokes, and heart attacks. However, there were some differences, notably higher
rates of injury through accidents at work and lower rates of smoking. Drinking was
rated as ‘about the same’ or ‘slightly higher’ than average, however it wasn’t rated as
University of Exeter/ADAS UK Ltd
Longer-term effects of a bTB breakdown: draft report 30 September 2008
132
a particular concern in medical terms even though in some cases drinking had
increased during stressful times.
The mental health of farmers
The primary area of impact on farmer’s health was in their psychological health.
Depression, and related symptoms such as anxiety, insomnia, loss of appetite,
withdrawal and other chronic problems, was a commonly cited area of concern. In
extreme cases this resulted in suicide, though the cases cited were attributed to the
effects of FMD and debt (delays in receiving the SFP) rather than bTB. In all cases
the suicides were unexpected, even if, particularly under FMD, some were anticipated
– the particular cases could not have been predicted. This is supported by suggestions
that farmers don’t present early, if at all, with depressive symptoms. Issues of mental
health, therefore, whilst the key area of concern for GPs, was still not adequately
captured - it is likely that what they see only represents the “tip of the iceberg”.
However where cases of depression were presented they were often recurrent
problems, and could be monitored.
The broader impacts of bTB on people
It wasn’t always easy to differentiate between the effect of a bTB breakdown and the
effect of other forms of stress facing the farmer, such as FMD, market conditions,
weather, or delays in single farm payments. Indeed, part of the effect of such a
breakdown, or fear of a future breakdown, can only be understood as part of an
accumulation of numerous stressors:
“I think they’ve had plenty of stresses other than bovine TB, over the last ten
years they’ve had an awful lot of problems to cope with just with no money,
diversification if they can, trying not to sell up. They’ve had plenty of
problems. I guess the bTB has just been one of them….”
“Diabolical state of the livestock industry...it’s hard to pin it down to bTB…I
had someone come into me yesterday who said that he’d got less for a beef
stock at [the] market yesterday than he did in 1971…I hear things like that all
the time”
University of Exeter/ADAS UK Ltd
Longer-term effects of a bTB breakdown: draft report 30 September 2008
133
For others the devastation of a previous incident may have served to negate the
perceived impact of a bTB outbreak. In one area where the GP was aware of at least
one outbreak every 6 months, the health effect of these outbreaks was less noticeable:
“I work in an area which was absolutely ravaged by foot and mouth and we had
huge numbers of people who lost all their herd and I think hardly any of them
had foot and mouth, they were all contiguous stuff and that had an absolutely
devastating effect on quite a lot of my patients. And I did some semi research
work at the time and it worked out something like one in every three
consultations had a knock on effect from foot and mouth at the time. Bovine
TB hasn’t really had much of an impact. Whether that’s because the farmers are
mostly immune to it – they’ve had so many things go wrong that comparatively
this isn’t that much and I also don’t think we’ve had a lot of cases..[..].. (with)
foot and mouth, I think we had three suicides.. we had a lot of farmers who lost
their stock and never got round to doing it again, a lot of depression – quite
silent depression – I had people turning up three years after foot and mouth
who’d been struggling and struggling and never got over it. Certainly the
families of the three that committed suicide had huge problems because of, it
was the way it was handled rather than just the stock being lost. And politically,
the way it was managed down here was a complete disaster. So generally
speaking people around here are phlegmatic, particularly the farmers, because
they’ve had one set-back after another. But I can’t really speak to a farmer
without them being flat and thoroughly fed-up. We’ve got very few who are
wealthy and managed to get over everything…I saw a chap last week who, their
farm had been in the family for about four generations who, and I think it was
delayed payments that got them, who just said he’d just had enough and had
sold off to go off and do something different.”
This case occurred in a region which had previously experienced problems with
organo-phosphates. Identifying the ‘bTB effect’, therefore, was not always possible
in this context as other stressors, particular large-scale crises, had a ‘masking’ or
numbing effect. Equally one GP (practicing for 30 years) felt that accidents
(including fatal accidents) were a far bigger problem than the stresses and the
suicides. However, the presentation of symptoms (particularly stress related) was
University of Exeter/ADAS UK Ltd
Longer-term effects of a bTB breakdown: draft report 30 September 2008
134
often seen at the same time as a bTB breakdown, or around the time of a repeat test.
The lack of control, or capacity to ‘manage’ bTB was also cited as problematic.
The costs of bTB to the National Health Service
It was not possible to quantify the impact of the demands made by farmers on the
NHS, and due to their reticence to come forward any costing of health services used
would not fully measure the real health cost. Furthermore some of the measures, such
as days off sick, are not applicable in a family run farming business. Farmers were
seen as comparatively stoic when it comes to health and tend not to seek medical
attention, as it was perceived as “an admission of failure” or they “had other things to
do”:
“The vast majority would feel depressed, I should think they feel desperate, but
they’re not … the majority of farmers I would say do not present early. They’re
used to coping and they’ve got other things to do”.
One case was given of a farmer who suffered a heart attack but waited until the
morning before calling the doctor. Indications of possible concerns are often
apparent through the spouses who are more likely to seek medical care, though there
was a general feeling that farmers, and even their partners and children to a lesser
extent, didn’t tend to visit the doctor as regularly as those from the non-farming
community. There was also a gender-effect, with women (wives and daughters) more
likely to access health services and discuss their concerns for other family members,
though even they were “pretty self-sufficient has far as health goes”. In some cases
doctors were proactive in offering screening, but the take-up was not high. It was
also suggested that if there was any additional use of services this would be reflected
in the primary care sector.
Farming family and support
Stress and depression can also manifest itself in terms of domestic violence and
relationship breakdown, however there was no evidence to suggest that this was a
particular problem in these farming communities – in fact they were often described
as “more stable”. However there was evidence to suggest that the shape of the
farming family was changing as a result of pressures in farming, with farmers leaving
the profession (typically selling up to wealthy ex-city dwellers), or diversifying away
University of Exeter/ADAS UK Ltd
Longer-term effects of a bTB breakdown: draft report 30 September 2008
135
from farming such as the development of holiday property, bed and breakfast,
creation of riding stables, and the younger generation increasingly choosing not to get
involved:
“Now you get to the generation where kids coming through school who would
normally have gone into farming and almost without exception they’re going off
to uni and coming home and saying the last thing I’d want to do is farming.”
There was also general consensus that the family was a key mechanism of (mutual)
support (most farms were a husband and wife team). It is therefore the lack of this
support that made farmers more vulnerable to the effects of stress (in one case cited
where a farmer had become widowed there was an exponential increase in the
number of visits to the doctor through stress-related illness). It was also felt that the
experience of farm-related stress was mainly felt within the family, and primarily by
the farmer, rather than those allied to the farm. Farm workers were typically not seen
as detrimentally affected as they didn’t shoulder the responsibility, and the non-
farming local rural community was also seen as detached from the problems (and
“only interested in cheap food”).
Other farmers were also a valuable source of support, and though most farmers
benefited from this, not all enjoyed this support network - some farmers were
described as quite lonely (though this was alleviated to some extent through good
family support). In many cases farmers were connected by marriage, thereby
providing an extended family support network. Farmers who are lonely were
identified as particularly at risk.
External support and agencies
The GPs interviewed were also questioned about their assessment of the external
sources of support available to, and used by, farmers and the farming community
generally, and for other aspects of the general and mental health of farmers. The
following comments are typical of the responses from a number of doctors:
“quite a few of them (farmers) have been quietly miserable for many years
because of the difficulty of making a living….they don’t expect much in the
way of support”
University of Exeter/ADAS UK Ltd
Longer-term effects of a bTB breakdown: draft report 30 September 2008
136
“I think it’s (bTB) just one of many stresses that they’re currently under, and I
don’t think they feel that anyone’s really there to help them very much – that
they’re on their own. That people are looking for fault and not to support them”
“I think they feel sort of desperate really, and I think they don’t know where to
turn really. Their life is tied up in farms and they probably feel fairly hopeless
and perhaps lack confidence in changing and doing other things.”
There was a general feeling that farmers felt a considerable amount of annoyance at
the situation they are in and anger was expressed at Defra for their “lack of
decisiveness” and “procrastination” and for the “costs to the country”. Defra’s
approach to dealing with the problems of bTB, a feeling that they were “useless”,
“unsupportive”, “inaccessible” and provided “insufficient information” were also
cited as concerns/ stressing factors raised by farmers. Even the NFU, with one
exception (perhaps indicating a regional variation – though the data set is too small to
substantiate this9) was also cited as typically unsupportive:
“I think they find both Defra and the NFU pretty ineffective, or possibly even
hostile. I don’t think they find Defra supportive at all”
“I’m sure it’s crucial the way that Defra approach it, from what farmers say
about it, the way they actually approach each individual situation”
The CLA was rated more highly for their support for farmers with bTB outbreaks.
However farmers were also described as “rubbish” at approaching other support
services – perhaps unsurprising given their take-up of medical assistance. However
the younger generations were also described as better at accessing information &
support services (perhaps through being more ‘IT literate’).
The lack of control experienced with an outbreak – due to the process, information,
support and so on - was seen as acting as a stressor, though this experience was also
compared with the FMD outbreak which was seen as a more significant problem, and
had a more significant impact on depression and stress.
9 In this case, where the NFU was described as ‘thriving’ it was also suggested that farmers, whilst
angry at Defra, also understood the overall picture.
University of Exeter/ADAS UK Ltd
Longer-term effects of a bTB breakdown: draft report 30 September 2008
137
Moderating factors
There were a number of factors that were seen to moderate the likelihood of
presentation of symptoms (usually stress-related).
Age: One doctor was impressed with coping mechanisms of younger generations
(twenties to forties), though those of younger generations with families to support
were often perceived as at an increased risk (more likely to present with symptoms)
as there were more demands on them, a longer career ahead of them (and a pressure
to keep the farm as a going concern) and they were perceived as having higher
expectations of the industry (less battle-weary) than their older counterparts. These
groups were also sometimes associated with higher alcohol consumption. Many of
the older farmers were seen as better able to cope (in one of the areas identified the
average age of farmers was estimated at around 70).
Duration in farming: Though related to age, duration in farming (the longer the
better) was also seen as a moderating factor. A desire to maintain the farm for the
next generation was also cited as a stressor.
Farm ownership: Farmers who owned their farms were generally thought of as less
affected than tenant farmers. The farm size was also described as helping to
moderate the effects of stress. In both cases this suggests the financial security is key
to reducing stress. However Duchy tenant farmers (in more than one location)
consistently rated their landlord as sympathetic and in these cases the stress
differential between owner and tenant farmer was reduced.
.Diversification: Diversification was seen to alleviate the effects to some extent but
thus was also seen as ‘limited’ moderator (as one doctor pointed out – there can be
only so many B&Bs or riding stables in a locality). Diversification, therefore, was
closely linked with debt alleviation.
Support: The degree of isolation and loneliness was also identified as a key factor.
Those with good family (usually “supportive wives”), and farming support networks
were less likely to present with symptoms. But even with family support farmers
would present with depressive symptoms, such as:
University of Exeter/ADAS UK Ltd
Longer-term effects of a bTB breakdown: draft report 30 September 2008
138
“hopelessness and not knowing where to go from there.”
Community support was not cited as a factor that was known to have a significant
effect.
Other crises: FMD, in particular, acted as a moderating factor on the effect of bTB.
In one area there were three suicides, in another it was felt that about 1 in 10 of the
surgery’s farming patients had left the profession. These experiences, alongside
delays in SFPs amongst others, marginalized the direct effect of bTB.
Summary
Whilst farmers clearly discuss their concerns with GPs about bTB and the badger
population, on the basis of these case studies the cost to the health service appears not
to have been substantial. However it is clear from this study that we cannot assume
that there isn’t a significant cost (in health terms) to the farmers, and others in the
farming community, even if these are not presented at the surgery. The tendency for
farmers not to access health services, and the effects of other crises in the farming
industry which have lead to a cumulative ‘stress’ effect, means that the impact of bTB
on the farming community remains difficult to assess, but there is evidence to suggest
that there are significant mental health concerns.
In one interview, for example, the badger problem (and repetition of reaction) led two
farmers (aged 50 and 63) to leave the profession in what was an otherwise viable
business. One of these farmers was also treated for depression and received
counselling. Whilst the costs to the NHS were negligible as no medication was given,
the GP described the costs to the farmers as “considerable”. It is important, therefore,
to understand the hidden costs to both the farmers and their families and also the
future of farming families – demonstrated by the lack of interest by offspring to take
on the farm. Whilst these factors cannot always be attributed to bTB, it is evident
from this part of the research that a succession of crises in farming has had a
demonstrable effect on the health and well-being of farmers.
The farmers’ view: results from the interview survey
This chapter dealing with the effects of a bTB breakdown on the health of the farming
community concludes with the findings from the interview survey, which involved
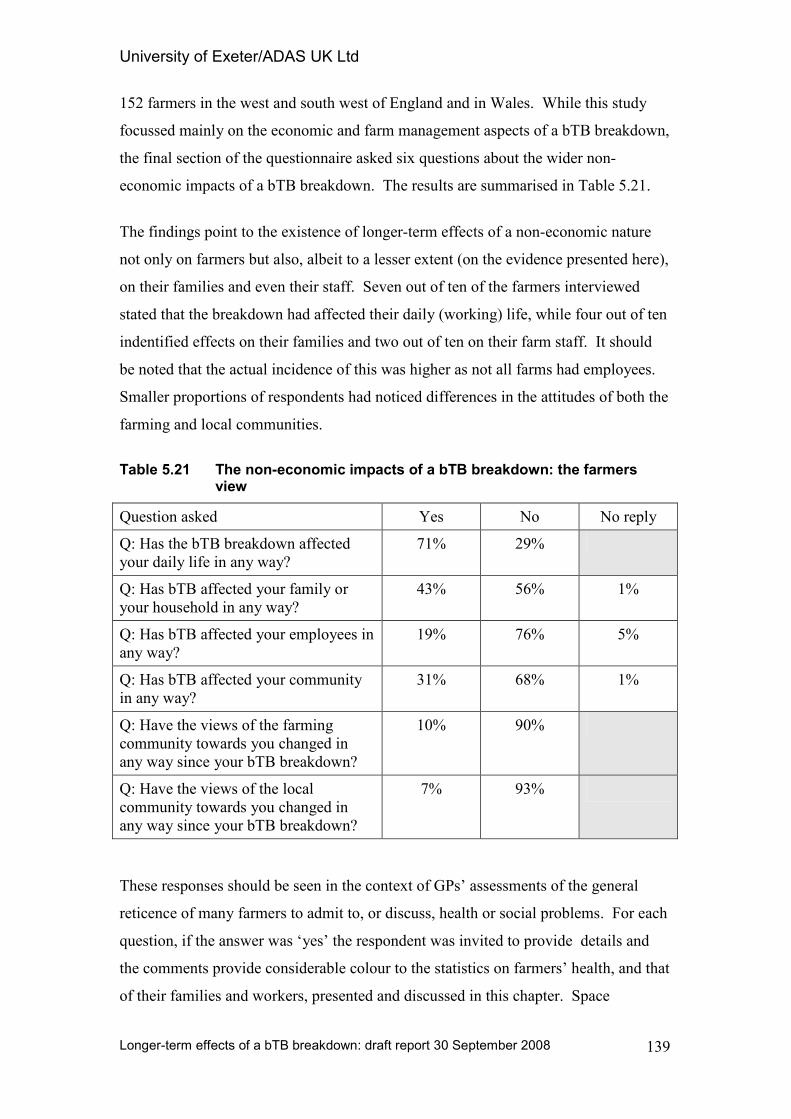
University of Exeter/ADAS UK Ltd
Longer-term effects of a bTB breakdown: draft report 30 September 2008
139
152 farmers in the west and south west of England and in Wales. While this study
focussed mainly on the economic and farm management aspects of a bTB breakdown,
the final section of the questionnaire asked six questions about the wider non-
economic impacts of a bTB breakdown. The results are summarised in Table 5.21.
The findings point to the existence of longer-term effects of a non-economic nature
not only on farmers but also, albeit to a lesser extent (on the evidence presented here),
on their families and even their staff. Seven out of ten of the farmers interviewed
stated that the breakdown had affected their daily (working) life, while four out of ten
indentified effects on their families and two out of ten on their farm staff. It should
be noted that the actual incidence of this was higher as not all farms had employees.
Smaller proportions of respondents had noticed differences in the attitudes of both the
farming and local communities.
Table 5.21 The non-economic impacts of a bTB breakdown: the farmers view
Question asked Yes No No reply
Q: Has the bTB breakdown affected
your daily life in any way?
71% 29%
Q: Has bTB affected your family or
your household in any way?
43% 56% 1%
Q: Has bTB affected your employees in
any way?
19% 76% 5%
Q: Has bTB affected your community
in any way?
31% 68% 1%
Q: Have the views of the farming
community towards you changed in
any way since your bTB breakdown?
10% 90%
Q: Have the views of the local
community towards you changed in
any way since your bTB breakdown?
7% 93%
These responses should be seen in the context of GPs’ assessments of the general
reticence of many farmers to admit to, or discuss, health or social problems. For each
question, if the answer was ‘yes’ the respondent was invited to provide details and
the comments provide considerable colour to the statistics on farmers’ health, and that
of their families and workers, presented and discussed in this chapter. Space
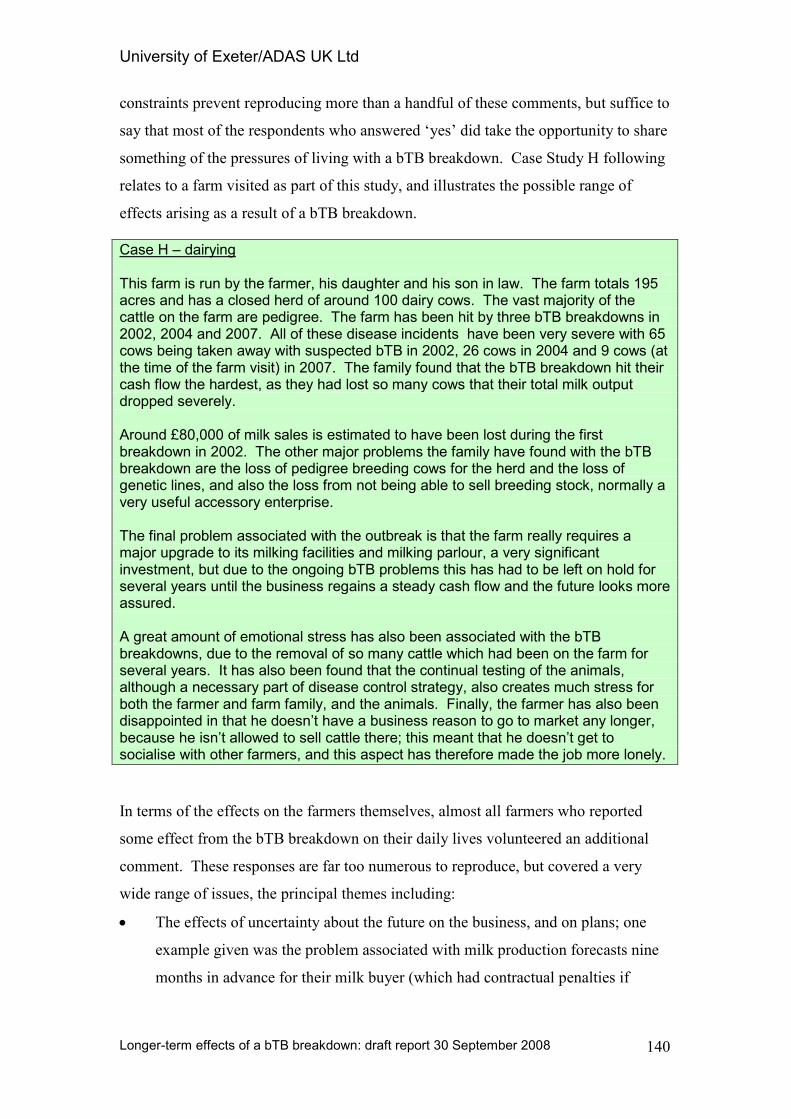
University of Exeter/ADAS UK Ltd
Longer-term effects of a bTB breakdown: draft report 30 September 2008
140
constraints prevent reproducing more than a handful of these comments, but suffice to
say that most of the respondents who answered ‘yes’ did take the opportunity to share
something of the pressures of living with a bTB breakdown. Case Study H following
relates to a farm visited as part of this study, and illustrates the possible range of
effects arising as a result of a bTB breakdown.
Case H – dairying This farm is run by the farmer, his daughter and his son in law. The farm totals 195 acres and has a closed herd of around 100 dairy cows. The vast majority of the cattle on the farm are pedigree. The farm has been hit by three bTB breakdowns in 2002, 2004 and 2007. All of these disease incidents have been very severe with 65 cows being taken away with suspected bTB in 2002, 26 cows in 2004 and 9 cows (at the time of the farm visit) in 2007. The family found that the bTB breakdown hit their cash flow the hardest, as they had lost so many cows that their total milk output dropped severely. Around £80,000 of milk sales is estimated to have been lost during the first breakdown in 2002. The other major problems the family have found with the bTB breakdown are the loss of pedigree breeding cows for the herd and the loss of genetic lines, and also the loss from not being able to sell breeding stock, normally a very useful accessory enterprise. The final problem associated with the outbreak is that the farm really requires a major upgrade to its milking facilities and milking parlour, a very significant investment, but due to the ongoing bTB problems this has had to be left on hold for several years until the business regains a steady cash flow and the future looks more assured. A great amount of emotional stress has also been associated with the bTB breakdowns, due to the removal of so many cattle which had been on the farm for several years. It has also been found that the continual testing of the animals, although a necessary part of disease control strategy, also creates much stress for both the farmer and farm family, and the animals. Finally, the farmer has also been disappointed in that he doesn’t have a business reason to go to market any longer, because he isn’t allowed to sell cattle there; this meant that he doesn’t get to socialise with other farmers, and this aspect has therefore made the job more lonely.
In terms of the effects on the farmers themselves, almost all farmers who reported
some effect from the bTB breakdown on their daily lives volunteered an additional
comment. These responses are far too numerous to reproduce, but covered a very
wide range of issues, the principal themes including:
• The effects of uncertainty about the future on the business, and on plans; one
example given was the problem associated with milk production forecasts nine
months in advance for their milk buyer (which had contractual penalties if
University of Exeter/ADAS UK Ltd
Longer-term effects of a bTB breakdown: draft report 30 September 2008
141
supply fell short, which would be the result if too many cows were taken in the
meantime).
• Aspects of ‘stress’ were very commonly articulated: physical, mental and
emotional effects were mentioned, as well as the effects of living with the
problem for months and years – the sheer longevity of the issue was seen as
taking its toll.
• The time taken for cattle testing often constitutes a very real increase in
workload, many farms already operating with the minimum labour required
because of financial pressures. Farmers mentioned aspects of the time to fetch
animals, the actual testing operations, and their perceptions of a lack of any
direct) benefit from the time spent. Some mentioned the adverse effects of the
testing on the cattle, including the increased incidence of spontaneous abortions,
for example.
• Notwithstanding the compensation for cattle taken, several mentioned increased
financial pressures as a result of the bTB breakdown; this may result from one
or more of reduced throughput, additional costs, curtailed expansion, or a
change of system (to a sub-optimal system) in order for the business to continue
to function with the cattle movement restrictions, for example.
• Generally, following a bTB breakdown there is a noticeably increased workload
with on-going time pressures; in addition to the cattle management aspects (e.g.
the isolation of IRs, etc.) the increased administration was also frequently
mentioned, such as additional paperwork, telephone calls etc.
The best way to understand something of the flavour of the comments made is to hear
the words spoken, and the following examples of farmers’ comments are typical:
“It was a worry at the time. And all the testing is so much extra work and puts
stress on the cows.”
“Had to spend so much time testing. It puts you behind with harvesting and
other jobs. It leaves me exhausted every time.”
“My family have farmed for generations. But I've lost heart in it now. I shall
never re build my suckler herd.”
'Harder work. More stock to keep. So much worry about whether we got the
paperwork right.
“There is so much stress. And every six weeks we dread the next test. What
has to go next?”
“Financially tied. More work. Stress. So much time with no benefit from it.
Shooting down good animals for no reason and the cause is not addressed.”
University of Exeter/ADAS UK Ltd
Longer-term effects of a bTB breakdown: draft report 30 September 2008
142
“More stress because of worries about cost of feeding when can't sell them.
Also worrying about how long going to be closed down for. The hassle of
having to test every 60 days. Also worry of extra cost.”
“Stress and additional testing increases workload. Looking after IR's that have
to be isolated also extra work. TB testing is stressful for the animals and
between the three of them they have required hospital treatment five times due
to TB testing accidents. (Cattle) not normally wild but know when testing
time.”
“Felt a bit down at the time of the first outbreak but coped better with passing of
time.”
“The stress impacts on my working, married & family life. There is extra
tension with bTB. Especially when cows slip calves etc. The test seems
inaccurate.”
“As TB wiped out the herd, there was a large reduction in income.”
“Very stressful, husband became very ill. Way of life has now changed as a
direct result. Financial constraints were the hardest.”
“Workload increase AND the uncertainty of everything (can't make plans for
the short or medium-term future, feels as if the business is 'on hold').”
Many farming businesses operate as notably tightly focussed family enterprises, often
with little or no distinction between business and family space e.g. the farm kitchen
not infrequently serves as part of the farm office and hosts round table business
discussions in addition to its purely domestic role. In these circumstances, it is not
unexpected that other family members will be all too aware of business pressures, and
these may be exacerbated when children have a direct interest in, or even
responsibility for, some of the animals. The following comments give an indication
of the range of possible effects on family members:
“Fraught at home due to all the worry.”
“We are always talking about it. It's caused so much hassle and really upset us.”
'All the children were tested because they all drank the milk. They all used to
help with the cows and they were all devastated. My son will not drink milk
any more because he does not like shop milk and he has not eaten a bowl of
cereal since.
“Tries to not let it affect the family.”
“Children worried. Wife had to go out to work.”
“Put stress on wife and marriage.”
“We are stressed with the anxiety and upset. These cause mood swings of the
farmer which impact on the whole family.”
“Wife's temper. All the vets and workers had to be fed every 2 months for 5
years.”
“Kids very upset by seeing their favourites having to be slaughtered.”
University of Exeter/ADAS UK Ltd
Longer-term effects of a bTB breakdown: draft report 30 September 2008
143
“Children hate to see calves shot/taken; also, heifers groomed, walked, shown at
Agric. Shows - painful to see them destroyed (four taken and killed for bTB).”
Fewer farmers thought that a bTB breakdown affected employees (and many did not
employ anyone other than the family), but of those who did it was often recognised
that they too could be affected. The economic effects could range through extra work
pressures for no more money, through enforced extra (paid) overtime to losing their
employment. Again, a few representative comments are as follows:
“They get fed up with the job. They still have to do their other work so they get
overtime.”
“Herdswoman's favourite cow. She used to bring her an apple every day. She
was terribly upset.”
“I had a lad full time who had been here since he left school. Well I could not
afford to keep him full time and in the end he left agriculture altogether. If we
had not had TB I expect he would still be here.”
“Additional workload in testing 500-600 head of cattle every 60 days.”
“Workman injured his back during a bTB test and was out of action for four
months. On other occasions jobs don't get done as the employee may be in
contact with infected animals on another farm under restrictions which would
breach our bio-security.”
The respondent was also asked about the effects on the local community, on the
farming community and whether the views of the local community towards the
farmer had changed following the bTB breakdown. While some of the responses
reflect an overlap between these questions, there was a general feeling that the local
community was not overly affected, even if they knew of it. People from outside
farming often didn’t appreciate the consequences for the farm and the farm family,
although a number mentioned adverse effects since farmers had less money to spend
locally. For most farmers, their immediate neighbours are other farmers, and there
was a range of responses here: some reported increased friction between farmers,
others acknowledged sympathy and support, some said the farming community was
more open about bTB now while others said it was a very closed topic. Broadly,
most non-farmers were not expected to understand, although some were clearly
sympathetic and supportive; one mentioned a reluctance of ramblers to comply with
bio-security precautions (dipping feet).
University of Exeter/ADAS UK Ltd
Longer-term effects of a bTB breakdown: draft report 30 September 2008
144
Conclusions
With respect to the implications of a bTB breakdown for human health, the main
conclusions are as follows;
• The work reported here has augmented previous research on both (a) the short-
term effects of a bTB breakdown and (b) other studies of the effects of livestock
crises on the farming community.
• While a bTB breakdown is less dramatic than some other livestock disease
crises (such as FMD and BSE) by its nature the persistence and pervasiveness of
the control programme represents a clear source of on-farm stress, typically
over an extended period.
• The stakeholder consultation reflected perceptions of a range of human health
effects as a consequence of bTB, including physical, mental, emotional and
social changes. Many highlighted ‘uncertainty’ and ‘lack of control’ as
powerful drivers of human health problems.
• The GHQ-12 study provides objective evidence of the scale of the longer-term
effects of a bTB breakdown:
o In general terms, a much greater proportion of farmers exhibit signs of
psychiatric morbidity that the population as a whole.
o Overall, the highest stress levels are seen on farms which have been
under livestock movement restrictions for a long period.
o However, on dairy farms, where people are generally more stressed
than on beef farms, the greatest stressor is the loss of a large number of
cattle.
o There is evidence that bTB is associated with raised stress levels for
people other than the farmer, particularly spouses; but the sample was
too small for reliable results for farm workers.
o For farmers, a bTB breakdown causes significant stress: this is highest
for dairy farmers, especially where they have lost a large number of
cattle; while for both trading beef and suckler beef farmers, a long
period under restriction is the greater stressor.
• The study of rural GPs identified that farmers typically present late with
symptoms and, for mental health issues in particular, GPs probably only see a
small proportion of cases. Other findings include:
University of Exeter/ADAS UK Ltd
Longer-term effects of a bTB breakdown: draft report 30 September 2008
145
o Several GPs pointed to the range of pressures affecting farmers,
particularly livestock farmers, of which bTB is only one; and the
consequent difficulty in direct attribution of cause and effect.
o The lack of control experienced as a result of a bTB breakdown was
identified as an important stressor; even so, bTB was thought to be a
less serious problem than the FMD epidemic of 2001.
o A range of moderating factors include age, farming experience, farm
ownership, diversification, the availability of support and the
significance of other crises.
• At interview, most farmers identified adverse effects on their daily lives, and
often on those of their families and others. Key effects relate to uncertainty,
stress, time pressures and financial worries. Knock-on effects on the local and
farming communities do not appear in general to be very significant.
University of Exeter/ADAS UK Ltd
Longer-term effects of a bTB breakdown: draft report 30 September 2008
146
6 EXPLORING FARMERS’ WTP FOR A bTB VACCINE
Background
The project also explored farmers’ willingness-to-pay (WTP) for a bTB cattle vaccine
using a methodology based on a choice experiment (CE) questionnaire, which was
designed with appropriate choice sets to elicit cattle farmers' willingness to pay. The
choice experiment was used to estimate WTP for a vaccine depending upon a number
of vaccine characteristics including, inter alia, the efficacy of the vaccine and whether
subsequent breakdown losses (i.e. even with vaccination) are covered by an insurance
programme. Using appropriate scenarios the aim was to provide estimates of cattle
farmers' WTP for a bTB cattle vaccine, given that such a vaccine is likely to be less
than 100 per cent efficacious.
The project target was to administer the choice experiment to a sample of 300 cattle
farmers, with the sample split according to those that have suffered a bTB breakdown
and those that have not but are situated within bTB 'hotspot' areas. The sample was
split according to survey method. All of the target 152 cattle farmers interviewed as
part of the farm survey were also invited subsequently to complete the choice
experiment questionnaire, with a target of a further 150 cattle farmers also being
interviewed; both samples were interviewed by telephone. Both sets of farmers were
sent explanatory material relating to the choice experiment by post in advance of the
interview. The combined sample of 300 was thought to be adequate to ensure
statistical significance for the main analyses.
Study objectives and methodology
Formally, this part of the research project had the following specific objectives:
1. Estimate cattle farmers’ WTP for a bTB cattle vaccine.
2. Assess how farmers’ WTP varies with selected vaccine attributes.
The methods used in this part of the research project have a strong theoretical basis
and, in particular, the WTP estimation methods combined two established
University of Exeter/ADAS UK Ltd
Longer-term effects of a bTB breakdown: draft report 30 September 2008
147
approaches. Farmers’ WTP for the vaccine attributes were estimated from the choice
experiment responses using a Bayesian logit model in accordance with Koop and
Poirier (1993). Farmers’ WTP for the cattle vaccine specified in the contingent
valuation (CV) questions were estimated using a Bayesian interval data estimation
method, which is a special case of the simultaneous equation probit estimator
described by Cameron and James (1987). This Bayesian estimator should be very
similar to the maximum likelihood estimator.
Main stages of the research
The research into farmers’ WTP involved a number of stages, designed to ensure that
the scenarios and assumptions used were robust, scientifically realistic and well
grounded in terms of cattle farmers’ understanding and expectations. The principal
stages in designing the questionnaire and refining the approach included:
1. Scoping and consideration of vaccine attributes.
2. Initial questionnaire design.
3. Farmer focus group.
4. Questionnaire development and pre-testing.
5. Questionnaire pilot survey.
6. Main telephone survey.
7. Data entry and analysis.
8. Reporting.
The first two stages involved discussions with Defra and others concerning vaccine
attributes and design of a questionnaire to elicit farmers’ WTP for a bTB cattle
vaccine. The next stage involved undertaking a focus group of cattle farmers. Focus
group participants were recruited from a veterinary practice list of cattle farmer
clients. The practice was based in a bTB ‘hotspot’ near Tiverton in Devon. Nine
cattle farmers were recruited for the focus group made up of dairy, suckler beef and
finishing beef cattle farms. Of these, six had had a bTB breakdown within the last
five years and three had never had a breakdown. The focus group was undertaken in
a public house near Tiverton over lunch time for two hours led by the researcher as
facilitator and an assistant. The focus group was structured around two main
objectives which were (a) to discuss farmer’s perceptions of and attitudes to bTB, a
University of Exeter/ADAS UK Ltd
Longer-term effects of a bTB breakdown: draft report 30 September 2008
148
cattle vaccine and other methods of bTB control and (b) testing the draft
questionnaire for ease of understanding and ability to complete the questions.
The fourth stage of research involved using the findings of the focus group to further
develop the questionnaire followed by a pre-testing of the questionnaire by means of
personal and telephone interviews to known farmers. Following these the
questionnaire was further refined prior to undertaking a pilot survey.
A pilot survey of 30 farmers was then undertaken using those sampled from the
VetNet data base. Following this pilot any minor problems in the questionnaire were
amended and the main telephone survey was undertaken. Responses to the
questionnaire were entered onto a database (MS Access) for analysis. Analyses
involved production of descriptive statistics for each question and estimation of
willingness to pay. Additional analyses involved cross tabulation and exploration of
correlations between question responses/variables.
Questionnaire design
The questionnaire used in the telephone survey was structured into eight main parts
(see Appendix F for the actual questionnaire), as follows:
1. Basic farm information (such as whether dairy or beef, size of herd etc.).
2. Information relating to bTB on the farm.
3. Attitudinal statements and questions concerning bTB risk, bio-security etc.
4. Information statement about bTB and a possible cattle vaccine.
5. A CE exercise (containing a description of the choice experiment and
explanation of what the respondent should do and presentation of eight choice
sets).
6. A CV question.
7. Open-ended debriefing question (asking respondents to explain the reasoning
behind the choices they made) and follow-up attitudinal questions relating to
their WTP.
8. Personal details of the farmer and the farm family (e.g. age, family members
farming).
University of Exeter/ADAS UK Ltd
Longer-term effects of a bTB breakdown: draft report 30 September 2008
149
Sampling frame and survey method
A stratified sample of cattle farmers in annually bTB-tested areas in England and
Wales was drawn from the VetNet database. The sample was stratified according to
whether farms were dairy or beef, whether they had had a bTB breakdown in the last
five or ten years or never had a breakdown and by area. The sample also included the
152 farms which took part in the farm survey.
Farmers were contacted by telephone and asked if they would participate in the
survey. For those that agreed, a convenient time for the telephone interview was
agreed and a confirmatory letter and additional information was then sent to the
participant prior to the telephone interview. The additional material sent comprised
the information statement, including a description of the choice experiment exercise,
and a copy of the choice sets from which they would be asked to select their preferred
choice.
The interviews lasted approximately 15 minutes. In most cases participants had read
the information statement and marked their choices on the choice sets previously sent
to them prior to the interview. This considerably aided the interview process and
limited the time taken to conduct the interview.
CE and CV design
The information statement described a single-dose bTB cattle vaccine that would be
administered once only to targeted groups of cattle. Four attributes were chosen in
relation to the way in which the cattle vaccine as characterised in the choice sets,
having been selected following discussions with Defra and others and following the
guidance gained at the farmer focus group. The attributes were:
(i) vaccine effectiveness in terms of the ability of a vaccine to reduce the risk of
a farm having a bTB breakdown (i.e. its ability to prevent a breakdown);
(ii) vaccine effectiveness in terms of the ability of a vaccine to reduce the
severity of a breakdown (i.e. reduction in the number of reactors);
(iii) the level of insurance or ‘loss recovery’ associated with a vaccine where a
vaccine fails to prevent a bTB breakdown; and
(iv) the cost per dose per animal of the vaccine.
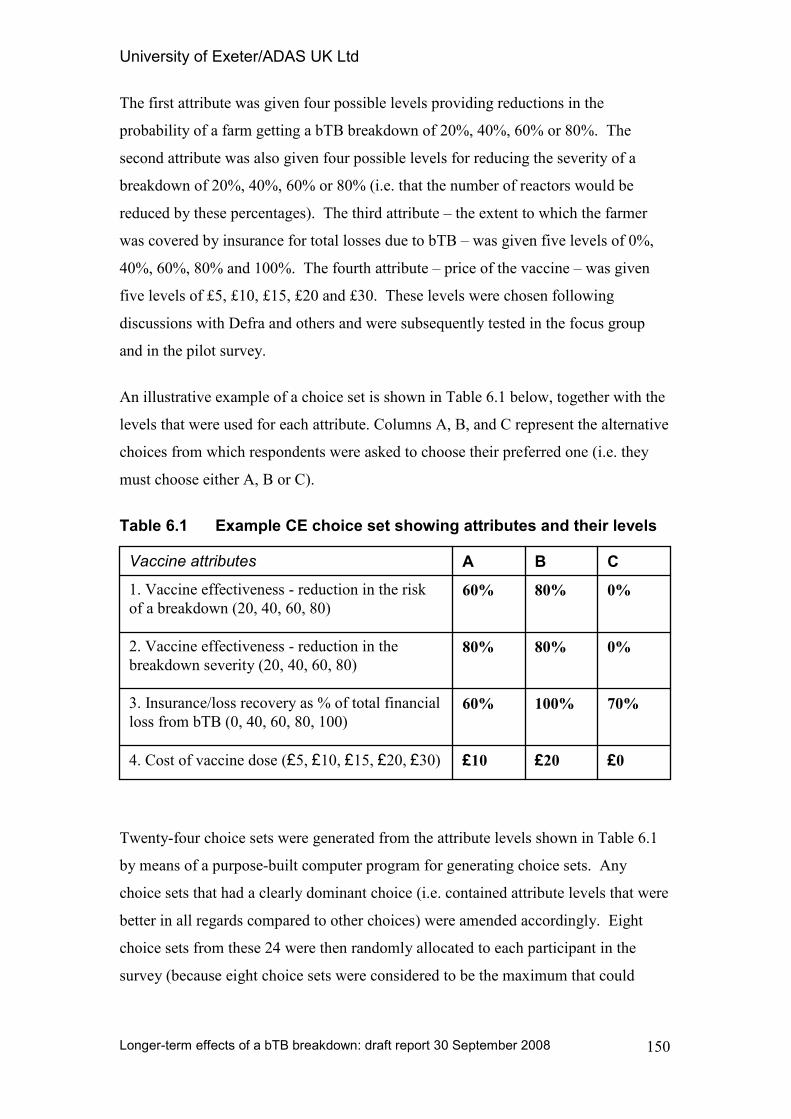
University of Exeter/ADAS UK Ltd
Longer-term effects of a bTB breakdown: draft report 30 September 2008
150
The first attribute was given four possible levels providing reductions in the
probability of a farm getting a bTB breakdown of 20%, 40%, 60% or 80%. The
second attribute was also given four possible levels for reducing the severity of a
breakdown of 20%, 40%, 60% or 80% (i.e. that the number of reactors would be
reduced by these percentages). The third attribute – the extent to which the farmer
was covered by insurance for total losses due to bTB – was given five levels of 0%,
40%, 60%, 80% and 100%. The fourth attribute – price of the vaccine – was given
five levels of £5, £10, £15, £20 and £30. These levels were chosen following
discussions with Defra and others and were subsequently tested in the focus group
and in the pilot survey.
An illustrative example of a choice set is shown in Table 6.1 below, together with the
levels that were used for each attribute. Columns A, B, and C represent the alternative
choices from which respondents were asked to choose their preferred one (i.e. they
must choose either A, B or C).
Table 6.1 Example CE choice set showing attributes and their levels
Twenty-four choice sets were generated from the attribute levels shown in Table 6.1
by means of a purpose-built computer program for generating choice sets. Any
choice sets that had a clearly dominant choice (i.e. contained attribute levels that were
better in all regards compared to other choices) were amended accordingly. Eight
choice sets from these 24 were then randomly allocated to each participant in the
survey (because eight choice sets were considered to be the maximum that could
£0 £20 £10 4. Cost of vaccine dose (£5, £10, £15, £20, £30)
70% 100% 60% 3. Insurance/loss recovery as % of total financial
loss from bTB (0, 40, 60, 80, 100)
0% 80% 80% 2. Vaccine effectiveness - reduction in the
breakdown severity (20, 40, 60, 80)
0% 80% 60% 1. Vaccine effectiveness - reduction in the risk
of a breakdown (20, 40, 60, 80)
C B A Vaccine attributes
University of Exeter/ADAS UK Ltd
Longer-term effects of a bTB breakdown: draft report 30 September 2008
151
reasonably be presented to each participant). An illustrative example of just one of
these choice sets is shown in Table 6.1.
The CV question immediately followed the CE exercise. In this, participants were
provided with a brief scenario of a bTB cattle vaccine that was 90% efficacious and
backed by a 100% insurance/loss recovery of total losses due to a TB breakdown. It
was assumed that the vaccine had to be administered annually.
The CV question was double bounded and asked participants ‘Would you be willing
to pay £x per animal per year for such a vaccine?’ Participants were first asked this
question in relation to either £10 or £15 (chosen randomly). If they answered ‘no’ to
this first question they were then asked whether they would be willing to pay a lower
amount, either £5 or £7 respectively. If they answered ‘yes’ to the first question they
were then asked whether they would be willing to pay a higher amount, either £20 or
£30 respectively.
Study results
Findings from the focus group
The main findings of the focus group were that:
• All farmers felt at high risk of their cattle getting bTB.
• There was a general consensus that there may need to be control of badgers
(and possibly other wildlife) as well as other bTB control strategies – but they
felt that information regarding the pros and cons of badger culling was
confusing.
• There was recognition that bTB was a ‘political issue’ and a belief that any
policy decision (e.g. regarding badgers) needed to have the backing of the
general public.
• There was a desire to ensure that a vaccine should not hinder international
trade (e.g. a differential test must be able to differentiate vaccinated cattle
from those exposed to bTB).
• It was questioned whether farmers should have to pay all of the costs of
administering a cattle vaccine or whether there should be some cost sharing
with government.
University of Exeter/ADAS UK Ltd
Longer-term effects of a bTB breakdown: draft report 30 September 2008
152
• It was strongly felt that a vaccine should be insurance-backed to provide
against adverse outcomes from using an ineffective vaccine.
• The most important vaccine attribute for farmers was the ability to prevent a
breakdown (not ability to reduce breakdown severity).
• It was recognised that a ‘bTB-free’ label could be good for marketing
purposes, of both cattle and cattle products.
• The draft questionnaire largely worked well and participants could understand
and answer all of the questions.
The telephone survey results
Completed questionnaires were obtained from 287 cattle farmers in England and
Wales. Sixty-five per cent of those farmers who agreed initially to participate in the
survey actually completed the telephone interview, the relatively high ‘failure to
complete’ rate being explained by on-farm pressures of work when the time to take
part actually arrived. Eighty-seven of these had also participated in the University of
Exeter/ADAS interviews.
The sample comprised 46% dairy farmers and 54% beef farmers. Of these, 5.6%
were registered organic. The mean size of farm was 147 dairy cows and 50 beef
cattle. Twenty-four per cent of herds were pedigree. Thirty per cent of dairy herds
and 52% of beef farms had a beef fattening/finishing enterprise. Fifty per cent of
farms also had a sheep enterprise (30% of dairy and 67% of beef farms), whilst 5%
had pigs and 5% poultry. Average milk yield per cow was 7,246 litres per year for
dairy herds and suckler beef herds had an average calving rate of 95%. Ninety per
cent of respondents were aged 40 yrs or over and the majority (88%) were owners of
their farms (12% were tenant farmers and just 1% were farm managers). Around
63% of farmers had successors to the farm business whilst 93% intended to continue
cattle farming for the foreseeable future (this percentage was almost identical for
farms which had had a bTB breakdown compared to those that had not). Of those
who intended not to continue cattle farming, 21% (only five respondents, representing
about a fifth of the ‘give up cattle farming’ group) gave bTB as the reason.
In terms of their bTB history, 68% of farms had had a bTB breakdown (74% of dairy
farms and 63% of beef farms), of which 78% were confirmed breakdowns. On
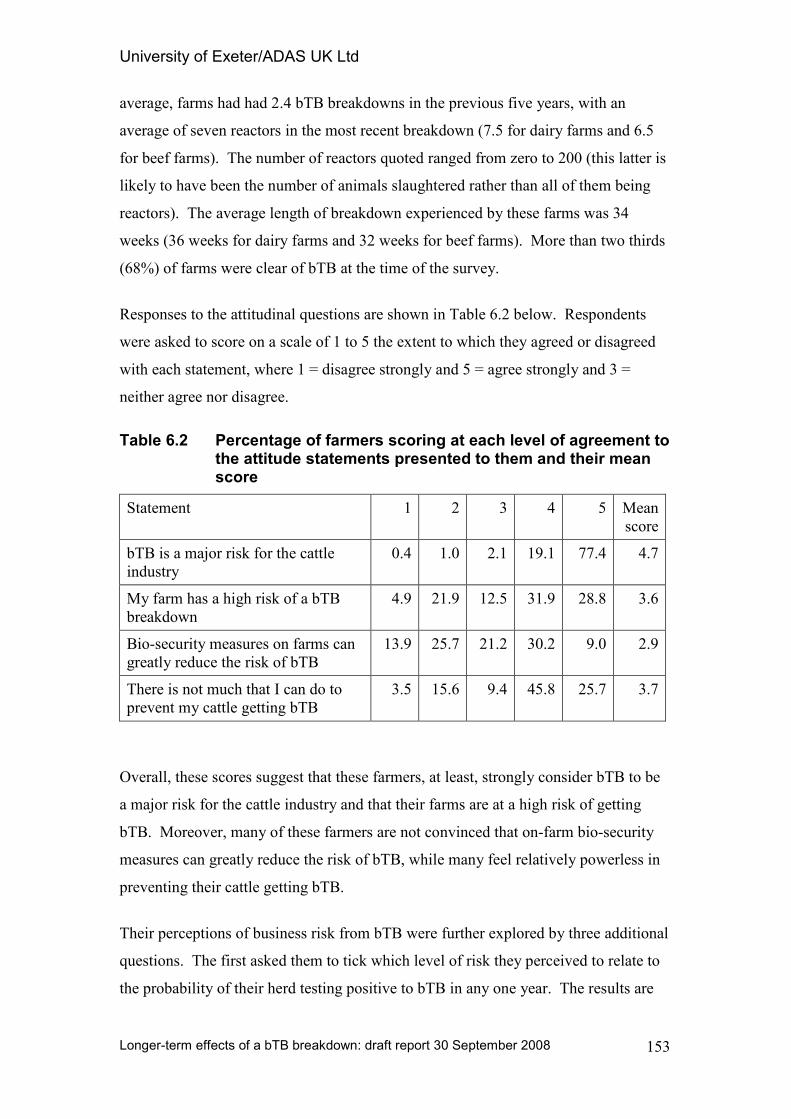
University of Exeter/ADAS UK Ltd
Longer-term effects of a bTB breakdown: draft report 30 September 2008
153
average, farms had had 2.4 bTB breakdowns in the previous five years, with an
average of seven reactors in the most recent breakdown (7.5 for dairy farms and 6.5
for beef farms). The number of reactors quoted ranged from zero to 200 (this latter is
likely to have been the number of animals slaughtered rather than all of them being
reactors). The average length of breakdown experienced by these farms was 34
weeks (36 weeks for dairy farms and 32 weeks for beef farms). More than two thirds
(68%) of farms were clear of bTB at the time of the survey.
Responses to the attitudinal questions are shown in Table 6.2 below. Respondents
were asked to score on a scale of 1 to 5 the extent to which they agreed or disagreed
with each statement, where 1 = disagree strongly and 5 = agree strongly and 3 =
neither agree nor disagree.
Table 6.2 Percentage of farmers scoring at each level of agreement to the attitude statements presented to them and their mean score
Statement 1 2 3 4 5 Mean
score
bTB is a major risk for the cattle
industry
0.4 1.0 2.1 19.1 77.4 4.7
My farm has a high risk of a bTB
breakdown
4.9 21.9 12.5 31.9 28.8 3.6
Bio-security measures on farms can
greatly reduce the risk of bTB
13.9 25.7 21.2 30.2 9.0 2.9
There is not much that I can do to
prevent my cattle getting bTB
3.5 15.6 9.4 45.8 25.7 3.7
Overall, these scores suggest that these farmers, at least, strongly consider bTB to be
a major risk for the cattle industry and that their farms are at a high risk of getting
bTB. Moreover, many of these farmers are not convinced that on-farm bio-security
measures can greatly reduce the risk of bTB, while many feel relatively powerless in
preventing their cattle getting bTB.
Their perceptions of business risk from bTB were further explored by three additional
questions. The first asked them to tick which level of risk they perceived to relate to
the probability of their herd testing positive to bTB in any one year. The results are
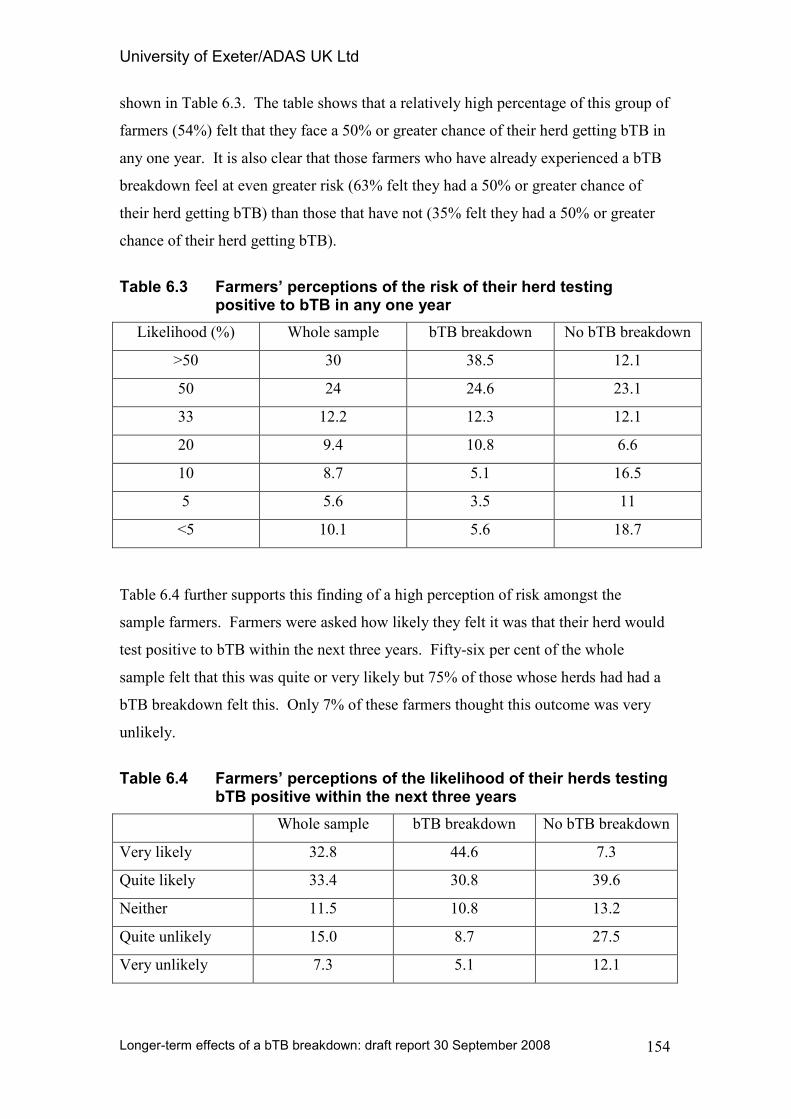
University of Exeter/ADAS UK Ltd
Longer-term effects of a bTB breakdown: draft report 30 September 2008
154
shown in Table 6.3. The table shows that a relatively high percentage of this group of
farmers (54%) felt that they face a 50% or greater chance of their herd getting bTB in
any one year. It is also clear that those farmers who have already experienced a bTB
breakdown feel at even greater risk (63% felt they had a 50% or greater chance of
their herd getting bTB) than those that have not (35% felt they had a 50% or greater
chance of their herd getting bTB).
Table 6.3 Farmers’ perceptions of the risk of their herd testing positive to bTB in any one year
Likelihood (%) Whole sample bTB breakdown No bTB breakdown
>50 30 38.5 12.1
50 24 24.6 23.1
33 12.2 12.3 12.1
20 9.4 10.8 6.6
10 8.7 5.1 16.5
5 5.6 3.5 11
<5 10.1 5.6 18.7
Table 6.4 further supports this finding of a high perception of risk amongst the
sample farmers. Farmers were asked how likely they felt it was that their herd would
test positive to bTB within the next three years. Fifty-six per cent of the whole
sample felt that this was quite or very likely but 75% of those whose herds had had a
bTB breakdown felt this. Only 7% of these farmers thought this outcome was very
unlikely.
Table 6.4 Farmers’ perceptions of the likelihood of their herds testing bTB positive within the next three years
Whole sample bTB breakdown No bTB breakdown
Very likely 32.8 44.6 7.3
Quite likely 33.4 30.8 39.6
Neither 11.5 10.8 13.2
Quite unlikely 15.0 8.7 27.5
Very unlikely 7.3 5.1 12.1
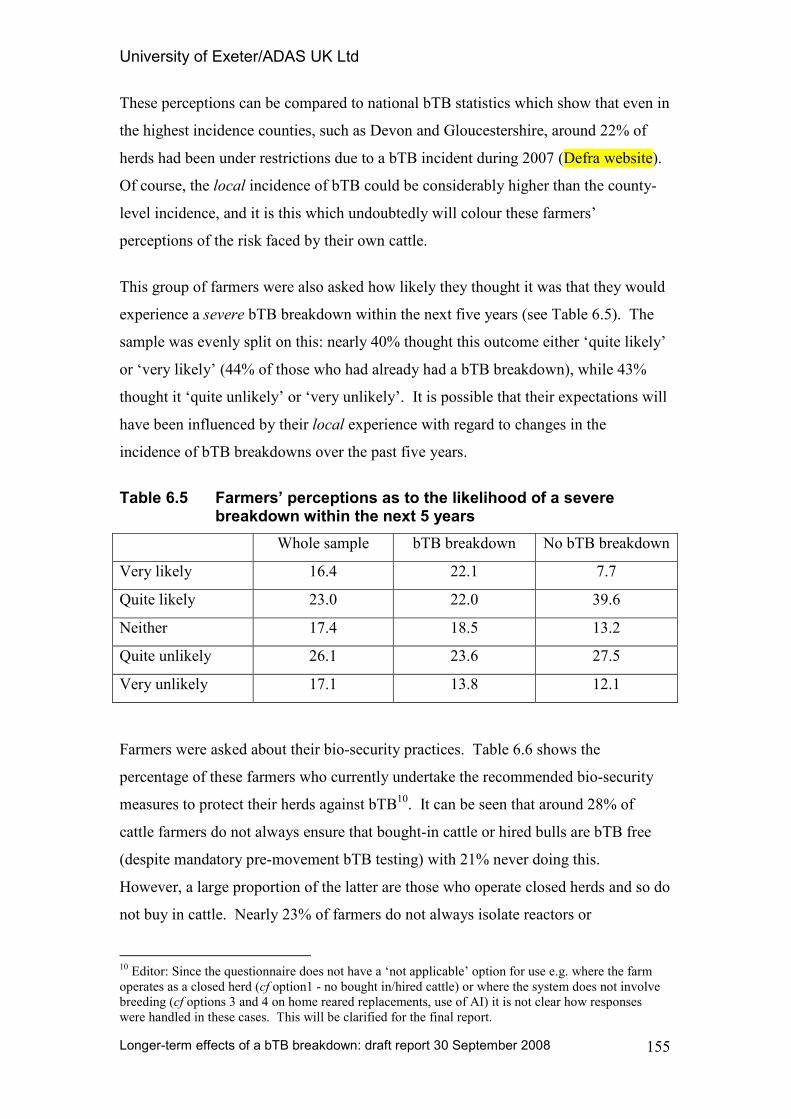
University of Exeter/ADAS UK Ltd
Longer-term effects of a bTB breakdown: draft report 30 September 2008
155
These perceptions can be compared to national bTB statistics which show that even in
the highest incidence counties, such as Devon and Gloucestershire, around 22% of
herds had been under restrictions due to a bTB incident during 2007 (Defra website).
Of course, the local incidence of bTB could be considerably higher than the county-
level incidence, and it is this which undoubtedly will colour these farmers’
perceptions of the risk faced by their own cattle.
This group of farmers were also asked how likely they thought it was that they would
experience a severe bTB breakdown within the next five years (see Table 6.5). The
sample was evenly split on this: nearly 40% thought this outcome either ‘quite likely’
or ‘very likely’ (44% of those who had already had a bTB breakdown), while 43%
thought it ‘quite unlikely’ or ‘very unlikely’. It is possible that their expectations will
have been influenced by their local experience with regard to changes in the
incidence of bTB breakdowns over the past five years.
Table 6.5 Farmers’ perceptions as to the likelihood of a severe breakdown within the next 5 years
Whole sample bTB breakdown No bTB breakdown
Very likely 16.4 22.1 7.7
Quite likely 23.0 22.0 39.6
Neither 17.4 18.5 13.2
Quite unlikely 26.1 23.6 27.5
Very unlikely 17.1 13.8 12.1
Farmers were asked about their bio-security practices. Table 6.6 shows the
percentage of these farmers who currently undertake the recommended bio-security
measures to protect their herds against bTB10. It can be seen that around 28% of
cattle farmers do not always ensure that bought-in cattle or hired bulls are bTB free
(despite mandatory pre-movement bTB testing) with 21% never doing this.
However, a large proportion of the latter are those who operate closed herds and so do
not buy in cattle. Nearly 23% of farmers do not always isolate reactors or
10 Editor: Since the questionnaire does not have a ‘not applicable’ option for use e.g. where the farm
operates as a closed herd (cf option1 - no bought in/hired cattle) or where the system does not involve
breeding (cf options 3 and 4 on home reared replacements, use of AI) it is not clear how responses
were handled in these cases. This will be clarified for the final report.
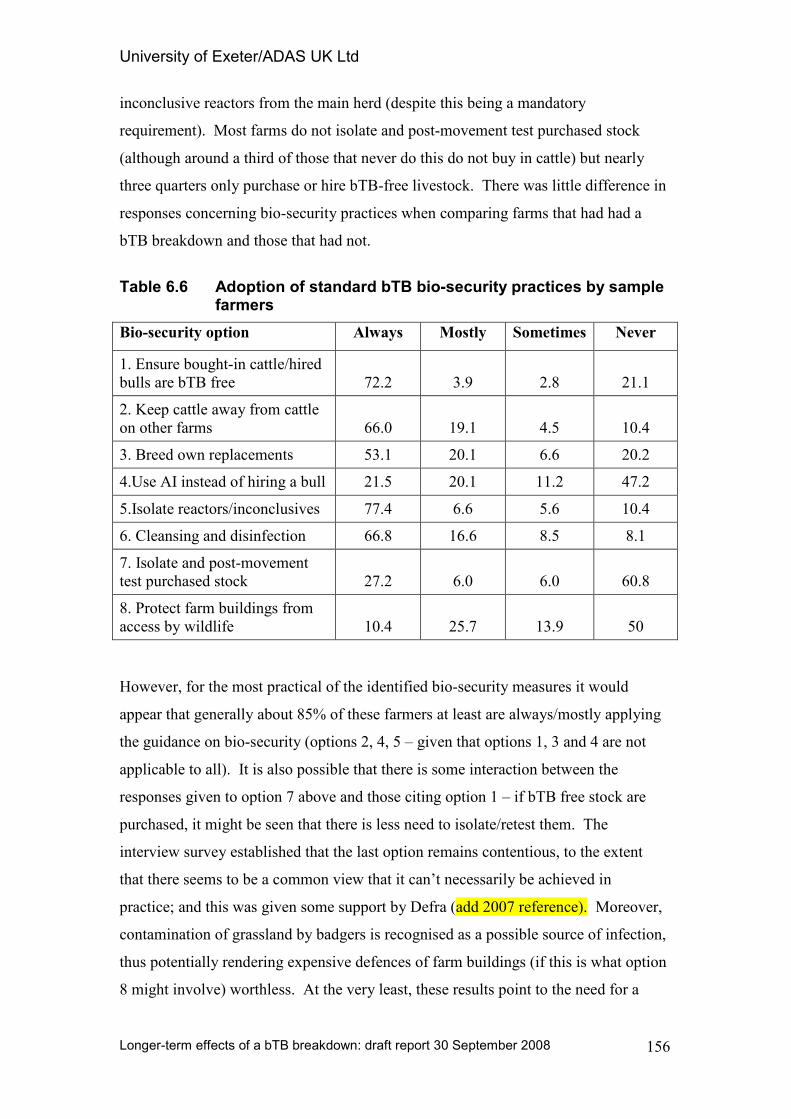
University of Exeter/ADAS UK Ltd
Longer-term effects of a bTB breakdown: draft report 30 September 2008
156
inconclusive reactors from the main herd (despite this being a mandatory
requirement). Most farms do not isolate and post-movement test purchased stock
(although around a third of those that never do this do not buy in cattle) but nearly
three quarters only purchase or hire bTB-free livestock. There was little difference in
responses concerning bio-security practices when comparing farms that had had a
bTB breakdown and those that had not.
Table 6.6 Adoption of standard bTB bio-security practices by sample farmers
Bio-security option Always Mostly Sometimes Never
1. Ensure bought-in cattle/hired
bulls are bTB free 72.2 3.9 2.8 21.1
2. Keep cattle away from cattle
on other farms 66.0 19.1 4.5 10.4
3. Breed own replacements 53.1 20.1 6.6 20.2
4.Use AI instead of hiring a bull 21.5 20.1 11.2 47.2
5.Isolate reactors/inconclusives 77.4 6.6 5.6 10.4
6. Cleansing and disinfection 66.8 16.6 8.5 8.1
7. Isolate and post-movement
test purchased stock 27.2 6.0 6.0 60.8
8. Protect farm buildings from
access by wildlife 10.4 25.7 13.9 50
However, for the most practical of the identified bio-security measures it would
appear that generally about 85% of these farmers at least are always/mostly applying
the guidance on bio-security (options 2, 4, 5 – given that options 1, 3 and 4 are not
applicable to all). It is also possible that there is some interaction between the
responses given to option 7 above and those citing option 1 – if bTB free stock are
purchased, it might be seen that there is less need to isolate/retest them. The
interview survey established that the last option remains contentious, to the extent
that there seems to be a common view that it can’t necessarily be achieved in
practice; and this was given some support by Defra (add 2007 reference). Moreover,
contamination of grassland by badgers is recognised as a possible source of infection,
thus potentially rendering expensive defences of farm buildings (if this is what option
8 might involve) worthless. At the very least, these results point to the need for a
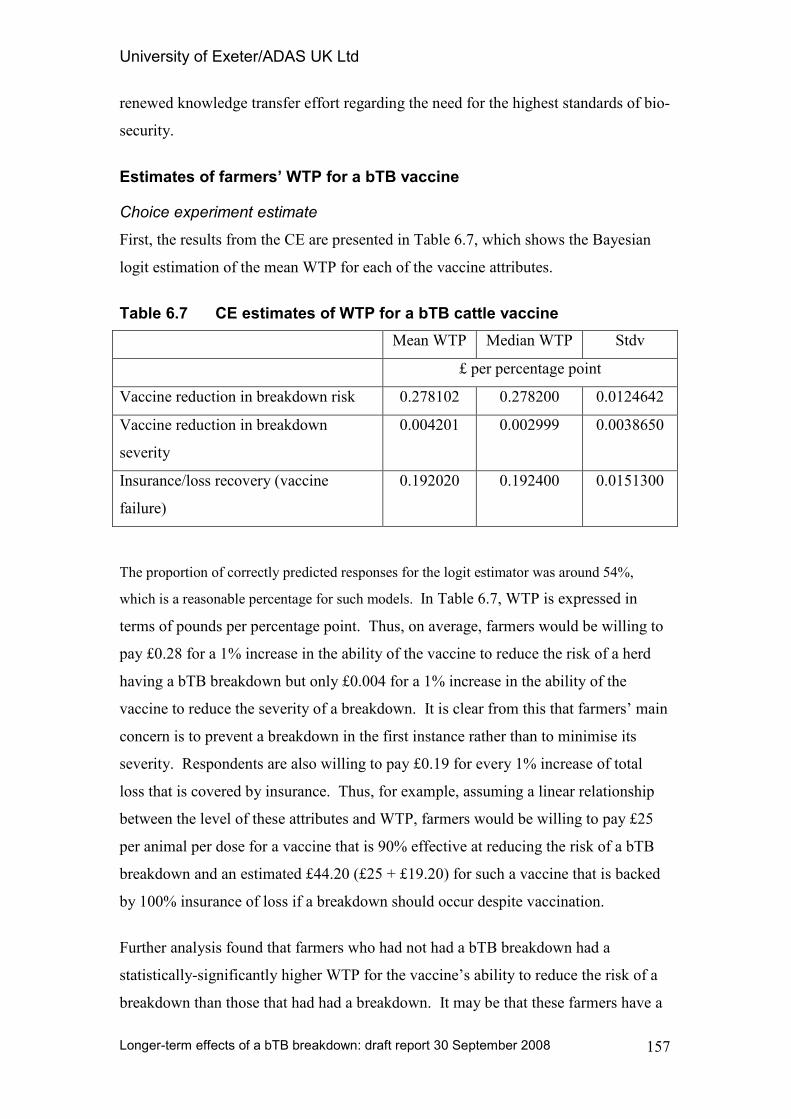
University of Exeter/ADAS UK Ltd
Longer-term effects of a bTB breakdown: draft report 30 September 2008
157
renewed knowledge transfer effort regarding the need for the highest standards of bio-
security.
Estimates of farmers’ WTP for a bTB vaccine
Choice experiment estimate
First, the results from the CE are presented in Table 6.7, which shows the Bayesian
logit estimation of the mean WTP for each of the vaccine attributes.
Table 6.7 CE estimates of WTP for a bTB cattle vaccine
Mean WTP Median WTP Stdv
£ per percentage point
Vaccine reduction in breakdown risk 0.278102 0.278200 0.0124642
Vaccine reduction in breakdown
severity
0.004201 0.002999 0.0038650
Insurance/loss recovery (vaccine
failure)
0.192020 0.192400 0.0151300
The proportion of correctly predicted responses for the logit estimator was around 54%,
which is a reasonable percentage for such models. In Table 6.7, WTP is expressed in
terms of pounds per percentage point. Thus, on average, farmers would be willing to
pay £0.28 for a 1% increase in the ability of the vaccine to reduce the risk of a herd
having a bTB breakdown but only £0.004 for a 1% increase in the ability of the
vaccine to reduce the severity of a breakdown. It is clear from this that farmers’ main
concern is to prevent a breakdown in the first instance rather than to minimise its
severity. Respondents are also willing to pay £0.19 for every 1% increase of total
loss that is covered by insurance. Thus, for example, assuming a linear relationship
between the level of these attributes and WTP, farmers would be willing to pay £25
per animal per dose for a vaccine that is 90% effective at reducing the risk of a bTB
breakdown and an estimated £44.20 (£25 + £19.20) for such a vaccine that is backed
by 100% insurance of loss if a breakdown should occur despite vaccination.
Further analysis found that farmers who had not had a bTB breakdown had a
statistically-significantly higher WTP for the vaccine’s ability to reduce the risk of a
breakdown than those that had had a breakdown. It may be that these farmers have a
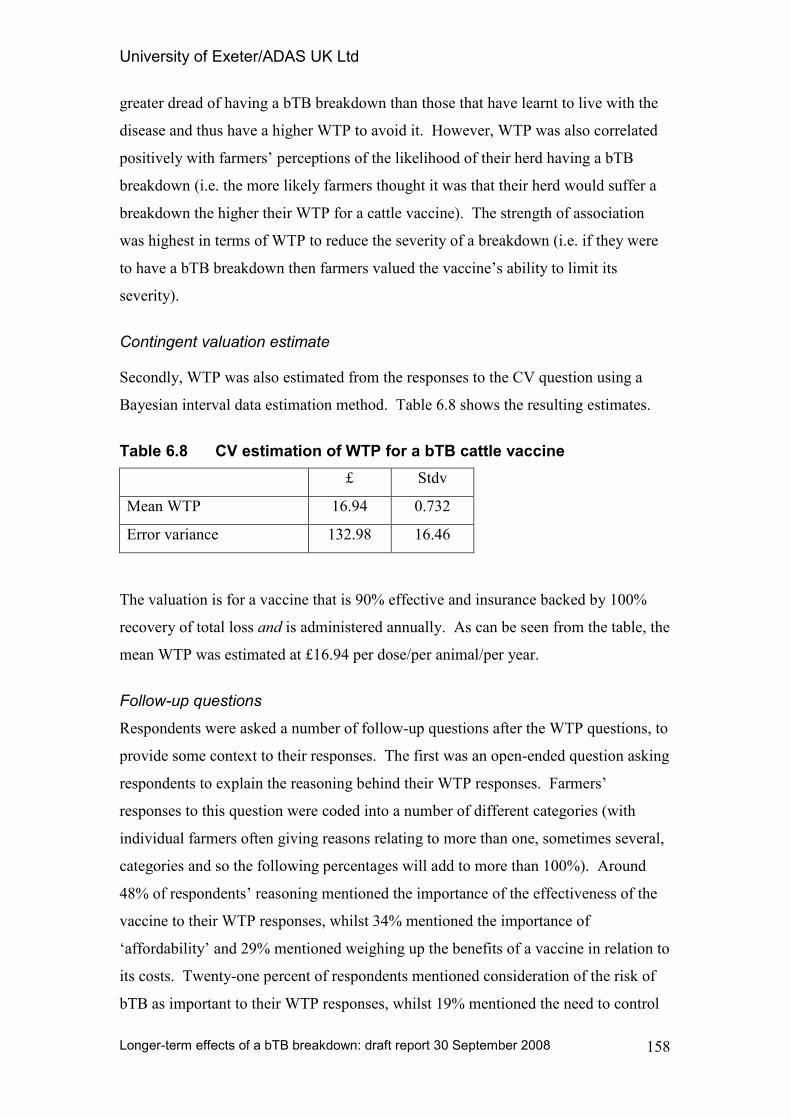
University of Exeter/ADAS UK Ltd
Longer-term effects of a bTB breakdown: draft report 30 September 2008
158
greater dread of having a bTB breakdown than those that have learnt to live with the
disease and thus have a higher WTP to avoid it. However, WTP was also correlated
positively with farmers’ perceptions of the likelihood of their herd having a bTB
breakdown (i.e. the more likely farmers thought it was that their herd would suffer a
breakdown the higher their WTP for a cattle vaccine). The strength of association
was highest in terms of WTP to reduce the severity of a breakdown (i.e. if they were
to have a bTB breakdown then farmers valued the vaccine’s ability to limit its
severity).
Contingent valuation estimate
Secondly, WTP was also estimated from the responses to the CV question using a
Bayesian interval data estimation method. Table 6.8 shows the resulting estimates.
Table 6.8 CV estimation of WTP for a bTB cattle vaccine
£ Stdv
Mean WTP 16.94 0.732
Error variance 132.98 16.46
The valuation is for a vaccine that is 90% effective and insurance backed by 100%
recovery of total loss and is administered annually. As can be seen from the table, the
mean WTP was estimated at £16.94 per dose/per animal/per year.
Follow-up questions
Respondents were asked a number of follow-up questions after the WTP questions, to
provide some context to their responses. The first was an open-ended question asking
respondents to explain the reasoning behind their WTP responses. Farmers’
responses to this question were coded into a number of different categories (with
individual farmers often giving reasons relating to more than one, sometimes several,
categories and so the following percentages will add to more than 100%). Around
48% of respondents’ reasoning mentioned the importance of the effectiveness of the
vaccine to their WTP responses, whilst 34% mentioned the importance of
‘affordability’ and 29% mentioned weighing up the benefits of a vaccine in relation to
its costs. Twenty-one percent of respondents mentioned consideration of the risk of
bTB as important to their WTP responses, whilst 19% mentioned the need to control
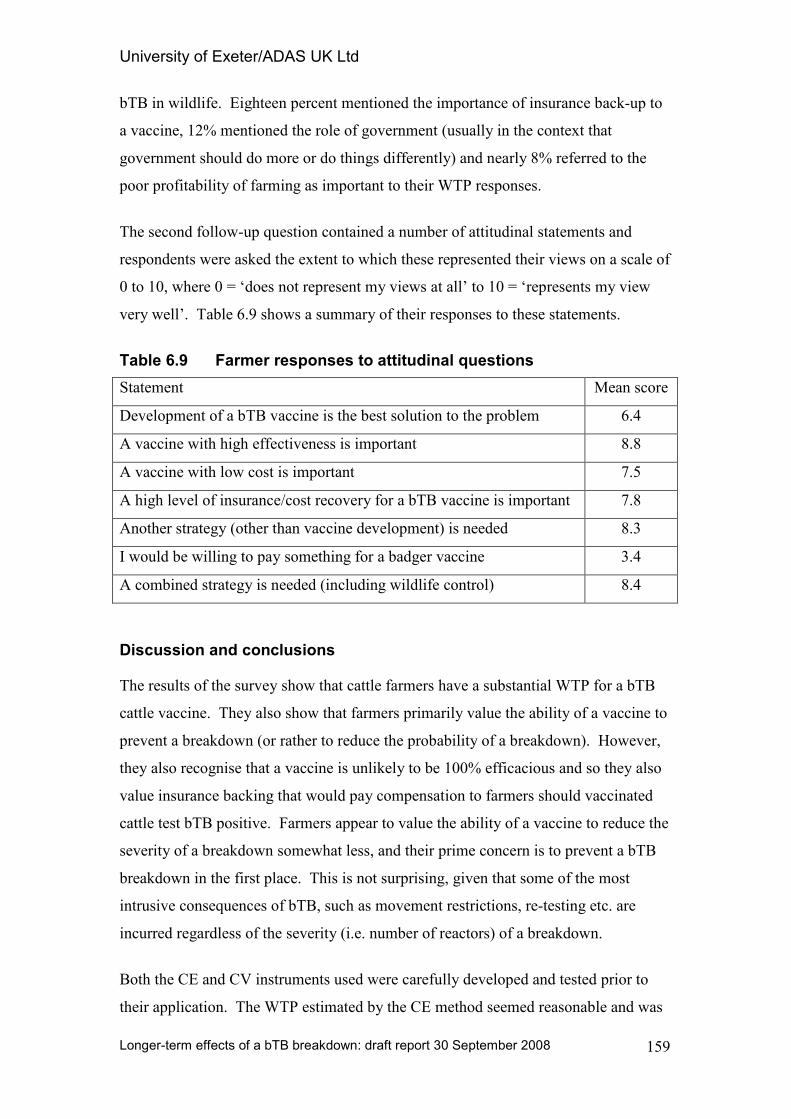
University of Exeter/ADAS UK Ltd
Longer-term effects of a bTB breakdown: draft report 30 September 2008
159
bTB in wildlife. Eighteen percent mentioned the importance of insurance back-up to
a vaccine, 12% mentioned the role of government (usually in the context that
government should do more or do things differently) and nearly 8% referred to the
poor profitability of farming as important to their WTP responses.
The second follow-up question contained a number of attitudinal statements and
respondents were asked the extent to which these represented their views on a scale of
0 to 10, where 0 = ‘does not represent my views at all’ to 10 = ‘represents my view
very well’. Table 6.9 shows a summary of their responses to these statements.
Table 6.9 Farmer responses to attitudinal questions
Statement Mean score
Development of a bTB vaccine is the best solution to the problem 6.4
A vaccine with high effectiveness is important 8.8
A vaccine with low cost is important 7.5
A high level of insurance/cost recovery for a bTB vaccine is important 7.8
Another strategy (other than vaccine development) is needed 8.3
I would be willing to pay something for a badger vaccine 3.4
A combined strategy is needed (including wildlife control) 8.4
Discussion and conclusions
The results of the survey show that cattle farmers have a substantial WTP for a bTB
cattle vaccine. They also show that farmers primarily value the ability of a vaccine to
prevent a breakdown (or rather to reduce the probability of a breakdown). However,
they also recognise that a vaccine is unlikely to be 100% efficacious and so they also
value insurance backing that would pay compensation to farmers should vaccinated
cattle test bTB positive. Farmers appear to value the ability of a vaccine to reduce the
severity of a breakdown somewhat less, and their prime concern is to prevent a bTB
breakdown in the first place. This is not surprising, given that some of the most
intrusive consequences of bTB, such as movement restrictions, re-testing etc. are
incurred regardless of the severity (i.e. number of reactors) of a breakdown.
Both the CE and CV instruments used were carefully developed and tested prior to
their application. The WTP estimated by the CE method seemed reasonable and was
University of Exeter/ADAS UK Ltd
Longer-term effects of a bTB breakdown: draft report 30 September 2008
160
backed up by appropriate reasoning given by respondents. The CV estimate was of
broadly the same order of magnitude as the CE estimate, despite the two valuation
methods being fundamentally different and the payment vehicle used also being
different, and with a different vaccine scenario presented to respondents. This
provides some reassurance that the WTP estimates are robust and will not vary
greatly depending on the valuation method or the nuances of the scenario presented to
respondents.
Many cattle farmers in the survey felt at high risk of their cattle having a bTB
breakdown. Indeed, their (subjective) perception of risk is likely to be somewhat
higher than the actual (objective) risk that they face11. This perception of risk was
found to be positively correlated with their WTP. Despite this, farmers often did not
adopt all possible bio-security measures against bTB, although it is likely that not all
are equally relevant on every farm, or for every farming system. Many farmers felt
that there was little they could do to prevent their herds getting bTB.
Overall, cattle farmers did not think that development of a cattle vaccine was, by
itself, the answer to the bTB problem but that a combined strategy was necessary with
a number of elements, including wildlife control.
11 It would be useful to contrast farmers’ perceptions of risk (at a local level) with appropriate
statistically derived estimates of risk, for possible use in a knowledge transfer programme.
University of Exeter/ADAS UK Ltd
Longer-term effects of a bTB breakdown: draft report 30 September 2008
161
7 DISCUSSION AND CONCLUSIONS
Review and reflection
The research programme reported here involved a very wide range of activities and,
as discussed in Chapter 1, it is recognised that from some perspectives this approach
to research is less academically satisfying than what might be termed ‘pure’ research,
in that it lacks a clear conceptual coherence and can give the impression of a ‘scatter-
gun’ approach. However, for the reasons set out earlier, for this particular topic it is
difficult to identify alternative ways in which it could have been pursued.
Hence, our research approach is best regarded as investigative research in that it relied
on a number of distinct RAs to build as comprehensive a set of information as
possible, from as wide a range of sources as possible. Further, it was structured to
provide a foundation for possible future research exploring the longer term impacts of
bTB (e.g. through the use of a standard questionnaire). Comprehensive reviews and
analyses of all existing data sources that could be identified as having potentially
useful information on the topic were carried out, while at the heart of the programme
was a series of focussed empirical studies of both economic and human health aspects
of a bTB breakdown.
The findings are set out and discussed at length in the earlier chapters, and in the
appendices, and it remains only to draw together the main findings. Bovine TB has
over the past decade or so become endemic in an increasing number of areas of
England and Wales which are characterised by high cattle populations associated with
primarily pastoral livestock farming systems. Not only have the short-term impacts
of a bTB breakdown of farm businesses been well established, but also the likely
existence of longer-term effects (Bennett, op cit; Sheppard and Turner, op cit; and
NAO Wales, op cit). This study has been carried out to provide more substantive
evidence on the nature, scale and incidence of the longer-term implications for farm
businesses. An important part of the research programme as a whole, though not an
University of Exeter/ADAS UK Ltd
Longer-term effects of a bTB breakdown: draft report 30 September 2008
162
integral part of the broad investigative research, has been the study by Reading
University of farmers’ WTP for a bTB vaccine.
The research has aimed to address five main objectives, in pursuance of the overall
aim of providing an evidence base on the longer-term effects of a bTB breakdown on
farm businesses, and so to inform policy development in the future control of bTB.
The two principal areas for concern were identified in earlier studies to be (a) the
economic effects within businesses that extend over a period of many months and
years, or even result in permanent changes (e.g. to the farm system); and (b) the
adverse effects on the people involved on the farm, including both health and social
effects.
The first objective was to review the existing evidence from a wide range of studies
of relevance to the study area, and including economic, socio-economic and medical
studies. Using economic principles as a framework the review defined longer-term in
the context of the present study to encompass both medium term and long term
impacts on farm resource use. Hence, a modification to the farming system (e.g. to
accommodate the constraints arising from livestock movement restrictions, one of the
bTB control measures), investment in bio-security measures to reduce the risk of
cattle infection, and giving up dairy or even cattle production are examples of the
longer-term adjustments which are the focus of the study. The empirical and desk
studies provide extensive evidence of the nature and scale of these adjustments.
The literature review also identified the themes which came to dominate the research:
aspects of farmers’ decision-making which cannot be explained adequately by
reference to conventional economic variables; the lack of evidence on the human
stress effects of a bTB breakdown, although other animal disease epidemics have
been well researched; the shaping of farmers’ attitudes to authorities by their
perceptions or risk and the consequences of animal disease; and a range of issues
around the responsibility of farmers to improve the bio-security on their farms, and
thereby contribute directly to the control of bTB. This brief overview will pick up
these themes.
Farmers’ decision-making was found to be influenced by bTB considerations on more
than a third of the farms visited as part of the interview survey, and in four out of five
University of Exeter/ADAS UK Ltd
Longer-term effects of a bTB breakdown: draft report 30 September 2008
163
cases where bTB had been a driver of past change it was listed as the most important.
However, it was almost always one factor among others, a finding that provides some
reassurance about the quality of farmers’ decision-making. It seems likely that the
identified role of bTB in driving strategic change on farm businesses goes at least part
way to explaining the inability of conventional studies of the economics of resource
use in dairying to fully capture the dynamics of structural change. This conclusion is
strengthened by the GIS-based analysis of parish-level change in cattle farming,
which found clear linkages between extraordinary structural changes and bTB
incidents.
Although the stress effects of other animal diseases has been reasonably well
researched, little specific attention has been given to the implications of a bTB
breakdown, and the GHQ-12 study provides objective evidence of the scale of these
effects for the first time. In general terms, a much greater proportion of farmers
exhibit signs of psychiatric morbidity that the population as a whole. Overall, the
highest stress levels are seen on farms which have been under livestock movement
restrictions for a long period. However, on dairy farms, where people are generally
more stressed than on beef farms, the greatest stressor is the loss of a large number of
cattle. There is evidence that bTB is associated with raised stress levels for people
other than the farmer, particularly spouses; but the sample was too small for reliable
results for farm workers. For farmers, a bTB breakdown causes significant stress:
this is highest for dairy farmers, especially where they have lost a large number of
cattle; while for both trading beef and suckler beef farmers, a long period under
restriction is the greater stressor.
One of the very interesting findings of this research study has been that farmers’
perceptions of the risk of a bTB breakdown may be well out of line with the objective
statistical probability, based on the very detailed parish-level bTB statistics now
available. This was highlighted as part of the WTP study conducted by Reading
University, which identified a cognitive dissonance between subjective and objective
assessments of risk. While this is an area that deserves further research, inasmuch as
it is the farmers’ subjective assessment of risk which drives decision-making at farm
level and also contributes to the stress experienced by farmers and others, both in the
University of Exeter/ADAS UK Ltd
Longer-term effects of a bTB breakdown: draft report 30 September 2008
164
wake of a specific bTB breakdown but probably also in the more generic context on
farms which are in, or close to, bTB ‘hotspot’ parishes.
Insurance is one of the classic tools for managing business risk, and the research
identified what appears to be an emerging problem in relation to the cost and the
level, even availability, of cover against a bTB breakdown. It is evident that the
spread of bTB has already caused revisions both to bTB insurance premiums and the
level of cover offered by insurers. This is clearly an adverse economic effect as far as
farm businesses are concerned, even if it appears inevitable in the context of the
spread of bTB. While the firms consulted remain committed to providing the best
terms to their clients, and being as fair as possible in the circumstances, their
experience is of rising claims. Further adjustments to premiums and cover, driven by
both claims experience and statistics on the incidence of bTB, cannot be ruled out for
the future.
Finally, the research sheds some further light on the sometimes contentious issue of
bio-security. The WTP study identifies the existence of a continuing gap in the
adoption by farmers of the full range of bio-security recommendations, while the
farmers’ interview survey identified the level of investment some of the sample
farmers had made in pursuit of improved bio-security. However, anecdotal evidence,
from this research and elsewhere, points to continuing uncertainty among farmers
about some bio-security measures, on the grounds or one or more of the following:
their practicality, their efficacy or their value-for-money. At the very least this
suggest that a concerted knowledge transfer programme on this issue is required but,
as Enticott (2008) points out, the effective introduction of new forms of disease
control (represented by extensions to bio-security) in the context of an erosion of trust
between the farming community and government raises important issues which need
to be addressed in a comprehensive way if progress is to be made in disease control.
Concluding summary
This research has focussed on the longer-term effects of a bTB breakdown and has
considerably extended the evidence base. There are two aspects of the research as a
whole that deserve final mention here: the identification of the key factors which are
associated with longer-term effects, and the exploration of farmers; WTP for a bTB
University of Exeter/ADAS UK Ltd
Longer-term effects of a bTB breakdown: draft report 30 September 2008
165
vaccine. The key factors were identified through studies of impact (a) within the
farm business and (b) on the people associated with the farm, while the WTP study
was essentially an independent RA.
First, the key factors analysis relied on distinguishing two distinct areas of impact:
those within the ambit of farm business economics, as identified by the effects on
strategic decision-making; and those directly affecting the people involved on the
farm, in terms of human mental health (psychiatric morbidity). Although the two
estimates were derived independently of each other, there is a very close fit between
them. Overall, the factor most likely to result in longer-term impacts is the loss of a
large number of cattle, closely followed by being under movement restrictions for a
long period; even a light brush with bTB has measurable effects on farm decision-
making on a significant minority of farms. However, for beef farms as a whole the
most stressful factor was being under movement restrictions for a long period. The
two sets of estimate are not mutually incompatible, of course, and it’s likely that if
sample sizes had been large enough to distinguish between beef suckler herds and
beef trading units further finessing of these findings would have resulted.
Second, the work undertaken by Reading University shows that cattle farmers have a
substantial WTP for a bTB cattle vaccine. Moreover, it finds that farmers primarily
value the ability of a vaccine to prevent a breakdown (or rather to reduce the
probability of a breakdown). However, farmers also recognise that a vaccine is
unlikely to be 100% efficacious and so they also value insurance backing that would
pay compensation to farmers should vaccinated cattle test bTB positive. Farmers
appear to value the ability of a vaccine to reduce the severity of a breakdown
somewhat less, and their prime concern is to prevent a bTB breakdown in the first
place. This is not surprising, given that some of the most intrusive consequences of
bTB, such as movement restrictions, re-testing etc. are incurred regardless of the
severity (i.e. number of reactors) of a breakdown. The broad comparability of the
two WTP estimates, from the CE and CV approaches respectively, provides some
reassurance of their robustness. The issue of risk perceptions deserves further study,
since farmers’ (subjective) perceptions of risk appear to be higher than the actual
(objective) risk that they face. This perception of risk was found to be positively
correlated with their WTP.
University of Exeter/ADAS UK Ltd
Longer-term effects of a bTB breakdown: draft report 30 September 2008
166
Bibliography
Bennett, R M (2004). Assessment of the economic impacts of TB and alternative
control policies, Final Project Report, SE3112, Department for Environment, Food
and Rural Affairs, 2004
Bennett, R M and Cooke, R (2005). ‘Control of bovine TB: preferences of farmers
who have suffered a TB breakdown’, Veterinary Record, 156: 143-145, 2005
Cameron, T A and James, M D (1987). ‘Efficient estimation methods for "closed-
ended" contingent valuation surveys’. Review of Economics and Statistics 69 (2),
269-276.
Cheeseman, C L and Mallinson, P J (1981). ‘Behaviour of badgers (Meles meles)
infected with bovine tuberculosis’, Journal of Zoology, 194: 284-289
Colman, D (2008). U.K. Milk Production: The Challenge of Structural Change. Paper
prepared for Dairy UK
Colman, D, Burton, M, Rigby, D and Franks, J (2002). ‘Structural Change and Policy
Reform in the UK Dairy Sector’, Journal of Agricultural Economics, Volume 53,
Number 3, 645-663
Colman, D and Harvey, D (2004).The Future of UK Dairy Farming, Report
commissioned jointly by the MDC, DIAL and Defra, with project advice from the
NFU, on behalf of the Dairy Supply Chain Forum
Colman, D, Farrar, J and Zhuang, Y (2004). Economics of Milk Production (England
and Wales) 2002-03, Farm Business Unit, Centre for Agricultural, Food and Resource
Economics (CAFRE), Special Studies in Agricultural Economics, Report No. 58
Colman, D and Zhuang, Y (2005).Changes in England and Wales Dairy Farming
Since 2002/03, Centre for Agricultural, Food and Resource Economics (CAFRE),
Economic Studies, School of Social Sciences, Manchester University
Colman, D, Zhuang, Y and Franks, J R (2004). UK Milk Production Following the
2003 Reform of the CAP, Centre for Agricultural, Food and Resource Economics
(CAFRE), Economic Studies, School of Social Sciences, Manchester University
University of Exeter/ADAS UK Ltd
Longer-term effects of a bTB breakdown: draft report 30 September 2008
167
Curry Commission (2002). Farming and Food: A Sustainable Future. Report of the Policy
Commission on the Future of Farming and Food. London: Cabinet Office
Dairy Council, (2002). Dairy Facts and Figures, 2001 Edition, the Dairy Council,
London
DairyCo, (2008). Dairy Statistics, an Insider’s Guide
Deaville, J and Jones, L (2001). The Health Impact of the Foot and Mouth Situation
in People In Wales – The Service Providers Perspective, A summary report to the
National Assembly for Wales by the Institute of Rural Health
Defra (2002a). Response to the Report of the Policy Commission on the Future of Farming
and Food by HM Government. Cm 5709. London: TSO
Defra (2002b). Farming and Food’s Contribution to Sustainable Development: Economic
and Statistical Analysis. London: Department for Environment, Food and Rural Affairs
Defra (2002c). The Strategy for Sustainable Farming and Food: Facing the Future. London:
Department for Environment, Food and Rural Affairs
Defra (2004a). Animal Health and Welfare Strategy for Great Britain. London: Department
for Environment, Food and Rural Affairs
Defra (2004b). Cattle compensation: Bovine TB, Brucellosis, BSE and Enzootic Bovine
Leukosis. PB 10268. London: Department for Environment, Food and Rural Affairs
Defra (2005a). An Epidemiological Investigation into Bovine Tuberculosis: Towards a
Science-Based Control Strategy. Fourth Report of the Independent Scientific Group on Cattle
TB. London: Department for Environment, Food and Rural Affairs.
Defra (2005b). Government strategic framework for the sustainable control of bovine
tuberculosis (bTB) in Great Britain: a sub-strategy of the Animal Health and Welfare
Strategy for Great Britain. London: Department for Environment, Food and Rural Affairs.
Defra (2007a). Do you know what’s happening in your feed store? Defra leaflet PB124747C.
Available at www.defra.gov.uk/animalh/tb/pdf/feed_store.pdf
Defra (2007b). Bovine TB: Do you know how to reduce your risk? Defra leaflet PB12590.
Available at www.defra.gov.uk/animalh/tb/pdf/husbandry_bestpractice.pdf
Defra (2008). Bovine Tuberculosis Related Husbandry/Bio-security Research: Background
Information. Available at www.defra.gov.uk/animalh/tb/pdf/husbandry_background.pdf
Defra TB statistics. Available at www.defra.gov.uk/animalh/tb/stats/
University of Exeter/ADAS UK Ltd
Longer-term effects of a bTB breakdown: draft report 30 September 2008
168
Department of Health (2004). Health Survey for England, 2003, Volume 2. London:
TSO
Delahay, R J, Ward, A I, Walker, N, Long, B and Cheeseman, C L (2007).
‘Distribution of badger latrines in a high-density population: habitat selection and
implications for the transmission of bovine tuberculosis to cattle’, Journal of Zoology,
272: 311-320
Enticott, G (2008). ‘The spaces of biosecurity: prescribing and negotiating solutions
to bovine tuberculosis’, Environment and Planning A, 40: 1568-1582
Farrar, J and Franks, J (1998).Dairy Enterprise Costs: A Review of the Structure and
Economics of Milk Production in England and Wales 1996/97, Farm Business Unit,
School of Economic Studies, University of Manchester, Special Studies in
Agricultural Economics, Report No. 45
Fogerty, M and Robbins, K (2006). Lowland Grazing Livestock Production in
England, Farm Business Survey 2006/2007, Rural Business Research and Duchy
College Rural Business School
Garnett, B T, Delahay, R J and Roper, T J (2005). ‘Ranging behaviour of European
badgers (Meles meles) in relation to bovine tuberculosis (Mycobacterium bovis)
infection,’ Applied Animal Behaviour Science, 94: 331-340
ISG (2007). Bovine TB: The Scientific Evidence. Final report of the Independent
Scientific Group on Cattle TB. London: Defra
Koop, G and Poirier, D (1993). ‘Bayesian analysis of logit models using natural
conjugate priors’. Journal of Econometrics 56, 323-340
Lobley, M, Johnson, G, Reed, M, Winter, M and Little, J (2004). Rural Stress
Review: Final Report. CRR Research Report 7. Exeter: Centre for Rural Research,
University of Exeter
Lobley, M and Butler, A (2004). The Impact of CAP Reform on Devon’s Agriculture:
Final Report to Devon County Council. CRR Research Report 6. Exeter: Centre for
Rural Research, University of Exeter
Van Haaften, E H, Olff, M and Kertsen, P H (2004). ‘The psychological impact of the
Foot and Mouth Disease crisis on Dutch dairy farmers’, Netherlands Journal of
Agricultural Science, 51 (4): 339-349
University of Exeter/ADAS UK Ltd
Longer-term effects of a bTB breakdown: draft report 30 September 2008
169
McGregor, M, Willock, J and Deary, I (1995). ‘Farmer Stress’, Farm Management, 9
(2): 57-65
MDC, (2006). Dairy Statistics: An Insider’s Guide, Milk Development Council
NAO Wales, (2003). Compensating Farmers for Bovine Tuberculosis in Wales.
Report to the National Assembly by the Auditor General for Wales. Cardiff: National
Audit Office Wales
NDC (1997). Dairy Facts and Figures, 1996 Edition, National Dairy Council,
London
Ministry of Agriculture, Fisheries and Food (MAFF), (1999). TB in cattle: reducing
the risk, London: MAFF Publications
Peck, D F (2005). ‘Foot and mouth outbreak: lessons for mental health services,’
Advances in Psychiatric Treatment, 11: 270-276
Peck, D F, Grant, S, McArthur, W and Godden, D (2002). ‘Psychological impact of
foot-and-mouth disease on farmers’, Journal of Mental Health, 11 (5): 523-531
Phillips, C J C, Foster, C, Morris, P and Teverson, R (2000). The Role of Cattle
Husbandry in the Development of a Sustainable Policy to Control M Bovis Infection
in Cattle. Report of the Independent Husbandry Panel. London: MAFF Publications
Phillips, C J C, Foster, C, Morris, P and Teverson, R (2001). The role of cattle
husbandry in the development of a sustainable policy to control M. bovis infection in
cattle. Report of the Independent Husbandry Panel to MAFF. London: Ministry of
Agriculture, Fisheries and Food
Phillips, C J C, Foster, C, Morris, P and Teverson, R (2003). ‘The transmission of
Mycobacterium bovis infection to cattle’, Research in Veterinary Science, 74: 1-15
PSI (2005). Farmers, Farm Workers and Work-Related Stress. Prepared by the Policy
Studies Institute for the Health and Safety Executive. Research Report 362
Robertson, P and Wilson, P (2007). Farm Business Survey 2005/2006 - Dairy
Farming in England, Rural Business Research Unit, University of Nottingham
Robertson, P and Wilson, P (2008). Farm Business Survey 2006/2007 - Dairy
Farming in England, Rural Business Research Unit, University of Nottingham
University of Exeter/ADAS UK Ltd
Longer-term effects of a bTB breakdown: draft report 30 September 2008
170
Pollock, J D, Gilman, A and Willock, J (2002). ‘A preliminary study into stress in
Welsh farmers’, in Journal of Mental Health, 11:2, 213-221
Sheppard, A and Turner, M M (2005). An Economic Impact Assessment of Bovine
Tuberculosis in South West England, Centre for Rural Research, University of Exeter,
Research Report No. 9
Temple, M and Tuer, S M (2000). The Cost At Farm Level of Consequential Losses
from Tuberculosis Control Measures, Report commissioned by the Bovine TB and
Zoonoses Division, MAFF. Wolverhampton: ADAS
Thomas, H V, Lewis, G, Thomas, D Rh, Salmon, R L, Chalmers, R M, Coleman, T J,
Kench, S M, Morgan-Capner, P, Meadows, D, Sillis, M and Softley, P (2003).
‘Mental health of British farmers,’ Occupational Environmental Medicine, 60: 181-
186
Tolhurst, B A, Ward, A I, Delahay, R J, MacMaster, A-M and Roper, T J (2008).
‘The behavioural responses of badgers (Meles meles) to exclusion from farm
buildings using an electric fence’, Applied Animal Behaviour Science, 113: 224-235
Walker, L S, and Walker, J (1987). ‘Stressors and Symptoms Predictive of Distress
in Farmers’, Family Relations, 36 (4): 374-378
Watts, P, Coe, N, Clarkson, J, Hughes, J, Wilkes, L, Giles, A, Cull, W and Giddy, M
(2003). Farmers’ Stress in Somerset 2002, Dorset and Somerset Strategic Health
Authority
Ward, A I, Tolhurst, B A and Delahay, R J (2006). ‘Farm husbandry and the risks of
disease transmission between wild and domestic mammals: a brief review focusing
on bovine tuberculosis in badgers and cattle’, Animal Science, 82: 767-783
Ward, A I, Tolhurst, B A, Walker, N J, Roper, T J and Delahay, R J (2008). ‘Survey
of badger access to farm buildings and facilities in relation to contact with cattle’,
Veterinary Record, 163: 107-111
Williams, H, Reeves, N, Jones, D and Morris, W (2005). The Economics of Lowland
Beef Production in England, 2003: A report on the results of a Special Study of
lowland beef enterprises in England, Special Studies in Agricultural Economics
Report No. 62, Farm Business Survey, Institute of Rural Sciences, The University of
Wales, Aberystwyth
University of Exeter/ADAS UK Ltd
Longer-term effects of a bTB breakdown: draft report 30 September 2008
171
APPENDICES
A Stakeholders’ consultation: overall summary
B Farmers’ interview survey: summary results
C Desk study using FBS data: summary results
D Postal survey: the GHQ-12
E The GIS study of changes in cattle populations
F The choice experiment bTB cattle vaccine questionnaire
University of Exeter/ADAS UK Ltd
Longer-term effects of a bTB breakdown: draft report 30 September 2008
172
Appendix A Stakeholder consultation: overall summary
Introduction
In order to identify the full range of claimed longer-term impacts on farm businesses
arising from bTB breakdowns, a range of organisations and farmer representatives
were consulted. ADAS consultants devised a short self-completion questionnaire
which respondents posted back. In total 56 questionnaires were sent out and 40 were
returned, a response rate of 71%. The views of those respondents who were
considered to have a direct interest (33) and of those who did not have an evident
direct interest (7) are considered separately.
Respondents with a direct interest
Economic Effects
The identification of adverse effects from a bTB breakdown commonly pointed to
farm incomes, reductions in capital value, the inhibition of business development and
the delaying, or abandonment, of plans for future business development.
The majority of respondents felt that there are often severe longer term financial
effects following a bTB breakdown, although the scale of these effects are dependant
on the duration and extent of any outbreak. While occasional breakdowns interrupt
trade in the short term, where animals are under restriction for a number of years this
has had longer term repercussions for many farm businesses. Farms may not be able
to trade stock effectively for years, and are unable to sell cattle in the open market.
Prolonged movement restrictions lead to an adverse cash flow, due to increased feed
requirements and problems with cattle welfare. Following the loss of breeding cattle,
and herd replacements, there is often disruption of calving patterns long into the
future, which has a clear financial impact.
In some cases where replacement cattle have been bought in, this has lead to the
inadvertent introduction and promotion of other diseases (such as rotavirus and
pneumonia) and this is then associated with increased veterinary costs in the
University of Exeter/ADAS UK Ltd
Longer-term effects of a bTB breakdown: draft report 30 September 2008
173
treatment of these. In the longer term there is very often an unwillingness to invest in
the business due to uncertainty about the future, and it was reported that many
farmers in this situation feel expansion of the business is going to be difficult.
Pre-movement testing was considered by some respondents to be a burden over the
longer term, and as a bTB control policy it does not appear to be working. The extra
costs such as fencing were considered by some respondents to be another long term
capital cost, while others viewed this as more of a short term item. Some of those
who commented on this felt it was extremely naïve to think that fencing alone would
stop badgers entering. Another major long term cost identified by some is the cost to
the taxpayer for compensating affected farms, although clearly this issue lies outside
the focus of the present study.
Social Effects
The majority of respondents highlighted the increased stress farmers feel when
directly affected by a bTB breakdown. Even when one outbreak clears up there is
still the worry that it will reoccur. Many identified bTB as being the ‘unknown
quantity’ with the on-going potential to cause stress: cattle farmers simply do not
know when something may happen and, in any case, feel powerless to prevent it. In a
number of cases, it was reported, this has led to high blood pressure, nervous
breakdown, strokes and even suicide. In some cases it appears to have been a
contributory factor in marriage breakdown.
Several stakeholder respondents identified the increased pressure on family members
to help out (some with family living near who may not normally work on the farm)
which is sometimes associated with a bTB breakdown. A longer term effect, it was
felt, is that younger family members may be discouraged from going into farming,
although this may also be a consequence of what is seen as political inaction. Within
the rural community, some stakeholders identified the increased workloads involved
in looking after more animals (a common consequence of the imposition of
movement restrictions following a bTB breakdown) can lead to reluctance, or
inability, to support community events.
Furthermore, it was reported that relationships between farmers and their neighbours
can become tense, particularly if it is perceived that one neighbour is not doing
University of Exeter/ADAS UK Ltd
Longer-term effects of a bTB breakdown: draft report 30 September 2008
174
enough to prevent the spread of the infection. One farmer stated that he felt very
guilty that when his farm was found to be infected with bTB as all the neighbouring
farms had to be tested, with all that implies for those farmers and their families. Also,
where a farmer has neighbours who come from a more urban background, or where
neighbours are very concerned with badger conservation, this can lead to fraught
relationships, where they have diametrically opposing views. Clearly, the potential
for increased levels of stress following a bTB breakdown is generated by a number of
possible causes.
Other effects
It was stated by some that, in the longer term, more farmers may decide not to keep
cattle, or some at least would change to other farming methods; and that additional
production and disease costs may well make the sector unviable. If this happens, it
was felt, it will have adverse effects on the environment and some suckler beef
systems, for example, have been moved from upland and hill land due to declining
economic returns. Some felt that the gradual depopulation of cattle in Wales will
result in a changing landscape and this could damage tourism. An imbalance in
ecosystems in the countryside due to the reduction in the numbers of cattle will lead
to reductions in wildlife such as ground nesting birds, hedgehogs etc.
Some respondents pointed to changes in (some) farmers’ attitudes to wildlife; in
particular, it was felt, attitudes to badgers have changed and farmers have become
very wary of the presence of these animals on their farms.
There was almost unanimous anger from this group of respondents that Defra had
taken no action to control bTB in wildlife, coupled with frustration that it seemed the
authorities were prepared to protect sick wildlife rather than cattle. One consequence
of this, it was felt by some, is that farmers are losing respect for authority and have
less confidence in wider issues of farm and rural policy development.
Some stakeholders felt that the press attention given to the levels of compensation for
cattle slaughtered may cause some degree of public backlash against farmers in the
future. It was felt by some respondents that there is little account taken of the
consequential loss to farmers associated with bTB.
University of Exeter/ADAS UK Ltd
Longer-term effects of a bTB breakdown: draft report 30 September 2008
175
Respondents with no direct interest
In broad terms, respondents without a direct interest held similar views to those with
a clear direct interest, and identified a similar range of factors.
Economic Effects
It was agreed by most respondents that the effects of bTB depend on the duration and
frequency of outbreaks and that it was also asserted that over time many businesses
do become unviable. It was thought by one stakeholder that in the long run beef
production will be reduced due to lack of control on bTB. It was noted that dairy
farmers are being forced to shoot Friesian bull calves at birth where there have been
long term breakdowns. Some stakeholders made a comparison of bTB policy
between the UK and elsewhere in Europe, where the objective was given as
eradication (of the disease).
Accountants in particular highlighted the trading losses and a significantly increased
borrowing requirement by some farmers, just in order to keep afloat following a
severe bTB outbreak. Again, the extra costs of keeping animals which would
otherwise have been sold and the need to rear more replacements were identified as
common economic problems for affected farm businesses. Fencing costs were
considered by these respondents to be essentially short term.
In terms of other business effects, it was noted that there was less interest being
shown in the breeding of high quality cows, for fear that a lifetime’s work could be
destroyed almost totally. It was reported that there is also less interest in the
environment while no bTB eradication programme is in place.
Social Effects
The effects highlighted by this group of stakeholders also included stress, in this case
identifying that associated with not being able to market animals at the appropriate
time, and generally adverse effects on both the mental health and physical well being
of farmers. It was also noted that where bankruptcy had occurred, by implication as a
result of a bTB breakdown, there could be more indirect effects on social well-being:
for example, a case where the farmers’ children felt unable to go on school trips.
Some of these stakeholders also highlighted the fact that, all too often, some local
University of Exeter/ADAS UK Ltd
Longer-term effects of a bTB breakdown: draft report 30 September 2008
176
community members did not understand the pressures on farm businesses, of which a
bTB breakdown often represented a considerable escalation.
Other effects
In terms of other business effects, it was noted that there was less interest being
shown in the breeding of high quality cows, for fear that a lifetime’s work could be
destroyed almost totally. It was reported that there is also less interest in the
environment while no bTB eradication programme is in place.
Summary
The stakeholder consultation reported here found a broad consistency between
respondents with a direct interest and those without. For clarity, it should be
understood that respondents are here identifying the range of effects of which they are
aware, rather than reporting on the typical incidence or likelihood of a particular
effect being evident. This study found that, in the views of these stakeholders, the
principal longer term effects of a bTB breakdown on farm businesses include:
• Financial effects: o reduced incomes, due to extra costs of holding unsold animals, extra
costs for testing, fencing
o interrupted calving patterns
o increased borrowing and bankruptcy
o less interest in business development
• Health effects: o Stress
o very severe problems such as heart trouble, stroke and suicide
o no time off/holiday
• Social effects: o marital breakdown
o deterioration of relationships with neighbours
o lack of participation in community events
o dependence on family members for help leads to extra family hardship
• Other effects: o loss of confidence in the industry and therefore no interest in
succession from family
o loss of confidence in the industry
o lack of confidence in authority on policy making
o effects on the environment and landscapes
o change in attitudes to wildlife
University of Exeter/ADAS UK Ltd
Longer-term effects of a bTB breakdown: draft report 30 September 2008
177
APPENDIX B
Farm interview survey: summary results
This contains the analysed data from the farmer’s interview survey, presented in a
form which mainly follows the format of the questionnaire itself. The survey
involved 152 farms, all of which had had at least one bTB breakdown during the ten
years prior to 2007, and was carried out between October and December 2007. Many
of the results are presented for a sub-group of the sample in addition to ‘all farms’.
The group labelled ‘bTB drivers’ comprise those farmers who cited bTB as a driver
of at least one strategic change made to their farm business over the previous ten
years; the group labelled ‘non bTB drivers’ are all other sample farmers. In total 57
farmers (37.5%) reported bTB as a driver of a major business change. For more
information on this see Section B following and also Chapter 1.
Section
A Background information about you and your farm
business
B A review of your business strategy
C Animal health control on your farm
D History of cattle disease on your farm
E Movement restrictions
F Other effects associated with the bTB breakdown
G Expected future impacts of bTB on the farm business
H Wider non-economic impacts of a bTB breakdown
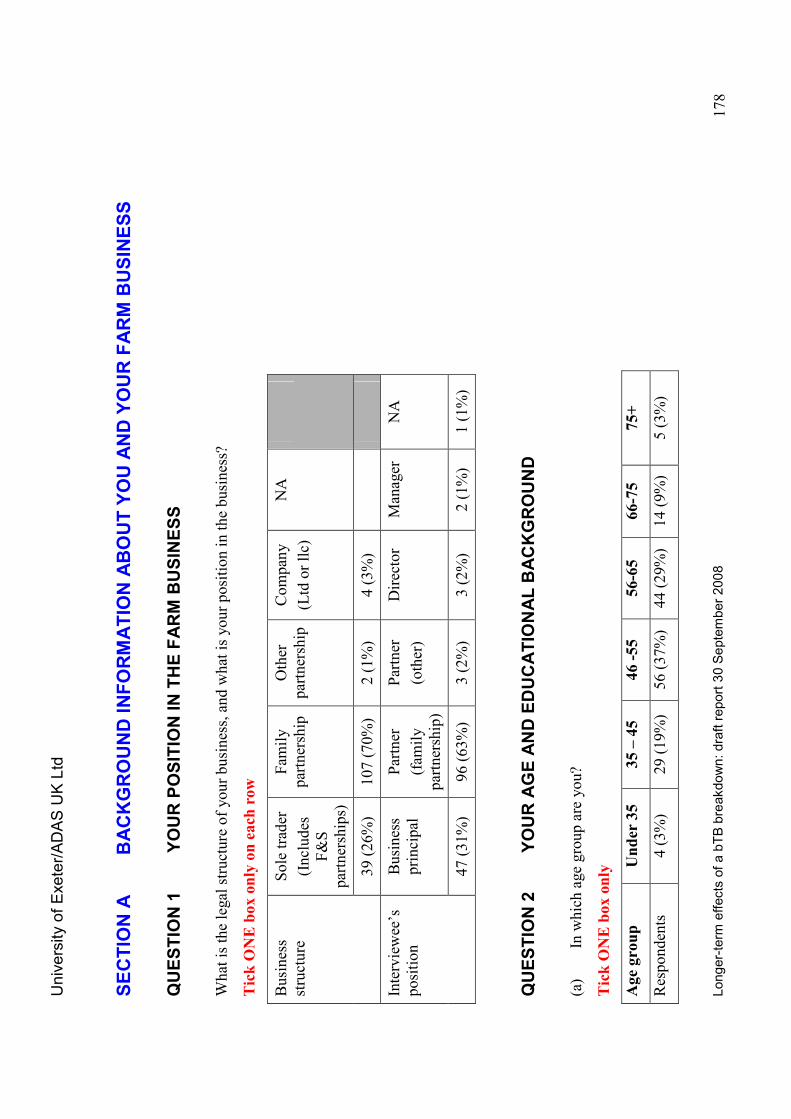
University of Exeter/ADAS UK Ltd
Longer-term effects of a bTB breakdown: draft report 30 September 2008
178
SECTION A
BACKGROUND INFORMATION ABOUT YOU AND YOUR FARM BUSINESS
QUESTION 1
YOUR POSITION IN THE FARM BUSINESS
What is the legal structure of your business, and what is your position in the business?
Tick O
NE box only on each row
Sole trader
(Includes
F&S
partnerships)
Fam
ily
partnership
Other
partnership
Company
(Ltd or llc)
NA
Business
structure
39 (26%)
107 (70%)
2 (1%)
4 (3%)
Business
principal
Partner
(fam
ily
partnership)
Partner
(other)
Director
Manager
NA
Interviewee’s
position
47 (31%)
96 (63%)
3 (2%)
3 (2%)
2 (1%)
1 (1%)
QUESTION 2
YOUR AGE AND EDUCATIONAL BACKGROUND
(a)
In which age group are you?
Tick O
NE box only
Age group
Under 35
35 – 45
46 -55
56-65
66-75
75+
Respondents
4 (3%)
29 (19%)
56 (37%)
44 (29%)
14 (9%)
5 (3%)
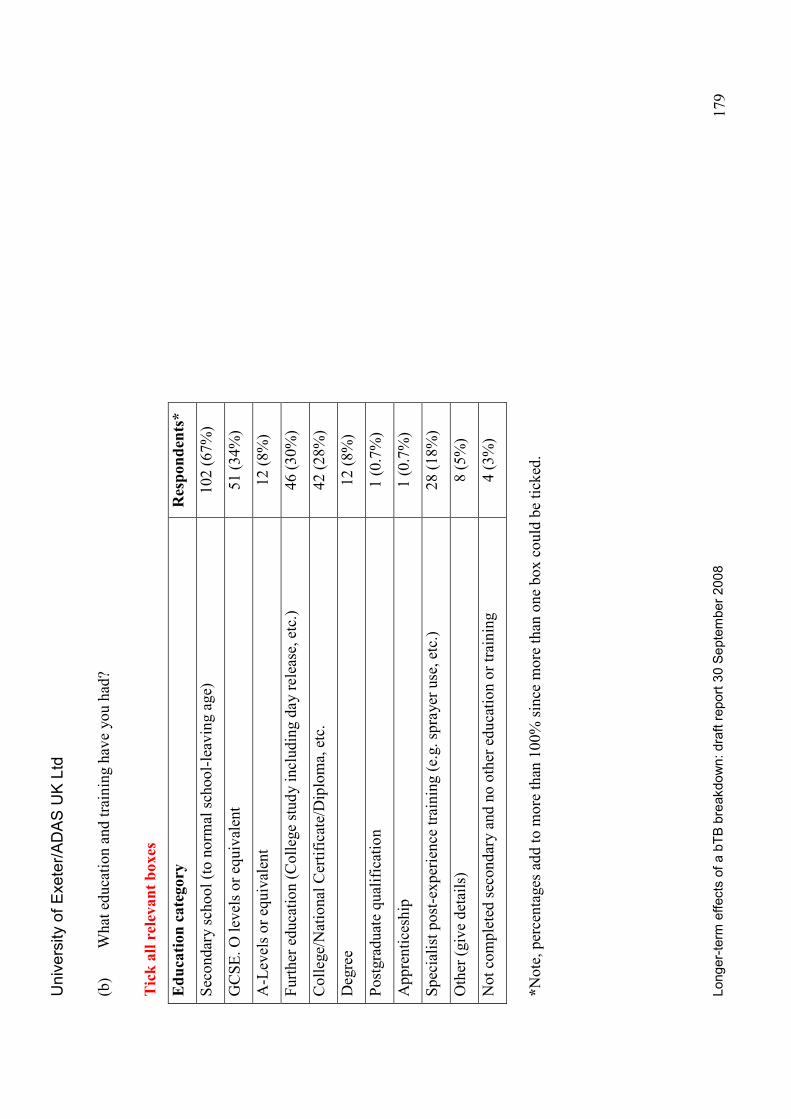
University of Exeter/ADAS UK Ltd
Longer-term effects of a bTB breakdown: draft report 30 September 2008
179
(b)
What education and training have you had?
Tick all relevant boxes
Education category
Respondents*
Secondary school (to norm
al school-leaving age)
102 (67%)
GCSE. O levels or equivalent
51 (34%)
A-Levels or equivalent
12 (8%)
Further education (College study including day release, etc.)
46 (30%)
College/National Certificate/Diploma, etc.
42 (28%)
Degree
12 (8%)
Postgraduate qualification
1 (0.7%)
Apprenticeship
1 (0.7%)
Specialist post-experience training (e.g. sprayer use, etc.)
28 (18%)
Other (give details)
8 (5%)
Not completed secondary and no other education or training
4 (3%)
*Note, percentages add to more than 100% since more than one box could be ticked.
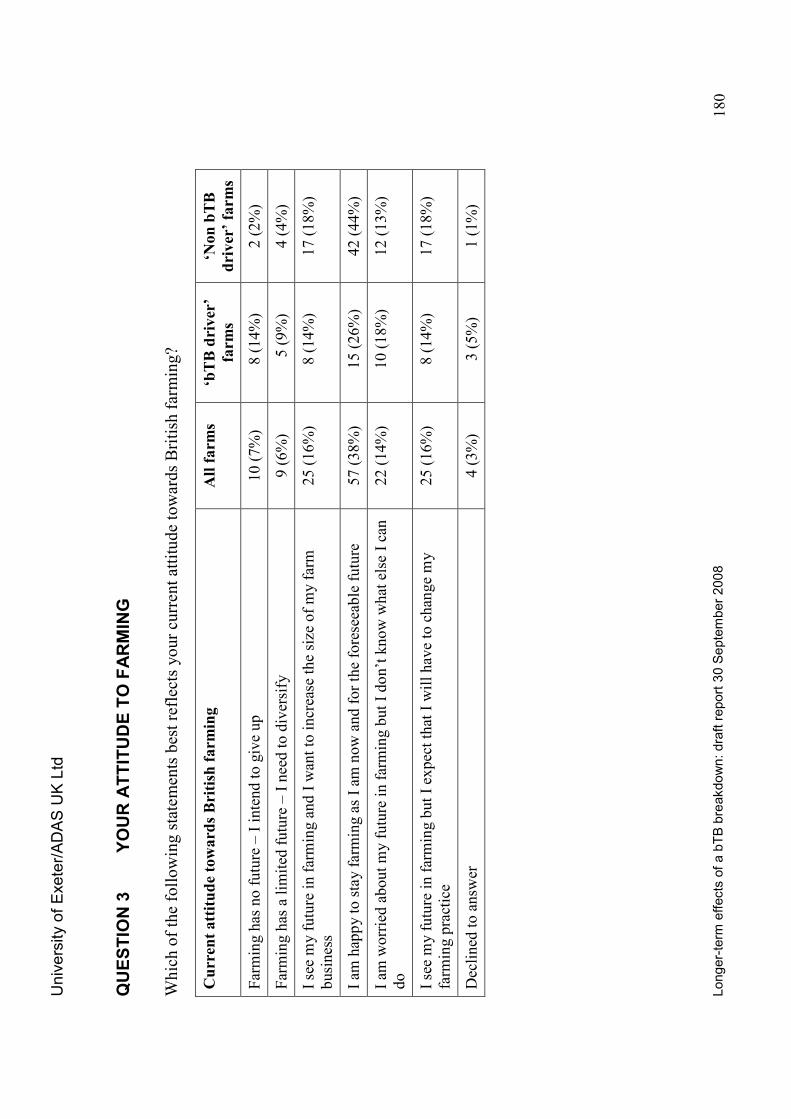
University of Exeter/ADAS UK Ltd
Longer-term effects of a bTB breakdown: draft report 30 September 2008
180
QUESTION 3
YOUR ATTITUDE TO FARMING
Which of the following statements best reflects your current attitude towards British farming?
Current attitude towards British farm
ing
All farm
s ‘bTB driver’
farm
s
‘Non bTB
driver’ farms
Farming has no future – I intend to give up
10 (7%)
8 (14%)
2 (2%)
Farming has a limited future – I need to diversify
9 (6%)
5 (9%)
4 (4%)
I see my future in farming and I want to increase the size of my farm
business
25 (16%)
8 (14%)
17 (18%)
I am
happy to stay farming as I am
now and for the foreseeable future
57 (38%)
15 (26%)
42 (44%)
I am
worried about my future in farming but I don’t know what else I can
do
22 (14%)
10 (18%)
12 (13%)
I see my future in farming but I expect that I will have to change my
farming practice
25 (16%)
8 (14%)
17 (18%)
Declined to answ
er
4 (3%)
3 (5%)
1 (1%)
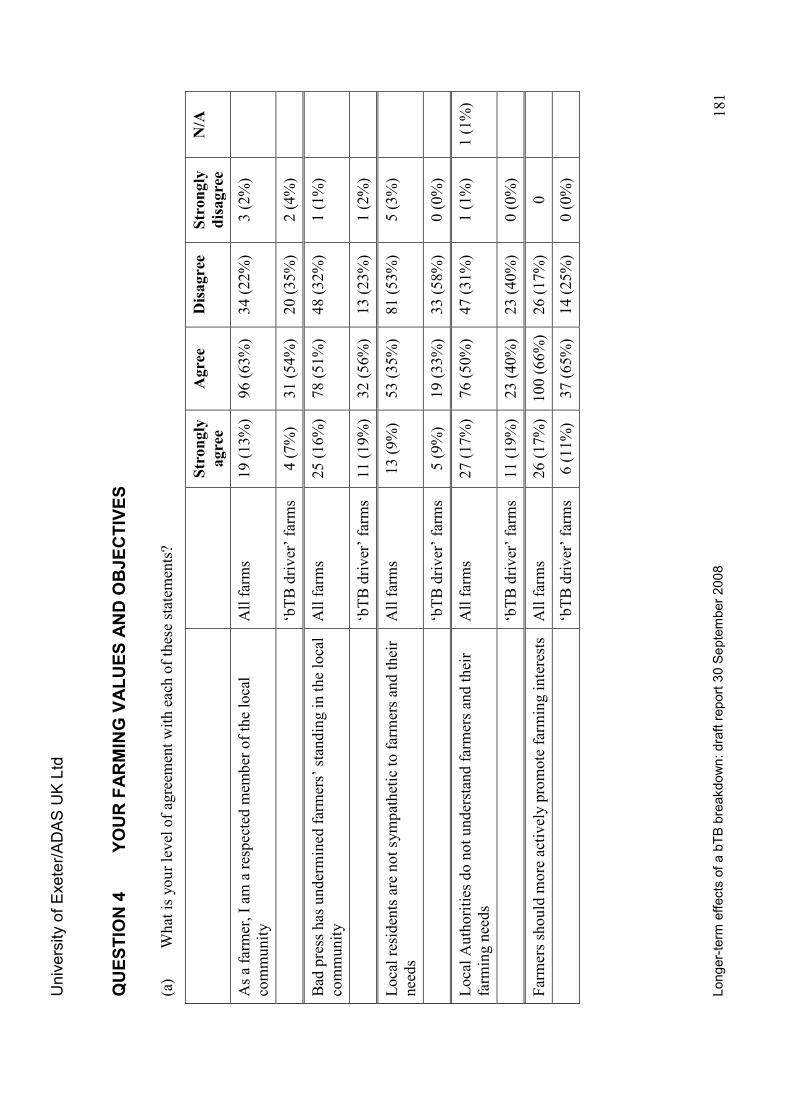
University of Exeter/ADAS UK Ltd
Longer-term effects of a bTB breakdown: draft report 30 September 2008
181
QUESTION 4
YOUR FARMING VALUES AND OBJECTIVES
(a)
What is your level of agreem
ent with each of these statem
ents?
Strongly
agree
Agree
Disagree
Strongly
disagree
N/A
As a farmer, I am
a respected mem
ber of the local
community
All farms
19 (13%)
96 (63%)
34 (22%)
3 (2%)
‘bTB driver’ farms
4 (7%)
31 (54%)
20 (35%)
2 (4%)
Bad press has undermined farmers’ standing in the local
community
All farms
25 (16%)
78 (51%)
48 (32%)
1 (1%)
‘bTB driver’ farms
11 (19%)
32 (56%)
13 (23%)
1 (2%)
Local residents are not sympathetic to farmers and their
needs
All farms
13 (9%)
53 (35%)
81 (53%)
5 (3%)
‘bTB driver’ farms
5 (9%)
19 (33%)
33 (58%)
0 (0%)
Local Authorities do not understand farmers and their
farming needs
All farms
27 (17%)
76 (50%)
47 (31%)
1 (1%)
1 (1%)
‘bTB driver’ farms
11 (19%)
23 (40%)
23 (40%)
0 (0%)
Farmers should more actively promote farming interests
All farms
26 (17%)
100 (66%)
26 (17%)
0
‘bTB driver’ farms
6 (11%)
37 (65%)
14 (25%)
0 (0%)
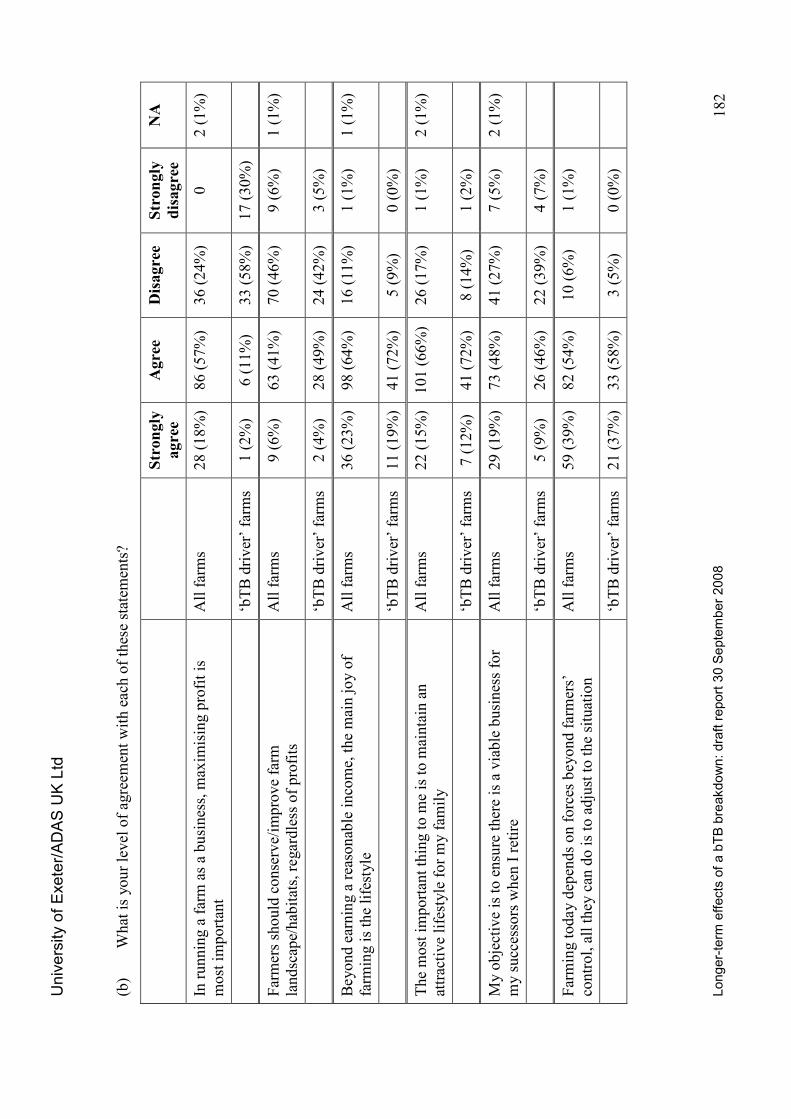
University of Exeter/ADAS UK Ltd
Longer-term effects of a bTB breakdown: draft report 30 September 2008
182
(b)
What is your level of agreem
ent with each of these statem
ents?
Strongly
agree
Agree
Disagree
Strongly
disagree
NA
In running a farm as a business, maximising profit is
most important
All farms
28 (18%)
86 (57%)
36 (24%)
0
2 (1%)
‘bTB driver’ farms
1 (2%)
6 (11%)
33 (58%)
17 (30%)
Farmers should conserve/improve farm
landscape/habitats, regardless of profits
All farms
9 (6%)
63 (41%)
70 (46%)
9 (6%)
1 (1%)
‘bTB driver’ farms
2 (4%)
28 (49%)
24 (42%)
3 (5%)
Beyond earning a reasonable income, the main joy of
farming is the lifestyle
All farms
36 (23%)
98 (64%)
16 (11%)
1 (1%)
1 (1%)
‘bTB driver’ farms
11 (19%)
41 (72%)
5 (9%)
0 (0%)
The most important thing to me is to maintain an
attractive lifestyle for my fam
ily
All farms
22 (15%)
101 (66%)
26 (17%)
1 (1%)
2 (1%)
‘bTB driver’ farms
7 (12%)
41 (72%)
8 (14%)
1 (2%)
My objective is to ensure there is a viable business for
my successors when I retire
All farms
29 (19%)
73 (48%)
41 (27%)
7 (5%)
2 (1%)
‘bTB driver’ farms
5 (9%)
26 (46%)
22 (39%)
4 (7%)
Farming today depends on forces beyond farmers’
control, all they can do is to adjust to the situation
All farms
59 (39%)
82 (54%)
10 (6%)
1 (1%)
‘bTB driver’ farms
21 (37%)
33 (58%)
3 (5%)
0 (0%)
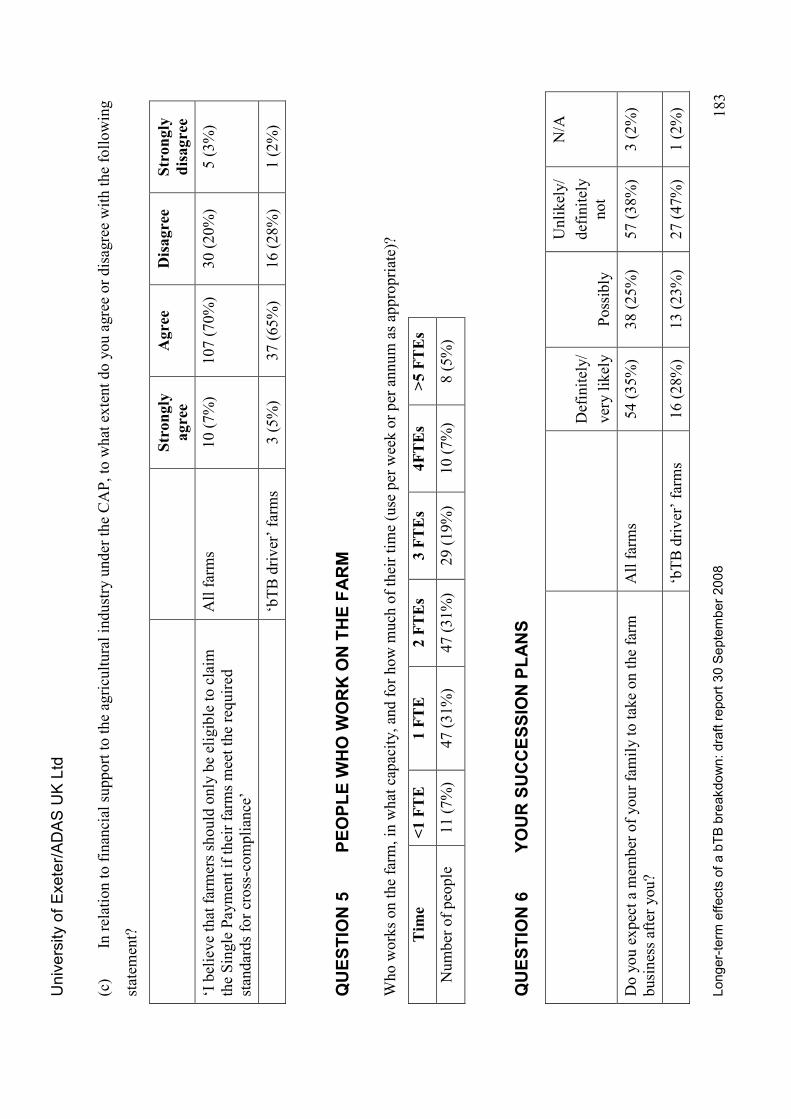
University of Exeter/ADAS UK Ltd
Longer-term effects of a bTB breakdown: draft report 30 September 2008
183
(c)
In relation to financial support to the agricultural industry under the CAP, to what extent do you agree or disagree with the following
statem
ent?
Strongly
agree
Agree
Disagree
Strongly
disagree
‘I believe that farmers should only be eligible to claim
the Single Payment if their farms meet the required
standards for cross-compliance’
All farms
10 (7%)
107 (70%)
30 (20%)
5 (3%)
‘bTB driver’ farms
3 (5%)
37 (65%)
16 (28%)
1 (2%)
QUESTION 5
PEOPLE W
HO W
ORK ON THE FARM
Who works on the farm, in what capacity, and for how much of their time (use per week or per annum as appropriate)?
Tim
e <1 FTE
1 FTE
2 FTEs
3 FTEs
4FTEs
>5 FTEs
Number of people
11 (7%)
47 (31%)
47 (31%)
29 (19%)
10 (7%)
8 (5%)
QUESTION 6
YOUR SUCCESSION PLANS
Definitely/
very likely
Possibly
Unlikely/
definitely
not
N/A
Do you expect a mem
ber of your family to take on the farm
business after you?
All farms
54 (35%)
38 (25%)
57 (38%)
3 (2%)
‘bTB driver’ farms
16 (28%)
13 (23%)
27 (47%)
1 (2%)
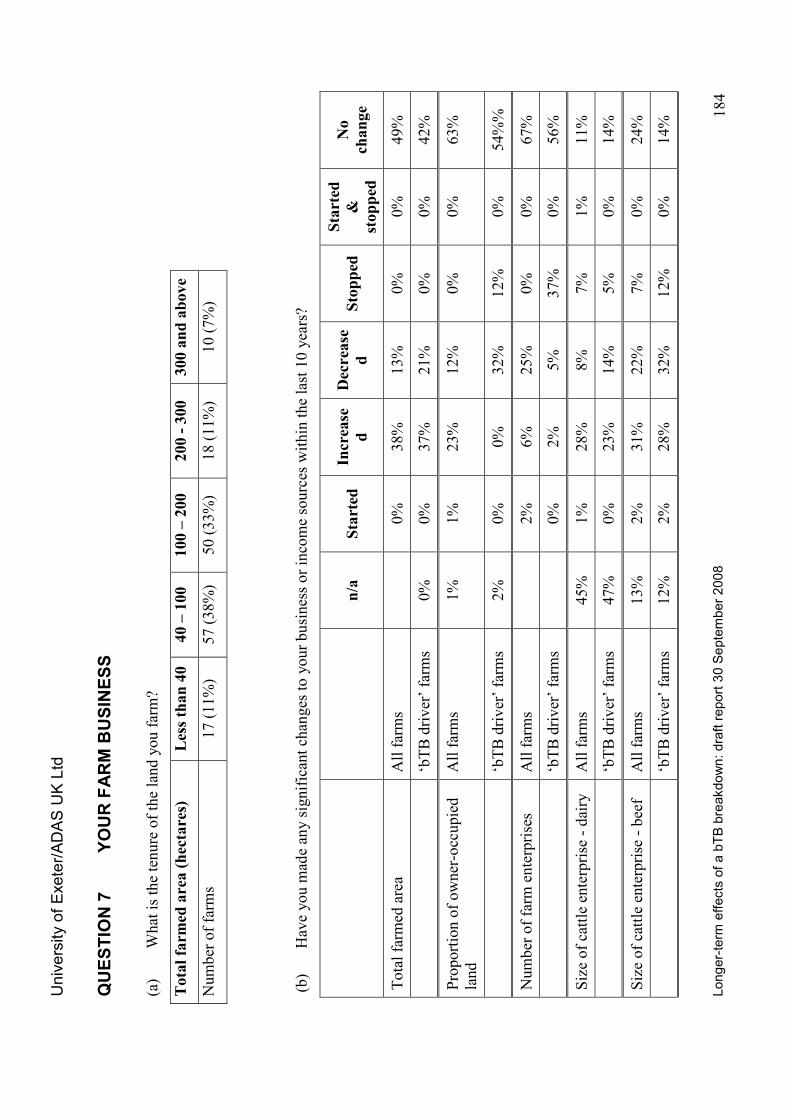
University of Exeter/ADAS UK Ltd
Longer-term effects of a bTB breakdown: draft report 30 September 2008
184
QUESTION 7
YOUR FARM BUSINESS
(a)
What is the tenure of the land you farm?
Total farm
ed area (hectares)
Less than 40
40 – 100
100 – 200
200 - 300
300 and above
Number of farms
17 (11%)
57 (38%)
50 (33%)
18 (11%)
10 (7%)
(b)
Have you made any significant changes to your business or income sources within the last 10 years?
n/a
Started
Increase
d
Decrease
d
Stopped
Started
&
stopped
No
change
Total farmed area
All farms
0%
38%
13%
0%
0%
49%
‘bTB driver’ farms
0%
0%
37%
21%
0%
0%
42%
Proportion of owner-occupied
land
All farms
1%
1%
23%
12%
0%
0%
63%
‘bTB driver’ farms
2%
0%
0%
32%
12%
0%
54%%
Number of farm enterprises
All farms
2%
6%
25%
0%
0%
67%
‘bTB driver’ farms
0%
2%
5%
37%
0%
56%
Size of cattle enterprise - dairy
All farms
45%
1%
28%
8%
7%
1%
11%
‘bTB driver’ farms
47%
0%
23%
14%
5%
0%
14%
Size of cattle enterprise - beef
All farms
13%
2%
31%
22%
7%
0%
24%
‘bTB driver’ farms
12%
2%
28%
32%
12%
0%
14%
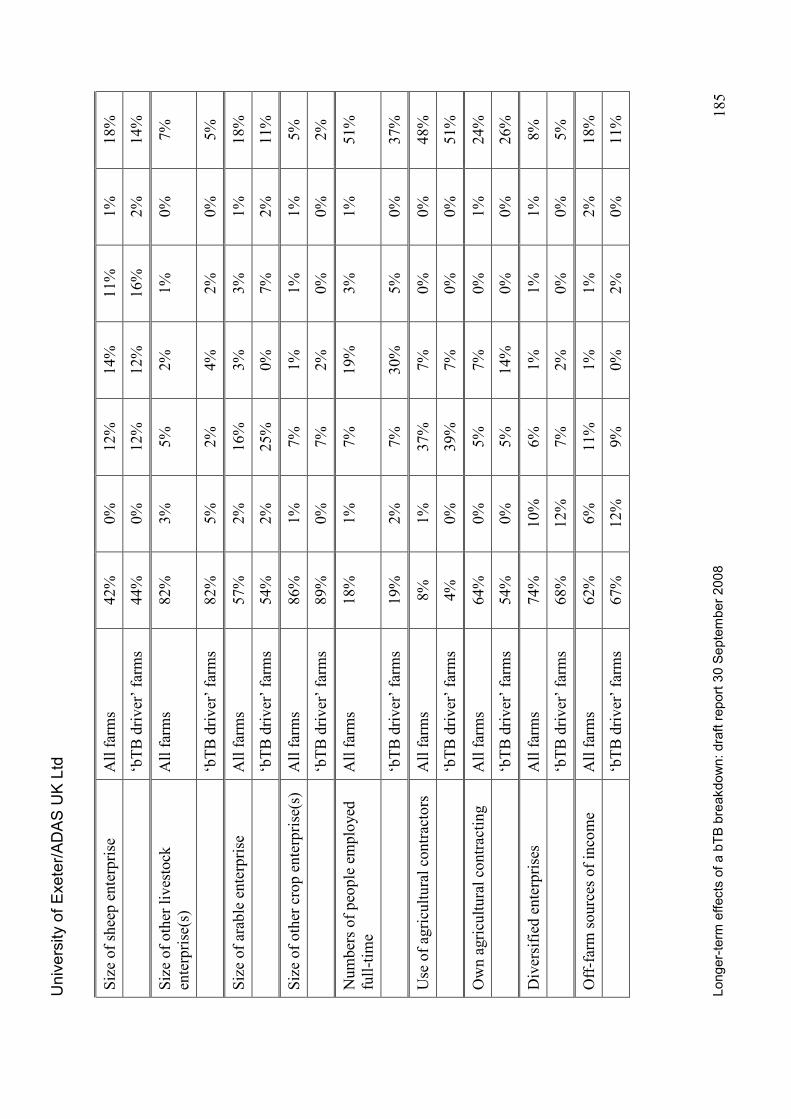
University of Exeter/ADAS UK Ltd
Longer-term effects of a bTB breakdown: draft report 30 September 2008
185
Size of sheep enterprise
All farms
42%
0%
12%
14%
11%
1%
18%
‘bTB driver’ farms
44%
0%
12%
12%
16%
2%
14%
Size of other livestock
enterprise(s)
All farms
82%
3%
5%
2%
1%
0%
7%
‘bTB driver’ farms
82%
5%
2%
4%
2%
0%
5%
Size of arable enterprise
All farms
57%
2%
16%
3%
3%
1%
18%
‘bTB driver’ farms
54%
2%
25%
0%
7%
2%
11%
Size of other crop enterprise(s)
All farms
86%
1%
7%
1%
1%
1%
5%
‘bTB driver’ farms
89%
0%
7%
2%
0%
0%
2%
Numbers of people employed
full-time
All farms
18%
1%
7%
19%
3%
1%
51%
‘bTB driver’ farms
19%
2%
7%
30%
5%
0%
37%
Use of agricultural contractors
All farms
8%
1%
37%
7%
0%
0%
48%
‘bTB driver’ farms
4%
0%
39%
7%
0%
0%
51%
Own agricultural contracting
All farms
64%
0%
5%
7%
0%
1%
24%
‘bTB driver’ farms
54%
0%
5%
14%
0%
0%
26%
Diversified enterprises
All farms
74%
10%
6%
1%
1%
1%
8%
‘bTB driver’ farms
68%
12%
7%
2%
0%
0%
5%
Off-farm sources of income
All farms
62%
6%
11%
1%
1%
2%
18%
‘bTB driver’ farms
67%
12%
9%
0%
2%
0%
11%
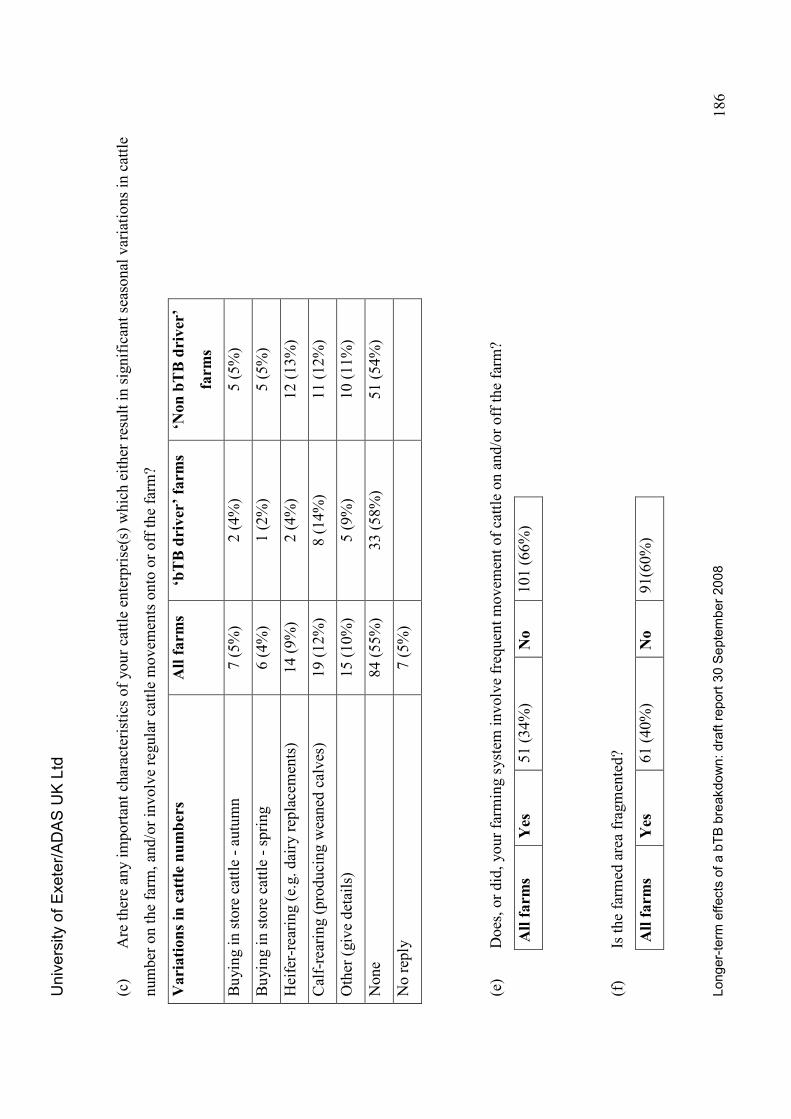
University of Exeter/ADAS UK Ltd
Longer-term effects of a bTB breakdown: draft report 30 September 2008
186
(c)
Are there any important characteristics of your cattle enterprise(s) which either result in significant seasonal variations in cattle
number on the farm, and/or involve regular cattle movem
ents onto or off the farm?
Variations in cattle numbers
All farm
s ‘bTB driver’ farm
s ‘N
on bTB driver’
farm
s
Buying in store cattle - autumn
7 (5%)
2 (4%)
5 (5%)
Buying in store cattle - spring
6 (4%)
1 (2%)
5 (5%)
Heifer-rearing (e.g. dairy replacements)
14 (9%)
2 (4%)
12 (13%)
Calf-rearing (producing weaned calves)
19 (12%)
8 (14%)
11 (12%)
Other (give details)
15 (10%)
5 (9%)
10 (11%)
None
84 (55%)
33 (58%)
51 (54%)
No reply
7 (5%)
(e)
Does, or did, your farming system
involve frequent movem
ent of cattle on and/or off the farm?
All farm
s Yes
51 (34%)
No
101 (66%)
(f)
Is the farm
ed area fragmented?
All farm
s Yes
61 (40%)
No
91(60%)
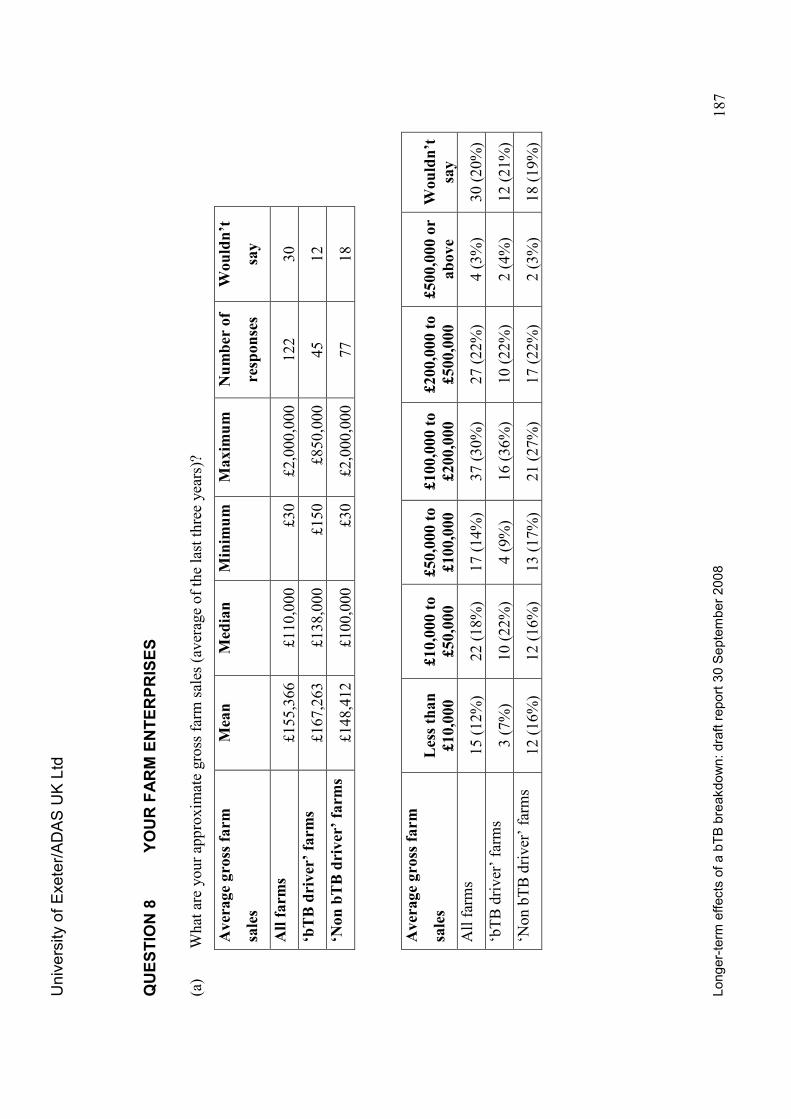
University of Exeter/ADAS UK Ltd
Longer-term effects of a bTB breakdown: draft report 30 September 2008
187
QUESTION 8
YOUR FARM ENTERPRISES
(a)
What are your approximate gross farm sales (average of the last three years)?
Average gross farm
sales
Mean
Median
Minim
um
Maxim
um
Number of
responses
Wouldn’t
say
All farm
s £155,366
£110,000
£30
£2,000,000
122
30
‘bTB driver’ farm
s £167,263
£138,000
£150
£850,000
45
12
‘Non bTB driver’ farm
s £148,412
£100,000
£30
£2,000,000
77
18
Average gross farm
sales
Less than
£10,000
£10,000 to
£50,000
£50,000 to
£100,000
£100,000 to
£200,000
£200,000 to
£500,000
£500,000 or
above
Wouldn’t
say
All farms
15 (12%)
22 (18%)
17 (14%)
37 (30%)
27 (22%)
4 (3%)
30 (20%)
‘bTB driver’ farms
3 (7%)
10 (22%)
4 (9%)
16 (36%)
10 (22%)
2 (4%)
12 (21%)
‘Non bTB driver’ farms
12 (16%)
12 (16%)
13 (17%)
21 (27%)
17 (22%)
2 (3%)
18 (19%)
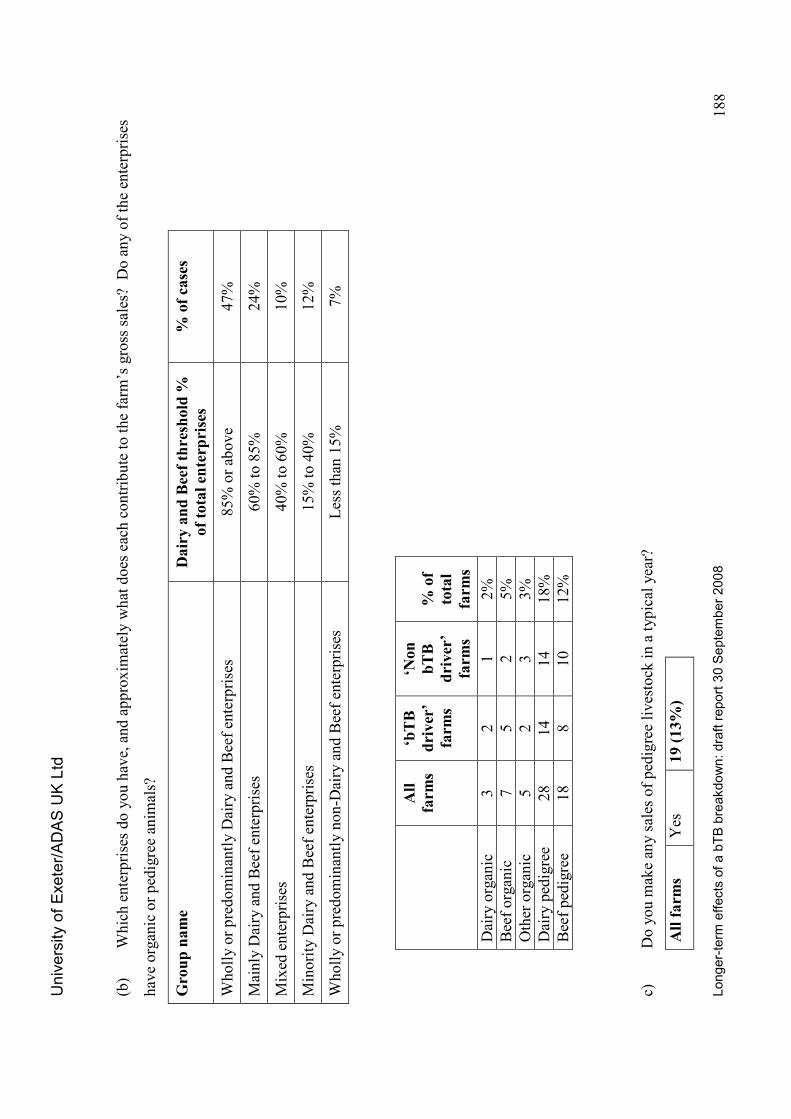
University of Exeter/ADAS UK Ltd
Longer-term effects of a bTB breakdown: draft report 30 September 2008
188
(b)
Which enterprises do you have, and approximately what does each contribute to the farm’s gross sales? Do any of the enterprises
have organic or pedigree animals?
Group name
Dairy and Beef threshold %
of total enterprises
% of cases
Wholly or predominantly Dairy and Beef enterprises
85% or above
47%
Mainly Dairy and Beef enterprises
60% to 85%
24%
Mixed enterprises
40% to 60%
10%
Minority Dairy and Beef enterprises
15% to 40%
12%
Wholly or predominantly non-Dairy and Beef enterprises
Less than 15%
7%
All
farm
s
‘bTB
driver’
farm
s
‘Non
bTB
driver’
farm
s
% of
total
farm
s
Dairy organic
3
2
1
2%
Beef organic
7
5
2
5%
Other organic
5
2
3
3%
Dairy pedigree
28
14
14
18%
Beef pedigree
18
8
10
12%
c)
Do you make any sales of pedigree livestock in a typical year?
All farm
s Yes
19 (13%
)
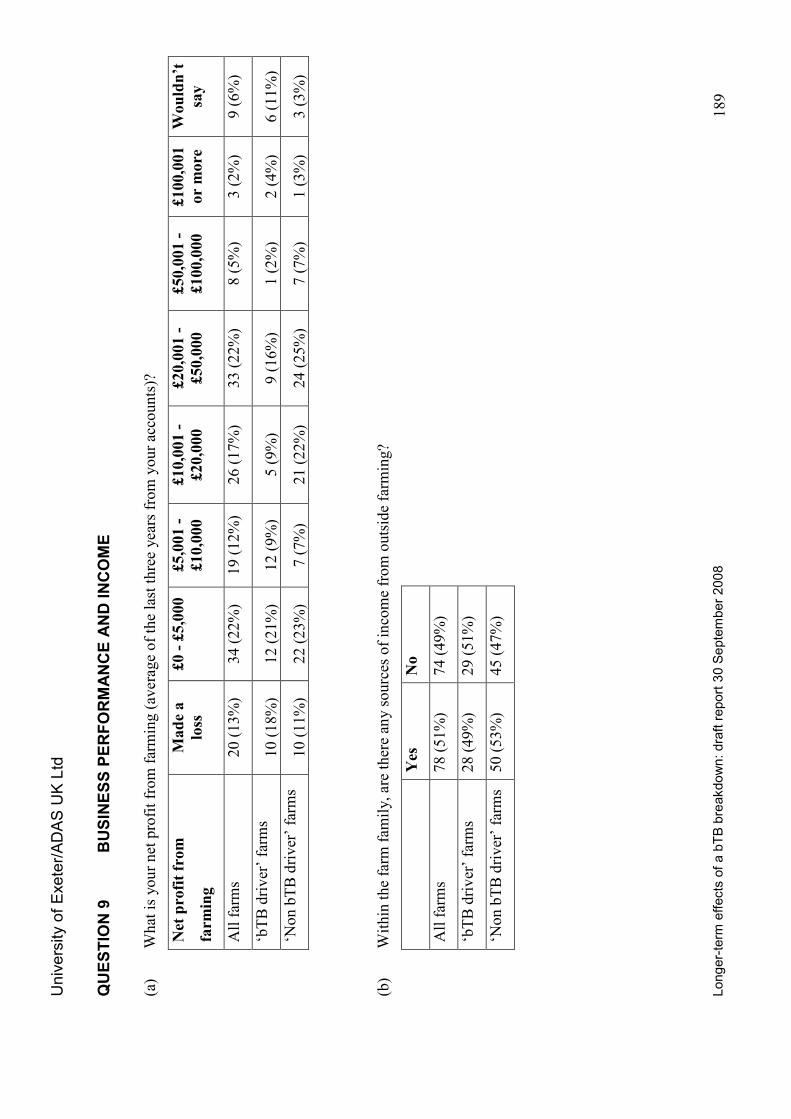
University of Exeter/ADAS UK Ltd
Longer-term effects of a bTB breakdown: draft report 30 September 2008
189
QUESTION 9
BUSINESS PERFORMANCE AND INCOME
(a)
What is your net profit from farming (average of the last three years from your accounts)?
Net profit from
farm
ing
Made a
loss
£0 - £5,000
£5,001 -
£10,000
£10,001 -
£20,000
£20,001 -
£50,000
£50,001 -
£100,000
£100,001
or more
Wouldn’t
say
All farms
20 (13%)
34 (22%)
19 (12%)
26 (17%)
33 (22%)
8 (5%)
3 (2%)
9 (6%)
‘bTB driver’ farms
10 (18%)
12 (21%)
12 (9%)
5 (9%)
9 (16%)
1 (2%)
2 (4%)
6 (11%)
‘Non bTB driver’ farms
10 (11%)
22 (23%)
7 (7%)
21 (22%)
24 (25%)
7 (7%)
1 (3%)
3 (3%)
(b)
Within the farm fam
ily, are there any sources of income from outside farming?
Yes
No
All farms
78 (51%)
74 (49%)
‘bTB driver’ farms
28 (49%)
29 (51%)
‘Non bTB driver’ farms
50 (53%)
45 (47%)
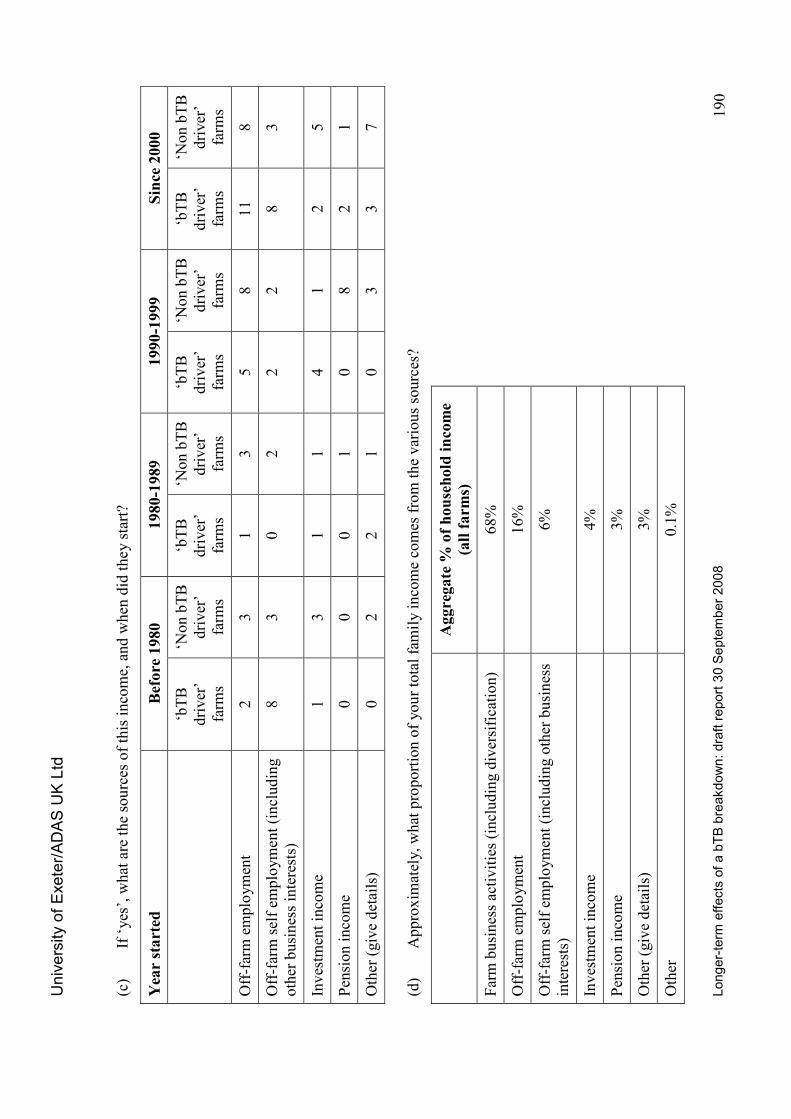
University of Exeter/ADAS UK Ltd
Longer-term effects of a bTB breakdown: draft report 30 September 2008
190
(c)
If ‘yes’, what are the sources of this income, and when did they start?
Year started
Before 1980
1980-1989
1990-1999
Since 2000
‘bTB
driver’
farms
‘Non bTB
driver’
farms
‘bTB
driver’
farms
‘Non bTB
driver’
farms
‘bTB
driver’
farms
‘Non bTB
driver’
farms
‘bTB
driver’
farms
‘Non bTB
driver’
farms
Off-farm employment
2
3
1
3
5
8
11
8
Off-farm self em
ployment (including
other business interests)
8
3
0
2
2
2
8
3
Investment income
1
3
1
1
4
1
2
5
Pension income
0
0
0
1
0
8
2
1
Other (give details)
0
2
2
1
0
3
3
7
(d)
Approximately, what proportion of your total family income comes from the various sources?
Aggregate %
of household income
(all farm
s)
Farm business activities (including diversification)
68%
Off-farm employment
16%
Off-farm self em
ployment (including other business
interests)
6%
Investment income
4%
Pension income
3%
Other (give details)
3%
Other
0.1%
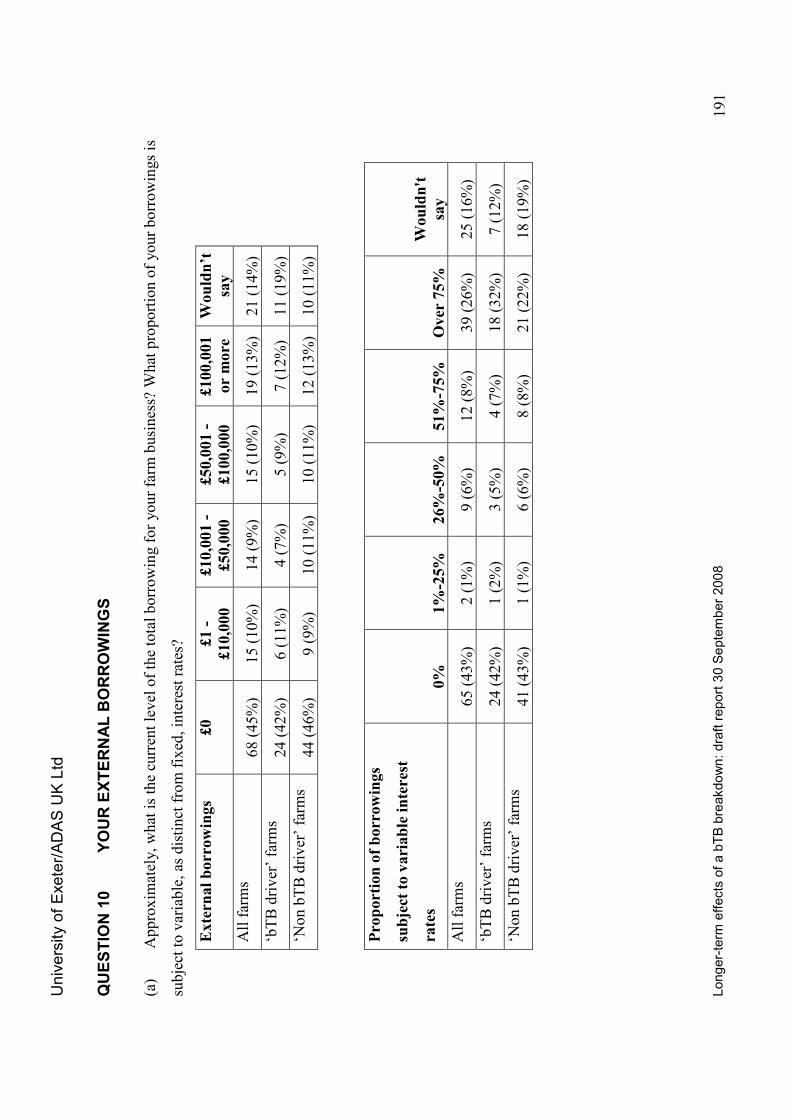
University of Exeter/ADAS UK Ltd
Longer-term effects of a bTB breakdown: draft report 30 September 2008
191
QUESTION 10
YOUR EXTERNAL BORROWINGS
(a)
Approximately, what is the current level of the total borrowing for your farm
business? W
hat proportion of your borrowings is
subject to variable, as distinct from fixed, interest rates?
External borrowings
£0
£1 -
£10,000
£10,001 -
£50,000
£50,001 -
£100,000
£100,001
or more
Wouldn’t
say
All farms
68 (45%)
15 (10%)
14 (9%)
15 (10%)
19 (13%)
21 (14%)
‘bTB driver’ farms
24 (42%)
6 (11%)
4 (7%)
5 (9%)
7 (12%)
11 (19%)
‘Non bTB driver’ farms
44 (46%)
9 (9%)
10 (11%)
10 (11%)
12 (13%)
10 (11%)
Proportion of borrowings
subject to variable interest
rates
0%
1%
-25%
26%
-50%
51%
-75%
Over 75%
Wouldn't
say
All farms
65 (43%)
2 (1%)
9 (6%)
12 (8%)
39 (26%)
25 (16%)
‘bTB driver’ farms
24 (42%)
1 (2%)
3 (5%)
4 (7%)
18 (32%)
7 (12%)
‘Non bTB driver’ farms
41 (43%)
1 (1%)
6 (6%)
8 (8%)
21 (22%)
18 (19%)
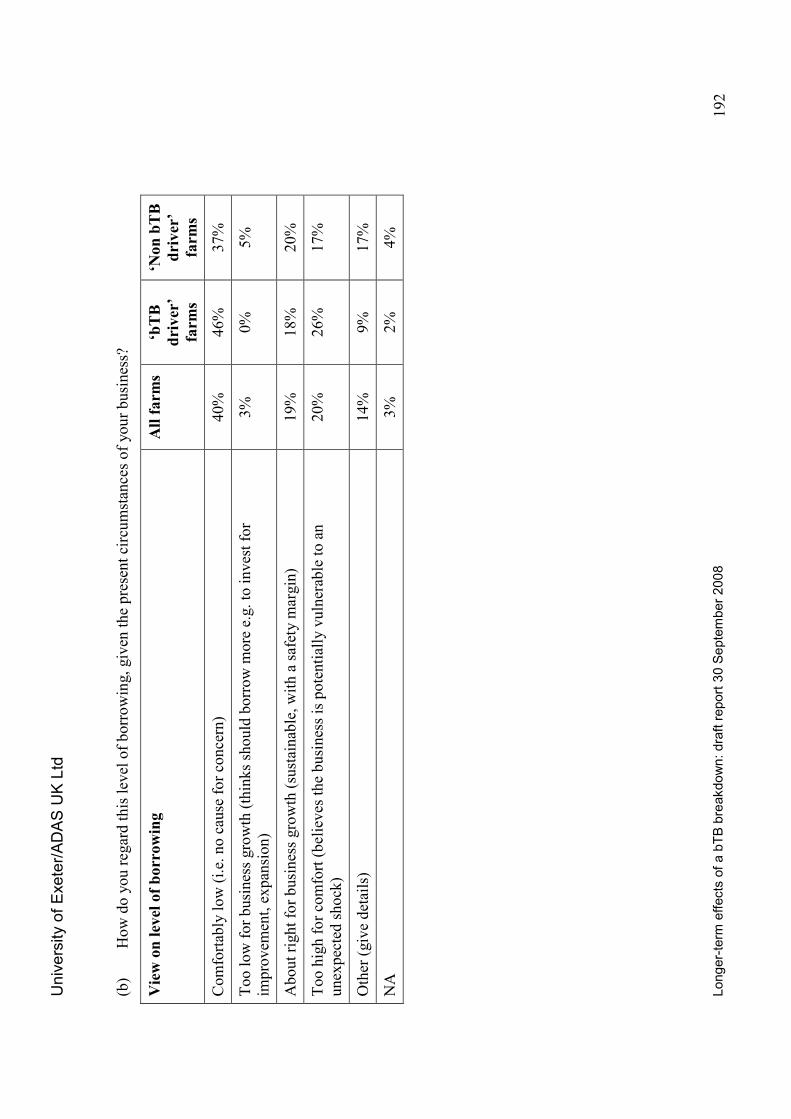
University of Exeter/ADAS UK Ltd
Longer-term effects of a bTB breakdown: draft report 30 September 2008
192
(b)
How do you regard this level of borrowing, given the present circumstances of your business?
View on level of borrowing
All farm
s ‘bTB
driver’
farm
s
‘Non bTB
driver’
farm
s
Comfortably low (i.e. no cause for concern)
40%
46%
37%
Too low for business growth (thinks should borrow more e.g. to invest for
improvem
ent, expansion)
3%
0%
5%
About right for business growth (sustainable, with a safety margin)
19%
18%
20%
Too high for comfort (believes the business is potentially vulnerable to an
unexpected shock)
20%
26%
17%
Other (give details)
14%
9%
17%
NA
3%
2%
4%
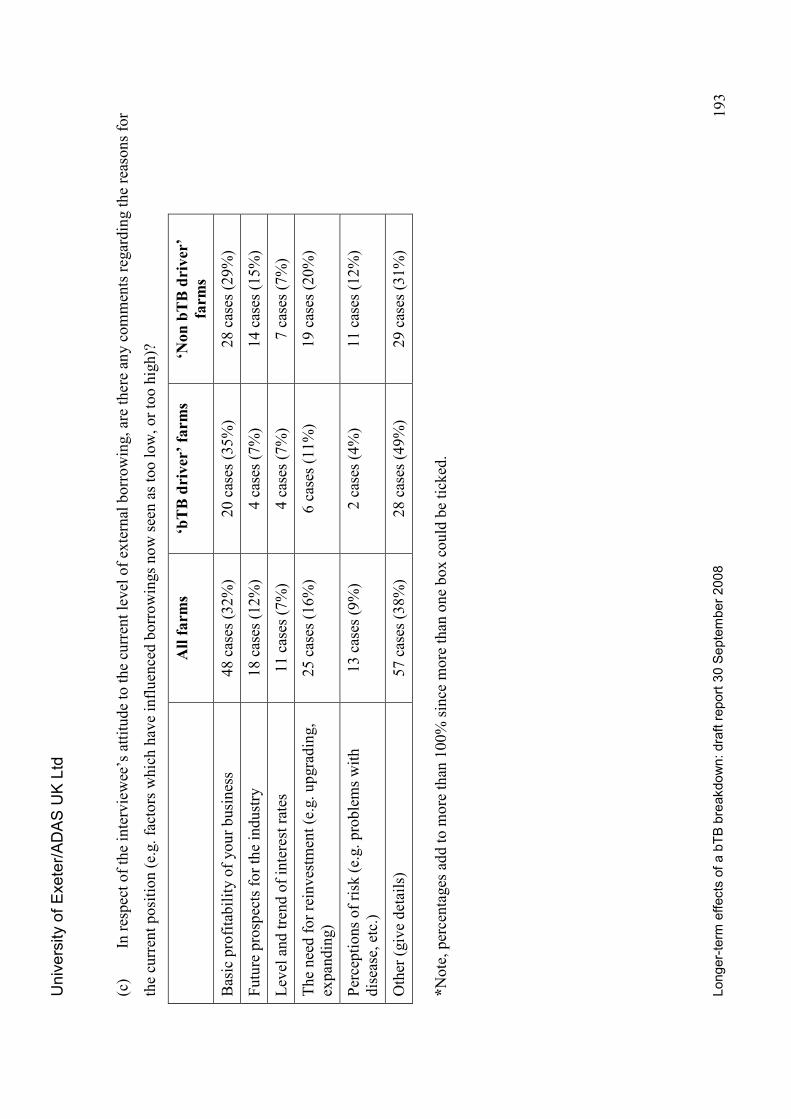
University of Exeter/ADAS UK Ltd
Longer-term effects of a bTB breakdown: draft report 30 September 2008
193
(c)
In respect of the interviewee’s attitude to the current level of external borrowing, are there any comments regarding the reasons for
the current position (e.g. factors which have influenced borrowings now seen as too low, or too high)?
All farm
s ‘bTB driver’ farm
s ‘N
on bTB driver’
farm
s
Basic profitability of your business
48 cases (32%)
20 cases (35%)
28 cases (29%)
Future prospects for the industry
18 cases (12%)
4 cases (7%)
14 cases (15%)
Level and trend of interest rates
11 cases (7%)
4 cases (7%)
7 cases (7%)
The need for reinvestment (e.g. upgrading,
expanding)
25 cases (16%)
6 cases (11%)
19 cases (20%)
Perceptions of risk (e.g. problems with
disease, etc.)
13 cases (9%)
2 cases (4%)
11 cases (12%)
Other (give details)
57 cases (38%)
28 cases (49%)
29 cases (31%)
*Note, percentages add to more than 100% since more than one box could be ticked.
University of Exeter/ADAS UK Ltd
Longer-term effects of a bTB breakdown: draft report 30 September 2008
194
SECTION B
A REVIEW OF YOUR BUSINESS STRATEGY
QUESTION 11
BUSINESS STRATEGY AND CHANGES
(a)
Thinking about your business planning decisions, please explain what changes you have made in the past TEN years (e.g. buying,
selling or letting land; extended existing buildings; built new
buildings or other infra-structure; introduced one or more new
enterprises;
abandoned one or more enterprises; expansion/reduction of enterprises including diversification change in key farm practices; major changes
to the machinery/equipment inventory; major changes to the use of technical/business advice; major changes to the financial structure of the
business)?
(b)
What are the reasons/drivers behind the changes you have already made (e.g. changing relative profitability, succession issues,
ageing
(c)
Thinking about your business planning decisions, please explain what changes you intend to make to your farm business over the
next TEN years (e.g. buying, selling or letting land; extended existing buildings; built new
buildings or other infra-structure; introduced one
or more new
enterprises; abandoned one or more enterprises; expansion/reduction of enterprises including diversification change in key farm
practices; major changes to the machinery/equipment inventory; major changes to the use of technical/business advice; major changes to the
financial structure of the business)?
(d)
What are the reasons/drivers behind the changes you intend to make (e.g. changing relative profitability, succession issues, ageing
infra-structure, rising input prices, poor prices in future for farm products, animal health issues, legislation, retirement, etc.)?
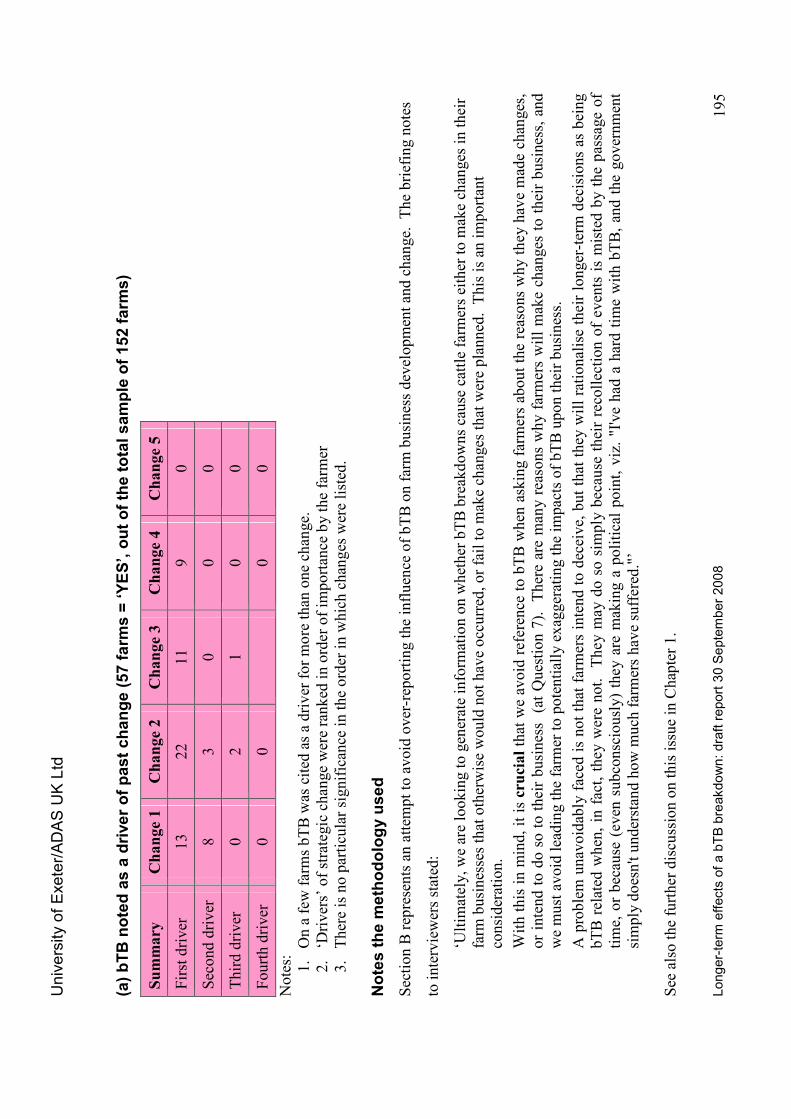
University of Exeter/ADAS UK Ltd
Longer-term effects of a bTB breakdown: draft report 30 September 2008
195
(a) bTB noted as a driver of past change (57 farm
s = ‘YES’, out of the total sample of 152 farm
s)
Summary
Change 1
Change 2
Change 3
Change 4
Change 5
First driver
13
22
11
9
0
Second driver
8
3
0
0
0
Third driver
0
2
1
0
0
Fourth driver
0
0
0
0
Notes:
1. On a few
farms bTB was cited as a driver for more than one change.
2. ‘Drivers’ of strategic change were ranked in order of importance by the farm
er
3. There is no particular significance in the order in which changes were listed.
Notes the m
ethodology used
Section B represents an attem
pt to avoid over-reporting the influence of bTB on farm business development and change. The briefing notes
to interviewers stated:
‘Ultimately, we are looking to generate information on whether bTB breakdowns cause cattle farmers either to make changes in their
farm businesses that otherwise would not have occurred, or fail to make changes that were planned. This is an important
consideration.
With this in mind, it is crucial that we avoid reference to bTB when asking farmers about the reasons why they have made changes,
or intend to do so to their business (at Question 7). There are many reasons why farmers will make changes to their business, and
we must avoid leading the farm
er to potentially exaggerating the impacts of bTB upon their business.
A problem unavoidably faced is not that farmers intend to deceive, but that they will rationalise their longer-term decisions as being
bTB related when, in fact, they were not. They m
ay do so simply because their recollection of events is misted by the passage of
time, or because (even subconsciously) they are m
aking a political point, viz. "I've had a hard time with bTB, and the government
simply doesn't understand how much farmers have suffered."’
See also the further discussion on this issue in Chapter 1.
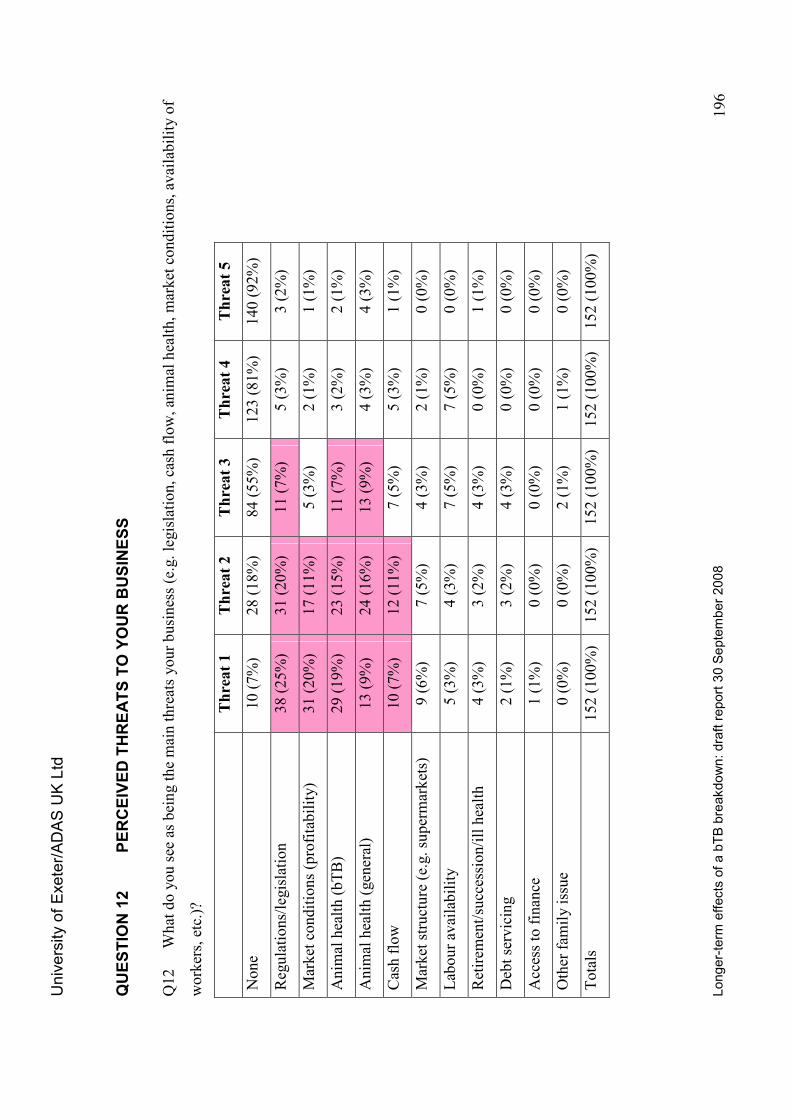
University of Exeter/ADAS UK Ltd
Longer-term effects of a bTB breakdown: draft report 30 September 2008
196
QUESTION 12
PERCEIVED THREATS TO YOUR BUSINESS
Q12
What do you see as being the main threats your business (e.g. legislation, cash flow, animal health, market conditions, availability of
workers, etc.)?
Threat 1
Threat 2
Threat 3
Threat 4
Threat 5
None
10 (7%)
28 (18%)
84 (55%)
123 (81%)
140 (92%)
Regulations/legislation
38 (25%)
31 (20%)
11 (7%)
5 (3%)
3 (2%)
Market conditions (profitability)
31 (20%)
17 (11%)
5 (3%)
2 (1%)
1 (1%)
Animal health (bTB)
29 (19%)
23 (15%)
11 (7%)
3 (2%)
2 (1%)
Animal health (general)
13 (9%)
24 (16%)
13 (9%)
4 (3%)
4 (3%)
Cash flow
10 (7%)
12 (11%)
7 (5%)
5 (3%)
1 (1%)
Market structure (e.g. supermarkets)
9 (6%)
7 (5%)
4 (3%)
2 (1%)
0 (0%)
Labour availability
5 (3%)
4 (3%)
7 (5%)
7 (5%)
0 (0%)
Retirem
ent/succession/ill health
4 (3%)
3 (2%)
4 (3%)
0 (0%)
1 (1%)
Debt servicing
2 (1%)
3 (2%)
4 (3%)
0 (0%)
0 (0%)
Access to finance
1 (1%)
0 (0%)
0 (0%)
0 (0%)
0 (0%)
Other fam
ily issue
0 (0%)
0 (0%)
2 (1%)
1 (1%)
0 (0%)
Totals
152 (100%)
152 (100%)
152 (100%)
152 (100%)
152 (100%)
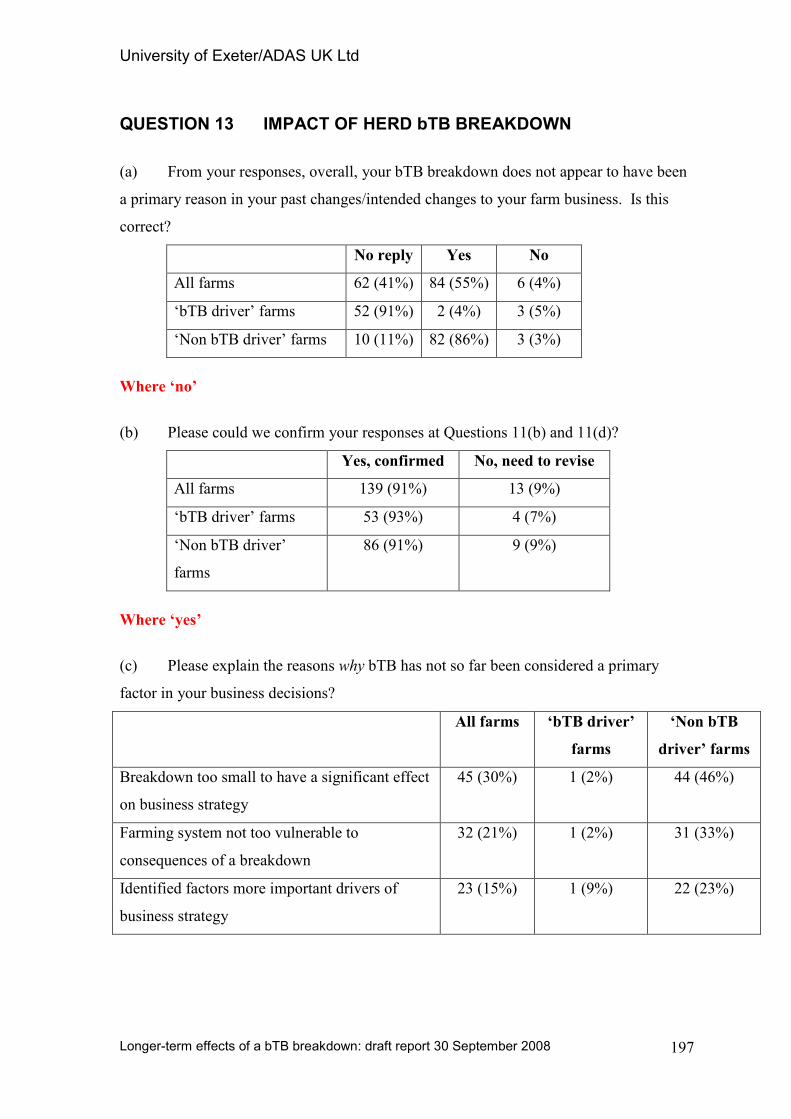
University of Exeter/ADAS UK Ltd
Longer-term effects of a bTB breakdown: draft report 30 September 2008
197
QUESTION 13 IMPACT OF HERD bTB BREAKDOWN
(a) From your responses, overall, your bTB breakdown does not appear to have been
a primary reason in your past changes/intended changes to your farm business. Is this
correct?
No reply Yes No
All farms 62 (41%) 84 (55%) 6 (4%)
‘bTB driver’ farms 52 (91%) 2 (4%) 3 (5%)
‘Non bTB driver’ farms 10 (11%) 82 (86%) 3 (3%)
Where ‘no’
(b) Please could we confirm your responses at Questions 11(b) and 11(d)?
Yes, confirmed No, need to revise
All farms 139 (91%) 13 (9%)
‘bTB driver’ farms 53 (93%) 4 (7%)
‘Non bTB driver’
farms
86 (91%) 9 (9%)
Where ‘yes’
(c) Please explain the reasons why bTB has not so far been considered a primary
factor in your business decisions?
All farms ‘bTB driver’
farms
‘Non bTB
driver’ farms
Breakdown too small to have a significant effect
on business strategy
45 (30%) 1 (2%) 44 (46%)
Farming system not too vulnerable to
consequences of a breakdown
32 (21%) 1 (2%) 31 (33%)
Identified factors more important drivers of
business strategy
23 (15%) 1 (9%) 22 (23%)
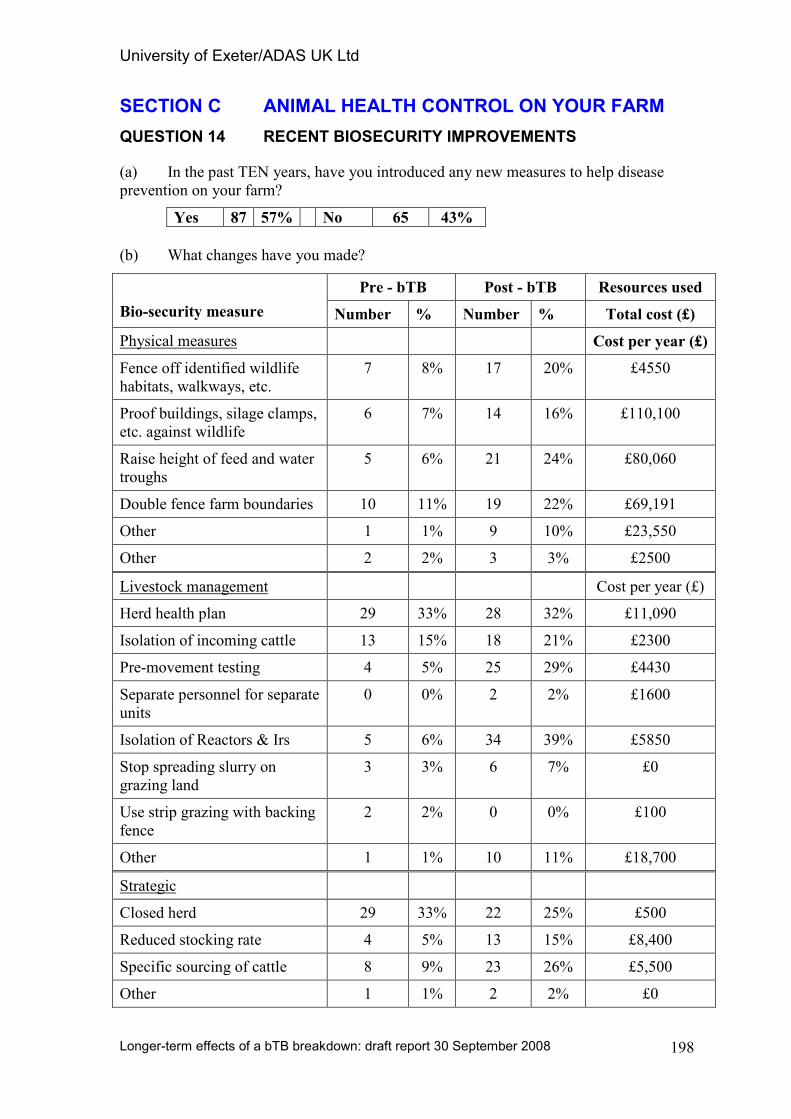
University of Exeter/ADAS UK Ltd
Longer-term effects of a bTB breakdown: draft report 30 September 2008
198
SECTION C ANIMAL HEALTH CONTROL ON YOUR FARM
QUESTION 14 RECENT BIOSECURITY IMPROVEMENTS
(a) In the past TEN years, have you introduced any new measures to help disease
prevention on your farm?
Yes 87 57% No 65 43%
(b) What changes have you made?
Pre - bTB Post - bTB Resources used
Bio-security measure Number % Number % Total cost (£)
Physical measures Cost per year (£)
Fence off identified wildlife
habitats, walkways, etc.
7 8% 17 20% £4550
Proof buildings, silage clamps,
etc. against wildlife
6 7% 14 16% £110,100
Raise height of feed and water
troughs
5 6% 21 24% £80,060
Double fence farm boundaries 10 11% 19 22% £69,191
Other 1 1% 9 10% £23,550
Other 2 2% 3 3% £2500
Livestock management Cost per year (£)
Herd health plan 29 33% 28 32% £11,090
Isolation of incoming cattle 13 15% 18 21% £2300
Pre-movement testing 4 5% 25 29% £4430
Separate personnel for separate
units
0 0% 2 2% £1600
Isolation of Reactors & Irs 5 6% 34 39% £5850
Stop spreading slurry on
grazing land
3 3% 6 7% £0
Use strip grazing with backing
fence
2 2% 0 0% £100
Other 1 1% 10 11% £18,700
Strategic
Closed herd 29 33% 22 25% £500
Reduced stocking rate 4 5% 13 15% £8,400
Specific sourcing of cattle 8 9% 23 26% £5,500
Other 1 1% 2 2% £0
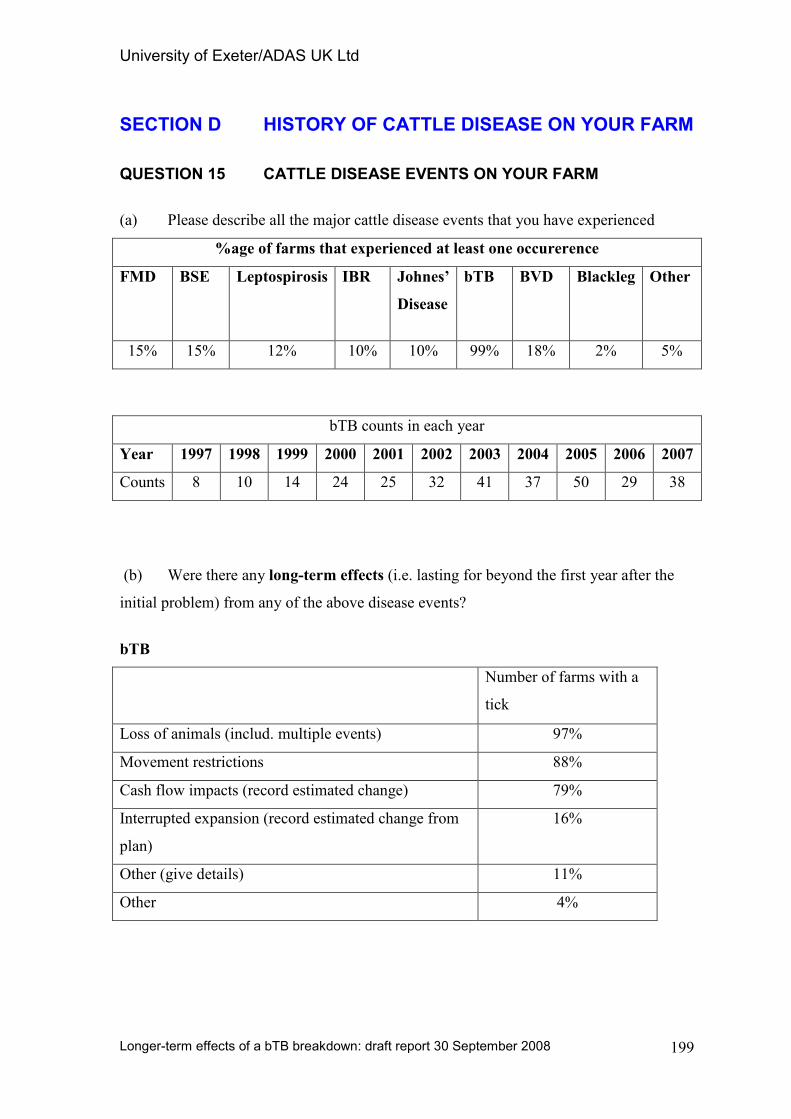
University of Exeter/ADAS UK Ltd
Longer-term effects of a bTB breakdown: draft report 30 September 2008
199
SECTION D HISTORY OF CATTLE DISEASE ON YOUR FARM
QUESTION 15 CATTLE DISEASE EVENTS ON YOUR FARM
(a) Please describe all the major cattle disease events that you have experienced
%age of farms that experienced at least one occurerence
FMD BSE Leptospirosis IBR Johnes’
Disease
bTB BVD Blackleg Other
15% 15% 12% 10% 10% 99% 18% 2% 5%
bTB counts in each year
Year 1997 1998 1999 2000 2001 2002 2003 2004 2005 2006 2007
Counts 8 10 14 24 25 32 41 37 50 29 38
(b) Were there any long-term effects (i.e. lasting for beyond the first year after the
initial problem) from any of the above disease events?
bTB
Number of farms with a
tick
Loss of animals (includ. multiple events) 97%
Movement restrictions 88%
Cash flow impacts (record estimated change) 79%
Interrupted expansion (record estimated change from
plan)
16%
Other (give details) 11%
Other 4%
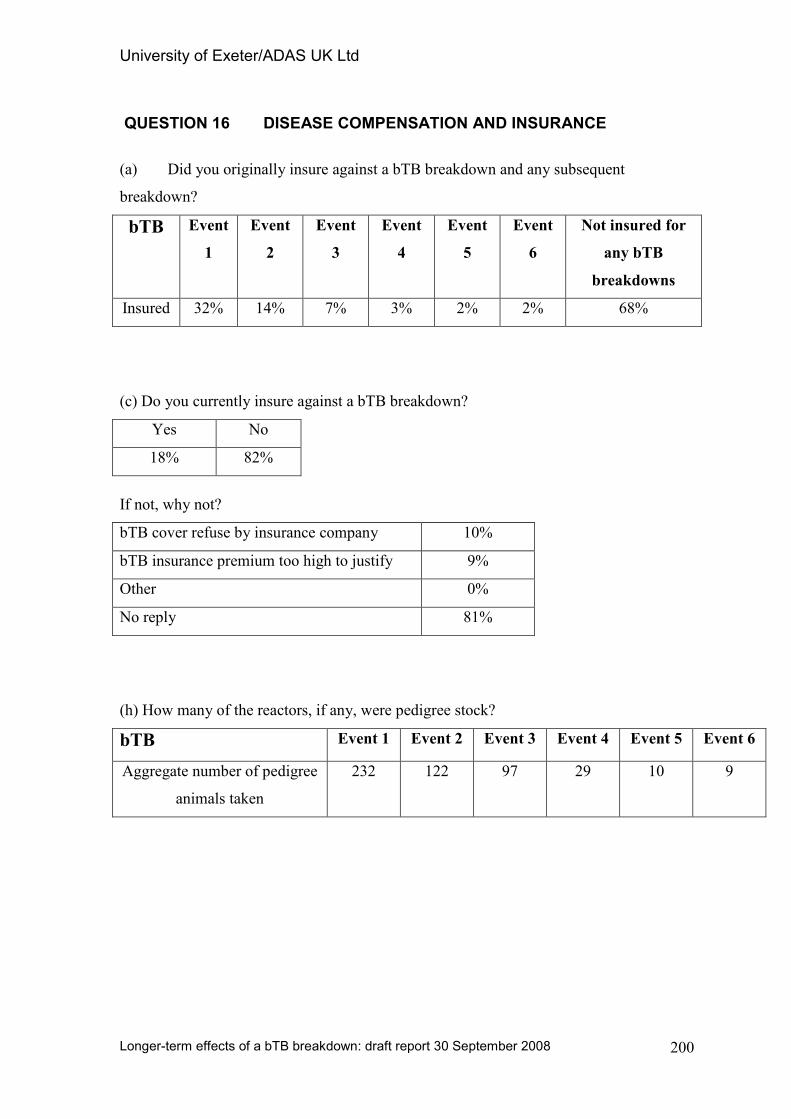
University of Exeter/ADAS UK Ltd
Longer-term effects of a bTB breakdown: draft report 30 September 2008
200
QUESTION 16 DISEASE COMPENSATION AND INSURANCE
(a) Did you originally insure against a bTB breakdown and any subsequent
breakdown?
bTB Event
1
Event
2
Event
3
Event
4
Event
5
Event
6
Not insured for
any bTB
breakdowns
Insured 32% 14% 7% 3% 2% 2% 68%
(c) Do you currently insure against a bTB breakdown?
Yes No
18% 82%
If not, why not?
bTB cover refuse by insurance company 10%
bTB insurance premium too high to justify 9%
Other 0%
No reply 81%
(h) How many of the reactors, if any, were pedigree stock?
bTB Event 1 Event 2 Event 3 Event 4 Event 5 Event 6
Aggregate number of pedigree
animals taken
232 122 97 29 10 9
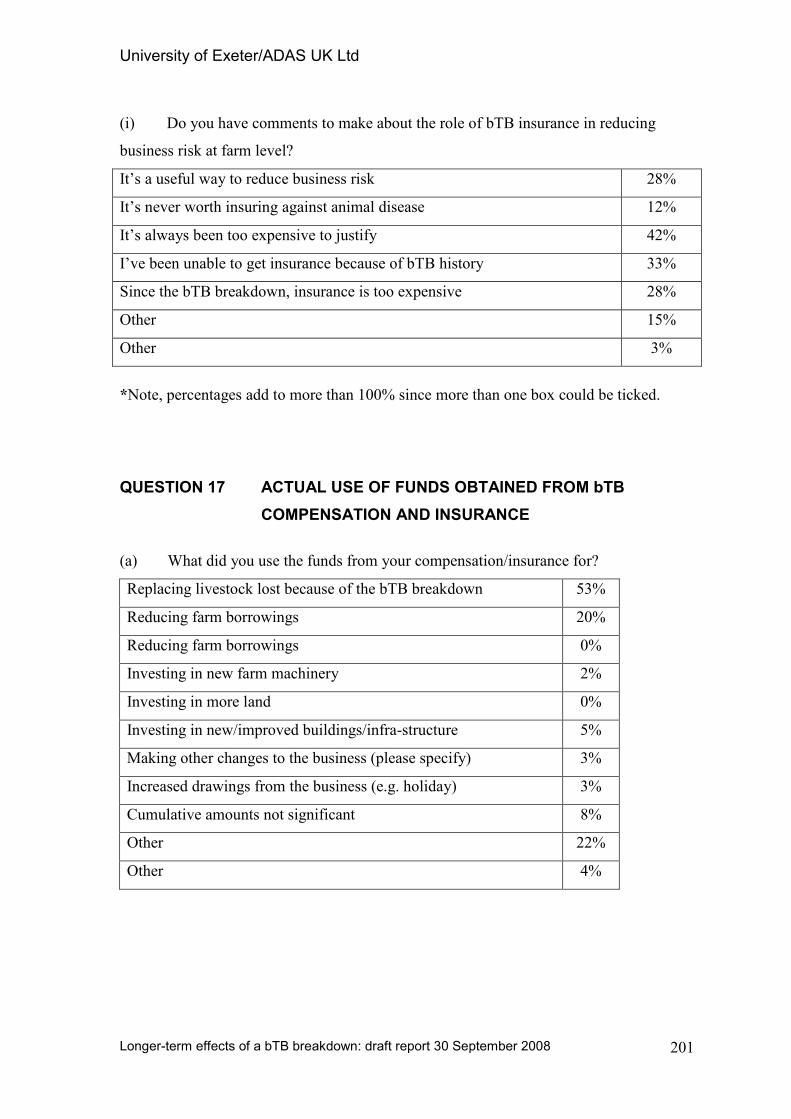
University of Exeter/ADAS UK Ltd
Longer-term effects of a bTB breakdown: draft report 30 September 2008
201
(i) Do you have comments to make about the role of bTB insurance in reducing
business risk at farm level?
It’s a useful way to reduce business risk 28%
It’s never worth insuring against animal disease 12%
It’s always been too expensive to justify 42%
I’ve been unable to get insurance because of bTB history 33%
Since the bTB breakdown, insurance is too expensive 28%
Other 15%
Other 3%
*Note, percentages add to more than 100% since more than one box could be ticked.
QUESTION 17 ACTUAL USE OF FUNDS OBTAINED FROM bTB
COMPENSATION AND INSURANCE
(a) What did you use the funds from your compensation/insurance for?
Replacing livestock lost because of the bTB breakdown 53%
Reducing farm borrowings 20%
Reducing farm borrowings 0%
Investing in new farm machinery 2%
Investing in more land 0%
Investing in new/improved buildings/infra-structure 5%
Making other changes to the business (please specify) 3%
Increased drawings from the business (e.g. holiday) 3%
Cumulative amounts not significant 8%
Other 22%
Other 4%
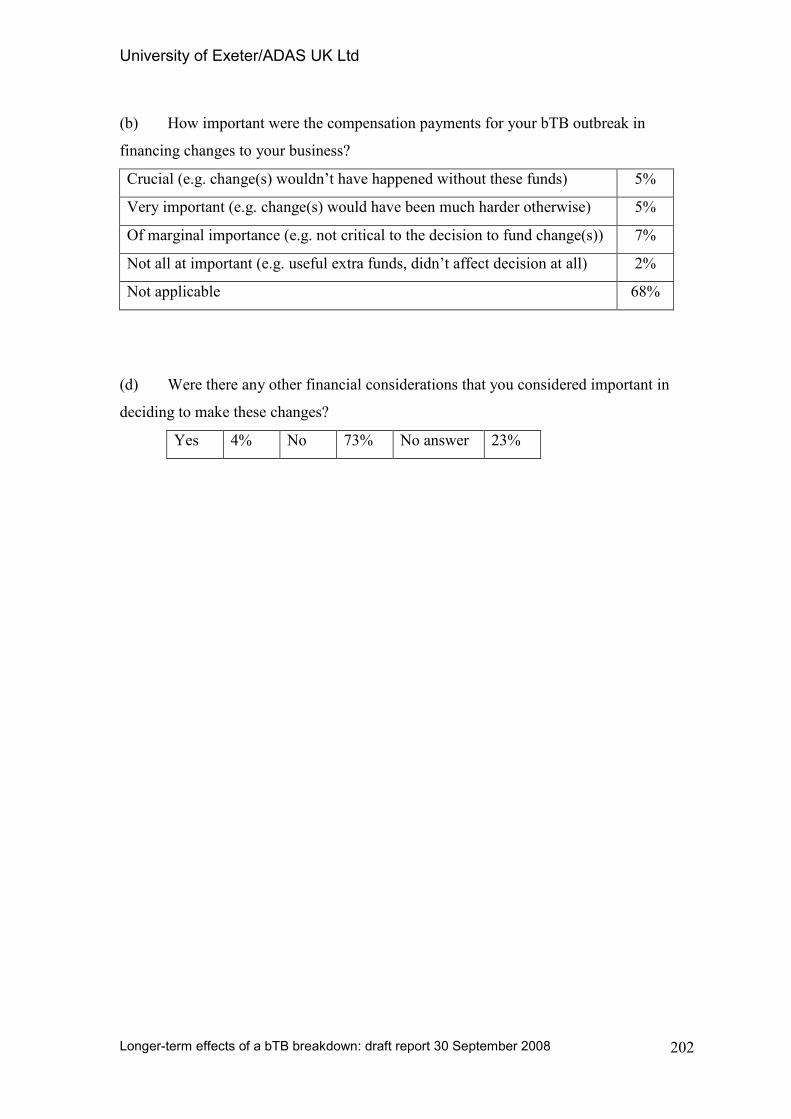
University of Exeter/ADAS UK Ltd
Longer-term effects of a bTB breakdown: draft report 30 September 2008
202
(b) How important were the compensation payments for your bTB outbreak in
financing changes to your business?
Crucial (e.g. change(s) wouldn’t have happened without these funds) 5%
Very important (e.g. change(s) would have been much harder otherwise) 5%
Of marginal importance (e.g. not critical to the decision to fund change(s)) 7%
Not all at important (e.g. useful extra funds, didn’t affect decision at all) 2%
Not applicable 68%
(d) Were there any other financial considerations that you considered important in
deciding to make these changes?
Yes 4% No 73% No answer 23%
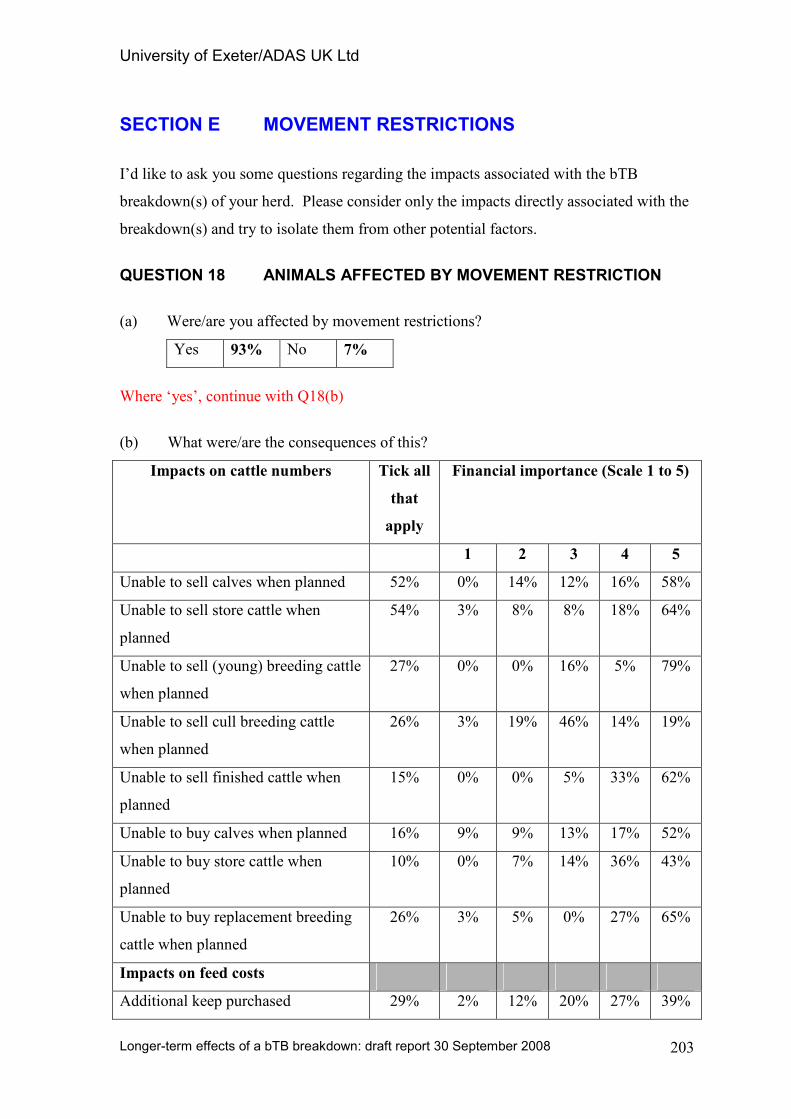
University of Exeter/ADAS UK Ltd
Longer-term effects of a bTB breakdown: draft report 30 September 2008
203
SECTION E MOVEMENT RESTRICTIONS
I’d like to ask you some questions regarding the impacts associated with the bTB
breakdown(s) of your herd. Please consider only the impacts directly associated with the
breakdown(s) and try to isolate them from other potential factors.
QUESTION 18 ANIMALS AFFECTED BY MOVEMENT RESTRICTION
(a) Were/are you affected by movement restrictions?
Yes 93% No 7%
Where ‘yes’, continue with Q18(b)
(b) What were/are the consequences of this?
Impacts on cattle numbers Tick all
that
apply
Financial importance (Scale 1 to 5)
1 2 3 4 5
Unable to sell calves when planned 52% 0% 14% 12% 16% 58%
Unable to sell store cattle when
planned
54% 3% 8% 8% 18% 64%
Unable to sell (young) breeding cattle
when planned
27% 0% 0% 16% 5% 79%
Unable to sell cull breeding cattle
when planned
26% 3% 19% 46% 14% 19%
Unable to sell finished cattle when
planned
15% 0% 0% 5% 33% 62%
Unable to buy calves when planned 16% 9% 9% 13% 17% 52%
Unable to buy store cattle when
planned
10% 0% 7% 14% 36% 43%
Unable to buy replacement breeding
cattle when planned
26% 3% 5% 0% 27% 65%
Impacts on feed costs
Additional keep purchased 29% 2% 12% 20% 27% 39%
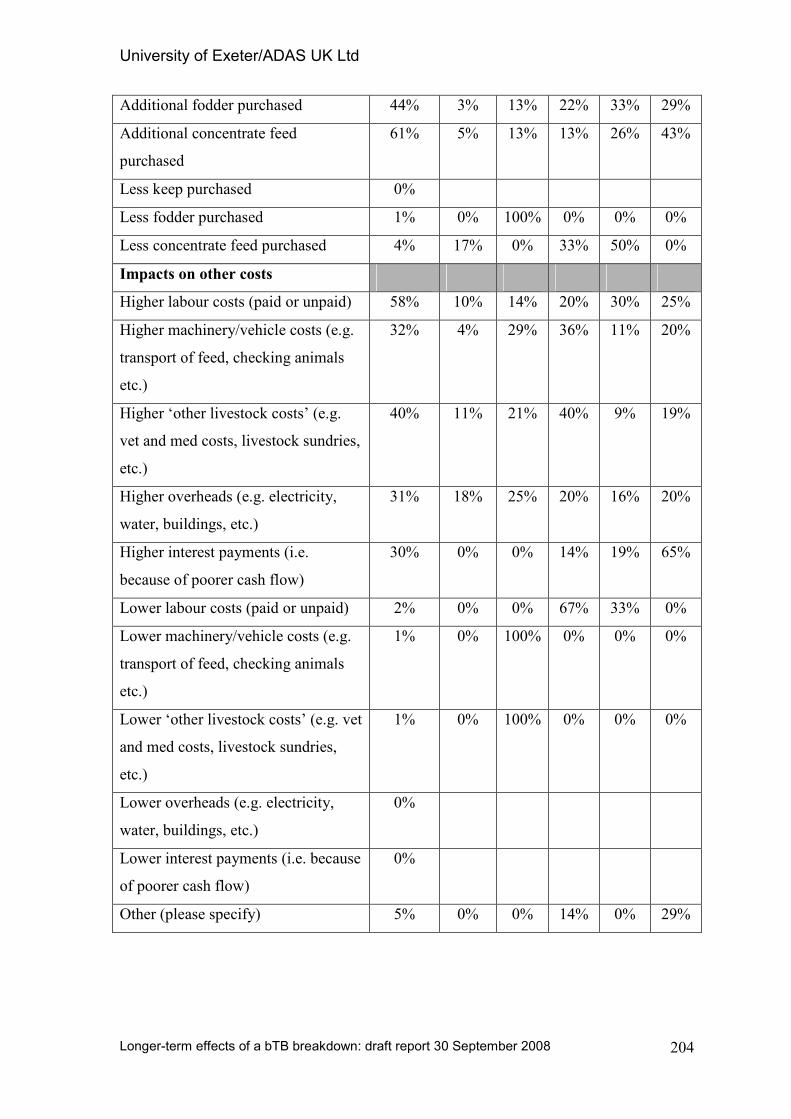
University of Exeter/ADAS UK Ltd
Longer-term effects of a bTB breakdown: draft report 30 September 2008
204
Additional fodder purchased 44% 3% 13% 22% 33% 29%
Additional concentrate feed
purchased
61% 5% 13% 13% 26% 43%
Less keep purchased 0%
Less fodder purchased 1% 0% 100% 0% 0% 0%
Less concentrate feed purchased 4% 17% 0% 33% 50% 0%
Impacts on other costs
Higher labour costs (paid or unpaid) 58% 10% 14% 20% 30% 25%
Higher machinery/vehicle costs (e.g.
transport of feed, checking animals
etc.)
32% 4% 29% 36% 11% 20%
Higher ‘other livestock costs’ (e.g.
vet and med costs, livestock sundries,
etc.)
40% 11% 21% 40% 9% 19%
Higher overheads (e.g. electricity,
water, buildings, etc.)
31% 18% 25% 20% 16% 20%
Higher interest payments (i.e.
because of poorer cash flow)
30% 0% 0% 14% 19% 65%
Lower labour costs (paid or unpaid) 2% 0% 0% 67% 33% 0%
Lower machinery/vehicle costs (e.g.
transport of feed, checking animals
etc.)
1% 0% 100% 0% 0% 0%
Lower ‘other livestock costs’ (e.g. vet
and med costs, livestock sundries,
etc.)
1% 0% 100% 0% 0% 0%
Lower overheads (e.g. electricity,
water, buildings, etc.)
0%
Lower interest payments (i.e. because
of poorer cash flow)
0%
Other (please specify) 5% 0% 0% 14% 0% 29%
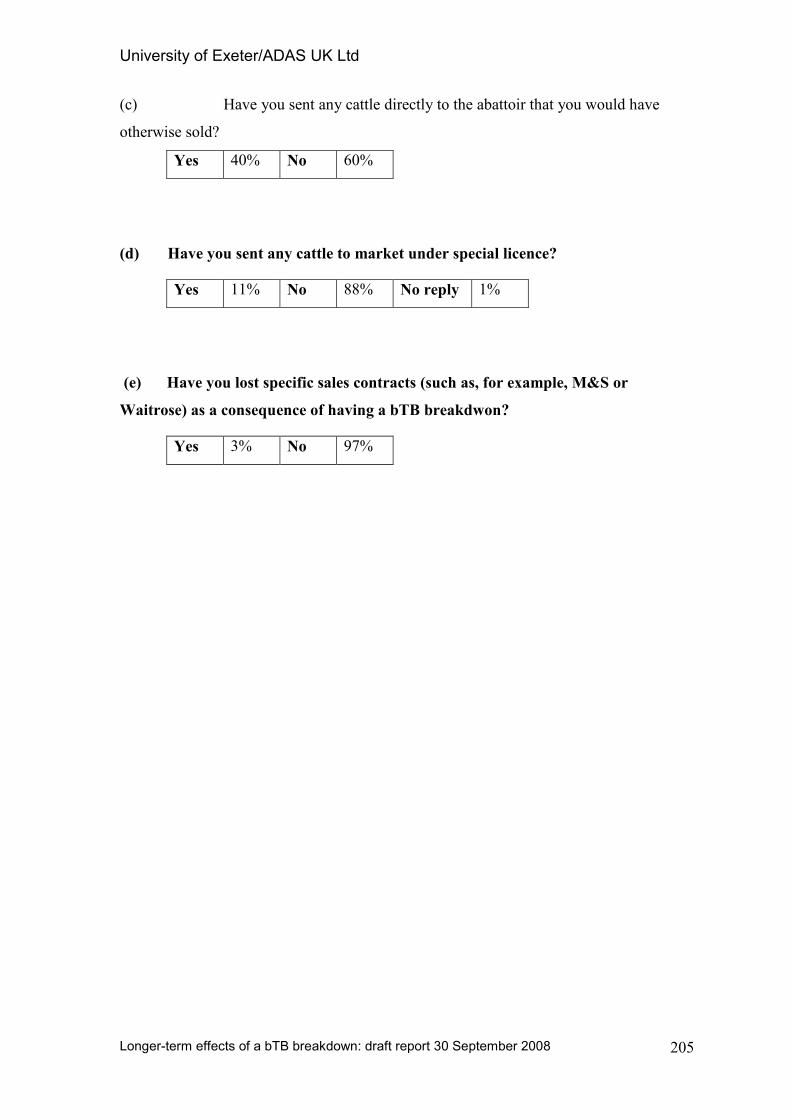
University of Exeter/ADAS UK Ltd
Longer-term effects of a bTB breakdown: draft report 30 September 2008
205
(c) Have you sent any cattle directly to the abattoir that you would have
otherwise sold?
Yes 40% No 60%
(d) Have you sent any cattle to market under special licence?
Yes 11% No 88% No reply 1%
(e) Have you lost specific sales contracts (such as, for example, M&S or
Waitrose) as a consequence of having a bTB breakdwon?
Yes 3% No 97%
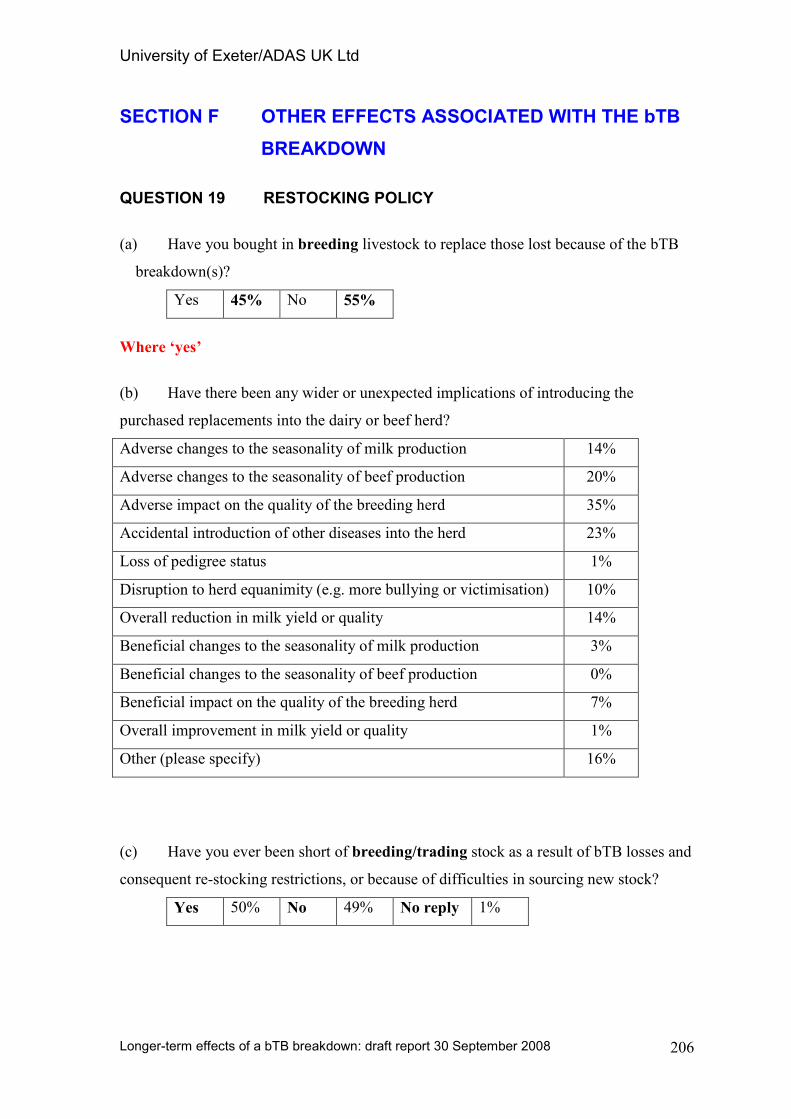
University of Exeter/ADAS UK Ltd
Longer-term effects of a bTB breakdown: draft report 30 September 2008
206
SECTION F OTHER EFFECTS ASSOCIATED WITH THE bTB
BREAKDOWN
QUESTION 19 RESTOCKING POLICY
(a) Have you bought in breeding livestock to replace those lost because of the bTB
breakdown(s)?
Yes 45% No 55%
Where ‘yes’
(b) Have there been any wider or unexpected implications of introducing the
purchased replacements into the dairy or beef herd?
Adverse changes to the seasonality of milk production 14%
Adverse changes to the seasonality of beef production 20%
Adverse impact on the quality of the breeding herd 35%
Accidental introduction of other diseases into the herd 23%
Loss of pedigree status 1%
Disruption to herd equanimity (e.g. more bullying or victimisation) 10%
Overall reduction in milk yield or quality 14%
Beneficial changes to the seasonality of milk production 3%
Beneficial changes to the seasonality of beef production 0%
Beneficial impact on the quality of the breeding herd 7%
Overall improvement in milk yield or quality 1%
Other (please specify) 16%
(c) Have you ever been short of breeding/trading stock as a result of bTB losses and
consequent re-stocking restrictions, or because of difficulties in sourcing new stock?
Yes 50% No 49% No reply 1%
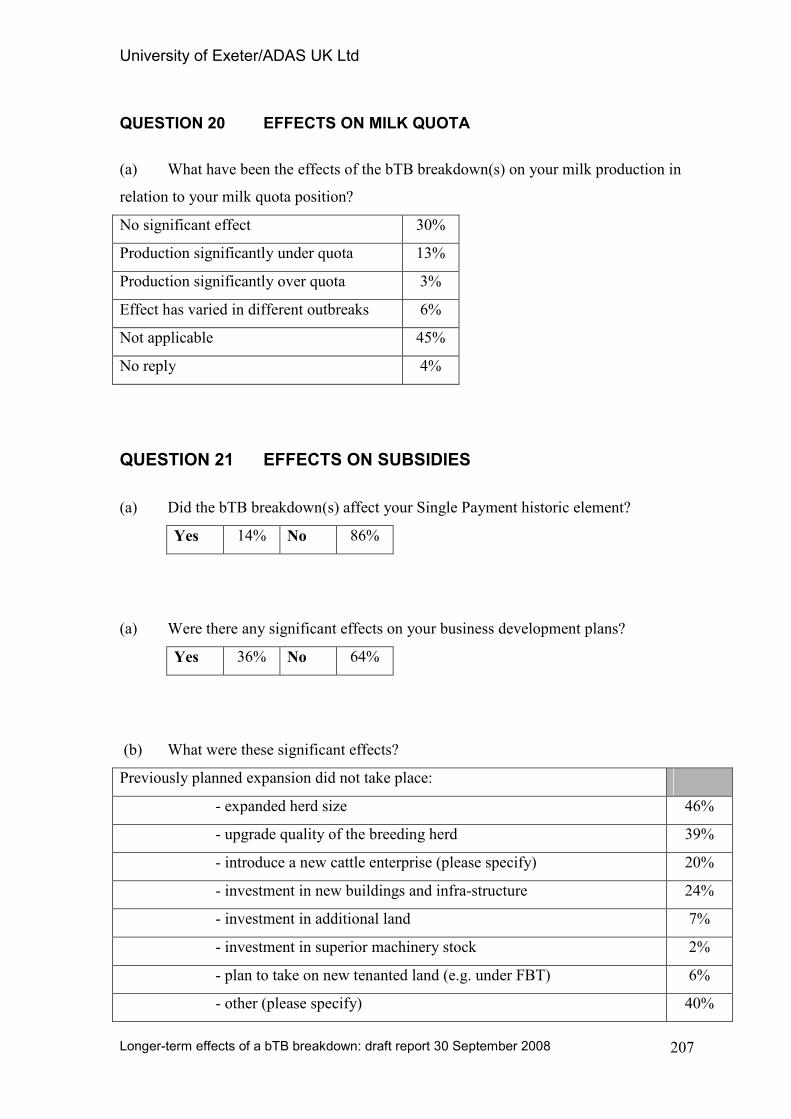
University of Exeter/ADAS UK Ltd
Longer-term effects of a bTB breakdown: draft report 30 September 2008
207
QUESTION 20 EFFECTS ON MILK QUOTA
(a) What have been the effects of the bTB breakdown(s) on your milk production in
relation to your milk quota position?
No significant effect 30%
Production significantly under quota 13%
Production significantly over quota 3%
Effect has varied in different outbreaks 6%
Not applicable 45%
No reply 4%
QUESTION 21 EFFECTS ON SUBSIDIES
(a) Did the bTB breakdown(s) affect your Single Payment historic element?
Yes 14% No 86%
(a) Were there any significant effects on your business development plans?
Yes 36% No 64%
(b) What were these significant effects?
Previously planned expansion did not take place:
- expanded herd size 46%
- upgrade quality of the breeding herd 39%
- introduce a new cattle enterprise (please specify) 20%
- investment in new buildings and infra-structure 24%
- investment in additional land 7%
- investment in superior machinery stock 2%
- plan to take on new tenanted land (e.g. under FBT) 6%
- other (please specify) 40%
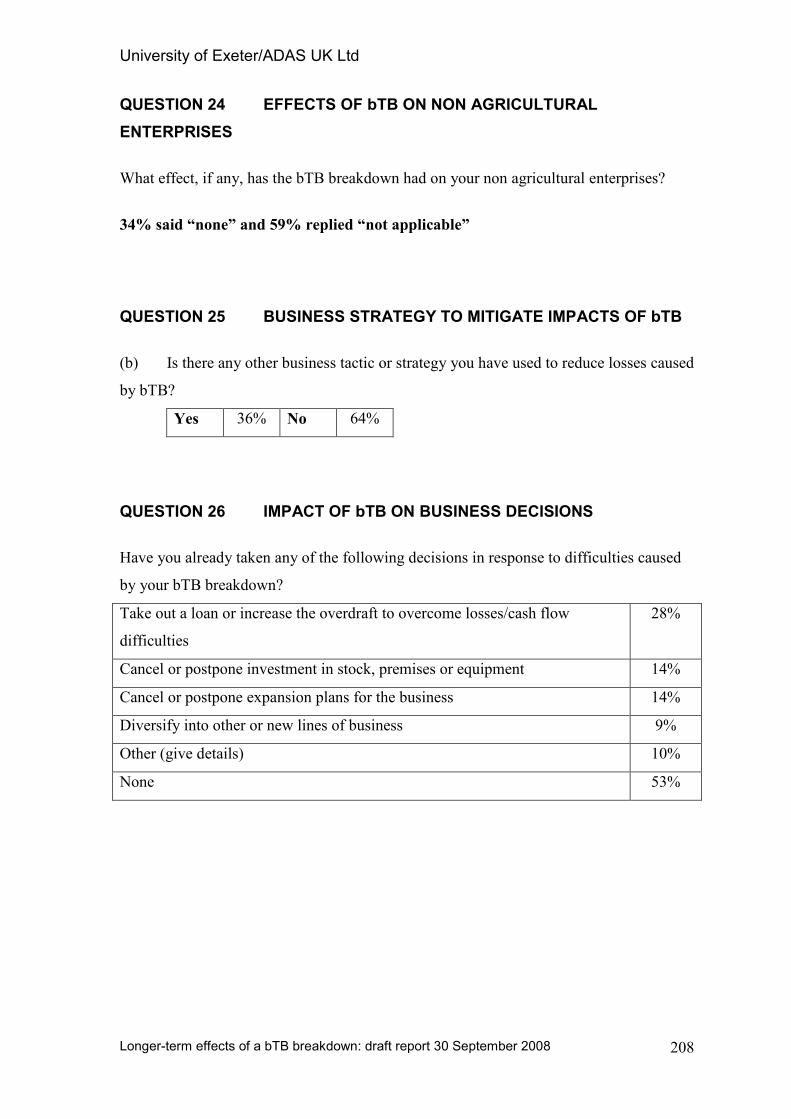
University of Exeter/ADAS UK Ltd
Longer-term effects of a bTB breakdown: draft report 30 September 2008
208
QUESTION 24 EFFECTS OF bTB ON NON AGRICULTURAL
ENTERPRISES
What effect, if any, has the bTB breakdown had on your non agricultural enterprises?
34% said “none” and 59% replied “not applicable”
QUESTION 25 BUSINESS STRATEGY TO MITIGATE IMPACTS OF bTB
(b) Is there any other business tactic or strategy you have used to reduce losses caused
by bTB?
Yes 36% No 64%
QUESTION 26 IMPACT OF bTB ON BUSINESS DECISIONS
Have you already taken any of the following decisions in response to difficulties caused
by your bTB breakdown?
Take out a loan or increase the overdraft to overcome losses/cash flow
difficulties
28%
Cancel or postpone investment in stock, premises or equipment 14%
Cancel or postpone expansion plans for the business 14%
Diversify into other or new lines of business 9%
Other (give details) 10%
None 53%
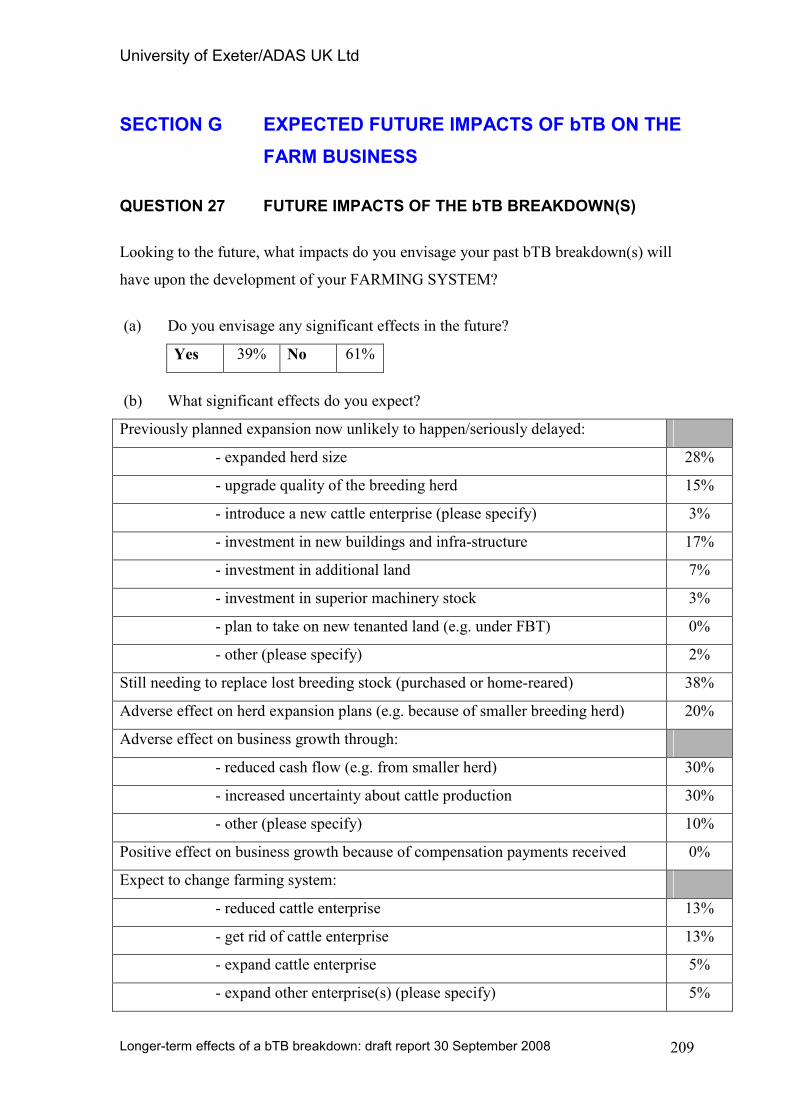
University of Exeter/ADAS UK Ltd
Longer-term effects of a bTB breakdown: draft report 30 September 2008
209
SECTION G EXPECTED FUTURE IMPACTS OF bTB ON THE
FARM BUSINESS
QUESTION 27 FUTURE IMPACTS OF THE bTB BREAKDOWN(S)
Looking to the future, what impacts do you envisage your past bTB breakdown(s) will
have upon the development of your FARMING SYSTEM?
(a) Do you envisage any significant effects in the future?
Yes 39% No 61%
(b) What significant effects do you expect?
Previously planned expansion now unlikely to happen/seriously delayed:
- expanded herd size 28%
- upgrade quality of the breeding herd 15%
- introduce a new cattle enterprise (please specify) 3%
- investment in new buildings and infra-structure 17%
- investment in additional land 7%
- investment in superior machinery stock 3%
- plan to take on new tenanted land (e.g. under FBT) 0%
- other (please specify) 2%
Still needing to replace lost breeding stock (purchased or home-reared) 38%
Adverse effect on herd expansion plans (e.g. because of smaller breeding herd) 20%
Adverse effect on business growth through:
- reduced cash flow (e.g. from smaller herd) 30%
- increased uncertainty about cattle production 30%
- other (please specify) 10%
Positive effect on business growth because of compensation payments received 0%
Expect to change farming system:
- reduced cattle enterprise 13%
- get rid of cattle enterprise 13%
- expand cattle enterprise 5%
- expand other enterprise(s) (please specify) 5%
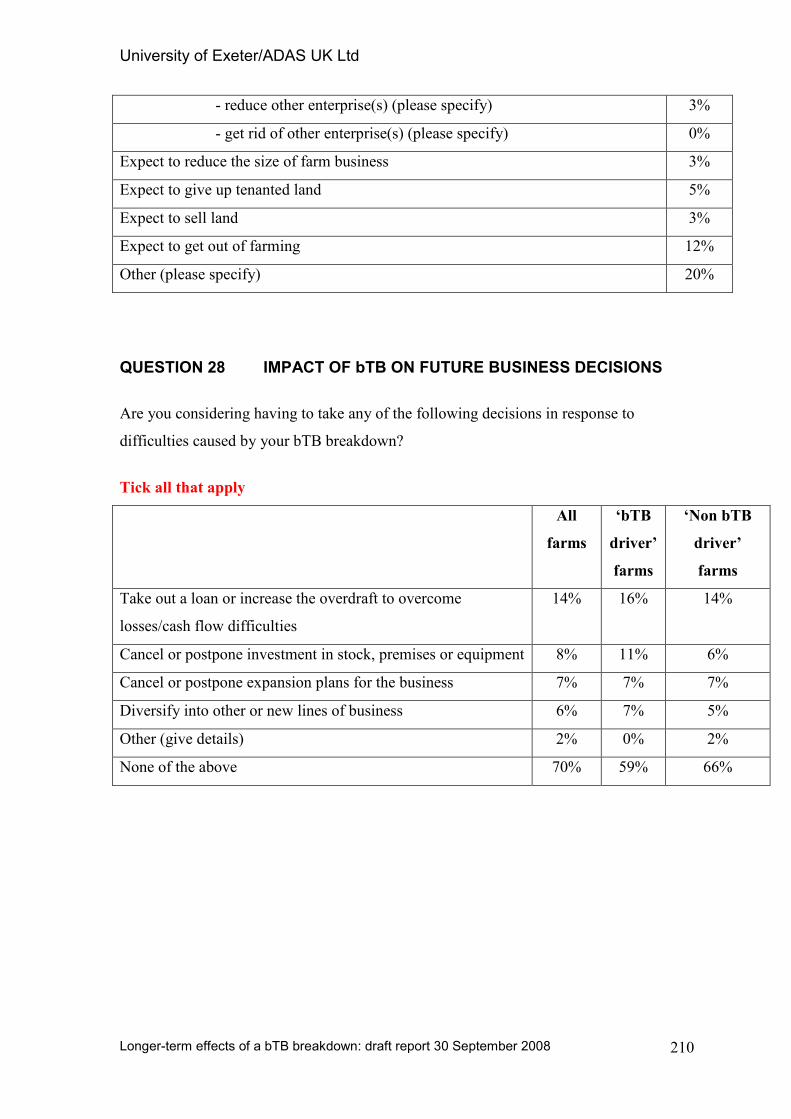
University of Exeter/ADAS UK Ltd
Longer-term effects of a bTB breakdown: draft report 30 September 2008
210
- reduce other enterprise(s) (please specify) 3%
- get rid of other enterprise(s) (please specify) 0%
Expect to reduce the size of farm business 3%
Expect to give up tenanted land 5%
Expect to sell land 3%
Expect to get out of farming 12%
Other (please specify) 20%
QUESTION 28 IMPACT OF bTB ON FUTURE BUSINESS DECISIONS
Are you considering having to take any of the following decisions in response to
difficulties caused by your bTB breakdown?
Tick all that apply
All
farms
‘bTB
driver’
farms
‘Non bTB
driver’
farms
Take out a loan or increase the overdraft to overcome
losses/cash flow difficulties
14% 16% 14%
Cancel or postpone investment in stock, premises or equipment 8% 11% 6%
Cancel or postpone expansion plans for the business 7% 7% 7%
Diversify into other or new lines of business 6% 7% 5%
Other (give details) 2% 0% 2%
None of the above 70% 59% 66%
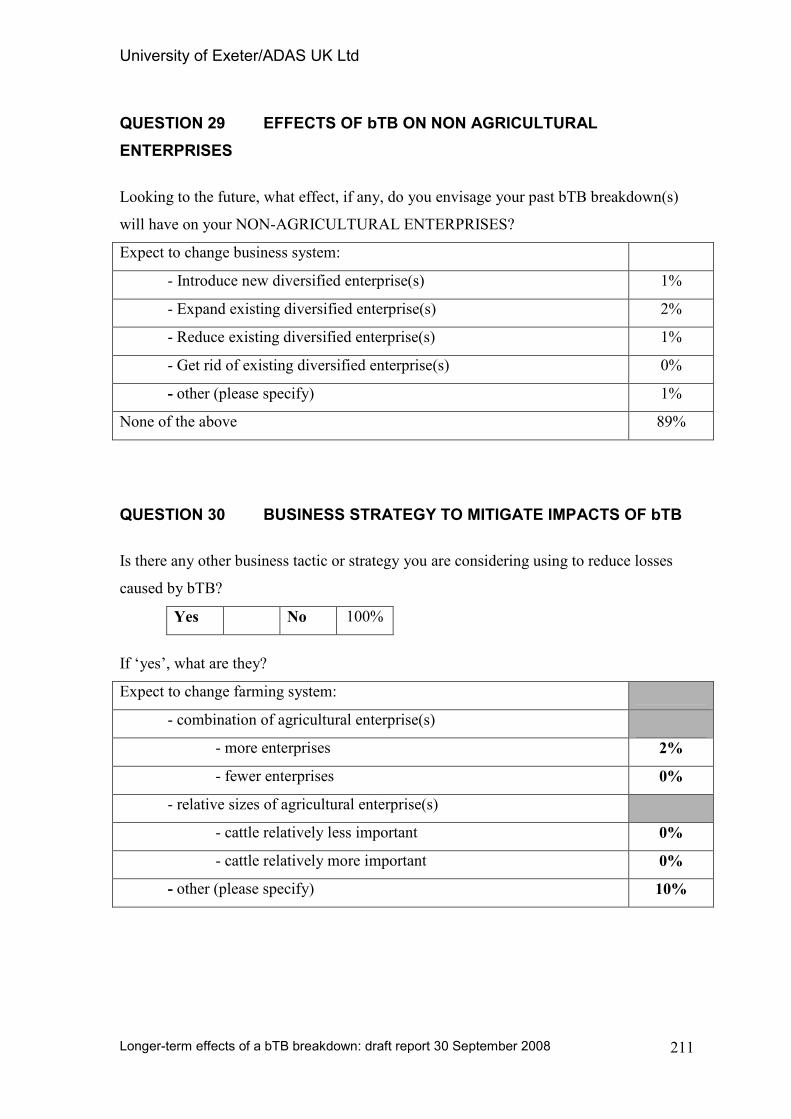
University of Exeter/ADAS UK Ltd
Longer-term effects of a bTB breakdown: draft report 30 September 2008
211
QUESTION 29 EFFECTS OF bTB ON NON AGRICULTURAL
ENTERPRISES
Looking to the future, what effect, if any, do you envisage your past bTB breakdown(s)
will have on your NON-AGRICULTURAL ENTERPRISES?
Expect to change business system:
- Introduce new diversified enterprise(s) 1%
- Expand existing diversified enterprise(s) 2%
- Reduce existing diversified enterprise(s) 1%
- Get rid of existing diversified enterprise(s) 0%
- other (please specify) 1%
None of the above 89%
QUESTION 30 BUSINESS STRATEGY TO MITIGATE IMPACTS OF bTB
Is there any other business tactic or strategy you are considering using to reduce losses
caused by bTB?
Yes No 100%
If ‘yes’, what are they?
Expect to change farming system:
- combination of agricultural enterprise(s)
- more enterprises 2%
- fewer enterprises 0%
- relative sizes of agricultural enterprise(s)
- cattle relatively less important 0%
- cattle relatively more important 0%
- other (please specify) 10%
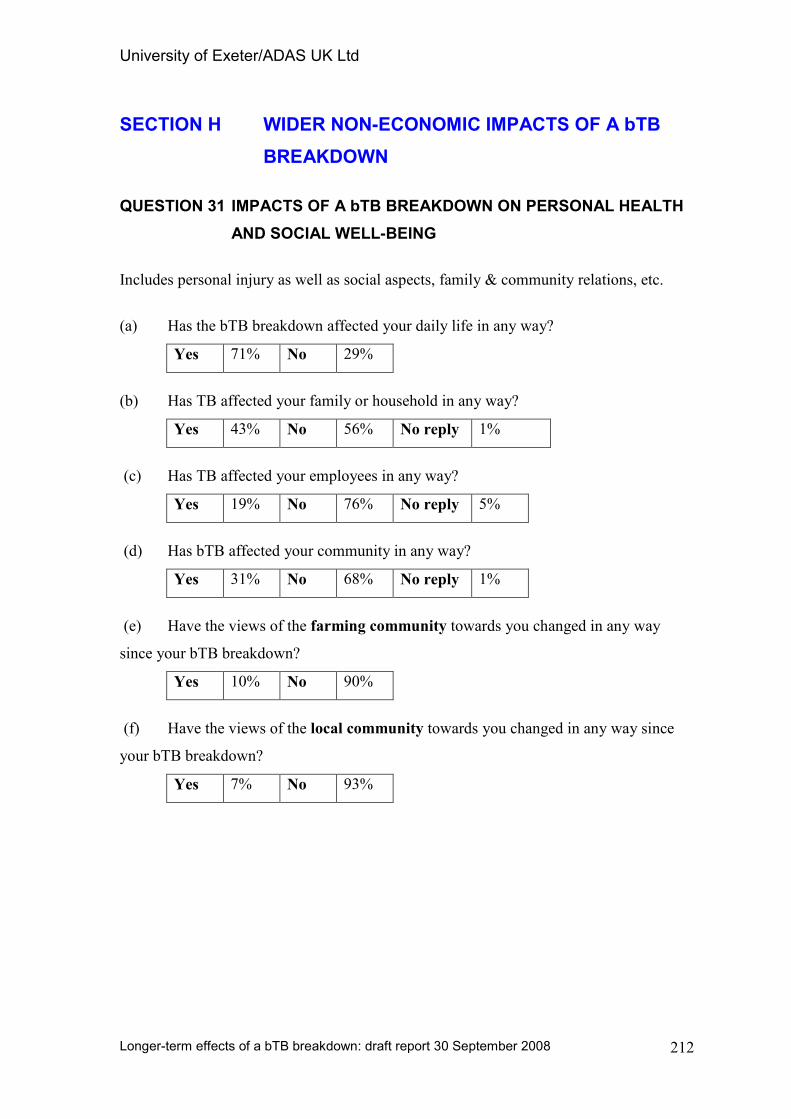
University of Exeter/ADAS UK Ltd
Longer-term effects of a bTB breakdown: draft report 30 September 2008
212
SECTION H WIDER NON-ECONOMIC IMPACTS OF A bTB
BREAKDOWN
QUESTION 31 IMPACTS OF A bTB BREAKDOWN ON PERSONAL HEALTH
AND SOCIAL WELL-BEING
Includes personal injury as well as social aspects, family & community relations, etc.
(a) Has the bTB breakdown affected your daily life in any way?
Yes 71% No 29%
(b) Has TB affected your family or household in any way?
Yes 43% No 56% No reply 1%
(c) Has TB affected your employees in any way?
Yes 19% No 76% No reply 5%
(d) Has bTB affected your community in any way?
Yes 31% No 68% No reply 1%
(e) Have the views of the farming community towards you changed in any way
since your bTB breakdown?
Yes 10% No 90%
(f) Have the views of the local community towards you changed in any way since
your bTB breakdown?
Yes 7% No 93%
University of Exeter/ADAS UK Ltd
Longer-term effects of a bTB breakdown: draft report 30 September 2008
213
Appendix C Desk study using FBS data: summary results Table C1 FBS study: Dairy farms income indicators, 2002/03 to 2006/07
Table C2 FBS study: Dairy farms investment indicators, 2002/03 to 2006/07
Table C3 FBS study: Dairy farms liabilities and assets indicators, 2002/03 to 2006/07
Table C4 FBS study: Dairy farms technical indicators, 2002/03 to 2006/07
Table C5 FBS study: Suckler beef farms income indicators, 2002/03 to 2006/07
Table C6 FBS study: Suckler beef farms investment indicators, 2002/03 to 2006/07
Table C7 FBS study: Suckler beef farms liabilities and assets indicators, 2002/03 to 2006/07
Table C8 FBS study: Suckler beef farms technical indicators, 2002/03 to 2006/07
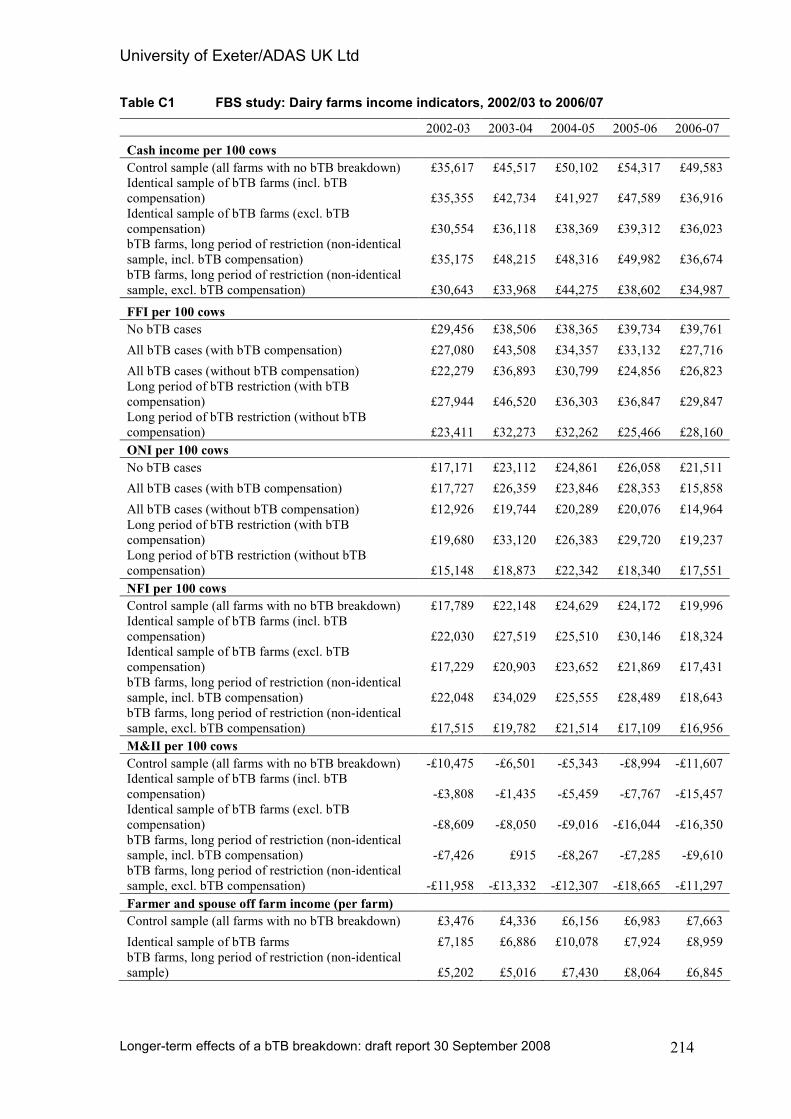
University of Exeter/ADAS UK Ltd
Longer-term effects of a bTB breakdown: draft report 30 September 2008
214
Table C1 FBS study: Dairy farms income indicators, 2002/03 to 2006/07
2002-03 2003-04 2004-05 2005-06 2006-07
Cash income per 100 cows
Control sample (all farms with no bTB breakdown) £35,617 £45,517 £50,102 £54,317 £49,583
Identical sample of bTB farms (incl. bTB
compensation) £35,355 £42,734 £41,927 £47,589 £36,916
Identical sample of bTB farms (excl. bTB
compensation) £30,554 £36,118 £38,369 £39,312 £36,023
bTB farms, long period of restriction (non-identical
sample, incl. bTB compensation) £35,175 £48,215 £48,316 £49,982 £36,674
bTB farms, long period of restriction (non-identical
sample, excl. bTB compensation) £30,643 £33,968 £44,275 £38,602 £34,987
FFI per 100 cows
No bTB cases £29,456 £38,506 £38,365 £39,734 £39,761
All bTB cases (with bTB compensation) £27,080 £43,508 £34,357 £33,132 £27,716
All bTB cases (without bTB compensation) £22,279 £36,893 £30,799 £24,856 £26,823
Long period of bTB restriction (with bTB
compensation) £27,944 £46,520 £36,303 £36,847 £29,847
Long period of bTB restriction (without bTB
compensation) £23,411 £32,273 £32,262 £25,466 £28,160
ONI per 100 cows
No bTB cases £17,171 £23,112 £24,861 £26,058 £21,511
All bTB cases (with bTB compensation) £17,727 £26,359 £23,846 £28,353 £15,858
All bTB cases (without bTB compensation) £12,926 £19,744 £20,289 £20,076 £14,964
Long period of bTB restriction (with bTB
compensation) £19,680 £33,120 £26,383 £29,720 £19,237
Long period of bTB restriction (without bTB
compensation) £15,148 £18,873 £22,342 £18,340 £17,551
NFI per 100 cows
Control sample (all farms with no bTB breakdown) £17,789 £22,148 £24,629 £24,172 £19,996
Identical sample of bTB farms (incl. bTB
compensation) £22,030 £27,519 £25,510 £30,146 £18,324
Identical sample of bTB farms (excl. bTB
compensation) £17,229 £20,903 £23,652 £21,869 £17,431
bTB farms, long period of restriction (non-identical
sample, incl. bTB compensation) £22,048 £34,029 £25,555 £28,489 £18,643
bTB farms, long period of restriction (non-identical
sample, excl. bTB compensation) £17,515 £19,782 £21,514 £17,109 £16,956
M&II per 100 cows
Control sample (all farms with no bTB breakdown) -£10,475 -£6,501 -£5,343 -£8,994 -£11,607
Identical sample of bTB farms (incl. bTB
compensation) -£3,808 -£1,435 -£5,459 -£7,767 -£15,457
Identical sample of bTB farms (excl. bTB
compensation) -£8,609 -£8,050 -£9,016 -£16,044 -£16,350
bTB farms, long period of restriction (non-identical
sample, incl. bTB compensation) -£7,426 £915 -£8,267 -£7,285 -£9,610
bTB farms, long period of restriction (non-identical
sample, excl. bTB compensation) -£11,958 -£13,332 -£12,307 -£18,665 -£11,297
Farmer and spouse off farm income (per farm)
Control sample (all farms with no bTB breakdown) £3,476 £4,336 £6,156 £6,983 £7,663
Identical sample of bTB farms £7,185 £6,886 £10,078 £7,924 £8,959
bTB farms, long period of restriction (non-identical
sample) £5,202 £5,016 £7,430 £8,064 £6,845
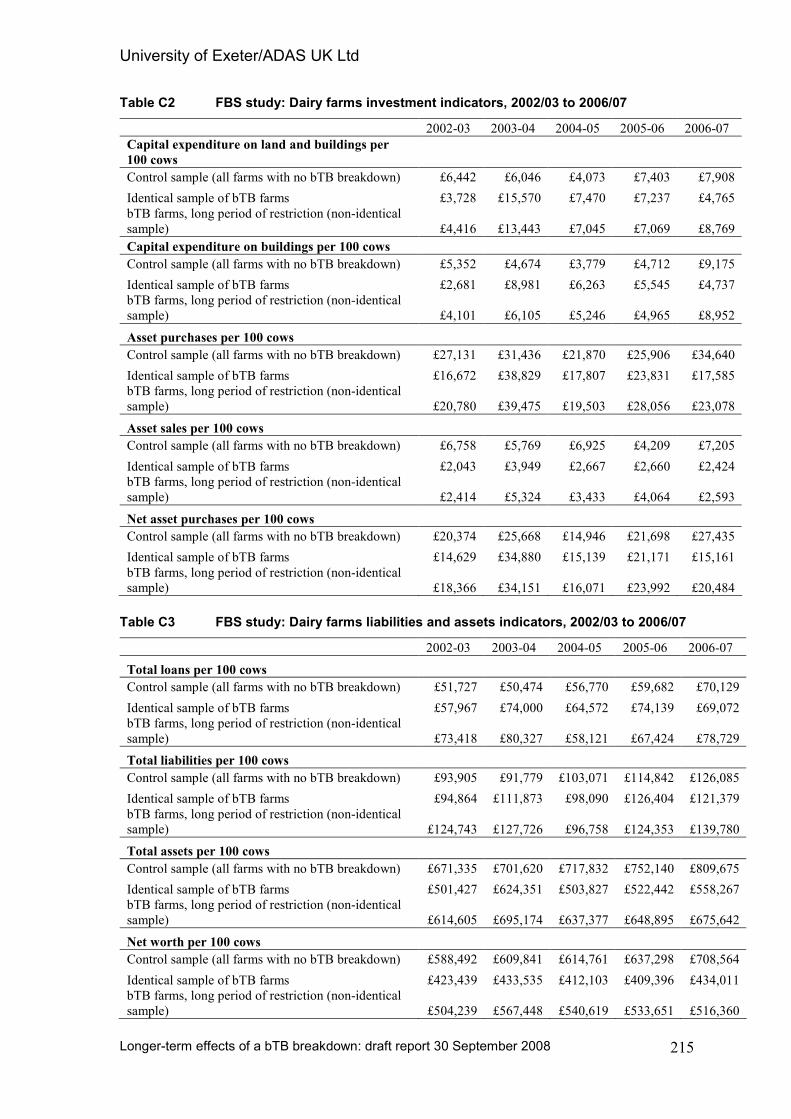
University of Exeter/ADAS UK Ltd
Longer-term effects of a bTB breakdown: draft report 30 September 2008
215
Table C2 FBS study: Dairy farms investment indicators, 2002/03 to 2006/07
2002-03 2003-04 2004-05 2005-06 2006-07
Capital expenditure on land and buildings per
100 cows
Control sample (all farms with no bTB breakdown) £6,442 £6,046 £4,073 £7,403 £7,908
Identical sample of bTB farms £3,728 £15,570 £7,470 £7,237 £4,765
bTB farms, long period of restriction (non-identical
sample) £4,416 £13,443 £7,045 £7,069 £8,769
Capital expenditure on buildings per 100 cows
Control sample (all farms with no bTB breakdown) £5,352 £4,674 £3,779 £4,712 £9,175
Identical sample of bTB farms £2,681 £8,981 £6,263 £5,545 £4,737
bTB farms, long period of restriction (non-identical
sample) £4,101 £6,105 £5,246 £4,965 £8,952
Asset purchases per 100 cows
Control sample (all farms with no bTB breakdown) £27,131 £31,436 £21,870 £25,906 £34,640
Identical sample of bTB farms £16,672 £38,829 £17,807 £23,831 £17,585
bTB farms, long period of restriction (non-identical
sample) £20,780 £39,475 £19,503 £28,056 £23,078
Asset sales per 100 cows
Control sample (all farms with no bTB breakdown) £6,758 £5,769 £6,925 £4,209 £7,205
Identical sample of bTB farms £2,043 £3,949 £2,667 £2,660 £2,424
bTB farms, long period of restriction (non-identical
sample) £2,414 £5,324 £3,433 £4,064 £2,593
Net asset purchases per 100 cows
Control sample (all farms with no bTB breakdown) £20,374 £25,668 £14,946 £21,698 £27,435
Identical sample of bTB farms £14,629 £34,880 £15,139 £21,171 £15,161
bTB farms, long period of restriction (non-identical
sample) £18,366 £34,151 £16,071 £23,992 £20,484
Table C3 FBS study: Dairy farms liabilities and assets indicators, 2002/03 to 2006/07
2002-03 2003-04 2004-05 2005-06 2006-07
Total loans per 100 cows
Control sample (all farms with no bTB breakdown) £51,727 £50,474 £56,770 £59,682 £70,129
Identical sample of bTB farms £57,967 £74,000 £64,572 £74,139 £69,072
bTB farms, long period of restriction (non-identical
sample) £73,418 £80,327 £58,121 £67,424 £78,729
Total liabilities per 100 cows
Control sample (all farms with no bTB breakdown) £93,905 £91,779 £103,071 £114,842 £126,085
Identical sample of bTB farms £94,864 £111,873 £98,090 £126,404 £121,379
bTB farms, long period of restriction (non-identical
sample) £124,743 £127,726 £96,758 £124,353 £139,780
Total assets per 100 cows
Control sample (all farms with no bTB breakdown) £671,335 £701,620 £717,832 £752,140 £809,675
Identical sample of bTB farms £501,427 £624,351 £503,827 £522,442 £558,267
bTB farms, long period of restriction (non-identical
sample) £614,605 £695,174 £637,377 £648,895 £675,642
Net worth per 100 cows
Control sample (all farms with no bTB breakdown) £588,492 £609,841 £614,761 £637,298 £708,564
Identical sample of bTB farms £423,439 £433,535 £412,103 £409,396 £434,011
bTB farms, long period of restriction (non-identical
sample) £504,239 £567,448 £540,619 £533,651 £516,360
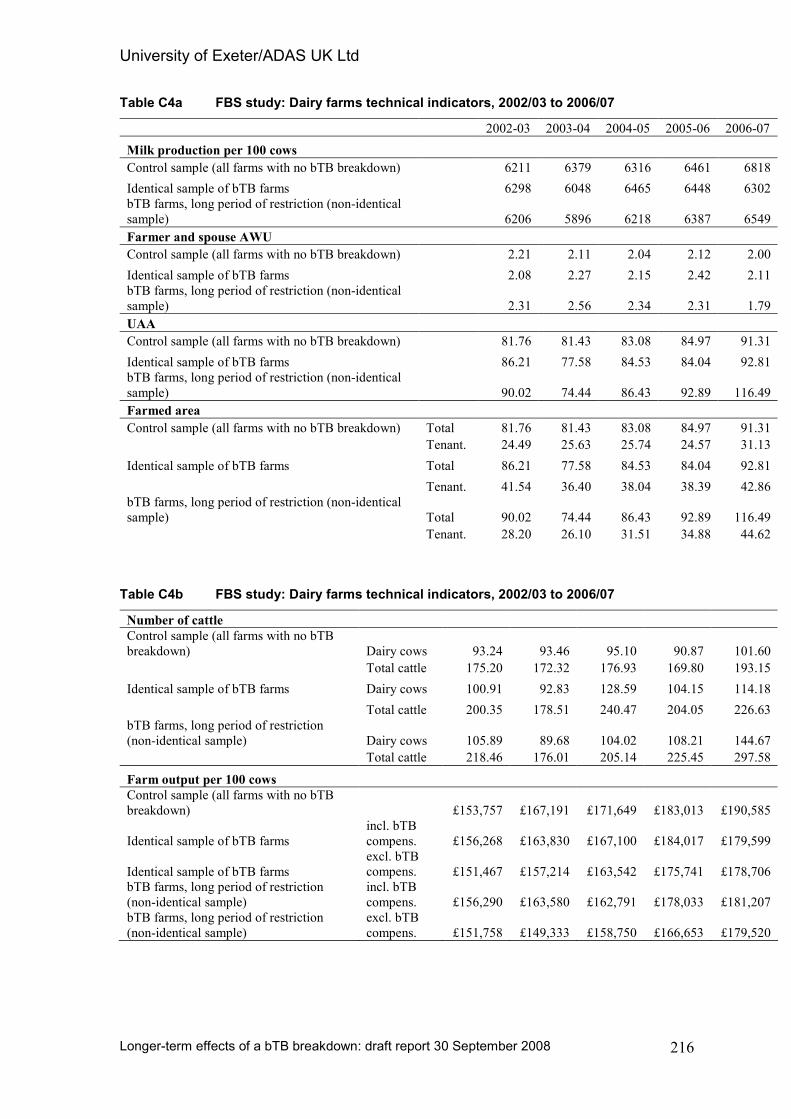
University of Exeter/ADAS UK Ltd
Longer-term effects of a bTB breakdown: draft report 30 September 2008
216
Table C4a FBS study: Dairy farms technical indicators, 2002/03 to 2006/07
2002-03 2003-04 2004-05 2005-06 2006-07
Milk production per 100 cows
Control sample (all farms with no bTB breakdown) 6211 6379 6316 6461 6818
Identical sample of bTB farms 6298 6048 6465 6448 6302
bTB farms, long period of restriction (non-identical
sample) 6206 5896 6218 6387 6549
Farmer and spouse AWU
Control sample (all farms with no bTB breakdown) 2.21 2.11 2.04 2.12 2.00
Identical sample of bTB farms 2.08 2.27 2.15 2.42 2.11
bTB farms, long period of restriction (non-identical
sample) 2.31 2.56 2.34 2.31 1.79
UAA
Control sample (all farms with no bTB breakdown) 81.76 81.43 83.08 84.97 91.31
Identical sample of bTB farms 86.21 77.58 84.53 84.04 92.81
bTB farms, long period of restriction (non-identical
sample) 90.02 74.44 86.43 92.89 116.49
Farmed area
Control sample (all farms with no bTB breakdown) Total 81.76 81.43 83.08 84.97 91.31
Tenant. 24.49 25.63 25.74 24.57 31.13
Identical sample of bTB farms Total 86.21 77.58 84.53 84.04 92.81
Tenant. 41.54 36.40 38.04 38.39 42.86
bTB farms, long period of restriction (non-identical
sample) Total 90.02 74.44 86.43 92.89 116.49
Tenant. 28.20 26.10 31.51 34.88 44.62
Table C4b FBS study: Dairy farms technical indicators, 2002/03 to 2006/07
Number of cattle
Control sample (all farms with no bTB
breakdown) Dairy cows 93.24 93.46 95.10 90.87 101.60
Total cattle 175.20 172.32 176.93 169.80 193.15
Identical sample of bTB farms Dairy cows 100.91 92.83 128.59 104.15 114.18
Total cattle 200.35 178.51 240.47 204.05 226.63
bTB farms, long period of restriction
(non-identical sample) Dairy cows 105.89 89.68 104.02 108.21 144.67
Total cattle 218.46 176.01 205.14 225.45 297.58
Farm output per 100 cows
Control sample (all farms with no bTB
breakdown) £153,757 £167,191 £171,649 £183,013 £190,585
Identical sample of bTB farms
incl. bTB
compens. £156,268 £163,830 £167,100 £184,017 £179,599
Identical sample of bTB farms
excl. bTB
compens. £151,467 £157,214 £163,542 £175,741 £178,706
bTB farms, long period of restriction
(non-identical sample)
incl. bTB
compens. £156,290 £163,580 £162,791 £178,033 £181,207
bTB farms, long period of restriction
(non-identical sample)
excl. bTB
compens. £151,758 £149,333 £158,750 £166,653 £179,520
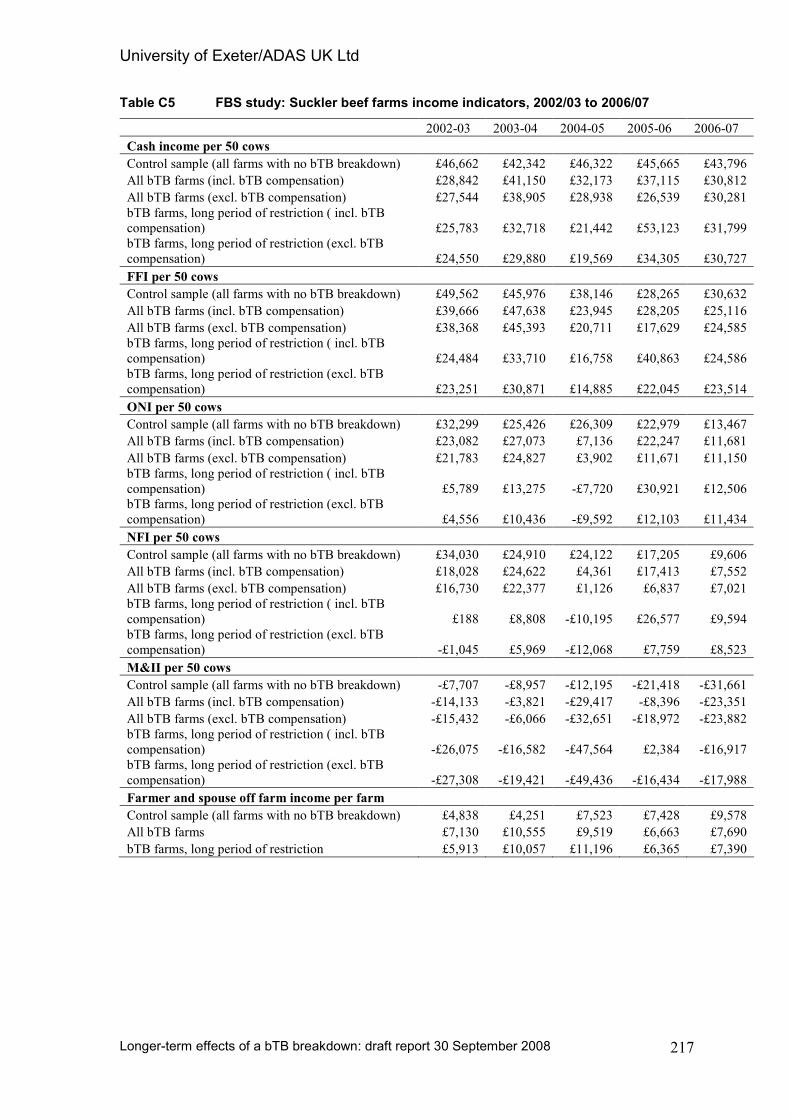
University of Exeter/ADAS UK Ltd
Longer-term effects of a bTB breakdown: draft report 30 September 2008
217
Table C5 FBS study: Suckler beef farms income indicators, 2002/03 to 2006/07
2002-03 2003-04 2004-05 2005-06 2006-07
Cash income per 50 cows
Control sample (all farms with no bTB breakdown) £46,662 £42,342 £46,322 £45,665 £43,796
All bTB farms (incl. bTB compensation) £28,842 £41,150 £32,173 £37,115 £30,812
All bTB farms (excl. bTB compensation) £27,544 £38,905 £28,938 £26,539 £30,281
bTB farms, long period of restriction ( incl. bTB
compensation) £25,783 £32,718 £21,442 £53,123 £31,799
bTB farms, long period of restriction (excl. bTB
compensation) £24,550 £29,880 £19,569 £34,305 £30,727
FFI per 50 cows
Control sample (all farms with no bTB breakdown) £49,562 £45,976 £38,146 £28,265 £30,632
All bTB farms (incl. bTB compensation) £39,666 £47,638 £23,945 £28,205 £25,116
All bTB farms (excl. bTB compensation) £38,368 £45,393 £20,711 £17,629 £24,585
bTB farms, long period of restriction ( incl. bTB
compensation) £24,484 £33,710 £16,758 £40,863 £24,586
bTB farms, long period of restriction (excl. bTB
compensation) £23,251 £30,871 £14,885 £22,045 £23,514
ONI per 50 cows
Control sample (all farms with no bTB breakdown) £32,299 £25,426 £26,309 £22,979 £13,467
All bTB farms (incl. bTB compensation) £23,082 £27,073 £7,136 £22,247 £11,681
All bTB farms (excl. bTB compensation) £21,783 £24,827 £3,902 £11,671 £11,150
bTB farms, long period of restriction ( incl. bTB
compensation) £5,789 £13,275 -£7,720 £30,921 £12,506
bTB farms, long period of restriction (excl. bTB
compensation) £4,556 £10,436 -£9,592 £12,103 £11,434
NFI per 50 cows
Control sample (all farms with no bTB breakdown) £34,030 £24,910 £24,122 £17,205 £9,606
All bTB farms (incl. bTB compensation) £18,028 £24,622 £4,361 £17,413 £7,552
All bTB farms (excl. bTB compensation) £16,730 £22,377 £1,126 £6,837 £7,021
bTB farms, long period of restriction ( incl. bTB
compensation) £188 £8,808 -£10,195 £26,577 £9,594
bTB farms, long period of restriction (excl. bTB
compensation) -£1,045 £5,969 -£12,068 £7,759 £8,523
M&II per 50 cows
Control sample (all farms with no bTB breakdown) -£7,707 -£8,957 -£12,195 -£21,418 -£31,661
All bTB farms (incl. bTB compensation) -£14,133 -£3,821 -£29,417 -£8,396 -£23,351
All bTB farms (excl. bTB compensation) -£15,432 -£6,066 -£32,651 -£18,972 -£23,882
bTB farms, long period of restriction ( incl. bTB
compensation) -£26,075 -£16,582 -£47,564 £2,384 -£16,917
bTB farms, long period of restriction (excl. bTB
compensation) -£27,308 -£19,421 -£49,436 -£16,434 -£17,988
Farmer and spouse off farm income per farm
Control sample (all farms with no bTB breakdown) £4,838 £4,251 £7,523 £7,428 £9,578
All bTB farms £7,130 £10,555 £9,519 £6,663 £7,690
bTB farms, long period of restriction £5,913 £10,057 £11,196 £6,365 £7,390
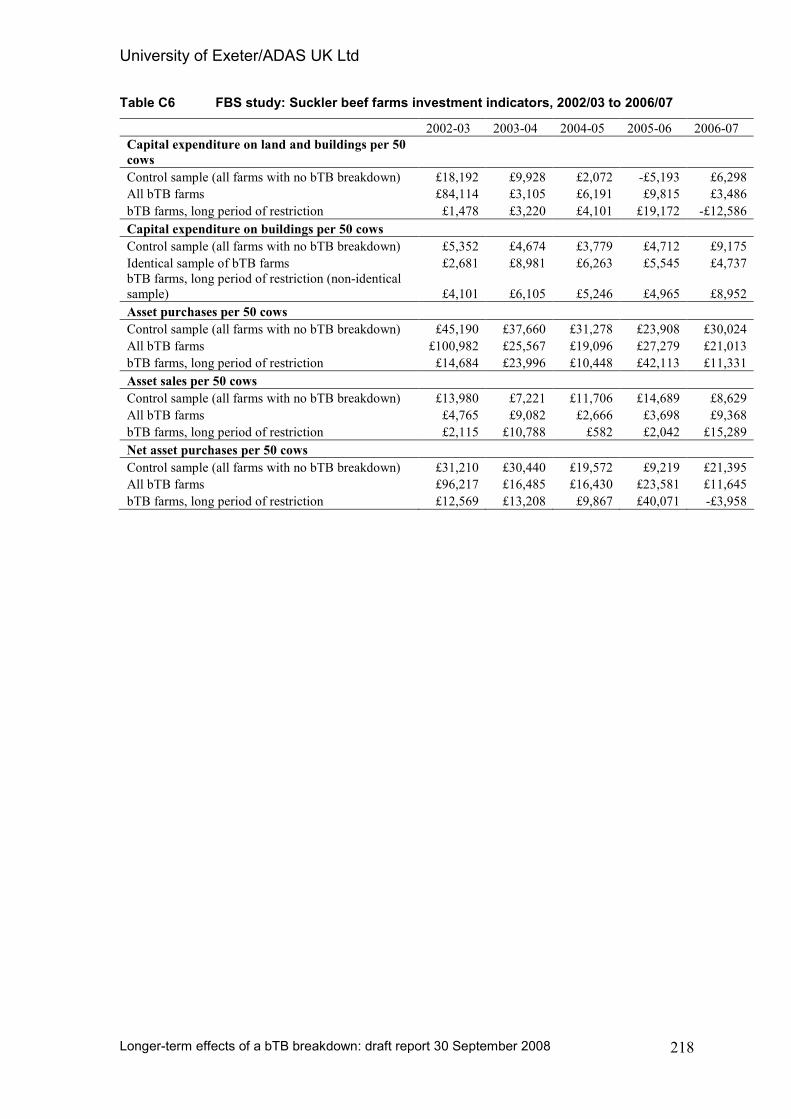
University of Exeter/ADAS UK Ltd
Longer-term effects of a bTB breakdown: draft report 30 September 2008
218
Table C6 FBS study: Suckler beef farms investment indicators, 2002/03 to 2006/07
2002-03 2003-04 2004-05 2005-06 2006-07
Capital expenditure on land and buildings per 50
cows
Control sample (all farms with no bTB breakdown) £18,192 £9,928 £2,072 -£5,193 £6,298
All bTB farms £84,114 £3,105 £6,191 £9,815 £3,486
bTB farms, long period of restriction £1,478 £3,220 £4,101 £19,172 -£12,586
Capital expenditure on buildings per 50 cows
Control sample (all farms with no bTB breakdown) £5,352 £4,674 £3,779 £4,712 £9,175
Identical sample of bTB farms £2,681 £8,981 £6,263 £5,545 £4,737
bTB farms, long period of restriction (non-identical
sample) £4,101 £6,105 £5,246 £4,965 £8,952
Asset purchases per 50 cows
Control sample (all farms with no bTB breakdown) £45,190 £37,660 £31,278 £23,908 £30,024
All bTB farms £100,982 £25,567 £19,096 £27,279 £21,013
bTB farms, long period of restriction £14,684 £23,996 £10,448 £42,113 £11,331
Asset sales per 50 cows
Control sample (all farms with no bTB breakdown) £13,980 £7,221 £11,706 £14,689 £8,629
All bTB farms £4,765 £9,082 £2,666 £3,698 £9,368
bTB farms, long period of restriction £2,115 £10,788 £582 £2,042 £15,289
Net asset purchases per 50 cows
Control sample (all farms with no bTB breakdown) £31,210 £30,440 £19,572 £9,219 £21,395
All bTB farms £96,217 £16,485 £16,430 £23,581 £11,645
bTB farms, long period of restriction £12,569 £13,208 £9,867 £40,071 -£3,958
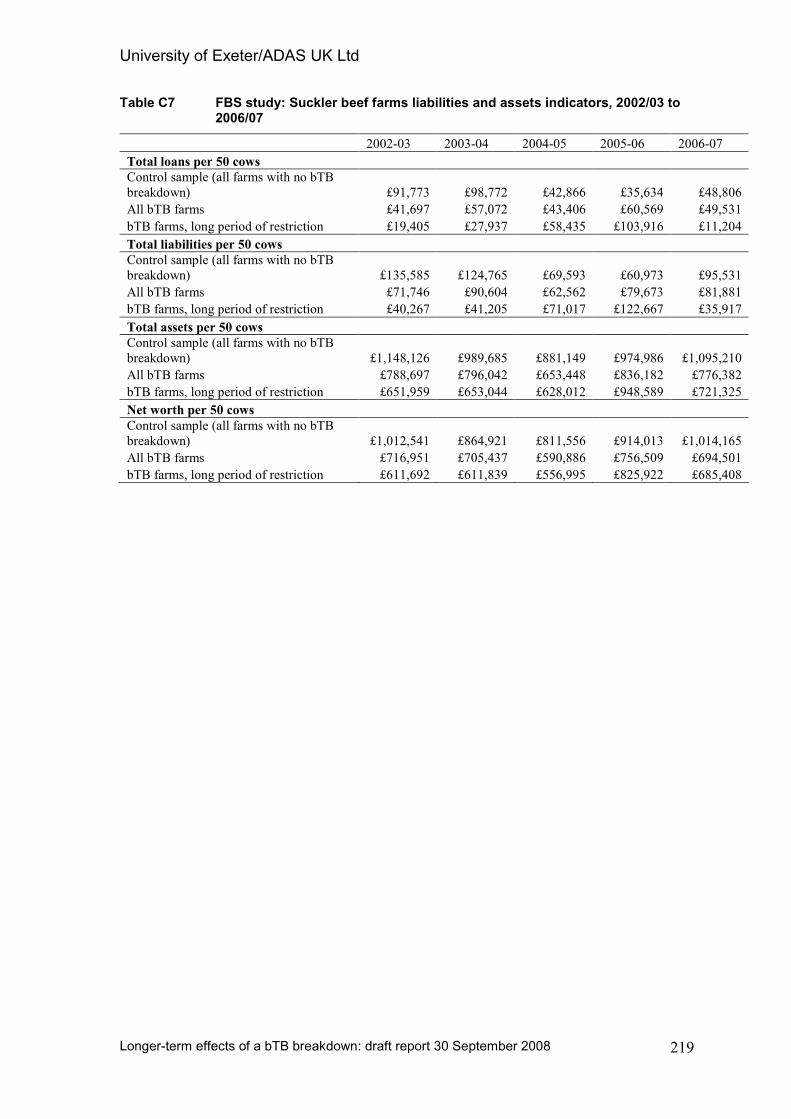
University of Exeter/ADAS UK Ltd
Longer-term effects of a bTB breakdown: draft report 30 September 2008
219
Table C7 FBS study: Suckler beef farms liabilities and assets indicators, 2002/03 to 2006/07
2002-03 2003-04 2004-05 2005-06 2006-07
Total loans per 50 cows
Control sample (all farms with no bTB
breakdown) £91,773 £98,772 £42,866 £35,634 £48,806
All bTB farms £41,697 £57,072 £43,406 £60,569 £49,531
bTB farms, long period of restriction £19,405 £27,937 £58,435 £103,916 £11,204
Total liabilities per 50 cows
Control sample (all farms with no bTB
breakdown) £135,585 £124,765 £69,593 £60,973 £95,531
All bTB farms £71,746 £90,604 £62,562 £79,673 £81,881
bTB farms, long period of restriction £40,267 £41,205 £71,017 £122,667 £35,917
Total assets per 50 cows
Control sample (all farms with no bTB
breakdown) £1,148,126 £989,685 £881,149 £974,986 £1,095,210
All bTB farms £788,697 £796,042 £653,448 £836,182 £776,382
bTB farms, long period of restriction £651,959 £653,044 £628,012 £948,589 £721,325
Net worth per 50 cows
Control sample (all farms with no bTB
breakdown) £1,012,541 £864,921 £811,556 £914,013 £1,014,165
All bTB farms £716,951 £705,437 £590,886 £756,509 £694,501
bTB farms, long period of restriction £611,692 £611,839 £556,995 £825,922 £685,408
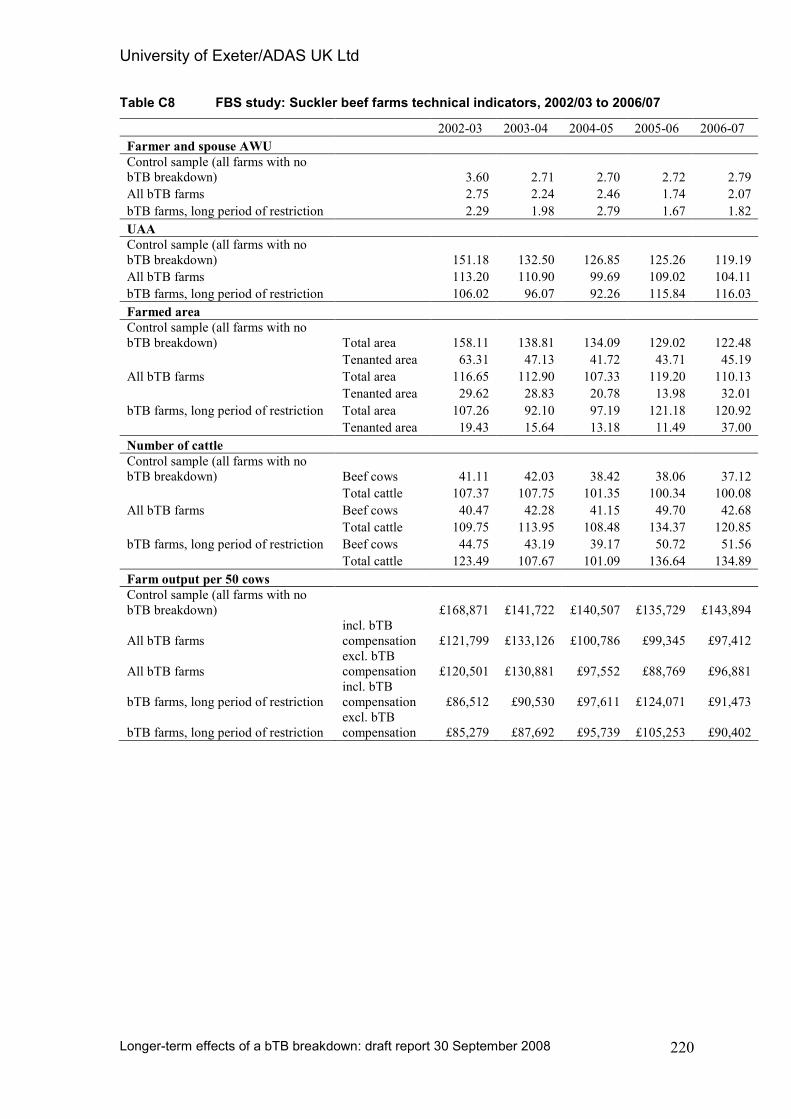
University of Exeter/ADAS UK Ltd
Longer-term effects of a bTB breakdown: draft report 30 September 2008
220
Table C8 FBS study: Suckler beef farms technical indicators, 2002/03 to 2006/07
2002-03 2003-04 2004-05 2005-06 2006-07
Farmer and spouse AWU
Control sample (all farms with no
bTB breakdown) 3.60 2.71 2.70 2.72 2.79
All bTB farms 2.75 2.24 2.46 1.74 2.07
bTB farms, long period of restriction 2.29 1.98 2.79 1.67 1.82
UAA
Control sample (all farms with no
bTB breakdown) 151.18 132.50 126.85 125.26 119.19
All bTB farms 113.20 110.90 99.69 109.02 104.11
bTB farms, long period of restriction 106.02 96.07 92.26 115.84 116.03
Farmed area
Control sample (all farms with no
bTB breakdown) Total area 158.11 138.81 134.09 129.02 122.48
Tenanted area 63.31 47.13 41.72 43.71 45.19
All bTB farms Total area 116.65 112.90 107.33 119.20 110.13
Tenanted area 29.62 28.83 20.78 13.98 32.01
bTB farms, long period of restriction Total area 107.26 92.10 97.19 121.18 120.92
Tenanted area 19.43 15.64 13.18 11.49 37.00
Number of cattle
Control sample (all farms with no
bTB breakdown) Beef cows 41.11 42.03 38.42 38.06 37.12
Total cattle 107.37 107.75 101.35 100.34 100.08
All bTB farms Beef cows 40.47 42.28 41.15 49.70 42.68
Total cattle 109.75 113.95 108.48 134.37 120.85
bTB farms, long period of restriction Beef cows 44.75 43.19 39.17 50.72 51.56
Total cattle 123.49 107.67 101.09 136.64 134.89
Farm output per 50 cows
Control sample (all farms with no
bTB breakdown) £168,871 £141,722 £140,507 £135,729 £143,894
All bTB farms
incl. bTB
compensation £121,799 £133,126 £100,786 £99,345 £97,412
All bTB farms
excl. bTB
compensation £120,501 £130,881 £97,552 £88,769 £96,881
bTB farms, long period of restriction
incl. bTB
compensation £86,512 £90,530 £97,611 £124,071 £91,473
bTB farms, long period of restriction
excl. bTB
compensation £85,279 £87,692 £95,739 £105,253 £90,402
University of Exeter/ADAS UK Ltd
Longer-term effects of a bTB breakdown: draft report 30 September 2008
221
Appendix D Postal survey: the GHQ-12 questionnaire
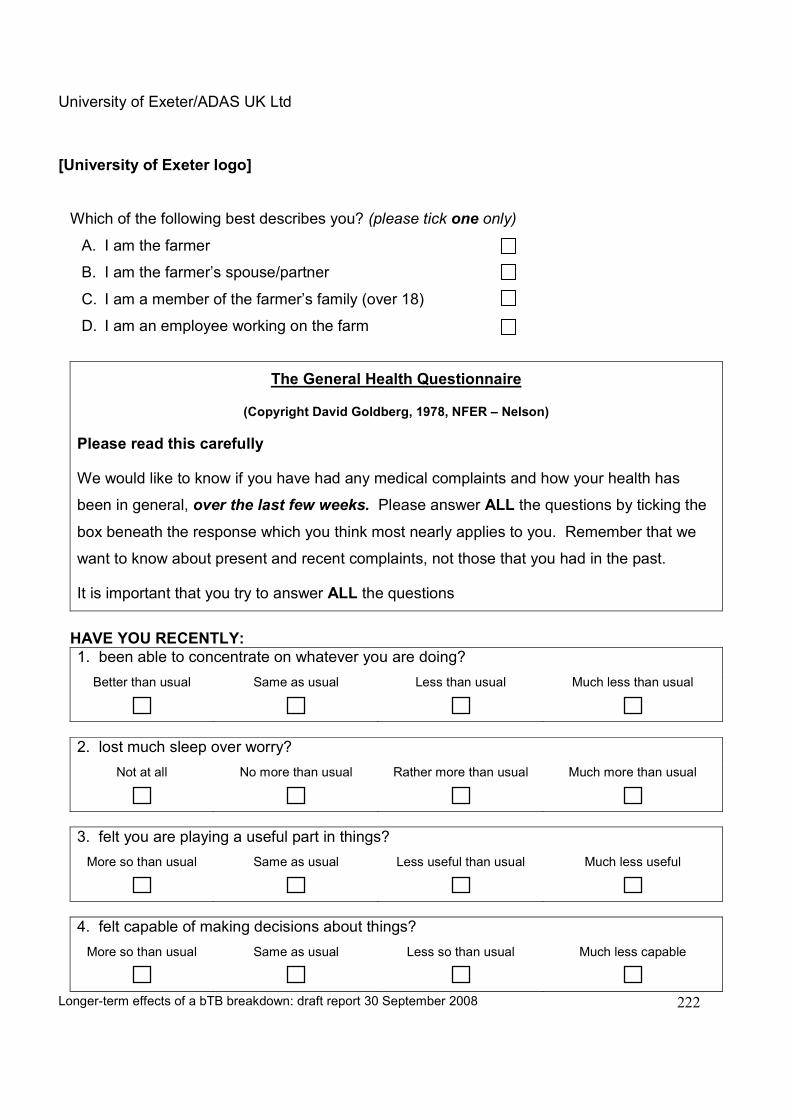
University of Exeter/ADAS UK Ltd
Longer-term effects of a bTB breakdown: draft report 30 September 2008
222
[University of Exeter logo]
Which of the following best describes you? (please tick one only)
A. I am the farmer
B. I am the farmer’s spouse/partner
C. I am a member of the farmer’s family (over 18)
D. I am an employee working on the farm
The General Health Questionnaire
(Copyright David Goldberg, 1978, NFER – Nelson)
Please read this carefully
We would like to know if you have had any medical complaints and how your health has
been in general, over the last few weeks. Please answer ALL the questions by ticking the
box beneath the response which you think most nearly applies to you. Remember that we
want to know about present and recent complaints, not those that you had in the past.
It is important that you try to answer ALL the questions
HAVE YOU RECENTLY:
1. been able to concentrate on whatever you are doing?
Better than usual
Same as usual
Less than usual
Much less than usual
2. lost much sleep over worry?
Not at all
No more than usual
Rather more than usual
Much more than usual
3. felt you are playing a useful part in things?
More so than usual
Same as usual
Less useful than usual
Much less useful
4. felt capable of making decisions about things?
More so than usual
Same as usual
Less so than usual
Much less capable

University of Exeter/ADAS UK Ltd
Longer-term effects of a bTB breakdown: draft report 30 September 2008
223
General Health Questionnaire
Continued
5. felt constantly under strain?
Not at all
No more than usual
Rather more than usual
Much more than usual
6. felt you couldn’t overcome your difficulties?
Not at all
No more than usual
Rather more than usual
Much more than usual
7. been able to enjoy your normal day-to-day activities?
More so than usual
Same as usual
Less so than usual
Much less than usual
8. been able to face up to your problems?
More so than usual
Same as usual
Less able than usual
Much less able
9. been feeling unhappy and depressed?
Not at all
No more than usual
Rather more than usual
Much more than usual
10. been losing confidence in yourself?
Not at all
No more than usual
Rather more than usual
Much more than usual
11. been thinking of yourself as a worthless person?
Not at all
No more than usual
Rather more than usual
Much more than usual
12. been feeling reasonably happy all things considered?
More so than usual
About the same as usual
Less so than usual
Much less than usual
THANK YOU FOR YOUR CO-OPERATION
University of Exeter/ADAS UK Ltd
Longer-term effects of a bTB breakdown: draft report 30 September 2008
224
Appendix E The GIS study of changes in cattle populations
Background to the study
One possible longer term cost of bTB and its control is that cattle farmers give up cattle
production or switch to less profitable cattle systems (for example, moving from dairying
to beef). The objective of the work done for this part of the research study was to
examine the evidence relating to temporal changes in cattle populations (as recorded by
Defra’s June Census/survey) to see whether there is a connection between bTB endemic
areas and relative divergence in trend changes in cattle populations over the longer term.
This work aimed to examine the available data to establish the existence, or otherwise of
dissonance in cattle population trends for ‘bTB endemic’ areas and ‘bTB-free’ areas.
ADAS holds 1km² spatial data sets for the June census for England for 1970, 1980, 1995,
2000 and 2004. For this work the parish testing interval was used as an indicator of bTB
risk and this information was integrated with ADAS’ June census database to determine
the existence and strength of any correlations, within both regions and sub-regions,
between changes in cattle populations and the testing interval. Where data allows, an
investigation into the number of cattle holdings was also carried out, determining trends
in farm types within affected areas. This short report presents the output of this work,
with tabulated summaries presenting the statistical results. This research activity was led
and undertaken by ADAS UK Ltd.
Study methodology
This study relied on a number of distinct data sources which included information
available from the Agricultural Census, the VetNet database and spatial data. The data
actually used in each case is summarised below.
University of Exeter/ADAS UK Ltd
Longer-term effects of a bTB breakdown: draft report 30 September 2008
225
Agricultural Census data
Agricultural census data for England mapped to 1km x 1km squares were used to
calculate the numbers of dairy females, beef females and total cattle per parish for each
census year included in the scope of the study (1970, 1980, 1995, 2000 and 2004).
VetNet data
VetNet data (complete from 1988 onwards) was provided by Defra for every farm in the
UK. The data that was extracted from this database for use by this project were the
number of bTB tests performed on a herd and the dates and types of these tests; the
number of bTB breakdowns that a herd experiences and the dates of these breakdowns,
and the XY coordinates of the holding. These data were used to provide a parish
incidence of bTB for the four years prior to and including each census year (from the
1995 census onwards). The four yearly incidence was used as this was the maximum
period that could be used without having overlapping years in the incidence calculations.
Also, the minimum testing interval is four years, therefore every farm should have had at
least one bTB test within this period. VetNet data was also used to calculate the number
of cattle farms in each parish during each four-year period as this variable was not
available from the census data.
Spatial data
The locations of UK farms from the VetNet database were plotted and the numbers of
routine herd tests and breakdowns per parish (using 2004 boundaries) was calculated.
Four-year incidences were then calculated for each parish by dividing the number of
breakdowns by the total number of routine herd tests. Regional boundaries were used to
select parishes within three areas with extensive bTB hotspots (the bTB endemic
regions), these being the South-West, West-Midlands and Wales. Parish IDs, along with
the numbers of cattle, tests and breakdowns, and the four-year bTB incidence were
exported for each region for input into the statistical software.
University of Exeter/ADAS UK Ltd
Longer-term effects of a bTB breakdown: draft report 30 September 2008
226
Analytical approaches
Complete testing records were not available from the VetNet database before 1988 (and
the parish testing interval was only recorded from 1998), therefore the effects of bTB on
cattle populations were assessed over the period 1992-2004, using census data from 1995,
2000 and 2004. The analyses controlled for starting cattle numbers taken from the 1980
census. Parishes were allocated to bTB incidence categories of either 0 or 1, defined as
follows:
Category 0 – the ‘no bTB group’, comprised parishes which (a) had had no incidences
of bTB during the four years prior to each census year from 1995 until 2004, and (b)
where at least five routine herd tests had been performed within the parish during each
four-year period.
Category 1 – the ‘bTB group’, comprised parishes in which bTB had occurred, and two
sets of analyses were completed for this group:
1. For the first set of analyses, parishes were included in Category 1 if their
bTB incidence in each of the four-year periods was above the median value of all
parishes with a bTB incidence in the four-year period prior to 1995. This group
was chosen to maximise the differences between the two categories (‘bTB’and
‘non-bTB’), albeit at the expense of reducing sample size in Category 1.
2. A second set of analyses were performed using the less rigorous
requirement for inclusion in Category 1, which for these analyses included parishes
where there had been at least one bTB incidence in all four-year periods.
The results presented here use the first analytical method (bTB incidence above the
median value) for the South-West, which has a higher overall incidence of bTB; and the
second analytical method (of at least one bTB incidence) for both the West Midlands and
Wales. Results were qualitatively similar between the two sets of analyses.
Outcome variables were (i) the total number of cattle per parish; (ii) the number of dairy
females per parish; (iii) the number of beef females per parish, (iv) the ratio of dairy
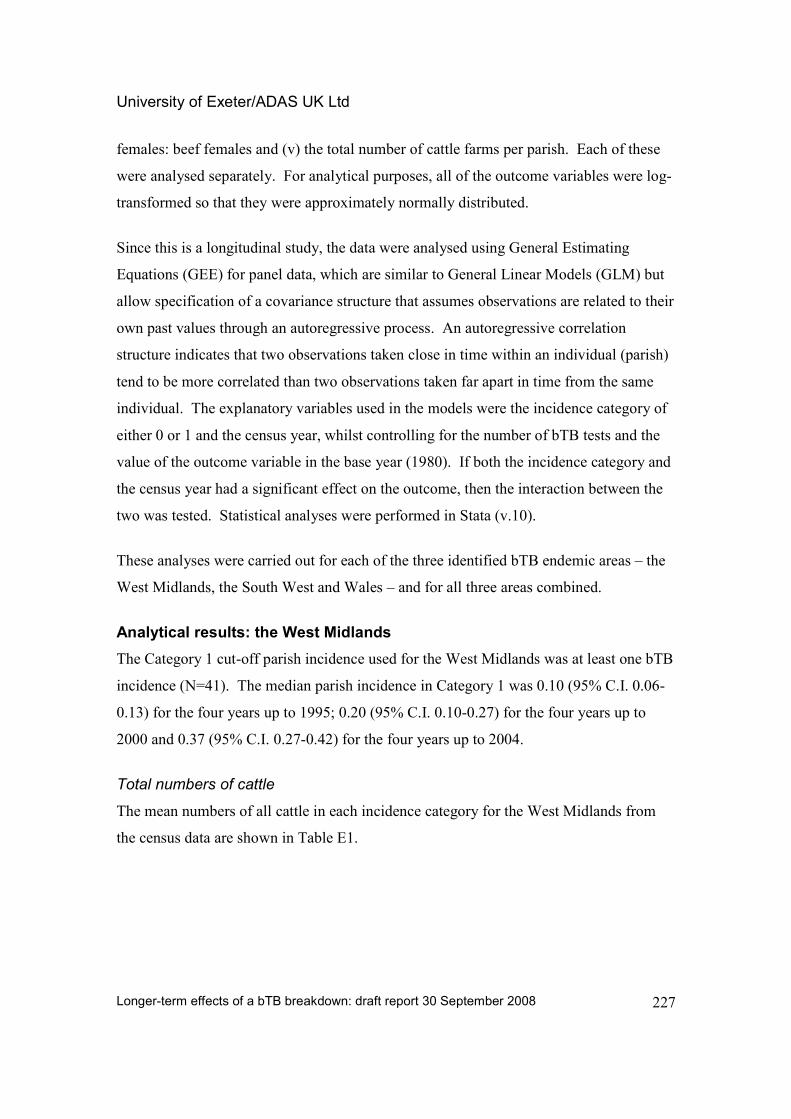
University of Exeter/ADAS UK Ltd
Longer-term effects of a bTB breakdown: draft report 30 September 2008
227
females: beef females and (v) the total number of cattle farms per parish. Each of these
were analysed separately. For analytical purposes, all of the outcome variables were log-
transformed so that they were approximately normally distributed.
Since this is a longitudinal study, the data were analysed using General Estimating
Equations (GEE) for panel data, which are similar to General Linear Models (GLM) but
allow specification of a covariance structure that assumes observations are related to their
own past values through an autoregressive process. An autoregressive correlation
structure indicates that two observations taken close in time within an individual (parish)
tend to be more correlated than two observations taken far apart in time from the same
individual. The explanatory variables used in the models were the incidence category of
either 0 or 1 and the census year, whilst controlling for the number of bTB tests and the
value of the outcome variable in the base year (1980). If both the incidence category and
the census year had a significant effect on the outcome, then the interaction between the
two was tested. Statistical analyses were performed in Stata (v.10).
These analyses were carried out for each of the three identified bTB endemic areas – the
West Midlands, the South West and Wales – and for all three areas combined.
Analytical results: the West Midlands
The Category 1 cut-off parish incidence used for the West Midlands was at least one bTB
incidence (N=41). The median parish incidence in Category 1 was 0.10 (95% C.I. 0.06-
0.13) for the four years up to 1995; 0.20 (95% C.I. 0.10-0.27) for the four years up to
2000 and 0.37 (95% C.I. 0.27-0.42) for the four years up to 2004.
Total numbers of cattle
The mean numbers of all cattle in each incidence category for the West Midlands from
the census data are shown in Table E1.
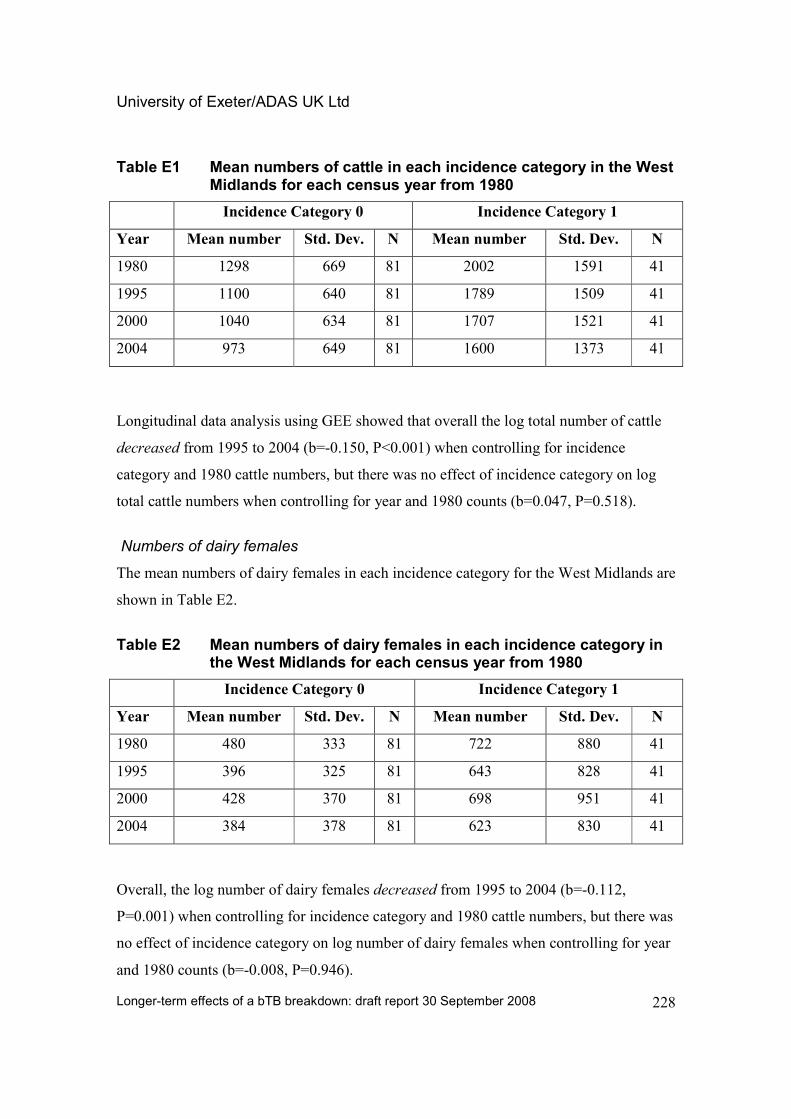
University of Exeter/ADAS UK Ltd
Longer-term effects of a bTB breakdown: draft report 30 September 2008
228
Table E1 Mean numbers of cattle in each incidence category in the West Midlands for each census year from 1980
Incidence Category 0 Incidence Category 1
Year Mean number Std. Dev. N Mean number Std. Dev. N
1980 1298 669 81 2002 1591 41
1995 1100 640 81 1789 1509 41
2000 1040 634 81 1707 1521 41
2004 973 649 81 1600 1373 41
Longitudinal data analysis using GEE showed that overall the log total number of cattle
decreased from 1995 to 2004 (b=-0.150, P<0.001) when controlling for incidence
category and 1980 cattle numbers, but there was no effect of incidence category on log
total cattle numbers when controlling for year and 1980 counts (b=0.047, P=0.518).
Numbers of dairy females
The mean numbers of dairy females in each incidence category for the West Midlands are
shown in Table E2.
Table E2 Mean numbers of dairy females in each incidence category in the West Midlands for each census year from 1980
Incidence Category 0 Incidence Category 1
Year Mean number Std. Dev. N Mean number Std. Dev. N
1980 480 333 81 722 880 41
1995 396 325 81 643 828 41
2000 428 370 81 698 951 41
2004 384 378 81 623 830 41
Overall, the log number of dairy females decreased from 1995 to 2004 (b=-0.112,
P=0.001) when controlling for incidence category and 1980 cattle numbers, but there was
no effect of incidence category on log number of dairy females when controlling for year
and 1980 counts (b=-0.008, P=0.946).
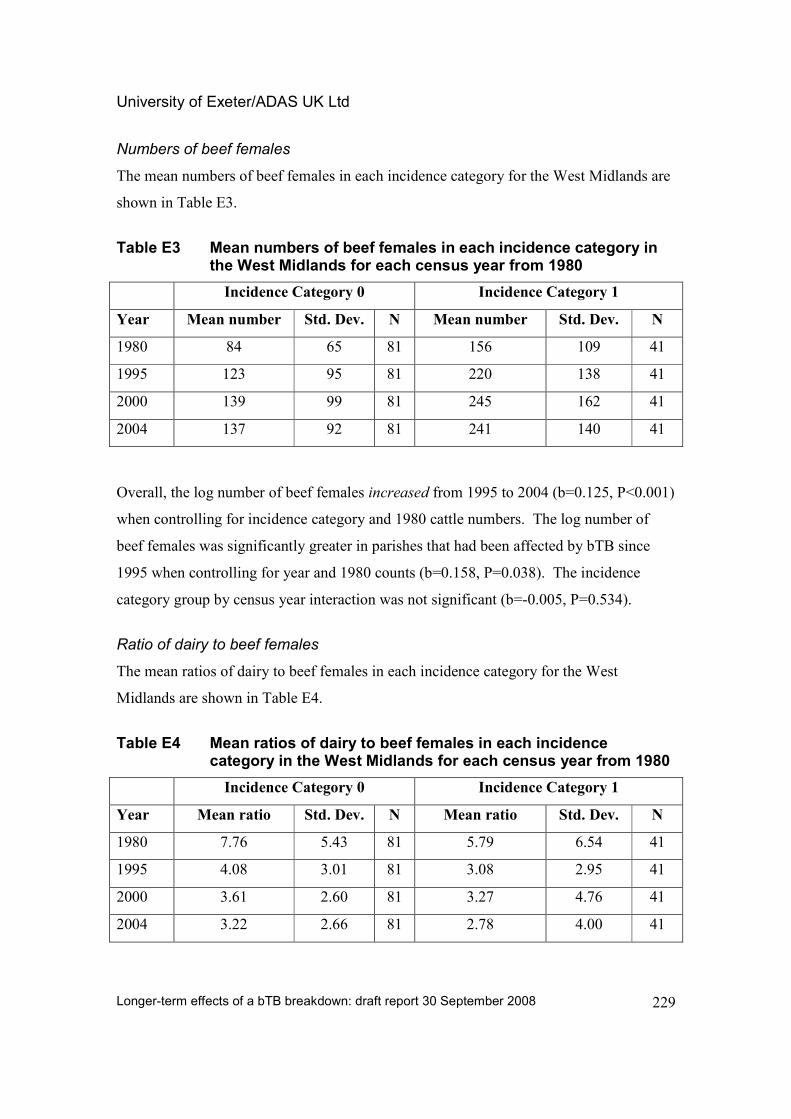
University of Exeter/ADAS UK Ltd
Longer-term effects of a bTB breakdown: draft report 30 September 2008
229
Numbers of beef females
The mean numbers of beef females in each incidence category for the West Midlands are
shown in Table E3.
Table E3 Mean numbers of beef females in each incidence category in the West Midlands for each census year from 1980
Incidence Category 0 Incidence Category 1
Year Mean number Std. Dev. N Mean number Std. Dev. N
1980 84 65 81 156 109 41
1995 123 95 81 220 138 41
2000 139 99 81 245 162 41
2004 137 92 81 241 140 41
Overall, the log number of beef females increased from 1995 to 2004 (b=0.125, P<0.001)
when controlling for incidence category and 1980 cattle numbers. The log number of
beef females was significantly greater in parishes that had been affected by bTB since
1995 when controlling for year and 1980 counts (b=0.158, P=0.038). The incidence
category group by census year interaction was not significant (b=-0.005, P=0.534).
Ratio of dairy to beef females
The mean ratios of dairy to beef females in each incidence category for the West
Midlands are shown in Table E4.
Table E4 Mean ratios of dairy to beef females in each incidence category in the West Midlands for each census year from 1980
Incidence Category 0 Incidence Category 1
Year Mean ratio Std. Dev. N Mean ratio Std. Dev. N
1980 7.76 5.43 81 5.79 6.54 41
1995 4.08 3.01 81 3.08 2.95 41
2000 3.61 2.60 81 3.27 4.76 41
2004 3.22 2.66 81 2.78 4.00 41
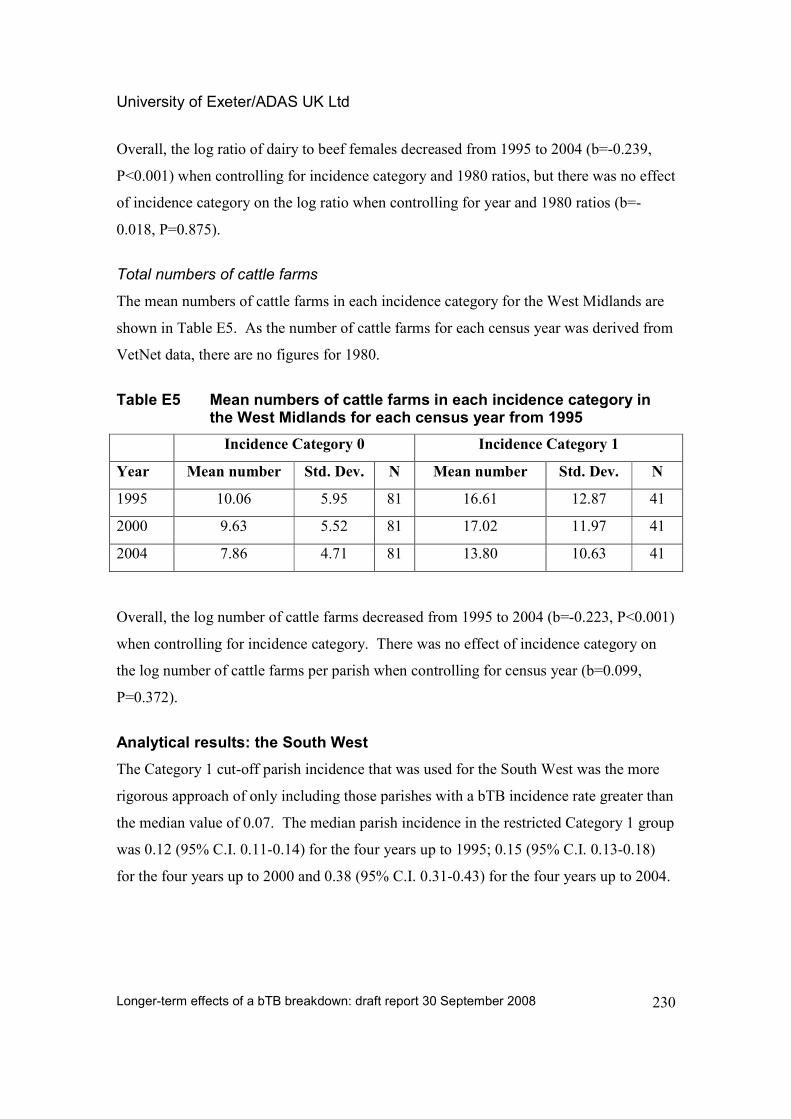
University of Exeter/ADAS UK Ltd
Longer-term effects of a bTB breakdown: draft report 30 September 2008
230
Overall, the log ratio of dairy to beef females decreased from 1995 to 2004 (b=-0.239,
P<0.001) when controlling for incidence category and 1980 ratios, but there was no effect
of incidence category on the log ratio when controlling for year and 1980 ratios (b=-
0.018, P=0.875).
Total numbers of cattle farms
The mean numbers of cattle farms in each incidence category for the West Midlands are
shown in Table E5. As the number of cattle farms for each census year was derived from
VetNet data, there are no figures for 1980.
Table E5 Mean numbers of cattle farms in each incidence category in the West Midlands for each census year from 1995
Incidence Category 0 Incidence Category 1
Year Mean number Std. Dev. N Mean number Std. Dev. N
1995 10.06 5.95 81 16.61 12.87 41
2000 9.63 5.52 81 17.02 11.97 41
2004 7.86 4.71 81 13.80 10.63 41
Overall, the log number of cattle farms decreased from 1995 to 2004 (b=-0.223, P<0.001)
when controlling for incidence category. There was no effect of incidence category on
the log number of cattle farms per parish when controlling for census year (b=0.099,
P=0.372).
Analytical results: the South West
The Category 1 cut-off parish incidence that was used for the South West was the more
rigorous approach of only including those parishes with a bTB incidence rate greater than
the median value of 0.07. The median parish incidence in the restricted Category 1 group
was 0.12 (95% C.I. 0.11-0.14) for the four years up to 1995; 0.15 (95% C.I. 0.13-0.18)
for the four years up to 2000 and 0.38 (95% C.I. 0.31-0.43) for the four years up to 2004.
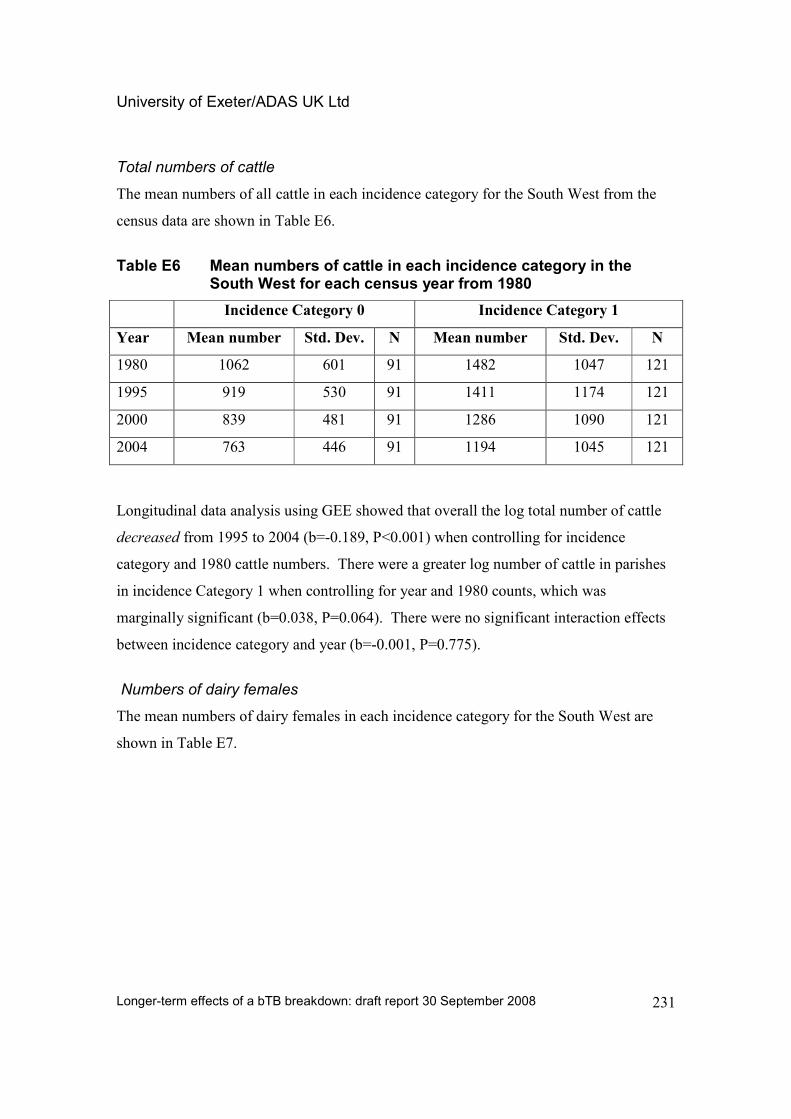
University of Exeter/ADAS UK Ltd
Longer-term effects of a bTB breakdown: draft report 30 September 2008
231
Total numbers of cattle
The mean numbers of all cattle in each incidence category for the South West from the
census data are shown in Table E6.
Table E6 Mean numbers of cattle in each incidence category in the South West for each census year from 1980
Incidence Category 0 Incidence Category 1
Year Mean number Std. Dev. N Mean number Std. Dev. N
1980 1062 601 91 1482 1047 121
1995 919 530 91 1411 1174 121
2000 839 481 91 1286 1090 121
2004 763 446 91 1194 1045 121
Longitudinal data analysis using GEE showed that overall the log total number of cattle
decreased from 1995 to 2004 (b=-0.189, P<0.001) when controlling for incidence
category and 1980 cattle numbers. There were a greater log number of cattle in parishes
in incidence Category 1 when controlling for year and 1980 counts, which was
marginally significant (b=0.038, P=0.064). There were no significant interaction effects
between incidence category and year (b=-0.001, P=0.775).
Numbers of dairy females
The mean numbers of dairy females in each incidence category for the South West are
shown in Table E7.
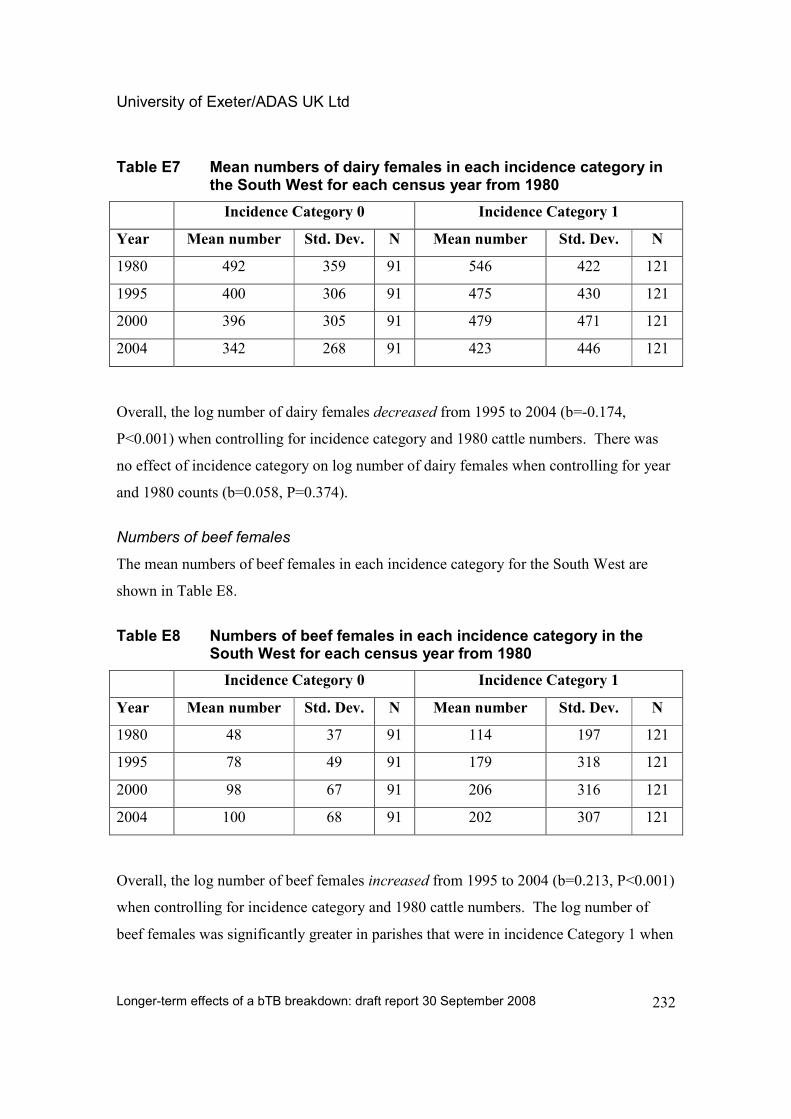
University of Exeter/ADAS UK Ltd
Longer-term effects of a bTB breakdown: draft report 30 September 2008
232
Table E7 Mean numbers of dairy females in each incidence category in the South West for each census year from 1980
Incidence Category 0 Incidence Category 1
Year Mean number Std. Dev. N Mean number Std. Dev. N
1980 492 359 91 546 422 121
1995 400 306 91 475 430 121
2000 396 305 91 479 471 121
2004 342 268 91 423 446 121
Overall, the log number of dairy females decreased from 1995 to 2004 (b=-0.174,
P<0.001) when controlling for incidence category and 1980 cattle numbers. There was
no effect of incidence category on log number of dairy females when controlling for year
and 1980 counts (b=0.058, P=0.374).
Numbers of beef females
The mean numbers of beef females in each incidence category for the South West are
shown in Table E8.
Table E8 Numbers of beef females in each incidence category in the South West for each census year from 1980
Incidence Category 0 Incidence Category 1
Year Mean number Std. Dev. N Mean number Std. Dev. N
1980 48 37 91 114 197 121
1995 78 49 91 179 318 121
2000 98 67 91 206 316 121
2004 100 68 91 202 307 121
Overall, the log number of beef females increased from 1995 to 2004 (b=0.213, P<0.001)
when controlling for incidence category and 1980 cattle numbers. The log number of
beef females was significantly greater in parishes that were in incidence Category 1 when
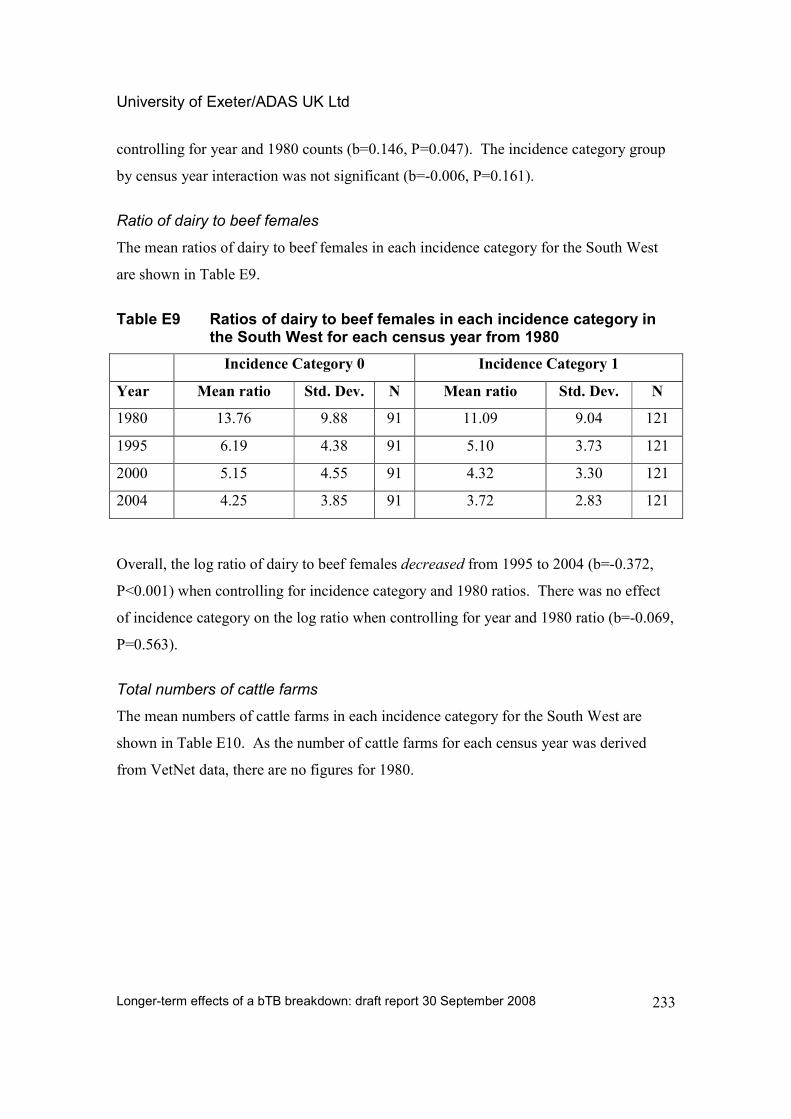
University of Exeter/ADAS UK Ltd
Longer-term effects of a bTB breakdown: draft report 30 September 2008
233
controlling for year and 1980 counts (b=0.146, P=0.047). The incidence category group
by census year interaction was not significant (b=-0.006, P=0.161).
Ratio of dairy to beef females
The mean ratios of dairy to beef females in each incidence category for the South West
are shown in Table E9.
Table E9 Ratios of dairy to beef females in each incidence category in the South West for each census year from 1980
Incidence Category 0 Incidence Category 1
Year Mean ratio Std. Dev. N Mean ratio Std. Dev. N
1980 13.76 9.88 91 11.09 9.04 121
1995 6.19 4.38 91 5.10 3.73 121
2000 5.15 4.55 91 4.32 3.30 121
2004 4.25 3.85 91 3.72 2.83 121
Overall, the log ratio of dairy to beef females decreased from 1995 to 2004 (b=-0.372,
P<0.001) when controlling for incidence category and 1980 ratios. There was no effect
of incidence category on the log ratio when controlling for year and 1980 ratio (b=-0.069,
P=0.563).
Total numbers of cattle farms
The mean numbers of cattle farms in each incidence category for the South West are
shown in Table E10. As the number of cattle farms for each census year was derived
from VetNet data, there are no figures for 1980.
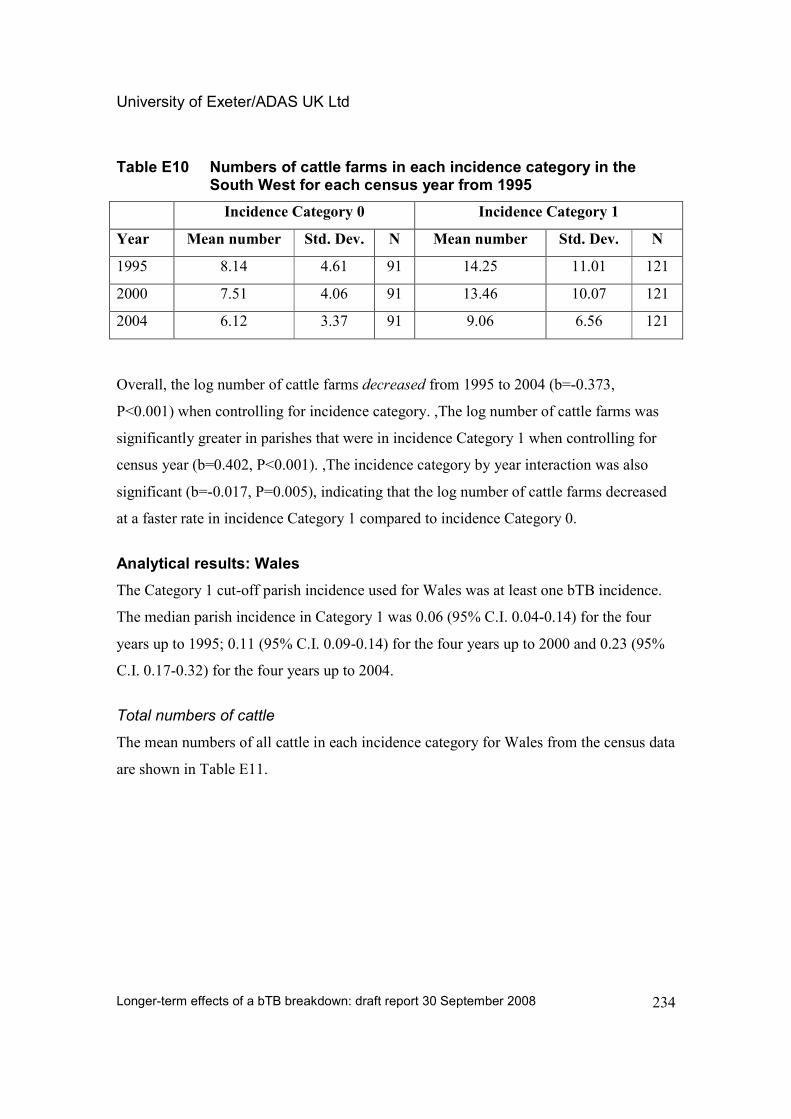
University of Exeter/ADAS UK Ltd
Longer-term effects of a bTB breakdown: draft report 30 September 2008
234
Table E10 Numbers of cattle farms in each incidence category in the South West for each census year from 1995
Incidence Category 0 Incidence Category 1
Year Mean number Std. Dev. N Mean number Std. Dev. N
1995 8.14 4.61 91 14.25 11.01 121
2000 7.51 4.06 91 13.46 10.07 121
2004 6.12 3.37 91 9.06 6.56 121
Overall, the log number of cattle farms decreased from 1995 to 2004 (b=-0.373,
P<0.001) when controlling for incidence category. ,The log number of cattle farms was
significantly greater in parishes that were in incidence Category 1 when controlling for
census year (b=0.402, P<0.001). ,The incidence category by year interaction was also
significant (b=-0.017, P=0.005), indicating that the log number of cattle farms decreased
at a faster rate in incidence Category 1 compared to incidence Category 0.
Analytical results: Wales
The Category 1 cut-off parish incidence used for Wales was at least one bTB incidence.
The median parish incidence in Category 1 was 0.06 (95% C.I. 0.04-0.14) for the four
years up to 1995; 0.11 (95% C.I. 0.09-0.14) for the four years up to 2000 and 0.23 (95%
C.I. 0.17-0.32) for the four years up to 2004.
Total numbers of cattle
The mean numbers of all cattle in each incidence category for Wales from the census data
are shown in Table E11.
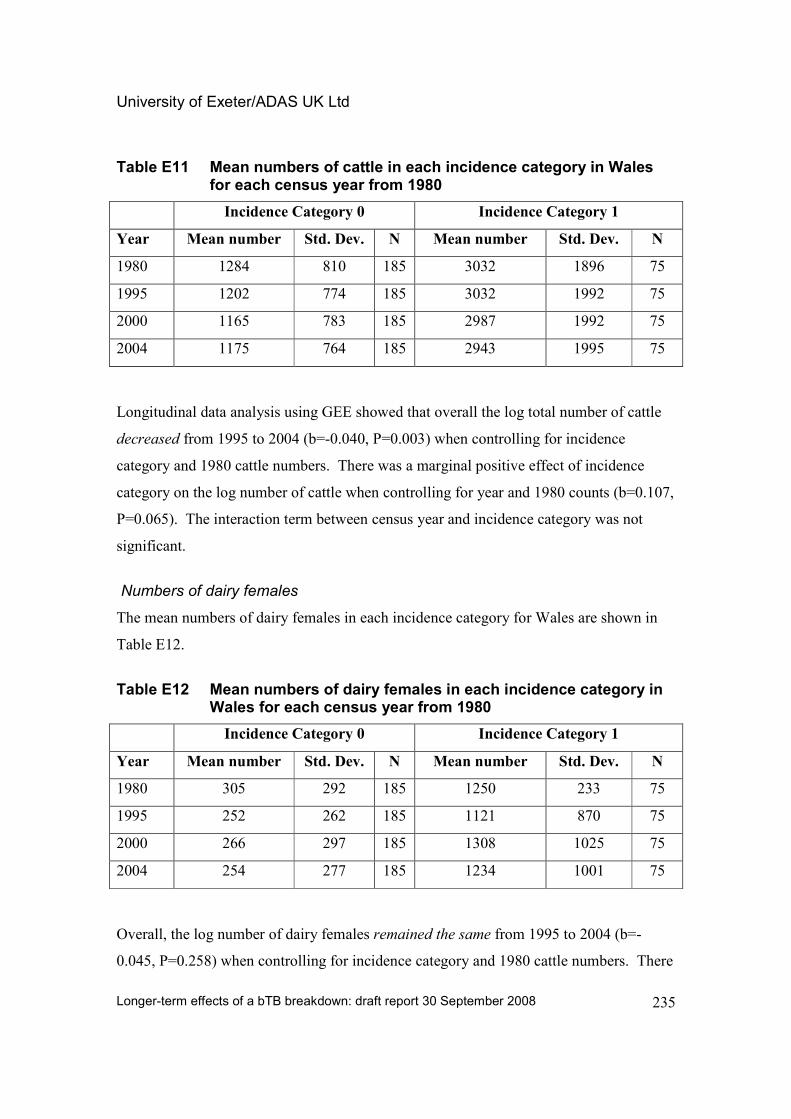
University of Exeter/ADAS UK Ltd
Longer-term effects of a bTB breakdown: draft report 30 September 2008
235
Table E11 Mean numbers of cattle in each incidence category in Wales for each census year from 1980
Incidence Category 0 Incidence Category 1
Year Mean number Std. Dev. N Mean number Std. Dev. N
1980 1284 810 185 3032 1896 75
1995 1202 774 185 3032 1992 75
2000 1165 783 185 2987 1992 75
2004 1175 764 185 2943 1995 75
Longitudinal data analysis using GEE showed that overall the log total number of cattle
decreased from 1995 to 2004 (b=-0.040, P=0.003) when controlling for incidence
category and 1980 cattle numbers. There was a marginal positive effect of incidence
category on the log number of cattle when controlling for year and 1980 counts (b=0.107,
P=0.065). The interaction term between census year and incidence category was not
significant.
Numbers of dairy females
The mean numbers of dairy females in each incidence category for Wales are shown in
Table E12.
Table E12 Mean numbers of dairy females in each incidence category in Wales for each census year from 1980
Incidence Category 0 Incidence Category 1
Year Mean number Std. Dev. N Mean number Std. Dev. N
1980 305 292 185 1250 233 75
1995 252 262 185 1121 870 75
2000 266 297 185 1308 1025 75
2004 254 277 185 1234 1001 75
Overall, the log number of dairy females remained the same from 1995 to 2004 (b=-
0.045, P=0.258) when controlling for incidence category and 1980 cattle numbers. There
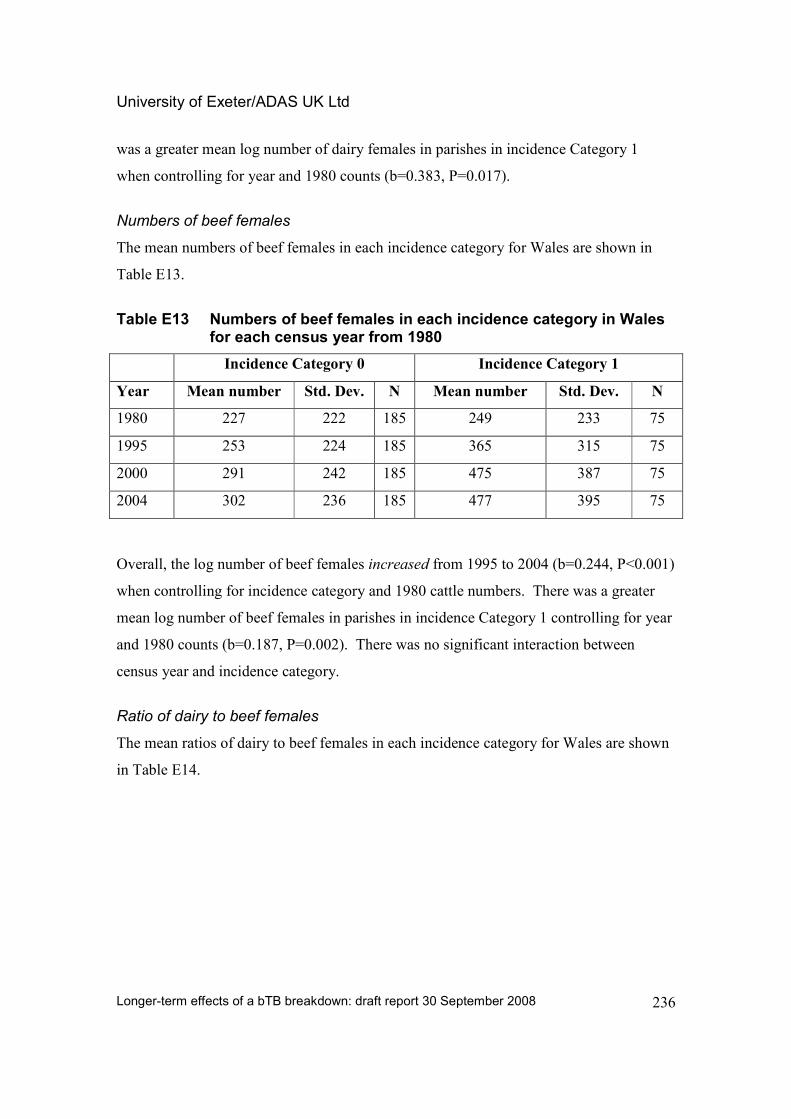
University of Exeter/ADAS UK Ltd
Longer-term effects of a bTB breakdown: draft report 30 September 2008
236
was a greater mean log number of dairy females in parishes in incidence Category 1
when controlling for year and 1980 counts (b=0.383, P=0.017).
Numbers of beef females
The mean numbers of beef females in each incidence category for Wales are shown in
Table E13.
Table E13 Numbers of beef females in each incidence category in Wales for each census year from 1980
Incidence Category 0 Incidence Category 1
Year Mean number Std. Dev. N Mean number Std. Dev. N
1980 227 222 185 249 233 75
1995 253 224 185 365 315 75
2000 291 242 185 475 387 75
2004 302 236 185 477 395 75
Overall, the log number of beef females increased from 1995 to 2004 (b=0.244, P<0.001)
when controlling for incidence category and 1980 cattle numbers. There was a greater
mean log number of beef females in parishes in incidence Category 1 controlling for year
and 1980 counts (b=0.187, P=0.002). There was no significant interaction between
census year and incidence category.
Ratio of dairy to beef females
The mean ratios of dairy to beef females in each incidence category for Wales are shown
in Table E14.
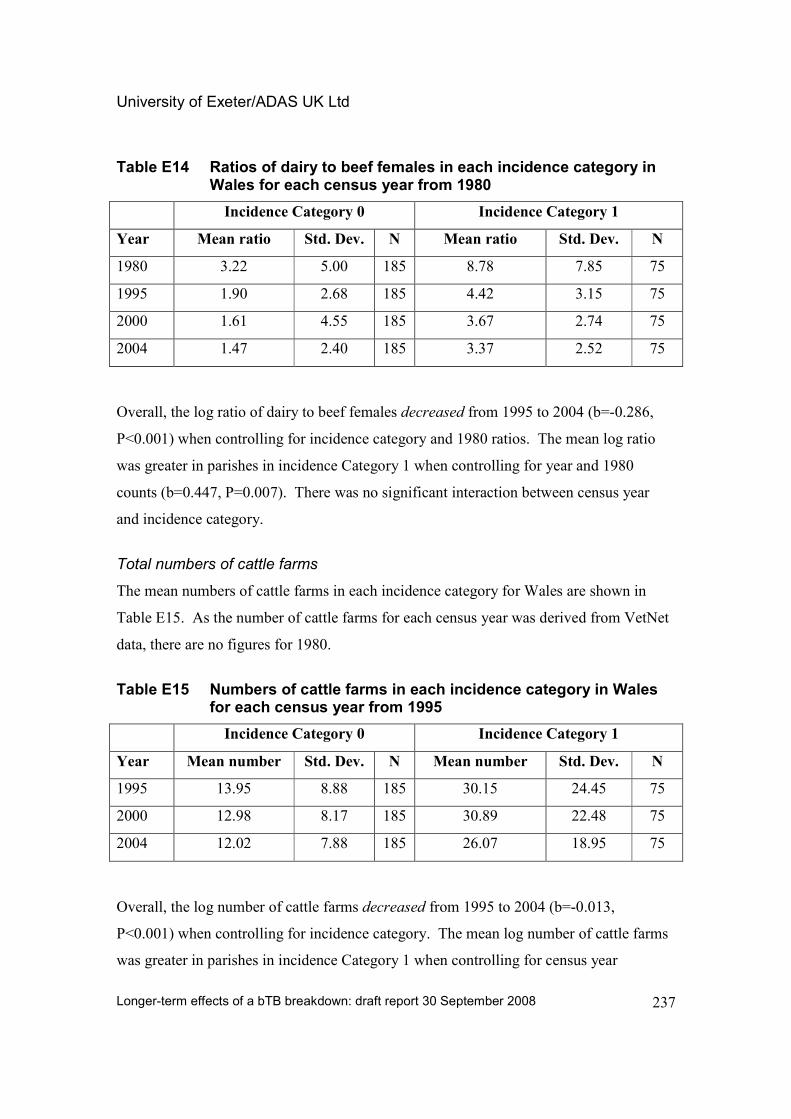
University of Exeter/ADAS UK Ltd
Longer-term effects of a bTB breakdown: draft report 30 September 2008
237
Table E14 Ratios of dairy to beef females in each incidence category in Wales for each census year from 1980
Incidence Category 0 Incidence Category 1
Year Mean ratio Std. Dev. N Mean ratio Std. Dev. N
1980 3.22 5.00 185 8.78 7.85 75
1995 1.90 2.68 185 4.42 3.15 75
2000 1.61 4.55 185 3.67 2.74 75
2004 1.47 2.40 185 3.37 2.52 75
Overall, the log ratio of dairy to beef females decreased from 1995 to 2004 (b=-0.286,
P<0.001) when controlling for incidence category and 1980 ratios. The mean log ratio
was greater in parishes in incidence Category 1 when controlling for year and 1980
counts (b=0.447, P=0.007). There was no significant interaction between census year
and incidence category.
Total numbers of cattle farms
The mean numbers of cattle farms in each incidence category for Wales are shown in
Table E15. As the number of cattle farms for each census year was derived from VetNet
data, there are no figures for 1980.
Table E15 Numbers of cattle farms in each incidence category in Wales for each census year from 1995
Incidence Category 0 Incidence Category 1
Year Mean number Std. Dev. N Mean number Std. Dev. N
1995 13.95 8.88 185 30.15 24.45 75
2000 12.98 8.17 185 30.89 22.48 75
2004 12.02 7.88 185 26.07 18.95 75
Overall, the log number of cattle farms decreased from 1995 to 2004 (b=-0.013,
P<0.001) when controlling for incidence category. The mean log number of cattle farms
was greater in parishes in incidence Category 1 when controlling for census year
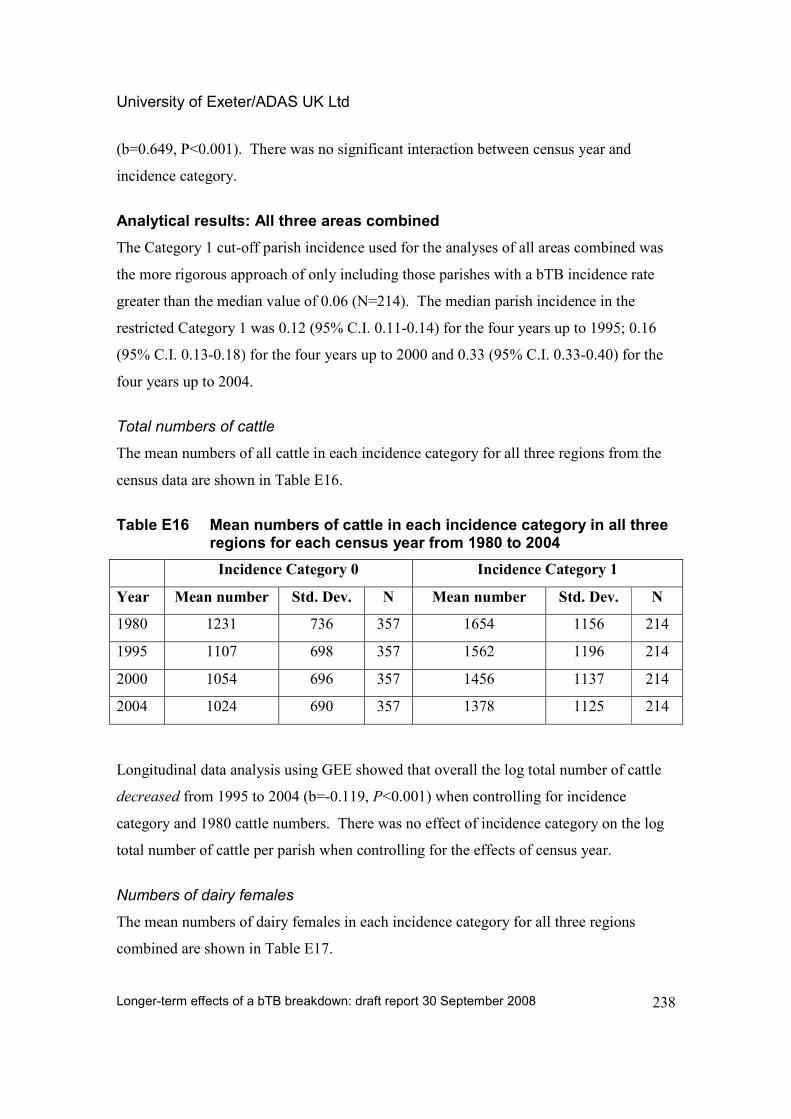
University of Exeter/ADAS UK Ltd
Longer-term effects of a bTB breakdown: draft report 30 September 2008
238
(b=0.649, P<0.001). There was no significant interaction between census year and
incidence category.
Analytical results: All three areas combined
The Category 1 cut-off parish incidence used for the analyses of all areas combined was
the more rigorous approach of only including those parishes with a bTB incidence rate
greater than the median value of 0.06 (N=214). The median parish incidence in the
restricted Category 1 was 0.12 (95% C.I. 0.11-0.14) for the four years up to 1995; 0.16
(95% C.I. 0.13-0.18) for the four years up to 2000 and 0.33 (95% C.I. 0.33-0.40) for the
four years up to 2004.
Total numbers of cattle
The mean numbers of all cattle in each incidence category for all three regions from the
census data are shown in Table E16.
Table E16 Mean numbers of cattle in each incidence category in all three regions for each census year from 1980 to 2004
Incidence Category 0 Incidence Category 1
Year Mean number Std. Dev. N Mean number Std. Dev. N
1980 1231 736 357 1654 1156 214
1995 1107 698 357 1562 1196 214
2000 1054 696 357 1456 1137 214
2004 1024 690 357 1378 1125 214
Longitudinal data analysis using GEE showed that overall the log total number of cattle
decreased from 1995 to 2004 (b=-0.119, P<0.001) when controlling for incidence
category and 1980 cattle numbers. There was no effect of incidence category on the log
total number of cattle per parish when controlling for the effects of census year.
Numbers of dairy females
The mean numbers of dairy females in each incidence category for all three regions
combined are shown in Table E17.
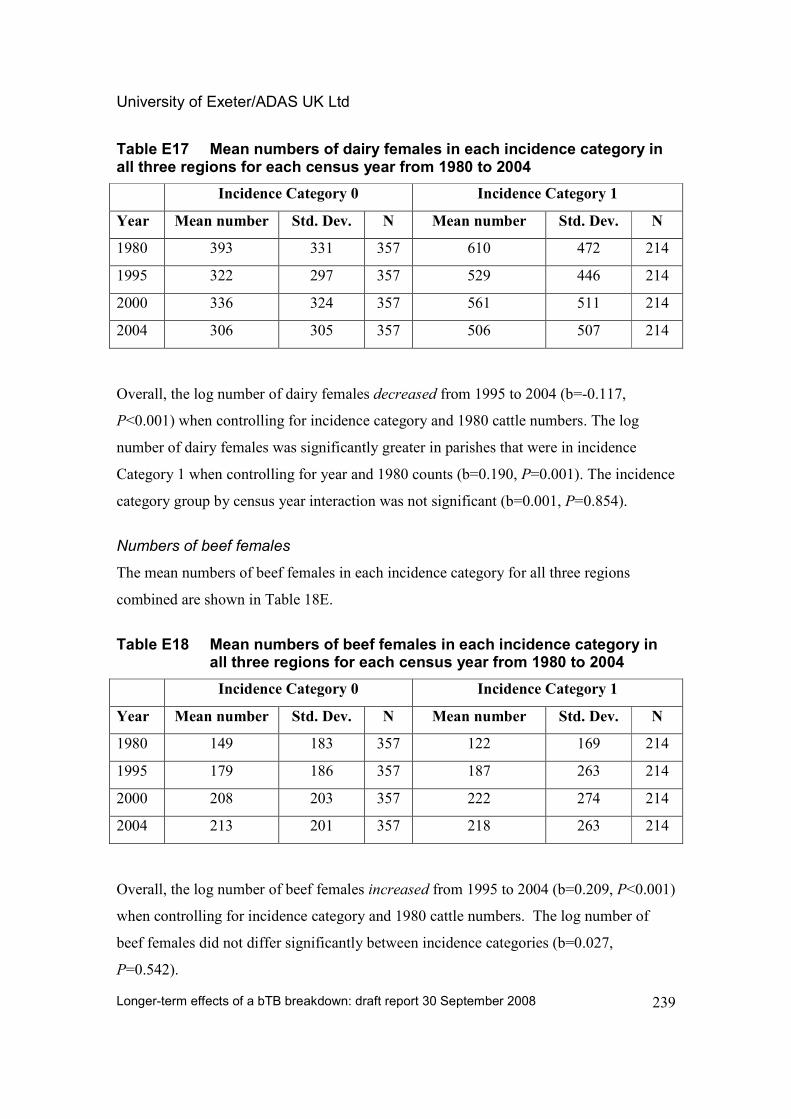
University of Exeter/ADAS UK Ltd
Longer-term effects of a bTB breakdown: draft report 30 September 2008
239
Table E17 Mean numbers of dairy females in each incidence category in all three regions for each census year from 1980 to 2004
Incidence Category 0 Incidence Category 1
Year Mean number Std. Dev. N Mean number Std. Dev. N
1980 393 331 357 610 472 214
1995 322 297 357 529 446 214
2000 336 324 357 561 511 214
2004 306 305 357 506 507 214
Overall, the log number of dairy females decreased from 1995 to 2004 (b=-0.117,
P<0.001) when controlling for incidence category and 1980 cattle numbers. The log
number of dairy females was significantly greater in parishes that were in incidence
Category 1 when controlling for year and 1980 counts (b=0.190, P=0.001). The incidence
category group by census year interaction was not significant (b=0.001, P=0.854).
Numbers of beef females
The mean numbers of beef females in each incidence category for all three regions
combined are shown in Table 18E.
Table E18 Mean numbers of beef females in each incidence category in all three regions for each census year from 1980 to 2004
Incidence Category 0 Incidence Category 1
Year Mean number Std. Dev. N Mean number Std. Dev. N
1980 149 183 357 122 169 214
1995 179 186 357 187 263 214
2000 208 203 357 222 274 214
2004 213 201 357 218 263 214
Overall, the log number of beef females increased from 1995 to 2004 (b=0.209, P<0.001)
when controlling for incidence category and 1980 cattle numbers. The log number of
beef females did not differ significantly between incidence categories (b=0.027,
P=0.542).
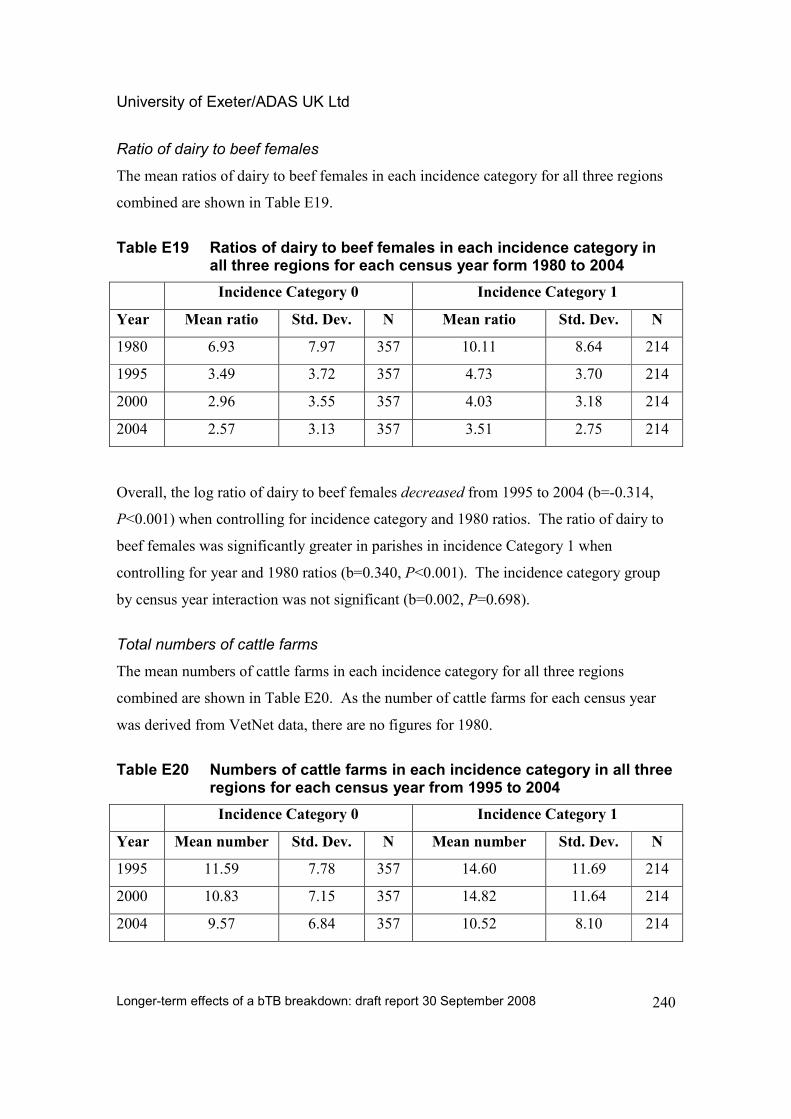
University of Exeter/ADAS UK Ltd
Longer-term effects of a bTB breakdown: draft report 30 September 2008
240
Ratio of dairy to beef females
The mean ratios of dairy to beef females in each incidence category for all three regions
combined are shown in Table E19.
Table E19 Ratios of dairy to beef females in each incidence category in all three regions for each census year form 1980 to 2004
Incidence Category 0 Incidence Category 1
Year Mean ratio Std. Dev. N Mean ratio Std. Dev. N
1980 6.93 7.97 357 10.11 8.64 214
1995 3.49 3.72 357 4.73 3.70 214
2000 2.96 3.55 357 4.03 3.18 214
2004 2.57 3.13 357 3.51 2.75 214
Overall, the log ratio of dairy to beef females decreased from 1995 to 2004 (b=-0.314,
P<0.001) when controlling for incidence category and 1980 ratios. The ratio of dairy to
beef females was significantly greater in parishes in incidence Category 1 when
controlling for year and 1980 ratios (b=0.340, P<0.001). The incidence category group
by census year interaction was not significant (b=0.002, P=0.698).
Total numbers of cattle farms
The mean numbers of cattle farms in each incidence category for all three regions
combined are shown in Table E20. As the number of cattle farms for each census year
was derived from VetNet data, there are no figures for 1980.
Table E20 Numbers of cattle farms in each incidence category in all three regions for each census year from 1995 to 2004
Incidence Category 0 Incidence Category 1
Year Mean number Std. Dev. N Mean number Std. Dev. N
1995 11.59 7.78 357 14.60 11.69 214
2000 10.83 7.15 357 14.82 11.64 214
2004 9.57 6.84 357 10.52 8.10 214
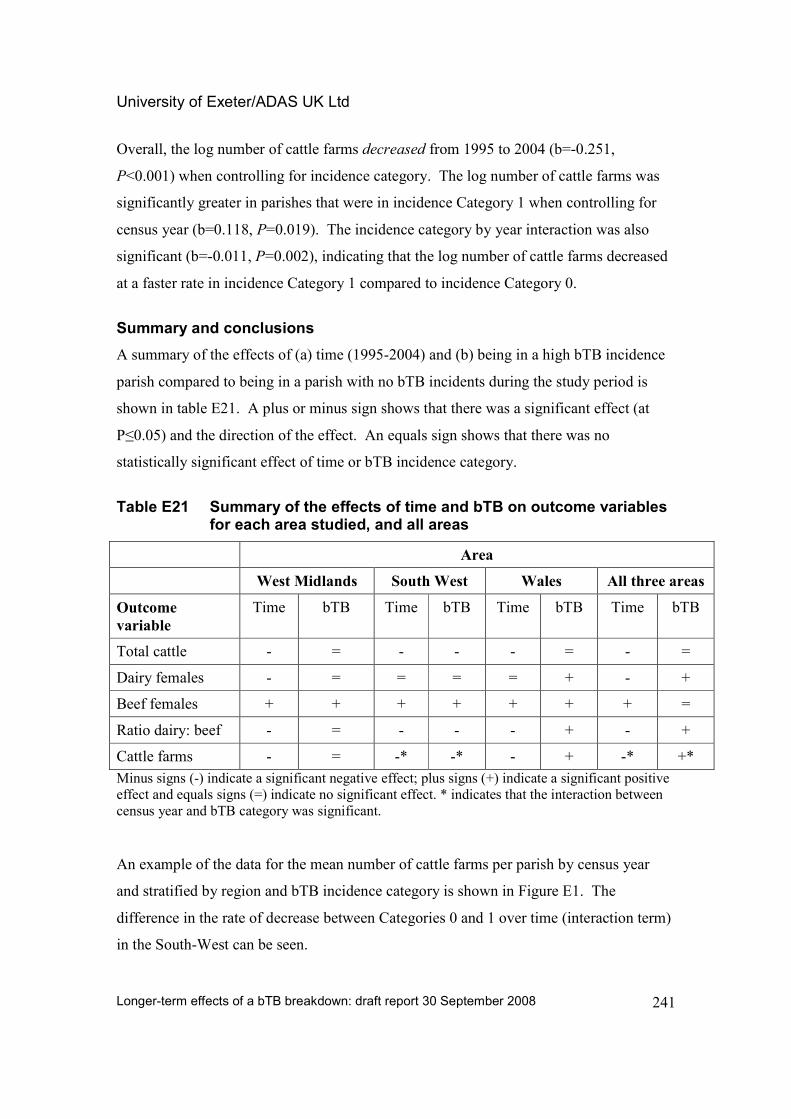
University of Exeter/ADAS UK Ltd
Longer-term effects of a bTB breakdown: draft report 30 September 2008
241
Overall, the log number of cattle farms decreased from 1995 to 2004 (b=-0.251,
P<0.001) when controlling for incidence category. The log number of cattle farms was
significantly greater in parishes that were in incidence Category 1 when controlling for
census year (b=0.118, P=0.019). The incidence category by year interaction was also
significant (b=-0.011, P=0.002), indicating that the log number of cattle farms decreased
at a faster rate in incidence Category 1 compared to incidence Category 0.
Summary and conclusions
A summary of the effects of (a) time (1995-2004) and (b) being in a high bTB incidence
parish compared to being in a parish with no bTB incidents during the study period is
shown in table E21. A plus or minus sign shows that there was a significant effect (at
P≤0.05) and the direction of the effect. An equals sign shows that there was no
statistically significant effect of time or bTB incidence category.
Table E21 Summary of the effects of time and bTB on outcome variables for each area studied, and all areas
Area
West Midlands South West Wales All three areas
Outcome
variable
Time bTB Time bTB Time bTB Time bTB
Total cattle - = - - - = - =
Dairy females - = = = = + - +
Beef females + + + + + + + =
Ratio dairy: beef - = - - - + - +
Cattle farms - = -* -* - + -* +*
Minus signs (-) indicate a significant negative effect; plus signs (+) indicate a significant positive
effect and equals signs (=) indicate no significant effect. * indicates that the interaction between
census year and bTB category was significant.
An example of the data for the mean number of cattle farms per parish by census year
and stratified by region and bTB incidence category is shown in Figure E1. The
difference in the rate of decrease between Categories 0 and 1 over time (interaction term)
in the South-West can be seen.
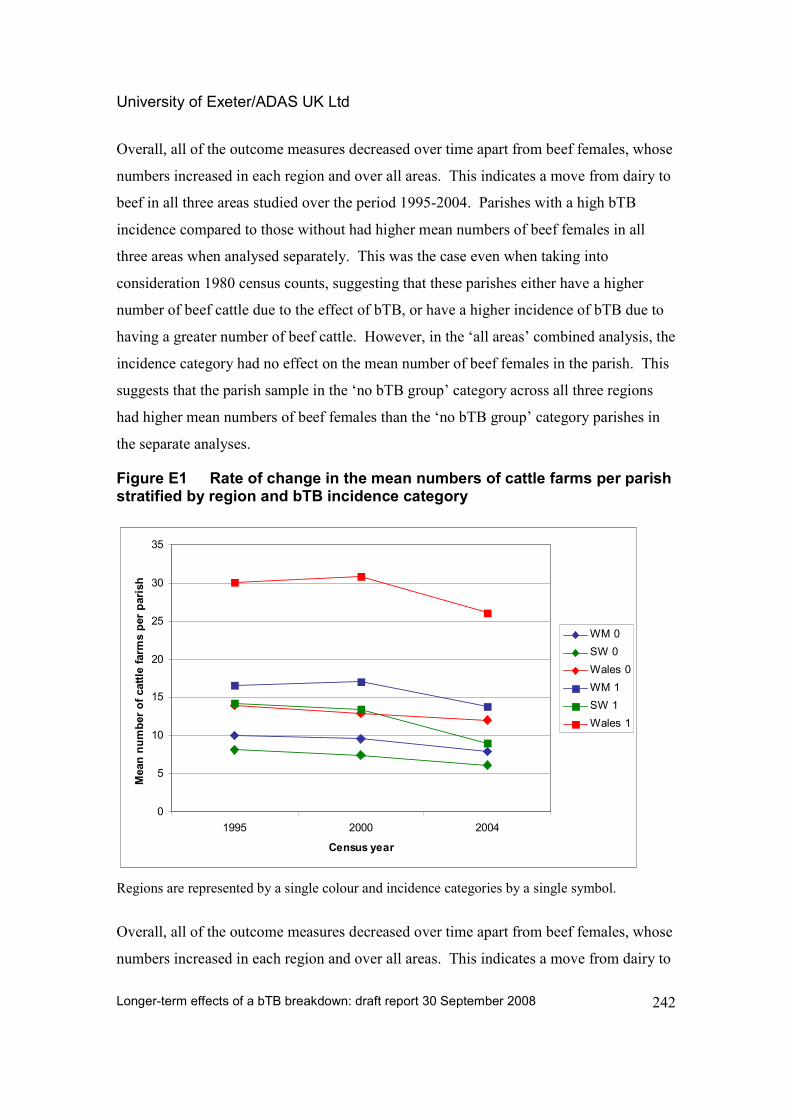
University of Exeter/ADAS UK Ltd
Longer-term effects of a bTB breakdown: draft report 30 September 2008
242
Overall, all of the outcome measures decreased over time apart from beef females, whose
numbers increased in each region and over all areas. This indicates a move from dairy to
beef in all three areas studied over the period 1995-2004. Parishes with a high bTB
incidence compared to those without had higher mean numbers of beef females in all
three areas when analysed separately. This was the case even when taking into
consideration 1980 census counts, suggesting that these parishes either have a higher
number of beef cattle due to the effect of bTB, or have a higher incidence of bTB due to
having a greater number of beef cattle. However, in the ‘all areas’ combined analysis, the
incidence category had no effect on the mean number of beef females in the parish. This
suggests that the parish sample in the ‘no bTB group’ category across all three regions
had higher mean numbers of beef females than the ‘no bTB group’ category parishes in
the separate analyses.
Figure E1 Rate of change in the mean numbers of cattle farms per parish stratified by region and bTB incidence category
0
5
10
15
20
25
30
35
1995 2000 2004
Census year
Mean number of cattle farm
s per parish
WM 0
SW 0
Wales 0
WM 1
SW 1
Wales 1
Regions are represented by a single colour and incidence categories by a single symbol.
Overall, all of the outcome measures decreased over time apart from beef females, whose
numbers increased in each region and over all areas. This indicates a move from dairy to
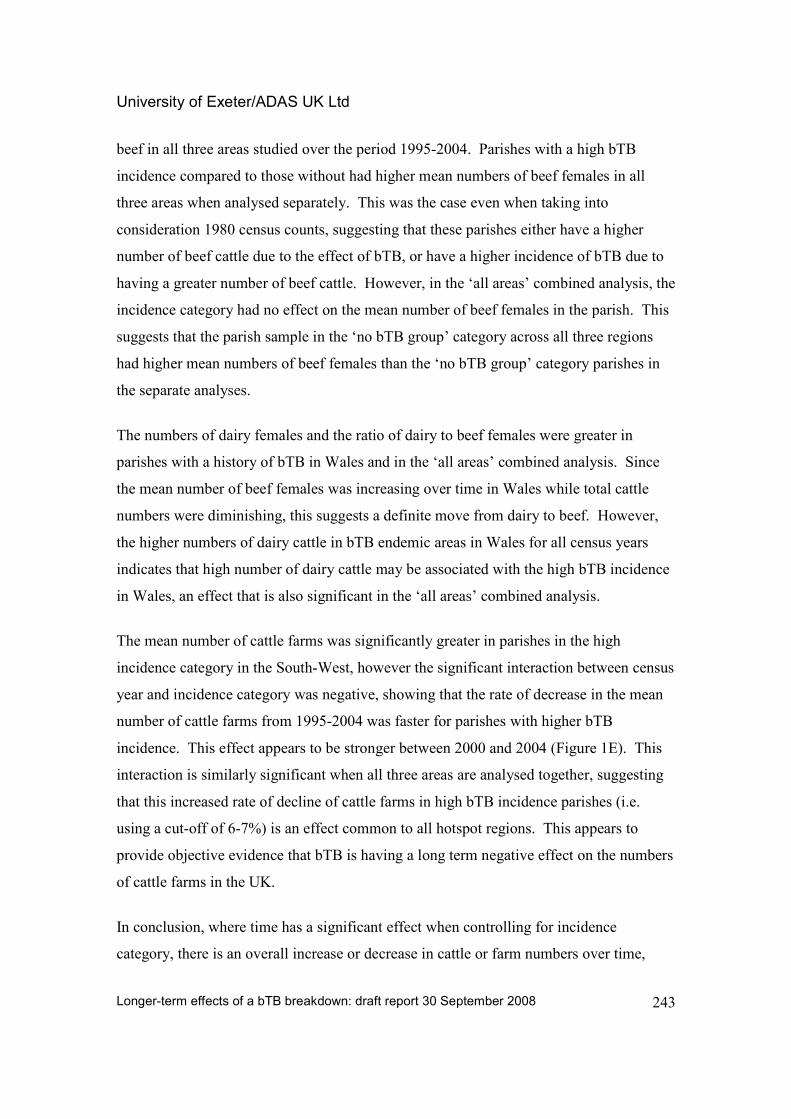
University of Exeter/ADAS UK Ltd
Longer-term effects of a bTB breakdown: draft report 30 September 2008
243
beef in all three areas studied over the period 1995-2004. Parishes with a high bTB
incidence compared to those without had higher mean numbers of beef females in all
three areas when analysed separately. This was the case even when taking into
consideration 1980 census counts, suggesting that these parishes either have a higher
number of beef cattle due to the effect of bTB, or have a higher incidence of bTB due to
having a greater number of beef cattle. However, in the ‘all areas’ combined analysis, the
incidence category had no effect on the mean number of beef females in the parish. This
suggests that the parish sample in the ‘no bTB group’ category across all three regions
had higher mean numbers of beef females than the ‘no bTB group’ category parishes in
the separate analyses.
The numbers of dairy females and the ratio of dairy to beef females were greater in
parishes with a history of bTB in Wales and in the ‘all areas’ combined analysis. Since
the mean number of beef females was increasing over time in Wales while total cattle
numbers were diminishing, this suggests a definite move from dairy to beef. However,
the higher numbers of dairy cattle in bTB endemic areas in Wales for all census years
indicates that high number of dairy cattle may be associated with the high bTB incidence
in Wales, an effect that is also significant in the ‘all areas’ combined analysis.
The mean number of cattle farms was significantly greater in parishes in the high
incidence category in the South-West, however the significant interaction between census
year and incidence category was negative, showing that the rate of decrease in the mean
number of cattle farms from 1995-2004 was faster for parishes with higher bTB
incidence. This effect appears to be stronger between 2000 and 2004 (Figure 1E). This
interaction is similarly significant when all three areas are analysed together, suggesting
that this increased rate of decline of cattle farms in high bTB incidence parishes (i.e.
using a cut-off of 6-7%) is an effect common to all hotspot regions. This appears to
provide objective evidence that bTB is having a long term negative effect on the numbers
of cattle farms in the UK.
In conclusion, where time has a significant effect when controlling for incidence
category, there is an overall increase or decrease in cattle or farm numbers over time,
University of Exeter/ADAS UK Ltd
Longer-term effects of a bTB breakdown: draft report 30 September 2008
244
which could be due to a variety of reasons. Where incidence category affiliation has a
significant effect when controlling for time, but the interaction is not significant, the
mean numbers of cattle and cattle farms are greater in one group of parishes compared to
the other. This is more likely to be a cause rather than an effect of high bTB incidence
or, conceivably, a correlate of a farming practice that is more conducive to bTB, since
there is no differential rate of change over time (i.e. with increasing severity of bTB).
Where the interaction term is significant, this represents a differential time effect between
parish groups, which suggests that it is the high bTB incidence itself that is driving the
rate of change.
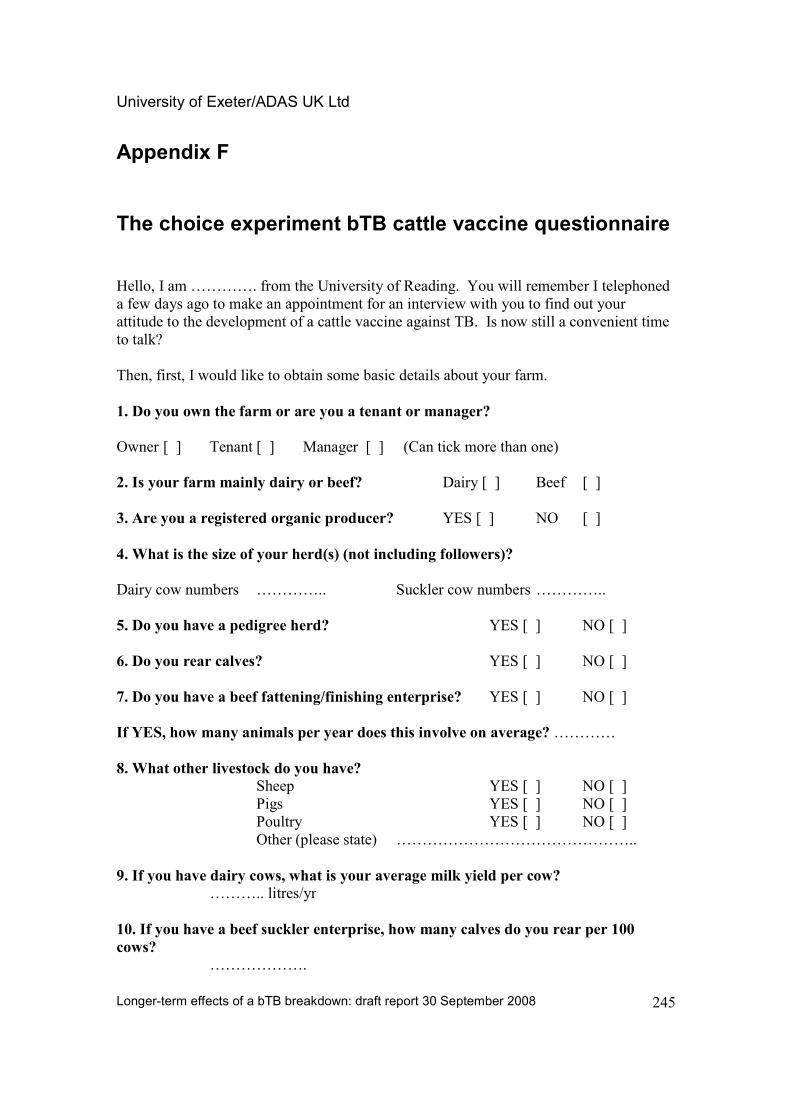
University of Exeter/ADAS UK Ltd
Longer-term effects of a bTB breakdown: draft report 30 September 2008
245
Appendix F The choice experiment bTB cattle vaccine questionnaire
Hello, I am …………. from the University of Reading. You will remember I telephoned
a few days ago to make an appointment for an interview with you to find out your
attitude to the development of a cattle vaccine against TB. Is now still a convenient time
to talk?
Then, first, I would like to obtain some basic details about your farm.
1. Do you own the farm or are you a tenant or manager?
Owner [ ] Tenant [ ] Manager [ ] (Can tick more than one)
2. Is your farm mainly dairy or beef? Dairy [ ] Beef [ ]
3. Are you a registered organic producer? YES [ ] NO [ ]
4. What is the size of your herd(s) (not including followers)?
Dairy cow numbers ………….. Suckler cow numbers …………..
5. Do you have a pedigree herd? YES [ ] NO [ ]
6. Do you rear calves? YES [ ] NO [ ]
7. Do you have a beef fattening/finishing enterprise? YES [ ] NO [ ]
If YES, how many animals per year does this involve on average? …………
8. What other livestock do you have? Sheep YES [ ] NO [ ]
Pigs YES [ ] NO [ ]
Poultry YES [ ] NO [ ]
Other (please state) ………………………………………..
9. If you have dairy cows, what is your average milk yield per cow? ……….. litres/yr
10. If you have a beef suckler enterprise, how many calves do you rear per 100
cows? ……………….
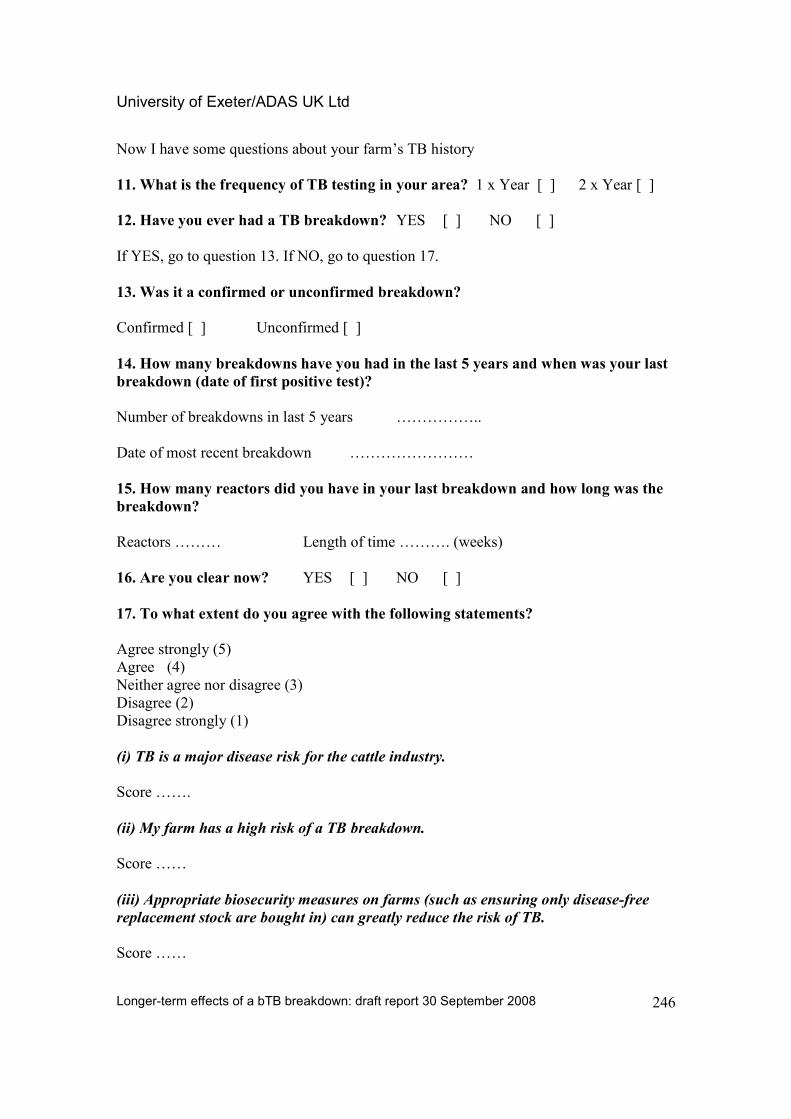
University of Exeter/ADAS UK Ltd
Longer-term effects of a bTB breakdown: draft report 30 September 2008
246
Now I have some questions about your farm’s TB history
11. What is the frequency of TB testing in your area? 1 x Year [ ] 2 x Year [ ]
12. Have you ever had a TB breakdown? YES [ ] NO [ ]
If YES, go to question 13. If NO, go to question 17.
13. Was it a confirmed or unconfirmed breakdown?
Confirmed [ ] Unconfirmed [ ]
14. How many breakdowns have you had in the last 5 years and when was your last
breakdown (date of first positive test)?
Number of breakdowns in last 5 years ……………..
Date of most recent breakdown ……………………
15. How many reactors did you have in your last breakdown and how long was the
breakdown?
Reactors ……… Length of time ………. (weeks)
16. Are you clear now? YES [ ] NO [ ]
17. To what extent do you agree with the following statements?
Agree strongly (5)
Agree (4)
Neither agree nor disagree (3)
Disagree (2)
Disagree strongly (1)
(i) TB is a major disease risk for the cattle industry.
Score …….
(ii) My farm has a high risk of a TB breakdown.
Score ……
(iii) Appropriate biosecurity measures on farms (such as ensuring only disease-free
replacement stock are bought in) can greatly reduce the risk of TB.
Score ……
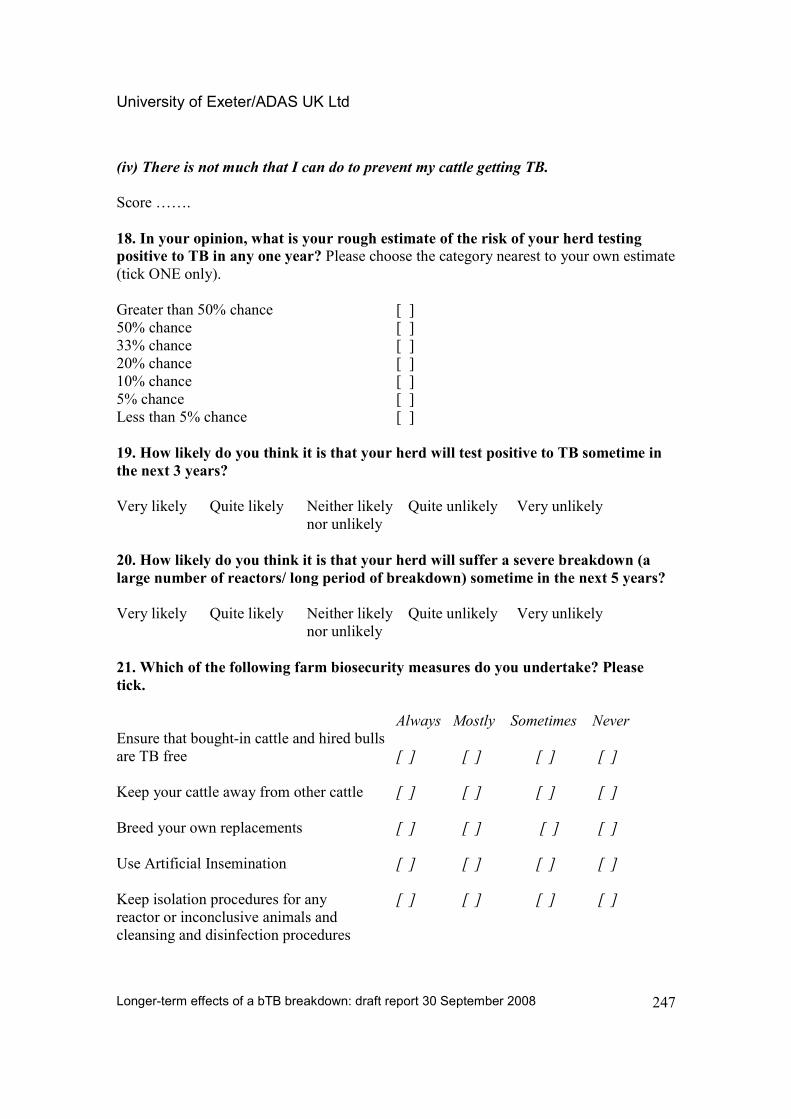
University of Exeter/ADAS UK Ltd
Longer-term effects of a bTB breakdown: draft report 30 September 2008
247
(iv) There is not much that I can do to prevent my cattle getting TB.
Score …….
18. In your opinion, what is your rough estimate of the risk of your herd testing
positive to TB in any one year? Please choose the category nearest to your own estimate
(tick ONE only).
Greater than 50% chance [ ]
50% chance [ ]
33% chance [ ]
20% chance [ ]
10% chance [ ]
5% chance [ ]
Less than 5% chance [ ]
19. How likely do you think it is that your herd will test positive to TB sometime in
the next 3 years?
Very likely Quite likely Neither likely Quite unlikely Very unlikely
nor unlikely
20. How likely do you think it is that your herd will suffer a severe breakdown (a
large number of reactors/ long period of breakdown) sometime in the next 5 years?
Very likely Quite likely Neither likely Quite unlikely Very unlikely
nor unlikely
21. Which of the following farm biosecurity measures do you undertake? Please
tick.
Always Mostly Sometimes Never
Ensure that bought-in cattle and hired bulls
are TB free [ ] [ ] [ ] [ ]
Keep your cattle away from other cattle [ ] [ ] [ ] [ ]
Breed your own replacements [ ] [ ] [ ] [ ]
Use Artificial Insemination [ ] [ ] [ ] [ ]
Keep isolation procedures for any [ ] [ ] [ ] [ ]
reactor or inconclusive animals and
cleansing and disinfection procedures
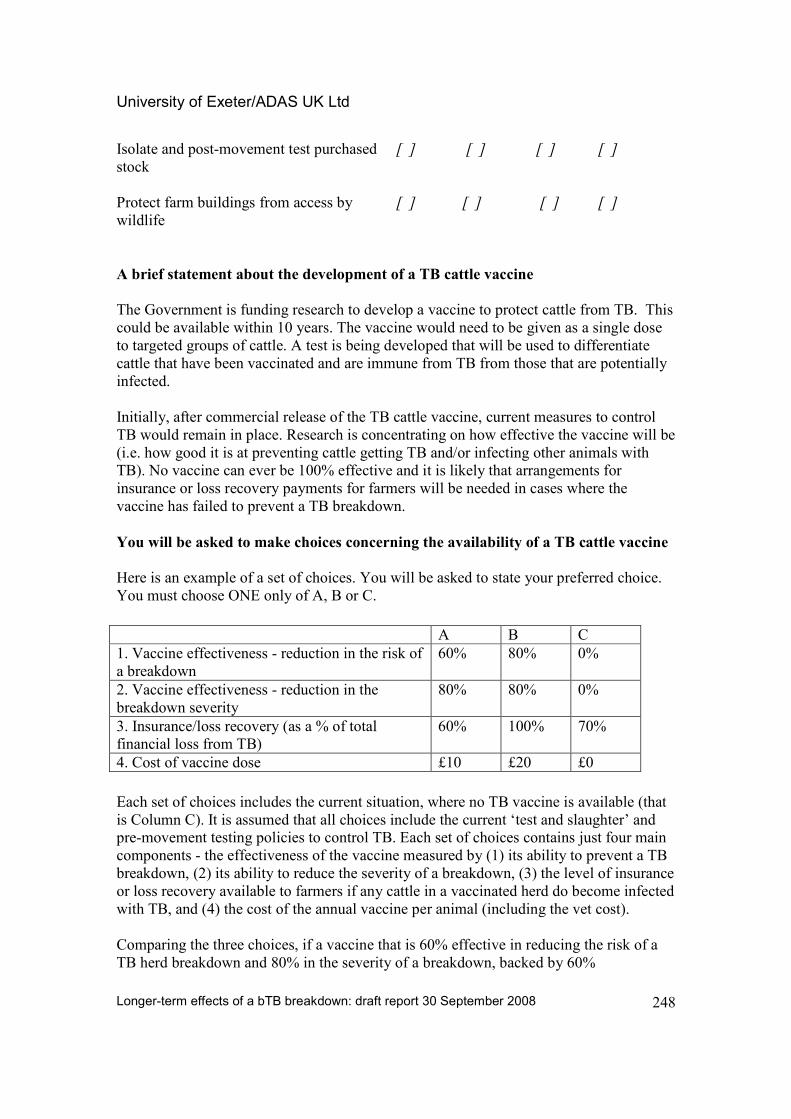
University of Exeter/ADAS UK Ltd
Longer-term effects of a bTB breakdown: draft report 30 September 2008
248
Isolate and post-movement test purchased [ ] [ ] [ ] [ ]
stock
Protect farm buildings from access by [ ] [ ] [ ] [ ]
wildlife
A brief statement about the development of a TB cattle vaccine
The Government is funding research to develop a vaccine to protect cattle from TB. This
could be available within 10 years. The vaccine would need to be given as a single dose
to targeted groups of cattle. A test is being developed that will be used to differentiate
cattle that have been vaccinated and are immune from TB from those that are potentially
infected.
Initially, after commercial release of the TB cattle vaccine, current measures to control
TB would remain in place. Research is concentrating on how effective the vaccine will be
(i.e. how good it is at preventing cattle getting TB and/or infecting other animals with
TB). No vaccine can ever be 100% effective and it is likely that arrangements for
insurance or loss recovery payments for farmers will be needed in cases where the
vaccine has failed to prevent a TB breakdown.
You will be asked to make choices concerning the availability of a TB cattle vaccine
Here is an example of a set of choices. You will be asked to state your preferred choice.
You must choose ONE only of A, B or C.
A B C
1. Vaccine effectiveness - reduction in the risk of
a breakdown
60% 80% 0%
2. Vaccine effectiveness - reduction in the
breakdown severity
80% 80% 0%
3. Insurance/loss recovery (as a % of total
financial loss from TB) 60% 100% 70%
4. Cost of vaccine dose £10 £20 £0
Each set of choices includes the current situation, where no TB vaccine is available (that
is Column C). It is assumed that all choices include the current ‘test and slaughter’ and
pre-movement testing policies to control TB. Each set of choices contains just four main
components - the effectiveness of the vaccine measured by (1) its ability to prevent a TB
breakdown, (2) its ability to reduce the severity of a breakdown, (3) the level of insurance
or loss recovery available to farmers if any cattle in a vaccinated herd do become infected
with TB, and (4) the cost of the annual vaccine per animal (including the vet cost).
Comparing the three choices, if a vaccine that is 60% effective in reducing the risk of a
TB herd breakdown and 80% in the severity of a breakdown, backed by 60%
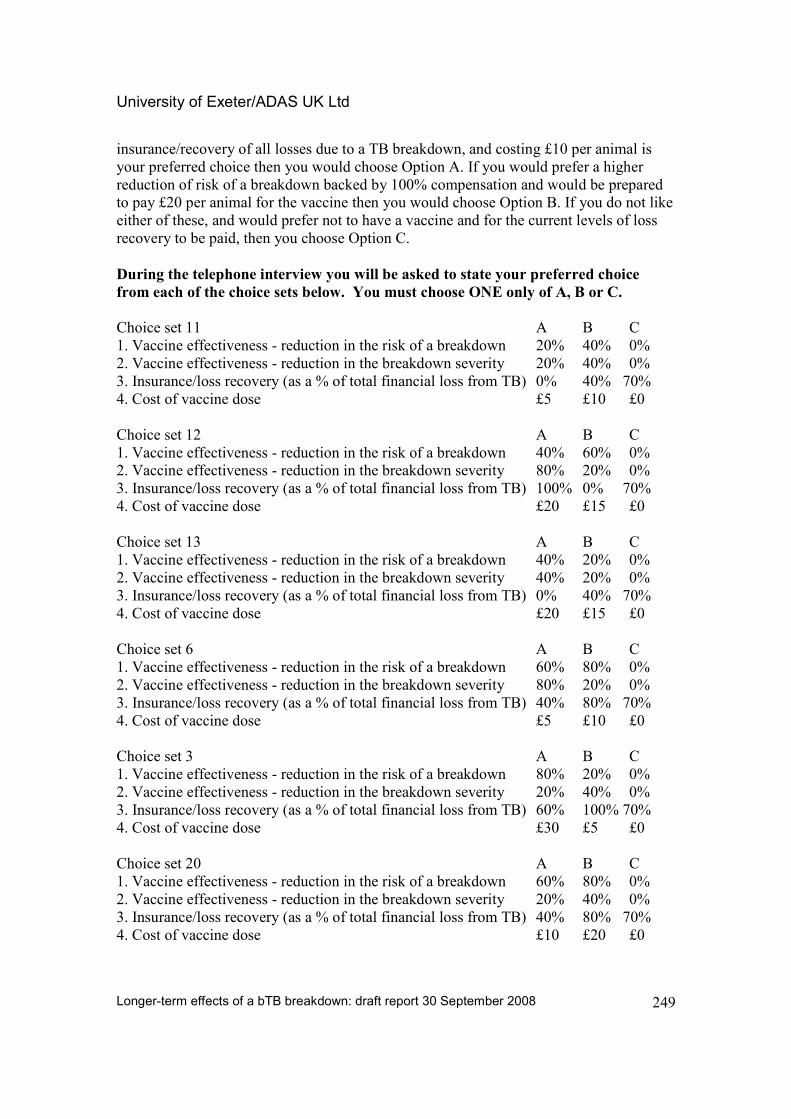
University of Exeter/ADAS UK Ltd
Longer-term effects of a bTB breakdown: draft report 30 September 2008
249
insurance/recovery of all losses due to a TB breakdown, and costing £10 per animal is
your preferred choice then you would choose Option A. If you would prefer a higher
reduction of risk of a breakdown backed by 100% compensation and would be prepared
to pay £20 per animal for the vaccine then you would choose Option B. If you do not like
either of these, and would prefer not to have a vaccine and for the current levels of loss
recovery to be paid, then you choose Option C.
During the telephone interview you will be asked to state your preferred choice
from each of the choice sets below. You must choose ONE only of A, B or C.
Choice set 11 A B C
1. Vaccine effectiveness - reduction in the risk of a breakdown 20% 40% 0%
2. Vaccine effectiveness - reduction in the breakdown severity 20% 40% 0%
3. Insurance/loss recovery (as a % of total financial loss from TB) 0% 40% 70%
4. Cost of vaccine dose £5 £10 £0
Choice set 12 A B C
1. Vaccine effectiveness - reduction in the risk of a breakdown 40% 60% 0%
2. Vaccine effectiveness - reduction in the breakdown severity 80% 20% 0%
3. Insurance/loss recovery (as a % of total financial loss from TB) 100% 0% 70%
4. Cost of vaccine dose £20 £15 £0
Choice set 13 A B C
1. Vaccine effectiveness - reduction in the risk of a breakdown 40% 20% 0%
2. Vaccine effectiveness - reduction in the breakdown severity 40% 20% 0%
3. Insurance/loss recovery (as a % of total financial loss from TB) 0% 40% 70%
4. Cost of vaccine dose £20 £15 £0
Choice set 6 A B C
1. Vaccine effectiveness - reduction in the risk of a breakdown 60% 80% 0%
2. Vaccine effectiveness - reduction in the breakdown severity 80% 20% 0%
3. Insurance/loss recovery (as a % of total financial loss from TB) 40% 80% 70%
4. Cost of vaccine dose £5 £10 £0
Choice set 3 A B C
1. Vaccine effectiveness - reduction in the risk of a breakdown 80% 20% 0%
2. Vaccine effectiveness - reduction in the breakdown severity 20% 40% 0%
3. Insurance/loss recovery (as a % of total financial loss from TB) 60% 100% 70%
4. Cost of vaccine dose £30 £5 £0
Choice set 20 A B C
1. Vaccine effectiveness - reduction in the risk of a breakdown 60% 80% 0%
2. Vaccine effectiveness - reduction in the breakdown severity 20% 40% 0%
3. Insurance/loss recovery (as a % of total financial loss from TB) 40% 80% 70%
4. Cost of vaccine dose £10 £20 £0
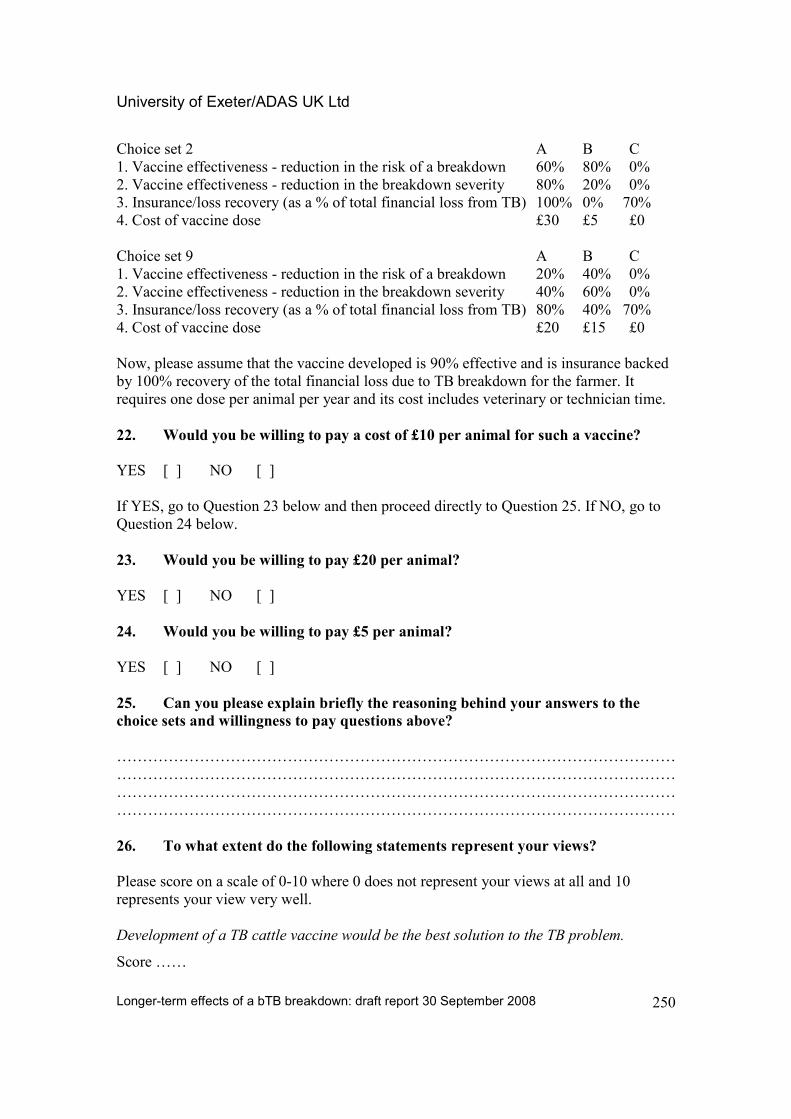
University of Exeter/ADAS UK Ltd
Longer-term effects of a bTB breakdown: draft report 30 September 2008
250
Choice set 2 A B C
1. Vaccine effectiveness - reduction in the risk of a breakdown 60% 80% 0%
2. Vaccine effectiveness - reduction in the breakdown severity 80% 20% 0%
3. Insurance/loss recovery (as a % of total financial loss from TB) 100% 0% 70%
4. Cost of vaccine dose £30 £5 £0
Choice set 9 A B C
1. Vaccine effectiveness - reduction in the risk of a breakdown 20% 40% 0%
2. Vaccine effectiveness - reduction in the breakdown severity 40% 60% 0%
3. Insurance/loss recovery (as a % of total financial loss from TB) 80% 40% 70%
4. Cost of vaccine dose £20 £15 £0
Now, please assume that the vaccine developed is 90% effective and is insurance backed
by 100% recovery of the total financial loss due to TB breakdown for the farmer. It
requires one dose per animal per year and its cost includes veterinary or technician time.
22. Would you be willing to pay a cost of £10 per animal for such a vaccine?
YES [ ] NO [ ]
If YES, go to Question 23 below and then proceed directly to Question 25. If NO, go to
Question 24 below.
23. Would you be willing to pay £20 per animal?
YES [ ] NO [ ]
24. Would you be willing to pay £5 per animal?
YES [ ] NO [ ]
25. Can you please explain briefly the reasoning behind your answers to the
choice sets and willingness to pay questions above?
………………………………………………………………………………………………
………………………………………………………………………………………………
………………………………………………………………………………………………
………………………………………………………………………………………………
26. To what extent do the following statements represent your views?
Please score on a scale of 0-10 where 0 does not represent your views at all and 10
represents your view very well.
Development of a TB cattle vaccine would be the best solution to the TB problem.
Score ……
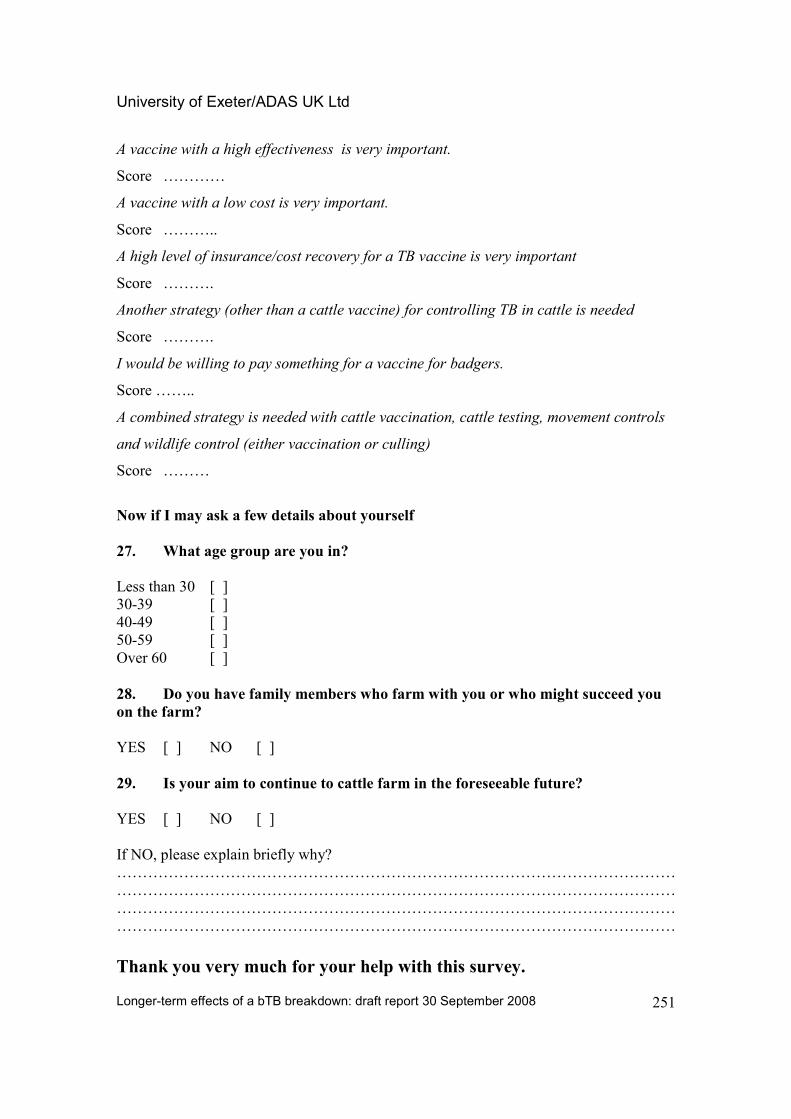
University of Exeter/ADAS UK Ltd
Longer-term effects of a bTB breakdown: draft report 30 September 2008
251
A vaccine with a high effectiveness is very important.
Score …………
A vaccine with a low cost is very important.
Score ………..
A high level of insurance/cost recovery for a TB vaccine is very important
Score ……….
Another strategy (other than a cattle vaccine) for controlling TB in cattle is needed
Score ……….
I would be willing to pay something for a vaccine for badgers.
Score ……..
A combined strategy is needed with cattle vaccination, cattle testing, movement controls
and wildlife control (either vaccination or culling)
Score ………
Now if I may ask a few details about yourself
27. What age group are you in?
Less than 30 [ ]
30-39 [ ]
40-49 [ ]
50-59 [ ]
Over 60 [ ]
28. Do you have family members who farm with you or who might succeed you
on the farm?
YES [ ] NO [ ]
29. Is your aim to continue to cattle farm in the foreseeable future?
YES [ ] NO [ ]
If NO, please explain briefly why?
………………………………………………………………………………………………
………………………………………………………………………………………………
………………………………………………………………………………………………
………………………………………………………………………………………………
Thank you very much for your help with this survey.